Archaeology in Three Dimensions - Computer-Based Methods in Archaeological Research
Upload
khangminh22Category
view
0download
0
THE EVOLUTION OF COMPETITION AND COOPERATION IN FIJIAN
PREHISTORY: ARCHAEOLOGICAL RESEARCH IN THE SIGATOKA VALLEY,
FIJI
A DISSERTATION SUBMITTED TO THE GRADUATE DIVISION OF THE
UNIVERSITY OF HAWAI‘I IN PARTIAL FULFILLMENT OF THE
REQUIREMENTS FOR THE DEGREE OF
DOCTOR OF PHILOSOPHY
IN
ANTHROPOLOGY
DECEMBER 2003
By
Julie S. Field
Dissertation Committee:
Terry Hunt, Chairperson
Michael Graves
Miriam Stark
Thegn Ladefoged
Matt McGranaghan

ii
We certify that we have read this dissertation and that, in our opinion, it is satisfactory in
scope and quality as a dissertation for the degree of Doctor of Philosophy in
Anthropology.

iii
© 2003, Julie S. Field

iv
ACKNOWLEDGMENTS
Funding for this research was provided by the National Science Foundation
(Dissertation Improvement Grant # BCS-0106221), the University of Hawai‘i Space
Grant College (Fellowship, 1997-1999), the Honolulu Branch of the American
Association of University Women (Pacific Fellowship, 2001), the Waikato Radiocarbon
Dating Laboratory (Waikato Archaeological Dating Fund, 2002), and the University of
Hawai‘i College of Arts and Sciences (Advisory Award, 1998 and 1999). My thanks and
appreciation go to the Anthropology and Geography Departments of the University of
Hawai‘i, Mānoa, in particular Drs. Terry Hunt, Michael Graves, Miriam Stark, and Matt
McGranaghan. These individuals guided me throughout this research, and contributed in
many ways to the conception, initiation, and completion of this project. I must express
additional gratitude to Dr. Thegn Ladefoged (University of Auckland) for many instances
of long-distance commentary and critique, and also Dr. Julie Stein (University of
Washington) for aid in the interpretation of geoarchaeological data.
The archaeological research described in this dissertation was the result of
numerous visits and over 10 months of survey and excavation. My special thanks go to
the Fiji Museum, in particular the past and present directors, Tarisi Sorovi-Vunidilo and
Sagale Buadromo, and the staff of the Archaeology Department, Jone Naucabalavu and
Sepeti Matararaba. Archival research was also made possible by Sela Rayawa. I also
wish to thank the Roko Tui of the Nadrogā/Navosa Provincial Office, Lote Naikasewa,
for permitting archaeological research in Nadrogā and Navosa from August 2001 to
March of 2002. Marika Nagata of the Navatumali Navosa Provincial Office also

v
provided essential aid. The use of a 4WD vehicle was permitted by Australian National
University, and my gratitude goes out to Drs. Geoff Hope (ANU) and Paddy Nunn
(USP), and also Lyndall Fisher (FASANOC).
Research within Nadrogā and Navosa would not have been possible without the
blessing of many villages and individuals. In particular, I wish to thank the villages of
Malevu, Nayawa, Laselase, Naduri, Nakalavo, Narata, Raiwaqa, Tawatawadi, Tonuve,
Volinagerua, Sawene, Korovou, Nubuyanitu, Waibasaga, and Korolevu. The results of
excavations at the koro makawa for these villages have provided important cultural and
historical information concerning the prehistory of Fiji, and I must express my immense
gratitude for the opportunity to investigate these sites further. Men and women from
these villages also expertly conducted survey and excavation. My thanks go to them for
their diligent and careful work at the sites, without which this project would have
suffered greatly.
I also wish to acknowledge the immense contributions of the late Bruce Palmer
and John Parry to the study of Fijian fortifications and settlement patterns. In both
published works and unpublished manuscripts, these gentlemen collected and synthesized
vast amounts of data pertaining to Fijian prehistory. My research in the Sigatoka Valley
benefited in innumerable ways from their previous work, and I hope that the results
summarized within this dissertation can serve as a modest tribute to their memory.

vi
ABSTRACT
This dissertation explores the emergence and consequences of competitive and
cooperative strategies in Fijian prehistory. The Sigatoka Valley, located in southwestern
Viti Levu, is the subject of a series of geographical, environmental, and archaeological
analyses. Using GIS-based analyses, the effects of environmental fluctuations on
agricultural productivity (i.e., the El Niño Southern Oscillation [ENSO], and also the
transition between the Little Climatic Optimum [LCO] and Little Ice Age [LIA]) are
reconstructed and used to predict zones of low-yields and episodic shortfalls. These
results indicate that the Sigatoka Valley was both spatially and temporally variable in
terms of agricultural productivity and predictability. In the context of an evolutionary
ecology-based model of competition and cooperation, this environment encouraged the
development of conflict and defensive habitation strategies between human groups.
The results of environmental analyses are also compared to the archaeological
record, and used to determine the presence of three modes of habitation/subsistence:
territorial strongholds, remote refuges, and agricultural production sites. Archaeological
testing of these classes in tandem with GIS-based environmental research indicate that
the Sigatoka Valley was initially occupied between Cal BC 20 – Cal AD 80, in
association with dense and predictable resources. Fortifications that utilized natural
topography, and also remote refuges, were established ca. AD 700, and remained in use
throughout the prehistoric period. Environmental refuges associated with the effects of
the LCO/LIA transition were established ca. AD 1300-1500. Constructed fortifications

vii
that utilized an annular ditch, and which were located in the valley bottom, appeared ca.
AD 1700 – 1850.
The chronology of habitation/subsistence strategies is also compared to land-
tenure and archaeological data (e.g., land-holdings of yavusa, and also evidence for
unique artifacts and valley-wide exchange). These data suggest particular historical
trajectories in the Sigatoka delta and highlands, and also varying frequencies of
competition and cooperation in prehistory. In sum, this dissertation identifies interaction
between humans and their environment as the fundamental relationship that conditioned
change in prehistoric Fiji.

viii
TABLE OF CONTENTS
ACKNOWLEDGMENTS ............................................................................................ IV
ABSTRACT ................................................................................................................. VI
LIST OF TABLES ..................................................................................................... XIII
LIST OF FIGURES ..................................................................................................... XV
CHAPTER 1. INTRODUCTION ....................................................................................1
1.1 THE ANTHROPOLOGY OF WAR ................................................................................2
1.2 EVOLUTIONARY ECOLOGY .....................................................................................3
1.3 THE SIGATOKA VALLEY .........................................................................................6
CHAPTER 2. UNDERSTANDING COMPETITION AND COOPERATION IN FIJIAN
PREHISTORY .............................................................................................................. 11
The Origin of Fortifications ................................................................................... 11
2.1. MODELS OF FIJIAN PREHISTORY .......................................................................... 14
2.2. RESEARCH QUESTIONS ........................................................................................ 18
2.2. EVOLUTIONARY ECOLOGY ................................................................................... 20
Methodological Individualism................................................................................ 21
Behavioral Strategies and Hypothetico-Deductive Modeling .................................. 22
2.3. AN EVOLUTIONARY ECOLOGY MODEL FOR COMPETITION AND COOPERATION ...... 24
The Formation of Groups ....................................................................................... 25
Social Stratification ................................................................................................ 26
The Development of Competition and/or Cooperation Between Groups ................. 26
The Persistence of Competition and/or Cooperation Between Groups .................... 30
2.4 TESTABLE HYPOTHESES FOR THE SIGATOKA VALLEY CASE................................... 31
2.5 CHAPTER SUMMARY ............................................................................................ 33
CHAPTER 3. SPATIO-TEMPORAL VARIABILITY AND UNPREDICTABILITY IN
THE SIGATOKA VALLEY ENVIRONMENT ............................................................ 34
3.1 THE STUDY AREA: THE SIGATOKA VALLEY .......................................................... 34
The Upper, Middle, and Lower Sigatoka Valley..................................................... 35
Flora and Fauna of the Interior ............................................................................... 42
3.2. SUBSISTENCE ISSUES IN FIJIAN PREHISTORY ......................................................... 44
Pacific Islands Agriculture ..................................................................................... 44
3.3 SPATIAL ANALYSES OF DRYLAND CULTIVATION ................................................... 46
3.4 TEMPORAL VARIABILITY IN THE SIGATOKA VALLEY ENVIRONMENT ..................... 50
Seasonal Variability in Rainfall .............................................................................. 51
The Frequency and Amplitude of Environmental Fluctuations ............................... 57
The El Niño Southern Oscillation (ENSO) ............................................................. 58
ENSO in the Fiji Islands: El Niño and La Niña ..................................................... 59
3.5. EVALUATING THE EFFECT OF ENSO ON AGRICULTURAL PRODUCTION IN THE
SIGATOKA VALLEY..................................................................................................... 61

ix
Tracing ENSO Events in Prehistory ....................................................................... 65
3.6 PUNCTUATED CLIMATIC CHANGE: THE LCO/LIA TRANSITION ............................. 69
3.7 EVALUATION OF THE EFFECTS OF THE LCO/LIA TRANSITION ............................... 71
3.8 CONCLUSION: SPATIO-TEMPORAL VARIABILITY IN THE SIGATOKA VALLEY .......... 73
3.9 CHAPTER SUMMARY ............................................................................................ 77
CHAPTER 4. ANALYTICAL UNITS AND ANALYSES ........................................... 79
4.1. DEFINING ARTIFACT CLASSES .............................................................................. 80
Natural and Constructed Defenses .......................................................................... 82
Detecting Cooperation ........................................................................................... 83
4.2 THE ARCHAEOLOGICAL RECORD OF THE SIGATOKA VALLEY ................................. 84
4.3 GIS ANALYSES: QUANTIFYING NATURAL AND CONSTRUCTED DEFENSE................ 89
4.4 INTEGRATION IN THE GIS ..................................................................................... 91
4.5 INITIAL OBSERVATIONS: CONSTRUCTION AND LANDFORM IN THE SIGATOKA
VALLEY ..................................................................................................................... 92
4.6 SPATIO-TEMPORAL VARIATIONS IN IRRIGATED AGRICULTURAL PRODUCTIVITY .... 96
Irrigated Terraces: Distribution and Productivity between Wet and Dry Seasons ... 96
Results: Wetland Cultivation in the Sigatoka Valley .............................................. 99
4.7 THE EFFECT OF ENSO-RELATED CLIMATIC PERTURBATIONS ON WETLAND
PRODUCTION ............................................................................................................ 103
4.8. PROXIMITY ANALYSES AND SPATIO-TEMPORAL VARIATIONS IN TOTAL
AGRICULTURAL PRODUCTIVITY ................................................................................ 104
Proximity to Wetland and Dryland Cultivation as an Index of Subsistence Strategies
............................................................................................................................ 106
Evaluation: Yield Variability and Implications for Seasonal Shortfalls ................. 108
4.9 DEFENSE AND PRODUCTION IN THE SIGATOKA VALLEY ....................................... 111
Defensive Strategy ............................................................................................... 112
Defended Production Strategy .............................................................................. 114
Production Strategy .............................................................................................. 116
4.10 POTENTIAL TRENDS IN DEFENSIVE SETTLEMENT AND SUBSISTENCE IN THE
SIGATOKA VALLEY................................................................................................... 117
4.11 CHAPTER SUMMARY ......................................................................................... 120
CHAPTER 5. EXCAVATIONS AND CHRONOLOGY ............................................ 122
5.1. PREVIOUS EXCAVATIONS IN THE SIGATOKA VALLEY .......................................... 122
5.2 ORAL TRADITIONS AND THE HISTORICAL RECORD .............................................. 123
5.3 ARCHAEOLOGICAL EXCAVATION IN THE SIGATOKA VALLEY: SAMPLING ............. 126
5.4 EXCAVATION METHODS ..................................................................................... 127
5.5 TATUBA CAVE (1-NMT-015) ............................................................................. 132
The Cave System ................................................................................................. 134
Historical Descriptions of the Cave System .......................................................... 136
The 1972 Excavations .......................................................................................... 137
Tatuba Cave: 2002 Excavations ........................................................................... 140
Tatuba Cave: Test Unit 1: Layers I-II ................................................................... 141
Tatuba Cave: Test Unit 1: Layers III, IV, and IX .................................................. 144

x
Tatuba Cave: Test Unit 1: Layers V and VII ........................................................ 145
Tatuba Cave: Test Unit 1: Feature 1 ..................................................................... 145
Tatuba Cave: Test Unit 1: Layers IV and IX ........................................................ 147
Tatuba Cave: Test Unit 1: Layers IV, VIII, and IX .............................................. 149
Tatuba Cave: Test Unit 1: Layer IX, 70-150 cmbs ............................................... 150
Tatuba Cave: Test Unit 1: Layer IX, 150-190 cmbs.............................................. 152
Tatuba Cave: Chronology and Site Analysis ........................................................ 152
5.6 NOKONOKO (2-NOK-009) .................................................................................. 154
Nokonoko: Test Unit 1 ......................................................................................... 156
Nokonoko: Test Units 2, 3, and 4 ......................................................................... 161
Nokonoko: Test Unit 5 ......................................................................................... 162
Nokonoko: Test Units 6 and 7 .............................................................................. 164
Nokonoko: Test Units 8 and 9 .............................................................................. 165
Nokonoko: Test Unit 10 ....................................................................................... 166
Nokonoko: Chronology and Site Analysis ............................................................ 167
5.7 QOROQOROVAKATINI (2-QMR-007) ................................................................... 168
Qoroqorovakatini: Test Unit 1.............................................................................. 171
Qoroqorovakatini: Test Unit 2.............................................................................. 172
The Wall of Qoroqorovakatini ............................................................................. 173
Qoroqorovakatini: Test Unit 4.............................................................................. 173
Qoroqorovakatini: Chronology and Site Analysis ................................................. 175
5.8 MALUA (1-NSK-015) ......................................................................................... 177
Malua: Test Unit 1 ............................................................................................... 180
Malua: Test Unit 2 ............................................................................................... 181
Malua: Chronology and Site Analysis .................................................................. 183
5.9 KOROVATUMA (2-MAV-047) ............................................................................. 184
Korovatuma: Test Unit 1 ...................................................................................... 187
Korovatuma: Test Unit 2 ...................................................................................... 189
Korovatuma: Chronology and Site Analysis ......................................................... 190
5.10 BUKUSIA (2-MAV-049) ................................................................................... 192
Bukusia: Test Unit 1 ............................................................................................ 195
Bukusia: Test Unit 2 ............................................................................................ 196
Other Cultural Areas of Bukusia .......................................................................... 199
Bukusia: Chronology and Site Analysis ............................................................... 200
5.11 KOROKUNE (2-CON-010) ................................................................................ 201
Korokune: Test Unit 1.......................................................................................... 202
Korokune: Test Unit 2.......................................................................................... 204
Korokune: Chronology and Site Analysis............................................................. 205
5.12 MADRAYA (1-NKR-031) .................................................................................. 209
Madraya: Test Unit 1 ........................................................................................... 209
Madraya Chronology and Site Analysis ............................................................... 211
5.13 BĀTIRI (1-SIG-005) ......................................................................................... 212
Bātiri: Test Unit 1 ................................................................................................ 213
Chronology and Site Analysis .............................................................................. 215

xi
5.14 KOROHEWA (2-MAV-048) ............................................................................... 217
Korohewa: Test Unit 1 ......................................................................................... 218
Korohewa: Test Unit 2 ......................................................................................... 219
Korohewa: Chronology and Site Function ............................................................ 220
5.15 VITOGO (2-BMA-011) ..................................................................................... 221
Vitogo: Test Unit 1 .............................................................................................. 223
Vitogo: Test Unit 2 .............................................................................................. 226
Vitogo: Test Unit 3 .............................................................................................. 227
Vitogo: Chronology and Site Analysis ................................................................. 227
5.16 NADROGĀ (1-NKR-046) .................................................................................. 228
Nadrogā: Test Unit 1 ............................................................................................ 231
Nadrogā Chronology and Site Analysis ................................................................ 232
5.17 CHAPTER SUMMARY ........................................................................................ 232
CHAPTER 6. GENERAL TRENDS IN COMPETITION AND COOPERATION ..... 235
6.1. TRENDS IN STRATEGIES OF DEFENSE AND SUBSISTENCE IN SIGATOKA VALLEY
PREHISTORY ............................................................................................................. 235
The Establishment of Territorial Fortifications and Refuges ................................. 237
Relocation to Environmental Refuges During Periods of Disturbance .................. 240
Constructed Fortifications and Undefended Production Sites ............................... 243
6.2 IMPLICATIONS FROM OTHER CHRONOLOGICAL AND ENVIRONMENTAL ANALYSES246
6.3 PREDICTIONS FOR THE ENTIRE SIGATOKA VALLEY SAMPLE................................. 246
6.4 PREDICTION 1: ESTABLISHING TERRITORIES (PROPOSED FOR 2000-1500 BP) ....... 248
6.5 PREDICTION 2 : TERRITORIES AND PERSISTENT COMPETITION (1500 – 150 BP) .... 250
6.6 PREDICTION 3: BUFFERING AGAINST SHORTFALLS (730-525 BP) ........................ 254
6.7 PREDICTION 4: CONSTRUCTED DEFENSES AND PRODUCTION IN THE VALLEY
BOTTOM (500 – 150 BP) ........................................................................................... 256
6.8. THE COSTS AND BENEFITS OF COMPETITION ...................................................... 258
6.9 CHAPTER SUMMARY .......................................................................................... 260
CHAPTER 7. COMPETITIVE AND COOPERATIVE STRATEGIES: REGIONAL
VARIATIONS ............................................................................................................ 262
7.1 DETECTING REGIONAL VARIATION I: COMPETITION AND COOPERATION VIA SOCIAL
DATA ....................................................................................................................... 262
The Distribution of Mataqali and Yavusa ............................................................. 264
Cluster Analyses .................................................................................................. 265
Environmental and Social Factors ........................................................................ 269
Yavusa Origins .................................................................................................... 273
7.2 DETECTING REGIONAL VARIATIONS II: YAVU VARIATION AND THE DISTRIBUTION
OF MONUMENTAL AND RELIGIOUS ARCHITECTURE ................................................... 275
Variation in Yavu Form and Construction ............................................................ 276
The Distribution of Monumental Architecture ...................................................... 279
The Distribution and Function of Naga ................................................................ 281
7.3. DETECTING REGIONAL TRENDS III: EXCHANGE ITEMS AND UNIQUE ARTIFACTS . 282
Food Exchange .................................................................................................... 282

xii
Unique Ceramic Forms ........................................................................................ 283
7.4 EVALUATION: PATTERNS OF COMPETITION AND COOPERATION AND INDICATIONS
FOR REGIONAL DIVERGENCE..................................................................................... 285
7.5 CHAPTER SUMMARY .......................................................................................... 289
CHAPTER 8. DISCUSSION: IMPLICATIONS FOR FIJIAN PREHISTORY .......... 291
8.1 LINGUISTIC DIVISIONS: NADROGĀ AND NUCLEAR WESTERN ............................... 291
8.2 MIGRATIONS AND INTERACTION NETWORKS IN PREHISTORY ............................... 294
8.3. MODELS OF FIJIAN PREHISTORY ........................................................................ 298
8.4 CHAPTER SUMMARY .......................................................................................... 302
CHAPTER 9. SUMMARY AND CONCLUSION ...................................................... 303
9.1. DISSERTATION SUMMARY ................................................................................. 303
9.2 CONCLUSION ...................................................................................................... 311
APPENDIX A. SIGATOKA VALLEY SITE DATA.................................................. 313
APPENDIX B. SIGATOKA VALLEY AGRICULTURAL FEATURE DATA .......... 376
APPENDIX C. CERAMIC ANALYSIS ..................................................................... 400
APPENDIX D. ARTIFACTS ..................................................................................... 467
APPENDIX E. HUMAN REMAINS .......................................................................... 479
APPENDIX F. GEOARCHAEOLOGICAL ANALYSES OF TATUBA CAVE ........ 492
NOTES........................................................................................................................ 504
REFERENCES ............................................................................................................ 506

xiii
LIST OF TABLES
Table Page
2.1 Relationship between resource distribution and foraging strategies…………. 32
3.1 Geographic variation between the upper, middle, and lower valley…………. 37
3.2 Flora and fauna of the Sigatoka Valley………………………………………. 43
3.3 Topographic and sedimentological data for the Sigatoka Valley…………….. 50
3.4 Effects of desiccation on Sigatoka Valley soils………………………………. 65
4.1 Summary of defenses for habitation sites in the Sigatoka Valley……………. 94
4.2 The distribution of agricultural features in the Sigatoka Valley………………101
4.3 Distribution of wetland, dryland, and mixed reliant habitation sites…………. 108
4.4 Yield variability for wetland, dryland, and mixed reliant sites………………. 110
4.5 Distribution of production, defended production, and defensive strategies….. 114
5.1 Topographic, environmental, and archaeological data pertaining to the 12
excavated in the 2001-2002 season…………………………………….……. 128
5.2 Standard radiometric (14
C) and AMS dates for the site of Tatuba Cave………148
.
5.3 AMS dates for the site of Nokonoko…………………………………………. 158
5.4 Standard radiometric (14
C) and AMS dates for the site of
Qoroqorovakatini…………………………………………………………….. 172
5.5 AMS dates for the site of Malua……………………………………………… 182
5.6 AMS dates for the site of Korovatuma……………………………………….. 189
5.7 Standard radiometric (14
C) and AMS dates for the site of Bukusia………….. 197
5.8 Standard radiometric (14
C) and AMS dates for Korokune…………………… 205

xiv
Table Page
5.9 AMS date for the site of Madraya…………………………………………… 211
5.10 AMS date for the site of Bātiri………………………………………………. 216
5.11 AMS date for the site of Korohewa………………………………………….. 221
5.12 AMS dates for the site of Vitogo…………………………………………….. 225
5.13 AMS date for the site of Nadrogā…………………………………………….. 233
6.1 Frequencies and nearest neighbor distributions amongst the four predicted
strategies……………………………………………………………………… 251
A.1 Province and district codes for archaeological sites of the Sigatoka Valley… 313
A.2 Habitation site data including natural and constructed defensive features….. 338
A.3 Habitation site data including associated agricultural features and overall
productivity………………………………………………………………… 356
B.1 Example of the point-scoring system for irrigated agricultural terraces…….. 376
B.2 Irrigated terrace and ponded-field productivity data for wet and dry seasons.. 387
C.1 Attribute codes for ceramic decorations……………………………………… 407
C.2 Attribute codes for ceramic tempers…………………………………………. 410
C.3 Attribute data for ceramic rims recovered from the Sigatoka Valley
excavations…………………………………………………………………… 422
D.1 List of artifact frequencies by weight and temporal period………………… 467
D.2 List of faunal remains by weight and temporal period……………………….. 471
D.3 List of lithic artifacts by weight and temporal period………………………... 477
E.1 List of human remains from the Sigatoka Valley excavations………………. 488

xv
LIST OF FIGURES
Figure Page
1.1 Map of the Fiji Islands showing location of the Sigatoka Valley……………. 7
3.1 Topographic map of the Sigatoka Valley…………………………….……….36
3.2 Topographic map of the upper valley………………………………………… 38
3.3 Topographic map of the middle valley………………………………………. 40
3.4 Topographic map of the lower valley………………………………………… 41
3.5 Distribution of soils in the valley according to fertility……………………… 47
3.6 Distribution of soils of high, moderate, and low fertility……………………. 49
3.7 Characteristics of rainfall regime in Viti Levu……………………………….. 52
3.8 Distribution of soils that experience severe, moderate, and weak dry season.. 53
3.9 Environmental zones of the Sigatoka Valley………………………………….56
3.10 Predicted extent of flooding during a severe El Niño cycle………………….. 63
3.11 Predictions for the extent of La Niña-related droughts……………………… 66
3.12 Historical record of El Niño events in South America……………………….. 68
3.13 Graphic depiction of sea-level change AD 1100-1600 ……………………….70
3.14 Longitudinal geological section of the Sigatoka Valley……………………… 72
3.15 Extent of areas affected by the LCO/LIA transition…………………………. 74
3.16 Comparison of the environmental zones identified by soil/topographic analyses
with the extent of disturbance related to ENSO and the LCO/LIA
transition……………………………………………………………………… 76
4.1 Archaeological features of the Sigatoka Valley……….…………………….. 86
4.2 The use of natural and constructed defenses in the Sigatoka Valley…………. 93

xvi
Figure Page
4.3 Distribution of irrigated terraces and ponded fields in the Sigatoka Valley... 100
4.4 Production potential for irrigated terraces and ponded fields in the Sigatoka
Valley…………………………………………………………………………. 102
4.5 Distribution of habitation sites reliant upon wetland, dryland, or mixed
cultivation…………………………………………………………………….. 107
4.6 Distribution of habitation sites reflecting reliance upon variable yields……... 109
4.7 Distribution of the three proposed settlement/subsistence strategies………… 113
5.1 Location of archaeological sites in the Sigatoka Valley that were excavated
between 2001-2002…………………………………………………………… 129
5.2 Map of cultural features surrounding Tatuba Cave………………………….. 133
5.3 Plans of Tatuba Cave…………………………………………………………. 135
5.4 Entrance 1 of Tatuba Cave…………………………………………………… 135
5.5 Plan of interior of Tatuba Cave, indicating the locations of the 1972 and 2002
excavations…………………………………………………………………… 138
5.6 Profiles of the southern and western walls of Test Unit 1, Tatuba Cave……. 143
5.7 South profile of Test Unit 1 showing location of hearth feature…………….. 147
5.8 The east profile of Test Unit 1, following wall collapse……………………... 151
5.9 Map of the site of Nokonoko, detailing architecture and excavation units…. 157
5.10 West profile, Test Unit 1, Nokonoko………………………………………… 161
5.11 North wall of Test Unit 3, Nokonoko……………………………………….. 163
5.12 East profile of Test Unit 5, Nokonoko………………………………………. 164
5.13 Map of the site of Qoroqorovakatini, detailing architecture and excavation
units…………………………………………………………………………. 170
5.14 Photograph of the wall of Qoroqorovakatini………………………………… 174

xvii
Figure Page
5.15 Map of the site of Malua, detailing architecture and excavation units………. 178
5.16 Location of Test Unit 2 beneath rockshelter, Malua…………………………. 182
5.17 Map of the site of Korovatuma, detailing architecture and excavation units… 186
5.18 East profile of Test Unit 1, Korovatuma……………………………………... 187
5.19 Map of the site of Bukusia, detailing architecture and excavation units…….. 194
5.20 Photograph of the 50+ sperm whale teeth……………………………………. 195
5.21 Photograph and south/east profile of Test Unit 2, Bukusia………………….. 198
5.22 Map of Korokune, detailing architecture and location of excavation units….. 203
5.23 Photo and south wall profile of Test Unit 2, Korokune……………………... 206
5.24 Map of the terrace feature of Madraya………………………………………. 210
5.25 Map of the site of Bātiri showing location of excavation and also ancient
ditch………………………………………………………………………….. 214
5.26 Test Unit 1 of Bātiri, showing location of shell-filled hearth feature……….. 216
5.27 Map of Korohewa, detailing architecture and excavation units…………….. 219
5.28 Map of the site of Vitogo, detailing architecture and excavation units……… 224
5.29 Eastern profile of Test Unit 1, Vitogo………………………………………... 225
5.30 Map of the site of Nadrogā, detailing architecture and excavation units…….. 230
6.1 Calibrated ages for the 2001-2002 Sigatoka Valley excavations……………. 236
6.2 The distribution of earliest occupations for each excavated site…………….. 238
6.3 Trends in habitation and subsistence for the Sigatoka Valley……………….. 247
6.4 Distribution of habitation sites resulting from Prediction 1………………….. 249
6.5 Distribution of habitation sites resulting from Prediction 2…………………. 253

xviii
Figure Page
6.6 Distribution of habitation sites resulting from Prediction 3…………………. 255
6.7 Distribution of habitation sites resulting from Prediction 4………………….. 257
7.1 GIS generated image indicating the distribution of land-holdings at the
mataqali level……………………………………………………………….. 266
7.2 GIS generated image indicating the distribution of land-holdings at the
yavusa level…………………………………………………………………. 267
7.3 Density of habitation sites compared with clustering of yavusa…………….. 268
7.4 Overlay of environmental zones with yavusa land-claims…………………… 270
7.5 GIS-generated image indicating the extent of land-holdings by yavusa
that claim local and non-local origins……………………………………….. 274
7.6 Distribution of yavu forms, naga, and monumental architecture…………….. 278
7.6 Proposed boundary between high and low frequencies of competitive and
cooperative strategies………………………………………………………… 286
8.1 Communalects of the Sigatoka Valley………………………………………. 292
8.2 Some of the migrations recorded for Sigatoka Valley yavusa………………. 296
A.1 Reference map for site locations in the Sigatoka Valley……………………. 314
A.2 Location of link-mounds and naga sites in the Sigatoka Valley…………… 329
A.3 View from above Tatuba Cave, upper valley………………………………… 330
A.4 View of Naqalimare gorge, middle valley…………………………………… 330
A.5 View of delta area, lower valley……………………………………………… 331
A.6 Aerial view of Tatuba Cave………………………………………………….. 331
A.7 Aerial view of Nokonoko……………………………………………………. 332
A.8 Aerial view of Qoroqorovakatini…………………………………………….. 332

xix
Figure Page
A.9 Aerial view of Malua…………………………………………………………. 333
A.10 Aerial view of Korovatuma………………………………………………….. 333
A.11 Aerial view of Bukusia……………………………………………………….. 334
A.12 Aerial view of Korokune…………………………………………………….. 334
A.13 Aerial view of Madraya……………………………………………………… 335
A.14 Aerial view of Bātiri………………………………………………………….. 335
A.15 Aerial view of Korohewa…………………………………………………….. 336
A.16 Aerial view of Vitogo………………………………………………………… 336
A.17 Aerial view of Nadroga……………………………………………………… 337
B.1 Diagram and data table demonstrating the stream-order method……………. 376
B.2 Stream flow data from 19 tributaries of the Sigatoka River…………………. 377
B.3 Reference map for agricultural features in the Sigatoka Valley……………… 378
C.1 Location of metric morphological modes measured in the ceramic
Classification…………………………………………………………………. 405
C.2 Illustration of variable non-metric attributes recorded for the modes rim-
orientation, rim-course, rim-body contour, rim profile, and lip shape………. 406
C.3 Examples of decoration attributes…………………………………………… 408
C.4 Frequency of bowl rim forms in the upper, middle, and lower valley, and
temporal periods 1-4………………………………………………………… 412
C.5 Frequency of jar rim forms in the upper, middle, and lower valley, and
temporal periods 1-4…………………………………………………………. 415
C.6 ‘Nakoro’ style vessel (also known as kuro balavu)…………………………. 418
C.7 Frequency of decorated ceramics in the upper, middle, and lower valley,
and temporal periods 1-4……………………………………………………. 419

xx
Figure Page
E.1 Diagram of the features and burials of Test Unit 1, Nokonoko, between
95 and 105 cmbs……………………………………………………………… 481
E.2 Photo and sketch of Burial 1, from Test Unit 2, Korovatuma……………….. 482
E.3 View of Burial 1, Test Unit 1, 20 cmbs, Bukusia……………………………. 484
E.4 View of Burial 2, Test Unit 1, 40 cmbs, Bukusia……………………………. 484
E.5 Photo and sketch of Burial 1, Test Unit 4, Qoroqorovakatini……………… 486
E.6 Human remains from 60-70 cmbs……………………………………………. 487
F.1 Stratigraphic profile of Tatuba Cave, showing locations of sediment samples. 495
F.2 Percentage of CaCO3 for the deposits of Tatuba Cave………………………. 496
F.3 Percentage of organic matter for the deposits of Tatuba Cave………………. 496
F.4 pH values for the deposits of Tatuba Cave…………………………………… 497

1
CHAPTER 1. INTRODUCTION
Competitive and cooperative strategies have structured much of human history.
In their most extreme form, strategies of competition and cooperation have allowed
human groups to participate in long periods of warfare, resulting in the extirpation or
eradication of rival groups. Other more subtle permutations of competition and
cooperation have led to the development of exchange networks, social hierarchies, and
the division of labor. In broad terms, competition and cooperation can be conceptualized
as opposing mechanisms for regulating behavioral relations between individuals and
groups in a society (Boone 1992; Gumerman 1986). For anthropologists and
archaeologists, the examination of the causes and consequences of competition and
cooperation offers a viewpoint from which cultural developments can be measured and
assessed.
This dissertation applies such an approach to the topic of Fijian prehistory.
Archaeological and historic research in this archipelago has identified an extensive record
of warfare and conflict, which resulted in a settlement and subsistence system that
privileged defense and fortifications. Recent research of global climatic patterns such as
the El Niño Southern Oscillation (ENSO) suggest that environmental perturbances played
a primary role in the development of competitive settlement strategies in the 18th
and 19th
centuries (Parry 1997). These findings pose important questions for Fijian prehistory:
how, when, and why did environmental and social variables affect the development of
prehistory at both local and regional scales? An investigation of these questions has the
potential to address a number of outstanding issues in Fijian prehistory, in particular the

2
sequence of settlement in the interior, and varying levels of interaction between Fijian
populations. The results provide specific insights into Fiji’s past, and also offer
important commentary on the analysis of environment and subsistence on Pacific Islands.
This research also provides a general model for the evolution of competition and
cooperation between groups, and assesses the utility of the model in an archaeological
application.
1.1 The Anthropology of War
The social and biological sciences offer several theoretical perspectives on the
occurrence of conflict, competition, and aggression amongst human groups. Indeed, the
topic has engendered a great deal of interest amongst anthropologists over the past
century. Beginning with Tylor (1874) and Morgan (1877), warfare and aggression were
depicted as developmental stages that humanity passed through on its way to civilized
behavior. With the advent of field research and ethnographic studies, anthropologists
developed several theoretical perspectives on the proximate causes for warfare, and these
can be divided into two major themes: biological and psychological causes, or
institutional and environmental causes (Lekson 2002). In sum, these studies suggest that
competition and conflict meets three objectives in simple human societies: capturing
resources, driving away rivals, and revenge (Chagnon 1968, 1979, 1990; Divale 1971,
1974; Ember and Ember 1992; Ferguson 1984; Ferrill 1997; Haas 1990; Heider 1979;
LeBlanc 1999; Otterbein 1970, 1985; Rappaport 1968; Vayda 1956, 1976).
Environmental and population stress is also posited as a primary causal factor in the

3
development of conflict, especially within circumscripted environments (Carneiro 1970;
Cohen 1977). Similarly, anthropological studies of state-level societies conclude that
competition for power and control result in conflict, and in some instances the
establishment of hierarchies (Boone 1983, 1992; Carneiro 1970, 1978, 1981; Ehrenreich
1997; Gibson 1990; Otterbein 1973, 1977, 1999).
Collectively, these studies express neoevolutionary notions concerning human
intent and environmental surplus, and suggest that conflict emerges as a strategy by
which humans may interact with each other and the environment. In addition, these
studies suggest that conflict rarely exists in the absence of cooperative agreements and
alliances, and both can occur simultaneously at different scales (e.g., social grouping for
defense involves networks of cooperation that have competitive oriented goals
[Gumerman 1986:44]). While such generalizations suggest how particular environments
foster the development of warfare and alliances, they do little to explain why variations in
competitive or cooperative strategies occur at different temporal periods or locations. In
most cases, explanation of competitive/cooperative variability resides at the level of
human intention, such as a need for wealth and power (Haas 1987), social integration, or
an increased subsistence base (Carneiro 1990).
1.2 Evolutionary Ecology
Explaining not only how competition and cooperation develop, but why these
strategies variably persist through time and space requires an approach that privileges
scientific causation (i.e., cause is derived from theory, tested empirically, and conclusions

4
are drawn from the results). For archaeology, which seeks to understand and explain the
diversity of human behavior in the past, evolutionary ecology has the potential to pair
both theory and analysis in the generation of proximate and ultimate explanation. This
approach is also amenable to the study of particular behavioral strategies like competition
and cooperation because evolutionary ecology assumes that human beings and their
social behaviors are the product of evolution, and that all behaviors can be modeled as
cost/benefit strategies designed to maximize fitness, or reduce risk (Boyd and Richerson
1985:7-12; Smith and Winterhalder 1992:39-40). It also posits that the structure and
variability of the environment affects the relative success or failure of human endeavors,
and it encourages members of populations to behave in either cooperative or competitive
ways.
Within the last few decades there has been an increase in archaeological studies
based in evolutionary ecology, with topics ranging from shifts in foraging strategies
(Broughton 1994a, 994b, 1997; Moniz-Nakamura 1999; Rosenberg 1998), agricultural
intensification and diversification (Gremillion 1996; Ladefoged and Graves 2000;
Maxwell 1995), conflict and warfare (Kennett and Kennett 2000; Lambert and Walker
1991), and emergent social complexity (Aswani and Graves 1998; Graves and Ladefoged
1995). These studies seek to explain how and why environmental and social variables
condition change. The methodological issues outlined in these studies suggest that an
archaeological analysis of competitive and cooperative strategies requires a set of theory-
based expectations, followed by a schema of testing that traces the interplay between

5
resources, populations, and human choices, and the effect of the success or failure of
those choices on subsequent generations.
The inclusion of both competitive and cooperative strategies is essential, as
evolutionary ecology research suggests that the emergence of competitive behavioral
responses can be directly linked to temporally and spatially delimited environmental
variables, such as strong climatic variability and sustained terrestrial drought (Kennett
1998; Lambert 1994, 1997; Lambert and Walker 1991; Raab and Larson 1997). These
studies note that in situations in which resources are scarce or stressed, prehistoric
populations react differently: at times competing violently for available resources, and
cooperating in others (Kennett and Kennett 2000). Importantly, Boone has noted that the
long-term stability of competitive and cooperative behaviors is dependent upon the
reactions of people living in adjacent areas, and their status as either kin or non-kin
(Boone 1992). These generalizations suggest a series of expectations for the
development of competitive and cooperative strategies which may be tested
archaeologically.
In sum, evolutionary ecology presents a set of middle-range theories that explain
how and why competition and cooperation variably developed in prehistory. The
research described in the following chapters utilizes such a method to investigate the
history of competitive and cooperative interaction amongst the social groups of the
Sigatoka Valley, Fiji.

6
1.3 The Sigatoka Valley
This research addresses the issue of competition and cooperation in prehistory in
an integrated archaeological study of the prehistory of the Sigatoka Valley. Located in
the southwestern corner of the island of Viti Levu, Fiji, this valley straddles the island
from north to south and covers approximately 1700 km2, providing a substantial sample
of the Fiji archipelago (Figure 1.1). Previous archaeological research in the region
identified an abundant and diverse prehistoric record, with colonization of the delta by
2640 ± 90 BP (GaK 946)(Birks 1973). An excavation in the valley interior has produced
a single radiocarbon date of 1000 ± 70 BP (GaK 4311) for a fortified occupation (Palmer
1972, in Parry 1987:31). In addition, geographical studies of fortified sites completed by
Parry (1987) formed the basis for the preliminary research described in this monograph,
which integrates aerial photographs, ground-level surveys, and satellite imagery into a
geographic information systems (GIS) database (Field 1998, 2002). This research has
identified over 700 archaeological features in the valley, ranging from fortified hill-top
and lowland occupations, open villages, and irrigated agricultural terraces.
The research described herein builds upon this foundation, and integrates it with
local and regional data that indicate zones of high and low frequency environmental
fluctuations. Analyses include the examination of geographical variation in soils and
topography, and the temporal distribution of seasonal rainfall. The effects of episodic
environmental perturbations, including the effects of the El Niño Southern Oscillation
and the transition from the Little Climatic Optimum and Little Ice Age are also assessed
in terms of agricultural production and risk. In brief, the results of these analyses suggest

7
Figure 1.1. Map of the Fiji Islands showing location of the Sigatoka Valley. Italicized
names refer to 19th century political centers.
that the Sigatoka Valley was both spatially and temporally variable, and generated an
atmosphere of unpredictability with periodic shortfalls that perpetuated competition.
Analyses of the distribution of related and non-related social groups via land tenure data
are also included in this research. These results suggest divergent historical trajectories
for the upper and lower valley based upon environmental stability, population size, and
the colonization of the interior by Fijians with origins in different parts of the
archipelago. In addition, archaeological investigations conducted in the valley provide
for a chronology of fortified and unfortified habitations, and suggest general and regional
trends in competition, subsistence, and interaction. Specifically, these excavations

8
indicate the valley was occupied as early as 20 BC, with fortifications emerging by the 7th
century AD.
This approach is novel, as it combines the principles and expectations of
evolutionary ecology with specific social data that are particular to Fijian culture.
Moreover, by examining the relationship between spatially and temporally variable
resources, this study contributes to future anthropological studies of competition and
cooperation. Tracing the extent of such trends has the potential to paint, in broad strokes,
the details of history.
This dissertation is divided into the following chapters:
Chapter 2, “ Understanding Competition and Cooperation in Prehistory,” introduces the
topic of Fijian warfare, and describes previous attempts to understand and explain this
phenomenon. These explanations are also placed into the context of regional prehistoric
models. The main tenets of evolutionary theory are outlined, and a general model for the
occurrence and persistence of competition and cooperation is presented. A set of
expectations are also outlined.
Chapter 3, “Spatio-Temporal Variability and Unpredictability in the Sigatoka
Valley Environment,” describes the geography of the region, and the effects of
environmental variability on topography, the distribution of soils, and hydrology.
Environmental zones are defined according to risk, and compared to the effects of ENSO
and the LCO/LIA transition. This allows for the further classification of environmental
zones that would have been more or less severely impacted by environmental
fluctuations.

9
Chapter 4, “Analytical Units and Analyses,” defines the variables of competition
and cooperation that are the subject of archaeological investigation. In addition, initial
calculations of agricultural productivity for the habitation sites of the Sigatoka Valley are
presented. These results are compared with the distribution of fortifications, and three
strategies of defense and subsistence are determined. The distribution of these strategies
across the environmental zones also allows for the identification of particular modes of
fortification.
Chapter 5, “Excavations and Chronology,” details the results of 12 excavations
conducted in the Sigatoka Valley, including chronological data from standard radiometric
(14
C) and AMS dating. Site function in the context of environmental variability is also
discussed.
Chapter 6, “General Trends in Competition and Cooperation,” describes three
general trends in habitation and subsistence identified by archaeological and
environmental analyses. These trends are compared against the expectations of the
evolutionary ecology model. A series of predictions based upon criteria identified by
these trends allow for the extrapolation of the settlement history of the Sigatoka Valley.
Chapter 7, “Competitive and Cooperative Strategies: Regional Variations,”
analyzes modern land-tenure data from the Sigatoka Valley to produce finer regional
chronologies and elicit the frequency of different competitive and cooperative strategies.
Other data, including architecture and exchange items, are included and used to detect
integration and regional differences.

10
Chapter 8, “ Discussion: Implications for Fijian Prehistory,” examines linguistic
communalects in the Sigatoka Valley, and compares migration data with general
interaction models that have been proposed for Fijian prehistory. The potential
implications of environmental unpredictability are hypothesized for other parts of Fiji and
the Pacific.
Chapter 9, “Summary and Conclusion,” presents a summary of the research
findings, and also assesses the potential for the application of the methods and theoretical
perspectives presented herein to other historical studies.

11
CHAPTER 2. UNDERSTANDING COMPETITION AND COOPERATION IN FIJIAN
PREHISTORY
When the earliest European explorers sailed into Fijian waters between the 17th
and 19th
centuries (e.g., Tasman in 1643, Cook in 1772, Bligh in 1789, and Wilkes in
1845), they did so with trepidation. These islands were known as the ‘Cannibal Islands,’
and their neighbors, Tongans and Samoans alike, feared the ferocious nature of the Fijian
warriors. Oral histories recorded during the last century in the Tukutuku Raraba ni
Veitiarogi ni Vanua1 also indicate the prominent role that conflict played in Fijian life,
and provide glimpses of the competitive nature of traditional Fijian society as it existed in
prehistory. Despite the defensive character of Fiji’s archaeological record, it is important
to note that conflict was common in the Southwestern Pacific, and many Pacific Island
nations (e.g., Tonga, Samoa, and New Zealand) are similarly endowed with a record of
fortifications, refuges, and conquest.
The Origin of Fortifications
Since the advent of archaeology in the Pacific, several hypotheses have been
forwarded to explain this distribution. In the 1950s and 1960s, the pan-Oceanic presence
of these features was assumed to be the product of cultural migrations. Green (1967) in
particular argued that parallels in fortification design in New Zealand, Tonga, and Samoa
were the result of either the historical relatedness of the island populations, or the
diffusion of fort-building technology. For Fiji, Palmer (1969a, 1969b) suggested that the
earliest fortifications were located in the valley bottoms, and consisted of villages
encircled with an annular ditch and bank. He also proposed that this form was antecedent
12
to fortifications located on ridges, which often employed a similar ditch-style defense.
However, Groube (1971) was the first to suggest that fortification design was determined
by topography and the character of local warfare, and fortifications were essentially a
public good that was constructed for the benefit of the local community.
In later decades, Frost (1974), Best (1984), and Crosby (1988) reconstituted and
refocused archaeological inquiry at the scale of regions, taking into account the
distribution of sites across different environmental zones and temporal periods. Frost’s
research on Taveuni indicated that annular-ditch forms and ridge forms of fortifications
occurred simultaneously in prehistory (e.g., AD 1200). He also concluded that changes
in design styles in ceramics coincided with the occurrence of the earliest fortifications on
the island, suggesting the invasion of non-Fijian migrants ca. AD 1100 (Frost 1974:119-
122) (cf. Babcock 1977). However, in limiting his sample to fortifications, Frost failed to
truly identify a prehistoric migration that clearly associated ceramics and new settlement
patterns (i.e., Rouse 1958). Nevertheless, similar linkages between ceramic variability
and settlement patterns were further advanced by Best (1984:640-646), who suggested
that the movement of populations from the coast to defended positions in the interior of
Lakeba ca. AD 750 and 1020 could be linked to both population stress and the influence
of Tongan exchange systems. Within the Lakeban sequence, fortifications that utilized
mountains and ridges developed ca. AD 1000, and maintained in use until after AD 1500,
when annular-ditch style fortifications appear in the lowlands. Best suggests that this
new form of fortification is associated with increased interaction with Tongans and
migrants from Rewa and Bau (Best 1984:662). In contrast, Crosby’s research on Beqa

13
suggested a reverse sequence: annular ditch fortifications gave rise to ridge fortifications
after AD 1500, and this pattern was influenced by increased rates of interaction between
Beqa and Rewa (1988:228).
Perhaps more importantly, Crosby suggested that changes in settlement patterns
and ceramics in Beqan prehistory were indicative of fluctuations (or technological
changes) in the subsistence system (1988:236). Crosby’s findings reflect theoretical
advancements that brought new ideas and critiques to the problems of warfare in Pacific
prehistory. In particular, the writings of neoevolutionists such as Carneiro (1970, 1978),
Sahlins (1958), Service (1975), and Vayda (1976) posited the causes of aggression and
warfare lie in the material and ecological foundations of society. In addition to Crosby’s
research, the geographical and environmental investigations of Fijian fortifications
conducted by Parry (1977, 1982, 1987) provide a clear association between resource
variability and the establishment of fortifications. However, it is important to note that
Parry concluded that site locale was largely determined by the co-occurrence of
environmental and social variables—namely the production levels of crops and the
defensive capabilities of the surrounding topography, and the configuration of the
neighboring population (Parry 1987:131). Parry’s explanation of warfare is similar to
systemic neoevolutionary models that have been developed for other parts of the Pacific,
which link competition and cooperation to population growth, agricultural intensification,
and the rise of an elite social strata (e.g., Brookfield 1972; Cordy 1981, Earle 1991;
Goldman 1970; Kirch 1984). These models also treat phenomena such as warfare and

14
territoriality as stabilizing mechanisms which served to regulate population pressure
(Carneiro 1970, 1972; Flannery 1972; Harris 1979).
2.1. Models of Fijian Prehistory
Despite these advances, it can be argued that the linkage between the emergence
of competition (as evinced by fortifications) in Fijian prehistory is only tenuously
connected to regional models of prehistoric change. This is perhaps due to the fact that
since the advent of archaeology in Fiji, investigation has focused on the detection of
interaction, in particular the extent of interaction during the Lapita period. Identified by
distinctive ceramics and associated artifacts, Lapita populations were the first to cross
into the remote Pacific between 3500 and 3300 years BP, extending through the
Bismarcks, Vanuatu, Fiji, Tonga, and Samoa (Bellwood 1985, 1989, Enright and Gosden
1992, Green 1979, Irwin 1992, Kirch 1996; Terrell 1986). Excavations revealed that for
the first 300-500 years of settlement, distant Lapita populations interacted with one
another, exchanging volcanic glass, basalt, and ceramics with distinctive temper materials
(Best 2002; Clark 1999a). Changes in rates of interaction in later centuries, as well as
potential contacts with Melanesian populations to the west, have provided an alluring
puzzle for Pacific archaeologists. This has led to intensive studies of design and ceramic
provenance, and the identification of regional spheres of interaction.
As an outgrowth of Lapita research, three general models have been developed to
describe and explain cultural change throughout Fijian prehistory. Best (2002), Marshall
et al. (2000), and Clark (1999b), identify these as: the ‘primacy of local processes’ model,

15
the ‘continuity of interaction’ model, and the ‘punctuated interaction’ model (Clark
1999b:43-45). Both the ‘primacy of local processes’ and ‘punctuated interaction’ models
argue that following the initial Lapita colonization, Fiji was in contact with other islands
(e.g., Vanuatu and New Caledonia to the west, and Samoa and Tonga to the east)
throughout prehistory, but evaluate the impact of this interaction as more or less
important to overall trends in Fijian prehistory. The former (advocated by Hunt 1986,
and Rechtman 1992) posit that contact between Fiji and other islands did occur but had a
small effect in comparison to trajectories of change generated within the archipelago.
The latter (advocated by Best 1984, 2002, and Frost 1974) advocates that local processes
in Fiji are generally dominant, but changes brought on by contact with other islands
punctuate and to an extent redirect historical trajectories. In contrast, ‘the continuity of
interaction’ model forwarded by Wahome (1997, 1998) and Davidson (1977) posits that
Fiji was in long-term and regular contact with other archipelagoes, resulting in
incremental and gradual transformation of Fijian society.
Although none of these models can be entirely discounted via archaeological
research, the ‘primacy of local processes’ model, and the ‘punctuated interaction’ model
are more robust, and appear to more accurately summarize Fijian history. After many
decades of study, archaeologists suggest that the societal changes evident between the
earliest Lapita colonists and the later populations of Fiji were primarily the result of a
decline and then re-emergence of regional interaction (Clark 1999b; Hunt 1987),
paralleled by the movement of settlements from the coast into the more easily defended
interior (Best 1984; Crosby 1988). In most circumstances, historical and archaeological

16
studies attribute the occurrence of warfare and fortifications in prehistory to population
growth and the development of chiefdoms (Best 1984; Ladefoged 1993; Parry 1977,
1982; Rechtman 1992), population aggregation and chiefly exchange (Rosenthal 1991),
and also the intrusion of migrants from Vanuatu and New Caledonia ca. AD 200 and
1100 (Best 1984, 2002; Frost 1974, 1979; Green 1967). More recently, regional
syntheses detail the diversity of ceramic sequences and settlement patterns in the various
parts of Fiji, deducing that most regions followed their own developmental trajectories in
the formation of interaction networks and acquisition of fortifications (Marshall et al.
2000).
As in other parts of the Pacific, ceramics serve as the preeminent data source for
elucidating the details of prehistory alluded to in these models. For Fiji, ceramic analysis
has relied upon comparative statistical techniques and provenance studies, and
interpretations have been loosely tied to social interaction theory (i.e., Cleland 1972; Plog
1983) and information-exchange theory (i.e., Hegmon 1992; Pauketat and Emerson 1992;
Wobst 1977). These theories posit that the degree of stylistic similarity between loci
(e.g., individuals, communities, regions) is directly proportional to the amount of social
interaction, and that style functions within cultural systems as a mode of communication.
These studies assume that statistical distance between assemblages provides a measure of
the social distance, which in turn provides an indication of the geographic and temporal
dimensions of the regional ceramic tradition. A full critique of the strengths and
weaknesses associated with this theoretical perspective (and accompanying methods of
ceramic analysis) are beyond the scope of this dissertation. However, it must be noted

17
that in the case of Fiji, focus on ceramic-based interaction models has encouraged
proximate explanations for the emergence of fortifications (i.e., the invasion of non-Fijian
populations created a need for defense), and also resulted in minimal development of
other issues in prehistory, in particular aspects of subsistence, settlement patterns, and
cultural adaptations to environmental and social conditions. This is particularly evident
in the studies of Taveuni (Frost 1974), and Lakeba (Best 1984, 2002), in which
interpretations of interaction based upon ceramic change ‘flesh-out’ trends in subsistence
and settlement patterns in prehistory. Hence, indications for competition and conflict in
prehistory have been relegated to ad hoc explanations that include migration, population
growth, environmental disturbance, and the emergence of social complexity. The
simplicity of these explanations do not negate the value of these studies to Fijian
prehistory, but they do suggest that there are wide gaps that require additional study.
In particular, recent research suggests that ancient Pacific Islanders were broadly
affected by seasonal or annual climatic fluctuations that extend into antiquity (Bridgman
1983; Finney 1985; Nunn 1994; Nunn and Britton 2001; O’Connell and Allen 1995;
Parry 1997). As has been recognized in other parts of the world, global climatic
variations often shaped human history (e.g., robust phenotypes in cooler climates
(Pearson 2000); and the transition to agriculture during the Holocene (Richerson et al.
2001). Most significantly, archaeological research has identified a close linkage between
conflict and unpredictable environments (Bawden and Reycraft 2000; Dean 1988;
Kuckelman et al. 2002; Lekson 2002). These studies suggest that prehistoric research
that attempts to incorporate a broader range of variables, both social and environmental,

18
has the potential to more accurately assess the causes and consequences of competitive
strategies in prehistory.
2.2. Research Questions
As mentioned in Chapter 1, the examination of the causes and consequences of
competition and cooperation offers a viewpoint from which cultural developments can be
measured and assessed. The research of Crosby (1988) and Parry (1977, 1982, 1987)
offer glimpses of an environment-based approach that incorporates archaeological and
environmental data into analyses of subsistence, settlement, and interaction. Similar
research conducted by Dewar (2003), Kirch and Yen (1982), O’Connell and Allen
(1995), and Spriggs (1985, 1997) have indicated ways in which ancient Pacific Islanders
were broadly affected by, or participated in, environmental trends that resulted in cultural
change. These studies demonstrate that archaeological research that directly tests the
relationship between the environment and specific strategies can provide tangible insights
into cultural trajectories, yet also incorporate analyses of ceramics or other artifacts that
may indicate cultural traits or practices with origins in other parts of the Pacific.
The research described herein seeks to address the issue of competition as well as
cooperation in Fijian prehistory. Specifically, this research seeks to integrate both social
and environmental data, and thus investigate the following research questions in the
context of the Sigatoka Valley:

19
1) When did competition arise in the valley’s prehistory?
2) To what extent did regional environmental conditions select for competitive or
cooperative strategies, and how did these strategies vary across the physical and social
landscape?
3) In what ways did global climatic fluctuations condition the development and
persistence of competition and cooperation? What factors affected the variability of
responses?
4) How did competitive or cooperative strategies shape social boundaries, and
how did these relationships change over time?
5) What are the implications of the Sigatoka Valley case for other parts of Fiji, as
well as the rest of the Pacific?
As has been demonstrated in other archaeological studies of conflict (e.g., Kennett
1998, Lambert 1994, Lekson 2002), the frequency of competitive and cooperative
behaviors in prehistory can be addressed at a number of temporal and spatial scales. For
this research, environmental and archaeological data allow for the identification of broad
general trends in Sigatoka Valley prehistory, and also provide for assessments of
particular regions and temporal periods that would have encouraged increased rates of
competition or cooperation. More precise archaeological and social data from ceramics,
exchange items, and historic records of land tenure allow for a reevaluation of these
trends at regional levels, and also redefine the Sigatoka Valley in terms of the persistence
of particular historical trajectories in the highland and delta regions.

20
2.2. Evolutionary Ecology
Investigating the extent of competition and cooperation in Fiji’s past requires a
robust theoretical conception of human behavior and environmental variation, and also a
theoretical perspective that allows for addressing ultimate, as well as proximate,
causation. As a subfield of evolutionary biology and cultural ecology, evolutionary
ecology articulates a series of middle-range explanations which link empirical
phenomena and ecological theory. At its core are the assumptions of Darwinian theory:
1) all living things are members of a lineage that owe their existence to inherited traits,
and variation amongst lineages differentially affects their capacity to survive and
reproduce; 2) natural selection is a mechanism of change, which determines the
differential persistence of lineages, and also determines which traits will be successful
over time, and become prevalent within a population (Smith and Winterhalder 1992:26).
It is important to note that evolutionary theory acknowledges that natural selection may
act on any heritable trait, including non-biological (i.e., phenotypic) behavioral strategies.
This has led to the heuristic concept of genotype and phenotype; the genotype can be
summarized as traits inherited from the parents, while the phenotype is the physical and
behavioral manifestation of those traits (Boyd and Richerson 1985). Although the
transmission of the genotype is limited to biological reproduction, the phenotype can be
transmitted within and between generations through the process of learning. Thus,
particular behaviors or strategies that are transmitted as part of an individual’s phenotype
are also the product of evolutionary processes, and change occurs through time and space

21
in a fashion that is not unlike the transmutation of species (Cavalli-Sforza and Feldman
1981; Durham 1991, 1992; Leonard and Jones 1987).
Overall, Darwinian theory provides the explanatory power of evolutionary
ecology models, as it suggests that processes of natural selection and the interaction of
organisms with the environment will either result in the “good fit” of those organisms
within the surrounding ecosystem, or the extinction of that particular lineage. In so
doing, evolutionary ecology examines why particular phenotypes (i.e., biological and
behavioral traits) evolve in particular ecological contexts. In practice, evolutionary
ecology also relies upon three tenets: a focus on the individual, the postulation of
behavioral strategies, and the use of hypothetico-deductive modeling in the generation of
explanation (Smith and Winterhalder 1992:50-59).
Methodological Individualism
Evolutionary ecology identifies the individual as the fundamental unit of study,
and also the level at which selection operates (Smith and Winterhalder 1992:29). Like
biology, evolutionary ecology also suggests that individuals employ strategies that
optimize their own reproductive success, and in most circumstances behave in ways that
benefit themselves. Perhaps most importantly, evolutionary ecology identifies social
groups as aggregates of individuals, and as such the rules and practices of social
institutions are the result of collective behavioral strategies. Although selection
fundamentally acts at the level of the individual, field studies suggest that selection at the
level of the group can occur, especially if strategies benefit groups of closely related
individuals (e.g., kin selection) (Hamilton 1964).

22
Behavioral Strategies and Hypothetico-Deductive Modeling
Most evolutionary ecology studies begin with a question about a particular
behavior. It is assumed that that there is a fitness related goal to the behavior in question
(e.g., frogs croak to attract mates, birds build nests to protect their eggs, etc.), therefore,
behaviors are equated with strategies which individuals employ in an attempt to survive
and reproduce. This assumption also posits that there are costs and benefits associated
with each strategy, and selection will tend to favor the best strategy from amongst a set of
alternatives. Smith suggests that the strategy that predominates within a population, and
which also persists thorough time, is identifiable as an evolutionary stable strategy
(ESS)(Smith 1988).
Significantly, evolutionary ecologists have identified the ability of organisms to
behave ‘optimally’ as an evolutionary stable strategy. In most cases, the conception of
optimizing refers to foraging strategies that maximize food returns and minimize harvest
time, but in more general terms it suggests that individuals select strategies that are the
most effective. This concept has allowed for the development of a variety of
hypothetico-deductive optimization models, all of which specify an actor, a series of
choices, a method for the evaluation the costs and benefits, and a context of
environmental and cognitive constraints (Broughton and O’Connell 1999; Smith
1987:202; Stephens and Krebs 1986:9). Smith has suggested that optimization models
such as these are advantageous in that they allow for testing the empirical world against
the expectations of evolutionary theory, and also provide a means for assessing fitness
(i.e., the ‘success’ of a particular strategy). It is important to note that the concept of

23
optimization relies upon defining a currency, such as time or amount of intake, in the
determination of costs and benefits for particular strategies (Stephens and Krebs 1986).
In recent decades other currencies have been identified as pertaining to optimization,
including minimizing time or risks, (Cashdan 1990, 1992; Stephens 1990), or maximizing
stability in harvest rates over time (Gremillion 1996; Rautman 1993, 1996). These
currencies have broadened hypothetico-deductive models to include a variety of
subsistence strategies, and also re-identified optimality as a variable that relates through
time to costs and payoffs. These studies stress that the assumption of optimization is not
necessarily a real-world observation, but when encapsulated within a model that
designates a set of choices, a currency, and a set of environmental constraints, it can serve
as a heuristic tool for predicting evolutionary outcomes (Smith 1987).
In conclusion, Lewontin (1974) has pointed out that any scientific discipline
requires a body of theory that is both dynamically and empirically sufficient. These
terms refer to the ability of theory to adequately explain the empirical world, and also
generate units that are directly measurable. In addition, the application of theory must
also designate criteria by which the closeness of the match between theoretical
expectations and real-world measurements can be assessed. In the case of human
behaviors such as competition and cooperation, evolutionary ecology offers a theoretical
perspective that accounts for change and provides a series of expectations that can be
tested against empirical phenomena. The following section will present an evolutionary
ecology model for competition and cooperation. Both the general developmental trends
suggested by the model, as well as the finer details relating to group formation,

24
interaction, and human articulation with the environment, will provide for a set of
expectations that will be tested in the Sigatoka Valley case.
2.3. An Evolutionary Ecology Model for Competition and Cooperation
In explaining the development of competition and cooperation in human societies,
evolutionary ecology has drawn heavily from sociobiological and evolutionary biological
models of the formation of groups, the development of social hierarchies, and the
establishment of settlement strategies and territoriality. In particular, the writings of
Cashdan (1983), Durham (1976), Dyson-Hudson and Smith (1979), Smith (1981, 1983,
1985), and Boone (1983, 1992) form the core components for an evolutionary ecology
perspective on competition and cooperation in human societies. In addition, biological
studies of kinship (Alexander 1974), and territoriality (Brown 1964; Godfrey 1987)
provide additional insights relating to aspects of cooperation and competition within
families and extended lineages. Computer aided agent-based modeling, and biology-
derived game theory have also produced individual-based cooperative and competitive
models (e.g., Axelrod 1997, Bowles and Gintis 2003). Lastly, environmental studies and
the occurrence of warfare have generated several generalizations relating to resource
unpredictability and conflict in human societies (Dean 1988; Ember and Ember 1992;
Halstead and O’Shea 1989; Kennett and Kennett 2000; Raab and Larson 1997). The
following sections outline an evolutionary ecology model that combines these
approaches. These principles will generate hypotheses for the investigation of

25
competitive and cooperative settlement strategies in Fijian prehistory, and also direct
research towards the identification of evolutionary sequences in the Sigatoka Valley case.
The Formation of Groups
Durham (1976), Smith (1981, 1983) and Boone (1992) posit that the size and
structure of human social groups can be explained in terms of the aggregate
consequences of individual behavioral strategies. In simple terms, individuals strive to
maximize access to or control over limited resources through competitive and
cooperative interaction with other individuals. Smith (1981, 1983, 1985, 1987) suggests
that the process of group formation can be understood from a cost/benefit perspective,
wherein individuals weigh the costs of group affiliation, versus the costs of foraging
alone, migrating to a less competitive environment, or affiliating with another group
under more favorable terms. Boone (1992) has further outlined this process by
suggesting that in some circumstances, it may be in the best interest of group members to
either include or exclude new members. He posits that a group will reach an optimal size
in which the members all receive a greater per capita return than if they were each
foraging singly. The character of the resource base also affects the extent to which
individuals cooperate with one another. In agriculture-based societies where there is
often a time limit within which work must be completed, individuals will choose to
cooperate. This is because the formation of work groups benefit each member of the
group in turn, and thus reap greater rewards for all (Boone 1992:305).

26
Social Stratification
According to Smith and Boone, social stratification begins as an attempt by
individuals to minimize variance in resource income through sharing. The key
assumption in the model is that each actor is subject to random variation in harvest rates,
yet seeks to optimize (or stabilize) returns through exchange. Boone suggests that social
stratification can occur with the establishment of a patron/client relationship, in which the
client exchanges something with the patron in order to insure adequate amounts of
necessary resources (Boone 1992:306). When there is a balance achieved between
dominants and subordinates, both reap benefits that are greater than those gained outside
of the group. This explains the development of inequality--as long as the benefits
outweigh the costs, a social hierarchy that permits inequality will persist as a favorable
strategy. However, Boone contends that as long as there is unoccupied territory available
and emigration/dispersal remains and economically viable strategy, hierarchies are
unlikely to form. Contrariwise, if an area is circumscribed environmentally or socially,
emigration becomes less attractive, and hierarchical social organization within a group
will be encouraged under conditions of increasing population density.
The Development of Competition and/or Cooperation Between Groups
As with individuals, groups vie for a limited number of resources, and employ
different strategies to obtain what they need. Therefore, the emergence of competition is
heavily dependent upon demographic, environmental, and social variables (Carneiro
1970). Dyson-Hudson and Smith (1979) note that the distribution of resources in time
and space plays a pivotal role in the formation of groups, the foraging strategies

27
employed, and the extent to which groups either compete or cooperate with each other.
For example, in situations in which resources are predictable and also densely distributed,
groups will settle in either home ranges or territories as a strategy of resource acquisition
or maintenance. In addition, Dyson-Hudson and Smith (1979:25-26) and Cashdan (1983)
suggest that competitive strategies are most favored in environments in which the
resources are densely distributed, and temporally predictable. This is because dense and
predictable resources achieve “economic defendability” in that the benefits accrued from
maintaining exclusive access outweigh the cost of defense. In these environments,
groups are expected to invest in an aggressive offensive strategy, or some form of
defensive territory maintenance.
Importantly, Boone adds that there is a correlation between high fitness value and
defense-related energy expenditures: the more valuable the resource, the more cost a
group can absorb from a fight. This is a product of resource quality, which must be high
enough for a net gain in fitness value for each individual. Therefore, small groups may
be willing to defend a territory at a great cost to them, provided the exclusive access to
the resources in that territory will benefit surviving members (Boone 1992). These costs
may include energy expenditures far beyond that needed strictly for reproduction, such as
investment in public works (e.g., constructed defenses) for the home territory. Axelrod
(1984) equates these situations to ‘zero-sum’ games within Prisoner’s Dilemma game
theory, and suggests that if the strategy is replicated as an effective means of maintaining
control over limited resources, it will persist as a stable strategy.

28
Durham (1976) suggests that cooperation on the part of individuals in inter-group
aggression or defense can also provide specific individual benefits. First, when a group
competes for limited resources, successful warriors may themselves directly benefit from
the fitness-value of resources defended or acquired. However, Durham notes that
intergroup aggression can evolve by natural selection even when all of the warriors do
not derive direct resource benefit from the conflict, so long as their fitness costs are more
than compensated for by other benefits from within the group.
Competitive strategies, in particular conflict and warfare, are also strongly
influenced by temporal environmental variability. In studies of warfare around the world
(including skeletal populations, signs of physical trauma, trophies relating to combat,
weapons, and fortifications), many researchers have noted that periods of environmental
unpredictability are preludes to the emergence of conflict. This has been particularly
visible in the North American Southwest, where droughts have been linked to increases
in both violence and abandonment ca. AD 1300 (Bawden and Reycraft 2000; Dean 1988;
Kuckleman et al. 2002; Lekson 2002; Tainter and Tainter 1996). These interpretations fit
within some of the tenets of evolutionary ecology, especially if conflict is viewed as a
strategy for maintaining territorial integrity, and also a strategy of buffering against
resource variance by intimidation or defeat of competitors (e.g., Durham 1976). Thus,
unpredictability in environments intensifies competitive strategies, and conflict is a
common outcome.
However, studies of variable or unpredictable environments have also suggested
that competition cannot exist entirely without some form of cooperation. Cashdan

29
(1990), Dyson-Hudson and Smith (1979), and Halstead and O’Shea (1989) posit that in
situations in which resources are unpredictable and widely scattered, groups will attempt
to buffer against resource variance, and in many instances cooperate with each other by
employing an information-sharing network or participating in exchange. Essentially,
these behaviors are a form of mutualism that seeks to improve the fitness outcomes for
both parties (e.g., Axelrod 1984). The formation of networks, which may be kin based,
serve to distribute information and resources within and between groups. However, the
structure of these networks is conditioned by the size and distribution of the participating
population, and also by other strategies (such as mobility, storage, or diversification)
which can be simultaneously employed to ward off shortfalls.
Although individual cooperation in evolutionary ecology models is generally
attributed to self-interest, or in the least, attributed to genetic altruism, recent studies of
cooperating behaviors within groups have established that cooperation may also serve as
a method of unification. Through sociological studies, Bowles and Gintis identify
specific individuals who cooperate in all situations as ‘strong reciprocators’. These
individuals dramatically improve the survival chances of groups under stress, as they
mobilize emotions in support of cooperative behavior, and thus attenuate conflict
between individual interests (Bowles and Gintis 2003:3). Therefore, within temporally
variable environments, or during periods of extreme duress, groups may persist under a
regimen of intense cooperation.

30
The Persistence of Competition and/or Cooperation Between Groups
In the theoretical conception of competition and cooperation, the distribution of
resources conditions the formation of groups and strategies of subsistence. In cases in
which resources are dense and predictable, groups are expected to resort to competitive
strategies, such as a form of boundary maintenance or defense, in order to maintain
exclusive access. In situations in which resources are unpredictable and widely
dispersed, groups will resort to cooperation, such as resource sharing or exchange, in
order to supplement their own harvests. Temporal variability, in particular
unpredictability, will encourage the intensification of either strategy. Importantly, Boone
notes that the long-term stability of competitive and cooperative strategies is dependent
upon the reactions of people living in adjacent areas, and their status as either kin or non-
kin. Axelrod (1997) encounters similar results in his computer-generated agent models.
He notes that individuals continuously hedge bets between cooperative and competitive
strategies, and their choices are based upon their knowledge of whom they are interacting
with, and the potential for that individual to either cheat or defect (Axelrod 1997:7).
These theoretical perspectives on competition and cooperation suggest that the
persistence of either behavior depends in part upon the spatial distribution of related and
non-related social groups, and the quality and quantity of their pre-existing levels of
interaction.

31
2.4 Testable Hypotheses for the Sigatoka Valley Case
The summaries above provide both a heuristic model for the development of
competition and cooperation in prehistory, and also define as series of hypotheses that
can be tested in the Sigatoka Valley case. These are as follows:
1) The distribution of resources in time and space play a pivotal role in the
formation of groups, the foraging strategies employed, and the extent to which groups
either compete or cooperate with each other. As outlined in Table 2.1, competitive
strategies are beneficial in environments in which the resources are densely distributed,
and temporally predictable, and territories are expected to form. In situations in which
resources are unpredictable and widely scattered, groups are expected to cooperate with
each other by employing an information-sharing network, and practice some form of
mobility. Cooperation is predominantly kin based, although under conditions of extreme
scarcity, groups may persist under a regimen of intense cooperation.
2) Temporally variable environments (e.g., unpredictability) intensify competitive
and cooperative strategies. Archaeological studies suggest that human groups resort to
conflict during long periods of resource unpredictability. However, environments that
contained scarce resources to begin with will encourage intensive cooperation.
3) The long-term stability of competitive and cooperative strategies is conditioned
by the reactions of people living in adjacent areas, their status as either kin or non-kin,
and also the configuration of resources over time and space.
4) If individuals are subject to random variations in harvest rates, social
stratification occurs as a product of individual buffering strategies. However, if

32
Table 2.1. Relationship between resource distribution and foraging strategies. Adapted
from Dyson-Hudson and Smith (1979:26).
Resource
Distribution
Economic
Defendability
Resource
Utilization
Degree
of
Mobility
‘Temporally
Predictable’
Environments
‘Temporally
Unpredictable’
Environments
Unpredictable
and Dense Low Info-sharing High Cooperative Cooperative
Unpredictable
and Scarce Low Dispersion
Very
High Cooperative Cooperative
Predictable
and Dense High Territoriality Low Competitive
Competitive
and Cooperative
Predictable
and Scarce Fairly Low
Home
Ranges
Low-
medium Cooperative
Competitive
and
Cooperative
emigration or dispersal remains and economically viable strategy, individuals will seek
out better circumstances elsewhere.
The hypotheses derived from the evolutionary ecology model can be investigated
at a variety of scales within the Sigatoka Valley environment. These scales are
determined by both the nature of the research questions posed (e.g., Chapter 1), and also
the resolution of both archaeological and paleoenvironmental data. The following
chapter will discuss the issues relating to an archaeological study of competition and
cooperation in finer detail, in particular the evaluation of environmental productivity and
predictability.

33
2.5 Chapter Summary
Initial explanations of competition and warfare in Pacific prehistory were
predominantly attributed to the spread of populations that retained warfare as a cultural
trait. Theoretical developments also suggested that the causes of aggression and warfare
lay in the material and ecological foundations of societies, although little attention has
been paid to environmental data that suggest that Pacific islands have been broadly
affected by climatic fluctuations throughout prehistory. This omission has prompted a
series of research questions focused on the antiquity of competition and cooperation in
Fijian prehistory.
Evolutionary ecology is identified as the theoretical perspective that is most suited
to addressing the problem of competition and cooperation in the Fiji case. With an
evolutionary perspective that privileges the role of the individual, a tradition of
hypothetico-deductive modeling, and an emphasis on determining how and why
strategies designed to articulate with the environment evolve and persist, evolutionary
ecology offers a comprehensive approach to the problem of competitive and cooperative
strategies in prehistory. A combined model of group formation, competition, territory
establishment, temporal variation, and social hierarchy formation is presented, which
specifies expectations for the Fiji case.

34
CHAPTER 3. SPATIO-TEMPORAL VARIABILITY AND UNPREDICTABILITY IN
THE SIGATOKA VALLEY ENVIRONMENT
As outlined in section 2.3, evolutionary ecology suggests that the spatial and
temporal distribution of resources critically affects the formation of groups, and also
conditions the development and persistence of competitive strategies. In particular, the
model indicates that regions that experience unpredictable environmental fluctuations
(i.e., non-cyclical transitions between high frequency and low frequency fluctuations, or
extremes in duration or amplitude) encourage the intensification of competitive
strategies. The following discussion assesses the Sigatoka Valley in terms of spatial and
temporal environmental variability, and analyzes the impact of this variability on modes
of subsistence. Three specific analyses are employed: 1) the distribution soils are
compared with topography to determine the maximum extent and configuration of arable
land in prehistory; 2) regional and seasonal rainfall patterns are compared with
topography to determine the environmental zones most suited to growing either wetland
or dryland crops; and 3) the frequency and amplitude of climatic perturbations are
assessed for Fiji, and modern data are used to predict regions of damage or shortfall. The
results of these analyses indicate a trend towards competition that is based upon
environmental limitations and cyclical climatic perturbations.
3.1 The Study Area: The Sigatoka Valley
The Sigatoka Valley is located within the southwestern corner of the main island
of Viti Levu, extending across 1700 km2 of rugged mountains and grassy hills. The
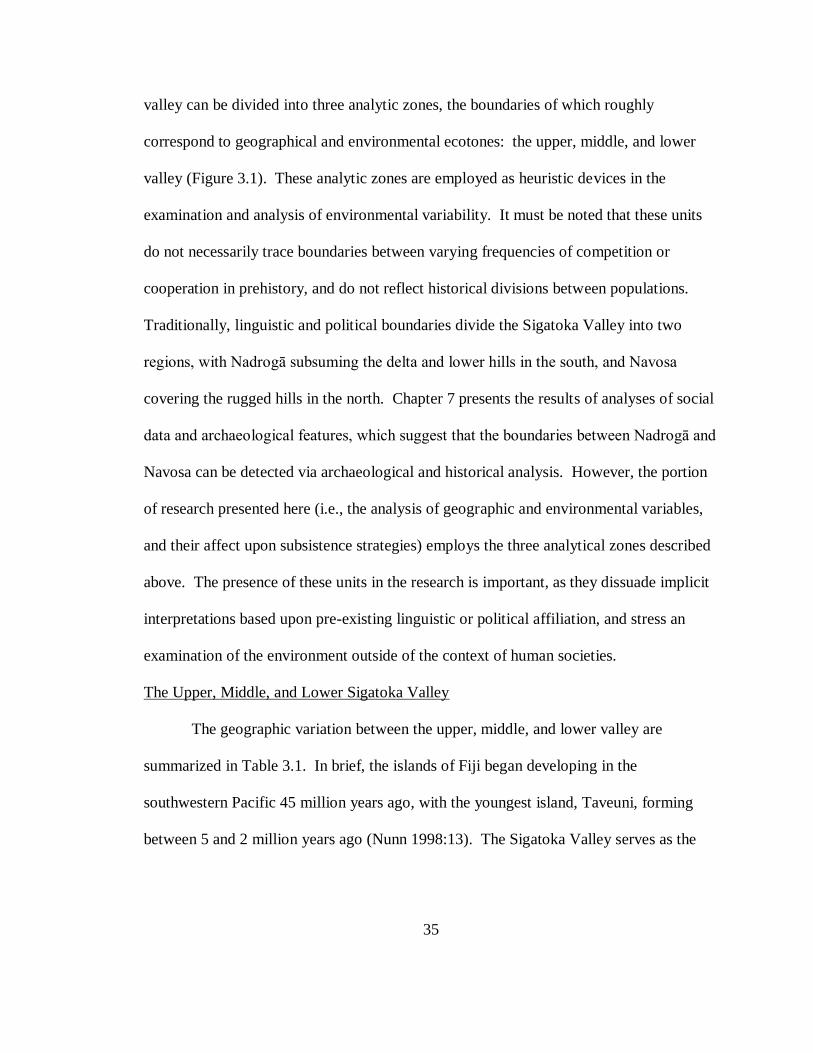
35
valley can be divided into three analytic zones, the boundaries of which roughly
correspond to geographical and environmental ecotones: the upper, middle, and lower
valley (Figure 3.1). These analytic zones are employed as heuristic devices in the
examination and analysis of environmental variability. It must be noted that these units
do not necessarily trace boundaries between varying frequencies of competition or
cooperation in prehistory, and do not reflect historical divisions between populations.
Traditionally, linguistic and political boundaries divide the Sigatoka Valley into two
regions, with Nadrogā subsuming the delta and lower hills in the south, and Navosa
covering the rugged hills in the north. Chapter 7 presents the results of analyses of social
data and archaeological features, which suggest that the boundaries between Nadrogā and
Navosa can be detected via archaeological and historical analysis. However, the portion
of research presented here (i.e., the analysis of geographic and environmental variables,
and their affect upon subsistence strategies) employs the three analytical zones described
above. The presence of these units in the research is important, as they dissuade implicit
interpretations based upon pre-existing linguistic or political affiliation, and stress an
examination of the environment outside of the context of human societies.
The Upper, Middle, and Lower Sigatoka Valley
The geographic variation between the upper, middle, and lower valley are
summarized in Table 3.1. In brief, the islands of Fiji began developing in the
southwestern Pacific 45 million years ago, with the youngest island, Taveuni, forming
between 5 and 2 million years ago (Nunn 1998:13). The Sigatoka Valley serves as the

36
Fig
ure
3.1
. T
opogra
phic
map
of
the
Sig
atoka
Val
ley,
show
ing u
pper
, m
iddle
and l
ow
er
anal
yti
c unit
s.
Ele
vat
ions
indic
ated
by s
pot
hei
ghts
.

37
Table 3.1 Geographic variation between the upper, middle, and lower valley.
Geographic Features Lower Valley Middle Valley Upper Valley
Size (km2)
399.8
395.0
453.3
Slopes > 45° 104 (26 %) 229.1 (57 %) 280 (61 %)
Alluvial terraces (km2) 55.5 58.7 74.3
Elevation range (m) 0-400 20-700 20-1300
Vegetation grassland grassland/shrubs grassland/shrubs
main drainage system for nearly one-third of the island of Viti Levu, and within its
expanse a great deal of the island’s geological history and geographical variability is
exposed. As a geographical unit, the upper valley is dominated by its steepness and
extreme elevations (over 1100 m) especially at its northern end (Figure 3.2 and Appendix
A, Figure A.3). Land classifications performed by the Fijian Dept. of Agriculture
indicate that most of the soils of the upper valley exist on steep and mountainous slopes,
61% of which are greater than 45° (Fox et al. 1952; Houtz 1960; Wright and Twyford
1965). However, the length of the river in the upper valley, and also the confluence of
the Namada River and several isolated tributaries provide approximately 74 km2 of flat
alluvial deposits that would have served as arable land. Approximately 5 km2 of
planation surfaces (high erosion surfaces) of Pliocene age also extend across portions of
the higher elevations of the upper valley (Nunn 1998:119).
The boundaries of the middle valley subsume a long linear segment of the
Sigatoka River, within which Miocene and Pliocene-aged deposits have been carved out

38
Fig
ure
3.2
. T
opogra
phic
map
of
the
upper
val
ley. E
levat
ions
indic
ated
by s
pot
hei
ghts
.

39
to produce a gorge. Despite frequent floods in the gorge, approximately 55 km2 of
alluvial terraces run along its length, and the higher elevations above retain a steep
topography with 57% of the slopes at 45° or greater (Figure 3.3 and Appendix A, Figure
A.4). At its northernmost extreme, the middle valley contains an abandoned meander
that was formed when the river changed course between the Pliocene and the Pleistocene.
Since this repositioning the Tonuve meander has become a poorly drained swamp of
approximately 3 km2 in area. To the south, the river passes the Naqalimare limestone
formation, which is 12 km2 in area, and reaches a height of 453 meters above sea level
(Chandra 1971).
Lastly, the lower valley is typified by several large meanders that curve across the
landscape, ultimately forming the broad delta region of the Sigatoka Valley. Although
the extent of alluvial deposits in the lower valley is limited to 55 km2, 74% of the region
contains other arable deposits that lay between 0 and 45° slope (Figure 3.4, and Appendix
A, Figure A.5). In general the topography of the lower valley is much gentler, with hills
that rarely reach over 300 m. Standing out sharply are the Sigatoka Sand Dunes, which
are located along the western boundary of the delta. According to geological and
sedimentological studies, these dunes began forming 1500 years ago as result of
increased erosion in the Sigatoka River (Dickinson et al. 1998). The rate of dune
accumulation has varied throughout the centuries, at times covering, and then revealing,
one of the earliest and most notable sites of human occupation in Fiji, the Sigatoka Dunes
lapita site (Best 1987a; Birks 1973; Burley 1997; Burley and Shortland 1999; Marshall et
al. 2000).
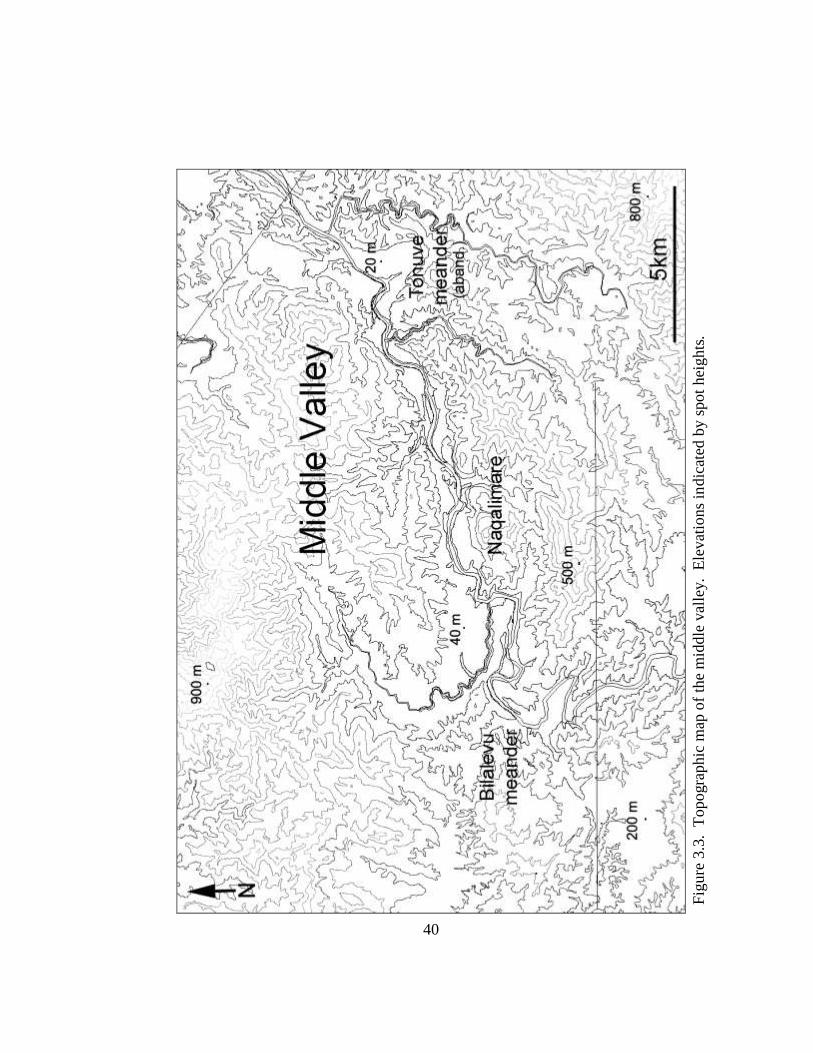
40
Fig
ure
3.3
. T
opogra
phic
map
of
the
mid
dle
val
ley. E
levat
ions
indic
ated
by s
pot
hei
ghts
.

41
Fig
ure
3.4
. T
opogra
phic
map
of
the
low
er v
alle
y. E
levat
ions
indic
ated
by s
pot
hei
ghts
.

42
Flora and Fauna of the Interior
The Sigatoka Valley is located on the leeward side of the archipelago, and it
receives between 1500 and 2250 mm of rain per year, much of which falls between the
months of December and February. This climate fostered the growth of dry tropical
forest and grasslands, the latter of which extend over much of western Viti Levu
(Mueller-Dombois and Fosberg 1998; Parham 1972). Since the time of human
colonization many of the larger hardwood species have been decimated, and today exist
only in small patches within forest reserves. Table 3.2 lists some of the varieties of trees
known to exist in the Sigatoka Valley, and also indicates a number of invasive species.
By and large much of the vegetation of the lower and middle Sigatoka Valley consists of
a rolling grass savannah that is composed of invasive species, such as mission grass
(Pennisetum polystachyon), and spear grass (Heteropogon contortus), however, several
native shrubs such as wase (Dodonaea viscosa) and gasau (Miscanthus floridulus), are
also widely distributed on the hillsides of the Sigatoka Valley. For the most part this
savannah is referred to as talasiga, or “sun burned land”, as it is too poor and dry for
agriculture, and can support little in the way of plant life.2 The floral regime of the upper
valley is more lush, with a higher abundance of shrubs and forest patches.
The native fauna of Fiji is similar to that of other islands of the southwest Pacific,
and is listed in limited detail in Table 3.2. This list includes a few species (such as grass
owls and golden doves) that today are exceptionally rare or extinct. Of note are the
abundant species of birds, and also introduced species such as pig, dog, rat, and chicken.
Freshwater clams and snails (Batissa violacea and Melanoides spp.), eels (Anguilla

43
Table 3.2. Flora and fauna of the Sigatoka Valley (not exhaustive).
Flora and Fauna Common/Fijian Name Genus and Species
Native trees and shrubs
Yaka
Dacrydium nidulum Native trees Buabua Fagraea gracilipes
Vesi Intsia bijuga
Lauci Aleurites moluccana
Kaudamu Myristica castaneifolia
Ivi Inocarpus fagifer
Nokonoko Casuarina equisetifolia
Deqedeqe Psychoria spp.
Betabeta Cyrtandra jugalis
Voivoi Freycinetia spp.
Kura Morinda citrifolia
Vau Hibiscus tiliaceus
Niu Cocos nucifera
Invasive/introduced trees Bamboo Bambusa vulgaris
Breadfruit Artocarpus altilis
Guava Psidium guavajava
Mango Mangifera indica
Native grasses Wase Dodonaea viscosa
Nuqanuqa Decasermum fruticosum
Gasau Miscanthus floridulus
Invasive grasses Mission grass Pennisetum polystachyon
Spear grass Heteropogon contortus
Plume grass Imperata conferta
Native ferns Pteridium esculentum
Dicranopters linearis
Native fauna Long-tailed fruit bat Notopteris macdonaldii
Samoan flying fox Pteropus samoensis
Monkey faced bat Peralopex acrodonta
Sheath-tailed bat Emballonura semicaudata
Bolo loa snake Ogmodon vitianus
Pacific boa Engyrus bibronii
Banded iguana Brachylophus fasciatus
Frogs and geckoes various
Peregrine falcon Falco peregrinus
Reef heron Egretta sacra
Grass owl Tyto longimembris Sulpher-breasted musk parrot Prosopeia personata White-throated pigeons Columba vitiensis
Golden doves Ptilinopus luteovirens
Many-colored fruit doves Ptilinopus perousii
Giant forest honeyeater Gymnomyza viridis
River perch Kuhlia rupestris
Catfish Plotosidae spp.
Mullet Mugil cephalus
Goby Eleotris spp.
River eel Anguilla marmorata

44
Table 3.2. (Continued) Flora and fauna of the Sigatoka Valley.
Flora and Fauna Common/Fijian Name Genus and Species
Native fauna Neritina snail Neritina spp.
Melanoides snail Melanoides spp.
Freshwater crabs and prawn
Freshwater clam Batissa violacea
Introduced fauna Pacific rat Rattus exulans
Dog Canis familis
Chicken Gallus gallus
Pig Sus scrofa
marmorata) and fish were also important to prehistoric subsistence strategies in the
interior (Haynes 2001; Pernetta and Watling 1978; Ryan 2000).
3.2. Subsistence Issues in Fijian Prehistory
The evolutionary ecology model suggests that the analysis of competition and
cooperation must be tied to a quantitative analysis of the environmental context within
which human groups must subsist and interact. In particular, the model suggests that
both the configuration and predictability of resources within an environment play critical
roles in the development of competitive and cooperative strategies. The following
discussion examines the variables that may have induced such strategies (i.e., the
subsistence regimes of prehistoric Fiji).
Pacific Islands Agriculture
Investigation of the earliest archaeological sites in the Pacific suggests that the
colonists of Fiji were predominantly marine-focused, but also maintained a tradition of
horticulture (Kirch 1997:203). The appearance of root and tree-crops throughout the

45
Pacific suggests that these voyagers brought with them a variety of agricultural products,
which were planted as needed to supplement marine harvests. As populations grew and
extended into the interior, the lack of marine and terrestrial fauna fostered the growth of a
diet based upon these imported root crops. As in the rest of the Pacific, subsistence in the
Fiji relied upon the cultivation of hydrophilic crops (plants that grow in partially
submerged conditions) such as dalo (Colocasia esculenta) and via kana ‘giant swamp
taro’ (Cyrtosperma chamissonis), and dryland crops such as uvi (Dioscorea spp.),
elephant ear taro (Alocasia macrorrhiza), and dryland taro3 (Barrau 1961, 1965; Gosden
1992; Kirch 1994; Kuhlken 1994; Spriggs 1982, 1984, 1985). With adequate amounts of
moisture, hydrophilic dalo can yield approximately 20+ tons/hectare/year, can be planted
year round, and harvested every 8-10 months (Brookfield 1979, in Spriggs 1984:129).
Thus, the location of dalo cultivation is usually predetermined by the co-occurrence of
moisture and silty soils, and earthworks such as ponded-fields and terraces were often
installed to take advantage of water supplies and encourage vibrant growth.
Uvi and other dryland crops were cultivated in swiddens (slash-and-burn gardens)
that were well-drained and occasionally terraced to retard erosion. With adequate
amounts of rainfall, uvi and dryland taro yield between 5-15 tons/hectare/year (Kirch
1994:8; Tindall 1983:203). Unlike dalo, uvi are only planted at the beginning of the wet
season, and they can be harvested 7-9 months later. However, the topographic and
environmental features required for uvi production are generally not as spatially limited
as that of dalo—most lands of moderate fertility and less than 45° slope will do. After a
few years of cultivation, the garden plots are also allowed to lie fallow so that the nutrient

46
levels in the soils can be replenished (Conklin 1963). Thus, in most traditional Fijian
agrosystems, the yearly calendar of planting and harvesting was dictated by the cycle of
uvi and dalo cultivation.
3.3 Spatial Analyses of Dryland Cultivation
According to Parry’s analysis of the soil types of the Sigatoka Valley, all of the
soils would have been suitable for growing non-irrigated crops such as uvi and dry taro
(Parry 1987:25-27). More specific are the soils surveys and classifications that were
performed by Wright and Twyford (1965), and Fox et al. (1952) which provide a great
deal of information concerning soil fertility in the Sigatoka Valley. Figure 3.5 indicates
the distribution of soils in the valley according to their fertility, as determined by nutrient
status. The soils of the delta, as well as the hills and mountains surrounding the middle
valley are of the best quality, while the fringes of the delta and the highlands in the upper
valley are of low fertility levels. Small pockets of highly fertile soil also lie in the beds of
some of the larger tributaries. When viewed as a whole, the Sigatoka Valley is typified
by sedimentary deposits that are moderately to highly fertile. This suggests that dryland
cultivation would have been very successful on these soils for the most part. However,
topography also affects the ability of the land to be productive. Dryland crops such as uvi
thrive on well- drained, slightly rocky soils, and they suffer no ill effects from being
planted upon land that lies at an inclined slope. However, the ability of farmers to till and
cultivate land that lies at an extreme slope is limited, as the disturbance of the soil leads
to erosion and the loss of valuable topsoil. Studies of cultivation worldwide indicate that

47
Fig
ure
3.5
. D
istr
ibuti
on o
f so
ils
in t
he
val
ley a
ccord
ing t
o f
erti
lity
(ad
apte
d f
rom
Wri
ght
and T
wyfo
rd 1
965
).

48
lands that lie at slopes greater than 45° are rarely put under cultivation, as erosion affects
crop yield, and ultimately degrades the landscape (Van Zuidam 1986:442). In order to
assess the cultivation potential of this landscape, the analytic capabilities of a geographic
information system (GIS) were used to analyze and classify the topography illustrated in
Figure 3.1. These calculations produced an image that indicates the distribution of soils
according to fertility, and between 0 and 45° slope (Figure 3.6 and Table 3.3).
Of note, the topography of the landscape limits the amount of land that is arable
and markedly divides the upper and middle valley from the lower valley. Relative to its
size, the upper valley has the least amount of arable land, with only 38% of its area at
slopes less than 45°. The middle valley has somewhat more, with 42% of its lands at
slopes less than 45°. It is the lower valley, however, that has the greatest amount—74%
of its lands lie at slopes that would be suitable for dryland cultivation. Table 3.3 and
Figure 3.6 also indicate the distribution of fertile soils in the Sigatoka Valley. The arable
areas of the middle and upper valley are predominantly small and scattered, as opposed to
the large contiguous configuration of patches of the lower valley (a large expanse of
alluvial terraces in the upper valley is the exception). The middle and upper portions of
the valley contain the richest soils, 57-79 % of which are of moderate-high nutrient
status. In contrast, the lower valley appears to have a ‘bottleneck’ distribution, with the
most fertile soils restricted to the valley bottom. In sum, only 40% of the lower valley
soils are moderate-high quality. These analyses suggest that relative soil fertility would
have allowed for the cultivation of crops such as uvi and dryland taro in most portions of
the Sigatoka Valley, although garden sizes (and by extension, harvest sizes) would have

49
Fig
ure
3.6
. D
istr
ibuti
on o
f so
ils
of
hig
h,
moder
ate,
and l
ow
fer
tili
ty o
n a
reas
wit
h l
ess
than
45°
slope.

50
Table 3.3. Topographic and sedimentological data for the Sigatoka Valley.
Lower Valley Middle Valley Upper Valley
Moderate-high
fertility 118 km
2 (40.6 %) 132 km
2 (79.6 %) 98.61 km
2 (57 %)
Moderate fertility 94 km2 (31.3 %) 6 km
2 (3.6 %) 72 km
2 (41.6 %)
Moderate-weak fertility
83 km2 (28.1 %) 28.2 km
2 (16.8 %) 3 km
2 (1.4 %)
Strong dry season
130.4 km2 (44 %)
46.78 km2 (28 %)
15.85 km2 (9.1 %)
Moderate dry season 153.4 km2 (52 %) 101.78 km
2 (61.3 %) 127.7 km
2 (73.7 %)
Weak dry season 11.2 km2 (3.7 %) 17.84 km
2 (10.7 %) 30 km
2 (17.2 %)
been constrained by topography in both the middle and upper portions of the valley.
Cultivation was certainly possible in these areas, but was likely restricted to widely
distributed ‘pocket gardens.’ Further, certain areas of the lower and upper valley
contained large, contiguous tracts of arable land, and these areas are likely to have been
particularly valued by ancient farmers. The distribution of poor quality soils on the hills
of the lower valley undoubtedly accentuated this focus.
3.4 Temporal Variability in the Sigatoka Valley Environment
From a spatial standpoint, two variables affect the cultivation of Fijian root crops:
the distribution of arable topography, including land of low elevation and mild slope; and
the distribution of adequate soil quality, including mineral content, grain size, and
permeability. However, hydrology (including annual rainfall and flow of streams and
rivers), is both spatially and temporally variable. The following discussion focuses on
the nature of hydrology in the Sigatoka Valley, and the degree to which particular crops
were restricted to either wetter or drier environmental zones. The evaluation of

51
interannual rainfall also suggests that the region experienced hydrological perturbations
of varying amplitude and frequency. These data allow for an evaluation of both the
variability and unpredictability of the prehistoric Sigatoka Valley environment at both
local and regional scales.
Seasonal Variability in Rainfall
Fiji’s latitude and location in the southwestern Pacific places it in the path of the
southern trade winds, which supply it with an annual monsoon pattern of a hot, rainy
season followed by a cooler, dry season. The mean annual temperature in western Fiji is
24.7°C (an annual range of 20.1 - 29.3°C), with cooler temperatures predominating in the
highlands. The difference between the wet and dry season is significant in the Sigatoka
Valley, with 75% of the 1500-2250 mm of rain falling between the months of December
and February (Figure 3.7). Parry (1987) has indicated that the region experiences
approximately 150 - 200 rain days per annum, however, there is a moderately high
amount of fluctuation in the amount of rainfall that falls throughout the year. According
to data collected over the past 65 years, the coefficient of variation for annual rainfall in
the Sigatoka Valley is moderately high when compared to the annual rainfall for
windward Fiji. This indicates that intraannual rainfall can be unpredictable in the
Sigatoka Valley, even during the months that would usually produce the most number of
rain days (Parry 1997:20).
Rainfall in the Sigatoka Valley is also spatially variable, with more rainfall falling
in the higher elevations, and in the upper valley. Figure 3.8 and Table 3.3 indicate the
distribution of soils at less than 45° slope and which experience strong, moderate, and

52
Figure 3.7. Characteristics of rainfall regime in Viti Levu (adapted from Parry 1997:21,
based on data from Harris 1963, and Coulter et al. 1983).
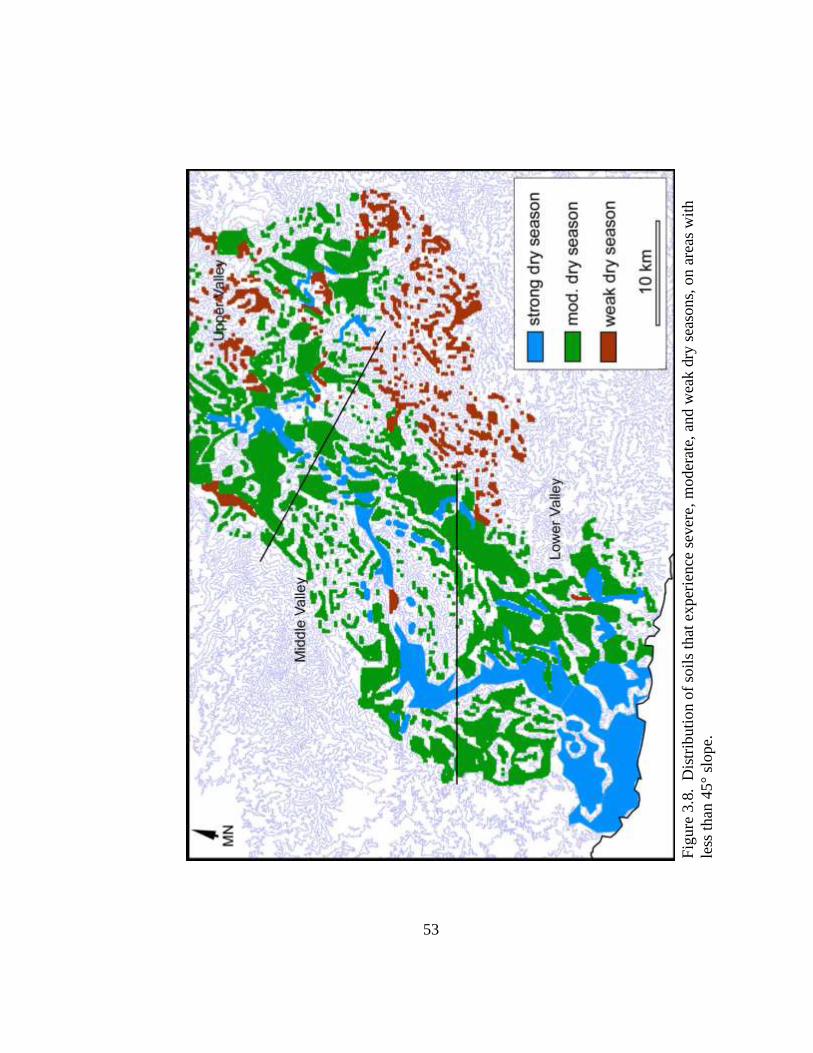
53
Fig
ure
3.8
. D
istr
ibuti
on o
f so
ils
that
exper
ience
sev
ere,
moder
ate,
and w
eak d
ry s
easo
ns,
on a
reas
wit
h
less
than
45°
slope.

54
weak dry seasons. As indicated by the blue shading in Figure 3.8, the delta region and
valley bottom constitutes a zone that experiences the most severe effects of the dry
season. Soils in this zone receive very little rain during the months between April and
October, and their porous qualities allow for little moisture retention. Cultivation of uvi
undoubtedly occurred on these deposits as the nutrient levels and flat topography would
have encouraged high yields. However, variation in seasonal rainfall recorded for the
Sigatoka Valley suggests that farmers may have experienced shortfalls in this zone, as
extended dry seasons could restrict uvi germination and growth.
The bulk of the valley’s lands experience a moderate dry season, with some rain
occurring outside of the wet season. As indicated in Figure 3.8, the mountainous
character of this zone serves to segment arable land into isolated patches, although many
are of large size (e.g., > 5 km2). The rainfall and nutrient levels of these soils would have
encouraged uvi germination and growth, and dalo cultivation would have been possible
in isolated patches. However, the effects of topography are clearly visible in Figure 3.8
(and also Table 3.3), as much of the middle valley and portions of the upper valley were
too rugged for cultivation of any kind. This is also the case for the portions of the valley
that experienced the weakest dry season—most of these areas are extremely rugged, and
cultivation would have been widely dispersed.
In sum, the analysis of topography, soil quality, and rainfall suggest that portions
of the Sigatoka Valley would have been more amenable to either wetland or dryland
cultivation. Moreover, rainfall patterns and soil quality suggest that portions of the valley
would have experienced a higher frequency of fluctuations between the wet and dry

55
season, while other regions remained relatively stable. These data suggest the presence
of three environmental zones: Zone 1) lands suited to dryland cultivation, and which also
experienced severe shortfalls due to severe dry seasons; Zone 2) lands suited to mixed
wetland and dryland cultivation, and which also experienced mild shortfalls due to
moderate dry seasons; and Zone 3) lands suited to wetland cultivation, and which also
experienced minimal shortfalls due to weak dry seasons. Figure 3.9 reveals the
geographic extent of these zones, which are based upon the analyses of soils and dry
season severity discussed above (e.g., Wright and Twyford 1965). Although this image
does not incorporate topographic limitations, it does indicate in general terms how some
portions of the valley were more suited to a particular form of cultivation, and less suited
to the application of another. Of note, it suggests that the mountainous areas surrounding
the valley bottom, as well as much of the upper valley (Zones 2 and 3), would have
allowed for a greater variety of cultivation strategies, and also experienced fewer (or less
severe) shortfalls related to seasonal dryness. However, gardens in this region would
have been smaller, and widely dispersed.
In the short view, the results of these analyses simply suggest that the inhabitants
of the valley must have privileged one mode of cultivation over the other. However, it
also suggests that portions of the Sigatoka Valley were more restricted in terms of
cultivation strategies, and more at risk from severe, long-term droughts. In the context of
the evolutionary ecology model, these results suggest that Zones 2 and 3 were likely the
focus of territorialism, as these areas would have offered both dense and predictable
resources. However, episodes of severe environmental fluctuations may have encouraged

56
Fig
ure
3.9
. E
nvir
onm
enta
l zo
nes
of
the
Sig
atoka
Val
ley,
as i
den
tifi
ed b
y s
oil
fer
tili
ty a
nd s
ever
ity o
f dry
sea
son.

57
a general trend towards increased competition and conflict. The following section
evaluates evidence for climatic perturbances in Fijian prehistory, and predicts the effects
of these phenomena on the Sigatoka Valley environment.
The Frequency and Amplitude of Environmental Fluctuations
Archaeologists and anthropologists note an association between variations in
environmental productivity and the development of competition and warfare (e.g., Dean
et al. 1985; Ember and Ember 1992; Jones et al. 1999; Haas and Creamer 1993; Raab and
Larson 1997). Based upon studies that incorporate the frequency and amplitude of
paleoenvironmental fluctuations (including temperature change and precipitation rates),
with long-term trends in competition and violence, these researchers suggest that periods
within which the environment fluctuates at a high frequency and/or unpredictably results
in the intensification of competitive strategies. As outlined in the evolutionary ecology
model (Chapter 2), this reaction is related to human subsistence needs, and competitive
strategies designed to reduce variation in harvest rates or insure access/control over
essential resources. The persistence of such strategies is also indicative of the duration of
disruptive episodes, and in some situations implies a cycle of intense or frequent
perturbations.
Archaeological and historical studies suggest that the episodic nature of the El
Niño Southern Oscillation (ENSO) produces broad ranging environmental fluctuations
that vary in both intensity and duration. Research performed by Moseley (1997),
Caviedes (2001), Sandweiss et al. (1996) and Quinn (1992) identify prehistoric periods in
South America in which ENSO occurrences were extremely variable in terms of intensity

58
and frequency, and these periods are correlated with an increase in competitive strategies.
These findings are significant to research of Fijian prehistory, as they suggest that the
occurrence of competition and conflict may be related to long and short term
environmental fluctuations, perhaps related to the effects of ENSO in the southwestern
Pacific. Therefore, the assessment of the paleoclimatic history of Fiji, specifically
episodic or punctuated variations in the climate that are indicative of ENSO, is crucial to
understanding how and why competition developed in prehistory. Such research also has
the potential to outline the specific effects of ENSO-related disturbances, and in the case
of the Sigatoka Valley indicate the extent and severity of environmental damage.
The El Niño Southern Oscillation (ENSO)
According to climatologists, the phenomena known as ENSO is brought about by
global changes in air pressure and ocean temperatures. The cycle begins when the center
of air pressure in the eastern South Pacific collapses, and the wind system incorporated
into it slackens or ceases altogether. When this happens, the warm waters of the western
Pacific bleed eastwards, bringing with them hot and humid air masses. In tandem with
this event is the development of a high-pressure climatic cell over Indonesia, which
fosters droughts in Australia and South Asia through the disruption of the monsoon
system. The climate becomes drier, and the sea temperatures drop in the eastern Pacific
(Caviedes 2001:8). For climatologists, the difference between the air pressures of the
eastern South Pacific and Indonesia cells provide an index of the severity of the El Niño
event (the Southern Oscillation Index, or SOI). A low or negative SOI indicates weak or
absent easterly winds, high humidity, and warm ocean conditions-- a severe El Niño

59
event, while a high SOI signifies the dominance of easterly winds and cooler sea
conditions-- a La Niña event (Caviedes 2001:8). According to climate specialists, ENSO
events occur at intervals of 3.5 years, and major events repeat every 5-7 years. Some El
Niño and La Niña events are stronger than others, or last for longer periods (Caviedes
2001:9; Kiladis and Diaz 1989; Peel et al. 2002).
ENSO in the Fiji Islands: El Niño and La Niña
Recent research by climatologists (Nichols and Wong 1990; Salinger et al. 1995)
and geographers (Nunn 1990) have confirmed that Fiji is strongly affected by climatic
perturbances associated with the El Niño Southern Oscillation (ENSO). However, it is
important to note that although Fiji is particularly prone to ENSO-related disturbances,
nearby Samoa and northern Tonga are not (Salinger et al. 1995). Thus, the effects of
ENSO on Fiji (and Fijian prehistory) may not be comparable to the effects of ENSO
elsewhere. This is due to the fact that the southwestern Pacific is influenced by both the
low pressure system of the eastern Pacific and the high pressure system located over
Indonesia. As a result, the interplay between El Niño and La Niña events produce a
unique cycle of rains and droughts that vary across the southwestern Pacific region. In
Fiji, El Niño years associated with a low or negative SOI index can result in severe
droughts, as well as a higher percentage of tropical cyclones. The Fijian Meteorological
Service states that, “droughts in Fiji can be closely linked to the ENSO phenomenon,
which results in generally below average rainfall for Fiji. A strong ENSO episode is
likely to result in a major drought over the country, as happened during 1982/83 and
1997/98 ENSO events” (Fiji Meteorological Service 2003).

60
Parry’s research on the North Coast of Viti Levu provides indications for the
complex nature of ENSO related disturbances in Fiji, in particular the relationship
between El Niño and La Niña episodes. Parry compares the precipitation records from
three stations in northern Viti Levu with the SOI records for the years spanning 1935 to
1990 (Parry 1997:22). His data suggest that El Niño years are exceptionally dry—nearly
1000 mm less than average. However, he also notes that the droughts associated with a
strong El Niño are preceded and followed by two very different La Niña episodes. At the
onset, early La Niña conditions result in higher than average rains. Parry suggests that
this permutation of the ENSO cycle can be explained in terms of the progressive collapse
of the eastern trade winds, which allow for the extension of a westerly convective zone in
the west central Pacific (Parry 1997:24). This transitional period results in torrential rains
in Fiji as the winds gradually slacken or shift altogether. The more devastating portions
of the El Niño cycle occur in the years that follow a strong El Niño event. These late La
Niña episodes are typified by moderate to extreme droughts, and can last from 2 to 3
years.
According to historical documents from the 19th century in Fiji, wet years were
followed by strings of disastrous dry years in 1874-75, and 1879-1881 (Parry 1997:26).
Journal entries from these periods describe months of drought, and the loss of irrigation
water. These data concur with the recent findings by Salinger et al., (1995) that for the
entire archipelago of Fiji, the years that follow the El Niño event (the La Niña years) are
the driest. In addition, these data also concur with historic data for hurricanes in Fiji,
which are more likely to occur under the low-pressure conditions of an El Niño year.

61
According to Nunn, of the twenty-four tropical cyclones that developed in the region
between 1940 and 1985, twenty-one developed during a negative ENSO index (Nunn
1994:164). This suggests that Fiji could have experienced the proverbial double-blow in
prehistory, such as the 1971-72 hurricane season (with 10 severe storms buffeting the
region), followed by years of a dry La Niña episode.
3.5. Evaluating the Effect of ENSO on Agricultural Production in the Sigatoka Valley
The most recent El Niño episode in Fiji provides an index by which the severity
of past ENSO events can be assessed. According to relief agencies, the 18-month
1997/1998 El Niño event resulted in a severe drought throughout the country. During
this time rainfall was 22-42% of normal for the rainy season, and national production loss
for sugarcane was 50%, with the worst losses on the marginal land near the ocean and on
steep slopes. Western Viti Levu (including the Sigatoka Valley) was severely effected,
with most of the population receiving food and water rations due to the devastation of
local agriculture. In addition, drinking water was depleted, and health problems rose
significantly. Economic analyses also suggest that the average income for subsistence
farmers dropped from F$3500 to F$1500 per annum (a reduction of 42%) due to the
effects of the drought (Kaloumaira 2000). If modern experience and historical notation
serve as any guide, the Sigatoka Valley was subject to devastation during a severe ENSO
episode. With the onset of a ENSO period, the valley experienced a year of heavy rains
and floods that soaked the low-lying areas and destroyed root crops such as uvi that were
not located on well-drained landforms (Terry et al. 2001). Full-blown El Niño conditions

62
also introduced a higher frequency of tropical storms and cyclones, which could
devastate the countryside with high winds and torrential floods.
The analytic capabilities of the GIS can be used to predict the extent of damage
caused by ENSO-related droughts and floods. Figure 3.10 predicts the extent of flood
damage for the Sigatoka Valley. The limits of flood damage indicated in the map were
generated via interviews with modern Sigatoka Valley inhabitants, who pointed out the
extent of cyclone-related flood damage (and also the location of villages that were
evacuated due to flooding) to the author during the 2001-2002 field season. These
interviews identified the 20 m contour line as the upper limit of flooding in the Sigatoka
Valley, extending to the 40 m contour in the higher elevation areas of the upper valley.
Evidence for the maximum extent of flooding in the valley’s past can also be assessed
from the deposits of flood gravels atop the lowest alluvial terraces in the lower and
middle valley. The results of these analysis indicate that the delta portion of the lower
valley and the main river channel would have been the most effected, as they are today
during flood events. The hillier portions of the valley would have been less damaged,
and it is likely that irrigated agriculture would have profited from the extra water,
especially the areas of the lower and middle valley that are only nominally productive.
However, modern ENSO patterns suggest that as El Niño conditions abated, a La
Niña-related drought would have developed. As suggested by the economic devastation
inflicted on Fiji during the prolonged 1997/1998 ENSO episode, prehistoric droughts
would have stalled the productivity of the irrigated cultivation of dalo, and eventually

63
Fig
ure
3.1
0. P
redic
ted e
xte
nt
of
floodin
g d
uri
ng a
sev
ere
El
Niñ
o c
ycl
e.
64
rendered the more drought-prone areas and soils to near-sterility. This would have been
particularly disastrous for the cultivation of uvi, which requires soil moisture and rainfall
in order to germinate and develop. Soil analyses performed by Wright and Twyford
(1965) determined the severity of desiccation for all of the deposits in the Sigatoka
Valley. As summarized in Table 3.4, their analyses suggest that alluvial sands, loams,
and clays experience the most severe desiccation, while the nigrescent stony/bouldery
loams and clays allow for greater moisture retention. Based upon Wright and Twyford’s
designations of weak, moderate, and severe desiccation for the Sigatoka Valley soils, the
extent and severity of La Niña conditions are calculated for the Sigatoka Valley.
Figure 3.11. indicates that the majority of the lands of the Sigatoka Valley would
have experienced at least strong La Niña drought conditions. The extreme-drought zone
predominates in the delta of the lower valley, and extends along the alluvium of the main
river channel up into the upper valley. These areas would have suffered most, as these
soils normally experience a strong dry season, and are composed of well-drained
particles. La Niña conditions in the more mountainous portions of the valley, in
particular the upper valley, would have been moderately severe. However, even these
conditions would have posed hazards for the local populations, as the effects of the
drought are so expansive, and potentially of long duration. A few areas, such as portions
of the upper valley, may have fared better than others during particularly severe ENSO
disturbances. Soils and precipitation data suggest that this region would have
experienced a weakened El Niño flood and drought event, and enjoyed relatively fewer
extreme environmental fluctuations. Therefore, agricultural productivity in this region

65
Table 3.4. Effects of desiccation on Sigatoka Valley soils (Wright and Twyford 1965).
Severe Desiccation Moderate Desiccation Weak Desiccation
Acidic alluvial sand Basic alluvial stony clay Humic latosolic loam
Basic alluvial sandy clay Nigrescent bouldery clay Humic latosolic stony clay
Podzolic loam Podzolic sandy clay Nigrescent stony clay
(upland only)
Nigrescent marl clay Podzolic stony clay
Nigrescent stony clay
would have remained more stable over the long run.
Tracing ENSO Events in Prehistory
Paleoclimatology seeks to detect variation in global climate history via the
analyses of diverse data (Wright et al. 1993). For example, palynological studies
performed upon lake-sediment cores document changing vegetation regimes and charcoal
signatures (e.g., Haberle and Ledru 2001; Huntley and Prentice 1993), and Holocene sea-
surface temperatures have been reconstructed via the analysis of marine microfauna
assemblages (e.g., Morley and Dworetzky 1993; Sandweiss 2002; Sandweiss et al. 1996).
Ice-cores from South American glaciers have also provided data concerning the
atmospheric responses to ENSO-related events (Thompson et al. 1984). Perhaps better
known to archaeology, tree-ring analyses document the variable growth of trees in wet
and dry years, and have been systematized to provide environmental indicators for
regions around the world (Ahlstrom et al. 1995; Bannister and Robinson 1974; Blasing
and Fritts 1976). Stratigraphic analysis and dating of sedimentary deposits has also been
used to date the occurrence of floods in various parts of the world, and these are often
firm indicators of El Niño occurrences (Quinn 1992). In addition, coring of large tropical

66
Fig
ure
3.1
1 P
redic
tion
s fo
r th
e ex
tent
of
sever
e, m
oder
ate,
and w
eak L
a N
iña-r
elat
ed d
roughts
, bas
ed u
pon
the
rela
tive
sever
ity o
f so
il d
esic
cati
on f
or
the
Sig
atoka
Val
ley (a
dap
ted f
rom
Wri
ght
and T
wyfo
rd 1
965).

67
corals has documented the influx of sedimentation and fresh water, byproducts of
changing climates in the tropics (Nunn 1994; Tudhope et al. 2001; Urban et al. 2000).
Moseley (1997), Caviedes (2001), Nunn (1994), and Sandweiss et al (1996) also
incorporate historical accounts of droughts and storminess in the construction of ENSO
chronologies. All of these analyses have suggested many regional chronologies for El
Niño episodes. A recent summary of broad scale paleoclimatic data suggest that global
ENSO conditions were absent between 9000 and 6000 BP, and only between 6000 and
3000 BP did ENSO events occur in low frequencies. These data also suggest that after
3000 BP ENSO frequencies varied within the modern range, (i.e., assumed frequencies
that are essentially identical to modern) (Sandweiss 2002).
Prehistoric data pertaining to the frequency and amplitude of ENSO related
environmental perturbations are slowly being assembled for the South Pacific. Parry’s
analyses of historic data for Fiji suggest that severe ENSO-related climatic perturbations
occurred in the years between 1815 and 1835, and again between 1865 and 1892. The
frequency of these disturbances is suggestive of a linkage with El Niño episodes recorded
for South America (Figure 3.12). Parry’s analyses also imply that severe ENSO events
occurred in every century in Fiji, perhaps as frequently as every 12 years. More recently,
Nunn has generated a chronology of ENSO episodes for Fiji that is based upon oxygen-
isotope analyses of a New Zealand stalagmite (Wilson et al. 1979) and also syntheses of
ENSO frequencies by Anderson (1992). This reconstruction indicates that El Niño
events occurred in Fiji throughout the Holocene, and were both severe and mild in
character. Importantly, sea-level and sea-surface temperature data suggest that El Niño

68
Figure 3.12. Historical record of El Niño events in South America (after Quinn et al.
1987) and a reference list of ethnohistorical source materials detailing weather
disturbances in Fiji (reproduced from Parry 1997:26).

69
events increased in frequency and severity after AD 1300 (Nunn and Britton 2001)
(Figure 3.13). Thus, in prehistoric times populations of the Sigatoka Valley experienced
a wide variety of climatic perturbations relating to ENSO, and the effects of these
disturbances extended throughout the valley at different levels of intensity and duration.
Moreover, the frequency of severe episodes predicted for Fiji indicates that several events
could occur during the lifespan of a single person. In accordance with the evolutionary
ecology model outlined in Chapter 2, the Sigatoka Valley represents an unpredictable
environment. This finding suggests that increasing frequencies of competition and
conflict were associated with long-term trends of environmental fluctuations, and higher
rates of conflict were more common in the most severely affected areas. In this case,
GIS-based analyses of soil quality, dry season severity, and the effects of drought and
flood indicate that Zone 1 was the locus of the most intense competition.
3.6 Punctuated Climatic Change: The LCO/LIA Transition
Paleoclimatic data from New Zealand caves as well as shell conglomerates in
Fijian shorelines indicate that dramatic environmental perturbations occurred in the
region approximately 700 years ago. These events mark the transition period between the
warmer Little Climatic Optimum (1250 – 700 BP) and cooler Little Ice Age (700 -200
BP) (Fagan 2001). According to recent analyses in Fiji and Niue by Nunn and others
(Nunn 2000a, 2000b, 2003; Nunn et al. 2003; Nunn and Britton 2001), the disturbances
of the transition were quite dramatic, and were marked by cooler weather and sea

70
Figure 3.13. Graphic depiction of sea-level change AD 1100-1600 from Pacific Island
data. Chart reproduced from Nunn and Britton (2001:7). Chart also includes temperature
changes from oxygen-isotope analyses of a New Zealand stalagmite (Wilson et al. 1979)
and also a reconstruction of El Niño frequency (after Anderson 1992).
temperatures, and a rapid lowering of sea level by over one meter between 730 – 525
BP. Nunn proposes that these changes were devastating for both coastal and interior
populations: sea-level fall would have converted embayments to brackish wetlands, and
also caused the submersion of groundwater for the interiors of the Fiji Islands. Extensive
incising of the riverbeds and streambeds, as well as decreased soil moisture levels in
many of the alluvial terraces that supported uvi cultivation, resulted in the dramatic

71
reduction of uvi yields in the lowlands. Also, the loss of near-shore marine resources due
to reef exposure impacted coastal populations, who relied upon reef fishing and shellfish
gathering for a substantial portion of their diet. Nunn and Britton (2001:9-13) also
suggest that the uplands of Fiji suffered from periods of torrential rainfall, resulting in
erosion and landslides in dalo-producing areas.
Hydrogeological studies of the Sigatoka Valley aquifer by Davies (1992) appear
to uphold Nunn’s suggestions for the impact of a one meter sea level fall in the region.
As a result of exploratory well drillings in the valley, Davies concluded that the Sigatoka
River basement is incised to a depth of 80 m (Figure 3.14). The depth of the basement
places water beyond the reach of most conventional wells, and it also deprives the
alluvial terraces that surround the main river channel (at distances greater than 400 m) of
residual moisture (Davies 1992:59-61). These data suggest that a drop in sea level and
subsequent submersion of the water table would have further reduced the moisture-
retention capabilities for the Sigatoka Valley soils, especially those that were
exceptionally porous (i.e., alluvial deposits). Moreover, the extension of the coastline
during this period would have also effected the extent of marine influx into the valley,
and thus reduced the upwelling of freshwater in the delta region.
3.7 Evaluation of the Effects of the LCO/LIA Transition
Although the effects of the LCO/LIA transition are still being assessed for Fiji,
the soil analyses provided by Wright and Twyford (1965) allow for preliminary
calculations of the extent of damage produced by a one meter sea level fall. Using the

72
Fig
ure
3.1
4. L
ongit
udin
al g
eolo
gic
al s
ecti
on
of
the
Sig
atoka
Val
ley. R
epro
duce
d f
rom
Dav
ies
1992:6
0.

73
analytical capabilities of the GIS, the extent of alluvial deposits identified by Wright and
Twyford (Table 3.4) which also lay at the lowest elevations (< 20 m) in the valley were
identified as the most likely candidates for desiccation as a result of sea level fall, river
incision, and water table submersion. As detailed in Figure 3.15, the distribution of these
soils suggests that the LCO/LIA transition would have had the most impact on the middle
and lower portions of the Sigatoka Valley, but perhaps extended into the upper valley as
far as the confluence of the Namada river. Figure 3.15 also indicates areas that contain
extremely steep slopes (45-55° or greater) that would have been prone to landsliding and
erosion during torrential rain. These regions were identified by both GIS-based analyses
of slope, and also topographic calculations provided by Wright and Twyford (1965). The
central part of the middle valley, and also the most easterly portion of the upper valley,
were likely the most effected by disturbances of this nature, as they receive the most
rainfall.
3.8 Conclusion: Spatio-temporal Variability in the Sigatoka Valley
Figure 3.16 combines the results of the analyses described above and allows for
the formulation of the following conclusions: 1) Zone 1 would have experienced the
most severe effects of ENSO-related droughts and floods, and also suffered from sea-
level fall during the LCO/LIA transition; 2) Zone 2 would have experienced moderate
ENSO-related droughts, and been affected to a limited degree by the landslides and
erosion associated with the LCO/LIA transition; and 3) Zone 3 would have been weakly

74
Fig
ure
3.1
5. E
xte
nt
of
area
s af
fect
ed b
y t
he
LC
O/L
IA t
ransi
tion,
as p
redic
ted b
y G
IS a
nal
yse
s an
d f
ield
surv
ey.

75
effected by ENSO-related droughts or floods, and experienced a high/moderate amount
of erosion during the LCO/LIA transition. In the context of the potential cultivation
strategies suggested for the Sigatoka Valley, these conclusions suggest that uvi
cultivation in Zone 1 would have experienced the highest frequencies of shortfalls as a
result of seasonal and episodic droughts and floods. Contrariwise, Zones 2 and 3 would
have allowed for the cultivation of both dalo and uvi, and experienced lower frequencies
of environmental fluctuations. However, the topography of these regions would have
limited harvest sizes, and also forced the dispersal of cultivation to far-flung areas.
According to the evolutionary ecology model outlined in Chapter 2, all Zones
were probably the focus of territorialism, however, Zones 2 and 3 would have allowed for
increased stability (i.e., particular territories endure over longer periods). In addition, a
broader assessment of spatio-temporal variability and climatic data indicates that Fiji is
strongly effected by ENSO, and experienced episodes of drought and flood that reduced
yields throughout the Sigatoka Valley. According to the evolutionary ecology model
outlined in Chapter 2, the variable frequency and amplitude of these conditions are
suggestive of a situation of environmental unpredictability, which would have
encouraged the intensification of pre-existing competitive and cooperative strategies.
The results of the analyses described above suggest that uvi cultivation in Zone 1 would
have encouraged increased frequencies of competitive strategies as a result of ENSO
and/or LCO/LIA transition perturbations, as the character of the soil, rainfall regime, and
germination requirements would have made cultivation riskier.

76
Figure 3.16. Comparison of the environmental zones identified by soil/topographic
analyses with the extent of disturbance related to ENSO and the LCO/LIA transition.

77
The following chapter will assess the archaeological remains of the Sigatoka
Valley. As elsewhere, these features provide a summary of the subsistence and
settlement strategies employed in the past, and also provide indications for spatio-
temporal trends in technological innovation and population growth. The distribution of
features relating to competition and subsistence will also indicate the ways in which
ancient populations coped with the environmental variations described above.
3.9 Chapter Summary
The Sigatoka Valley represents a diverse productive environment. Prehistoric
subsistence strategies that focused upon the cultivation of dalo and uvi would have been
spatially restricted to certain portions of the valley’s topography. In addition, the quality
of soils, amount of rainfall, and extent of steep slopes would have limited the size of
harvests, and made some areas more susceptible to shortfalls. These analyses suggest
three zones of cultivation: Zone 1) lands suited to dryland cultivation, and which also
experienced severe shortfalls due to severe dry seasons; Zone 2) lands suited to mixed
wetland and dryland cultivation, and which also experienced mild shortfalls due to
moderate dry seasons; and Zone 3) lands suited to wetland cultivation, and which also
experienced minimal shortfalls due to weak dry season. According to the evolutionary
ecology model, territorialism would have occurred in all Zones, but individual territories
would have been more stable (i.e., lasted for longer periods) in Zones 2 and 3.
Paleoclimatic data indicate that Fiji is strongly influenced by climatic
perturbations stemming from the El Niño Southern Oscillation (ENSO). Research within

78
Fiji and abroad has established that this climatic cycle induces periods of drought and
flood, and historical data from Fiji suggest that the archipelago experienced a sequence of
severe ENSO episodes in the recent past, in particular droughts and cyclones.
Reconstructions for the Sigatoka Valley suggest that large portions of the valley would
have been effected by El Niño, and these disturbances would have devastated the
production of root crops, in particular uvi in Zone 1. According to the evolutionary
ecology model, the general atmosphere of unpredictability would have encouraged the
intensification of competitive strategies.
Paleoclimatic data also indicate that Fiji experienced a period of environmental
disturbance relating to the LCO/LIA transition (730 – 525 BP). The effects of sea-level
fall and erosion are predicted for the Sigatoka Valley, and Zone 1 is identified as the
region that would have been most severely effected by these disturbances. In sum, these
data suggest that cultivation-based subsistence in the Sigatoka Valley was both spatially
and temporally constrained in prehistory, and episodically unpredictable. According to
the tenets of the evolutionary ecology model, this environment would have encouraged
the development of competition, and likely allowed it to persist as an evolutionary stable
strategy.

79
CHAPTER 4. ANALYTICAL UNITS AND ANALYSES
The model described in section 2.3 suggests ways in which an evolutionary
perspective can be used to address the issue of competition in prehistory, or more
explicitly, the development of competitive and cooperative strategies between groups.
However, testing the hypotheses outlined by the model requires the identification of
specific strategies, and a means by which those strategies may be linked to the
archaeological record. As Chapter 3 discussed and evaluated the environmental
variability inherent to the region, the following section focuses on the remains that are
indicative of subsistence strategies in prehistory. Specifically, this chapter surveys the
archaeological record of the Sigatoka Valley and assesses regional variation in habitation
sites and agricultural production. The three zones of cultivation (Zones 1, 2, and 3)
defined in Chapter 3 are used to compare the extent of subsistence strategies with the
results of environmental analyses. In brief, these analyses suggest that: 1) wetland
cultivation would have been restricted to the more well-watered portions of the valley, in
particular the higher elevations of Zone 2 and all of Zone 3; 2) Zones 2 and 3 are also the
most rugged, and cultivation in these areas would have been mixed, limited in size, and
also spatially dispersed; and 3) Zone 1 offered the most expansive cultivation area for
uvi, but was prone to severe dry seasons and the most extreme ENSO and LCO/LIA-
related environmental fluctuations.
This chapter also evaluates the seasonal and interannual potential for production,
and provides indications for three strategies of defensive habitation/subsistence: defended
production, defensive habitation, and production. Analyses of the distributions are

80
critical to this research as they provide an indication of the relative fitness (e.g., how
successfully a feature or behavior functions) of competitive and cooperative strategies
within the context of the environment, and also indicate how spatial and temporal
variability encouraged particular historical trajectories.
4.1. Defining Artifact Classes
As archaeologists only deal with the preserved remains of past actions, artifacts
are the central focus of all prehistoric investigations. Previous archaeological studies
have linked competition to a variety of artifact classes. This has included the
construction of monolithic, self-aggrandizing structures (Neiman 1995), evidence for
physical trauma and injury amongst skeletal populations (Lambert 1994), cannibalism
(Turner and Turner 1999) and trophy items made from human remains (Clunie 1977).
Fortifications are perhaps the most secure corollaries of group-level competition in the
archaeological record, as they consist of permanent, immobile structures built by groups
for primarily defensive purposes. In the context of evolutionary ecology, fortifications
are often linked to conceptions of territorialism or refuge, and thus are associated with
both long and short-term strategies of resource acquisition and/or control. However,
studies of fortifications from historic periods have identified other factors, such as
religious ideologies and access to trade routes, that also contribute to fortification
construction in limited cases. These situations are more commonly linked with complex
state-level societies, and provide an indication of higher scales of competition.

81
The frequency of fortifications in spatio-temporal contexts also provides an
assessment of the success of competitive strategies in particular environments. For
example, the presence of fortified occupations over long periods suggests a degree of
permanency for competitive strategies, and also indicates that the costs of fortification
construction and maintenance do not outweigh the benefits of resource access and/or
control. Moreover, increasing frequencies of fortifications in discrete spatial zones or
temporal intervals suggests that fortification-dependent strategies may allow for
population growth or expansion (i.e., reproductive success), or perhaps reflect the
successful transmission of the strategy to other populations (i.e., replicative success).
Additional measures, such as increased rates of resource acquisition, rates of population
growth within groups, and overall population health, can independently assess the costs
and benefits of competitive behaviors that employ fortifications. In sum, fortifications
provide an indication for the presence and character of competitive strategies, and are
also amenable to historical studies.
This research identifies competition via the occurrence of fortifications, or more
specifically, habitation areas that are defended by either natural or constructed means.
The study of fortifications in Fiji was revolutionized by the geographer John Parry (Parry
1977, 1982, 1987, 1997). Like his predecessors (e.g., Best 1984; Clunie 1977; Frost
1974; Green 1967; Groube 1971; Higham 1967; Irwin 1985; Palmer 1969a, 1969b), Parry
used a classification system that was ethnographically based. This typology contained
two forms of fortification: ‘hill-forts’ (koro ni valu), in which villages utilized a hill-top
or ridge prominence for defense, and ‘ring-ditch forts’ (koro waiwai), in which the

82
village proper was encircled by an excavated moat and raised embankment. Although
Parry incorporated the location and topographical situation of fortifications into his
classifications, his analyses were directed by the rigid definitions of ‘hill-forts’ and ‘ring-
ditch forts’, and the variability within the forts themselves was muted by their placement
into one of these strict categories. Unlike Parry, natural and constructed features, as
outlined in previous publications by the author (Field 1998, 2002) constitute the principle
units of classification and analysis for fortifications in the Sigatoka Valley. This
classification enumerates the presence of ditches or walls, and also incorporates the
steepness of slope and extent of view provided by topographic location. This system is
beneficial as it provides more accurate summaries of the variable location and
construction of habitation sites, and expands potential avenues of analysis for defense-
related competitive strategies.
Natural and Constructed Defenses
Best (1993), Irwin (1985), Green (1967, 2002) and others have commented on the
construction of fortifications throughout the Pacific. Much of this literature focuses on
constructed features that were made to impede access, including excavated ditches (both
linear and annular), raised embankments, pits, and rubble walls. Although rarely
preserved, wooden palisades were also important defensive constructions, and some
archaeological signatures have suggested their presence. All of these features can be
referred to as constructed defenses, as they were manufactured. Therefore, the presence
or absence of such features at habitation sites, as well as their quantity or size, provide an

83
essential unit of measurement that can be used in the analysis of fortifications. In this
research, these features will be referred to as constructed defenses.
Studies of fortifications worldwide have indicated that the selection of site locale
is also part of a suite of successful defensive behaviors (Madry and Rakos 1996:104;
Ruggles and Medyckyj-Scott 1996:127). The first and most obvious defensive capability
the landscape can provide is inaccessibility. The steepness of slope can dramatically
reduce the accessibility of a site, and Best has noted that even slopes of 27° can serve to
diminish the speed at which an attacker can approach a location (Best 1993:428). Even
steeper slopes and cliffs serve to deter offensive attacks due to the fact that the ascent
would be extremely arduous, and the attackers are exposed to defensive retaliation by the
holders of the high ground. Thus, habitation sites surrounded by steep slopes are
fortifications in that they have topographic defenses. The second advantage that the
landscape can provide is visibility. Rugged terrain and also sheer elevation provide some
locations with a wide field of view. View is an essential component of warfare, as it
serves to alert defenders of approaching attacks. In such circumstances, habitation sites
with an extensive view have visual defenses. Combined, steepness of slope and a wide
field of view can be collectively referred to as natural defenses.
Detecting Cooperation
In contrast, cooperative behaviors have been less defined archaeologically, and in
scenarios in which competition is known to have been persistent, cooperation is often
inferred in the archaeological record by the absence of competition-associated artifact
classes. The notable exceptions are archaeological studies that link cooperation with

84
food sharing and exchange (Blinman and Wilson 1992; Cashdan 1990, 1992; Halstead
and O’Shea 1989; Hunt 1989; Jochim 1976; Smith and Boyd 1990; Welsch and Terrell
1998). The detection of exchange in the archaeological record can be accomplished
through the recognition of exotic materials, or the presence of production or factory areas
that generated surplus material items for exchange. This research identifies cooperation
via the presence of unfortified archaeological habitation sites, and also the presence of
exotic or imported artifacts within archaeological deposits. As with competition, the
success of cooperative strategies is measured archaeologically through the persistence
and expansion of exchange-related artifact classes or unfortified habitation sites through
time and across regions.
4.2 The Archaeological Record of the Sigatoka Valley
The next stage of research involves determining the location and character of
archaeological sites in the Sigatoka Valley. As in Parry’s work, aerial photographic
coverage provide an economical and extensive method for survey of the valley. The use
of aerial photography in archaeological endeavors has been demonstrated in several
studies (Avery and Lyons 1977; Agache 1952; Becker 1990; Jones 1994; Parry 1981,
1987, 1997). The process involves the identification of visible archaeological features,
which may be indicated in the photograph by elements of shape, size, shadow, tone,
contrast, texture, pattern, and phase-- a change in appearance between seasons (Parry
1987:54). The use of a stereo-pairs and a stereoscope is essential, as this technique
simulates the perception of depth and helps to emphasize (and thus more easily identify)

85
changes in elevation in archaeological remains. Scale is also critical, as large scale aerial
photographs (1:30,000 or more) are not of a resolution that is amenable to detecting sub-
meter archaeological features.
For this study, approximately 1300 km2
of the Sigatoka Valley drainage was
analyzed using 158 black and white aerial-photographs at a scale of 1: 16,000. This
analysis expanded Parry's original survey area by nearly 600 km2, and allowed for the
identification of archaeological remains in the more remote drainages in the upper
reaches of the Sigatoka Valley. All of the photos were stereo-pairs, and a 4x stereoscope
was used to increase the detection of vertical change, and a 10x hand-lens was used to
magnify the areas of interest. Recording the location and character of archaeological
sites involved placing mylar overlays over each photograph, and marking the observed
features with ink. Later each of these features was sketched and described, and the
visible elements that comprised each site were used to generate a classification system for
archaeological features, which were then assembled into a GIS linked database. The
primary archaeological units are as follows:
Mound: A raised round or square earthen platform. Mounds occur singly on the
summit of low-lying hills (interpreted to be historic-aged burial mounds), or in clusters
(interpreted to be house foundations, or yavu, within prehistoric habitation sites) (Figure
4.1a).
Ditch: A linear excavated feature usually positioned in a defensive location in
order to impede access. Ditches with extreme elevation change along one side are
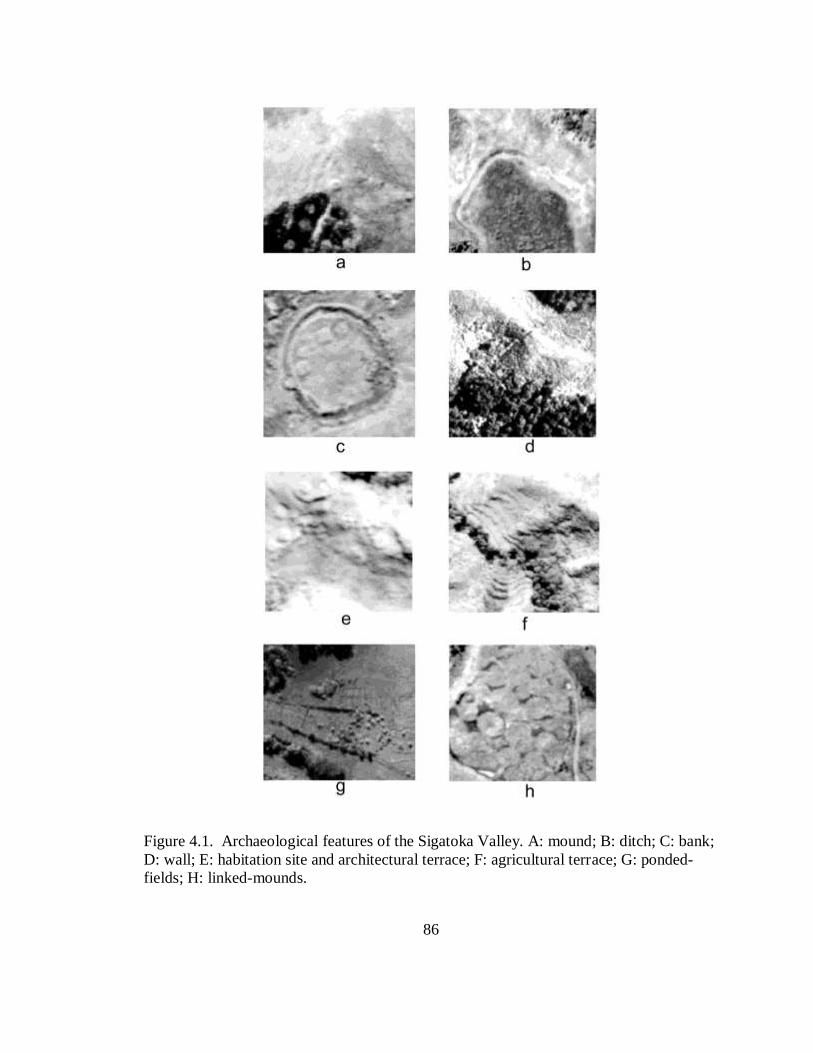
86
Figure 4.1. Archaeological features of the Sigatoka Valley. A: mound; B: ditch; C: bank;
D: wall; E: habitation site and architectural terrace; F: agricultural terrace; G: ponded-
fields; H: linked-mounds.

87
referred to as a ‘scarp’. Identified by elevation change or by the presence of dense
vegetation in a linear alignment. (Figure 4.1b).
Bank: A raised linear embankment also positioned to impede access. Identified
by elevation and vegetation change (Figure 4.1c).
Wall: Also a raised linear structure composed of fitted stone blocks and placed in
a location to impede access (Figure 4.1d).
Habitation Site: An area of disturbed ground with occasional fruit trees. These
areas may also contain clusters of mounds that indicate the use of the area as a habitation
area (Figure 4.1e).
Architectural Terrace: A large raised platform within a habitation site. House
foundations or other mounds are usually located on top of an architectural terrace. These
features are non-defensive, and serve to flatten the ground for living space, and
occasionally indicate social boundaries (Figure 4.1e).
Agricultural Terrace: A level platform cut from a gently sloping embankment.
Terraces usually form a multiple staircase construction. Irrigated terraces (tābawai)
occur within or alongside drainages, and supply water via the uppermost terrace or side
canals. Non-irrigated terraces occur on gently sloping hillsides and rely solely on
precipitation for moisture (Figure 4.1f).
Ponded-fields and Raised Beds: Sets of square or rectangular units, either raised
with an encircling ditch or excavated into a flat alluvial terrace (also known as vuci).
Occasionally the beds themselves are indistinct, however the outline of the entire
complex is retained in the boundaries of modern cultivation or plants. Irrigation in the

88
form of diverted streams or canals is also evident in linear alignments of vegetation
(Figure 4.1g).
Linked Mounds: A tight cluster of low, circular mounds surrounded by sunken
swampland. These features are probably agricultural and associated with nearby springs
or streams (Figure 4.1h).
As in Parry’s analyses, the topographical situation of each site was recorded using
standard geographical terminology. The following eleven topographical situations were
encountered in the course of analysis in the Sigatoka Valley. The first five generally
afforded the habitation upon it a certain degree of natural defense due to the steepness
inherent in the form. The remaining six could only provide defense in the form of a wide
field of view, however this only occurred in the higher elevations. With these definitions
as a guide, the 158 aerial photographs were analyzed in order to determine the
topographic situation for each site. These data were also recorded in an attached
database:
Knoll: A small conical hill with steep sides and small apex.
Ridge: The crest of a mountain that extends in a linear formation above a valley.
Promontory: A ridge that ends abruptly and/or which juts out over a valley.
Summit Apex: The conical peak of a mountain, usually of the highest elevation.
Summit Flat: An extensive area of flat land, located at or near the crest of a
mountain, but surrounded on all sides by steep slopes.
River Flat: A raised alluvial terrace, usually the remnant on an earlier period of
deposition, located some distance away from the modern river channel.

89
River/Coastal Terrace: A raised alluvial terrace in close proximity to the modern
river channel or shoreline.
Confluence: Small spur of land located between the confluences of two river
channels.
Meander Core: Piece of land located in the center of an incised river meander.
Valley Bench: A naturally occurring terrace backed by a steep slope.
Levee: A raised bank of alluvium flanking a river, formed by the grading of
sediments during a flood.
4.3 GIS Analyses: Quantifying Natural and Constructed Defense
In the past, it was nearly impossible to quantify geographical variables such as
steepness and visibility. However, digital technologies that analyze representations of
landscapes have been developed over the past three decades, and these programs provide
a means by which geographical variables can be measured and analyzed. Geographic
information systems (GIS) are a suite of software that contain applications for the
plotting and analysis of geographical data. Elements of geography such as slope, aspect,
and extent of view can be extracted from topographical data by GIS applications, which
can then be displayed on-screen and linked to corresponding databases. By transforming
geographical data into digital ‘themes’, topographical, environmental, and archaeological
variables can also be overlaid and cross-referenced (Worboys 1997).
The creation of a GIS database for the Sigatoka Valley was essential to the study
of natural defenses. Topographic maps at a scale of 1:50,000 that covered the extent of

90
the Sigatoka Valley drainage were assembled and transformed into digital representations
using a digitizing tablet. Once integrated into the GIS, a slope analysis subprogram was
used to analyze the topographical location of each habitation site, and thus determine the
degree of natural defense afforded by its location and topographical situation. For this
research, habitation sites immediately surrounded by terrain steeper than 45° were
designated as naturally fortified. Sites that were not immediately surrounded by land
steeper than 45° but were located at elevations above 400 meters were also included in
this category, as their extreme elevations served to fortify them.
In addition, a viewshed calculation subprogram within the GIS was used to
determine the extent of view that each habitation site experienced. If the site had a clear
view of 50% of the land within 1 km, that site was considered to be naturally fortified.
The results of the slope and viewshed analyses were then compared to the topographic
situation of each site, in order to determine whether a site was naturally fortified via
single or multiple natural features. These data were assembled into a regional database,
which also allowed for the additional classification of fortified and non-fortified
habitation sites based on the presence of constructed defenses, such as walls, ditches, or
raised embankments. In sum, the following subclass definitions were established for the
habitation sites of the Sigatoka Valley:
Fortified Habitation Site: An area of disturbed ground with occasional fruit trees.
House foundations and architectural terraces are usually present. Constructed
fortifications in the form of ditches and walls are also usually present. However, if the
site is located on a knoll, ridge, promontory, summit apex, or summit flat, and/or is

91
surrounded by a significant (> 45°) slope or extensive (150+ km2) view, it is considered
to be naturally fortified.
Unfortified Habitation Site: An area of disturbed ground with occasional fruit
trees. These areas may also contain clusters of mounds that indicate their use as a
habitation area. No ditches or walls are present and the site is easily reached on foot.
4.4 Integration in the GIS
Five layers of polygons were used to plot the distribution of features in the GIS
database-- one each for habitation sites (including fortified and unfortified), terraced
agricultural features (including irrigated and non-irrigated terraces), ponded-field
agricultural features (including raised beds and ponded fields), and linked-mounds.
Other features such as the mounds within habitation sites and exterior defensive features
were not plotted individually but listed in a database that was linked to the GIS. The
number of features ultimately identified through the aerial photograph analysis is quite
extensive: 384 habitation sites were identified, as well as 236 sets of agricultural terraces,
48 instances of ponded-field agriculture, and 11 link-mound features. The grand total,
that of 679 features, represents the most extensive survey in the Sigatoka Valley to date4.
In addition, the database designates via a coding system the provenance of that site in the
province and district. For example, “2-CON-049” refers to site # 49 in the province of
Nadrogā, and in the district of Conua. Appendix A lists the codes used for the districts
and provinces of the Sigatoka Valley sample, and the related natural and constructed

92
defense data for each site. The location of each site is also indicated within the large
scale reference map.
4.5 Initial Observations: Construction and Landform in the Sigatoka Valley
Figure 4.2 is a GIS generated image that reveals the distribution of fortified and
unfortified habitation sites in the Sigatoka Valley. The variable icons on the map indicate
which of the habitation sites are defended with either natural defenses, constructed
defenses, a combination of both, or none at all. Of the 384 habitation sites in the study
area, 298 are fortified in some way (also see Table 4.1). The most prolific means of
defense is the use of constructed features, such as ditches and walls. Upon analysis, these
sites are clustered closely together and near the river, and are largely subsumed within
Zone 1. The bulk of these sites (109 or 87.2%) are defended by means of an annular
ditch, although a few also employ a double ditch system and additional walls and banks.
The high frequency of these sites, their location on the landforms of the valley bottom,
and use of constructed fortifications in lieu of a naturally defended position suggests that
these habitations were placed to take advantage of resources within the boundaries of the
valley floodplain.
Eighty-eight (22.9%) of the fortified sites employed the landscape as the sole
defensive feature for the habitation. As indicated in Figure 4.2, habitation sites that relied
on natural defenses were distributed on the outskirts of the valley, and exhibit less
clustering than their constructed fortification counterparts. These landforms provided
defensive capabilities in the form of steep slopes and wide views, as indicated by the

93
Fig
ure
4.2
. T
he
use
of
nat
ura
l an
d c
onst
ruct
ed d
efen
ses
in t
he
Sig
atoka
Val
ley.
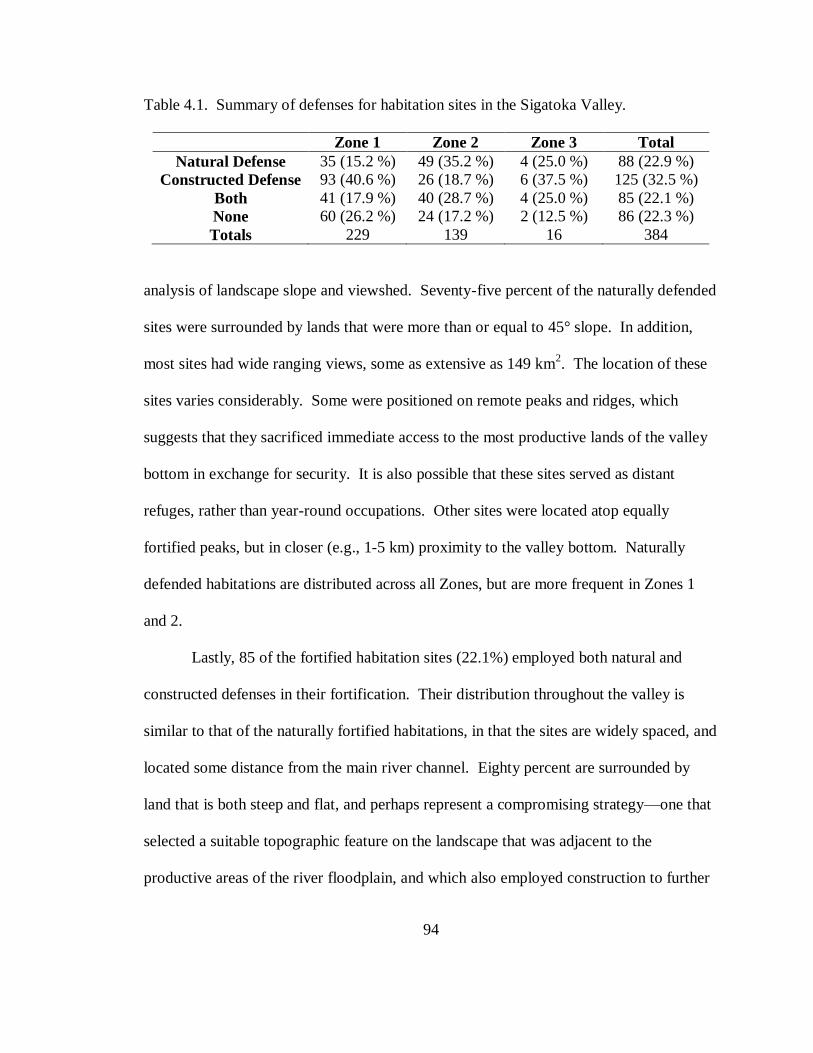
94
Table 4.1. Summary of defenses for habitation sites in the Sigatoka Valley.
Zone 1 Zone 2 Zone 3 Total
Natural Defense 35 (15.2 %) 49 (35.2 %) 4 (25.0 %) 88 (22.9 %)
Constructed Defense 93 (40.6 %) 26 (18.7 %) 6 (37.5 %) 125 (32.5 %)
Both 41 (17.9 %) 40 (28.7 %) 4 (25.0 %) 85 (22.1 %)
None 60 (26.2 %) 24 (17.2 %) 2 (12.5 %) 86 (22.3 %)
Totals 229 139 16 384
analysis of landscape slope and viewshed. Seventy-five percent of the naturally defended
sites were surrounded by lands that were more than or equal to 45° slope. In addition,
most sites had wide ranging views, some as extensive as 149 km2. The location of these
sites varies considerably. Some were positioned on remote peaks and ridges, which
suggests that they sacrificed immediate access to the most productive lands of the valley
bottom in exchange for security. It is also possible that these sites served as distant
refuges, rather than year-round occupations. Other sites were located atop equally
fortified peaks, but in closer (e.g., 1-5 km) proximity to the valley bottom. Naturally
defended habitations are distributed across all Zones, but are more frequent in Zones 1
and 2.
Lastly, 85 of the fortified habitation sites (22.1%) employed both natural and
constructed defenses in their fortification. Their distribution throughout the valley is
similar to that of the naturally fortified habitations, in that the sites are widely spaced, and
located some distance from the main river channel. Eighty percent are surrounded by
land that is both steep and flat, and perhaps represent a compromising strategy—one that
selected a suitable topographic feature on the landscape that was adjacent to the
productive areas of the river floodplain, and which also employed construction to further

95
guard against aggressive attacks. The bulk of these sites are scattered across Zones 1 and
2.
It must also be noted that 86 habitation sites (22.3 %) in the Sigatoka Valley are
unfortified, in that they lack any visible means of fortification. It is possible that many of
these sites were fortified with wood palisades or the spiny moli (Fijian ‘living fence’) that
have long since deteriorated, leaving no traces in aerial photos of the sites. However,
some of these sites may have never been fortified, and thus represent a settlement
strategy that did not require physical defense, or was never under threat by neighboring
rivals5. As indicated in Figure 4.2, these sites are scattered throughout Zone 1, and show
a focus on the main channel of the river, and also in the remote drainages of the Upper
Valley. Like the habitation sites that relied upon constructed defenses, this distribution
suggests that some of these sites must have been focused on immediate access to the
productive lands of the valley bottom.
In sum, the act of habitation in the Sigatoka Valley employed four strategies: 1)
habitation sites employed constructed defenses and were situated on the valley bottom; 2)
habitation sites utilized the topographic features of the landscape for defense, and were
located in areas that were remote and poorly provisioned with resources; 3) habitation
sites utilized both natural and constructed defenses and were located in various
situations—some with immediate (1 km) proximity to agricultural resources of the valley
bottom, and others with more distant (1-5 km) access; and 4) habitation sites that were
unfortified, and located along the valley bottom in direct association with agricultural
resources. These distributions suggest that settlement strategies were extremely

96
variable—at times utilizing natural features, and in other instances constructing defenses.
Their distributions in Zones 1, 2, and 3 also suggest that the application of these
strategies must have varied according to the temporal and spatial distribution of
resources, as well as the degree of competition for resource access. The following
section (4.6), examines prehistoric agricultural productivity in the Sigatoka Valley, and
compares the results of surveys and predictive analyses with the distribution of
fortifications summarized above.
4.6 Spatio-Temporal Variations in Irrigated Agricultural Productivity
The analyses summarized in Chapter 3 indicate that the Sigatoka Valley offered a
variety of environments for cultivation, some of which were more or less prone to
seasonal and interannual fluctuations. These findings also suggest that certain regions
would have fostered specific cultivation technologies. The following analyses will
investigate the archaeological record of the Sigatoka Valley, and reveal the ways in
which ancient farmers responded to and buffered against these variations. Specific trends
in agricultural productivity will be assessed in finer detail, and in so doing determine the
factors that led to competition, and hence the construction of fortified and non-fortified
habitations in the Sigatoka Valley. These analyses will also provide indications for
general and regional trends in competitive and cooperative strategies.
Irrigated Terraces: Distribution and Productivity between Wet and Dry Seasons
As was described in section 4.2, aerial photographs were used to locate and plot
the location and size of constructed agricultural features. Irrigated terraces (tābawai)

97
were cut in a stair-step fashion into the hillsides, and when fed by diverted creeks they
produced a series of hydrated platforms that could be used for cultivation. Ponded-fields
(vuci) were either excavated from existing swamps, or carved as grid of interconnected
channels on the surfaces of well-watered alluvial terraces. The size, location, and
position of these features in the hydrological system was plotted into the GIS as a
thematic layer with an attached data table. Additionally, soil data (Fox et al. 1952;
Wright and Twyford 1965) was transformed into a thematic layer in the GIS, and the
drainage network of the Sigatoka Valley was digitized from maps and photos and turned
into another GIS layer (Appendix B). The integration of these data into the GIS allowed
for the analysis of agricultural productivity and predictability (in terms of high yields in
both the wet and dry season) for the irrigated terraces and pond-fields.
One measure of predictability is the flow rate of irrigation water that was
potentially available to agricultural features. Hydrological modeling offers several
methods for determining flow rates within drainages. The analysis presented here utilizes
the stream order method, which calculates rates of stream-flow within the various
branches of a tributary (Appendix B). The stream-order method is ideal for calculating
the rates of flow for all of the stream order segments within the drainage. As most
stream-flow meters are placed at the mouths of tributaries (i.e., the segment of the highest
order), determining the rates of stream-flow at the locations where irrigated agricultural
features are located becomes merely a matter of counting and calculation. This is due to
the premise of the stream-order formula; that order number is directly proportional to the
size of the contributing watershed, to channel dimensions, and to stream discharge at that

98
place in the system. In this manner, two drainage networks that differ greatly in linear
scale can be compared with respect to the use of order number (Strahler 1964: 4:43).
In Davies' hydrogeological study of the Sigatoka Valley (Davies 1992), the
monthly rates of stream flow are given for 19 tributaries of the Sigatoka River over a
single-year period (Appendix B). Using the stream-order technique, the amount of water
flowing through the tributaries during the wet and dry seasons was calculated, which then
indicated the potential seasonal rates of stream flow for irrigated agricultural features that
were fed by different segments of the drainage. In addition, Davies' data were used to
estimate the rates of flow for tributaries that were not included in the original study. The
extent of unmetered drainages (their area, and the number of streams in each order) was
compared to the extent and flow rates of the drainages reported in Davies' study. This
allowed for proxy estimates to be made for the flow-rates of all the irrigated terraces in
Sigatoka Valley sample.
In addition to determining the rates of stream-flow for each stream in the Sigatoka
Valley, the flow data were compared to the area of the terraces they fed in order to
determine if the rates of flow would provide adequate amounts of irrigation water (140-
373 m3/hectare/day) for year-round high yield hydrophilic agriculture. According to
studies of taro cultivation in Hawai‘i, the minimum irrigation requirement for normal
growth is between 140 and 373 m3/hectare/day (Watson 1970, in Kirch 1994:153),
although some strains require somewhat less water, around 79 m3 /hectare/day (Hollyer
1997:62). If indeed the rates of stream flow were adequate to produce high yields (more
than 140 m3/hectare/day), then the flow was deemed ‘sufficient’. If the stream rates fell

99
between 79 and 140 m3 of water/hectare/day, then the flow was deemed to be ‘possibly
sufficient’. Rates that fell below 79 m3 /hectare/day were deemed ‘insufficient’. The
resulting data indicate which terraces in the Sigatoka Valley would have been productive
in both the wet and dry seasons in terms of high-yields for hydrophilic dalo. Depending
upon the level of productivity during the wet and dry season, a point score was
established for each terrace. The highest score was awarded to terraces that would
produce high yields in both seasons (10 points). Appendix B lists the point-scoring
system used in this analysis, and also indicates the range of potentials for all of the
terraces in the Sigatoka Valley.
Results: Wetland Cultivation in the Sigatoka Valley
Figure 4.3 displays the spatial distribution of agricultural features in the study
area. Of the 236 instances of irrigated terracing, 164 (69.4%) occur in Zone 2,
predominantly in the far northeast corner of the valley (Table 4.2). The prevalence of
this technology in this area is not surprising, as the environmental data summarized in
Chapter 3 indicate that the high run-off and steep topography in this region make
irrigated terracing the best option for cultivation. The bulk of the terraces occur in the
tributary creeks that lie to the east of the main river channel, in particular the valley of the
Nasa creek, which boasts 56 terraces. The inhabitants of this region would have enjoyed
a substantial surplus of dalo, as the number of terraces suggests large harvests would
have been available year-round. The remaining terraces are scattered throughout the
southern portions of Zones 1, 2, and 3, and these demonstrate a pattern of small size and
isolation. This distribution corroborates environmental data, which suggest that the bulk

100
Fig
ure
4.3
. D
istr
ibuti
on o
f ir
rigat
ed t
erra
ces
and p
onded
fie
lds
in t
he
Sig
atoka
Val
ley.

101
Table 4.2. The distribution of agricultural features in the Sigatoka Valley.
Zone 1 Zone 2 Zone 3 Total
Terraces 42 (17.7 %) 164 (69.4 %) 27 (11.4 %) 236
High Yield Terraces 11 (14.2 %) 63 (81.8 %) 3 (3.8 %) 77
Mod. Yield Terraces 15 (15.4 %) 70 (72.1 %) 12 (12.3 %) 97
Low Yield Terraces 23 (37.0 %) 30 (48.3 %) 9 (14.5 %) 62
Ponded-Fields 27 (56.2) 16 (33.3) 5 (10.4) 48
of the Sigatoka Valley lacked the surplus of water needed for irrigated cultivation. The
instances where irrigated terracing occurs suggests the exploitation of opportune
circumstances.
However, the presence of irrigated agricultural features does not necessarily
imply that high yields were always available. Figure 4.4 displays the productive potential
of irrigated terraces in the Sigatoka Valley, as determined by the calculations of steam-
flow and terrace size described above. The bulk of the terraces (49 out of 77, or 63.6 %)
that could produce high yields in both the wet and dry season were located in the most
northerly portion of Zone 2. In addition, 62% of the terraces that could produce moderate
yields in both the wet and dry season were located in this same region These data
indicate that the populations in and around Nasa creek had access to resources that would
have been very dense, stable, and predictable. In contrast, irrigated terracing that could
produce high and moderate yields were only sparsely distributed in Zone 1, and the
southern portion of Zone 2. Figure 4.4 indicates where only thirteen instances of high
yield terraces, and fifteen instances of moderate yield terraces were developed in these
regions, and these features are also small and located in isolated pockets. Terraces that
could produce very low yields, or only seasonal yields, are much more common. In sum,

102
Fig
ure
4.4
. P
roduct
ion p
ote
nti
al f
or
irri
gat
ed t
erra
ces
and p
onded
fie
lds
in t
he
Sig
atoka
Val
ley.

103
populations in the southern portions of Zones 1 and 2 utilized irrigated terracing when
local conditions permitted, but most of the Sigatoka Valley was not physically suited for
the production of crops via irrigated terracing. Only the well-watered highlands in Zone
2 provided the necessary variables, and it is in this region that irrigated cultivation was
extensively developed.
However, the distribution of ponded-fields and link-mound agricultural features in
the Sigatoka Valley reveals some instances of high-yield irrigation technology in Zone 1.
Ponded-fields are generally located on the valley bottom, and are constructed to make use
of surpluses of water in abandoned river meanders or on delta plains. Link-mounds
utilize springs or perched water tables to flood the land surrounding the raised production
mounds (Appendix A). Forty-eight instances of ponded-fields and link-mounds covering
approximately 700 hectares were identified in the aerial photograph survey. Twenty-
seven of the 48 ponded-fields (56 %) were located in Zone 1, including the expanses
contained with the abandoned Tonuve meander. Smaller ponded-fields are scattered
throughout the delta regions of the valley. These features would have been able to
produce large amounts of dalo, but likely would have been limited to seasonal production
as a consequence of dropping river levels during the dry season.
4.7 The Effect of ENSO-related Climatic Perturbations on Wetland Production
The extent of ENSO-related flood and drought damage predicted for the Sigatoka
Valley undoubtedly conditioned the development and persistence of wetland agricultural
production in the region, and likely also impacted the relative yields of pre-existing

104
irrigated features. As illustrated in Figure 3.16, environmental fluctuations would have
been most severe in Zone 1, and constructed agricultural features such as terraces or
ponded fields would have been periodically washed away or rendered unproductive by a
lack of water. In contrast, the weak effects of ENSO-related droughts in Zones 2 and 3
suggests that irrigated terracing in these regions would have been moderately productive
in even the worst times. Although drought effects would have represented a marked
decrease in what these features were capable of, populations undoubtedly took advantage
of the milder conditions in these areas and constructed irrigated terraces in great number.
As mentioned, the rugged topography would also have encouraged cultivation strategies
of this nature.
These results indicate that portions of the Sigatoka Valley could have produced
both dense and predictable resources via wetland cultivation technologies, while other
areas were strictly seasonal, or could not produce at optimal levels even with these
methods. It is likely then that the bulk of the inhabitants of Zone 1 and the southern
portion of Zone 2 must have relied upon other resources, probably dryland cultivation
practices, for meeting subsistence needs. The following section will examine the
geographic variables that would have affected dryland cultivation, and also assess the
seasonal aspects of productivity and predictability.
4.8. Proximity Analyses and Spatio-Temporal Variations in Total Agricultural
Productivity
Anthropological studies of modern Fijian populations suggest that agricultural
gardens generally range from 1-5 km distant of the village proper, although the majority

105
are much closer, between 1-2 km (Ravuvu 1983:71 ). This suggests that a study of
resource proximity has the potential to indicate the quality and quantity of resources that
were immediately available to ancient populations, and also provide an index of site
function (e.g., sites with very few resources within their immediate proximity are
unlikely to have been constructed for the purpose of agricultural production). For this
research, the buffering function of the GIS was used to place a 1 km buffer around each
habitation site. The percentage of land within the 1 km buffer below 45° slope was
calculated, and used to generate a productivity score. For example, a habitation that had
80% of its lands at less than 45° would receive a productivity score of 80. In addition,
the number of irrigated terraces, ponded-fields, and non-irrigated terraces within that 1
km were tallied, and their productivity scores calculated (Appendix B). According to the
scoring scheme used, a habitation site that had only 10% of its lands at less than 45° (10
points) was equivalent to a site that had access to a single irrigated terrace system that
could produce high yields year-round (10 points).
Although this method does not account for the variable size of the irrigated
terraces (which range from 0.8 – 12.8 hectares, and average 4 hectares in size), it assumes
the average-sized irrigated terrace system, which can produce 20+ tons/hectare/year of
root crops in ideal conditions, is equivalent in productivity to dry-land cultivation on
approximately 31 hectares of lands that lie at less than 45° 6 . As dry-land cultivation is
seasonal and yields range in size from between 5 to 15 tons/hectare/year, the productivity
of 30 hectares was deemed to be equivalent to 4 hectares of highly productive irrigated
terraces or ponded-fields. Thus, the total score for wetland and dryland production that

106
fell within 1 km of each habitation site was then tallied, and used to produce a total
productive potential score for each habitation site (Appendix A). Overlap between
proximity buffers occurred in many cases, as habitation sites often occur close together.
However, as the chronology of habitation sites in the valley has only lately been assessed
(see Chapters 5 - 6), the issue of resource sharing between sites that may or may not have
been contemporaneous cannot be addressed at this time.
Proximity to Wetland and Dryland Cultivation as an Index of Subsistence Strategies
Figure 4.5 graphically depicts the potential for wetland, dryland, and mixed
cultivation within 1 km of each habitation site. Only 7.6% (29) of the sites in the sample
could have been solely reliant upon irrigated wetland cultivation (Table 4.3). Four
clusters are apparent in this distribution: the northern portion of Zone 2, where irrigated
terrace cultivation was the most dense, and three isolated instances of irrigated terraces
and ponded-fields that stretch along the river to the south (Zones 1 and 2). Thirteen
percent (50) of the habitation sites in the Sigatoka Valley had access to mixed cultivation,
and these are similarly distributed in the northernmost portion of Zone 2 and portions of
Zones 1 and 2 to the south. However, what is most obvious from the image in Figure 4.5
is the near total reliance upon dryland cultivation throughout the Sigatoka Valley. Out of
a sample of 384, 79.4% (305) of the habitation sites would have been reliant upon lands
that could support only dryland cultivation practices, in particular the seasonal uvi. These
are distributed throughout Zones 1 and 2, and demonstrate both clustering and dispersal.
This pattern reflects the location of habitations in remote tributaries and distant hill-tops,
and also tight clustering atop the alluvial terraces of the valley bottom.

107
Fig
ure
4.5
. D
istr
ibuti
on o
f hab
itat
ion s
ites
ref
lect
ing t
hei
r re
lian
ce u
pon w
etla
nd, dry
land,
or
mix
ed c
ult
ivat
ion.
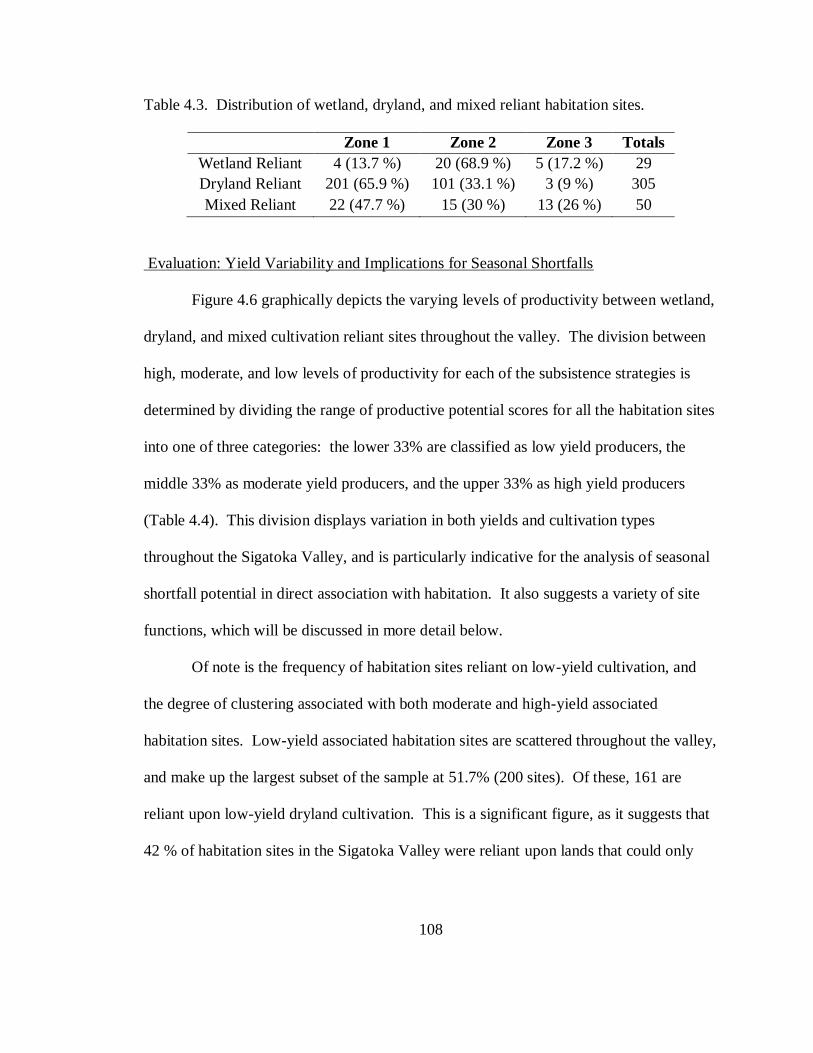
108
Table 4.3. Distribution of wetland, dryland, and mixed reliant habitation sites.
Zone 1 Zone 2 Zone 3 Totals
Wetland Reliant 4 (13.7 %) 20 (68.9 %) 5 (17.2 %) 29
Dryland Reliant 201 (65.9 %) 101 (33.1 %) 3 (9 %) 305
Mixed Reliant 22 (47.7 %) 15 (30 %) 13 (26 %) 50
Evaluation: Yield Variability and Implications for Seasonal Shortfalls
Figure 4.6 graphically depicts the varying levels of productivity between wetland,
dryland, and mixed cultivation reliant sites throughout the valley. The division between
high, moderate, and low levels of productivity for each of the subsistence strategies is
determined by dividing the range of productive potential scores for all the habitation sites
into one of three categories: the lower 33% are classified as low yield producers, the
middle 33% as moderate yield producers, and the upper 33% as high yield producers
(Table 4.4). This division displays variation in both yields and cultivation types
throughout the Sigatoka Valley, and is particularly indicative for the analysis of seasonal
shortfall potential in direct association with habitation. It also suggests a variety of site
functions, which will be discussed in more detail below.
Of note is the frequency of habitation sites reliant on low-yield cultivation, and
the degree of clustering associated with both moderate and high-yield associated
habitation sites. Low-yield associated habitation sites are scattered throughout the valley,
and make up the largest subset of the sample at 51.7% (200 sites). Of these, 161 are
reliant upon low-yield dryland cultivation. This is a significant figure, as it suggests that
42 % of habitation sites in the Sigatoka Valley were reliant upon lands that could only

109
Fig
ure
4.6
. D
istr
ibuti
on o
f si
tes
reli
ant
upon v
aria
ble
yie
lds
of
wet
land,
dry
land
, an
d m
ixed
cult
ivat
ion.

110
Table 4.4. Yield variability for wetland, dryland and mixed reliant sites.
Zone 1 Zone 2 Zone 3 Totals
High wetland reliant 0 6 (85.7 %) 1 (14.3 %) 7
High dryland reliant 40 (93 %) 3 (6.9 %) 0 43
High mixed reliant 5 (41.6 %) 6 (50%) 1 (8.3 %) 12
Mod. wetland reliant 2 (16.6 %) 8 (6.6 %) 2 (16.6 %) 12
Mod. dryland reliant 84 (83.1 %) 16 (15.8 %) 1 (9 %) 101
Mod. mixed reliant 7 (5.8 %) 4 (3.3 %) 1 (8.3 %) 12
Low wetland reliant 2 (20 %) 7 (70 %) 1 (10 %) 10
Low dryland reliant 78 (49.0 %) 81 (50.9 %) 0 159
Low mixed reliant 10 (35.7 %) 8 (28.5 %) 10 (35.7 %) 28
provide low yields of seasonal crops. The distribution of these habitation sites along the
fringes of the Sigatoka delta and atop the more mountainous parts of Zones 1 and 2
suggest that these sites served as refuges. The next largest subset are habitation sites
reliant upon moderate-yield dryland cultivation. These sites are clustered along the
valley bottom, and are most common in Zone 1. This distribution suggests a significant
focus on the production of uvi, tempered with the use of topography for immediate
natural defense. Combined, moderate and low-yield dryland reliant sites make up nearly
68% of the habitation sites in the sample, indicating that a strategy of defense and
production was the most common form of subsistence and habitation in the Sigatoka
Valley. These findings also corroborate the environmental analyses outlined in Chapter
3, which strongly indicate the potential for seasonal and interannual shortfalls in Zones 1
and 2. Moreover, the sheer number of habitation sites reliant upon low-moderate levels
of dryland cultivation suggests that the bulk of the population of the Sigatoka Valley

111
would have experienced a episodic periods of environmental fluctuations relating to the
ENSO cycle.
Contrariwise, high-yield reliant habitation sites are loosely clustered in the
Sigatoka delta (Zone 1), and in the northernmost tributaries of Zones 2 and 3. Isolated
pockets of high-moderate cultivation are also scattered upriver along Zone 1. These sites
constitute 16 % of the entire sample, and analysis of cultivation type indicates that the
majority of these habitations were mixed or dryland focused. Only the populations in the
uppermost reaches of the valley had immediate access to year-round wetland cultivation.
Thus, these data suggest that only a small portion of the population of the Sigatoka
Valley had immediate access to resources that were dense and predictable, as well as
resilient to the effects of climatic disturbance. The evolutionary ecology model outlined
in Chapter 2 suggests that competition would have been focused upon these locales, as
the represent islands of stability within a region of frequent annual and interannual
shortfall. This being the case, habitation sites in these regions have the potential for both
early and lengthy occupations, as the productive potential would have been attractive to
early settlers.
4.9 Defense and Production in the Sigatoka Valley
When the total productive potentials for all the resources surrounding the
habitation sites are combined and compared with the variable levels of natural and
constructed defense, the result is a graphic depiction of production and defense in the
Sigatoka Valley. The following classification was used: depending on the presence or

112
absence of constructed defenses, the location of a habitation site on a naturally defended
topographic feature, and the immediate access to low, moderate, or high yield cultivation,
the habitation sites in the study were divisible into three classes; that of a defensive
strategy, a production strategy, and a defended production strategy. Figure 4.7
graphically depicts the distribution of these strategies in the Sigatoka Valley. In
accordance with the tenets of evolutionary theory, these classes appear to have afforded
distinctive benefits that would have enhanced the fitness of the valley populations. These
benefits, and their alternative costs, are described as well.
Defensive Strategy
Twenty-four percent of the habitation sites in the valley (94 sites) exhibit a
defensive strategy that privileges the position of a defensive location and constructions
over access to the most agriculturally productive areas (Table 4.5). This strategy is
typified by the construction of large sites (which range from .2 to 55.2 ha, and average
5.25 ha) along ridge-lines and mountain tops, some of which are further defended with
constructed ditches and scarps. As indicated in Figure 4.7, sites that utilized this strategy
are most common on the higher-elevation ridge lines above the main river channel, and
on distant peaks. Defensive strategy sites are more common in Zone 2, and are more
tightly clustered in the mountainous areas surrounding the Naqalimare limestone
formation (Figure 3.2). This distribution indicates that these habitations had little or no
drinking water, and the majority had access to minimal amounts of low-yield dryland
cultivation. Therefore, it is likely that these habitations represent a strategy of refuge, by
which inhabitants in Zone 1 maintained a distant mountain village as an expedient

113
Fig
ure
4.7
. D
istr
ibuti
on o
f th
e th
ree
pro
pose
d s
ettl
emen
t/su
bsi
sten
ce s
trat
egie
s.

114
Table 4.5. Distribution of production, defended production, and defensive strategies.
Zone 1 Zone 2 Zone 3 Totals
Production 61 (70.9 %) 20 (23.2 %) 5 (5.8 %) 86
Defended Production 139 (68.1 %) 55 (26.9 %) 10 (4.9 %) 204
Defensive 29 (30.8 %) 58 (61.7 %) 5 (5.3 %) 94
fortress. These sites may have been stocked with water and supplies, and perhaps were
inhabited year-round by a few individuals who maintained the village for use during
times of war. The large average size for these sites also suggests their communal use as a
refuge for more than one village in the valley bottom.
The fitness benefits associated with a purely defensive settlement strategy appear
to be limited to short-term gains, such as physical safety during times of exceptional
danger. Although populations would have benefited from investment in refuge sites
during these times, the costs associated with long-term habitation in such a location
appear to outweigh the benefits, as the energy spent traveling to and from these sites
(including distance and elevation gain) would detract from activities normally dedicated
to subsistence. Therefore, it is unlikely that this defensive strategy represents the most
common mode of habitation in the Sigatoka Valley, although it could have developed
early and persisted through time in low frequencies. However, the distribution of refuge
habitations throughout the valley suggests that this was a wide-ranging strategy, perhaps
related to the seasonal deficiencies identified for habitations in Zone 1.
Defended Production Strategy
The second class of habitation sites in the Sigatoka Valley is by far the most
common. Fifty-three percent (204) of the habitation sites in the sample can be classified

115
as adhering to a defended production strategy. As indicated in Figure 4.7, these sites are
largely restricted to Zone 1, and the most northerly portion of Zone 2. These habitations
had 1 km access to lands that could provide low to high yields of dryland and wetland
cultigens, and were also fortified with constructed fortifications or located on a
topographic feature that also provided a means for natural defense. Geographically,
defended production strategy sites are located on low hills above the main river channel,
although some are located on the flat alluvial terraces of the valley bottom or in the
distant tributary valleys of the upper reaches of the valley. These sites are equally
distributed on all landforms, but the most common form of constructed defense is an
annular ditch. Nearly half of the defended production sites are located in the delta
regions of Zone 1, while the remainder are distributed equally in the northerly portions of
Zones 1 and 2.
The coupling of access to arable land and defensive features suggests that these
habitations employed a territorial strategy, which generally focused on access to
extensive agricultural resources. Therefore, these habitations could have been occupied
year round, and perhaps maintained for many generations. Defended production
habitations average 4.16 ha in size, although a small proportion are much larger (between
15 and 35 ha), and contain instances of monumental architecture (e.g., large mounds,
with attached courtyards and platforms). It is possible that these large habitations were
multi-purpose, and served as both habitations and regional strongholds for populations
that occupied the productive valley bottom. Population growth or aggregation may have
also provided for another form of defense—armed warriors.

116
The fitness benefits associated with a defended production strategy are largely
equivalent to the benefits outlined for territorialism by Dyson-Hudson and Smith
(1979:26). The populations that selected habitation locales that were in close proximity
to dense and predictable resources would have insured continued access to those
resources via defense. This strategy would have persisted in high frequency as long as
the harvest returns outweighed defense costs, including danger of physical harm, loss in
harvest time due to defense requirements, and energy loss due to investment in
constructed features. The predominance of defended production sites in Zone 1 also
suggests a linkage between competition and environmental shortfalls, as this area has
been identified as highly prone to seasonal and interranual environmental fluctuations.
Production Strategy
Lastly, 22% (86) of the habitation sites in the Sigatoka Valley are associated with
a production strategy. Compared with defended production and defensive strategy
habitations, these sites are small in size—averaging 1.78 ha, and show no visible signs of
fortification, either in constructions or location on a prominent feature. Their distribution
is restricted to Zone 1, although a loose cluster also occur in association with the irrigated
terraces of the northern portion of Zone 2. Geographically, these habitations lay atop the
lowest alluvial terraces of the main river channel, where the land is the flattest and most
expansive. They are also evenly distributed throughout the valley, and have 1 km access
to all levels of production. However, one half have access to moderate/high levels of
wetland, dryland, or mixed production, which suggests that site location was a direct
result of proximity requirements.

117
As was mentioned in section 4.5, these sites lack visible defenses, but may have
been fortified by means of a wooden palisade or thorny hedge during prehistoric times.
Their location in the low-lying alluvial areas suggest they were primarily focused on the
production of crops, although their small size and association with seasonal production
suggests that these habitations may not have been long-term occupations. Rather, these
sites may represent instances of multi-year or seasonal occupation, perhaps as part of the
system of planting and harvest. The fitness benefits associated with a purely production
strategy are determined by the net yield of resources obtained during harvest, relative to
the costs of security and perhaps transport between seasonal patches. It is expected that
the abandonment of any form of defense signifies a general reduction in competition in
the area, thus undefended habitations with purely productive foci may have been
restricted to a geographic region, or perhaps a temporal period. As the distribution of
production sites indicated in Figure 4.7 reveals that these sites occur throughout the
valley, it can be hypothesized that these sites represent a either a strategy of periodic
abandonment or mobility. Contrariwise, the strategy may represent an extended lapse in
regional competition, which perhaps occurred during a discrete temporal period.
4.10 Potential Trends in Defensive Settlement and Subsistence in the Sigatoka Valley
Following the analysis of fortifications in the Nakauvadra range of Viti Levu,
Kuhlken and Crosby concluded that ancient Fijian farmers privileged defense over
subsistence, and did not make use of the most fertile agricultural land in the valley
bottoms (Kuhlken and Crosby 1999). In addition, Parry (1987) suggested that the spatial
118
distribution of fortifications in the Sigatoka Valley was not suggestive of any serious
pressure on land or resources. In contrast, the analyses of the Sigatoka Valley presented
above suggest that prehistoric farmers employed a variety of subsistence and defensive
strategies, and occupied all the available environmental zones. Moreover, environmental
analyses indicate that the geographic variability of the Sigatoka Valley restricted both
cultigens and agricultural technologies to particular parts of the valley, thus producing
disparities in both yield size and yearly harvests.
Temporal fluctuations in seasonal rainfall and episodic climatic disturbances also
impacted the Sigatoka Valley, creating three zones that were more or less affected by
drought and flood. The comparison of habitation sites across these zones and geographic
regions indicates that pressure on production not only occurred in prehistory, but at times
was severe. According to the evolutionary ecology model outlined in Chapter 2, this
situation is indicative of both the emergence of competition as a product of episodic
environmental perturbations, and territorialism focused upon dense and predictable
resources. Specifically, populations developed two forms of fortification in direct
association with geographical restrictions and environmental trends outlined by the
boundaries of Zones 1 and 2—defended production sites and defensive sites. From an
evolutionary perspective, these strategies conveyed three distinct fitness benefits: these
structures insured continued access to necessary resources, increased overall yields
through the exclusion of others, and in the case of defensive sites served as refuges that
protected populations during times of extreme hardship.

119
The antiquity of the relationship between ENSO and competitive strategies in the
Sigatoka Valley is suggested by the ubiquitous presence of fortifications, although the
disparities of Zone 1 may have provided the initial impetus for the development of
competition in the valley. It is proposed herein that defensive production sites that
utilized natural defense were the earliest form of fortification, as these locations did not
require a substantial labor force in order to generate a system of defensive barriers. More
costly forms of defense, such as villages surrounded by an annular ditch and moat
system, would have required additional labor (and larger populations), and are likely to
have been produced in only the latest temporal periods. Refuges may have been
established early, although their continued use was undoubtedly tied to the frequency of
environmental perturbations, and also population growth in Zone 1.
As described in Chapter 3 the effects of the LCO/LIA transition would have been
felt most strongly Zone 1. This suggests that nearly all of the production sites would
have been effected, as losses in soil moisture would have resulted in severely restricted
harvests. Approximately 50% of the defended production sites in the valley would have
suffered a similar fate, although defensive sites in Zone 2 would have remained relatively
unaffected. This disparity suggests that the LCO/LIA transition period may have
encouraged removal from Zone 1, and resettlement in Zone 2. Such a transition would
have required a substantial shift in subsistence and mobility, and perhaps also population
structure (e.g., group size).
In sum, the results of GIS-based analyses of habitation sites, associated
subsistence strategies, geography, and the effects of cyclical and punctuated

120
environmental/climatic change, suggest that the Sigatoka Valley was a dynamic
environment, which encouraged the application of a variety of subsistence and defense
strategies across time and space. Moreover, these data suggest that environmental
factors, in particular ENSO-related droughts and floods, conditioned the application of
these strategies, and encouraged their development through time. However, the absence
of chronological data impedes any further analysis. In order to more closely examine the
issues relating to competitive and cooperative strategies in the prehistory of the Sigatoka
Valley, the following chapter describes recent archaeological investigations of a sample
of sites in the Sigatoka Valley. The resulting chronology provides a means by which
competition and cooperation can be traced through prehistory, and also used to assess
historical developments.
4.11 Chapter Summary
Analytical units linked to the strategies of competition and cooperation are
defined for the archaeological record of the Sigatoka Valley, with a distinction made
between natural and constructed defenses. These summary definitions are then used in
the analysis of the landscape of the study area, and also in the analysis of a series of aerial
photographs. These photographs allow for the recognition of over 700 archaeological
features, which are subsequently analyzed in a GIS database. Using the analytic
capabilities of the GIS, the variables of slope and visibility are quantified and used to
indicate varying degrees of defense.

121
The stream-flow method is used to calculate the productive potential of irrigated
agricultural features in the Sigatoka Valley. The results of these analyses suggest that
irrigated (i.e., year-round) cultivation was geographically restricted to the northern
portion of the valley. In addition, the analysis of the degree of slope within 1 km of each
habitation site was used to determine the productive potential available to site inhabitants.
The results of these analyses indicate that much of the valley was reliant upon dryland,
seasonal cultivation. Further analysis of yields suggests that three habitation strategies
were employed as a result of spatio-temporal variation in resources: defensive strategies,
in which habitations served as temporary refuges; defended productions strategies, in
which habitations allowed for a territorial strategy of defense and cultivation; and
production strategies, in which villages were undefended, and perhaps represent a
strategy of mobility or temporary production.
The comparison of these findings with the environmental and climatic data
presented in Chapter 3 lead to the conclusion that the competitive stances of Sigatoka
Valley inhabitants were conditioned by regional disparities, and the effects of ENSO-
related environmental perturbations. As outlined by the evolutionary ecology model, the
geography of the area would have encouraged a competitive focus on dense and
predictable resources. Over time, episodic fluctuations, as well as geographic restriction
of high-yield, multi-season cultivation, would have intensified conflict, and perpetuated a
tradition of defensive settlement.

122
CHAPTER 5. EXCAVATIONS AND CHRONOLOGY
The results of the analyses discussed in Chapter 4 indicate that the acquisition of
chronological data are required for further analysis of the prehistory of the Sigatoka
Valley. The following section describes a series of archaeological excavations in the
Sigatoka Valley, the explicit goal of which was to determine the absolute age of a sample
of fortified and unfortified habitation sites. The age of constructed fortifications that
were added to pre-existing habitation sites are also assessed. The chronological
indications derived from these analyses allow for the generation of general historical
trends, which are compared against the environmental data and expectations of the
evolutionary ecology model presented in Chapters 2 and 3. Specifically, these
excavations reveal that habitation in remoter portions of the Sigatoka Valley occurred as
early as 20 BC, and continued until the contact period (AD 1800-1875).
5.1. Previous Excavations in the Sigatoka Valley
Archaeological investigation in the Sigatoka Valley was initiated by E. W.
Gifford, who surveyed the Sigatoka Dunes in 1947 and noted the presence of ceramics
similar to those found in Tonga and New Caledonia (Gifford 1951). As regional studies
of Polynesian culture history got underway in the 1960s, excavations were conducted at
the Sigatoka Dunes in hopes of clarifying the relationship between those materials and
similar items recovered from Samoa and Tonga. The Sigatoka Dunes yielded a great deal
of ceramics, and charcoal samples from the earliest layer firmly associated the site with

123
the prehistoric Lapita expansion. Later occupations at the dunes indicated the
development of endemic Fijian ceramic styles (Birks 1973).
As director of the Fiji Museum in 1965, Bruce Palmer noted that as an access
corridor from the coast to the hill country, the Sigatoka Valley likely bore witness to the
prehistoric movement of populations following the Lapita colonization (Palmer 1966).
This led to the development of the Sigatoka Research Project (1965-1973), which utilized
ground-based surveys to document the presence of 67 sites in the valley. A single
excavation was conducted at the site of Tatuba Cave, which produced a radiocarbon date
of 1000 ± 70 years BP (GaK4311) (Palmer 1966; Palmer, Clunie, and Moce 1973). This
date, in tandem with other studies of prehistoric settlement in Fiji suggest that
colonization of the interior likely occurred sometime between 2000 and 1500 years BP
(Best 1984; Crosby 1988; Frost 1974). Much of these data are integrated into John
Parry’s ‘The Sigatoka Valley—Pathway into Prehistory’ (1987).
5.2 Oral Traditions and the Historical Record
The region has also experienced a dynamic history, as recorded in the oral
recollections of the valley’s inhabitants. Traditionally, the delta region of the Sigatoka
River was known as Nadrogā, which is a reference to the raspy-voiced speaking style of
the Tongan ancestors that settled in this region in the 17th
or 18th centuries (Brewster
1922:78-88). However, there are also several recollections of migrants from the
Nakauvadra Mountains, which lay in the far northeastern corner of Viti Levu. Gifford’s
analysis of yavusa origins in Fiji suggests that some of the populations of the Sigatoka

124
Valley claim ancestral lineages that originated in this area (Gifford 1952). Fijian oral
traditions and historians also recollect an atmosphere of persistent hostility between the
inhabitants of the upper, middle and lower valley-- the Kai Colo, the Kai Rā, and the Kai
Waitui. According to histories collected by Forbes (1875:327), Stonehewer Cooper
(1880: 53), and Thomson (1894:272), these groups practiced raids upon one another that
often reached deep into enemy territory, and perhaps were inspired by food shortages or
feuds.
Nadalo (1957) and Gordon (1879) record that the 18th
and 19th centuries in
Nadrogā were especially violent and tumultuous. It was during this period that the
confederacies of Rewa and Bau were extending their power, and fleets of war canoes
harried the coastal villages of southern Viti Levu demanding tribute. European
merchants, missionaries, and colonists made the village of Nasigatoka their port of call
during this period, and by the 1860s Nadrogā had a small population of Christian
converts, including the high chief of Nadrogā, the Ka Levu. The political troubles
deepened when the highland tribes of Viti Levu, the Kai Colo, rejected the influence of
the new Fijian government that had been established when Cakobau, the Vunivalu of
Bau, ceded the islands to England in 1858. An attempt was made to placate the highland
tribes in January of 1875, when the Kai Colo chiefs met with the government
representative and agreed to abandon cannibalism and accept the authority of the new
colonial government. However, Gordon notes that this attempt failed miserably, as the
chiefs who attended the meetings were all exposed to measles.

125
Although the actual death toll for the epidemic is not known for the highland
populations, the rapid spreading of the disease was the undeniable cause for the uprising
of the Kai Colo in the months that followed the meeting. Brewster (1922) and Gordon
(1879) suggest that the highland populations saw measles as a form of witchcraft, and
quickly associated the disease with the adoption of Christianity. Suspicion, and the long-
standing enmity between the Kai Colo, Kai Rā, and Kai Waitui, encouraged a series of
attacks upon the Christian settlements of the coast and highlands.
The following year (1876) saw the unfolding of the ‘Little War’, in which
government constabulary forces assembled in the Sigatoka Valley in an attempt to bring
the hostile tribes under the control of the government. Between January and August,
forces led by Sir Arthur Gordon and Captain Knollys invaded the lower and upper
portions of the Sigatoka Valley, and fought several battles against tribesmen who were
ensconced in mountain fortresses and caves (Gordon 1879). Using superior firepower, all
of the rebel-held fortifications were stormed and taken, and in many instances large
numbers of warriors were taken captive. The leaders of the rebels, including several high
chiefs, were given a trial in the few days following the end of the government invasion,
and all were sentenced to death (Von Hugel 1876, in Roth and Hooper 1990:396-397).
Lastly, in a dramatic show of colonial power, all the fortified villages of the valley were
burned to the ground, and the inhabitants forced to resettle along the riverbank. A
garrison was also established at the site of Natuatuacoko in the highlands, in order to
maintain peace and stability in the region (Parry 1987:50). In the decades that followed,

126
the inhabitants of the valley were forced to renounce cannibalism and warfare, and were
encouraged to adopt Christianity and raise crops for local and export markets.
5.3 Archaeological Excavation in the Sigatoka Valley: Sampling
The excavation strategy for the Sigatoka Valley was conducted in accordance
with the GIS-based research described in Chapters 3 and 4, which suggested that certain
environments of the valley would have been more productive, both in terms of yield and
predictability, and would have been the focus of habitation at an early stage. In addition,
other strategies (i.e., production, defended production, and defensive) were investigated
in order to determine potential chronological sequences. The large population of
prehistoric habitation sites in the Sigatoka Valley (384) prohibited full excavation, and
for this reason, sampling techniques were employed to test approximately 3% (12 sites)
of the total population of sites in the valley. Stratified random sampling has been used
throughout the archaeological discipline as a method for examining archaeological
populations (Mueller 1975). The method is based on the principle that if the target
population is differentially distributed in either environmental zones or functional classes,
a more representative sample can be obtained if each class is sampled individually. In
addition, the application of random methods will effectively eliminate selector-induced
bias, and has the most potential to produce a fair representation of the target population.
However, as archaeological investigations must necessarily be limited by time and costs,
it is often prudent to examine sites that are most likely to contain deposits that are of
desirable antiquity. For the purpose of this research, a random 10% sample was selected

127
from each of the three classes of settlement. Of these 37 sites, 15 were selected for
excavation due to the fact that they were of considerable size and potential antiquity, and
accessible by trail or road. Twelve of these sites were excavated during the 2001-2002
field season. Table 5.1. lists geographical, feature, and production potential information
for each excavated site, while Figure 5.1 displays their location in the Sigatoka Valley.
5.4 Excavation Methods
In an effort to collect the needed data without destroying large portions of the
sites, small test excavations were elected as the most economical means of investigation.
The excavation protocol that was employed in the 2001-2002 season was typical of
standard archaeological techniques: a bucket auger was used to test deposits for depth
and artifact content, and excavation loci were chosen based upon results. Excavations
were focused on two aspects of habitation sites: the construction of habitations, and the
construction of features related to fortification. Thus, excavations were generally
performed upon the remains of house foundations, and also located at the base of rock
and rubble walls, across ditch causeways, and across the slope of raised earth
embankments. Excavations varied in size; the largest used was 1 m x 2 m, but 50 cm x 2
m as well as 50 cm x 50 cm were common. Each site had at least one excavation
conducted upon it, and a maximum of 10 units was reached for one site.
Standard archaeological techniques were observed in the excavation of the units.
Stratigraphic recording was based upon the observation of sedimentary layers, which
were subdivided into 10 cm levels. Standard soil science terminology (e.g., French 2003)

128
Table 5.1. Topographic, environmental, and archaeological data pertaining to the 12 sites excavated in the
2001-2002 season.
District
No.
Name Area Elev. Situation Zones Const. Viewshed No. % slopes No. Agri. Total Productive Strategy
(ha) (m) Def. size sites > 45 Feats. Product. Yield
(km2) in view 1 km Score
1-NKR-
031
Madraya 12.5 191 summit flat 2-3 47.64 25 70 3 54 med mixed defended
production
1-NKR-
046
Nadroga 1.5 100 river terrace 2-3 walls 31.98 21 70 1 40 low dryland defended
production
1-NMT-
015
Tatuba 25 200 knoll 2 walls 92.93 31 83 0 17 low dryland defensive
2-BMA-
011
Vitogo 1.4 35 river flat 2 ditch 20.21 12 15 0 85 high wetland defended
production
2-CON-
010
Korokune 4.6 184 summit apex 1 scarp 177.4 37 72 0 28 low dryland defended
production
2-MAV-
047
Korovatuma 9 160 summit apex 2 131.38 39 90 0 10 low dryland defensive
2-MAV-
048
Korohewa 1.1 60 river terrace 1 1.98 0 70 4 34 med mixed production
2-MAV-
049
Bukusia 37 123 knoll 2 walls 34.78 22 80 0 20 low dryland defensive
2-NOK-009
Nokonoko 19.3 200 ridge 1-2 ditch 44.6 17 85 0 15 low dryland defensive
2-QMR-007
Qoroqoro. 12.5 200 ridge 1-2 walls 58.96 24 98 1 8 low wetland defensive
2-SIG-005
Batiri 3 20 river flat 1 ditch 34.21 21 0 0 100 high dryland defended production
1-NSK-015
Malua
35
100
promontory
2
walls
29.92
15
62
1
46
low dryland
defended production
128

129
Fig
ure
5.1
. L
oca
tion o
f ar
chae
olo
gic
al s
ites
in t
he
Sig
atoka
Val
ley t
hat
wer
e ex
cavat
ed b
etw
een 2
001
-2002.

130
was used to describe each deposit. The bottom of each level was photographed with
color film, and sedimentary samples from each layer were analyzed using a touch-texture
protocol, and a Munsell color-chip test. A horizontal grid system was used to record the
provenience of in-situ artifacts and features, and a line-level and tape were used to
maintain accurate vertical layers and record depths. Stratigraphy profiles were
photographed for at least two walls in each excavation unit, and profile drawings were
created for at least one wall of each unit. Stratigraphic profiling also included the
analysis of the structure of the sedimentary layers via the touch-texture protocol. All
sediments removed during excavation were sieved through 1/8 inch metal sieves, and
samples were collected for geoarchaeological analysis from a single site (Tatuba Cave).
At the termination of each excavation, all units were refilled with the sieved back-dirt.
In most cases, all archaeological materials encountered during excavation were
collected. The exceptions included some human remains, large stones that were part of
either house or wall construction, and one large pecked-stone maul that was too heavy to
be transported. These items were photographed and sketched into site maps or level form
diagrams, and left in the field. Artifacts collected during the excavations were placed
into plastic bags and labeled with a unique catalog number, and information pertaining to
their site of origin, excavation unit number, layer, and level provenience. All materials
were separated according to material type, and later washed if appropriate. The materials
encountered during excavation are typical of Fijian archaeology: ceramic fragments,
lithics, riparian and marine shells, animal and human bones, and historic glass and metal

131
fragments. Rare materials included whales teeth, fragments of matting, a shell armband,
a sling stone, and a partial ceramic vessel (Appendix D).
Features were encountered frequently during excavations, and included post-
holes, cooking hearths, and burials. All features were photographed and sketched into
level forms. Special care was taken in the event of encountering a burial. Depending
upon the wishes of the local landowners, the burials were exposed, photographed, and
either reburied or exhumed and collected for later study (Appendix E). All human
remains that were collected during the 2001-2002 season are scheduled to be returned to
their site of origin for reburial.
Most sites were mapped with either a Topcon autolevel and stadia rod, or with a
tape and sighting-compass. Four of the sites had been previously mapped by Palmer
(1966), and the location of excavation units were plotted onto these maps. In a few
instances the sites were too heavily covered with trees and brush to allow for mapping, so
these sites were sketched by pacing and taking compass readings. All sites were explored
in order to determine the extent of cultural features, although it is likely that features were
missed or partially hidden by heavy vegetation. All excavations were performed with the
permission of the Dept. of Immigration, the Fiji Museum, the Nadrogā/Navosa Provincial
Office, and local chiefs and village mayors. Fieldwork assistance was provided by local
men from the villages that claimed these sites as their ancestral homes.
Four samples of charcoal were submitted to the Waikato Radiocarbon Laboratory
for 14
C dating, as were 30 samples of charcoal and bone to the University of Arizona

132
AMS Laboratory for accelerated mass spectrometry dating. The results of these analyses
will be discussed in the sections to follow, and also analyzed in detail in Chapter 6 and 7.
It is important to note that the full details of all 12 excavations are summarized in a
collection of reports on file at the Fiji Museum, and the Nadrogā/Navosa Provincial
Office. Due to the sheer volume of these reports (in excess of 500 pages), they could not
be reproduced in entirety in this dissertation. Therefore, this chapter contains a summary
of the results of the excavations. The following descriptions begin with the oldest site in
the sample, and continue in chronological order.
5.5 Tatuba Cave (1-NMT-015)
The site of Tatuba Cave is located within the district of Namataku, and directly
across the river from the modern village of Sawene. This site is one of many in the area,
however, it is most famous for its use as a distribution point for firearms, and also a site
of rebel siege in 1876. The site is located amongst a substantial outcrop of the
Naqalimare limestone formation that encircles the eastern flanks of Talenalawe peak
(Appendix A, Figure A.6) provides an aerial view of the topography of the Tatuba locale,
and also indicates the location of several associated sites. The most prominent feature is
the cliff-face, which extends northwest-southeast for approximately 1.5 km. Figure 5.2
displays the cultural features associated with Tatuba Cave. This map was created by
surveys conducted by Clunie and Moce in 1972, and was updated by the author in 2002.
Over 50 yavu and mounds are associated with Tatuba Cave, and they vary tremendously
in size, elevation, and complexity. The most impressive are located atop the perimeter

133
Fig
ure
5.2
. M
ap o
f cu
ltura
l fe
ature
s su
rroundin
g T
atuba
Cav
e.

134
ridge that parallels the cave entrances to the west. These ridges are topped with high oval
yavu, which may have been the foundation for a bure kalou (spirit house), which was
later topped with a stone-faced burial mound.
The Cave System
To date, subsurface archaeological investigation at Tatuba has focused almost
exclusively on the contents of the cave. As described for the sites of Bukusia and
Qoroqorovakatini, the caves of Tatuba are solution caves, being formed by the constant
flowing of water through an outcrop of the Naqalimare limestone. The caves of Tatuba
were surveyed by biologists and speleologists in the 1970s and 1980s (Gilbert 1984;
Watling and Pernetta 1977), which produced a rough sketch map of the caverns and
passages (Figure 5.3), as well as descriptions of its geological features. The cave has two
entrances that face to the west, and the higher and more southerly entrance (Entrance 1)
was barricaded at some time in prehistory with a heavy stone wall, and the interior is
relatively dry (Figure 5.4). This is the more ancient entrance, as evinced by the thick
deposits of guano—the source of which are the sheath-tailed bat (Emballonura
semicaudata) and the white-rumped swiftlet (Collocallia spodiopygia) that use the cave
as a roosting area. According to Gilbert (1984:114), the caverns of Tatuba extend for
approximately 420 m, and in some instances the chamber ceilings reach a height of 25 m.
At some point in prehistory the flowing water that created Entrance 1 undercut its own
bed, and flowed northward to form Entrance 2 at a slightly lower elevation. This opening
lacks the guano deposits, and runs with water-flow throughout the year. Of note, the
bottom of this passage shows significant down cutting, as the water is gradually cutting a

135
Figure 5.3. Plans of Tatuba Cave (listed here as Saweni Cave). Reproduced from Gilbert
1984:115.
Figure 5.4. Entrance 1 of Tatuba Cave, which is fortified with a dry-laid stone wall.

136
new channel into the pre-existing cave floor. Large amounts of ceramics and stone-tool
fragments are visible on the surface of the cave exit. It is likely these remains were
washed into the cave or were deposited here during the final occupation episode. The
exit is surrounded on all sides by the walls of the upper sink-hole, the surface of which
contains abundant amounts of ceramics, lithics, and animals bones.
Historical Descriptions of the Cave System
Histories that have been collected from the Namataku region indicate that Tatuba
was considered to be a very important defensive location in prehistoric times, and it had
always been fought over. Even the name ‘Tatuba’ hints at a defensive history for the site,
as it is undoubtedly derived from the word ‘taubā’, which means “to anticipate the
enemy, having fenced in the town in readiness” (Capell 1991:222). According to oral
histories recounted by the Tui Namataku and his relatives, mountain tribes from as far as
the Wainimala River (approximately 50 km to the east) had sought control of the caves in
the past. Moreover, the Namataku themselves represent one of the later waves of
migrants to the region. Their own oral histories record a series of migrations, wars, and
group fissions that began near modern Nadi, and ended when they advanced to the upper
reaches of the Sigatoka River. These histories suggest that the Namataku and were
successful in gaining control of Muawai and Tatuba, perhaps between AD 1780 and
1800.
Full investigation of the cultural features of the caves did not occur until the
archaeological investigations of the 1970’s. Palmer et al. described several features
within Entrance 1 and the main passage, including the presence of several fire hearths

137
along the walls (Figure 5.5), and also a detailed map of the stone wall. Throughout these
areas there were signs of occupation, such as fragments of bamboo and coconut, as well
as abundant pottery. They also noted the presence of large amounts of debris in the exit
of the cave, including oven stones, bamboo, ash, ceramics, glass fragments, and musket
balls. According to their Namataku informants, the bamboo fragments may have been
the remains of a palisade that was hastily constructed at the cave exit during the siege of
1876.
The 1972 Excavations
The abundance of cultural features in the cave encouraged Palmer to investigate
further, thus the first archaeological excavations were undertaken beginning in July of
1972. At the time of these excavations, the ceramic chronology for the Sigatoka Dunes
had only recently been established, but whether or not this sequence applied to the
interior of the islands was unknown. This being the case, Palmer and his assistants
attempted to retrieve archaeological materials that were of Lapita age, as well as draw
comparisons between the Tatuba materials and the ceramic chronologies of the coast.
Excavations were conducted within the cave and the materials were partially analyzed by
Palmer et al. at the Fiji Museum. However, the final report never materialized due to the
untimely death of Bruce Palmer in 1973. A full report of the 1972 excavations is
contained within the 2003 site reports for the Sigatoka Valley (Field 2003).
In brief, the 1972 excavations of Tatuba Cave were primarily focused on the area
immediately inside the overhang of Entrance 1 (Figure 5.5). Three 2 x 2 m units (AC 1-

138
Figure 5.5. Plan of interior of Tatuba Cave, indicating the locations of the 1972 and 2002
excavations.

139
2, ACc1-2, and CD1-2) were placed to the east of the stone wall, and a fourth unit,
‘Location B’ was a 2 x 2 m unit that was located approximately 14 m inside the cave
passage, near the location of a scattered hearth feature. According to Palmer’s notes, the
upper layers all of the units consisted of loose, dry guano, which varied in depth from 3
to 5 cm. Artifact density was high, consisting of ceramic fragments, bones, riparian clam
and snail shells, cut wood fragments, glass fragments, adze flakes, and candlenut shells.
The base or sterile layer of the cave consisted of a bright orange deposit, which Palmer
hypothesized was eroded limestone. Palmer encountered hearths, post-holes, and the
remains of two burials within the excavations of test units AC1-2, ACc1-2, and CD1-2,
which reached a maximum depth of 59 cm. Numerous post-holes, including a fragment
of bamboo, were encountered in Location B. Palmer suggested that the post-holes may
represent the use of wooden braces for pot-stands, pig enclosures, or perhaps the
construction of roasting or drying racks. More recent analyses of the post-holes the
context of stratigraphy and AMS dates indicate that the postholes with the largest
diameters and deepest extents may in fact be the remains of a wooden or bamboo
palisade that was constructed ca. AD 1200 (Field 2003).
The maximum depth of Location B reached 70 cmbs, and it was from this unit
that the single 14
C date was retrieved. Palmer’s notes indicate that the fragment came
from a wooden stake that was embedded in the hearth that lay at the bottom of Location
B, at a depth of 54 cmbs. This hearth lay directly above the sterile orange basal layer,
and the stake extended into this layer to a depth of 7 cm. The wood fragment (GaK
4311) was submitted to Gakushuin laboratory in Japan, and the resulting date of 1000 ±
140
70 years BP suggested that the occupations of Tatuba Cave that lay atop the sterile
orange layer were considerably younger than the Lapita aged settlements of Sigatoka
Dunes (ca. 2900 BP). With modern calibration, the wood sample dates the hearth
deposits at 54 cmbs to between Cal AD 970 and 1160 (at 1σ).
Based upon the presence of imported pearl shell, complete and incomplete shell
ornaments, and food remains at the cave, Palmer hypothesized that Tatuba was both an
occupation site and a center for shell-ornament manufacture. Whether or not the site was
a ‘center’ is difficult to ascertain at this time, although the lack of pearl shell at other sites
in the Sigatoka Valley does suggest that the resource was restricted in some way. The
analysis of post-holes suggests that a wooden palisade once blocked access to the mouth
of the cave, and the stone wall was probably built shortly after. Tatuba Cave may have
also been used for housing pigs, as suggested by the alignment of smaller post-holes
along the cave walls. In addition, the site was used for burials, as evinced by the
presence of human remains in units AC1-2 and CD1-2.
Tatuba Cave: 2002 Excavations
The excavation performed in 2002 was focused primarily on establishing a more
secure chronological sequence for the occupation of the cave and the Tatuba locale in
general. The excavation was also intended to sample the deepest deposits of the cave,
and determine the depositional history of both the natural and cultural deposits. It is
important to note that Entrance 1 appeared to be a ‘keyhole passage’, which is a
particular limestone cave formation that occurs when water is forced between two
bedding planes (an epiphreatic cave). Nunn suggests that the sequences of down cutting

141
observable at Tatuba Cave is associated with tectonic uplift in the central portion of Viti
Levu, perhaps between 5-7 million years ago (Nunn 1998:126-131). Thus, Unit 1 was
positioned in between the 1972 excavations of Location B and ACc1-2 – CD1-2, and also
along the centerline of the chamber, in hopes of reaching the very deepest cultural and
natural deposits along the center of the cave.
The ceramic fragments encountered in the 2002 excavations were analyzed and
compared to existing classifications for early, middle, and late vessel forms and designs
(Appendix C). Other artifacts such as shell, bone, and plant remains were classified
according to taxa (Appendix D). The potential formation processes at the site were also
investigated: standard soil science terminology was used to describe the layers that were
encountered, and samples were taken for later geoarchaeological analyses, including the
measurement of pH levels, CaCO3 content, organic matter content, and grain size
distributions (Appendix F). In addition, drawings and photos of the layers and cultural
features visible at each 10 cm layer were generated, as were stratigraphic profiles for all
the walls of the unit. Perhaps most important, five organic samples, including a fragment
of human bone, were submitted for AMS and standard radiometric dating. Combined,
these data provide new insights into the depositional history of the cave, and also serve to
enrich the results from the 1972 excavations, generating a greater understanding of the
cave and its history.
Tatuba Cave: Test Unit 1: Layers I-II
Two deposits were encountered during the excavation of the first 10 cm of
sediment that lay below the surface. As with Palmer et al.’s excavations, the surface

142
layer (Layer I) consisted of dry, loose, guano-laden deposit, with the consistency of cake-
flour. This deposit was approximately 5-8 cm thick, and extended as a horizon across the
entire test unit (Figure 5.6). The analysis of this deposit in both the field and laboratory
suggested that material was a sandy loam, 24% of which was calcium carbonate
(Appendix F). Within 5-8 cm Layer II was encountered, which also extended across the
entire surface of the unit. This deposit was more compacted, and it also contained a high
proportion of charcoal fragments and many thin lenses of ash. The sheer number and
thinness of these lenses made it impossible to excavate them as features, however they
were highly visible in the profiles of the unit.
The cultural materials encountered in Layers I and II were exceptionally diverse.
These included waterworn stones (pot stands), a fragment of a shell arm-band, a pendant
made from a dog canine, and abundant riparian clam and snail shell and toto (Aleurites
moluccana) nutshell. An assortment of rat (Rattus spp.), sheath-tailed bat (Emballonura
semicaudata), and pig (Sus scrofa) bones were also emerged in the fill. These fragments
(especially the pig) may represent food remains, but may also be naturally occurring
fauna. Seven adze fragments were also recovered, all of which were composed of dense
aphanitic basalt (Appendix D). Over 400 ceramic fragments were also recovered from
Level 1, 9.8% were decorated with crossed paddle impressed, parallel paddle impressed,
incised, end-tool, and wiped-neck designs. Thirty-two of the fragments were from the
rim and necks of vessels, and of these, 10 were complete enough to allow for the
morphology of the parent vessel to be reconstructed and analyzed (Appendix C). In brief,
the bowls are predominantly square-lipped, although there is a great deal of variation in

143
Fig
ure
5.6
. P
rofi
les
of
the
south
ern a
nd w
este
rn w
alls
of
Tes
t U
nit
1, T
atuba
Cav
e.

144
the profile of the lip shape, which include parallel and contracting forms. Two jars (#s
270, 278) are similar to the ‘Nakoro’ style pot, which was identified by Palmer as having
an ovoid body, elongated straight neck, and a sharply curved and pointed rim (Appendix
C).
Tatuba Cave: Test Unit 1: Layers III, IV, and IX
The excavation encountered three additional Layers—III, IV, and IX, at
approximately 20 cmbs, which occurred within different portions of the unit (Figure 5.6).
As the excavation continued in the southern portion of the unit, a single feature began to
appear at the bottom of Layer III, consisting of a deposit of thick ash and charcoal
(Feature 1, Layer VI). Layer IV was also a sandy loam, but had a reddish brown color
and fewer instances of charcoal inclusions. As indicated in the profiles from the south
and west wall, Layer IV underwent a great deal of mixing and disturbance in this portion
of the cave, and the intrusion of several deposits from above and below are visible.
However, as excavation continued in the northern portion of the unit, intact deposits from
Layer IV were encountered from depths of 70 cmbs in the western portion of the unit,
and at 120 cmbs in the eastern portion.
Layer IX, which appeared to be the remains of an intrusive burial, was also
encountered between 10 and 20 cmbs in the extreme northwest corner of the unit. This
deposit is entirely mixed and disturbed, and was not further tested with either chemical or
physical analyses. It continued to extend in depth throughout the excavation, and reached
a maximum depth of 140 cmbs. The artifacts recovered from Layers III, IV, and IX were

145
of fewer number than Layers I and II, but are similar in terms of artifact type and variety.
The ceramics are illustrated in Appendix C.
Tatuba Cave: Test Unit 1: Layers V and VII
As the excavation continued into the deposits that lay between 30 and 40 cmbs,
the orange lens (Layer VII) from the southern portion of the unit was observed to extend
to the north for approximately 25 cm, at which point it dipped sharply down and
disappeared under the overlying Layer IV that constituted the rest of the unit. Also of
note, another layer of unknown origin was identified as lying directly atop the orange
horizon, and it consisted of a thin layer (approximately 2 cm) of reddish-brown sediment
(Layer V). Geoarchaeological analyses of Layer V indicated that this deposit was a
occupational layer that was deposited immediately prior to the construction of the hearth
feature (Appendix F). Also of importance is the character of the basal layer, Layer VII.
No artifacts were encountered in the orange deposit, and its inclusion-free matrix further
suggests that it may actually be eroded limestone, as surmised by Palmer. Chemical
analyses of this deposit indicate that only 2.5% of the calcium carbonate remained in this
material, and the pH level for this deposit was very acidic (4). This indicates that the
orange basal layer was the original limestone floor of the cave, which has since eroded
away into a sandy conglomerate of clay minerals.
Tatuba Cave: Test Unit 1: Feature 1
As described, Feature 1 consisted of an ash-filled hearth that was approximately
40 cm wide, and extended out from the south wall of the unit to reveal the most northerly
20 cm of the feature. During the occupation of the cave, the base of the hearth was

146
carved into the sterile orange basal layer, reaching a maximum depth of 55 cmbs.
However, this feature is intrusive into Layers IV, V, and VII, as is clearly seen in the
profile for the south wall of the unit (Figure 5.7). Feature 1 was excavated separately,
and all the materials within the hearth were removed prior to continuing the excavation of
deeper levels. The bulk of the fill within the hearth was ash, 41% of which was calcium
carbonate that was probably deposited in the hearth following the burning of organic
materials over limestone cooking stones. Organic content was also high, at 14%. A
portion of a globular vessel (# 335) was visible in the ash at 44 cmbs (Appendix C). This
vessel was undoubtedly used for cooking, and its body had a diameter of approximately
36 cm. The neck of the vessel was curved slightly inward, and its rim was contracted in
profile, and slightly pointed at the lip. The hearth feature also contained 4 g of riparian
clam and snail shell (Batissa violacea and Melanoides spp.) amongst the ash deposits, as
well as the shell of an unidentified marine mussel, possibly kuku (Modiola tulipa)
(Appendix D). A single large fish bone from an unidentified species was also recovered
from the bottom of the hearth.
The largest charcoal fragment recovered from Feature 1 was submitted for 14
C
dating as sample Wk-11137 (Table 5.2). The resulting date suggests that the wood
fragments deposited in the hearth date to 968 ± 52 years BP. After calibration, this result
indicates that the hearth dates to between Cal AD 1020 and 1160 (1σ). This date
corroborates the single date for the deepest cultural deposits of the 1972 excavation,
which suggested that Tatuba Cave was occupied as early as AD 1000. This date also
indicates that habitations and hearths along the wall of the cave were placed atop the

147
Figure 5.7. South profile of Test Unit 1 showing location of hearth feature.
eroded limestone ‘bench’, which by AD 1000 was soft enough to be excavated and used
for hearth foundations.
Tatuba Cave: Test Unit 1: Layers IV and IX
Past 40 cmbs rocks and cobble sized pebbles increased to 20% of the fill, and they
were especially common in the northern portion of the unit. As indicated by Figure 5.6
these cobbles were probably associated with the intrusive burial deposit (Layer IX) that
extended downwards through the north and west profiles. However, the bulk of the
deposits from Layer IV located in the center and eastern portion of the unit appeared to
be intact. Unfortunately, the boundary of the intrusive burial was difficult to detect
during the excavation, thus the artifacts that were contained within its mixed deposits

148
Table 5.2. Standard radiometric (14
C) and AMS dates for the site of Tatuba Cave.
Lab No. Provenience Material Measured 13
C/12
C
Calibrated Age
Range
Calibrated Age
Range
14C Age
BP Ratio Probability Probability
Distributions (1σ)* Distributions (2σ)*
Tatuba
Cave
GaK4311
Loc. B, 54
cmbs Wood 1000 ± 70 ? Cal AD 970 - 1160 Cal AD 890 - 1220
Wk-11137 TU1, Feature 1 Wood 968 ± 52 -28 Cal AD 1020 - 1160 Cal AD 1000 - 1220
(45-55 cmbs) Charcoal
AA50298
TU1, 50-60
cmbs Wood 1294 ± 40 -25.6 Cal AD 685 - 780 Cal AD 660 - 880
Charcoal
AA50294 TU1, 80-90 Wood 1993 ± 35 -26
Cal BC 20 - Cal AD
80
Cal BC 50 - Cal AD
130
Charcoal
AA50293 TU 1, 130-140 H. Bone 339 ± 40 -20.6 Cal AD 1510 - 1650 Cal AD 1480 - 1660
cmbs int. burial
AA50292 TU1, 140-150 Wood 1802 ± 34 -25.5 Cal AD 210 - 340 Cal AD 130 - 380
cmbs Charcoal
AA50291 TU1, 190-200 Wood 207 ± 31 -28.1 Cal AD 1650 - 1950 Cal AD 1640 - 1950
cmbs Charcoal
*All determinations were calibrated using the terrestrial calibration curve of Stuiver et al.
(1998), with 27 ± 5 years subtracted from the CRA to account for the southern
hemisphere offset in 14
C (McCormac et al. 1998).
were also collected during the excavation of each 10 cm level. As in previous levels,
small amounts of riparian clam and snail shell (Batissa violacea and Melanoides spp.),
and toto nutshells (Aleurites moluccana) were recovered from the deposits between 40-50
cmbs (Appendix D). Ceramic frequencies are also similar to previous levels, and were
decorated with incising, wiping, and crossed-paddle impressed designs.

149
Despite the low artifact frequencies after 50 cmbs, charcoal remained abundant
throughout all layers. Sixteen grams of charcoal were recovered from Layer IV at this
level, and the largest fragment was submitted for AMS dating as sample AA50298. The
resulting date indicates that this charcoal is 1294 ± 40 years BP in age (Table 5.2). At 1σ
calibration, this sample indicates an age range of Cal AD 685 to 780 for the deposits that
occurred between 50 and 60 cmbs. The analysis of the sediments from Layer IV at this
depth also supports a cultural origin for this deposit, as 20% of it was organic in content
(Appendix F). Thus, this date indicates that occupations in Tatuba Cave pre-dated the
AD 1000 date that was established by Palmer et al. for the occupations atop the eroded
limestone shelf. Moreover, the location of this date in Layer IV suggests that the central
and deepest portion of the cave contains cultural deposits that are considerably older than
the occupations along the cave walls.
Tatuba Cave: Test Unit 1: Layers IV, VIII, and IX
As excavation continued past 60 cmbs, an additional deposit of sterile, eroded
limestone was encountered in the southern portion of the unit. Geoarchaeological
analyses suggest that this deposit was also once limestone, and over the ages the
precipitation of acid through the profile has eroded away the CaCO3 that formerly
constituted the bulk of the limestone (Appendix F). The top of this deposit lays directly
below the base of the hearth feature, and also the orange Layer VII in the southern
portion of the unit. However, as with Layer VII this deposit did not extend further into
the northern portion of the unit, and plunged steeply downwards.

150
However, excavation continued in the center and northern portion of the unit, and
the fill of Layers IV and IX at 60 to 70 cmbs continued to be mottled and laden with
pebbles and cobbles. Human remains from the intrusive burial in the northern portion of
the unit were also encountered (Appendix E). As with previous levels, these layers had a
small amount of cultural material. This included charcoal, toto nutshell (Aleurites
moluccana), and ceramic fragments decorated with crossed-paddle impressed and incised
designs.
Tatuba Cave: Test Unit 1: Layer IX, 70-150 cmbs
Past 70 cmbs, the excavation was almost exclusively confined to Layer IX, which
continued downwards in the northern portion of the unit. As before, small amounts of
toto nutshell, charcoal, chert, ceramics, human remains, and riparian clam snail shell
were recovered. One of these artifacts was a fragment of a polished basalt adze, which
was grooved with hafting scars. By this point in the excavation, the walls of the unit
became very unstable and all except the southern wall collapsed to some extent (Figure
5.8). The materials that fell into the unit were discarded, however, of note was a large
(30 cm) wooden torch or stake, which fell out from beneath the hearth feature in the
eastern wall. This artifact quickly disintegrated, but the burned and cut surface of the
torch was clearly visible. Appendix C illustrates the variety of bowls and jars that
occurred within these deposits.
Several fragments of charcoal and human bone from the intrusive burial were
submitted for AMS dating. The results indicate that the charcoal fragments from between
80 - 90 cmbs and 130-140 cmbs were stratigraphically inverted: sample AA50294 from

151
Figure 5.8. The east profile of Test Unit 1, following wall collapse. Depth
approximately 110 cmbs.
90 cmbs resulted in a date of 1993 ± 35 BP, which calibrates at 1σ to between Cal BC 20
and Cal AD 80 (Table 5.2). Of similar age, sample AA50293 from 150 cmbs resulted in
a date of 1802 ± 34 BP, which calibrates at 1σ to between Cal AD 210 and 340. The fact
that these samples are inverted and also separated by 60 cm suggests that they are the
remnants of what was likely the earliest occupation layer in the cave, which was later
disturbed and redeposited by the intrusive burial in the northern portion of the unit. Also
of note, a single fragment of human cranium from the burial was recovered from 140
cmbs. This fragment (sample AA50293) was submitted for AMS dating, and the results
indicate that the death of this individual occurred at 339 ± 40 BP. After calibration, this

152
date indicates that the burial and subsequent disturbance of the deposits occurred between
Cal AD 1510 and 1650 (1σ).
Tatuba Cave: Test Unit 1: Layer IX, 150-190 cmbs
Excavation continued with great difficulty past 150 cmbs. The sediment was
extremely loose and dry, and voids between large cobbles and boulders were very
common. Ceramics, toto nutshell, charcoal, wood fragments, and riparian clam and snail
shell continued throughout the deposits until a maximum depth of 170 cmbs. Portions of
the walls continued to collapse, and in several instances the deposits from the profiles
collapsed into the bottom of the unit and had to be removed. A single fragment of
charcoal was collected from 190 cmbs. This yielded an AMS date of 207 ± 31 BP (Cal
AD 1650-1950, sample AA50291) (Table 5.2). This date for Tatuba Cave has been
discarded as it most likely originated in much later deposits that fell into the bottom of
the unit.
Tatuba Cave: Chronology and Site Analysis
The results of the 2002 excavation reveal that Tatuba Cave has been occupied for
the past two millennia. Evidence for the earliest occupations is contained in Layer IV. If
conditions within Entrance 2 serve as a guide, the limestone base of Entrance 1 is also
‘keyhole’ shaped, and thus Layer IV lies within the base ‘gutter’ of this formation.
Occupations first occurred upon this deposit ca. Cal BC 20. Later centuries saw the slow
accumulation of guano in the cave, which was acidic enough to decompose the limestone
floor, and thus produce the eroded benches that parallel the wall of the cave (Layers VII
and VIII). Although the disturbance caused by the burial (Layer IX) makes it difficult to

153
determine if occupation was continuous through time from Cal BC 20 onwards, the
cultural deposits and dates from Layer IV suggest occupations were present during the 7th
century AD. In addition, the cultural deposits that top Layer VII ( i.e., the hearth feature,
and Layers I, II, and III), can be securely dated to ca. AD 1000. In addition, the presence
of ceramics, lithics, faunal remains, and the burial during the 16th century AD also
suggest that occupation at the cave was constant. Future excavations focused on the
features outside the cave will undoubtedly show evidence of additional occupations
during these time periods.
These data, in tandem with the 1972 excavations, indicate that Tatuba Cave was
perhaps the most ancient and important population center in the region. Cultural
materials suggest that the inhabitants had access to diverse food items, such as riparian
clams, which must have been imported from the Sigatoka or Bā river delta, and marine
mussels and pearl shell. The inhabitants also manufactured or exchanged for ornaments,
such as marine-shell armbands, pearl shell plates, and perforated dog-teeth. The
extensive size of Tatuba and its associated sites, and also the number and variety of yavu
and architecture, indicate that Tatuba supported a sizeable population. Without doubt,
the sheltering capabilities of the cave attracted early inhabitants, however, the locale is
also blessed with a variety of environmental resources that would have been desirable to
newcomers, and also encouraged continued occupations.
As described in Chapters 3 and 4, Tatuba had immediate access to small tracts of
land suited to dryland cultivation. However, Tatuba is also within a three kilometers of
much larger expanses of alluvial terraces in the vicinity of Sawene and the confluence of

154
the Namada river. In this case, it may be more accurate to suggest that Tatuba Cave was
associated with distant (e.g., 2-3 km) production areas. These areas are divided by soil
quality and rainfall patterns in Zones 1 and 2, which suggests that production would have
been susceptible to decreased yields during severe ENSO floods, but largely buffered
against drought. The presence of extensive archaeological remains of vuci (ponded-
fields) in this region also indicates that the topography and hydrology was amenable to
high-yield production of dalo. Additional areas suited to cultivation lie to the immediate
north and east of the Tatuba, atop elevated planation surfaces.
The extent and quality of resources near Tatuba, and also the natural topographic
defenses of the location, suggest that the site served as an ideal base for occupation and
defense. Hence, Tatuba fits the expectations of a territory as defined by the evolutionary
ecology model, and served as a stronghold in association with dense and predictable
resources. In addition, the conditions of the LCO/LIA transition may not have been as
severe in this region, as Davies’ research suggests that groundwater is much closer to the
surface in this portion of the valley (Davies 1992). Thus, agricultural production may
have remained relative stable during this period. However, the effects of the transition on
the entire Sigatoka Valley are recorded at Tatuba, as it was during this time that the cave
was fortified with a wooden palisade.
5.6 Nokonoko (2-NOK-009)
One of the largest hilltop fortifications in the lower valley is the site of Nokonoko.
Located atop a 280 m forested peak with large ridges extending to the east and west, this

155
site towers over all others in the Lower Valley (Appendix A, Figure A.7). This site is
shown on British Admiralty charts from the 1870s, and is also present on Gordon’s
sketch map of the Sigatoka Valley from his 1876 military campaign. However,
Nokonoko is not mentioned in Gordon’s journals as an occupied village during that
period, and it is likely that it had been abandoned prior to the 1870s. Knowledge that
Nokonoko had once been an important fortification was retained by the local inhabitants
however, and in later decades Nokonoko was used as a burial site for the lineage of the
Tui Tabanivono, the traditional chiefs for the district of Nokonoko.
The site was surveyed and mapped in the 1960s as part of the Sigatoka Valley
Archaeological project. At this time Bruce Palmer collected incised and impressed
ceramic fragments from the surface of the site, and speculated that they may be
representative of the late Navatu phase, ca. AD 1100. He also noted the great number of
yavu at the site (50+), many of which were round or oval in shape, in addition to the more
typical square, rectangular, or sub-rectangular shaped mounds. With its large size and
diverse archaeological features, Nokonoko has a great potential for providing
chronological indicators for the development of competition and fortifications in the
lower Sigatoka Valley. Although it is within 2 km of prime arable land in the valley
bottom, Nokonoko is located atop a steep complex of ridges, has limited access to water,
and very little arable land in its immediate surroundings. Thus, Nokonoko was a
defensive site, and its inhabitants would have been required to make the arduous trek to
and from the village in order to obtain supplies. The goal of archaeological testing at

156
Nokonoko was to obtain chronological data that indicated when this site was first
occupied, and also determine the extent of habitation throughout prehistory.
Nokonoko is reached by a trail may have been fortified in ancient times with
ditches and embankments. The site is roughly U-shaped, with three prominent peaks that
were cut and sculpted into tiered mounds (Figure 5.9). The mounds on the western side
of the site (Mounds 1 and 2) are round, with rounded platforms at their bases. The
eastern mound (Mound 28) is rectangular with a sub-rectangular base supporting it.
Connecting the peaks are three rārā (flattened open space used for social events), two of
which are lined with rows of yavu. Three ridges extend downhill from the tiered peaks,
and these areas are also clustered with yavu and architectural terraces. Nokonoko has an
extensive view in nearly every direction, especially of the alluvial terraces surrounding
Nawamagi and Naduri villages. Five cores and 10 test excavation units were completed
at Nokonoko, and over 95 kg of ceramics, shell, lithics, bone, and other materials were
collected. In addition, five charcoal samples and one riparian shell sample were collected
from the excavations and submitted for AMS dating (Table 5.3).
Nokonoko: Test Unit 1
Test Unit 1 began as a 2 x 1 m unit located on top of the high burial mound that
tops Mound 2. This mound is approximately 6 m in diameter and 3 m high, with very
steep sides. The top of the mound is capped with a thick iron panel of unknown origin
and function, but which probably marks the gravesite of one of the Tui Tabanivono that
were buried here in either the proto-historic or historic era. The purpose of excavating in
this area was to determine whether the highest burial mound indeed dated to the historic

157
Fig
ure
5.9
. M
ap o
f th
e si
te o
f N
okonoko,
det
aili
ng a
rchit
ect
ura
l fe
ature
s an
d e
xca
vat
ion u
nit
s.

158
Table 5.3. AMS dates for the site of Nokonoko.
Lab No. Provenience Material Measured 13
C/12
C
Calibrated Age
Range
Calibrated Age
Range
14
C Age BP Ratio Probability Probability
Distributions (1σ)* Distributions (2σ)*
Nokonoko
AA50287 TU 5, Wood 1492 ± 43 -26.7 Cal AD 560 - 645 Cal AD 460 - 670
20-30cmbs Charcoal
AA50283 TU 1 Wood 1311 ± 39 -25 Cal AD 685 - 775 Cal AD 650 - 860
95-105cmbs Charcoal
AA50284 TU 3 Riparian 674 ± 37 -8.7 Cal AD 1295 - 1390 Cal AD 1280 - 1400
10-20cmbs Shell
AA50288 TU 6 Wood 212 ± 37 -24.5 Cal AD 1660 - 1950 Cal AD 1640 - 1960
30-40cmbs Charcoal
AA50299 TU 7 Wood 185 ± 62 27.4 Cal AD 1660 - 1950 Cal AD 1650 - 1960
30-40cmbs Charcoal
AA50289 TU 10 Wood 135 ± 31 -24.9 Cal AD 1690 - 1920 Cal AD 1670 - 1960
10-20cmbs Charcoal
*All determinations were calibrated using the terrestrial calibration curve of Stuiver et al.
(1998), with 27 ± 5 years subtracted from the CRA to account for the southern
hemisphere offset in 14
C (McCormac et al. 1998).
period, or if it was used in prior centuries as a yavu site.
The sediment did not demonstrate any layering, and throughout the upper 95 cm
of the excavation the fill remained a dark brown silty clay loam with red and yellow clay
mottles. There were also no discernable cultural features, although artifact frequencies
generally increased with depth. Ceramics, charcoal, riparian shell, mammal bone, and
fragments of human bone were all present in modest amounts (Appendices D and E).
Fragments of stone adzes were recovered from between 74 and 84 cmbs, and 3 fragments
of green bottle glass were recovered from a depth of 45 cmbs. The general homogeneity

159
of the deposits, as well as the occurrence of historic glass, suggests that the upper 90 cm
of the mound represents a single construction event, perhaps dating to the mid 19th
century. The ceramics that were recovered from the fill deposit are typical of late-
prehistoric bowl and jar styles that were common throughout Fiji in the 18th
and 19th
centuries. The fragments complete enough to reconstruct the morphology of the original
vessels are listed in Appendix C.
At 95 cmbs, a concentration of human bone fragments and a pit feature was
encountered in the southeast quadrant of TU1. The pit feature (Feature 1) consisted of a
10 cm lens of soft dark reddish brown silty clay loam and was potentially a small hearth
that was constructed prior to the creation of the mound, or the location of an object that
was burned in situ. Also in context with the pit/hearth feature was a concentration of
human bone fragments (Burial 1) that consisted of an infant burial (Appendix E).
Clustered amongst the remains were several adult phalanges (6 distal phalanges, and also
a single 3rd
phalanx), and a fragment of a pig tooth. The presence of human phalanges
amongst the concentration suggests the practices of lolokunimate, in which the relatives
of the deceased amputated all or portions of their fingers as an act of mourning, and
buried the fingers with the remains of their relative (Williams 1860:169).
At 104 cmbs, a portion of an articulated human skeleton were encountered in the
eastern portion of the unit (Burial 2). The remains consisted of an adult that had been
positioned on his/ her right side, facing downhill from the mound with his/her legs
extended to the north. The fragmented nature of the remains did not allow for the
determination of the sex of the individual, however, the remains are definitely those of an

160
adult, and the size of the remains is indicative of a female (Appendix E). Immediately to
the west of the remains was a large burned surface, which contained fragments of burned
wood and toto nutshell (Aleurites moluccana), but no ash. Excavation in the
southwestern portion of the unit encountered a deposit of rocky clay at 105 cmbs, which
may be the remains of the original hilltop sediment. Excavation to a similar depth in the
northwest corner of the unit encountered a fragment of green glass amongst additional fill
deposits. The presence of glass and continued fill in this portion of the unit indicates that
the fill of the burial mound may be deepest at its center (Figure 5.10). However, due to
time constraints the excavation of Test Unit 1 was halted at 105 cmbs.
Wood charcoal from Feature 2 was submitted for AMS dating as sample
AA50283. The resulting date of 1311 ± 39 BP indicates that the earliest deposits
encountered in the mound significantly pre-date the historic period (Table 5.3). At 1σ,
the charcoal sample dates to Cal AD 685 - 775. This date suggests that the charcoal of
Feature 2, and most likely the remains in Burial 2, were deposited sometime between the
7th and 8
th centuries AD. The close proximity of the Burial 1 may also indicate that the
interment of the child occurred during the same period. However, the presence of
historic bottle glass in the mixed fill deposits in the 95 cm above these burials and
features suggests that Mound 2 was raised to its present height sometime in the 18th or
19th century. The previous mound, which may have been the foundation of a yavu that
was built sometime before AD 685, was modified and capped with 1 meter of sediment
as part of the interment of a high ranking individual, most likely one of the chiefs of the
Tui Tabanivono lineage.

161
Figure 5.10. Photo of west profile of Test Unit 1, Nokonoko.
Nokonoko: Test Units 2, 3, and 4
Following the completion of excavations at Mound 2, the next three excavations
were focused on testing the deposits of the surface and yavu of the Second Rārā, which is
located to the northwest of the Mound 2 complex (Figure 5.10). The goal of these
excavations was to obtain chronological data that was derived from the occupation of the
site, either before or after the construction of Mound 2. Test Unit 2 was located atop a
low platform that appeared to be a very eroded yavu (Yavu 3). However, upon
excavation it was determined that this feature was natural.
Test Unit 3 was located on the surface of the northern edge of the Second Rārā
(Figure 5.9). This unit encountered a dark yellowish-brown silty clay loam, at the bottom
of which was a thin layer of riparian clamshells and a single ceramic fragment (Figure

162
5.11). This thin layer appeared to mark an older surface of the rārā. Approximately 70 g
of the shells (Batissa violacea) were recovered at a depth of 15 cmbs, and a single
fragment was submitted for AMS dating as sample AA50284. The results of the AMS
dating indicate that the shell (and consequently the surface of the rārā upon which the
shell lay) dates to 674 ± 37 BP (Table 5.3). After calibration, this result suggests an age
for the occupation of the rārā surface to between Cal AD 1295 and 1390 (at 1σ). This
date is significant, as it indicates that Nokonoko was occupied as a habitation (complete
with food refuse) between the 13th and 14
th centuries, which is in addition to the evidence
for late prehistoric and historic occupation, and the use of the site for burials and/or
habitation in the 7th and 8
th centuries AD.
Test Unit 4 was also located on the Second Rārā, and atop a large round yavu
(Yavu 8) that was positioned at the extreme north of the site, the south side of which was
flush with ground level. The shape of this yavu was evidently created by cutting away
the sloping ridge material that lay around the mound, and the top may have also been
scraped and flattened for the placement of the structure upon it. The subsurface deposits
and contained only a few fragments of green bottle glass and riparian clamshell. No
datable material was obtained.
Nokonoko: Test Unit 5
Test Unit 5 was located along the slopes that lay below and to the east of the
Second Rārā (Figure 5.9). The surface of these slopes contained abundant shell and
ceramic refuse, most of which had probably eroded or was thrown downslope from the

163
Figure 5.11. North wall of Test Unit 3, Nokonoko. Layer of shell and ceramic is faintly
visible at approximately 15 cmbs.
occupations above. This cultural deposits of this slope consisted of a reddish brown silty
clay colluvium with strong ped structure and grade, below which was a thick midden
deposit (Figure 5.12). The bottom of this deposit has an irregular boundary, sinking as
deep as 30 cmbs near the center of the unit. Approximately 4 kg of shell was recovered
from this layer, as well as 122 ceramic fragments. Ninety-five percent of the ceramics
were body sherds, and seven were recovered that were decorated with parallel paddle-
impressed and incised designs.
A sample of wood charcoal was recovered from this layer and submitted for AMS
dating as sample AA50287. The result of 1492 ± 43 BP indicates that the deposits of
Layer II date to between Cal AD 560 and 645 (1σ) (Table 5.3). As this date is similar to
the age of Feature 2 and Burial 2 of Test Unit 1, and they are also associated with paddle-
impressed ceramics, it appears most probable that the deposits of Test Unit 5 are derived
from the earliest occupations at Nokonoko. Perhaps more significantly,

164
Figure 5.12. East profile of Test Unit 5, Nokonoko.
the dates and food refuse (riparian clamshells) corroborate that the site of Nokonoko was
occupied as a habitation site as early as the 7th century AD. The fact that the site is
located atop a high and steep peak further indicates the need for defense, even at this
early stage in prehistory.
Nokonoko: Test Units 6 and 7
Test Units 6 and 7 were located atop of Yavu 33 and 34. All the yavu on this
terrace consist of partially raised, rounded platforms that share their northwestern edges
with the surface of the slope behind them. The upper surface layers of both units
consisted of silty clay colluvium, which contained abundant riparian clam and snail shell,
chert lithics, and animal bone, as well as a large assemblage of incised and parallel-
paddle impressed ceramics (Appendices C and D). Both units contained thick, ashy
165
hearth deposits at approximately 30 cmbs. The base level of Unit 7’s hearth was indented
with several depressions, which probably mark the location of stone pot-stands (sue).
The ceramic vessel reconstructions for these two units include square lipped jars and
bowls that are typical of the late prehistoric period (Appendix C).
A few grams of charcoal were recovered from the hearth of Test Unit 6 were
submitted for AMS dating as sample AA50288 (Table 5.3), and the results indicate that
the hearth dates to 212 ± 37 BP. Calibration of the results at 1σ provide calendar dates of
Cal AD 1660 - 1950. A single sample of charcoal was also collected from the hearth
deposit of Test Unit 7 and submitted for AMS dating as sample AA50299. Radiometric
age determination for this sample indicated a date of 185 ± 62 BP, which upon calibration
at 1σ indicates an age range of Cal AD 1660 and 1950. As this date is statistically
identical to results generated for sample AA50288, it can be assumed that the occupations
atop Yavu 33 and 34 were contemporaneous, and represent one of the locales of
occupation at Nokonoko during the decades between the late pre-historic and historic
period.
Nokonoko: Test Units 8 and 9
The remaining three test excavations were focused on the large rectangular
stepped mound on the eastern side of the site (Mound 28), and the sequence of
rectangular platforms that extended to the south along the eastern ridgeline (Figure 5.9).
Test Unit 8 was located atop Mound 28, but the near sterility of the surface deposits made
it apparent that the mound had been constructed by cutting back the soil of the pre-
existing promontory. Thus, the deposits on the top of the mound are very deflated. No

166
cultural items other than fragments of charcoal were encountered, and excavation at TU 8
was terminated at 25 cmbs.
Test Unit 9 was located along the slope that lies directly below and to the
southwest of the sub-rectangular terrace that surrounds Mound 28. The deposits of TU 9
were very homogeneous, and varied most in the frequency of yellow sandstone mottles.
The artifact concentrations were the most dense in the upper levels of Layer II, including
pig teeth and ceramics (Appendices C and D). None of the charcoal samples from this
unit were submitted for radiometric or AMS dating.
Nokonoko: Test Unit 10
Test Unit 10 was located atop Yavu 31, the last to occur along the southeastern
ridgeline of Nokonoko. This yavu appears to have been constructed by cutting back and
flattening the ridge, as its most northerly boundary was flush with the surface of the
ridge. The yavu is roughly sub-rectangular in shape, and its southern boundary is raised
approximately 30 cm above the natural surface of the ridge. Upon excavation, a layer of
colluvium was encountered at the surface that consisted of dark reddish brown loamy
clay with frequent clay pebble inclusions. This layer extended to a depth of 20 cmbs,
where it transitioned into the yellow sterile substrata. In addition to the remnants of the
flat tray, a single bowl (#118) and a single jar (#117) could be reconstructed from the
deposits of Test Unit 10 (Appendix C). A charcoal sample from the lowest cultural layer
was submitted for AMS dating as sample AA50289, and the resulting age determination
indicated a deposition date of 135 ± 31 BP. Calibration of the sample produced similar
results to the dates for Test Units 6 and 7. At 1σ, the sample ranged in age from Cal AD

167
1690 to 1920 (Table 5.3). This suggests that the construction of Yavu 31 and possibly
28-30, date to the latest period of occupation at Nokonoko.
Nokonoko: Chronology and Site Analysis
As indicated by the extent of cultural deposits, there is ample evidence for the use
of Nokonoko as a habitation, and its history stretches back to 1500 years ago.
Undoubtedly, this site has served as a fortification in even its earliest period, as it is
located atop a high, remote peak. Life at Nokonoko would have been difficult—water
must have been transported to the site, along with all of the sustenance the people needed.
However, the great number of yavu, and deep middens of clamshell and ceramics,
suggest that Nokonoko was occupied as a village year-round, and not a temporary remote
refuge. The results of excavations suggest that the highest portion of Nokonoko, which
includes the land surrounding Mound 2 and also the extent of the 2nd
Rārā, is the oldest
portion of the site. This area was occupied as early as the 7th
century AD, and only in
subsequent centuries did the village grow and extend downhill to the 1st and 3
rd Rārā.
Nokonoko probably reached its maximum size sometime in the early 1700’s, when
Mounds 1, 2, and 28 were constructed. The age and size of these mounds suggests that
inhabitants did not choose to invest in monumental architecture until the latest phase of
prehistory. A discussion of the factors that may account for these developments is
presented in Chapters 7 and 8.
GIS-based analyses of the topography and agricultural resources that surround
Nokonoko suggest that production in the immediate area surrounding the site would have
poor, and allowed for only low yields of dryland crops. However, the large size and long

168
chronology of this village suggests that Nokonoko was associated with both defense and
production, and not purely defensive as was suggested from the analyses of Chapter 4.
As Nokonoko is within 2 km of the large alluvial expanses of the valley bottom, it is
more accurate to suggest that like Tatuba Cave, the site was established as a fortification
in association with distant (e.g., 2-3 km) production areas. However, Nokonoko’s
position on the landscape, and also the extensive nature of the arable land in the valley
bottom, indicates that the site meets the evolutionary ecology expectations outlined for
the establishment of territories: association with dense and predictable resources.
Nokonoko is also located along the boundary between Zones 1 and 2. GIS-based
analyses of the effects of ENSO and the LCO/LIA transition indicate that the arable land
in Zone 1 would have been severely impacted by floods and drought. In addition, the
drop in sea-level projected for the region ca. AD 1300 would have also damaged
cultivation. Although the site is located above the extent of damage, the episodic nature
of disturbances would have strongly affected the resource base for this region, and served
to perpetuate the use of Nokonoko as a defensive settlement. In sum, the age of the
earliest occupations on Nokonoko suggests that warfare and competition for access to
prime agricultural land existed early in prehistory (i.e., 7th century AD, or perhaps
earlier), and remained at a high level for many centuries.
5.7 Qoroqorovakatini (2-QMR-007)
Qoroqorovakatini is a defensive site located atop the Naqalimare limestone
formation. During the time of Gordon’s campaign in the Sigatoka (1876), the Kai

169
Naqalimare controlled this portion of the valley for a distance of approximately 10 km,
and maintained many fortresses atop the rocky crag of the Naqalimare limestone
formation. According to Von Hugel’s report in 1876, the fortified towns of Wakuku and
Qoroqorovakatini were the last towns belonging to the Naqalimare tribe to fall during
Gordon’s pacification campaign (Von Hugel 1876, in Roth and Hooper 1990:407).
The site was first surveyed and described by Bruce Palmer in 1965 as part of the
Sigatoka Valley Research Project. Qoroqorovakatini is located along a flat saddle at the
eastern end of the Naqalimare formation, at approximately 200 m elevation (Appendix A,
Figure A.8). The site is approximately 12.5 ha in area, and extends from the edge of the
cliffs to a large stone wall that lies to the south. The site of Qoroqorovakatini is along the
watercourse of Rakete creek, which disappears into a cave with a deep vertical shaft prior
to reaching the edge of the cliffs. Access to Qoroqorovakatini is via a trail that climbs the
slope of the Naqalimare, transforming into a series of toe-holds that scale the rocky cliff
to the ridge above.
Qoroqorovakatini is located within a sunken area, and the site is effectively
enclosed by a perimeter of monolithic stone outcrops and cliffs. Twenty-two yavu of
various shapes were recorded at Qoroqorovakatini in the 2002 field season, and
excavations were performed on three of them in order to determine the varying ages of
occupation for the site (Figure 5.13). In addition, an excavation was performed at the
base of the rubble wall that lies at the southeast corner of the site, in hopes of determining
its date of construction.

170
Fig
ure
5.1
3. M
ap o
f th
e si
te o
f Q
oro
qoro
vak
atin
i, d
etai
ling a
rchit
ectu
ral
feat
ure
s an
d e
xca
vat
ions.

171
Qoroqorovakatini: Test Unit 1
Test Unit 1 was located atop Yavu 10, located near the northernmost cliff that
encircles the site (Figure 5.13). Several other yavu of various shapes are nearby. The fill
of Yavu 10 consisted of a loose sandy clay loam, with a weak grade and a few limestone
pebbles and cobbles scattered throughout. No features were encountered in the
excavation at any of the levels, but a variety of artifacts, in particular lithics, decorated
ceramics and riparian clamshell (Batissa violacea), were encountered throughout the
deposit (Appendix D). The drop in ceramic frequency after 60 cmbs may suggest that the
deeper layers (60-100 cmbs) were not part of the yavu fill, but were deposited when the
area was a simple living surface. A single fragment of charcoal was recovered from
between 90 and 100 cmbs and submitted for AMS dating as sample AA50307. The
percentage of decorated ceramics from Test Unit 1 of Qoroqorovakatini was one of the
highest of any site investigated during the 2001-2002 Sigatoka Valley season. Of the 298
ceramic fragments recovered, 38 (13%) were decorated. Nearly all of these decorations
consisted of parallel paddle-impressed designs, however a few sherds with crossed
paddle-impressed designs, as well as incised and wiped designs, were recovered
(Appendix C).
Sample AA50307 (Table 5.4) provided the date of 974 ± 43. With calibration,
this result indicates that the cultural deposits at the bottom of Yavu 10 date to between
Cal AD 1020 and 1160 (1σ). This result is significant, as it indicates that
Qoroqorovakatini, a naturally fortified habitation, was occupied circa AD 1000.

172
Table 5.4. Standard radiometric (14
C) and AMS dates for the site of Qoroqorovakatini.
Lab No. Provenience Material Measured 13
C/12
C
Calibrated Age
Range
Calibrated Age
Range
14
C Age BP Ratio Probability Probability
Distributions (1σ)* Distributions (2σ)*
Qoroqoro.
AA50307 TU1, 90-100 Wood 974 ± 43 -29.4 Cal AD 1020 - 1160 Cal AD 1000 - 1210
cmbs Charcoal
AA50308 TU3, 20-30 Wood 182 ± 42 -29.1 Cal AD 1660 - 1950 Cal AD 1660 - 1960
cmbs Charcoal
Wk-11134 TU4, 50-70 Wood 259 ± 99 -28.2 Cal AD 1510 - 1950 Cal AD 1470 - 1960
cmbs Charcoal
*All determinations were calibrated using the terrestrial calibration curve of Stuiver et al.
(1998), with 27 ± 5 years subtracted from the CRA to account for the southern
hemisphere offset in 14
C (McCormac et al. 1998).
Qoroqorovakatini: Test Unit 2
Test Unit 2 was located amongst a cluster of yavu (Yavu 20 through 24) that were
set in two rows in the southwestern corner of the site (Figure 5.13). The fill of this yavu
consisted of a strong brown sandy clay, with a modest number of artifacts that included
riparian clamshell, historic bottle glass, and ceramic fragments. At 30 cmbs the remains
of a large, burned wooden beam was encountered. This beam likely stood at the center
of the yavu, and was probably the central beam that supports the roof, known in Fijian as
the bou. The beam was approximately 25 cm in diameter, and tapered to a point at its
bottom end as a result of being cut with an axe or adze. Although the burning of
Qoroqorovakatini is not specifically recorded in Gordon’s notes, most of the captured
villages in the 1876 campaign were burned to prohibit resettlement. Thus, the burned
bou may be a relic of the destruction of the village in 1876. The sediment surrounding

173
the bou also yielded additional artifacts that suggest the late proto-historic period was the
era during which this yavu was constructed and occupied (Appendix D).
The Wall of Qoroqorovakatini
The south end of the site slopes downhill to a craggy rubble field, which is
blocked at both ends by stone walls. The stone wall on the eastern side is large and
extensive, and has remained relatively intact (Figure 5.14). Built atop a rocky ledge and
stretching between two towering outcrops, the wall is approximately 8 m long, and 2 m
wide. There are several small caves and overhangs associated with the wall that contain
evidence of occupation in the form of charcoal and ceramic fragments. Test Unit 3 was a
50 x 50 cm unit that was flush with the north side of the wall (Figure 5.13). Excavation
to a depth of 40 cmbs revealed a variety of ceramics, riparian clamshell, and charcoal
(Appendix D). A sample of charcoal extracted from the side of TU 3 (hence under the
stone wall) was submitted for AMS dating as sample AA50308. The resulting date of
182 ± 42 BP indicates that the wall was constructed between Cal AD 1660 - 1950 (1σ)
(Table 5.4). This suggests that the wall was constructed sometime between AD 1660 and
the 1875 abandonment of Qoroqorovakatini. Although the date from Test Unit 1
indicates that Qoroqorovakatini was occupied as early as AD 1020, the wall was not
constructed until the final phase of occupation.
Qoroqorovakatini: Test Unit 4
The final excavation at Qoroqorovakatini was conducted atop Yavu 2, a tall (2 m
high) oval mound. This mound lies in the southwestern corner of the site, very close to a
tall limestone outcrop that backs this portion of the site with high cliffs (Figure 5.13).

174
Figure 5.14. Photograph of the wall of Qoroqorovakatini. View is to the north.
The goal of excavating this mound was to determine if the deepest deposits could be
associated with an early occupation episode or later burial at this site. The fill of Yavu 2
consisted of a strong brown sandy clay loam, with modest amounts of ceramics, riparian
clamshell (Batissa violacea), and charcoal throughout. Between 20 and 55 cmbs,
additional samples of ceramics, charcoal, and shell were encountered. The rim of a
single bowl was recovered from between 40-50 cmbs, and this fragment allowed for the
morphological reconstruction of the parent vessel. Appendix C illustrates this vessel (#
216) as a small shallow bowl with an expanding incurved rim, similar to a vessel that was
recovered from Test Unit 2. An articulated human burial was encountered between 55
and 65 cmbs (Appendix E). A single fragment of charcoal was submitted for standard

175
14C dating as sample Wk-11134. The final 10 cm of TU4 (70-80 cmbs) did not reveal
any additional occupational features. The human remains were reburied in the unit
following the termination of the excavation at the site.
Sample Wk-11134 resulted in the date of 259 ± 99 years BP (Table 5.4). This is
not a very accurate date, as with calibration and within 1σ there is a 68.2% probability
that this event occurred between Cal AD 1510 and 1950 (1σ). This broad range can of
course be shortened by the known abandonment date for the site, however, it is difficult
to ascertain exactly when between 1510 and 1876 that the burial took place. The
presence of vessel # 216, which is nearly identical in form to vessel # 204 (Test Unit 2)
suggests deposition some time between 1800 and 1876. The good condition of the
skeleton in Burial 1 suggests that a later date is also more likely.
Qoroqorovakatini: Chronology and Site Analysis
The excavations performed at Qoroqorovakatini suggest that the site was
occupied for at least the last 1000 years. Like Tatuba Cave and Nokonoko, the
occupation of Qoroqorovakatini demonstrates a preference for naturally defended locales
in the early periods of Sigatoka Valley prehistory. It also indicates that they were willing
to sacrifice immediate access to the best agricultural areas in order to maintain a strategic
(and perhaps unshakable) position on the landscape. Qoroqorovakatini offered a
commanding view of the valley, a remote and naturally defended position that was
riddled with hidden caves and fissures, and in some instances access to drinking water in
the form of an ephemeral stream. The bottomlands would have allowed for extensive uvi
production, although access to and from the habitation would have required a

176
considerable climb of 300+ meters each day. GIS-based environmental analyses and the
remains of irrigated terraces suggest that Qoroqorovakatini would have been associated
with low levels of wetland cultivation in its immediate area.
However, it is difficult to ascertain whether Qoroqorovakatini was occupied year-
round, or only temporarily as need arose. Additional dating of the site may clarify this
issue. At any rate, the site was actively used from AD 1000 to the contact period, and
had social contacts with other populations in Fiji. In particular, the presence of riparian
clamshell, imported glass, metal, and crockery, indicate that the inhabitants of the site
had contacts with people in the delta regions of Sigatoka Valley. The presence of
riparian shell at 80 cmbs (which most likely dates to between AD 1000 and 1200)
indicates that these relationships stretch back into antiquity.
The GIS-based analyses discussed in Chapter 5 suggest that the site of
Qoroqorovakatini stands on the boundary between Zones 1 and 2. Thus, the site itself
would not have been damaged by ENSO-related flood events, although, the agricultural
resources that were located in the nearby valley bottom would have been episodically
destroyed. The constricted nature of the valley in this region ensures that floods are a
yearly occurrence, and in recent decades the effects of cyclone-related floods in this area
have been severe7. In addition, ENSO-related droughts in the region would have
wreaked havoc on the dry alluvial deposits of Zone 1, and agricultural yields would have
been significantly impacted during these cycles. However, the limestone outcrop that
serves as the site’s fortification may have dampened the effects of LCO/LIA sea-level
fall, and provided a steady supply of water during the poorest seasons. In sum, like

177
Tatuba Cave and Nokonoko, Qoroqorovakatini was established as a territorial stronghold
in association with agricultural areas of the valley bottom.
5.8 Malua (1-NSK-015)
The site of Malua is located within the district of Nasikawa, although its history is
often associated with the Namataku district, which lies directly to the west (Appendix A,
Figure A.9). Like the sites of Tatuba and Muawai, the fortification of Malua was once
occupied by the Namataku people who migrated into the region from the their homelands
in Bā. According to oral histories collected by Fiji Museum staff, the site of Malua was
occupied by the Namataku in the centuries immediately prior to their removal to Tatuba
and Muawai (Palmer et al. 1973). However, the neighboring yavusa of Ruailevu also
claims Malua as their koro makawa (ancient village). Oral histories from the inhabitants
of the nearby village of Korovou suggest that the Ruailevu people were the founders of
Malua, as they acknowledge a long historical connection with the site, and are the
primary claimants for the lands that surround it. By the 1860s the site had been
abandoned, and its inhabitants had moved downriver to the settlement of Wālā.
However, Gordon suggests that Malua was used as a refuge during the Little War of 1876
by warriors from the hostile towns of Matawalu and Vatula (Gordon 1879).
The site of Malua was surveyed by staff of the Fiji Museum in 1970, and a single
map was produced that details the natural and cultural features of the site (Figure 5.15).
The Sigatoka Valley is extremely rugged in this region, and the river lies at the bottom of
a steep chasm that carves through clastic marine sediments of Miocene age. The site of

178
Figure 5.15. Map of the site of Malua, detailing architectural features and excavation
units.

179
Malua is located atop and around an outcrop of the Naqalimare limestone, which has
forced an obvious northerly bend in the river’s course. The name of the site, ‘Malua’
may refer to the slow current of the river in this area, as it has been forced to run slowly
around the hard flanks of the outcrop. Several deep pools are also present in the river
channel to the east of the site, and according to oral histories these serve as habitat for the
large freshwater eel (Anguilla marmorata) (Palmer et al. 1973). The site is covered with
heavy vegetation and forest, and is used by the residents of Korovou as pasturage for
cattle and goats.
Malua encompasses approximately 35 ha, extending across the flat alluvial
terraces to a series of yavu that cap the highest ridgeline. The site also appears to have
been extensively occupied for long periods, as evinced by the 64 yavu of various sizes
and shapes, and the large naga (ceremonial structure) that is present in the northwestern
portion of the site. The inhabitants seemed to have preferred the locale for its natural
defensive capabilities, which include steep slopes, a long view both up and downriver,
and at least one large cave amid a jumble of limestone boulders. The site was also further
fortified with constructed walls and gates, which limit access to upper portions of the site.
In the 1970s, the cave and rock shelters contained remnants of ‘Nakoro’ style pots
(Palmer and Shaw 1968), riparian clam shells (Batissa violacea), toto (Aleurites
moluccana) nutshells, human bone, pot stands, and a fragment of a stingray barb. Palmer
noted that the cave sloped steeply downwards, but contained a series of low stone-faced
terraces. These artifacts were not visible in 2001, but the floor is littered with ceramic
fragments and animal bones, and contains thick deposits of bird and bat guano.

180
The lower portion of Malua consists of the alluvial terraces the flank the river,
which are bisected by the creek into eastern and western sections. Thirty-four mounds
are scattered in linear formations on the terraces to the east of the creek. The most
prominent feature is a huge square mound of Vatukolokolo, that raises to 2 m high on its
northwest side, and which is attached to a stone-faced rectangular courtyard. To the west
of the creek the alluvial terraces are broad and flat, and contain the remains of a large
naga, or late-prehistoric religious site. This naga consists of four parallel walls, which
are composed of waterworn cobbles and are stacked to a height of approximately 50-80
cm, although they were most likely much higher in prehistory. Named for the site itself,
the naga of Malua lies along an axis of roughly northeast/southwest, and was described
and mapped in some detail by Palmer (1971).
Malua: Test Unit 1
Archaeological investigations were undertaken in two portions of the site of
Malua; amongst the round yavu of the high ridgeline, and within the rockshelter located
amongst the limestone outcrops. These investigations were focused upon chronology, as
the oral histories for the region suggest that the site was occupied at different periods by
both the Ruailevu and Namataku people. It seemed highly likely that the site of Malua
could have ancient deposits, as the presence of caves and rock shelters would have
offered simple shelter to early Fijian settlers. Test Unit 1 was located atop Yavu 8, which
was round in shape, approximately 3 m in diameter, and between 30 and 50 cm high.
The sediment within the yavu consisted of gray clay, with moderate amounts of lithics,
ceramics, and charcoal. Historic glass was also encountered in the surface layer

181
(Appendix C). At 55 cmbs Feature 1 was encountered, which appeared to be scattered
remains of a hearth. A single stone adze fragment was recovered from the scattered
charcoal of the hearth feature, in addition to 5 undecorated ceramic fragments. A
fragment of the charcoal from the hearth feature was submitted for AMS dating as sample
AA50290, which provided the date of 159 ± 34 BP (Table 5.5). With calibration, this
dates the construction of the hearth (and possibly pre-dates the construction of the yavu
that lies above it) to between Cal AD 1670 and 1950 (1σ). As the site is known to have
been abandoned prior to 1876, it seems likely that the hearth materials were deposited in
the hearth between AD 1670 and 1875
Malua: Test Unit 2
Test Unit 2 was located beneath the overhang of a large cluster of limestone
boulders (Figure 5.16). The surface of the ground beneath the rockshelter contained
loose, organic soil, with large amounts of lithics and ceramics visible. Any remnants of
the ‘Nakoro’ style pots and pot-stands noted by Palmer in 1970 have either been removed
or destroyed in the intervening decades. The sediment within the excavation unit
consisted of black clay of moderate grade and firm consistency. A small amount of
ceramics, lithics, mammal bone, and riparian clam and snail shell were recovered to a
depth of 30 cmbs (Appendix C). In total, these remains suggest the presence of a deflated
hearth. A few grams of charcoal were recovered from the bottom of Layer II. Sample
AA50295 provided the date of 624 ± 33 BP (Table 5.5). Calibrated at 1σ, this suggests
that the occupation of the limestone outcrop of lower Malua dates to between Cal AD
1305 and 1405.
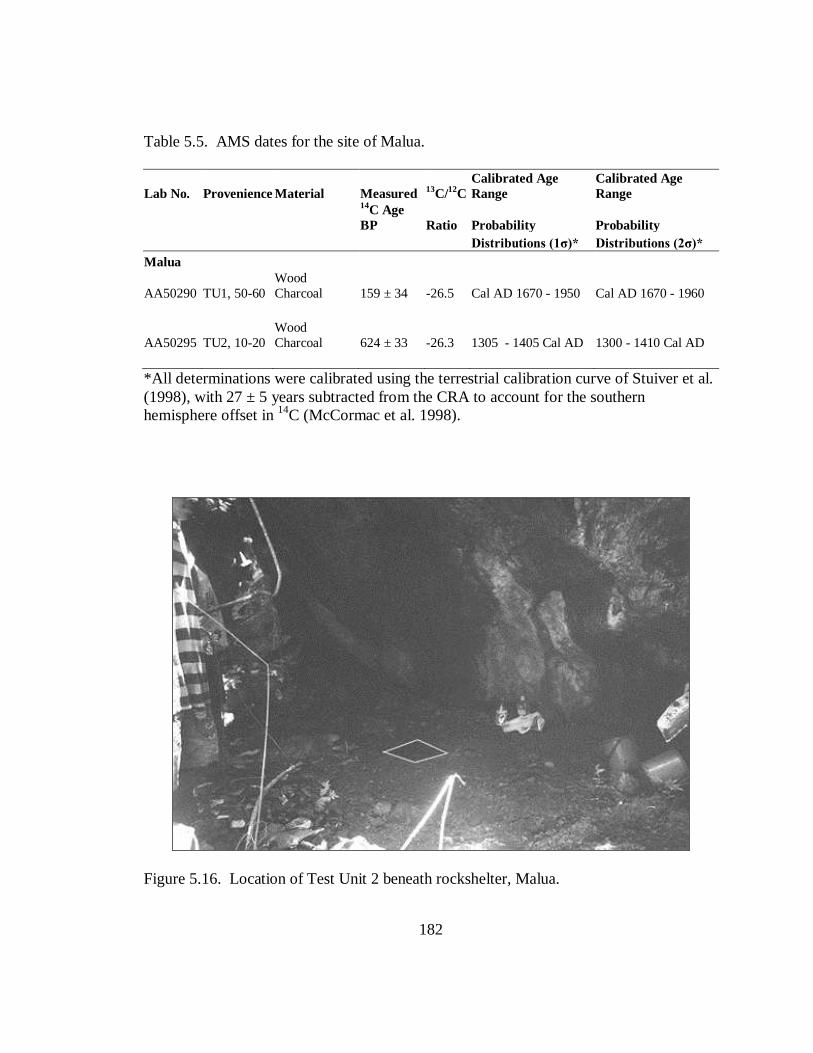
182
Table 5.5. AMS dates for the site of Malua.
Lab No. Provenience Material Measured 13
C/12
C
Calibrated Age
Range
Calibrated Age
Range
14C Age
BP Ratio Probability Probability
Distributions (1σ)* Distributions (2σ)*
Malua
AA50290 TU1, 50-60
Wood
Charcoal 159 ± 34 -26.5 Cal AD 1670 - 1950 Cal AD 1670 - 1960
AA50295 TU2, 10-20
Wood
Charcoal 624 ± 33 -26.3 1305 - 1405 Cal AD 1300 - 1410 Cal AD
*All determinations were calibrated using the terrestrial calibration curve of Stuiver et al.
(1998), with 27 ± 5 years subtracted from the CRA to account for the southern
hemisphere offset in 14
C (McCormac et al. 1998).
Figure 5.16. Location of Test Unit 2 beneath rockshelter, Malua.

183
Malua: Chronology and Site Analysis
The limited excavations at Malua suggest that the site was initially occupied
between Cal AD 1300 and 1400. This early occupation may have consisted of a
temporary occupation of the rockshelter and nearby cave, although more permanent
structures in the immediate area are also possible. This early habitation may have
focused on the acquisition of riparian snails (Melanoides spp.) from the nearby creek.
The small size of these animals is suggestive of their inclusion in a diversified diet, which
may also indicate the initial use of Malua as a refuge during times of scarcity.
The limited excavations at Malua cannot determine whether the site was
continuously occupied until the late prehistoric period. However, the sheer size of the
site (60+ mounds) would suggest that this may be the case. At any rate, the round yavu at
the upper portion of Malua appear not to have been constructed until the latest period of
occupation, however, the portion of the ridgeline above the cave (Yavu 1-18) may date to
an early period. Oral histories from the region suggest that the high ridge area with round
yavu was occupied by indigenous (Ruailevu) chiefs, while the large number of square
yavu along the river terrace were the homes of the Namataku migrants, who settled in the
area in the 18th or 19
th centuries.
The GIS-based analyses of the environment surrounding Malua suggest that the
site was located within Zone 2, and had immediate access to small amounts of dryland
cultivation. All of the arable land was on the opposite side of the river, and of moderate
quality. To the south the land is fertile but far too steep for cultivation. Environmental
analyses of the surrounding soils and rain regimes suggest that the region surrounding

184
Malua would not have been severely affected by ENSO related droughts, and the site was
high enough to avoid flood damage. Thus, it seems likely that Malua served as a
defensive refuge, and was also buffered against severe environmental disturbances. Like
Tatuba Cave, this region also would not have been impacted by sea-level fall as proposed
for the LCO/LIA transition, although mass-wasting events may have occurred in the
region.
The date for the initial occupation of Malua, as well as the general level of
environmental stability associated with the surrounding region, suggests that populations
may have established the site in response to the LCO/LIA transition. Therefore, Malua
may represent a new refuge strategy—environmental refuge. If this is the case, this
strategy may have included the colonization of the more environmentally stable areas,
and a focus on a mixed cultivation strategy and diversified diet. Additional habitation
sites that appear to have been associated with a strategy of environmental refuge are
discussed in the following sections.
5.9 Korovatuma (2-MAV-047)
The site of Korovatuma is one of the infamous rebel strongholds that was
besieged and destroyed by Gordon and his forces during the 1876 campaign in the
Sigatoka Valley. Korovatuma, along with the nearby fortress of Bukusia, were held by
the rebels from the Mavua district, who had perpetrated the attacks upon the Christian
villages of the Lower Sigatoka in April 1875. The government-led counter attack drove
the rebels out of the fortress of Tavuni and the village of Nadrala, and on June 8th the

185
fortress of Korovatuma was attacked and taken. According to Gordon, this defeat was a
total surprise to the rebels, as Korovatuma, “had never been taken in any of the old Fijian
wars” (Gordon 1879 Vol. I, p. 297). It is not surprising that Korovatuma’s
impregnability was legendary, as the site consists of a precipitous limestone-topped crag,
with steep slopes and an impressive view of the approaching ridgelines to the east and
west. Even within the site the topography is precipitous, as many large boulders and
areas of rubble are perched atop one another, leaving several instances of cliffs and
gullies (Appendix A, Figure A.10).
Korovatuma can be separated into two portions: the naturally fortified limestone-
cragged peak on the north, and an unfortified grassy ridge spur that extends to the south,
and which is covered with many yavu (Figure 5.17). The upper portion of Korovatuma
lies at the western end of a high ridgeline, the apex of which reaches an elevation of 250
m above sea level. The steep cliffs on both the northern and southern flanks provide a
natural defense, while the outcrops of Naqalimare limestone at the peak serves to block
off access to the ridge from the east. Dry-laid stone walls connect the outcrops and
scatters of rubble, dividing the site internally with additional fortifications.
As the site is known to have been occupied and used as a fortification as late as
1875, archaeological investigation of Korovatuma was focused on determining the
earliest instances of occupation. Although there is some water available from nearby
streams, the analyses detailed in Chapter 5 indicated that the land surrounding
Korovatuma is rugged and ill suited to cultivation (Table 5.1). Thus it seems most likely
that Korovatuma has always served as a fortification, but it may have been stocked and

186
Figure 5.17. Map of the site of Korovatuma, detailing architecture and excavation units.

187
used during times of war, and often left abandoned.
Korovatuma: Test Unit 1
Test Unit 1 was located atop Yavu 3, and six stratigraphic layers were
encountered during excavation (Figure 5.18). The upper layers consisted of silty clay
loam deposits with high concentrations of riparian clam and snail shell, ceramics, fish
bones, and glass (Appendix D). The jar fragments are particularly unusual in that they
have curving rim profiles that taper to a sharp, pointed lip (Appendix C). The reddish
clay of Layer V and the deposit of ash deposited above it (Layers III and IV) likely
represent a disturbed hearth feature. Ceramics, riparian clam and snail shell, and charcoal
were recovered from this level, and a single fragment was submitted for AMS dating as
sample AA50301. Layers IV and V contained 296 g of riparian clam and snail shell
(Batissa violacea, Melanoides aspirans, and Neritina spp.), and also a single spine from a
large sea urchin (Heterocentrotus mammillatus). Rocks were continuously encountered
as the excavation continued, reaching a maximum depth of 70 cmbs in the northernmost
portion of the test unit. One thin sea urchin spine (Diadema spp.) was identified from
these deposits, as were fragments of the marine snails Turbo spp., and Trochus spp.,
yellow chert debitage, the root of a pig tooth (possibly a canine or incisor), mammal
bones, and a few grams of charcoal. A single fragment was submitted for AMS dating as
sample AA50300.
Sample AA50301, which was retrieved from the ashy hearth deposit of Layer IV,
dates to 188 ± 42 BP (Table 5.6). Calibration at 1σ suggests that the charcoal sample
derives from the use of the hearth between the years of Cal AD 1660 and 1950.

188
Figure 5.18. East profile of Test Unit 1, Korovatuma.
As Korovatuma is known to have been occupied and then abandoned in 1876, it
can safely be assumed that the hearth deposit encountered in Test Unit 1 dates to between
1660 and 1876. The presence of 19th century bottle glass also suggests that this upper
layer of the site is late-prehistoric to historic in age. In contrast, the second charcoal
fragment submitted for AMS dating (sample AA50300) was retrieved from the deepest
cultural deposits in Test Unit 1, between 60 and 70 cmbs. The results from the AMS

189
Table 5.6. AMS dates for the site of Korovatuma.
Lab No. Provenience Material Measured 13
C/12
C
Calibrated Age
Range
Calibrated Age
Range
14
C Age BP Ratio Probability Probability
Distributions (1σ)* Distributions (2σ)*
Korovatuma
AA50301 TU 1, Wood 188 ± 42 -27.2 Cal AD 1660 - 1950 Cal AD 1660 - 1960
20-30cmbs Charcoal
AA50300 TU 1 Wood 527± 53 -27.2 Cal AD 1330 - 1450 Cal AD 1300 - 1490
60-70cmbs Charcoal
AA50310 TU 2 Wood 338 ± 46 -26 Cal AD 1510 - 1650 Cal AD 1460 - 1670
60cmbs Charcoal
*All determinations were calibrated using the terrestrial calibration curve of Stuiver et al.
(1998), with 27 ± 5 years subtracted from the CRA to account for the southern
hemisphere offset in 14
C (McCormac et al. 1998).
dating of this sample indicate that these deposits date to 527 ± 53 BP. At 1σ, these
deposits date to between Cal AD 1330 and 1450.
Korovatuma: Test Unit 2
Test Unit 2 was located atop Yavu 19, which is one of a cluster of three sub-
rectangular yavu perched atop an architectural terrace on the ridge spur that extends south
from Korovatuma (Figure 5.17). This ridge is approximately 300 m long, and its grass-
covered surface rolls gently downhill and to the southwest. A monolithic boulder located
at the northwest end of the ridge blocks access to the area to some degree, while the
slopes surrounding the ridge are very steep, and prohibit access from the drainage below.
The goal of excavation in this area was to determine whether this portion of Korovatuma
was contemporary with the 14th and 15
th century occupations at the upper ridge area, or if
it dated to another period.

190
Test Unit 2 encountered black clay loam colluvium in Layer I, II, and III, and a
light scattering of ceramics, charcoal, and lithics. At 55 cmbs the articulated remains of a
human burial (Feature 1) were encountered (Appendix E). The material surrounding the
remains was excavated and removed, in order to more clearly determine the extent of the
burial. This contained lithic fragments, shells of both freshwater clams and snails,
mammal bones, lithics, and ceramics (Appendix D). The largest fragment of charcoal
from the sediment surrounding the burial was submitted for AMS dating as sample
AA50310 (Table 5.6). The results of dating suggest that the remains interred in Yavu 19
date to 338 ± 46 BP. Calibration at 1σ indicates that the burial dates to between Cal AD
1510 and 1650. This date suggests that Yavu 19, and probably the other yavu the line the
south flank of Korovatuma, were constructed before AD 1450, and the burial occurred at
some point in the following century. This date is slightly later than the one obtained for
Yavu 3, and suggests that the southern portion of the site was not occupied until several
centuries after the initial founding of the site at the crest of Korovatuma peak.
Korovatuma: Chronology and Site Analysis
The three dates for Korovatuma indicate that the site was founded as early as AD
1330, and was occupied at least intermittently until the contact period. The distinct
stratigraphy of the deposits of Test Unit 1 suggest that the site was occupied as occasion
required, rather than year-round. However, the presence of freshwater clams at the site is
evidence for access to the Sigatoka River, which lies several kilometers to the west. The
presence of marine taxa recovered in the deposits of Yavu 3 also indicate that the
inhabitants of Korovatuma had some form of access to coastal resources during the 14th

191
and 15th
centuries. Shellfish could have been brought to the site via trading, or as a result
of long-distance foraging trips. In either circumstance, the transport time for these
resources would need to be minimized, as marine snails, urchins, and other creatures
spoil very quickly in tropical conditions. This is significant, as it suggests that despite its
remote and isolated location, the inhabitants of Korovatuma were still able to maintain
social contacts or exchange networks with distant populations. It also is suggestive of
attempts to diversify the subsistence base, which included not only large-sized animals,
but small snails and sea-urchins that are of limited caloric value.
The GIS-analyses of topography and cultivation potential indicate that the
immediate surroundings of Korovatuma were limited to low yields of dryland crops.
However, small pockets of arable land may have been available for the cultivation of
irrigated crops in the riparian area to the north of the site. These resources would have
been small, but available during the wet and dry season due to the spring that flows from
Bukusia. However, this site would not have attracted farmers as an ideal location for
raising crops. As GIS-based analyses place Korovatuma into Zone 2, the site would not
have been severely affected by ENSO-related floods, and only moderately impacted by
droughts. Therefore, this site offered physical security, and buffering against extreme
drought conditions. The steep slopes surrounding the site, and also nearby mountains,
may have posed risks in the form of torrential rainfall and landslides, however these
events would not have affected the habitations at the site.
These findings suggest that ancient populations may have established
Korovatuma during times of hardship or increased competition, but the site was probably

192
not the locus of year-round, long term occupation. Like Malua, the founding date (Cal
AD 1330 – 1450), presence of diverse food remains, and character of the surrounding
resources, is suggestive of the use of Korovatuma as an environmental refuge during the
LCO/LIA transition.
5.10 Bukusia (2-MAV-049)
Like Korovatuma, the site of Bukusia is also one of the rebel strongholds that
were destroyed by Gordon and his forces during the 1876 campaign in the Sigatoka
Valley. On June 8th, the government forces attacked and destroyed Korovatuma, and in
the ensuing panic and shock the rebel forces abandoned the nearby fortress of Bukusia
and reportedly fled northward to the fortress of Matanavatu (Gordon 1879 Vol. I, p. 297).
Like Korovatuma, Bukusia’s impregnability was legendary, as the site was located “on
the summit of precipitous crags covered with forest and honeycombed with caves”, and
which was further fortified with “earthworks and fences both of stone and bamboo,
wherever natural defense was absent (Gordon 1879 Vol. I., p. 295). Indeed the site is
impressive, covering approximately 37 ha, and consisting of a rocky outcrop of
Naqalimare limestone that rises out of a low-lying riparian area (Appendix A, Figure
A.11). The largest outcrop of limestone contains several caves, some of which showed
evidence of occupation with scatters of ceramics and shells, and also yavu. Heavy forest
and brush cover the site today, making it difficult to view features and determine
locations. Six sections of the site were surveyed during the 2001 season: the cave area,
the fortified outcrop, the north ridgeline, the west peak, and two clusters of yavu located

193
on the northern and southern flanks of the site (Figure 5.19). Only the area of the
fortified outcrop was tested for archaeological deposits. Undoubtedly, other important
cultural areas are present at Bukusia, but the heavy forest cover and sheer size of the site
prohibited a complete survey in 2001.
The first area of archaeological inquiry was focused on a cluster of monolithic
limestone boulders located at the eastern end of Bukusia, and above one of two main
drainages that lead from the site to Yaloku creek. The outcrop (Outcrop 3) is flanked
along its northeast side by a 1 m high stone and earthen wall. This wall encloses the
north side of the outcrop, and a rubble ramp extends from the ground level to the crest of
the outcrop. A single yavu/ occupation area was identified on its uppermost surface,
while three additional yavu/terraces were located along a lower level on the southern side
of the outcrop. In the general vicinity of the fortified Outcrop 3 are several rectangular
stone-faced yavu, which extend along the ridgeline to the north. Test Unit 1 was located
atop Outcrop 3, and within a flattened clearing that likely served as a house
foundation/occupation area. Approximately 50 burned sperm whale (Physeter
macrocephalus) teeth were recovered from the upper surface of Outcrop 3 (Figure 5.20).
All of the proximal ends of the teeth that were recovered were perforated, indicating that
the teeth had once been part of necklace, known as a wāsekaseka. Traditionally,
wāsekaseka were highly prized items, and typically worn by chiefs or warriors as part of
battle regalia. The fact that they were found on the surface and also burned suggests that
this necklace was lost during the abandonment and destruction of Bukusia by Gordon’s
forces.

194
Fig
ure
5.1
9. M
ap o
f th
e si
te o
f B
ukusi
a, d
etai
ling t
he
loca
tion o
f ar
chit
ectu
ral
feat
ure
s an
d e
xca
vat
ions.

195
Figure 5.20. Photograph of the 50+ sperm whale teeth (Physeter macrocephalus)
recovered from the vicinity of Test Unit 1, Bukusia. All of the teeth had been perforated
in the fashion of a wāsekaseka necklace.
Bukusia: Test Unit 1
Test Unit 1 was located in the northwestern corner of the occupation area.
Excavation into the deposits revealed riparian clamshell (Batissa violacea), fragments of
human remains, ceramic fragments, and burned toto nutshells (Aleurites moluccana).
Layer I continued to a maximum depth of 37 cmbs, and remained consistent throughout.
A portion of an articulated human burial (Burial 1) was encountered between 16 and 18
cmbs in the eastern portion of TU 1 (Appendix E). The remains were uncovered and
photographed, and then removed in order to continue the excavation. The bones were

196
later reburied in Test Unit 1 at the end of excavation. A suite of artifacts was recovered
from the sediment immediately above and surrounding the human remains. These
included ceramic fragments, lithics, and riparian clamshell. At 35 cmbs, a second human
burial feature was encountered (Appendix E). The sediment surrounding the remains
also contained a few artifacts, including paddle-impressed ceramic fragments, lithics, and
charcoal. A single fragment of charcoal was submitted for AMS dating as sample
AA50303. This resulted in a date of 189 ± 49 BP, which with calibration suggests that
the burial dates to between Cal AD 1660 and 1950 (1σ) (Table 5.7). As Bukusia is
known to have been abandoned in June of 1876, this date indicates that the burial most
likely occurred between AD 1660 and 1876. The occupation area atop the fortified
Outcrop 3 upon which Test Unit 1 was placed undoubtedly dates to the same era, or
perhaps the immediately preceding centuries.
Bukusia: Test Unit 2
As detailed in Figure 5.19, a stone and earthen wall of approximately 100 m long
and 1.5 m high encircles the northeast side of Outcrop 3. As one of the goals of the
research in the Sigatoka Valley was to date the construction of fortifications, the wall was
selected for archaeological investigation in order to determine if it was built before or
after the initial habitation of the site. Hence, Test Unit 2 consisted of a .50 x 1.5 m
trench, which was set into the northern face of the encircling wall (Figure 5.21). Two
distinctive layers were encountered in the wall. The upper and surface layer of Test Unit
2 consisted of a very dark brown clay, with no mottles or inclusions and a moderate sized

197
Table 5.7. Standard radiometric (14
C) and AMS dates for the site of Bukusia.
Lab No. Provenience Material Measured 13
C/12
C
Calibrated Age
Range
Calibrated Age
Range
14
C Age BP Ratio Probability Probability
Distributions (1σ)* Distributions (2σ)*
Bukusia
AA50303 TU 1, Wood 189 ± 49 -28.3 Cal AD 1660 - 1950 Cal AD 1650 - 1960
30-40cmbs Charcoal
AA50304 TU 2 Wood 259 ± 40 -24.3 Cal AD 1630 - 1950 Cal AD 1520 - 1950
40-50cmbs Charcoal
Wk-11135 TU 2 Wood 202 ± 59 -29.6 Cal AD 1650 - 1950 Cal AD 1640 - 1960
80-90cmbs Charcoal
*All determinations were calibrated using the terrestrial calibration curve of Stuiver et al.
(1998), with 27 ± 5 years subtracted from the CRA to account for the southern
hemisphere offset in 14
C (McCormac et al. 1998).
ped structure. This layer (Layer I) was approximately 50 cm thick as it flowed down the
wall surface, and had an abrupt lower boundary. Heavy amounts of riparian clam shell
and snail shell were recovered from this deposit, in addition to lithic fragments, ceramics,
fragments of mammal bone and human bone, and several grams of charcoal. A single
gram of charcoal recovered from between 40 and 50 cmbs was submitted for AMS dating
as sample AA50304.
Layer II was encountered at approximately 40 cmbs, and consisted of dark brown
sandy clay with frequent shell inclusions, and an increase in pebble inclusions. This layer
graded gradually into Layer IV, which has a 50% higher shell and pebble content. The
marked difference between layers I/II and IV suggest that the wall was constructed in two
phases, and perhaps used different fill material. A single fragment of charcoal from 90
cmbs, and also from the back of the unit (i.e., the innermost portion of the wall) was

198
Photograph of Test Unit 2, Bukusia, 50 cmbs. Unit is cutting into earthen wall.
Figure 5.21. Photograph and south/east profile of Test Unit 2, Bukusia. Profile indicates
extent and character of deposits used in the creation of the wall.

199
recovered and submitted for standard 14
C dating as sample Wk- 11135.
The results of AMS dating for sample AA50304 indicate that the sample dates to
259 ±40 BP, and calibrates to a calendar date of Cal AD 1630 -1950 (at 1σ) (Table 5.7).
The radiometric age determination for sample Wk-11135 indicates that the charcoal
deposits at the base of the wall (90 cmbs) dated to 202 ± 59 years BP in age. With
calibration, this date suggests that the sample originated from wood deposits that were
burned between Cal AD 1650 and 1950 (1σ). As Bukusia is known from historical
documents to have been inhabited and abandoned in the years prior to 1876, the two dates
suggest that the construction of the stone and earthen wall around Outcrop 3 occurred
between AD 1650 and 1876. As the fill shows a distinct stratigraphic break, the wall may
have been constructed in two episodes during this period.
Other Cultural Areas of Bukusia
As mentioned, five other cultural areas of Bukusia were investigated during the
2001 field season. Bukusia cave is located within the south face of an extremely large
limestone monolith. Several pools lead up to the occupation areas that front the cave, and
ultimately a 3 m cliff face with carved toe-holds must be scaled to reach the mouth. The
narrow entrance to the main chamber gives the site its name, as “Bukusia” translates to
“a tight fit”. The main chamber of Bukusia cave is an active solution cave—water still
flows through the limestone and exits the cave to the south. Abundant cultural remains in
the form of ceramics and stone tool fragments litter the floor. Outside the cave and to the
west, two overhangs were investigated that have evidence of occupation contained within
them. The most westerly overhang has a stone-faced yavu constructed at its rear, and

200
fragments of ceramics and shell were abundant. The more easterly overhang appeared to
have midden deposits along its floor.
A second cultural area is located on the north side of the monolith. This area
contains several square and sub-rectangular yavu. To the west of the occupation area a
grassy ridge rises up, running as a series of peaks that are topped with flattened
architectural platforms or yavu. Upon inspection, these areas showed small scatterings of
ceramics and shell, likely the remains of habitations that once stood upon this ridgeline.
A large round mound, known as by the inhabitants of Raiwaqa as ‘Bemana’, stands at the
apex. This mound was likely the abode of the chief of Bukusia, and may also have
served as a grave.
Bukusia: Chronology and Site Analysis
As only a small portion of Bukusia was investigated with archaeological
excavations, it is difficult to assess the full chronology of the site. The dates from Test
Units 1 and 2 suggest that the fortified Outcrop 3 was occupied and modified with the
north wall between AD 1650 and 1876. However, the fill that was used to create the wall
must have been deposited in prior centuries, and redeposited during the latest
construction events at the site. The density of the remains in the wall fill, especially the
high amounts of faunal and human remains, and paddle-impressed ceramics, may be
indicative of the length of occupation in previous centuries. The wall also contained the
remains of riparian clams and snails, as well as pig bone, which is indicative of a diverse
resource base. Future dating of other deposits at Bukusia, especially within the
overhangs and caves, may well indicate that the site was inhabited as early as AD 1000.

201
Moreover, the great number of cultural areas and yavu suggest that Bukusia
attracted a sizeable population at one time. Bukusia would have been especially
appealing for its riparian area, which could have been used for growing small amounts of
wetland dalo. The cave would have also provided a water-source and also a storage area.
The close proximity of Korovatuma, which has far fewer resources, suggests that Bukusia
would have drawn occupants at least as early as AD 1330. In addition, Bukusia is located
within Zone 2, and would have been buffered against some of the harsher environmental
perturbations. Its high elevation would have put it beyond the reach of ENSO-related
floods, and drought in the area would have been moderate. Moreover, the effects of the
LCO/LIA transition would have been significantly reduced by the remoteness of the site,
save for occasional landslides. In sum, Bukusia likely attracted inhabitants early, and
may have served as both an environmental refuge and long-term occupation, until the
contact period.
5.11 Korokune (2-CON-010)
The site of Korokune is located on the top of a forested coastal peak, which rises
210 meters above sea level (Appendix A, Figure A.12). The site extends east-west along
a steep ridge, the western extent of which provides for extensive views of both the coast
and delta regions, and north into the interior of the lower valley. Korokune is one of the
sites of the delta region to be claimed by the Noi Toga, a yavusa that is descended from
Tongan migrants that settled in the lower Sigatoka Valley ca. AD 1750 (Brewster 1922;
Gifford 1952; Palmer 1966; Parry 1987; Thomson 1908). According to oral histories, a

202
group of chiefs under Finau Maile Latumai were banished from Tonga in the 17 th
or 18th
century and resettled along the coast and delta of the Sigatoka River. In the years that
followed, Maile Latumai and his descendents settled or married into several villages in
the region, including Tavuni, Nawamagi, and Korokune. However, it is uncertain
whether these villages were founded entirely by Tongans, or if they represent the
resettlement of ancient sites, and the subsequent melding of indigenous Fijians and
Tongan descendents.
Korokune lies upon a high narrow ridge that essentially protects the site from any
advance from the east. Three faint depressions cross the ridgeline at its apex, which may
be the remains of excavated ditches that once were part of a gated entrance to the site
(Appendix A). As this ridge extends to the west, its top broadens to form a wide
platform, which is flanked on all sides by steep slopes. The occupation area of the site is
80 m in length, and approximately 35 m wide (Figure 5.22). The flatness of the ridge
surface suggests that the inhabitants may have leveled off the top of the ridge, and also
used excavation and slope cutting as a means to divide up living space. Three
architectural terraces are located on the northern and western sides of the site, as well as
four distinct earthen-walled yavu, and two sub-rectangular yavu.
Korokune: Test Unit 1
Archaeological investigation of Korokune consisted of three series of corings for
subsurface deposits, and two excavations. Test Unit 1 (TU 1) of Korokune was a .50 x 2
m trench which crossed the extent of the embankment that rose above the north terrace of
the site. The amount and provenience of the artifacts recovered from Test Unit 1 suggest

203
Fig
ure
5.2
2. M
ap o
f K
oro
kune,
det
aili
ng a
rchit
ectu
re a
nd l
oca
tion o
f ex
cavat
ion u
nit
s.

204
that they were probably the result of erosion on the terrace above. Artifacts included
ceramics, charcoal, and mixed marine shell. Five grams of charcoal fragments were
recovered from the deepest cultural deposit, and the largest fragment was selected for
submission as sample AA50281 (Table 5.8).
Results of dating indicate an age of 130 ± 64 BP for the charcoal sample from
Test Unit 1. Calibrated radiometric age determinations for this sample indicate that this
wood was burned between Cal AD 1680 and 1930 (1σ). The wide range of this age
determination does not accurately indicate whether the charcoal was deposited either in
the pre- or post- contact era. However, it does establish that the site was used for at least
temporary occupation in the centuries leading up to the contact period, most likely
between Cal AD 1680 and 1875.
Korokune: Test Unit 2
Test Unit 2 consisted of a 2 x 1 meter unit set across the southeastern end of Yavu
4. Excavation in the eastern half of the unit reached sterile deposits at 50 cmbs, and
excavation was halted at that point. Cultural deposits continued in the western half of the
unit to a depth of 70 cmbs, and ten post-hole features were encountered through the
course of excavation (Figure 5.23). Each of these features was excavated separately and
documented with drawings and photographs. The configuration of the post-holes
suggests that the house that stood atop Yavu 4 was square or rectangular in shape,
although the presence of smaller, shallower posts in the later deposits suggest that the
house was rebuilt at least once, or perhaps stabilized with additional wall posts.
Test Unit 2 yielded large amounts of plain ceramics, a small amount of riparian

205
Table 5.8. Standard radiometric (14
C) and AMS dates for the site of Korokune.
Lab No. Provenience Material Measured 13
C/12
C
Calibrated Age
Range
Calibrated Age
Range
14
C Age BP Ratio Probability Probability
Distributions (1σ)* Distributions (2σ)*
Korokune
Wk-11136 TU2, Wood 478 ± 141 -24.7 Cal AD 1320 – 1640 Cal AD 1250 – 1950
Feat. 7 Charcoal
AA50285 TU2, Wood 426 ± 44 -26.4 Cal AD 1440 – 1620 Cal AD 1430 – 1640
Feat. 5 Charcoal
AA50286 TU2, Wood 406 ± 53 -26 Cal AD 1440 – 1630 Cal AD 1430 – 1640
60-70 cmbs Charcoal
AA50281 TU1, Wood 130 ± 64 -11 Cal AD 1680 – 1930 Cal AD 1660 – 1960
20-30 cmbs Charcoal
*All determinations were calibrated using the terrestrial calibration curve of Stuiver et al.
(1998), with 27 ± 5 years subtracted from the CRA to account for the southern
hemisphere offset in 14
C (McCormac et al. 1998).
(Batissa violacea) and marine shell (Trochus spp., Turbo spp.), and also cracked toto
nutshells (Aleurites moluccana) from throughout the deposits. The interiors of these nuts
contain an oily germ, which can be used to create balms or small lamps. Six ceramic
fragments were recognizable as being portions of bowls, while another five contained the
curving rim of jar shaped vessels (Appendix C). All of the jars from TU 2 have everted
rims, and there is a great deal of variation in the angle of rim orientation and rim height.
Two fragments of green glass were recovered from the first 10 cm of Test Unit 2, which
are typical of the imported whisky bottles that were common in Fiji in the 19th century.
Korokune: Chronology and Site Analysis
Samples of charcoal were submitted for dating from both the post-hole features

206
Test Unit 2, Korokune, with excavated post-holes (Features 5-9)
Figure 5.23. Photo and south wall profile of Test Unit 2, Korokune. Both photo and
profile indicate location of post-hole features.

207
and the deepest cultural layer. A charcoal fragment from between 60 and 70 cmbs was
submitted for age determinations as sample AA50286, and AMS dating provided a date
of 406 ± 53 years BP. Calibration at 1σ indicates that the sample dates to between Cal
AD 1440 and 1630 (Table 5.8) . In addition, 19 g of charcoal were recovered from
Feature 5 and submitted for AMS dating as sample AA50285. Age determinations
indicate that the charcoal material dates to 426 ± 44 years BP, and calibrates to Cal AD
1440 to 1620 (1σ). Lastly, the charcoal fragments from Feature 7 appeared to be the
burned remains of one of the wooden house-posts (Sample Wk-11136). Standard
radiometric (14
C) dating produced the broadly ranged date of 478 ± 141 BP. At 1σ, this
sample had a 68.2% probability of ranging between Cal AD 1320 and 1640.
The result of AMS and 14
C dating suggests that the initial construction of
Korokune dates to between AD 1440 and 1630. Charcoal fragments from the
embankment on the northernmost terrace suggest that the site was also occupied between
AD 1640 and the contact period. There is a possibility that both samples (AA50285 and
Wk-11136) are from timbers that were already several hundred years old prior to their
being cut for housing material. The diameter of the post-holes, suggests that they were
mature trees, and thus this possibility cannot be excluded. However, sample AA50286
was recovered from the very bottom of the fill for Yavu 4, and this fragment produced a
similar age of Cal AD 1440 – 1630. It seems unlikely that this sample is also dating old
wood, thus the founding of Korokune can be securely placed between the 15th and 17
th
centuries. This predates the genealogy-based chronology for the coming of the Tongans
to the area by at least 150 years (ca. 1750, according Thomson’s [1908] calculation).

208
Therefore, Korokune may have been inhabited for several centuries prior to the arrival of
the Tongans. However, it is equally possible that the Tongan influx occurred much
earlier than has previously been calculated, and Korokune represents their arrival in the
earlier 15th century. In either circumstance, Korokune does not contain the oval house
mound (or post-hole pattern) indicative of the Tongan house-style that has been
suggested for the lower Sigatoka Valley (e.g., Palmer 1966).
As listed in Table 5.1, the low number of yavu, as well as the size of the site,
suggests that Korokune sheltered a small population. Although it is located atop a
summit apex, has an extensive view, and is also fortified with a series of ridge scarps, the
surrounding landscape would have allowed for dryland cultivation. However, steep
slopes would have limited cultivation to low yields of dryland crops such as uvi or
dryland taro. The close proximity of the site to the ocean and also the presence of marine
shell in the cultural deposits indicates that the inhabitants had access to coastal resources.
Korokune is located within Zone 1, and in the long term the site would have been
severely affected by ENSO-related droughts, but been spared from flooding events.
During the LCO/LIA transition, the lands surrounding this site would have experienced a
submerged water table and loss of soil moisture, and the nearby coastal resources also
would have been radically affected. However, the small population size estimated for the
site, as well as low-yield agricultural areas in close proximity, may have allowed the
inhabitants to withstand local shortfalls.

209
5.12 Madraya (1-NKR-031)
The mountain of Madraya contains many of the natural features that would have
made it suitable for a defended habitation site. However, the inhabitants of Korolevu,
which lies at the foot of the Madraya outcrop, do not claim the site as a koro makawa, but
suggest that the mountain has been used as a cemetery. Investigation of the area
determined that Madraya was occupied in prehistory, but perhaps for only a short period.
The northernmost portion of Madraya is a jutting prominence, which forms a
stony cliff face that rises nearly 100 m above the river bank (207 m above sea level). To
the east and west, the slopes that surround the top of Madraya are very steep and covered
with dense brush. However, the top of Madraya is relatively flat, and extends to the
southwest as a long, level surface (Appendix A, Figure A.13). Survey on Madraya
located a series of terraces, which consisted of heavy stones that had been arranged in a
rectangular formation, and capped with a level platform of sediment (Figure 5.24). At its
most northerly end were two roughly oval stone features, which were identified as i rara:
long fire pits that were constructed within houses for warmth, but not for cooking. The i
rara features were each approximately 1.5 m long and .75 m wide, and spaced
approximately 2 m apart. It was suggested that these fire pits marked the sleeping
quarters of the structure that once stood upon this terrace, as the cooler weather of the
highlands would have necessitated the use of i rara indoors during the winter months.
Madraya: Test Unit 1
Temporal constraints limited the amount of archaeological investigation to a
single excavation. This consisted of a single 50 x 50 cm unit that was located between

210
Figure 5.24. Map of the terrace feature of Madraya.
the two i rara. The sediment of the terrace consisted of soft clay, that was of moderate
grade and with a light scattering of lithics, ceramics, and charcoal. The largest fragment
of charcoal from 30 cmbs at TU 1 was submitted for AMS dating as sample AA50296.
The results indicate a date of 398 ± 38 BP (Table 5.9). With calibration, this date
suggests that the terrace occupation of Madraya (most likely predating the construction
of the i rara) dates to between Cal AD 1450 and 1630 (1σ).

211
Table 5.9. AMS date for the site of Madraya.
Lab No. Provenience Material Measured 13
C/12
C
Calibrated Age
Range
Calibrated Age
Range
14
C Age BP Ratio Probability Probability
Distributions (1σ)* Distributions (2σ)*
Madraya
AA50296
TU1, 20-30
cmbs
Wood
Charcoal 398 - 38 -28.7 Cal AD 1450 - 1630 Cal AD 1440 - 1640
*All determinations were calibrated using the terrestrial calibration curve of Stuiver et al.
(1998), with 27 ± 5 years subtracted from the CRA to account for the southern
hemisphere offset in 14
C (McCormac et al. 1998).
Madraya Chronology and Site Analysis
The single date and low-level of cultural remains atop Madraya suggest that the
site was used sparingly, and perhaps only for short periods. However, Madraya was
naturally fortified, and used for occupation for at least a short period in the 15th century.
GIS-analyses of topography, hydrology, and soils indicate that the surrounding landscape
of Madraya would have allowed for mixed agricultural production, and moderate yields.
According to the expectations outlined in the evolutionary ecology model, the habitations
atop the naturally fortified plateau were established to ensure continued access to these
resources.
GIS-based environmental analyses also determined that Madraya lay along the
boundary between Zones 2 and 3, and thus experienced very low frequencies of ENSO-
related environmental fluctuations, and a highly stable pattern of seasonal rainfall.
However, the timing of the occupation may be indicative of the effects of the LCO/LIA
transition, rather than the establishment of territories associated with dense and
predictable resources. GIS-analyses suggest that Madraya would not have been severely

212
impacted by sea-level change, although mass-wasting events may have occurred in the
area. However, the effects of the LCO/LIA transition downriver (e.g., population
movement and resettlement) may have encouraged the establishment of naturally fortified
occupations at even the distant outpost of Madraya.
5.13 Bātiri (1-SIG-005)
The site of Bātiri is located within a small tributary valley that is known locally as
Olo Olo, which lies directly east of Nayawa Village (Appendix A). This valley is
approximately 1.5 km2 in size, and is drained by the Caluwe Creek. The site lies atop a
thick layer of alluvium that is today used for cultivating sugarcane, dalo, and other
vegetables. Steep grassy hillsides flank the valley of Olo Olo, and the ancient fortress of
Vatuvoko lies above its eastern termination. Arthur Gordon (1879) described that the
villages of this region belonged to ‘the Bātiri Christians’ (1879:I, xi-xiii), who were
routed by rebel tribesmen in 1875. Thus, according to historical documents the sites of
Bātiri and nearby Lomaloma were destroyed in 1875, and populations resettled
elsewhere. Later, these populations founded the modern village of Nayawa. Both Bātiri
and Lomaloma were fortified sites, with large annular ditches and palisades. The faint
remainder of the ditch that surrounded Bātiri is visible in modern aerial photos (Appendix
A, Figure A.14). Based upon the size of this and other village sites in the Olo Olo
tributary valley, Parry calculated that the Bātiri district likely contained approximately
1000 people during the 19th century. Archaeological investigation in 2001 was focused

213
on determining the earliest occupation date for the historic site of Bātiri, and also
examining the deposits for evidence of early prehistoric occupations.
The most prominent visible cultural feature of Bātiri is its annular ditch, which is
roughly circular in shape (Figure 5.25). The ditch extends to the east and west as it
encircles the site, and has been moderately disturbed by cultivation and animals. It ditch
is shallow and saturated with water, and ranges from 2 to 12 m in width, and averages 8
m. It surrounds the entire site of Bātiri, making the site 125 m long, and 100 m wide.
The interior portion of the site thus comprises approximately 7850 m2.
Bātiri: Test Unit 1
Test Unit 1 consisted of a 1 x 1 meter unit located within a plowed field that once
contained the occupation areas of the site. According to the landowners, the site of Bātiri
had been plowed by both a gas tractor and an oxen-drawn plow. Upon excavation the
plow zone was detected at a maximum depth of 20 cmbs. Thus, the first 20 cm yielded a
great amount of material that had been crushed and disturbed by the plowing process,
including several kilograms of ceramics, and abundant riparian and marine shell
(Appendix D). Between 30 and 40 cmbs, the fill deposit changed in color from dark
grayish brown to yellowish brown, and a hearth feature was encountered. All of the shell
fragments of this layer were from the riparian bivalve, Batissa violacea, and the ceramic
component contained many fragments of flat tray vessels. Over half of these fragments
were encrusted with carbonized food remains, thus this flat tray was likely used for frying
or cooking over a flame. Artifact frequencies decreased significantly between 40 and 50
cmbs, and the excavation was discontinued past 60 cmbs. The auger was used to core the

214
Figure 5.25. Map of the site of Bātiri showing location of excavation and also ancient
ditch.

215
deeper deposits to a depth of 120 cmbs, however no additional cultural materials were
recovered.
Feature 1 (Figure 5.26) was excavated separately from the other arbitrary levels in
the unit, and reached a maximum depth of 55 cmbs. There were several lenses of ash in
the deposit, the most prominent occurring at 40 cmbs, and extending laterally across the
feature. A large fragment of charcoal from the deepest ash lens in the feature was
submitted for AMS dating as sample AA50282. Artifacts were also densely packed in
the feature, and included marine shell, riparian shell, ceramics, and fish and mammal
bone (Appendix D). The ceramics of Test Unit 1 also demonstrate a great deal of
diversity in both form and decoration styles, and are broadly typical of late-period
decorations—incising, appliqué, tool impressing, and wiping.
Chronology and Site Analysis
Sample AA50282 provided an AMS date of 233 ± 38 BP (Table 5.10). This
result indicates an age range of Cal AD 1650 -1950 (1σ) for the establishment of Bātiri.
Although plowing has destroyed the occupational features of the site, it can be assumed
that the hearth feature encountered in Test Unit 1 once lay atop a yavu, the outline of
which was obliterated following the transition of the site into agricultural land. The drop
in artifact frequency after 30 cmbs (the upper horizon of the hearth) suggests that the
deeper deposits represent yavu fill material that slightly predates the deposition of
materials in the hearth. The late prehistoric date concurs with historical data that indicate
that the site was inhabited by Christianized Fijians in the mid-19th century, and destroyed
by rebel forces in 1875. Thus, the hearth deposit encountered in Feature 1 may have been

216
Figure 5.26. Test Unit 1 of Bātiri, showing location of shell-filled hearth feature in south
profile.
Table 5.10. AMS date for the site of Bātiri.
Lab No. Provenience Material Measured 13
C/12
C
Calibrated Age
Range
Calibrated Age
Range
14
C Age BP Ratio Probability Probability
Distributions (1σ) Distributions (2σ)
Batiri
AA50282 Feature 1 Wood 233 ± 38 -25.3 Cal AD 1650 - 1950 Cal AD 1630- 1960
30-55cmbs charcoal
*All determinations were calibrated using the terrestrial calibration curve of Stuiver et al.
(1998), with 27 ± 5 years subtracted from the CRA to account for the southern
hemisphere offset in 14
C (McCormac et al. 1998).

217
established in the 1800’s following a few years of occupation at the site. The richer
deposits that lie immediately around and above the hearth feature probably amount to
cooking refuse that accumulated as the hearth was used, and which was later scattered by
the plow. Although there are no dated samples for the ditch that surrounds the site, it
most likely dates to between AD 1650 and 1875.
GIS-based analyses of the features and landscape associated with Bātiri indicate
that this site served both the function of production and defense. As described, the site
was located atop a flat alluvial plain, and protected with a large constructed ditch. The
contents of the excavation suggest that the inhabitants had access to both riparian and
marine resources, and faunal remains suggest the consumption of large pelagic fish, and
also pig. Analyses of the topography and nutrient status of the local soil suggest that the
site could have produced high yields of dryland crops, and wetland crops may have been
possible if Caluwe creek was fitted for irrigation. However, the site is located within
Zone 1, and its low elevation may have put it at risk for cyclone-related floods. It also
would have experienced severe ENSO-related droughts. If the site had been occupied
during the LCO/LIA transition, the land in the immediate vicinity may have fared
moderately well, as the dense clay of Olo Olo valley would have retained moisture for a
longer period.
5.14 Korohewa (2-MAV-048)
As its names suggests, Korohewa is a small site (‘hewa’ translates to ‘small’ in
the Nadrogā dialect), consisting of four sub-rectangular yavu that lie along the northern

218
slope above Tubadreiseli Creek (Appendix A, Figure A.15). At this portion of the
Tubadreiseli, the ridgeline on the northwest side of the tributary extends sharply to the
east, narrowing the valley and forcing the creek into a sharp bend. The site of Korohewa
is located on this slope, facing southeast and over the creek. Four large outcrops of
boulders are scattered in this area, in some instances forming shallow rock shelters that
have scatterings of toto nutshells (Aleurites moluccana) in their surface deposits (Figure
5.27). The site is thickly forested with young trees, which suggests that the site is not of
great antiquity. According to the inhabitants of Raiwaqa, Korohewa was only occupied
for a brief period, and the inhabitants moved to the south and settled in the Sigatoka delta
region.
Korohewa: Test Unit 1
All of the yavu of Korohewa were constructed as platforms that extend outwards
from the hillside. Yavu 1 consisted of a 1 m high mound that was faced on two sides with
stone facing, and located at the north end of the site beyond a very large stone outcrop.
TU1 was located atop this yavu. The sediment encountered in the excavation was dark
brown clay with a fine grade and very soft consistency. This layer continued to a
maximum depth of 70 cmbs, and occasionally contained mottling of grayish/yellow clay.
No features were encountered during the excavation, and ceramic frequencies remained
relatively constant, although there was an increase in the amount of charcoal encountered
between 40 and 50 cmbs (Appendix D). A fragment of the charcoal from the deepest
cultural deposit was submitted for AMS dating as sample AA50305.

219
Figure 5.27. Map of Korohewa detailing architecture and excavation units.
Korohewa: Test Unit 2
The second excavation unit at Korohewa was located atop Yavu 2, a large
rectangular yavu approximately 7 m in length, with stone facing along the eastern and
southern faces. The surface of the yavu appeared to be covered in a layer of clay
colluvium, which was very dark gray in color, with a moderate grade and rare occurrence
of pebbles or other inclusions. Small amounts of ceramics, riparian clamshell (Batissa
violacea), and fragments of unidentified mammal bone were recovered to a depth of 50

220
cmbs. All the ceramics recovered from the deepest cultural layer were decorated with
parallel paddle-impressed designs, however, none of them were complete enough to
allow the reconstruction of vessel morphologies (Appendix C).
Korohewa: Chronology and Site Function
The single fragment of charcoal from the bottom of Test Unit 1 provided the date
of 210 ± 39 BP for the oldest cultural remains of Korohewa (Table 5.11). With
calibration, this result suggests that Korohewa was occupied between Cal AD 1660 and
1950 (1σ). The lack of historic and imported items (e.g., glass, metal, or imported
crockery) at the site further indicates that Korohewa was occupied prior to the 1850s,
thus it may be more accurate to suggest that Korohewa was occupied and abandoned
during the centuries between AD 1660 and 1840. This would have made the site
contemporaneous with later occupations at the nearby sites of Korovatuma and Bukusia.
The small size of the site suggests that it was occupied by a small population for a short
period.
Korohewa is one of the few sites in the Sigatoka Valley to lack fortifications, and
thus was perhaps used solely for farming. GIS-based analyses of the topography and
environment indicate that Korohewa also lacked an expansive view, or a steep terrain. In
actuality the topography is quite gentle, and the site has access to a small but well
watered riparian area, and also expanses of alluvial deposits near the river. As far as
production potential is concerned, the site is classified as a ‘mixed’ strategy of wetland
and dryland cultivation, with would have been moderately productive throughout the
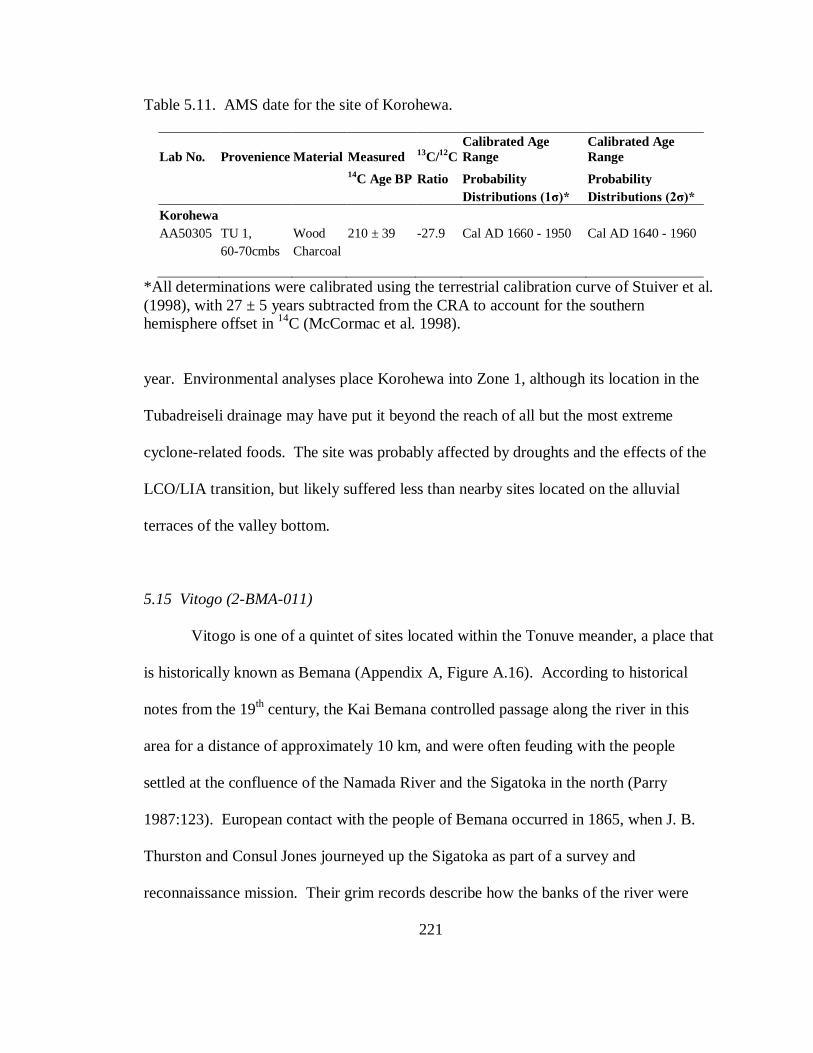
221
Table 5.11. AMS date for the site of Korohewa.
Lab No. Provenience Material Measured 13
C/12
C
Calibrated Age
Range
Calibrated Age
Range
14
C Age BP Ratio Probability Probability
Distributions (1σ)* Distributions (2σ)*
Korohewa
AA50305 TU 1, Wood 210 ± 39 -27.9 Cal AD 1660 - 1950 Cal AD 1640 - 1960
60-70cmbs Charcoal
*All determinations were calibrated using the terrestrial calibration curve of Stuiver et al.
(1998), with 27 ± 5 years subtracted from the CRA to account for the southern
hemisphere offset in 14
C (McCormac et al. 1998).
year. Environmental analyses place Korohewa into Zone 1, although its location in the
Tubadreiseli drainage may have put it beyond the reach of all but the most extreme
cyclone-related foods. The site was probably affected by droughts and the effects of the
LCO/LIA transition, but likely suffered less than nearby sites located on the alluvial
terraces of the valley bottom.
5.15 Vitogo (2-BMA-011)
Vitogo is one of a quintet of sites located within the Tonuve meander, a place that
is historically known as Bemana (Appendix A, Figure A.16). According to historical
notes from the 19th century, the Kai Bemana controlled passage along the river in this
area for a distance of approximately 10 km, and were often feuding with the people
settled at the confluence of the Namada River and the Sigatoka in the north (Parry
1987:123). European contact with the people of Bemana occurred in 1865, when J. B.
Thurston and Consul Jones journeyed up the Sigatoka as part of a survey and
reconnaissance mission. Their grim records describe how the banks of the river were

222
deserted as they approached, and the village was fortified with strong fences, moats, and
outer earthworks. They also recorded that the people of Bemana ate three human bodies
during their stay at the village, a not-uncommon event in proto-historic and prehistoric
Fiji (Parliamentary Papers LVIII, 1887, in Parry 1987:73).
Ten years later and shortly after Gordon’s campaign, Baron Von Hugel journeyed
to Bemana, and found it to be a fair and pleasant village. He also noted the presence of
the water-filled moats and bamboo fencing, and he suggests that one of the largest
villages, Natuatuacoko, was in disrepair and mostly abandoned (Von Hugel 1876, in Roth
and Hooper 1990:403). These notes suggest that Bemana was a large and active
population center between 1865 and 1875, and the inhabitants were in good health and
economic straights. They also suggest that the population was divided into several
separate villages, and based upon their state of repair, these structures had probably been
built at separate times. Aerial photo surveys by Parry (1987:85) and the author
(Appendix B) identified over 30 acres of ponded fields (vuci) on the saturated plains of
the Tonuve meander. The value of this resource suggests that Bemana would have
attracted inhabitants, and the presence of early prehistoric occupations in this region is
likely. Investigation during the 2002 season was directed toward determining the age of
fortifications in the area, and also assessing the landscape for the presence of early,
possibly unfortified occupations. Three of the known prehistoric/proto-historic Bemana
villages were surveyed and mapped: Natuatuacoko, Ikoro, and Vitogo (Appendix A).
The sites of Ikoro and Vitogo were also cored for deep deposits, and excavations were
conducted at Vitogo.

223
Vitogo is surrounded by a flooded annular ditch that is approximately 7 m wide
(Figure 5.28). Three causeways breach the ditch—one in the south that is nearly
completely covered by a large banyan tree, and one each in the north and northwest
corners of the site. The causeways are approximately 5 m wide, and are raised above the
surface of the water by approximately 30-50 cm. During the course of mapping Vitogo,
three yavu were encountered, as well as a historic gravesite. All the yavu were located
near the outer edge of the site, and were constructed of earth and of rectangular shape.
Additional yavu may well be present under the heavy foliage located in the center and
western side of the site. Currently, Vitogo is maintained as a garden and cemetery, and it
is surrounded by barbed wire that prohibits entry by livestock.
Vitogo: Test Unit 1
Test Unit 1 consisted of a 50 x 50 cm unit that was located atop Yavu 1. The
yavu fill consisted of grayish brown clay with a weak grade, with a moderate amount of
charcoal, ceramics, lithics, and fragments of riparian clamshell (Batissa violacea)
(Appendix D). Several of the ceramic fragments were decorated with appliqué, notching,
and a perforation (Appendix C). At 30 cmbs a horizontal lens of artifacts was detected
extending across the east side of the unit. The occurrence of the ceramics, charcoal, and
shell in the lens suggest that this feature represents a cultural deposit related to the
occupation of Yavu 1, and perhaps was the living floor of the structure at one time
(Figure 5.29). A fragment of charcoal from this feature was submitted for AMS dating as

224
Figure 5.28. Map of the site of Vitogo, detailing architectural features and excavation
units.
sample AA50306. The excavation was continued to a maximum depth of 70 cmbs, and a
fragment of charcoal recovered from the lowest cultural layer was submitted for AMS
dating as sample AA50302 (Table 5.12).

225
Figure 5.29. Eastern profile of Test Unit 1, Vitogo. A lens of ceramics from an earlier
occupation layer is visible near the bottom of the unit.
Table 5.12. AMS dates for the site of Vitogo.
Lab No. Provenience Material Measured 13
C/12
C
Calibrated Age
Range
Calibrated Age
Range
14
C Age BP Ratio Probability Probability
Distributions (1σ)* Distributions (2σ)*
Vitogo
AA50306 TU1, 20-30 Wood 175 ± 40 -25 Cal AD 1670 - 1950 Cal AD 1660 - 1960
cmbs Charcoal
AA50302 TU1, 60-77 Wood 198 ± 63 -24.9 Cal AD 1660 - 1950 Cal AD 1640 - 1960
cmbs Charcoal
AA50309 TU2, 40-50 Wood 261 ± 46 -25.1 Cal AD 1530 - 1950 Cal AD 1490 - 1960
cmbs Charcoal
*All determinations were calibrated using the terrestrial calibration curve of Stuiver et al.
(1998), with 27 ± 5 years subtracted from the CRA to account for the southern
hemisphere offset in 14
C (McCormac et al. 1998).

226
The results for AMS sample AA50306 indicate that the yavu surface at 28 cmbs
dates to 175 ± 40 BP (Table 5.12). With calibration, this suggests that the lens deposit of
ceramics and shell dates to between Cal AD 1670 and 1950 (1σ). In addition, sample
AA50302 produced the similar result of 198 ± 63 years BP. With calibration, this sample
most likely dates to between Cal AD 1660 and 1950 (1σ). These dates indicated that
Yavu 1 is late prehistoric in age, and contains cultural materials that were deposited when
Vitogo was occupied in the 17th
and 18th
centuries. Most likely a bure had stood upon
Yavu 1 for a century or more, and the remains that were encountered in the excavation of
Test Unit 1 are the result of the accumulation of debris related to cooking and living in
the bure. It seems very likely that Yavu 1 was occupied throughout the 1800s, and thus
was probably in use as a house site during Thurston and Jones’ visit in 1865.
Vitogo: Test Unit 2
Test Unit 2 was also a 50 x 50 cm unit, which was located along the northeastern
edge of Yavu 2 (Figure 5.28). No features were encountered during excavation, and
throughout the upper 60 cmbs the deposit consisted of a very dark brown clay, that had a
weak grade and very few pebble inclusions. The upper layer to a depth of 10 cmbs
yielded a single fragment of green bottle glass, most likely from an historic whisky bottle.
However, fragments of ceramics decorated with parallel paddle-impressed designs were
recovered to a depth of 40 cmbs. As indicated in Appendix C, both bowls were less than
10 cm in diameter, and had square lips. Between 40 and 60 cmbs, 5 undecorated
ceramics were recovered that were associated with a scattering of 6 g of charcoal. A
single fragment of this charcoal was submitted for AMS dating as sample AA50309.

227
This provided a date of 261 ± 46 years BP. With calibration, this date suggests that the
deposits at the base of Test Unit 2 were deposited between Cal AD 1530 and 1950 (1σ)
(Table 5.12).
Vitogo: Test Unit 3
Test Unit 3 was located in the center of the northeastern causeway, which was a
raised earthen feature of approximately 10 m wide and 20 m long (Figure 5.28). Due to
the high level of the surrounding water in the ditch, as well as the heavy rain that
occurred during the excavation of Vitogo, Test Unit 3 was flooded and required bailing in
order to continue excavation. Despite this problem, excavation in the unit reached a
maximum depth of 60 cmbs. The goal of excavating on the causeway was to obtain
samples of organic material such as shell, charcoal, or bone, which could later be
submitted for radiometric dating analysis. Unfortunately, these remains were not
encountered. Other materials, in particular the historic items and ceramics from Test
Unit 3, suggest that the causeway is late prehistoric in age (Appendix D).
Vitogo: Chronology and Site Analysis
Although datable materials were not encountered in Test Unit 3, the array of
ceramics and the metal fragment suggests that the causeway is of a similar age to that of
the uppermost deposits of Test Units 1 and 2. In these units, the presence of historic
artifacts and AMS dates suggest that the ancient village of Vitogo was constructed
between Cal AD 1600 and 1800. During this period the moat and causeways were
constructed around the village, and Yavu 1 and 2 were erected. These dates correspond

228
with oral histories for the site, which indicate that the village was the home of the
grandparents and great-grandparents of modern-day Tonuve and Volinagerua villages.
The location of these sites in a well watered and highly productive area, and also
the presence of constructed fortifications, is suggestive of the desirability of this locale to
prehistoric farmers. However, the late age of the site of Vitogo indicates that the region
was not occupied with habitations until relatively recently. Of course, additional
archaeological investigation in the area may locate evidence to the contrary. GIS-based
analyses suggest that Vitogo would have had access to dense and predictable wetland
resources, but floods may have negatively affected the site during severe ENSO cycles.
According to GIS-based environmental analyses, Vitogo is situated within Zone 2. Thus,
ENSO related droughts would have had a moderate impact on the surrounding region,
although the ponded-fields within the Tonuve meander may have fared well during these
periods. Also of note, Vitogo would have felt little of the LCO/LIA transition, as it is far
enough upriver to escape much of the effects of sea-level fall, and it is protected within
the Bemana meander from landslides and flash floods. In sum, the inhabitants of Vitogo
(and most likely the nearby sites of Ikoro and Natuatuacoko) likely established fortified
settlements as a strategy for maintaining access to the dense and predictable resources of
the Tonuve meander.
5.16 Nadrogā (1-NKR-046)
According to oral traditions, the ancestors of the yavusa Koroivakabeka lived at
the site of Nadrogā, which was located along the east bank of the Sigatoka River, just

229
above the confluence of Nasa creek in the old district of Nuyakoro. Following a dispute
over land title during the 17th or 18
th centuries, the yavusa Koroivakabeka split and the
inhabitants moved away to found the two villages of Korolevu and Nubuyanitu. Thus,
the site of Nadrogā is claimed as the koro makawa for both villages. The site is not
mentioned in Gordon’s report of the Little War, thus it is possible that the site had been
abandoned prior to 1876.
Although in a low area compared to most ancient villages in the Sigatoka Valley,
Nadrogā is also located on the leeward side of a westward bend in the river, thus it is
largely protected from mild floods by the gravel bars and embankments that lie upstream
and to the northeast (Appendix A, Figure A.17). A much larger alluvial terrace that is
composed of sand and large river cobbles also stretches between Nadrogā and the river’s
edge. One kilometer to the south and across the Nasa creek lies the flattened hilltop of
Sautabu, which according to local inhabitants was the burial ground for ancient chiefs.
Sautabu may have also served as a defensive fortification, as it is encircled by a ditch on
the north and east sides, and has mounds and additional constructed fortifications on the
peak to the south.
Nadrogā is a very small site (approximately 1.5 ha), but for its size it contains a
significant amount of dry-laid stone architecture (Figure 5.30). It is laid out in a roughly
northeast-southwest orientation, and a trail that is used by people and livestock cuts
through the middle of the site. Yavu of a variety of sizes, heights, and shapes are
scattered throughout Nadrogā. However, on the eastern side of the site is the monolithic
Yavu 4, which is surrounded by a 1 m annular stone wall. Yavu 4 itself is known as
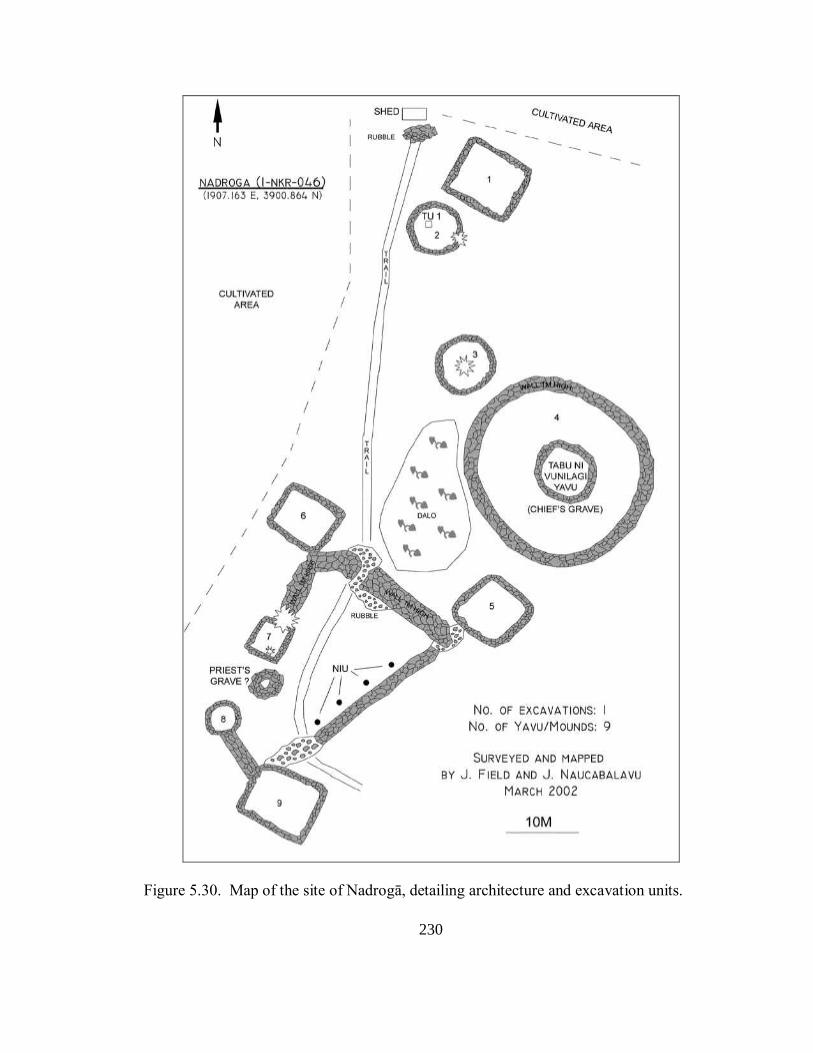
230
Figure 5.30. Map of the site of Nadrogā, detailing architecture and excavation units.

231
Tabu ni Vunilagi by the people of Nubuyanitu, and it is presumed to be the house
foundation and/or grave of one of the ancient chiefs of the area. The mound is round and
approximately 8 m in diameter, and rises to a height of 2 m. To the south and west of
Tabu ni Vunilagi is a very unusual complex of yavu and a stone enclosure, which are
fronted on the north by a modern plot of dryland taro. Yavu 5 and 6 are both square in
shape, approximately 6 m wide and 1 m high, with stone facing. These yavu lay at the
northern corners of a roughly triangular enclosure, the wall of which is between 1.5 m
and 1 m wide, and approximately 1 m to 1.5 m high. The northernmost portion of the
enclosure (which runs roughly east-west) has been significantly impacted by the trail that
cuts through the site, so much so that the bulk of the wall has fallen down in this area.
However, during the 2001-2002 season the wall could clearly be seen to curve
southwards, where it terminated against the northern side of Yavu 7. This small stone
faced yavu is square in shape, and like the others is stone faced and approximately 1m
high. Approximately 1 m south of Yavu 7 is a very steep, conical mound, which was
tentatively identified as a priest’s burial by a Fiji Museum Field Officer.
Nadrogā: Test Unit 1
A single 50 x 50 cm test excavation was performed atop Yavu 2. Time
constraints prohibited the excavation of additional yavu, although as most of the mounds
appeared to be in relatively similar condition, it was assumed that the site was
constructed during a single short episode (i.e., within a span of 10-15 years). Test Unit 1
encountered a marbled clay yavu fill, and light amounts of lithics, charcoal, and ceramics
with broad, crossed paddle impressions were recovered (Appendix C). A large fragment

232
of wood charcoal was recovered from between 50 and 60 cmbs, and this was submitted
for AMS dating as sample AA50297. The results of AMS dating indicate that the
charcoal fragment dates to 224 ± 50 BP. With calibration, these data suggest that Yavu 2
was constructed between Cal AD 1650 and 1950 (1σ) (Table 5.13).
Nadrogā Chronology and Site Analysis
This site is similar to Korohewa in that it lacks extensive constructed
fortifications. Although it is technically classified as a defended production site, the
walls that cross-cut the site may be more social than defensive, as they serve to divide
space between the yavu. Moreover, the walls do not encircle the site, and access can
easily be gained from the east, west, and north. However, there is a possibility that the
site was defended with a wooden palisade that has since deteriorated. According to GIS-
based environmental analyses, Nadrogā had immediate access to land suited to dryland
cultivation, and it was of moderate-high fertility. The site is also located along the
boundary between Zones 2 and 3, which suggests that the conditions of the soil and
climate in the area would have lessened the impact of ENSO-related droughts. However,
the site would have been threatened by severe floods. The late age of Nadrogā suggests
that it was not affected by the LCO/LIA transition, but in any case the site would have
not felt the effects of sea-level fall or landslides.
5.17 Chapter Summary
Twelve sites were selected for excavation in the Sigatoka Valley, producing 34
14C and AMS dates. The investigation of cultural deposits within Tatuba Cave indicate
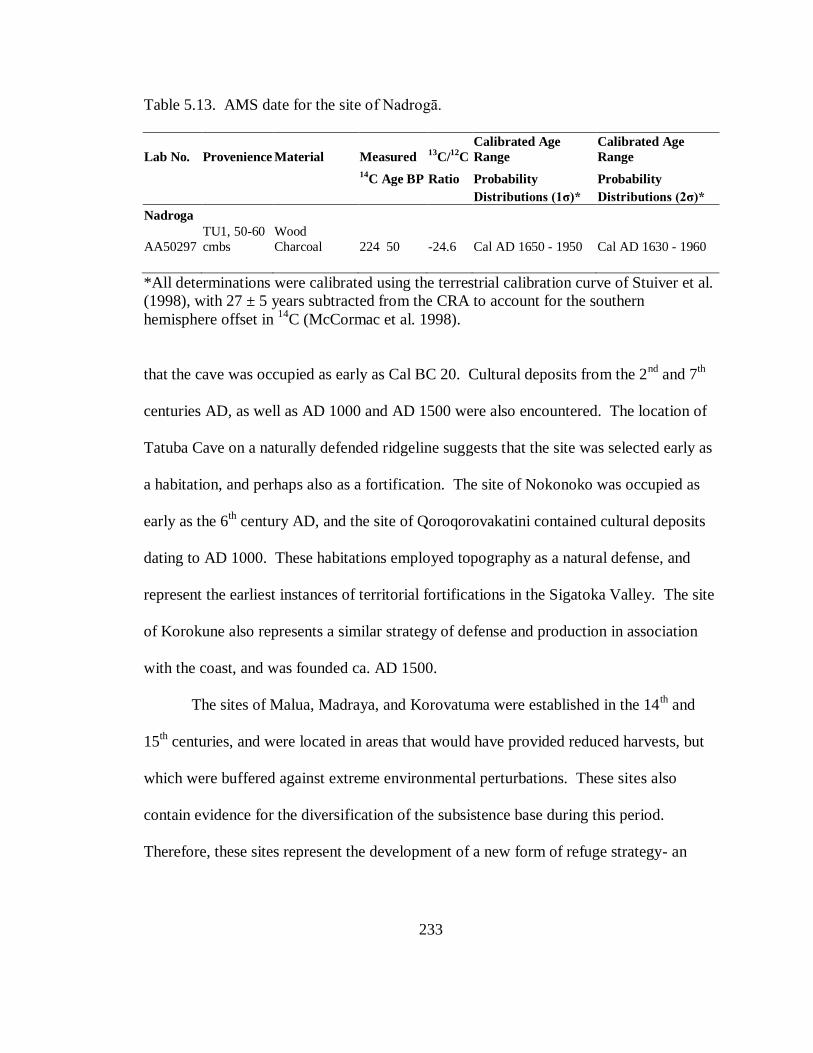
233
Table 5.13. AMS date for the site of Nadrogā.
Lab No. Provenience Material Measured 13
C/12
C
Calibrated Age
Range
Calibrated Age
Range
14
C Age BP Ratio Probability Probability
Distributions (1σ)* Distributions (2σ)*
Nadroga
AA50297
TU1, 50-60
cmbs
Wood
Charcoal 224 50 -24.6 Cal AD 1650 - 1950 Cal AD 1630 - 1960
*All determinations were calibrated using the terrestrial calibration curve of Stuiver et al.
(1998), with 27 ± 5 years subtracted from the CRA to account for the southern
hemisphere offset in 14
C (McCormac et al. 1998).
that the cave was occupied as early as Cal BC 20. Cultural deposits from the 2nd
and 7th
centuries AD, as well as AD 1000 and AD 1500 were also encountered. The location of
Tatuba Cave on a naturally defended ridgeline suggests that the site was selected early as
a habitation, and perhaps also as a fortification. The site of Nokonoko was occupied as
early as the 6th century AD, and the site of Qoroqorovakatini contained cultural deposits
dating to AD 1000. These habitations employed topography as a natural defense, and
represent the earliest instances of territorial fortifications in the Sigatoka Valley. The site
of Korokune also represents a similar strategy of defense and production in association
with the coast, and was founded ca. AD 1500.
The sites of Malua, Madraya, and Korovatuma were established in the 14th and
15th centuries, and were located in areas that would have provided reduced harvests, but
which were buffered against extreme environmental perturbations. These sites also
contain evidence for the diversification of the subsistence base during this period.
Therefore, these sites represent the development of a new form of refuge strategy- an

234
environmental refuge. The site of Bukusia may have also been founded during this
period, and represent a similar strategy.
Lastly, the unfortified sites of Korohewa, and also the sites of Bātiri and Vitogo
(fortified with annular ditches), and Nadrogā (possibly fortified with a wooden palisade
or wall system) were established between the 17th or 18
th centuries AD. These sites did
not employ any natural topographic features for defense, but were within close proximity
to high yield agricultural resources.
235
CHAPTER 6. GENERAL TRENDS IN COMPETITION AND COOPERATION
The analysis of environmental and archaeological data from the Sigatoka Valley
allow for the discussion of several of the research questions outlined in Chapter 2.
Namely, 1) when did competition arise in the valley’s prehistory? 2) to what extent did
regional environmental conditions select for competitive or cooperative strategies, and
how did these strategies vary across the physical and social landscape? And 3) in what
ways did global climatic fluctuations condition the development and persistence of
competition and cooperation? Moreover, the results of these analyses can be compared
and contrasted with the series of evolutionary ecology-based expectations that were
presented in Chapter 2. These data, along with the results of environmental analyses
detailed in Chapters 3 and 4, explain why fortifications were established in different parts
of the valley at different times in prehistory. Significantly, these patterns provide insight
into population growth and distribution, and changes associated with new modes of
optimality and risk aversion. Additional examination of these patterns is provided by the
extrapolation of subsistence and habitation strategies to the rest of the Sigatoka Valley
sample.
6.1. Trends in Strategies of Defense and Subsistence in Sigatoka Valley Prehistory
Figure 6.1 displays the range of dates associated for each habitation site, and also
designates four temporal periods: T1 (2000-1500 BP), T2 (1500-1000 BP), T3 (1000-500
BP), and T4 (500-150 BP). The period proposed for the LCO/LIA transition is also
indicated in the diagram. The geographic distribution of sites according to founding date
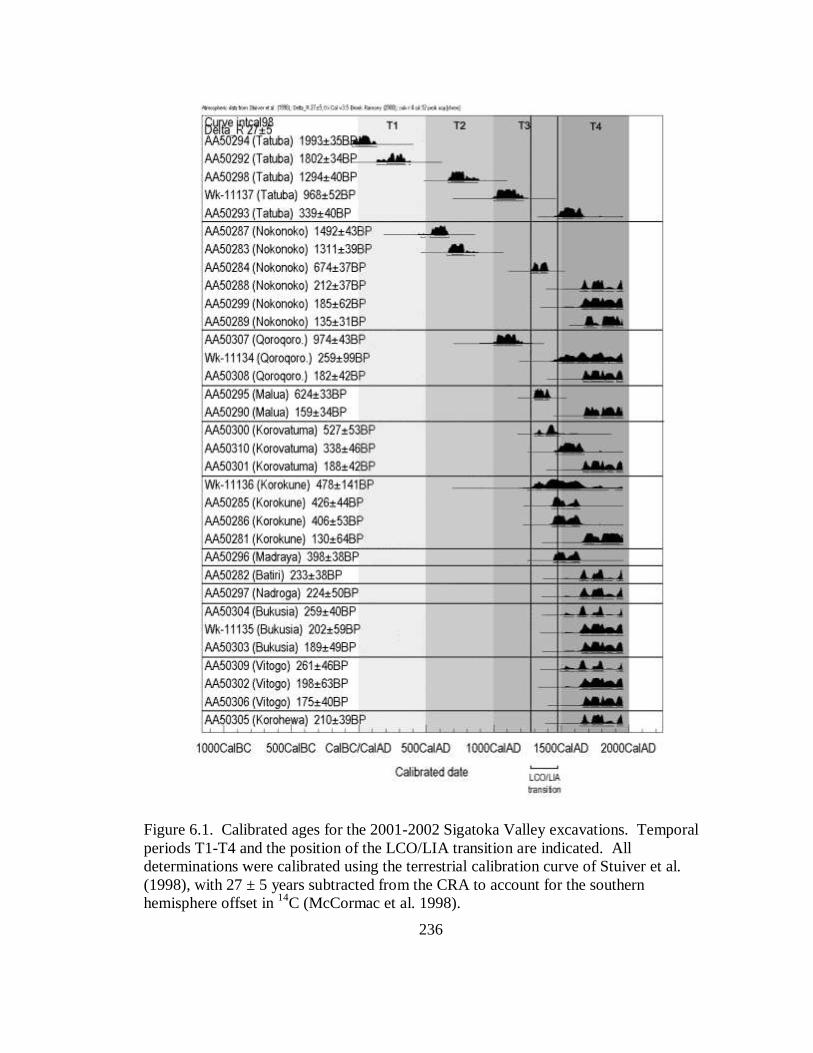
236
Figure 6.1. Calibrated ages for the 2001-2002 Sigatoka Valley excavations. Temporal
periods T1-T4 and the position of the LCO/LIA transition are indicated. All
determinations were calibrated using the terrestrial calibration curve of Stuiver et al.
(1998), with 27 ± 5 years subtracted from the CRA to account for the southern
hemisphere offset in 14
C (McCormac et al. 1998).

237
and assignment into one of four temporal periods is displayed in Figure 6.2. Based upon
these results and the results of environmental analyses in the Sigatoka Valley, three
general trends in strategies of habitation and subsistence are identified: 1) the
establishment of territorial fortifications and refuges in association with resource
variation; 2) relocation to environmental refuges during periods of disturbance; and 3) the
emergence of constructed fortifications and undefended production sites as a factor of
population growth and/or increased social integration. The following sections discuss
each of these trends in turn, and evaluates them according to the expectations outlined in
the evolutionary ecology model.
The Establishment of Territorial Fortifications and Refuges
The earliest occupation in the Sigatoka Valley occurred at Tatuba Cave between
Cal BC 20 and Cal AD 80. GIS-based environmental analyses demonstrate that Tatuba
Cave is located within a region that had moderately high soil fertility, and which also
experienced a moderate dry season. In addition, Tatuba Cave had immediate access to
small tracts of land suited to dryland cultivation, and was also within a few kilometers of
much larger expanses of alluvial terraces suitable for vuci construction and dalo
cultivation. Of note, the site is located within Zone 2, but a substantial portion of its
resource base is located in Zone 1. Although Zone 1 would have been susceptible to
flooding and drought during severe ENSO cycles, the surrounding region was generally
buffered against extreme climatic phenomena. Thus, Tatuba Cave meets the expectations
of the evolutionary ecology model in that it represents an early occupation (period T1) in
an area that would have been most desirable in terms of productivity, predictability, and

238
Fig
ure
6.2
. T
he
dis
trib
uti
on o
f ea
rlie
st o
ccupat
ions
for
each
exca
vat
ed s
ite
acco
rdin
g t
o t
empora
l per
iod.

239
aversion to loss. As populations were undoubtedly small during the earliest period of
occupation, the initial use of the site as a fortification is unlikely. However, it would have
provided a natural fortification if the need arose, and archaeological investigation suggest
that this was the case ca. AD 1200. Thus, Tatuba Cave also meets the expectations of the
evolutionary ecology model in that it represents the application of a strategy of
territorialism associated with dense and predictable resources. The size of the entire
Tatuba Cave locale (area, and also number of yavu and architectural features) also
suggests that the area remained desirable as an occupation site during the following two
millennia (T1-T4), and the strategy of territorialism persisted in the region.
Similarly, the sites of Nokonoko and Qoroqorovakatini suggest an association
between the founding of territorial strongholds and refuges as a response to dense and
predictable resources and environmental shortfalls. Both of these sites consist of remote
and naturally defended peaks that are over 240 m above the valley bottom, and contain
complex archaeological features and deposits of substantial antiquity. Nokonoko was
established as early as the 6th century AD (1492 ± 43 years BP, or T1) and
Qoroqorovakatini was constructed several centuries later (974 ± 43 years BP, or T2). In
the case of Nokonoko, the range of dates, the high frequency of yavu, and also the deep
middens of clamshell and ceramics suggest that the site was occupied throughout the
prehistoric period. Thus, this site most closely represents a territorial stronghold that was
occupied year-round. In contrast, Qoroqorovakatini contains deposits that indicate
episodic occupations, hence the site may represent a combination of remote refuge and
territorial stronghold.
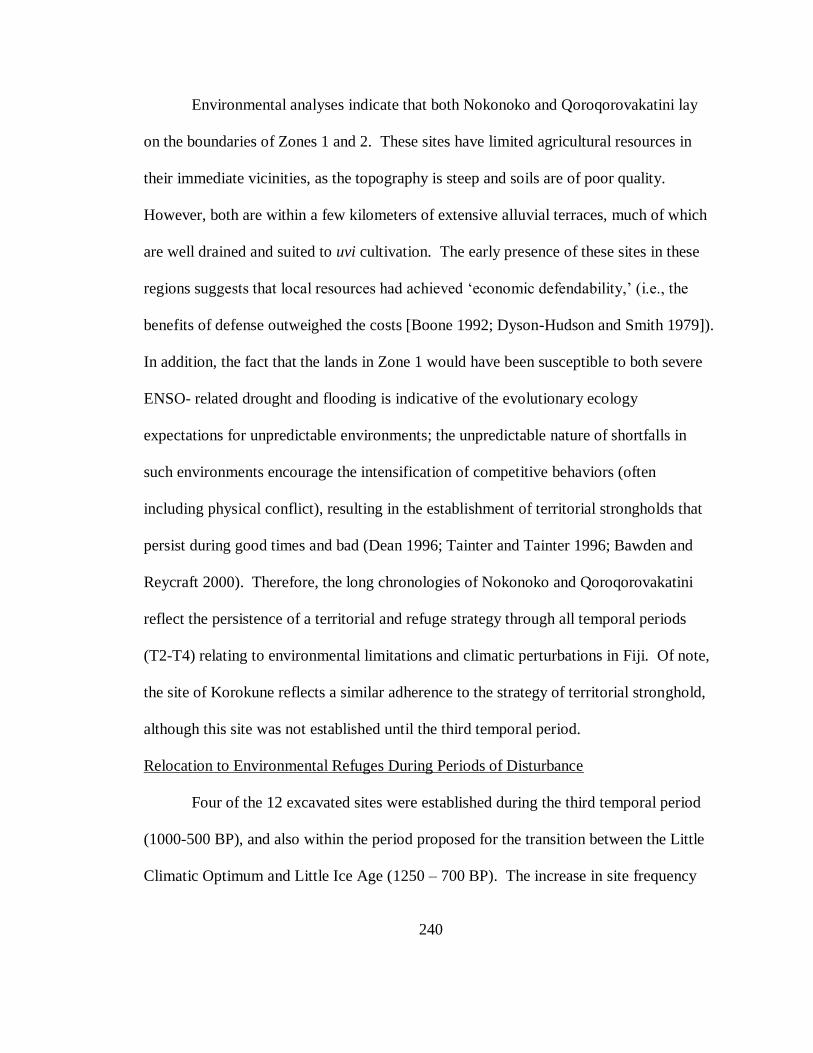
240
Environmental analyses indicate that both Nokonoko and Qoroqorovakatini lay
on the boundaries of Zones 1 and 2. These sites have limited agricultural resources in
their immediate vicinities, as the topography is steep and soils are of poor quality.
However, both are within a few kilometers of extensive alluvial terraces, much of which
are well drained and suited to uvi cultivation. The early presence of these sites in these
regions suggests that local resources had achieved ‘economic defendability,’ (i.e., the
benefits of defense outweighed the costs [Boone 1992; Dyson-Hudson and Smith 1979]).
In addition, the fact that the lands in Zone 1 would have been susceptible to both severe
ENSO- related drought and flooding is indicative of the evolutionary ecology
expectations for unpredictable environments; the unpredictable nature of shortfalls in
such environments encourage the intensification of competitive behaviors (often
including physical conflict), resulting in the establishment of territorial strongholds that
persist during good times and bad (Dean 1996; Tainter and Tainter 1996; Bawden and
Reycraft 2000). Therefore, the long chronologies of Nokonoko and Qoroqorovakatini
reflect the persistence of a territorial and refuge strategy through all temporal periods
(T2-T4) relating to environmental limitations and climatic perturbations in Fiji. Of note,
the site of Korokune reflects a similar adherence to the strategy of territorial stronghold,
although this site was not established until the third temporal period.
Relocation to Environmental Refuges During Periods of Disturbance
Four of the 12 excavated sites were established during the third temporal period
(1000-500 BP), and also within the period proposed for the transition between the Little
Climatic Optimum and Little Ice Age (1250 – 700 BP). The increase in site frequency

241
during this period suggests significant population growth between periods T1 and T3.
More importantly, the location of three newly founded habitations in Zones 2 and 3
suggests the development of a new strategy of habitation and subsistence that is directly
related to environmental disturbance. In particular, the environmental conditions
surrounding these sites, their topographic positions in remote drainages, and also the
presence of faunal material indicating a diversified resource base, are suggestive of a
distinctive and new settlement pattern focused on environmental buffering.
Malua, and Korovatuma (and perhaps also Bukusia) are emblematic of this new
trend. Both were established between AD 1300-1630, and are located atop dramatic
outcrops that provided natural defense. The surrounding lands were of moderate quality
but extraordinarily rugged. Cultivation of dalo was certainly possible, but the arable land
was restricted to ‘pocket gardens,’ (i.e., small isolated patches along minor creeks).
Neither site had access to the large tracts of alluvial deposits that were available in earlier
periods (e.g., Nokonoko, Tatuba Cave, and Qoroqorovakatini). However, environmental
analyses place these sites within Zone 2, which indicates that the resource base
surrounding these sites would not have been affected by severe drought or a reduction of
soil moisture due to sea-level fall predicted for the LCO/LIA transition. Unlike
significant portions of the valley bottom (Zone 1), cultivation of dalo and uvi in Zones 2
and 3 would have continued as normal. The timing of the founding of the sites, as well as
quality of the surrounding environment, strongly suggest that these new habitations
represent a strategy of environmental refuge relating to the effects of the LCO/LIA
transition.

242
It is important to note that these sites vary greatly in size and complexity: the sites
of Malua, Bukusia, and Korovatuma each contain a large number of mounds and
architectural features, while the site of Madraya is rather modest by comparison. This
suggests that settlement patterns during the LCO/LIA transition employed both long-term
and short-term occupations, and that population densities may have varied greatly across
the landscape. Moreover, archaeological deposits indicate that subsistence regimes
broadened to include tiny riparian snails and fish, and also incorporated marine and
riparian foods that were acquired from long distances (e.g., over 40 km). In addition, two
of the more ancient sites in the valley, Tatuba Cave and Nokonoko, were refurbished with
fortifications and occupations at this time. Cumulatively, these data suggest that the
LCO/LIA transition encouraged populations to optimize in a new way: 1) less investment
in large but risk-laden agricultural surplus, and increased focus on temporally stable
resources; 2) variable patterns of population aggregation and dispersal, perhaps coupled
with mobility; 3) diversification of the resource base; and 4) exchange or travel for non-
local food items.
According to Dyson-Hudson and Smith’s model of resource distribution
(1979:26), the LCO/LIA transition period may represent a period during which Zone 1
switched from a region typified by dense and predictable resources, to a region of
unpredictable and scarce resources. Thus, strategies of mobility, exchange,
diversification, and storage may have emerged (or increased in frequency) as populations
sought to adapt to a less productive environment (Halstead and O’ Shea 1989; Cashdan
1990; Rosenberg 1998). Cooperative strategies, such as the formation of work groups

243
and food sharing between relatives is also expected to increase in frequency. However, it
is important to note that competition (as evinced by the use of naturally defended locales
and refurbishment of sites with constructed features) also dates to this period. This
reflects the continued emphasis on territorial integrity, and perhaps increased rates of
conflict between populations that have access to a more stable resource base, and
populations that resort to mobility or relocation due to shortfalls in their home territories.
In this instance, the coarseness of the evolutionary ecology model does not allow for the
determination of a more resolute explanation.
Constructed Fortifications and Undefended Production Sites
The final phase of Sigatoka Valley prehistory (period T4) witnessed the
persistence of previously established strategies (territorial strongholds, remote refuges,
and environmental refuges), and also the emergence of a new form of fortification on the
valley bottom: villages surrounded by a constructed moat and ditch. The sudden
appearance of this kind of fortification suggests the diffusion of new ideas concerning
defensive construction, and also an increasingly large population. The sites of Vitogo
and Bātiri are a case in point. Both of these sites were constructed between 260-150 BP
and are of the ‘ring-ditch’ type; (i.e., protected with an annular ditch, bank, and palisade).
Unlike previous centuries, these villages did not make use of any topographical features
for defense, but were located within swampy, riparian environments that would have
been prime locations for growing dalo. The size of annular ditch and bank construction
for these sites suggests a significant investment and labor pool: in the case of Bātiri, the
ditch was 10 m wide with a circumference of 390 m. This is a marked difference from

244
the fortifications of previous centuries, which employed naturally fortified positions that
required minimal initial investment, and which also did not require a sizeable population
for defense or construction tasks. Therefore, the restriction of manufactured fortifications
in the latest period is almost certainly a factor of population size, and perhaps also related
to the transmission of this innovative design throughout Fiji in the late prehistoric period.
The emergence of undefended habitation sites in the valley bottom may also be
related to population growth, and perhaps the integration of small communities with
larger territorial strongholds. The sites of Nadrogā and Korohewa are representative of
this strategy. These habitations were of small size, late age, and were located on the
valley bottom. No visible defenses were encountered at Korohewa, and only a modest
wall unrelated to defense was present at Nadrogā. The lack of defenses at these sites
breaks nearly two millennia of tradition for the Sigatoka Valley; for the first time,
villages did not employ topography as the first line of defense against invaders. This
omission strongly suggests that these populations were integrated with regional centers,
or were protected by another form of defense-- armed warriors. Moreover, the presence
of undefended habitation sites may be related to cooperative strategies that were
established during the establishment LCO/LIA transition. In this case, undefended
settlements may have been linked to fortifications maintained by close relatives.
It is also important to note that architecture relating to social divisions (i.e., the
extensive retaining walls and division of high conical mounds from lower square mounds
at the site of Nadrogā, or the monumental Mounds 1, 2, and 28 of Nokonoko) appear to
have only been constructed in the Sigatoka Valley in the latest temporal period. It has

245
been suggested from reference to historical documents that high mounds and spatial
divisions within settlements are indicative of Fijian social structure (Best 1984:661-662).
The fact that these features date to the latest temporal period and are associated with the
intensive settlement of the valley bottom suggests that social divisions became more
important after 500 BP. This may also suggest that the transition from isolation
(habitation on distant mountain peaks) to integration (habitation on the accessible surface
of the valley floor) encouraged portions of the population to communicate elite status
(Wobst 1977, Hegmon 1992). Alternatively, Boone (1992) suggests that social
hierarchies emerge as strategies that reduce the variance in individual harvest rates, but
only occur if emigration or dispersal to a less populated area is not an option.
Archaeological data that are currently available for the Sigatoka Valley can neither
confirm or reject these hypotheses. However, the linkage between constructed
fortifications and a larger population size by the latest temporal period seems certain.
Lastly, the location of constructed fortifications and undefended production sites
was restricted to Zones 1 and 2, in particular the lower elevations and valley bottom.
Although these settlements were established after the LCO/LIA transition period, the
populations of this period were undoubtedly affected by moderate and severe ENSO-
related floods and droughts. However, the populations may have responded by simply
moving to a new locale and constructing a new fortification (or, residing in a regional
stronghold for a short duration). Undefended production sites were probably less
common, or were occupied for shorter periods.

246
6.2 Implications from Other Chronological and Environmental Analyses
This general chronological sequence is confirmed by observations generated by
Dickinson et al. (1998), who concluded from geoarchaeological analyses that the Sigatoka
Dunes (located at the mouth of the Sigatoka River) developed in response to massive
erosional events in the Sigatoka drainage. Dating of deposits at the dunes and also the
nearby Nadrala swamp (Hope et al. 1999) suggest that erosion in the interior began ca.
1600 BP (period T1), and continued in earnest until 700 BP (period T3). In addition,
recent research on charcoal horizons in the Sigatoka Valley (Nunn and Kumar 2003)
indicate that burning events ostensibly associated with slash and burn agriculture occurred
in the upper valley between 2900 and 2500 BP (prior to T1), and again between 300 and
465 BP (period T4). These dates also match the sequence of occupations and population
growth proposed for the Sigatoka Valley, and provide another indication of population
dispersal into the more remote drainages in periods T3 and T4.
6.3 Predictions for the Entire Sigatoka Valley Sample
Figure 6.3 provides a summary diagram of the trends identified and described
above. This diagram is based solely upon the 12 excavated sites, and thus represents a
hypothesis for the distribution of each habitation/subsistence strategy across temporal
periods and environmental zones. However, the frequency of Sigatoka Valley sites
associated with each strategy within each temporal period remains unknown. The
following section describes the extrapolation of these strategies to the full archaeological
record of the Sigatoka Valley. This analysis allows for the examination of strategy
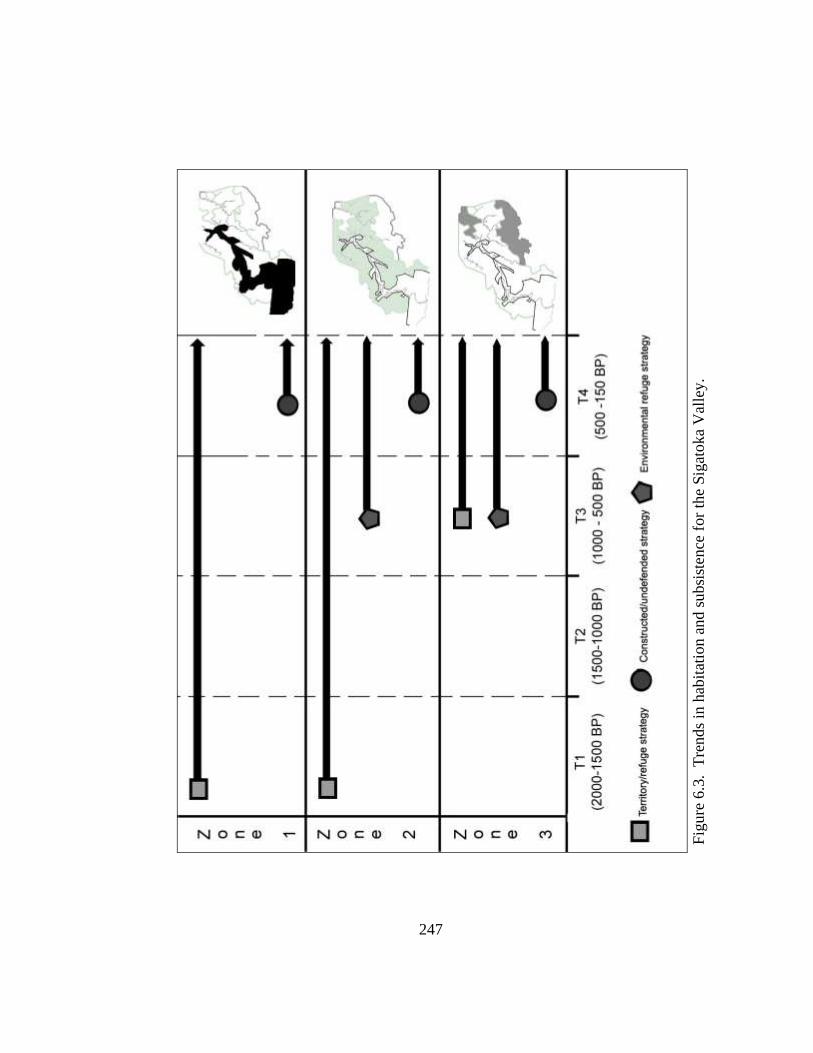
247
Fig
ure
6.3
. T
rends
in h
abit
atio
n a
nd s
ubsi
sten
ce f
or
the
Sig
atoka
Val
ley.

248
distributions and frequencies. In addition, the inclusion of defensive, defended
production, and production classifications that were outlined in Chapter 4 allow for more
concise assessment of settlement patterns between territorial strongholds, refuges, and
production sites. Nearest neighbor analyses are used to measure the distribution of sites
associated with different strategies, and assess the relative degrees of dispersal, clustering,
and population size. Although this method does not adequately indicate the effects of
topography and elevation on direct distances, it does provide a rough index of
distributions and patterns.
6.4 Prediction 1: Establishing Territories (Proposed for 2000-1500 BP)
The topographic situation, environmental conditions, and cultural features of the
sites of Tatuba Cave and Nokonoko provide criteria by which early occupations may be
identified in the archaeological record. In this case, sites that were within close proximity
to high yield agricultural resources, and either naturally fortified, or fortified with both
natural and constructed defenses, were included in the sample that defined Prediction 1.
These criteria seek to incorporate sites that were positioned to be both fortified and
associated with dense and predictable resources, as observed for Tatuba Cave. In
addition, sites that had 20 or more yavu, and which were fortified with both natural and
constructed fortifications, were included as well. These sites are likely to have had a long
history, and thus are a candidate for inclusion in Prediction 1. Twenty-one out of a total
of 384 sites (5.4%), are identified. Figure 6.4 reveals that the majority of these habitation
sites are scattered throughout Zone 1 and include the fortifications in proximity to the
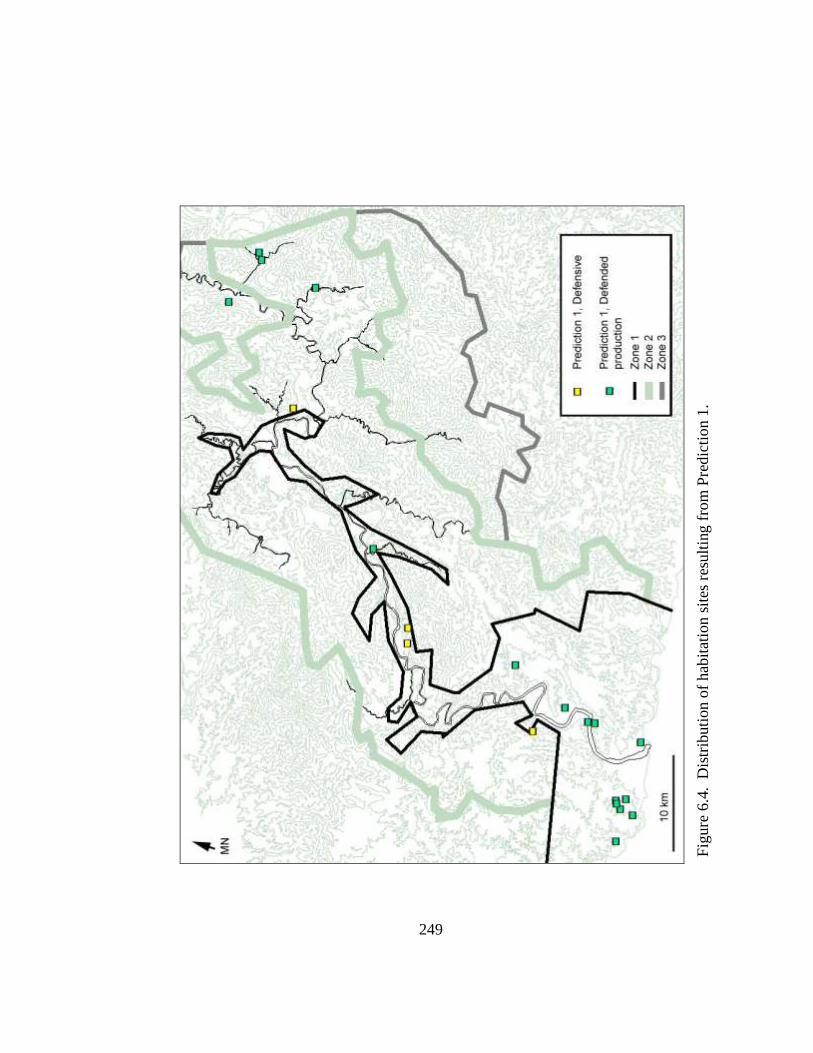
249
Fig
ure
6.4
. D
istr
ibuti
on o
f hab
itat
ion s
ites
res
ult
ing f
rom
Pre
dic
tion 1
.

250
Lapita site of Sigatoka Dunes, as well as the historically known sites of Tavuni and
Lomolomo. In addition, a handful of sites occur in association with the irrigated terraces
of the northernmost part of Zone 2. Overall, the distribution of sites in Prediction 1
suggests that early occupation in the Sigatoka Valley extended all the way from the delta
to the headwaters, but was primarily focused in the delta region.
The variation in color in Figure 6.4 also reveals the different defensive and
production strategies that were previously identified for these habitation sites. Eighty
percent of the habitation sites are associated with a defended production strategy (dp), and
20% a purely defensive strategy (d) (Table 6.1). The distribution of these sites across the
environmental zones suggests that this ratio remains fairly stable across space. However,
nearest neighbor analyses indicate that the average distance between defensive sites and
defended production sites (d to dp) is twice that of the distances between defended
production sites (dp to dp). These distributions suggest that during the earliest period in
the prehistory of the Sigatoka Valley, populations established a pattern of residing in
territorial strongholds, yet also invested in refuges that were several kilometers away.
The average distances between sites (4 –8 km) also indicates that populations were widely
dispersed during this period.
6.5 Prediction 2 : Territories and Persistent Competition (1500 – 150 BP)
Prediction 2 serves as a category for the strategy of production and defense that
was present in all periods following the initial establishment of fortifications in the
Sigatoka Valley. Essentially these habitation sites represent a strategy of territorialism,

251
Table 6.1. Frequencies and nearest neighbor distances for defensive (d), defended
production (dp), and production (p) strategies amongst the four predicted strategies.
Prediction 1
Zone 1 Zone 2 Zone 3
13 dp (86%) 3 dp (60%) 1 dp (100%)
2 d (13%) 2 d (40%)
Analyses Average Nearest Range
d to dp 8.25 6.14-10.47
dp to dp 4.7 .69-15.83
Prediction 2
Zone 1 Zone 2 Zone 3
39 dp (79%) 12 dp (33%) 2 dp (50%)
7 d (14%) 23 d (63%) 1 d (25%)
3 p (6.1%) 1 p (2.7%) 1 p (25%)
Analyses Average Nearest Range
d to dp 1.83 .74-3.86
d to p 2.98 1.52-4.05
d to d 3.55 1.11-10.12
dp to dp 2.14 .83-10.56
dp to p 3.35 .82-5.86
p to p 13.21 5.64-19.31
Prediction 3
Zone 1 Zone 2 Zone 3
10 dp (52%) 14 dp (23.7%) 1 dp (20%)
5 d (26%) 44 d (74.5%) 3 d (60%)
4 p (21%) 1 p (1.6 %) 1 p (20 %)
Analyses Average Nearest Range
d to dp 2.08 .9-3.88
d to p 5.5 1.48-12.10
d to d 2.02 .86-6.10
dp to dp 3.80 1.01-11.05
dp to p 5.45 3.37-7.95
p to p 14.2 11.04-16.71
Prediction 4
Zone 1 Zone 2 Zone 3
75 dp (52.4%) 20 dp (46.5%) 6 dp (60%)
12 d (8%) 1 d (2%) 0 d (0%) 56 p (39.1%) 22 p (51.1%) 4 p (40%)
Analyses Average Nearest Range
d to dp 2.03 .83-5.02
d to p 2.68 .79-7.25
d to d 3.34 .83-11.69
dp to dp 1.81 .66-4.35
dp to p 1.92 .63-7.2
p to p 1.90 .5-7.84

252
and they had variable access to high, moderate, and low yield resources, and were located
atop mountaintops or within the valley proper. They were not necessarily associated with
buffering strategies, or social networks, thus their distributions need not be restricted to
either mountain areas or the valley bottom. The distinguishing characteristic of
Prediction 2 is the employment of defense, either constructed, natural, or a combination
of the two. Thus, adherents to this strategy may date to shortly after the initial occupation
of the interior, to a few years before the Little War of 1876. The fact that Prediction 2
spans such a long period of time is very problematic for the analysis of population and
population distribution, however it does provide for very general observations of the
distribution of territorial strategies in space.
With those criteria in mind, 89 (23%) of the sites in the Sigatoka Valley were
identified as potential members of the Prediction 2 class, and they are nearly equally
distributed between Zones 1 and 2. As detailed in Figure 6.5, these sites were distributed
atop the hills and ridges above the valley proper, and in some cases hidden in remote
drainages or distant peaks. Defended production sites are more common in Zone 1 and
Zone 3, while defensive sites are more common in Zone 2. Nearest neighbor analysis
indicates that the distances between defended production, defensive, and production sites
are all in the range of 2.5-3 km, although distances between purely defensive sites are
slightly further, around 3.5 km. These distributions suggest that populations utilizing a
strategy of territorial stronghold are regularly spaced, and in general are distributed fairly
evenly across the valley and the 3 environmental zones. Only the sites that would have
been focused on production are dispersed, with average distances of 13 km.

253
Fig
ure
6.5
. D
istr
ibuti
on o
f hab
itat
ion s
ites
res
ult
ing f
rom
Pre
dic
tion 2
.

254
6.6 Prediction 3: Buffering Against Shortfalls (730-525 BP)
The refuge sites of Malua, Madraya, Korovatuma, and Bukusia provide the
characteristics for Prediction 3. As described in section 6.1, the occupants of these sites
sought to buffer against environmental shortfalls by moving to mountain areas and
shifting subsistence from expansive cultivation of uvi, to smaller, more stable patches of
dalo and other diverse foods. This strategy privileges the use of natural defense, in
particular remote refuges, that were often associated with springs or other subsistence-
related resources. Thus, the predictive criteria sought to include sites that were located on
land that was steep or precipitous, and/or also located in regions had very weak dry
seasons, and/or were relatively unaffected by the perturbances of ENSO and the
LCO/LIA transition (AD 1270-1475) (i.e., Zones 2 and 3).
The resulting analysis identifies 79 sites out of a total of 384 (20.6%) that were
likely associated with buffering strategies of the character of Prediction 3. As revealed in
Figure 6.6, sites are predominantly located in Zones 2 and 3, although there are a small
number scattered along the edges of Zone 1, and along the coastline. According to the
lack of expansive agricultural resources associated with these sites, nearly 60% are
classified as purely defensive. Although they match some the characteristics identified
for refuges in earlier periods, they likely contain archaeological deposits indicative of a
diversified diet and/or exchange. Of note, the distribution of sites, as well as their
number, suggests that populations were more dispersed during this period, averaging
distances of 3.80-5.45 km between habitations.

255
Fig
ure
6.6
. D
istr
ibuti
on o
f hab
itat
ion s
ites
res
ult
ing f
rom
Pre
dic
tion 3
.

256
6.7 Prediction 4: Constructed Defenses and Production in the Valley Bottom (500 –
150 BP)
The character and chronology of the sites of Korohewa, Bātiri, Nadrogā, and
Vitogo allowed for the definition of Prediction 4. These habitation sites did not take
advantage of natural features for defense, and were located in flat, alluvial areas that
allowed for immediate access to arable land. In instances where habitation sites were
fortified, they employed an annular ditch and bank system. These criteria seek to
incorporate populations that were focused on production, and which employed
constructed defenses in their habitations to maintain access to cultivation areas. As
described in section 6.1, these populations may have relied upon armed warriors, or have
been associated with a nearby fortress, as part of a defensive strategy. The resulting
assemblage suggests that this strategy had the highest frequency of adherents: 196 out of
the total of 384 habitation sites (51%).
The distribution of Prediction 4 across the Sigatoka Valley is largely restricted to
Zone 1, and the bottomlands of some of the major tributaries in Zone 2 (Figure 6.7). The
sites are very densely clustered, and in terms of proximity are regularly spaced, averaging
distances of 1.81-2.0 km. Unlike previous predictions, the number of habitation sites that
utilize some kind of defense are roughly equal in number to sites that are undefended.
This suggests that that populations were fragmented into smaller groups, but generally in
close association with each other. The density of sites may also indicate that populations
were more mobile, and habitations represent only short-term, expedient constructions.
Nearest neighbor analyses indicate that production sites are extremely dense, and average
1.9 km distances from one another (p to p).
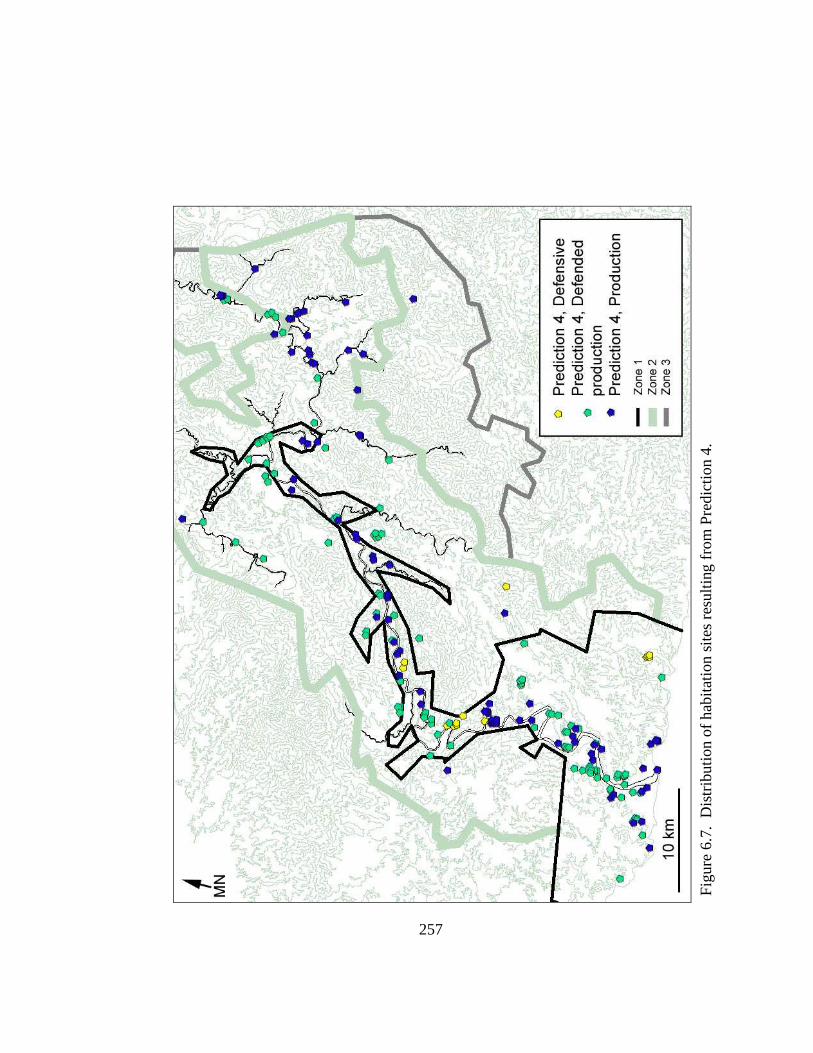
257
Fig
ure
6.7
. D
istr
ibuti
on o
f h
abit
atio
n s
ites
res
ult
ing f
rom
Pre
dic
tion 4
.

258
6.8. The Costs and Benefits of Competition
The results of the analyses above suggest that populations employed fortifications
as both full-time habitations and refuges throughout the prehistoric period. In terms of
costs and benefits, the persistence of this strategy through time and across temporal
periods is highly indicative of its utility, and also its general success as a means by which
populations could obtain and maintain access to resources during times of environmental
disparity. The preference for natural defenses, especially in the first through third
temporal periods, suggests that populations either lacked the necessary labor to construct
artificial fortifications, or had yet to develop (or be exposed to) artificial fortification
designs.
The frequency and distributions of both fortifications and refuges in the earliest
temporal period (2000-1500 BP) suggests that populations were both small and dispersed,
and distributed evenly throughout the valley. However, the extrapolations described
above suggest that more regular spacing of populations began to develop between 1500-
1000 BP, especially within Zone 1. These patterns suggest a gradual trend in population
growth and expansion, resulting in the gradual ‘filling’ of the valley bottom and foothills
with new fortifications and territorial boundaries. It also suggests that a climate of
competition and conflict was not detrimental to population growth. However, the number
of habitation sites in the upper portions of the valley suggests that growth was slower in
this region.
The gradual nature of population expansion appears to end in the third temporal
period (1000-500 BP), at which point populations abruptly expanded into Zone 2 and the

259
upper reaches of the valley. Thus, period T3 represents a second period of dispersal, in
which a much larger population relocated to previously uninhabited environments or less
populated regions of the valley. Instances of aggregation and mobility also served to
distribute populations unevenly throughout the landscape during this period. At this
point, the traditional mode of fortification in Zone 1 became too costly, and populations
sought more stable modes of subsistence in other parts of the valley.
The final temporal period is typified by a second surge in population growth (as
evinced by fortification frequency) and a third relocation to the valley bottom. In this
period a more labor-intensive form of fortification was employed. The multitudes of
these sites in close proximity to one another suggests that populations were of large size,
and did not longer require topographic defenses in order to insure control over
agricultural areas. These habitations may have been allied with a much larger regional
center, or perhaps were able to defend themselves with armed warriors. In either case, the
close proximity of habitations suggests a population that was more integrated.
In sum, these analyses suggest general trends in population growth, distribution,
and strategies of subsistence and habitation. However, there are indications for regional
variations in these trends, and the examination of these data are the subject of the
following chapter. Most significantly, these data suggest that the populations of the
valley were of different sizes, had diverse origins, and employed cultural traditions that
were unique to particular regions. These data also suggest that different modes of
competition (including conflict, invasion, and conquest) and cooperation (including food

260
sharing and exchange) occurred at varying rates throughout the valley. The analysis of
the trends provides a fuller picture of the prehistory of the Sigatoka Valley.
6.9 Chapter Summary
The results of 12 excavations conducted in the Sigatoka Valley allow for the
generation of three general trends in habitation and subsistence: 1) the establishment of
territorial fortifications and refuges in association with resource variation; 2) relocation to
environmental refuges during periods of disturbance; and 3) the emergence of
constructed fortifications and undefended production sites as a factor of population
growth and/or increased social integration. The earliest occupations in the Sigatoka
Valley (2000-1500 BP) were established in association with dense and predictable
resources of Zones 1 and 2, and also utilized a strategy of territorial stronghold and
remote refuge. The effects of periodic droughts and floods associated with ENSO served
to perpetuate a climate of competition, and encouraged the persistence of the
fortification/refuge tradition throughout the prehistoric sequence. The general success of
this strategy fostered population growth, and the landscape (especially Zone 1) gradually
filled between 1500 and 1000 BP, creating a pattern of regularly spaced fortifications.
Resettlement of the valley occurred during the third temporal period (1000-500
BP) which coincides with the onset of the LCO/LIA transition. The relocation to remote
fortifications in Zone 2, coupled with archaeological evidence for a diversified
subsistence base, suggest that populations sought to escape the loss of productivity that
occurred in the valley bottom. Population levels remained high during this period, but

261
habitations were relatively dispersed and varied in size and complexity. In the final
temporal period (500-150 BP), the valley bottom was resettled with constructed
fortifications (i.e., the annular ditch and bank form of fortification). The frequency of
sites in Zone 1, as well as their close proximity, suggest that populations were larger and
more integrated than previous periods.

262
CHAPTER 7. COMPETITIVE AND COOPERATIVE STRATEGIES: REGIONAL
VARIATIONS
The general chronology presented in the previous chapter suggests that three
trends in habitation and subsistence are identifiable the archaeological record for the
Sigatoka Valley: 1) territorial fortifications and refuges; 2) environmental refuges; and 3)
constructed fortifications and undefended production. These trends occur with varying
frequency across the different environmental zones of the valley, and also demonstrate
temporal distributions of long and short duration. The following analyses trace
alternative indices of competition and cooperation that are particular to certain regions.
In addition, regional trajectories of competition and cooperation are identified that pertain
to the influence of environmental factors, and also the presence of particular social
groups. Analyses include an evaluation of patterns of land tenure, a survey of the
distribution of architectural elements, and a survey of exchange items. The results
suggest differences in both the frequency and mode of competition and cooperation
between the delta and upper reaches of the Sigatoka. Further elaboration on this division
is presented in Chapter 8.
7.1 Detecting Regional Variation I: Competition and Cooperation via Social Data
Social data pertaining to land tenure has the potential to provide a valuable
avenue of research into the prehistory of competition and cooperation in Fijian
prehistory. In modern Fiji, social relations are often conditioned by membership in two
hierarchical levels of patrilineal relations—the yavusa, or ancestral lineage, and the
mataqali, the family lineage. A yavusa consists of several mataqali, which are

263
themselves descendents of the original yavusa founder. Additionally, within each
mataqali are smaller social units, called mbito, which consist of closely related families
that acknowledge the same relative as their head (Capell and Lester 1941; Nayacakalou
1955). Anthropological literature describes kinship configurations such as these as
‘unilineal descent groups’, as they trace all ancestry through a single parent lineage.
Nayacakalou (1955), Parry (1977), and Belshaw (1964), indicate that this kinship system
has a direct relevance to land occupancy and tenure, as the structure of the system
mandates that land is passed down through the male line, and title remains under the
control of the mataqali. In addition, the Fijian kinship system is hierarchical in nature;
each yavusa has a founding (or eldest brother) mataqali, and all other mataqali are
considered to be later branches off of the founding core group (Nayacakalou 1965, 1978).
Modern Fijian anthropology suggests that social controls that are part of the hierarchical
nature of the yavusa system, and cultural values such as the importance of age and
seniority, reciprocity, food sharing, and sibling cooperation, serve to monitor the extent to
which conflict occurs between mataqali of the same yavusa (Nayacakalou 1978:13-14;
Ravuvu 1983:8-12).
Anthropologists posit that unilineal descent systems are one of the most
temporally stable organizations in human societies. Importantly, groups often persist
when they are engaged in a form of group property or obligation, such as ownership of
indivisible land, the construction of intensive agricultural systems, or village-wide
defensive systems, or service in a particular organization (Fox 1967; Holy 1996).
Although individuals and families may own specific parcels of land, the descent group is

264
the primary claimant for all properties, and is responsible for the creation of public
works. These generalizations suggest that the extent of land-claims in the Sigatoka
Valley may be indicative of the history of particular lineages. In particular, the
configuration of land-claims may divulge the impact of competitive and cooperative
strategies on prehistoric populations, and perhaps trace the character and frequency of
interaction between related and unrelated unilineal descent groups. In the context of
evolutionary ecology, it is expected that cooperation will be more frequent amongst
mataqali of the same yavusa, as these people would have regarded themselves as related.
Contrariwise, the boundaries between yavusa are also suggestive of competitive
boundaries, between which cooperative strategies would have passed less frequently.
The Distribution of Mataqali and Yavusa
The first documentation of patrilineal descent groups in the Sigatoka Valley
occurred in the years following the Little War (1876), when members of the Colonial
government installed a governor in the region to oversee the native inhabitants. Data
pertaining to land tenure was recorded 40 years later (1912-1916), when the Native Lands
Commission funded a series of surveys in the Sigatoka Valley. These maps and their
indices detail the holdings of particular families, and most significantly, their
membership within particular mataqali and yavusa. Using a digitizer and the database
capabilities of the GIS, the enormous quantity of data provided by these maps were
transformed into a single digital representation, using the parcels owned by particular
families or mataqali as the fundamental units. This digital map was then linked to a
database that contained the mataqali and yavusa affiliation for each parcel. Analyses

265
within the GIS reveal that by 1912 the Sigatoka Valley was divided into 379 parcels.
One hundred and twenty-three mataqali, which were members of 66 yavusa, were
recorded as the land-owners. The extent of these land-claims are detailed in Figures 7.1.
and 7.2.
As revealed by the extent of parcel boundaries and the presence of color shading,
Figure 7.1. indicates that the distribution of lands held by mataqali is quite variable
across space, and there is a clear distinction in parcel size between the delta region and
the northern portion of the valley. In general, the lands held by the same mataqali are
only moderately clustered, endowing the map with an intense “patchwork” quality.
However, when the extent of land-holdings by the yavusa, the higher level of the kinship
hierarchy, is displayed, clustering is noticeable (Figure 7.2). This is to be expected, as
the yavusa subsumes the parcels of the mataqali within its own confines.
Cluster Analyses
Cluster analyses based upon relative parcel size and average distances between
parcels reveals that some patrilineal descent groups owned parcels of land that were
clustered closely together, at both the mataqali and yavusa level. On average, clustering
was highest amongst land-parcels owned by yavusa in the upper reaches of the Sigatoka
Valley, and these parcels were also significantly larger than parcels to the southwest and
in the delta region (Figure 7.3). Contrariwise, the yavusa of the delta (including the
westernmost portion of the valley) held smaller parcels that were spread more widely
apart, and rarely directly adjacent to one another. The impact of yavusa clustering and
dispersal is also visible in the distribution of habitation sites (fortified and unfortified)

266
Fig
ure
7.1
. G
IS g
ener
ated
im
age
indic
atin
g t
he
dis
trib
uti
on o
f la
nd
-hold
ings
at t
he
mata
qali
lev
el.

267
Fig
ure
7.2
. G
IS g
ener
ated
im
age
indic
atin
g t
he
dis
trib
uti
on o
f la
nd
-hold
ings
at t
he
yavu
sa l
evel
.

268
Fig
ure
7.3
. D
ensi
ty o
f hab
itat
ion s
ites
com
par
ed w
ith c
lust
erin
g o
f ya
vusa
.

269
across the valley (Figure 7.3). Site density is highest along the valley bottom, where
parcels are of small size. In addition, areas of high site density coincide more often with
moderately and highly dispersed yavusa. This configuration indicates that parcel size and
site density is strongly correlated with the degree of dispersal experience by yavusa in
prehistory.
Environmental and Social Factors
The comparison of yavusa land-tenure claims with the environmental zones
outlined in Chapter 3 strongly suggests that parcel size and yavusa dispersal is correlated
with environmental variability. Figure 7.4 overlays the boundaries of Zones 1, 2, and 3
with the extent of yavusa, yavusa clustering, and also habitation sites. Most notable is the
distribution of small parcels within the confines of Zone 1. Chapter 3 identified this zone
as a region high productivity (e.g., extensive alluvial deposits for the cultivation of uvi),
and also a region that was prone to extreme fluctuations as a product of seasonal and
ENSO related droughts and floods. In contrast, the boundaries of Zones 2 and 3, which
were identified as more rugged but with lower frequencies of environmental fluctuations,
contain a higher proportion of densely clustered yavusa, and also much larger parcels.
Evolutionary ecology and social theory suggest that higher frequencies of competitive
strategies, in particular group fission and invasion, are the most likely explanation for
these distributions. Specifically, kinship studies suggest that spatially dispersed unilineal
descent groups are indicative of instances of group fission, invasion, or population
decrease in prehistory. This is due to the fact that unilineal descent groups often face a
demographic problem—if land is limited, population growth can result in some lineages

270
Figure 7.4. Overlay of environmental zones with yavusa land-claims. Diagram also
indicates relative clustering of yavusa and density of habitation sites.

271
becoming too large for their land holdings to support. This encourages expansion and
migration, as the youngest generation of the lineage must acquire land from non-related
neighbors. The reverse of this, a lack of lineage members, will create a situation in which
much of the land is underutilized, and thus unprotected from the advances of marauding
neighbors (Fox 1967:153).
In the Sigatoka Valley case, small parcel size and a high degree of yavusa
dispersal in Zone 1 is probably a factor of population growth in the region, and a general
climate of instability fostered by geographic and climatic variation. The high density of
sites amongst the regions that contain the smallest parcels also signifies the increased
frequency of conflict in these areas. Perhaps not coincidentally, oral histories from the
Sigatoka Valley describe a tradition of conquest in the delta, led by a succession of chiefs
that sought to claim larger territories. In particular, the accounts recorded by Nadalo
(1957) describe how chiefs from this area ranged far afield in their conquests, reaching as
far as the Mamanuca islands to the west. In tandem with the environmental conditions
outlined above, these accounts suggest that the process of inter-yavusa conflict in the
delta and middle region of the Sigatoka Valley carved land-holdings into smaller and
smaller parcels.
In sharp contrast, the expansive parcels of the upper reaches of the Sigatoka
Valley, as well as fewer and more dispersed habitation sites, imply that inter-yavusa
competition occurred with less frequency. In addition, the majority of the yavusa-level
land-claims are tightly clustered, which suggests that the inhabitants of these areas were
more able to control large areas, and did not have to rely upon offensive conquest to gain

272
land for new lineage members. Cooperative strategies at the level of the mataqali (e.g.,
food sharing, or work groups associated with intensive agriculture) are also expected to
have occurred with more frequency in this region, as the smaller populations and
clustered nature of land-claims suggests that neighbors were often related to one another.
As outlined by Boone (1992) and also Bowles and Gintis (2003), cooperation between
mataqali of the same yavusa would have provided distinctive fitness benefits for all
participants, in the form of increased yields and reductions in yield variances. Perhaps it
is also unsurprising to note that the location of the largest land-claims in the Sigatoka
Valley also occur in regions that were identified as more environmentally stable (Zones 2
and 3).
Importantly, differences in the length of the prehistoric sequence in the Sigatoka
Valley cannot be identified as causal factors in the density of sites or parcel sizes. As
identified in Chapter 5, occupations in both the upper and lower valley stretch back to
2000 BP and greater (e.g., the Sigatoka Dunes and Tatuba Cave). However, population
size and distribution may have been played a causal role in the instigation of conflict,
particularly in the environmental zones that were the most unpredictable. As indicated in
the analysis of Chapter 6, Zone 1 generally contained the larger proportion of the
population, although there were periods (e.g., T3) where relocation to Zones 2 and 3
effectively dispersed the population throughout the valley. However, in nearly all periods
the very upper reaches of the Sigatoka Valley had a smaller and more dispersed
population. This suggests that decreased rates of competition in this region may be
equally related to environmental stability and a lack of competitors.
273
Yavusa Origins
There are some indications within the land-tenure and kinship data that suggest
that the application of cooperative and competitive strategies was conditioned by the
individual histories of lineages, and their antiquity within the Sigatoka Valley. Research
performed by Gifford (1952) recorded the names of yavusa throughout Fiji, and he also
recorded their yavutu, or the site from which a particular yavusa claims origin. Most
yavusa in Fiji claim a yavutu, and many claim a yavutu in the Nakauvadra mountain
range, located along the northern coast of Viti Levu. Oral histories describe how
populations from these mountains migrated to the various parts of Fiji, possibly between
AD 1500 and 1750, and their descendents are now found throughout the island.
The Sigatoka Valley is unusual in that many of the yavusa do not claim a yavutu
at all. However, the majority of those that do claim a yavutu claim one from the Sigatoka
Valley itself (Figure 7.5). As described in Chapter 5, a small fraction in the upper valley
claim Nakauvadra and Bā descent, while a small group in the delta region claims an
ancestor that originated in Tonga. These groups are known to be intrusive, and also new
arrivals in the valley (ca. AD 1700-1800). Gifford (1952) remarked that the prevalence
for local yavusa in the Sigatoka, as well as those that do not claim an origin site, may
represent an early stratum of the ancient Fijian population. Interestingly, some of the
yavusa identified by GIS analyses as highly clustered also claim Sigatoka Valley origins.
This suggests that those particular yavusa lineages may be of greatest antiquity in the

274
Fig
ure
7.5
. G
IS-g
ener
ated
im
age
indic
atin
g t
he
exte
nt
of
land
-hold
ings
by y
avu
sa t
hat
cla
im l
oca
l
and n
on
-loca
l ori
gin
s.

275
valley, and that these populations were successful at not only maintaining control over a
particular area over a long period, but perhaps were also more successful at integrating
their own populations, and warding off marauding neighbors. In addition, the bulk of the
yavusa that claim local origins also have considerably larger land-holdings.
Undoubtedly, the relations between the mataqali within these yavusa must have included
cooperative strategies of work sharing and food sharing, as a part of group cohesion (i.e.,
Ravuvu 1983).
However, this cooperative integration amongst mataqali of the same yavusa may
not have always been successful, as evinced by the presence of both Nakauvadra and Bā
migrants in the central portion of the upper valley. As identified by both environmental
and archaeological studies, the area that they inhabit is the richest in the region. Oral
histories record that these lands were seized by the Namataku and Keiyasi people ca. AD
1500-1800, which closely tracks the period of disturbance associated with the LCO/LIA
transition (Palmer 1972).
7.2 Detecting Regional Variations II: Yavu Variation and the Distribution of
Monumental and Religious Architecture
Research in the Sigatoka Valley by the author, Palmer (1966, 1971, 1972) Parry
(1987) and also Freeman (1986) has identified the presence of a variety of architectural
features. These can be divided into three categories: house mounds (yavu), monumental
architecture, and religious complexes called naga. The distribution of these features, as
well as variations in form, suggest historical trajectories particular to the upper and lower
portions of the Sigatoka Valley.

276
Variation in Yavu Form and Construction
In the case of yavu, Marshall et al.’s (2000:83) research at the Sigatoka Dunes
suggests that house-mounds (yavu) were not constructed until after AD 1500.
Contrariwise, Best’s research in the Lau Group indicates that, at least in parts of Fiji,
yavu were in use by AD 1000. The Sigatoka Valley data suggest that house-mounds first
appeared in between AD 1300 and 1500, and dramatically increased in frequency and
diversity of form after AD 1600. Palmer (1966) was the first to identify the diversity of
yavu forms in the Sigatoka Valley, and also argued that certain forms could be linked to
specific ethnic and linguistic groups. He noted the diversity of shapes and sizes,
including round, oval, square, and rectangular, and also the employment of stepped ramps
and stone facing. Palmer suggested that yavu shape was determined by the style of house
that was built above it, thus square and round yavu were most likely capped with center-
poled houses (rausina), while rectangular yavu probably served as the foundation for
oblong houses with horizontally positioned roof beams (vāsemasema).
Ethnographic work by Freeman (1986) in western Viti Levu demonstrated that
center-poled houses could also be of oblong shape, and thus employ a rectangular yavu.
In addition, ethnographic research in the lower Sigatoka Valley hinted that oval yavu
were most likely related to Tongan house-building traditions, which employed straight-
sided houses with rounded ends (Gifford 1952; Palmer 1966). These yavu are restricted
to the lower valley, and in context with villages associated with Finau Maile (section
5.11). Contrariwise, historical documents (Gordon 1879; Kleinschmidt 1877) have
indicated that square-mounded, center-poled houses were the most common in western

277
Viti Levu, especially in the highlands and prior to European contact. Round yavu center-
pole houses were most common in the upper valley, and these features were capped with
round rausina-style houses (Clunie pers. comm., in Freeman 1986:9). Freeman has
outlined the causal factors behind house and mound style that have been forwarded in
recent years. These include the availability of building materials, climate variation, and
diverse religious sentiments. However, she also suggests that center-poled houses, in
particular forms that included a center-post, a conical roof structure, and ring-shaped
rafter attachments, are markedly similar to house-building techniques that are restricted to
New Caledonia and the Loyalty Islands (Leenhardt 1930, in Freeman 1986:16-17).
Although archaeological research in Fiji has yet to clearly document the presence
of a distinctive migration of New Caledonians or niVanuatu, distinctive linguistic traits
(Geraghty 1983) and the presence of obsidian in eastern Fiji (Best 2002) provide
evidence for a history of interaction between Fiji and the archipelagoes to the west. The
presence of similar house construction techniques (and not merely yavu form) in western
Viti Levu and New Caledonia is also suggestive of prehistoric contacts, as has been
demonstrated in other studies of technological style (e.g., Cameron 1998; Jordan and
Kaups 1989; Stark et al. 1995). However, the prehistory of New Caledonia has only of
late been assessed in detail (Galipaud 1996; Sand 1996, 1999), and the precise nature and
frequency of interaction between the archipelago and Fiji are unknown.
Figure 7.6 reveals the distribution of yavu styles that have been recorded from the
Sigatoka Valley8. Of note, several of the sites contain a variety of yavu styles, including
round, oval, square, and rectangular. The round and square yavu forms, which have been

278
Fig
ure
7.6
. D
istr
ibuti
on o
f ya
vu f
orm
s, n
aga,
and m
onum
enta
l ar
chit
ectu
re.

279
most securely linked to house construction styles of New Caledonia, do not occur within
habitation sites that are also within the confines of yavusa that claim an origin in the
Sigatoka Valley. If these yavusa are of indeed of greatest antiquity in the Sigatoka
Valley, then the distribution of yavu corroborates the results of archaeological testing at
the sites of Qoroqorovakatini, Malua, and Nokonoko, which suggests that center-poled
house forms were of late prehistoric age (Chapter 5). Alternatively, the distribution of
round yavu forms across lands that did not claim any yavutu (local Sigatoka, Tongan,
Nakauvadran, or otherwise) points to non-Fijian, and possibly New Caledonian ancestry
for the inhabitants of these sites, with their arrival in the Sigatoka Valley region delayed
until the latest phases of prehistory (cf. Gifford 1952).
The Distribution of Monumental Architecture
Significantly, 62% of habitation sites with diverse yavu (square, oval, round, and
rectangular) also contain a high frequency of monumental architecture. These include
elaborate burial mounds (e.g., Nokonoko, Nadrogā), stepped habitation mounds with
enclosed courtyards (e.g., Malua, Tatuba), apex habitations (e.g., Bukusia), and
extremely large meeting houses (e.g., Nokonoko). As identified in Chapter 6, the
emergence of monumental architecture in the Sigatoka Valley occurs between AD 1500-
1875. Changes in modes of defensive settlement during this period (i.e., the transition
from naturally fortified locales to densely distributed constructed fortifications in the
lowlands) in tandem with the occurrence of monumental architecture and a greater
variety of yavu shape is suggestive of integration and perhaps the emergence of social
hierarchy. The scale of monumental constructions in the Sigatoka Valley also points to

280
cooperative interaction within a stratified society. For example, the burial mounds of
Nokonoko and Nadrogā are over 15 m in diameter and 2-3 m high, while the courtyard
and meeting hall of Malua and Nokonoko are over 30 m in length. Although not the most
impressive architectural feats in the Pacific, these features would have required a
significant amount of labor and collaboration to be constructed. The fact that
monumental architecture occurs amongst sites that are diverse in terms of yavu forms
signifies a least a tentative association between the emergence of social hierarchies, and
social integration in the late prehistoric period.
Perhaps most significantly, the location of monumental architecture in the
southwestern and delta portions of the Sigatoka Valley corresponds to the location of
lands held by yavusa that claim a local Sigatoka origin. This co occurrence implies that
the lineages with the longest ancestry in the Sigatoka Valley were the most likely to
develop social hierarchies, and be generally more integrated. Considering the frequency
of conflict that has been suggested for the delta, the co occurrence of these variables
strongly suggests that chiefly lineages in this region were involved in, and perhaps
promoted, instances of conflict. Gumerman (1986:44) suggests that societies that include
chiefly hierarchies are likely to be more ‘efficient’ at employing competitive behaviors,
as the presence of such individuals allows for long-range tactical planning, marshaling of
forces, and more organized expeditions. However, this situation may be more accurately
described by Boone’s (1983) hypothesis that elites within a socially stratified society
simultaneously secure resources for themselves while redirecting intra-group competition

281
away from themselves and towards other groups. In so doing, elite individuals enhance
their own relative fitness by eliminating rivals from within their own community.
The Distribution and Function of Naga
Lastly, Palmer’s research in the 1960s allowed for the documentation of naga
sites (religious complexes), which were first described in Fiji by Baron Von Hugel
(1889). Later accounts (Lester 1953) suggested that naga were affiliated with magico-
religious societies that originated in the upper reaches of the Wainimala, Sigatoka, and
Navua rivers. During the course of several surveys in the interior of Viti Levu, Palmer
concluded that naga sites consisted of linear arrangements of walls that were often
partitioned into several cells, and associated with small cairns and low walls. According
to the activities witnessed by Von Hugel, naga were built anew every two years, and
were related to feasting that marked the beginning of the wet season. Palmer observed
that many of the activities documented for naga are not typical of Fiji—Von Hugel
mentions ceremonies including initiation into secret societies, male circumcision, and pig
worship. Palmer suggests that the uniqueness of naga, and the activities performed
within them, further attests to the isolation of highland populations (Palmer 1971:94).
Figure 7.6. reveals the distribution of naga sites, which are restricted to the
remote tributaries of the northeastern Sigatoka Valley. The antiquity of their presence in
this region is unknown, although the accounts of Von Hugel suggest that they are of late
manufacture. Like round-shaped yavu, naga are distributed across the lands of yavusa
that do not claim a local or other Fijian yavutu. Comparison of their distribution with the
extent of topography, soil types, and annual rainfall indicates that these sites were located

282
in Zones 2 and 3, in particular areas that were of rugged and of moderate-low production
value. Given these variables and the nature of the activities described for naga, these
sites may represent the development of a strategy of integration between small and
dispersed populations in the upper valley tributaries. The yearly feasts and initiations
described by Von Hugel may have served to mitigate the effects of occasional conflict,
and also maintain social networks from year to year. The higher frequency of
cooperative strategies amongst related mataqali that has been proposed for this part of the
Sigatoka Valley also supports this proposition.
7.3 Detecting Regional Trends III: Exchange Items and Unique Artifacts
Artifacts from within the archaeological sites of the Sigatoka Valley provide
tentative indications of spatial and temporal trends of interaction, and also relative
degrees of isolation. These artifacts include items of food exchange (e.g., riparian clams)
and unique ceramic forms, in particular the ovoid-bodied ‘Nakoro’ jar.
Food Exchange
The strongest evidence in support of regional networks of exchange is the nearly
ubiquitous presence of freshwater clamshells (Batissa violacea) at sites throughout the
Sigatoka Valley. These clams are only available from select beds of the Sigatoka River,
which extend upriver as far as the influx of marine water permits. As was described in
Chapter 5, the remains of the shells occur at all periods (2000- 150 BP) in Tatuba Cave,
which is approximately 40 km from the most northerly occurrence of the species. The

283
presence of these shells at this great distance suggests food exchange or access in
prehistory.
Significantly, shell remains were recovered from deposits dating to the LCO/LIA
transition at Qoroqorovakatini, Korokune, Tatuba, Korovatuma, and Nokonoko. This
increase in frequency, and also the distance from the source, suggests that river clams
were either exchanged or part of far-reaching foraging strategies during this period. The
presence of marine shell at the site of Korovatuma also dates to AD 1330-1450, and may
be related to this trend. By the latest period, nearly all sites in the Sigatoka Valley
contained remains of the imported clams, including Malua, at a distance of approximately
50 km from the clam source. Although it is generally difficult to distinguish between
access and exchange, the presence of these shells at distances of 50 km (a five day
journey on foot) is suggestive of the presence of cooperative exchange networks that
spanned the entire valley, and which ostensibly date to 2000 BP for Tatuba Cave. The
increasing frequency of the shells between AD 1300 and the contact period perhaps
demonstrates the effects of increasing populations, and also increasing use of exchange
networks following the LCO/LIA transition.
Unique Ceramic Forms
Approximately 4,430 ceramic fragments were recovered from the 2001-2002
excavations in the Sigatoka Valley. Two hundred and fifty-eight (5.8%) were diagnostic
fragments that could be used to infer vessel form, and 213 were decorated with a variety
of incised and impressed decorations. However, following intensive classification and
analysis it was determined that the observed frequencies of decorative and morphological

284
variation are a function of small sample size. Although ceramic diversity can provide a
measure of the frequency of prehistoric interaction, in this case the ceramic sample is
limited to descriptive purposes only. A full description of the methods and issues
involves in the evaluation of the ceramic assemblage is presented in Appendix C.
The variety of vessels recovered from the excavations reflects the typical Fijian
assemblage of drinking vessels, yaqona serving bowls, cooking jars, and finger bowls.
These forms occurred in greatest frequency and variety in the latest temporal period, and
were recovered from throughout the valley. Tempering most commonly employed river
sand, although a few sherds from Tatuba Cave were also tempered with crushed
limestone. The most distinctive aspect of the ceramic assemblage was the presence of the
‘Nakoro’ cooking jar (also known as the kuro balavu, or ‘long pot’). These jars are
typically ovoid in shape, with a long flat neck and distinctive beak-shaped rim (see
Figure C.6). Ethnographic surveys conducted in the 1960s determined that these vessels
were only made in the upper reaches of the Sigatoka Valley throughout the late
prehistoric and historic period, and the tradition survives today in a few villages (Palmer
and Shaw 1968). The long bodies of these pots are reminiscent of vessels known from
Malakula Island in Vanuatu (Galipaud and Yoringmal 1994), but the actual degree of
similarity between them has not been assessed in an archaeological study. According to
the results of AMS dating from the 2002 excavations of Tatuba Cave, the ‘Nakoro’ jar
form emerged during the third temporal period (1000-500 BP).
Of note, Palmer recorded that ‘Nakoro’ style pots were found in direct association
with naga sites, which are also restricted to the remote drainages of the upper Sigatoka

285
Valley (Palmer 1971). The co occurrence of these two unique forms suggests that the
inhabitants of this region developed or maintained unique artifacts ca. 1000-500 BP, and
these forms were not transmitted to other portions of Fiji. If the population of this region
was smaller and more dispersed than other portions of the valley, this may indicate that
lower levels of interaction are responsible for the restriction of these forms to this area.
7.4 Evaluation: Patterns of Competition and Cooperation and Indications for Regional
Divergence
The analyses presented above demarcate the southern portions of the Sigatoka
Valley (e.g., the delta and the southwestern portion of the valley) as the most contentious
region in the Sigatoka Valley. Figure 7.7 indicates the potential boundary between
higher and lower frequencies of competition and cooperation as suggested by the extent
of small, highly dispersed land-claims, and also the position for the boundary between
Zones 1 and 2. Land tenure data reveal that yavusa were highly fractured within this
region, suggesting that demographic growth and environmental perturbations resulted in
a higher frequency of competitive strategies that carved territories into small sizes. These
strategies may have included invasion, group fission, and migration. Genealogical data
collected by Gifford suggests that some of the yavusa of this region claim a local
Sigatoka Valley origin, and it is these populations that appear to have had the most
success in maintaining large tracks of land with contiguous boundaries. Significantly, the
sites of Nokonoko and Bukusia are subsumed within the boundaries of these yavusa, and
in the case of Nokonoko provides further indications as to the antiquity (e.g., 7th century)
of these local yavusa. In addition, the distribution of local yavusa in tandem with the

286
Fig
ure
7.7
. P
ropose
d b
oundar
y b
etw
een h
igh a
nd l
ow
fre
quen
cies
of
com
pet
itiv
e an
d c
ooper
ativ
e st
rate
gie
s.

287
occurrence of monumental architecture suggests that these populations were socially
stratified, with chiefly lineages at their head. Observations of the organizational
capabilities by Gumerman (1986) and also historical accounts collected by Nadalo (1957)
lead to the conclusion that these yavusa were more integrated, and more efficient at both
defense and competitive forays against other yavusa. This situation also confirms
hypotheses outlined by Boone (1983) which suggest that elites in socially stratified
societies can insure their own relative fitness through the re-direction of intra-group
competition towards other non-related groups or communities.
These findings also uphold the conclusions of Chapter 3, which suggest that Zone
1 experienced a more severe dry season, and was also subject to intense perturbations
relating to ENSO episodes. In sum, these conditions encouraged the formation of
territories in the most dense and predictable environmental zones, and also created an
atmosphere of episodic unpredictability. Over time, populations of this region resorted to
competitive strategies of conflict and defense as mechanisms for maintaining adequate
harvests. The extreme scarcities of the LCO/LIA transition may have also integrated pre-
existing social groups (such as territorially successful yavusa) and also elucidated higher
frequencies of cooperation between related populations.
North of the boundary, Zones 2 and 3 (in particular the higher elevations and
remote tributaries of the northeast) offer a stark contrast in terms of social configuration,
material culture, and the frequency of competitive and cooperative strategies. Land
tenure data in this region reveals that yavusa maintained territorial integrity over vast
areas, and were distributed in such a way that allowed related mataqali to be in proximity

288
to one another. The distribution of habitation sites across this region suggests that
populations were also dispersed and of small size, but of antiquity equal to or greater than
the inhabitants of the delta. These factors suggest that throughout prehistory, the
populations in the northern portions of the Zones 2 and 3 relied less on competition and
conflict, and perhaps more commonly employed social integration. This does not deny a
role for defensive strategies, as archaeological investigations clearly indicate their early
presence in this region in association with dense and predictable resources. However,
from a broad perspective the populations of the upper reaches of the valley employed
invasion, conquest, and migration at much lower rates than their counterparts in the
Sigatoka delta. However, the presence of invasive yavusa (i.e., the Nakauvadra and Bā
yavusa) in the richest agricultural area of the upper valley suggests that this strategy was
not always successful. In particular, local populations were not able to maintain control
over this region during (and perhaps shortly after) the LCO/LIA transition.
In sum, these results suggest a regional division between the upper and lower
portions of the Sigatoka Valley. In the context of the evolutionary ecology model, this
division represents the junction of two trends of competitive and cooperative strategies,
which owe their character to the environmental and geographic variables that cross-cut
the valley as a whole. Demographic factors also played an important role in the
development and application of particular strategies, as did the presence of particular
yavusa lineages that originated in the valley, and which successfully maintained their
territorial integrity. The history of these lineages introduces a third factor that may have
affected the development of competition and cooperation in the region: the presence of a

289
linguistic division between populations of the upper and lower portions of the Sigatoka
Valley. The following chapter investigates the extent of this division, and compares it to
the environmental and social data presented above. These analyses suggest that the
inhabitants of the upper valley had close ties with, and perhaps can trace their origins to,
northern Viti Levu. This discussion also has implications for other aspects of Fijian
prehistory, in particular the migration of populations in late prehistory, and the
emergence of social complexity.
7.5 Chapter Summary
This chapter examines archaeological and social data that have implications for
specific variations in competitive and cooperative strategies in the prehistory of the
Sigatoka Valley. The extent of land-claims by Fijian unilineal descent groups (yavusa)
are analyzed in terms of parcel size and relative degree of clustering. Evidence for the
antiquity of particular lineages, and their abilities to maintain territorial integrity, are also
assessed. These data are then compared to the extent of environmental variation outlined
in Chapter 3. The results suggest that populations in the delta and southwestern portions
of the valley experienced a high frequency of competition, in particular strategies of
invasion, conquest, and migration. The results of this process are visible in the extent of
yavusa dispersal, and also small parcel sizes. Environmental analyses suggest that this
fragmentation is a result of higher frequencies of environmental perturbations in Zone 1.
The occurrence of monumental architecture in association with yavusa that claim an

290
origin in the valley also indicates the participation of elite levels of society with strategies
of conflict and invasion.
Similarly, analyses in Zones 2 and 3 identify the upper reaches of the Sigatoka
Valley as a region of reduced conflict and competition. Small dispersed populations, and
also the prevalence for large, expansive land-claims, suggest that the inhabitants of this
region were more successful at maintaining control over large territories. Environmental
data suggest that the higher frequency of integration and cooperation may also be linked
to general environmental stability, and resistance to shortfalls. The presence of religious
architecture in this region is also suggestive of strategies of encouraged cooperative
interaction and integration between related (and potentially non-related) unilineal descent
groups.

291
CHAPTER 8. DISCUSSION: IMPLICATIONS FOR FIJIAN PREHISTORY
The analyses of the preceding chapters indicate that temporal trends in habitation
and subsistence, and also spatial strategies of competition and cooperation, were
conditioned by both environmental and social variables. This in turn led to the
development of unique historical trajectories in portions of the Sigatoka Valley.
However, other aspects of Fijian history, in particular the distribution of linguistic
communities and intrusive yavusa, serve to contextualize the Sigatoka Valley into the
much larger landscape of Fijian prehistory. These data have implications for much
grander historical trends, in particular Fiji-wide migrations, and also suggest how
competitive and cooperative strategies identified for the Sigatoka Valley may relate to
social developments in other parts of Fiji. Moreover, these data have direct implications
for models of local and regional interaction for Fijian prehistory presented in Chapter 2
(e.g., the ‘primacy of local processes’ model, and the ‘punctuated interaction’ model).
8.1 Linguistic Divisions: Nadrogā and Nuclear Western
Geraghty’s (1983) study of Fijian languages details the linguistic diversity in the
Sigatoka Valley, the boundaries of which are indicated in Figure 8.1. These boundaries
trace the hazy division between three communalects: Nuclear Western to the north,
Nadrogā to the south, and Namosi-Naitasiri-Serua (NNS) to the southeast. The upper
portion of the Sigatoka Valley is included in the Nuclear Western communalect, which
includes speakers from the Yasawa Islands and Bā, both of which lie to the northwest of
the Sigatoka Valley. The lower portion of the Sigatoka Valley comprises the Nadrogā

292
Fig
ure
8.1
. C
om
munal
ects
of
the
Sig
atoka
Val
ley. A
dap
ted f
rom
Ger
aghty
1983:2
80.

293
communalect, which also includes the populations of the extreme southeastern coast of
Viti Levu. According to Geraghty, these communalects are defined by the presence of
exclusively shared features (such as sound shifts), that are likely to be innovations of
recent age (1983:277-281). In the context of the Sigatoka Valley, the location of the
division between the communalects of Nadrogā and Nuclear Western is similar to the
division between high and low frequencies of competitive and cooperative strategies
identified for the upper and lower portions of the Sigatoka Valley (Figure 7.7). However,
the origins of this division may in fact reflect the settlement of the Sigatoka Valley by
populations from different parts of Fiji, or perhaps a higher frequency of interaction
between upper valley populations and the inhabitants of Bā. The presence of unique
ceramic forms, architecture, and linguistic innovations strongly suggests a cultural divide
between populations on either side of the linguistic boundary. Unfortunately, without
further study outside the Sigatoka Valley it is impossible to determine if these traits are a
product of a Bā origin for the upper valley populations, or simply increased rates of
interaction in this direction.
The physical location of the linguistic division between Nuclear Western and
Nadrogā may well be a product of geographic and social constraints. Figure 3.3.
provides a detailed image of the topography of the region across which the linguistic
boundary passes (also see Figure A.4, which provides a photograph of the same area).
According to Geraghty’s (1983) research, the communalect boundary lies to the north of
the Naqalimare formation, which forces the valley bottom into a long, narrow gorge that
extends for approximately 10 km. If one assumes that the valley bottom served at the

294
primary route of interaction in the Sigatoka Valley, the location of the boundary to the
east of the gorge suggests a topographic and social ‘bottleneck’, which effectively
separated the Sigatoka Valley populations. Thus, colonization and/or interaction in the
Sigatoka Valley may have followed two routes (i.e., downriver from the north, or upriver
from the south), and the linguistic division between the two communalects emerged as a
product of geographic constriction, and ostensibly social restrictions relating to territory
maintenance in the Naqalimare.
Other kinds of social boundaries in Fiji may owe portions of their distributions to
similar combinations of social and geographic constraints. Perhaps most notable is the
distribution of intrusive and aboriginal yavusa throughout Fiji. If the Sigatoka Valley
represents some of the broader trends that conditioned prehistory, then the dispersal of
particular groups may be related to long-term and punctuated trends in environmental
variability that affected the archipelago as a whole. These trends also have implications
for rates of interaction, and also the emergence of social hierarchies.
8.2 Migrations and Interaction Networks in Prehistory
Chapter 5 and 7 note the presence of intrusive yavusa in the Sigatoka Valley.
According to oral histories recorded by ethnographers (e.g., Capell and Lester 1941;
Gifford 1952; Reisenfield 1950; Hocart 1919; Brewster 1922) and also the Tukutuku
Raraba ni Veitiarogi ni Vanua1 extensive migrations occurred throughout Fiji in the late
prehistoric period. Based upon genealogical calculations, the timing of these migrations
is tentatively suggested to be the 16th and 17
th centuries (Brewster 1922:78-80). In

295
addition, these records suggest the exodus was dominated by settlers out of the
Nakauvadra range. According to other oral accounts, the descendents of these
populations founded some of the confederacies of Rewa and Bau (see Figure 1.1). Oral
histories from the Sigatoka Valley suggest that migrations occurred in multiple
directions, some of which are summarized in Figure 8.2. Based upon oral histories, the
Namataku migrants (the Bā yavusa) migrated from Bā to Nadrogā via a coastal route, and
then traveled up the Sigatoka River, conquering and occupying specific fortifications
along the route. Other yavusa appear to have traveled downriver, and settled in the delta.
The timing of these migrations suggests a linkage between the environmental
perturbations of the LCO/LIA transition. This linkage appears particularly strong in light
of archaeological reconstructions for the earlier chapters of Fiji prehistory. In particular,
recent analyses of Lapita ceramics and exchange patterns suggests a gradual decline in
interaction ca. 2650-2100 BP, which is presumably correlated with increasingly isolated
populations, and the settlement of the interior (Clark 1999b:234-236). However, Clark
detects the re-emergence of interaction networks between 1880-1000 BP, and argues that
the frequency and scale of ceramic stylistic similarity reflects localized interaction
between groups with low residential mobility.
In this context, the timing and abrupt nature of the large scale-migrations in the
latest prehistoric period is strongly suggestive of a dramatic transition ca. 700-500 BP.
There is also evidence for an increase in interaction and exchange that may be a product
of increasing interaction and mobility after 500 BP. Clark’s synthesis of adze

296
Fig
ure
8.2
. S
om
e o
f th
e m
igra
tions
reco
rded
for
Sig
atoka
Val
ley y
avu
sa.
Sum
mar
ized
fro
m
Par
ry (
1987),
Gif
ford
(1952),
and P
alm
er e
t al
. 1972.

297
material provenance led him to suggest that an elaborate network of exchange developed
between Fiji and Tonga as early as 650 – 450 BP (Clark 2002:232-234). Similarly, Best
(1984:661-662) and Crosby (1988:228) note that exotic ceramics, grinding stones, and
freshwater clamshells only occur in Lakeba and Beqa after 400 BP, and these materials
have their origins in distant Rewa. Evidence for an increase in interaction also comes
from western Fiji, where Bentley has determined that ceramic exchange occurred
between the Sigatoka delta and the Yasawa Islands (Bentley 2000). The dating of
Sigatoka Valley sites (e.g., Nokonoko) by the author suggest that Bentley’s samples date
to ca. 500 BP.
In sum, archaeological data linked to interaction and exchange suggest the
emergence of larger, more complex social networks ca. 500 BP, which roughly
corresponds to the dates proposed for the LCO/LIA transition. If the developments of the
Sigatoka Valley serve as a guide, populations throughout Fiji were affected by the
harshness of the LCO/LIA transition, and resorted to strategies of relocation, exchange,
and mobility, in an attempt to buffer against resource variance (e.g., Cashdan 1990;
Halstead and O’Shea 1989; Winterhalder and Smith 1992). As demonstrated by the
populations of the upper and lower Sigatoka Valley, social groups invested in a variety of
strategies in order to recoup the losses of shortfalls, and in the long-run these strategies
contributed to diverse historical trajectories. Hypothetically, these developments may
have also influenced the development of social stratification in Rewa and Bau (e.g.,
Boone 1983).

298
8.3. Models of Fijian Prehistory
Best (2002), Marshall et al. (2000), and Clark (1999b), identify three models of
Fijian prehistory: the ‘primacy of local processes’ model, the ‘continuity of interaction’
model, and the ‘punctuated interaction’ model (Clark 1999b:43-45). These models
variably emphasize the importance of interaction in Fijian prehistory, in particular the
impact of contacts with Vanuatu, New Caledonia, and also Tonga. As has been
demonstrated by research in the Sigatoka Valley, a focus on settlement patterns within
the context of spatio-temporal environmental and climatic variability offers a new mode
of evaluation for general trends in Fijian prehistory. In brief, this research supports the
‘primacy of local processes’ model.
As summarized in Chapters 5, 6, and 7, the Sigatoka Valley data indicate that
settlement in the remote interior of Fiji occurred as early as 1993 ±35 BP. Although this
date corroborates both Crosby (1988) and Best’s (1984) data for the initial occupation of
naturally fortified peaks in the interior of Lakeba and Beqa, it must be noted that the
occupation of the Sigatoka Valley represents a much more significant settlement shift—
over 40 km inland (a five-day journey on foot, as recorded by Von Hugel (Roth and
Hooper 1990:371-414), and into an environment that is radically different from the coast
and islands. The fact that this settlement occurred early in Fijian prehistory, and during a
time when populations were undoubtedly small, suggests that environmental factors
directed early horticulturalists towards the most dense and productive areas. Similarly,
the episodic nature of ENSO in Fiji resulted in a general climate of unpredictability for
subsistence farming, and Fijian cultivators quickly learned to take advantage of naturally

299
defended locales as part of a territorial strategy as early as the 7th century AD. This
contradicts fortification sequences identified for Beqa (Crosby 1988:228) that suggest the
earliest fortifications were predominantly the annular ditch variety. This also contradicts
suggestions by Frost (1974) and Best (1984) that attribute conflict and fortification
construction to the intrusion of migrants and gradual population growth.
The Sigatoka Valley data indicate that a strategy of defended habitations was very
successful, and persisted throughout Fijian prehistory. Although the ceramic
assemblages of the Sigatoka Valley excavations are not of adequate richness and
evenness to allow for the study of interaction, exchange items and modern land-tenure
data suggest that competition was tempered with cooperation. Mataqali of the same
yavusa did interact amicably with each other throughout prehistory, although the
prevalence of fortifications indicates that episodes of inter-yavusa conflict were common.
The size of land-holdings in portions of the valley, as well as clustering of aboriginal
yavusa, suggests that some chiefly hierarchies (and perhaps increased integration
between mataqali and yavusa) were established by the 7th century AD. However,
changes in settlement patterns and ceramic forms in association with particular migrant
groups (e.g., Best 1984, 2002; Frost 1974) can not be discerned in the Sigatoka Valley.
Architectural and ceramic traits that are similar to those found in Vanuatu (e.g., center-
poled houses and ‘Nakoro’ pots) do occur in the latest temporal period, but these are also
not distinctive enough to indicate the presence of distinctively non-Fijian migrants (cf.
Best 2002:30-32).

300
Significantly, climatic reconstructions by Nunn and others (Nunn 2003; Nunn and
Britton 2001) mark the period of AD 1275-1475 as a period of dramatic environmental
disturbance. In the Sigatoka Valley, this period coincided with the relocation of
populations into the more buffered mountain regions (also see Kuhlken and Crosby
1999). There are also indications for access to or exchange of a variety of food items
between competing and cooperating populations. These changes are more indicative of
an environment-driven change in settlement patterns, as opposed to an invasion (cf. Frost
1974).
The final period in Sigatoka Valley prehistory (500-150 BP) suggests that
population growth, and also the transmission or development of a new fortification
technology, allowed for the intensive settlement of the valley bottom. This settlement
pattern ostensibly fostered increased frequencies of integration, as populations were no
longer isolated on the tops of mountains, and could interact more freely. However,
fortifications that employed topography, and which were used for both full-time
residence and temporary refuge, persisted through this period. Higher populations in the
valley bottom may have also encouraged the development (or elaboration) of social
stratification, as evinced by the occurrence of monumental architecture in the largest
habitation sites.
In sum, this chronology supports the ‘primacy of local processes’ model for Fijian
prehistory. In particular, the research outlined in this dissertation identifies interaction
between humans and their environment as the fundamental relationship that conditioned
change in prehistoric Fiji. This is in accordance with an evolutionary ecology-based

301
focus on adaptation described in Chapter 1. However, it is important to note that this
perspective also provides for the identification of alternative strategies, many of which
are contingent upon human interaction, and the aggregate consequences of human
actions. This perspective does not deny a role for human intent, but it does mandate that
the most successful strategy will ultimately predominate and persist through time.
Therefore, the sequence of the Sigatoka Valley does not imply an identical historical
sequence for the rest of Fiji, although it does provide a series of strong implications for
general trends.
The results of this research also provide broad implications for other aspects of
Pacific prehistory. Nunn and Britton (2001:10) suggest that the effects of sea-level fall
relating to the LCO/LIA transition impacted subsistence in Tikopia, Kosrae,
Kapingamarangi, and Aitutaki. Other more cyclical phenomena, such as ENSO, appear
to have affected different parts of the Pacific with more or less intensity. According to
Salinger et al.’s (1995: 290-292) calculations, the effects of ENSO (e.g., variation in
rainfall and temperature) in Fiji are similar to those in New Caledonia, northern Tonga,
Niue, the southern Cook Islands, and the southwestern islands of French Polynesia. In
contrast, Samoa, Tokelau, eastern Kiribati, the northern Cook Islands, and northern
French Polynesia are less affected, and show little variation in association with the ENSO
cycle. If human strategies of subsistence and habitation in these archipelagoes were
similarly impacted by these environmental perturbations, it can be expected that the
Pacific region shares broad patterns of competition and cooperation.

302
8.4 Chapter Summary
This chapter examines the presence of two linguistic communalects in the
Sigatoka Valley (Nadrogā and Nuclear Western). The boundary between these
communalects is identified and compared to social, environmental, and archaeological
data. The results suggest that the populations of the upper Sigatoka Valley originated in,
or were in more regular contact with, the populations of Bā to the north. The narrow
confines of the middle portion of the valley (e.g., the Naqalimare region) appear to have
spatial and socially restricted the inhabitants of the Sigatoka Valley to either the upper or
lower regions, and encouraged isolation of the most northern populations. In contrast,
evidence for large migrations in Fijian prehistory are identified for the Sigatoka Valley,
and compared with prehistoric evidence for post-Lapita interaction. These findings
suggest that the migrations attributed to the 16th
and 17th centuries may be a product of
the upheavals associated with the LCO/LIA transition.
The results of archaeological and GIS-based research in the Sigatoka Valley are
compared with general models of Fijian prehistory. These data indicate an adherence to
the ‘primacy of local processes’ model, which advocates that Fijian prehistory was
strongly influenced by local processes. In accordance with evolutionary ecology, the
Sigatoka Valley research identifies interaction between humans and their environment as
the fundamental relationship that conditioned change in prehistoric Fiji. A similar
relationship is suggested to have been at work in other parts of the Pacific.

303
CHAPTER 9. SUMMARY AND CONCLUSION
The causes and consequences of conflict in Fijian prehistory are explored in detail
in this dissertation. This topic is important, as archaeological and historical research in
the archipelago has identified an extensive record of conflict, and a settlement system that
privileged fortifications. Recent research in Fiji (i.e., Parry 1987, 1997) identified spatio-
temporal environmental variability as a potentially crucial factor in the development of
conflict and territorialism. This is in contrast to earlier models, which suggest that
conflict resulted from the invasion of migrants into the region ca. AD 1100 (Frost 1974).
In response to this dichotomy, the role of the environment in the development,
distribution, and persistence of conflict in the Sigatoka Valley is identified and assessed
in this dissertation. Variations in behavioral strategies that are linked to cooperation in
prehistory are also included in this analysis.
9.1. Dissertation Summary
Evolutionary ecology is selected as the guiding theory for this research. As a
subfield of evolutionary biology and cultural ecology, evolutionary ecology articulates a
series of middle-range explanations that link empirical phenomena and ecological theory.
Importantly, it employs a Darwinian perspective on change, and assumes that human
beings and their behaviors are the product of evolution (Smith and Winterhalder 1992).
In this manner, all behaviors can be conceived as cost/benefit strategies designed to
maximize fitness or reduce risk. Within the tradition of hypothetico-deductive modeling,
a combined model of group formation, competition, territory establishment, temporal
variation, and social hierarchy formation is presented, which specifies expectations for

304
the Fiji case (Axelrod 1997; Boone 1983, 1992; Durham 1976; Dyson-Hudson and Smith
1979). These expectations suggest: 1) the distribution of resources in time and space
plays a pivotal role in the formation of groups, the foraging strategies employed, and the
extent to which they compete or cooperate with each other; 2) temporally variable
environments intensify competitive and cooperative strategies; 3) the long-term stability
of competitive and cooperative strategies is conditioned by the reactions of related or
non-related people living in adjacent areas; and 4) individuals promote the development
of social stratification as part of individual strategies of dominance and resource control
(Chapter 2).
The Sigatoka Valley, located in southwestern Viti Levu, is the subject of a series
of geographical, environmental, and climatic analyses. Preliminary analyses of the
valley’s topography, soils, and hydrology utilize the analytical capabilities of geographic
information systems (GIS) software. These analyses determine that prehistoric
subsistence strategies that focused upon the cultivation of dalo (Colocasia esculenta) and
uvi (Dioscorea spp.) would have been largely restricted to the northernmost portions of
the valley’s topography, and further constrained by seasonal rainfall (Chapter 3). In
particular, rainfall patterns and the ability of the soil to resist desiccation allow for the
classification of the landscape in the three environmental zones (Zones 1, 2, and 3).
These zones indicate the portions of the landscape that experience high or low
frequencies of environmental fluctuation.
Modern and historic data are presented that indicate the effects of ENSO (the El
Niño Southern Oscillation) in Fiji. These data indicate that Fiji is strongly influenced by

305
this phenomena and its associated droughts and floods. Reconstructions of the effects of
ENSO are generated for the Sigatoka Valley. The results of these analyses suggest that
Zone 1 would have been severely affected by droughts and floods related to El Niño and
La Niña events, and these disturbances would have devastated the production of root
crops, in particular uvi, in this area. Paleoclimatic data also indicate that Fiji experienced
a period of severe environmental disturbance relating to the LCO/LIA transition. The
effects of sea-level fall and erosion are predicted for the Sigatoka Valley, and compared
with the extent of ENSO damage. The results suggest that 1) Zone 1 would have
experienced the most severe effects of both phenomena; 2) Zone 2 would have
experienced moderate ENSO-related droughts, and been effected to a limited degree by
erosion relating to the LCO/LIA transition; and 3) Zone 3 would have only been weakly
effected by ENSO-related droughts or floods. These results suggest that shortfalls would
have occurred in the highest frequencies in Zone 1, while Zones 2 and 3 would have been
more stable. In the context of the evolutionary ecology model, Zone 1 would have
fostered the most intense competition, and encouraged it to persist as an evolutionary
stable strategy.
Aerial photographs are used to survey the landscape of the Sigatoka Valley, and
also serve to define analytical units (e.g., archaeological features and landforms) that can
be linked to the strategies of competition and cooperation (Chapter 4). These
photographs allow for the recognition of over 700 archaeological features, 384 of which
are habitation sites. The analytic capabilities of the GIS also allow for the analysis of
defensive variables relating to topography and landscape—slope and the extent of view.
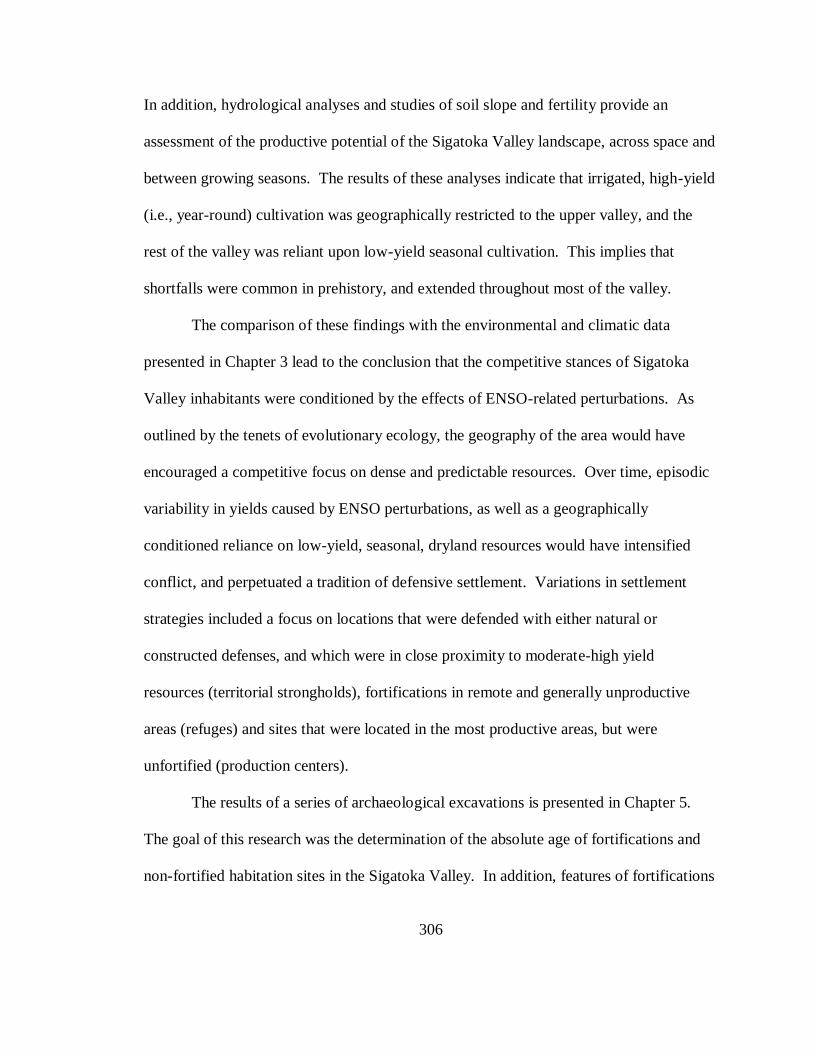
306
In addition, hydrological analyses and studies of soil slope and fertility provide an
assessment of the productive potential of the Sigatoka Valley landscape, across space and
between growing seasons. The results of these analyses indicate that irrigated, high-yield
(i.e., year-round) cultivation was geographically restricted to the upper valley, and the
rest of the valley was reliant upon low-yield seasonal cultivation. This implies that
shortfalls were common in prehistory, and extended throughout most of the valley.
The comparison of these findings with the environmental and climatic data
presented in Chapter 3 lead to the conclusion that the competitive stances of Sigatoka
Valley inhabitants were conditioned by the effects of ENSO-related perturbations. As
outlined by the tenets of evolutionary ecology, the geography of the area would have
encouraged a competitive focus on dense and predictable resources. Over time, episodic
variability in yields caused by ENSO perturbations, as well as a geographically
conditioned reliance on low-yield, seasonal, dryland resources would have intensified
conflict, and perpetuated a tradition of defensive settlement. Variations in settlement
strategies included a focus on locations that were defended with either natural or
constructed defenses, and which were in close proximity to moderate-high yield
resources (territorial strongholds), fortifications in remote and generally unproductive
areas (refuges) and sites that were located in the most productive areas, but were
unfortified (production centers).
The results of a series of archaeological excavations is presented in Chapter 5.
The goal of this research was the determination of the absolute age of fortifications and
non-fortified habitation sites in the Sigatoka Valley. In addition, features of fortifications

307
(e.g., walls, ditches) that may have been added to pre-existing habitations in later periods
were investigated. Twelve sites were selected for excavation in the Sigatoka Valley. The
earliest, Tatuba Cave, was associated with both production and defense, and initially
occupied between Cal BC 20 and Cal AD 80. Later deposits in the cave date occupations
to between Cal AD 210 and Cal AD 1650. The sites of Nokonoko and Qoroqorovakatini
were both defensive habitation sites, with the former established as early as the 7th
century AD, and the latter ca. AD 1000. Environmental conditions in the vicinity of
these sites suggests their use as territorial strongholds in association with uvi production
in the valley bottom. The sites of Korovatuma, Korokune, Malua, Madraya, and possibly
Bukusia were established ca. AD 1300-1500, which corresponds to the onset of the
LCO/LIA transition. The environmental conditions associated with these sites indicate
that populations were attempting to buffer against extreme environmental perturbations
via relocation to distant, less climatically variable areas, and also diversifying their
resource base. The sites of Korohewa, Bātiri, Vitogo, and Nadrogā all date to ca. AD
1700-1850, and are located in the valley bottom. Unlike the populations of previous
centuries, the inhabitants of these sites did not utilize natural topography for defense, but
employed constructed defenses (e.g., annular ditch and bank constructions) or none at all.
These populations would have had direct access to the most productive zones, but must
have relied upon innovations in defensive features or social relations to insure security
and access.
The results of excavations suggest three general trends for the Sigatoka Valley: 1)
the establishment of territorial refuges in association with resource variation; 2)

308
relocation to environmental refuges during periods of disturbance; and 3) the emergence
of constructed fortifications and undefended production sites as a factor of population
growth and/or increased social integration (Chapter 6). These trends are extrapolated as a
set of criteria to the 384 habitation sites identified via aerial photographic survey of the
Sigatoka Valley. This allows for the prediction of habitation/subsistence strategies across
temporal periods and environmental zones. In brief, these predictions suggest that 5.4%
of the Sigatoka Valley sites are potentially early occupations (e.g., 2000-1500 BP), which
were distributed throughout the valley in direct association with dense and predictable
resources. In the second period, population growth and territorialism encouraged
settlement of the valley bottom and surrounding foothills (Zone 1, and portions of Zone
2). Twenty-three percent of the sites in the valley were identified as potential members
of this settlement/period. By the third temporal period (1000-500 BP), settlements are
identified in similarly large numbers (20%), which are located in the higher elevations of
Zones 2 and 3. In the last temporal period (500-150 BP), the population relocated to the
valley bottom (Zone 1), and employed constructed fortifications in high numbers. Fifty-
one percent of the sites in the Sigatoka Valley are identified as potential members of this
class. These frequencies and distributions suggest changing costs and benefits associated
with fortification construction and occupation, and also variation in optimal subsistence
strategies.
Alternative indices of competition and cooperation are the subject of Chapter 7.
In particular, modern land tenure data from the Sigatoka Valley is presented as a means
by which the frequency of competitive and cooperative strategies may be measured.

309
GIS-based analyses indicate a higher degree of expansive yavusa land-claims and
clustering in the upper valley. In contrast, the delta region contains many small parcels,
which suggest increased rates of invasion and conquest, hence yavusa dispersal, in
prehistory. These distributions are compared to the extent of environmental zones, which
further indicates that yavusa dispersal in Zone 1 is probably a factor of population growth
and climatic instability. Genealogical data concerning yavusa origins also suggest a
linkage between lineage antiquity and territorial integrity, especially in the upper valley.
The analysis of architectural traits, monumental architecture, exchange items, and unique
artifacts are also employed in the analysis of competition and cooperation. Architectural
traits, in particular the distribution of naga and monumental architecture, suggests the
development of social integration in the later periods of the valley’s prehistory. The
presence of unique ceramic forms (e.g., ‘Nakoro’ pots) and also round-house mounds in
the uppermost portions of the valley suggests smaller, more isolated populations, and
perhaps increased rates of cooperation between related populations. These traits are also
similar to architectural and ceramic forms in Vanuatu, however, no explicit link can be
made between the Sigatoka Valley and these populations. The co occurrence of
environmental zone boundaries and small parcel sizes suggests a potential boundary in
the Sigatoka Valley between the upper and lower valley, with higher frequencies of inter-
yavusa competition occurring in the lower valley, specifically the Sigatoka delta.
Chapter 8 identifies two linguistic communalects (Nadrogā and Nuclear Western)
in the Sigatoka Valley, and investigates their origins. It is hypothesized that the
inhabitants of the northeastern portions of the Sigatoka Valley can trace their origins to,

310
or perhaps interacted more with, populations in Bā (to the north). The narrow
Naqalimare gorge is identified as a geographical constraint that may have limited the
transmission of linguistic traits between populations in the upper and lower valley. In
addition, evidence for large migrations in Fijian prehistory are identified and compared
with prehistoric evidence for post-Lapita interaction. These findings suggest that the
migrations attributed to the 16th
and 17th centuries may be a product of the upheavals
associated with the LCO/LIA transition.
Lastly, the results of the analyses described above are compared with general
models of Fijian prehistory. In particular, the results of analyses in the Sigatoka Valley
suggest that: 1) fortifications are the result of competitive strategies that originated early
in Fijian prehistory (ca. AD 700) as a response to spatio-temporal environmental
variability, specifically the effects of the El Niño Southern Oscillation (cf. Frost 1974,
Best 1984); 2) fortifications utilized natural topography from the earliest period onwards,
and this pattern persisted throughout all temporal periods, with annular ditch style
fortifications only occurring in the latest temporal period (ca. 1700 AD) (cf. Crosby
1988); 3) changes in settlement patterns ca. AD 1300 can be linked to the LCO/LIA
transition, as opposed to the influx of migrants (cf. Frost 1974). In sum, the ‘primacy of
local processes’ model (e.g., Clark 1999b) is forwarded as the most suitable for Fijian
prehistory.

311
9.2 Conclusion
This research suggests that environmental factors influenced strategies of
subsistence and settlement from the earliest period onwards, and the episodic nature of
ENSO encouraged the development and persistence of fortifications. In particular, the
detection of new strategies of settlement and subsistence during the LCO/LIA transition
period contradicts claims made by Frost (1974) and Best (1984, 2002) which specify the
influx of Melanesian migrants as the causal factors behind increasing rates of
fortifications during this period.
Based upon the research presented herein, the application of paleoenvironmental
data to archaeological problems reveals itself to be a promising avenue for future
research. In particular, further elucidation of the effects of ENSO on prehistoric societies
may offer insights into a variety of cultural phenomena, including population growth and
demographic change, the development of new technologies or human phenotypic traits,
and even modes of cultural elaboration and political development. However it is
important to note that the full nature of the ENSO phenomenon has yet to be completely
understood, and the projection of oscillation cycles back in time will undoubtedly be
altered and refined in future years. It is not impossible that many of the cycles and
episodes that archaeologists have used in the evaluation of change may yet be
recalibrated according to new measurements of amplitude and frequency.
The analytical capabilities of a GIS, in particular the analysis of landscapes via
slope, aspect, and viewshed, are shown in this research to have particular value to spatial
analysis, and can be modified to incorporate a temporal aspect. A landscape approach, as

312
demonstrated in the Sigatoka Valley, attempts to incorporate all the variables that affect
subsistence and habitation. This goes beyond the settlement pattern analyses that typified
earlier decades of archaeology, and identifies the region as the object of study.
Increasing resolution of the data involved in these kinds of analyses will undoubtedly
multiply the analytical potential for archaeological studies.
Lastly, an evolutionary perspective is identified in this research as both an
integrated set of principles that both define and direct research, and also a set of middle-
range expectations that can be tested in an archaeological case. Evolutionary ecology is
particularly adept at assessing the interaction of individuals and the environment, and
determining how and why the selection of particular strategies results in increased fitness
for the actor. When placed in an archaeological context, the analysis of human strategies
and environmental variables within a framework of evolutionary principles aids in
determining not only how change occurs, but why it occurs. Future research that includes
similar methods may well address archaeological problems of increasingly greater scale
and complexity.

313
APPENDIX A. SIGATOKA VALLEY SITE DATA
Table A.1. Province and district codes for archaeological sites of the Sigatoka Valley.
Province Codes District Code Location
1 Navosa Province
2 Nadrogā Province
3 Serua Province
WCB Waicoba District
VTA Vatukarasa District
NVS Navatusila District
CUV Cuvu District
KNS Koronisau District
NSK Nasikawa District
NKR Noikoro District
BMA Bemana District
CON Conua District
MAV Mavua District
NOK Nokonoko District
QMR Qalimare District
SIG Sigatoka District

314
Fig
ure
A.1
. R
efer
ence
map
for
site
loca
tions
in t
he
Sig
atoka
Val
ley (
inse
ts o
n f
oll
ow
ing p
ages
).

315

316
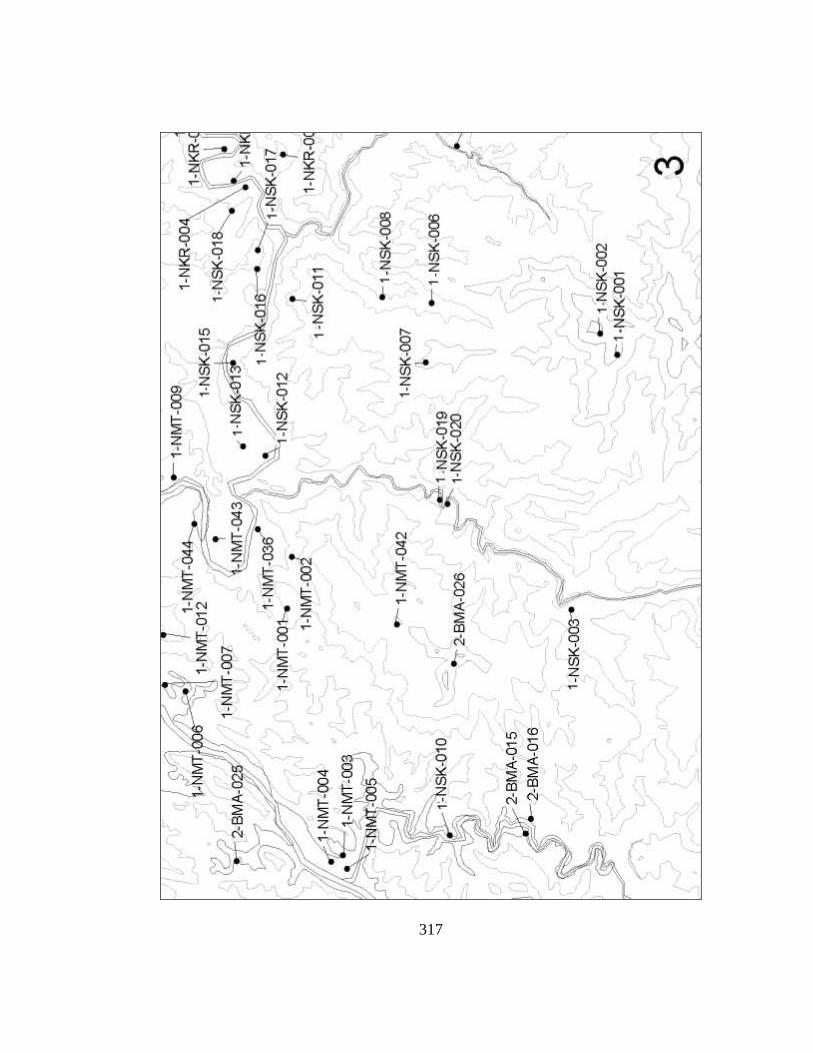
317

318

319

320

321

322

323

324

325

326

327

328

329
Fig
ure
A.2
. L
oca
tion o
f li
nk
-mounds
and n
aga s
ites
in t
he
Sig
atoka
Val
ley.

330
Figure A.3. View from above Tatuba Cave, upper valley.
Figure A.4. View of Naqalimare gorge, middle valley.

331
Figure A.5. View of delta area, lower valley.
Figure A.6. Aerial view of Tatuba Cave.

332
Figure A.7. Aerial view of Nokonoko.
Figure A.8. Aerial view of Qoroqorovakatini.
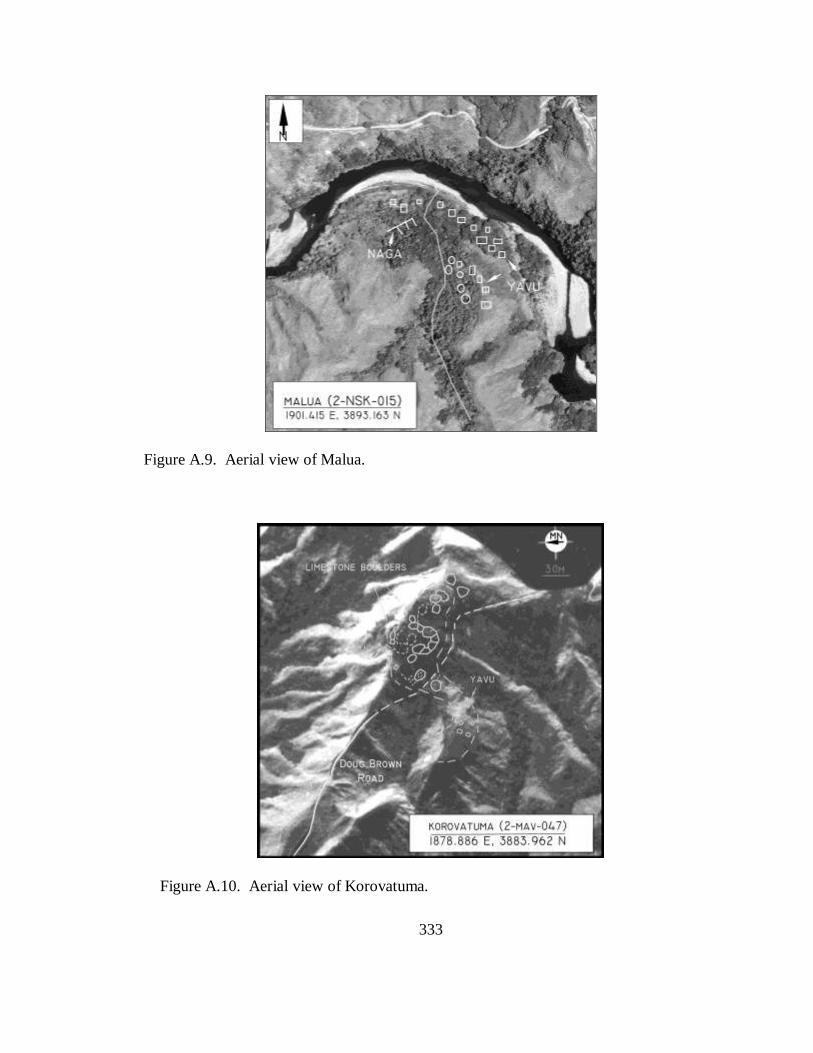
333
Figure A.9. Aerial view of Malua.
Figure A.10. Aerial view of Korovatuma.

334
Figure A.11. Aerial view of Bukusia.
Figure A.12. Aerial view of Korokune.

335
Figure A.13. Aerial view of Madraya.
Figure A.14. Aerial view of Bātiri.

336
Figure A.15. Aerial view of Korohewa.
Figure A.16. Aerial view of Vitogo.

337
Figure A.17. Aerial view of Nadroga.

338
Table A.2. Habitation site data including natural and constructed defensive features.
District No. Name Easting Northing Area Elev. Situation Const. Const. Viewshed No. % Strategy
(ha) (m) Def. 1 Def. 2 size sites > 45
(km2) in view
1-NKR-001 Korowai 1904.955 3897.805 1.4 300 promontory 106.31 29 78 defended production
1-NKR-002 1908.020 3896.943 9.7 273 summit flat 95.19 24 63 defended production
1-NKR-003 1905.753 3898.058 0.4 269 ridge 106.31 29 30 defended production
1-NKR-004 Namacawa 1904.310 3898.527 1.7 100 valley bench 30.73 17 70 production
1-NKR-005 1904.438 3898.760 1.3 100 valley bench 30.73 17 70 production
1-NKR-006 Tubarua 1905.048 3898.940 0.7 100 valley bench 28.23 21 88 production
1-NKR-007 1905.412 3899.016 0.7 100 valley bench 30.73 17 70 production
1-NKR-008 1909.972 3898.645 2.5 200 promontory 34.82 12 75 defended production
1-NKR-009 1906.681 3899.131 1.7 100 valley bench 14.11 4 60 production
1-NKR-010 Navesau 1905.292 3900.467 1.2 131 valley bench 32.35 18 68 production
1-NKR-011 Togalevu 1906.816 3900.054 7.1 100 summit flat ditch 82.37 44 10 defended production
1-NKR-012 1904.194 3900.771 4 300 promontory 56.98 17 94 defensive
1-NKR-013 1903.563 3900.196 5.5 303 promontory ditch 102.75 40 94 defensive
1-NKR-014 1902.912 3900.280 1.2 201 ridge 102.75 40 85 defensive
1-NKR-015 1902.828 3900.259 0.9 201 ridge 102.75 40 85 defensive
1-NKR-016 1908.074 3900.780 0.7 183 knoll 34.78 22 70 defended production
1-NKR-017 1908.078 3900.644 0.8 151 river terrace 34.78 22 70 production
1-NKR-018 1908.091 3800.431 1.8 151 river terrace 34.78 22 65 production
1-NKR-019 1908.511 3899.943 1.3 200 river terrace 49.54 13 67 production
1-NKR-020 1911.118 3899.669 5.3 500 summit apex ditch 45.94 9 90 defensive
1-NKR-021 Narewa 1909.535 3800.536 4.5 360 promontory ditch scarps 30.94 9 88 defended production
1-NKR-022 Dualagi 1909.918 3800.792 2.4 381 promontory ditch scarps 30.94 9 88 defended production
1-NKR-023 1911.054 3901.188 10 400 promontory ditch scarps 30.94 9 95 defensive
338

339
Table A.2. (Continued) Habitation site data including natural and constructed defensive features.
District No. Name Easting Northing Area Elev. Situation Const. Const. Viewshed No. % Strategy
(ha) (m) Def. 1 Def. 2 size sites > 45
(km2) in view
1-NKR-024 Naviti 1906.813 3901.909 1.3 100 river terrace 12.01 6 83 production
1-NKR-025 1908.491 3902.423 2.3 126 river terrace ditch 24.14 22 88 defended production
1-NKR-026 1903.968 3903.370 1.8 400 knoll 41.29 21 85 defensive
1-NKR-027 Vunivuga 1905.460 3903.913 15.2 432 knoll ditch 105.14 38 85 defensive
1-NKR-028 1906.027 3903.598 1.6 400 ridge ditch scarp 34.70 8 85 defensive
1-NKR-029 1906.523 3904.923 6.6 493 promontory ditch 36.19 12 85 defensive
1-NKR-030 1910.523 3903.626 0.8 400 ridge 66.20 25 88 defended production
1-NKR-031 Madraya 1908.546 3903.022 12.5 191 summit flat 47.64 25 70 defended production
1-NKR-032 Matawalu 1900.446 3903.333 1.3 100 meander core ditch 36.20 11 70 defended production
1-NKR-033 1908.639 3902.099 1.1 112 river terrace ditch 24.14 22 85 defended production
1-NKR-034 1901.060 3902.923 2.7 199 promontory ditches 30.49 10 80 defensive
1-NKR-035 1910.011 3906.248 0.4 200 river terrace 29.88 17 73 production
1-NKR-036 1913.052 3903.573 0.3 324 ridge 43.07 10 97 defended production
1-NKR-037 1909.999 3906.344 0.4 200 river terrace 29.88 17 73 production
1-NKR-038 Nadarakalou 1913.297 3906.000 39.9 511 ridge 46.99 20 99 defensive
1-NKR-039 1912.426 3903.339 0.4 286 summit apex 23.21 7 85 defended production
1-NKR-040 Nalaba 1908.654 3906.104 0.8 200 confluence ditch 29.88 17 70 defended production
1-NKR-041 1908.758 3906.254 3.6 300 ridge ditch 34.66 9 90 defended production
1-NKR-042 Vunilagi 1907.634 3905.606 55.2 478 summit flat ditch 97.01 50 93 defensive
1-NKR-043 Namoli II 1909.783 3905.830 1.6 200 river terrace ditch 29.88 17 75 defended production
1-NKR-044 1908.251 3901.819 1.3 99 river terrace ditch 24.14 22 75 defended production
1-NKR-045 1910.065 3906.430 0.2 200 river terrace 29.88 17 73 production
1-NKR-046 Nadroga 1906.931 3901.227 1.5 100 river terrace walls 31.98 21 70 defended production
1-NKR-047 1911.903 3901.574 4.3 596 ridge ditch scarp 61.99 14 95 defensive
339

340
Table A.2. (Continued) Habitation site data including natural and constructed defensive features.
District No. Name Easting Northing Area Elev. Situation Const. Const. Viewshed No. % Strategy
(ha) (m) Def. 1 Def. 2 size sites > 45
(km2) in view
1-NKR-048 1912.675 3900.284 0.7 600 promontory 27.62 1 90 defensive
1-NKR-049 Nadoso 1910.028 3906.150 3.6 200 knoll scarp 29.88 17 73 defended production
1-NKR-050 Lateka 1909.502 3895.921 1 200 valley bench 14.47 4 85 production
1-NKR-051 1908.712 3899.421 1 200 river terrace 49.54 13 77 production
1-NKR-052 Nabokotini 1909.700 3899.100 2 120 river terrace 34.82 12 73 production
1-NKR-053 Lotoloto 1912.824 3903.281 1 200 river terrace 22.96 0 90 production
1-NMT-001 1896.208 3897.729 3.7 203 summit flat 78.29 18 86 defensive
1-NMT-002 Matalevu 1897.199 3897.632 1.3 100 valley bench ditch 33.00 13 68 defended production
1-NMT-003 1891.449 3896.648 1.6 40 river flat ditches 12.21 11 15 defended production
1-NMT-004 1891.328 3896.875 1.9 40 river flat ditch 12.21 11 15 defended production
1-NMT-005 1891.188 3896.574 1.9 40 river flat 12.21 11 15 production
1-NMT-006 1894.612 3899.687 4.6 40 ridge 47.23 19 72 defensive
1-NMT-007 1894.735 3900.082 1.7 40 ridge 47.23 19 42 defended production
1-NMT-008 1894.572 3900.290 4.9 40 river flat 47.23 19 37 production
1-NMT-009 Tawaleka 1898.715 3899.907 2.3 93 valley bench 20.30 7 65 production
1-NMT-010 1908.641 3899.797 0.8 200 river terrace 49.54 13 76 production
1-NMT-011 1893.651 3900.467 1 40 river terrace 47.23 19 5 production
1-NMT-012 1895.697 3900.108 1.9 283 knoll ditches scarps 183.47 48 96 defensive
1-NMT-013 1895.790 3900.327 2.7 200 knoll ditches scarps 183.47 48 96 defensive
1-NMT-014 Muawai 1898.585 3900.848 1.5 100 knoll walls 88.15 27 83 defensive
1-NMT-015 Tatuba 1899.443 3900.584 25 200 knoll walls scarps 92.93 31 83 defensive
1-NMT-016 Talenalawe I 1899.801 3900.434 1 200 knoll scarps 92.93 31 83 defensive
1-NMT-017 1900.960 3900.542 3.2 195 ridge ditch scarps 51.68 19 76 defended production
340

341
Table A.2. (Continued) Habitation site data including natural and constructed defensive features.
District No. Name Easting Northing Area Elev. Situation Const. Const. Viewshed No. % Strategy
(ha) (m) Def. 1 Def. 2 size sites > 45
(km2) in view
1-NMT-018 1901.670 3900.491 15.3 195 ridge ditch scarps 64.66 22 76 defended production
1-NMT-019 Drala 1885.693 3901.238 4.2 134 meander core ditch 7.48 0 77 defensive
1-NMT-020 1890.557 3901.860 4.5 100 summit flat ditch 60.74 8 20 defended production
1-NMT-021 1895.039 3901.928 0.9 40 river terrace ditch 52.22 25 20 defended production
1-NMT-022 Natuatuacoko 1897.788 3901.379 1.3 40 valley bench ditches walls 39.71 15 20 defensive
1-NMT-023 1911.459 3902.047 4.7 614 ridge ditch 64.38 11 95 defensive
1-NMT-024 Nasaucoko I 1887.908 3902.826 6.2 100 river flat ditch 51.27 8 25 defended production
1-NMT-025 Nakorovou 1888.234 3902.812 4.3 100 river flat ditches 51.27 8 25 defensive
1-NMT-026 Vatumali II 1894.336 3902.433 0.6 78 valley bench ditch 53.38 17 0 defended production
1-NMT-027 Vatumali I 1894.837 3902.641 1.1 57 valley bench ditch 53.38 17 0 defended production
1-NMT-028 1895.912 3902.564 6.3 40 valley bench ditch 55.08 17 5 defended production
1-NMT-029 1898.177 3902.285 1 50 river terrace ditch 41.81 28 25 defended production
1-NMT-030 1892.662 3903.731 3 100 promontory 51.15 12 45 defended production
1-NMT-031 1897.346 3903.298 3 40 knoll ditches 40.60 17 50 defended production
1-NMT-032 1897.578 3903.259 1.4 40 river flat ditch 40.60 17 50 defended production
1-NMT-033 1896.260 3904.054 1.1 40 river terrace ditches 32.96 25 42 defended production
1-NMT-034 1889.347 3905.162 1.7 100 river flat ditch 44.44 6 25 defended production
1-NMT-035 1889.637 3906.351 1.6 100 knoll 44.44 4 50 defended production
1-NMT-036 1897.729 3898.290 0.7 89 valley bench 35.34 16 77 production
1-NMT-038 1898.164 3902.542 4.2 40 valley bench ditch 41.81 28 25 defended production
1-NMT-039 1898.012 3902.436 0.7 61 river terrace ditch 41.81 28 25 defended production
1-NMT-040 1897.841 3902.695 1.6 61 knoll scarp 41.81 28 25 defended production
1-NMT-041 1897.820 3902.870 0.4 40 river terrace ditch 41.81 28 75 defended production
341

342
Table A.2. (Continued) Habitation site data including natural and constructed defensive features.
District No. Name Easting Northing Area Elev. Situation Const. Const. Viewshed No. % Strategy
(ha) (m) Def. 1 Def. 2 size sites > 45
(km2) in view
1-NMT-042 Drenebukete 1895.894 3895.603 2.3 456 promontory ditch scarp 74.65 16 98 defensive
1-NMT-043 Nakasi 1897.542 3899.109 2.5 41 river terrace 21.51 4 0 production
1-NMT-044 Sawene 1897.838 3899.519 6.1 48 river terrace 21.51 4 78 production
1-NMT-045 Rewasali 1881.550 3894.300 0.5 80 confluence ditch 8.12 0 50 defended production
1-NMT-046 Togovere 1881.600 3894.200 6 80 confluence ditch 8.12 0 50 defended production
1-NVS-001 Koroilaulau 1913.265 3908.841 35.7 514 ridge 5.26 0 100 defensive
1-NVS-002 Vunatawa 1910.953 3909.346 0.8 200 meander core 8.53 7 85 production
2-BMA-001 Drasia 1890.229 3889.996 4.3 100 meander core 48.04 3 16 production
2-BMA-002 1887.388 3892.243 3.8 27 river terrace 13.79 2 60 production
2-BMA-003 1884.893 3892.380 1.6 20 river flat 24.06 16 77 production
2-BMA-004 1884.979 3892.975 1.7 23 summit apex ditches 17.27 9 68 defended production
2-BMA-005 Nalebaleba 1884.988 3893.144 2.9 35 river terrace ditch 17.27 9 68 defended production
2-BMA-006 1886.149 3893.892 1.4 25 river terrace 16.13 4 57 production
2-BMA-007 1887.242 3893.656 2.4 40 ridge 25.52 7 0 defended production
2-BMA-008 1887.826 3893.597 1.2 40 valley bench 25.52 7 17 production
2-BMA-009 1888.134 3893.655 1.5 40 river terrace 25.52 7 17 production
2-BMA-010 Ikoro 1890.059 3892.894 21.1 40 river flat ditch 20.21 12 50 defended production
2-BMA-011 Vitogo 1890.104 3893.411 1.4 35 river flat ditch 20.21 12 15 defended production
2-BMA-012 1889.806 3893.156 0.9 40 river flat ditch 20.21 12 72 defended production
2-BMA-013 1889.696 3893.351 2 30 river flat ditch 20.21 12 72 defended production
2-BMA-014 Natuatuacoko 1899.900 3893.536 5.9 33 river flat ditch 20.21 12 40 defended production
2-BMA-015 1891.866 3893.134 0.6 40 meander core ditch 10.64 3 63 defended production
2-BMA-016 1892.150 3893.029 1.9 62 river terrace ditches 10.64 3 63 defended production
342

343
Table A.2. (Continued) Habitation site data including natural and constructed defensive features.
District No. Name Easting Northing Area Elev. Situation Const. Const. Viewshed No. % Strategy
(ha) (m) Def. 1 Def. 2 size sites > 45
(km2) in view
2-BMA-017 1887.499 3894.949 4.3 71 promontory 30.70 8 58 defended production
2-BMA-018 Tuvu 1889.156 3895.175 3.8 69 river terrace 24.51 8 0 production
2-BMA-019 1889.614 3894.962 4.7 27 river terrace 24.51 8 72 production
2-BMA-020 1890.000 3895.076 10 34 river terrace 24.51 8 68 production
2-BMA-021 1890.249 3895.900 3 40 meander core ditch 23.58 8 68 defended production
2-BMA-022 Korobalavu 1887.278 3896.709 1.7 498 knoll 59.04 15 88 defensive
2-BMA-023 1886.004 3897.588 7.7 400 knoll 115.65 21 87 defensive
2-BMA-024 1889.257 3887.373 3.2 40 river terrace scarps 12.21 3 25 defended production
2-BMA-025 1891.331 3898.693 1.4 40 meander core ditch 3.88 1 70 defended production
2-BMA-026 Koroimaia 1895.139 3894.517 6.2 504 ridge 69.11 10 94 defensive
2-BMA-027 1884.850 3893.007 1.4 26 river terrace ditch 17.27 9 68 defended production
2-BMA-028 Tuvu Cave 1888.600 3896.540 5 233 knoll 30.00 2 75 defensive
2-CON-001 1879.798 3870.438 1.1 20 river flat ditch 8.69 5 80 defensive
2-CON-002 1879.662 3870.447 1.3 20 river flat ditch 8.69 5 80 defensive
2-CON-003 1879.733 3870.583 1 20 river flat ditch 8.69 5 80 defensive
2-CON-004 Navere 1879.648 3870.709 0.4 20 river flat ditches 8.69 5 80 defensive
2-CON-005 Vatukarasa 1879.409 3869.481 0.5 20 river flat 31.82 0 80 production
2-CON-006 1878.954 3870.776 1.2 200 ridge ditch 98.87 3 90 defensive
2-CON-007 1877.926 3869.439 0.7 4 coastal terrace ditch 74.00 0 68 defended production
2-CON-008 1877.438 3874.289 1.5 114 promontory 33.68 1 40 defended production
2-CON-009 1876.266 3874.752 0.5 200 promontory 45.98 11 70 defended production
2-CON-010 Korokune 1874.488 3871.751 4.6 184 summit apex scarp 177.40 37 72 defended production
2-CON-011 1873.421 3850.468 1.4 70 ridge 129.68 4 72 defended production
343

344
Table A.2. (Continued) Habitation site data including natural and constructed defensive features.
District No. Name Easting Northing Area Elev. Situation Const. Const. Viewshed No. % Strategy
(ha) (m) Def. 1 Def. 2 size sites > 45
(km2) in view
2-CON-012 1873.427 3870.110 1 70 ridge 129.68 4 72 defended production
2-CON-013 1873.251 3870.078 1.2 29 ridge ditch 129.68 4 72 defended production
2-CON-014 1872.611 3869.881 0.9 20 coastal terrace 129.68 4 50 production
2-CON-015 1872.641 3869.773 0.8 20 coastal terrace 129.68 4 15 production
2-CON-016 1872.539 3869.727 0.6 20 coastal terrace 129.68 4 15 production
2-CON-017 1872.305 3870.325 0.7 20 coastal terrace 129.68 4 30 production
2-CON-018 Korotogo 1872.462 3870.243 0.5 17 coastal terrace 129.68 4 30 production
2-CON-019 1872.148 3872.018 0.9 100 summit apex 89.29 14 68 defended production
2-CON-020 Vatuvoko 1871.572 3873.483 5.7 99 summit flat ditches scarps 59.40 29 60 defended production
2-CON-021 1873.479 3873.768 2.1 100 summit apex ditches scarp 53.01 19 20 defended production
2-CON-022 Qalivatuvoko 1873.004 3874.126 2.6 100 ridge ditches scarps 54.15 18 70 defended production
2-CON-023 1873.027 3874.376 1.3 100 ridge 54.15 18 60 defended production
2-CON-024 1873.215 3874.764 1.1 68 promontory scarps 54.15 18 75 defensive
2-CON-025 1874.976 3874.777 3.8 71 promontory scarps 55.56 29 16 defended production
2-CON-026 1874.753 3874.839 1.5 132 summit apex ditch scarps 55.56 29 16 defended production
2-CON-027 1876.369 3877.374 1.2 38 ridge ditch 40.80 34 65 defended production
2-CON-028 1875.005 3876.754 1.1 41 promontory ditch scarps 39.87 27 50 defended production
2-CON-029 1874.879 3876.902 1.3 20 promontory ditch scarps 39.87 27 40 defended production
2-CON-030 1873.583 3876.408 0.7 20 valley bench ditch 63.89 58 60 defended production
2-CON-031 1873.605 3876.640 2.4 20 valley bench 63.89 58 50 production
2-CON-032 1872.468 3876.727 1.7 20 river terrace 63.89 58 0 production
2-CON-033 Serua 1872.934 3876.881 3.6 20 river terrace 63.89 58 0 production
2-CON-034 Nadrala 1873.859 3877.043 1 20 river flat ditch 63.89 58 30 defended production
344

345
Table A.2. (Continued) Habitation site data including natural and constructed defensive features.
District No. Name Easting Northing Area Elev. Situation Const. Const. Viewshed No. % Strategy
(ha) (m) Def. 1 Def. 2 size sites > 45
(km2) in view
2-CON-035 1873.336 3877.372 1.2 20 river flat ditch 63.89 58 0 defended production
2-CON-036 1873.317 3877.520 0.6 20 river flat ditch 63.89 58 0 defended production
2-CON-037 1872.054 3877.216 1.2 20 river terrace ditch 63.89 58 40 defended production
2-CON-038 1871.957 3877.377 1 20 river terrace ditch 63.89 58 40 defended production
2-CON-039 1872.065 3877.508 0.9 20 river terrace ditch 63.89 58 40 defended production
2-CON-040 1872.100 3877.565 2.3 20 river terrace ditch 63.89 58 40 defended production
2-CON-041 Nawamagi 1872.254 3877.970 1.7 20 summit apex scarps 63.89 58 50 defended production
2-CON-042 1872.370 3878.099 5 20 river terrace 63.89 58 50 production
2-CON-043 1874.713 3878.100 3.3 20 river terrace ditch 67.73 54 25 defended production
2-CON-044 Narata II 1874.909 3878.340 2.1 20 meander core 67.73 54 25 production
2-CON-045 1874.307 3880.342 1.1 20 river terrace 63.29 60 25 production
2-CON-046 1875.726 3880.486 1.7 20 valley bench 63.29 60 25 production
2-CON-047 Navuwai 1874.989 3881.414 13.6 100 summit apex ditch scarp 99.28 45 38 defended production
2-CON-048 1873.358 3877.012 1.3 20 promontory ditch 63.89 58 20 defended production
2-CON-049 Tavuni 1872.009 3874.405 8.8 21 ridge ditches 42.98 38 70 defended production
2-CON-050 Naroro 1871.800 3874.500 2.4 20 river terrace 82.25 0 10 production
2-CON-051 Natuamaoli 1872.600 3877.950 0.2 20 ridge 58.39 30 5 defended production
2-CON-052 Mahevu 1872.500 3878.300 0.2 20 ridge 58.39 30 5 defended production
2-CUV-001 Naualuvatu 1893.950 3872.100 5 20 summit apex walls 24.10 18 70 defended production
2-CUV-002 1864.646 3871.041 2.1 20 coastal terrace ditch 36.88 19 0 defended production
2-CUV-003 1863.541 3870.441 0.9 19 coastal terrace 36.88 19 0 production
2-CUV-004 1863.923 3871.112 1.7 20 ridge ditch 36.88 19 0 defended production
2-CUV-005 1861.676 3872.577 2 20 knoll ditch 113.91 4 0 defended production
345

346
Table A.2. (Continued) Habitation site data including natural and constructed defensive features.
District No. Name Easting Northing Area Elev. Situation Const. Const. Viewshed No. % Strategy
(ha) (m) Def. 1 Def. 2 size sites > 45
(km2) in view
2-CUV-006 1860.950 3872.921 1.8 20 coastal terrace ditch 166.48 2 0 defended production
2-CUV-007 Koroiqara 1865.786 3871.102 1.2 20 river terrace 36.88 19 0 production
2-CUV-008 1865.639 3871.806 0.7 20 valley bench 36.88 19 0 production
2-CUV-009 1865.323 3871.700 1.8 20 ridge 36.88 19 0 defended production
2-CUV-010 Nalali 1864.450 3872.200 0.6 80 knoll 47.02 26 0 defended production
2-CUV-011 1864.972 3872.514 0.6 30 ridge 24.10 18 0 defended production
2-KNS-001 1881.478 3880.355 1.6 121 ridge 10.39 0 79 defensive
2-KNS-002 1885.994 3880.384 2.6 600 promontory 55.11 8 80 defensive
2-KNS-003 1880.791 2880.996 1.7 100 river terrace ditch 39.47 13 43 defended production
2-KNS-004 1870.781 3881.164 0.5 100 meander core ditch 39.47 13 43 defended production
2-KNS-005 1884.466 3880.981 0.9 400 promontory 8.00 5 92 defensive
2-KNS-006 1884.544 3881.057 0.2 400 ridge 8.00 5 92 defensive
2-KNS-007 1885.514 3881.865 0.4 500 ridge walls 6.91 5 92 defensive
2-KNS-008 1886.340 3881.841 4.5 500 ridge scarps 46.22 8 91 defensive
2-KNS-009 1886.533 3882.402 2.9 492 summit apex scarps 89.20 8 92 defensive
2-KNS-010 1885.834 3882.711 2.1 400 promontory scarps 4.69 2 92 defensive
2-KNS-011 1885.589 3882.502 1.3 304 river terrace ditch 4.69 2 92 defensive
2-KNS-012 1885.337 3882.358 0.2 315 ridge 4.69 2 92 defensive
2-KNS-013 1883.553 3882.765 0.8 200 ridge 32.55 9 19 defended production
2-KNS-014 1883.318 3882.594 2.3 200 river terrace 32.55 9 0 production
2-MAV-001 1877.760 3881.174 0.4 20 valley bench ditch 77.76 27 50 defended production
2-MAV-002 1877.674 3881.337 0.2 20 valley bench ditch 77.76 27 40 defended production
2-MAV-003 1877.453 3881.213 0.5 20 valley bench ditch 77.76 27 30 defended production
346

347
Table A.2. (Continued) Habitation site data including natural and constructed defensive features.
District No. Name Easting Northing Area Elev. Situation Const. Const. Viewshed No. % Strategy
(ha) (m) Def. 1 Def. 2 size sites > 45
(km2) in view
2-MAV-004 1877.287 3881.243 0.4 20 valley bench ditch 77.76 27 20 defended production
2-MAV-005 1877.041 3881.308 0.2 77 ridge ditch 77.76 27 10 defended production
2-MAV-006 1875.619 3882.029 0.1 34 ridge 6.96 5 44 defended production
2-MAV-007 Raiwaqa 1875.201 3883.660 7 20 river terrace 39.22 31 20 production
2-MAV-008 1877.053 3884.294 1.1 20 river flat 39.22 31 35 production
2-MAV-009 1875.047 3884.081 0.8 20 river flat 39.22 31 35 production
2-MAV-010 1874.899 3884.034 0.8 20 river flat 39.22 31 35 production
2-MAV-011 1874.898 3885.115 4.8 100 summit apex scarps 56.53 17 76 defended production
2-MAV-012 1874.267 3884.271 1.9 20 river terrace ditch 39.22 31 75 defensive
2-MAV-013 1874.115 3886.688 1.2 20 river flat ditch 18.72 8 90 defensive
2-MAV-014 Mavua 1873.941 3886.635 1.6 20 river flat ditch 18.72 8 90 defensive
2-MAV-015 Nakurivatu 1873.815 3886.884 1.8 20 river flat ditch 18.72 8 88 defensive
2-MAV-016 Koroqele III 1877.014 3886.871 1.7 492 summit flat 39.92 15 100 defensive
2-MAV-017 Koroqele I 1877.959 3886.823 8.3 500 summit flat ditch scarps 29.92 15 95 defensive
2-MAV-018 1880.025 3886.894 0.8 400 summit apex 66.84 21 90 defensive
2-MAV-019 1872.194 3887.140 3.1 20 river terrace ditch 41.93 27 48 defended production
2-MAV-020 Korokula 1874.083 3887.248 1.8 24 river terrace ditch 16.18 7 70 defended production
2-MAV-021 Navala 1873.886 3887.466 1.2 20 river terrace ditch 16.18 7 75 defensive
2-MAV-022 1874.618 3887.717 0.6 100 ridge 72.70 26 90 defensive
2-MAV-023 1877.204 3887.572 9.5 322 promontory 81.85 31 100 defensive
2-MAV-024 Koroqele II 1880.181 3887.945 33.2 499 ridge ditches 110.84 27 98 defensive
2-MAV-025 1878.989 3887.897 1.8 270 promontory scarps 43.11 16 92 defensive
2-MAV-026 1875.801 3888.260 2.5 200 promontory scarps 88.56 29 92 defensive
347

348
Table A.2. (Continued) Habitation site data including natural and constructed defensive features.
District No. Name Easting Northing Area Elev. Situation Const. Const. Viewshed No. % Strategy
(ha) (m) Def. 1 Def. 2 size sites > 45
(km2) in view
2-MAV-027 Namoli I 1874.432 3888.780 2 29 river terrace ditch 44.40 19 50 defended production
2-MAV-028 Nalotawa 1874.010 3888.766 3.3 24 river terrace ditch 43.23 25 80 defended production
2-MAV-029 Nabiarea 1873.795 3888.777 2 24 summit apex ditches 43.23 25 80 defensive
2-MAV-030 Nabuavatu 1873.107 3888.207 2.5 20 river terrace ditch 37.57 15 25 defended production
2-MAV-031 1872.783 3889.106 0.5 20 ridge 46.22 22 20 defended production
2-MAV-032 1874.581 3889.356 5.4 20 river terrace ditch 54.07 39 50 defended production
2-MAV-033 1874.956 3889.233 0.9 20 river terrace ditch 54.07 39 50 defended production
2-MAV-034 1875.670 3889.626 0.9 20 valley bench 55.24 36 20 production
2-MAV-035 Nakeli 1875.341 3889.890 0.8 20 knoll ditch 55.24 36 20 defended production
2-MAV-036 1875.591 3889.910 1.6 20 knoll ditch 55.24 36 25 defended production
2-MAV-037 1876.732 3889.712 3.2 20 river terrace 45.61 35 50 production
2-MAV-038 Koroira 1878.163 3890.705 2.1 20 valley bench ditch scarps 15.60 14 85 defensive
2-MAV-039 1877.837 3890.362 1.4 200 summit flat 77.03 40 85 defensive
2-MAV-040 Matanavatu 1876.809 3890.434 12 20 summit apex scarp 46.02 39 50 defended production
2-MAV-041 1876.893 3890.268 0.7 20 summit apex scarps 46.02 39 50 defended production
2-MAV-042 1876.052 3890.938 2.5 33 ridge scarps 43.18 30 50 defended production
2-MAV-043 1875.032 3890.983 0.7 36 summit apex 43.19 30 15 defended production
2-MAV-044 1875.198 3890.960 0.8 34 summit apex 43.19 30 15 defended production
2-MAV-045 1877.342 3890.997 2 20 summit apex 20.18 29 70 defended production
2-MAV-046 1877.622 3891.329 1.4 21 valley bench ditch 20.18 29 70 defended production
2-MAV-047 Korovatuma 1878.800 3883.900 9 160 summit apex 131.38 39 90 defensive
2-MAV-048 Korohewa 1875.742 3884.640 1.1 60 river terrace 1.98 0 70 production
2-MAV-049 Bukusia 1877.500 3884.900 37 123 knoll walls scarps 34.78 22 80 defensive
348

349
Table A.2. (Continued) Habitation site data including natural and constructed defensive features.
District No. Name Easting Northing Area Elev. Situation Const. Const. Viewshed No. % Strategy
(ha) (m) Def. 1 Def. 2 size sites > 45
(km2) in view
2-MAV-050 1874.521 3888.643 0.4 53 promontory 44.40 19 60 defended production
2-NOK-001 1869.360 3877.796 7.1 106 ridge 27.34 10 35 defended production
2-NOK-002 1869.027 3878.314 1 200 promontory scarps 49.66 17 83 defensive
2-NOK-003 1868.837 3878.753 1.6 200 promontory 49.66 17 83 defensive
2-NOK-004 Korolevu 1867.607 3878.761 12.7 212 summit apex ditch scarps 30.13 8 70 defended production
2-NOK-005 1868.154 3877.656 1.6 99 promontory 5.98 0 55 defended production
2-NOK-006 1868.113 3876.756 1.9 190 promontory ditches 40.36 8 55 defended production
2-NOK-007 Narata I 1874.821 3878.647 1 20 levee ditch 67.73 54 25 defended production
2-NOK-008 1874.880 3878.873 0.9 20 levee ditch 67.73 54 25 defended production
2-NOK-009 Nokonoko 1870.900 3879.780 19.3 200 ridge ditch scarp 44.60 17 85 defensive
2-NOK-010 1870.713 3879.204 2.4 200 ridge 26.36 12 90 defensive
2-NOK-011 1870.504 3878.039 3.2 166 promontory 88.60 48 80 defensive
2-NOK-012 1870.231 3876.796 1.3 20 river terrace ditch 35.18 33 70 defended production
2-NOK-013 1874.288 3881.383 0.4 20 river terrace 53.14 44 75 production
2-NOK-014 Tualevu 1872.757 3880.854 5.2 100 ridge ditch scarp 72.00 25 85 defensive
2-NOK-015 Qereqere 1870.646 3871.154 3.3 200 summit apex ditch scarp 86.01 38 85 defensive
2-NOK-016 1868.242 3881.339 1.2 236 ridge 24.38 12 70 defended production
2-NOK-017 1868.393 3881.738 2.9 218 ridge ditch scarp 10.55 0 55 defended production
2-NOK-018 1869.953 3881.657 4.9 200 summit apex 25.35 11 70 defended production
2-NOK-019 1870.566 3882.262 1.8 300 summit flat 149.05 47 70 defended production
2-NOK-020 1871.299 3881.866 3.3 99 ridge 61.66 23 71 defensive
2-NOK-021 1871.854 3881.674 2 100 ridge 61.66 23 66 defended production
1-NSK-001 1901.083 3891.372 1.4 703 promontory 87.02 3 98 defensive
349

350
Table A.2. (Continued) Habitation site data including natural and constructed defensive features.
District No. Name Easting Northing Area Elev. Situation Const. Const. Viewshed No. % Strategy
(ha) (m) Def. 1 Def. 2 size sites > 45
(km2) in view
1-NSK-002 1901.499 3891.693 4.5 787 knoll 87.02 3 100 defensive
1-NSK-003 Nasikawa 1896.187 3892.256 2.1 99 river flat ditch 4.08 0 80 defended production
1-NSK-004 Nalesutale 1907.196 3893.092 2.3 200 river flat 4.48 1 87 production
1-NSK-005 Lega 1905.109 3894.466 1.5 200 river flat 35.54 10 64 production
1-NSK-006 1902.086 3894.932 1.2 261 river flat 12.30 3 97 production
1-NSK-007 Korodruga 1900.938 3895.048 6.4 443 summit flat 128.19 35 96 defensive
1-NSK-008 Busabusa 1902.199 3895.891 9 200 river flat walls 5.26 4 85 defensive
1-NSK-009 Vunatoto 1905.458 3895.701 1.4 200 river flat 45.13 5 19 production
1-NSK-010 1891.836 3894.595 1.2 40 meander core 15.04 0 64 production
1-NSK-011 1902.166 3897.623 0.6 150 promontory 18.56 10 83 defensive
1-NSK-012 Wala 1899.137 3898.147 2.1 100 meander core ditch 48.40 18 56 defended production
1-NSK-013 Kurimalawai I 1899.319 3898.572 2 100 river terrace ditch 48.40 18 10 defended production
1-NSK-015 Malua 1900.924 3898.762 35 100 promontory walls 29.92 15 62 defended production
1-NSK-016 Koronadoko 1902.741 3898.305 4 200 summit apex ditch scarp 29.92 15 80 defensive
1-NSK-017 Waibasaga 1903.101 3898.285 1.9 201 river terrace ditch walls 51.15 16 80 defended production
1-NSK-018 1903.864 3898.787 3.5 100 ridge 35.02 20 70 defended production
1-NSK-019 Nubutolu 1898.290 3894.787 2.1 100 river flat 17.83 6 77 production
1-NSK-020 1898.211 3894.638 1.6 99 river flat 17.83 6 77 production
2-QMR-001 1878.112 3891.399 1.7 20 river terrace 15.61 14 70 production
2-QMR-002 Toga 1878.730 3891.117 1.7 55 valley bench scarps 15.61 14 80 defensive
2-QMR-003 1878.996 3891.322 2.6 41 ridge scarps 15.61 14 80 defensive
2-QMR-004 1879.473 3891.303 2.2 67 ridge 12.25 13 80 defended production
2-QMR-005 1879.861 3891.562 1.3 20 river terrace 12.25 13 80 production
350

351
Table A.2. (Continued) Habitation site data including natural and constructed defensive features.
District No. Name Easting Northing Area Elev. Situation Const. Const. Viewshed No. % Strategy
(ha) (m) Def. 1 Def. 2 size sites > 45
(km2) in view
2-QMR-006 1881.208 3889.818 0.6 51 river terrace walls 13.43 3 82 defended production
2-QMR-007 Qoroqorovakatini 1880.308 3890.643 12.5 200 ridge walls 58.96 24 98 defensive
2-QMR-008 Tawaditawadi 1880.611 3890.807 3.5 145 summit apex 58.96 24 96 defensive
2-QMR-009 Korosamisi 1882.524 3890.307 8.4 161 summit flat 50.10 14 88 defensive
2-QMR-010 Naduri I 1880.131 3891.353 1.6 28 river terrace 18.68 13 80 production
2-QMR-011 1880.663 3891.742 2.1 20 knoll 18.68 13 85 defended production
2-QMR-012 1880.903 3891.862 1.1 25 river terrace 18.68 13 85 production
2-QMR-013 1881.068 3892.008 1.8 26 river terrace scarp 18.68 13 85 defended production
2-QMR-014 Sautabu 1881.274 3891.070 2 27 river terrace 14.32 7 75 production
2-QMR-015 1883.188 3891.858 3.5 35 river terrace scarps 34.57 16 52 defended production
2-QMR-016 Namaliwa 1883.316 3893.288 1.7 31 river flat ditches 24.88 6 15 defended production
2-QMR-017 1883.001 3893.335 2.7 37 river flat 24.88 6 15 production
2-QMR-018 Vunaqoru 1882.486 3892.039 1.6 20 river terrace 26.00 13 50 production
2-QMR-019 1882.771 3892.330 2.4 20 river terrace 26.00 13 70 production
2-QMR-020 1884.653 3892.371 1.2 20 river flat 24.06 16 77 production
2-QMR-021 1879.215 3893.627 0.3 200 ridge 27.82 11 75 defended production
2-QMR-022 1879.248 3891.009 1.6 92 valley bench ditch 87.59 35 85 defensive
2-QMR-023 Nabociwa 1878.945 3890.658 4 185 ridge walls 87.59 35 94 defensive
2-QMR-024 Koroemalu 1878.712 3890.430 1.1 267 ridge 87.59 35 96 defensive
2-QMR-025 Wakuku 1879.770 3890.535 1.4 296 ridge scarp 62.72 24 96 defensive
2-QMR-026 Naduri II 1873.700 3880.100 1.6 15 confluence ditches 24.10 18 5 defended production
2-QMR-027 Korovusulo 1880.308 3890.100 0.5 240 promontory 58.96 24 50 defended production
2-SIG-001 Sigatoka Dunes 1868.100 3869.950 5 2 coastline 180.00 0 70 production
351

352
Table A.2. (Continued) Habitation site data including natural and constructed defensive features.
District No. Name Easting Northing Area Elev. Situation Const. Const. Viewshed No. % Strategy
(ha) (m) Def. 1 Def. 2 size sites > 45
(km2) in view
2-SIG-002 1870.167 3869.825 1.7 1 coastal terrace 149.26 4 0 production
2-SIG-003 1870.290 3870.382 2.7 6 summit apex ditches scarps 149.26 4 0 defended production
2-SIG-004 1870.246 3870.966 2.2 13 coastal terrace 149.26 4 0 production
2-SIG-005 Batiri 1869.765 3872.447 3 20 river flat ditch 34.21 21 0 defended production
2-SIG-006 1869.685 3872.539 0.4 20 river flat ditch 34.21 21 0 defended production
2-SIG-007 1869.577 3872.606 0.3 20 river flat ditch 34.21 21 0 defended production
2-SIG-008 1869.624 3872.613 1.3 20 river flat ditch 34.21 21 0 defended production
2-SIG-009 Lomaloma 1869.764 3872.835 2.5 20 knoll 34.21 21 0 defended production
2-SIG-010 1869.744 3873.103 1.1 20 river flat ditch 34.21 21 0 defended production
2-SIG-011 1869.518 3873.128 1.6 19 river flat ditch 34.21 21 0 defended production
2-SIG-012 Duanasali 1868.918 3872.530 1.1 8 river terrace ditch 34.21 21 0 defended production
2-SIG-013 Nacoke 1869.452 3874.058 1.2 20 river flat ditch 59.40 29 15 defended production
2-SIG-014 1870.081 3876.057 1.7 17 river terrace ditch 35.18 33 60 defended production
2-SIG-015 1869.900 3875.419 1 20 river flat ditch 46.70 47 50 defended production
2-SIG-016 1870.076 3875.363 1.4 20 river flat ditch 46.70 47 30 defended production
2-SIG-017 1879.204 3875.529 0.4 20 river flat ditch 46.70 47 30 defended production
2-SIG-018 1870.246 3875.465 0.6 20 river flat ditch 46.70 47 30 defended production
2-SIG-019 1870.389 3875.452 0.5 20 river flat ditch 46.70 47 30 defended production
2-SIG-020 1870.105 3875.104 3.4 20 river flat ditches 46.70 47 30 defended production
2-SIG-021 1870.093 3874.906 1.1 20 river flat ditch 46.70 47 30 defended production
2-SIG-022 1870.982 3875.221 1.6 20 river terrace 53.09 40 5 production
2-SIG-023 1871.506 3875.298 1.6 20 river terrace 53.09 40 0 production
2-SIG-024 Lomolomo 1872.083 3874.979 1.4 20 knoll scarps 47.96 43 60 defended production
352

353
Table A.2. (Continued) Habitation site data including natural and constructed defensive features.
District No. Name Easting Northing Area Elev. Situation Const. Const. Viewshed No. % Strategy
(ha) (m) Def. 1 Def. 2 size sites > 45
(km2) in view
2-SIG-025 1872.266 3875.080 1.2 20 river flat 47.96 43 40 production
2-SIG-026 Muasara 1872.382 3874.987 0.9 20 river terrace ditch 47.96 43 40 defended production
2-SIG-027 Lawai 1869.510 3874.821 1.3 20 river flat ditch 38.54 37 55 defended production
2-SIG-028 1867.730 3875.336 1.1 100 ridge ditch 48.85 7 53 defended production
2-SIG-029 1867.721 3875.208 0.5 100 ridge 48.85 7 53 defended production
2-SIG-030 1868.107 3874.039 1.5 50 summit apex scarps 29.64 17 65 defended production
2-SIG-031 Etuba 1868.504 3873.741 0.8 16 river terrace ditch 29.64 17 65 defended production
2-SIG-032 Noco 1868.358 3873.702 0.7 17 river flat ditch 29.64 17 35 defended production
2-SIG-033 1868.038 3873.472 0.4 17 river flat 29.64 17 35 production
2-SIG-034 Namuaciri 1867.767 3873.686 0.8 19 river flat 29.64 17 60 production
2-SIG-035 Ebuto 1867.817 3872.821 2.6 16 river flat ditches 29.64 17 0 defended production
2-SIG-036 1868.236 3871.862 1.5 5 river terrace ditch 36.88 19 0 defended production
2-SIG-037 1868.186 3871.218 1.8 4 river terrace ditch 36.88 19 0 defended production
2-SIG-038 1868.324 3871.090 0.5 4 river terrace 36.88 19 0 production
2-SIG-039 1868.615 3970.640 0.2 1 river terrace 36.88 19 0 production
2-SIG-040 1865.904 3871.532 0.5 20 river terrace ditch 36.88 19 0 defended production
2-SIG-041 Naruku 1866.015 3871.539 5 20 valley bench ditch 36.88 19 0 defended production
2-SIG-042 Nubumarau 1865.251 3872.536 2 20 summit apex ditches 36.88 19 0 defended production
2-SIG-043 1866.085 3871.650 0.9 20 river terrace ditch 36.88 19 0 defended production
2-SIG-044 1865.750 3871.836 0.8 20 valley bench ditch 36.88 19 0 defended production
2-SIG-045 Volivoli 1866.500 3871.600 3.4 5 river terrace 82.25 0 0 production
2-SIG-046 Nasama 1868.050 3871.950 3.4 5 river terrace 82.25 0 0 production
2-SIG-047 Vunavutu 1867.950 3871.300 3.4 5 river terrace 82.25 0 0 production
353

354
Table A.2. (Continued) Habitation site data including natural and constructed defensive features.
District No. Name Easting Northing Area Elev. Situation Const. Const. Viewshed No. % Strategy
(ha) (m) Def. 1 Def. 2 size sites > 45
(km2) in view
2-SIG-048 Nadai 1869.250 3872.100 3.4 5 summit apex 101.82 16 20 defended production
2-WCB-001 1874.350 3883.325 1.3 20 river terrace 39.22 31 60 production
2-WCB-002 1874.110 3883.320 0.7 20 river terrace 39.22 31 60 production
2-WCB-003 1874.016 3883.414 0.6 20 river terrace 39.22 31 60 production
2-WCB-004 1874.196 3883.471 0.4 20 river terrace 39.22 31 60 production
2-WCB-005 1874.321 3883.673 0.7 20 river terrace 39.22 31 60 production
2-WCB-006 1874.168 3883.613 1 20 river terrace 39.22 31 60 production
2-WCB-007 1874.139 3883.794 2.7 20 river terrace ditches 39.22 31 60 defended production
2-WCB-008 1873.661 3883.435 1.4 22 promontory 39.22 31 60 defended production
2-WCB-009 Vulo 1872.970 3884.108 9.5 200 summit apex ditches scarps 39.22 31 70 defended production
2-WCB-010 1872.481 3884.984 2.7 100 promontory scarps 55.07 13 95 defensive
2-WCB-011 Sinabukabuka 1871.035 3886.128 51.2 200 ridge ditches scarps 93.17 32 95 defensive
2-WCB-012 1874.670 3886.141 2.1 100 river flat ditch 17.15 7 75 defensive
2-WCB-013 1868.436 3886.695 5.3 123 summit apex 15.61 6 55 defended production
2-WCB-014 1870.087 3887.440 1.9 85 river terrace 23.25 28 77 production
2-WCB-015 1871.410 3888.661 2 20 ridge ditch 39.43 32 63 defended production
2-WCB-016 Naicuwaga 1868.633 3888.472 5.7 206 ridge ditches 39.43 32 74 defensive
2-WCB-017 Tubaintuba 1871.329 3888.887 0.8 20 river terrace ditch 39.43 32 74 defended production
2-WCB-018 1872.816 3890.758 6.5 172 ridge scarps 84.19 24 84 defensive
2-WCB-019 1874.957 3891.367 1.3 64 river terrace ditch 47.96 30 15 defended production
2-WCB-020 1874.177 3889.960 0.9 20 ridge 58.07 39 20 defended production
2-WCB-021 1874.334 3889.835 1.2 20 ridge 58.07 39 20 defended production
2-WCB-022 1875.465 3891.520 1.9 72 river terrace ditch 47.96 30 40 defended production
354

355
Table A.2. (Continued) Habitation site data including natural and constructed defensive features.
District No. Name Easting Northing Area Elev. Situation Const. Const. Viewshed No. % Strategy
(ha) (m) Def. 1 Def. 2 size sites > 45
(km2) in view
2-WCB-023 1875.436 3891.362 1.9 68 river terrace ditch 47.96 30 40 defended production
2-WCB-024 1874.031 3883.735 1 20 river terrace 39.22 31 60 production
2-WCB-025 Navalili 1872.200 3887.900 6 20 knoll ditch 47.03 25 10 defensive
2-WCB-026 Waicoba 1869.082 3889.254 0.2 100 ridge 44.60 17 25 defended production
3-VTR-001 1881.011 3907.892 7.9 100 river flat ditches 44.68 5 20 defended production
3-VTR-002 Nakoto 1891.290 3909.645 1.4 100 river flat 29.03 6 70 production
355

356
Table A.3. Habitation site data including associated agricultural features and overall productivity.
District No. Name Easting Northing No. No. Agri. Product. % land Total Cult. Relative
Yavu Feats. Score < 45 Product. Emph. Yield
1km (0-100) 1km Score
1-NKR-001 Korowai 1904.955 3897.805 indistinct 3 20 22 42 mixed low mixed
1-NKR-002 1908.020 3896.943 indistinct 4 28 37 65 mixed med mixed
1-NKR-003 1905.753 3898.058 indistinct 9 66 30 96 wetland med wetland
1-NKR-004 Namacawa 1904.310 3898.527 indistinct 2 16 30 46 dryland low dryland
1-NKR-005 1904.438 3898.760 1 8 30 38 dryland low dryland
1-NKR-006 Tubarua 1905.048 3898.940 indistinct 9 70 12 82 wetland med wetland
1-NKR-007 1905.412 3899.016 indistinct 9 70 30 100 wetland high wetland
1-NKR-008 1909.972 3898.645 indistinct 11 74 25 99 wetland high wetland
1-NKR-009 1906.681 3899.131 12 72 40 112 mixed high mixed
1-NKR-010 Navesau 1905.292 3900.467 indistinct 0 0 32 32 dryland low dryland
1-NKR-011 Togalevu 1906.816 3900.054 indistinct 0 0 90 90 dryland med dryland
1-NKR-012 1904.194 3900.771 indistinct 0 0 6 6 dryland low dryland
1-NKR-013 1903.563 3900.196 indistinct 0 0 6 6 dryland low dryland
1-NKR-014 1902.912 3900.280 0 0 15 15 dryland low dryland
1-NKR-015 1902.828 3900.259 0 0 15 15 dryland low dryland
1-NKR-016 1908.074 3900.780 0 0 30 30 dryland low dryland
1-NKR-017 1908.078 3900.644 1 1 30 31 dryland low dryland
1-NKR-018 1908.091 3800.431 0 0 35 35 dryland low dryland
1-NKR-019 1908.511 3899.943 indistinct 15 90 33 123 wetland high wetland
1-NKR-020 1911.118 3899.669 indistinct 1 6 10 16 mixed low mixed
356

357
Table A.3. (Continued) Habitation site data including associated agricultural features and overall productivity.
District No. Name Easting Northing No. No. Agri. Product. % land Total Cult. Relative
Yavu Feats. Score < 45 Product. Emph. Yield
1km (0-100) 1km Score
1-NKR-021 Narewa 1909.535 3800.536 02 4 37 12 49 wetland med wetland
1-NKR-022 Dualagi 1909.918 3800.792 06 4 37 12 49 wetland med wetland
1-NKR-023 1911.054 3901.188 indistinct 2 12 5 17 wetland low wetland
1-NKR-024 Naviti 1906.813 3901.909 indistinct 1 10 17 27 mixed low mixed
1-NKR-025 1908.491 3902.423 indistinct 9 76 12 88 wetland med wetland
1-NKR-026 1903.968 3903.370 indistinct 0 0 15 15 dryland low dryland
1-NKR-027 Vunivuga 1905.460 3903.913 indistinct 1 1 15 16 dryland low dryland
1-NKR-028 1906.027 3903.598 1 1 15 16 dryland low dryland
1-NKR-029 1906.523 3904.923 indistinct 4 14 15 29 mixed low mixed
1-NKR-030 1910.523 3903.626 indistinct 6 31 12 43 wetland low wetland
1-NKR-031 Madraya 1908.546 3903.022 01 3 24 30 54 mixed med mixed
1-NKR-032 Matawalu 1900.446 3903.333 indistinct 0 0 30 30 dryland low dryland
1-NKR-033 1908.639 3902.099 indistinct 8 70 15 85 wetland med wetland
1-NKR-034 1901.060 3902.923 0 0 20 20 dryland low dryland
1-NKR-035 1910.011 3906.248 indistinct 4 18 27 45 mixed low mixed
1-NKR-036 1913.052 3903.573 indistinct 3 22 3 25 mixed high mixed
1-NKR-037 1909.999 3906.344 indistinct 4 18 27 45 mixed low mixed
1-NKR-038 Nadarakalou 1913.297 3906.000 indistinct 0 0 1 1 dryland low dryland
1-NKR-039 1912.426 3903.339 indistinct 3 8 15 23 dryland high mixed
1-NKR-040 Nalaba 1908.654 3906.104 4 18 30 48 mixed low mixed
357

358
Table A.3. (Continued) Habitation site data including associated agricultural features and overall productivity.
District No. Name Easting Northing No. No. Agri. Product. % land Total Cult. Relative
Yavu Feats. Score < 45 Product. Emph. Yield
1km (0-100) 1km Score
1-NKR-041 1908.758 3906.254 indistinct 1 6 10 16 mixed high mixed
1-NKR-042 Vunilagi 1907.634 3905.606 indistinct 2 7 7 14 mixed low mixed
1-NKR-043 Namoli II 1909.783 3905.830 4 18 25 43 mixed low mixed
1-NKR-044 1908.251 3901.819 8 70 25 95 wetland med wetland
1-NKR-045 1910.065 3906.430 indistinct 4 18 27 45 mixed low mixed
1-NKR-046 Nadroga 1906.931 3901.227 10 1 10 30 40 dryland low dryland
1-NKR-047 1911.903 3901.574 indistinct 1 6 5 11 mixed low mixed
1-NKR-048 1912.675 3900.284 0 0 10 10 dryland low dryland
1-NKR-049 Nadoso 1910.028 3906.150 indistinct 4 18 27 45 mixed low mixed
1-NKR-050 Lateka 1909.502 3895.921 2 20 15 35 mixed low mixed
1-NKR-051 1908.712 3899.421 15 102 33 135 wetland high wetland
1-NKR-052 Nabokotini 1909.700 3899.100 17 118 27 145 wetland high wetland
1-NKR-053 Lotoloto 1912.824 3903.281 02 5 12 10 22 mixed low mixed
1-NMT-001 1896.208 3897.729 indistinct 0 0 14 14 dryland low dryland
1-NMT-002 Matalevu 1897.199 3897.632 indistinct 2 7 32 39 dryland low dryland
1-NMT-003 1891.449 3896.648 1 1 85 86 dryland med dryland
1-NMT-004 1891.328 3896.875 indistinct 2 7 85 92 dryland med dryland
1-NMT-005 1891.188 3896.574 indistinct 1 1 85 86 dryland med dryland
1-NMT-006 1894.612 3899.687 indistinct 0 0 28 28 dryland low dryland
1-NMT-007 1894.735 3900.082 indistinct 0 0 58 58 dryland med dryland
358

359
Table A.3. (Continued) Habitation site data including associated agricultural features and overall productivity.
District No. Name Easting Northing No. No. Agri. Product. % land Total Cult. Relative
Yavu Feats. Score < 45 Product. Emph. Yield
1km (0-100) 1km Score
1-NMT-008 1894.572 3900.290 indistinct 0 0 63 63 dryland med dryland
1-NMT-009 Tawaleka 1898.715 3899.907 indistinct 0 0 35 35 dryland low dryland
1-NMT-010 1908.641 3899.797 15 90 33 123 wetland high wetland
1-NMT-011 1893.651 3900.467 indistinct 1 6 95 101 dryland high dryland
1-NMT-012 1895.697 3900.108 indistinct 0 0 4 4 dryland low dryland
1-NMT-013 1895.790 3900.327 indistinct 0 0 4 4 dryland low dryland
1-NMT-014 Muawai 1898.585 3900.848 16 0 0 17 17 dryland low dryland
1-NMT-015 Tatuba 1899.443 3900.584 56 0 0 17 17 dryland low dryland
1-NMT-016 Talenalawe I 1899.801 3900.434 indistinct 0 0 17 17 dryland low dryland
1-NMT-017 1900.960 3900.542 indistinct 5 35 24 59 mixed med mixed
1-NMT-018 1901.670 3900.491 indistinct 5 35 24 59 mixed med mixed
1-NMT-019 Drala 1885.693 3901.238 0 0 23 23 dryland low dryland
1-NMT-020 1890.557 3901.860 indistinct 0 0 80 80 dryland med dryland
1-NMT-021 1895.039 3901.928 indistinct 0 0 80 80 dryland med dryland
1-NMT-022 Natuatuacoko 1897.788 3901.379 indistinct 0 0 80 80 dryland med dryland
1-NMT-023 1911.459 3902.047 2 12 5 17 wetland low wetland
1-NMT-024 Nasaucoko I 1887.908 3902.826 12 0 0 75 75 dryland med dryland
1-NMT-025 Nakorovou 1888.234 3902.812 indistinct 0 0 75 75 dryland med dryland
1-NMT-026 Vatumali II 1894.336 3902.433 indistinct 2 16 100 116 dryland high dryland
1-NMT-027 Vatumali I 1894.837 3902.641 09 2 16 100 116 dryland high dryland
359

360
Table A.3. (Continued) Habitation site data including associated agricultural features and overall productivity.
District No. Name Easting Northing No. No. Agri. Product. % land Total Cult. Relative
Yavu Feats. Score < 45 Product. Emph. Yield
1km (0-100) 1km Score
1-NMT-028 1895.912 3902.564 indistinct 0 0 95 95 dryland med dryland
1-NMT-029 1898.177 3902.285 indistinct 0 0 75 75 dryland med dryland
1-NMT-030 1892.662 3903.731 indistinct 0 0 55 55 dryland med dryland
1-NMT-031 1897.346 3903.298 indistinct 0 0 50 50 dryland med dryland
1-NMT-032 1897.578 3903.259 indistinct 0 0 50 50 dryland med dryland
1-NMT-033 1896.260 3904.054 0 0 58 58 dryland med dryland
1-NMT-034 1889.347 3905.162 0 0 75 75 dryland med dryland
1-NMT-035 1889.637 3906.351 0 0 50 50 dryland med dryland
1-NMT-036 1897.729 3898.290 indistinct 2 12 23 35 mixed low mixed
1-NMT-038 1898.164 3902.542 indistinct 0 0 75 75 dryland med dryland
1-NMT-039 1898.012 3902.436 0 0 75 75 dryland med dryland
1-NMT-040 1897.841 3902.695 indistinct 0 0 75 75 dryland med dryland
1-NMT-041 1897.820 3902.870 indistinct 0 0 75 75 dryland med dryland
1-NMT-042 Drenebukete 1895.894 3895.603 13 0 0 2 2 dryland low dryland
1-NMT-043 Nakasi 1897.542 3899.109 indistinct 0 0 100 100 dryland high dryland
1-NMT-044 Sawene 1897.838 3899.519 indistinct 0 0 22 22 dryland low dryland
1-NMT-045 Rewasali 1881.550 3894.300 indistinct 0 0 50 50 dryland med dryland
1-NMT-046 Togovere 1881.600 3894.200 23 0 0 50 50 dryland med dryland
1-NVS-001 Koroilaulau 1913.265 3908.841 indistinct 3 3 0 3 wetland low wetland
1-NVS-002 Vunatawa 1910.953 3909.346 2 16 15 31 mixed low mixed
360

361
Table A.3. (Continued) Habitation site data including associated agricultural features and overall productivity.
District No. Name Easting Northing No. No. Agri. Product. % land Total Cult. Relative
Yavu Feats. Score < 45 Product. Emph. Yield
1km (0-100) 1km Score
2-BMA-001 Drasia 1890.229 3889.996 0 0 84 84 dryland med dryland
2-BMA-002 1887.388 3892.243 0 0 40 40 dryland low dryland
2-BMA-003 1884.893 3892.380 indistinct 1 6 23 29 dryland low dryland
2-BMA-004 1884.979 3892.975 0 0 32 32 dryland low dryland
2-BMA-005 Nalebaleba 1884.988 3893.144 0 0 32 32 dryland low dryland
2-BMA-006 1886.149 3893.892 indistinct 0 0 43 43 dryland low dryland
2-BMA-007 1887.242 3893.656 indistinct 0 0 100 100 dryland high dryland
2-BMA-008 1887.826 3893.597 indistinct 0 0 83 83 wetland med wetland
2-BMA-009 1888.134 3893.655 indistinct 0 0 83 83 wetland med wetland
2-BMA-010 Ikoro 1890.059 3892.894 06 0 0 50 50 wetland med wetland
2-BMA-011 Vitogo 1890.104 3893.411 04 0 0 85 85 wetland high wetland
2-BMA-012 1889.806 3893.156 0 0 28 28 wetland low wetland
2-BMA-013 1889.696 3893.351 0 0 28 28 wetland low wetland
2-BMA-014 Natuatuacoko 1899.900 3893.536 11 0 0 60 60 wetland med wetland
2-BMA-015 1891.866 3893.134 0 0 37 37 dryland low dryland
2-BMA-016 1892.150 3893.029 indistinct 0 0 37 37 dryland low dryland
2-BMA-017 1887.499 3894.949 indistinct 0 0 42 42 dryland low dryland
2-BMA-018 Tuvu 1889.156 3895.175 indistinct 0 0 100 100 dryland high dryland
2-BMA-019 1889.614 3894.962 indistinct 0 0 28 28 dryland low dryland
2-BMA-020 1890.000 3895.076 indistinct 0 0 52 52 dryland med dryland
361

362
Table A.3. (Continued) Habitation site data including associated agricultural features and overall productivity.
District No. Name Easting Northing No. No. Agri. Product. % land Total Cult. Relative
Yavu Feats. Score < 45 Product. Emph. Yield
1km (0-100) 1km Score
2-BMA-021 1890.249 3895.900 indistinct 0 0 32 32 dryland low dryland
2-BMA-022 Korobalavu 1887.278 3896.709 indistinct 0 0 12 12 dryland low dryland
2-BMA-023 1886.004 3897.588 1 6 13 19 dryland low dryland
2-BMA-024 1889.257 3887.373 indistinct 2 20 75 95 dryland med dryland
2-BMA-025 1891.331 3898.693 indistinct 5 38 30 68 mixed med mixed
2-BMA-026 Koroimaia 1895.139 3894.517 0 0 6 6 dryland low dryland
2-BMA-027 1884.850 3893.007 indistinct 0 0 32 32 dryland low dryland
2-BMA-028 Tuvu Cave 1888.600 3896.540 0 0 25 25 dryland low dryland
2-CON-001 1879.798 3870.438 0 0 20 20 dryland low dryland
2-CON-002 1879.662 3870.447 0 0 20 20 dryland low dryland
2-CON-003 1879.733 3870.583 0 0 20 20 dryland low dryland
2-CON-004 Navere 1879.648 3870.709 0 0 20 20 dryland low dryland
2-CON-005 Vatukarasa 1879.409 3869.481 0 0 20 20 dryland low dryland
2-CON-006 1878.954 3870.776 0 0 10 10 dryland low dryland
2-CON-007 1877.926 3869.439 0 0 32 32 dryland low dryland
2-CON-008 1877.438 3874.289 indistinct 0 0 60 60 dryland med dryland
2-CON-009 1876.266 3874.752 indistinct 0 0 30 30 dryland low dryland
2-CON-010 Korokune 1874.488 3871.751 06 0 0 28 28 dryland low dryland
2-CON-011 1873.421 3850.468 indistinct 0 0 38 38 dryland low dryland
2-CON-012 1873.427 3870.110 indistinct 6 39 38 77 mixed med mixed
362

363
Table A.3. (Continued) Habitation site data including associated agricultural features and overall productivity.
District No. Name Easting Northing No. No. Agri. Product. % land Total Cult. Relative
Yavu Feats. Score < 45 Product. Emph. Yield
1km (0-100) 1km Score
2-CON-013 1873.251 3870.078 indistinct 6 39 38 77 mixed med mixed
2-CON-014 1872.611 3869.881 indistinct 6 39 50 89 mixed med mixed
2-CON-015 1872.641 3869.773 indistinct 6 39 85 124 mixed high mixed
2-CON-016 1872.539 3869.727 indistinct 6 39 85 124 mixed high mixed
2-CON-017 1872.305 3870.325 6 39 70 109 mixed high mixed
2-CON-018 Korotogo 1872.462 3870.243 indistinct 6 39 70 109 mixed high mixed
2-CON-019 1872.148 3872.018 indistinct 0 0 32 32 dryland low dryland
2-CON-020 Vatuvoko 1871.572 3873.483 06 0 0 40 40 dryland low dryland
2-CON-021 1873.479 3873.768 0 0 80 80 dryland med dryland
2-CON-022 Qalivatuvoko 1873.004 3874.126 01 0 0 30 30 dryland low dryland
2-CON-023 1873.027 3874.376 0 0 40 40 dryland low dryland
2-CON-024 1873.215 3874.764 0 0 25 25 dryland low dryland
2-CON-025 1874.976 3874.777 0 0 84 84 dryland med dryland
2-CON-026 1874.753 3874.839 0 0 84 84 dryland med dryland
2-CON-027 1876.369 3877.374 0 0 35 35 dryland low dryland
2-CON-028 1875.005 3876.754 2 11 50 61 dryland med dryland
2-CON-029 1874.879 3876.902 2 11 60 71 dryland med dryland
2-CON-030 1873.583 3876.408 indistinct 1 10 40 50 dryland med dryland
2-CON-031 1873.605 3876.640 1 10 50 60 dryland med dryland
2-CON-032 1872.468 3876.727 indistinct 0 0 100 100 dryland high dryland
363

364
Table A.3. (Continued) Habitation site data including associated agricultural features and overall productivity.
District No. Name Easting Northing No. No. Agri. Product. % land Total Cult. Relative
Yavu Feats. Score < 45 Product. Emph. Yield
1km (0-100) 1km Score
2-CON-033 Serua 1872.934 3876.881 1 4 100 104 dryland high dryland
2-CON-034 Nadrala 1873.859 3877.043 5 46 70 116 mixed high mixed
2-CON-035 1873.336 3877.372 5 46 100 146 dryland high dryland
2-CON-036 1873.317 3877.520 5 46 100 146 dryland high dryland
2-CON-037 1872.054 3877.216 1 4 60 64 dryland med dryland
2-CON-038 1871.957 3877.377 1 4 60 64 dryland med dryland
2-CON-039 1872.065 3877.508 1 4 60 64 dryland med dryland
2-CON-040 1872.100 3877.565 1 4 60 64 dryland med dryland
2-CON-041 Nawamagi 1872.254 3877.970 indistinct 4 28 50 78 mixed med mixed
2-CON-042 1872.370 3878.099 4 28 50 78 mixed med mixed
2-CON-043 1874.713 3878.100 indistinct 2 16 75 91 dryland med dryland
2-CON-044 Narata II 1874.909 3878.340 indistinct 2 16 75 91 dryland med dryland
2-CON-045 1874.307 3880.342 0 0 75 75 dryland med dryland
2-CON-046 1875.726 3880.486 1 10 75 85 dryland med dryland
2-CON-047 Navuwai 1874.989 3881.414 04 2 14 62 76 dryland med dryland
2-CON-048 1873.358 3877.012 5 46 80 126 mixed high mixed
2-CON-049 Tavuni 1872.009 3874.405 37 0 0 30 30 dryland low dryland
2-CON-050 Naroro 1871.800 3874.500 0 0 90 90 dryland med dryland
2-CON-051 Natuamaoli 1872.600 3877.950 0 0 95 95 dryland med dryland
2-CON-052 Mahevu 1872.500 3878.300 07 0 0 95 95 dryland med dryland
364

365
Table A.3. (Continued) Habitation site data including associated agricultural features and overall productivity.
District No. Name Easting Northing No. No. Agri. Product. % land Total Cult. Relative
Yavu Feats. Score < 45 Product. Emph. Yield
1km (0-100) 1km Score
2-CUV-001 Naualuvatu 1893.950 3872.100 34 0 0 30 30 dryland low dryland
2-CUV-002 1864.646 3871.041 indistinct 1 1 100 101 dryland high dryland
2-CUV-003 1863.541 3870.441 0 0 100 100 dryland high dryland
2-CUV-004 1863.923 3871.112 indistinct 0 0 100 100 dryland high dryland
2-CUV-005 1861.676 3872.577 indistinct 0 0 100 100 dryland high dryland
2-CUV-006 1860.950 3872.921 indistinct 0 0 100 100 dryland high dryland
2-CUV-007 Koroiqara 1865.786 3871.102 08 0 0 100 100 dryland high dryland
2-CUV-008 1865.639 3871.806 1 1 100 101 dryland high dryland
2-CUV-009 1865.323 3871.700 indistinct 1 1 100 101 dryland high dryland
2-CUV-010 Nalali 1864.450 3872.200 0 0 100 100 dryland high dryland
2-CUV-011 1864.972 3872.514 1 1 100 101 dryland high dryland
2-KNS-001 1881.478 3880.355 indistinct 0 0 21 21 dryland low dryland
2-KNS-002 1885.994 3880.384 indistinct 1 1 20 21 dryland low dryland
2-KNS-003 1880.791 2880.996 indistinct 1 1 57 58 dryland med dryland
2-KNS-004 1870.781 3881.164 1 1 57 58 dryland med dryland
2-KNS-005 1884.466 3880.981 indistinct 2 2 8 10 dryland low dryland
2-KNS-006 1884.544 3881.057 indistinct 1 1 8 9 dryland low dryland
2-KNS-007 1885.514 3881.865 indistinct 2 2 8 10 dryland low dryland
2-KNS-008 1886.340 3881.841 1 1 9 10 dryland low dryland
2-KNS-009 1886.533 3882.402 indistinct 1 1 8 9 dryland low dryland
365

366
Table A.3. (Continued) Habitation site data including associated agricultural features and overall productivity.
District No. Name Easting Northing No. No. Agri. Product. % land Total Cult. Relative
Yavu Feats. Score < 45 Product. Emph. Yield
1km (0-100) 1km Score
2-KNS-010 1885.834 3882.711 1 1 8 9 dryland low dryland
2-KNS-011 1885.589 3882.502 indistinct 2 2 8 10 dryland low dryland
2-KNS-012 1885.337 3882.358 indistinct 1 1 8 9 dryland low dryland
2-KNS-013 1883.553 3882.765 indistinct 1 1 81 82 dryland med dryland
2-KNS-014 1883.318 3882.594 indistinct 1 1 100 101 dryland high dryland
2-MAV-001 1877.760 3881.174 indistinct 5 14 50 64 dryland med dryland
2-MAV-002 1877.674 3881.337 indistinct 5 14 60 74 dryland med dryland
2-MAV-003 1877.453 3881.213 indistinct 5 14 70 84 dryland med dryland
2-MAV-004 1877.287 3881.243 indistinct 5 14 80 94 dryland med dryland
2-MAV-005 1877.041 3881.308 indistinct 5 14 90 104 dryland high dryland
2-MAV-006 1875.619 3882.029 indistinct 2 14 56 70 dryland med dryland
2-MAV-007 Raiwaqa 1875.201 3883.660 indistinct 0 0 80 80 dryland med dryland
2-MAV-008 1877.053 3884.294 indistinct 0 0 65 65 dryland med dryland
2-MAV-009 1875.047 3884.081 indistinct 0 0 65 65 dryland med dryland
2-MAV-010 1874.899 3884.034 indistinct 0 0 65 65 dryland med dryland
2-MAV-011 1874.898 3885.115 indistinct 4 4 24 28 mixed low mixed
2-MAV-012 1874.267 3884.271 2 1 25 26 dryland low dryland
2-MAV-013 1874.115 3886.688 0 0 10 10 dryland low dryland
2-MAV-014 Mavua 1873.941 3886.635 0 0 10 10 dryland low dryland
2-MAV-015 Nakurivatu 1873.815 3886.884 0 0 12 12 dryland low dryland
366

367
Table A.3. (Continued) Habitation site data including associated agricultural features and overall productivity.
District No. Name Easting Northing No. No. Agri. Product. % land Total Cult. Relative
Yavu Feats. Score < 45 Product. Emph. Yield
1km (0-100) 1km Score
2-MAV-016 Koroqele III 1877.014 3886.871 indistinct 1 1 0 1 wetland low wetland
2-MAV-017 Koroqele I 1877.959 3886.823 2 2 5 7 dryland low dryland
2-MAV-018 1880.025 3886.894 indistinct 0 0 10 10 dryland low dryland
2-MAV-019 1872.194 3887.140 indistinct 0 0 52 52 dryland med dryland
2-MAV-020 Korokula 1874.083 3887.248 0 0 30 30 dryland low dryland
2-MAV-021 Navala 1873.886 3887.466 0 0 25 25 dryland low dryland
2-MAV-022 1874.618 3887.717 indistinct 0 0 10 10 dryland low dryland
2-MAV-023 1877.204 3887.572 indistinct 2 9 0 9 wetland low wetland
2-MAV-024 Koroqele II 1880.181 3887.945 indistinct 0 0 2 2 dryland low dryland
2-MAV-025 1878.989 3887.897 indistinct 0 0 8 8 dryland low dryland
2-MAV-026 1875.801 3888.260 indistinct 0 0 8 8 dryland low dryland
2-MAV-027 Namoli I 1874.432 3888.780 indistinct 0 0 50 50 dryland med dryland
2-MAV-028 Nalotawa 1874.010 3888.766 indistinct 4 14 20 34 mixed low mixed
2-MAV-029 Nabiarea 1873.795 3888.777 0 0 20 20 dryland low dryland
2-MAV-030 Nabuavatu 1873.107 3888.207 0 0 75 75 dryland med dryland
2-MAV-031 1872.783 3889.106 indistinct 0 0 80 80 dryland med dryland
2-MAV-032 1874.581 3889.356 0 0 50 50 dryland med dryland
2-MAV-033 1874.956 3889.233 0 0 50 50 dryland med dryland
2-MAV-034 1875.670 3889.626 1 1 80 81 dryland med dryland
2-MAV-035 Nakeli 1875.341 3889.890 1 1 80 81 dryland med dryland
367

368
Table A.3. (Continued) Habitation site data including associated agricultural features and overall productivity.
District No. Name Easting Northing No. No. Agri. Product. % land Total Cult. Relative
Yavu Feats. Score < 45 Product. Emph. Yield
1km (0-100) 1km Score
2-MAV-036 1875.591 3889.910 1 1 75 76 dryland med dryland
2-MAV-037 1876.732 3889.712 2 2 50 52 dryland med dryland
2-MAV-038 Koroira 1878.163 3890.705 2 2 15 17 dryland low dryland
2-MAV-039 1877.837 3890.362 2 2 15 17 dryland low dryland
2-MAV-040 Matanavatu 1876.809 3890.434 2 2 50 52 dryland med dryland
2-MAV-041 1876.893 3890.268 indistinct 2 2 50 52 dryland med dryland
2-MAV-042 1876.052 3890.938 indistinct 1 1 50 51 dryland med dryland
2-MAV-043 1875.032 3890.983 indistinct 1 1 85 86 dryland med dryland
2-MAV-044 1875.198 3890.960 indistinct 1 1 85 86 dryland med dryland
2-MAV-045 1877.342 3890.997 2 2 30 32 dryland low dryland
2-MAV-046 1877.622 3891.329 2 2 30 32 dryland low dryland
2-MAV-047 Korovatuma 1878.800 3883.900 21 0 0 10 10 dryland low dryland
2-MAV-048 Korohewa 1875.742 3884.640 04 4 4 30 34 mixed med mixed
2-MAV-049 Bukusia 1877.500 3884.900 32 0 0 20 20 dryland low dryland
2-MAV-050 1874.521 3888.643 indistinct 0 0 40 40 dryland low dryland
2-NOK-001 1869.360 3877.796 0 0 65 65 dryland med dryland
2-NOK-002 1869.027 3878.314 0 0 17 17 dryland low dryland
2-NOK-003 1868.837 3878.753 indistinct 0 0 17 17 dryland low dryland
2-NOK-004 Korolevu 1867.607 3878.761 indistinct 1 1 30 31 dryland low dryland
2-NOK-005 1868.154 3877.656 indistinct 1 1 45 46 dryland low dryland
368

369
Table A.3. (Continued) Habitation site data including associated agricultural features and overall productivity.
District No. Name Easting Northing No. No. Agri. Product. % land Total Cult. Relative
Yavu Feats. Score < 45 Product. Emph. Yield
1km (0-100) 1km Score
2-NOK-006 1868.113 3876.756 indistinct 0 0 45 45 dryland low dryland
2-NOK-007 Narata I 1874.821 3878.647 2 9 75 84 dryland med dryland
2-NOK-008 1874.880 3878.873 2 18 75 93 dryland med dryland
2-NOK-009 Nokonoko 1870.900 3879.780 55 0 0 15 15 dryland low dryland
2-NOK-010 1870.713 3879.204 0 0 10 10 dryland low dryland
2-NOK-011 1870.504 3878.039 indistinct 1 4 20 24 dryland low dryland
2-NOK-012 1870.231 3876.796 0 0 30 30 dryland low dryland
2-NOK-013 1874.288 3881.383 indistinct 0 0 25 25 dryland low dryland
2-NOK-014 Tualevu 1872.757 3880.854 0 0 15 15 dryland low dryland
2-NOK-015 Qereqere 1870.646 3871.154 indistinct 0 0 15 15 dryland low dryland
2-NOK-016 1868.242 3881.339 indistinct 2 2 30 32 dryland low dryland
2-NOK-017 1868.393 3881.738 2 2 45 47 dryland low dryland
2-NOK-018 1869.953 3881.657 indistinct 0 0 30 30 dryland low dryland
2-NOK-019 1870.566 3882.262 indistinct 0 0 30 30 dryland low dryland
2-NOK-020 1871.299 3881.866 0 0 29 29 dryland low dryland
2-NOK-021 1871.854 3881.674 indistinct 0 0 34 34 dryland low dryland
1-NSK-001 1901.083 3891.372 indistinct 0 0 2 2 dryland low dryland
1-NSK-002 1901.499 3891.693 indistinct 0 0 0 0 mixed low mixed
1-NSK-003 Nasikawa 1896.187 3892.256 indistinct 2 20 20 40 mixed low mixed
1-NSK-004 Nalesutale 1907.196 3893.092 9 74 13 87 wetland med wetland
369

370
Table A.3. (Continued) Habitation site data including associated agricultural features and overall productivity.
District No. Name Easting Northing No. No. Agri. Product. % land Total Cult. Relative
Yavu Feats. Score < 45 Product. Emph. Yield
1km (0-100) 1km Score
1-NSK-005 Lega 1905.109 3894.466 6 52 36 88 wetland med wetland
1-NSK-006 1902.086 3894.932 indistinct 0 0 3 3 dryland low dryland
1-NSK-007 Korodruga 1900.938 3895.048 indistinct 0 0 4 4 dryland low dryland
1-NSK-008 Busabusa 1902.199 3895.891 44 1 6 15 21 dryland low dryland
1-NSK-009 Vunatoto 1905.458 3895.701 indistinct 5 34 81 115 dryland high mixed
1-NSK-010 1891.836 3894.595 indistinct 0 0 36 36 dryland low dryland
1-NSK-011 1902.166 3897.623 indistinct 2 0 17 17 dryland low dryland
1-NSK-012 Wala 1899.137 3898.147 25 1 6 44 50 dryland med dryland
1-NSK-013 Kurimalawai I 1899.319 3898.572 09 1 6 90 96 dryland med dryland
1-NSK-015 Malua 1900.924 3898.762 64 1 8 38 46 dryland low dryland
1-NSK-016 Koronadoko 1902.741 3898.305 indistinct 0 0 20 20 dryland low dryland
1-NSK-017 Waibasaga 1903.101 3898.285 20 1 6 20 26 mixed high mixed
1-NSK-018 1903.864 3898.787 indistinct 1 8 30 38 dryland low dryland
1-NSK-019 Nubutolu 1898.290 3894.787 indistinct 2 11 23 34 dryland low dryland
1-NSK-020 1898.211 3894.638 indistinct 2 11 23 34 dryland low dryland
2-QMR-001 1878.112 3891.399 2 2 30 32 dryland low dryland
2-QMR-002 Toga 1878.730 3891.117 indistinct 1 6 20 26 dryland low dryland
2-QMR-003 1878.996 3891.322 1 6 20 26 dryland low dryland
2-QMR-004 1879.473 3891.303 indistinct 3 18 20 38 mixed low mixed
2-QMR-005 1879.861 3891.562 indistinct 4 24 20 44 mixed low mixed
370

371
Table A.3. (Continued) Habitation site data including associated agricultural features and overall productivity.
District No. Name Easting Northing No. No. Agri. Product. % land Total Cult. Relative
Yavu Feats. Score < 45 Product. Emph. Yield
1km (0-100) 1km Score
2-QMR-006 1881.208 3889.818 2 12 18 30 mixed low mixed
2-QMR-007 Qoroqorovakatini 1880.308 3890.643 22 1 6 2 8 wetland low wetland
2-QMR-008 Tawaditawadi 1880.611 3890.807 indistinct 2 16 4 20 wetland low wetland
2-QMR-009 Korosamisi 1882.524 3890.307 indistinct 1 10 12 22 mixed low mixed
2-QMR-010 Naduri I 1880.131 3891.353 indistinct 4 24 20 44 mixed low mixed
2-QMR-011 1880.663 3891.742 3 18 15 33 mixed low mixed
2-QMR-012 1880.903 3891.862 indistinct 4 24 15 39 mixed low mixed
2-QMR-013 1881.068 3892.008 indistinct 3 18 15 33 mixed low mixed
2-QMR-014 Sautabu 1881.274 3891.070 03 5 38 25 63 mixed med mixed
2-QMR-015 1883.188 3891.858 indistinct 0 0 48 48 dryland low dryland
2-QMR-016 Namaliwa 1883.316 3893.288 indistinct 0 0 85 85 dryland med dryland
2-QMR-017 1883.001 3893.335 0 0 85 85 dryland med dryland
2-QMR-018 Vunaqoru 1882.486 3892.039 0 0 50 50 dryland med dryland
2-QMR-019 1882.771 3892.330 indistinct 1 6 30 36 dryland low dryland
2-QMR-020 1884.653 3892.371 1 6 23 29 dryland low dryland
2-QMR-021 1879.215 3893.627 indistinct 1 8 25 33 dryland low dryland
2-QMR-022 1879.248 3891.009 1 6 15 21 dryland low dryland
2-QMR-023 Nabociwa 1878.945 3890.658 29 0 0 6 6 dryland low dryland
2-QMR-024 Koroemalu 1878.712 3890.430 02 0 0 4 4 dryland low dryland
2-QMR-025 Wakuku 1879.770 3890.535 1 6 4 10 mixed low mixed
371

372
Table A.3. (Continued) Habitation site data including associated agricultural features and overall productivity.
District No. Name Easting Northing No. No. Agri. Product. % land Total Cult. Relative
Yavu Feats. Score < 45 Product. Emph. Yield
1km (0-100) 1km Score
2-QMR-026 Naduri II 1873.700 3880.100 indistinct 0 0 95 95 dryland med dryland
2-QMR-027 Korovusulo 1880.308 3890.100 2 12 50 62 dryland med dryland
2-SIG-001 Sigatoka Dunes 1868.100 3869.950 0 0 30 30 dryland low dryland
2-SIG-002 1870.167 3869.825 indistinct 0 0 100 100 dryland high dryland
2-SIG-003 1870.290 3870.382 0 0 100 100 dryland high dryland
2-SIG-004 1870.246 3870.966 indistinct 0 0 100 100 dryland high dryland
2-SIG-005 Batiri 1869.765 3872.447 01 0 0 100 100 dryland high dryland
2-SIG-006 1869.685 3872.539 0 0 100 100 dryland high dryland
2-SIG-007 1869.577 3872.606 0 0 100 100 dryland high dryland
2-SIG-008 1869.624 3872.613 0 0 100 100 dryland high dryland
2-SIG-009 Lomaloma 1869.764 3872.835 indistinct 0 0 100 100 dryland high dryland
2-SIG-010 1869.744 3873.103 0 0 100 100 dryland high dryland
2-SIG-011 1869.518 3873.128 0 0 100 100 dryland high dryland
2-SIG-012 Duanasali 1868.918 3872.530 0 0 100 100 dryland high dryland
2-SIG-013 Nacoke 1869.452 3874.058 0 0 85 85 dryland med dryland
2-SIG-014 1870.081 3876.057 indistinct 0 0 40 40 dryland low dryland
2-SIG-015 1869.900 3875.419 0 0 50 50 dryland med dryland
2-SIG-016 1870.076 3875.363 0 0 70 70 dryland med dryland
2-SIG-017 1879.204 3875.529 0 0 70 70 dryland med dryland
2-SIG-018 1870.246 3875.465 0 0 70 70 dryland med dryland
372

373
Table A.3. (Continued) Habitation site data including associated agricultural features and overall productivity.
District No. Name Easting Northing No. No. Agri. Product. % land Total Cult. Relative
Yavu Feats. Score < 45 Product. Emph. Yield
1km (0-100) 1km Score
2-SIG-019 1870.389 3875.452 0 0 70 70 dryland med dryland
2-SIG-020 1870.105 3875.104 0 0 70 70 dryland med dryland
2-SIG-021 1870.093 3874.906 indistinct 0 0 70 70 dryland med dryland
2-SIG-022 1870.982 3875.221 0 0 95 95 dryland med dryland
2-SIG-023 1871.506 3875.298 0 0 100 100 dryland high dryland
2-SIG-024 Lomolomo 1872.083 3874.979 31 0 0 40 40 dryland low dryland
2-SIG-025 1872.266 3875.080 indistinct 0 0 60 60 dryland med dryland
2-SIG-026 Muasara 1872.382 3874.987 indistinct 0 0 60 60 dryland med dryland
2-SIG-027 Lawai 1869.510 3874.821 0 0 45 45 dryland low dryland
2-SIG-028 1867.730 3875.336 indistinct 0 0 47 47 dryland low dryland
2-SIG-029 1867.721 3875.208 indistinct 0 0 47 47 dryland low dryland
2-SIG-030 1868.107 3874.039 0 0 35 35 dryland low dryland
2-SIG-031 Etuba 1868.504 3873.741 0 0 35 35 dryland low dryland
2-SIG-032 Noco 1868.358 3873.702 0 0 65 65 dryland med dryland
2-SIG-033 1868.038 3873.472 0 0 65 65 dryland med dryland
2-SIG-034 Namuaciri 1867.767 3873.686 0 0 40 40 dryland low dryland
2-SIG-035 Ebuto 1867.817 3872.821 0 0 100 100 dryland high dryland
2-SIG-036 1868.236 3871.862 0 0 100 100 dryland high dryland
2-SIG-037 1868.186 3871.218 0 0 100 100 dryland high dryland
2-SIG-038 1868.324 3871.090 0 0 100 100 dryland high dryland
373

374
Table A.3. (Continued) Habitation site data including associated agricultural features and overall productivity.
District No. Name Easting Northing No. No. Agri. Product. % land Total Cult. Relative
Yavu Feats. Score < 45 Product. Emph. Yield
1km (0-100) 1km Score
2-SIG-039 1868.615 3970.640 0 0 100 100 dryland high dryland
2-SIG-040 1865.904 3871.532 0 0 100 100 dryland high dryland
2-SIG-041 Naruku 1866.015 3871.539 27 1 1 100 101 dryland high dryland
2-SIG-042 Nubumarau 1865.251 3872.536 indistinct 1 1 100 101 dryland high dryland
2-SIG-043 1866.085 3871.650 indistinct 1 1 100 101 dryland high dryland
2-SIG-044 1865.750 3871.836 1 1 100 101 dryland high dryland
2-SIG-045 Volivoli 1866.500 3871.600 0 0 100 100 dryland high dryland
2-SIG-046 Nasama 1868.050 3871.950 0 0 100 100 dryland high dryland
2-SIG-047 Vunavutu 1867.950 3871.300 0 0 100 100 dryland high dryland
2-SIG-048 Nadai 1869.250 3872.100 indistinct 0 0 80 80 dryland med dryland
2-WCB-001 1874.350 3883.325 0 0 40 40 dryland low dryland
2-WCB-002 1874.110 3883.320 0 0 40 40 dryland low dryland
2-WCB-003 1874.016 3883.414 0 0 40 40 dryland low dryland
2-WCB-004 1874.196 3883.471 0 0 40 40 dryland low dryland
2-WCB-005 1874.321 3883.673 0 0 40 40 dryland low dryland
2-WCB-006 1874.168 3883.613 0 0 40 40 dryland low dryland
2-WCB-007 1874.139 3883.794 indistinct 0 0 40 40 dryland low dryland
2-WCB-008 1873.661 3883.435 0 0 40 40 dryland low dryland
2-WCB-009 Vulo 1872.970 3884.108 indistinct 0 0 30 30 dryland low dryland
2-WCB-010 1872.481 3884.984 3 2 5 7 dryland low dryland
374

375
Table A.3. (Continued) Habitation site data including associated agricultural features and overall productivity.
District No. Name Easting Northing No. No. Agri. Product. % land Total Cult. Relative
Yavu Feats. Score < 45 Product. Emph. Yield
1km (0-100) 1km Score
2-WCB-011 Sinabukabuka 1871.035 3886.128 indistinct 3 2 5 7 dryland low dryland
2-WCB-012 1874.670 3886.141 indistinct 3 3 25 28 dryland low dryland
2-WCB-013 1868.436 3886.695 indistinct 0 0 45 45 dryland low dryland
2-WCB-014 1870.087 3887.440 2 7 23 30 dryland low dryland
2-WCB-015 1871.410 3888.661 indistinct 2 7 37 44 dryland low dryland
2-WCB-016 Naicuwaga 1868.633 3888.472 05 0 0 26 26 dryland low dryland
2-WCB-017 Tubaintuba 1871.329 3888.887 indistinct 1 6 37 43 dryland low dryland
2-WCB-018 1872.816 3890.758 indistinct 0 0 16 16 dryland low dryland
2-WCB-019 1874.957 3891.367 0 0 85 85 dryland med dryland
2-WCB-020 1874.177 3889.960 0 0 80 80 dryland med dryland
2-WCB-021 1874.334 3889.835 0 0 80 80 dryland med dryland
2-WCB-022 1875.465 3891.520 0 0 60 60 dryland med dryland
2-WCB-023 1875.436 3891.362 18 84 60 144 mixed high mixed
2-WCB-024 1874.031 3883.735 0 0 40 40 dryland low dryland
2-WCB-025 Navalili 1872.200 3887.900 0 0 90 90 dryland med dryland
2-WCB-026 Waicoba 1869.082 3889.254 05 0 0 75 75 dryland med dryland
3-VTR-001 1881.011 3907.892 0 0 80 80 dryland med dryland
3-VTR-002 Nakoto 1891.290 3909.645 0 0 30 30 dryland low dryland
375

376
APPENDIX B. SIGATOKA VALLEY AGRICULTURAL FEATURE DATA
Figure B.1. Diagram and data table demonstrating the stream-order method. Sufficiency
is reached if the terrace receives enough irrigation (140 m3/ha/day).
Table B.1. Example of the point-scoring system for irrigated agricultural terraces.
Terrace No. Wet Season Dry Season Point Score
T8 sufficient sufficient 10
T9 sufficient possibly sufficient 8
T10 sufficient insufficient 6
T11 possibly sufficient possibly sufficient 4
T12 possible sufficient insufficient 2
T13 insufficient insufficient 1
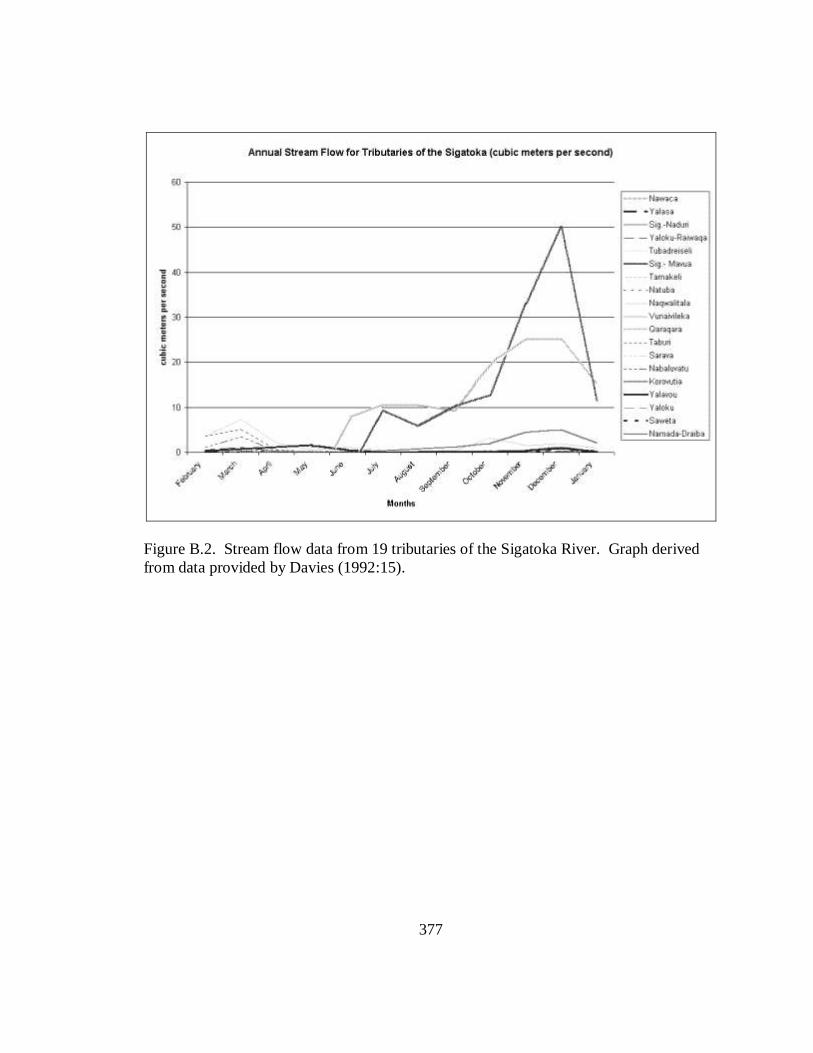
377
Figure B.2. Stream flow data from 19 tributaries of the Sigatoka River. Graph derived
from data provided by Davies (1992:15).

378
Fig
ure
B.3
. R
efer
ence
map
for
agri
cult
ura
l fe
ature
s in
the
Sig
atoka
Val
ley (
inse
ts o
n f
oll
ow
ing
pag
es).

379

380

381

382

383

384
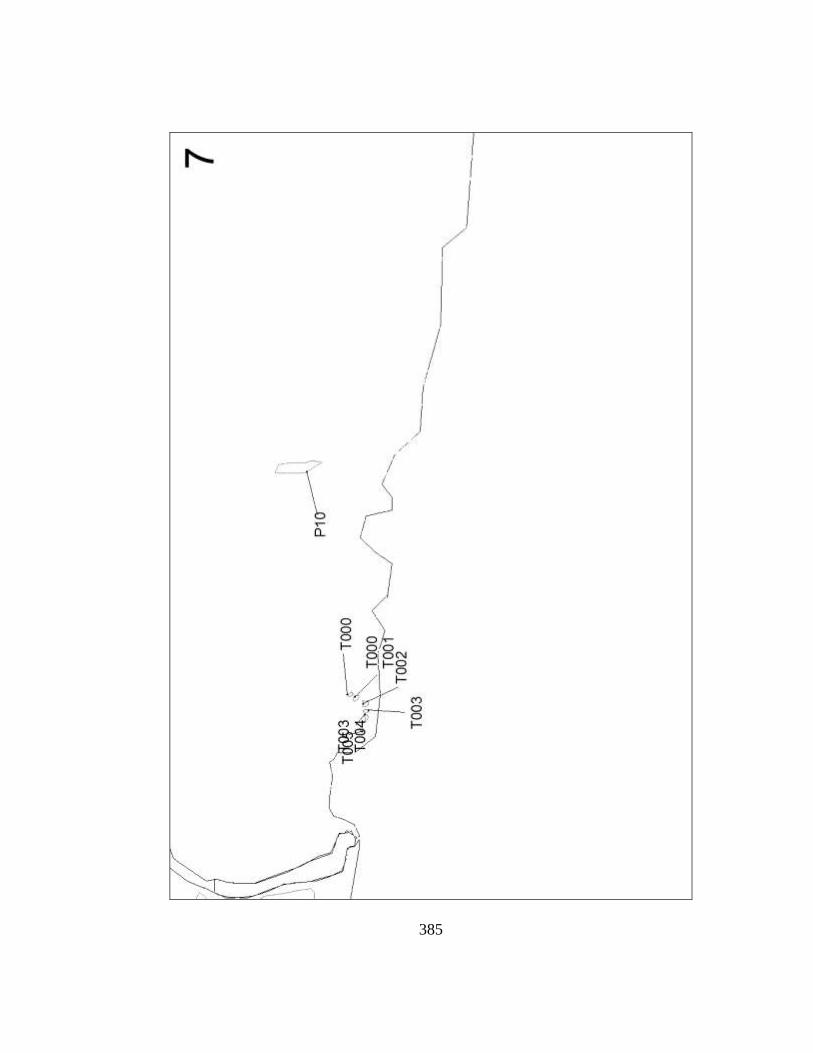
385

386

387
Table B.2. Irrigated terrace and ponded-field productivity data for wet and dry seasons.
Terrace Area Stream Wet Seas. Wet Seas. Dry Seas. Dry Seas. Wet Seas. Dry Seas. Wet Seas. Dry Seas. Product.
No. (ha) Order Yield Yield Yield Yield Yield/ha Yield/ha Sufficient? Sufficient? Score
m3/sec. m3/ha/day m3/sec. m3/ha/day (>140m3/ha/day) (>140m3/ha/day)
T000 0.8 1 0.002 172.8 0.002 172.8 over over sufficient sufficient 10
T001 1.6 1 0.002 172.8 0.002 172.8 108 108 poss. sufficient poss. sufficient 4
T002 5.8 1 0.002 172.8 0.002 172.8 29.8 29.8 insufficient insufficient 1
T003 0.9 1 0.002 172.8 0.002 172.8 over over sufficient sufficient 10
T004 1.3 1 0.002 172.8 0.002 172.8 133 133 possibly poss. sufficient 4
T005 0.9 1 0.002 172.8 0.002 172.8 over over sufficient sufficient 10
T006 4.8 1 0.002 172.8 0.002 172.8 36 36 insufficient insufficient 1
T007 7.6 2 0.006 518.4 0.007 604.8 68.2 79.5 insufficient poss. sufficient 1
T008 2.2 1
T009 2.9 1 0.002 172.8 0.002 172.8 59.6 59.6 insufficient insufficient 1
T010 1.7 2 0.011 950.4 0.005 432 559 254 sufficient sufficient 10
T011 1 1 0.002 172.8 0.0011 95.04 172.8 95.04 poss. sufficient poss. sufficient 4
T012 1.7 2 0.011 950.4 0.005 432 559 254 sufficient sufficient 10
T013 1.2 2 0.011 950.4 0.005 432 792 360 sufficient sufficient 10
T014 1.2 1 0.002 172.8 0.0011 95.04 144 79.2 poss. sufficient poss. sufficient 4
T015 1.2 1 0.002 172.8 0.0011 95.04 144 79.2 poss. sufficient poss. sufficient 4
T016 1.4 1 0.002 172.8 0.0011 95.04 123 67.8 poss. sufficient insufficient 2
T017 2.8 1 0.002 172.8 0.002 172.8 61.7 61.7 insufficient insufficient 1
T018 2.5 1 0.002 172.8 0.0011 95.04 69.12 38 insufficient insufficient 1
T019 1.7 1 0.007 604.8 0.0017 146.88 355.7 86 sufficient poss. sufficient 8
T020 1.2 2 0.006 518.4 0.007 604.8 432 504 sufficient sufficient 10
T021 1.9 2 0.011 950.4 0.005 432 678.8 227 sufficient sufficient 10
387

388
Table B.2. (Continued) Irrigated terrace and ponded-field productivity data for wet and dry seasons.
Terrace Area Stream Wet Seas. Wet Seas. Dry Seas. Dry Seas. Wet Seas. Dry Seas. Wet Seas. Dry Seas. Product.
No. (ha) Order Yield Yield Yield Yield Yield/ha Yield/ha Sufficient? Sufficient? Score
m3/sec. m3/ha/day m3/sec. m3/ha/day (>140m3/ha/day) (>140m3/ha/day)
T022 0.8 1
T023 0.6 1
T024 2.6 2 0.006 518.4 0.007 604.8 199.3 232.6 sufficient sufficient 10
T025 1.8 1 0.002 172.8 0.002 172.8 96 96 poss. sufficient poss. sufficient 4
T026 0.9 2 0.006 518.4 0.007 604.8 over over sufficient sufficient 10
T027 3.3 1 0.002 172.8 0.002 172.8 52.4 52.4 insufficient insufficient 1
T028 1.8 1
T029 4.3 1 0.002 172.8 0.002 172.8 40.1 40.1 insufficient insufficient 1
T030 6.5 1 0.002 172.8 0.002 172.8 26.5 26.5 insufficient insufficient 1
T031 3.2 1 0.002 172.8 0.0011 95.04 54 29.7 insufficient insufficient 1
T032 2.6 1 0.002 172.8 0.0011 95.04 66.4 36.5 insufficient insufficient 1
T033 2.3 1
T034 1.5 1 0.001 86.4 0.0006 51.84 57.6 34.5 insufficient insufficient 1
T035 2.3 1 0.001 86.4 0.0006 51.84 37.5 22.5 insufficient insufficient 1
T036 1.4 1 0.001 86.4 0.0006 51.84 61.7 37 insufficient insufficient 1
T037 2.2 1 0.001 86.4 0.0006 51.84 39.2 23.5 insufficient insufficient 1
T038 1.1 1 0.001 86.4 0.0006 51.84 78.5 47.12 insufficient insufficient 1
T039 1.3 1 0.001 86.4 0.0006 51.84 66.4 39.8 insufficient insufficient 1
T040 1.9 4 0.057 4924.8 0.029 2505.6 2592 1318.73 sufficient sufficient 10
T041 1.1 3 0.028 2419.2 0.014 1209.6 2199.2 1099.6 sufficient sufficient 10
T042 2.6 1 0.002 172.8 0.0011 95.04 66.46 36.55 insufficient insufficient 1
T043 2.5 1 0.002 172.8 0.0011 95.04 69.12 38.01 insufficient insufficient 1
388

389
Table B.2. (Continued) Irrigated terrace and ponded-field productivity data for wet and dry seasons.
Terrace Area Stream Wet Seas. Wet Seas. Dry Seas. Dry Seas. Wet Seas. Dry Seas. Wet Seas. Dry Seas. Product.
No. (ha) Order Yield Yield Yield Yield Yield/ha Yield/ha Sufficient? Sufficient? Score
m3/sec. m3/ha/day m3/sec. m3/ha/day (>140m3/ha/day) (>140m3/ha/day)
T044 1.8 1
T045 1.7 1 0.002 172.8 0.0011 95.04 101.6 55.9 sufficient insufficient 6
T046 3.9 1 0.002 172.8 0.0011 95.04 44.3 24.36 insufficient insufficient 1
T047 3.4 1 0.002 172.8 0.0011 95.04 50.8 2795 insufficient sufficient 1
T048 1.2 1
T049 1.8 1
T050 2.3 1
T051 6.6 3 0.03 2592 0.007 604.8 392.7 91.6 sufficient poss. sufficient 8
T052 1.8 1
T053 1.6 1
T054 3 1 0.005 432 0.001 86.4 144 28.8 sufficient insufficient 6
T055 1.8 1 0.005 432 0.001 86.4 240 48 sufficient insufficient 6
T056 2.8 2 0.031 2678.4 0.003 259.2 956.4 92.5 sufficient poss. sufficient 8
T057 2.8 1 0.002 172.8 0.002 172.8 61.7 61.7 insufficient insufficient 1
T058 4.2 1 0.002 172.8 0.002 172.8 41.1 41.7 insufficient insufficient 1
T059 2.8 1 0.002 172.8 0.002 172.8 61.7 61.7 insufficient insufficient 1
T060 1 1
T061 2.2 1
T062 3.6 1
T063 5.1 1 0.005 432 0.001 86.4 84.7 16.9 poss. sufficient insufficient 2
T064 0.9 4 0.061 5270 0.014 1209.6 over over sufficient sufficient 10
T065 3.1 1 0.006 518.4 0.0007 60.4 167.2 19.5 sufficient insufficient 6
389
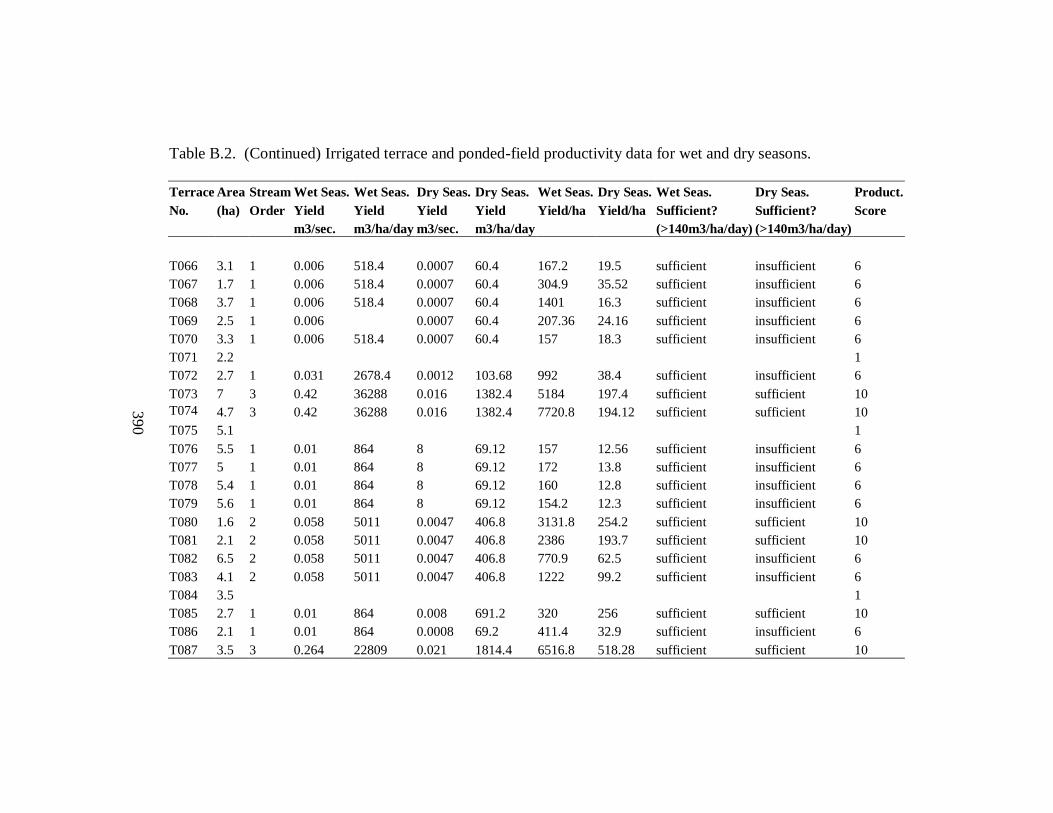
390
Table B.2. (Continued) Irrigated terrace and ponded-field productivity data for wet and dry seasons.
Terrace Area Stream Wet Seas. Wet Seas. Dry Seas. Dry Seas. Wet Seas. Dry Seas. Wet Seas. Dry Seas. Product.
No. (ha) Order Yield Yield Yield Yield Yield/ha Yield/ha Sufficient? Sufficient? Score
m3/sec. m3/ha/day m3/sec. m3/ha/day (>140m3/ha/day) (>140m3/ha/day)
T066 3.1 1 0.006 518.4 0.0007 60.4 167.2 19.5 sufficient insufficient 6
T067 1.7 1 0.006 518.4 0.0007 60.4 304.9 35.52 sufficient insufficient 6
T068 3.7 1 0.006 518.4 0.0007 60.4 1401 16.3 sufficient insufficient 6
T069 2.5 1 0.006 0.0007 60.4 207.36 24.16 sufficient insufficient 6
T070 3.3 1 0.006 518.4 0.0007 60.4 157 18.3 sufficient insufficient 6
T071 2.2 1
T072 2.7 1 0.031 2678.4 0.0012 103.68 992 38.4 sufficient insufficient 6
T073 7 3 0.42 36288 0.016 1382.4 5184 197.4 sufficient sufficient 10
T074 4.7 3 0.42 36288 0.016 1382.4 7720.8 194.12 sufficient sufficient 10
T075 5.1 1
T076 5.5 1 0.01 864 8 69.12 157 12.56 sufficient insufficient 6
T077 5 1 0.01 864 8 69.12 172 13.8 sufficient insufficient 6
T078 5.4 1 0.01 864 8 69.12 160 12.8 sufficient insufficient 6
T079 5.6 1 0.01 864 8 69.12 154.2 12.3 sufficient insufficient 6
T080 1.6 2 0.058 5011 0.0047 406.8 3131.8 254.2 sufficient sufficient 10
T081 2.1 2 0.058 5011 0.0047 406.8 2386 193.7 sufficient sufficient 10
T082 6.5 2 0.058 5011 0.0047 406.8 770.9 62.5 sufficient insufficient 6
T083 4.1 2 0.058 5011 0.0047 406.8 1222 99.2 sufficient insufficient 6
T084 3.5 1
T085 2.7 1 0.01 864 0.008 691.2 320 256 sufficient sufficient 10
T086 2.1 1 0.01 864 0.0008 69.2 411.4 32.9 sufficient insufficient 6
T087 3.5 3 0.264 22809 0.021 1814.4 6516.8 518.28 sufficient sufficient 10
390

391
Table B.2. (Continued) Irrigated terrace and ponded-field productivity data for wet and dry seasons.
Terrace Area Stream Wet Seas. Wet Seas. Dry Seas. Dry Seas. Wet Seas. Dry Seas. Wet Seas. Dry Seas. Product.
No. (ha) Order Yield Yield Yield Yield Yield/ha Yield/ha Sufficient? Sufficient? Score
m3/sec. m3/ha/day m3/sec. m3/ha/day (>140m3/ha/day) (>140m3/ha/day)
T088 3.2 3 0.264 22809 0.021 1814.4 7127.8 567 sufficient sufficient 10
T089 3.8 2 0.058 5011.2 0.0047 406 1318.7 106.8 sufficient sufficient 10
T090 2.3 1
T091 1.4 2 0.058 5011.2 0.0047 406 3579.4 290 sufficient sufficient 10
T092 12.8 1 0.01 864 0.008 691.2 67.5 54 insufficient insufficient 1
T093 6.3 1 0.01 864 0.0008 69.1 137.1 10.96 sufficient insufficient 6
T094 1.7 1 0.01 864 0.0008 69.1 508.2 40.6 sufficient insufficient 6
T095 1.8 1
T096 1.8 4 0.528 45619 0.043 3715.2 25344 2064 sufficient sufficient 10
T097 3.6 2 0.058 5011.2 0.0047 406 1392 112.7 sufficient poss. sufficient 8
T098 2.8 2 0.058 5011.2 0.0047 406 1789.7 145 sufficient poss. sufficient 8
T099 2 1 0.01 864 0.0047 406 432 203 sufficient sufficient 10
T100 4.1 1 0.019 1641.6 0.001 86.4 400.3 21.07 sufficient insufficient 6
T101 7.8 2 0.058 5011.2 0.0047 406 642.4 52 sufficient insufficient 6
T102 2.8 1
T103 1 4 1.83 158112 0.111 9590 158112 9590 sufficient sufficient 10
T104 0.9 2 0.101 8726.4 0.006 518.4 over over sufficient sufficient 10
T105 1.2 1 0.019 1641.6 0.001 86.4 1367.5 72 sufficient insufficient 6
T106 1.6 1 0.019 1641.6 0.001 86.4 1026 54 sufficient insufficient 6
T107 2.1 2 0.101 8726.4 0.006 518.4 4155.4 246.85 sufficient sufficient 10
T108 2.4 1 0.019 1641.6 0.001 86.4 684 36 sufficient insufficient 6
T109 1.2 1 0.019 1641.6 0.001 86.4 1367.5 72 sufficient insufficient 6
391

392
Table B.2. (Continued) Irrigated terrace and ponded-field productivity data for wet and dry seasons.
Terrace Area Stream Wet Seas. Wet Seas. Dry Seas. Dry Seas. Wet Seas. Dry Seas. Wet Seas. Dry Seas. Product.
No. (ha) Order Yield Yield Yield Yield Yield/ha Yield/ha Sufficient? Sufficient? Score
m3/sec. m3/ha/day m3/sec. m3/ha/day (>140m3/ha/day) (>140m3/ha/day)
T110 2.1 4 1.83 158112 0.11 9504 75291 4525.7 sufficient sufficient 10
T111 2.5 4 1.83 158112 0.11 9504 63244 3801.6 sufficient sufficient 10
T112 2.9 1 0.019 1641.6 0.001 86.4 566 29.79 sufficient insufficient 6
T113 3.6 4 1.83 158112 0.111 9590 43920 2663 sufficient sufficient 10
T114 1.7 4 1.83 158112 0.111 9590 93007 5641 sufficient sufficient 10
T115 1.3 1 0.019 1641.6 0.001 86.4 1262.7 66.46 sufficient insufficient 6
T116 1.4 4 1.83 158112 0.111 9590 112937 6850 sufficient sufficient 10
T117 2 4 1.83 158112 0.111 9590 79056 4795 sufficient sufficient 10
T118 3 4 1.83 158112 0.111 9590 52704 3196.6 sufficient sufficient 10
T119 1.4 4 1.83 158112 0.111 9590 112937 6850 sufficient sufficient 10
T120 0.7 3 0.457 39484 0.027 2332.8 over over sufficient sufficient 10
T121 3.3 3 0.457 39484 0.027 2332.8 11964 706.9 sufficient sufficient 10
T122 1.9 1 0.019 1641.6 0.001 86.4 864 45.47 sufficient insufficient 6
T123 3 2 0.101 8726.4 0.006 518.4 2908.8 172.8 sufficient poss. sufficient 8
T124 3.4 2 0.101 8726.4 0.006 518.4 2566 152.3 sufficient poss. sufficient 8
T125 3.7 1 0.019 1641.6 0.001 86.4 443.6 23.3 sufficient insufficient 6
T126 6.5 1 0.019 1641.6 0.001 86.4 252.5 13.2 sufficient insufficient 6
T127 2.6 2 0.101 8726.4 0.006 518.4 3356.3 199.3 sufficient sufficient 10
T128 4 1 0.031 2678.4 0.0012 103.6 669.6 25.9 sufficient insufficient 6
T129 8 1 0.031 2678.4 0.0012 103.6 334.8 12.9 sufficient insufficient 6
T130 3.1 2 0.129 11145.6 0.005 432 3595.3 139.35 sufficient poss. sufficient 8
T131 3.5 2 0.129 11145.6 0.005 432 3184.4 123.4 sufficient poss. sufficient 8
392
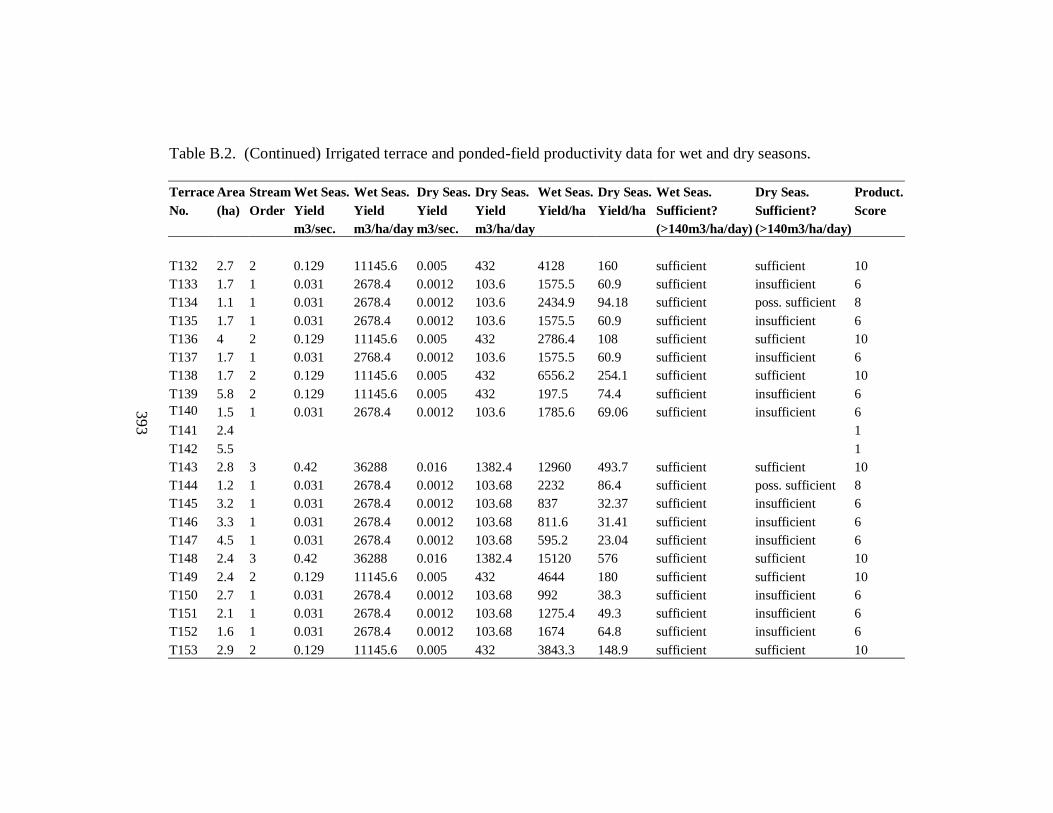
393
Table B.2. (Continued) Irrigated terrace and ponded-field productivity data for wet and dry seasons.
Terrace Area Stream Wet Seas. Wet Seas. Dry Seas. Dry Seas. Wet Seas. Dry Seas. Wet Seas. Dry Seas. Product.
No. (ha) Order Yield Yield Yield Yield Yield/ha Yield/ha Sufficient? Sufficient? Score
m3/sec. m3/ha/day m3/sec. m3/ha/day (>140m3/ha/day) (>140m3/ha/day)
T132 2.7 2 0.129 11145.6 0.005 432 4128 160 sufficient sufficient 10
T133 1.7 1 0.031 2678.4 0.0012 103.6 1575.5 60.9 sufficient insufficient 6
T134 1.1 1 0.031 2678.4 0.0012 103.6 2434.9 94.18 sufficient poss. sufficient 8
T135 1.7 1 0.031 2678.4 0.0012 103.6 1575.5 60.9 sufficient insufficient 6
T136 4 2 0.129 11145.6 0.005 432 2786.4 108 sufficient sufficient 10
T137 1.7 1 0.031 2768.4 0.0012 103.6 1575.5 60.9 sufficient insufficient 6
T138 1.7 2 0.129 11145.6 0.005 432 6556.2 254.1 sufficient sufficient 10
T139 5.8 2 0.129 11145.6 0.005 432 197.5 74.4 sufficient insufficient 6
T140 1.5 1 0.031 2678.4 0.0012 103.6 1785.6 69.06 sufficient insufficient 6
T141 2.4 1
T142 5.5 1
T143 2.8 3 0.42 36288 0.016 1382.4 12960 493.7 sufficient sufficient 10
T144 1.2 1 0.031 2678.4 0.0012 103.68 2232 86.4 sufficient poss. sufficient 8
T145 3.2 1 0.031 2678.4 0.0012 103.68 837 32.37 sufficient insufficient 6
T146 3.3 1 0.031 2678.4 0.0012 103.68 811.6 31.41 sufficient insufficient 6
T147 4.5 1 0.031 2678.4 0.0012 103.68 595.2 23.04 sufficient insufficient 6
T148 2.4 3 0.42 36288 0.016 1382.4 15120 576 sufficient sufficient 10
T149 2.4 2 0.129 11145.6 0.005 432 4644 180 sufficient sufficient 10
T150 2.7 1 0.031 2678.4 0.0012 103.68 992 38.3 sufficient insufficient 6
T151 2.1 1 0.031 2678.4 0.0012 103.68 1275.4 49.3 sufficient insufficient 6
T152 1.6 1 0.031 2678.4 0.0012 103.68 1674 64.8 sufficient insufficient 6
T153 2.9 2 0.129 11145.6 0.005 432 3843.3 148.9 sufficient sufficient 10
393

394
Table B.2. (Continued) Irrigated terrace and ponded-field productivity data for wet and dry seasons.
Terrace Area Stream Wet Seas. Wet Seas. Dry Seas. Dry Seas. Wet Seas. Dry Seas. Wet Seas. Dry Seas. Product.
No. (ha) Order Yield Yield Yield Yield Yield/ha Yield/ha Sufficient? Sufficient? Score
m3/sec. m3/ha/day m3/sec. m3/ha/day (>140m3/ha/day) (>140m3/ha/day)
T154 2.5 2 0.129 11145.6 0.005 432 4458.2 12.8 sufficient insufficient 6
T155 1.8 1 0.031 2678.4 0.0012 103.68 1488 57.6 sufficient insufficient 6
T156 3 1 0.031 2678.4 0.0012 103.68 892.8 34.5 sufficient insufficient 6
T157 1.3 1 0.031 2678.4 0.0012 103.68 2061 79.7 sufficient poss. sufficient 8
T158 4 1 0.031 2678.4 0.0012 103.68 669.6 25.92 sufficient insufficient 6
T159 2.6 4 1.68 145152 0.066 5702.4 55827 2193 sufficient sufficient 10
T160 2.9 4 1.68 145152 0.066 5702.4 50052.4 1966.3 sufficient sufficient 10
T161 2.9 1 0.019 1641.6 0.001 86.4 566 29.79 sufficient insufficient 6
T162 0.8 1 0.019 1641.6 0.001 86.4 over over sufficient sufficient 10
T163 2.4 1 0.019 1641.6 0.001 86.4 684 36 sufficient insufficient 6
T164 2.1 1 0.019 1641.6 0.001 86.4 781.7 41.1 sufficient insufficient 6
T165 4.7 1 0.034 2937.6 0.0012 103.68 625 22 sufficient insufficient 6
T166 5 2 0.129 11145.6 0.005 432 2229.12 86.4 sufficient insufficient 6
T167 3.3 2 0.129 11145.6 0.005 432 3377.4 130.9 sufficient poss. sufficient 8
T168 2.9 1 0.031 2678.4 0.0012 103.68 923.9 35.7 sufficient insufficient 6
T169 2.5 1 0.031 2678.4 0.0012 103.68 1071.3 41.47 sufficient insufficient 6
T170 3.3 1 0.031 2678.4 0.0012 103.68 811.63 31.41 sufficient insufficient 6
T171 5.1 2 0.129 11145.6 0.005 432 2185.4 84.7 sufficient poss. sufficient 8
T172 2.6 1 0.031 2678.4 0.0012 103.68 1030 39.8 sufficient insufficient 6
T173 1.3 1 0.031 2678.4 0.0012 103.68 2060.3 79.7 sufficient poss. sufficient 8
T174 4.4 1 0.031 2678.4 0.0012 103.68 608.7 23.56 sufficient insufficient 6
T175 1.3 1 0.031 2678.4 0.0012 103.68 2060.3 79.7 sufficient poss. sufficient 8
394

395
Table B.2. (Continued) Irrigated terrace and ponded-field productivity data for wet and dry seasons.
Terrace Area Stream Wet Seas. Wet Seas. Dry Seas. Dry Seas. Wet Seas. Dry Seas. Wet Seas. Dry Seas. Product.
No. (ha) Order Yield Yield Yield Yield Yield/ha Yield/ha Sufficient? Sufficient? Score
m3/sec. m3/ha/day m3/sec. m3/ha/day (>140m3/ha/day) (>140m3/ha/day)
T176 2.6 1 0.031 2678.4 0.0012 103.68 1030.1 39.8 sufficient insufficient 6
T177 2.2 1 0.031 2678.4 0.0012 103.68 1217.4 47.12 sufficient insufficient 6
T178 1.6 1
T179 1.6 1 0.031 2678.4 0.0012 103.68 1674 64.8 sufficient insufficient 6
T180 5.9 4 1.68 145152 0.066 5702.4 24602 966.5 sufficient sufficient 10
T181 3 1 0.031 2678.4 0.0012 103.68 892.8 34.5 sufficient insufficient 6
T182 7.5 1 0.031 2678.4 0.0012 103.68 357.12 13.8 sufficient insufficient 6
T183 1.9 3 0.42 36288 0.016 1382.4 19098.9 727.5 sufficient sufficient 10
T184 3.4 1 0.031 2678.4 0.0012 103.68 788 30.49 sufficient insufficient 6
T185 4.9 1 0.031 2678.4 0.0012 103.68 546.6 12.15 sufficient insufficient 6
T186 7.6 1 0.031 2678.4 0.0012 103.68 352.4 13.64 sufficient insufficient 6
T187 1 3 0.42 36288 0.016 1382.4 36288 1382.4 sufficient sufficient 10
T188 5.4 1
T189 4 4 1.68 145152 0.066 5702.4 36288 1425.6 sufficient sufficient 10
T190 0.6 1 0.031 2678.4 0.0012 103.68 over over sufficient sufficient 10
T191 3.1 2 0.129 11145.6 0.005 432 3595.3 139.3 sufficient poss. sufficient 8
T192 1.8 2 0.129 11145.6 0.005 432 6192 240 sufficient sufficient 10
T193 1.2 2 0.129 11145.6 0.005 432 9288 360 sufficient sufficient 10
T194 0.6 1 0.031 2678.4 0.0012 103.68 over over sufficient sufficient 10
T195 1.2 2 0.129 11145.6 0.005 432 9288 360 sufficient sufficient 10
T196 4 1 0.031 2678.4 0.0012 103.68 669.6 25.92 sufficient insufficient 6
T197 2.4 1 0.031 2678.4 0.0012 103.68 1116 43.2 sufficient insufficient 6
395

396
Table B.2. (Continued) Irrigated terrace and ponded-field productivity data for wet and dry seasons.
Terrace Area Stream Wet Seas. Wet Seas. Dry Seas. Dry Seas. Wet Seas. Dry Seas. Wet Seas. Dry Seas. Product.
No. (ha) Order Yield Yield Yield Yield Yield/ha Yield/ha Sufficient? Sufficient? Score
m3/sec. m3/ha/day m3/sec. m3/ha/day (>140m3/ha/day) (>140m3/ha/day)
T198 2.3 1 0.031 2678.4 0.0012 103.68 1164 45.07 sufficient insufficient 6
T199 4 1 0.031 2678.4 0.0012 103.68 669.6 25.92 sufficient insufficient 6
T200 3.3 1 0.031 2678.4 0.0012 103.68 811.63 31.41 sufficient insufficient 6
T201 12.6 3 0.42 36288 0.016 1382.4 2880 109.7 sufficient poss. sufficient 8
T202 6.7 1 0.031 2678.4 0.0012 103.68 399.7 15.47 sufficient insufficient 6
T203 10 1 0.031 2678.4 0.0012 103.68 267.8 10.36 sufficient insufficient 6
T204 2.8 1
T205 2.2 1
T206 4.4 1 0.031 2678.4 0.0012 103.68 608.7 23.56 sufficient insufficient 6
T207 8 2 0.129 11145.6 0.005 432 1393.2 54 sufficient insufficient 6
T208 6.3 1 0.031 2678.4 0.0012 103.68 425.1 16.45 sufficient insufficient 6
T209 8.2 1 0.031 2678.4 0.0012 103.68 326.6 12.64 sufficient insufficient 6
T210 2.6 1
T211 4.7 1 0.031 2678.4 0.0012 103.68 569.8 22.05 sufficient insufficient 6
T212 4.9 1 0.031 2678.4 0.0012 103.68 546.6 21.15 sufficient insufficient 6
T213 8.3 1 0.031 2678.4 0.0012 103.68 322.6 12.49 sufficient insufficient 6
T214 3.1 1 0.031 2678.4 0.0012 103.68 864 33.4 sufficient insufficient 6
T215 3 1 0.031 2678.4 0.0012 103.68 892.8 34.5 sufficient insufficient 6
T216 2.2 1 0.031 2678.4 0.0012 103.68 1217.4 47.12 sufficient insufficient 6
T217 0.8 1
T218 11.7 1 0.031 2678.4 0.0012 103.68 228.9 8.86 sufficient insufficient 6
T219 2.2 1
396

397
Table B.2. (Continued) Irrigated terrace and ponded-field productivity data for wet and dry seasons.
Terrace Area Stream Wet Seas. Wet Seas. Dry Seas. Dry Seas. Wet Seas. Dry Seas. Wet Seas. Dry Seas. Product.
No. (ha) Order Yield Yield Yield Yield Yield/ha Yield/ha Sufficient? Sufficient? Score
m3/sec. m3/ha/day m3/sec. m3/ha/day (>140m3/ha/day) (>140m3/ha/day)
T220 3.7 1 0.031 2678.4 0.0012 103.68 723.8 28.02 sufficient insufficient 6
T221 4.7 1 0.031 2678.4 0.0012 103.68 569.8 22.05 sufficient insufficient 6
T222 10.9 3 0.42 36288 0.016 1382.4 3329.1 126.8 sufficient poss. sufficient 8
T223 15.6 2 0.129 11145.6 0.005 432 714.4 27.6 sufficient insufficient 6
T224 2.3 1 0.031 2678.4 0.0012 103.68 1164.52 45.07 sufficient insufficient 6
T225 0.9 4 1.68 145152 0.006 518.4 over over sufficient sufficient 10
T226 1.8 1
T227 5.2 1
T228 1.8 1 0.031 145152 0.0012 103.68 80640 57.6 sufficient insufficient 6
T229 1.6 1 0.031 145152 0.0012 103.68 90720 64.8 sufficient insufficient 6
T230 8.6 1 0.031 145152 0.0012 103.68 16878.1 12.05 sufficient insufficient 6
T231 4.7 1 0.031 145152 0.0012 103.68 569.8 22.05 sufficient insufficient 6
T232 2.4 1
T233 2.2 1
T234 2 1
T235 4 2 0.129 145152 0.005 432 2786.4 108 sufficient sufficient 1
P42 10 10
P43 1 10
P45 20 10
P48 1 10
P47 9 10
P46 10 10
397

398
Table B.2. (Continued) Irrigated terrace and ponded-field productivity data for wet and dry seasons.
Terrace Area Stream Wet Seas. Wet Seas. Dry Seas. Dry Seas. Wet Seas. Dry Seas. Wet Seas. Dry Seas. Product.
No. (ha) Order Yield Yield Yield Yield Yield/ha Yield/ha Sufficient? Sufficient? Score
m3/sec. m3/ha/day m3/sec. m3/ha/day (>140m3/ha/day) (>140m3/ha/day)
P44 30 10
P40 10 10
P35 15 10
P34 17 10
P33 1 10
P32 8.5 10
P27 25 10
P26 12 10
P24 90 10
P23 10 10
P22 10 10
P21 18 10
P20 3 10
P19 80 10
P18 9 10
P17 40 10
P16 13 10
P15 12 10
P14 1.5 10
P13 3 10
P11 2 10
P09 7 10
398

399
Table B.2. (Continued) Irrigated terrace and ponded-field productivity data for wet and dry seasons.
Terrace Area Stream Wet Seas. Wet Seas. Dry Seas. Dry Seas. Wet Seas. Dry Seas. Wet Seas. Dry Seas. Product.
No. (ha) Order Yield Yield Yield Yield Yield/ha Yield/ha Sufficient? Sufficient? Score
m3/sec. m3/ha/day m3/sec. m3/ha/day (>140m3/ha/day) (>140m3/ha/day)
P08 7 10
P07 9 10
P06 4 10
P05 2 10
P04 3 10
P03 5 10
P02 5 10
P01 5 10
P41 12.6 10
P39 12 10
P38 8 10
P37 40 10
P36 20 10
P31 12 10
P30 15 10
P29 20 10
P28 18 10
P25 18 10
P12 25 10
P10 15 10
399

400
APPENDIX C. CERAMIC ANALYSIS
Ceramics have played a preeminent role in the study of interaction throughout the
world, and the Pacific is no exception. Beginning in the late 1970s, Pacific scholars
began to apply comparative statistical techniques in the analysis of decorated ceramic
assemblages (Green 1978, 1979; Crosby 1988; Frost 1974; Hunt 1986; Best 1984). This
method integrated hypotheses within anthropological, social, and biological theory,
which posit that stylistic similarity is indicative of social interaction, and dissimilarity
suggests the presence of social boundaries (e.g., Rouse 1939; Willey and Phillips 1958;
Plog 1983; Wobst 1977; Hegmon 1992). A broad survey of recent literature concerning
Lapita and post-Lapita interaction (Best 2002; Burley 1999; Bedford 1999) suggests that
most Pacific archaeologists implicitly equate stylistic similarity with interaction. The
means of assessing the validity of style-based interaction models (and also teasing out the
potential for homologous relationships) has come primarily through provenance research
of ceramic tempers (Dickinson 1971), clay sources (Best 1984; Anson 1983; Hunt 1989)
and lithic sources (Best 1987b; Davidson 1978; Kirch and Yen 1982).
Over the last decade archaeologists have re-examined the issue of trait
transmission, providing a series of insights that have significance for all ceramic studies
in the Pacific. In particular, the work of Bronitsky (1986), Dunnell (1978), and Neiman
(1995) has determined that when the stylistic distributions of traits across assemblages
are used as proxies for interaction, the frequency of trait sharing (transmission) is only
directly proportional to interaction when certain factors are controlled for. These factors
include issues of classification, sample size and duration, the isolation of stylistic
401
variability, the exclusion of variability due to adaptive constraints, depositional
processes, artifact use, technological characteristics, and chance (including drift). If these
variables are not controlled for, these authors suggest that the resulting models of
interaction are of dubious utility. Although these studies suggest that stylistic analysis is
a powerful tool for the study of both chronology and interaction, the nature of material
culture and factors affecting change over time stipulate strict controls for the factors
outlined above.
Cochrane and Hunt (ms.) note that these conclusions are of particular importance
to Fijian archaeology, as they imply that the ceramic analyses of the past decades only
provide rough approximations of chronology and interaction. The computer-assisted
analyses that came into vogue in the 1970s (such as the similarity matrices and
dendrograms generated by Frost [1974] and Best [1984]) may be particularly
problematic. Of foremost concern is the conflation of spatial variation in interaction with
temporal variation, the use of ceramic classes that mix decorative characteristics with
features related to vessel function, and the fact that sample richness may have been
determined by sample size (Cochrane and Hunt ms:10-12). They also note that
computer-assisted analyses such as similarity matrices or dendrograms will always
generate a result, no matter the quantity or quality of data employed. Cochrane and
Hunt’s own application of a rigorous and refined method of seriation and similarity
matrices for Fijian ceramics serves as a case in point: of the 17 assemblages from the
Yasawa Group, only 3 adequately represent the richness and evenness of classes in the
underlying population, and thus can be subject to seriation. Their evaluation of the
402
‘successful’ dendrograms using identical data suggests that erroneous chronologies can
be generated with little effort. The uses of such techniques in the modeling of Fijian
prehistory, in particular interaction, are likely to be of limited potential for future
research.
Analytic Potential in the Sigatoka Valley Ceramic Assemblage
The discussions presented above suggest that a robust theoretical conception of
interaction must be paired with a rigorous and testable method in order to produce
accurate results. However, of equal importance are sample populations that are of large
size, and equal in terms of richness and evenness. In the event that samples of this
quality and quantity are not produced during fieldwork (and when additional sampling is
not possible), the avenues available to the analyst are severely limited. In the case of
seriation, the potential for the construction of chronologies that are both precise and
accurate drops dramatically when samples are small and uneven. However, in such
instances the analyst can still make use of his or her collections by using other methods,
such as the percentage stratigraphy, which plots the frequencies of classes based upon
independently dated deposits (e.g., Spier 1917, Lyman et al. 1998). Lyman et al. note
that percentage stratigraphy differs from occurrence seriation in that it does not sort
collections so that classes display a continuous occurrence. Rather, the discontinuous
occurrence of a class through a vertical sequence of deposits might indicate that the type
is not temporally sensitive, the samples are inadequate, or the strata are mixed (Lyman et
al. 1998: 244). When samples from a number of distinct excavation units are integrated
together, this process is referred to as ‘interdigitation’. Although these analyses often

403
results in the construction of chronologies that are broad and general, they can be of use
in tracing similarity in artifact classes across time and space, and also indicate areas of
poor sampling or classification problems.
In the case of the Sigatoka Valley, the size of the ceramic assemblage precludes
the use of occurrence or frequency seriation. However, with a classification based upon
ceramic attributes (both decorative and related to vessel form), the construction of
integrated percentage-stratigraphies between all sites within each temporal period is
possible. The results suggest broad patterns of similarity within the ceramic traditions of
the Sigatoka Valley, and perhaps also divergence between the upper and lower valley.
Ceramic Census for the Sigatoka Valley
Approximately 4,430 ceramic fragments were recovered from the 12 excavated
sites of the Sigatoka Valley. As described in Chapter 7, standard radiometric and AMS
dating suggests that these sites span the last 2000 years of Fijian prehistory, although
only a single site, Tatuba Cave, contains deposits that include the entire sequence. As the
Sigatoka Valley represents a large area with considerable antiquity, samples from each
site are analyzed with respect to their placement in chronological and geographical
categories: T1 (2000-1500 BP), T2 (1500-1000 BP), T 3 (1000-500 BP), T4 (500-150
BP), and also their location in either the upper, middle, and lower valley (Chapter 3). In
addition, ceramic analysis focused on three distinct subsets of the assemblages: bowls,
jars, and decorated body fragments. These divisions generated the following subsets:
2374 ceramic fragments were recovered from the lower valley, 828 from the middle

404
valley, and 1228 from the upper valley. By temporal period, 3447 ceramic fragments
were recovered from deposits dating to T4, 690 from T3, 133 from T2, and 108 from T1.
The system used to classify the ceramics was adapted from Cochrane and Hunt
(ms.) and Clark (1999b), and consisted of paradigmatic coding system of decorative and
morphological attributes that other researchers have developed and utilized for Fijian
ceramic analysis (Best 1984; Crosby 1988; Hunt 1980). The classification developed for
the Sigatoka Valley contained 14 modes with 2-13 attributes each, which allows for the
generation of 588,736,512 unique classes. As illustrated in Figures C.1 and C.2, the
classification recorded the presence and morphology of diagnostic features, including rim
orientation and rim-body contour (which indicate the overall form of the vessel as either
inverted or everted bowls and jars), rim course, rim profile, and lip shape (which indicate
the morphology of the rim), rim orientation angle, neck inclination angle, rim height
(which describe the morphology of jar forms), and rim thickness, orifice diameter, and
temper type (which indicate the overall size, fabric, and coarseness of the vessel).
Although some of the latter classes are metric measurements, numeric codes representing
their variability were substituted in the classification.
In addition, the presence or absence of a variety of surface decorations, as well as
their positions on either the lip, rim, or body of the vessel, were included in the
classification (Table C.1, Figure C.3). When possible, the orientation of the vessels was
determined by placing the fragment on its rim atop of a white piece of paper, and then
using a bright light to aid the angling the sherd (indicated by the presence or loss of light
under the rim) until the correct orientation of the rim could be determined (e.g.,

405
Figure C.1. Location of metric morphological modes measured in the ceramic
classification.

406
Figure C.2. Illustration of variable non-metric attributes recorded for the modes rim-
orientation, rim-course, rim-body contour, rim profile, and lip shape.

407
Table C.1. Attribute codes for ceramic decorations.
Decoration - Lip Code
Plain 0
End-tool 73
Appliqué 100
Incised 101
Decoration – Rim/Body Code
Plain 0
Paddle Impressed, Crossed (square or diamond) 64/65
Paddle Impressed, Parallel 66
End-tool 73
Notching 86
Incised 90
Appliqué 100
Finger-gouge/pinch 106
Grass-impressed 107
Wiped 108
Shell-end impressed 109
Joukowsky 1980:423). All of the diagnostic sherds were drawn in profile, and the
measurement of rim orientation and neck angles was performed upon the drawings with a
compass. Sherds that were incomplete were excluded from this analysis. Sherd
thicknesses and rim heights were measured with vernier calipers, and vessel diameters
were determined by comparison of rim curvatures to a rim diameter chart (Rice 1987).
Sherd cross-sections were also examined with a 10x hand-lens, and the size, type, and
density of temper grains recorded. Descriptions of the recognized tempers are included
in Table C.2.
Of the 4,430 sherds recovered from excavations, 258 (5.8%) were diagnostic
fragments that could be used to infer vessel form. These fragments detailed the
morphology for 209 jars, 48 bowls, and 1 tray. Additionally, 28 small or fragmented rim

408
Figure C.3. Examples of decoration attributes. A: wiping; B: appliqué; C: notching
(rim); D: incising; E: finger-gouge; F: grass impressing; G: crossed paddle impressed
(diamond); H: parallel paddle impressed; I: crossed-paddle impressed (square); J: tool
impressing; K: shell-end impressing.

409
or neck pieces could not be identified as either bowls or jars were classified as having
unknown forms. Unfortunately, the fragmentary nature of the ceramic assemblages
limited the degree to which each diagnostic sherd could be completely classified. Of the
jars, 68 of the 209 (32%) could be classified according to rim morphology (attributes rim
course, profile shape, and lip shape), however only 43 (20.5%) could be fully classified
with rim and body morphology (the previous attributes plus rim orientation angle, rim
thick, rim height, and neck inclination). This was less of a problem with the bowl forms,
47 (98%) of which could be classified according to rim morphology alone.
As mentioned in above and in Chapter 8, small sample sizes are problematic for most
ceramic analyses, and unfortunately for the Sigatoka Valley materials, neither the bowl or
jar assemblages are large enough to accurately reflect the diversity and frequency of
forms in the parent population. According to sampling statistics, a sample size of at least
96 vessels is required to adequately represent the 128 possible rim class combinations at a
confidence level of 95%. The small sample of classifiable fragments from the Sigatoka
Valley severely limits the potential for analyses that could accurately trace ceramic
change over time and space. Thus, the following observations should be treated as part
of an exploratory analysis. The a full listing of attributes for each diagnostic ceramic
fragment is listed at the end of this appendix in Table C.3. Illustrations of all complete
rims are also included at the end of this appendix.
Bowls
Using a spreadsheet program, the distribution of bowl rim forms in the upper,
middle, and lower valley, as well as their temporal position in one of four time periods

410
Table C.2. Attribute codes for ceramic tempers.
Temper type, Density, and Grain-size Code
Alluvial, 10-20%, 1-2mm 1
Alluvial, 10-20%, 2-4mm 2
Alluvial, 20+%, 1-2mm 3
Alluvial, 20+%, 2-4mm 4
Pyroxene 5
Alluvial mixed with beach sand 6
Alluvial mixed with limestone 7
(derived from AMS dating of corresponding deposits) were plotted and examined. The
low frequency of many attributes proved to be unmanageable for seriation, and as a
consequence several attributes were combined for the final analysis: curved rim course
(attributes 27, 28, 29), square lip shape (attributes 39, 40), and round lip shape (attributes
44, 45, 47, and 50). According to the distribution of rim and lip morphology amongst
bowl vessels, bowls with straight rim courses (attribute 26), parallel rim profiles (attribute
30), and square lips (attributes 39/40) were the most common in all time periods.
Instances of contracting lips (attribute 35) and rounded lips (attributes 44-50) were by
and large restricted to the latest temporal period (T4, 500 –150 BP), although there are
some instances of these classes in the lower valley in T3 (1000 – 1500 BP). Other
combinations, such as bowls with expanding rim profiles (attributes 31 and 32) occurred
as a single instance in T1 of the upper valley. For the most part, the most notable pattern
discerned from the distribution of form classes is the dramatic increase in rim course and
profile forms from the earliest to latest temporal periods. These forms included bowls
with curved rims (attributes 27-29), expanding profiles (attributes 31 and 32), and angled
lips (attributes 38 and 42). In addition, decoration on the lips and rims was more
411
common with the lower valley bowls, with 8 instances of appliqué, incising, fingernail
incision, and end-tool design.
The distribution of bowl traits was further condensed into a series of vessel
classes. For example, vessels with straight rim courses, expanding rim profiles, and
square lips were designated as bowl class A (Ba). The resulting classification is
displayed as a frequency diagram in Figure C.4. Of note, the most frequent bowl form is
Bb (vessels with straight rim courses, parallel rim profiles, and square lips), and these
vessels occurred early (ca. 2000 BP) and continued throughout the temporal sequence in
large numbers. These forms continue to be made in the region today as dari, or yaqona
serving bowls. Bowls with contracting rims and/or rounded lips (Classes Bc, Bd, Bg)
occur in the latest time periods, between 1000 BP and the contact period, but do not
appear to have been manufactured in historic times. Other classes of bowls (e.g., Ba, Be,
Bf, Bh, Bi, Bj) occurred as mostly single cases in the last time period, between 500 BP
and the historic period.
Of note, the thicknesses for the entire Sigatoka Valley bowl assemblage appear to
vary randomly throughout time, with a very slight increase in thickness in the latest
temporal period, T4. And although there is no correlation between vessel thickness and
rim/lip shape, decoration in the form of lip incising and appliqué are more common
amongst the thicker-walled vessels (> .90cm). The vessels also vary in diameter from 18-
54 cm, and their sizes also do not correlate to either rim form or vessel wall thickness—
forms were extremely variable throughout the assemblage. In addition, temper types

412
Figure C.4. Frequency of bowl rim forms in the upper, middle, and lower valley, and temporal periods 1-4.
Ba Bb Bc Bd Be Bf Bg Bh Bi Bj
26.31.39/40 26.30.39/40 26.35.39/40 26.35.44-50 26.32.38 26.32.39/40 26.30.44-50 27-
29.30.39/40 27-29.32.38 27-
29.35.44-50
UV T1 x xx
UV T2
UV T3 xx
UV T4 x xxx x xx
MV T1
MV T2
MV T3
MV T4 xxxxxxxxx x x x
LV T1
LV T2 x
LV T3 x xx x x xx
LV T4 x xxxxxx xx x x xx x x
Full T1 x xx
Full T2 x
Full T3 x xxxx x x xx
Full T4 xx xxxxxxxxxxxxxxxxxx xxx xx xx x xx xx x x
412

413
were predominantly (95%) alluvial sand (placer material), most of which contained
grains that were between 1-2 mm in size, and a density of 10-20% of the ceramic matrix.
The occurrence of larger grained tempers (2-4 mm) was also common, and more often
observed in the thicker-walled specimens.
Jars
The jar forms of the Sigatoka Valley are extremely diverse. Even when modes
were combined (such as pointed and rounded lip shape), the 6 attribute classification of
rim morphology (rim course, rim profile, and lip shape) and overall vessel morphology
(rim orientation, neck inclination, rim height, and neck thickness) proved too complex to
be seriated at either the scale of full valley or lower, middle and upper valley, as it
generated too many classes which were represented by only a single example. When
combined, the 43 rim and neck fragments filled 36 mode combinations, 31 of which were
represented by a single specimen. Splitting the classification into two independent
seriations of rim shape and vessel morphology proved to be slightly more workable,
although the problem of large numbers of single-case classes remained. When split, the
43 samples represented 9 different rim morphology attribute combinations (Classes Ja –
Ji), and 16 different body morphology combinations. However, even at this level (and
levels of increasing simplification in which aberrant types and other classes were
removed), occurrence seriations without breaks could not be generated for the jars.
Despite these problems, the results tentatively suggest that all forms of rim and
body morphology occurred throughout the chronological sequence of the Sigatoka
Valley. The earliest (ca. 2000 –1500 BP) jar forms had curved or straight rims that were

414
oriented between 22.5 and 45° from the center of the vessel, and which formed a neck
inclination between 110 and 140°. Moreover, the rims had a parallel profile and square
lip shape, and are reminiscent of mid-sequence jar forms identified by Clark (1999b) and
also by Burley (pers. com.) as derivatives of Lapita Plainware. These jars are also
smaller in diameter than other jars in the sample (22-24 cm), and are on the lower end in
terms of thickness (.39-.55 cm). This form was recovered from the deeper intact deposits
of Tatuba Cave, and also amongst the mixed fill of a later (AD 1500 ) cave burial.
The interdigitated stratigraphic percentage diagram generated for the jars suggests
that jars with curved rim courses, parallel rim profiles, and square lips were the most
common throughout the prehistoric sequence of the Sigatoka Valley (Class Jb, Figure
C.5). However, new variations in the form of contracting rim profiles, round lips,
common or angled expanding lips (Classes Jc, Jd, Je, Jf) increased in frequency during
the later temporal periods (T3 and T4, or between AD 1000 and the contact period). Both
the upper and lower valley were equally diverse in terms of the number of rim
combinations that occurred within the sample. In addition, the comparison of
morphology data suggests that the neck inclination angle, which is fairly broad during the
earliest temporal period, decreases in most cases to between 80 – 110° during periods T3
and T4. Also of note, the wall thicknesses for the entire Sigatoka Valley jar assemblage
appear to vary randomly throughout time, however there is a correlation between vessel
wall thickness and diameter, with the larger jars (30-50 cm) having walls less than .50 cm
thick. However, most jars of average diameter (25-35 cm) were of varying wall
thicknesses. There is no correlation between vessel thickness and rim/lip shape, although

415
Figure C.5. Frequency of jar rim forms in the upper, middle, and lower valley, and temporal periods 1-4.
Ja Jb Jc Jd Je Jf Jg Jh Ji
27-29.30.39/40 26.30.39/40 26.35.39/40
27-29.35.39/40
27-29.35.44-50
27-29.30.44-50
27-29.31/32.44-
50 27-
29.31/32.39/40 27-
29.31/32.38
UV T1 xx x
UV T2
UV T3 x xx x x x xx
UV T4 xxxx xxx x x xxx x x
MV T1
MV T2
MV T3
MV T4 xx x x xx xx
LV T1
LV T2
LV T3 x xx
LV T4 xxxx xxxxxxxxxxxxxxx xxx xxx xx xx
Full T1 xx x
Full T2
Full T3 xx xxxxxxxxxxxxxxxxxxx x x xxx xx
Full T4 xxxxxxxxxx xxxxxxxxxxxxxxxxxxx xxxx xxxxxx xxxxx xxx x xx x
415

416
jars with straight rim courses, parallel rim profiles, and square lips tend to also have
larger diameters (30 –50 cm).
Decoration occurs very infrequently amongst the jars, with only 14 specimens
(6.6%) decorated on either the lip, rim, or body. Seven (50%) of the decorated pieces
contained wiped surfaces, which were created when the wet clay was wiped with a
fibrous cloth prior the ultimate drying of the vessel. The remaining decorations consisted
of single instances of end-tool decoration and appliqué buttons on the lip, incising on the
rim, and incising, grass-impressing, and diamond-crossed and parallel paddle impressed
designs on the body surfaces. For the most part, lip and rim decoration is restricted to the
latest temporal period, and occurs in the lower and middle portions of the valley. Body
decoration occurs in all portions of the valley, and in temporal periods 3 and 4 (ca. 1000
BP to contact). As with the bowls, the jar temper types were predominantly (95%)
alluvial sand (placer material), most of which contained grains that were between 1-2 mm
in size, and a density of 10-20% of the ceramic matrix. The occurrence of larger grained
tempers (2-4 mm) was also common, and more often observed in the thicker-walled
specimens.
In later periods and throughout the valley, a great variety of kuro, or the
traditional Fijian cooking pot, were manufactured. Cooking vessels were made locally
throughout the valley through the prehistoric and historic periods, and the tradition
survives today in a few villages in the Sigatoka River delta (Nakabuta, Lawai, Nayawa,
Yavulo, and Vunavutu), and a single isolated village in the Fijian interior (Nakoro).
During cooking, the kuro was placed on its side atop three stones or clay pot-stands (sue),

417
and the fire lit beneath it. Food was then put inside and the mouth of the kuro was sealed
with a plug (jivu ni kuro) made of leaves (Palmer and Shaw 1968:86). In most cases kuro
had wide mouths that allowed for easy access to the food being prepared inside, and were
roughly globular in shape. However, the populations of the upper valley developed a
tradition of long, ovoid-bodied pots with flat necks and sharply angled and pointed lips,
known as ‘Nakoro’ pots (or kuro balavu) (Figure C.5, rim Je, and Figure C.6). These
pots are reminiscent of oblong pots known from ethnographic collections of Malakula
Island, Vanuatu (Galipaud and Yoringmal 1994). The linkage between the Fijian and
Vanuatu ‘long pot’ is unknown at this time.
Ceramic Decoration in Sigatoka Valley Prehistory
The final set of analyses of the Sigatoka Valley ceramics was focused upon the
spatial distribution and temporal frequency of decorated, non-diagnostic (e.g., body, as
opposed to rim or neck) sherds. Two hundred and thirteen (4.8%) of the 4430 ceramic
fragments recovered from the Sigatoka Valley excavations were included in this sample.
Based upon the curvature of the sherds, it is assumed that most of these fragments are
derived from the bodies of jars, although there is a possibility that some of these
fragments are from water jugs or small bowls. However, this determination did not play
a role in the subsequent analyses. As described above, each fragment was classified
according to the presence or absence of one of 11 mutually exclusive decorative
attributes, and assembled into a interdigitated stratigraphic percentage diagram. The
results suggest that nearly all decorative attributes were present throughout the valley in

418
Figure C.6. ‘Nakoro’ style vessel (also known as kuro balavu). Reproduced from
Palmer 1971:106.
all or most time periods, although there are several trends that suggest increasing
frequencies of specific decorative techniques in the later periods. Figure C.7 compares
the distribution of decorative attributes between the temporal periods of the upper,
middle, and lower valley, and also displays the cumulative frequency for all decorative
attributes during all the temporal periods for the entire Sigatoka Valley. Problems related
to sampling are genuinely visible in the gaps between temporal periods, and also in the
number of sherds representing the different geographical regions of the Sigatoka Valley.
This being the case, the following observations should be taken to be purely tentative.
The frequency seriations suggest that patterns of ceramic decoration change are
broadly similar in the upper, middle, and lower portions of the valley. In particular,
ceramics decorated with parallel crossed-paddle impressing occurred in all periods

419
Figure C.7. Frequency of decorated ceramics in the upper, middle, and lower valley, and temporal periods 1-4.
Crossed Crossed Crossed Incising Wp. Ap. Grass End Fing. Notch Shell
Paddle Paddle Paddle Imp. Tool Gou. Imp.
Diamond Square Parallel
UV T 1 xxxxxxxxxxx xxxxxxxxxxxxx x x x
UV T 2 xxxxxxxx x x
UV T 3 xxxxxxxxxx xxxxxxxxxxxxxxxx xx xxxxx xx x x x
UV T 4 xxxxxxx xxxxxxxx xxxxxxxxxxx xxxxxxxxxxxxxxxxx x x x x
MV T 3 xxx xxxxxxxxxxxxxxxxx xx
MV T 4 xxx xx xxxxxxxxxxxxxxxxxxxx xxxxxx x xx
LV T 2 x x x
LV T 3 xx xx
LV T 4 xx x xxxxxxx xxxxxxxxxxxxxx xxxx x
Full T 1 xxxxxxxxxxx xxxxxxxxxxxxx x x x
Full T 2 xxxxxxxx x x xx x
Full T 3 xxxxxxxxxxxx xxxxxxxxxxxxxxxx xxxxxxxxxxxxxxxxxxx xxxxxxx xxxx x xxx x
Full T 4 xxxxxxxxxxxx xxxxxxxxxxx xxxxxxxxxxxxxxxxxxxxxxxxxxxx xxxxxxxxxxxxxxxxxxxxxxxxxxxxx xxxx xxxx xx xx x x
419

420
throughout the valley, but increased in frequency from 3% of the assemblage in T1
(2000-1500 BP), to 34% of the assemblage in T4 (500-150 BP). In a similar fashion,
incised designs also increased in frequency from 3% to 33% in the later periods. In
contrast, diamond and square crossed-paddle impressing occurred in all time
periods, but was most common during the earliest periods (T1 and T2), during which it
composed between 69 and 88% of the decorated assemblage. Although the 85% of the
diamond and square crossed-paddle impressed is restricted to the upper valley, there is a
slight suggestion that the frequency of this decoration class peaked during Period 3 (1000
–500 BP), and was in decline during Period 4 (500 BP to contact).
Other decorative techniques were less common, but also show similar trends of
increasing frequency. Grass impressing occurred on 4% of the sample from throughout
the valley, but only shows a continuous temporal distribution in the upper valley. The
more sporadic occurrence of grass-impressing in the later periods may be indicative of an
increase in frequency of this decorative style over time. Finger gouging (1% of the
sample) was also observed amongst ceramics in the upper and lower portions of the
valley, but was restricted to a slight increase during periods T3 and T4. Wiping is
slightly more common at 3% of the sample, and is restricted to the later temporal periods
in both the upper and lower valley. The remaining five design attributes—appliqué, end
tool, side tool notch, and shell end impressing occurred very infrequently, and constitute
the final 2% of the decorated assemblage. With the exception of end-tool designs that
occurred in the middle valley, all of these decorative attributes are restricted to the upper
valley and the last two time periods (1000 BP to contact).

421
Conclusion
The variability of the Sigatoka Valley ceramic assemblage is typical of most
Fijian assemblages, and includes fragments of drinking vessels, yaqona serving bowls,
cooking jars, and finger bowls. Moreover, decoration includes incising, paddle
impressing, tool impressing, grass impressing, wiping, and appliqué. Although the small
sample size prohibits more precise analyses, future research with a larger assemblage
may elicit general trends in form and decoration that are particular to the upper and lower
valley, and also each temporal period.

422
Table C.3. Attribute data for ceramic rims recovered from the Sigatoka Valley excavations.
Vess. Rim Rim- Rim Rim Lip Lip Rim Bod Rim Rim Rim Neck Orif. Site Excav. Depth Vessel Portion Temp. Reg. Per. Vess.
No. Orit. Bod. Cse. Prof. Shp Dec. Dec. Dec. Orit. Thik. Ht. Incl. Diam. Name Unit (cmbs) Form Gp. Type
Cont. Ang. Ang.
001 17 24 0 0 0 0 90 0 0 0.52 0 0 0 Korokune TU 1 0-10 jar neck 1 LV T4
002 17 24 0 0 0 0 0 0 21 1.08 0 140 14 Korokune TU 1 10-20 jar neck 3 LV T4
003 17 24 27 30 39 0 0 0 15 0.57 2.5 160 20 Korokune TU 1 0-10 jar rim 6 LV T4 Ja
004 17 23 26 35 39 0 0 0 0 0.69 0 0 48 Korokune TU 2 0-10 bowl rim 1 LV T3 Bc
005 17 23 26 30 45 0 0 0 0 0.61 0 0 40 Korokune TU 2 0-10 bowl rim 1 LV T3 Bg
006 17 24 27 30 39 0 0 0 5 0.81 3.3 60 34 Korokune TU 2 10-20 jar rim 2 LV T3 Ja
007 17 24 0 0 0 0 0 0 0 0 0 0 0 Korokune TU 2 10-20 jar neck 4 LV T3
008 17 24 26 35 50 0 0 0 14 0.5 2 130 10 Korokune TU 2 10-20 jar rim/neck 1 LV T3 Je
009 17 23 26 30 40 100 0 0 0 0.7 0 0 32 Korokune TU 2 10-20 bowl rim 6 LV T3 Bb
010 17 23 26 31 40 0 0 0 0 0.7 0 0 30 Korokune TU 2 10-20 bowl rim 3 LV T3 Ba
011 17 23 26 30 44 0 0 0 0 0.69 0 0 0 Korokune TU 2 10-20 bowl rim 1 LV T3 Bg
012 17 24 0 0 0 0 0 0 0 1.15 0 0 0 Korokune TU 2 20-30 jar neck 2 LV T3
013 0 0 0 0 0 0 0 0 0 0 0 0 0 Korokune TU 2 20-30 Unk. body 3 LV T3
014 17 23 26 30 40 73 0 0 0 0.75 0 0 54 Korokune TU 2 40-50 bowl rim 1 LV T3 Bb
015 17 24 28 35 0 0 0 0 0 0.75 0 0 0 Korokune TU 2 50-60 jar neck 6 LV T3
016 0 0 0 0 0 0 0 0 0 0.6 0 0 0 Batiri TU 1 0-10 Unk. neck 1 LV T4
017 17 23 29 30 40 0 73 0 0 0.39 0 0 0 Batiri TU 1 0-10 bowl rim/neck 1 LV T4 Bh
018 0 0 0 0 0 0 90 0 0 0.52 0 0 0 Batiri TU 1 0-10 Unk. rim/neck 1 LV T4
019 0 0 0 0 0 0 0 0 0 0.35 0 0 0 Batiri TU 1 0-10 Unk. neck 1 LV T4
020 17 24 26 35 0 0 0 0 0 0.79 0 0 0 Batiri TU 1 0-10 jar neck 4 LV T4
021 0 0 0 30 39 0 0 0 0 0.32 0 0 30 Batiri TU 1 0-10 Unk. rim 1 LV T4
022 0 0 27 30 40 0 0 0 0 0.5 0 0 20 Batiri TU 1 0-10 bowl rim 1 LV T4 Bh
422

423
Table C.3. (Continued) Attribute data for ceramic rims recovered from the Sigatoka Valley excavations.
Vess. Rim Rim- Rim Rim Lip Lip Rim Bod Rim Rim Rim Neck Orif. Site Excav. Depth Vessel Portion Temp. Reg. Per. Vess.
No. Orit. Bod. Cse. Prof. Shp Dec. Dec. Dec. Orit. Thik. Ht. Incl. Diam. Name Unit (cmbs) Form Gp. Type
Cont. Ang. Ang.
023 17 23 26 30 39 0 0 0 0 0.57 0 0 18 Batiri TU 1 0-10 bowl rim 2 LV T4 Bb
024 17 24 27 31 40 0 0 0 0 2 2.2 120 0 Batiri TU 1 0-10 jar rim/neck 1 LV T4
025 17 23 26 31 39 0 0 0 0 0.61 0 0 28 Batiri TU 1 0-10 bowl rim 1 LV T4 Ba
026 17 23 26 30 39 0 0 0 0 0.57 0 0 0 Batiri TU 1 0-10 bowl rim 1 LV T4 Bb
027 0 0 0 0 0 0 0 0 0 0.9 0 0 0 Batiri TU 1 0-10 Unk. neck 2 LV T4
028 0 0 0 0 0 0 0 0 0 0 0 0 0 Batiri TU 1 0-10 Unk. neck 4 LV T4
029 17 24 27 35 0 0 0 0 0 0 0 0 0 Batiri TU 1 10-20 jar neck 2 LV T4
030 17 24 0 0 0 0 0 0 0 0 0 0 0 Batiri TU 1 10-20 jar neck 2 LV T4
031 17 24 0 0 0 0 0 0 0 0 0 0 0 Batiri TU 1 10-20 jar neck 4 LV T4
032 17 24 26 32 45 0 0 0 0 1.55 2.5 86 12 Batiri TU 1 20-30 jar rim/neck 4 LV T4
033 17 24 26 30 39 73 0 0 2 0.74 2.1 115 16 Batiri TU 1 20-30 jar rim/neck 1 LV T4 Jb
034 0 0 0 0 0 0 0 0 0 0 0 0 0 Batiri TU 1 20-30 Unk. body 1 LV T4
035 0 0 0 0 0 0 0 0 0 0 0 0 0 Batiri TU 1 20-30 Unk. body 4 LV T4
036 17 24 27 0 0 0 0 0 0 0.7 0 0 0 Batiri TU 1 20-30 jar neck 1 LV T4
037 17 23 26 35 39 0 0 0 0 0.6 0 0 40 Batiri TU 1 20-30 bowl rim 2 LV T4 Bc
038 0 0 0 0 0 0 0 0 0 0 0 0 0 Batiri TU 1 20-30 Unk. neck 2 LV T4
039 17 24 27 35 40 0 0 0 25 0.55 3 112 16 Batiri TU 1 20-30 jar rim/neck 4 LV T4 Jd
040 0 0 0 0 0 0 0 0 0 0 0 0 0 Batiri TU 1 20-30 Unk. body 4 LV T4
041 17 24 27 30 39 0 0 0 11 0.65 2.2 140 0 Batiri TU 1 20-30 jar rim/neck 1 LV T4 Ja
042 0 0 0 0 0 0 0 0 0 0 0 0 0 Batiri TU 1 20-30 Unk. body 2 LV T4
043 0 0 0 0 0 0 0 90 0 0 0 0 0 Batiri TU 1 50-60 Unk. body 2 LV T4
044 0 0 26 30 40 0 0 0 0 0.6 0 0 0 Batiri TU 1 40-50 Unk. rim 1 LV T4
423

424
Table C.3. (Continued) Attribute data for ceramic rims recovered from the Sigatoka Valley excavations.
Vess. Rim Rim- Rim Rim Lip Lip Rim Bod Rim Rim Rim Neck Orif. Site Excav. Depth Vessel Portion Temp. Reg. Per. Vess.
No. Orit. Bod. Cse. Prof. Shp Dec. Dec. Dec. Orit. Thik. Ht. Incl. Diam. Name Unit (cmbs) Form Gp. Type
Cont. Ang. Ang.
045 0 0 0 0 0 0 0 0 0 0 0 0 0 Batiri TU 1 40-50 Unk. body 2 LV T4
046 17 24 0 0 0 0 0 0 0 0 0 0 0 Batiri TU 1 40-50 jar neck 4 LV T4
047 17 24 26 30 40 0 108 0 0 0 0 0 0 Batiri TU 1 40-50 jar rim/neck 2 LV T4 Jb
048 17 24 28 32 42 0 0 0 15 1.6 4 110 0 Batiri TU 1 40-50 jar rim/neck 3 LV T4 Jh
049 17 24 27 0 0 0 0 0 30 0 0 100 0 Batiri TU 1 40-50 jar neck 2 LV T4
050 17 24 0 0 0 0 0 0 0 0 0 0 0 Batiri TU 1 40-50 jar neck 4 LV T4
051 17 24 0 0 0 0 0 0 0 0 0 0 0 Batiri TU 1 40-50 jar neck 4 LV T4
052 0 0 0 0 0 0 0 0 0 0 0 0 0 Batiri TU 1 30-40 tray body 1 LV T4
053 17 24 26 30 39 0 0 0 13 0.59 2.6 108 26 Batiri TU 1 50-60 jar rim 4 LV T4 Jb
054 17 23 26 30 39 73 0 0 0 0.9 0 0 0 Noko. TU 1 20-30 bowl rim 1 LV T4 Bb
055 17 23 26 30 40 0 0 0 0 0.44 0 0 38 Noko. TU 1 20-30 bowl rim 1 LV T4 Bb
056 17 24 27 30 0 0 0 0 24 0 0 110 0 Noko. TU 1 20-30 jar neck 1 LV T4
057 0 0 0 0 0 0 90 0 0 0 0 0 0 Noko. TU 1 30-40 Unk. rim 1 LV T4
058 0 0 0 0 0 0 0 108 0 0 0 0 0 Noko. TU 1 50-60 Unk. body 2 LV T4
059 0 0 0 0 0 0 0 66 0 0 0 0 0 Noko. TU 1 60-70 Unk. body 2 LV T4
060 0 0 0 0 0 0 0 90 0 0 0 0 0 Noko. TU 1 60-70 Unk. body 2 LV T4
061 0 0 0 0 0 0 0 108 0 0 0 0 0 Noko. TU 1 70-80 jar neck 3 LV T4
062 17 24 0 0 0 0 0 0 0 0 0 0 0 Noko. TU 1 80-90 jar body 2 LV T4
063 17 24 0 0 0 0 108 0 0 0 0 0 0 Noko. TU 1 80-90 jar neck 2 LV T4
064 17 23 26 30 39 90 0 0 0 0.94 0 0 30 Noko. TU 1 90-100 bowl rim 2 LV T2 Bb
065 17 24 0 0 0 0 0 0 0 1 0 0 0 Noko. TU 5 0-10 jar neck 2 LV T4
066 17 24 0 0 0 0 0 0 0 0.9 0 0 0 Noko. TU 5 0-10 Unk. neck 3 LV T4
424
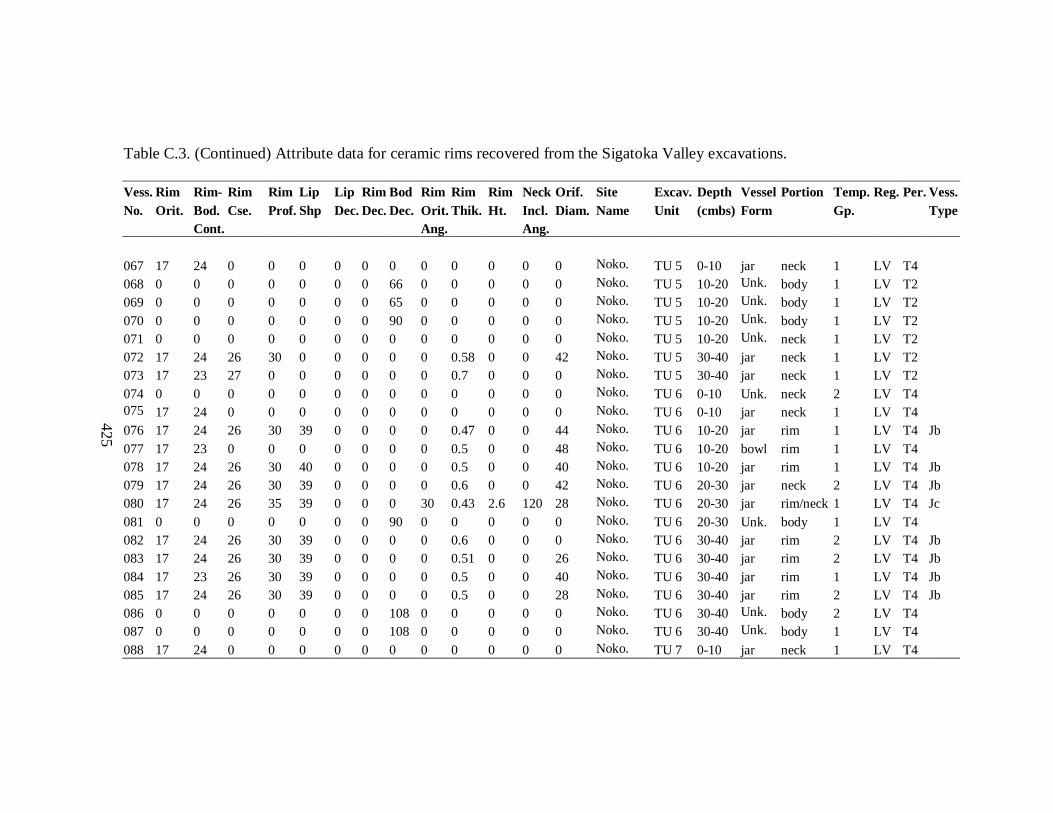
425
Table C.3. (Continued) Attribute data for ceramic rims recovered from the Sigatoka Valley excavations.
Vess. Rim Rim- Rim Rim Lip Lip Rim Bod Rim Rim Rim Neck Orif. Site Excav. Depth Vessel Portion Temp. Reg. Per. Vess.
No. Orit. Bod. Cse. Prof. Shp Dec. Dec. Dec. Orit. Thik. Ht. Incl. Diam. Name Unit (cmbs) Form Gp. Type
Cont. Ang. Ang.
067 17 24 0 0 0 0 0 0 0 0 0 0 0 Noko. TU 5 0-10 jar neck 1 LV T4
068 0 0 0 0 0 0 0 66 0 0 0 0 0 Noko. TU 5 10-20 Unk. body 1 LV T2
069 0 0 0 0 0 0 0 65 0 0 0 0 0 Noko. TU 5 10-20 Unk. body 1 LV T2
070 0 0 0 0 0 0 0 90 0 0 0 0 0 Noko. TU 5 10-20 Unk. body 1 LV T2
071 0 0 0 0 0 0 0 0 0 0 0 0 0 Noko. TU 5 10-20 Unk. neck 1 LV T2
072 17 24 26 30 0 0 0 0 0 0.58 0 0 42 Noko. TU 5 30-40 jar neck 1 LV T2
073 17 23 27 0 0 0 0 0 0 0.7 0 0 0 Noko. TU 5 30-40 jar neck 1 LV T2
074 0 0 0 0 0 0 0 0 0 0 0 0 0 Noko. TU 6 0-10 Unk. neck 2 LV T4
075 17 24 0 0 0 0 0 0 0 0 0 0 0 Noko. TU 6 0-10 jar neck 1 LV T4
076 17 24 26 30 39 0 0 0 0 0.47 0 0 44 Noko. TU 6 10-20 jar rim 1 LV T4 Jb
077 17 23 0 0 0 0 0 0 0 0.5 0 0 48 Noko. TU 6 10-20 bowl rim 1 LV T4
078 17 24 26 30 40 0 0 0 0 0.5 0 0 40 Noko. TU 6 10-20 jar rim 1 LV T4 Jb
079 17 24 26 30 39 0 0 0 0 0.6 0 0 42 Noko. TU 6 20-30 jar neck 2 LV T4 Jb
080 17 24 26 35 39 0 0 0 30 0.43 2.6 120 28 Noko. TU 6 20-30 jar rim/neck 1 LV T4 Jc
081 0 0 0 0 0 0 0 90 0 0 0 0 0 Noko. TU 6 20-30 Unk. body 1 LV T4
082 17 24 26 30 39 0 0 0 0 0.6 0 0 0 Noko. TU 6 30-40 jar rim 2 LV T4 Jb
083 17 24 26 30 39 0 0 0 0 0.51 0 0 26 Noko. TU 6 30-40 jar rim 2 LV T4 Jb
084 17 23 26 30 39 0 0 0 0 0.5 0 0 40 Noko. TU 6 30-40 jar rim 1 LV T4 Jb
085 17 24 26 30 39 0 0 0 0 0.5 0 0 28 Noko. TU 6 30-40 jar rim 2 LV T4 Jb
086 0 0 0 0 0 0 0 108 0 0 0 0 0 Noko. TU 6 30-40 Unk. body 2 LV T4
087 0 0 0 0 0 0 0 108 0 0 0 0 0 Noko. TU 6 30-40 Unk. body 1 LV T4
088 17 24 0 0 0 0 0 0 0 0 0 0 0 Noko. TU 7 0-10 jar neck 1 LV T4
425

426
Table C.3. (Continued) Attribute data for ceramic rims recovered from the Sigatoka Valley excavations.
Vess. Rim Rim- Rim Rim Lip Lip Rim Bod Rim Rim Rim Neck Orif. Site Excav. Depth Vessel Portion Temp. Reg. Per. Vess.
No. Orit. Bod. Cse. Prof. Shp Dec. Dec. Dec. Orit. Thik. Ht. Incl. Diam. Name Unit (cmbs) Form Gp. Type
Cont. Ang. Ang.
089 0 0 0 0 0 0 0 0 0 0 0 0 0 Noko. TU 7 0-10 jar neck 1 LV T4
090 0 0 0 0 0 0 0 66 0 0 0 0 0 Noko. TU 7 0-10 Unk. body 2 LV T4
091 0 0 0 0 0 0 90 0 0 0 0 0 0 Noko. TU 7 0-10 Unk. neck 1 LV T4
092 19 24 29 35 50 0 0 0 1 1.8 3.8 125 24 Noko. TU 7 10-20 jar rim/neck 2 LV T4 Je
093 0 0 0 0 0 0 0 90 0 0 0 0 0 Noko. TU 7 20-30 Unk. body 4 LV T4
094 0 0 0 0 0 0 0 66 0 0 0 0 0 Noko. TU 7 20-30 Unk. body 1 LV T4
095 17 23 28 32 38 73 0 0 0 1.34 0 0 0 Noko. TU 7 20-30 bowl rim 2 LV T4 Bi
096 17 24 28 35 39 0 108 0 0 0.7 0 0 0 Noko. TU 7 20-30 jar rim 3 LV T4 Jd
097 17 24 26 30 39 0 0 0 0 0.56 0 0 0 Noko. TU 7 20-30 jar rim 1 LV T4 Jb
098 0 0 0 0 0 0 0 66 0 0 0 0 0 Noko. TU 7 30-40 Unk. body 1 LV T4
099 0 0 0 0 0 0 0 108 0 0 0 0 0 Noko. TU 7 30-40 Unk. body 4 LV T4
100 0 0 0 0 0 0 0 66 0 0 0 0 0 Noko. TU 7 30-40 Unk. body 1 LV T4
101 17 24 26 35 40 0 0 0 0 0.89 0 0 38 Noko. TU 7 30-40 bowl rim 4 LV T4 Bc
102 17 24 26 30 39 0 0 0 0 0.65 0 0 16 Noko. TU 7 30-40 jar rim 3 LV T4 Jb
103 17 24 26 30 39 0 0 0 0 0.55 0 0 40 Noko. TU 7 30-40 jar rim 3 LV T4 Jb
104 17 24 26 30 39 0 0 0 0 0.6 0 0 30 Noko. TU 7 30-40 jar rim 3 LV T4 Jb
105 17 24 27 30 39 0 0 0 40 0.75 3.4 95 22 Noko. TU 7 40-50 jar rim/neck 1 LV T4 Ja
106 17 24 0 0 0 0 0 0 0 0 0 0 0 Noko. TU 9 0-10 jar neck 1 LV T4
107 17 23 27 35 44 0 0 0 0 0.49 0 0 20 Noko. TU 9 10-20 bowl rim 1 LV T4 Bj
108 0 0 0 0 0 0 0 90 0 0 0 0 0 Noko. TU 9 10-20 Unk. body 1 LV T4
109 17 24 26 35 39 0 0 0 30 0.42 1.9 103 50 Noko. TU 9 30-40 jar rim 1 LV T4 Jc
110 17 24 27 35 40 0 0 0 0 0.5 0 0 30 Noko. TU 9 30-40 jar rim/neck 2 LV T4 Jd
426

427
Table C.3. (Continued) Attribute data for ceramic rims recovered from the Sigatoka Valley excavations.
Vess. Rim Rim- Rim Rim Lip Lip Rim Bod Rim Rim Rim Neck Orif. Site Excav. Depth Vessel Portion Temp. Reg. Per. Vess.
No. Orit. Bod. Cse. Prof. Shp Dec. Dec. Dec. Orit. Thik. Ht. Incl. Diam. Name Unit (cmbs) Form Gp. Type
Cont. Ang. Ang.
111 0 0 0 0 0 0 0 90 0 0 0 0 0 Noko. TU 9 30-40 Unk. body 1 LV T4
112 0 0 0 0 0 0 0 90 0 0 0 0 0 Noko. TU 10 0-10 Unk. body 1 LV T4
113 0 0 0 0 0 0 0 90 0 0 0 0 0 Noko. TU 10 0-10 Unk. body 2 LV T4
114 17 24 0 0 0 0 0 0 0 0 0 0 0 Noko. TU 10 0-10 jar neck 1 LV T4
115 0 0 0 0 0 0 0 0 0 0 0 0 0 Noko. TU 10 0-10 Unk. neck 1 LV T4
116 17 24 0 0 0 0 0 0 0 0 0 0 0 Noko. TU 10 0-10 jar neck 1 LV T4
117 17 24 28 32 42 0 0 0 0 0.49 0 0 0 Noko. TU 10 0-10 jar rim 1 LV T4 Jh
118 17 23 26 30 39 0 0 0 0 0.42 0 0 0 Noko. TU 10 0-10 bowl rim 1 LV T4 Bb
119 17 24 27 35 47 0 0 0 32 0.7 2.7 108 20 Korova. TU 1 0-10 jar rim/neck 2 LV T4 Je
120 17 24 0 0 0 0 0 0 0 0 0 0 0 Korova. TU 1 0-10 jar neck 2 LV T4
121 17 24 0 0 0 0 0 0 0 0 0 0 0 Korova. TU 1 10-20 jar neck 1 LV T3
122 17 23 26 35 47 0 0 0 0 0.6 0 0 40 Korova. TU 1 20-30 bowl rim 2 LV T3 Bd
123 17 24 27 35 47 0 0 0 39 0.51 2.4 104 12 Korova. TU 1 20-30 jar rim/neck 2 LV T3 Je
124 17 24 0 0 0 0 0 107 0 0 0 0 0 Korova. TU 1 20-30 jar neck 2 LV T3
125 0 0 0 0 0 0 0 108 0 0 0 0 0 Korova. TU 1 30-40 Unk. body 1 LV T3
126 17 24 0 0 0 0 0 0 0 0 0 0 0 Korova. TU 1 40-50 jar neck 1 LV T3
127 17 24 0 0 0 0 0 0 0 0 0 0 0 Korova. TU 1 40-50 jar neck 1 LV T3
128 0 0 0 0 0 0 0 108 0 0 0 0 0 Korova. TU 1 40-50 Unk. body 2 LV T3
129 0 0 0 0 0 0 107 0 0 0 0 0 0 Korova. TU 1 40-50 Unk. neck 7 LV T3
130 0 0 0 0 0 0 0 108 0 0 0 0 0 Korova. TU 1 50-60 Unk. body 4 LV T3
131 0 0 0 0 0 0 0 107 0 0 0 0 0 Korova. TU 1 60-70 Unk. body 4 LV T3
132 0 0 0 0 0 0 0 90 0 0 0 0 0 Korova. TU 2 20-30 Unk. body 1 LV T4
427

428
Table C.3. (Continued) Attribute data for ceramic rims recovered from the Sigatoka Valley excavations.
Vess. Rim Rim- Rim Rim Lip Lip Rim Bod Rim Rim Rim Neck Orif. Site Excav. Depth Vessel Portion Temp. Reg. Per. Vess.
No. Orit. Bod. Cse. Prof. Shp Dec. Dec. Dec. Orit. Thik. Ht. Incl. Diam. Name Unit (cmbs) Form Gp. Type
Cont. Ang. Ang.
133 0 0 0 0 0 0 0 90 0 0 0 0 0 Korova. TU 2 30-40 Unk. body 1 LV T4
134 17 23 26 30 39 73 0 0 0 1.1 0 0 46 Korova. slope surface bowl rim 1 LV T4 Bb
135 17 24 0 0 0 0 0 0 0 0 0 0 0 Bukusia TU 1 0-10 jar neck 4 LV T4
136 0 0 0 0 0 0 0 65 0 0 0 0 0 Bukusia TU 1 10-20 Unk. body 1 LV T4
137 17 23 26 32 38 0 0 0 0 0.87 0 0 30 Bukusia TU 1 10-20 bowl rim 1 LV T4 Be
138 0 0 0 0 0 0 0 0 0 0 0 0 0 Bukusia TU 1 20-30 Unk. neck 5 LV T4
139 0 0 0 0 0 0 0 90 0 0 0 0 0 Bukusia TU 1 30-40 Unk. body 1 LV T4
140 0 0 0 0 0 0 0 106 0 0 0 0 0 Bukusia TU 1 40-50 Unk. body 1 LV T4
141 0 0 0 0 0 0 0 66 0 0 0 0 0 Bukusia TU 1 40-50 Unk. body 1 LV T4
142 0 0 0 0 0 0 0 64 0 0 0 0 0 Bukusia TU 2 40-50 Unk. body 1 LV T4
143 17 24 0 0 0 0 0 0 0 0 0 0 0 Bukusia TU 2 50-60 jar neck 4 LV T4
144 17 24 27 30 39 0 0 0 35 0.53 2.5 113 20 Bukusia TU 2 50-60 jar rim/neck 2 LV T4 Ja
145 17 24 0 0 0 0 0 0 0 0 0 0 0 Bukusia TU 2 50-60 jar neck 1 LV T4
146 17 23 26 30 44 77 0 0 0 0.7 0 0 26 Bukusia TU 2 60-70 bowl rim 2 LV T4 Bg
147 17 24 0 0 0 0 0 0 0 0 0 0 0 Bukusia TU 2 60-70 jar neck 2 LV T4
148 17 24 0 0 0 0 0 0 0 0 0 0 0 Bukusia TU 2 60-70 jar neck 2 LV T4
149 17 24 26 30 39 0 0 0 0 0.38 0 0 18 Bukusia TU 2 60-70 jar rim 1 LV T4 Jb
150 17 24 0 0 0 0 0 0 0 0 0 0 0 Bukusia TU 2 70-80 jar neck 4 LV T4
151 17 24 0 0 0 0 108 0 0 0 0 0 0 Bukusia TU 2 70-80 jar neck 2 LV T4
152 0 0 0 0 0 0 0 64 0 0 0 0 0 Bukusia TU 2 70-80 Unk. body 5 LV T4
153 17 24 0 0 0 0 0 0 0 0 0 0 0 Bukusia TU 2 80-90 jar neck 1 LV T4
154 17 24 26 35 39 0 0 0 30 0.5 3.2 120 30 Bukusia TU 2 80-90 jar rim/neck 1 LV T4 Jc
428

429
Table C.3. (Continued) Attribute data for ceramic rims recovered from the Sigatoka Valley excavations.
Vess. Rim Rim- Rim Rim Lip Lip Rim Bod Rim Rim Rim Neck Orif. Site Excav. Depth Vessel Portion Temp. Reg. Per. Vess.
No. Orit. Bod. Cse. Prof. Shp Dec. Dec. Dec. Orit. Thik. Ht. Incl. Diam. Name Unit (cmbs) Form Gp. Type
Cont. Ang. Ang.
155 0 0 0 0 0 0 0 66 0 0 0 0 0 Bukusia TU 2 90-100 Unk. body 1 LV T4
156 17 24 0 0 0 0 0 0 0 0 0 0 0 Bukusia TU 2
100-
110 jar neck 1 LV T4
157 0 0 0 0 50 0 0 0 0 0 0 0 0 Korohewa TU 1 0-10 Unk. rim 1 LV T4
158 0 0 0 0 0 0 0 0 0 0 0 0 0 Qoroqor. TU 1 0-10 Unk. body 1 MV T4
159 17 23 26 30 40 0 0 0 0 0.9 0 0 28 Qoroqor. TU 1 0-10 bowl rim 5 MV T4 Bb
160 17 24 27 35 39 0 0 0 40 0.28 1.8 109 40 Qoroqor. TU 1 0-10 jar rim/neck 1 MV T4 Jd
161 0 0 0 0 0 0 0 0 0 0 0 0 0 Qoroqor. TU 1 0-10 Unk. body 1 MV T4
162 0 0 0 0 0 0 0 66 0 0 0 0 0 Qoroqor. TU 1 0-10 Unk. body 3 MV T4
163 0 0 0 0 0 0 0 66 0 0 0 0 0 Qoroqor. TU 1 0-10 Unk. body 2 MV T4
164 0 0 0 0 0 0 0 66 0 0 0 0 0 Qoroqor. TU 1 0-10 Unk. body 2 MV T4
165 0 0 0 0 0 0 0 66 0 0 0 0 0 Qoroqor. TU 1 10-20 Unk. body 1 MV T4
166 0 0 0 0 0 0 0 90 0 0 0 0 0 Qoroqor. TU 1 10-20 Unk. body 1 MV T4
167 0 0 0 0 0 0 0 90 0 0 0 0 0 Qoroqor. TU 1 10-20 Unk. body 1 MV T4
168 0 0 0 0 0 0 0 64 0 0 0 0 0 Qoroqor. TU 1 10-20 Unk. body 1 MV T4
169 17 24 0 0 0 0 0 0 0 0 0 0 0 Qoroqor. TU 1 10-20 jar neck 1 MV T4
170 0 0 0 0 0 0 0 66 0 0 0 0 0 Qoroqor. TU 1 20-30 Unk. body 1 MV T4
171 0 0 0 0 0 0 0 90 0 0 0 0 0 Qoroqor. TU 1 20-30 Unk. body 1 MV T4
172 0 0 0 0 0 0 0 90 0 0 0 0 0 Qoroqor. TU 1 20-30 Unk. body 1 MV T4
173 17 24 26 35 39 0 0 0 0 0.36 0 0 38 Qoroqor. TU 1 20-30 jar rim 1 MV T4 Jc
174 17 23 26 30 39 0 0 0 0 0.71 0 0 48 Qoroqor. TU 1 20-30 bowl rim 1 MV T4 Bb
175 0 0 0 0 0 0 0 66 0 0 0 0 0 Qoroqor. TU 1 30-40 Unk. body 1 MV T4
429

430
Table C.3. (Continued) Attribute data for ceramic rims recovered from the Sigatoka Valley excavations.
Vess. Rim Rim- Rim Rim Lip Lip Rim Bod Rim Rim Rim Neck Orif. Site Excav. Depth Vessel Portion Temp. Reg. Per. Vess.
No. Orit. Bod. Cse. Prof. Shp Dec. Dec. Dec. Orit. Thik. Ht. Incl. Diam. Name Unit (cmbs) Form Gp. Type
Cont. Ang. Ang.
176 0 0 0 0 0 0 0 66 0 0 0 0 0 Qoroqor. TU 1 40-50 Unk. body 1 MV T3
177 0 0 0 0 0 0 0 0 0 0 0 0 0 Qoroqor. TU 1 40-50 Unk. body 1 MV T3
178 0 0 0 0 0 0 0 66 0 0 0 0 0 Qoroqor. TU 1 40-50 Unk. body 1 MV T3
179 0 0 0 0 0 0 0 66 0 0 0 0 0 Qoroqor. TU 1 40-50 Unk. body 1 MV T3
180 17 24 0 0 0 0 0 0 0 0 0 0 0 Qoroqor. TU 1 50-60 jar neck 1 MV T3
181 0 0 0 0 0 0 0 66 0 0 0 0 0 Qoroqor. TU 1 50-60 Unk. neck 1 MV T3
182 0 0 0 0 0 0 0 66 0 0 0 0 0 Qoroqor. TU 1 50-60 Unk. body 1 MV T3
183 0 0 0 0 0 0 0 0 0 0 0 0 0 Qoroqor. TU 1 50-60 Unk. body 1 MV T3
184 0 0 0 0 0 0 0 90 0 0 0 0 0 Qoroqor. TU 1 50-60 Unk. body 1 MV T3
185 0 0 0 0 0 0 0 66 0 0 0 0 0 Qoroqor. TU 1 60-70 Unk. body 1 MV T3
186 0 0 0 0 0 0 0 64 0 0 0 0 0 Qoroqor. TU 1 60-70 Unk. body 1 MV T3
187 0 0 0 0 0 0 0 66 0 0 0 0 0 Qoroqor. TU 1 60-70 Unk. body 1 MV T3
188 0 0 0 0 0 0 0 64 0 0 0 0 0 Qoroqor. TU 1 60-70 Unk. body 1 MV T3
189 0 0 0 0 0 0 0 66 0 0 0 0 0 Qoroqor. TU 1 60-70 Unk. body 1 MV T3
190 0 0 0 0 0 0 0 66 0 0 0 0 0 Qoroqor. TU 1 60-70 Unk. body 1 MV T3
191 0 0 0 0 0 0 0 66 0 0 0 0 0 Qoroqor. TU 1 60-70 Unk. body 1 MV T3
192 0 0 0 0 0 0 0 66 0 0 0 0 0 Qoroqor. TU 1 70-80 Unk. body 1 MV T3
193 0 0 0 0 0 0 0 66 0 0 0 0 0 Qoroqor. TU 1 70-80 Unk. body 1 MV T3
194 0 0 0 0 0 0 0 64 0 0 0 0 0 Qoroqor. TU 1 80-90 Unk. body 1 MV T3
195 0 0 0 0 0 0 0 66 0 0 0 0 0 Qoroqor. TU 1 80-90 Unk. body 1 MV T3
196 0 0 0 0 0 0 0 66 0 0 0 0 0 Qoroqor. TU 1 80-90 Unk. body 1 MV T3
197 0 0 0 0 0 0 0 66 0 0 0 0 0 Qoroqor. TU 1 80-90 Unk. body 1 MV T3
430

431
Table C.3. (Continued) Attribute data for ceramic rims recovered from the Sigatoka Valley excavations.
Vess. Rim Rim- Rim Rim Lip Lip Rim Bod Rim Rim Rim Neck Orif. Site Excav. Depth Vessel Portion Temp. Reg. Per. Vess.
No. Orit. Bod. Cse. Prof. Shp Dec. Dec. Dec. Orit. Thik. Ht. Incl. Diam. Name Unit (cmbs) Form Gp. Type
Cont. Ang. Ang.
198 0 0 0 0 0 0 0 90 0 0 0 0 0 Qoroqor. TU 1 80-90 Unk. body 1 MV T3
199 0 0 0 0 0 0 0 66 0 0 0 0 0 Qoroqor. TU 1 90-100 Unk. body 1 MV T3
200 0 0 0 0 0 0 0 66 0 0 0 0 0 Qoroqor. TU 1 90-100 Unk. body 1 MV T3
201 0 0 0 0 0 0 0 90 0 0 0 0 0 Qoroqor. TU 4 10-20 Unk. body 1 MV T4
202 0 0 0 0 0 0 0 64 0 0 0 0 0 Qoroqor. TU 4 20-30 Unk. body 1 MV T4
203 17 24 27 35 39 0 0 0 0 0.39 0 0 40 Qoroqor. TU 2 10-20 jar rim/neck 1 MV T4 Jd
204 17 23 26 32 40 0 0 0 0 0.83 0 0 24 Qoroqor. TU 2 10-20 bowl rim 1 MV T4 Bf
205 17 23 26 30 39 0 0 0 0 0.81 0 0 40 Qoroqor. TU 2 10-20 bowl rim 1 MV T4 Bb
206 17 24 26 30 39 0 0 0 30 0.37 1.1 117 0 Qoroqor. TU 2 10-20 jar rim 1 MV T4 Jb
207 17 24 27 30 40 0 0 0 40 0.5 1.8 84 50 Qoroqor. TU 2 60-70 jar rim/neck 1 MV T4 Ja
208 17 23 26 30 40 0 0 0 0 0.47 0 0 0 Qoroqor. TU 2 60-70 bowl rim/neck 1 MV T4 Bb
209 17 24 0 0 0 0 0 0 0 0 0 0 0 Qoroqor. TU 2 40-50 jar neck 2 MV T4
210 0 0 0 0 0 0 0 73 0 0 0 0 0 Qoroqor. TU 2 10-20 Unk. body 2 MV T4
211 0 0 0 0 0 0 0 73 0 0 0 0 0 Qoroqor. TU 2 10-20 Unk. body 1 MV T4
212 17 24 0 0 0 0 0 0 0 0 0 0 0 Qoroqor. TU 2 0-10 jar neck 1 MV T4
213 0 0 0 0 0 0 0 90 0 0 0 0 0 Qoroqor. TU 4 50-60 Unk. body 1 MV T4
214 17 24 0 0 0 0 0 0 0 0 0 0 0 Qoroqor. TU 4 50-60 Unk. neck 1 MV T4
215 0 0 0 0 0 0 0 65 0 0 0 0 0 Qoroqor. TU 4 40-50 Unk. body 1 MV T4
216 17 23 26 32 38 0 0 0 0 1.17 0 0 0 Qoroqor. TU 4 40-50 bowl rim 3 MV T4 Be
217 17 24 0 0 0 0 0 0 0 0 0 0 0 Qoroqor. TU 4 40-50 jar neck 1 MV T4
218 17 24 0 0 0 0 0 0 0 0 0 0 0 Qoroqor. TU 4 30-40 jar neck 1 MV T4
219 0 0 0 0 0 0 0 0 0 0.65 0 0 0 Qoroqor. TU 4 30-40 Unk. body 1 MV T4
431

432
Table C.3. (Continued) Attribute data for ceramic rims recovered from the Sigatoka Valley excavations.
Vess. Rim Rim- Rim Rim Lip Lip Rim Bod Rim Rim Rim Neck Orif. Site Excav. Depth Vessel Portion Temp. Reg. Per. Vess.
No. Orit. Bod. Cse. Prof. Shp Dec. Dec. Dec. Orit. Thik. Ht. Incl. Diam. Name Unit (cmbs) Form Gp. Type
Cont. Ang. Ang.
220 0 0 0 0 0 0 0 0 0 0 0 0 0 Qoroqor. TU 4 30-40 Unk. neck 1 MV T4
221 17 24 0 0 0 0 0 0 0 0 0 0 0 Qoroqor. TU 4 30-40 jar neck 1 MV T4
222 17 24 0 0 0 0 0 0 0 0 0 0 0 Qoroqor. TU 4 20-30 jar neck 1 MV T4
223 17 24 0 0 0 0 0 0 0 0 0 0 0 Qoroqor. TU 4 20-30 jar neck 1 MV T4
224 17 24 0 0 0 0 0 0 0 0 0 0 0 Qoroqor. TU 3 20-30 jar neck 4 MV T4
225 17 24 0 0 0 0 0 0 0 0 0 0 0 Qoroqor. TU 4 20-30 jar neck 1 MV T4
226 17 23 26 30 50 0 90 0 0 0.67 0 0 30 Vitogo TU 1 0-10 bowl rim 1 MV T4 Bg
227 17 23 26 30 39 100 0 0 0 0.89 0 0 40 Vitogo TU 1 10-20 bowl rim 2 MV T4 Bb
228 17 24 27 35 0 0 0 0 45 0 0 100 30 Vitogo TU 1 10-20 jar neck 1 MV T4
229 17 23 26 30 39 0 0 0 0 0.75 0 0 40 Vitogo TU 1 10-20 bowl rim 1 MV T4 Bb
230 17 24 27 35 50 0 0 0 45 0.7 2.2 95 30 Vitogo TU 1 10-20 jar rim/neck 1 MV T4 Je
231 0 0 0 0 50 0 0 0 0 0.7 0 0 0 Vitogo TU 1 10-20 Unk. rim 1 MV T4
232 0 0 0 0 0 0 0 107 0 0 0 0 0 Vitogo TU 1 10-20 Unk. body 1 MV T4
233 17 24 27 30 40 0 0 0 27 0.65 2.2 135 24 Vitogo TU 1 20-30 jar rim/neck 1 MV T4 Ja
234 17 24 0 0 0 0 0 0 0 0 0 0 0 Vitogo TU 1 20-30 jar neck 1 MV T4
235 17 24 0 0 0 0 100 0 0 0 0 0 0 Vitogo TU 1 20-30 jar neck 2 MV T4
236 17 23 26 30 39 0 0 0 0 0.84 0 0 36 Vitogo TU 1 30-40 bowl rim 3 MV T4 Bb
237 0 0 0 0 0 0 0 65 0 0 0 0 0 Vitogo TU 1 40-50 Unk. body 1 MV T4
238 17 24 27 35 47 0 108 0 0 0.55 0 0 0 Vitogo TU 1 50-60 jar rim 1 MV T4 Je
239 0 0 0 0 0 0 0 0 0 0 0 0 0 Vitogo TU 2 0-10 Unk. neck 2 MV T4
240 0 0 0 0 0 0 0 66 0 0 0 0 0 Vitogo TU 2 0-10 Unk. body 4 MV T4
241 0 0 0 0 0 0 0 66 0 0 0 0 0 Vitogo TU 2 0-10 Unk. body 1 MV T4
432
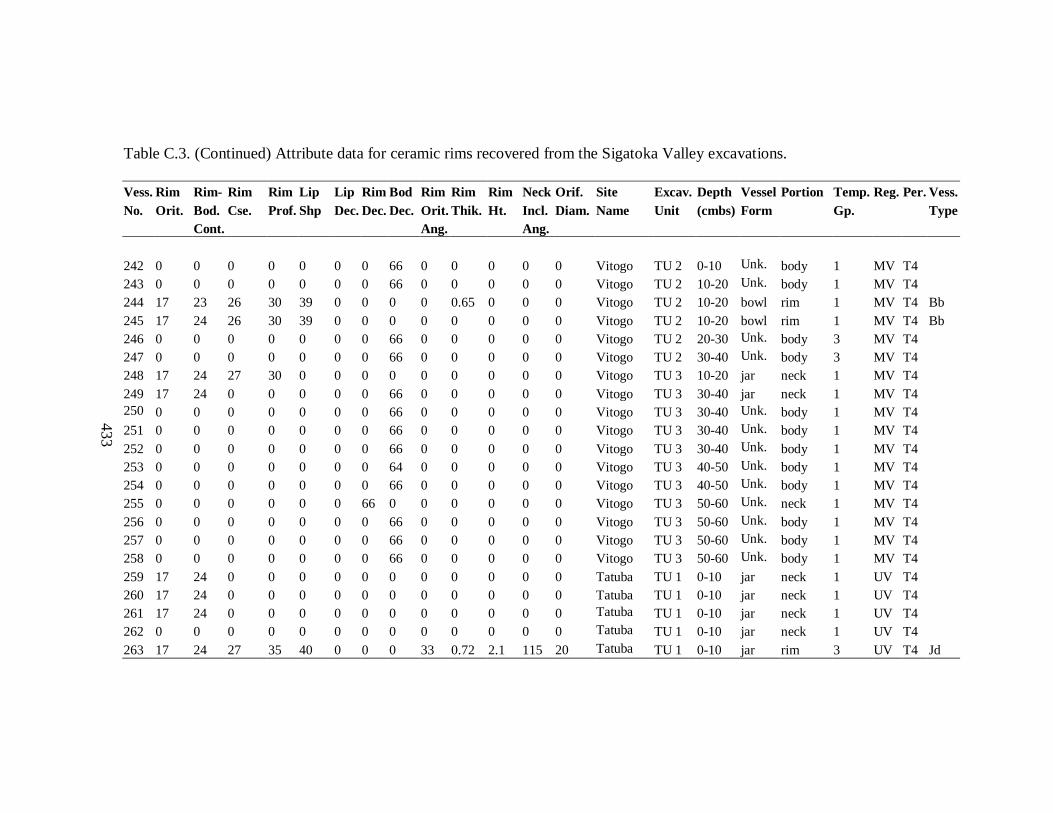
433
Table C.3. (Continued) Attribute data for ceramic rims recovered from the Sigatoka Valley excavations.
Vess. Rim Rim- Rim Rim Lip Lip Rim Bod Rim Rim Rim Neck Orif. Site Excav. Depth Vessel Portion Temp. Reg. Per. Vess.
No. Orit. Bod. Cse. Prof. Shp Dec. Dec. Dec. Orit. Thik. Ht. Incl. Diam. Name Unit (cmbs) Form Gp. Type
Cont. Ang. Ang.
242 0 0 0 0 0 0 0 66 0 0 0 0 0 Vitogo TU 2 0-10 Unk. body 1 MV T4
243 0 0 0 0 0 0 0 66 0 0 0 0 0 Vitogo TU 2 10-20 Unk. body 1 MV T4
244 17 23 26 30 39 0 0 0 0 0.65 0 0 0 Vitogo TU 2 10-20 bowl rim 1 MV T4 Bb
245 17 24 26 30 39 0 0 0 0 0 0 0 0 Vitogo TU 2 10-20 bowl rim 1 MV T4 Bb
246 0 0 0 0 0 0 0 66 0 0 0 0 0 Vitogo TU 2 20-30 Unk. body 3 MV T4
247 0 0 0 0 0 0 0 66 0 0 0 0 0 Vitogo TU 2 30-40 Unk. body 3 MV T4
248 17 24 27 30 0 0 0 0 0 0 0 0 0 Vitogo TU 3 10-20 jar neck 1 MV T4
249 17 24 0 0 0 0 0 66 0 0 0 0 0 Vitogo TU 3 30-40 jar neck 1 MV T4
250 0 0 0 0 0 0 0 66 0 0 0 0 0 Vitogo TU 3 30-40 Unk. body 1 MV T4
251 0 0 0 0 0 0 0 66 0 0 0 0 0 Vitogo TU 3 30-40 Unk. body 1 MV T4
252 0 0 0 0 0 0 0 66 0 0 0 0 0 Vitogo TU 3 30-40 Unk. body 1 MV T4
253 0 0 0 0 0 0 0 64 0 0 0 0 0 Vitogo TU 3 40-50 Unk. body 1 MV T4
254 0 0 0 0 0 0 0 66 0 0 0 0 0 Vitogo TU 3 40-50 Unk. body 1 MV T4
255 0 0 0 0 0 0 66 0 0 0 0 0 0 Vitogo TU 3 50-60 Unk. neck 1 MV T4
256 0 0 0 0 0 0 0 66 0 0 0 0 0 Vitogo TU 3 50-60 Unk. body 1 MV T4
257 0 0 0 0 0 0 0 66 0 0 0 0 0 Vitogo TU 3 50-60 Unk. body 1 MV T4
258 0 0 0 0 0 0 0 66 0 0 0 0 0 Vitogo TU 3 50-60 Unk. body 1 MV T4
259 17 24 0 0 0 0 0 0 0 0 0 0 0 Tatuba TU 1 0-10 jar neck 1 UV T4
260 17 24 0 0 0 0 0 0 0 0 0 0 0 Tatuba TU 1 0-10 jar neck 1 UV T4
261 17 24 0 0 0 0 0 0 0 0 0 0 0 Tatuba TU 1 0-10 jar neck 1 UV T4
262 0 0 0 0 0 0 0 0 0 0 0 0 0 Tatuba TU 1 0-10 jar neck 1 UV T4
263 17 24 27 35 40 0 0 0 33 0.72 2.1 115 20 Tatuba TU 1 0-10 jar rim 3 UV T4 Jd
433

434
Table C.3. (Continued) Attribute data for ceramic rims recovered from the Sigatoka Valley excavations.
Vess. Rim Rim- Rim Rim Lip Lip Rim Bod Rim Rim Rim Neck Orif. Site Excav. Depth Vessel Portion Temp. Reg. Per. Vess.
No. Orit. Bod. Cse. Prof. Shp Dec. Dec. Dec. Orit. Thik. Ht. Incl. Diam. Name Unit (cmbs) Form Gp. Type
Cont. Ang. Ang.
264 17 23 26 35 39 0 0 0 0 0.51 0 0 32 Tatuba TU 1 0-10 bowl rim 1 UV T4 Bc
265 17 24 0 0 0 0 0 0 0 0 0 0 0 Tatuba TU 1 0-10 jar neck 1 UV T4
266 17 23 26 35 50 0 0 0 0 0.61 0 0 0 Tatuba TU 1 0-10 bowl rim 3 UV T4 Bd
267 17 24 0 0 0 0 0 0 0 0 0 0 0 Tatuba TU 1 0-10 jar neck 1 UV T4
268 17 24 0 0 0 0 0 0 0 0 0 0 0 Tatuba TU 1 0-10 jar neck 1 UV T4
269 17 24 0 0 0 0 0 0 0 0 0 0 0 Tatuba TU 1 0-10 jar neck 1 UV T4
270 17 24 28 30 47 0 0 0 0 0.72 0 0 0 Tatuba TU 1 0-10 jar rim 1 UV T4 Jf
271 17 24 0 0 0 0 0 0 0 0 0 0 0 Tatuba TU 1 0-10 jar neck 1 UV T4
272 17 23 26 30 40 0 0 0 0 0.78 0 0 0 Tatuba TU 1 0-10 bowl rim 1 UV T4 Bb
273 17 24 0 0 0 0 0 0 0 0 0 0 0 Tatuba TU 1 0-10 jar neck 1 UV T4
274 17 24 0 0 0 0 0 0 0 0 0 0 0 Tatuba TU 1 0-10 jar neck 1 UV T4
275 17 23 26 31 39 0 0 0 0 0.51 0 0 0 Tatuba TU 1 0-10 bowl rim 1 UV T4 Ba
276 17 24 0 0 0 0 0 0 0 0.52 0 0 0 Tatuba TU 1 0-10 jar rim 1 UV T4
277 17 23 26 30 39 0 0 0 0 0.95 0 0 32 Tatuba TU 1 0-10 bowl rim 1 UV T4 Bb
278 17 24 28 30 47 0 0 0 60 0.8 2.6 120 14 Tatuba TU 1 0-10 jar rim 1 UV T4 Jf
279 17 24 0 0 0 0 0 0 0 0 0 0 0 Tatuba TU 1 0-10 jar neck 1 UV T4
280 17 24 0 0 0 0 0 0 0 0 0 0 0 Tatuba TU 1 0-10 jar neck 1 UV T4
281 17 23 26 35 47 0 0 0 0 0.35 0 0 0 Tatuba TU 1 0-10 bowl rim 1 UV T4 Bd
282 17 24 0 0 0 0 0 0 0 0 0 0 0 Tatuba TU 1 0-10 jar neck 1 UV T4
283 17 24 26 30 40 0 0 0 0 0.43 0 0 0 Tatuba TU 1 0-10 jar rim 1 UV T4 Jb
284 17 24 0 0 0 0 0 0 0 0 0 0 0 Tatuba TU 1 0-10 jar neck 2 UV T4
285 17 24 0 0 0 0 0 0 0 0 0 0 0 Tatuba TU 1 0-10 jar neck 1 UV T4
434

435
Table C.3. (Continued) Attribute data for ceramic rims recovered from the Sigatoka Valley excavations.
Vess. Rim Rim- Rim Rim Lip Lip Rim Bod Rim Rim Rim Neck Orif. Site Excav. Depth Vessel Portion Temp. Reg. Per. Vess.
No. Orit. Bod. Cse. Prof. Shp Dec. Dec. Dec. Orit. Thik. Ht. Incl. Diam. Name Unit (cmbs) Form Gp. Type
Cont. Ang. Ang.
286 17 24 0 0 0 0 0 0 0 0 0 0 0 Tatuba TU 1 0-10 jar neck 1 UV T4
287 17 24 0 0 0 0 0 0 0 0 0 0 0 Tatuba TU 1 0-10 jar neck 1 UV T4
288 17 24 0 0 0 0 0 0 0 0 0 0 0 Tatuba TU 1 0-10 jar neck 1 UV T4
289 17 24 0 0 0 0 0 0 0 0 0 0 0 Tatuba TU 1 0-10 jar neck 1 UV T4
290 0 0 0 0 0 0 0 0 0 0 0 0 0 Tatuba TU 1 0-10 Unk. rim 1 UV T4
291 0 0 0 0 0 0 0 66 0 0 0 0 0 Tatuba TU 1 0-10 Unk. neck 1 UV T4
292 0 0 0 0 0 0 0 90 0 0 0 0 0 Tatuba TU 1 0-10 Unk. body 1 UV T4
293 0 0 0 0 0 0 0 90 0 0 0 0 0 Tatuba TU 1 0-10 Unk. body 1 UV T4
294 0 0 0 0 0 0 0 90 0 0 0 0 0 Tatuba TU 1 0-10 Unk. body 1 UV T4
295 0 0 0 0 0 0 0 64 0 0 0 0 0 Tatuba TU 1 0-10 Unk. body 1 UV T4
296 0 0 0 0 0 0 0 66 0 0 0 0 0 Tatuba TU 1 0-10 Unk. body 1 UV T4
297 0 0 0 0 0 0 0 106 0 0 0 0 0 Tatuba TU 1 0-10 Unk. body 1 UV T4
298 0 0 0 0 0 0 0 65 0 0 0 0 0 Tatuba TU 1 0-10 Unk. body 1 UV T4
299 0 0 0 0 0 0 0 90 0 0 0 0 0 Tatuba TU 1 0-10 Unk. body 1 UV T4
300 0 0 0 0 0 0 0 90 0 0 0 0 0 Tatuba TU 1 0-10 Unk. body 1 UV T4
301 0 0 0 0 0 0 0 90 0 0 0 0 0 Tatuba TU 1 0-10 Unk. body 1 UV T4
302 0 0 0 0 0 0 0 90 0 0 0 0 0 Tatuba TU 1 0-10 Unk. body 1 UV T4
303 0 0 0 0 0 0 0 66 0 0 0 0 0 Tatuba TU 1 0-10 Unk. body 1 UV T4
304 0 0 0 0 0 0 0 65 0 0 0 0 0 Tatuba TU 1 0-10 Unk. body 1 UV T4
305 0 0 0 0 0 0 0 90 0 0 0 0 0 Tatuba TU 1 0-10 Unk. body 1 UV T4
306 0 0 0 0 0 0 0 65 0 0 0 0 0 Tatuba TU 1 0-10 Unk. body 1 UV T4
307 0 0 0 0 0 0 0 90 0 0 0 0 0 Tatuba TU 1 0-10 Unk. body 1 UV T4
435

436
Table C.3. (Continued) Attribute data for ceramic rims recovered from the Sigatoka Valley excavations.
Vess. Rim Rim- Rim Rim Lip Lip Rim Bod Rim Rim Rim Neck Orif. Site Excav. Depth Vessel Portion Temp. Reg. Per. Vess.
No. Orit. Bod. Cse. Prof. Shp Dec. Dec. Dec. Orit. Thik. Ht. Incl. Diam. Name Unit (cmbs) Form Gp. Type
Cont. Ang. Ang.
308 0 0 0 0 0 0 0 90 0 0 0 0 0 Tatuba TU 1 0-10 Unk. body 1 UV T4
309 0 0 0 0 0 0 0 90 0 0 0 0 0 Tatuba TU 1 0-10 Unk. body 1 UV T4
310 0 0 0 0 0 0 0 64 0 0 0 0 0 Tatuba TU 1 0-10 Unk. body 1 UV T4
311 0 0 0 0 0 0 0 90 0 0 0 0 0 Tatuba TU 1 0-10 Unk. body 1 UV T4
312 17 24 26 30 40 0 0 0 0 0.53 0 0 0 Tatuba TU 1 10-20 jar rim 1 UV T4 Jb
313 17 24 28 35 47 0 0 0 65 0.8 3 110 28 Tatuba TU 1 10-20 jar rim/neck 2 UV T4 Je
314 17 24 0 0 0 0 0 0 0 0 0 0 0 Tatuba TU 1 10-20 jar rim/neck 1 UV T4
315 17 24 27 32 39 0 0 0 29 1.19 4.7 120 20 Tatuba TU 1 10-20 jar rim/neck 2 UV T4 Ji
316 17 24 0 0 0 0 0 0 0 0 0 0 0 Tatuba TU 1 10-20 jar neck 1 UV T4
317 17 24 0 30 40 0 0 0 70 0.6 0 0 40 Tatuba TU 1 10-20 jar rim 1 UV T4
318 17 24 27 31 40 0 0 0 28 0.72 2.1 127 30 Tatuba TU 1 10-20 jar rim 1 UV T4 Ji
319 17 24 0 0 0 0 0 0 0 0 0 0 0 Tatuba TU 1 10-20 jar neck 2 UV T4
320 17 24 0 0 0 0 0 0 0 0 0 0 0 Tatuba TU 1 10-20 jar neck 4 UV T4
322 17 24 0 0 0 0 0 0 0 0 0 0 0 Tatuba TU 1 10-20 jar neck 1 UV T4
323 17 24 0 0 0 0 0 0 0 0 0 0 0 Tatuba TU 1 10-20 jar rim/neck 1 UV T4
324 17 24 0 0 0 0 0 0 0 0 0 0 0 Tatuba TU 1 10-20 jar rim/neck 1 UV T4
325 17 24 0 0 0 0 0 0 0 0 0 0 0 Tatuba TU 1 10-20 jar neck 1 UV T4
326 17 24 27 31 47 0 0 0 40 0.75 3.5 104 20 Tatuba TU 1 10-20 jar rim 2 UV T4 Jg
327 17 24 0 0 0 0 0 0 0 0 0 0 0 Tatuba TU 1 10-20 jar rim 1 UV T4
328 17 24 0 0 0 0 0 0 0 0 0 0 0 Tatuba TU 1 10-20 jar neck 1 UV T4
329 17 24 0 0 0 0 0 0 0 0 0 0 0 Tatuba TU 1 10-20 jar neck 2 UV T4
330 17 24 0 0 0 0 0 0 0 0 0 0 0 Tatuba TU 1 10-20 jar neck 1 UV T4
436

437
Table C.3. (Continued) Attribute data for ceramic rims recovered from the Sigatoka Valley excavations.
Vess. Rim Rim- Rim Rim Lip Lip Rim Bod Rim Rim Rim Neck Orif. Site Excav. Depth Vessel Portion Temp. Reg. Per. Vess.
No. Orit. Bod. Cse. Prof. Shp Dec. Dec. Dec. Orit. Thik. Ht. Incl. Diam. Name Unit (cmbs) Form Gp. Type
Cont. Ang. Ang.
331 17 24 27 30 40 0 0 0 41 0.67 3.4 105 20 Tatuba TU 1 10-20 jar rim/neck 2 UV T4 Ja
332 17 24 0 0 0 0 0 0 0 0 0 0 0 Tatuba TU 1 10-20 jar neck 1 UV T4
333 17 24 0 0 0 0 0 0 0 0 0 0 0 Tatuba TU 1 10-20 jar neck 2 UV T4
334 17 24 0 0 0 0 0 0 0 0 0 0 0 Tatuba TU 1 10-20 jar neck 2 UV T4
335 17 24 26 35 39 0 0 0 30 0.51 3.3 100 36 Tatuba TU 1 40-50 jar body 1 UV T3 Jc
336 17 24 0 0 0 0 0 0 0 0 0 0 0 Tatuba TU 1 10-20 jar neck 1 UV T4
337 17 24 0 0 0 0 0 0 0 0 0 0 0 Tatuba TU 1 10-20 jar neck 1 UV T4
338 17 24 0 0 0 0 0 0 0 0 0 0 0 Tatuba TU 1 10-20 jar neck 2 UV T4
339 17 24 0 0 0 0 0 0 0 0 0 0 0 Tatuba TU 1 10-20 jar neck 4 UV T4
340 17 24 0 0 0 0 0 0 0 0 0 0 0 Tatuba TU 1 10-20 jar neck 1 UV T4
341 17 24 0 0 0 0 0 0 0 0 0 0 0 Tatuba TU 1 10-20 jar neck 1 UV T4
342 17 24 27 30 39 0 0 0 51 0.77 1.8 82 18 Tatuba TU 1 10-20 jar rim 1 UV T4 Ja
343 17 24 26 30 39 0 0 0 0 0.47 0 0 0 Tatuba TU 1 10-20 jar rim 1 UV T4 Jb
344 17 24 0 0 0 0 0 0 0 0 0 0 0 Tatuba TU 1 10-20 jar neck 1 UV T4
345 17 24 0 0 0 0 0 0 0 0 0 0 0 Tatuba TU 1 10-20 jar neck 2 UV T4
346 17 24 27 30 39 0 0 0 30 0.79 2.5 128 20 Tatuba TU 1 10-20 jar rim 4 UV T4 Ja
347 17 24 0 0 0 0 0 0 0 0 0 0 0 Tatuba TU 1 10-20 jar neck 1 UV T4
348 17 24 0 0 0 0 0 0 0 0 0 0 0 Tatuba TU 1 10-20 jar neck 1 UV T4
349 17 24 0 0 0 0 0 0 0 0 0 0 0 Tatuba TU 1 10-20 jar neck 1 UV T4
350 17 24 0 0 0 0 0 0 0 0 0 0 0 Tatuba TU 1 10-20 jar neck 1 UV T4
351 17 24 0 0 0 0 0 0 0 0 0 0 0 Tatuba TU 1 10-20 jar neck 1 UV T4
352 17 24 0 0 0 0 0 0 0 0 0 0 0 Tatuba TU 1 10-20 jar neck 1 UV T4
437

438
Table C.3. (Continued) Attribute data for ceramic rims recovered from the Sigatoka Valley excavations.
Vess. Rim Rim- Rim Rim Lip Lip Rim Bod Rim Rim Rim Neck Orif. Site Excav. Depth Vessel Portion Temp. Reg. Per. Vess.
No. Orit. Bod. Cse. Prof. Shp Dec. Dec. Dec. Orit. Thik. Ht. Incl. Diam. Name Unit (cmbs) Form Gp. Type
Cont. Ang. Ang.
353 0 0 0 0 0 0 0 66 0 0 0 0 0 Tatuba TU 1 10-20 Unk. body 1 UV T4
354 0 0 0 0 0 0 0 66 0 0 0 0 0 Tatuba TU 1 10-20 Unk. body 1 UV T4
355 0 0 0 0 0 0 0 65 0 0 0 0 0 Tatuba TU 1 10-20 Unk. body 1 UV T4
356 17 24 0 0 0 0 0 0 0 0 0 0 0 Tatuba TU 1 10-20 jar neck 1 UV T4
357 0 0 0 0 0 0 0 90 0 0 0 0 0 Tatuba TU 1 10-20 Unk. body 1 UV T4
358 0 0 0 0 0 0 0 107 0 0 0 0 0 Tatuba TU 1 10-20 Unk. body 1 UV T4
359 0 0 0 0 0 0 0 90 0 0 0 0 0 Tatuba TU 1 10-20 Unk. body 1 UV T4
360 0 0 0 0 0 0 0 90 0 0 0 0 0 Tatuba TU 1 10-20 Unk. body 1 UV T4
361 0 0 0 0 0 0 0 64 0 0 0 0 0 Tatuba TU 1 10-20 Unk. body 1 UV T4
362 0 0 0 0 0 0 0 66 0 0 0 0 0 Tatuba TU 1 10-20 Unk. body 1 UV T4
363 0 0 0 0 0 0 0 65 0 0 0 0 0 Tatuba TU 1 10-20 Unk. body 1 UV T4
364 0 0 0 0 0 0 0 109 0 0 0 0 0 Tatuba TU 1 10-20 Unk. body 1 UV T4
365 0 0 0 0 0 0 0 90 0 0 0 0 0 Tatuba TU 1 10-20 Unk. body 1 UV T4
366 0 0 0 0 0 0 0 64 0 0 0 0 0 Tatuba TU 1 10-20 Unk. body 2 UV T4
367 0 0 0 0 0 0 0 66 0 0 0 0 0 Tatuba TU 1 10-20 Unk. body 1 UV T4
368 0 0 0 0 0 0 0 65 0 0 0 0 0 Tatuba TU 1 10-20 Unk. body 1 UV T4
369 0 0 0 0 0 0 0 64 0 0 0 0 0 Tatuba TU 1 10-20 Unk. body 1 UV T4
370 0 0 0 0 0 0 0 90 0 0 0 0 0 Tatuba TU 1 10-20 Unk. body 1 UV T4
371 0 0 0 0 0 0 0 66 0 0 0 0 0 Tatuba TU 1 10-20 Unk. body 2 UV T4
372 0 0 0 0 0 0 0 65 0 0 0 0 0 Tatuba TU 1 10-20 Unk. body 1 UV T4
373 0 0 0 0 0 0 0 66 0 0 0 0 0 Tatuba TU 1 10-20 Unk. body 2 UV T4
374 0 0 0 0 0 0 0 64 0 0 0 0 0 Tatuba TU 1 10-20 Unk. body 1 UV T4
438

439
Table C.3. (Continued) Attribute data for ceramic rims recovered from the Sigatoka Valley excavations.
Vess. Rim Rim- Rim Rim Lip Lip Rim Bod Rim Rim Rim Neck Orif. Site Excav. Depth Vessel Portion Temp. Reg. Per. Vess.
No. Orit. Bod. Cse. Prof. Shp Dec. Dec. Dec. Orit. Thik. Ht. Incl. Diam. Name Unit (cmbs) Form Gp. Type
Cont. Ang. Ang.
375 0 0 0 0 0 0 0 64 0 0 0 0 0 Tatuba TU 1 10-20 Unk. body 1 UV T4
376 0 0 0 0 0 0 0 65 0 0 0 0 0 Tatuba TU 1 20-30 Unk. body 3 UV T3
377 0 0 0 0 0 0 0 64 0 0 0 0 0 Tatuba TU 1 20-30 Unk. body 1 UV T3
378 0 0 0 0 0 0 0 65 0 0 0 0 0 Tatuba TU 1 20-30 Unk. body 1 UV T3
379 17 24 26 30 39 0 0 64 2 0.4 1.8 112 10 Tatuba TU 1 20-30 jar rim/neck 1 UV T3 Jb
380 0 0 0 0 0 0 0 90 0 0 0 0 0 Tatuba TU 1 20-30 Unk. body 1 UV T3
381 0 0 0 0 0 0 0 64 0 0 0 0 0 Tatuba TU 1 20-30 Unk. body 3 UV T3
382 0 0 0 0 0 0 0 64 0 0 0 0 0 Tatuba TU 1 20-30 Unk. body 1 UV T3
383 0 0 0 0 0 0 0 64 0 0 0 0 0 Tatuba TU 1 20-30 Unk. body 1 UV T3
384 0 0 0 0 0 0 0 64 0 0 0 0 0 Tatuba TU 1 20-30 Unk. body 1 UV T3
385 0 0 0 0 0 0 0 64 0 0 0 0 0 Tatuba TU 1 20-30 Unk. body 1 UV T3
386 0 0 0 0 0 0 0 65 0 0 0 0 0 Tatuba TU 1 20-30 Unk. body 1 UV T3
387 0 0 0 0 0 0 0 65 0 0 0 0 0 Tatuba TU 1 20-30 Unk. body 4 UV T3
388 0 0 0 0 0 0 0 90 0 0 0 0 0 Tatuba TU 1 20-30 Unk. body 3 UV T3
389 0 0 0 0 0 0 0 64 0 0 0 0 0 Tatuba TU 1 20-30 Unk. body 1 UV T3
390 0 0 0 0 0 0 0 64 0 0 0 0 0 Tatuba TU 1 20-30 Unk. body 2 UV T3
391 0 0 0 0 0 0 0 65 0 0 0 0 0 Tatuba TU 1 20-30 Unk. body 2 UV T3
392 0 0 0 0 0 0 0 65 0 0 0 0 0 Tatuba TU 1 20-30 Unk. body 1 UV T3
393 0 0 0 0 0 0 0 64 0 0 0 0 0 Tatuba TU 1 20-30 Unk. body 1 UV T3
394 0 0 0 0 0 0 0 65 0 0 0 0 0 Tatuba TU 1 20-30 Unk. body 2 UV T3
395 0 0 0 0 0 0 0 100 0 0 0 0 0 Tatuba TU 1 20-30 Unk. body 2 UV T3
396 0 0 0 0 0 0 0 65 0 0 0 0 0 Tatuba TU 1 20-30 Unk. body 1 UV T3
439

440
Table C.3. (Continued) Attribute data for ceramic rims recovered from the Sigatoka Valley excavations.
Vess. Rim Rim- Rim Rim Lip Lip Rim Bod Rim Rim Rim Neck Orif. Site Excav. Depth Vessel Portion Temp. Reg. Per. Vess.
No. Orit. Bod. Cse. Prof. Shp Dec. Dec. Dec. Orit. Thik. Ht. Incl. Diam. Name Unit (cmbs) Form Gp. Type
Cont. Ang. Ang.
397 0 0 0 0 0 0 0 65 0 0 0 0 0 Tatuba TU 1 20-30 Unk. body 1 UV T3
398 0 0 0 0 0 0 0 90 0 0 0 0 0 Tatuba TU 1 20-30 Unk. body 3 UV T3
399 0 0 0 0 0 0 0 0 0 0.35 0 0 0 Tatuba TU 1 20-30 Unk. body 7 UV T3
400 17 24 26 30 40 0 0 0 27 0.68 2.4 100 24 Tatuba TU 1 20-30 jar rim 2 UV T3 Jb
401 17 24 29 35 47 0 0 0 31 0.63 6 107 24 Tatuba TU 1 20-30 jar rim/neck 1 UV T3 Je
402 17 24 0 0 0 0 0 0 0 0 0 0 0 Tatuba TU 1 20-30 jar neck 1 UV T3
403 17 24 0 0 0 0 0 0 0 0 0 0 0 Tatuba TU 1 20-30 jar neck 1 UV T3
404 17 24 27 30 50 0 0 0 70 0.67 1.7 109 18 Tatuba TU 1 20-30 jar rim 2 UV T3 Jf
405 17 24 27 30 39 0 0 0 30 0.49 3.1 112 18 Tatuba TU 1 20-30 jar rim/neck 1 UV T3 Ja
406 17 24 0 0 0 0 0 0 0 0 0 0 0 Tatuba TU 1 20-30 jar neck 1 UV T3
407 17 24 0 0 0 0 0 0 0 0 0 0 0 Tatuba TU 1 20-30 jar neck 1 UV T3
408 17 24 0 0 0 0 0 0 0 0 0 0 0 Tatuba TU 1 20-30 jar neck 1 UV T3
409 17 24 0 0 0 0 0 0 0 0 0 0 0 Tatuba TU 1 20-30 jar neck 1 UV T3
410 17 24 0 0 0 0 0 0 0 0 0 0 0 Tatuba TU 1 20-30 jar neck 1 UV T3
411 17 24 27 30 50 0 0 0 37 0.7 1.8 108 18 Tatuba TU 1 20-30 jar rim 1 UV T3 Jf
412 17 24 0 0 0 0 0 0 0 0 0 0 0 Tatuba TU 1 20-30 jar neck 1 UV T3
413 17 24 0 0 0 0 0 90 0 0 0 0 0 Tatuba TU 1 20-30 jar neck 1 UV T3
414 17 24 0 0 0 0 0 0 0 0 0 0 0 Tatuba TU 1 20-30 jar neck 1 UV T3
415 17 24 0 0 0 0 0 0 0 0 0 0 0 Tatuba TU 1 20-30 jar neck 2 UV T3
416 17 24 26 30 39 0 0 0 0 0.5 0 0 0 Tatuba TU 1 020-30 bowl rim 1 UV T3 Bb
417 0 0 0 0 0 0 0 0 0 0 0 0 0 Tatuba TU 1 20-30 Unk. body 2 UV T3
418 0 0 0 0 0 0 0 66 0 0 0 0 0 Tatuba TU 1 30-40 Unk. body 3 UV T3
440

441
Table C.3. (Continued) Attribute data for ceramic rims recovered from the Sigatoka Valley excavations.
Vess. Rim Rim- Rim Rim Lip Lip Rim Bod Rim Rim Rim Neck Orif. Site Excav. Depth Vessel Portion Temp. Reg. Per. Vess.
No. Orit. Bod. Cse. Prof. Shp Dec. Dec. Dec. Orit. Thik. Ht. Incl. Diam. Name Unit (cmbs) Form Gp. Type
Cont. Ang. Ang.
419 0 0 0 0 0 0 0 106 0 0 0 0 0 Tatuba TU 1 30-40 Unk. body 3 UV T3
420 0 0 0 0 0 0 0 66 0 0 0 0 0 Tatuba TU 1 30-40 Unk. body 1 UV T3
421 0 0 0 0 0 0 0 65 0 0 0 0 0 Tatuba TU 1 30-40 Unk. body 1 UV T3
422 0 0 0 0 0 0 0 90 0 0 0 0 0 Tatuba TU 1 30-40 Unk. body 1 UV T3
423 0 0 0 0 0 0 0 65 0 0 0 0 0 Tatuba TU 1 30-40 Unk. body 1 UV T3
424 0 0 0 0 0 0 0 108 0 0 0 0 0 Tatuba TU 1 30-40 Unk. body 1 UV T3
425 0 0 0 0 0 0 0 65 0 0 0 0 0 Tatuba TU 1 30-40 Unk. body 1 UV T3
426 0 0 0 0 0 0 0 0 0 0 0 0 0 Tatuba TU 1 30-40 Unk. body 1 UV T3
427 0 0 0 0 0 0 0 64 0 0 0 0 0 Tatuba TU 1 30-40 Unk. body 2 UV T3
428 0 0 0 0 0 0 0 65 0 0 0 0 0 Tatuba TU 1 30-40 Unk. body 1 UV T3
429 17 24 0 0 0 0 0 0 0 0 0 0 0 Tatuba TU 1 30-40 jar neck 3 UV T3
430 17 24 0 0 0 0 0 0 0 0 0 0 0 Tatuba TU 1 30-40 jar neck 2 UV T3
431 17 24 0 0 0 0 0 0 0 0 0 0 0 Tatuba TU 1 30-40 jar neck 1 UV T3
432 0 0 0 0 0 0 0 0 0 0 0 0 0 Tatuba TU 1 30-40 Unk. body 1 UV T3
433 17 23 26 30 39 0 0 0 0 0.58 0 0 0 Tatuba TU 1 030-40 bowl rim 1 UV T3 Bb
434 17 24 0 0 0 0 0 0 0 0 0 0 0 Tatuba TU 1 30-40 jar neck 1 UV T3
435 17 24 0 0 0 0 0 0 0 0 0 0 0 Tatuba TU 1 30-40 jar neck 1 UV T3
436 0 0 0 0 0 0 0 107 0 0 0 0 0 Tatuba TU 1 30-40 Unk. body 1 UV T3
437 17 24 27 0 0 0 0 0 0 0 0 0 0 Tatuba TU 1 40-50 jar neck 1 UV T3
438 17 24 0 0 0 0 0 108 0 0 0 0 0 Tatuba TU 1 40-50 jar neck 1 UV T3
439 17 24 0 0 0 0 0 0 0 0 0 0 0 Tatuba TU 1 40-50 jar neck 1 UV T3
440 17 24 0 0 0 0 0 0 0 0 0 0 0 Tatuba TU 1 40-50 jar neck 1 UV T3
441

442
Table C.3. (Continued) Attribute data for ceramic rims recovered from the Sigatoka Valley excavations.
Vess. Rim Rim- Rim Rim Lip Lip Rim Bod Rim Rim Rim Neck Orif. Site Excav. Depth Vessel Portion Temp. Reg. Per. Vess.
No. Orit. Bod. Cse. Prof. Shp Dec. Dec. Dec. Orit. Thik. Ht. Incl. Diam. Name Unit (cmbs) Form Gp. Type
Cont. Ang. Ang.
441 0 0 0 0 0 0 0 90 0 0 0 0 0 Tatuba TU 1 40-50 Unk. body 2 UV T3
442 0 0 0 0 0 0 0 65 0 0 0 0 0 Tatuba TU 1 40-50 Unk. body 2 UV T3
443 0 0 0 0 0 0 0 65 0 0 0 0 0 Tatuba TU 1 40-50 Unk. body 2 UV T3
444 0 0 0 0 0 0 0 64 0 0 0 0 0 Tatuba TU 1 50-60 Unk. body 1 UV T2
445 0 0 0 0 0 0 0 64 0 0 0 0 0 Tatuba TU 1 50-60 Unk. body 1 UV T2
446 0 0 0 0 0 0 0 107 0 0 0 0 0 Tatuba TU 1 50-60 Unk. body 1 UV T2
447 0 0 0 0 0 0 0 0 0 0 0 0 0 Tatuba TU 1 50-60 Unk. body 1 UV T2
448 17 24 0 0 0 0 0 0 0 0 0 0 0 Tatuba TU 1 60-70 jar neck 1 UV T2
449 0 0 0 0 0 0 0 64 0 0 0 0 0 Tatuba TU 1 60-70 Unk. body 1 UV T2
450 0 0 0 0 0 0 0 64 0 0 0 0 0 Tatuba TU 1 60-70 Unk. body 1 UV T2
451 0 0 0 0 0 0 0 64 0 0 0 0 0 Tatuba TU 1 60-70 Unk. body 1 UV T2
452 0 0 0 0 0 0 0 64 0 0 0 0 0 Tatuba TU 1 60-70 Unk. body 1 UV T2
453 0 0 0 0 0 0 0 90 0 0 0 0 0 Tatuba TU 1 60-70 Unk. body 1 UV T2
454 0 0 0 0 0 0 0 64 0 0 0 0 0 Tatuba TU 1 60-70 Unk. body 1 UV T2
455 0 0 0 0 0 0 0 64 0 0 0 0 0 Tatuba TU 1 60-70 Unk. body 1 UV T2
456 17 24 27 30 39 0 0 0 27 0.39 3.2 124 24 Tatuba TU 1 70-80 jar rim 1 UV T1 Ja
457 0 0 0 0 0 0 0 90 0 0 0 0 0 Tatuba TU 1 70-80 Unk. body 1 UV T1
458 0 0 0 0 0 0 0 65 0 0 0 0 0 Tatuba TU 1 70-80 Unk. body 7 UV T1
459 0 0 0 0 0 0 0 65 0 0 0 0 0 Tatuba TU 1 70-80 Unk. body 7 UV T1
460 0 0 0 0 0 0 0 64 0 0 0 0 0 Tatuba TU 1 70-80 Unk. body 1 UV T1
461 0 0 0 0 0 0 0 65 0 0 0 0 0 Tatuba TU 1 80-90 Unk. body 1 UV T1
462 0 0 0 0 0 0 0 64 0 0 0 0 0 Tatuba TU 1 80-90 Unk. body 1 UV T1
442

443
Table C.3. (Continued) Attribute data for ceramic rims recovered from the Sigatoka Valley excavations.
Vess. Rim Rim- Rim Rim Lip Lip Rim Bod Rim Rim Rim Neck Orif. Site Excav. Depth Vessel Portion Temp. Reg. Per. Vess.
No. Orit. Bod. Cse. Prof. Shp Dec. Dec. Dec. Orit. Thik. Ht. Incl. Diam. Name Unit (cmbs) Form Gp. Type
Cont. Ang. Ang.
463 0 0 0 0 0 0 0 64 0 0 0 0 0 Tatuba TU 1 80-90 Unk. body 1 UV T1
464 0 0 0 0 0 0 0 65 0 0 0 0 0 Tatuba TU 1 80-90 Unk. body 2 UV T1
465 17 23 26 31 39 0 0 0 0 0.61 0 0 20
Tatuba TU 1
090-
100 bowl rim 1 UV T1 Ba
466 0 0 0 0 0 0 0 64 0 0 0 0 0 Tatuba TU 1 90-100 Unk. body 1 UV T1
467 0 0 0 0 0 0 0 64 0 0 0 0 0 Tatuba TU 1 90-100 Unk. body 1 UV T1
468 0 0 0 0 0 0 0 0 0 0 0 0 0 Tatuba TU 1 90-100 Unk. body 1 UV T1
469 0 0 0 0 0 0 0 64 0 0 0 0 0 Tatuba TU 1 90-100 Unk. body 1 UV T1
470
0 0 0 0 0 0 0 65 0 0 0 0 0
Tatuba TU 1
100-
110
Unk. body 2 UV T1
471 0 0 0 0 0 0 0 107 0 0 0 0 0
Tatuba TU 1
100-
110
Unk. body 1 UV T1
472 17 24 0 0 0 0 0 0 0 0 0 0 0
Tatuba TU 1
100-
110 jar neck 1 UV T1
473 17 24 26 30 39 0 0 0 24 0.55 3.1 118 22
Tatuba TU 1
110-
120 jar rim 1 UV T1 Jb
474 17 0 26 26 39 0 0 0 0 0.5 0 0 0
Tatuba TU 1
110-
120 Unk. rim 1 UV T1
475 17 23 26 30 39 0 0 0 0 0.85 0 0 20
Tatuba TU 1
110-
120 bowl rim 2 UV T1 Bb
476 17 24 0 0 50 0 0 0 0 0.62 0 0 0
Tatuba TU 1
110-
120
Unk. rim 1 UV T1
477 0 0 0 0 0 0 0 65 0 0 0 0 0
Tatuba TU 1
110-
120
Unk. body 1 UV T1
443

444
Table C.3. (Continued) Attribute data for ceramic rims recovered from the Sigatoka Valley excavations.
Vess. Rim Rim- Rim Rim Lip Lip Rim Bod Rim Rim Rim Neck Orif. Site Excav. Depth Vessel Portion Temp. Reg. Per. Vess.
No. Orit. Bod. Cse. Prof. Shp Dec. Dec. Dec. Orit. Thik. Ht. Incl. Diam. Name Unit (cmbs) Form Gp. Type
Cont. Ang. Ang.
478 0 0 0 0 0 0 0 65 0 0 0 0 0
Tatuba TU 1
110-
120
Unk. body 1 UV T1
479 0 0 0 0 0 0 0 65 0 0 0 0 0
Tatuba TU 1
110-
120
Unk. body 2 UV T1
480 0 0 0 0 0 0 0 0 0 0 0 0 0
Tatuba TU 1
110-
120
Unk. neck 1 UV T1
481 0 0 0 0 0 0 0 0 0 0 0 0 0
Tatuba TU 1
110-
120
Unk. neck 2 UV T1
482 0 0 0 0 0 0 0 64 0 0 0 0 0
Tatuba TU 1
110-
120
Unk. body 1 UV T1
483
0 0 0 0 0 0 0 65 0 0 0 0 0
Tatuba TU 1
110-
120
Unk. body 1 UV T1
484 0 0 0 0 0 0 0 65 0 0 0 0 0
Tatuba TU 1
110-
120
Unk. body 1 UV T1
485 17 24 0 0 0 0 0 0 0 0 0 0 0
Tatuba TU 1
110-
120 jar neck 1 UV T1
486 0 0 0 0 0 0 0 66 0 0 0 0 0
Tatuba TU 1
110-
120
Unk. body 1 UV T1
487 0 0 0 0 0 0 0 64 0 0 0 0 0
Tatuba TU 1
110-
120
Unk. body 1 UV T1
488 0 0 0 0 0 0 0 65 0 0 0 0 0
Tatuba TU 1
110-
120
Unk. body 2 UV T1
489 17 24 27 30 40 0 0 0 42 0.42 3.2 97 0
Tatuba TU 1
120-
130 jar rim 7 UV T1 Ja
444

445
Table C.3. (Continued) Attribute data for ceramic rims recovered from the Sigatoka Valley excavations.
Vess. Rim Rim- Rim Rim Lip Lip Rim Bod Rim Rim Rim Neck Orif. Site Excav. Depth Vessel Portion Temp. Reg. Per. Vess.
No. Orit. Bod. Cse. Prof. Shp Dec. Dec. Dec. Orit. Thik. Ht. Incl. Diam. Name Unit (cmbs) Form Gp. Type
Cont. Ang. Ang.
490 17 24 0 0 0 0 0 0 0 0 0 0 0
Tatuba TU 1
130-
140 jar neck 1 UV T1
491 17 23 26 30 39 0 0 0 0 0.82 0 0 0
Tatuba TU 1
130-
140 bowl rim 2 UV T1 Bb
492 0 0 0 0 0 0 0 65 0 0 0 0 0
Tatuba TU 1
130-
140
Unk. body 1 UV T1
493 0 0 0 0 0 0 0 65 0 0 0 0 0
Tatuba TU 1
130-
140
Unk. body 1 UV T1
494 17 24 0 0 0 0 0 0 0 0 0 0 0
Tatuba TU 1
140-
150 jar neck 1 UV T1
495
17 24 0 0 50 0 0 0 0 0 0 0 0
Tatuba TU 1
140-
150 jar rim 1 UV T1
496 0 0 0 0 0 0 0 64 0 0 0 0 0
Tatuba TU 1
140-
150 Unk. body 1 UV T1
497 0 0 0 0 0 0 0 64 0 0 0 0 0
Tatuba TU 1
140-
150
Unk. body 1 UV T1
498 0 0 0 0 0 0 0 64 0 0 0 0 0
Tatuba TU 1
150-
160
Unk. body 1 UV T1
499 17 24 0 0 0 0 0 0 0 0 0 0 0 Malua TU 1 10-20 jar neck 3 UV T4
500 0 0 0 0 0 0 0 86 0 0 0 0 0 Malua TU 1 10-20 Unk. body 5 UV T4
501 17 24 27 30 50 0 0 0 42 0.51 1.9 108 30 Malua TU 1 10-20 jar rim 1 UV T4 Jf
502 17 24 0 0 0 0 0 0 0 0 0 0 0 Malua TU 1 30-40 jar neck 1 UV T4
503 0 0 0 0 0 0 0 108 0 0 0 0 0 Malua TU 2 10-20 Unk. body 2 UV T3
504 17 24 0 0 0 0 0 0 0 0 0 0 0 Malua TU 2 0-10 jar neck 1 UV T4
445

446
Table C.3. (Continued) Attribute data for ceramic rims recovered from the Sigatoka Valley excavations.
Vess. Rim Rim- Rim Rim Lip Lip Rim Bod Rim Rim Rim Neck Orif. Site Excav. Depth Vessel Portion Temp. Reg. Per. Vess.
No. Orit. Bod. Cse. Prof. Shp Dec. Dec. Dec. Orit. Thik. Ht. Incl. Diam. Name Unit (cmbs) Form Gp. Type
Cont. Ang. Ang.
505 17 23 26 30 39 0 0 0 0 0.66 0 0 30 Malua TU 2 0-10 bowl rim 1 UV T4 Bb
506 0 0 0 0 0 0 0 66 0 0 0 0 0 Malua TU 2 0-10 Unk. body 1 UV T4
507 17 24 29 35 39 0 0 0 30 0.6 3.2 102 20 Malua TU 2 10-20 jar rim 2 UV T3 Jd
508 0 0 0 0 0 0 0 0 0 0 0 0 0 Malua TU 2 10-20 Unk. neck 1 UV T3
509 17 24 0 0 0 0 0 0 0 0 0 0 0 Nadroga TU 1 0-10 jar neck 1 UV T4
510 0 0 0 0 0 0 0 66 0 0 0 0 0 Nadroga TU 1 10-20 Unk. body 3 UV T4
511 17 24 27 30 39 0 0 0 31 0.8 2.6 95 48 Nadroga TU 1 30-40 jar rim 2 UV T4 Ja
512 17 24 0 0 0 0 0 0 0 0 0 0 0 Nadroga TU 1 50-60 jar neck 1 UV T4
446

447
Vessel Illustrations: Bowls
Bowl # 4, Korokune, TU 2, 0-10 cmbs
Temper Class: 1
Bowl # 5, Korokune, TU2, 0-10 cmbs
Temper Class: 1
Bowl # 9, Korokune, TU2, 10-20 cmbs
Temper Class: 6
Bowl # 10, Korokune, TU2, 10-20 cmbs
Temper Class: 3
Bowl # 11, Korokune, TU2, 10-20 cmbs
Temper Class: 1
Bowl # 14, Korokune, TU2, 50-80 cmbs
Temper Class: 1

448
Bowl # 17, Bātiri, TU1, 0-20 cmbs
Temper Class: 1
Bowl # 22, Bātiri, TU1, 0-20 cmbs
Temper Class: 1
Bowl # 23, Bātiri, TU1, 0-20 cmbs
Temper Class: 2
Bowl # 25, Bātiri, TU1, 0-20 cmbs
Temper Class: 1
Bowl # 26, Bātiri, TU1, 0-20 cmbs
Temper Class: 1
Bowl # 37, Bātiri, TU1, 20-30 cmbs
Temper Class: 2

449
Bowl # 54, Nokonoko, TU1, 20-30 cmbs
Temper Class: 1
Bowl # 55, Nokonoko, TU1, 20-30 cmbs
Temper Class: 1
Bowl # 77, Nokonoko, TU 6, 10-20 cmbs
Temper Class: 1
Bowl # 95, Nokonoko, TU 7, 20-30 cmbs
Temper Class: 2
Bowl # 101, Nokonoko, TU 7, 30-40 cmbs
Temper Class: 4
Bowl # 107, Nokonoko, TU 9, 10-20 cmbs
Temper Class: 1
Bowl # 118, Nokonoko, TU 10, 0-10 cmbs
Temper Class: 1

450
Bowl # 134, Korovatuma, surface of south slope
Temper Class: 1
Bowl # 122, Korovatuma, TU 1, 20-30 cmbs
Temper Class: 2
Bowl # 137, Bukusia, TU1, 10-20 cmbs
Temper Class: 1
Bowl #146, Bukusia, TU2, 60-70 cmbs
Temper Class: 2
Bowl # 159, Qoroqorovakatini, TU1, 0-10 cmbs
Temper Class: 5
Bowl # 174, Qoroqorovakatini, TU1, 20-30 cmbs
Temper Class: 1

451
Bowl # 204, Qoroqorovakatini, TU2, 10-20 cmbs
Temper Class: 1
Bowl # 205, Qoroqorovakatini, TU2, 10-20 cmbs
Temper Class: 1
Bowl # 208, Qoroqorovakatini, TU2, 60-70 cmbs
Temper Class: 1
Bowl # 216, Qoroqorovakatini, TU 4, 40-50 cmbs
Temper Class: 3
Bowl # 226, Vitogo, TU 1, 0-10 cmbs
Temper Class: 1
Bowl # 227, Vitogo, TU 1, 10-20 cmbs
Temper Class: 2
Bowl # 229, Vitogo, TU 1, 10-20 cmbs
Temper Class: 1

452
Bowl # 236, Vitogo, TU 1, 30-40 cmbs
Temper Class: 3
Bowl # 244, Vitogo, TU 2, 10-20 cmbs
Temper Class: 1
Bowl # 245, Vitogo, TU 2, 10-20 cmbs
Temper Class: 1
Bowl # 264, Tatuba Cave, TU1, 0-10 cmbs
Temper Class: 1
Bowl # 266, Tatuba Cave, TU1, 0-10 cmbs
Temper Class: 3
Bowl # 272, Tatuba Cave, TU1, 0-10 cmbs
Temper Class: 1

453
Bowl # 275, Tatuba Cave, TU1, 0-10 cmbs
Temper Class: 1
Bowl # 277, Tatuba Cave, TU1, 0-10 cmbs
Temper Class: 1
Bowl # 281, Tatuba Cave, TU1, 0-10 cmbs
Temper Class: 1
Bowl # 417, Tatuba Cave, TU1, 20-30 cmbs
Temper Class: 2
Bowl # 433, Tatuba Cave, TU1, 30-40 cmbs
Temper Class: 1
Bowl # 465, Tatuba Cave, TU1, 90-100 cmbs
Temper Class:1

454
Bowl # 475, Tatuba Cave, TU1, 110-120 cmbs
Temper Class: 2
Bowl # 491, Tatuba Cave, TU1, 130-140 cmbs
Temper Class: 2
Bowl # 505, Malua, TU2, 0-10 cmbs
Temper Class: 1
Bowl # 509, Nadrogā, TU1, 0-10 cmbs
Temper Class: 1

455
Vessel Illustrations: Jars
Jar # 3, Korokune, TU 1, 10-20 cmbs
Temper Class: 6
.
Jar # 6, Korokune, TU2, 10-20 cmbs
Temper Class: 2
Jar # 8, Korokune, TU2, 10-20 cmbs
Temper Class: 1
Jar # 24, Bātiri, TU1, 0-20 cmbs
Temper Class: 1
Jar # 32, Bātiri, TU1, 20-30 cmbs
Temper Class: 4

456
Jar # 33, Bātiri, TU1, 20-30 cmbs
Temper Class: 1
Jar # 39, Bātiri, TU1, 20-30 cmbs
Temper Class: 4
Jar # 41, Bātiri, TU1, 20-30 cmbs
Temper Class: 1
Jar # 47, Bātiri, TU1, Feature 1
Temper Class: 2
Jar # 48, Bātiri, TU1, Feature 1
Temper Class: 3
Jar # 53, Bātiri, TU1, 50-60 cmbs
Temper Class: 4

457
Jar # 76, Nokonoko, TU 6, 10-20 cmbs
Temper Class: 1
Jar # 78, Nokonoko, TU 6, 10-20 cmbs
Temper Class: 1
Jar # 79, Nokonoko, TU 6, 10-20 cmbs
Temper Class: 9
Jar # 80, Nokonoko, TU 6, 20-30 cmbs
Temper Class: 1
Jar # 82, Nokonoko, TU6, 30-40 cmbs
Temper Class: 2
Jar # 83, Nokonoko, TU 6, 30-40 cmbs
Temper Class: 2
Jar # 84, Nokonoko, TU 6, 30-40 cmbs
Temper Class: 1

458
Jar # 85, Nokonoko, TU 6, 30-40 cmbs
Temper Class: 2
Jar # 92, Nokonoko, TU 7, 10-20 cmbs
Temper Class: 2
Jar # 96, Nokonoko, TU 7, 20-30 cmbs
Temper Class: 3
Jar # 97, Nokonoko, TU 7, 20-30 cmbs
Temper Class: 1
Jar # 102, Nokonoko, TU7, 30-40 cmbs
Temper Class: 3
Jar # 103, Nokonoko, TU7, 30-40 cmbs
Temper Class: 3
Jar # 104, Nokonoko, TU7, 30-40 cmbs
Temper Class: 3

459
Jar # 105, Nokonoko, TU7, 40-50 cmbs
Temper Class: 1
Jar # 110, Nokonoko, TU 9, 30-40 cmbs
Temper Class: 2
Jar # 109, Nokonoko, TU9, 30-40 cmbs
Temper Class: 1
Jar # 117, Nokonoko, TU 10, 0-10 cmbs
Temper Class: 1
Jar # 119, Korovatuma, TU 1, 0-10 cmbs
Temper Class: 2
Jar # 123, Korovatuma, TU 1, 20-30 cmbs
Temper Class: 2

460
Jar #144, Bukusia, TU2, 50-60 cmbs
Temper Class: 2
Jar #149, Bukusia, TU2, 60-70 cmbs
Temper Class: 1
Jar #154, Bukusia, TU2, 80-90 cmbs
Temper Class 1
Jar # 160, Qoroqorovakatini, TU1, 0-10 cmbs
Temper Class: 1
Jar # 173, Qoroqorovakatini, TU1, 20-30 cmbs
Temper Class 1
Jar # 203, Qoroqorovakatini, TU2, 10-20 cmbs
Temper Class: 1

461
Jar # 206, Qoroqorovakatini, TU2, 10-20 cmbs
Temper Class: 1
Jar # 207, Qoroqorovakatini, TU2, 60-70 cmbs
Temper Class: 1
Jar # 230, Vitogo, TU1, 20-30 cmbs
Temper Class: 1
Jar # 233, Vitogo, TU 1, 20-30 cmbs
Temper Class: 1
Jar # 238, Vitogo, TU 1, 50-60 cmbs
Temper Class: 1
Jar # 263, Tatuba Cave, TU1, 0-10 cmbs
Temper Class: 3
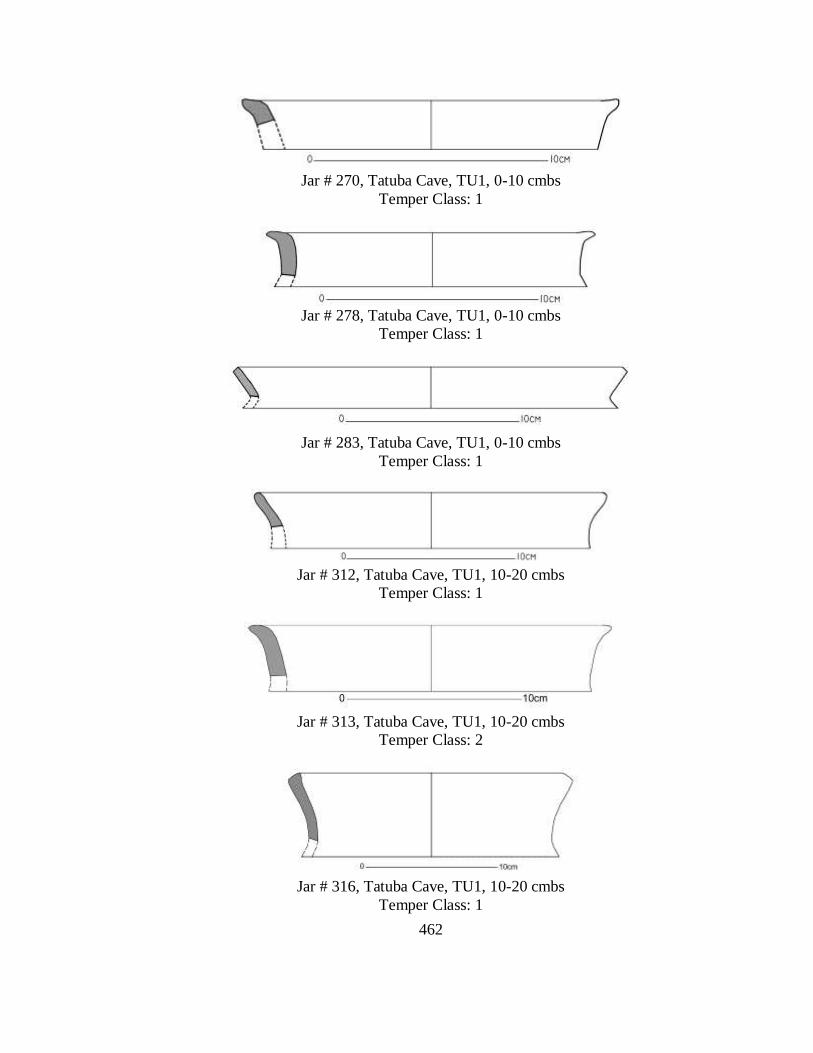
462
Jar # 270, Tatuba Cave, TU1, 0-10 cmbs
Temper Class: 1
Jar # 278, Tatuba Cave, TU1, 0-10 cmbs
Temper Class: 1
Jar # 283, Tatuba Cave, TU1, 0-10 cmbs
Temper Class: 1
Jar # 312, Tatuba Cave, TU1, 10-20 cmbs
Temper Class: 1
Jar # 313, Tatuba Cave, TU1, 10-20 cmbs
Temper Class: 2
Jar # 316, Tatuba Cave, TU1, 10-20 cmbs
Temper Class: 1

463
Jar # 317, Tatuba Cave, TU1, 10-20 cmbs
Temper Class: 1
Jar # 318, Tatuba Cave, TU1, 10-20 cmbs
Temper Class: 1
Jar # 326, Tatuba Cave, TU1, 10-20 cmbs
Temper Class: 2
Jar # 331, Tatuba Cave, TU1, 10-20 cmbs
Temper Class: 2
Jar # 342, Tatuba Cave, TU1, 10-20 cmbs
Temper Class: 1
Jar # 343, Tatuba Cave, 10-20 cmbs
Temper Class: 1

464
Jar # 346, Tatuba Cave, 10-20 cmbs
Temper Class: 4
Jar # 379, Tatuba Cave, 20-30 cmbs
Temper Class: 1
Jar # 400, Tatuba Cave, TU 1, 20-30 cmbs
Temper Class: 2
Jar # 401, Tatuba Cave, TU1, 20-30 cmbs
Temper Class: 1

465
Jar # 404, Tatuba Cave, TU1, 20-30 cmbs
Temper Class: 2
Jar # 405, Tatuba Cave, TU1, 20-30 cmbs
Temper Class: 1
Jar # 411, Tatuba Cave, TU1, 20-30 cmbs
Temper Class: 1
Jar # 334, Tatuba Cave, TU 1, Feature 1 (35 cmbs)
Temper Class: 1
Jar # 456, Tatuba Cave, TU1, 70-80 cmbs
Temper Class: 1

466
Jar # 473, Tatuba Cave, TU1, 110-120 cmbs
Temper Class: 1
Jar# 489, Tatuba Cave, TU1, 120-130 cmbs
Temper Class: 7
Jar # 501, Malua, TU1, 0-10 cmbs
Temper Class: 1
Jar # 507, Malua, TU2, 20 cmbs
Temper Class: 2
Jar # 511, Nadrogā, TU1, 30-40 cmbs
Temper Class:2

467
APPENDIX D. ARTIFACTS
Table D.1. List of artifact frequencies by weight and temporal period.
Site Name
Temporal
Period
Artifact
Description Weight
(g)
Korokune T3 ceramic 1496.6
charcoal 654.6
glass 3.8
lithic 3.6
misc. shell 25.9
toto nut shell 6.4
T4 ceramic 291.1
charcoal 14.4
misc. shell 187.1
Batiri T4 ceramic 5203.5
charcoal 56.7
misc. shell 3005.7
toto nut shell 0.1
mammal bone 53.6
bird bone 0.2
Nokonoko T2 ceramic 385.1
charcoal 94
glass 2.9
human bone 128.8
misc. shell 252.3
T4 adze fragment 32.1
ceramic 2056.7
charcoal 424.3
glass 27.6
hammerstone frag. 8.5
human bone 162.4
lithic 27.8
metal 9.9
misc. shell 6025.5
pig tooth 7.6
mammal bone 99.9
Korovatuma T3 ceramic 414.8
charcoal 19.9
fish tooth 0.2
glass 4.4
human tooth 0.5
lithic 14.2
misc. shell 1130.6

468
Table D.1. (Continued) List of artifact frequencies by weight and temporal period.
Site Name
Temporal
Period
Artifact
Description Weight
(g)
mammal bone 0.1
T4 ceramic 145
charcoal 19.8
fish bone 0.1
lithic 21.6
mammal bone 5.8
Bukusia T4 ceramic 858.4
ceramic vessel
charcoal 66.2
core 550
human bone 68
lithic 100.1
misc. shell 785.7
toto nut shell 1.8
mammal bone 112.7
whale teeth
Korohewa T4 ceramic 193.6
charcoal 40.8
misc. shell 6.6
mammal bone 3.1
Qoroqoro. T3 ceramic 329.2
charcoal 28.3
lithic 4.2
misc. shell 1.1
T4 ceramic 1670.9
charcoal 288.9
glass 9.4
lithic 4.5
metal fragments 38.6
metal nails 13.2
misc. shell 33.7
mammal bone 0.5
Vitogo T4 bird bone 1.3
botanic 0.4
ceramic 980.4
charcoal 107.5
glass 1.7
lithic 848.1
metal 6.4

469
Table D.1. (Continued) List of artifact frequencies by weight and temporal period.
Site Name
Temporal
Period
Artifact
Description Weight
(g)
Vitogo T4 misc. shell 3.5
Tatuba Cave T1 ceramic 427.4
charcoal 55.8
human hair 0.8
human bone 16.4
lithic 9.1
matting 1.1
misc. shell 2.4
toto nut shell 25.8
unident. nutshell 0.1
wood fragment 19.1
T2 ceramic 187.5
charcoal 12.7
human bone 0.3
toto nut shell 0.4
T3 bird bone 0.1
ceramic 2182.2
charcoal 95.6
lithic 324.5
misc. shell 17.7
toto nut shell 8.5
T4 ceramic 5960
charcoal 88.7
dog tooth pendant 0.9
glass 6.5
lithic 354.2
misc. shell 99.6
rifle cartridge 11.1
shell armlet 5.9
sling stone 211.5
toto nut shell 112.5
mammal bone 11.3
Malua T3 ceramic 68.3
charcoal 1.3
lithic 19.7
misc. shell 7.4
mammal bone 1.1
T4 ceramic 688.4
charcoal 72
glass 2.3
lithic 134.3

470
Table D.1. (Continued) List of artifact frequencies by weight and temporal period.
Site Name
Temporal
Period
Artifact
Description Weight
(g)
Malua T4 misc. shell 4.2
Nadroga T4 ceramic 507.8
charcoal 9.1
lithic 64.2
Madraya T4 ceramic 16.7
charcoal 8.5
lithic 0.4
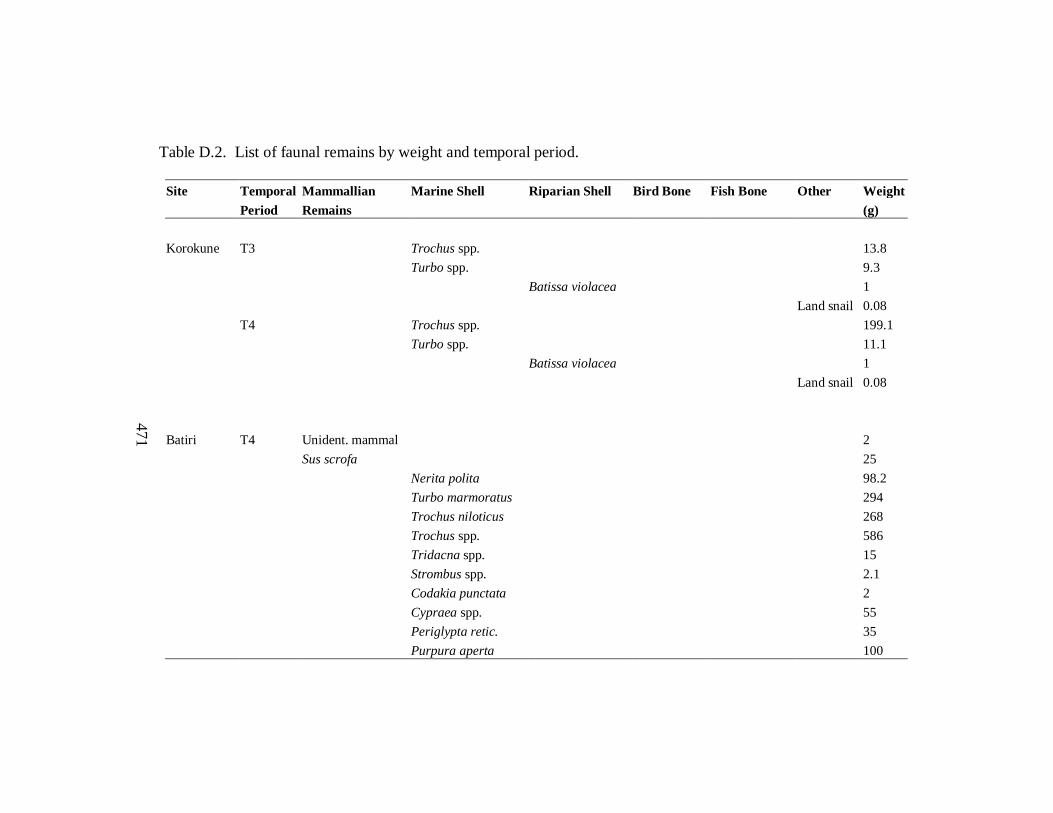
471
Table D.2. List of faunal remains by weight and temporal period.
Site Temporal Mammallian Marine Shell Riparian Shell Bird Bone Fish Bone Other Weight
Period Remains (g)
Korokune T3 Trochus spp. 13.8
Turbo spp. 9.3
Batissa violacea 1
Land snail 0.08
T4 Trochus spp. 199.1
Turbo spp. 11.1
Batissa violacea 1
Land snail 0.08
Batiri T4 Unident. mammal 2
Sus scrofa 25
Nerita polita 98.2
Turbo marmoratus 294
Trochus niloticus 268
Trochus spp. 586
Tridacna spp. 15
Strombus spp. 2.1
Codakia punctata 2
Cypraea spp. 55
Periglypta retic. 35
Purpura aperta 100
471

472
Table D.2. (Continued) List of faunal remains by weight and temporal period.
Site Temporal Mammallian Marine Shell Riparian Shell Bird Bone Fish Bone Other Weight
Period Remains (g)
Batiri T4 Littoraria scabra 0.1
Conus spp. 30.2
Conus bandanus 410
Conus textile 10
Rhinoclavus spp. 3
Pinctada marg. 1
Tellina scobinata 5
Costellaria spp. 3.2
Rock oyster 27
Unidentified mussell 5
Unidentified shell 12.6
Batissa violacea 608.2
Melanoides spp. 34.2
Percoid 1
Serranus spp. 4
Unident. fish 22.1
Nokonoko T2 Batissa violacea 122.6
Melanoides spp. 1
Neritina spp. 1
T4 Sus scrofa (teeth) 21
472

473
Table D.2. (Continued) List of faunal remains by weight and temporal period.
Site Temporal Mammallian Marine Shell Riparian Shell Bird Bone Fish Bone Other Weight
Period Remains (g)
Nokonoko T4 Unident. mammal 26.7
Batissa violacea 6000
Melanoides spp. 19.9
Neritina spp. 1
Pssamobidae 2
Clithon spp. 1
Land snail 4.6
Korovatuma T3 Unident. mammal 1
Sus scrofa (teeth) 0.8
Notopteris
macdonaldii 0.2
Heterocentrotus
mammillatus 0.2
Diadema spp. 0.2
Trochus spp. 1
Turbo spp. 0.2
Batissa violacea 1004.7
Septaria suffreni 1.4
Melanoides spp. 24
Thiara bellicosa 0.2
473

474
Table D.2. (Continued) List of faunal remains by weight and temporal period.
Site Temporal Mammallian Marine Shell Riparian Shell Bird Bone Fish Bone Other Weight
Period Remains (g)
Korovatuma T3 Neritodryas spp.
S. subsulcata 0.2
Septaria
bougainvillei 0.2
Unident. tooth 0.1
T4 Unident. mammal 0.2
Batissa violacea 98.4
Melanoides spp. 0.5
Thiara bellicosa 0.5
Septaria suffreni 0.2
Bukusia
T4 Sus scrofa (teeth) 1
Sus scrofa 31
Unident. mammal 36
Batissa violacea 4362
Melanoides spp. 14
Thiara bellicosa 9
Thiara terpsichore 2
Unidentified 1
Table D.2. (Continued) List of faunal remains by weight and temporal period.
474

475
Site Temporal Mammallian Marine Shell Riparian Shell Bird Bone Fish Bone Other Weight
Period Remains (g)
Korohewa T4 Unident. mammal 3.1
Qoroqoro. T3 Batissa violacea 0.2
T4 Sus scrofa (fibula) 0.5
Batissa violacea 34.7
Tatuba Cave T1 Batissa violacea 1.4
T3 Modiola tulipa 1
Melanoides spp. 3
Batissa violacea 7.8
Melanoides spp. 7
Unident. fish 0.1
T4 Rattus
exulans (mandible) 0.5
Emballonura
semicaudata 0.1
Sus scrofa 3
Unident. mammal 5
Unident. operculum 1
Batissa violacea 70
Melanoides spp. 27.6
Physastra nasuta 1
Unident. bird 0.2
Table D.2. (Continued) List of faunal remains by weight and temporal period.
475

476
Site Temporal Mammallian Marine Shell Riparian Shell Bird Bone Fish Bone Other Weight
Period Remains (g)
Tatuba T4 Unident. fish 0.3
Malua T3 Unident. mammal 0.5
Melanoides spp. 7.2
Unidentified 0.2
Unident. fish 0.6
T4 Batissa violacea 3.2
Melanoides spp. 1
476

477
Table D.3. List of lithic artifacts by weight and temporal period.
Site Temporal Artifact Material Number Weight
Period Description (g)
Korokune T3 adze frag. basalt 1 3.6
Nokonoko T4 adze frag. basalt 5 17
pounder frag. basalt 6 29.7
primary flake unidentified 4 21.7
Korovatuma T3 primary flake chert 1 4.2
secondary flake chert 1 4.1
T4 primary flake unidentified 1 8.5
primary flake basalt 2 4.3
primary flake chert 10 20.3
pounder basalt 1
Bukusia T4 pounder frag. basalt 2 5.1
core chert 1 550
primary flake chert 2 3.7
secondary flake basalt 1 4
secondary flake unidentified 4 3.9
Qoroqoro. T3 retouched flake chert 1 4.2
T4 primary flake unidentified 1 4.5
Vitogo T4 potstand conglomerate 1
ground stone basalt 1 45
primary flake unidentified 2 3.1
Tatuba Cave T1 adze frag. basalt 1 5.2
secondary flake basalt 1 2.1
secondary flake chert 2 2
T3 pounder frags. basalt 2 10
secondary flake basalt 5 6
adze frag. basalt 3 23
primary flake chert 1 2
core chert 1 301
retouched chert 1 2
T4 sling stone basalt 1 211
primary flake basalt 15

478
Table D.3. (Continued) List of lithic artifacts by weight and temporal period.
Site Temporal Artifact Material Number Weight
Period Description (g)
secondary flake chert 13
primary flake chert 52
secondary flake basalt 60
adze frag. chert 14 236
Malua T4 primary flake chert 5 1
secondary flake basalt 11 1
primary flake basalt 5 1.3
secondary flake chert 8 2
adze frag. basalt 6 54
pounder frag basalt 1 78
Nadroga T4 primary flake unidentified 2 28.4
secondary flake unidentified 2 35.8
Madraya T4 secondary flake chert 1 0.4

479
APPENDIX E. HUMAN REMAINS
Human remains were fairly common within the archaeological deposits of the
Sigatoka Valley. Remains consisted of scattered fragments within fill material, and also
discrete burials. The details concerning all human remains encountered during the
excavations are listed at the end of this section in Table E.1.
The Human Remains of Nokonoko
As described in Chapter 6, Test Unit 1 atop the high mound of Nokonoko
contained two discrete burials, and also a large deposit of fill that contained a variety of
human bones. The remains from within the mound fill were redeposited when the mound
was made or re-capped with additional soil, and included rib fragments, cranium
fragments, burned long-bone fragments, several teeth, and also the mental protuberance
(chin) of a child’s mandible. There was also a great deal of fractured bone that was not
unidentifiable, but may have also been human. Several of the long bone fragments had
been burned.
Burial 1 was located within the mound at a depth of 95 cmbs, and consisted of an
infant burial, with the rib cage, spinal column, and several long bones intact and in
anatomical position. The fragments of bone were collected, and upon analysis revealed
to be the remains of a young child, perhaps younger than 2 years of age. The remains
were in good condition, and there was no evidence of burning or cut-marks. Clustered
amongst the remains were several adult phalanges (6 distal phalanges and also a single 3rd
phalanx), and a fragment of a pig tooth. The child’s cranium was absent from the burial,
although it is possible this element did not preserve. The presence of human phalanges

480
amongst the concentration suggests the practice of lolokunimate, in which the relatives of
the deceased amputated all or portions of their fingers as an act of mourning, and buried
the fingers with the remains of their relative (Williams 1860:169).
Burial 2 was encountered at a depth of 104 cmbs. Following the removal of the
contents of Feature 1 and Burial 1, the excavation continued into the deposits between 95
and 105 cmbs. At 104 cmbs, a portion of an articulated human skeleton was encountered
in the eastern portion of the unit (Burial 2). The remains consisted of an adult that had
been positioned on his/ her right side, facing downhill from the mound with his/her legs
extended to the north. The left femur, pelvis, and ribs from the left side of the individual
were clearly visible in the eastern half of Test Unit 1, although they were extremely
fragmented, and in a poor state of preservation. Samples of the femur, pelvis, and ribs
were collected for study. Unfortunately, the fragmented nature of the remains did not
allow for the determination of the sex of the individual. However, the remains were
definitely those of an adult, and the size of the femur suggested a female individual.
Immediately to the west of the remains was a large burned surface, which contained
fragments of burned wood and toto nutshell (Aleurites moluccana), but no ash. This
hearth (Feature 2) appears to have been placed atop the pelvis/lower back area of the
Burial 2, and the remains appear to have been slightly disturbed by the intrusion of this
feature. However, there is no evidence that the remains were burned or altered by the
heat of the fire, which may suggest that the hearth was only used temporarily. Its surface
was roughly 20 x 20 cm in size, and approximately 2 cm thick.

481
Figure E.1. Diagram of the features and burials of Test Unit 1, Nokonoko, between 95
and 105 cmbs.
The Human Remains of Korovatuma
At 55 cmbs within Test Unit 2, the articulated remains of a human burial (Burial
1) were encountered. The remains consisted of a femur, patella, tibia, and fibula,
oriented in a flexed position and from the right side of the body (Figure E.2). The
position of the bones indicate that the individual had been laid upon his/her left side, with
the head laying to the south and beyond the limits of Test Unit 2. The remains were in
fair condition, and appeared to be those of an adult. However, the sex of the individual
could not be determined from the portion of the skeleton that was visible. The material
surrounding the remains was excavated and removed in order to more clearly determine

482
Photo of Burial 1, Test Unit 2, 55 cmbs
Figure E.2. Photo and sketch of Burial 1, from Test Unit 2, Korovatuma. Image shows
extent of left femur, tibia, and fibula, and also estimates position of the rest of the lower
skeleton.

483
the extent of the burial. The sediment immediately surrounding the remains contained 2
lithic fragments, shells of both freshwater clams and snails (Batissa violacea, Melanoides
spp., and Neritodryas subsulcata), 2 unidentified mammal bones, 3 lithic fragments, 2
undecorated ceramic body fragments, and several grams of scattered charcoal. The
artifacts from the sediment surrounding the remains were collected for future analysis,
however the burial was left undisturbed. Cursory examination could not determine the
sex or age of the individual. Most certainly the skeleton was that of an adult, but it could
not be determined if the individual died of injury, illness, or old age. Following
photography and sketching, the remains were left in place and the excavation terminated.
The Human Remains of Bukusia
The remains of a human burial (Burial 1) were encountered between 20 and 30
cmbs in Test Unit 1 of Bukusia. Figure E.3 details the extent of the remains, which
included metacarpals, and fragments of a fractured ulna, radius, and humerus. The
remains were that of an adult that had been laid out his/her back, with the head oriented
to the north. Test Unit 1 appeared to have been located adjacent to the remains, thus only
the individual’s humerus, radius, ulna, and metacarpals were visible in the excavation.
The remains appeared to be those of an adult, however the sex was not determined. The
remains were removed to allow the excavation to continue, and were reburied when the
excavation was terminated.
A second burial (Burial 2) was encountered between 40 and 50 cmbs in Test Unit
1 of Bukusia. This burial contained the articulated remains of an adult that had been laid
atop a scattering of limestone cobbles, with the head oriented to the northeast. Test Unit

484
Figure E.3. View of Burial 1, Test Unit 1, 20 cmbs, Bukusia. Photo and image detail the
position of the fragmented arm bones of an adult.
Figure E.4. View of Burial 2, Test Unit 1, 40 cmbs, Bukusia. Photo and image detail the
position of a fragmented tibia and femur.

485
1 encountered only the lower portion of the individual, uncovering the left tibia, patella,
femur, and portion of the pelvis (the fibula was absent) (Figure E.4). There is a
possibility that the remains of Burial 1 and 2 are from the same individual that had been
disarticulated immediately prior to or after burial. The remains of Burial 2 are also those
of an adult of indeterminate sex.
In addition, a variety of human remains were recovered from the fill of the wall
that was excavated in Test Unit 2. These remains were deposited in the wall during its
construction, thus the fill material must have originated in a cemetery area. Table E.1
lists the identified elements.
The Human Remains of Qoroqorovakatini
An articulated human burial was encountered in TU 4 of Qoroqorovakatini
between 55 and 65 cmbs (Figure E.5). The remains consisted of an adult that was laid
out on his/her back, with the head oriented to the south. The excavation uncovered the
bones of the left arm and hand, and also the vertebrae of the spine, a portion of the pelvis,
and the upper portion of the femur. The burial was uncovered for sketching and
photography, and then the remains were carefully removed in order to continue
excavating in the sediments below the remains. The remains appeared to be those of an
adult male, and they were in good condition. No signs of injury or alteration to the
skeleton were evident. All the bones and fragments were reburied in the bottom of TU 4
following the termination of the excavation at the site.

486
Photo of Burial 1, TU 4, 60 cmbs
Figure E.5. Photo and sketch of Burial 1, Test Unit 4, Qoroqorovakatini. Remains
included the lower arm and hand, portions of the lower vertebrae, and left pelvis and
femur.

487
The Human Remains of Tatuba Cave
Fragments of human bone, hair, and fiber mat were recovered from Layer IX at a
depth of 60-150 cmbs. The fragments of long bones and crania were reburied at the site,
although single cranium fragments, and fragments of mat and hair, were collected for
analysis. Preliminary analyses indicated that the remains consisted of a single adult of
undetermined sex. The fragments of fiber mat had adhered to the shaft of the femur,
which suggests that the individual had been wrapped within a mat prior to burial (Figure
E.6).
The single fragment of human cranium was submitted for AMS dating sample
AA50293. The resulting date indicates that the death of this individual occurred at 339 ±
40 BP. After calibration, this date indicates that the burial and subsequent disturbance of
the deposits occurred between Cal AD 1450 and 1650.
Figure E.6. Human remains from 60-70 cmbs. Long bone fragment is encrusted with a
fiber mat.

488
Table E.1. List of human remains from the Sigatoka Valley excavations.
Site Unit Layer Level Depth Number of Elements Age Sex
(cmbs)
Nokonoko TU 1 I 1 0-20 1 rib fragment adult unknown
2 crania fragments adult unknown
I 2 20-33 4 crania fragments adult unknown
4 long bone fragments adult unknown
I 3 33-44 1 rib fragment adult unknown
1 molar adult unknown
1 crania fragment adult unknown
5 rib fragments adult unknown
I 5 54-62 1 mandible fragment child 1-3 years unknown
2 deciduous incisors child 1-3 years unknown
1 premolar, heavily worn elderly adult unknown
1 molar adult unknown
2 crania fragments adult unknown
I 6 62-74 1 molar (burned) adult unknown
2 premolars adult unknown
4 crania fragments adult unknown
4 metatarsals adult unknown
6 rib fragments adult unknown
I 7 74-84 1 rib fragment adult unknown
1 crania fragment adult unknown
1 mandible fragment adult unknown
1 molar fragment adult unknown
Burial 1 none 84-95 1 crania fragment adult unknown
6 phalanges (4th) adult unknown
1 phalanx (3rd) adult unknown
18 vertebrae child, 1-3 years unknown
42 ribs child, 1-3 years unknown
1 ulna fragment child, 1-3 years unknown
1 clavicle fragment child, 1-3 years unknown
1 tibia fragment child, 1-3 years unknown
2 femur fragments child, 1-3 years unknown
1 fibula fragment child, 1-3 years unknown
120 other small fragments child, 1-3 years unknown
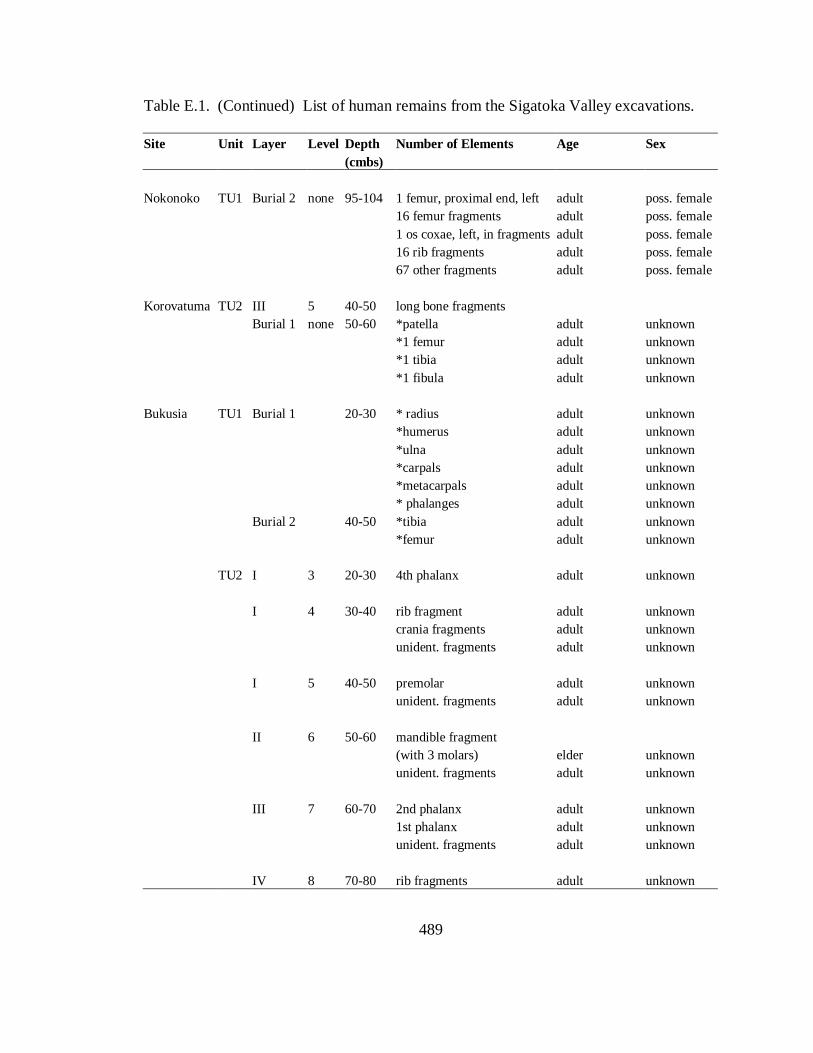
489
Table E.1. (Continued) List of human remains from the Sigatoka Valley excavations.
Site Unit Layer Level Depth Number of Elements Age Sex
(cmbs)
Nokonoko TU1 Burial 2 none 95-104 1 femur, proximal end, left adult poss. female
16 femur fragments adult poss. female
1 os coxae, left, in fragments adult poss. female
16 rib fragments adult poss. female
67 other fragments adult poss. female
Korovatuma TU2 III 5 40-50 long bone fragments
Burial 1 none 50-60 *patella adult unknown
*1 femur adult unknown
*1 tibia adult unknown
*1 fibula adult unknown
Bukusia TU1 Burial 1 20-30 * radius adult unknown
*humerus adult unknown
*ulna adult unknown
*carpals adult unknown
*metacarpals adult unknown
* phalanges adult unknown
Burial 2 40-50 *tibia adult unknown
*femur adult unknown
TU2 I 3 20-30 4th phalanx adult unknown
I 4 30-40 rib fragment adult unknown
crania fragments adult unknown
unident. fragments adult unknown
I 5 40-50 premolar adult unknown
unident. fragments adult unknown
II 6 50-60 mandible fragment
(with 3 molars) elder unknown
unident. fragments adult unknown
III 7 60-70 2nd phalanx adult unknown
1st phalanx adult unknown
unident. fragments adult unknown
IV 8 70-80 rib fragments adult unknown

490
Table E.1. (Continued) List of human remains from the Sigatoka Valley excavations.
Site Unit Layer Level Depth Number of Elements Age Sex
(cmbs)
Bukusia TU2 IV 8 70-80 unident. fragments adult unknown
IV 9 80-90 incisor juvenile unknown
crania fragment adult unknown
ulnae fragment,
(proximal) adult unknown
unident. fragments adult unknown
IV 10 85-94 molar adult unknown
premolar adult unknown
4th phalanx adult unknown
rib fragment
(proximal) adult unknown
crania fragment adult unknown
scapula fragment adult unknown
radius fragment
(distal) adult
unident. fragments adult unknown
IV 11 94-100 2nd phalanx adult unknown
unident. fragments adult unknown
Tatuba Cave TU1 III/IV/IX 7 60-70 *crania fragments adult unknown
*femur fragment adult unknown
70-80 *tibia fragment adult unknown
*crania fragments adult unknown
*clavicle fragment adult unknown
*rib fragment adult unknown
*zygomatic arch fragment adult unknown
hair
IX 9 80-90 *crania fragments adult unknown
hair
IX 10 90-100 *crania fragments adult unknown
hair
*mandible fragments adult unknown
*2 molars adult unknown
*vertebrae adult unknown
*os coxae fragments adult unknown

491
Table E.1. (Continued) List of human remains from the Sigatoka Valley excavations.
Site Unit Layer Level Depth Number of Elements Age Sex
(cmbs)
Tatuba Cave TU1 IX 11 100-110 *crania fragment adult unknown
IX 14 130-140 hair
*crania fragments adult unknown
*vertebrae adult unknown
*Indicates remains that were reburied at the site of origin.

492
APPENDIX F. GEOARCHAEOLOGICAL ANALYSES OF TATUBA CAVE
The complex stratigraphy of Tatuba Cave prompted a series of geoarchaeological
analyses, the goal of which was to determine both the origin of the sediments of the cave,
and also the formation processes involved in the development of Layers I-IX. As Tatuba
is limestone solution cave (i.e., composed of calcium carbonate), and also appears to have
had a long history as a bat and bird roosting area, the chemical makeup of the cave
sediments is particularly complex. This is due to the fact that birds and bats produce
guano, which is essentially the result of chemical weathering on their droppings. In most
cases guano has a very low pH value, and thus should be highly erosive to limestone.
Thus it is expected that in addition to water-erosion, the stratigraphy and bedrock of
Tatuba Cave has been altered by this extreme chemical process.
As was described in Chapter 6, samples for each stratigraphic layer were
classified according to color, ped structure, and also fraction according to a touch test. In
addition, 10 samples from the nine stratigraphic layers were transported to a sediment
laboratory and analyzed in a more technical manner. These analyses included testing for
pH, organic materials (OM) and calcium carbonate (CaCO3) content (loss on ignition
test), and grain-size (flotation with a hydrometer, and also dry nested sieves). These
analyses were performed in order to determine the origin and formation processes that
resulted in each of the stratigraphic layers encountered in the excavation, in particular the
sterile layers VII and VIII. Figure F.1 indicates the location of each sample within the
stratigraphy, and Figures F.2-F.5 indicate the overall trends in chemistry and organic
material in the deposits of Tatuba Cave.

493
Methods
The geoarchaeological analyses of the sediments of Tatuba Cave followed
protocols that are standard for most soil sciences. The grain-size analysis was performed
using a hydrometer and 40 g of each sediment sample (Visher 1969). The samples were
mixed with a peptizing agent and then placed in suspension within a 1000 ml cylinder.
Readings of the hydrometer were then taken at specific intervals, and the results were
used to calculate the fraction of silt and clay sized particles (4ø -16ø) within the sample.
Following these analyses, the sediment was then poured into a 4ø wet sieve, and then
allowed to dry. The remaining fraction was then placed into a set of nested sieves, which
were then shaken to divide the larger sized fractions of sand and pebbles (4ø - -4ø). The
resulting samples were weighed and then compared with the starting weight to determine
the percentage of the sand-sized fraction for the sample.
Organic matter and CaCO3 content were determined using a loss-on-ignition
(LOI) protocol (Dean 1974; Stein 1984). Approximately 20 g of each sample was placed
into a pre-weighed crucible, and then dried for one hour in a drying oven. After a second
weighing, the samples were placed into a muffle furnace at 550° C for 1 hour, and then
allowed to cool in a dessicator. The crucibles were weighed a third time, and the
differences used to determine the percentage of organic matter in the samples. At this
point the samples were put back into the muffle furnace a second hour at 1000 °C. After
cooling and re-weighing, the differences in weights allowed for the calculation of the
percentage of CaCO3 in the samples.

494
Lastly, pH readings were taken for each sample using an Altex pH meter (Deetz
and Dethlefsen 1963). Samples were ground to a powder and then moistened with
distilled water. Three readings were taken for each sample, with distilled water used as a
control.
Layer I (Sample 5100)
Located at 5 cmbs on the south profile. In profile, this layer was approximately 8
cm thick, with an abrupt boundary. It was also mottled with lenses of black charcoal and
white ash. When moist, the color was 10YR 2/3, very dark brown. When dry, the color
was 10 YR 3/2, very dark grayish brown. The touch-test of the sample indicated that
this sediment was sandy loam, and it had a loose and soft consistency when dry, a friable
consistency when moist, and a very plastic, non-sticky consistency when wet. It had a
structureless ped structure, and the grains were single grains, and of very fine size. The
LOI test indicated that 24% of the material in this sample was calcium carbonate, and
20% was organic matter. The pH of the sample was 7.6 (Figures F.2-F.4). Grain size
analyses indicate that Layer I consisted of 78% sand sized fractions, and 21% fine sized
fractions. This was the final occupation layer, and consists of cultural debris and guano.
Layer II (No sample)
This layer appeared to have similar consistencies to Layers I and III. It was a
dark grayish sandy loam, and formed a 5 cm lens across part of the southern profile. It
also extended into the profile as two post-holes.
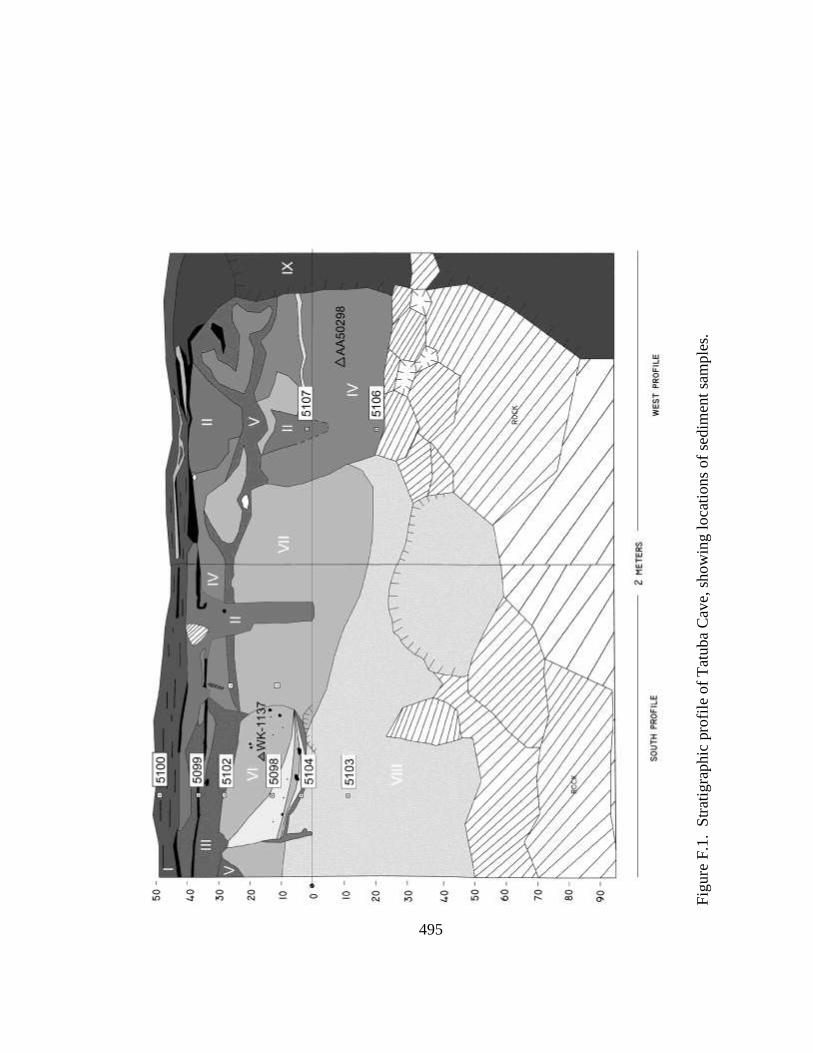
495
Fig
ure
F.1
. S
trat
igra
phic
pro
file
of
Tat
uba
Cav
e, s
how
ing l
oca
tions
of
sedim
ent
sam
ple
s.

496
Figure F.2. Percentage of CaCO3 for the deposits of Tatuba Cave.
Figure F.3. Percentage of organic matter for the deposits of Tatuba Cave.

497
Figure F.4. pH values for the deposits of Tatuba Cave.
Layer III (Samples 5099 and 5102)
The sample was located along a lens of charcoal at base of Layer III, at 15 cmbs
on the south profile. The touch test of the sample indicated it was a sandy loam, and it
had a loose and soft consistency when dry, a friable consistency when moist, and was a
very plastic, non-stick consistency when wet. When dry, the color was 10YR 4/2, dark
grayish brown. When moist, the color was 10YR 3/2, very dark grayish brown. In
profile, the lens and layer had an abrupt boundary, but with a very irregular topography.
The layer above it, Layer II, had several instances of intrusive post-holes that cut through
from a later period. The layer had no mottling, and the grade was weak. The peds were
of fine-very fine size, and of crumb form. Ninety-nine percent of the sediment was

498
smaller than 2 mm. Chemical analyses indicate that 29% of the material in the sample
was calcium carbonate, and 14% was organic matter. The pH of the sample was 7.6.
Grain size analyses indicate that the sample was composed of 65% sand-sized particles,
and 34% fine-sized particles.
Sample 5103 was located on the south profile at 23 cmbs. This sample was also
located within Layer III, but not within the band of charcoal that 5099 was sampling.
19% of the material was calcium carbonate, and was 14% organic matter. The pH of the
sample was 7.5. Color and touch test the same as sample 5099. Grain size analyses
indicate that the sample was 61% sand-sized particles, and 38.7% fine-sized particles.
Layer IV (Samples 5105, 5106, and 5107)
This layer extended as a 10 cm thick layer across the southernmost portion of the
unit, and which thickened to a depth of 60 cm in the northern portion of the unit, where
the gutter formation likely existed below the surface (see discussion of cave formation,
Chapter 5). This layer had a very abrupt lower boundary, which was very smooth except
for where it was cross-cut by intrusive deposits from the layers above it. The results from
the analyses of various samples of this layer at different depths are as follows:
Calcium carbonate:
5105 (25 cmbs): 3%
5107 (48 cmbs): 7.9%
5106 (70 cmbs): 11%

499
Organic matter:
5105 (25 cmbs): 17%
5107 (48 cmbs): 16%
5106 (70 cmbs): 20%
pH:
5105 (25 cmbs): 6
5107 (48 cmbs): 3.4
5106 (70 cmbs): 2.9
Sample no. 5105 is more securely taken from Layer IV. The other samples come from a
more mixed deposit in the west wall.
As with Layers II and III, this deposit was described as being sandy loam, that
had a soft consistency when dry, a moist consistency when moist, and was very plastic
and non-sticky when wet. Its grade was weak, with fine-very fine size peds, and crumb
forms. There was a slight increase in the amount of pebbles, to 5% compared to previous
layers. The layer was also of different color, considered to be 7.5 YR 4/4, brown, when
dry and wet. The results from the grain size analyses are as follows:
Sample 5105: 67% sand-sized fraction, 32% fine-sized fraction
Sample 5107: 67% sand-sized fraction, 32% fine-sized fraction
Sample 5106: 56% sand-sized fraction, 41% fine-sized fraction

500
Layer V (Sample 5104)
This layer lie as a 5 cm lens directly beneath Layer IV, and directly over the
sterile Layer VII in the south profile. This layer also occurs at the base of the hearth
feature in the south profile. This lens had a very abrupt boundary, and smooth
topography. Its grade was moderate-strong, and the peds were fine-medium in size. The
touch test indicated that this deposit had a loamy sand texture, and when dry it was
slightly hard. When moist, it was friable, and when wet, it was slightly plastic. When
dry, the sample was 2.5Y 6/2 in color, or light brownish gray. When moist, the sample
was 7.5YR 5/3 in color, or brown.
The sample that was tested in the laboratory was removed from the base of the
hearth feature. This sample had a calcium carbonate content of 7.8%, and an organic
content of 13%. The pH for this sample was 7. This layer predates the deposition of
layer IV, and lies directly atop the sterile layer VII in the south end of the unit. In the
north end of the unit, this layer appears to mix as a band. Grain size analyses indicate
that the deposit was composed of 64% sand-sized fractions, and 35.8% fine-sized
fractions.
Layer VI (Sample 5098)
This deposit was an ash filled hearth, and the sediment was largely ash that was
very loose when dry and moist, and plastic when wet. The deposit was intrusive into
Layers IV, V, VII, and VIII. The grade of the ash was structureless, and the size of the
peds was predominantly very fine. Chunks of charcoal were common. Chemical

501
analyses indicate that the hearth deposit had a calcium carbonate content of 41%, and an
organic content of 14%. The pH was 7.8. Grain size analyses of the contents of the ash
indicate that 59% of the deposit was a sand-sized fraction, while 40% was a fine-sized
fraction.
Layer VII (Sample 5101)
This was the bright orange basal layer, which was also sterile. This layer existed
only in the southern portion of the unit. The layer was approximately 40 cm thick, and
had an abrupt boundary. The grade was moderate, and the ped-size medium. The pebble
content was 10%. A touch test indicated that this deposit was loamy sand, with a soft
consistency, which was friable when moist and plastic when wet. Its color was 10 YR
6/6, or brownish yellow when dry, and 10 YR 5/6 or yellowish brown when wet.
Chemical analyses indicate this layer had a calcium carbonate content of 2.5%, and an
organic content of 12%. The pH for this deposit was 4. This particular chemical profile
suggests that this sterile deposit was originally a limestone outcrop, which has been
weathered by the acidity of the guano in the cave. The attenuated nature of the
distribution of this deposit suggests that the outcrop had been shaped by water prior to the
chemical weathering that resulted in the orange, sandy deposit that currently resides in
the cave. Grain size analyses indicate that 71.9% of the sample consisted of a sand-sized
fraction, and 20.1% was a fine-sized fraction.

502
Layer VIII (Sample 5103)
This sample is also an eroded limestone of some kind. Its base lie atop limestone
rocks, and its grade was strong, with medium-coarse sized peds that were crumb to
subangular blocky in form. The sediment percentages were 50/50 pebble and gravel.
The touch test of the deposit indicated that this was a loamy sand, that when dry had a
slightly hard consistency, and when moist was friable and firm. When wet, it was
slightly plastic. Its color was 10YR 7/4, or very pale brown when dry and moist.
The chemical profile for this deposit indicates the layer had a calcium carbonate content
of 1.8%, and an organic content of 10%. The pH for this layer was 3.5.
This chemical profile also suggests that this sterile deposit is a chemically weathered
limestone. The grain sizes of the sample indicate that this deposit was 75% sand-sized
particles, and 24% fine-sized particles.
Layer IX (No sample)
This intrusive burial is a mixture of all the sediments except for layer VIII and
possibly layer VII.
Stratigraphic Summary
Geoarchaeological analyses, radiocarbon, and AMS dates suggest that Layers
VIII and VII were the original floor of the cave, and composed of limestone prior to the
cessation of water flow. Water flow likely carved out a narrow channel along the center
of the cave, thus producing the distinctive bench formation of Layers VIII and VII. It is

503
further proposed herein that once Tatuba Cave began to drain through Entrance 2, a layer
of guano began to accumulate upon the floor, filling up the gutter area with Layer IV.
Approximately 2000 years BP, the first human occupations left behind ceramics,
charcoal, and toto nutshells, which were deposited within this layer. Analyses in the
laboratory determined that Layer VIII had an extremely small amount of calcium
carbonate (1.8%), and a very acidic pH level of 3.5. These results suggest that this
deposit was also once limestone, and over the ages the precipitation of acid through the
profile has eroded away the CaCO3. Thus, the sandy conglomerate of Layers VIII and
VII has been a product of weathering over the centuries.
AMS dates indicate that occupations continued in the cave for the next 700 years,
and these remains are subsumed within Layer IV. Other portions of the cave that are not
disturbed by burials may contain a secure stratigraphic sequence of artifacts from Layer
IV. Layer V, which lies directly above it, also contains chemical and physical
characteristics that suggest and extended human occupation. The intrusion of the hearth
feature into the sterile eroded limestone of Layer VII, represents an occupation ca. 1000
BP.
The deposits of Layers III, II, and IX most likely accumulated between AD 1000
and 1300. During this period the intrusive burial within Layer IX was excavated through
Layer IV, and the distinctive post-holes visible in the south and west profiles of Test Unit
were excavated down into Layers IV, V, and VII. Layer I represents the latest prehistoric
period of occupation, from ca. AD 1500 to 1875.

504
NOTES
1 This is a body of oral histories that were collected by the Fiji Native Lands Commission
between 1880 and 1965. The Tukutuku contains information relating to the origins and
migrations of different Fijian yavusa and mataqali, and also records land-claims and
social hierarchies related to chiefly titles.
2 Several Pacific scholars have suggested that the extent of the talasiga-grassland
complex shadows the boundaries of the aboriginal dry tropical forests, which potentially
covered the leeward zones of Pacific Islands prior to human colonization (Cochrane
1969; Hughes et al. 1979; Smith 1979). Although Dickinson et al’s. (1998) study of the
growth of the Sigatoka Dunes provides compelling evidence to support the increase in
deforestation and erosion ca. 1600 BP in Fiji, until extensive palynological studies are
conducted, it will be impossible to know whether or not an aboriginal forest existed, or if
humans were responsible for its extirpation.
3When grown without irrigation, Colocasia esculenta produces corms that are smaller
and tougher in composition. Although they are genetically identical to crops grown
under irrigation, they are morphologically dissimilar. Additional crops were also
included in the prehistoric diet, but were less common. These included sweet potato
(Ipomoea batatas), breadfruit (Artocarpus altilis), coconut (Cocos nucifera), hibiscus leaf
(Hibiscus manihot), and bananas (Musa spp.).
4 Initially, all the habitation sites and single burial mounds, were numbered sequentially
by the digitization process, creating a list of site ID numbers: S000 – S472. In later
phases of analysis some clusters of single mounds were combined and renumbered as a

505
single site. Also, the totals include 12 naga sites, which were identified by Palmer (1971)
but not visible in the aerial photograph survey due to dense forest cover.
5Fourteen other unfortified habitation sites were also encountered in the aerial photo
analysis, but were discarded from the sample due to their late age. These sites are known
from historic documents as the “new villages” that were built following the pacification
of the region by government forces in 1876 (Gordon 1879). Because of this, they are not
viable for additional analysis in this study.
6There are 100 hectares within 1 km
2, but as this study focuses on the proximity of
resources to habitation sites, it is more prudent to measure areas within 1 km radius of
each site locale. Thus, each proximity buffer is 314 hectares in size. Ten percent of the
land within an area of such size is equal to 31.4 hectares.
7 The villages of Koronisagana and Nasautabu had been located along the southern banks
of the river up until the 1970s. Following severe floods, these villages moved to higher
ground across the river.
8Erosion, heavy vegetation, and large scale make the determination of yavu shape from
aerial photographs very difficult. Thus, this research uses data generated by Parry (1987:
115), who was able to examine aerial photographs from the 1950s and 1960s. Multiple
flight runs allowed him to compare shadow, vegetation change, and watermarks for many
sites in the Sigatoka Valley, and thus determine yavu shape. However, even his attempts
were limited, and only 23 sites could be adequately classified.

506
REFERENCES
Agache, R.
1952 Airborne surveyors. Fortune 2:119-150.
Ahlstrom, R. V. N., C. R. Van West, and J. S. Dean
1995 Environmental and Chronological Factors in the Mesa Verde – Northern
Rio Grande Migration. Journal of Anthropological Archaeology 14: 125-142.
Alexander, R. D.
1974 The Evolution of Social Behavior. Annual Review of Ecology and
Systematics 5:325-383.
Anderson, R.
1992 Long-term Changes in the Frequency of Occurrence of El Niño Events. In
El Niño: Historical and Paleoclimatic Aspects of the Southern Oscillation, edited
by H. F. Diaz and V. Markgraf, pp. 193-200. Cambridge University
Press, New York.
Anson, D.
1983 Lapita Pottery of the Bismarck Archipelago and its Affinities. Unpublished
PhD thesis, University of Sydney.
Aswani, S., Graves, M.
1998 The Tongan Maritime Expansion: A Case in the Evolutionary Ecology of
Social Complexity. Asian Perspectives 37, 135-164.
Avery, T. E.; Lyons, T. R.
1977 Remote sensing: Practical Exercises on Remote Sensing in Archaeology 32.
Axelrod, R.
1984 The Evolution of Cooperation. Basic Books, New York.
1997 The Complexity of Cooperation: Agent Based Models of Competition and
Collaboration. Princeton University Press, Princeton N. J.
Babcock, T. F.
1977 A Re-analysis of Pottery from Fortified Sites on Taveuni, Fiji. Archaeology
and Physical Anthropology in Oceania 7:112-134.
Bannister, B. and W. J. Robinson
1974 Tree-Ring Dating in Archaeology. World Archaeology 7(2): 210-25.
Barrau, J.

507
1961 Subsistence Agriculture in Polynesia and Micronesia. Bernice P. Bishop
Museum Publication 219. Bishop Museum Press, Honolulu.
1965 L'humide et le sec: An essay on ethnobiological adaptation to contrastive
Environments in the Indo Pacific area. Journal of the Polynesian Society 74, 329-
46.
Bawden, G. and R. M. Reycraft
2000 Environmental Disaster and the Archaeology of Human Response (editors).
Maxwell Museum of Anthropology, Anthropological Paper No. 7, Albuquerque.
Becker, H.
1990 Combination of Aerial-photography with Groundmagnetics in Digital Image
Processing Technique. In Aerial Photography and Geophysical Prospection in
Archaeology. Proc. 2. Int. Symposium Brussels 2: 25-35.
Bedford, S.
1999 Lapita and Post-Lapita Ceramic Sequences from Erromango, Southern
Vanuatu. In Le Pacifique de 5000 a 2000 avant le present:
Supplements a l’histoire d’une colonization, edited by J.-C. Galipaud and I. Lilley,
pp. 127-137. IRD, Paris.
Belshaw, C.
1964 Under the Ivi Tree: Society and Economic Growth in Rural Fiji. University
of California Press, Los Angeles.
Bellwood, P.
1985 Prehistory of the Indo Malaysian Archipelago. Academic Press, Sydney.
1989 The Colonisation of the Pacific: Some Current Hypotheses. In The
Colonization of the Pacific: A Genetic Trail, edited by A. Hill and S.
Serjeantson, pp. 1-59. Clarendon Press, Oxford.
Bentley, R. A.
2000 Provenance Analysis of Pottery from Fijian Hillforts: Preliminary
Implications for Exchange Within the Archipelago. Archaeology in Oceania 35,
82-91.
Best, S.
1984 Lakeba: The Prehistory of a Fijian Island. Unpublished PhD thesis,
University of Auckland.
1987a A Preliminary Report on the Sigatoka Burials. Domodomo 3, 2-15.
1987b Long Distance Obsidian Travel and Possible Implications for the
Settlement of Fiji. Archaeology in Oceania 22:27-31.
1993 At the Halls of the Mountain Kings. Fijian and Samoan Fortifications:
Comparison and Analysis. Journal of the Polynesian Society 102(4):385-447.

508
2002 Lapita: A View From the East. New Zealand Archaeological Association
Monograph 24. New Zealand Archaeological Association, Auckland.
Birks, L.
1973 Archaeological Excavations at Sigatoka Dune Site, Fiji. Bulletin of the Fiji
Museum No. 1. The Fiji Museum, Suva.
Blasing, T. J., and H. C. Fritts
1976 Reconstructing Past Climatic Anomalies in the North Pacific and Western
North America from Tree-Ring Data. Quaternary Research 6(4): 563-79.
Blinman, E. and C. D. Wilson
1992 Ceramic Production and Exchange in the Northern San Juan Region A.D.
600-900. In Ceramic Production and Distribution: An Integrated Approach,
edited by G. Bey and C. Pool, pp. 155-174. Westview Press, Boulder.
Boone, J. L.
1983 Noble Family Structure and Expansionist Warfare in the Late Middle Ages:
A Socioecological Approach. In Rethinking Human Adaptation: Biological and
Cultural Models, edited by M.A. Little and R. Dyson-Hudson, pp. 79-96.
Westview Press, Boulder.
1992 Competition, Conflict, and the Development of Social Hierarchies. In
Evolutionary Ecology and Human Behavior, edited by E. A. Smith and B.
Winterhalder, pp. 301-337. Aldine de Gruyter, New York.
Bowles, S. and H. Gintis
2003 The Origins of Human Cooperation. In The Genetic and Cultural Origins of
Cooperation, edited by P. Hammerstein, pp. 1-17. MIT Press, Boston.
Boyd, R. and P. J. Richerson
1985 Culture and the Evolutionary Process. The University of Chicago Press,
Chicago.
Brewster, A. B.
1922 The Hill Tribes of Fiji. Seeley Service and Co., London.
Bridgman, H. A.
1983 Could Climate Change Have Had an Influence on the Polynesian Migrations?
Paleaogeography, Palaeoclimatology, Palaeoecology 41, 193-240.
Bronitsky, G.
1986 The Use of Materials Science Techniques in the Study of Pottery Construction
and Use. In Advances in Archaeological Method and Theory, Vol. 9, edited by M.
Schiffer, pp. 206-276. Academic Press, Orlando.
509
Brookfield, H. C.
1972 Intensification and Disintensification in Pacific Agriculture. Pacific
Viewpoint 13, 30-47.
1979 Lakeba: Environmental Change, Population Dynamics and Resource Use.
The UNESCO/UNFPA. Population and Environment Project in the Eastern
Islands of Fiji, Island Reports No. 5. Australian National University Press,
Canberra.
Broughton, J. M.
1994a Late Holocene Resource Intensification in the Sacramento Valley California:
The Vertebrate Evidence. Journal of Archaeological Science 21: 501-514.
1994b Declines in Mammalian Foraging Efficiency during the late Holocene, San
Francisco Bay, California. Journal of Anthropological Archaeology 13: 371-401.
1997 Widening Diet Breadth, Declining Foraging Efficiency, and Prehistoric
Harvest Pressure: Ichthyofaunal Evidence from the Emeryville Shellmound,
California. Antiquity 71: 845-862.
Broughton, J. M and J. O'Connell
1999 On Evolutionary Ecology, Selectionist Archaeology, and Behavioral
Archaeology. American Antiquity 64(1): 153-165.
Brown, J. L.
1964 The Evolution of Diversity in Avian Territorial Systems. Wilson Bulletin
76:160-169.
Burley, D.
1997 Archaeological Research, Sigatoka Dune National Park June 1996.
Unpublished Report. Department of Archaeology, Simon Frasier University.
1999 Lapita Settlement to the East: New Data and Changing Perspectives from
Ha’apai (Tonga) Prehistory. In Le Pacifique de 5000 a 2000 avant le present:
Supplements a l’histoire d’une colonization, edited by J.-C. Galipaud and I. Lilley,
pp. 189-200. IRD, Paris.
Burley, D. and R. Shortland
1999 Report on 1998 Field Work Activities Sigatoka Dunes National Park Viti
Levu, Fiji. Unpublished Report. Department of Archaeology, Simon Frasier
University.
Cameron, C.
1998 Coursed Adobe Architecture, Style, and Social Boundaries in the American
Southwest. In The Archaeology of Social Boundaries, edited by M. Stark, pp. 183-
207. Smithsonian Institution Press, Washington DC.

510
Capell, A.
1991 The Fijian Dictionary. Government Printer, Suva, Fiji.
Capell, A. and R. H. Lester
1941 Local Divisions and Movements in Fiji. Oceania XI-4:313 and XII-1:21-48.
Carneiro, R. L.
1970 A Theory of the Origin of the State. Science 169:733-738.
1972 From Autonomous Village to the State, a Numerical Estimation. In
Population Growth: Anthropological Implications, edited by. B. Spooner, pp. 64-
77. Massachusetts Institute of Technology Press, Cambridge.
1978 Political Expansion as an Expression of the Principle of Competitive
Exclusion. In Origins of the State: The Anthropology of Political Evolution, edited
by R. Cohen and E. R. Service, pp. 205-224. Institute for the Study of Human
Issues, Philadelphia.
1981 Chiefdom: Precursor of the State. In The Transition to Statehood in the New
World, edited by G. Jones and R. Kautz, pp. 37-45. Cambridge University Press,
New York.
1990 Chiefdom-level Warfare as Exemplified in Fiji and the Cauca Valley. In The
Anthropology of War, edited by J. Haas, pp. 190-211. Cambridge University
Press, Cambridge.
Cashdan, E.
1983 Territoriality Among Human Foragers: Ecological Models and an Application
to Four Bushman Groups. Current Anthropology 24:47-66.
1990 Risk and Uncertainty in Tribal and Peasant Economies (editor), Westview
Press, Boulder.
1992 Spatial Organization and Habitat use. In Ecology, Evolution, and Human
Behavior, edited by E.A. Smith and B. Winterhalder, pp. 237-266. Aldine de
Gruyter, New York.
Cavalli-Sforza, L. L. and M. W. Feldman
1981 Cultural Transmission and Evolution: A Quantitative Approach. Princeton
University Press, Princeton N. J.
Caviedes, C. N.
2001 El Niño in History: Storming Through the Ages. University Press of Florida,
Gainsville.
Chagnon, N.
1968 Yanomamo: The Fierce People. Holt, Rinehart, and Winston, New York.
1979 Mate Competition, Favoring Close Kin, and Village Fissioning Among the
Yanomamo Indians. In Evolutionary Biology and Human Social Behavior, edited
by N. Chagnon and W. Irons, pp. 86-132. Duxbury, North Scituate.

511
1990 Reproductive and Somatic Conflicts of Interest in the Genesis of Violence and
Warfare Among Tribesmen. In The Anthropology of War, edited by J. Haas, pp.
77-104. Cambridge University Press, Cambridge.
Chandra, S.
1971 Soils of the Sigatoka Valley. Unpublished report. Soil Survey and Land Use
Section, Dept. of Agriculture, Koroniva, Fiji.
Clark, G. R.
1999a Mid-Sequence Isolation in Fiji 2500-1000 BP. In Indo-Pacific Prehistory:
The Melaka Papers, edited by Bellwood et al., pp. 152-158. Bulletin of the Indo-
Pacific Prehistory Association Number 19.
1999b Post-Lapita Fiji: Cultural Transformation in the Mid-Sequence. Unpublished
PhD thesis, Australian National University, Canberra.
2002 Adzes of Interaction: Samoan Basalt Artifacts in Fiji. In Fifty Years in the
Field: Essays in Honour and Celebration of Richard Shutler Jr’s Archaeological
Career, edited by S. Bedford, C. Sand, and D. Burley, pp. 227-238.
New Zealand Archaeological Association Monograph No. 25. New Zealand
Archaeological Association, Auckland.
Cleland, C. E.
1972 From Sacred to Profane: Style Drift in the Decoration of Jesuit Finger Rings.
American Antiquity 37(2):202-210.
Clunie, F.
1977 Fijian Weapons and Warfare. Bulletin of the Fiji Museum, No. 2. The Fiji
Museum, Suva.
Cochrane, E. and T. Hunt
ms Measuring Ceramic Stylistic Change in the Fiji Islands. Submitted to
Antiquity 2003.
Cochrane, G. R.
1969 Problems of Vegetation Change in Western Viti Levu, Fiji. In Settlement and
Encounter: Geographical Studies presented to Sir Grenfell Price, edited by F. Gale
and G.H. Lawton. Oxford University Press, Melbourne, Australia.
Cohen, N. M.
1977 The Food Crises in Prehistory. Yale University Press, New Haven.
Conklin, H. C.
1963 A Study of Shifting Cultivation. Union Pan-American Studies and
Monographs 6. Union Pan-American, Washington D. C.
512
Cordy, R.
1981 A Study of Prehistoric Social Change: The Development of Complex
Societies in the Hawaiian Islands. Academic Press, New York.
Crosby, A.
1988 Beqa: Archaeology, Structure, and History of Fiji. Unpublished MA thesis,
University of Auckland, Auckland.
Coulter, J., S. Kishore, and P. Kumar
1983 Aspects of the Rainfall and Evaporation Climate in Fiji. Technical Note
21, Fiji Meteorological Service, Suva.
Davidson, J. M.
1977 Western Polynesia and Fiji: Prehistoric Contact, Diffusion, and
Differentiation in Adjacent Archipelagoes. World Archaeology 9(1):82-93.
1978 Western Polynesia and Fiji: The Archaeological Evidence. Mankind
11(3): 383-390.
Davies, J.
1992 Sigatoka Valley Rural Development Scheme: Groundwater for Irrigation.
Mineral Resources Department Hydrogeological Report 3. Ministry of Lands and
Mineral Resources, Suva.
Dean, J. S.
1988 Dendrochronology and Paleoenvironmental Reconstruction on the Colorado
Plateau. In The Anasazi in a Changing Environment, edited by J. Gumerman, pp.
119-167. Cambridge University Press.
1996 Demography, Environment and Subsistence Stress. In Evolving Complexity
and Environmental Risk in the Prehistoric Southwest, edited by J. Tainter, and B.
Tainter, pp. 25-56. Proceedings Vol. XXIV, Santa Fe Institute Studies in the
Sciences of Complexity. Addison-Wesley, Reading.
Dean, J. S., R. C. Euler, G. J. Gumerman, F. Plog, R. Hevly, and T. Karlstrom
1985 Human Behavior, Demography, and Paleoenvironment on the Colorado
Plateaus. American Antiquity 50(3):537-554.
Dean, W.
1974 Determination of Carbonate and Organic Matter in Calcareous Sedimentary
Rocks by Loss-on-Ignition: Comparison with Other Methods. Journal of
Sedimentary Petrology 44:242-248.
Deetz, J. and E. Dethlefsen
1963 Soil pH as a Tool in Archaeological Site Interpretation. American Antiquity
38:242-243.

513
Dewar, R. E.
2003 Rainfall Variability and Subsistence Systems in Southeast Asia and the
Western Pacific. Current Anthropology 44(3):369-388.
Dickinson, W. R.
1971 Petrography of Some Sand Tempers in Prehistoric Pottery from Viti Levu,
Fiji. Records of the Fiji Museum 1(5):108-121.
Dickinson, W. R., D. V. Burley, P. D. Nunn, A. Anderson, G. Hope, A. Biran, C. Burke,
and S. Matararaba
1998 Geomorphic and Archaeological Landscapes of the Sigatoka Dunes Site, Viti
Levu, Fiji: Interdisciplinary Investigations. Asian Perspectives 37(1):1-31.
Divale, W. T.
1971 Warfare in Primitive Societies: A Selected Bibliography. California State
College, Center for the Study of Armament and Disarmament, Los Angeles.
1974 Migration, External Warfare, and Matrilocal Residence. Behavioral Science
Research 9:75-133.
Dunnell, R. C.
1978 Style and Function: A Fundamental Dichotomy. American Antiquity
43:192-202.
Durham, W. H.
1976 Resource Competition and Human Aggression, Part I: A Review of Primitive
War. The Quarterly Review of Biology 51:385-415.
1991 Coevolution: Genes, Culture and Human Diversity. Stanford University
Press, Palo Alto, Ca.
1992 Applications of Evolutionary Culture Theory. Annual Review of
Anthropology 21:331-355.
Dyson-Hudson, R. and E. A. Smith
1979 Human Territoriality: An Ecological Reassessment. American
Anthropologist 80:21-41.
Earle, T.
1991 The Evolution of Chiefdoms. In Chiefdoms, Power, Economy, and Ideology,
edited by T. Earle, pp. 1-15. Cambridge University Press, New York.
Ehrenreich, B.
1997 Blood Rites: Origins and History of the Passions of War. Metropolitan
Books/Harry Holt & Co., NewYork.

514
Ember, C. R., and M. Ember
1992 Resource Unpredictability, Mistrust, and War. Journal of Conflict Resolution
36:242-262.
Enright, N. J. and C. Gosden
1992 Unstable Archipelagoes-- South-West Pacific Environment and Prehistory
Since 30,000 B. P. In The Naive Lands: Prehistory and Environmental Change in
Australia and the South-west Pacific, edited by J. Dodson, pp. 160-198. Longman
Cheshire, Melbourne.
Fagan, B.
2001 The Little Ice Age: How Climate Made History, 1300-1850. Basic Books,
New York.
Ferguson, R. B.
1984 Introduction: Studying War. In Warfare, Culture and Environment, edited by
R. B. Ferguson, pp. 1-81. Academic Press, Orlando.
Ferrill, A.
1997 The Origins of War: From the Stone Age to Alexander the Great. Westview
Press, Boulder, Colorado.
Field, J. S.
1998 Natural and Constructed Defenses in Fijian Fortifications. Asian Perspectives
37: 32-58.
2002 GIS-based Analyses of Agricultural Production and Habitation in the Sigatoka
Valley, Fiji. In Pacific Landscapes: Archaeological Approaches, edited by
T. Ladefoged and M.W. Graves, pp. 97-124. Easter Island Foundation Press, Los
Osos.
2003 Archaeological Excavations in the Sigatoka Valley, 2001-2002. Ms. on
file, Fiji Museum, Suva.
Fiji Meteorological Service
2003 Climate. < http://www.met.gov.fj/climate_fiji.html > (Nov. 2003)
Finney, B.
1985 Anomalous Westerlies, El Niño, and the Colonization of Polynesia.
American Anthropologist 87, 9-27.
Flannery, K. V.
1972 The Cultural Evolution of Civilizations. Annual Review of Ecology and
Systematics 3:399-426.
Forbes, L.

515
1875 Two Years in Fiji. Green, London.
Fox, R.
1967 Kinship and Marriage. Cambridge University Press, Cambridge.
Fox, J. P., A. Wright, I. Baumgart, and I. Twyford
1952 Report on the Soil Resources of Fiji. Government of Fiji Publishers.
Freeman, S.
1986 The Centre-Poled Houses of Western Vitilevu. Domodomo 4, 2-19.
French, C. A. I.
2003 Geoarchaeology in Action: Studies in Soil Micromorphology and Landscape
Evolution. Routledge, New York.
Frost, E. L.
1974 Archaeological Excavations of Fortified Sites on Taveuni, Fiji. Asian and
Pacific Archaeology Series No. 6, University of Hawai‘i Press, Honolulu.
1979 Fiji. In The Prehistory of Polynesia, edited by J. Jennings, pp. 61-81.
Australian National University Press, Canberra.
Galipaud, J.-C.
1996 New Caledonia: Some Recent Archaeological Perspectives. In Oceanic
Culture History: Essays in Honour of Roger Green, edited by J. Davidson, G.
Irwin, F. Leach, A. Pawley, and D. Brown, pp. 297-305. New Zealand Journal
of Archaeology Special Publication, Auckland.
Galipaud, J-C. and F. Yoringmal
1994 Pottery of Vanuatu (poster). IPU Printer, Port Vila.
Geraghty, P.
1983 The History of the Fijian Languages. Oceanic Linguistics Special
Publication, No. 19. University of Hawai‘i Press, Honolulu.
Gibson, T.
1990 Raiding, Trading, and Tribal Autonomy in Insular Southeast Asia. In The
Anthropology of War, edited by J. Haas, pp. 125-145. Cambridge University Press,
Cambridge.
Gifford, E. W.
1951 Archaeological Excavations in Fiji. Anthropological Records 13:189-288.
University of California Press, Berkeley and Los Angeles.
1952 Tribes of Viti Levu and their Origin Places. Anthropological Records
13(5):337-341. University of California Press, Berkeley and Lost Angeles.
516
Gilbert, T.
1984 Limestone and Volcanic Caves of the Fiji Islands. Transactions of the British
Cave Research Association 11(2):105-118.
Godfrey, H. C. J.
1987 The Evolution of Clutch Size in Parasitic Wasps. American Naturalist
129:221-233.
Goldman, I.
1970 Ancient Polynesian Society. University of Chicago Press, Chicago.
Gordon, A. D. H. G.
1879 Letters and Notes Written During the Disturbances in the Highlands (known
as the ‘devil country’) of Viti Levu, Fiji, 1876. R. and R. Clark, Edinburgh.
Gosden, C.
1992 Production Systems and the Colonization of the Western Pacific. World
Archaeology 24:55-69.
Graves, M. W., and T. N. Ladefoged
1995 The Evolutionary Significance of Ceremonial Architecture in Polynesia.
In Evolutionary Archaeology: Methodological Issues, edited by. P. Teltser, pp.
149-174. University of Arizona Press, Tucson.
Green, R.
1967 Fortifications in Other Parts of Tropical Polynesia. New Zealand
Archaeological Newsletter, 10:96-113.
1978 New Sites with Lapita Pottery and their Implications for an Understanding
of the Settlement of the Western Pacific. Working Papers in Anthropology
Archaeology, Linguistics and Maori Studies No. 51. Dept. of Anthropology,
University of Auckland.
1979 Lapita. In The Prehistory of Polynesia, edited by J. Jennings, pp. 27-60.
Harvard University Press, Cambridge.
2002 Interpretations of Samoan Fortifications. Archaeology in New Zealand 45(4):
309-324.
Gremillion, K. J.
1996 Diffusion and Adoption of Crops in Evolutionary Perspective. Journal of
Anthropological Archaeology 15:183-204.
Groube, R. C.
1971 The Origin and Development of Earthwork Fortifications in the Pacific.
Studies in Oceanic Culture History, Pacific Anthropological Association Records

517
1(12):133-164.
Gumerman, G. J.
1986 The Role of Competition and Cooperation in the Evolution of Island
Societies. In Island Societies: Archaeological Approaches to Evolution and
Transformation, edited by P. V. Kirch, pp. 42-49. Cambridge University Press,
New York.
Haas, J.
1987 The Exercise of Power in Early Andean State Development. In The Origins
and Development of the Andean State, edited by J. Haas, S. Pozorski, and T.
Pozorski, pp. 31-35. Cambridge University Press, Cambridge.
1990 The Anthropology of War (editor). Cambridge University Press, Cambridge.
Haas, J. and W. Creamer
1993 Stress and Warfare among the Kayenta Anasazi of the 13th Century AD.
Fieldiana: Anthropology, n.s. 88.
Haberle, S. G. and M. P. Ledru
2001 Correlations Among Charcoal Records of Fires from the Past 16,000 years
in Indonesia, Papua New Guinea, and Central and South America. Quaternary
Research 55:97-104.
Halstead, P., and J. O’Shea
1989 Bad Year Economics: Cultural Responses to Risk and Uncertainty.
Cambridge University Press, New York.
Hamilton, W. D.
1964 The Genetical Evolution of Social Behaivour. Journal of Theoretical Biology
7:1-52.
Harris, M.
1979 Cultural Materialism: The Struggle for a Science of Culture. Random
House, New York.
Harris, N. V.
1963 Rainfall Patterns in Fiji. New Zealand Geographer 19(1):25-45.
Haynes, A.
2001 Freshwater Snails of the Tropical Pacific Islands. Institute of Applied
Sciences, University of the South Pacific, Suva.
Hegmon, M.
1992 Archaeological Research on Style. Annual Review of Anthropology 21:

518
517-536.
Heider, K.
1979 Grand Valley Dani: Peaceful Warriors. Holt, Rinehart, Winston, New York.
Higham, C. F. W.
1967 The Role of Fortifications in N.Z. Prehistory. New Zealand Archaeological
Association Newsletter 10(3): 130-33.
Hocart, A. M.
1919 Early Fijians. Journal of the Royal Anthropological Institute 49, 42-51.
Hollyer, J.
1997 Taro: Mauka to Makai. A Taro Production and Business Guide for Hawai‘i
Growers. College of Tropical Agriculture and Human Resources, University of
Hawai‘i, Honolulu.
Holy, L.
1996 Anthropological Perspectives on Kinship. Pluto Press, Chicago.
Hope, G., D. O’Dea, W. Southern
1999 Holocene Vegetation Histories in the Western Pacific –Alternative Records of
Human Impact. In Le Pacifique de 5000 a 2000 avant le present:
Supplements a l’histoire d’une colonization, edited by J.-C. Galipaud and I. Lilley,
pp. 387-406. Institut de Recherche Pour le Developpement, Paris.
Houtz, R. E.
1960 Geology of the Singatoka Area, Viti Levu. Fiji Geological Survey
Department Bulletin 6. Government Printers, Suva.
Hughes, P. J., G. Hope, M. Latham, and M. Brookfield
1979 Prehistoric Man-Induced Degradation of the Lakeba Landscape: Evidence
From Two Inland Swamps, In Lakeba: Environmental Change, Population
Dynamics and Resource Use, edited by H. Brookfield, pp. 93-110. Australian
National University, Canberra.
Hunt, T. L.
1980 Toward Fiji's Past: Archaeological Research on Southwestern Viti Levu.
Unpublished MA thesis, University of Auckland, New Zealand.
1986 Conceptual and Substantive Issues in Fijian Prehistory. In Island Societies:
Archaeological Approaches to the Evolution and Transformation, edited by
P. Kirch, pp. 20-32. Cambridge University Press, Cambridge.
1987 Patterns of Human Interaction and Evolutionary Divergence in the Fiji
Islands. Journal of the Polynesian Society 96, 299-334.

519
1989 Lapita Ceramic Exchange in the Mussau Islands, Papua New Guinea.
Unpublished PhD thesis, University of Washington.
Huntley, B. and I. C. Prentice
1993 Holocene Vegetation and Climates of Europe. In Global Climates Since the
Last Glacial Maximum, edited by Wright et al., pp. 138-168. University of
Minnesota Press, Minneapolis.
Irwin, G.
1985 Land, Pa, and Polity: A Study Based on the Maori Fortifications of Pouto.
Monograph 15 of the New Zealand Archaeological Association, Auckland.
1992 The Prehistoric Exploration and Colonisation of the Pacific. Cambridge
University Press, Cambridge.
Jochim, M. A.
1976 Hunter-Gatherer Subsistence and Settlement: A Predictive Model.
Academic Press, New York.
Jones, K. L.
1994 Nga Tohuwhenua mai Te Rangi: A New Zealand Archaeology in Aerial
Photographs. Victoria University Press, Wellington.
Jones, T. L., G. M. Brown, L. M. Raab, J. L. McVickar, W. G. Spaulding, D. J. Kennett,
A. York, and P. L. Walker
1999 Environmental Imperatives Reconsidered: Demographic Crises in Western
North America During the Medieval Climatic Anomaly. Current Anthropology
40(2):137-170.
Jordan, T. G. and M. Kaups
1989 The American Backwoods Frontier: An Ethnic and Ecological Interpretation.
The Johns Hopkins University Press, Boston.
Joukowsky, M.
1980 A Complete Manual of Field Archaeology. Tools and Techniques of Field
Work for Archaeologists. Prentice Hall, New Jersey.
Kaloumaira, A.
2000 Reducing the Impact of Environmental Emergencies Through Early Warning
and Preparedness- The case of El Niño-Southern Oscillation (ENSO). South
Pacific Applied Geosciences Commission < http://www.esig.ucar.edu/un/fiji.html
> (June 16th, 2003).
Kennett, D. J.
1998 Behavioral Ecology and the Evolution of Hunter-Gatherer Societies on the

520
Northern Channel Islands, California. Unpublished PhD dissertation,
Department of Anthropology, University of California, Santa Barbara.
Kennett, D. J., and J. P. Kennett
2000 Competitive and Cooperative Responses to Climatic Instability in Coastal
Southern California. American Antiquity 65, 379-396.
Kiladis, G. N. and H. F. Diaz
1989 Global Climatic Anomalies Associated with Extremes in the Southern
Oscillation. Journal of Climate 2:1069-90.
Kirch, P. V.
1984 The Evolution of Polynesian Chiefdoms. Cambridge University Press,
Cambridge.
1994 The Wet and the Dry: Irrigation and Agricultural Intensification in
Polynesia. The University of Chicago Press, Chicago.
1996 Lapita and Its Aftermath: Austronesian Settlement of Oceania. In Prehistoric
Settlement of the Pacific, edited by W. Goodenough. American Philosophical
Society 86:57-70.
1997 The Lapita Peoples: Ancestors of the Oceanic World. Blackwell, Cambridge.
Kirch, P. V. and D. Yen
1982 Tikopia: The Prehistory and Ecology of a Polynesian Outlier. BPBM
Bulletin 238, Honolulu.
Kleinschmidt, T.
1877 Notes on the Hill Tribes of Vitilevu. Compiled and edited by H. Tischner.
Translated into English by S. V. Waine. Notes by F. Clunie, Domodomo 1984
2(4):146-190.
Kuckelman, K., R. Lightfoot, and D. Martin
2002 The Bioarchaeology and Taphonomy of Violence at Castle Rock and Sand
Canyon Pueblos, Southwestern Colorado. American Antiquity 67(3):486-513.
Kuhlken, R.
1994 Agricultural Terracing in the Fiji Islands. Unpublished PhD dissertation,
Louisiana State University.
Kuhlken, R., Crosby, A.
1999 Agricultural Terracing at Nakauvadra, Viti Levu: A Late Prehistoric Irrigated
Agrosystem in Fiji. Asian Perspectives 38: 62-89.
Ladefoged, T.N.
1993 The Impact of Resource Diversity on the Sociopolitical Structure of Rotuma:

521
A Geographic Information System Analysis. In The Evolution and Organization of
Prehistoric Society in Polynesia, edited by M. Graves, and R.C. Green, pp.64-71.
New Zealand Archaeological Association 19. New Zealand Archaeological
Association, Auckland.
Ladefoged, T. N., and M. W. Graves
2000 Evolutionary Theory and the Historical Development of Dry-Land
Agriculture in North Kohala, Hawai‘i. American Antiquity 65, 423-448.
Lambert, P. M.
1994 War and Peace on the Western Front: A Study of Violent Conflict and its
Correlates in Prehistoric Hunter-Gatherer Societies of Coastal Southern
California. PhD dissertation, University of California, Santa Barbara.
1997 Patterns of Violence in Prehistoric Hunter-Gatherer Societies of Coastal
Southern California. In Troubled Times, edited by D. L. Martin and D. W. Frayer,
pp. 77-109. Gordon and Breach, Amsterdam.
Lambert, P. M. and P. L. Walker
1991 Physical Anthropological Evidence for the Evolution of Social Complexity in
Coastal Southern California. Antiquity 65:963-973.
LeBlanc, S. A.
1999 Prehistoric Warfare in the American Southwest. University of Utah Press,
Salt Lake City.
Lekson, S. H.
2002 War in the Southwest, War in the World. American Antiquity 67(4):607-624.
Leonard, R. D. and G. T. Jones
1987 Elements of an Inclusive Evolutionary Model for Archaeology. Journal of
Anthropological Archaeology 6:199-210.
Lester, R. H.
1953 Secret Societies of Viti Levu, Fiji. Transactions of the Fiji Society 2:117-134.
Lewontin, R.
1974 The Genetic Basis of Evolutionary Change. Columbia University Press, New
York.
Lyman, R. L., S. Wolverton, and M. J. O’Brien
1998 Seriation, Superposition, and Interdigitation: A History of Americanist Graphic
Depictions of Culture Change. American Antiquity 63(2):239-261.

522
McCormac, F. G. A. G. Hogg, T. F. G. Higham, J. Lynch-Steiglitz, W. S. Broeker, M. G.
L. Baille, J. G. Palmer, L. Xiong, J. R. Pilcher, D. Brown, and S. T. Hooper.
1998 Temporal Variation in the Interhemisphere 14
C Offset. Geophysical Research
Letters 25(9):1321-4.
Madry, S. L. H., and L. Rakos
1996 Line of Sight and Cost-Surface Techniques for Regional Research in the
Arroux River Valley. In New Methods, Old Problems: Geographic Information
Systems in Modern Archaeological Research, pp. 104-127. Center for
Archaeological Investigations, Occasional Paper No. 23. Southern Illinois
University at Carbondale, Carbondale.
Marshall, Y., A. Crosby, S. Matararaba, and S. Wood
2000 Sigatoka: The Shifting Sands of Fijian Prehistory. Oxbow Books/University
of Southampton Press, Southampton.
Maxwell, T. D.
1995 The Use of Comparative and Engineering Analyses in the Study of Prehistoric
Agriculture. In Evolutionary Archaeology: Methodological Issues, edited by. P.
Teltser, pp. 113-128. University of Arizona Press, Tucson.
Moniz-Nakamura, J.
1999 The Archaeology of Human Foraging and Bird Resources on the Island of
Hawai‘i: The Evolutionary Ecology of Avian Predation, Resource Intensification,
Extirpation and Extinction. Unpublished PhD dissertation, University of Hawai‘i,
Honolulu.
Morgan, L. H.
1877 Ancient Society; or, Researches in the Lines of Human Progress from
Savagery, through Barbarism to Civilization. C.H. Kerr, Chicago.
Morley, J. J., and B. A. Dworetzky
1993 Holocene Temperature Patterns in the South Atlantic, Southern, and Pacific
Oceans. In Global Climates Since the Last Glacial Maximum, edited by Wright et
al., pp. 125-135. University of Minnesota Press, Minneapolis.
Mueller, J. W.
1975 Sampling in Archaeology. University of Arizona Press, Tucson.
Mueller-Dombois, D. and F. R. Fosberg
1998 Vegetation of the Tropical Pacific Islands. Springer Press, New York.
Nadalo, I.
1957 Old Wars of Western Fiji. Transactions and Proceedings of the Fiji Society
6-I, 1955-57:51-57.

523
Nayacakalou, R. R.
1955 The Fijian System of Kinship and Marriage, Part I. Journal of the Polynesian
Society, Volume 64.
1965 Amalgamation and Bifurcation of Fijian Lineages Over a Period of 50 Years.
Proceedings of the Fiji Society 1960-61, Suva.
1978 Tradition and Change in the Fijian Village. South Pacific Sciences
Association, Suva.
Neiman, F.
1995 Stylistic Variation in Evolutionary Perspective: Implications for Middle
Woodland Ceramic Diversity. American Antiquity 60:7-36.
Nichols, N. and K. K. Wong
1990 Dependence of Rainfall Variability on Mean Rainfall, Latitude, and the
Southern Oscillation. Journal of Climate 3:163-170.
Nunn, P. D.
1990 Warming of the South Pacific since 1880: Evidence, Causes, and
Implications. Journal of Pacific Studies 12:35-50.
1994 Oceanic Islands. Blackwell, Cambridge.
1998 Pacific Island Landscapes: Landscape and Geological Development of
Southwestern Pacific Islands, Especially Fiji, Samoa, and Tonga. Institute
of Pacific Studies, University of the South Pacific. Suva.
2000a Environmental Catastrophe in the Pacific Islands about AD 1300.
Geoarchaeology 15: 715-740.
2000b Illuminating Sea-Level Fall around AD 1220-1510 (730-440 cal yr BP) in
the Pacific Islands: Implications for Environmental Change and Cultural
Transformation. New Zealand Geographer 56:46-54.
2003 Revising Ideas About Environmental Determinism: Human-Environment
Relations in the Pacific Islands. Asia Pacific Viewpoint 44, 63-72.
Nunn, P., J. Britton
2001 Human-Environmental Relationships in the Pacific Islands around A.D. 1300.
Environment and History 7, 3-22.
Nunn, P., and R. Kumar
2003 Alluvial Charcoal in the Sigatoka Valley, Viti Levu Island, Fiji.
Paleogeography, Paleoclimatology, Paleoecology (in review, May 2003).
Nunn, P., J. Stone, and R. Kumar
2003 Corroborating the ‘AD-1300 sea-level fall’ in the South Pacific: New Dates
from Niue and Fiji. South Pacific Journal of Natural Science 20: in press.

524
O’Connell, J. and J. Allen
1995 Human Reactions to the Pleistocene-Holocene Transition in Greater Australia:
A Summary. Antiquity 69: 855-862.
Otterbein, K. F.
1970 The Evolution of War: A Cross-Cultural Study. Human Relations Area Files
Press, New Haven.
1973 The Anthropology of War. In Handbook of Social and Cultural Anthropology,
edited by J. Honigmann, pp. 923-958. Rand McNally and Co., New York.
1977 Warfare: A Hitherto Unrecognized Critical Variable. American Behavioral
Scientist 20:693-710.
1985 Evolution of War: A Cross-Cultural Study. 2nd
Edition. Yale University Press,
New Haven.
1999 A History of Research on Warfare in Anthropology. American Anthropologist
101(4):794-805.
Palmer, B.
1966 Site Survey- Sigatoka Valley, 1965-66. Preliminary Report I, Sigatoka
Research Project. Unpublished ms., Fiji Museum Archives.
1969a Ring-ditch Fortifications on Windward Viti Levu, Fiji. Archaeology and
Physical Anthropology in Oceania 4, 182-197.
1969b Fortified Sites on Ridge Junctions, Fiji. New Zealand Archaeological
Association Newsletter 12, 15-19.
1971 Naga Ceremonial Sites in Navosa Upper Sigatoka Valley. Final Report
No. 1. Records of the Fiji Museum 1(5):92-106.
1972 Tatuba Cave Excavations, 1972. Unpublished field notes, Fiji Museum
Archives.
Palmer, B., F. Clunie, K. Moce
1973 Excavations at Tatuba Cave. Unpublished ms., Fiji Museum Archives
Palmer, B., and E. Shaw
1968 Pottery-Making at Nakoro, Fiji. Records of the Fiji Museum I(4):80-90.
Parham, J. W.
1972 Plants of the Fiji Islands. Government Printers, Suva.
Parry, J.
1977 Ring-Ditch Fortifications: Ring-Ditch Fortifications in the Rewa Delta: Fiji,
Air Photo Interpretation and Analysis. Bulletin of the Fiji Museum, No. 3. The
Fiji Museum, Suva.
1982 Ring-Ditch Fortifications II: Ring-Ditch Fortifications in the Navua Delta,
Fiji: Air Photo Interpretation and Analysis. Bulletin of the Fiji Museum, No. 7.
The Fiji Museum, Suva.
525
1987 The Sigatoka Valley- Pathways into Prehistory. Fiji Museum Bulletin No. 9.
The Fiji Museum, Suva.
1997 The North Coast of Viti Levu Bā to Rā: Air Photo Archaeology and
Ethnohistory. Bulletin of the Fiji Museum, No. 10. The Fiji Museum, Suva.
Pauketat, T. R. and T. Emerson
1992 The Ideology of Authority and the Power of the Pot. American
Anthropologist 93:919:941.
Pearson, O. M.
2000 Activity, Climate, and Postcranial Robusticity: Implications for Modern
Human Origins and Scenarios of Adaptive Change. Current Anthropology 41, 569-
608.
Peel, M. C., T. McMahon, and B. Finlayson
2002 Variability of Annual Precipitation and its Relationship to the El Niño-
Southern Oscillation. Journal of Climate 15, 545-551.
Pernetta, J. C. and D. Watling
1978 The Introduced and Native Terrestrial Vertebrates of Fiji. Pacific Science
32: 223-243.
Plog, S.
1983 Analysis of Style in Artefacts. Annual Review of Anthropology 12:125-142.
Quinn, W. H.
1992 A Study of the Southern Oscillation-Related Climatic Activity for A.D. 622-
1900 Incorporating Nile River Flood Data. In El Niño: Historical and
Paleoclimatic Aspects of the Southern Oscillation, edited by H. Diaz, and V.
Markgraf, pp. 119-149. Cambridge University Press, New York.
Quinn, W. H., V. T. Neal, S. Antunez de Mayolo
1987 El Niño Occurrences Over the Past Four and Half Centuries. Journal of
Geophysical Research 92(14):449-461.
Raab, L. M. and D. O. Larson
1997 Medieval Climatic Anomaly and Punctuated Cultural Evolution in Coastal
Southern California. American Antiquity 62:319-336.
Rappaport, R. A.
1968 Pigs for the Ancestors: Ritual in the Ecology of a New Guinea People. Yale
University Press, New Haven.
Rautman, A. E.

526
1993 Resource Variability, Risk, and the Structure of Social Networks: An
Example from the Prehistoric Southwest. American Antiquity 58: 403-424.
1996 Risk, Reciprocity, and the Operation of Social Networks. In Evolving
Complexity and Environmental Risk in the Prehistoric Southwest, edited by J.
Tainter and B. Tainter, pp. 197-223. Addison-Wesely Publishing Co., Boston.
Ravuvu, A.
1983 Vaki I Taukei: The Fijian Way of Life. Institute of Pacific Studies, University
of the South Pacific, Suva.
Rechtman, R.
1992 The Evolution of Socio-Political Complexity in the Fiji Islands. Unpublished
PhD dissertation, University of Michigan.
Reycraft, R. M.
2000 Long-term Human Responses to El Niño in South Coastal Peru, circa A.D.
1400. In Environmental Disaster and the Archaeology of Human Response,
edited by G. Bawden, and R. Reycraft, pp. 99-120. Maxwell Museum of
Anthropology Anthropological Papers No. 7. University of New Mexico,
Albuquerque.
Rice, P.
1987 Pottery Analysis. A Sourcebook. University of Chicago Press, Chicago.
Richerson, P. J., R. Boyd, and R. Bettinger
2001 Was Agriculture Impossible During the Pleistocene but Mandatory During the
Holocene? A Climate Change Hypothesis. American Antiquity 66: 387-412.
Rosenberg, M.
1998 Cheating at Musical Chairs: Territoriality and Sedentism in an Evolutionary
Context. Current Anthropology 39(5):653-681.
Rosenthal, M.
1991 Realms and Ritual: The Form and Rise of Civitas and Urbs in Southeastern
Viti Levu, Fiji. PhD dissertation, University of Chicago.
Roth, J. and S. Hooper
1990 The Fiji Journals of Baron Anatole Von Hügel, 1875-1877. The Fiji Museum,
Suva.
Rouse, I.
1939 Prehistory of Haiti: A Study in Method. Yale University Publications
in Anthropology 21. New York: Yale University Press.
1958 The Inference of Migrations from Anthropological Evidence. In Migrations

527
in New World Culture History, edited by R. Thompson. University of Arizona
Press, Tucson.
Ruggles, C. L. N., D. J. Medychyj-Scott
1996 Site Location, Landscape Visibility, and Symbolic Astronomy: A Scottish
Case Study. In New Methods, Old Problems: Geographic Information
Systems in Modern Archaeological Research, pp. 127-147. Center for
Archaeological Investigations, Occasional Paper No. 23. Southern Illinois
University at Carbondale, Carbondale.
Ryan, P. A.
2000 Fiji’s Natural Heritage. Exisle Publishing Limited, Auckland, New Zealand.
Sahlins, M.
1958 Social Stratification in Polynesia. University of Washington Press, Seattle.
Salinger, M. J., R. Basher, B. Fitzharris, J. Hay, P. Jones, J. McVeigh, and I. Schmidely-
Leleu.
1995 Climate Trends in the South-West Pacific. International Journal of
Climatology 15: 285-302.
Sand, C.
1996 Recent Developments in the Study of New Caledonia’s Prehistory.
Archaeology in Oceania 31:5-71.
1999 Lapita and Non-Lapita Ware During New Caledonia’s First Millennium
of Austronesian Settlement. In Le Pacifique de 5000 a 2000 avant le present:
Supplements a l’histoire d’une colonization, edited by J.-C. Galipaud and I. Lilley,
pp. 139-159. IRD, Paris.
Sandweiss, D. H.
2002 The Prehistory of El Nino: An Archaeological Perspective. Presented at the
Smithsonian Tropical Research Institute Annual meeting for the Association for
Tropical Biology, Panama City, Panama.
Sandweiss, D. H., J. B. Richardson III, E. J. Reitz, H. B. Rollins, and K.A. Maasch
1996 Geoarcheological Evidence from Peru for a 5000 Years B.P. Onset of El
Niño. Science 273:1531-1533.
Service, E.
1975 Origins of the State and Civilization: A Process of Cultural Evolution.
Norton Publishers, New York.
Smith, A. C.
1979 Flora Vitiensis Nova. Volume 1. Pacific Tropical Botanic Garden, Lawai,

528
Hawaii.
Smith, E. A.
1981 The Application of Optimal Foraging Theory to the Analysis of Hunter-
Gatherer Group Size. In Hunter-Gatherer Foraging Strategies, edited by. B.
Winterhalder and E. A. Smith, pp. 36-65. University of Chicago Press, Chicago.
1983 Anthropology, Evolutionary Ecology, and the Explanatory
Limitations of the Ecosystem Concept. In The Ecosystem Concept in
Anthropology, edited by E.F. Moran, pp.51-85. Westview Press,
Boulder.
1985 Inuit Foraging Groups: Some Simple Models Incorporating Conflicts of
Interest, Relatedness, and Central-Place Sharing. Ethnology and Sociobiology
6:27-37.
1987 Optimization Theory in Anthropology: Applications and Critiques. In The
Latest on the Best: Essays on Evolution and Optimality, edited by J. Dupre, pp.
201-249. MIT Press, Cambridge.
1988 Risk and Uncertainty in the ‘Original Affluent Society’: Evolutionary
Ecology of Resource-Sharing and Land Tenure. In Hunters and Gatherers I:
History, Evolution, and Social Change, edited by T. Ingold, D. Riches, J.
Woodburn, pp. 222-251. Berg, New York.
Smith, E. A., and R. Boyd
1990 Risk and Reciprocity: Hunter-Gatherer Socioecology and the Problem of
Collective Action. In Risk and Uncertainty in Tribal and Peasant Economies,
Edited by E. Cashdan, pp. 167-192. Westview Press, Boulder.
Smith, E. A. and B. Winterhalder
1992 Natural Selection and Decision Making: Some Fundamental Principles. In
Ecology, Evolution, and Human Behavior, edited by E. A. Smith and B.
Winterhalder, pp. 25-60. Aldine de Gruyter, New York.
Spier, L.
1917 An Outline for a Chronology of Zuni Ruins. American Museum of Natural
History, Anthropological Papers, Vol. 18, No. 3.
Spriggs, M.
1982 Taro Cropping Systems in the Southeast Asian-Pacific Region.
Archaeology in Oceania 17: 7-15.
1984 Taro Irrigation Techniques in the Pacific. In Edible Aroids, edited by S.
Chandra, pp. 123-55. Clarendon Press, Oxford.
1985 Prehistoric Man-Induced Landscape Enhancement in the Pacific: Examples
and Implications. In Prehistoric Intensive Agriculture in the Tropics, edited by I.
Farrington, pp. 409-434. BAR, Oxford.
1997 Landscape Catastrophe and Landscape Enhancement: Are Either or Both True

529
in the Pacific? In Historic Ecology in the Pacific Islands: Prehistoric Environment
and Landscape Change, edited by P. V. Kirch and T.L. Hunt, T.L pp. 80-104. Yale
University Press, New Haven,
Stark, M. T., J. J. Clark, and M. D. Elson
1995 Causes and Consequences of Migration in the 13th Century Tonto Basin.
Journal of Anthropological Archaeology 14: 212-246.
Stein, J. K.
1984 Organic Matter and Carbonates in Archaeological Sites. Journal of Field
Archaeology 11:239-246.
Stephens, D. W.
1990 Risk and Incomplete Information in Behavioral Ecology. In Risk and
Uncertainty in Tribal and Peasant Economies, edited by E. Cashdan, pp. 19-46.
Westview Press, Boulder.
Stephens, D. W. and J. R. Krebs
1986 Foraging Theory. Princeton University Press, Princeton N. J.
Stonehewer-Cooper, H.
1880 Coral Lands. Richard-Bentley, London.
Strahler, A. N.
1964 Quantitative Geomorphology of Drainage Basins and Channel Networks. In
Handbook of Applied Hydrology, edited by V. T. Chow, pp. 39-76. McGraw-Hill,
New York.
Stuiver M., P. Reimer, E. Bard, J. Beck, G. Burr, K. Hughen, B. Kromer, G. McCormac,
J. van der Plicht, and M. Spurk
1998 INTCAL98 Radiocarbon Age Calibration, 24000-0 Cal BP. Radiocarbon
40: 1041-1083.
Tainter, J. and B. Tainter
1996 Evolving Complexity and Environmental Risk in the Prehistoric Southwest.
Proceedings Vol. XXIV, Santa Fe Institute Studies in the Sciences of Complexity.
Addison-Wesley, Reading.
Terrell, J. E.
1986 Prehistory in the Pacific Islands: A Study of Variation in Language, Customs
and Human Biology. Cambridge University Press, Cambridge.
Terry, J. P., R. Raj, and R. Kostaschuk
2001 Links Between the Southern Oscillation Index and Hydrological Hazards on a

530
Tropical Pacific Island. Pacific Science 55: 275-283.
Thomson, B. H.
1894 South Sea Yarns. Blackwoods, London.
1908 The Fijians: A Study of the Decay of Custom. Heinemann, London.
Thompson, L., E. Mosley-Thompson, and B. M. Arnao
1984 El Niño-Southern Oscillation Events Recorded in the Stratigraphy of the
Tropical Quelccaya Ice Cap, Peru. Science 226:50-53.
Tindall, H. D.
1983 Vegetables in the Tropics. The Macmillan Press, Ltd., New Hampshire.
Tudhope, A. D., C. Chilcott, M. McCulloch, E. Cook, J. Chappell, R. Ellam, D. Lea, J.
Lough, and G. Shimmield
2001 Variability in the El Niño-Southern Oscillation Through a Glacial-Interglacial
Cycle. Science 291: 1511-1517.
Turner, C. and J. Turner
1999 Man Corn: Cannibalism and Violence in the Prehistoric American Southwest.
The University of Utah Press, Salt Lake City.
Tylor, E. B.
1874 Primitive Culture: Researches into the Development of Mythology,
Philosophy, Religion, Language, Art and Customs. H. Holt and company, New
York.
Urban, F. E., J. Cole, and J. T. Overpeck
2000 Influence of Mean Climate Change on Climatic Variability from a 155-year
Tropical Pacific Coral Record. Nature 407:989-993.
van Zuidam, R. A.
1986 Aerial Photo Interpretation in Terrain Analysis and Geomorphic
Mapping. International Institute for Aerospace Survey and Earth Sciences (ITC).
Smits Publishers, The Hague, Netherlands.
Vayda, A. P.
1956 Maori Warfare. Unpublished PhD dissertation, Columbia University.
1976 Warfare in an Ecological Perspective. Annual Review of Ecology and
Systematics 5:183-193.
Visher, G. S
1969 Grain Size Distributions and Depositional Processes. Journal of Sedimentary
Petrology 39:1077-1108.

531
Wahome, E. W.
1997 Continuity and Change in Lapita and Post-Lapita Ceramics: A Review of
Evidence from the Admiralty Islands and New Ireland, Papua New Guinea.
Archaeology in Oceania 32(1):118-123.
1998 Ceramic and Prehistoric Exchange in the Admiralty Islands, Papua New
Guinea. Unpublished PhD thesis, Australian National University, Canberra.
Watling, R., J. C. Pernetta
1977 Limestone Caves in the Sigatoka Valley, Viti Levu, Fiji. Studies in
Speleology 3(2):78-86.
Watson, L. J.
1970 The Legal Importance of the Water Requirements of Taro Colocasia
Esculenta. In Tropical Root and Tuber Crops of Tomorrow, edited by D. L.
Plucknett, pp. 149-151. College of Tropical Agriculture and Human Resources,
University of Hawai‘i, Honolulu.
Welsch, R. L. and J. E. Terrell
1998 Material Culture, Social Fields, and Social Boundaries on the Sepik
Coast of New Guinea. In The Archaeology of Social Boundaries, pp. 50-77.
Smithsonian Institute Press, Washington D.C.
Wilkes, C.
1845 The Narrative of the United States Exploring Expedition During the Years
1838-1842: Vol. III. Lea and Blanchard, Philadelphia.
Willey, G. and P. Phillips
1958 Method and Theory in American Archaeology. University of Chicago
Press, Chicago.
Williams, T.
1860. Fiji and the Fijians. Reprinted by the Fiji Museum, Suva (1982).
Wilson, A., C. Hendy, and C. Reynolds
1979 Short-Term Climate Change and New Zealand Temperatures During the Last
Millennium. Nature 279:315-317.
Wobst, M. H.
1977 Stylistic Behavior and Information Exchange. In For the Director: Research
Essays in Honour of James B. Griffin, edited by C. Cleland, pp. 317-342.
University of Michigan, Museum of Anthropology, Anthropology Papers 61.
Worboys, M. F.

532
1997 GIS. A Computing Perspective. Taylor and Francis, Bristol.
Wright, H. E. Jr., J. E. Kutzbach, T. Webb III, W. F. Ruddiman, F. A. Street-Perrott, and
P. J. Bartlein
1993 Global Climates Since the Last Glacial Maximum. University of Minnesota
Press, Minneapolis.
Wright, A. D., Twyford, I.
1965 The Soil Resources of the Fiji Islands. Government of Fiji Publishers, Suva.
Copyright © 2022 FDOKUMEN