Fort Valley Experimental Forest-A Century of Research 1908 ...
299
United States Department of Agriculture Forest Service / Rocky Mountain Research Station Proceedings RMRS-P-55 December 2008 Fort Valley Experimental Forest— A Century of Research 1908-2008 Conference Proceedings August 7–9, 2008 Flagstaff, AZ
-
Upload
khangminh22 -
Category
Documents
-
view
0 -
download
0
Transcript of Fort Valley Experimental Forest-A Century of Research 1908 ...

United States Department of Agriculture
Forest Service / Rocky Mountain Research Station
Proceedings RMRS-P-55
December 2008
Fort Valley Experimental Forest— A Century of Research
1908-2008
Conference Proceedings
August 7–9, 2008
Flagstaff, AZ

Rocky Mountain Research Station240 W. Prospect Rd.
Fort Collins, Colorado 80526
Olberding, Susan D., and Moore, Margaret M., tech. coords. 2008. Fort Valley Experimental Forest—A Century of Research 1908-2008. Conference Proceedings; August 7-9, 2008; Flagstaff, AZ. Proc. RMRS-P-55. Fort Collins, CO: U.S. Department of Agriculture, Forest Service, Rocky Mountain Research Station. 282 p.
AbstractOne hundred years ago, the USFS began its forest research program in a two-room cabin near Flagstaff, Arizona, with one staff person, Gustaf A. Pearson. The site became known as the Fort Valley Experiment Station and was the first in a national network of research sites developed to address uncertainties regarding the rehabilitation and conservation for forest and range lands in the nation. Fort Valley’s name has changed over the century and for today’s reader, Fort Valley Experimental Forest (FVEF) is used. The conference recognized pioneering silvicultural, range, and watershed research and how the work continues today. Invited papers and contributed poster papers were presented during the first day of the conference. The second day’s schedule included field trips and the dedication of new monuments at the historic Fort Valley Experimental Forest headquarters. The conference consisted of USFS retired researchers, current scientists, and students that addressed issues affecting the perpetuation of the ponderosa pine forest of the Southwest.
Keywords: long-term research, ponderosa pine, range research, silviculture, cultural resources, Fort Valley Experimental Forest, Long Valley Experimental Forest, http://www.rmrs.nau.edu/fortvalley/
Cover photo: Fort Valley Experimental Forest headquarters in winter. The San Francisco Peaks are in the background.
1920 photo by G.A. Pearson.
NOTE: Papers were edited to a uniform style; however, authors are responsible for the content and accuracy of their papers.
The use of trade or firm names in this publication is for reader information and does not imply endorsement by the U.S. Depatment of Agricuture of any product or service.

Fort Valley Experimental Forest— A Century of Research 1908–2008
Conference ProceedingsAugust 7–9, 2008
Flagstaff, AZ
Technical CoordinatorsSusan D. Olberding, Historian/Archivist
USFS RMRSFort Valley Experimental Forest
Flagstaff, AZ
Margaret M. Moore, ProfessorSchool of Forestry
Northern Arizona UniversityFlagstaff, AZ
SponsorsRocky Mountain Research Station, USDAFS
Coconino National ForestNorthern Arizona University, School of Forestry
Ecological Restoration InstituteSociety of American Foresters, Southwestern SectionUniversity of Arizona, School of Natural Resources
Conference Program CommitteeSusan D. Olberding, Rocky Mountain Research Station
Margaret M. Moore, Northern Arizona UniversityDavid R. Patton, U.S. Forest Service and Northern Arizona University (ret.)
Peter F. Ffolliott, University of ArizonaPeter J. Pilles, Jr., Coconino National Forest
Daniel G. Neary, Rocky Mountain Research Station

Preface
The conference program committee was comprised of people long associated with Fort Valley and its research. Our goal was to summarize the important contributions to southwestern forest and range management that evolved from Fort Valley-based projects. We pulled folks from retirement to prepare the invited papers that list past and present research endeavors. We are extremely grateful for their willingness to, at least once more, put pen to paper and share their vast experiences. We also thank those who prepared poster papers that consist primarily of the most recent research occurring on the Fort Valley Experimental Forest.
Daniel P. Huebner, RMRS, provided invaluable help with the technical side to these proceedings. The Conference Planning committee included: Diane T. Jacobs, Brenda Strohmeyer, Jose Iniguez, Cody Stropki, Doc Smith, Brian Geils, Daniel G. Neary, Margaret M. Moore, David R. Patton, and Peter F. Ffolliott.
ii
Welcome!
Forest science has come a long way in only 100 years. We’ve learned much from our investigations at Fort Valley. Just one century ago, the horse and steam-powered timber industry was harvesting giant old-growth yellow pine and milling them as fast as the chugging locomotives could pull the log-laden cars down the tracks. As far as people could see at the time, new forests were not growing to replace the big yellow pines that fell to axes and misery whips. This was not an insignificant problem to the fledgling Forest Service charged with conservation of the nation’s forest resources. The beautiful open park-like stands of giant yellow pine extended from Canada to Mexico, and comprised the most extensive coniferous forest in the West. Failing to conserve the yellow pine forests would be a conservation tragedy comparable to the worst nightmares early foresters could imagine. So, here we are 100 years later and, so far, we de-clare the mission accomplished. Lessons learned from Fort Valley about our nation’s ponderosa pine ecosystems give us reason to celebrate.
The Fort Valley Experimental Forest was established less than 100 years after British horticulturist David Douglas dis-covered and identified the species called western yellow pine and blackjack or bull pine by pioneers, differentiating be-tween slow-growing and rapidly growing trees, respectively. Settlers started building permanent homes under yellow pine only around 50 years before Fort Valley. About all we knew at the birth of Fort Valley was that yellow pine made wonderful lumber and the old trees were being felled at an alarming rate.
Just stop and think: since a team of mules pulled the first wagon load of supplies to Fort Valley, we’ve landed explora-tion vehicles on Mars and data about Mars is streaming back to earth. It’s been an exciting century for scientists, and the
iii
Opening Remarks for the Fort Valley Centennial Celebration
G. Sam Foster, Station Director, USFS Rocky Mountain Research Station, Fort Collins, CO
Abstract—The Rocky Mountain Research Station recognizes and values the contributions of our scientists and collaborators for their work over the past century at Fort Valley Experimental Forest. With the help of our partners and collaborators, Rocky Mountain Research Station is working to improve coordination across its research Program Areas and Experimental Forests and Ranges to better support an integrated landscape research platform for the Interior West region. Given the rich historic context of Fort Valley, and the long-term studies and data it en-tails, together we can adapt and innovate our future research strategy to meet the challenges of the twenty-first century.
next 100 years promise to deliver even greater discoveries. To determine the direction of future scientific research, it helps to examine where we have been. Today we are here to recognize the past—so that we can prepare better for an uncertain future.
The Fort Valley Experimental Forest Centennial Celebra-tion provides a perfect setting for commemorating past successes in natural resource research in the twentieth centu-ry and rising to the new challenges of the twenty-first. Forest Service Research and Development has a unique strength in the ability to conduct long-term land-based research studies over multiple decades and scientists’ careers. The long-term data and research studies from Fort Valley and other Research Station Experimental Forests and Ranges, and the hard work of our dedicated research scientists and their collaborators will be invaluable in meeting new research challenges.
I would like to welcome and express thanks to the sci-entists, partners, and collaborators participating in the Fort Valley Experimental Forest Centennial Celebration. I want to extend my sincere appreciation to the host for our Fort Valley Experimental Forest lands, the Coconino National Forest, and congratulations on their centennial celebration this year. Since the very beginning, the Coconino National Forest has been a vital and important partner for forest research.
We also deeply appreciate the long-term collaboration of the Northern Arizona University, the Ecological Restoration Institute, United States Geological Survey, Agricultural Research Service, University of Arizona, Soil Conservation Service, U.S. Biological Survey, Kaibab National Forest, Grand Canyon National Park, the National Forest System Southwestern Region and other collaborators at Fort Valley. Northern Arizona University also hosts our Flagstaff Laboratory, home to 28 of our full-time employees. Northern Arizona University is also a very old and valued partner in research at Fort Valley.

Our Celebration’s Historic Context
Arizona has given “multiple births” to Forest Service place-based long-term research. The story is well known of Raphael Zon, Willard Drake, and Gus Pearson’s horseback ride on a hot August afternoon in 1908 to examine the site proposed for what was to become the Coconino Experiment Station. After waiting out a heavy thundershower and ford-ing a rain-swollen and silt-choked stream, they arrived at a “beautiful stand of ponderosa pine,” as Gus Pearson put it. “Here,” Zon said, “we shall plant the tree of research” (Gaines and Shaw 1958). Arizona was also the birthplace of two other important Forest Service firsts for long-term research: the first Research Natural Area, the Santa Catalina RNA in 1927 on the Coronado National Forest, and the Santa Rita Range Reserve in 1903 (later the Santa Rita Experimental Range) in southern Arizona. Together, these initiatives served to establish a main strength of Forest Service Research and Development: the ability to conduct long-term land-based research studies over multiple decades and often across the careers of several scientists.
In their 50-year “Fort Valley Golden Anniversary” Station Paper, Gaines and Shaw (1958) also noted that, “Lack of funds, equipment, and personnel has always limited the Fort Valley research program.” Some things never change! Fort Valley lore also has it that during a visit to the Wing Mountain Sample Plot, Gifford Pinchot tore his pants climbing through a fence. In another first, the Fort Valley Station boasted the first indoor bathroom in Region 3 in 1918, just a decade after Gus Pearson endured his first winter in an uninsulated cabin. Gus must have felt he was living in the lap of luxury.
Fort Valley was originally established to investigate the lack of ponderosa pine regeneration in the Southwest. In their 1958 “Golden Anniversary” publication, Ed Gaines and Elmer Shaw noted that only 1 year to date, 1919, had had the requisite combination of ingredients for good repro-duction. Silvicultural management systems for regenerating, growing, and harvesting ponderosa pine were developed at Fort Valley during this period, and up into the 1980s. Research was also conducted on insects and diseases affect-ing ponderosa pine. Research at Fort Valley, particularly that of Gus Pearson, has provided fundamentals for understand-ing what we now call ponderosa pine ecology. The long-term Fort Valley data sets in meteorology, ponderosa pine re-generation, range conditions, dwarf mistletoe, and western conifer stress physiology provide invaluable baselines for new research.
The long-term weather records at Fort Valley provide an invaluable baseline as we begin new investigations on how to adapt to the influences of climate change. We are fortunate that long ago Gus Pearson investigated the rela-tionship of moisture to ponderosa pine seedling germination and survival as well as the effect of elevation on ponderosa pine. Not only do we know that moisture and temperature
iv
are related to the conservation of old yellow pine and the re-generation of new forests, the databases from Fort Valley tell us the amount of moisture available throughout each year. At the beginning of this century, we are far better prepared to manage these pine forests in a fluctuating climate. We are also better prepared to consider potential elevation changes in future ponderosa pine forests, because long ago in 1916 Gus put weather stations at different elevations. In fact, Arizona’s recent prolonged drought has already added new climate change data at Fort Valley and on the San Francisco Peaks. Scientists are already beginning to observe climate influences on blister rust and the decline of aspen stands.
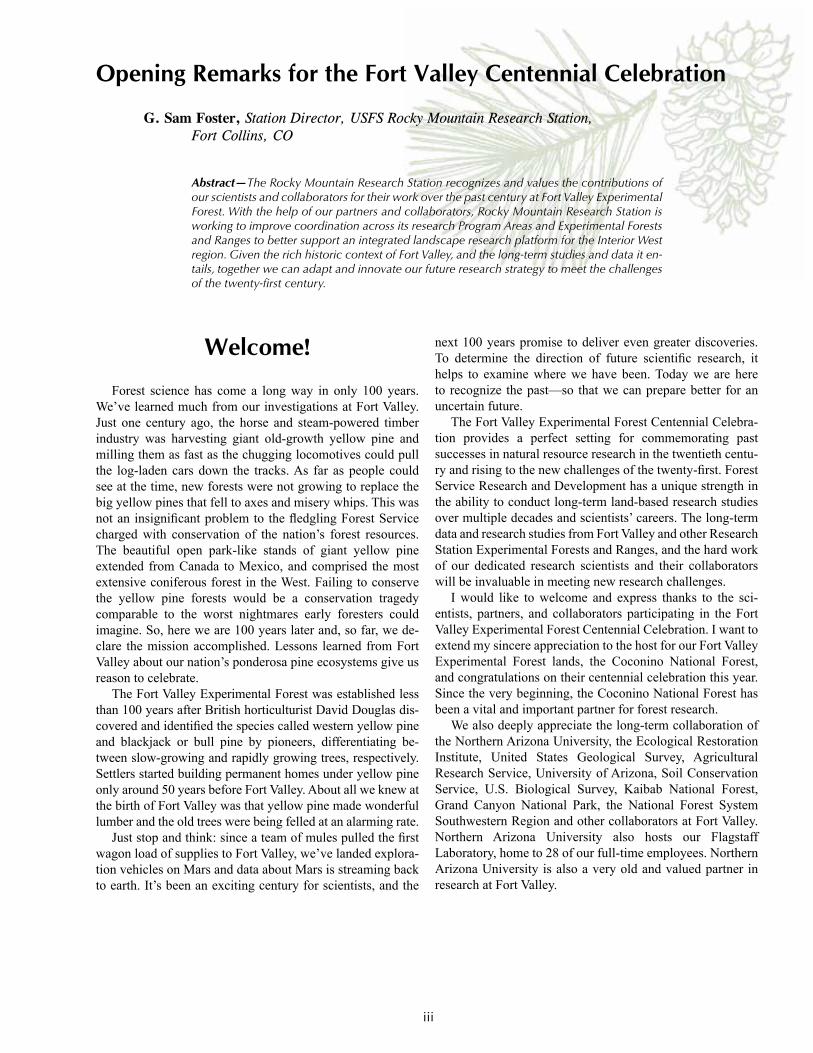
Under the previous organizational structure for the Rocky Mountain Research Station, day-to-day operations of Experimental Forests and Ranges were delegated to scien-tists-in-charge, who were either Project Leaders or Research Scientists within a local Research Work Unit. This contrib-uted to a “pride of ownership” of the Experimental Forest or Range by the Research Work Unit resulting in excellent care of the facilities and substantial investment in research studies by the Research Work Unit over the years. Funds for these were initially all provided by the Research Work Unit. Decentralized management worked well when travel and communications were slow and cumbersome. However, this was not conducive to integrated, collaborative research across Rocky Mountain Research Station territory. In recent years, corporate funds were provided for limited corporate data collection and archiving of the long-term databases deemed to have corporate value.
Our Unique Research Strength
Though the term “ecosystem” had not yet been coined when most Experimental Forests and Ranges were selected, the people doing the job certainly knew one when they saw it. Our predecessor’s foresight in establishing a system of Experimental Forests and Ranges across the United States provided the unique strength of Forest Service Research and Development to conduct long-term place-based research to answer fundamental questions in natural resources. The Rocky Mountain Research Station’s Experimental Forests and Ranges have demonstrated their value many times over. Examples of important research from Experimental Forests and Ranges in Rocky Mountain Research Station territory include:
• In 1911, Wagon Wheel Gap was the first paired-watershed experiment on forested lands in the United States, established in the Rio Grande National Forest in southern Colorado.
• Gus Pearson’s 1950 monograph on management of ponderosa pine in the Southwest, based on his work at Fort Valley, and other work on ponderosa pine at the Black Hills, Long Valley, and Manitou Experimental Forests.
• Long-term work on western larch at Coram Experimental Forest, western white pine at Deception Creek and Priest River, and lodgepole pine at Fraser and Tenderfoot Creek Experimental Forests.
• Fool Creek clearcuts at Fraser Experimental Forest demonstrated streamflow augmentation at subalpine elevations through partial or complete overstory removal.
• On the Great Basin Experimental Range, early watershed work demonstrated important linkages between livestock grazing, plant cover and soil erosion.
• At the Desert Experimental Range, the development of ecologically sound domestic livestock grazing regimes for the salt-deserts of the Western United States.
• The development of long-term multi-decadal data sets on forest growth, meteorology, and stream flow across our Experimental Forests.
Research efforts such as these helped establish Forest Service Research and Development as a premiere world-class research institution. Rocky Mountain Research Station is rightfully proud of the substantial contribution from places like the Fort Valley Experimental Forest.
Again using ponderosa pine as an example, when we com-pare our data from Fort Valley with ponderosa pine studies at the Black Hills Experimental Forest and at the Boise Basin Experimental Forest our understanding deepens for conserv-ing ponderosa pine ecosystems across their large range. Fort Valley is no longer isolated, but is part of a much larger learn-ing network.
New technology adds new value to the long-term data and previous research on Experimental Forests and Ranges. Geographic information system, global positioning systems, multi-spectral remote sensing, and more powerful statistical analysis techniques have provided a spatial relevance and context previously lacking in the long-term data sets, result-ing in new insights. The need to access decades of research data for a study location highlights the necessity of consci-entious data archiving and continuously adapting access to changing technology.
A Challenge for the Future
The twenty-first century brings with it new capabili-ties and challenges for Rocky Mountain Research Station’s Experimental Forests and Ranges such as Fort Valley. Personal computers and laptops, data loggers, and communications improvements such as high-speed internet access continue to accelerate the flow of information. Interstate highways and improved secondary roads provide speedy, year-around access to areas like Fort Valley that were once considered remote and inaccessible. At many duty stations, it is now pos-sible to drive from a laboratory location to an Experimental Forest or Range, conduct field work, and be back the same or next day, if necessary. The complex research problems we
v
are facing today often can no longer be addressed by a single research scientist and require a multidisciplinary team ap-proach at multiple locations.
Rocky Mountain Research Station is addressing some of these challenges through organizational restructuring. Over the past two years, reorganizing 28 Research Work Units into eight functional Program Areas administratively streamlined our decisionmaking and management processes, and brought a higher level of corporate strategic research planning. Day-to-day management on Experimental Forests and Ranges is still delegated to research scientists-in-charge across four of the Program Areas. However, we are moving the funding of day-to-day operations from what was originally the Research Work Unit level to the corporate level. All costs, other than those associated with individual research studies, will no lon-ger be the responsibility of a Program Area. This is intended to encourage a more coordinated corporate approach to re-search activities across Experimental Forests and Ranges, with improved collaboration and equal access by all poten-tial researchers, regardless of location. Establishment of a corporate-level Experimental Forest and Range Coordinator position at Rocky Mountain Research Station will facilitate interaction and coordination between Experimental Forests and Ranges, as well as the corporate budgeting process.
Today’s research studies address causative factors that are external to individual study locations, such as socioeco-nomic and environmental change. These include the effects of climate change and human connections on terrestrial eco-systems, water quality and availability, and wildfire in the Interior West, as addressed in our draft Rocky Mountain Research Station Strategic Framework Update. These chal-lenges require long-term, wide-scale approaches to address issues affecting geographic regions.
The predicted effects of climate change across Rocky Mountain Research Station territory may have profound ef-fects on our terrestrial systems, which can be studied across our network Experimental Forests and Ranges. This long-term place-based network provides the opportunity for interlinked terrestrial ecosystems studies to address the in-teracting components of these systems and the processes that control them on a region-wide basis.
Water is an integrative factor and a precious resource in the dry Western United States and is critical to sustainable populations and ecosystems. The rapidly increasing gap be-tween water supply and demand, and potential changes in precipitation and temperature regimes, creates management challenges and research opportunities, which we have the ca-pability to address through coordinated research across our Experimental Forests and Ranges.
Human connections to Interior West landscapes have increased dramatically in recent decades. Growing and shifting populations have resulted in an expanding wildland-urban interface. This potentially affects many if not all of our Experimental Forests and Ranges as people are more mobile in their recreation and often live closer to their de-sired recreation destinations. We must also develop studies to understand and assess the role of wildland fire that will

increase ecosystem resiliency. We look forward to the op-portunity to coordinate research throughout our Interior West Experimental Forest and Range network with others nation-wide through such efforts as the National Experimental Forest and Range Synthesis Workshop scheduled for September, 2008.
Summary
We are moving away from the organizational decentral-ization that was a necessity in the early days of the Forest Service. This is necessary in order to meet the new generation of research challenges that are regional, national, and global in their context. New technologies allow state-of-the-art re-search studies to build on the existing long-term data available across our network of Experimental Forests and Ranges, and apply it to answer questions never dreamed of by the research scientists who initiated their studies decades ago. This is the beauty of well conceived and executed long-term research. Rocky Mountain Research Station Experimental Forests and Ranges, such as Fort Valley, will meet this challenge through
vi
a widening net of research coordination to answer questions important to the Interior West.
Today managers stand at an intersection in time amid a growing throng of challenges. Looking in one direction we see climate change coming, in another an expanding wildland urban interface, and in still another invasive species rapidly spreading. We hope by continuing the work started at Fort Valley we can help land managers safely traverse this excit-ing intersection in time. Forest Service research scientists will work side-by-side with managers and policy makers to navigate these challenges. Please join me in celebrating 100 years of accomplishment at Fort Valley and looking forward to meeting new challenges in the next century.
Reference
Gaines, Edward M.; Shaw, Elmer W. 1958. Half a century of research—Fort Valley Experimental Forest 1908-1958. Station Paper No. 38, Fort Collins, CO: U.S. Department of Agriculture, Forest Service, Rocky Mountain Forest and Range Experiment Station. 16 p.

vii
ContentsPreface ........................................................................................................ ii
Opening Remarks for the Fort Valley Centennial Celebration ...................iiiG. Sam Foster, Station Director, USFS Rocky Mountain Research Station,
Fort Collins, CO
Fort Valley Studies: A Natural Laboratory for Research and Education ......1Brian W. Geils, Scientist-in-Charge, USFS, Rocky Mountain Research
Station, Flagstaff, AZ
“It Was a Young Man’s Life”: G. A. Pearson ...............................................3Susan D. Olberding, Historian/Archivist, USFS Fort Valley Experimental
Forest, Rocky Mountain Research Station, Flagstaff, AZ
Historical Review of Fort Valley Studies on Stand Management ...............18Peter F. Ffolliott, Professor, School of Natural Resources, University of
Arizona, Tucson, AZ
Forest Regeneration Research at Fort Valley .............................................25L. J. (Pat) Heidmann, (ret.), USFS, Fort Valley Experimental Forest, Rocky
Mountain Research Station, Flagstaff, AZ
Fire and Fuels Research at Fort Valley and Long Valley Experimental Forests .............................................................................38
Stephen S. Sackett (ret.) and Sally M. Haase, Research Foresters, US Forest Service, Pacific Southwest Research Station, Riverside, CA
Range Management Research, Fort Valley Experimental Forest ................48Henry A. Pearson, (ret.), USFS/Agricultural Research Service, Athens,
TX; Warren P. Clary, (ret.), USFS, Meridian, ID; Margaret M. Moore, Northern Arizona University School of Forestry, Flagstaff, AZ; and Carolyn Hull Sieg, USFS, Rocky Mountain Research Station, Flagstaff, AZ
Contributions of Silvicultural Studies at Fort Valley to Watershed Management of Arizona’s Ponderosa Pine Forests ................................60
Gerald J. Gottfried, Research Forester, USFS Rocky Mountain Research Station, Forests and Woodlands Program, Phoenix, AZ; Peter F. Ffolliott, University of Arizona, School of Natural Resources, Tucson, AZ; and Daniel G. Neary, USFS Rocky Mountain Research Station, Flagstaff, AZ
Forest Pathology and Entomology at Fort Valley Experimental Forest ......68Brian W. Geils, USFS, Rocky Mountain Research Station, Flagstaff, AZ
The Fort Valley Experimental Forest, Ponderosa Pine, and Wildlife Habitat Research .....................................................................81
David R. Patton, (ret.), Northern Arizona University, Flagstaff, AZ, and Former Project Leader, USFS, Rocky Mountain Forest and Range Experiment Station, Fort Collins, CO
Memories of Fort Valley From 1938 to 1942 ............................................89Frank H. Wadsworth, (ret.), Research Forester, USFS International
Institute of Tropical Forestry, San Juan, PR

viii
Poster Papers
Plant Recruitment in a Northern Arizona Ponderosa Pine Forest: Testing Seed- and Leaf Litter-Limitation Hypotheses .............................94
Scott R. Abella, Public Lands Institute and School of Life Sciences, University of Nevada Las Vegas, Las Vegas, NV
Forty Years Later at Taylor Woods: Merging the Old and New ..............100John D. Bailey, College of Forestry, Oregon State University,
Corvallis, OR
“Growing Trees Backwards”: Description of a Stand Reconstruction Model .........................................................................106
Jonathan D. Bakker, College of Forest Resources, University of Washington, Seattle, WA; Andrew J. Sánchez Meador, USFS Forest Management Service Center, Fort Collins, CO; Peter Z. Fulé, School of Forestry, Northern Arizona University, Flagstaff, AZ; David W. Huffman, Ecological Restoration Institute, Northern Arizona University, Flagstaff, AZ; and Margaret M. Moore, School of Forestry, Northern Arizona University, Flagstaff, AZ
The Hill Plots: A Rare Long-Term Vegetation Study ................................116Jonathan D. Bakker, College of Forest Resources, University of
Washington, Seattle, WA; Margaret M. Moore, School of Forestry, Northern Arizona University, Flagstaff, AZ; and Daniel C. Laughlin, Ecological Restoration Institute, Northern Arizona University, Flagstaff, AZ
Removing the Tree-Ring Width Biological Trend Using Expected Basal Area Increment ..........................................................................124
Franco Biondi, DendroLab, Department of Geography, University of Nevada, Reno, NV; and Fares Qeadan, Department of Mathematics and Statistics, University of Nevada, Reno, NV
Characteristics of Buckbrush Shrubs Exposed to Herbivores after Seven Years of Protection ...................................................................132
W. Walker Chancellor, David W. Huffman, Ecological Restoration Institute, Northern Arizona University, Flagstaff, AZ; and Margaret M. Moore, School of Forestry, Northern Arizona University, Flagstaff, AZ
Revisiting Pearson’s Climate and Forest Type Studies on the Fort Valley Experimental Forest ..........................................................135
Joseph E. Crouse, Ecological Restoration Institute (ERI), Northern Arizona University, Flagstaff, AZ; Margaret M. Moore, School of Forestry, Northern Arizona University, Flagstaff, AZ; and Peter Z. Fulé, ERI and School of Forestry, Northern Arizona University, Flagstaff, AZ

ix
Early Thinning Experiments Established by the Fort Valley Experimental Forest .............................................................................145
Benjamin P. De Blois, School of Forestry, Northern Arizona University, Flagstaff, AZ; Alex. J. Finkral, School of Forestry, Northern Arizona University, Flagstaff, AZ; Andrew J. Sánchez Meador, USFS, Forest Management Service Center, Fort Collins, CO; and Margaret M. Moore, School of Forestry, Northern Arizona University, Flagstaff, AZ
Historical and Contemporary Lessons From Ponderosa Pine Genetic Studies at the Fort Valley Experimental Forest, Arizona ........150
Laura E. DeWald, Natural Resources Conservation Management, Western Carolina University, Cullowhee, NC; and Mary Frances Mahalovich, U.S. Forest Service, Northern, Rocky Mountain, Southwestern and Intermountain Regions, Moscow, ID
Forest Structure and Tree Recruitment Changes on a Permanent Historical Cinder Hills Plot Over a 130-Year Period ...........................156
Jacob H. Dyer, Department of Forest and Wildlife Ecology, University of Wisconsin, Madison, WI; Andrew J. Sánchez Meador, USFS, Forest Management Service Center, Fort Collins, CO; Margaret M. Moore, School of Forestry, Northern Arizona University, Flagstaff, AZ; and Jonathan D. Bakker, College of Forest Resources, University of Washington, Seattle, WA
Pine Regeneration Following Wildland Fire ............................................162Katherine J. Elliott, James M. Vose, USFS, Coweeta Hydrologic
Laboratory, Southern Research Station, Otto, NC; and Alan S. White, School of Forest Resources, University of Maine, Orono, ME
The U.S. Geological Survey Paleomagnetics Laboratory at Fort Valley Experimental Forest—1970-1991 ......................................168
Shirley Elston and Carolyn Shoemaker, Volunteers and Wives, U.S. Geological Survey, Flagstaff, AZ
Growth of a 45-Year-Old Ponderosa Pine Plantation: An Arizona Case Study .............................................................................175
Peter F. Ffolliott, School of Natural Resources, University of Arizona, Tucson, AZ; Gerald J. Gottfried, USFS, Rocky Mountain Research Station, Phoenix, AZ; Cody L. Stropki, School of Natural Resources, University of Arizona, Tucson, AZ; and L. J. Heidmann USFS (ret.), Rocky Mountain Research Station, Flagstaff, AZ
The Resin Composition of Ponderosa Pine (Pinus ponderosa) Attacked by the Roundheaded Pine Beetle (Dendroctonus adjunctus) (Coleoptera: Curculionidae, Scolytinae) .............................178
Melissa J. Fischer, Kristen M. Waring, Richard W. Hofstetter, and Thomas E. Kolb, School of Forestry, Northern Arizona University, Flagstaff, AZ

x
A Century of Meteorological Observations at Fort Valley Experimental Forest: A Cooperative Observer Program Success Story .....................183
Daniel P. Huebner and Susan D. Olberding, USFS, Rocky Mountain Research Station, Flagstaff, AZ; Byron Peterson, National Weather Service, Flagstaff Weather Forecast Office, Bellemont, AZ; and Dino DeSimone, USDA Natural Resources Conservation Service, Phoenix, AZ
Dynamics of Buckbrush Populations Under Simulated Forest Restoration Alternatives ......................................................................186
David W. Huffman, Ecological Restoration Institute, Northern Arizona University, Flagstaff, AZ; and Margaret M. Moore, School of Forestry, Northern Arizona University, Flagstaff, AZ
Understanding Ponderosa Pine Forest-Grassland Vegetation Dynamics at Fort Valley Experimental Forest Using Phytolith Analysis ...............191
Becky K. Kerns, USFS, Pacific Northwest Research Station, Portland, OR; Margaret M. Moore and Stephen C. Hart, School of Forestry, Northern Arizona University, Flagstaff, AZ
Tree Ecophysiology Research at Taylor Woods .......................................196Thomas E. Kolb, School of Forestry, Northern Arizona University,
Flagstaff, AZ; and Nate G. McDowell, Los Alamos National Laboratory, Earth and Environmental Sciences Division, Los Alamos, NM
Forest and Range Research on the “Wild Bill Plots” (1927-2007) ...........203Daniel C. Laughlin, School of Forestry and Ecological Restoration
Institute, Northern Arizona University, Flagstaff, AZ; and Margaret M. Moore, School of Forestry, Northern Arizona University, Flagstaff, AZ
Ecological Restoration Experiments (1992-2007) at the G. A. Pearson Natural Area, Fort Valley Experimental Forest ....................................209
Margaret M. Moore, W. Wallace Covington, Peter Z. Fulé, Stephen C. Hart, and Thomas E. Kolb, School of Forestry, Northern Arizona University, Flagstaff, AZ; Joy N. Mast, Carthage College, Kenosha, WI; Stephen S. Sackett, (ret.), USFS Pacific Southwest Research Station, Riverside, CA; and Michael R. Wagner, School of Forestry, Northern Arizona University, Flagstaff, AZ
Total Carbon and Nitrogen in Mineral Soil After 26 Years of Prescribed Fire: Long Valley and Fort Valley Experimental Forests .....219
Daniel G. Neary, USFS, Rocky Mountain Research Station, Flagstaff, AZ; Sally M. Haase, USFS, Pacific Southwest Research Station, Riverside CA; and Steven T. Overby, USFS, Rocky Mountain Research Station, Flagstaff, AZ
A Century of Cooperation: The Fort Valley Experimental Forest and the Coconino National Forest in Flagstaff ....................................224
Susan D. Olberding, USFS, Rocky Mountain Research Station, Flagstaff, AZ; Karen Malis-Clark and Peter J. Pilles, Jr., USFS, Coconino National Forest, Flagstaff, AZ; and Dennis Lund, USFS (ret.), Ecological Restoration Institute, NAU, Flagstaff, AZ

93 Years of Stand Density and Land-Use Legacy Research at the Coulter Ranch Study Site .....................................................................230
Andrew J. Sánchez Meador, USFS, Forest Management Service Center, Fort Collins, CO; and Margaret M. Moore, School of Forestry, Northern Arizona University, Flagstaff, AZ
Fort Valley’s Early Scientists: A Legacy of Distinction .............................237Andrew J. Sánchez Meador, USFS, Forest Management Service Center,
Fort Collins, CO; and Susan D. Olberding, USFS, Rocky Mountain Research Station, Flagstaff, AZ
Vascular Plant Checklist of the Chimney Spring and Limestone Flats Prescribed Burning Study Areas Within Ponderosa Pine Experimental Forests in Northern Arizona ..........................................242
Catherine Scudieri, School of Forestry, Northern Arizona University, Flagstaff, AZ, USFS, Rocky Mountain Research Station, Flagstaff, AZ; James F. Fowler, Carolyn Hull Sieg, USFS, Rocky Mountain Research Station, Flagstaff, AZ; Laura Williams, Department of Biological Sciences, Northern Arizona University, Flagstaff, AZ; and Sally M. Haase, USFS, Pacific Southwest Research Station, Riverside, CA
Effects of Ecological Restoration Alternative Treatments on Nonnative Plant Species Establishment ...............................................250
Michael T. Stoddard and Christopher M. McGlone, Ecological Restoration Institute (ERI), Northern Arizona University, Flagstaff, AZ; and Peter Z. Fulé, ERI and School of Forestry, Northern Arizona University, Flagstaff, AZ
Roots of Research: Raphael Zon and the Origins of Forest Experiment Stations .............................................................................257
Jeremy C. Young, Indiana University, Bloomington, IN
Appendices
Fort Valley Experimental Forest Research Projects: 1909-1926 .......263
Publications Related to Fort Valley Experimental Forest Research ..267Compiled by Susan D. Olberding
xi

xii

xiii


USDA Forest Service RMRS-P-55. 2008. 1
Drought, wildfire, extinction, and invasive species are considered serious threats to the health of our forests. Although these issues have global connections, we most readily see their consequences locally and attempt to respond with management based on science. For 100 years, the Fort Valley Experimental Forest (FVEF) has provided educational and experimental support for management of natural ecosys-tems in the Southwest. This introduction provides a context for how we address forest health threats through adaptive management.
Fort Valley is a forest-enclosed prairie in northern Arizona, at the base of the San Francisco Peaks. The volca-nic Peaks form an isolated, compact montane complex on the extensive Colorado Plateau. The Southwest includes several ecoregions with highland landforms in a warm-dry conti-nental zone. Precipitation is strongly bimodal due to winter
storms and summer monsoons; annual precipitation is highly variable. The Southwest interfaces with several biotic prov-inces—Rocky Mountain, Great Plains, Mexican, Californian, and Great Basin. Because of its geography, the region has a relatively high biodiversity and is characterized by numerous, isolated ‘sky islands’ with biota that are generically similar but locally distinct. The biological phenomena of life zones are well displayed as one ascends from the Painted Desert to the summits of the San Francisco Peaks, as first scientifically described by C. Hart Merriam in 1890. His observations on the distributions of flora and fauna and their correlation to el-evation, aspect, and therefore climate, demonstrate the value of Fort Valley as a biogeographical laboratory.
In the late 1800s, the northern Arizona forests provided an abundant timber supply of valuable and easily harvested southwestern yellow pine (Pinus ponderosa) for railroad
Fort Valley: A Natural Laboratory for Research and Education
Brian W. Geils, Fort Valley Scientist-in-Charge, USFS Rocky Mountain Research Station, Flagstaff, AZ
A graphical rendition of the San Francisco Peaks, circa 1890 illustrates forest stands were composed of several size-classes, arranged into tree groups and openings. Because several non-forested, alpine slopes in the composition closely resemble what is seen today, this artwork is considered a faithful representation. From: C. Hart Merriam.North American Fauna No. 3. (orig. pub 1890. In: Selected Works of Clinton Hart Merrian, NY: Arno Press. 1974.
In: Olberding, Susan D., and Moore, Margaret M., tech coords. 2008. Fort Valley Experimental Forest—A Century of Research 1908-2008. Proceedings RMRS-P-55. Fort Collins, CO: U.S. Department of Agriculture, Forest Service, Rocky Mountain Research Station. 282 p.

2 USDA Forest Service RMRS-P-55. 2008.
ties. The harvesting process required the heavy cutting of old-growth timber with little attention given to future pro-ductivity. This era did, however, generate a concern for forest conservation and especially the local need for regeneration of ponderosa pine on cut-over lands. G.A. Pearson quickly de-termined that ponderosa pine seeds irregularly and conditions for germination and establishment in the Southwest are in-frequent. Chance combined for several years around 1919 to abundantly regenerate Fort Valley’s pine forest. Silviculture research could then focus on improvement cutting and re-duction of losses from various agents including sheep and mistletoe.
An extensive forest of young ponderosa pine developed. Fire suppression caused a near absence of the frequent, surface fires common in preceding generations and the new forest hardly resembled the forest it was replacing. Technology also developed so by the time of the second cut on Fort Valley silviculture plots, truck logging replaced railroad logging. Silviculturalists could consider options of lighter and more frequent cuttings. Although sheep no lon-ger were a menace to pine, mistletoe became an even greater threat. Plot experiments to compare alternatives for silvicul-tural control of mistletoe were supplemented with detailed studies of life history and epidemiology. Other research of the time included continuation of meteorological observa-tion, range investigations, studies of other tree species (e.g., Douglas-fir and aspen), and expansion of work to additional sites in the region.
New research methods and questions emerged as the new pine forest grew into dense stands of mostly even-aged black-jack ponderosa pine. Technology provided mensurationists with electronic computers and improved statistical analysis. For optimizing forest productivity through density manage-ment and sanitation, research developed growth and yield
models. Before prescribed burning was a common manage-ment practice in the Southwest, Fort Valley research began quantifying the effects of different burning regimes. The dis-appearance of old-growth yellow pine exacerbated concerns over loss of wildlife species and their special habitat needs such as large snags.
The 1919 pine forest has reached middle age. Dominant, unstressed trees are large and their growth is still accel-erating; but many trees are crowded and their growth is suppressed. With the occurrence of extreme fires and bark beetle infestations, more of the public became involved in forest management discussions and pressed for reduction of fire hazard and restoration of forest health. Research has been established at Fort Valley to test whether re-creating a pre-settlement forest structure and fire regime could produce desirable forest conditions.
The lessons from Fort Valley are that forests and so-cieties change, sometimes unexpectedly and contrary to control efforts. An alternative approach is adaptive manage-ment—management as experiment, involving a diverse and informed public with flexible management agencies to foster resilient, healthy ecosystems. In that regard, the Fort Valley Experimental Forest serves several valuable functions. Fort Valley is dedicated for the purpose of long-term research to develop better management strategies and tactics, whether as historically for maximizing timber productivity or cur-rently for sustaining ecological services, or in the future for responding to climate change. With partners, managers, and stakeholders, Fort Valley researchers and professionals bring their scientific experience and knowledge to designing and conducting management experiments. Historically, Fort Valley had been the ranger school, now it can be a conserva-tion education classroom and laboratory for students of all ages and diverse interests to learn ecosystem stewardship.
The content of this paper reflects the views of the author(s), who are responsible for the facts and accuracy of the information presented herein.

USDA Forest Service RMRS-P-55. 2008. 3
Introduction
Nine miles separate Flagstaff from Fort Valley over a meandering road that skirts the base of the San Francisco Peaks climbing from 6900 feet to 7300 feet in elevation. The road weaves through a stunning forest interspersed with small meadows, or parks. The journey provides glimpses of a splendid ponderosa pine with a 36-inch diameter and fire scars towering above smaller trees. The final mile opens into Fort Valley, an expansive meadow with abundant grass and water and a settlement history defined by people who enjoyed the beauty and resources but not the extreme weather condi-tions (Figure 1, Olberding 2002).
Protection of these resources was the reason Raphael Zon, Gustaf A. Pearson, and the others considered Fort Valley as a research site with a mission to study and perpetu-ate the predominant tree of the Southwest—the ponderosa pine (Figure 2). The forests were threatened by extensive logging and grazing and were not regenerating. T. A. and M. J. Riordan, owners of Flagstaff’s Arizona Lumber and Timber Company sawmill, foresaw trouble as they faced a fast-depleting resource. Upon the advice of USFS inspector Frederick E. Olmsted, the Riordans sent a letter in 1903 to their friend Gifford Pinchot, Forester of the USDA Bureau of Forestry (later to be the U.S. Forest Service), suggesting that they “...do some experimenting in forestry work.” Pinchot didn’t need any encouragement and directed Chief of Silvics Raphael Zon to create an outline for experiment stations (Zon 1908).
In: Olberding, Susan D., and Moore, Margaret M., tech coords. 2008. Fort Valley Experimental Forest—A Century of Research 1908-2008. Proceedings RMRS-P-55. Fort Collins, CO: U.S. Department of Agriculture, Forest Service, Rocky Mountain Research Station. 282 p.
Zon met young forester Gustaf A. Pearson in Flagstaff in August 1908 to explore several sites recommended by Zon’s assistant, Samuel Trask Dana, for the first experiment station (Fry 1967). Pearson, originally hired by the USFS in 1907 to work on the Wallowa National Forest, was already in north-ern Arizona studying reproduction of western yellow pine. Zon and Pearson most likely encountered USFS Associate Forester Albert F. Potter, once an Arizona livestock operator, who had arrived in Flagstaff in late July (Coconino Sun July 31, 1908). The Coconino Sun of August 7, 1908, noted:
Mr. Zon will establish temporary headquarters at Fort Valley for the purpose of making exten-sive investigations concerning the growth of pines, and endeavor to ascertain what causes most affect the growth of seedlings. The reason for non-growth in localities and other interest-ing and valuable information will be gathered by an exhausting study of conditions here. Mr. Pearson will have direct charge of the work.
Fort Valley was the first of nine USFS forest experi-ment stations that opened between 1908 and 1914 to study American silviculture through ongoing research working co-operatively with a forest’s natural cycle, yet seeking optimal growth for timber harvesting. Objectives were to gain knowl-edge of timber, range, and water resources management and to furnish answers to technical and practical issues for both public and private lands administrators. Silviculturists and other forest investigators were to appraise the relationship of the entire forest biological unit and then furnish scientific data to National Forest management (Pearson 1914).
“It Was a Young Man’s Life”: G. A. Pearson
Susan D. Olberding, Historian/Archivist, USFS Fort Valley Experimental Forest, Rocky Mountain Research Station, Flagstaff, AZ
Abstract—The nation’s initial USFS research site commenced in a rustic cabin in the midst of northern Arizona’s expansive ponderosa pine forest. Gustaf A. Pearson was the first in a distinguished line of USFS scientists to live and study there. A visitor to Fort Valley today often wishes he could have stood in Pearson’s large boots (he was said to have enormous feet) as he and his early compatriots were true pioneers on a journey toward understanding nature’s methods of ponderosa pine regeneration. Over the past century, their efforts have been honed into an extensive foundation of silviculture, range and watershed research that benefits current and future researchers. The pioneering seeds of techniques they sowed and carefully nurtured have grown into modus operandi for scientists. The tree Raphael Zon planted is now a towering, stately ponderosa pine that proffers progress in science, knowl-edge, and preservation. This historic spot and its scientific yields have earned celebration and acknowledgment. This paper looks at the cultural history of FVEF and provides introduction to the subsequent papers in these proceedings.

4 USDA Forest Service RMRS-P-55. 2008.
Figure 1. Fort Valley park area in 1918 with the San Francisco Peaks in the background. The FVEF headquarters are to the left center in the trees. This view is looking north. USFS photo 89769 by G. A. Pearson.
Figure 2. G. A. Pearson in 1944 just prior to his retirement. This photo is taken on permanent sample plot 10, near FVEF headquarters. USFS photo 433053.
Directors of Fort Valley Experimental Forest1908-1935 - Gustaf A. Pearson1935-1942 - Arthur Upson (then the SWFRES)1942-1953 - Raymond Price(In 1953, the SWFRES merged with the RMFRES and
Project Directors have since been in charge of Fort Valley/Flagstaff RMRS)

USDA Forest Service RMRS-P-55. 2008. 5
The Work Begins
Fort Valley provided an ideal research locale as the forest had not been decimated by logging because of its distance from the railroad. Water was readily available, and an ex-isting cabin gave Pearson a home/office (Figure 3). That first autumn he planted a nursery, established meteorologi-cal sites, and designed experiments. When winter came, he relocated to the “Hotel de Flag,” a large house in Flagstaff rented by bachelor USFS employees and used also by vis-iting USFS scientists (Maunder 1958). He returned to the uninsulated and fireplace-less cabin once official word ar-rived that the Experiment Station was to permanently open on January 1, 1909 (Arizona Farmer 1946). He chinked the walls with whatever he could find and buried his canned food in the ground to keep it from freezing, but it still froze and the labels came off. He never knew what his meal would consist of until he had opened a few cans (Schubert 1965). Pearson,
accompanied by his two mules, Pat and Mike, conducted research within walking, snowshoeing, or riding distance from the cabin. Those mules could travel the nine miles into Flagstaff in one hour and forty minutes, when encouraged with a whip. Later, when more staff was on site, the mules escorted the young men into town for Saturday night enter-tainment. Pearson valued the mules, but one staff member considered them grumpy, independent and more trouble than they were worth (Fritz 1964, Pearson 1936).
The official opening was a brief mention in the local newspaper stating that Ranger William W. Wilson was as-signed to assist Pearson at the Experiment Station (Coconino Sun January 9, 1909). Townspeople generally regarded the new facility with passing interest as most were not con-cerned about a small research lab in distant, cold Fort Valley. Foresters and lumbermen, and later, stock raisers, were cog-nizant of the Station’s work, but its remote location limited visitors and curiosity seekers.
Figure 3. The ranger cabin that Pearson used as quarters when the FVEF first opened during the winter of 1908-09. USFS photo 89799 by G. A. Pearson.
Figure 3a. The ranger cabin as it appeared in August 1909. Screened planting beds and shade frames appear in the foreground. USFS photo 83522 by G. A. Pearson.

6 USDA Forest Service RMRS-P-55. 2008.
The Fort Valley Experimental Forest
Initially called the Coconino Experiment Station, the name changed in 1911 to the Fort Valley Experiment Station to avoid confusion with the Coconino National Forest. The area is named Fort Valley because of a stockade built in the area in the 1870s by John Willard Young, a son of LDS President Brigham Young (Olberding 2002). Today, Fort Valley Experimental Forest (FVEF) headquarters is com-monly used.
An April 7, 1909, agreement between the Coconino National Forest and Coconino Experiment Station exempted the lands near the Fort Valley headquarters from hunting, log-ging, fuelwood cutting, or homesteading. The only exceptions to these protections were to occur as part of the research plan. The District 3 Investigative Committee Report of December 1915 stated that progress on designation as an experimen-tal forest would not proceed until funds were allocated for this work. One thousand dollars was estimated as needed for examinations and mapping and an annual $5,000 sum was re-quested “...to place the Forest under the form of management required to make it serve the ends for which it is created” (USFS 1915). Finally, in 1931, this agreement was made into a Forester’s Order that permanently withdrew 2,420 acres as the Fort Valley Experimental Forest. Amendments in 1935 and 1941 brought the total to 4,950 acres.
The five separate units of the Fort Valley Experimental Forest originally included: (1) the headquarters, (2) on U.S. Highway 180 between Snowbowl Road and Hidden Hollow area, (3) Wing Mountain, (4) Hwy 89 North Cinder Pits area, and (5) Coulter Ranch, south of Mormon Lake. The Cinder Pits area was returned to the Coconino National Forest in 1975. The current total acreage for the Fort Valley Experimental Forest is 5,270 acres. The 154-acre G. A. Pearson Natural Area of old-growth ponderosa pine was es-tablished in 1951 and is included in Unit 1.
“… if regeneration worked here … it could be done anywhere else more easily.” (Fritz 1964)
Forest Assistant Harrison D. Burrall, Student Assistant Harold H. Greenamyre, and a clerk joined Pearson as staff in the spring of 1909. Their ideas and experiments were restrict-ed only by human limitations and budget restraints. They studied regeneration, impact of weather on seedlings, seed sprouting, uses of forest products, disease and insect control, harvesting methods, and livestock effects. Research locales expanded around the Southwest as roads and vehicles im-proved. Several permanent technical men and ten to twelve temporary summer workers were assigned to Fort Valley as years passed. A cook/janitor was hired at $60 plus board per month since Pearson felt scientists were hired to do research,
not cook. His salary was paid by both the Forest Service and staff; prorated to about $1/day/man (Figure 4, Pearson 1914).
Fort Valley evolved into a well-respected scientific site where researchers fostered innovative silviculture work. USFS pioneering scientists overlooked marginal living and working situations and without their spirit and dedication, the Forest Service Research program would not have progressed as rapidly as it did. Fort Valley scientists relished walking out their front doors into their workplace, moonlight snowshoe-ing, and taking long walks. Work in the forest was done from sunup to sundown, six days a week, for about $3.00 per day. Reports were written beside dim lantern light in drafty tents or while sitting by the fireplace. Early scientists who worked at Fort Valley include Clarence F. Korstian, Alexander J. Jaenicke, Jack Boyce, Ferdinand S. Haasis, Max H. Foerster, Wilbur R. Mattoon, Robert R. Hill, Harold S. Betts, E. M. Hornibrook, and Enoch W. Nelson, to name just a few (Figure 5, Gaines and Shaw 1958). Some researchers were assigned to specific experiments and left after a short stint, others stayed for years. Families were often in residence. In 1921, Ferdinand Haasis’ wife, when eight months pregnant, traveled to Albuquerque to give birth as Flagstaff did not have a hospital (Bean 1999). Visitors, usually USFS related, included Zon, and a rumor persists that Gifford Pinchot tore
Figure 4. The water tank and bath house at FVEF. The mess house is to the left. USFS photo 92583 by G. A. Pearson in 1911.

USDA Forest Service RMRS-P-55. 2008. 7
his pants on the barbed wire fence at the Wing Mountain per-manent sample plot. Pearson noted that in those early days, guests could stay for awhile and not have to leave right away for another appointment (Pearson 1936).
Pearson wanted the headquarters to blend in with the for-est as if the structures magically appeared. After five years as FVEF Director, he wrote that construction of facilities should be accomplished prior to beginning scientific work,
although Fort Valley did not occur that way (Pearson 1914). A total of $500 was allotted for construction during 1909, and a combined home/office (today’s Pearson House) that Pearson made sure was insulated was built. Improvements in the initial years were a greenhouse/laboratory, store house, water plant that included a well, windmill and elevated tank, and root cellar (rare in the Southwest) to store perishables, as electricity did not reach the site until 1936. Pearson encour-aged a neat and orderly appearance of an experiment station, and believed facilities should be available to the public for educational purposes so people could view forestry science in action (Figure 6, Pearson 1914). He hoped that experiment stations would be permanent with ongoing facilities, staff and organization to carry on long-term work. Pearson noted this was most important in the southwestern forests because 200-300 years is required to mature a forest and twenty years to restock it after harvesting (Coconino Sun September 3, 1920). Fort Valley claims the construction of the first bath-room in Region 3, built in l9l8. It actually was a bath house, built inches away from the Pearson House since there were cost limitations on existing buildings (Pearson 1936).
By l927, after 19 years, Fort Valley consisted of only four structures. Additional funding from the McSweeney-McNary Act enabled increases in construction and research projects. The Southwestern Forest and Range Experiment Station (SWFRES) was created as the administrative umbrella over all USFS Research occurring in Arizona and New Mexico. Pearson was named Director and headquarters were estab-lished in Tucson. Staff moved seasonally between Tucson to the various field sites, including Fort Valley, which then fo-cused on forest and range investigations.
To house the extra scientists, the Civilian Conservation Corps built structures and worked on various projects re-lated to silviculture research. More construction occurred
Figure 5. 3 USFS scientists prepare for work in 1913. From left: Hermann Krauch, M. W. Talbot, and Reginald Forbes. USFS photo F16929A.
Figure 6. The FVEF headquarters as viewed from the nursery site about 1912. Note the windmill. Tents are used by temporary employees. USFS photo 449257 by G. A. Pearson.

8 USDA Forest Service RMRS-P-55. 2008.
during the 1930s than during the previous two decades of Fort Valley’s existence and most of the extant residences are CCC-built. All the commotion caused Pearson to comment that the garage built for sixteen vehicles still left some out in the rain (Figure 7, Pearson 1936). The CCC installed a two and one-half mile underground pipeline between Little Leroux Springs and the FVEF. Later, Big Leroux Springs wa-ter came through the same pipeline.
The FVEF complex consisted of a two-story office build-ing with a built-in safe, a laboratory, garage, workshop, water plant, schoolhouse, mess hall, dormitory, and seven furnished residences by the end of the 1930s. It was a bus-tling community with activities like square dances, group waffle breakfasts and Thanksgiving dinners, and volleyball games with twenty people on each side of the court. The so-cial activity was short-lived as staff dwindled during World War II. A brief occupancy surge occurred prior to the merging of the SWFRES into the Rocky Mountain Forest and Range Experiment Station (now RMRS) in 1953. But, in 1958, at Fort Valley’s fiftieth anniversary, the Arizona State College in Flagstaff (now Northern Arizona University) opened a forest-ry school in which USFS researchers worked in conjunction with faculty from an office building constructed next to the forestry school. Foresters then worked and lived in town and visited Fort Valley.
Other agencies rented many of the Fort Valley structures from the 1970s-1990s that kept the facility mostly intact. Residents have been sporadic since. The site was listed on the National Register of Historic Places in 2001. The his-toric headquarters has had minimal occupancy and upkeep until 2005 when USFS deferred maintenance funds enabled some sorely-needed repairs to occur on four of the twelve buildings.
The Science of Silviculture
Restocking the Southwest forest was a key element in District 3’s research agenda. The scientists’ task was to re-plant the forest so the trees could again be harvested, thereby supporting local economy yet also perpetuating the resource. Over 85 percent of the timber cut in 1908 in Arizona and New Mexico was ponderosa pine, unquestionably the most valu-able marketable tree (Pearson 1942). Studies were initiated on every factor that might influence a tree’s life: livestock grazing, weather, disease, and rodents. Silviculture science is the cultivation and care of forest trees. “Cultivation” re-fers to ridding the forest of inferior products and improving quality and growth and “care” refers to encouragement of natural regeneration and maintenance of all age classes. A balanced program between fundamental and applied research contained the following objectives: cutting methods, per-petuating the forest crop, and fostering natural regeneration. One approach sometimes took precedence to respond to im-mediate demands. Every FVEF project fit into one or both of these categories, i.e., pruning ill-formed stems, keeping livestock away from the seedlings, selective cutting, or thin-ning of stands. Through these tests, defined by Pearson in 1944 as a form of agriculture, scientists endeavored to learn methods of tending the ponderosa pine forests when Nature was discouraged from using her preferred managerial style (Pearson 1944).
The science was new and challenging. Every factor that might influence a tree’s life was analyzed. Plots were es-tablished to study how to thin, prune, burn, plant, harvest, or control disease and pests. They were fenced and then re-fenced higher to exclude elk. Trees were planted, nurtured,
Figure 7. CCC workers sit atop juniper posts at the FVEF headquarters. The schoolhouse shows to the right. USFS photo 330506 by G. A. Pearson in September 1936.

USDA Forest Service RMRS-P-55. 2008. 9
abused, or left alone, but never forgotten. Research plans were continually adapted to fit current conditions or to follow a surprise discovery. The main research topics fo-cused around ponderosa pine: (1) ecology of forest types; (2) growth, reproduction, and mortality; (3) artificial refor-estation; (4) stand improvement; (5) control of damage; (6) sale and logging of timber; and (7) management of the forests (Pearson 1942, Ronco 1998).
Researchers explored unencumbered space to really see what was affecting a tree’s life. They could find where: a por-cupine had enjoyed a tasty meal of pine needles, an elk had bedded down, mistletoe had taken hold, a lightning-struck tree had fallen onto a neighbor, or snow pack had bent a tree over. This intense, on-the-ground time helped scientists plan their experiments and course of action. Data recording was meticulously scrutinized and redone when necessary. Publications documenting research work received similar in-spection (Figure 8).
Communicating research findings to District 3 National Forest managers was accomplished through a quarterly “Fort Valley Bulletin,” first published on May 1, 1917, in efforts to provide the scientific results to the foresters. The introduc-tory issue mentioned the research analysis determined that 15-30 years or more is needed to restock cutover yellow pine stands. Studies of forest types, tip moths, brush disposal, and Douglas-fir were also addressed.
Permanent Sample Plots
District (now Region) 3 Chief of Silviculture Theodore S. Woolsey, Jr. aspired to mark 50,000 acres of logged-over
southwestern National Forest lands as permanent sample plots, but compromised on 2,000 acres, which still made District 3 one of the National Forest Regions with the highest number of research lands set aside. Woolsey, Pearson, and Wilbur R. Mattoon developed the methods and ideas used on the sample plots; Harrison D. Burrall did much of the establishment work. The initial plots were on the Coconino National Forest, and by 1912, 25 plots around the Southwest had been established. Lengthy instructions on how to estab-lish a sample plot were written and revised several times (Mattoon 1909, Woolsey 1912).
Permanent sample plots maintained ongoing experi-ments that attempted to understand a forest’s natural growth cycle. “Extensive” plots of 72 to 480 acres contained trees that were not tagged and measured. Smaller plots, known as “Intensive,” ranged from 3 to 14 acres. On the Intensive plots, each tree was tagged with a number and then monitored over its lifetime. Maps of the plots show exact locations of every thing on it, for example downed logs, stumps, plants, rocks. Usually a tree was measured every five years, some-times more often, and checked for disease infestation or damage from rodents or a number of other factors that af-fected growth. Pearson ideally wanted a 200-year record of measurement for a complete life history; however, the major-ity of the trees were not recorded after a twenty-year span because of changes in investigative emphasis. Most of the plots were remeasured in the 1990s.
Everything needed to be invented—choosing the site and marking it off, forms used in recording data, best use of photo-graphs, how often to examine, and what to examine. Pearson was a stickler for detail and documenting every particular element. This frustrated some co-workers, but for historical
Figure 8. Two USFS scientists record data on seedling-count strips on the Fort Valley Experimental Forest, AZ. USFS photo 16931 by Hermann Krauch in 1913.

10 USDA Forest Service RMRS-P-55. 2008.
TURPENTINEIn April 1908, just prior to Fort Valley’s establishment, Royal S. Kellogg of the Department
of Forestry called upon Flagstaff lumberman Michael J. Riordan to discuss his idea of developing a pulp wood operation on the Coconino National Forest and using the waste for turpentine and other byproducts. Kellogg was anticipating a shortage of turpentine due to exhaustion of the southern trees’ supply of resin. Riordan’s reply is lost to history, but perhaps this inquiry led to the 1910 and 1911 turpentine experiments near Fort Valley.
Harold S. Betts, Forest Service engineer for timber tests, first began a turpentine experiment at Fort Valley in Fall 1910. He brought laborers from the southeastern forests to tap yellow pines within walking distance of FVEF. Ninety trees were notched and hung with cups to collect the dripping resin. To tap a tree, the outer bark is removed from one side near the base. An incision is made and an “apron” is inserted, with a cup placed below the apron. The apron collects the gum that drips into the cup. A new chip is made into the tree each week above the previous one. Two collections of resin during a two-month period showed that the ponderosa pine produces an average of 23 barrels of resin per dipping. The southwestern trees average 25-30 barrels per dipping. These results were promising enough to cause Betts to plan more extensive experiments the following year, especially as demand for turpentine was increasing.
In April 1911, a second season of turpentining was established near FVEF in four different areas over 28 acres of black and yellow pine that involved 600 trees. Betts described the area as having little undergrowth and only a few trees less than 12 inches in diameter. Resin was collected every three weeks after the initial tap. The collected gum was put in buckets and then weighed to determine how much dip was gathered. In 1911, an average flow of 0.217 lbs/cup/week compared to a Florida average of 0.263 lbs/cup/week. The dip was comprised of 77.9% rosin and 22.1% turpentine, both of which are satisfactory for commercial use.
On two of the four areas, the blackjacks produced more resin than the yellow pine; while on the third area the opposite happened. In the fourth area, fifty trees larger than 15 inches in diameter were tapped with two cups—one on the north side and one on the south—to test the difference of production between cups. Twenty-seven south cups yielded more than the north while 17 north cups produced more than the south, and six trees had the same flow on each side. One occurrence unfamiliar to the southerners was the diurnal temperature ranges of at least 40 degrees which caused the gum to harden overnight. After a few hours in the morning sun, the gum would melt and drip again. Such temperature fluctuations are rare in the hot and humid south.
Ponderosa pine produces about 4/5 the quantity of southeastern trees when factors such as length of season are the same. The southern season lasts for 35 weeks while northern Arizona lasts 26 weeks at best since flow corresponds to temperature changes. But for whatever reasons, the turpentine project did not continue and the market never developed.
Turpentine work on a ponderosa pine in northern Arizona in August 1910. USFS photo 93752.

USDA Forest Service RMRS-P-55. 2008. 11
records, the attention to specifics is very helpful in allowing the research to continue today. Letters between Pearson and Regional staff on what paper to use for forms are indicators of his exactness. The original measurements of 1909 were amended by the 1914 (5-year increment) measurements to include factors missed in the initial record. Tin tree tags were replaced by galvanized tags and placed four and one-half feet above ground level, a point that was determined by actual measurement, not merely guessed at. Initial methods were al-tered when a newer one presented itself to be more accurate, as in the 1912 change from using calipers for diameter mea-surements to using a steel diameter tape (Scherer 1914). All trees were then remeasured with the steel tape. Instructions were prepared for newcomers who practiced on an already-measured plot before going out on their own. These forms and reports are housed in the FVEF archives.
Critical to the work was the accurate measurement of trees. Initially, the method of measuring a tree’s diameter at breast height (dbh) was to be taken at the level of a man’s chest. Chest heights vary, so the dbh of a tree could also fluctuate depending upon who did the measuring. FVEF scientists re-defined the proper way of determining a tree’s dbh: it is to be taken four feet above a nail driven into the south-facing base of a tree at ground level with all litter (fallen pine needles and grass) cleared away. Two to two-and-a-half inches of the nail was to be exposed so the nail wouldn’t be overgrown before the next measurement (Pearson 1915).
Natural Regeneration
The Riordans had grumbled at leaving two to four trees per acre, and science showed four to six seed trees above 20 inches dbh were needed to restock a logged area. Seedlings became established only under favorable conditions of seed, moisture, loose soil in the seed ground, protection, and weath-er and only one to two percent of germinated seeds survive. Pearson’s prediction that less than five percent of germinated seedlings survive caused Zon to caution that Pearson may be “digging a grave for himself instead of a monument” (Myers and Martin 1963, Pearson 1936, Ronco 1998).
Nature blessed scientific study in 1919-1920 when abun-dant precipitation in 1918 produced an exceptional ponderosa pine seed crop. An unusual rainfall of three and one-half inch-es in late May 1919 allowed germination of the 1918 seed crop to take root. Cloudy skies also kept the nighttime tem-peratures higher. These new seedlings could sink good roots before the fall drought time and resist frost-heave. Scientists were delighted with this unique opportunity to study tree sur-vival under superb conditions with this introduction of a new age class. But, the overstocking created new problems and foresters were soon lamenting the small-diametered, dense areas of spindly trees. The term “doghair thicket,” or trees as thick as the hair on a dog’s back, was heard. Arid conditions over the next decade caused high mortality rates of this crop, but the problem of overcrowded trees still exists (Gaines and Shaw 1958, Myers and Martin 1963).
Artificial Regeneration/Nurseries
One of the first projects at Fort Valley was to establish a nursery. Opportunities existed for experimental work to find what methods of planting, gathering seeds, mulch, trans-planting, etc., proved successful and what failed. Nurseries opened around the Southwest during the 1910s and grew thousands of seedlings that were later transplanted. As usual, these efforts were sparsely staffed. Expensive attempts at ar-tificial restoration failed except for the knowledge gained. By 1927, science indicated artificial planting was most success-ful when a small plot was completely cleared of herbaceous vegetation and the soil raked, seeds planted in gravelly soil, and the area screened against rodents. But transplanting continued to have mortality rates for fifteen years (Figure 9, Pearson 1950).
Meteorological Studies
Studying climatological effects on ponderosa pine regener-ation was an early Fort Valley priority. Three (later increased to six) meteorological observation stations were established in a chain across the open park of Fort Valley in 1909. The stations contained equipment to monitor temperature, precipitation, relative humidity, wind movement, measurement of melting, soil moisture and temperature, frost, and snow accumulation. Stations were placed in various locales—near the trees or in the open, and all were subject to different wind directions (Figure 10, Jaenicke and Foerster 1911, Pearson 1913).
Figure 9. Transpiration pots at FVEF in 1920. USFS photo 49175 by F. W. Haasis.

12 USDA Forest Service RMRS-P-55. 2008.
The data collected for this experiment indicated small, but important, differences in climactic variations. Additional re-search on forest cover in relation to temperature needed to be conducted and it was determined that the park area would not be a prime location for forest nursery development. A more
extensive weather study from November 1916 to January 1, 1920, provided data for the purpose of identifying ecological dif-ferences in changes of vegetation as an aid to fire protection. Scientists believed that forest types varied depending on when fire was most likely to occur because they dried out at different times. With the data, fire look-outs could then watch for indi-cators that a particular area was dry and susceptible to fire. A component of this project was to determine the point at which litter and ground cover will ignite and the effect of brush in various conditions as a fire hazard (Zon and Pearson 1915).
Instruments placed at various locations and altitudes recorded physical condi-tions that measured air temperature, soil temperature and moisture, precipitation, and wind. This project amplified C. Hart Merriam’s earlier work in 1889 that iden-tified lifezones. Stations were set from the woodland range of 5,100 feet to timberline at 11,500 feet in elevation. Forest rangers at Ash Fork and Walnut Canyon kept data for their locales. The weather stations placed at points up the San Francisco Peaks in the zones of yellow pine, Douglas-fir, Limber pine-Bristlecone pine, Engelmann spruce, and timberline were monitored by FVEF scientists. Young silviculturist Emanuel Fritz was involved in this project as he and co-workers installed the spruce loca-tion at 10,500 feet in mid-November when the ground was already frozen solid and they had to chip out ice and dirt to create a support hole for the station. They gathered data weekly from the stations, regardless of the weather. Departing from FVEF on foot at 5 a.m. with snowshoes, lunch, dog, and a snow measuring tube, they climbed 3,000 feet in elevation before they reached the first station. They had to brush snow away from the instruments, take the mea-surements with half-frozen fingers and then hike up to the next sites. When they finished they ran back down the mountain via moonlight (Fritz 1964).
Publications written about Fort Valley weather always noted the importance of climatic factors in relation to ponderosa pine regeneration. Lack of heat in the higher altitudes affects pines where spruce and fir dominate, and water was the limiting factor toward growth in the desert regions.
Edward C. Martin and Florence Cary MartinEdward C. Martin (1902-1972), considered by his peers as the
“world’s strongest mortal,” was hired by Pearson to build fence in 1932. He later supervised the Fort Valley CCC camps and eventually was named Station Superintendent. Ed’s formal schooling ended at the sixth grade as his father wanted him to take over the family farm, but Ed’s ambitions led elsewhere. He pitched baseball for a Chicago Cubs farm team but declined a spot on the major league roster because of no money. He ended up in Arizona where he and a partner kept mustangs in Sycamore Canyon one winter and sold them the next spring. He then accepted a position at FVEF. For the next 40 years, Ed worked either at Fort Valley or Tucson. He was amiable, proficient with tools, and well-respected as a firefighter (it is said he worked two shifts to everyone else’s one during a fire).
Florence Cary (1904-2001 arrived at FVEF in May, 1933 to work as G.A. Pearson’s secretary. She recalled driving from Tucson on that spring morning wearing sandals and stepping out into snow at FVEF. Her coworkers, including her future husband, chuckled at her. Florence worked in the office building on the Silvics side while the other side held the staff of the Range Division.
Single women lived in the apartment (known as the penthouse) above the office. After a several year courtship, Florence Cary and Edward C. Martin married in 1938 and soon moved into the Krauch residence. She went into Flagstaff about every three weeks for supplies on the very rocky and unpaved road which would later become Highway 180. Their daughter, Maybelle, aka Marty, was born in 1940 and raised at FVEF. Marty enjoyed an idyllic childhood with pet Abert squirrels and forts built amongst the rocks. She recalled swinging in a tree swing built by her father and hearing a mountain lion scream. She bolted to the ground and ran home with her feet barely touching the ground.
The Martin family were the only people living all year at Fort Valley during World War II. Florence planted a Victory garden and grew carrots, turnips, potatoes, lettuce, and beans in a flat area east of the nursery and stored the produce in the root cellar. She eventually had to quit her gardening because of rules regarding such activities on federal property. At one point during the War, she and Ed drove to the Coulter Sample Plot cabin where she knew some sugar was kept. With sugar being in short supply then, she didn’t want it to go to waste.
The family moved between Fort Valley and Tucson and retired in Flagstaff. In 1995, a birthday lunch for Florence was held in her work space at the FVEF office building. She entertained her hosts with stories of the past. Florence turned 91 years young that day.

USDA Forest Service RMRS-P-55. 2008. 13
The Science of Range Research
The southwestern range was as jeopardized as the forest when scientists began studying its perpetuation. Enormous numbers of grazing sheep, cattle, horses, and goats mowed down the native grasses in the late 1800s. The establishment of Forest Reserves initially prohibited access to public lands grazing, but ranchers objected and lobbied Washington of-ficials for a policy change. Finally, the Arizona Woolgrowers Association (AWGA) invited Gifford Pinchot to see first hand the effects of livestock grazing on public lands in northern
Arizona. In June 1900, Pinchot and USDA botanist Frederick J. Coville were met in Winslow by local hosts that included popular Holbrook rancher Albert F. (Bert) Potter, then an AWGA officer. They journeyed south to Show Low during the typical dry and dusty June and noted the few water holes were polluted and noted erosion on excessively overgrazed areas. Ponderosa pine seedlings had been eaten and trampled. By the end of the trip, Pinchot realized the need for livestock operators to have access to the public lands grass to stay in business. He next formed the USFS Branch of Grazing and, knowing he needed a man who knew his way around both the rangelands and the halls of Congress, asked Potter to head the new division. Potter crafted a grazing policy that protected the local stockmen as well as the forage, and implemented range research on specific sites (Pinchot 1947). But it was 1928 before adequate structure and funding was in place for a solid Range Research program.
Southwestern scientists had to keep in mind that by the time research plots were established, the range was so severe-ly overgrazed that, in many areas, the grasses would never recover to pre-European conditions. This must be remem-bered when interpreting data from protected plots. Range studies were first directed from District 3 headquarters in New Mexico where they had been a part of the curriculum since the beginning of the Forest Reserves. General admin-istration for the range studies came from the Washington DC, Office of Grazing Studies and then later the Division of Range Research.
Grazing Effects on Tree Regeneration
In Fort Valley, Pearson opposed any livestock grazing on the forests, but discerned he was fighting a losing battle, and proceeded with studies to best determine how young seed-lings could be protected from domestic graziers. In 1910, range research began in two areas near the FVEF, both upon the Tusayan (later the Kaibab) National Forest (Figure 11). One range, known as the Wild Bill (also called the Fort Valley Experimental Range), included 24,000 acres and was grazed by cattle. The other was 8,000 acres known as the Willaha sheep range near Kendrick Peak. Both ranges are of wood-land and ponderosa pine forest types, which comprise 88 percent of the southwestern forest types. Studies have once again begun on these areas.
The five Hill Plots, named for District 3 Chief of Grazing Studies Robert R. Hill, were established on the Coconino National Forest in 1910 to study the effects of intense live-stock grazing on tree regeneration (Hill 1911). In 1912, a secondary study of the recovery of understory vegetation when protected from livestock grazing began. These areas were examined until 1947, then not again until 2002.
Initial evidence showed that grazing impacted tree re-generation and stockmen, especially sheep raisers, naturally resented hearing that overgrazing was hazardous to range health. Efforts to discredit the scientists and their work and suppress the findings led to political pressure to close FVEF. During a joint meeting of the AWGA and the Arizona Cattle
Figure 10. A USFS scientist gathers weather records from the Campbell’s Camp area during the San Francisco Peaks study, 1917-20. USFS photo 31948A taken in February 1917.

14 USDA Forest Service RMRS-P-55. 2008.
Growers Association (ACGA) in July 1920, a Resolution passed by the conference members said the Fort Valley Experiment Station was considered worthless because “...the work has been an entire failure and a use-less expense to the amount of approximately $20,000 per annum,” and recom-mended that it be abandoned and that the lands occupied by it be restored to entry...” as reported in the Coconino Sun of July 9, 1920. A letter from Secretary of Agriculture Edwin T. Meredith to ACGA president Charles Mullen asked for spe-cifics as to where FVEF had failed. An apologetic response blamed the Resolution on “some sheepmen” that was approved by weary, uninterested cattlemen who passed it without real-izing what they were saying. FVEF remained open.
In 1927, with the creation of the SWFRES, range re-search was added to Fort Valley’s scope. Scientists, led by Charles K. “Coop” Cooperrider, conducted studies of range resources, domestic livestock, wildlife, and forest and range influences. Their purpose was to develop methods to ensure sustained yield of forage, develop livestock management pol-icies to stabilize range industry, and to modify these methods to serve the maximum proper use.
Major findings of Fort Valley range research was noted by Tucker (1989): “Coop and other Research men found that in several plots that had been under fence for a good many
years, death from drouth, mice and other rodents was almost equal to the damage outside of the plots.”
Edward Clayton Crafts began his USFS career at Fort Valley in 1932 on both timber and range studies and eventu-ally became USFS Associate Chief. He said a definite decision was never reached about grazing’s impact on regeneration and wildlife grazing had more effect on timber management than domestic grazing (Figure 12, Crafts and Schrepfer 1972).
Conflict
“Full crops of timber and forage can not grow on the same ground at the same time. The two may thrive side by side for a few years, but sooner or later one or the other must decline” (Pearson 1927).
By 1937, an irreparable breach between senior scientist Pearson and range staff caused administration to separate sil-vicultural and range. Mudslinging, accusations, suppression of scientific facts, and other harmful acts were occurring from both sides. By 1941, Pearson was instructed to limit his work to only pine reproduction before his 1945 retirement and to summarize his three decades of research into a manuscript that was published posthumously in 1950 as “Management of Ponderosa Pine in the Southwest.”
Figure 11. Steers at the edge of Deer Mountain tank on the Tusayan National Forest, AZ (now part of the Coconino National Forest). Note the browse line on the aspens. USFS photo 269371 by C. K. Cooperrider in 1929.

USDA Forest Service RMRS-P-55. 2008. 15
The Science of Watershed Studies
Fort Valley research concentrated on regeneration; however, part of the SWFRES mandate was to study watersheds at sites like the Sierra Ancha Experimental Forest in eastern Arizona and later, Beaver Creek in cen-tral Arizona. In 1925, Pearson and “Coop” corresponded with Washington office staff Earle H. Clapp, formerly of District 3, and W.R. Chapline on wording for an appropri-ation for watershed research. A watershed is an upstream drainage area that feeds a larger river basin. Scientists began watershed management investigations on the im-portance and effect of vegetative cover to the quantity and quality of stream flow, along with the indirect studies of reforestation that affect watersheds.
Summary
Even after a century, efforts toward the goal of 200 years worth of tree records are only half attained. The lands and resources of the twelve USFS Region 3 National Forests still have much of their research value. Ecological distinctions or lifezones, initially described by C. Hart Merriam, and de-veloped further by FVEF scientists, contain numerous study projects. The papers and poster papers included in these Proceedings contain more information on many of the com-ponents to Fort Valley-based research over the past century.
Edward C. Crafts, among others, believed that research-ers should live in the forest instead of in town and that researchers were hampered and frustrated because their projects were planned by administrators subject to political whims far from sample plots (Crafts and Schrepfer 1972). Methods of conducting research changed when a scientist
Figure 12. USFS scientist Edward C. Crafts holds a measuring stick as part of the Cooperrider/Cassidy grazing study at FVEF. USFS photo 319004 by W. J. Cribbs in 1935.

16 USDA Forest Service RMRS-P-55. 2008.
would drive to the office in a personal vehicle, then drive to the forest in a government vehicle, gather data, and return to the office to compile results while looking at a computer screen. Originally, researchers would walk from home to the office, then walk into the forest and gather data, return to the office and ponder the data while looking at the forest outside the window, and then walk home in the evening. A forester should instinctively consider all options—altitude, exposure, wildlife, flora, water table, and understory—in an attempt to determine tree growth success or failure (Figure 13). They should also research and analyze experiments on a given study in more than one area before making blanket recommendations, especially in the diverse Southwest where climate, soil types, and conditions change so rapidly.
Cooperrider, Krauch, Pearson, Zon, and the Riordans believed the use/abuse of the Southwest forests and ranges detrimental to future generations. They saw beyond imme-diate greed and wastefulness and on to the importance of conservation and fought for it. Their efforts continue today by scientists and students with the same vision: perpetuation of the magnificent ponderosa pine forest and expansive range lands of the Southwest. Fort Valley’s scope of work for its second century has a strong, firm foundation from which to build upon because of the pioneering scientists of yesterday, today, and those yet to come.
Acknowledgments
Special thanks to historian Joan Brundige-Baker and USFS Historian Aaron Shapiro for reviewing this paper and providing insightful comments and suggestions. I also want to thank those who shared their stories of life at FVEF.
References
Arizona Farmer. 1946. Pearson of the pines. Vol. 25:1.Bean, Barbara Haasis. 1999. Interview with author, April 25, 1999.Coconino Sun, Flagstaff, AZ.: July 31, 1908, August 7, 1908. Jan.
9, 1909, July 9, 1920, Sept. 3, 1920.Crafts, Edward C.; Schrepfer, Susan R. 1972. Forest Service
researcher and congressional liaison: An eye to multiple use. Forest History Society, Oral History Office. Santa Cruz, CA.
Fritz, Emanuel. 1964. Recollections of Fort Valley, 1916-1917. Forest History. 8(3).
Fry, Amelia. R. 1967. Samuel T. Dana: The development of forestry in government and education. Berkeley, CA: University of CA Regional Oral History Office. p. 8-9.
Figure 13. A portion of the FVEF headquarters as it appears today. Photo by S. D. Olberding.

USDA Forest Service RMRS-P-55. 2008. 17
Gaines, Edward M.; Shaw, Elmer W. 1958. Half a century of research—Fort Valley Experiment Forest 1908-1958. Sta. Pap. No. 38. Fort Collins, CO: U.S. Department of Agriculture, Forest Service, Rocky Mountain Forest and Range Experiment Station.
Hill, Robert R. 1911. Damage to forest reproduction by grazing on the Coconino and Tusayan National Forests. Circ. Washington, DC: U.S. Department of Agriculture, Forest Service.
Jaenicke, Alexander J.; Foerster, M.H. 1915. The influence of a western yellow pine forest on the accumulation and melting of snow. The Monthly Weather Review. 43.
Mattoon, W.R. 1909. The Establishment of Permanent Sample plots on Cut-Over Areas To determine the Rate of Growth. Unpub. Pap. on file at Flagstaff, AZ: U.S. Department of Agriculture, Forest Service, Rocky Mountain Research Station, Fort Valley Experimental Forest archives.
Maunder, Elwood R. 1958. Oral history interview with A. B. Recknagel. St. Paul: Forest History Foundation.
Myers, Clifford A.; Martin, Edward C. 1963. Fifty years’ progress in converting virgin southwestern ponderosa pine to managed stands. Journal of Forestry. 61(8).
Olberding, Susan D. 2002. Fort Valley: Then and now. Flagstaff, AZ: Fort Valley Publishing.
Pearson, G.A. 1913. A meteorological study of parks and timbered areas in the western yellow-pine forest of Arizona. Monthly Weather Review. 41.
Pearson, G.A. 1914. The administration of a forest experiment station. Forest Quarterly. 12(2).
Pearson, G.A. 1915. Instructions for the establishment of permanent sample plots. Unpub. Pap. on file at Flagstaff, AZ: U.S. Department of Agriculture, Forest Service, Rocky Mountain Research Station, Fort Valley Experimental Forest archives.
Pearson, G.A. 1927. Grazing and Reforestation. Journal of Forestry. 25(5).
Pearson, G.A. 1936. The oldest forest experiment station. Unpub. Pap. on file at Flagstaff, AZ: U.S. Department of Agriculture, Forest Service, Rocky Mountain Research Station, Fort Valley Experimental Forest archives.
Pearson, G.A. 1942. The Fort Valley Forest Experiment Station. Tucson, AZ: U.S. Department of Agriculture, Forest Service, Southwestern Forest and Range Experiment Station. 25 p.
Pearson, G.A. 1944. Multiple use in forestry. Journal of Forestry. 42(4).
Pearson, G.A. 1950. Management of ponderosa pine in the southwest. Mono. 6. Washington, DC: U.S. Department of Agriculture, Forest Service.
Pearson, G.A. n.d. Autobiographial Sketch. Unpub. Pap. on file at Flagstaff, AZ: U.S. Department of Agriculture, Forest Service, Rocky Mountain Research Station, Fort Valley Experimental Forest archives.
Pinchot, Gifford. Breaking new ground. NY: Harcourt, Brace and Co.
Riordan, T.A. 1903. Letter to Gifford Pinchot. Letterbook 585, Box 361, MS 47, Northern Arizona University.
Ronco, Frank. 1998. History of the Fort Valley Experimental Forest. Unpub. Pap. on file at Flagstaff, AZ: U.S. Department of Agriculture, Forest Service, Rocky Mountain Research Station, Fort Valley Experimental Forest archives.
Scherer, Norman W. 1914. Relative accuracy of calipers and steel tape. Proc. Society of American Foresters. Vol. 9(1).
Schubert, Gilbert H. 1965. Fort Valley Experimental Forest. Speech given at 1958 FVEF 50th birthday celebration. Unpub. Pap. on file at Flagstaff, AZ: U.S. Department of Agriculture, Forest Service, Rocky Mountain Research Station, Fort Valley Experimental Forest archives.
Tucker, Edwin A., comp. 1989. The early days: A sourcebook of southwestern region history. Albuquerque: Southwestern Region, USDA Forest Service.
U.S. Forest Service, District 3. 1915. Investigative Committee Report of December. Unpub. Pap. on file at Flagstaff, AZ: U.S. Department of Agriculture, Forest Service, Rocky Mountain Research Station, Fort Valley Experimental Forest archives.
Woolsey, Theodore S., Jr. 1912. Permanent sample plots. Forest Quarterly. 10(1).
Zon, Raphael. 1908. Plan for creating forest experiment stations. College Park, MD: National Archives and Records Administration, Box 189, PI-18, Entry 115, RG 95,
Zon, Raphael; Pearson, G.A. 1915. Fire protection: Preliminary working plan. District Investigative Reports, 1915. Unpub. Pap. on file at Flagstaff, AZ: U.S. Department of Agriculture, Forest Service, Rocky Mountain Research Station, Fort Valley Experimental Forest archives.
The content of this paper reflects the views of the author(s), who are responsible for the facts and accuracy of the information presented herein.

18 USDA Forest Service RMRS-P-55. 2008.
Introduction
Early Cutting Experiments
Early cutting experiments at Fort Valley were largely partial timber harvests aimed at initiating the conversion of virgin stands to managed stands. Three timber management objectives were the primary underpinnings in planning these cuttings—harvesting a crop of merchantable timber for sale; retaining growing stock capable of providing “satisfactory” future crops of timber; and encouraging natural regeneration on sites where growing stocking was deficient (Gaines and Shaw 1958, Pearson 1950). Intermingling sapling and pole stands received less attention than sawtimber stands, because of the pressing need to obtain better silvicultural information on sawtimber and a lack of market outlets for the smaller materials. The five cutting methods tested in these early ex-periments spanning the period from 1919 to 1945 were group selection, favoring dominants, favoring subordinates, sal-vage, and improvement selection (Pearson and Wadsworth 1941, Pearson 1944, 1950). An unharvested stand (the pres-ent G.A. Pearson Natural Area) was included for comparison purposes.
Descriptions of Cutting Methods
Cutting of larger sawtimber trees for railroad construction at the time removed nearly 65 percent of the merchantable
In: Olberding, Susan D., and Moore, Margaret M., tech coords. 2008. Fort Valley Experimental Forest—A Century of Research 1908-2008. Proceedings RMRS-P-55. Fort Collins, CO: U.S. Department of Agriculture, Forest Service, Rocky Mountain Research Station. 282 p.
Historical Review of Fort Valley Studies on Stand Management
Peter F. Ffolliott, Professor, School of Natural Resources, University of Arizona, Tucson, AZ
Abstract—One hundred years ago, the U.S. Forest Service launched a research program on the Fort Valley Experimental Forest to enhance the management of southwestern ponderosa pine (Pinus ponderosa) forests. This research program was the first scientific venture of its kind in the United States at the time it was initiated in 1908—and it is now the oldest in the country. Much of the early research was undertaken by G. A. “Gus” Pearson, who established the experimental forest in 1908 and guided its research program until his retirement in 1945. Research conducted at Fort Valley can be grouped into the general categories of ecology and silvical characteristics to provide a foundation for management; obtaining successful regeneration, which was a main reason for beginning research at Fort Valley; stand manage-ment including conversion of the original (virgin) stands to a condition of improved growth and quality; and control of damaging agents to maintain stands in a healthy and productive status (Gaines and Kotok 1954, Pearson 1942, 1950, Schubert 1974, and others). This histori-cal review focuses mainly on the research efforts aimed at stand management with a lesser emphasis on the control of damaging agents.
sawtimber volume in the group selection method of cutting. Intermingling groups of smaller sawtimber trees were mostly undisturbed. A partial harvest of trees in lower crown classes provided growing space for selected dominant trees in the cutting experiment favoring the dominants. Most of the trees larger than 75 cm (30 inches) in diameter (dbh) and smaller trees of poor form and high risk of not surviving were also cut. Dominants were cut where “good subordinates” could be liberated in the cutting experiment favoring subordinates. Additionally, most of the trees larger than 65 cm (26 inches) in dbh were cut. Harvesting of larger trees not expected to live 30 years into the future removed about 35 percent of the merchantable sawtimber volume in the salvage cutting. Subordinate trees were not intentionally released.
Improvement selection was developed at Fort Valley be-cause the other cuttings tested were “silviculturally deficient” according to Pearson (1942, 1950) and Gaines and Shaw (1958). Improvement selection was aimed at placing a stand in a “vigorous growing condition” and building up effective growing stock by improving the spacing of trees in sawtim-ber groups to increase their growth; retaining the best quality trees for future growth; and removing poor-form and high-risk trees. These intentions took precedence over immediate timber sales and planning for future timber yields.
Timber Yields Following the Cuttings
Pearson (1950) and other silviculturalists working at Fort Valley anticipated that timber yields following the cuttings

USDA Forest Service RMRS-P-55. 2008. 19
would be reflected by the subsequent growth, mortality, and replacement of trees in the treated stands. Growth would manifest itself by increased diameter and height increments that (in turn) could be translated into volume. Mortality would eliminate trees and, in doing so, lower aggregate increments of the stands. It was felt, however, that replace-ment by regeneration and the movement of smaller trees into merchantable size classes would balance mortality to some extent. Therefore, measurements of growth, mortality, and replacement were taken following the cuttings to evaluate the “effectiveness” of each of the experiments in satisfying the timber management objectives (Gaines and Kotok 1954, Pearson 1950). Similar measurements were also made in the virgin stand.
Analyses and summaries of the growth, mortality, and re-placement measurements obtained are too extensive to present in this paper. However, in addition to the publications cited above, information on the progression of growth, mortality, and replacement patterns in the cut stands in comparison to the virgin stand are found in early papers by Krauch (1926, 1930, 1937), Lexen (1935, 1939), Pearson (1940, 1942), and others.
Second Cutting Experiments
Pearson and the other silviculturalists felt that the initial cutting experiments at Fort Valley often failed to place the treated stands in a “desired state” for future timber production. A predominance of older sawtimber trees remained and there was a deficiency in intermediate and smaller trees in many of the treated stands. Also, the advanced reproduction fol-lowing the cuttings did not always bridge the gap of missing age classes. As a consequence, a second cycle of experimen-tal cuttings, focusing mainly on salvage and improvement selection, were imposed to rectify these shortcomings. Measurements of growth, mortality, and replacement were again obtained (Gaines and Kotok 1954, Myers and Martin 1963a, 1963b, Pearson 1950, and others).
Treated stands were far from their virgin condition follow-ing these second cuttings. The numbers of high-risk trees were less; densities of immature groups of trees had been reduced; and thinned stands of saplings and poles had been established to provide growing stock for future timber harvests. Marking rules for the initial one or two cuttings in virgin stands and the first re-cutting in older cutover stands were obtained from the results of the second cutting experiments.
A process of converting virgin stands to managed stands evolved from the findings obtained from the assemblage Fort Valley cutting experiments (Myers and Martin 1963a, Pearson 1950). It was determined, for example, that initial cuttings should remove poor-quality and high-risk trees and reduce the densities of immature sawtimber groups where necessary. Dense sapling and pole stands should be thinned as soon as possible to increase the growth of this needed growing stock. Non-stocked sites should be planted where natural regener-ation had failed or occurred at irregular and unpredictable intervals. Conventional cutting systems resulting in either
uneven-aged or even-aged stands should be scheduled after a second or third cutting in previously unharvested stands.
Silvicultural Control of Dwarf Mistletoe
Dwarf mistletoe (Arceuthobium vaginatum var. cryptopo-dum), a destructive disease of southwestern ponderosa pine, often infects virgin stands with diseased groups of trees inter-mingling with healthy groups. The spread of dwarf mistletoe is typically from large sawtimber trees to smaller trees within the overstory. A number of silvicultural treatments to reduce or eliminate dwarf mistletoe had been tested for many years on the Fort Valley Experimental Forest (Herman 1961). Heidmann (1968) summarized the information obtained from a large-scale study on Fort Valley to silviculturally control dwarf mistletoe in heavily infected stands. Whether heavily infected stands can be controlled by harvest cuttings and stand improvement and what is the influence of stand improvement selection cuttings on the incidence of dwarf mistletoe were among the questions this study was designed to answer.
Study Design
A virgin stand of ponderosa pine trees that had been heav-ily infected with dwarf mistletoe was the study area. The control treatments were limited control by harvest cutting and stand improvement; complete control; and light stand-improvement selection cutting. Each of the three treatments was replicated three times on nine 10-ha (25-acre) plots. The objective of limited control was to reduce the intensity of dwarf mistletoe infection to a level considered by silvi-culturalists to be “unimportant” to timber management; the objective of complete control was to eliminate the infection to the extent possible; and the objective of the light stand-improvement selection was to establish a standard of control practices for comparative purposes. The initial harvest cut-tings to remove infected sawtimber trees were completed in 1951. Follow-up silvicultural treatments to remove or reduce the level of infection in the smaller trees were carried out in 1953. The plots were re-treated in 1958 and marked for the second re-treatment in 1963 although the trees were not cut. It was assumed, however, that the marked trees mimicked the anticipated post-treatment stocking and infection.
Specifications of the harvest cuttings and the guidelines for the stand-improvement selection are too detailed to sum-marize in this paper. However, this information can be found in Herman (1961), Heidmann (1968), and others.
Results
Over 75 percent of the original sawtimber was removed by both the limited and complete control treatments in the study period. Infected stocking was reduced from 46 to

20 USDA Forest Service RMRS-P-55. 2008.
4 percent by limited control and from 52 to 3 percent by com-plete control (Heidmann 1968). The light stand-improvement treatment removed 35 percent of the sawtimber volume, but it did not reduce the proportion of infected stocking. Before re-treatment in 1958, the guidelines for cutting the limited control plots were modified to “widen” the difference in im-pact between the limited and complete control treatments. As a result, the stocking of infected trees was 17 percent higher on the limited control plots than the complete control plots in 1963. Stocking for all of the treatments increased between 1958 and 1963, with the greatest increase on the limited con-trol plots.
Heidmann (1968) concluded that dwarf mistletoe in heav-ily infected ponderosa pine stands could be controlled by almost complete removal of the trees in the original stand. Because partial clearing of trees leaving a relatively “open stand” can cause windthrow of the residual trees, clearcut-ting was the treatment suggested. Limited control appeared impractical, while the light stand-improvement selection treatment had little effect on the occurrence of infected trees.
Growing Stock Levels
The early cutting experiments conducted at Fort Valley did not provide all of the information required by managers to prescribe appropriate growing stock levels for even-aged stands, however. This deficiency of knowledge became in-creasingly apparent as the conversions to managed stands continued. There had been little attempt to evaluate the “low-reserve densities” that might be retained in thinned stands. Largely because of this lack of information, a large-scale study of growing stock levels in even-aged stands of western pon-derosa pine was designed to obtain growth information over a range of stand and site conditions (Myers 1967). The Coconino Plateau of north-central Arizona was selected as one of the five provinces for this study, with Taylor Woods, part of the Fort Valley Experimental Forest, the site for this phase.
Study Design
Densities to be retained in thinned even-aged stands at Taylor Woods were specified in terms of growing stock lev-els that were defined by a series of relationships between basal area and average stand dbh. Numerical designation of the growing stock level for a stand represented the level of basal area per acre that should remain following thin-ning when the average diameter of trees in the stand is 25 cm (10 inches) in dbh or more (Myers 1967). The den-sity of a stand less than 25 cm (10 inches) in dbh was a “perspective density level” that was designated by the re-lationship between basal area and stand diameter for the selected growing stock level. For example, a stand with an average dbh of 14 cm (5.5 inches) to be “managed” at a
growing stock level of 18.3 m2/ha (80 ft2/acre) would have 11.8 m2/ha (51.6 ft2/acre) of basal area following a thin-ning treatment (Figure 1). The thinning schedule shown by the relationships in figure 1 for a growing stock level of 18.3 m2/ha (80 ft2/acre) specifies residual tree densities to be obtained through the thinning treatments. More than one thinning might be necessary to “keep” the stand on the pre-scribed path.
Six growing stock levels investigated at Taylor Woods were 6.9, 13.8, 18.3, 22.9, 27.5, and 34.4 m2/ha (30, 60, 80, 100, 120, and 150 ft2/ac). These growing stock levels were selected for study on the basis of earlier silvicultural experi-ence; baseline information obtained from temporary growth plots; and the results from the earlier Fort Valley cutting experiments. The highest and lowest growing stock lev-els were considered to be beyond the “desirable range” of growing stock for timber production, but they were included in the study to provide a range of management alternatives (Myers 1967). Each of the growing stock levels studied was replicated three times. Stands were marked and thinned in late summer to early fall of 1962. Implementation of the study was largely a low thinning operation with the smallest trees and “rough dominants” removed.
Results
Initial results at Taylor Woods obtained five years after thinning indicated that periodic annual diameter, basal area, and volume growth of residual trees in the thinned stands increased in varying magnitudes throughout the range of growing stock levels (Schubert 1971). Furthermore, the increases in growth were concentrated in few and higher quality trees. However, stands with the higher growing stock levels remained understocked according to the designated basal area levels required for the average stand diameters measured. It was concluded, therefore, that slower growth at the higher levels had “prevented” these stands from over-coming their original understocked conditions.
The 20-year findings of the study reported by Ronco and others (1985) differed somewhat from the early results of Schubert (1971). With the exception of height growth, all av-erages of the other tree characteristics measured by Ronco and others exhibited a negative relationship with increasing stand densities. A two- to three-fold increase in periodic annu-al diameter growth and the two-thirds increase in the average stand diameter between the highest and lowest growing stock levels confirmed earlier observations of the growth potentials of ponderosa pine stands. In contrast to tree characteristics, however, stand characteristics such as basal area and volume increments showed a positive relationship with increasing stand densities. Intervening tree mortality had little effect on the overall results for the first 20 years of the study.
A 40-year update of the study of growing stock levels at Taylor Woods is presented by John Bailey elsewhere in the proceedings of this conference.

USDA Forest Service RMRS-P-55. 2008. 21
A Status-of-Knowledge Report
Technical information and observations on stand man-agement that had accumulated through the early 1970s were summarized in a “status-of-knowledge report” on the sil-viculture of southwestern ponderosa pine forests prepared by Schubert (1974). This report brought together important timber-oriented facts to provide a reference for managers. Much of the knowledge presented had been gained from the findings from the Fort Valley cutting experiments. Included in the report was a review of silvicultural treatments to ma-nipulate stands to create either even-aged or uneven-aged structures. Research at Fort Valley and elsewhere in the region suggested that depending on the management objec-tives, many stands could be managed as either one structure or the other. However, if the conversion from one structure to the other was deemed advisable, it was stressed that the conversion process should be made without destroying the residual growing stock. Furthermore, it was suggested that the conversion process be accomplished by combining groups of stands of similar condition classes. Also, retaining size classes of trees beyond their “normal rotation” or stimu-lating growth rates of smaller size classes to accelerate their entry into larger size classes might be required.
Figure 1. Residual basal area of a stand after thinning in relation to average stand diameter (from Myers 1967). The relationships shown are thinning schedules for selected growing stock levels in southwestern ponderosa pine stands.
Intermediate cuts to be made following the establish-ment of a managed stand until it was time to replace it with a regeneration cut were outlined in the report. Among the in-termediate cuttings were thinnings to improve tree spacing, release cuttings, improvement cuttings, sanitation cuttings, and salvage cuttings. Standard regeneration cuttings includ-ing the shelterwood, seed-tree, clearcutting, and selection methods were also reviewed with reference to their applica-tions in southwestern ponderosa pine forests.
A Changing Situation
Following increases in allowable timber harvesting into the 1960s, when removals were generally one-third to two-thirds of the merchantable volume, the levels of harvesting in the region remained relatively flat into the 1980s. However, timber harvesting operations and silvicultural treatments to improve stand structures began to decline in the early 1990s after a number of lawsuits filed by environmental organiza-tions challenged many of the sales. These challenges were based on a perceived failure—in the opinion of the envi-ronmental organizations—to adequately protect biological diversity and the habitats of rare, threatened, and endangered

22 USDA Forest Service RMRS-P-55. 2008.
species. A lack of merchantable trees and unfavorable market conditions also contributed to this situation. With the curtail-ment in timber harvesting have been consequent alterations in the structure, stocking, and growth of the region’s forests. The earlier emphasis that managers often placed on obtaining and maintaining even-aged stand structures has been largely replaced with a gradual movement to more natural uneven-aged structures.
Increases in large wildfires have also altered the charac-ter of the region’s forests. Stands experiencing high severity fire have been damaged or destroyed or their ecological func-tioning has been disrupted, while the stands burned by lower severities fire are often impacted less. Such stand alterations occurred following the Rodeo-Chediski Wildfire of 2002, the largest known wildfire in Arizona’s history (Neary and others 2005). A mosaic of stands burned at varying fire severities with intermingling unburned stands was created following this fire.
Stand-level experiments at Fort Valley and silvicultural research elsewhere in the southwestern region have been re-oriented (to some extent) in response to this changing situ-ation brought about by the curtailment of timber harvesting and increases in large wildfires. Two efforts of note in this regard have been the initiation of restoration studies and fire and fire surrogate studies.
Restoration Studies
Concerns about the increasing fire danger to people’s lives and property because of the increasingly larger fuel loads and (possible) changing climatic regimes led to the establishment of the Grand Canyon Forests Partnership in 1996—renamed the Greater Flagstaff Forests Partnership in 2002. The aim of this partnership of public agencies and private organizations has been largely implementing (on a larger scale) the findings obtained from a keystone restoration experiment on the G. A. Pearson Natural Area at Fort Valley. These findings showed the response of trees, herbaceous plants, and soils to an ar-ray of thinning and burning treatments (Covington and others 1997). Ideals of ecology, community collaboration, and econ-omy were the collective visions to be realized in these larger experiments to be placed on demonstration plots.
Study Design
Twelve blocks within Fort Valley were the demonstra-tion areas for the studies. Nine of these blocks were thinned and/or burned to varying prescriptions, while the remaining blocks remained untreated controls. The idea was that the thinnings would create stand structures emulating those rep-resentative of presettlement conditions, allowing ecosystem processes including recurring “low-level” fire to be sustained (Covington and others 1997, Mast and others 1999, Moore and others 1999). Old-growth trees were considered to be largely of presettlement origin and, therefore, generally left
standing. A specified number of younger trees were desig-nated “replacement trees” to also be left following thinning. The thinning treatments were completed in 1998, with the slash piled and burned after which the treated blocks were broadcast burned in 2000 and 2001.
Initial Results
Initial results of the treatments studied revealed restora-tion opportunities. Tree densities of treated stands have been reduced by up to 85 percent. Blocks with old-growth trees are looking like the open forests of presettlement times. However, many younger trees left in these blocks were small in size and surrounded by “fresh” stumps, bare soil, and in-vasive plant species (Friederici 2003, Fulé and others 2001). On a positive note, flammable fuels in tree canopies had been reduced by the thinning treatments and the burning of slash piles and the imposed broadcast burning reduced fuels on the forest floor. It has been generally concluded that it will likely take decades or even centuries before the stands attain a con-dition approximating the presettlement era.
Fire and Fire Surrogate Study
Even in the face of more frequent wildfires, many unburned stands have become increasingly dense over the last century, with excessive accumulations of flammable fuels. The es-calating occurrences of catastrophic wildfires in the region have often been (at least partially) attributed to this condition. Managers, therefore, need better information on the appropri-ate stand management to avoid future wildfires and restore the densely stocked stands to a “more natural” state. A ques-tion asked by the managers is: Can “fire surrogates” such as varying combinations of tree cuttings and mechanical fuel treatments replace the ecological role of natural fire in retain-ing the health of these stands? In attempting to answer this question, a set of interdisciplinary studies funded by the Joint Fire Sciences Program was initiated in 1999 to evaluate the ecological and economic consequences of the alternative fuel reduction treatments available to managers.
Seven of the 13 study sites are located in western conif-erous forests where ponderosa pine is a main component (Edminster and others 2000). One of these sites is situated close to the Fort Valley Experimental Forest. Fuel reduction treatments on this site include mechanical only, prescribed fire only, mechanical and prescribed fire, and a (untreated) control. The response variables measured on the site reflect fuels and fire behavior, vegetative conditions, soils and forest floor characteristics, hydrologic processes, wildlife condi-tions, occurrences of insects and diseases, treatment costs, and social values. While the measurement of these variables continues, it is anticipated that the results obtained will lead to management prescriptions that will reduce the threat of devastating wildfire in the future and enhance the health of the managed stands.

USDA Forest Service RMRS-P-55. 2008. 23
Summary
Studies on stand management at the Fort Valley Experimental Forest and surrounding areas have largely par-alleled management needs in southwestern ponderosa pine forests. Initial emphasis was placed on converting virgin stands to management stands through partial timber har-vesting. Cuttings to sustain the conditions achieved in the managed stands were then tested. Insufficient knowledge of the low-reserve densities to retain in even-aged stands to be thinned led to a regional study of growing stock levels, with one of the study sites located at Fort Valley. More recently, studies on stand management have changed in their focus in response to the curtailment of timber harvesting and increas-ing occurrence of wildfires. Restoration studies and studies of fire and fire surrogates have been initiated as a result. A theme of the recent research has been to provide a better foundation to the planning for sustainable forest management practices to achieve ecosystem-based, and multiple-benefit goals in ponderosa pine forests.
References
Covington, W. W.; Fulé, P. Z.; Moore, M. M.; Hart, S. C.; Kolb, T. E.; Mast, J. N.; Sackett, S. S.; Wagner, M. R. 1997. Restoring ecosystem health in ponderosa pine forests of the Southwest. Journal of Forestry. 95(4): 23-29.
Edminster, C. B.; Weatherspoon, C. P.; Neary, D. G. 2000. The fire and fire surrogates study: Providing guidelines for fire in future forest management decisions. In: Ffolliott, P. F.; Baker, M. B., Jr.; Edminster, C. B.; Dillon, M. C.; Mora, K. L., tech. coords. Land stewardship in the 21st century: The contributions of watershed management. Proc. RMRS-P-13. Fort Collins, CO: U.S. Department of Agriculture, Forest Service, Rocky Mountain Research Station: 312-315.
Friederici, P. 2003. The “Flagstaff Model.” In: Friederici, P., ed. Ecological restoration of southwestern ponderosa pine forests. Washington, DC: Island Press: 7-25.
Fulé, P. Z.; McHugh, C.; Heinlein, T. A.; Covington, C. C. 2001. Potential fire behavior is reduced following forest restoration treatments. In: Vance, G. K., comp. Ponderosa pine ecosystems restoration and conservation: Steps toward stewardship. Proc. RMRS-22. Ogden, UT: U.S. Department of Agriculture, Forest Service, Rocky Mountain Research Station: 28-35.
Gaines, E. M.; Kotok, E. S. 1954. Thinning ponderosa pine in the Southwest. Sta. Pap. 17. Fort Collins, CO: U.S. Department of Agriculture, Forest Service, Rocky Mountain Forest and Range Experiment Station. 20 p.
Gaines, E. M.; Shaw, E. W. 1958. Half century of research—Fort Valley Experimental Forest. Sta. Pap. 38. Fort Collins, CO: U.S. Department of Agriculture, Forest Service, Rocky Mountain Forest and Range Experiment Station. 17 p.
Heidmann, L. J. 1968. Silvicultural control of dwarfmistletoe in heavily infected stands of ponderosa pine in the Southwest. Res. Pap. RM-36. Fort Collins, CO: U.S. Department of Agriculture, Forest Service, Rocky Mountain Forest and Range Experiment Station. 11 p.
Herman, F. R. 1961. Silvicultural control of dwarfmistletoe on southwestern ponderosa pine, a progress report. Sta. Pap. 62. Fort Collins, CO: U.S. Department of Agriculture, Forest Service, Rocky Mountain Forest and Range Experiment Station. 20 p.
Krauch, H. 1926. The determination of increment in cut-over stands of western yellow pine in Arizona. Journal of Agricultural Research. 32: 501-541.
Krauch, H. 1930. Mortality in cutover stands of western yellow pine. Journal of Forestry. 28: 1085-1097.
Krauch, H. 1937. Growth and yield of cut-over stands of ponderosa pine in Arizona under different methods of cutting. Journal of Forestry. 35: 1134-1147.
Lexen, B. R. 1935. Some factors influencing the yield and mortality of ponderosa pine in the Southwest. Journal of Agricultural Research. 50: 777-787.
Lexen, B. R. 1939. Growth following partial cutting in ponderosa pine. Journal of Forestry. 7(12): 943-946.
Mast, J. N.; Fulé, P. Z.; Moore, M. M.; Covington, W. W.; Waltz, A. 1999. Restoration of presettlement age structure of an Arizona ponderosa pine forest. Ecological Applications. 9: 228-239.
Moore, M. M.; Covington, W. W.; Fulé, P. Z. 1999. Reference conditions and ecological restoration: A southwestern ponderosa pine perspective. Ecological Applications. 9: 1266-1277.
Myers, C. A. 1967. Growing stock levels in even-aged ponderosa pine. Res. Pap. RM-33. Fort Collins, CO: U.S. Department of Agriculture, Forest Service, Rocky Mountain Forest and Range Experiment Station. 8 p.
Myers, C. A.; Martin, E. C. 1963a. Fifty years’ progress in converting virgin southwestern ponderosa pine to managed stands. Journal of Forestry. 61: 583-586.
Myers, C. A.; Martin, E. C. 1963b. Mortality of southwestern ponderosa pine sawtimber after second partial harvest. Journal of Forestry. 61: 128-130.
Neary, D. G.; Ryan, K. C.; DeBano, L. F., eds. 2005. Wildland fire in ecosystems: Effects of fire on soil and water. Gen. Tech. Rep. RMRS-GTR-42-Volume 4. Fort Collins, CO: U.S. Department of Agriculture, Forest Service, Rocky Mountain Research Station. 250 p.
Pearson, G. A. 1940. Growth and mortality of ponderosa pine in relation to size of trees and method of cutting. Journal of Forestry. 38 (4): 323-327.
Pearson, G. A. 1942. Improvement selection cutting in ponderosa pine. Journal of Forestry. 40 (10): 753-760.
Pearson, G. A. 1944. Cutting cycles in ponderosa pine. Journal of Forestry. 42 (8): 575-585.
Pearson, G. A. 1950. Management of ponderosa pine in the Southwest. Agriculture Monograph 6. Washington, DC: U.S. Department of Agriculture, Forest Service. 218 p.
Pearson, G. A.; Wadsworth, F. H. 1941. An example of timber management in the Southwest. Journal of Forestry. 39(5): 434-452.
Ronco, F., Jr.; Edminster, C. B.; Trujillo, D. P. 1985. Growth of ponderosa pine thinned to different stocking levels in northern Arizona. Res. Pap. RM-262. Fort Collins, CO: U.S. Department of Agriculture, Forest Service, Rocky Mountain Forest and Range Experiment Station. 15 p.

24 USDA Forest Service RMRS-P-55. 2008.
Schubert, G. H. 1971. Growth response of even-aged ponderosa pines related to stand density levels. Journal of Forestry. 69(12): 857-860.
Schubert, G. H. 1974. Silviculture of southwestern ponderosa pine: The status of our knowledge. Res. Pap. RM-123. Fort Collins, CO: U.S. Department of Agriculture, Forest Service, Rocky Mountain Forest and Range Experiment Station. 71 p.
The content of this paper reflects the views of the author(s), who are responsible for the facts and accuracy of the information presented herein.

USDA Forest Service RMRS-P-55. 2008. 25
Introduction
Regenerating ponderosa pine in the Western United States is difficult. The primary obstacle to regeneration of this spe-cies throughout its natural range is drought (Curtis and Lynch 1957). Annual precipitation in the western and southwestern United States is generally adequate for tree growth, but errat-ic distribution during the year makes seedling establishment
In: Olberding, Susan D., and Moore, Margaret M., tech coords. 2008. Fort Valley Experimental Forest—A Century of Research 1908-2008. Proceedings RMRS-P-55. Fort Collins, CO: U.S. Department of Agriculture, Forest Service, Rocky Mountain Research Station. 282 p.
Forest Regeneration Research at Fort Valley
L. J. (Pat) Heidmann, (ret.), USFS, Fort Valley Experimental Forest, Rocky Mountain Research Station, Flagstaff, AZ
Abstract—When G. A. Pearson arrived at Fort Valley to establish the first Forest Service Experiment Station he found many open park-like stands similar to those in Figure 1. Within two years, Pearson had outlined the major factors detrimental to the establishment of pon-derosa pine seedlings (Pearson 1910). During the next almost 40 years, he wrote many articles on methods of cutting, tree planting, thinning, raising seedlings, natural regeneration and other aspects of forest management. His findings are contained in his landmark treatise, “Management of Ponderosa Pine in the Southwest” (1950). Gaines and Shaw (1958) sum-marize the first fifty years of research at Fort Valley. The following reviews Pearson’s findings along with discoveries made since 1958.
difficult. In the southwestern United States, annual precipi-tation in the ponderosa pine type varies from 38 to 64 cm (15-25 inches) (Schubert 1974). About half of this occurs as snow during the winter months and half as rainfall, pri-marily during a summer “monsoon” season during July and August. Spring and fall droughts are common. Shortly after tree planting in the spring, a drought period of up to 60 days or more may occur.
Figure 1. Open park-like stand of ponderosa pine in 1909. USFS photo 89806 by G. A. Pearson.

26 USDA Forest Service RMRS-P-55. 2008.
Figure 2. Dense stand of Arizona fescue (Festuca arizonica) and mountain muhly (muhlenbergia montana) at Wing Mountain, AZ, in 1962. USFS photo by L. J. Heidmann.
Dry conditions coupled with competition from various herbaceous species, primarily perennial grasses, (Figure 2) effectively lowers soil water potential (Ψ) to a point where pine seedlings have difficulty extracting moisture from the soil. Natural seedlings that do not germinate until summer rains begin in late July and August face a very short period during which to become established before a fall drought. Growth of seedlings on volcanic soils is very slow. As a result seedlings are very susceptible to drought and frost heaving (Heidmann 1976, Larson 1961).
Obstacles to Regeneration
Soils
Regeneration problems are closely related to soils type. In the Southwest, forest soils are primarily volcanic or sedi-mentary in origin. Volcanic soils, derived from basalt rocks and cinders (throughout this paper volcanic soils will be referred to as basalt soils) contain high amounts of silt (60-70%) with the remaining fraction composed primarily of clay (Heidmann and Thorud 1975). On these soils, seed germina-tion is usually adequate, but seedlings at the end of the first growing season are very small (3-5 cm tall, Figure 3). Small seedlings on these soils are highly susceptible to frost heav-ing (Heidmann and Thorud 1976, Larson 1961, Schramm 1958). In addition, on basalt derived soils, moisture becomes limiting when soil moisture content (SMC) drops below 10% and (Ψ) is approximately -2.0 MPa (-20 bars, Heidmann and
King 1992, Figure 4). Frost heaving and moisture stress ef-fectively prevent natural regeneration on these soils. There are indications, however, that first year seedlings growing on basalt soils on which litter has been burned are much larger in size and do not heave as readily as smaller seedlings (Sackett 1984).
Sedimentary soils, derived from limestone and sandstone parent material, in contrast, are much coarser in texture, often containing 65% or more sand-sized particles. In these soils, moisture does not become limiting until SMC drops below 1.5%, after which very small losses in SMC result in (Ψ) low-ering dramatically (becomes more negative) (Heidmann and King 1992, Figure 4). First year seedlings on sedimentary soils are usually much larger than seedlings on basalt soils; however, in greenhouse studies both container and bare-root seedlings seemed to survive as well or better on basalt soils (Heidmann and King 1992). Frost heaving is less of a prob-lem on sedimentary soils, but will occur, especially if soils are compacted (Heidmann and Thorud 1975, Figure 5).
Moisture Stress
Although soil moisture is often limiting, seedlings can en-dure severe moisture stress and recover. Seedlings appear able to “shut down” physiologically during periods of moisture stress and resume physiological activity when soil moisture is replenished. Studies by Heidmann and King (1992) have shown that ponderosa pine seedlings grown for 134 days without watering have very low transpiration (ts) and stoma-tal conductance (gs) rates in addition to a dramatic reduction in net photosynthetic (pn) rates, but after re-watering, seed-lings appear to recover rapidly. Heidmann and Sandoval 1900

USDA Forest Service RMRS-P-55. 2008. 27
Figure 3. Ponderosa pine seedling growing on bare volcanic soil at the end of summer 1957. Seedlings in this study were watered three times a week throughout the summer and are no taller than a toothpick. USFS photo by L. J. Heidmann.
Figure 4. Soil moisture content (%) plotted against soil water potential in mega-pascals (Mpa) for a basalt soil in northern Arizona. One Mpa roughly equals ten bars of atmospheric pressure. Below 10% SMC water becomes more limiting for ponderosa pine seedlings.
8.0
7.0
6.0
5.0
4.0
3.0
2.0
1.0
00 10 20 30 40 50
Moisture content (percent)
Soi
l wat
er p
oten
tial (
MP
a)
Basalt soil

28 USDA Forest Service RMRS-P-55. 2008.
(unpublished data) and Heidmann and Huntsberger 1990 (un-published data) observed that ponderosa pine seedlings in a chamber in which the roots were sealed in plastic bags sub-jected to very high osmotic solutions of polyethylene glycol were able to absorb moisture from a saturated atmosphere through the seedling tops.
Heidmann (personal observation) found a ponderosa pine tree approximately 50 cm (20 in) tall growing in a small depression on top of a boulder, approximately 90 cm in di-ameter, in which there was a small collection of litter. The tree fell during examination since it had almost no root sys-tem. Although ponderosa pine is very drought tolerant, trees put on significantly greater height growth when moisture is plentiful.
Competing Vegetation
The combination of competing vegetation and inadequate soil moisture effectively restricts natural and artificial regen-eration efforts on all soil types. The most severe competitors are spring-growing bunch grasses such as Arizona fescue (Festuca arizonica). This species has an extensive root sys-tem (Figure 6) that appropriates soil moisture from the upper soil layers at the expense of tree seedlings. In addition, fescue and other grasses contain growth inhibiting chemicals that restrict germination of pine seed and subsequent growth of seedlings (Rietveld 1975). The combination of dense grass root systems, growth inhibitors, low soil temperatures and low moisture until July or later make it very difficult for seed-lings to survive (Larson 1961, Pearson 1950, Rietveld 1975).
Figure 5. Mean frost heaving per day by soil bulk density for six soils in northern Arizona. Measurements were conducted in the laboratory using a specially designed freezing chest. USFS photo by L. J. Heidmann.
Figure 6. Root system of Arizona fescue (Festuca arizonica). These roots are very dense and fibrous and can completely appropriate moisture from the upper 20 to 25 cm of soil. USFS photo by L. J. Heidmann.
Average Frost Heavefor 6 Soils
Mea
n H
eave
in1.
25 m
m p
er d
ay
Bulk DensityMinimum Mean Maximum
1.75
0.75
1.25

USDA Forest Service RMRS-P-55. 2008. 29
Climate
In addition to erratic precipitation, wind is another climatic factor detrimental to establishment of tree seedlings. Strong winds are common throughout much of the ponderosa pine range. At or shortly after tree planting in the spring, plan-tation sites are subjected to warm days, very low humidity, little or no precipitation, and strong winds. Under these con-ditions, especially if site preparation is inadequate or lacking, tree seedlings desiccate very quickly.
Biotic Factors
Other elements affecting reforestation efforts can be com-bined under “biotic attrition.” A whole host of insects, birds and mammals feed on ponderosa pine seed and young trees, and may effectively prevent tree establishment. The great-est threat comes from domestic livestock and large browsing mammals. If cattle or sheep are allowed to graze in newly established regeneration areas failure is sure to follow. In the Southwest, sheep have grazed forest land on Indian reserva-tions since their establishment. Now, however, tribal leaders realize the necessity of protecting regeneration and recom-mend excluding sheep and cattle from regeneration sites (Arbab and Metteba, no date).
Other large mammals, such as mule deer (Odocoileus hemionus) and elk (Cervus elaphus), cause considerable browsing and trampling damage. Small mammals, such as gophers (Thomomys spp.) and rabbits (Sylvilagus and Lepus), cause severe local damage (Figure 7). Mice, particularly the white-footed deer mouse (Peromyscus maniculatus), con-sume vast amounts of seeds that fall to the ground, and Abert squirrels (Sciurus aberti) consume large amounts of cones as they mature on the tree (Larson and Schubert 1970).
Despite these adverse factors, ponderosa pine may be re-generated both naturally and artificially if proper procedures are followed (Heidmann and Haase 1989, Heidmann and oth-ers 1982, Hermann 1965, Schubert and others1970, Schubert 1974).
Findings in the Last Fifty Years
Artificial RegenerationPlanting
For planting to succeed it is essential to have a thoroughly prepared site. Countless experiments over the years have shown that tree planting on sites where competing vegeta-tion has not been deadened or removed is a waste of time and money. Several experiments were conducted at Wing Mountain, near Fort Valley, in the 1960s to test several her-bicides for their effectiveness in killing perennial grasses and their effect on soil moisture.
In one experiment, soil moisture was studied at depths of up to 112 cm (44 inches) for two years on plots that had
grasses, primarily Arizona fescue, either killed with herbicide or removed completely (Figure 8). Soil moisture was signif-icantly higher on plots where grass was deadened than on plots with the grass removed or control plots where the grass was undisturbed (Figure 9), especially for the critical 0 to 20 cm (0 to 8 inches) depth. Under these conditions the grass serves as excellent mulch. This was especially true during the summer of 1962 (Figure 9) that had an unusual precipitation pattern. Each of the months from May to October received approximately 2.54 cm. (one inch) of precipitation and this generally came on one or two days (Heidmann 1969).
To sample mulching techniques, an experiment found that a mulch of three rocks (Figure 10), placed around the stem of ponderosa pine seedlings, improved survival regardless of the site preparation treatment, but survival was highest on plots where all the grass had been removed (Heidmann 1963b).
In another experiment, several herbicides were studied for their effectiveness in killing perennial grasses, primarily Arizona fescue and mountain muhly (Muhlenbergia mon-tana). The least expensive and most effective herbicide was dalapon (2,2-dichloropropionic acid) (Heidmann 1968a). Unfortunately, this herbicide is no longer available in the United States. In later experiments it was found that her-bicides such as Roundup (glyphosate) are also effective but more expensive. Roundup kills both grasses and forbs (weeds) (Heidmann 1967, 1968a).
Figure 7. Planted ponderosa pine seedling showing rabbit damage. The seedling top has been clipped off. USFS photo by L. J. Heidmann.

30 USDA Forest Service RMRS-P-55. 2008.
Figure 8. Soil moisture study at Wing Mountain, AZ, in 1962. Soil moisture was compared on plots with grass sprayed with dalapon, removed completely, or left undisturbed over a two-year period. USFS photo by L. J. Heidmann.
Figure 9. Soil moisture at Wing Mountain, AZ, for 0 to 20 cm depth comparing moisture on plots with dead grass, grass removed, and live grass, in 1963. USFS photo by L. J. Heidmann.
Figure 10. Mulch of 3-rocks placed around the stem of a ponderosa pine transplant at A-1 Mountain, AZ, in 1960. USFS photo by L. J. Heidmann.

USDA Forest Service RMRS-P-55. 2008. 31
At the Forest Service tree nursery at Albuquerque, New Mexico, two herbicides were tested for effectiveness in controlling weeds in nursery beds. Both Goal (oxyfluor-fen) and Modown (Bifenox) sprayed over newly germinated ponderosa pine seedlings were effective in preventing es-tablishment of grasses and forbs without damaging pine seedlings (Heidmann and Haase 1984).
Most site preparation methods in the Southwest have in-volved plowing or disking to get rid of grasses and forbs. These methods, however, do not result in as high a soil moisture as killing the vegetation and leaving the dead plants to serve as a mulch.
Seedlings
Seed Production
In a study of the Apache-Sitgreaves National Forest in which cone and seed production were studied in 1979, it was found that ponderosa pine produced an average of 25 pounds of seed per acre. Individual plots produced as much as 62 pounds of seed (Heidmann 1983a). This amount of seed (25 pounds per acre) is greater than the amount of seed estimated by Pearson (1950) for these soils. Twenty-five pounds of seed per acre is approximately six times the amount Pearson (1950) considered to be a bumper crop and is closer to findings by Larson and Schubert (1970) for ba-salt soils.
Heavy fertilization did not have an appreciable effect on the growth of ponderosa pine pole sized trees but it did significantly increase cone production and resulted in more frequent cone crops (Heidmann 1984). Application of urea ammonium phosphate at rates of up to 1,121 kg per hectare (1,000 lbs/acre) for four years resulted in good bumper cone crops in three of five years with seed production on indi-vidual plots of almost 1,000,000 seeds per hectare (400,000 per acre) (Heidmann 1984).
Ponderosa pine seed retain viability for long periods of time if stored at low moisture contents (mc). Seeds collect-ed and stored at Fort Valley for 27 years at a (mc) of 6.2% had a viability of 46% (Heidmann 1962).
Seedlings for planting should be grown from seed col-lected from an area near the eventual planting site that is similar in elevation and climate (Schubert and others 1970). Cones should not be collected from trees of poor form or which are obviously diseased. Seedlings should have a proper root/shoot ratio and should not be lifted from the nursery bed until they have a high root regenerating poten-tial (RRP) (Jenkinsen 1980). Experiments conducted with trees raised at the Albuquerque USFS nursery (since closed) showed that for six National Forests in Arizona and New Mexico that the later trees are lifted from the nursery bed (for example, nearest to the time of planting), the greater the rate of survival (Heidmann 1982b).
Planting Procedures
Seedlings have been planted successfully utilizing both planting machines or manual methods (Figures 11a
and 11b). Regardless of the method, seedlings need to be planted properly (Schubert and others 1969). Trees need to be kept moist until they are planted then the roots should extend straight down the planting hole and the soil needs to be compacted firmly around the roots. These are simple procedures that are necessary for success wherever trees are planted. In the Southwest, however, many plantations have failed over the years because of poor planting techniques.
Protection
Plantations need to be protected for several years from browsing and grazing mammals. Countless experiments over the years have proven that cattle and sheep grazing newly planted areas can effectively destroy the plantation. On the Navajo Indian Reservation, sheep were allowed to graze pine regeneration areas for decades. However, now grazing animals are excluded from regeneration areas (Arbab and Metteba, no date).
Experiments conducted at Fort Valley have shown that seedlings repeatedly browsed by cattle and/or deer can be protected from browsing using animal repellents (Heidmann 1963a, Figures 12a and 12b). Figure 12a shows trees in the foreground that have been browsed repeatedly over the years. They are the same age (38 years) as the trees in the background. Trees repeatedly browsed have an extensive root system and once released from browsing grow rapidly.
Natural Regeneration
Although Pearson suggested that natural regeneration could be obtained by leaving a prescribed number of seed trees per acre and following other procedures, attempts were unsuccessful. My first supervisor, Edward M. Gaines, told me when I arrived in Flagstaff in 1957 that no deliberate at-tempts to get natural regeneration in the Southwest had ever been successful.
Natural regeneration has generally not been successful on basalt soils primarily because first year seedlings are very small on these fine textured soils, and as a result, are highly susceptible to drought and frost heaving the first year, as has already been stated. On sedimentary soils seedlings have less difficulty extracting water from the soil because of larger soil pores and as a result seedlings grow to a much larger size the first year. These seedlings are much less susceptible to frost heaving. Seedlings with larger tops heave less readily than smaller trees (Schramm 1958). In order for successful natural regeneration on these soils, however, the following steps are essential:
1. Determine if a potential cone crop can be expected. Ponderosa pine cones develop over three years. The female flowers form the first season then the following spring they are pollinated and grow to about the size of a marble. The following year they are fertilized and grow rapidly until they mature in the fall. Thus, it is necessary to survey potential regeneration areas the year before

32 USDA Forest Service RMRS-P-55. 2008.
Figure 11a. Site of wildfire at Jones Mountain, AZ, approximately 64 km south of Flagstaff, AZ. Picture taken prior to tree planting in 1960. USFS photo by L. J. Heidmann.
Figure 11b. Site 19 years later after planting with 3-rock mulch. Success is obvious. USFS photo by L. J. Heidmann.
cones mature. Making cone counts using binoculars does this.
2. Next, a rodent census needs to be conducted to determine if the population of seed eating rodents is high. If it is, control measures need to be taken.
3. The regeneration area needs to be logged a year before seedfall leaving at least five seed bearing trees with an average diameter of 51 cm (20 inches).
4. After seedfall in the fall, run a harrow or disc over the site to cover the seed.
5. Exclude cattle for three to five years (Heidmann and others 1982).
Thousands of acres of ponderosa pine have been success-fully regenerated on the Apache-Sitgreaves National Forest, for example, by following these procedures.

USDA Forest Service RMRS-P-55. 2008. 33
Figure 12a. Ponderosa pine in the foreground that have been repeatedly browsed by cattle or deer. Trees are the same age (38) as the trees in the background. USFS photo by L. J. Heidmann.
Figure 12b. The same site a few years after browsed trees were treated with deer repellents. USFS photo by L. J. Heidmann.

34 USDA Forest Service RMRS-P-55. 2008.
Basalt Soils
Sometimes useful information can be gathered by obser-vation as well as from scientific experimentation. The author has observed that on areas where slash piles had been burned that first year ponderosa pine seedlings were six to eight times as tall as seedlings on unburned areas. The larger seed-lings have a much greater chance of surviving frost heaving because heaving is inversely related to the size of seedling tops (Schramm 1958). It therefore appears that on basalt soils natural regeneration should be successful if the area is logged and slash burned before seedfall. However, the same steps prescribed for success on sedimentary soils should also be taken.
Frost Heaving
Frost heaving has been cited several times in this paper as a cause of seedling mortality. I became interested in frost heaving my first year at Fort Valley when I helped Mel Larson with a field study he was using for a master’s thesis at the University of Washington (Larson 1961). This was a seeding study conducted inside a rodent proof enclosure at S-3, about six miles southwest of Fort Valley, where seed size and germi-nation dates were related to survival. Beginning in June and throughout the summer, seedlings were watered three times a week, even during the rainy season. I took over the study for Mel while he was away at school. In early October 1957, 52% of approximately 1,000 seedlings heaved from the ground in one night. By spring of 1958 only a handful of seedlings were left. I was impressed by what had happened but did not think about frost heaving for a while because I was working on other things such as site preparation, planting, and animal repellents for controlling browsing by cattle and deer. Then, I read a paper by Schramm (1958) where he described heav-ing of coniferous and deciduous seedling on coal fields in Pennsylvania. He reported why very small seedlings heaved while seedlings with larger tops did not (true for coniferous species; larger deciduous species such as oak did heave). This piqued my interest but, once again, I did not think about the subject until I entered the University of Arizona to work on my PhD. I needed a dissertation subject and, even though my major was plant physiology, I decided to use a study of frost heaving for my dissertation. My dissertation director, Dr. David Thorud, who studied freezing of soils in Minnesota, helped me in this decision (Heidmann 1974).
My approach was to do a search of the world’s literature relating to freezing of soils and frost heaving. It quickly be-came apparent that no work of a basic nature had been done in either forestry or agriculture. The overwhelming body of work had been conducted by scientists and engineers attached to the United States Army (CRREL, Cold Regions Research and Engineering Laboratory, Hanover, New Hampshire) who carried out most of their research in the Arctic, and by high-way engineers. In addition, the Russians were doing a great deal of research (Heidmann 1976).
Next, I conducted a series of studies in the lab on the heav-ing characteristics of six soils from northern Arizona using a specially constructed freezing apparatus placed into a chest freezer. Several chemicals were tested for their ability to re-strict water movement in the soil to a freezing front or their ability to lower the freezing temperature of the soil water and thus reduce heaving susceptibility (Heidmann 1975b, Heidmann and Thorud 1976). The chemicals were also stud-ied to determine their effect on the germination of ponderosa pine seeds. Another major part of the study was to determine the effect of soil bulk density on the heaving of the six soils (Heidmann and Thorud 1975).
Tests were also conducted in the field inside the same enclosure used by Larson to study the heaving of wooden dowels and small plastic cylinders from the soil using a time lapse camera. The results from these studies are contained in six papers published by the USDAFS Rocky Mountain Forest and Range Experiment Station and in a dissertation from the University of Arizona (Heidmann 1974).
Frost heaving occurs because there is a segregation of soil water. Water migrates from lower soil depths to the surface where it freezes into lenses or palisade layers (Figure 13). Haasis (1923) described frost heaving on the Experimental Forest and included sketches but did not explore the basic cause. This water movement is a function of soil pore size, undercooling of soil water (soil water is at a temperature less than freezing), and soil surface temperatures slightly be-low freezing temperature (Heidmann 1976, Schramm 1958, Taber 1929, 1930). Soils with high silt contents are suited to heaving because the pore size is conducive to lowering the freezing point of the soil water that results in a negative pres-sure causing water to be drawn to the surface where it freezes into the lenses described. In order for ice lenses to form it is necessary that one gram of water arrive at the freezing zone at the surface for each gram of water that freezes. The result is that the surface of the soil is moved upward taking the seed-ling along with it (Figure 14).
Basalt soils studied in northern Arizona are high in silt content, often containing 60% or more (Heidmann 1975), with the remaining fraction clay and sand. According to Penner (1958), soils with high silt contents are ideally suited to heaving. Heaving is closely related to soil bulk density. Figure 5 clearly shows that for six soils studied in the labora-tory in northern Arizona, the more the soil was compacted, the greater the rate of heaving, even in coarser sandy soils. The total water content for soils at minimum, mean, and max-imum bulk density was the same, which indicates that at the minimum bulk density, there is considerable air in the soil pores that results in a broken water column restricting water flow to the freezing front at the soil surface. If water does not arrive at the freezing front as fast as it freezes then the soil freezes solid and no lenses are formed.
Methods to Reduce Frost Heaving
Since frost heaving is closely correlated with soil bulk density, the less the soil is compacted with heavy equipment

USDA Forest Service RMRS-P-55. 2008. 35
prior to regeneration efforts the better the chances for success. Loosening the soil by disking prior to seedfall is beneficial. A harrow can be drawn over the site to lightly cover the seed af-ter seedfall (Heidmann and others 1982). Certain chemicals, such as ferric chloride, cement soil particles together result-ing in restricted water flow to the freezing front at the surface and thus reducing the formation of ice lenses (Heidmann and Thorud 1976).
Plant Growth Hormones
Plant growth hormones play an important role in the growth and development of plants. Several experiments with hormones were conducted over the years at Fort Valley. Seeds were treated with various hormones in an attempt to speed up germination. Results from these experiments were inconsistent. Gibberellic acid (GA4/7) was found to increase the height of ponderosa pine seedlings when applied as a root soak (Heidmann 1982a). A combination of GA 4/7 plus adenosine triphosphate (ATP) increased height growth nine times that of untreated seedlings.
Abscisic acid (ABA) is a plant growth hormone that controls dormancy in plants. Levels build up in the plant in response to day length. In the fall, when levels are high, growth of seedling tops ceases and a terminal bud is set. In the spring, when ABA levels are relatively low, buds break dormancy and top growth begins. The level of ABA in plants also tends to rise under stress. Equipment for studying hor-mone levels in plants is very expensive. In 1987 we found that hormone levels could be quantified by using monoclonal antibodies, a much less expensive process. We used this pro-cedure to study ABA levels in stressed ponderosa pine in the greenhouse. Levels of ABA were six times higher in stressed seedlings after a ten week drought than in well watered seed-lings (Heidmann and Huntsberger 1990, unpublished).
Dwarf Mistletoe
Dwarf mistletoe (Arceuthobium vaginatum f. cryptopo-dum (Engelmann) Gill), is the most destructive disease of
Figure 13. Example of frost action on basalt soil at Unit S-3 (Wing Mountain, AZ) during one night. This is an example of a ‘palisade’ layer of ice. Careful examination reveals extruded plant material on the surface.
Figure 14. A ponderosa pine seedling that has heaved from a basalt soil. The seedling is at least two years old because of the presence of needle fascicles.

36 USDA Forest Service RMRS-P-55. 2008.
ponderosa pine in the Southwest (Hawksworth 1961). In the 1960s it was estimated that 2.5 million acres of the 7.5 million acres of commercial ponderosa pine southwestern timberland were infected. The disease had been studied for many years but it was not until 1950 that a large pilot plant study was initiated to determine if the parasite could be controlled by silvicultural methods. Complete control was compared to lim-ited control and light “Improvement Selection.” After several treatments, it was determined that in order to control dwarf mistletoe by cutting, it was necessary to almost eliminate the entire overstory (Heidmann 1968b, 1983b). The mistletoe, however, is very slow growing and takes many years to kill host trees. For a comprehensive study of dwarf mistletoe in the Southwest, the reader is referred to Hawksworth (1961).
Summary
The humble beginnings at Fort Valley in 1908 eventually led to the establishment of the Forest and Range Experiment Station system throughout the United States. Many scientists have worked at Fort Valley in the last 100 years. Their find-ings are not only applicable to Arizona and the Southwest but around the country as a whole. In many instances scien-tists around the world have expressed interest in our findings. Drought and frost heaving are problems in most forested areas of the world. This paper has not discussed insects and dis-ease, except for dwarf mistletoe briefly. These are problems of a global nature. One of our scientists, Frank Hawksworth, had a worldwide reputation as a mistletoe expert and Dick Tinus was equally well known for developing methods for raising container trees in greenhouses (Tinus and McDonald 1979). Who knows what the next 100 years will yield in the field of forest research?
Acknowledgments
My thanks to Mert Richards and Jerry Gottfried for re-viewing this paper and making helpful suggestions.
References
Arbab, Amannullah K.; Metteba, Marvin. No date. Reforestation on the Navajo Forest: A Condition report. Ft. Defiance, AZ: Navajo Nation, Forestry Dept. 18 p.
Curtis, James D.; Lynch, Donald W. 1957. Silvics of ponderosa pine. Misc. Pub. No. 12. Ogden, UT: U.S. Department of Agriculture, Forest Service, Intermountain Forest and Range Experiment Station. 37 p.
Gaines, Edward M.; Shaw, Elmer W. 1958. Half a century of research—Fort Valley Experimental Forest, 1908-1958. Stn. Pap. No. 38. Fort Collins, CO: U.S. Department of Agriculture, Forest Service, Rocky Mountain Forest and Range Experiment Station.17 p.
Haasis, F. W. 1923. Frost heaving of western yellow pine seedlings. Ecol. 4: 378-390.
Hawksworth, Frank G. 1961. Dwarf mistletoe of ponderosa pine in the southwest. Agr. Tech. Bull. 1246. Washington, DC: U.S. Department of Agriculture. 112 p.
Heidmann, L.J. 1962. Longevity of ponderosa pine seed. Ecol. 43 (2): 344.
Heidmann, L.J. 1963a. Deer repellents are effective on ponderosa pine in the southwest. Journal of Forestry. 61(1): 53-54.
Heidmann, L.J. 1963b. Effects of rock mulch and scalping on survival of ponderosa pine in the southwest. Res. Note RM-10. Fort Collins, CO: U.S. Department of Agriculture, Forest Service, Rocky Mountain Forest and Range Experiment Station. 7 p.
Heidmann, L.J. 1967. Herbicides for preparing ponderosa pine planting sites in the southwest. Res. Note RM-83. Fort Collins, CO: U.S. Department of Agriculture, Forest Service, Rocky Mountain Forest and Range Experiment Station. 4 p.
Heidmann, L.J. 1968a. Herbicides for preparing ponderosa pine planting sites in the southwest. Down to Earth. 24(1): 18-20.
Heidmann, L.J. 1968b. Silvicultural control of dwarf mistletoe in heavily infected stands of ponderosa pine in the southwest. Res. Pap. RM-36. Fort Collins, CO: U.S. Department of Agriculture, Forest Service, Rocky Mountain Forest and Range Experiment Station. 11 p.
Heidmann, L.J. 1969. Use of herbicides for planting site preparations in the southwest. Journal of Forestry. 67(7): 506-509.
Heidmann, L.J. 1974. An investigation into the causes and prevention of frost heaving of forest tree seedlings. Tucson, AZ: University of Arizona. 183 p. Dissertation.
Heidmann, L. J.; Thorud, David B. 1975a. Effect of bulk density on frost heaving of six soils in Arizona. Res. Note RM-294. Fort Collins, CO: U.S. Department of Agriculture, Forest Service, Rocky Mountain Forest and Range Experiment Station. 4 p.
Heidmann, L.J. 1975b. Predicting frost heaving susceptibility of Arizona soils. Res. Note RM-295. Fort Collins, CO: U.S. Department of Agriculture, Forest Service, Rocky Mountain Forest and Range Experiment Station. 7 p.
Heidmann, L.J.; Thorud, David B. 1976a. Controlling frost heaving of ponderosa pine seedlings in Arizona. Res. Pap. RM-172. Fort Collins, CO: U.S. Department of Agriculture, Forest Service, Rocky Mountain Forest and Range Experiment Station. 12 p.
Heidmann, L.J. 1976b. Frost heaving of tree seedlings: A literature review of causes and possible control. Gen. Tech. Rep. RM-21. Fort Collins, CO: U.S. Department of Agriculture, Forest Service, Rocky Mountain Forest and Range Experiment Station. 10 p.
Heidmann, L.J. 1982a. Effect of selected natural and synthetic growth regulators on the growth of ponderosa pine seedlings. Forest Science. 28(1): 156-160.

USDA Forest Service RMRS-P-55. 2008. 37
Heidmann, L. J.1982b. An initial determination of the “lifting window” for ponderosa pine seedlings raised at Albuquerque, New Mexico. Proc. Western Nurserymen’s Conference, Medford, Oregon, 1982 Aug. 10-12.
Heidmann, L.J., Johnsen, Thomas N., Jr.; Cole, Quinten W.; Cullum, George. 1982. Establishing natural regeneration of ponderosa pine in central Arizona. Journal of Forestry. 80(2): 77-79.
Heidmann, L.J. 1983a. Seed production in southwestern ponderosa pine on a sedimentary soil. Res. Note RM-434. Fort Collins, CO: U.S. Department of Agriculture, Forest Service, Rocky Mountain Forest and Range Experiment Station. 2 p.
Heidmann, L.J. 1983b. Silvicultural control of dwarf mistletoe in southwestern ponderosa pine. Res. Note RM-433. Fort Collins, CO: U.S. Department of Agriculture, Forest Service, Rocky Mountain Forest and Range Experiment Station. 4 p.
Heidmann, L.J. 1984a. Fertilization increases cone production in a 55-year-old ponderosa pine stand in central Arizona. Forest Science. 30(4): 1079-1083.
Heidmann, L.J.; Haase, Sally M. 1984b. Herbicides for controlling weeds at the Albuquerque forest tree nursery. In: Proc. Combined Mtg. Western Forest Nursery Council and Intermountain Nurseryman’s Association; Coeur d’Alene, ID; 1984 Aug 14-16: 91-94.
Heidmann, L.J.; Haase, Sally M. 1989. Causes of mortality in outplanted ponderosa pine container seedlings in the Southwest. USDAFS Tree Planter’s Notes. 40(3): 16-19.
Heidmann, L.J.; King, Rudy M. 1992. Effect of prolonged drought on water relations of ponderosa pine seedlings grown in basalt and sedimentary soils. Res. Pap. RM-301. Fort Collins, CO: U.S. Department of Agriculture, Forest Service, Rocky Mountain Forest and Range Experiment Station. 8 p.
Hermann, Richard K. 1965. Survival of planted ponderosa pine in southern Oregon. Res. Pap. No. 2. Corvallis, OR: Oregon State University. 32 p.
Jenkinson, James L., 1980. Improving plantation establishment by optimizing growth capacity and planting time of western yellow pine. Res. Pap. PSW-154. Berkeley, CA: U.S. Department of Agriculture, Forest Service, Pacific Southwest Forest and Range Experiment Station. 22 p.
Larson, M.M. 1961. Seed size, germination dates, and survival relationships of ponderosa pine in the Southwest. Res. Note RM-66. Fort Collins, CO: U.S. Department of Agriculture, Forest Service, Rocky Mountain Forest and Range Experiment Station. 6 p.
Larson, M.M.; Schubert, Gilbert H. 1970. Cone crops of ponderosa pine in central Arizona including the influence of abert squirrels. Res. Pap. RM-58. Fort Collins, CO: U.S. Department of Agriculture, Forest Service, Rocky Mountain Forest and Range Experiment Station. 15 p.
Pearson, G.A. 1910. Reproduction of western yellow pine in the Southwest. For. Serv. Circ. 174. Washington, DC: U.S. Department of Agriculture. 16 p.
Pearson, G.A. 1950. Management of ponderosa pine in the Southwest. Mono. 6. Washington, DC: U.S. Department of Agriculture, Forest Service. 218 p.
Penner, E., 1958. The nature of frost action. Tech. Pap. 53 Proc. Thirty Eighth Convention of the Canadian Good Roads Assoc.: 234-243.
Rietveld, W.J. 1975. Phytotoxic grass residues reduce germination and initial root growth of ponderosa pine. Res. Pap. RM-153. Fort Collins, CO: U.S. Department of Agriculture, Forest Service, Rocky Mountain Forest and Range Experiment Station. 15 p.
Sackett, Stephen S. 1984. Observations on natural regeneration in ponderosa pine following a prescribed fire in Arizona. Res. Note RM-435. Fort Collins, CO: U.S. Department of Agriculture, Forest Service, Rocky Mountain Forest and Range Experiment Station. 8 p.
Schramm, J. R., 1958. The mechanism of frost heaving of tree seedlings. Am. Philos. Soc. Proc. 102(4): 333-350.
Schubert, Gilbert H.; Pearl, Robert W.; Heidmann, L.J. 1969. Here’s how: A guide to tree planting in the Southwest. Res. Pap. RM-49. Fort Collins, CO: U.S. Department of Agriculture, Forest Service, Rocky Mountain Forest and Range Experiment Station. 17 p.
Schubert, Gilbert H.; Heidmann, L.J.; Larson, M.M. 1970. Artificial reforestation practices for the Southwest. Agri. Handb. 370. Washington, DC: U.S. Department of Agriculture, Forest Service. 25 p.
Schubert, Gilbert H. 1974. Silviculture of southwestern ponderosa pine: The status of our knowledge. Res. Pap. RM-123. Fort Collins, CO: U.S. Department of Agriculture, Forest Service, Rocky Mountain Forest and Range Experiment Station. 71 p.
Taber, S. 1929. Frost heaving. J. Geol. 37: 428-461.Taber, S. 1930. The mechanics of frost heaving. J. Geol. 38:
303-317.Tinus, Richard. W.; McDonald, Stephen E. 1979. How to grow
tree seedlings in containers in greenhouses. GTR RM-60. Fort Collins, CO: U.S. Department of Agriculture, Forest Service, Rocky Mountain Forest and Range Experiment Station. 256 p.
The content of this paper reflects the views of the author(s), who are responsible for the facts and accuracy of the information presented herein.

38 USDA Forest Service RMRS-P-55. 2008.
Introduction
Since its inception in 1908, Fort Valley Experimental Forest has been the site of many research projects, mostly dealing with the ecology, silvics, and regeneration of ponder-osa pine (Pinus ponderosa). Fire was viewed as a damaging agent, to be dealt with only after the fact, and guides were developed to salvage forests damaged by fire (Gaines and Shaw 1958).
It seems strange that early research never fully realized the critical role that fire played in many ecosystems, including long needled pines, notably ponderosa pine. Early research-ers could hardly have missed the numerous fire scars on the old growth yellow pines. They may have been influenced by the prevailing view at the time—that trees were primarily for forest products and any injury reduced product value. In fact, the primary role of the forest manager was to perpetuate the species for the purpose of forest products by improving re-generation and growth rates, while utilizing overmature trees with low productivity. Thus, fire was considered a threat resulting in product damage or even mortality. They accom-plished their goal of preventing fire from damaging valuable trees through pre-suppression measures including slash fuel reduction.
Even in the early 1970s forest managers did not discuss prescribed fire as an option largely due to the char produced on boles destined for pulp production. Fire was used only in the form of slash pile burning. This standard treatment of fuels was done in the winter months to further minimize the risk to trees, using the snow to keep fires from running be-yond the piles through the woods willy-nilly.
In: Olberding, Susan D., and Moore, Margaret M., tech coords. 2008. Fort Valley Experimental Forest—A Century of Research 1908-2008. Proceedings RMRS-P-55. Fort Collins, CO: U.S. Department of Agriculture, Forest Service, Rocky Mountain Research Station. 282 p.
In 1974, Jack Dieterich returned to the U.S. Forest Service Fire Research community from a tour in the Peace Corps. Upon his return, he was asked to head up a new fire research unit for the Rocky Mountain Forest and Range Experiment Station. I (Sackett) worked for Jack at the Southern Forest Fire Laboratory in Macon, Georgia, in the late 1960s, prior to Jack’s service in the Peace Corps. For reasons of efficien-cy, the new fire research unit should have been located in Flagstaff, Arizona. However, the decision-makers at the time chose to establish the unit at the Forestry Sciences Laboratory on the campus of Arizona State University in Tempe, Arizona.
The first effort to explore potential fire conditions across the southwest region was to extensively survey the surface and ground fuel loadings in unharvested ponderosa pine/Arizona fescue ecosystem. Some mixed conifer stands were also included in this survey but the focus was on natural fuels of the southwestern ponderosa pine forest—the largest ex-panse of its kind in the world (Sackett 1979).
The results of that first fuel load survey were quite eye opening to many forest managers. Until then, when managers looked at fire hazard in the ponderosa forests, their focus was mainly the slash problem. The survey results revealed that, in fact, there was a serious natural fuel hazard even without the slash (Sackett 1979, Sackett and Haase 1996) with the potential for extreme wildfire behavior and high severity fire effects.
Four plots of the natural fuel survey were located on the Fort Valley Experimental Forest (FVEF) and Long Valley Experimental Forest (LVEF). The results of the survey showed total forest floor fuels less than 1-inch diameter ranged from 11.7-17.7 tons per acre. The mean of the 62 plots
Fire and Fuels Research at Fort Valley and Long Valley Experimental Forests
Stephen S. Sackett (ret.) and Sally M. Haase, Research Foresters, USDA Forest Service, Pacific Southwest Research Station, Riverside, CA
Abstract—Fire research began on the Fort Valley and Long Valley Experimental Forests in the mid 1970s. The U.S. Forest Service and other agencies in the Southwest (BIA and state) had been utilizing prescribed fire to reduce piled hazardous fuels from harvesting. Most managers had not viewed the use of prescribed fire to reduce natural fuels on a broad scale positively. The use of rotational prescribed burning has been investigated for over 30 years to determine the long-term effects of the reintroduction of this natural event. This paper summarizes the events that led up to the establishment of this long-term research project and general findings resulting from this work.

USDA Forest Service RMRS-P-55. 2008. 39
covering the southwestern range of ponderosa pine was ap-proximately 12.5 tons per acre. The experimental forest plots averaged 2.2 tons per acre heavier.
After surveying the fuels over the entire range of south-west ponderosa pine, it became evident to us why current day wildfires in the region were stand-consuming in nature. Out of that evidence, questions arose. A key question was how these forests could have survived and actually thrived for so long historically if naturally ignited fires (lightning) destroyed entire sections of the landscape. We know that yellow pines alive today on FVEF plots were seedlings well before the dis-covery of America. Supporting this theory is the fact that the first fire scare recorded on one of the trees evaluated at FVEF occurred in 1540 A.D. (Dieterich 1980b). Subsequently, how could these forests survive with the removal of fire, if this ex-tremely flammable ecosystem had received regular exposure to wildfire in the past?
Jack Dieterich set out to determine the actual historical occurrence of natural fire in ponderosa pine—a topic sorely overlooked by researchers investigating ponderosa pine, es-pecially in the Southwest. He collected his initial samples along the eastern edge of the FVEF at an area we now know as Chimney Spring. His sample trees dated back to the 1500s and fire scars in the tree rings themselves were numerous. The natural fire-return interval was as short as 1.25 years. Over the entire span of time (1540-1876) the average inter-val between fires at Chimney Spring was 4.9 years. Jack’s research clearly demonstrated that fire played a dominant role in the life of ponderosa pine prior to the Euro-American settlement of the Southwest.
Based on our survey, observations and experience in the southern species of yellow pine (loblolly and long leaf pines) where prescribed fire has been common practice for decades, Jack and I (Sackett) determined that natural fires were criti-cal in maintaining the balance in ponderosa pine. With the combination of recent fire absence and high fuel hazard, the obvious management direction would be to replace the element (fire) that had been removed from the system as hu-man settlement interrupted the natural process of the forest. It seemed clear that prescribed burning should be a primary option for protecting ponderosa pine forests from devastating wildfire. To test this, an ambitious prescribed fire research project was planned.
Before anything could be done to set up this prescribed fire study, we first had to decide where it could be established in a research context and how it would happen. Flagstaff was the obvious choice since there was an experimental forest there—Fort Valley. To begin exploring our options we first needed to talk with someone familiar with the area. That someone was Gil Schubert, “Mr. Ponderosa Pine.” Gil was the leader of the Rocky Mountain Station at the Forestry Sciences Laboratory silvicultural research unit in Flagstaff. In addition, he was in charge of Fort Valley. Like many silviculturalists at the time, Gil was not too supportive of prescribed fire or fire research. Wildfire was to be fought and protected against. Prescribed fire was to be avoided. Jack’s silver tongue finally persuaded Gil to let us look around for a site.
Our options for research plots were quite limited due to the number of historic studies and ones in process located throughout most of the experimental forest. We finally found a site adjacent to the Coconino National Forest on the eastern boundary of FVEF. According to Gil, nothing had happened to the site in the history of FVEF. Jack and I (Sackett) agreed to take it. Chimney Spring was the closest landmark, hence, we called our area Chimney Spring Prescribed Fire Research Area.
In 1976, Chimney Spring was divided into twenty-nine 2.5-acre (1 hectare) square plots. Twenty-one randomly se-lected plots had a 1-, 2-, 4-, 6-, 8-, or 10-year burning rotation or no burning (control) assigned three times (three replica-tions per treatment). The remaining eight plots were set aside for future studies. The primary research goal was to deter-mine how often it was appropriate to apply prescribed fire in order to keep the forest relatively safe from severe wildfire while assessing collateral fire impacts. From previous work, Jack and I knew that a single burn would not be adequate for continuous protection. In fact, a single burn can cause an increase in fuel for the period following the initial burn in the form of scorched crowns, increase of dead stems, and such.
Our research staff took many before-burn measurements in cooperation with folks at the Northern Arizona University School of Forestry. Vegetation transects were established by Dr. Lee Fitzhugh, wildlife professor, and runoff studies were conducted by Dr. Charles Avery. We contracted with NAU forestry students to survey overstory conditions while our technicians sampled fuel conditions. In hindsight, it may have been wise to wait another year to study and accumulate more and better pre-burn variables, but at the time, we chose to proceed with the data we had accumulated during that first summer.
The summer of 1976 was very dry. We postponed the ini-tial burn a number of times. We consulted regularly with the Coconino National Forest staff to keep informed of condi-tions in order to select the appropriate and safe time to burn, avoiding burning under severe and potentially dangerous con-ditions. Our delays lasted into late fall and we realized that something had to be done. Bill Buck, Fire Staff Officer for the Coconino, suggested we might try to burn under cooler conditions at night and so we did. Using all the overhead of the Coconino National Forest and our technicians, we began ignition at Chimney Spring the evening of November 7, 1976.
The valley-slip air movement had already started moving down the San Francisco Peaks, so we carefully started ap-plying fire at the bottom (south end) of the plots and worked our way toward the top. We all had plenty to do to get all of the burn plots completely ignited, keeping the fire moving without accidentally igniting the controls, and keeping the fire within the study boundaries. For these reasons, no one had much time to photograph the event. There was, however, a young professor at Northern Arizona University (NAU) who had an interest in what we were doing. Wally Covington was “savvy” enough to take some pictures of this historic and hectic event. Once the plots were ignited, they were left to burn all evening. In fact, they burned for the next two days.

40 USDA Forest Service RMRS-P-55. 2008.
Forest floor fuel loadings were heavy on these plots since no previous disturbance or fire had been noted since 1876—100 years previous (Dieterich 1980a). During our initial prescribed fire, 94% of the area consumed 64% of the weight of the fuel. Heavy scorching of “doghair” or sapling thickets took place as well as exposing of mineral soil in many places especially around large, mature yellow pines.
Chimney Spring is located just under the San Francisco Peaks making the soils basalt in nature. Since southwest pon-derosa pine also grows on sedimentary soils, we thought it important, especially for fire effects research, to include a comparison study on sandy soils.
Fortunately for us, there was the Long Valley Experimental Forest (LVEF). After checking again with Gil Schubert, we duplicated the prescribed fire rotation study at LVEF, which is the Limestone Flats Prescribed Fire Research Area. We modified some of our sampling techniques based on what we learned from our experiences at Chimney Spring but the overall study design remained similar.
Long Valley was somewhat different from Fort Valley in ways other than soil type. Long Valley was not a “virgin” stand like Chimney Spring. The application of a sanitation cut over the area in the late 1960s during a wet March cre-ated some mechanical disturbances to the soil. In contrast to Chimney Spring, Limestone Flats, as we refer to it, was a more open stand, much like other parts of the vast ponderosa pine stands along the Mogollon Rim. The last recorded natu-ral fire occurrence was in 1898, twenty-two years later than at the Chimney Spring site (Dieterich 1980b).
Unlike the summer of 1976, 1977 had an abundance of moisture during the monsoon season, so burning was not “all consuming” like the burning in the previous year. The ignition in 1977 occurred over a two-day period, October 26-27, which was almost as late as the original Chimney Spring burn.
Forest floor fuels, the heart of the energy system of wild-land fire, are commonly defined as either fine, light fuels or heavier woody fuels. Fine fuels consist of needles and small twigs while heavier fuels are generally branch wood, tree boles, stumps, etc. The real heart of the fire lies in the con-sumption of the fine, new needles and small twigs that make up the vertical flames or fire intensity portion of the material. The older, decomposed needles, twigs, cones, etc. result in the fire severity and are associated with glowing combustion of the total wildfire phenomenon (Harrington and Sackett 1988, Sackett and Haase 1998). Total fuel loading at both sites was quite different at the start of the studies. Chimney Spring had almost 23 tons per acre where as Limestone Flats had about 32 tons per acre (Sackett 1980, Sackett and Haase 1996). Fine fuels, which most affect what happens to a site, were virtu-ally identical—15+ tons per acre. The first Chimney Spring fire eliminated 65% of all fuels on the site whereas the wetter season fire at Limestone Flats eliminated only 43%.
In any case, the initial burns at both locations set in motion the return of fire to an environment that had been without the benefit of a valuable natural phenomenon for 70-100 years. The absence of fire, during the period when fire suppression
was the rule, created problems in the ponderosa pine eco-system that we are still trying to understand. Once seen as a grassland with scattered trees, the southwest ponderosa pine forest has turned into a system of very old trees and “never before seen” stands of millions upon millions of stagnated and unhealthy trees that were started in two good seed years in the early 1900s (Sackett and others 1994, 1996a,b).
Restoring fire and studying its effects has been and will continue to be the goal of fire research at the Fort Valley and Long Valley Experimental Forests. The initial burns of 1976 and 1977 began the research study that exists to this day. Knowing that a single burn was inadequate in having a “naturalizing effect” on any facet of the environment, our study sought to look at the effects of fire reintroduced on a recurring basis. Plots were assigned different burn intervals ranging from annual to 10-year rotations. To date, the annual plots have had fire applied 32 times, which is quite a feat. As previously stated, the original hypothesis was to determine the burn interval that would “protect” a ponderosa pine for-est from severe wildfire damage. This is difficult to prove or even to test, but we can make inferences from the study data on fuels, crown height from ground, and other variables common to wildfire behavior. Figure 1 demonstrates before- and after-treatment stand changes over a 20-year period at the FVEF site. Figure 2 shows changes in stand structure after a 20-year period at the LVEF.
More importantly, these two study sites give us valuable information about the effects of fire associated with reinstall-ing the fire as a natural phenomenon in the ponderosa pine forests. What does burning do to the soil? What are the ef-fects on vegetation composition and growth? What does fire do to soil moisture? We and other cooperators have been studying these and other questions during the years of this ongoing research.
Bringing fire back into a heavily fire dominated ecosys-tem after so many years of exclusion creates situations that are completely unpredictable. Some responses make per-fect sense after a little thought. One such example was our attempt to understand an unexpected, yet significant nega-tive impact of the prescribed burns: the mortality of large numbers of the yellow pine following the first entry burns. When some managers in non-fire disciplines view this re-sult, any further discussion of using prescribed burning is almost shutdown.
As previously mentioned, there are two types of forest floor fuels associated with how fire behaves. First is the fine, light, relatively new needle fuels that affect fire intensity. The second, fire severity fuels, consist of decomposed dense fuels below the top layers that burn more with glowing combus-tion than with flaming combustion. Southwest ponderosa pine forests are very dry systems. Desert or dry pinon/juniper eco-systems surround our vast stands of ponderosa pine. Due to the dryness of our forests, decomposition manifests itself ex-tremely slowly, resulting in heavy forest floor accumulations. These factors cause us to focus on the flaming front of a fire and to ignore the glowing combustion that takes over after the frontal passage of a fire.

USDA Forest Service RMRS-P-55. 2008. 41
Figure 1. Stand changes on a 4-year burn rotation treatment plot at Chimney Spring research area are shown by comparing photo (a) that was taken prior to the burn treatment in 1976 and photo (b) that was taken in 2002.
a
b
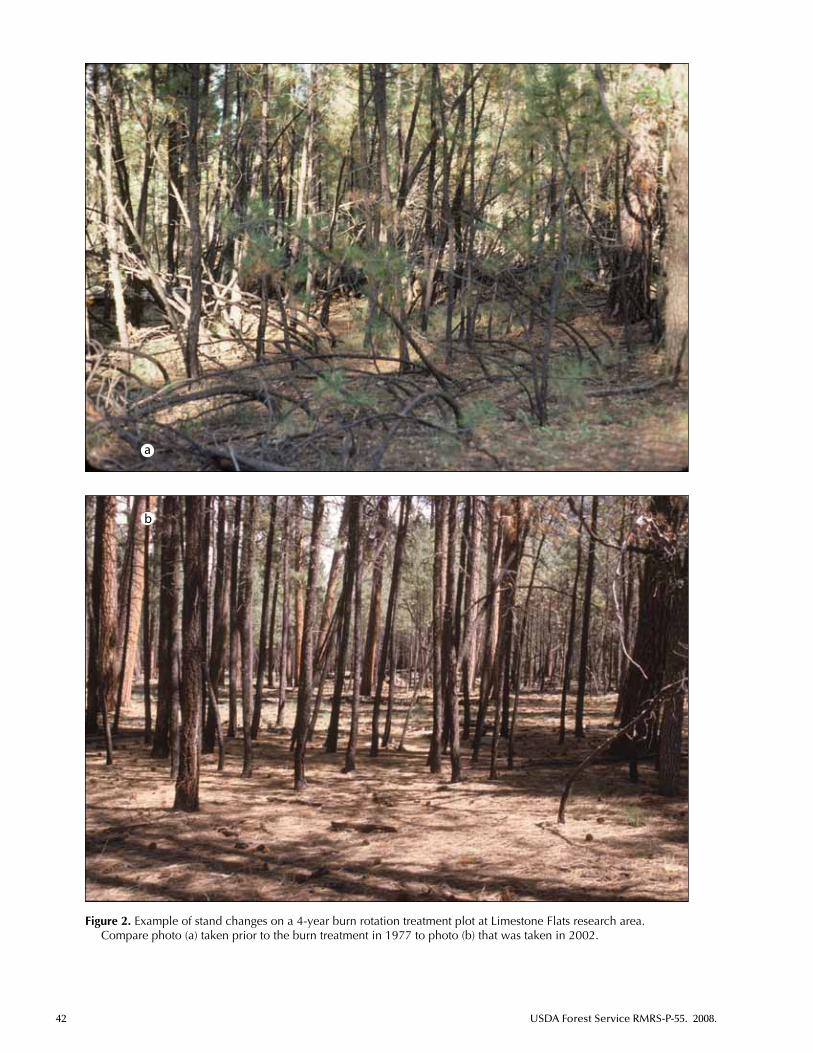
42 USDA Forest Service RMRS-P-55. 2008.
Figure 2. Example of stand changes on a 4-year burn rotation treatment plot at Limestone Flats research area. Compare photo (a) taken prior to the burn treatment in 1977 to photo (b) that was taken in 2002.
a
b

USDA Forest Service RMRS-P-55. 2008. 43
Old yellow pines tend to accumulate large amounts of fuel around their bases resulting in tremendous amounts of potential energy that lies dormant until glowing combus-tion ignites it. During one of our burns, we began digging around the base of an old yellow pine. Inadvertently, we struck a root while using a tool. As the root split open, ex-posing the suberized layer, steam escaped. We exclaimed, “Oh yes, it is hot down there!” This experience led us to conclude that real, yet not obvious damage can occur in the soil when there is no apparent damage in the crown or on the bole of the tree.
The greatest unnatural and problematic portion of these untreated ecosystems is the extremely heavy fuel loads around the bases of mature yellow pines. After-the-fact mea-surements indicate unusually high fuel loadings, ranging from 38 to 121 tons per acre equivalent right at the base of individual trees. The range of fuel loads under the tree cano-py range from 19 to 116 tons per acre equivalent. These fuel load conditions demonstrate the need for mitigating measures if large, old trees are to remain a part of the system.
Our original premise with regard to mortality of these veteran trees was that the root systems were affected by soil heating (fire severity) while the heating at the bole of the tree was conducted through the bark into the cambium, the living cells of the tree. Loss of roots and girdling of the bole are “sure fire” ways to increase tree mortality. If, as we surmised, one could eliminate one of the two problems, the tree might survive the unnaturally extreme heat flux of a first entry burn.
Figure 3. Soil and cambium temperatures being measured during a prescribed fire at Limestone Flats research area where the forest floor material has been removed around the base of the tree.
We felt that the easiest solution would be to eliminate the fuel from around the base of these prized mature trees. In fact, our studies at FVEF and LVEF showed us that taking away the forest floor fuels around the base of “saver” trees could eliminate the heat flux on the boles. This process, although quite labor intensive, is greatly enhanced with the use of a backpack leaf blower. Not only does the blower eliminate the forest floor, it scatters it out away from the heaviest fuel ac-cumulations close to the boles.
The research on old-growth tree mortality started at that moment (Sackett and Haase 1991, 1998). Since then, soil and cambium temperatures have been measured on more than 100 individual trees in Regions 3 and 5. Soil temperatures are measured at six depths down to at least 10 inches at 3 to 4 locations beneath the individual tree’s canopy while six cambium temperature points are measured on each tree under “normal” prescribed fire conditions (Figure 3). The obvious conclusion shows excessive heating both of root systems and at the growing cells of tree boles (cambium).
Decades without fire in a fire-adapted forest has created the current artificial and unnatural ecosystem. Modified means are necessary to reintroduce fire back into the system. Much of the work at Fort Valley and Long Valley gave us valuable insights into reestablishing fire into an old over-protected system. Forest managers are realizing the need to restore fire to ecosystems that have historically incorporated fire as a natural part of the system and see the benefits that go beyond just fuel reduction.

44 USDA Forest Service RMRS-P-55. 2008.
Conclusion
As we answer questions regarding the use of prescribed fire in the southwestern United States, scientists and manag-ers raise additional questions. Examination of the fire seasons in the most recent past demonstrates the successes of using prescribed fire in wildland/urban use areas. The increased number of acres treated with prescribed fire allows fire man-agers to successfully function under the current directive of Appropriate Management Response (AMR), allowing wildfire or wildfire use to do what occurs naturally in areas. Reduction of this natural fuel buildup by prescribed burning expands allowable burning conditions. There is no guarantee that a management tool such as prescribed burning is perfect, but with additional use and experience, the success of fire as a tool is improved. Forest Service research as well as univer-sity cooperative research has been responsible for looking at many of these fire effects (see Appendix A). We are proud of the successes of these students, many of whom are produc-tive Forest Service or university researchers in their own right in other geographic areas of the United States. We take great pride in knowing that we have had a small role in their ca-reer. We are also grateful to the grant process of the Joint Fire Science Program for funding to remeasure critical variables (ground and canopy fuels, stand overstory conditions, soil ammonium and nitrate, vegetation density and diversity) after 30 years of research. The goal is to evaluate more than thirty years of repeated rotational prescribed burning treatments in southwestern ponderosa pine, a truly rare opportunity.
Acknowledgments
We would like to thank Drs. Wally Covington (NAU) and Stan Faeth (ASU) for their help in compiling the pertinent theses and dissertation list of studies associated with these two long-term study areas. We would also like to thank our technicians who over the past 30+ years faithfully worked to protect and continue the research on these two areas.
References
Dieterich, John H. 1980a. Chimney Spring forest fire history. Res. Pap. RM-220. Fort Collins, CO: U.S. Department of Agriculture, Forest Service, Rocky Mountain Forest and Range Experiment Station. 8 p.
Dieterich, John H. 1980b. The composite fire interval—a tool for more accurate interpretation of fire history. In: Stokes, Marvin A.; Dieterich, John H., tech. coord. Proceedings of the fire history workshop; 1980 October 20-24; Tucson, AZ. Proc. Gen. Tech. Rep. RM-81. Fort Collins, CO: U.S. Department of Agriculture, Forest Service, Rocky Mountain Forest and Range Experiment Station: 8-14.
Dieterich, John H.; Swetnam, Thomas W. 1984. Dendrochronology of a fire-scarred ponderosa pine. Forest Science. 30(1): 238-247.
Gaines, Edward M.; Shaw, Elmer W. 1958. Half a century of research—Fort Valley Experimental Forest 1908-1958. Station Paper No. 38. Fort Collins, CO: U.S. Department of Agriculture, Forest Service, Rocky Mountain Forest and Range Experiment Station. 18 p.
Harrington, Michael G.; Sackett, Stephen S. 1988. Using fire as a management too in southwestern ponderosa pine. In: Krammes, J. S., tech. coord. Effects of fire management of southwestern natural resources. 1988 November 15-17, Tucson, AZ. Gen. Tech. Rep. RM-191. Fort Collins, CO: U.S. Department of Agriculture, Forest Service, Rocky Mountain Forest and Range Experiment Station: 122-133.
Sackett, Stephen S. 1979. Natural fuel loadings in ponderosa pine and mixed conifer forests of the Southwest. Res. Pap. RM-213. Fort Collins, CO: U.S. Department of Agriculture, Rocky Mountain Forest and Range Experiment Station. 10 p.
Sackett, Stephen S. 1980. Reducing natural ponderosa pine fuels using prescribed fires: two case studies. Res. Note RM-392. Fort Collins, CO: U.S. Department of Agriculture, Rocky Mountain Forest and Range Experiment Station. 6 p.
Sackett, Stephen S.; Haase, Sally M. 1991. Measuring soil and tree temperatures during prescribed fires with thermocouple probes. Gen. Tech. Rep. PSW-GTR-131. Albany, CA: U.S. Department of Agriculture, Forest Service, Pacific Southwest Research Station. 15 p.
Sackett, Stephen S.; Haase, Sally M. 1996. Fuel loadings in Southwestern ecosytems of the United States. In: Ffolliott, Peter F; DeBano, Leonard F.; Baker, Jr., Malchus B.; Gottfried, Gerald J.; Solis-Garza, Gilberto; Edminster, Carleton B.; Neary, Daniel G.; Allen, Larry S.; Hamre, R. H., tech. coords. Effects of fire on Madrean Province ecosystems: a symposium proceedings. 1996 March 11-15l; Tucson, AZ. Gen. Tech. Rep. RM-GTR-289. Fort Collins, CO: U.S. Department of Agriculture, Forest Service, Rocky Mountain Forest and Range Experiment Station: 187-192.
Sackett, Stephen S.; Haase, Sally M.; Harrington, Michael G. 1994. Restoration of southwestern ponderosa pine ecosystems with fires. In: Covington, Wallace W.; DeBano, Leonard F., tech coords. Sustainable ecological systems: implementing an ecological approach to land management. 1993 July 12-15; Flagstaff, AZ. Gen. Tech. Rep. RM-247. Fort Collins, CO: U.S. Department of Agriculture, Forest Service, Rocky Mountain Forest and Range Experimental Forest: 115-121.
Sackett, Stephen S.; Haase, Sally M.; Harrington, Michael G. 1996a. Lessons learned from fire use for restoring southwestern ponderosa pine ecosystems. In: Covington, Wallace; Wagner, Pamela K., tech. coords. Conference on adaptive ecosystem restoration and management: restoration of Cordilleran conifer landscapes of North America; June 6-8, 1996; Flagstaff, AZ. Gen. Tech Rep. RM-GTR-278. Fort Collins, CO: U.S. Department of Agriculture, Forest Service, Rocky Mountain Forest and Range Experiment Station: 54-61.
Sackett, Stephen S.; Haase, Sally M.; Harrington, Michael G. 1996b. Prescribed burning in Southwestern ponderosa pine. In: Ffolliott, Peter F.; DeBano, Leonard F.; Baker, Jr., Malchus B.; Gottfried, Gerald J.; Solis-Garza, Gilberto; Edminster, Carleton B.; Neary, Daniel G.; Allen, Larry S.; Hamre, R.H., tech. coords. Effects of fire on Madrean Province ecosystems: a symposium proceedings. 1996 March 11-15; Tucson, AZ. Gen.

USDA Forest Service RMRS-P-55. 2008. 45
Tech. Rep. RM-GTR-289. Fort Collins, CO: U.S. Department of Agriculture, Forest Service, Rocky Mountain Forest and Range Experiment Station: 178-186.
Sackett, Stephen S.; Haase, Sally M. 1998. Two case histories for using prescribed fire to restore ponderosa pine ecosystems in northern Arizona. In: Pruden, Teresa L.; Brennan, Leonard A., eds. Fire in ecosystem management: shifting the paradigm from suppression to prescription. Tall Timbers Fire Ecology Conference Proceedings, No. 20. Tall Timbers Research Station, Tallahassee, FL: 380-389.

46 USDA Forest Service RMRS-P-55. 2008.
This appendix contains graduate student research the-ses pertinent to Chimney Spring and Limestone Flats that have been produced from 1978 through 2008 in cooperation with the School of Forestry at Northern Arizona University, University of Arizona, and Arizona State University. Also in-cluded are journal articles, proceedings, research notes, and other publications resulting from the graduate work and ad-ditional publications not included in the citation section.
Theses and Dissertations:
Cook, J. E. 1985. Evaluating competition among understory plants in northern Arizona ponderosa pine stands: Greenhouse and field approaches. Flagstaff, AZ: Northern Arizona University. Thesis.
Haase, S. M. 1981. Effects of prescribed burning on ponderosa pine seed germination in the Southwest. Flagstaff, AZ: Northern Arizona University. Thesis.
Harris, G. R. 1978. The effect of prescribed burning on nutrient concentrations and production of understory vegetation in ponderosa pine. Flagstaff, AZ: Northern Arizona University. Thesis.
Jani, Andrea. 2005. Association of Neotyphodium endophytes and alkaloids with community structure in native grass systems. Tempe, AZ: Arizona State University. Thesis.
Kogutt, J. L. 1984. Effects of prescribed burning on forage quality in southwestern ponderosa pine at two sites. Flagstaff, AZ: Northern Arizona University. Thesis.
Meyer, C. L. 2000. Microclimatic changes and biotic effects across forest structural gradients associated with ponderosa pine restoration. Flagstaff, AZ: Northern Arizona University. Thesis.
Milne, M. M. 1979. The effects of burning, root trenching, and shading on mineral soil nutrients in southwestern ponderosa pine. Flagstaff, AZ: Northern Arizona University. Thesis.
Ower, C. L. 1985. Changes in ponderosa pine seedling growth and soil nitrogen following prescribed burning and manual removal of the forest floor. Flagstaff, AZ: Northern Arizona University. Thesis.
Rambo, J. 2006. The response of understory vegetation to prescribed fire in Northern Arizona Ponderosa pine forest. Tempe, AZ: Arizona State University. Thesis.
Ryan, M. G. 1978. The effect of prescribed burning on ponderosa pine on the inorganic nitrogen content of the soil. Flagstaff, AZ: Northern Arizona University. Thesis.
Schulthess, Franziska. 1997. Endophytes of Festuca arizonica: Distribution and effects of the host. Tempe, AZ: Arizona State University. Thesis.
Scudieri, C. A. In preparation. Understory vegetation response to 30 years of interval prescribed burning at two southwestern ponderosa pine sites. Flagstaff, AZ: Northern Arizona University. Thesis.
Sullivan, T. J. 2003. Geographic and genetic variation in the Neotyphodium/Festuca arizonica interaction. Tempe, AZ: Arizona State University. Dissertation.
Appendix A_____________________________________________
Sutherland, E. K. 1989. The effect of prescribed burning on southwestern ponderosa pine growth. Tucson, AZ: University of Arizona. Dissertation.
Vose, J. M. 1984. Establishment and growth of common understory plants following prescribed fire in an Arizona ponderosa pine community. Flagstaff, AZ: Northern Arizona University. Thesis.
Wright, R. J. 1996. Fire effects on fine roots, mycorrhizae, and nutrient dynamics in a southwestern ponderosa pine forest. Flagstaff, AZ: Northern Arizona University. Thesis.
Other Publications and Proceedings:
Cheplick, G. P.; Faeth, S. H. [In press.] The Ecology and Evolution of the Grass-Endophyte Symbiosis. Oxford University Press, Oxford UK.
Covington, W. W.; Sackett, S. S. 1984. The effect of a prescribed burn in southwestern ponderosa pine on organic matter and nutrients in woody debris and forest floor. Forest Science. 30(1): 183-192.
Covington, W. W.; Sackett, S. S. 1986. Effect of periodic burning on soil nitrogen concentrations in ponderosa pine. Soil Science of America Journal. 50(2): 452-457.
Covington, W. W.; Sackett, S. S. 1992. Soil mineral nitrogen changes following prescribed buring in ponderosa pine. Forest Ecology and Management. 54: 175-191.
Faeth, S. H.; Haase, S. H.; Sackett, S. S.; Sullivan, T. J.; Keithley, R. K; Hamilton, C. E. 2002. Does fire maintain systemic endophyte infections in native grasses? Symbiosis. 32: 211-228.
Faeth, S. H.; Hamilton, C. E. 2006. Does an asexual endophyte symbiont alter life stage and long-term survival in a perennial host grass? Microbial Ecology. 52: 748-755.
Faeth S. H.; Saikkonen, K. 2007. Variability is the nature of the endophyte-grass interaction., In: Popay, A.; Thom, E. R., eds. Proceedings of the 6th International Symposium on Fungal Endophytes of Grasses. New Zealand Grassland Association, Dunedin, New Zealand: 37-48.
Haase, S. M. 1986. Effect of prescribed burning on soil moisture and germination of southwestern ponderosa pine seed on basaltic soils. Res. Note RM-462. Fort Collins, CO: U.S. Department of Agriculture, Forest Service, Rocky Mountain Forest and Range Experiment Station. 6 p.
Haase, S. M.; Sackett, S. S. [In press]. A comparison of visual and quantitative changes from rotational prescribed burning in old growth stands of southwestern ponderosa pine. In: Narog, M. G., tech. coord. Proceedings of the 2002 Fire Conference: managing fire fuels in the remaining wildlands and open spaces of the Southwestern United States, 2002 December 2-5, San Diego, CA. Gen. Tech. Rep. PSW-GTR-189. Albany, CA: U.S. Department of Agriculture, Forest Service, Pacific Southwest Research Station.
Hamilton, C. E.; Faeth, S. H. 2005. Asexual, systemic endophytes in grasses: a test of the seed germination and pathogen resistance hypothesis. Symbiosis. 38: 69-86.

USDA Forest Service RMRS-P-55. 2008. 47
Hamilton, C. E.; Faeth, S. H. 2007. Neotyphodium infection and hybridization as a function of environmental variation. In: Popay, A.; Thom, E. R., eds. Proceedings of the 6th International Symposium on Fungal Endophytes of Grasses. New Zealand Grassland Association, Dunedin, New Zealand: 215-217.
Harris, G. R.; Covington, W. W. 1983. The effect of a prescribed fire on nutrient concentration and standing crop of understory vegetation in ponderosa pine. Canadian Journal of Forest Research. 13(3): 501-507.
Hart, S. C.; Classen, A. T.; Wright, R. J. 2005. Long-term interval burning alters fine root and mycorrhizal dynamics in a ponderosa pine forest. Journal of Applied Ecology. 42: 752-761.
Meyers, C.; Sisk, T. D. 2001. Butterfly response to microclimatic changes following ponderosa pine restoration. Restoration Ecology. 9: 453-461.
Meyers, C.; Sisk. T. D.; Covington, W. W. 2001. Microclimatic changes induced by ecological restoration of ponderosa pine forest in northern Arizona. Restoration Ecology. 9: 443-452.
Peterson, D. L.; Sackett, S. S.; Robinson, L. J.; Haase, S. M. 1994. The effects of repeated prescribed burning on Pinus ponderosa growth. International Journal of Wildland Fire. 4(4): 239-247.
Ryan, M. G.; Covington, W. W. 1986. Effect of a prescribed burn in ponderosa pine on inorganic nitrogen concentrations of mineral soil. Res. Note RM-464. Fort Collins, CO: U.S. Department of Agriculture, Forest Service, Rocky Mountain Forest and Range Experiment Station. 5 p.
Sackett, S. S.; Haase, S. M. 1991. Predicting forest floor weights indirectly. In: Andrews, P. L.; Potts, D. F., eds. Proceedings of the 11th conference on fire and forest meteorology; 1991 April 16-19; Missoula, MT. Society of American Foresters; SAF Publication 91-04: 381-386.
Sullivan, T. J.; Faeth, S. H. 2004. Gene flow in the endophyte Neotyphodium and implications for coevolution with Festuca arizonica. Molecular Ecology. 13: 649-656.
Sullivan, T. J.; Faeth, S. H. 2008. Local adaptation in Festuca arizonica infected by hybrid and non-hybrid Neotyphodium endophytes. Microbial Ecology 55 (in press). DOI 10.1007/s00248-007-9312-4
Vose, J. M.; White, A. S. 1987. Processes of understory seedling recruitment 1 year after prescribed fire in an Arizona ponderosa pine community. Canadian Journal of Botany. 65: 2280-2290.
Vose, J. M.; White, A. S. 1991. Biomass mechanisms of understory species the first year after prescribed burning in an Arizona ponderosa pine community. Forest Ecology and Management. 40: 175–187.
White, A. S.; Cook J. E.; Vose, J. M. 1991. Effects of fire and stand structure on grass phenology in a ponderosa pine forest. American Midland Naturalist. 126: 269-278.
Wright, R. J.; Hart, S. C. 1997. Nitrogen and phosphorus status in a ponderosa pine forest after 20 years of interval burning. Ecoscience 4: 526–533.
The content of this paper reflects the views of the author(s), who are responsible for the facts and accuracy of the information presented herein.

48 USDA Forest Service RMRS-P-55. 2008.
Introduction
The purpose of this paper is to document the first 100 years of range management research at the U.S. Forest Service’s Fort Valley Experimental Forest (FVEF) and to explain the significance of this research on the field of range ecology and management. Although we em-phasize the work done at FVEF in the ponderosa pine forest, we also touch on other research projects in nearby experimental plots in other vegetation types such as pinyon- juniper and chaparral communities.
The paper has three sections, each reflecting a distinct time period and Forest Service range research focus. The FVEF was established in 1908 in northern Arizona to provide alternatives for protecting and managing forest and range re-sources. For the period from 1908 to 1950, forest grazing was used primarily for regional economic stability. During this first period, range research focused largely on how domestic livestock grazing impacted forage grasses and ponderosa pine regeneration. From 1950 to 1978, the focus of range research changed from livestock production to multiple use emphasiz-ing timber, forage, and animal interactions in ponderosa pine, pinyon-juniper, and chaparral vegetation types. The period from 1978 to 2008 represents yet another era, wherein the focus shifted to biodiversity, ecosystem restoration, and ecol-ogy of invasive non-native plant species.
Range research at Fort Valley during the 100-year his-tory included: (1) ecological baseline information and management practices, (2) tree overstory and understory
In: Olberding, Susan D., and Moore, Margaret M., tech coords. 2008. Fort Valley Experimental Forest—A Century of Research 1908-2008. Proceedings RMRS-P-55. Fort Collins, CO: U.S. Department of Agriculture, Forest Service, Rocky Mountain Research Station. 282 p.
Range Management Research, Fort Valley Experimental Forest
Henry A. Pearson, (ret.), USFS/Agricultural Research Service, Athens, TX; Warren P. Clary, (ret.), USFS, Meridian, ID; Margaret M. Moore, Northern Arizona School of Forestry, Flagstaff, AZ; and Carolyn Hull Sieg, USFS, Rocky Mountain Research Station, Flagstaff, AZ
Abstract—Range management research at the Fort Valley Experimental Forest during the past 100 years has provided scientific knowledge for managing ponderosa pine forests and forest-range grazing lands in the Southwest. Three research time periods are identified: 1908 to 1950, 1950 to 1978, and 1978 to 2008. Early research (1908-1950) addressed ecologi-cal effects of livestock grazing on pine regeneration and forage plant growth. In later years (1950-1978) the research scope broadened to include the multiple uses of forest resources (trees, understory vegetation, livestock, wildlife, etc.), environmental and socio-economic impacts, and tree, forage, and animal interactions and interrelationships. Currently (1978-2008) research is focused on biodiversity, ecosystem restoration, and ecology of invasive non-native species.
plant relationships, (3) plant-animal relationships, and (4) en-vironmental issues, concerns, and evaluations. Our goal is to highlight range research techniques and practices developed at FVEF and nearby sites and touch on key researchers and some of their significant contributions.
Ecological Effects of Livestock Grazing: 1908 to 1950
In the early years of the FVEF, field researchers often spent their winters in Tucson and summers at Fort Valley. Later they were housed all year at each location conducting their respec-tive research. Onsite U.S. Forest Service (USFS) scientists were often accompanied by Washington Office personnel who reviewed, coordinated, and assisted in research prog-ress and/or conducted their own independent field research. Some of the noted early scientists and administrators were: G. A. Pearson, R. R. Hill, W. R. Chapline, C. L. Forsling, E. W. Nelson, M.W. Talbot, F. Haasis, C. K. Cooperrider, H. O. Cassidy, E. C. Crafts, R. Price, J. F. Arnold, R. H. Canfield, G. Glendening, C. F. Cooper, B. I. Judd, K. W. Parker, H. Weaver, and A. W. Lindenmuth.
During the period from 1908 to 1950, the livestock in-dustry was strong and grazing lands were utilized mainly for immediate economic returns with limited regard for biodiver-sity. Range research focused on baseline studies to determine how plant species recovered from past overuse, response of

USDA Forest Service RMRS-P-55. 2008. 49
forage plants to the current-day grazing practices, the impacts of grazing on pine regeneration, and determining range condi-tion and trend. The use of grazing exclosures and permanent measurement plots was essential for building baseline infor-mation; several of these original projects are discussed here.
R. R. Hill, a USFS Grazing Examiner, divided his time among the first USFS grazing reconnaissance on the Coconino National Forest (1912) and a study to determine the effects of intense livestock grazing on tree regeneration from 1910 to 1914 (Hill 1917). In 1912, he established a study to ex-amine how understory vegetation recovered when protected from livestock grazing. He worked with M. W. Talbot, W. R. Chapline, and G. A. Pearson to select five livestock exclo-sure sites on the Coconino National Forest, locally known as the “Hill plots.” Permanent quadrats were established inside and outside the exclosures, and the vegetation was mapped periodically between 1912 and 1941. Early reports (Arnold 1950, Glendening 1941, Hill 1917, 1921, Merrick 1939, Talbot and Hill 1923) concluded that the herbaceous under-story vegetation requires several decades to recover from “severe livestock” grazing. As described below (time period 1978-2008), this early research resumed in 2002 (Bakker and Moore 2007, Bakker and others, this proceedings).
G. A. Pearson established permanent silviculture plots at Fort Valley (USFS permanent sample plots) in 1909. In 1914, understory plots within the silviculture plots were added to quantify woody and herbaceous plant composition, second-ary plant succession, and effects of livestock, rodents, and other possible forms of competition on pine seedling surviv-al (Haasis 1923, Pearson 1923,1933,1942). All plants were charted on 24 plots, then half of the plots were denuded and all plot pairs were remapped five years later (1919). These plots were remeasured again in 1996 (Bakker and others 2002) and results are discussed in a later section (time period 1978-2008).
In 1927 on USFS allotments northwest of Flagstaff (locally known as the “Cooperrider-Cassidy” or “Wild Bill-Willaha” plots), C. K. Cooperrider and H. O. Cassidy studied biological factors responsible for injury to ponderosa pine regeneration and grazing impacts on herbaceous vegetation. After nine years, they observed that cattle, sheep, game ani-mal browsing, and tip moths did the most injury to seedlings more than three years old, whereas rodents damaged younger seedlings (Cooperrider 1938). The herbaceous composition data were never published; however, measurements resumed in 2006 (Laughlin and Moore, this proceedings) and are dis-cussed later (time-period 1978 to 2008).
In the 1940s, J.F. Arnold remeasured the “Hill” plots to further describe the ponderosa pine-bunchgrass successional patterns and forage yields (Arnold 1950, Bakker and Moore 2007, Clary 1975, Milchunas 2006). He used plant life-form classifications to evaluate range condition and trend and showed bunchgrass survival was reduced by removing the plant apex (Arnold 1955).
After Pearson’s retirement in 1945, G.S. Meagher (Timber Management Research Leader) returned to Fort Valley in 1946 to help complete G.A. Pearson’s (1950) mono-graph. Other research during this time period included the
development of Range Utilization Standards (USDA Forest Service 1937), shrub invasion control, flood control sur-veys, and the Cooperative Western Range Survey. These efforts from 1936 to 1941 were in cooperation with the Soil Conservation Service, Bureau of Agriculture Economics, and Corp of Engineers. In the 1940s, range study plots were es-tablished throughout the National Forest Region to provide information on range recovery, utilization, condition, and trend, which provided benchmark data for future measure-ments. In addition, the Wild Bill allotment was used to test the widely used line intercept method (Canfield 1941).
Multiple Use Era: 1950 to 1978
From 1950 to 1978, the USFS research emphases changed from single-use livestock production to multiple-use. Arriving in 1956, Don Jameson, plant physiologist and range scien-tist, assisted Elbert H. Reid (Range Management Research Assistant Director) in initially establishing the Southwest Chaparral Woodland and Forest Range Project (SCWFRP) on the Northern Arizona University (NAU) campus in Flagstaff, AZ (Arizona State College before 1966). This initiative was to provide basic and applied range management information and focused on timber, forage, and animal interactions in the ponderosa pine, pinyon-juniper, and chaparral range types. Research approaches involved plant physiology, ecology, plant and animal (livestock and wildlife) nutrition, econom-ics, and environmental sciences.
Much of Jameson’s early research was concerned with plant physiological responses to tissue removal and resis-tance of plants to heat and desiccation (Jameson and Huss 1959, Jameson 1961a, 1962, 1963). Later he studied the ef-fects of natural growth inhibitors on herbaceous vegetation, plant competition, and plant patterns (Jameson 1961b, 1965a, 1966a, 1966b, 1967, 1968, 1970). Jameson initiated a large-scale ecological study in the nearby pinyon-juniper type that provided a method of comparing the ability of different soils (sedimentary vs. basaltic) to produce native vegetation following tree overstory removal. Herbage yields were deter-mined based on soils, annual precipitation, pretreatment tree canopy cover, and pretreatment nitrates (Clary and Jameson 1981, Jameson 1965b, Jameson and Dodd 1969). In his last years at Flagstaff, Don became the local expert on the newly developed computers and computer modeling. One of his many contributions was the modeling of optimum stand se-lection for juniper control (Jameson 1971).
Arriving in 1962, Henry Pearson (ruminologist, nutri-tionist, and range scientist) mainly focused his research efforts on the “Wild Bill Range” (Pearson and Jameson 1967). This study estimated livestock gains from forage intake and nutritional plant values (Figure 1) for cattle graz-ing in different ponderosa pine stand densities (Clary and Pearson 1976, Pearson 1964, 1972). Grazing intensity was also calculated for maximum livestock profits on ponderosa

50 USDA Forest Service RMRS-P-55. 2008.
pine ranges (Pearson 1973). Prior to study initiation, the prevalent dense ponderosa pine stands were thinned or clear-cut to specific tree stand densities: 80, 60, 40, 20, and zero (clear-cut units) sq ft basal area/acre (Figure 2). The original stand density (untreated unit) averaged 110 ft2 basal area per acre. Three events were touted as reasons for the exceptionally high densities (thousands of seedlings per acre) of the 40+ year-old spindly ponderosa pine: (1) lim-ited livestock control during 1918 (allowing overgrazing and grass competition reductions), (2) exceptionally high ponderosa pine seed yields during the spring of 1919, and (3) unusually high rainfall during June 1919 (normally a dry month). The new pine seedlings flourished when the July summer monsoons began.
Several basic and applied studies branched out to include management and technical methods for timber, livestock, and wildlife (Pearson 1963, 1967a, 1968, Pearson and others 1971). In vitro digestibility techniques for livestock and wild-life research were described in the 1968 national symposium in Flagstaff and Fort Valley (Pearson 1964, 1965a, 1967b, 1967c, 1970). Using rumen fistulated cattle (Figure 3), this nutrition research was a first for the USFS (claimed to be “cutting edge” research by Washington Office Range Division Chief Ken Parker in 1964), resulting in Pearson’s appointment to the 17-state Western Range Livestock Nutrition Committee. Rumen studies resulted in microbial descriptions for mule deer, white-tailed deer, pronghorn, and bison (Pearson 1965b, 1967d, 1969a, 1969b). A 7-foot snow-fall in December 1967 precipitated a study determining why pronghorn, which were provided highly nutritious alfalfa hay after extended periods without food, died from starvation more than those not provided any supplemental feed. Rumen microbial examinations indicated that the limited rumen ab-sorption of nutrients was confounded by the increased acid production from the high quality hay causing the pronghorn to die from acute acid indigestion (Pearson 1969b). Similar results occurred earlier in mule deer herds of northern Utah
(Doman and Rasmussen 1944). Other techniques developed and tested included freeze branding, remote cattle weigh-ing and recording (Pond and Pearson 1971), forage sample storage (Pond and Pearson 1970), remote livestock water developments (Pearson and others 1969), rumen microbial techniques (Pearson 1965a, 1965b, 1967b), and remote radio telemetry.
A May 1967 lightning strike ignited the White Horse wildfire north of the Fort Valley headquarters, burning about 800 acres of forest land, including two experimental pastures on the “Wild Bill Range” (Pearson and others 1972). The unthinned ponderosa pines were decimated by the resulting crown-fire, but the adjacent thinned pines were virtually un-damaged due to the fire going across the pasture as a ground fire. Ponderosa pine radial growth increased on trees with crown scorch less than 60% but decreased where it was more than 60% (Figure 4). Burning initially enhanced herbaceous plant growth and nutritive values after the fire.
Arriving in 1966, Floyd Pond (ecologist and range sci-entist) focused his research on the chaparral range type; however, he also studied plant responses in forested ranges using grazing and clipping studies (Pond 1960). He also found that plant dry matter yield reductions occurred with increased frequency and intensity of harvesting (Pond 1961).
Range scientist Warren Clary, assigned to the nearby Beaver Creek Multiple Resource Evaluation Project, was the longest tenured range scientist at the Flagstaff headquarters (1960–1976). The Beaver Creek Project (Figure 5), a coop-erative Rocky Mountain Station (RM) and National Forest System (NFS) Region 3 effort located south of Flagstaff, was established to make multiple resource evaluations of land and vegetation treatments designed to increase overland water yields (Figure 6). Clary first focused on the sampling needed to evaluate herbaceous productivity on the newly formed project.
Clary and colleagues (Peter Ffolliott, Fred Larson, Art Tiedemann, and Bill Kruse) studied the impact of ponder-osa pine and pinyon-juniper modifications, such as cabling, sawing, and herbicide treatments on timber growth, forage yields, and their interrelationships with soil, hydrologic re-sponse, and wildlife habitat (Clary 1964, Clary and Ffolliott 1966, Clary and Jameson 1981, Clary and Larson 1971, Clary and others 1974, 1978, Ffolliott and Clary 1975, 1982). Each treatment approach produced a different combination of effects.
The economic effectiveness of tree overstory modifications on forage value, livestock carrying capacity and distribution on the landscape, trade-off relationships, and optimum com-binations of timber products (such as sawtimber, pulpwood, and fuelwood) and livestock were studied (Figure 7, Clary 1978, 1983, 1987, 1988, Clary and Grelen 1978, Clary and others 1974, 1975, 1978). Cooperators Don Neff and Clay McCulloch, Arizona Game and Fish Department, and Hudson G. Reynolds, USFS RMRS Wildlife Biologist, examined the effects of treatments on forage and habitat for deer, elk, live-stock, and small mammals (Clary 1972, Reynolds and others 1970).
Figure 1. Estimated livestock gains based on forage intake and nutritional plant values (Pearson 1972).

USDA Forest Service RMRS-P-55. 2008. 51
Figure 2. Map of the Wild Bill study area. Top: Location of study area relative to the Fort Valley Headquarters. Bottom: Eight experimental pastures by acreage and stand density (Pearson and Jameson 1967).

52 USDA Forest Service RMRS-P-55. 2008.
Arriving in 1965, range technician William (Bill) Kruse eventually became the only range researcher at the Flagstaff location following Clary’s departure in 1976. He was later transferred to Green Valley, Arizona, as superintendent of the Santa Rita Experimental Range (Ffolliott and others 2003). He returned to Flagstaff as a range scientist following comple-tion of his MS degree. Some of his accumulated wisdom and experience was expressed in Kruse and Baker, Jr. (1998) and in two book chapters: “Grazing systems of the Southwest” (Kruse and Jemsion 2000) and “Livestock grazing in ripar-ian areas: environmental impacts, management practices and management implications” (Clary and Kruse 2004).
During the 1950-1978 era of research at Flagstaff, the Agricultural Research Service housed three scientists (Thomas N. Johnsen, Jr., Fred Lavin, and Fred B. Gomm) at the Forest Service Laboratory on the NAU campus. They conducted research on range seeding and noxious plant con-trol across northern Arizona including on or near the Fort Valley headquarters (Johnsen 1980, 1986a, 1986b, Johnsen and Gomm 1981, Lavin 1967, Lavin and others 1968, 1973, 1981).
Biodiversity and Restoration Era: 1978 to 2008
The period from 1978 to 2008 represents yet another era in range-related research at Fort Valley. This era represented a shift from research focused on achieving multiple products
Figure 3. Bill Kruse assisting with rumen fistulated cattle (Pearson 1970).
Figure 4. Ponderosa pine radial growth increased on trees with crown scorch less than 60%, but decreased where it was more than 60% as a result of the White Horse fire that burned two experimental pastures on the “Wild Bill Range” in 1967 (Pearson and others 1972).
to efforts to restore native forest diversity and studies on the ecology of invasive non-native plants. Major efforts have focused on resampling permanent plots, experimenting with cutting and burning treatments designed to restore historic structure and functions, and greater emphasis on understand-ing how treatments and wild fires influence the growing number of non-native species.
Continued Work on the Hill, Pearson, Cooperrider Permanent Plots
In recent years, there has been an increased interest in quantifying herbaceous vegetation structural and composi-tional changes in the southwestern ponderosa pine-bunchgrass ecosystems from the early 1900s to present. The rediscovery of the permanent chart quadrats originally established and mapped by R. R. Hill, G. A. Pearson, and C. K. Cooperrider and other scientists between 1912 and 1941 (described in 1908 to 1950 section) provided opportunities to detect and quantify long-term changes in the understory vegetation. With the fine-grained maps showing the location of individual plants, life history (establishment, survival, growth, death) and plant com-munity attributes (composition, cover, etc.) can be quantified. New technologies including geographic information systems and more powerful statistical methods allowed vegetation analyses that were not possible 100 years ago.

USDA Forest Service RMRS-P-55. 2008. 53
Figure 5. Map of the Beaver Creek Watershed.
From 1996 until 2007, Margaret Moore and associates at NAU, with the original records and old maps from the USFS Fort Valley Archives and the aid of a metal detector, relocated most of the original field plots and have reanalyzed some of these data (Figure 8, Bakker and others 2002, 2006a, 2006b, Bakker and Moore 2007, Bakker and others, this proceedings, Laughlin and Moore, this proceedings). Data collections in 1996 on the Pearson understory plots showed species rich-ness reductions and shifts in C3 and C4 grasses, although the ‘natural’ and denuded plot pairs did not differ after 90+ years (Bakker and others 2002). Recent analyses on data from the Hill plots have shown that differences between historical grazing treatments, which may have been evident at one time, have now disappeared once overstory effects such as shading
are taken into account. Although herbaceous species richness and cover have declined from 1941 to present, it is due to the overwhelming effect of increasing tree density (Arnold 1950, Bakker and Moore 2007, Clary 1975). Currently, the research team continues to relate shifts in plant composition to physical soil traits, climate, and land-use changes; and to build predictive models using these unique data sets.
GPNA—Restoration ExperimentAn experiment was initiated in 1992 on a decommissioned
portion of the G.A. Pearson Natural Area on the FVEF to evaluate long-term ecosystem responses to two restora-tion treatments: thinning only and thinning with prescribed

54 USDA Forest Service RMRS-P-55. 2008.
Figure 6. Cattle grazing in a Beaver Creek ponderosa pine forest opening.
Figure 7. Production possibilities for ponderosa pine ranges based on 1982 product values from the Wild Bill Range.

USDA Forest Service RMRS-P-55. 2008. 55
burning (composite treatment). These experiments were similar to the ones initiated on the “Wild Bill Range” in the 1960s and 70s (discussed above), but restoration treatments have a slightly different emphasis on retaining old-growth trees, examining tree spatial pattern, and evaluating restora-tion of ecosystem functions. Age data were used to document the presettlement forest structure in 1876. Overstory and un-derstory vegetation and ecosystem responses were examined within treatments and further stratified by four patch types (Moore and others, this proceedings). As expected, the her-baceous standing crop, measured between 1994 and 2004, was significantly higher on the two treated areas (thinned and thinned plus burned) than on the control over the entire post-treatment period, but did not differ between the treatments (Moore and others 2006). Restoring herbaceous species di-versity and community composition continues to be more difficult than restoring ecosystem structure such as herba-ceous standing crop.
Floristics and Ecology of Non-Native Invasive Plant Species
Carolyn Hull Sieg and colleagues have begun studies at the FVEF and surrounding areas with new objectives focus-ing on documenting biodiversity and addressing the ecology of non-native invasive plant species. In 1976, Jack Dieterich and Stephen Sackett began a study at Chimney Spring on the FVEF and in 1977 at Limestone Flats on the Long Valley Experimental Forest to examine the effects of reintroducing fire at varying intervals into ponderosa pine forests (Sackett
1980, Sackett and others 1996, Sackett and Haase, this pro-ceedings). Marking 30 years of burning treatments at Chimney Spring and Limestone Flats, Scudieri and others (this proceed-ings) provide a complete plant species list for each study site in an effort to document important changes since these studies were initiated. Other studies focused on non-native plant in-vasives and examined the role of disturbances in perpetuating bull thistle (Crisp 2004) and Dalmatian toadflax (Dodge and others, in press), and how plant communities have changed following recent wildfires (Kuenzi and others 2008, Sabo and others, in press). Their work has documented the presence of several non-native species that have been used in past seed-ing projects to enhance livestock forage (Fowler and others 2008), and also a number of new invaders that pose problems for perpetuating productive native plant communities. Given the number of recent arrivals, land managers will be forced to prioritize which non-native species they cannot afford to ignore (Sieg and others 2003).
Summary
Several important range management research methods and land management recommendations were developed during the 100-year history of the FVEF. Although multidis-ciplinary studies were common since FVEF was established in 1908, the research focus has gradually evolved over the years. Until the early 1950s, studies largely focused on the ecological effects of livestock grazing on ponderosa pine
Figure 8. Repeat photographs illustrating the dramatic changes that have occurred in southwestern ponderosa pine forests. Repeat photos of one Hill Plot site called Black Springs in 1941 (left) and 2003 (right). Note circles indicating same stump in middle of both pictures (behind smaller tree in 2003) and forked tree in both photos (right foreground). 2003 photo: J. Bakker

56 USDA Forest Service RMRS-P-55. 2008.
regeneration and forage plants. In the multiple-use era, from 1950 to 1978, studies shifted from single-use livestock pro-duction to multiple-use management questions. The most recent era of range-related research at FVEF, beginning in 1978, is characterized by increasing emphasis on biodiver-sity, ecosystem restoration, and ecology of invasive plant species. Many sampling and fundamental management tech-niques for forested rangelands came from these studies. The research results originating from FVEF and nearby experi-mental plots had widespread implications and applications to forests and ranges throughout the Southwest.
Acknowledgments
The authors thank Ronald E. Thill, Kieth Severson, and Susan D. Olberding for manuscript reviewing and editing prior to the final product. Amanda Kuenzi helped us with the figures.
References
Arnold, J. F. 1950. Changes in ponderosa pine bunchgrass ranges in northern Arizona resulting from pine regeneration and grazing. Journal of Forestry. 48: 118-126.
Arnold, J. F. 1955. Plant life-form classification and its use in evaluating range condition and trend. Journal of Range Management. 8: 176-181.
Bakker, J. D.; Moore, M. M. 2007. Controls on vegetation structure in southwestern ponderosa pine forests, 1941 and 2004. Ecology. 88: 2305-2319.
Bakker, J. D.; Moore, M. M.; Springer, J. D.; Crouse, J. E. 2002. Long-term (85-year) understory vegetation change in Pinus ponderosa stands in northern Arizona. Oral presentation at the 87th Annual Meeting of the Ecological Society of America, Tucson, AZ. August, 2002.
Bakker, J. D.; Moore, M. M.; Sánchez Meador, A. J. 2006a. Land-use legacies in southwestern ponderosa pine forests: Effects of historical livestock grazing. Oral presentation at the 3rd International Fire Ecology & Management Congress, San Diego, CA. November 13-17 2006.
Bakker, J. D.; Moore, M. M.; Covington, W. W. 2006b. Long-term vegetation studies in the Southwest. Pp. 187-195 in Long-term silvicultural & ecological studies: results for science and management. L. C. Irland, A. E. Camp, J. C. Brissette, and Z. R. Donohew (eds). GISF Research Paper 005. New Haven, CT.: Global Institute for Sustainable Forestry, School of Forestry and Environmental Studies, Yale University.
Canfield, R. H. 1941. Application of the line interception method in sampling range vegetation. Journal of Forestry. 39: 388-394.
Clary, W. P. 1964. A method for predicting potential herbage yields on the Beaver Creek pilot watersheds. In: ASA Special Publication 5: 244-250, Forage plant physiology and soil-range relationships. American Society of Agronomists.
Clary, W. P. 1972. A treatment prescription for improving big game habitat in ponderosa pine forest. Annual Arizona Watershed Symposium Proceedings. 16: 25-28.
Clary, W. P. 1975. Range management and its ecological basis in the ponderosa pine type of Arizona: the status of our knowledge. Res. Pap. RM-158. Fort Collins, CO: U.S. Department of Agriculture Forest Service, Rocky Mountain Forest and Range Experiment Station. 35 p.
Clary, W. P. 1978. Arizona fescue mountain rangelands. p. 205-207. Donald N. Hyder (ed) In: Proceedings of the 1st International Rangeland Congress. Denver, CO: Society for Range Management.
Clary, W. P. 1983. Interfacing physical data and economics. In: Proc.-range economics symposium and workshop. Gen. Tech. Rep. INT-149. p. 115-119. Ogden, UT: U.S. Department of Agriculture Forest Service, Intermountain Forest and Range Experiment Station.
Clary, W. P. 1987. Herbage production and livestock grazing on pinyon-juniper woodlands. In: Everett, R. L., comp. Proceedings:pinyon-juniper conference. Gen. Tech. Rep. INT-215. Ogden, UT: U.S. Department of Agriculture, Forest Service, Intermountain Research Station: 440–447.
Clary, W. P. 1988. Silvicultural systems for forage production in ponderosa pine forests. In: Baumgartner, D. M.; J. E. Lotan. Ponderosa pine-the species and its management: symposium proceedings; 1987 Sep 29-Oct 1; Spokane WA. Pullman, WA: Coop Ext Washington State University: 185-191.
Clary, W. P.; Ffolliott, P. F. 1966. Differences in herbage-timber relationships between thinned and unthinned ponderosa pine stands. Res. Note RM-74. Fort Collins, CO, U.S. Department of Agriculture, Forest Service, Rocky Mountain Forest and Range Experiment Station.4 p.
Clary, W. P.; Grelen, H. E. 1978. Comparison of beef gain potentials on cool semiarid and subtropical pine forest ranges. In: Proceedings of the 1st International Rangeland Congress, Donald N. Hyder (ed). Denver, CO: Society for Range Management: 600-602.
Clary, W. P.; Jameson, D. A. 1981. Herbage production following tree and shrub removal in the pinyon-juniper type of Arizona. Journal of Range Management. 34: 109-113.
Clary, W. P.; Kruse, W. H. 2004. Livestock grazing in riparian areas: environmental impacts, management practices and management implications. In: Malchus B. Baker, Jr., Peter F. Ffolliott, Leonard F. DeBano, and Daniel G. Neary, eds. Riparian areas of the Southwestern United States. Boca Raton, FL: Lewis Publishers: 237-258.
Clary, W. P.; Larson, F. R.1971. Elk and deer use are related to food sources in Arizona ponderosa pine. Res. Note RM-202. Fort Collins, CO, U.S. Department of Agriculture, Forest Service, Rocky Mountain Forest and Range Experiment Station. 4 p.
Clary, W. P.; Pearson, H. A. 1976. Herbage changes following thinning and grazing of a southwestern ponderosa pine stand. Abstr of Papers, 29th Annu Meeting, Soc Range Manage, Omaha NE, Feb 16-20, 1976: 37.
Clary, W. P.; Baker, Jr., M. B.; O’Connell, P. F.; Johnsen, Jr., T. N.; Campbell, R. E.1974. Effects of pinyon-juniper removal on natural resource products and uses in Arizona. Res. Pap. RM-128. Fort Collins, CO: U.S. Department of Agriculture Forest Service, Rocky Mountain Forest and Range Experiment Station. 28 p.
Clary, W. P.; Kruse, W. H.; Larson, F. R. 1975. Cattle grazing and wood production under different ponderosa pine basal areas. Journal of Range Management. 28: 434-437.
USDA Forest Service RMRS-P-55. 2008. 57
Clary, W. P.; Ffolliott, P. F.; Larson, F. R. 1978. Factors affecting forage consumption by cattle in Arizona ponderosa pine forests. Journal of Range Management. 31: 9-10.
Cooperrider, C. K.1938. Recovery processes of ponderosa pine reproduction following injury to young annual growth. Plant Physiology. 13: 5–27.
Crisp, D. L. 2004. Survival and recruitment of bull thistle (Cirsium vulgare (Savi) Tenore) after pile burning and litter removal. Flagstaff, AZ: Northern Arizona University. M.S. Thesis.
Dodge, R. S.; Fulé, P. Z.; Sieg, C. H. 2008. Dalmatian Toadflax (Linaria dalmatica) response to wildfire in a Southwestern USA Forest. Ecoscience. 15(2): 213-222.
Doman, E. R.; Rasmussen, D. I. 1944. Supplemental winter feeding of mule deer in northern Utah. J Wildl Manage. 8: 317-338.
Ffolliott, P. F.; Clary, W. P. 1975. Differences in herbage-timber relationships on sedimentary and igneous soils in Arizona ponderosa pine stands. Prog. Agric. Ariz. 27(3): 6-7.
Ffolliott, P. F.; Clary, W. P. 1982. Understory-overstory vegetation relationships: an annotated bibliography. Gen. Tech. Rep. INT-136. Ogden, UT: U.S. Department of Agriculture, Forest Service, Intermountain Forest and Range Experiment Station. 39 p.
Ffolliott, P. F.; Gottfried, G. J.; Kruse, W. H. 2003. Vegetation management practices: Past and Present. Pp 48-58. In: McClaran M. P.; Ffolliott, P. F.; Edminster, C. B. 2003 Santa Rita Experimental Range: 100 years (1903-2003) of accomplishments and contributions. Conf Proc; 2003 Oct 30-Nov1; Tucson AZ. Proc RMRS-P-30. Ogden, UT: U.S. Department of Agriculture, Forest Service, Rocky Mountain Research Station. 197 p.
Fowler, J. F.; Sieg, C. H.; Dickson, B. G.; Saab, V. 2008. Exotic Plant Species Diversity: Roadside vs. Forest Interior Habitats. Rangeland Ecology and Management. 61: 284-293.
Glendening, G. E. 1941. Work plan—summer 1941: Hill study plots—Coconino. Unpub. Pap. on file at Flagstaff, AZ: U.S. Department of Agriculture, Forest Service, Rocky Mountain Research Station, Fort Valley Experimental Forest archives. 3 p.
Haasis, F. W. 1923. Frost heaving of western yellow pine seedlings. Ecology. 4: 378-390.
Hill, R. R. 1917. Effects of grazing upon western yellow-pine reproduction in the National Forests of Arizona and New Mexico. Forest Service Bull. 580. U.S. Department of Agriculture, Forest Service.
Hill, R. R. 1921. Notes taken on Coconino trip with Grazing Examiner M. W. Talbot, Fall of 1921. Unpub. Pap. on file at Flagstaff, AZ: U.S. Department of Agriculture, Forest Service, Rocky Mountain Research Station, Fort Valley Experimental Forest archives. 20 p.
Jameson, D. A. 1961a. Heat and desiccation resistance of tissue of important trees and grasses of the pinyon-juniper type. Botanical Gazette. 122(3): 174-179.
Jameson, D. A. 1961b. Growth inhibitors in native plants of northern Arizona. Res. Note 61. Fort Collins, CO: U.S. Department of Agriculture, Forest Service, Rocky Mountain Forest and Range Experiment Station. 2 p.
Jameson, D. A. 1962. Effects of burning on a galleta-black grama range invaded by juniper. Ecology. 43(4): 760-763.
Jameson, D. A. 1963. Responses of individual plants to harvesting. Botanical Review. 1963: 532-594.
Jameson, D. A. 1965a. Arrangement and growth of pinyon and one-seed juniper trees. Flagstaff, AZ: Museum of Northern Arizona. Plateau. 37(4): 121-127.
Jameson, D. A. 1965b. Phenology of grasses of the northern Arizona pinyon-juniper type. Res. Note RM-47. Fort Collins, CO: USDA Forest Service, Rocky Mountain Forest and Range Experiment Station.
Jameson, D. A. 1966a. Pinyon-juniper litter reduces growth of blue grama. Journal of Range Management. 19: 214-217.
Jameson, D. A. 1966b. Competition in a blue grama-broom snakeweed-actinea community and responses to selective herbicides. Journal of Range Management. 19(3): 121-124.
Jameson, D. A. 1967. The relationship of tree overstory and herbaceous understory vegetation. Journal of Range Management. 20: 247-249.
Jameson, D. A. 1968. Species interactions of growth inhibitors in native plants of northern Arizona. Res. Note RM-13. Fort Collins, CO: U.S. Department of Agriculture, Forest Service, Rocky Mountain Forest and Range Experiment Station. 2 p.
Jameson, D. A. 1970. Degradation and accumulation of inhibitory substances from Juniperus osteosperma (Torr.) Little. Plant and Soil. 33(1-3): 213-224.
Jameson, D. A. 1971. Optimum stand selection for juniper control on southwestern woodland ranges. Journal of Range Management. 24(2): 94-99.
Jameson, D. A.; Huss, D. L. 1959. The effect of clipping leaves and stems on number of tillers, herbage weights, root weights, and food reserves of little bluestem. Journal of Range Management. 12: 122-126.
Jameson, D. A.; Dodd, J. D. 1969. Herbage production differs with soil in the pinyon-juniper type of Arizona. Res. Note RM-131. Fort Collins, CO: U.S. Department of Agriculture, Rocky Mountain Forest and Range Experiment Station. 4 p.
Johnsen, T. N., Jr. 1980. Picloram in water and soil from a semiarid pinyon-juniper watershed. Journal of Environmental Quality. 9: 601-605.
Johnsen, T. N., Jr. 1986a. Seeding pinyon-juniper sites in the Southwest. In: Everett, R. L. compiler. Proceedings-pinyon-juniper conference. USDA Forest Service, General Technical Report INT-215, pp 465-472.
Johnsen, T.N., Jr. 1986b. Using herbicides for pinyon-juniper control in the Southwest. In: Everett, R.L. comp. Proceedings-pinyon-juniper conference. Gen. Tech. Rep. INT-215. Ogden, UT: U.S. Department of Agriculture, Forest Service: 330-334.
Johnsen, T. N., Jr.; Gomm, F. B. 1981. Forage plantings on six Arizona pinyon-juniper subtypes. Journal of Range Management. 34:131-136.
Kruse, W. H.; Baker, Jr., M. B. 1998. Twenty years of watershed response to strip-cutting ponderosa pine in central Arizona. In: Proceedings of AWRA Specialty Conference. Rangeland management and water resources (D. F. Potts, ed); 1998 May 27-29; Reno, NV. Herndon, VA: American Water Resources Association: 179-185.
Kruse, W. H.; Jemison, R. 2000. Grazing systems of the Southwest. In: Livestock Management in the American Southwest. NY: Elseveir: 27-52.
Kuenzi, A. M.; Fulé, P. Z.; Sieg, C. H. 2008. Effects of fire severity and pre-fire stand treatment on plant community recovery after a large wildfire. Forest Ecology and Management. 255: 855-865.

58 USDA Forest Service RMRS-P-55. 2008.
Lascano, C. E.; Theurer, C. B.; Pearson, H. A.; Hale, W. H. 1970. Factors influencing fiber and lignin content of rumen fistula forage. Proceedings of the Western Section of the American Society of Animal Scientists. 21: 87-92.
Lavin, F. 1967. Fall fertilization of intermediate wheatgrass in the southwestern ponderosa pine zone. Journal of Range Management. 20(1): 16-21.
Lavin, F., Jameson, D. A.; Gomm, F.B. 1968. Juniper extract and deficient aeration effects on germination of six range species. Journal of Range Management. 21: 262-263.
Lavin, F.; Gomm, F. B.; Johnsen, Jr., T. N. 1973. Cultural, seasonal, and site effects on pinyon-juniper rangeland plantings. Journal of Range Management. 26(4): 279-285.
Lavin, F., Johnsen, Jr., T. N.; Gomm, F. B. 1981. Mulching, furrowing, and fallowing of forage plantings on Arizona pinyon-juniper ranges. Journal of Range Management. 34: 171-177.
Merrick, G. D. 1939. Revegetation of deteriorated range land in northern Arizona.. Durham, NC: Duke University. M.A. Thesis.
Milchunas, D. 2006. Plant community response to grazing in the Southwest. RMRS GTR 169. Fort Collins, CO: U.S. Department of Agriculture Forest Service, Rocky Mountain Forest and Range Experiment Station.
Moore, M. M.; Casey, C. A.; Bakker, J. D.; Springer, J. D.; Fulé, P. Z.; Covington, W. W.; Laughlin, D. C. 2006. Herbaceous vegetation responses (1992-2004) to restoration treatments in a ponderosa pine forest. Rangeland Ecology and Management. 59:135-144.
Pearson, G. A. 1923. Natural reproduction of western yellow pine in the southwest. Bull. 1105. Washington, DC: U.S. Department of Agriculture. 143 p.
Pearson, G. A. 1933. A twenty year record of changes in an Arizona pine forest. Ecology. 14: 272-285.
Pearson, G. A. 1942. Herbaceous vegetation a factor in natural regeneration of ponderosa pine in the Southwest. Ecological Monograph. 12: 315-338.
Pearson, G. A. 1950. Management of ponderosa pine in the southwest. Mono. 6. Washington, DC: U.S. Department of Agriculture, Forest Service. 218 p.
Pearson, H. A. 1963. Beef—trees—or both. Ariz Cattlelog (March issue): 9-10.
Pearson, H. A. 1964. Studies of forage digestibility under ponderosa pine stands. Proceeding of the Society of American Forestry: 71-73.
Pearson, H. A. 1965a. Low-cost constant-temperature water bath. Journal of Range Management. 18: 149-150.
Pearson, H. A. 1965b. Rumen organisms in white-tailed deer from south Texas. Journal of Wildlife Management. 29: 493-496.
Pearson, H. A. 1967a. Range animal nutrition. Proc. 5th West Texas Ranch Manage. Conf Oct. 13, Texas Technological College, Lubbock, TX, Spec Rep 3: 66-82.
Pearson, H. A. 1967b. Effect of delays in inoculum collection on artificial rumen digestibilities. Journal of Range Management. 20: 332-333.
Pearson, H. A. 1967c. Cattle diet digestibilities determined from components. Journal of Range Management. 20: 405-406.
Pearson, H. A. 1967d. Rumen microorganisms in buffalo from southern Utah. Applied Microbiology. 15(6): 1450-1451.
Pearson, H. A. 1968. Thinning, clearcutting, and reseeding affect deer and elk use of ponderosa pine forests in Arizona. Res. Note RM-119. Fort Collins, CO: U.S. Department of Agriculture, Forest Service, Rocky Mountain Forest and Range Experiment Station. 4 p.
Pearson, H. A. 1969a. Rumen microbial ecology in mule deer. Applied Microbiology. 17(6): 819-824.
Pearson, H. A. 1969b. Starvation in antelope with stomachs full of feed. Res. Note RM-148. Fort Collins, CO: U.S. Department of Agriculture, Forest Service, Rocky Mountain Forest and Range Experiment Station. 4 p.
Pearson, H. A. 1970. Digestibility trials: In vitro techniques. Misc. Pub. 1147:82-92. Washington, DC: U.S. Department of Agriculture, Forest Service.
Pearson, H. A. 1972. Estimating cattle gains from consumption of forage on ponderosa pine range. Journal of Range Management. 25: 18-20.
Pearson, H. A. 1973. Calculating grazing intensity for maximum profit on ponderosa pine range in northern Arizona. Journal of Range Management. 26: 277-278.
Pearson, H. A.; Jameson, D. A. 1967. Relationship between timber and cattle production on ponderosa pine range: The Wild Bill range. Fort Collins, CO: U.S. Department of Agriculture, Forest Service, Rocky Mountain Forest and Range Experiment Station. 10 p.
Pearson, H. A.; Morrison, D. C.; Wolke, W. K. 1969. Trick tanks: water developments for range livestock. Journal of Range Management. 22: 359-360.
Pearson, H. A.; Mann, J. F.; Howard, D. A. 1971. Timing use of cool- and warm-season grasses on pine ranges. Journal of Range Management. 24: 162-163.
Pearson, H. A.; Davis, J. R.; Schubert, G. H. 1972. Effects of wildfire on timber and forage production in Arizona. Journal of Range Management. 25: 250-253.
Pond, F. W. 1960. Vigor of Idaho fescue in relation to different grazing intensities. Journal of Range Management. 13: 28-30.
Pond, F. W. 1961. Effect of three intensities of clipping on the density and production of meadow vegetation. Journal of Range Management. 14: 34-38.
Pond, F. W.; Pearson, H. A.1970. Storage does not affect crude protein of forage samples. Res. Note RM-160. Fort Collins, CO: U.S. Department of Agriculture, Forest Service, Rocky Mountain Forest and Range Experiment Station. 1 p.
Pond, F. W.; Pearson, H. A. 1971. Freeze branding cattle for individual identification. Journal of Range Management. 24: 466-467.
Reynolds, H. G.; Clary, W. P.; Ffolliott, P. F. 1970. Gambel oak for southwestern wildlife. Journal of Forestry. 68: 545-547.
Sabo, K. E.; Hart, S. C.; Sieg, C. H.; Bailey, J. D. 2008. Tradeoffs in overstory and understory aboveground net primary productivity in southwestern ponderosa pine stands. Forest Science. 54(4): 408-416.
Sackett, S.S. 1980. Reducing natural ponderosa pine fuels using prescribed fire: two case studies. Res. Note RM-392. Fort Collins, CO: U.S. Department of Agriculture, Forest Service, Rocky Mountain Forest and Range Experiment Station. 6 p.
Sackett, S. S.; Haase, S. M.; Harrington, M. H. 1996. Lessons learned from fire use for restoring southwestern ponderosa pine systems. In: Covington, Wallace; Wagner, Pamela K., tech.

USDA Forest Service RMRS-P-55. 2008. 59
coords. Conference on adaptive ecosystem restoration and management: Restoration of Cordilleran conifer landscapes of North America: 1996 June 6-8; Flagstaff, AZ. Gen. Tech. Rep. RM-278. Fort Collins, CO: Rocky Mountain Research Station. p. 54-61.
Sieg, C. H.; Phillips, B. G; Moser, L. P. 2003. Exotic Invasive Plants. In: P. Friederici (ed) Ecological Restoration of Southwestern Ponderosa Pine Forests. Washington, DC: Island Press: 251-267 + refs.
The content of this paper reflects the views of the author(s), who are responsible for the facts and accuracy of the information presented herein.
Talbot, M. W.; Hill, R. R. 1923. Progress report on the range study plots on the Coconino National Forest comprising a description of project and digest of data. Unpub. Pap. on file at Flagstaff, AZ: U.S. Department of Agriculture, Forest Service, Rocky Mountain Research Station, Fort Valley Experimental Forest archives. 32 p.
U.S. Department of Agriculture Forest Service. 1937. Range plant handbook. Washington, DC: U.S. Government Printing Office. 512 p.

60 USDA Forest Service RMRS-P-55. 2008.
Introduction
Water yield improvement has been a historical manage-ment objective for ponderosa pine (Pinus ponderosa) forests in the Southwest. While its relative importance has declined in recent years as management for other ecosystem values increase, it is still an important consideration. There are two general options and combinations of these options available to modify a forest to meet watershed management goals and objectives. These options are completely or partially clearing tree overstories to create openings of different sizes, shapes, and orientations; thinning tree densities to varying intensi-ties; and combinations of clearing and thinning treatments.
The size of the Fort Valley Experimental Forest, its to-pography, and the character of the drainage network are not conducive to watershed-scale hydrologic studies. The first U.S. Forest Service watershed study was initiated at Wagon Wheel Gap in Colorado in 1909 (Bates and Henry 1928). Larger-scale hydrologic studies at Fraser Experimental Forest in Colorado and Sierra Ancha Experimental Forest in Arizona (Gottfried and others 1999a) did not begin until the 1930s. The Beaver Creek watershed studies followed later in the mid 1950s (Baker and Ffolliott 1999). However,
In: Olberding, Susan D., and Moore, Margaret M., tech coords. 2008. Fort Valley Experimental Forest—A Century of Research 1908-2008. Proceedings RMRS-P-55. Fort Collins, CO: U.S. Department of Agriculture, Forest Service, Rocky Mountain Research Station. 282 p.
1 References for many of the earlier silvicultural studies at Fort Valley are found in a series of bibliographies compiled by Axelton (1967, 1974, 1977). References on ponderosa pine research in addition to the studies at Fort Valley are also listed in these bibliographies.
Contributions of Silvicultural Studies at Fort Valley to Watershed Management of Arizona’s Ponderosa Pine Forests
Gerald J. Gottfried, Research Forester, USFS Rocky Mountain Research Station, Forests and Woodlands Program, Phoenix, AZ; Peter F. Ffolliott, University of Arizona, School of Natural Resources, Tucson, AZ; and Daniel G. Neary, USFS Rocky Mountain Research Station, Flagstaff, AZ
Abstract—Watershed management and water yield augmentation have been important objectives for chaparral, ponderosa pine, and mixed conifer management in Arizona and New Mexico. The ponderosa pine forests and other vegetation types generally occur in rela-tively high precipitation zones where the potential for increased water yields is great. The ponderosa pine forests have been the subject of numerous research and management ac-tivities. Although the size, topography, and drainage patterns of the Fort Valley Experimental Forest are not conducive to watershed-scale hydrologic studies, results from Fort Valley have demonstrated the potential of silvicultural options to increase water yields. These included creating openings of different sizes, shapes, and orientations, or reducing stand densities or combinations of the two. While the importance of managing forests for water yield improve-ment has declined, it is still a consideration in multi-resource planning. This paper reviews silvicultural prescriptions employed on some of the major watershed research studies within the ponderosa pine forests and discusses their management implications.
results from the long history of silvicultural studies on the Fort Valley Experimental Forest (Pearson 1950, Schubert 1974, and other researchers1) provided the basic foundation for prescribing water yield improvement options to test in the ponderosa pine forests on the Beaver Creek and Castle Creek watersheds (Figure 1). The four case studies presented below describe some of the silvicultural treatments imposed on these watersheds and the results and conclusions. They also suggest options available for multi-resource forest management. Further details of these and other water-yield improvement treatments based on Fort Valley silvicultural studies and the results are found in the literature that evolved from these efforts and at the web-site: http://ag.arizona.edu/OALS/watershed/.

USDA Forest Service RMRS-P-55. 2008. 61
ARIZONA
Castle CreekWatershed
Beaver Creek Watershed
Salt RiverVerde River
Phoenix
Flagstaff
Figure 1. The major Arizona watershed study areas discussed in this paper are located within the Salt-Verde River Basin, which provides water for Phoenix and adjacent communities in the Salt River Valley. Ponderosa pine forests are located along the Mogollon Rim, on the southern Colorado Plateau, and at higher elevations throughout Arizona. The figure is adapted from Brown and others (1974).

62 USDA Forest Service RMRS-P-55. 2008.
Complete Clearing of Tree Overstories
The U.S. Forest Service established the Beaver Creek watersheds, about 83 km (50 miles) south of Flagstaff (Figure 1), to study the potential for increasing water yields from ponderosa pine forests in the Salt-Verde River Basin (Baker 1986). Paired watersheds were used to evaluate the potential for water yield augmentation. The analyses com-pare results from treated watersheds with conditions on untreated watersheds for the same time period. The ponder-osa pine watersheds are located above 1,980 m (6,500 ft) in elevation where annual precipitation averages between 508 and 635 mm (20 and 25 inches). The impacts of silvicultural treatments on herbage production and wildlife habitats were important parts of this effort. Questions about the impacts of treatments on soil physical and chemical characteristics were not addressed in these early studies.
Watershed 12 is a 172-ha (425-acres) instrumented catchment on the larger Beaver Creek watershed that was completely cleared in 1966 and 1967 to evaluate the effects of this “most drastic” silvicultural treatment on streamflow (Baker 1986). The overstory consisted of ponderosa pine and intermingling Gambel oak (Quercus gambelii) and alligator juniper (Juniperus deppeana). Once cut, the merchantable wood was removed and residual slash was piled in parallel windrows that were aligned perpendicular to the stream chan-nel to facilitate a more direct transport of overland flow into the channel. While the original treatment prescription called for herbicide control of post-treatment Gambel oak and al-ligator juniper sprouts, subsequent chemical-use restrictions prevented implementation of this treatment phase.
Streamflow ResponseStreamflow increased for seven years on Watershed 12
following the complete clearing of the tree overstory (Baker 1986). The average streamflow increase with the standard er-ror was 43 ± 5 mm (1.7 ± 0.2 inches), or 29.9 ± 3.1 percent. The largest annual increase of 140 mm (5.5 inches) occurred in 1973, one of the wettest years in the region. The increase in streamflow was primarily due to the decrease in water loss by transpiration (Baker 1986, Baker and Ffolliott 1999, Brown and others 1974). More overland flow also resulted from melting snowpacks—the primary source of annual stream-flow from the watershed—due to a reduction in soil moisture deficits. The windrowed slash trapped snow and delayed melt rates on the lee sides of the windrows until the ambient tem-perature increased enough to rapidly melt snow. As a result, more of the overland flow reached the stream channels (Baker 1983). Within seven years following the clearing treatment, vegetation recovered sufficiently so that the initial soil- water depletion was about the same as under the pre-treatment cover. Sediment yields are generally small from untreated stands on soils derived from basalt parent material. Average annual yield was about 1.3 t/ha (0.6 tons/acre) (Brown and
others 1974). Sediment yield increases following the clearing treatment ranged from 0.02 to 60.5 t/ha (0.01 to 27 tons/acre). The highest value occurred immediately after treatment and probably reflects the maximum sediment loss potential from similar watersheds.
Silvicultural Impacts
The treatment removed Watershed 12 from timber pro-duction into the foreseeable future, but it could be managed for forage production, wildlife habitats, and watershed pro-tection. Stocking by natural regeneration of ponderosa pine seedlings declined from 65 percent in the pre-treatment con-ditions to about 15 percent after the clearing treatment, only 5 percent of the watershed was stocked with seedlings that had germinated since the treatment (Ffolliott and Gottfried 1991). Stocking remained relatively constant for 23 years following the clearing treatment (last inventoried in 1989). At this time, it appears unlikely that the watershed could be managed for future timber production without artificial regeneration.
Gambel oak and alligator juniper sprouts were numerous and remained vigorous into the early 1990s. Silvicultural studies at Fort Valley (Schubert and others 1970, Schubert 1974) suggest that artificial regeneration of ponderosa pine must be initiated soon after clearings to minimize the prob-lems of competing vegetation. Artificial regeneration was not prescribed for Watershed 12. However, management goals other than “traditional timber production” are possible (Baker and Ffolliott 1999). Increases in the production of forage plants can improve the potential for livestock graz-ing. Baker and Ffolliott (1999) report average increases in the production of forage and non-forage understory species of about 560 kg/ha (500 lb/acre) after complete overstory removal at Beaver Creek. Untreated ponderosa pine forests in this area usually produce about 222 kg/ha (198 lb/acre) annually of grasses, forbs, half-shrubs, and shrubs (Brown and others 1974). An abundance of post-treatment Gambel oak sprouts is also beneficial to big game and other wildlife species (Ffolliott and Gottfried 1991). The clearing treatment created a more diverse landscape for wildlife by breaking up the largely continuous ponderosa pine cover in the im-mediate area. This landscape is more aesthetically pleasing. Gambel oak and alligator sprouts also produce firewood for local inhabitants.
Thinning of Tree Densities
The tree overstory on the 121 ha (298 acres) Beaver Creek Watershed 17 was commercially harvested by group selec-tion and the remaining ponderosa pine trees were uniformly thinned in 1969. This left residual stands in even-aged groups at a basal area level of about 5.7 m2/ha (25 ft2/acre). While the prescribed basal area level was less than the “general guide-line” for the region at the time of the treatment (Ffolliott and

USDA Forest Service RMRS-P-55. 2008. 63
Figure 2. The Beaver Creek watershed is upstream from the junction of Beaver Creek and the Verde River. The three vegetation types found on the watershed are ponderosa pine, pinyon-juniper, and semi-desert shrubs. Twenty pilot watersheds within the Beaver Creek watershed were installed to test the effects of vegetation management practices on water yield and other resources. The figure is adapted from Baker and Ffolliott 1998.
others 2000), it was considered above the level where ex-cessive windthrow of residual ponderosa pine trees might occur. It was also “slightly above” the initial thinning level of 6.9 m2/ha (30 ft2/acre) on the Growing Stock Level plots at Taylor Woods in the Fort Valley Experimental Forest (Myers 1967, Ronco and others 1985, Schubert 1971). Growing stock levels are numerical indices defining the basal area in square feet per acre that residual stands have or will have when the average diameter, breast high (dbh), of the thinned stand is 25 cm (10 inches) or more. With the exception of den trees, Gambel oak trees larger than 38 cm (15 inches) in dbh were removed from the watershed and all alligator juniper trees were cut regardless of their size. Seventy-five percent of the original basal area was removed from the watershed leaving an average of about 4.6 m2/ha (20 ft2/acre) of basal area in trees 18 cm (7 inches) and larger at dbh. Slash was piled in windrows in a manner similar to the treatment on Watershed 12.
Streamflow Response
Significant streamflow increases persisted for 10 years following the thinning treatment (Baker 1986, Baker and Ffolliott 1999, Brown and others 1974). The average annual streamflow increase was 41 ± 5 mm (1.6 ± 0.2 inches) and ranged from 10 to 30 percent above the predicted streamflow if the watershed had remained untreated. The post-treatment streamflow response was considered the result of reduced transpiration losses and increased efficiency in the transport of overland flow to the stream channel. It appeared that the residual windrowed slash influenced snowpack accumula-tion and melt patterns in a manner similar to that observed on Watershed 12. Annual sediment yields were between 0.07 and 0.72 t/ha (0.03 and 0.32 tons/acre) following treatment (Brown and others 1974).

64 USDA Forest Service RMRS-P-55. 2008.
Silvicultural Impacts
The treatment resulted in a large initial reduction in the number of trees, basal area, and volume per acre. However, the stand is currently recovering but the levels are still less than before the treatment. An inventory conducted 25 years after the treatment indicated that the basal area and volume of the residual trees increased on a per acre basis while the number of trees remained essentially the same (Ffolliott and others 2000). Researchers hypothesized at the time treatment was implemented that basal area and volume would continue to increase as the residual trees increased in size. The trends observed on Watershed 17 were similar to those reported in earlier thinning studies by Gaines and Kotok (1954), Myers and Martin (1963), Pearson (1950), Schubert (1974), and others. Stocking of natural regeneration was severely re-duced by the treatment from over 50 percent before to less than 2 percent immediately after thinning. The initial loss in natural regeneration was temporary. Nearly 40 percent of the watershed became re-stocked with natural regeneration with-in 10 years of the thinning (Ffolliott and others 2000). The scarified soil surface resulting from the treatment provided a favorable bed for germination of seeds dispersed in the 1970 and 1973 seed years (1 and 3 years following the treatment, respectively). The resulting stocking level was about 25 per-cent higher than that observed 23 years after the trees were cleared on Watershed 12 (Ffolliott and Gottfried 1991).
While the integrity of future stands on Watershed 17 should be retained at relatively low density levels, it is un-likely that timber production can be sustained (Ffolliott and others 2000). Managing for other resource values is a more plausible scenario (Baker and Ffolliott 1999). Increases in forage production relative to pre-treatment conditions should continue into the near future. Watershed 17 produced an an-nual average of 112 kg/ha (100 lb/acre) of additional herbage following treatment (Brown and others 1974). Clary (1975) indicated that herbage production under thinned stands was significantly greater than under unthinned stands for given basal areas of less than 16.1 m2/ha (70 ft2/ acre). The habi-tats for many wildlife species have been enhanced largely because of the combined increased forage production and retention of protective cover.
Combined Clearing and Thinning of Tree Overstories
A combined stripcut-thinning treatment was carried out on the 546-ha (1,350-acre) Beaver Creek Watershed 14 in 1970 and 1971. Trees were cleared in alternate strips 18 m (60 ft) wide with leave strips 36 m (120 ft) wide. The stripcuts were irregularly shaped for aesthetic purposes and oriented in the general direction of the land slope. Occasional ponderosa pine and Gambel oak trees were left in the stripcuts to break up their continuity. Ponderosa pine trees in the intervening leave
strips were thinned to 18.4 m2/ha (80 ft2/acre) by a silvicultur-al prescription designed to favor size classes in short-supply in the region at the time, specifically trees 30 to 61 cm (12 to 24 inches) in dbh. Thinning was based on individual groups of trees. Dominance was determined by the size class of trees with crowns occupying the greatest portion of the area. All of the trees in the non-dominant size classes were cut, with the exception of those in places where the basal area of the pre-dominant class was less than 18.4 m2/ha (80 ft2/acre). Gambel oak over 38 cm (15 inches) in dbh was cut unless there was evidence of use as a den tree. All alligator juniper trees were cut regardless of size. The stripcut-thinning treatment re-moved about 40 percent of the basal area on the watershed. Slash was pushed to the center of the stripcuts and burned. Ponderosa pine seedlings were planted in the stripcuts on the better sites to supplement natural seedlings that survived the thinning treatment.
Streamflow Response
The thought behind the combined stripcut-thinning treat-ment was that streamflow would increase because water loss by transpiration would decrease and the efficiency in trans-porting overland flow to the stream channel would increase because of the uphill-downhill orientation of the stripcuts. Increased overland flow was anticipated because more snow would accumulate in the stripcuts due to reductions in inter-ception losses and a re-distribution of snowfall by wind. A significant increase in streamflow was observed on the wa-tershed, but lasted only for 4 years (Baker 1986, Baker and Ffolliott 1999, Brown and others 1974). The average annual post-treatment streamflow increase was 25 ±2 mm (1.0 ± 0.1 inches), or 12 to 24 percent. The short duration of increased streamflow was possibly due to the recovery of vegetation in the stripcuts, including planted ponderosa pine seedlings (Ffolliott and Baker 2001).
Silvicultural Impacts
The combined clearing and thinning treatment removed the tree overstory in the stripcuts and left a mosaic of even-aged stands comprised mostly of trees 20 to 46 cm (8 to 18 inches) in dbh in the leave strips. Number of trees, basal area, and volume per acre of the residual trees in the leave strip increased in the initial 25-year post-treatment evalua-tion period (Ffolliott and Baker 2001). This finding differed from the results of earlier ponderosa pine thinning treatments where little or no increase in basal area and volume per acre was observed, but where individual trees grew faster once released by thinning (Gaines and Kotok 1954, Krauch 1949, Myers and Martin 1963, Pearson 1950, and other scientists). Similar trends to earlier studies were also observed follow-ing the thinning treatment on Beaver Creek Watershed 17. Pearson (1950) believed that this was related to the low resid-ual stocking and high mortality of virgin and cutover stands. A pre-treatment inventory indicated nearly 20 percent stock-ing of ponderosa pine seedlings on the entire Watershed 14.

USDA Forest Service RMRS-P-55. 2008. 65
Stocking in the leave strips was reduced to less than 12 per-cent by felling and skidding trees marked for thinning. This level remained largely unchanged in the 25 years since the treatment (Ffolliott and Baker 2001). Stocking in the strip-cuts immediately following thinning was unknown, although stocking of reproduction in the stripcuts that were planted with ponderosa pine seedlings was almost 45 percent in 1996.
The integrity of ponderosa pine stands in the leave strips should be maintained into the future. Growth of these stands should increase as residual trees in the leave strips increase in basal area and volume. However, management of ponderosa pine forests has changed from a timber production emphasis in the early 1970s to a more holistic perspective of natural resources management. Current forest management consid-ers other ecosystem-based, multiple-use benefits. Increases in forage production will likely continue in the near future in both the stripcuts and leave strips and wildlife habitat should improve as a result of increases in forage production, reten-tion of protective cover in the leave strips, and edge effect (ecotone) between the cut and leave strips.
Timber Harvesting and Thinning of Tree Overstories
The two Castle Creek watersheds in eastern Arizona, south of Alpine (Figure 1), are part of a group of pondero-sa pine, mixed conifer, or mountain grassland experimental watersheds within the Apache-Sitgreaves National Forests. The Castle Creek watersheds were originally established to investigate the effects of harvesting timber in ponderosa pine forests on streamflow volumes based on the “best thinking” of U.S. Forest Service personnel at the time of treatment (Rich 1972, Rich and Thompson 1974). As part of this over-all effort, a timber harvest and silvicultural treatment was applied to the 364-ha (900-acre) West Fork of Castle Creek in 1965 through 1967 to obtain timber resources and place the remaining tree overstory into the “best growing condition possible.” The plan was to initiate movement of the pre- treatment uneven-aged stand structures to an even-aged sys-tem of management. The adjacent East Fork watershed was maintained as the hydrologic control.
The timber harvesting operation involved clearing one-sixth of West Fork in openings (blocks) fitted to the existing stands of over-mature and unneeded tree size-classes. The remaining five-sixths were thinned to remove poor-risk and over-mature trees, mature trees necessary to release crop trees, damaged trees, and all trees infected with dwarf mistle-toe (Arceuthobium vaginatum var. cryptopodum) (Gottfried and DeBano 1990, Gottfried and others 1999b). This treat-ment phase “mimicked” a shelterwood system at a growing level of about 13.7 m2 /ha (60 ft2 /acre). The idea was to simulate “commercial timber management” by initiating a 120-year rotation with a 20-year cutting cycle. This manage-ment model was based on the results of earlier silvicultural studies at Fort Valley and later proposed by Schubert (1974)
and others to produce the “highest possible” sustained yield of high-quality trees. About 50 percent of the original basal area of 31 m2 /ha (135 ft2/ acre) was removed by this harvest-ing and thinning treatment.
Streamflow Response
Increases in streamflow on West Fork remained largely stable at 13 mm (0.5 inches), or about 30 percent, for more than 20 years after implementing this treatment (Gottfried and others 1999b). These increases are largely attributed to reduced evapotranspiration rates and increased snowpack ac-cumulations (Gottfried and DeBano 1990, Rich 1972, Rich and Thompson 1974). The increased streamflow was pre-sumed a consequence of new tree roots not fully occupying the soil mantle and to the height differences between residual trees surrounding the cut openings and regeneration in these openings. This caused aerodynamic conditions that increased snowpack accumulations in the openings (Gottfried and oth-ers 1999b).
Silvicultural Impacts
The treatment on West Fork achieved the original purpose of initiating a schedule of harvesting timber and management of ponderosa pine stands in a shelterwood system with a ro-tation of 120 years with a 20-year re-entry cycle (Rich and Thompson 1974). The post-treatment stand structure on West Fork more closely resembled the initial stages of a balanced even-aged condition than did the pre-treatment structure. Silvicultural studies at Fort Valley indicated that a balanced even-aged stand structure has a greater timber-productivity potential than an unbalanced stand (Pearson 1950, Schubert 1974, and other scientists). However, since timber production is no longer a management emphasis in Arizona’s ponderosa pine forests, the main focus at the present time is to obtain ecosystem-based, multiple use benefits (Gottfried and others 1999b). Effects of the harvesting and thinning treatment on West Fork were particularly valuable to wildlife. The mixture of forest cover and interspersed cleared blocks provided ex-cellent habitats for big game species (Patton 1974).
Management Implications
Results from the silvicultural studies conducted at Fort Valley were important to planning treatments designed to improve water-yields in the ponderosa pine forests of the Southwest. The research provided the foundation for prescriptions that were evaluated on the experimental water-sheds at Beaver Creek, Castle Creek, and on other watersheds in the state. Subsequent findings from these “watershed ex-periments” have become major contributions of the Arizona Watershed Program. This initiative was formed in the late 1950s by the U.S. Forest Service and its cooperators to

66 USDA Forest Service RMRS-P-55. 2008.
ascertain the potentials for increasing streamflow from the upland watersheds by manipulating forest and other vegeta-tive covers (Fox and others 2000). The studies demonstrated increased water yields when watersheds were cleared and when stand densities were reduced. Some studies such as the strip cutting and thinning on Watershed 14 and the openings and improvement harvest at Castle Creek employed a com-bination of strategies. Improved water yields are attributed to reductions in stand evapotranspiration or to the redistribution and differential melting of snow. All treatments were benefi-cial for wildlife and range resources depending on opening characteristics and degree of canopy reductions. Much of the accumulated knowledge gained in the program’s 40 years provides today’s managers with a better, more holistic, and perhaps, more realistic basis for management of the natu-ral resources in Arizona’s ponderosa pine forests. The case studies presented in this paper represent only a few of the contributions to watershed management from the Fort Valley silvicultural studies. Other examples are found in the litera-ture that evolved from the watershed program.
References
Axelton, E. A. 1967. Ponderosa pine bibliography through 1965. Res. Pap. INT-40. Ogden, UT: U.S. Department of Agriculture, Forest Service, Intermountain Forest and Range Experiment Station.
Axelton, E. A. 1974. Ponderosa pine bibliography II: 1966-1970. Gen. Tech. Rep. INT-12. Ogden, UT: U.S. Department of Agriculture, Forest Service, Intermountain Forest and Range Experiment Station.
Axelton, E. A. 1977. Ponderosa pine bibliography III: 1971 through 1975. Gen. Tech. Rep. INT-33. Ogden, UT: U.S. Department of Agriculture, Forest Service, Intermountain Forest and Range Experiment Station.
Baker, M. B., Jr. 1983. Influence of slash windrows on streamflow. Hydrology and Water Resources in Arizona and the Southwest. 13: 21-25.
Baker, M. B., Jr. 1986. Effect of ponderosa pine treatments on water yield in Arizona. Water Resources Research. 23: 67-73.
Baker, M. B., Jr.; Ffolliott, P. F. 1998. Multiple resource evaluations on the Beaver Creek Watershed: an annotated bibliography (1956-1996). Gen. Tech. Rep. RMRS-GTR-13. Fort Collins, CO: U.S. Department of Agriculture, Forest Service, Rocky Mountain Research Station. 69 p.
Baker, M. B., Jr.; Ffolliott, P. F. 1999. Interdisciplinary land use along the Mogollon Rim. In: Baker, M. B., Jr., comp. History of watershed research in the Central Arizona Highlands. Gen. Tech. Rep. RMRS-GTR-29: Fort Collins, CO: U.S. Department of Agriculture, Forest Service, Rocky Mountain Research Station: 27-34.
Bates, C. G.; Henry, A. J. 1928. Forest and streamflow experiments at Wagon Wheel Gap, Colorado. Washington, DC, USA: U.S. Department of Agriculture, Weather Bureau Monthly Weather Review, Supplement No. 30.
Brown, H. E.; Baker, M. B., Jr.; Rogers, J. J.; Clary, W. P.; Kovner, J. L.; Larson, F. R.; Avery, C. C.; Campbell, R. E. 1974. Opportunities for increasing water yields and other multiple use values on ponderosa pine forest lands. Res. Pap. RM-129. Fort Collins, CO: U.S. Department of Agriculture, Forest Service, Rocky Mountain Forest and Range Experiment Station. 36 p.
Clary, W. P. 1975. Range management and its ecological basis in the ponderosa pine type of Arizona: the status of our knowledge. Res. Pap. RM-158. Fort Collins, CO: U.S. Department of Agriculture, Forest Service, Rocky Mountain Forest and Range Experiment Station. 35 p.
Ffolliott, P. F.; Baker, M. B., Jr. 2001. Stripcut-thinning of ponderosa pine stands: An Arizona case study. Res. Pap. RMRS-RP-34. Fort Collins, CO: U.S. Department of Agriculture, Forest Service, Rocky Mountain Research Station.
Ffolliott, P. F.; Gottfried, G. J. 1991. Natural regeneration after clearcutting in Arizona’s ponderosa pine forests: Two long-term case studies. Res. Note RM-507. Fort Collins, CO: U.S. Department of Agriculture, Forest Service, Rocky Mountain Forest and Range Experiment Station. 6 p.
Ffolliott, P. F.; Baker, M. B., Jr.; Gottfried, G. J. 2000. Heavy thinning of ponderosa pine stands: An Arizona case study. Res. Pap. RMRS-RP-22. Fort Collins, CO: U.S. Department of Agriculture, Forest Service, Rocky Mountain Research Station. 6 p.
Fox, K. M.; Ffolliott, P. F.; Baker, M. B., Jr.; DeBano, L. F. 2000. More water for Arizona: A history of the Arizona Watershed Program and the Arizona Water Resources Committee. Primer Publishers, Phoenix, Arizona. 118 p.
Gaines, E. M.; Kotok, E. S. 1954. Thinning ponderosa pine in the Southwest. Station Paper 17. U.S. Department of Agriculture, Forest Service, Rocky Mountain Forest and Range Experiment Station. 20 p.
Gottfried, G. J.; DeBano, L. F. 1990. Streamflow and water quality responses to preharvest burning in an undisturbed ponderosa pine watershed. In: Krammes, J. S., tech. coord. Effects of fire management of southwestern natural resources. Gen. Tech. Rep. RM-191. Fort Collins, CO: U.S. Department of Agriculture, Forest Service, Rocky Mountain Forest and Range Experiment Station: 222-228.
Gottfried, G. J.; DeBano, L. F.; Baker, M. B., Jr. 1999a. Beginning of water studies in the Central Arizona Highlands. In: Baker, M. B., Jr., comp. History of watershed research in the Central Arizona Highlands. Gen. Tech. Rep. RMRS-GTR-29. Fort Collins, CO: U.S. Department of Agriculture, Forest Service, Rocky Mountain Research Station: 7-12.
Gottfried, G. J.; DeBano, L. F.; Ffolliott, P. F. 1999b. Creating a basis for watershed management in high elevation forests. In: Baker, M. B., Jr., compiler. History of watershed research in the Central Arizona Highlands. Gen. Tech. Rep. RMRS-GTR-29. Fort Collins, CO: U.S. Department of Agriculture, Forest Service, Rocky Mountain Research Station: 35-41.
Krauch, H. 1949. Results of thinning experiment in ponderosa pine pole stands in central Arizona. Journal of Forestry. 47: 466-469.
Myers, C. A. 1967. Growing stock levels in even-aged ponderosa pine. Res. Pap. RM-33. Fort Collins, CO: U.S. Department of Agriculture, Forest Service, Rocky Mountain Forest and Range Experiment Station. 8 p.
Myers, C. A.; Martin, E. C. 1963. Fifty years’ progress in converting virgin ponderosa pine to managed stands. Journal of Forestry. 61: 583-586.

USDA Forest Service RMRS-P-55. 2008. 67
Patton, D. R. 1974. Patch cutting increases deer and elk use in a pine forest in Arizona. Journal of Forestry. 72: 764-766.
Pearson, G. A. 1950. Management of ponderosa pine in the Southwest. Agricultural Monograph 6. Washington, DC: U.S. Department of Agriculture. 218 p.
Rich, L. R. 1972. Managing a ponderosa pine forest to increase water yield. Water Resources Research. 8: 422-428.
Rich, L. R.; Thompson, J.R. 1974. Watershed management in Arizona’s mixed conifer forests: The status of our knowledge. Gen. Tech. Rep. RM-130. Fort Collins, CO: U.S. Department of Agriculture, Forest Service, Rocky Mountain Forest and Range Experiment Station. 15 p.
Ronco, F., Jr.; Edminster, C. B.; Trujillo, D. P. 1985. Growth of ponderosa pine thinned to different stocking levels in northern Arizona. Res. Pap. RM-262. Fort Collins, CO: U.S. Department of Agriculture, Forest Service, Rocky Mountain Forest and Range Experiment Station. 15 p.
The content of this paper reflects the views of the author(s), who are responsible for the facts and accuracy of the information presented herein.
Schubert, G. H. 1971. Growth response of even-aged ponderosa pines related to stand density levels. Journal of Forestry. 69:857-860.
Schubert, G. H. 1974. Silviculture of southwestern ponderosa pine: The status of our knowledge. Res. Pap. RM-123. Fort Collins, CO: U.S. Department of Agriculture, Forest Service, Rocky Mountain Forest and Range Experiment Station. 71 p.
Schubert, G. H.; Heidmann, L. J.; Larson, M. M. 1970. Artificial reforestation practices for the Southwest. Agricultural Handbook 370. Washington, DC: U.S. Department of Agriculture. 25 p.

68 USDA Forest Service RMRS-P-55. 2008.
Introduction
Research at Fort Valley Experimental Forest (Pearson 1918) began with studies to determine the best silvicultur-al practices for timber production of southwestern yellow pine (Pinus ponderosa). Besides issues of stocking levels and cutting cycles, this work sought economical methods for reducing losses from various physical factors and biotic agents. One of the most important of these agents was the southwestern dwarf mistletoe (Arceuthobium vaginatum). The early research in forest pathology and entomology was conducted by long-term monitoring on a series of silviculture plots (Table 1) and later by specific life history studies. As a consequence of virgin stand conditions, initial harvesting practices, and abundant natural regeneration circa 1919, the stands that developed on the silviculture plots consisted of a mistletoe-infected overstory and an understory showered with mistletoe seeds. Since mistletoe requires a living host and disperses a short distance, killing the infected overstory or pruning infected branches were logical controls for protect-ing the regeneration. Besides silviculture and control studies with infested plots, research included comparisons of stand growth and yield to plots with little or no mistletoe. After a half-century, a silviculture foundation for the Southwest was established (Egan 1954, Gaines and Shaw 1958). Soon after this, however, sentiment shifted to concern over for-est health in general (Dahms and Geils 1997) and mistletoe control in particular as more damaging than the disease itself (Conklin 2000). This review briefly examines a century of forest pathology and entomology research at Fort Valley and by associated scientists in the Southwest (also see Appendix). This history illustrates the importance of Fort Valley research for a better understanding of the relevance of geography and evolution of ecosystems and societies.
The Southwest forests share many forest pathogens and insects with other western regions, yet the individual species and their behavior are regionally distinctive (Pearson 1943).
Research at Fort Valley contributes to an understanding of forest pathogens and insects applicable both generally across the West and specifically within the Southwest. General re-search concepts developed in one region can be used widely, but many relationships need to be fit for a specific region. The Fort Valley Experimental Forest has filled the general and specific roles of research by serving as an individual experimental forest for long-term, plot-level research, by contributing to comparative, regional studies, and by its sci-entists integrating information from multiple regions and disciplines into useful management tools.
Southwestern Dwarf Mistletoe
Silviculture Plots
Of forest pathogens in the Southwest, the most common and damaging are clearly the mistletoes (Geils and oth-ers 2002, Hawksworth and others 1989). Dwarf mistletoes (Arceuthobium spp.) are long-lived, obligate, aerial parasites of conifers; they disperse locally by ballistic discharge of moderately large seeds. Trees infected by southwestern dwarf mistletoe form characteristic, large brooms clearly shown in many old Arizona photographs (see Moir and others 1997 for 1890 photograph by Gifford Pinchot). In the 1800s, dwarf mistletoe was common and already recognized as poten-tially damaging (MacDougal 1899). At Fort Valley, Burrall (1910) established the first known plot to quantify the effects of southwestern dwarf mistletoe on tree growth. Assistant Southwest Forester, T. S. Woolsey, Jr. well understood the general biology and pathology of this mistletoe and declared it a “serious menace” to ponderosa pine (Woolsey 1991). In 1911, William “Doc” Long was appointed as the first regional forest pathologist and given the assignment to study how to reduce losses in the Mountain West from mistletoe, decay, and rust. Although Doc Long and later other pathologists and
Forest Pathology and Entomology at Fort Valley Experimental Forest
Brian W. Geils, USFS, Rocky Mountain Research Station, Flagstaff, AZ
Abstract—Forest pathology and entomology have been researched at Fort Valley Experimental Forest throughout its history. The pathogens and insects of particular interest are mistletoes, decay and canker fungi, rusts, bark beetles, and various defoliators. Studies on life history, bi-otic interactions, impacts, and control have been published and incorporated into silvicultural programs. A brief review of select pathogens and insects illustrates the evolution of research problems, approaches, and applications. Southwestern dwarf mistletoe, a serious pathogen of ponderosa pine, provides a case history of research transitioning from eradication methods for a menacing pest to adaptive management for an ecological keystone species.
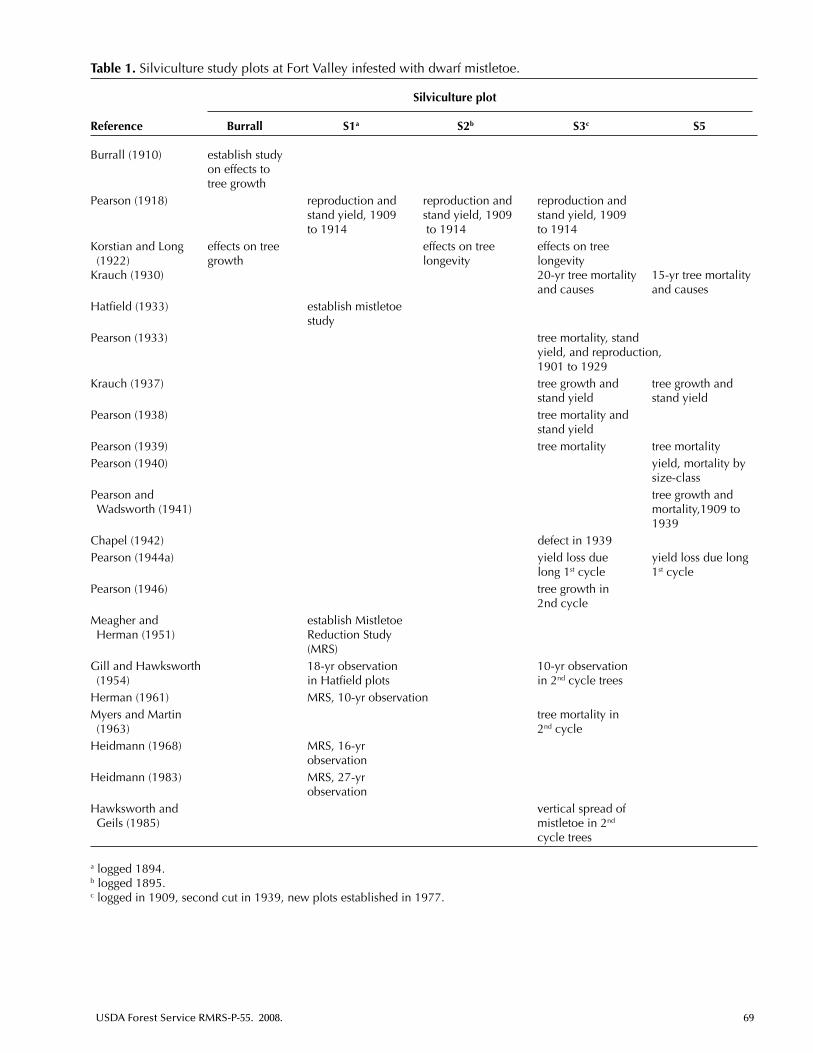
USDA Forest Service RMRS-P-55. 2008. 69
Table 1. Silviculture study plots at Fort Valley infested with dwarf mistletoe.
Silviculture plot
Reference Burrall S1a S2b S3c S5
Burrall (1910) establish study on effects to tree growthPearson (1918) reproduction and reproduction and reproduction and stand yield, 1909 stand yield, 1909 stand yield, 1909 to 1914 to 1914 to 1914Korstian and Long effects on tree effects on tree effects on tree (1922) growth longevity longevity Krauch (1930) 20-yr tree mortality 15-yr tree mortality and causes and causesHatfield (1933) establish mistletoe studyPearson (1933) tree mortality, stand yield, and reproduction, 1901 to 1929Krauch (1937) tree growth and tree growth and stand yield stand yieldPearson (1938) tree mortality and stand yieldPearson (1939) tree mortality tree mortalityPearson (1940) yield, mortality by size-classPearson and tree growth and Wadsworth (1941) mortality,1909 to 1939Chapel (1942) defect in 1939Pearson (1944a) yield loss due yield loss due long long 1st cycle 1st cyclePearson (1946) tree growth in 2nd cycleMeagher and establish Mistletoe Herman (1951) Reduction Study (MRS)Gill and Hawksworth 18-yr observation 10-yr observation (1954) in Hatfield plots in 2nd cycle treesHerman (1961) MRS, 10-yr observationMyers and Martin tree mortality in (1963) 2nd cycleHeidmann (1968) MRS, 16-yr observationHeidmann (1983) MRS, 27-yr observationHawksworth and vertical spread of Geils (1985) mistletoe in 2nd cycle trees
a logged 1894.b logged 1895.c logged in 1909, second cut in 1939, new plots established in 1977.

70 USDA Forest Service RMRS-P-55. 2008.
eventually entomologists were stationed at an Albuquerque federal lab, they conducted much of their work in the Fort Valley area and associated themselves with its research.
G. A. “Gus” Pearson (1918) established a series of silvicul-ture plots at Fort Valley (Table 1) and included observations on mistletoe as a principal cause of defect, growth loss, mor-tality, and vulnerability to bark beetles and windthrow. This first series of Fort Valley plots were in heavily harvested stands that were soon well stocked with regeneration under mistletoe-infested overstory trees. Since Gus Pearson knew mistletoe was lethal to small trees and pine reproduction was infrequent and subject to many losses, his first priority was protection of this regeneration. Control methods for mistle-toe included cutting, poisoning, and pruning overstory trees. The research problems were: 1) the threat infected trees posed to neighbors and understory; 2) overstory losses due to growth reduction and mortality directly by mistletoe or by windthrow; and 3) stand productivity losses due to incom-plete occupancy. The first important results from these plots were described by Korstian and Long (1922) who recom-mended management use silviculture to control mistletoe spread and intensification and thereby reduce host growth loss and mortality.
Additional silviculture plots (Table 1) established at Fort Valley represented uncut stands and stands on different soil types. Since several of these plots had little or no dwarf mis-tletoe, they provided baseline information on stand growth and yield. Other plots established by Hatfield (1933) and by Meagher and Herman (1951) investigated silvicultural prescriptions for controlling mistletoe with least cost and least reduction in forest productivity. Pearson (1946) con-cluded his initial efforts at mistletoe control had not been sufficiently “drastic” to reduce mistletoe to a negligible level. Determining the best level of sanitation (removal of mistletoe infections) in heavily infested stands, however, presented several problems. If the cut were too severe, the residuals might be lost to windthrow. If a stand were clear cut, expensive and risky planting would be required. Even if cutting left a well-stocked and wind-firm stand, mistletoe resurgence from missed or latent infections would require several re-cleanings to control mistletoe. Mistletoe generally occurred on larger trees, was distributed in patches, intensi-fied slowly, and caused no apparent growth loss or mortality until the infestation was severe. The immediate goal of full site occupancy with the largest trees conflicted with a control objective of eradicating mistletoe from the stand.
The research approach used by Hatfield (1933) and Meagher and Herman (1951) was to compare alternative con-trol treatments in a few experimental plots. A later approach, including the work of Myers and others (1972), was to model stand growth and yield as a function of tree density, basal area, and mistletoe severity. Relationships were developed from numerous even-aged stands thinned (with sanitation) to represent a broad range of growing stock level and mistletoe severity. One study was established on a permanent sample plot S3 (Table 1) and monitored until 1989. Results from the Fort Valley silviculture, control, and growth and yield plots
have been published (Table 1) and used to develop man-agement guidelines and simulation models (e.g., Edminster 1978, Schubert 1974). The Fort Valley plots have not been remeasured recently, but their well-documented history of cutting, growth, and mortality provides an opportunity to ex-amine the effects of silviculture and mistletoe on long-term stand development.
Frank Hawksworth
The silviculture and control plots at Fort Valley were complemented with a series of pathology studies directed by Lake Gill and conducted by Frank Hawksworth (Figure 1). Hawksworth (1961) investigated the crucial topics in mis-tletoe pathology—life history, seed flight, dispersal period, rate of spread, effects on host growth and fitness, types of witches’ brooms, distribution, and control. Before 1950, the severity of mistletoe infection had been variously described in subjective terms and little attempt had been made to quan-tify the relation of mistletoe severity to either intensification or effects. Using southwestern dwarf mistletoe–ponderosa pine as a model, Hawksworth (1977) devised a rating system now used globally for quantifying mistletoe severity.
The Hawksworth studies and rating system provided the basis for developing several models of mistletoe spread, intensification, and effects on host growth and survival. Silviculturalists had traditionally used standardized tables of yield by age; computer programs allowed variable den-sity tables to be calculated and to include mistletoe effects (Myers and others 1972). Growth and yield models soon progressed from computation tables of stand averages (Edminster and others 1991) to simulations of individual trees (Dixon 2002). Silviculture and pathology studies con-ducted at Fort Valley provided the fundamental relations used
Figure 1. Frank G. Hawksworth in 1961 inoculating seedlings with dwarf mistletoe. Photo by B. Schacht.

USDA Forest Service RMRS-P-55. 2008. 71
in the Southwest variant of the Forest Vegetation Simulator (FVS). Coincidentally, the primary architect of FVS, Albert Stage, (1973) was a Fort Valley scientist; and the present applications director, Gary Dixon, developed a mistle-toe spread model (Dixon and Hawksworth 1976). The conceptual mistletoe model constructed by Hawksworth was adapted by Robinson and Geils (2006) for spatial simu-lation of mistletoe dynamics in complex stands. Frank Hawksworth’s contributions in quantifying mistletoe were, however, only a part of his pro-ductive career.
Frank Hawksworth was a key investigator on mistletoe control projects at the South Rim of the Grand Canyon (Lightle and Hawksworth 1973) and on the Mescalero Apache Indian Reservation (Hawksworth and Lusher 1956). The Grand Canyon project was an important test of the Fort Valley control methods (killing and prun-ing) applied to improve tree health and longevity in an old-growth recreation forest. With a long-term record (1949 to 2003) of comparison plots, the Grand Canyon project (see Robinson and Geils 2006) well complemented the Fort Valley silviculture plots. Observations at the Grand Canyon demonstrated that reducing the mistletoe population could increase the longevity of residual old-growth trees (Geils and others 1991), stimulate pine regeneration, and retard mistletoe spread and intensification (Robinson and Geils 2006); but the long-term ecological effects and affects on fire hazard have not been assessed. The Mescalero project was a test of Fort Valley control methods for optimizing timber productivity through repeated cleanings aimed at mistletoe eradication. Early Fort Valley studies had sub-stantiated that severe mistletoe infection greatly reduced tree growth and survival; the Grand Canyon and Mescalero projects demonstrated that significant mistletoe reduction was possible if a sufficient and sustained effort were imple-mented. Many forest managers, however, were unconvinced that the mistletoe was sufficiently widespread and serious to justify control (Gill 1960).
Frank Hawksworth participated in forest- to region-wide surveys (Andrews and Daniels 1960, Hawksworth 1959) to quantify the distribution and severity of dwarf mistletoes. These surveys served as prototypes for other regions and a Southwest re-survey to assess the 30-year trend in mistletoe
distribution (Maffei and Beatty 1989). Approximately one-third of stands in the Southwest were infested in each survey (Andrews and Daniels 1960, Maffei and Beatty 1989).
Although these surveys can be variously interpreted with regards to past success in mistletoe management, they nonetheless document that southwestern dwarf mistletoe remains a frequent and eco-logically influential species in many Southwest forests.
Four additional Hawks-worth projects illustrate the connection of Fort Valley research with topics of cur-rent interest—effects of climate change, high-elevation pines, prescribed burning, and wildlife habitat. Mark and Hawksworth (1976) re-lated mistletoe distribution to geographic and altitudinal cli-mates. A warmer climate would allow southwestern dwarf mistletoe to migrate northward and up-slope. In resolving a question on the taxonomy of the dwarf mis-tletoe on bristlecone pine (Pinus aristata), Mathiasen and Hawksworth (1980), also mapped the distributions
of the five-needled pines (subgenus Strobus) on the San Francisco Peaks. This provided a monitoring baseline for the potential effects of climate change and white pine blis-ter rust (Cronartium ribicola) on these high-elevation pines. Alexander and Hawksworth (1975) reviewed the complex fire ecology of dwarf mistletoe; Harrington and Hawksworth (1990) conducted at the Grand Canyon one of the first stud-ies on prescribed burning for mistletoe control. Data of that study corroborated a sanitation model developed by Conklin and Geils (2008). Many hours of scanning tree crowns for dwarf mistletoe at Fort Valley allowed Frank Hawksworth to observe the associated wildlife. Mistletoe-wildlife interac-tions include seed dispersal, mistletoe and infected branches as food, brooms for nesting and cover, and effects of mistle-toe on habitat (Hawksworth and Geils 1996). Frank was an avid birder who didn’t considered dwarf mistletoe as an in-sidious pest but as a member of a diverse biotic community with many, profound effects and interactions (i.e., a keystone species). As often the case in science, knowledge gained in one study eventually benefits greater understanding else-where. Frank Hawksworth was hired to improve pest control methods; he gave us a personal example of appreciating na-ture through humor and understanding an odd, little parasitic plant (see sidebar).
Mistletoe Power
Frank Hawksworth knew of the importance of applying research to crucial national needs. But he also had a dry sense of humor. In 1973, an oil embargo directed against the United States demonstrated the vital economic importance of a secure, domestic energy supply. From his distribution surveys and research on seed biology, Hawksworth (1973) estimated with a few simple calculations that the annual production and discharge of mistletoe seeds in the Southwest produced 67,000 kilowatts of energy! And this is a renewable resource that is basically solar power, produces water (like fuel-cells), has a low carbon-footprint (way better than clean coal), its “nuclear” activity does not produce radioactive wastes. He suggests “American ingenuity…and multi-billion dollar crash program” could solve the slight problem of collecting energy when seeds are expelled from billions of fruits over millions of acres discharged in thousandths of a second.

72 USDA Forest Service RMRS-P-55. 2008.
Other Pathogens and Forest Insects
In addition to dwarf mistletoe, numerous physical pro-cesses and other biotic agents known to damage or kill trees have been studied at Fort Valley. Krauch (1930) identifies lightning, fire, windthrow, frost heaving, drought, breakage, and animals as important mortality factors. The damages caused by many of these factors are often confounded by those of fungi and insects. For example, root disease and decay predisposes trees to windthrow and breakage, which increases vulnerability to attack by bark beetles and addi-tional decay fungi. Pathogenic or saprophytic fungi cause needle cast, decay, canker, rust, and root disease (Ellis 1939, Lightle 1967). Phytophagous insects include bark and twig beetles, sap-sucking and shoot-feeding insects, and defo-liators (Fairweather and others 2006). Many of these insects and some fungi typically display periods of outbreak and col-lapse; others are ubiquitous and persistent.
From the utilitarian perspective of timber production (Kolb and others 1994), damaging irruptive species are character-ized as pests. The general biology and destructive potential of these species were known when the Fort Valley station was established. Initial research focused on taxonomy, life history, effects, and epidemiology with the objectives of min-imizing losses and preventing or reducing outbreaks. Over time, however, the Fort Valley forest has been seen less as a tree farm and more as a biotic community and natural eco-system. From the ecological perspective, these pathogens and insects are not pests but symbionts at the host level (Combes 1996) and transformers at the ecosystem level (Richardson and others 2000). Gunderson and Holling (2002) describes cycles of forest ecosystem renewal to include stages of ex-ploitation, conservation, release, and reorganization. A few but diverse pathogen and insect species play influential roles in that renewal cycle. Their influence on forest structure and dynamics depend on their specific effect (e.g., needle cast vs. root disease) and their particular epidemiology (e.g., out-break typically short and showy vs. nearly permanent).
Wood decays are persistent, saprophytic fungi (Gilbertson 1974). The western red rot (Dichomitus squalens) is common in the Southwest as a saprophyte of ponderosa pine heart-wood (Andrews and Gill 1943); cull in early defect studies determined losses at 10 to 15% but occasionally as high as 50%. Unlike the old-growth decays of other regions, western red rot enters through dead branches and attacks young pon-derosa pine trees in open stands. Recommended silvicultural modifications are to delay thinning for the first 80 years, then thin the stand and prune the residuals. Fort Valley silviculture and utilization studies of the past contributed to reducing cull; new studies need to address decay of live ponderosa pine for it affects on soils, fuels and carbon sequestration.
The rust fungi cause several kinds of disease includ-ing foliage rust, broom rust, gall rust, limb rust, and stem rust. Hawksworth (1953) describes observations at Fort Valley that determined that limb rust has several taxonomic
forms (Cronartium and Peridermium). He also reports a gall-forming rust on the San Francisco Peaks that is differ-ent from the common, damaging gall rust of other regions. This white-spored rust (Peridermium sp.) appears to be a genetically distinct, rare endemic with small disjunct popu-lations from west Texas, to southern Nevada, to northern Colorado (Vogler and Bruns 1998). Generally, the native pine stem rusts have not caused severe economic or ecologi-cal impacts in the Southwest. Gilbertson (1985), however, describes a case wherein a rare stem rust native on ponderosa pine (Cronartium comandrae) unexpectedly and with serious damage appeared on an Asian pine species (Pinus elderica) introduced to Arizona. Combes (1996) provides numerous examples where a parasite plays a major but secretive role after a biotic system is disturbed. Although we have some knowledge on the pine rusts, we have much to learn before we understand their evolutionary history, genetic potential, and ecology.
Pine defoliators include both fungi and insects. Needle cast fungi belong to several taxonomic groups (e.g., molds) that infect live conifer foliage and cause early shedding (Ellis 1939, Gill 1940). Twig beetles (e.g., Pitygenes), Prescott scale (Matsucoccus vexillorum), sawflies (Neodiprion), pan-dora moth (Coloradia pandora) and other insect defoliators feed on shoots and foliage (McMillin and Wagner 1998, Wagner and Mathiasen 1985). These fungi and insects are usually eruptive with rapid and spectacular appearance re-lated to favorable weather. Red foliage and defoliation can be alarming, especially when synchronous outbreaks occur over a large area. Although defoliation outbreaks in the Fort Valley area have several times prompted initiation of new, large in-vestigations, these were short-lived when they determined the outbreak cause and its modest impact on host growth and survival. The most recent Fort Valley study on a defoliator is the now terminated laboratory work on the western spruce budworm (see Clancy 2002). University and Forest Service entomologists are now studying an eminent pandora moth outbreak in northern Arizona.
Canker fungi are pathogens that usually enter the stem through an injury and cause a perennially, enlarging wound; some are associated with decay (Hinds 1985). Aspen (Populus tremuloides) is easily susceptible to injury, canker disease, and decay. Although aspen can sprout prolifically after the clone is cut or burned, young stems are often so severely browsed that regeneration fails. Herman (1951) de-scribes Fort Valley aspen regeneration studies and mentions fencing to prevent animal damage. The course of that and other experiments (see Martin 1965) have established the need for fencing to protect aspen, now principally from elk (Shepperd and Fairweather 1994, Rolf 2001). Aspen decline present now on the San Francisco Peaks is due to a complex of abiotic and biotic causes. Sustaining aspen communities requires cooperation among forest pathologists, forest and wildlife managers to ensure success of the aspen renewal cycle.
Most root disease fungi are also decay fungi, but these pathogens attack living roots and thereby cause host decline and vulnerability to windthrow or insect attack (Andrews

USDA Forest Service RMRS-P-55. 2008. 73
1957). Although root disease is found throughout the Southwest (Wood 1983), it has not been as important in the Fort Valley forest as elsewhere in the region. However, restoration and fuel treatments conducted recently here have greatly increased the food stock for root diseases (i.e., fresh stumps). Because root disease develops slowly but is very persistent, early detection and monitoring studies at Fort Valley would be prudent.
For pines of the Southwest, bark beetles are the insects of principal concern (DeGomez and Young 2002). These insects bore into and feed upon the inner bark of living trees. They usu-ally form mass attacks on stressed trees or upper tree crowns, but when insect populations are sufficient they can successful-ly attack and kill healthy trees (Pearson 1943). The mountain pine beetle (Dendroctonus ponderosae) has been an aggressive cause of landscape-scale tree mortality on the North Kaibab plateau (Lang and Stewart 1909) but is uncommon elsewhere in the Southwest. On the Fort Valley plots, Krauch (1930) rec-ognizes bark beetles as contributing to mortality (but minor compared to mistletoe). Hornibrook (1936) reports on a small, early study to reduce Ips populations by peeling the bark of infested trees (also see Vincent 1935 and Wadsworth 1939 for similar studies). Although Ips and other Dendroctonus beetles usually attack diseased trees in dense, blackjack stands, fol-lowing a sustained drought as recently experienced, these bark beetles can kill thousands of trees in a forest-wide outbreak (Kenaley and others 2006). Recent work at Fort Valley con-ducted by university researchers has investigated the effects of forest thinning on the physiological defense of residual trees to bark beetle attack.
In the pine forest of the late 1800s, frequent, low-intensity fire had been an important natural disturbance for maintain-ing the system (Covington and others 1997, Moir and others 1997). Fire suppression for most of the past 100 years had dis-rupted that function, but a new fire policy is aimed at restoring it (Dahms and Geils 1997). Unfortunately, we know less about the natural disturbance regimes of bark beetles, other forest insects, fungal pathogens and mistletoes. Fort Valley studies have provided information valuable for developing guidelines and technologies for insect and disease management in a tradi-tional forestry context. Additional research would be required, however, to determine the insect and disease regimes of a resilient, well-functioning ecosystem for providing various ecological services (Geils and others 1995).
Fort Valley, a Learning Experience
Historically, the Fort Valley scientists had the objective of learning and communicating practical information for man-aging productive timber stands and controlling pests (this proceedings). They developed information on pathogen and insect identity, distribution, life history, and epidemiology. They applied that knowledge to damage assessment, projec-tion, and management. Beyond results of individual studies, however, also emerged an appreciation for the complexity
of biotic systems and importance of symbiotic interactions of diverse form. For example, Jameson (1994) studied pinyon-juniper woodlands subjected to stress and distur-bance. He recognized that succession was not just steady, species replacement to a single endpoint; succession could display rapid jumps to multiple, nearly irreversible endpoints in consequence to various stresses and insect or disease outbreaks. Among the authors he referenced for early de-velopment of ideas on complexity and interaction was C. S. Holling. Gunderson and Holling (2002) provide a conceptual framework in terms of adaptive management and cycles of ecosystem renewal that are useful for organizing our under-standing of the ecology and management for forest pathogens and insects.
Hawksworth (1961) originally presented his work on the life history and spread of southwestern dwarf mistletoe in the silvicultural context of the time (Figure 2, from obser-vations at Fort Valley). Like Jameson (1994), he developed an appreciation for the complexity of the mistletoe–pine pathosystem—multiple impacts and alternative outcomes occur as result of differences in initial conditions and interac-tions of various factors. Spread of dwarf mistletoe is more than an increasing area removed from timber production. Although Pearson (1944b) recognized he knew little about host resistance, he suspected that regenerating a stand from mistletoe-free trees would improve its genetics. Mistletoe’s first effect by disease or by control may be on host fitness, but we have much to learn on this topic. Regardless of the genetic consequences, infected trees are often retained as a seed source and left long enough that the regeneration becomes infected (e.g., Fort Valley plot S3). Mistletoe in a re-sidual, overstory tree continues to intensify until the host dies (Figure 2). Early Fort Valley studies sought to identify which trees would be “lost” before the next cutting cycle; but later studies recognized these snags as valuable for wildlife habitat (a second effect). The first infected sapling dies rapidly, leav-ing a persistent and later increasing canopy gap (a third effect). Bickford and others (2005) determined that reducing compe-tition around an infected tree at least temporally improves its growth, but mistletoe growth is also enhanced. Although poles survive infection longer than seedlings, they develop mistletoe brooms of various types (a fourth effect). Brooms reduce host vigor, yet they also provide special habitat for wildlife (Hawksworth and Geils 1976). By itself or in combi-nation with other factors (Krauch 1930), mistletoe eventually kills the host and may lead to additional mortality by fire or bark beetles (a fifth effect, Kenaley and others 2006). But released of competition from the ponderosa pine, many other plant species thrive to create a different biotic community than one of pine only (a sixth effect). More than just reduc-ing timber volume, mistletoe affects biodiversity, vegetation pattern, and ecosystem functions. Although individual trees can be killed or pruned, we’ve learned that eradication may be undesirable (Conklin 2000). We’ve learned how to model the effects of mistletoe on infected trees; we have yet to learn how to manage forest stands for optimizing the benefits of mistletoe to forest health.

74 USDA Forest Service RMRS-P-55. 2008.
Acknowledgment
I thank the several reviewers and commentators who helped me see what was really required of this paper: Joel McMillin, entomology; Dave Conklin, pathology; Susan Olberding, Fort Valley history; Detlev Vogler, natural histo-ry; and Don Robinson, adaptive management. I thank Frank Hawksworth for showing me how interesting were the mis-tletoes and rusts and for giving me the opportunity to learn.
References
Alexander, M. E.; Hawksworth, F. G. 1975. Wildland fires and dwarf mistletoes: a literature review of ecology and prescribed burning. Gen. Tech. Rep. RM-14. Fort Collins, CO: U.S. Department of Agriculture, Rocky Mountain Forest and Range Experiment Station. 12 p.
Andrews, S. R. 1957. Forest disease research at Albuquerque Forest Insect and Disease Laboratory. May 1, 1957. Problem analysis. Albuquerque, New Mexico: U.S. Department of Agriculture, Forest Service, Rocky Mountain Forest and Range Experiment Station. 94 p. Unpub. Pap. on file at Flagstaff, AZ: U.S. Department of Agriculture, Forest Service, Rocky Mountain Research Station, Forest Pathology archives.
Andrews, S. R.; Daniels, J. P. 1960. A survey of dwarfmistletoes in Arizona and New Mexico. Sta. Pap. 49. Fort Collins, CO: U.S. Department of Agriculture, Forest Service, Rocky Mountain Forest and Range Experiment Station. 17 p.
Andrews, S. R.; Gill, L. S. 1943. Western red rot in immature ponderosa pine in the Southwest. Journal of Forestry. 41(8):565–573.
Bickford, C. P.; Kolb, T. E.; Geils, B. W. 2005. Host physiological condition regulates parasitic plant performance: Arceuthobium vaginatum subsp. cryptopodum on Pinus ponderosa. Oecologia. 146(2):179–189. [Online]. doi: 10.1007/s00442-005-0215-0
Burrall, H. D. 1910. Report on measurements taken on western yellow pine to ascertain the effects of mistletoe on its growth. Typed report. Albuquerque, NM: U.S. Department
Figure 2. Spread of dwarf mistletoe as a phenomena of overstory to understory spread followed by expansion of the infestation. Reprinted from Hawksworth and Gill 1960.

USDA Forest Service RMRS-P-55. 2008. 75
of Agriculture, Forest Service, Coconino National Forest and Albuquerque Lab. 50 p. Unpub. Pap. on file at Flagstaff, AZ: U.S. Department of Agriculture, Forest Service, Rocky Mountain Research Station, Fort Valley Experimental Forest archives.
Chapel, W. L. 1942. Unmerchantability in second cut ponderosa pine. Journal of Forestry. 40(1):45–48.
Clancy, K. M. 2002. Mechanisms of resistance in trees to defoliators. In: Wagner, M. R.; Clancy, K. M; Lieutier, F.; Paine, T. D., eds. Mechanisms and deployment of resistance in trees to insects. Dordrecht, the Netherlands: Kluwer Academic Publishers: 79–103.
Combes, C. 1996. Parasites, biodiversity and ecosystem stability. Biodiversity and Conservation. 5:953–962.
Conklin, D. A. 2000. Dwarf mistletoe management and forest health in the Southwest. Albuquerque, NM: U.S. Department of Agriculture, Forest Service, Southwest Region. 30 p. [Online]. Available: http://www.fs.fed.us/r3/publications/documents/dwarfmistletoe.pdf
Conklin, D. A.; Geils, B. W. 2008. Survival and sanitation of dwarf mistletoe-infested ponderosa pine following prescribed under-burning. Western Journal of Applied Forestry. [accepted August 7, 2007].
Covington, W. W.; Fulé, P. Z.; Moore, M. M.; Hart, S. C.; Kolb, T. E.; Mast, J. N.; Sackett, S. S.; Wagner, M. R. 1997. Restoring ecosystem health in ponderosa pine forests of the Southwest. Journal of Forestry. 95(4):23–29.
Dahms, C. W.; Geils, B. W., tech. eds. 1997. An assessment of forest ecosystem health in the Southwest. Gen. Tech. Rep. RM-GTR-295. Fort Collins, CO: U.S. Department of Agriculture, Forest Service, Rocky Mountain Forest and Range Experiment Station. 97 p. [Online]. Available: http://www.rms.nau.edu/publications/rm_gtr_295/
DeGomez, T.; Young, D. 2002. Pine bark beetles. AZ1300. Tucson, AZ: University of Arizona, Cooperative Extension. 3 p. [Online]. Available: http://www.ag.arizona.edu/pubs/natresources/az1300.pdf
Dixon, G. E., comp. 2002. Essential FVS: a user’s guide to the Forest Vegetation Simulator. (Revision January, 2006). Fort Collins, CO: U.S. Department of Agriculture, Forest Service, Forest Management Service Center. [Online]. Available: http://www.fs.fed.us/fmsc/ftp/fvs/docs/gtr/Essent
Dixon, G. E.; Hawksworth, F. G. 1979. A spread and intensification model for southwestern dwarf mistletoe in ponderosa pine. Forest Science. 24(1):43–52.
Edminster, C. B. 1978. Development of growth and yield models for dwarf mistletoe-infested stands. In: Scharpf, R. F.; Parmeter, J. R., Jr., tech. coords. Symposium on Dwarf Mistletoe Control through Forest Management. 1978 April 11–13; Berkeley, CA. Berkeley, CA: U.S. Department of Agriculture, Forest Service, Pacific Southwest Forest and Range Experiment Station: 172–177.
Edminster, C. B.; Mowrer, H. T.; Mathiasen, R. L.; Schuler, T. M.; Olsen, W. K.; Hawksworth, F. G. 1991. GENGYM: A variable density stand table projection system calibrated for mixed conifer and ponderosa pine stands in the Southwest. Res. Pap. RM-297. Fort Collins, CO: U.S. Department of Agriculture, Forest Service, Rocky Mountain Forest and Range Experiment Station. 32 p.
Egan, J. E. 1954. Silvicultural foundations for National Forest cutting practice in the ponderosa pine stands of the Southwest. Journal of Forestry. 52(10):756–766.
Ellis, D. E. 1939. Conifer diseases hitherto unreported from the Southwest. Plant Disease Reporter. 23(21):341.
Fairweather, M. L.; McMillin, J.; Rogers, T.; Conklin, D. A.; Fitzgibbon, B. 2006. Field guide to insects and diseases of Arizona and New Mexico. MR-R3-16-3. Albuquerque, NM: U.S. Department of Agriculture, Forest Service, Southwestern Region. 271 p. [Online]. Available: http://www.fs.fed.us/r3/resources/health.
Gaines, E. M.; Shaw, E. W. 1958. Half a century of research, Fort Valley Experimental Forest 1908–1958. Sta. Pap. RM-38. Fort Collins, CO: U.S. Department of Agriculture, Forest Service, Rocky Mountain Forest and Range Experiment Station. 17 p.
Geils, B. W.; Cibrian Tovar, J.; Moody, B., tech coords. 2002. Mistletoes of North American conifers. Gen. Tech. Rep. RMRS-GTR-98. Ogden, UT: U.S. Department of Agriculture, Forest Service, Rocky Mountain Research Station. 123 p. [Online]. Available: http://www.fs.fed.us/rm/pubs/rmrs_gtr098.pdf
Geils, B. W.; Hawksworth, F. G.; Janssen, J. E. 1991. Longevity of ponderosa pine parasitized by southwestern dwarf mistletoe. Bulletin of the Ecological Society of America. 72 (Suppl 2): 122.
Geils, B. W.; Lundquist, J. E.; Negron, J. F.; Beatty, J. S. 1995. Disturbance regimes and their relationships to forest health. In: Eskew, L. G., comp.; Forest health through silviculture: Proceedings of the 1995 National Silviculture Workshop; 1995 May 8–11; Mescalero, NM. Gen. Tech. Rep. RM-GTR-267. Fort Collins, CO: U.S. Department of Agriculture, Forest Service, Rocky Mountain Forest and Range Experiment Station: 67–72. [Online]. Available: http://www.fs.fed.us/rm/pubs_rm/rm_gtr267/rm_gtr267_067_073.pdf
Gilbertson, R. L. 1974. Fungi that decay ponderosa pine. Tucson, AZ: University of Arizona Press. 197 p.
Gilbertson, R. L. 1985. Comandra blister rust on Mondell pine in Arizona. Arizona Plant Pathology. Tucson, AZ: University of Arizona, Cooperative Extension Service. 3 p.
Gill, L. S. 1940. Activities of Albuquerque Branch, Division of Forest Pathology, March 8, 1939 to February 26, 1940. February 16, 1940. Annual report for 1940. Albuquerque, NM: U.S. Department of Agriculture, Division of Forest Pathology. 33 p. Unpub. Pap. on file at Flagstaff, AZ: U.S. Department of Agriculture, Forest Service, Rocky Mountain Research Station, Forest Pathology archives.
Gill, L. S. 1960. Principles and practice of dwarfmistletoe control. 7th Western International Forest Disease Work Conference. 1959 December 1–4; Pullman, WA: 94–98.
Gill, L. S.; Hawksworth, F. G. 1954. Dwarfmistletoe control in southwestern ponderosa pine forests under management. Journal of Forestry. 52(5): 347–353.
Gunderson, L. H.; Holling, C. S., eds. 2002. Panarchy, Understanding transformations in human and natural systems. Washington, DC: Island Press. 507 p.
Harrington, M. G.; Hawksworth, F. G. 1990. Interactions of fire and dwarf mistletoe on mortality of southwestern ponderosa pine. In: Krammes, J. S., tech. coord.; Effects of fire management of southwestern natural resources; 1988 November 15–17; Tucson, AZ. Gen. Tech. Rep. RM-191. Fort Collins, CO: U.S. Department of Agriculture, Forest Service, Rocky Mountain Forest and Range Experiment Station: 234–240.

76 USDA Forest Service RMRS-P-55. 2008.
Hatfield, I. J. 1933. The establishment of an experimental control plots at the Fort Valley Experimental Forest, Flagstaff, Arizona. September 29, 1933. Mimeographed report. Albuquerque, NM: U.S. Department of Agriculture, Forest Service. 17 p. Unpub. Pap. on file at Flagstaff, AZ: U.S. Department of Agriculture, Forest Service, Rocky Mountain Research Station, Fort Valley Experimental Forest archives.
Hawksworth, F. G. 1953. The pycnial stage of Cronartium filamentosum. Plant Disease Reporter. 37(4): 246.
Hawksworth, F. G. 1959. Distribution of dwarfmistletoes in relation to topography on the Mescalero Apache Reservation, New Mexico. Journal of Forestry. 57(12): 919–922.
Hawksworth, F. G. 1961. Dwarfmistletoe of ponderosa pine in the Southwest. Tech. Bull. 1246. Washington, DC: U.S. Department of Agriculture, Forest Service. 112 p.
Hawksworth, F. G. 1973. On a new power source. Journal of Irreproducible Results. 20(1): 20.
Hawksworth, F. G. 1977. The 6-class dwarf mistletoe rating system. Gen. Tech. Rep. RM-48. Fort Collin, CO: U.S. Department of Agriculture, Forest Service, Rocky Mountain Forest and Range Experiment Station. 7 p.
Hawksworth, F. G.; Geils, B. W. 1985. Vertical spread of dwarf mistletoe in thinned ponderosa pine in Arizona. Res. Note RM-460. Fort Collins, CO: U.S. Department of Agriculture, Forest Service, Rocky Mountain Forest and Range Experiment Station. 3 p.
Hawksworth, F. G.; Geils, B. W. 1976. Biotic associates. In: Hawksworth, F. G.; Wiens, D. Dwarf mistletoes: Biology, pathology, and systematics. Agric. Handbk. 709. Washington, DC: U.S. Department of Agriculture, Forest Service: 73–89. [Online]. Available: http://www.rmrs.nau.edu/publications/ah_709/
Hawksworth, F. G.; Gill, L. S. 1960. Rate of spread of dwarfmistletoe in ponderosa pine in the Southwest. Res. Note RM-42. Fort Collins, CO: U.S. Department of Agriculture, Forest Service, Rocky Mountain Forest and Range Experiment Station. 2 p.
Hawksworth, F. G.; Lusher, A. A. 1956. Dwarfmistletoe survey and control on the Mescalero Apache Reservation, New Mexico. Journal of Forestry. 54(6): 384–390.
Hawksworth, F. G.; Shaw, C. G., III; Tkacz, B. M. 1989. Damage and control of diseases of southwest ponderosa pine. In: Tecle, A.; Covington, W. W.; Hamre, R. H., tech. coords.; Multiresource Management of Ponderosa Pine Forests; 1989 November 14–16; Flagstaff, AZ. Gen. Tech. Rep. RM–185. Fort Collins, CO: U.S. Department of Agriculture, Forest Service, Rocky Mountain Forest and Range Experiment Station: 116–129.
Heidmann, L. J. 1968. Silvicultural control of dwarf mistletoe in heavily infected stands of ponderosa pine in the Southwest. Res. Pap. RM-36. Fort Collins, CO: U.S. Department of Agriculture, Forest Service, Rocky Mountain Forest and Range Experiment Station. 11 p.
Heidmann, L. J. 1983. Silvicultural control of dwarf mistletoe in southwestern ponderosa pine. Res. Note RM-433. Fort Collins, CO: U.S. Department of Agriculture, Forest Service, Rocky Mountain Forest and Range Experiment Station. 4 p.
Herman, F. R. 1951. Hockderfer [sic] aspen reproduction study. November 30, 1951. Establishment report. 3 p. Unpub. Pap. on file at Flagstaff, AZ: U.S. Department of Agriculture, Forest Service, Rocky Mountain Research Station, Forest Pathology archives.
Herman, F. R. 1961. Silvicultural control of dwarfmistletoe on southwestern ponderosa pine. Sta. Pap. 62. Fort Collins, CO: U.S. Department of Agriculture, Forest Service, Rocky Mountain Forest and Range Experiment Station. 20 p.
Hinds, T. E. 1985. Diseases. Aspen: Ecology and management in the western United States. Gen. Tech. Rep. RM-119. Fort Collins, CO: U.S. Department of Agriculture, Forest Service, Rocky Mountain Forest and Range Experiment Station: 87–106.
Hornibrook, E. M. 1936. The effectiveness of partial bark peeling in the control of Ips. Journal of Forestry. 34(6): 620–622.
Jameson, D. A. 1994. Continuous and discontinuous change in a southwestern woodland. In: Covington W. S.; DeBano L. F.; Sustainable ecological systems: Implementing an ecological approach to land management; 1993 July 12–15; Flagstaff, AZ. Gen. Tech. Rep. RM-247. Fort Collins, CO: U.S. Department of Agriculture, Forest Service, Rocky Mountain Forest and Range Experiment Station: 137–142.
Kenaley, S. C.; Mathiasen, R. L.; Daugherty, C. M. 2006. Selection of dwarf mistletoe-infected ponderosa pines by Ips species (Coleoptera: Scolytidae) in northern Arizona. Western North American Naturalist. 66(3): 279–284.
Kolb, T. E.; Wagner, M. R.; Covington, W. W. 1994. Concepts of forest health: Utilitarian and ecosystem perspectives. Journal of Forestry. 92(7): 10–15.
Korstian, C. F.; Long, W. H. 1922. The western yellow pine mistletoe, Effect on growth and suggestions for control. Bull. 1112. Washington, DC: U.S. Department of Agriculture. 35 p.
Krauch, H. 1930. Mortality in cut-over stands of western yellow pine in the Southwest. Journal of Forestry. 28(12): 1085–1097.
Krauch, H. 1937. Growth and yield of cut-over stands of ponderosa pine in Arizona under different methods of cutting. Journal of Forestry. 35(12): 1134–1147.
Lang, D. M.; Stewart, S. S. 1909. Reconnaissance of the Kaibab National Forest. 37 p. Unpub. Pap. on file at Flagstaff, AZ: U.S. Department of Agriculture, Forest Service, Rocky Mountain Research Station, Forest Pathology archives.
Lightle, P. C. 1967. Major disease problems and status of disease research in the southwestern United States. In: 15th Western International Forest Disease Work Conference. 1967 September 11–15. Santa Fe, NM: 7–11.
Lightle, P. C.; Hawksworth, F. G. 1973. Control of dwarf mistletoe in a heavily used ponderosa pine recreation forest, Grand Canyon, Arizona. RP-RM-106. Fort Collins, CO: U.S. Department of Agriculture, Forest Service, Rocky Mountain Forest and Range Experiment Station. 22 p.
MacDougal, D. T. 1899. Seed dissemination and distribution of Razoumofskya robusta (Engelm.) Kuntze. Minnesota Botany Studies. 2 (12): 169–173.
Maffei, H. M.; Beatty, J. S. 1989. Changes in the incidence of dwarf mistletoe over 30 years in the Southwest. In: van der Kamp, B. J., comp. 36th Western International Forest Disease Work Conference. 1988 September 19–23. Park City, UT. Vancouver, BC: University of British Columbia: 88–90.
Mark, W. R.; Hawksworth, F. G. 1976. Distribution of ponderosa pine dwarf mistletoe (Arceuthobium vaginatum subsp. cryptopodum) in relation to climatic factors. In: 4th National Conference on Fire and Forest Meteorology. 1976 November 16–18; St. Louis, MO. Society of American Foresters and American Meteorological Society.

USDA Forest Service RMRS-P-55. 2008. 77
Martin, E. C. 1965. Growth and change in structure of an aspen stand after a harvest cutting. Res. Note RM-45. Fort Collins, CO: U.S. Department of Agriculture, Forest Service, Rocky Mountain Forest and Range Experiment Station. 2 p.
Mathiasen, R. L.; Hawksworth, F. G. 1980. Taxonomy and effects of dwarf mistletoe on bristlecone pine on the San Francisco Peaks, Arizona. Res. Pap. RM-224. Fort Collins, CO: U.S. Department of Agriculture, Forest Service, Rocky Mountain Forest and Range Experiment Station. 10 p.
McMillin, J. D.; Wagner, M.R. 1998. Influence of host plant versus natural enemies on the spatial distribution of a pine sawfly, Neodiprion autumnalis (Hymenoptera: Diprionidea). Ecological Entomology. 23(4): 397–408.
Meagher, G. S.; Herman, F. R. 1951. Working plan for study of management of ponderosa pine stands heavily infected with mistletoe. February 7, 1951. Study plan. Tucson, AZ: Southwestern Forest and Range Experiment Station. 37 p. Unpub. Pap. on file at Flagstaff, AZ: U.S. Department of Agriculture, Forest Service, Rocky Mountain Research Station, Forest Pathology archives.
Moir, W. H.; Geils, B. W.; Benoit, M. A.; Scurlock, D. 1997. Ecology of southwestern ponderosa pine forests. In: Block, W. M.; Finch, D. M. Songbird ecology in southwestern ponderosa pine forests: a literature review. Gen. Tech. Rep. RM-GTR-292. Fort Collins, CO: U.S. Department of Agriculture, Forest Service, Rocky Mountain Forest and Range Experiment Station: 3–27. [Online]. Available: http://www.fs.fed.us/rm/pubs_rm/rm_gtr292/rm_gtr292_003_027.pdf
Myers, C. A.; Hawksworth, F. G.; Lightle, P. C. 1972. Simulating yields of southwestern ponderosa pine stands, including effects of dwarf mistletoe. Res. Pap. RM-87. Fort Collins, CO: U.S. Department of Agriculture, Forest Service, Rocky Mountain Forest and Range Experiment Station. 16 p.
Myers, C. A.; Martin, E. C. 1963. Mortality of southwestern ponderosa pine sawtimber after second partial harvest. Journal of Forestry. 61(2): 128–130.
Pearson, G. A. 1918. Studies of yield and reproduction of western yellow pine in Arizona and New Mexico. Journal of Forestry. 16(3): 273–293.
Pearson, G. A. 1933. A twenty-year record of changes in an Arizona pine forest. Ecology. 14(3): 272–285.
Pearson, G. A. 1938. Lighter cuts and larger yields in ponderosa pine. Journal of Forestry. 36(8): 779–789.
Pearson, G. A. 1939. Mortality in cutover stands of ponderosa pine. Journal of Forestry. 37(5): 383–387.
Pearson, G. A. 1940. Growth and mortality of ponderosa pine in relation to size of trees and method of cutting. Journal of Forestry. 38(4): 323–327.
Pearson, G. A. 1943. How local is silviculture? Journal of Forestry. 41(12): 917–919.
Pearson, G. A. 1944a. Growth, mortality, and cutting cycles in New Mexico ponderosa pine. Journal of Forestry. 42(12): 901–905.
Pearson, G. A. 1944b. Applied genetics in forestry. Scientific Monthly. 58: 444–453.
Pearson, G. A. 1946. Ponderosa pine in the second cutting cycle. Journal of Forestry. 44(5): 354–368.
Pearson, G. A.; Wadsworth, F. H. 1941. An example of timber management in the Southwest. Journal of Forestry. 39(5): 434–452.
Richardson, D. M.; Pysek, P.; Rejmanek, M.; Barbour, M. G.; Panetta, F. D.; West, C. J. 2000. Naturalization and invasion of alien plants: Concepts and definitions. Diversity and Distributions. 6(2): 93–107. [Online]. doi: 10.1046/j.1472-4642.2000.00083.x
Robinson, D. C. E.; Geils, B. W. 2006. Modelling dwarf mistletoe at three scales: life history, ballistics and contagion. Ecological Modelling. 119:23–38. [Online]. doi:10.1016/j.ecolmodel.2006.06.007
Rolf, J. A. 2001. Aspen fencing in northern Arizona: A 15-year perspective. In: Shepperd, W. D.; Binkley, D.; Bartos, D. L.; Stohlgren, T. J.; Eskew, L. G., comps.; Sustaining aspen in western landscapes; 2000 June 13–15; Grand Junction, CO. Proceedings RMRS-P-18. Fort Collins, CO: U.S. Department of Agriculture, Forest Service, Rocky Mountain Research Station: 193–196. [Online]. http://www.fs.fed.us/rm/pubs/rmrs_p018/rmrs_p018_193_196.pdf
Schubert, G. H. 1974. Silviculture of southwestern ponderosa pine: the status of our knowledge. Res. Pap. RM-123. U.S. Department of Agriculture, Forest Service, Rocky Mountain Forest and Range Experiment Station. 71 p.
Shepperd, W. D.; Fairweather, M. L. 1994. Impact of large ungulates in restoration of aspen communities in a southwestern ponderosa pine ecosystem. In: Covington W. S.; DeBano L. F. Sustainable ecological systems: Implementing an ecological approach to land management. 1993 July 12–15. Flagstaff, AZ. Gen. Tech. Rep. RM-247. Fort Collins, CO: U.S. Department of Agriculture, Forest Service, Rocky Mountain Forest and Range Experiment Station: 344–347.
Stage, A. R. 1973. Prognosis model for stand development. Res. Pap. INT-137. Ogden, UT: U.S. Department of Agriculture, Forest Service, Intermountain Forest and Range Experiment Station. 32 p.
Vincent, P. Y. 1935. Ips (Tomicus) confusus and the effect of stripping on pole stands after a thinning and improvement cutting in ponderosa pine. 6 p. Unpub. Pap. on file at Flagstaff, AZ: U.S. Department of Agriculture, Forest Service, Rocky Mountain Research Station, Fort Valley Experimental Forest archives.
Vogler, D. R.; Bruns, T. D. 1998. Phylogenetic relationships among the pine stem rust fungi (Cronartium and Peridermium spp.). Mycologia. 90(2): 244–257. [Online]. Available: http://www.jstor.org/stable/3761300
Wadsworth, F. H. 1939. Control of Ips beetles by the trap tree method. 13 p. Unpub. Pap. on file at Flagstaff, AZ: U.S. Department of Agriculture, Forest Service, Rocky Mountain Research Station, Fort Valley Experimental Forest archives.
Wagner, M. R.; Mathiasen, R. L. 1985. Dwarf mistletoe–pandora moth interaction and its contribution to ponderosa pine mortality in Arizona. Great Basin Naturalist. 45(3): 423–426.
Wood, R. E. 1983. Mortality caused by root diseases and associated pests on six national forests in Arizona and New Mexico. Rep. R3 83-13. Albuquerque, NM: U.S. Department of Agriculture, Forest Service, Southwestern Region. 31 p.
Woolsey, T. S., Jr. 1911. Western yellow pine in Arizona and New Mexico. Bull. 101. Washington, DC: U.S. Department of Agriculture, Forest Service. 64 p.

78 USDA Forest Service RMRS-P-55. 2008.
A timeline for selected events in the history of forest pa-thology and entomology related to research associated with the Fort Valley Experimental Forest.
1908–1917, G.G. Hedgcock makes nearly annual pathology collecting trips to the West; these specimens become the core of the USFS Forest Pathology–Fort Collins herbarium.
1910, U.S. Forest Service and Bureau of Plant Industry agree to cooperate on forest pathology research; this collaboration continues until 1954 when the Division of Forest Pathology is incorporated into Forest Service research organization.
1910, H.D. Burrall reports measurements taken on western yellow pine to ascertain the effects of mistletoe on host growth.
1910, D.M. Lang and S.S. Stewart survey north Kaibab forest and observe ‘mistletoe quit prominent…but insect infestation [bark beetles] has attained enormous proportions of scattered trees or whole acres’.
1911, W.H. Long is assigned as first regional pathologist and stationed in Albuquerque.
1911, T.S. Woolsey claims dwarf mistletoe is a serious menace to ponderosa pine and report large areas occur on Coconino and Tusayan Forests with over 60% of trees infected.
1912, G.A. Pearson reports seed from mistletoe-infected ponderosa pine had 17% lower germination.
1914, T.S. Woolsey advocates shelterwood cutting even within infested areas and removal of only those infected trees expected to die soon.
1917, E.P. Meineke observes that American forestry is in transition for virgin to regulated forests and proposes that purpose of forestry is good economic utilization and that sanitation and hygiene are required to achieve that end.
1918, G.A. Pearson regrets that in previous cutting, mistletoe was not given sufficient attention and now advocates greater discrimination of heavily infected trees.
1922, W.J. Perry admits pruning and cutting could decrease mistletoe but questions if it can be economically justified.
1922, C.F. Korstian and W.H. Long issue a comprehensive report on southwestern dwarf mistletoe; they note effects on growth vary by severity of infection (for example, on heavily infected trees this is a 14% reduction in radial and 30% reduction in volume).
1923, G.A. Pearson advises cutting all heavily infected trees, leaving moderately diseased trees only where no other seed source present and recognizes several cleanings are necessary.
1923, W.J. Perry describes mistletoe distribution is more common on ridges and dry slopes, notes that dispersal is usually only 10 to 15 ft but occasionally farther if carried by birds; indicates control can be effected with repeated pruning; observes mistletoe is also often associated with red rot (to 20% loss) and that heavily infected trees may ultimately killed by bark beetles.
1925, E.P. Meineke reviews the history of forest pathology in America and states the primary interests are cull, sanitation (especially for mistletoe), disease interactions in stands (‘not just concerned with sick trees’), impacts on productivity (‘not dead tree count’), and a national forest disease survey.
1926/30, H. Krauch records pine losses due to mistletoe (50% of killed, especially larger trees), wind, suppression, and insects.
1930, E.E. Hubert places responsibility on foresters for keeping future timber stands ‘healthy’, that is ‘producing a maximum rate of yield of sound timber.’
1933, G.A. Pearson in a 20-year summary of Plot S3 notes mistletoe is the most common mortality agent but that mistletoe is even more important for its impact on growth of young and middle-age trees.
1933, I.J. Hatfield establishes an experimental control plots at the Fort Valley.
1934, D.E. McHenry questions if mistletoe kills trees or just pre-disposes them to other agents.
1935, L.S. Gill revises mistletoe taxonomy.1937, H. Krauch declares that on Plot S3, mistletoe accounts for
more deaths and greater loss in volume that any other agent.1938, D.E. Ellis studies ponderosa pine twig blight associated with
scale insects, fungi, and climate.1940, L.S. Gill describes several major projects at the Division of
Forest Pathology, Albuquerque Lab as 1) twig blight (noticed in 1917 at Prescott, epidemic in 1933 epidemic at Prescott and several other valleys, determined to be a scale insect, severity varies over a irregular, several year period); 2) mistletoe (plots at Fort Valley and elsewhere); 3) pathological survey (needle cast on Douglas-fir, parasites of dwarf mistletoe, miscellaneous diseases, Armillaria root disease, herbarium), and 4) western red rot (survey finds decay is serious in young timber stands).
1940/1941, G.A. Pearson and F. Wadsworth provide update on Plot S3 where mistletoe has intensified and pine growth has declined on severely infected trees (amount varies); they write that trees with infections throughout crown maintained growth for a while but eventually declined and died.
1941, W.G. Thomson affirms that western red rot can cause from 70% to 80% of total defect and 20% to 30% of volume loss.
1942, L.S. Gill and S.R. Andrews warn mistletoe readily spreads to regeneration under infected overstory.
1942, W.L. Chapel and others report on the second cut at Fort Valley. They observe that un-merchantability totaled 10.8% compared to 25% to 50% in first cut and that 2.5% is due to miscellaneous causes including crooks, forks, mistletoe, porcupine damage, rough tops. They also note that mistletoe is mostly controlled except one block and that small crown trees can be release and produce.
1943, S.R. Andrews and L.S. Gill summarize the western red rot survey; they note decay is important in immature trees and conclude fungus enters thorough dead branches.
1944, G.A. Pearson (3 papers) summarizes conclusions from experiments at Fort Valley and operational harvests in New Mexico. He notes that in the Southwest, silviculture and protection different from other regions but that intensive management can still produce an economic return if a 20-year cutting cycle were employed.
1946, G.A. Pearson summarizes the 2nd cutting cycle at Fort Valley Plot S3 and observes that ‘errors of the past now stand out clearly. Mistletoe control should have been more drastic’.
Appendix_______________________________________________

USDA Forest Service RMRS-P-55. 2008. 79
1949 and 1951, F.R. Herman begins an aspen study at Hart Prairie after partial cutting and installs fencing.
1949, F.G. Hawksworth develops a plan to study the effect of mistletoe on cone and seed production.
1950, C. Hartley divides forest pathology history into three stages: 1899–1912, primarily reconnaissance; 1912–1930, evaluation of damage with an emphasis on introduced epidemics and in the West on silviculture and diseases; and 1930–1950, continued work on introduced epidemics but with more effort on forest management and on deterioration of forest products.
1951, G.S. Meagher and F.R. Herman draft study plan for management of ponderosa pine stands heavily infected with dwarf mistletoe at Fort Valley Unit 1.
1952, Division of Forest Pathology identifies its major projects to include 1) mistletoe control in the Southwest, 2) western red rot–pruning, 3) limb rust survey, 4) sanitation and fertilization of aspen (North Rim), 5) mistletoe seed germination, and 6) trunk cankers of aspen.
1953, F.G. Hawksworth observes limb rust pycnial stage.1954, L.S. Gill and F.G. Hawksworth study mistletoe incubation
and dispersal; they note that most infected reproduction occurs within 60 feet of infected overstory trees.
1954, J.E. Egan writing on silviculture in Southwest suggests that with frequent selection cuts, losses from lightning, insects, blister rust, red rot, and mistletoe (except in extreme cases) can be held to a minimum.
1954, Rocky Mountain Forest and Range Experiment Station report states that mistletoe has little effect on ability of poles to accept decay retardants.
1955, F.G. Hawksworth and S.R. Andrews provide early results of Region 3 survey that has completed work in northern Arizona and Mescalero, NM; they find that 50% of stands have mistletoe and greater mortality occurs in heavily infested stands.
1956, S.R. Andrews warns that in spite of detailed, plot-level observation over many years, there remains a need for range-wide appraisal of mistletoe impacts before mistletoe control will be supported.
1956, F.G. Hawksworth reports on the Mescalero survey of ponderosa pine that 53% of stands are infested, losses are three times greater in cut-over stands than virgin stands, and a control program is in progress.
1957, S.R. Andrews drafts a problem analysis for Albuquerque Lab with a good review of the history and present situation. He describes the natural and social environment of the region and identifies chief forest disease problems as dwarf mistletoes; heart rots; rusts and foliage diseases; root rots; physiological, climatic, and environmental diseases.
1958, G.H. Hepting and G.M. Jameson provide a national timber resources review on forest protection, growth loss and mortality and note that diseases being persistent and ubiquitous have large impact.
1958, F.G. Hawksworth completes Ph.D. work, which serves as a basis for several 1961 papers.
1959, F.R. Larsen continues aspen study at Hart Prairie and reaffirms the need to protect aspen from browsing to get and keep good regeneration.
1960, S.R. Andrews and J.P. Daniels complete a Southwest-wide survey; they report 36% of ponderosa stands infested, mostly in virgin stands and ridges, increasing with elevation (Hawksworth finds most of infested stands at mid-elevations).
They also report 47% of Douglas-fir is infested and mortality is several-folder greater within infested stands.
1960, F.G. Hawksworth and L.S. Gill diagram mistletoe spread and report spread averaged 1.2 feet per year in dense stands and 1.7 feet per year in open.
1961, F.G. Hawksworth and S.R. Andrews issue pruning guides that branches 1 inch in diameter can be effectively pruned if mistletoe shoots not closer than 6 inches from the bole and that for each 1-inch increase in diameter, the safe distance should be increased by 2 inches.
1961, F. Herman reviews silvicultural control of mistletoe based on work from Fort Valley.
1961, L.S. Gill and F.G. Hawksworth review of world literature on mistletoes.
1962, F.G. Hawksworth takes lead for west-wide studies on mistletoe taxonomy, hosts, and distribution and assembles mistletoe collection.
1963, C.A. Myers and E.C. Martin observe that at Plot S3, dwarf mistletoe caused 24.4% of tree mortality and 15.7 percent of the volume loss.
1965, F.G. Hawksworth studies mistletoe on bristlecone pine on San Francisco Peaks.
1965, F.G. Hawksworth and T.E. Hinds photograph mistletoe seed discharge.
1967, F.G. Hawksworth reviews a program for mistletoe research, history of dwarf mistletoe research in Rocky Mountain and Southwest Regions since 1910 and specifies what information is most needed to develop controls.
1967, P.C. Lightle and others describe re-cleaning at Mescalero.1968, L.J. Heidmann writes on mistletoe control at Fort Valley
that limited control appeared impractical but that silvicultural control of heavy infections required almost complete stand destruction and opened stands to serious risk of windthrow.
1972, C.E. Myers and others simulate yields of southwestern ponderosa pine stands, including effects of dwarf mistletoe (later, C.B. Edminster authors several papers continuing this series).
1973, P.C. Lightle and F.G. Hawksworth review program for control of dwarf mistletoe in a heavily used ponderosa pine recreation forest, Grand Canyon, Arizona.
1973, G.H. Schubert issues a silviculture review (additional reviews by other authors follow over several years).
1976, W.R. Mark and F.G. Hawksworth relate distribution of southwestern dwarf mistletoe to climate, as January and June temperature means and note absence of mistletoe where January temp <6 ºC.
1977, J.W. Walters and B.W. Geils demonstrate use of simulations to develop management plans for mistletoe-infested ponderosa pine.
1977, F.G. Hawksworth publishes the already well-established 6-class rating system for dwarf mistletoe severity.
1977, G.E. Dixon completes Ph.D. on a mistletoe spread using a regression modeling approach.
1980, R.L. Mathiasen and F.G. Hawksworth determine the mistletoe on bristlecone on San Francisco Peak is A. microcarpum, which is also found on spruce and rarely on white pine.
1983, L.J. Heidmann suggests that for mature, heavily infested stands of ponderosa the only effective silvicultural treatment is 1) eliminate the source of infection in the overstory by cutting,

80 USDA Forest Service RMRS-P-55. 2008.
2) remove infection in pole and sapling stands by cutting or pruning, 3) re-treat periodically and 4) regenerate if needed. Similar recommendations are made in 1984 by F. Ronco, G. Gottfried, and R. Alexander.
1985, F.G. Hawksworth and B.W. Geils observe vertical spread at an average of 10 cm/yr or 2/3 host height growth for 343 trees over 6 years at Fort Valley.
1985, T.E. Hinds reviews diseases of aspen.1989, H.M. Maffei and J.S. Beatty speculate on causes for
apparent, regional increase from the 1960 to 1980s survey. They suggest the increase from 30% to 38% may be due to single tree selection, incomplete or inappropriate prescriptions to control mistletoe, and lack of priorities for treating mistletoe infected stands.
1990, R.L. Mathiasen and others survey mistletoe on Douglas-fir. They note that volume growth reduction increases with mistletoe class: 3, 10%; class 4, 23%; class 5, 45%; and class 6, 65%. and that mortality in severely infested stands is three to four times that of healthy stands.
1990, M.G. Harrington and F.G. Hawksworth report reduction in dwarf mistletoe at Grand Canyon due to prescribed burning (first such research in the Southwest).
1991, C.B. Edminster and others release GENGYM with mistletoe effects (later incorporated into Forest Vegetation Simulator).
1992, R.T. Reynolds and others issue management guidelines for goshawk that considers mistletoe effects. They recognize there are some wildlife benefits from mistletoe but also caution that the pathogen over time has detrimental effect retarding or regressing stand stage to detriment of prey species.
1994, W.S. Allred and W.S. Gaud report that the Albert squirrel shows selective preference for certain trees and feeds upon mistletoe and within mistletoe-infected trees. But since selection was not correlated with physical appearance, conclude that removing diseased, deformed trees should not impact the squirrel.
1994, W.D. Sheppard and M.L. Fairweather indicate fencing to protect aspen for elk browsing is required to protect saplings and given the high animal numbers and grazing pressure, admonish that fencing must remain indefinitely.
1997, C.W. Dahms and B.W. Geils edit an assessment of forest ecosystem health in the Southwest.
1997, W.H. Moir and others review the ecology of ponderosa pine in Southwest.
2000, D.A. Conklin presents a history of dwarf mistletoe control in the Southwest, discusses ecological factors relevant to management and presents guidelines based on his review of research, management, and public involvement.
2001, J.A. Rolf writes more on fencing aspen to protect from elk browsing.
2005, C.P. Bickford and others conduct an experiment to assess how much host physiological condition may regulate parasitic plant performance.
2006, G.N. Garnett and others find Abert squirrel uses mistletoe brooms for caching, foraging, and nesting; they recommends retaining larger, broomed trees.
2006, D.E. Robinson and B.W. Geils construct and evaluate an epidemiology model for mistletoe spread.
2006, S.C. Kenaley and others conclude the probability of ponderosa pine mortality due to Ips is greater in stands severely infested with southwestern dwarf mistletoe.
2008, D.A. Conklin and B.W. Geils present results on effects of fire on dwarf mistletoe. Relatively uniform burns generating 50% average crown scorch set back mistletoe intensification by 10 years.
The content of this paper reflects the views of the author(s), who are responsible for the facts and accuracy of the information presented herein.

USDA Forest Service RMRS-P-55. 2008. 81
Introduction
When the Fort Valley Experimental Forest was estab-lished in 1908 the research mission was to study the natural regeneration, growth, mortality and methods of cutting pon-derosa pine (Pinus ponderosa). Although a concern existed by foresters that wildlife, particularly the Abert’s squirrel (Sciurus aberti) (Figure 1), was inflicting severe damage to ponderosa pine natural regeneration, there was no mission or direction by the Forest Service to include wildlife as a re-search emphasis.
Cox (in Taylor 1927) suggested that animals that feed on ponderosa pine seed might become so numerous as to endan-ger its existence as part of the forest. In California, Bowles (in Taylor 1927) estimated that hundreds of thousands of dol-lars of damage is done annually to Douglas-fir (Pseudotsuga menziesii) by the western gray squirrel (Sciurus griseus) and
In: Olberding, Susan D., and Moore, Margaret M., tech coords. 2008. Fort Valley Experimental Forest—A Century of Research 1908-2008. Proceedings RMRS-P-55. Fort Collins, CO: U.S. Department of Agriculture, Forest Service, Rocky Mountain Research Station. 282 p.
The Fort Valley Experimental Forest, Ponderosa Pine, and Wildlife Habitat Research
David R. Patton, (ret.), Northern Arizona University, Flagstaff, AZ, and Former Project Leader, USFS, Rocky Mountain Forest and Range Experiment Station, Fort Collins, CO
Abstract—Wildlife research at the Fort Valley Experimental Forest began with studies to deter-mine how to control damage by wildlife and livestock to ponderosa pine (Pinus ponderosa) reproduction and tree growth. Studies on birds, small mammals, and mule deer (Odocoileus hemionus) browsing were initiated in the early 1930s and 1940s but these were short term efforts to develop control techniques. While researchers at Fort Valley and other study ar-eas expressed a need for more information on forest wildlife, there was no major effort in this direction until 1962 when the Rocky Mountain Forest and Range Experiment Station established the first Wildlife Research Work Unit in Arizona on the Arizona State University campus in Tempe. In cooperation with state and federal agencies, research was started on non-game birds, wild turkey (Meleagris gallopavo), and effects of forest manipulation on mule deer and elk (Cervus elaphus) habitat. A major long-term focus was on the ecology and management of the Abert’s squirrel (Sciurus aberti) and its relation to management of ponderosa pine.
Results of research from several state and federal agencies confirm that squirrels need a certain size, density, and arrangement of ponderosa pine to survive and reproduce. In turn, there is evidence that squirrels and other small animals recycle nutrients that contribute to the health of ponderosa pine. The Abert’s squirrel and other small rodents have not caused damage to the extent predicted by foresters in the early 1900s and both are part of an eco-system that has been functioning for thousands of years. It appears, from what we now know, discounting dramatic climate change, that future generations will continue to enjoy both the Abert’s squirrel and ponderosa pine for another several thousand years.
G. A. Pearson (1950) stated that the Abert’s squirrel could become the most destructive of all animals in the pine forests of the Southwest.
Pioneering Efforts
Wildlife studies that occurred from 1908 until 1960 on the Fort Valley Experimental Forest and surrounding National Forests were mostly to determine who (rodents, birds) were doing what (eating seeds, roots, live twigs, etc.) to whom (ponderosa pine). The following summaries provide insight into the first efforts of early researchers to obtain informa-tion on selected animals, and from field observations by G. A. Pearson (1950) during his study on the management of ponderosa pine.

82 USDA Forest Service RMRS-P-55. 2008.
Birds and Rodents
Because rodents and birds had been suggested as obsta-cles to successful regeneration of ponderosa pine, a series of plots designed to exclude small rodents and birds was es-tablished near the FVEF headquarters. Results of the study showed that seedlings germinated on study plots did not sur-vive except for those that were completely protected (Taylor and Gorsuch 1932). Vertebrates implicated in the disappear-ance of seedlings were the golden-mantled ground squirrel (Spermophilus lateralis), Steller’s jay (Cyanocitta stelleri) and northern flicker (Colaptes auratus). The gray-collared chipmunk (Eutamias cinereicollis) and white-footed mouse (Peromyscus maniculatus) may also have killed seedlings.
Taylor and Gorsuch (1932) suggested that reproduction of ponderosa pine in the Southwest depends on a generous seed crop and favorable rains the following year—a combina-tion that occurs only at intervals, but when a positive season happens, regeneration takes place in spite of all obstacles. A major conclusion of the Taylor and Gorsuch exclosure study was that under natural conditions seed-eating rodents and birds have little or no detrimental effect on the long-term es-tablishment of ponderosa pine or other trees. They also stated that their information does not justify control operations on birds or rodents, nor should conclusions from isolated inves-tigations be extended too far.
Pearson (1950) continued to believe that during light or moderate seed years the seeds are largely consumed by rodents and it is only in exceptionally good years that the remaining seed is likely to be adequate for regeneration. He stated that in dense stands this may not be serious and may perform a useful service by eliminating surplus stems, but where the stand is already deficient every kill or deformed seedling represents a loss. In addition to small rodents, the larger jack rabbits (Lepus spp.) eat pine needles and buds in winter. Fortunately, they are not abundant in pine and higher forest types but their numbers have increased noticeably dur-ing the past 30 years (Pearson 1950).
Figure 1. Abert’s squirrel. USFS poto by D. R. Patton.
A forked tree is a common result of porcupine (Erethizon dorsatum) activity that was reported for ponderosa pine at Fort Valley (Pearson 1950). Porcupines girdle the stems of seedlings and saplings near the ground. As the trees increase in size the porcupines transfer their activities to the upper por-tion of the trunk. Young trees from 4 to 12 inches in diameter are often deformed and become “wolf trees” to such degree as to render them worthless for lumber. Effective control of porcupines is by poisoning and shooting as complementary measures. Pearson (1950) encouraged forest staff to carry shotguns and “kill the creatures.”
Deer Browsing
Injury to ponderosa pine from browsing seedlings was observed at Fort Valley during the late summer of 1925 and 1926 (Pearson 1950). Livestock (cattle and sheep) and browsing game animals (deer) as well as tip moths, caused the most injury to seedlings older than three years, whereas rodents were largely responsible for cutting off tops of the younger seedlings. In a range-timber study to determine the effects of browsing, Cooperrider (1938) found that mule deer (Odocoileus hemionus), in contrast to the other animals stud-ied, may destroy terminal buds soon after shoot elongation begins in spring. On parts of the experimental forest where deer congregated, shoots were browsed in May during the early stages of growth before livestock were on these ranges.
Deer tended to concentrate on areas where grazing by domestic livestock is light (Pearson 1950). On two areas lightly stocked with domestic animals since 1930, browsing increased noticeably and so did the number of deer. In 1944 both areas were unused by domestic animals, but browsing by deer continued. Pearson emphasized the importance of proper stocking by both deer and domestic livestock. He sug-gested that the best control measure for damage to ponderosa pine by deer is reduction of their numbers through regulated hunting.
Abert’s Squirrel
At Fort Valley, Pearson (1950) found that twig cutting on ponderosa pine was the most injurious activity of the Abert’s squirrel during winter months. He stated that removal of twigs from the lower branches would not be serious but squir-rels prefer active shoots from the upper portion of the crown, especially the terminal and the upper laterals. Besides loss of foliage, removal of these stems automatically destroys most of the first-year cones. Pearson stated that saplings and poles suffer most because of the loss of terminal shoots that retards height growth and may deform the bole. Although squirrel activity has been noticeable during the past 30 years, it is only in the last decade that damage has attained such propor-tions as to be a cause of concern (Pearson 1950).
At the request of G. A. Pearson, the Fish and Wildlife Service and Arizona Game and Fish Department initiated a project on the Abert’s squirrel to: (1) reduce the population of squirrels by hunting, trapping and relocating and, (2) secure

USDA Forest Service RMRS-P-55. 2008. 83
quantitative data about squirrel populations (Trowbridge and Lawson 1942). Some of the general findings were: (1) cut and sparsely timbered lands have less than one-half as many squirrels per unit area as stands of virgin ponderosa pine; (2) approximately three squirrels per hour could be harvested under all conditions of weather, forest type, and hour of the day; and (3) squirrel activity was most pronounced during the morning hours.
The Need for Research
“Where is the forest biologist?” asked E. N. Munns (1926) in an article in the Journal of Forestry. He stated that wildlife research from a forest point of view had not yet been under-taken except from the standpoint of control. A year later, also in the Journal of Forestry, the need for research and more in-formation by managers was expressed by Taylor (1927) when he was making the case that publications about silviculture were relatively numerous, but one must search to discover information on forest biology even though the problems of forest production are fundamentally biological.
The forest is a community of specialized living organisms, including certain plants and ani-mals. The trees, to which so large a percentage of research is directed, are but one expression of the life in this community. The grass, weeds, and browse are others, and the birds, mammals, insects, reptiles, and lower animal forms are still others. In order to secure the best results in production of trees we must acquire a scien-tific knowledge of the predominant organisms, throughout the entire forest biota (Taylor 1927).
Research on wildlife as more than destructive agents changed after forester Aldo Leopold published his textbook on Game Management in 1933. The following year, the Fish and Wildlife Coordination Act was enacted. In 1936 the Forest Service hired Dr. Homer Shantz as the first Director of Wildlife Management. President Roosevelt signed the Federal Aid in Wildlife Restoration Act into law in 1937. While most of the concerns about damage to ponderosa pine by birds and mammals could not be addressed at Fort Valley, they were later incorporated into studies that were to become part of the Forest Service’s research mission particularly after the passage of the Multiple-Use Sustained-Yield Act of 1960.
Southwestern Ponderosa Pine
Silviculture of southwestern ponderosa pine (Schubert 1974) was published to update Pearson’s work (1950). The report continued Pearson’s classification of birds, small mammals, deer, elk (Cervus elaphus) and sheep as damag-ing agents to ponderosa pine. Schubert and Adams (1971)
determined that loss could be reduced by direct seeding and using a nonpoisonous chemical (Thiram) as a repellent or by covering the seeds with soil. An option to reducing damage to seedlings is by spraying them with Thiram (Dietz and Tigner 1968, Heidmann 1963). While damage to cone production by the Abert’s squirrel has an adverse impact it may not be significant (Larson and Schubert 1970). In his ending sum-mary, Schubert repeated Taylor’s (1927) comment that we need to know how ponderosa pine and other plants and ani-mals reproduce, grow, and interact with each other and with the physical environment.
A New Direction
The first Forest Service wildlife research project in Arizona was implemented in 1962. Dr. Hudson G. Reynolds was transferred from the Santa Rita Experimental Range to the campus of Arizona State University in Tempe to be the Project Leader with a new problem statement:
To determine the effects of management prac-tices on the habitat and populations of forest wildlife such as deer, elk, turkey (Meleagris gal-lopavo), nongame birds, and squirrels.
As a result of an increased research effort by the Forest Service, in cooperation with state and federal agencies, there is now considerable wildlife information available for man-agers to use in the ecosystem management, planning, and decision-making process for National Forests. Some exam-ples of research completed from 1962-1975, which focused primarily on the ponderosa pine ecosystem, show the depth and breadth of research on wildlife in Arizona:
• use by deer, elk and cattle (Reynolds 1966),• thinning, clear cutting, and reseeding affect on deer and
elk use (Pearson 1968),• foliage use by birds (Balda 1969),• roost tree characteristics for Merriam’s turkey (Boeker
and Scott 1969),• a treatment prescription for improving big game habitat
(Clary 1972),• response of deer and elk to watershed treatments (Neff
1972),• reproductive biology and food habits of Abert’s squirrels
(Stephenson 1974),• Abert’s squirrel cover requirements (Patton 1975), and• food selection of small rodents (Goodwin 1975).
While the studies listed were in progress, others were added to the research program in ecosystems adjacent to ponderosa pine. These included the effects of grazing on ri-parian habitat, management of cavity nesting birds, habitat requirements of endangered birds and fish, and development of habitat models for forest wildlife species.
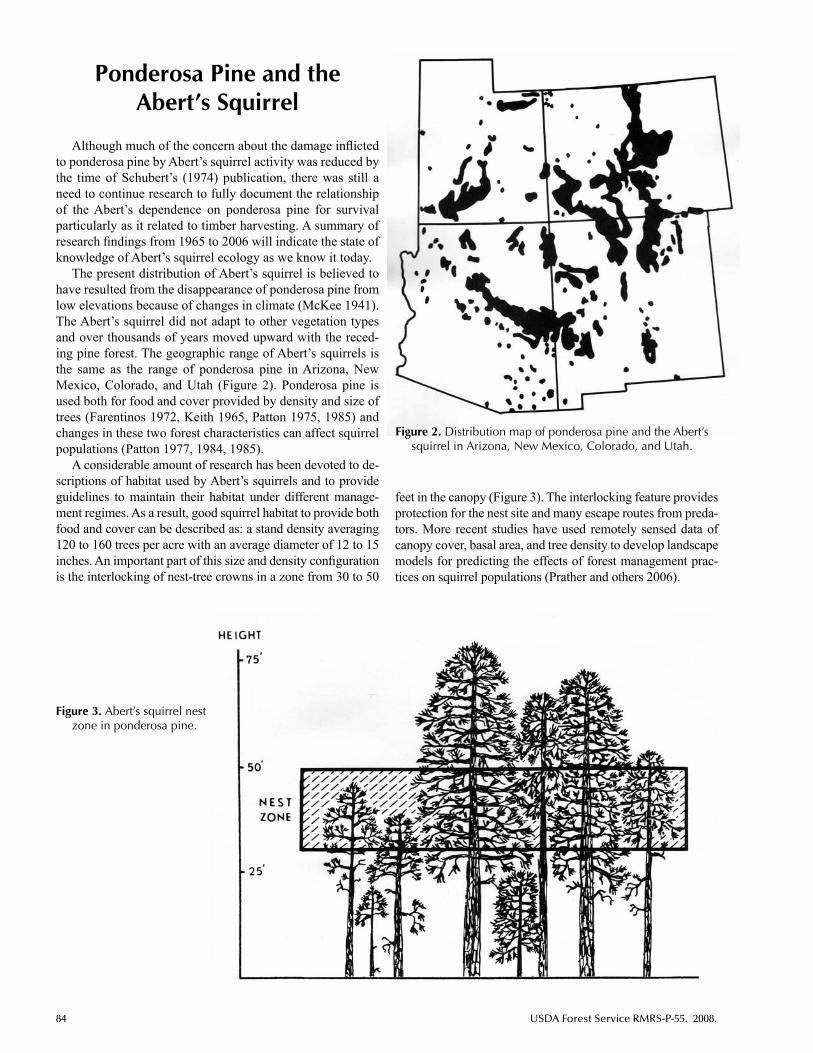
84 USDA Forest Service RMRS-P-55. 2008.
Ponderosa Pine and the Abert’s Squirrel
Although much of the concern about the damage inflicted to ponderosa pine by Abert’s squirrel activity was reduced by the time of Schubert’s (1974) publication, there was still a need to continue research to fully document the relationship of the Abert’s dependence on ponderosa pine for survival particularly as it related to timber harvesting. A summary of research findings from 1965 to 2006 will indicate the state of knowledge of Abert’s squirrel ecology as we know it today.
The present distribution of Abert’s squirrel is believed to have resulted from the disappearance of ponderosa pine from low elevations because of changes in climate (McKee 1941). The Abert’s squirrel did not adapt to other vegetation types and over thousands of years moved upward with the reced-ing pine forest. The geographic range of Abert’s squirrels is the same as the range of ponderosa pine in Arizona, New Mexico, Colorado, and Utah (Figure 2). Ponderosa pine is used both for food and cover provided by density and size of trees (Farentinos 1972, Keith 1965, Patton 1975, 1985) and changes in these two forest characteristics can affect squirrel populations (Patton 1977, 1984, 1985).
A considerable amount of research has been devoted to de-scriptions of habitat used by Abert’s squirrels and to provide guidelines to maintain their habitat under different manage-ment regimes. As a result, good squirrel habitat to provide both food and cover can be described as: a stand density averaging 120 to 160 trees per acre with an average diameter of 12 to 15 inches. An important part of this size and density configuration is the interlocking of nest-tree crowns in a zone from 30 to 50
feet in the canopy (Figure 3). The interlocking feature provides protection for the nest site and many escape routes from preda-tors. More recent studies have used remotely sensed data of canopy cover, basal area, and tree density to develop landscape models for predicting the effects of forest management prac-tices on squirrel populations (Prather and others 2006).
Figure 2. Distribution map of ponderosa pine and the Abert’s squirrel in Arizona, New Mexico, Colorado, and Utah.
Figure 3. Abert’s squirrel nest zone in ponderosa pine.

USDA Forest Service RMRS-P-55. 2008. 85
Environmental factors of predation by raptors, severe winters, and poor cone crops keep the Abert’s population in balance (Keith 1965, Stephenson and Brown 1980). Winter survival of the Abert’s squirrel in central Arizona has been found to be inversely related to duration of snow cover (Dodd and others 2003). Snow cover as a factor influencing squirrel mortality had previously been identified by Stephenson and Brown (1980).
Although there is some indication that squirrels prefer certain trees for feeding, Hall (1981) could not validate this difference in his chemical analyses of ponderosa pine on the Kaibab National Forest. Nutritional value of ponderosa pine twigs had four to six percent protein and seven percent fat in the Beaver Creek Watershed on the Coconino National Forest in September (Patton 1974). This indicates that a diet of inner bark in winter months without other food could put squirrels in a weak condition for survival.
There is no doubt that squirrels, especially when popula-tions are high, have the potential of consuming large amounts of inner bark from twigs and seeds from cones. From these ac-tivities there is also a loss of green needles and in one instance the litter was 71.7 lb/ac. for a 13.8 ac. study area (Allred and Gaud 1994). Calculated nitrogen in ponderosa pine stands that is returned to the forest floor was 5.3 lb/ac. compared with ar-eas where there is no squirrel feeding activity (Skinner 1976).
Evidence exists for a rest-rotation process in feed tree se-lection. In a five-year study on 1,390 permanently identified pine trees on the Coconino National Forest, 56 percent were used one in four years, 29 percent were used two in four years; 13 percent were used three in four years; and only two per-cent were used in all four years (Ffolliott and Patton 1978). This finding is contrary to the “year-after-year” use reported by Larson and Schubert (1970). In addition to using pine products for food the Abert’s squirrel is known to be a major consumer of truffels (Stephenson 1975).
Subterranean mushrooms are primarily associated with intermediate to mature pine stands with high canopy densi-ties (States 1985). While foraging squirrels excavate pits to get the mycorrhizal fruiting bodies there also is a soil tilling effect that tends to create traps for moisture, helps in nutri-ent redistribution, and inoculates pine roots with mycorrhizal spores (Figure 4, Allred and Gaud 1999). Studies to deter-mine squirrel use of different fungi species showed a higher use in August than in January or April, and fungal content in the diet was positively related to basal area of tree species (Dodd and others 2003).
The first estimate of the Abert’s squirrel’s home range and space requirements was made in ponderosa pine stands at Fort Valley (Trowbridge and Lawson 1942). Using travel distance between captures of marked animals as a radius, the approximate home range was 18 acres. In the Beaver Creek Watershed, squirrels were tagged with radio collars to determine movement and nest tree use (Patton 1975a). The home range varied from 10 to 85 acres and squirrels used two to six nests. The longest distance recorded for travel by one squirrel away from a nest site was approxi-mately four miles as determined by radio tracking. On the
Apache-Sitgeaves National Forest at one study site a nest tree was used for ten years and maintained with new ma-terial each year (Figure 5, Patton 1975a). Studies on nest tree selection (Snyder and Linhart 1994) on the Fort Valley
Figure 5. Abert’s squirrel nest in ponderosa pine, Coconino National Forest. USFS photo by D.R. Patton.
Figure 4. Hole dug by Abert’s squirrel hunting for mushrooms, Coconino National Forest. USFS photo by D.R. Patton.

86 USDA Forest Service RMRS-P-55. 2008.
Experimental Forest indicate that tree chemistry is involved in selecting nest trees over other trees.
Pogany and Allred (1993) and Allred and Pogany (1996) suggested that Abert’s squirrels have more than one breed-ing season each year. The maximum amount of sperm in males occurred through March and April with sperm still in the vas deferens as late as June (Pogany and Allred 1995). Data resulting from eight years of trapping squirrels on the Kaibab National Forest were used to develop a life table to document the survival and mortality of a cohort from 1973 to 1980 (Patton 1997). From an original population of 58 squirrels, 26 remained in year two, 14 in year three, 10 in year four, 5 in year five, and 2 in year six when the study ended (Table 1).
The Fort Valley Influence
Located within the 1.8 million acre Coconino National Forest, the influence that Fort Valley had on setting a di-rection for Forest Service Research extended beyond the Experimental Forest boundary. The research effort on ponderosa pine was fortuitous because it was not just an important timber resource—it also contains habitat for over 300 wildlife species. The idea expressed by Taylor (1927) that we must have knowledge of the entire forest biota to understand the production of trees was an early projection of the current direction of ecosystem management by the U.S. Forest Service—it just took a long time to happen. In the meantime, knowledge began to accumulate that animals are part of the nutrient cycling and energy flow process that makes forests function as ecological systems.
If the damage to ponderosa pine was as great as first pre-dicted (Cox, Bowles (in Taylor 1927), Pearson 1950), then we would not have ponderosa pine today at Fort Valley or the national forests surrounding Flagstaff. Ponderosa pine with its animal components, including the Abert’s squirrel, has functioned as an ecosystem for thousands of years. It appears, from what we now know, discounting dramatic cli-mate change, that future generations will continue to enjoy both the Abert’s squirrel and ponderosa pine for another several thousand years.
Acknowledgments
Several people deserve recognition for their efforts in providing agency support to initiate long-term research on the Abert’s squirrel and for expanding research on oth-er species in ponderosa pine and other ecosystems in the Southwest. Some of these dedicated professionals were: D. I. Rasmussen, Forest Service; David Brown, Arizona Game and Fish Department; and Dale Jones, Forest Service. This special recognition category also includes G. A. Pearson and Hudson Reynolds. Pearson’s Monograph (1950) set the standards for design and implementation of research for fu-ture studies on the silvics of tree species. Hudson Reynolds was a pioneer in the area of forest wildlife habitat research at a time when managers needed decision-making informa-tion to meet the needs of National Forest strategic plans and federal regulations.
We owe a debt of gratitude to the people that came before us for their contributions to science and society. While many are no longer with us, their work lives on in manuscripts, in journals, symposium proceedings, books and government publications. And finally, several state and federal research-ers owe much of their publication record to a tassel-eared tree squirrel that uses ponderosa pine for food and cover.
References
Allred, W. S.; Gaud, W. S. 1993. Green foliage losses from ponderosa pines induced by Abert squirrels and snowstorms: A comparison. Western Journal of Applied Forestry. 8(1): 16-18.
Allred, W. S.; Pogany, G. 1996. Early estrus in a female Abert squirrel. The Southwestern Naturalist. 41(1): 90.
Allred, W. S.; Gaud, W. S. 1999. Abert squirrel as a soil excavator. The Southwestern Naturalist. 44(1): 88-89.
Balda, R. P. 1969. Foliage use by birds of the oak-juniper woodland and ponderosa pine forest in southern Arizona. Condor. 71: 339-412.
Boeker, E. L.; Scott, V. E. 1969. Roost tree characteristics for Merriam’s turkey. Journal of Wildlife Management. 33: 121-124.
Table 1. Composite life table for the Abert’s squirrel (author’s original data).
Age Frequency Survival Mortality Mortality rate Survival rate
0-1 58 1000 552 0.552 0.4481-2 26 448 207 0.462 0.5382-3 14 241 69 0.286 0.7143-4 10 172 86 0.500 0.5004-5 5 86 52 0.605 0.3955-6 2 34 34 1.000

USDA Forest Service RMRS-P-55. 2008. 87
Clary, W. P. 1972. A treatment prescription for improving big game habitat in ponderosa pine forests. p. 25-28. In: Proceedings of the 16th Annual Arizona Watershed Symposium. Arizona Water Commission Report 2. Phoenix, AZ. September. 43 p.
Cooperrider, C. K. 1938. Recovery processes of ponderosa pine reproduction following injury to young annual growth. Plant Physiology. 13(1): 5-27.
Dietz, D. R.; Tigner, J. R. 1968. Evaluation of two mammal repellents applied to browse species in the Black Hills. Journal of Wildlife Management. 32: 109-114.
Dodd, N. D. and others 2002. Tassel-eared squirrel population, habitat condition, and dietary relationships in north-central Arizona. Journal of Wildlife Management. 67(3): 622-632.
Farentinos, R. C. 1972. Observations on the ecology of the tassel-eared squirrel. Journal of Wildlife Management. 36: 1234-1239
Ffolliott, P. F.; Patton, D. R. 1978. Abert squirrel use of ponderosa pine as feed trees. Res. Note RM-362. Fort Collins, CO: U.S. Department of Agriculture, Forest Service, Rocky Mountain Forest and Range Experiment Station. 3 p.
Goodwin, J. G. 1975. Population densities and food selection of small rodents in Arizona ponderosa pine forests. Tucson: University of Arizona. 72 p. Thesis.
Hall, J. G. 1981. A field study of the Kaibab squirrel in the Grand Canyon National Park. The Wildlife Society Wildlife Monograph 75. 54 p.
Heidmann, L. J. 1963. Deer repellents are effective on ponderosa pine in the Southwest. Journal of Forestry. 61: 53-54.
Keith, J. O. 1965. The Abert squirrel and its dependence on ponderosa pine. Ecology. 46: 150-163.
Larson, M. M.; Schubert, G. H. 1970. Cone crops of ponderosa pine in central Arizona, including the influence of Abert squirrels. Res. Pap. RM 58. Fort Collins, CO: U.S. Department of Agriculture, Forest Service, Rocky Mountain Forest and Range Experiment Station. 15 p.
Leopold, A. 1933. Game Management. Charles Scribner’s Sons. New York, NY. 481 p.
McKee, E. D. 1941. Distribution of the tassel-eared squirrels. Flagstaff, AZ: Museum of Northern Arizona. Plateau. 14: 12-20.
Munns, E. N. 1926. Where is the forest biologist? Journal of Forestry. 24(8): 911-194.
Neff, D. J. 1972. Responses of deer and elk to Beaver Creek watershed treatments. Proceedings of Arizona Watershed Symposium. Phoenix. 16: 18-22.
Patton, D. R.; Green, W. 1970. Abert’s squirrels prefer mature ponderosa pine. Res. Note RM-272. Fort Collins, CO: U.S. Department of Agriculture, Forest Service, Rocky Mountain Forest and Range Experiment Station. 3 p.
Patton, D. R. 1974. Estimating food consumption from twigs clipped by the Abert squirreles. Res. Note RM-145. Fort Collins, CO: U.S. Department of Agriculture, Forest Service, Rocky Mountain Forest and Range Experiment Station. 3 p.
Patton, D. R. 1975b. Abert squirrel cover requirements in Southwestern ponderosa pine. Res. Pap. RM-272. Fort Collins, CO: U.S. Department of Agriculture, Forest Service, Rocky Mountain Forest and Range Experiment Station. 12 p.
Patton, D. R. 1975a. Nest use and home range of three Abert squirrels as determined by radio tracking. Res. Note RM-281. Fort Collins, CO: U.S. Department of Agriculture, Forest Service, Rocky Mountain Forest and Range Experiment Station. 3 p.
Patton, D. R. 1977. Managing southwestern ponderosa pine for the Abert squirrel. Journal of Forestry. 75: 264-267.
Patton, D. R. 1984. A model to evaluate Abert squirrel habitat in uneven-aged ponderosa pine. Wildlife Society Bulletin. 12: 408-414.
Patton, D. R.; Wadleigh, R. L.; Hudack, H. G. 1985. The effects of timber harvesting on the Kaibab squirrel. Journal of Wildlife Management. 49(1): 14-19.
Patton, D. R. 1997. Wildlife habitat relationships in forested ecosystems. Timber Press. Portland, OR. 502 p.
Pearson, G. A. 1950. Management of ponderosa pine in the Southwest. Agriculture Monograph 6. U.S. Department of Agriculture. Government Printing Office, Washington, DC. 218 p.
Pearson, H. A. 1968. Thinning, clearcutting, and reseeding affect deer and elk use of ponderosa pine forests in northern Arizona. Res. Note RM-119, Fort Collins, CO: U.S. Department of Agriculture, Forest Service, Rocky Mountain Forest and Range Experiment Station. 4 p.
Pogany, G. C.; Allred, W. S. 1995. Abert squirrels of the Colorado Plateau: their reproductive cycle. p. 293-305. In: Van Riper, C., ed. Proceedings of the Second Biennial Conference on Research in Colorado Plateau Parks. National Biological Service Information Transfer Center, Fort Collins, CO. 305 p.
Prather, J. W.; Dodd, N.; and others 2006. Landscape models to predict the influence of forest structure on tassel-eared squirrel populations. Journal of Wildlife Management. 70(3): 723-731.
Reynolds, H. G. 1966. Use of a ponderosa pine forest in Arizona by deer, elk, and cattle. Res. Note RM-63. Fort Collins, CO: U.S. Department of Agriculture, Forest Service, Rocky Mountain Forest and Range Experiment Station. 7 p.
Schubert, G. H. 1974. Silviculture of southwestern ponderosa pine: The status of our knowledge. Res. Pap. RM-123. Fort Collins, CO: U.S. Department of Agriculture, Forest Service, Rocky Mountain Forest and Range Experiment Station. 71 p.
Schubert, G. H.; Adams, R. S. 1971. Reforestation practices for conifers in California. California Division of Forestry, Sacramento. 359 p.
Skinner, T. H. 1976. Contributions of Abert squirrels to nutrient transfer through litterfall in a ponderosa pine ecosystem. Tuscon: University of Arizona. 77 p. Thesis.
Snyder, M. A.; Linhart, Y. B. 1994. Nest-site selection by Abert’s squirrel: Chemical characteristics of nest trees. Journal of Mammalogy. 75: 136-141.
States, J. S. 1985. Hypogeous, mycorrhizal fungi associated with ponderosa pine: sporocarp phenology. In: Molina, R., ed. Proceedings of the 6th North American Conference on Mycorrhizae. Bend, Oregon. 271 p.
Stephenson, R. L. 1974. Seasonal food habits of the Abert’s squirrel (Sciurus aberti). Eighteenth Annual Meeting. Proceedings Supplement. Arizona Academy of Science 9. Northern Arizona University, Flagstaff. 53 p.

88 USDA Forest Service RMRS-P-55. 2008.
The content of this paper reflects the views of the author(s), who are responsible for the facts and accuracy of the information presented herein.
Stephenson, R. L.; Brown, D. E. 1980. Snow cover as a factor influencing tassel-eared squirrel mortality. Journal of Wildlife Management. 44: 951-955
Taylor, W. P. 1927. The biological side of the business of forest and forage production. Journal of Forestry. 25(4): 386-414.
Taylor, W. P.; Gorsuch, D. M.1932. A test of some rodent and bird influences on western yellow pine reproduction at Fort Valley, Flagstaff, Arizona. Journal of Mammalogy. 13(3): 218-223.
Taylor, W. P. 1930. Methods of determining rodent pressure on the range. Ecology. 11: 523-542.
Trowbridge, A. H.; Lawson, L.1942. Abert squirrel-ponderosa pine relationships at the Fort Valley Experimental Forest, Flagstaff Arizona. A preliminary report. Tucson, AZ: U.S. Department of Interior, Fish and Wildlife Service. 38 p.

USDA Forest Service RMRS-P-55. 2008. 89
A visit to Fort Valley in 1935 as a forestry student led me to apply for a position. I returned in 1938 as an Assistant Field Assistant at $1,620 per year. Mr. Pearson met me at the Santa Fe depot. Fort Valley proper was an open park with dairy farms separated by zigzag rail fences. The Station was on a slight rise adjacent to the west of the park, surrounded by tall relics of a ponderosa pine forest with a beautiful view of the San Francisco Peaks. There was a two-story office/apart-ment building, a circle of residences and an enclosed water tower. The central area was landscaped with spruces brought down from the mountain. Their new growth was frostbitten, unadapted to the warmer temperatures of the lower elevation followed by late frosts. Aluminum wind shields surrounded a snow gauge.
The research season at the Station was from April to December, with snow at both ends. Residents at the time were: Gus and May Pearson, Gus having recently relin-quished the Directorship of the Southwestern Forest and Range Experiment Station to return to research; George and Florence Meagher and their cocker “Crusty,” with George studying woodland regeneration, juniper post durability, and aspen at Hart Prairie; Ed and Sally Crafts, Ed on range ecology and economics; Elbert (Doc) Little using current-year piñon pine flowering in the Navajo Reservation to locate next year’s crops of nuts for Indian collection and sale in New York; and Bert and Lydia Lexen, with Bert on biometry. Also living there were: Ed Martin, property man-ager, and Florence Cary, accountant, who later married; and Georgia Savage served as secretary and recorded the tree growth data on atlas sized sheets stored in a closet. A retired cowpuncher, Mr. Oldham, kept things running. Hermann Krauch, a silviculturist, came periodically but worked more at Coulter Ranch south of Flagstaff, and was concerned also with Douglas fir at higher elevations near Cloudcroft, New Mexico. Charles Cooperrider, Hugh Cassidy, George
In: Olberding, Susan D., and Moore, Margaret M., tech coords. 2008. Fort Valley Experimental Forest—A Century of Research 1908-2008. Proceedings RMRS-P-55. Fort Collins, CO: U.S. Department of Agriculture, Forest Service, Rocky Mountain Research Station. 282 p.
Memories of Fort Valley From 1938 to 1942
Frank H. Wadsworth, (ret.), Research Forester, USFS International Institute of Tropical Forestry, San Juan, PR
Abstract—This delightful essay records Frank Wadsworth’s early forestry career at FVEF in the late 1930s. Frank married Margaret Pearson, G.A. and May Pearson’s daughter, in 1941. Pearson believed Frank could not continue to work for him because of nepotism rules, so Frank and Margaret moved to San Juan, Puerto Rico in 1942 where Frank continued his forestry career. His retirement now includes writing up research that he didn’t get to while employed and tending his multi-acre orchards in Puerto Rico.
Glendening, and Ken Parker of the range research staff made occasional visits. Lake Gill and Stuart Andrews of the Agricultural Research Administration came from Albuquerque periodically to study forest pathology. Waldo Glock, of the University of Minnesota, and students visited and worked on dendrochronology.
I was sent to the quarters for bachelors and vehicles with Doc Little. We came to an agreement about cooking and dish washing. Kitchen efficiencies I picked up there were liabili-ties in later married life. We had to refrigerate immediately the milk from down in the valley placed daily on the step be-fore lightning soured it. On Sundays Doc tried recipes from food boxes, like cake from Bisquick. An experiment without replication was a turnip pie. Doc, an avid field botanist, was collecting the flora above timberline. One weekend we drove up to the Spruce Cabin weather station at 10,500 feet and climbed above timberline to Agassiz Peak. When we came down our pickup had disappeared. We spent a cool night alternating between sleeping curled up around a fire and pre-venting the sleeper from burning. At that elevation the first light arrived at about 3 AM, and we soon found our quarry.
Gus Pearson’s research was on what was said to be the world’s most extensive pure pine forest (with apologies to Juniperus deppeana, Quercus gambeli, and Robinia neo-mexicana), extending from the Kaibab and Prescott National Forests in central Arizona to the Gila in central New Mexico. Gus’s intense dedication, constantly visible, appeared to be that of an exemplary employee. With pride and hat, Gus wore a well pressed Forest Service uniform for official busi-ness in town. He recounted to me his studies of climate up the Peaks including the winter, why the parks are treeless, and his failures with pine planting. Apparently because of past Forest Ranger training at Fort Valley in which he was involved, Gus was known throughout the Southwest Region of the Forest Service. His scientific writing, according to

90 USDA Forest Service RMRS-P-55. 2008.
Henry Clepper of the Journal of Forestry, required no edit-ing, a rare tribute from an editor. Gus said to me that Uncle Sam was the world’s best employer and cautioned me not to mistreat him. He expected full use of official time and care of vehicles, allowing one trip to town per week but not after dark. I still sense repeatedly the virtue of the high ethical standard he symbolized at the beginning of my official life.
Shortly after I arrived, the Station sold for $55 to a Flagstaff dealer “Forest Service #128,” a venerable 1931 Ford coupe with a trunk. I bought it for $75, had the en-gine rebored, the brakes fixed, and found that it responded well to pliers and wire. On free time it took me to the Grand Canyon for a moonlight descent on foot, through floods that stalled other cars after Hopi snake dances, to the “dusty” Grand Falls of the Little Colorado River, to Schnebley Hill to watch the production of the film “Virginia City,” through a desert flood along the Camino del Diablo between Ajo and Tinajas Altas, and to Culiacan, deep in Mexico, and back.
My appointment at Fort Valley was fortunate but only temporary. The government offered so few “permanent” Civil Service jobs during the depression that I had to take the Junior Forester examination three successive years to re-main on the register. After about six months at Fort Valley I received a Civil Service appointment with the Prairie States Forestry Project (the shelterbelt) in Nebraska. To refuse it would drop me off the register and require a fourth ex-amination to remain eligible to return to Fort Valley. The
Figure 1. Frank Wadsworth on FVEF permanent sample plot S6A, amongst a mature stand of ponderosa pine. USFS photo 366890 by G.A. Pearson in August 1938.
downward slope of my progressive exam grades was such that I couldn’t chance this. The Ford took me through a February blizzard in Kansas to Ewing, Nebraska.
Six months later I received a Civil Service appointment to Fort Valley as a Junior Forester. I left the Ford with my field worker and set off after supper in a new car. Beyond North Platte I fell asleep and went off the road onto a benevolent wide shoulder. At the next opportunity I drank coffee for the first time. The next night in the Wasatch Mountains entering Utah I came upon a barred owl perched on a dead rabbit. The owl had been injured so I stopped and threw a topcoat over it. As I wrapped it up a claw sunk into my hand, and I got to wondering about rabbit fever. Although it was after midnight when I reached Salt Lake I found a doctor and a taxidermist. The following afternoon I reached Fort Valley.
I rejoined Doc Little. This time on a weekend we walked down to the Rainbow Bridge in Glen Canyon, a 14-miler. Doc was slight physically and yet more able than I was to deal with the 107 degrees recorded at Holbrook the day we climbed out. At the Goldwater Lodge, I drank 17 glasses of water.
Gus had established a network of permanent sample plots with tagged trees, some to 160 acres or more. The ones I knew included S-3 on the Kaibab, with S-3A requiring a 10-foot deer-proof fence; S-4 in the cinder country near Sunset Crater (slower growth); S-5 on the best site outside of the malpais in Long Valley (taller trees); S-6 and S-7 beside

USDA Forest Service RMRS-P-55. 2008. 91
what became Highway 180; and others on the Prescott Forest downstate and on the Carson and the Datil Forests in New Mexico. From these plots and his counterparts Gus had learned that his pines grew faster than those of Carlos Bates in the Black Hills, and that the ponderosas of Thornton Munger and Leo Isaac in the Pacific Northwest and those of Duncan Dunning in California were taller than in the Southwest.
A major task of mine was tape remeasurement of the breast-height trunk diameters of the trees in the plots, start-ing with 30-year-old S-3. For this I had a good technician by the name of Pendergrass. In addition, thickets of saplings and small poles had arisen beneath openings in the forest, products of 1914, 1919, and 1927, the only years with spring rains adequate to germinate pine seeds before they were all eaten. These needed thinning, pruning and mistletoe re-moval. I had a Civilian Conservation Corps crew, at first of young Mexican Americans, followed by others from some tough area in Philadelphia. For a period, the use of double-bitted axes by many of these young men was not forestry.
Gus thinned the densest sapling stands where logging was in progress by sending the log skidders directly through them. Pruning of mistletoe from branches on pole-sized trees just made it reappear on the central trunks, so the crews had to remove infected trees. We also were on the watch for Ips bark beetle attacks common in S-6 and S-7. They required removal of not only the yellowing trees but some of their still green neighbors with the newly emerged insects starting in them. Logging and thinning produced slash that was piled in openings and burned on calm days.
In S-3, apparently Gus’s favorite, he had us pruning lower dead branches from large trees. Pole sawing of thick branch-es was onerous. We saw it only as of cosmetic value since the trees looked too near to maturity to outgrow the stubs. I white-painted many stubs and recorded tree numbers and stem diameters at the stubs to follow occlusion. During a visit forty years later the paint was still visible.
From a pine group beside the Station entrance road long before I arrived, Gus had harvested the dominant trees, ex-posing to full light formerly suppressed trees. He later noted that their crowns had filled out. Increment borings confirmed that increased growth had continued ever since release. A re-sult was Improvement Selection, a silvicultural practice for Forest Service ponderosa pine timber sales adopted by the Southwest Region. These suppressed trees, left and released from former root competition, despite their ages, promised a second harvest of clear boles before the regeneration ma-tured. I set up Plot S-8 on the east side of the Wing Mountain road where Gus made a demonstration of Improvement Selection.
Gus had differences with some members of the ecosys-tem. Included were deer that browsed new pine growth, porcupines that girdled upper pine trunks (the day I shot a gathering of 22 I was almost promoted), Abert squirrels that raid maturing pine cones, and Ips beetles.
Gus saved most of his vitriol for grazing on what he con-sidered were pinelands. He argued with Frank C.W. Pooler,
Regional Forester, that on the Coconino Plateau the Forest Service was getting only a pittance for grazing permits while pine growth on the same lands would produce seven times the value. Over time his pines won many a battle, reforesting clearings naturally, including, I’m told, much of the “Flag desert” of my time. More specifically Gus condemned cattle that ate pine tips; cattlemen who didn’t care; Basque sheep herders whose flocks twice a year en route from the desert to the Peaks bedded down in S-3 and chewed on everything in sight, eating the fescue and uprooting the mountain muhly; and National Forest personnel and range researchers with insufficient backbone to recommend keeping the cattle off National Forest “pinelands” until the new pine terminals had hardened by July first.
Gus’s passion did not spare his fellow scientists. After an argument Gus was reported to have left Hermann Krauch by a roadside. With a threat to “destroy professionally” Cooperrider and Cassidy in the Journal of Forestry if they
Figure 2. Frank Wadsworth in a ponderosa pine forest near FVEF. USFS photo 421057 by G.A. Pearson in October 1941.

92 USDA Forest Service RMRS-P-55. 2008.
published a manuscript using what he considered contrived photographs to allege that cattle eat pine leaders only be-cause they are thirsty, Gus got Director Upson to withhold the publication.
Gus detested what he considered an idle imposition of statistical confirmation on decades of his already published and widely recognized astute observations. A mathematically robust revision of his Plot S-5 in Long Valley, fragmenting it for replication and contrast, ended his interest in this, his best forest site. He said to me, “We are trying to learn about trees by looking at numbers.” Once I overheard him, obviously in exasperation, say to Bert Lexen, “I don’t care whether it is significant, is it important?” Bert admitted to me that he was trying to prove statistically “what Gus already knows.” More memorable, however, was the fact that the strong professional differences between these two were not personal. The Lexens and Pearsons alternated in hosting friendly Sunday dinners.
The Pearson house, the most expensive, had its bathroom separated by one inch to comply, I was told, with a federal ceiling of $2,500 on residences. On Sunday mornings Gus was up early and made pancakes and I was invited. In the woods his lunch was a small can of tuna, a practice I still like. May, a native Arizonan, knew the state from Betatakin to Baboquivari. An adventurous good cook, she arranged Sunday picnics and got Gus to go by telling him only when the lunch was in the car. To travel with them was a treat. They recalled historic events in the Grand Canyon, friends in Navajo trading posts, acquaintances living in Oak Creek Canyon and in Sedona. May, a Baptist, reportedly got Gus to go the nine miles to church in town only to discover that there he turned off his hearing aid. Their offspring, both now deceased, included a son, Arthur, an engineer who be-came a pilot of the B-36’s of the Air Force, and Margaret (Peggy) who was a concert soprano.
In April 1941 when I was about to marry Peggy, Gus explained that under the anti-nepotism rules of the federal government I would have to take a transfer. During the ten months when none appeared we lived in the middle cottage, next to the Crafts. Crossing the compound toward the office one night I heard through dense snowflakes what sounded like a cat’s meow. It was a fawn with a back leg dangling. It followed me back to our house, went in and lay down on the
The content of this paper reflects the views of the author(s), who are responsible for the facts and accuracy of the information presented herein.
floor. When it heard Peggy peeling an apple in the kitchen it stood on her feet and begged. “Cutie” lived at the Station for weeks while we tried in vain to bind up the broken hip. Miraculously it gradually set until we observed the four-footed leaping that characterizes the deer of the west. When it ate what then were precious pre-war nylons off a clothes-line, it was time for release, far from hunters, in Grand Canyon National Park. A family had found the fawn. Since the deer was of the forest, the family assumed the Forest Service should know what to do. It looked like we did.
One Saturday afternoon Peggy and I decided to take a walk on a trail behind the Station toward A-1 Mountain. We returned at about five o’clock to find our cottage burned to the ground and still smoldering. The few people that had not gone to town saw it only too late. By then, with flames being blown from the woodshed filled with resinous pine knots toward the house, a simple hose was useless. They rushed in and got out our clothes but not our unacknowledged wed-ding gifts. Director Upson concluded that the fire must have started by the sun’s rays on a bottle, something that remains uncertain. We moved to the apartment above the office. Georgia Savage, whose older son I had rescued when his brother accidentally shot him in a remote location, asked her boys to look for Peggy’s engagement ring left on the bureau in the bedroom. Using a window screen they sifted the ashes and found the diamond, which we had remounted.
Our remaining in Fort Valley apparently was not nepo-tism by the rules strictly because I was not requesting a job or a promotion. Not knowing this until 67 years later, we drove to Mobile and boarded a ship for Puerto Rico early in 1942.
As a sequel, forest remeasurements as at Fort Valley proved even more necessary for forest research in the trop-ics where tree growth rings are mostly invisible. The result produced a second set of long-term numbered tree growth records. Even the silvicultural practice developed in tropi-cal rain forests in Puerto Rico turned out to be similar to Improvement Selection, merely assuring crown illumination more than root space. The growing appreciation of diverse forest benefits intensifies the fundamental importance of the tree growth information of both locations to forest health, productivity, and sustainability.

USDA Forest Service RMRS-P-55. 2008. 93
Poster Papers

94 USDA Forest Service RMRS-P-55. 2008.
Introduction
Seed availability affects many ecological processes, such as granivory (consumption of seeds by animals and insects), plant regeneration, and many processes affected by seed-based plants. Just as nutrients or other factors can limit plant growth or recruitment, seeds can be a limiting resource in plant communities. Turnbull and others (2000) define seed limitation as an increase in population sizes following seed addition. Seed limitation occurred in half of the 40 studies Turnbull and others (2000) reviewed, most of which occurred in temperate ecosystems.
Leaf litter is another factor that can limit plant estab-lishment in some communities through several possible mechanisms. For example, litter can intercept light or inter-act with seeds by trapping them or forming a physical barrier to germination for seeds buried in soil (Facelli and Pickett 1991). Reducing litter can increase plant populations, pos-sibly by stimulating germination in the soil seed bank, allowing seed rain to reach the soil, or altering microclimate.
Western United States ponderosa pine (Pinus ponderosa) forests, especially after disturbance, meet criteria of commu-nities predicted to be particularly seed- and leaf litter-limited. Seed limitation is common in early successional communi-ties (Turnbull and others 2000), which characterize these
In: Olberding, Susan D., and Moore, Margaret M., tech coords. 2008. Fort Valley Experimental Forest—A Century of Research 1908-2008. Proceedings RMRS-P-55. Fort Collins, CO: U.S. Department of Agriculture, Forest Service, Rocky Mountain Research Station. 282 p.
Plant Recruitment in a Northern Arizona Ponderosa Pine Forest: Testing Seed- and Leaf Litter-Limitation Hypotheses
Scott R. Abella, Public Lands Institute and School of Life Sciences, University of Nevada Las Vegas, Las Vegas, NV
Abstract—Seed availability and leaf litter limit plant establishment in some ecosystems. To evaluate the hypothesis that these factors limit understory plant recruitment in Pinus ponde-rosa forests, I conducted a seeding and litter removal experiment at six thinned sites in the Fort Valley Experimental Forest, northern Arizona. Experimental seeding of four native spe-cies (Penstemon virgatus, Erigeron formosissimus, Elymus elymoides, and Festuca arizonica) and raking of litter occurred in 2005. Seeding resulted in a substantial recruitment of 14 to 103 seedlings/m2 (1 to 10/ft2) one month after seeding for two species (P. virgatus and E. ely-moides), but these densities subsequently declined by 13 and 27 months after treatment to near control densities. No P. virgatus adults established, and seeding also did not significantly increase densities of E. elymoides adults. Litter removal and seeding did not interact, as seed-ling density on raked + seeded plots did not differ from density on seed-only plots. Consistent with a previous experiment in these forests, litter removal also had no effect on plant richness or cover. Results suggest that (i) factors other than seed availability limited recruitment of adult plants of the four seeded species, and (ii) leaf litter did not limit plant recruitment.
forests following tree thinning or burning. Furthermore, Vose and White (1987) found that soil seed banks at a north-ern Arizona ponderosa pine site were sparse (< 25 seeds/m2 [2/ft2]) in both burned and unburned areas. In a synthesis of 35 leaf-litter studies, Xiong and Nilsson (1999) found that effects of litter removal on plant establishment were greater in coniferous compared to deciduous forests (possibly due to differences in litter type) and in communities with large amounts of litter. Litter thickness and weight in ponderosa pine forests, particularly in densely treed forests, equal or exceed those of many world forests (Vogt and others 1986). These observations also suggest that seed addition and leaf litter could interact. Seed addition may increase plant re-cruitment only when litter is reduced, and litter reduction may increase recruitment only when seeds are available.
Identifying factors limiting plant recruitment can be use-ful for understanding the development of plant communities and their management. If seeds are a primary limiting factor, for example, seeding is likely to be a successful revegetation tool, and unsuccessful if seeds are not limiting. I conducted a seed-addition and litter-reduction experiment in a pon-derosa pine forest to evaluate the following hypotheses: (1) plant population sizes are seed limited and seed addition will increase population sizes, and (2) litter removal and seed-ing interact, with litter removal increasing plant population sizes.

USDA Forest Service RMRS-P-55. 2008. 95
Methods
This experiment was conducted in six experimental blocks in a ponderosa pine forest in the Fort Valley Experimental Forest, 15 km (9 miles) north of the city of Flagstaff in northern Arizona at elevations of 2,243 to 2,311 m (7,357 to 7,580 ft). The blocks, ranging in size from 13 to 16 ha (32 to 40 acres), were physically separated from one another by 0.5 to 3 km (0.3 to 2 miles). These blocks are part of an exist-ing (1998-1999) thinning and burning ecological restoration project, with three blocks thinned by 85 percent (“1.5-3 treat-ment”) and three blocks by 89 percent (“2-4 treatment”) of pre-thinning densities detailed in Fulé and others (2001).
One site in each block was located by randomly selecting coordinates using a Geographic Information System, with the constraint that sites avoid overlying existing monitoring plots from the restoration project. At each site, four 2 × 2 m (7 × 7 ft) plots were established in a square pattern. Each plot was separated by 3 m (10 ft) from the nearest plot. One of four treatments was randomly assigned to each plot at each site: control, raking of leaf litter (Oi horizon), seeding, and raking + seeding. I performed raking treatments using a 75-cm (30 inch) wide plastic rake, removing approximately 500 to 700 g/m2 (70 oC oven-dry weight) of litter. The seed-ing treatment, performed after raking, was hand broadcast seeding of 300 seeds/m2 (28/ft2) of each of four native pe-rennial species. The species included the forbs upright blue beardtongue (Penstemon virgatus) and beautiful fleabane (Erigeron formosissimus), and the C3 (cool season) grasses squirreltail (Elymus elymoides) and Arizona fescue (Festuca arizonica). I standardized seeding rate by total seeds (rather than a measure like pure live seed) to avoid confounding vi-ability and germinability of seeds with absolute total seed limitation. Emergence was 61 (beardtongue), 64 (fleabane), 88 (squirreltail), and 79 percent (fescue) after two months in greenhouse conditions described in Abella and others (2007). Turnbull and others (2000) classify this experiment as seed augmentation, because the four seeded species inhabit the study sites. With the exception of squirreltail at 51 seeds/m2 (5/ft2), Korb and others (2005) found that species seeded in this experiment were sparse or absent in mineral soil seed banks at 0 to 5 cm (0 to 2 inch) depths in the study area.
I established plots, collected pre-treatment data, performed treatments, and installed granivory deterrents on August 7, 2005. Granivory deterrents (designed to reduce seed loss) were 0.5 × 0.5 m (0.25 m2 [3 ft2]) wooden squares, with mesh screen (7 mm [0.3 inch] openings) on top (Figure 1). I in-stalled these deterrents in the southwestern corner of each plot and established an equally sized control area adjacent to the east. Seedling and adult (well-developed or fruiting) plants of the four seeded species were counted in granivory deterrents, controls, and whole plots 1 (September 14, 2005), 13 (September 10, 2006), and 27 months (October 28, 2007) after treatment. On whole plots before treatment and dur-ing the 2006 and 2007 post-treatment sampling, I recorded the number of species (richness) and total areal plant cover
12
figure 1a 238
figure 1b 239
figure 1c 240
a
b
c
Figure 1. Views at three of six sites of 2 × 2 m experimental plots containing 0.5 × 0.5 m granivory deterrents in a ponderosa pine forest, northern Arizona. The plot in the bottom right corner of (a) shows leaf litter removed by raking. Even in areas illustrated in (b) where tree canopies were open, removal of litter had no effect on recruitment of seeded species or on resident species. In (c), the densely treed area in the top of the photo represents the edge of the thinned restoration area (which covers the rest of the photo) where plots are located. Photos by S.R. Abella, September 10, 2006 (a), and October 28, 2007 (b-c).

96 USDA Forest Service RMRS-P-55. 2008.
(visually categorized at 1 percent intervals to 10 percent cov-er, and at 5 percent intervals beyond).
Plant counts for each species were analyzed as a repeated measure, mixed model analysis of variance. Random effects were site-nested within the ecological restoration treatment (either the “1.5-3” or “2-4” thinnings) and its interactions with sample date, rake × date, and seed × date. Treatments, date, and all of their interactions were modeled as fixed ef-fects. Cover and richness were analyzed in a mixed model analysis of covariance, with pre-treatment cover or richness as a covariate. Plant counts and percent cover were log10 transformed to meet model assumptions. Analyses were con-ducted using SAS (PROC MIXED; SAS Institute 1999).
Results
Plant density of seeded species averaged among sample dates was similar inside (35/m2 [3/ft2]) and outside (34/m2 [3/ft2]) of granivory deterrents, so density was analyzed on a whole-plot basis. Few seedlings of fleabane and fescue were detected during the experiment (0 for fleabane and 2 for fescue), so the analysis focused on beardtongue and squirrel-tail. Raking did not significantly affect beardtongue density or squirreltail adults and was only marginally significant for
squirreltail seedlings (Table 1). In contrast, seeding strongly affected seedling density of both species. Seeding and time interacted, however, with significant declines in seedling den-sity through time from 2005 to 2007 (Figure 2). In September 2005, one month after seeding, average density of seedlings (which were about 5 cm [2 inches] tall) on seeded plots ranged from 14 to 16/m2 (1/ft2) for beardtongue and 85 to 103/m2 (8 to 10/ft2) for squirreltail. However, density subsequently decreased by 6- to 8-fold (beardtongue) and 4- to 18-fold (squirreltail) to levels that did not differ from unseeded plots. No adult beardtongue plants were observed during the ex-periment. Adult squirreltail density did not differ among treatments.
At the plant community level, treatments had no effect on species richness (Table 1). Seeding was a significant main effect that increased cover in both post-treatment years, but there were no significant differences within the rake × seed × time level (Figure 3).
Discussion
If plant recruitment is seed limited at either the seedling or adult stages, population sizes in these stages should in-crease with seed addition (Turnbull and others 2000). In this
Table 1. Summary of analysis of variance results for the effects of raking and seeding treatments on seeded species recruitment and plant community characteristics in a ponderosa pine forest, northern Arizona.
Plant establishmentb Community measures
Effecta df PV sl EE sl EE ad df Richness Cover
–––––––– P > F –––––––– ––––– P > F ––––
Rake 1,12 0.50 0.04 0.68 1,8 0.41 0.06Seed 1,12 <0.01 <0.01 0.08 1,7 0.79 <0.01Rake×seed 1,12 0.25 0.01 0.39 1,3 0.97 0.24ER tmt 1,12 0.26 0.80 0.36 1,3 0.31 0.04Rake×ER tmt 1,12 0.62 0.99 0.70 1,3 0.44 0.51Seed×ER tmt 1,12 0.23 0.98 0.77 1,3 0.23 0.15Rake×seed×ER tmt 1,12 0.99 0.46 0.29 1,3 0.97 0.09Time 2,8 <0.01 <0.01 0.66 1,4 0.13 0.07Rake×time 2,12 0.81 0.29 0.33 1,8 0.47 0.23Seed×time 2,12 <0.01 <0.01 0.59 1,7 0.73 0.50Rake×seed×time 2,12 0.97 0.86 0.93 1,3 0.76 0.69Time×ER tmt 2,12 0.92 0.25 0.95 1,3 0.81 0.47Rake×time×ER tmt 2,12 0.36 0.35 0.53 1,3 0.47 0.44Seed×time×ER tmt 2,12 0.67 0.78 0.75 1,3 0.79 0.93Rake×seed×time×ER tmt 2,12 0.42 0.21 0.88 1,3 0.23 0.67Covariate – – – – 1,3 <0.01 <0.01
aER tmt = ecological restoration treatment, serving as a blocking effect.bdf = degrees of freedom, PV sl = Penstemon virgatus (upright blue beardtongue) seedling density,
EE sl = Elymus elymoides (squirreltail) seedling density, and EE ad = Elymus elymoides adult density.

USDA Forest Service RMRS-P-55. 2008. 97
13
figure 2 241
Figure 2. Mean plant densities among raking and seeding treatments 1, 13, and 27 months after treatment in a ponderosa pine forest, northern Arizona. Error bars are one standard deviation. Means without shared letters differ at P < 0.05 (Tukey’s test).
experiment, two species (fleabane and fescue) showed no evidence of seed limitation because neither seedling nor adult density increased after seeding. The remaining two species (beardtongue and squirreltail) had seed-limited recruitment at the seedling but not adult stage, as increased seedling den-sity arising from seed addition did not increase adult density (Figure 2). The findings for beardtongue and squirreltail sup-port the generalization that conditions for establishment of adults are stricter than those for germination (Harper 1977). However, the prediction that understories in these thinned and burned forests should be seed limited was not supported, at least for the four studied species. These species include different growth forms, and dominant (the grasses) and sub-ordinate (the forbs) species, theoretically representing a range of potential responses to seed addition (Turnbull and others 2000). Seeding and leaf litter removal also did not interact
as hypothesized, with litter removal having no effect in con-cordance with a previous study in these forests (Abella and Covington 2007).
Several factors associated with the experimental conditions could have affected results. Although seeds were acquired from a local northern Arizona vendor, the exact genetic origin of the seeds was not available. Seeding in August was timed to correspond with monsoon rains, but it is not known if this seeding time was optimal. However, at least some seeds prob-ably remained on site to germinate at other times, a contention supported by the appearance of new beardtongue seedlings each year (Figure 2). Precipitation during the seeding month of August 2005 was 152 percent of normal (Fort Valley Station, Western Regional Climate Center, Reno, NV). In the summer monsoon months of July, August, and September, precipita-tion also was above normal in 2006 (158 percent) and 2007

98 USDA Forest Service RMRS-P-55. 2008.
(124 percent). Snowfall was below normal, however, which re-sulted in annual precipitation being 91 to 86 percent of normal in these years. This could have particularly affected establish-ment of the cool-season grasses (Clary and Kruse 1979).
Repeating the seeding with different seed sources, addi-tional species, at different times, and within the context of a site seed budget (Vose and White 1987) may be useful for fur-ther evaluating seed availability as a potential limiting factor relative to other factors (for example, tree density, root compe-tition). For instance, Springer and Laughlin (2004) monitored an operational seeding in northwestern Arizona ponderosa pine forests and found that 6 of 19 (32 percent) seeded spe-cies increased. This supports contentions that seed limitation is species specific, and conclusions from seed-addition studies depend on the included species (Turnbull and others 2000). An additional consideration is that I initiated my experiment six to seven years after tree thinning, and it is unclear if seed limita-tion changes with time since disturbance.
AcknowledgmentsI thank the Coconino National Forest and Rocky Mountain
Research Station for permission to conduct sampling; Don
Figure 3. Mean plant community measures among raking and seeding treatments before treatment and 13 and 27 months after treatment in a ponderosa pine forest, northern Arizona. Error bars are one standard deviation.
14
242
243
244
figure 3 245
246
Normandin and students with the Ecological Restoration Institute for building granivory deterrents; Cheryl Vanier (statistician, University of Nevada Las Vegas) for performing statistical analyses; Sharon Altman (Public Lands Institute) for preparing Figure 2; Judy Springer (Ecological Restoration Institute) and Jill Craig (Public Lands Institute) for reviewing the manuscript; and the Public Lands Institute for funding travel for resampling in 2006.
References
Abella, Scott R.; Covington, W. Wallace. 2007. Forest-floor treatments in Arizona ponderosa pine restoration ecosystems: no short-term effects on plant communities. Western North American Naturalist. 67: 120-132.
Abella, Scott R.; Springer, Judith D.; Covington, W. Wallace. 2007. Seed banks of an Arizona Pinus ponderosa landscape: responses to environmental gradients and fire cues. Canadian Journal of Forest Research. 37: 552-567.
Clary, Warren P.; Kruse, William H. 1979. Phenology and rate of height growth of some forbs in the southwestern ponderosa pine type. Res. Note RM-376. Fort Collins, CO: U.S. Department of Agriculture, Forest Service, Rocky Mountain Forest and Range Experiment Station. 8 p.

USDA Forest Service RMRS-P-55. 2008. 99
Facelli, José M.; Pickett, Steward T. A. 1991. Plant litter: its dynamics and effects on plant community structure. Botanical Review. 57: 1-32.
Fulé, Peter Z.; McHugh, C.; Heinlein, Thomas A.; Covington, W. Wallace. 2001. Potential fire behavior is reduced following forest restoration treatments. In: Vance, Regina K; Edminster, Carleton B.; Covington, W. Wallace; Blake, Julie A., comps. Ponderosa pine ecosystems restoration and conservation: steps toward stewardship; 2000 April 25-27; Flagstaff, AZ. Proceedings RMRS-P-22. Ogden, UT: U.S. Department of Agriculture, Forest Service, Rocky Mountain Research Station: 28-35.
Harper, John L. 1977. Population biology of plants. New York: Academic Press. 892 p.
Korb, Julie E.; Springer, Judith D.; Powers, Stephanie R.; Moore, Margaret M. 2005. Soil seed banks in Pinus ponderosa forests in Arizona: clues to site history and restoration potential. Applied Vegetation Science. 8: 103-112.
SAS Institute. 1999. SAS/STAT user’s guide. Cary, NC: SAS Institute, Inc. 3,864 p.
Springer, Judith D.; Laughlin, Daniel C. 2004. Seeding with natives increases species richness in a dry ponderosa pine forest (Arizona). Ecological Restoration. 22: 220-221.
Turnbull, Lindsay A.; Crawley, Michael J.; Rees, Mark. 2000. Are plant populations seed-limited? A review of seed sowing experiments. Oikos. 88: 225-238.
Vogt, K. A.; Grier, C. C.; Vogt, D. J. 1986. Production, turnover, and nutrient dynamics of above- and below-ground detritus of world forests. Advances in Ecological Research. 15: 303-377.
Vose, James M.; White, Alan S. 1987. Processes of understory seedling recruitment 1 year after prescribed fire in an Arizona ponderosa pine community. Canadian Journal of Botany. 65: 2280-2290.
Xiong, Shaojun; Nilsson, Christer. 1999. The effects of plant litter on vegetation: a meta-analysis. Journal of Ecology. 87: 984-994.
The content of this paper reflects the views of the author(s), who are responsible for the facts and accuracy of the information presented herein.

100 USDA Forest Service RMRS-P-55. 2008.
Introduction
Stand density is a major regulator of tree growth and, as such, has been closely studied for many decades and for many commercial species. Systematic “level of growing stock” (LOGS) studies were initiated for ponderosa pine (Pinus ponderosa) as well as other species in the mid-1900s to generate consistent scientific data on this effect across re-gions, site qualities and stand conditions (Myers 1967, Oliver and Edminster 1988, Ronco and others 1985). These LOGS studies have quantified and illuminated the subtleties of early-century observations of stocking differences and thin-ning responses (e.g., Gaines and Kotok 1954).
Taylor Woods (Figure 1), located in the Fort Valley Experimental Forest, was established in 1962 as part of the ponderosa pine LOGS study site network. It is a particularly important addition to the network given it’s relatively low productivity. The original stand consisted of scattered large, sawtimber-sized trees (>50 cm DBH) with abundant slow-growing, pole-sized material in a mid-story originating from a major 1919 regeneration event (Pearson 1950). Detailed site descriptions, study implementation and early growth pat-terns were documented by Schubert (1971) and Ronco and others (1985). To summarize here, three replicated plots for
In: Olberding, Susan D., and Moore, Margaret M., tech coords. 2008. Fort Valley Experimental Forest—A Century of Research 1908-2008. Proceedings RMRS-P-55. Fort Collins, CO: U.S. Department of Agriculture, Forest Service, Rocky Mountain Research Station. 282 p.
Forty Years Later at Taylor Woods: Merging the Old and New
John D. Bailey, College of Forestry, Oregon State University, Corvallis, OR
Abstract—The Taylor Woods “Levels-of-Growing-Stock” study was established in 1962 to create a replicated ponderosa pine density experiment for the Southwest, making a valuable addition to research in the Fort Valley Experimental Forest. Basal area treatments ranged from 5-20 m2/ha (19-80 ft2/ac) when installed, designed as growing stock levels 30/40, 60, 80, 100, 120 and 150. Residual trees averaged only 12 cm DBH despite being 42 years old. These 0.3- to 0.5-ha (0.75- to 1.24-ac) plots, with three of each growing stock level, were revisited for maintenance on a decadal basis including a recent entry in 2002/3 (the fifth). Once trees averaged 25 cm (10 in), which varied among treatments, plots were maintained at their target basal area per the intent of growing stock studies; all plots were at or above that point in 2002 with the largest trees >50 cm (20 in). Results have shown clear and predictable patterns for height and diameter growth for southwestern ponderosa pine, not different than other parts of the species’ range or other species. Lower density plots have shown consistently larger diameters and faster diameter and height growth on an individual tree basis. Stand-level basal area growth is higher at higher densities based on the higher number of trees per plot (and per ha). The density at which stands can achieve maximum basal area growth has varied progressively over the four decades. But beyond such traditional interpretations of density effects on tree and stand growth, the long-term patterns shown at Taylor Woods now provide valuable insights into tree vigor and insect resistance, understory development, fire behavior, ecological restoration and potential implications of regional land management choices in light of climate change.
each of six growing stock levels were thinned heavily in 1962 to establish the range of basal area treatments, and lightly re-thinned to adjust stocking each decade thereafter. Ronco and others (1985) reported that, except for tree height, all other size and growth metrics (i.e., stem diameter, crown length, and crown height) were negatively correlated with stand den-sity; volume increments, including basal area growth, were positively correlated with stand density. These findings were consistent with ponderosa pine growth patterns for the region (Oliver and Edminster 1988) and LOGS studies in general (e.g., Curtis and Marshall 1986).
Measurements have continued at Taylor Woods every five years and density maintenance treatments every ten years since. This paper summarizes size and growth pat-terns through 2002, by which time the highest density plots had achieved a mean diameter of 25 cm (10 in) such that all growing stock designations can be converted to simple basal area. The objective of this research was to sustain this important long-term study, update the data with 20 more years of information, and extend the interpretation of these data into broader land management questions. This work also enchances the chances that the site is maintained over the coming decades, and that additional research can be conduct-ed well beyond the original intent of the LOGS studies.

USDA Forest Service RMRS-P-55. 2008. 101
Methods
The Taylor Woods LOGS site is situated along Snowbowl Road in the southeastern section of the Fort Valley Experimental Forest (Figure 1). Slopes are gentle at <4%, climate is identical to the nearby headquarters facil-ity (Ronco and others 1985), and site index for ponderosa pine is 73 (based on a base age of 100), primarily regulat-ed by cool temperatures in this area. Soils are productive
Figure 1. Taylor Woods Levels of Growing Stock (LOGS) study site, showing 3 replicate plots each of 7 stand density treatment levels, 3 unthinned areas, and their respective arrangement. Individual plots are approximately one acre. Growing Stock Level (GSL) is defined as “basal area (ft2/ac) when the trees are, on average, 10 inches in diameter at breast height” and actual stand basal area when trees are > 10 inches, which was the case at the last measurement in 2002. Adapted from Schubert (1971).
for the region, classified as a relatively deep, well-drained Typic Argiboroll over fractured bedrock (Meurisse 1971). Ponderosa pine is dominant with scattered patches of New Mexico locust (Robinia neomexicana) in an understory dom-inated by Arizona fescue (Festuca arizonica). Initial stand conditions, plot layout, and volume removals are available in Schubert (1971) and Ronco and others (1985) for each of the three replicates over the six treatment levels installed. In addition, there are 0 basal area plots and unthinned plots for comparison.

102 USDA Forest Service RMRS-P-55. 2008.
Standard mensurational techniques were used to measure diameter at breast height (by diameter tape to the nearest 0.25 cm) for all trees in each plot since last published for 1982. Heights (hand-held clinometers to the nearest 0.3 m) were measured on a subsample of trees identified for the 1998 re-measurement, comprised of ten trees in each 2.5-cm diameter class (<10% of trees in high density plots, but >60% of the trees in lower density plots). Individual trees were identified by permanent metal tags; all plots also had marked corners. Percent understory vegetative cover was estimated visually to within 10% using a 0.5x2 m sampling frame as a guide to broadly classify the range of surface vegetation abundance.
The strength of this study is certainly in the long-term nature of the data and the contribution of recent re-measure-ments, but that value was enhanced with ANOVA analysis of 2002 conditions using a mixed model for year and treat-ment effect (SAS). Several regressions on growth trends are also presented within this paper. A complete presentation of this extensive data set, including crown characteristics and volume growth trends, is available from the Rocky Mountain Research Station and in an upcoming Research Paper.
T a y lo r W o o d s: F o u r d e c a d e s o f T R E E H E IG H T g ro w t h ; 1 9 6 2 - 20 0 2
y = - 2 . 1 8 8 6 L n ( x ) + 1 4 . 6 7 5
R2
= 0 . 6 7 3 6
y = -1 . 4 5 4 3 L n ( x ) + 1 1 . 6 5 4
R2
= 0 . 3 7 7 3
y = - 2 . 3 8 3 9 L n ( x ) + 1 6 . 3 9 1
R2
= 0 . 6 4 5 5
y = - 1 . 8 4 1 8 L n ( x ) + 1 3 . 5 6 8
R2
= 0 . 6 6 7 2
0
2
4
6
8
1 0
0 2 0 4 0 6 0 8 0 1 0 0 1 2 0 1 4 0 1 6 0
G S L4 0 196 2 - 1 97 2
G S L6 0 196 2 - 1 97 2
G S L8 0 196 2 - 1 97 2
G S L1 00 19 62 - 19 72
G S L1 20 19 62 - 19 72
G S L1 50 19 62 - 19 72
196 2 - 1 97 2
197 2 - 1 98 2
198 2 - 1 99 2
199 2 - 2 00 2
Log . ( 19 62 - 1 97 2 )
Log . ( 19 72 - 1 98 2 )
Log . ( 19 82 - 1 99 2 )
Log . ( 19 92 - 2 00 2 )
Taylor Woods: Four decades of TREE DIAMETER growth; 1962-2002
Basal area sf/ac at decade’s beginning
GSL40 1962-1972GSL60 1962-1972
GSL80 1962-1972GSL100 1962-1972GSL120 1962-1972
GSL150 1962-1972
1972-19821982-1992
1992-2002Log. 1962-1972
Log. 1972-1982
Log. 1982-1992Log. 1992-2002
4
00
6
20
8
10
40 60 80 100 120 140 160
2
y = -2.1886Ln(x) + 14.675R2 = 0.6736
y = -1.4543Ln(x) + 11.654R2 = 0.3773
y = -2.3839Ln(x) + 16.391R2 = 0.6455
y = -1.8418Ln(x) + 13.568R2 = 0.6672
Hei
ght g
row
th (f
eet/
deca
de)
Figure 2. Mean height growth of ponderosa pine trees at Taylor Woods, northern Arizona, across six basal area treatments and four measurement decades: 1962-72, 1972-82, 1982-92, and 1992-2002, shown as separate regression lines.
Results and Discussion
Mean height growth (m/decade) varied among GSLs (p<0.001), and did not vary among measurement cycles from 1962 to 2002 (Figure 2); dominant tree height and height growth, however, did not vary among GSLs. This first trend for mean height is consistent with higher density plots of pon-derosa pine containing some smaller trees and, thus, lowering mean height and mean height growth (Myers 1958). The lack of trend with dominant tree height reflects a relatively uni-form site quality at Taylor Woods, measured as height growth over time, with a greater effect of small microsite conditions on height growth than a large range of density treatments. Both patterns are consistent with basic silvicultural texts (e.g., Tappeiner and others 2007) and with Ronco and others (1985) for this site.
Diameter/radial growth showed a steeper slope across GSLs (Figure 3; p<0.001), also a standard pattern for density studies (Oliver and Edminster 1988) and recorded immedi-ately at Taylor Woods by Schubert (1971). Diameter growth varied significantly, however, among decades (p<0.001) as

USDA Forest Service RMRS-P-55. 2008. 103
well, and showed an interaction between GSLs and years (p<0.001). This effect is attributable to a general slowing of diameter growth in lower density plots in the last decade, shown consistently in all replicates relative to the decade end-ing in 1992. Some decrease in radial/diameter growth with increasing size is a normal growth pattern for ponderosa pine across the west (Alexander and Edminster 1980), and trees in the lowest basal area treatment are nearly twice the diam-eter of those in the highest basal area treatment. Basal area growth per tree was different among GSLs (p<0.001) and a consistent shape (slope and intercept not different) among the four decades. This was consistent with a progressive drop in diameter growth (Figure 3) and may reflect the unusually dry climatic conditions beginning in 1996.
Stand-level basal area growth (m2/ha/decade) varied significantly among GSLs (p<0.001), but the shape of that relationship (slopes and intercepts of decadal lines) were not different (Figure 4), indicating no change in this relationship over time. Within the lower range of basal area (10-20 m2/ha), however, decade is a significant effect (p<0.001) except with-in 1972-1992. The visual progression of curves in Figure 4 demonstrates the natural progression of basal area growth with increasing tree size. The consistency of its shape is
T a y lo r W o o d s : F o u r d e c a d e s o f T R E E D IA M E T E R g ro w t h ; 1 9 6 2 - 2 0 0 2
y = - 1 . 3 1 4 6 L n ( x ) + 7 . 1 0 6
R2
= 0 . 9 7
y = - 1 . 4 1 5 L n ( x ) + 7 . 6 4 4 7
R2
= 0 . 9 7 9 3
y = - 1 . 4 8 2 1 L n ( x ) + 8 . 2 5 5 7
R2
= 0 . 9 8 7 3
y = - 1 . 1 8 6 7 L n ( x ) + 6 . 8 1 1 2
R2
= 0 . 9 7 6 7
0
1
2
3
4
0 2 0 4 0 6 0 8 0 1 0 0 1 2 0 1 4 0 1 6 0
b a s a l a r e a ( s f / a c ) a t d e c a d e ' s b e g i n n i n g
G S L 40 19 62 - 1 97 2
G S L 60 19 62 - 1 97 2
G S L 80 19 62 - 1 97 2
G S L 10 0 1 96 2 - 19 72
G S L 12 0 1 96 2 - 19 72
G S L 15 0 1 96 2 - 19 72
1 9 62 - 19 7 2
1 9 72 - 19 8 2
1 9 82 - 19 9 2
1 9 92 - 20 0 2
L o g. ( 1 9 62 - 19 7 2)
L o g . ( 1 9 72 - 19 8 2)
L o g . ( 1 9 82 - 19 9 2)
L o g . ( 1 9 92 - 20 0 2)
Taylor Woods: Four decades of TREE DIAMETER growth; 1962-2002
Basal area sf/ac at decade’s beginning
GSL40 1962-1972
GSL40 1962-1972
GSL40 1962-1972GSL40 1962-1972GSL40 1962-1972
GSL40 1962-1972
1972-19821982-1992
1992-2002Log. 1962-1972
Log. 1972-1982
Log. 1982-1992Log. 1992-2002
11
00
2
20
3
4
40 60 80 100 120 140 160
y = 1.3146Ln(x) + 7.106R2 = 0.97
y = -1.415Ln(x) + 7.6447R2 = 0.9793
y = -1.4821Ln(x) + 8.2557R2 = 0.9873
y = -1.867Ln(x) + 6.8112R2 = 0.9767
DBH
gro
wth
(inc
hes/
deca
de)
Figure 3. Mean diameter (breast height) growth of ponderosa pine trees at Taylor Woods, northern Arizona, across six basal area treatments and four measurement decades: 1962-72, 1972-82, 1982-92, and 1992-2002, shown as separate regression lines.
remarkable and indicative for the close regulation of spacing in this study (Ronco and others 1985). This basal area growth trend is standard among density studies and first recorded for Taylor Woods by Schubert (1971). The larger gap between the decades ending 1992 and 2002 may further indicate the dry climatic cycle noted above for diameter growth rates, but such a trend is speculative until the next measurement cycle.
The Future
The value of this long-term study, with continued and care-ful maintenance of density treatments, re-measurement, and replicated plots (though <0.5 ha), has gone well beyond the LOGS height and diameter growth trends presented here or the detailed volume projections in Ronco and others (1985) and a pending updated Research Paper for which it was originally designed. Tree and stand responses seen at Taylor Woods relate to stand responses following low-density harvest treatments intended to restore presettlement structure in southwestern ponderosa pine (Moore and others 2004). The two lowest den-sity treatments represent mid- and upper-range presettlement

104 USDA Forest Service RMRS-P-55. 2008.
Taylor Woods: Four decades of BASAL AREA INCREMENT; 1962-2002
Basal area sf/ac at decade’s beginning
2
00
3
20
4
5
40 60 80 100 120 140 160
1
y = 1.2083Ln(x) - 0.9753
R2 = 0.8205
y = 1.2243Ln(x) - 2.1492
R2 = 0.7956
y = 1.363Ln(x) - 2.9245
R2 = 0.9148
y = 1.3034Ln(x) - 3.5106
R2 = 0.9691
G S L 4 0 1 9 6 2 - 1 9 7 2
G S L 6 0 1 9 6 2 - 1 9 7 2
G S L 8 0 1 9 6 2 - 1 9 7 2
G S L 1 0 0 1 9 6 2 -1 9 7 2
G S L 1 2 0 1 9 6 2 -1 9 7 2
G S L 1 5 0 1 9 6 2 -1 9 7 2
1 9 6 2 -1 9 7 2
1 9 7 2 -1 9 8 2
1 9 8 2 -1 9 9 2
1 9 9 2 -2 0 0 2
L o g . (1 9 6 2 -1 9 7 2 )
L o g . (1 9 7 2 -1 9 8 2 )
L o g . (1 9 8 2 -1 9 9 2 )
L o g . (1 9 9 2 -2 0 0 2 )
GSL40 1962-1972
GSL60 1962-1972
GSL80 1962-1972
GSL100 1962-1972GSL120 1962-1972
GSL150 1962-1972
1972-1982
1982-1992
1992-2002Log. 1962-1972
Log. 1972-1982
Log. 1982-1992Log. 1992-2002
BA g
row
th (s
f/ac
/yea
r)
y = 1.2083Ln(x) + 0.9753R2 = 0.8205
y = 1.2243Ln(x) + 2.1492R2 = 0.7956
y = 1.3034Ln(x) + -3.5106R2 = 0.9691
y = 1.363Ln(x) + -2.9245R2 = 0.9148
density, so individual tree growth and architecture patterns can be analyzed and compared to older presettlement trees still surviving in the landscape. Similarly, understory plant com-munity responses can be compared and projected from the five-fold increase (5 to 25% cover) in mean understory cover from the highest to lowest basal area treatments. Living un-derstory plant cover is negligible (<10%) with any more than 10 m2/ha of evenly-distributed ponderosa pine overstory. Clumping residual trees and basal area, as with restoration treatments and group selection silviculture, may raise this threshold and, at a minimum, promote spatially diverse under-story conditions where that is a land management objective. And this understory development, combined with overstory inputs, allows fuel accumulation dynamics to be constructed for comparison.
Taylor Woods has also become a template for several ba-sic studies of ponderosa pine ecology and physiology (e.g., Kolb and others 1998, McDowell and others 2006) related to water use efficiency, drought tolerance and insect resistance in southwestern ponderosa pine. These and other studies have made use of the 0 basal area and unthinned control plots of comparison. Continued interest in the effects of climatic fluc-tuations and long-term drift can be further explored across these treatments. Having an experimental framework to examine the role of density is fundamental to advance the science in all these areas. As a long-term and uninterrupted
Figure 4. Mean basal area growth per unit land area of ponderosa pine trees at Taylor Woods, northern Arizona, across six basal area treatments and four measurement decades: 1962-72, 1972-82, 1982-92, and 1992-2002, shown as separate regression lines.
data set, Taylor Woods will provide further insight in under-story development, fuels accumulation, fire behavior, and stand structure responses to climatic variability. In fact, few sites will be able to provide such insights as we move into the next century.
References
Alexander, Robert A.; Edminster, Carleton B. 1980. Management of ponderosa pine in even-aged stands in the southwest. Res. Pap. RM-225. Fort Collins, CO: U.S. Department of Agriculture, Forest Service, Rocky Mountain Forest and Range Experiment Station. 11 p.
Curtis, Robert O.; Marshall, David D. 1986. Levels-of-growing-stock cooperative study in Douglas-fir: Report No. 8—The LOGS study: Twenty-year results. Res. Pap. PNW-356. Portland, OR: U.S. Department of Agriculture, Forest Service, Pacific Northwest Research Station. 113 p.
Gaines, Edward M.; Kotok, E. S. 1954. Thinning ponderosa pine in the Southwest. Sta. Pap. No. 17. Fort Collins, CO: U.S. Department of Agriculture, Forest Service, Rocky Mountain Forest and Range Experiment Station. 20 p.
Kolb, Thomas E.; Holmberg, Kristina M.; Wagner, Michael R.; Stone, Joseph E. 1998. Regulation of ponderosa pine foliar physiology and insect resistance mechanism by basal area treatments. Tree Phys. 18: 375-381.

USDA Forest Service RMRS-P-55. 2008. 105
McDowell, Nate G.; Adams, Henry D.; Bailey, John D.; Hess, Marcey; Kolb, Thomas E. 2006. Homeostatic maintenance of ponderosa pine gas exchange in response to stand density changes. Ecol. Apps. 16(3): 1164-1182.
Meurisse, R.T. 1971. Soil report on the San Francisco Peaks area. Flagstaff, AZ; U.S. Department of Agriculture, Forest Service, Coconino National Forest, Elden and Flagstaff Ranger Districts.
Moore, Margaret. M.; Huffman, David W.; Fulé, Peter Z.; Covington, W. Wallace; Crouse, Joseph E. 2004. Comparison of historical and contemporary forest structure and composition on permanent plots in southwestern ponderosa pine forests. Forest Science. 50(2): 162-176.
Myers, Clifford A. 1958. Thinning improves development of young stand of ponderosa pine in the Black Hills. J. Forestry. 56(9): 656-659.
Myers, Clifford A. 1967. Growing Stock Levels in even-aged ponderosa pine. Res. Pap. RM-33. Fort Collins, CO: U.S. Department of Agriculture, Forest Service, Rocky Mountain Forest and Range Experiment Station. 8 p.
Oliver, William W.; Edminster, Carleton B. 1988. Growth of ponderosa pine thinned to different stocking levels in the western United States. Proceedings of a symposium: 1986 September 29–October 3; Missoula, MT. Gen. Tech. Rep. INT-243. Fort Collins, CO: U.S. Department of Agriculture, Forest Service, Rocky Mountain Forest and Range Experiment Station. 402 p.
Pearson, G.A. 1950. Management of ponderosa pine in the southwest. Agri. Mono. 6. U.S. Department of Agriculture, Forest Service, Washington, DC. 218 p.
Ronco, Frank, Jr.; Edminster, Carleton B.; Trujillo, David P. 1985. Growth of ponderosa pine thinned to different stocking levels in northern Arizona. Res. Pap. RM-262. Fort Collins, CO: U.S. Department of Agriculture, Forest Service, Rocky Mountain Forest and Range Experiment Station. 15 p.
Schubert, Gilbert H. 1971. Growth response of even-aged ponderosa pines reltated to stand density levels. J. Forestry. 69(12): 857-860.
Tappeiner, John C.; Maguire, Douglas A.; Harrington, Timothy B. 2007. Silviculture and ecology of western U.S. forests. Corvallis, OR: Oregon State University Press. 440 p.
The content of this paper reflects the views of the author(s), who are responsible for the facts and accuracy of the information presented herein.

106 USDA Forest Service RMRS-P-55. 2008.
Introduction
Understanding stand development is an important line of evidence about reference conditions that can guide current restoration activities. Furthermore, biometric measurements such as diameter at breast height (DBH) can be related to tree biomass, nutrient storage, and other aspects of ecosystem structure and function (Jenkins and others 2004). We often lack empirical information about stand development and are therefore required to use models to estimate how stands developed. Stand reconstruction models are one means to ob-tain information on past forest structure such as tree density and diameter classes (Everett and others 2007, Groven and others 2002, Harrod and others 1999).
Fulé and others (1997) and Huffman and others (2001) outlined a method of reconstructing past forest structure in southwestern ponderosa pine forests on the basis of con-temporary measurements. Their model, which is built upon in this paper, overestimated tree size and forest density by ~ 7% (Huffman and others 2001). Model accuracy was as-sessed by comparing reconstructed forest structure with actual data from the Woolsey plots, a unique set of historical stem-mapped plots on the Fort Valley Experimental Forest (FVEF) and throughout Arizona and New Mexico (Moore and others 2004). However, the model utility is limited by
In: Olberding, Susan D., and Moore, Margaret M., tech coords. 2008. Fort Valley Experimental Forest—A Century of Research 1908-2008. Proceedings RMRS-P-55. Fort Collins, CO: U.S. Department of Agriculture, Forest Service, Rocky Mountain Research Station. 282 p.
“Growing Trees Backwards”: Description of a Stand Reconstruction Model
Jonathan D. Bakker, College of Forest Resources, University of Washington, Seattle, WA; Andrew J. Sánchez Meador, USFS Forest Management Service Center, Fort Collins, CO; Peter Z. Fulé, School of Forestry, Northern Arizona University, Flagstaff, AZ; David W. Huffman, Ecological Restoration Institute, Northern Arizona University, Flagstaff, AZ; and Margaret M. Moore, School of Forestry, Northern Arizona University, Flagstaff, AZ
Abstract—We describe an individual-tree model that uses contemporary measurements to “grow trees backward” and reconstruct past tree diameters and stand structure in ponde-rosa pine dominated stands of the Southwest. Model inputs are contemporary structural measurements of all snags, logs, stumps, and living trees, and radial growth measurements, if available. Key steps include the application of inverse decay functions to estimate snag and log death dates, and the estimation of tree size in the reconstruction year via radial growth data or accrued basal area increment. The model is provided as a function for R, and can be modified for other species and regions.
how it was parameterized. First, the allometric equations used in the model were compiled from a variety of sources rather than being locally parameterized, and therefore did not fit the data as good as possible. For example, DBH and diameter at stump height (DSH) were regressed, but the pub-lished regression was based on a stump height of 30 cm (12”; Hann 1976) while the data used to validate the model were obtained at 40 cm stump height. Second, the model was writ-ten using a software language that is no longer commonly used, and thus its utility was greatly diminished. We have ported the model to R, an open-source statistical language (R Development Core Team 2007), and have published the code as a script (Appendix 1) that can be updated for other species and forest types.
Here, we summarize the model structure, including the improvements we have made to it. We also note some of the limitations of the model as it is currently formulated.
Model Requirements
The model operates on an individual-tree basis. It requires data on all trees in the stand, both live and dead. A number of field-collected variables are recorded for each tree (Table 1, Table 3). If available, radial growth data from increment cores can also be incorporated to provide accurate infor-mation about individual trees. Although the original model

USDA Forest Service RMRS-P-55. 2008. 107
included more species, the revised model presented here is parameterized for ponderosa pine (Pinus ponderosa Laws. var. scopulorum Engelm.) and Gambel oak (Quercus gam-belii Nutt.). All variables must be in metric units.
Model Structure
Step 1: Parameter Specification
Parameters to be specified include the inventory year (year when measurements were obtained; can differ among trees), reconstruction year (Year X, a constant; all trees will be re-constructed back to this year), and death dates of stumps, if known.
Table 1. Variables to be measured, and allowed values for each.
Variable Values / Comments
Species Required.Condition Required. See Table 3 for details.Field-called Age Class Required. 0 (post-plot; ~100 years old), 1 (pre-plot; >100 years old), or 2 (pre-settlement; >130 years old). See Moore et al. (2004) for details.DBH Outside bark, in cm. Either DBH or DSH is required.DSH Outside bark, in cm. Either DBH or DSH is required.Increment Core Optional. If a core is taken, the following variables should be measured on it: i) center date; ii) radial increment from inventory year back to Year X, in cm; iii) radial increment from inventory year back to pith, in cm.
Step 2: Populate Required Inventory Year Variables
It is often not practical to measure all required variables for all trees. For example, we generally measure DBH on live trees but DSH on dead trees, snags, and logs. Therefore, we used DBH-DSH regressions to estimate missing data val-ues. The regressions (Table 2) were developed from trees on the Woolsey plots, a series of permanent plots on the Fort Valley Experimental Forest and throughout Arizona and New Mexico (Moore and others 2004). For each species, multiple regression analysis indicated that this relationship did not dif-fer between trees of different field-called age classes.
Second, all trees were assigned in the field to one of three field-called age classes, but our model is based on two age classes. In ponderosa pine, these age classes
Table 2. Regressions between outside-bark diameter at breast height (DBH, in cm) and diameter at a stump height of 40 cm (DSH, in cm) and between DSH and annual basal area increment (Annual.BAI, in cm2) for ponderosa pine (PIPO) and Gambel oak (QUGA) trees. Data are from Woolsey plots throughout Arizona and New Mexico.
Range of Range of independent dependent Species Equation N R2 SEEa variable variable
DBH-DSH Regressions
PIPO DSH = 1.664 + 1.063 DBH 8375 0.9935 1.511 0.25 to 99.06 1.02 to 103.63QUGA DSH = 1.093 + 1.034 DBH 1400 0.9884 1.268 0.25 to 77.98 0.25 to 72.14
DSH-Annual.BAI Regressions
PIPOb ln(Annual.BAI) = -3.718 + 1.736 ln(DSH) 3008 0.9612 0.227 1.5 to 64.0 0.05 to 35.58PIPOc ln(Annual.BAI) = -3.216 + 1.541 ln(DSH) 2014 0.6772 0.314 7.6 to 92.0 0.62 to 72.97QUGAb ln(Annual.BAI) = -3.161 + 1.370 ln(DSH) 206 0.8777 0.284 1.8 to 25.7 0.07 to 6.04QUGAc ln(Annual.BAI) = -3.090 + 1.384 ln(DSH) 143 0.5828 0.263 9.7 to 64.5 0.93 to 19.21
a Standard error of the estimate.b “Post-plot” field-called age class.c “Pre-plot” and “Presettlement” field-called age classes.

108 USDA Forest Service RMRS-P-55. 2008.
roughly correspond to black jack (trees <150 years old) and yellow pine (trees >150 years old, Moore and others 2004). Calculated age classes are adjusted based on age data, where available, or on the field-called age class and size of the tree.
Step 3: Estimating Snag and Log Death Dates
Dead trees, snags, and logs are ‘undecomposed’ to esti-mate their death dates (Table 3). Decay rates are based on Rogers and others (1984) and assumed the 50th decomposi-tion rate percentile as this percentile has been shown to work well (Huffman and others 2001).
Step 4: Back-Growth of Trees
Trees are back-grown from their inventory or death date (whichever is earlier) to Year X. Three methods are used, de-pending on the availability of increment data. If a complete increment core (i.e., containing radial increments from Year X to present and from pith to present) is available, diameter in Year X is reconstructed using the proportional reconstruction method (Bakker 2005). If only the radial increment from Year X to present is available, diameter in Year X is reconstruct-ed by subtracting twice the radial increment from the inside bark diameter. Inside bark diameters were calculated using published equations for ponderosa pine (Myers 1963) and as-suming that bark thickness equaled 5% of stem diameter for
Table 3. Condition classes and decay rates applied to trees on the Woolsey plots. The example shows the estimated death date for a 50 cm DBH tree measured in 2008. For instance, a 50 cm DBH condition 3 tree is estimated to have died in 2008 while a condition 7 log of the same size is estimated to have died in 1943.
Condition Description Annual transition rate Example
1 Live - 2 Fading - 3 Recently dead snag 0 (assumed to have died in 2008 inventory year) 4 Loose bark snag 20% 2004 5 Clean bark snag Condition 4 + 15% 1999 6 Snag broken above breast height (BH) Condition 5 + Diameter 1971 dependent snag fall rate 7 Log (snag broken below BH) Condition 5 + 2(Diameter 1943 dependent snag fall rate) 8 Windthrow (dead and down; log Diameter dependent snag 1980 with root ball present) fall rate 9 Cut stump Death date = Cut date, if known, else default date assigned to all stumps 10 Stump hole Same as Condition 7 1943 11 Tree missing Same as Condition 7 1943
Note: Transition rates are for ponderosa pine and are derived from Rogers and others (1984).
Gambel oak. Finally, if no increment data are available, di-ameter in Year X is reconstructed by calculating the expected basal area increment for the interval between Year X and the inventory year and subtracting that increment from the basal area in the inventory year. Diameter-BAI regressions were calculated from trees on Woolsey plots through Arizona and New Mexico (Table 2). Advantages of these regressions are that they are on a log-log scale, are based on large sample sizes from a wide geographic range, and span a much larger DBH range than previous regressions. All back-growth cal-culations are conducted at DSH since that is the height at which increment cores and BAI data were obtained.
Discussion
The accuracy with which individual trees are modeled di-rectly affects the accuracy of stand-level attributes such as tree density and basal area. There are three main elements that affect model accuracy. First, reconstructions presume that all tree structures in the stand, including highly de-composed snags, logs, and stumps, were identified. This is feasible in arid environments like the Southwest; during sam-pling in 1997-1999, Moore and others (2004) missed only 9% of the trees present at plot establishment (1909-1913). In environments with more mesic climates or faster decomposi-tion rates, this model may not be applicable over as long of time periods. Similarly, stand disturbances such as fires that

USDA Forest Service RMRS-P-55. 2008. 109
consume woody debris will reduce the number of detectable tree structures.
Second, there are a number of known issues related to es-timates of snag and log death dates. First, these rates were derived for ponderosa pine but are applied to all species since we lack specific rates for other species. Second, tree condition 6 (snags broken below BH) is poorly linked to age (Waskiewicz and others 2007). Third, death dates of condi-tion 8 (logs with root balls) trees appear to be underestimated since they are calculated to be of an age intermediate between conditions 5 and 6 (Table 3). Fourth, conditions 10 (stump hole) and 11 (missing) were not included in Rogers and oth-ers (1984); we have assumed that trees of these conditions are at least as old as condition 7 (log; snag broken below BH) trees. Finally, the decay functions are linear and deter-ministic, and do not capture the range of variability observed (Waskiewicz and others 2007).
Third, the three back-growth methods yield different es-timates of historical DBH. To assess this, we identified 389 live ponderosa pine trees on the Woolsey plots that have complete increment cores and for which we knew their actual DBH at plot establishment. These particular trees are locat-ed on the Coconino and Prescott National Forests (Sánchez Meador and Moore, this proceedings; De Blois and others, this proceedings). Plots on the Coconino were established in 1909-1913 while those on the Prescott were established in 1925-1930. We estimated the DBH of each tree at plot establishment using all three reconstruction methods, and calculated the precision of each estimate as the deviation be-tween the estimated and actual DBH divided by the actual DBH. On average, the proportional reconstruction method underestimated the actual DBH by 3.3% (s = 16.8%) while the radial increment method underestimated DBH by 15.2% (s = 16.0%). Using the BAI method, 6.4% of trees were estimated to have been too small to be present at plot estab-lishment (i.e., their estimated diameters were negative). For those trees large enough to be present, DBH was underesti-mated by 12.7% (s = 29.1%).
Future research should address the model limitations identified here and explore the effect of time interval on re-construction accuracy. Future enhancements could include the incorporation of variable stump heights and spatial informa-tion such as distance-dependent competition from neighbors. In addition, although the model is currently parameterized for only two species in the Southwest, the code (Appendix 1) can be edited to parameterize it for other species or regions. In spite of these limitations, stand reconstructions permit us to visualize stand development, estimate reference conditions that guide current restoration activities, and quantify the ef-fects of stand development on ecosystem function.
Acknowledgments
We thank R. Everett and W.W. Covington for reviewing an earlier version of this paper. Contemporary measure-ments of the Woolsey plots were supported by USFS Rocky
Mountain Research Station (RMRS) Joint Venture Agreement 28-JV7-939 and USDA Cooperative State Research, Education and Extension Service grant 2003-35101-12919. Additional funding was provided by McIntire-Stennis appropriations to the School of Forestry and grants from the Ecological Restoration Institute (ERI) at Northern Arizona University. We are grateful to numerous people from the ERI who provided field, laboratory, data entry assistance, and logistical support. We thank the USFS RMRS, Coconino National Forest, and Prescott National Forest for permission to sample their lands.
References
Bakker, J.D. 2005. A new, proportional method for reconstructing historical tree diameters. Canadian Journal of Forest Research. 35: 2515-2520.
Everett, R.; Baumgartner, D.; Ohlson, P.; Schellhaas, R.; Harrod, R. 2007. Development of current stand structure in dry fir-pine forests of eastern Washington. Journal of the Torrey Botanical Society. 134: 199-214.
Fulé, P.Z.; Covington, W.W.; Moore, M.M. 1997. Determining reference conditions for ecosystem management of southwestern ponderosa pine forests. Ecological Applications. 7: 895-908.
Groven, R.; Rolstad, J.; Storaunet, K.O.; Rolstad, E. 2002. Using forest stand reconstructions to assess the role of structural continuity for late-successional species. Forest Ecology and Management. 164: 39-55.
Hann, D.W. 1976. Relationship of stump diameter to diameter at breast height for seven tree species in Arizona and New Mexico. Res. Note INT-212. USDA Forest Service, Intermountain Forest and Range Experiment Station, Ogden, UT.
Harrod, R.J., McRae, B.H.; Hartl, W.E.1999. Historical stand reconstruction in ponderosa pine forests to guide silvicultural prescriptions. Forest Ecology and Management. 114: 433-446.
Huffman, D.W.; Moore, M.M.; Covington, W.W.; Crouse, J.E.; Fulé, P.Z. 2001. Ponderosa pine forest reconstruction: comparisons with historical data. Pages 3-8 in R.K. Vance, C.B. Edminster, W.W. Covington, and J.A. Blake (comps.). Ponderosa pine ecosystems restoration and conservation: steps toward stewardship. 2000 April 25-27, Flagstaff, AZ. Proceedings RMRS-P-22. USDA Forest Service, Rocky Mountain Research Station, Ogden, UT.
Jenkins, J.C.; Chojnacky, D.C.; Heath, L.S.; Birdsey, R.A. 2004. Comprehensive database of diameter-based biomass regressions for North American tree species. Gen. Tech. Rep. NE-319. USDA Forest Service, Northeastern Research Station, Newtown Square, PA.
Moore, M.M., Huffman, D.W.; Fulé, P.Z.; Covington, W.W.; Crouse, J.E. 2004. Comparison of historical and contemporary forest structure and composition on permanent plots in southwestern ponderosa pine forests. Forest Science. 50: 162-176.
Myers, C.A. 1963. Estimating past diameters of ponderosa pines in Arizona and New Mexico. Res. Note RM-7. USDA Forest Service, Rocky Mountain Forest and Range Experiment Station, Fort Collins, CO.

110 USDA Forest Service RMRS-P-55. 2008.
R Development Core Team. 2007. R: a language and environment for statistical computing. R Foundation for Statistical Computing, Vienna, Austria.
Rogers, J.J.; Prosser, J.M.; Garrett, L.D.; Ryan, M.G. 1984. ECOSIM: a system for projecting multiresource outputs under alternative forest management regimes. Administrative report, Rocky Mountain Forest and Range Experiment Station, Fort Collins, CO.
Waskiewicz, J.D.; Fulé, P.Z.; Beier, P. 2007. Comparing classification systems for ponderosa pine snags in northern Arizona. Western Journal of Applied Forestry. 22: 233-240.
The content of this paper reflects the views of the author(s), who are responsible for the facts and accuracy of the information presented herein.

USDA Forest Service RMRS-P-55. 2008. 111
1
Appendix 1. R function. Text following a ‘#’ on a line are comments, not executable code.
# R code to calculate prior forest structure in northern Arizona ponderosa
pine forests
# based on contemporary Data.
# J.D. Bakker, May 30, 2008
# Based on R code from A.J. Sanchez Meador and a R-Base macro from
# P.Z. Fule, A. Waltz, J. Crouse, D. Huffman, and A.J. Sanchez Meador.
# Formatting Notes:
# 1.All Data must be in metric units.
# 2.Data must be comma delimited (csv), with headers on the first line.
# 3.No spaces in column headings (use '.' instead)
# Model Arguments (variables):
# tree.num - Unique tree number. Required.
# orig.tree.num - number assigned at plot establishment or remeasurement.
Optional.
# spp - Species code. Valid codes: PIPO, QUGA. All other species omitted at
present. Required.
# cond - tree condition. Valid numbers range from 1 to 11. Required.
# age - Field call of age class. Valid codes are 0 (post-plot), 1 (pre-plot),
or 2 (pre-settlement). Required.
# dbh - DBH, outside bark, in cm. Optional, but either dbh or dsh is
required.
# dsh - DSH, in cm. Usually outside bark. Optional, but either dbh or dsh is
required.
# core - 0 (no core) or 1 (cored). Optional.
# center.date - Center date. Optional.
# inc.x.yr - Increment from inventory year to desired reconstruction year
(Year X), in cm. Optional.
# inc.excl.yr - Increment from inventory year to fire exclusion year, in cm.
Optional.
# inc.pith - Increment from inventory year to pith of stem, in cm. Optional.
# cut.date - Cut date of stump or death date of tree. Optional.
# inv.yr - Inventory year. Required.
# dbh.inv - Calculated DBH (outside bark) in inventory year for use in model.
Returned by model.
# dsh.inv - Calculated DSH (outside bark) in inventory year for use in model.
Returned by model.
# age.inv - Calculated age class in inventory year for use in model. Returned
by model.
# death.yr - Calculated; last year in which tree was alive (inventory year
for live trees) Returned by model..
# dsh.x - Calculated DSH (outside bark) in Year X. Returned by model.
# dbh.x - Calculated DBH (outside bark) in Year X. Returned by model.
# Future Enhancements:
# -parameterize for other species
# -incorporate stump height
##### RECON.MODEL FUNCTION #####
recon.model<-function(Data, xyr, exclyr) {

112 USDA Forest Service RMRS-P-55. 2008.
3
for(i in 1:nrow(Data)) {
if(Data$cond[i] <= 2) {
if((!is.na(Data$center.date[i]) && Data$center.date[i] <= excl.yr) ||
!is.na(Data$inc.excl.yr[i])) {
Data$age.inv[i]=1 }
}
if(Data$cond[i] >= 3 && Data$age[i] > 0) Data$age.inv[i]=1
}
cat("Determine Presettlement age class for dead trees/stumps with/without
field calls", "\n")
for(i in 1:nrow(Data)) {
if(Data$spp[i] == 'PIPO' && Data$cond[i] == 9 && Data$age[i] < 1) { if
(Data$dsh.inv[i] >= 31.8) Data$age.inv[i]=1 }
if(Data$spp[i] == 'QUGA' && Data$dbh.inv[i] >= 17) Data$age.inv[i]=1
}
cat("Final check for age inconsistencies", "\n")
for(i in 1:nrow(Data)) {
if(!is.na(Data$center.date[i]) && Data$center.date[i] <= excl.yr)
Data$age.inv[i]=1
if(Data$age[i] > 0 && Data$cond[i] <= 2 && (is.na(Data$center.date[i]) ||
Data$center.date[i] >= Data$inv.yr[i]) && (is.na(Data$inc.x.yr[i]) ||
Data$inc.x.yr[i] == 0)) Data$age.inv[i]=1
if(!is.na(Data$center.date[i]) && Data$center.date[i] > excl.yr &&
Data$center.date[i] < Data$inv.yr[i]) Data$age.inv[i]=0
}
cat("Age/Size Class determination complete", "\n")
### “UN-DECOMPOSE” DEAD TREES TO DETERMINE DEATH DATES ###
cat("Step 4. Estimate Death Dates of Dead Trees", "\n")
cat("Initialize death date at inventory year for all trees", "\n")
Data$death.yr <- Data$inv.yr
pctile = 0.5 # Set decomposition percentile
cat("Decomposition percentile =", pctile, "\n")
for(i in 1:nrow(Data)) {
# Condition 3 assumed to have died in inventory year
if(Data$cond[i] == 4) { Data$death.yr[i] = Data$inv.yr[i] + ((log(pctile)-
log(1))/log(1.2)) }
if(Data$cond[i] == 5) { Data$death.yr[i] = Data$inv.yr[i] + ((log(pctile)-
log(1))/log(1.2)) + ((log(pctile)-log(1))/log(1.15)) }
if(Data$cond[i] == 6) { Data$death.yr[i] = Data$inv.yr[i] + ((log(pctile)-
log(1))/log(1.2)) + ((log(pctile)-log(1))/log(1.15)) + ((log(pctile)-
log(1))/log(1+(1/(2*(Data$dbh.inv[i]/2.54))))) }
if(Data$cond[i] == 7) { Data$death.yr[i] = Data$inv.yr[i] + ((log(pctile)-
log(1))/log(1.2)) + ((log(pctile)-log(1))/log(1.15)) + 2*((log(pctile)-
log(1))/log(1+(1/(2*(Data$dbh.inv[i]/2.54))))) }
if(Data$cond[i] == 8) { Data$death.yr[i] = Data$inv.yr[i] + ((log(pctile)-
log(1))/log(1+(1/(2*(Data$dbh.inv[i]/2.54))))) }
if(Data$cond[i] == 9) {
if(!is.na(Data$cut.date[i])) { Data$death.yr[i] = Data$cut.date[i] }
else {
if(!is.na(Data$orig.tree.num[i])) { Data$death.yr[i] = 1940 }
else { Data$death.yr[i] = 1980 }}}
if(Data$cond[i] == 10) { Data$death.yr[i] = Data$inv.yr[i] + ((log(pctile)-

USDA Forest Service RMRS-P-55. 2008. 113
3
for(i in 1:nrow(Data)) {
if(Data$cond[i] <= 2) {
if((!is.na(Data$center.date[i]) && Data$center.date[i] <= excl.yr) ||
!is.na(Data$inc.excl.yr[i])) {
Data$age.inv[i]=1 }
}
if(Data$cond[i] >= 3 && Data$age[i] > 0) Data$age.inv[i]=1
}
cat("Determine Presettlement age class for dead trees/stumps with/without
field calls", "\n")
for(i in 1:nrow(Data)) {
if(Data$spp[i] == 'PIPO' && Data$cond[i] == 9 && Data$age[i] < 1) { if
(Data$dsh.inv[i] >= 31.8) Data$age.inv[i]=1 }
if(Data$spp[i] == 'QUGA' && Data$dbh.inv[i] >= 17) Data$age.inv[i]=1
}
cat("Final check for age inconsistencies", "\n")
for(i in 1:nrow(Data)) {
if(!is.na(Data$center.date[i]) && Data$center.date[i] <= excl.yr)
Data$age.inv[i]=1
if(Data$age[i] > 0 && Data$cond[i] <= 2 && (is.na(Data$center.date[i]) ||
Data$center.date[i] >= Data$inv.yr[i]) && (is.na(Data$inc.x.yr[i]) ||
Data$inc.x.yr[i] == 0)) Data$age.inv[i]=1
if(!is.na(Data$center.date[i]) && Data$center.date[i] > excl.yr &&
Data$center.date[i] < Data$inv.yr[i]) Data$age.inv[i]=0
}
cat("Age/Size Class determination complete", "\n")
### “UN-DECOMPOSE” DEAD TREES TO DETERMINE DEATH DATES ###
cat("Step 4. Estimate Death Dates of Dead Trees", "\n")
cat("Initialize death date at inventory year for all trees", "\n")
Data$death.yr <- Data$inv.yr
pctile = 0.5 # Set decomposition percentile
cat("Decomposition percentile =", pctile, "\n")
for(i in 1:nrow(Data)) {
# Condition 3 assumed to have died in inventory year
if(Data$cond[i] == 4) { Data$death.yr[i] = Data$inv.yr[i] + ((log(pctile)-
log(1))/log(1.2)) }
if(Data$cond[i] == 5) { Data$death.yr[i] = Data$inv.yr[i] + ((log(pctile)-
log(1))/log(1.2)) + ((log(pctile)-log(1))/log(1.15)) }
if(Data$cond[i] == 6) { Data$death.yr[i] = Data$inv.yr[i] + ((log(pctile)-
log(1))/log(1.2)) + ((log(pctile)-log(1))/log(1.15)) + ((log(pctile)-
log(1))/log(1+(1/(2*(Data$dbh.inv[i]/2.54))))) }
if(Data$cond[i] == 7) { Data$death.yr[i] = Data$inv.yr[i] + ((log(pctile)-
log(1))/log(1.2)) + ((log(pctile)-log(1))/log(1.15)) + 2*((log(pctile)-
log(1))/log(1+(1/(2*(Data$dbh.inv[i]/2.54))))) }
if(Data$cond[i] == 8) { Data$death.yr[i] = Data$inv.yr[i] + ((log(pctile)-
log(1))/log(1+(1/(2*(Data$dbh.inv[i]/2.54))))) }
if(Data$cond[i] == 9) {
if(!is.na(Data$cut.date[i])) { Data$death.yr[i] = Data$cut.date[i] }
else {
if(!is.na(Data$orig.tree.num[i])) { Data$death.yr[i] = 1940 }
else { Data$death.yr[i] = 1980 }}}
if(Data$cond[i] == 10) { Data$death.yr[i] = Data$inv.yr[i] + ((log(pctile)-

114 USDA Forest Service RMRS-P-55. 2008.
4
log(1))/log(1.2)) + ((log(pctile)-log(1))/log(1.15)) + 2*((log(pctile)-
log(1))/log(1+(1/(2*(Data$dbh.inv[i]/2.54))))) }
if(Data$cond[i] == 11) { Data$death.yr[i] = Data$inv.yr[i] + ((log(pctile)-
log(1))/log(1.2)) + ((log(pctile)-log(1))/log(1.15)) + 2*((log(pctile)-
log(1))/log(1+(1/(2*(Data$dbh.inv[i]/2.54))))) }
}
Data$death.yr <- as.integer(Data$death.yr)
cat("Determination of Death Dates Complete", "\n")
### UN-GROW ALL TREES TO YEAR X ###
cat("Step 5. Un-Grow Trees to Year X", "\n")
for(i in 1:nrow(Data)) {
if((!is.na(Data$center.date[i]) & Data$center.date[i] > x.yr) |
(Data$death.yr[i] < x.yr)) {
Data$dbh.x[i] = 0
} # Trees obviously not present in Year X
if(Data$spp[i] == 'PIPO') {
if(!is.na(Data$inc.x.yr[i])) {
if(!is.na(Data$inc.pith[i])) { # Proportional reconstruction method if
increment to pith measured
prop = (Data$inc.pith[i] - Data$inc.x.yr[i]) / Data$inc.pith[i]
Data$dsh.x[i] = Data$dsh.inv[i] * prop
}
else { # For trees without increment to pith measured
if(Data$age.inv[i] == 1) { # Yellow pine bark thickness equations
(Myers 1963)
Data$dsh.x[i] = 1.0524 * (((0.9498 * Data$dsh.inv[i]) - 2.8491) -
(2 * Data$inc.x.yr[i])) - 3.0272
}
else { # Blackjack bark thickness equations (Myers 1963)
Data$dsh.x[i] = 1.0698 * (((0.9344 * Data$dsh.inv[i]) - 3.0284) -
(2 * Data$inc.x.yr[i])) - 3.2614
}
}
Data$dbh.x[i] = (Data$dsh.x[i] - 1.6643787) / 1.0632921
# Formula from Woolsey plots; r^2 = 0.994; N = 8375
if(Data$dbh.x[i] < 0) { Data$dbh.x[i] == 0 }
}
else { # For trees without increment data
if(Data$age.inv[i] == 1) { # Yellow pine equation from Woolsey plots;
r^2 = 0.6772; N = 2014
Data$dbh.x[i] = sqrt(Data$dbh.inv[i]^2 - (4/pi * exp(-3.21600 +
1.54140 * log(Data$dbh.inv[i])) * (Data$death.yr[i] - x.yr)))
if(is.nan(Data$dbh.x[i])) { Data$dbh.x[i] = 0 }
}
else { # Blackjack equation from Woolsey plots; r^2 = 0.9612; N = 3008
Data$dbh.x[i] = sqrt(Data$dbh.inv[i]^2 - (4/pi * exp(-3.718047 +
1.735790 * log(Data$dbh.inv[i])) * (Data$death.yr[i] - x.yr)))
if(is.nan(Data$dbh.x[i])) { Data$dbh.x[i] = 0 }
}
}
}
if(Data$spp[i] == 'QUGA') {
if(!is.na(Data$inc.x.yr[i])) { # For trees with increment data
# NOTE - All formulas here assume 5% bark thickness for QUGA (no literature)

USDA Forest Service RMRS-P-55. 2008. 115
5
# TODO - Develop QUGA bark thickness equations
if(!is.na(Data$inc.pith[i])) { # Proportional reconstruction method if
increment to pith measured
prop = (Data$inc.pith[i] - Data$inc.x.yr[i]) / Data$inc.pith[i]
Data$dsh.x[i] = Data$dsh.inv[i] * prop
}
else { # For trees without increment to pith measured
Data$dsh.x[i] = ((0.95 * Data$dsh.inv[i]) - (2 * Data$inc.x.yr[i])) /
0.95
}
Data$dbh.x[i] = (Data$dsh.x[i] - 1.092945) / 1.033582
# Formula from Woolsey plots; r^2 = 0.988; N = 1400
if(Data$dbh.x[i] < 0) { Data$dbh.x[i] = 0 }
}
else { # For trees without increment data
if(Data$age.inv[i] == 1) { # Large/old tree equation from Woolsey
plots; r^2 = 0.5828; N = 143
Data$dbh.x[i] = sqrt(Data$dbh.inv[i]^2 - (4/pi * exp(-3.09044 +
1.38412 * log(Data$dbh.inv[i])) * (Data$death.yr[i] - x.yr)))
if(is.nan(Data$dbh.x[i])) { Data$dbh.x[i] = 0 }
}
else { # Small tree equation from Woolsey plots; r^2 = 0.8777; N = 206
Data$dbh.x[i] = sqrt(Data$dbh.inv[i]^2 - (4/pi * exp(-3.16137 +
1.37009 * log(Data$dbh.inv[i])) * (Data$death.yr[i] - x.yr)))
if(is.nan(Data$dbh.x[i])) { Data$dbh.x[i] = 0 }
}
}
}
}
# Other species omitted at present
cat("Un-Growth of Trees to Year X Complete", "\n")
### SUMMARIZE DATA ###
cat("Step 6. Summarize Data", "\n")
cat("Comparison of field Age Class calls with model age/size classes", "\n")
table(Data[c("age", "age.inv", "spp")]) # Creates a contingency table, by
species
hist(Data$dbh.x[Data$dbh.x > 0])
write.csv(Data, file = file.choose())
#NOTE - Remember to specify a “.csv” ending to file name, otherwise R will
specify no file extension!
cat("Data Saved to CSV file", "\n")
#detach(Data)
}
##### END OF RECON.MODEL FUNCTION #####
### CODE TO RUN RECON.MODEL FUNCTION ###
Data <- read.csv(file.choose(), header = TRUE, sep = ",", quote="\"",
dec=".", fill = TRUE, na.strings = "NA")
recon.model(Data, xyr=1909, exclyr=1876)

116 USDA Forest Service RMRS-P-55. 2008.
Introduction
In the decades around 1900, livestock grazing and tim-ber harvesting were largely unregulated and unsustainable in northern Arizona. These land uses clearly needed to be bal-anced, and the Coconino National Forest (CNF), which was established in 1908, did so by regulating when, where, and how they were conducted. In 1910, Robert R. Hill, a U.S. Forest Service (USFS) Grazing Examiner with District 3 (now Region 3) and the Fort Valley Experimental Forest (FVEF) initiated a study to examine potential livestock damage to pon-derosa pine (Pinus ponderosa Laws. var. scopulorum Engelm.) regeneration (Hill 1917). This study included detailed observa-tions on the amount of browsing damage to pine seedlings and saplings on 150 plots in 1910 and an additional 100 plots in 1912 (250 plots total). All plots were within 40 km (25 miles) of Flagstaff, AZ. The fate of the seedlings and saplings was followed from 1912 to 1914. Hill (1917) concluded that: 1) a third of the seedlings were severely or moderately damaged; 2) damage was concentrated in specific times of the year; and 3) sheep generally do the most severe damage to seedlings, though all classes of livestock are likely to damage small trees on overgrazed range. Hill conducted this study while also lead-ing the first range reconnaissance in the United States, which was conducted on CNF in 1912 (Bodley 1913).
As part of his grazing effects study, Hill established ~ 0.6 ha (1.5 acre) livestock exclosures at five sites to experimentally determine the effects of grazing protection on pine reproduc-tion. Sites were selected to span a range of soil types and elevations (Table 1). An incidental goal of these exclosures
In: Olberding, Susan D., and Moore, Margaret M., tech coords. 2008. Fort Valley Experimental Forest—A Century of Research 1908-2008. Proceedings RMRS-P-55. Fort Collins, CO: U.S. Department of Agriculture, Forest Service, Rocky Mountain Research Station. 282 p.
The Hill Plots: A Rare Long-Term Vegetation Study
Jonathan D. Bakker, College of Forest Resources, University of Washington, Seattle, WA; Margaret M. Moore, School of Forestry, Northern Arizona University, Flagstaff, AZ; and Daniel C. Laughlin, Ecological Restoration Institute, Northern Arizona University, Flagstaff, AZ
Abstract—One legacy of the Fort Valley Experimental Forest is the number and quality of long-term studies associated with it. One such study is the “Hill plots,” which began in 1912 and is still being actively studied. Livestock exclosures were built at five sites to examine veg-etation recovery when protected from livestock grazing. Sites span a range of soil types and elevations. Materials associated with the Hill plots include historical data, plant specimens, and photographs. In this paper, we summarize the research that has occurred on the Hill plots, historical personnel who worked on them, threats they have experienced, ecological insights they have provided, and current research directions.
was to permit an assessment of the effects of livestock grazing on forage plants (Hill 1917), yet this aspect of the research has been the primary focus since 1914. Collectively, these sites are now known as the “Hill plots” in recognition of Hill’s foresight in establishing them. Here, we summarize the research that has been conducted on these sites, historical personnel who worked on them, threats they have experienced, ecological in-sights they have provided, and current research directions.
Historical Research
Historical work on the Hill plots occurred from 1912 to 1956. Many USFS scientists worked on these plots through-out the years (Table 2), and went on to become leaders in the fields of range ecology and management. Hill served as direc-tor of the Santa Rita Experimental Range in 1920, and later became Grazing Examiner in charge of the Regional Office of Grazing Studies. Other notable scientists include W. R. Chapline, M. W. Talbot, C. L. Forsling, E. W. Nelson, C. K. Cooperrider, and J. F. Arnold.
In 1912, Hill established fifty chart quadrats, five inside and five outside each exclosure. Quadrats were 1 x 1 m, and were marked in each corner with a wooden stake. Chart quad-rats, plots in which the positions of all plants are accurately noted, were a common method of studying vegetation in the early 1900s (e.g., Clements 1905, Weaver and Clements 1929, Figure 1, Table 3). The vegetation on these quadrats was mapped, recording the basal area of grass clumps and prostrate species (e.g., Antennaria) as polygons, and individual stems

USDA Forest Service RMRS-P-55. 2008. 117
Tabl
e 1.
Sum
mar
y in
form
atio
n ab
out t
he H
ill p
lots
. Inf
orm
atio
n ad
apte
d fr
om B
akke
r (2
005)
.
B
ig F
ill
Bla
ck S
prin
gs
Fry
Park
a R
eese
Tan
kb R
oger
s La
ke
Loca
tion
SW¼
Sec
21,
T21
N, R
8E
SW¼
Sec
8, T
20N
, R7E
N
E¼ S
ec 3
1, T
20N
, R6E
N
E¼ S
ec 8
, T23
N, R
7E
NW
¼ S
ec 8
, T20
N, R
6EC
urre
nt ju
risd
ictio
nc C
NF
CN
F C
NF
CN
F C
F/C
NF
Excl
osur
e ar
ea (h
a)
0.61
8 0.
786
0.84
0 0.
669
0.57
4M
ean
elev
atio
n (m
) 20
70
2100
21
70
2490
22
20Pa
rent
mat
eria
ld Li
mes
tone
Li
mes
tone
/San
dsto
ne
Bas
alt/C
inde
rs
Mix
ed Ig
neou
s B
asal
t/Cin
ders
Dis
turb
ance
his
tory
e
Loca
lized
PL
194
6 PL
ca.
195
4 N
one
RD
ca.
197
8 N
one
Gen
eral
ized
SH
189
6, 1
919,
194
7 SH
190
2; P
CT
1976
, 199
7 SH
191
0 SH
194
0,19
78,1
989;
SH
190
5
PC
T 19
64; P
B 1
999
(wes
t hal
f)
Gra
zing
inte
nsity
Bef
ore
1912
f O
verg
raze
d O
verg
raze
d O
verg
raze
d O
verg
raze
d O
verg
raze
d19
12-1
924f
Ove
rgra
zed
Hea
vy
Ove
rgra
zed
Mod
erat
e O
verg
raze
d19
24-1
938f
Hea
vy
Hea
vy
Ove
rgra
zed
Mod
erat
e O
verg
raze
d19
39-1
941g
0.58
; Cat
tle
1.01
; Cat
tle
1.35
; Cat
tle
0.17
; She
ep
-; S
heep
2002
-200
4g N
one
sinc
e 20
00
Non
e si
nce
ca. 1
960
0.03
; Cat
tle
Non
e si
nce
ca. 1
992
0.18
; She
ep
a Als
o kn
own
as F
rye
Park
.b A
lso
know
n as
Ree
s Ta
nk.
c CN
F =
Coc
onin
o N
atio
nal F
ores
t; C
F =
Cen
tenn
ial F
ores
t.d
From
Mill
er a
nd o
ther
s (1
995)
.e D
ata
obta
ined
from
unp
ublis
hed
docu
men
ts in
For
t Val
ley
Arc
hive
s, A
rnol
d (1
950)
, and
Coc
onin
o N
atio
nal F
ores
t (J.
Rol
f, pe
rs. c
omm
.). C
odes
: PB
= p
resc
ribe
d bu
rn; P
CT
= p
re-c
omm
erci
al th
inni
ng; P
L =
pow
er/p
hone
line
bui
lt th
roug
h si
te; R
D =
roa
d bu
ilt th
roug
h si
te; S
H =
sel
ectiv
e ov
erst
ory
harv
est.
f Des
crip
tions
from
Mer
rick
(193
9).
g Uni
ts a
re a
nim
al u
nit m
onth
s pe
r ha
; lar
ger
valu
es in
dica
te h
ighe
r gr
azin
g in
tens
ity. 1
939-
41 d
ata
are
from
the
Fort
Val
ley
Arc
hive
s, a
nd c
onte
mpo
rary
dat
a ar
e fr
om a
nnua
l ran
ge in
spec
tions
on
file
at th
e C
ocon
ino
Nat
iona
l For
est.
The
Big
Fill
and
Bla
ck S
prin
gs s
ites
wer
e ne
ar s
heep
dri
vew
ays
hist
oric
ally
. Gra
zing
inte
n-si
ty d
ata
from
193
9-19
41 a
re n
ot a
vaila
ble
for
Rog
ers
Lake
.

118 USDA Forest Service RMRS-P-55. 2008.
of most forbs and shrubs as points. Quadrats were measured periodically between 1912 and 1941 (Figure 2). Early mapping was done manually until Hill adapted the pantograph for use in vegetation studies (Hill 1920).
Site maps showing the locations of chart quadrats do not ap-pear to have been made originally, and several quadrats could not be relocated after 1914. In 1920, site maps were drawn showing the location of each quadrat relative to fences and other features. In addition, the wooden stakes were replaced around this time with angle iron stakes, and one corner of each quadrat was tagged with a metal numbered tag.
Around 1931, the exclosures at Fry Park and Black Springs were expanded to permit assessments of vegetation recovery in areas that had received two additional decades of livestock grazing. However, these assessments appear to have been done visually or with photographs; we have not found data collected specifically in these areas.
While the pantograph simplified the process of mapping a chart quadrat, the time commitment was still considerable and resulted in a low number of samples for a given area. In the late 1930s, R. H. Canfield adapted the line intercept sam-pling method to rangeland vegetation (Canfield 1941). This
Table 2. Personnel who worked on the Hill plots (1912-1956). Initials are provided for individuals that have not been definitively identified.
Person Date Range Activities
Robert R. Hill 1912-1921 Established exclosures; Recorded damage to ponderosa pine regeneration; Chart quadratsW. R. Chapline 1912 Chart quadratsM. W. Talbot 1920-1923 Chart quadrats; PhotographsC. L. Forsling 1920 Chart quadratsEnoch W. Nelson 1924 Chart quadratsC. K. Cooperrider 1925-1926 Chart quadrats; PhotographsLAW 1925 Chart quadratsR. F. Copple 1926-1930 Chart quadratsE. H. Bomberger 1930-1938 Chart quadratsE. Shirley Bliss 1930 Chart quadratsBarnard A. Hendricks 1930 Chart quadratsCFD 1931 Chart quadratsOran B. Stanley 1931 Chart quadratsHugh O. Cassidy 1930-1933 Chart quadratsJ. D. Jones 1932 PhotographsGordon D. Merrick 1933-1938 Chart quadratsTGW 1933 Chart quadratsWilliam J. Cribbs 1935 PhotographsGeorge E. Glendening 1941 Chart quadrats; Line intercept sampling; PhotographsBHM 1941 Chart quadrats; Line intercept samplingEES 1941 Chart quadrats; Line intercept samplingEFP 1941 Line intercept samplingHAL 1941 Line intercept samplingJames G. Rowbury, Jr. 1941 Line intercept samplingJoseph F. Arnold 1947-1952 Line transect samples; PhotographsKenneth W. Parker 1947 PhotographsT. M. Smith 1956 Photographs
Sources: Unpublished records in Fort Valley Experimental Forest Archives; Arnold (1950); Price (1976); Chapline (1980).
method greatly increased the speed and therefore the number of samples that could be obtained from an area. The Hill plots were sampled in this manner in 1941 and 1948 (Arnold 1950, Bakker and Moore 2007).
Historical Collections
The historical vegetation data (chart quadrat maps and line intercept data sheets) are housed in the Fort Valley Experimental Forest Archives in Flagstaff, AZ. The Archives also contain other pertinent information such as summaries of grazing intensity for the allotments in which the sites are lo-cated, and hand-drawn maps of quadrat locations within sites.
Photographs were taken of sites and of individual chart quadrats between 1921 and 1956. Of particular note are a se-ries of photographs taken by M. W. Talbot in 1921 and reshot by K. W. Parker in 1947 (e.g., Figure 3). Many of the photo-points were drawn onto the site maps to permit their relocation. Historical images are housed in the Fort Valley Archives and the National Archives and Records Administration (NARA).
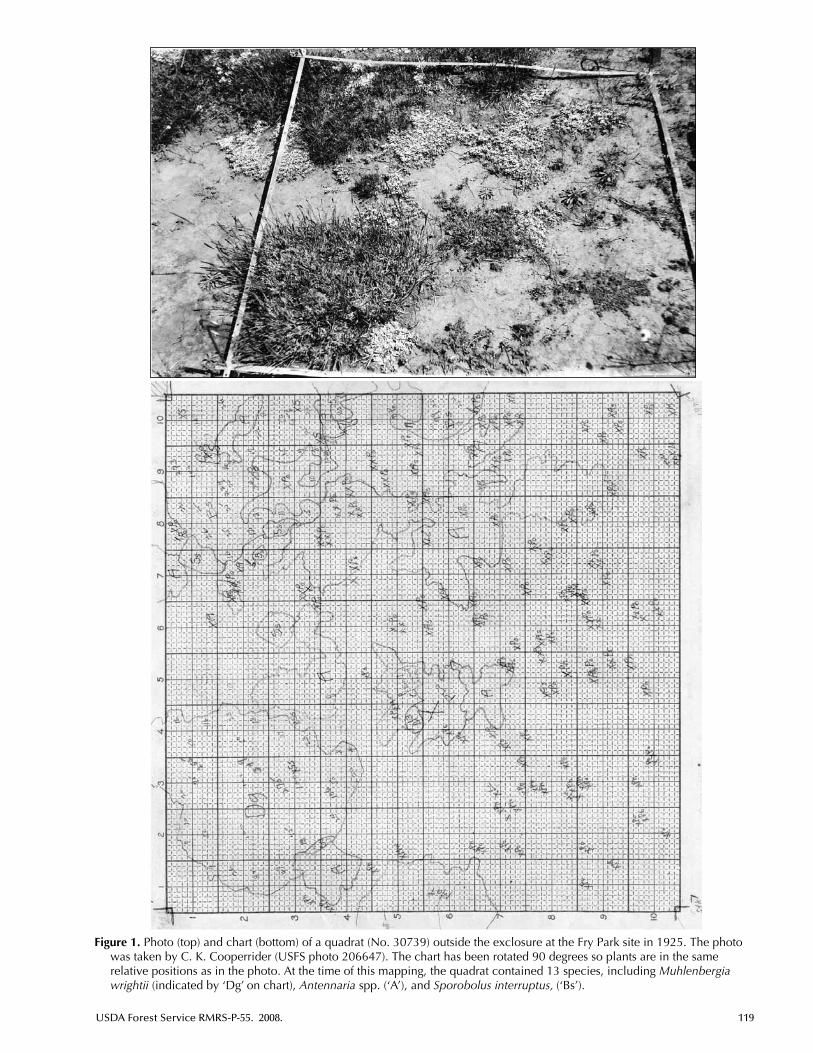
USDA Forest Service RMRS-P-55. 2008. 119
Figure 1. Photo (top) and chart (bottom) of a quadrat (No. 30739) outside the exclosure at the Fry Park site in 1925. The photo was taken by C. K. Cooperrider (USFS photo 206647). The chart has been rotated 90 degrees so plants are in the same relative positions as in the photo. At the time of this mapping, the quadrat contained 13 species, including Muhlenbergia wrightii (indicated by ‘Dg’ on chart), Antennaria spp. (‘A’), and Sporobolus interruptus, (‘Bs’).

120 USDA Forest Service RMRS-P-55. 2008.
Table 3. Examples of chart quadrat studies established in the early 20th century.
Date Name Geographic Location Established Citation
Wallowa Mountains Northeastern Oregon 1907 Sampson 1914Woolsey Plots Northern Arizona 1909 Pearson 1923Hill Plots Northern Arizona 1912 Arnold 1950, Bakker and Moore 2007Great Basin Experiment Station Wasatch Mountains, central Utah 1913 Sampson 1915, Prevedel and others 2005Santa Rita Experimental Range Southeastern Arizona ca. 1915a Canfield 1957, McClaran and others 2003Jornada Experimental Range Southern New Mexico 1915 Gibbens and Beck 1988, Yao and others 2006Wild Bill Northern Arizona 1928 Cooperrider and Cassidy 1939Hays Hays, Kansas 1932 Albertson and Tomanek 1965Rodent Study Plots Northern and Northwestern Arizona 1924 Taylor and Loftfield 1924Vegetation of NE Arizona Northeastern Arizona 1924 Hanson 1924U.S. Sheep Experimental Station Southern Idaho 1930 West and others 1979
a Established by R. R. Hill (Canfield 1957).
Figure 2. Number of Hill plots sampled in each year between 1912 and 2007.
Scanned images of many photographs are available in the USFS Rocky Mountain Research Station Image Database (http://www.rmrs.nau.edu/imagedb/bcollection.shtml).
Early scientists made plant collections a priority; hundreds of specimens were obtained during the CNF range reconnais-sance (Bodley 1913; Memo on Plant Identification from W. A. Dayton to J. T. Jardine, 1916, in Fort Valley Archives). Plant samples were taken from the Hill plots between 1921 and 1945. Specimens are housed in numerous herbaria (e.g., CNF, Northern Arizona University, Museum of Northern Arizona, Arizona State University, University of Arizona, Desert Botanical Garden, National Herbarium of the USFS). Plant database projects are increasingly making these records available via the internet.
Threats
It has been almost a century since the Hill plots were es-tablished, and they have not survived unscathed. Sites have experienced prescribed burns and silvicultural treatments, and have been bisected by power lines, phone lines, and roads (Table 1). Two sites are within the current Flagstaff city limits. In addition, livestock no longer graze at several sites. However, there have also been surprising instances where sites and quadrats have survived major activities such as the build-ing of Interstate 17 (i.e., Black Springs), major forest thinning projects (i.e., Black Springs and Rogers Lake), and large wild-fires (i.e., Reese Tank on the edge of the Bear Jaw fire).

USDA Forest Service RMRS-P-55. 2008. 121
Contemporary Research
In 2002, we rediscovered the historical vegetation data in the Fort Valley Archives and the exclosures and chart quad-rats in the field. These old exclosures were relatively easy to find since we had specific legal descriptions and some of the fences were maintained over the years. Most of the chart quadrats were relocated with the aid of a metal detector. Since then, we have conducted a number of measurements on these sites.
Figure 3. Repeat photograph series from the Fry Park site in 1923 (top), 1947 (middle), and 2005 (bottom). The 1923 photo was taken by M. W. Talbot (USFS photo 184084), the 1947 photo by K. W. Parker (USFS photo K-1144A), and the 2005 photo by J. D. Bakker.
Vegetation on the chart quadrats has been remapped an-nually from 2002 to 2007. On sites where quadrats were missing, new quadrats have been established. The chart quadrat maps have been digitized in a geographical informa-tion system to permit analyses of spatial dynamics and trends in plant cover and abundance over time. Glendening’s 1941 line intercept transects were re-measured in 2004 (Bakker and Moore 2007). Most of the historical photographs were retaken between 2003 and 2005 (e.g., Figure 3).

122 USDA Forest Service RMRS-P-55. 2008.
The overstory vegetation has been measured within all exclosures and in a 20 x 20 m area around each quadrat out-side the exclosures. Measurements included tree species, diameter, height, spatial coordinates, and age (for a subset of trees). The contemporary overstory data permits the appli-cation of stand reconstruction methods (Bakker and others, this proceedings) to estimate stand dynamics and permit overstory-understory comparisons with historical data.
More recently, we have measured a variety of physical and chemical soil properties for each chart quadrat. We are also quantifying litter decomposition rates and analyzing the re-lationships between the soil and plant community structure to determine how long-term vegetation changes have influ-enced ecosystem function.
Ecological Insights
Early work demonstrated that vegetation recovery may take decades following severe livestock grazing (Merrick 1939, Talbot and Hill 1923). Arnold (1950) showed that ponderosa pine in-growth had reduced the abundance of the understory vegetation. More recent work demonstrated that this effect is still evident today, as are the consequences of continued livestock grazing in the early 1900s: current tree densities are twice as high inside than outside exclosures while basal area is 40% higher inside exclosures (Bakker and Moore 2007). Since plot establishment, understory abundance and diversity have declined and plant species have responded differentially to grazing and pine in-growth (Bakker 2005). Effects of veg-etation type and livestock grazing on diversity are expressed at different spatial scales (Rudebusch 2006). As noted above, research is ongoing on these sites. Research on these sites has answered questions beyond those originally posed by Hill. Who knows what insights they will provide in the future?
Acknowledgments
We thank D.W. Huffman and R.A. Gill for reviewing an earlier version of this paper. Contemporary measurements of the Hill plots were supported by the Ecological Restoration Institute (ERI) and School of Forestry at Northern Arizona University. We particularly thank the ERI field and lab crews for their assistance with data collection and entry. We thank the U.S. Forest Service and NAU Centennial Forest for per-mission to sample their lands.
References
Albertson, F. W.; Tomanek, G. W. 1965. Vegetation changes during a 30-year period in grassland communities near Hays, Kansas. Ecology. 46: 714-720.
Arnold, J. F. 1950. Changes in ponderosa pine bunchgrass ranges in northern Arizona resulting from pine regeneration and grazing. Journal of Forestry. 48:118-126.
Bakker, J. D. 2005. Long-term vegetation dynamics of ponderosa pine forests. Ph.D. dissertation. Northern Arizona University, Flagstaff, AZ. 164 p.
Bakker, J. D.; Moore, M. M. 2007. Controls on vegetation structure in southwestern ponderosa pine forests, 1941 and 2004. Ecology. 88: 2305-2319.
Bodley, R. E. 1913. Grazing reconnaissance on the Coconino National Forest. The University of Nebraska Forest Club Annual. 5: 71-81.
Canfield, R. H. 1941. Application of the line interception method in sampling range vegetation. Journal of Forestry. 39: 388-394.
Canfield, R. H. 1957. Reproduction and life span of some perennial grasses of southern Arizona. Journal of Range Management. 10(5): 199-203.
Chapline, W. R. 1980. First 10 years of the Office of Grazing Studies. Rangelands. 2: 223-227.
Clements, F. E. 1905. Research methods in ecology. The University Publishing Company, Lincoln, NE.
Cooperrider, C. K.; Cassidy, H. O. 1937. Cattle grazing on cut-over timberlands in relation to regeneration of pine forests. Unpub. Pap. on file at Flagstaff, AZ: U.S. Department of Agriculture, Forest Service, Rocky Mountain Research Station, Fort Valley Experimental Forest archives. 93 p.
Gibbens, R. P.; Beck, R. F. 1988. Changes in grass basal area and forb densities over a 64-year period on grassland types of the Jornada Experimental Range. Journal of Range Management. 41: 186-192.
Hanson, H. C. 1924. A study of the vegetation of northeastern Arizona. University of Nebraska Studies. 24: 85-175.
Hill, R. R. 1917. Effects of grazing upon western yellow-pine reproduction in the National Forests of Arizona and New Mexico. Bull. 580. USDA Forest Service, Washington, DC. 27 p.
Hill, R. R. 1920. Charting quadrats with a pantograph. Ecology. 1: 270-273.
McClaran, M. P.; Ffolliott, P. F.; Edminster, C. B. (tech. coords.). 2003. Santa Rita Experimental Range: 100 years (1903 to 2003) of accomplishments and contributions. Proc. RMRS-P-30. USDA Forest Service, Rocky Mountain Research Station, Odgen, UT. 197 p.
Merrick, G. D. 1939. Revegetation of deteriorated range land in northern Arizona. Duke University, Durham, NC. M.A. Thesis.
Miller, G.; Ambos, N.; Boness, P.; Reyher, D.; Robertson, G.; Scalzone, K.; Steinke, R.; Subirge, T. 1995. Terrestrial ecosystems survey of the Coconino National Forest. USDA Forest Service, Southwestern Region, Albuquerque, NM.
Pearson, G. A. 1923. Natural reproduction of western yellow pine in the Southwest. Bull. 105. Washington, DC: U.S. Department of Agriculture. 143 p.
Prevedel, D. A.; McArthur, E. D.; Johnson, C. M. 2005. Beginnings of range management: an anthology of the Sampson-Ellison photo plots (1913 to 2003) and a short history of the Great Basin Experiment Station. Gen. Tech. Rep. RMRS-GTR-154. USDA Forest Service, Rocky Mountain Research Station, Fort Collins, CO. 60 p.
Price, R. 1976. History of Forest Service research in the central and southern Rocky Mountain Regions, 1908-1975. Gen. Tech.

USDA Forest Service RMRS-P-55. 2008. 123
The content of this paper reflects the views of the author(s), who are responsible for the facts and accuracy of the information presented herein.
Rep. RM-27. USDA Forest Service, Rocky Mountain Forest and Range Experiment Station, Fort Collins, CO. 100 p.
Rudebusch, F. 2006. Vegetation responses to long-term livestock grazing and habitat. Undergraduate research paper. Northern Arizona University, Flagstaff, AZ. 35 p.
Sampson, A. W. 1914. Natural revegetation of range lands based upon growth requirements and life history of the vegetation. Journal of Agricultural Research. 3(2): 93-147.
Sampson, A. W. 1915. The quadrat method as applied to investigations in forestry. The University of Nebraska Forest Club Annual. 6: 11-31.
Talbot, M. W.; Hill, R. R.1923. Progress report on the range study plots on the Coconino National Forest comprising a description of project and digest of data. Unpub. Pap. on file at Flagstaff, AZ: U.S. Department of Agriculture, Forest Service, Rocky
Mountain Research Station, Fort Valley Experimental Forest archives. 32 p.
Taylor, W. P.; Loftfield, J. V. G. 1924. Damage to range grasses by the Zuni prairie dog. Bull. 1227. Washington, DC: U.S. Department of Agriculture. 15 p.
Weaver, J. E.; Clements, F. E. 1929. Plant ecology. McGraw-Hill Book Company, New York, NY.
West, N. E.; Rea, K. H.; Harniss, R. O. 1979. Plant demographic studies in sagebrush-grass communities of southeastern Idaho. Ecology. 60: 376-388.
Yao, J.; Peters, D. P. C.; Havstad, K. M.; Gibbens, R. P.; Herrick, J. E. 2006. Multi-scale factors and long-term responses of Chihuahuan Desert grasses to drought. Landscape Ecology. 21: 1217-1231.

124 USDA Forest Service RMRS-P-55. 2008.
In: Olberding, Susan D., and Moore, Margaret M., tech coords. 2008. Fort Valley Experimental Forest—A Century of Research 1908-2008. Proceedings RMRS-P-55. Fort Collins, CO: U.S. Department of Agriculture, Forest Service, Rocky Mountain Research Station. 282 p.
Introduction
As trees grow older and increase in size, annual ring width generally decreases along a cross-sectional radius, mostly because of the geometrical constraint to add new wood lay-ers over an expanding surface (Cook 1987, Douglass 1919, Fritts 1976). In shade-intolerant, open grown trees, this trend dominates the temporal sequence of annual wood formation throughout the life history of the tree (Helama and others 2005, Husch and others 2003). In shade-tolerant, forest interior trees this period of ring-width decline normally occurs after the tree has become dominant, and is commonly preceded by one or more periods of growth suppression and release while the tree occupies lower canopy levels (e.g., Canham 1990, Fraver and White 2005, Piovesan and others 2005). Regardless of their overall shape, such individual growth trends are associated with a change in the year-to-year ring-width variation, so that when ring widths are larger, their variability is larger as well (Cook and Peters 1997). A number of ways have been pro-posed in the literature to remove growth variations in both mean and variance that are specific to an individual tree, i.e. to “standardize” ring-width series prior to combining them into a master chronology (Biondi 1993, Cook and Kairiukstis
Removing the Tree-Ring Width Biological Trend Using Expected Basal Area Increment
Franco Biondi, DendroLab, Department of Geography, University of Nevada, Reno, NV; and Fares Qeadan, Department of Mathematics and Statistics, University of Nevada, Reno, NV
Abstract—One of the main elements of dendrochronological standardization is the removal of the biological trend, i.e., the progressive decline of ring width along a cross-sectional ra-dius that is mostly caused by the corresponding increase in stem diameter over time. A very common option for removing this biological trend is to fit a modified negative exponential curve to the ring-width measurements. Because this method has numerical and conceptual drawbacks, we propose an alternative way based on a simple assumption, namely that a constant basal area increment is distributed over a growing surface. We then derive a math-ematical expression for the biological trend, which can be easily calculated and used for dendrochronological standardization. In turn, this “C-method” provides an empirical test of existing theories on life-long progression of tree basal area increment. The proposed meth-od was applied to tree-ring records from ponderosa pines (Pinus ponderosa Douglas ex P.Lawson & C.Lawson) located at the G. A. Pearson Natural Area in northern Arizona, U.S.A. Master ring-index chronologies built with the C-method reproduced stand-wide patterns of tree growth, and are therefore preferable for ecological applications. Other advantages of the C-method are that it is theoretically derived, it is applicable to individual series, and it does not require fitting a growth curve using nonlinear regression.
1990, Warren and Leblanc 1990). Most of these techniques require the elimination of the biological trend by fitting a curve to the raw ring-width measurements. Recently, debate has focused on which standardization option should be used to retain climatic variability at long timescales, i.e., “low-fre-quency” modes (e.g., Bunn and others 2004, Esper and others 2003, 2005, Helama and others 2005, Melvin and others 2007, National Research Council 2006). In fact, the length of indi-vidual ring-width series used to produce a master chronology (rather than the length of the chronology itself) can determine the maximum timescale of retrievable climatic fluctuations (Cook and others 1995). As a contribution to the debate on tree-ring standardization, we have focused on those methods that remove the biological trend by fitting a modified negative exponential function to individual ring-width series. This op-tion is commonly implemented through the software program ARSTAN (Cook and Holmes 1986), and is widely adopted in dendrochronological investigations under the loose term of “conservative” detrending (e.g., Salzer and Kipfmueller 2005, Villalba and others 1998, Woodhouse and Lukas 2006). In this paper we propose an alternative method, which is mathemati-cally derived from the simple assumption of distributing a constant basal area increment over an expanding surface. By formally describing this process, a purely empirical approach

USDA Forest Service RMRS-P-55. 2008. 125
to tree-ring standardization is replaced with a theoretical one. An illustration of the method is provided using data from the G. A. Pearson Natural Area. This approach to ring-width standardization can also be used to empirically test existing theories on expected patterns of basal area increment for indi-vidual trees.
Model Specification
A mathematical representation of the modified nega-tive exponential option for ring-width standardization is as follows: wt = ae-bt + k (1)where wt is ring width at year t, a is ring-width at year zero (if k is negligible), b is the slope of the decrease in ring width (hence, the “concavity” of the curve), and k is the minimum ring width, which is asymptotically approximated for large values of t. When the estimated value of either a or b is negative, a linear regression is fit to the data, usually with slope ≤ 0 (Fritts and others 1969; Cook and Holmes 1986). Historically, the asymptote of the modified negative expo-nential equation was introduced to allow for the relatively constant ring width of very old conifers in the Western United States (Fritts and others 1969). This modification, however, makes the equation “open form” because fitting this model is equivalent to estimating a nonlinear regression equation, hence model parameters are computed iteratively (Press and others 2002). This implies that the method is sensitive to several choices made for estimation purposes. For instance, depending on the tolerance assigned for the goodness-of-fit statistic, the starting values, the number of iterations allowed, and the resolution of the incremental changes made to the initial parameter values, different results can be obtained. In other words, instead of fitting a modified negative expo-nential, a straight line could be selected simply because of numerical instabilities (for an example, see Figure 3B). This can have important consequences, especially if the estimated curve parameters are then used for drawing climatic or eco-logical inferences (as was done by Helama and others 2005).
Even more relevant for tree-ring standardization is the presence of an asymptote in equation (1), given its impli-cations for basal area increment (BAI), which represents overall tree growth better than ring width (Husch and others 2003, LeBlanc 1990, Valentine 1985). Because BAI at year t is equivalent to annual ring area (e.g., Biondi 1999, LeBlanc 1993, Phipps and Whiton, 1988), one can write
BAIt = π Rt² - π R²t-1 (2)
where Rt is the stem radius at the end of the annual increment, and Rt-1 is the stem radius at the beginning of the annual in-crement (Figure 1). Considering that annual ring width (wt) is equivalent to the annual radial increment (wt = Rt - Rt-1), it follows that: BAIt = π (wt² + 2 wt Rt-1) (3)
From equation (3) one can see that the asymptote of equa-tion (1) corresponds to a constant increase of BAI over time. Although such a pattern can occasionally be found (Phipps 2005), it is at odds with the majority of observations and theories found in the scientific literature. Forest ecologists have shown that BAI of dominant, healthy trees can rise for varying periods of time during their life, but even in the best growing conditions, BAI is bound to approach an as-ymptotic level (Duchesne and others 2002, 2003, Elvir and others 2003, Pederson 1998, Poage and Tappeiner II 2002, Valentine and Mäkelä 2005).
The biological trend of ring width can be estimated using a simple assumption, namely that a constant basal area incre-ment is distributed over a growing surface over time. From equation (3), this assumption can be written as
wt2 + 2wtRt-1 = c (4)
with c being the constant BAI. It is easily shown that (4) is a quadratic equation in the variable wt, and that the only logical solution (given that wt ≥ 0) is as follows:
wt= Rt-1+ Rt-12 + c (5)
Considering that Rt-1 is the sum of all ring widths from year 0 (the pith date) to year t-1, one can write
wt= wii=0
i= t-1
/d n
2
+ c- wii=0
i= t-1
/ (6)
For t = 0 there is yet no ring width, hence an expression of the tree potential for growth can be derived from the previous equation, as follows:
w0 = c (7)
Using equations (6) and (7), it is straightforward to verify that, for any time t, the expected ring width (Ewt ) when basal area increment remains constant is given by
Ewt= c t+1] g- ct (8)
This relationship implies that the biological trend in ring-width of mature trees can be removed by knowing the value of c, which, in turn, can be mathematically derived from equation (8), with the following result:
c=2t+1- 2t 1+ t
1Ewt] g
2
(9)
For estimation purposes, one can then use
= t=1,...,nmedian
2t+1- 2t 1+ t1
wt2
f p (10)

126 USDA Forest Service RMRS-P-55. 2008.
with c/
i = estimated constant basal area for tree i, c/
t = esti-mated constant basal area for year t, and n = number of years in the ring-width series. Given its notation, this approach is described as the “C-method” in the remainder of the article.
Application to Ponderosa Pines at the G. A. Pearson
Natural Area
Tree-ring records from a long-term monitoring forest re-search area in northern Arizona were used to illustrate the model (Table 1, Figure 2). The area is occupied by a pondero-sa pine (Pinus ponderosa Douglas ex P.Lawson & C.Lawson) ecosystem, which has been thoroughly studied in relation to impacts on forest vegetation of land use changes caused by Euro-American settlement (Biondi 1999, Covington and oth-ers 2001, Moore and others 2006). This dataset was selected because several increment cores either included the pith or came close to it, hence allowing for accurate ages to be as-signed to each ring (Table 1). Furthermore, it was possible
Figure 1. Schematic representation of a conifer cross section, modified from Fig. 2.3 of Fritts (1976). At each year, annual ring width (wt) is equal to the difference between the current tree radius (Rt) and the prior year radius (Rt-1).
Tabl
e 1.
Sum
mar
y of
tree
-rin
g sa
mpl
es c
olle
cted
from
pon
dero
sa p
ines
at t
he G
.A. P
ears
on N
atur
al A
rea
(35.
27°N
, 111
.74°
W, 2
230-
2260
m a
sl),
nort
hern
Ari
zona
, U.S
.A. (
Bio
ndi 1
999)
, and
use
d fo
r ill
ustr
atin
g th
e C
-met
hod
of r
ing-
wid
th s
tand
ardi
zatio
n.
Si
te I
nfor
mat
ion
Incr
emen
t C
ore
Sum
mar
y R
ing-
Wid
th S
tati
stic
s
D
BH
H
eigh
t Le
ngth
To
tal N
o.
Year
s Pe
riod
Mea
n SD
M
in
Max
Tree
Typ
e *
(cm
) (m
) (y
rs)
of R
ings
to
pit
h (y
rs)
LAR
(m
m)
(mm
) (m
m)
(mm
) A
1
Smal
l(“
Bla
ckja
ck”)
31
.8
14.4
78
7
7 1.
45
0.78
0.
34
3.75
0.
78
19.5
-46.
8 9.
6-23
.4
53-1
44
4509
1-
34
1847
-199
0 (0
.16%
) 0.
92-2
.23
0.30
-1.4
8 0-
0.94
1.
96-7
.21
0.26
-0.9
5La
rge
(“Ye
llow
pin
e”)
82.4
29
.0
283
64
194
1.08
0.
61
0.08
3.
17
0.73
50
.4-1
14.8
18
.3-3
6.0
92-4
18
1640
8 1-
249
1570
-199
0 (1
.18%
) 0.
48-2
.05
0.23
-1.2
4 0-
0.65
1.
20-5
.50
0.38
-0.9
2
* 58
core
s fr
om 2
9 tr
ees
wer
e us
ed fo
r ea
ch o
f the
se tw
o si
ze c
lass
es.
DB
H: d
iam
eter
at b
reas
t hei
ght (
the
aver
age
as w
ell a
s th
e m
in-m
ax a
re s
how
n).
Leng
th: n
umbe
r of
yea
rs in
clud
ed in
the
58 w
ood
core
s (th
e av
erag
e as
wel
l as
the
min
-max
are
sho
wn;
the
tota
l is
give
n in
the
next
col
umn)
.Ye
ars
to p
ith:
est
imat
ed g
ap fr
om th
e in
nerm
ost r
ing
of th
e co
re to
the
stem
pith
(the
ave
rage
as
wel
l as
the
min
-max
are
sho
wn)
.Pe
riod
: firs
t and
last
yea
r of
the
time
inte
rval
cov
ered
by
the
com
bina
tion
of a
ll m
easu
red
ring
s.LA
R =
loca
lly a
bsen
t rin
gs (r
ing
wid
th e
qual
to z
ero;
the
perc
enta
ge r
efer
s to
the
tota
l num
ber
of r
ings
).SD
= s
tand
ard
devi
atio
n of
the
ring
-wid
th m
easu
rem
ents
(the
ave
rage
as
wel
l as
the
min
-max
are
sho
wn)
.A
1 =
firs
t-or
der
auto
corr
elat
ion
of th
e ri
ng-w
idth
mea
sure
men
ts (t
he a
vera
ge a
s w
ell a
s th
e m
in-m
ax a
re s
how
n).

USDA Forest Service RMRS-P-55. 2008. 127
1600 1650 1700 1750 1800 1850 1900 1950 2000
Year (1570-1990)
Ring W
idth (mm
)
1860
Year (1847-1990)
1900 1940 1980
Ring W
idth (mm
)
Figure 2. Time-series plots of ring-width measurements, sorted by first year, from wood increment cores taken at the G. A. Pearson Natural Area, Arizona, U.S.A. (see text for details). The vertical scale (not shown) was the same for all segments.
Ponderosa pines with DBH > 50 cmPonderosa pines with DBH < 50 cm

128 USDA Forest Service RMRS-P-55. 2008.
to make comparisons between young “blackjacks” (DBH < 50 cm), whose xylem rings formed mostly during the 20th century, when lack of fire and successful regeneration in-creased the density of the stand, and old “yellow pines” (DBH > 50 cm), whose annual growth had occurred under widely dif-ferent conditions prior to Euro-American settlement (Biondi 1996, Mast and others 1999). Finally, the dataset had already been used to compare the outcome of various standardization methods, knowing what the overall growth trend in the for-est had been over the 20th century because of repeated timber inventories that were conducted at the study area (Biondi and others 1994, Biondi 1999).
Ring-width series were visually cross-dated, measured with a resolution of 0.01 mm, and checked for errors using computer-aided techniques (Grissino-Mayer 2001, Holmes 1983). Pines with DBH < 50 cm had a much lower number of years between the innermost measured ring width and the stem pith (Table 1). Pith location was usually easier to iden-tify in cores from these trees than in cores from pines with DBH > 50 cm (Biondi 1999). Time series plots of the original measurements (Figure 2) showed clearly the age difference between the two groups of trees, which was also reflected in the number of locally absent rings (Table 1). Old “yellow” pines had more than seven times the percentage of locally absent rings than young “blackjacks.”
The C-method was used to standardize the ponderosa pine ring width series after aligning them according to biological age (i.e., years since pith formation). The method was applied to individual ring width series, and in each case the resulting curve did not need additional smoothing. Ring indices were obtained as ratios between the ring width measurements and their expected values, then indices were realigned according to calendar years, and the master chronology computed as ei-ther the mean or the median of the indices by calendar year.
Common patterns among index time series were quantified by pairwise linear correlation coefficients (Wigley and oth-ers 1984), by pairwise Baillie-Pilcher’s t-values (Baillie and Pilcher 1973), and by the first principal component (Jolliffe 1986) for the 1938-1987 period common to all samples.
There was little difference between computing chronolo-gies either as the mean or the median of the indices for each year, hence only the latter is plotted in Figures 3 and 4. A greater amount of common variability was found in the older ponderosas than in the younger ones; ring indices of pines with DBH > 50 cm had higher cross-dating statistics (Table 2). Despite changes in sample depth from 1-2 samples per year in the early part of the chronologies to 58 samples per year in the most recent period, the C-method generated master chronologies with relatively stable variance over time (Figures 3 and 4).
Estimated constant basal area increment (c/
i, Table 2) was about twice as large for pines with DBH > 50 cm as for those with DBH < 50 cm. This was most likely related to the over-all slower decline in ring size with biological age seen in the older trees compared to the younger ones. In other words, the increasing stand density during the 20th century, which prompted drastic changes in individual growth rates (Biondi and others 1994, Biondi 1996), also caused this difference in C-method statistics between pre- and post-settlement trees.
From a comparison with other detrending options applied to the same dataset (Biondi 1999), it was already known that applying ‘conservative’ standardization methods generated chronologies with trends that did not match those of repeat-ed forest inventories. In this study, C-method chronologies shared the ability of ring-area chronologies to reproduce the stand-wide decline of tree growth during the 20th century (Biondi 1996). In addition, C-method chronologies mimicked
Figure 3. Tree-ring chronologies (Median Index) obtained using the C-method for ponderosa pines with DBH < 50 cm (lower panel), and ponderosa pines with DBH > 50 cm (upper panel). The number of samples per year (Obs.) is also shown (black line).

USDA Forest Service RMRS-P-55. 2008. 129
Figure 4. Tree-ring chronologies (Median Index) for ponderosa pines with DBH < 50 cm (dashed lines), and ponderosa pines with DBH > 50 cm (solid lines) obtained using the C-method. The number of samples per year (Obs.) is also shown (black line).
Table 2. Statistics of standardized ring-width indices obtained from the division between the original measurements and the expected ring width from the C-method. The arithmetic average and the minimum-to-maximum interval are shown for most parameters.
DBH Pairwise Pairwise 1st PC c/
i
(cm) Mean SD Min Max A1 r-value t-value % Var. (mm2 yr -1)
< 50 1.05 0.40 0.27 2.14 0.56 0.33 4.8 43 271 0.96-1.29 0.22-0.86 0-0.57 1.35-3.94 0.09-0.87 -0.43 to 0.90 -0.1 to 28.3 75-713
> 50 1.08 0.55 0.08 3.12 0.68 0.47 9.9 63 563 0.98-1.32 0.29-1.08 0-0.45 1.91-5.34 0.43-0.87 -0.48 to 0.92 1.9-37.9 225-1269
SD, A1 = see definitions under Table 11st PC % Var. = percentage of overall variance during the common period 1938-1987 explained by the first principal com-
ponent
c/
i = estimated constant basal area increment for each ring-width series
the steeper decrease of annual increment found in large pines compared to small ones, so that while large pines were grow-ing faster than small pines in the early 1900s, the opposite was true at the end of the 1900s (Figure 4). This reversal in the order of individual growth rates was not so accurately reproduced even by the ring area method (see Figures 4 and 5 in Biondi 1999).
The C-method performance (Table 2, Figures 3 and 4) provides support for its simple assumption, namely that the biological trend is mostly caused by the geometrical con-straint to distribute a constant basal area increment over an expanding surface. The well-established pipe theory (Valentine 1985) suggests that sapwood cross-sectional area averaged over the length of the bole approximates the sap-wood area at the base of the crown (Valentine and Mäkelä 2005). Considering that most ring-width series with any cli-matic information come from mature, dominant trees (Fritts 1976), which have already reached their maximum height, the assumption of constant annual basal area increment trans-lates directly into a constant rate of wood accumulation. Basal area increment usually outperforms ring width for measuring
overall tree growth, as it has been repeatedly shown with re-gard to tree mortality (Bigler and Bugmann 2003, 2004b, a, Bigler and others 2004a, b).
The C-method, just like basal area increment computed from ring-width data, requires knowing the biological age of each growth ring. However, both the C-method and the cal-culation of ring area can fit individual ring-width series, so they are well suited for relatively small sample sizes (< 100 series). Another advantage of the ring area and C-method ap-proaches is their numerical simplicity, since all computations can be done in a spreadsheet, and there is no need to fit a growth curve using nonlinear regression methods.
In any method based on biological ring age, it is risky to assume that the innermost ring is the closest one to the pith, especially when dealing with very old trees or irregular stems. As detrending methods based on the biological age of growth rings become more commonly used, specific metada-ta on the difference between ring order and ring age will have to be included in archived and publicly available datasets.
While benchmarking dendrochronological standard-ization methods against forest growth data is ecologically

130 USDA Forest Service RMRS-P-55. 2008.
sound, additional research should be aimed at comparing this (and other) methods of removing the biological trend in terms of their ability to properly reconstruct climatic signals for a variety of biogeographic regions, ecosystems, and tree conditions (species, age, etc.). For instance, it is possible that, when dealing with ring-width series from extremely old trees with irregular growth forms, from forest interior environments, from shade-tolerant species, and from relict or subfossil wood, the best standardization method would simply be a smoothing algorithm with a known frequency response, such as the cubic spline option in the ARSTAN package (Cook and Peters 1981, Cook and Holmes 1986). Still, the C-method already provides a superior alternative in all those cases where fitting a modified negative exponential curve (or a straight line) is used for removing the biological growth trend from ring-width series.
AcknowledgmentsThis work originated during the first author’s doctoral
studies at the Laboratory of Tree-Ring Research, University of Arizona, Tucson, U.S.A. Research partially supported by NSF grants ATM-0503722 and ATM-CAREER-0132631. Helpful suggestions on numerical analyses were made by David M. Ritson, and Björn Reineking. Additional comments on the manuscript were provided by Laurel Saito and Marc Macias Fauria.
ReferencesBaillie, M. G. L.; Pilcher, J. R. 1973. A simple cross-dating
program for tree-ring research. Tree-Ring Bulletin. 33: 7-14.Bigler, C.; Bugmann, H. K. M. 2003. Growth-dependent tree
mortality models based on tree rings. Canadian Journal of Forest Research. 33: 210-221.
Bigler, C.; Bugmann, H. K. M. 2004a. Assessing the performance of theoretical and empirical tree mortality models using tree-ring series of Norway spruce. Ecological Modelling. 174: 225-239.
Bigler, C.; Bugmann, H. K. M. 2004b. Predicting the time of tree death using dendrochronological data. Ecological Applications. 14: 902-914.
Bigler, C.; Gričar, J.; Bugmann, H. K. M.; Čufar, K. 2004. Growth patterns as indicators of impending tree death in silver fir. Forest Ecology and Management. 199: 183-190.
Biondi, F. 1993. Climatic signals in tree-rings of Fagus sylvatica L. from the central Apennines, Italy. Acta Oecologica. 14: 57-71.
Biondi, F. 1996. Decadal-scale dynamics at the G.A.Pearson Natural Area: evidence for inverse (a)symmetric competition? Canadian Journal of Forest Research. 26: 1397-1406.
Biondi, F. 1999. Comparing tree-ring chronologies and repeated timber inventories as forest monitoring tools. Ecological Applications. 9: 216-227.
Biondi, F.; Myers, D. E.; Avery, C. C. 1994. Geostatistically modeling stem size and increment in an old-growth forest. Canadian Journal of Forest Research. 24: 1354-1368.
Bunn, A. G.; Sharac, T. J.; Graumlich, L. J. 2004. Using a simulation model to compare methods of tree-ring detrending and to investigate the detectability of low-frequency signals. Tree-Ring Research. 60: 77-90.
Canham, C. D. 1990. Suppression and release during canopy recruitment in Fagus grandfolia. Bulletin of the Torrey Botanical Club. 117: 1-7.
Cook, E. R. 1987. The decomposition of tree-ring series for environmental studies. Tree-Ring Bulletin. 47: 37-58.
Cook, E. R.; Briffa, K. R.; Meko, D. M.; Graybill, D. A.; Funkhouser, G. 1995. The ‘segment length curse’ in long tree-ring chronology development for palaeoclimatic studies..The Holocene. 5: 229-237.
Cook, E. R.; Holmes, R. L. 1986. Guide for computer program ARSTAN, Laboratory of Tree-Ring Research, University of Arizona, Tucson.
Cook, E. R.; Kairiukstis, L. A. (eds.) 1990. Methods of Dendrochronology. Kluwer, Dordrecht, The Netherlands. 394 p.
Cook, E. R.; Peters, K. 1981. The smoothing spline: A new approach to standardizing forest interior tree-ring width series for dendroclimatic studies. Tree-Ring Bulletin. 41: 45-53.
Cook, E. R.; Peters, K. 1997. Calculating unbiased tree-ring indices for the study of climatic and environmental change. The Holocene. 7: 361-370.
Covington, W. W.; Fulé, P. Z.; Hart, S. C.; Weaver, R. P. 2001. Modeling ecological restoration effects on ponderosa pine forest structure. Restoration Ecology. 9: 421-431.
Douglass, A. E. 1919. Climatic Cycles and Tree-Growth. Carnegie Institution, Washington.
Duchesne, L.; Ouimet, R.; Houle, D. 2002. Basal area growth of sugar maple in relation to acid deposition, stand health, and soil nutrients. Journal of Environmental Quality. 31: 1676-1683.
Duchesne, L.; Ouimet, R.; Morneau, C. 2003. Assessment of sugar maple health based on basal area growth pattern. Canadian Journal of Forest Research 33: 2074–2080.
Elvir, J. A.; Wiersma, G. B.; White, A. S.; Fernandez, I. J. 2003. Effects of chronic ammonium sulfate treatment on basal area increment in red spruce and sugar maple at the Bear Brook Watershed in Maine. Canadian Journal of Forest Research. 33: 862–869.
Esper, J.; Cook, E. R.; Krusic, P. J.; Peters, K.; Schweingruber, F. H. 2003. Tests of the RCS method for preserving low-frequency variability in long tree-ring chronologies. Tree-Ring Research. 59: 81-98.
Esper, J.; Wilson, R. J. S.; Frank, D. C.; Moberg, A.; Wanner, H.; Luterbacher, J. 2005. Climate: past ranges and future changes. Quaternary Science Reviews. 24: 2164-2166.
Fraver, S.; White, A. S. 2005. Identifying growth releases in dendrochronological studies of forest disturbance. Canadian Journal of Forest Research. 35: 1648-1656.
Fritts, H. C. 1976. Tree Rings and Climate. Academic Press, London, 567 p.
Fritts, H. C.; Mosimann, J. E.; Bottorff, C. P. 1969. A revised computer program for standardizing tree-ring series. Tree-Ring Bulletin. 29: 15-20.
Grissino-Mayer, H. D. 2001. Evaluating crossdating accuracy: a manual and tutorial for the computer program COFECHA. Tree-Ring Research. 57: 205-221.
Helama, S.; Timonen, M.; Lindholm, M.; Meriläinen, J.; Eronen, M. 2005. Extracting long-period climate fluctuations from

USDA Forest Service RMRS-P-55. 2008. 131
tree-ring chronologies over timescales of centuries to millennia. International Journal of Climatology. 25: 1767–1779.
Holmes, R. L. 1983. Computer-assisted quality control in tree-ring dating and measurement. Tree-Ring Bulletin. 43: 69-78.
Husch, B.; Beers, T. W.; Kershaw Jr., J. A. 2003. Forest Mensuration. John Wiley & Sons, Hoboken, NJ. 443 p.
Jolliffe, I. T. 1986. Principal Component Analysis. Springer-Verlag, New York. 271 p.
LeBlanc, D. C. 1990. Relationships between breast-height and whole-stem growth indices for red spruce on Whiteface Mountain, NY. Canadian Journal of Forest Research. 20: 1399-1407.
LeBlanc, D. C. 1993. Temporal and spatial variation of oak growth–climate relationships along a pollution gradient in the midwestern United States. Canadian Journal of Forest Research. 23: 772-782.
Mast, J. N.; Fulé, P. Z.; Moore, M. M.; Covington, W. W.; Waltz, A. E. M. 1999. Restoration of presettlement age structure of an Arizona ponderosa pine forest. Ecological Applications. 9: 228-239.
Melvin, T. M. M.; Briffa, K. R.; Nicolussi, K.; Grabner, M. 2007. Time-varying-response smoothing. Dendrochronologia. 25: 65-69.
Moore, M. M.; Casey, C. A.; Bakker, J. D.; Springer, J. D.; Fulé, P. Z.; Covington, W. W.; Laughlin, D. C. 2006. Herbaceous vegetation responses (1992-2004) to restoration treatments in a ponderosa pine forest. Rangeland Ecology and Management. 59: 135-144.
National Research Council. 2006. Surface Temperature Reconstructions for the Last 2,000 Years No. Committee on Surface Temperature Reconstructions for the Last 2,000 Years, The National Academies Press, Washington, DC.
Pedersen, B. F. 1998. The role of stress in the mortality of midwestern oaks as indicated by growth prior to death. Ecology. 79: 79-93.
Phipps, R. L. 2005. Some geometrical constraints on ring-width trend. Tree-Ring Research. 61: 73-76.
Phipps, R. L.; Whiton, J. C. 1988. Decline in long-term growth of white oak. Canadian Journal of Forest Research. 18: 24-32.
Piovesan, G.; Di Filippo, A.; Alessandrini, A.; Biondi, F.; Schirone, B. 2005. Structure, dynamics, and dendroecology of an old-growth Fagus forest in the Apennines. Journal of Vegetation Science. 16: 13-28.
Poage, N. J.; Tappeiner II, J. C. 2002. Long-term patterns of diameter and basal area growth of old-growth Douglas-fir trees in western Oregon. Canadian Journal of Forest Research; 31: 1232-1243.
Press, W. H.; Teukolsky, S. A.; Vetterling, W. T.; Flannery, B. P. 2002. Numerical Recipes in C++: The Art of Scientific Computing. Cambridge University Press, Cambridge, U.K. 1002 p.
Salzer, M. W.; Kipfmueller, K. F. 2005. Reconstructed temperature and precipitation on a millennial timescale from tree-rings in the southern Colorado Plateau, U.S.A. Climatic Change. 70: 465-487.
Valentine, H. T. 1985. Tree-growth models: Derivations employing the pipe-model theory. J. Theor. Biol. 117: 579-585.
Valentine, H. T.; Mäkelä, A. 2005. Bridging process-based and empirical approaches to modeling tree growth. Tree Physiology. 25: 769-779.
Villalba, R.; Grau, H. R.; Boninsegna, J. A.; Jacoby, G. C.; Ripalta, A. 1998. Tree-ring evidence for long-term precipitation changes in subtropical South America. International Journal of Climatology. 18: 1463-1478.
Warren, W. G.; Leblanc, D. C. 1990. Dynamic standardization of tree-ring series. Canadian Journal of Forest Research. 20: 1422-1431.
Wigley, T. M. L.; Briffa, K. R.; Jones, P. D. 1984. On the average value of correlated time series, with applications in dendroclimatology and hydrometeorology. Journal of Climate and Applied Meteorology. 23: 201-213.
Woodhouse, C. A.; Lukas, J. J. 2006. Multi-century tree-ring reconstructions of Colorado streamflow for water resource planning. Climatic Change. 78: 293-315.
The content of this paper reflects the views of the author(s), who are responsible for the facts and accuracy of the information presented herein.

132 USDA Forest Service RMRS-P-55. 2008.
In: Olberding, Susan D., and Moore, Margaret M., tech coords. 2008. Fort Valley Experimental Forest—A Century of Research 1908-2008. Proceedings RMRS-P-55. Fort Collins, CO: U.S. Department of Agriculture, Forest Service, Rocky Mountain Research Station. 282 p.
Introduction
Buckbrush (Ceanothus fendleri Gray) is a native shrub spe-cies, common in ponderosa pine (Pinus ponderosa Laws. var. scopulorum Engelm.) forests of northern Arizona. As a nitro-gen-fixer, its leaves, stems, and flowers are relatively nutritious, which makes buckbrush a preferred browse plant for large un-gulates such as mule deer (Odocoileus hemionus) and Rocky Mountain elk (Cervus elaphus) (Allen 1996, Urness and others 1975). In some areas, herbivory on buckbrush can be severe and constrain growth, flowering, and stem recruitment (Huffman and Moore 2003). Large mature buckbrush plants typically have stout woody stems and spines that discourage herbivory (Kearney and Peebles 1964). Where herbivory is severe, how-ever, plants may remain small and have reduced structural defenses. In this study, we were interested in herbivore effects on buckbrush during the process of ponderosa pine forest resto-ration. Specifically, we wondered if protecting buckbrush from large herbivores for a period of several years following forest thinning would allow plants to develop resistant morphologies. If this were true, we would expect few differences between control plants (those that remained protected from herbivores) and exposed plants for which protection had been removed. Conversely, if plants did not develop adequate defenses dur-ing the protection period, exposing them to herbivores should result in measurable morphological differences compared with
Characteristics of Buckbrush Shrubs Exposed to Herbivores after Seven Years of Protection
W. Walker Chancellor, David W. Huffman, Ecological Restoration Institute, Northern Arizona University, Flagstaff, AZ; and Margaret M. Moore, School of Forestry, Northern Arizona University, Flagstaff, AZ
Abstract—In dense ponderosa pine (Pinus ponderosa Laws.) forests of northern Arizona, forage limitations may lead to severe herbivory by large ungulates on certain plant species. In 1999, we fenced 76 buckbrush (Ceanothus fendleri Gray) shrubs to protect them from herbivores and study growth and reproduction in response to forest restoration treatments implemented on the Fort Valley Experimental Forest. After seven years, we removed fences from around half the plants and examined herbivore impacts on vegetative characteristics. In spring, and again in fall, we measured stem heights and took photographs of exposed shrubs and protected controls. In fall, we also collected stems to analyze size, biomass, and leaf area. Plants exposed to herbivores had significantly less leaf area and total leaf weight than protected control plants. Stem length, diameter, and weight were statistically similar between exposed and control groups. Results from this study suggest that temporary protection from herbivores during the early stages of forest restoration may enhance rates of development and persistence of native plants such as buckbrush.
controls. This research was designed to provide information that could be used by forest managers to anticipate outcomes and refine restoration prescriptions for ponderosa pine forests of northern Arizona.
Methods
Study Design
We conducted our study on the Fort Valley Experimental Forest in Coconino County approximately 10 km northwest of Flagstaff, AZ. In 1998-1999, forest units of 14-16 hectares in size were thinned as part of a larger ecological restoration experiment conducted at the site (see Fulé and others 2001 for restoration prescription details). Soon after thinning, we located 76 buckbrush plants and built “rabbit wire” exclo-sures around them in order to protect the shrubs from large herbivores. Exclosures were 2 x 2 m in area and 1.4 m in height. In the center of these, we established circular sample plots, each with a radius of 56.4 cm (1 m2 in area). Exclosures were left in place for seven years until 2006. In spring of 2006, we randomly selected half of the exclosures (n = 33) to remove. We counted stems on plots, collected stem height measurements, and took photographs of the buckbrush shrubs within plots at the time of exclosure removal.

USDA Forest Service RMRS-P-55. 2008. 133
In October, one growing season after exclosures had been removed, we returned to the plots and again collected stem height measurements and took photographs. We also har-vested stems for detailed laboratory analysis. Stems were systematically selected by harvesting the three closest to the center of each plot. Stems were stored in a cooler un-til processed in the laboratory. For each harvested stem, we measured leaf area, stem length and diameter, and stem and leaf biomass (dry weight) in the lab. One-sided leaf area per stem was measured by removing all leaves, placing them on a light table, and using a video projection system (AGVIS). Stem length was measured to the nearest cm and diameter was measured to the nearest mm using a digital caliper. Stems and leaves were dried at 70 ºC for 48 hours then weighed to determine biomass.
Data AnalysesTo test for differences between protected controls and
exposed plants, we used one-way analysis of variance (ANOVA). The Shapiro-Wilk and Leven’s tests were used to test for data normality and homogeneity of variance, respectively. Raw data were transformed using natural log-arithm values when the above tests indicated that ANOVA assumptions had not been met. Statistical differences were considered significant at P ≤ 0.05.
Spring pretreatment differences in mean stem number and height between control and exposed groups were tested and no significant differences were found. For late summer post-treatment stem collections, parameters tested were mean leaf area per stem, leaf weight per stem, stem weight, stem length, and stem diameter. We also used simple linear regression (P < 0.05) to test relationships between stem length and leaf weight per stem. All tests were performed using SAS JMP Version 4.
ResultsPlants exposed to herbivores for one growing season had
significantly less leaf area per stem and total leaf weight per stem than protected control plants (Table 1). Leaf area and leaf weight differed between control and exposed groups by a factor of four.
Table 1. Means (and standard errors) of buckbrush (Ceanothus fendleri) characteristics for protected control and exposed plants. P-values less than 0.05 indicate statistically significant differences between control and exposed means.
Variable Control Exposed P-value
Leaf Area (cm2) 40.63 (1.19) 10.13 (1.21) < 0.001Leaf Weight (g stem-1) 0.321 (1.21) 0.076 (1.22) < 0.001Stem Weight (g) 0.836 (0.812) 0.829 (1.23) 0.9694Stem Length (cm) 22.85 (1.09) 19.88 (1.10) 0.1743Stem Diameter (mm) 2.90 (1.06) 2.91 (1.07) 0.9526
No significant differences in stem length, stem diameter, or stem weight were found between protected control and ex-posed plants (Table 1).
Regressions indicated significant (P < 0.001) positive relationships between stem length and leaf weight per stem (Figure 1). This relationship was stronger for plants protected from herbivores than those that had been exposed.
Discussion and ConclusionsResults from this study suggest that short-term protec-
tion during the early stages of forest restoration may allow buckbrush plants to develop characteristics that provide resistance to herbivory. For example, stem characteristics such as length, diameter, and weight were similar between protected control plants and those that were exposed for one growing season after seven years of protection. Since buck-brush stems produce woody tissue and spines as they grow larger and older, protection for a number of years appears to allow these defensive structures to develop and increase this species’ resistance to herbivory by large animals such as Rocky Mountain elk. This conclusion is supported by earlier work done by Huffman and Moore (2003) at the Fort Valley site, which showed that buckbrush plants protected from large herbivores for two years had stem lengths averaging more than two-times longer than those of plants that had nev-er been protected. In addition, protected plants in Huffman and Moore’s (2003) study had larger stem diameter and more current-year biomass than unprotected plants. Intensive use appeared to create a positive feedback loop by keeping buck-brush plants in a reduced form with few mechanisms to deter further herbivory. In our study, seven years may have been a long enough period of protection to allow defensive struc-tures to develop. However, because we examined buckbrush characteristics only one year after protection was removed, it is not clear whether these plants will remain resistant if her-bivore pressure continues to be high in the future. Similarly, for other species without defensive structures, longer term protection may be needed (Shepperd and Fairweather 1994).
Although stem size and weight were similar between pro-tected and exposed plants, we found large differences in leaf area and leaf weight between the two treatment groups. Total dry weight of leaves on individual stems may be predicted

134 USDA Forest Service RMRS-P-55. 2008.
from stem length and the equations presented in this study may be used by managers to determine forage availability and for monitoring. This relationship was weaker for stems defoliated as a result of exposure to herbivory. Defoliation may lead to a variety of plant responses both detrimental as well as beneficial to persistence of populations (Maschinski and Whitham 1989); however, we did not attempt to assess such effects in our study. More work is needed to determine the effects of short-term, intensive losses of buckbrush leaf area on processes such as flowering and viable seed produc-tion. The data presented in this study suggest that treatments to restore northern Arizona ponderosa pine forests should in-clude temporary methods to decrease herbivory in order to help conserve populations of native plants.
References
Allen, C.D. 1996. Elk response to the La Mesa fire and current status in the Jemez mountains. pp.179-195 in Allen, C.D. (ed.), Proceedings of the 2nd La Mesa Fire Symposium. USDA Forest Service General Technical Report RM-GTR-286, Rocky Mountain Forest and Range Experiment Station, Fort Collins, CO, U.S.A.
Figure 1. Relationships (P < 0.001) between stem length and leaf weight per stem for protected control (solid circles) and exposed (gray squares) buckbrush plants. Leaf weight values have been natural log-transformed to improve linearity.
Fulé, P.Z.; McHugh, C.; Heinlein, T.A.; Covington, W.W. 2001. Potential fire behavior is reduced following forest restoration treatments. Pp. 28-35 in Vance, R.K., C.B. Edminster, W.W. Covington, and J.A. Blake (comps.), Ponderosa pine ecosystems restoration and conservation: steps toward stewardship. USDA Forest Service Proceedings RMRS-P-22.
Huffman, D.W.; Moore, M.M. 2003. Ungulate herbivory on buckbrush in an Arizona ponderosa pine forest. Journal of Range Management. 56: 358-363.
Kearney, T.H.; Peebles, R.H. 1951. Arizona flora. University of California Press, Los Angeles, CA, U.S.A.
Maschinski, J.; Whitham, T.G. 1989. The continuum of plant responses to herbivory: the influence of plant association, nutrient availability, and timing. The American Naturalist.134: 1-19.
Shepperd, W.D.; Fairweather, M.L. 1994. Impact of large ungulates in restoration of aspen communities in a southwestern ponderosa pine ecosystem. Pp. 344-347 in Covington, W.W., and L.F. DeBano (tech. eds.), Sustainable ecological systems: implementing an ecological approach to land management. USDA Forest Service General Technical Report RM-247.
Urness, P.J.; Neff, D.J.; Watkins, R.K. 1975. Nutritive value of mule deer forages on ponderosa pine summer range in Arizona. Res. Note RM-304. Fort Collins, CO, U.S.A. USDA Forest Service, Rocky Mountain Forest and Range Experiment Station.
The content of this paper reflects the views of the author(s), who are responsible for the facts and accuracy of the information presented herein.

USDA Forest Service RMRS-P-55. 2008. 135
In: Olberding, Susan D., and Moore, Margaret M., tech coords. 2008. Fort Valley Experimental Forest—A Century of Research 1908-2008. Proceedings RMRS-P-55. Fort Collins, CO: U.S. Department of Agriculture, Forest Service, Rocky Mountain Research Station. 282 p.
Introduction
Climate and vegetation studies have been conducted on the San Francisco Peaks of northern Arizona since the late 1880s (Maienschein 1994). C. Hart Merriam developed his pioneering life-zones concept here because of the wide range of climate and vegetation types in close proximity to one another (Merriam 1890). In 1898, Daniel T. MacDougal, a physiological ecologist (most famous for his desert ecol-ogy studies at the Desert Laboratory, Carnegie Institution), conducted a lesser known, but important study on the effects of temperature inversions on plant distributions of the San Francisco Peaks and Flagstaff area (MacDougal 1899, 1900). This latter project was sponsored by the USDA to investigate the potential for agriculture in the region. These early climate and vegetation studies prompted the Forest Service to begin an investigation, known as “The Study of Forest Types,” to determine the factors that controlled and limited forest types (Pearson 1920a, Zon 1908). Raphael Zon, U.S. Forest Service Chief of Silvics in 1907 and later Chief of Forest Investigations, noted that climate was not the only factor that determined vegetation type but that soil type, soil moisture and topography played a large role (Zon 1908). He encour-aged G.A. (Gus) Pearson to initiate a forest type study at the newly formed Fort Valley Experimental Forest (FVEF).
Revisiting Pearson’s Climate and Forest Type Studies on the Fort Valley Experimental Forest
Joseph E. Crouse, Ecological Restoration Institute (ERI), Northern Arizona University, Flagstaff, AZ; Margaret M. Moore, School of Forestry, Northern Arizona University, Flagstaff, AZ; and Peter Z. Fulé, ERI and School of Forestry, Northern Arizona University, Flagstaff, AZ
Abstract—Five weather station sites were established in 1916 by Fort Valley personnel along an elevational gradient from the Experimental Station to near the top of the San Francisco Peaks to investigate the factors that controlled and limited forest types. The stations were located in the ponderosa pine, Douglas-fir, limber pine, Engelmann spruce, and Engelmann spruce/ bristlecone pine (“timberline”) forest types. Climatological and phenological data were collected at one or more of these sites weekly from 1916 through 1920. Soil samples were taken monthly during the growing season at all sites in 1918. Experimental plantings were conducted at some of these sites to determine the ability of species to survive outside their normal growing conditions. Recent field reconnaissance at Campbell’s Camp located fence posts and steel corner pipes associated with the seedling experimental area. The histori-cal weather stations and nearby tree plantations were an important contribution to the new science of ecology in the early twentieth century and they may be an important resource for helping scientists understand climate change today.
Fort Valley Studies
Soon after the creation of the FVEF in 1908, Pearson initi-ated a study to determine the influence of microclimate and forest cover on ponderosa pine regeneration (Pearson 1913). He established six weather stations in the immediate vicinity of the headquarters, along a line from the ponderosa pine for-est on the west side of FVEF headquarters buildings, across a large grassland (Fort Valley Park; Figure 1), and into the forest on the east side of the headquarters. From 1909-1912, Pearson took daily readings of temperature, precipitation, hu-midity, and wind movement at three of the stations (stations 1-3) and only temperature at the other three (stations 4-6), and eventually related these data to pine seedling establish-ment, survival, and growth (Pearson 1913).
Beginning in 1916, Pearson began a second study to in-vestigate the physical factors that controlled and limited forest types on the San Francisco Peaks and in the Southwest (Pearson 1920a 1920b, 1930, 1931). That year, a series of weather stations were established by FVEF personnel along the southwest shoulder of Agassiz Peak (Figure 2). These five station sites were located within each of the vegetation types found on the Peaks beginning with the ponderosa pine type and moving up in elevation into the Douglas-fir type, the lim-ber pine type, the spruce-fir type and, finally, what Pearson

136 USDA Forest Service RMRS-P-55. 2008.
called the timberline type1. The ponderosa and Douglas-fir sites each had three individual weather stations and the spruce-fir and timberline sites each had two weather stations. Multiple stations at these sites allowed microsite temperature and precipitation variations to be investigated.
These weather stations on the Peaks were visited weekly or semi-weekly from 1917 through 1920 for the collection of meteorological data (Pearson 1920a, b), an amazing fact considering a climb of over 4,000 feet was required to visit the highest station. Under the best of conditions this would have been a difficult undertaking, but considering this task was accomplished even during the winter months makes it even more impressive (Figures 3 and 4).
In addition to the climatological records, detailed phe-nological records and seedling experiments were conducted at the weather station sites to determine the survivability of individual tree species outside of their normal growing con-ditions. These planting experiments were started in 1917 (Pearson 1931) but seedlings were planted at the Douglas-fir site in 1912 and mapped in 1914 (Figure 5) perhaps with the knowledge that the weather stations might be established at a later date. Funding shortages and, later, Forest Service per-sonnel called to duty during World War I, forced Pearson to conduct his research as resources allowed.
Figure 1. Weather station in Fort Valley park adjacent to the Experimental Forest headquarters. USFS photo 91883 by Max H. Foerster in 1911.
Tree seeds were both collected and germinated at Forest Service nurseries in the Southwest. Then, the seedlings were transplanted to the weather station locations on the Peaks. The Douglas-fir site seedling experiments were carefully mapped and seedling survival was monitored for several years (Figure 5). This map shows Douglas-fir species from three different nurseries and ponderosa pine from five nurser-ies that were planted. Austrian pine and Norway spruce were also planted. Seedling survival appears to be mixed in an early photograph from the site (Figure 6). According to the photo caption, sheep are to blame for the browsing damage to the seedlings.
Permanent structures were constructed on at least two of the sites: the Douglas-fir and the spruce-fir sites. The Douglas-fir site was known as Campbell’s Camp and is shown on an early Forest Service map as being the location of the Frisco Ranger Station (Figure 7). The cabin at Campbell’s Camp is shown in Figure 8. The Spruce Cabin, located at the spruce-fir weather site (Figure 9), would have provided a welcome refuge from freezing winter weather even though, at times, it was nearly covered in snow (Figure 10).
A reconnaissance by the authors to the ponderosa pine (near FVEF headquarters) and Douglas-fir (Campbell’s Camp) sites was conducted in the fall of 2007. No evidence of the ponderosa pine weather station structures was found. A single Douglas-fir, from the seedling experiment, is still alive. Surprisingly little is left to indicate all the work that was done at the site. There is considerably more evidence at the Douglas-fir site. While neither of the weather stations or even the cabin foundation were found, the seedling experi-ment area was easily located. The fence posts delineating it are still standing and bits of wire fence line exist (Figure 11). Galvanized pipes, spaced one chain (66 feet) apart, were
1 In Pearson’s “Factors controlling the distribution of forest types” articles (1920a, 1920b), he also describes the climate and soils for the desert-grassland and pinyon-juniper forest types, yet these records were obtained by U.S. Weather Bureau (Kingman, Williams, Flagstaff, and Winslow) or Forest Service (Ash Fork) or Park Service (Walnut Canyon) personnel.

USDA Forest Service RMRS-P-55. 2008. 137
Figure 2. The San Francisco Peaks as seen from the southwestern edge of Fort Valley. USFS photo 89770 by G. A. Pearson in 1918.
Figure 3. Timberline on Agassiz Peak, 1918. Snow is 6-8 feet deep. Timberline weather station site is nearby. USFS photo 41427A.
located. It appeared that very few, if any, of the ponderosa pine seedlings survived and, not surprisingly, no Norway spruce or Austrian pine were evident. Survival of the pon-derosa pine seedlings was likely limited by the dense aspen overstory (Figure 12). A considerable number of Douglas-fir are located within the seedling experiment. A handful of these were cored and the rings counted on-site. These appeared to be the correct age for trees that were planted by Forest Service personnel in 1912, the time of the establishment of the seedling experiment.
Summary
Data from the San Francisco weather stations established by G. A. Pearson and Fort Valley Experiment Forest person-nel gave southwestern foresters a better understanding of growing conditions needed for particular tree species, and factors that limit their distribution. Some of the factors he determined to be of the greatest importance were that the up-per elevational limits for vegetation are largely defined by low temperatures and that the lower elevational limits are de-termined by soil moisture rather than by high temperatures. These original weather station and transplant experiment sites have the potential to continue to be a valuable resource for climate change research in the Southwest.

138 USDA Forest Service RMRS-P-55. 2008.
Figure 4. Forest Assistant Lenthall Wyman traveling to weather station sites, 1917. USFS photo 31951 by G. A. Pearson.
This type of long-term dataset allows researchers to in-vestigate nearly a century of changes. Studies such as the “Woolsey Project” (Moore and others 2004) have used simi-lar datasets, also attributable to Pearson, to analyze changes in ponderosa pine in the Southwest.
Acknowledgments
The authors would like to acknowledge the hard work and dedication of all the past Forest Service personnel that collected and maintained the weather station and seedling experiment data over the years. Thank you to Susan D. Olberding, David Huffman and John Paul Roccaforte for their reviews of an earlier version of this manuscript.
References
MacDougal, D. T. 1899. Influence of inversions of temperature and vertical air-currents on the distribution of plants. The American Naturalist. 33: 211-213.
MacDougal, D. T. 1900. Influence of inversions of temperature, ascending and descending currents of air, upon [plant]distribution. Biol. Lectures Wood’s Hole. 1899: 37-47.
Maienschein, J. 1994. Pattern and process in early studies of Arizona’s San Francisco Peaks. Bioscience. 44: 479-485.
Merriam, C. H. 1890. Results of a Biological Survey of the San Francisco Mountain Region and Desert of the Little Colorado, Arizona. Government Printing Office, Washington, DC.
Moore, M. M.; Huffman, D. W.; Fulé, P. Z.; Covington, W. W.; Crouse, J. E. 2004. Comparison of historical and contemporary forest structure and composition on permanent plots in Southwestern ponderosa pine forests. Forest Science. 50(2): 162-176.
Pearson, G. A. 1913. A meteorological study of parks and timbered areas in the western yellow pine forests of Arizona and New Mexico. Monthly Weather Review. 10: 1615-1629.
Pearson, G. A. 1920(a). Factors controlling the distribution of forest types, Part I. Ecology. 1(3): 139-159.
Pearson, G. A. 1920(b). Factors controlling the distribution of forest types, Part II. Ecology. 1(4): 289-308.
Pearson, G. A. 1930. Studies of climate and soil in relation to forest management in the southwestern United States. The Journal of Ecology. 18: 139-144.
Pearson, G. A. 1931. Forest types in the Southwest as determined by climate and soil. Technical Bulletin 247. USDA Forest Service, Washington, DC. 27 p.
Zon, R. 1908. Principles involved in determining forest types. Forest Quarterly. 6:263-271. [Reprinted from Proceedings of the Society of American Foresters, 1906]

USDA Forest Service RMRS-P-55. 2008. 139
Figure 5. Seedling experiment located near the Douglas-fir weather station site; plantings were in 1912 and map was made in 1914. USFS Fort Valley Experimental Forest archives.

140 USDA Forest Service RMRS-P-55. 2008.
Figure 6. Hermann Krauch at seedling experiment at Campbell’s Camp, 1925. USFS photo 205397 by G. A. Pearson.

USDA Forest Service RMRS-P-55. 2008. 141
Figure 7. USFS map showing location of Frisco Ranger Station (upper right) (Campbell’s Camp) relative to the Fort Valley Experimental Forest.

142 USDA Forest Service RMRS-P-55. 2008.
Figure 8. Cabin at Campbell’s Camp, 1911. USFS photo 83932 G. A. Pearson.
Figure 9. Spruce Cabin located at the spruce-fir weather station site, 1917-1919. USFS photo 41429A by G. A. Pearson.

USDA Forest Service RMRS-P-55. 2008. 143
Figure 10. Spruce Cabin, ~1919. USFS photo 43839A by G. A. Pearson.
Figure 11. Fence posts at Campbell’s Camp located during September 2007 reconnaissance. P. Z. Fulé, photographer.

144 USDA Forest Service RMRS-P-55. 2008.
Figure 12. Ponderosa pine seedling planted underneath canopy of aspen at Campbell’s Camp experimental planting site, 1929. USFS photo 239922 by G. A. Pearson.
The content of this paper reflects the views of the author(s), who are responsible for the facts and accuracy of the information presented herein.

USDA Forest Service RMRS-P-55. 2008. 145
In: Olberding, Susan D., and Moore, Margaret M., tech coords. 2008. Fort Valley Experimental Forest—A Century of Research 1908-2008. Proceedings RMRS-P-55. Fort Collins, CO: U.S. Department of Agriculture, Forest Service, Rocky Mountain Research Station. 282 p.
Introduction
In 1908, the Fort Valley Experiment Forest (FVEF) was established with a primary purpose of solving forest manage-ment problems in the Southwest (Pearson 1942). One issue of particular importance was how to manage densely stocked young stands of ponderosa pine (Pinus ponderosa Laws. var. scopulorum Engelm.), which were numerous throughout the Southwest by the early 1920s. This prompted G. A. Pearson, Director of the Station, to initiate the first thinning experi-ments in the Southwest.
Between 1925 and 1936, a series of seven forest thin-ning sites were established in second growth ponderosa pine stands in Arizona and New Mexico (Gaines and Kotok 1954). The objectives of these original thinning were to: 1) convert an essentially even-aged stand of second-growth ponderosa pine to a more uneven-aged structure through periodic par-tial cuttings, often referred to as crop tree thinnings (Krauch 1949); 2) shorten the rotation period required to produce crop trees of sawlog size; and 3) determine the volume of wood that could be periodically harvested in both thinned and unthinned stands. The crop tree method involved selecting 60 to 120 trees per acre as crop trees. If a designated crop tree held a dominant position in the canopy, then little to no
Early Thinning Experiments Established by the Fort Valley Experimental Forest
Benjamin P. De Blois, School of Forestry, Northern Arizona University, Flagstaff, AZ; Alex. J. Finkral, School of Forestry, Northern Arizona University, Flagstaff, AZ; Andrew J. Sánchez Meador, USFS, Forest Management Service Center, Fort Collins, CO; and Margaret M. Moore, School of Forestry, Northern Arizona University, Flagstaff, AZ
Abstract—Between 1925 and 1936, the Fort Valley Experimental Forest (FVEF) scientists initiated a study to examine a series of forest thinning experiments in second growth pon-derosa pine stands in Arizona and New Mexico. These early thinning plots furnished much of the early background for the development of methods used in forest management in the Southwest. The plots ranged from 0.1 ac to 5 ac (0.04 ha to 2.02 ha) in size and many of the thinning plots and control plots were remeasured at 2- to 10-year intervals until the 1940s. The first thinning plots in the Southwest, called the White Spar plots, were established in 1925 on the Prescott National Forest. The residual trees on the thinned White Spar plots maintained higher growth rates than the control until the mid 1970s. The results from these early stand thinning experiments led G. A. Pearson, Director of FVEF, and others to largely abandon uniform thinning treatments and adopt the crop-tree thinning method as an im-proved method for thinning southwestern ponderosa pine stands.
release was prescribed. If the crop tree did not hold a domi-nant position in the canopy, then the crown was freed on at least three sides (Gaines and Kotok 1954). In this paper, we list the location, size, and establishment date for all of the original thinning studies established by the FVEF between 1925-1936, and we describe the earliest thinning study site, the White Spar site, in detail.
Study Sites
Stand thinning plots were located in a variety of loca-tions and stand conditions, with the unifying factor being an overstory dominated by naturally regenerated ponderosa pine. Table 1 provides an overview of each study site. The majority of the plots was located in pole-sized stands of pon-derosa pine of various ages while the Decker Wash and Corey Pasture plots were established in stands of sapling-sized pon-derosa pine (12-20 years old) that established in 1914 (Gaines and Kotok 1954).
The White Spar plots were the earliest plots established, and are the only ones that have been re-measured since the late 1940s. These plots are located on the Prescott National Forest in central Arizona. The plots are located at an elevation

146 USDA Forest Service RMRS-P-55. 2008.
of 5,800 ft (1,768 m) and receive approximately 19 inches (50 cm) of precipitation per year (Fogarty and Staudenmaier 2007). The soils are derived from granite and are fairly shal-low (Pearson 1936).
Methods
Upon plot establishment, trees were tagged and their height and diameter at breast height were measured and recorded. After each thinning treatment, plots were re-mea-sured at 2 to10-year intervals up until the late 1940s. The White Spar site consisted of two control plots, plots B and D, and one treated plot, plot A.
To remeasure the White Spar plots, we used the same survey and inventory methods that were used at plot es-tablishment in 1925. Measurements were taken in English units and later converted into metric units. The original plot corners were destroyed, so we relocated trees with histori-cal tags and then reestablished a plot perimeter that captured all tagged trees. If the original tree tag still existed, we mea-sured the diameter at the location of the original nail and tag. Otherwise, diameters were measured to the nearest tenth of an inch at breast height (4.5 ft or 1.37 m above ground) using a diameter tape. All living trees, which were left as the result of thinning in 1925, were cored to determine age and decadal growth rates from 1925-2005.
Increment core samples were mounted, sanded, and cross-dated with a tree ring chronology from a research site near Granite Mountain on the Prescott National Forest (PIPO-ITRDB AZ036; NOAA 2006). After crossdating many cores, we adapted the Granite Mountain chronology data and cre-ated a chronology list for the White Spar plots. After each
Table 1. Overview of each series of experimental sites and plots established in the Southwest between 1925-1936 (information from Gaines and Kotok 1954).
Site Number Acreage (ac) Establishment Last Historical Elevation (ft)Forest Name of Plots (ha) Date Re-measurement (m)
Apache Sitgreaves Decker Wash 5 0.12 to 0.14 1926 1948 7,000 (0.12 to 0.05) (2,133)Coconino Ft. Valley- Ranger 7 0.04 to 0.15 1927 1946 7,600 (0.02 to 0.06) (2,316) Ft. Valley- Sec. 19 8 0.27-0.50 1936 1947 7,600 (0.11 to 0.20) (2,316) Ft. Valley- Corey Pasture 4 0.12 1934 1947 7,350 (0.05) (2,240)Gila Redstone 16 0.1-0.25 1933 1948 7,300 (0.04 to 0.10) (2,225)Prescott Copper Basin 3 0.6 1933 1948 6,400 (0.24) (1,951) White Spar-A 4 0.24-4.2 1925 1946 5,500 (0.10 to 1.70) (1,676)
core was crossdated and inspected, radial decadal growth increments were measured.
To quantify radial growth, we converted the radial growth (from pith to last tree ring) measurements into 10-year basal area increments (BAI). A BAI is a measure of tree growth over a given period of time. This conversion was performed to account for the fact that distance between growth rings may decrease as the tree increases in size, even if actual growth rates remain the same (Thomas and Parresol 1989).
Results
The current status of each original thinning study site is summarized in Table 2. Many sites have yet to be relocated and a portion of those that have been relocated are no longer in a condition that can be remeasured.
The White Spar site was relocated and the plots were remeasured during the summer of 2005 (Figure 1a, b). The thinned plot had a higher BAI until the 1970s. Control plot B never surpassed the growth rates of either the thinned plot or control plot D. Control plot D had the highest BAI from the 1980s until 2005 (Figure 2).
Discussion and Conclusions
These studies were the first to demonstrate the effects of thinning ponderosa pine forests in the Southwest. All seven study sites demonstrated that diameter growth of crop trees was increased when competition was decreased (Gaines and Kotok 1954). Although this does not seem surprising

USDA Forest Service RMRS-P-55. 2008. 147
Table 2. Overview of each series of experimental sites and plots established in the Southwest between 1925-1936 (information from Gaines and Kotok 1954).
Forest Site Name Re-located Condition of Plot
Apache-Sitgreaves Decker Wash No UnknownCoconino Ft. Valley- Ranger No Unknown Ft. Valley- Sec. 19 No Unknown Ft. Valley- Corey Pasture No UnknownGila Redstone 8 of 16 Variable, but mostly intactPrescott Copper Basin Yes Rendered useless by road and insects White Spar Yes Intact and Re-measured
Figure 1a, b. Photographs of White Spar site taken in 1925 (top) as well as a photograph taken in 2005 (bottom). (Source: USFS photo 205392 by Ben De Blois).

148 USDA Forest Service RMRS-P-55. 2008.
to foresters today, the spacing guidelines and potential tree growth for ponderosa pine stands were largely unknown when these studies were established.
Ultimately, the results from these early stand thinning experiments led Pearson and others to abandon uniform thin-ning treatments and adopt the crop-tree method as a more general thinning guide in southwestern ponderosa pine stands (Pearson 1950). The findings of these studies were directly applied to timber stand improvement guidelines throughout the Southwest (Gaines and Kotok 1954, Pearson 1940).
The White Spar plots demonstrate that the crop tree thin-ning method allowed the residual trees on the thinned plots to maintain higher growth rates for about 50 years. Such find-ings are consistent with that of earlier studies performed on the White Spar plots (Gaines and Kotok 1954, Krauch 1949, Pearson 1936). Our data also suggest that an additional thin-ning occurred in the early to mid 1970s, because there is a notable increase in radial growth, especially in control plot D. More details about the pre-treatment stocking levels would be useful and may have shown why the thinned plot had a high-er net basal area before the thinning treatment occurred. For example, Krauch (1949) states that many of the pine stands were nearly clear-cut 40 years prior to the establishment of the White Spar study site. Such information on the stand his-tory is critical in determining conditions prior to thinning and suggests other factors that might influence tree growth.
The rigor of experimental design in forestry studies has changed significantly since these early thinning trials in the
Southwest. The study sites were not randomly located or thoroughly replicated. Microsite differences may have had a disproportionate affect on the results for the White Spar study site and possibly the other thinning studies. However, these original thinning plots, established by the Fort Valley Experimental Forest in the 1920s and 1930s, furnished much of the early background for the development of methods used in forest management in the Southwest today.
Acknowledgments
We thank Jonathan D. Bakker and Thomas E. Kolb for reviewing earlier versions of this paper. The 2005 resurvey of the White Spar thinning plot was supported by USDA Cooperative State Research, Education and Extension Service grant 2003-35101-12919. Additional funding and personnel support was provided by the Ecological Restoration Institute (ERI) at Northern Arizona University and a NAU Hooper Undergraduate Research award granted to B. De Blois. We are grateful to Jonathan Bakker, Jacob Dyer, Dave Bell, Don Normandin and numerous people from the ERI who provided field, laboratory, data entry assistance, and logistical support. We thank the Prescott National Forest for permission to con-duct sampling. We also thank Susan Olberding, archivist and historian, RMRS Fort Valley Experimental Forest Archives, Flagstaff, AZ, who helped us locate historical maps, photos
Figure 2. Comparison of the basal area growth increments (BAI), after converting radial growth into basal area growth per tree per year averaged over each ten year period, for the thinned and unthinned White Spar plots.
0
5
10
15
20
25
30
1920 1930 1940 1950 1960 1970 1980 1990 2000
Decadal Measurements (Years)
BA
Gro
wth
(cm
_)
Thinned Plot
Control B
Control D

USDA Forest Service RMRS-P-55. 2008. 149
and ledger data. Finally, we are indebted to G.A. Pearson, who had the foresight to establish these permanent thinning plots in 1925 to advance the knowledge of southwestern pon-derosa pine management today.
References
Fogarty, B.; Staudenmaier, M. 2007. NOAA Technical Memorandum NWS WR-274. http://www.wrh.noaa.gov/wrh/techMemos/TM-274.pdf
Fort Valley Archives, USFS Rocky Mountain Research Station, Flagstaff, AZ. http://www.rms.nau.edu/imagedb/viewrec.shtml?id=19038&colid=fv
Gaines, E.M.; Kotok, E.S. 1954. Thinning ponderosa pine in the Southwest. Sta. Pap. 17. Fort Collins, CO: U.S. Department of Agriculture, Forest Service, Rocky Mountain Forest and Range Experiment Station. 20 p.
Krauch, H. 1949. Results of thinning experiment in ponderosa pine pole stands in Central Arizona. Journal of Forestry. 47: 466-469.
NOAA, Contributors of the International Tree-Ring Data Bank, IGBP PAGES/World Data Center for Paleoclimatology, NOAA/NGDC Paleoclimatology Program, Boulder, Colorado, U.S.A. 2006. http://www.ngdc.noaa.-gov/paleo/treering.html
Pearson, G.A. 1936. A thinning experiment applied to timber stand improvement. Journal of Forestry. 34: 855-861.
Pearson, G.A. 1940. Timber stand improvement in the Southwest. Forestry Pub. 6. Southwest Forest and Range Experiment Station. 12 p.
Pearson, G.A. 1942. The Fort Valley Experiment Station. Tucson, AZ. USDA Forest Service. 25 p.
Pearson, G.A. 1950. Management of ponderosa pine in the Southwest. Agriculture Monograph 6. USDA Forest Service, Government Printing Office. Washington, DC.
Thomas, C.E.; Parresol, B.R. 1989. Comparing basal area growth rates in repeated inventories: Simpson’s Paradox in forestry. Forest Science. 35: 4.
The content of this paper reflects the views of the author(s), who are responsible for the facts and accuracy of the information presented herein.

150 USDA Forest Service RMRS-P-55. 2008.
In: Olberding, Susan D., and Moore, Margaret M., tech coords. 2008. Fort Valley Experimental Forest—A Century of Research 1908-2008. Proceedings RMRS-P-55. Fort Collins, CO: U.S. Department of Agriculture, Forest Service, Rocky Mountain Research Station. 282 p.
Historical Provenance Study
In a provenance experiment, seed is collected from many natural stands (i.e., sources) and then grown in a common en-vironment to study genetic diversity and adaptation patterns. Provenance research began in North America in the late 1800s (Wright 1976). Three large pioneer studies of pondero-sa pine were established in 1911-1927 by early United States Forest Service (USFS) scientists sent west in 1909. These three ponderosa pine racial variation trials (hereafter referred to as provenance tests) are among the earliest and now old-est existing provenance tests in North America. One of these tests was established by Gustaf A. Pearson at the Fort Valley Experimental Forest (35° 16’latitude, 111° 44’ 30” longitude) in Arizona (Table 1, Figures 1 and 2). This historical test in-cluded seed collected from 18 National Forests representing much of the range of ponderosa pine (Table 1). The other two tests were established in Idaho and Washington/Oregon and included Coconino sources collected from the Fort Valley Experimental Forest.
Historical and Contemporary Lessons From Ponderosa Pine Genetic Studies at the Fort Valley Experimental Forest, Arizona
Laura E. DeWald, Natural Resources Conservation Management, Western Carolina University, Cullowhee, NC; and Mary Frances Mahalovich, U.S. Forest Service, Northern, Rocky Mountain, Southwestern and Intermountain Regions, Moscow, ID
Abstract—Forest management will protect genetic integrity of tree species only if their genetic diversity is understood and considered in decision-making. Genetic knowledge is particularly important for species such as ponderosa pine (Pinus ponderosa Dougl. ex Laws.) that are distributed across wide geographic distances and types of climates. A ponderosa pine study initiated in 1910 at the Fort Valley Experimental Forest is among the earliest ponderosa pine genetic research efforts in the United States. This study contributed to the description of ponderosa pine’s varietal differences, genetic diversity and adaptation patterns, and helped confirm the importance of using local seed sources. The role this and other pioneer studies had in improving forest management of ponderosa pine was, and still is critical. These early studies have long-term value because they improve our knowledge of responses to climate change and our understanding of genetic variability in physiology and pest resistance in older trees. More recently, studies of natural ponderosa pine stands at Fort Valley using molecular markers have shown the importance of stand structure and disturbance regimes to genetic composition and structural patterns. This knowledge is important to ensure ecological resto-ration efforts in ponderosa pine forests will also restore and protect genetic integrity into the future. Highlights of these historical and contemporary studies at Fort Valley are summarized and their applications to management of ponderosa pine forests are described.
Most of the seedlings used to establish the Fort Valley prov-enance test were grown by G. A. “Gus” Pearson in a nursery at Fort Valley. The nursery-grown seedlings were transplant-ed into the test site located west of the Experimental Forest Headquarters at 7,300 feet elevation. The seedlings were hand-planted at a 6-foot spacing, in rows oriented east-west. Each row represented one seed source and varied in length up to 660 feet. Survival was monitored annually until 1919, and then in 1928, 1951, 1964, and 1995. Heights were mea-sured in 1928, and both height and diameter were measured in 1964 and 1995-1996. It is noteworthy that the 1995-1996 data were collected by Roy Silen, who was a retired project leader for genetics research, USFS Pacific Northwest Forest Research Station in Corvallis, Oregon. Roy Silen (who is now deceased) spent his personal time and resources during his retirement to measure this historical test because of his strong belief in the long-term value of such studies.
Although some results of the Fort Valley test are summa-rized by Pearson in a variety of reports (e.g., Pearson 1950), the first full analysis of the provenance test was not published until 1966 in a USFS Research Note written by M. M. Larson,

USDA Forest Service RMRS-P-55. 2008. 151
Table 1. Seed origins of ponderosa pine seed sources in a provenance study at the U.S. Forest Service Fort Valley Experimental Forest, Arizona (adapted from Silen unpublished data and Larson 1966).
National Forest State Latitude Longitude Elevation (ft) Variety # Planted
Coconino a AZ 35o 05’ 111o 35’ 7400 Scopulorum 2784Santa Fe NM 36o 10’ 106o 30’ 8000 Scopulorum 84Gila NM 32o 30’ 108o 20’ -- b Scopulorum 87San Isabel a CO 38o 15’ 107o 00’ 8000 Scopulorum 791Roosevelt CO 44o 30’ 116o 00’ 5000 Scopulorum 200Ashley UT 37o 20’ 107o 50’ -- Scopulorum 65Manti-La Sal UT 37o 50’ 110o 00’ -- Scopulorum 84Fishlake UT 40o 30’ 105o 15’ -- Scopulorum 14Black Hills SD -- -- -- Scopulorum 273Harney SD 43o 45’ 103o 30’ 6000 Scopulorum 152Bitterroot MT 36o 00’ 114o 20’ 4600 Ponderosa 78Boise ID 43o 30’ 114o 50’ 5500 Ponderosa 26Payette ID -- -- -- Ponderosa 65Salmon ID 45o 15’ 114o 10’ 4500 Ponderosa 43Siskiyou OR 42o 10’ 123o 40’ 2000 Ponderosa 22Tahoe CA 38o 50’ 120o 15’ 6500 Ponderosa 12Klamath CA 41o 30’ 122o 40’ -- Ponderosa 0 c
Angeles CA 34o 30’ 118o 10’ 6500 Ponderosa 0 c
a 607 of the seedlings from these San Isabel seed sources were propagated at the Monument Nursery in Colorado, and 372 seedlings of the Coconino seed source were propagated at the Fort Bayard Nursery in New Mexico. All other San Isabel and Coconino seedlings were propagated at the nursery in Fort Valley, AZ.
b -- Indicates unknown collection location data.c All seedlings were killed in the Fort Valley nursery by freezing temperatures (-3 oF).
a Forest Physiologist located at what was then the Rocky Mountain Forest and Range Experiment Station in Flagstaff, AZ. In this paper, Larson includes information from a 16-page unpublished progress report “Source of Seed—Western Yellow Pine” prepared by Gus Pearson in 1920 (on file at the Rocky Mountain Forest and Range Experiment Station, Flagstaff, AZ). Larson indicated that Pearson noticed varietal differences among seed sources both in the nursery and early on in the provenance test where “despite the seemingly better health of the northern and western seed sources, these seed-lings turned out to be sensitive to frost and drought.” It is likely these same climatic variables contributed to mortality over time. Larson (1966) reported that after 50 years, seed sources from only nine of the National Forests survived and mortality was greater than 75% for all sources (Table 2). These sources were still alive after 80 years but survival had decreased to an average of 15% (Table 2). Most of the variation in mortality occurred from 1913-1928 and mortality after that time was relatively evenly divided among the remaining sources. After 50 years, Larson (1966) reported that seed sources originating from National Forests in Arizona, Utah and Colorado (e.g., locations most similar to the latitude and/or elevation to the test site) had the best survival, tallest heights and greatest di-ameters (Table 2), while trees originating from the northern and western sources did not survive. This variation can be at-tributed to varietal differences.
Figure 1. Ponderosa pine racial variation study located in the Fort Valley Experimental Forest. Photograph by Mahalovich, June 1999.

152 USDA Forest Service RMRS-P-55. 2008.
Figure 2. Geographic range (adapted from Fowells 1965) and locations (★) of Pinus ponderosa sources included in the Fort Valley provenance study (adapted from Silen unpublished report and Larson 1966). Populations west of the dotted line are var. ponderosa and east of the dotted line are var. scopulorum.
Table 2. Performance of ponderosa pine seed sources in a provenance study at the U.S. Forest Service Fort Valley Experimental Station, Arizona (from Silen unpublished data and Larson 1966).
Volume per Survival (%) Mean Height (ft) acre (ft3)
Seed Source Variety Number Planted 5-yr 50-yr 80-yr 5-yr 50-yr 80-yr 50-yr 80-yr
Coconino Scopulorum 2784 29 21 19 1.2 26.6 32.0 507 1032Santa Fe Scopulorum 84 52 24 24 0.8 24.6 28.0 566 1748Gila Scopulorum 87 33 6 3 0.7 21.5 25.9 65 136San Isabel Scopulorum 791 34 17 16 1.1 22.9 26.1 304 560Roosevelt Scopulorum 200 26 7 6 0.7 19.8 20.4 94 97Ashley Scopulorum 65 35 12 8 0.5 21.0 20.4 94 97Manti-La Sal Scopulorum 84 45 21 20 0.6 28.7 30.8 825 1696Black Hills Scopulorum 273 41 18 16 1.2 27.6 27.2 667 963Harney Scopulorum 152 30 20 19 0.8 19.8 30.8 109 203Fishlake Scopulorum 14 0 0 0 0 0 0 0 0Bitterroot Ponderosa 78 0 0 0 0 0 0 0 0Boise Ponderosa 26 0 0 0 0 0 0 0 0Payette Ponderosa 65 0 0 0 0 0 0 0 0Salmon Ponderosa 43 0 0 0 0 0 0 0 0Siskiyou Ponderosa 22 0 0 0 0 0 0 0 0Tahoe Ponderosa 12 0 0 0 0 0 0 0 0

USDA Forest Service RMRS-P-55. 2008. 153
Varietal Differences
The 50-year Fort Valley results summarized by Larson (1966) were consistent but opposite in trend with results from the Idaho and WA-OR tests reported by Squillace and Silen (1962); in the northern tests, performance of the south-ern Rocky Mountain sources was the poorest. These 50-year trends corresponded with the range delineations of the two varieties (ponderosa and scopulorum, Figure 1). In addition, variation in seed source performance was roughly a continu-um of decreasing height and survival with increasing distance from origin. This relationship was consistent with other early provenance test results and prompted Forest Service scien-tists such as Roeser (1962) to conclude that seed collections for a given area should be confined to local varieties. This is still sound advice today (Johnson and others 2004). Results from tests such as at Fort Valley led to the development of seed transfer guidelines (e.g., Mahalovich and Rehfeldt 2005, 2003) to ensure that mistakes made in the movement of seed such as described for ponderosa pine in DeWald and Mahalovich (1997) do not happen again.
Climate-Genetic Relationships
We now know that the geographic patterns in genetic diversity that emerged from the historical provenance tests reflect adaptive responses associated with changes in temper-ature and precipitation (Rehfeldt 1993). However, at the time the first ponderosa pine provenance tests were established, variation among trees was believed to be partly inherited, but mechanisms controlling this variation were unknown. It was speculated that natural selection had some role, but evidence to support this idea was lacking (Morgenstern 1996). Results from the early provenance studies such as at Fort Valley con-tributed evidence that certain traits were partially inherited, and that geographic patterns had a genetic basis (Squillace and Silen 1962). These results added to the accumulat-ing knowledge about inheritance, evolution and selective responses to varying intensities of natural and artificial selec-tion (Wright 1976) that was used to initiate tree breeding. The early provenance tests enabled the best trees in the best seed sources to be identified as potential breeding stock. Results from provenance tests such as at Fort Valley contributed to the foundation of our knowledge and continue to inform pon-derosa pine genetics and management (e.g., Baumgartner and Lotan 1987, Larson 1966, Mahalovich and Rehfeldt 2005, 2003, Munger 1947, Pearson 1950, Roeser 1962, Schreiner 1937, Silen unpublished report, Squillace and Silen 1962, Wang 1977, Weidman 1939, Wells 1964a, b).
Long-term tests such as at Fort Valley showed that early performance was not always a reliable predictor of later per-formance (Silen unpublished report). Non-local seed sources often tolerate average conditions of a site, but are usually poor-ly adapted to extremes of weather that occur less frequently but at regular intervals (Johnson and others 2004, Silen un-published report); they may perform well for several years, but then decline in health. At Fort Valley, nearly all the western and
northern provenances (i.e., var. ponderosa) died during the first decade, leaving only the scopulorum variety. However, it took another 70 years to sort the remaining provenances to a single best-yielding provenance (Santa Fe National Forest, Silen un-published report). Some of the non-local provenances grew faster than the local source early on, but in the end, the local seed source for 80-year height (32 ft) out-performed the others. Table 3 lists the seed sources and elevation bands based on a seed transfer expert system (Mahalovich and Rehfeldt 2005) that are considered local to the Fort Valley location. The long-term results from Fort Valley illustrate that shorter term studies may provide misleading information and highlights the value of historical long-term provenance tests.
The Fort Valley study has had approximately 100 years to respond to climate change and provide a testing ground for suggested management recommendations to address climate change. Local seed sources of the native variety scopulo-rum have persisted over time at Fort Valley. The Santa Fe National Forest seed source at 8,000 feet has one of the high-est percent survival followed by the Manti-La Sal National Forest source. Both the non-local Santa Fe and Manti-La Sal sources are more productive than the local Coconino source, as measured by height at age 80 (Table 2). The performance of seed sources at ages 50 and 80 in the historical tests are be-ginning to demonstrate a restoration principle used in mining reclamation (Mahalovich personal communication, USDA Forest Service in press), where seed sources adapted to ex-treme environments (higher latitudes and higher elevations) are utilized to revegetate these sites. Possible mitigation in the form of revising seed and plant movement guidelines em-phasizing a warming trend (IPCC 2007) recommend species and seed sources from more southerly latitudes and lower el-evations (Arbor Day Foundation 2006). Long-term data from the Fort Valley and Idaho studies do not support the selection of southerly latitude or lower elevation seed sources after 10 decades, rather local or local and higher in elevation sources have survived and been more productive. Although mortal-ity has been high, which is to be expected in these types of studies, the Fort Valley test exists today and represents a long-term study with historical and contemporary value.
Contemporary Genetic Studies
Results of the pioneer provenance tests demonstrated that genetic diversity is the raw material on which evolu-tion operates. One goal of ecological restoration is to restore evolutionary processes. Genetic knowledge gained from provenance tests has direct bearing on the success of ecologi-cal restoration (Falk and Holsinger 1991, Young and Clarke 2000) because knowing how genes are distributed and what controls the patterns of genetic diversity enables practitioners to restore genetic diversity patterns to meet specific manage-ment objectives.
Contemporary genetic research using molecular tech-niques demonstrated that the genetic diversity of ponderosa

154 USDA Forest Service RMRS-P-55. 2008.
pine trees established at Fort Valley prior to Euro-American settlement differed from trees established since then (Kolanoski 2002). It was also revealed that the clumpy spatial structure of historical southwestern ponderosa pine stands (White 1985) also corresponded to a clumpy genetic pattern. Regeneration within clumps was likely protected from frequent fire. Over time this created small “genetic neighborhoods” where trees within a clump were more closely related to each other than to trees between clumps. Inbreeding was avoided by high pollen movement in the open areas maintained by frequent fire between clumps of trees. As tree densities increased and the open spaces be-tween clumps filled in, pollen movement was restricted and the regeneration that became established between clumps differed genetically from the older trees. Thinning to health-ier densities will restore pollen flow, but full restoration of genetic diversity patterns also requires restoration of a clumpy versus evenly spaced forest structure (DeWald 2003, Kolanoski 2002).
In addition to changes in pollen movement, contemporary or “rapid” evolution also likely contributed to the genetic differences between the generations (Stockwell and others 2003). The older trees established themselves in environmen-tal conditions unlike those their contemporary progeny faced. Older pines generally experienced relatively little within-species competition during stand development because of frequent low-intensity fires. In contrast, the modern dense, shaded conditions created a different environment during the establishment of the younger trees that were likely selected
for different genetic material. The different genetic material in the younger trees may have future adaptive value and a conservative approach would be to maintain this genetic di-versity (Buchert and others 1997, El-Kassaby and Ritland 1996) along with that preserved in the old trees. Although thinning will help pollen move among the clumps of trees, it can also alter genetic diversity through losses of genetic ma-terial from the population of trees being thinned. Therefore, a sufficient number of the younger generation trees should be maintained along with the older trees in thinned stands. This can be accomplished by varying thinning densities across the landscape (DeWald 2003, Kolanoski 2002).
Genetic diversity allows populations to respond to, and evolve with the dynamic nature of the environment. Therefore, a primary objective of forest management should be to conserve and maintain genetic diversity of organisms and populations within forest ecosystems (DeWald and Mahalovich 1997). Absence of genetic information for adap-tive traits leads to poor management decisions. Likewise, prematurely changing management recommendations in-volving seed transfer in the context of climate change models emphasizing warming, may also lead to poor management decisions if we ignore hard data from long-term racial variation and provenance tests. In this regard, the historical ponderosa pine provenance study initiated at Fort Valley is still providing important information today, and along with contemporary genetic research helps provide the genetic knowledge critical to successful management of the ponder-osa pine ecosystem.
Table 3. Compatible ponderosa pine seed sources for planting at the Fort Valley Experimental Forest, Arizona, based on a seed transfer expert system (Mahalovich and Rehfeldt 2005).

USDA Forest Service RMRS-P-55. 2008. 155
References
Arbor Day Foundation. 2006. Hardiness zone map (2006 arborday.org Hardiness Zone Map). http://www.arborday.org/media/Zones.cfm.
Baumgartner, D.M.; Lotan, J.E. tech eds. 1987. Ponderosa pine: The species and its management. Proceedings of a symposium. 1987; September. 29-October1; Washington State University, Pullman WA.
Buchert, G.P.; Rajora, O.P.; Hood, J.V.; Dancik, B.P. 1997. Effects of harvesting on genetic diversity in old-growth eastern white pine in Ontario, Canada. Conservation Biology. 11: 747-758.
DeWald, L.E.; Mahalovich, M.F. 1997. The role of forest genetics in managing ecosystems. Journal of Forestry. 95: 12-16.
DeWald, L.E. 2003. Conserving genetic diversity during restoration thinning. Pages 226-227 In P. Friederici, ed. Ecological restoration of southwestern ponderosa pine forests. Island Press, Washington, DC.
El-Kassaby, Y.A.; Ritland, K. 1996. Impact of selection and breeding on the genetic diversity in Douglas-fir. Biodiversity and Conservation. 5: 795-813.
Falk, D.A.; Holsinger, K.E. eds. 1991. Genetics and conservation of rare plants. New York: Oxford University Press.
Fowells, H.A. compiler. 1965. Silvics of forest trees of the United States. USDA Forest Service Agriculture Handbook N. 271. Washington, DC.
IPCC 2007. The Fourth Assessment Report (AR4). Working Group III Report “Mitigation of Climate Change”. http://www.ipcc.ch/ipccreports/index.htm
Johnson, C.R.; Sorensen, F.C.; St. Clair, J.B.; Cronn, R.C. 2004. Pacific Northwest forest seed zones: A template for native plants? Native Plants. 5: 131-140
Kolanoski, K.M. 2002. Genetic variation of ponderosa pine in northern Arizona: Implications for restoration. MS Thesis, Northern Arizona University, Flagstaff, AZ.
Larson, M.M. 1966. Racial variation in ponderosa pine at Fort Valley, Arizona. USDA Forest Service Res. Note RM-73. 7 p.
Mahalovich, M.F.; Rehfeldt, G.E. 2005. Southwestern Ponderosa Pine Seed Transfer Expert System Pinus ponderosa var. scopulorum, Version 1.0.
Mahalovich, M.F.; Rehfeldt, G.E. 2003. Ponderosa Pine Seed Transfer Expert System Pinus ponderosa var. ponderosa, Version 2.1d.
Morgenstern, E.K. 1996. Geographic variation in forest trees: Genetic basis and application of knowledge in silviculture. UBC Press Vancouver. 209 p.
Munger, T.T. 1947. Growth of ten regional races of ponderosa pine in six plantations. Res. Notes 39. Portland, OR: U.S. Department of Agriculture, Forest Service, Pacific Northwest Forest and Range Experimental Station. 4 p.
Pearson, G.A. 1950. Management of ponderosa pine in the Southwest. USDA Monograph 6. 218 p.
Rehfedlt, G.E. 1993. Genetic variation in the Ponderosae of the Southwest. American Journal of Botany. 80(3): 330-343.
Roeser, J., Jr. 1962. The importance of seed source and the possibilities of forest tree breeding. Journal of Forestry. 24: 38-51.
Schreiner, E.J. 1937. Improvement of forest trees. USDA Yearbook 1937: 1242-1279.
Soller, E.A. 2003. Using native seed for revegetation: Science and policy. Flagstaff, AZ: Northern Arizona University. MS Thesis.
Squillace, A.E.; Silen, R.R. 1962. Racial variation in ponderosa pine. Forest Science Monograph. 2: 1-27.
Steinhoff, R.J. 1970. Northern Idaho ponderosa pine racial variation study: 50-year results. Res. Note INT-118. Ogden, UT: U.S. Department of Agriculture, Intermountain Forest and Range Experiment Station. 4 p.
Stockwell, C.A.; Hendry, A.P.; Kinnison, M.T. 2003. Contemporary evolution meets conservation biology. Trends in Ecology and Evolution. 18: 94-101.
USDA Forest Service. In press. FSH 2409.26f. Seed Handbook. USDA Forest Service, Southwestern Region, Albuquerque, NM. 233 p.
Wang, Chi-Wu. 1977. Genetics of ponderosa pine. USDA FS Res. Pap. WO-34. 24 p.
Weidman, R.H. 1939. Evidences of racial influence in a 25-year test of ponderosa pine. Journal of Agriculture Research. 59: 855-887.
Wells, O.O. 1964a. Geographic variation in ponderosa pine. I. The ecotypes and their distribution. Silvae Genetica. 13: 89-103.
Wells, O.O. 1964b. Geographic variation in ponderosa pine. II. Correlations between progeny performance and characteristics of the native habitat. Silvae Genetica. 13: 125-132.
White, A.S. 1985. Presettlement regeneration patterns in a southwestern ponderosa pine stand. Ecology. 66: 589-594.
Wright, J.W. 1976. Introduction to Forest Genetics. Academic Press, New York. 463 p.
Young, A.G.; Clarke A.G. eds. 2000. Genetics, demography, and viability of fragmented populations. Cambridge, UK: Cambridge University Press.
The content of this paper reflects the views of the author(s), who are responsible for the facts and accuracy of the information presented herein.

156 USDA Forest Service RMRS-P-55. 2008.
In: Olberding, Susan D., and Moore, Margaret M., tech coords. 2008. Fort Valley Experimental Forest—A Century of Research 1908-2008. Proceedings RMRS-P-55. Fort Collins, CO: U.S. Department of Agriculture, Forest Service, Rocky Mountain Research Station. 282 p.
Introduction
In the past two decades, much attention has been given to understanding the dramatic structural and functional changes observed in the ponderosa pine forests of northern Arizona (Allen and others 2002, Covington and Moore 1994, Fulé and others 1997, Mast and others 1999, Moore and others 2004). While it is widely accepted that these changes have culminated in forest conditions consistent with catastrophic disturbances and widespread degradation of these ecosys-tems (Allen and others 2002), few studies have been able to quantify long-term (100+ years) temporal and spatial chang-es in forest structure (Moore and others 2004).
The objective of this study was to quantify changes in for-est structure, tree recruitment, and associated spatial patterns between fire exclusion (~1874, Sánchez Meador and others 2008a) and contemporary conditions (2004). To do so, we analyzed forest structural data (tree size, tree density) and spatial pattern on a permanent plot at three points in time: onset of fire exclusion (1874), plot establishment (1909), and contemporary (2004). We also analyzed tree recruitment pat-terns as evidenced in spatial maps of regeneration from 1909 and 2004 and in the current stand age-structure. A particular-ly unusual aspect of this plot is that it occurs on a regionally unique parent material, cinder soils.
Forest Structure and Tree Recruitment Changes on a Permanent Historical Cinder Hills Plot Over a 130-Year Period
Jacob H. Dyer, Department of Forest and Wildlife Ecology, University of Wisconsin, Madison, WI; Andrew J. Sánchez Meador, USFS, Forest Management Service Center, Fort Collins, CO; Margaret M. Moore, School of Forestry, Northern Arizona University, Flagstaff, AZ; and Jonathan D. Bakker, College of Forest Resources, University of Washington, Seattle, WA
Abstract—We examined forest structure, tree recruitment, and spatial pattern over a 130-year period on cinder soils in northern Arizona. Data were collected from a 3.24 ha permanent, stem-mapped plot established in 1909. This site is unique in that it represents ponderosa pine (Pinus ponderosa Laws. var. scopulorum Engelm.) growing on black cinder soils, which are of limited extent in the Southwest. Tree diameter, tree density and spatial data reconstructed from 1874 and actual measurements from 1909 and 2004 were compared, and the current stand age-structure of living trees was examined. Unlike most studies of stand dynamics in the Southwest, this site has experienced little change in structure or spatial pattern between 1874 and 2004. This difference is thought to reflect the unique environmental conditions as-sociated with black cinder soils.
Methods
This study was conducted on a 3.24 ha (8 acre) site, denoted as COCS4A, located approximately 20 km north-east of Flagstaff, Arizona on the Coconino National Forest (35° 16.88’N, 111° 32.35’W). This plot is on the Fort Valley Experimental Forest unit east of Flagstaff, AZ (Unit 4) near Doney Park, and has also been referred to as the Cinder Hills or Cinder Plot, Greenlaw Plot, or Old Caves Crater plot. The plot was selectively harvested in 1909 (prior to plot establish-ment measurements) and in 1967.
The elevation of the study site is approximately 2,050 me-ters above sea level, mean annual total precipitation is approximately 430 mm, and mean annual average tempera-ture is 7.6° C (Western Regional Climate Center 2006). The parent material and soils of the site are typical of the San Francisco Volcanic Field (Tanaka and others 1986) with a surface layer of volcanic ejecta (cinders) ranging in thick-ness from 2.5–60 cm. The Terrestrial Ecosystem Survey (TES) classifies the soil type of the site as ashy-skeletal, frigid Vintrandic Ustochrepts, which are extremely cindery sand loams (TES Map Unit 512, Miller and others 1995). The overstory vegetation is ponderosa pine with scattered pinyon pine (Pinus edulis Engelm.). The understory vegetation con-sists primarily of dispersed perennial bunchgrasses.

USDA Forest Service RMRS-P-55. 2008. 157
We used the original 1909 survey and forest inventory methods to reestablish the plots (see Moore and others 2004 for details). Methods used to map spatial locations of trees (x,y coordinates), collect age data, reconstruct plot conditions at fire exclusion, and conduct spatial analyses are outlined by Sánchez Meador and others (2008a, 2008b). In addition, ages were corrected for the time to reach 40 cm height by adding ten years (Cormier 1990). With the exception of analyses of re-cruitment, all analyses were conducted on live trees ≥ 9.14 cm diameter at breast height (1.37 m above ground level). We de-termined stand structural attributes (mean tree size, trees per ha, basal area, quadratic mean diameter, and seedlings per ha) at three points in time: onset of fire exclusion (1874), plot establishment (1909), and contemporary (2004).
Spatial analyses included a first-order point pattern analy-sis of nearest neighbor distances (Clark and Evans’ R [Clark and Evans 1954]) to facilitate interpretation of changes in spatial pattern over time at the plot level and second-order point pattern analyses to examine changes at various spatial scales. Two second-order analyses were utilized: 1) Ripley’s K(t) univariate analysis (Ripley 1976, 1977) to examine changes in spatial patterns with scale of observation for each stand structural scenario, and 2) Ripley’s bivariate analysis (Ripley 1976, 1977) to quantify recruitment-establishment patterns of seedlings with respect to overstory trees.
Results
Stand structural and spatial conditions were similar in 1874 and 1909 to those observed in 2004 (Table 1). The 1909 group-selection harvest reduced the stand density (tree per hectare) by about a third and stand basal area by half, but had little effect on mean nearest neighbor distance. Contemporary age data revealed an uneven-aged structure with three main cohorts, centered in the mid-1800s, the early 1900s and in the mid-1900s. These pulses roughly correspond to periods of increased precipitation (Figure 1).
Live trees were clumped in all three scenarios (Figure 2). Ripley’s univariate K analyses detected subtle differences among time periods in intensity and scale (Figure 3). In 1874 and 1909, trees were clumped at all scales, with maximum intensity at a distance of 10 m. In 2004, trees were clumped with maximum intensity at 6 m, but only out to 30 m, after which they were randomly arranged.
Seedling recruitment was spatially patterned at smaller scales in 1909 than 2004 (Figure 4). In 1909, seedlings were attracted to overstory trees up to six m away, whereas in 2004, seedlings were attracted to overstory trees up to 17 m away.
Discussion
The most important finding in this study is that unlike most other studies in southwestern ponderosa pine (Cooper 1960,
Covington and Moore 1994, Fulé and others 1997, Mast and others 1999, Moore and others 2004), forest structure on this black cinder site is largely unchanged from the onset of fire exclusion (1874) until 2004. Ponderosa pine stands on this study site have lower tree densities, yet higher tree growth and greater overall tree size compared with other stands on historical permanent plots in the Southwest (Moore and others 2004). Other studies have also noted greater average growth of trees on volcanic cinder soils in northern Arizona, and attribute it to a number of factors including: 1) minimal herbaceous competition, 2) deep subsoils that have moisture retaining layers, and/or 3) loose soils that facilitate develop-ment of extensive, branched tree root systems (Abella and Covington 2006, Colton 1932, Haasis 1921). In addition, we did not see the large population explosion of pine seedlings in 1919, as observed in many studies across northern Arizona (Savage and others 1996). Originally, we suspected that the harsh environment of the cinder soils may have prevented seedling establishment, but later we learned that a cone-weevil outbreak that occurred at this site in 1918 prevented the large seed and seedling crop seen in other areas around Flagstaff (Pearson 1923).
The spatial pattern has remained aggregated throughout the site’s recorded history, and this is likely due to the pat-terns of pine recruitment. Recruitment is positively associated with the location of overstory trees. The existing tree canopy provides shade and increased soil moisture, which increases the chances of pine seedling survival (Stein and Kimberling 2003), especially on these more inhospitable surface soils (Abella and Covington 2006).
Summary
Ponderosa pine stands that occur on black cinders par-ent material account for a small proportion of the Coconino National Forest in northern Arizona (Miller and others 1995). Even though these stands do not occupy much area, they are unique. The uniqueness of this forest type was recognized in 1909 when G. A. Pearson established a FVEF East Unit (Unit 4) and several permanent plots to describe this forest type. We remeasured these permanent plots in 2004 and com-pared the forest structure (age, size, density) in 2004 to that in 1909 and to plots reconstructed to 1874. We found that the forest structure had not changed greatly from 1874 to 2004.
Acknowledgments
Contemporary measurements for COCS4 Cinder Hills plots were supported by USFS Rocky Mountain Research Station (RMRS) Joint Venture Agreement 28-JV7-939 and USDA Cooperative State Research, Education and Extension Service grant 2003-35101-12919. Additional funding was provided by the Ecological Restoration Institute (ERI) at

158 USDA Forest Service RMRS-P-55. 2008.
Northern Arizona University (NAU) and a NAU Hooper Undergraduate Research award granted to J. Dyer. We are grateful to D. Vanderzanden, J. Crouse, D. Huffman, D. Bell, D. Normandin, and numerous people from the ERI who pro-vided field, laboratory, data entry assistance, and logistical support. We thank the USFS RMRS and Coconino National Forest for permission to sample their lands. We also thank S. Olberding, archivist and historian, RMRS Fort Valley Experimental Forest Archives, Flagstaff, AZ, who helped us locate historical maps and ledger data. Finally, we are in-debted to G.A. Pearson and T.S. Woolsey, Jr., who had the foresight to establish these permanent plots and map and re-cord the forest structure in 1909.
References
Abella, S.R.; Covington, W.W. 2006. Forest ecosystems of an Arizona Pinus ponderosa landscape: multifactor classification and implications for ecological restoration. Journal of Biogeography. 33: 1368-1383.
Allen, C.D.; Savage, M.; Falk, D.A.; Suckling, K.F.; Swetnam, T.W.; Schulke, T.; Stacey, P.B.; Morgan, P.; Hoffman, M.; Klingel, J.T. 2002. Ecological restoration of Southwestern ponderosa pine ecosystems: A broad perspective. Ecological Applications. 12: 1418-1433.
Clark, P.J.; Evans, F.C. 1954. Distance to nearest neighbor as a measure of spatial relationships in populations. Ecology. 35: 445-453.
Colton, H.S. 1932. Sunset Crater: the effect of a volcanic eruption on the ancient Pueblo people. Geographical Review. 22: 582-590.
Cook, E.R.; Meko, D.M.; Stahle, D.W.; Cleaveland, M.K. 1996. Tree-ring reconstructions of past drought across the conterminous United States: tests of a regression method and calibration/verification results. Pages 155-170 in Dean, J.S.; Meko, D.M.; Swetnam, T.W., eds. Tree rings, environment, and humanity: proceedings of the international conference. Radiocarbon, Department of Geosciences, University of Arizona, Tucson, Arizona, U.S.A.
Cooper, C.F. 1960. Changes in vegetation, structure, and growth of southwestern pine forests since white settlement. Ecological Monographs. 30: 129-164.
Cormier, K.L. 1990. Modeling natural regeneration of even-aged ponderosa pine following shelterwood cutting in northern Arizona. Thesis. Northern Arizona University, Flagstaff, Arizona, U.S.A.
Covington, W.W.; Moore, M.M. 1994. Southwestern ponderosa pine forest structure and resource conditions: changes since Euro-American settlement. Journal of Forestry. 92: 39-47.
Fulé, P.Z.; Covington, W.W.; Moore, M.M. 1997. Determining reference conditions for ecosystem management of southwestern ponderosa pine forests. Ecological Applications. 7: 895-908.
Haasis, F.W. 1921. Relations between soil type and root form of western yellow pine seedlings. Ecology. 2: 292-303.
Mast, J.N.; Fulé, P.Z.; Moore, M.M.; Covington, W.W.; Waltz, A.E.M. 1999. Restoration of presettlement age structure of an Arizona ponderosa pine forest. Ecological Applications. 9: 228-239.
Miller, G.; Ambos, N.; Boness, P.; Reyher, D.; Robertson, G.; Scalzone, K.; Steinke, R.; Subirge, T. 1995. Terrestrial Ecosystem Survey of the Coconino National Forest, USDA Forest Service Southwestern Region.
Moore, M.M.; Huffman, D.W.; Fulé, P.Z.; Covington, W.W.; Crouse, J.E. 2004. Comparison of historical and contemporary forest structure and composition on permanent plots in southwestern ponderosa pine forests. Forest Science. 50: 162-176.
Pearson, G.A. 1923. Natural reproduction of western yellow pine in the Southwest. USDA Forest Service Bulletin 105. Washington, DC. 143 p.
Ripley, B.D. 1976. The second-order analysis of stationary point processes. Journal of Applied Probabilities. 13: 255-266.
Ripley, B.D. 1977. Modeling spatial patterns. Journal of the Royal Statistical Society, Series B. 39: 172-212.
Savage, M.; Brown, P.M.; Feddema, J. 1996. The role of climate in a pine forest regeneration pulse in the southwestern United States. Ecoscience. 3: 310-318.
Sánchez Meador, A.J.; Moore, M.M.; Bakker, J.D.; Parysow, P.F. 2008a. 108 years of change in spatial pattern following selective harvest of a ponderosa pine stand in northern Arizona, U.S.A. Journal of Vegetation Science. doi: 10.3170/2008-8-18496..
Sánchez Meador, A.J.; Parysow, P.F.; Moore, M.M. 2008b. Historical stem-mapped permanent plots increase precision of reconstructed reference data in ponderosa pine forests of northern Arizona. Restoration Ecology. doi: 1111/j.1526-100X.2008.00442.x.
Stein, S.J.; Kimberling, D.N. 2003. Germination, establishment, and mortality of naturally seeded southwestern ponderosa pine. Western Journal of Applied Forestry. 18: 109-114.
Tanaka, K.L.; Shoemaker, E.M.; Ulrich, G.E.; Wolfe, E.W. 1986. Migration of volcanism in the San Francisco volcanic field, Arizona. Geological Society of America Bulletin. 97: 129-141.
Western Regional Climate Center (WRCC). 2006. Arizona Climate Summaries. [Online]. http://www.wrcc.dri.edu/summary/climsmaz.html [May 11, 2006].

USDA Forest Service RMRS-P-55. 2008. 159
Figure 1. Age distribution by decade of COCS4A with overlay of Palmers Drought Severity Index showing the correlation between wet years and regeneration events.
Table 1. Stand-level structural and spatial attributes for live trees ≥9.14 cm dbh on COCS4A for presettlement (1874), plot establishment (1909), and contemporary scenarios (2004).
Attribute 1874 1909 2004
StructuralDiameter at breast height (cm)
Mean 40.8 34.4 42.9Minimum 9.4 11.2 10.2Maximum 96.4 96.5 92.2
Trees per ha 79.4 58.3 75.0Basal area (m2 ha-1) 13.4 6.7 12.8QMD (cm) 46.3 38.4 46.7Seedlings per haa ???b 8.6 29.6
SpatialNearest Neighbor Distance (m)
Mean 4.4 4.2 4.5Median 2.6 2.1 3.6Minimum 0.6 0.1 0.2Maximum 25.7 34.8 17.2
Clark & Evans Rc 0.78 0.63 0.77
a Seedlings are >0.3 m tall and <9.14 cm dbh.b 1874 seedlings per ha are not quantifiable with these data.c All values significant at the 95% confidence level.

160 USDA Forest Service RMRS-P-55. 2008.
Figure 2. Stem maps of live trees ≥9.14 cm dbh for three time periods: (a) onset of fire exclusion (1874; n = 257), (b) plot establishment (1909; n = 189), and (c) contemporary (2004; n = 243). Point or circle size is proportional to stem diameter and on a different scale from tree coordinates for visual clarity.
Figure 3. Ripley’s K(t) univariate statistic (transformed as [L(t)-t]) as a function of lag distance for three time periods: (a) onset of fire exclusion (1874; n = 257), (b) plot establishment (1909; n = 189), and (c) contemporary (2004; n = 243). The horizontal dashed line is the expectation if trees are randomly distributed. Calculated values that fall outside of the confidence interval are statistically significant; values >0 indicate aggregation and values <0 indicate uniform (regular) spatial distribution.

USDA Forest Service RMRS-P-55. 2008. 161
Figure 4. Stem maps showing overstory trees (black circles) and seedlings (grey squares) and the associated Ripley’s K12(t) bivariate statistic (transformed as [L12(t)-t]) as a function of lag distance) for 1909 plot establishment (a & b), and 2004 contemporary (c & d) conditions. The horizontal dashed line is the expectation if trees are randomly distributed, and the dotted lines are the 95% confidence limits. Calculated values that fall outside of the confidence interval are statistically significant; values >0 indicate attraction and values <0 indicate repulsion between the two populations.
The content of this paper reflects the views of the author(s), who are responsible for the facts and accuracy of the information presented herein.

162 USDA Forest Service RMRS-P-55. 2008.
In: Olberding, Susan D., and Moore, Margaret M., tech coords. 2008. Fort Valley Experimental Forest—A Century of Research 1908-2008. Proceedings RMRS-P-55. Fort Collins, CO: U.S. Department of Agriculture, Forest Service, Rocky Mountain Research Station. 282 p.
Introduction
Early ecologists (Haasis 1921, 1923, Pearson 1923) were investigating methods to secure natural regeneration of west-ern yellow pine (Pinus ponderosa) since the establishment of Fort Valley Experimental Forest headquarters at Flagstaff in 1908. Restoration of native pine communities continues to be a focus of land managers, particularly following wild-land fire (wildfire or prescribed fire) (Hardy and Arno 1996). In this paper, we compare pine regeneration efforts in the Southwest (based on a study by Elliott and White [1987]) to efforts in southern Appalachia (Clinton and others 1993, Elliott and Vose 1993, Clinton and others 1997, Elliott and others 1999, Elliott and others 2002, Elliott and Vose 2005).
1 Plant species nomenclature follows http://plants.usda.gov/
Pine Regeneration Following Wildland Fire
Katherine J. Elliott, James M. Vose, USFS, Coweeta Hydrologic Laboratory, Southern Research Station, Otto, NC; and Alan S. White, School of Forest Resources, University of Maine, Orono, ME
Abstract—Pine regeneration following wildland fire continues to be a serious problem across the western and southeastern U.S. Frequency of large wildfires has increased over the last several decades and restoration of these burned areas is a major problem confronting land managers. Prescribed fires are used primarily to reduce heavy fuel loads and secondarily to reduce competition or prepare sites for natural or planted pine regeneration. In 1983, an experiment was initiated near the Fort Valley Experimental Forest to evaluate the growth of ponderosa pine (Pinus ponderosa1) seedlings planted after a severe wildfire. This study evalu-ated different herbaceous species effects on survival and growth of ponderosa pine seedlings. The study reported that competition from nonnative grass species (Dactylis glomerata and Agropyron desertorum) significantly reduced water and nitrogen availability and pine seed-ling growth; whereas, native grasses (Bouteloua gracilis and Sitanion hystrix) had no effect on soil resources or pines. In southern Appalachia, pine regeneration success after wildland fire varies depending on fire severity and growing season precipitation. After a high intensity, moderate severity fire on dry southern Appalachian ridges, pitch pine (Pinus rigida) seedling germination was high (3,000 seedlings/ha); however, most pine seedlings did not survive beyond the first year due to unusually low precipitation late in the growing season. Even in these mountains that normally receive high precipitation, drought can reduce pine seedling growth and induce mortality. More often, light and nitrogen are the limiting resources to pine seedling growth, and sprouting hardwoods are more competitive than herbaceous species with the regenerating pines. Further studies in southern Appalachia suggest that success-ful regeneration of pine (e.g., Pinus strobus, P. echinata, or P. rigida) after prescribed fire will not be achieved without planting pine seedlings and reducing fast growing hardwood competitors.
Both regions attempt to restore pine forests that have experi-enced a combination of drought, bark beetle (mountain pine beetle [MPB, Dendroctonus ponderosae Hopkins] (Jenkins and others 2008) or southern pine beetle [SPB, Dendroctonus frontalis Zimmermann]), and wildland fire.
Pine Regeneration in the Southwest
In the Southwest, ponderosa pine (Pinus ponderosa) forests occur between 1830 to 2590 m (6000 to 8500 ft) in elevation and are semi-arid with ~50 cm (20 inches) of pre-cipitation per year. Historically, natural pine regeneration and overstory recruitment were highly episodic; related to both optimal climate conditions for seed production, seed-ling germination and growth and longer intervals between
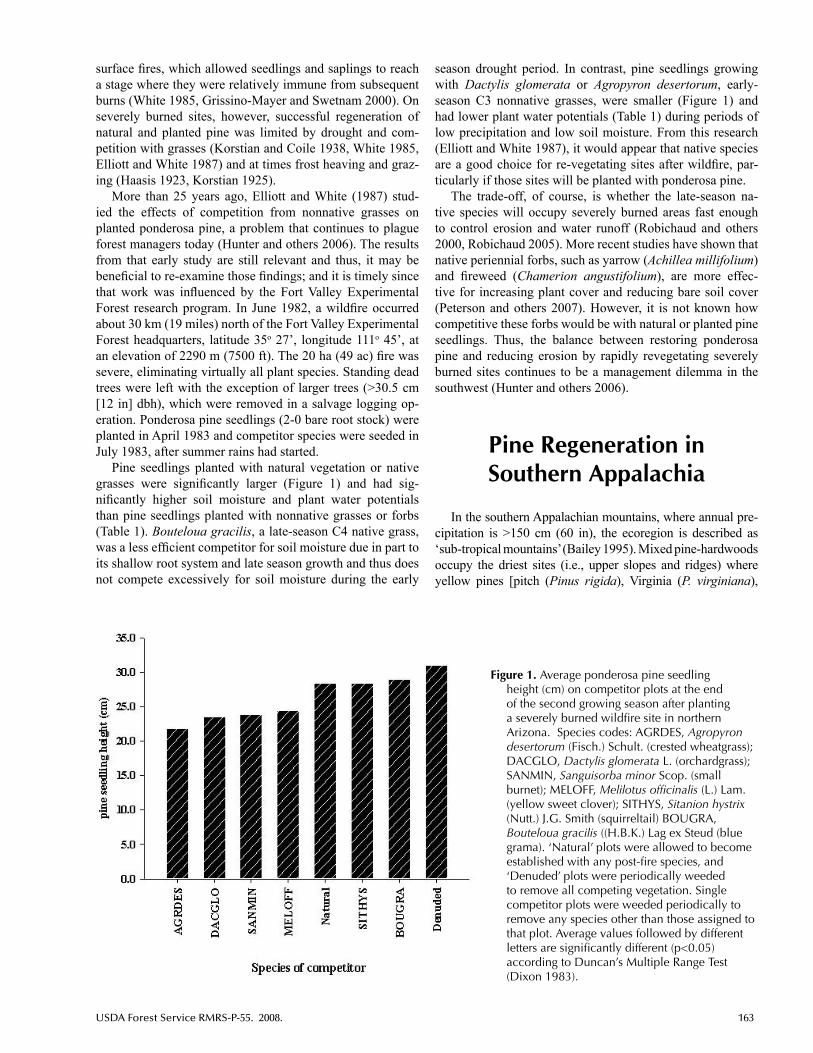
USDA Forest Service RMRS-P-55. 2008. 163
surface fires, which allowed seedlings and saplings to reach a stage where they were relatively immune from subsequent burns (White 1985, Grissino-Mayer and Swetnam 2000). On severely burned sites, however, successful regeneration of natural and planted pine was limited by drought and com-petition with grasses (Korstian and Coile 1938, White 1985, Elliott and White 1987) and at times frost heaving and graz-ing (Haasis 1923, Korstian 1925).
More than 25 years ago, Elliott and White (1987) stud-ied the effects of competition from nonnative grasses on planted ponderosa pine, a problem that continues to plague forest managers today (Hunter and others 2006). The results from that early study are still relevant and thus, it may be beneficial to re-examine those findings; and it is timely since that work was influenced by the Fort Valley Experimental Forest research program. In June 1982, a wildfire occurred about 30 km (19 miles) north of the Fort Valley Experimental Forest headquarters, latitude 35o 27’, longitude 111o 45’, at an elevation of 2290 m (7500 ft). The 20 ha (49 ac) fire was severe, eliminating virtually all plant species. Standing dead trees were left with the exception of larger trees (>30.5 cm [12 in] dbh), which were removed in a salvage logging op-eration. Ponderosa pine seedlings (2-0 bare root stock) were planted in April 1983 and competitor species were seeded in July 1983, after summer rains had started.
Pine seedlings planted with natural vegetation or native grasses were significantly larger (Figure 1) and had sig-nificantly higher soil moisture and plant water potentials than pine seedlings planted with nonnative grasses or forbs (Table 1). Bouteloua gracilis, a late-season C4 native grass, was a less efficient competitor for soil moisture due in part to its shallow root system and late season growth and thus does not compete excessively for soil moisture during the early
season drought period. In contrast, pine seedlings growing with Dactylis glomerata or Agropyron desertorum, early-season C3 nonnative grasses, were smaller (Figure 1) and had lower plant water potentials (Table 1) during periods of low precipitation and low soil moisture. From this research (Elliott and White 1987), it would appear that native species are a good choice for re-vegetating sites after wildfire, par-ticularly if those sites will be planted with ponderosa pine.
The trade-off, of course, is whether the late-season na-tive species will occupy severely burned areas fast enough to control erosion and water runoff (Robichaud and others 2000, Robichaud 2005). More recent studies have shown that native periennial forbs, such as yarrow (Achillea millifolium) and fireweed (Chamerion angustifolium), are more effec-tive for increasing plant cover and reducing bare soil cover (Peterson and others 2007). However, it is not known how competitive these forbs would be with natural or planted pine seedlings. Thus, the balance between restoring ponderosa pine and reducing erosion by rapidly revegetating severely burned sites continues to be a management dilemma in the southwest (Hunter and others 2006).
Pine Regeneration in Southern Appalachia
In the southern Appalachian mountains, where annual pre-cipitation is >150 cm (60 in), the ecoregion is described as ‘sub-tropical mountains’ (Bailey 1995). Mixed pine-hardwoods occupy the driest sites (i.e., upper slopes and ridges) where yellow pines [pitch (Pinus rigida), Virginia (P. virginiana),
Figure 1. Average ponderosa pine seedling height (cm) on competitor plots at the end of the second growing season after planting a severely burned wildfire site in northern Arizona. Species codes: AGRDES, Agropyron desertorum (Fisch.) Schult. (crested wheatgrass); DACGLO, Dactylis glomerata L. (orchardgrass); SANMIN, Sanguisorba minor Scop. (small burnet); MELOFF, Melilotus officinalis (L.) Lam. (yellow sweet clover); SITHYS, Sitanion hystrix (Nutt.) J.G. Smith (squirreltail) BOUGRA, Bouteloua gracilis ((H.B.K.) Lag ex Steud (blue grama). ‘Natural’ plots were allowed to become established with any post-fire species, and ‘Denuded’ plots were periodically weeded to remove all competing vegetation. Single competitor plots were weeded periodically to remove any species other than those assigned to that plot. Average values followed by different letters are significantly different (p<0.05) according to Duncan’s Multiple Range Test (Dixon 1983).

164 USDA Forest Service RMRS-P-55. 2008.
Table 1. Ponderosa pine predawn xylem water potential (Ψ) and extractable soil nitrogen (0-5 and 5-15 cm soil depths) comparison among various grass species, two growing seasons after a severe wildfire.
Extractable soil nitrogen (Sept 1984)
NO3-N (mg/Kg) NH4-N (mg/Kg)
Treatment Ψ (- MPa) 0-5 cm 5-15 cm 0-5 cm 5-15 cm
Bouteloua gracilis 0.54 b 1.60 a 2.68 a 1.96 a 2.40 aDactylis glomerata 1.32 a 0.18 b 0.12 b 2.88 b 3.32 bAgropyron desertorum 1.55 aControl (denuded) 0.48 b 4.37 a 3.07 a 2.14 a 2.38 aNatural vegetationa 0.56 b
aNatural vegetation consisted of squirreltail (Sitanion hystrix [Nutt.]), mountain muhly (Muhlen-bergia montana [Nutt] Hitch.), Arizona fescue (Festuca arizonica Vasey), lupine (Lupinus spp.), and others.
Average values in a column followed by different letters are significantly (p≤0.05) different ac-cording to a nonparametric equivalent to Tukey’s multiple comparison test (Dixon 1983). Taken from Elliott and White (1987).
Table Mountain (P. pungens), and/or shortleaf (P. echinata)] are mixed with oaks [scarlet (Quercus coccinea), chestnut (Q. montana), and white (Q. alba)] and other hardwoods [red ma-ple (Acer rubrum), blackgum (Nyssa sylvatica)]. Over the past century, pine-hardwoods have been on a trajectory of increased pine overstory mortality, a lack of tree regeneration, loss of ground layer herbs and grasses (Elliott and others 1999,Vose and Swank 1993, Vose 2000), and expansion of mountain laurel (Kalmia latifolia) (Dobbs 1998). The most recent SPB outbreak (1999-2002) resulted in extensive and widespread pine mortality.
Forest managers prescribe fire as a silvicultural treatment in pine-hardwood forests (http://www.fs.fed.us/fire; http://www.nature.nps.gov/firemanagement) to reduce fuel load, to restore diversity and productivity (Clinton and others 1993, Clinton and Vose 2000), and to promote regeneration of na-tive pines and oaks (Vose 2000). Fire reduces mountain laurel and delays its growth (Clinton and others 1993), en-courages oaks and other tree species including pines to sprout (Elliott and others 2004), and provides a seedbed for native pine germination and establishment (Elliott and others 1999, Waldrop and others 2000).
Fire research in southern Appalachia has investigated the effects of wildland fire on ecosystem processes such as net primary production, nutrient and carbon cycling, and veg-etation dynamics (http://www.srs.fs.usda.gov/coweeta). Part of this program is to assess restoration of pine-hardwoods (Clinton and Vose 2000) by evaluating the competitive en-vironment of planted and naturally regenerating pine (Elliott and Vose 1995, Elliott and others 2002). On ridge sites, where fire intensity is highest, stand-replacing fires can
consume understory vegetation and ignite crowns. Pitch pine and Table Mountain pine seedling germination may be high (Waldrop and others 2000). However, pine seedlings may not survive beyond the first year (Figure 2) when precipitation in late summer is below the long-term average (Elliott and others 1999).
Other fire studies have focused on restoration of short-leaf pine/bluestem grass communities (Hubbard and others 2004). Prescribed burn treatments were intended to reduce competition; promote regeneration of shortleaf pine; and promote a diverse ground flora including native bluestem grasses (Andropogon gyrans, A. gerardii, and Schizachyrium scoparium) (Elliott and Vose 2005). While some undesirable species were reduced (Figure 3), hardwoods and blueberries (Vaccinium spp.) were more abundant, and shortleaf pine and bluestem grass did not regenerate (Figure 3). Elliott and Vose (2005) concluded that more aggressive treatments would be necessary to restore shortleaf pine and native bluestem grass on these sites.
Another study was designed [http://www.firescience.gov/JFSP_Search/Vose] with collaboration from the Cherokee National Forest, Tennessee to restore shortleaf pine/bluestem grass in forests heavily impacted by SPB induced tree mortal-ity. Following burn treatments (March 2006), shortleaf pine seedlings were hand planted (~ 270 seedlings/ha [110 seed-lings/acre]) and native bluestem grass seeds were broadcast spread. Survival of planted pine averaged 75% the first grow-ing season; whereas, establishment of bluestem grass did not occur until the second growing season. Preliminary results suggest that planting shortleaf pine and seeding bluestem grass could accelerate the recovery of these forests.

USDA Forest Service RMRS-P-55. 2008. 165
Figure 2. Changes in number of tree seedlings after prescribed fire in the Wine Spring Creek watershed, western North Carolina; pre-burn (1994) and the first (1995), second (1996) and tenth (2005) growing seasons post-burn. Species codes: ACERUB, Acer rubrum; AMEARB, Amelanchier arborea; QUECOC, Quercus coccinea; QUEMON, Quercus montana; QUERUB, Quercus rubra; QUEVEL, Quercus velutina; ROBPSE, Robinia pseudoacacia; SASALB, Sassafras albidum; PINRIG, Pinus rigida. Species nomenclature follows Gleason and Cronquist (1991).
Figure 3. Changes in number of tree seedlings (<0.5 m height) and saplings (>0.5 m height, <5.0 cm dbh) after prescribed fire in the Conasauga River Watershed, eastern Tennessee and north Georgia: pre-burn (2000) and the first (2001) and second (2002) growing seasons post-burn. Species codes: ACERUB, Acer rubrum; LIRTUL, Liriodendron tulipifera; QUEALB, Quercus alba; QUECOC, Quercus coccinea; QUEVEL, Quercus velutina; QUEMON, Quercus montana; SASALB, Sassafras albidum; CARYA, Carya spp.; PINSTR, Pinus strobus; PINVIR, Pinus virginiana; NYSSYL, Nyssa sylvatica. Species nomenclature follows Gleason and Cronquist (1991).

166 USDA Forest Service RMRS-P-55. 2008.
Summary
Costly and dramatic post-fire rehabilitation (i.e., erosion control) efforts, such as those used in the western states, are not required in southern Appalachia. Even after severe fire, recovery rates of Appalachian forests are much faster than southwestern forests due to rapid vegetative re-growth. However, this re-growth may not have the desired species composition that restores native pines or oaks to the pine-hardwood forest. Thus, restoring ecosystems after wildland fire by establishing pine regeneration can be problematic in both the southwest and the southern Appalachians. In the Southwest, pine regeneration is often limited by competition from seeded nonnative grasses and the most limiting resource is water. In southern Appalachia, pine regeneration is also limited by competition, but the most aggressive competitors are fast-growing hardwood sprouts. Even though water can limit establishment of pine seedlings, the most limiting re-source to pine seedling growth is light.
References
Bailey, R.G. 1995. Descriptions of Ecoregions of the United States (2nd edition). Misc. pub. 1391. Map scale 1:7,500,000. Washington, DC: U.S. Department of Agriculture, Forest Service. 108 p.
Clinton, B.D.; Elliott, K.J.; Swank, W.T. 1997. Response of planted eastern white pine (Pinus strobus L.) to mechanical release, competition, and drought in the southern Appalachians. Southern Journal of Applied Forestry. 21(1): 19-23.
Clinton, B.D.; Vose, J.M. 2000. Plant succession and community restoration following felling and burning in the southern Appalachians. In: Moser, W.K.; Moser, C.F. (eds.). Fire and forest ecology: innovative silviculture and vegetation management. Proceedings of the Tall Timbers Fire Ecology Conference. Tallahassee, FL: Tall Timbers Research Station: 21: 22-29.
Clinton, B.D.; Vose, J.M.; Swank, W.T. 1993. Site preparation burning to improve southern Appalachian pine-hardwood stands: vegetation composition and diversity of 13-year-old stands. Canadian Journal of Forest Research. 23: 2271-2277.
Dobbs, M.M. 1998. Dynamics of the evergreen understory at Coweeta Hydrologic Laboratory, North Carolina. Athens: University of Georgia. Dissertation.
Dixon, W.J. 1983. BMDP statistical software. Berkeley: University of California Press. 733 p.
Elliott, K.J.; Hendrick, R.L.; Major, A.E.; Vose, J.M.; Swank, W.T. 1999. Vegetation dynamics after a prescribed fire in the southern Appalachians. Forest Ecology and Management. 114: 199-213.
Elliott, K.J.; Vose, J.M. 1993. Site preparation burning to improve southern Appalachian pine-hardwood stands: Photosynthesis, water relations, and growth of planted Pinus strobus L. seedlings during establishment. Canadian Journal of Forest Research. 23: 2278-2285.
Elliott, K.J.; Vose, J.M. 1995. Evaluation of the competitive environment for white pine (Pinus strobus L.) seedlings planted on prescribed burn sites in the southern Appalachians. Forest Science. 41(3): 513-530.
Elliott, K.J.; Vose, J.M. 2005. Effects of understory prescribed burning on shortleaf pine (Pinus echninata Mill.)/mixed-hardwood forests. Journal of the Torrey Botanical Society. 132: 236-251.
Elliott, K.J.; Vose, J.M.; Clinton, B.D. 2002. Growth of eastern white pine (Pinus strobus L.) related to forest floor consumption by prescribed fire in the southern Appalachians. Southern Journal of Applied Forestry. 26(1): 18-25.
Elliott, K.J.; Vose, J.M.; Clinton, B.D.; Knoepp, J.D. 2004. Effects of understory burning in a mesic, mixed-oak forest in the southern Appalachians. In: Engstrom, T.T.; Galley, K.E.M.; de Groot, W.J. (eds.). Fire in temperate, boreal, and montane ecosystems. Proceedings of the Tall Timbers Fire Ecology Conference. Tallahassee, FL: Tall Timbers Research Station: 22: 272-283.
Elliott, K.J.; White, A.S. 1987. Competitive effects of various grasses and forbs on ponderosa pine seedlings. Forest Science. 33(2): 356-366.
Gleason, H.A.; Cronquist, A. 1991. Manual of vascular plants of Northeastern United States and Adjacent Canada, second edition. Bronx, NY: The New York Botanical Garden. 910 p.
Grissino-Mayer, H.D.; Swetnam, T.W. 2000. Century-scale climate forcing of fire regimes in the American Southwest. Holocene. 10: 207-214.
Haasis, F.W. 1921. Relations between soil type and root form of western yellow pine seedlings. Ecology. 2: 292-303.
Haasis, F.W. 1923. Frost heaving of western yellow pine seedlings. Ecology. 4: 378-390.
Hardy, C.C., Arno, S.F. (eds.). 1996. The use of fire in forest restoration. GTR-INT-341, Ogden, UT: U.S. Department of Agriculture, Forest Service, Intermountain Research Station.
Hubbard, R.T.; Clinton, B.D.; Vose, J.M.; Knoepp, J.D.; Elliott, K.J. 2004. Nutrient and carbon pools and fluxes following stand restoration burning in oak/pine forest types in the Conasauga River Watershed. Forest Ecology and Management. 190: 311-321.
Hunter, M.E.; Omi, P.N.; Martinson, E.J.; Chong, G.W. 2006. Establishment of non-native plant species after wildfires: effects of fuel treatments, abiotic and biotic factors, and post-fire grass seeding treatments. International Journal of Wildland Fire. 15: 271-281.
Hursh, C.R.; Haasis, F.W. 1931. Effects of 1925 summer drought on southern Appalachian hardwoods. Ecology. 12: 380-386.
Jenkins, M.J.; Hebertson, E.; Page, W.; Jorgensen C.A. 2008. Bark beetles, fuels, fires and implications for forest management in the Intermountain West. Forest Ecology and Management. 254: 16-34.
Korstian, C.F. 1925. Some ecological effects of shading coniferous nursery stock. Ecology 6: 48-51.
Korstian, C.F.; Coile, C. 1938. Plant competition in forest stands. Duke University Bulletin. 3: 1-125.
Pearson, G.A. 1923. Natural reproduction of western yellow pine in the Southwest. USDA Bulletin 1105. Washington, DC: U.S. Department of Agriculture. 143 p.

USDA Forest Service RMRS-P-55. 2008. 167
Peterson, D.W.; Dodson, E.K.; Harrod, R.J. 2007. Assessing the effectiveness of seedling and fertilization treatments for reducing erosion potential following severe wildfire. In: Butler, B.W.; Cook, W. (comps). The fire environment—innovations, management, and policy; conference proceedings, 26-30 March 2007; Destin, FL. Proceedings RMRS-P-46CD. Fort Collins, CO: U.S. Department of Agriculture, Forest Service, Rocky Mountain Research Station: 662 p. CD-ROM.
Robichaud, P.R. 2005. Measurement of post-fire hillslope erosion to evaluate and model rehabilitation treatment effectiveness and recovery. International Journal of Wildland Fire. 14: 475-485.
Robichaud, P.R.; Beyers, J.L.; Neary, D.G. 2000. Evaluating the effectiveness of postfire rehabilitation treatments. RMRS-GTR-63, Fort Collins, CO: U.S. Department of Agriculture, Forest Service, Rocky Mountain Research Station. 89 p.
SAS Institute Inc. 1999-2000. SAS/STAT Guide for Personal Computers. Version 8.1, Cary, NC.
Vose, J.M. 2000. Perspectives on using prescribed fire to achieve desired ecosystem conditions. In: Moser, W.K.; Moser, C.F. (eds.). Fire and forest ecology: innovative silviculture and vegetation management. Proceedings of the Tall Timbers Fire Ecology Conference. Tallahassee, FL: Tall Timbers Research Station. 21: 12-17.
Vose, J.M.; Swank, W.T. 1993. Site preparation burning to improve southern Appalachian pine-hardwood stands: aboveground biomass, forest floor mass, and nitrogen and carbon pools. Canadian Journal of Forest Research. 23: 2255-2262.
Vose, J.M.; Swank, W.T.; Clinton, B.D.; Knoepp, J.D.; Swift, L.W., Jr. 1999. Using stand replacement fires to restore southern Appalachian pine-hardwood ecosystems: effects on mass, carbon, and nutrient pools. Forest Ecology and Management. 114: 215-226.
Waldrop, T.A.; Welch, N.T.; Brose, P.H.; Elliott, K.J.; Mohr, H.H.; Gray, E.A.; Ellis, F.H. 2000. Current research on restoring ridgetop pine communities with stand replacement fire. In: Yaussey, D.A. (compiler). Fire, people, and the central hardwood landscape. 2000 March 12-14; Richmond, KY. Gen. Tech. Rep. NRS-274. Newton Square, PA: U.S. Department of Agriculture, Forest Service, Northern Research Station:103-109.
White, A.S. 1985. Presettlement regeneration patterns in a southwestern ponderosa pine stand. Ecology. 66: 589-594.
The content of this paper reflects the views of the author(s), who are responsible for the facts and accuracy of the information presented herein.

168 USDA Forest Service RMRS-P-55. 2008.
In: Olberding, Susan D., and Moore, Margaret M., tech coords. 2008. Fort Valley Experimental Forest—A Century of Research 1908-2008. Proceedings RMRS-P-55. Fort Collins, CO: U.S. Department of Agriculture, Forest Service, Rocky Mountain Research Station. 282 p.
Figure 1. Main laboratory building at FVEF. (All photos coutesy of the Donald Elston Collection, NAU Special Collections, Flagstaff, AZ)
The U.S. Geological Survey Paleomagnetics Laboratory at Fort Valley Experimental Forest—1970-1991
Shirley Elston and Carolyn Shoemaker, Volunteers and Wives, U.S. Geological Survey, Flagstaff, AZ
Abstract—The United States Geological Survey (USGS) Paleomagnetics Laboratory was es-tablished in 1970, when Dr. Donald P. Elston of USGS negotiated with officials of the U.S. Forest Service in Flagstaff for the use of several buildings at the Fort Valley Experimental Forest (FVEF). The Fort Valley location was ideal for use as a laboratory, because its distance from Flagstaff mitigated the possibility of outside magnetic disturbance, which could affect any results obtained. It should also be noted that the necessary space was potentially available, in that most of the buildings were in states of disrepair and in danger of being torn down or moved. The USGS updated the buildings used by the Laboratory and helped ensure that the FVEF remained intact (Figure 1).
USDA Forest Service RMRS-P-55. 2008. 169
IntroductionPaleomagnetism is an important aspect of geology. It is the
study of the Earth’s magnetic history for the past billion-plus years (Archean-Pre-Cambrian to the present). Each rock has a “remanent” magnetization relative to the magnetic North Pole, which is imprinted when it is originally deposited. This “magnetic moment” can be preserved to the present, and is a tool for dating ancient beds by the position of the magnetic North Pole, and places them in time, in the history of the Earth. Thus a rock whose preserved magnetic position indi-cates that it should be in the middle of the Atlantic Ocean was probably deposited there many millions to billions of years ago. Careful selection and processing of rock samples per-mit the scientist to determine the latitude and longitude of the original formational location, which can be thousands of miles away from the sample’s present-day location. Over the years the techniques have been refined so that the results have scientific legitimacy. The ensuing research papers have pro-vided a fairly accurate map of the Earth’s past history, helping to substantiate the theory of continental drift—movement of the continents throughout geologic time. Paleomagnetism al-lows Earth scientists to decipher our planet’s past physical history (but not to predict its future!).
The studies begin with the collection of samples of rocks. First the geologist carefully chooses the rocks to be sampled. Flat-lying red sandstones, which are relatively iron-rich in magnetic minerals and unweathered, are generally preferred. This is because “secondary magnetization” can occur in rocks that have been exposed to the elements; also, rocks struck by lightning will definitely be remagnetized. Some igneous rocks, such as basalt, also yield good results.
Samples are obtained using a portable chainsaw adapted to drill rocks to obtain one inch-diameter cores in the cho-sen rocks, with a barrel whose cutting edge is encrusted with industrial diamonds (Figure 2). The drilling tools include a water can with pump to keep the core barrel relatively cool during the procedure. The cores (two to three inches long) are oriented, marked, labeled, and then removed from the holes and their numbers recorded. Then they are placed in individual sample bags, marked with this information, and numbered in ascending order. The sample marking tool (known as the ‘scritcher’) is made of brass as is the sample holder (or orienting tool). Finally, the small bags are placed in larger sample bags and their localities noted on the bags. The information is recorded in field notebooks to assure that all needed information is preserved (Figure 3).
The Paleomagnetics Lab at Fort Valley
The initial piece of equipment in the Lab was a spin-ner magnetometer built from a kit by Gary Scott, the first Lab employee and who later earned a PhD based on pa-leomagnetics research. The magnetometer (Figure 4) was
a rather primitive instrument. It required many procedures before any useful information could be obtained. Gary also constructed an “astatic” magnetometer (Figure 5), which, although it worked well enough, required dark-ness and was even slower than the air turbine spinner, so it was not used much (Scott 2008). A liquid-helium cooled super-conducting cryogenic magnetometer (hard-lined to a PDP-8 computer and later to an Apple II) with on-line plot-ters and printer was purchased in the early 1970s. Other equipment included a large low-field oven for thermal demagnetization.
When the cores reached the Lab many procedures were necessary before the results could be analyzed, studied, plot-ted, ruminated upon and reports finally written. The cores were first cut (Figure 6) to fit the superconducting magne-tometer core-holders. Several measurements of each core were made and, for this magnetometer only, were simultane-ously sent to an attached computer for recording; diagrams were plotted and the determination of position on a world map was done automatically. Data from the other magne-tometers were recorded and inputted manually. If the results appeared “skewed,” the cores were subjected to thermal de-magnetization, and progressively subjected to temperatures up to 550 degrees F in an attempt to determine the original direction. It then became the task of the geologist to inter-pret, compile the many measurements and decide where to place more accurately the particular set of cores on the present-day world map. Igneous samples remagnetized by lightning could in some cases have the lightning-induced magnetization removed by applying progressively more in-tense alternating electromagnetic fields.
During many summers, staff at the Lab included graduate students from Cal Tech and other students associated with Dr. Eugene Shoemaker’s paleomagnetism research projects. They learned the techniques necessary for evaluating their sampling results and at least two now have college labora-tories of their own: Joe Kirschvink at Cal Tech, and Tullis Onstott at Princeton. David Van Alstine continued in the field, founding Applied Paleomagnetics, Inc. in 1986. Many oth-ers, including Michael Purucker, Duane Champion, Stephen Gillett, and Kenneth Tanaka, published their paleomagnetic studies and are still pursuing scientific careers. Other work-ers, for both Lab and fieldwork, were recruited from the earth science students at Northern Arizona University. They were hired under the auspices of a U.S.G.S.-subsidized program, M.P.E.S. (Minority Participation in the Earth Sciences) to encourage minorities and females to study earth science.
The Lab’s first sampling expedition was a hike down the poorly marked Tanner Trail in Grand Canyon National Park in April of 1970. Elston, sons Geoff and Jay, and Gary Scott started down with food, water, drill, sampling kit, and high hopes. They emerged two days later with 30-plus samples (Figure 7). In the summer of 1971, a detailed magneto-stratigraphic study of the Triassic Moenkopi sandstone at Gray Mountain, Arizona, was begun with Shoemaker, and Michael Purucker, a graduate student at Cal Tech. This study alone resulted in more than five major publications.

170 USDA Forest Service RMRS-P-55. 2008.
Figure 2. A core after cutting, ready for measuring.
Figure 3. Sampling kit.
Figure 4. Spinner magnetometer.

USDA Forest Service RMRS-P-55. 2008. 171
Figure 5. Astatic magnetometer. Figure 6. Core cutting equipment.
Figure 7. Easy access to outcrops is not a requirement. Don Elston drilling in the Grand Canyon.

172 USDA Forest Service RMRS-P-55. 2008.
At least eighteen research-river trips and one helicopter trip in the Grand Canyon (1972-1988) yielded thousands of core samples that were measured and worked on in the Laboratory (we thank the Grand Canyon National Park for permission to run research trips and sample in the GCNP). The river trips lasted about 18 days each with 15-18 people on a 225-mile journey down the Colorado River from Lee’s Ferry to Diamond Creek. Stops were made at pre-determined locales where outcrops were sampled over the course of one to three days per stop. These studies focused primarily on the pre-Cambrian rocks, more precisely, the red Dox Sandstone, which is clearly visible from the eastern Canyon rim just under the “Great Unconformity.” Some other Arizona locali-ties studied were the Verde Valley-Hackberry Mountain area, the Devonian strata of central Arizona and the pre-Cambri-an rocks of the Mazatzal Mountains, (a hiking, pack–horse trip because of the Wilderness status of the area). The re-sulting reports were published in peer-reviewed scientific journals. Two major publications should be mentioned: the “Guidebook to the Geology of the Grand Canyon” published in 1988; and in 1993, the Geological Society of America pub-lished Volume C-2 in the Decade of North American Geology Series, which contains three articles co-authored by Elston.
A National Science Foundation-sponsored project in the 1980s led to at least five sampling trips and collection of hundreds of samples from Taylor Valley, one of the so-called “Dry Valleys” in Antarctica. They were called that because the glacial ice does not accumulate there and the ground is barren most of the year. The samples were processed and reports were written on the samples, which were stored in the Elston freezer and transported to the Lab for measuring. Some of these samples were collected as described previ-ously. Others were taken from cores drilled by the sampling teams in Antarctica during a cooperative project with New Zealand’s Department of Scientific and Industrial Research—Antarctic Division (Figure 8). Additionally, samples were taken from cores drilled by the Dry Valley Drilling Project (DVDP). Results from Antarctica were published in U.S. and New Zealand publications.
Elston was involved in other foreign cooperative projects during the Lab’s existence. He was invited to visit Hungary to study three continuous deeply drilled cores by the Hungarian Geological Survey (MAFI), and spent several months in Budapest, over the span of about ten years, working on the cores and preparing papers with his Hungarian counterparts. An invitation to China resulted in two sampling trips to North and South China, and preliminary results were published in Chinese. A project with several geologists of the USSR Academy of Sciences resulted in a month-long sampling trip to the Lena River in northern Siberia in the summer of 1988; results were not published because of time constraints.
The USGS Laboratory hosted many foreign scientists dur-ing its existence, including two from China who each spent six months processing samples obtained during the two sam-pling trips to that country. They lived at the FVEF while in the United States. Other countries represented were Hungary, France, and New Zealand. Samples from trips to Poland and
New Zealand did not result in publications because the in-formation obtained was incoherent. The foreign guests from Hungary, China, and New Zealand now have paleomagnetics laboratories in their countries (France already had one) as a result of their visits to the FVEF. We like to think that the early contacts with China, the former USSR, and Hungary made a small contribution to the ongoing international coop-eration among scientists of diverse ideologies.
The Lab operated until its closure in the fall of 1991. The physical equipment was transferred to the USGS facility at the Denver Federal Center, where it was used until 1995 when it was placed on the “surplus list” (Reynolds 2008). Elston continued his studies, and papers were published af-ter his retirement, including a comprehensive paper on the Belt Supergroup of Montana and Canada in 2002. This was made possible by the very able contributions of, and col-laboration with, Randy Enkin of the Canadian Geological Survey. The products of the Flagstaff USGS Paleomagnetics Laboratory were its publications, which contributed to the science of paleomagnetism, and the confirmation of the theory of continental drift. The papers on the Precambrian Grand Canyon Supergroup and Belt Supergroup of Montana and Idaho helped fill a void in the early geologic history of those localities.
Figure 8. Drilling in Antarctica.

USDA Forest Service RMRS-P-55. 2008. 173
A Magnetometer in place at FVEF headquarters.
Unfortunately few pictures were taken inside the lab during its history. The few existing are in the Donald Elston Collection at Special Collections, Cline Research Library, Northern Arizona University, Flagstaff, AZ. The collection was donated to the Cline Library after Dr. Elston’s death in 2006, and contains slides and photographs of geologic interest in Arizona, Colorado, and adjacent states.

174 USDA Forest Service RMRS-P-55. 2008.
Acknowledgments
We thank Dr. Gary Scott, Berkeley Geochronology Group, Berkeley, CA, and Dr. Kenneth Tanaka of the U.S. Geological Survey in Flagstaff, AZ, for their reviews.
Author Information: Shirley and Carolyn are not ge-ologists (we tell people who ask that we are geologists by marriage). We are good friends who first met in 1954, and were fortunate enough to have shared our husbands’ lives in the office and field. We are proud and happy to collaborate in this report on subjects near to our hearts: paleomagnetism, polar wandering, continental drift, and, needless to say, field work.
References
Bressler, S.L.; Elston, D.P. 1974. Paleomagnetism of some Cambrian and Devonian rocks of north-central Arizona: Geological Society of America, Abstracts with Programs. 6(5): 428.
Elston, D.P.; Bressler, S.L. 1977. Paleomagnetic poles and polarity zonation from Cambrian and Devonian strata of Arizona. Earth and Planetary Science Letters. 36(3): 423-433.
Elston, D.P.; Purucker, M.E. 1979. Detrital magnetization in red beds of the Moenkopi Formation (Triassic), Gray Mountain, Arizona. Journal of Geophysical Research. 84(B4): 1653-1666.
Purucker, M.E.; Elston, D.P.; Shoemaker, E.M. 1980. Early acquisition of stable magnetization in red beds of Triassic Moenkopi Formation, Gray Mountain, Arizona. Journal of Geophysical Research. 85(B2): 997-1012.
Reynolds, Richard L. 2008. Personal communication.Scott, Gary. 2008. Personal communication.Shoemaker, E.M.; Elston, D.P.; Helsley, C.E. 1973 Depositional
history of the Moenkopi Formation in light of its magnetostratigraphy: Ann. Mtg. Geological Society of America, Abstracts with Programs. 5(7): 807-808.
Tanaka, K.L.; Onstott, T.C.; Shoemaker, E.M. 1990. Magnetostratigraphy of the San Francisco Volcanic Field, Arizona: U.S. Geological Survey Bull. 1929. 35 p.
The content of this paper reflects the views of the author(s), who are responsible for the facts and accuracy of the information presented herein.

USDA Forest Service RMRS-P-55. 2008. 175
In: Olberding, Susan D., and Moore, Margaret M., tech coords. 2008. Fort Valley Experimental Forest—A Century of Research 1908-2008. Proceedings RMRS-P-55. Fort Collins, CO: U.S. Department of Agriculture, Forest Service, Rocky Mountain Research Station. 282 p.
Introduction
Information on the growth of forest plantations is necessary for planning of ecosystem-based management of the planta-tions. This information is also useful in validating or refining computer simulators that estimate plantation growth into the future. Such growth information has been obtained from a pon-derosa pine plantation located 3.2 km (2 miles) north of the Fort Valley Experimental Forest headquarters and about 24 km (15 miles) north of Flagstaff, Arizona. It was estimated from early planting histories in the area that this plantation is ap-proximately 45 years of age.
Study ProtocolThe 1.1-ha (2.7-acre) plantation, located in the Hart Prairie
area, is similar in structure to other ponderosa pine plantations established by the U.S. Forest Service in the early 1960s to reforest sites where the forest overstory had been destroyed by wildfire. The plantation is 2,077 m (6,800 ft) in eleva-tion, located on basaltic soils, with slopes less than 5 percent. Annual temperature at the nearby Fort Valley headquarters av-erages 6º C (43º F), ranging from -4º C (25º F) in January to 17º C (63º F) in July (Ronco and others 1985). Average an-nual precipitation is about 635 mm (25 inches), with one-third of the precipitation occurring in the summer monsoons. The
Growth of a 45-Year-Old Ponderosa Pine Plantation: An Arizona Case Study
Peter F. Ffolliott, School of Natural Resources, University of Arizona, Tucson, AZ; Gerald J. Gottfried, USFS, Rocky Mountain Research Station, Phoenix, AZ; Cody L. Stropki, School of Natural Resources, University of Arizona, Tucson, AZ; and L. J. Heidmann, USFS (ret.), Rocky Mountain Research Station, Flagstaff, AZ
Abstract—Information on the growth of forest plantations is necessary for planning of ecosystem-based management of the plantations. This information is also useful in validat-ing or refining computer simulators that estimate plantation growth into the future. Such growth information has been obtained from a 45-year-old ponderosa pine (Pinus ponderosa) plantation in the Hart Prairie area north of the Fort Valley Experimental Forest headquarters. Average annual growth in terms of number of trees, basal area, and volume was obtained. Growth information such as that obtained on this plantation is crucial to planning of long-term forest management activities.
estimated site index of 20 m (65 ft) at 100 years (Minor 1964) is equivalent to the Southwestern Region’s Site Class 2 desig-nation (Schubert 1974). More than two-thirds of the ponderosa pine forests in the Hart Prairie vicinity are found within this site class.
Age and quality of the seedlings planted by the Forest Service in establishing the plantation, the site preparation tech-niques applied, the planting methods used, and initial survival of the seedlings are unknown. However, surviving trees when the plantation was measured in 2007 were spaced 1.2 m (4 ft) apart in parallel rows with 2.4 m (8 ft) intervals between the rows. Diameter breast height (dbh) of these trees was measured by standard procedures. Total height measurements taken on a sub-sample of 30 trees indicated that the dbh-height relation-ship established in a nearby 30-year-old plantation (Heidmann and others 1997) also applied in the plantation in the current study. The dbh measurements and dbh-height relationship were used to calculate basal area and volume of the measured trees. A formula for young-growth (blackjack) southwestern ponderosa pine trees (Myers 1963) was applied in the volume calculation.
Results
A total of 1,050 trees (equivalent to 960 stems/ha [388.8 stems/acre]) were measured in the plantation. Average dbh of these trees was 19.8 cm (7.8 inches), with a range of values

176 USDA Forest Service RMRS-P-55. 2008.
from 1.3 to 36.3 cm (0.5 to 14.3 inches). Average basal area was 32.7 m2/ha (142.5 ft2/acre) and average volume was 93.9 m3/ha (1,324.5 ft3/acre). Respective frequencies of 2.5-cm (1-inch) dbh values approximated slightly skewed bell-shaped distributions for these parameters (Figure 1). Heidmann and others (1997) reported similar distributions for dbh and volume in their study of the nearby plantation; a frequency distribution for basal area values was not included in the latter study.
Assuming that the estimated age is correct and that tree mortality has been insignificant, average annual growth rates since establishment of the plantation studied were 0.73 m2/ha (3.18 ft2/acre) of basal area and 2.08 m3/ha (29.4 ft3/acre) of volume, respectively. Both of these values were larger than those reported for the 30-year-old ponderosa pine planta-tion (Heidmann and others 1997). The average annual basal area and volume growth rates for this latter plantation were 0.45 m2/ha (1.95 ft2/acre) and 1.25 m3/ha (17.6 ft3/acre), re-spectively. However, inferences on comparative growth rates for the two plantations must be made in relation to the differ-ing histories of the plantations.
The plantation measured in this current study was 15 years older when it was measured in 2007 than the plantation mea-sured by Heidmann and others. It was not surprising, therefore, that larger trees (up to 37.0 cm [14.6 inches] dbh) were tal-lied in the former than in the latter (28.6 cm [11.3 inches] dbh). Furthermore, a precommercial thinning was conducted in the plantation measured by Heidmann and others (1997) in 1984—about 20 years following its establishment—removed an estimated 840 stems/ha (340 stems/acre). If tree mortal-ity from the time of the precommercial thinning to when the plantation was measured by Heidmann and his colleagues was also insignificant, about 60 percent of the trees were removed from the plantation by the thinning operation. There had been no thinning or other silvicultural treatments imposed in the 45-year-old plantation studied since its establishment.
DiscussionAverage dbh and tree density information can be used with
stand and growing stock tables that predict the conditions of fully stocked even-aged stands with average dbh values up to almost 60 cm (24 inches) (Myers 1967, Ronco and others 1985, Schubert 1974). Growing stock levels are numerical indices designating the basal area level in square meter per hectare (square feet per acre) that a residual stand has—or will have—when the average dbh of the stand is 25.4 cm (10 inch-es). The 45-year-old plantation in this study, with its average dbh of 19.8 cm (7.8 inches) and density of 960 stems/ha (388.8 stems/acre) has a growing stock level in excess of 27.5 m2/ha (120 ft2/acre) according to the tables. Managers could use this information to reduce the current stocking of the plantation to achieve a growing stock level of 13.8 m2/ha (60 ft2/acre) that
is more consistent with optimizing the range of resources in southwestern ponderosa pine forests including (potential) tim-ber production, forage production, and the augmentation of water yield (Brown and others 1974). The current basal area of the 45-year-old plantation should be reduced from 32.7 m2/ha (142.5 ft2/acre) to 14.3 m2/ha (62.4 ft2/acre) and the tree density to 412 stems/ha (167 stems/acre) to achieve this goal.
SummaryThe 45-year-old plantation studied is representative of
many of the reforestation efforts of the U.S. Forest Service in southwestern ponderosa pine forests. However, with only few exceptions, growth information for these plantations is limited. One exception is the information provided by Heidmann and others (1997). Growth information is crucial to planning of long-term forest management activities to attain ecosystem-based, multi-benefit goals in southwestern ponderosa pine forests.
ReferencesBrown, H. E.; Baker, M. B., Jr.; Rogers, J. J.; Clary, W. P.; Kovner,
J. L.; Larson, F. R.; Avery, C.C.; Campbell, R. E. 1974. Opportunities for increasing water yields and other multiple use values on ponderosa pine forest lands. Res. Pap. RM-129. Fort Collins, CO: U.S. Department of Agriculture, Forest Service, Rocky Mountain Forest and Range Experiment Station. 36 p.
Heidmann, L. J.; Ffolliott, P. F.; Gottfried, G. J. 1997. Thirty-year growth and yield of a ponderosa pine plantation in Arizona. Res. Note RM-RN-537. Fort Collins, CO: U.S. Department of Agriculture, Forest Service, Rocky Mountain Forest and Range Experiment Station. 6 p.
Minor, C. O. 1964. Site-index curves for young-growth ponderosa pine in northern Arizona. Res. Note RM-37. Fort Collins, CO: U.S. Department of Agriculture, Forest Service, Rocky Mountain Forest and Range Experiment Station. 8 p.
Myers, C. A. 1963. Volume, taper, and related tables for southwestern ponderosa pine. Res. Pap. RM-2. Fort Collins, CO: U.S. Department of Agriculture, Forest Service, Rocky Mountain Forest and Range Experiment Station. 24 p.
Myers, C. A. 1967. Growing stock levels in even-aged ponderosa pine. Res. Pap. RM-33. Fort Collins, CO: U.S. Department of Agriculture, Forest Service, Rocky Mountain Forest and Range Experiment Station. 8 p.
Ronco, F., Jr.; Edminster, C. B.; Trujillo, D. P. 1985. Growth of ponderosa pine thinned to different stocking levels in northern Arizona. Res. Pap. RM-262. Fort Collins, CO: U.S. Department of Agriculture, Forest Service, Rocky Mountain Forest and Range Experiment Station. 15 p.
Schubert, G. H. 1974. Silviculture of southwestern ponderosa pine: The status of our knowledge. Res. Pap. RM-123. Fort Collins, CO: U.S. Department of Agriculture, Forest Service, Rocky Mountain Forest and Range Experiment Station. 71 p.
The content of this paper reflects the views of the author(s), who are responsible for the facts and accuracy of the information presented herein.

USDA Forest Service RMRS-P-55. 2008. 177
Figure 1. Frequency distributions of the number of trees (top), basal area (middle), and volume (bottom) of the Hart Prairie Ponderosa Pine Plantation by 2.5 cm (1 inch) dbh classes.

178 USDA Forest Service RMRS-P-55. 2008.
In: Olberding, Susan D., and Moore, Margaret M., tech coords. 2008. Fort Valley Experimental Forest—A Century of Research 1908-2008. Proceedings RMRS-P-55. Fort Collins, CO: U.S. Department of Agriculture, Forest Service, Rocky Mountain Research Station. 282 p.
Introduction
The roundheaded pine beetle, Dendroctonus adjunctus (Coleoptera: Curculionidae, Scolytinae), is an aggressive bark beetle (Negrón 1997, Negrón and others 2000) that attacks several species of pine throughout its range from southern Utah and Colorado south to Guatemala (Chansler 1967). Dendroctonus adjunctus has periodic outbreaks that cause extensive tree mortality in the southwestern United States (Negrón 1997, Negrón and others 2000). Outbreaks have been associated with dense stand conditions and drought (Negrón 1997, Negrón and others 2000), which is similar to other Dendroctonus species (Fettig and others 2007). Host selection by bark beetles for specific trees within these dense stands remains unclear (Wood 1982). Multiple hypotheses have been presented to describe the mechanisms driving bark beetle host selection. These include: 1) locat-ing damaged or diseased trees by the volatile chemicals they emit (Byers 1995, Hofstetter and others 2008, Wood 1982); 2) attraction or repulsion caused by monoterpenes released by trees (Byers 1995, El-Sayed and Byers 2000, Fettig and others 2007, Hofstetter and others 2008, Wood 1982); 3) at-traction to aggregation pheromones released by beetles of the same species or to volatiles produced by competing in-sect species during colonization (Byers 1995, Hofstetter and others 2008, Wood 1982); and 4) bark beetles choose trees
The Resin Composition of Ponderosa Pine (Pinus ponderosa) Attacked by the Roundheaded Pine Beetle (Dendroctonus adjunctus) (Coleoptera: Curculionidae, Scolytinae)
Melissa J. Fischer, Kristen M. Waring, Richard W. Hofstetter, and Thomas E. Kolb, School of Forestry, Northern Arizona University, Flagstaff, AZ
Abstract—Dendroctonus adjunctus is an aggressive bark beetle species that attacks several species of pine throughout its range from southern Utah and Colorado south to Guatemala. A current outbreak of D. adjunctus provided a unique opportunity to study the relationship between this beetle and pine resin chemistry in northern Arizona. We compared the resin composition of trees that had been attacked by D. adjunctus compared with unattacked trees and found significant differences in the composition of the monoterpenes α-pinene, ß-pinene, myrcene and limonene between attacked and unattacked trees. Attacked trees contained significantly higher percentages of α-pinene, myrcene, and limonene, but lower levels of ß-pinene when compared to unattacked trees. Although it is unknown whether D. adjunctus prefers or is repelled by trees with specific monoterpene content, our results sug-gest that D. adjunctus may use specific chemical cues in host tree selection.
for attack randomly (Byers 1995, Wood 1982). Finally, stand conditions may affect host selection on a larger scale; for ex-ample, microclimate and tree vigor vary with stand density and may partially determine which stands will be attacked (Fettig and others 2007, Miller and Keen 1960, Wood 1982).
The resin of conifers contains monoterpenes that have been found to both attract and repel bark beetles (Byers 1995, El-Sayed and Byers 2000, Fettig and others 2007, Hofstetter and others 2008, Smith 1966, Sturgeon 1979). Some common monoterpenes found within resin include α-pinene, ß-pinene, and limonene (Latta and others 2000). Which monoterpenes repel or attract bark beetles is still uncertain, even among the most well-studied bark beetle species (El-Sayed and Byers 2000). Studies on host mono-terpene and bark beetle interactions have been inconclusive. For example, lodgepole pines with high levels of limonene were readily attacked and killed by D. ponderosae (Byers 1995); conversely, ponderosa pines with high levels of limo-nene were not attacked by D. brevicomis (Sturgeon 1979).
The overall goal of this project is to gain a better un-derstanding of host selection behavior of bark beetles. We use D. adjunctus—ponderosa pine as a model system to investigate:
1. If attacked trees exhibit different size, resin composition, growth rate, crown characteristics, or phloem thickness than unattacked trees;

USDA Forest Service RMRS-P-55. 2008. 179
2. If beetles cause changes in tree resin composition following attack; and
3. If surrounding forest stand density is correlated with beetle attacks in northern Arizona.
In this paper, we test the hypothesis that attacked trees exhibit a different resin composition, specifically monoter-penes, than unattacked trees.
Materials and Methods
Study Area
The study was located near Flagstaff, Arizona, approxi-mately 2.14 km (1.33 miles) north of the Flagstaff Nordic Center. Twenty-five pairs of “attacked” and “unattacked” ponderosa pine trees (50 trees total) were selected in 2007. Paired trees were similar in diameter at breast height (dbh) (Table 1) and location, with the greatest distance being 5.52 m (18.11ft) apart. Numerous pitch tubes and the presence of frass were used to identify successfully attacked trees (Chansler 1967, Nebeker 1993, Smith 1966); bark was re-moved and galleries inspected on a sub-sample of trees to confirm beetle identification. Trees selected as unattacked had no pitch tubes and/or frass. Attacks by the western pine beetle (D. brevicomis) were also present on site. We differ-entiated between trees attacked solely by D. adjunctus and D. brevicomis by the size of the pitch tubes on the bole of at-tacked trees (D. brevicomis attacked trees have smaller pitch tubes) and location of pitch tubes on the bole (pitch tubes caused by D. brevicomis tend to be higher on the bole than those caused by D. adjunctus). We did not select trees that had signs of only D. brevicomis attack.
During September 2007, the bark and phloem of each tree was punched at breast height (1.37 m) using a number fif-teen 2-cm (0.79 inches) metal punch and a glass vial inserted to collect resin. The glass vials were then removed from the trees and moved to cold storage prior to composition analy-sis. Resin collection corresponded to D. adjunctus fall flight; trees that were chosen as pairs were in the process of be-ing attacked when resin was collected. Resin was analyzed for total monoterpene content and composition using gas chromatography by the Analytical Chemical Laboratory at Northern Arizona University. Because some of the trees had no flowing resin at the time of collection and others did not produce enough resin to be analyzed, only resin from 13 of the attacked trees and 17 of the unattacked trees were used for this analysis. Due to the fact that we did not have resin for all trees, the resin data was not analyzed as matched pairs, but was instead pooled by attacked or non-attacked. Data were not normally distributed so statistical comparisons were made using the Kruskal-Wallis test.
Results
No significant difference was found between the diam-eters of the paired trees (Table 1).
Percentages of α-pinene, ß-pinene, myrcene and limonene were significantly different between attacked and unattacked trees (Table 2, Kruskal-Wallis test, p<0.05), while 3-carene and longifolene were not significantly different between tree pairs (Table 2, Kruskal-Wallis test, p>0.05).
Attacked trees contained significantly higher percentag-es of α-pinene, myrcene, and limonene, but lower levels of ß-pinene when compared to unattacked trees (Figure 1).
Table 1. Matched pairs t-test comparing the diameters of the ponderosa pine trees paired as attacked and unattacked.
Mean DBH Mean Difference SEM p-value
Attacked 29.6 cm (11.65 inches) 1.12 cm (0.44 inches) 0.9392 0.2447Non-attacked 30.72 cm (12.09 inches)
Table 2. Results of Kruskal-Wallis tests comparing percentage monoterpene content between D. adjunctus attacked and unattacked ponderosa pine trees in northern Arizona.
α-pinene ß-pinene Myrcene 3-carene Limonene Longifolene
Chi-Square 5.591 4.828 4.646 0.036 4.206 1.738df 1 1 1 1 1 1Asymp. Sig. 0.018 0.028 0.031 0.850 0.040 0.187

180 USDA Forest Service RMRS-P-55. 2008.
Although ß-pinene showed a significant difference be-tween attacked and unattacked trees, high levels of ß-pinene were not found in all of the unattacked trees (Figure 2b). Amount of individual monoterpenes as a percentage of the total monoterpene content varied between attacked and unat-tacked trees for most analyzed monoterpenes (Figure 2).
Discussion
Our study demonstrated that there are significant dif-ferences in monoterpene composition between bark beetle attacked and non-attacked trees. Contrary to past studies on other bark beetle species that found high levels of myrcene (Byers 1995) and limonene (Sturgeon 1979) in unattacked trees, half of our unattacked trees showed high levels of ß-pinene. Differences between the monoterpene composi-tion of unattacked trees in our study compared with previous studies (Byers 1995, Smith 1966, Sturgeon 1979) may be explained by geographic variation (Byers 1995, Hofstetter and others 2008). Monoterpenes vary widely between geo-graphic regions and among trees within local populations of ponderosa pine (Hofstetter and others 2008, Latta and
Figure 1. Average percent of individual monoterpenes in the total monoterpene content of D. adjunctus attacked and unattacked ponderosa pine trees in northern Arizona. Error bars represent 95 percent confidence intervals and asterisks signify significant differences (p<0.05; see text for details).
others 2000, Smith 1966, Thoss and Byers 2006). Thus, those monoterpenes shown to be important in host selection for a bark beetle species in one geographic region might not be at-tractive to populations of the same species in another region (Byers 1995, Hofstetter and others 2008).
Genetic differences among beetles from different geo-graphic regions may reflect the variation in the monoterpene composition of their host as well (Byers 1995, Hofstetter and others 2008). Bark beetle populations may be adapted to monoterpene ratios specific to geographic region (Byers 1995, Hofstetter and others 2008). As a result, total mono-terpene composition or certain ratios may be more important in determining host repellency than individual monoterpenes such as limonene (Byers 1995).
Attraction of D. adjunctus to host tree compounds, includ-ing monoterpenes, has not been previously studied (Byers 1995). Therefore, whether D. adjunctus prefers or is re-pelled by trees with specific monoterpene composition is not known. Our results suggest that D. adjunctus, or at least this particular local population of D. adjunctus, may be attracted to or repelled from certain host tree compounds. Additional research has yet to be completed, including a baiting study to ensure that the resin composition of the trees analyzed was not induced by D. adjunctus attack.

USDA Forest Service RMRS-P-55. 2008. 181
Figure 2. Individual monoterpene content as a percent of total monoterpene found in D. adjunctus attacked and unattacked ponderosa pine trees in northern Arizona: a. α-pinene; b. β-pinene; c. myrcene; d. 3-carene; e. limonene and f. longifolene.
Acknowledgments
This research was supported, in part, by McIntire-Stennis appropriations to NAU and the State of Arizona. Resin analyses were paid for by U.S.D.A. Cooperative Agreement 06-CA-11330129-046 (to R.W.H) and completed by the Analytical Chemical Laboratory at Northern Arizona University. Barbara Bentz, Joel McMillin and José Negrón provided beneficial reviews of the draft manuscript.
References
Byers, John A. 1995. Host chemistry affecting colonization in bark beetles. In: Carde, T.; Bell, William J. Chemical ecology of insects 2. New York: Chapman & Hall: 154-213.
Chansler, John F. 1967. Biology and life history of Dendroctonus adjunctus (Coleoptera: Scolytidae). Annals of the Entomological Society of America. 60: 760-767.

182 USDA Forest Service RMRS-P-55. 2008.
Christiansen, Erik; Waring, Richard H.; Berryman, Alan A. 1987. Resistance of conifers to bark beetle attack: Searching for general relationships. Forest Ecology and Management. 22(1-2): 89-106.
El-Sayed, Ashraf M.; Byers, John A. 2000. Inhibitory effect of monoterpenes on response of Pityogenes bidentatus to aggregation pheromone released by piezoelectric sprayer for precision release of semiochemicals. Journal of Chemical Ecology. 26: 8.
Fettig, Christopher J.; Klepzig, Kier D.; Billings, Ronald F.; Munson, A. Steven; Nebeker, T. Evan; Negrón, José F.; Nowak, John T. 2007. The effectiveness of vegetation management practices for prevention and control of bark beetle infestations in coniferous forests of the western and southern United States. Forest Ecology and Management. 238: 24-53.
Hofstetter, R. W.; Chen, Z.; Gaylord, M. L.; McMillin, J. D.; Wagner, M. R. 2008. Synergistic effects of a-pinene and exo-brevicomin on pine bark beetles and associated insects of Arizona. Journal of Applied Entomology. 132: 387-397.
Latta, R. G.; Linhart, Y. B.; Lundquist, L.; Snyder, M. A. 2000. Patterns of monoterpene variation within individual trees in ponderosa pine. Journal of Chemical Ecology. 26(6): 1341-1357.
Miller, J. M.; Keen, F. P. 1960. Biology and control of the western pine beetle. A summary of the first fifty years of research. Washington, DC: U.S. Department of Agriculture; 381 p.
Nebeker, T. E.; Hodges, J. D.; Blanche, C. A. 1993. Host response to bark beetle and pathogen colonization. In: Scholwalter, T. D.; Filip, G. M., eds. Beetle-pathogen interactions in conifer forests. New York: Academic Press: 157-169.
Negrón, José. 1997. Estimating probabilities of infestation and extent of damage by the roundheaded pine beetle in ponderosa pine in the Sacramento Mountains, New Mexico. Canadian Journal of Forest Research. 27: 1936-1945.
Negrón, José; Wilson, Jill L.; Anhold, John A. 2000. Stand conditions associated with roundheaded pine beetle (Coleoptera: Scolytidae) infestations in Arizona and Utah. Environmental Entomology. 29(1): 20-7.
Smith, R. H. 1966. The monoterpene composition of ponderosa pine xylem resin and of D. brevicomis pitch tubes. Forest Science. 12: 1.
Smith, R. H. 1975. Formula for describing the effect of insect and host tree factors on resistance to western pine beetle attack. Journal of Economic Entomology. 68: 841-844.
Sturgeon, Kareen B. 1979. Monoterpene variation in ponderosa pine xylem resin related to western pine beetle predation. Evolution. 33: 803-814.
Thoss, Vera; Byers, John A. 2006. Monoterpene chemodiversity of ponderosa pine in relation to herbivory and bark beetle colonization. Chemoecology. 16: 51-58.
Wood, D. L. 1982. The role of pheromones, kairomones, and allomones in the host selection and colonization behavior of bark beetles. Annual Review of Entomology. 27: 411-446.
The content of this paper reflects the views of the author(s), who are responsible for the facts and accuracy of the information presented herein.

USDA Forest Service RMRS-P-55. 2008. 183
In: Olberding, Susan D., and Moore, Margaret M., tech coords. 2008. Fort Valley Experimental Forest—A Century of Research 1908-2008. Proceedings RMRS-P-55. Fort Collins, CO: U.S. Department of Agriculture, Forest Service, Rocky Mountain Research Station. 282 p.
Beginnings
Collection and use of meteorological data has always been an integral part of Forest Service research. The charge for Experiment Stations to keep meteorological records was spelled out in Zon (1908):
“Meteorological observations should be made at the Forest Experiment Stations, not only for the purpose of obtaining data which will show the influence of the forest on various factors of climate, but in order to furnish the data neces-sary for a proper understanding of all of the experiments in which the climatic factor enters into the results.”
Following this guidance, meteorological observations at Coconino Experiment Station (now Fort Valley Experimental Forest, FVEF) were among the first records kept by staff. Partnership between the U.S. Weather Service (then Weather Bureau) and the U.S. Forest Service through the Cooperative Observer Program (COOP) has continued from 1909 to the present.
Early Research
Answering questions about ponderosa pine regeneration in the Southwest (or lack thereof) was the impetus for the creation of the FVEF. Early research was tightly intertwined
A Century of Meteorological Observations at Fort Valley Experimental Forest: A Cooperative Observer Program Success Story
Daniel P. Huebner and Susan D. Olberding, USFS, Rocky Mountain Research Station, Flagstaff, AZ; Byron Peterson (ret.), National Weather Service, Flagstaff Weather Forecast Office, Bellemont, AZ; and Dino DeSimone, USDA Natural Resources Conservation Service, Phoenix, AZ
Abstract—Meteorological observations at Fort Valley Experimental Forest began with its es-tablishment as early silvicultural research made heavy use of meteorological data. The Fort Valley weather data represent the longest climatological record for northern Arizona with records dating back to 1909. Importance of long-term meteorological records and access to the weather record are described.
with meteorological observations as illustrated by these early publications:Mattoon, W. R. 1909. Measurements of the effects of forest cover
upon the conservation on snow waters. Forest Quarterly. 7(3): 245-248.
Pearson, G. A. 1913. A meteorological study of parks and timbered areas in the western yellow-pine forest of Arizona. Monthly Weather Review. 41: 1615-1629.
Jaenicke, A. J., Foerster, M. H. 1915. The influence of a western yellow pine forest on the accumulation and melting of snow. The Monthly Weather Review. 43: 115-126.
Pearson, G. A. 1918. The relation between spring precipitation and height growth of western yellow-pine saplings in Arizona. Journal of Forestry. 16: 677-689.
Parameters Measured
Various meteorological parameters have been measured at Fort Valley including rainfall, snowfall, air and soil tempera-ture, humidity, evaporation and wind. Near-continuous air temperature and precipitation records have been maintained since 1909. FVEF has the longest climatological record in northern Arizona.
In 1946 a snow course was established by the U.S. Department of Agriculture’s Soil Conservation Service (now Natural Resources Conservation Service) as part of the Cooperative Snow Survey and Water Supply Forecasting pro-gram. This has resulted in a data record exceeding 60 years. Snow survey measurement data collected at the Fort Valley

184 USDA Forest Service RMRS-P-55. 2008.
G. A. Pearson measuring water level in evaporation pan. USFS photo 90950 by A. G. Varela, 1912.
FVEF staff member Edward C. Martin drew this cartoon describing Fort Valley’s fluctuating weather. He began work at Fort Valley in the early 1930s and retired in 1970. This cartoon is from the FVEF archives.

USDA Forest Service RMRS-P-55. 2008. 185
snow course are used to describe current snowpack condi-tions and to help predict snowmelt runoff. The goal of the Snow Survey program is to provide accurate and timely wa-ter resources information to help water managers and users make wise and informed decisions about the use of limited seasonal water supplies.
Modernization
The Fort Valley weather station was automated in 1994. A data logger was installed along with a heated tipping bucket rain gauge and temperature sensor, permitting these data to be retrieved remotely via phone line. This facilitated the con-tinuation of the weather record since staff members were no longer living on site. Each half hour the most recent data is uploaded to the RMRS Flagstaff Lab web server that per-mits public access to very recent (provisional) data. These data can be accessed via the web from www.rmrs.nau.edu/fortvalley/. Following checks to assure quality, the data and metadata are available from the RMRS Data Archive (http://www.fs.fed.us/rm/data_archive/).
In June of 2008 the Natural Resource Conservation Service installed snow telemetry (SNOTEL) equipment to automate collection of snow data near the existing manual snow course. This exciting development will increase the fre-quency of data collection (hourly) and make these data more rapidly available to the managers, researchers and the public
via the NRCS SNOTEL web site (http://www.wcc.nrcs.usda.gov/snow/).
Significance
Long term meteorological records are of great value in many arenas of research. This is well illustrated by one of the more pervasive issues thus far in the 21st century—climate change. Much credit is due to those that foresaw the impor-tance of meteorological observations, those that initiated the record keeping, and to the many people that helped keep the data flowing over the past century. While future land manage-ment issues and research directions are unknown it is safe to suggest that meteorological records will play a key role in many important future studies and that long term records, such as those from the Fort Valley weather station, will be particularly useful.
Reference
Zon, Raphael. 1908. Plan for creating Forest Experiment Stations. Internal Forest Service Memo. NARA-CP RG95 PI-18/Entry 115 Box 189.
FVEF weather station as it is now. March 21, 2008.Arizona snow survey. 1965 NRCS photograph.
The content of this paper reflects the views of the author(s), who are responsible for the facts and accuracy of the information presented herein.

186 USDA Forest Service RMRS-P-55. 2008.
In: Olberding, Susan D., and Moore, Margaret M., tech coords. 2008. Fort Valley Experimental Forest—A Century of Research 1908-2008. Proceedings RMRS-P-55. Fort Collins, CO: U.S. Department of Agriculture, Forest Service, Rocky Mountain Research Station. 282 p.
Introduction
Buckbrush (Ceanothus fendleri Gray) is a common shrub found in northern Arizona ponderosa pine forests. It is ca-pable of nitrogen-fixation, provides important browse for wildlife such as mule deer (Odocoileus hemionus) and elk (Cervus elaphus), and adds structural diversity to predomi-nantly herbaceous understories of these ecosystems (Allen 1996, Story 1974, Urness and others 975).
Plant life history traits are adaptive strategies that influence a species’ potential for survival, growth, and reproduction in a changing environment (Bellingham and Sparrow 2000). Life history traits include characteristic seed germination requirements, rates of growth and development of individu-als, patterns of flowering, and recruitment of new individuals (Barbour and others 1999). With an understanding of how life history traits and environmental conditions interact, models of long-term plant population dynamics may be constructed. Such models can be useful in evaluating potential effects of
Dynamics of Buckbrush Populations Under Simulated Forest Restoration Alternatives
David W. Huffman, Ecological Restoration Institute, Northern Arizona University, Flagstaff, AZ; and Margaret M. Moore, School of Forestry, Northern Arizona University, Flagstaff, AZ
Abstract—Plant population models are valuable tools for assessing ecological tradeoffs be-tween forest management approaches. In addition, these models can provide insight on plant life history patterns and processes important for persistence and recovery of populations in changing environments. In this study, we evaluated a set of ecological restoration alterna-tives for their long-term effects on buckbrush (Ceanothus fendleri Gray), a shrub common in understories of ponderosa pine (Pinus ponderosa Laws. var. scopulorum Engelm.) forests of the southwestern United States. The field data were collected from a set of forest restora-tion units located on the Fort Valley Experimental Forest. We constructed simple stage-based models in order to simulate 25-year population dynamics. Results showed that scenarios that included overstory thinning, herbivore protection, and prescribed fire resulted in buckbrush populations with significantly greater numbers of aboveground stems than populations in the other alternatives. Vegetative stem recruitment, flowering, and seedling emergence were im-portant in producing these results. For alternatives that included protection from herbivores, burning at 2-year frequencies resulted in populations with significantly greater numbers of aboveground stems than scenarios with longer intervals between burning. In contrast, fre-quent burning in alternatives without herbivore protection resulted in population decline. These results indicate that protecting buckbrush from large herbivores allowed plants to complete life cycles and fully express these life history traits. This research demonstrates that population modeling can help illuminate ecological tradeoffs associated with land manage-ment alternatives.
various land management alternatives. Our objectives in this study were the following: (1) to construct population models that describe demographic responses of buckbrush to various treatment alternatives used to restore southwestern pondero-sa pine forests; (2) to use these models to analyze long-term effects of restoration alternatives on buckbrush populations; and (3) to interpret model results in order to provide informa-tion useful to ecologists and forest managers.
Methods
Demographic and Life Stage Data
To build buckbrush population models, we used life history and demographic data derived from field and labo-ratory experiments conducted 1999-2002. Field experiments were conducted on the Fort Valley Experimental Forest about 7 km northwest of Flagstaff. We established a total of

USDA Forest Service RMRS-P-55. 2008. 187
210 buckbrush-centered plots in three experimental forest restoration units and three untreated units (see Fulé and oth-ers 2001 for forest restoration experiment details). Buckbrush plots were 2 x 2 m in size. We randomly assigned each plot to one of five treatments: (1) no thinning, no herbivore pro-tection, no prescribed fire (control); (2) overstory thinning only (thin-only); (3) overstory thinning plus herbivore pro-tection (thin-protect); (4) overstory thinning plus prescribed burning (thin-burn); and (5) overstory thinning plus herbi-vore protection plus prescribed burning (thin-protect-burn). Herbivore protection was provided by wire fence exclosures built around plots. Plots were burned with prescribed, low-intensity fire in April-May, 2000 and 2001. Field data were collected each year 1999-2002 and included measurements of flowering, seed production, stem density, and seedling density (see Huffman 2003 for details). In addition, seed ger-mination characteristics, including response to heat and cold stratification, were determined in the laboratory.
Simulation Modeling and Analysis
To model management effects on population dynamics, the life cycle of buckbrush was simplified into four discrete stages (Figure 1). Seeds and aerial stems were chosen as the population units of analysis. Aerial stems were defined as in-dividuals that arose singularly from the soil surface but with various amounts of aboveground branching. Stage-based transition matrices (Caswell 2001) were built from 1999-2002 field and laboratory data. Vital rates for stage elements were calculated as the average of the annual changes for each life stage transition over the four years of field study. Separate transition matrices were constructed for buckbrush field data from each experimental forest unit (n=3) and were used as replicates in our analysis. Details of vital rate assumptions and calculations are described in Huffman (2003). Buckbrush
population dynamics for the five management scenarios were modeled using the computer software RAMAS Metapop (Akçakaya 1998). Model parameters, including stochastic-ity, initial population structure, and density dependence, are found in Huffman (2003). One-year time step and 25-year duration was used for all simulations. Prescribed burning scenarios were modeled by treating fire as a probabilistic “ca-tastrophe” in the plant population sense of the word (Harper 1977). In years when fire occurred, we adjusted vital rates to reflect values derived from field and laboratory observations of fire response. In addition to analyzing 25-year buckbrush dynamics for the five restoration alternatives, we also exam-ined effects of 2, 5, 10, and 25-year prescribed fire intervals for overstory thinning alternatives with and without herbi-vore protection by varying fire probabilities in our model.
We used analysis of variance (ANOVA) and Bonferroni adjusted pairwise comparisons to test effects of restoration alternatives on the following model outputs: (1) total abun-dance (population size including seeds); (2) total number of above-ground plants (not including seeds); and (3) relative abundance of each life stage at the end of the 25-year period. Output values analyzed were the average of 1000 simulations for each restoration alternative and P-values less than 0.05 were considered statistically significant.
Results
Restoration alternatives that included protection from large herbivores had significantly greater rates of population increase (λ=1.33) than those that did not include protec-tion (λ=0.99-1.06) (Table 1). Prescribed fire did not change model estimates of λ. Population trajectories showed con-siderably different patterns among the five management
Figure 1. Simplified life cycle of buckbrush (Ceanothus fendleri) based on field observations. Seedlings are identified by size and presence of cotyledons (seed leaves). Vegetative stems produce no flowers whereas reproductive stems do flower. Arrows indicate probable life stage transitions, including seed contributions from reproductive adult stems.

188 USDA Forest Service RMRS-P-55. 2008.
scenarios (Figure 2). At the end of the 25-year period, the thin-protect alternative had significantly greater total popu-lation abundance (aerial stems plus seeds) than control and thin-burn alternatives (Table 2). Thin-protect-burn and thin-only had significantly greater total abundance than thin-burn. Restoration scenarios also affected abundance of individuals in the four life stages (Table 2). For example, thin-protect-burn had significantly greater number of aerial stems and relatively more seedlings and reproductive stems than all other alternatives (Table 2).
Fire frequency and protection from herbivores interacted to affect buckbrush population size and structure (Figure 3). Total population abundances of protected and unprotected populations at the end of the simulated period were signifi-cantly greater under the 25-year prescribed fire interval than under the 2-year interval. Both protected and unprotected populations showed a pattern of increasing seed abundance with longer intervals between fires (Figure 3). However, herbivore protection and fire interval interacted to affect abundance of other life stages. For example, seedling, veg-etative and reproductive stem abundances tended to decline in protected populations but increase in unprotected popula-tions as fire interval decreased (Figure 3).
Discussion and Conclusions
Results of this study indicated that buckbrush popula-tions benefit most from restoration alternatives that include overstory thinning, prescribed fire, and protection from large herbivores. These results reflected responses linked to the life history of this species. Important responses were the fol-lowing: (1) seedling emergence in years of fire due to heat scarification of seeds (Huffman 2006); (2) recruitment of vegetative stems from belowground buds in both fire and no-fire years; and (3) recruitment of reproductive stems in years without fire. For control populations, aerial stems showed gradual attrition, although seed survival in seed banks may represent potential for eventual population recovery. These responses demonstrated evolutionary characteristics that allow buckbrush to thrive in open forests with frequent, low-severity fire regimes (Arnold 1950, Fulé and others 1997). Protecting buckbrush from large herbivores appeared to al-low plants to complete life cycles and fully express life history traits. Prescribed fire facilitated recruitment of new individuals, a process that may enhance population viabil-ity by increasing genetic variation. In contrast, intensive use
Table 1. Mean values and standard error (SEM) of finite rate of increase (λ) for simulated management scenarios of buckbrush (Ceanothus fendleri). Prescribed fire did not affect values of λ. Different letters associated with values denote statistically different means at P ≤ 0.05.
Restoration Alternative λ SEM
Control 0.99 b 0.001Thin-only 1.06 b 0.036Thin-protect 1.33 a 0.044
Figure 2. Buckbrush (Ceanothus fendleri) population trajectories for five restoration management scenarios. Abundance is total number in population, including dormant seeds. Chart shows carrying capacity (K) “ceiling” for abundance, which was a user-defined model parameter.

USDA Forest Service RMRS-P-55. 2008. 189
Table 2. Mean characteristics of buckbrush populations (Ceanothus fendleri) after 25-year simulations of five restoration alternatives. Different letters read across management scenarios denote statistically different means at P ≤ 0.05.
Restoration Alternative
Characteristic Control Thin-only Thin-protect Thin-burn Thin-protect-burn
Number in Population: Aerial stems1 25.6 b 198.4 b 119.4 b 175.9 b 575.8 a Total2 922.3 bc 1847.1 ab 2420.0 a 468.2 c 1832.4 ab
Relative Abundance in Population (%): Seeds 97.2 a 90.6 a 95.0 a 58.3 b 68.6 b Seedlings 1.3 b 1.1 b 1.0 b 8.9 a 10.3 a Vegetative 1.4 b 8.0 ab 2.4 b 31.8 a 16.3 ab Reproductive <0.01 c 0.3 bc 1.6 b 1.1 bc 5.8 a
1 Number of aerial stems in population—does not include seeds.2 Number in population; total aerial stems plus seeds.
Figure 3. Life stage abundances (number in population) for buckbrush populations protected and unprotected from large herbivores under four simulated prescribed fire intervals.

190 USDA Forest Service RMRS-P-55. 2008.
by large herbivores such as Rocky Mountain elk appeared to constrain long-term population growth and simplify popu-lation structure. This research demonstrates that population modeling can help provide insights concerning ecological tradeoffs associated with land management alternatives.
References
Akçakaya, H.R. 1998. RAMAS Metapop: viability analysis for stage-structured metapopulations (version 3.0). Applied Biomathematics, Setauket, New York.
Allen, C.D. 1996. Elk response to the La Mesa fire and current status in the Jemez mountains. pp.179-195 in Allen, C.D. (Ed.), Proceedings of the 2nd La Mesa Fire Symposium. USDA Forest Service General Technical Report RM-GTR-286.
Arnold, J.F. 1950. Changes in ponderosa pine bunchgrass ranges in northern Arizona resulting from pine regeneration and grazing. Journal of Forestry. 48(2): 118-126.
Barbour, M.G.; Burk, J.H.; Pitts, W.D.; Gilliam, F.S.; Schwartz, M.W. 1999. Terrestrial plant ecology. Addison Wesely Longman, Inc. NY.
Bellingham, P.J.; Sparrow, A.D. 2000. Resprouting as a life history strategy in wood plant communities. Oikos. 89: 409-416.
Caswell, H. 2001. Matrix population models: construction, analysis, and interpretation. Sinauer Associates Inc., Sunderland, MA.
Fulé, P.Z.; Covington, W.W.; Moore, M.M. 1997. Determining reference conditions for ecosystem management in southwestern ponderosa pine forests. Ecological Applications. 7(3): 895-908.
Fulé, P.Z.; McHugh, C.; Heinlen, T.A.; Covington, W.W. 2001. Potential fire behavior is reduced following forest restoration treatments. Pp. 28-35 in Vance, R.K., C.B. Edminster, W.W. Covington, and J.A. Blake (comps.), Ponderosa pine ecosystems restoration and conservation: steps toward stewardship. USDA Forest Service Proceedings RMRS-P-22.
Harper, J.L. 1977. Population biology of plants. Academic Press, New York.
Huffman, D.W. 2003. Population ecology of Fendler ceanothus: responses to herbivory and forest restoration treatments. Flagstaff, AZ: Northern Arizona University. Ph.D. Dissertation.
Huffman, D.W. 2006. Production, losses and germination of Ceanothus fendleri seeds in an Arizona ponderosa pine forest. Western North American Naturalist. 66: 365-373.
Story, M.T. 1974. Nitrogen fixation by Ceanothus fendleri and Lupinus argenteus as a function of parent material and vegetal cover. Tucson, AZ: University of Arizona. M.S. Thesis.
Urness, P.J.; Neff, D.J.; Watkins, R.K. 1975. Nutritive value of mule deer forages on ponderosa pine summer range in Arizona. Res. Note RM-304. Fort Collins, CO: U.S. Department of Agriculture, Forest Service, Rocky Mountain Forest and Range Experiment Station.
The content of this paper reflects the views of the author(s), who are responsible for the facts and accuracy of the information presented herein.

USDA Forest Service RMRS-P-55. 2008. 191
In: Olberding, Susan D., and Moore, Margaret M., tech coords. 2008. Fort Valley Experimental Forest—A Century of Research 1908-2008. Proceedings RMRS-P-55. Fort Collins, CO: U.S. Department of Agriculture, Forest Service, Rocky Mountain Research Station. 282 p.
Introduction
There is considerable evidence that in the southwestern United States, present-day ponderosa pine stand structure and composition, accumulation of wildfire fuel, and frequen-cy and severity of wildfire, are historically uncharacteristic (Covington and others 1997, Covington and Moore 1994, Fulé and others 1997, Savage and others 1996, Swetnam and Baisan 1996). Decades of exclusion and suppression of fre-quent, low intensity surface fires has been implicated as the main cause, although timber harvesting and replanting, his-torical periods of overgrazing, and climate shifts were also likely important. Substantial information exists regarding forest fire history and recent shifts in tree stand structure and composition, but quantitative studies investigating understo-ry reference conditions are lacking.
Understanding Ponderosa Pine Forest-Grassland Vegetation Dynamics at Fort Valley Experimental Forest Using Phytolith Analysis
Becky K. Kerns, USFS, Pacific Northwest Research Station, Portland, OR; Margaret M. Moore and Stephen C. Hart, School of Forestry, Northern Arizona University, Flagstaff, AZ
Abstract—In the last century, ponderosa pine forests in the Southwest have changed from more open park-like stands of older trees to denser stands of younger, small-diameter trees. Considerable information exists regarding ponderosa pine forest fire history and recent shifts in stand structure and composition, yet quantitative studies investigating understory refer-ence conditions are lacking. We developed and applied an approach using phytoliths to understand forest-grassland vegetation dynamics and historical conditions. Phytoliths are particles of hydrated silica that form in the cells of living plants that are often morphologi-cally distinct. Upon plant death and decay, the stable silica remains in the soil. Soil phytoliths are a useful tool to examine the vegetation history of an area. We created and published a phytolith reference collection, including a previously undescribed diagnostic phytolith for ponderosa pine, examined relationships between contemporary vegetation and surface soil phytolith assemblages using a phytolith classification system, and used phytoliths to explore forest-grassland vegetation dynamics. Results indicate that soil phytolith assemblages reflect long-term accumulation of organic matter in soils, and do not mirror contemporary vegeta-tion at the scale of several meters, but rather several kilometers. Our data suggest that in the past, some C4 (warm-season) grasses were more widely distributed but less abundant, grasses were more spatially continuous, total grass production was greater, and some species (Koeleria sp. and Bromus sp.) were more common in the study area. These results provide important information on historical understory conditions useful to ecologists and land man-agers for developing and implementing strategies promoting desired future conditions in the region.
Phytolith analysis is a promising tool for understanding vegetation dynamics in these ecosystems. Phytoliths are mor-phologically distinct particles of hydrated silica that form in the cells of living plants (Figure 1). Upon plant death and decay, many silica phytoliths resist dissolution and remain in the soil for centuries to millennia as evidence of the vegeta-tion history of an area. Because grasses generally produce an order of magnitude more phytoliths than trees, many soils beneath grassland vegetation contain significantly more phytoliths by mass than soils beneath forest vegetation (Jones and Beavers 1964, Norgen 1973, Wilding and Drees 1971). Examination of phytolith concentration in soils can be used to decipher changes in grassland and forest ecotones through time. Analysis of individual phytolith morphology and phytolith assemblages can provide more detailed taxo-nomic information regarding vegetation change, particularly for species in the grass family (Fredlund and Tieszen 1994, Kerns and others 2001, Mulholland 1989).

192 USDA Forest Service RMRS-P-55. 2008.
Figure 1. Scanning electron microscope photos of two diagnostic phytoliths. Above: panicoid lobate in situ from the grass Schizachyrium scoparium. Below: spiny body from Pinus ponderosa.

USDA Forest Service RMRS-P-55. 2008. 193
The goal of our work was to provide data regarding phyto-lith assemblage formation, herbaceous understory reference conditions, and provide additional insights into the vegeta-tion dynamics of a ponderosa pine-bunchgrass community within the Fort Valley Experimental Forest.
Methods
The study site was located in northern Arizona, U.S.A., within the Fort Valley Experimental Forest, 10 km northwest of Flagstaff. Present-day forest structure is characterized by small patches (0.02-0.29 ha) of larger old-growth ponderosa pine trees in clumps of three or more (White 1985) inter-spersed with dense thickets of younger, smaller ponderosa pine trees, and relatively open canopy areas (<0.01 ha) with bunchgrasses and other herbaceous plants. Understory spe-cies composition is dominated by native bunchgrasses, including Muhlenbergia montana, Festuca arizonica, Poa fendleriana, Blepharoneuron tricholepis and Elymus elymoi-des (Kerns and others 2001). Common forbs include Cirsium wheeleri, Solidago sparsiflora, and Lotus wrightii. The only understory shrub found was Ceanothus fendleri.
Fifteen 40-m2 circular plots were established within the three forest canopy types found on the site (5 plots per canopy type): 1) old-growth pine (OG); 2) dense young pine thicket (DYP); and 3) open canopy (OC). Above-ground herbaceous plant biomass was determined by harvesting all plants within a 1.5 m x 0.5 m rectangular subplot. The forest floor layer was then removed from the subplot and two composite mineral soil samples were collected: 0-2 cm depth and 2-7 cm depth. Soils were air-dried and visible organic matter removed prior to passing soil through a 2-mm sieve. Phytoliths were extract-ed using a modified heavy liquid flotation technique (Pearsall 1986). Phytolith forms were viewed three dimensionally in a medium of Canada Balsam and classified into eight diag-nostic types based on a system developed for the local flora (Kerns 2001). Only grass short-cells were considered; be-cause they are fairly equal in size and silicification, they were assumed equally resistant to post-depositional degradation. The only non-graminoid phytolith form described and used in this study was the spiny body diagnostic for ponderosa pine (Figure 1, Kerns 2001). Photographs of diagnostic phy-toliths from dry ash plant material were made using a LEO 435VP Scanning Electron Microscope located at the Northern Arizona University Electron Microscope Facility.
Analysis of variance was used to test for differences among the three canopy types in total above-ground herba-ceous biomass, graminoid functional group (e.g., C3 and C4 grasses), phytolith morphotypes and phytolith concentration. If differences were significant (p < 0.10), pairwise tests were conducted using Tukey’s procedure for multiple compari-sons. Variables were transformed as appropriate. Non-metric multidimensional scaling was used to assess similarities in species and phytolith composition among the plot canopy types (Minchin 1987). Vector fitting was used to examine
relationships between different forest structure variables and vegetation and phytolith assemblages (Kantivilas and Minchin 1989).
Results and Discussion
Current Vegetation
Open canopy plots had significantly more herbaceous plant biomass (20.3 ± 2.7 g/m2) compared to OG (5.1 ± 2.4 g/m2) and DYP (2.5 ± 1.2 g/m2). Warm-season grasses (C4) were only found on OC plots; these plots also had significant-ly more species present compared to plots of other canopy types. The most common grass was Elymus elymoides, a C3 species found in all plots. Festuca arizonica and Poa fendle-riana were only found in OG plots. Ceanothus fendleri, an important browse species and possible N-fixing plant, was not found on any of the DYP plots. Non-metric multidimen-sional scaling indicated that species composition corresponds to canopy type. Stand age, light availability, and O horizon thickness were significant vectors associated with the ordi-nation (Kerns and others 2001). These results suggest that the recently documented increase in tree density, decrease in light availability, and accumulation of forest floor material have probably resulted in loss of understory production and diversity, as well as potentially important functional species.
Soil Phytolith Assemblages
We created and published a phytolith reference collection including a previously unknown diagnostic phytolith for ponderosa pine (Kerns 2001). We then used a phytolith classification system to examine relationships between contemporary vegetation and surface soil phytolith assemblages as well as forest-grassland vegetation dynamics (Kerns and others 2001, 2003). Our results indicated that local or plot-scale vegetation patterns associated with overstory canopy types were only weakly detected. Surface phytolith assemblage ordination revealed some correspondence to contemporary vegetation; however, even on open canopy plots dominated by warm season grasses with few to no trees, the percentage of warm season grass and ponderosa pine type phytoliths were not statistically different from heavily forested plots where warm-season grasses were absent (Kerns and others 2001). Past research has shown inconsistent results in terms of local in-situ phytolith formation (Fisher and others 1995, Fredlund and Tieszen 1994), possibly due to differing methodologies or factors that influence phytolith assemblage formation. Fire, herbivory and erosion may cause phytolith mixing and assemblage homogenization, leading to the lack of local sensitivity in our phytoliths assemblages. It is also likely that understory species were not spatially stable through time and that many phytoliths have remained preserved in the soil. Our results suggest that phytolith assemblages should be viewed as a long-term average of vegetation composition, not an instantaneous snapshot of vegetation.

194 USDA Forest Service RMRS-P-55. 2008.
Our results also indicated that vegetation composition has shifted through time. Results are summarized in Table 1. Grasses were more spatially continuous in the past (Kerns and others 2001), lending additional support to the idea that grass productivity was greater in the past. In the past some C4 grasses (species in the Chloridoideae, e.g., Blepharoneuron tricholepis, Muhlenbergia spp.) were more widely distributed but relatively less abundant compared to C3 grasses. Several mechanisms that could explain this shift (e.g., increased temperatures, over grazing and preferential selection of C3 grasses), are reviewed in Kerns and others (2001). It is important to reiterate that surface phytolith assemblages representing the present are long-term averages of vegetation composition. The assemblages do not reflect a snapshot of the present-day vegetation. Thus the increase in some C4 type phytoliths seen in surface soils could be explained by extensive grazing of domestic ungulates that favored C3 grasses from late 1800s to approximately the mid-1900s. Because tree cover has increased over the past 50 years, it is generally thought that C4 grasses have decreased substantially due to shading.
Another important finding that emerged from our study was that phytolith forms diagnostic of Koeleria cristata and native species in the genus Bromus (i.e., Bromus ciliatus and Bromus anomalus) were more abundant in subsurface com-pared to surface soil horizons. Although these species are presently uncommon in the study area, they may have been more abundant in the past (Table 1).
Acknowledgments
This research was supported by state funds provided by the School of Forestry, Northern Arizona University, the USDI Bureau of Land Management, Arizona State Office, and sev-eral Northern Arizona Graduate College Organized Research Grants. We are especially thankful to Lauren Labate for field and laboratory assistance. Dr. Deborah Pearsall, University of Missouri at Columbia, provided much needed expertise regarding phytolith morphology.
Table 1. Summary of results for relative changes in vegetation in the study area as determined from surface and subsurface soil phytolith assemblages.
Vegetation Presenta Diagnostic Phytolith Evidence
Ponderosa pine Increased More spiny bodies in surface soilsAll grasses Decreased and spatially restricted Phytolith concentrationC3 grasses Decreased, particularly Koeleria More rondels & crenates in subsurface soils macrantha and Bromus spp.C4 grasses(Chloridoideae) Increased but spatially restricted More saddles in surface soilsa The present is determined from surface phytolith assemblages that represent long-term averages of vegeta-
tion composition and do not represent a snapshot of present-day vegetation.
References
Covington, W.W.; Moore, M.M. 1994. Postsettlement changes in natural fire regimes and forest structure: ecological restoration of old-growth ponderosa pine forests. Journal of Sustainable Forestry. 2: 153-181.
Covington, W.W.; Fulé, P.Z.; Moore, M.M.; Hart, S.C.; Kolb, T.E.; Mast, J.N.; Sackett, S.S.; Wagner, M.R. 1997. Restoration of ecosystem health in southwestern ponderosa pine forests. Journal of Forestry. 95: 25-29.
Fisher, R.F.; Brown, C.N.; Fisher, W.F. 1995. Opal phytoliths as an indicator of the floristics of prehistoric grasslands. Geoderma. 68: 243-255.
Fredlund, G.G.; Tieszen, L.T. 1994. Modern phytolith assemblages from the North American Great Plains. Journal of Biogeography. 21: 321-335.
Fulé, P.Z.; Covington, W.W.; Moore, M.M. 1997. Determining reference conditions for ecosystem management of southwestern ponderosa pine forests. Ecological Applications. 7: 895-908.
Jones, R.L.; Beavers, A.H. 1964. Aspects of catenary development and depth distribution of opal phytoliths in Illinois soils. Soil Science Society of America Journal. 28: 413-416.
Kantvilas, G.; Minchin, P.R. 1989. An analysis of epiphytic lichen communities in Tasmanian cool temperate rainforest. Vegetatio. 84:99-112.
Kerns, B.K. 2001. Diagnostics phytoliths for a ponderosa pine-bunchgrass community near Flagstaff, Arizona. The Southwestern Naturalist. 46: 282-294.
Kerns, B.K.; Moore, M.M.; Hart, S.C. 2001. Estimating forest-grassland dynamics using soil phytolith assemblages and SOM delta13C. Écoscience. 8: 478-488.
Kerns, B.K.; Moore, M.M.; Timpson, M.E.; Hart, S.C. 2003. Soil properties associated with vegetation patches in a ponderosa pine-bunchgrass mosaic. Western North American Naturalist. 63: 452-462.
Minchin, P.R. 1987. An evaluation of the relative robustness of techniques for ecological ordination. Vegetatio. 68:89-107.
Mulholland, S.C. 1989. Phytolith shape frequencies in North Dakota grasses: a comparison to general patterns. Journal of Archaeological Science. 16: 489-511.
Norgen, A. 1973. Opal phytoliths as indicators of soil age and vegetative history. Oregon State University, Corvallis, OR, USA. Ph.D. Dissertation.

USDA Forest Service RMRS-P-55. 2008. 195
Pearsall, D.M. 1986. Paleoethnobotany, A Handbook of Procedures. Academic Press, Inc., Harcourt Brace Jovanovich, Publishers.
Savage, M.; Brown, P.M.; Feddema, J. 1996. The role of climate in a pine forest regeneration pulse in the southwestern United States. Écoscience. 3: 310-318.
Swetnam, T.W.; Baisan, C.H. 1996. Historical fire regime patterns in the southwestern United States since AD 1700. Pages 11-32 in C.D. Allen (ed.). Fire effects in southwestern forests. GTR
RM-246. Fort Collins, CO: U.S. Department of Agriculture, Forest Service, Rocky Mountain Forest and Range Experiment Station.
White, A.S. 1985. Presettlement regeneration patterns in a southwestern ponderosa pine stand. Ecology. 66: 589-594.
Wilding, L.P.; Drees, L.R.1971. Biogenic opal in Ohio soils. Soil Science Society of America Proceedings. 35: 1004-1010.
The content of this paper reflects the views of the author(s), who are responsible for the facts and accuracy of the information presented herein.

196 USDA Forest Service RMRS-P-55. 2008.
In: Olberding, Susan D., and Moore, Margaret M., tech coords. 2008. Fort Valley Experimental Forest—A Century of Research 1908-2008. Proceedings RMRS-P-55. Fort Collins, CO: U.S. Department of Agriculture, Forest Service, Rocky Mountain Research Station. 282 p.
Introduction
The stand density experiment initiated in 1962 at Taylor Woods, Fort Valley Experimental Forest, Arizona, set the stage for a series of tree ecophysiology studies conducted between 1994 and 2003 that provide insight on effects of stand density management in ponderosa pine forests on tree and stand growth and physiology. Many of the questions ad-dressed in these recent studies were not anticipated when the stand density experiment was started in 1962. Maintenance of the density experiment for over 40 years by Rocky Mountain Research Station staff, notably Carl Edminster, provided us with the opportunity to ask contemporary ques-tions about impacts of long-term silvicultural thinning on a range of tree- and stand-level physiological characteristics that is not possible in short-term studies. Thus, Taylor Woods has proven to be one of the most important long-term forestry research sites in the southwestern United States.
This paper briefly describes results of our ecophysiol-ogy studies at Taylor Woods. For brevity, we introduce the study site and follow with major findings. Our methods have been described in detail elsewhere (Kolb and others 1998, McDowell and others 2006, McDowell and others 2007).
Taylor Woods is in the Fort Valley Experimental Forest (35°16’11” N, 111°44’30” W) located within the Coconino National Forest approximately 15 km northwest of Flagstaff, Arizona, U.S.A. The stand is approximately 35.6 ha and is dominated by ponderosa pine (Pinus ponderosa var. scopu-lorum) that regenerated naturally in approximately 1919 (Ronco and others 1985, Savage and others 1996). A sparse understory of grasses and forbs is present. The stand has flat topography and is located at 2,266 m elevation. Mean an-nual temperature from 1909 to 1990 near the study site was 6.0 °C and mean annual precipitation was 56.4 cm with
Tree Ecophysiology Research at Taylor Woods
Thomas E. Kolb, School of Forestry, Northern Arizona University, Flagstaff, AZ; and Nate G. McDowell, Los Alamos National Laboratory, Earth and Environmental Sciences Division, Los Alamos, NM
Abstract—We summarize the key findings of tree ecophysiology studies performed at Taylor Woods, Fort Valley Experimental Forest, Arizona between 1994 and 2003 that provide unique insight on impacts of long-term stand density management in ponderosa pine forests on tree water relations, leaf gas exchange, radial growth, leaf area-to-sapwood-area ratio, growth ef-ficiency, leaf area index, resin defenses, and stand-level above-ground carbon sequestration.
approximately half of this amount falling as snow (Schubert 1974). The region has a monsoonal climate typical of the Southwest United States with precipitation distributed in a bimodal pattern that peaks in the winter and late summer, and a pronounced drought during May and June.
We utilized a replicated set of stand basal area treatments at Taylor Woods to obtain data about physiological and struc-tural responses to changes in stand basal area (BA). The initial experiment was designed by the U.S. Forest Service to determine effects of stand BA on ponderosa pine growth (Myers 1967, Ronco and others 1985). The forest was first thinned in October 1962 to generate three replicated plots of each of six BA (34, 28, 23, 18, 14, 7 m-2 ha-1) plus an un-thinned control. The residual BA levels were maintained by re-thinning once per decade (1972, 1982, 1992, 2003). The plots are about 0.4 ha in size, and have 0-10 m buffers. Stand structural data for year 2003 are shown in Table 1.
Major Findings
Direct measurements of leaf gas exchange in summer 1994 following the third thinning in 1992 show that thinning increased net photosynthetic rate (Pn; Figure 1A). Increased Pn in response to thinning was highly correlated with leaf-level stomatal conductance (Kolb and others 1998) and was not associated with increased leaf nitrogen concentration (Kolb and others 1998) or a change in carboxylation efficien-cy (McDowell and others 2006). Hence much of the positive effect of thinning on Pn was due to increased supply of carbon dioxide to chloroplasts due to higher stomatal conductance.
Data from 1994 (Kolb and others 1998) show that thinning increased water availability to trees. Stand BA was inversely and linearly related to average growing-season leaf xylem

USDA Forest Service RMRS-P-55. 2008. 197
Table 1. Stand characteristics in year 2003 for each basal area treatment at the Taylor Woods, Fort Valley Experimental Forest, Arizona. One standard error of the mean is shown in parentheses. The unthinned 45 m2 ha-1 treatment had only one plot, therefore no standard errors are provided. Following McDowell and others (2006).
Basal area treatment Stem density Mean Mean (m2 ha-1) ( no. ha-1) DBHa (cm) height (m)
7 70.(3.8) 47.(0.99) 19.514 145.(3.3) 40.(0.43) 18.618 245.(11.6) 34.8.(0.87) 18.923 366.(18.0) 31.7.(0.76) 18.928 471.(39.3) 30.4.(1.24) 16.935 789.(1.6) 25.5.(0.03) 15.945 3160 13.4 11.1
a Diameter at breast height.
predawn water potential (Figure 1B). Thus, thinning can be used to reduce water stress on ponderosa pine in northern Arizona.
A chronology of basal area increment (BAI) calculated from increment cores sampled at breast height shows that BAI increased at all BA levels starting two years after the onset of thinning. BAI was similar for all BA prior to thinning between 1940 and 1961 (Figure 2A). The increase in BAI started in the second year after thinning (1964) for all treatments. BAI was consistently higher in all thinned plots compared with the control in all years between 1964 and 2002. BAI in the control was ex-tremely low (between 0 and 2 cm2 yr-1) in all years. Thinning to a BA of 7 m2 ha-1 caused the largest increase in BAI, followed by the 14 m2 ha-1 and 18 m2 ha-1 BA levels (Figure 2A). Trees in the 23, 28, and 34 m2 ha-1 BA levels had similar BAI in most years. Increases in BAI after the later thinnings (i.e., post 1962) were most pronounced in the 7 m2 ha-1 BA. BAI de-
creased at all BA following the 1992 thinning (Figure 2A); this reduction was associated with drought between 1993 and 2000 (Figure 2B). These results can be used by silviculturists to design treatments to control individual tree growth.
Comparison of the slope of the relationship between BAI and the Palmer drought severity index (PDSI) during drought years (negative PDSI, Figure 2B) showed that the sensitiv-ity of BAI to drought differed among BA (Figure 3). The slope, and thus sensitivity of BAI to drought, was inversely and linearly related to BA (Figure 3). BAI in low BA was more sensitive to drought than in high BA. In contrast, there was no significant relationship between sensitivity of BAI to PDSI when data from all years (i.e., positive and negative PSDI) were used in the comparison (McDowell and others 2006). The results suggest that severe droughts will have greater relative (e.g., proportional) impacts on BAI of fast-growing trees at low BA than slow-growing trees at high BA.
The chronosequence of carbon isotope discrimination (∆) derived from tree rings and corrected for temporal changes in atmospheric carbon isotope ratio caused by fossil fuel emissions (McDowell and others 2006) shows that thinning had a pronounced effect on the ratio of carbon dioxide con-centration in the leaf mesophyll (Ci) to concentration in the atmosphere (Ca; Figure 4). With no change in carboxylation efficiency as was shown for the thinning treatments at Taylor Woods (McDowell and others 2006), and assuming similar Ca, vapor pressure deficit and light intensity, increased ∆ re-sults from increased Ci due to greater stomatal conductance. Normalization of ∆ relative to ∆ either prior to thinning (Figure 4B) or relative to the unthinned control (Figure 4C) provided a clearer signal of the effect of thinning than non-normalized data (Figure 4A). Relative to the control (Figure 4C), thinning increased ∆ at all wide range of BA levels 5 and 12 years after treatment suggesting a large simulation in Ci and stomatal conductance. Interestingly, the second thinning
1.5
2.0
2.5
3.0 A
-0.8
-0.6
-0.4B
Stand basal area (m2 ha-1)
0 10 20 30 40
ΨΨ ΨΨp
re(M
Pa)
Pn
( υυ υυm
olm
-2s
-1)
Figure 1. A) Leaf-level net photosynthetic rate (Pn) based on all-sided leaf area and averaged from May to September, 1994 vs. stand basal area (BA). B) Leaf xylem predawn water potential (Ψpre) averaged from May to September, 1994 vs. BA. Bars are +/- one standard error. Equations for the regression lines are A. Pn = 4.28•BA•(-0.24), r2=0.99, p=0.02, B. Ψpre = -0.009•BA -0.44, r2=0.99, p=0.02. Derived from Kolb and others (1998) and McDowell and others (2006).

198 USDA Forest Service RMRS-P-55. 2008.
increased ∆ for only one post-thinning year (1973) and only at the lowest BA (7 and 14 m2 ha-1, Figure 4B, C). Effects of the third thinning (1982) on ∆ were similar to the first thin-ning with a general increase in ∆ for all BA for several years after thinning (Figure 4C). The fourth thinning (1992) did not increase ∆ in any BA relative to the control (Figure 4C).
Thinning had unequal effects on whole-tree leaf area and sapwood area, which changed the ratio of leaf area to sap-wood area (McDowell and others 2006). Reduction of BA by thinning increased both tree leaf area (Figure 5A) and sap-wood area at breast height (Figure 5B) as would be expected due to a general stimulation of tree growth by thinning. The ratio of leaf area to sapwood area was inversely and linearly related to BA (Figure 5C); sapwood of trees growing at low BA supported more leaf area than trees at high BA. These results combined with the ∆ results suggest that thinning increases tree BAI first by greatly increasing stomatal con-ductance, followed by a large increase in carbon allocation to leaf area.
Thinning altered growth efficiency, defined as yearly bio-mass production divided by either sapwood area or leaf area (Waring and others 1980, Waring 1983). In four of six cases, growth efficiency decreased in response to reduction in BA (Figure 6B, D, E, F; McDowell and others 2007). Growth efficiency increased with thinning intensity in only one case (Figure 6A). Thus, our results are not consistent with ear-lier hypotheses (Waring and others 1980, Waring 1983) that thinning increases the “efficiency” of wood production using conventional measurements of growth efficiency.
Year
1940 1950 1960 1970 1980 1990 2000
-6
-4
-2
0
2
4
6
10
20
30
40
50
60
45 BA
34 BA
28 BA
23 BA
18 BA
14 BA
7 BA
A
B
BA
I (
cm
2)
PD
SI
Stand basal area (m-2 ha-1)
0 10 20 30 40
BA
I v
s. P
DS
I s
lop
e
0.0
0.5
1.0
1.5
2.0
2.5
Figure 2. A) Basal area increment (BAI) for seven basal area (BA) treatments (7 to 45 m2 ha-1). Data are averaged for three plots per treatment with the exception of the 45 m2 ha-1 control treatment (no thinning), which had a single plot. Bars are +/- one standard error. The initial thinning treatment (1962) and subsequent thinning treatments (1972, 1982, 1992) are indicated by the vertical lines. B) Annual Palmer drought severity index (PDSI) for Region 2 of Arizona. Negative PDSI values represent drought and positive PDSI values represent wet periods. From McDowell and others (2006).
Figure 3. Treatment-specific slopes of basal area increment (BAI) versus annual Palmer drought severity index (PDSI) using all plots per treatment, and only the negative PDSI years from 1962 to 2001. The regression equation is: BAI:PDSI = -0.051•BA + 2.62, r2=0.93, p<0.01. From McDowell and others (2006).

USDA Forest Service RMRS-P-55. 2008. 199
B
∆∆ ∆∆ n
orm
ali
zed
by p
re-t
hin
mean
(‰
)
-1.5
-1.0
-0.5
0.0
0.5
1.0
1.5
∆∆ ∆∆ (
‰)
15.0
15.5
16.0
16.5
17.0
17.5
18.0
18.5
45 BA
28 BA
14 BA
7 BA
C
Year
1950 1960 1970 1980 1990 2000
∆∆ ∆∆ n
orm
ali
zed
by c
on
tro
l (‰
)
-2
-1
0
1
A
Figure 4. A) Carbon isotope discrimination (∆), B) ∆ nominalized to prethinning (1952-1961) ∆, and C) ∆ normalized to the unthinned control for the 45, 28, 14 and 7 m-2 ha-1 basal area treatments for years 1952-2001. Each point represents a plot mean value obtained by pooling five trees per plot into a single sample. The initial thinning treatment (1962) and subsequent thinning treatments (1972, 1982, 1992) are indicated by the vertical dashed lines. From McDowell and others (2006).
Al (m
2)
0
20
40
60
80
100
120
140
160
As (
cm
2)
0
200
400
600
800
1000
1200
A
Stand Basal Area (m2 ha
-1)
0 10 20 30 40 50
Al:
As (
m2 c
m-2
)
0.00
0.02
0.04
0.06
0.08
0.10
0.12
0.14
0.16
C
B
Figure 5. A) Whole tree leaf area (Al), B) sapwood area (As) and C) leaf area:sapwood area ratio (Al:As) versus stand basal area (BA). Bars are +/- one standard error. The regressions equations are: A) Al = -82.55 • ln (BA) + 308.6, r2 = 0.99, p<0.01, B) As = -519.2 • ln (BA) + 2086, r2 = 0.97, p<0.01, and C) Al:As = -0.0029 • BA + 0.165, r2 = 0.92, p<0.01. Derived from McDowell and others (2006, 2007).
Thinning also affected leaf area index (LAI). Understory LAI, measured in 1998 and 1999, was more responsive to thinning than overstory or total stand LAI (Figure 7). Thinning increased understory LAI, and the largest increase occurred at low BA (Figure 7A). Understory LAI was a small proportion of total stand LAI at all BA (Figure 7B); the con-tribution of the understory to total LAI ranged from about 15% at the lowest BA (7 m2 ha-1) to about 0% at the high-est (45 m2 ha-1) BA (Figure 7B). Overstory and total LAI were highest at intermediate BA, and were lowest at both the
highest and lowest BA (Figure 7B). Peak total-stand project-ed-area LAI was about 2.0 m2 m-2. These results can be used to inform models of forest photosynthesis and transpiration and range production.
We pooled data on bole resin flow in response to phlo-em wounding over a range of BA at Taylor Woods in 1994 (Kolb and others 1998) with data from four similar studies of ponderosa pine in northern AZ to address whether resin defense against bark beetles was related to stand basal area (McDowell and others 2007). Resin flow was negatively

200 USDA Forest Service RMRS-P-55. 2008.
related to BA for data from Taylor Woods and pooled over all studies (Figure 8A). Resin flow was positively related to tree BAI for data from Taylor Woods and pooled over all studies (Figure 8B). Silviculturists can use our results to design treat-ments that enhance tree resin defense against bark beetles.
Control of stand basal area by three and a half decades of repeated thinning strongly influenced stand-level above-ground carbon sequestration, which was measured as above-ground net primary production (NPPstand) in years 1996-2001 (McDowell and others 2007). Net primary pro-duction decreased with stand basal area for non-normalized NPPstand (Figure 9A) and for NPPstand normalized by stand LAI (Figure 9B). Thus, greater NPPstand at high BA occurred because the greater density of stems at high BA (Table 1) overcompensated for the lower growth rate of individual trees at high compared with low BA (e.g., Figure 2A).
BA
I/A
s
0.00
0.01
0.02
0.03
0.04
BA
I/A
l
0.0
0.1
0.2
0.3
0.4
B
NP
Ps/ A
s
0.05
0.10
0.15
NP
Ps/ A
l
0
1
2
3
A
VI/A
s
0.0000
0.0001
0.0002
stand basal area (m2 ha
-1)
5 10 15 20 25 30 35 40
VI/A
l
0.000
0.001
0.002
0.003
C
D
E
F
Figure 6. Individual-tree growth efficiency versus stand basal area (BA). Panels and regression relationships are:
A) BAI per unit sapwood area (BAI/As, cm2 cm-2 As y-1) =
-0.0003 * BA + 0.031, p<0.01, r2=0.51, B) BAI per unit leaf area (BAI/Al, cm2 m-2 Al yr-1) = 0.006 * BA
+ 0.127, p<0.01, r2=0.84, C) NPPs per unit sapwood area (NPPs/As, g cm-2 As yr-1), no
significant relationship, D) NPPs per unit leaf area (NPPs/Al, g m-2 Al yr-1)
=0.328*e(0.048*BA), p<0.01, r2=0.95, E) VI per unit sapwood area (VI/As, m
3 cm-2 As yr-1) = 0.00005 * BA + 0.048, p<0.01, r2=0.88, and
F) VI per unit leaf area (VI/Al, m3 m-2 Al yr-1) = 0.0002 *
e(0.078*BA), p<0.01, r2=0.96. From McDowell and others (2007).
Figure 5
Un
dersto
ry L
AI (
m2 m
-2)
0.0
0.1
0.2
0.3
B
Stand basal area (m2 ha
-1)
0 10 20 30 40 50
Oversto
ry a
nd
tota
l L
AI (
m2 m
-2)
0.0
0.5
1.0
1.5
2.0
2.5
A
Understory LAI = 0.46e(-0.068BA)
, r2
= 0.83
Figure 7. A) Understory leaf area index (LAI) versus stand basal area, and B) overstory (open symbols) and total (closed symbols) LAI verses stand basal area. From McDowell and others (2007).

USDA Forest Service RMRS-P-55. 2008. 201
Basal area increment (cm2)
0 5 10 15 20 25 30 35
Basal area (m2 ha
-1)
0 10 20 30 40 50
7-d
ay
Resin
Flo
w (
ml)
0
5
10
15
20
25
30
35
A B
Figure 8. Seven day resin flow after phloem wounding versus A) stand basal area (BA), and B) individual tree basal area increment (BAI). The regression relationships are: A) resin flow = -0.28*BA + 18.9 (p=0.03, r2=0.36), and B) resin flow=0.79*BAI+ 4.5, (p=0.01, r2=0.84). The symbols denote different studies (see McDowell and others 2007 for details). The dashed line in A) represents the relationship when the resin flow data that was converted from 24-hour values to 7-day values (open triangles) is excluded.
Figure 9. A) Stand-level primary production (NPPstand; annual average for 1996-2001) verses stand basal area, and B) stand level growth efficiency defined as NPPstand/total leaf area index (LAI) verses stand basal area. Bars are one standard error. From McDowell and others (2007).
NP
Psta
nd (
g m
-2 y
r-1
)
0
50
100
150
200
250
300
B
stand basal area (m2 ha
-1)
0 10 20 30 40 50
NP
Psta
nd/ L
AI (
g m
-2 y
r-1
)
0
50
100
150
200
250
A
Stand level NPPs/LAI = 23.36*e
(0.050*BA), r
2 = 0.97
Stand level NPPs = 6.34*BA - 9.94, r
2 = 0.98

202 USDA Forest Service RMRS-P-55. 2008.
References
Kolb, T.E.; Holmberg, K.M.; Wagner, M.R.; Stone, J.E. 1998. Regulation of ponderosa pine foliar physiology and insect resistance mechanisms by basal area treatments. Tree Physiology. 18: 375-381.
McDowell, N.G.; Adams, H.D.; Bailey, J.D.; Hess, M.; Kolb, T.E. 2006. Homeostatic maintenance of ponderosa pine gas exchange in response to stand density changes. Ecological Applications. 16: 1164-1182.
McDowell, N.G.; Adams, H.D.; Bailey, J.D.; Kolb, T.E. 2007. The role of stand density on growth efficiency, leaf area index, and resin flow in southwestern ponderosa pine forests. Canadian Journal of Forest Research. 37: 343-355.
Myers, C.A. 1967. Growing stock levels in even-aged ponderosa pine. Res. Pap. RM-33. Fort Collins, CO: USDA, For. Serv., Rocky Mountain Res. For. Range. Exp. Sta. 8 p.
The content of this paper reflects the views of the author(s), who are responsible for the facts and accuracy of the information presented herein.
Ronco, F.J.; Edminster, C.B.; Trujillo, D.P. 1985. Growth of ponderosa pine thinned to different stocking levels in northern Arizona. Res. Pap. RM-262. Fort Collins, CO: USDA, For. Serv., Rocky Mountain Res. For. Range. Exp. Sta. 15 p.
Savage, M.; Brown, P.M.; Feddema, J. 1996. The role of climate in a pine forest regeneration pulse in the southwestern United States. Ecoscience. 3: 310-318.
Schubert, G.H. 1974. Silviculture of the southwest ponderosa pine: the status of our knowledge. Res. Pap. RM-123. Fort Collins, CO: USDA, For. Serv., Rocky Mountain Res. For. Range. Exp. Sta. 71 p.
Waring, R.H. 1983. Estimating forest growth and efficiency in relation to canopy leaf area. Advances in Ecological Research. 13: 327-354.
Waring, R.H.; Theis, W.G.; Muscato, D. 1980. Stem growth per unit of leaf area: a measure of tree vigor. Forest Science. 26: 112-117.

USDA Forest Service RMRS-P-55. 2008. 203
Introduction
One of the first major management conundrums in the ponderosa pine-bunchgrass ecosystem of northern Arizona was how to manage public land for optimum use of both range and timber resources. The heart of the conflict was due to livestock grazing impacts on ponderosa pine (Pinus ponderosa Laws. var. scopulorum Engelm.) reproduction. Cattlemen and sheep men wanted to fully utilize the produc-tive forage resources on the rangeland, but they could not guarantee that their livestock would not damage woody seed-lings. This alarmed the foresters who were already concerned about the lack of pine reproduction in the ponderosa pine re-gions of the Southwest. Therefore, it was up to the forest and range scientists to quantify the impact of livestock on pine reproduction and forage production, to determine whether wild herbivores or other agents may be responsible for pine seedling demise, and to define proper grazing management for ponderosa pine-bunchgrass rangelands.
In 1927, the Fort Valley Experimental Forest initiated a range-timber reproduction study. The study was one of the first attempts to experimentally isolate the agents respon-sible for injury to ponderosa pine regeneration, and at the same time assess the impacts of livestock grazing on her-baceous vegetation. The study was conducted on the United States Forest Service (USFS) range allotments northwest of Flagstaff, Arizona, known as Wild Bill and Willaha, and covered ~30,000 acres (~12,000 ha, Figure 1). Locally, the project was known as the “Cooperrider-Cassidy study.”
In: Olberding, Susan D., and Moore, Margaret M., tech coords. 2008. Fort Valley Experimental Forest—A Century of Research 1908-2008. Proceedings RMRS-P-55. Fort Collins, CO: U.S. Department of Agriculture, Forest Service, Rocky Mountain Research Station. 282 p.
Forest and Range Research on the “Wild Bill Plots” (1927-2007)
Daniel C. Laughlin, School of Forestry and Ecological Restoration Institute, Northern Arizona University, Flagstaff, AZ; and Margaret M. Moore, School of Forestry, Northern Arizona University, Flagstaff, AZ
Abstract—In 1927, the Fort Valley Experimental Forest initiated a range-timber reproduction study. The study was one of the first attempts to experimentally isolate the agents respon-sible for injury to ponderosa pine regeneration, and at the same time assess the impacts of livestock grazing on herbaceous vegetation. The study was conducted on the USFS range allotments northwest of Flagstaff, Arizona, known as Wild Bill and Willaha, and covered ~12,000 ha (~30,000 acres). Fifty-five permanently marked ponderosa pine “reproduction plots” were established to follow the fate of ponderosa pine seedlings, while an additional 28-1 m2 chart quadrats were established to quantify herbaceous vegetation composition and cover. In 2006, most of the Wild Bill and Willaha plots were relocated and remeasured and examples of key preliminary findings are reported in this proceedings paper.
Two types of plots were established. First, 55 rectangu-lar plots of variable size and dimension were established on patches of pine regeneration. Second, 28 1 x 1 m chart quadrats (Clements 1905) were established to study the her-baceous vegetation.
Pine Reproduction Study
Fifty-five permanently marked ponderosa pine “repro-duction plots” (ranging from 0.005 to 0.01 ac in size) were established throughout the range. Thirty plots were estab-lished on the open range (where livestock had free access to forage from June through October), while 25 were estab-lished within grazing enclosures. The enclosures were used to control the duration and timing of livestock use during the grazing season. These plots were centered on existing patch-es of “scattered” or “dense” ~seven-year old ponderosa pine regeneration within areas represented by “badly overgrazed,” “properly utilized” and “under used” (these categories were determined by the expert opinions of the range scientists). Within each plot, the researchers numbered, mapped, and tagged all the seedlings and small saplings (Figure 2). Over the grazing season, they recorded pine seedling height, con-dition, and apparent injury agent, and followed the fate of these seedlings from 1927 until 1938. Repeat photos were taken throughout the original study (1927-1938) and again in 2006 (Figure 3). A series of photographs of plot 149A on the Willaha range north of Kendrick Mountain illustrate the

204 USDA Forest Service RMRS-P-55. 2008.
abundance of ponderosa pine regeneration in 1935 and the dramatic shift in the forest structure (tree size, density, and canopy closure) during the 71-year period.
C. K. Cooperrider and H. O. Cassidy published a number of research notes and reports from the Wild Bill and Willaha reproduction plots on the how to manage cattle and sheep on cut-over ponderosa pine-bunchgrass ranges to prevent in-jury to pine regeneration (Cassidy 1937a, b, Cooperrider and Cassidy 1939a, b). Cooperrider (1938) also produced a semi-nal study in Plant Physiology about the recovery capacity of regenerating ponderosa pine following damage by animals. He observed that cattle, browsing game animals, sheep and tip moths did the most injury to seedlings older than three years, whereas rodents tended to damage the younger seed-lings. Rodents and tip moths tended to induce the most damage. Of the 2,139 ponderosa pine seedlings in the study, 69% were browsed one or more times; only 3% of these browsed seedlings died. Additionally, 8% of the total number were injured by rodents, and 74% of these injured pines died. The young pines exhibited an extraordinary capacity to pro-duce substitute buds and shoots to recover from shoot injury. Overall, only 2.1% (44 seedlings/2139) died from browsing while 5.9% (127 seedlings/2139) died from rodent damage.
Figure 1. Wild Bill and Willaha study sites are located northwest of the San Francisco Peaks near Kendrick Mountain in northern Arizona.
No data were available for comparing dead tree seedlings from natural causes such as drought, wildfire, or other veg-etation competition. Cooperrider (1938) concluded that if the southwestern ponderosa pine species did not have this ca-pacity, then grazing would have seriously jeopardized future forests. Cooperrider (1939) also reviewed the problems of grazing on timber lands of the Southwest and gave sugges-tions to range managers about how to prevent livestock from damaging reproduction and from creating conditions that are not conducive to pine seedling establishment. He emphasized that livestock should not be allowed on the open range during times when water and forage are scarce, since these are the situations when pine seedlings are browsed the most heavily (Cooperrider 1939).
Herbaceous Utilization and Production Study
In addition to the pine reproduction plots, 28 1 x 1 m plots were established to quantify herbaceous composition and cover within grazing enclosures and in the open range. To our knowledge, the data that were gathered on the 28 chart quadrats was never formally published. However, all of the original data, complete with chart quadrat maps and sum-maries, were stored in the Fort Valley Experimental Forest Archives at the USFS Rocky Mountain Research Station (RMRS) in Flagstaff, AZ (http://www.rmrs.nau.edu/fortval-ley/). Hand-drawn cloth maps and a metal detector were used to locate the historical plots and 27 of the 28 quadrats were found. The only missing quadrat was apparently buried in a slash pile.
We have mapped the plant species found on the chart quadrats to quantify the long-term changes in plant commu-nity composition, diversity, and abundance (Figure 4). We digitized the maps in a Geographical Information System (GIS) to facilitate the calculations of individual plant and total basal cover and density. We used a repeated measures analysis (paired t-test) to evaluate whether changes in plant species richness and basal cover between 1928 and 2007 dif-fered significantly from zero. On average three species were lost per plot (mean difference = -3.1 species; paired t = -3.5, P = 0.0015), and 12% plant basal cover was lost per plot (mean difference = -12.0, paired t = -6.8, P < 0.0001) over the past 80 years (Figure 5). The reduction in plant diversity and abundance was likely caused by the increase in pine over-story dominance and subsequent reduction of light and other critical resources (Figure 3). We are currently reconstructing historical forest structure (Bakker and others, this proceed-ings) on 20 x 20 m plots centered on the chart quadrats to estimate forest structural changes on each plot.
In addition, Canfield (1941) evaluated and tested his line intercept method for measuring the density and com-position of herbaceous vegetation and shrubs in rangelands and forests on the Wild Bill allotment. This method, which
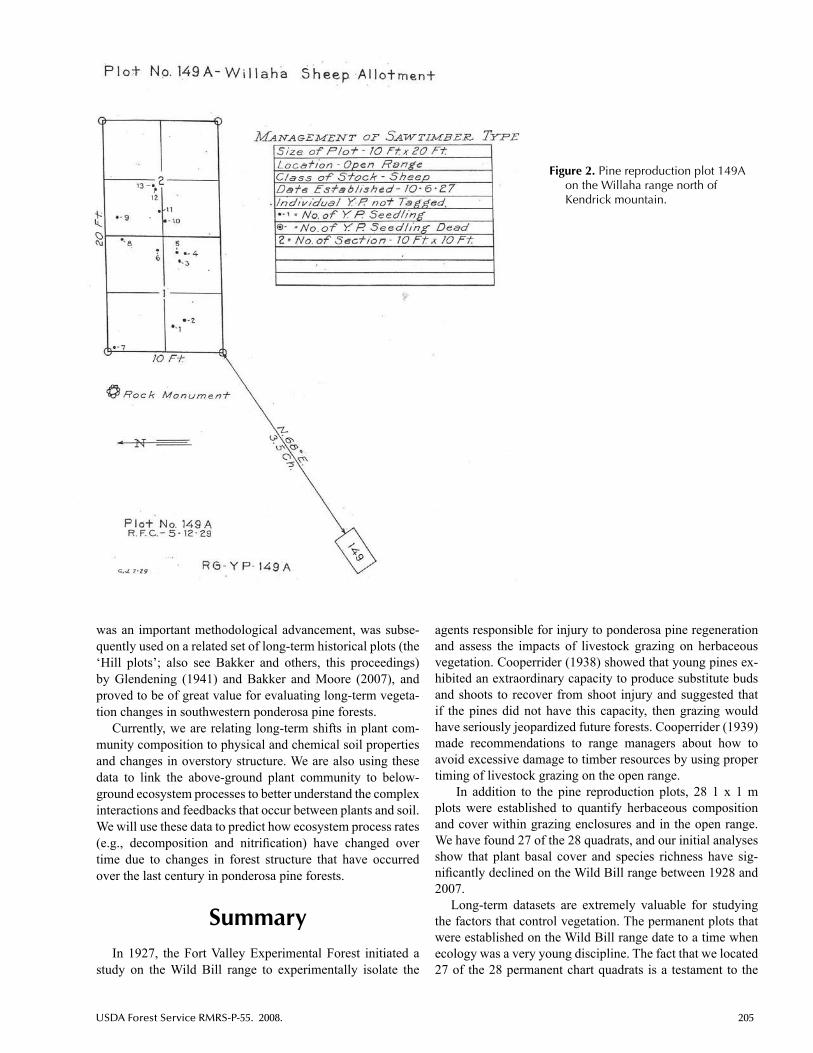
USDA Forest Service RMRS-P-55. 2008. 205
was an important methodological advancement, was subse-quently used on a related set of long-term historical plots (the ‘Hill plots’; also see Bakker and others, this proceedings) by Glendening (1941) and Bakker and Moore (2007), and proved to be of great value for evaluating long-term vegeta-tion changes in southwestern ponderosa pine forests.
Currently, we are relating long-term shifts in plant com-munity composition to physical and chemical soil properties and changes in overstory structure. We are also using these data to link the above-ground plant community to below-ground ecosystem processes to better understand the complex interactions and feedbacks that occur between plants and soil. We will use these data to predict how ecosystem process rates (e.g., decomposition and nitrification) have changed over time due to changes in forest structure that have occurred over the last century in ponderosa pine forests.
SummaryIn 1927, the Fort Valley Experimental Forest initiated a
study on the Wild Bill range to experimentally isolate the
Figure 2. Pine reproduction plot 149A on the Willaha range north of Kendrick mountain.
agents responsible for injury to ponderosa pine regeneration and assess the impacts of livestock grazing on herbaceous vegetation. Cooperrider (1938) showed that young pines ex-hibited an extraordinary capacity to produce substitute buds and shoots to recover from shoot injury and suggested that if the pines did not have this capacity, then grazing would have seriously jeopardized future forests. Cooperrider (1939) made recommendations to range managers about how to avoid excessive damage to timber resources by using proper timing of livestock grazing on the open range.
In addition to the pine reproduction plots, 28 1 x 1 m plots were established to quantify herbaceous composition and cover within grazing enclosures and in the open range. We have found 27 of the 28 quadrats, and our initial analyses show that plant basal cover and species richness have sig-nificantly declined on the Wild Bill range between 1928 and 2007.
Long-term datasets are extremely valuable for studying the factors that control vegetation. The permanent plots that were established on the Wild Bill range date to a time when ecology was a very young discipline. The fact that we located 27 of the 28 permanent chart quadrats is a testament to the

206 USDA Forest Service RMRS-P-55. 2008.
Figure 3. Repeat photograph (1935, top; 2006, bottom) of pine reproduction plot #149A in the Willaha range north of Kendrick Mountain. The black circles show the same galvanized steel pipes that mark the corners of the reproduction plot, and the arrow indicates the location of the angle iron that marks one corner of chart quadrat #1. Photo credit: 1935 by W. J. Cribbs; 2006 by D. C. Laughlin.
quality of work done by the first range and forest scientists in Arizona. In addition, the care and storage of the historical data in the USFS RMRS Fort Valley archives was critical for making this long-term study possible.
AcknowledgmentsWe thank Warren P. Clary and Henry A. Pearson for pro-
viding valuable comments on this manuscript. Funding was provided by McIntire-Stennis appropriations to the School of Forestry, and additional financial and logistical support were provided by the Ecological Restoration Institute (ERI). We thank S. D. Olberding for maintaining the historical data collections in the Fort Valley Archives (U.S. Forest Service, Rocky Mountain Research Station, Flagstaff, AZ). We also thank the staff and students at the Ecological Restoration Institute (ERI) for assistance with field and lab tasks, and
the Coconino National Forest for permission to sample study sites. Lastly, we recognize C. K. Cooperrider and H. O. Cassidy for establishing these sites in 1927 and plot remea-surement between 1927 and 1938.
ReferencesBakker, J. D.; Moore, M. M. 2007. Controls on vegetation
structure in southwestern ponderosa pine forests, 1941 and 2004. Ecology. 88: 2305-2319.
Canfield, R. H. 1941. Application of the line interception method in sampling range vegetation. Journal of Forestry. 39: 388-394.
Cassidy, H. O. 1937a. How cattle may use cut-over ponderosa pine-bunchgrass with minimum injury to reproduction. Res. Note 15. Tucson, AZ: U.S. Department of Agriculture, Forest Service, Southwestern Forest and Range Experiment Station. 3 p.

USDA Forest Service RMRS-P-55. 2008. 207
Figu
re 4
. Cha
nges
in h
erba
ceou
s ve
geta
tion
on c
hart
qua
drat
#1
(loca
ted
insi
de p
ine
repr
oduc
tion
plot
149
A in
Fig
ure
3 an
d no
ted
by a
rrow
) on
the
Will
aha
rang
e no
rth
of K
endr
ick
mou
ntai
n. T
he le
ft pa
nels
illu
stra
te th
e ch
art q
uadr
ats
as th
ey a
re m
appe
d in
the
field
, and
the
righ
t pan
els
illus
trat
e th
e di
gitiz
ed d
ata.
Not
e la
rge
redu
ctio
n in
her
bace
ous
prod
uctio
n, c
over
and
spe
cies
ric
hnes
s fr
om 1
931
to 2
006.

208 USDA Forest Service RMRS-P-55. 2008.
Cassidy, H. O. 1937b. How to handle sheep on cut-over ponderosa pine-bunchgrass ranges to keep injury to reproduction to a minimum. Res. Note 16. U.S. Department of Agriculture, Forest Service, Southwestern Forest and Range Experiment Station. 2 p.
Clements, F. E. 1905. Research methods in ecology. Lincoln, NE: The University Publ. Co.
Cooperrider, C. K. 1938. Recovery processes of ponderosa pine reproduction following injury to young annual growth. Plant Physiology. 13: 5-27.
Cooperrider, C. K. 1939. Grazing and western timber production. Proceedings of the Range Research Seminar, USDA Forest Service: 375-380.
Cooperrider, C.K.; Cassidy, H.O. 1939a. Cattle grazing in cutover timberlands in relation to regeneration of ponderosa pine forests
Figure 5. Significant declines in plant cover and species richness have occurred on the 1 m2 Wild Bill and Willaha chart quadrats (n = 27) from 1928-1938 to 2007. A paired t-test was used to perform a repeated measures analysis to test whether changes in species richness and plant cover were significantly different than zero.
of the Southwest. Southwestern Forest and Range Experimental Station. Unpub. Pap. on file at Flagstaff, AZ: U.S. Department of Agriculture, Forest Service, Rocky Mountain Research Station, Fort Valley Experimental Forest archives.
Cooperrider, C.K.; Cassidy, H.O. 1939b. Sheep grazing in cutover timberlands in relation to regeneration of ponderosa pine forests of the Southwest. Southwestern Forest and Range Experimental Station. Unpub. Pap. on file at Flagstaff, AZ: U.S. Department of Agriculture, Forest Service, Rocky Mountain Research Station, Fort Valley Experimental Forest archives.
Glendening, G.E. 1941. Work plan—summer 1941: Hill study plots, Coconino. Unpub. Pap. on file at Flagstaff, AZ: U.S. Department of Agriculture, Forest Service, Rocky Mountain Research Station, Fort Valley Experimental Forest archives.
The content of this paper reflects the views of the author(s), who are responsible for the facts and accuracy of the information presented herein.

USDA Forest Service RMRS-P-55. 2008. 209
In: Olberding, Susan D., and Moore, Margaret M., tech coords. 2008. Fort Valley Experimental Forest—A Century of Research 1908-2008. Proceedings RMRS-P-55. Fort Collins, CO: U.S. Department of Agriculture, Forest Service, Rocky Mountain Research Station. 282 p.
Introduction and Background
Prior to fire exclusion in the late 19th century, pondero-sa pine forests in northern Arizona and the Southwest were described as a matrix of grass-dominated openings inter-spersed with smaller groups or stands of pine (Cooper 1960, Pearson 1950). Today, most southwestern ponderosa pine forests have a closed overstory canopy intermixed with a few fragmented, remnant grass openings (Covington and Moore 1994, Covington and others 1997). This study was initiated in 1992 at the G.A. Pearson Natural Area (GPNA) on the Fort Valley Experimental Forest (FVEF) to restore a reasonable approximation of the presettlement ponderosa pine structure and function and to evaluate long-term ecosystem responses to two restoration treatments (Covington and others 1997). This “presettlement or pre-fire-exclusion model” quickly returned tree structure to what it was in pre-Euro American settlement times through thinning postsettlement trees, and re-introduced low-intensity surface fire (Covington and oth-ers 1997). Ideally, these treatments will reduce the threat of unnaturally intense crown fires and bark beetle attack, and allow this ponderosa pine ecosystem to respond adaptively to climate change. Tree physiology, herbaceous vegetation, and ecosystem responses within thinning and prescribed burning treatments were examined. Here we report key findings; read-ers should refer to specific publications listed in Appendix I for details.
Ecological Restoration Experiments (1992-2007) at the G. A. Pearson Natural Area, Fort Valley Experimental Forest
Margaret M. Moore, W. Wallace Covington, Peter Z. Fulé, Stephen C. Hart, and Thomas E. Kolb, School of Forestry, Northern Arizona University, Flagstaff, AZ; Joy N. Mast, Carthage College, Kenosha, WI; Stephen S. Sackett, (ret.), USFS Pacific Southwest Research Station, Riverside, CA; and Michael R. Wagner, School of Forestry, Northern Arizona University, Flagstaff, AZ
Abstract—In 1992 an experiment was initiated at the G. A. Pearson Natural Area on the Fort Valley Experimental Forest to evaluate long-term ecosystem responses to two restoration treatments: thinning only and thinning with prescribed burning. Fifteen years of key findings about tree physiology, herbaceous, and ecosystem responses are presented.
Methods
Study Site
This study was conducted on a decommissioned portion of the GPNA, located 10 km northwest of Flagstaff, Arizona in the FVEF, Coconino National Forest. The 4.5 ha study site ranges from 2195-2255 m in elevation, and has a flat to gen-tly rolling topography. Soils are Brolliar stony clay loams, and a complex of fine, smectitic Typic Argiborolls and Mollic Eutroboralfs (Kerns and others 2003). The average annual temperature is 7.5°C. Average annual precipitation is approx-imately 57 cm, with approximately half occurring as rain in July and August and half as snow in the winter. Drought was common during this study, with 2002 being especially severe (Figure 1). In 1992, a 2.4 m tall fence was constructed to exclude wild and domestic ungulates from the GPNA res-toration experiment. The specific portion of GPNA used in this study was never harvested for timber (Avery and oth-ers 1976). The last major fire in the area occurred in 1876 (Dieterich 1980). Ponderosa pine (Pinus ponderosa Laws. var. scopulorum Engelm.) is the only tree species on the study site and Fendler’s ceanothus (Ceanothus fendleri Gray) is the only shrub. The understory is dominated by perennial graminoid and forb species.

210 USDA Forest Service RMRS-P-55. 2008.
Treatments and Patch Types
In 1992, five 0.2-0.3-ha plots were established in each of three treatments: 1) thinning from below (thinning; see Figure 2); 2) thinning from below plus forest floor manipu-lation with periodic prescribed burning (composite); and 3) control. The five control treatment plots were located non-randomly on one side of the study site, while the thinning and composite treatment plots were assigned randomly. This design was necessary so that the fuel break created by the treated plots would protect the historical buildings of the ad-jacent FVEF.
Each treatment plot contained four patch types: pre-settlement tree groups, unthinned postsettlement trees (“postsettlement retained”), thinned postsettlement trees (“postsettlement removed”), and remnant grass openings (Figure 3). Presettlement tree patches consisted of groups of two or more large trees (mostly > 30 cm) that established prior to 1876. Postsettlement retained patches consisted of a group of small-diameter (< 30 cm) trees that established after 1876. Postsettlement removed patches consisted of an area where most or all postsettlement trees were thinned and removed from the site, thereby creating an opening. Remnant grass patches were located within open areas between patch-es of trees.
Pretreatment data were collected in 1992. In 1993, thinning resulted in the removal of 2226 trees ha-1. All pre-settlement trees and trees > 40.6 cm diameter at breast height were retained. In addition, 5-15 smaller diameter trees were retained in each plot to replace stumps, snags, and downed logs and recreate the group pattern of the presettlement for-est (Covington and others 1997, Edminster and Olsen 1996, White 1985). Pine basal area was reduced by 45% in the postsettlement retained patches and by 95% in the postsettle-ment removed patches. The first prescribed burn occurred in October 1994 and subsequent burns occurred in October
Figure 1. Annual precipitation from 1992-2004 as percent departure from the long-term (51 yr) average. Annual totals included the 12 months of precipitation before vegetation sampling (previous September through August). Dark symbols indicate years in which vegetation was sampled (1992-2004). From Moore and others (2006).
1
23
45
6Figure 2. Repeat photographs of a thinning treatment photo
point (photo point 302) in the GPNA in 1992, prior to treatment (top photo), in 1998, 5 years after thinning (middle photo), and in 2004, 11 years after thinning (bottom photo). The arrows highlight the same tree (approx. 15 cm at dbh) in each photo. All photos were taken in early autumn (September to early October). Note the difference in herbaceous standing crop between 1998, an average year in precipitation, and 2004, which was > 40% below normal. Photo credits: Ecological Restoration Institute, Northern Arizona University. From Moore and others (2006).

USDA Forest Service RMRS-P-55. 2008. 211
1998, 2002, and 2006. See Covington and others (1997) and subsequent publications listed in Appendix I for more de-tailed accounts of experimental design, data collections and analyses.
Results and Discussion
Stand Structure
Age data were used to document 1876 forest structure (the year of the last major fire), to monitor treatment effects on old-tree persistence, and to test methods of reconstructing past forest conditions (Mast and others 1999). The oldest liv-ing tree in 1992 had a center date of 1554 but the oldest tree that was alive in 1876 had a center date of 1333 (Figures 4, 5).
Approximately 20% of the trees were ≥ 200 yr old in 1876 with ages ranging to 540 yr. If dead trees had not been included in the reconstruction, the distribution would have
Figure 3. Example photos of each patch type used in this study: (a) presettlement, (b) postsettlement retained, (c) remnant grass, and (d) postsettlement removed. Plot centers for smaller subplots are located between black buckets. Photo credits: Ecological Restoration Institute, Northern Arizona University. From Laughlin and others (2006).
been biased toward younger trees and a 40% shorter age range. The presettlement age distribution was multimodal with broad peaks of establishment. Although fire disturbance regimes and climatic conditions varied over the centuries be-fore 1876, a clear relationship between these variations and tree establishment was not observed. Due to fire exclusion, reduced grass competition, and favorable climatic events, high levels of regeneration in the 20th century raised forest density from 60 trees ha-1 in 1876 to 3000 trees ha-1 in 1992. This ecological restoration experiment conserved all living presettlement trees and reduced the density of young trees to near presettlement levels.
Effect of Treatments on Old-Growth Trees
The old, presettlement trees responded to thinning in the first year with greater water uptake, stomatal conductance, net photosynthetic rate, and leaf nitrogen concentration,

212 USDA Forest Service RMRS-P-55. 2008.
Figure 4. Reconstructed 1876 age structure of the sampled 4.5-ha ponderosa pine stand at the G.A. Pearson Natural Area (GPNA), Arizona. Dates are midpoints of 10-year age classes. Center dates of 203 trees are shown. The smoothed reconstructed Palmer Drought Stress Index GP-41 (Cook and others 1996) and a standardized tree-ring width index for the GPNA (AZ521.CRN [Graybill 1987]) are shown for comparison with the presettlement tree establishment dates. All the indices are dimensionless. From Mast and others (1999).
Figure 5. Age structure in 1992 after 116 yr of fire exclusion. The graph is a composite of dated trees of presettlement origin and a subsample of dated trees of postsettlement origin. From Mast and others (1999).

USDA Forest Service RMRS-P-55. 2008. 213
and these physiological changes persisted through at least the seventh post-treatment year (Feeney and others 1998, Stone and others 1999, Wallin and others 2004). Thinning consistently increased bole basal area increment starting in the second post-treatment year and for the next 10 years, ex-cept in the severe drought of 2002 (Figure 6, Kolb and others 2007). Thinning also reduced crown dieback over the first 10 post-treatment years (Kolb and others 2007). Resin flow de-fense against bark beetles was consistently stimulated by the composite treatment only (Feeney and others 1998, Wallin and others 2004). Two cycles of burning in the composite treatment reduced leaf nitrogen concentration compared with the thin alone treatment (Wallin and others 2004), but growth was similar for trees in both treatments in most post- treatment years (Kolb and others 2007).
Effects of Treatments and Patch Type on Herbaceous Plants
Total herbaceous standing crop, measured between 1994 and 2004, was significantly higher on the treated areas than on the control over the entire post-treatment period, but did not differ between the two treatments (Moore and others 2006). In general, the graminoid standing crop responded within several years after the initial treatments and contin-ued to increase through time, until a series of severe droughts reduced standing crop to pretreatment levels (Figure 7). C3 graminoids (primarily bottlebrush squirreltail, Elymus elymoides) dominated the standing-crop response. C4 grami-noids, such as mountain muhly (Muhlenbergia montana) had a minimal response to restoration treatments, possibly
because this species was less abundant before the experiment began or adversely affected by autumn burning. Legumes and forbs exhibited a 4–5 year lag response to treatment. Patch type had a greater influence on the herbaceous stand-ing crop than treatment effect (Figure 8, Laughlin and others 2006), and differed by functional group and species. Species richness and composition differed among patch types prior to treatment, and there was a long lag time (11 and 5 yrs, re-spectively) before any treatment differences were significant (Laughlin and others 2008).
Effects of Treatments on Ecosystem Processes
During the first two years following treatments, total net primary production (npp) was similar among control and restored (treated) plots because a 30-50% decrease in pine fo-liage and fine-root production in restored plots was balanced by greater wood, coarse root, and herbaceous production (Figure 9, Kaye and others 2005). Elemental flux rates (C, N, and P) in control plots generally declined more in a drought year than rates in restored plots (Kaye and others 2005). Net N mineralization and nitrification rates generally were higher in restored compared to control plots (Kaye and others 2005), and were also typically higher in grass patches than under pine trees (Kaye and Hart 1998a). Estimates of N and P loss via leaching were low and similar among treatments (Kaye and others 1999). During this initial response period, soil CO2 efflux (a measure of below-ground biological activity) was similar among treatments during a near-average precipitation year, but was higher in restored plots during a dry year (Kaye
Figure 6. Basal area increment of old ponderosa pine at the GPNA in northern Arizona was stimulated by thinning treatments and increment was similar for trees in thinned alone and thinned plus prescribed burned treatments. The vertical line shows the year of treatment. The P values are from repeated measures MANOVA for the post-treatment years. * indicates significant (P<0.05) differences among treatments in ANOVA by year. Another MANOVA showed no difference in increment among trees in different treatments for the 10 pretreatment years (1984-1993). Error bars are one standard error of the mean. From Kolb and others (2007).

214 USDA Forest Service RMRS-P-55. 2008.
Figure 7. Total herbaceous standing crop (mean + SD) in three treatments between 1992 and 2004. Data from 1992 represent pretreatment data. Lowercase letters indicate significant differences among treatments within years. The arrow denotes the extreme drought year (2002) and vertical lines denote prescribed burn years. From Moore and others (2006).
Figure 8. Total herbaceous standing crop (mean +1 SD) among patch types from 1992 to 2004. Pairwise comparisons of patches within years are reported for each year. From Laughlin and others (2006).
and Hart 1998b). A similar interaction between water avail-ability and treatment responses on soil CO2 efflux was found seven years after the initial treatments were implemented (Boyle and others 2005). Seven years post-treatment, soil enzyme activities were higher in the composite restoration plots than the other treatments (moist periods only), and the community-level physiological capacities of soil microor-ganisms in composite restoration plots (dry period only) also differed from the other treatments (Boyle and others 2005). Surface soil temperature in the composite restoration plots during the growing season has consistently been 1-5 °C high-er than in the control plots, with the thinning restoration plots
intermediate. In contrast, surface soil water content generally showed the opposite pattern, with soil water content higher in control plots (Boyle and others 2005).
Simulation modeling with the ecological process model FIRESUM showed that repeated surface fire was predicted to maintain the open forest structure of the composite treatment. In contrast, the thin-only treatment was forecast to return to high forest densities similar to those of the control within a century. These simulation results suggest restoration of dis-turbance process, as well as characteristic forest structure, are both important for sustaining the function of these forests (Covington and others 2001).

USDA Forest Service RMRS-P-55. 2008. 215
Summary
The “presettlement model” restoration approach quickly returned tree structure to what it was in pre-Euro American settlement times through thinning postsettlement trees. Low-intensity surface fires were also re-introduced every four years. Surprisingly, few differences were found between the thinned and composite (thinned and burned) treatments, al-though the treated plots did differ from the untreated control. Old-growth tree growth, herbaceous standing crop, net N mineralization and nitrification rates were higher in treated compared to control plots. Subtle but important variables such as resin flow defense against bark beetles and soil en-zyme activities were higher in the composite treatment. Patch type had a greater influence than the treatment on specific variables such as herbaceous standing crop. A major role of fire in maintaining ecosystem function is as a manager of vegetation structure rather than as a direct mineralizer of nu-trients “tied-up” in detritus (Hart and others 2005). Thinning and composite treatments both do a good job “returning” ecosystem function but repeated fire maintains the structure while thinning alone will eventually allow the ecosystem to return to its pretreatment state. Inter-annual variability in cli-mate plays a key role in how the ecosystem responds to any treatment.
Figure 9. Total net primary production (NPP) in untreated control, thinning restoration, and composite restoration treatments. Bars depict means +1 SE (n = 5 plots). There were no significant differences among treatments in aboveground NPP (ANPP), belowground NPP (BNPP), or total NPP for individual years or repeated-measures ANOVA (P > 0.10). From Kaye and others (2005).
Acknowledgments
We thank Carl Fiedler and Jason Kaye for reviewing an earlier version of this paper. We also thank the staff and stu-dents of the Ecological Restoration Institute (ERI) at Northern Arizona University (NAU) for collecting data, processing samples, and maintaining the database for the G.A. Pearson Natural Area experimental treatments. Particular thanks go to J. Bakker, J. Barber, M. Behnke, S. Boyle, C. Casey, D. Chapman, R. Cobb, S. Curran, M. Daniels, S. Feeney, D. Guido, B. Housely, J. Kaye, B. Kerns, L. Labate, D. Laughlin, M. Luce, L. Machina, J. Roccaforte, K. Skov, J. Springer, M. Stoddard, J. Stone, J. Thomas, and K. Wallin. A special thanks to the USDA Forest Service Rocky Mountain Research Station, especially C. Edminster, for helping establish the ex-periment, and to the Coconino National Forest for assistance with prescribed burns. Funding was provided by a National Science Foundation grant (DEB-9322706), McIntire-Stennis appropriations to the NAU School of Forestry, and additional funding from the Ecological Restoration Institute. Funding for remeasurement and analysis in 2004 was provided by the USDA Forest Service (#03-22 DG-11031600-088).
References Cited
Avery, C. C.; Larson, F. R.; Schubert, G. H. 1976. Fifty-year records of virgin stand development in southwestern ponderosa pine. USDA Forest Service, General Technical Report RM-22. 71 p.
Boyle, S. I.; Hart, S. C.; Kaye, J. P.; Waldrop, M. P. 2005. Restoration and canopy type influence soil microflora in a ponderosa pine forest. Soil Science Society of America Journal. 69:1627-1638.
Cook, E. R.; Meko, D. M.; Stahle, D. W.; Cleaveland, M. K. 1996. Tree-ring reconstructions of past drought across the conterminous United States: tests of a regression method and calibration/verification results. Pp. 155-170 in J. S. Dean, D. M. Meko, and T. W. Swetnam, editors. Tree rings, environment, and humanity: Proceedings International Conf. Radiocarbon, Dept. of Geosciences, Univ. of Arizona, Tucson, AZ.
Cooper, C. F. 1960. Changes in vegetation, structure, and growth of southwestern pine forests since white settlement. Ecology. 42:493-499.
Covington, W. W.; Moore, M. M. 1994. Southwestern ponderosa forest structure: changes since Euro-American settlement. Journal of Forestry. 92:39-47.
Covington, W. W.; Fulé, P. Z.; Moore, M. M.; Hart, S. C.; Kolb, T. E.; Mast, J. N.; Sackett, S. S.; Wagner, M. R. 1997. Restoring ecosystem health in ponderosa pine forests of the Southwest. Journal of Forestry. 95:23-29.
Covington, W. W.; Fulé, P. Z.; Hart, S. C.; Weaver, R. P. 2001. Modeling ecological restoration effects on ponderosa pine forest structure. Restoration Ecology. 9:421-431.
Dieterich, J. H. 1980. Chimney Spring forest fire history. USDA Forest Service Research Paper RM-220.

216 USDA Forest Service RMRS-P-55. 2008.
Edminster, C. B.; Olsen, W. K. 1996. Thinning as a tool in restoring and maintaining diverse structure in stands of southwestern ponderosa pine. Pages 62-68 in USDA Forest Service General Technical Report RM-GTR-278.
Feeney, S. R.; Kolb, T. E.; Wagner, M. R.; Covington, W. W. 1998. Influence of thinning and burning restoration treatments on presettlement ponderosa pines at the Gus Pearson Natural Area. Canadian Journal of Forestry Research. 28:1295-1306.
Graybill, D. A. 1987. Unpublished tree-ring chronologies AZ521 and AZ547. Archived at the National Geophysical Data Center, World Data Center-A for Paleoclimatology, Boulder, Colorado, USA.
Hart, S. C.; DeLuca, T. H.; Newman, G. S.; MacKenzie, M. D.; Boyle, S. I. 2005. Post-fire vegetative dynamics as drivers of microbial community structure and function in forest soils. Forest Ecology and Management. 220:166-184.
Kaye, J. P.; Hart, S. C. 1998a. Ecological restoration alters nitrogen transformations in a ponderosa pine-bunchgrass ecosystem. Ecological Applications. 8:1052-1060.
Kaye, J. P.; Hart, S. C. 1998b. Restoration and canopy type effects on soil respiration in a ponderosa pine-bunchgrass ecosystem. Soil Science Society of America Journal. 62:1062-1072.
Kaye, J. P.; Hart, S. C.; Cobb, R. C.; Stone, J. E. 1999. Water and nutrient outflow following the ecological restoration of a ponderosa pine forest. Restoration Ecology. 7:252-261.
Kaye, J. P.; Hart, S. C; Fulé, P. Z.; Covington, W. W.; Moore, M. M.; Kaye, M. W. 2005. Initial carbon, nitrogen, and phosphorus fluxes following ponderosa pine restoration treatments. Ecological Applications. 15:1581-1593.
Kerns, B. K.; Moore, M. M.; Timpson, M. E.; Hart, S. C. 2003. Soil properties associated with vegetation patches in a Pinus ponderosa-bunchgrass mosaic. Western North American Naturalist. 63:452-462.
Kolb, T. E.; Agee, J. K.; Fulé, P. Z.; McDowell, N. G.; Pearson, K.; Sala, A.; Waring, R. H. 2007. Perpetuating old ponderosa pine. Forest Ecology and Management. 249:141-157.
Laughlin, D. C.; Bakker, J. D.; Daniels, M. L; Moore, M. M.; Casey, C. A.; Springer, J. D. 2008. Restoring plant species diversity and community composition in a ponderosa pine bunchgrass ecosystem. Plant Ecology. 197:139-151.
Laughlin, D. C.; Moore, M. M.; Bakker, J. D.; Casey, C. A.; Springer, J. D.; Fulé, P. Z.; Covington, W. W. 2006. Assessing targets for the restoration of herbaceous vegetation in ponderosa pine forests. Restoration Ecology. 14:548-560.
Mast, J. N.; Fulé, P. Z.; Moore, M. M.; Covington, W. W.; Waltz, A. E. M. 1999. Restoration of presettlement age structure of an Arizona ponderosa pine forest. Ecological Applications. 9:228-239.
Moore, M. M.; Casey, C. A.; Bakker, J. D.; Springer, J. D.; Fulé, P. Z.; Covington, W. W.; Laughlin, D. C. 2006. Herbaceous response to restoration treatments in a ponderosa pine forest, 1992-2004. Rangeland Ecology and Management. 59:135-144.
Pearson, G. A. 1950. Management of ponderosa pine in the Southwest. USDA Forest Service, Monograph No. 6.
Stone, J. E.; Kolb, T. E.; Covington, W. W. 1999. Effects of restoration thinning on presettlement Pinus ponderosa in northern Arizona. Restoration Ecology. 7:172-182.
Wallin, K. F.; Kolb, T. E.; Skov, K. R.; Wagner, M. R. 2004. Seven-year results of the influence of thinning and burning restoration treatments on presettlement ponderosa pines at the Gus Pearson Natural Area. Restoration Ecology. 12:239-247.
White, A. S. 1985. Presettlement regeneration patterns in a southwestern ponderosa pine stand. Ecology. 66:589-594.

USDA Forest Service RMRS-P-55. 2008. 217
This appendix contains all research publications and grad-uate student theses and dissertations from the G. A. Pearson Natural Area (GPNA) restoration experimental site from fall 1992 through spring 2008.
Articles and Proceedings:
Bailey, J. D.; Covington, W. W. 2002. Evaluating ponderosa pine regeneration rates following ecological restoration treatments in northern Arizona, USA. Forest Ecology and Management. 155:271-278.
Boyle, S. I.; Hart, S. C.; Kaye, J. P.; Waldrop, M. P. 2005. Restoration and canopy type influence soil microflora in a ponderosa pine forest. Soil Science Society of America Journal. 69:1627-1638.
Covington, W. W.; Fulé, P. Z.; Moore, M. M.; Hart, S. C.; Kolb, T. E.; Mast, J. N.; Sackett, S. S.; Wagner, M. R. 1997. Restoring ecosystem health in ponderosa pine forests of the Southwest. Journal of Forestry. 95:23-29.
Covington, W. W.; Fulé, P. Z.; Hart, S. C.; Weaver, R. P. 2001. Modeling ecological restoration effects on ponderosa pine forest structure. Restoration Ecology. 9:421-431.
Edminster, C. B.; Olsen, W. K. 1996. Thinning as a tool in restoring and maintaining diverse structure in stands of southwestern ponderosa pine. Pages 62-68 in USDA Forest Service General Technical Report RM-GTR-278.
Feeney, S. R.; Kolb, T. E.; Wagner, M. R.; Covington, W. W. 1998. Influence of thinning and burning restoration treatments on presettlement ponderosa pines at the Gus Pearson Natural Area. Canadian Journal of Forestry Research. 28:1295–1306.
Fulé, P. Z.; Covington, W. W. 1995. Changes in fire regimes and stand structures of unharvested Petran and Madrean pine forests. Pages 408-415 in DeBano, L. F., and others (technical coordinators), Biodiversity and Management of the Madrean Archipelago: the Sky Islands of Southwestern United States and Northwestern Mexico. September 19-23, 1994, Tucson, AZ. USDA Forest Service General Technical report RM-GTR-264.
Kaye, J. P.; Hart, S. C. 1998a. Ecological restoration alters nitrogen transformations in a ponderosa pine-bunchgrass ecosystem. Ecological Applications. 8:1052-1060.
Kaye, J. P.; Hart, S. C. 1998b. Restoration and canopy type effects on soil respiration in a ponderosa pine-bunchgrass ecosystem. Soil Science Society of America Journal. 62:1062-1072.
Kaye, J. P.; Hart, S. C.; Cobb, R. C.; Stone, J. E. 1999. Water and nutrient outflow following the ecological restoration of a ponderosa pine forest. Restoration Ecology. 7:252-261.
Kaye, J. P.; Hart, S. C.; Fulé, P. Z.; Covington, W. W.; Moore, M. M.; Kaye, M. W. 2005. Initial carbon, nitrogen, and phosphorus fluxes following ponderosa pine restoration treatments. Ecological Applications. 15:1581–1593.
Kerns, B. K. 2001. Diagnostic phytoliths for a ponderosa pine-bunchgrass community near Flagstaff, Arizona. Southwestern Naturalist. 46:282-294.
Kolb, T. E.; Agee, J. K.; Fulé, P. Z.; McDowell, N. G.; Pearson, K.; Sala, A.; Waring, R. H. 2007. Perpetuating old ponderosa pine. Forest Ecology and Management. 249:141-157.
Appendix I______________________________________________
Kolb, T. E.; Fulé, P. Z.; Wagner, M. R.; Covington, W. W. 2001. Six-year changes in mortality and crown condition of old-growth ponderosa pines in different ecological restoration treatments at the G.A. Pearson Natural Area. In: Vance, R. K., Edminster, C. B., Covington, W. W., Blake, J. A. (Compilers), Ponderosa Pine Ecosystems Restoration and Conservation: Steps Towards Stewardship, Conference Proceedings. United States Department of Agriculture Forest Service Proceedings RMRS-P-22. Ogden, UT, pp. 61-66.
Laughlin, D. C.; Bakker, J. D.; Daniels, M. L; Moore, M. M.; Casey, C. A.; Springer, J. D. 2008. Restoring plant species diversity and community composition in a ponderosa pine bunchgrass ecosystem. Plant Ecology. 197:139-151.
Laughlin, D. C.; Moore, M. M.; Bakker, J. D.; Casey, C. A.; Springer, J. D.; Fulé, P. Z.; Covington, W. W. 2006. Assessing targets for the restoration of herbaceous vegetation in ponderosa pine forests. Restoration Ecology. 14:548-560.
Mast, J. N.; Fulé, P. Z.; Moore, M. M.; Covington, W. W.; Waltz, A. E. M. 1999. Restoration of presettlement age structure of an Arizona ponderosa pine forest. Ecological Applications 9:228-239.
Moore, M. M.; Casey, C. A.; Bakker, J. D.; Springer, J. D.; Fulé, P. Z.; Covington, W. W.; Laughlin, D. C. 2006. Herbaceous response to restoration treatments in a ponderosa pine forest, 1992-2004. Rangeland Ecology and Management. 59:135-144.
Savage, M.; Brown, P. M.; Feddema, J. 1996. The role of climate in a pine forest regeneration pulse in the southwestern United States. Ecoscience. 3:310-318.
Stone, J. E.; Kolb, T. E.; Covington, W. W. 1999. Effects of restoration thinning on presettlement Pinus ponderosa in northern Arizona. Restoration Ecology. 7:172–182.
Wallin, K. F.; Kolb, T. E.; Skov, K. R.; Wagner, M. R. 2004. Seven-year results of the influence of thinning and burning restoration treatments on presettlement ponderosa pines at the Gus Pearson Natural Area. Restoration Ecology. 12:239–247.
Theses and Dissertations:
Boyle, S. I. 2002. Impact of ecological restoration on soil microbial communities in Pinus ponderosa ecosystems in northern Arizona. M.S. Thesis, Northern Arizona University, Flagstaff, AZ.
Casey, C. A. 2004. Herbaceous biomass and species composition responses to ponderosa pine restoration treatments. M.S. Thesis, Northern Arizona University, Flagstaff, AZ.
Feeney, S. R. 1997. Old-growth ponderosa pine physiology, growth, and insect resistance mechanisms following thinning and burning restoration treatments. M.S. Thesis, Northern Arizona University, Flagstaff, AZ.
Kaye, J. P. 1997. Effects of succession and ecological restoration on the biogeochemistry of a ponderosa pine-bunchgrass ecosystem. M.S. Thesis, Northern Arizona University, Flagstaff, AZ.
Kerns, B. K. 1999. Phytolith assemblages and soil characteristics from a southwestern ponderosa pine-bunchgrass community. Dissertation, Northern Arizona University, Flagstaff, AZ.

218 USDA Forest Service RMRS-P-55. 2008.
Laughlin, D. C. In preparation. Functional consequences of long-term vegetation changes in ponderosa pine-bunchgrass ecosystems. Dissertation, Northern Arizona University, Flagstaff, AZ.
Machina, L. M. In revision. Lupinus argenteus and Blepharoneuron tricholepis growth and reproduction increases with ponderosa pine restoration. M. S. Thesis, Northern Arizona University, Flagstaff, AZ.
Stone, J. E. 1997. Thinning effects on northern Arizona presettlement ponderosa pine growth, water relations, photosynthesis, and foliar nutrients. M. S. Thesis, Northern Arizona University, Flagstaff, AZ.
The content of this paper reflects the views of the author(s), who are responsible for the facts and accuracy of the information presented herein.

USDA Forest Service RMRS-P-55. 2008. 219
In: Olberding, Susan D., and Moore, Margaret M., tech coords. 2008. Fort Valley Experimental Forest—A Century of Research 1908-2008. Proceedings RMRS-P-55. Fort Collins, CO: U.S. Department of Agriculture, Forest Service, Rocky Mountain Research Station. 282 p.
Introduction
Prior to European settlement of the Mogollon Rim, pon-derosa pine forests consisted of open stands of uneven-aged trees with a significant grassy understory (Sackett 1979). Grass biomass reduction from intensive sheep and cattle grazing in the late 19th century, a large ponderosa pine (Pinus ponderosa) regeneration pulse in the early 20th cen-tury, and then forest fire suppression during much of the 20th century resulted in the development of dense, overstocked stands. Forest floor fuels most likely were less than 4 Mg/ha prior to 1870 but have since increased ten to one hun-dred fold (Sackett 1979, Sackett and others 1996). Annual accumulations now are in the range of 1.3 to 7.8 Mg/ha/yr. Tree densities that were once <130 stems/ha have increased to more than 2,750 stems/ha in the densest stands (Covington and Sackett 1986, Sackett 1980).
Fires can greatly alter nutrient cycles of forest ecosystems depending on fire severity, fire frequency, vegetation, and cli-mate (Neary and others 1996). Responses of total carbon (C) and nitrogen (N) are variable and depend on the site conditions and fire characteristics (DeBano and others 1998). Sackett (1980) established a set of studies near Flagstaff, Arizona
Total Carbon and Nitrogen in Mineral Soil After 26 Years of Prescribed Fire: Long Valley and Fort Valley Experimental Forests
Daniel G. Neary, USFS, Rocky Mountain Research Station, Flagstaff, AZ; Sally M. Haase, USFS, Pacific Southwest Research Station, Riverside, CA; and Steven T. Overby, USFS, Rocky Mountain Research Station, Flagstaff, AZ
Abstract—Prescribed fire was introduced to high density ponderosa pine stands at Fort Valley and Long Valley Experimental Forests in 1976. This paper reports on mineral soil total carbon (C) and nitrogen (N) at Long Valley. Total soil C and N levels were highly variable and exhibited an increasing, but inconsistent, concentration trend related to burn interval. Total N ranged from 0.1 to 0.45%. Randomly collected soil sample C ranged from 2.2 to 5.7%, but stratified sampling indicated a greater total C range from 1.7 to 11.5%. Random sampling allows scaling up to stand and landscape level but stratified sampling does not. The latter provides an index of C and N variability due to stand conditions (old growth, pole-sized stands, and ponderosa pine thickets), clearings devoid of trees, or heavy woody debris accumulations.
(Chimney Spring, Fort Valley Experimental Forest (EF), and Limestone Flats, Long Valley EF), to restore overstocked pon-derosa pine stands by introducing prescribed fire at 1-, 2-, 4-, 6-, 8-, and 10-year intervals. Covington and Sackett (1986) previ-ously examined N concentrations in the upper 5 cm of mineral soil at the Chimney Spring burning interval study. They found that mineral forms of N (NH4-N and nitrate nitrogen, NO3-N) made up <2% of the total N pool. Burning at 1- and 2-year intervals significantly increased only NH4-N levels in the soil. Total soil N in the upper 5 cm was not affected by prescribed fire interval. A later study (Wright and Hart 1997) assessed the effects of the two-year burning interval at the Chimney Spring site. Neary and others (2002, 2003) reported on the initial analysis of C and N levels in both Chimney Springs and Limestone Flats soils.
The purpose of the study reported here was to determine the levels of total N and C in the upper 5 cm of the mineral soil at the Chimney Spring and Limestone Flats research sites 16 years after the Covington and Sackett (1986) study. Another objective of this study was to determine if additional sampling might be necessary to determine if soil C and N were related to burning frequency. The focus of this paper is on the general results from both sites with a special focus on Limestone Flats results.

220 USDA Forest Service RMRS-P-55. 2008.
Methods
Study Sites
The original study sites established in 1976 and 1977 were designed to determine the optimum burning interval neces-sary to provide continuous fire hazard reduction. The studies are described in greater detail by Sackett (1980), Covington and Sackett (1986), and Sackett and others (1996). Twenty-one 1.0-ha plots make up each study site. There are three replications of unburned, 1-, 2-, 4-, 6-, 8-, and 10-year pre-scribed fire treatments.
Chimney Spring
The Chimney Spring study is located in the Fort Valley Experimental Forest, Rocky Mountain Research Station, Coconino National Forest about 3 km northwest of Flagstaff, Arizona. Soils are stony clay loam textured fine smectitic, frigid, Typic Argiborolls derived from basalt and cinders. Stand structure and fuels were described by Sackett (1980).
Limestone Flats
The Limestone Flats study is located in the Long Valley Experimental Forest, Rocky Mountain Research Station, Coconino National Forest, about 2 km northwest of Clint’s Well, Arizona. Soils are very fine sandy loam textured, fine smectitic Typic Cryoboralfs. These soils developed from weathered sandstone with limestone inclusions. Sackett (1980) described the original stand structure and fuels, and prior land management.
Sampling
The soils at both the Chimney Spring and Limestone Flats sites were first sampled in late December 2002. The initial sampling location was located randomly within the center 400 m2 of each plot. The next two samples were located 5 km from the first sample, selected by a randomization process, on two of the cardinal directions from the first sample. About 0.5 kg was collected from the 0-5 cm depth of the mineral soil. The samples were air dried in the laboratory, sieved to < 2 mm, then sub-sampled and ground to pass a 100 mesh sieve (0.149 mm), and sub-sampled again for analysis. Sub samples were oven dried further at about 30o C.
The second sampling of Limestone Flats occurred in 2004. Ten random soil samples were collected using a Cartesian Coordinate System. This system is based on randomly se-lected grid coordinates, referenced to the plot center (Burt and Barber 1996). Bearings and distances are calculated from the plot center to locate the sampling points on the virtual grid system. For the systematic sampling, three replicate soil samples spaced 1 m from a sampling center were collected from the center of representative old growth areas, pole-size stands, dense thickets, clearings, and coarse woody de-bris piles. Samples were processed the same as in the 2003 sampling.
Analytical
Soil total C and N were analyzed on a Thermo-Quest Flash EA1112 C-N analyzer. The computer-controlled instrument
Table 1. Studentized Tukey’s test for C and N by treatment, Limestone Flats and Chimney Springs, Arizona, burning interval restoration studies, 2002 sampling.
Burning Interval Tukey’s Test Element (years) Mean (%) (p = 0.05) Samples - n
Carbon 0 3.035 A 18 1 3.282 AB 18 2 3.432 AB 18 4 4.294 AB 18 6 3.942 AB 18 8 5.634 B 18 10 4.472 AB 18 Nitrogen 0 0.200 A 18 1 0.199 AB 18 2 0.227 AB 18 4 0.298 AB 18 6 0.228 AB 18 8 0.352 B 18 10 0.281 AB 18

USDA Forest Service RMRS-P-55. 2008. 221
oxidizes samples at 1,200o C, and determines C and N con-tent by thermal conductivity following separation by a gas chromatographic column measuring CO2 and NO. Quality controls were analyzed along with replicate samples every 10th sample, then regresses using a calibration curve devel-oped from known standards and blanks.
Statistical Analysis
Data were analyzed using the SAS univariate ANOVA un-der the GLM Procedure (SAS 2000). The Station statistician determined that the ANOVA was robust enough to be useful without data transformation (R.M. King, personal communi-cation). Tukey’s Studentized Range test was used for means separation of C and N values (p = 0.05).
Results
2002 Sampling
Soil total C and total N are strongly correlated (Neary and others 2002, 2003). Organic matter in the soil is a major source of N, and organic and cation exchange sites adsorb the mineral forms of N.
Total C levels in the Limestone Flats and Chimney Spring mineral soil (0-15 cm) in the 2002 sampling exhibited two trends (Figure 1; Neary and others 2002, 2003). The first is that soil C was higher in the Chimney Spring volcanic soils. Soil classification explains part of the difference between the C in the Limestone Flats and Chimney Spring soils. The latter were classified as Argiborolls belonging to the Mollisol soil order, indicating that they have naturally higher organic mat-ter contents than the Cryoboralfs (Alfisol soil order) found at Limestone Flats. The second trend in the soil C data ap-peared to be one of increasing amounts up to burn interval 8 years, which would indicate the influence of the fire. The
Fig. 1
EFFECT OF FIRE INTERVAL ON SOIL NITROGEN
0.00
0.05
0.10
0.15
0.20
0.25
0.30
0.35
0.40
0.45
0 1 2 4 6 8 10
FIRE INTERVAL - YEARS
PE
RC
EN
T N
ITR
OG
EN
LF Limestone/Sandstone Soils CS Basalt Soils
Figure 1. Effect of prescribed fire interval on soil total nitrogen, Limestone Flats (LF) and Chimney Springs (CS) burning interval study, 2002, Coconino National Forest, Arizona (Neary and others 2003).
C concentration in the soil increased from 3.04% in the con-trol (no burning) to 5.63% in the 8-year interval (Table 1). However, only the control and 8-year interval were statisti-cally different. These data reflect more of the variability in soil C detected in the 2002 random sampling approach than any burning interval trend.
Total N levels followed the same trends as total soil C. Total N concentrations were mostly higher across the range of burning intervals. Concentrations increased from an av-erage of 0.20% in the unburned control plots to 0.35% in the 8-year burn interval. The data from the 2002 sampling (Neary and others 2003) did not support Wright and Hart’s (1997) hypothesis that burning at 2-year intervals can have detrimental long-term effects on N cycling, along with deple-tion of the forest floor and surface mineral soil C and N pools.
The lack of a burning interval response in this study was most likely affected by site variability and the random sam-pling used. The 1-year burning interval plot samples for total C at Limestone Flats ranged from 2.22% to 4.79%, a span of 2.57%. The unburned control samples had a range from 1.43% to 3.95%, a very similar span of 2.52%. The 8-year burning interval plots at Chimney Spring had the highest variability. Soil total C ranged from 2.25% to 12.24%, a span of 9.99%. The unburned control plot samples at Chimney Spring had a range from 1.78% to 6.66%, a span (4.88%) nearly double that of the Limestone Flats control. A full discussion of within plot variability, found to be greater at Chimney Springs than at Limestone Flats, can be found in Neary and others (2003).
2003 Sampling
The random soil sampling in 2003 using a larger number of samples and a Cartesian Coordinate sampling design de-tected a similar pattern to the mineral soil N measured in the 2002 sampling (Figure 2). Soil total N increased from 0.13% in the 1-year burns to a peak of 0.25% in the 8-year burns. Concentrations in the 2003 sampling at the Long Valley

222 USDA Forest Service RMRS-P-55. 2008.
Limestone Flats site were lower than in 2002. The largest dif-ference between the 2003 and 2002 samplings was that the range in total N was less (0.13 to 0.25%) and the unburned sites had higher levels of soil total N, more similar to the 8-year burning interval than the 1-year interval.
The degree of variability in soil total N (hence soil total C) can be seen in the data comparing random samples to site-specific samples (Figure 3). Soil total N ranged from 0.10% in unburned clearings to 0.43% next to piles of decomposing woody debris. This 4-fold range is twice the range of val-ues between burning intervals (0.13 to 0.25%). This situation complicates interpretation of the sampling data relative to the question of the impact of prescribed fire on soil C and N.
DiscussionThe total C and N variability observed from the random
samples at the Chimney Spring and Limestone Flats sites was probably influenced by a number of factors. It was evident
during the 2002 sampling that there were visually evident differences in the levels of litter accumulations and OM concentrations in the mineral soil under these three differ-ent stand types. The 2003 sampling that compared random to site-specific sampling verified that there is a larger range in variability of soil C and N due to site than due to burning interval. Areas with high amounts of organic matter, such as woody debris piles, old-growth tree bases, and pine thick-ets, have higher amounts of soil C and N. Whereas clearings with lower amounts of organic matter accumulations, are much lower in C and N concentrations. The range of soil C and N based on site is twice that based on burning interval. This makes it difficult to accept or disprove the hypothesis of Wright and Hart (1997) that the most frequent burning inter-val could deplete soil N and C pools.
Another factor that was identified in the 2002 sampling (Neary and others 2003) as potentially important is the pres-ence of “hot spots” where dead and decaying logs were at some point in time completely combusted by the prescribed fires. These logs would create zones of high fire severity that would burn much of the soil OM and drive off most of the surface mineral soil N (DeBano and others 1998). Another possibility is that the soil could be high in black C, increas-ing the total soil content (Wardle and others 2008). The 2003 sampling was not able to identify these areas across the range of burning intervals so “hot spots” were not considered in the analysis. Flagging and marking these locations in subsequent burns could allow this type of analysis in the future.
Summary and Conclusions
The effects of restoration of burning intervals in pon-derosa pine stands on total C and N concentrations in the A horizon of two different soil types at Fort Valley and Long Valley Experimental Forests was examined. The burning in-tervals (0-, 1-, 2-, 4-, 6-, 8-, and 10-years) were provided by
SOIL N (0- 5cm), PONDEROSA PINE, LIMESTONE
FLATS BURNING INTERVAL, RANDOM SAMPLES
0
0.05
0.1
0.15
0.2
0.25
0.3
0 1 2 4 6 8 10
BURNING INTERVAL - YEARS
NIT
RO
GE
N -
%
LIMESTONE FLATS NITROGEN CONTROL
0.000
0.050
0.100
0.150
0.200
0.250
0.300
0.350
0.400
0.450
0.500
RA OG PS TK CL CW
NIT
RO
GE
N -
%
Figure 3. Variability in soil total N.
Figure 2. Effect of prescribed fire burning intervals (1, 2, 4, 6, 8, and 10 years; 0 is the control) on surface soil total nitrogen measured in random samples, Limestone Flats, Coconino National Forest, Arizona, 2004.

USDA Forest Service RMRS-P-55. 2008. 223
a study established in 1976 and 1977, and have been main-tained thereafter (Sackett 1980, Sackett and others 1996). Although there were statistically significant differences de-tected in 2002 between the total C and N levels in soils of the unburned plots and the 8-year burning interval, there were no differences between burning intervals. Although the 2003 sampling measured higher levels of soil total C and N, site variability makes it difficult to assess these results in light of Wright and Hart’s (1997) conclusion that the most frequent burning interval could deplete soil N and C pools. Systematic sampling using the Cartesian Coordinate system allowed for relatively rapid sampling, but did not encompass the high variability in C and N shown by the results of the stratified sampling. Additional work is needed at greater level of de-tail to adequately address the differences between Wright and Hart (1997) and this paper produced by the considerable variability in C and N. Stratification is needed to begin to un-derstand the dynamics of C and N differences in these stands. This also points out the difficulty in assessing the actual C and N content of forest soils in any C accounting or trading system.
References
Covington, W.W.; Sackett, S.S. 1986. Effect of burning on soil nitrogen concentrations in ponderosa pine. Soil Science Society of America Journal. 50: 452-457.
DeBano, L.F.; Neary, D.G.; Ffolliott, P.F. 1998. Fire’s Effects on Ecosystems. John Wiley & Sons, Inc., New York, NY. 333 p.
Neary, D.G.; Overby, S.T.; Gottfried, G.J.; Perry, H.M. 1996. Nutrients in fire-dominated ecosystems. Gen. Tech. Rep.
RM-289. Fort Collins, CO: U.S. Department of Agriculture, Forest Service, Rocky Mountain Forest and Range Experiment Station. p. 107-117
Neary, D.G.; Klopatek, C.C.; DeBano, L.F.; Ffolliott, P.F. 1999. Fire effects on belowground sustainability: a review and synthesis. Forest Ecology and Management. 122: 51-71.
Neary, D.G.; Overby, S.T.; Haase, S.M. 2003. Effects of fire interval restoration on carbon and nitrogen in sedimentary- and volcanic-derived soils of the Mogollon Rim, Arizona. Colorado State University Symposium on Fire and Fuels, Fort Collins, CO, April 2002.
Neary, E.L.; Neary, D.G.; Overby, S.T.; Haase, S.M. 2002. Prescribed fire impacts on soil carbon and nitrogen. Water Resources in Arizona and the Southwest. 32: 95-102.
Sackett, S.S. 1979. Natural fuel loadings in ponderosa pine and mixed conifer forests of the Southwest. Res. Pap. RM-213. Fort Collins, CO: U.S. Department of Agriculture, Forest Service, Rocky Mountain Forest and Range Experiment Station. 10 p.
Sackett, S.S. 1980. Reducing natural ponderosa pine fuels using prescribed fire: Two case studies. Res. Pap. RM-392. Fort Collins, CO: U.S. Department of Agriculture, Forest Service, Rocky Mountain Forest and Range Experiment Station. 6 p.
Sackett, S.S.; Haase, S.M.; Harrington, M.G. 1996. Lessons learned from fire use restoring southwestern ponderosa pine ecosystems. Gen. Tech. Rep. RM-278. Fort Collins, CO: U.S. Department of Agriculture, Forest Service, Rocky Mountain Forest and Range Experiment Station. p. 54-61. SAS 2000. GLM Procedure, SAS Institute, Cary, NC. Version 8.1
Wardle, D.A.; Nilsson, Marie-Charlotte; Zackrisson. 2008. Fire-derived charcoal causes loss of forest humus. Science. 320: 629.
Wright, R.J.; Hart, S.C. 1997. Nitrogen and phosphorus status in a ponderosa pine forest after 20 years of interval burning. Ecoscience. 4: 526-533.
The content of this paper reflects the views of the author(s), who are responsible for the facts and accuracy of the information presented herein.

224 USDA Forest Service RMRS-P-55. 2008.
In: Olberding, Susan D., and Moore, Margaret M., tech coords. 2008. Fort Valley Experimental Forest—A Century of Research 1908-2008. Proceedings RMRS-P-55. Fort Collins, CO: U.S. Department of Agriculture, Forest Service, Rocky Mountain Research Station. 282 p.
FVEF and the Coconino National Forest
Ranger Training Camps
“An all-important thing here is building a Service-spirit of morale and esprit de corps.” (G.A. Pearson, 1941 Ranger Training camp.)
District 3 held its initial ranger training camp in 1909 at Fort Valley. Newly hired forest rangers received instruction on how to do their jobs and also heard about the purpose of re-search projects initiated by Fort Valley scientists. The camps lasted two weeks and much camaraderie was established be-tween the rangers and scientists (Figure 2). A camp-closing baseball game between the Arizona and New Mexico rang-ers included two rules: players were not to carry firearms or wear spurs when running the bases. Ranger camps continued
A Century of Cooperation: The Fort Valley Experimental Forest and the Coconino National Forest in Flagstaff
Susan D. Olberding, USFS, Rocky Mountain Research Station, Flagstaff, AZ; Karen Malis-Clark and Peter J. Pilles, Jr., USFS, Coconino National Forest, Flagstaff, AZ; and Dennis Lund, USFS (ret.), Ecological Restoration Institute, NAU, Flagstaff, AZ
Abstract—This poster presents the continuing cooperative relationship between the Fort Valley Experimental Forest (FVEF), Coconino National Forest (CNF), USFS Region 3, and the long-term partnerships with the Museum of the Northern Arizona and the NAU School of Forestry.
Fort Valley was initially named the Coconino Experiment Station and funds were channeled through Region (then District) 3 and the CNF. CNF Ranger William Wilson assisted G.A. Pearson that first winter at Fort Valley. Since Fort Valley’s establishment as an experimental area, Forest Service Research has worked in conjunction with the National Forest System to sustain the magnificent ponderosa pine forest. Scientists study the forest and range ecosys-tems on the National Forests and make recommendations to ensure the natural resources are protected in perpetuity (Figure 1). Some of the permanent sample plots implemented in 1912 are still used for research and urgently need protection from other National Forest ac-tivities. A proposal to list the permanent sample plots on National Forests in Region 3 on the National Register of Historic Places is a step that will safeguard the research sites. Both Fort Valley and the Coconino celebrate centennials in 2008. Also included are the connections of Fort Valley scientists to the Museum of Northern Arizona and Arizona State College, now Northern Arizona University (NAU).
usually annually until the 1940s with the start of World War II (Figure 3). They have been held sporadically since. District 3 constructed three buildings at FVEF in 1927 to serve the ranger camps: a schoolhouse (still extant), and a dorm and mess hall (moved offsite in the 1970s).
Little Leroux Springs Nursery
A forest nursery nursery began near Little Leroux Springs in 1935, managed by Roland Rotty. National Forest phi-losophy placed emphasis on transplanting seedlings into the Forest (Figure 4) and offered the trees to residents. The wa-ters of Little Leroux Springs became USFS property in the 1930s and an underground pipeline carried water from the Springs to FVEF headquarters. FVEF personnel, equipment, and headquarters buildings were used for this project. In the 1980s, Rocky Mountain Research Station, CNF, and the NAU School of Forestry collaborated to plant an arboretum at the site.

USDA Forest Service RMRS-P-55. 2008. 225
Figure 1. Page 1 of a document between the FVEF and the Coconino National Forest that sets aside lands around the Fort Valley Experimental Forest headquarters.
Permanent Sample Plots
District 3’s Investigative Studies Committee, of which G.A. Pearson was a member, planned and implemented re-search projects around the southwestern National Forests in the early years. The Committee determined research proj-ects based on budget and most immediate needs. An early project around District 3 National Forests established per-manent sample plots to intensely study life cycles in the forest. The plots vary in size and research scope and are monitored over long periods. As time passed and person-nel changed, the importance of maintaining the long-term
records on these plots diminished. In the 1990s, NAU School of Forestry professor Margaret M. Moore began remea-surement of these plots to document changes over the past century. Fire management specialists from the Coconino National Forest have assisted with prescribed fire projects at the G.A. Pearson Natural Area and on other plots. Today, NAU, CNF, and RMRS are working to list these plots on both the general Forest maps and the National Register of Historic Places so that the plots are known to Forest plan-ners, who will then ensure the areas are not impacted by logging or other uses. This project has already occurred on some plots on the Kaibab National Forest.

226 USDA Forest Service RMRS-P-55. 2008.
Figure 2. News article from the Coconino Sun of September 3, 1909 announcing the Coconino Ranger School.
Arizona State College (ASC), School of Forestry
Earle H. Clapp, once of District 3 and later of the Washington, DC, office, expanded on Raphael Zon’s idea to locate experiment stations near urban universities so that stu-dents could actively be involved in projects on a long-term basis. In Flagstaff, Forester Charles O. (Chuck) Minor be-gan the School of Forestry at ASC (now Northern Arizona University (NAU) that enabled Zon’s vision to transpire. FVEF-based personnel participated by lecturing, offering laboratory opportunities to students, and serving on graduate committees.
Commencement of the ASC Forestry program coincided with the fiftieth anniversary of FVEF and activities celebrated both events with more emphasis on the on-campus research center and less on the historic FVEF headquarters. The com-bined office and lab was located next to the ASC Forestry building, then housed in Frier Hall (Figure 5). Studies in-cluded silviculture, forest utilization, range management, watershed, surveying, and economics. Research and Forestry professionals team-taught a multi-resource forest manage-ment curriculum.
The USFS Rocky Mountain Research Stations (RMRS) and the School of Forestry moved into the Southwest Forest Science Complex constructed on NAU’s south campus in 1992 (Figure 6). RMRS Station (the administrator for FVEF) consolidated its research programs into this new building and closed other labs and offices around Arizona. Professionals, graduate students, and undergraduates now share offices and labs in one structure. Also housed in the Southwest Forest Science Complex is the Ecological Research Institute (ERI), which has projects on the FVEF. Nearby is a 20,000 square foot greenhouse used for plant propagation, cold hardiness, and other research.
The Forest Service and the University plan cooperatively to offer students forestry related courses. Several graduate papers included in these proceedings have evolved from NAU students utilizing historic FVEF archival material and comparing it to today’s landscape.
Museum of Northern Arizona (MNA)
MNA co-founder Harold S. Colton and neighbor FVEF Director G. A. Pearson formed a lifetime friendship, as they were both scientists intensely curious about the natural en-vironment of northern Arizona. The two well-respected men became champions for the other’s institution. Pearson served on the MNA Board of Directors for several decades until his permanent move to Tucson. Subsequent USFS research sci-entists would fill this seat after Pearson’s retirement. Colton persuaded the U.S. Department of Agriculture in the 1930s to keep FVEF open when operating funds were scarce. Four

USDA Forest Service RMRS-P-55. 2008. 227
Figure 3. The Ranger training camp at Fort Valley Experimental Forest. USFS photo 90925 by A.G. Varela, 1910.
Figure 4. “Clipper” fanning mill for cleaning tree seed before planting at the Little Leroux Springs nursery. Photo taken at FVEF by Roland Rotty in May 1937. USFS photo 345054.
Figure 5. A 1967 winter scene at the Forestry Science Lab on the NAU campus. USFS photo by G.H. Schubert.

228 USDA Forest Service RMRS-P-55. 2008.
decades later, Colton’s successor, Edward B. (Ned) Danson, repeated the request when another proposal to dismantle FVEF was planned.
The Museum of Northern Arizona honored FVEF’s 50th anniversary with an exhibit on the sites’ history, and Colton attended the banquet held during the weekend festivities. Program highlights included talks by ex-FVEF scientists Emanuel Fritz and Bert Lexen and a tour of research sites.
FVEF personnel have contributed articles to MNA’s pub-lications and loaned equipment. MNA named its meeting hall after G.A. Pearson and houses FVEF collections (Figure 7).
Other Collaborations
Between 1971 and 1982, the Agricultural Research Service (ARS) managed a “poppy lab” at FVEF, to study ge-netics of opium production and provide targets to calibrate remote sensors to recognize poppy fields.
The U.S. Geological Survey (USGS) rented FVEF build-ings from the 1970s through the early 1990s and established a paleomagnetics laboratory, the story of which is featured in a poster paper.
Figure 6. Current USFS Rocky Mountain Research Station headquarters on the NAU campus. USFS photo by Wade Hubbard.
Figure 7. Pearson Hall on the Museum of Northern Arizona campus, Flagstaff, AZ. Photo by S.D. Olberding.

USDA Forest Service RMRS-P-55. 2008. 229
Acknowledgments
The authors thank Joan Brundige Baker and David R. Patton for their helpful suggestions to this poster paper.
References
Arizona State College Bulletin.1958. Forestry. Bull. 40(4).Museum of Northern Arizona Archives, Flagstaff, AZ.U.S.D.A. Forest Service, Region 3. Forest Pioneer.U.S.D.A. Forest Service, Rocky Mountain Forest and Range
Experiment Station; Northern Arizona University School of Forestry. 1992. Flagstaff, AZ: The Southwest Forest Science Complex.
The content of this paper reflects the views of the author(s), who are responsible for the facts and accuracy of the information presented herein.

230 USDA Forest Service RMRS-P-55. 2008.
In: Olberding, Susan D., and Moore, Margaret M., tech coords. 2008. Fort Valley Experimental Forest—A Century of Research 1908-2008. Proceedings RMRS-P-55. Fort Collins, CO: U.S. Department of Agriculture, Forest Service, Rocky Mountain Research Station. 282 p.
Introduction
In 1913, Fort Valley Experimental Forest (FVEF) initiated an experiment to determine the effects of different timber har-vesting methods on regeneration and growth of a ponderosa pine (Pinus ponderosa Laws. scopulorum Engelm.)–Gambel oak (Quercus gambelii Nutt.) site in northern Arizona (Krauch 1916, 1937, Pearson 1923). We investigated how three of these harvesting methods influenced tree density and size over a 93-year period. We had four questions: (1) What was stand density like immediately before the 1913 timber harvest? (2) How were stand density and mean tree size af-fected by each harvest method? (3) How have stand density and mean tree size changed over the long-term, as observed in 2003-2006? (4) How did livestock grazing influence con-temporary stand density?
Methods
Study Site and Plot Description
This study was conducted on a 162-ha (400-ac) site lo-cated 21 km south of Flagstaff, Arizona, on the Coconino National Forest (Figure 1); latitude 35°0.91’ N, longi-tude 111°36.26’ W. Ponderosa pine and Gambel oak are
93 Years of Stand Density and Land-Use Legacy Research at the Coulter Ranch Study Site
Andrew J. Sánchez Meador, USFS, Forest Management Service Center, Fort Collins, CO; and Margaret M. Moore, School of Forestry, Northern Arizona University, Flagstaff, AZ
Abstract—In 1913, the Fort Valley Experimental Forest initiated an unprecedented case-study experiment to determine the effects of harvesting methods on tree regeneration and growth on a ponderosa pine-Gambel oak forest at Coulter Ranch in northern Arizona. The harvest-ing methods examined were seed-tree, group selection, and light selection. In addition, the effects of livestock grazing (excluded or not) were examined. We revisited the Coulter Ranch Study Site to examine the effects of these treatments on historical (1913) and contemporary (2003-2006) stand density and tree size. The key finding was that while initial 1913 harvests reduced average pine density by one- to two-thirds, tree densities increased from three to nine times those prior to harvest over the 93-year period. The greatest increase was in the seed-tree method.
the dominant trees, with scattered New Mexican locust (Robinia neomexicana Gray) thickets and single alligator junipers (Juniperus deppeana Steud.) occurring throughout the study area. The site (Figure 2) was established in 1913 as part of the FVEF by Hermann Krauch (Forest Examiner) and C. F. Korstian (Silviculturist), who initially divided the site into four harvesting systems: Scattered Seed-tree (61 ha or ~151 ac), Group selection (56 ha or ~138 ac), Light selection (45 ha or ~111 ac; originally called “Shelterwood” but later changed as the prescription was altered; essentially the same as the group selection except more mature trees were left), and the Wagner border method (not examined in this study). Their goals were to examine the effects of har-vesting, grazing, and slash disposal methods on advanced regeneration, new seedling establishment, and residual tree growth (Krauch 1916, 1933, 1937, Lexen 1939, Pearson 1923, 1944, 1950).
Twenty-one permanent, stem-mapped plots were es-tablished; seven per harvesting system. In this study, we examined nine plots (Table 1), ranging in size from 0.8 to 1.9 ha. We selected the largest plots, and also made sure that one plot per harvesting system had been excluded from grazing. Plots are identified using the original FVEF naming system (Figure 2), which used a combination of letters and numbers representing the silvicultural unit (S5, Coulter Ranch), the harvesting system or method (Group selection = 1, Seed-tree = 2, or Light selection = 3) and individual permanent plot designations (A, B, ..., G).

USDA Forest Service RMRS-P-55. 2008. 231
Field Measurements
Historical (1913) and contemporary (2003-2006) field methods for measuring these plots are detailed by Moore and others (2004). Contemporary species identity and di-ameter at breast height (DBH; 1.37 m aboveground) data for all live and dead (stumps, snags, logs) trees were ob-tained in the 2003-2006 field seasons. Historical (1913) individual tree data were obtained from the plot ledgers lo-cated at the USFS RMRS Fort Valley Experimental Forest Archives (Flagstaff, AZ). All analyses focus on trees ≥ 9.14 cm (3.6 inch) DBH.
Analyses
To quantify how stand density changed in the short-term (immediately following harvesting in 1913) and over the long-term (2003-2006; 93 years later), we examined chang-es in the mean number of trees per hectare and basal area (m2 ha-1) by tree species by harvest method. In addition, we were interested in how the stand density may have looked in the absence of timber harvesting in 1913, so we obtained an estimate of tree density and basal area in the absence of harvesting by adding the number and size of older cut stumps to the living tree data of 1913. Reconstruction model assump-tions and details regarding the methods used to determine how the stand density may have looked in the absence of timber harvesting and the number of oak present at the time
Figure 1. Location of the Coulter Ranch Study Site on the Coconino National Forest in northern Arizona.
of harvest are found in Sánchez Meador (2006) and Sánchez Meador and others (2008).
To summarize, we examined the following three stand structural scenarios on each plot: (1) ‘1913 unharvested’ (stand density as if harvesting had not occurred in 1913); (2) ‘1913 harvested’ (actual 1913 stand density); and (3) ‘contemporary’ (actual 2003-2006 stand density) for each harvest method.
ResultsWhile the 1913 harvest reduced average pine density (for
trees ≥ 9.14 cm DBH) by one- to two-thirds (Figure 3), tree densities at the end of the 93-year period were three (Light selection) to nine (Seed-tree) times higher than those ob-served prior to harvest. Reconstructed (1913) tree density was highest on S5C1 (164 trees ha-1) and was lowest on S5E2 (75 trees ha-1). Similar trends were observed for mean basal area (e.g., Figures 3 and 4) and DBH (not shown), which prior to harvest were 19.0 m2 ha-1 (s = 4.5) and 38.3 cm (s = 7.5), respectively. Contemporary mean basal area and DBH for all plots (regardless of grazing history) had in-creased to 34.2 m2 ha-1 (s = 12.4) and decreased to 21.0 cm (s = 5.1), respectively. Contemporary (2003-2006) tree den-sity was highest on S5B2 (1492 trees ha-1), lowest on S5D3 (317 trees ha-1) (e.g., Figure 5), and found to be higher on plots where livestock grazing was excluded, regardless of harvesting method.

232 USDA Forest Service RMRS-P-55. 2008.
Figure 2. Original site map created by C.F. Korstian in 1913. This map shows several features including the harvesting treatment, repeat photography stations, topography, skid trails, and permanent sample plots (called “reproduction plots”). The nine plots remeasured for this study are shaded (dark grey).

USDA Forest Service RMRS-P-55. 2008. 233
Table 1. Plot descriptions and management histories for nine historical permanent plots established in 1913 at Coulter Ranch, Coconino National Forest (Arizona).
Plot Size (ha) Elevation (m) TEUa Livestock Excluded?b Harvesting System
S5A2 1.2 2300 585 N Seed-treeS5B2 1.2 2272 585 Y Seed-treeS5E2 1.0 2239 582/585 Y Seed-treeS5B1 1.9 2260 585/586 Y Group selectionS5C1 1.2 2272 585 N Group selectionS5G1 0.8 2267 585 N Group selectionS5B3 1.2 2255 582/585 Y Light selectionS5D3 0.8 2262 585 N Light selectionS5F3 0.8 2255 585 N Light selection
a Terrestrial Ecosystem Unit (Miller and others 1994). The corresponding soil orders are: 582 = Typic Argiborolls and Mollic Eutroboralfs; 585 = Lithic Eutroboralfs; 586 = Mollic Eutroboralfs and Lithic Eutroboralfs.
b Sites excluded from livestock grazing by fencing in 1919.
Figure 3. Historical (a) and Contemporary (b) tree density (tree ha-1) for ponderosa pine and reconstructed Gambel oak trees ( ≥ 9.14 cm DBH) on plots at the Coulter Ranch Study Site. Historical densities include trees that were reconstructed because they were either harvested prior to (Harvested Pine* - light grey) or not measured at the time of plot establishment (Live Oak* - dark grey).

234 USDA Forest Service RMRS-P-55. 2008.
Figure 4. Historical (a) and Contemporary (b) stand basal area (m2 ha-1) for ponderosa pine and reconstructed Gambel oak trees (≥ 9.14 cm DBH) on plots at the Coulter Ranch Study Site. Historical stand basal area includes trees that were reconstructed because they were either harvested prior to (Harvested Pine* - light grey) or not measured at the time of plot establishment (Live Oak* - dark grey).
Figure 5. 1913 (left) and 2006 (right) photographs taken on S5B3 (Light selection System). The circles indicate the plot corner in each photo. Note the even-aged recruitment in foreground near plot corner, general increases in tree density, the complete decomposition of logging slash, and increased numbers of small trees throughout. The 1913 photo was taken by H. Krauch (USFS photo 17011A), and the 2006 photo by A.J. Sánchez Meador.

USDA Forest Service RMRS-P-55. 2008. 235
Discussion and Conclusions
Overall, both pine and oak densities increased with each harvesting system, but the seed-tree had the largest increase and the light selection had the least. Previous research on these sites showed that pine recruitment, over the past 93 years, occurred commonly in interspaces or canopy gap (e.g., Figure 6) and away from older, live trees or residual tree patches (Sánchez Meador and others 2008).
The tree density differences observed in the harvest methods are not surprising, though there are few long-term studies that quantify these differences. The Seed-tree method essentially removed the overstory, leaving only a few wide-ly spaced trees to provide for uniformly distributed seed. Drastically opening the tree canopy, and increased distur-bance to the forest floor by the harvest itself, likely increased the sites for ponderosa pine seedlings to establish. The Light group selection method, on the other hand, harvested mature and older pines, either isolated or in groups.
These overall increases in tree density are consistent with the structural changes in ponderosa pine ecosystems re-ported throughout Arizona (Fulé and others 1997, Mast and others 1999, Moore and others 2004). Contemporary stand conditions (increased density and smaller trees) most likely resulted from numerous pulses of pine establishment in the early 1900s (Savage and others 1996, Sánchez Meador and
others 2008) following heavy livestock grazing and intensive harvesting (e.g., seed-tree or clearcut systems). Intense graz-ing provided favorable seedbeds for seedling establishment, similar to those created historically by fire or more recently by harvesting, and when combined with fire exclusion would allow an unusually high density of trees to become estab-lished and persist (Bakker and Moore 2007, Cooper 1960, Mast and others 1999, White 1985).
Although we found differences in tree densities among the harvest treatments in 1913 and 2003-2006, and also dif-ferences due to livestock grazing, we must interpret these results with caution. Our ability to draw causal inferences is limited by the lack of treatment replication, which is a com-mon problem in assessing change using retrospective studies (Carpenter 1990) and with case studies in general. In addition, we also note that the 1913 reconstructed data (unharvested scenario) do not represent presettlement reference conditions (Kaufmann and others 1994, Fulé and others 1997, Moore and others 1999). The 1913 unharvested scenarios embod-ies some 30+ years of fire exclusion and intense livestock grazing.
Despite the cautions and limitations, historical permanent plot data can provide unique opportunities to quantify tem-poral and spatial changes in forest structure, and to determine the impacts of past land-use (harvesting, livestock grazing, fire exclusion), natural disturbances, and climate.
Figure 6. 1913 (left) and 2006 (right) photographs taken on S5B2 (Seed-tree system). The circles indicate the plot corner in each photo. Note the increased numbers of small trees in 2006, the presence of ladder fuels, the complete decomposition of logging slash, and loss of herbaceous plants in the understory. The 1913 photo was taken by H. Krauch (USFS photo 16976A), and the 2006 photo by A.J. Sánchez Meador.

236 USDA Forest Service RMRS-P-55. 2008.
Acknowledgments
We thank David Huffman and Jon Bakker for reviewing earlier versions of this paper. Contemporary measurements were supported by USFS Rocky Mountain Research Station (RMRS) Joint Venture Agreement 28-JV7-939 and USDA Cooperative State Research, Education and Extension Service grant 2003-35101-12919. Additional funding was provided by McIntire-Stennis appropriations to the School of Forestry and grants from the Ecological Restoration Institute (ERI) at Northern Arizona University. We are grateful to nu-merous people from the ERI who provided field, laboratory, data entry assistance, and logistical support. We thank the USFS RMRS and Coconino National Forest for permission to sample their lands. We also thank Susan Olberding, ar-chivist and historian, RMRS Fort Valley Experimental Forest Archives, Flagstaff, AZ, who helped us locate historical maps and ledger data. Finally, we are indebted to Hermann Krauch, and C. F. Korstian who exhibited experimental foresight a full decade prior to popular adoption.
References
Bakker, J. D.; Moore, M. M. 2007. Controls on vegetation structure in southwestern ponderosa pine forests, 1941 and 2004. Ecology. 88: 2305-2319.
Carpenter, S. R. 1990. Large-scale perturbations: opportunities for innovation. Ecology. 71: 2038-2043.
Cooper, C. F. 1960. Changes in vegetation, structure, and growth of southwestern pine forests since white settlement. Ecological Monographs. 30: 129-164.
Fulé, P. Z.; Covington, W. W.; Moore, M. M. 1997. Determining reference conditions for ecosystem management of southwestern ponderosa pine forests. Ecological Applications. 7: 895-908.
Kaufmann, M. R.; Graham, R. T.; Boyce, D. A., Jr.; Moir, W. H.; Perry, L.; Reynolds, R. T.; Bassett, R. L.; Mehlhop, P.; Edminster, C. B.; Block, W. M.; Corn, P. S. 1994. An ecological basis for ecosystem management. Gen. Tech. Rep. RM-246. Fort Collins, CO: USDA Forest Service, Rocky Mountain Forest and Range Experiment Station. 22 p.
Krauch, H. 1916. Report on Project Mc-2-D-3 “Different methods of cutting,” Coconino National Forest. Unpub. Pap. on file at Flagstaff, AZ: U.S. Department of Agriculture, Forest Service, Rocky Mountain Research Station, Fort Valley Experimental Forest archives.
Krauch, H. 1933. Increment and mortality in cutover stands of ponderosa pine as based on records of permanent sample plots. Report. Washington, DC: United States Government Printing Office. 13 p.
Krauch, H. 1937. Growth and yield of cut-over stands of ponderosa pine in Arizona under different methods of cutting. Journal of Forestry. 35: 1134-1147.
Lexen, B. R. 1939. Growth following partial cutting in ponderosa pine. Journal of Forestry. 37: 943-946.
Mast, J. N.; Fulé, P. Z.; Moore, M. M.; Covington, W. W.; Waltz, A. E. M. 1999. Restoration of presettlement age structure of an Arizona ponderosa pine forest. Ecological Applications. 9: 228-239.
Miller, G.; Ambos, N.; Boness, P.; Reyher, D.; Robertson, G.; Scalzone, K.; Steinke, R.; Subirge, T. 1994. Terrestrial ecosystems survey of the Coconino National Forest. Albuquerque, NM: U.S. Department of Agriculture, Forest Service, Southwestern Region.
Moore, M. M.; Covington, W. W.; Fulé, P. Z. 1999. Reference conditions and ecological restoration: A southwestern ponderosa pine perspective. Ecological Applications. 9: 1266-1277.
Moore, M. M.; Huffman, D. W.; Fulé, P. Z.; Covington, W. W.; Crouse, J. E. 2004. Comparison of historical and contemporary forest structure and composition on permanent plots in southwestern ponderosa pine forests. Forest Science. 50: 162-176.
Pearson, G. A. 1923. Natural reproduction of western yellow pine in the southwest. Bull. 1105. Washington, DC: U.S. Department of Agriculture. 143 p.
Pearson, G. A. 1944. Cutting cycles in ponderosa pine. Journal of Forestry. 42: 575-585.
Pearson, G. A. 1950. Management of ponderosa pine in the Southwest. USDA Agri. Mono. 6. Washington, DC: United States Government Printing Office. 218 p.
Sánchez Meador, A. J. 2006. Modeling spatial and temporal changes of ponderosa pine forests in northern Arizona since Euro-American settlement. Flagstaff, AZ: Northern Arizona University. 154 p. Ph.D. Dissertation
Sánchez Meador, A. J.; Moore, M. M.; Bakker, J. D.; Parysow, P. F. 2008. 108 years of change in spatial pattern following selective harvest of a ponderosa pine stand in northern Arizona, USA. Journal of Vegetation Science. In press.
Savage, M.; Brown, P. M.; Feddema, J. 1996. The role of climate in a pine forest regeneration pulse in the southwestern United States. EcoScience. 3: 310-318.
White, A. S. 1985. Presettlement regeneration patterns in a southwestern ponderosa pine stand. Ecology. 66: 589-594.
The content of this paper reflects the views of the author(s), who are responsible for the facts and accuracy of the information presented herein.

USDA Forest Service RMRS-P-55. 2008. 237
In: Olberding, Susan D., and Moore, Margaret M., tech coords. 2008. Fort Valley Experimental Forest—A Century of Research 1908-2008. Proceedings RMRS-P-55. Fort Collins, CO: U.S. Department of Agriculture, Forest Service, Rocky Mountain Research Station. 282 p.
Introduction
The following offers a glimpse into the early years of vari-ous Fort Valley Experiment Station (Fort Valley) researchers. This article serves to demonstrate that Fort Valley was a prov-ing ground for research foresters who ultimately had colossal impacts reaching much further than the ponderosa pine forest of northern Arizona. There is a primary focus on the foresters who came to Fort Valley to further develop solid technical foundations for national forest management and how through their careers impacted early American silviculture and for-estry at a national scale (Figure 1).
Gustaf “Gus” Adolph Pearson (1880–1949)
It makes sense to begin with Pearson (Figure 2), a Nebraska farm boy who graduated from the University of Nebraska. Pearson joined the Forest Service in 1907 and began his career studying depleted range conditions on the Wallowa National Forest in Oregon, but transferred to work with the Arizona ponderosa pines by the summer of 1908 and was named the first Fort Valley Director. His entire career re-volved around Fort Valley and southwestern ponderosa pine regeneration. Pearson retired in 1945 and spent the last years of his life compiling his decades of research into a book that became THE manual on ponderosa pine management. He died at his Tucson desk in 1949 while editing this monograph
Fort Valley’s Early Scientists: A Legacy of Distinction
Andrew J. Sánchez Meador, USFS, Forest Management Service Center, Fort Collins, CO; and Susan D. Olberding, USFS, Rocky Mountain Research Station, Flagstaff, AZ
Abstract—When the Riordan brothers of Flagstaff, Arizona, asked Gifford Pinchot to de-termine why there was a deficit in ponderosa pine seedlings, neither party understood the historical significance of what they were setting in motion for the field of forest research. The direct result of that professional favor was the establishment of the Fort Valley Experiment Station (Fort Valley) in 1908, and the insights produced through its research program are remarkable. The scientists that passed through Fort Valley are an accolade that commonly goes unmentioned, and includes extraordinary individuals such as: Gustaf “Gus” Pearson, Emanuel Fritz, Edward C. Crafts, and Ruthford H. Westveld.
that was published posthumously as The Management of Ponderosa Pine in the Southwest1.
He is buried in Flagstaff alongside his wife, May Perkins Pearson. In 1951, a 154-acre ponderosa pine plot near Fort Valley was named the G. A. Pearson Natural Area by the Southwestern Section, Society of American Foresters (SAF), to honor and pay tribute to Pearson’s decades of service in perpetuating the southwestern ponderosa pine forest. The SAF also named Pearson one of the top four silviculturalists of the twentieth century.
Edward C. Crafts (1910–1980)
Crafts was assigned to Fort Valley in 1932 and began work with the range staff who were examining the effects of live-stock browsing on forest vegetation. While at Fort Valley, he was placed in charge of the Civilian Conservation Corps (CCC) camp at Mormon Lake and conducted a large amount of tree thinning in and around Flagstaff. After seven years in the Southwest with about as many job changes and duty sta-tions, he was promoted to Forest Economist and transferred to the California Forest and Range Experiment Station in Berkeley, CA. His long Forest Service career eventually led to him being named as USFS Assistant Chief in 19502, and an appointment by Secretary Udall as head of the Bureau of Outdoor Recreation.
1 Pearson, G. A. 1950. Management of ponderosa pine in the Southwest. Agriculture Monograph 6. Washington, DC, United States Government Printing Office.
2 Crafts E. C.; Schrepfer, S. R. 1972. Edward C. Crafts: Forest Service researcher and congressional liaison—An eye to multiple use. Forest History Society.

238 USDA Forest Service RMRS-P-55. 2008.
Figure 1. Known locations where early Fort Valley Experimental Forest scientists progressed to established research and/or service programs throughout the United States. The locations in black indicate places referenced in this manuscript.
Figure 2. Gustaf “Gus” Adolph Pearson served as the first Fort Valley Director and was instrumental to sending off many durable foresters. USFS photo 193734 by E. S. Shipp in 1924.

USDA Forest Service RMRS-P-55. 2008. 239
Hermann Krauch (1886–1962)
Minnesota-born Hermann Krauch first arrived at Fort Valley in May 1913, where he worked on a Coconino National Forest marking study. Thus began his frequent oc-cupancy of Fort Valley (as a base of operations) over the next three decades. He graduated with a degree in Forestry from the University of Minnesota in 1910 and accepted a summer job with the Kaniksu National Forest in Washington. By April 1914, he was on the Pecos (now the Santa Fe) National Forest in charge of the Gallinas nursery that produced Douglas-fir and Engelmann spruce for transplanting onto burned for-est areas. Krauch also headed the Cloudcroft nursery on the Lincoln National Forest and worked on timber recon-naissance, compiled working plan data, and miscellaneous investigations. He spoke German, wore a hearing aid (as did Pearson and stories are told of shouting matches between the two men), and was known for keeping copious notes.
Charles Knesal Cooperrider (1889–1944)
Charles “Coop” Cooperrider (Figure 3) is little known in today’s world, but a man considered a prophet by legendary Aldo Leopold. “Coop” recognized the relationship between water, land, and people, and how the pace of use would de-plete available natural resources. Cooperrider graduated
from the University of Ohio in 1914 and moved to the arid Southwest to ease his tuberculosis. He joined the Forest Service in 1915 as assistant ranger on the Santa Fe National Forest and immediately recognized the dangers associated with erosion caused by overgrazing cattle. “Coop” would later be assigned to District 3 headquarters in Albuquerque as a range scientist where he studied the effects of grazing. In 1927, when Range Research received appropriation, “Coop” led the southwestern division and created the foundation for watershed studies. He lived between Fort Valley, Tucson, and Sierra Ancha most of the time. Many in the USFS rec-ognized and respected him and often sought his advice on watershed projects. The majority of his career was spent in the Southwest, except for a short time at the Forest Products Laboratory in Wisconsin.
During World War II, Cooperrider was assigned to work in Mexico with the Guayule rubber project. His fragile health worsened while in Mexico and he died in 1944 at 55 years of age. Leopold, who eventually would write Cooperrider’s obituary in the Journal of Wildlife Management3, considered “Coop” a mentor, a friend, and a man ahead of his time with respect to conservation.
Figure 3. Charles Knesal Cooperrider, an outspoken and respected rangeland and watershed scientist, who often publicly disagreed with Pearson and was said to have possessed a “spark of divinity” by Aldo Leopold. USFS photo 307644 by W. J. Cribbs in 1933.
3 Obituary of Charles Knesal Cooperrider, July, Journal of Wildlife Management, republished in Aldo Leopold’s Wilderness (Harrisburg, PA: Stackpole Books 1990). 229.

240 USDA Forest Service RMRS-P-55. 2008.
Emanuel Fritz (1886–1988)
Emanuel Fritz, a Maryland native, graduated from Cornell in mechanical engineering in 1908 and received a Masters in forestry from Yale University in 1914. He joined the U.S. Forest Service in 1915, working first in Montana and then eventually ending up at Fort Valley for about a year. His Recollections of Fort Valley4 article tells of life in the early days that men-tions Pearson’s appreciation of Fritz’ engineering background and knack for dealing with troublesome equipment. He left Fort Valley to serve in World War I, after which he became an Assistant Professor of Forestry at UC-Berkeley. For the following seven decades he was a major figure in California forestry, co-founding the California state forestry program, serving as editor for the Journal of Forestry, and was instru-mental in developing redwood forestry5.
Ruthford Henry Westveld (1900–1985)
Westveld (Figure 4) served at Fort Valley as a forest ex-aminer and went on to work for the USFS in Arizona, New
Figure 4. Ruthford Henry Westveld would go on to become a professor of Silviculture and was the creative and persistent force behind the McIntire-Stennis Act of 1962. Photo by C. M. Linthicum @ 1920. Courtesy of FVEF archives.
Mexico, and Oregon. After two short tenures at Michigan State and the University of Missouri, Westveld joined the faculty of the School of Forestry at the University of Florida in 1938 as Professor of Silviculture. While at Florida, he did pioneering work on the nutritional requirements of southern pines and wrote two widely used texts, Applied Silviculture and Forestry in Farm Management. He then served as Director of the Forestry School at Missouri from 1947-1965. He was the creative and persistent force behind the McIntire-Stennis Act of 1962 that changed the face of forestry research by providing a continuing source of funding.
Clarence F. Korstian (1889–1968)
Like Pearson, Nebraska-born Korstian was educated in forestry at the University of Nebraska, but would go on to receive his doctorate from Yale University. His brief tenure as silviculturist at Fort Valley helped prepare him for his next assignment in 1921 to the newly opened Appalachian Forest Experiment Station in Asheville, NC, where he continued to specialize in silviculture. In 1930, he left the Forest Service and went to work for Duke University in Durham, NC, where he became a professor of forestry and the first director of Duke Forest. He organized the Duke graduate school of for-estry, and became its dean in 1938. He was president of the SAF national council from 1938-1941, and president of the North Carolina Forestry Association from 1943-1947.
4 Fritz, Emanuel. 1964 Recollections of Fort Valley, 1916-1917. Forest History. Vol. 8 (3).
5 J. A. Zivnuska, H. J. Vaux, R. A. Cockrell. 1989. Emanuel Fritz, Forestry: Berkeley. University of California: In Memoriam. http://sunsite.berkeley.edu/uchistory/archives_exhibits/in_memoriam/

USDA Forest Service RMRS-P-55. 2008. 241
Frank Wadsworth (1915– )
Frank Wadsworth began his career at Fort Valley in 1938 by being tasked with the 30-year remeasurement and indi-vidual tree pruning of the Wing Mountain plots, nearby to Fort Valley. While at Fort Valley, Wadsworth participated in many of the weekend social gatherings often put on by May Perkins Pearson, Gus Pearson’s wife. Undoubtedly, it was at one of these functions where Wadsworth met Gus and May’s daughter, Margaret, who was a concert soprano and whom he would later marry. Because of perceived nepotism laws, Wadsworth transferred from Fort Valley and went to the USFS International Institute of Tropical Forestry (IITF) in San Juan, Puerto Rico, where he spent his career as the leader in the preservation of fragile tropical forests and served as the Director of the Institute of Tropical Forestry and Supervisor of the Caribbean National Forest for over 22 years. Wadsworth was instrumental in the formation of Puerto Rico’s Department of Natural Resources and Environment and the island’s Environmental Quality Board, and played major roles in the protection of a Puerto Rican forest, mangroves, and natural resources at Maricao, Arroyo, and Mona Island, respectively. Over the course of his career, he has written over 100 technical papers and co-authored a book about tropical forestry and preservation, Common Trees of Puerto Rico and the Virgin Islands.
Conclusions
There can be no doubt that the time these scientists spent at Fort Valley was significant and their influence has had a profound impact on American Forestry. Much of their legacy is currently housed at the historical archives, located at the Rocky Mountain Research Station in Flagstaff, AZ. Artifacts conserved here, such as personal diaries and photographs, provide fascinating glimpses into the lives of these amazing pioneers of forest science and range management from brief to expansive. Examples include Pearson’s diaries detailing budgetary and logistic matters to Krauch’s diaries including many personal notes, such as what western novels he read (e.g., Zane Grey’s Riders of the Purple Sage) and details on the Forest Service’s new uniforms. While most of these men have passed on, their legacy and dedication to forest science and the field of forestry continue as a testament to the early USFS and the Fort Valley Experimental Forest.
Acknowledgments
We thank Frank Wadsworth, Lynda Sánchez, and Katherine Sánchez Meador for reviewing earlier versions of this paper and for their helpful suggestions and insight. We thank the USFS Rocky Mountain Research Station and the NAU Ecological Restoration Institute. Finally, we are indebt-ed to the scientists and foresters of the first USFS research facility established in this nation.
The content of this paper reflects the views of the author(s), who are responsible for the facts and accuracy of the information presented herein.
242 USDA Forest Service RMRS-P-55. 2008.
In: Olberding, Susan D., and Moore, Margaret M., tech coords. 2008. Fort Valley Experimental Forest—A Century of Research 1908-2008. Proceedings RMRS-P-55. Fort Collins, CO: U.S. Department of Agriculture, Forest Service, Rocky Mountain Research Station. 282 p.
Introduction
In 1976, a long-term prescribed burn study was initiated by the USFS, Rocky Mountain Forest and Range Experiment Station at the Chimney Spring study area on the Fort Valley Experimental Forest. A year later a similar study was be-gun at the Limestone Flats study area on the Long Valley Experimental Forest. These studies were designed to ex-amine the effects of varying burn intervals on several forest characteristics including the abundance and composition of understory vegetation. At these study sites, 1-ha (2.5 acres) plots have been burned at different frequencies ranging from every year to every ten years for the past 30 years using
Vascular Plant Checklist of the Chimney Spring and Limestone Flats Prescribed Burning Study Areas Within Ponderosa Pine Experimental Forests in Northern Arizona
Catherine Scudieri, School of Forestry, Northern Arizona University, Flagstaff, AZ, USFS, Rocky Mountain Research Station, Flagstaff, AZ; James F. Fowler, Carolyn Hull Sieg, USFS, Rocky Mountain Research Station, Flagstaff, AZ; Laura Williams, Department of Biological Sciences, Northern Arizona University, Flagstaff, AZ; and Sally M. Haase, USFS, Pacific Southwest Research Station, Riverside, CA
Abstract—This paper presents a vascular plant species list for two sites that are part of a long-term study exploring the effects of varying fire intervals on forest characteristics includ-ing the abundance and composition of understory vegetation. The Chimney Spring study area is on the Fort Valley Experimental Forest near Flagstaff, AZ, and the Limestone Flats study area is on the Long Valley Experimental Forest, 90 km (56 mi) southeast of Flagstaff. Since 1976 (Chimney Spring) and 1977 (Limestone Flats), three replicates of each of seven burn intervals (1, 2, 4, 6, 8, 10 years, plus unburned) have been maintained by the USFS Pacific Southwest Research Station. Each study area encompasses approximately 40 to 48 ha (99 to 119 acres) of dense ponderosa pine (Pinus ponderosa) forest. Our plant species list was generated through systematic sampling of the understory vegetation in 2006 and 2007 as well as surveys of the entire study areas for additional species. We documented a total of 147 species, with 96 species found at Chimney Spring and 123 species at Limestone Flats. There are eight introduced species on the list, with six introduced species found at Chimney Spring and seven found at Limestone Flats. All of the exotic species we found have been intentionally introduced to North America, either directly or indirectly, and are widespread throughout the United States so their presence at these sites is not surprising. This survey will serve as base-line information for these two sites when examining future floristic changes due to continued research on fuels management and prescribed fire.
low-severity fall burns (Sackett and others 1996). At various intervals throughout the last 30 years, data on the abundance and composition of the understory vegetation has been col-lected as part of these long-term studies.
In 2006 and 2007 we continued the long-term sampling of the understory vegetation using the original sampling proto-cols for both sites augmented with additional sampling and survey methods. We have compiled a vascular plant species list for Chimney Spring and Limestone Flats from a combi-nation of the recent sampling and surveys of the entire study areas in 2006 and 2007. Although this is a long-term study, historical data is not presented here because prior data was not collected at the same scale (entire site) as the data pre-sented in this paper.

USDA Forest Service RMRS-P-55. 2008. 243
Methods
Study Area and History
Both study areas are within the Coconino National Forest in northern Arizona. These sites are dominated by dense stands of an almost exclusive Pinus ponderosa (ponderosa pine) overstory with a bunchgrass understory dominated by Festuca arizonica (Arizona fescue) and Elymus elymoides (squirreltail). Chimney Spring is located approximately 11 km (7 mi) northwest of Flagstaff, Arizona, at an elevation of 2250 m (7380 ft) on basalt soils with an average annu-al precipitation of 56 cm (22 inches) (U.S. Department of Agriculture 1995, Western Regional Climate Center 2007). Limestone Flats is approximately 90 km (56 mi) southeast of Flagstaff at an elevation of 2100 m (6900 ft) on limestone/sandstone soils with an average annual precipitation of 66 cm (26 inches) (U.S. Department of Agriculture 1995, Western Regional Climate Center 2007).
Before 1876, surface fires were common at both sites with mean fire intervals averaging 2.5 years (Swetnam and Baisan 1996). Dendrochronological studies in this region document
that this frequent fire regime was abruptly halted in the late 1800s primarily due to grazing, logging, and fire suppres-sion (Dieterich 1980a, Dieterich 1980b, Fulé and others 1997, Swetnam and Baisan 1996). Neither site has experi-enced wildfire since that time. Livestock have been excluded from the study sites since before the studies began and the sites have never been logged with only a few downed and mistletoe-infested trees removed from the sites (Dieterich 1980b, Sackett 1980, Sutherland and others 1991).
Study Design
The same general study design is used at both Chimney Spring and Limestone Flats. The design includes seven dif-ferent burn intervals: an unburned control and 1, 2, 4, 6, 8, and 10-year burn frequencies. Chimney Spring encompasses approximately 40 ha (99 acres) and Limestone Flats encom-passes approximately 48 ha (119 acres). Each study area is divided into 21 1-ha (2.5 acres) plots, separated by 1-m (3-ft) wide firelines, with each plot randomly assigned one of the seven burn intervals with three replicates of each interval (Figure 1). Beginning in 1976 at Chimney Spring and in 1977
Figure 1. Plot layouts for the Chimney Spring and Limestone Flats study areas. Numbers indicate the assigned burn interval. Chimney Spring is located at 111° 41’ 7.1” W and 35° 16’ 0.4” N. Limestone Flats is located at 111° 19’ 39” W and 34° 33’ 37.9” N.

244 USDA Forest Service RMRS-P-55. 2008.
at Limestone Flats, the plots were burned using low-severity fall burns according to each assigned burn frequency.
The original sampling design for the understory vegeta-tion at Chimney Spring used a total of 200 20- x 50-cm (8- x 20-inches) quadrats spaced at 1-m (3-ft) intervals within four permanent 5- x 26-m (16- x 85-ft) subplots in each plot. At Limestone Flats the original understory sampling design is different from that at Chimney Spring. Five permanent 21-m (70-ft) transects were installed in each plot with six 30- x 60-cm (1- x 2-ft) quadrats per transect spaced at 3-m (10-ft) intervals, for a total of 30 quadrats per plot.
In 2006 and 2007 a list of the understory flora was com-piled at both sites using the above sampling designs. In addition, in 2007, species composition was measured at both sites by systematically searching a 25- x 52-m (82- x 170-ft) subplot within each plot. In addition to the above sampling, both study areas were surveyed in 2006 and 2007 in their entirety for any species not previously found during the sam-pling. We walked the entire study area, for both sites, within the fence line several times throughout the growing season (from early spring to late fall) and collected any additional species that we had not previously observed.
Nomenclature and nativity are based on Flora of North America (Flora of North America Editorial Committee 1993+), Intermountain Flora (Cronquist and others 1972+), and Arizona Flora (Kearney and Peebles 1960) in that or-der of priority. The plant checklist format incorporates the guidelines from Palmer and others (1995). Species were verified at the Rocky Mountain Herbarium at the University of Wyoming in Laramie and at the Deaver Herbarium in Flagstaff, Arizona. We deposited voucher specimens at the USFS herbarium at the Rocky Mountain Research Station in Flagstaff, Arizona. Voucher specimens have been collected for nearly all species from both sites and we hope to complete our collection in 2008.
ResultsThe vascular plant species list was compiled from the sam-
pling and survey methods described above for the Chimney Spring and Limestone Flats study areas (Appendix A). Table 1 provides a floristic summary of the species found at these study areas. We documented a total of 147 species,
with 96 species found at Chimney Spring and 123 species at Limestone Flats. The species list consists of 40 families; 30 at Chimney Spring and 36 at Limestone Flats. There are 24 plant species unique to Chimney Spring and 51 species unique to Limestone Flats. At Chimney Spring, 73 (76 per-cent) species are forbs, 16 (17 percent) graminoids, and 7 (7 percent) woody species. At Limestone Flats the propor-tion of species in each functional group is similar with 93 (75 percent) forbs, 23 (19 percent) graminoids, and 7 (6 per-cent) woody species. Waif species were excluded from this list. There are eight introduced species on the list, with six introduced species found at Chimney Spring and seven found at Limestone Flats. The introduced species range in rate of occurrence from infrequent (difficult to find but found in sev-eral locations) to frequent (easily found in common habitats but not dominant) (Palmer and others 1995). Linaria dalmat-ica occurs frequently, Medicago lupulina, Rumex acetosella, Taraxacum officinale, Tragapogon dubius, and Verbascum thapsus occur occasionally, while Bromus tectorum and Poa pratensis occur infrequently at Chimney Spring and occasionally at Limestone Flats. The list contains three spe-cies that are endemic to northern Arizona: Draba asprella, Hymenoxys jamesii, and Triteleia lemmoniae.
DiscussionA five-year study examining the effects of prescribed burn-
ing on ponderosa pine understory vegetation at sites near both study areas found similar proportions of forb, graminoid, and woody species: 72, 20, and 8 percent respectively (Fowler, data on file). Although that study had greater total species richness (269 vs. 147), it also sampled larger, more diverse habitats, so our survey methods have likely found most of the flora at these sites. We estimate that we have found at least 85 percent of the species at these sites. Short-lived annuals were likely among the under-represented species.
All of the exotic species we found have been intentionally introduced to North America, either directly or indirectly, through seeding programs, as seed contaminants, or in the case of Linaria dalmatica, as an ornamental plant (Dodge and others 2008, Fowler and others 2008, Mack and Erneberg 2002). These introduced species are widespread throughout the United States (the Western U.S. for Linaria dalmatica)
Table 1. Floristic summary of the vascular plant species at the Chimney Spring and Limestone Flats Study Areas for 2006 and 2007.
Species
Group Families Genera Native Exotic Total
Gymnosperm 2 3 5 0 5Monocot 6 25 29 2 31Dicot 32 91 105 6 111Total 40 119 139 8 147

USDA Forest Service RMRS-P-55. 2008. 245
so their presence at these sites is not surprising. Although some of these species occur frequently at these study sites, their overall abundance is still quite low. The low abundance and richness of these exotic species at Chimney Spring and Limestone Flats is consistent with other studies that have examined the effects of low levels of disturbance, such as low-severity fire, on invasive species (Crawford and others 2001, Fowler and others 2008, Griffis and others 2001). We were unable to determine the nativity of Lepidium virginicum to northern Arizona due to conflicting information from au-thoritative sources.
This survey will serve as baseline information for these two sites when examining future floristic changes due to continued research on fuels management and prescribed fire practices in the absence of tree harvesting.
AcknowledgmentsFunding for this project has been provided by the Joint
Fire Sciences Program (06-2-1-36) and the USFS, both the Pacific Southwest and Rocky Mountain Research Stations. We would like to thank David Hammond, Glenn Rink, Michael Harrington, Daniel Laughlin, and Judy Springer for reviewing this paper. We would also like to thank our field crew for all their hard work, especially Bonni Corcoran, Gloria Burke, Anna Arias, Cat Yang, Jenn Watt, Amy Van Gundy, and Justin Bendell.
ReferencesCrawford, Julie A.; Wahren, C.-H.A.; Kyle, S.; Moir, W.H. 2001.
Response of exotic plant species to fires in Pinus ponderosa forests in northern Arizona. Journal of Vegetation Science. 12: 261-268.
Cronquist, Arthur; Holmgren, Arthur H.; Holmgren, Noel H.; Reveal, James L; Holmgren, Patricia K. 1972+. Intermountain Flora: Vascular Plants of the Intermountain West, USA. Vols. 2A, 3A, 3B, 4, & 5. New York: The New York Botanical Garden.
Dieterich, John H. 1980a. Chimney Spring forest fire history. Res. Pap. RM-220. Fort Collins, CO: U.S. Department of Agriculture, Forest Service, Rocky Mountain Forest and Range Experiment Station. 8 p.
Dieterich, John H. 1980b. The composite fire interval: A tool for more accurate interpretation of fire history. In: Stokes, M.A. and Dieterich, J.H. eds. Proceedings of the Fire History Workshop, 1980 October 20-24, Tucson, AZ. Gen. Tech. Rep. RM-81. U.S. Department of Agriculture, Forest Service, Rocky Mountain Forest and Range Experiment Station. pp. 8-14.
Dodge, Rita S.; Fulé, Peter Z.; Sieg, Carolyn H. 2008. Dalmatian Toadflax (Linaria dalmatica) response to wildfire in a southwestern USA forest. Ecoscience. 15(2): 213-22.
Flora of North America Editorial Committee, eds. 1993+. Flora of North America North of Mexico. New York: Oxford University Press. 13+ vols.
Fowler, James F.; Sieg, Carolyn Hull; Dickson, Brett G.; Saab, Victoria. 2008. Exotic plant species diversity: Influence of roads and prescribed fire in Arizona ponderosa pine forests. Rangeland Ecology and Management. 61(3): 284-293.
Fulé, Peter Z.; Covington, W. Wallace, and Moore, Margaret M. 1997. Determining reference conditions for ecosystem management of southwestern ponderosa pine forests. Ecological Applications. 7: 895-908.
Griffis, Kerry L.; Crawford, Julie A.; Wagner, Michael R.; Moir, W.H. 2001. Understory response to management treatments in northern Arizona ponderosa pine forests. Forest Ecology and Management. 146: 239-245.
Kearney, Thomas H.; Peebles, Robert H. 1960. Arizona Flora. 2nd ed. Berkeley: University of California Press. 1085 p.
Mack, Richard N.; Erneberg, Marianne. 2002. The United States naturalized flora: largely the product of deliberate introductions. Annals of the Missouri Botanical Garden. 89: 176-189.
Palmer, Michael W.; Wade, Gary L.; Neal, Paul. 1995. Standards for the writing of floras. BioScience. 45(5): 339-345.
Sackett, Stephen S. 1980. Reducing natural ponderosa pine fuels using prescribed fire: Two case studies. Res. Note RM-392. Fort Collins, CO: U.S. Department of Agriculture, Forest Service, Rocky Mountain Forest and Range Experiment Station. 6 p.
Sackett, Stephen S.; Haase, Sally M.; Harrington, Michael H. 1996. Lessons learned from fire use for restoring southwestern ponderosa pine systems. In: Covington, Wallace; Wagner, Pamela. K., tech. coords. Conference on adaptive ecosystem restoration and management: Restoration of Cordilleran conifer landscapes of North America: 1996 June 6-8; Flagstaff, AZ. Gen. Tech. Rep. RM-278. Fort Collins, CO: U.S. Department of Agriculture, Forest Service, Rocky Mountain Research Station. p. 54-61.
Sutherland, Elaine Kennedy; Covington, W. Wallace; Andariese, Steve. 1991. A model of ponderosa pine growth response to prescribed burning. Forest Ecology and Management. 44(2-4): 161-173.
Swetnam, Thomas W.; Baisan, Christopher H. 1996. Historical fire regime patterns in the southwestern United States since AD 1700. In: C. Allen ed. Fire Effects in Southwestern Forests, Proceedings of the Second La Mesa Fire Symposium, Los Alamos, N.M. 1994 March 29-31. Gen. Tech. Rep. RM-286. Fort Collins, CO: U.S. Department of Agriculture, Forest Service, Rocky Mountain Forest and Range Experiment Station. p.11-32.
U.S. Department of Agriculture. 1995. Terrestrial Ecosystem Survey of the Coconino National Forest. U.S. Department of Agriculture, Forest Service, Southwestern Region.
Western Regional Climate Center. April 30, 2007. Arizona historical climate summaries. <http://www.wrcc.dri.edu/summary/Climsmaz.html>. Accessed March 21, 2008.

246 USDA Forest Service RMRS-P-55. 2008.
The annotational abbreviations used in this checklist are: native (N), exotic (E), uncertain (U), conservation concern (C). The conservation concern comment is based on Flora of North America Editorial Committee (1993+). The site loca-tion abbreviations are as follows: Chimney Spring (CS) and Limestone Flats (LF). The frequency of occurrence ratings follow guidelines set by Palmer and others (1995) and are: abundant, dominant or codominant in one or more common habitats; frequent, easily found in one or more common hab-itats but not dominant in any common habitat; occasional, widely scattered but not difficult to find; infrequent, difficult to find with few individuals or colonies but found in several locations; rare, very difficult to find and limited to one or very few locations or uncommon habitats. These ratings ap-ply specifically to these two study sites and not the larger area. The species noted as Endemic are endemic to northern Arizona.
Apiaceae
Cymopterus lemmonii (J.M. Coult & Rose) Dorn. N, CS frequent, LF frequent
Asclepiadaceae
Asclepias asperula (Decne.) Woodson. Antelope horns, N, LF infrequent
Asteraceae
Achillea millefolium Linnaeus. Common yarrow, N, CS frequent, LF occasional
Ageratina herbacea (A. Gray) R.M. King & H. Robinson. N, LF infrequent
Agoseris parviflora (Nuttall) D. Dietrich. N, CS occasional, LF occasional
Amauriopsis dissecta (A. Gray) Rydberg. N, CS occasional, LF occasional
Antennaria marginata Greene. White-margin pussytoes, N, CS occasional, LF occasional
Antennaria parvifolia Nuttall. Small-leaf pussytoes, N, CS frequent, LF frequent
Antennaria rosulata Rydberg. Kaibab pussytoes, N, CS infrequent, LF infrequent
Artemisia carruthii Alph. Wood ex Carruth. N, CS occasional, LF occasional
Artemisia ludoviciana Nuttall subsp. mexicana (Willdenow) ex Spreagel D.D. Keck. N, CS occasional, LF occasional
Chrysothamnus viscidiflorus (Hooker) Nuttall. N, CS infrequent
Cirsium wheeleri (A. Gray) Petrak. N, CS frequent, LF frequent
Conyza canadensis (Linnaeus) Cronquist. N, LF occasional
Dieteria canescens (Pursh) Nuttall var. canescens. N, CS infrequent
Erigeron divergens Torrey & A. Gray. N, CS frequent, LF frequent
Erigeron flagellaris A. Gray. N, CS occasionalErigeron formosissimus Greene var. viscidus (Rydberg)
Cronquist. N, CS occasional, LF occasionalErigeron speciosus (Lindley) de Candolle. N, LF
occasionalErigeron tracyi Greene. N, LF infrequentHeliomeris multiflora Nuttall var. nevadensis (A. Nelson)
W.F. Yates. N, CS occasional, LF occasionalHeterotheca villosa (Pursh) Shinners var. pedunculata
(Greene) V.L. Harms ex Semple. N, LF frequentHieracium fendleri Schultz-Bipontinus. N, CS
occasional, LF frequentHymenopappus mexicanus A. Gray. N, LF occasionalHymenoxys bigelovii (A. Gray) K.F. Parker. N, CS
occasional, LF occasionalHymenoxys jamesii Bierner. N, LF infrequent,
Endemic, CLaennecia schiedeana (Lessing) G.L. Nesom. N, CS
frequent, LF occasionalPackera multilobata (Torrey & A. Gray) W.A. Weber &
A. Löve. N, CS frequentPackera neomexicana (A. Gray) W.A. Weber & A. Löve
var. neomexicana. N, LF frequentPseudognaphalium macounii (Greene) Kartesz. N, CS
frequent, LF occasionalSenecio actinella Greene. N, CS infrequent, LF
occasionalSenecio eremophilus Richardson var. kingii Greenman.
N, CS infrequentSenecio wootonii Greene. N, CS infrequentSolidago velutina de Candolle subsp. sparsiflora. N, CS
frequent, LF frequentSymphyotrichum falcatum (Lindley) G.L. Nesom var.
commutatum (Torrey & A. Gray) G.L. Nesom. N, CS occasional, LF occasional
Taraxacum officinale F.H. Wiggers. Common dandelion, E, CS occasional, LF occasional
Townsendia exscapa (Richardson) Porter. N, LF infrequent
Tragopogon dubius Scopoli. Yellow salsify, E, CS occasional, LF occasional
Appendix A. Checklist of Vascular Plants of the Chimney Spring and Limestone Flats Study Areas

USDA Forest Service RMRS-P-55. 2008. 247
Berberidaceae
Berberis repens Lindley. N, LF occasional
Boraginaceae
Lithospermum multiflorum Torr. ex A. Gray. N, CS infrequent, LF occasional
Brassicaceae
Boechera fendleri (S. Watson) W.A. Weber. N, CS infrequent
Draba asprella Greene. N, LF frequent, EndemicHesperidanthus linearifolius (A. Gray) Rydb. N, LF
infrequentLepidium virginicum L. var. virginicum. U, LF occasionalNoccaea montana (L.) F.K. Mey. N, LF occasionalPennellia longifolia (Benth.) Rollins. N, CS infrequent,
LF infrequent
Caryophyllaceae
Arenaria lanuginosa (Michaux) Rohrbach var. saxosa (A. Gray) Zarucchi. N, CS occasional, LF occasional
Cerastium nutans var. obtectum Rafinesque. N, LF infrequent
Drymaria leptophylla (Chamisso & Schlechtendal) Fenzl ex Rohrbach var. leptophylla. N, CS occasional, LF infrequent
Silene antirrhina Linnaeus. N, LF infrequentSilene laciniata (A. Gray) C.L. Hitchcock & Maguire
subsp. greggii Cavanilles. N, LF occasional
Chenopodiaceae
Chenopodium berlandieri Moquin-Tandon. N, CS infrequent
Chenopodium fremontii S. Watson. N, CS infrequent, LF infrequent
Dysphania graveolens (Willdenow) Mosyakin. N, CS frequent, LF occasional
Commelinaceae
Commelina dianthifolia Delile. N, LF occasionalTradescantia pinetorum Greene. N, LF infrequent
Convolvulaceae
Ipomoea plummerae Gray. N, CS occasional, LF infrequent
Cupressaceae
Juniperus deppeana Steudel var. deppeana. Alligator juniper, N, LF occasional
Juniperus monosperma (Engelmann) Sargent. One-seed juniper, N, LF infrequent
Juniperus scopulorum Sargent. Rocky Mountain juniper, N, LF infrequent
Cyperaceae
Carex occidentalis L.H. Bailey. N, CS frequent, LF frequent
Cyperus fendlerianus Boeckeler. N, CS infrequent, LF occasional
Ericaceae
Pterospora andromedea Nutt. Pinedrops, N, LF rare
Euphorbiaceae
Chamaesyce serpyllifolia (Pers.) Small. N, CS infrequent, LF infrequent
Euphorbia brachycera Engelm. N, CS infrequent, LF occasional
Tragia ramosa Torr. N, CS infrequent
Fabaceae
Astragalus humistratus A. Gray. N, CS frequent, LF infrequent
Astragalus tephrodes Gray var. brachylobus (Gray) Barneby. N, LF occasional
Cologania longifolia Gray. N, CS infrequent, LF infrequent
Dalea candida Michx. ex Willd. White prairie clover, N, LF infrequent
Dalea filiformis Gray. N, LF infrequentLathyrus lanszwertii Kellogg var. leucanthus (Rydb.)
Dorn. N, LF occasionalLotus wrightii (A. Gray) Greene. N, CS frequent, LF
frequentLupinus argenteus Pursh var. hillii (Greene) Barneby. N,
CS occasional, LF frequentMedicago lupulina L. Black medick, E, LF occasionalOxytropis lambertii Pursh. Purple locoweed, N, CS
occasional, LF infrequentThermopsis rhombifolia (Nutt. ex Pursh) Richardson var.
ovata (Robinson ex Piper) Egely. N, CS infrequentTrifolium longipes Nutt. var. rusbyi (Greene) H.
Harrington. N, CS occasional, LF infrequentVicia americana Muhl. ex Willd. N, CS frequent, LF
occasional
Fagaceae
Quercus gambelii Nuttall. Gambel oak, N, CS infrequent, LF occasional
Geraniaceae
Geranium caespitosum E. James. N, CS occasional, LF occasional
Grossulariaceae
Ribes cereum Douglas. Wax currant, N, CS infrequent

248 USDA Forest Service RMRS-P-55. 2008.
Hydrophyllaceae
Nama dichotomum (Ruiz & Pavon) Choisy. N, CS occasional
Phacelia heterophylla Pursh var. heterophylla. N, LF infrequent
Iridaceae
Iris missouriensis Nuttall. Rocky Mountain iris, N, CS frequent
Lamiaceae
Prunella vulgaris L. var. lanceolata (W. Barton) Fern. N, LF infrequent
Liliaceae
Echeandia flavescens (Schultes & Schultes f.) Cruden. N, CS occasional, LF infrequent
Triteleia lemmoniae (S. Watson) Greene. N, LF infrequent, Endemic
Linaceae
Linum australe A. Heller. N, CS infrequent, LF occasional
Nyctaginaceae
Mirabilis linearis var. (Pursh) Heimerl var. decipiens (Standley) S.L. Welsh. N, CS infrequent
Onagraceae
Gayophytum racemosum Torr. & A. Gray. N, CS occasional, LF occasional
Gayophytum ramosissimum Torr. & A. Gray. N, LF infrequent
Oenothera laciniata Hill. N, LF occasional
Orchidaceae
Malaxis soulei L.O. Williams. N, LF occasionalCorallorhiza maculata (Rafinesque) Rafinesque var.
maculata. N, CS infrequent
Oxalidaceae
Oxalis caerulea (Small) Kunth. N, CS infrequent, LF infrequent
Pinaceae
Pinus ponderosa Douglas ex Lawson & C. Lawson var. scopulorum Engelmann. Rocky Mountain ponderosa pine, N, CS abundant, LF abundant
Pseudotsuga menziesii (Mirbel) Franco var. glauca (Mayr) Franco. Rocky Mountain Douglas-fir, N, CS infrequent
Plantaginaceae
Plantago patagonica Jacq. N, LF occasional
Poaceae
Agrostis scabra Willd. N, LF infrequentAristida arizonica Vasey. Arizona threeawn, N, LF
occasionalBlepharoneuron tricholepis (Torr.) Nash. Pine dropseed,
N, CS frequent, LF frequentBouteloua gracilis (Kunth) Lag. ex Griffiths. Blue
gramma, N, CS frequent, LF occasionalBromus ciliatus L. Fringed brome, N, CS occasional Bromus tectorum L. Cheatgrass, E, CS infrequent, LF
occasionalDichanthelium oligosanthes (Schult.) Gould. N, LF
infrequentElymus elymoides (Raf.) Swezey subsp. brevifolius (J.G.
Sm.) Barkworth. Squirreltail, N, CS abundant, LF frequent
Eragrostis mexicana (Hornem.) Link subsp. mexicana. N, LF occasional
Festuca arizonica Vasey. Arizona fescue, N, CS abundant, LF abundant
Koeleria macrantha (Ledeb.) Schult. Junegrass, N, LF frequent
Muhlenbergia minutissima (Steud.) Swallen. N, CS infrequent, LF occasional
Muhlenbergia montana (Nutt.) Hitchc. Mountain muhly, N, CS frequent, LF frequent
Muhlenbergia ramulosa (Kunth) Swallen. N, CS occasional, LF infrequent
Muhlenbergia straminea Hitchc. Screwleaf muhly, N, CS infrequent, LF occasional
Muhlenbergia wrightii Vasey ex J.M. Coult. Spike muhly, N, CS occasional, LF infrequent
Panicum bulbosum Kunth. Bulb panicgrass, N, LF infrequent
Piptochaetium pringlei (Beal) Parodi. Pringle’s speargrass, N, LF occasional
Poa fendleriana (Steud.) Vasey subsp. longiligula (Scribn. & T.A. Williams) Soreng. Muttongrass, N, CS abundant, LF abundant
Poa pratensis L. subsp. pratensis. Kentucky bluegrass, E, CS infrequent, LF occasional
Schizachyrium scoparium (Michx.) Nash var. scoparium. Little bluestem, N, CS infrequent, LF occasional
Vulpia octoflora (Walter) Rydb. var. hirtella (Piper) Henrard. N, LF occasional
Polemoniaceae
Gilia aggregata (Pursh) Sprengel var. maculata M.E. Jones. Skyrocket, N, LF infrequent
Microsteris gracilis (Hook.) Greene var. humilior (Hook.) Cronq. N, LF infrequent

USDA Forest Service RMRS-P-55. 2008. 249
Polygonaceae
Eriogonum alatum Torrey var. alatum. N, CS infrequentEriogonum racemosum Nuttall. N, CS occasional, LF
infrequentPolygonum sawatchense Small subsp. sawatchense. N,
CS occasional, LF occasionalRumex acetosella Linnaeus. Sheep sorrel, E, LF
occasional
Portulacaceae
Lewisia brachycalyx Engelmann ex A. Gray. N, LF infrequent
Ranunculaceae
Thalictrum fendleri Engelmann ex A. Gray. N, CS occasional, LF occasional
Rhamnaceae
Ceanothus fendleri A. Gray. N, CS occasional, LF occasional
Rosaceae
Geum triflorum Pursh var. ciliatum (Pursh) Fassett. N, CS infrequent
Potentilla crinita A. Gray. N, CS frequent, LF frequentPotentilla diversifolia Lehm. N, CS occasional, LF
occasionalPotentilla hippiana Lehm. N, CS occasional, LF
occasionalPotentilla subviscosa Greene. N, CS occasionalRosa woodsii Lindl. var. ultramontana (S. Watson) Jeps.
N, CS occasional
Rubiaceae
Houstonia wrightii A. Gray. N, CS infrequent, LF occasional
Saxifragaceae
Lithophragma tenellum Nutt. N, LF infrequentSaxifraga rhomboidea Greene. N, LF infrequent
Scrophulariaceae
Castilleja miniata Douglas ex Hook. N, CS infrequent, LF infrequent
Linaria dalmatica (L.) Miller. Dalmatian toadflax, E, CS frequent
Mimulus rubellus A. Gray. N, CS infrequentPedicularis centranthera A. Gray. N, CS infrequent, LF
occasionalPenstemon virgatus Gray. N, CS occasional, LF
occasionalVerbascum thapsus L. Common mullein, E, CS
occasional, LF occasionalVeronica peregrina L. var. xalapensis (H.B.K.) St. John
& Warren. N, LF infrequent
Verbenaceae
Verbena macdougalii A.A. Heller. N, CS infrequent
The content of this paper reflects the views of the author(s), who are responsible for the facts and accuracy of the information presented herein.

250 USDA Forest Service RMRS-P-55. 2008.
In: Olberding, Susan D., and Moore, Margaret M., tech coords. 2008. Fort Valley Experimental Forest—A Century of Research 1908-2008. Proceedings RMRS-P-55. Fort Collins, CO: U.S. Department of Agriculture, Forest Service, Rocky Mountain Research Station. 282 p.
Introduction
Altered forest structure, functional processes and past land management practices have led to many critical conserva-tion problems in southwestern ponderosa pine ecosystems, including loss of native biological diversity, declining her-baceous productivity and increased severity of disturbances such as wildfires (Bakker and Moore 2007, Covington and Moore 1994). Currently, efforts are underway to restore the ecological integrity and biodiversity of these ecosystems. Ecological restoration treatments, using thinning and pre-scribed fire, are an effective approach for reversing the loss of habitat and biodiversity in ponderosa pine ecosystems (Landres and others 1999, Moore and others 1999). Both overstory thinning and prescribed burning can have mixed re-sults on understory recovery, depending upon thinning level, burning frequency and severity, the community composition prior to the disturbance, past land use and climatic conditions
Effects of Ecological Restoration Alternative Treatments on Nonnative Plant Species Establishment
Michael T. Stoddard and Christopher M. McGlone, Ecological Restoration Institute (ERI), Northern Arizona University, Flagstaff, AZ; and Peter Z. Fulé, ERI and School of Forestry, Northern Arizona University, Flagstaff, AZ
Abstract—Disturbances generated by forest restoration treatments have the potential for en-hancing the establishment of nonnative species thereby impeding long-term native plant recovery. In a ponderosa pine forest next to the Fort Valley Experimental Forest, Arizona, we examined the establishment of nonnative species after three alternative treatments with dif-ferent intensities of tree thinning, coupled with prescribed burning and an untreated control, in relation to total species abundance and richness. Pretreatment data were collected in 1998 and postreatment responses were measured from 2001 through 2006. Total herbaceous cov-er and richness were significantly higher in the two more intensely thinned areas compared to the control over the entire post-treatment period. Native species were the most prevalent in terms of cover (92%) and richness (90%) across all treated units, though greater under-story plant responses were linked to heavier amounts of tree thinning. Nonnative species abundance and richness also increased significantly in response to restoration treatments, particularly in the two more intense treatments. The proportion of nonnative abundance to the total abundance within the two heavily treated areas decreased through time and began to converge back towards the undisturbed control unit. One year following treatments, 15% of the total cover (27%) was composed of nonnative species in the heaviest treated unit. This proportion dropped almost 50% by the fifth year following treatment. Our results sug-gest that disturbances associated with restoration treatments can facilitate establishment of nonnative plants, however the post-treatment plant community was increasingly dominated by native species.
during ecosystem recovery (Swetnam and Betancourt 1998; Wienk and others 2004). While a primary goal of ecological restoration is to promote a self-sustaining indigenous plant community possessing all functional groups necessary to maintain the ecosystem (SER 2004), disturbances can shift the system into an alternate stable state (Laycock 1991). Proliferation of nonnative, disturbance-loving plant species can alter the successional trajectory of an ecosystem, leading to undesired results from the restoration project (Allen and others 2002, Westoby and others 1989).
Here, our objectives were to: (1) evaluate nonnative plant responses to different intensities of restoration treatments; and (2) track changes in understory vegetation cover and richness over time. We hypothesized that total plant cover and richness, including nonnative species, would increase with increasing treatment intensity. However, we also hy-pothesized that nonnative species would eventually decline over time and contribute relatively little to the overall under-story composition.

USDA Forest Service RMRS-P-55. 2008. 251
MethodsStudy Site
We implemented restoration treatments on a ~56-ha (140-acre) site adjacent to the Fort Valley Experimental Forest, on the Coconino National Forest, northwest of Flagstaff, Arizona (N 35° 16’, W 111° 44’). Prior to treatment, stands were close-canopied, even-aged “blackjack” Pinus ponderosa that averaged 726 trees/ha (1793 trees/acre) with occasional patches of presettlement “yellowpine.” Stands were previous-ly thinned but remained close-canopied. For a detailed site description reference Korb and others (2007). Mean annual precipitation is 56 cm (22 in), although precipitation varied ex-tremely throughout the duration of the study (Figure 1).
Restoration Treatments
All treatments focused on restoring site-specific overstory density and spatial arrangement consistent with presettlement forest patterns (Covington and Moore 1994, Fulé and others 1997, Mast and others 1999). Restoration treatments retained all living presettlement trees (described in: Covington and Moore 1994, White 1985). In addition, we retained post-settlement trees as replacements for remnant presettlement materials (e.g., snags, logs, stumps). The three treatments dif-fered in the numbers of postsettlement trees selected to replace dead presettlement evidence as described in Fulé and others (2001). Trees were whole tree harvested, creating large slash piles. Slash piles were then burned prior to broadcast burning. Broadcast burning was conducted in spring 2000.
Treatments were randomly assigned to each unit and in-cluded: (a) 1.5-3 tree replacement (high-intensity), (b) 2-4 tree replacement (medium-intensity), (c) 3-6 tree replacement (low-intensity), and (d) no thinning, no burning (Control).
Field Methods and Analysis
Each treatment was applied on a 14-ha (35-acre) unit. We established twenty subplots in each of the four treatment units. Understory data were collected in 1998 (pre-treatment), and re-measured in 2001, 2002, and 2006. A 50-m (164-ft) point line transect was used to quantify plant foliar cover and a belt transect 500m2 (5382ft2) was used to quantify species richness on each plot (modified from USDI NPS 1992).
Statistical comparisons between the treatment units were carried out using 20 pseudoreplicated subplots in each treat-ment, since only one instance of each experimental treatment was implemented to each experimental unit. Understory to-tal cover and richness within treatment were analyzed with repeated measures MANOVA. To account for significant dif-ferences in pretreatment richness, 1998 data were included as part of the effects model and analyzed with repeated measures MANCOVA. Total cover was transformed (square-root) in order to meet ANOVA assumptions. Following a significant treatment x time result, we compared treatment differences within year with Tukey’s post hoc tests. Treatment effects on nonnative cover and richness were analyzed using non-parametric Kruskal-Wallis tests because these data strongly violated the assumption of normality. When results were significant, Mann-Whitney tests were used to make pairwise treatment comparisons. For all analyses, α = 0.05. Where appropriate, alpha levels were adjusted using a Bonferonni correction (Kuehl 1994).
Results
We detected no pretreatment differences for any param-eter except total richness (Figure 2). Total cover and richness
Figure 1. Mean annual precipitation during the study (1998-2006) versus the long-term 53 year average. The arrow denotes prescribed burn year. Dark symbols indicate years in which vegetation was sampled. Weather data were obtained from the Fort Valley Experimental Forest weather records (USFS, Rocky Mountain Research Station 2006).

252 USDA Forest Service RMRS-P-55. 2008.
averaged 12.3% and 18.4 species, respectively across all ex-perimental units. Nonnative species contributed <1% of the cover and richness prior to treatment.
After treatment, total plant cover and richness differed significantly among treatments, time and treatment x time interaction (Figure 2). Plant cover and species richness were greatest in the high- and medium-intensity units following every posttreatment year. There were no differences in plant cover between the control and low-intensity treatments, although species richness was significantly greater in the low-intensity unit when compared to the control unit. Graminoids
dominated the posttreatment understory (Table 1). Though the majority of increases in total cover and richness were due to native plants, there was a significant increase in nonnative species richness on all three treatments and nonnative cover in the high- and medium-intensity plots.
In 2001 (one year following burning), the understory in the high- and medium-intensity treatments showed signifi-cant increases in nonnative species cover and richness when compared to the low-intensity treatment and untreated con-trol unit (Figure 2). Nonnative species comprised of 17% and 12% of the total understory cover (24.6%) and species
Figure 2. Average percent cover and species richness for total and nonnative species under experimental treatments in 1998, 2001, 2002, and 2006. Values indexed within each year by a different letter are significantly different at α = 0.05. Bars represent ±1 standard error of the mean (n = 20).

USDA Forest Service RMRS-P-55. 2008. 253
Con
trol
Hig
h M
ediu
mLo
w19
9820
0120
0220
0619
9820
0120
0220
0619
9820
0120
0220
0619
9820
0120
0220
06
Car
ex sp
**1.
9 (0
.5)
2.0
(0.7
)1.
1 (0
.3)
0.8
(0.3
)2.
2 (0
.5)
2.2
(0.4
)1.
3 (0
.3)
1.9
(0.3
)1.
0 (0
.3)
1.5
(0.4
)0.
9 (0
.2)
0.9
(0.2
)3.
5 (0
.7)
3.0
(0.7
)1.
4 (0
.4)
1.0
(0.2
)
Cir
sium
whe
eler
i 0
0.2
(0.1
)T
T 0.
4 (0
.2)
2.0
(0.4
)0.
3 (0
.1)
1.5
(0.3
)T
0.8
(0.3
)T
0.6
(0.2
)0.
2 (0
.1)
0.2
(0.1
)
T
T
Elym
us e
lym
oide
s**
0.8
(0.2
)1.
5 (0
.4)
0.7
(0.2
)0.
4 (0
.1)
2.9
(0.5
)7.
7 (0
.8)
3.6
(0.6
)6.
9 (0
.9)
1.7
(0.3
)6.
8 (0
.9)
3.6
(0.5
)4.
3 (0
.8)
2.4
(0.6
)3.
8 (0
.9)
1.1
(0.3
)0.
7 (0
.2)
Fest
uca
ariz
onic
a**
2.7
(0.9
)3.
0 (1
.0)
1.9
(0.6
)0.
9 (0
.3)
3.0
(0.7
)7.
1 (1
.4)
5.8
(1.2
)6.
7 (1
.5)
2.1
(0.6
)3.
9 (1
.2)
2.8
(0.7
)2.
4 (0
.7)
2.0
(0.6
)1.
3 (0
.5)
1.0
(0.4
)0.
5 (0
.2)
Muh
lenb
ergi
a M
onta
na**
3.7
(1.2
)2.
5 (1
.1)
2.3
(0.8
)1.
2 (0
.7)
5.5
(1.4
)4.
3 (0
.9)
3.6
(0.8
)7.
6 (1
.7)
4.6
(1.6
)2.
4 (1
.2)
2.3
(1.0
)2.
3 (0
.9)
3.6
(0.9
)2.
3 (0
.5)
2.6
(0.7
)1.
6 (0
.4)
Poa
fend
leri
ana*
*T
0.2
(0.2
)T
T 0.
5 (0
.1)
0.6
(0.2
)0.
4 (0
.2)
0.5
(0.2
)0.
2 (0
.1)
0.3
(0.1
)0.
4 (0
.1)
0.5
(0.2
)T
T T
T
Cir
sium
vul
gare
* 0
0 0
0 0
0 0
0.3
(0.2
)0
T T
0.4
(0.2
)0
0 0
0
Lina
ria
dalm
atic
a*
T 0
0 0
0 0.
6 (0
.2)
0.2
(0.1
)1.
4 (0
.5)
0 T
T 0.
4 (0
.2)
T T
T 0
Verb
ascu
m th
apus
*
0 0
0
0 0
3.7
(0.7
)1.
8 (0
.5)
0.4
(0.2
)0
4.9
(1.2
)2.
3 (0
.7)
0.2
(0.1
)0
0.5
(0.2
)0.
1 (0
.1)
0.5
(0.2
)
Tabl
e 1.
Mea
n co
ver
(S.E
.) of
dom
inan
t nat
ive
and
nonn
ativ
e he
rbac
eous
spe
cies
for
each
trea
tmen
t uni
t and
eac
h sa
mpl
ing
year
. Non
nativ
e sp
ecie
s ar
e de
note
d w
ith a
n *.
Gra
min
oid
spec
ies
are
deno
ted
with
an
**. T
sig
nifie
s co
ver
valu
es le
ss th
an 0
.1%
.
richness (35.0), respectively across the two higher intensity treatments. In 2006, nonnative species cover continued to be significantly greater in the high- and medium-intensity treat-ments though decreased when compared to initial responses (Figure 2). Species richness continued to be significantly
different between treatment and control units, but did not differ among the treatment intensities (Figure 2). The most common nonnative species across all treated units included: Verbascum thapsus, Linaria dalmatica, Cirsium vulgare (Table 1).

254 USDA Forest Service RMRS-P-55. 2008.
Discussion
Plant cover and species richness increased with thinning and prescribed burning treatments with the greatest responses occurring in the areas most heavily thinned. Our results are consistent with several other overstory-understory studies in ponderosa pine forest that demonstrated increases in under-story productivity through the reduction of overstory density (Moore and others 2006, Moore and Deiter 1992, Wienk and others 2004). Research has also shown that understory production and diversity increase following fire, though in-creases are often species specific and highly dependent on the fire severity (Harris and Covington 1983, Wayman and others 2006).
Disturbances have highly variable impacts on under-story communities and often promote the establishment of nonnative species (Griffis and others 2001, Keeley 2005). In our study, the post-disturbance flora was comprised of mostly native species, although significant increases in non-native species were found in the high- and medium-intensity treatments. While several of the nonnative species are of management concern, the total average cover of nonnative species did not exceed 5.0% in any of the treated units. Only Verbascum thapus had foliar cover greater than 3%, imme-diately following treatment. After five years, however, cover had reduced to less than 0.5%.
Disturbance severity is often an important predictor in the spread of nonnative species (Crawford and others 2001, Hunter and others 2006, Keeley 2005). For example, Crawford and others 2001 found high values of nonnative species establishment following severe wildfires, whereas Laughlin and others (2004) found few nonnative species following a low-intensity wildfire. In the present study, pre-scribed fire severities were relatively low, though burning of slash piles resulted in high fire severity on a local scale that may have promoted the establishment of nonnative species. Our results suggest that varying levels of thinning inten-sity may influence the establishment of nonnatives species, though thinning trees in general has the potential to promote the establishment of nonnative plants (Hunter and others 2006). Different harvesting techniques may also produce different levels of soil disturbance that can facilitate the es-tablishment of nonnative species (Battles and others 2001, Korb and others 2007). The present study was whole-tree harvested, which can produce high levels of soil disturbance (Korb and others 2007), thereby facilitating the initial estab-lishment of nonnative species.
Disturbance is inevitable in ecological restoration treat-ments, thereby providing an opportunity for nonnative species to establish (D’Antonio and Meyerson 2002). What is not ex-actly clear is whether this invasion is short-lived or whether such disturbances provide an opportunity for the long-term persistence of nonnative species. Our results suggest distur-bances associated with restoration treatments can facilitate
the establishment of nonnative plants. Encroachment by non-native species does not mean that these species will dominate the system (Figure 3). Time since disturbance should be considered an important factor when evaluating restoration targets within southwestern ponderosa pine forests. While our results are encouraging, more research is clearly needed as ecosystems are dynamic and further changes in community composition and structure are to be expected. The continued presence of aggressive nonnative species suggests continued monitoring of the site and potentially, further maintenance of the understory.
Acknowledgments
This work was supported by the USDA Forest Service, 05-CR-11031600-079, and by the State of Arizona and Northern Arizona University. Support for the original es-tablishment of the experiment was provided by the USDA Forest Service Rocky Mountain Research Station, Research Joint Venture Agreement No. RMRS-98134-RJVA. Thanks to the Coconino National Forest, especially A. Farnsworth, B. Thornton, T. Randall-Parker, and G. Waldrip; Rocky Mountain Research Station, especially Carl Edminster, and staff and students of the Ecological Restoration Institute. We also like to thank M. Hunter and K.Waring for reviewing this manuscript.
References
Allen, C.D.; Savage, M.; Falk, D.A.; Suckling, K.F.; Swetnam, T.W.; Schulke, T.; Stacey, P.B.; Morgan, P.; Hoffman, M.; Klingel, J.T. 2002. Ecological restoration of southwestern ponderosa pine ecosystems: a broad perspective. Ecological Applications. 12(5): 1418-1433.
Bakker, J.; Moore, M.M. 2007. Control on vegetation structure in southwestern ponderosa pine forests, 1941 and 2004. Ecology. 88(9): 2305-2319.
Battles, J.J.; Shlisky, A.J.; Barrett, R.H.; Heald, R.C.; Allen-Diaz, B.H. 2001. The effects of forest management on plant species diversity in a Sierran conifer forest. Forest Ecology and Management. 146: 211-222.
Covington, W.W.; Moore, M.M. 1994. Southwestern ponderosa pine forest structure. Changes since Euro-American settlement. Journal of Forestry. 92: 39-47.
Crawford, J.A.; Wahren, C.H.A; Kyle, S.; Moir, W.H. 2001. Responses of exotic plant species to fires in Pinus ponderosa forests in northern Arizona. Journal of Vegetation Science. 12: 261-268.
D’Antonio, C.D.; Meyerson, L.A. 2002. Exotic plant species as problems and solutions in ecological restoration: A synthesis. Restoration Ecology. 10: 703-710.

USDA Forest Service RMRS-P-55. 2008. 255
Figure 3. Time-series photographs of a high-intensity plot prior to treatment (1998, top photo), 1 year after prescribed burn (2001, middle photo), and 5 years after prescribed burn (2006, bottom photo). The arrows highlight the same tree with a reference tag.

256 USDA Forest Service RMRS-P-55. 2008.
Fulé, P.Z.; Covington, W.W.; Moore, M.M. 1997. Determining reference conditions for ecosystem management of southwestern ponderosa pine. Ecological Application. 7: 895-908.
Fulé, P.Z.; McHugh, C.; Heinlein, T.A.; Covington, W.W. 2001. Potential fire behavior is reduced following forest restoration treatments. RMRS-P-22. Fort Collins, CO: U.S. Department of Interior, Forest Service, Rocky Mountain Research Station. Proc: 28-35.
Griffis, K.L.; Crawford, J.A.; Wagner, M.R.; Moir, W.H. 2001. Understory response to management treatments in northern Arizona ponderosa pine forests. Forest Ecology and Management. 146: 239-245.
Harris, G.R.; Covington, W.W. 1983. The effect of prescribed fire on nutrient concentration and biomass of understory vegetation in ponderosa pine. Canadian Journal of Forest Research. 13: 501-507.
Hunter, M.E.; Omi, P.N.; Martinson, E.J.; Chong, G.W. 2006. Establishment of nonnative plant species after wildfires: effects of fuel treatments, abiotic and biotic factors, and post-fire grass seeding treatments. International Journal of Wildland Fire. 15: 271-281.
Keeley, Jon. E. 2006. Fire management impacts on invasive plants in the Western United States. Conservation Biology. 20(2): 375-384.
Korb, J.E.; Fulé, P.Z.; Gideon, B. 2007. Different restoration thinning treatments affect level of soil disturbance in ponderosa pine forests of northern Arizona, USA. Ecological Restoration. 25(1): 43-49.
Kuehl, R.O.1994. Statistical principles of research design and analysis. Wadsworth Pub. Co., California: Belmont.
Landres, P.B.; Morgan, P.; Swanson, F.J. 1999. Overview of the use of natural variability concepts in managing ecological systems. Ecological Application. 1999: 1179-1188.
Laughlin, D.C.; Bakker, J.D.; Stoddard, M.T.; Daniels, M.L.; Springer, J.D.; Gilar, C.N.; Green, A.M.; Covington, W.W. 2004. Toward reference conditions: wildfire effects on flora in an old-growth ponderosa pine forest. Forest Ecology and Management. 199: 137-152.
Laycock, W.A. 1991. Stable states and thresholds of range condition on northern American rangelands: a viewpoint. Journal of Range Management. 44(5): 427-433.
Mast, J.N.; Fulé, P.Z.; Moore, M.M.; Covington, W.W.; Waltz, A.E.M. 1999. Restoration of presettlement age structure of an Arizona ponderosa pine forest. Ecological Applications. 9(1): 228-239.
Moore, M.M.; Deiter, D.A. 1992. Stand density index as a predictor of forage production in northern Arizona pine forests. Journal of Range Management. 45: 267-271.
Moore, M.M.; Casey, C.A.; Bakker, J.D.; Springer, J.D.; Fulé, P.Z.; Covington, W.W.; Laughlin, D.C. 2006. Herbaceous vegetation responses (1992-2004) to restoration treatments in a ponderosa pine forest. Rangeland Ecology and Management. 59: 135-144.
Moore, M.M.; Covington, W.W.; Fulé, P.Z. 1999. Reference conditions and ecological restoration: a Southwestern ponderosa pine perspective. Ecological Application. 9: 1266-1277.
Society for Ecological Restoration (SER). 2004. The SER primer on ecological restoration. www.ser.org
Swetnam, T.W.; Betancourt, J.L. 1998. Mesoscale disturbance and ecological response to decadal climate variability in the American Southwest. Journal of Climate 11: 3128-3147.
Wayman, R.B.; Malcolm, N. 2007. Intial response of a mixed-conifer understory plant community to burning and thinning restoration treatments. Forest Ecology and Management. 239: 32-44.
Westoby, M.; Walker, B.; Noy-Meir, I. 1989. Opportunistic management for rangelands not at equilibrium. Journal of Range Management. 42(5): 266-271.
Wienk, C.L.; Sieg, C.H.; McPherson, G.R. 2004. Evaluating the role of cutting treatments, fire and soil seed bank in an experimental framework in ponderosa pine forests of the Black Hills, South Dakota. Forest Ecology and Management. 192: 375-393.
White, A.S. 1985. Presettlement regeneration pattern in a southwestern ponderosa pine stand. Ecology. 66(2): 589-594.
The content of this paper reflects the views of the author(s), who are responsible for the facts and accuracy of the information presented herein.

USDA Forest Service RMRS-P-55. 2008. 257
In: Olberding, Susan D., and Moore, Margaret M., tech coords. 2008. Fort Valley Experimental Forest—A Century of Research 1908-2008. Proceedings RMRS-P-55. Fort Collins, CO: U.S. Department of Agriculture, Forest Service, Rocky Mountain Research Station. 282 p.
Introduction
Nearly six thousand miles of land and sea separate Vienna, Austria, and Fort Valley, Arizona, yet the two locales jointly played a leading role in the development and implementation of an important concept in forest research and management. The idea of forest experiment stations—government-run fa-cilities charged with scientifically improving tree planting and growing procedures—was spawned in Vienna just after the American Civil War. Imported to the United States through the ideas of German-American forest scientist Bernhard Fernow, experiment stations became the centerpiece of out-spoken forester Raphael Zon’s bold plan to institutionalize scientific investigation in the U.S. Forest Service—a quest that achieved its unlikely fruition in the northern Arizona wilderness.
European Origins
In 1868, a group of German foresters and soil scientists at a Vienna convention, concerned with their country’s lack of any comprehensive plan of forest research, appointed a five-member committee of experts to explore the best methods for enacting such an organized system (Heske 1938). The result was a network of government-operated forest experiment stations, associated with schools of forestry and staffed by professors. The first two stations were established in 1870 in Baden and Saxony; within two years, six more outposts were in operation throughout Germany, and a Union of German
Roots of Research: Raphael Zon and the Origins of Forest Experiment Stations
Jeremy C. Young, Indiana University, Bloomington, IN
Abstract—The 1908 founding of the first American forest experiment station in Fort Valley, Arizona was an event of considerable historical significance. The Fort Valley station was the linchpin of forester Raphael Zon’s bold plan to create the first program of organized research in U.S. Forest Service history. It also represented the beginning of a fruitful marriage between German and American methods of forestry. This project traces the history of government-run experiment stations from its roots in Vienna, Austria, in the 1870s, through the work of German-American forester Bernhard Fernow and finally to Zon, Fernow’s student. The process through which Zon successfully promoted forest experiment stations within the U.S. Forest Service, culminating in the creation of the Fort Valley station, is also discussed.
Forest Experiment Stations was set up to standardize and codify experiments conducted at the various locations. This German Union created so much useful data that in 1892 an international forest research association was formed in Eberswalde, Germany, along similar lines. Both organizations were still operating in 1938 and may have continued to do so after World War II.
When German forester Bernhard Fernow immigrated to the United States in 1876, he brought with him a fervent belief in the forestry practices of his homeland, including the efficacy of experiment stations (Miller 2007, Rodgers 1951). Fernow’s 1886 appointment to head the U.S. Division of Forestry put him in a position to act on these views. Under Fernow, the Division created temporary planting stations in Minnesota and Pennsylvania and worked closely with the leaders of state-run experiment stations in nine states, the first of which were chartered in California in 1887 at the urging of state forest commissioner Abbot Kinney (Rodgers 1951). These state-run experiment stations were productive, but their scope was lim-ited by their inability to study phenomena across state lines. To rectify this problem, Fernow began initiating federally funded research projects, most notably the “Bruner plantation” in Holt County, Nebraska. Suggested to Fernow in 1891 by University of Nebraska forestry professor Charles Edwin Bessey, whose students would later include Fort Valley Experiment Station director G. A. Pearson, the “Bruner plantation” was essentially a prototype federal experiment station, with a multi-year pro-gram of tree planting organized and managed by Division of Forestry directive. The “Bruner plantation” differed from the German and later American forest experiment stations, how-ever, in the fact that ownership of the facility was retained and day-to-day labor performed by Hudson Bruner, a private

258 USDA Forest Service RMRS-P-55. 2008.
citizen, instead of by the government. Similar collaborative efforts would continue in later years, but they would largely be eclipsed in importance by the federal system of experiment stations.
Before he was able to make any further progress in encour-aging scientific research, Fernow left the Division of Forestry in 1898 to direct the new degree-granting forestry school at Cornell University. The forestry curriculum he established was based on “the most advanced German ideas in forestry education” (Miller 2007). Fernow and his fellow German-born forestry instructor, Filibert Roth, “emphasized economics and the long-term profitability of forestry over silviculture,” but they also taught their students that more scientific data was needed in order to achieve these goals (Lewis 2000). One of their first students at Cornell was Raphael Zon, who would soon become the most vocal advocate of scientific forestry in America. A cantankerous Russian immigrant who had come to the United States to avoid a ten-year prison sentence for labor organizing, Zon quickly gravitated toward forestry as an out-let for his prodigious creative talents (Miller 2007, Schmaltz 1980), and at Cornell he devoured and then mastered the cur-riculum with a will (Lewis 2000).
Zon’s Crusade
After securing employment in 1901 under new Forester Gifford Pinchot, Zon became convinced that the German methods of forest science advocated by Fernow were being improperly utilized by the Bureau of Forestry. Zon’s blunt and argumentative manner—even his friends admitted that “his ability to criticize searchingly” was “sometimes a bit overwhelming”—led him to act forcefully on this concern (Richards 1926). In a 1904 memorandum to Pinchot he painted a dire picture of the state of forest research. “The need for silvical data upon which one can rely in making his practical recommendations,” he wrote with characteristic zeal, “is felt by every member of the Bureau. …” The solution, Zon believed, was a Section of Silvics with wide administrative independence that would serve as “the source of information for all field men regarding the silvical data on hand.” A silviculture department was in fact created in 1906, with Zon placed in charge the following year, but the restless forester was already thinking along new lines. It was not enough simply to organize whatever data the Forest Service (as the Bureau was renamed in 1905) happened to produce, wrote Zon and Treadwell Cleveland, Jr., in a 1906 memorandum; the “desultory scientific efforts of the Forest Service” were unlikely to produce much useful research anyway. Nor were state-run or locally-administered experiment stations, such as the Bruner plantation or Kinney’s projects in California, adequate for solving forestry problems of a national scope, though Zon later wrote that “there should always…be the closest possible cooperation” between the Forest Service and these groups (Zon 1920). Instead, he urged, the money being spent on haphazard studies
Figure 1. Raphael Zon, seen here in 1926, was the most important advocate of scientific forestry in the early Forest Service. Photograph courtesy of the Forest History Society, Durham, NC.
should be “diverted into one channel and spent for carrying on a series of systematic, well-thought-out investigations under one head” (Zon and Cleveland 1906).
Zon’s knowledge of German forestry suggested a proven method for conducting this research: forest experiment sta-tions. Though he would not observe a German experiment station until the end of 1908 (Rodgers 1951), Zon saw at once how to modify the European system for American use. While the Germans, working within a smaller land area, had placed stations in nearly every state, the Forest Service need build only one for each administrative region, selecting a “typical reserve where the desired experiments may be carried on, and the results applied to the whole region” (Zon and Cleveland 1906). And where German stations were staffed by forestry professors, a troublesome proposition in the largely remote American forest reserves, the United States could make do with “the best m[e]n the Forest Service can afford to get with-in its ranks. …”
Zon’s reasoning was convincing to Gifford Pinchot, who scrawled his assent on his copy of the Zon-Cleveland memo-randum: “I have read this with great interest – Pls let me see the detailed plan.” In May 1908, Zon produced this proposal, titled “Plan for Forest Experiment Stations.” “The purpose of such stations,” wrote Zon, “is to carry on… experiments and studies leading to a full and exact knowledge of American

USDA Forest Service RMRS-P-55. 2008. 259
silviculture, to the most economic utilization of the prod-ucts of the forest, and to a fuller appreciation of the indirect benefits of the forest.” These stations, like their German counterparts, would be essentially permanent, allowing “for experiments requiring a number of years, and for the main-tenance of model forests typical of the silvicultural region.” Zon also envisioned a broad public role for the experiment stations, which would “furnish the most valuable, instructive and convincing object lessons for the public in general” as well as much-needed technical data. Pinchot was delighted with the document: “I am for this, with some changes,” he wrote on the plan’s cover. In fact, he authorized the experi-ment stations so quickly that Zon was able to establish the first only three months later.
The Prototype: Fort Valley
Zon and Pinchot decided to locate the inaugural Forest Service experiment station in the Southwest. Zon’s assistant, Samuel Trask Dana, canvassed the Arizona-New Mexico area in early 1908 to look for a suitable location (Olberding 2000). By May of that year, Zon had narrowed the choice to either the Coconino National Forest near Flagstaff or the
Black Mesa Forest in eastern Arizona, with the final decision to be made “more on the question of accessibility than on any other point” (Zon 1908). At the time, Flagstaff was eas-ily the more accessible of the two areas; the bustling lumber town was located on a major railroad and was home to what forester A. B. Recknagel recalled was “a wonderful group of bachelor [forester]s…” (Maunder 1958). The Flagstaff area was also recommended to Zon and Pinchot by Flagstaff lumbermen Timothy and Michael Riordan or by Coconino National Forest Supervisor Frank C. Pooler (Olberding 2000, Riordan 1903, Rodgers 1951).
The Coconino Experiment Station—renamed in 1911 the Fort Valley Experiment Station after the valley outside Flagstaff in which it was located—was the first of many. By 1915, when a separate Branch of Research was created in the Forest Service, Zon’s experiment station network had blossomed to include seven locations, and more were added in ensuing years. Yet Zon clearly viewed Fort Valley as the linchpin of his program of scientific forest investigation. He selected the exact location of the site himself in August 1908, announcing to two of his fellow foresters that he was “plant[ing] the tree of research” (Pearson 1936); later, he
Figure 2. German experimental plots, like this one at Colditz, were the inspiration for Zon’s program of American forest experiment stations. This photo, taken in 1935, shows an American delegation of foresters that includes Aldo Leopold (center, with binoculars). Photograph courtesy of the Forest History Society, Durham, NC. Figure 3. Bernhard Fernow, the first professional forester
employed by the U.S. Government, was a mentor and teacher for Zon during his years at the Cornell School of Forestry. Photograph courtesy of the Forest History Society, Durham, NC.

260 USDA Forest Service RMRS-P-55. 2008.
helped “shingle the roof and build the road in from the main route to the station” (Schmaltz 1980). In addition, according to a 1916 Forest Service inspection chart, Zon personally performed annual inspections of the Fort Valley station in seven of the following eight years, more often than at any other station; in 1915, he spent two entire weeks at Fort Valley, the longest amount of time he had spent at any of the stations.
Experiment Stations Today
“Our goal,” wrote Zon in 1917, “is to develop our knowl-edge of American silviculture so as to enable us to safeguard and perpetuate our forests for all the needs of our country.” For Zon, as for the foresters in Vienna forty years earlier, for-est experiment stations were not simply a research tool; they were a symbol of the importance of scientific inquiry in forest
Figure 4. A view of the Fort Valley Experimental Forest headquarters. USFS photo 449254 by G. A. Pearson in 1916.
Figure 5. Gustav Adolph “Gus” Pearson was the founding director of the Fort Valley Experiment Station and served there from 1908 until his retirement in 1944. USFS photo 223964 taken in 1927.
administration. The same principle animates much of Forest Service work today. When experts at the Forest Service’s Rocky Mountain Research Station in Flagstaff investigate how best to clear, thin, and care for the national forests, for instance, they invoke the same spirit of scientific management champi-oned by Zon a hundred years in the past. Through the work of these professionals and many others, the “tree of research” that Zon planted a century ago has bloomed, and Flagstaff and Fort Valley continue to play a central role in protecting our forests for future generations.
Acknowledgments
The author would like to thank Susan Olberding for her kind assistance in researching and preparing this paper. He would also like to thank Michael McGerr and Aaron Shapiro for their assistance in reviewing this paper.

USDA Forest Service RMRS-P-55. 2008. 261
References
Heske, Franz. 1938. German forestry. New Haven, CT: Yale University Press. 342 p.
Inspection of experiment stations by Raphael Zon and S. T. Dana. 1916. [Unpublished table]. U.S. Forest Service: n.p. Available: National Archives and Records Administration, College Park, MD, Record Group 95, PI-18/Entry 115 (Research Compilation File), Box 189.
Lewis, James G. 2000. Raphael Zon & Forestry’s First School of Hard Knocks. Journal of Forestry. 98 (November 2000): 13-17.
Maunder, Elwood R. 1958. Oral history interview with A. B. Recknagel, former Technical Director of Forestry, St. Regis Paper Company, and formerly with the United States Forest Service, Tucson, Arizona, October 28, 1958. St. Paul, MN: Forest History Foundation, Inc. [Online]. Available: <http://www.foresthistory.org/Research/Biltmore_Project/OHIs/RecknagelOHI.pdf>. 46 p.
Miller, Char. 2007. Ground work: conservation in American culture. Durham, NC: Forest History Society. 182 p.
Olberding, Susan Deaver. 2000. Fort Valley: the beginnings of forest research. Forest History Today. Winter 2000: 9-15.
Pearson, Gustaf Adolph. 1936. The oldest forest experiment station. Unpub. Pap. on file at Flagstaff, AZ: U.S. Department of Agriculture, Forest Service, Rocky Mountain Research Station, Fort Valley Experimental Forest archives.
Pinchot, Gifford. 1947. Breaking new ground. New York: Harcourt, Brace & Co. Repr. ed. 1998. Washington, DC: Island Press. 522 p.
Richards, Edward. 1926. Raphael Zon—The Man. Journal of Forestry. 24(8): 850-857.
Riordan, Timothy, to Gifford Pinchot, 23 July 1903. Northern Arizona University Cline Library, AL&T Collection, MS47, Box 361, Letterbook 585.
Rodgers, Andrew Denny III. 1951. Bernhard Eduard Fernow: A Story of North American Forestry. Orig. pub. Princeton, NJ: Princeton University Press, 1951. Repr ed. 1991. Durham, NC: Forest History Society. 623 p.
Schmaltz, Norman J. 1980. Raphael Zon: forest researcher. Journal of Forest History. 24(1, 2): 24-39, 86-97.
Zon, Raphael. 1917. Our goal: read at dinner, University Club, Washington, DC, March 2, 1917, before members in attendance at research conference. U.S. Forest Service: n.p. Available: National Archives and Records Administration, College Park, MD, Record Group 95, PI-18/Entry 115 (Research Compilation File), Box 186.
———. 1920. The Part of Public, Academic, and Private Organizations in the Promotion of Forest Research. U.S. Forest Service: n.p. Available: National Archives and Records Administration, College Park, MD, Record Group 95, PI-18/Entry 15 (Research Compilation File), Box 186.
———. 1908. Plan for Creating Forest Experiment Stations. U.S. Forest Service: n.p. Available: National Archives and Records Administration, College Park, MD, Record Group 95, PI-18/Entry 115 (Research Compilation File), Box 189.
———. 1904. Plan for the Development of Silvical Investigation in the Bureau of Forestry. U.S. Forest Service: n.p. Available: National Archives and Records Administration, College Park, MD, Record Group 95, PI-18/Entry 115 (Research Compilation File), Box 186.
Zon, Raphael, and Treadwell Cleveland, Jr. 1906. The concentration of scientific work in the Forest Service. U.S. Forest Service: n.p. Available: National Archives and Records Administration, College Park, MD, Record Group 95, PI-18/Entry 115 (Research Compilation File), Box 189.
The content of this paper reflects the views of the author(s), who are responsible for the facts and accuracy of the information presented herein.

262 USDA Forest Service RMRS-P-55. 2008.
Appendices

USDA Forest Service RMRS-P-55. 2008. 263
Fort Valley Experimental Forest Research Projects:
1909-1926
Compiled by Susan D. Olberding from material in the files of the USFS Fort Valley Experimental Forest archives, RMRS, Flagstaff, AZ
1909:
Source: “Fort Valley Experiment Station List of Experiments” 1 December 1909.
X-1: Brush scattering experiment. Greenlaw area. S34, T22N, R8E and S3,T21N, R6E. 126 acres, begun Fall 1908.
X-2: Seeding experiment, Greenlaw area. S33, T22N, R8E, 18 acres, begun Fall 1908.
X-3: Brush scattering experiment, Fort Valley. S27, T22N, R6E, 20 rods west of ranger stable. 14’ x 14’. Begun Fall 1908. (Note: Ranger stable was just north of old Entomology lab)
X-4: Seeding experiment, Fort Valley. S27, T22N, R6E, @ 10 acres, Fall 1908–Summer 1910.
X-5: Planting experiment, Fort Valley. S27, T22N, R6E, 6 acres. Spring 1909–Summer 1910
X-6: Planting experiment, Greenlaw area. S33, T22N, R8E. 7 acres. Spring 1909–Summer 1910.
X-7: Planting experiment, Riordan area, south of Flagstaff. S33, T21N, R7E. 7 acres. Spring 1909–Summer 1910.
X-8: Seeding experiment, Riordan area, south of Flagstaff. S33, T22N, R7E, adjoining above. Summer 1909–Summer 1910.
X-9: Planting experiment, Fort Valley Meteorological Station 1. 54 plants, 1909, 54 plants, Spring 1910.
X-10: Planting experiment, Fort Valley Meteorological Station 3. 54 plants 1909, 54 plants Spring 1910.
1910:
Source: Coconino Experiment Station List of Experiments 1 September 1910 and report dated 1 October 1910.
X-1: Brush Scattering Experiment, Greenlaw area. S34, T22N, R8E and S3, T21N, R6E. 126 acres. Begun Fall 1908.
X-2: Seeding Experiment, Greenlaw area. S33, T22N, R8E. 18 acres, begun Fall 1908.
X-3: Brush Scattering Experiment, Fort Valley. S27, T22N, R6E, 20 rods west of ranger stable. 14’ x 14’. Begun Fall 1908.
X-4: Seeding Experiment, Fort Valley. S27, T22N, R6E, @ 10 acres. Fall 1908–Summer 1910.
X-5: Planting Experiment, Fort Valley. S27, T22N, R6E. 6 acres. Spring 1909–Summer 1910
X-6: Planting Experiment, Greenlaw area. S33, T22N, R8E. 7 acres, Spring 1909–Summer, 1910.
X-7: Planting Experiment, Riordan area, south of Flagstaff. S33, T21N, R7E. 7 acres. Spring 1909–Summer 1910.
X-8: Seeding Experiment, Riordan. S33, T22N, R7E, adjoining above. Summer 1909–Summer 1910.
X-9: Planting Experiment, Fort Valley Meteorological Station 1. 54 plants, 1909. 54 plants, Spring 1910.
Planting Exp, Fort Valley Meteorological Station 3. 54 plants, 1909, 54 plants, Spring 1910.
X-10: Planting Experiment, Fort Valley Meteorological Station 3.
X-11: Study of light requirements of yellow pine seedlings, Greenlaw area. S4, T21N, R8E. Begun 1909.
X-12: Study of light requirements of yellow pine seedlings, Gosney’s Pasture S25, T21N, R6E, 1908. (2 different Experiments on same land.)
X-13: Study of light requirements of yellow pine seedlings, Gosney’s Pasture S25, T21N, R6E, 1908. (2 different Experiments on same land.)
X-14: Process of natural reproduction. Sample Plot, Greenlaw area, Gosney’s pasture. S30, T21N, R7E. 1908.
X-15: Same as above, on S33, T22N, R8E. 1908. X-16: Grass Seedling Experiment , Fort Valley. S27,
T22N, R6E, Park. 7 acres sown Summer 1909, 7 acres sown, Fall 1909.
X-16B: 40 rods west, plowed ground, 6 acres sown. Summer 1910.
X-17: Grass Seeding Experiment, Fort Valley. S27, T22N, R6E. Forest. 4 acres sown Summer 1909; 3 acres sown Fall 1909.
X-18: Study of the influence of the forest upon meteorological conditions, Fort Valley headquarters.
X-19: Permanent Sample Plots—cut-over areas, Coconino National Forest: S1: S27, T22N, R6E, 325 acres; S2: S25, T22N, R6E, 160 acres; S3: S24, T22N, R5E, 480 acres.
X-20: Seeding Experiment—Jeffrey pine, Greenlaw area. S34, T22N, R8E. Fall 1909–Summer 1910.
X-21: Germination tests of seeds from WYP of different conditions of age and health. 22 trees, 1908, 100 trees, 1909.
X-22: Nursery experiment, Fort Valley, Park and Forest (WYP), Campbell’s Camp (Douglas fir), Slope east side of saddle (Engelmann Spruce).
X-23: Planting experiment, Campbell’s Camp, Douglas fir. S7, T22N, R7E.

264 USDA Forest Service RMRS-P-55. 2008.
X-24: Sowing experiment, Campbell’s Camp, Douglas fir. S7, T22N, R7E.
X-25: Sowing experiment, east side of Salle (saddle?), SF Peaks Englemann Spruce.
X-26: Determination of relative amount of damage to reproduction by grazing during different seasons of the year.
X-27: Occurrence of double annual rings. X-28: Durability of different species for fence posts.X-29: Management of composite type on Apache
National Forest.X-30: Study of influences of mistletoe upon growth of
WYP.
Source: The 1910 Coconino National Forest Annual Report: (12/20/1910): lists the following investigations as completed or in progress:
Completed:
1. Reproduction of WYP. Failure to regenerate is due to adverse climatic conditions, but fairly good reproduction can be obtained by conservative cutting, fire exclusion, and regulation of grazing.
2. Meteorological Studies: Forest has a decided moderating influence upon temperature extremes, wind movement, and evaporation as compared to non-forest.
3. Seed Tests: Comparison of different ages and conditions of WYP with respect to germinative quality of seed.
4. Injury to reproduction by grazing. Less damage during summer when green feed is abundant that in spring and fall. Less damage when adequate water.
5. Management of mixed stands on the Apache NF. Management plan for the mixed stands of WYP, Douglas fir, and blue spruce.
In progress:
1. Planting. WYP, limited scale because of lack of hardy, acclimated stock.
2. Sowing. Broadcast sowing of all species a total failure due to rodents, birds, damping off, drought, frost.
3. Nursery. Plan is to grow only enough to supply the needs for Experimental planting. Goal is fibrous root systems.
4. Permanent Sample Plots. Four on a total of 1286 acres established in 1909, 1910 on Coconino. Object is to ascertain rate of growth, loss from windfall and lightning, effect of different degrees of cutting, brush disposal, grazing, and other factors upon reproduction. Will be remeasured every 5-10 years
5. Effect of Mistletoes. Several hundred trees, affected and unaffected, measured and photographed. Future exams to show effect of mistletoe upon rate of growth and tree development.
6. Durability of different trees for fence posts. 10-30 posts from eight local species set in ground as fence under uniform conditions. Each post is numbered, described, and its position in the fence indicated. Both green and seasoned posts from WYP, pinon, limber pine, Douglas fir, aspen, Gambel oak, alligator juniper, and one-seed juniper.
7. Range Improvement. Best grasses are being supplanted by inferior ones because former is cropped too closely and can’t seed. Suggests grazing only in the fall, to allow good forage plants to go to seed. Little success in cultivating forage plants.
8. Meteorological Studies. Instrumental records are being obtained, with a view of ascertaining the climatic factors which determine the main types of forest growth in this region.
1911:
Only information available is “Planting, seeding and nursery experiments.” Lists what was planted when and where.
1912:
Source: Partial report prepared for District 3 Investigation Committee. Projects listed by title:
A1: Methods of combating seed destroying animals. B1: Brush disposal.C1-6: Studies on cut over areas.D1: Effect of Mistletoe on the growth and seed
production of WYP.D2: Rate of decadence of mature WYP.D3: Root mould in transplants.G: Damage to reproduction by grazing on Coconino
and Tusayan, begun 1910. (cooperation with grazing reconnaissance).
G4: Recovery of WYP injured by grazing.I1: Insect attacks on cupped WYP.M1: Growth in WYP stands before and after cutting.M2: The relative accuracy of calipers and steel tape
in measuring the diameter of trees for growth records, begun 1911, completed.
M3: Occurrence of double annual rings of growth, begun 1910, completed, but missing.
Met. 7: A meteorological study of parks and timbered areas in the yellow pine forests of the southwest.
N2: Experiment in root development of WYP.N3: General nursery work.N4: Field nurseries.
USDA Forest Service RMRS-P-55. 2008. 265
N6: Effect of spacing upon development of WYP transplants, begun 1911.
P4: Planting Douglas Fir under aspen.P5: Spring planting WYP.P6: Top pruning summer planted WYP, begun 1911. P8: Effect of an aspen nurse in Douglas Fir planting. P10: Pot Planting.P11: Ball planting, begun 1911, discontinued. P19: Planting exotic species for ornamental purposes. P20: Planting in parks. P21: Comparison of different classes of stock in WYP
planting. P22: Comparison of wide and narrow holes and
prepared spots in WYP planting. P23: Planting sites for WYP. P24: Planting methods for WYP. P25: Planting methods for Douglas Fir. P26: Comparison of different classes of stock in
Douglas Fir planting.P27: Width of planting holes for Douglas Fir. P28: Early and late spring planting of Douglas Fir. R2: The loss of seedlings in the forest during the early
stages of development, begun 1908. S1: Influence of source of seed upon the character of
WYP seedlings, begun 1908. S2: WYP breeding, begun 1911. Se1: Broadcast
sowing WYP, begun 1908. Se9: Seedspotting pinon pine, begun 1911. Se10: Seedspotting Chilgoza pine, begun 1910. Se11: Seedspotting Jeffrey Pine. Se13: Seedspotting WYP. Se14: Seedspotting Austrian pine. Se15: Seedspotting Black Locust. Se16: Seedspotting Douglas Fir. Se17: Seedspotting Norway spruce. Stra.1: Influence of a forest cover and rate of melting
of snow and upon run-off, begun 1910. T1: Type Studies: Study of the composite type,
Apache NF, completed. U1: Utilization: Durability of fence posts, records
established 1910.
New Projects Proposed for 1912:
Insects: Insect attacks on cupped WYP. Planting: Advantage of wide holes and prepared spots
in wyp planting.Comparison of different classes of stock in Douglas fir
planting. Early and late spring planting of Douglas Fir. Planting methods for Douglas Fir.
Planting methods of WYP Width of planting holes for Douglas Fir.
Planting sites for WYP. Planting in parks Planting under different conditions.Seed: District seed testing.Amount of seed production (omitted) Soils: Non-available moisture in soils in on typical
planting areas.
1913:
Source: Investigative ReportsAnimals: “methods of combating seed destroying
animals” discontinued as Biological Survey is doing.
New Projects approved: “Investigations of yield of WYP stands”
Dec, 1913—proposal accepted to set aside 160 acres of virgin WYP adjacent to Fort Valley headquarters to Experiment in intensive methods and as a public demonstration area.
Dec. 1913—cultivation of indigenous forage plants for artificial reseeding, progress report. 4 acres fenced, adjoining Fort Valley headquarters grounds.
Dec.1913—Sources of nursery stock: Fort Valley Planting Area A1, Blocks 3&4.
Dec. 1913—Source of seed—WYP. project begun in 1908. Completed.
Dec. 1913—General nursery practice, Fort Valley, Progress Report.
Dec. 1913—Test of species, Fort Valley, Progress Report.
Dec. 1913—WYP, Fort Valley Planting area A1, Block 4.
Dec. 1913—Douglas Fir, planting area D-1, Block II & III.
Dec. 1913—Season for planting—Douglas fir, progress report. Area D-1, Block I.
Dec. 1913—Methods of planting Western Yellow Pine, Progress Report, Area A 1, Block 4.
Dec. 1913—Effect of cover—Douglas Fir, progress report, Area D-1.
Nov. 1913—Study of sites—WYP planting in parks, Fort Valley Park. Also, planting in Area B-1, Block III, Plot 2; Area A-1, Block IV, Plots 13 & 33, Area C-1, Block I, Plot 31, Area D-1, Block II, Plot 14.
Dec. 1913—Methods of planting Douglas Fir, progress report, Area D-1.
Dec. 1913—Effect of different methods of cutting, progress report, 4 plots on Coc. NF, begun 1909.
Dec. 1913—Brush disposal, progress report. Greenlaw Sale area (Area C-2), 126 ac.
266 USDA Forest Service RMRS-P-55. 2008.
Dec. 1913—Natural reproduction – WYP, Progress Report, begun in 1908, 5 plots on Coc, 2 plots on Apache.
Dec. 1913—Recuperation of different tree species from injury by grazing, progress report, FV.
Dec. 1913—Root mould in Transplants, progress report. FV nursery.
Dec. 1913—Effect of mistletoe upon the growth and seed production of WYP, progress report.
Dec. 1913—Decadence of mature WYP, progress report.
Nov. 1913—Insect attacks on cupped WYP, progress report. Related to turpentine project, FV.
Dec. 1913—The May-Beetle in forest nurseries and experiments relative to its eradication, FV nursery.
1914:
Dec. 1914—Forestation: Seed studies, FV, begun 1908. Forestation: Nursery Practice, FV, Ft. Bayard, Gallinas nurseries. Forestation: Sowing and planting, FV, Ft. Bayard. Management: Method of cutting, WYP, Douglas fir, begun 1910.
1915:
Dec, 1915 report: District pathologist Dr. W.H. Long working on mistletoe and heart-rot at FV.
New projects: Protection: Fire: Relation of moisture content to inflammability of forest litter and ground cover (climatic survey).
Forest Types: Study of Forest Types.Completed: Nursery practice: time of sowing – exp.
Occurred for @ 4 yrs“: method of sowing“: root development: Forestation: comparison of different classes of wyp
stock: Forestation: Sowing & Planting: Methods of sowing
and playing wyp : forestation: Sowing & Planting: Comp. of diff.
Classes of stock, D Fir : forestation: Sowing & Planting, methods of plant/
sow, D Fir In Progress: Forestation: Seed studies, Source of
seed, wyp Forestation: Nursery: Field nurseries, Dfir, wyp, Engelmann, to complete in 1916. Forestation: Nursery Practice, amount of seed to sow, complete @1917. Forestation: Nursery Practice: time and method of transplanting, complete @1916.
Forestation: Sowing & Planting: study of sites, wypForestation: “ “: test of species, Jeffrey pine
Forestation: Planting & Sowing(?): reforestation of mtn burns
Forestation: Sowing & Planting: test of species, AZ Cypress, complete in 1916.
Forestation: “ “: test of species: black locust, white elm, green ash, desert willow, honey locust, Carolina poplar, box elder, Russian olive, Norway spruce, limber pine, to complete in 1917.
Management: Brush Disposal: Effect of scattering brush after logging upon repro, wyp
Management: Methods of Cutting: effect of diff. Methods, wyp
Management: Natural Repro: nat. repro, wypMensuration: Volume growth and yeidl, wyp, Dfir,
Engel, White firProtection: Grazing: Recuperation of diff. Tree species
from injury by grazingProtection: Disease: effect of mistletoe on growth &
see production of wyp, complete @1917, coop with Dist. Pathologist
Protection: Disease: Decadence of mature wypProtection: Disease: Study of heart rots in relation to
timber sale practice, complete in 1917Protection: Prelimiary study of erosion problem
1916:
“Survey of Work Carried on by the FVES” by G.A. Pearson, 4/7/1916. Summarizes first years of FV work.
1916 Dist Inv committee report: Projects carried on in 1916:
Forestation: Seed Studies, Nursery Pratice, Sowing & Planting
Management: Methods of cutting, brush disposal, natural repro
Mensuration: Volume StudiesProtection: Erosion Studies, fire studies, pathological
studies, isnect studies, windfall studies Forest Types, Economic studies
1917:
FV Bulletin, 5/1/1917: narrative list work in Management Studies (PSPs, mistletoe, rodents, windfall, lightning), Forest Types (determine site factors limiting distribution of tree species), forestation (planting, seed source, nurseries, planting of grasses), Study of Brush Disposal, Douglas Fir Volume Table.
1918:
FV Bulletin 1/1/1918: narrative on Seed Studies, Nursery Practice, Field Planting, Methods of Cutting, Natural Reproduction, Forest Types, durability of Fence Posts. 1918 report on how

USDA Forest Service RMRS-P-55. 2008. 267
Silviculture needs to coop with Grazing to determine sheep numbers grazing on Forest. Suggest project: Damage by Sheep Grazing, Extensive & Historical Study, yp type, on Coc and Tusayan.
1919:
Important projects: Forestation, Methods of Cutting, Management, Study of Forest Types, and Study of Damage by Grazing.
1926:
March, 1926 Historical Facts Regarding the Southwestern Forest Experiment Station – lists when, who. Investigations in 1909: Reproduction of WYP, Forest planting, Brush Disposal, Forest Influences, Establishment of management plots.
Investigations in progress in 1926: 1,2,5 listed above, plus Reproduction & mgmt of Douglas fir and Engelmann spruce, forest types, thinnings, erosion, life history and control of porcupines.
1935–53:
Research projects are found in the USFS Southwestern Forest and Range Experiment Station Annual Reports (copies available at RMRS, Flagstaff, AZ).
Publications Related to Fort Valley Experimental Forest
Research
Aldon, Earl F.; Shaw, Douglas W. eds. 1993. Managing pinon-juniper ecosystems for sustainability and social needs. Gen. Tech. Rep. RMRS-GTR-236. Fort Collins, CO: U.S. Department of Agriculture, Forest Service, Rocky Mountain Forest and Range Experiment Station. 169 p.
Andrews, Stuart R. 1947. Pruning protects young ponderosa pine of the southwest from disease. Forest Pathology. U.S. Department of Agriculture, Bureau of Plant Industry, Division of Forest Pathology. 14 p.
Andrews, Stuart R. 1955. Red rot of ponderosa pine. Agri. Mono. 23. U.S. Department of Agriculture, U.S. Forest Service. 34 p.
Andrews, Stuart R. 1957. Dwarfmistletoe of ponderosa pine in the southwest. Forest Pest Leaflet 19. Washington, DC: U.S. Department of Agriculture, Forest Service. 4 p.
Anon. 1952? Timber growing in ponderosa pine; A guide for field trips. Unpub. Pap. on file at Flagstaff, AZ: U.S. Department of Agriculture, Forest Service, Rocky Mountain Research Station, Fort Valley Experimental Forest archives. 16 p.
Arizona Farmer. 1946. Pearson of the pines. Vol. 25: 1.Arnold, Joseph F. 1942. Forage consumption and preferences of
experimentally fed Arizona and antelope jack rabbits. Tech. Bull. 98. Tucson, AZ: University of Arizona. 86 p.
Arnold, Joseph F. 1950a. Changes in ponderosa pine bunchgrass ranges in northern Arizona resulting from pine regeneration and grazing. Journal of Forestry. 48(2): 118-126.
Arnold, Joseph F. 1950?b. Jack Rabbits and their effects on grazing lands. Unpub. Pap. on file at Flagstaff, AZ: U.S. Department of Agriculture, Forest Service, Rocky Mountain Research Station, Fort Valley Experimental Forest archives. 4 p.
Arnold, Joseph F. 1950c. Range resources and their management in the ponderosa pine zone of northern Arizona. Unpub. Pap. on file at Flagstaff, AZ: U.S. Department of Agriculture, Forest Service, Rocky Mountain Research Station, Fort Valley Experimental Forest archives. 129 p.
Arnold, Joseph F. 1952. Forage management in the multiple-purpose forest lands of northern Arizona. Unpub. Pap. on file at Flagstaff, AZ: U.S. Department of Agriculture, Forest Service, Rocky Mountain Research Station, Fort Valley Experimental Forest archives. 140 p.
Arnold, Joseph F. 1954. Plant life form, a basis for evaluating the ecological condition and trend of range communities within the ponderosa pine zone of Arizona. Unpub. Pap. on file at Flagstaff, AZ: U.S. Department of Agriculture, Forest Service, Rocky Mountain Research Station, Fort Valley Experimental Forest archives. 108 p.
Arnold, Joseph F.; Schroeder, William L. 1955. Juniper control increases forage production on the Fort Apache Indian Reservation. Sta. Pap. 18. U.S. Department of Agriculture, Forest Service, Rocky Mountain Forest and Range Experiment Station. 35 p.
Arnold, Joseph F. 1963. Crusade for rangeland restoration. American Forests. May issue. 5 p.
Arnold, Joseph F.; Jameson, Donald A.; Reid, Elbert H. 1964. The pinyon-juniper type of Arizona: Effects of grazing, fire, and tree control. Prod. Res. Rep. 84. U.S. Department of Agriculture, Forest Service. 28 p.
Arnold, Joseph F. 1969. Reproduction of Arizona Sycamore. Unpub. Pap. on file at Flagstaff, AZ: U.S. Department of Agriculture, Forest Service, Rocky Mountain Research Station, Fort Valley Experimental Forest archives. 3 p.
Arthur, Guy B. 1939. Common range plants, Arizona and New Mexico. P.T. Series 13. U.S. Department of Agriculture, Civilian Conservation Corps Project Training. 118 p.
Avery, Charles C.; Larson, Frederic R.; Schubert, Gilbert H. 1976. Fifty-year records of virgin stand development in southwestern ponderosa pine. Gen. Tech. Rep. RM-22. Fort Collins, CO: U.S. Department of Agriculture, Forest Service, Rocky Mountain Forest and Range Experiment Station. 71 p.
Baker, F.S.; Korstian, Clarence F. 1931. Suitability of brush lands in the intermountain region for the growth of natural or planted western yellow pine forests. Tech. Bull. 256. Washington, DC: U.S. Department of Agriculture. 82 p.
Baker, Malchus B., Jr. 1986. Effects of ponderosa pine treatments on water yield in Arizona. Water Resources Research 22(1): 67-73.
Baker, Malchus B., Jr., comp. 1998a. History of watershed research in the central Arizona highlands. Res. Pap. RMRS-GTR-29. Fort Collins, CO: U.S. Department of Agriculture, Forest Service, Rocky Mountain Research Station. 56 p.
Baker, Malchus B., Jr.; Ffolliott, Peter F. 1998b. Multiple resource evaluations on the Beaver Creek watershed: An annotated bibliography (1956-1996). Gen. Tech. Rep. 13. Fort Collins, CO: U.S. Department of Agriculture, Forest Service, Rocky Mountain Research Station. 69 p.

268 USDA Forest Service RMRS-P-55. 2008.
Bakker, Jonathan D. 2005. Long-term vegetation dynamics of ponderosa pine forests. Flagstaff, AZ: Northern Arizona University. 164 p. Dissertation.
Bakker, Jonathan D.; Moore, Margaret M. 2007. Controls on vegetation structure in southwestern ponderosa pine forests, 1941 and 2004. Ecology. 88(9): 2305-2319.
Bakker, J.D.; Moore, M.M.; Covington, W.W. 2006. Long-term vegetation studies in the southwest. In: Irland, L.C., Camp, A.E., Brissette, J.C., and Donohew, Z.R. (eds). Long-term silvicultural and ecological studies: results for science and management. Global Institute for Sustainable Forestry Research Paper 005. New Haven, CT: Yale University, School of Forestry and Environmental Studies: 187-195.
Barnes, Will C. 1926. The story of the range. Washington, DC: U.S. Department of Agriculture. 60 p.
Barr, George W. 1956. Recovering rainfall: Arizona watershed program. Tucson, AZ: University of Arizona, Department of Agricultural Economics. 33 p.
Bell, D.M.; Parysow, P.F.; Moore, M.M. [In press]. Assessing the representativeness of the oldest permanent inventory plots in northern Arizona ponderosa pine forests. Restoration Ecology.
Berg, Willis E. 1913. Agriculture in the vicinity of Flagstaff, Arizona. Flagstaff, AZ: Northern Arizona Normal School, Agricultural Department. 11 p.
Betts, H.S. 1912. Possibilities of western pines as a source of naval stores. Bull. 116, Washington, DC: U.S. Department of Agriculture, Forest Service. 23 p.
Blake, Elizabeth A.; Wagner, Michael R.; Koerber, Thomas W. 1986. Insects destructive to ponderosa pine crops in northern Arizona. In: Proc. Conifer Tree Seed in the Inland Mtn West; 1985 Aug. 5-9; Missoula, MT IFRES Gen Tech. Rep. INT-203: 238-242.
Bliss, E. Shirley. 1935? A physical comparison of stock injured western yellow pine reproduction with normal reproduction. Unpub. Pap. on file at Flagstaff, AZ: U.S. Department of Agriculture, Forest Service, Rocky Mountain Research Station, Fort Valley Experimental Forest archives. 15 p.
Block, William M.; Finch, Deborah M., tech. eds. 1997. Songbird ecology in southwestern ponderosa pine forests: A literature review. Gen. Tech. Rep. RM-GTR-292. Fort Collins, CO: U.S. Department of Agriculture, Forest Service, Rocky Mountain Forest and Range Experiment Station. 152 p.
Braun, C.D.; Enderson, J.H.; et.al. 1996. Northern goshawk and forest management in the southwestern United States. Wildl. Soc. Tech. Rev. 96-2. 19 p.
Brown, Harry E. 1965. Preliminary results in cabling Utah juniper, Beaver Creek watershed evaluation project. 1965 Sept. 22; Tempe, AZ. Proc. Arizona Watershed Symp: 16-21.
Brown, Harry E. 1970. Status of pilot watershed studies in Arizona. Journal of the Irrigation and Drainage Division, ASCE 96(IR1) Proc. Pap. 7129: 11-23.
Brown, Harry E.; Baker, Malchus B., Jr.; Rogers, James J.; Clary, Warren P.; Kovner, J.L.; Larson, Frederic R.; Avery, Charles C.; Campbell, Ralph E. 1974. Opportunities for increasing water yields and other multiple use values on ponderosa pine forest lands. Res. Pap. RM-129. Fort Collins, CO: U.S. Department of Agriculture, Forest Service, Rocky Mountain Forest and Range Experiment Station. 36 p.
Cable, Dwight R. 1958. Estimating surface area of ponderosa pine foliage in central Arizona. Forest Science. 4(1): 45-49.
Campbell, Robert S.; Crafts, Edward C. 1939. How to keep and increase black grama on southwestern ranges. Leaflet 180, Washington, DC: U.S. Department of Agriculture. 8 p.
Campbell, Robert S. 1940. Range management research methods in the western U.S. Herbage Review. 8(3,4): 121-138.
Canfield, R.H. 1941. Application of the line interception method in sampling range vegetation. Journal of Forestry. 39(4): 388-394.
Canfield, R.H. 1942. Sampling ranges by the line interception method. Res. Rep. 4. Tucson, AZ: U.S. Department of Agriculture, Forest Service, Southwestern Forest and Range Experiment Station. 28 p.
Cassidy, H.O. 1937. How cattle may use cut-over ponderosa pine-bunchgrass ranges with minimum injury to reproduction. Res. Note 15, Tucson, AZ: U.S. Department of Agriculture, Forest Service, Southwestern Forest and Range Experiment Station. 3 p.
Chapel, William L. 1937. A guide to the forest trees of Arizona and New Mexico. CCC Training Course. Albuquerque, NM: U.S. Department of Agriculture, Forest Service, Southwestern Region. 52 p.
Chapline, W.R.; Campbell, R.S. 1938. Managing our range resources. Journal of Forestry. 36(9): 849-852.
Chapline, W.R. 1980. First 10 years of the office of grazing studies. Rangelands. 2(6): 223-227.
Clapp, Earle H. 1936. Management and use of forest and range lands. Unpub. Pap. on file at Flagstaff, AZ: U.S. Department of Agriculture, Forest Service, Rocky Mountain Research Station, Fort Valley Experimental Forest archives. 11 p.
Clary, W.P. 1964. A method for predicting potential herbage yields on the Beaver Creek pilot watersheds. In: Forage plant physiology and soil-range relationships. American Society of Agronomists Spec. Pub. 5: 244-250.
Clary, Warren P.; Ffolliott, Peter F.; Jameson, Donald A. 1968. Relationship of different forest floor layers to herbage production. Res. Note RM-123. Fort Collins, CO: U.S. Department of Agriculture, Forest Service, Rocky Mountain Forest and Range Experiment Station. 3 p.
Clary, Warren P.; Pearson, Henry A. 1969a. Cattle preferences for forage species in northern Arizona. Journal of Range Management. 22(2): 114-116.
Clary, Warren P.; Ffolliott, Peter F. 1969b. Water holding capacity of ponderosa pine forest floor layers. J. of Soil and Water Cons. 24(10). 2 p.
Clary, W.P. 1972. A treatment prescription for improving big game habitat in ponderosa pine forest. In: Proc. 16th Ann. AZ Watershed Symp: 25-28.
Clary, Warren P. 1975a. Present and future multiple use demands on the pinyon-juniper type. In: The pinyon-juniper ecosystem: A symposium. 1975 May. Logan, UT. Proc. Utah State University, Utah Agricultural Experiment Station: 19-26.
Clary, Warren P.; Kruse, William H.; Larson, Frederic R. 1975b. Cattle grazing and wood production with different basal areas of ponderosa pine. Journal of Range Management. 28(6): 434-437.
Clary, Warren P. 1975. Range management and its ecological basis in the ponderosa pine type of Arizona: The status of our knowledge. Res. Pap. RM-158. Fort Collins, CO: U.S. Department of Agriculture, Forest Service, Rocky Mountain Forest and Range Experiment Station. 35 p.

USDA Forest Service RMRS-P-55. 2008. 269
Clary, W.P. 1978. Arizona fescue mountain rangelands. In: Hyder, Donald N., ed. Proc.1st Intn. Rangeland Cong. Denver, CO: Society for Range Management: 205-207.
Clary, Warren P. 1978. Producer-consumer biomass in Arizona ponderosa pine. Gen. Tech. Rep. RM-56. Fort Collins, CO: U.S. Department of Agriculture, Forest Service, Rocky Mountain Forest and Range Experiment Station. 4 p.
Clary, Warren P.; Kruse, William H. 1979. Phenology and rate of height growth of some forbs in the southwestern ponderosa pine type. Res. Note RM-37. Fort Collins, CO: U.S. Department of Agriculture, Forest Service, Rocky Mountain Forest and Range Experiment Station. 8 p.
Clary, W.P.; Jameson, D.A. 1981. Herbage production following tree and shrub removal in the pinyon-juniper type of Arizona. Journal of Range Management. 34: 109-113.
Clary, W.P.; Kruse, W.H. 2004. Livestock grazing in riparian areas: environmental impacts, management practices and management implications. In: Baker, Malchus B., Jr.; Ffolliott, Peter F.; DeBano, Leonard F.; Neary, Daniel G., eds. Riparian areas of the Southwestern United States. Boca Raton, FL: Lewis Pub: 237-258.
Cooperrider, Charles K. 1924. The national forests of Arizona. Dept. Circ. 318: Washington, DC: U.S. Department of Agriculture. 18 p.
Cooperrider, Charles K. 1931. Watershed conditions. Unpub. Pap. on file at Flagstaff, AZ: U.S. Department of Agriculture, Forest Service, Rocky Mountain Research Station, Fort Valley Experimental Forest archives. 8 p.
Cooperrider, Charles K. 1936. Forests. In: Arizona and its heritage. Gen. Bull. 3. Tucson, AZ: University of Arizona: 53-60.
Cooperrider, Charles K.; Cassidy, H.O. 1937. Cattle grazing on cut-over timberlands in relation to regeneration of pine forests. Unpub. Pap. on file at Flagstaff, AZ: U.S. Department of Agriculture, Forest Service, Rocky Mountain Research Station, Fort Valley Experimental Forest archives. 93 p.
Cooperrider, Charles K. 1938. Recovery processes of ponderosa pine reproduction following injury to young annual growth. Plant Physiology. 5-27.
Cooperrider, Charles K.; Cassidy, H.O.; Niederhof, C.H. 1945. Forecasting stream-flow of the Salt River, Arizona. American Geophysical Union. Transactions. 26(2): 275-282.
Cooperrider, Charles K.; Sykes, Glenton G. 1938. The relationship of stream flow to precipitation on the Salt River watershed above Roosevelt Dam. Tech. Bull. 76. Tucson, AZ: University of Arizona, College of Agriculture, Agricultural Experiment Station. 69 p.
Cooperrider, Charles K.; Hendricks, B.A. 1940. The role of vegetation on steep mountain slopes. Res. Note 85. Tucson, AZ: U.S. Department of Agriculture, Forest Service, Southwestern Forest and Range Experiment Station. 3 p.
Cotner, Melvin L.; Jameson, Donald A. 1959. Costs of juniper control: Bulldozing vs. burning individual trees. Sta. Pap. 43. Fort Collins, CO: U.S. Department of Agriculture, Forest Service, Rocky Mountain Forest and Range Experiment Station. 14 p.
Covington, Wallace W.; Moore, Margaret M. 1994a. Postsettlement changes in natural fire regimes and forest structure: Ecological restoration of old-growth Ponderosa pine forests. Ecological and Historical Perspectives. Co-published simultaneously in the Journal of Sustainable Forestry 2(1/2): 153-181; Sampson, R. Neil, Adams, David L., eds. Assessing Forest Ecosystem Health in the Inland West The Haworth Press, Inc.
Covington, Wallace W.; Moore, Margaret M. 1994b. Southwestern ponderosa forest structure. Journal of Forestry. 92(1): 39-47.
Covington, Wallace W.; Fulé, P.Z.; Moore, M.M.; Hart, S.C.; Kolb, T.E.; Mast, J.N.; Sackett, S.S.; Wagner, M.R. 1997. Restoring ecosystem health in ponderosa pine forests of the southwest. Journal of Forestry. 95(4): 23-29.
Crafts, Edward C. 1938. Experimental ranges and other range research centers of the Forest Service. Tucson, AZ: U.S. Department of Agriculture, Forest Service, Southwestern Forest and Range Experiment Station. 14 p.
Crafts, Edward C. 1938. Range utilization tables and charts. Unpub. Pap. on file at Flagstaff, AZ: U.S. Department of Agriculture, Forest Service, Rocky Mountain Research Station, Fort Valley Experimental Forest archives. 29 p.
Dahms, Cathy W.; Geils, Brian W. 1997. An assessment of forest ecosystem health in the southwest. Gen. Tech. Rep. RM-GTR-295. Fort Collins, CO: U.S. Department of Agriculture, Forest Service, Rocky Mountain Forest and Range Experiment Station. 97 p.
Dana, Samuel Trask. 1909. Experiment stations in connection with the national forest. Proc. Society of America Foresters. Vol. 4(1): 23-29.
Dayton, W.A. 1931. Glossary of botanical terms commonly used in range research. Misc. Pub.110. Washington, DC: U.S. Department of Agriculture. 40 p.
Dieterich, John H. 1976. Prescribed burning in ponderosa pine—state of the art. Unpub. Pap. on file at Flagstaff, AZ: U.S. Department of Agriculture, Forest Service, Rocky Mountain Research Station, Fort Valley Experimental Forest archives. 18 p.
Dieterich, John H. 1980a. Chimney Spring forest fire history. Res. Pap. RM-220. Fort Collins, CO: U.S. Department of Agriculture, Forest Service, Rocky Mountain Forest and Range Experiment Station. 8 p.
Dieterich, John H. 1980b. The composite fire interval—a tool for more accurate interpretation of fire history. In: Stokes, Marvin A.; Dieterich, John H. tech. coord. Proc. of the fire history workshop; 1980 October 20-24; Tucson, AZ. Proc. Gen. Tech. Rep. RM-81. Fort Collins, CO: U.S. Department of Agriculture, Forest Service, Rocky Mountain Forest and Range Experiment Station: 8-14.
Dieterich, John H.; Swetnam, Thomas W. 1984. Dendrochronology of a fire-scarred ponderosa pine. Forest Science. 30(1): 238-247.
Dittmer, Howard J. 1951. Vegetation of the southwest—past and present. The Texas Journal of Science. 3(3): 350-355.
Dorroh, John H., Jr. 1946. Certain hydrologic and climatic characteristics of the southwest. UNM Pub. in Eng. 1. Albuquerque, NM: University of New Mexico Press. 64 p.
Dorroh, John H., Jr. 1951. Watershed yields in Arizona and New Mexico. Unpub. Pap. on file at Flagstaff, AZ: U.S. Department of Agriculture, Forest Service, Rocky Mountain Research Station, Fort Valley Experimental Forest archives. 8 p.
Evans, Keith E., tech. coord. 1997. Research needs for forest and rangeland management in Arizona and New Mexico. RM-GTR-291. Fort Collins, CO: U.S. Department of Agriculture, Forest Service, Rocky Mountain Forest and Range Experiment Station. 27 p.
Fernow, Bernhard E. 1897. The forests and deserts of Arizona. National Geographic. 8.

270 USDA Forest Service RMRS-P-55. 2008.
Ffolliott, P.F.; Clary, W.P. 1975a. Differences in herbage-timber relationships on sedimentary and igneous soils in Arizona ponderosa pine stands. Prog. Agric. Ariz. 27(3): 6-7.
Ffolliott, Peter F.; Patton, David R. 1975b. Production-rating functions for Abert squirrels in southwestern ponderosa pine. Wild. Soc. Bull. 3: 162-165.
Ffolliott, Peter F.; Thorud, David B. 1975c. Vegetation management for increased water yield in Arizona. Tech. Bull. 215. Tucson, AZ: University of Arizona, Agricultural Experiment Station. 38 p.
Ffolliott, Peter F.; Patton, David R. 1978. Abert squirrel use of ponderosa pine as feed trees. Res. Note RM-362. Fort Collins, CO: U.S. Department of Agriculture, Forest Service, Rocky Mountain Forest and Range Experiment Station. 4 p.
Ffolliott, Peter F.; Gottfried, Gerald J. 1991a. Mixed conifer and aspen regeneration in small clearcuts within a partially harvested Arizona mixed conifer forest. Res. Pap. RM-294. Fort Collins, CO: U.S. Department of Agriculture, Forest Service, Rocky Mountain Forest and Range Experiment Station. 9 p.
Ffolliott, Peter F.; Gottfried, Gerald J. 1991b. Natural tree regeneration after clearcutting in Arizona’s ponderosa pine forests. Two long-term case studies. Res. Note RM-507. Fort Collins, CO: U.S. Department of Agriculture, Forest Service, Rocky Mountain Forest and Range Experiment Station. 6 p.
Ffolliott, Peter F.; Baker, Malchus B., Jr.; and others, tech. coords. 2000. Land stewardship in the 21st Century: The contributions of watershed management. 2000 March 13-16; Tucson, AZ. Proc. RMRS-P-13. Fort Collins, CO: U.S. Department of Agriculture, Forest Service, Rocky Mountain Research Station. 438 p.
Ffolliott, P.F.; Gottfried, G.J.; Kruse, W.H. 2003. Vegetation management practices: Past and Present. Pp 48-58. In: McClaran M.P.; Ffolliott P.F.; Edminster, C.B. 2003 Santa Rita Experimental Range: 100 years (1903-2003) of accomplishments and contributions. Conf Proc; 2003 Oct 30-Nov 1; Tucson AZ. Proc RMRS-P-30. Ogden UT: U.S. Department of Agriculture, Forest Service, Rocky Mountain Research Station. 197 p.
Fletcher, Rick. 1979. Regeneration in the southwest—it can work! Forestry Research West: 9-12.
Fletcher, Rick. 1986. It helps…Understanding seedling hardiness. American Christmas Tree Journal. 30(3): 61-63.
Foerster, Max H. 1911. The influence of a western yellow pine forest on the accumulation and melting of snow. Unpub. Pap. on file at Flagstaff, AZ: U.S. Department of Agriculture, Forest Service, Rocky Mountain Research Station, Fort Valley Experimental Forest archives. 36 p.
Forsling, C.L. 1957. The water challenge of the southwest. Speech at Soil Conservation Society of America. Unpub. Pap. on file at Flagstaff, AZ: U.S. Department of Agriculture, Forest Service, Rocky Mountain Research Station, Fort Valley Experimental Forest archives. 16 p.
Fox, Kel M.; Ffolliott, Peter F.; Baker, Malchus B., Jr.; DeBano, Leonard F. 2000. More water for Arizona: A history of the Arizona Water Resources Committee. Phoenix, AZ: Primer Publishers. 118 p.
Fritz, Emanuel. 1958. Reminiscences of Fort Valley, 1916-1917. Text of speech given at 50th anniversary, Fort Valley, Arizona. Unpub. Pap. on file at Flagstaff, AZ: U.S. Department of Agriculture, Forest Service, Rocky Mountain Research Station, Fort Valley Experimental Forest archives. 12 p.
Fritz, Emanuel. 1964. Recollections of Fort Valley, 1916-1917. Forest History. 8(3): 2-6.
Fulé, Peter Z. 2001. Periodic remeasurement of the Gus Pearson Natural Area. Flagstaff, AZ: Northern Arizona University, Ecological Restoration Institute. 21 p.
Gaines, Edward M.; Kotok, E.S. 1954. Thinning ponderosa pine in the southwest. Sta. Pap. 17. Fort Collins, CO: U.S. Department of Agriculture, Forest Service, Rocky Mountain Forest and Range Experiment Station. 20 p.
Gaines, Edward M. 1955. A test of “plotless” timber cruising. Special management camp. Unpub. Pap. on file at Flagstaff, AZ: U.S. Department of Agriculture, Forest Service, Rocky Mountain Research Station, Fort Valley Experimental Forest archives. 6 p.
Gaines, Edward M.; Shaw, Elmer W. 1958. Half a century of research—Fort Valley Experimental Forest 1908-1958. Sta. Pap. 38. Fort Collins, CO: U.S. Department of Agriculture, Forest Service, Rocky Mountain Forest and Range Experiment Station. 17 p.
Geils, Brian W.; Tovar, Jose C.; Moody, Benjamin. tech. cords. 2002. Mistletoes of North American conifers. RMRS-GTR-98. Fort Collins, CO: U.S. Department of Agriculture, Forest Service, Rocky Mountain Research Station. 123 p.
Gill, Lake S.; Hawksworth, Frank G. 1954. Dwarfmistletoe control in southwestern ponderosa pine forests under management. Journal of Forestry. 52(5): 347-353.
Glendening, G. E. 1941. Work plan—summer 1941: Hill study plots—Coconino. Unpub. Pap. on file at Flagstaff, AZ: U.S. Department of Agriculture, Forest Service, Rocky Mountain Research Station, Fort Valley Experimental Forest archives. 3 p.
Glendening, George E. 1944. Some factors affecting cattle use of northern Arizona pine-bunchgrass ranges. Res. Rep. 6. Tucson, AZ: U.S. Department of Agriculture, Forest Service, Southwestern Forest and Range Experiment Station. 9 p.
Glock, Waldo S. 1933. Tree-ring analysis on Douglass System. Pan-American Geologist. 60. 14 p.
Glock, Waldo S. 1934. The language of tree rings. The Scientific Monthly. 38: 501-510.
Glock, Waldo S. 1937. Principles and methods of tree-ring analysis. Washington, DC: Carnegie Institution of Washington. 100 p.
Gottfried, Gerald J.; Embry, Robert S. 1977. Distribution of Douglas-fir and ponderosa pine dwarf mistletoes in a virgin Arizona mixed conifer stand. Res. Pap. RM-192. Fort Collins, CO: U.S. Department of Agriculture, Forest Service, Rocky Mountain Forest and Range Experiment Station. 16 p.
Gottfried, Gerald J. 1980. Control of New Mexican locust and the effect on planted ponderosa pine in central Arizona. Res. Note RM-386. Fort Collins, CO: U.S. Department of Agriculture, Forest Service, Rocky Mountain Forest and Range Experiment Station. 6 p.
Gottfried, Gerald J. 1983. Stand changes on a southwestern mixed conifer watershed after timber harvesting. Journal of Forestry. 83(5): 311-316.
Gottfried, Gerald J.; Patton, David R. 1984. Pocket gopher food habits in two disturbed forest sites in central Arizona. Res. Pap. RM-255. Fort Collins, CO: U.S. Department of Agriculture, Forest Service, Rocky Mountain Forest and Range Experiement Station. 9 p.

USDA Forest Service RMRS-P-55. 2008. 271
Gottfried, Gerald J.; Heidmann, L.J. 1986. Effects of cold stratification and seed coat sterilization treatments on pinyon (Pinus edulis) germination. In: Proc. Conifer Tree Seed in the Inland Mountain West; 1985 Aug 5-9; Missoula, MT; Gen. Tech. Rep Int-203. Ogden, UT: Intermountain Forest and Range Experiment Station. 6 p.
Gottfried, Gerald J.; Heidmann, L.J. 1992. Effects of gibberellic acid, N-6-benzylaminopurine, and acetone on pinyon (Pinus edulis) germination. Res. Note RM-514. Fort Collins, CO: U.S. Department of Agriculture, Forest Service, Rocky Mountain Forest and Range Experiment Station. 5 p.
Greenamyre, Harold H. 1912? Growth in western yellow pine stands before and after cutting. Unpub. Pap. on file at Flagstaff, AZ: U.S. Department of Agriculture, Forest Service, Rocky Mountain Research Station, Fort Valley Experimental Forest archives. 25 p.
Haasis, Ferdinand W. 1921. Relations between soil type and root form of western yellow pine seedlings. Ecology. 2(4): 292-303.
Haasis, Ferdinand W. 1923. Frost heaving of western yellow pine seedlings. Ecology. 4(4): 378-390.
Hansen, Edward A.; Ffolliott, Peter F. 1968. Observations of snow accumulation and melt in demonstration cuttings of ponderosa pine in central Arizona. Res. Note RM-11. Fort Collins, CO: U.S. Department of Agriculture, Forest Service, Rocky Mountain Forest and Range Experiment Station. 12 p.
Harrington, Michael G. 1987. Ponderosa pine mortality from spring, summer, and fall crown scorching. West. J. Appl. For. 2: 14-16.
Harrington, Michael G.; Sackett, Stephen S. 1988. Using fire as a management too in southwestern ponderosa pine. In: Krammes, J.S., tech. coord. Effects of fire management of southwestern natural resources. 1988 November 15-17; Tucson, AZ. Gen. Tech. Rep. RM-191. Fort Collins, CO: U.S. Department of Agriculture, Forest Service, Rocky Mountain Forest and Range Experiment Station: 122-133.
Hatfield, Ira J. 1933. The establishment of an experimental mistletoe-control plot at the Fort Valley Experimental Forest, Flagstaff, Arizona. USFS Field Report, Sept. 29, 1933. Unpub. Pap. on file at Flagstaff, AZ: U.S. Department of Agriculture, Forest Service, Rocky Mountain Research Station, Fort Valley Experimental Forest archives. 15 p.
Hawksworth, Frank G. 1951b. Seventeen year record on the 1933 Fort Valley mistletoe control plots. Washington, DC: U.S. Department of Agriculture, Bureau of Plant Industry, Division of Forest Pathology. 16 p.
Hawksworth, Frank G.; Andrews, Stuart R. 1961. Guides for pruning dwarfmistletoe-infected ponderosa pine branches. Res. Note RM-64. Fort Collins, CO: U.S. Department of Agriculture, Forest Service, Rocky Mountain Forest and Range Experiment Station. 3 p.
Hawksworth, Frank G. 1965. Notes on arceuthobium on bristlecone pine. Leaflets of Western Botany. 10(10): 163-164.
Hawksworth, F.G.; Wiens, D. 1970. Biology and taxonomy of the dwarf mistletoes. Annual Review of Phytopathology. 8: 187-208.
Hayes, D.C.; Bumstead, Jon S.; Richards, Merton T. eds. A southwestern mosaic: Proceedings of the southwestern region new perspectives University Colloquium; 1991 Oct/Nov; New Mexico and Arizona. Gen. Tech. Rep. RM-216. Fort Collins, CO: U.S. Department of Agriculture, Forest Service, Rocky Mountain Forest and Range Experiment Station. 52 p.
Heidmann, L.J.; Bierwagen, Walter. 1961. Improved cone-drying rack. USDAFS Tree Planter’s Notes 47: 13-14.
Heidmann, L.J. 1962. Longevity of ponderosa pine seed. Ecology. 43(2): no page no.
Heidmann, L.J. 1963a. Deer repellents are effective on ponderosa pine in the southwest. Journal of Forestry. 61(1): 53-54.
Heidmann, L.J. 1963b. Effects of rock mulch and scalping on survival of ponderosa pine in the southwest. Res. Note RM-10. Fort Collins, CO: U.S. Department of Agriculture, Forest Service, Rocky Mountain Forest and Range Experiment Station. 7 p.
Heidmann, L.J. 1963c. Heavy pruning reduces growth of southwestern ponderosa pine. Res. Note RM-3. Fort Collins, CO: U.S. Department of Agriculture, Forest Service, Rocky Mountain Forest and Range Experiment Station. 3 p.
Heidmann, L.J. 1967. Herbicides for preparing ponderosa pine planting sites in the southwest. Res. Note RM-83. Fort Collins, CO: U.S. Department of Agriculture, Forest Service, Rocky Mountain Forest and Range Experiment Station. 4 p.
Heidmann, L.J. 1968. Herbicides for preparing ponderosa pine planting sites in the southwest. Down to Earth. 24(1): 18-20.
Heidmann, L.J. 1968. Silvicultural control of dwarf mistletoe in heavily infected stands of ponderosa pine in the southwest. Res. Pap. RM-36. Fort Collins, CO: U.S. Department of Agriculture, Forest Service, Rocky Mountain Forest and Range Experiment Station. 11 p.
Heidmann, L.J. 1969. Use of herbicides for planting site preparations in the southwest. Journal of Forestry. 67(7): 506-509.
Heidmann, L.J. 1970. Pre-emergent herbicides for preparing ponderosa pine planting sites in the southwest. Res. Note RM-164. Fort Collins, CO: U.S. Department of Agriculture, Forest Service, Rocky Mountain Forest and Range Experiment Station. 4 p.
Heidmann, L.J. 1972. An initial assessment of mammal damage in the forests of the southwest. Res. Note RM-219. Fort Collins, CO: U.S. Department of Agriculture, Forest Service, Rocky Mountain Forest and Range Experiment Station. 7 p.
Heidmann, L.J. 1973. Frost heaving in ponderosa pine. In: Proc. Ann. Mtg. Western Reforestation Coord. Committee; San Jose, CA; 1973 Dec 4-5: 136-138.
Heidmann, L.J. 1974a. An inexpensive chest for conducting frost heaving experiments. Res. Note RM-269. Fort Collins, CO: U.S. Department of Agriculture, Forest Service, Rocky Mountain Forest and Range Experiment Station. 4 p.
Heidmann, L.J. 1974b. An investigation into the causes and prevention of frost heaving of forest tree seedlings. Tucson, AZ: University of Arizona. 183 p. Dissertation.
Heidmann, L.J. 1975. Predicting frost heaving susceptibility of Arizona soils. Res. Note RM-295. Fort Collins, CO: U.S. Department of Agriculture, Forest Service, Rocky Mountain Forest and Range Experiment Station. 7 p.
Heidmann, L. J.; Thorud, David B. 1975. Effect of bulk density on frost heaving of six soils In Arizona. Res. Note RM-294. Fort Collins, CO: U.S. Department of Agriculture, Forest Service, Rocky Mountain Forest and Range Experiment Station. 4 p.
Heidmann, L.J. 1976a. Frost heaving of tree seedlings: A literature review of causes and possible control. Gen. Tech. Rep. RM-21. Fort Collins, CO: U.S. Department of Agriculture, Forest Service, Rocky Mountain Forest and Range Experiment Station. 10 p.

272 USDA Forest Service RMRS-P-55. 2008.
Heidmann, L.J.; Thorud, David B. 1976b. Controlling frost heaving of ponderosa pine seedlings in Arizona. Res. Pap. RM-172. Fort Collins, CO: U.S. Department of Agriculture, Forest Service, Rocky Mountain Forest and Range Experiment Station. 12 p.
Heidmann, L.J.; Larson, Frederic R.; Rietveld, W.J. 1977. Evaluation of ponderosa pine reforestation techniques in central Arizona. Res. Pap. RM-190. Fort Collins, CO: U.S. Department of Agriculture, Forest Service, Rocky Mountain Forest and Range Experiment Station. 10 p.
Heidmann, L.J.; Rietveld, W.J.; Trujillo, D.P. 1979. Fertilization Increases cone production and diameter growth of a 55-year-old ponderosa pine stand in Arizona. In: Proc. Flowering and seed development in trees: A symposium, Southern For. Exp. Sta, Miss. St. Uni. IUFRO. 1978 May 15-18: 197-205.
Heidmann, L.J. 1981. Overcoming temperature-dependent dormancy of southwestern ponderosa pine. Res. Note RM-406. Fort Collins, CO: U.S. Department of Agriculture, Forest Service, Rocky Mountain Forest and Range Experiment Station. 4 p.
Heidmann, L.J. 1982. Effect of selected natural and synthetic growth regulators on the growth of ponderosa pine seedlings. Forest Science. 28(1): 156-160.
Heidmann, L.J., Johnsen, Thomas N., Jr.; Cole, Quinten W.; Cullum, George. 1982. Establishing natural regeneration of ponderosa pine in central Arizona. Journal of Forestry. 80(2): 77-79.
Heidmann, L.J. 1983. Seed production in southwestern ponderosa pine on a sedimentary soil. Res. Note RM-434. Fort Collins, CO: U.S. Department of Agriculture, Forest Service, Rocky Mountain Forest and Range Experiment Station. 2 p.
Heidmann, L.J. 1983. Silvicultural control of dwarf mistletoe in southwestern ponderosa pine. Res. Note RM-433. Fort Collins, CO: U.S. Department of Agriculture, Forest Service, Rocky Mountain Forest and Range Experiment Station. 4 p.
Heidmann, L.J. 1984a. Fertilization increases cone production in a 55-year-old ponderosa pine stand in central Arizona. Forest Science 30(4): 1079-1083.
Heidmann, L.J. 1984b. Using herbicides for reforestation in the southwest. Gen. Tech. Rep. RM-103. Fort Collins, CO: U.S. Department of Agriculture, Forest Service, Rocky Mountain Forest and Range Experiment Station. 12 p.
Heidmann, L.J.; Haase, Sally M. 1984. Herbicides for controlling weeds at the Albuquerque forest tree nursery. In: Proc. Combined Mtg. Western Forest Nursery Council and Intermountain Nurseryman’s Association; Coeur d’Alene, ID; 1984 Aug 14-16: 91-94.
Heidmann, L.J. 1985. Ponderosa pine regeneration in the southwest. In: Proc. Soc. Am. For. Natl. Conv. Fort Collins, CO; 1985 July 28-31: 228-232.
Heidmann, L.J.; Cornett, Zane J. 1985. Effect of various nutrient regimes and ectomycorrhizal inoculations on field survival and growth of ponderosa pine (Pinus ponderosa var. scopulorum Engelm.) Container seedlings in Arizona.Tree Planters’ Notes. 37(2): 15-19.
Heidmann, L.J. 1986. Acetone is unreliable as a solvent for introducing growth regulators into seeds of southwestern ponderosa pine (Pinus ponderosa var. scopulorum). In: Proc. Conifer Tree Seed in the Inland Mtn West; Missoula, MT; 1985 Aug 5-9. Gen. Tech. Rep. INT-203. Ogden, UT: U.S. Department of Agriculture, Forest Service, Intermountain Forest and Range Experiment Station: 44-46.
Heidmann, L.J. 1986. The interaction of givverellic acid, N-6-benzylaminopurine and abscisic acid in the germination of pinus ponderosa var. scopulorum. 21st ISTA Congress; Brisbane, Australia; 1986 July 10-19. 16 p.
Heidmann, L.J. Regeneration strategies for ponderosa pine. In: Ponderosa pine the species and its management, Symp. Proc. Coop. Exten; Wash. State Univ; 1987 Sept 29–Oct. 1: 227-233.
Heidmann, L.J. 1989. Induction of buds on juvenile conifers with N-6-benzylaminopurine and phloroglucinol. Res. Rep. Plant Propagator. 1(1): 14-16.
Heidmann, L.L.; Haase, Sally M. 1989. Causes of mortality in outplanted ponderosa pine container seedlings in the southwest. USDAFS Tree Planter’s Notes. 40(3): 16-19.
Heidmann, L.J.; Harrington, Michael G.; King, Rudy M. 1990. Comparison of moisture retention curves for representative basaltic and sedimentary soils in Arizona prepared by two methods. Res. Note RM-500. Fort Collins, CO: U.S. Department of Agriculture, Forest Service, Rocky Mountain Forest and Range Experiment Station. 4 p.
Heidmann, L.J.; King, Rudy M. 1992. Effect of prolonged drought on water relations of ponderosa pine seedlings grown in basalt and sedimentary soils. Res. Pap. RM-301. Fort Collins, CO: U.S. Department of Agriculture, Forest Service, Rocky Mountain Forest and Range Experiment Station. 8 p.
Heidmann, L.J.; Ffolliott, Peter F.; Gottfried, Gerald J. 1997. Thirty-year growth and yield of a ponderosa pine plantation in Arizona. Res. Note RM-RN-537. Fort Collins, CO: U.S. Department of Agriculture, Forest Service, Rocky Mountain Forest and Range Experiment Station. 6 p.
Herman, Francis R. 1949. Growth of aspen following partial cutting. Res. Note 117. Tucson, AZ: U.S. Department of Agriculture, Forest Service, Southwestern Forest and Range Experiment Station. 3 p.
Herman, Francis R. 1949. Use of “Ammate” for poisoning ponderosa pine in stand improvement. Res. Note. 118. Tucson, AZ: U.S. Department of Agriculture, Forest Service, Southwestern Forest and Range Experiment Station. 5 p.
Herman, Francis R. 1950. Survival of fire-damaged ponderosa pine—A progress report. Res. Note SW-119. Tucson, AZ: U.S. Department of Agriculture, Forest Service, Southwestern Forest and Range Experiment Station. 3 p.
Herman, Francis R. 1954. A guide for marking fire-damaged ponderosa pine in the southwest. Res. Note 13. Fort Collins, CO: U.S. Department of Agriculture, Forest Service, Rocky Mountain Forest and Range Experiment Station. 4 p.
Herman, Francis R. 1954. Use of “Ammate” crystals for poisoning ponderosa pine in stand improvement. Res. Note RM-14. Fort Collins, CO: U.S. Department of Agriculture, Forest Service, Rocky Mountain Forest and Range Experiment Station. 5 p.
Herman, Francis R. 1958. Silvical characteristics of Rocky Mountain juniper. Sta. Pap. 29. Fort Collins, CO: U.S. Department of Agriculture, Forest Service, Rocky Mountain Forest and Range Experiment Station. 20 p.
Hill, Robert R. 1911. Damage to forest reproduction by grazing on the Coconino and Tusayan National Forests. Washington, DC: U.S. Department of Agriculture, Forest Service. 42 p.
Hill, Robert R. 1917. Effects of grazing upon western yellow-pine reproduction in the national forests of Arizona and New Mexico. Bull. 580. Washington, DC: U.S. Department of Agriculture, Forest Service. 27 p.

USDA Forest Service RMRS-P-55. 2008. 273
Hill, Robert R.1918. Can an over-grazed range come back? Progress Rep., Albuquerque, NM: U.S. Department of Agriculture, Forest Service, District 3. 6 p.
Hill, R.R.1921. Notes taken on Coconino trip with grazing examiner M. W. Talbot, Fall of 1921. Unpub. Pap. on file at Flagstaff, AZ: U.S. Department of Agriculture, Forest Service, Rocky Mountain Research Station, Fort Valley Experimental Forest archives. 20 p.
Hornibrook, Ezra M.1935. Some results of thinning in small pole stands of ponderosa pine in the southwest. Journal of Forestry. 34(9): 862-866.
Hornibrook, Ezra M.1948. Merchantable height volume table for engelmann spruce. Res. Note RM-3. Fort Collins, CO: U.S. Department of Agriculture, Forest Service, Rocky Mountain Forest and Range Experiment Station. 2 p.
Hornibrook, Ezra M. 1936. The effectiveness of partial bark peeling in the control of ips. Journal of Forestry. 34 (6): 620-622.
Huffman, D. W., Moore, M.M. 2004. Responses of fendler ceanothus to forest thinning, prescribed fire, and drought in an Arizona ponderosa pine forest. Forest Ecology and Management. 198: 105-115.
Humphrey, Robert R. 1955. Forage production on Arizona ranges, IV. Coconino, Navajo, Apache Counties: A study in range condition. Bull. 266. Tucson, AZ: University of Arizona. 84 p.
Huss, Donald L.1964. A glossary of terms used in range management. Portland, OR: American Society of Range Management. 32 p.
Jaenicke, Alexander J.; Foerster, M.H. 1915. The influence of a western yellow pine forest on the accumulation and melting of snow. The Monthly Weather Review 43: 115-126.
Jameson, Donald A. 1961b. Growth inhibitors in native plants of northern Arizona. Res. Note RM-61. Fort Collins, CO: U.S. Department of Agriculture, Forest Service, Rocky Mountain Forest and Range Experiment Station. 2 p.
Jameson, Donald A. 1965. Arrangement and growth of pinyon and one-seed juniper trees. Flagstaff, AZ: Museum of Northern Arizona. Plateau. 37(4): 121-127.
Jameson, Donald A. 1967. The relationship of tree overstory and herbaceous understory vegetation. Journal of Range Management. 20(4): 247-249.
Jameson, Donald A. 1968a. Rainfall patterns on vegetation zones in northern Arizona. Flagstaff, AZ: Museum of Northern Arizona. Plateau. 41(3): 105-111.
Jameson, Donald A. 1968b. Species interactions of growth inhibitors in native plants of northern Arizona. Res. Note RM-113. Fort Collins, CO: U.S. Department of Agriculture, Forest Service, Rocky Mountain Forest and Range Experiment Station. 2 p.
Jameson, Donald A.; Dodd, J.A. 1969. Herbage production differs with soil in the pinyon-juniper type of Arizona. Res. Note RM-131. Fort Collins, CO: U.S. Department of Agriculture, Forest Service, Rocky Mountain Forest and Range Experiment Station. 4 p.
Jardine, James T.; Anderson, Mark. 1919. Range management of the National Forests. Bull. 790. Washington, DC: U.S. Department of Agriculture. 97 p.
Johnsen, Thomas N., Jr. 1962. One-seed juniper invasion of northern Arizona grasslands. Ecological Monographs. 3: 187-207.
Johnsen, Thomas N., Jr.; Schubert, Gilbert H.; Almas, Dewey P. 1973. The Rocky Mountain-Intermountain region. Journal of Forestry. 71(3): 144-147.
Jones, John R. 1974b. Silviculture of southwestern mixed conifers and aspen: The status of our knowledge. Res. Pap. RM-122. Fort Collins, CO: U.S. Department of Agriculture, Forest Service, Rocky Mountain Forest and Range Experiment Station. 44 p.
Jones, John R. 1975. A southwestern mixed conifer plantation—Case history and observations. Res. Pap. RM-148. Fort Collins, CO: U.S. Department of Agriculture, Forest Service, Rocky Mountain Forest and Range Experiment Station. 8 p.
Jones, John R. 1977. How to tell engelmann from blue spruce in the southwest. Gen. Tech Rep. RM-34. Fort Collins, CO: U.S. Department of Agriculture, Forest Service, Rocky Mountain Forest and Range Experiment Station. 10 p.
Kaye, J.P.; Hart, S.C.; Fulé, P.Z.; Covington, W.W.; Moore, M.M.; Kaye, M.W. 2005. Initial carbon, nutrient, and water fluxes following ponderosa pine restoration treatments. Ecological Applications. 15: 1581-1593.
Keith, James O. 1965. The abert squirrel and its dependence on ponderosa pine. Ecol. 46: 150-163.
Kennedy, Fred H. 1962. Thinning ponderosa pine. In: The Arizona Watershed Program in review. 1962 Sept 18; Proc. 6th Ann. Watershed Symp: 13-16.
Kohnke, Helmut; Dreibelbis, F.R. 1940. A survey and discussion of lysimeters and a bibliography on their construction and performance. Misc. Pub. 372. Washington, DC: U.S. Department of Agriculture. 68 p.
Korstian, Clarence F. 1914. The use of Frustum Form factors in constructing volume tables for western yellow pine in the southwest. Albuquerque, NM: U.S. Department of Agriculture, Forest Service. 14 p.
Korstian, Clarence F. 1916. Hewn-tie versus saw-timber rotations. Proc. Society of American Foresters. 11(3): 315-329.
Korstian, Clarence F.; Long, W.H. 1922. The western yellow pine mistletoe. Bull. 1112. Washington, DC: U.S. Department of Agriculture. 36 p.
Kramp, Betty A.; Ffolliott, Peter F.; Patton, David R. 1983. The effects of fire on wildlife habitat and species. Wildlife Technical Unit Series. RUN WILD Wildlife Habitat Relationships. Albuquerque, NM: U.S. Department of Agriculture, Forest Service, Southwestern Region. 29 p.
Krauch, Hermann. 1918. Some new aspects regarding the use of the Forest Service standard (gradimeter) hypsometer. Journal of Forestry. 16: 772-776.
Krauch, Hermann. 1924. Acceleration of growth in western yellow pine stands after cutting. Journal of Forestry. 22(6): 39-42.
Krauch, Hermann. 1926. The determination of increment in cut-over stands of western yellow pine in Arizona. Journal of Agricultural Research. 32(6): 501-541.
Krauch, Hermann. 1930a. Mortality in cut-over stands of western yellow pine. Journal of Forestry. 28(8): 1085-1097.
Krauch, Hermann; Pearson, G.A. 1930b. Recovery of western yellow pine injured by grazing animals. Prog. Rep. Flagstaff, AZ: U.S. Department of Agriculture, Forest Service, Southwestern Forest Experiment Station. 16 p.
Krauch, Hermann. 1930?c. Nursery and planting methods developed at the Gallinas Nursery, Santa Fe National Forests. [Place of pub. unk.]. 4 p. On file at Flagstaff, AZ: U.S. Department of Agriculture, Forest Service, Rocky Mountain Research Station, Fort Valley Experimental Forest archives.

274 USDA Forest Service RMRS-P-55. 2008.
Krauch, Hermann. 1933. Increment and mortality in cutover stands of ponderosa pine as based on records of permanent sample plots. Tucson, AZ: U.S. Department of Agriculture, Forest Service, Southwestern Forest and Range Experiment Station. 13 p.
Krauch, Hermann. 1934a. Diameter growth of ponderosa pine as related to age and crown development. Journal of Forestry. 32(1): 68-71.
Krauch, Hermann. 1934b. Does it pay to reserve thrifty mature trees of ponderosa pine for future cutting? Journal of Forestry. 31(1): 72- 75.
Krauch, Hermann. 1936. Some factors influencing douglas fir reproduction in the southwest. Journal of Forestry. 34(6): 601-608.
Krauch, Hermann. 1937. Growth and yield of cut-over stands of ponderosa pine in Arizona under different methods of cutting. Journal of Forestry. 35(12): 1134-1147.
Krauch, Hermann. 1939a. Analysis of a 36-year record of precipitation at Cloudcroft, NM. Res. Note 60. Tucson, AZ: U.S. Department of Agriculture, Forest Service, Southwestern Forest and Range Experiment Station. 5 p.
Krauch, Hermann. 1939b. First remeasurement of Gila stand improvement plots indicates uniform thinning of ponderosa pine pole stands not desirable. Res. Note 62. Tucson, AZ: U.S. Department of Agriculture, Forest Service, Southwestern Forest and Range Experiment Station. 6 p.
Krauch, Hermann. 1945a. Cutting practice for the douglas fir type. n.p. 2 p.
Krauch, Hermann. 1945b. Influence of rodents on natural regeneration of Douglas-fir in the southwest. Journal of Forestry. 43(8): 585-588.
Krauch, Hermann. 1949. Growth after cutting in an even-aged mature ponderosa pine stand. Journal of Forestry. 47(4): 296-299.
Krauch, Hermann. 1949. Results of thinning experiment in ponderosa pine pole stands in central Arizona. Journal of Forestry. 47(6): 466-469.
Krauch, Hermann. 1949. Silvicultural treatment of virgin douglas fir stands in the southwest. Journal of Forestry. 47(3): 200-203.
Krauch, Hermann. 1956. Management of Douglas-fir timberland in the southwest. Sta. Pap. 21. Fort Collins, CO: U.S. Department of Agriculture, Forest Service, Rocky Mountain Forest and Range Experiment Station. 59 p.
Kruse, William H. 1970. Temperature and moisture stress affect germination of Gutierrezia sarothrae. Journal of Range Management. 23(2): 143-144.
Landis, Thomas D.; Tinus, Richard W.; McDonald, Stephen E.; Barnett, James P. 1989-1992. The Container Tree Nursery Manual. Agri. Handb. 672. Washington, DC: U.S. Department of Agriculture, Forest Service. Vol. 2-5.
Larson, Merlyn M. 1959. Regenerating aspen by suckering in the southwest. Res. Note RM-39. Fort Collins, CO: U.S. Department of Agriculture, Forest Service, Rocky Mountain Forest and Range Experiment Station. 2 p.
Larson, M.M. 1960. Frost heaving influences drought hardiness of ponderosa pine seedlings. Res. Note RM-45. Fort Collins, CO: U.S. Department of Agriculture, Forest Service, Rocky Mountain Forest and Range Experiment Station. 2 p.
Larson, M.M. 1961. Seed size, germination dates, and survival relationships of ponderosa pine in the southwest. Res. Note RM-66. Fort Collins, CO: U.S. Department of Agriculture,
Forest Service, Rocky Mountain Forest and Range Experiment Station. 6 p.
Larson, M.M. 1963. Initial root development of ponderosa pine seedlings as related to germination date and size of seed. Forest Science. 9(4): 456-460.
Larson, M.M. 1966. Racial variation in ponderosa pine at Fort Valley, AZ. Res. Note RM-73. Fort Collins, CO: U.S. Department of Agriculture, Forest Service, Rocky Mountain Forest and Range Experiment Station. 7 p.
Larson, M.M. 1967. Effect of temperature on initial development of ponderosa pine seedlings from three sources. Forest Science. 13(3): 286-294.
Larson, M.M.; Schubert, Gilbert H. 1969a. Effect of osmotic water stress on germination and initial development of ponderosa pine seedlings. Forest Science. 15(1): 30-36.
Larson, M.M.; Schubert, Gilbert H. 1969b. Root competition between ponderosa pine seedlings and grass. Res. Pap. RM-54. Fort Collins, CO: U.S. Department of Agriculture, Forest Service, Rocky Mountain Forest and Range Experiment Station. 12 p.
Larson, M.M.; Schubert, Gilbert H. 1970. Cone crops of ponderosa pine in central Arizona including the influence of abert squirrels. Res. Pap. RM-58. Fort Collins, CO: U.S. Department of Agriculture, Forest Service, Rocky Mountain Forest and Range Experiment Station. 15 p.
Laughlin, D.C.; Bakker, J.D.; Daniels, M.L.; Moore, M.M.; Casey, C.A.; Springer, J.D. [In press]. Restoring plant species diversity and community composition in a ponderosa pine-bunchgrass ecosystem. Plant Ecology.
Laughlin, D.C.; Moore, M.M.; Bakker, J.D.; Casey, C.A.; Springer, J.D.; Fulé, P.Z.; Covington, W.W. 2006. Assessing targets for the restoration of herbaceous vegetation in ponderosa pine forests. Restoration Ecology. 4: 548-560.
Lavin, Fred. 1953a. Guide for reseeding burned and logged over ponderosa pine lands in the southwest. Res. Note 10. Tucson, AZ: U.S. Department of Agriculture, Forest Service, Southwestern Forest and Range Experiment Station. 11 p.
Lavin, Fred. 1953b. Intermediate wheatgrass for reseeding southwestern ponderosa pine and upper woodland ranges in the southwest. Res. Rep. 9. Tucson, AZ: U.S. Department of Agriculture, Forest Service, Southwestern Forest and Range Experiment Station. 11 p.
Lavin, Fred. 1955. Seeding in the southwestern pine zone for forage improvement and soil protection. Agri. Handb. 89. Washington, DC: U.S. Department of Agriculture, Forest Service. 52 p.
Layser, Earle F.; Schubert, Gilbert H. 1979. Preliminary classification for the coniferous forest and woodland series of Arizona and New Mexico. Res. Pap. RM-208. Fort Collins, CO: U.S. Department of Agriculture, Forest Service, Rocky Mountain Forest and Range Experiment Station. 27 p.
Leiberg, John B.; Rixon, T.F.; Dodwell, Arthur. 1904. Forest conditions: San Francisco Mountains Forest Reserve, Arizona. Prof. Pap. 22. Washington, DC: United States Geological Survey, Department of the Interior: 36-45.
Lexen, B.R. 1935. Some factors influencing the yield and mortality of ponderosa pine in the southwest. Journal of Agricultural Research. 50(9): 777-787.
Lexen, Bert; Thomson, Walter G. 1938. Merchantable height volume table for the southwestern white pines. Res. Note 28. Tucson, AZ: U.S. Department of Agriculture, Forest Service, Southwestern Forest and Range Experiment Station. 2 p.
USDA Forest Service RMRS-P-55. 2008. 275
Lexen, B.R. 1939. Growth following partial cutting in ponderosa pine. Journal of Forestry. 37(12): 943-946.
Lexen, Bert. 1939. Space requirements of ponderosa pine by tree diameter. Res. Note 63. Tucson, AZ: U.S. Department of Agriculture, Forest Service, Southwestern Forest and Range Experiment Station. 2 p.
Lexen, Bert. 1942. Sale of stumpage on the basis of tree measurement. Res. Note 63. Tucson, AZ: U.S. Department of Agriculture, Forest Service, Southwestern Forest and Range Experiment Station. 4 p.
Little, Elbert L., Jr. 1938a. The earliest stages of pinon cones. Res. Note 46. Tucson, AZ: U.S. Department of Agriculture, Forest Service, Southwestern Forest and Range Experiment Station. 4 p.
Little, Elbert L., Jr. 1938b. Portrait of a tree. Arizona Highways. 14(9): 22-23.
Little, Elbert L. Jr. 1939b. Suggestions for estimating pinon nut crops. Res. Note 58. Tucson, AZ: U.S. Department of Agriculture, Forest Service, Southwestern Forest and Range Experiment Station. 4 p.
Little, Elbert L., Jr. 1943. Common insects on pinyon (Pinus edulis). Journal of the New York Entomological Society. Vol. 51: 239-252.
Little, Elbert L., Jr. 1948. Older names for two western species of juniperus. Leaflets of Western Botany. 5(8): 126-132.
Little, Elbert L., Jr. 1950. Southwestern trees: A guide to the native species of New Mexico and Arizona. Agri. Handb. 9. Washington, DC: U.S. Department of Agriculture, Forest Service. 109 p.
Little, Elbert L., Jr. 1951. Key to southwestern trees. Res. Rep. 8. Tucson, AZ: U.S. Department of Agriculture, Forest Service, Southwestern Forest and Range Experiment Station. 28 p.
Little, Elbert L., Jr.; Righter, Francis I. 1965. Botanical descriptions of forty artificial pine hybrids. Tech. Bull. 1345. Washington, DC: U.S. Department of Agriculture, Forest Service. 47 p.
Loftfield, J.V.G. 1924. Quantitative studies on the vegetation of the grazing ranges of northern Arizona. Tucson, AZ: University of Arizona 99 p. Dissertation.
Long, W.H. 1917. A preliminary report on the occurrence of western red-rot in Pinus ponderosa. Bull. 490. Washington, DC: U.S. Department of Agriculture, Bureau of Plant Industry. 8 p.
Long, W. H. 1924. The self pruning of western yellow pine. Phytopathology. 14(7): 336-337.
Loveridge, Earl W. 1924. Spruce barrens and sheep grazing. Journal of Forestry. 22(7): 806-809.
Lowe, Phillip O.; Ffolliott, Peter F.; Dieterich, John H.; Patton, David R. 1978. Determining potential wildlife benefits from wildfire in Arizona ponderosa pine forests. Gen. Tech. Rep. RM-52. Fort Collins, CO: U.S. Department of Agriculture, Forest Service, Rocky Mountain Forest and Range Experiment Station. 12 p.
McGinnies, W.G.; Parker, K.W.; Glendening, G.E. 1951. Southwestern range ecology. U.S. Department of Agriculture, Forest Service 1941. Rep.1951. orig. pub.1941. 202 p.
Marsh, R.E. 1969. Timber cruising on National Forests of the southwest. Forest History. 13(3): 212-32.
Martin, E.C. Growth and change in structure of an aspen stand after a harvest cutting. Res. Note RM-45. Fort Collins, CO: U.S. Department of Agriculture, Forest Service, Rocky Mountain Forest and Range Experiment Station. 2 p.
Martin, Edward C. 1969. The relation of precipitation to flow from Little Leroux Spring on the San Francisco Peaks, Arizona. Res. Note RM-129. Fort Collins, CO: U.S. Department of Agriculture, Forest Service, Rocky Mountain Forest and Range Experiment Station. 4 p.
Mattoon, W.R. 1909a.The establishment of permanent sample plots on cut-over areas to determine the rate of growth. Unpub. Pap. on file at Flagstaff, AZ: U.S. Department of Agriculture, Forest Service, Rocky Mountain Research Station, Fort Valley Experimental Forest archives. 9 p.
Mattoon, Wilbur. R. 1909b. Measurements of the effects of forest cover upon the conservation of snow waters. Forest Quarterly. 7(3): 245-248.
Meagher, George S. 1940. Service life of untreated juniper fence posts in Arizona. Res. Note 89. Tucson, AZ: U.S. Department of Agriculture, Forest Service, Southwestern Forest and Range Experiment Station. 4 p.
Meagher, George S. 1950. Reproduction of ponderosa pine. Journal of Forestry. 48(3): 189-191.
Merrick, Gordon D. 1937. Effect of grazing on forage grasses in northern Arizona. Unpub. Pap. on file at Flagstaff, AZ: U.S. Department of Agriculture, Forest Service, Rocky Mountain Research Station, Fort Valley Experimental Forest archives. 30 p.
Merrick, Gordon D. 1939. Revegetation of deteriorated range land in northern Arizona. Durham, NC: Duke University. 37 p. Thesis.
Miller, Fred H. 1921. Reclamation of grass lands by Utah juniper on the Tusayan National Forest, Arizona. Journal of Forestry. 19(6): 647-651.
Minor, Charles O. 1962. Converting basal area to volume. Res. Note RM-70. Fort Collins, CO: U.S. Department of Agriculture, Forest Service, Rocky Mountain Forest and Range Experiment Station. 2 p.
Minor, Charles O. 1964. Site-index curves for young-growth ponderosa pine in northern Arizona. Res. Note RM-37. Fort Collins, CO: U.S. Department of Agriculture, Forest Service, Rocky Mountain Forest and Range Experiment Station. 8 p.
Mirov, N.T.; Kraebel, Charles J. 1939. Collecting and handling seeds of wild plants. For. Pub. 5. Washington, DC: U.S. Department of Agriculture, Civilian Conservation Corps. 42 p.
Moir, William H.; Ludwig, John A. 1979. A classification of spruce-fir and mixed conifer habitat types of Arizona and New Mexico. Res. Pap. RM-207. Fort Collins, CO: U.S. Department of Agriculture, Forest Service, Rocky Mountain Research Station. 47 p.
Moore, Barrington. 1912. Management of western yellow pine in the southwest. Forest Quarterly. 10(1): 50-56.
Moore, Margaret M.; Huffman, David W.; Covington, W. Wallace; [and others]. 2000. Southwestern ponderosa pine forest structure and fire regime disruption date: Re-measurement of historical permanent forest plots. Final Report. Flagstaff, AZ: Northern Arizona University, School of Forestry. 153 p.
276 USDA Forest Service RMRS-P-55. 2008.
Moore, Margaret M.; Huffman, David W.; Fulé, Peter Z. [and others]. 2004a. Comparison of historical and contemporary forest structure and composition on permanent plots in southwestern ponderosa pine forests. Forest Science. 50(2): 162-176.
Moore, Margaret M.; Huffman, David W.; Bakker, Jonathan D. [and others]. 2004b. Quantifying forest reference conditions for ecological restoration: The Woolsey plots. Final report. Flagstaff, AZ: Northern Arizona University, School of Forestry & Ecological Restoration Institute. 55 p.
Moore, Margaret M.; Casey, C.A.; Bakker, J.D.; Springer, J.D.; Fulé, P.Z.; Covington, W.W.; Laughlin, D.C. 2006. Herbaceous response to restoration treatments in a ponderosa pine forest, 1992-2004. Rangeland Ecology and Management. 59: 135-144.
Mueller, L.A.; Kotok, E.S. 1953a. Possibility for wood-molasses production in Arizona. Res. Rep. 12. Tucson, AZ: U.S. Department of Agriculture, Forest Service, Southwestern Forest and Range Experiment Station. 9 p.
Mueller, L.A.; Kotok, E.S. 1953b. Possibility for wood-preservation industry in Arizona. Res. Rep. 11. Tucson, AZ: U.S. Department of Agriculture, Forest Service, Southwestern Forest and Range Experiment Station. 8 p.
Munns, E.N. 1938. The distribution of important forest trees of the United States. Misc. Pub. 287. Washington, DC: U.S. Department of Agriculture. 176 p.
Myers, Clifford A. 1962. Twenty-year growth of Utah juniper in Arizona. Res. Note RM-71. Fort Collins, CO: U.S. Department of Agriculture, Forest Service, Rocky Mountain Forest and Range Experiment Station 2 p.
Myers, Clifford A.; Martin, Edward C. 1963a. Fifty years progress in converting virgin southwestern ponderosa pine to managed stands. Journal of Forestry. 61(8): 583-586.
Myers, Clifford A.; Martin, Edward C. 1963b. Mortality of southwestern ponderosa pine sawtimber after second partial harvest. Journal of Forestry. 61(2): 128-130.
Myers, Clifford A. 1964. Merriam’s classification of the ponderosa pine forest in relation to current knowledge. Flagstaff, AZ: Museum of Northern Arizona. Plateau. 37(2): 67-72.
Myers, Clifford A. 1967. Growing stock levels in even-aged ponderosa pine. Res. Pap. RM-33. Fort Collins, CO: U.S. Department of Agriculture, Forest Service, Rocky Mountain Range and Forest Experiment Station. 8 p.
Nichol, A.A. 1952. The natural vegetation of Arizona. Tech. Bull.127. Tucson, AZ: University of Arizona, College of Agriculture, Agricultural Experiment Station. Rev. of Tech. Bull. 68: 189-230.
Olberding, Susan D. 1994. The Fort Valley Forest Experiment Station: Where forest research began. Flagstaff, AZ: Arizona Natural History Association & Flagstaff, AZ: U.S. Department of Agriculture, Forest Service, Rocky Mountain Forest and Range Experiment Station. 16 p.
Olberding, Susan D. 1998. Prospecting for turpentine in northern Arizona. Flagstaff, AZ: Grand Canyon Pioneers Society Ol’ Pioneer. 12.
Olberding, Susan D. 2000. Fort Valley: The beginnings of forest research. Forest History Today. Spring: 9-15.
Olberding, Susan D. 2002. Fort Valley: Then and now. Flagstaff, AZ: Fort Valley Publishing. 90 p.
Olberding, Susan D.; Mitchell, John E.; Mitchell; Moore, Margaret M. 2005. “Doing the best we could with what we had”: USFS range research in the southwest. Rangelands. 27(3): 29-36.
Otis, Alison T.; Honey, William D., et.al. 1986. The Forest Service and the Civilian Conservation Corps: 1933-42. FS-395. Washington, DC: U.S. Department of Agriculture, Forest Service. 219 p.
Patton, David R. 1969. Deer and elk use of a ponderosa pine forest in Arizona before and after timber harvest. Res. Note RM-139. Fort Collins, CO: U.S. Department of Agriculture, Forest Service, Rocky Mountain Forest and Range Experiment Station. 7 p.
Patton, David R.; Green, Win. 1970. Abert’s squirrels prefer mature ponderosa pine. Res. Note RM-169. Fort Collins, CO: U.S. Department of Agriculture, Forest Service, Rocky Mountain Forest and Range Experiment Station. 3 p.
Patton, David R. 1974. Estimating food consumption from twigs clipped by the abert squirrel. Res. Pap. RM-272. Fort Collins, CO: U.S. Department of Agriculture, Forest Service, Rocky Mountain Forest and Range Experiment Station. 13 p.
Patton, David R. 1974. Patch cutting increases deer and elk use of a pine forest in Arizona. Journal of Forestry. 72(12): 764-766.
Patton, David R. 1975a. Abert squirrel cover requirements in southwestern ponderosa pine. Res. Pap. RM-145. Fort Collins, CO: U.S. Department of Agriculture, Forest Service, Rocky Mountain Forest and Range Experiment Station.12 p.
Patton, David R. 1975b. Nest use and home range of three abert squirrels as determined by radio tracking. Res. Note RM-281. Fort Collins, CO: U.S. Department of Agriculture, Forest Service, Rocky Mountain Forest and Range Experiment Station. 3 p.
Patton, David R. 1976. Timber harvesting increases deer and elk use of a mixed conifer forest. Res. Note RM-329. Fort Collins, CO: U.S. Department of Agriculture, Forest Service, Rocky Mountain Forest and Range Experiment Station. 3 p.
Patton, David R.; Hudak, Howard G.; Ratcliff, Thomas R.1976.Trapping, anesthetizing, and marking the abert squirrel. Res. Note RM-507. Fort Collins, CO: U.S. Department of Agriculture, Forest Service, Rocky Mountain Forest and Range Experiment Station. 2 p.
Patton, David R.; Ratcliff, Thomas R.; Rogers, Kenneth J. 1976. Weight and temperature of the abert and kaibab squirrels. Southwest Naturalist. 21: 34-35.
Patton, David R. 1977. Managing southwestern ponderosa pine for the abert squirrel. Journal of Forestry. 75(5): 264-267.
Patton, David R. 1982. Management applications of biotic community data. In: Brown, David E. Biotic communities of the American Southwest—United States and Mexico. Desert Plants. 4. 7 p.
Patton, David R.; Ertl, Mary G. 1982. Wildlife food plants of the Southwest. Wildlife Technical Unit Series. RUN WILD Wildlife Habitat Relationships. Albuquerque, NM: U.S. Department of Agriculture, Forest Service, Southwestern Region. 49 p.
Patton, David R. 1982. Wildlife habitat in land management planning: Some ideas and principles. In: Proc. Effects of land management practices on fish and wildlife in southwestern conifer forests; 1982 Feb 16-17; Tucson, AZ: University of Arizona, School of Renewable Natural Resources. 40 p.
Patton, David R. 1984. A model to evaluate abert squirrel habitat in uneven-aged ponderosa pine. Wildl. Soc. Bull 12: 408-414.
Patton, David R.; Wadleigh, Richard L.; Hudak, Howard G. 1985. The effects of timber harvesting on the kaibab squirrel. Journal of Wildlife Management. 49: 14-19.
USDA Forest Service RMRS-P-55. 2008. 277
Patton, David R. 1987. Habitat and wildlife relations of major Rocky Mountain shrubs in the ponderosa pine. In: Fisser, Herb, ed.; 16th Wyoming Shrub Ecology Workshop; 1987 May 26-27; Sundance, WY: 71 p.
Paul, Benson H.; Meagher, George. 1949. Growth-quality study of ponderosa pine. Madison, WI: U.S. Department of Agriculture, Forest Service, Forest Products Laboratory. 14 p.
Pearson, G.A. 1907. The light requirements and leaf structure of tree seedlings. Lincoln, NE: University of Nebraska. 35 p. Thesis.
Pearson, G.A. 1910a. Marking yellow pine for cutting in the southwest. Annual 2. University of Nebraska Forest Club: 15-20.
Pearson, G.A. 1910b. Reproduction of western yellow pine in the southwest. For. Serv. Circ. 174. Washington, DC: U.S. Department of Agriculture. 16 p.
Pearson, G.A. 1911. Methods of measuring light in the forest. For. Serv. Bull. Washington, DC: U.S. Department of Agriculture. 77 p.
Pearson, G.A. 1912. The influence of age and condition of the tree upon seed production in western yellow pine. Circ.196. Washington, DC: U.S. Department of Agriculture, Forest Service. 11 p.
Pearson, G.A. 1913a. A meteorological study of parks and timbered areas in the western yellow-pine forest of Arizona. Monthly Weather Review. 41: 1615-1629.
Pearson, G.A. 1913b. What is the proper basis for the classification of forest land into types? Proc. Society of American Foresters. 8(1): 79-84.
Pearson, G.A. 1914a. The administration of a forest experiment station. Forest Quarterly. 12: 211-222.
Pearson, G.A. 1914b. Forest planting in Arizona and New Mexico. Proc. Society of American Foresters. Vol. 9(4): 457-478.
Pearson, G.A. 1914c. The role of aspen in the reforestation of mountain burns in Arizona and New Mexico. The Plant World. 17(9): 249-260.
Pearson, G.A. 1918a. The relation between spring precipitation and height growth of western yellow-pine saplings in Arizona. Journal of Forestry. 16: 677-689.
Pearson, G.A. 1918b. Studies of yield and reproduction of western yellow pine in Arizona and New Mexico. Journal of Forestry. 16(3): 273-291.
Pearson, G.A. 1920a. Factors controlling the distribution of forest types. Ecology. 1(3,4): 139-159, 289-308.
Pearson, G.A. 1920b. The Fort Valley Forest Experiment Station. Coconino Sun. Also Unpub. Pap. on file at Flagstaff, AZ: U.S. Department of Agriculture, Forest Service, Rocky Mountain Research Station, Fort Valley Experimental Forest archives. 9 p.
Pearson, G.A. 1920?c. Study of parks in the yellow pine forests of Arizona. Unpub. Pap. on file at Flagstaff, AZ: U.S. Department of Agriculture, Forest Service, Rocky Mountain Research Station, Fort Valley Experimental Forest archives. 3 p.
Pearson, G.A. 1921a. Brush disposal in western yellow pine. Journal of Forestry. 19(1): 36-38.
Pearson, G.A. 1921b. Making a permanent resource out of the forests of the southwest. The Southern Lumberman.
Pearson, G.A. 1922a. Even-aged stands in western yellow pine. Journal of Forestry. 20(7): 832-833.
Pearson, G.A. 1922b. Preservation of natural areas in the National Forests. Ecology. 3(4): 284-287.
Pearson, G.A. 1922c. Seasonal distribution of rainfall as related to forest fires in Arizona and New Mexico. Journal of Forestry. 20(7): 776-779.
Pearson, G.A. 1923. Natural reproduction of western yellow pine in the southwest. Bull. 1105. Washington, DC: U.S. Department of Agriculture. 143 p.
Pearson, G.A. 1924a. The growing season of western yellow pine. Journal of Forestry. 29(4): 203-204.
Pearson, G.A. 1924b. The Southwestern Forest Experiment Station. Unpub. Pap. on file at Flagstaff, AZ: U.S. Department of Agriculture, Forest Service, Rocky Mountain Research Station, Fort Valley Experimental Forest archives. 4 p.
Pearson, G.A. 1924c. Studies in transpiration of coniferous tree seedlings. Ecology. 5(4): 340-347.
Pearson, G.A. 1924d. Some conditions for effective research. Science. 60(1543).
Pearson, G.A. 1924e. Temperature summations with reference to plant life. U.S. Monthly Weather Review. 52: 218-220.
Pearson, G.A. 1927a. Forest grazing control aids tree growth. Washington, DC: U.S. Department of Agriculture. Yrbk of Agri. 1926: 386-388.
Pearson, G.A. 1927b. Grazing and reforestation. Journal of Forestry. 25(5): 529-541.
Pearson, G.A.; Follweiler, A.D. 1927c. Acceleration of growth in western yellow pine after cutting. Journal of Forestry. 25(8): 981-988.
Pearson, G.A. 1928. Measurement of physical factors in silviculture. Ecology. 9(4): 404-411.
Pearson, G.A. 1929. The other side of the light question. Journal of Forestry. 27(7): 807-812.
Pearson, G.A. 1930a. Forest-grown evergreens can be transplanted if proper care is taken. Also known as Transplanting forest-grown evergreens. U.S. Department of Agriculture Yrbk of Agric. 1930: 277-278.
Pearson, G.A. 1930b. Light and moisture in forestry. Ecology. 11(1): 145-160.
Pearson, G.A. 1930c. Studies of climate and soil in relation to forest management in the southwestern United States. Journal of Ecology. 18(1): 139-144.
Pearson, G.A. 1931a. Forest types in the southwest as determined by climate and soil. Tech. Bull. 247. Washington, DC: U.S. Department of Agriculture. 144 p.
Pearson, G.A. 1931b. Recovery of western yellow pine seedlings from injury by grazing animals. Journal of Forestry. 29(6): 876-894.
Pearson, G.A. 1932a. Reforestation an important field for employment. Unpub. Pap. on file at Flagstaff, AZ: U.S. Department of Agriculture, Forest Service, Rocky Mountain Research Station, Fort Valley Experimental Forest archives. 3 p.
Pearson, G.A. 1932b. The Southwestern Forest and Range Experiment Station. Unpub. Pap. on file at Flagstaff, AZ: U.S. Department of Agriculture, Forest Service, Rocky Mountain Research Station, Fort Valley Experimental Forest archives. 6 p.
Pearson, G.A. 1933a. The conifers of northern Arizona. Flagstaff, AZ: Museum of Northern Arizona. Museum Notes. 6(1): 1-7.
Pearson, G.A. 1933b. Forestry looks up in the southwest. American Forests. 39(2): 69-71,94.
Pearson, G.A. 1933c. A twenty year record of changes in an Arizona pine forest. Ecology. 14(3): 272-285.
278 USDA Forest Service RMRS-P-55. 2008.
Pearson, G.A. 1934. Grass, pine seedlings and grazing. Journal of Forestry. 32(5): 545-555.
Pearson, G.A. 1935a. Public values in cutover timber lands. Journal of Forestry. 33(6): 590-594.
Pearson, G.A. 1935b. Timber stand improvement in the southwest. Journal of Forestry. 33(2): 128-132.
Pearson, G.A.; McIntyre, Arthur C. 1935c. Slash disposal in ponderosa pine forests of the southwest. Circ. 357. Washington, DC: U.S. Department of Agriculture. 29 p.
Pearson, G.A.; Marsh, R.E. 1935d. Timber growing and logging practice in the southwest and in the Black Hills region. Tech. Bull. 480. Washington, DC: U.S. Department of Agriculture, Forest Service. 80 p.
Pearson, G.A. 1936a. Lumber industry. In: Arizona and its heritage. Gen. Bull. 3. Tucson, AZ: University of Arizona: 176-181.
Pearson, G.A. 1936b. The oldest forest experiment station. Unpub. Pap. on file at Flagstaff, AZ: U.S. Department of Agriculture, Forest Service, Rocky Mountain Research Station, Fort Valley Experimental Forest archives. 3 p.
Pearson, G.A. 1936c. Some observations on the reaction of pine seedlings to shade. Ecology. 17(2): 270-276.
Pearson, G.A. 1936d. A thinning experiment applied to timber stand improvement. Journal of Forestry. 34(9): 855-861.
Pearson, G.A. 1936e. Why the prairies are treeless. Journal of Forestry. 34(4): 405-408.
Pearson, G.A. 1937a. Conservation and use of forests in the southwest. The Scientific Monthly. 45: 150-157.
Pearson, G.A. 1937b. Factors influencing the growth of trees. In: Glock, Waldo S. Principles and Methods of Tree-Ring Analysis. Washington, DC: Carnegie Institution: 65-68.
Pearson, G.A. 1937c. Poisoning conifers in stand improvement and timber sale practice. Journal of Forestry. 35(6): 587-590.
Pearson, G.A. 1937d. Silvicultural trends in the southwest as seen by Pearson. Forestry News Digest: 20.
Pearson, G.A. 1937e. Trees, shrubs, and vines suitable for planting in Flagstaff. Coconino Sun. December 10, 1937.
Pearson, G.A. 1938a. Growth of virgin stands of ponderosa pine. Res. Note 34. Tucson, AZ: U.S. Department of Agriculture, Forest Service, Southwestern Forest and Range Experiment Station. 2 p.
Pearson, G.A. 1938b. Lighter cuts and larger yields in ponderosa pine. Journal of Forestry. 36(8): 779-789.
Pearson, G.A. 1938c. Remodeling a forest with the CCC. West Coast Lumberman. 65(11): 33, 36.
Pearson, G.A. 1938d. Timber farming in Arizona. Arizona Producer (March-April issues). 4 installments.
Pearson, G.A. 1938e. Timber farming in the southwest. Unpub. Pap. on file at Flagstaff, AZ: U.S. Department of Agriculture, Forest Service, Rocky Mountain Research Station, Fort Valley Experimental Forest archives. 19 p.
Pearson, G.A. 1939a. Fort Valley Experimental Forest: Silvical Data. Part 1,2. Unpub. Pap. on file at Flagstaff, AZ: U.S. Department of Agriculture, Forest Service, Rocky Mountain Research Station, Fort Valley Experimental Forest archives. 182 p.
Pearson, G.A. 1939b. Mortality in cutover stands of ponderosa pine. Journal of Forestry. 37(5): 383-387.
Pearson, G.A. 1939c. Windbreaks for farm homes in Coconino County. Flagstaff Journal. April 1 issue.
Pearson, G.A. 1940a. Forest land use. Journal of Forestry 38: 261-270.
Pearson, G.A. 1940b. Growth and mortality of ponderosa pine in relation to size of trees and method of cutting. Journal of Forestry. 38(4): 323-327.
Pearson, G.A. 1940c. Reforestation in the southwest by CCC camps. For. Pub. 7. Washington, DC: Federal Security Administration, Civilian Conservation Corps. 14 p.
Pearson, G.A. 1940d. A second cutting of ponderosa pine. The Timberman. 41(3). 3 p.
Pearson, G.A. 1940e. Shade effects in ponderosa pine. Journal of Forestry. 38(10): 778-780.
Pearson, G.A.; Wadsworth, Frank H. 1940f. Timber management in the Fort Valley Experimental Forest Wing Mountain Unit. Res. Rep.1. Tucson, AZ: U.S. Department of Agriculture, Forest Service, Southwestern Forest and Range Experiment Station. 21 p.
Pearson, G.A. 1940g. Timber management plots in the Fort Valley Experimental Forest. Unpub. Pap. on file at Flagstaff, AZ: U.S. Department of Agriculture, Forest Service, Rocky Mountain Research Station, Fort Valley Experimental Forest archives For SAF-SW section meeting. 10 p.
Pearson, G.A. 1940h. Timber stand improvement in the southwest. For. Pub. 6. Washington, DC: Federal Security Agency, Civilian Conservation Corps. 12 p.
Pearson, G.A.; Wadsworth, Frank H. 1941a. An example of timber management in the southwest. Journal of Forestry. 39(5): 434-452.
Pearson, G.A. 1941b. Lessons from a second cutting of ponderosa pine. In: The Forest Pioneer. Albuquerque, NM: U.S. Department of Agriculture, Forest Service, Southwestern Region: 21-23.
Pearson, G.A. 1941c. The second crop on conservatively cut and heavily cut Ponderosa pine lands. In: The Forest Pioneer. Albuquerque, NM: U.S. Department of Agriculture, Forest Service, Southwestern Region: 20-21.
Pearson, G.A. 1941d. What forest trees tell about climate and soil. In: Conservation of Renewable Natural Resources. University of Pennsylvania Bicentennial Conference. September 16-20, 1940. Philadelphia, PA: University of Pennsylvania Press: 19-31.
Pearson, G.A. 1942a. Estimates of the 1942 Pinon nut crop on National Forests of Arizona and New Mexico. Res. Note 103. Tucson, AZ: U.S. Department of Agriculture, Forest Service, Southwestern Forest and Range Experiment Station. 4 p.
Pearson, G.A. 1942b. The Fort Valley Forest Experiment Station. Tucson, AZ: U.S. Department of Agriculture, Forest Service, Southwestern Forest and Range Experiment Station. 25 p.
Pearson, G.A. 1942c. Herbaceous vegetation a factor in natural regeneration of ponderosa pine in the southwest. Ecological Monographs. 12: 315-338.
Pearson, G.A. 1942d. Improvement selection cutting in ponderosa pine. Journal of Forestry. 40(10): 753-760.
Pearson, G.A. 1942e. Logging improves old cut-over areas in the southwest. The Timberman. 43(8): 2 p.
Pearson, G.A. 1942f. Rehabilitation of cut-over pine stands in the southwest. Blair, NE: Ames Forester: 23-41.
Pearson, G.A. 1942g. Timber farming—The easy way. Arizona Farmer. Unpub. Pap. on file at Flagstaff, AZ: U.S. Department of Agriculture, Forest Service, Rocky Mountain Research Station, Fort Valley Experimental Forest archives. 3 p.

USDA Forest Service RMRS-P-55. 2008. 279
Pearson, G.A. 1943a. The facts behind improvement selection. Journal of Forestry. 41(10): 740-752.
Pearson, G.A. 1943b. How local is silviculture? Journal of Forestry. 41(12): 917-919.
Pearson, G.A. 1943c. Intensive forestry needed. In: Management of loblolly pine. Journal of Forestry. 41(10): 727-729.
Pearson, G.A. 1943d. Sawlogs in the making. Tucson, AZ: U.S. Department of Agriculture, Forest Service, Southwestern Forest and Range Experiment Station. 1 p.
Pearson, G.A. 1944a. Applied genetics in forestry. The Scientific Monthly. 58: 444-453.
Pearson, G.A. 1944b. Cutting cycles in ponderosa pine. Journal of Forestry. 42(8): 575-585.
Pearson, G.A. 1944c. Cutting in virgin stands of ponderosa pine—Fort Valley Experimental Forest. Unpub. Pap. on file at Flagstaff, AZ: U.S. Department of Agriculture, Forest Service, Rocky Mountain Research Station, Fort Valley Experimental Forest archives. 22 p.
Pearson, G.A. 1944d. Growth, mortality, increment, and cutting cycles (ponderosa pine), Fort Valley Experimental Forest. Unpub. Pap. on file at Flagstaff, AZ: U.S. Department of Agriculture, Forest Service, Rocky Mountain Research Station, Fort Valley Experimental Forest archives. 29 p.
Pearson, G.A. 1944e. Multiple use in forestry. Journal of Forestry. 42(4): 243-249.
Pearson, G.A. 1944f. Records from a virgin stand of ponderosa pine—Fort Valley Experimental Forest. Unpub. Pap. on file at Flagstaff, AZ: U.S. Department of Agriculture, Forest Service, Rocky Mountain Research Station, Fort Valley Experimental Forest archives. 17 p.
Pearson, G.A. 1944g. Tree classifications. Journal of Forestry. 42(1): 49-51.
Pearson, G.A. 1945. Growth, mortality, and cutting cycles in New Mexico ponderosa pine. Journal of Forestry. 43(1): 901-905.
Pearson, G.A. 1946a. Age-and-vigor classes in relation to timber marking. Journal of Forestry. 44(9): 652-659.
Pearson, G.A. 1946b. A plea for applied silviculture in forest research. Journal of Forestry. 44(11): 958-961.
Pearson, G.A. 1946c. Ponderosa pine in the second cutting cycle. Journal of Forestry. 44(5): 354-368.
Pearson, G.A. 1946d. Suggestions for tree planting in Flagstaff. Unpub. Pap. on file at Flagstaff, AZ: U.S. Department of Agriculture, Forest Service, Rocky Mountain Research Station, Fort Valley Experimental Forest archives. 8 p.
Pearson, G.A. 1946e. Timber farming in Arizona. Arizona Highways. 22(10). 2 p.
Pearson, G.A. 1948. Retired forester’s views on timber vs. grass Issue. Arizona Farmer. Jan. 10: 24.
Pearson, G.A. 1949. Management of cut-over land in the interior ponderosa pine type. Journal of Forestry. 47(3): 172-178.
Pearson, G.A. 1950. Management of ponderosa pine in the southwest. Mono. 6. Washington, DC: U.S. Department of Agriculture, Forest Service. 218 p.
Pearson, G.A. 1951. A comparison of the climate in four ponderosa pine regions. Journal of Forestry. 49(4): 256-258.
Pearson, Henry A. 1964. Studies of forage digestibility under ponderosa pine stands. Proc. Society of American Foresters, Denver, CO. 3 p.
Pearson, Henry A. 1967a. Phenology of Arizona fescue and mountain muhly in the northern Arizona ponderosa pine type. Res. Note RM-89. Fort Collins, CO: U.S. Department of Agriculture, Forest Service, Rocky Mountain Forest and Range Experiment Station. 4 p.
Pearson, Henry A.; Jameson, Donald A. 1967b. Relationship between timber and cattle production on ponderosa pine range: The Wild Bill range. Fort Collins, CO: U.S. Department of Agriculture, Forest Service, Rocky Mountain Forest and Range Experiment Station. 10 p.
Pearson, Henry A. 1968. Thinning, clearcutting, and reseeding affect deer and elk use of ponderosa pine forests in Arizona. Res. Note RM-119. Fort Collins, CO: U.S. Department of Agriculture, Forest Service Rocky Mountain Forest and Range Experiment Station. 4 p.
Pearson, H.A.; Davis, J.R.; Schubert, G.H. 1972a. Effects of wildfire on timber and forage production in Arizona. Journal of Range Management. 25(4): 250-253.
Pearson, Henry A. 1972b. Estimating cattle gains from consumption of digestible forage on ponderosa pine range. Journal of Range Management. 25(1): 18-20.
Pearson, Henry A. 1973. Calculating grazing intensity for maximum profit on ponderosa pine range in northern Arizona. Journal of Range Management. 26(4): 277-278.
Peterson, Geraldine. 1939. Merchantable height volume table for ponderosa pines. Res. Note 75. Tucson, AZ: U.S. Department of Agriculture, Forest Service, Southwestern Forest and Range Experiment Station. 2 p.
Pickford, G.D. 1949. Range survey methods in western United States. Herbage Reviews. 8(1): 12 p.
Ponderosa pine management conference: Fort Valley Experimental Forest. 1944. Tucson, AZ: U.S. Department of Agriculture, Forest Service, Southwestern Forest and Range Experiment Station. 41 p.
Potter, Albert F. 1905. Grazing on the public lands. Bull. 62. Washington, DC: U.S. Department of Agriculture, Forest Service. 31 p.
Price, Raymond. 1944. Ponderosa pine management conference, Fort Valley Experimental Forest. Journal of Forestry. 42(12): 921-922.
Price, Raymond. 1976. History of Forest Service research in the central and southern Rocky Mountain regions 1908-1975. Gen. Tech. Rep. RM-27. Fort Collins, CO: U.S. Department of Agriculture, Forest Service, Rocky Mountain Forest and Range Experiment Station. 100 p.
Ratcliff, Thomas R.; Patton, D.R.; Ffolliott, P.F. 1975. Ponderosa pine basal area and the kaibab squirrel. Journal of Forestry. 73(5): 284-286.
Recknagel, A.B. 1910. The progress of reconnaissance. Forest Quarterly. 7(4): 415-418.
Renner, F.G., et. al. 1938. A selected bibliography on management of western ranges, livestock, and wildlife. Misc. Pub. 281. Washington, DC: U.S. Department of Agriculture. 468 p.
Rich, Lowell R.; Gottfried, Gerald J. 1976. Water yields resulting from treatments on the Workman Creek Experimental Watersheds in central Arizona. Water Resources Research. 12(5): 1053-1059.

280 USDA Forest Service RMRS-P-55. 2008.
Rietveld, W.J.; Heidmann, L.J. 1969. Influence of antitranspirants on water use, growth characteristics, and relative drought resistance of ponderosa pine seedlings. Res. Note RM-151. Fort Collins, CO: U.S. Department of Agriculture, Forest Service, Rocky Mountain Forest and Range Experiment Station. 7 p.
Rietveld, W.J.; Heidmann, L.J. 1974. Mulching planted ponderosa pine seedlings in Arizona gives mixed results. Res. Note RM-257. Fort Collins, CO: U.S. Department of Agriculture, Forest Service, Rocky Mountain Forest and Range Experiment Station. 3 p.
Rietveld, W.J. 1975. Phytotoxic grass residues reduce germination and initial root growth of ponderosa pine. Res. Pap. RM-153. Fort Collins, CO: U.S. Department of Agriculture, Forest Service, Rocky Mountain Forest and Range Experiment Station. 15 p.
Rietveld, W.J.; Heidmann, L.J. 1976. Direct seeding ponderosa pine on fresh burns in Arizona. Res. Note RM-312. Fort Collins, CO: U.S. Department of Agriculture, Forest Service, Rocky Mountain Forest and Range Experiment Station. 8 p.
Rietveld, W.J. 1976. Cone maturation in ponderosa pine foliage scorched by wildfire. Res. Note RM-317. Fort Collins, CO: U.S. Department of Agriculture, Forest Service, Rocky Mountain Forest and Range Experiment Station. 7 p.
Rietveld, W.J. 1977. Phytotoxi effects of bunchgrass residues on germination and initial root growth of yellow sweetclover. Journal of Range Management. 30(1): 39-43.
Rietveld, W.J. 1978. Forecasting seed crops and determining cone ripeners in southwestern ponderosa pine. Gen. Tech. Rep. RM-50. Fort Collins, CO: U.S. Department of Agriculture, Forest Service, Rocky Mountain Forest and Range Experiment Station. 12 p.
Ronco, Frank, Jr.; Gottfried, Gerald J.; Alexander, Robert R. 1984. Silviculture of mixed conifer forests in the southwest. RM-TT-6. Fort Collins, CO: U.S. Department of Agriculture, Forest Service, Rocky Mountain Forest and Range Experiment Station. 72 p.
Ronco, Frank; Edminster, Carleton B.; Trujillo, David P. 1985. Growth of ponderosa pine thinned to different stocking levels in northern Arizona. Res. Pap. RM-262. Fort Collins, CO: U.S. Department of Agriculture, Forest Service, Rocky Mountain Forest And Range Experiment Station. 15 p.
Ronco, Frank. 1998. History of the Fort Valley Experimental Forest. Unpub. Pap. on file at Flagstaff, AZ: U.S. Department of Agriculture, Forest Service, Rocky Mountain Research Station, Fort Valley Experimental Forest archives. 56 p.
Ryan, Michael; Covington, W.W. 1986. Effect of a prescribed burn in ponderosa pine on inorganic nitrogen concentrations on mineral soil. Res. Note RM-464. Fort Collins, CO: U.S. Department of Agriculture, Forest Service, Rocky Mountain Forest and Range Experiment Station. 5 p.
Sackett, Stephen S. 1979. Natural fuel loadings in ponderosa pine and mixed conifer forests of the southwest. Res. Pap. RM-213. Fort Collins, CO: U.S. Department of Agriculture, Rocky Mountain Forest and Range Experiment Station. 10 p.
Sackett, Stephen S. 1980. Reducing natural ponderosa pine fuels using prescribed fires: Two case studies. Res. Note RM-392. Fort Collins, CO: U.S. Department of Agriculture, Rocky Mountain Forest and Range Experiment Station. 6 p.
Sackett, Stephen S. 1984. Observations on natural regeneration in ponderosa pine following a prescribed fire in Arizona. Res. Note RM-435. Fort Collins, CO: U.S. Department of
Agriculture, Forest Service, Rocky Mountain Forest and Range Experiment Station. 8 p.
Sackett, Stephen S.; Haase, Sally M. 1991. Measuring soil and tree temperatures during prescribed fires with thermocouple probes. Gen. Tech. Rep. PSW-GTR-131. Albany, CA: U.S. Department of Agriculture, Forest Service, Pacific Southwest Research Station. 15 p.
Sackett, Stephen S.; Haase, Sally M.; Harrington, Michael G. 1994. Restoration of southwestern ponderosa pine ecosystems with fires. In: Covington, Wallace W.; DeBano, Leonard F., tech coord. Sustainable ecological systems: implementing an ecological approach to land management. 1993 July 12-15; Flagstaff, AZ. Gen. Tech. Rep. RM-247. Fort Collins, CO: U.S. Department of Agriculture, Forest Service, Rocky Mountain Forest and Range Experimental Forest: 115-121.
Sackett, Stephen S.; Haase, Sally M. 1996a. Fuel loadings in southwestern ecosytems of the United States. In: Ffolliott, Peter F; DeBano, Leonard F.; Baker, Jr., Malchus B.; Gottfried, Gerald J.; Solis-Garza, Gilberto; Edminster, Carleton B.; Neary, Daniel G.; Allen, Larry S.; Hamre, R.H. tech. coord. Effects of fire on Madrean Province ecosystems: a symposium proceedings. 1996 March 11-15; Tucson, AZ. Gen. Tech. Rep. RM-GTR-289. Fort Collins, CO: U.S. Department of Agriculture, Forest Service, Rocky Mountain Forest and Range Experiment Station: 187-192.
Sackett, Stephen S.; Haase, Sally M.; Harrington, Michael G. 1996b. Lessons learned from fire use for restoring southwestern ponderosa pine ecosystems. In: Covington, Wallace; Wagner, Pamela K., tech coord. Conference on adaptive ecosystem restoration and management: restoration of Cordilleran conifer landscapes of North America; 1996 June 6-8; Flagstaff, AZ. Gen. Tech Rep. RM-GTR-278. Fort Collins, CO: U.S. Department of Agriculture, Forest Service, Rocky Mountain Forest and Range Experiment Station: 54-61.
Sackett, Stephen S.; Haase, Sally M.; Harrington, Michael G. 1996c. Prescribed burning in Southwestern ponderosa pine. In: Ffolliott, Peter F.; DeBano, Leonard F.; Baker, Jr., Malchus B.; Gottfried, Gerald J.; Solis-Garza, Gilberto; Edminster, Carleton B.; Neary, Daniel G.; Allen, Larry S.; Hamre, R.H. tech. coord. Effects of fire on Madrean Provicne ecosystems: a symposium proceedings. 1996 March 11-15; Tucson, AZ. Gen. Tech. Rep. RM-GTR-289. Fort Collins, CO: U.S. Department of Agriculture, Forest Service, Rocky Mountain Forest and Range Experiment Station: 178-186.
Sackett, Stephen S.; Haase, Sally M. 1998. Two case histories for using prescribed fire to restore ponderosa pine ecosystems in northern Arizona. In: Pruden, Teresa L.; Brennan, Leonard A., eds. Fire in ecosystem management: shifting the paradigm from suppression to prescription. Tall Timbers Fire Ecology Conference Proceedings, No. 20. Tall Timbers Research Station, Tallahassee, FL. : 380-389.
Sánchez Meador, Andrew J., Moore, M.M., Bakker, J.D., Parysow, P.F. [In press]. Short- and long-term effects of selective harvesting on spatial pattern and stand development in a ponderosa pine forest. Journal of Vegetation Science.
Sánchez Meador, Andrew J., Parysow, P.F., and Moore, M.M. [In press]. Historical stem-mapped permanent plots increase precision of reconstructed reference conditions in ponderosa pine forests of northern Arizona. Restoration Ecology.
Scherer, Norman W. 1914. Relative accuracy of calipers and steel tape. Proc. Soc. of American Foresters. 9(1): 102-106.
USDA Forest Service RMRS-P-55. 2008. 281
Schubert, Gilbert H. 1965. Fort Valley Experimental Forest. Text of speech. Unpub. Pap. on file at Flagstaff, AZ: U.S. Department of Agriculture, Forest Service, Rocky Mountain Research Station, Fort Valley Experimental Forest archives. 12 p.
Schubert, Gilbert H.; Pearl, Robert W.; Heidmann, L.J. 1969a. Here’s how: A guide to tree planting in the southwest. Res. Pap. RM-49. Fort Collins, CO: U.S. Department of Agriculture, Forest Service, Rocky Mountain Forest and Range Experiment Station. 17 p.
Schubert, Gilbert H. 1969b. Ponderosa pine regeneration problems in the southwest. In: Hermann, R.K., ed. Regeneration of Ponderosa pine; 1969 Sept. 11-12; Corvallis, OR. Proc. Corvallis, OR: Oregon State University, School of Forestry: 1-4.
Schubert, Gilbert H.; Heidmann, L.J.; Larson, M.M. 1970a. Artificial reforestation practices for the southwest. Agri. Handb. 370. Washington, DC: U.S. Department of Agriculture, Forest Service. 25 p.
Schubert, Gilbert H. 1971a. Growth response of even-aged ponderosa pines related to stand density levels. Journal of Forestry. 69(12): 857-860.
Schubert, Gilbert H. 1971b. The phenology of bristlecone pine on the San Francisco Peaks of Arizona. Journal of the Arizona Academy of Science. 6(4): 245-248.
Schubert, Gilbert H.; Pitcher, J.A. 1973. A provisional tree seed-zone and cone-crop rating system for Arizona and New Mexico. Res. Pap. RM-105. Fort Collins, CO: U.S. Department of Agriculture, Forest Service, Rocky Mountain Forest and Range Experiment Station. 8 p.
Schubert, Gilbert H. 1974. Silviculture of southwestern ponderosa pine: The status of our knowledge. Res. Pap. RM-123. Fort Collins, CO: U.S. Department of Agriculture, Forest Service, Rocky Mountain Forest and Range Experiment Station. 71 p.
Schubert, Gilbert H. 1975a. Silviculturist’s point of view on use of nonlocal trees. Gen. Tech. Rep. RM-11. Fort Collins, CO: U.S. Department of Agriculture, Forest Service, Rocky Mountain Forest and Range Experiment Station. 12 p.
Schubert, Gilbert H.; Crawford, Darrell W. 1975?b. Yields and guides related to stand density in the southwest. Unpub. Pap. on file at Flagstaff, AZ: U.S. Department of Agriculture, Forest Service, Rocky Mountain Research Station, Fort Valley Experimental Forest archives. 18 p.
Schubert, Gilbert H. 1976. Silvicultural practices for intensified forest management. In: Trees—the renewable resource. 1976 Mar; Tucson, AZ. Proc. Rocky Mtn Conf.: 37-54.
Schubert, Gilbert H. 1977. Forest regeneration of arid lands.1977 Oct. 2-6; Albuquerque, NM. Washington, DC: Proc. Soc. Amer. For. Natl Con: 82-87.
Scott, Virgil E.; Patton, David R.1975. Cavity-nesting birds of Arizona and New Mexico forests. Gen. Tech. Rep. RM-10. Fort Collins, CO: U.S. Department of Agriculture, Forest Service, Rocky Mountain Forest and Range Experiment Station. 52 p.
Shupe, Dorothy G. 1965. Arizona’s forest area and timber volume. Res. Note INT-33. Ogden, UT: U.S. Department of Agriculture, Forest Service, Intermountain Forest and Range Experiment Station. 4 p.
Silen, Roy R; Weber, John C.; Olson, Donald L.; Steinhoff, Ray J. et.al. 1999? Late-rotation trends in variation among provenances in four pioneer studies of ponderosa pine (Pinus ponderosa Dougl.ex Laws). Unpub. Pap. on file at Flagstaff, AZ: U.S. Department of Agriculture, Forest Service, Rocky
Mountain Research Station, Fort Valley Experimental Forest archives. 31 p.
Solomon, Rhey M.; Ffolliott, Peter F.; Baker, Malchus B., Jr.; Gottfried, Gerald J.; Thompson, J.R. 1975. Snowmelt runoff efficiencies on Arizona watersheds. Res. Rep. 274. Tucson, AZ: University of Arizona, Agricultural Experiment Station. 50 p.
Spencer, John S., Jr. 1966. Arizona’s forests. Res. Bull. INT-6. Fort Collins, CO and Ogden, UT: U.S. Department of Agriculture, Forest Service, Rocky Mountain Forest and Range Experiment Station and Intermountain Forest and Range Experiment Station. 56 p.
Sutton, R.F.; Tinus, R.W. 1983. Root and Root System Terminology. Forest Science Monograph. 24. 137 p.
Szaro, Robert C.; Balda, Russell P. 1982. Selection and monitoring of avian indicator species: An example from a ponderosa pine forest in the southwest. Gen. Tech. Rep. RM-89. Fort Collins, CO: U.S. Department of Agriculture, Forest Service, Southwestern Forest and Range Experiment Station. 8 p.
Talbot, M.W.; Hill, R.R. 1923. Progress report on the range study plots on the Coconino National Forest comprising a description of project and digest of data. Unpub. Pap. on file at Flagstaff, AZ: U.S. Department of Agriculture, Forest Service, Rocky Mountain Research Station, Fort Valley Experimental Forest archives. 32 p.
Talbot, M.W. 1937. Indicators of southwestern range conditions. Farmers’ Bull. 1782. Washington, DC: U.S. Department of Agriculture. 35 p.
Talbot, M.W.; Cronemiller, F.P. 1961. Some of the beginnings of range management. Journal of Range Management. 14(2): 95-102.
Taylor, Walter P.; Gorsuch, D.M. 1932. A test of some rodent and bird influences on western yellow pine reproduction at Fort Valley, Flagstaff, Arizona. Journal of Mammalogy. 13(3): 218-223.
Thomson, Walter G. 1939. A growth rate classification of ponderosa pine according to age and vigor. U.S. Department of Agriculture, Forest Service. 41 p.
Tinus, Richard W.; McDonald, Stephen E. 1979. How to grow tree seedlings in containers in greenhouses. GTR RM-60. Fort Collins, CO: U.S. Department of Agriculture, Forest Service, Rocky Mountain Forest and Range Experiment Station. 256 p.
Tree Ring Bulletin. 1934-38. Flagstaff, AZ: Museum of Northern Arizona. Tree Ring Society. Vol. 1-4.
Trowbridge, Albert H.; Lawson, Leon L. 1942. Abert squirrel—ponderosa pine relationships at the Fort Valley Experimental Forest, Flagstaff, Arizona. Unpub. Pap. on file at Flagstaff, AZ: U.S. Department of Agriculture, Forest Service, Fort Valley Experimental Forest archives. 38 p.
Turner, James M.; Larson, Frederic R. 1974. Cost analysis of experimental treatments on ponderosa pine watersheds. Res. Pap. RM-116. Fort Collins, CO: U.S. Department of Agriculture, Forest Service, Rocky Mountain Forest and Range Experiment Station. 12 p.
U.S. Department of Agriculture, Forest Service. 1944. The history of western range research. Agricultural History. 18: 127-143.
U.S. Department of Agriculture, Forest Service. 1956. Forest and range influences publications, 1905-1955. 78 p.
U.S. Department of Agriculture, Forest Service. 1958. Range management publications issued in 1957 by Forest Service Research personnel and cooperators. 6 p.

282 USDA Forest Service RMRS-P-55. 2008.
U.S. Department of Agriculture, Forest Service. 1958. Range plants of Arizona and New Mexico names, symbols, and notations. Fort Collins, CO: U.S. Department of Agriculture, Forest Service, Rocky Mountain Forest and Range Experiment Station. 86 p.
U.S. Department of Agriculture, Forest Service. 1973. Silvicultural systems for the major forest types of the United States. Agri. Handb. 445. Washington, DC: U.S. Department of Agriculture, Forest Service. 124 p.
U.S. Department of Agriculture, Forest Service. 1980? Culture of southwest conifers and aspen. Flagstaff, AZ: U.S. Department of Agriculture, Forest Service, Rocky Mountain Forest and Range Experiment Station. 2 p.
U.S. Department of Agriculture, Forest Service. 1985. Arizona forest survey field procedures. Ogden, UT: U.S. Department of Agriculture, Forest Service, Intermountain Forest and Range Experiment Station. 111 p.
U.S. Department of Agriculture, Forest Service, Intermountain Forest and Range Experiment Station. 111 p.
U.S. Department of Agriculture, Forest Service. 2000. Environmental assessment for the Fort Valley ecosystem restoration project. Flagstaff, AZ: U.S. Department of Agriculture, Forest Service, Coconino National Forest. 178 p.
U.S. Department of Agriculture, Soil Conservation Service. 1980. Summary of snow survey measurements for Arizona and pertinent portions of New Mexico 1938-1980. 179 p.
Urness, P.J.; Neff, D.J.; Vahle, J.R. 1975. Nutrient content of mule deer diets from ponderosa pine range. Journal of Wildlife Management. 39(4): 670-673.
Vincent, Paul Y. 1935. IPS (Tomicus) Confuscus and the effect of stripping on pole stands after a thinning and improvement cutting in ponderosa pine. Unpub. Pap. on file at Flagstaff,
AZ: U.S. Department of Agriculture, Forest Service, Rocky Mountain Research Station, Fort Valley Experimental Forest archives. 6 p.
Wadsworth, Frank H. 1939. Control of ips beetles by the trap tree method. Unpub. Pap. on file at Flagstaff, AZ: U.S. Department of Agriculture, Forest Service, Rocky Mountain Research Station, Fort Valley Experimental Forest archives. 13 p.
Wadsworth, Frank H. 1942. Value of small-crowned ponderosa pines in reserve stands in the southwest. Journal of Forestry. 40(10): 767-771.
Wadsworth, Frank H.; Pearson, G.A. 1943. Growth & mortality in a virgin stand of ponderosa pine compared with a cut-over stand. Res. Rep. 5. Tucson, AZ: U.S. Department of Agriculture, Forest Service, Southwestern Forest and Range Experiment Station. 16 p.
Wadsworth, Frank H. 1943b. Lightning damage to ponderosa pine stands of northern Arizona. Journal of Forestry. 41(9): 684-685.
Wales, H. Basil. 1916. The probable rate of growth of western yellow pine in cut over areas, as indicated by sample plot studies. School unknown. 29 p. Thesis.
Wollum, A.G., II; Schubert, Gilbert H. 1975. Division S-7 forest and range soils—Effect of thinning on the foliage and forest floor properties of ponderosa pine stands. Proc. Soil Sci. Soc. Am. 39(5): 968-972.
Woolsey, Theodore S., Jr. 1909. The Coconino Ranger School. Forest Quarterly. 7: 243-244.
Woolsey, Theodore S., Jr. 1911. Western yellow pine in Arizona and New Mexico. Bull.101. Washington, DC: U.S. Department of Agriculture, Forest Service. 64 p.
Woolsey, Theodore S., Jr. 1912. Permanent sample plots. Forest Quarterly. 10: 38-44.

Federal Recycling Program Printed on Recycled Paper
Rocky Mountain Research Station
The Rocky Mountain Research Station develops scientific information and technology to improve management, protection, and use of the forests and rangelands. Research is designed to meet the needs of the National Forest managers, Federal and State agencies, public and private organizations, academic institutions, industry, and individuals. Studies accelerate solutions to problems involving ecosystems, range, forests, water, recreation, fire, resource inventory, land reclamation, community sustainability, forest engineering technology, multiple use economics, wildlife and fish habitat, and forest insects and diseases. Studies are conducted cooperatively, and applications may be found worldwide.
Station Headquarters Rocky Mountain Research Station
240 W Prospect RoadFort Collins, CO 80526
(970) 498-1100
Research Locations
Reno, NevadaAlbuquerque, New MexicoRapid City, South Dakota
Logan, UtahOgden, UtahProvo, Utah
The U.S. Department of Agriculture (USDA) prohibits discrimination in all its programs and activities on the basis of race, color, national origin, age, disability, and where applicable, sex, marital status, familial status, parental status, religion, sexual orientation, genetic information, political beliefs, reprisal, or because all or part of an individual’s income is derived from any public assistance program. (Not all prohibited bases apply to all programs.) Persons with disabilities who require alternative means for communication of program information (Braille, large print, audiotape, etc.) should contact USDA’s TARGET Center at (202) 720-2600 (voice and TDD). To file a complaint of discrimination, write to USDA, Director, Office of Civil Rights, 1400 Independence Avenue, S.W., Washington, DC 20250-9410, or call (800) 795-3272 (voice) or (202) 720-6382 (TDD). USDA is an equal opportunity provider and employer.
Flagstaff, ArizonaFort Collins, Colorado
Boise, IdahoMoscow, Idaho
Bozeman, MontanaMissoula, Montana