Application Performance Monitor User Guide for Version 3.110
189
Application Performance Monitoring User Guide Application Performance Monitoring User Guide Software Version 3.110.00 Document ID: RDWR-APM-V0311000_UG1804 April 2018
-
Upload
khangminh22 -
Category
Documents
-
view
0 -
download
0
Transcript of Application Performance Monitor User Guide for Version 3.110
Application Performance Monitoring User Guide
Application Performance MonitoringUser Guide
Software Version 3.110.00Document ID: RDWR-APM-V0311000_UG1804 April 2018
Application Performance Monitoring User Guide
2 Document ID: RDWR-APM-V0311000_UG1804
Application Performance Monitoring User Guide
Table of Contents
Document ID: RDWR-APM-V0311000_UG1804 3
Table of ContentsImportant Notices .......................................................................................................... 9
Copyright Notices ........................................................................................................ 10
Standard Warranty ...................................................................................................... 15
Limitations on Warranty and Liability ........................................................................... 17
Safety Instructions ....................................................................................................... 18
Electromagnetic-Interference Statements ................................................................... 27
Altitude and Climate Warning ...................................................................................... 31
Document Conventions ............................................................................................... 32
Chapter 1 – Introduction......................................................................................... 33
Intended Audience ...................................................................................................... 33
Scope of This Guide .................................................................................................... 33
Related Documentation ............................................................................................... 33
Chapter 2 – Overview.............................................................................................. 35
APM Benefits ............................................................................................................... 35Detect Application Performance Issues—Before Your Customer Does ............................. 35Key Values of Radware’s Application Performance Monitoring ........................................... 35
How APM Works ......................................................................................................... 37
Chapter 3 – Getting Started with APM Management ........................................... 39
Accessing the APM Web Interface .............................................................................. 39
Logging In and Logging Out ........................................................................................ 40
The APM GUI .............................................................................................................. 40
Viewing APM Version Information ............................................................................... 41
Monitoring of APM-Enabled Devices and Services ..................................................... 41Monitoring of APM-Enabled Services .................................................................................. 41Monitoring of APM-Enabled Devices ................................................................................... 42
Exporting and Importing the APM Configuration ......................................................... 42Exporting the APM Server Configuration ............................................................................. 42Importing the APM Server Configuration ............................................................................. 43
Exporting and Importing the APM Server Database .................................................... 44
Data Export to a CSV File ........................................................................................... 44
Application Performance Monitoring User Guide Table of Contents
4 Document ID: RDWR-APM-V0311000_UG1804
Chapter 4 – Managing APM Dashboards and Reports........................................ 47
Changing the Application in Focus ............................................................................. 47
Specifying the Timeframe that the APM Views Display .............................................. 48Select Today ....................................................................................................................... 48Select a Recent Interval ...................................................................................................... 49Select a Custom Timeframe ................................................................................................ 49Select a Previous Date/Time Selection ............................................................................... 49
Managing Your Favorites ........................................................................................... 50
Sharing the Display .................................................................................................... 51
Accessing APM Help .................................................................................................. 51
Chapter 5 – Managing APM Settings .................................................................... 53
Managing Parameters Settings .................................................................................. 53
Configuring SMTP Settings ........................................................................................ 54
Managing Alerts Settings ............................................................................................ 55
Managing Applications Settings ................................................................................. 55Defining a Monitored Application ......................................................................................... 55Assigning Transactions to an Application ............................................................................ 56Configuring and Testing Transaction Naming (Basic Mode) ............................................... 57Deploying Collectors on Target Application Nodes ............................................................. 58Defining SLAs and Alerts for the Application ....................................................................... 58
Managing Transformation Rules Settings .................................................................. 59Transformation Rules—General Information ...................................................................... 59Working with Transformation Rules .................................................................................... 60Common Transformation Rules Usage Scenarios .............................................................. 73
Viewing Areas/Locations Settings .............................................................................. 77MaxMind Geo IP Database Integration ............................................................................... 78
Managing Maintenance Settings ................................................................................ 79
Chapter 6 – Navigating the APM User Interface Main Menu............................... 81
Introduction to APM Use Cases ................................................................................. 81
Monitoring Use Cases ................................................................................................ 82Monitoring Use-Case Groups .............................................................................................. 82Monitoring Use-Case Views ................................................................................................ 83
Understanding Use-Case Selection and Output Displays .......................................... 83
Exploring the Use-Case Bar in the APM Main Menu .................................................. 83Using the APM Main Menu .................................................................................................. 83Viewing Expanded Versus Basic Views .............................................................................. 84
Application Performance Monitoring User Guide
Table of Contents
Document ID: RDWR-APM-V0311000_UG1804 5
Chapter 7 – APM Monitoring Use-Case Menus .................................................... 85
Monitoring - Applications ............................................................................................. 85Using the Applications View for User Experience Information ............................................. 85Using the Applications View for Data-Center Information .................................................... 86Using the Application Dashboard for User-Experience Information .................................... 87Using the Application Dashboard for Data-Center Information ............................................ 88Using the Transactions View for User Experience Information ........................................... 89Using the Transactions View for Data-Center Information .................................................. 90
Monitoring - Locations ................................................................................................. 91
Monitoring - Data Center Analysis ............................................................................... 93
Chapter 8 – APM User Interface View Types........................................................ 97
Working with Alerts View ............................................................................................. 97
Working with the Application Dashboard ..................................................................... 98Using the Application Dashboard - Data Center Information Perspective ........................... 98Using the Application Dashboard - User Experience Perspective ....................................... 99Working with the Application Dashboard—Additional Functionality ................................. 100
Topology Map and the KPI Panes ............................................................................ 103Accessing the Application Topology View ........................................................................ 104Viewing the Topology ....................................................................................................... 104Working with the Topology Map Display: Channels, Legend, and Map Settings ............. 105Comparing Channel Behavior with a Previous Period ...................................................... 105Topology Map Controls ..................................................................................................... 108Using Topology Map Layout Options ................................................................................ 108Working with the Topology Map Summary Tab KPI Display ............................................ 109
Working with Response-Time SLA Views ................................................................ 111User Interface Features of All SLA Watch Views ............................................................. 111Using End User Watch vs. Data Center SLA Watch Views .............................................. 114Exploring Transaction Behavior ........................................................................................ 114Viewing End User - Locations SLA Watch ........................................................................ 114
Using Compare Good Versus Bad ........................................................................... 115Viewing the Layout ........................................................................................................... 115Viewing Access for Transaction Level Good Vs. Bad Comparison Information ............... 115Viewing Access for Application Level Good Versus Bad Comparison Information .......... 115Viewing UI and Functional Features ................................................................................. 116
Working with Compare Timeframes Views ............................................................... 116Viewing Compare Timeframes ......................................................................................... 116Working with Compare Timeframes ................................................................................. 117
Examining Individual Transaction Instances ............................................................ 117Finding the Relevant Transaction Instance ...................................................................... 118Investigating Transaction Instances ................................................................................. 119Navigating Between the Transaction Instance Views ....................................................... 119Viewing Tier Distribution on the Transaction Views .......................................................... 121Viewing the Transaction’s Response Time Breakdown Representation in the Transaction
Application Performance Monitoring User Guide Table of Contents
6 Document ID: RDWR-APM-V0311000_UG1804
Instance Views .................................................................................................................. 122Using the Transaction Instance Views .............................................................................. 122Viewing the Critical Path ................................................................................................... 123Using the Transaction Topology View ............................................................................... 124Understanding the Segment Details Display ..................................................................... 124Viewing the Transaction Properties Dialog Box ................................................................ 125Viewing the Transaction Model ......................................................................................... 125Working with Transaction Properties ................................................................................. 127
Working with Global User Experience ...................................................................... 127
Working with the Advanced Breakdown View .......................................................... 131Using the Advanced Breakdown View .............................................................................. 131Using the Tooltips for Advanced Breakdown Information ................................................. 134Viewing Measured Elements ............................................................................................. 135Viewing Displayed Measurements .................................................................................... 135Working with Advanced Breakdown Layout ...................................................................... 135Working with the Advanced Breakdown View’s Legend ................................................... 136Working with Drill-downs from the Main Graph in the Advanced Breakdown View .......... 137Using the Advanced Breakdown View Toolbar ................................................................. 137Advanced Breakdown View—Secondary Graphs ............................................................ 138
IPv6 Support ............................................................................................................. 138
Search ...................................................................................................................... 139Quick Search ..................................................................................................................... 139Advanced Search .............................................................................................................. 139
Chapter 9 – Using APM Alert Views.................................................................... 143
Using the Alerts View for User Experience Information ............................................ 143
Using Alerts for Data-Center Information ................................................................. 144
Chapter 10 – Using APM Reports........................................................................ 145
On-Demand Report Generation from the New Report Tab ...................................... 145
Scheduling Reports from the Scheduled Reports Tab ............................................. 146The Scheduled Reports Tab ............................................................................................. 146Scheduling a Report .......................................................................................................... 147
Working with the Report Queue ............................................................................... 148Report Queue Display ....................................................................................................... 148Available Actions ............................................................................................................... 148Filtering the Report 4Queue .............................................................................................. 149
Configuring the Mail Server ...................................................................................... 149
Available Reports ..................................................................................................... 149
Application Performance Monitoring User Guide
Table of Contents
Document ID: RDWR-APM-V0311000_UG1804 7
Chapter 11 – Response-Time SLA Management and Failed Transaction Management .......................................................................................................... 153
APM Response-Time SLA Basics ............................................................................ 153
Introduction to Setting Response-Time and Failed-Transaction SLAs and SLA Alerts .... 154
Configuring Response-Time SLAs and Response-Time-SLA Alerts ........................ 154
Configuring Transaction Failure Alerts ..................................................................... 158
Configuring SLAs and SLA Alerts from Transaction Properties ............................... 159
Configuring Transaction Failure Alerts from Transaction Properties ........................ 162
Adding Data Center and End User SLAs for One Transaction Type ........................ 163
Adding End-user SLAs ............................................................................................. 164
Setting SLA by Automatic Calculation of SLA Value ................................................ 165
Setting SLA by Automatic Calculation of SLA Value ................................................ 166
Alert Actions ............................................................................................................. 167
Setting Alert Sensitivity Levels ................................................................................. 167
Viewing Alerts and Their Settings ............................................................................. 167
Appendix A – Finding Problematic Spots in Application Code........................ 169
Searching for Method Level Hotspots ...................................................................... 169
Drilling Down from Method Level Hotspot Indications .............................................. 169
Method Level Hotspots for Specific Transaction ...................................................... 170The Header ....................................................................................................................... 170Time-Consuming Methods Section ................................................................................... 170Method Trace Section ....................................................................................................... 171Data Displayed ................................................................................................................. 171
Method Trace Interactive Interface Features ............................................................ 172Filtering ............................................................................................................................. 172Restoring Method Trace to the State Before Filtering ...................................................... 173Searching .......................................................................................................................... 173Saving Method Trace to a File .......................................................................................... 173
Appendix B – Troubleshooting Too Many Event Types.................................... 175
Understanding Too Many Event Types .................................................................... 175
Procedure for Solving Too Many Event Types Alerts and Errors ............................. 176
Tips for Controlling the Number of Event Types per Application .............................. 176
Appendix C – Managing Application Monitoring ............................................... 179
Application Properties Dialog Box ............................................................................ 179
Event Type Viewer ................................................................................................... 180
Transaction Naming ................................................................................................. 181
Application Performance Monitoring User Guide Table of Contents
8 Document ID: RDWR-APM-V0311000_UG1804
Appendix D – Glossary......................................................................................... 183
Radware Ltd. End User License Agreement ...................................................... 185
Application Performance Monitoring User Guide
Document ID: RDWR-APM-V0311000_UG1804 9
Important NoticesThe following important notices are presented in English, French, and German.
Important NoticesThis guide is delivered subject to the following conditions and restrictions:Copyright Radware Ltd. 2018. All rights reserved.The copyright and all other intellectual property rights and trade secrets included in this guide are owned by Radware Ltd.The guide is provided to Radware customers for the sole purpose of obtaining information with respect to the installation and use of the Radware products described in this document, and may not be used for any other purpose.The information contained in this guide is proprietary to Radware and must be kept in strict confidence.It is strictly forbidden to copy, duplicate, reproduce or disclose this guide or any part thereof without the prior written consent of Radware.
Notice importanteCe guide est sujet aux conditions et restrictions suivantes:Copyright Radware Ltd. 2018. Tous droits réservés.Le copyright ainsi que tout autre droit lié à la propriété intellectuelle et aux secrets industriels contenus dans ce guide sont la propriété de Radware Ltd.Ce guide d’informations est fourni à nos clients dans le cadre de l’installation et de l’usage des produits de Radware décrits dans ce document et ne pourra être utilisé dans un but autre que celui pour lequel il a été conçu.Les informations répertoriées dans ce document restent la propriété de Radware et doivent être conservées de manière confidentielle.Il est strictement interdit de copier, reproduire ou divulguer des informations contenues dans ce manuel sans avoir obtenu le consentement préalable écrit de Radware.
Wichtige AnmerkungDieses Handbuch wird vorbehaltlich folgender Bedingungen und Einschränkungen ausgeliefert:Copyright Radware Ltd. 2018. Alle Rechte vorbehalten.Das Urheberrecht und alle anderen in diesem Handbuch enthaltenen Eigentumsrechte und Geschäftsgeheimnisse sind Eigentum von Radware Ltd.Dieses Handbuch wird Kunden von Radware mit dem ausschließlichen Zweck ausgehändigt, Informationen zu Montage und Benutzung der in diesem Dokument beschriebene Produkte von Radware bereitzustellen. Es darf für keinen anderen Zweck verwendet werden.Die in diesem Handbuch enthaltenen Informationen sind Eigentum von Radware und müssen streng vertraulich behandelt werden.Es ist streng verboten, dieses Handbuch oder Teile daraus ohne vorherige schriftliche Zustimmung von Radware zu kopieren, vervielfältigen, reproduzieren oder offen zu legen.
Application Performance Monitoring User Guide
10 Document ID: RDWR-APM-V0311000_UG1804
Copyright NoticesThe following copyright notices are presented in English, French, and German.
Copyright NoticesThe programs included in this product are subject to a restricted use license and can only be used in conjunction with this application.The OpenSSL toolkit stays under a dual license, i.e. both the conditions of the OpenSSL License and the original SSLeay license apply to the toolkit. See below for the actual license texts. Actually both licenses are BSD-style Open Source licenses. In case of any license issues related to OpenSSL, please contact [email protected] LicenseCopyright (c) 1998-2011 The OpenSSL Project. All rights reserved.Redistribution and use in source and binary forms, with or without modification, are permitted provided that the following conditions are met:
1. Redistributions of source code must retain the above copyright notice, this list of conditions and the following disclaimer.
2. Redistributions in binary form must reproduce the above copyright notice, this list of conditions and the following disclaimer in the documentation and/or other materials provided with the distribution.
3. All advertising materials mentioning features or use of this software must display the following acknowledgement:
This product includes software developed by the OpenSSL Project for use in the OpenSSL Toolkit. (http://www.openssl.org/)
4. The names “OpenSSL Toolkit” and “OpenSSL Project” must not be used to endorse or promote products derived from this software without prior written permission. For written permission, please contact [email protected].
5. Products derived from this software may not be called “OpenSSL” nor may “OpenSSL” appear in their names without prior written permission of the OpenSSL Project.
6. Redistributions of any form whatsoever must retain the following acknowledgment:
“This product includes software developed by the OpenSSL Project for use in the OpenSSL Toolkit (http://www.openssl.org/)”
THIS SOFTWARE IS PROVIDED BY THE OpenSSL PROJECT “AS IS'' AND ANY EXPRESSED OR IMPLIED WARRANTIES, INCLUDING, BUT NOT LIMITED TO, THE IMPLIED WARRANTIES OF MERCHANTABILITY AND FITNESS FOR A PARTICULAR PURPOSE ARE DISCLAIMED. IN NO EVENT SHALL THE OpenSSL PROJECT OR ITS CONTRIBUTORS BE LIABLE FOR ANY DIRECT, INDIRECT, INCIDENTAL, SPECIAL, EXEMPLARY, OR CONSEQUENTIAL DAMAGES (INCLUDING, BUT NOT LIMITED TO, PROCUREMENT OF SUBSTITUTE GOODS OR SERVICES; LOSS OF USE, DATA, OR PROFITS; OR BUSINESS INTERRUPTION) HOWEVER CAUSED AND ON ANY THEORY OF LIABILITY, WHETHER IN CONTRACT, STRICT LIABILITY, OR TORT (INCLUDING NEGLIGENCE OR OTHERWISE) ARISING IN ANY WAY OUT OF THE USE OF THIS SOFTWARE, EVEN IF ADVISED OF THE POSSIBILITY OF SUCH DAMAGE.This product includes cryptographic software written by Eric Young ([email protected]). This product includes software written by Tim Hudson ([email protected]).Original SSLeay LicenseCopyright (C) 1995-1998 Eric Young ([email protected])All rights reserved.This package is an SSL implementation written by Eric Young ([email protected]).
Application Performance Monitoring User Guide
Document ID: RDWR-APM-V0311000_UG1804 11
The implementation was written so as to conform with Netscapes SSL.This library is free for commercial and non-commercial use as long as the following conditions are aheared to. The following conditions apply to all code found in this distribution, be it the RC4, RSA, lhash, DES, etc., code; not just the SSL code. The SSL documentation included with this distribution is covered by the same copyright terms except that the holder is Tim Hudson ([email protected]).Copyright remains Eric Young's, and as such any Copyright notices in the code are not to be removed.If this package is used in a product, Eric Young should be given attribution as the author of the parts of the library used.This can be in the form of a textual message at program startup or in documentation (online or textual) provided with the package.Redistribution and use in source and binary forms, with or without modification, are permitted provided that the following conditions are met:
1. Redistributions of source code must retain the copyright notice, this list of conditions and the following disclaimer.
2. Redistributions in binary form must reproduce the above copyright notice, this list of conditions and the following disclaimer in the documentation and/or other materials provided with the distribution.
3. All advertising materials mentioning features or use of this software must display the following acknowledgement:
"This product includes cryptographic software written by Eric Young ([email protected])" The word 'cryptographic' can be left out if the rouines from the library being used are not cryptographic related :-).
4. If you include any Windows specific code (or a derivative thereof) from the apps directory (application code) you must include an acknowledgment:
"This product includes software written by Tim Hudson ([email protected])"THIS SOFTWARE IS PROVIDED BY ERIC YOUNG “AS IS”' AND ANY EXPRESS OR IMPLIED WARRANTIES, INCLUDING, BUT NOT LIMITED TO, THE IMPLIED WARRANTIES OF MERCHANTABILITY AND FITNESS FOR A PARTICULAR PURPOSE ARE DISCLAIMED. IN NO EVENT SHALL THE AUTHOR OR CONTRIBUTORS BE LIABLE FOR ANY DIRECT, INDIRECT, INCIDENTAL, SPECIAL, EXEMPLARY, OR CONSEQUENTIAL DAMAGES (INCLUDING, BUT NOT LIMITED TO, PROCUREMENT OF SUBSTITUTE GOODS OR SERVICES; LOSS OF USE, DATA, OR PROFITS; OR BUSINESS INTERRUPTION) HOWEVER CAUSED AND ON ANY THEORY OF LIABILITY, WHETHER IN CONTRACT, STRICT LIABILITY, OR TORT (INCLUDING NEGLIGENCE OR OTHERWISE) ARISING IN ANY WAY OUT OF THE USE OF THIS SOFTWARE, EVEN IF ADVISED OF THE POSSIBILITY OF SUCH DAMAGE.The licence and distribution terms for any publically available version or derivative of this code cannot be changed. i.e. this code cannot simply be copied and put under another distribution licence [including the GNU Public Licence.]This product contains the Rijndael cipher The Rijndael implementation by Vincent Rijmen, Antoon Bosselaers and Paulo Barreto is in the public domain and distributed with the following license: @version 3.0 (December 2000)Optimized ANSI C code for the Rijndael cipher (now AES)@author Vincent Rijmen <[email protected]>@author Antoon Bosselaers <[email protected]>@author Paulo Barreto <[email protected]>The OnDemand Switch may use software components licensed under the GNU General Public License Agreement Version 2 (GPL v.2) including LinuxBios and Filo open source projects. The source code of the LinuxBios and Filo is available from Radware upon request. A copy of the license can be viewed at: http://www.gnu.org/licenses/old-licenses/gpl-2.0.html.
Application Performance Monitoring User Guide
12 Document ID: RDWR-APM-V0311000_UG1804
This code is hereby placed in the public domain.This product contains code developed by the OpenBSD ProjectCopyright ©1983, 1990, 1992, 1993, 1995The Regents of the University of California. All rights reserved.Redistribution and use in source and binary forms, with or without modification, are permitted provided that the following conditions are met:
1. Redistributions of source code must retain the above copyright notice, this list of conditions and the following disclaimer.
2. Redistributions in binary form must reproduce the above copyright notice, this list of conditions and the following disclaimer in the documentation and/or other materials provided with the distribution.
3. Neither the name of the University nor the names of its contributors may be used to endorse or promote products derived from this software without specific prior written permission.
This product includes software developed by Markus FriedlThis product includes software developed by Theo de RaadtThis product includes software developed by Niels ProvosThis product includes software developed by Dug SongThis product includes software developed by Aaron CampbellThis product includes software developed by Damien MillerThis product includes software developed by Kevin StevesThis product includes software developed by Daniel KourilThis product includes software developed by Wesley GriffinThis product includes software developed by Per AllanssonThis product includes software developed by Nils NordmanThis product includes software developed by Simon WilkinsonRedistribution and use in source and binary forms, with or without modification, are permitted provided that the following conditions are met:
1. Redistributions of source code must retain the above copyright notice, this list of conditions and the following disclaimer.
2. Redistributions in binary form must reproduce the above copyright notice, this list of conditions and the following disclaimer in the documentation and/or other materials provided with the distribution.
This product contains work derived from the RSA Data Security, Inc. MD5 Message-Digest Algorithm. RSA Data Security, Inc. makes no representations concerning either the merchantability of the MD5 Message - Digest Algorithm or the suitability of the MD5 Message - Digest Algorithm for any particular purpose. It is provided “as is” without express or implied warranty of any kind.
Notice traitant du copyrightLes programmes intégrés dans ce produit sont soumis à une licence d'utilisation limitée et ne peuvent être utilisés qu'en lien avec cette application.Ce produit renferme des codes développés dans le cadre du projet OpenSSL.Ce produit inclut un logiciel développé dans le cadre du projet OpenSSL. Pour un usage dans la boîte à outils OpenSSL (http://www.openssl.org/).Copyright ©1998-2005 Le projet OpenSSL. Tous droits réservés. Ce produit inclut la catégorie de chiffre Rijndael. L’implémentation de Rijindael par Vincent Rijmen, Antoon Bosselaers et Paulo Barreto est du domaine public et distribuée sous les termes de la licence suivante:@version 3.0 (Décembre 2000)
Application Performance Monitoring User Guide
Document ID: RDWR-APM-V0311000_UG1804 13
Code ANSI C code pour Rijndael (actuellement AES)@author Vincent Rijmen <[email protected]>@author Antoon Bosselaers <[email protected]>@author Paulo Barreto <[email protected]>.Le commutateur OnDemand peut utiliser les composants logiciels sous licence, en vertu des termes de la licence GNU General Public License Agreement Version 2 (GPL v.2), y compris les projets à source ouverte LinuxBios et Filo. Le code source de LinuxBios et Filo est disponible sur demande auprès de Radware. Une copie de la licence est répertoriée sur: http://www.gnu.org/licenses/old-licenses/gpl-2.0.html.Ce code est également placé dans le domaine public.Ce produit renferme des codes développés dans le cadre du projet OpenSSL.Copyright ©1983, 1990, 1992, 1993, 1995Les membres du conseil de l’Université de Californie. Tous droits réservés.La distribution et l’usage sous une forme source et binaire, avec ou sans modifications, est autorisée pour autant que les conditions suivantes soient remplies:
1. La distribution d’un code source doit inclure la notice de copyright mentionnée ci-dessus, cette liste de conditions et l’avis de non-responsabilité suivant.
2. La distribution, sous une forme binaire, doit reproduire dans la documentation et/ou dans tout autre matériel fourni la notice de copyright mentionnée ci-dessus, cette liste de conditions et l’avis de non-responsabilité suivant.
3. Le nom de l’université, ainsi que le nom des contributeurs ne seront en aucun cas utilisés pour approuver ou promouvoir un produit dérivé de ce programme sans l’obtention préalable d’une autorisation écrite.
Ce produit inclut un logiciel développé par Markus Friedl Ce produit inclut un logiciel développé par Theo de Raadt Ce produit inclut un logiciel développé par Niels Provos Ce produit inclut un logiciel développé par Dug SongCe produit inclut un logiciel développé par Aaron Campbell Ce produit inclut un logiciel développé par Damien Miller Ce produit inclut un logiciel développé par Kevin Steves Ce produit inclut un logiciel développé par Daniel Kouril Ce produit inclut un logiciel développé par Wesley Griffin Ce produit inclut un logiciel développé par Per Allansson Ce produit inclut un logiciel développé par Nils NordmanCe produit inclut un logiciel développé par Simon Wilkinson.La distribution et l’usage sous une forme source et binaire, avec ou sans modifications, est autorisée pour autant que les conditions suivantes soient remplies:
1. La distribution d’un code source doit inclure la notice de copyright mentionnée ci-dessus, cette liste de conditions et l’avis de non-responsabilité suivant.
La distribution, sous une forme binaire, doit reproduire dans la documentation et/ou dans tout autre matériel fourni la notice de copyright mentionnée ci-dessus, cette liste de conditions et l’avis de non-responsabilité suivant.LE LOGICIEL MENTIONNÉ CI-DESSUS EST FOURNI TEL QUEL PAR LE DÉVELOPPEUR ET TOUTE GARANTIE, EXPLICITE OU IMPLICITE, Y COMPRIS, MAIS SANS S’Y LIMITER, TOUTE GARANTIE IMPLICITE DE QUALITÉ MARCHANDE ET D’ADÉQUATION À UN USAGE PARTICULIER EST EXCLUE.
Application Performance Monitoring User Guide
14 Document ID: RDWR-APM-V0311000_UG1804
EN AUCUN CAS L’AUTEUR NE POURRA ÊTRE TENU RESPONSABLE DES DOMMAGES DIRECTS, INDIRECTS, ACCESSOIRES, SPÉCIAUX, EXEMPLAIRES OU CONSÉCUTIFS (Y COMPRIS, MAIS SANS S’Y LIMITER, L’ACQUISITION DE BIENS OU DE SERVICES DE REMPLACEMENT, LA PERTE D’USAGE, DE DONNÉES OU DE PROFITS OU L’INTERRUPTION DES AFFAIRES), QUELLE QU’EN SOIT LA CAUSE ET LA THÉORIE DE RESPONSABILITÉ, QU’IL S’AGISSE D’UN CONTRAT, DE RESPONSABILITÉ STRICTE OU D’UN ACTE DOMMAGEABLE (Y COMPRIS LA NÉGLIGENCE OU AUTRE), DÉCOULANT DE QUELLE QUE FAÇON QUE CE SOIT DE L’USAGE DE CE LOGICIEL, MÊME S’IL A ÉTÉ AVERTI DE LA POSSIBILITÉ D’UN TEL DOMMAGE.
CopyrightvermerkeDie in diesem Produkt enthalten Programme unterliegen einer eingeschränkten Nutzungslizenz und können nur in Verbindung mit dieser Anwendung benutzt werden.Dieses Produkt enthält einen vom OpenSSL-Projekt entwickelten Code.Dieses Produkt enthält vom OpenSSL-Projekt entwickelte Software. Zur Verwendung im OpenSSL Toolkit (http://www.openssl.org/).Copyright ©1998-2005 The OpenSSL Project. Alle Rechte vorbehalten. Dieses Produkt enthält die Rijndael cipherDie Rijndael-Implementierung von Vincent Rijndael, Anton Bosselaers und Paulo Barreto ist öffentlich zugänglich und wird unter folgender Lizenz vertrieben:@version 3.0 (December 2000)Optimierter ANSI C Code für den Rijndael cipher (jetzt AES)@author Vincent Rijmen <[email protected]>@author Antoon Bosselaers <[email protected]>@author Paulo Barreto <[email protected]>Der OnDemand Switch verwendet möglicherweise Software, die im Rahmen der DNU Allgemeine Öffentliche Lizenzvereinbarung Version 2 (GPL v.2) lizensiert sind, einschließlich LinuxBios und Filo Open Source-Projekte. Der Quellcode von LinuxBios und Filo ist bei Radware auf Anfrage erhältlich. Eine Kopie dieser Lizenz kann eingesehen werden unter:http://www.gnu.org/licenses/old-licenses/gpl-2.0.htmlDieser Code wird hiermit allgemein zugänglich gemacht.Dieses Produkt enthält einen vom OpenBSD-Projekt entwickelten CodeCopyright ©1983, 1990, 1992, 1993, 1995The Regents of the University of California. Alle Rechte vorbehalten.Die Verbreitung und Verwendung in Quell- und binärem Format, mit oder ohne Veränderungen, sind unter folgenden Bedingungen erlaubt:
1. Die Verbreitung von Quellcodes muss den voranstehenden Copyrightvermerk, diese Liste von Bedingungen und den folgenden Haftungsausschluss beibehalten.
2. Die Verbreitung in binärem Format muss den voranstehenden Copyrightvermerk, diese Liste von Bedingungen und den folgenden Haftungsausschluss in der Dokumentation und/oder andere Materialien, die mit verteilt werden, reproduzieren.
3. Weder der Name der Universität noch die Namen der Beitragenden dürfen ohne ausdrückliche vorherige schriftliche Genehmigung verwendet werden, um von dieser Software abgeleitete Produkte zu empfehlen oder zu bewerben.
Dieses Produkt enthält von Markus Friedl entwickelte Software Dieses Produkt enthält von Theo de Raadt entwickelte Software Dieses Produkt enthält von Niels Provos entwickelte Software Dieses Produkt enthält von Dug Song entwickelte Software Dieses Produkt enthält von Aaron Campbell entwickelte Software Dieses Produkt enthält von Damien Miller entwickelte Software
Application Performance Monitoring User Guide
Document ID: RDWR-APM-V0311000_UG1804 15
Dieses Produkt enthält von Kevin Steves entwickelte Software Dieses Produkt enthält von Daniel Kouril entwickelte Software Dieses Produkt enthält von Wesley Griffin entwickelte Software Dieses Produkt enthält von Per Allansson entwickelte Software Dieses Produkt enthält von Nils Nordman entwickelte SoftwareDieses Produkt enthält von Simon Wilkinson entwickelte SoftwareDie Verbreitung und Verwendung in Quell- und binärem Format, mit oder ohne Veränderungen, sind unter folgenden Bedingungen erlaubt:
1. Die Verbreitung von Quellcodes muss den voranstehenden Copyrightvermerk, diese Liste von Bedingungen und den folgenden Haftungsausschluss beibehalten.
Die Verbreitung in binärem Format muss den voranstehenden Copyrightvermerk, diese Liste von Bedingungen und den folgenden Haftungsausschluss in der Dokumentation und/oder andere Materialien, die mit verteilt werden, reproduzieren.SÄMTLICHE VORGENANNTE SOFTWARE WIRD VOM AUTOR IM IST-ZUSTAND (“AS IS”) BEREITGESTELLT. JEGLICHE AUSDRÜCKLICHEN ODER IMPLIZITEN GARANTIEN, EINSCHLIESSLICH, DOCH NICHT BESCHRÄNKT AUF DIE IMPLIZIERTEN GARANTIEN DER MARKTGÄNGIGKEIT UND DER ANWENDBARKEIT FÜR EINEN BESTIMMTEN ZWECK, SIND AUSGESCHLOSSEN.UNTER KEINEN UMSTÄNDEN HAFTET DER AUTOR FÜR DIREKTE ODER INDIREKTE SCHÄDEN, FÜR BEI VERTRAGSERFÜLLUNG ENTSTANDENE SCHÄDEN, FÜR BESONDERE SCHÄDEN, FÜR SCHADENSERSATZ MIT STRAFCHARAKTER, ODER FÜR FOLGESCHÄDEN EINSCHLIESSLICH, DOCH NICHT BESCHRÄNKT AUF, ERWERB VON ERSATZGÜTERN ODER ERSATZLEISTUNGEN; VERLUST AN NUTZUNG, DATEN ODER GEWINN; ODER GESCHÄFTSUNTERBRECHUNGEN) GLEICH, WIE SIE ENTSTANDEN SIND, UND FÜR JEGLICHE ART VON HAFTUNG, SEI ES VERTRÄGE, GEFÄHRDUNGSHAFTUNG, ODER DELIKTISCHE HAFTUNG (EINSCHLIESSLICH FAHRLÄSSIGKEIT ODER ANDERE), DIE IN JEGLICHER FORM FOLGE DER BENUTZUNG DIESER SOFTWARE IST, SELBST WENN AUF DIE MÖGLICHKEIT EINES SOLCHEN SCHADENS HINGEWIESEN WURDE.
Standard WarrantyThe following standard warranty is presented in English, French, and German.
Standard Warranty Radware offers a limited warranty for all its products (“Products”). Radware hardware products are warranted against defects in material and workmanship for a period of one year from date of shipment. Radware software carries a standard warranty that provides bug fixes for up to 90 days after date of purchase. Should a Product unit fail anytime during the said period(s), Radware will, at its discretion, repair or replace the Product.For hardware warranty service or repair, the product must be returned to a service facility designated by Radware. Customer shall pay the shipping charges to Radware and Radware shall pay the shipping charges in returning the product to the customer. Please see specific details outlined in the Standard Warranty section of the customer's purchase order.Radware shall be released from all obligations under its Standard Warranty in the event that the Product and/or the defective component has been subjected to misuse, neglect, accident or improper installation, or if repairs or modifications were made by persons other than Radware authorized service personnel, unless such repairs by others were made with the written consent of Radware.EXCEPT AS SET FORTH ABOVE, ALL RADWARE PRODUCTS (HARDWARE AND SOFTWARE) ARE PROVIDED BY “AS IS” AND ANY EXPRESS OR IMPLIED WARRANTIES, INCLUDING, BUT NOT LIMITED TO, THE IMPLIED WARRANTIES OF MERCHANTABILITY AND FITNESS FOR A PARTICULAR PURPOSE ARE DISCLAIMED.
Application Performance Monitoring User Guide
16 Document ID: RDWR-APM-V0311000_UG1804
Garantie standardRadware octroie une garantie limitée pour l'ensemble de ses produits (" Produits "). Le matériel informatique (hardware) Radware est garanti contre tout défaut matériel et de fabrication pendant une durée d'un an à compter de la date d'expédition. Les logiciels (software) Radware sont fournis avec une garantie standard consistant en la fourniture de correctifs des dysfonctionnements du logiciels (bugs) pendant une durée maximum de 90 jours à compter de la date d'achat. Dans l'hypothèse où un Produit présenterait un défaut pendant ladite(lesdites) période(s), Radware procédera, à sa discrétion, à la réparation ou à l'échange du Produit.S'agissant de la garantie d'échange ou de réparation du matériel informatique, le Produit doit être retourné chez un réparateur désigné par Radware. Le Client aura à sa charge les frais d'envoi du Produit à Radware et Radware supportera les frais de retour du Produit au client. Veuillez consulter les conditions spécifiques décrites dans la partie " Garantie Standard " du bon de commande client.Radware est libérée de toutes obligations liées à la Garantie Standard dans l'hypothèse où le Produit et/ou le composant défectueux a fait l'objet d'un mauvais usage, d'une négligence, d'un accident ou d'une installation non conforme, ou si les réparations ou les modifications qu'il a subi ont été effectuées par d'autres personnes que le personnel de maintenance autorisé par Radware, sauf si Radware a donné son consentement écrit à ce que de telles réparations soient effectuées par ces personnes.SAUF DANS LES CAS PREVUS CI-DESSUS, L'ENSEMBLE DES PRODUITS RADWARE (MATERIELS ET LOGICIELS) SONT FOURNIS " TELS QUELS " ET TOUTES GARANTIES EXPRESSES OU IMPLICITES SONT EXCLUES, EN CE COMPRIS, MAIS SANS S'Y RESTREINDRE, LES GARANTIES IMPLICITES DE QUALITE MARCHANDE ET D'ADEQUATION A UNE UTILISATION PARTICULIERE.
Standard GarantieRadware bietet eine begrenzte Garantie für alle seine Produkte ("Produkte") an. Hardware Produkte von Radware haben eine Garantie gegen Material- und Verarbeitungsfehler für einen Zeitraum von einem Jahr ab Lieferdatum. Radware Software verfügt über eine Standard Garantie zur Fehlerbereinigung für einen Zeitraum von bis zu 90 Tagen nach Erwerbsdatum. Sollte ein Produkt innerhalb des angegebenen Garantiezeitraumes einen Defekt aufweisen, wird Radware das Produkt nach eigenem Ermessen entweder reparieren oder ersetzen.Für den Hardware Garantieservice oder die Reparatur ist das Produkt an eine von Radware bezeichnete Serviceeinrichtung zurückzugeben. Der Kunde hat die Versandkosten für den Transport des Produktes zu Radware zu tragen, Radware übernimmt die Kosten der Rückversendung des Produktes an den Kunden. Genauere Angaben entnehmen Sie bitte dem Abschnitt zur Standard Garantie im Bestellformular für Kunden.Radware ist von sämtlichen Verpflichtungen unter seiner Standard Garantie befreit, sofern das Produkt oder der fehlerhafte Teil zweckentfremdet genutzt, in der Pflege vernachlässigt, einem Unfall ausgesetzt oder unsachgemäß installiert wurde oder sofern Reparaturen oder Modifikationen von anderen Personen als durch Radware autorisierten Kundendienstmitarbeitern vorgenommen wurden, es sei denn, diese Reparatur durch besagte andere Personen wurden mit schriftlicher Genehmigung seitens Radware durchgeführt.MIT AUSNAHME DES OBEN DARGESTELLTEN, SIND ALLE RADWARE PRODUKTE (HARDWARE UND SOFTWARE) GELIEFERT "WIE GESEHEN" UND JEGLICHE AUSDRÜCKLICHEN ODER STILLSCHWEIGENDEN GARANTIEN, EINSCHLIESSLICH ABER NICHT BEGRENZT AUF STILLSCHWEIGENDE GEWÄHRLEISTUNG DER MARKTFÄHIGKEIT UND EIGNUNG FÜR EINEN BESTIMMTEN ZWECK AUSGESCHLOSSEN.
Application Performance Monitoring User Guide
Document ID: RDWR-APM-V0311000_UG1804 17
Limitations on Warranty and LiabilityThe following limitations on warranty and liability are presented in English, French, and German.
Limitations on Warranty and LiabilityIN NO EVENT SHALL RADWARE LTD. OR ANY OF ITS AFFILIATED ENTITIES BE LIABLE FOR ANY DAMAGES INCURRED BY THE USE OF THE PRODUCTS (INCLUDING BOTH HARDWARE AND SOFTWARE) DESCRIBED IN THIS USER GUIDE, OR BY ANY DEFECT OR INACCURACY IN THIS USER GUIDE ITSELF. THIS INCLUDES BUT IS NOT LIMITED TO ANY DIRECT, INDIRECT, INCIDENTAL, SPECIAL, EXEMPLARY, OR CONSEQUENTIAL DAMAGES (INCLUDING, BUT NOT LIMITED TO, PROCUREMENT OF SUBSTITUTE GOODS OR SERVICES; LOSS OF USE, DATA, OR PROFITS; OR BUSINESS INTERRUPTION). THE ABOVE LIMITATIONS WILL APPLY EVEN IF RADWARE HAS BEEN ADVISED OF THE POSSIBILITY OF SUCH DAMAGES. SOME JURISDICTIONS DO NOT ALLOW THE EXCLUSION OR LIMITATION OF IMPLIED WARRANTIES OR LIABILITY FOR INCIDENTAL OR CONSEQUENTIAL DAMAGES, SO THE ABOVE LIMITATION OR EXCLUSION MAY NOT APPLY TO YOU.
Limitations de la Garantie et ResponsabilitéRADWARE LTD. OU SES ENTITIES AFFILIES NE POURRONT EN AUCUN CAS ETRE TENUES RESPONSABLES DES DOMMAGES SUBIS DU FAIT DE L'UTILISATION DES PRODUITS (EN CE COMPRIS LES MATERIELS ET LES LOGICIELS) DECRITS DANS CE MANUEL D'UTILISATION, OU DU FAIT DE DEFAUT OU D'IMPRECISIONS DANS CE MANUEL D'UTILISATION, EN CE COMPRIS, SANS TOUTEFOIS QUE CETTE ENUMERATION SOIT CONSIDEREE COMME LIMITATIVE, TOUS DOMMAGES DIRECTS, INDIRECTS, ACCIDENTELS, SPECIAUX, EXEMPLAIRES, OU ACCESSOIRES (INCLUANT, MAIS SANS S'Y RESTREINDRE, LA FOURNITURE DE PRODUITS OU DE SERVICES DE REMPLACEMENT; LA PERTE D'UTILISATION, DE DONNEES OU DE PROFITS; OU L'INTERRUPTION DES AFFAIRES). LES LIMITATIONS CI-DESSUS S'APPLIQUERONT QUAND BIEN MEME RADWARE A ETE INFORMEE DE LA POSSIBLE EXISTENCE DE CES DOMMAGES. CERTAINES JURIDICTIONS N'ADMETTANT PAS LES EXCLUSIONS OU LIMITATIONS DE GARANTIES IMPLICITES OU DE RESPONSABILITE EN CAS DE DOMMAGES ACCESSOIRES OU INDIRECTS, LESDITES LIMITATIONS OU EXCLUSIONS POURRAIENT NE PAS ETRE APPLICABLE DANS VOTRE CAS.
Haftungs- und GewährleistungsausschlussIN KEINEM FALL IST RADWARE LTD. ODER EIN IHR VERBUNDENES UNTERNEHMEN HAFTBAR FÜR SCHÄDEN, WELCHE BEIM GEBRAUCH DES PRODUKTES (HARDWARE UND SOFTWARE) WIE IM BENUTZERHANDBUCH BESCHRIEBEN, ODER AUFGRUND EINES FEHLERS ODER EINER UNGENAUIGKEIT IN DIESEM BENUTZERHANDBUCH SELBST ENTSTANDEN SIND. DAZU GEHÖREN UNTER ANDEREM (OHNE DARAUF BEGRENZT ZU SEIN) JEGLICHE DIREKTEN; IDIREKTEN; NEBEN; SPEZIELLEN, BELEGTEN ODER FOLGESCHÄDEN (EINSCHLIESSLICH ABER NICHT BEGRENZT AUF BESCHAFFUNG ODER ERSATZ VON WAREN ODER DIENSTEN, NUTZUNGSAUSFALL, DATEN- ODER GEWINNVERLUST ODER BETRIEBSUNTERBRECHUNGEN). DIE OBEN GENANNTEN BEGRENZUNGEN GREIFEN AUCH, SOFERN RADWARE AUF DIE MÖGLICHKEIT EINES SOLCHEN SCHADENS HINGEWIESEN WORDEN SEIN SOLLTE. EINIGE RECHTSORDNUNGEN LASSEN EINEN AUSSCHLUSS ODER EINE BEGRENZUNG STILLSCHWEIGENDER GARANTIEN ODER HAFTUNGEN BEZÜGLICH NEBEN- ODER FOLGESCHÄDEN NICHT ZU, SO DASS DIE OBEN DARGESTELLTE BEGRENZUNG ODER DER AUSSCHLUSS SIE UNTER UMSTÄNDEN NICHT BETREFFEN WIRD.
Application Performance Monitoring User Guide
18 Document ID: RDWR-APM-V0311000_UG1804
Safety Instructions The following safety instructions are presented in English, French, and German.
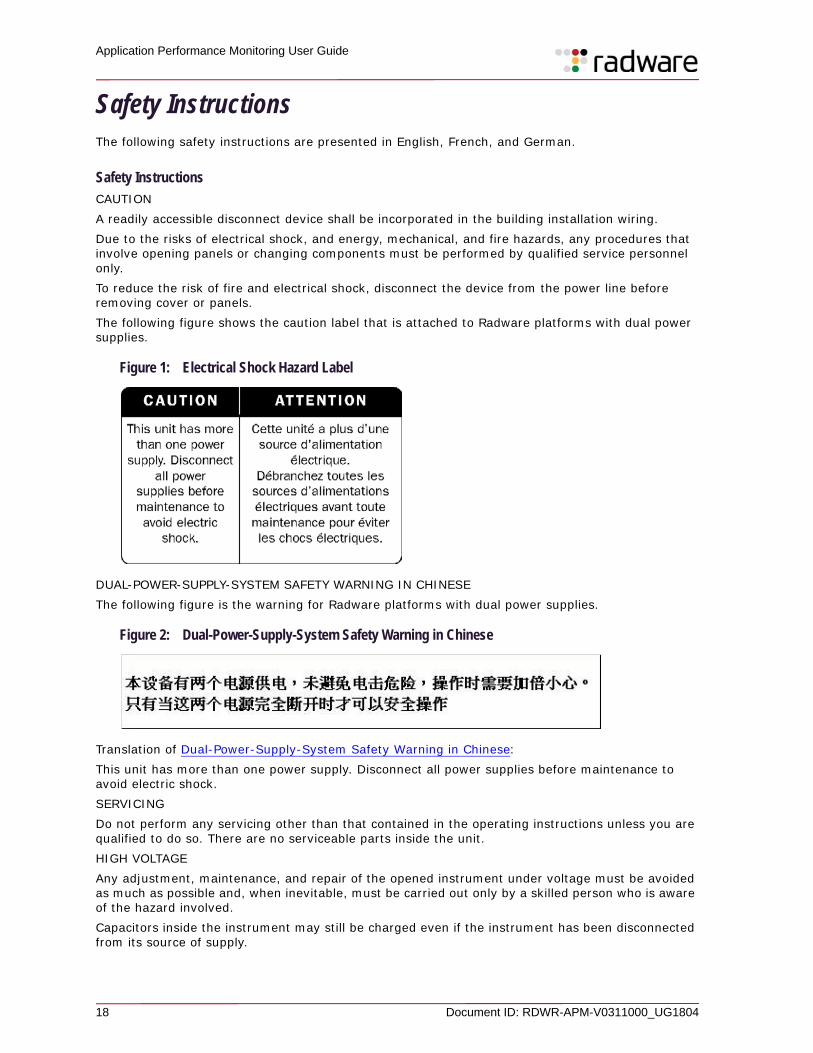
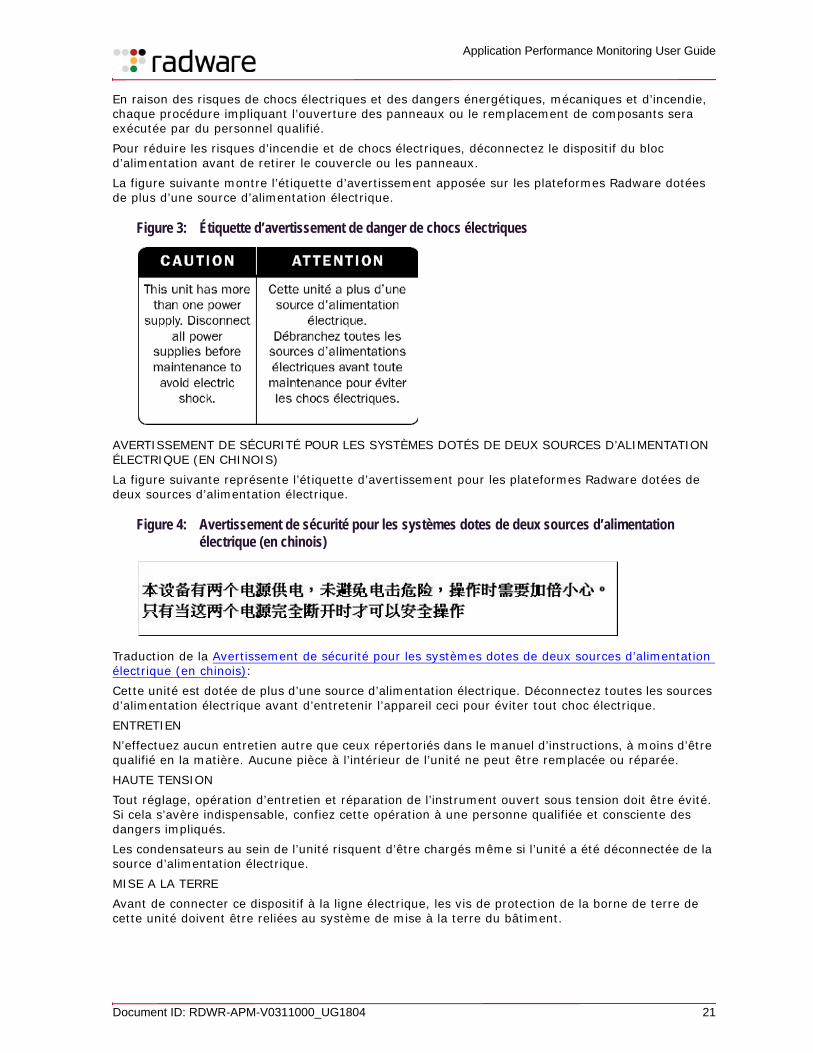
Safety InstructionsCAUTION A readily accessible disconnect device shall be incorporated in the building installation wiring. Due to the risks of electrical shock, and energy, mechanical, and fire hazards, any procedures that involve opening panels or changing components must be performed by qualified service personnel only.To reduce the risk of fire and electrical shock, disconnect the device from the power line before removing cover or panels. The following figure shows the caution label that is attached to Radware platforms with dual power supplies.
Figure 1: Electrical Shock Hazard Label
DUAL-POWER-SUPPLY-SYSTEM SAFETY WARNING IN CHINESEThe following figure is the warning for Radware platforms with dual power supplies.
Figure 2: Dual-Power-Supply-System Safety Warning in Chinese
Translation of Dual-Power-Supply-System Safety Warning in Chinese:This unit has more than one power supply. Disconnect all power supplies before maintenance to avoid electric shock. SERVICING Do not perform any servicing other than that contained in the operating instructions unless you are qualified to do so. There are no serviceable parts inside the unit. HIGH VOLTAGEAny adjustment, maintenance, and repair of the opened instrument under voltage must be avoided as much as possible and, when inevitable, must be carried out only by a skilled person who is aware of the hazard involved.Capacitors inside the instrument may still be charged even if the instrument has been disconnected from its source of supply.
Application Performance Monitoring User Guide
Document ID: RDWR-APM-V0311000_UG1804 19
GROUNDINGBefore connecting this device to the power line, the protective earth terminal screws of this device must be connected to the protective earth in the building installation.LASERThis equipment is a Class 1 Laser Product in accordance with IEC60825 - 1: 1993 + A1:1997 + A2:2001 Standard.FUSESMake sure that only fuses with the required rated current and of the specified type are used for replacement. The use of repaired fuses and the short-circuiting of fuse holders must be avoided. Whenever it is likely that the protection offered by fuses has been impaired, the instrument must be made inoperative and be secured against any unintended operation. LINE VOLTAGE Before connecting this instrument to the power line, make sure the voltage of the power source matches the requirements of the instrument. Refer to the Specifications for information about the correct power rating for the device. 48V DC-powered platforms have an input tolerance of 36-72V DC.SPECIFICATION CHANGES Specifications are subject to change without notice.
Note: This equipment has been tested and found to comply with the limits for a Class A digital device pursuant to Part 15B of the FCC Rules and EN55022 Class A, EN 55024; EN 61000-3-2; EN 61000-3-3; IEC 61000 4-2 to 4-6, IEC 61000 4-8 and IEC 61000-4-11For CE MARK Compliance. These limits are designed to provide reasonable protection against harmful interference when the equipment is operated in a commercial environment. This equipment generates, uses and can radiate radio frequency energy and, if not installed and used in accordance with the instruction manual, may cause harmful interference to radio communications. Operation of this equipment in a residential area is likely to cause harmful interference in which case the user is required to correct the interference at his own expense.
SPECIAL NOTICE FOR NORTH AMERICAN USERSFor North American power connection, select a power supply cord that is UL Listed and CSA Certified 3 - conductor, [18 AWG], terminated in a molded on plug cap rated 125 V, [10 A], with a minimum length of 1.5m [six feet] but no longer than 4.5m...For European connection, select a power supply cord that is internationally harmonized and marked “<HAR>”, 3 - conductor, 0,75 mm2 minimum mm2 wire, rated 300 V, with a PVC insulated jacket. The cord must have a molded on plug cap rated 250 V, 3 A.RESTRICT AREA ACCESSThe DC powered equipment should only be installed in a Restricted Access Area. INSTALLATION CODESThis device must be installed according to country national electrical codes. For North America, equipment must be installed in accordance with the US National Electrical Code, Articles 110 - 16, 110 -17, and 110 -18 and the Canadian Electrical Code, Section 12.INTERCONNECTION OF UNITS Cables for connecting to the unit RS232 and Ethernet Interfaces must be UL certified type DP-1 or DP-2. (Note- when residing in non LPS circuit)OVERCURRENT PROTECTION A readily accessible listed branch-circuit over current protective device rated 15 A must be incorporated in the building wiring for each power input.
Application Performance Monitoring User Guide
20 Document ID: RDWR-APM-V0311000_UG1804
REPLACEABLE BATTERIESIf equipment is provided with a replaceable battery, and is replaced by an incorrect battery type, then an explosion may occur. This is the case for some Lithium batteries and the following is applicable:• If the battery is placed in an Operator Access Area, there is a marking close to the battery or
a statement in both the operating and service instructions.• If the battery is placed elsewhere in the equipment, there is a marking close to the battery or a
statement in the service instructions.
This marking or statement includes the following text warning:CAUTIONRISK OF EXPLOSION IF BATTERY IS REPLACED BY AN INCORRECT BATTERY TYPE. DISPOSE OF USED BATTERIES ACCORDING TO THE INSTRUCTIONS.Caution – To Reduce the Risk of Electrical Shock and Fire
1. This equipment is designed to permit connection between the earthed conductor of the DC supply circuit and the earthing conductor equipment. See Installation Instructions.
2. All servicing must be undertaken only by qualified service personnel. There are not user serviceable parts inside the unit.
3. DO NOT plug in, turn on or attempt to operate an obviously damaged unit.
4. Ensure that the chassis ventilation openings in the unit are NOT BLOCKED.
5. Replace a blown fuse ONLY with the same type and rating as is marked on the safety label adjacent to the power inlet, housing the fuse.
6. Do not operate the device in a location where the maximum ambient temperature exceeds 40°C/104°F.
7. Be sure to unplug the power supply cord from the wall socket BEFORE attempting to remove and/or check the main power fuse. CLASS 1 LASER PRODUCT AND REFERENCE TO THE MOST RECENT LASER STANDARDS IEC 60 825-1:1993 + A1:1997 + A2:2001 AND EN 60825-1:1994+A1:1996+ A2:2001
AC units for Denmark, Finland, Norway, Sweden (marked on product):• Denmark - “Unit is class I - unit to be used with an AC cord set suitable with Denmark
deviations. The cord includes an earthing conductor. The Unit is to be plugged into a wall socket outlet which is connected to a protective earth. Socket outlets which are not connected to earth are not to be used!”
• Finland - (Marking label and in manual) - “Laite on liitettävä suojamaadoituskoskettimilla varustettuun pistorasiaan”
• Norway (Marking label and in manual) - “Apparatet må tilkoples jordet stikkontakt”• Unit is intended for connection to IT power systems for Norway only.• Sweden (Marking label and in manual) - “Apparaten skall anslutas till jordat uttag.”
To connect the power connection:
1. Connect the power cable to the main socket, located on the rear panel of the device.2. Connect the power cable to the grounded AC outlet.
CAUTIONRisk of electric shock and energy hazard. Disconnecting one power supply disconnects only one power supply module. To isolate the unit completely, disconnect all power supplies.
Instructions de sécuritéAVERTISSEMENTUn dispositif de déconnexion facilement accessible sera incorporé au câblage du bâtiment.
Application Performance Monitoring User Guide
Document ID: RDWR-APM-V0311000_UG1804 21
En raison des risques de chocs électriques et des dangers énergétiques, mécaniques et d’incendie, chaque procédure impliquant l’ouverture des panneaux ou le remplacement de composants sera exécutée par du personnel qualifié.Pour réduire les risques d’incendie et de chocs électriques, déconnectez le dispositif du bloc d’alimentation avant de retirer le couvercle ou les panneaux.La figure suivante montre l’étiquette d’avertissement apposée sur les plateformes Radware dotées de plus d’une source d’alimentation électrique.
Figure 3: Étiquette d’avertissement de danger de chocs électriques
AVERTISSEMENT DE SÉCURITÉ POUR LES SYSTÈMES DOTÉS DE DEUX SOURCES D’ALIMENTATION ÉLECTRIQUE (EN CHINOIS)La figure suivante représente l’étiquette d’avertissement pour les plateformes Radware dotées de deux sources d’alimentation électrique.
Figure 4: Avertissement de sécurité pour les systèmes dotes de deux sources d’alimentation électrique (en chinois)
Traduction de la Avertissement de sécurité pour les systèmes dotes de deux sources d’alimentation électrique (en chinois):Cette unité est dotée de plus d’une source d’alimentation électrique. Déconnectez toutes les sources d’alimentation électrique avant d’entretenir l’appareil ceci pour éviter tout choc électrique.ENTRETIENN’effectuez aucun entretien autre que ceux répertoriés dans le manuel d’instructions, à moins d’être qualifié en la matière. Aucune pièce à l’intérieur de l’unité ne peut être remplacée ou réparée.HAUTE TENSIONTout réglage, opération d’entretien et réparation de l’instrument ouvert sous tension doit être évité. Si cela s’avère indispensable, confiez cette opération à une personne qualifiée et consciente des dangers impliqués.Les condensateurs au sein de l’unité risquent d’être chargés même si l’unité a été déconnectée de la source d’alimentation électrique.MISE A LA TERREAvant de connecter ce dispositif à la ligne électrique, les vis de protection de la borne de terre de cette unité doivent être reliées au système de mise à la terre du bâtiment.
Application Performance Monitoring User Guide
22 Document ID: RDWR-APM-V0311000_UG1804
LASERCet équipement est un produit laser de classe 1, conforme à la norme IEC60825 - 1: 1993 + A1: 1997 + A2: 2001.FUSIBLESAssurez-vous que, seuls les fusibles à courant nominal requis et de type spécifié sont utilisés en remplacement. L’usage de fusibles réparés et le court-circuitage des porte-fusibles doivent être évités. Lorsqu’il est pratiquement certain que la protection offerte par les fusibles a été détériorée, l’instrument doit être désactivé et sécurisé contre toute opération involontaire.TENSION DE LIGNEAvant de connecter cet instrument à la ligne électrique, vérifiez que la tension de la source d’alimentation correspond aux exigences de l’instrument. Consultez les spécifications propres à l’alimentation nominale correcte du dispositif.Les plateformes alimentées en 48 CC ont une tolérance d’entrée comprise entre 36 et 72 V CC.MODIFICATIONS DES SPÉCIFICATIONSLes spécifications sont sujettes à changement sans notice préalable.Remarque: Cet équipement a été testé et déclaré conforme aux limites définies pour un appareil numérique de classe A, conformément au paragraphe 15B de la réglementation FCC et EN55022 Classe A, EN 55024, EN 61000-3-2; EN 61000-3-3; IEC 61000 4-2 to 4-6, IEC 61000 4-8, et IEC 61000-4-11, pour la marque de conformité de la CE. Ces limites sont fixées pour fournir une protection raisonnable contre les interférences nuisibles, lorsque l’équipement est utilisé dans un environnement commercial. Cet équipement génère, utilise et peut émettre des fréquences radio et, s’il n’est pas installé et utilisé conformément au manuel d’instructions, peut entraîner des interférences nuisibles aux communications radio. Le fonctionnement de cet équipement dans une zone résidentielle est susceptible de provoquer des interférences nuisibles, auquel cas l’utilisateur devra corriger le problème à ses propres frais.NOTICE SPÉCIALE POUR LES UTILISATEURS NORD-AMÉRICAINSPour un raccordement électrique en Amérique du Nord, sélectionnez un cordon d’alimentation homologué UL et certifié CSA 3 - conducteur, [18 AWG], muni d’une prise moulée à son extrémité, de 125 V, [10 A], d’une longueur minimale de 1,5 m [six pieds] et maximale de 4,5m...Pour la connexion européenne, choisissez un cordon d’alimentation mondialement homologué et marqué “<HAR>”, 3 - conducteur, câble de 0,75 mm2 minimum, de 300 V, avec une gaine en PVC isolée. La prise à l’extrémité du cordon, sera dotée d’un sceau moulé indiquant: 250 V, 3 A.ZONE A ACCÈS RESTREINTL’équipement alimenté en CC ne pourra être installé que dans une zone à accès restreint. CODES D’INSTALLATIONCe dispositif doit être installé en conformité avec les codes électriques nationaux. En Amérique du Nord, l’équipement sera installé en conformité avec le code électrique national américain, articles 110-16, 110 -17, et 110 -18 et le code électrique canadien, Section 12. INTERCONNEXION DES UNÎTESLes câbles de connexion à l’unité RS232 et aux interfaces Ethernet seront certifiés UL, type DP-1 ou DP-2. (Remarque- s’ils ne résident pas dans un circuit LPS) PROTECTION CONTRE LES SURCHARGES.Un circuit de dérivation, facilement accessible, sur le dispositif de protection du courant de 15 A doit être intégré au câblage du bâtiment pour chaque puissance consommée.
Application Performance Monitoring User Guide
Document ID: RDWR-APM-V0311000_UG1804 23
BATTERIES REMPLAÇABLESSi l’équipement est fourni avec une batterie, et qu’elle est remplacée par un type de batterie incorrect, elle est susceptible d’exploser. C’est le cas pour certaines batteries au lithium, les éléments suivants sont donc applicables:• Si la batterie est placée dans une zone d’accès opérateur, une marque est indiquée sur la
batterie ou une remarque est insérée, aussi bien dans les instructions d’exploitation que d’entretien.
• Si la batterie est placée ailleurs dans l’équipement, une marque est indiquée sur la batterie ou une remarque est insérée dans les instructions d’entretien.
Cette marque ou remarque inclut l’avertissement textuel suivant: AVERTISSEMENTRISQUE D’EXPLOSION SI LA BATTERIE EST REMPLACÉE PAR UN MODÈLE INCORRECT. METTRE AU REBUT LES BATTERIES CONFORMÉMENT AUX INSTRUCTIONS.Attention - Pour réduire les risques de chocs électriques et d’incendie
1. Cet équipement est conçu pour permettre la connexion entre le conducteur de mise à la terre du circuit électrique CC et l’équipement de mise à la terre. Voir les instructions d’installation.
2. Tout entretien sera entrepris par du personnel qualifié. Aucune pièce à l’intérieur de l’unité ne peut être remplacée ou réparée.
3. NE branchez pas, n’allumez pas ou n’essayez pas d’utiliser une unité manifestement endommagée.
4. Vérifiez que l’orifice de ventilation du châssis dans l’unité n’est PAS OBSTRUE.
5. Remplacez le fusible endommagé par un modèle similaire de même puissance, tel qu’indiqué sur l’étiquette de sécurité adjacente à l’arrivée électrique hébergeant le fusible.
6. Ne faites pas fonctionner l’appareil dans un endroit, où la température ambiante dépasse la valeur maximale autorisée. 40°C/104°F.
7. Débranchez le cordon électrique de la prise murale AVANT d’essayer de retirer et/ou de vérifier le fusible d’alimentation principal.
PRODUIT LASER DE CLASSE 1 ET RÉFÉRENCE AUX NORMES LASER LES PLUS RÉCENTES: IEC 60825-1: 1993 + A1: 1997 + A2: 2001 ET EN 60825-1: 1994+A1: 1996+ A2: 2001Unités à CA pour le Danemark, la Finlande, la Norvège, la Suède (indiqué sur le produit):• Danemark - Unité de classe 1 - qui doit être utilisée avec un cordon CA compatible avec les
déviations du Danemark. Le cordon inclut un conducteur de mise à la terre. L’unité sera branchée à une prise murale, mise à la terre. Les prises non-mises à la terre ne seront pas utilisées!
• Finlande (Étiquette et inscription dans le manuel) - Laite on liitettävä suojamaadoituskoskettimilla varustettuun pistorasiaan
• Norvège (Étiquette et inscription dans le manuel) - Apparatet må tilkoples jordet stikkontakt• L’unité peut être connectée à un système électrique IT (en Norvège uniquement).• Suède (Étiquette et inscription dans le manuel) - Apparaten skall anslutas till jordat uttag.
Pour brancher à l’alimentation électrique:
1. Branchez le câble d’alimentation à la prise principale, située sur le panneau arrière de l’unité.2. Connectez le câble d’alimentation à la prise CA mise à la terre.
AVERTISSEMENTRisque de choc électrique et danger énergétique. La déconnexion d’une source d’alimentation électrique ne débranche qu’un seul module électrique. Pour isoler complètement l’unité, débranchez toutes les sources d’alimentation électrique.
Application Performance Monitoring User Guide
24 Document ID: RDWR-APM-V0311000_UG1804
ATTENTIONRisque de choc et de danger électriques. Le débranchement d’une seule alimentation stabilisée ne débranche qu’un module “Alimentation Stabilisée”. Pour Isoler complètement le module en cause, il faut débrancher toutes les alimentations stabilisées.Attention: Pour Réduire Les Risques d’Électrocution et d’Incendie
1. Toutes les opérations d’entretien seront effectuées UNIQUEMENT par du personnel d’entretien qualifié. Aucun composant ne peut être entretenu ou remplacée par l’utilisateur.
2. NE PAS connecter, mettre sous tension ou essayer d’utiliser une unité visiblement défectueuse.
3. Assurez-vous que les ouvertures de ventilation du châssis NE SONT PAS OBSTRUÉES.
4. Remplacez un fusible qui a sauté SEULEMENT par un fusible du même type et de même capacité, comme indiqué sur l’étiquette de sécurité proche de l’entrée de l’alimentation qui contient le fusible.
5. NE PAS UTILISER l’équipement dans des locaux dont la température maximale dépasse 40 degrés Centigrades.
6. Assurez vous que le cordon d’alimentation a été déconnecté AVANT d’essayer de l’enlever et/ou vérifier le fusible de l’alimentation générale.
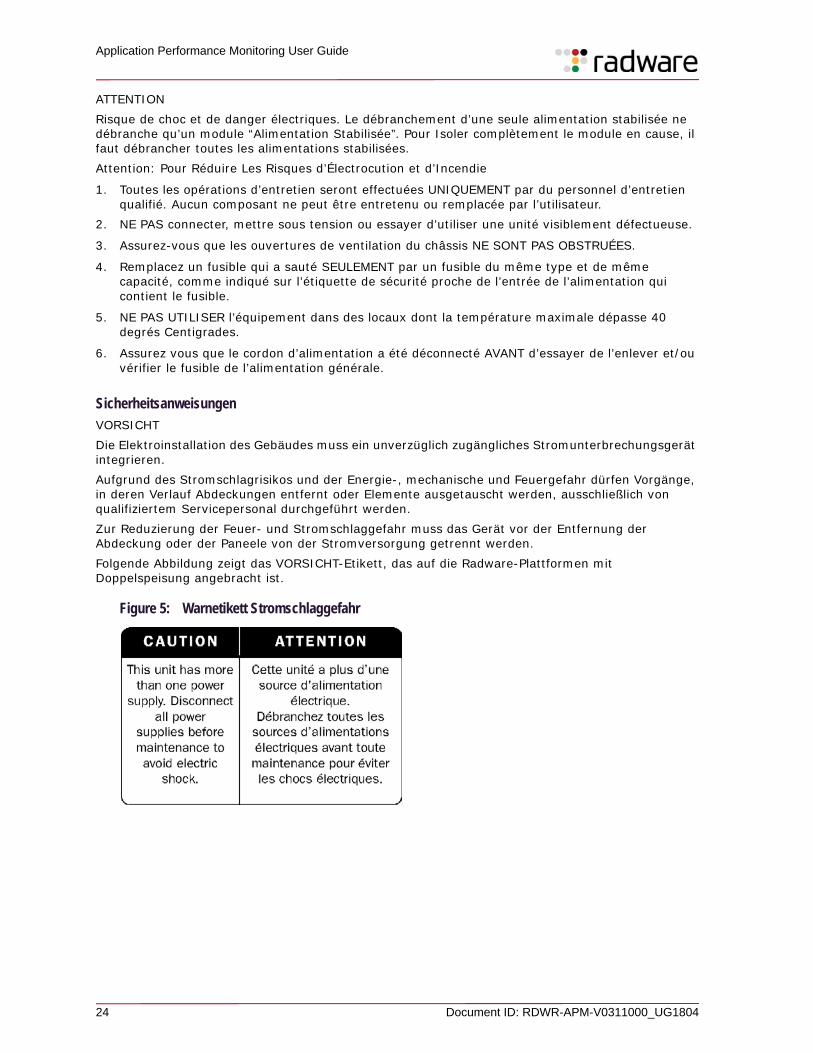
SicherheitsanweisungenVORSICHTDie Elektroinstallation des Gebäudes muss ein unverzüglich zugängliches Stromunterbrechungsgerät integrieren.Aufgrund des Stromschlagrisikos und der Energie-, mechanische und Feuergefahr dürfen Vorgänge, in deren Verlauf Abdeckungen entfernt oder Elemente ausgetauscht werden, ausschließlich von qualifiziertem Servicepersonal durchgeführt werden.Zur Reduzierung der Feuer- und Stromschlaggefahr muss das Gerät vor der Entfernung der Abdeckung oder der Paneele von der Stromversorgung getrennt werden.Folgende Abbildung zeigt das VORSICHT-Etikett, das auf die Radware-Plattformen mit Doppelspeisung angebracht ist.
Figure 5: Warnetikett Stromschlaggefahr
Application Performance Monitoring User Guide
Document ID: RDWR-APM-V0311000_UG1804 25
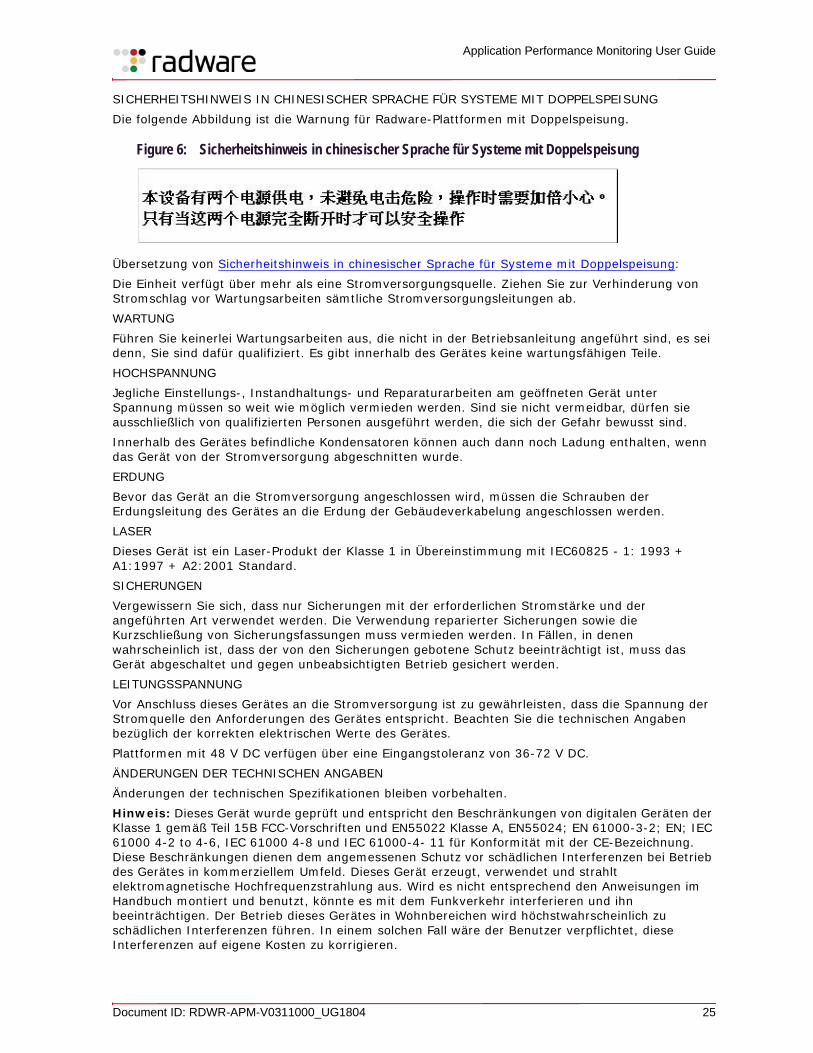
SICHERHEITSHINWEIS IN CHINESISCHER SPRACHE FÜR SYSTEME MIT DOPPELSPEISUNGDie folgende Abbildung ist die Warnung für Radware-Plattformen mit Doppelspeisung.
Figure 6: Sicherheitshinweis in chinesischer Sprache für Systeme mit Doppelspeisung
Übersetzung von Sicherheitshinweis in chinesischer Sprache für Systeme mit Doppelspeisung:Die Einheit verfügt über mehr als eine Stromversorgungsquelle. Ziehen Sie zur Verhinderung von Stromschlag vor Wartungsarbeiten sämtliche Stromversorgungsleitungen ab.WARTUNGFühren Sie keinerlei Wartungsarbeiten aus, die nicht in der Betriebsanleitung angeführt sind, es sei denn, Sie sind dafür qualifiziert. Es gibt innerhalb des Gerätes keine wartungsfähigen Teile.HOCHSPANNUNGJegliche Einstellungs-, Instandhaltungs- und Reparaturarbeiten am geöffneten Gerät unter Spannung müssen so weit wie möglich vermieden werden. Sind sie nicht vermeidbar, dürfen sie ausschließlich von qualifizierten Personen ausgeführt werden, die sich der Gefahr bewusst sind.Innerhalb des Gerätes befindliche Kondensatoren können auch dann noch Ladung enthalten, wenn das Gerät von der Stromversorgung abgeschnitten wurde.ERDUNGBevor das Gerät an die Stromversorgung angeschlossen wird, müssen die Schrauben der Erdungsleitung des Gerätes an die Erdung der Gebäudeverkabelung angeschlossen werden.LASERDieses Gerät ist ein Laser-Produkt der Klasse 1 in Übereinstimmung mit IEC60825 - 1: 1993 + A1:1997 + A2:2001 Standard.SICHERUNGENVergewissern Sie sich, dass nur Sicherungen mit der erforderlichen Stromstärke und der angeführten Art verwendet werden. Die Verwendung reparierter Sicherungen sowie die Kurzschließung von Sicherungsfassungen muss vermieden werden. In Fällen, in denen wahrscheinlich ist, dass der von den Sicherungen gebotene Schutz beeinträchtigt ist, muss das Gerät abgeschaltet und gegen unbeabsichtigten Betrieb gesichert werden.LEITUNGSSPANNUNGVor Anschluss dieses Gerätes an die Stromversorgung ist zu gewährleisten, dass die Spannung der Stromquelle den Anforderungen des Gerätes entspricht. Beachten Sie die technischen Angaben bezüglich der korrekten elektrischen Werte des Gerätes.Plattformen mit 48 V DC verfügen über eine Eingangstoleranz von 36-72 V DC. ÄNDERUNGEN DER TECHNISCHEN ANGABENÄnderungen der technischen Spezifikationen bleiben vorbehalten.Hinweis: Dieses Gerät wurde geprüft und entspricht den Beschränkungen von digitalen Geräten der Klasse 1 gemäß Teil 15B FCC-Vorschriften und EN55022 Klasse A, EN55024; EN 61000-3-2; EN; IEC 61000 4-2 to 4-6, IEC 61000 4-8 und IEC 61000-4- 11 für Konformität mit der CE-Bezeichnung. Diese Beschränkungen dienen dem angemessenen Schutz vor schädlichen Interferenzen bei Betrieb des Gerätes in kommerziellem Umfeld. Dieses Gerät erzeugt, verwendet und strahlt elektromagnetische Hochfrequenzstrahlung aus. Wird es nicht entsprechend den Anweisungen im Handbuch montiert und benutzt, könnte es mit dem Funkverkehr interferieren und ihn beeinträchtigen. Der Betrieb dieses Gerätes in Wohnbereichen wird höchstwahrscheinlich zu schädlichen Interferenzen führen. In einem solchen Fall wäre der Benutzer verpflichtet, diese Interferenzen auf eigene Kosten zu korrigieren.
Application Performance Monitoring User Guide
26 Document ID: RDWR-APM-V0311000_UG1804
BESONDERER HINWEIS FÜR BENUTZER IN NORDAMERIKAWählen Sie für den Netzstromanschluss in Nordamerika ein Stromkabel, das in der UL aufgeführt und CSA-zertifiziert ist 3 Leiter, [18 AWG], endend in einem gegossenen Stecker, für 125 V, [10 A], mit einer Mindestlänge von 1,5 m [sechs Fuß], doch nicht länger als 4,5 m. Für europäische Anschlüsse verwenden Sie ein international harmonisiertes, mit “<HAR>” markiertes Stromkabel, mit 3 Leitern von mindestens 0,75 mm2, für 300 V, mit PVC-Umkleidung. Das Kabel muss in einem gegossenen Stecker für 250 V, 3 A enden.BEREICH MIT EINGESCHRÄNKTEM ZUGANGDas mit Gleichstrom betriebene Gerät darf nur in einem Bereich mit eingeschränktem Zugang montiert werden.INSTALLATIONSCODESDieses Gerät muss gemäß der landesspezifischen elektrischen Codes montiert werden. In Nordamerika müssen Geräte entsprechend dem US National Electrical Code, Artikel 110 - 16, 110 - 17 und 110 - 18, sowie dem Canadian Electrical Code, Abschnitt 12, montiert werden. VERKOPPLUNG VON GERÄTEN Kabel für die Verbindung des Gerätes mit RS232- und Ethernet-müssen UL-zertifiziert und vom Typ DP-1 oder DP-2 sein. (Anmerkung: bei Aufenthalt in einem nicht-LPS-Stromkreis)ÜBERSTROMSCHUTZEin gut zugänglicher aufgeführter Überstromschutz mit Abzweigstromkreis und 15 A Stärke muss für jede Stromeingabe in der Gebäudeverkabelung integriert sein.AUSTAUSCHBARE BATTERIENWird ein Gerät mit einer austauschbaren Batterie geliefert und für diese Batterie durch einen falschen Batterietyp ersetzt, könnte dies zu einer Explosion führen. Dies trifft zu für manche Arten von Lithiumsbatterien zu, und das folgende gilt es zu beachten:• Wird die Batterie in einem Bereich für Bediener eingesetzt, findet sich in der Nähe der Batterie
eine Markierung oder Erklärung sowohl im Betriebshandbuch als auch in der Wartungsanleitung.• Ist die Batterie an einer anderen Stelle im Gerät eingesetzt, findet sich in der Nähe der Batterie
eine Markierung oder einer Erklärung in der Wartungsanleitung.Diese Markierung oder Erklärung enthält den folgenden Warntext: VORSICHTEXPLOSIONSGEFAHR, FALLS BATTERIE DURCH EINEN FALSCHEN BATTERIETYP ERSETZT WIRD. GEBRAUCHTE BATTERIEN DEN ANWEISUNGEN ENTSPRECHEND ENTSORGEN.• Denmark - “Unit is class I - mit Wechselstromkabel benutzen, dass für die Abweichungen in
Dänemark eingestellt ist. Das Kabel ist mit einem Erdungsdraht versehen. Das Kabel wird in eine geerdete Wandsteckdose angeschlossen. Keine Steckdosen ohne Erdungsleitung verwenden!”
• Finland - (Markierungsetikett und im Handbuch) - Laite on liitettävä suojamaadoituskoskettimilla varustettuun pistorasiaan
• Norway - (Markierungsetikett und im Handbuch) - Apparatet må tilkoples jordet stikkontakt Ausschließlich für Anschluss an IT-Netzstromsysteme in Norwegen vorgesehen
• Sweden - (Markierungsetikett und im Handbuch) - Apparaten skall anslutas till jordat uttag.
Anschluss des Stromkabels:
1. Schließen Sie das Stromkabel an den Hauptanschluss auf der Rückseite des Gerätes an.2. Schließen Sie das Stromkabel an den geerdeten Wechselstromanschluss an.
VORSICHTStromschlag- und Energiegefahr Die Trennung einer Stromquelle trennt nur ein Stromversorgungsmodul von der Stromversorgung. Um das Gerät komplett zu isolieren, muss es von der gesamten Stromversorgung getrennt werden.
Application Performance Monitoring User Guide
Document ID: RDWR-APM-V0311000_UG1804 27
Vorsicht - Zur Reduzierung der Stromschlag- und Feuergefahr
1. Dieses Gerät ist dazu ausgelegt, die Verbindung zwischen der geerdeten Leitung des Gleichstromkreises und dem Erdungsleiter des Gerätes zu ermöglichen. Siehe Montageanleitung.
2. Wartungsarbeiten jeglicher Art dürfen nur von qualifiziertem Servicepersonal ausgeführt werden. Es gibt innerhalb des Gerätes keine vom Benutzer zu wartenden Teile.
3. Versuchen Sie nicht, ein offensichtlich beschädigtes Gerät an den Stromkreis anzuschließen, einzuschalten oder zu betreiben.
4. Vergewissern Sie sich, dass sie Lüftungsöffnungen im Gehäuse des Gerätes NICHT BLOCKIERT SIND.
5. Ersetzen Sie eine durchgebrannte Sicherung ausschließlich mit dem selben Typ und von der selben Stärke, die auf dem Sicherheitsetikett angeführt sind, das sich neben dem Stromkabelanschluss, am Sicherungsgehäuse.
6. Betreiben Sie das Gerät nicht an einem Standort, an dem die Höchsttemperatur der Umgebung 40°C überschreitet.
7. Vergewissern Sie sich, das Stromkabel aus dem Wandstecker zu ziehen, BEVOR Sie die Hauptsicherung entfernen und/oder prüfen.
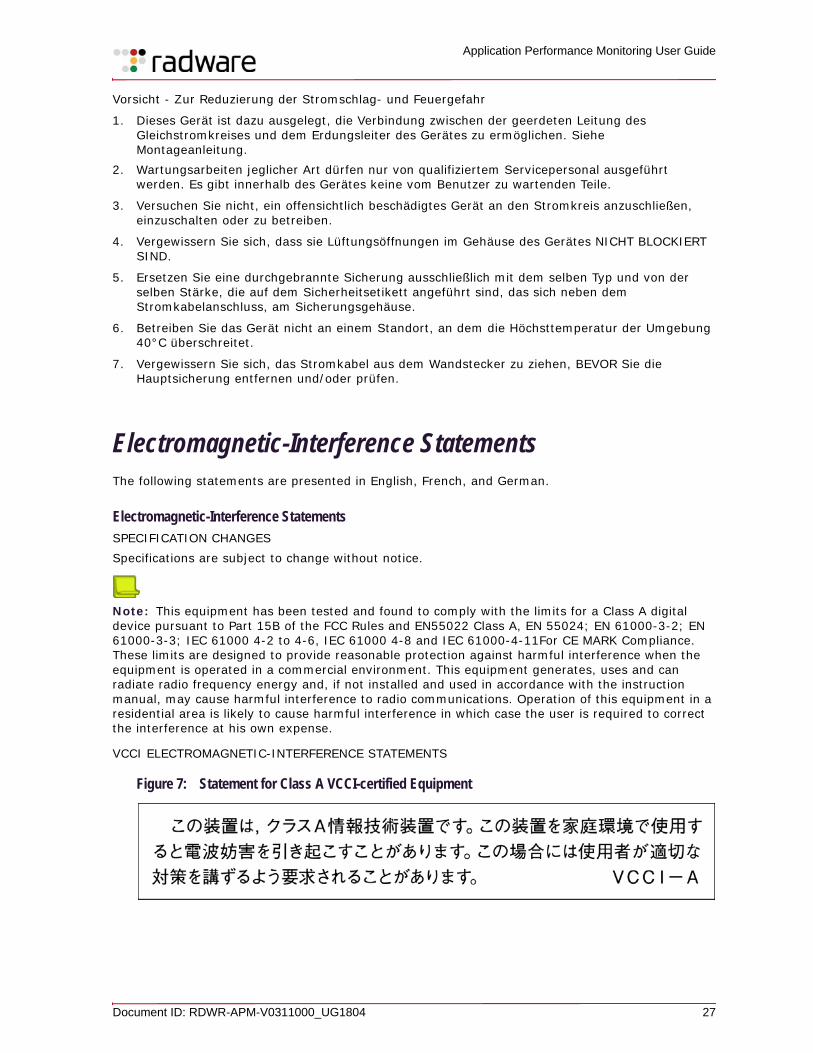
Electromagnetic-Interference StatementsThe following statements are presented in English, French, and German.
Electromagnetic-Interference StatementsSPECIFICATION CHANGES Specifications are subject to change without notice.
Note: This equipment has been tested and found to comply with the limits for a Class A digital device pursuant to Part 15B of the FCC Rules and EN55022 Class A, EN 55024; EN 61000-3-2; EN 61000-3-3; IEC 61000 4-2 to 4-6, IEC 61000 4-8 and IEC 61000-4-11For CE MARK Compliance. These limits are designed to provide reasonable protection against harmful interference when the equipment is operated in a commercial environment. This equipment generates, uses and can radiate radio frequency energy and, if not installed and used in accordance with the instruction manual, may cause harmful interference to radio communications. Operation of this equipment in a residential area is likely to cause harmful interference in which case the user is required to correct the interference at his own expense.
VCCI ELECTROMAGNETIC-INTERFERENCE STATEMENTS
Figure 7: Statement for Class A VCCI-certified Equipment
Application Performance Monitoring User Guide
28 Document ID: RDWR-APM-V0311000_UG1804
Translation of Statement for Class A VCCI-certified Equipment:This is a Class A product based on the standard of the Voluntary Control Council for Interference by Information Technology Equipment (VCCI). If this equipment is used in a domestic environment, radio disturbance may occur, in which case, the user may be required to take corrective actions. Install and use the equipment according to the instruction manual.KCC KOREA
Figure 8: KCC—Korea Communications Commission Certificate of Broadcasting and Communication Equipment
Figure 9: Statement for Class A KCC-certified Equipment in Korean
Translation of Statement for Class A KCC-certified Equipment in Korean:This equipment is Industrial (Class A) electromagnetic wave suitability equipment and seller or user should take notice of it, and this equipment is to be used in the places except for home.BSMI
Figure 10: Statement for Class A BSMI-certified Equipment
這是甲類的資訊產品,在居住的環境使用中時,可能會造成射頻
干擾,在這種情況下,使用者會被要求採取某些適當的對策。
Translation of Statement for Class A BSMI-certified Equipment:This is a Class A product, in use in a residential environment, it may cause radio interference in which case the user will be required to take adequate measures.
Déclarations sur les Interférences ÉlectromagnétiquesMODIFICATIONS DES SPÉCIFICATIONSLes spécifications sont sujettes à changement sans notice préalable.Remarque: Cet équipement a été testé et déclaré conforme aux limites définies pour un appareil numérique de classe A, conformément au paragraphe 15B de la réglementation FCC et EN55022 Classe A, EN 55024, EN 61000-3-2; EN 61000-3-3; IEC 61000 4-2 to 4-6, IEC 61000 4-8, et IEC 61000-4-11, pour la marque de conformité de la CE. Ces limites sont fixées pour fournir une protection raisonnable contre les interférences nuisibles, lorsque l’équipement est utilisé dans un environnement commercial. Cet équipement génère, utilise et peut émettre des fréquences radio et, s’il n’est pas installé et utilisé conformément au manuel d’instructions, peut entraîner des interférences nuisibles aux communications radio. Le fonctionnement de cet équipement dans une zone résidentielle est susceptible de provoquer des interférences nuisibles, auquel cas l’utilisateur devra corriger le problème à ses propres frais.
Application Performance Monitoring User Guide
Document ID: RDWR-APM-V0311000_UG1804 29
DÉCLARATIONS SUR LES INTERFÉRENCES ÉLECTROMAGNÉTIQUES VCCI
Figure 11: Déclaration pour l’équipement de classe A certifié VCCI
Traduction de la Déclaration pour l’équipement de classe A certifié VCCI:Il s’agit d’un produit de classe A, basé sur la norme du Voluntary Control Council for Interference by Information Technology Equipment (VCCI). Si cet équipement est utilisé dans un environnement domestique, des perturbations radioélectriques sont susceptibles d’apparaître. Si tel est le cas, l’utilisateur sera tenu de prendre des mesures correctives.Installez et utilisez l’équipement selon le manuel d’instructions.KCC Corée
Figure 12: KCC—Certificat de la commission des communications de Corée pour les equipements de radiodiffusion et communication.
Figure 13: Déclaration pour l’équipement de classe A certifié KCC en langue coréenne
Translation de la Déclaration pour l’équipement de classe A certifié KCC en langue coréenne:Cet équipement est un matériel (classe A) en adéquation aux ondes électromagnétiques et le vendeur ou l’utilisateur doit prendre cela en compte. Ce matériel est donc fait pour être utilisé ailleurs qu’ á la maison.BSMI
Figure 14: Déclaration pour l’équipement de classe A certifié BSMI
這是甲類的資訊產品,在居住的環境使用中時,可能會造成射頻
干擾,在這種情況下,使用者會被要求採取某些適當的對策。
Translation de la Déclaration pour l’équipement de classe A certifié BSMI:Il s’agit d'un produit de Classe A; utilisé dans un environnement résidentiel il peut provoquer des interférences, l'utilisateur devra alors prendre les mesures adéquates.
Erklärungen zu Elektromagnetischer InterferenzÄNDERUNGEN DER TECHNISCHEN ANGABENÄnderungen der technischen Spezifikationen bleiben vorbehalten.
Application Performance Monitoring User Guide
30 Document ID: RDWR-APM-V0311000_UG1804
Hinweis: Dieses Gerät wurde geprüft und entspricht den Beschränkungen von digitalen Geräten der Klasse 1 gemäß Teil 15B FCC-Vorschriften und EN55022 Klasse A, EN55024; EN 61000-3-2; EN; IEC 61000 4-2 to 4-6, IEC 61000 4-8 und IEC 61000-4- 11 für Konformität mit der CE-Bezeichnung. Diese Beschränkungen dienen dem angemessenen Schutz vor schädlichen Interferenzen bei Betrieb des Gerätes in kommerziellem Umfeld. Dieses Gerät erzeugt, verwendet und strahlt elektromagnetische Hochfrequenzstrahlung aus. Wird es nicht entsprechend den Anweisungen im Handbuch montiert und benutzt, könnte es mit dem Funkverkehr interferieren und ihn beeinträchtigen. Der Betrieb dieses Gerätes in Wohnbereichen wird höchstwahrscheinlich zu schädlichen Interferenzen führen. In einem solchen Fall wäre der Benutzer verpflichtet, diese Interferenzen auf eigene Kosten zu korrigieren.ERKLÄRUNG DER VCCI ZU ELEKTROMAGNETISCHER INTERFERENZ
Figure 15: Erklärung zu VCCI-zertifizierten Geräten der Klasse A
Übersetzung von Erklärung zu VCCI-zertifizierten Geräten der Klasse A:Dies ist ein Produkt der Klasse A gemäß den Normen des Voluntary Control Council for Interference by Information Technology Equipment (VCCI). Wird dieses Gerät in einem Wohnbereich benutzt, können elektromagnetische Störungen auftreten. In einem solchen Fall wäre der Benutzer verpflichtet, korrigierend einzugreifen.Montieren und benutzen Sie das Gerät laut Anweisungen im Benutzerhandbuch.KCC KOREA
Figure 16: KCC—Korea Communications Commission Zertifikat für Rundfunk-und Nachrichtentechnik
Figure 17: Erklärung zu KCC-zertifizierten Geräten der Klasse A
Übersetzung von Erklärung zu KCC-zertifizierten Geräten der Klasse A:Verkäufer oder Nutzer sollten davon Kenntnis nehmen, daß dieses Gerät der Klasse A für industriell elektromagnetische Wellen geeignete Geräten angehört und dass diese Geräte nicht für den heimischen Gebrauch bestimmt sind.BSMI
Application Performance Monitoring User Guide
Document ID: RDWR-APM-V0311000_UG1804 31
Figure 18: Erklärung zu BSMI-zertifizierten Geräten der Klasse A
這是甲類的資訊產品,在居住的環境使用中時,可能會造成射頻
干擾,在這種情況下,使用者會被要求採取某些適當的對策。
Übersetzung von Erklärung zu BSMI-zertifizierten Geräten der Klasse A:Dies ist ein Class A Produkt, bei Gebrauch in einer Wohnumgebung kann es zu Funkstörungen kommen, in diesem Fall ist der Benutzer verpflichtet, angemessene Maßnahmen zu ergreifen.
Altitude and Climate Warning
Note: This warning only applies to The People’s Republic of China.
1. 对于在非热带气候条件下运行的设备而言, Tma:为制造商规范允许的最大环境温度,或者为 25°C,采用两者中的较大者。
2. 关于在海拔不超过 2000m或者在非热带气候地区使用的设备,附加警告要求如下:
关于在海拔不超过 2000m的地区使用的设备,必须在随时可见的位置处粘贴包含如下内容或者类似用语的警告标记、或者附件 DD中的符号。
“只可在海拔不超过 2000m的位置使用。”
关于在非热带气候地区使用的设备,必须在随时可见的位置处粘贴包含如下内容的警告标记:
“只可在非热带气候地区使用。”
附件DD:有关新安全警告标记的说明。
DD.1 海拔警告标记
标记含义:设备的评估仅基于 2000m以下的海拔高度,因此设备只适用于该运行条件。如果在海拔超过 2000m的位置使用设备,可能会存在某些安全隐患。
DD.2气候警告标记
标记含义:设备的评估仅基于温带气候条件,因此设备只适用于该运行条件。如果在热带气候地区使用设备,可能会存在某些安全隐患。
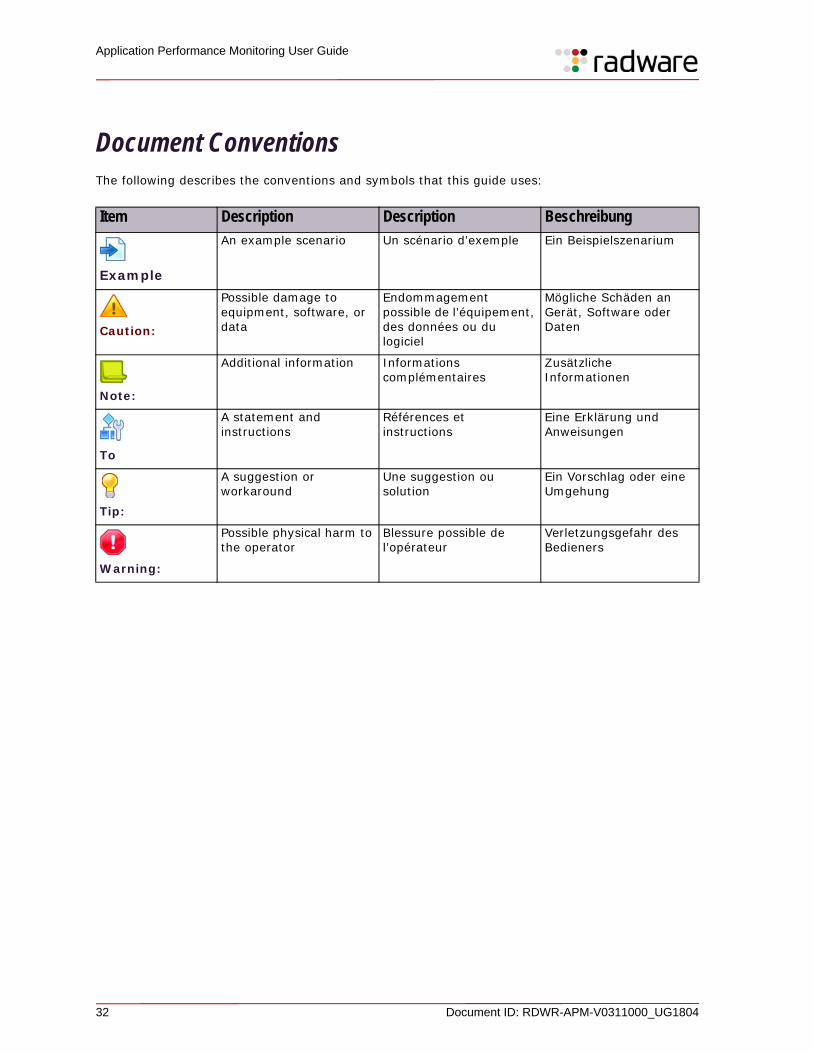
Application Performance Monitoring User Guide
32 Document ID: RDWR-APM-V0311000_UG1804
Document ConventionsThe following describes the conventions and symbols that this guide uses:
Item Description Description Beschreibung
Example
An example scenario Un scénario d’exemple Ein Beispielszenarium
Caution:
Possible damage to equipment, software, or data
Endommagement possible de l’équipement, des données ou du logiciel
Mögliche Schäden an Gerät, Software oder Daten
Note:
Additional information Informations complémentaires
Zusätzliche Informationen
To
A statement and instructions
Références et instructions
Eine Erklärung und Anweisungen
Tip:
A suggestion or workaround
Une suggestion ou solution
Ein Vorschlag oder eine Umgehung
Warning:
Possible physical harm to the operator
Blessure possible de l’opérateur
Verletzungsgefahr des Bedieners
Document ID: RDWR-APM-V0311000_UG1804 33
Chapter 1 – Introduction
This guide describes how to use Application Performance Monitoring (APM) version 3.110 to manage application performance.
Intended AudienceThis guide is intended for the IT professionals who are responsible for managing infrastructure and applications, and responsible for the quality of service that the applications provide.
Scope of This GuideThis guide describes how IT in your enterprise can utilize APM functionality to monitor performance by measuring application performance including end-user experience.
Related DocumentationSee the following documentation for information that is related to APM but not detailed in this guide:• Application Performance Monitoring Quick Deployment Guide—A one-stop-shop
technical guide, which can ensure a successful and smooth APM-installation experience.
• APSolute Vision Installation and Maintenance Guide—For information on the requirements and installation the APM server, which is part of the APSolute Vision server with APM server VA offering.
• APSolute Vision online help—Especially the following sections:
— Configuring the APM Server in an Alteon—For information on how to add an APM server to the configuration of an Alteon device.
— Managing an APM Server in APSolute Vision—For information on the configuration of the APM server in APSolute Vision.
— Configuring a Virtual Service for a Virtual Server—For information on how to enable APM on an Alteon device.
• Application Performance Monitoring Troubleshooting and Technical Guide—For information that can help you resolve issues that may arise during APM configuration or after a successful APM deployment that stops working as expected.

Application Performance Monitoring User Guide Introduction
34 Document ID: RDWR-APM-V0311000_UG1804
Document ID: RDWR-APM-V0311000_UG1804 35
Chapter 2 – Overview
This chapter describes the benefits and basic workings of Radware APSolute Vision APM.This chapter contains the following main sections: • APM Benefits, page 35• How APM Works, page 37
APM Benefits This section contains the following topics:• Detect Application Performance Issues—Before Your Customer Does, page 35• Key Values of Radware’s Application Performance Monitoring, page 35
Detect Application Performance Issues—Before Your Customer DoesIn today’s online business landscape, having fast-performing applications is a top priority. Cutting-edge acceleration solutions, such as Radware’s FastView™, result-driven Web Performance Optimization (WPO) technology embedded into the Alteon Application Delivery Controller (ADC), offers a holistic approach, addressing the various aspects impacting Web application performance.Although having the right technology to accelerate Web application performance is crucial, it is not enough. Since Web applications continuously change and evolve, Web-application-performance optimization is not a one-time effort, but rather an ongoing objective. In fact, to detect application-performance issues in real-time—before your customers experience them, it is essential to have an end-to-end monitoring solution, one that provides complete visibility into your applications’ performance to ensure they meet SLAs at all times.
Key Values of Radware’s Application Performance Monitoring To ensure that Web-application performance meets your customers’ expectations and consistently delivers their business SLA, you need to attain visibility into the application performance and the actual quality of experience (QoE) that end-users are experiencing. Radware provides the Application Performance Monitoring (APM) module, supporting an end-to-end, proactive approach to monitor and maintain high SLAs of user-facing Web portals as well as internal Web applications.Radware’s APM provides the following key values:• Complete visibility of Web application performance and real-user experience, managing and
tracking user-defined SLAs• Fast root-cause analysis using highly granular measurement, in real-time• Monitoring of actual user traffic, with no dedicated scripts per Web application
Complete Application Performance Insight Based on User-Defined SLARadware’s APM—comprising APSolute Vision, Alteon, and the APM server—provides a comprehensive picture of all applications, transactions, and real servers in data centers, letting you drill down to the application and transaction level, globally or for a particular user. In addition, the picture reflects the actual end-user QoE—wherever the real clients are—at all times.The performance measurements are based on user-defined SLAs. The measurements may include the minimum average response time that the application should provide and the minimum latency at a data center. The SLA can also be defined for a geographical location, letting administrators determine if there is a problem with users from a specific region.
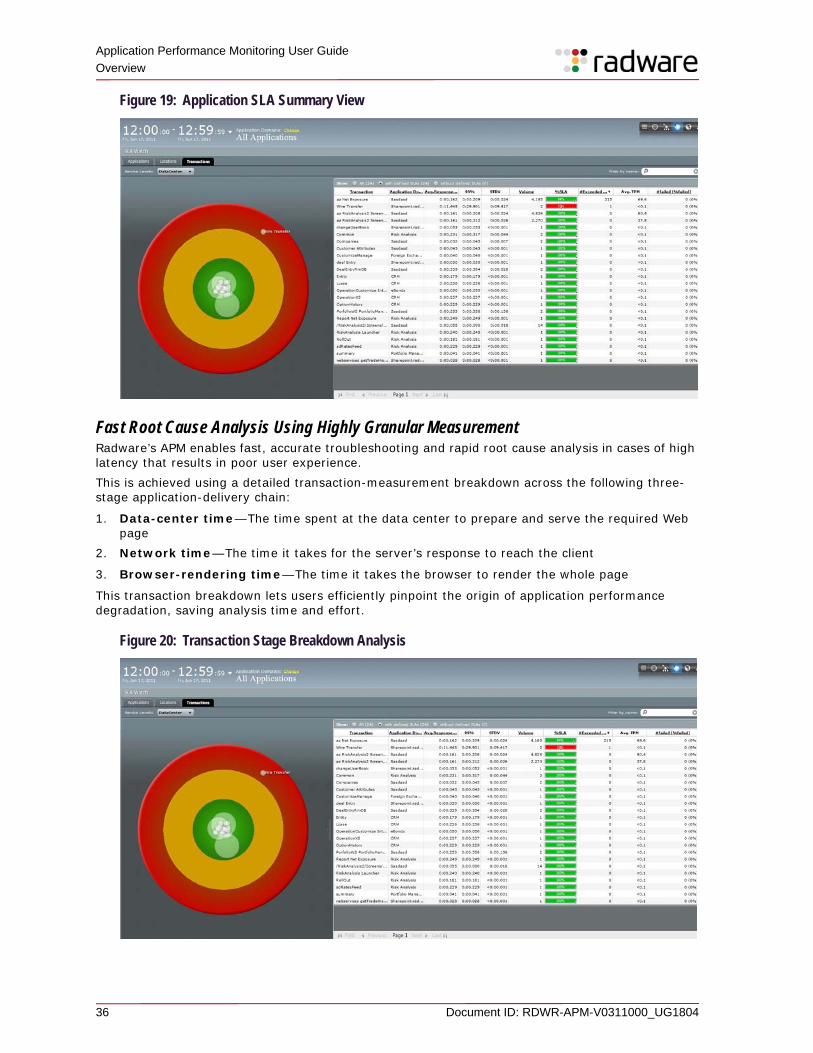
Application Performance Monitoring User Guide Overview
36 Document ID: RDWR-APM-V0311000_UG1804
Figure 19: Application SLA Summary View
Fast Root Cause Analysis Using Highly Granular Measurement Radware’s APM enables fast, accurate troubleshooting and rapid root cause analysis in cases of high latency that results in poor user experience. This is achieved using a detailed transaction-measurement breakdown across the following three-stage application-delivery chain:
1. Data-center time—The time spent at the data center to prepare and serve the required Web page
2. Network time—The time it takes for the server’s response to reach the client
3. Browser-rendering time—The time it takes the browser to render the whole page
This transaction breakdown lets users efficiently pinpoint the origin of application performance degradation, saving analysis time and effort.
Figure 20: Transaction Stage Breakdown Analysis
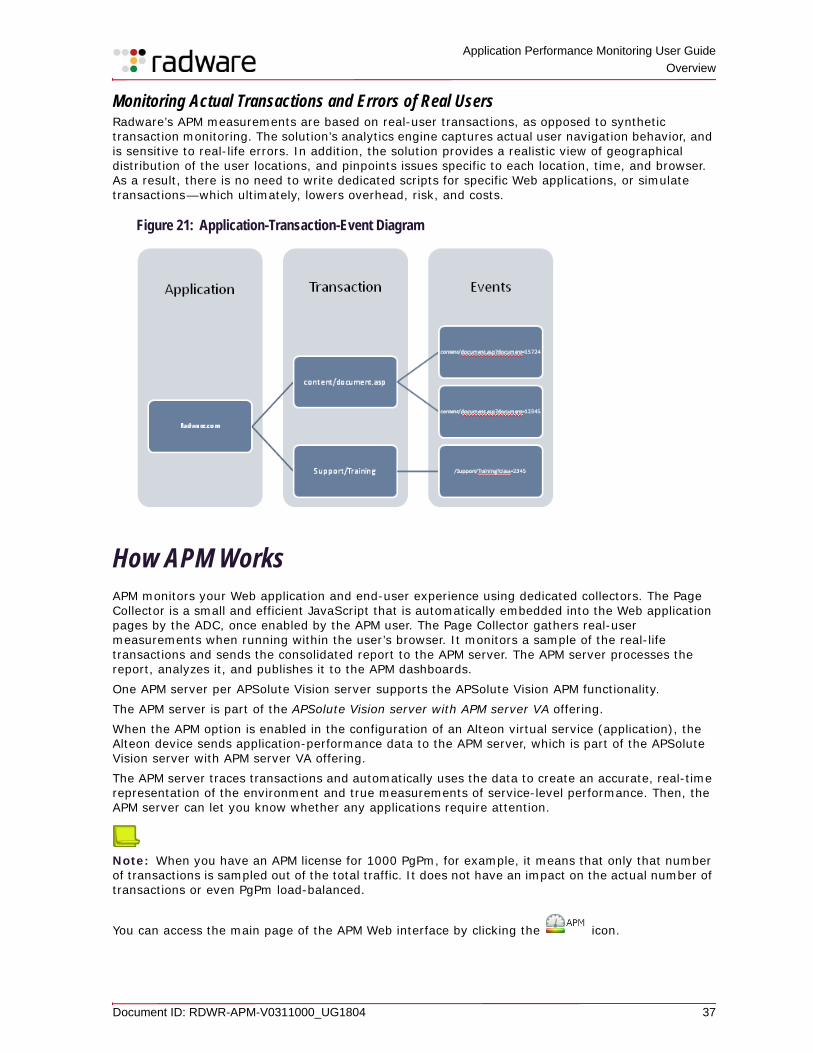
Application Performance Monitoring User Guide
Overview
Document ID: RDWR-APM-V0311000_UG1804 37
Monitoring Actual Transactions and Errors of Real UsersRadware’s APM measurements are based on real-user transactions, as opposed to synthetic transaction monitoring. The solution’s analytics engine captures actual user navigation behavior, and is sensitive to real-life errors. In addition, the solution provides a realistic view of geographical distribution of the user locations, and pinpoints issues specific to each location, time, and browser. As a result, there is no need to write dedicated scripts for specific Web applications, or simulate transactions—which ultimately, lowers overhead, risk, and costs.
Figure 21: Application-Transaction-Event Diagram
How APM WorksAPM monitors your Web application and end-user experience using dedicated collectors. The Page Collector is a small and efficient JavaScript that is automatically embedded into the Web application pages by the ADC, once enabled by the APM user. The Page Collector gathers real-user measurements when running within the user’s browser. It monitors a sample of the real-life transactions and sends the consolidated report to the APM server. The APM server processes the report, analyzes it, and publishes it to the APM dashboards.One APM server per APSolute Vision server supports the APSolute Vision APM functionality. The APM server is part of the APSolute Vision server with APM server VA offering. When the APM option is enabled in the configuration of an Alteon virtual service (application), the Alteon device sends application-performance data to the APM server, which is part of the APSolute Vision server with APM server VA offering. The APM server traces transactions and automatically uses the data to create an accurate, real-time representation of the environment and true measurements of service-level performance. Then, the APM server can let you know whether any applications require attention.
Note: When you have an APM license for 1000 PgPm, for example, it means that only that number of transactions is sampled out of the total traffic. It does not have an impact on the actual number of transactions or even PgPm load-balanced.
You can access the main page of the APM Web interface by clicking the icon.
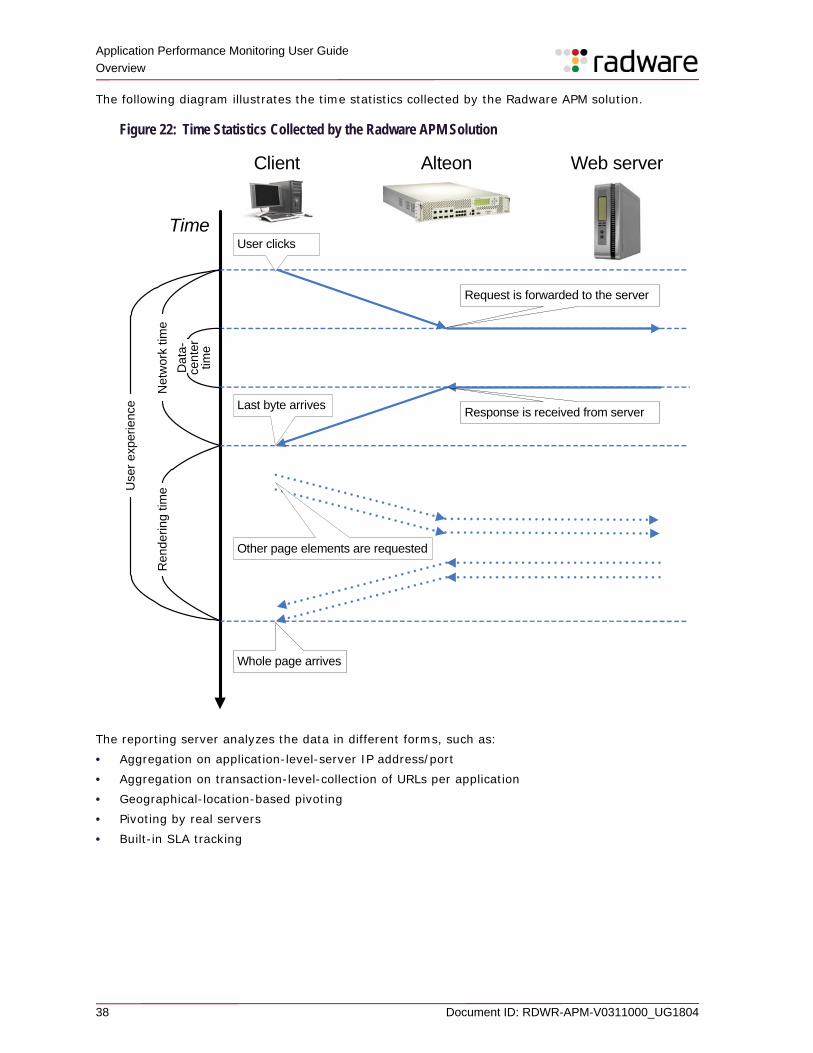
Application Performance Monitoring User Guide Overview
38 Document ID: RDWR-APM-V0311000_UG1804
The following diagram illustrates the time statistics collected by the Radware APM solution.
Figure 22: Time Statistics Collected by the Radware APM Solution
The reporting server analyzes the data in different forms, such as:• Aggregation on application-level-server IP address/port• Aggregation on transaction-level-collection of URLs per application• Geographical-location-based pivoting• Pivoting by real servers• Built-in SLA tracking
ClientN
etw
ork
time
User clicks
Request is forwarded to the server
Last byte arrivesResponse is received from server
Other page elements are requested
Whole page arrives
Re
nde
ring
time
Da
ta-
cen
ter
time
Alteon Web server
Time
Use
r e
xper
ienc
e
Document ID: RDWR-APM-V0311000_UG1804 39
Chapter 3 – Getting Started with APM Management
This chapter describes the basic management of APM components.This chapter contains the following main sections: • Accessing the APM Web Interface, page 39• Logging In and Logging Out, page 40• Viewing APM Version Information, page 41• Monitoring of APM-Enabled Devices and Services, page 41• Exporting and Importing the APM Configuration, page 42• Exporting and Importing the APM Server Database, page 44• Data Export to a CSV File, page 44
For information on the following, see the Application Performance Monitoring Quick Deployment Guide:• Recommended versions• APSolute Vision and Alteon compatibility and connectivity architecture• APM topology—recent connectivity enhancements• General APM limitations• APM performance capacity• Prerequisites and constraints• Installing the APM server license• APM server deployment and initial configuration• Alteon ADC device configuration and results
Accessing the APM Web InterfaceAPSolute Vision supports a single sign-on across APSolute Vision and APM. A user authenticated as an APSolute Vision user is able to access APM.Alternatively, a local APM role can be used to access APM. The default username is vision, and the default password is radware.
Note: The user authentication process begins when the primary APSolute Vision server is contacted and a login is attempted to APSolute Vision. APSolute Vision uses the authentication mode defined in APSolute Vision: Local User, TACACS+, RADIUS, or LDAP.
Upon a successful login to APM, the user sees one of the following:• The Settings option, if the APSolute Vision user has the role of Administrator• All the virtual services with APM enabled that the APSolute Vision server can reach-based on
device scope of the roleIf the login fails, a local APM authentication is attempted using the local APM user list.You can access APM directly with the following URL: http://<APM server IP address>/sharepath
Application Performance Monitoring User Guide Getting Started with APM Management
40 Document ID: RDWR-APM-V0311000_UG1804
To open the APM Web interface
> In the main toolbar, click .
The APSolute Vision interface with the configuration of the virtual service includes a hyperlink to the APM for the corresponding application (that is, the application that the virtual service handles).
Tip: For information on how to use the APM Web interface, click (Help) in the APM Web interface.
Logging In and Logging OutAs a security precaution, when APM is idle for specified time (set by an administrator), users are automatically logged out and must log in again. Each user name and password combination is assigned a permission level (administrator, manager, or viewer).
To log in to APM
1. In the address field of a supported Internet browser, type the APM application URL provided by your APM administrator. The Login dialog box opens.
2. Enter your user name in the Username text box.
3. Enter your password in the Password text box.
4. Click Log in.
To log out of APM
> Click the Sign out option from the user drop-down list control located in the upper-right corner of the APM screen.
The APM GUI The APM GUI is divided into three horizontal strips.The top strip contains:• The APM logo (clicking the logo opens the APM splash screen)• The Favorites icon• The Settings icon (available to administrator only)• The Share icon• The Help icon• The user-control area
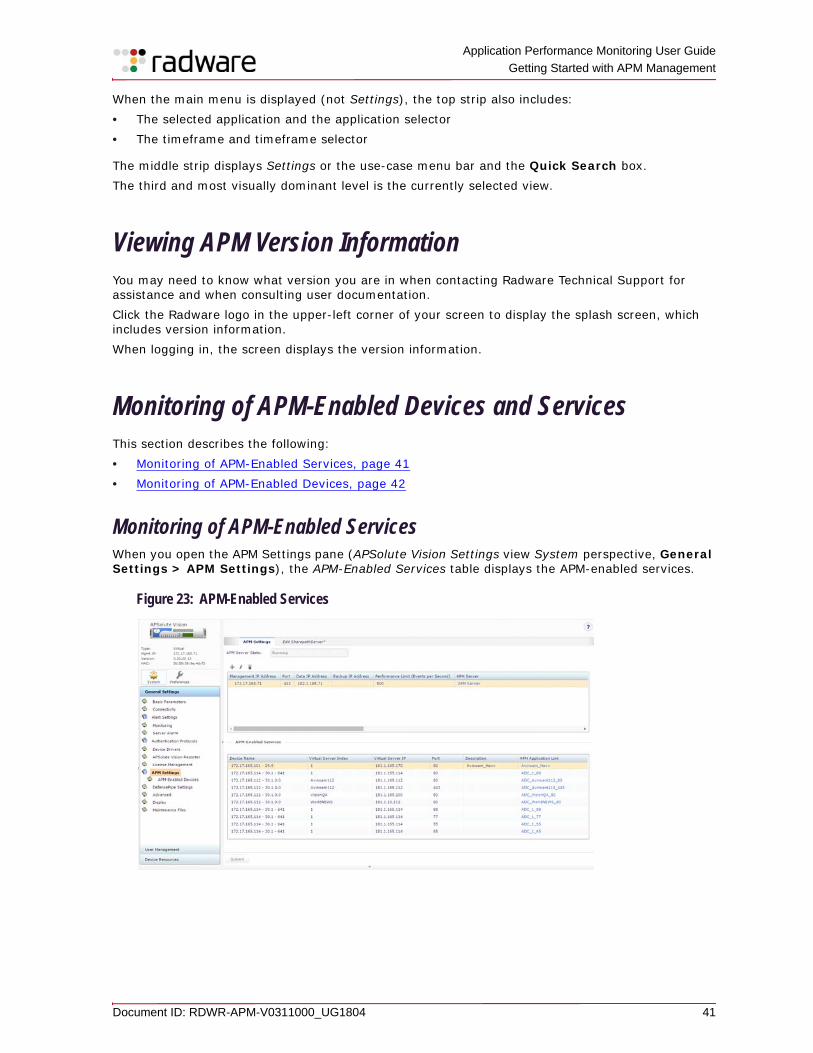
Application Performance Monitoring User Guide
Getting Started with APM Management
Document ID: RDWR-APM-V0311000_UG1804 41
When the main menu is displayed (not Settings), the top strip also includes:• The selected application and the application selector • The timeframe and timeframe selector
The middle strip displays Settings or the use-case menu bar and the Quick Search box.The third and most visually dominant level is the currently selected view.
Viewing APM Version InformationYou may need to know what version you are in when contacting Radware Technical Support for assistance and when consulting user documentation. Click the Radware logo in the upper-left corner of your screen to display the splash screen, which includes version information.When logging in, the screen displays the version information.
Monitoring of APM-Enabled Devices and ServicesThis section describes the following:• Monitoring of APM-Enabled Services, page 41• Monitoring of APM-Enabled Devices, page 42
Monitoring of APM-Enabled ServicesWhen you open the APM Settings pane (APSolute Vision Settings view System perspective, General Settings > APM Settings), the APM-Enabled Services table displays the APM-enabled services.
Figure 23: APM-Enabled Services
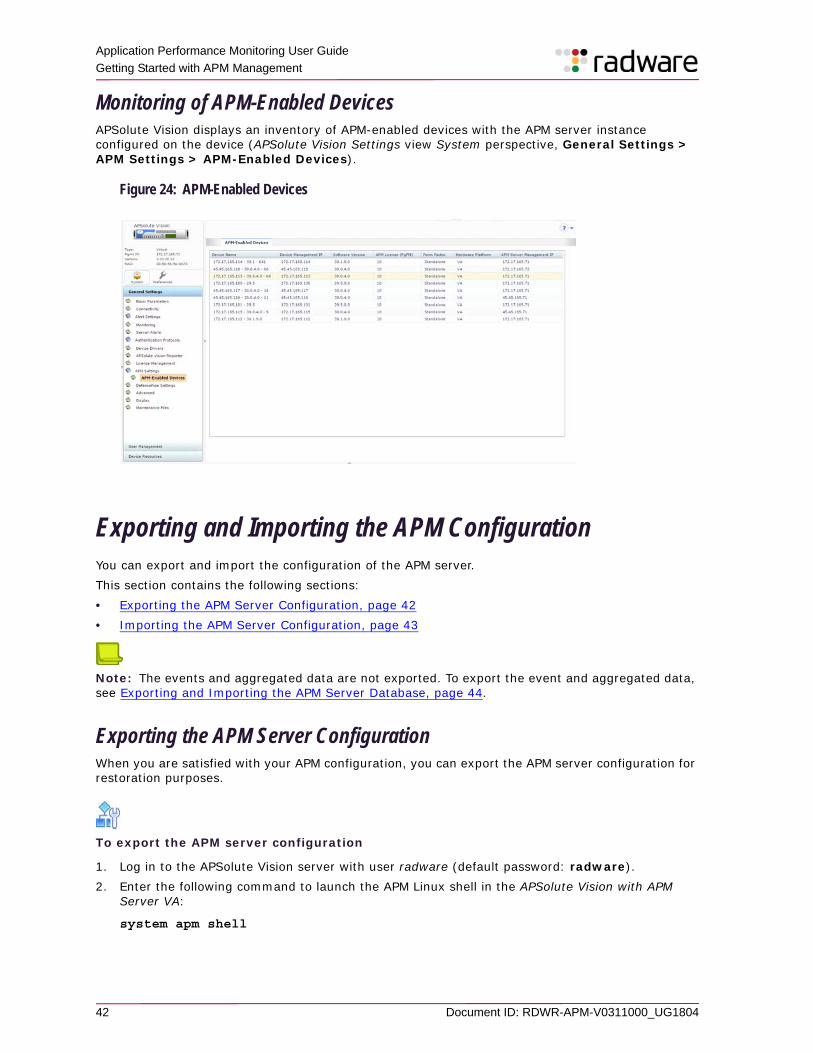
Application Performance Monitoring User Guide Getting Started with APM Management
42 Document ID: RDWR-APM-V0311000_UG1804
Monitoring of APM-Enabled DevicesAPSolute Vision displays an inventory of APM-enabled devices with the APM server instance configured on the device (APSolute Vision Settings view System perspective, General Settings > APM Settings > APM-Enabled Devices).
Figure 24: APM-Enabled Devices
Exporting and Importing the APM ConfigurationYou can export and import the configuration of the APM server.This section contains the following sections:• Exporting the APM Server Configuration, page 42• Importing the APM Server Configuration, page 43
Note: The events and aggregated data are not exported. To export the event and aggregated data, see Exporting and Importing the APM Server Database, page 44.
Exporting the APM Server ConfigurationWhen you are satisfied with your APM configuration, you can export the APM server configuration for restoration purposes.
To export the APM server configuration
1. Log in to the APSolute Vision server with user radware (default password: radware).2. Enter the following command to launch the APM Linux shell in the APSolute Vision with APM
Server VA:
system apm shell
Application Performance Monitoring User Guide
Getting Started with APM Management
Document ID: RDWR-APM-V0311000_UG1804 43
3. Enter the following commands:
a. SPSERVER_INSTANCE=rad /usr/share/sharepath/server/sbin/spserver-initd.sh --action=stop
b. service tomcat stop
c. SPSERVER_INSTANCE=rad /usr/share/sharepath/server/bin/spserver-configuration-migration.sh --action=export --export-dir=<export_path>
Notes
• An example of <export_path> would be /tmp.
• Once completed, start your Tomcat and APM services by substituting stop from the first two commands above with start.
Importing the APM Server ConfigurationIf you experience a problem with your APM server installation and Radware Technical Support recommends installing a clean instance of the APM server, you may want to import a previously saved working configuration.
Caution: Performing this procedure completely erases your APM server database instance. You will lose all existing data in the database. Radware strongly recommends backing up your database and contacting Radware Technical Support prior to performing this procedure.
To import your APM server configuration
1. Log in to the APSolute Vision server with user radware (default password: radware).2. Enter the following command to launch the APM Linux shell in the APSolute Vision with APM
Server VA:
system apm shell
3. Enter the following commands:
a. SPSERVER_INSTANCE=rad /usr/share/sharepath/server/sbin/spserver-initd.sh --action=stop
b. service tomcat stop
c. SPSERVER_INSTANCE=rad /usr/share/sharepath/server/bin/spserver-configuration-migration.sh --action=import --configuration-file=<server-configuration-export TAR.GZ file>
Notes
• An example of <server-configuration-export TAR.GZ file> is tmp/20160605083149-23984-server-configuration-export.tar.gz.
• The import process may take a while to complete. When the process is completed, start your Tomcat and APM services by substituting stop from the first two commands above with start.
Application Performance Monitoring User Guide Getting Started with APM Management
44 Document ID: RDWR-APM-V0311000_UG1804
Exporting and Importing the APM Server DatabaseRadware recommends backing up the APM database after you have finished the initial system configuration and prior to large upgrades.
To export and import the APM server database
1. Log in to the APSolute Vision server with user radware (default password: radware).2. Enter the following command to launch the APM Linux shell in the APSolute Vision with APM
Server VA:
system apm shell
3. Under /usr/share/sharepath/server/bin, enter the following command:
spserver-db-maintenance.sh --instance=rad --mode=<mode> --temp=<temp_dir> --backup-dir=<backup_dir> --log=<logfilepath>
where:
— <mode> specifies the operation mode.
Values: backup, restore
— <temp_dir> specifies the directory for temporary files.
— <backup_dir> specifies the name of the backup directory. This should be a new, non-existing directory.
— <logfilepath> specifies the filepath of the log file.
Example
/usr/share/sharepath/server/bin/spserver-db-maintenance.sh --instance=rad--mode=backup --temp=/tmp/backup_tmp_files --backup-dir=/tmp/my_backup/ --log=/tmp/mylog.log
Data Export to a CSV FileAPM supports export of aggregated data to an external file in the JSON format. The export is configurable and provides multi-dimensional data based on time-interval (date), location, transaction type, and application name selections. This allows export of data to third-party tools for further analysis and storage.Script location:
/usr/share/sharepath/server/bin/. Script name is spserver-aggregations-export.sh
Instructions:
Launch ./spserver-aggregations-export.sh -help to get command details.
The minimal execution configuration is as follows:
./spserver-aggregations-export.sh -help -user=<username> -password=<password> -startTime={unix timestamp} -endTime={unix timestamp}
Application Performance Monitoring User Guide
Getting Started with APM Management
Document ID: RDWR-APM-V0311000_UG1804 45
where:
• <username> (mandatory) is the username.
• <password> (mandatory) is the user password.
A valid user is either a user in APSolute Vision or a local APM user. The data exported are limited to the user’s scope as defined by the role-based access control (RBAC).
Application Performance Monitoring User Guide Getting Started with APM Management
46 Document ID: RDWR-APM-V0311000_UG1804
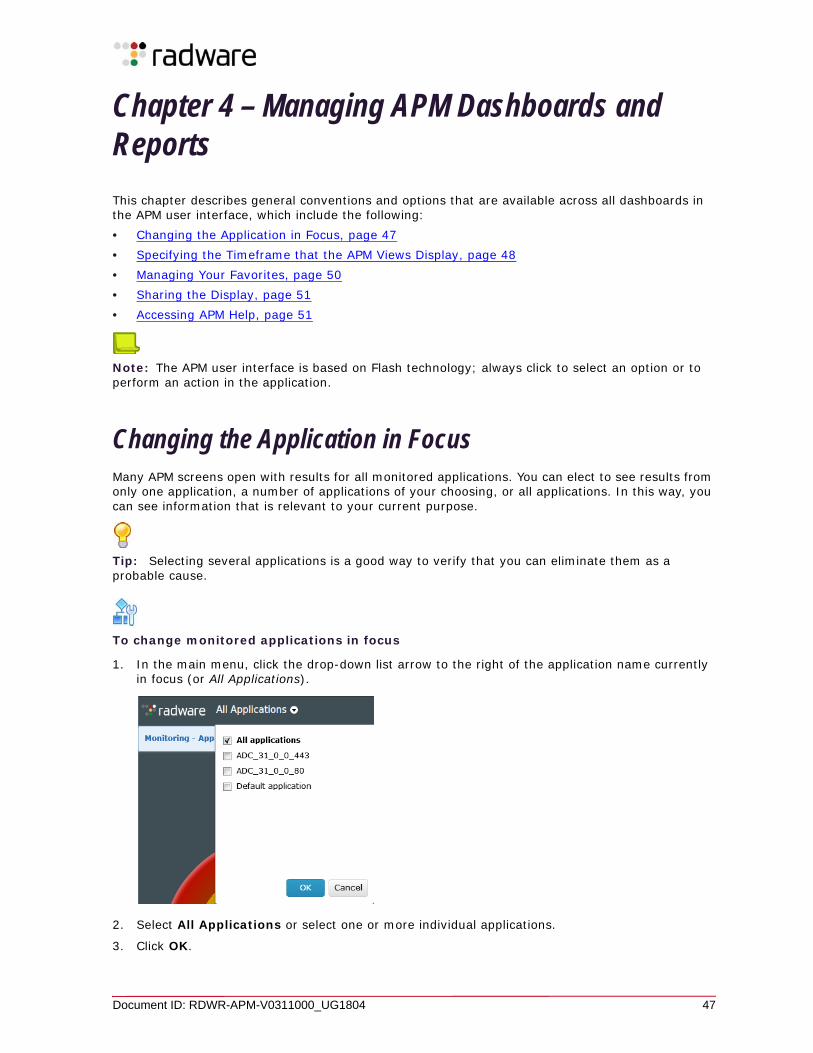
Document ID: RDWR-APM-V0311000_UG1804 47
Chapter 4 – Managing APM Dashboards and Reports
This chapter describes general conventions and options that are available across all dashboards in the APM user interface, which include the following:• Changing the Application in Focus, page 47• Specifying the Timeframe that the APM Views Display, page 48• Managing Your Favorites, page 50• Sharing the Display, page 51• Accessing APM Help, page 51
Note: The APM user interface is based on Flash technology; always click to select an option or to perform an action in the application.
Changing the Application in FocusMany APM screens open with results for all monitored applications. You can elect to see results from only one application, a number of applications of your choosing, or all applications. In this way, you can see information that is relevant to your current purpose.
Tip: Selecting several applications is a good way to verify that you can eliminate them as a probable cause.
To change monitored applications in focus
1. In the main menu, click the drop-down list arrow to the right of the application name currently in focus (or All Applications).
2. Select All Applications or select one or more individual applications.
3. Click OK.
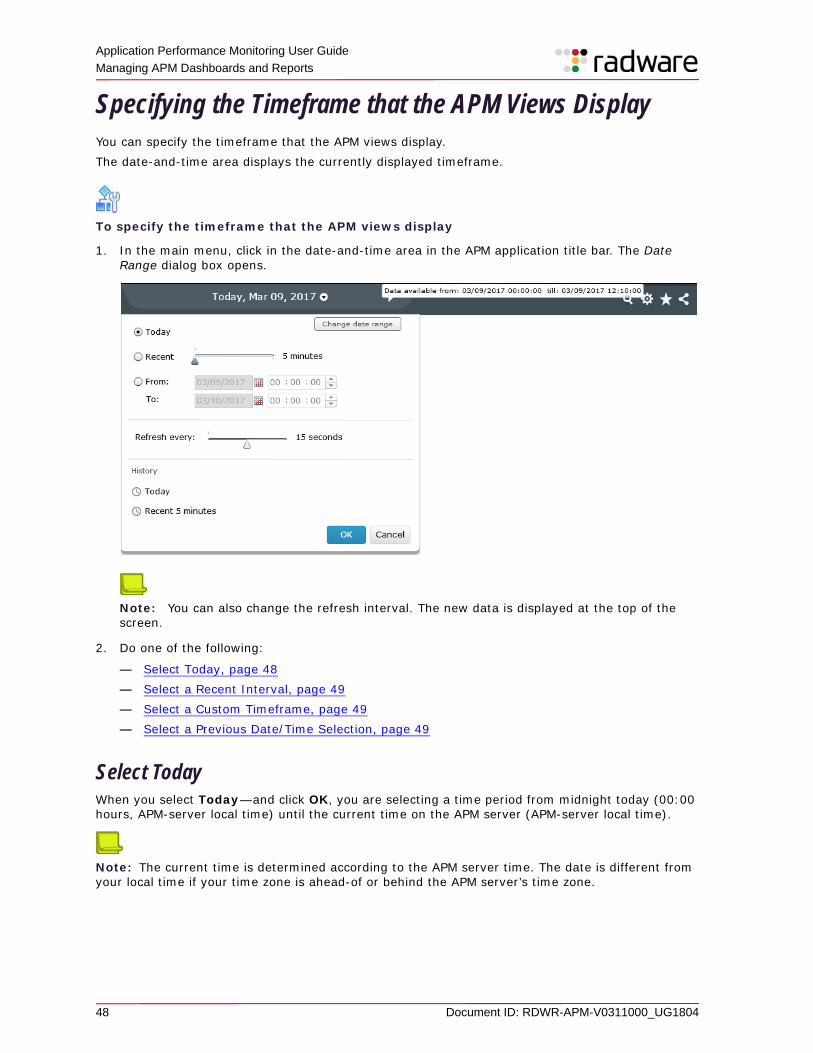
Application Performance Monitoring User Guide Managing APM Dashboards and Reports
48 Document ID: RDWR-APM-V0311000_UG1804
Specifying the Timeframe that the APM Views DisplayYou can specify the timeframe that the APM views display. The date-and-time area displays the currently displayed timeframe.
To specify the timeframe that the APM views display
1. In the main menu, click in the date-and-time area in the APM application title bar. The Date Range dialog box opens.
Note: You can also change the refresh interval. The new data is displayed at the top of the screen.
2. Do one of the following:
— Select Today, page 48— Select a Recent Interval, page 49— Select a Custom Timeframe, page 49 — Select a Previous Date/Time Selection, page 49
Select TodayWhen you select Today—and click OK, you are selecting a time period from midnight today (00:00 hours, APM-server local time) until the current time on the APM server (APM-server local time).
Note: The current time is determined according to the APM server time. The date is different from your local time if your time zone is ahead-of or behind the APM server’s time zone.
Application Performance Monitoring User Guide
Managing APM Dashboards and Reports
Document ID: RDWR-APM-V0311000_UG1804 49
Select a Recent IntervalYou can select a self-updating timeframe that starts up to 30 minutes before the current time and ends with the current time.
To select a recent interval
1. Select Recent, and then, click the slider or drag its pointer to specify the length of the recent time interval from the available lengths:— 5 minutes— 15 minutes— 30 minutes— hour
2. Click the Refresh every slider or drag its pointer to specify a refresh interval from the available alternatives: Never (no refresh), 15 seconds, or 1 Minute.
3. Click OK.
Select a Custom Timeframe
To set a specific timeframe
1. Click the From-To option button.2. Specify the From and To dates and hours.
3. Click OK.
Select a Previous Date/Time SelectionAPM saves up to eight of your most recent date selections on the Choose Date Range dialog box.
To select a recently selected date/time selection
1. Click the required Date/Time section in the History list at the bottom of the dialog box.2. Click OK.
Application Performance Monitoring User Guide Managing APM Dashboards and Reports
50 Document ID: RDWR-APM-V0311000_UG1804
Managing Your FavoritesUse the Favorites feature to manage quick access to the views that you find most useful. Favorites are for your personal use. You can create a Favorite that links to the generic view that is always modified by the timeframe and selected applications at the time that you access it. Radware recommends including the words “Generic View” when creating this type of a Favorite.You can create a Favorite that always shows you the same timeframe and selected applications as in the view you saw when you created the Favorite. To create this type of Favorite, select the Save timeframe and applications checkbox. Radware recommends specifying a label for the Favorite that reflects the timeframe and applications.
Note: Creating a Favorite with timeframe and application information is similar to sharing a view but keeps the view, making it available for personal reference or for later sharing. You can share any
Favorite by clicking the Share icon ( ) when in Favorite view is active.
To create a Favorite
1. Verify that the view you wish to make a Favorite currently displays.
2. Click the Favorites ( ) icon.
3. To favorite the current view displaying data for the same applications in the same timeframe, select the Include timeframe and applications checkbox.
Note: A Favorite saved with timeframe and application can become obsolete when the data for the provided timeframe is no longer retained in the APM database. If you click such a Favorite, the required screen will be displayed with a No data message. Be sure to delete the Favorite from your list.
4. Edit the name of the Favorite Link.
Note: The default title of the currently selected view displays in the dialog box.
To save the specific view as a Favorite
> If you are interested in saving the timeframe and applications as part of the Favorite link, select the Include timeframe and applications checkbox.
To save a general link to this view
1. To create a generic Favorite that links to a view that displays data for the timeframe and applications that are selected at the time you activate it, clear the Include timeframe and applications checkbox.
2. Click Add. A new Favorite link is added to the list.
Application Performance Monitoring User Guide
Managing APM Dashboards and Reports
Document ID: RDWR-APM-V0311000_UG1804 51
To view a Favorite
1. Click the Favorites ( ) icon.2. Click a view name in the displayed list in the dialog box that opens.
Sharing the DisplayYou can provide access to the view you are currently seeing to other APM users. This allows you to share with others observed problems and performance insights you see in APM views. You do not need to simulate or reproduce a problem, take screen captures. Sharing lets you show other users the exact data display that you saw, based on the same information, as long as the data is still available in the APM repository. Sharing of APM visual data with colleagues and managers provides timely reporting and enables timely, relevant discussion, and problem-solving collaboration.
To share the display you are currently viewing
1. Click the Share icon ( ) icon to get the exact URI. A small dialog box opens with the URI information selected.
2. Click Copy to copy the URI information to your system’s clipboard.
3. Paste the information into a document or e-mail it.
Accessing APM HelpAPM Help is available throughout the APM application.
To get help about the current APM screen
> Click the Help icon ( ) near the upper-right corner of your screen. A new browser window opens with explanations relevant to the current APM screen in the right frame and the APM User Guide Table of Contents (TOC) displayed in the left frame.
Application Performance Monitoring User Guide Managing APM Dashboards and Reports
52 Document ID: RDWR-APM-V0311000_UG1804
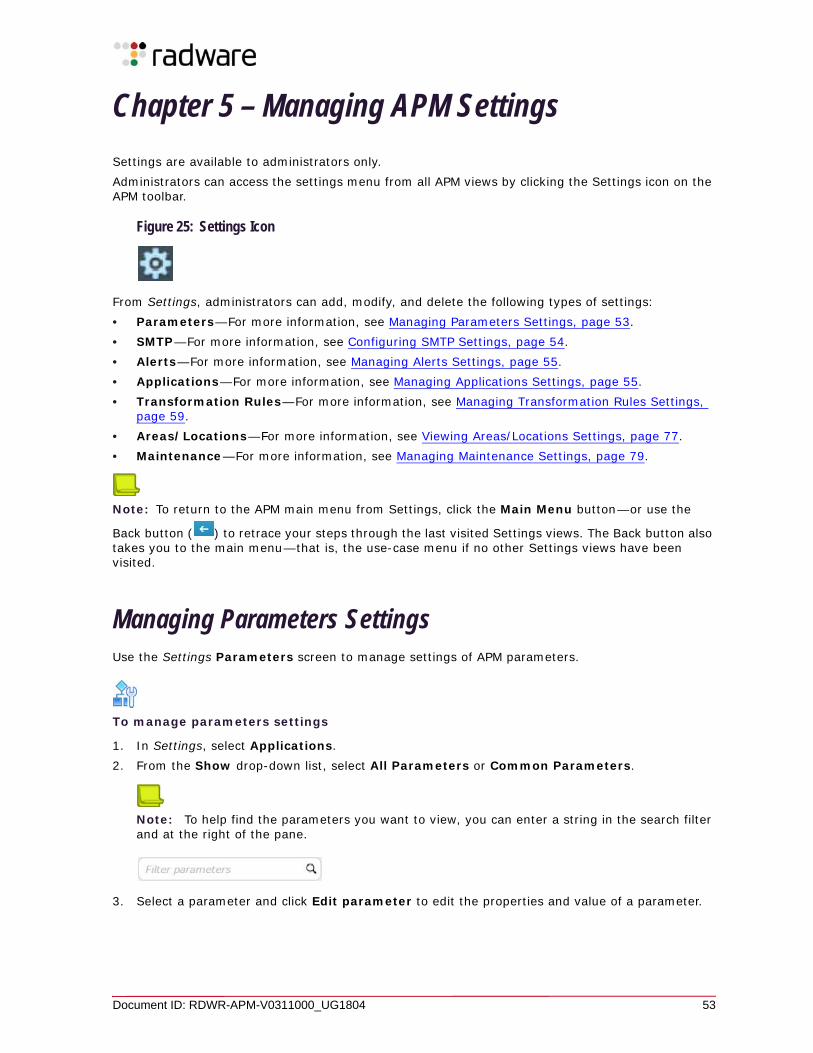
Document ID: RDWR-APM-V0311000_UG1804 53
Chapter 5 – Managing APM Settings
Settings are available to administrators only. Administrators can access the settings menu from all APM views by clicking the Settings icon on the APM toolbar.
Figure 25: Settings Icon
From Settings, administrators can add, modify, and delete the following types of settings:• Parameters—For more information, see Managing Parameters Settings, page 53.• SMTP—For more information, see Configuring SMTP Settings, page 54.• Alerts—For more information, see Managing Alerts Settings, page 55.• Applications—For more information, see Managing Applications Settings, page 55.• Transformation Rules—For more information, see Managing Transformation Rules Settings,
page 59.• Areas/Locations—For more information, see Viewing Areas/Locations Settings, page 77.• Maintenance—For more information, see Managing Maintenance Settings, page 79.
Note: To return to the APM main menu from Settings, click the Main Menu button—or use the
Back button ( ) to retrace your steps through the last visited Settings views. The Back button also takes you to the main menu—that is, the use-case menu if no other Settings views have been visited.
Managing Parameters SettingsUse the Settings Parameters screen to manage settings of APM parameters.
To manage parameters settings
1. In Settings, select Applications.2. From the Show drop-down list, select All Parameters or Common Parameters.
Note: To help find the parameters you want to view, you can enter a string in the search filter and at the right of the pane.
3. Select a parameter and click Edit parameter to edit the properties and value of a parameter.
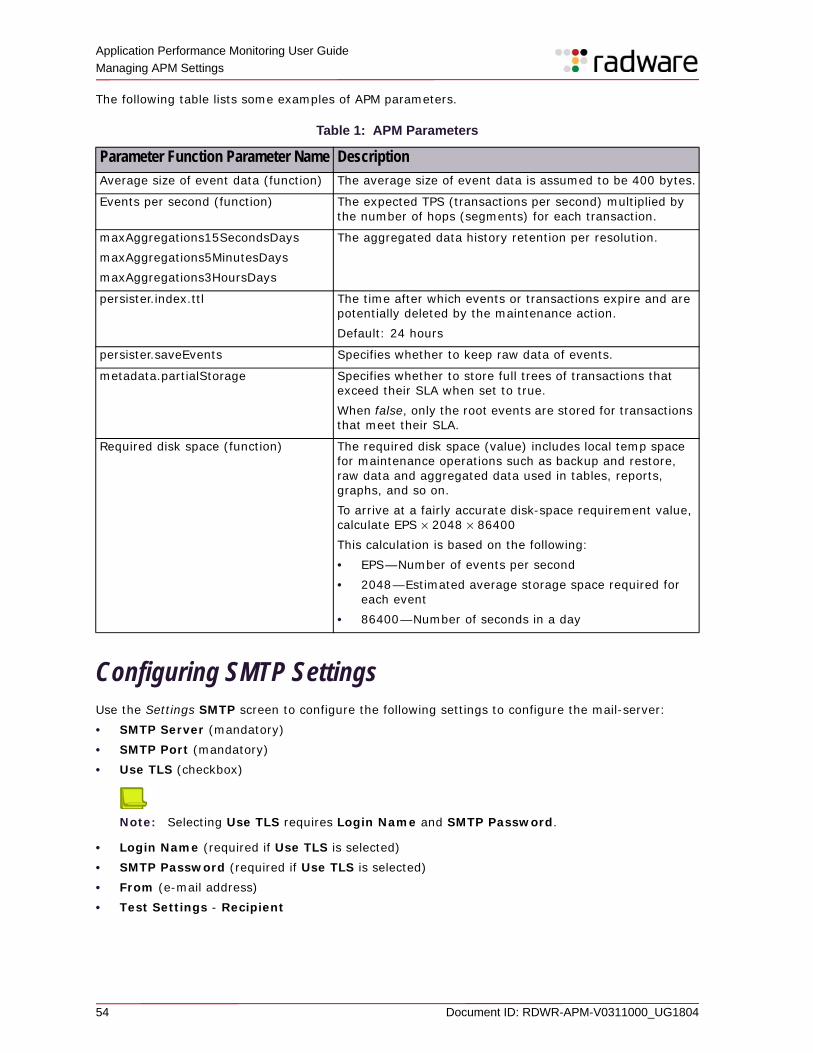
Application Performance Monitoring User Guide Managing APM Settings
54 Document ID: RDWR-APM-V0311000_UG1804
The following table lists some examples of APM parameters.
Configuring SMTP SettingsUse the Settings SMTP screen to configure the following settings to configure the mail-server:• SMTP Server (mandatory)• SMTP Port (mandatory)• Use TLS (checkbox)
Note: Selecting Use TLS requires Login Name and SMTP Password.
• Login Name (required if Use TLS is selected) • SMTP Password (required if Use TLS is selected)• From (e-mail address)• Test Settings - Recipient
Table 1: APM Parameters
Parameter Function Parameter Name DescriptionAverage size of event data (function) The average size of event data is assumed to be 400 bytes.
Events per second (function) The expected TPS (transactions per second) multiplied by the number of hops (segments) for each transaction.
maxAggregations15SecondsDaysmaxAggregations5MinutesDaysmaxAggregations3HoursDays
The aggregated data history retention per resolution.
persister.index.ttl The time after which events or transactions expire and are potentially deleted by the maintenance action. Default: 24 hours
persister.saveEvents Specifies whether to keep raw data of events.
metadata.partialStorage Specifies whether to store full trees of transactions that exceed their SLA when set to true. When false, only the root events are stored for transactions that meet their SLA.
Required disk space (function) The required disk space (value) includes local temp space for maintenance operations such as backup and restore, raw data and aggregated data used in tables, reports, graphs, and so on.To arrive at a fairly accurate disk-space requirement value, calculate EPS × 2048 × 86400This calculation is based on the following:• EPS—Number of events per second• 2048—Estimated average storage space required for
each event • 86400—Number of seconds in a day
Application Performance Monitoring User Guide
Managing APM Settings
Document ID: RDWR-APM-V0311000_UG1804 55
Managing Alerts SettingsUse the Settings Alerts screen to review SLA alerts and other defined alerts. For more information, see Response-Time SLA Management and Failed Transaction Management, page 153.
Managing Applications SettingsUse the Settings Applications screen for application management. The screen is used in the process of monitored-application first-time deployment, but it also allows for editing the APM properties of the application.To understand how to use this screen when adding a new monitored application to APM, see Defining a Monitored Application, page 55. To fully understand the role of this screen and its place in the monitored application definition process, see the following sections:• Deploying APM on One Application—Overview, page 55• Defining a Monitored Application, page 55• Assigning Transactions to an Application, page 56• Configuring and Testing Transaction Naming (Basic Mode), page 57• Deploying Collectors on Target Application Nodes, page 58• Defining SLAs and Alerts for the Application, page 58
Deploying APM on One Application—OverviewDeploying APM on an Application in the context of Alteon and APSolute Vision is performed automatically via the configuration of the Alteon virtual service.
Defining a Monitored ApplicationDefining a monitored Application in APM is performed automatically by enabling APM in the configuration of the Alteon virtual service.
To define a new monitored application on the APM server
1. In Settings, select Applications.
2. Click the Create ( ) button. The Create Application dialog box opens.
3. In the Name field, type a name for your application
4. In the Description field, type a meaningful description.
5. Verify that the value for Max. Event Types is set at the default value of 500or a different value that your team has decided upon.
Application Performance Monitoring User Guide Managing APM Settings
56 Document ID: RDWR-APM-V0311000_UG1804
Notes
— APM issues alerts when the number of event types approaches the Max. Event Types. When the number is reached, APM collects all new events under one default name until the situation is corrected.
— For more on this subject, see Troubleshooting Too Many Event Types, page 175.6. To display this application’s Key Parameter Indicators (KPI doughnut) in the Topology Screen,
select the Show in topology dashboard checkbox.
Note: You can delay defining SLAs and alerts the monitored application until all collectors have been deployed and some response-time data has been collected. In this case, you can skip the next step.
7. (Optional) Add SLA definitions and Alerts for various timeframes. See Configuring Response-Time SLAs and Response-Time-SLA Alerts, page 154.
Repeat this step to create SLA definitions and Alerts for as many timeframes as required. This step is optional because, in the absence of an administrator-defined SLA, APM automatically defines the SLA based on application performance.
8. Click Save. At this point, your monitored application is established. Two wizards are displayed consecutively for determining transaction assignment and transaction naming for the application.
9. Use the context-menu options to instruct APM to identify transactions that are to be assigned exclusively to this application and assign meaningful names to those transactions.
For more information, see:— Assigning Transactions to an Application, page 56— Configuring and Testing Transaction Naming (Basic Mode), page 57
Assigning Transactions to an ApplicationDefining a monitored Application in APM is performed automatically by enabling APM in the configuration of the Alteon virtual service.This section describes assigning transactions to an application.
To assign transactions to an application
1. In Settings, select Applications.2. Click the relevant application and select Transaction Assignment from the context menu.
3. In the dialog box, define which transactions are assigned to the application. In order for a transaction to be assigned to the application, it must comply with all selected checkboxes that describe the conditions a transaction must meet to be assigned to the application.
Selected conditions are described in terms of the following:— Strings (if included in the request)— Host destinations (if defined in the request header’s host field)— Host Manager destinations (if one is shared by the request) — Post Parameter/Value combinations (if one is matched by the request)
4. Click Save.
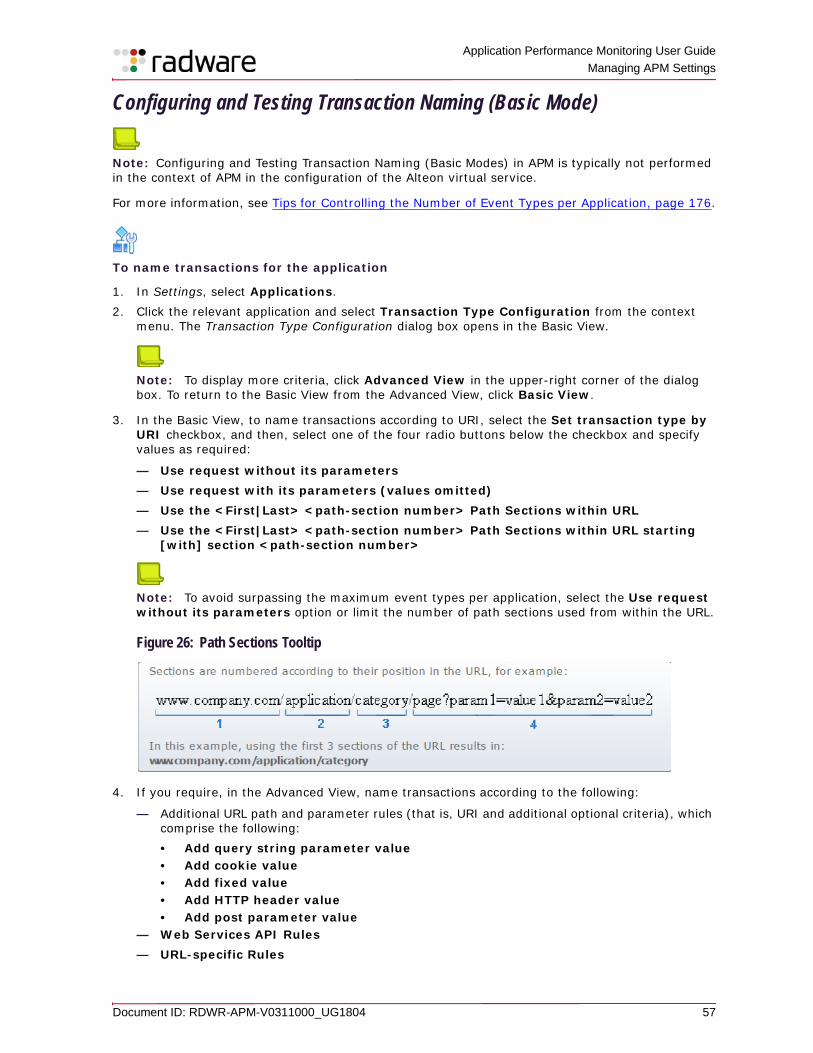
Application Performance Monitoring User Guide
Managing APM Settings
Document ID: RDWR-APM-V0311000_UG1804 57
Configuring and Testing Transaction Naming (Basic Mode)
Note: Configuring and Testing Transaction Naming (Basic Modes) in APM is typically not performed in the context of APM in the configuration of the Alteon virtual service.
For more information, see Tips for Controlling the Number of Event Types per Application, page 176.
To name transactions for the application
1. In Settings, select Applications.2. Click the relevant application and select Transaction Type Configuration from the context
menu. The Transaction Type Configuration dialog box opens in the Basic View.
Note: To display more criteria, click Advanced View in the upper-right corner of the dialog box. To return to the Basic View from the Advanced View, click Basic View.
3. In the Basic View, to name transactions according to URI, select the Set transaction type by URI checkbox, and then, select one of the four radio buttons below the checkbox and specify values as required:
— Use request without its parameters— Use request with its parameters (values omitted)— Use the <First|Last> <path-section number> Path Sections within URL— Use the <First|Last> <path-section number> Path Sections within URL starting
[with] section <path-section number>
Note: To avoid surpassing the maximum event types per application, select the Use request without its parameters option or limit the number of path sections used from within the URL.
Figure 26: Path Sections Tooltip
4. If you require, in the Advanced View, name transactions according to the following:
— Additional URL path and parameter rules (that is, URI and additional optional criteria), which comprise the following:• Add query string parameter value• Add cookie value• Add fixed value• Add HTTP header value• Add post parameter value
— Web Services API Rules— URL-specific Rules
Application Performance Monitoring User Guide Managing APM Settings
58 Document ID: RDWR-APM-V0311000_UG1804
5. In the Default transaction type field of the Default section (displayed in both the Basic View and Advanced View), enter the default transaction type to apply to transactions that fit none of the transaction naming criteria defined for the application.
6. Click Save.
To test the Transaction Naming Rule
1. In Settings, select Applications. 2. Click Test Rules. The Load Existing Transaction Instances dialog box opens.
3. Choose the mode for loading transaction instances:
— Only those instances that were recently assigned to the application— By timeframe (and then specify the timeframe in the UI feature provided)— By transaction ID
4. Click Load Sample Data.
Deploying Collectors on Target Application Nodes
Note: Deploying collectors on target application nodes in APM is typically not performed in the context of APM in the configuration of the Alteon virtual service.
After the application is created, follow the instructions for deploying collectors on application nodes.After each new application deployment, make sure that:• Node descriptions are set so that you can easily identify those nodes while using APM. If there is
no node description or if the node description requires modification, go to Settings > Nodes, double-click the required node, and edit the Description field in the Node Properties dialog box.
• Logical names are assigned to Node IDs.• Nodes are assigned to Tiers.
Defining SLAs and Alerts for the Application
Note: Defining SLAs and alerts for the application in APM is typically not performed in the context of APM in the configuration of the Alteon virtual service.
After deploying collectors and configuring nodes for your application, you will start receiving data for the application. This is a good time to return to the <Application> Properties dialog box to define SLAs and alerts (Settings, Applications > Application Properties). For more information, see:• Configuring Response-Time SLAs and Response-Time-SLA Alerts, page 154• Configuring Transaction Failure Alerts, page 158
Application Performance Monitoring User Guide
Managing APM Settings
Document ID: RDWR-APM-V0311000_UG1804 59
Managing Transformation Rules Settings
Note: Managing transformation rules settings in APM is typically not performed in the context of APM in the configuration of the Alteon virtual service.
Use the Settings Transformation Rules screen to fine-tune the handling of monitored transaction segments (events) as they arrive at the APM backend.The Event Transformation tree consists of factory-configured and enterprise-configured customizable rules. The transformation rules (based on matchers and transformers) control how an event progresses through the Event Transformation tree, how APM treats the event, and whether the event’s statistics become part of APM data.Every transaction that reaches the APM backend goes through at least some part of the Event Transformation tree. Attributes of the transaction segment are matched using Transformation Rules matchers and actions are taken by applying Transformation Rules transformers.This section includes the following:• Transformation Rules—General Information, page 59• Working with Transformation Rules, page 60• Common Transformation Rules Usage Scenarios, page 73
Transformation Rules—General InformationUsing the Transformation Rules engine—also referred to as the Event Transformation Rules engine, APM administrators can define rules that control the handling of transactions that reach the APM backend.Transformation Rules can be added or updated at any time.Each Transformation Rule belongs to a group, which may have many rules. Groups help organize rules. You can perform some operations on all the rules in a group at once. For example, you can enable or disable a group of rules.Rules consist of matchers and transformers. If a transaction matches all the matchers of a rule, all the transformers of the rule are applied. The variety of matchers and transformers included in the Event Transformation tree makes configuring event transformation flexible and efficient. See Available Matchers, page 65 for a list of existing matchers and Transformers. See Available Transformers, page 68 for a list of existing Transformers.The position of the rule in the rules list is significant, because an event entering this workflow passes through all the rules from top to bottom, until a drop event or stop matching transformer is reached. By positioning the rule, you control the order of rule execution.Likewise, the order of matchers can be significant.In general, when APM processes a request is processed against a matcher that it does not match, APM moves to the next rule and begins to check the transaction against its matchers.Each transaction reaching the backend is taken through the Transformation Rules tree unless and until it encounters a stop matching or drop event transformer. The drop event transformer causes the event to receive no further treatment by APM; it does not appear in SLA Watch and is not be part of APM data.The stop matching transformer causes the event to cease being matched against further rules. Stop matching is often used when continuing to go through the rules is not necessary or could result in an undesired outcome.
Application Performance Monitoring User Guide Managing APM Settings
60 Document ID: RDWR-APM-V0311000_UG1804
Working with Transformation Rules
Note: Working with Transformation Rules in APM is typically not performed in the context of APM in the configuration of the Alteon virtual service.
Administrators can manage Transformation Rules.Working with Event Transformation Rules comprises the following:• Creating Transformation Rule Groups and Rules, page 60• Deleting Rules, page 62• Renaming Rules, page 62• Reordering Rules, page 62• Duplicating Rules, page 63• Editing Rules, page 63• Defining Parameter Types, page 64• Defining Attribute Types, page 64• Available Matchers, page 65• Available Transformers, page 68
Creating Transformation Rule Groups and Rules
Note: Creating Transformation Rule groups and rules in APM is typically not performed in the context of APM in the configuration of the Alteon virtual service.
Rules can be added, as needed, to transform the designation and treatment of events with precision and specificity. The ability to add Transformation Rules assures that a specific treatment can be applied to aspects of events as required. It is easier to find and reuse Transformation Rules that are logically grouped.
To create a new Transformation Rule group
1. In Settings, select Transformation Rules.2. Click the Transformation Rules (root) node.
3. Click the Add new group.
4. Click the New Group node that is added.
5. Complete the Group Properties dialog box that opens as required.
6. Click Apply.
To create a new Transformation Rule
1. In Settings, select Transformation Rules. 2. Select the group node to which the rule should belong.
3. Click the Create new rule.
4. Click the New Rule that is added.
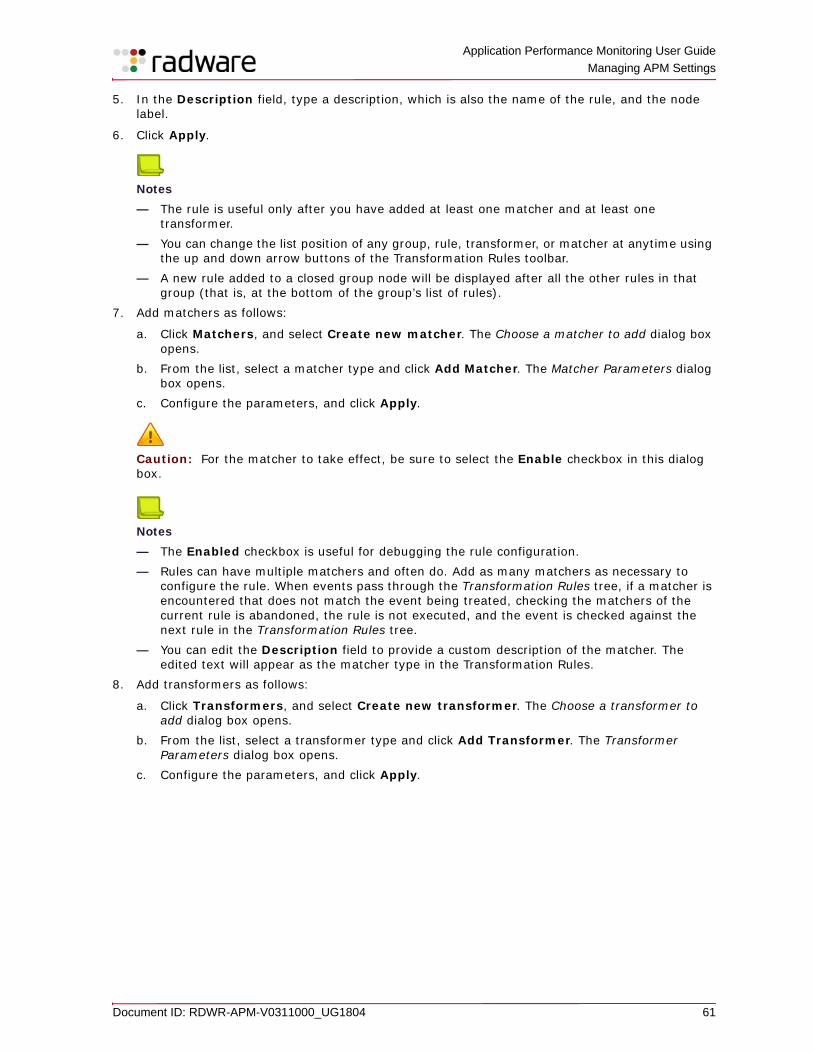
Application Performance Monitoring User Guide
Managing APM Settings
Document ID: RDWR-APM-V0311000_UG1804 61
5. In the Description field, type a description, which is also the name of the rule, and the node label.
6. Click Apply.
Notes
— The rule is useful only after you have added at least one matcher and at least one transformer.
— You can change the list position of any group, rule, transformer, or matcher at anytime using the up and down arrow buttons of the Transformation Rules toolbar.
— A new rule added to a closed group node will be displayed after all the other rules in that group (that is, at the bottom of the group’s list of rules).
7. Add matchers as follows:
a. Click Matchers, and select Create new matcher. The Choose a matcher to add dialog box opens.
b. From the list, select a matcher type and click Add Matcher. The Matcher Parameters dialog box opens.
c. Configure the parameters, and click Apply.
Caution: For the matcher to take effect, be sure to select the Enable checkbox in this dialog box.
Notes
— The Enabled checkbox is useful for debugging the rule configuration.— Rules can have multiple matchers and often do. Add as many matchers as necessary to
configure the rule. When events pass through the Transformation Rules tree, if a matcher is encountered that does not match the event being treated, checking the matchers of the current rule is abandoned, the rule is not executed, and the event is checked against the next rule in the Transformation Rules tree.
— You can edit the Description field to provide a custom description of the matcher. The edited text will appear as the matcher type in the Transformation Rules.
8. Add transformers as follows:
a. Click Transformers, and select Create new transformer. The Choose a transformer to add dialog box opens.
b. From the list, select a transformer type and click Add Transformer. The Transformer Parameters dialog box opens.
c. Configure the parameters, and click Apply.
Application Performance Monitoring User Guide Managing APM Settings
62 Document ID: RDWR-APM-V0311000_UG1804
Deleting Rules
Note: Deleting Rules in APM is typically not performed in the context of APM in the configuration of the Alteon virtual service.
You can delete rules that are no longer relevant.
To delete a Transformation Rule
1. In Settings, select Transformation Rules. 2. Select the rule, click Delete.
3. Click Yes to confirm the deletion.
Renaming Rules
Note: Renaming Rules in APM is typically not performed in the context of APM in the configuration of the Alteon virtual service.
Rules are easier to work with if they have meaningful names.
To rename a Transformation Rule
1. In Settings, select Transformation Rules.2. Click the rule whose name you want to change. The Rule Properties dialog box opens.
3. Edit the Description field.
4. Click Apply.
Reordering Rules
Note: Reordering Rules in APM is typically not performed in the context of APM in the configuration of the Alteon virtual service.
In certain cases, the position of a rule in relation to other rules affecting the same transaction is crucial. For example, you would not want a rule that drops an event to be executed before a rule that you require to be checked against the same event is executed. To be sure that rules are executed as required for expected events, you may need to change the order of rules or create similar rules to be located at different points in the list of Transformation Rules.
To change the position of a rule in the Transformation Rules tree
1. In Settings, select Transformation Rules.2. Select the rule whose position you want to change.
3. Use the toolbar arrows to change the position of the rule.
Application Performance Monitoring User Guide
Managing APM Settings
Document ID: RDWR-APM-V0311000_UG1804 63
Duplicating Rules
Note: Deleting Rules in APM is typically not performed in the context of APM in the configuration of the Alteon virtual service.
You can a duplicate rule to create a new rule that is a variation of an existing rule.
To duplicate a rule in the Transformation Rules tree
1. In Settings, select Transformation Rules.2. Select the rule to duplicate, and click Copy rule.
3. Select the group node that will contain the rule, and click the Paste rule.
Editing Rules
Note: Editing Rules in APM is typically not performed in the context of APM in the configuration of the Alteon virtual service.
Editing rules include editing the text of the rule description (name), setting the rules status as enabled or not enabled (using the Enabled checkbox), and editing the matchers and transformers for the rule.
To edit the rule name and enabled properties
> Double-click the rule name.
To edit the rule properties
> Double-click a numbered transformer or numbered matcher.
To delete a transformer
> Select the numbered transformer and click the toolbar delete button.
To delete a matcher
> Select the numbered matcher and click the toolbar delete button.
To change the position of a transformer or matcher within the rule
> Select the numbered item and use the toolbar up and down arrows.
Application Performance Monitoring User Guide Managing APM Settings
64 Document ID: RDWR-APM-V0311000_UG1804
Defining Parameter Types
Note: Defining Parameter Types in APM is typically not performed in the context of APM in the configuration of the Alteon virtual service.
Parameter Type can be one of the following:• http_req_prm (GET URL parameters)• http_post_prm (POST request content parameters)• http_req_cookie (request cookies)• http_req_header (request headers)• http_resp_header (response header)Parameter Name is the name given to the parameter by the application being monitored.Value refers to the actual content of the parameter.Parameter can also be a property of the Event sent by the Host Manager. In this case, the Parameter Type is Event, and its name can be one of the following:• event_id (Unique event id)• parent_event_id• protocol• process_id• process_name• node_id (Node generated the event)• request (Original request. for example: mydir/index.xml?param1=1¶m2=2)• request_start_time• request_end_time• response_start_time• response_end_time• sent_bytes_number• received_bytes_number
Defining Attribute Types
Note: Defining Attribute Types in APM is typically not performed in the context of APM in the configuration of the Alteon virtual service.
Attribute is a property added to the event by the Transformation Rule engine. Once it is added, it can be queried, for example, by Transaction Assembler.The following table describes the Attribute types.
Table 2: Attribute Types
Attribute Type Descriptionsp_event_name String The event name (type).
sp_transaction_name String The transaction type, used in case this event eventually will define the whole transaction.
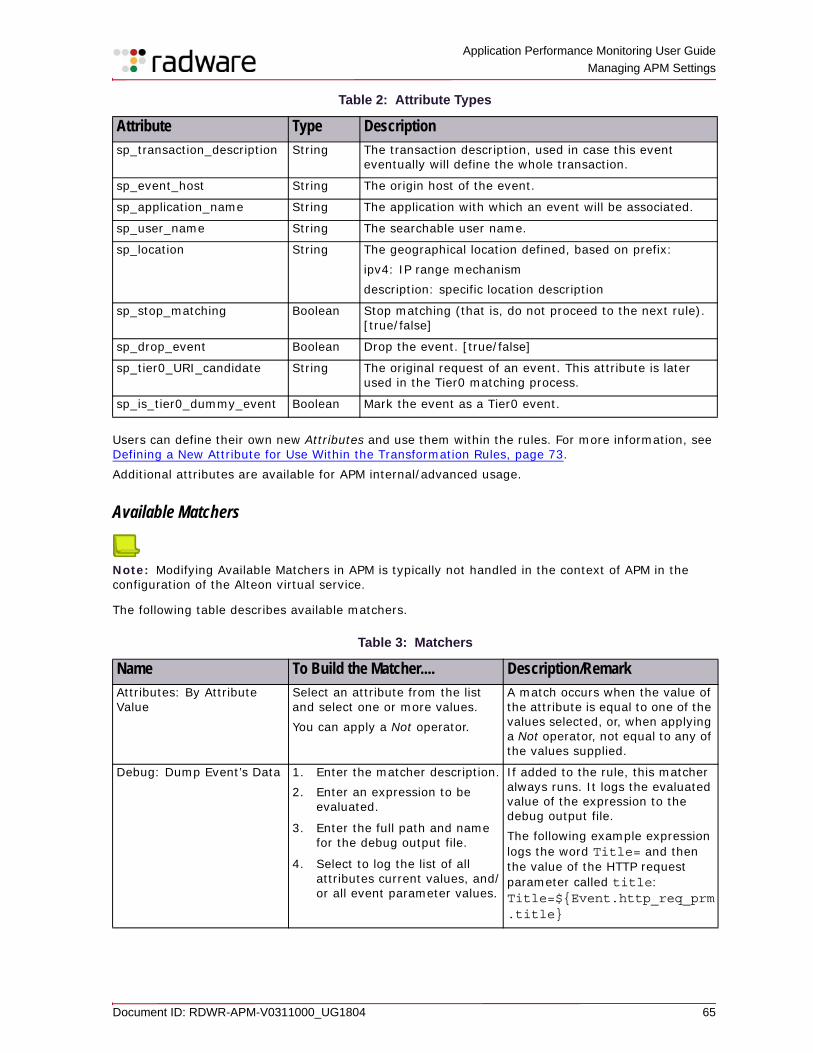
Application Performance Monitoring User Guide
Managing APM Settings
Document ID: RDWR-APM-V0311000_UG1804 65
Users can define their own new Attributes and use them within the rules. For more information, see Defining a New Attribute for Use Within the Transformation Rules, page 73.Additional attributes are available for APM internal/advanced usage.
Available Matchers
Note: Modifying Available Matchers in APM is typically not handled in the context of APM in the configuration of the Alteon virtual service.
The following table describes available matchers.
sp_transaction_description String The transaction description, used in case this event eventually will define the whole transaction.
sp_event_host String The origin host of the event.
sp_application_name String The application with which an event will be associated.
sp_user_name String The searchable user name.
sp_location String The geographical location defined, based on prefix:ipv4: IP range mechanismdescription: specific location description
sp_stop_matching Boolean Stop matching (that is, do not proceed to the next rule). [true/false]
sp_drop_event Boolean Drop the event. [true/false]
sp_tier0_URI_candidate String The original request of an event. This attribute is later used in the Tier0 matching process.
sp_is_tier0_dummy_event Boolean Mark the event as a Tier0 event.
Table 3: Matchers
Name To Build the Matcher.... Description/RemarkAttributes: By Attribute Value
Select an attribute from the list and select one or more values.You can apply a Not operator.
A match occurs when the value of the attribute is equal to one of the values selected, or, when applying a Not operator, not equal to any of the values supplied.
Debug: Dump Event’s Data 1. Enter the matcher description.2. Enter an expression to be
evaluated.
3. Enter the full path and name for the debug output file.
4. Select to log the list of all attributes current values, and/or all event parameter values.
If added to the rule, this matcher always runs. It logs the evaluated value of the expression to the debug output file.The following example expression logs the word Title= and then the value of the HTTP request parameter called title:Title=${Event.http_req_prm.title}
Table 2: Attribute Types
Attribute Type Description
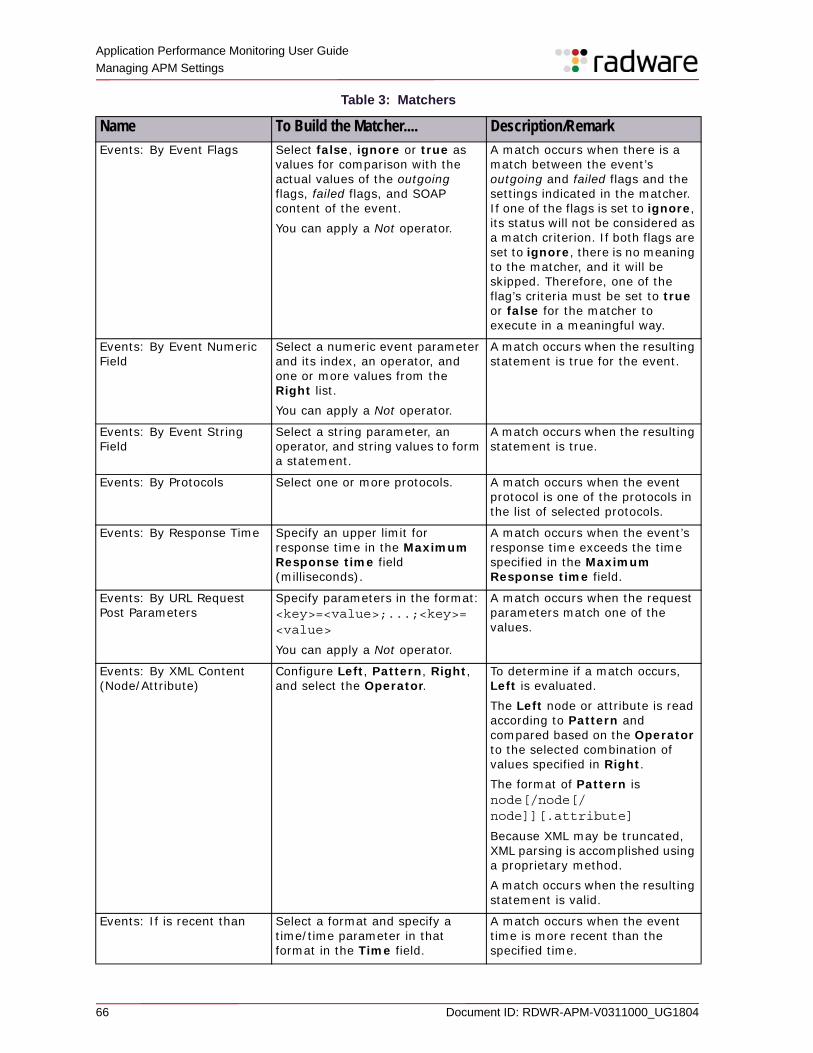
Application Performance Monitoring User Guide Managing APM Settings
66 Document ID: RDWR-APM-V0311000_UG1804
Events: By Event Flags Select false, ignore or true as values for comparison with the actual values of the outgoing flags, failed flags, and SOAP content of the event. You can apply a Not operator.
A match occurs when there is a match between the event’s outgoing and failed flags and the settings indicated in the matcher. If one of the flags is set to ignore, its status will not be considered as a match criterion. If both flags are set to ignore, there is no meaning to the matcher, and it will be skipped. Therefore, one of the flag’s criteria must be set to true or false for the matcher to execute in a meaningful way.
Events: By Event Numeric Field
Select a numeric event parameter and its index, an operator, and one or more values from the Right list. You can apply a Not operator.
A match occurs when the resulting statement is true for the event.
Events: By Event String Field
Select a string parameter, an operator, and string values to form a statement.
A match occurs when the resulting statement is true.
Events: By Protocols Select one or more protocols. A match occurs when the event protocol is one of the protocols in the list of selected protocols.
Events: By Response Time Specify an upper limit for response time in the Maximum Response time field (milliseconds).
A match occurs when the event’s response time exceeds the time specified in the Maximum Response time field.
Events: By URL Request Post Parameters
Specify parameters in the format: <key>=<value>;...;<key>=<value>
You can apply a Not operator.
A match occurs when the request parameters match one of the values.
Events: By XML Content (Node/Attribute)
Configure Left, Pattern, Right, and select the Operator.
To determine if a match occurs, Left is evaluated.The Left node or attribute is read according to Pattern and compared based on the Operator to the selected combination of values specified in Right.The format of Pattern is node[/node[/node]][.attribute]
Because XML may be truncated, XML parsing is accomplished using a proprietary method.A match occurs when the resulting statement is valid.
Events: If is recent than Select a format and specify a time/time parameter in that format in the Time field.
A match occurs when the event time is more recent than the specified time.
Table 3: Matchers
Name To Build the Matcher.... Description/Remark
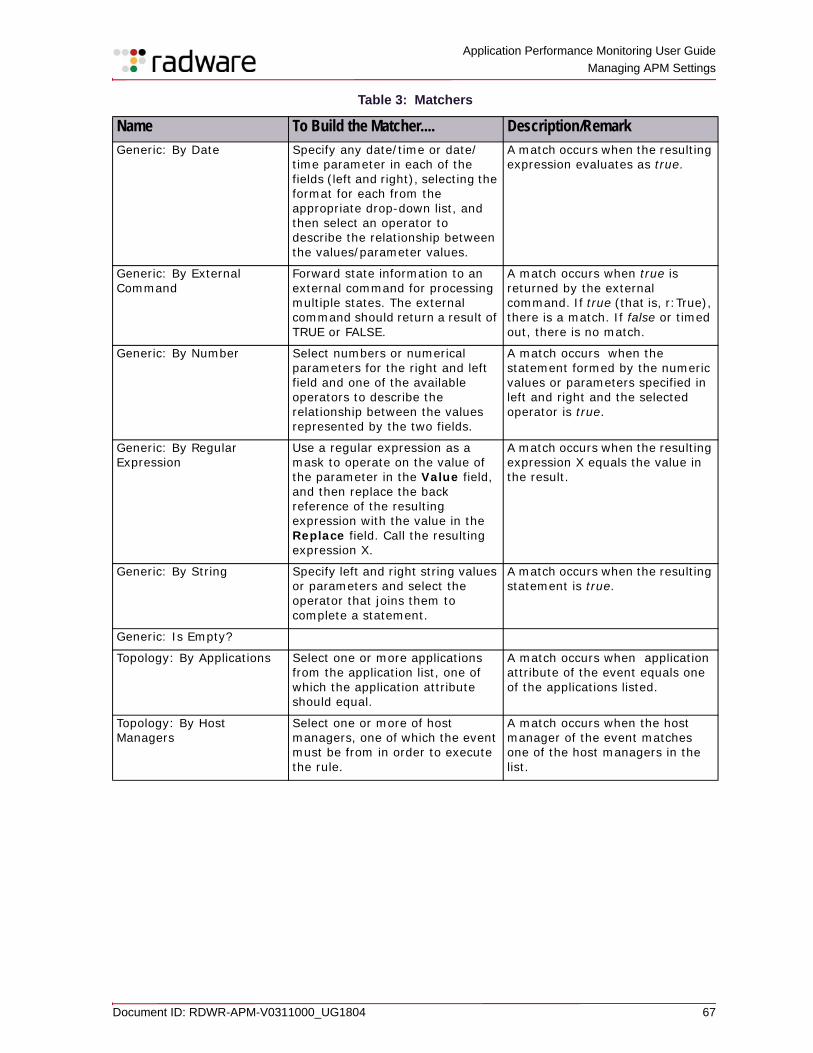
Application Performance Monitoring User Guide
Managing APM Settings
Document ID: RDWR-APM-V0311000_UG1804 67
Generic: By Date Specify any date/time or date/time parameter in each of the fields (left and right), selecting the format for each from the appropriate drop-down list, and then select an operator to describe the relationship between the values/parameter values.
A match occurs when the resulting expression evaluates as true.
Generic: By External Command
Forward state information to an external command for processing multiple states. The external command should return a result of TRUE or FALSE.
A match occurs when true is returned by the external command. If true (that is, r:True), there is a match. If false or timed out, there is no match.
Generic: By Number Select numbers or numerical parameters for the right and left field and one of the available operators to describe the relationship between the values represented by the two fields.
A match occurs when the statement formed by the numeric values or parameters specified in left and right and the selected operator is true.
Generic: By Regular Expression
Use a regular expression as a mask to operate on the value of the parameter in the Value field, and then replace the back reference of the resulting expression with the value in the Replace field. Call the resulting expression X.
A match occurs when the resulting expression X equals the value in the result.
Generic: By String Specify left and right string values or parameters and select the operator that joins them to complete a statement.
A match occurs when the resulting statement is true.
Generic: Is Empty?
Topology: By Applications Select one or more applications from the application list, one of which the application attribute should equal.
A match occurs when application attribute of the event equals one of the applications listed.
Topology: By Host Managers
Select one or more of host managers, one of which the event must be from in order to execute the rule.
A match occurs when the host manager of the event matches one of the host managers in the list.
Table 3: Matchers
Name To Build the Matcher.... Description/Remark
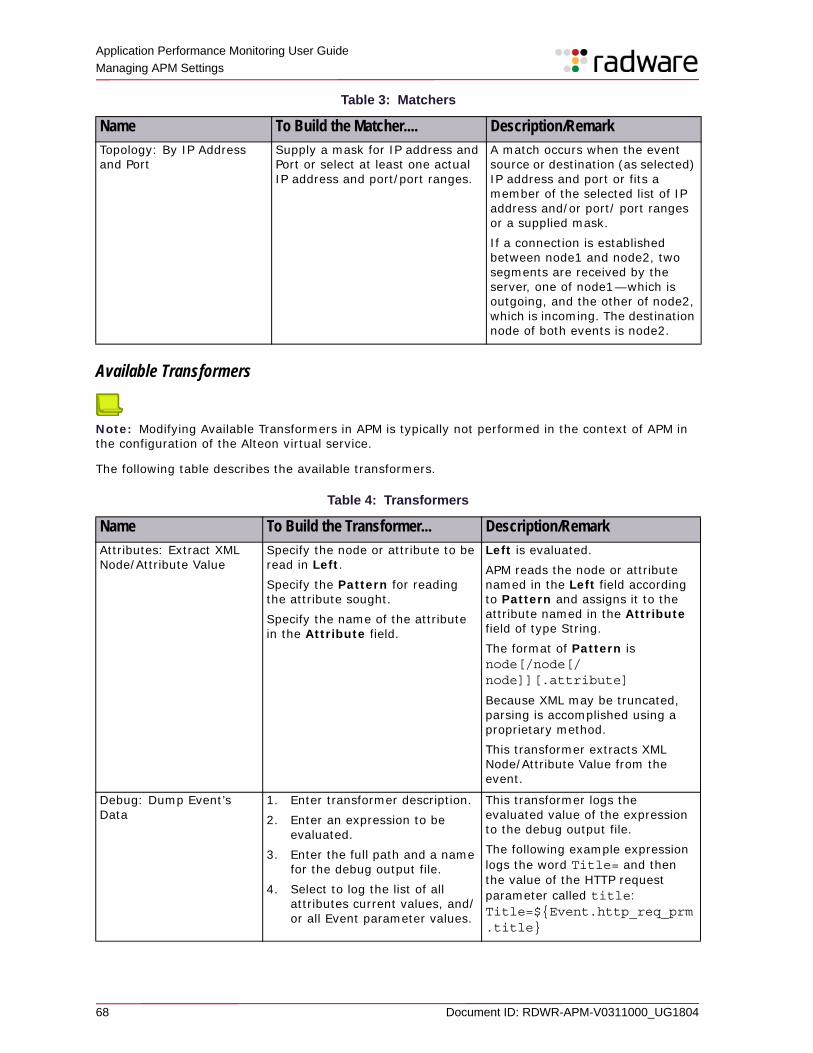
Application Performance Monitoring User Guide Managing APM Settings
68 Document ID: RDWR-APM-V0311000_UG1804
Available Transformers
Note: Modifying Available Transformers in APM is typically not performed in the context of APM in the configuration of the Alteon virtual service.
The following table describes the available transformers.
Topology: By IP Address and Port
Supply a mask for IP address and Port or select at least one actual IP address and port/port ranges.
A match occurs when the event source or destination (as selected) IP address and port or fits a member of the selected list of IP address and/or port/ port ranges or a supplied mask.If a connection is established between node1 and node2, two segments are received by the server, one of node1—which is outgoing, and the other of node2, which is incoming. The destination node of both events is node2.
Table 4: Transformers
Name To Build the Transformer... Description/RemarkAttributes: Extract XML Node/Attribute Value
Specify the node or attribute to be read in Left. Specify the Pattern for reading the attribute sought. Specify the name of the attribute in the Attribute field.
Left is evaluated.APM reads the node or attribute named in the Left field according to Pattern and assigns it to the attribute named in the Attribute field of type String.The format of Pattern is node[/node[/node]][.attribute]
Because XML may be truncated, parsing is accomplished using a proprietary method.This transformer extracts XML Node/Attribute Value from the event.
Debug: Dump Event’s Data
1. Enter transformer description.2. Enter an expression to be
evaluated. 3. Enter the full path and a name
for the debug output file.4. Select to log the list of all
attributes current values, and/or all Event parameter values.
This transformer logs the evaluated value of the expression to the debug output file.The following example expression logs the word Title= and then the value of the HTTP request parameter called title:Title=${Event.http_req_prm.title}
Table 3: Matchers
Name To Build the Matcher.... Description/Remark
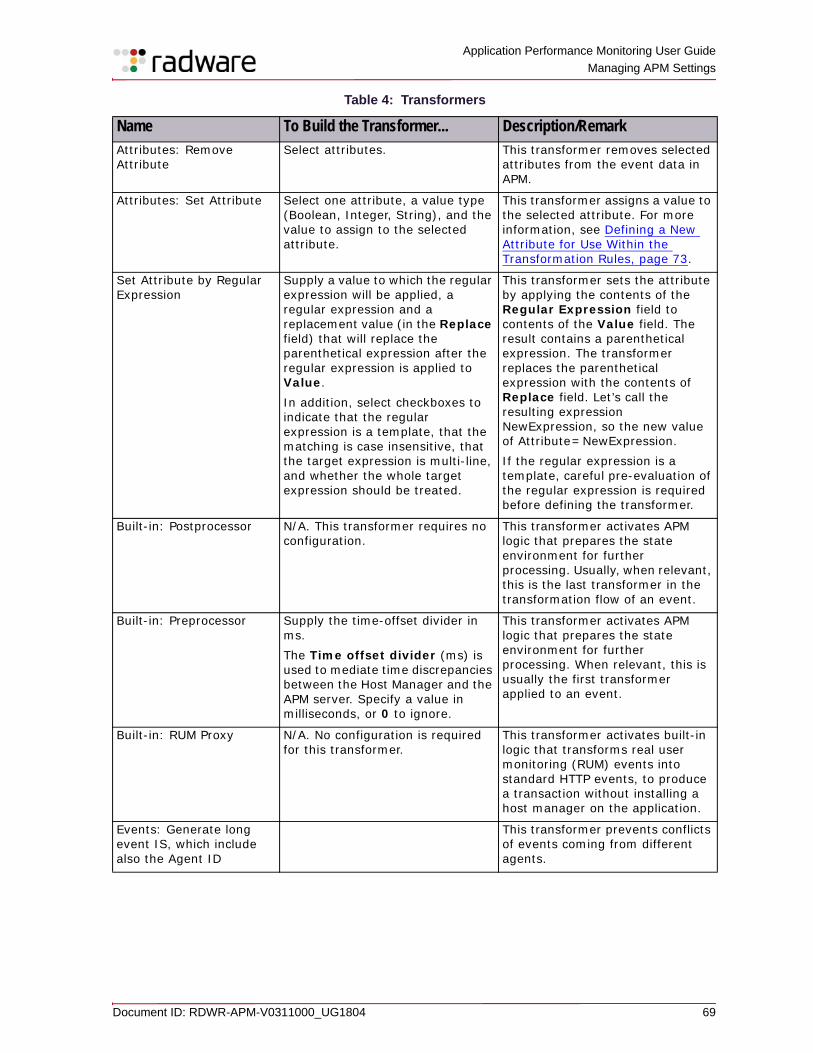
Application Performance Monitoring User Guide
Managing APM Settings
Document ID: RDWR-APM-V0311000_UG1804 69
Attributes: Remove Attribute
Select attributes. This transformer removes selected attributes from the event data in APM.
Attributes: Set Attribute Select one attribute, a value type (Boolean, Integer, String), and the value to assign to the selected attribute.
This transformer assigns a value to the selected attribute. For more information, see Defining a New Attribute for Use Within the Transformation Rules, page 73.
Set Attribute by Regular Expression
Supply a value to which the regular expression will be applied, a regular expression and a replacement value (in the Replace field) that will replace the parenthetical expression after the regular expression is applied to Value.In addition, select checkboxes to indicate that the regular expression is a template, that the matching is case insensitive, that the target expression is multi-line, and whether the whole target expression should be treated.
This transformer sets the attribute by applying the contents of the Regular Expression field to contents of the Value field. The result contains a parenthetical expression. The transformer replaces the parenthetical expression with the contents of Replace field. Let’s call the resulting expression NewExpression, so the new value of Attribute=NewExpression. If the regular expression is a template, careful pre-evaluation of the regular expression is required before defining the transformer.
Built-in: Postprocessor N/A. This transformer requires no configuration.
This transformer activates APM logic that prepares the state environment for further processing. Usually, when relevant, this is the last transformer in the transformation flow of an event.
Built-in: Preprocessor Supply the time-offset divider in ms. The Time offset divider (ms) is used to mediate time discrepancies between the Host Manager and the APM server. Specify a value in milliseconds, or 0 to ignore.
This transformer activates APM logic that prepares the state environment for further processing. When relevant, this is usually the first transformer applied to an event.
Built-in: RUM Proxy N/A. No configuration is required for this transformer.
This transformer activates built-in logic that transforms real user monitoring (RUM) events into standard HTTP events, to produce a transaction without installing a host manager on the application.
Events: Generate long event IS, which include also the Agent ID
This transformer prevents conflicts of events coming from different agents.
Table 4: Transformers
Name To Build the Transformer... Description/Remark
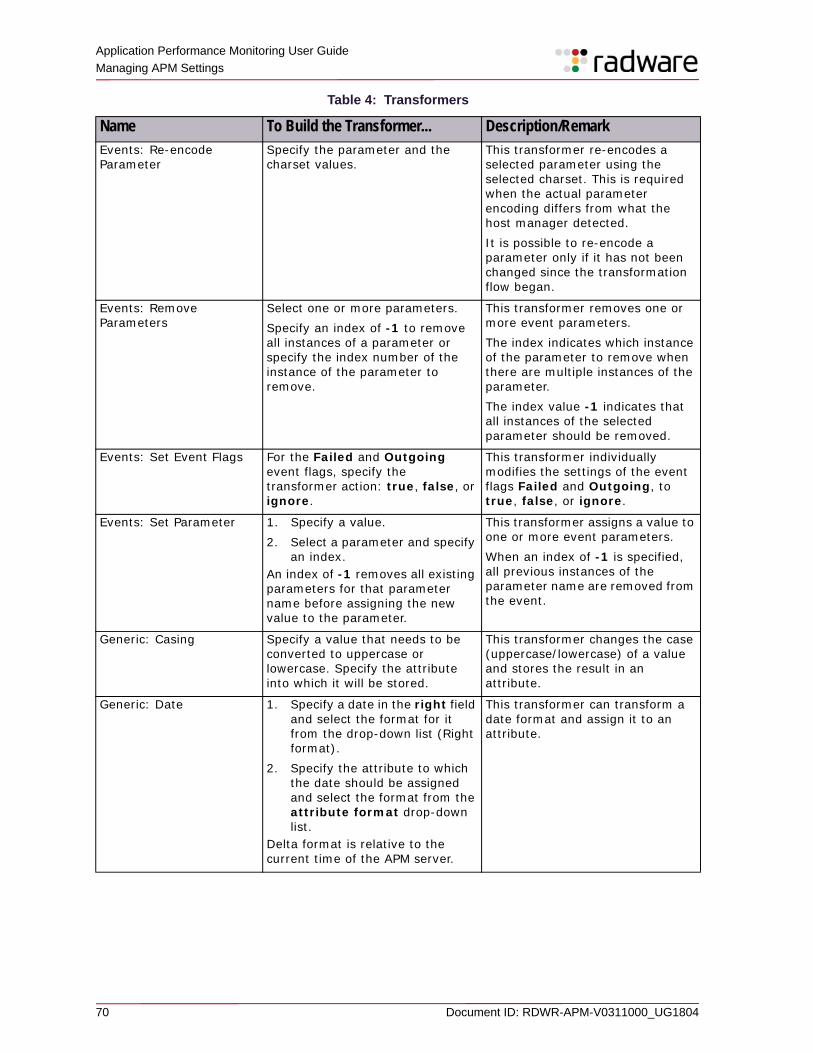
Application Performance Monitoring User Guide Managing APM Settings
70 Document ID: RDWR-APM-V0311000_UG1804
Events: Re-encode Parameter
Specify the parameter and the charset values.
This transformer re-encodes a selected parameter using the selected charset. This is required when the actual parameter encoding differs from what the host manager detected.It is possible to re-encode a parameter only if it has not been changed since the transformation flow began.
Events: Remove Parameters
Select one or more parameters.Specify an index of -1 to remove all instances of a parameter or specify the index number of the instance of the parameter to remove.
This transformer removes one or more event parameters.The index indicates which instance of the parameter to remove when there are multiple instances of the parameter.The index value -1 indicates that all instances of the selected parameter should be removed.
Events: Set Event Flags For the Failed and Outgoing event flags, specify the transformer action: true, false, or ignore.
This transformer individually modifies the settings of the event flags Failed and Outgoing, to true, false, or ignore.
Events: Set Parameter 1. Specify a value.2. Select a parameter and specify
an index. An index of -1 removes all existing parameters for that parameter name before assigning the new value to the parameter.
This transformer assigns a value to one or more event parameters. When an index of -1 is specified, all previous instances of the parameter name are removed from the event.
Generic: Casing Specify a value that needs to be converted to uppercase or lowercase. Specify the attribute into which it will be stored.
This transformer changes the case (uppercase/lowercase) of a value and stores the result in an attribute.
Generic: Date 1. Specify a date in the right field and select the format for it from the drop-down list (Right format).
2. Specify the attribute to which the date should be assigned and select the format from the attribute format drop-down list.
Delta format is relative to the current time of the APM server.
This transformer can transform a date format and assign it to an attribute.
Table 4: Transformers
Name To Build the Transformer... Description/Remark
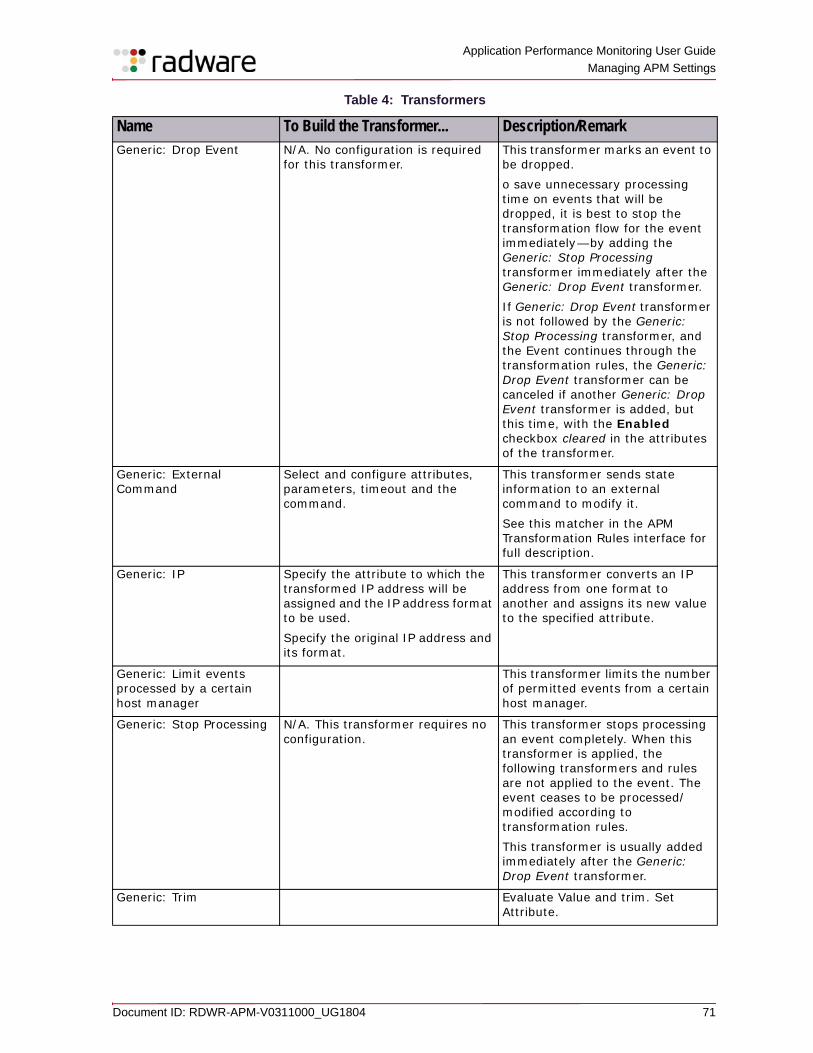
Application Performance Monitoring User Guide
Managing APM Settings
Document ID: RDWR-APM-V0311000_UG1804 71
Generic: Drop Event N/A. No configuration is required for this transformer.
This transformer marks an event to be dropped. o save unnecessary processing time on events that will be dropped, it is best to stop the transformation flow for the event immediately—by adding the Generic: Stop Processing transformer immediately after the Generic: Drop Event transformer. If Generic: Drop Event transformer is not followed by the Generic: Stop Processing transformer, and the Event continues through the transformation rules, the Generic: Drop Event transformer can be canceled if another Generic: Drop Event transformer is added, but this time, with the Enabled checkbox cleared in the attributes of the transformer.
Generic: External Command
Select and configure attributes, parameters, timeout and the command.
This transformer sends state information to an external command to modify it. See this matcher in the APM Transformation Rules interface for full description.
Generic: IP Specify the attribute to which the transformed IP address will be assigned and the IP address format to be used. Specify the original IP address and its format.
This transformer converts an IP address from one format to another and assigns its new value to the specified attribute.
Generic: Limit events processed by a certain host manager
This transformer limits the number of permitted events from a certain host manager.
Generic: Stop Processing N/A. This transformer requires no configuration.
This transformer stops processing an event completely. When this transformer is applied, the following transformers and rules are not applied to the event. The event ceases to be processed/modified according to transformation rules. This transformer is usually added immediately after the Generic: Drop Event transformer.
Generic: Trim Evaluate Value and trim. Set Attribute.
Table 4: Transformers
Name To Build the Transformer... Description/Remark
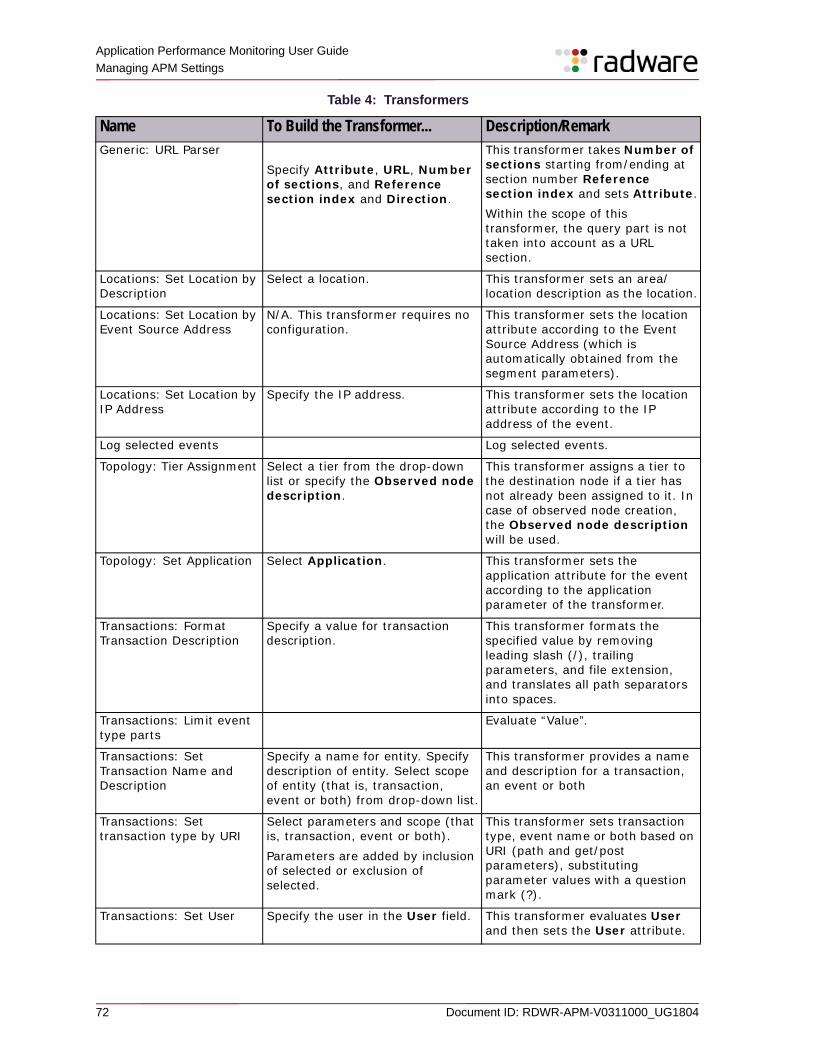
Application Performance Monitoring User Guide Managing APM Settings
72 Document ID: RDWR-APM-V0311000_UG1804
Generic: URL ParserSpecify Attribute, URL, Number of sections, and Reference section index and Direction.
This transformer takes Number of sections starting from/ending at section number Reference section index and sets Attribute.Within the scope of this transformer, the query part is not taken into account as a URL section.
Locations: Set Location by Description
Select a location. This transformer sets an area/location description as the location.
Locations: Set Location by Event Source Address
N/A. This transformer requires no configuration.
This transformer sets the location attribute according to the Event Source Address (which is automatically obtained from the segment parameters).
Locations: Set Location by IP Address
Specify the IP address. This transformer sets the location attribute according to the IP address of the event.
Log selected events Log selected events.
Topology: Tier Assignment Select a tier from the drop-down list or specify the Observed node description.
This transformer assigns a tier to the destination node if a tier has not already been assigned to it. In case of observed node creation, the Observed node description will be used.
Topology: Set Application Select Application. This transformer sets the application attribute for the event according to the application parameter of the transformer.
Transactions: Format Transaction Description
Specify a value for transaction description.
This transformer formats the specified value by removing leading slash (/), trailing parameters, and file extension, and translates all path separators into spaces.
Transactions: Limit event type parts
Evaluate “Value”.
Transactions: Set Transaction Name and Description
Specify a name for entity. Specify description of entity. Select scope of entity (that is, transaction, event or both) from drop-down list.
This transformer provides a name and description for a transaction, an event or both
Transactions: Set transaction type by URI
Select parameters and scope (that is, transaction, event or both).Parameters are added by inclusion of selected or exclusion of selected.
This transformer sets transaction type, event name or both based on URI (path and get/post parameters), substituting parameter values with a question mark (?).
Transactions: Set User Specify the user in the User field. This transformer evaluates User and then sets the User attribute.
Table 4: Transformers
Name To Build the Transformer... Description/Remark
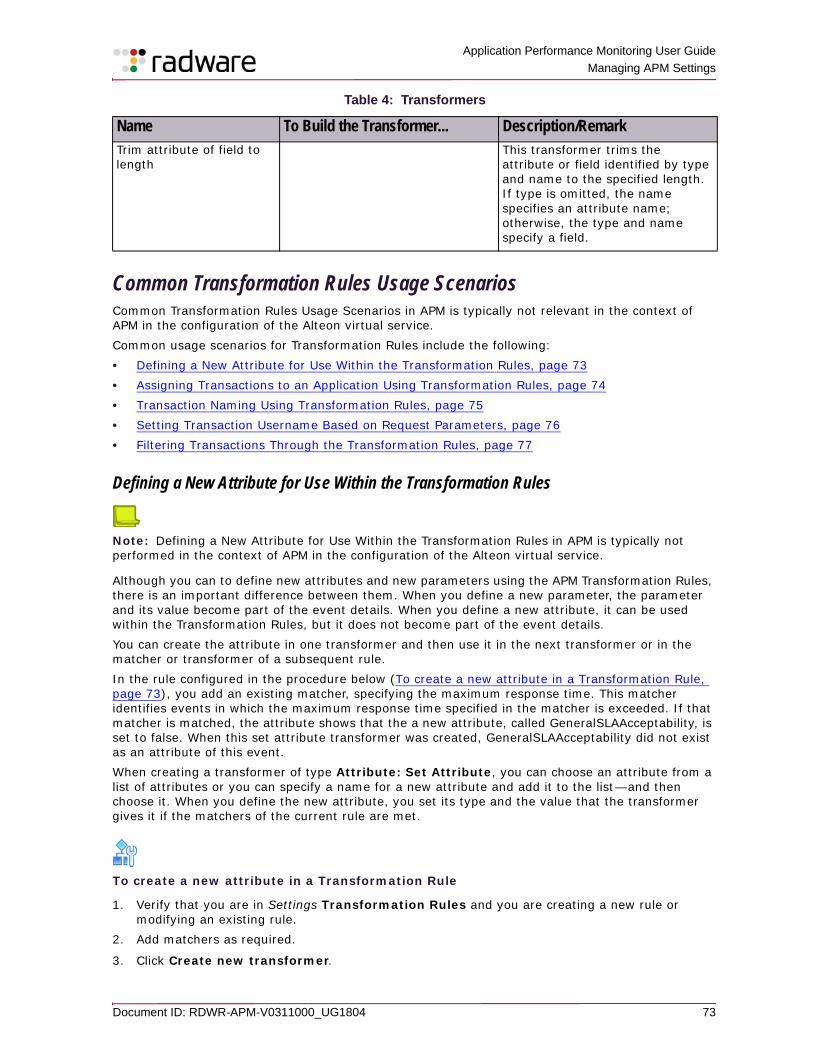
Application Performance Monitoring User Guide
Managing APM Settings
Document ID: RDWR-APM-V0311000_UG1804 73
Common Transformation Rules Usage ScenariosCommon Transformation Rules Usage Scenarios in APM is typically not relevant in the context of APM in the configuration of the Alteon virtual service.Common usage scenarios for Transformation Rules include the following:• Defining a New Attribute for Use Within the Transformation Rules, page 73• Assigning Transactions to an Application Using Transformation Rules, page 74• Transaction Naming Using Transformation Rules, page 75• Setting Transaction Username Based on Request Parameters, page 76• Filtering Transactions Through the Transformation Rules, page 77
Defining a New Attribute for Use Within the Transformation Rules
Note: Defining a New Attribute for Use Within the Transformation Rules in APM is typically not performed in the context of APM in the configuration of the Alteon virtual service.
Although you can to define new attributes and new parameters using the APM Transformation Rules, there is an important difference between them. When you define a new parameter, the parameter and its value become part of the event details. When you define a new attribute, it can be used within the Transformation Rules, but it does not become part of the event details.You can create the attribute in one transformer and then use it in the next transformer or in the matcher or transformer of a subsequent rule.In the rule configured in the procedure below (To create a new attribute in a Transformation Rule, page 73), you add an existing matcher, specifying the maximum response time. This matcher identifies events in which the maximum response time specified in the matcher is exceeded. If that matcher is matched, the attribute shows that the a new attribute, called GeneralSLAAcceptability, is set to false. When this set attribute transformer was created, GeneralSLAAcceptability did not exist as an attribute of this event. When creating a transformer of type Attribute: Set Attribute, you can choose an attribute from a list of attributes or you can specify a name for a new attribute and add it to the list—and then choose it. When you define the new attribute, you set its type and the value that the transformer gives it if the matchers of the current rule are met.
To create a new attribute in a Transformation Rule
1. Verify that you are in Settings Transformation Rules and you are creating a new rule or modifying an existing rule.
2. Add matchers as required.
3. Click Create new transformer.
Trim attribute of field to length
This transformer trims the attribute or field identified by type and name to the specified length. If type is omitted, the name specifies an attribute name; otherwise, the type and name specify a field.
Table 4: Transformers
Name To Build the Transformer... Description/Remark
Application Performance Monitoring User Guide Managing APM Settings
74 Document ID: RDWR-APM-V0311000_UG1804
4. From the Choose Transformer to Add dialog box, click Attribute: Set Attribute, and then click Add Transformer. The Transformer Parameters dialog box opens.
5. In the Add value field, specify the name of the new attribute, and then click Add.
6. Verify that the new attribute is selected in the list of attribute names.
7. From the Type drop-down list, choose the data type of the value that the attribute can have (Boolean, Integer, or String).
8. In the Value field, enter the value this transformer will give to the attribute. For example, for Boolean type, the value can be True or False.
Assigning Transactions to an Application Using Transformation Rules
Note: Assigning Transactions to an Application Using Transformation Rules in APM is typically not performed in the context of APM in the configuration of the Alteon virtual service.
Assigning transactions to an application using Transformation Rules involves the following:• Assigning Transactions to an Application Using Transformation Rules, page 74• Configuring and Testing Transaction Naming (Basic Mode), page 57For special cases, the following procedures can also be used.When defining a monitored application in APM, you can name transactions and assign them to the newly-defined application. Using the Transformation Rules engine, you can assign transactions to an application at any time.The following example shows how to set a transaction assignment rule that assigns all the requests whose URI starts with /MyApp (for example, /MyApp/something.asp and /MyApp/somethingelse.asp) to a specific application.
To assign all request URIs that start with /MyApp to a specific application using Transformation Rules
1. In Settings, select Transformation Rules. 2. Click the group node in the tree.
3. Click Create new rule. A new rule is added to the Transformation Rules tree.
4. Double-click the new rule to open its Rule Properties dialog box.
5. In the Description field, name the rule, and click Apply.
Note: This step can be postponed. The name (description) should describe the rule’s purpose and make it easily locatable (for copying or modifying). The rule name can be modified at any time.
6. Click Matchers, and select Create new matcher. The Choose a matcher to add dialog box opens.
7. Select the matcher type. Since the aim of this procedure is to find transactions whose URIs start with /MyApp, do the following:
a. Add a matcher of type Generic: By String. b. In the Left field, type the Request URI parameter.c. From the Operator, drop-down list, select starts with.d. In the Right field, type /MyApp.
Application Performance Monitoring User Guide
Managing APM Settings
Document ID: RDWR-APM-V0311000_UG1804 75
The whole statement formed by the matcher is equivalent to Request URI Parameter starts with ‘/MyApp’.
8. (Optional) Edit the Description field to provide a custom description of the matcher in this immediate use. The edited text will appear as the matcher type in the Transformation Rules.
Caution: For the matcher to take effect, be sure to select the Enable checkbox in this dialog box.
9. Click Apply.
10. Repeat step step 6 through step 9 as often as necessary to define the rule. When a matcher is encountered that does not match the transaction being treated, checking is abandoned, the rule is not executed, and the transaction is then checked against the next rule in the tree.
11. Select the Transformers node of the current rule, and click Create new transformer.
12. Double-click Topology: Set Application.
13. Configure the transformer parameters.
14. Click Apply.
Transaction Naming Using Transformation Rules
Note: Transaction Naming Using Transformation Rules in APM is typically not performed in the context of APM in the configuration of the Alteon virtual service.
By automatically naming transactions, you can transform cumbersome, long, and difficult-to-work-with request labels into meaningful transaction types that are easy to recognize, work with, and talk about.
Note: In the example procedure above, To create a new attribute in a Transformation Rule, page 73, we used the starts with operator, but in many cases with a similar goal, you may use the contains operator.
In the following example, the monitored application has multiple URLs, each of which includes obfuscated paths:
It so happens that the activity type of requests beginning with the string /webps/myportal is stored as the value of one of the parameters within the HTTP request payload PORTAL-REQUEST.To have meaningful data for APM from a specific application, the goal is to rename all the requests from the application that start with the string /webps/myportal to the value of the parameter PORTAL-REQUEST.
/webps/myportal/as/xv/u/nn/13_GR98gSDH984kGDFH90349jv0dejdkltSBos_gQA8cgc3Mft2ATE_cQA0PTMFNTAwgAykdiyruYmcDkidDt7mUW7OJl6WTmZOJrYOblYhRgQJxuP4_83FT9SP0ocwxVll7OMFUh-gW5oRHl5Y6KAHDFfH4!/dl2/d1/L0lJSklKQ2dwUkNncFJBISEvb0V3d0FBQdfjhgSDFG3456n98xdGSDriu04kt523542253ZXFssgklddporkjDDFg9ZQnB4SkY0a3N0eW9Vc2p5cnchIS82X1QwQVI3N0xGUzQ0R1QwMTVVNTUwM23413DAwMDAwLzdfVDBBUjc3TEZTNDRHVDAxNUhJSDAwMDAwMDAvbWVudS9zdWJzY3JpYmVySWQvMjAwMTQ4536345XDFsdgSD2wNzY3/
Application Performance Monitoring User Guide Managing APM Settings
76 Document ID: RDWR-APM-V0311000_UG1804
As a result of creating and enabling this rule, each time a transaction that comes from the specified application and begins with the string /webps/myportal enters the APM backend, the transaction will be named with the value of its PORTAL-REQUEST parameter.
To accomplish the naming goal
1. In Settings, select Transformation Rules.2. Select the node, or the hierarchy of nodes, in the Transformation Rules group to which your new
Transformation Rule will be added.
Note: This may require creating a node for the Application for which the transaction naming is being done and selecting that node.
3. Click Create new rule. The Rule Properties dialog box opens.
4. In the Description field, type Name Transaction to Value of Portal Request or something similar, which describes the action of this rule.
5. Click Apply.
6. Add a matcher to limit this specific rule to transactions assigned to a specific application as follows:
a. Click Matchers, and select Create new matcher. The Choose a matcher to add dialog box opens.
b. From the list, select Topology: By Applications and click Add Matcher. The Matcher Parameters dialog box opens.
c. Select the application name from the drop-down list.d. Configure the other parameters, and click Apply.
7. Add a matcher to find the required string as follows:
a. Click Matchers, and select Create new matcher. The Choose a matcher to add dialog box opens.
b. From the list, select By name starts with and click Add Matcher. The Matcher Parameters dialog box opens.
c. Select the application name from the drop-down list.d. Configure the other parameters, and click Apply.
8. In the prefix field, enter the string “/webps/myportal” (because you are only going to rename requests that start with the string “/webps/myportal”).
9. Add the Sets the name of the transaction based on the value of the parameter transformer.
a. In the Type of Parameter field, specify http_req_parm.b. In the Key of the parameter field, specify PORTAL-REQUEST.c. Click Apply.
Setting Transaction Username Based on Request Parameters
Note: Setting Transaction Username Based on Request Parameters in APM is typically not performed in the context of APM in the configuration of the Alteon virtual service.
You can set a transaction’s username based on parameter values that are part of the end-user request.
Application Performance Monitoring User Guide
Managing APM Settings
Document ID: RDWR-APM-V0311000_UG1804 77
To set transaction username based on end-user request parameter values
1. In Settings, select Transformation Rules.2. Select the node, or the hierarchy of nodes, in the Transformation Rules group to which your new
Transformation Rule will be added.
Note: This may require creating a node for the Application for which the transaction naming is being done and selecting that node.
3. Click Create new rule. The Rule Properties dialog box opens.
4. In the Description field, type Set Transaction Username or something similar, which describes the action of this rule.
5. Click Apply.
6. If required, set appropriate matchers to focus on the required transactions.
7. Add the Attribute Set Attributes transformer.
8. In the Attribute field, select or add the required attribute name. For example, select the User name (sp_user_name) attribute at the bottom of the list.
9. From the Type drop-down list select string.
10. In the Value field enter the user request parameter or parameters combination that holds the values from which you wish to form the user name attribute value.
11. Click Apply.
Filtering Transactions Through the Transformation Rules
Note: Filtering Transactions Through the Transformation Rules in APM is typically not performed in the context of APM in the configuration of the Alteon virtual service.
Some events never reach the server because they were filtered previously by the host manager according to definitions in the host manager’s spagent.xml configuration file. Events that reach APM server can be further filtered as they are handled in the Transformation Rules engine.To identify transactions and events that need to be filtered, create relevant matchers. Filter these transactions and events using the Generic: Drop Event and Generic: Stop Processing transformers. For information on these transformers, see the relevant entries in Table 4 - Transformers, page 68.
Viewing Areas/Locations SettingsUse the Settings Areas/Locations screen to can add and delete areas and locations and define the range of the IP addresses for each location.Defining areas and locations enables monitoring the relationship between location and monitored indicators. This facilitates identification of network and infrastructure problems and local trends, which may require additional resources.
Note: APM supports MaxMind GEO IP database integration into APM for IPv4 and IPv6 address ranges. For more information, see MaxMind Geo IP Database Integration, page 78.
Application Performance Monitoring User Guide Managing APM Settings
78 Document ID: RDWR-APM-V0311000_UG1804
To add an area to your APM system settings
1. In Settings, select Areas/Locations.
2. Click the Create ( ) button on the left. The Create Area dialog box opens.
3. In the Description text box, type the Area name.
4. Click Save.
To add a location with IP ranges to an area
1. In Settings, select Areas/Locations.2. Select the target area on the left side of the screen.
3. Click the Create ( ) button on the right. The Create Location dialog box opens.
4. In the Description text box, type the location name.
5. In the IP Ranges section, click the Create ( ) button, specify the lowest and highest address in an IP range, and then click the adjacent Add button.
6. Repeat the previous step to add as many ranges as necessary.
7. Click Save to save the location to the area.
Administrators can do the following:• Add areas and locations using the toolbar add button and the related dialog boxes.• Delete and edit areas and locations using the context menu.• Add areas and locations using the toolbar buttons (add) and the dialogs they open.• Select an area (left side) to display the locations belonging to it the right side.• Select an area and click Edit area to edit the area description.• Select a location node and click Edit location to view, add, and delete IP address ranges.
MaxMind Geo IP Database IntegrationAPM supports MaxMind GEO IP database integration into APM for IPv4 and IPv6 address ranges.The worldwide country ZIP file can be downloaded from: http://dev.maxmind.com/geoip/geoip2/geolite2/#MaxMind_APIs Instructions:
1. Create a .csv file with the private IP addresses of the organization that should be mapped to Location and Area in APM. If no private IP-address-resolution is required, an empty file with the .csv extension must be created. Each row in the CSV file represents an IP range and should contain four columns: IP_from, IP_to, location, and area. Example:
1.1.1.1, 1.1.2.1, France_office, Europe
Caution: When adding new entries to an existing database, new entries with IP ranges overlapping existing IP address ranges are not inserted to the database. Using the example above, an entry with the IP range of 2.2.2.2-3.3.3.3 is inserted into the database, whereas an entry with the range of 1.1.1.1-1.3.3.3 is not inserted into the database.
Application Performance Monitoring User Guide
Managing APM Settings
Document ID: RDWR-APM-V0311000_UG1804 79
2. Import the MaxMind .zip file and .csv file to the APM file system as follows:
a. Log in to the APSolute Vision server as the radware user (default password: radware).b. Enter the following command to launch the APM Linux shell in the APSolute Vision server
with APM Server VA:
system apm shell
c. Go into the scripts directory: /usr/share/sharepath/server/bin/.
You can find the GEO script under the name spserver-geolite-parser.sh.
d. In the terminal, run following command:SPSERVER_INSTANCE=name ./spserver-geolite-parser.sh --user-data=<user-data_dir> --zip-file=<zip-file_dir> --log-dir=<log_dir>
where:
• The default name of SPSERVER_INSTANCE is rad.• <user-data_dir> is the directory containing the user CSV file.• <zip-file_dir> is the directory containing the MaxMind ZIP file.• <log_dir> (optional) is the directory containing the log file (parser.log). The default
directory is /var/log/sharepath/server/rad/maintenance/.Example:
SPSERVER_INSTANCE=rad ./spserver-geolite-parser.sh --user-data= /home/Myfile.csv --zip-file= /home /GeoLite2DB.zip --log-dir= /var/log/sharepath/server/rad/maintenance/
Note: If needed, review parser.log for details of all changes that were done by the utility.
Managing Maintenance SettingsUse the Settings Maintenance screen to manage the sending of log files and configuration files to Radware Technical Support.
To prepare and send log and configuration files
1. In Settings, select Maintenance.2. Set the timeframe for the required logs.
3. Click Prepare Log. When the log is ready, information displays in the Recent Log area regarding the latest log created—including the user who created it, the time and date of its creation, and the timeframe that it covers. The Status parameter displays the Download Log button and the size of the file.
4. Click Download Log to save the log to your computer.
5. To download only the configuration files (spserver_conf.tar.gz), in the Server Configuration section, click Download Configuration Files.
Application Performance Monitoring User Guide Managing APM Settings
80 Document ID: RDWR-APM-V0311000_UG1804
Document ID: RDWR-APM-V0311000_UG1804 81
Chapter 6 – Navigating the APM User Interface Main Menu
APM is designed to display the data and analytics you require quickly and intuitively. Navigating the APM main menu provides immediate access to the data and analysis you need. It facilitates navigation through various displays and analyses, illustrating the functioning of your data center and the end-user experience, displaying the answers you need immediately.This chapter contains the following sections: • Introduction to APM Use Cases, page 81• Monitoring Use Cases, page 82 • Understanding Use-Case Selection and Output Displays, page 83• Exploring the Use-Case Bar in the APM Main Menu, page 83
Introduction to APM Use CasesAPM maps all available information about your system so that you can get to the information quickly, in a manner that makes sense to you. The following table maps goals to use cases. Find the available views for information you are seeking by clicking on the menu, corresponding to the use case listed in the right column. After that, explore the available groups of views and the view options to display the specific data cross-sections and granularity of data that you require.
Table 5: Goals and Corresponding Use Cases
Goal Use CaseKnow what is happening right now in your system.Know the quality of the user experience now. Know how applications are performing right now.Examine and compare application performance across timeframes and gain full visibility of the applications and transactions.
Monitoring - Applications
Analyze performance across different areas and locations. Monitoring - Locations
Use an additional set of analytic capabilities to review and analyze performance trends on the data-center side.
Monitoring - Data Center
Get an instant look at active application alerts for one or more applications.
Alerts
Customize, schedule and generate preconfigured application-performance reports to be sent automatically (one time or on a regular basis) to selected stakeholders.
Reports
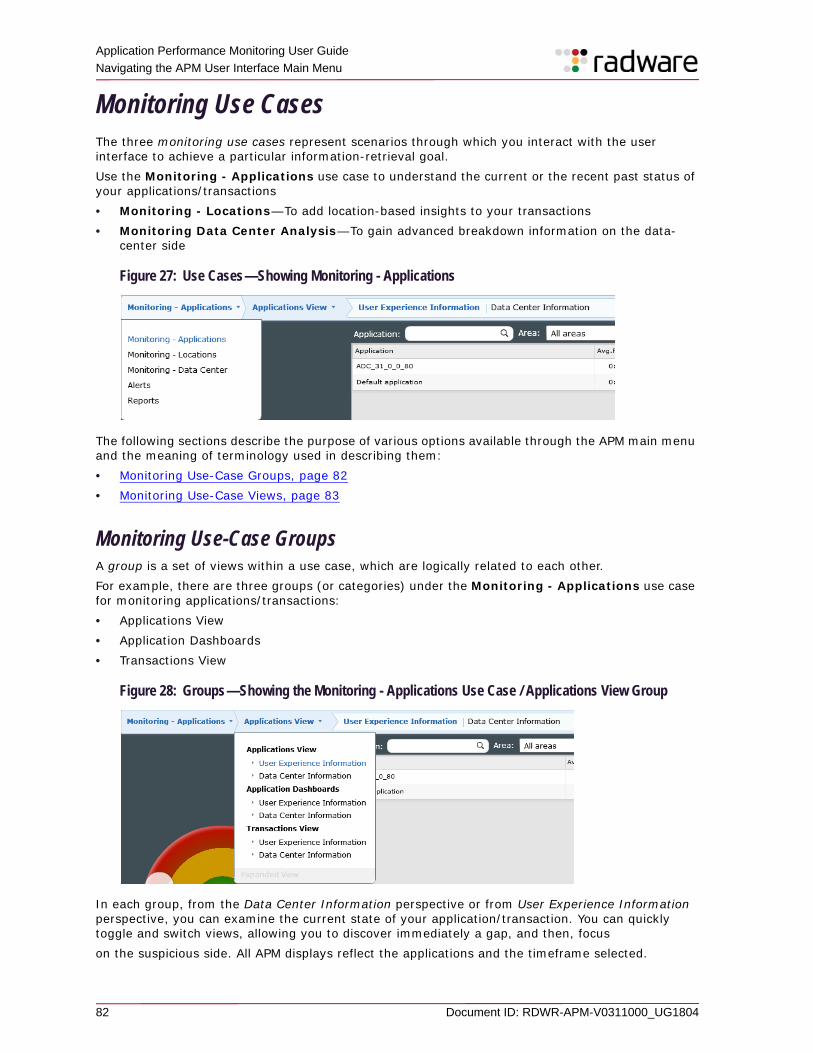
Application Performance Monitoring User Guide Navigating the APM User Interface Main Menu
82 Document ID: RDWR-APM-V0311000_UG1804
Monitoring Use CasesThe three monitoring use cases represent scenarios through which you interact with the user interface to achieve a particular information-retrieval goal. Use the Monitoring - Applications use case to understand the current or the recent past status of your applications/transactions• Monitoring - Locations—To add location-based insights to your transactions• Monitoring Data Center Analysis—To gain advanced breakdown information on the data-
center side
Figure 27: Use Cases—Showing Monitoring - Applications
The following sections describe the purpose of various options available through the APM main menu and the meaning of terminology used in describing them:• Monitoring Use-Case Groups, page 82• Monitoring Use-Case Views, page 83
Monitoring Use-Case GroupsA group is a set of views within a use case, which are logically related to each other.For example, there are three groups (or categories) under the Monitoring - Applications use case for monitoring applications/transactions:• Applications View• Application Dashboards• Transactions View
Figure 28: Groups—Showing the Monitoring - Applications Use Case / Applications View Group
In each group, from the Data Center Information perspective or from User Experience Information perspective, you can examine the current state of your application/transaction. You can quickly toggle and switch views, allowing you to discover immediately a gap, and then, focus on the suspicious side. All APM displays reflect the applications and the timeframe selected.
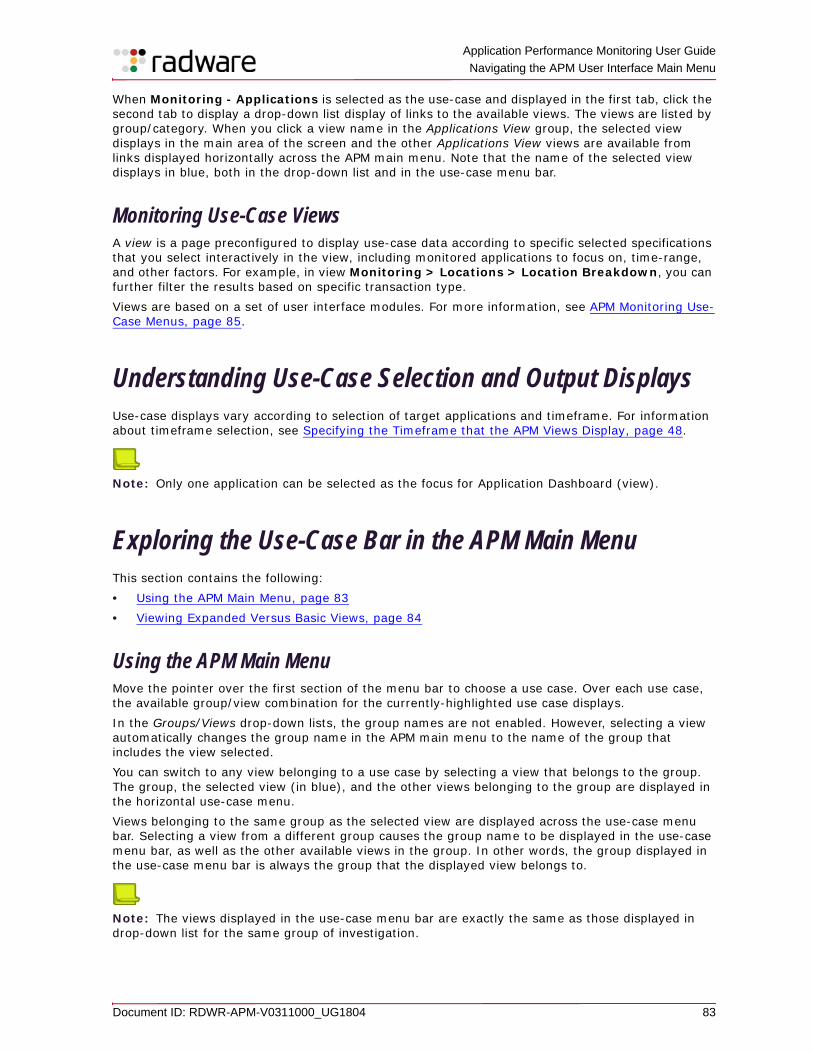
Application Performance Monitoring User Guide
Navigating the APM User Interface Main Menu
Document ID: RDWR-APM-V0311000_UG1804 83
When Monitoring - Applications is selected as the use-case and displayed in the first tab, click the second tab to display a drop-down list display of links to the available views. The views are listed by group/category. When you click a view name in the Applications View group, the selected view displays in the main area of the screen and the other Applications View views are available from links displayed horizontally across the APM main menu. Note that the name of the selected view displays in blue, both in the drop-down list and in the use-case menu bar.
Monitoring Use-Case ViewsA view is a page preconfigured to display use-case data according to specific selected specifications that you select interactively in the view, including monitored applications to focus on, time-range, and other factors. For example, in view Monitoring > Locations > Location Breakdown, you can further filter the results based on specific transaction type.Views are based on a set of user interface modules. For more information, see APM Monitoring Use-Case Menus, page 85.
Understanding Use-Case Selection and Output DisplaysUse-case displays vary according to selection of target applications and timeframe. For information about timeframe selection, see Specifying the Timeframe that the APM Views Display, page 48.
Note: Only one application can be selected as the focus for Application Dashboard (view).
Exploring the Use-Case Bar in the APM Main MenuThis section contains the following:• Using the APM Main Menu, page 83• Viewing Expanded Versus Basic Views, page 84
Using the APM Main MenuMove the pointer over the first section of the menu bar to choose a use case. Over each use case, the available group/view combination for the currently-highlighted use case displays.In the Groups/Views drop-down lists, the group names are not enabled. However, selecting a view automatically changes the group name in the APM main menu to the name of the group that includes the view selected.You can switch to any view belonging to a use case by selecting a view that belongs to the group. The group, the selected view (in blue), and the other views belonging to the group are displayed in the horizontal use-case menu.Views belonging to the same group as the selected view are displayed across the use-case menu bar. Selecting a view from a different group causes the group name to be displayed in the use-case menu bar, as well as the other available views in the group. In other words, the group displayed in the use-case menu bar is always the group that the displayed view belongs to.
Note: The views displayed in the use-case menu bar are exactly the same as those displayed in drop-down list for the same group of investigation.
Application Performance Monitoring User Guide Navigating the APM User Interface Main Menu
84 Document ID: RDWR-APM-V0311000_UG1804
Viewing Expanded Versus Basic Views You may prefer not to see all the views listed in the drop-down list groups-of-views menu. This type of view is referred to as an expanded view.
To see only the names of the groups displayed
1. Click Basic View at the bottom left of the group menu.The result of clicking Basic View is a collapsed view showing only the names of the view groups:
2. To display all the view names again, click Expanded View.
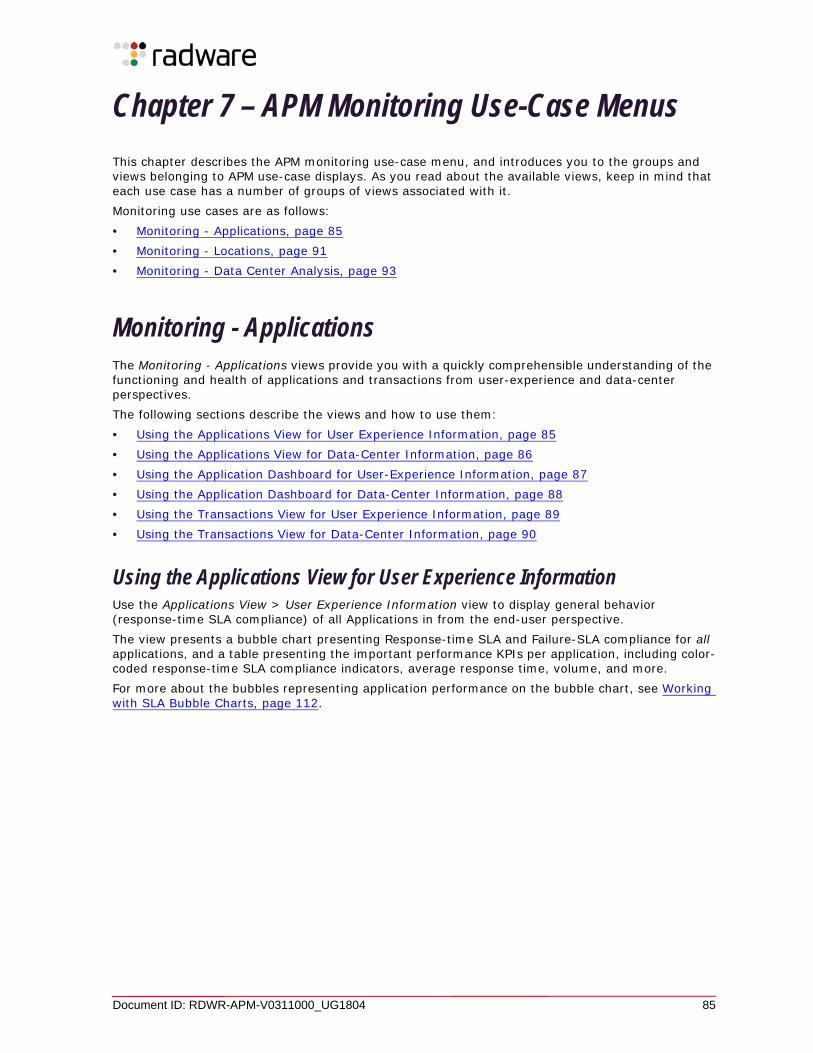
Document ID: RDWR-APM-V0311000_UG1804 85
Chapter 7 – APM Monitoring Use-Case Menus
This chapter describes the APM monitoring use-case menu, and introduces you to the groups and views belonging to APM use-case displays. As you read about the available views, keep in mind that each use case has a number of groups of views associated with it.Monitoring use cases are as follows:• Monitoring - Applications, page 85• Monitoring - Locations, page 91• Monitoring - Data Center Analysis, page 93
Monitoring - ApplicationsThe Monitoring - Applications views provide you with a quickly comprehensible understanding of the functioning and health of applications and transactions from user-experience and data-center perspectives.The following sections describe the views and how to use them:• Using the Applications View for User Experience Information, page 85• Using the Applications View for Data-Center Information, page 86• Using the Application Dashboard for User-Experience Information, page 87• Using the Application Dashboard for Data-Center Information, page 88• Using the Transactions View for User Experience Information, page 89• Using the Transactions View for Data-Center Information, page 90
Using the Applications View for User Experience InformationUse the Applications View > User Experience Information view to display general behavior (response-time SLA compliance) of all Applications in from the end-user perspective.The view presents a bubble chart presenting Response-time SLA and Failure-SLA compliance for all applications, and a table presenting the important performance KPIs per application, including color-coded response-time SLA compliance indicators, average response time, volume, and more.For more about the bubbles representing application performance on the bubble chart, see Working with SLA Bubble Charts, page 112.
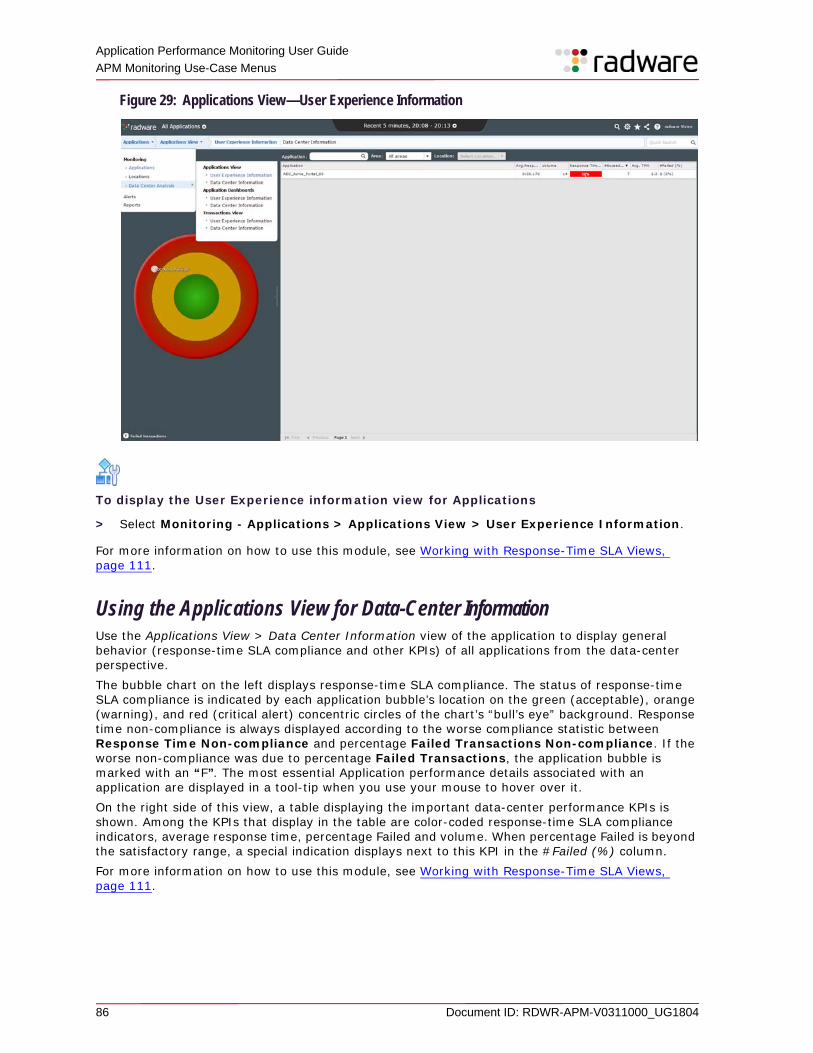
Application Performance Monitoring User Guide APM Monitoring Use-Case Menus
86 Document ID: RDWR-APM-V0311000_UG1804
Figure 29: Applications View—User Experience Information
To display the User Experience information view for Applications
> Select Monitoring - Applications > Applications View > User Experience Information.
For more information on how to use this module, see Working with Response-Time SLA Views, page 111.
Using the Applications View for Data-Center InformationUse the Applications View > Data Center Information view of the application to display general behavior (response-time SLA compliance and other KPIs) of all applications from the data-center perspective.The bubble chart on the left displays response-time SLA compliance. The status of response-time SLA compliance is indicated by each application bubble’s location on the green (acceptable), orange (warning), and red (critical alert) concentric circles of the chart’s “bull’s eye” background. Response time non-compliance is always displayed according to the worse compliance statistic between Response Time Non-compliance and percentage Failed Transactions Non-compliance. If the worse non-compliance was due to percentage Failed Transactions, the application bubble is marked with an “F”. The most essential Application performance details associated with an application are displayed in a tool-tip when you use your mouse to hover over it.On the right side of this view, a table displaying the important data-center performance KPIs is shown. Among the KPIs that display in the table are color-coded response-time SLA compliance indicators, average response time, percentage Failed and volume. When percentage Failed is beyond the satisfactory range, a special indication displays next to this KPI in the #Failed (%) column.For more information on how to use this module, see Working with Response-Time SLA Views, page 111.
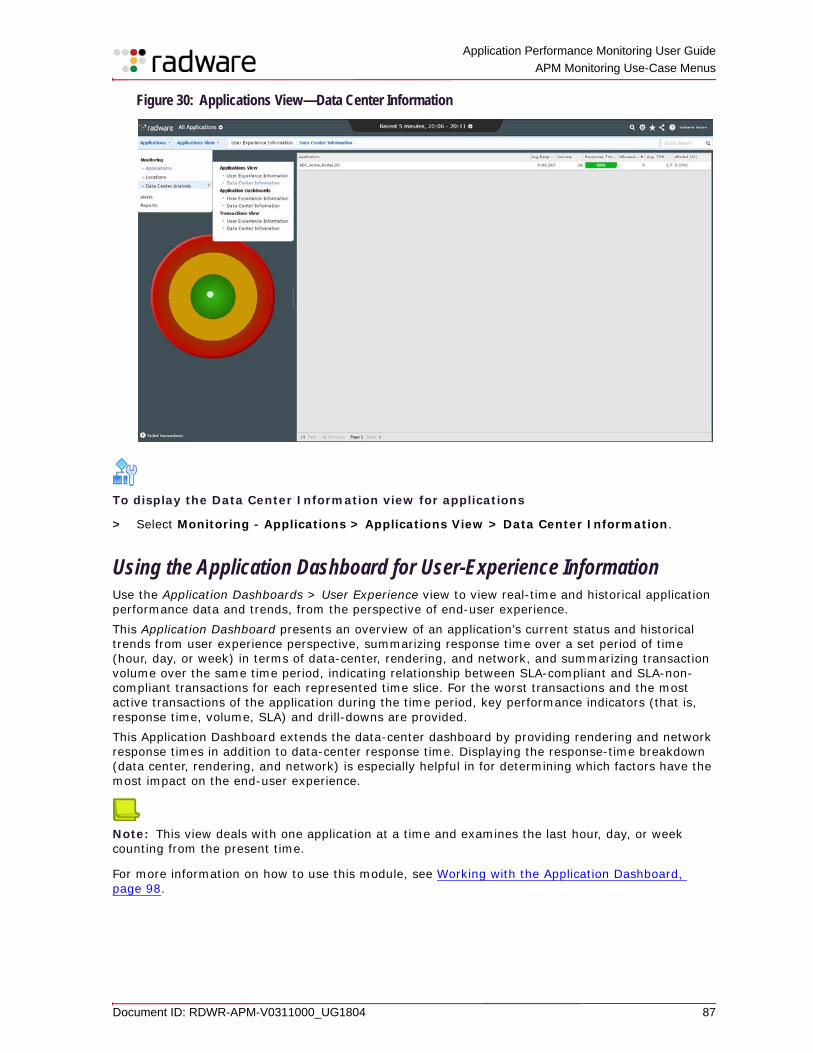
Application Performance Monitoring User Guide
APM Monitoring Use-Case Menus
Document ID: RDWR-APM-V0311000_UG1804 87
Figure 30: Applications View—Data Center Information
To display the Data Center Information view for applications
> Select Monitoring - Applications > Applications View > Data Center Information.
Using the Application Dashboard for User-Experience InformationUse the Application Dashboards > User Experience view to view real-time and historical application performance data and trends, from the perspective of end-user experience.This Application Dashboard presents an overview of an application’s current status and historical trends from user experience perspective, summarizing response time over a set period of time (hour, day, or week) in terms of data-center, rendering, and network, and summarizing transaction volume over the same time period, indicating relationship between SLA-compliant and SLA-non-compliant transactions for each represented time slice. For the worst transactions and the most active transactions of the application during the time period, key performance indicators (that is, response time, volume, SLA) and drill-downs are provided.This Application Dashboard extends the data-center dashboard by providing rendering and network response times in addition to data-center response time. Displaying the response-time breakdown (data center, rendering, and network) is especially helpful in for determining which factors have the most impact on the end-user experience.
Note: This view deals with one application at a time and examines the last hour, day, or week counting from the present time.
For more information on how to use this module, see Working with the Application Dashboard, page 98.
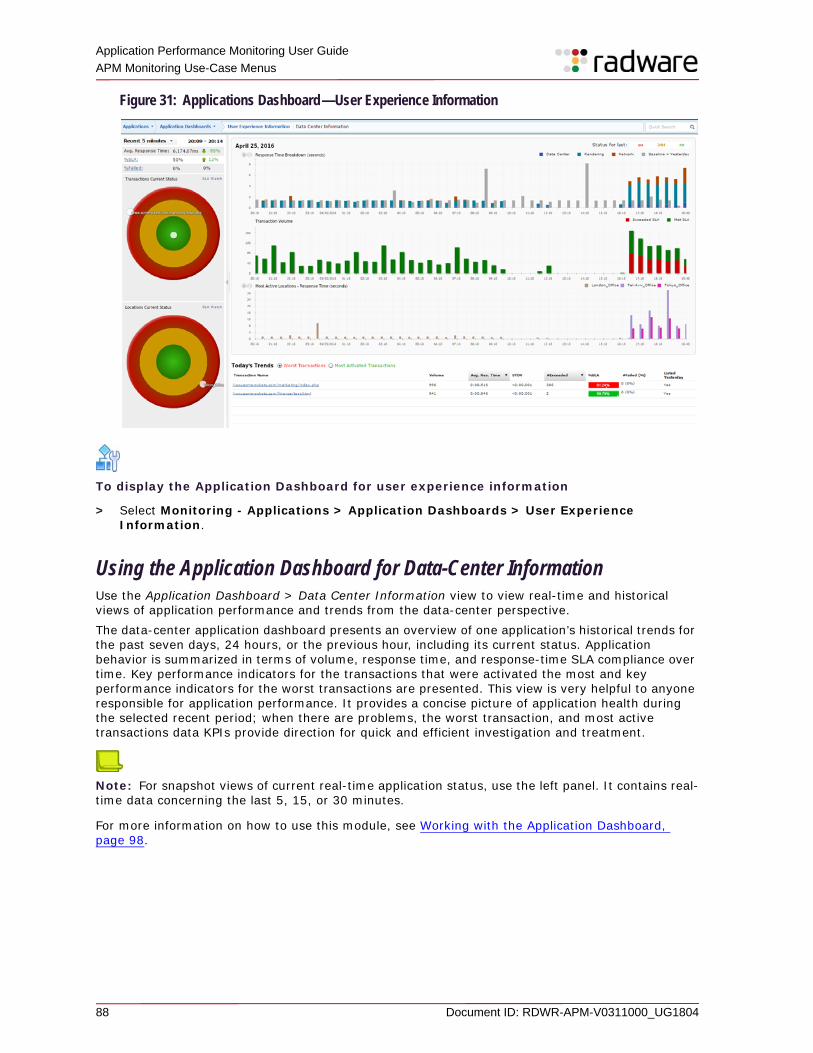
Application Performance Monitoring User Guide APM Monitoring Use-Case Menus
88 Document ID: RDWR-APM-V0311000_UG1804
Figure 31: Applications Dashboard—User Experience Information
To display the Application Dashboard for user experience information
> Select Monitoring - Applications > Application Dashboards > User Experience Information.
Using the Application Dashboard for Data-Center InformationUse the Application Dashboard > Data Center Information view to view real-time and historical views of application performance and trends from the data-center perspective.The data-center application dashboard presents an overview of one application’s historical trends for the past seven days, 24 hours, or the previous hour, including its current status. Application behavior is summarized in terms of volume, response time, and response-time SLA compliance over time. Key performance indicators for the transactions that were activated the most and key performance indicators for the worst transactions are presented. This view is very helpful to anyone responsible for application performance. It provides a concise picture of application health during the selected recent period; when there are problems, the worst transaction, and most active transactions data KPIs provide direction for quick and efficient investigation and treatment.
Note: For snapshot views of current real-time application status, use the left panel. It contains real-time data concerning the last 5, 15, or 30 minutes.
For more information on how to use this module, see Working with the Application Dashboard, page 98.
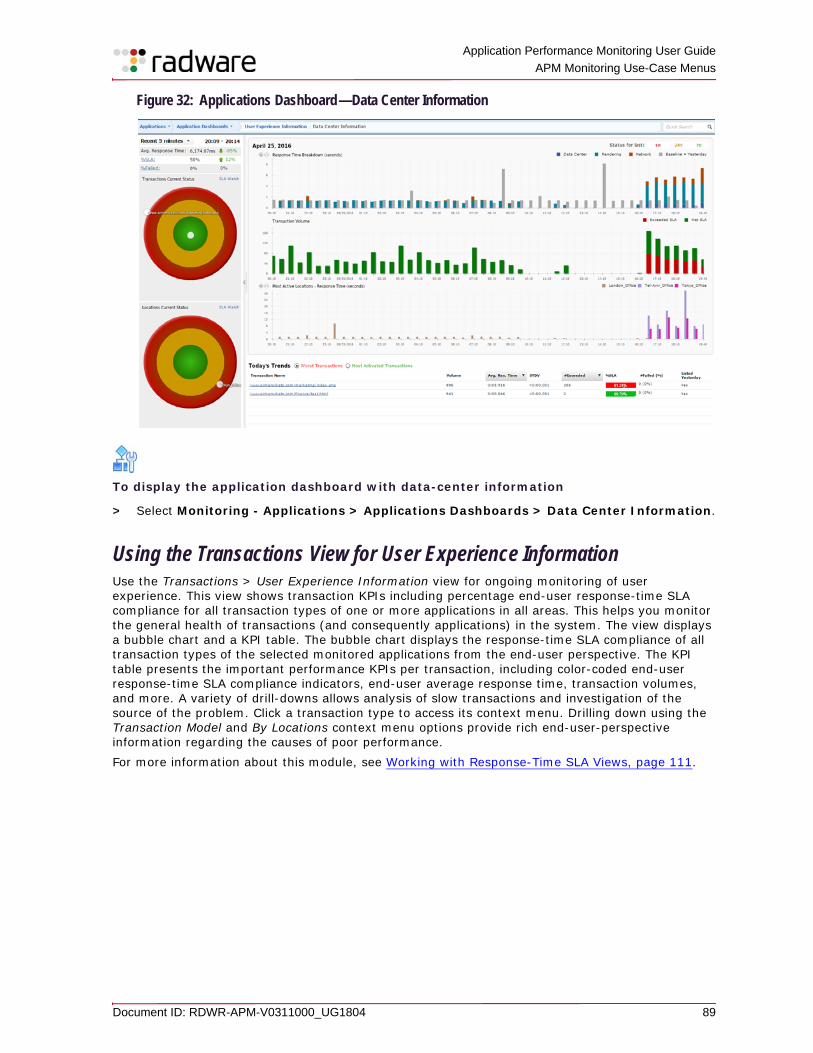
Application Performance Monitoring User Guide
APM Monitoring Use-Case Menus
Document ID: RDWR-APM-V0311000_UG1804 89
Figure 32: Applications Dashboard—Data Center Information
To display the application dashboard with data-center information
> Select Monitoring - Applications > Applications Dashboards > Data Center Information.
Using the Transactions View for User Experience InformationUse the Transactions > User Experience Information view for ongoing monitoring of user experience. This view shows transaction KPIs including percentage end-user response-time SLA compliance for all transaction types of one or more applications in all areas. This helps you monitor the general health of transactions (and consequently applications) in the system. The view displays a bubble chart and a KPI table. The bubble chart displays the response-time SLA compliance of all transaction types of the selected monitored applications from the end-user perspective. The KPI table presents the important performance KPIs per transaction, including color-coded end-user response-time SLA compliance indicators, end-user average response time, transaction volumes, and more. A variety of drill-downs allows analysis of slow transactions and investigation of the source of the problem. Click a transaction type to access its context menu. Drilling down using the Transaction Model and By Locations context menu options provide rich end-user-perspective information regarding the causes of poor performance.For more information about this module, see Working with Response-Time SLA Views, page 111.
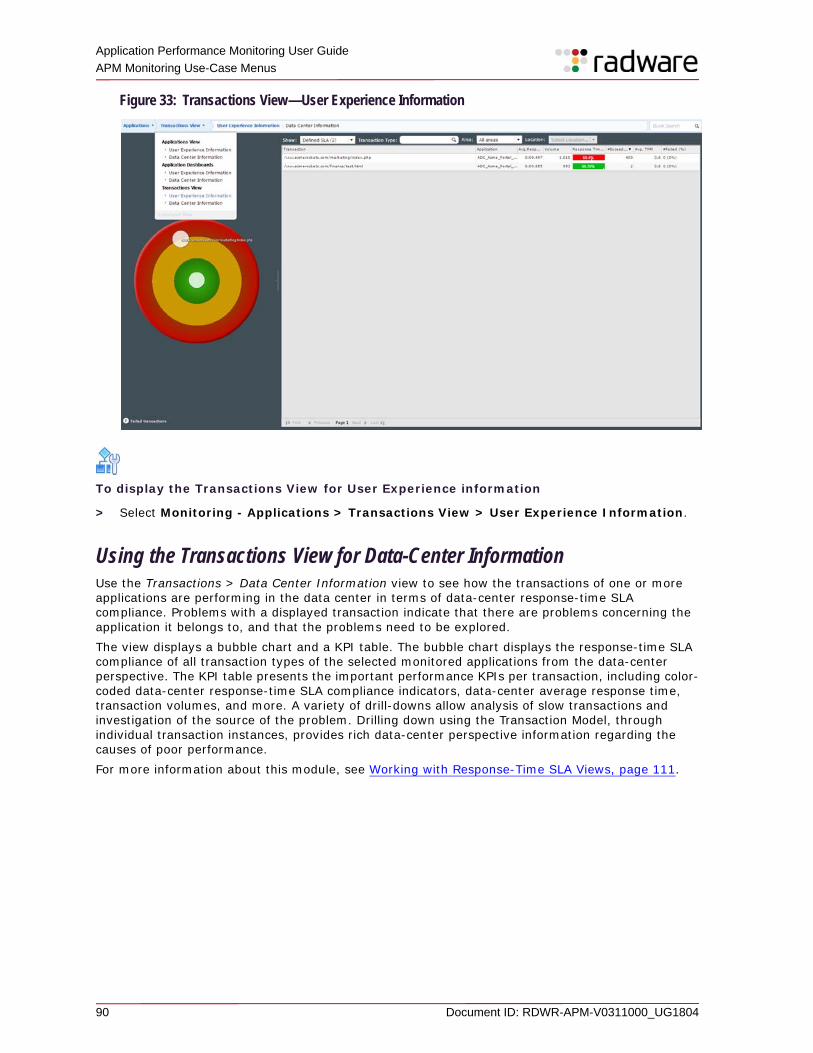
Application Performance Monitoring User Guide APM Monitoring Use-Case Menus
90 Document ID: RDWR-APM-V0311000_UG1804
Figure 33: Transactions View—User Experience Information
To display the Transactions View for User Experience information
> Select Monitoring - Applications > Transactions View > User Experience Information.
Using the Transactions View for Data-Center InformationUse the Transactions > Data Center Information view to see how the transactions of one or more applications are performing in the data center in terms of data-center response-time SLA compliance. Problems with a displayed transaction indicate that there are problems concerning the application it belongs to, and that the problems need to be explored.The view displays a bubble chart and a KPI table. The bubble chart displays the response-time SLA compliance of all transaction types of the selected monitored applications from the data-center perspective. The KPI table presents the important performance KPIs per transaction, including color-coded data-center response-time SLA compliance indicators, data-center average response time, transaction volumes, and more. A variety of drill-downs allow analysis of slow transactions and investigation of the source of the problem. Drilling down using the Transaction Model, through individual transaction instances, provides rich data-center perspective information regarding the causes of poor performance.For more information about this module, see Working with Response-Time SLA Views, page 111.
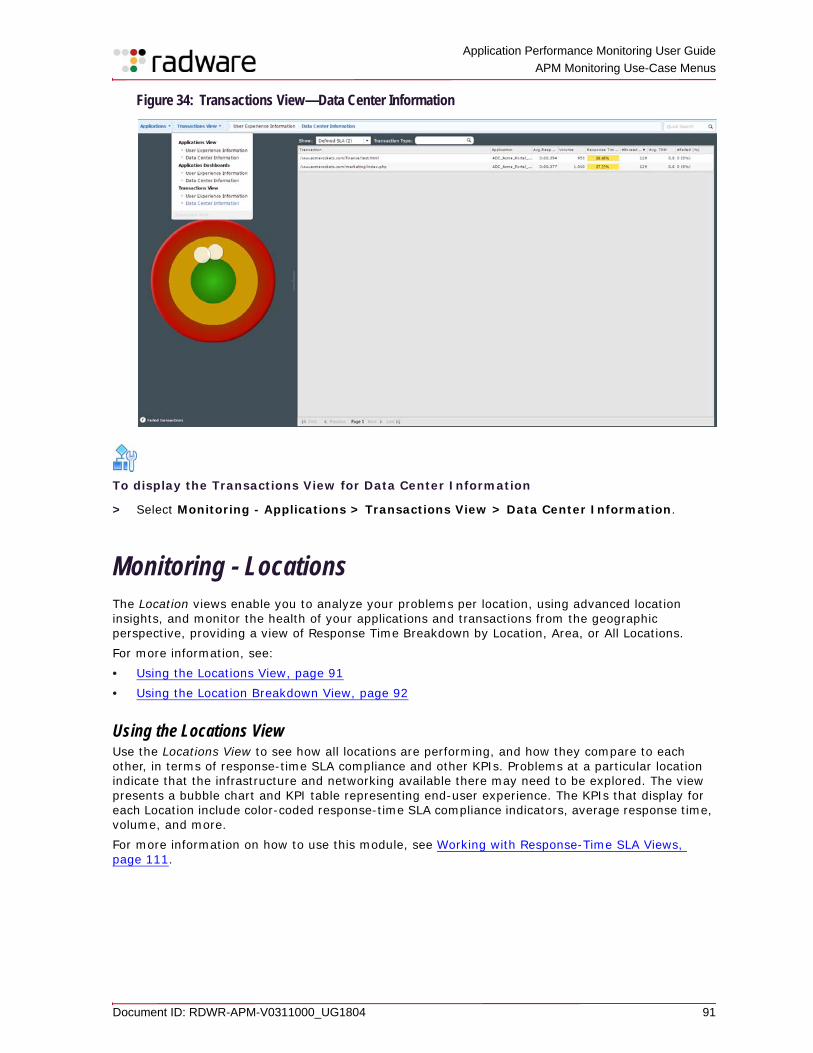
Application Performance Monitoring User Guide
APM Monitoring Use-Case Menus
Document ID: RDWR-APM-V0311000_UG1804 91
Figure 34: Transactions View—Data Center Information
To display the Transactions View for Data Center Information
> Select Monitoring - Applications > Transactions View > Data Center Information.
Monitoring - LocationsThe Location views enable you to analyze your problems per location, using advanced location insights, and monitor the health of your applications and transactions from the geographic perspective, providing a view of Response Time Breakdown by Location, Area, or All Locations.For more information, see:• Using the Locations View, page 91• Using the Location Breakdown View, page 92
Using the Locations ViewUse the Locations View to see how all locations are performing, and how they compare to each other, in terms of response-time SLA compliance and other KPIs. Problems at a particular location indicate that the infrastructure and networking available there may need to be explored. The view presents a bubble chart and KPI table representing end-user experience. The KPIs that display for each Location include color-coded response-time SLA compliance indicators, average response time, volume, and more.For more information on how to use this module, see Working with Response-Time SLA Views, page 111.
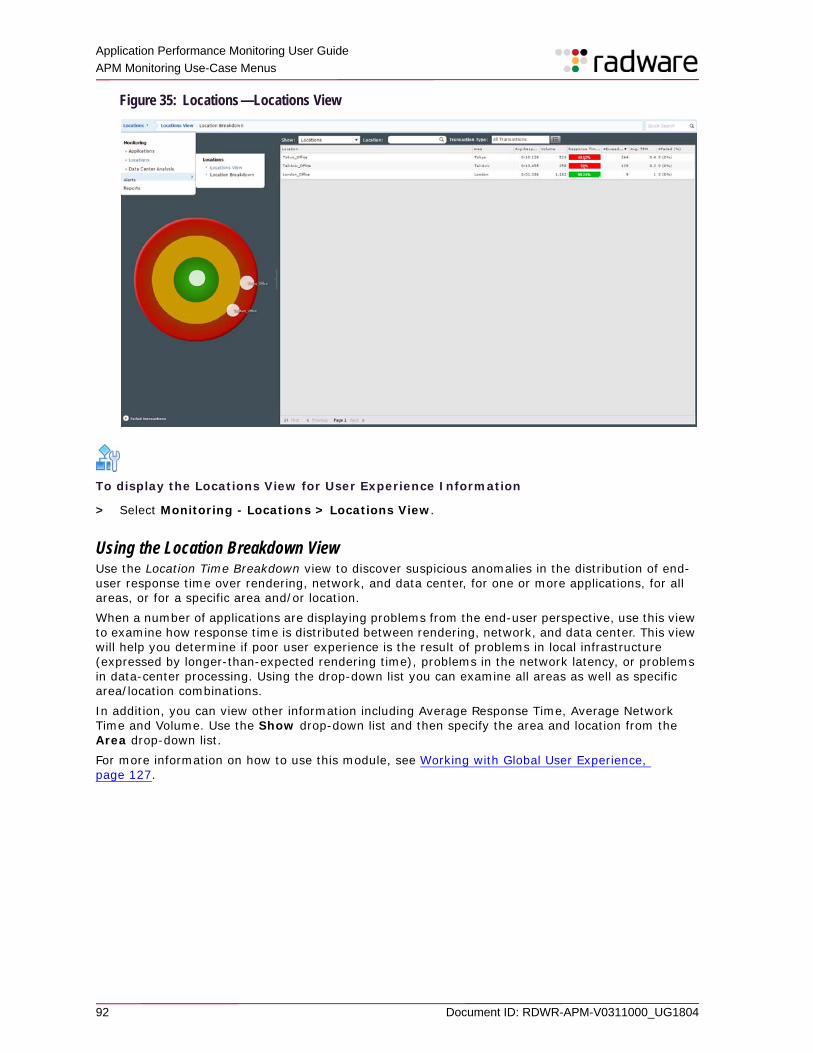
Application Performance Monitoring User Guide APM Monitoring Use-Case Menus
92 Document ID: RDWR-APM-V0311000_UG1804
Figure 35: Locations—Locations View
To display the Locations View for User Experience Information
> Select Monitoring - Locations > Locations View.
Using the Location Breakdown ViewUse the Location Time Breakdown view to discover suspicious anomalies in the distribution of end-user response time over rendering, network, and data center, for one or more applications, for all areas, or for a specific area and/or location.When a number of applications are displaying problems from the end-user perspective, use this view to examine how response time is distributed between rendering, network, and data center. This view will help you determine if poor user experience is the result of problems in local infrastructure (expressed by longer-than-expected rendering time), problems in the network latency, or problems in data-center processing. Using the drop-down list you can examine all areas as well as specific area/location combinations.In addition, you can view other information including Average Response Time, Average Network Time and Volume. Use the Show drop-down list and then specify the area and location from the Area drop-down list. For more information on how to use this module, see Working with Global User Experience, page 127.
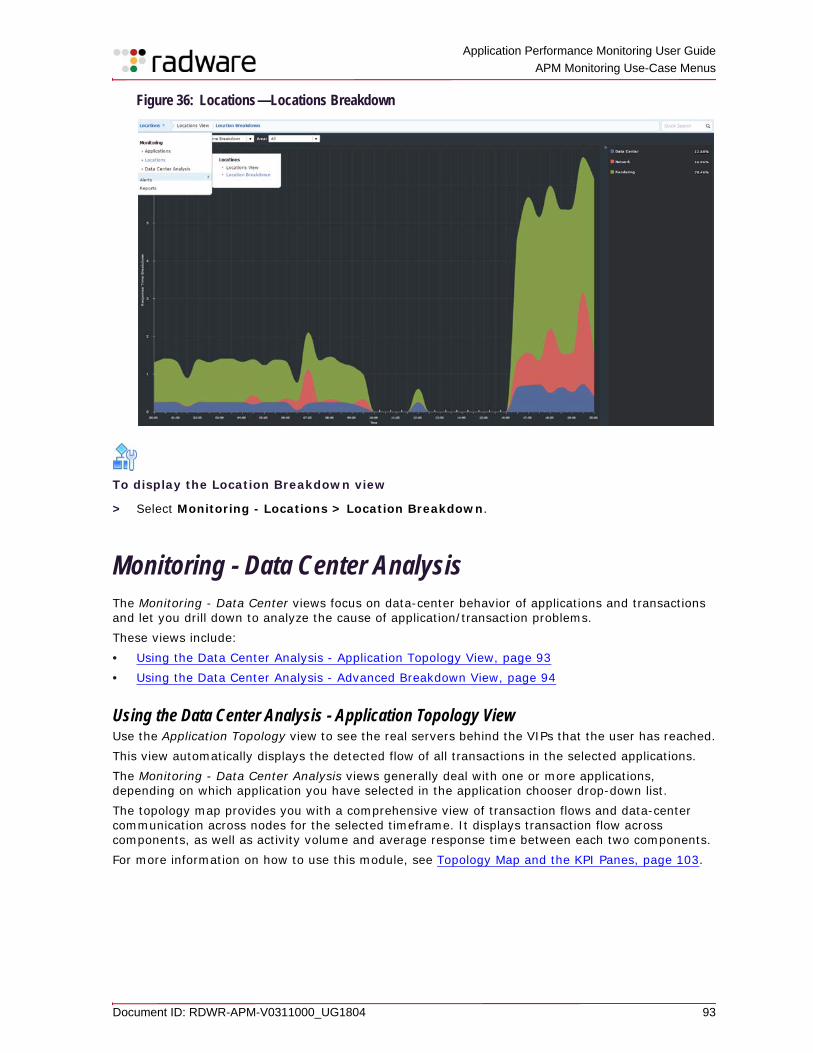
Application Performance Monitoring User Guide
APM Monitoring Use-Case Menus
Document ID: RDWR-APM-V0311000_UG1804 93
Figure 36: Locations—Locations Breakdown
To display the Location Breakdown view
> Select Monitoring - Locations > Location Breakdown.
Monitoring - Data Center AnalysisThe Monitoring - Data Center views focus on data-center behavior of applications and transactions and let you drill down to analyze the cause of application/transaction problems.These views include:• Using the Data Center Analysis - Application Topology View, page 93• Using the Data Center Analysis - Advanced Breakdown View, page 94
Using the Data Center Analysis - Application Topology ViewUse the Application Topology view to see the real servers behind the VIPs that the user has reached.This view automatically displays the detected flow of all transactions in the selected applications.The Monitoring - Data Center Analysis views generally deal with one or more applications, depending on which application you have selected in the application chooser drop-down list.The topology map provides you with a comprehensive view of transaction flows and data-center communication across nodes for the selected timeframe. It displays transaction flow across components, as well as activity volume and average response time between each two components.For more information on how to use this module, see Topology Map and the KPI Panes, page 103.
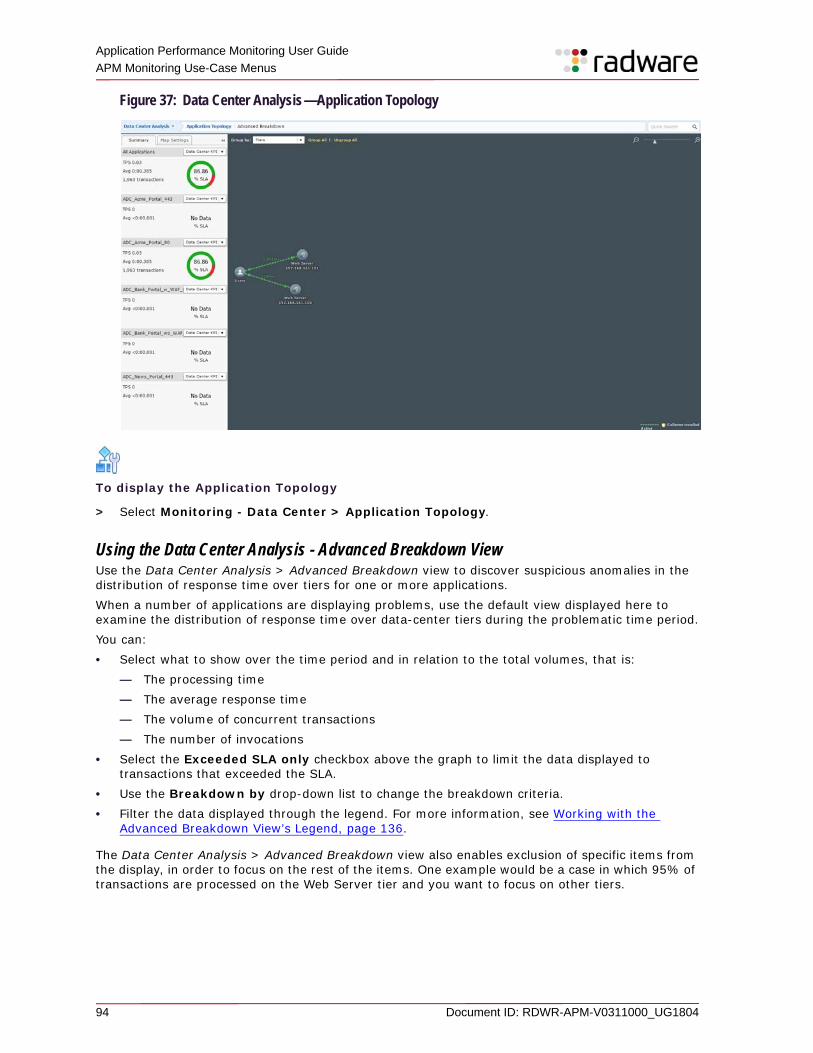
Application Performance Monitoring User Guide APM Monitoring Use-Case Menus
94 Document ID: RDWR-APM-V0311000_UG1804
Figure 37: Data Center Analysis—Application Topology
To display the Application Topology
> Select Monitoring - Data Center > Application Topology.
Using the Data Center Analysis - Advanced Breakdown ViewUse the Data Center Analysis > Advanced Breakdown view to discover suspicious anomalies in the distribution of response time over tiers for one or more applications.When a number of applications are displaying problems, use the default view displayed here to examine the distribution of response time over data-center tiers during the problematic time period.You can:• Select what to show over the time period and in relation to the total volumes, that is:
— The processing time— The average response time— The volume of concurrent transactions— The number of invocations
• Select the Exceeded SLA only checkbox above the graph to limit the data displayed to transactions that exceeded the SLA.
• Use the Breakdown by drop-down list to change the breakdown criteria.• Filter the data displayed through the legend. For more information, see Working with the
Advanced Breakdown View’s Legend, page 136.
The Data Center Analysis > Advanced Breakdown view also enables exclusion of specific items from the display, in order to focus on the rest of the items. One example would be a case in which 95% of transactions are processed on the Web Server tier and you want to focus on other tiers.
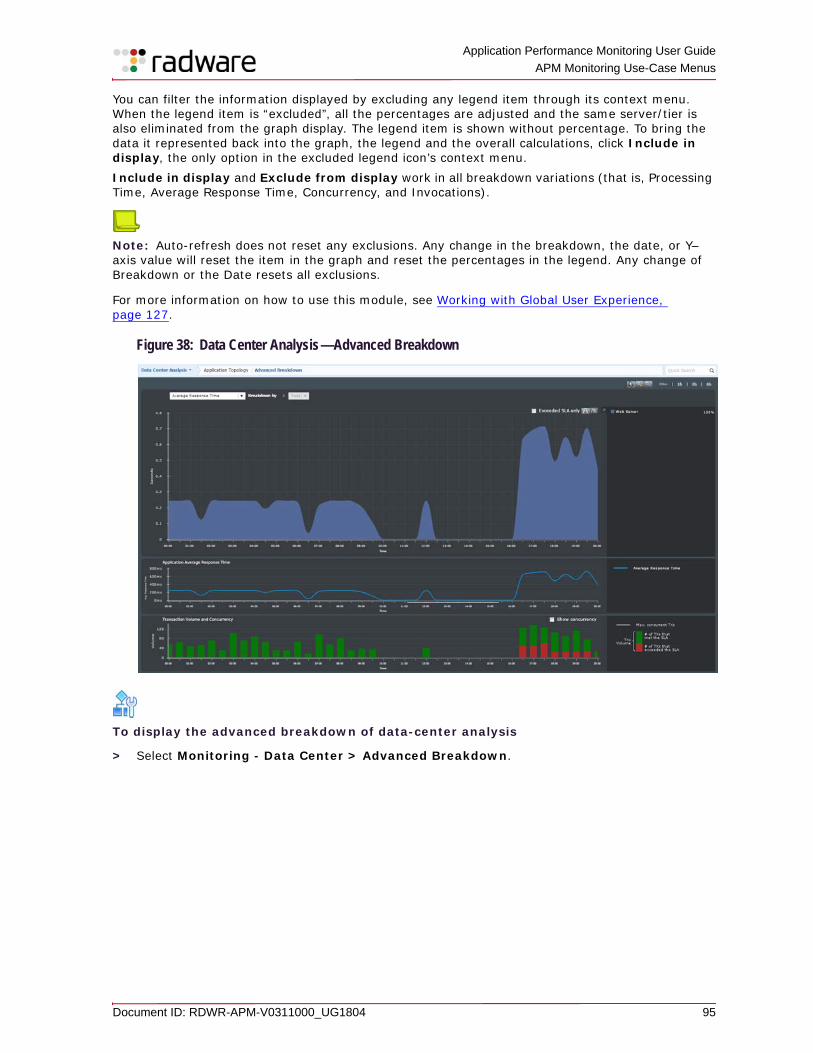
Application Performance Monitoring User Guide
APM Monitoring Use-Case Menus
Document ID: RDWR-APM-V0311000_UG1804 95
You can filter the information displayed by excluding any legend item through its context menu. When the legend item is “excluded”, all the percentages are adjusted and the same server/tier is also eliminated from the graph display. The legend item is shown without percentage. To bring the data it represented back into the graph, the legend and the overall calculations, click Include in display, the only option in the excluded legend icon’s context menu.Include in display and Exclude from display work in all breakdown variations (that is, Processing Time, Average Response Time, Concurrency, and Invocations).
Note: Auto-refresh does not reset any exclusions. Any change in the breakdown, the date, or Y–axis value will reset the item in the graph and reset the percentages in the legend. Any change of Breakdown or the Date resets all exclusions.
For more information on how to use this module, see Working with Global User Experience, page 127.
Figure 38: Data Center Analysis—Advanced Breakdown
To display the advanced breakdown of data-center analysis
> Select Monitoring - Data Center > Advanced Breakdown.

Application Performance Monitoring User Guide APM Monitoring Use-Case Menus
96 Document ID: RDWR-APM-V0311000_UG1804
Document ID: RDWR-APM-V0311000_UG1804 97
Chapter 8 – APM User Interface View Types
All of the views available from the APM main menu described in APM Monitoring Use-Case Menus, page 85 are based on well-defined modules designed to analyze and display your raw data in a variety of ways.This chapter provides a concise guide to using those modules, which include:• Working with Alerts View, page 97• Working with the Application Dashboard, page 98• Topology Map and the KPI Panes, page 103• Working with Response-Time SLA Views, page 111• Using Compare Good Versus Bad, page 115• Working with Compare Timeframes Views, page 116• Examining Individual Transaction Instances, page 117• Working with Global User Experience, page 127• Working with the Advanced Breakdown View, page 131• IPv6 Support, page 138• Search, page 139
Working with Alerts ViewThe Alerts dashboard, available for User Experience and Data Center, displays triggered alerts (as a default) for the selected application (or All applications). Adjust your display by using the Alert Type and Status drop-down lists.
Note: Alert types include the following:
• All, SLA Management• Statuses include All, OK, Warning, Critical, Critical / Warning to adjust your display.
The following table describes each column in the Alerts view.
Table 6: Alert
Column Header DescriptionName The transaction type or application name that issued the alert.
Status Critical or Warning.
Time The time alert was issued.
Interval The interval checked for criteria determining if an alert is issued.
Parent Name The transaction in which the fault occurred.
Application The application to which the issuing transaction belongs.
Sensitivity The sensitivity definition for issuing an alert.
Threshold The level that must be exceeded to warrant alert.
Measured Value The actual value of alert criterion parameter at the time the alert was issued.
Application Performance Monitoring User Guide APM User Interface View Types
98 Document ID: RDWR-APM-V0311000_UG1804
To control the alerts display appearance
1. Adjust the column size by dragging columns to change their position.2. Sort the alerts by any column.
Working with the Application DashboardThe Application Dashboards present an overview of an application’s status, summarizing all major performance indicators—for one application from the end-user perspective or from the data-center perspective—and providing links to related screens for more analysis options.
Note: The right and left panes are continuously updated at intervals defined, in minutes, by the administrator, using the parameters appDashboardRefreshRateRightPane and appDashboardRefreshRateLeftPane, respectively.
This section contains the following: • Using the Application Dashboard - Data Center Information Perspective, page 98• Using the Application Dashboard - User Experience Perspective, page 99• Working with the Application Dashboard—Additional Functionality, page 100
Using the Application Dashboard - Data Center Information Perspective
To access the Application Dashboard - Data Center Information perspective
> Go to Monitoring - Applications > Application Dashboards > Data Center Information.
There are three main sections in the Application Dashboard - Data Center Information perspective: • Recent—The left pane provides information about application performance during the most
recent 5, 15, or 30 minutes. • KPI Trends—The top part of the right panel presents three trends graphs describing application
performance during the last hour, 24 hours, or 7 days.— Response Time graph—Displays a line graph showing Response Time for the period
displayed. The baseline from the previous period is represented by a grey line. The requested time period is indicated in blue. (See the graph legend.)
— Transaction Volume graph—Displays volumes for the same intervals displayed in the Response Time graph. Each bar can include both a red portion, which represents the volume of SLA non-compliant transactions—and a green portion, which represents the volume of SLA compliant transactions. (See the graph legend.)
• Today’s Trends—This section is at the bottom of the right panel of the Application Dashboard view. Use the radio buttons to toggle between Worst Transactions and Most Activated Transactions of the current calendar day. KPIs are displayed for the set of transactions selected, providing a quick check on the health of the most active transactions, as well as a quick listing transactions that had the worst performance among all of the application’s transactions.
Application Performance Monitoring User Guide
APM User Interface View Types
Document ID: RDWR-APM-V0311000_UG1804 99
• Recent Period Display:— In the top section of the left panel of the Application Dashboard, you can choose which
recent period to display from the Recent Minutes drop-down list. (5, 10, or 15 minutes).— The average response time (Avg. Response Time), the response-time SLA compliance
(%SLA), and the percentage failed (%Failed) are displayed for this period are displayed, including percent of change and direction of change (positive or negative).
You can:— Click % SLA to display the Compare Good vs. Bad view for all application transactions
during the recent period.— Click % Failed to display all failed transactions of the application during the recent interval.The next two sections display the transaction bubble chart and the topology map for a recent period, where you can:— Click SLA Watch link to view the Transactions bubble chart and KPI table for the application
from data-center perspective.— Click the Topology Map link to view the data-center topology map of the application.
Using the Application Dashboard - User Experience Perspective
To access the Application Dashboard - User Experience perspective
> Go to Monitoring - Applications > Application Dashboards > User Experience Information.
There are three main sections in the Application Dashboard - Data Center Information perspective:
There are three main sections in the Application Dashboard - User Experience perspective:
• Recent—The left pane provides information about application performance during the most recent 5, 15, or 30 minutes.
• KPI Trends—The top part of the right panel presents three trends graphs describing application performance during the last hour, 24 hours, or 7 days, as follows:— Response Time Breakdown graph—Displays a pair of bar graphs for each interval
displayed. A grey bar to the right represents the previous baseline total response time, while the bar on the left displays the response time from the present period, color-coded to show the breakdown between data center, rendering, and network response time.
Use the buttons near the upper-left corner of graph to switch between line-graph and bar-graph displays.
— Transaction Volume graph—Displays volumes for the same intervals. Each bar can be composed of a red portion, which represents the volume of SLA non-compliant transactions and a green portion, which represents the volume of SLA compliant transactions.
— Most Active Locations Response Time graph—Displays response time in the most active locations.
Use the buttons near the upper-left corner of graph to switch between line-graph and bar-graph displays.
• Today’s Transaction Trends—Use the radio buttons to toggle between Worst Transactions and Most Activated Transactions of the current calendar day. KPIs are displayed for the set of transactions selected, providing a quick check on the health of the most active transactions as well as a quick listing transactions that had the worst performance among all of the application’s transactions.
Application Performance Monitoring User Guide APM User Interface View Types
100 Document ID: RDWR-APM-V0311000_UG1804
Recent Period Display:• In the top section of the left panel of the Application Dashboard, you can choose which Recent
period to display from the Recent Minutes drop-down list. (5, 10, or 15 minutes).• The Average Response Time, Response Time SLA compliance, and % Failed are displayed for
this period are displayed including percent of change and direction of change (positive or negative) displays.You can:— Click %SLA to display the Compare Good vs. Bad view for all application transactions during
the recent period.— Click %Failed to display all Failed Transactions of the application during the recent interval.The next two sections display a transaction bubble chart and a Location Bubble chart, each displaying Response Time SLA-compliance status for transaction types or locations, respectively, where you can do the following:— Click SLA Watch link from the Transaction Current Status bubble chart to view the
Transaction SLA bubble chart and KPI table from the end-user perspective.— Click SLA Watch link to the right of the Locations Current Status bubble chart to view the
Locations SLA bubble chart and KPI table.
Note: About refresh intervals in the Application Dashboard: The right and left panes are continuously updated at intervals defined in minutes by the administrator using the parameters appDashboardRefreshRateRightPane and appDashboardRefreshRateLeftPane, respectively.
Working with the Application Dashboard—Additional FunctionalityThe additional functionality of the Application Dashboard includes the following:• Using Drill-downs Available from the Trends Graphs, page 100• Selecting the Timeframe for Trends Graphs, page 101• Viewing At-a-Glance Application Response-Time SLA Compliance for 1 Hour, 1 Day and 7 Days,
page 101• Drilling Down from Graph Information Points on End User Application Dashboard Graphs,
page 101• Drilling Down from From-Graph Information Points on Data Center Transaction Volume Graph,
page 102• Drilling Down to Transaction Model from Today’s Trends - Data Center and End User Modes,
page 103
Using Drill-downs Available from the Trends GraphsThe following table contains the Trends Graphs and drill-downs that are available from them.
Table 7: Trend Graphs
Display Mode Trend Graph (Starting Point) Drill-down DisplayEnd User Response Time Breakdown Global User Experience
End User Transaction Volume Compare Good vs. Bad Global User Experience
End User Most Active Locations—Response Time
Global User Experience (for one location)
Data Center Response Time Breakdown Timeframe Comparison
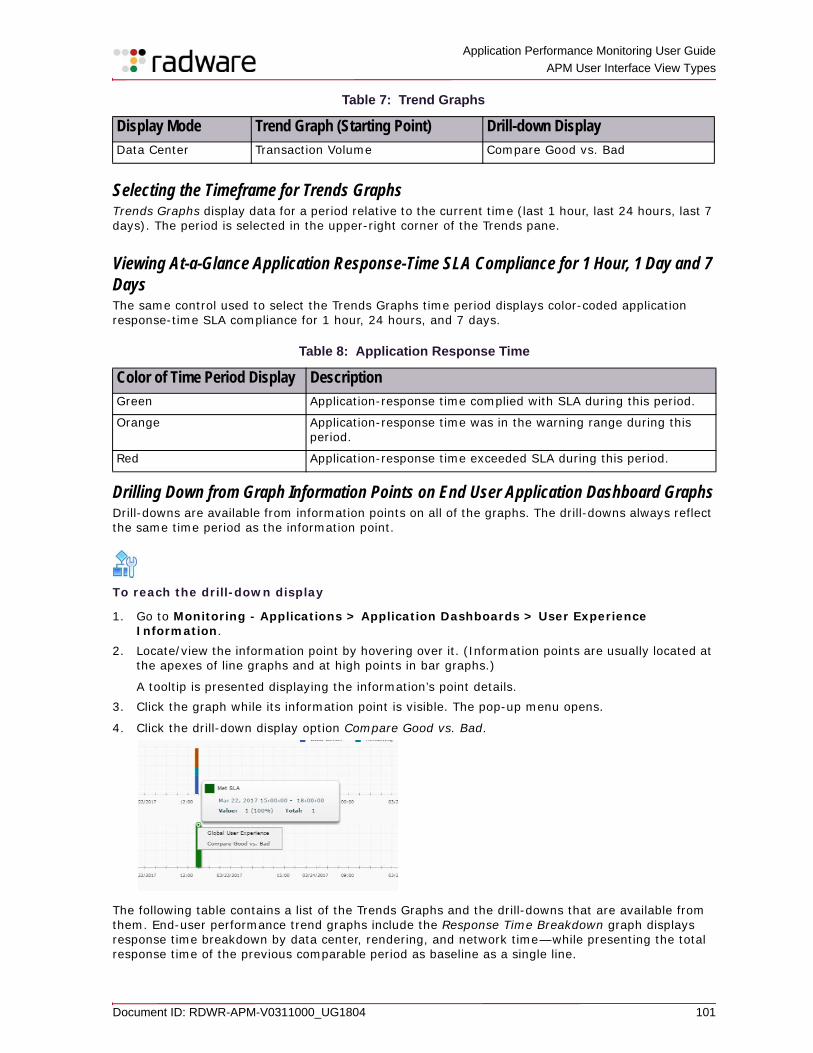
Application Performance Monitoring User Guide
APM User Interface View Types
Document ID: RDWR-APM-V0311000_UG1804 101
Selecting the Timeframe for Trends GraphsTrends Graphs display data for a period relative to the current time (last 1 hour, last 24 hours, last 7 days). The period is selected in the upper-right corner of the Trends pane.
Viewing At-a-Glance Application Response-Time SLA Compliance for 1 Hour, 1 Day and 7 DaysThe same control used to select the Trends Graphs time period displays color-coded application response-time SLA compliance for 1 hour, 24 hours, and 7 days.
Drilling Down from Graph Information Points on End User Application Dashboard GraphsDrill-downs are available from information points on all of the graphs. The drill-downs always reflect the same time period as the information point.
To reach the drill-down display
1. Go to Monitoring - Applications > Application Dashboards > User Experience Information.
2. Locate/view the information point by hovering over it. (Information points are usually located at the apexes of line graphs and at high points in bar graphs.)
A tooltip is presented displaying the information’s point details.3. Click the graph while its information point is visible. The pop-up menu opens.
4. Click the drill-down display option Compare Good vs. Bad.
The following table contains a list of the Trends Graphs and the drill-downs that are available from them. End-user performance trend graphs include the Response Time Breakdown graph displays response time breakdown by data center, rendering, and network time—while presenting the total response time of the previous comparable period as baseline as a single line.
Data Center Transaction Volume Compare Good vs. Bad
Table 8: Application Response Time
Color of Time Period Display DescriptionGreen Application-response time complied with SLA during this period.
Orange Application-response time was in the warning range during this period.
Red Application-response time exceeded SLA during this period.
Table 7: Trend Graphs
Display Mode Trend Graph (Starting Point) Drill-down Display
Application Performance Monitoring User Guide APM User Interface View Types
102 Document ID: RDWR-APM-V0311000_UG1804
You can hover over a key point of Data Center, Rendering, and Network Response times to display response time detail pop-ups.
Example Drilling down from the End User Application Dashboard Response Time Breakdown graph1. Verify you are in End User mode.2. Hover over an information point in the Response Time Breakdown graph.
3. Click to display the pop-up menu.
4. Click Global User Experience (or click Cancel to close the pop-up menu).
Caution: Click your browser’s back button to return to the Application Dashboard.
Drilling Down from From-Graph Information Points on Data Center Transaction Volume GraphThe Transaction Volume trends graph presents Transaction Volume for the selected period as a bar graph, with green bars representing the volume of response-time SLA-compliant transactions and red bars representing the volume of response-time SLA-non-compliant transactions.
Example - Drilling Down to Compare Good vs. Bad1. Verify you are in Data Center tab and displaying the Transaction Volume graph.2. Hover over the key point (located at a volume apex).
3. Click to display the pop-up menu.
4. Click Compare Good vs. Bad (or click Cancel to close the pop-up menu).
5. Hover over each colored segment of a bar for detailed statistics.
Example Drilling Down to Compare Good vs. BadThis graph displays two lines—one representing application response time (data-center response time) and the other representing the baseline (that is, the data for the previous parallel period.
To drill down to timeframe comparison
1. Verify you are in Data Center mode and displaying the Response Time graph.2. Hover over the key point (located at a response time apex).
3. Click to display the pop-up menu.
4. Click Timeframe Comparison (or click cancel to close the pop-up menu).
Application Performance Monitoring User Guide
APM User Interface View Types
Document ID: RDWR-APM-V0311000_UG1804 103
Drilling Down to Transaction Model from Today’s Trends - Data Center and End User ModesTransaction Model displays the accumulated behavior of all transactions of one transaction type, for data center or end user. Each tab of the drill-down is for today, and therefore displays information from 00:00 until the current time.
To drill down to the Transaction Model
> Click one of the transaction types in a Today’s Trends list (Worst Transactions or Most Activated Transactions).
The Transaction Profile displays according to the Application Dashboard mode (Data Center or End User).After viewing this Transaction Model, you can visit the other available tabs for this transaction type including End User (or Data Center), Compare Good vs. Bad, and Compare Timeframes.
Topology Map and the KPI PanesAPM automatically detects and generates a comprehensive topology map based on real transaction flows. The topology map: • Displays a real-time view of how your applications and business services communicate across
processes and hosts.• Can indicate congestion and service level reduction.• Can help you understand how transactions flow across the infrastructure and application stack.• Shows the real server IP address for each node as well as the server name if it was successfully
resolved.
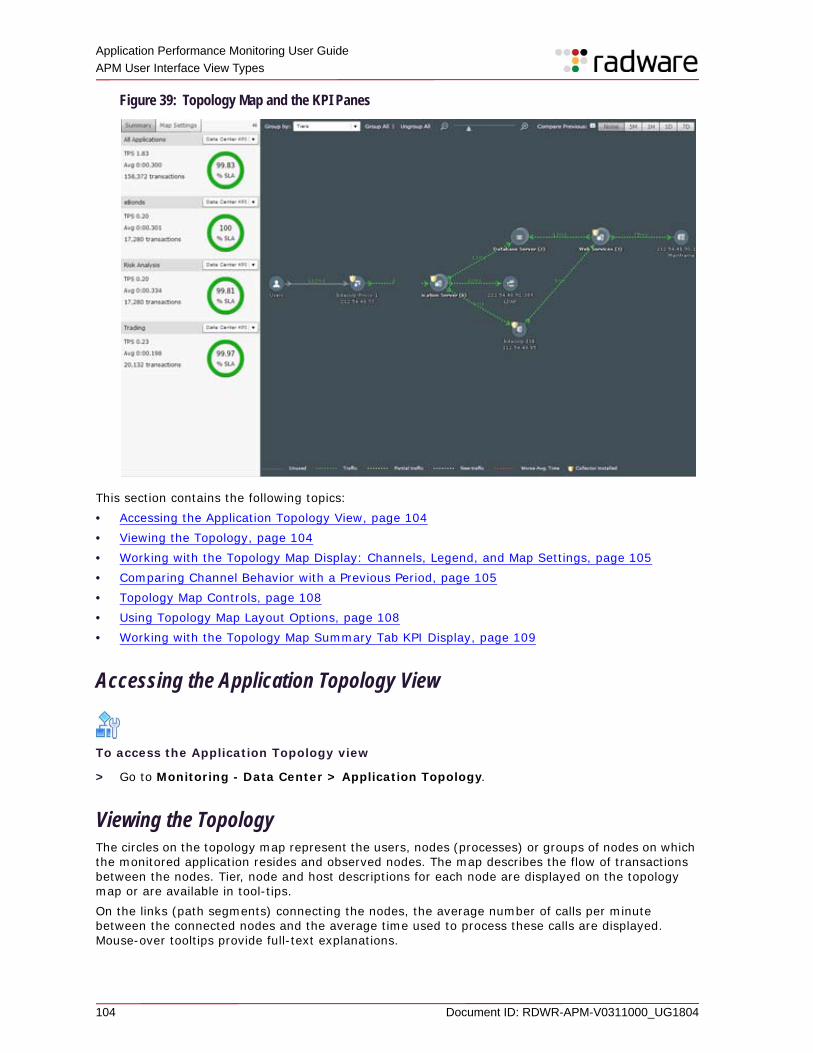
Application Performance Monitoring User Guide APM User Interface View Types
104 Document ID: RDWR-APM-V0311000_UG1804
Figure 39: Topology Map and the KPI Panes
This section contains the following topics:• Accessing the Application Topology View, page 104• Viewing the Topology, page 104• Working with the Topology Map Display: Channels, Legend, and Map Settings, page 105• Comparing Channel Behavior with a Previous Period, page 105• Topology Map Controls, page 108• Using Topology Map Layout Options, page 108• Working with the Topology Map Summary Tab KPI Display, page 109
Accessing the Application Topology View
To access the Application Topology view
> Go to Monitoring - Data Center > Application Topology.
Viewing the TopologyThe circles on the topology map represent the users, nodes (processes) or groups of nodes on which the monitored application resides and observed nodes. The map describes the flow of transactions between the nodes. Tier, node and host descriptions for each node are displayed on the topology map or are available in tool-tips.On the links (path segments) connecting the nodes, the average number of calls per minute between the connected nodes and the average time used to process these calls are displayed. Mouse-over tooltips provide full-text explanations.
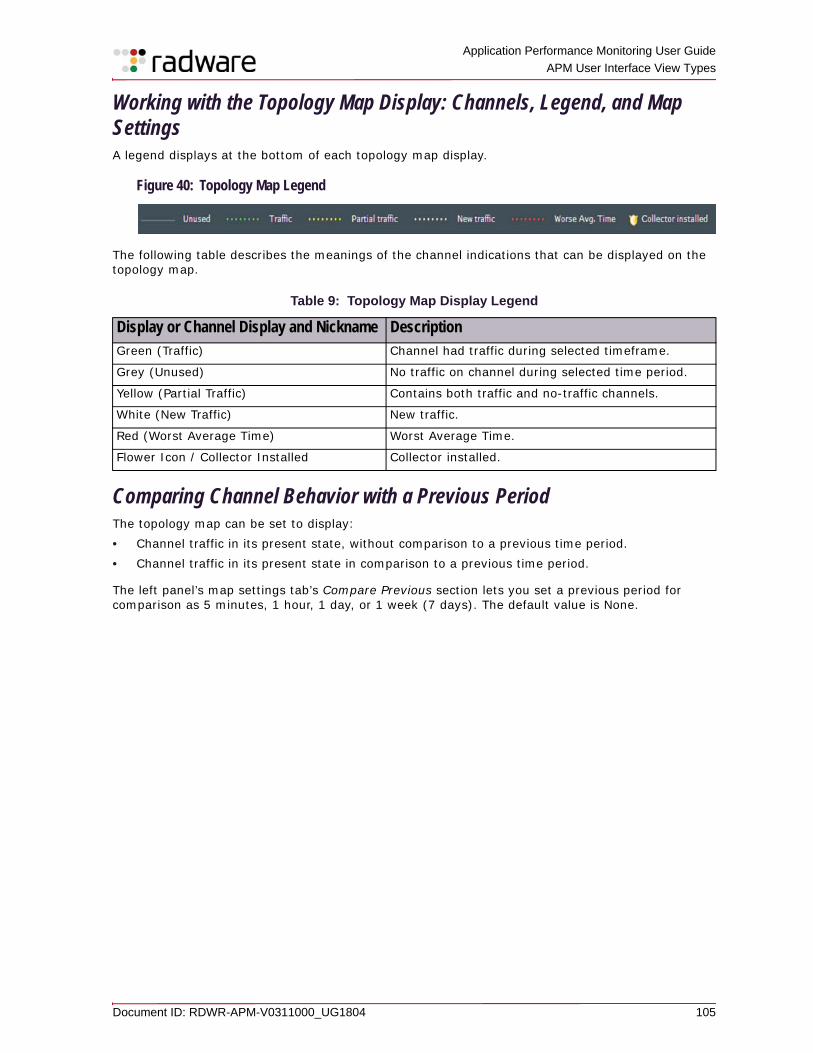
Application Performance Monitoring User Guide
APM User Interface View Types
Document ID: RDWR-APM-V0311000_UG1804 105
Working with the Topology Map Display: Channels, Legend, and Map SettingsA legend displays at the bottom of each topology map display.
Figure 40: Topology Map Legend
The following table describes the meanings of the channel indications that can be displayed on the topology map.
Comparing Channel Behavior with a Previous PeriodThe topology map can be set to display:• Channel traffic in its present state, without comparison to a previous time period.• Channel traffic in its present state in comparison to a previous time period.
The left panel’s map settings tab’s Compare Previous section lets you set a previous period for comparison as 5 minutes, 1 hour, 1 day, or 1 week (7 days). The default value is None.
Table 9: Topology Map Display Legend
Display or Channel Display and Nickname DescriptionGreen (Traffic) Channel had traffic during selected timeframe.
Grey (Unused) No traffic on channel during selected time period.
Yellow (Partial Traffic) Contains both traffic and no-traffic channels.
White (New Traffic) New traffic.
Red (Worst Average Time) Worst Average Time.
Flower Icon / Collector Installed Collector installed.
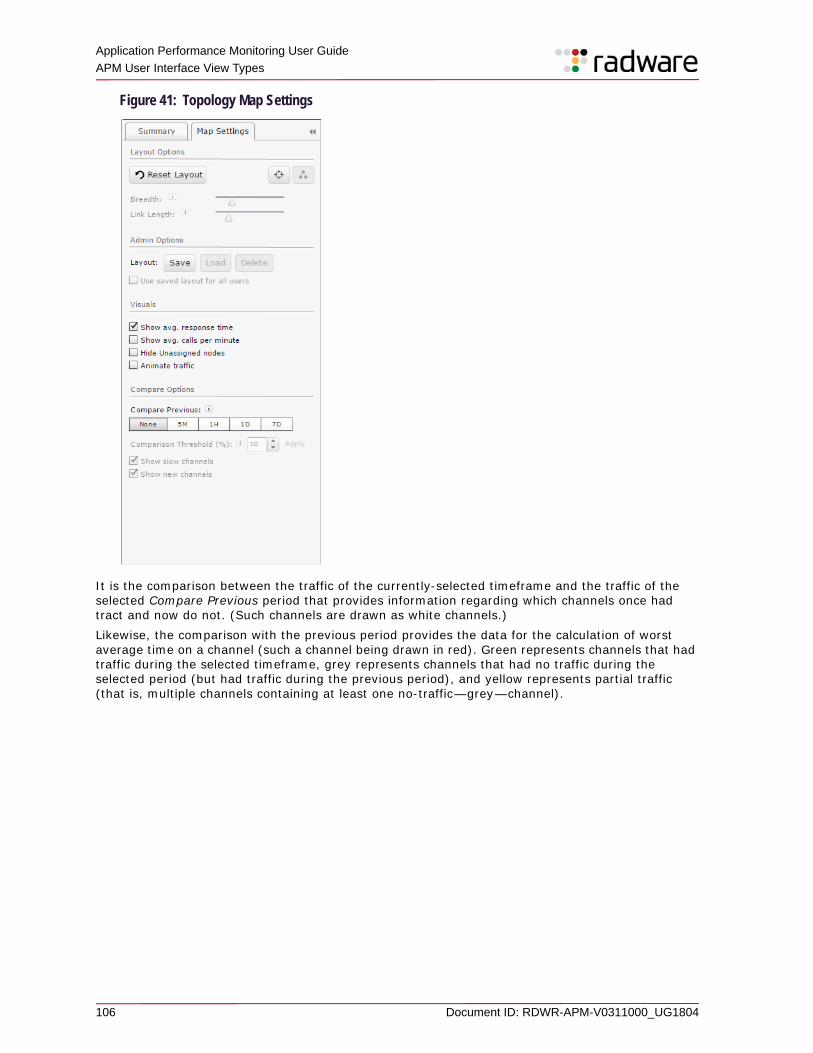
Application Performance Monitoring User Guide APM User Interface View Types
106 Document ID: RDWR-APM-V0311000_UG1804
Figure 41: Topology Map Settings
It is the comparison between the traffic of the currently-selected timeframe and the traffic of the selected Compare Previous period that provides information regarding which channels once had tract and now do not. (Such channels are drawn as white channels.)Likewise, the comparison with the previous period provides the data for the calculation of worst average time on a channel (such a channel being drawn in red). Green represents channels that had traffic during the selected timeframe, grey represents channels that had no traffic during the selected period (but had traffic during the previous period), and yellow represents partial traffic (that is, multiple channels containing at least one no-traffic—grey—channel).
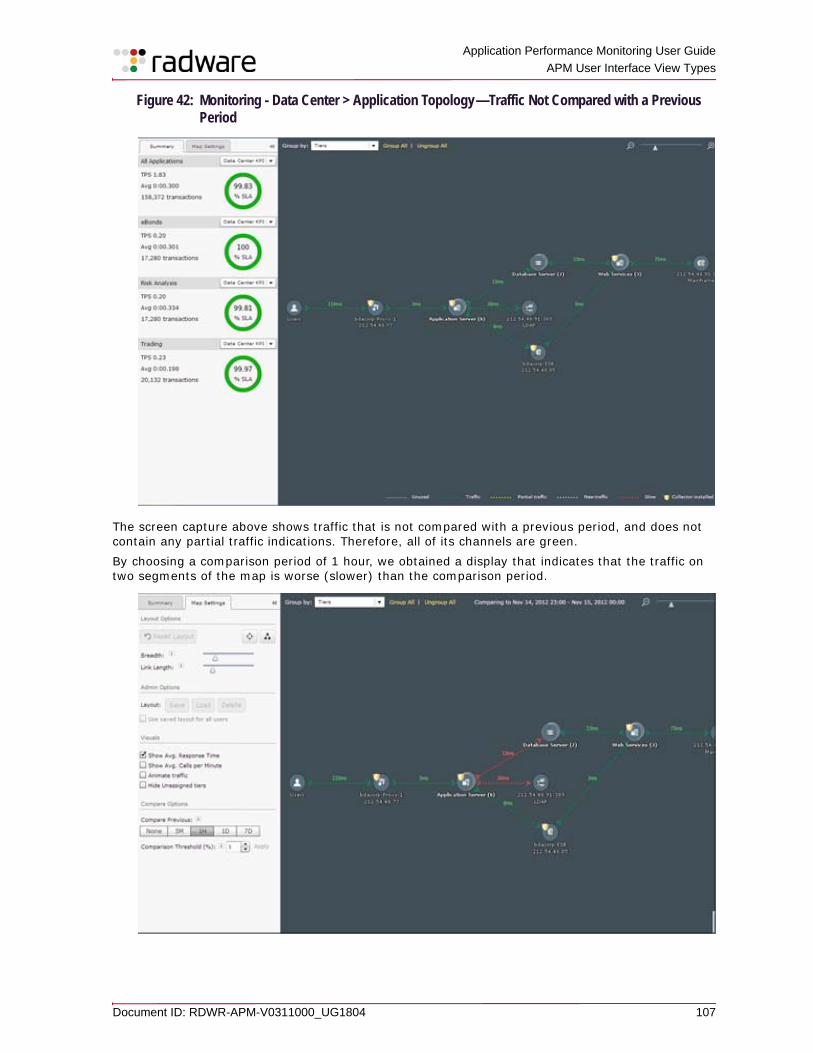
Application Performance Monitoring User Guide
APM User Interface View Types
Document ID: RDWR-APM-V0311000_UG1804 107
Figure 42: Monitoring - Data Center > Application Topology—Traffic Not Compared with a Previous Period
The screen capture above shows traffic that is not compared with a previous period, and does not contain any partial traffic indications. Therefore, all of its channels are green. By choosing a comparison period of 1 hour, we obtained a display that indicates that the traffic on two segments of the map is worse (slower) than the comparison period.
Application Performance Monitoring User Guide APM User Interface View Types
108 Document ID: RDWR-APM-V0311000_UG1804
However, it turns out that according to the setting for the Comparison Threshold, traffic even 1% slower than the previous period would provide this worse channel (red) traffic representation. Let’s see what happens we change the Change Threshold parameter to 25%.The red channels are now colored green.
Topology Map ControlsOn the topology map, you can choose from the Group by drop-down list to group by Tiers or by Host Managers. When grouping by tiers, use the Group All and Ungroup All buttons to group and Ungroup the displayed nodes by the tiers to which they belong.When you see several nodes grouped together by tier, you have the possibility of un-grouping that single group and display their individual traffic channels. To see the channels contained in a multiple-channel (whether it is yellow or green), un-group the related tier-groups by clicking it and clicking the Ungroup option.Hover over any path channel to display a tooltip that provides the average number of calls per minute between the connected nodes as well as the average time used to process those calls. The non-tooltip display information is controlled from the Visuals section of the Map Settings tab, where you can select checkboxes that indicate your display preferences, including: • Show Average Response Time• Show Average Calls per Minute• Hide unassigned tiers• Animate traffic
Using Topology Map Layout OptionsThe following Layout Options controls are available to all users.
The following Layout Options Controls are available to administrators only.
Table 10: Topology Map Layout Options Controls
Options DetailsReset Layout (button) Resets the layout to the default topology map that was defined for all
users.
Center Map
Centers the map.
Change Orientation
Places the User icon at the top or at the left (toggle).
Breadth slider Controls the space between nodes on the same level.
Link Length slider Controls the length of links between nodes.
Table 11: Layout Options Controls for Administrators
Options DetailsLayout: Save (button) Save the current display as your layout.
Layout: Load (button) Load the last layout that you saved.
Layout: Delete (button) Delete the presently displayed saved layout.
Application Performance Monitoring User Guide
APM User Interface View Types
Document ID: RDWR-APM-V0311000_UG1804 109
Working with the Topology Map Summary Tab KPI DisplayThe display of the Topology Map Summary tab KPI panes includes:• Transactions per second (TPS)• Average response time (AVG)%• Response-time SLA compliance• Number of transactions
By default, there is a KPI pane displaying KPIs for all monitored applications. You can configure a separate KPI pane for each monitored application. The following indicators are displayed in each KPI frame:Use the drop-down list control above each KPI circle to switch between data-center KPI and End User KPI.For Data Center, the average response time represents the response time as measured on the front end, and the response-time SLA compliance is based upon the data-center response-time SLA.The End User average response time is the average time it takes for the end users to see a response to their request on their desktops. The End User SLA refers to the SLA set for this response time.
Use saved layout for all users (checkbox)
As an administrator, you can set a saved layout to be the default layout with which all users start their Topology Map sessions.
Table 11: Layout Options Controls for Administrators
Options Details
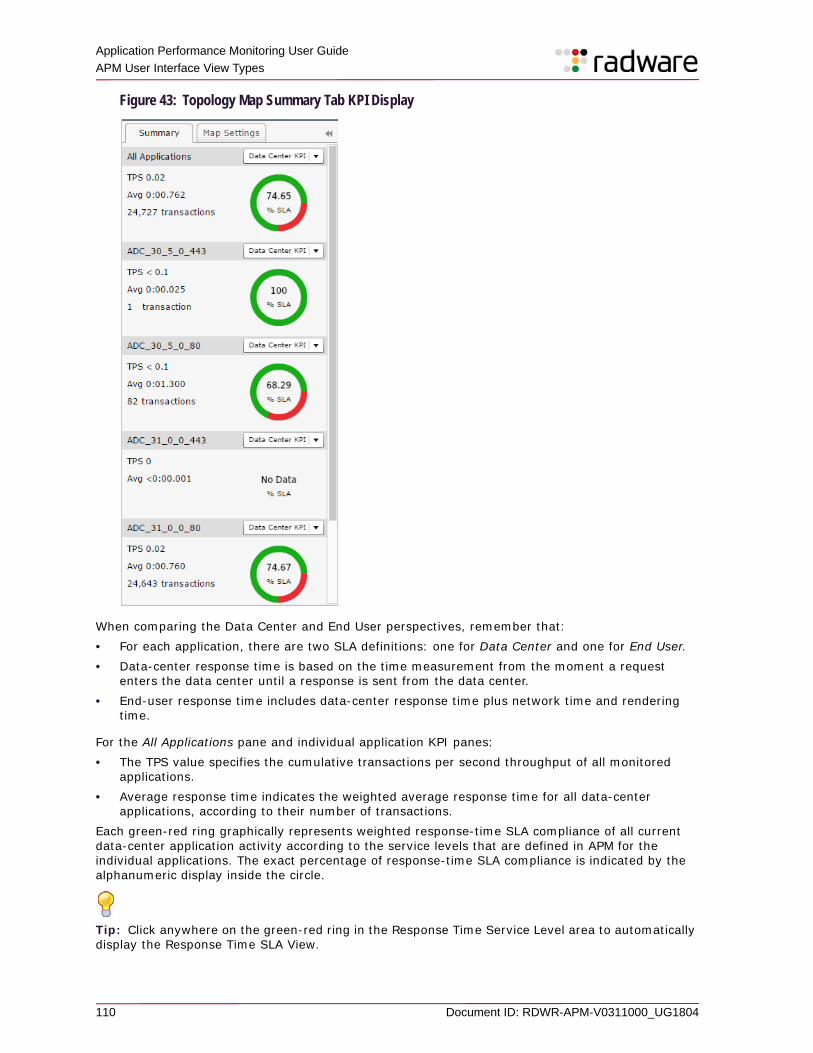
Application Performance Monitoring User Guide APM User Interface View Types
110 Document ID: RDWR-APM-V0311000_UG1804
Figure 43: Topology Map Summary Tab KPI Display
When comparing the Data Center and End User perspectives, remember that: • For each application, there are two SLA definitions: one for Data Center and one for End User. • Data-center response time is based on the time measurement from the moment a request
enters the data center until a response is sent from the data center.• End-user response time includes data-center response time plus network time and rendering
time.
For the All Applications pane and individual application KPI panes: • The TPS value specifies the cumulative transactions per second throughput of all monitored
applications.• Average response time indicates the weighted average response time for all data-center
applications, according to their number of transactions.Each green-red ring graphically represents weighted response-time SLA compliance of all current data-center application activity according to the service levels that are defined in APM for the individual applications. The exact percentage of response-time SLA compliance is indicated by the alphanumeric display inside the circle.
Tip: Click anywhere on the green-red ring in the Response Time Service Level area to automatically display the Response Time SLA View.
Application Performance Monitoring User Guide
APM User Interface View Types
Document ID: RDWR-APM-V0311000_UG1804 111
When there is no activity, the service-level area text inside the circle is grey.
Tip: Click any of the KPI panes. You can switch from the Topology Map to the specific SLA Transaction view that shows all the transactions for the represented application, by clicking on a KPI pane. The SLA View show all the transactions for the application represented by the KPI pane.
Working with Response-Time SLA ViewsThe response-time SLA views provide a basic understanding of the current health of your system. These views identify problematic applications, transactions and locations, displaying response-time SLA compliance and other KPIs, and provide drill-downs for reaching the root cause of poor performance. They help you discover the root causes of problematic performance. The views include the following:• The SLA Watch (Applications) displays response-time SLA compliance and main KPIs for
monitored applications using these items:— Monitoring - Applications > Applications View > User Experience Information— Monitoring - Applications > Applications View > Data Center Information
• The SLA Watch (Transactions) displays response-time SLA compliance and main KPIs for monitored transaction types. Use these paths: — Monitoring - Applications > Transactions View > User Experience Information— Monitoring - Applications > Transactions View > Data Center Information
• The SLA Watch (Locations) displays response-time SLA compliance and main KPIs for monitored locations. Use this path: — Monitoring - Locations > Locations View
For more information, see the following:• User Interface Features of All SLA Watch Views, page 111• Using End User Watch vs. Data Center SLA Watch Views, page 114• Exploring Transaction Behavior, page 114• Viewing End User - Locations SLA Watch, page 114
User Interface Features of All SLA Watch ViewsAll SLA Watch screens display a bubble chart on the left and a table of performance indicators on the right.The bubble chart provides a quickly comprehensible visual summary of response-time SLA compliance and volume for applications or transactions:• Each bubble represents an application or transaction type.• The size of the bubble reflects the volume.• The location of the bubble on the green, yellow or red zones represents the level of response-
time SLA compliance.
Note: There is no significance to the angle at which the bubble displays. What is significant is whether it is on a green, yellow or red area. These response-time SLA-compliance zones represent the overall health of the application, location, or transaction in terms of performance.
Application Performance Monitoring User Guide APM User Interface View Types
112 Document ID: RDWR-APM-V0311000_UG1804
In the bubble chart, the application’s location on the green, yellow, or red zones represents response-time SLA compliance, warning, or critical alert status.The table on the right displays the SLA Watch KPIs (key performance indicators) including response-time SLA, response time, volume, application, transaction, or location KPIs. The following sections describe the bubble charts and KPI tables included in the SLA Watch views.• Working with SLA Bubble Charts, page 112• Working with Graphic Features of SLA Watch Bubble Charts, page 112• Features of the SLA Watch KPI Tables, page 113
For related information, see Managing Application SLAs, page 113.
Working with SLA Bubble ChartsSLA Watch bubble charts provide an instant view into the overall state of applications, transactions, or locations, and highlight those that require attention.
Note: There is no significance to the angle at which the bubble displays with relation to the center of the graph. What is significant is whether a bubble is on a green, yellow or red area. These response-time SLA-compliance zones represent the overall health of the application, location, or transaction in terms of performance.
Hover over any bubble with your mouse for a tooltip display of details or that entity (application, transaction, or location). The tooltip details include the name of the application, transaction or location, the number of activations and its percentage of response-time SLA compliance. For every bubble in the bubble chart, there is a corresponding row in the KPI table that provides more details.
Working with Graphic Features of SLA Watch Bubble ChartsThe graphic features of the bubble chart make application/transaction/location behavior visually and quickly assessable, and cause the existence of problem applications to grab the attention of the APM user. These graphic features can be summarized as follows:• Bubble size—The size of the bubble representing an application/transaction/location is
determined by the number of times the application/transaction/location is activated during the current selected timeframe.
• Bubble location and zone color—The color of the concentric circle in which each application is represented indicates the health of the application/transaction/location behavior. When a circle representing an application displays in the green area, the performance of the application/transaction/location is at an acceptable level. A circle displayed in the yellow (alert) or red (response-time SLA non-compliance) area indicates a problem with the application/transaction/location that it represents.
• Failed bubbles and the letter F on an SLA bubble chart bubble—An F on an SLA bubble chart bubble signifies that the transaction type, location, or application that the bubble represents is in Failure Rate non-compliance—that is, it surpassed its threshold for Rate of Failed Transactions warning or critical alert. If the entity has too high a rate of transaction failures (that is, surpasses the SLA-threshold), the bubble that represents it cannot be in the green area of the bubble chart. This means, for instance, that bubbles with F for Failed Transaction Rate non-compliance are always in the orange or red areas of the chart, even if those transactions were in response-time SLA compliance.
Tip: You can hover over a bubble with your mouse to display a tooltip that specifies the application/transaction/location name, number of activations in the currently selected date range, and percentage of response-time SLA compliance.
Application Performance Monitoring User Guide
APM User Interface View Types
Document ID: RDWR-APM-V0311000_UG1804 113
Features of the SLA Watch KPI TablesData in all SLA Watch KPI tables always refers to the currently selected timeframe.
Managing Application SLAsAfter you have enabled the APM feature on a service, a corresponding application is defined in APM. All APM users can examine the application’s properties using the application’s Properties dialog box. Application properties include the following:• SLA values for application and/or transaction level by timeframes• Alerts• Severity thresholds• Alert sensitivity settings
Table 12: Watch KPI Tables
Column DescriptionApplication/Transaction Type/Location
The name of the application/transaction type or location the KPI values are about.
Average Response Time The average response time for transactions of this application/transaction type or location.
Note: This value will vary depending on service level selection.
95% The value that represents the 95th percentile of response times for transactions of the application/transaction type or location in this application. 95% of the transactions of this application/transaction type or location were completed with a response time lower than or equal to this value.
Note: This value will vary depending on service level selection.
STDV The standard deviation of response times. A low standard deviation indicates that the response times are close to the mean, whereas high standard deviation indicates that the data response times are spread over a large range of values.
Volume The number of transactions belonging to this application/transaction type or location that were processed during the currently selected timeframe.
Note: This value will be the same for End User and Data Center.
% SLA The percent of transactions of this application/transaction type or location that are in response-time SLA compliance with the currently defined response-time SLA.
Note: This value varies depending on service level selection.
#Exceeded SLA The number of transactions of this application/transaction type or location that exceeded SLA.
Avg. TPS The average transactions per second for this application, transaction type, or location.
# failed The number of transactions of this application/transaction type or location that failed.
% failed The percentage of transactions of this application/transaction type or location that failed.
Application Performance Monitoring User Guide APM User Interface View Types
114 Document ID: RDWR-APM-V0311000_UG1804
APM administrators and managers manage application SLAs. For details on managing application SLAs, see Configuring Response-Time SLAs and Response-Time-SLA Alerts, page 154.For a general overview of SLA Management, see Response-Time SLA Management and Failed Transaction Management, page 153.
Using End User Watch vs. Data Center SLA Watch ViewsThe difference between the End User and Data Center SLA Watch views is in the starting/ending points of the monitored statistics. End User SLA Watch displays statistics for transactions/applications from the time that a request is made by the end-user through rendering of the reply on the end-user’s workstation, including network latency. On the other hand, data-center SLA watches display monitored KPIs from the data center only.
Exploring Transaction BehaviorAPM automatically generates transaction and application models (see Viewing the Transaction Model - Data Center Tab, page 125) based on real-time transaction/application cross-tier tracking data. It provides you with the visible representations that help you continuously know which activities are in need of improvement most urgently. APM helps you improve overall end-user experience, while concentrating effort on the types of activities that require improvement most urgently.You can find out more about transaction behavior in your data center by the following:• Seeing the length of time they spent on each hop.• Using the Advanced Search Transaction Type view.
Clicking on any transaction listed in the Transaction tab provides access to a number of possibilities for examining individual transactions. See Examining Individual Transaction Instances, page 117.For more information, see:• Using the Transactions KPI Table, page 114• Using Transactions Bubble Chart, page 114
Using the Transactions KPI TableData in the KPI Table always refers to the currently selected timeframe. The KPIs shown in the initial table are aggregated statistics for each transaction type during the selected timeframe.
Using Transactions Bubble ChartThe Transactions bubble chart provides response-time SLA compliance information for monitored transaction types in a glance. Hover over any Transaction Type bubble with your mouse for a tooltip display of Transaction Type details (transaction type name, number of activations and percentage transactions in response-time SLA compliance). There is a corresponding row in the Transactions KPI table for every bubble in the Transactions bubble chart.
Viewing End User - Locations SLA WatchThis SLA Watch view monitors the health of locations and lets you see quickly at which locations the end-user experience not SLA-compliant.
Application Performance Monitoring User Guide
APM User Interface View Types
Document ID: RDWR-APM-V0311000_UG1804 115
Using Compare Good Versus BadCompare Good vs. Bad views provide a shortcut to identifying the root cause of performance problems. In these views, tier-usage of transaction instances that complied with their SLA is compared to tier usage of transaction instances that exceeded their SLA. Drill-downs in the non-compliant bar of tiers with the greatest difference in processing time per transaction between “good” transactions and “bad” transactions will lead you to the root causes of performance problems.Compare Good vs. Bad can be accessed to compare behavior of instances of one transaction type (transaction level) or, at the application infrastructure level, all transactions of an application.For more information, see:• Viewing the Layout, page 115• Viewing Access for Transaction Level Good Vs. Bad Comparison Information, page 115• Viewing Access for Application Level Good Versus Bad Comparison Information, page 115• Viewing UI and Functional Features, page 116
Viewing the LayoutOne pair of graphs (displayed on a darker background) represents the summary of the good vs. bad performance. The remainder of the good vs. bad pairs are displayed in descending order of contrast between good and bad transaction performance.
Viewing Access for Transaction Level Good Vs. Bad Comparison InformationAnalysis of one transaction type’s performance problems is most often accessed using the Transaction Model option. This option is available by clicking on a transaction instance in a search-results display:
1. Click the required transaction type or application.2. From the context menu that opens, choose an option that searches and lists transaction
instances.
3. Select the Transaction Model option from the context menu.
4. Select the Compare Good vs. Bad tab. The Compare Good vs. Bad for the Transaction Model of one transaction type displays.
Viewing Access for Application Level Good Versus Bad Comparison Information
To see god vs. bad for all transactions of an application or a group of applications
1. Choose the applications with the application chooser.2. Go to Monitoring - Applications > Transactions View > User Experience Information.
3. Click the relevant transaction.
4. From the pop-up menu, choose Compare Good vs. Bad. Good vs. bad displays for the Transaction Model based on all the transaction instances of the selected applications for the currently selected timeframe.
Application Performance Monitoring User Guide APM User Interface View Types
116 Document ID: RDWR-APM-V0311000_UG1804
Viewing UI and Functional FeaturesFor the selected application, this view compares aspects of tier-usage between transactions that complied with their SLA and transactions that exceeded their SLA. Tier-usage is examined for the following criteria:• Average processing time per transaction (seconds)• Average invocations per transaction
On a darker background, you can see bars that represent the total of the average processing times and the totals of average invocations across all tiers for transaction instances that were SLA-compliant and those that were not.
Note: A transaction can be processed on more than six tiers. However, only up to six of the most significant tiers upon which processing took place are represented in the view. The cumulative graph bars on the left side also represent up to six tiers.
You can drill down in each transaction tier comparison to compare the behavior of the transaction segments that comprise it. In addition, clicking on Total Number of Transaction Instances of this type takes you to a window displaying the individual transactions.Drilling down is an attempt to determine exactly which tier, which transaction, and which transaction segment is causing a problem.
Working with Compare Timeframes ViewsCompare Timeframes helps you solve application problems by comparing aspects of tier or node usage of an application’s transactions during the currently selected timeframe with their tier or node usage during a previous timeframe. Compare Timeframes is available under many labels and in many contexts in the APM main menu. Compare Timeframes lets you determine whether transaction performance has improved, declined, or stayed the same in comparison to a previous period. It is typically used to check after a correction, a known problem, or a version rollout. This view provides another means of finding the cause of application and transaction problems. This view compares transaction behavior of one or more applications during the present timeframe and a previous period. The view displays the time spent on the various tiers during the two periods. When the amount of time spent on a particular tier is much greater in one of the periods than in the other, you have reason to drill down and find out in which transaction segments or database calls problems occur. This section contains the following:• Viewing Compare Timeframes, page 116• Working with Compare Timeframes, page 117
Viewing Compare TimeframesThe columns representing the two time periods are color-coded by the period to which they belong. On the left side of the view, against a darker background, the cumulative processing times, and the number invocations for the two time periods are presented for each time period. Note that these one-column summaries are not proportional with their counterparts on the right side of the view.
Application Performance Monitoring User Guide
APM User Interface View Types
Document ID: RDWR-APM-V0311000_UG1804 117
Working with Compare TimeframesUse the second drop-down list to choose the comparison timeframe:• The same time the day before• The same time the week before• A custom time range
Tip: When you use the custom time range, be sure to define a time range that does not overlap with your current timeframe.
Between the selected time ranges, you can compare the behavior of all transactions or the behavior of the transactions that exceeded SLA. Compare a period of problematic application behavior with a period of non-problematic or less problematic application behavior and then drill down in the problematic tiers to determine in which transactions, transaction segments, and database calls the problems occurred.
Examining Individual Transaction InstancesWhen an application is not performing at SLA levels, you need to determine the cause of the problem. You can start by isolating the individual transactions or transaction segments in which the problem reveals itself through excessive processing time. The SLA Watch – Transactions view and the Search view provide drill-downs for doing just that. The Transaction Instance Views are drill-downs that provide rich detail about transaction instances. You can find general information that applies to all three of these views in the following sections.The Transaction Instance views provide rich detail about transaction instances. For more information, see the following:• Finding the Relevant Transaction Instance, page 118• Investigating Transaction Instances, page 119• Navigating Between the Transaction Instance Views, page 119• Viewing Tier Distribution on the Transaction Views, page 121• Viewing the Transaction’s Response Time Breakdown Representation in the Transaction Instance
Views, page 122• Using the Transaction Instance Views, page 122• Viewing the Critical Path, page 123• Using the Transaction Topology View, page 124• Understanding the Segment Details Display, page 124• Viewing the Transaction Properties Dialog Box, page 125• Viewing the Transaction Model, page 125• Working with Transaction Properties, page 127
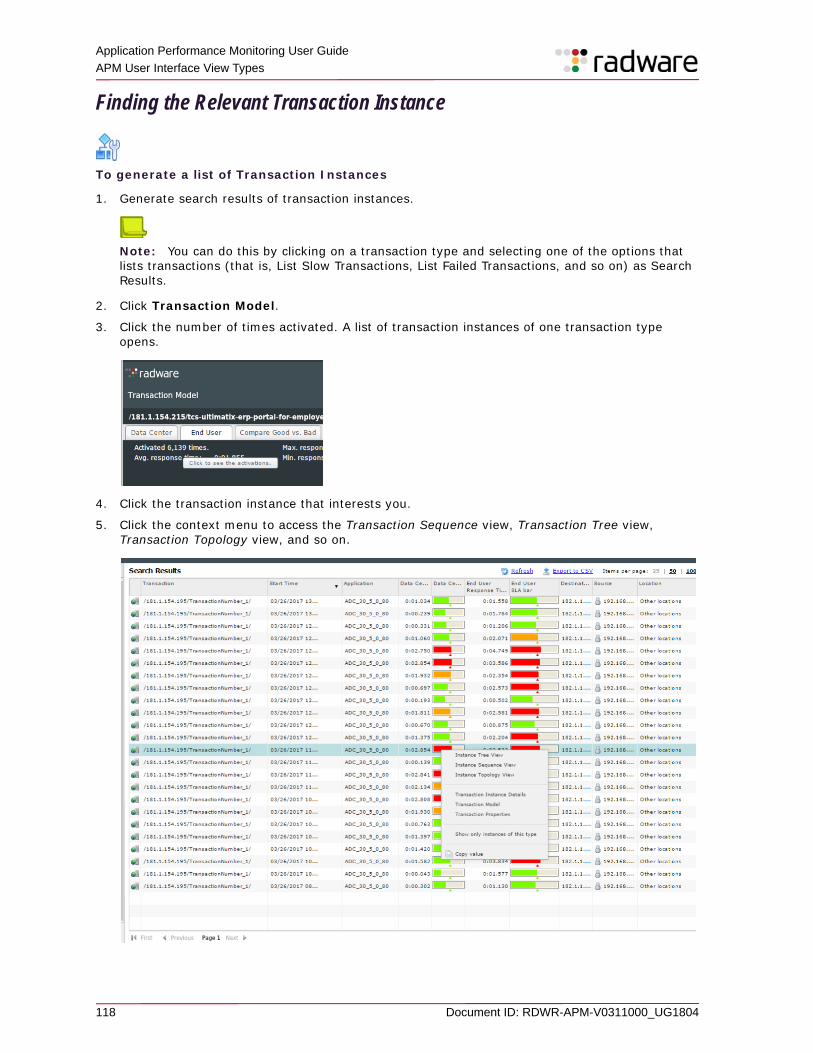
Application Performance Monitoring User Guide APM User Interface View Types
118 Document ID: RDWR-APM-V0311000_UG1804
Finding the Relevant Transaction Instance
To generate a list of Transaction Instances
1. Generate search results of transaction instances.
Note: You can do this by clicking on a transaction type and selecting one of the options that lists transactions (that is, List Slow Transactions, List Failed Transactions, and so on) as Search Results.
2. Click Transaction Model.
3. Click the number of times activated. A list of transaction instances of one transaction type opens.
4. Click the transaction instance that interests you.
5. Click the context menu to access the Transaction Sequence view, Transaction Tree view, Transaction Topology view, and so on.
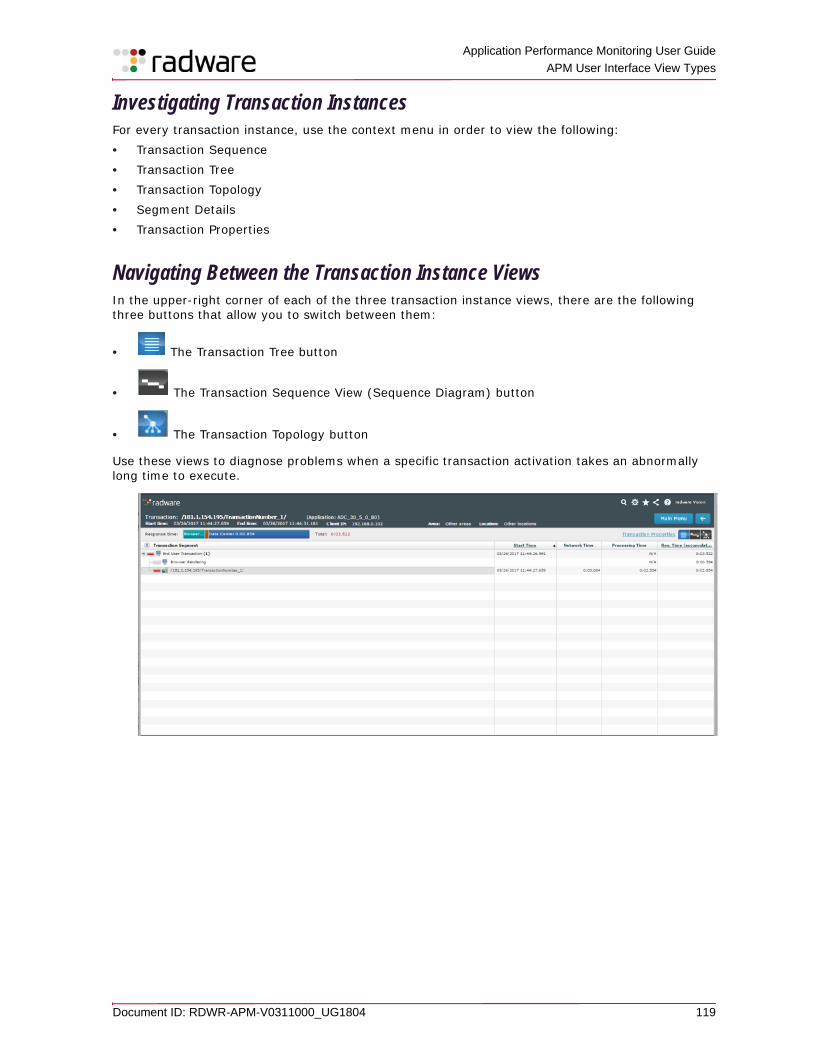
Application Performance Monitoring User Guide
APM User Interface View Types
Document ID: RDWR-APM-V0311000_UG1804 119
Investigating Transaction InstancesFor every transaction instance, use the context menu in order to view the following:• Transaction Sequence• Transaction Tree• Transaction Topology• Segment Details• Transaction Properties
Navigating Between the Transaction Instance ViewsIn the upper-right corner of each of the three transaction instance views, there are the following three buttons that allow you to switch between them:
• The Transaction Tree button
• The Transaction Sequence View (Sequence Diagram) button
• The Transaction Topology button
Use these views to diagnose problems when a specific transaction activation takes an abnormally long time to execute.
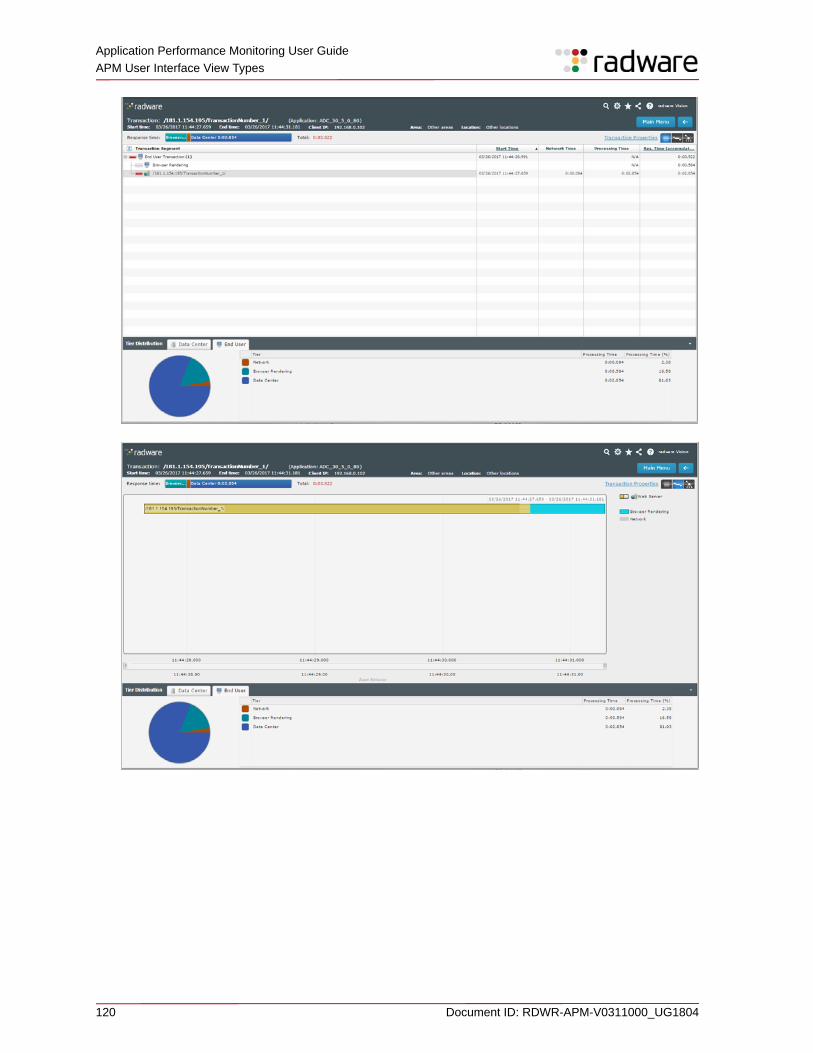
Application Performance Monitoring User Guide APM User Interface View Types
120 Document ID: RDWR-APM-V0311000_UG1804
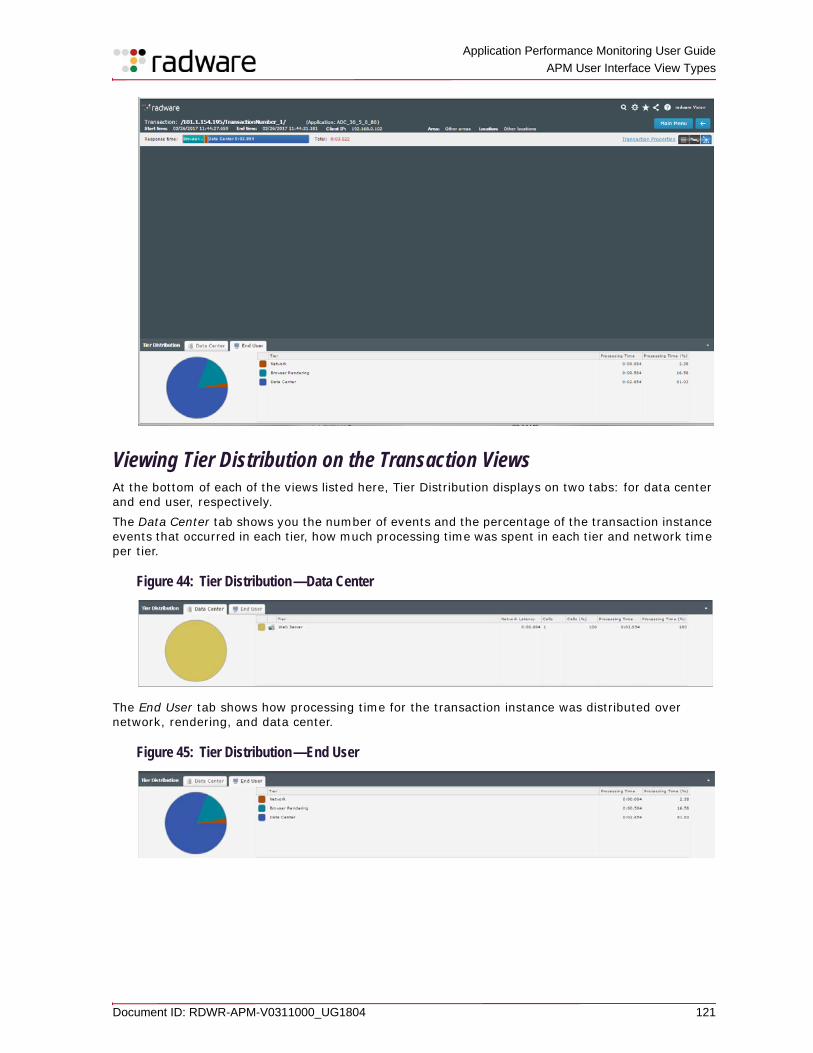
Application Performance Monitoring User Guide
APM User Interface View Types
Document ID: RDWR-APM-V0311000_UG1804 121
Viewing Tier Distribution on the Transaction ViewsAt the bottom of each of the views listed here, Tier Distribution displays on two tabs: for data center and end user, respectively. The Data Center tab shows you the number of events and the percentage of the transaction instance events that occurred in each tier, how much processing time was spent in each tier and network time per tier.
Figure 44: Tier Distribution—Data Center
The End User tab shows how processing time for the transaction instance was distributed over network, rendering, and data center.
Figure 45: Tier Distribution—End User
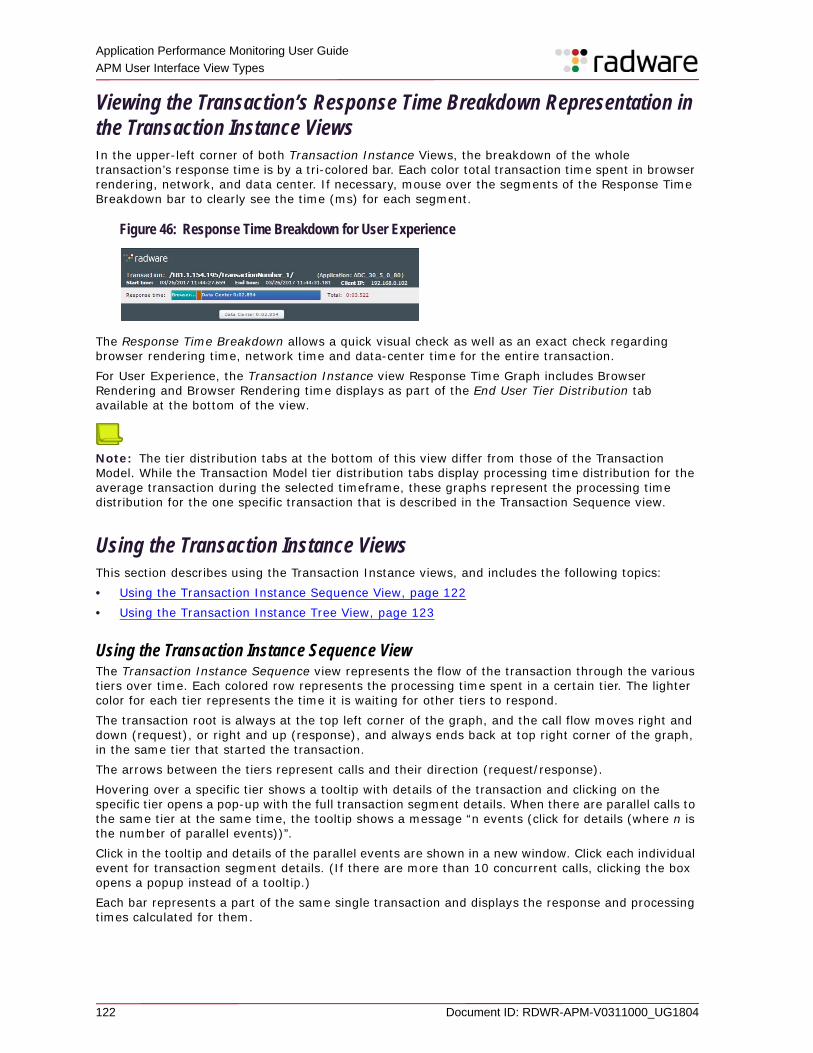
Application Performance Monitoring User Guide APM User Interface View Types
122 Document ID: RDWR-APM-V0311000_UG1804
Viewing the Transaction’s Response Time Breakdown Representation in the Transaction Instance ViewsIn the upper-left corner of both Transaction Instance Views, the breakdown of the whole transaction’s response time is by a tri-colored bar. Each color total transaction time spent in browser rendering, network, and data center. If necessary, mouse over the segments of the Response Time Breakdown bar to clearly see the time (ms) for each segment.
Figure 46: Response Time Breakdown for User Experience
The Response Time Breakdown allows a quick visual check as well as an exact check regarding browser rendering time, network time and data-center time for the entire transaction. For User Experience, the Transaction Instance view Response Time Graph includes Browser Rendering and Browser Rendering time displays as part of the End User Tier Distribution tab available at the bottom of the view.
Note: The tier distribution tabs at the bottom of this view differ from those of the Transaction Model. While the Transaction Model tier distribution tabs display processing time distribution for the average transaction during the selected timeframe, these graphs represent the processing time distribution for the one specific transaction that is described in the Transaction Sequence view.
Using the Transaction Instance ViewsThis section describes using the Transaction Instance views, and includes the following topics:• Using the Transaction Instance Sequence View, page 122• Using the Transaction Instance Tree View, page 123
Using the Transaction Instance Sequence ViewThe Transaction Instance Sequence view represents the flow of the transaction through the various tiers over time. Each colored row represents the processing time spent in a certain tier. The lighter color for each tier represents the time it is waiting for other tiers to respond.The transaction root is always at the top left corner of the graph, and the call flow moves right and down (request), or right and up (response), and always ends back at top right corner of the graph, in the same tier that started the transaction.The arrows between the tiers represent calls and their direction (request/response).Hovering over a specific tier shows a tooltip with details of the transaction and clicking on the specific tier opens a pop-up with the full transaction segment details. When there are parallel calls to the same tier at the same time, the tooltip shows a message “n events (click for details (where n is the number of parallel events))”. Click in the tooltip and details of the parallel events are shown in a new window. Click each individual event for transaction segment details. (If there are more than 10 concurrent calls, clicking the box opens a popup instead of a tooltip.)Each bar represents a part of the same single transaction and displays the response and processing times calculated for them.
Application Performance Monitoring User Guide
APM User Interface View Types
Document ID: RDWR-APM-V0311000_UG1804 123
Using the Transaction Instance Tree ViewThe Transaction Instance Tree view presents a tree that displays all the transaction segments of the transaction instance. Each node in the tree represents a single request (and response) from one component to another, displaying the start-time, network time, and accumulated response time for each request.This information allows examination of a single problematic transaction instance to determine exactly in which transaction segments problems are occurring. Once a problematic segment is identified, you can further examine it by invoking the Transaction Segment Details display from the segment’s own context menu.The following information is shown for each branch in the tree:• Transaction Segment (Event)• Start Time• Network Latency• Processing Time• Response Time (accumulated)
Note: Response Time includes the response time for current event and all its child events including processing time and network time between child events.
For more information, see:• Viewing the Critical Path, page 123• Using the Transaction Topology View, page 124• Understanding the Segment Details Display, page 124• Viewing the Transaction Properties Dialog Box, page 125
Viewing the Critical PathYou can find the critical path of any transaction using the Transaction Tree as follows:
1. For all children of the “current node”, choose the child with highest response time.2. If the response time of the child with the highest response time is greater than the processing
time of its parent, then continue exploring the descendants of this child.
3. If this is not the case (that is, the response time of that child is less than the processing time of its parent), stop.
Notes
• In partial mode, nothing is painted.
• Delayed transactions do not have critical path.
Application Performance Monitoring User Guide APM User Interface View Types
124 Document ID: RDWR-APM-V0311000_UG1804
Using the Transaction Topology ViewThe Transaction Topology view displays the path that a single transaction took from the end user’s request to rendering (when relevant) of the response on the end user’s screen. It displays details for each leg of the transaction’s path and each node—including node name, protocol, time expended, IP address, and tier.
Note: This view does not have display manipulation capabilities. Its purpose is to show all the segments of the transaction. A problematic segment would appear in red.
The information that is immediately viable from the Transaction Topology map and its Data Center and End User tabs make the Transaction Topology view valuable for diagnosing problems in completed transactions that are identified as problematic as well as in transactions that failed.
To access the Transaction Instance Topology view
> From the list of transaction instances, click a transaction of interest and select the Transaction Topology View option.
To view the Transaction Topology from a list of transaction instances
> Click a transaction of interest and select the Transaction Topology View option.
Understanding the Segment Details Display
To view in-depth details of a transaction segment
> Click the segment transaction tree / transaction sequence that you wish to examine.
For segment details that represent a root of a transaction, the details may be different depending on the end user’s browser type and version.This section contains the following:• Viewing Transaction Segment Details for End Users with Older Browsers, page 124• Viewing Transaction Segment Details for End Users with Newer Browsers, page 124
Viewing Transaction Segment Details for End Users with Older Browsers
Note: APM lets you use many starting points and action sequences to explore individual transactions.
Viewing Transaction Segment Details for End Users with Newer BrowsersYou can view transaction segment details for end users with newer browsers.
Application Performance Monitoring User Guide
APM User Interface View Types
Document ID: RDWR-APM-V0311000_UG1804 125
Viewing the Transaction Properties Dialog Box
To view the Transaction Properties dialog box
> Click Transaction Properties in the Transaction Instance Tree, Transaction Topology or Transaction Sequence view header.
Viewing the Transaction ModelYou can access the Transaction Model from context menu of any item in a listing of transaction types or transaction instances.Example:
1. Go to Monitoring - Applications > Transactions View > User Experience Information or Monitoring - Applications > Transactions View > Data Center Information.
2. Click a transaction.
3. Select End-User Transactions SLA or Data Center Transactions SLA correspondingly (SLA Watch - Transactions).
4. Select a transaction, and click Transaction Model.
The Transaction Model includes four tabs:• Data Center• End User (when Real-User Monitoring is enabled)• Compare Good vs. Bad• Compare TimeframesUsing the Transaction Model you can understand how transaction types behave across time from either end-user or data-center perspectives, and also to compare the behavior across timeframes, or compare compliant and non-compliant transaction behavior across tiers.The following sections describe the tabs of the Transaction Model screen:• Viewing the Transaction Model - Data Center Tab, page 125• Viewing the Transaction Model - End User Tab, page 126• Working with Transaction Model - Data Center and End User Tabs, page 126• Viewing the Transaction Model—Compare Timeframes Tab, page 126
Viewing the Transaction Model - Data Center TabTransaction Model > Data Center displays the composite behavior of all the transactions of one transaction type for the selected timeframe. The pie chart on this tab displays the response-time distribution across database tiers of all transactions of the named transaction type during the selected timeframe.See Working with Transaction Model - Data Center and End User Tabs, page 126 for an explanation of actions you can take from this tab.
Application Performance Monitoring User Guide APM User Interface View Types
126 Document ID: RDWR-APM-V0311000_UG1804
Viewing the Transaction Model - End User TabThis view shows you, for the composite of all transactions of this type during the selected timeframe, the breakdown of response time between data center, network, and rendering. See Working with Transaction Model - Data Center and End User Tabs, page 126 for an explanation of actions you can take from this tab.
Working with Transaction Model - Data Center and End User Tabs From the both the Data Center and the End User tabs of the Transaction Model, you can do the following:• Click the number link of the Activated parameter to view a configurable search listing
transactions of this type.• Click Transaction Properties to view the Transaction Properties dialog box. For more
information, see Working with Transaction Properties, page 127.• View maximum, minimum, and average response times as well as percentage of response-time
SLA compliance.• View the breakdown of data-center response time across tiers for the model of all transactions
of the designated transaction type. This is the main purpose for working with Working with Transaction Model - Data Center and End User tabs.
• Click Transaction Properties to display the Transaction Properties dialog box including the Transaction Type’s description, SLAs, Alert Thresholds, Alerts, and Alert Sensitivity. (Administrators and application managers can modify the transaction properties). Transaction Properties allows users to view important transaction type information and values including description, SLAs, Alert Thresholds, Alerts and Alert Sensitivity, and allows administrators/application managers, and so on to modify them.
For more information about the Transaction Properties dialog box, see the following: • Working with Transaction Properties, page 127• Response-Time SLA Management and Failed Transaction Management, page 153
Viewing the Transaction Model—Compare Good vs. Bad TabThis view compares the cross-tier activity of SLA-compliant transactions with SLA-non-compliant transactions during the selected timeframe. Drilling down in the non-compliant graph bars helps you determine the applications and calls that are at the root cause of the transaction behavior problems of the non-compliant transaction instances. For more, see Using Compare Good Versus Bad, page 115.
Viewing the Transaction Model—Compare Timeframes TabThis view lets you compare the behavior of a transactions during a recent period with that of transactions that were completed during a previous period. This is especially helpful for testing the impact of a change that has been made.
Using the Transaction Model—Compare Timeframes TabThe Compare Timeframes view always compares the behavior model of all transaction instances of the currently selected applications and timeframe with the behavior model of all transaction instances for the currently selected applications during a previous period, perhaps before some change occurred either in the system (that is, a new version was implemented) or in the system behavior (that is, performance degradation was observed).Columns on the left display the cumulative average processing time and cumulative average invocations per transaction across all tiers represented on the right side of the view.
Application Performance Monitoring User Guide
APM User Interface View Types
Document ID: RDWR-APM-V0311000_UG1804 127
Note: A transaction can be processed on more than six tiers. However, only up to six of the most significant tiers upon which processing took place are represented in the view. The cumulative graph bars on the left side also represent up to six tiers.
For more information, see Viewing Compare Timeframes, page 116.
Working with Transaction PropertiesThere are many ways you can reach Transaction Properties. One is from the Transaction Model. Another is by drilling down from the Transaction KPI table to Transaction > Search for Transaction instances > Transaction properties. You can also reach Transaction Properties through the Transaction Instance view, through the context menu of a transaction type in SLA Watch or using the Transaction Model.The Transaction Properties dialog box enables administrators and application managers to control SLA and Alert settings and to adjust the Description/Name of the transaction.SLA Management is available to Administrators. It is also available to Application Managers on applications for which they are authorized.This dialog box also enables you to open the application’s Properties dialog box.Users who do not have the required privilege to update this information can view the information in the Transactions Properties dialog box.For more about defining and adjusting SLAs, alerts, severity thresholds, and alert sensitivity settings, see:• Response-Time SLA Management and Failed Transaction Management, page 153• Configuring SLAs and SLA Alerts from Transaction Properties, page 159• Configuring Transaction Failure Alerts from Transaction Properties, page 162
Administrators and Application Managers can edit the following items in the Transaction Properties dialog box:• Description field• Inherit threshold definitions from application checkbox• SLA Management group box• Alert Sensitivity Settings group box
Working with Global User Experience Global User Experience lets you examine user experience issues from various perspectives by letting you compare response time, network time, and volume between areas and locations, seeing how the data center, network, rendering, and volume contributed to or influenced application behavior.You control the view using the Show, Area, and Location drop-down lists.
To view Global User Experience
1. In the APM main menu, go to Monitoring - Locations > Locations View.2. Click a location and click Global User Experience option in the context menu.
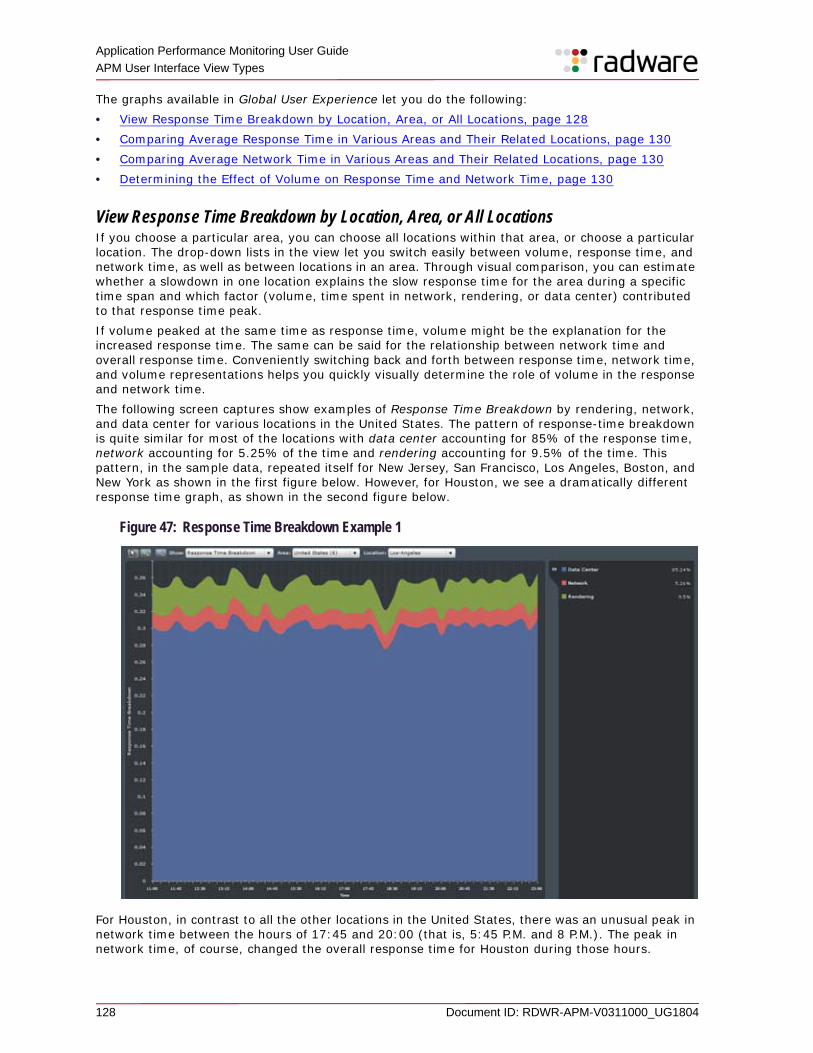
Application Performance Monitoring User Guide APM User Interface View Types
128 Document ID: RDWR-APM-V0311000_UG1804
The graphs available in Global User Experience let you do the following:• View Response Time Breakdown by Location, Area, or All Locations, page 128• Comparing Average Response Time in Various Areas and Their Related Locations, page 130• Comparing Average Network Time in Various Areas and Their Related Locations, page 130• Determining the Effect of Volume on Response Time and Network Time, page 130
View Response Time Breakdown by Location, Area, or All LocationsIf you choose a particular area, you can choose all locations within that area, or choose a particular location. The drop-down lists in the view let you switch easily between volume, response time, and network time, as well as between locations in an area. Through visual comparison, you can estimate whether a slowdown in one location explains the slow response time for the area during a specific time span and which factor (volume, time spent in network, rendering, or data center) contributed to that response time peak. If volume peaked at the same time as response time, volume might be the explanation for the increased response time. The same can be said for the relationship between network time and overall response time. Conveniently switching back and forth between response time, network time, and volume representations helps you quickly visually determine the role of volume in the response and network time.The following screen captures show examples of Response Time Breakdown by rendering, network, and data center for various locations in the United States. The pattern of response-time breakdown is quite similar for most of the locations with data center accounting for 85% of the response time, network accounting for 5.25% of the time and rendering accounting for 9.5% of the time. This pattern, in the sample data, repeated itself for New Jersey, San Francisco, Los Angeles, Boston, and New York as shown in the first figure below. However, for Houston, we see a dramatically different response time graph, as shown in the second figure below.
Figure 47: Response Time Breakdown Example 1
For Houston, in contrast to all the other locations in the United States, there was an unusual peak in network time between the hours of 17:45 and 20:00 (that is, 5:45 P.M. and 8 P.M.). The peak in network time, of course, changed the overall response time for Houston during those hours.
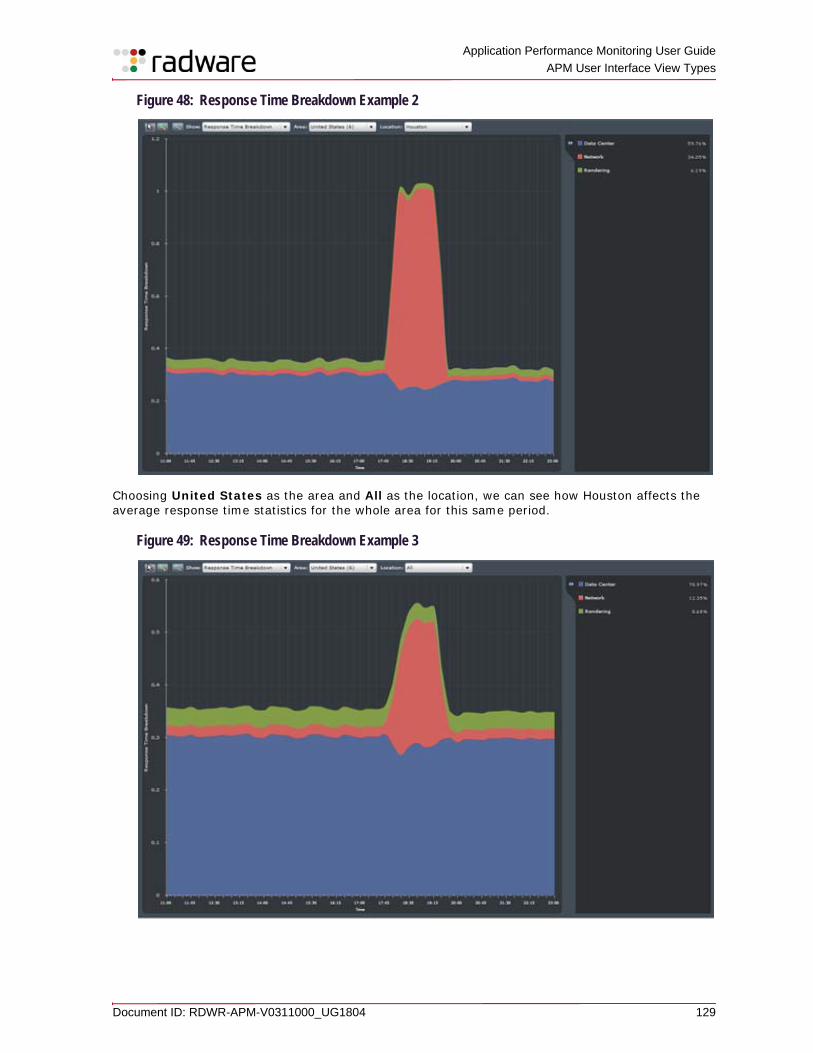
Application Performance Monitoring User Guide
APM User Interface View Types
Document ID: RDWR-APM-V0311000_UG1804 129
Figure 48: Response Time Breakdown Example 2
Choosing United States as the area and All as the location, we can see how Houston affects the average response time statistics for the whole area for this same period.
Figure 49: Response Time Breakdown Example 3
Application Performance Monitoring User Guide APM User Interface View Types
130 Document ID: RDWR-APM-V0311000_UG1804
Knowing that the peak in response time was in a specific location within the United States and that it was caused by a peak in network time will influence your next steps towards exploring and improving the situation. Such a step may be to compare the average network time in a related area.
Comparing Average Response Time in Various Areas and Their Related LocationsThe goal in exploring the Average Response Time in various areas and locations is to discover application behavior that deviates from the normal pattern during any problematic period and to understand the source of the problem (data center, network, or rendering).
To compare average response time in various areas and their related locations
1. In the APM main menu, go to Monitoring - Locations > Locations View.2. Click a location and click Global User Experience option in the context menu.
3. From the Show drop-down list, select Av.g Response Time.
4. From the Area drop-down list, select an area.
5. From the Location drop-down list, select All.
6. Navigate through the various areas to compare average response time by areas.
7. For each area of interest, navigate through the various locations to review average response time by location.
Comparing Average Network Time in Various Areas and Their Related LocationsThe goal in exploring the Average Network Time for various areas and locations is to discover cases in which network problems are causing poor application performance.
To compare average network time in various areas and their related locations
1. In the APM main menu, go to Monitoring - Locations > Locations View.2. Click a location and click Global User Experience option in the context menu.
3. From the Show drop-down list, select Avg. Network Time.
4. From the Area drop-down list, select an area.
5. From the Location drop-down list, select All.
6. Navigate through the various areas to compare average network times.
7. When the color of the peak in average network time, as displayed in the view, bears the legend color of a area/location in the display, the network latency problem needs to be explored in that area/location.
Determining the Effect of Volume on Response Time and Network TimeIt is important to be aware of peaks in activation volume, because they may explain changes in average network time and average response time.
To check for the effect of volume on response time and network time
1. In the APM main menu, go to Monitoring - Locations > Locations View.2. Click a location and click Global User Experience option in the context menu.
Application Performance Monitoring User Guide
APM User Interface View Types
Document ID: RDWR-APM-V0311000_UG1804 131
3. From the Show drop-down list, select Volume.
4. From the Area drop-down list, select an area of interest.
5. From the Location drop-down list, select a location of interest.
6. For problematic locations, locations where there are unexplained peaks of network time or response time, compare the volume pattern with the patterns of average network time and average response time to determine whether peaks in volume may explain peaks in these performance indicators.
Working with the Advanced Breakdown ViewThe Advanced Breakdown view provides advanced performance analytic capabilities, displays the overall resource usage of the applications’ infrastructure, and lets you analyze peaks of resource usage that may be impacting your end users. The user interface graphically displays the breakdown of processing time (total, or per transaction type) and invocations by tiers, hosts, nodes, applications, transaction types, transaction segments, and top users. This simplifies the isolation of performance issues and facilitates the quick identification of performance bottlenecks.For more information, see the following sections:• Using the Advanced Breakdown View, page 131• Using the Tooltips for Advanced Breakdown Information, page 134• Viewing Measured Elements, page 135• Viewing Displayed Measurements, page 135• Working with Advanced Breakdown Layout, page 135• Working with the Advanced Breakdown View’s Legend, page 136• Working with Drill-downs from the Main Graph in the Advanced Breakdown View, page 137• Using the Advanced Breakdown View Toolbar, page 137• Advanced Breakdown View—Secondary Graphs, page 138
Using the Advanced Breakdown ViewThe Advanced Breakdown view can be used to identify undesirable performance phenomena and to drill down to isolate the cause. This tool is based on the approach that trends are more important than the actual numbers. The initial view includes all the tiers and all the available display types. Significant changes, peaks, or sudden differences in the proportional relationship between the tiers indicate the elements that require more investigation through drill-down activity.Wherever you find unusual peaks in a measured element (that is, response time) more investigation should start with the tier consuming the most of the investigated resource (processing time in this case) during the activity peak indicated. The interface provides you with the possibility of isolating the problem, as explained in the following sections.For more information, see the following: • Advanced Breakdown View—Working Example, page 132• Reviewing Breakdown Possibilities, page 134
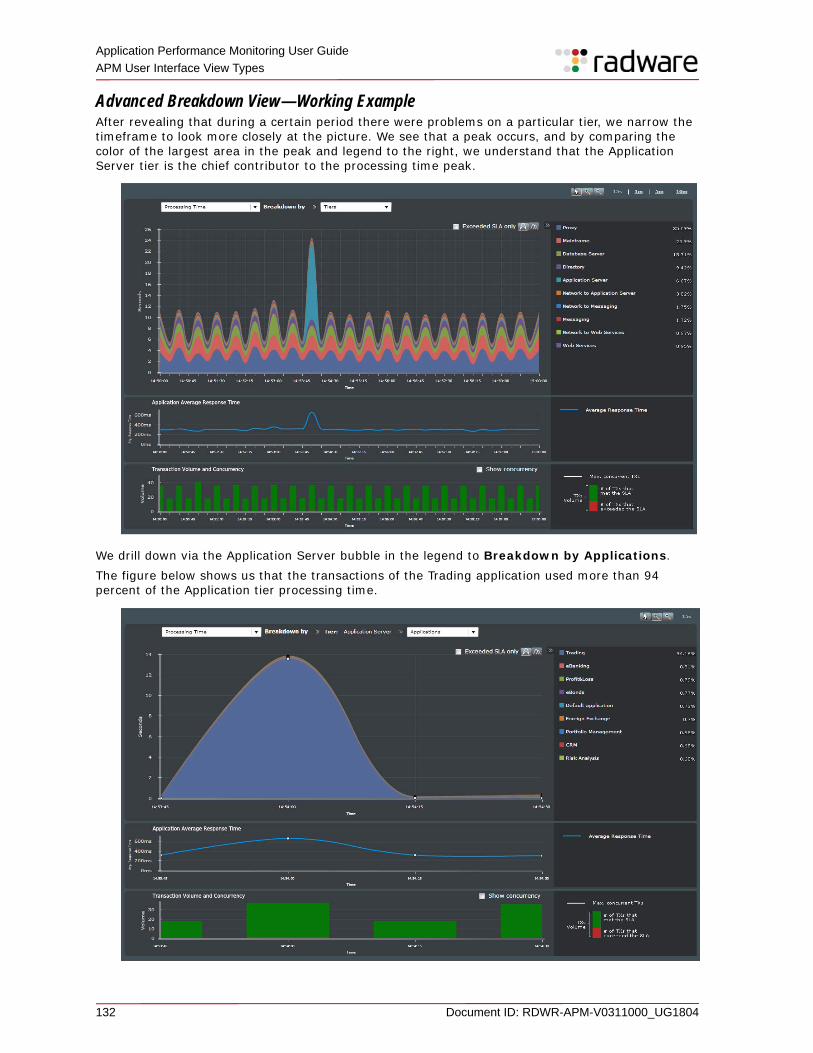
Application Performance Monitoring User Guide APM User Interface View Types
132 Document ID: RDWR-APM-V0311000_UG1804
Advanced Breakdown View—Working ExampleAfter revealing that during a certain period there were problems on a particular tier, we narrow the timeframe to look more closely at the picture. We see that a peak occurs, and by comparing the color of the largest area in the peak and legend to the right, we understand that the Application Server tier is the chief contributor to the processing time peak.
We drill down via the Application Server bubble in the legend to Breakdown by Applications. The figure below shows us that the transactions of the Trading application used more than 94 percent of the Application tier processing time.
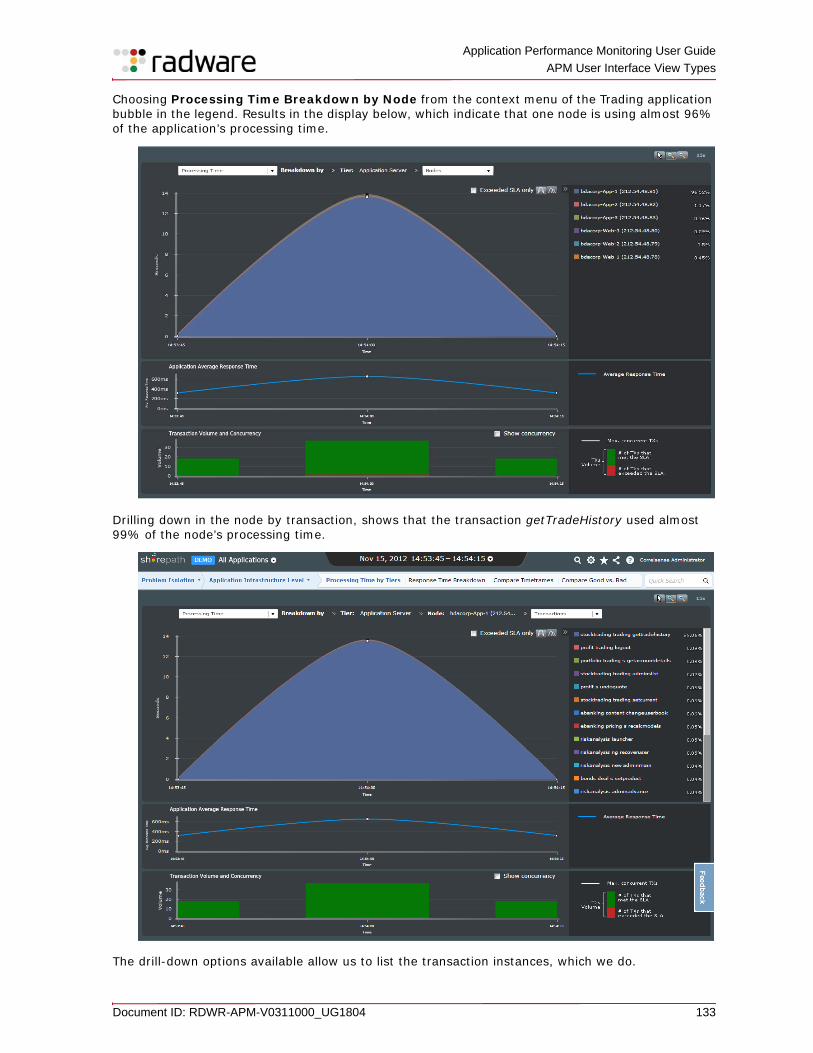
Application Performance Monitoring User Guide
APM User Interface View Types
Document ID: RDWR-APM-V0311000_UG1804 133
Choosing Processing Time Breakdown by Node from the context menu of the Trading application bubble in the legend. Results in the display below, which indicate that one node is using almost 96% of the application’s processing time.
Drilling down in the node by transaction, shows that the transaction getTradeHistory used almost 99% of the node’s processing time.
The drill-down options available allow us to list the transaction instances, which we do.
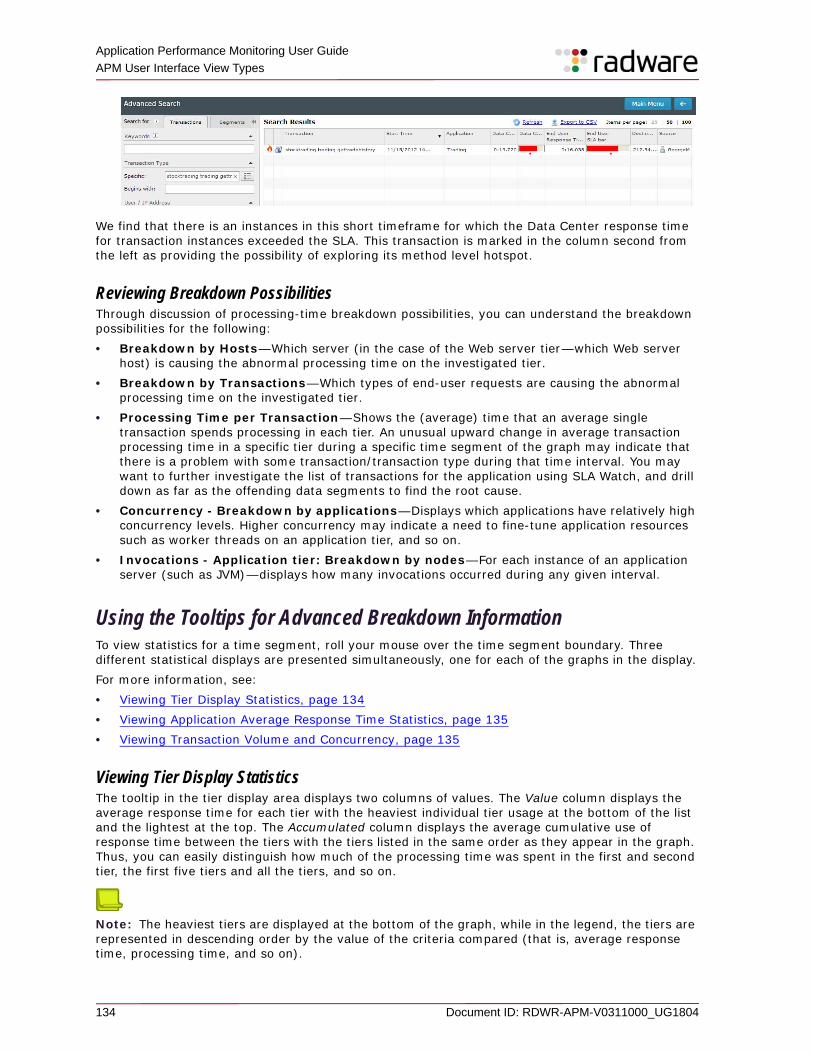
Application Performance Monitoring User Guide APM User Interface View Types
134 Document ID: RDWR-APM-V0311000_UG1804
We find that there is an instances in this short timeframe for which the Data Center response time for transaction instances exceeded the SLA. This transaction is marked in the column second from the left as providing the possibility of exploring its method level hotspot.
Reviewing Breakdown PossibilitiesThrough discussion of processing-time breakdown possibilities, you can understand the breakdown possibilities for the following:• Breakdown by Hosts—Which server (in the case of the Web server tier—which Web server
host) is causing the abnormal processing time on the investigated tier.• Breakdown by Transactions—Which types of end-user requests are causing the abnormal
processing time on the investigated tier.• Processing Time per Transaction—Shows the (average) time that an average single
transaction spends processing in each tier. An unusual upward change in average transaction processing time in a specific tier during a specific time segment of the graph may indicate that there is a problem with some transaction/transaction type during that time interval. You may want to further investigate the list of transactions for the application using SLA Watch, and drill down as far as the offending data segments to find the root cause.
• Concurrency - Breakdown by applications—Displays which applications have relatively high concurrency levels. Higher concurrency may indicate a need to fine-tune application resources such as worker threads on an application tier, and so on.
• Invocations - Application tier: Breakdown by nodes—For each instance of an application server (such as JVM)—displays how many invocations occurred during any given interval.
Using the Tooltips for Advanced Breakdown InformationTo view statistics for a time segment, roll your mouse over the time segment boundary. Three different statistical displays are presented simultaneously, one for each of the graphs in the display.For more information, see:• Viewing Tier Display Statistics, page 134• Viewing Application Average Response Time Statistics, page 135• Viewing Transaction Volume and Concurrency, page 135
Viewing Tier Display StatisticsThe tooltip in the tier display area displays two columns of values. The Value column displays the average response time for each tier with the heaviest individual tier usage at the bottom of the list and the lightest at the top. The Accumulated column displays the average cumulative use of response time between the tiers with the tiers listed in the same order as they appear in the graph. Thus, you can easily distinguish how much of the processing time was spent in the first and second tier, the first five tiers and all the tiers, and so on.
Note: The heaviest tiers are displayed at the bottom of the graph, while in the legend, the tiers are represented in descending order by the value of the criteria compared (that is, average response time, processing time, and so on).
Application Performance Monitoring User Guide
APM User Interface View Types
Document ID: RDWR-APM-V0311000_UG1804 135
Viewing Application Average Response Time StatisticsThe tooltip that opens over the Application Average Response Time graph displays the exact value of the cumulative average response time for the indicated time period.
Viewing Transaction Volume and ConcurrencyThe tooltip displays the distribution of transaction volume between transactions that complied with their SLA (represented by a green bar section) and those that did not (represented by a red bar section).
Viewing Measured ElementsIn the Advanced Breakdown view, the processing time performance metric can be broken down with the following measured elements: • Hosts—Servers (Operating System instance) in which transactions execute.• Tiers—Groups of nodes with the same logical role. For example, the application server tier is
composed of multiple JVM, and the database tier is composed of database instances.• Transactions—A type of end-user request.• Applications—A collection of end-user request types, which serve a business role.
Viewing Displayed MeasurementsThe Advanced Breakdown view displays the following types of measurements for each measured element: • Processing Time—For each interval of the graph, the Advanced Breakdown view shows the
summary of processing time spent in each measured element during a given interval.• Processing Time per Transaction—This measurement is calculated based on the total
processing time (sum) divided by the total number of transactions. For each interval of the graph, it shows the (average) amount of time that a single transaction was processed in each tier. This measurement is available only when viewing data broken down by tiers.
• Concurrency—Shows the maximum level of concurrent activity of each measured element in a given interval. Concurrency should be viewed in line mode (rather than in stacked mode).
• Invocations—Shows the number of invocations of each measured element in a given interval.
Working with Advanced Breakdown LayoutThe window is divided into three horizontal sections:• Resource breakdown• Application average response time• Application volume
The x-axis of the all the graphs represents the same units of time. Initially, any time period you choose with a date/time selection results in the entire period being displayed—using the time intervals that provide a full display of the time period.Intervals for the x-axis can be changed by clicking on one of the available intervals displayed on the X-Axis Interval Selector. The X-Axis Interval Selector is located on the upper-right frame of the Advanced Breakdown view.If you choose x-axis intervals that are very small relative to your requested time range, you may not see the full range of the time period.The y-axis changes according to the subject of the display.
Application Performance Monitoring User Guide APM User Interface View Types
136 Document ID: RDWR-APM-V0311000_UG1804
The granularity of the units displayed varies according to the data being displayed:• For Processing Time, the y-axis is seconds.• For Concurrency, the y-axis is the number of concurrent invocations.• For Invocations, the y-axis is the number of invocations per second.On the first graph, you can see the distribution of time or invocations distributed between tiers, transaction types, transaction segments, and so on—with more and more drill-down refinements available. The contextual drill-downs include lists and models specific to the data that your mouse pointer is hovering over.You can also change the way the layout displays. Two drop-down lists in the main screen enable specification of the intelligence displayed. Directly under these drop-down lists, there are the
stacked graph and overlaid graph buttons, which let you switch between display types.
Use the drop-down list above the Advanced Breakdown graph to choose the subject of the display and the basis of the display. Select the subject from the drop-down list to the right of Show. Select the basis of the display from the drop-down list to the right of Root. Interface features also let you do the following: • Drill down into a point on the graph, such as a spike, by single clicking it or its corresponding
item in the legend on the right, and then selecting a breakdown option (such as Breakdown by Transactions). This action changes the graph display to reflect your drill-down criteria.
• Mouse over the summit of any section of the tier to view summarized information about the tier.• Exclude and subsequently re-include legend items from the legend and graph calculations and
display.
Working with the Advanced Breakdown View’s LegendThis section describes:• Hiding and Displaying the Legend in the Advanced Breakdown View, page 136• Filtering Data Using the Legend of the Advanced Breakdown View, page 137
Hiding and Displaying the Legend in the Advanced Breakdown ViewThe legend display on the right side of the view can be hidden or displayed by means of a toggle. It is drill-down enabled.
To use the legend
1. Use the toggle button to hide/display legend area.2. Click an element of the breakdown in the legend to drill down.
Note: One item on the context menu, Exclude from display, is not a drill-down option. Use this option to filter data from the legend and the display and recalculate the displayed information. For more information, see Filtering Data Using the Legend of the Advanced Breakdown View, page 137.
Application Performance Monitoring User Guide
APM User Interface View Types
Document ID: RDWR-APM-V0311000_UG1804 137
Filtering Data Using the Legend of the Advanced Breakdown ViewTo simplify the view for your purposes, you can exclude any legend item through its context menu, by clicking on a legend item and selecting Exclude from the context menu.When the legend item is excluded, all the percentages are adjusted and the same server/tier is also eliminated from the graph display. The legend item is shown slightly faded and without any percentage. To bring the data it represented back into the graph, the legend and the overall calculations, click Include in Display, which is the only option in the excluded legend icon’s context menu. For example, in Data Center Analysis > Advanced Breakdown view, a view provides for the breakdown of processing time, concurrency, and invocations as well. Include in display and Exclude from display work for all breakdown variations of all Show items.
Note: Auto-refresh does not reset any exclusions. However, any change of breakdown or the date or resets all exclusions, as does leaving the page.
Working with Drill-downs from the Main Graph in the Advanced Breakdown ViewDrill down in the graph by clicking a point inside the graph and selecting an option from the pop-up menu that opens.Switch between a stacked view and an overlaid view using the icons in the top right hand corner of the window.
Note: The stacked view presents accumulated values for each measured graph point.
Use the time-interval options displayed by the tool bar to change the granularity of the graph. The options available to you depend on the total time period of the graph. The smallest interval you can choose is fifteen seconds and the largest is three hours.
Using the Advanced Breakdown View ToolbarThe Advanced Breakdown view provides a toolbar at the top right that enables you to maneuver within the displayed graph. The following table describes the buttons in the Advanced Breakdown view.
Icon DetailReturn cursor to Normal Mode.Click to return cursor to normal mode (from zoom mode). With your cursor in normal mode, you can click any point on the graph and drill down using the popup menu options that are displayed.
Zoom InClick Zoom In to set your cursor to zoom-in mode. Drag your cursor over the required area. In zoom-in mode, you can concentrate on a section of the time line. Notice that the time selection area in the upper-left corner of the screen changes to reflect the timeframe you have zoomed in on. Successive clicks on the zoom-out button will bring you back to the timeframe you selected for this session.
Zoom OutClick Zoom Out until you have returned to the original timeframe you selected for the session.
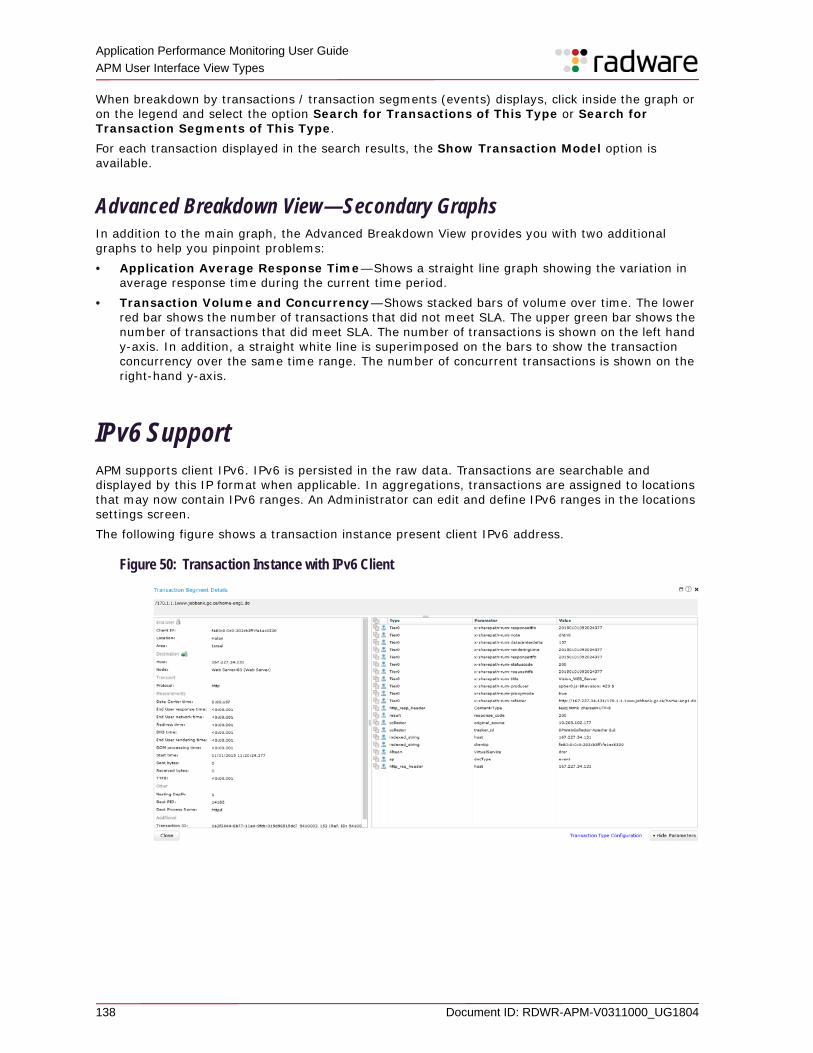
Application Performance Monitoring User Guide APM User Interface View Types
138 Document ID: RDWR-APM-V0311000_UG1804
When breakdown by transactions / transaction segments (events) displays, click inside the graph or on the legend and select the option Search for Transactions of This Type or Search for Transaction Segments of This Type. For each transaction displayed in the search results, the Show Transaction Model option is available.
Advanced Breakdown View—Secondary GraphsIn addition to the main graph, the Advanced Breakdown View provides you with two additional graphs to help you pinpoint problems:• Application Average Response Time—Shows a straight line graph showing the variation in
average response time during the current time period.• Transaction Volume and Concurrency—Shows stacked bars of volume over time. The lower
red bar shows the number of transactions that did not meet SLA. The upper green bar shows the number of transactions that did meet SLA. The number of transactions is shown on the left hand y-axis. In addition, a straight white line is superimposed on the bars to show the transaction concurrency over the same time range. The number of concurrent transactions is shown on the right-hand y-axis.
IPv6 SupportAPM supports client IPv6. IPv6 is persisted in the raw data. Transactions are searchable and displayed by this IP format when applicable. In aggregations, transactions are assigned to locations that may now contain IPv6 ranges. An Administrator can edit and define IPv6 ranges in the locations settings screen.The following figure shows a transaction instance present client IPv6 address.
Figure 50: Transaction Instance with IPv6 Client
Application Performance Monitoring User Guide
APM User Interface View Types
Document ID: RDWR-APM-V0311000_UG1804 139
Search
The Quick Search text box and the Advanced Search button ( ) are always available in the upper right of your APM screen, regardless of where you are in the APM main menu.For more information, see:• Quick Search, page 139• Advanced Search, page 139
Quick SearchQuick Search lets you search the database for transactions executed during the currently selected timeframe. You can search by client IP address, transaction type, segment name, username, application, or host address.
Note: Quick Search is limited to searching transactions. To search transaction segments, always use the Advanced Search feature.
To get instant help for quick search, hover over the Quick Search text box with your mouse and read the tooltip. The tooltip shown below describes the available search options—all in the format [type]:[value].
Advanced SearchUse the Advanced Search dialog box to obtain lists of transactions and transaction segments satisfying a variety of conditions and filters. You can explore each individual transaction listed in the transaction results.
To use the Advanced Search
> Click the Advanced Search button ( ). The Advanced Search dialog box opens.
For more information, see:• Searching for Specific Transactions or Specific Transaction Segments, page 139• Searching by Keywords, page 140• Adding New Keywords (Administrators Only), page 140• Searching for Method Level Hotspots, page 141
Searching for Specific Transactions or Specific Transaction Segments
1. Click the Advanced Search button ( ). The Advanced Search dialog box opens.For Transactions, you can limit your search as to transactions that fulfill the combination of conditions you select. Selectable conditions include:— marked as failed.— include end-user data. — include method-level hotspots.
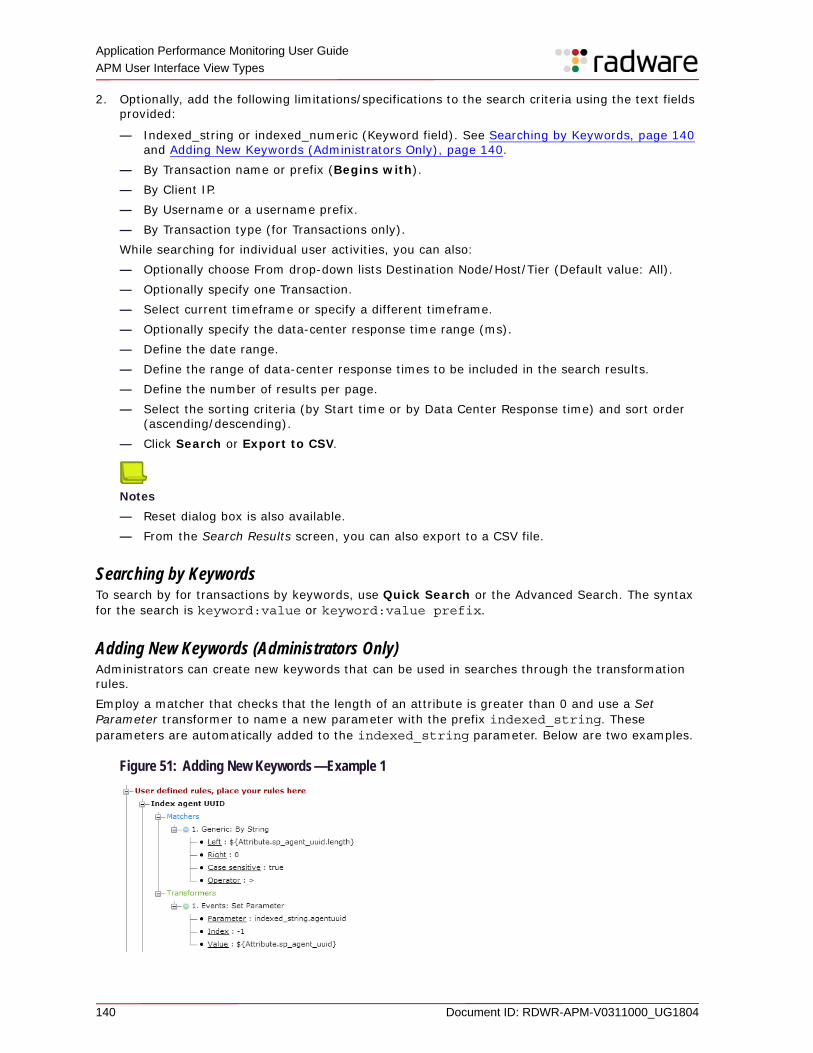
Application Performance Monitoring User Guide APM User Interface View Types
140 Document ID: RDWR-APM-V0311000_UG1804
2. Optionally, add the following limitations/specifications to the search criteria using the text fields provided:
— Indexed_string or indexed_numeric (Keyword field). See Searching by Keywords, page 140 and Adding New Keywords (Administrators Only), page 140.
— By Transaction name or prefix (Begins with). — By Client IP.— By Username or a username prefix. — By Transaction type (for Transactions only). While searching for individual user activities, you can also:— Optionally choose From drop-down lists Destination Node/Host/Tier (Default value: All).— Optionally specify one Transaction. — Select current timeframe or specify a different timeframe. — Optionally specify the data-center response time range (ms). — Define the date range.— Define the range of data-center response times to be included in the search results. — Define the number of results per page.— Select the sorting criteria (by Start time or by Data Center Response time) and sort order
(ascending/descending).— Click Search or Export to CSV.
Notes
— Reset dialog box is also available. — From the Search Results screen, you can also export to a CSV file.
Searching by KeywordsTo search by for transactions by keywords, use Quick Search or the Advanced Search. The syntax for the search is keyword:value or keyword:value prefix.
Adding New Keywords (Administrators Only)Administrators can create new keywords that can be used in searches through the transformation rules.Employ a matcher that checks that the length of an attribute is greater than 0 and use a Set Parameter transformer to name a new parameter with the prefix indexed_string. These parameters are automatically added to the indexed_string parameter. Below are two examples.
Figure 51: Adding New Keywords—Example 1
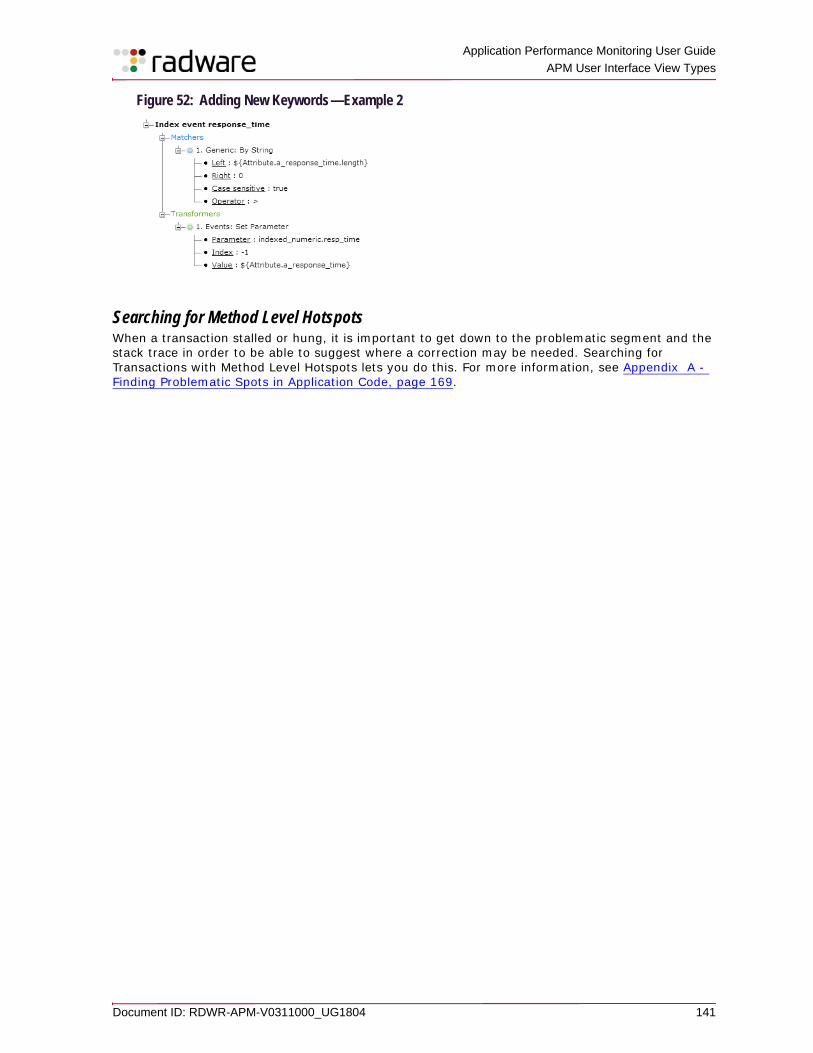
Application Performance Monitoring User Guide
APM User Interface View Types
Document ID: RDWR-APM-V0311000_UG1804 141
Figure 52: Adding New Keywords—Example 2
Searching for Method Level HotspotsWhen a transaction stalled or hung, it is important to get down to the problematic segment and the stack trace in order to be able to suggest where a correction may be needed. Searching for Transactions with Method Level Hotspots lets you do this. For more information, see Appendix A - Finding Problematic Spots in Application Code, page 169.
Application Performance Monitoring User Guide APM User Interface View Types
142 Document ID: RDWR-APM-V0311000_UG1804
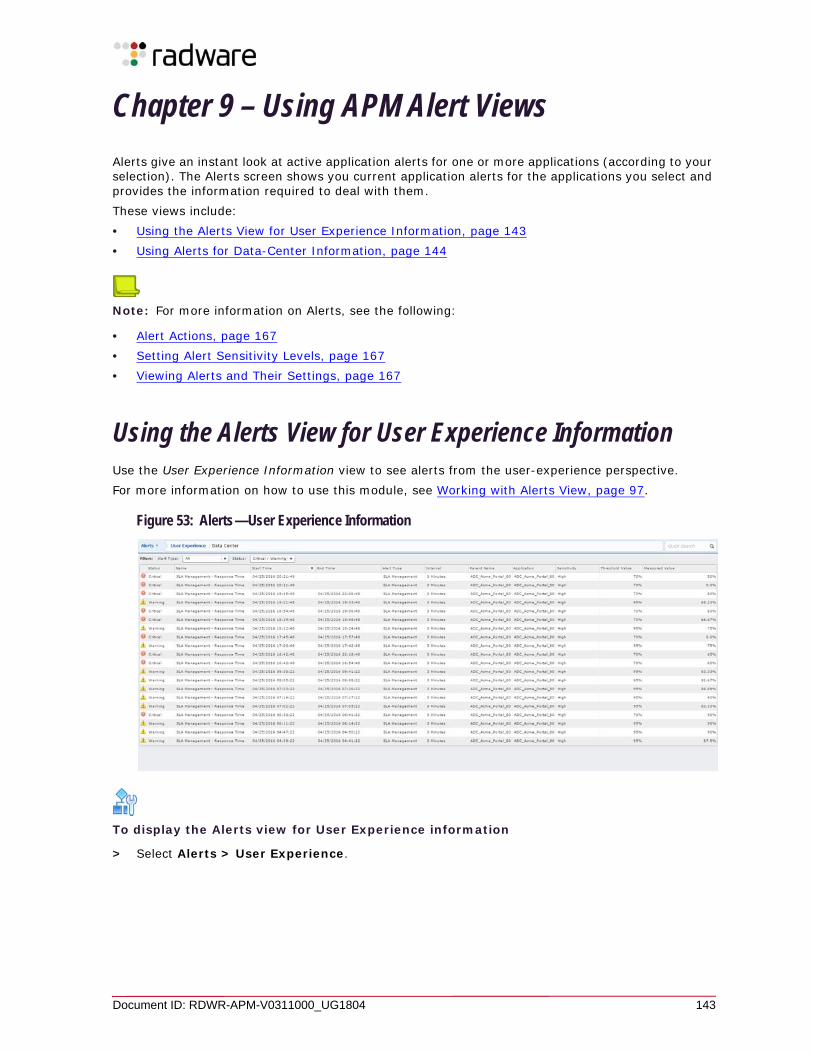
Document ID: RDWR-APM-V0311000_UG1804 143
Chapter 9 – Using APM Alert Views
Alerts give an instant look at active application alerts for one or more applications (according to your selection). The Alerts screen shows you current application alerts for the applications you select and provides the information required to deal with them.These views include:• Using the Alerts View for User Experience Information, page 143• Using Alerts for Data-Center Information, page 144
Note: For more information on Alerts, see the following:
• Alert Actions, page 167• Setting Alert Sensitivity Levels, page 167• Viewing Alerts and Their Settings, page 167
Using the Alerts View for User Experience InformationUse the User Experience Information view to see alerts from the user-experience perspective.For more information on how to use this module, see Working with Alerts View, page 97.
Figure 53: Alerts—User Experience Information
To display the Alerts view for User Experience information
> Select Alerts > User Experience.
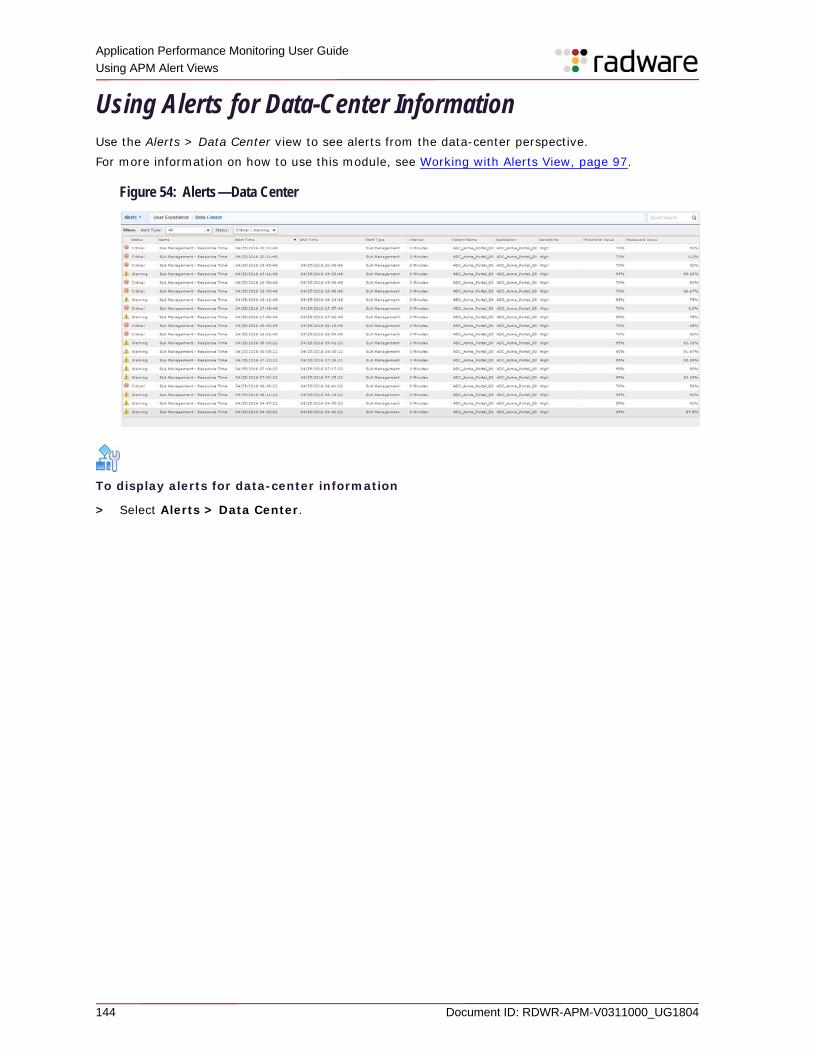
Application Performance Monitoring User Guide Using APM Alert Views
144 Document ID: RDWR-APM-V0311000_UG1804
Using Alerts for Data-Center InformationUse the Alerts > Data Center view to see alerts from the data-center perspective.For more information on how to use this module, see Working with Alerts View, page 97.
Figure 54: Alerts—Data Center
To display alerts for data-center information
> Select Alerts > Data Center.
Document ID: RDWR-APM-V0311000_UG1804 145
Chapter 10 – Using APM Reports
You can access the Reports screen from the main menu.The APM Reports interface allows any user to configure reports to execute immediately or on a fixed schedule. In both cases, the reports can be configured for e-mail dispatch to designated addressees. The designated addressees need not be APM users.The Scheduled Reports tab allows every user to see the listings for and execute on-demand scheduled reports of applications for which they have authorization. However, users can edit and control (enable, disable, delete) only those scheduled reports they created.Administrators can see the scheduling of all reports for all applications. Likewise, they can edit, enable, disable, and delete any report for any application.Examples of how scheduled reports are used include:• Scheduling the Change Impact Analysis report to run once a week, comparing the last week to
the week before it.• Scheduling the Weekly Application Performance report to run once a week, on Mondays.• Scheduling the SLA Trend report to run and be sent to designated addressee automatically each
month. By scheduling automatic reports, APM users are free to concentrate on their ongoing work while they, their colleagues, and other internal clients receive the information they require and expect, on a regular schedule, without fail, and without any need to request or remind.The three tabs of the Reports screen are:• New Report• Scheduled Reports• Report Queue
The following sections describe:• On-Demand Report Generation from the New Report Tab, page 145• Scheduling Reports from the Scheduled Reports Tab, page 146• Working with the Report Queue, page 148• Configuring the Mail Server, page 149• Available Reports, page 149
On-Demand Report Generation from the New Report Tab
To run a report one time, on demand
1. From the APM main menu, select Reports. 2. Select the New Report tab, which displays the list of available report types.
3. Click the name of the required report, and then click Create Report. The Create Report dialog box opens.
Note: As you click each report name, a description of the report displays to the right.
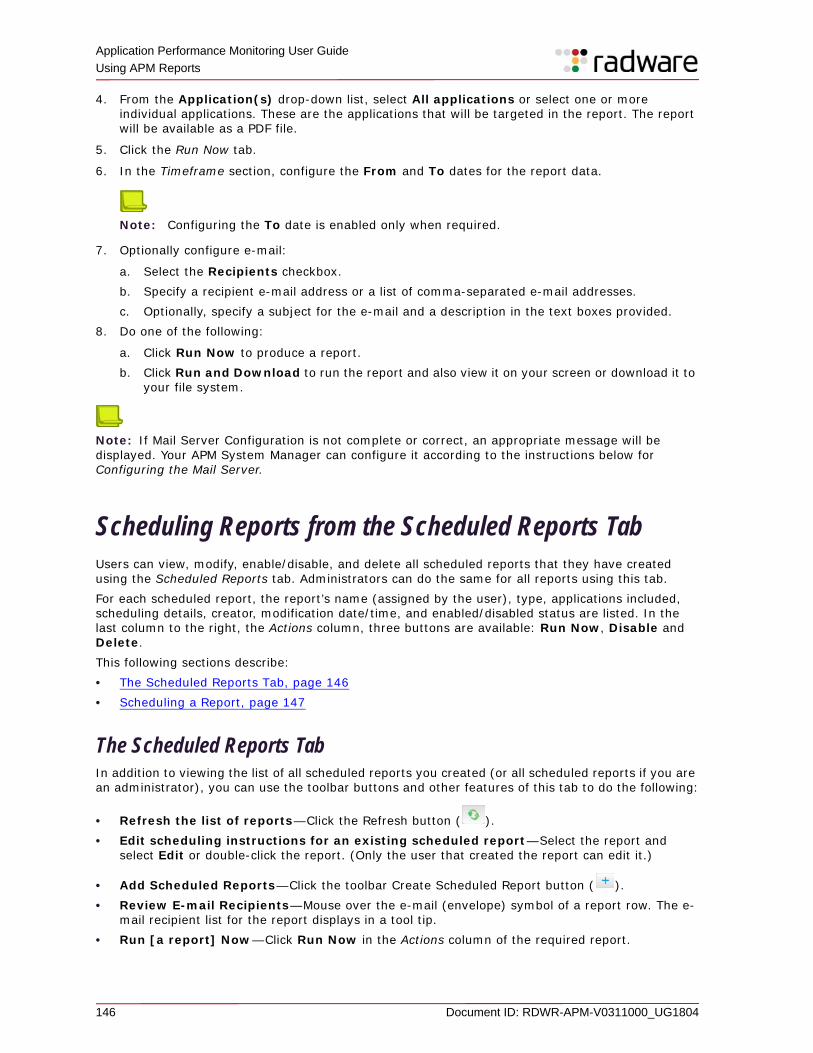
Application Performance Monitoring User Guide Using APM Reports
146 Document ID: RDWR-APM-V0311000_UG1804
4. From the Application(s) drop-down list, select All applications or select one or more individual applications. These are the applications that will be targeted in the report. The report will be available as a PDF file.
5. Click the Run Now tab.
6. In the Timeframe section, configure the From and To dates for the report data.
Note: Configuring the To date is enabled only when required.
7. Optionally configure e-mail:
a. Select the Recipients checkbox.b. Specify a recipient e-mail address or a list of comma-separated e-mail addresses.c. Optionally, specify a subject for the e-mail and a description in the text boxes provided.
8. Do one of the following:
a. Click Run Now to produce a report.b. Click Run and Download to run the report and also view it on your screen or download it to
your file system.
Note: If Mail Server Configuration is not complete or correct, an appropriate message will be displayed. Your APM System Manager can configure it according to the instructions below for Configuring the Mail Server.
Scheduling Reports from the Scheduled Reports TabUsers can view, modify, enable/disable, and delete all scheduled reports that they have created using the Scheduled Reports tab. Administrators can do the same for all reports using this tab.For each scheduled report, the report’s name (assigned by the user), type, applications included, scheduling details, creator, modification date/time, and enabled/disabled status are listed. In the last column to the right, the Actions column, three buttons are available: Run Now, Disable and Delete.This following sections describe:• The Scheduled Reports Tab, page 146• Scheduling a Report, page 147
The Scheduled Reports TabIn addition to viewing the list of all scheduled reports you created (or all scheduled reports if you are an administrator), you can use the toolbar buttons and other features of this tab to do the following:
• Refresh the list of reports—Click the Refresh button ( ).• Edit scheduling instructions for an existing scheduled report—Select the report and
select Edit or double-click the report. (Only the user that created the report can edit it.)
• Add Scheduled Reports—Click the toolbar Create Scheduled Report button ( ).• Review E-mail Recipients—Mouse over the e-mail (envelope) symbol of a report row. The e-
mail recipient list for the report displays in a tool tip.• Run [a report] Now—Click Run Now in the Actions column of the required report.
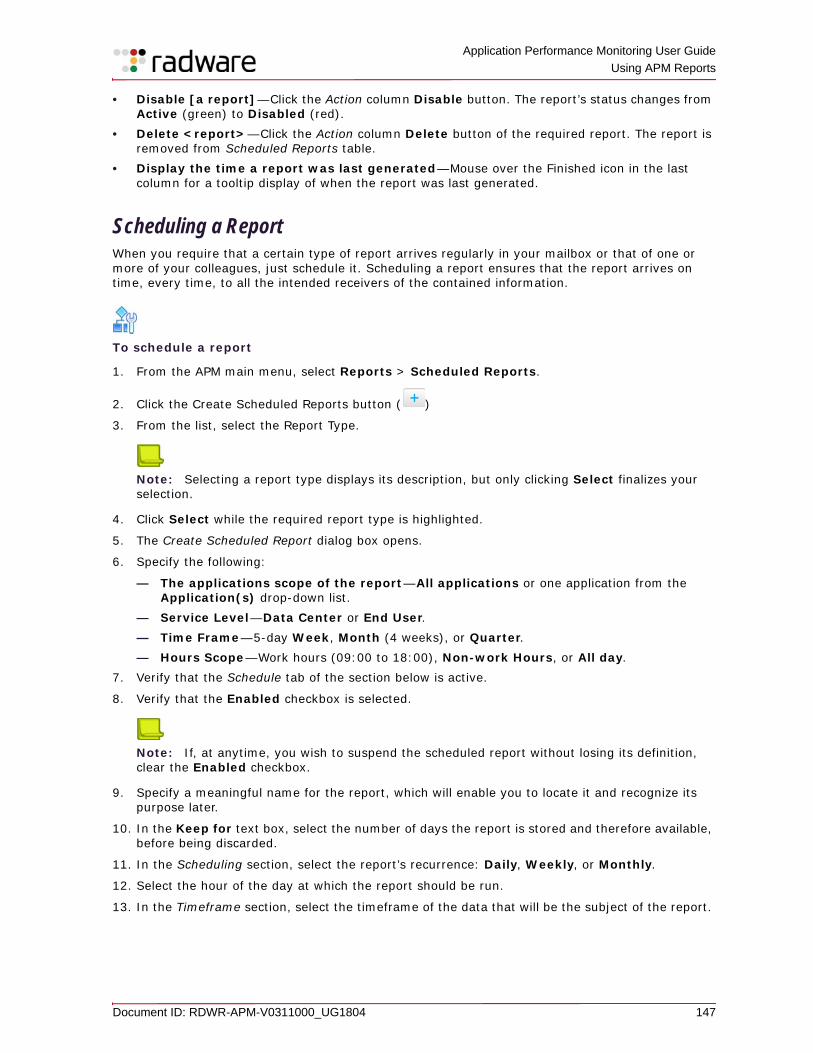
Application Performance Monitoring User Guide
Using APM Reports
Document ID: RDWR-APM-V0311000_UG1804 147
• Disable [a report]—Click the Action column Disable button. The report’s status changes from Active (green) to Disabled (red).
• Delete <report>—Click the Action column Delete button of the required report. The report is removed from Scheduled Reports table.
• Display the time a report was last generated—Mouse over the Finished icon in the last column for a tooltip display of when the report was last generated.
Scheduling a ReportWhen you require that a certain type of report arrives regularly in your mailbox or that of one or more of your colleagues, just schedule it. Scheduling a report ensures that the report arrives on time, every time, to all the intended receivers of the contained information.
To schedule a report
1. From the APM main menu, select Reports > Scheduled Reports.
2. Click the Create Scheduled Reports button ( )
3. From the list, select the Report Type.
Note: Selecting a report type displays its description, but only clicking Select finalizes your selection.
4. Click Select while the required report type is highlighted.
5. The Create Scheduled Report dialog box opens.
6. Specify the following:
— The applications scope of the report—All applications or one application from the Application(s) drop-down list.
— Service Level—Data Center or End User. — Time Frame—5-day Week, Month (4 weeks), or Quarter. — Hours Scope—Work hours (09:00 to 18:00), Non-work Hours, or All day.
7. Verify that the Schedule tab of the section below is active.
8. Verify that the Enabled checkbox is selected.
Note: If, at anytime, you wish to suspend the scheduled report without losing its definition, clear the Enabled checkbox.
9. Specify a meaningful name for the report, which will enable you to locate it and recognize its purpose later.
10. In the Keep for text box, select the number of days the report is stored and therefore available, before being discarded.
11. In the Scheduling section, select the report’s recurrence: Daily, Weekly, or Monthly.
12. Select the hour of the day at which the report should be run.
13. In the Timeframe section, select the timeframe of the data that will be the subject of the report.
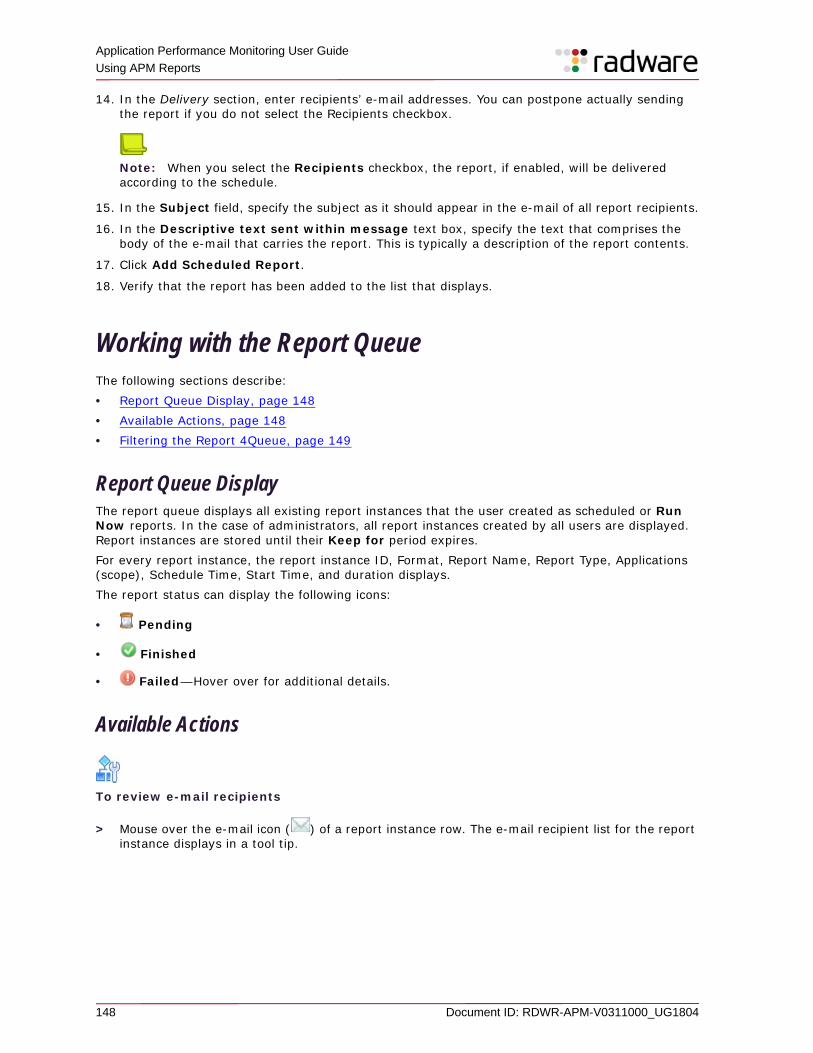
Application Performance Monitoring User Guide Using APM Reports
148 Document ID: RDWR-APM-V0311000_UG1804
14. In the Delivery section, enter recipients’ e-mail addresses. You can postpone actually sending the report if you do not select the Recipients checkbox.
Note: When you select the Recipients checkbox, the report, if enabled, will be delivered according to the schedule.
15. In the Subject field, specify the subject as it should appear in the e-mail of all report recipients.
16. In the Descriptive text sent within message text box, specify the text that comprises the body of the e-mail that carries the report. This is typically a description of the report contents.
17. Click Add Scheduled Report.
18. Verify that the report has been added to the list that displays.
Working with the Report QueueThe following sections describe:• Report Queue Display, page 148• Available Actions, page 148• Filtering the Report 4Queue, page 149
Report Queue DisplayThe report queue displays all existing report instances that the user created as scheduled or Run Now reports. In the case of administrators, all report instances created by all users are displayed. Report instances are stored until their Keep for period expires.For every report instance, the report instance ID, Format, Report Name, Report Type, Applications (scope), Schedule Time, Start Time, and duration displays.The report status can display the following icons:
• Pending
• Finished
• Failed—Hover over for additional details.
Available Actions
To review e-mail recipients
> Mouse over the e-mail icon ( ) of a report instance row. The e-mail recipient list for the report instance displays in a tool tip.
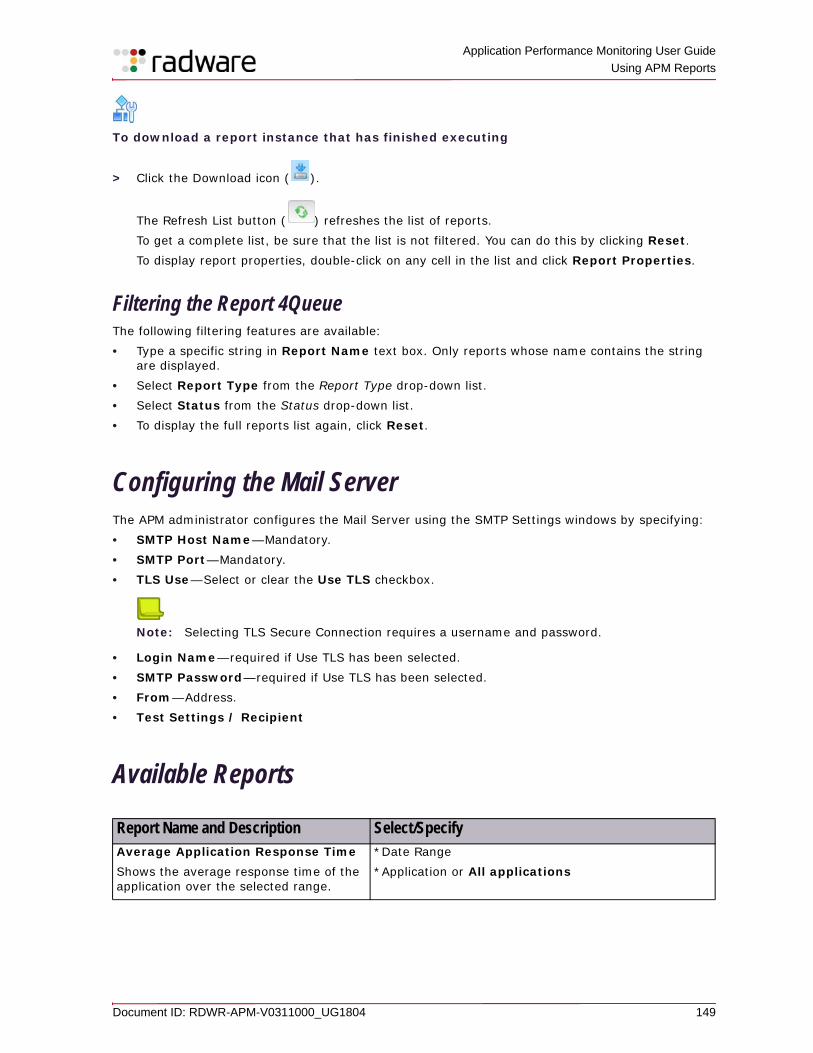
Application Performance Monitoring User Guide
Using APM Reports
Document ID: RDWR-APM-V0311000_UG1804 149
To download a report instance that has finished executing
> Click the Download icon ( ).
The Refresh List button ( ) refreshes the list of reports. To get a complete list, be sure that the list is not filtered. You can do this by clicking Reset.To display report properties, double-click on any cell in the list and click Report Properties.
Filtering the Report 4QueueThe following filtering features are available:• Type a specific string in Report Name text box. Only reports whose name contains the string
are displayed.• Select Report Type from the Report Type drop-down list.• Select Status from the Status drop-down list.• To display the full reports list again, click Reset.
Configuring the Mail ServerThe APM administrator configures the Mail Server using the SMTP Settings windows by specifying:• SMTP Host Name—Mandatory.• SMTP Port—Mandatory.• TLS Use—Select or clear the Use TLS checkbox.
Note: Selecting TLS Secure Connection requires a username and password.
• Login Name—required if Use TLS has been selected.• SMTP Password—required if Use TLS has been selected.• From—Address.• Test Settings / Recipient
Available Reports
Report Name and Description Select/SpecifyAverage Application Response TimeShows the average response time of the application over the selected range.
*Date Range *Application or All applications
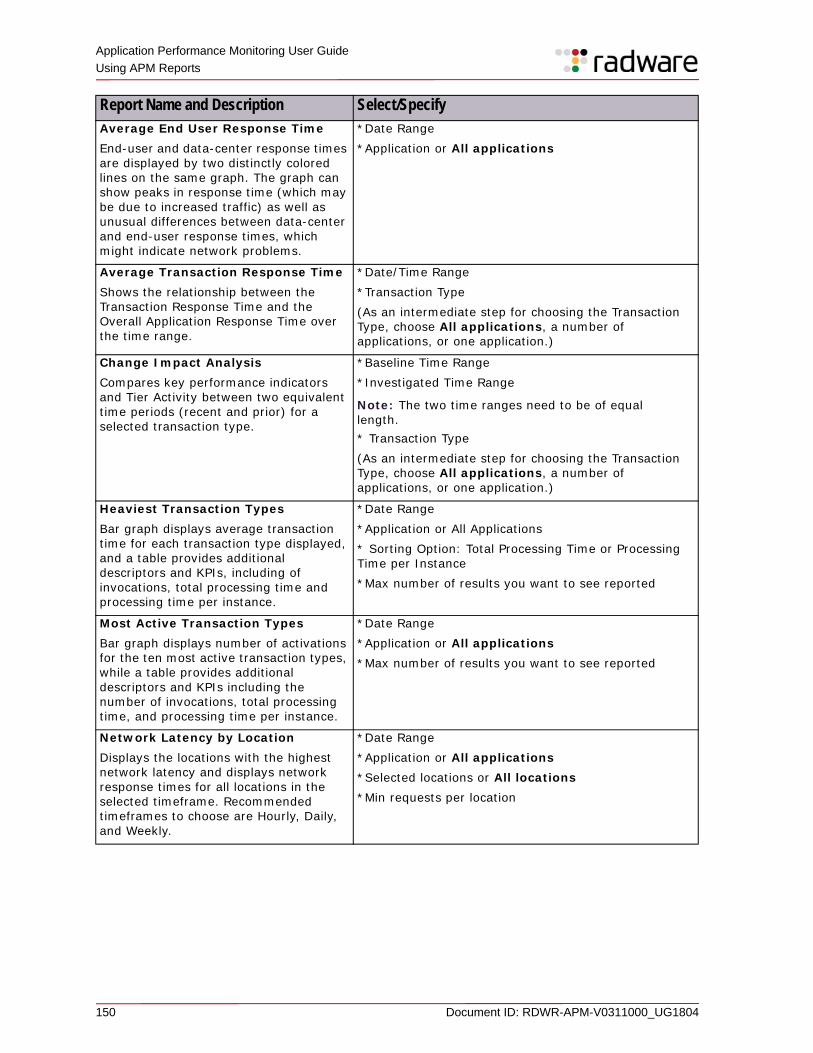
Application Performance Monitoring User Guide Using APM Reports
150 Document ID: RDWR-APM-V0311000_UG1804
Average End User Response TimeEnd-user and data-center response times are displayed by two distinctly colored lines on the same graph. The graph can show peaks in response time (which may be due to increased traffic) as well as unusual differences between data-center and end-user response times, which might indicate network problems.
*Date Range *Application or All applications
Average Transaction Response Time Shows the relationship between the Transaction Response Time and the Overall Application Response Time over the time range.
*Date/Time Range*Transaction Type(As an intermediate step for choosing the Transaction Type, choose All applications, a number of applications, or one application.)
Change Impact AnalysisCompares key performance indicators and Tier Activity between two equivalent time periods (recent and prior) for a selected transaction type.
*Baseline Time Range*Investigated Time Range
Note: The two time ranges need to be of equal length.* Transaction Type(As an intermediate step for choosing the Transaction Type, choose All applications, a number of applications, or one application.)
Heaviest Transaction TypesBar graph displays average transaction time for each transaction type displayed, and a table provides additional descriptors and KPIs, including of invocations, total processing time and processing time per instance.
*Date Range*Application or All Applications* Sorting Option: Total Processing Time or Processing Time per Instance*Max number of results you want to see reported
Most Active Transaction Types Bar graph displays number of activations for the ten most active transaction types, while a table provides additional descriptors and KPIs including the number of invocations, total processing time, and processing time per instance.
*Date Range *Application or All applications*Max number of results you want to see reported
Network Latency by LocationDisplays the locations with the highest network latency and displays network response times for all locations in the selected timeframe. Recommended timeframes to choose are Hourly, Daily, and Weekly.
*Date Range*Application or All applications*Selected locations or All locations*Min requests per location
Report Name and Description Select/Specify
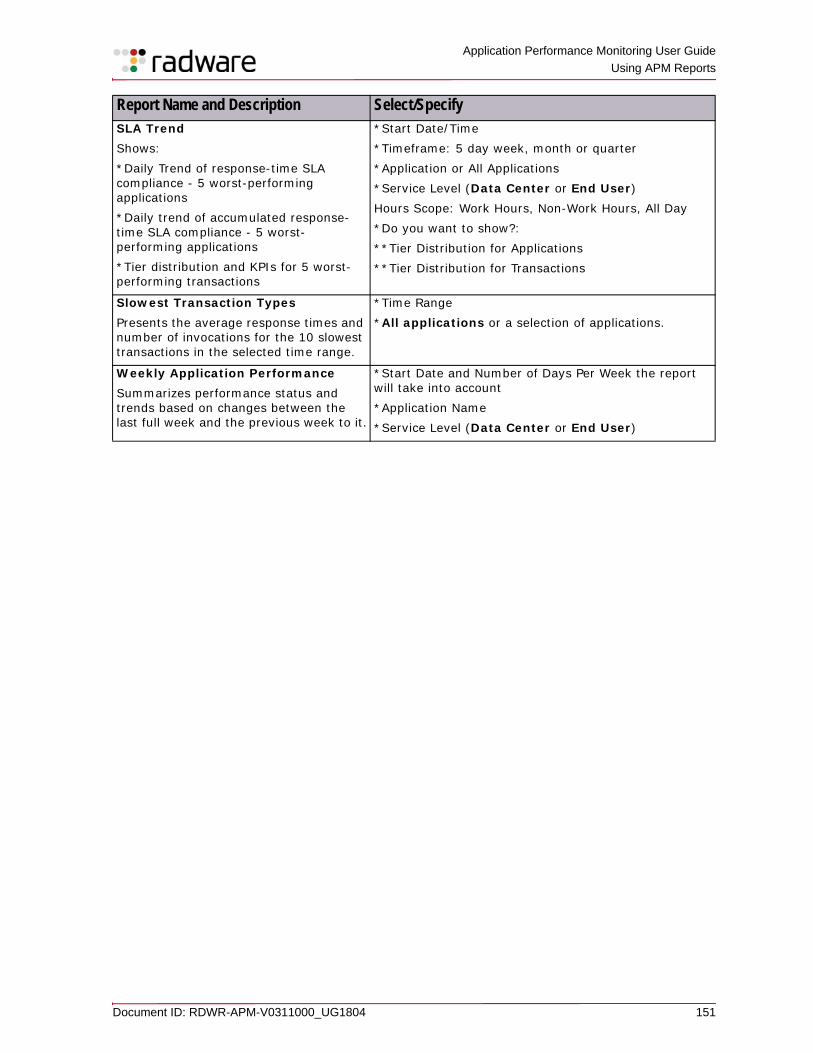
Application Performance Monitoring User Guide
Using APM Reports
Document ID: RDWR-APM-V0311000_UG1804 151
SLA TrendShows: *Daily Trend of response-time SLA compliance - 5 worst-performing applications*Daily trend of accumulated response-time SLA compliance - 5 worst-performing applications*Tier distribution and KPIs for 5 worst-performing transactions
*Start Date/Time*Timeframe: 5 day week, month or quarter *Application or All Applications*Service Level (Data Center or End User)Hours Scope: Work Hours, Non-Work Hours, All Day*Do you want to show?:**Tier Distribution for Applications**Tier Distribution for Transactions
Slowest Transaction TypesPresents the average response times and number of invocations for the 10 slowest transactions in the selected time range.
*Time Range*All applications or a selection of applications.
Weekly Application PerformanceSummarizes performance status and trends based on changes between the last full week and the previous week to it.
*Start Date and Number of Days Per Week the report will take into account*Application Name*Service Level (Data Center or End User)
Report Name and Description Select/Specify

Application Performance Monitoring User Guide Using APM Reports
152 Document ID: RDWR-APM-V0311000_UG1804
Document ID: RDWR-APM-V0311000_UG1804 153
Chapter 11 – Response-Time SLA Management and Failed Transaction Management
Response-time service-level agreements (SLAs) are the bases for determining transaction health. APM provides for setting response-time SLAs and corresponding alerts related to the following:• Transaction response time—The transaction-response-time SLA is exceeded when the
transaction instance’s response time exceeds the response time defined as acceptable for the transaction type.
Note: The response time of each transaction instance is compared independently with the transaction’s response-time SLA.
• Rate of transaction failure—The transaction-failure SLA is exceeded when the failure rate exceeds the failure rate defined as acceptable for the transaction type.
For more information, see the following sections:• APM Response-Time SLA Basics, page 153• Introduction to Setting Response-Time and Failed-Transaction SLAs and SLA Alerts, page 154• Configuring Response-Time SLAs and Response-Time-SLA Alerts, page 154• Configuring Transaction Failure Alerts, page 158• Configuring SLAs and SLA Alerts from Transaction Properties, page 159• Configuring Transaction Failure Alerts from Transaction Properties, page 162• Adding Data Center and End User SLAs for One Transaction Type, page 163• Adding End-user SLAs, page 164• Setting SLA by Automatic Calculation of SLA Value, page 165• Setting SLA by Automatic Calculation of SLA Value, page 166• Alert Actions, page 167• Setting Alert Sensitivity Levels, page 167• Viewing Alerts and Their Settings, page 167
APM Response-Time SLA BasicsThe presence of failed transaction instances means that an error is occurring during the processing of specific transaction instances.A high proportion of failed transactions indicates poor application performance.You can define Failed Transaction and Transaction Performance alerts at the transaction or application level using the Transaction Properties or <Application> Properties dialog box boxes, respectively. These alerts can are defined for two levels: Warning and Critical.Application-wide response-time SLAs are set from the <Application> Properties dialog box. These response-time SLAs are inherited by default by all transactions belonging to the same application. To define response-time SLAs and response-time SLA alerts that are different than the application-wide default, define them through the Transaction Properties dialog boxes.
Application Performance Monitoring User Guide Response-Time SLA Management and Failed Transaction Management
154 Document ID: RDWR-APM-V0311000_UG1804
Introduction to Setting Response-Time and Failed-Transaction SLAs and SLA AlertsSetting response-time and failed-transaction SLAs includes:• Making decisions about inheritance of severity thresholds and SLAs from application level to
transaction level.• Setting thresholds that determine what percentage of SLA-compliance or what percentage of
failed transactions characterizes normal, critical, or warning.• Setting alert sensitivity (by choosing between user-defined levels).• Setting actions to be taken when the alert is triggered.• Setting whether or not alert cancellations will also be announced and logged.
For more information, see:• Adding Data Center and End User SLAs for One Transaction Type, page 163• Adding End-user SLAs, page 164
Configuring Response-Time SLAs and Response-Time-SLA AlertsAdministrators and Application Managers can define default response-time SLAs for an application and for the individual transaction types belonging to the application from the SLA Management section of the <Application> Properties dialog box.There are two different modes for setting response-time SLAs from the <Application> Properties dialog box. You determine which mode you are working in through the drop-down list setting in the Data Center column. When this setting is Transaction Level, activating automatic calculation results in individual recalculation and automatic saving of response-time SLAs for each transaction belonging to the application.
Caution: These transaction-level changes take effect immediately. To revert to Inherit threshold values from application requires individual treatment of each transaction through its Transaction Properties dialog box.
When this setting is Application Level, only transactions that currently inherit their response-time SLA from the application are affected.
Note: You may need to add a new timeframe, add a location, or define a response-time SLA before adding an alert. After doing any of these, it will be necessary to apply changes (using the Apply button) before defining an alert. SLAs can be set manually or using automatic calculation based on existing transaction instances. For more information, see Setting SLA by Automatic Calculation of SLA Value, page 166.
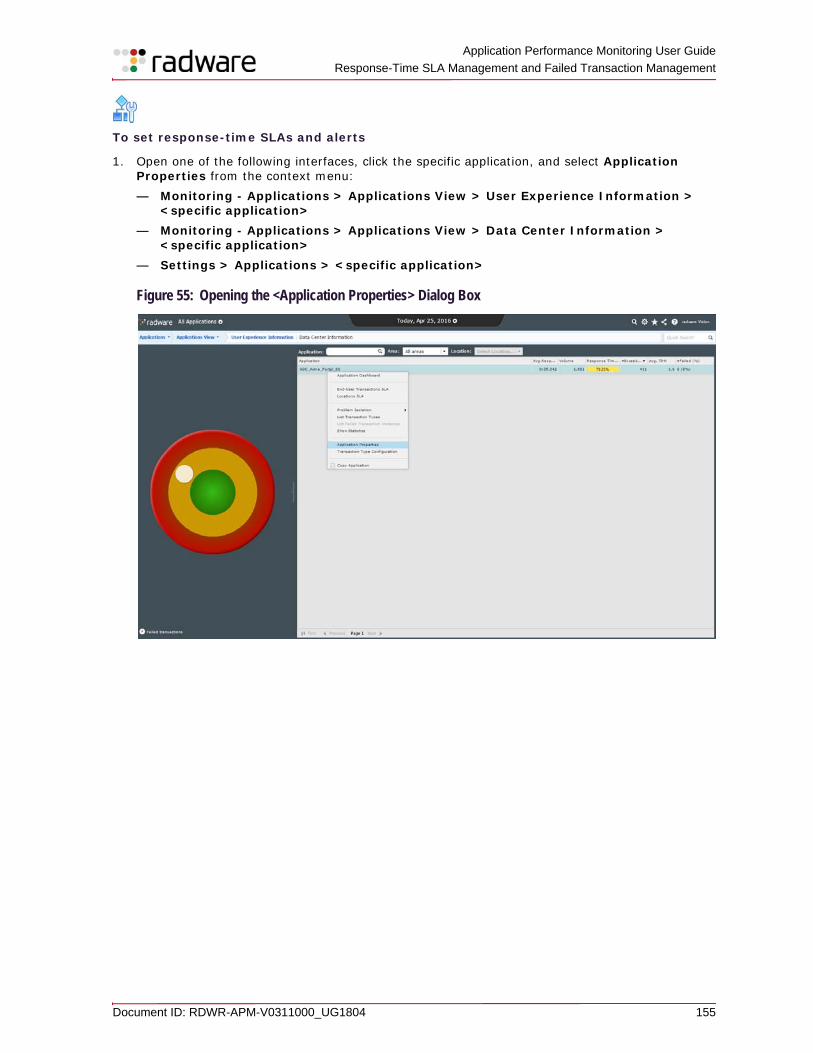
Application Performance Monitoring User Guide
Response-Time SLA Management and Failed Transaction Management
Document ID: RDWR-APM-V0311000_UG1804 155
To set response-time SLAs and alerts
1. Open one of the following interfaces, click the specific application, and select Application Properties from the context menu:— Monitoring - Applications > Applications View > User Experience Information >
<specific application>— Monitoring - Applications > Applications View > Data Center Information >
<specific application>— Settings > Applications > <specific application>
Figure 55: Opening the <Application Properties> Dialog Box
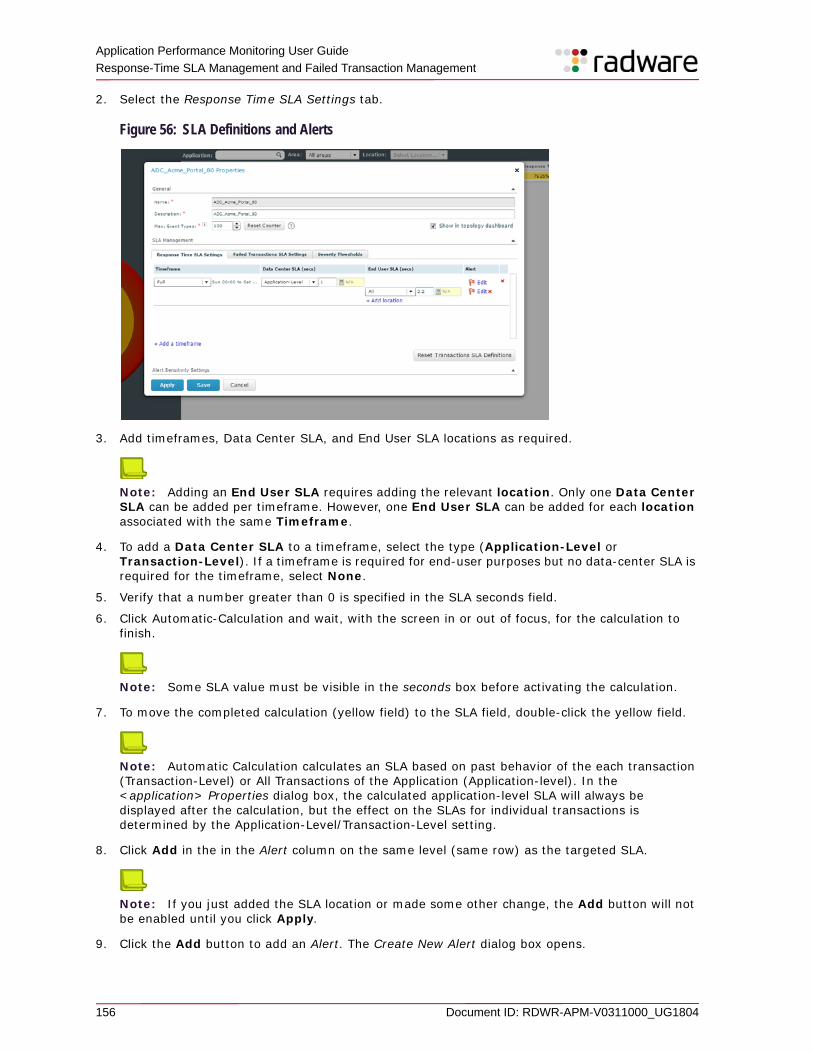
Application Performance Monitoring User Guide Response-Time SLA Management and Failed Transaction Management
156 Document ID: RDWR-APM-V0311000_UG1804
2. Select the Response Time SLA Settings tab.
Figure 56: SLA Definitions and Alerts
3. Add timeframes, Data Center SLA, and End User SLA locations as required.
Note: Adding an End User SLA requires adding the relevant location. Only one Data Center SLA can be added per timeframe. However, one End User SLA can be added for each location associated with the same Timeframe.
4. To add a Data Center SLA to a timeframe, select the type (Application-Level or Transaction-Level). If a timeframe is required for end-user purposes but no data-center SLA is required for the timeframe, select None.
5. Verify that a number greater than 0 is specified in the SLA seconds field.
6. Click Automatic-Calculation and wait, with the screen in or out of focus, for the calculation to finish.
Note: Some SLA value must be visible in the seconds box before activating the calculation.
7. To move the completed calculation (yellow field) to the SLA field, double-click the yellow field.
Note: Automatic Calculation calculates an SLA based on past behavior of the each transaction (Transaction-Level) or All Transactions of the Application (Application-level). In the <application> Properties dialog box, the calculated application-level SLA will always be displayed after the calculation, but the effect on the SLAs for individual transactions is determined by the Application-Level/Transaction-Level setting.
8. Click Add in the in the Alert column on the same level (same row) as the targeted SLA.
Note: If you just added the SLA location or made some other change, the Add button will not be enabled until you click Apply.
9. Click the Add button to add an Alert. The Create New Alert dialog box opens.
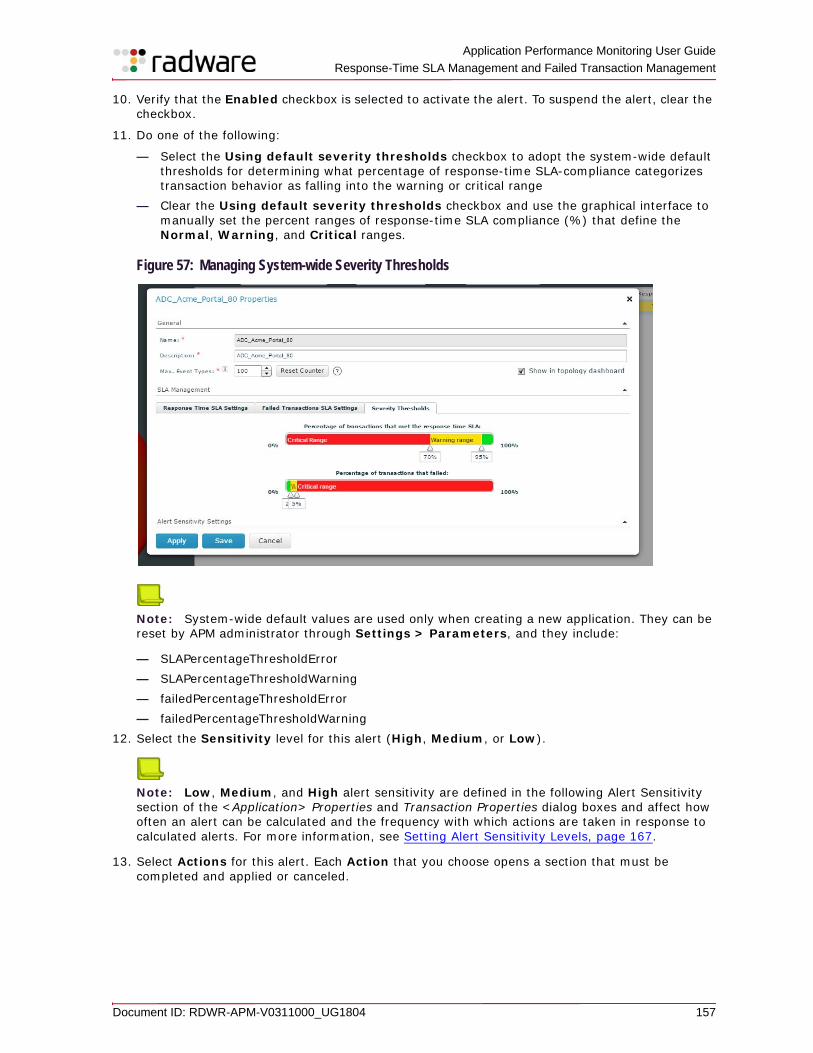
Application Performance Monitoring User Guide
Response-Time SLA Management and Failed Transaction Management
Document ID: RDWR-APM-V0311000_UG1804 157
10. Verify that the Enabled checkbox is selected to activate the alert. To suspend the alert, clear the checkbox.
11. Do one of the following:
— Select the Using default severity thresholds checkbox to adopt the system-wide default thresholds for determining what percentage of response-time SLA-compliance categorizes transaction behavior as falling into the warning or critical range
— Clear the Using default severity thresholds checkbox and use the graphical interface to manually set the percent ranges of response-time SLA compliance (%) that define the Normal, Warning, and Critical ranges.
Figure 57: Managing System-wide Severity Thresholds
Note: System-wide default values are used only when creating a new application. They can be reset by APM administrator through Settings > Parameters, and they include:
— SLAPercentageThresholdError— SLAPercentageThresholdWarning— failedPercentageThresholdError— failedPercentageThresholdWarning
12. Select the Sensitivity level for this alert (High, Medium, or Low).
Note: Low, Medium, and High alert sensitivity are defined in the following Alert Sensitivity section of the <Application> Properties and Transaction Properties dialog boxes and affect how often an alert can be calculated and the frequency with which actions are taken in response to calculated alerts. For more information, see Setting Alert Sensitivity Levels, page 167.
13. Select Actions for this alert. Each Action that you choose opens a section that must be completed and applied or canceled.
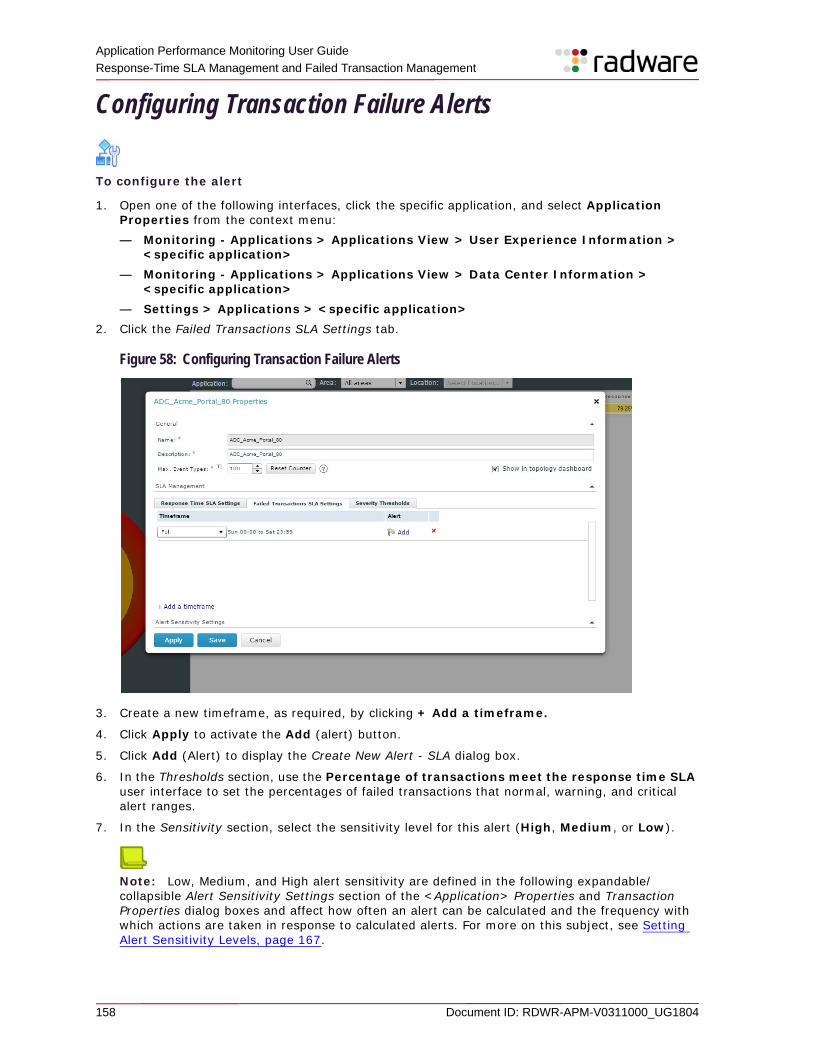
Application Performance Monitoring User Guide Response-Time SLA Management and Failed Transaction Management
158 Document ID: RDWR-APM-V0311000_UG1804
Configuring Transaction Failure Alerts
To configure the alert
1. Open one of the following interfaces, click the specific application, and select Application Properties from the context menu:— Monitoring - Applications > Applications View > User Experience Information >
<specific application>— Monitoring - Applications > Applications View > Data Center Information >
<specific application>— Settings > Applications > <specific application>
2. Click the Failed Transactions SLA Settings tab.
Figure 58: Configuring Transaction Failure Alerts
3. Create a new timeframe, as required, by clicking + Add a timeframe.
4. Click Apply to activate the Add (alert) button.
5. Click Add (Alert) to display the Create New Alert - SLA dialog box.
6. In the Thresholds section, use the Percentage of transactions meet the response time SLA user interface to set the percentages of failed transactions that normal, warning, and critical alert ranges.
7. In the Sensitivity section, select the sensitivity level for this alert (High, Medium, or Low).
Note: Low, Medium, and High alert sensitivity are defined in the following expandable/collapsible Alert Sensitivity Settings section of the <Application> Properties and Transaction Properties dialog boxes and affect how often an alert can be calculated and the frequency with which actions are taken in response to calculated alerts. For more on this subject, see Setting Alert Sensitivity Levels, page 167.
Application Performance Monitoring User Guide
Response-Time SLA Management and Failed Transaction Management
Document ID: RDWR-APM-V0311000_UG1804 159
8. In the Actions section, select Actions for this alert. Each Action that you choose opens a section that must be completed and applied or canceled. For more information, see Alert Actions, page 167
9. (Optional) Select the checkbox at the bottom of the dialog box to issue an alert every time this alert’s status changes to off.
10. Click Save to save the alert definition. The Create New Alert dialog box closes. A red flag displays in the Alert column of the <Application> Properties dialog box SLA Management section, next to (and in the same row as) the SLA for which you just created the alert. The flag indicates that an alert for the adjacent SLA setting now exists.
Note: You can click Edit to the right of the flag to view or edit the alert’s properties.
11. Click Save. The <Application> Properties dialog box closes.
Configuring SLAs and SLA Alerts from Transaction PropertiesAdministrators and Application Managers can define default SLA definitions and Alerts for a transaction type from the SLA Management section of the Transaction Properties dialog box.
To configure SLAs and SLA alerts from Transaction Properties
1. Do one of the following to open the Transaction Properties dialog box for the required transaction: — Click a transaction in the SLA Watch Transaction tab, and then select Transaction
Properties from the context menu that opens.— Click a transaction instance in search results, and then select Transaction Properties from
the context menu that opens.2. To enable setting SLAs for the transaction that are different from those inherited from the
application properties, clear the Inherit threshold definitions from application checkbox.
Note: If the Inherit threshold definitions from application checkbox is selected, transactions inherit SLA settings from the application.
3. Click Add a timeframe if you require an additional timeframe.
Note: There can only be one data-center SLA per timeframe.
4. Click the drop-down list in the Timeframe column, and select a timeframe from the list. Next to the selected timeframe, timeframe details display. Hover over the details to display the full description of the timeframe in a tooltip.
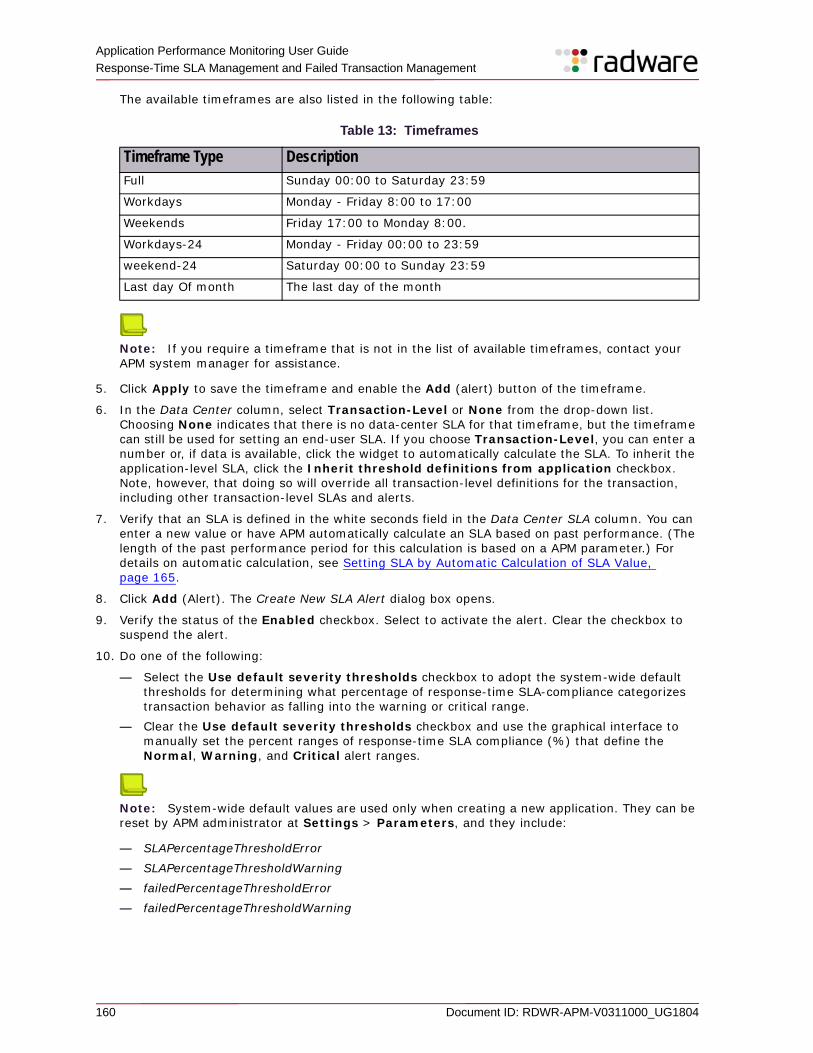
Application Performance Monitoring User Guide Response-Time SLA Management and Failed Transaction Management
160 Document ID: RDWR-APM-V0311000_UG1804
The available timeframes are also listed in the following table:
Note: If you require a timeframe that is not in the list of available timeframes, contact your APM system manager for assistance.
5. Click Apply to save the timeframe and enable the Add (alert) button of the timeframe.
6. In the Data Center column, select Transaction-Level or None from the drop-down list. Choosing None indicates that there is no data-center SLA for that timeframe, but the timeframe can still be used for setting an end-user SLA. If you choose Transaction-Level, you can enter a number or, if data is available, click the widget to automatically calculate the SLA. To inherit the application-level SLA, click the Inherit threshold definitions from application checkbox. Note, however, that doing so will override all transaction-level definitions for the transaction, including other transaction-level SLAs and alerts.
7. Verify that an SLA is defined in the white seconds field in the Data Center SLA column. You can enter a new value or have APM automatically calculate an SLA based on past performance. (The length of the past performance period for this calculation is based on a APM parameter.) For details on automatic calculation, see Setting SLA by Automatic Calculation of SLA Value, page 165.
8. Click Add (Alert). The Create New SLA Alert dialog box opens.
9. Verify the status of the Enabled checkbox. Select to activate the alert. Clear the checkbox to suspend the alert.
10. Do one of the following:
— Select the Use default severity thresholds checkbox to adopt the system-wide default thresholds for determining what percentage of response-time SLA-compliance categorizes transaction behavior as falling into the warning or critical range.
— Clear the Use default severity thresholds checkbox and use the graphical interface to manually set the percent ranges of response-time SLA compliance (%) that define the Normal, Warning, and Critical alert ranges.
Note: System-wide default values are used only when creating a new application. They can be reset by APM administrator at Settings > Parameters, and they include:
— SLAPercentageThresholdError— SLAPercentageThresholdWarning— failedPercentageThresholdError— failedPercentageThresholdWarning
Table 13: Timeframes
Timeframe Type Description Full Sunday 00:00 to Saturday 23:59
Workdays Monday - Friday 8:00 to 17:00
Weekends Friday 17:00 to Monday 8:00.
Workdays-24 Monday - Friday 00:00 to 23:59
weekend-24 Saturday 00:00 to Sunday 23:59
Last day Of month The last day of the month
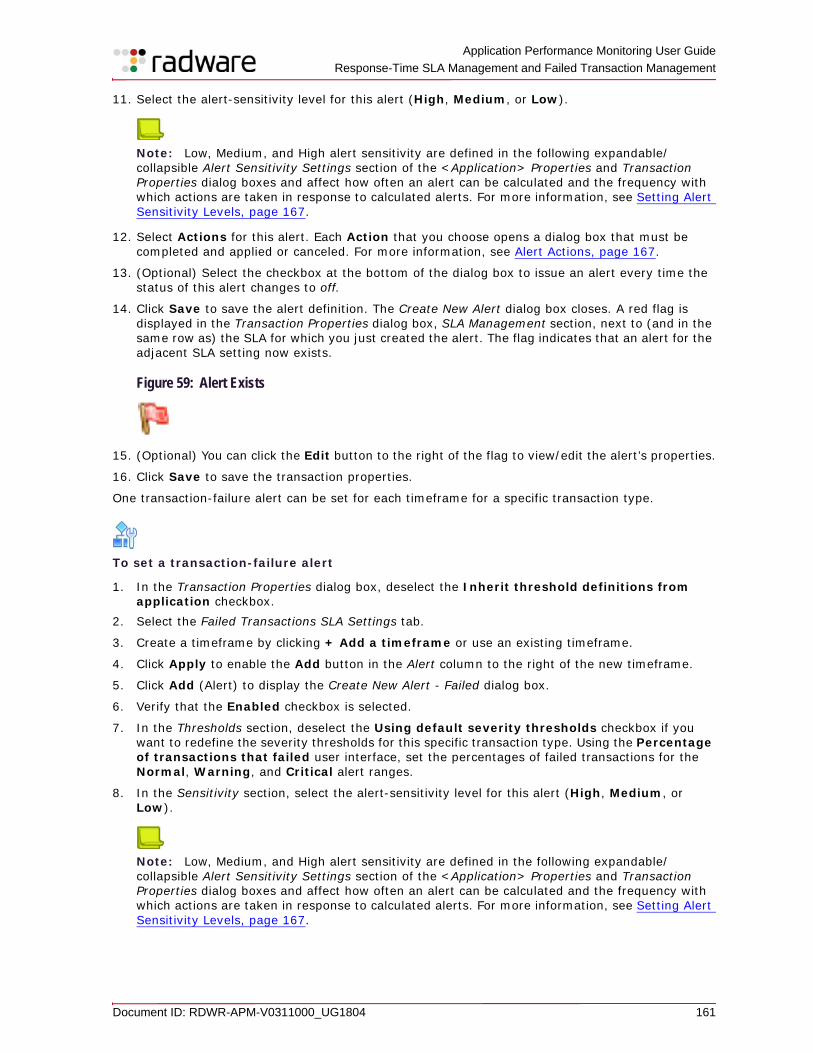
Application Performance Monitoring User Guide
Response-Time SLA Management and Failed Transaction Management
Document ID: RDWR-APM-V0311000_UG1804 161
11. Select the alert-sensitivity level for this alert (High, Medium, or Low).
Note: Low, Medium, and High alert sensitivity are defined in the following expandable/collapsible Alert Sensitivity Settings section of the <Application> Properties and Transaction Properties dialog boxes and affect how often an alert can be calculated and the frequency with which actions are taken in response to calculated alerts. For more information, see Setting Alert Sensitivity Levels, page 167.
12. Select Actions for this alert. Each Action that you choose opens a dialog box that must be completed and applied or canceled. For more information, see Alert Actions, page 167.
13. (Optional) Select the checkbox at the bottom of the dialog box to issue an alert every time the status of this alert changes to off.
14. Click Save to save the alert definition. The Create New Alert dialog box closes. A red flag is displayed in the Transaction Properties dialog box, SLA Management section, next to (and in the same row as) the SLA for which you just created the alert. The flag indicates that an alert for the adjacent SLA setting now exists.
Figure 59: Alert Exists
15. (Optional) You can click the Edit button to the right of the flag to view/edit the alert’s properties.
16. Click Save to save the transaction properties.
One transaction-failure alert can be set for each timeframe for a specific transaction type.
To set a transaction-failure alert
1. In the Transaction Properties dialog box, deselect the Inherit threshold definitions from application checkbox.
2. Select the Failed Transactions SLA Settings tab.
3. Create a timeframe by clicking + Add a timeframe or use an existing timeframe.
4. Click Apply to enable the Add button in the Alert column to the right of the new timeframe.
5. Click Add (Alert) to display the Create New Alert - Failed dialog box.
6. Verify that the Enabled checkbox is selected.
7. In the Thresholds section, deselect the Using default severity thresholds checkbox if you want to redefine the severity thresholds for this specific transaction type. Using the Percentage of transactions that failed user interface, set the percentages of failed transactions for the Normal, Warning, and Critical alert ranges.
8. In the Sensitivity section, select the alert-sensitivity level for this alert (High, Medium, or Low).
Note: Low, Medium, and High alert sensitivity are defined in the following expandable/collapsible Alert Sensitivity Settings section of the <Application> Properties and Transaction Properties dialog boxes and affect how often an alert can be calculated and the frequency with which actions are taken in response to calculated alerts. For more information, see Setting Alert Sensitivity Levels, page 167.
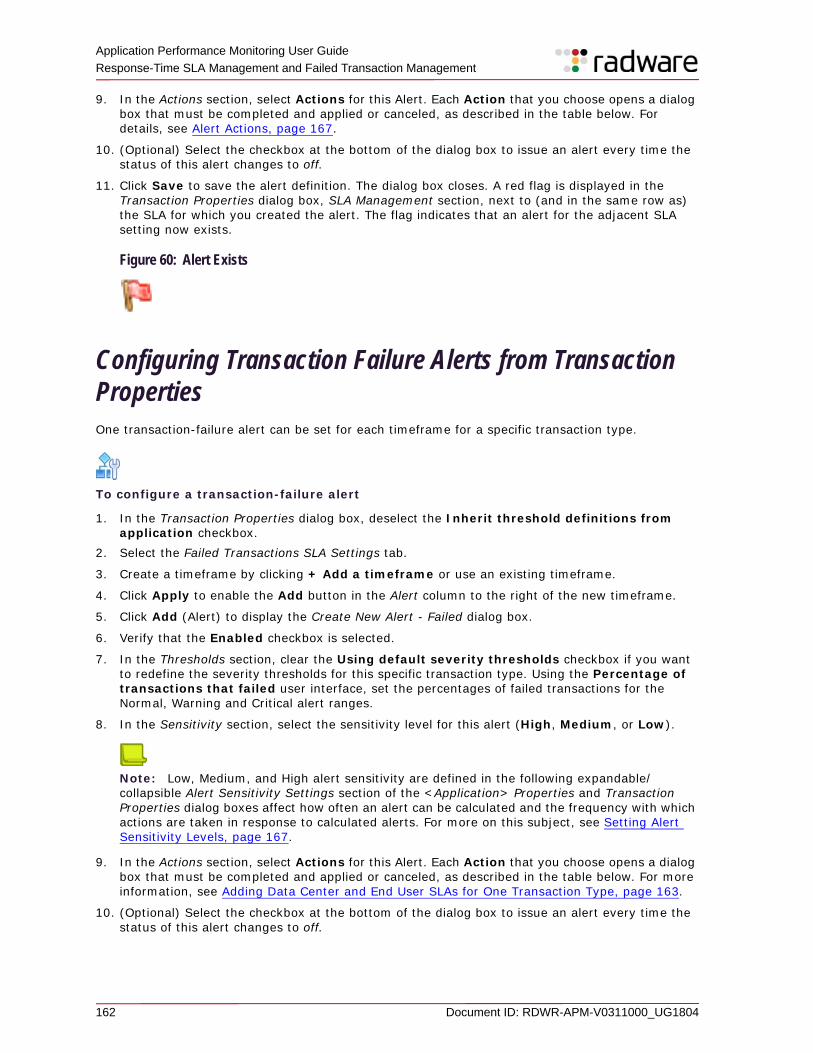
Application Performance Monitoring User Guide Response-Time SLA Management and Failed Transaction Management
162 Document ID: RDWR-APM-V0311000_UG1804
9. In the Actions section, select Actions for this Alert. Each Action that you choose opens a dialog box that must be completed and applied or canceled, as described in the table below. For details, see Alert Actions, page 167.
10. (Optional) Select the checkbox at the bottom of the dialog box to issue an alert every time the status of this alert changes to off.
11. Click Save to save the alert definition. The dialog box closes. A red flag is displayed in the Transaction Properties dialog box, SLA Management section, next to (and in the same row as) the SLA for which you created the alert. The flag indicates that an alert for the adjacent SLA setting now exists.
Figure 60: Alert Exists
Configuring Transaction Failure Alerts from Transaction PropertiesOne transaction-failure alert can be set for each timeframe for a specific transaction type.
To configure a transaction-failure alert
1. In the Transaction Properties dialog box, deselect the Inherit threshold definitions from application checkbox.
2. Select the Failed Transactions SLA Settings tab.
3. Create a timeframe by clicking + Add a timeframe or use an existing timeframe.
4. Click Apply to enable the Add button in the Alert column to the right of the new timeframe.
5. Click Add (Alert) to display the Create New Alert - Failed dialog box.
6. Verify that the Enabled checkbox is selected.
7. In the Thresholds section, clear the Using default severity thresholds checkbox if you want to redefine the severity thresholds for this specific transaction type. Using the Percentage of transactions that failed user interface, set the percentages of failed transactions for the Normal, Warning and Critical alert ranges.
8. In the Sensitivity section, select the sensitivity level for this alert (High, Medium, or Low).
Note: Low, Medium, and High alert sensitivity are defined in the following expandable/collapsible Alert Sensitivity Settings section of the <Application> Properties and Transaction Properties dialog boxes affect how often an alert can be calculated and the frequency with which actions are taken in response to calculated alerts. For more on this subject, see Setting Alert Sensitivity Levels, page 167.
9. In the Actions section, select Actions for this Alert. Each Action that you choose opens a dialog box that must be completed and applied or canceled, as described in the table below. For more information, see Adding Data Center and End User SLAs for One Transaction Type, page 163.
10. (Optional) Select the checkbox at the bottom of the dialog box to issue an alert every time the status of this alert changes to off.
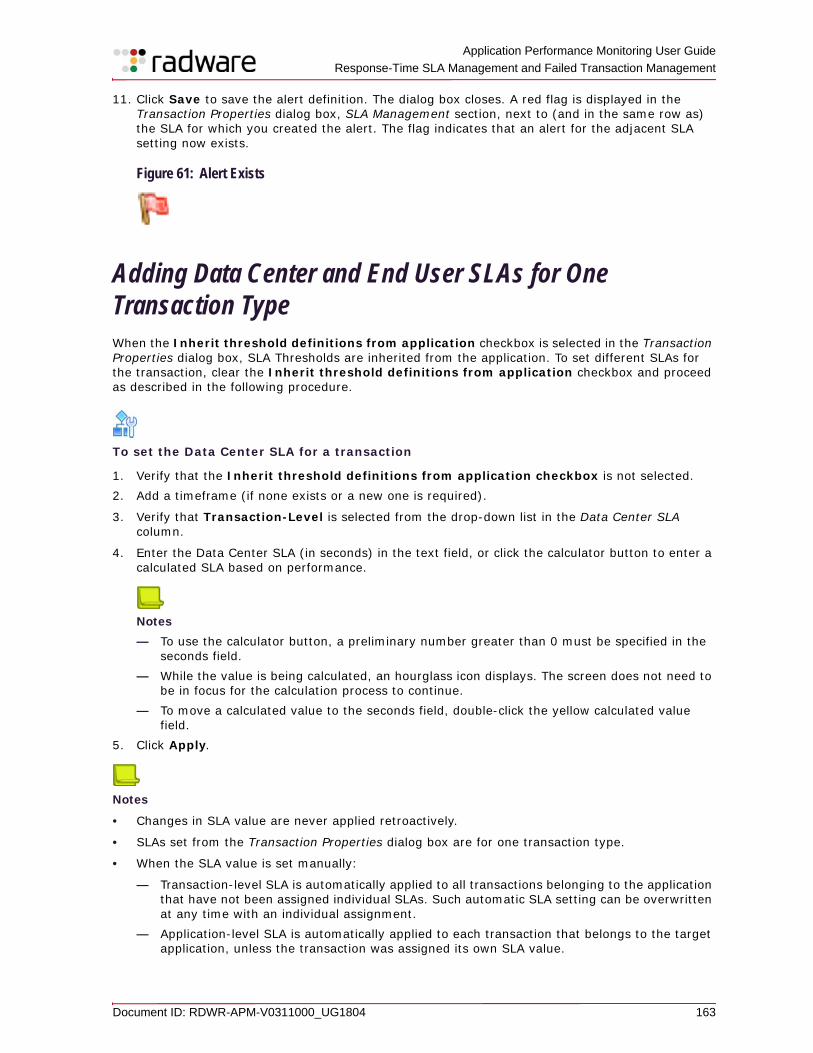
Application Performance Monitoring User Guide
Response-Time SLA Management and Failed Transaction Management
Document ID: RDWR-APM-V0311000_UG1804 163
11. Click Save to save the alert definition. The dialog box closes. A red flag is displayed in the Transaction Properties dialog box, SLA Management section, next to (and in the same row as) the SLA for which you created the alert. The flag indicates that an alert for the adjacent SLA setting now exists.
Figure 61: Alert Exists
Adding Data Center and End User SLAs for One Transaction TypeWhen the Inherit threshold definitions from application checkbox is selected in the Transaction Properties dialog box, SLA Thresholds are inherited from the application. To set different SLAs for the transaction, clear the Inherit threshold definitions from application checkbox and proceed as described in the following procedure.
To set the Data Center SLA for a transaction
1. Verify that the Inherit threshold definitions from application checkbox is not selected.2. Add a timeframe (if none exists or a new one is required).
3. Verify that Transaction-Level is selected from the drop-down list in the Data Center SLA column.
4. Enter the Data Center SLA (in seconds) in the text field, or click the calculator button to enter a calculated SLA based on performance.
Notes
— To use the calculator button, a preliminary number greater than 0 must be specified in the seconds field.
— While the value is being calculated, an hourglass icon displays. The screen does not need to be in focus for the calculation process to continue.
— To move a calculated value to the seconds field, double-click the yellow calculated value field.
5. Click Apply.
Notes
• Changes in SLA value are never applied retroactively.
• SLAs set from the Transaction Properties dialog box are for one transaction type.
• When the SLA value is set manually:
— Transaction-level SLA is automatically applied to all transactions belonging to the application that have not been assigned individual SLAs. Such automatic SLA setting can be overwritten at any time with an individual assignment.
— Application-level SLA is automatically applied to each transaction that belongs to the target application, unless the transaction was assigned its own SLA value.
Application Performance Monitoring User Guide Response-Time SLA Management and Failed Transaction Management
164 Document ID: RDWR-APM-V0311000_UG1804
— Data Center and End User SLAs can be calculated automatically based on existing transaction-instance response-time measurements.
To set the End User SLA for a transaction
1. Verify that the Inherit threshold definitions from application checkbox is not selected.2. Add a timeframe (if none exists or a new one is required).
3. Add a location to the timeframe.
4. Enter a non-zero value in the SLA seconds field and then click the calculator button to configure the SLA based on past performance.
Notes
— In order to use the calculator button, a preliminary number greater than 0 must be specified in the seconds field.
— While the value is being calculated, an hourglass icon displays. The screen does not need to be in focus for the calculation process to continue.
— To move a calculated value to the seconds field, double-click the yellow calculated value field.
5. Click Apply.
Notes
• Changes in SLA value are never applied retroactively.
• SLAs set from the Transaction Properties dialog box are for one transaction type.
• When the SLA value is set manually:
— Transaction level SLA is automatically applied to all transactions belonging to the application that have not been assigned individual SLAs. Such automatic SLA setting can be overwritten at any time with an individual assignment.
— Application level SLA is automatically applied to each transaction that belongs to the target application, unless the transaction was assigned its own SLA value.
— Data Center and End User SLAs can be calculated automatically based on existing transaction-instance response-time measurements.
Adding End-user SLAsIf required, set End User SLA for specific locations (and repeat as required).
To set an End User SLA
1. In the <Application> Properties dialog box, verify that the timeframe is the required timeframe.
Note: Timeframes are always defined in APM server time. For example, when the end user location is London and the APM server is in Boston, the timeframe follows Boston time.
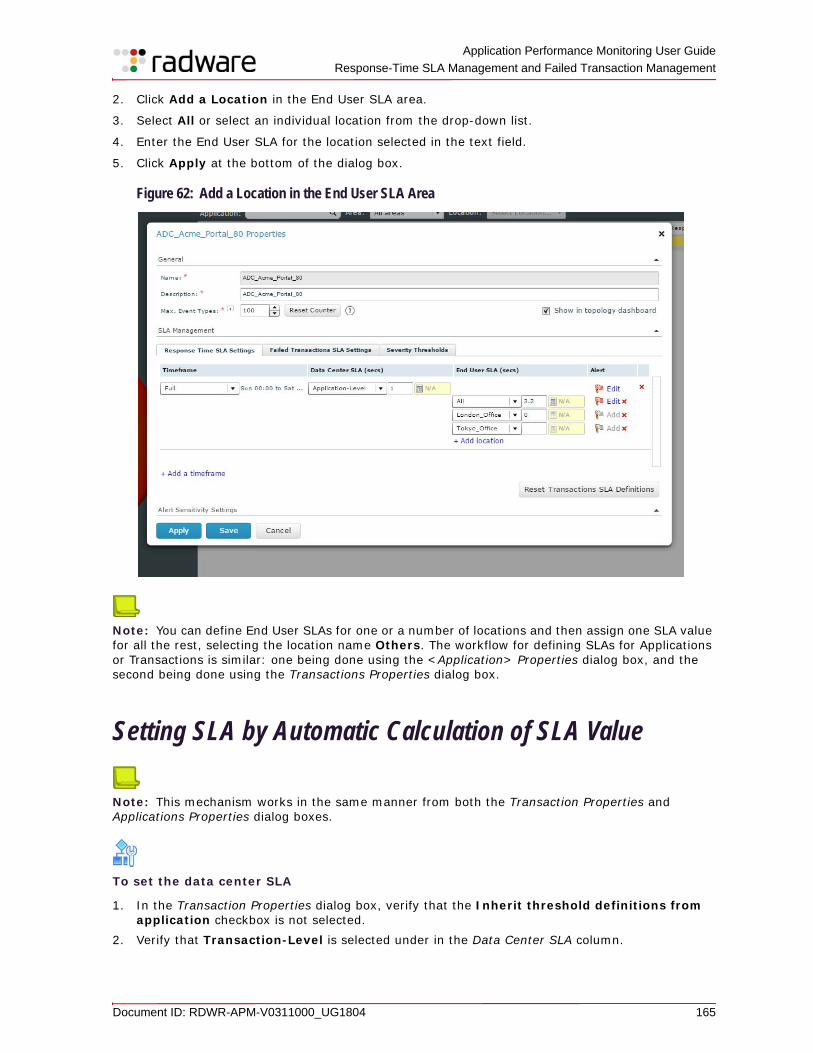
Application Performance Monitoring User Guide
Response-Time SLA Management and Failed Transaction Management
Document ID: RDWR-APM-V0311000_UG1804 165
2. Click Add a Location in the End User SLA area.
3. Select All or select an individual location from the drop-down list.
4. Enter the End User SLA for the location selected in the text field.
5. Click Apply at the bottom of the dialog box.
Figure 62: Add a Location in the End User SLA Area
Note: You can define End User SLAs for one or a number of locations and then assign one SLA value for all the rest, selecting the location name Others. The workflow for defining SLAs for Applications or Transactions is similar: one being done using the <Application> Properties dialog box, and the second being done using the Transactions Properties dialog box.
Setting SLA by Automatic Calculation of SLA Value
Note: This mechanism works in the same manner from both the Transaction Properties and Applications Properties dialog boxes.
To set the data center SLA
1. In the Transaction Properties dialog box, verify that the Inherit threshold definitions from application checkbox is not selected.
2. Verify that Transaction-Level is selected under in the Data Center SLA column.
Application Performance Monitoring User Guide Response-Time SLA Management and Failed Transaction Management
166 Document ID: RDWR-APM-V0311000_UG1804
3. Click the small calculator in the yellow field next to the Data Center SLA value box.
Note: APM calculates an SLA based on past performance of the transaction and places the results in the yellow field. While the calculation is ongoing, an hourglass icon displays in the yellow field. The calculation takes place in the background, and you can open other windows while it is ongoing. When the calculation has completed, the results display the yellow field.
4. Double-click the calculation results in the yellow window to duplicate them to the white field.
Note: If the calculated value displays only in the yellow field, it has no effect on APM.
Setting SLA by Automatic Calculation of SLA ValueWhen the automatic calculation of the SLA is done from the <Application> Properties dialog box, the processing times of all instances of all transaction types belonging to the application are taken into the calculation. It is very important to be aware of the Application-Level/Transaction-Level setting. When the Application-Level setting is in effect, all transactions whose SLAs are linked to the Application-Level setting will be updated, and those that are not linked will not be updated. When the Transaction-Level setting is in effect, the SLA settings for each and every transaction type of the application will be calculated individually and updated for the transaction type. For a transaction to again inherit its SLA from the application will require individual treatment of the transaction SLA via the transaction properties of that transaction.The calculation takes place in the background, and you can open other windows while it is ongoing. When the calculation has completed, the results will be displayed in the yellow field.
To set any data center or end-user SLA
1. Verify that Transaction-Level is selected under in the Data Center SLA column.2. Click the small calculator in the yellow field next to the Data Center SLA value box.
Note: APM calculates an SLA and places the results in the yellow field. While the calculation is ongoing, an hourglass icon displays in the yellow field. The calculation takes place in the background, and you can open other windows while it is ongoing. When the calculation has completed, the results will be displayed in the yellow field.
3. Double-click the calculation results in the yellow field to copy them to the white field.
Note: If the calculated value remains displays only in the yellow field, it has no effect on APM. Once the value moves to the white SLA field, it takes affect even without the Save or Apply buttons being activated.
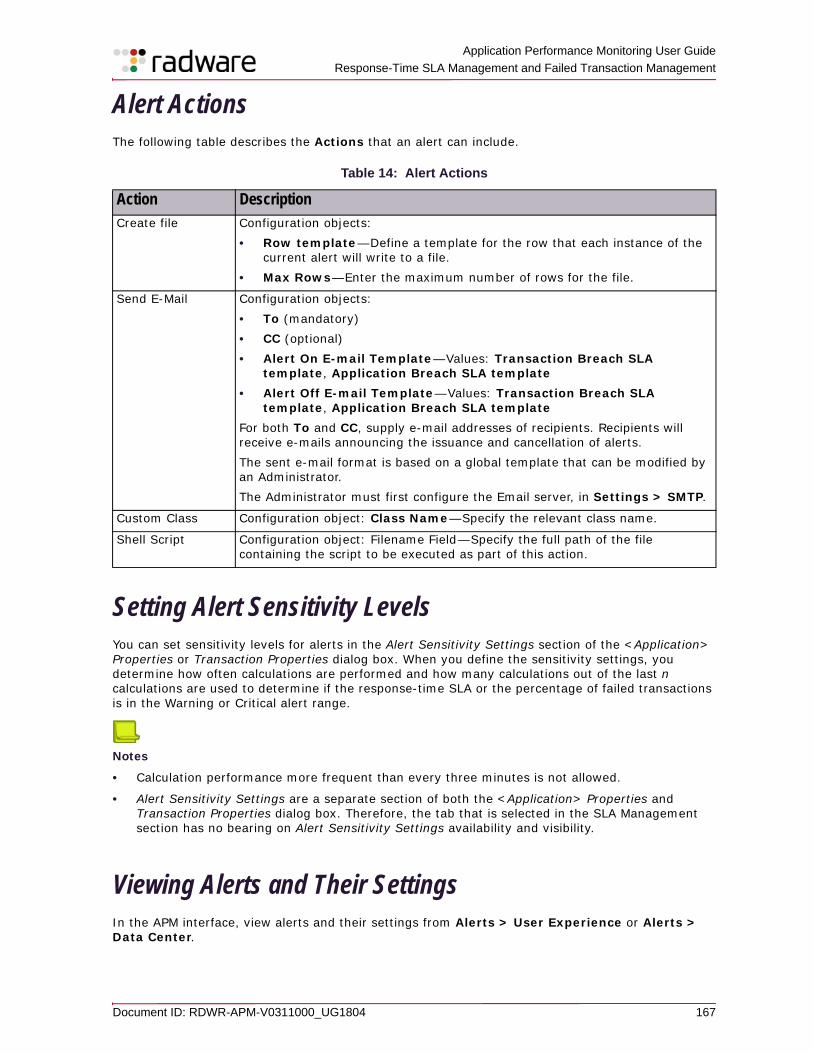
Application Performance Monitoring User Guide
Response-Time SLA Management and Failed Transaction Management
Document ID: RDWR-APM-V0311000_UG1804 167
Alert ActionsThe following table describes the Actions that an alert can include.
Setting Alert Sensitivity LevelsYou can set sensitivity levels for alerts in the Alert Sensitivity Settings section of the <Application> Properties or Transaction Properties dialog box. When you define the sensitivity settings, you determine how often calculations are performed and how many calculations out of the last n calculations are used to determine if the response-time SLA or the percentage of failed transactions is in the Warning or Critical alert range.
Notes
• Calculation performance more frequent than every three minutes is not allowed.
• Alert Sensitivity Settings are a separate section of both the <Application> Properties and Transaction Properties dialog box. Therefore, the tab that is selected in the SLA Management section has no bearing on Alert Sensitivity Settings availability and visibility.
Viewing Alerts and Their SettingsIn the APM interface, view alerts and their settings from Alerts > User Experience or Alerts > Data Center.
Table 14: Alert Actions
Action DescriptionCreate file Configuration objects:
• Row template—Define a template for the row that each instance of the current alert will write to a file.
• Max Rows—Enter the maximum number of rows for the file.
Send E-Mail Configuration objects: • To (mandatory) • CC (optional) • Alert On E-mail Template—Values: Transaction Breach SLA
template, Application Breach SLA template• Alert Off E-mail Template—Values: Transaction Breach SLA
template, Application Breach SLA templateFor both To and CC, supply e-mail addresses of recipients. Recipients will receive e-mails announcing the issuance and cancellation of alerts. The sent e-mail format is based on a global template that can be modified by an Administrator.The Administrator must first configure the Email server, in Settings > SMTP.
Custom Class Configuration object: Class Name—Specify the relevant class name.
Shell Script Configuration object: Filename Field—Specify the full path of the file containing the script to be executed as part of this action.
Application Performance Monitoring User Guide Response-Time SLA Management and Failed Transaction Management
168 Document ID: RDWR-APM-V0311000_UG1804
Document ID: RDWR-APM-V0311000_UG1804 169
Appendix A – Finding Problematic Spots in Application CodeYou can find code locations at which a specified transaction spent longer than expected. APM helps you do this by displaying aggregated stack traces that it gathered on the fly while the transaction was actually stalling. Trace capturing begins when the defined threshold parameter stalledThreshold, which is defined in spagent.xml on the agent machine is exceeded. Trace capturing then continues at configured intervals defined by the parameter stackTraceInterval.
Note: This Method Level visibility is supported for Java and .Net applications.
For more information, see:• Drilling Down from Method Level Hotspot Indications, page 169• Drilling Down from Method Level Hotspot Indications, page 169• Method Level Hotspots for Specific Transaction, page 170• Method Trace Interactive Interface Features, page 172
Searching for Method Level HotspotsYou can perform a search for transactions or transaction segments that may have experienced stalled methods.
1. In the APM toolbar, click the Advanced Search button ( ).2. Select Transactions or Transaction Segments and then select the Method-Level Hotspots
data: Exists.
3. Click Search. The result of search is a list of transaction segments that were stalled during the currently selected timeframe and for which method level hotspot data associated is available.
Drilling Down from Method Level Hotspot IndicationsPerform a transaction search as described above.
1. Check if some transactions have a flame icon in the Method Level Hotspot column.
Note: A flame icon in this column indicates Method Level Hotspots information is identified during the transaction’s execution.
2. Click a row containing the flame icon in the Method Level Hotspot column and select Transaction tree view or Transaction Segment View.
3. From the view displayed, click Method Level Hotspots. The Method Call Hotspots pane for the transaction opens.
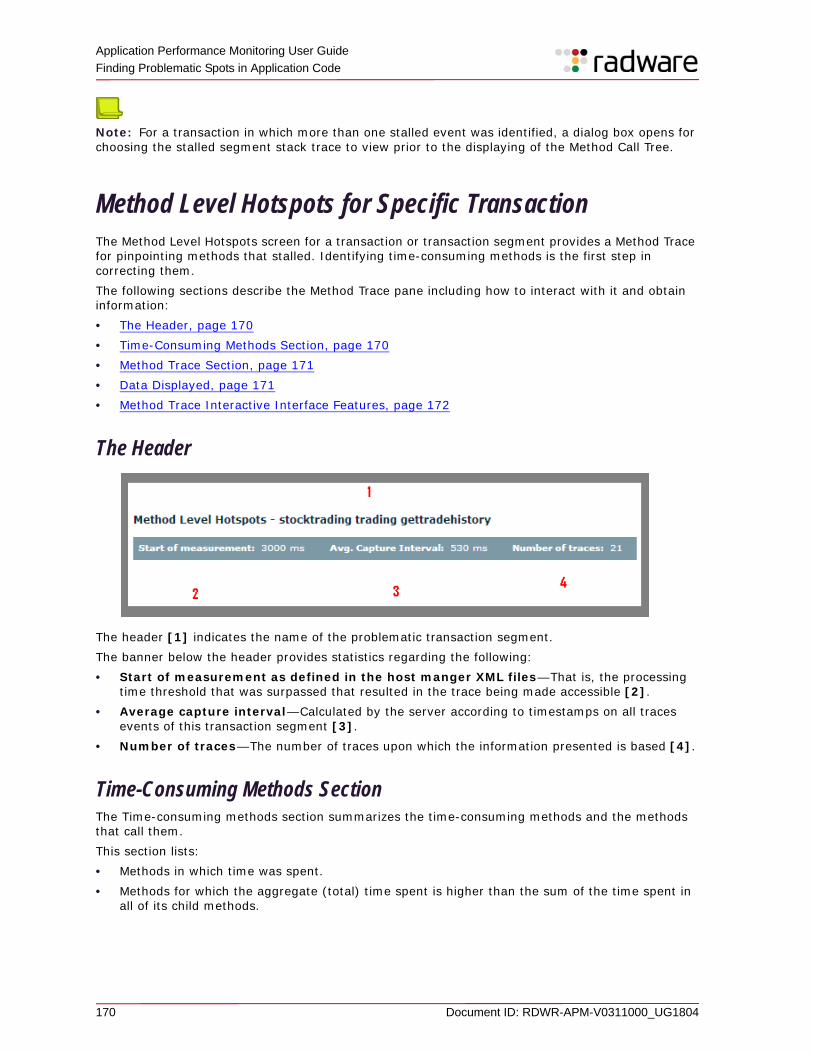
Application Performance Monitoring User Guide Finding Problematic Spots in Application Code
170 Document ID: RDWR-APM-V0311000_UG1804
Note: For a transaction in which more than one stalled event was identified, a dialog box opens for choosing the stalled segment stack trace to view prior to the displaying of the Method Call Tree.
Method Level Hotspots for Specific TransactionThe Method Level Hotspots screen for a transaction or transaction segment provides a Method Trace for pinpointing methods that stalled. Identifying time-consuming methods is the first step in correcting them.The following sections describe the Method Trace pane including how to interact with it and obtain information:• The Header, page 170• Time-Consuming Methods Section, page 170• Method Trace Section, page 171• Data Displayed, page 171• Method Trace Interactive Interface Features, page 172
The Header
The header [1] indicates the name of the problematic transaction segment. The banner below the header provides statistics regarding the following:• Start of measurement as defined in the host manger XML files—That is, the processing
time threshold that was surpassed that resulted in the trace being made accessible [2].• Average capture interval—Calculated by the server according to timestamps on all traces
events of this transaction segment [3].• Number of traces—The number of traces upon which the information presented is based [4].
Time-Consuming Methods SectionThe Time-consuming methods section summarizes the time-consuming methods and the methods that call them. This section lists:• Methods in which time was spent.• Methods for which the aggregate (total) time spent is higher than the sum of the time spent in
all of its child methods.
Application Performance Monitoring User Guide
Finding Problematic Spots in Application Code
Document ID: RDWR-APM-V0311000_UG1804 171
For each time-consuming method, its duration and percentage of parent method processing time are displayed in the two columns at the right. In other words, each parent method whose descendants include a time-consuming method but who itself is not consuming time (except by virtue of calling to and waiting for the time-consuming methods) shows the amount of time it takes and the percentage of time it takes in comparison to the total duration of all its descendants and the total percentage of processing time attributed to all of its descendants.For example, when the Duration column for a single method displays 3/10 ms, it signifies that this specific method consumed 3 ms, while the time spent in this method including all its descendant methods was 10 ms. The same type of notation applies to the Percentage column.
Method Trace SectionThe Method trace initially displays all the methods called by the parent methods and the descendants of the parent methods of the time-consuming methods. This complete analysis provides IT with all the information required to analyze and discover the causes of processing time overloads caused by time-consuming methods. Users can filter the display as well as collapse and expand the tree nodes to simplify the display or provide more details according to their needs.
When the tree is collapsed, a tree icon is added to emphasize that time was not spend on the collapsed method, but in its descendant methods.
Data DisplayedThe List of Time-consuming Methods and the Method Trace tree display in a tabular format:• Name - ClassName: (MethodName:line-of-code)• Time (ms)• %TimeTime and percentage calculation are based on aggregated stack trace information. For each stack trace, APM identifies the processed method and assigns the stack trace time information to it.
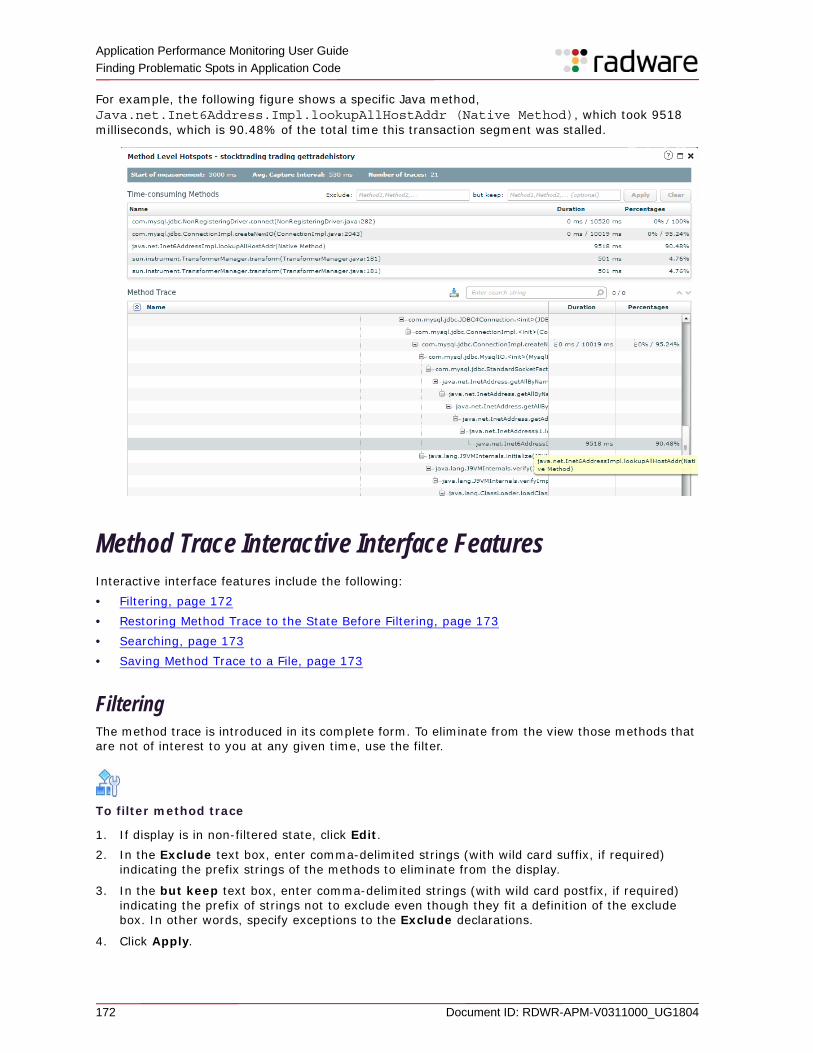
Application Performance Monitoring User Guide Finding Problematic Spots in Application Code
172 Document ID: RDWR-APM-V0311000_UG1804
For example, the following figure shows a specific Java method, Java.net.Inet6Address.Impl.lookupAllHostAddr (Native Method), which took 9518 milliseconds, which is 90.48% of the total time this transaction segment was stalled.
Method Trace Interactive Interface FeaturesInteractive interface features include the following:• Filtering, page 172• Restoring Method Trace to the State Before Filtering, page 173• Searching, page 173• Saving Method Trace to a File, page 173
FilteringThe method trace is introduced in its complete form. To eliminate from the view those methods that are not of interest to you at any given time, use the filter.
To filter method trace
1. If display is in non-filtered state, click Edit.2. In the Exclude text box, enter comma-delimited strings (with wild card suffix, if required)
indicating the prefix strings of the methods to eliminate from the display.
3. In the but keep text box, enter comma-delimited strings (with wild card postfix, if required) indicating the prefix of strings not to exclude even though they fit a definition of the exclude box. In other words, specify exceptions to the Exclude declarations.
4. Click Apply.
Application Performance Monitoring User Guide
Finding Problematic Spots in Application Code
Document ID: RDWR-APM-V0311000_UG1804 173
Restoring Method Trace to the State Before Filtering
To restore method trace to the state before filtering
1. Click Clear to clear the Exclude and But keep text boxes.2. Click Apply.
Searching
To search for a string in the method trace
1. Specify a string in the search box above the Method Trace window.2. Click the magnifying glass or press Enter.
The first instance of the searched for string is indicated with blue highlighting.The number of this instance and the total number of instances is indicated to the right of the search box.
3. Click the up and down arrows to the right of the Search box to navigate through instances of method trace lines containing that contain the search string.
Saving Method Trace to a File
You can save the method trace to a file by clicking on the Download tree icon ( ) located above the Method Trace display and to the left of the search box.
Application Performance Monitoring User Guide Finding Problematic Spots in Application Code
174 Document ID: RDWR-APM-V0311000_UG1804
Document ID: RDWR-APM-V0311000_UG1804 175
Appendix B – Troubleshooting Too Many Event TypesFor APM to effectively process the information related to each application monitored, the number of event types per application needs to be controlled. To understand the challenge and the solutions, see the following sections:• Understanding Too Many Event Types, page 175• Procedure for Solving Too Many Event Types Alerts and Errors, page 176• Tips for Controlling the Number of Event Types per Application, page 176
Understanding Too Many Event TypesAPM creates transaction types and event segments for an application according to the application’s Transaction Naming Rules and Transformation Rules for both Segment Naming and Transaction Naming.For each application, the Maximum Number of Event Types (application parameter) is defined in the <Application> Properties dialog box. The APM default value of Max. Event Types is 500. The current value of this parameter indicates the upper limit of the number of transaction types and event segment names that can be counted for the application. The total number of all transaction types and event segment names aggregated from one application must not exceed Max. Event Types defined for that application When that number is exceeded, all the data for new events will be aggregated under one default event name.For related information, see Tips for Controlling the Number of Event Types per Application, page 176In order to allow a data loss situation to be avoided, warnings are issued when the number of generated event types approaches the application Maximum Number of Event Types. When the Maximum Number of Event Types is reached, the data of new events is collected under one default event name called “Please reconfigure the application. Too many event types were created.” New events will be aggregated according to this default event type and not by unique event types until the situation is corrected.You can set warning and alert thresholds using the following two system-wide parameters:
• eventTypesPercentageThresholdWarning, default: 90
• eventTypesPercentageThresholdError, default: 95
If left with the default values: • A warning is issued when the sum of transaction types and event segment names being counted
has reached 90% of the current Max. Event Types.• An error is issued when the sum of transaction types and event segment names being counted
has reached 95% of the current Max. Event Types.
Application Performance Monitoring User Guide Troubleshooting Too Many Event Types
176 Document ID: RDWR-APM-V0311000_UG1804
Procedure for Solving Too Many Event Types Alerts and ErrorsAs mentioned previously, the number of event types per application must be controlled. When the number of event types approaches the Max. Event Types allowed for an application, alerts are displayed according to the thresholds set in the APM parameters mentioned above.In order to avoid a situation in which events are aggregated under the default event type, an occurrence which makes data aggregation for those events impossible, you should:• Adjust transaction and transaction segment (event) naming.• Reset counters according to anticipated need or in response to warnings.
To avoid a situation in which events are aggregated under the default event type
1. Go to Settings > Application. 2. Click the application of interest.
3. Select the Event Types Viewer option from the context menu.
4. Examine the events to determine which supersets of transactions or events are causing the Max. Event Types to be exceeded.
5. After identifying such a group of transactions or events, ask yourself how can the transaction type naming or event segment naming be changed to reduce the number of event types. (For more information, see Tips for Controlling the Number of Event Types per Application, page 176.)
6. Use the links at the bottom of the event viewer to access Transaction Naming Rules for the application and Transformation Rules for both transaction and transaction segment naming.
7. Reset the Event Type Counter of the application:
a. Go to Settings > Applications.b. Click the application, and choose Application Properties. The <Application> Properties
dialog box opens.8. Click Reset Counter. This sets the main Event Types counter to zero, restarting the count of the
event types being generated from incoming traffic of this application based on the modified application configuration.
Tips for Controlling the Number of Event Types per ApplicationThe following tips will help you control the number of event types per application.You should base the naming of transactions and segments on logic that serves your monitoring needs. Because each new type encountered adds to the event type count, it is important to find the right balance between groups of event types with detailed names that can impede the system and names that are too generalized in which detailed information is not readily available. APM makes it easy to change the naming configuration with no cost of lost data; it can be done without hesitation whenever it is needed.
Application Performance Monitoring User Guide
Troubleshooting Too Many Event Types
Document ID: RDWR-APM-V0311000_UG1804 177
To limit the number of transaction types through transaction naming
> Try one of these techniques:
— Select the Use request without its parameters transaction naming option.— Limit the number of path sections used from within an URL. The less differentiated the URL
used in naming, the fewer transaction types you will be defining.
Example Imagine events containing the following URLs, and many similar, where all the changes in the URL come after the “products” segment:
• http://www.thecompany.com/products/cat-1234666/subpage/123.html
• http://www.thecompany.com/products/cat-1234667/subpage/456.html
Limiting the transaction naming to http://www.thecompany.com/products/ (two URL segments) can group hundreds of URIs into one transaction type, instead of hundreds, which would result from including the next segment of the URL in the transaction naming.
Example Suppose the following three URLs represent thousands of transactions:
• http://creditcompanyAAA.com/users/59162
• http://creditcompanyAAA.com/users/52162
• http://creditcompanyAAA.com/users/72362
If you name the transaction type according to three segments, you will have a new counter for every account; that is, you will have thousands of event types. However, limiting the transaction naming for this application to two URL segments will provide you with one transaction type that provides the logic for the aggregation of thousands of individual transactions.Using type reducer transformation rules, you can also reduce and ignore unneeded segment names.

Application Performance Monitoring User Guide Troubleshooting Too Many Event Types
178 Document ID: RDWR-APM-V0311000_UG1804
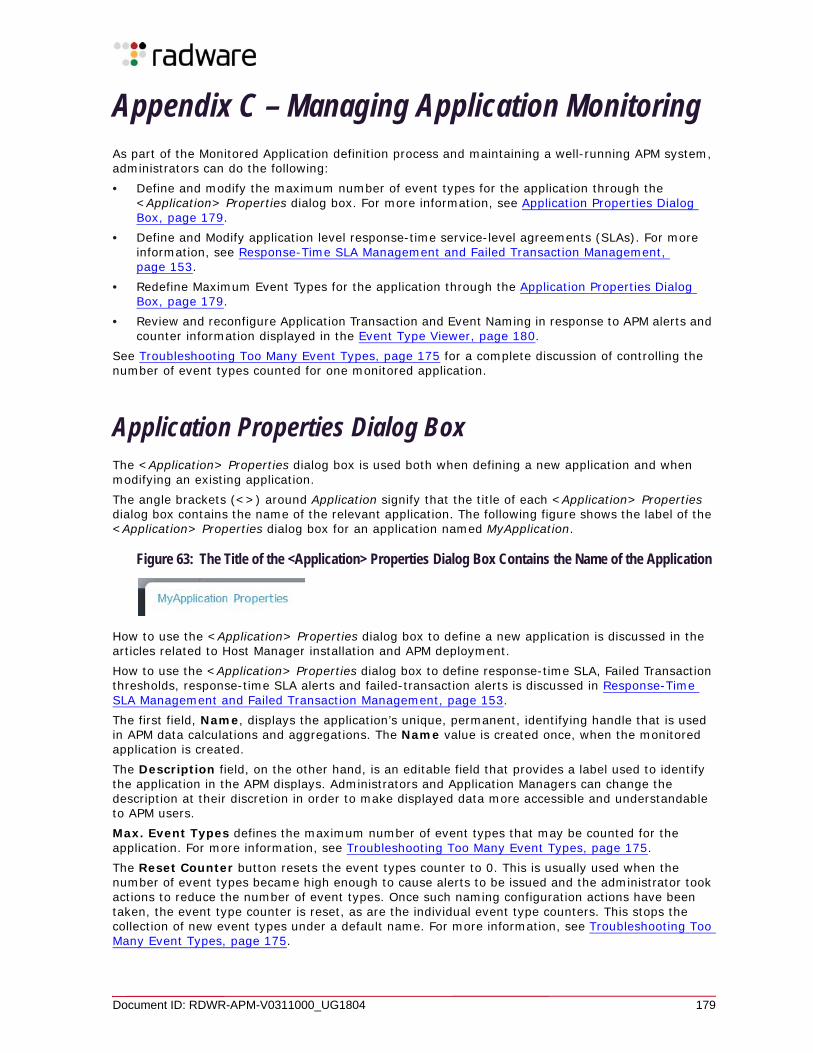
Document ID: RDWR-APM-V0311000_UG1804 179
Appendix C – Managing Application MonitoringAs part of the Monitored Application definition process and maintaining a well-running APM system, administrators can do the following:• Define and modify the maximum number of event types for the application through the
<Application> Properties dialog box. For more information, see Application Properties Dialog Box, page 179.
• Define and Modify application level response-time service-level agreements (SLAs). For more information, see Response-Time SLA Management and Failed Transaction Management, page 153.
• Redefine Maximum Event Types for the application through the Application Properties Dialog Box, page 179.
• Review and reconfigure Application Transaction and Event Naming in response to APM alerts and counter information displayed in the Event Type Viewer, page 180.
See Troubleshooting Too Many Event Types, page 175 for a complete discussion of controlling the number of event types counted for one monitored application.
Application Properties Dialog BoxThe <Application> Properties dialog box is used both when defining a new application and when modifying an existing application. The angle brackets (<>) around Application signify that the title of each <Application> Properties dialog box contains the name of the relevant application. The following figure shows the label of the <Application> Properties dialog box for an application named MyApplication.
Figure 63: The Title of the <Application> Properties Dialog Box Contains the Name of the Application
How to use the <Application> Properties dialog box to define a new application is discussed in the articles related to Host Manager installation and APM deployment.How to use the <Application> Properties dialog box to define response-time SLA, Failed Transaction thresholds, response-time SLA alerts and failed-transaction alerts is discussed in Response-Time SLA Management and Failed Transaction Management, page 153.The first field, Name, displays the application’s unique, permanent, identifying handle that is used in APM data calculations and aggregations. The Name value is created once, when the monitored application is created. The Description field, on the other hand, is an editable field that provides a label used to identify the application in the APM displays. Administrators and Application Managers can change the description at their discretion in order to make displayed data more accessible and understandable to APM users.Max. Event Types defines the maximum number of event types that may be counted for the application. For more information, see Troubleshooting Too Many Event Types, page 175.The Reset Counter button resets the event types counter to 0. This is usually used when the number of event types became high enough to cause alerts to be issued and the administrator took actions to reduce the number of event types. Once such naming configuration actions have been taken, the event type counter is reset, as are the individual event type counters. This stops the collection of new event types under a default name. For more information, see Troubleshooting Too Many Event Types, page 175.
Application Performance Monitoring User Guide Managing Application Monitoring
180 Document ID: RDWR-APM-V0311000_UG1804
The Show in Topology checkbox displays on the right side of the dialog box, at the same level as the Reset Counter button. Select the Show in Topology checkbox to display a KPI window for this application in the Topology map view.Three tabs are available in the lower half of the <Application> Properties dialog box: Response Time SLA Settings, Failed Transactions SLA Settings, and Severity Thresholds. These are fully discussed in Response-Time SLA Management and Failed Transaction Management, page 153.Apply, Save and Cancel buttons are available at the bottom of the dialog box.
Event Type ViewerThe Event Type Viewer allows examining the counted event types (Transactions and Event Segments) for one application. It allows administrators and application managers to make informed decisions regarding transaction and event-segment naming, which is especially helpful when there is a need to reduce the number of event types being counted. For more information, see Troubleshooting Too Many Event Types, page 175.
To reach the Event Type Viewer for your application
1. Go to Settings > Applications.2. Click the application of interest.
3. Select the Event Types Viewer option.
4. Use the Event Type Viewer to view counted transaction and segment types filtered by Tier, Description, and Date (Last Used) filters. Examining the events can help you decide on naming changes that can lower the number of event types, which must not exceed the value of the Max. Event Types parameter defined for each application.
Links are provided at the bottom of the event viewer to reach Transaction Naming Rules for the application and Transformation Rules for both transaction and transaction segment (event) naming. (The aim is to modify the naming of transactions and events in such a way the number of unique event types is reduced.)
5. After adjusting your naming configuration, you should do the following:
a. In Settings > Applications, click the application and choose Application Properties.b. In the <Application> Properties dialog box that opens, click Reset Counters. This sets the Event Types counter for the application to 0 and resets counters for individual transactions and events, including both their names and the quantities associated with them. Subsequently, the counters will acquire names and show the transformation and event counts as new events are processed according to the new changes in the application configuration (that is, the updated transaction and event naming rules).
Note: Previously collected data for this application is preserved.
Application Performance Monitoring User Guide
Managing Application Monitoring
Document ID: RDWR-APM-V0311000_UG1804 181
Transaction NamingTransaction naming is reached through:• Settings > Applications• Monitoring - Applications > Applications View > Data Center Information
In either of these application views, click the required application and then click Transaction Naming in the context menu. The Transaction Naming dialog box opens.

Application Performance Monitoring User Guide Managing Application Monitoring
182 Document ID: RDWR-APM-V0311000_UG1804
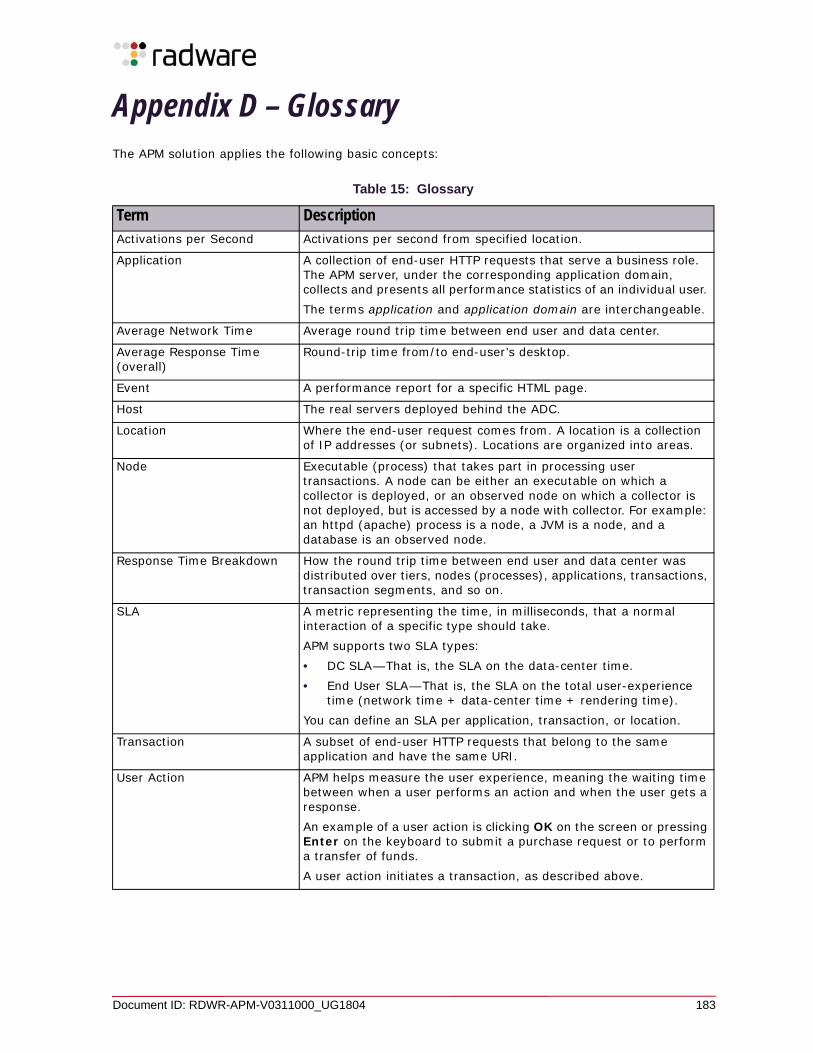
Document ID: RDWR-APM-V0311000_UG1804 183
Appendix D – GlossaryThe APM solution applies the following basic concepts:
Table 15: Glossary
Term DescriptionActivations per Second Activations per second from specified location.
Application A collection of end-user HTTP requests that serve a business role. The APM server, under the corresponding application domain, collects and presents all performance statistics of an individual user. The terms application and application domain are interchangeable.
Average Network Time Average round trip time between end user and data center.
Average Response Time (overall)
Round-trip time from/to end-user’s desktop.
Event A performance report for a specific HTML page.
Host The real servers deployed behind the ADC.
Location Where the end-user request comes from. A location is a collection of IP addresses (or subnets). Locations are organized into areas.
Node Executable (process) that takes part in processing user transactions. A node can be either an executable on which a collector is deployed, or an observed node on which a collector is not deployed, but is accessed by a node with collector. For example: an httpd (apache) process is a node, a JVM is a node, and a database is an observed node.
Response Time Breakdown How the round trip time between end user and data center was distributed over tiers, nodes (processes), applications, transactions, transaction segments, and so on.
SLA A metric representing the time, in milliseconds, that a normal interaction of a specific type should take. APM supports two SLA types:• DC SLA—That is, the SLA on the data-center time.• End User SLA—That is, the SLA on the total user-experience
time (network time + data-center time + rendering time).You can define an SLA per application, transaction, or location.
Transaction A subset of end-user HTTP requests that belong to the same application and have the same URI.
User Action APM helps measure the user experience, meaning the waiting time between when a user performs an action and when the user gets a response.An example of a user action is clicking OK on the screen or pressing Enter on the keyboard to submit a purchase request or to perform a transfer of funds.A user action initiates a transaction, as described above.

Application Performance Monitoring User Guide Glossary
184 Document ID: RDWR-APM-V0311000_UG1804
Document ID: RDWR-APM-V0311000_UG1804 185
Radware Ltd. End User License AgreementBy accepting this End User License Agreement (this “License Agreement”) you agree to be contacted by Radware Ltd.'s (“Radware”) sales personnel.If you would like to receive license rights different from the rights granted below or if you wish to acquire warranty or support services beyond the scope provided herein (if any), please contact Radware's sales team.THIS LICENSE AGREEMENT GOVERNS YOUR USE OF ANY SOFTWARE DEVELOPED AND/OR DISTRIBUTED BY RADWARE AND ANY UPGRADES, MODIFIED VERSIONS, UPDATES, ADDITIONS, AND COPIES OF THE SOFTWARE FURNISHED TO YOU DURING THE TERM OF THE LICENSE GRANTED HEREIN (THE “SOFTWARE”). THIS LICENSE AGREEMENT APPLIES REGARDLESS OF WHETHER THE SOFTWARE IS DELIVERED TO YOU AS AN EMBEDDED COMPONENT OF A RADWARE PRODUCT (“PRODUCT”), OR WHETHER IT IS DELIVERED AS A STANDALONE SOFTWARE PRODUCT. FOR THE AVOIDANCE OF DOUBT IT IS HEREBY CLARIFIED THAT THIS LICENSE AGREEMENT APPLIES TO PLUG-INS, CONNECTORS, EXTENSIONS AND SIMILAR SOFTWARE COMPONENTS DEVELOPED BY RADWARE THAT CONNECT OR INTEGRATE A RADWARE PRODUCT WITH THE PRODUCT OF A THIRD PARTY (COLLECTIVELY, “CONNECTORS”) FOR PROVISIONING, DECOMMISSIONING, MANAGING, CONFIGURING OR MONITORING RADWARE PRODUCTS. THE APPLICABILITY OF THIS LICENSE AGREEMENT TO CONNECTORS IS REGARDLESS OF WHETHER SUCH CONNECTORS ARE DISTRIBUTED TO YOU BY RADWARE OR BY A THIRD PARTY PRODUCT VENDOR. IN CASE A CONNECTOR IS DISTRIBUTED TO YOU BY A THIRD PARTY PRODUCT VENDOR PURSUANT TO THE TERMS OF AN AGREEMENT BETWEEN YOU AND THE THIRD PARTY PRODUCT VENDOR, THEN, AS BETWEEN RADWARE AND YOURSELF, TO THE EXTENT THERE IS ANY DISCREPANCY OR INCONSISTENCY BETWEEN THE TERMS OF THIS LICENSE AGREEMENT AND THE TERMS OF THE AGREEMENT BETWEEN YOU AND THE THIRD PARTY PRODUCT VENDOR, THE TERMS OF THIS LICENSE AGREEMENT WILL GOVERN AND PREVAIL. PLEASE READ THE TERMS AND CONDITIONS OF THIS LICENSE AGREEMENT CAREFULLY BEFORE OPENING THE PACKAGE CONTAINING RADWARE'S PRODUCT, OR BEFORE DOWNLOADING, INSTALLING, COPYING OR OTHERWISE USING RADWARE'S STANDALONE SOFTWARE (AS APPLICABLE). THE SOFTWARE IS LICENSED (NOT SOLD). BY OPENING THE PACKAGE CONTAINING RADWARE'S PRODUCT, OR BY DOWNLOADING, INSTALLING, COPYING OR USING THE SOFTWARE (AS APPLICABLE), YOU CONFIRM THAT YOU HAVE READ AND UNDERSTAND THIS LICENSE AGREEMENT AND YOU AGREE TO BE BOUND BY THE TERMS OF THIS LICENSE AGREEMENT. FURTHERMORE, YOU HEREBY WAIVE ANY CLAIM OR RIGHT THAT YOU MAY HAVE TO ASSERT THAT YOUR ACCEPTANCE AS STATED HEREINABOVE IS NOT THE EQUIVALENT OF, OR DEEMED AS, A VALID SIGNATURE TO THIS LICENSE AGREEMENT. IF YOU ARE NOT WILLING TO BE BOUND BY THE TERMS OF THIS LICENSE AGREEMENT, YOU SHOULD PROMPTLY RETURN THE UNOPENED PRODUCT PACKAGE OR YOU SHOULD NOT DOWNLOAD, INSTALL, COPY OR OTHERWISE USE THE SOFTWARE (AS APPLICABLE). THIS LICENSE AGREEMENT REPRESENTS THE ENTIRE AGREEMENT CONCERNING THE SOFTWARE BETWEEN YOU AND RADWARE, AND SUPERSEDES ANY AND ALL PRIOR PROPOSALS, REPRESENTATIONS, OR UNDERSTANDINGS BETWEEN THE PARTIES. “YOU” MEANS THE NATURAL PERSON OR THE ENTITY THAT IS AGREEING TO BE BOUND BY THIS LICENSE AGREEMENT, THEIR EMPLOYEES AND THIRD PARTY CONTRACTORS. YOU SHALL BE LIABLE FOR ANY FAILURE BY SUCH EMPLOYEES AND THIRD PARTY CONTRACTORS TO COMPLY WITH THE TERMS OF THIS LICENSE AGREEMENT.
1. License Grant. Subject to the terms of this Agreement, Radware hereby grants to you, and you accept, a limited, nonexclusive, nontransferable license to install and use the Software in machine-readable, object code form only and solely for your internal business purposes (“Commercial License”). If the Software is distributed to you with a software development kit (the “SDK”), then, solely with regard to the SDK, the Commercial License above also includes a limited, nonexclusive, nontransferable license to install and use the SDK solely on computers within your organization, and solely for your internal development of an integration or interoperation of the Software and/or other Radware Products with software or hardware products owned, licensed and/or controlled by you (the “SDK Purpose”). To the extent an SDK is distributed to you together with code samples in source code format (the “Code Samples”) that are meant to illustrate and teach you how to configure, monitor and/or control the Software and/or any other Radware Products, the Commercial License above further includes a limited,
Application Performance Monitoring User Guide Radware Ltd. End User License Agreement
186 Document ID: RDWR-APM-V0311000_UG1804
nonexclusive, nontransferable license to copy and modify the Code Samples and create derivative works based thereon solely for the SDK Purpose and solely on computers within your organization. The SDK shall be considered part of the term “Software” for all purposes of this License Agreement. You agree that you will not sell, assign, license, sublicense, transfer, pledge, lease, rent or share your rights under this License Agreement nor will you distribute copies of the Software or any parts thereof. Rights not specifically granted herein, are specifically prohibited.
2. Evaluation Use. Notwithstanding anything to the contrary in this License Agreement, if the Software is provided to you for evaluation purposes, as indicated in your purchase order or sales receipt, on the website from which you download the Software, as inferred from any time-limited evaluation license keys that you are provided with to activate the Software, or otherwise, then You may use the Software only for internal evaluation purposes (“Evaluation Use”) for a maximum of 30 days or such other duration as may specified by Radware in writing at its sole discretion (the “Evaluation Period”). The evaluation copy of the Software contains a feature that will automatically disable it after expiration of the Evaluation Period. You agree not to disable, destroy, or remove this feature of the Software, and any attempt to do so will be a material breach of this License Agreement. During or at the end of the evaluation period, you may contact Radware sales team to purchase a Commercial License to continue using the Software pursuant to the terms of this License Agreement. If you elect not to purchase a Commercial License, you agree to stop using the Software and to delete the evaluation copy received hereunder from all computers under your possession or control at the end of the Evaluation Period. In any event, your continued use of the Software beyond the Evaluation Period (if possible) shall be deemed your acceptance of a Commercial License to the Software pursuant to the terms of this License Agreement, and you agree to pay Radware any amounts due for any applicable license fees at Radware's then-current list prices.
3. Lab/Development License. Notwithstanding anything to the contrary in this License Agreement, if the Software is provided to you for use in your lab or for development purposes, as indicated in your purchase order, sales receipt, the part number description for the Software, the Web page from which you download the Software, or otherwise, then You may use the Software only in your lab and only in connection with Radware Products that you purchased or will purchase (in case of a lab license) or for internal testing and development purposes (in case of a development license) but not for any production use purposes.
4. Subscription Software. If you licensed the Software on a subscription basis, your rights to use the Software are limited to the subscription period. You have the option to extend your subscription. If you extend your subscription, you may continue using the Software until the end of your extended subscription period. If you do not extend your subscription, after the expiration of your subscription, you are legally obligated to discontinue your use of the Software and completely remove the Software from your system.
5. Feedback. Any feedback concerning the Software including, without limitation, identifying potential errors and improvements, recommended changes or suggestions (“Feedback”), provided by you to Radware will be owned exclusively by Radware and considered Radware's confidential information. By providing Feedback to Radware, you hereby assign to Radware all of your right, title and interest in any such Feedback, including all intellectual property rights therein. With regard to any rights in such Feedback that cannot, under applicable law, be assigned to Radware, you hereby irrevocably waives such rights in favor of Radware and grants Radware under such rights in the Feedback, a worldwide, perpetual royalty-free, irrevocable, sub-licensable and non-exclusive license, to use, reproduce, disclose, sublicense, modify, make, have made, distribute, sell, offer for sale, display, perform, create derivative works of and otherwise exploit the Feedback without restriction. The provisions of this Section 5 will survive the termination or expiration of this Agreement.
6. Limitations on Use. You agree that you will not: (a) copy, modify, translate, adapt or create any derivative works based on the Software; or (b) sublicense or transfer the Software, or include the Software or any portion thereof in any product; or (b) reverse assemble, disassemble, decompile, reverse engineer or otherwise attempt to derive source code (or the underlying ideas, algorithms, structure or organization) from the Software, in whole or in part, except and only to the extent: (i) applicable law expressly permits any such action despite this limitation, in which case you agree to provide Radware at least ninety (90) days advance written
Application Performance Monitoring User Guide
Radware Ltd. End User License Agreement
Document ID: RDWR-APM-V0311000_UG1804 187
notice of your belief that such action is warranted and permitted and to provide Radware with an opportunity to evaluate if the law's requirements necessitate such action, or (ii) required to debug changes to any third party LGPL-libraries linked to by the Software; or (c) create, develop, license, install, use, or deploy any software or services to circumvent, enable, modify or provide access, permissions or rights which violate the technical restrictions of the Software; (d) in the event the Software is provided as an embedded or bundled component of another Radware Product, you shall not use the Software other than as part of the combined Product and for the purposes for which the combined Product is intended; (e) remove any copyright notices, identification or any other proprietary notices from the Software (including any notices of Third Party Software (as defined below); or (f) copy the Software onto any public or distributed network or use the Software to operate in or as a time-sharing, outsourcing, service bureau, application service provider, or managed service provider environment. Notwithstanding the foregoing, if you provide hosting or cloud computing services to your customers, you are entitled to use and include the Software in your IT infrastructure on which you provide your services. It is hereby clarified that the prohibitions on modifying, or creating derivative works based on, any Software provided by Radware, apply whether the Software is provided in a machine or in a human readable form. Human readable Software to which this prohibition applies includes (without limitation) “Radware AppShape++ Script Files” that contain “Special License Terms”. It is acknowledged that examples provided in a human readable form may be modified by a user.
7. Intellectual Property Rights. You acknowledge and agree that this License Agreement does not convey to you any interest in the Software except for the limited right to use the Software, and that all right, title, and interest in and to the Software, including any and all associated intellectual property rights, are and shall remain with Radware or its third party licensors. You further acknowledge and agree that the Software is a proprietary product of Radware and/or its licensors and is protected under applicable copyright law.
8. No Warranty. The Software, and any and all accompanying software, files, libraries, data and materials, are distributed and provided “AS IS” by Radware or by its third party licensors (as applicable) and with no warranty of any kind, whether express or implied, including, without limitation, any non-infringement warranty or warranty of merchantability or fitness for a particular purpose. Neither Radware nor any of its affiliates or licensors warrants, guarantees, or makes any representation regarding the title in the Software, the use of, or the results of the use of the Software. Neither Radware nor any of its affiliates or licensors warrants that the operation of the Software will be uninterrupted or error-free, or that the use of any passwords, license keys and/or encryption features will be effective in preventing the unintentional disclosure of information contained in any file. You acknowledge that good data processing procedure dictates that any program, including the Software, must be thoroughly tested with non-critical data before there is any reliance on it, and you hereby assume the entire risk of all use of the copies of the Software covered by this License. Radware does not make any representation or warranty, nor does Radware assume any responsibility or liability or provide any license or technical maintenance and support for any operating systems, databases, migration tools or any other software component provided by a third party supplier and with which the Software is meant to interoperate.
This disclaimer of warranty constitutes an essential and material part of this License. In the event that, notwithstanding the disclaimer of warranty above, Radware is held liable under any warranty provision, Radware shall be released from all such obligations in the event that the Software shall have been subject to misuse, neglect, accident or improper installation, or if repairs or modifications were made by persons other than by Radware's authorized service personnel.
9. Limitation of Liability. Except to the extent expressly prohibited by applicable statutes, in no event shall Radware, or its principals, shareholders, officers, employees, affiliates, licensors, contractors, subsidiaries, or parent organizations (together, the “Radware Parties”), be liable for any direct, indirect, incidental, consequential, special, or punitive damages whatsoever relating to the use of, or the inability to use, the Software, or to your relationship with, Radware or any of the Radware Parties (including, without limitation, loss or disclosure of data or information, and/or loss of profit, revenue, business opportunity or business advantage, and/or business interruption), whether based upon a claim or action of contract, warranty, negligence, strict
Application Performance Monitoring User Guide Radware Ltd. End User License Agreement
188 Document ID: RDWR-APM-V0311000_UG1804
liability, contribution, indemnity, or any other legal theory or cause of action, even if advised of the possibility of such damages. If any Radware Party is found to be liable to You or to any third-party under any applicable law despite the explicit disclaimers and limitations under these terms, then any liability of such Radware Party, will be limited exclusively to refund of any license or registration or subscription fees paid by you to Radware.
10. Third Party Software. The Software includes software portions developed and owned by third parties (the “Third Party Software”). Third Party Software shall be deemed part of the Software for all intents and purposes of this License Agreement; provided, however, that in the event that a Third Party Software is a software for which the source code is made available under an open source software license agreement, then, to the extent there is any discrepancy or inconsistency between the terms of this License Agreement and the terms of any such open source license agreement (including, for example, license rights in the open source license agreement that are broader than the license rights set forth in Section 1 above and/or no limitation in the open source license agreement on the actions set forth in Section 6 above), the terms of any such open source license agreement will govern and prevail. The terms of open source license agreements and copyright notices under which Third Party Software is being licensed to Radware or a link thereto, are included with the Software documentation or in the header or readme files of the Software. Third Party licensors and suppliers retain all right, title and interest in and to the Third Party Software and all copies thereof, including all copyright and other intellectual property associated therewith. In addition to the use limitations applicable to Third Party Software pursuant to Section 6 above, you agree and undertake not to use the Third Party Software as a general SQL server, as a stand-alone application or with applications other than the Software under this License Agreement.
11. Term and Termination. This License Agreement is effective upon the first to occur of your opening the package of the Product, purchasing, downloading, installing, copying or using the Software or any portion thereof, and shall continue until terminated. However, sections 5-15 shall survive any termination of this License Agreement. The Licenses granted under this License Agreement are not transferable and will terminate upon: (i) termination of this License Agreement, or (ii) transfer of the Software, or (iii) in the event the Software is provided as an embedded or bundled component of another Radware Product, when the Software is unbundled from such Product or otherwise used other than as part of such Product. If the Software is licensed on subscription basis, this Agreement will automatically terminate upon the termination of your subscription period if it is not extended.
12. Export. The Software or any part thereof may be subject to export or import controls under applicable export/import control laws and regulations including such laws and regulations of the United States and/or Israel. You agree to comply with such laws and regulations, and, agree not to knowingly export, re-export, import or re-import, or transfer products without first obtaining all required Government authorizations or licenses therefor. Furthermore, You hereby covenant and agree to ensure that your use of the Software is in compliance with all other foreign, federal, state, and local laws and regulations, including without limitation all laws and regulations relating to privacy rights, and data protection. You shall have in place a privacy policy and obtain all of the permissions, authorizations and consents required by applicable law for use of cookies and processing of users' data (including without limitation pursuant to Directives 95/46/EC, 2002/58/EC and 2009/136/EC of the EU if applicable) for the purpose of provision of any services.
13. US Government. To the extent you are the U.S. government or any agency or instrumentality thereof, you acknowledge and agree that the Software is a “commercial computer software” and “commercial computer software documentation” pursuant to applicable regulations and your use of the Software is subject to the terms of this License Agreement.
14. Federal Acquisition Regulation (FAR)/Data Rights Notice. Radware's commercial computer software is created solely at private expense and is subject to Radware's commercial license rights.
15. Governing Law. This License Agreement shall be construed and governed in accordance with the laws of the State of Israel.
Application Performance Monitoring User Guide
Radware Ltd. End User License Agreement
Document ID: RDWR-APM-V0311000_UG1804 189
16. Miscellaneous. If a judicial determination is made that any of the provisions contained in this License Agreement is unreasonable, illegal or otherwise unenforceable, such provision or provisions shall be rendered void or invalid only to the extent that such judicial determination finds such provisions to be unreasonable, illegal or otherwise unenforceable, and the remainder of this License Agreement shall remain operative and in full force and effect. In any event a party breaches or threatens to commit a breach of this License Agreement, the other party will, in addition to any other remedies available to, be entitled to injunction relief. This License Agreement constitutes the entire agreement between the parties hereto and supersedes all prior agreements between the parties hereto with respect to the subject matter hereof. The failure of any party hereto to require the performance of any provisions of this License Agreement shall in no manner affect the right to enforce the same. No waiver by any party hereto of any provisions or of any breach of any provisions of this License Agreement shall be deemed or construed either as a further or continuing waiver of any such provisions or breach waiver or as a waiver of any other provision or breach of any other provision of this License Agreement.
IF YOU DO NOT AGREE WITH THE TERMS OF THIS LICENSE YOU MUST REMOVE THE SOFTWARE FROM ANY DEVICE OWNED BY YOU AND IMMEDIATELY CEASE USING THE SOFTWARE. COPYRIGHT © 2018, Radware Ltd. All Rights Reserved.