CA Nimsoft Monitor for Flow Analysis User Guide
41
User Guide Release 1.1 CA Nimsoft Monitor for Flow Analysis
-
Upload
khangminh22 -
Category
Documents
-
view
4 -
download
0
Transcript of CA Nimsoft Monitor for Flow Analysis User Guide
User Guide Release 1.1
CA Nimsoft Monitor for Flow Analysis

Document Revision History
Document Version Date Changes
1.1 11/30/2012 Updated for Flow Analysis 1.1. Added custom time interval for reports, explanation of data reporting intervals, and other minor changes.
1.0 9/10/2012 Initial version CA Nimsoft Monitor for Flow Analysis User Guide
Contact Nimsoft
For your convenience, Nimsoft provides a single site where you can access information about Nimsoft products.
At http://support.nimsoft.com/, you can access the following:
■ Online and telephone contact information for technical assistance and customer services
■ Information about user communities and forums
■ Product and documentation downloads
■ Nimsoft Support policies and guidelines
■ Other helpful resources appropriate for your product
Provide Feedback
If you have comments or questions about Nimsoft product documentation, you can send a message to [email protected].

Legal Notices Copyright © 2012, CA. All rights reserved.
Warranty
The material contained in this document is provided "as is," and is subject to being changed, without notice, in future editions. Further, to the maximum extent permitted by applicable law, Nimsoft LLC disclaims all warranties, either express or implied, with regard to this manual and any information contained herein, including but not limited to the implied warranties of merchantability and fitness for a particular purpose. Nimsoft LLC shall not be liable for errors or for incidental or consequential damages in connection with the furnishing, use, or performance of this document or of any information contained herein. Should Nimsoft LLC and the user have a separate written agreement with warranty terms covering the material in this document that conflict with these terms, the warranty terms in the separate agreement shall control.
Technology Licenses
The hardware and/or software described in this document are furnished under a license and may be used or copied only in accordance with the terms of such license.
No part of this manual may be reproduced in any form or by any means (including electronic storage and retrieval or translation into a foreign language) without prior agreement and written consent from Nimsoft LLC as governed by United States and international copyright laws.
Restricted Rights Legend
If software is for use in the performance of a U.S. Government prime contract or subcontract, Software is delivered and licensed as "Commercial computer software" as defined in DFAR 252.227-7014 (June 1995), or as a "commercial item" as defined in FAR 2.101(a) or as "Restricted computer software" as defined in FAR 52.227-19 (June 1987) or any equivalent agency regulation or contract clause. Use, duplication or disclosure of Software is subject to Nimsoft LLC’s standard commercial license terms, and non-DOD Departments and Agencies of the U.S. Government will receive no greater than Restricted Rights as defined in FAR 52.227-19(c)(1-2) (June 1987). U.S. Government users will receive no greater than Limited Rights as defined in FAR 52.227-14 (June 1987) or DFAR 252.227-7015 (b)(2) (November 1995), as applicable in any technical data.
Trademarks
Nimsoft is a trademark of CA.
Adobe®, Acrobat®, Acrobat Reader®, and Acrobat Exchange® are registered trademarks of Adobe Systems Incorporated.
Intel® and Pentium® are U.S. registered trademarks of Intel Corporation.
Java(TM) is a U.S. trademark of Sun Microsystems, Inc.
Microsoft® and Windows® are U.S. registered trademarks of Microsoft Corporation.
Netscape(TM) is a U.S. trademark of Netscape Communications Corporation.
Oracle® is a U.S. registered trademark of Oracle Corporation, Redwood City, California.
UNIX® is a registered trademark of the Open Group.
ITIL® is a Registered Trade Mark of the Office of Government Commerce in the United Kingdom and other countries.
All other trademarks, trade names, service marks and logos referenced herein belong to their respective companies.


Contents 5
Contents
Chapter 1: Introduction 7
About This Guide .......................................................................................................................................................... 7
Flow Analysis Concepts ................................................................................................................................................ 7
Flow Analysis Terminology .................................................................................................................................... 8
Chapter 2: Getting Started 11
Prerequisite Components .......................................................................................................................................... 11
Deploy the Flow Analysis Reporter Portlet ................................................................................................................ 12
Configuration.............................................................................................................................................................. 15
Open Port 9995 ................................................................................................................................................... 16
Enable NetFlow on Network Devices .................................................................................................................. 16
Opening the Configuration GUI ........................................................................................................................... 17
Configure Flow Analysis Probe ............................................................................................................................ 18
Configure Flow Analysis Collector ....................................................................................................................... 19
Configure Reports ............................................................................................................................................... 25
Chapter 3: Reports 27
Flow Analysis Data Reporting ..................................................................................................................................... 27
Understanding Data Reporting Intervals ............................................................................................................ 28
Why is the Displayed Interval Different Than the Requested Interval? .............................................................. 29
Common Elements ..................................................................................................................................................... 29
Top Bar Elements ................................................................................................................................................ 29
Chart Options ...................................................................................................................................................... 30
Column View Options.......................................................................................................................................... 31
Column Dragging ................................................................................................................................................. 31
Drill down links .................................................................................................................................................... 31
Display Tooltips ................................................................................................................................................... 31
Information String ............................................................................................................................................... 31
Flow Analysis Main Page ............................................................................................................................................ 32
Interfaces ................................................................................................................................................................... 33
Hosts ........................................................................................................................................................................... 35
Applications ................................................................................................................................................................ 36
Chapter 4: Troubleshooting 37
No Data Displayed in Reports (Time Delay in Reported Data) ................................................................................... 37

6 User Guide
Flow Analysis Stops Collecting Data After 15 Minutes ............................................................................................... 38
Links to USM Do Not Function ................................................................................................................................... 39
Link to USM Displays Incorrect Device ....................................................................................................................... 40
Collector not shown in drop down menu .................................................................................................................. 40
Error Message Code 500 ............................................................................................................................................ 40
Error Message Code 400 ............................................................................................................................................ 41
Error Messag Code 200 .............................................................................................................................................. 41

Chapter 1: Introduction 7
Chapter 1: Introduction
About This Guide
This guide helps you get the most out of the CA Nimsoft Monitor for Flow Analysis solution. The guide contains the following sections:
■ Introduction--information about this guide and an introduction to Flow Analysis concepts
■ Getting Started--covers the steps needed to start using Flow Analysis
■ Prerequisite Components
■ Setting up the Reporter Portlet
■ Configuration--covers necessary configuration tasks for:
■ Port access and routers that provide network flow data
■ Flow Analysis probe and Collector system
■ Flow Analysis portlet and GUI
■ Reports--describes the Flow Analysis GUI, its controls, and the flow data reports that are available
■ Troubleshooting--describes product use problems and their solutions
Flow Analysis Concepts
Flow Analysis has been designed to integrate a view of the traffic flowing through your network with QoS data and alarms, all viewable in the Nimsoft Unified Management Portal (UMP). With Flow Analysis you can:
■ Immediately identify the interfaces, hosts, and applications that generate the most traffic in your enterprise. This information is essential for short-term and long-term troubleshooting.
■ Review Nimsoft alarms together with flow data so you identify network problems quickly.
■ Analyze trends in applications, hosts, and conversations per class of service. This information helps you optimization your network infrastructure for application performance.

Flow Analysis Concepts
8 User Guide
Flow Analysis Terminology
NetFlow
NetFlow refers to the protocols (NetFlow versions 5, 7, and 9, as well as IPFIX, Jflow, sFlow, cflowd, Rflow, and NetStream) that enable collection of IP traffic statistics on network device interfaces. A router is configured to export flow information, sending UDP packets that contain flow statistics to a collector.
Flow information is useful in answering the following sorts of questions:
■ Do you know all of the applications running on your network?
■ What are the application traffic patterns?
■ Which applications and hosts are consuming the most bandwidth?
■ How much link capacity do I need in the future? Is more bandwidth really the answer to my performance problems?
Conversation
A conversation is a session of subnet-to-subnet or user-to-user (host-to-host) traffic. The Flow Analysis portal displays this information--you can find out whether a particular conversation is causing a traffic spike on an interface, for example, and identify the top volume-based conversations.
Flow
A flow is a set of IP packets that pass a network observation point during a certain time interval. A flow may consist of Flexible NetFlow, Sampled NetFlow, NetFlow v5, v7, or v9; sFlow version 5; or any comparable versions of IPFIX, Jflow, cFlow, or NetStream.
Interface
An interface is a point of connection, such as a Serial, Frame Relay, Fast Ethernet, ATM, or PVC interface. Flow Analysis reports on any logical interface that is enabled on a supported router that has flow enabled. The portal displays the interfaces that are monitored in your environment.

Flow Analysis Concepts
Chapter 1: Introduction 9
Protocol
A protocol is a standard for regulating communication between computers. Common protocols include: HTTP, SNMP, FTP, and VoIP. The information that is displayed may include the top protocols in and out for a particular interface. This information can help identify which application is causing network traffic. You can also create and run reports to determine which protocols and applications are used by different groups in your organization.
QoS (Quality of Service)
QoS (Quality of Service) is a defined level of performance--quality of transmission and service availability--in a data network.
Report
A report is a display of collected data, which you can view in the Flow Analysis portlet in UMP. You can export reports as comma-separated value (CSV) files.


Chapter 2: Getting Started 11
Chapter 2: Getting Started
This section contains the following topics:
Prerequisite Components (see page 11) Deploy the Flow Analysis Reporter Portlet (see page 12) Configuration (see page 15)
Prerequisite Components
Refer to the Flow Analysis Installation Guide and confirm that all necessary software components are installed, licensed, and operational:

Deploy the Flow Analysis Reporter Portlet
12 User Guide
Flow Analysis is comprised of these components:
■ NMS System - Nimsoft Monitor Server and NIS database
■ UMP System - Unified Monitoring Portal (UMP) and the Flow Analysis Reporter portlet
■ Collector System - Flow Analysis Collector and Database, a Nimsoft robot, and the Flow Analysis Collector probe and snmptd probe
Note: Flow Analysis Collector and Flow Analysis Database are based on CA NetQoS Harvester and Reporter/Analyzer products, respectively.
Deploy the Flow Analysis Reporter Portlet
To configure Flow Analysis components, and view the flow data reports, the Flow Analysis Reporter Portlet needs to be deployed within the Unified Monitoring Portal (UMP).
To get started, follow these steps:
1. Confirm that the ump_flow probe has been deployed on the UMP system robot. This can be checked in Infrastructure Manager. Find the UMP system robot icon, and the ump_flow probe icon should be visible beneath it and green in color. To review the installation instructions, see the section "Install Flow Analysis Reporter Portlet" in the Flow Analysis Installation Guide).
2. Launch UMP (http://<IPaddress_of_UMP_system>)
3. Follow the steps below to add the Flow Analysis tab to UMP.
Note: A more complete treatment of configuring pages and portals within UMP is available from the UMP online help in the section Welcome > Getting Started with UMP.
1. Add an empty page: In the top left of UMP, choose: Add > Page, assign a name to the new page (we recommend "Flow Analysis"), then click the check mark to confirm and save.

Deploy the Flow Analysis Reporter Portlet
Chapter 2: Getting Started 13
2. Adjust the layout of the page: Select the new page, then select Manage > Page Layout > 1 Column from the menu in the top left of the browser window and click Save.

Deploy the Flow Analysis Reporter Portlet
14 User Guide
3. Install the Flow Analysis portlet into the new page: Choose Add > Portlet. Then select Flow Analysis under Monitoring, and click Add.
4. The portlet is loaded into the page, starts, and finds available Flow Analysis collectors. Those that are found are displayed in the Collector drop down list in the form "hub/robot/domain."
Note: The discovery_server probe must be running on the NMS host for the Collector drop down list to display Flow Analysis Collectors. If an existing Collector is not listed in this drop-down menu, it may not have been discovered yet. Restarting the discovery_server and discovery_agent probes will cause discovery to re-run and find additional Collectors.
5. Select the desired Collector from the drop down list.
6. The main Flow Analysis page displays these three charts of TopN reporting data:
1. Top Interfaces
2. Top Hosts
3. Top Applications.
Note: If you have just started the system, then data may not show up until a fifteen-minute interval has passed.
You can drill down within the data displayed by clicking on the blue links. See the section on Flow Analysis Main Page (see page 32) for details.
Configuration
Chapter 2: Getting Started 15
Configuration
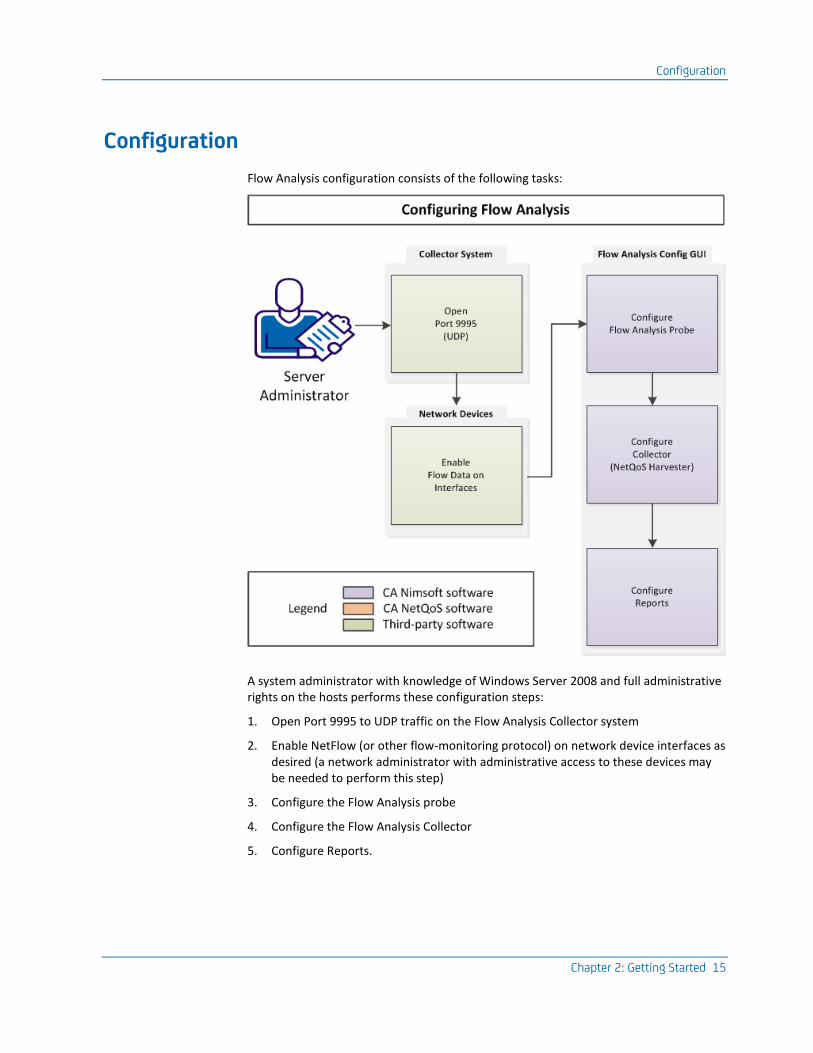
Flow Analysis configuration consists of the following tasks:
A system administrator with knowledge of Windows Server 2008 and full administrative rights on the hosts performs these configuration steps:
1. Open Port 9995 to UDP traffic on the Flow Analysis Collector system
2. Enable NetFlow (or other flow-monitoring protocol) on network device interfaces as desired (a network administrator with administrative access to these devices may be needed to perform this step)
3. Configure the Flow Analysis probe
4. Configure the Flow Analysis Collector
5. Configure Reports.

Configuration
16 User Guide
Open Port 9995
Open Port 9995 to UDP traffic on the Collector host. Confirm that UDP traffic can traverse between your network devices and the Collector host using this port.
Enable NetFlow on Network Devices
To enable NetFlow on NetFlow-capable routers, complete the following steps on each router that supports NetFlow versions 5, 7, or 9.
Note: Before you begin, collect the following information for each router that you plan to monitor:
– Source address
– SNMP read community string
– NetFlow version (if applicable)
Flow Protocols Supported:
■ NetFlow v5, v7, and v9
■ sFlow version 5
■ IPFIX, Jflow, cFlow, and NetStream standards that comply with the standards for NetFlow v5, v7, or v9
Follow these steps:
1. Save a backup copy of the current configuration to a TFTP (Trivial File Transfer Protocol) server or to the desktop.
2. Execute the copy run start or wr mem command before you make any changes to the routers that you want to monitor.
Running this command helps ensure that all current configurations are saved to static memory in case the router locks up or reboots.
3. Configure NetFlow export by entering the following IOS commands in the order shown:
ip flow-export version <version_number>
ip flow-export source <interface>
ip flow-export destination <IP address of the installation system>
9995
ip flow-cache timeout active 1
Note: For the second command in the series, the IP address of the source interface can change. Cisco recommends that you configure a loopback source interface to use.

Configuration
Chapter 2: Getting Started 17
4. For each logical interface, navigate to the interface and enter:
ip route-cache flow
or
ip flow ingress (for newer versions of IOS)
5. Configure index persistence on each router by using the following command:
config# snmp-server ifindex persist
Note: Routers in the Cisco 7200 Series, 7500 Series, and 12000 GSR family support index persistence.
6. Verify that you have a Sup II or greater supervisor engine, if you use Catalyst 6500 and 7600 switches.
Note: For additional Catalyst 6500 and 7600 switch commands, refer to Cisco's NetFlow commands documentation.
Verify that Flow Data is being Received
On the Collector system (where the Flow Analysis Database software component is installed), go to the D:\NETQOS\Netflow\datafiles\Harvester\Work directory. There should be several files in this directory named <numeric_value>-9995.tbn.inc. There may also be additional files with the same naming scheme with a .tmp extension. If you see <numeric_value>-9995.tbn.inc files that are larger than 0 KB, this indicates that flow data is being received.
Opening the Configuration GUI
Click the Configure button at the top-right of the Flow Analysis GUI in UMP to open the configuration GUI in a separate window:
Configuration
18 User Guide
When the configuration GUI is launched for the first time, there is no data in the left-hand frame to display until a Collector is enabled. With a Collector enabled, a hierarchy of network devices is shown.
In the right-hand frame are two tabs, Probe Configurations and Collector Configurations, which control settings for the Flow Analysis Probe and Collector respectively.
Configure Flow Analysis Probe
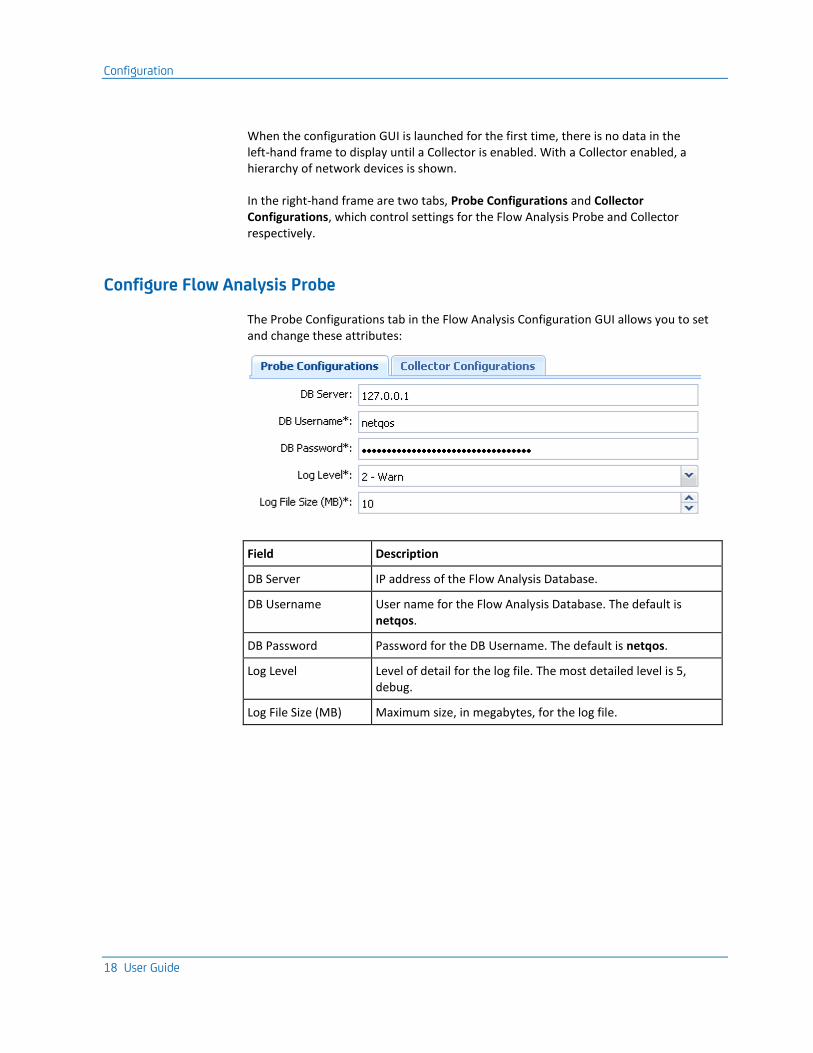
The Probe Configurations tab in the Flow Analysis Configuration GUI allows you to set and change these attributes:
Field Description
DB Server IP address of the Flow Analysis Database.
DB Username User name for the Flow Analysis Database. The default is netqos.
DB Password Password for the DB Username. The default is netqos.
Log Level Level of detail for the log file. The most detailed level is 5, debug.
Log File Size (MB) Maximum size, in megabytes, for the log file.
Configuration
Chapter 2: Getting Started 19
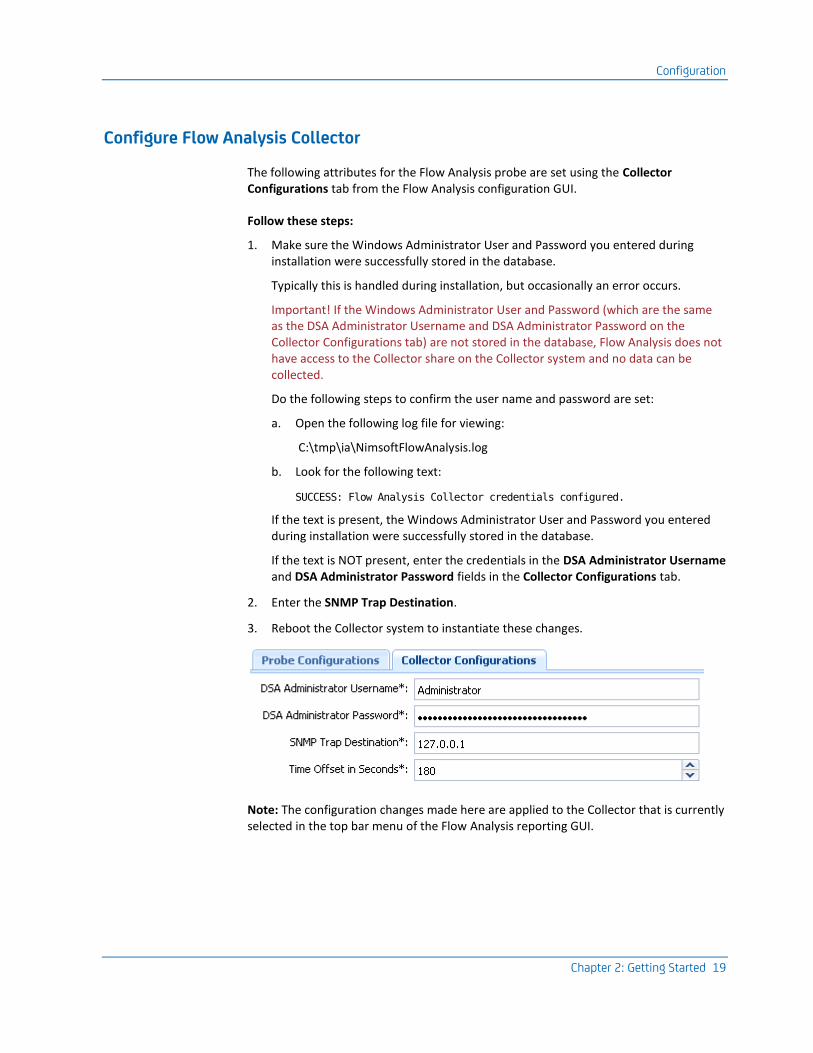
Configure Flow Analysis Collector
The following attributes for the Flow Analysis probe are set using the Collector Configurations tab from the Flow Analysis configuration GUI.
Follow these steps:
1. Make sure the Windows Administrator User and Password you entered during installation were successfully stored in the database.
Typically this is handled during installation, but occasionally an error occurs.
Important! If the Windows Administrator User and Password (which are the same as the DSA Administrator Username and DSA Administrator Password on the Collector Configurations tab) are not stored in the database, Flow Analysis does not have access to the Collector share on the Collector system and no data can be collected.
Do the following steps to confirm the user name and password are set:
a. Open the following log file for viewing:
C:\tmp\ia\NimsoftFlowAnalysis.log
b. Look for the following text:
SUCCESS: Flow Analysis Collector credentials configured.
If the text is present, the Windows Administrator User and Password you entered during installation were successfully stored in the database.
If the text is NOT present, enter the credentials in the DSA Administrator Username and DSA Administrator Password fields in the Collector Configurations tab.
2. Enter the SNMP Trap Destination.
3. Reboot the Collector system to instantiate these changes.
Note: The configuration changes made here are applied to the Collector that is currently selected in the top bar menu of the Flow Analysis reporting GUI.

Configuration
20 User Guide
Field Type Description
DSA Administrator Username
IP Address \ string
A Windows user that has administrative privileges on the Collector system. Typically this is set during installation of the Collector. If you do not know the DSA administrator name, check with the server administrator.
Example: 127.0.0.1\administrator (the default)
DSA Administrator Password
string Password for the DSA Administrator.
SNMP Trap Destination
IP address IP address of the robot that controls the flow and snmptd probes on the Collector system.
Time offset in Seconds
integer > 0 Number of seconds to subtract from the ending time of queries to the database. The default is 180 (3 minutes). For example, if you request a report for the last 15 minutes at 10:00, the query interval is pushed back 3 minutes to 9:42 to 9:57. This returns the 15-minute reporting interval of data that ends during that time, the data for 9:30 to 9:45. If the database is queried for data up to the current minute, the data may not be available yet and no data is returned. The 3-minute offset avoids issues caused by database latency. If you request data for the last 15 minutes at 10:03, data for 9:45 to 10:00 is displayed.
Generally, the faster the Collector System is, the shorter this interval can be, and vice versa.
Important! Do NOT change this value from the default unless instructed to do so by CA Nimsoft Technical Support.
More information:
No Data Displayed in Reports (Time Delay in Reported Data) (see page 37)

Configuration
Chapter 2: Getting Started 21
Set Up SNMP Profiles
Clicking on All Routers in the tree displays the SNMP Profile screen in the right-hand frame:
Clicking New under SNMP Profile, or clicking an existing profile, displays the SNMP Profile configuration fields to the right.
Note: When you create or edit SNMP profiles, the profiles may not respond immediately. It may take up to an hour for changes to be reflected in the Responding SNMP Profiles tab.
Field Description
Active Whether or not the profile is applied to the selected device. The default is Active.
Description Enter text to describe the profile.
Enabled Whether the profile is used when attempting to communicate with the selected device. The default is Enabled.
Management Port Port for the Flow Analysis Collector to use to communicate with the router. The default is 161.
Profile Rank Order in which a profile is tried/matched against a router.
SNMP Version Set the Community String for SNMP v1 and v2
For SNMP v3, choose the Security Type. Depending on the Security Type chosen, some fields may be disabled. Enter information in the active fields. If you do not know the information, contact your SNMP administrator.

Configuration
22 User Guide
Configure Interfaces
Clicking on a listed network device in the left-hand frame displays the Interfaces that are available on the selected network device:
Clicking on an interface displays the Interface Enabled configuration GUI below:
Attribute Type Notes
Enabled boolean whether or not the interface is being monitored for NetFlow data; default=enabled
Configure Traps
Clicking on Trap Configuration displays a listing of defined traps on the particular interface of the selected network device:
Configuration
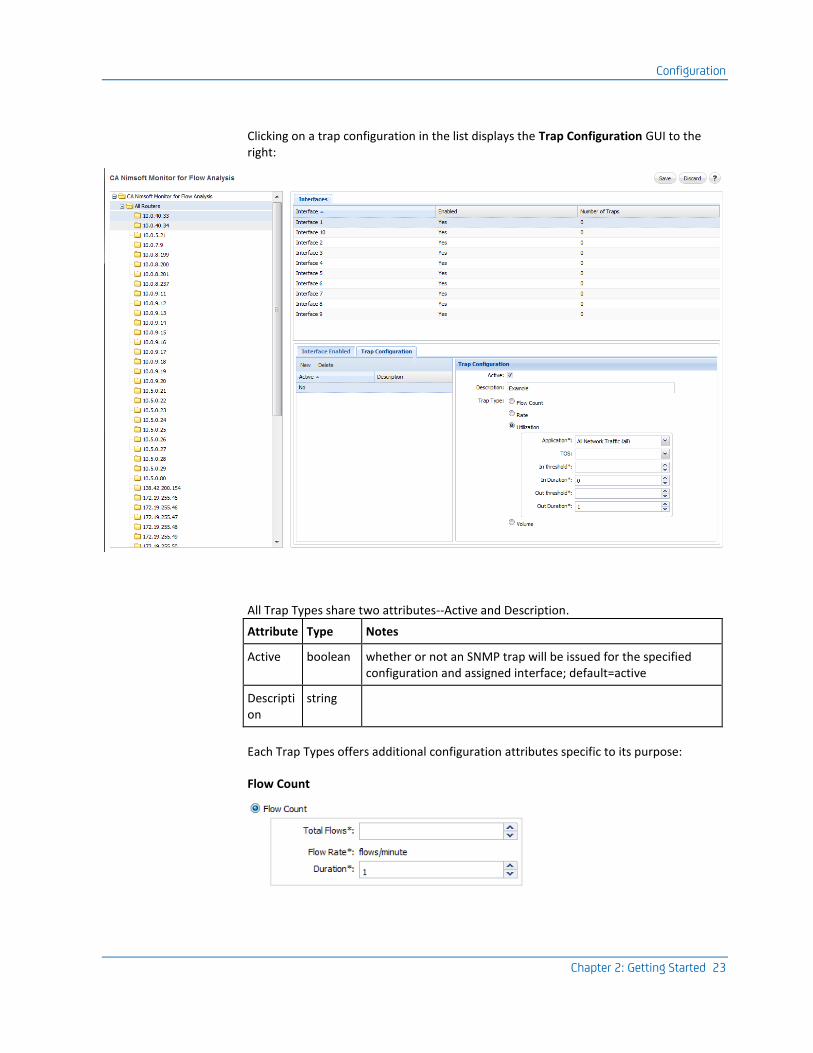
Chapter 2: Getting Started 23
Clicking on a trap configuration in the list displays the Trap Configuration GUI to the right:
All Trap Types share two attributes--Active and Description.
Attribute Type Notes
Active boolean whether or not an SNMP trap will be issued for the specified configuration and assigned interface; default=active
Description
string
Each Trap Types offers additional configuration attributes specific to its purpose:
Flow Count

Configuration
24 User Guide
Rate
Utilization
Volume

Configuration
Chapter 2: Getting Started 25
Configure Reports
After the preceding configuration steps are accomplished, you are ready to view Flow Analysis reports.
See the section on Reports (see page 27) for a description of setting up and using Flow Analysis reports, and the options that are available.


Chapter 3: Reports 27
Chapter 3: Reports
Flow Analysis Data Reporting
The Flow Analysis web interface provides an integrated view of your network's Top N applications, hosts, and device interfaces. This section describes the types of reports and options that are available.
Flow Analysis offers a multi-dimensional view into the flow data received from your network infrastructure. You can traverse the data to answer these, and other, types of questions:
■ Who talked to whom? When? (Optimize bandwidth allocations and cost savings, or detect malicious traffic)
■ What protocol is most heavily used? (Optimize Class of Service offerings)
■ Where is the highest volume of network traffic? (Optimize VPN settings and bandwidth allocation; troubleshoot sudden changes in usage)
■ What type of service (e.g. platinum, gold, silver) is being impacted?
Using flow reporting together with QoS data reports within UMP, you can view your IT service environment from a device-, service, or application-specific perspective.

Flow Analysis Data Reporting
28 User Guide
Understanding Data Reporting Intervals
Most data from the Flow Analysis probe is stored as aggregated data for 15-minute intervals. Data for each 15-minute interval that ends in the time window you specify is included in the report. If, for example, at 12:05 you request a report for the Top 10 for the last 15 minutes, the aggregated data for the interval 11:45 to 12:00 is displayed. If at 12:05 you request data for the last hour, you see data for the interval 11:00 to 12:00.
The exception to this is when you drill down to a report for an interface. For interfaces, data for the last 24 hours is stored in 1-minute intervals; data older than 24 hours is stored in 15-minute intervals.
The 1-minute data aids in troubleshooting, when you may need current and detailed data for an interface. When you click the name of an interface in the Top Interfaces chart in the main window, the report for the interface is displayed showing data for 1-minute intervals if possible. There are cases where 15-minute data is shown for an interface drilldown report:
■ If the report interval requested extends past 24 hours. The 1-minute data is stored only for the last 24 hours. If data older than 24 hours is requested, only 15-minute intervals are available.
■ If the report interval requested is longer than 5 hours. To avoid performance issues due to processing large amounts of data, 15-minute data is displayed for report intervals longer than 5 hours.
Data for Top Hosts and Top Applications is only stored for 15-minute intervals, including for drilldown reports.

Common Elements
Chapter 3: Reports 29
Why is the Displayed Interval Different Than the Requested Interval?
The caption below each chart tells you the interval of the data displayed, and the data interval requested. Sometimes the interval displayed is slightly different than the interval requested. For example, in the image below data for the last 15 minutes was requested at 10:52, and data from 10:30 to 10:45 is displayed.
This occurs because Flow Analysis data is stored in 15-minute chunks. When you request data for the last 15 minutes, data for the chunk that ends within the last 15 minutes is displayed. So, when at 10:52 you request data for the last 15 minutes (10:37 to 10:52), the chunk that ends within that window is data for the interval 10:30 to 10:45.
Also, there is a slight delay (up to 3 minutes) while data is stored in the database. So, if at 11:00 you request data for the last 15 minutes, you may see data for the 10:30 to 10:45 interval. At 11:03 if you request data for the last 15 minutes, you see data for the 10:45 to 11:00 interval.
Note: The delay does not occur when viewing 1-minute data in interface drilldown reports.
Common Elements
The following GUI elements are available in all Flow Analysis portlet reports:
Top Bar Elements

Common Elements
30 User Guide
1. Time -- the time interval over which the data displayed has been gathered (latest 15 min (default), latest 1 hour, latest 4 hours, latest day, latest week, Custom)
2. Top -- number of interfaces/hosts/applications shown in the Top N reports (5, 10 (default), 15, 20, 25)
3. Flow Analysis Collector -- collector that is supplying data to the reports; also known as the Flow Analysis Probe
4. Refresh button -- queries the database for the latest intervalized data. Can be set to: Manual and Auto refresh (1, 5, 10, and 15-minute intervals)
5. Configure button -- opens the Configuration panel
6. Help button -- displays online help
7. From, To, and Set -- Visible only if you choose Custom for the Time field. These fields allow you to select a time interval for displaying data. Enter time and date information in the From and To fields, then click Set. The time interval must be within the last 31 days.
Chart Options
1. Column Chart
2. Bar Chart
3. Line Chart
4. Export to CSV. Click the icon and enter a save location. The data that you see in the report is what is saved.

Common Elements
Chapter 3: Reports 31
Column View Options
Clicking on a column header toggles the data below in ascending or descending sort order. You can hide or display columns using the check boxes.
Column Dragging
You can drag entire columns into a preferred order. This column re-ordering is not persistent if you refresh or close the browser.
Drill down links
Click the blue links for interfaces, hosts, conversations, and other items. Each view in UMP is a "deep URL" which, if copied and pasted into another browser window or tab, will display the same webpage/report, with updated data for the latest time interval.
Display Tooltips
Display detailed information for some items in report views by positioning your cursor over the item. When you hover the cursor over the chart data bars you get both a tooltip and the corresponding data in the table is highlighted. Conversely, hovering over a data row in a table highlights the corresponding chart bar.
Information String
Beneath each report chart on the lower right is a caption that provides details about the data that is displayed in the report.
Flow Analysis Main Page
32 User Guide
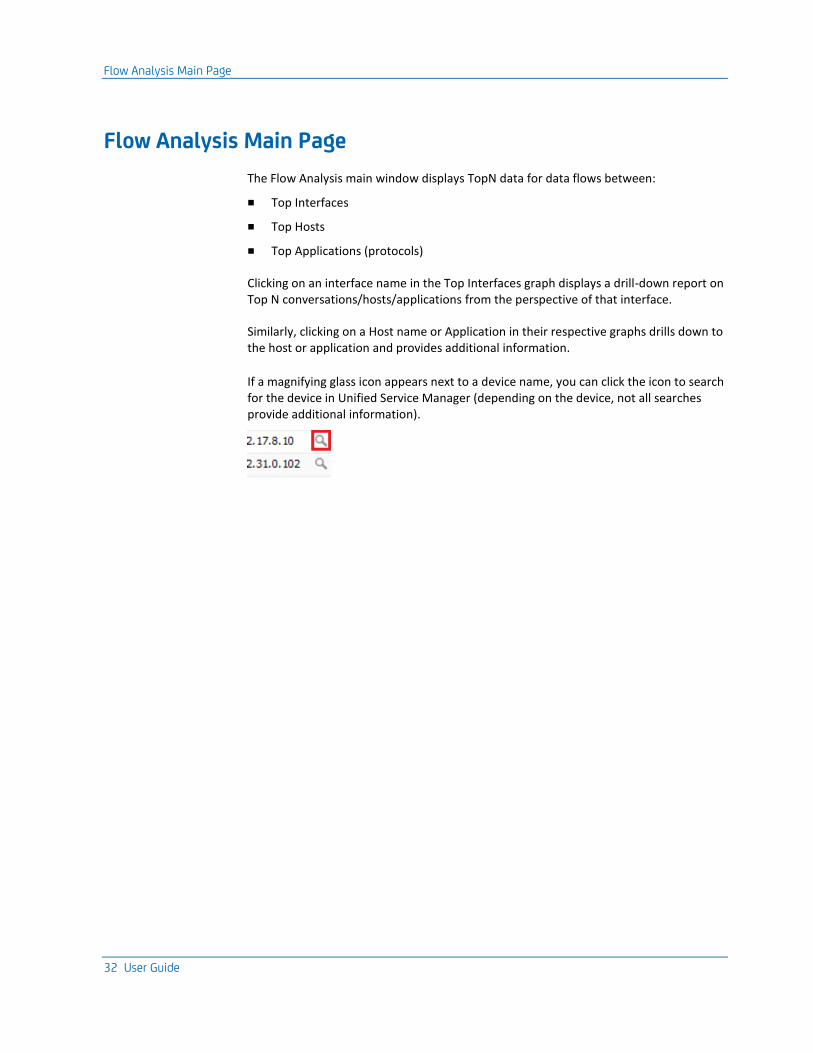
Flow Analysis Main Page
The Flow Analysis main window displays TopN data for data flows between:
■ Top Interfaces
■ Top Hosts
■ Top Applications (protocols)
Clicking on an interface name in the Top Interfaces graph displays a drill-down report on Top N conversations/hosts/applications from the perspective of that interface.
Similarly, clicking on a Host name or Application in their respective graphs drills down to the host or application and provides additional information.
If a magnifying glass icon appears next to a device name, you can click the icon to search for the device in Unified Service Manager (depending on the device, not all searches provide additional information).

Interfaces
Chapter 3: Reports 33
Interfaces
From the main report, drilling down on an interface shows the traffic that is flowing across the selected network device interface. This information is useful when optimizing VPN settings and bandwidth allocation, fine tuning service offerings, or troubleshooting sudden changes in usage. It can be used to optimize bandwidth allocations or to detect malicious traffic.
These reports are displayed:
■ Top Conversations by Application
■ Top Hosts by Application
■ Top Application
■ Top Type of Service by Conversation
■ Top Type of Service by Host

Interfaces
34 User Guide

Hosts
Chapter 3: Reports 35
Hosts
From the main display, drilling down on a host provides two reports about the traffic seen on that host:
■ Top Application
■ Top Interfaces

Applications
36 User Guide
Applications
Drilling down on an Application from the main screen displays, depending on the protocol, up to two detail reports:
■ Top Hosts
■ Top Interfaces

Chapter 4: Troubleshooting 37
Chapter 4: Troubleshooting
No Data Displayed in Reports (Time Delay in Reported Data)
Valid on all platforms
Symptom:
I keep seeing this error message:
Solution:
Increase the Time Offset setting in the Collector Configurations tab.
Setting Time Offset in Seconds to a larger value may be necessary for slow Flow Analysis Collector systems. Do not set this to a value greater than 500 or there will be a significant delay in displaying reports.
More information:
Configure Flow Analysis Collector (see page 19)

Flow Analysis Stops Collecting Data After 15 Minutes
38 User Guide
Flow Analysis Stops Collecting Data After 15 Minutes
Symptom:
The Flow Analysis probe seemed to function for 15 minutes, then stopped collecting data.
Solution:
The Windows administrator (DSA) credentials for the Flow Analysis Collector system are not correct. Enter the credentials in the DSA Administrator Username and DSA Administrator Password fields of the Collector Configurations tab in the Probe Configuration window.
The user name entered must have administrator privileges on the Flow Analysis Collector system.

Links to USM Do Not Function
Chapter 4: Troubleshooting 39
Links to USM Do Not Function
Valid on all platforms
Symptom:
When I click on the "search USM" magnifying-glass icon in the Flow Analysis GUI, the system tells me "No Metrics Available." This happens for all devices that I search for in USM.
Solution:
Verfiy that the snmptd probe is configured correctly using the following method:
In the snmptd probe configuration (double-click the snmptd probe icon in Infrastructure Manager), make sure the Remove Double Quotes check box is ticked.
Link to USM Displays Incorrect Device
40 User Guide
Link to USM Displays Incorrect Device
Valid on all platforms
Symptom:
When I click on the "search USM" magnifying glass icon in the Flow Analysis GUI, I am linked to the wrong device in the USM view.
Solution:
If a device is not a member of a group in USM, the USM search algorithm is unable to make an exact match and returns the closest match it finds. Check in UMP whether the device is a member of a group. If it is not in a group, add it to an existing or new group.
Collector not shown in drop down menu
Valid on all platforms
Symptom:
When I click on the top bar drop-down menu to show available Collectors, none are shown or the one I want is not listed.
Solution:
Discovery Services has not found the Collector probe on the Collector system. Stop and restart the Discovery_server and Discovery_agent probes from Infrastructure Manager.
Error Message Code 500
Symptom:
I get error code 500.
Solution:
Monitoring services can’t find any probes. This may mean that the discovery_server is not running. Even if the probe itself is not running it will show up (marked in orange/red) in the discovery list.

Error Message Code 400
Chapter 4: Troubleshooting 41
Error Message Code 400
Symptom:
I get error code 400.
Solution:
Cannot communicate to the probe. This happens if the probe is not running or cannot be communicated with.
Error Messag Code 200
Symptom:
I get error code 200
Solution:
The probe responds with an empty data set. This can happen if there is no data available for the time range selected or if the system time set on the NetQoS system is inaccurate.