Application of the Unfolding Model to the Aggression Dimension of the Dimensional Clinical...
18
Application of the Unfolding Model to the Aggression Dimension of the Dimensional Clinical Personality Inventory (DCPI) Paper in Press Revista Colombiana de Psicologia número 23 (2). Prof. Dr. Lucas de Francisco Carvalho (Universidade São Francisco, Itatiba, SP); Ananias Queiroga de Oliveira Filho (Universidade São Francisco, Itatiba, SP); Fernando Pessotto (Universidade São Francisco, Itatiba, SP); Silvana Ligia Vincenzi Bortolotti (Universidade Tecnológica Federal do Paraná, Campus Medianeira, Medianeira, PR) Endereço para correspondência e contato: 1 Lucas de Francisco Carvalho Universidade São Francisco, Rua Alexandre Rodrigues Barbosa, 45 CEP 13251-900, Itatiba, São Paulo, Brasil. E-mail: [email protected] ; Telefone: (11) 4534-8053 Fomento: CNPq; FAPESP. Application of the Unfolding Model to the Aggression Dimension of the Dimensional Clinical Personality Inventory (DCPI) Abstract This article compared the fit of models of dominance and unfolding for Aggressiveness DCPI dimension. The study included 975 subjects with ages ranging between 18 and 81 years (M = 29.82, SD = 12.28) and 58.9% women. The DCPI is composed of 163 items and 12 dimensions, 27 items related to Aggression. The analysis by the unfolding model indicated the exclusion of 15 items due to the standard error. Results showed a better fit for the dominance model. This result may be due to the nature of the construct, because the items assess pathological aspects of personality, representing one end of the continuum. Keywords: dominance model, unidimensional unfolding model, personality, personality disorders, item response theory. 1 Grant: FAPESP; CNPq.
Transcript of Application of the Unfolding Model to the Aggression Dimension of the Dimensional Clinical...

Application of the Unfolding Model to the Aggression Dimension of the
Dimensional Clinical Personality Inventory (DCPI)
Paper in Press Revista Colombiana de Psicologia número 23 (2).
Prof. Dr. Lucas de Francisco Carvalho (Universidade São Francisco, Itatiba, SP); Ananias
Queiroga de Oliveira Filho (Universidade São Francisco, Itatiba, SP); Fernando Pessotto
(Universidade São Francisco, Itatiba, SP); Silvana Ligia Vincenzi Bortolotti (Universidade
Tecnológica Federal do Paraná, Campus Medianeira, Medianeira, PR)
Endereço para correspondência e contato:1
Lucas de Francisco Carvalho
Universidade São Francisco, Rua Alexandre Rodrigues Barbosa, 45 CEP 13251-900, Itatiba,
São Paulo, Brasil. E-mail: [email protected] ; Telefone: (11) 4534-8053
Fomento: CNPq; FAPESP.
Application of the Unfolding Model to the Aggression Dimension of the
Dimensional Clinical Personality Inventory (DCPI)
Abstract
This article compared the fit of models of dominance and unfolding for Aggressiveness DCPI
dimension. The study included 975 subjects with ages ranging between 18 and 81 years (M =
29.82, SD = 12.28) and 58.9% women. The DCPI is composed of 163 items and 12
dimensions, 27 items related to Aggression. The analysis by the unfolding model indicated
the exclusion of 15 items due to the standard error. Results showed a better fit for the
dominance model. This result may be due to the nature of the construct, because the items
assess pathological aspects of personality, representing one end of the continuum.
Keywords: dominance model, unidimensional unfolding model, personality, personality
disorders, item response theory.
1 Grant: FAPESP; CNPq.

For the Item Response Theory (IRT), and psychometrics in general, it is assumed that
the items that operationalize the constructs function according to the principles of the
dominance model paradigm. In such paradigm, the more present and/or intense a given
construct is determined in the individual, the greater the likelihood that he or she agrees or
gets the correct answers for the items representing the construct. However, there is empirical
evidence (e.g., Roberts, Donoghue & Laughlin, 2000) suggesting that not all constructs or
items adequately fit the paradigm of dominance, indicating the need for using other models
such as the unfolding model.
In the unfolding model, it is assumed that the determination of the probability of the
individuals’ response to an item is more related to the proximity of the location of the item
and the subject, one in relation to the other, and not necessarily to the intensity of the
representation of the construct. Accordingly, the probability of agreeing with an item

increases as the level in the latent construct of the individual approaches the level on the
item’s construct. The present study verifies the postulation of the unfolding model, which fits
into the family of mathematical models of IRT, investigating its suitability compared to the
dominance of a set of items assessing personality characteristics of the model.
The IRT has been used in the development of instruments, and with regard to studies
of personality, most studies make use of a specific model - the dominance model (Meijer &
Baneke, 2004). In dominance models it is assumed that the higher the score on the latent trait,
the higher the probability of getting the correct response in case of skills, or of agreeing with
the item, in the case of non-cognitive constructs. It is noteworthy that this study focused on
non-cognitive constructs. For instance, when measuring depression using items such as "I am
often depressed", within the paradigm of dominance, it is reasonable to assume that, the more
someone is depressed, the greater the likelihood that the person agrees with the item.
In models of dominance, the information function of the scale indicates where the
measurement accuracy of the latent trait is higher or lower, because it is inversely related to
the standard error of measurement (Embretson & Reise, 2000). The models of dominance are
usually based on one, two, or three parameters to assess the skill level (ɵ) of respondents. The
model with one parameter, or Rasch model, makes use of the difficulty (b) index, which is
related to the probability of hit/agreement with the item, representing the necessary level in
the latent trait to properly respond to it.
In the two-parameter model, besides the difficulty, the discrimination power item (a)
is also part of the equation, which indicates how much it is able to differentiate individuals
based on knowledge of a particular subject or skill at some task. In the one-parameter model,
it is assumed that the power of discrimination is the same for all items. Finally, to the third
model is added the parameter that represents the probability of hit by chance (c), indicating
an increase in the probability of a subject with a certain level on the latent trait to choose a
given response, attributing this increase randomly. In all dominance models the Item
Characteristic Curves (ICC) are described by a monotonically increasing function.
Besides that, unlike the paradigm of dominance, a less usual model in the literature is
the so-called unfolding or ideal point model. Conceptually, the unfolding model implies that
a subject must agree with a certain item if both are closely located in the continuum of the
latent construct. With this, the ICC in the unfolding model is not represented by a
monotonically increasing function, but the curve is determined by the proximity of the level
on the latent construct by the item and by the respondent, and less to the increased likelihood
of agreement according to the intensity presented by the individual in this construct (Coombs,
1964; Roberts, Donoghue, & Laughlin, 1999).
Based on this perspective, the Generalized Graded Unfolding Model was developed
([GGUM]; Roberts, Donoghue & Laughlin, 2000). Although other types of developments are
being used with relative success, the GGUM has received considerably more attention in the
literature in relation to others, being also chosen for analysis in this research model.
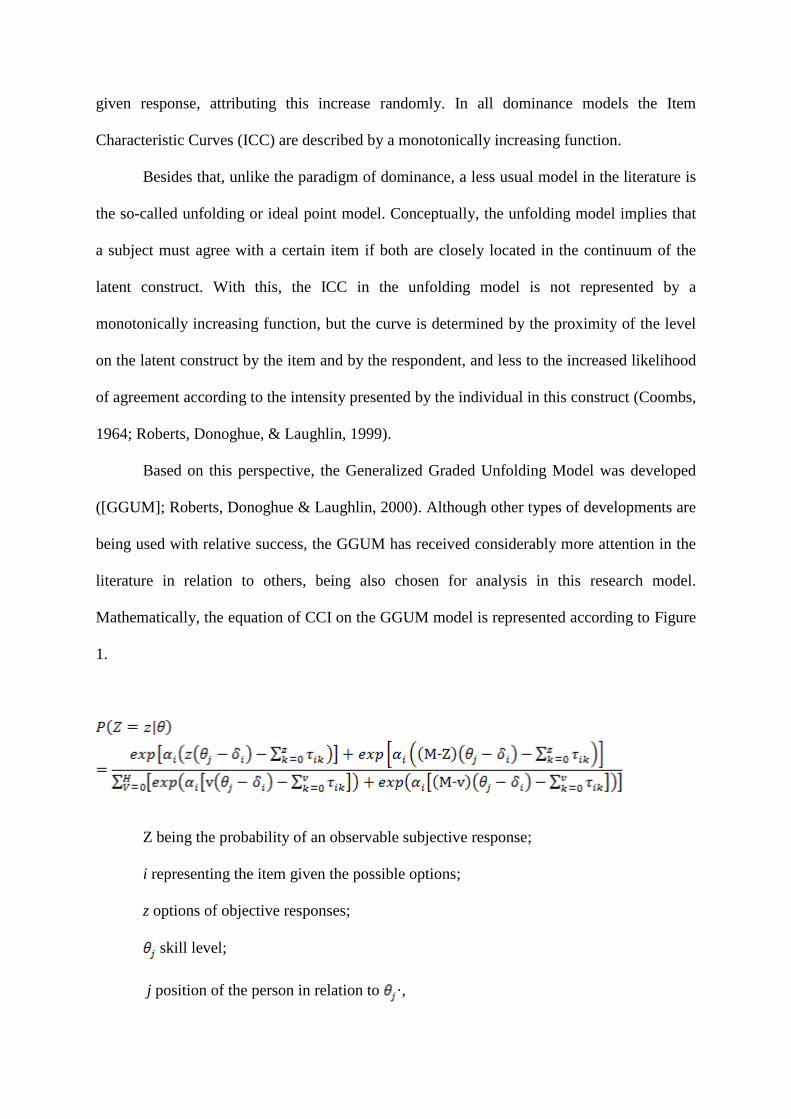
Mathematically, the equation of CCI on the GGUM model is represented according to Figure
1.
Z being the probability of an observable subjective response;
i representing the item given the possible options;
z options of objective responses;
skill level;
j position of the person in relation to ·,

difficulty of the item;
discrimination power of the item;
threshold category of the K-th option (where k is a number minus the number of
possible response options) or the level of the response.
Although the equation seems similar to the typical models of IRT, the interpretation is
quite different. The end or the location of a point is represented considering the attribute level
at which the item “unfolds” and begins to show a non-monotonic behavior. In this model,
people with an attribute level equal to δ are most likely to corroborate the item, and this
probability decreases for those with θ levels below or above δ. Roberts, Lin and Laughlin
(2001) explain that a person cannot corroborate an item if it presents an excessively negative
content, being its δ parameter much smaller than the parameter θ of the individual. The same
may occur in the event of an excessively positive content, since the δ parameter of the item is
considerably higher than the parameter θ of the individual. Thus, the level θ is so different in
relation to the level of δ, that the subject ends up not corroborating the item. That is, the
individual may disagree by lack or excess of θ, in this two situations the responses are called
subjective responses.
In other words, the parameters are distributed symmetrically around the point (θ – δ
= 0). Thus, to parameterize the GGUM it is assumed that for all options of objective
responses (for instance, “I disagree”), there are two options of subjective responses (may
disagree by being far above the position of the item or too low). On the scale of the latent
trait, “above” would be “to the right” of the item and “below” “to the left” of the item’s
position. Consider the item to assess the resistance to organizational change (Bortolotti,
2010): “When changes happen, try to do only what is necessary”. This item can be disagreed
by individuals who have no resistance to change (disagree above the item), i.e., those who
accept changes or by individuals that are resistance to change (disagree below the item).

Likewise, the number of thresholds and the possibility of subjective responses (subjective
response curves), M, is equal to 2 (H + 1), where H is the most extreme option. It is assumed
that these values are symmetrical around the point (δ – θ = 0) being half negative and half
positive in terms of value. Operationally, only half of the negative values are used in the
calculation of probabilities of response, because their positive valued reciprocals are
redundant.
We observed, then, that the dominance proposals, typically used in psychology in
analyses based on the IRT, and the unfolding proposals, present clearly distinct postulations.
Despite the still limited literature in the area, there are some studies using the unfolding
model for the verification of adequacy of items assessing non-cognitive constructs,
specifically, personality (Chernyshenko, Stark, Chan, Drasgow & Williams, 2001; Conn &
Rieke, 1994; Meijer & Baneke, 2004; Stark, Chernyshenko, Drasgow & Williams, 2006).
These studies demonstrate the applicability of the model and, more than that, that some items
or sets of items are better adequate for the unfolding proposal compared to the dominance
model (Wang, Tay & Drasgow, 2013). Basically, it is agreed that the better adequacy of these
items occurs by the nature of their content, i.e., in general, items that tend to neutral content
(and not clearly directed to an extreme) tend to fit more appropriately to the unfolding
models. However, specific constructs that are better adequate to one or other model are not
reported in the literature.
Considering the presented information, the objective of the present study was to verify
the adequacy of a set of items assessing a dimension of personality - Aggressiveness (of the
Dimensional Clinical Personality Inventory [DCPI]), by means of a model based on the
dominance paradigm (graduated response model, from the Rasch model family– Andrich
Rating Scale Model) and a model based on the unfolding paradigm (GGUM). Furthermore,
we sought to compare the levels of adequacy and discuss the possibilities of use of the

unfolding paradigm, still little used in psychology in Brazil. We specifically chose this set of
items, because (a) it is necessary that the set of items is unidimensional; (b) this dimension is
composed by a number of items sufficient for the analysis (other dimensions of the DCPI
present a very restricted number of item); and, we aimed to verify the possibility of use of
this model in a specific model of items for an specific construct, focused more on the model
than on the instrument itself.
Method
Participants
In the present study there were 975 individuals, selected by convenience, with ages
ranging from 18 and 81 years (M=29.82; DP=12.28), being 574 women (58.9%). Most part
of the sample was composed by university students (63.2%), followed by high school
students (11.4%), and 168 subjects (17.2%), did not inform their level of education.
Instrument
The DCPI (Carvalho & Primi, 2011) was developed based on Millon’s theory and on
diagnosis characteristics of DSM-IV-TR Axis II (APA, 2002) with the objective of analyzing
pathological personality characteristics specifically in adults (Carvalho, 2011). The
instrument is composed by 163 items distributed in 12 dimensions: Dependence (inability to
make decisions with inadequate self-performance beliefs), Aggressiveness (disregard to
others and violent acts), Mood Instability (mood oscillation with irritability, sadness, and
guilt), Eccentricity (eccentric behaviors, belief of being different and not taking pleasure in
being with other people), need for attention (search for friendships, seduction and
exaggerated need for attention of others), Distrust (inability to trust people and ideas of
persecution), Grandiosity (exaggerated need for recognition and admiration with exaggerated
beliefs in one’s own merit and superiority), Isolation (preference for being alone with little
pleasure in relationships), Avoidance of criticisms (beliefs of inability, humiliation, and

criticism by others), Self-sacrifice (self-disrespect, helping with harms to self),
Conscientiousness (need for organization, order, and perfectionism and excessive concern),
and Impulsivity (inconsequence, breaking laws, and engaging in dangerous activities).
Items must be answered from a 4-poing Likert-like scale, ranging from “does not
describe me at all” (1) and “describes accurately” (4). Studies were conducted searching for
evidence of validity and reliability and, according to Carvalho (2011), the results obtained
tended to be adequate. The approximate time for application is 20 minutes, and it can be
administered collectively or individually.
Procedures
This research was initially submitted to a Research Ethics Committee and
subsequently approved (C.A.A.E: 0144.0.142.000-07). After approval, participants were
recruited in classrooms or on the campus of private universities in the city of São Paulo.
Individuals were invited to participate in the research by means of an Informed Consent
Term, and participants were only included in the study after reading, and signing of the
document. During data collection, at least one authors was present to clarify possible
questions.
Data Analysis
After collection, data were tabulated and analyzed statistically. Considering the
objectives of this study, we proceeded with the implementation of the graduated response
(dominance model), and the Winsteps software was used with the mean difficulty set to zero,
and GGUM (unfolding model), which was done with the GGUM 2004 software. To run the
data with the GGUM model, a quadrature equal to 50 was set. The steps for calibration are
presented in the sequence.
Specifically, we verified the dimensionality of the set of items, the operation of
response categories, the summarized descriptive statistics of the latent traits (theta) of the
respondents, their respective fit indices (infit and outfit), plus the data regarding the items, the
level of difficulty, the fit indices, the item-theta correlation, and reliability indices. For both
models, we sought to obtain unidimensionality and an adequate operation of the response
categories. Specifically regarding the unfolding model, we also used as a criterion a
minimum number of items (15) and of the sample (750). Still, in relation to the dominance
model, we observed the fit indices and item-theta correlation for the verification of suitability
to the model; in the case of the unfolding model, these data were also observed, but before
that, the item had to present a similar level of standard error in relation to the other items of
the set so as to be kept in the analysis.
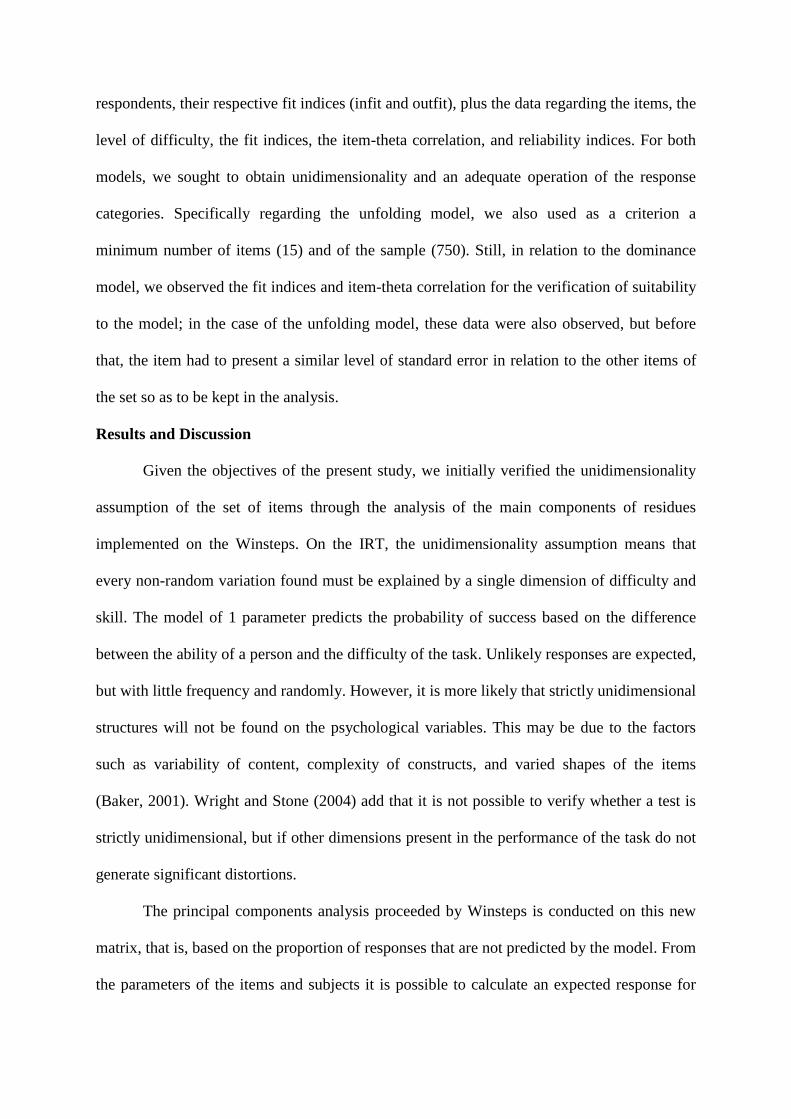
Results and Discussion
Given the objectives of the present study, we initially verified the unidimensionality
assumption of the set of items through the analysis of the main components of residues
implemented on the Winsteps. On the IRT, the unidimensionality assumption means that
every non-random variation found must be explained by a single dimension of difficulty and
skill. The model of 1 parameter predicts the probability of success based on the difference
between the ability of a person and the difficulty of the task. Unlikely responses are expected,
but with little frequency and randomly. However, it is more likely that strictly unidimensional
structures will not be found on the psychological variables. This may be due to the factors
such as variability of content, complexity of constructs, and varied shapes of the items
(Baker, 2001). Wright and Stone (2004) add that it is not possible to verify whether a test is
strictly unidimensional, but if other dimensions present in the performance of the task do not
generate significant distortions.
The principal components analysis proceeded by Winsteps is conducted on this new
matrix, that is, based on the proportion of responses that are not predicted by the model. From
the parameters of the items and subjects it is possible to calculate an expected response for

each individual at each item. The discrepancy between the modeled (expected) response and
the actual response is considered as waste. Thus, if a component presents items with a
magnitude greater than 2 (Linacre 2009), it is suggested that a second dimension can
potentially affect the data by obscuring the meaning of the first dimension. In the present
study eigenvalues equal to or greater than 2.0 for waste were not found, indicating the
unidimensionality of the set of items.
Once the unidimensionality was observed, it was also verified the functioning of
response categories of the set of items. The analysis of response categories allows us to
observe whether the categories on the Likert-like scale proposed for the test, obtained a
minimally adequate functioning. Figure 2 provides illustrative data about the response
categories of the Aggression dimension.
Figure 2 shows the response categories of the items, and the x-axis shows the theta
scale (level of respondents in latent trait) and the y-axis shows the probability of response of

participants at different levels of theta (in the figure, the b average was set at zero). The
figure also presents the probabilities of endorsement of the participants in each of the
response categories and their distributions at different levels of theta for an item bi=0 (i.e.,
average level of difficulty equal to zero). The intersection between two categories can be
interpreted as the threshold value between these categories. No overlap of the curves was
observed, suggesting that all response categories showed a region in the theta (horizontal
axis) in which they would be the most likely.
Besides the visual analysis of the response categories, it is also important to
investigate whether there is a clear progression in the theta scale on the passage between one
response category and another. There was a clear progression of the levels of theta as the
Likert scale increases, with a mean theta in the passage between categories 1-2 equal to -
0.30; 2-3 equal to 0,05; and 3-4 0.25.
For application of the models of graduated response and GGUM, the assumptions of
unidimensionality and distribution of response categories were checked. Specifically for the
GGUM model, three further criteria were observed: whether the response categories had a
frequency higher than zero; if the set of items comprises at least 15 items; and if the sample
comprises at least 750 individuals (Roberts, Laughlin & Donoghue, 2000). In the present
study all response categories showed frequency response greater than zero, a set of 27 items
was used, and as already explained, the sample had a greater N than 750, so all criteria have
been met.
After running the GGUM model, we assessed the standard error of the items, which
was an exclusion criterion (Chernyshenko, Stark, Drasgow & Roberts, 2007). On a first
analysis we observed that the two items obtained a discrepant standard error, that is, they
were way higher in relation to the others (as there is no cutoff point described in the literature
for this model) and, after the removal of the items, we proceeded to new analysis. It is

noteworthy that the exclusion of the items was conducted manually and not automatically by
the software. This indicated that 13 items had very different standard errors, with 15 items
excluded up to this moment. Then, an analysis of the 12 remaining items was conducted, and
the results were presented as follows.
In Table 1 we can observe the summarized descriptive statistics of the latent traits
(theta) of the respondents, their respective fit indices (infit and outfit), and the number of
items responded on the Aggressiveness dimension of the DCPI. Furthermore, this table
summarizes the descriptive data for the items, that is, the level of difficulty, the fit indices,
the item-theta correlation, and the reliability indexes (real and modulated).
Table 1: Descriptive summary statistics of persons and items
Pessoas Itens
Theta Infit Outfit b Infit Outfit Corr. theta-total fidedignidade
GG
UM
M (SD) 0,32
(0,67)
-1,02
(0,56)
0,92
(0,07)
0,84
(0,19) -0,07 - 0,61 -- Max. -0,75
-0,52 1 1
Min. 1,52
-2,65 0,74 0,29
Rat
ing
Sca
le
M (SD) -1,39
(0,90)
1,03
(0,41)
0,98
(0,51) 0 (0,46)
1,05
(0,15)
0,98
(0,22) 0,32-0,56 0,79 (0,81) Max. 2 2,71 4,54 1,21 1,40 1,50
Min. -3,71 0,19 0,20 -0,76 0,77 0,67
Note. Index for infit and outfit (mean, SD, minimum and maximum) were not presented, as well as the
reliability, for the GGUM model, since the software does not provide this data.
In the case of graduated response model, observing the mean theta (negative) of the
respondents, we verified that the mean of the items suggests that the subjects tended to
disagree. The mean level of the latent trait on the graduated model of response suggests that
the items are above the mean, indicating a greater presence of less endorsed items (b

positive). The standard error of theta suggests that the sample is composed of people with
distinct levels of intensity in relation to the characteristics assessed by the set of items. To
conduct this inference we assumed that the observed scores, lighter or more extreme, are
indicatives of the level of functioning of the subjects in aggressiveness. In the GGUM model,
differently from the graduated response model, the mean of the latent trait indicates that if the
items are close to the mean, alluding to an approximate frequency to more endorsed and less
endorsed items. Based on the theta standard error we may observe that, such as in the model
of graduated response, the participants have different levels of the latent trait.
In relation to the participants, by means of infit and outfit indices, on the model of
graduated response we verified discrepancies between the expected values and those
observed in relation to the estimation of the respondents’ thetas. These values tended to be
adequate (Linacre & Wright, 1994), once the mean was below 1.3. However, maximum
values of fit indices higher than 1.3 were found, suggesting discrepancies beyond the
expected by the model for some subjects. Furthermore, the reliability index of the theta
estimates calculated by the model of graduate response may be considered satisfactory
(Embretson, 2000). On the GGUM model, the fit analysis was conducted based on the outfit
and infit indices. The results found point a good fit of the items, as none of them was higher
than 1.3. It should be highlighted that one item presented outfit lower than 0.5, which
indicated a better fit than that expected by the model. Although it may suggest a possible
distortion of the model, this parameter was not used as an exclusion criterion for the items.
This information can be observed in Table 2.
Table 2: Descriptive data of the items of Aggression dimension
Dominance model Unfolding model
Item b Infit Outfit item-theta
corr
a delta(δ) Infit Outfit item-theta corr Discrimination (α)
A016 1,21 1,31 1,08 0,32 1,05
B123 1,02 1,21 0,76 0,39 1,10 -1,27 0,74 0,29 -0,07 4,03
B114 0,6 1,09 0,87 0,44 1,10 -1,12 0,92 0,87 0,55 1,33

B159 0,45 0,93 0,74 0,48 1,12
B212 0,33 0,81 0,67 0,52 1,15 -0,95 0,93 0,84 0,43 1,40
B215 0,27 0,9 0,67 0,53 1,19
A051 0,17 1,01 0,84 0,49 1,11 -1,11 0,95 0,91 0,46 0,74
B153 0,15 0,99 0,97 0,45 1,02
A107 0,14 0,93 0,73 0,51 1,11 -0,95 0,97 0,86 0,43 1,20
A098 0,1 1,04 1,04 0,43 0,97
A105 0,09 0,96 0,88 0,48 1,05 -2,65 0,80 0,69 0,23 0,89
B174 0,09 1,36 1,21 0,43 1,02
A067 0,03 1,03 0,94 0,49 1,07 -0,63 0,93 0,86 0,52 1,19
A068 -0,01 1,4 1,5 0,38 0,86
B158 -0,03 0,96 0,84 0,50 1,07 -0,90 0,95 0,95 0,61 0,67
B175 -0,06 0,77 0,69 0,56 1,14
B122 -0,12 1,09 0,97 0,48 1,02
B176 -0,14 0,96 0,91 0,51 1,06 -0,83 0,96 0,95 0,57 0,63
A014 -0,22 1,15 1,19 0,42 0,85 -0,60 1 1 0,60 0,20
A104 -0,3 1,01 0,98 0,47 0,91
B213 -0,36 0,98 1,03 0,47 0,88
A052 -0,37 1,27 1,25 0,44 0,84 -0,71 0,98 0,99 0,56 0,29
B155 -0,39 1,01 1,17 0,43 0,76
A106 -0,5 0,99 1,01 0,5 0,91
A053 -0,65 1,04 1,13 0,48 0,76 -0,52 0,97 0,97 0,42 0,66
B172 -0,74 0,96 0,99 0,56 0,99
A005 -0,76 1,14 1,5 0,36 0,28
Note. Lines of excluded items from GGUM are in blank.
Comparing the indices of difficulty, among the 12 common items analyzed in the two
models, we verified that only one item (A053) presented a higher level of difficulty on the
unfolding model, which shows that in this model the items are mostly assessed as easier. This
fact may be the result of the logic that bases the GGUM model, that is, different from the
model of graduates response which is based strictly on the subjects and the latent construct,
for the GGUM model this assumption seems to be equally functional or even sufficient for
the estimation of the model parameters (Roberts, Donoghue & Laughlin, 2000).
When the theta-item correlations obtained are confronted it appears that in seven
items the magnitudes of the correlations were higher on the graduated response model and in
five items the magnitudes were higher in GGUM. Specifically the B123 item presented

correlation close to zero (an negative) in the unfolding model, which is evidence that the item
does not help to assess the theta. Although no item was observed with equal magnitude, two
items (A051 and A067) had a difference lower than 0.05 (which can be seen by subtracting
the theta-total correlations between the two models).
The discrimination on the model of graduated answer is continuous in all items, being
attributed value 1, but empirically the discriminations do not present this equivalence. The
Winsteps, by means of a post-hoc analysis, may provide the estimative of the discrimination
of each item (Linacare, 2009). Analyzing the parameter of discrimination of the items, still
taking into consideration the 12 items analyzed in both models, we observed that most items
(N=8) presented greater discriminative power in the analysis by graduated response. An
exception to that was the B123 item, on the GGUM, with ability of discrimination quite
elevated, however, the outfit of the item was lower than 0.05, and the correlation with theta
was close to zero, which may evidence a distortion of the model.
The indices analyzed in this study provide information indicating a better adequacy of
the Aggression dimension items to the graded response model. This consideration can be
made when comparing the 12 items that were analyzed in the two models. This statement is
even more relevant when one considers that, based on GGUM, the full set of items could not
be analyzed, to meet the assumptions of the model (i.e., similar levels of standard error),
reducing the amount of information obtained by the model when compared with the
unfolding model (by Winsteps in this case), whereby the set of items as a whole was
analyzed.
Thus, Corroborating what is presented in the literature (Wang, Tay & Drasgow,
2013), i.e., that the unfolding model should work more adequately for items whose content
tends to neutrality and not to an extreme, there was a more impaired suitability of this model
compared to the most traditionally used model, the dominance model. Together with other
evidence (e.g., the level of difficulty of the items compared to average theta of participants),
the unsuitability of sets of items to the unfolding model may be an indicative of validity for
tests that explicitly seek to assess an extreme of a specific construct. Even so, we did not find
any study in the literature using the application of this model for such purpose.
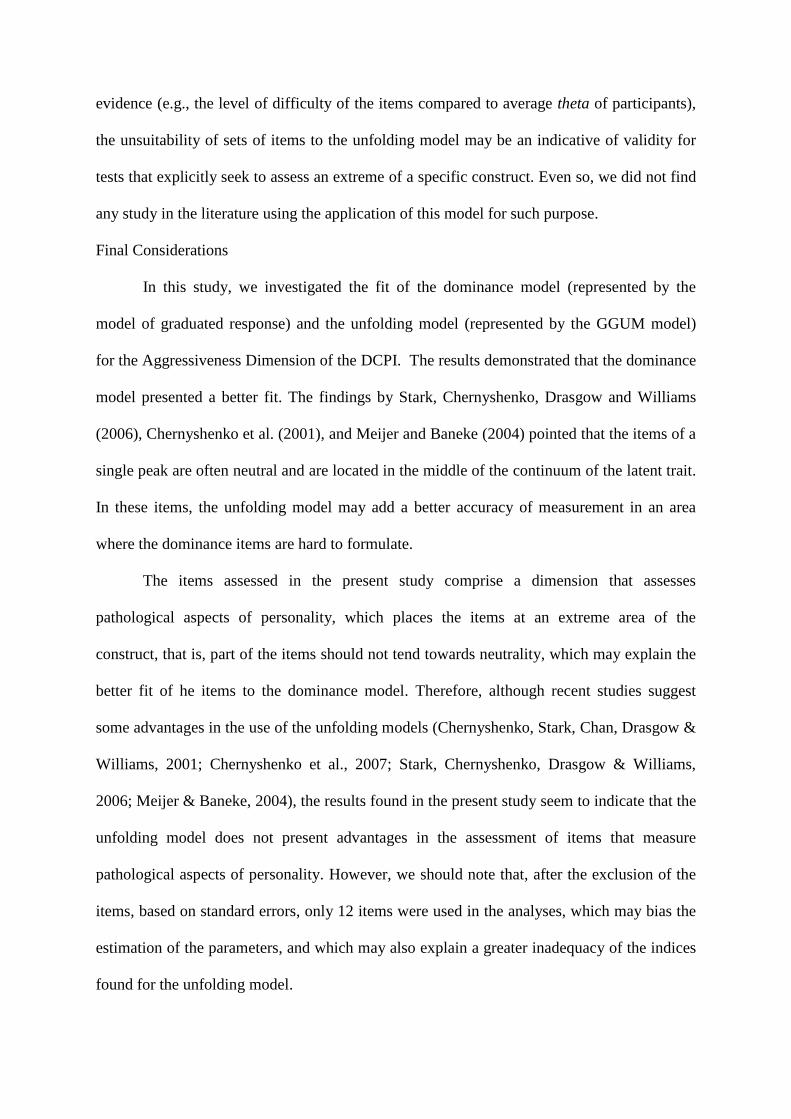
Final Considerations
In this study, we investigated the fit of the dominance model (represented by the
model of graduated response) and the unfolding model (represented by the GGUM model)
for the Aggressiveness Dimension of the DCPI. The results demonstrated that the dominance
model presented a better fit. The findings by Stark, Chernyshenko, Drasgow and Williams
(2006), Chernyshenko et al. (2001), and Meijer and Baneke (2004) pointed that the items of a
single peak are often neutral and are located in the middle of the continuum of the latent trait.
In these items, the unfolding model may add a better accuracy of measurement in an area
where the dominance items are hard to formulate.
The items assessed in the present study comprise a dimension that assesses
pathological aspects of personality, which places the items at an extreme area of the
construct, that is, part of the items should not tend towards neutrality, which may explain the
better fit of he items to the dominance model. Therefore, although recent studies suggest
some advantages in the use of the unfolding models (Chernyshenko, Stark, Chan, Drasgow &
Williams, 2001; Chernyshenko et al., 2007; Stark, Chernyshenko, Drasgow & Williams,
2006; Meijer & Baneke, 2004), the results found in the present study seem to indicate that the
unfolding model does not present advantages in the assessment of items that measure
pathological aspects of personality. However, we should note that, after the exclusion of the
items, based on standard errors, only 12 items were used in the analyses, which may bias the
estimation of the parameters, and which may also explain a greater inadequacy of the indices
found for the unfolding model.

We also highlight that further studies with other instruments are necessary to obtain
empirical evidence of the results of the present study, or even studies with other dimensions
of the DCPI. Further studies should investigate the reproducibility of the pattern found in
other set of items. Furthermore, it would be interesting to investigate the flexibility of the
unfolding models in the face of items with fewer trends towards neutrality.
References
APA (2002). Diagnostic and statistical manual of mental disorders – DSM-IV-TR (fourth
edition). American Psychiatric Association.
Baker, F. B. (2001). The basics of item response theory. Washington: ERIC Clearinghouse on
Assessment and Evaluation.
Bortolotti, S. L. V. (2010). Resistência à mudança organizacional: medida de avaliação por
meio da teoria da resposta ao item. Tese de doutorado – Programa de Pós Graduação
em Engenharia de Produção da Universidade Federal de Santa Catarina.
Carvalho, L. de F. (2011). Desenvolvimento e Verificação das Propriedades Psicométricas
do Inventário Dimensional Clínico da Personalidade (Tese de doutorado não
publicada). Universidade São Francisco, Itatiba.
Carvalho, L. de F. & Primi, R. (2011). Inventário Dimensional Clínico da Personalidade.
Teste psicológico não publicado.
Chernyshenko, O. S., Stark, S., Chan, K.-Y., Drasgow, F., & Williams, B. (2001). Fitting
item response theory models to two personality inventories: Issues and insights.
Multivariate Behavioral Research, 36(4), 523–562.
doi:10.1207/S15327906MBR3604_03
Chernyshenko, O. S., Stark, S., Drasgow, F., & Roberts, B. W. (2007). Constructing
personality scales under the assumptions of an ideal point response process: Toward
increasing the flexibility of personality measures. Psychological Assessment, 19(1),
88–106. doi:10.1037/1040-3590.19.1.88
Conn, S. R. & Rieke, M. L. (1994). 16PF Fifth Edition Technical Manual. Champagne, IL:
Institute for Personality and Ability Testing, Inc.
Coombs, C. H. (1964). A Theory of Data (first edition.). New York: John Wiley & Sons, Inc.
Embretson, S. E. (2000). Multidimensional Measurement from Dynamic Tests: Abstract
Reasoning under Stress. Multivariate Behavioral Research, 35(4), 505–42.
Embretson, S. E. & Reise, S. P. (2000). Item response theory for psychologists. Mahwah, NJ:
L. Erlbaum Associates.

Linacre, J. M. (2009). Winsteps (Version 3.68) [Computer Software]. Beaverton, Oregon:
Winsteps.com.
Linacre, J. M. & Wright, B. D. (1994). Chi-square fit statistics. Rasch Measurement
Transaction, 8(2), 261–360.
Meijer, R. R. & Baneke, J. J. (2004). Analyzing psychopathology items: A case for
nonparametric item response theory modeling. Psychological Methods, 9(3), 354–
368. doi:10.1037/1082-989X.9.3.354
Roberts, J. S., Donoghue, J. R., & Laughlin, J. E. (1999). Estimability of parameters in the
generalized graded unfolding model. Presented at the annual meeting of the American
Educational Research Association, April 22, Montreal, Canada. Roberts, J. S., Donoghue, J. R., & Laughlin, J. E. (2000). A general item response theory
model for unfolding unidimensional polytomous responses. Applied Psychological
Measurement, 24(1), 3–32. doi:10.1177/01466216000241001
Stark, S., Chernyshenko, O. S., Drasgow, F., & Williams, B. A. (2006). Examining
assumptions about item responding in personality assessment: Should ideal point
methods be considered for scale development and scoring? Journal of Applied
Psychology, 91(1), 25–39. doi:10.1037/0021-9010.91.1.25
Wang, W., Tay, L., & Drasgow, F. (2013). Detecting differential item functioning of
polytomous items for an ideal point response process. Applied Psychological
Measurement, 37 (4), 316-335.
Wright, B. D. & Stone, M. H. (2004). Making Measures. Chicago: Phaneron Press,
Incorporated.