defining fear and aggression: typological - UT Arlington
150
DEFINING FEAR AND AGGRESSION: TYPOLOGICAL EMOTIVE RESPONSES TO PERCEPTIONS OF TEXTUAL SYMBOLS by DONNA LYNN SALAZAR Presented to the Faculty of the Graduate School of The University of Texas at Arlington in Partial Fulfillment of the Requirements for the Degree of MASTER OF ARTS IN CRIMINOLOGY AND CRIMINAL JUSTICE THE UNIVERSITY OF TEXAS AT ARLINGTON MAY 2010
-
Upload
khangminh22 -
Category
Documents
-
view
1 -
download
0
Transcript of defining fear and aggression: typological - UT Arlington

DEFINING FEAR AND AGGRESSION: TYPOLOGICAL
EMOTIVE RESPONSES TO PERCEPTIONS
OF TEXTUAL SYMBOLS
by
DONNA LYNN SALAZAR
Presented to the Faculty of the Graduate School of
The University of Texas at Arlington in Partial Fulfillment
of the Requirements
for the Degree of
MASTER OF ARTS IN CRIMINOLOGY AND CRIMINAL JUSTICE
THE UNIVERSITY OF TEXAS AT ARLINGTON
MAY 2010

Copyright © by Donna Lynn Salazar 2010
All Rights Reserved

iii
ACKNOWLEDGEMENTS
As I complete this phase of my studies, I wish to acknowledge those to whom I
owe a great debt of gratitude.
First, to my major professor, Dr. Alejandro del Carmen, a committed mentor and
a true friend, thank you for your guidance, your support, and your patience; most of all,
thank you for believing in me even when I did not. To Dr. Rhonda Dobbs, a brilliant
guide through the obstacles of focused research, I appreciate your sincerity and your
gentle insights. And to Dr. Rodrigo Paris, thank you for standing ready to meet the
challenge of reviewing this, my final project in the Department of Criminology and
Criminal Justice at the University of Texas at Arlington.
To Cathy Moseley, who has kept me organized, thank you for all of the extra time
you have devoted to the projects and schedules we have arranged and re-arranged over
the years, and to all of the faculty, staff and students who have made lasting and
meaningful contributions to this successful end, I appreciate you.
Most of all, thank you to my family; to my daughter Gretchen Motlagh for her
unwavering love and support, to my sister Miriam Roque for spending endless late night
hours listening to me recount my studies and my thoughts, and to my granddaughter
Ciara Smith who may not know that her everyday activities remind me to set my goals
high and strive to achieve them.

iv
It is my hope that for all the precious gifts you have given to this tired old graduate
student—love, inspiration, support, insight, challenge, and camaraderie—this work will
serve as a suitable tribute to our memories.
April 6, 2010

v
ABSTRACT
\DEFINING FEAR AND AGGRESSION: TYPOLOGICAL
EMOTIVE RESPONSES TO PERCEPTIONS
OF TEXTUAL SYMBOLS
Donna Salazar, MA
The University of Texas at Arlington, 2010
Supervising Professor: Alejandro del Carmen
Millennial technology has shed new light on early biological theories of crime.
Recent evidence supports a new paradigm in criminological research designed to
embrace an integration of neuro-scientific, psychological, and sociological theories in
order to understand the multi-dimensional characteristics of causality involved in
criminal behavior. The current study explores the value of an integrated approach to
define typological fear and aggression emotive responses utilizing symbolic interaction as
the mechanism by which the various disciplines interact. Through perceptions of
emotionally charged textual symbols, typological representations of fear and aggression,
and a 3-Part electronic survey instrument, the study reveals support for an integrated

vi
approach, variations in perceptions between non-white and white respondents, as well as
possibilities that some respondents may not recognize emotional trigger symbols.

vii
TABLE OF CONTENTS
ACKNOWLEDGEMENTS ............................................................................................... iii
ABSTRACT .........................................................................................................................v
LIST OF ILLUSTRATIONS……………………………………………………………xiii
LIST OF TABLES .......................................................................................................... .xiv
Chapter Page
1. INTRODUCTION……………………………………..………..….. .................1
2. LITERATURE REVIEW ...................................................................................5
2.1 Introduction to the Literature .................................................................5
2.2 Current Standard Definitions .................................................................6
2.2.1 Crime.......................................................................................6
2.2.2 Fear .........................................................................................7
2.2.3 Aggression ..............................................................................7
2.2.4 Fear of Crime ..........................................................................8
2.3 History and Intellectual Background .....................................................8
2.3.1 Symbolic Communication ......................................................8
2.3.2 Symbolic Messages .................................................................9
2.3.2.1 Media .....................................................................10
2.3.3 Symbolic Cues ......................................................................12

viii
2.3.3.1 Words as Symbols……………………………...…13
2.3.3.2 Situations as Symbols .............................................14
2.3.4 Evolution of Negotiable Representations
Ascribed to Criminal Behavior .............................................15
2.4 Negotiating Fear and Aggression through Typologies ........................19
2.4.1 Typology of Fear...................................................................19
2.4.1.1 Autonomic Fear Response .....................................20
2.4.1.2 Cognitive Fear Response .......................................22
2.4.1.3 Anxiety ...................................................................22
2.4.2 Typology of Aggression .......................................................23
2.4.2.1 Covert Aggression ................................................24
2.4.2.2 Reactive Aggression ..............................................24
2.4.2.3 Hostile Aggression .................................................25
2.4.2.4 Instrumental Aggression ........................................25
2.5 Causal Arguments ................................................................................26
2.5.1 Millennial Validation of Early Ideology ...............................26
2.6 Summary of research ...........................................................................30
2.6.1 Social Science Studies ..........................................................30
2.6.1.1 Distinguishing Emotional Taxonomies..................31
2.6.1.2 Distinguishing Fear and Aggression Typologies ...31
2.6.1.3 Perceptions of Symbolic Guardianship ..................31
2.6.1.4 Correlation between
Actual Victimization and Fear of Crime…………32

ix
2.6.2 Neuro-psychological and Psycho-social Studies ..................32
2.6.2.1 Heavy Metals and Trace Metal Imbalances ..........33
2.6.2.2 Hormones ...............................................................35
2.6.2.3 Pre-frontal Grey Matter..........................................35
2.6.3 Genetic Studies .....................................................................36
2.6.3.1 Monoamine oxydase (MAO) .................................36
2.6.3.2 Hippocampus Pituitary Thyroid (HPT) Axis .........37
2.6.3.3 Critique of MAO Involvement ...............................38
2.6.4 Relationship between
MAO Genotype and Environmental Stressors ......................38
2.6.5 Processes and Effects ............................................................39
2.7 Limitations ...........................................................................................40
2.7.1 Weaknesses ...........................................................................41
2.8 Implications..........................................................................................42
2.8.1 Research ................................................................................42
2.8.2 Practice ..................................................................................43
2.8.3 Consequences ........................................................................43
2.8.4 Policy ....................................................................................44
2.8.5 Therapeutic Programming ....................................................46
2.9 Conclusion………….. .........................................................................47
3. METHODOLOGY ...........................................................................................50
3.1 Institutional Review Board (IRB) ........................................................50
3.2 Design ..................................................................................................50
x
3.3 Method .................................................................................................51
3.3.1 Conceptualization of
Dependent and Independent Variables..................................51
3.3.2 Validating Conceptualizations. .............................................52
3.3.3 Dependent and Independent Variables .................................52
3.3.4 Sample...................................................................................55
3.3.5 Distribution and Data Collection ..........................................55
3.3.6 Survey Instrument .................................................................55
3.3.6.1 Part 1-A ..................................................................57
3.3.6.2 Part 1-B ..................................................................57
3.3.6.3 Part 2 ......................................................................58
3.3.6.4 Part 3 ......................................................................58
3.3.7 Instrument Analysis Design ..................................................59
3.4 Timeline ...............................................................................................60
3.5 Limitations ...........................................................................................61
4. ANALYSIS .......................................................................................................63
4.1 Part 2 Demographics ............................................................................64
4.2 Part 1-A and Part 1-B Frequencies ......................................................70
4.3 Part 1-A and Part 1-B Cross-tabulations ..............................................74
4.4 Part 1-A and Part 1-B Comparisons.....................................................78
4.5 Part 1-A and Part 1-B Correlations ......................................................83
4.6 Part 3 Cross-tabulations .......................................................................86
5. FINDINGS ........................................................................................................91

xi
5.1 Interpretation of Data ...........................................................................91
5.1.1 Demographics .......................................................................91
5.1.1.1 Validity………………………………………….93
5.2 Patterns of Fear and Aggression ..........................................................94
5.2.1 Symbols.................................................................................94
5.2.1.1 Color Symbols .......................................................94
5.2.1.2 Object Symbols ......................................................95
5.2.1.3 Condition Symbols ................................................95
5.2.2 Controlling for Race/Ethnicity ..............................................96
5.2.2.1 Frequencies ............................................................96
5.2.2.2 Cross-tabulations....................................................97
5.2.2.3 Comparisons ..........................................................97
5.2.2.4 Correlations ............................................................98
5.2.3 Structural Control................................................................100
5.3 Policy Implications ............................................................................101
5.3.1 Current Assumptions ..........................................................101
5.3.1.1 Weakening Assumptions .....................................102
5.3.2 Call for Reform ...................................................................102
5.3.3 Deterrence ...........................................................................103
5.4 Public Impact .....................................................................................103
5.5 Suggestions for Future Studies ..........................................................105
5.6 Conclusion .........................................................................................106

xii
APPENDIX
A. PRELIMINARY INFORMAL PERSONAL INTERVIEW
QUESTIONNAIRE ........................................................................................108
B. FEAR AND AGGRESSION
TYPOLOGICAL SURVEY INSTRUMENT ..................................................110
REFERENCES ................................................................................................................127
BIOGRAPHICAL INFORMATION ...............................................................................135
xiii
LIST OF ILLUSTRATIONS
Figure Page
4.1 Part 3 Responses by Highest Percentage of Part 1-A Responses ................................87
4.1 Part 3 Responses by Highest Percentage of Part 1-B Responses .................................89

xiv
LIST OF TABLES
Table Page
4.1 Part 2 Question 2 Race/Ethnicity of Responses
(in percentages) ...........................................................................................................65
4.2 Part 2 Questions 2 & 3
Non White and White Respondents by Gender
(in percentages) ...........................................................................................................65
4.3 Part 2 Questions 1 & 2 Respondents’ Age
by Race/Ethnicity (in percentages) .............................................................................66
4.4 Part 2 Questions 7 & 2
Occupations of Respondents by Race/Ethnicity
(in percentages) ...........................................................................................................67
4.5 Part 2 Questions 7 & 2
Income of Respondents by Race/Ethnicity
(in percentages) ...........................................................................................................69
4.6 Part 1-A and Part 1-B Most and Least Often
Responses Overall .......................................................................................................71
4.7 Part 1-A and Part 1-B Most and Least Frequent Responses
by Race/Ethnicity ........................................................................................................75
4.8 Part 1-A and Part 1-B
Comparison of Frequencies between Fear and Aggression
(in percentages) ...........................................................................................................79
4.9 Part 1-A and Part 1-B Comparison of Frequencies between
Most and Least Frequent Responses by Race/Ethnicity..............................................81
4.10 Part 1-A and Part 1-B Comparison of Frequencies
Between Fear and Aggression by Race/Ethnicity - White (in percentages)..............82
4.11 Part 1-A and Part 1-B

xv
Correlations among Number of Times Responded Overall …..................................81
4.12 Part 1-A and Part 1-B
Correlations among Number of Times Responded By Race – Non White ……..…85
4.13 Part 1-A and Part 1-B
Correlations among Number of Times Responded by Race – White.....................….86

1
CHAPTER 1
INTRODUCTION
Many and various disciplines attempt to explain why social humans engage in
criminal activities. Among the disciplines, many scholars are recognized for their
contributions to the body of knowledge compiled to explain the root of criminal behavior.
After thousands of years of inquiry, many questions have, indeed, been answered. One
question, however, remains at the heart of every inquiry of the present time. That
question whose answer eludes modern researchers is asked in as many different ways as
there are research studies to ask it. Why, they ask, do some people commit crime while
others do not? Why is no one theoretical framework effective at explaining criminal
behavior in all its forms and intensities? Is there no singular manner in which to arrange
the many acts of criminal behavior in order to best understand its source? Is there no
focus, broad or narrow, to define the predictive circumstance of the criminal offender?
In the broadest sense, it is the work of social scientists to look for the answer to
such questions through the study of social behavior. Among social scientists, it is
criminologists who focus on the causes of criminal acts. Often, in criminological studies,
criminal behaviors are linked to emotional responses. In the case of socio-criminological
research, the most common emotions referenced in studies of criminal behavior are fear
and aggression, which are often conceptualized as perceptions of risk or perceptions of
safety using a likert-type scale as the means of measurement.
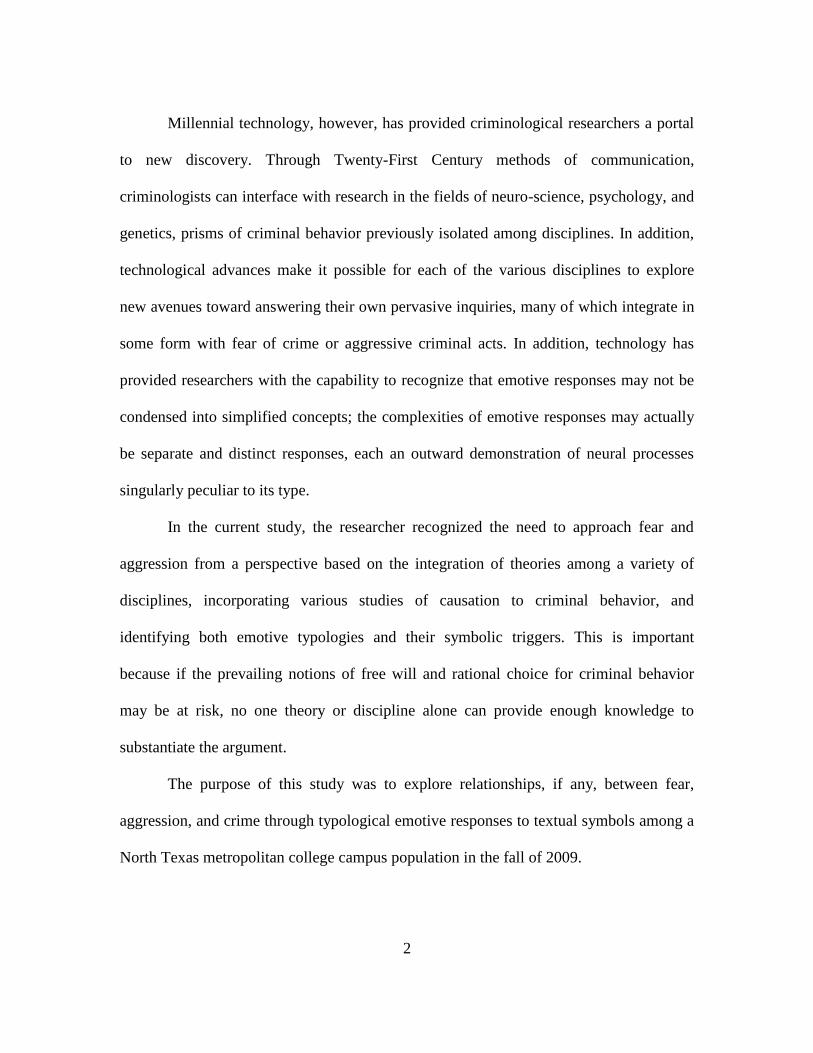
2
Millennial technology, however, has provided criminological researchers a portal
to new discovery. Through Twenty-First Century methods of communication,
criminologists can interface with research in the fields of neuro-science, psychology, and
genetics, prisms of criminal behavior previously isolated among disciplines. In addition,
technological advances make it possible for each of the various disciplines to explore
new avenues toward answering their own pervasive inquiries, many of which integrate in
some form with fear of crime or aggressive criminal acts. In addition, technology has
provided researchers with the capability to recognize that emotive responses may not be
condensed into simplified concepts; the complexities of emotive responses may actually
be separate and distinct responses, each an outward demonstration of neural processes
singularly peculiar to its type.
In the current study, the researcher recognized the need to approach fear and
aggression from a perspective based on the integration of theories among a variety of
disciplines, incorporating various studies of causation to criminal behavior, and
identifying both emotive typologies and their symbolic triggers. This is important
because if the prevailing notions of free will and rational choice for criminal behavior
may be at risk, no one theory or discipline alone can provide enough knowledge to
substantiate the argument.
The purpose of this study was to explore relationships, if any, between fear,
aggression, and crime through typological emotive responses to textual symbols among a
North Texas metropolitan college campus population in the fall of 2009.

3
It was the goal of this study to consider information from a variety of disciplines
in order to determine the value of an integrated approach to criminal behavior. Because
of the broad nature of the topic, the researcher focused on the relationship between fear
and aggression, and symbolic triggers to criminal behavior, controlling for race/ethnicity.
Since definitive values of terms and concepts may vary, crime, fear, and aggression were
defined separately as were the disciplinary context in which they are discussed. Both fear
and aggression were considered from the criminological perspective of neuro-genetic,
neuro-physiological, neuro-psychological, and psycho-social research. Symbolic
interaction provided the mechanism by which the disciplines interact.
Implications for the criminal justice system with regard to an integrated
theoretical approach to criminal behavior have emerged in the past decade as a result of
technological advancements in biological research instrumentation and mechanical
devices. Millennial technology has provided a new and improved prism through which to
view diverse relationships between that which is inherent and that which is learned.
Perspectives drawn through the multi-lens prism could alter the way free will and rational
choice ideology defines current practices across the American justice system in much the
same way that the evolution of deoxyribonucleic acid (DNA) testing has altered the way
evidence defines actual innocence.
It is the hope of the researcher that the findings of this study may serve as a
catalyst for further academic research related to interaction between biological (inherent)
characteristics and sociological (environmental or ecological) triggers; indeed,
characteristics and triggers that when aligned may result in a variety of distinguishable

4
aggressive behaviors covariant with similarly distinguishable patterns of fear. The
intention of this researcher is to encourage a multidimensional approach to assembling
Mills’ (2000) assortment of small pieces to more clearly understand the root
characteristics of criminal behavior.
In the following chapters, 2 through 5, the researcher will explain the structure of
the study, the methodology, and the conclusion. In Chapter 2, the researcher began with
standard definitions of terms common to assessments of criminal behavior in order to
establish a baseline reference for interpretation of literature, through which the researcher
explored studies conducted among various disciplines, and the means by which findings
support theoretical conclusions. The researcher provided a detailed account of research
methodology for the current study in Chapter 3, including construction of a 3-part
electronic survey instrument and rationale for electronic distribution, in addition to
selection of sampling frame and subjects. In Chapter 4, the researcher reflected the data
through tables, matrices, and figures, and in Chapter 5 the researcher interpreted the
tables and illustrations then concluded with implications and limitations of those findings,
as well as opportunities to expand on current research through future studies.

5
CHAPTER 2
LITERATURE REVIEW
2.1 Introduction to the Literature
In the current chapter, the researcher introduces literature defining concepts of
crime, fear, and aggression, as well as the manner in which those concepts are applied in
the construction of symbolic interaction, beginning with a historical and intellectual
background. The researcher follows with the ways fear and aggression are negotiated
through typologies, causal arguments across disciplines, and a summary of academic
research studies. Before concluding review of the academic literature for Chapter 2, the
researcher discusses implications of integrated study at some length in order to illustrate
its potential for impact on the way researchers approach the study of crime in the future,
as well as on the way criminal behavior is perceived among the public, and processed
through the justice system.
It is most often the practice of researchers to break off small pieces of an issue
and attempt to analyze its character as a representation of its larger whole. Once several
such pieces have been characterized, they ought to fit neatly back together and form an
informative picture of the problem, its character and its root.
According to Mills (2000), it is unlikely that the pieces will fit, not because the
information is incomplete, but because the value of that information is based on the

6
limitations of the variables ascribed to it that affect interpretation of the research
outcome. This is a type of error in analyses that Mills (2000) considers to be pervasive
throughout studies conducted among the social sciences and could be compounded across
disciplines when language and instrumentation are discipline specific. Mills (2000) also
recommends caution against observations too broad to isolate significant characteristics,
warning that such generalities offer little more than conjecture.
In order to achieve some intellectual advantage in research, F (1990) supports a
systems approach. Systems theory involves a systematic integration of theory within the
discipline and across a variety of disciplines in order to reach a broad understanding of
the target issue without sacrificing focus. According to Jeffery (1990), the answers social
scientists pursue do not exist exclusively in the societal context and should not be
restricted by purely sociological assessment, but should rather reach out to embrace
interdisciplinary variation. The challenge that exists in the interdisciplinary approach to
the integration of theory is that a complex variation of discipline specific terms and
procedures require interpretation across disciplines, and like any other form of
communication, much can be lost in the translation. Therefore, concepts, once generally
defined, must be systematically adapted within the context of symbolic interaction, rather
than re-defined to suit disciplinary limitations.
2.2 Current Standard Definitions
2.2.1 Crime
In modern western cultures, it is commonly accepted that crime is clearly defined
in text through policy. It is a social construct defined by the nature, circumstance and

7
intent of an action held by public consensus to be contrary to normative values of an
established society, or so repugnant to normative behavior as to require punitive
measures as a means of deterrence (Ferrell, 1999). Interpretations of crime are fixed, the
characteristics established. That is not to say research outcomes are in agreement about
why people commit crimes, or whether anyone in particular agrees that an act should or
should not be a crime, only that the public knows how a crime is defined in modern
American society.
2.2.2 Fear
Fear is defined as unpleasant, an emotional reaction caused by the threat of
danger, pain or harm or the perception that something unwelcome is about to happen
(Soanes, 2003). The dictionary definition of fear defines the emotion by a short list of
causative variables. One would believe, then, that the way we recognize fear is by threat
of danger, pain or harm; fear cannot occur without at least one causative variable. Other
than qualifying fear as an undesirable emotion, delineated by causation, we are left where
we started with no way to understand what it is we are experiencing when we emote fear.
2.2.3 Aggression
Broadly, aggression is characterized as the initiation of some threat of harm
(Blank, 2005). Often interpreted as a manifestation of feelings of anger or rage,
aggression among individuals may be directed intimately toward persons or property, or
socially toward groups, properties, institutions or polities. Based on a broad definition,
aggression as threat of harm should be inextricably linked with fear.

8
2.2.4 Fear of Crime
Since crime is an act against a person, property, or public held by society to be a
threat of harm to normative values, crimes may be characterized by aggression whether
or not the act is overtly violent. Property crimes, white collar crimes and crimes against
the public good are examples of crimes that may be aggressive in terms of threat of
adverse consequence. Violent crime, however, is always perceived as aggression that will
inflict some deep personal or public wound. If fear and aggression are inextricably
linked, it could be logically assumed that fear of crime should be experienced on a scale
representative of degree of violence (pain),proximity to threat (danger), and perception of
risk (harm).
2.3 History and Intellectual Background
2.3.1 Symbolic Communication
Anthropological studies provide evidence that primitive humans were limited in
means of communication (Maybin, 1994). Simple utterances and gestures were sufficient
among members of small autonomous communities whose lives were structured around
experiential (Surette, 2007) realities. As those communities grew, so did the need for
more developed means to share information. As populations expanded, early humans
began to shape a system of symbols.
By the time of the ancient philosophers, symbolism had become deeply engrained
in the various cultures as means to interpret, standardize, and convey norms and values.
Meaning ascribed to symbols developed as an art form among scholars and scribes of
many cultures, each symbol representative of some part of a sound, or an entire concept,
9
as required by the lingual interests of the time. The expansion of communication through
the use of symbols allowed those of greater experience (and thereby assumed to have
greater wisdom) to disseminate that experiential reality to those of lesser wisdom and
enlighten them through symbolic (Surette, 2007) reality, a kind of reality one could come
to accept without the benefit of actual experience.
Later, Feudal societies lived in environments where symbolic reality grew
pervasive throughout every aspect of personal and social life; symbolic power, symbolic
control, symbolic ideologies, symbolic institutions, all at the pleasure of the feudal ruler.
More recently, the Enlightenment redefined symbolism and the contribution of symbols
to experiential reality. New symbols emerged that would add or change the meanings of
daily social interaction. Structured symbols blossomed, driving intellectualism and
industrialization through the twentieth century.
2.3.2 Symbolic Messages
Modern humans facilitate progress through communication in many and various
forms. Each manner of communication represents a group of symbols used to convey a
message (Belk, Bahn & Mayer, 1982; Clark, 1986). Societies use those symbols to
reason, send messages, and to receive and interpret messages. At the most basic level,
symbolism is identifiable through motion, color and language (Belk et al., 1982; Clark,
1986; Isenberg et al., 1999; Leonard et al., 2000). With respect to groups, societies affix
symbolic meanings to objects, shapes and situations that mold social perspectives (Belk
et al., 1982; Clark, 1986).
As modern social beings, enlightened humans depend on interaction with one

10
another and with groups in order to define perceptions. George Herbert Mead (1863-
1931) emphasized the subjective meaning of human behavior in the social process based
on the study of human interaction as a pattern of symbolic definitions of events and
participants in those events. All means of social interaction are defined by symbols,
including communication, perception, action or reaction, events, objects, and even self as
object symbolic of place or purpose. Constructs based upon symbols are, however,
negotiable and therefore in constant flux (Blumer, 1969). This is important to
criminological research because it is within this negotiable reality that meaning is
attached to symbols that represent emotional responses related to crime.
2.3.2.1 Media
It is from social constructs, then, that societies learn to identify symbolic patterns
of behavior that induce neuro-physiological responses. For this reason, criminologists
have spent great energy on examining the ways in which social perceptions of crime are
affected by media symbols. Media is capable of direct delivery of distinct symbols as
well as an infinite number of combinations thereof to the mass population quickly and
efficiently (Clark, 1986). Media may also be organized to manipulate symbols in order to
bring about a desired response from its audience (Belk et al., 1982; Clark, 1986; Ferrell,
1999). Symbols of authority, courage, convention, convenience, success, and virtue
compete with those of power, cowardice, deviance, hardship, failure and vice.
According to Denton (2004), it is important to clearly understand the influence of
symbolic triggers on responses associated with media consumption, fear, and violent
aggression because manipulation of symbols may interfere with the natural evolution of

11
society. Studies support fear and aggression conditioning through repeated exposure to
experiential or symbolic triggers such as those situated in broadcast media, film, and the
internet (Ferrill, 1999; Goleman, 1995; Kemper, 1987). Fear and aggression as tools of
the media, whether used to sell skin treatments, increase ratings, or top the box office,
impact social behavior (Denton, 2004; Ray & Wilkie, 1970).
Audio-visual communications influence public perception, whether segmented or
en masse through contrived symbolic representations, and impact individuals in a
similarly artificial manner (Denton, 2004). Vakratsas and Ambler (1999) demonstrate
that the marketplace of American Capitalist commerce depends on advertising models
designed to deliver symbolic representations that deliberately elicit immediate neuro-
physical response, and repetitive delivery of the representation to insure desired
cognitive/affective responses over time. Ray and Wilkie (1970) notably criticized early
media for neglecting fear appeal in mass marketing. Although effects of that impact may
be common among individuals, they may be difficult to assess because of unique
distinctions in cognitive, affective, or neuro-physiological characteristics (Goleman,
1995; Raine, 2002).
Media manipulation often occurs as a matrix of symbols involving choreographed
motion, concise or poignant language, and color, situationally coordinated to affect a
desired mood (Clark, 1986; Ferrell, 1999). Tight weaving of widely accepted symbolic
representations can make the message seem as tangible as a fine cloak; one that media
providers hope the media consumer will wrap tightly around their mind and take with
them as a reminder of their media experience.

12
In the media connection with the public, it is re-cognition of the reminder
symbolism that is important to cognitive response. If the media consumer can be
repeatedly exposed to similar representations, they can be conditioned (Belk et al., 1982;
Ray &Wilkie, 1970; Vakratsas & Ambler, 1999). Ultimately, social humans, through
exposure to symbols, can be conditioned to anticipate or to experience neuro-
physiological response on cue (Ferrell, 1999).
2.3.3 Symbolic Cues
The symbolic reminder (the cue or the trigger) may be something as simple as a
word, a color, a scent or even a thought that elicits re-cognition of a symbol. For
example, a simple pattern we have come to identify as a swastika elicits strong anxiety
response that may trigger a physiological fear response in some people (Northwestern
Law, 1978). Prior to its relationship to reported heinous acts committed at the hands of
the Nazi party in twentieth century Germany, it was widely held as a Mesopotamian
symbol of fecundity (Loewenstein, 1941). Today, the symbolic representation of that
pattern, its representative language, the yellow color associated with it, or a thought of
reference to it, is so repugnant in America that the symbol has become subject to formal
legislation restricting its use and linking it directly to fear-inducing hate crime
(Northwestern Law, 1978). The same may be said for the confederate flag, a noose,
firearm, unaccompanied chemical substance, unattended package, or an odor that
provokes thoughts of danger (Bower, 2000).

13
2.3.3.1 Words as Symbols
Language, whether in and of itself, or representative of symbolic objects, deeds,
or acts, can trigger cognitive response (Isenberg et al., 1999; Maybin, 1994). Whether it
is manipulated in such a manner as to impose threat of eminent danger, casually
expressed in words that cue negative effect anxiety, or arranged to antagonize violent
aggression, linguistic expressions create a volatile environment for emotive interaction
(Isenberg et al., 1999). Perhaps it is because of the contextual dimension of linguistic
communication that seemingly benign verbiage may elicit a variety of interpretations,
each relative to a conditioned relationship with any associated attributes of word
construction or expression (Isenberg et al., 1999). Word choices, groupings, and
punctuation define the context of that which is communicated through text or oration
(Isenberg et al., 1999; Maybin, 1994).
Oral communication possesses a unique advantage to further contextualize
verbiage through the application of tone, volume and inflexion (Isenberg et al., 1999).
While a simple ―good evening‖ may be perceived to imply different and personal ideas
among a social audience, the same phrase laced with well composed tones, inflections
and volume could be perceived as quite sinister, and therefore a threat (Isenberg et al.,
1999), especially if it functions as a re-cognition, a reminder of a previous threat (Davis
et al., 1997; Gabriel & Greve, 2005).
The sense of threat, whether manifested in a tense and apprehensive negative
effect anxiety response, or a cognitive fear response, may resurface again at a later time
whenever the subject encounters that symbolic word combination whether or not it is

14
expressed in the same context (Travis, 2004). The more often the subject encounters the
symbolism, the more likely the subject is to experience cognitive response. (Davis et al.,
1997).
2.3.3.2 Situations as Symbols
A combination of symbolic features that, when blended, culminate in a separate
and distinct symbol—such as a situation--can excite cognitive response whether or
symbols are identified individually or collectively (Cohen & Felson, 1979; Holahan,
1986). Consider that darkness is often interpreted as a means of concealment. Add to that
limited escapability from a confined area. Install the subject alone and unarmed. Perhaps
the described situation is one of a dark deserted alley at night, the subject walking alone.
At face value, in text, the scenario may stir the beginnings of neuro-physiological
response as re-cognition ignites. Those three components are studied often and with great
interest among social scientists examining fear of crime. They are the basis of Cohen and
Felson’s (1979) Routine Activity Theory.
According to routine activity theory (Cohen & Felson, 1979), three conditions
must be present for a crime to occur: a likely offender, a suitable target and the absence
of a capable guardian. Symbolically, then, darkness enables an offender, limited
escapability increases the suitability of the victim, and alone and unarmed, no suitable
guardian is present to offer protection (Cohen & Felson, 1979). In that context, response
has been conditioned situationally as an experience of tension and apprehension at the
prospect of walking alone at night through a dark alley. If Tom, the cat, jumps without
warning from behind a discarded box, autonomic fear response will not fail. Blood

15
pressure will rise, heartbeat will increase, and the amygdala will send the message to
hydrate the smooth muscles for flight or fight (Goleman, 1995). If the situation described
includes visual symbols and if the situation was to be further complicated by sounds
demonstrating unfamiliar or unpleasant characteristics--or odors--the neuro-physiological
component of the response could increase to an intensity that may cause illness or death
(Bower, 2000; Seppa, 2005).
Further concern lies in the relationship between neuro-physiological response and
crime beyond the event, or when conditioning stops. Research findings indicate that
symbolic reminders will continue to provoke responses (Davis et al., 1997). Studies
show, however, that responses can be extinguished in many cases, by repeated exposure
to the perceived stimuli or equivalent symbols under highly structured circumstances
where new stimuli cannot be introduced to interfere with the reconditioning process
(Davis et al., 1997). Studies offer little reason to believe that there is significant variation
between actual participant neuro-physiological responses, first hand observation of a
response- provoking event, or virtual events, whether or not they are perceived to be real.
What do matter are symbolic impact, situational perception, and conditioning (Cohen &
Felson, 1979; Davis et al., 1997; Pavlov, 1941; Travis, 2004).
2.3.4 Evolution of Negotiable Representations Ascribed to Criminal Behavior
Concerns with emotions as the root causes of criminal behavior began early in
symbolic communication. Symbolic communication provided a portal for the pursuit of
structured inquiry, a means to question meta-ethics and threats to social cohesion that

16
would come to traverse a range of behaviors associated with evils that plagued social
interaction.
In the past, however, studies were inhibited by the absence of adequate means to
identify evidence that may support or refute early beliefs because of the inability to
identify unknown physical properties and variables. Some evidence exists that
Philosophers predating Aristotle contemplated the emotions of humankind, their seat in
the souls of man, and the mind that governed choices between good and evil as well as
the consequence of wicked acts. Aristotle, influenced by his mentors and in turn
influencing his students, is credited with attention to physiognomy, or judging the
character of people by facial characteristics. In Prior Analytics (350 B.C.E) Aristotle
discusses the various behaviors of men as ―natural‖ (innate) and observable in one’s
appearance, and the responses to those behaviors as also ―natural‖. Since the time of
Aristotle, physiognomy suffered cycles of interest and disinterest depending on social
values and climates across time and location.
Similarly, curiosity about the relationship between criminal behavior and fear is
apparent among philosophers and scholars long before sociology or criminology enjoyed
autonomy in their respective disciplines. Linguistic interpretations as early as the
thirteenth century suggest that philosophical examination of the relationship between
fear and danger yielded evidence strong enough to identify the fear response to danger as
one intrinsic to the nature of social humans, and therefore qualify it as an emotion. Prior
to that time, Germanic and Old English fear was communicated as little more than an
17
adjective in conjunction with damage or disaster (American Heritage Dictionary of the
English Language, 2000).
In more recent history Sir Thomas Brown wrote a then unpublished work, Religio
Medici (1642). In Religio Medici, Brown attested to his belief in a natural character, one
that could be read by the inscription on one’s face that extended to all animals, plants and
vegetables, and even to nations. He likened that character to a signature of a supreme
author.
Charles Darwin, best known for his controversial assertions that mankind is a
product of natural selection, an evolution of species rather than a mystical creation by an
elusive supreme being, published The Expression of the Emotions in Man and Animals
(1872). In Emotions, Darwin explained that emotional expressions are innate, even
universal among humans, and are shared among other animals as well.
Influenced by Darwin’s work, Cesare Lombroso studied social Darwinism. He
also studied eugenics and psychiatry. Lombroso, known as the father of positivist
criminology and founder of the Italian school of criminology, was a medical doctor (Pick,
1986). He was best known in nineteenth century Europe—and later throughout western
culture—for his conclusions that a man is born criminal, and that criminals are a product
of biological defect that assigns an atavistic nature, an atavist being a throwback to
primitive, uncivilized, or violent animalistic ancestry (Pick, 1986).
According to Lombroso (1876), the same defect that causes criminal behavior
also causes physical characteristics that make the criminal easily identifiable. Lombroso’s
nineteenth century theory that criminality among men was determined by inherent

18
biological traits faded as psycho-social, environmental, and ecological theories emerged.
Revivals of Lombroso’s theory of the relationship between physical characteristics and
criminal behavior were sporadic.
One such body of work seeking to link physical characteristics with behavior was
that of Sheldon (1940), who proposed somatotyping the human body. Sheldon (1940)
defined three somatotypes as mesomorph, endomorph, and ectomorph, among whom the
mesomorph is characteristically more aggressive. Another was evidence published
supporting a relationship between the XYY mitochondrial chromosome anomaly in males
and aggressive behavior (Neilsen, 1970) which was received with great enthusiasm and
shortly proven to be deeply flawed (Baron, 2001).
In modern western civilizations, the study of the relationship between fear and the
prospect of victimization has evolved among the many contemporary disciplines. Now, in
the new era of advanced technology, biological theories handed down over the centuries
have transformed into those from which biological phenomenon can be conceptualized,
concepts can be defined, and propositions can be tested (Raine, 2002).
Hard science, natural science and social science disciplines have made
contributions to scholarly collections. Researchers are no longer limited to measuring
facial features to assess the relationship between bio-physiological characteristics and
violent aggression. In modern science, researchers can actually look inside the bodies and
minds of individuals in order to observe neuro-physiological patterns--even root neuro-
genetic markers--that define what has been previously symbolized as simply emotion
(Raine, 2002; Anderson & Phelps, 2000).

19
Yet, from medical science to social studies, familiar patterns continue to emerge
under analyses; similar social groups exhibit fear of danger at similar rates, and perceive
risk in much the same manner (Hollway & Jefferson, 1997; Wilcox, Jordan & Pritchard,
2007). These findings should be encouraging, except some phenomena involved in this
agreement still prove perplexing. Findings in socio-criminological studies suggest an
exaggerated perception of risk (high levels of fear) among some groups, and low levels of
fear among those groups most at risk (Hollway & Jefferson, 1997; Wilcox et al., 2007).
In short, fear of victimization is often inconsistent with both perceived and actual risk
(Hollway & Jefferson, 1997; Wilcox et al., 2007).
2.4 Negotiating Fear and Aggression through Typologies
2.4.1 Typology of Fear
Fear as an emotional precursor or response to danger has only been referenced in
modern language since the 1200s (American Heritage Dictionary of the English
Language, 2000). Since fear has been relegated to the status of emotion, its perception is
accepted as universal and as such subject to interpretation (Gabriel & Greve, 2003).
Scholars attempt to characterize fear, attaching contextual variables in order to
situate some causal relationship or temporal correlation between fear and more concrete
social behaviors (Kemper, 1987; Stober, Tepperwein & Staak, 2000). While contextual
variables utilized to characterize fear allow researchers a means to examine effects of
criminal behavior, studies remain inconclusive when it comes to the nature of the fear-
crime relationship in explanations about why findings repeatedly indicate that fear of

20
victimization is inconsistent with perceived or actual risk (Gabriel & Greve, 2003;
Tewksbury & Mustaine, 2003; Wilcox et al., 2007).
In attempts to establish a more concrete identification of fear in the context of the
fear-risk relationship, research is also concerned with the ways in which fear is expressed
(Ben Zur, 2002; Kemper, 1987; Reiss, 1991). Expression of fear may be inhibited among
some groups as a result of narrow application of definitive variables, broad representation
of situational cues, or idiosyncratic interpretation of responses (Fisher, B., 1995; Kemper,
1987; Wilcox et al., 2007).
Some research argues that fear is closely related and even synonymous with
aggression as the fight component of the flight or fight tendency (Ax, 1953; Ben Zur,
1991; Boissy, 1995). Studies coin ―flight or fight‖ to explain active expressions of
physiological aspects of the cognitive fear response (Goleman, 1995; Boissy, 1995). Liu
(2004) agrees but cautions that such aggression must be differentiated as defense or affect
aggression, and not confused with predatory or instrumental aggression discussed later.
2.4.1.1 Autonomic Fear Response
For a more tangible description of fear, we can look at the findings of biological
research. The study of fear in experimental psychology tells us that fear is a physiological
response to some learned threat (Bower, 2000; Seppa, 2005). Once an individual
recognizes a symbol, a signal travels through the brain, from the eye through the
thalamus to the visual cortex in its usual process. Perception of danger attached to that
symbol, however, adds a shortcut. The thalamus sends the threat signal simultaneously to
the visual cortex and the amygdala. At that point, the amygdala excites hormones to

21
instruct the brain to activate ―flight or fight‖ hydration. The heart rate and blood pressure
increase to facilitate the flow of blood from the abdomen to the extremities, and the
smooth muscles are hydrated in preparation for quick action. (Goleman, 1995).
Research findings suggest that this autonomic fear response can have far reaching
influence on the way criminologists examine fear of crime (Goleman, 1995; Kemper,
1987). The challenge that exists is that it is not necessary for the subject to perceive
danger as eminent. In some cases visualization may elicit the same autonomic response
even if it is only a memory associated with danger (Goleman, 1995).
Autonomic response to fear occurs before reasoning begins or after it ends
(Goleman, 1995). Once the subject engages reason, fear becomes subjective. Reason
allows for assessment of risk, and rational choice as inferred by the flight or fight options.
It is reasoning through the assessment of risk that provides for the choice to escape
(flight), or mount a physical defense against danger (fight). Although the subject may
experience a sense of unpleasant tension and apprehension, those feelings are more
representative of anxiety as a function of reasoning (Goleman, 1995; Reiss, 1991). This
may explain why Kleck & Gertz (1995) find an elevated incidence of defensive gun use
in both violent and threatening victimization. In addition, Kleck and Gertz’s (1995) data
supports assertions by Wilcox et al.(2007) that more offenders are likely to be shot by
their victims than victims shot by offenders.
Further evidence of a physiological component of fear, is the ability of science to
inhibit or extinguish fear through the manipulation of hormone excretions, blocking the
pathways of enzymes and amino acids, or altering the neural pathways associated with

22
fear response (Boissy & Bouissou, 1994; Davis et al., 1997; Ressler et al., 2004). This
research has become so widely accepted that such treatment can often be applied
pharmaceutically. Pharmaceutical manipulation, combined with psycho-therapeutic
treatment has emerged as a viable method for controlling fear-related disorders (Ressler
et al., 2004).
2.4.1.2 Cognitive Fear Response
Many researchers find that fear responses are learned or conditioned. Using the
similar basic principles as those used in Pavlov’s Dog (Pavlov, 1941; Ivan Pavlov, 2008),
scientists condition animals to activate the cognitive fear response on cue (Davis et al.,
1997; Reiss, 1991; Weiss, McEwen, Silva & Kalkut, 1969). An accidental finding is that
the conditioning also suggests that there is a distinction between feelings of tension and
apprehension more definitive of negative effect anxiety and less representative of the
autonomic fear response (David et al., 1997; Weiss et al., 1969).
2.4.1.3 Anxiety
Some research describes anxiety as fear, but caution is recommended in
presuming the two are interchangeable (Kemper, 1987; Stober & Muijs, 2001). Anxiety
characterized as fear of danger is the sense of unpleasant tension and apprehension about
impending threat, real or not, that may or may not trigger an autonomic fear response
(Goleman, 1995; Stober & Muijs, 2001), yet a state of tension or apprehension without
autonomic fear response hints that reason is present with or without rational judgment
before or after physiological fear (Goleman, 1995; Kemper, 1987; Stober & Muijs, 2001).
Because the physiological process indicates a temporal factor, negative effect anxiety

23
(that which is characterized by reasoned tension or apprehension) is arguably more
closely related to neuroticism than fear response (Ben Zur, 2002; Stober et al., 2000).
Since fear is initiated by perception of danger, and since it can be triggered by
reminders, some argue that anxiety can be described as fear of being afraid or fear of
encountering fear reminders (Leonard et al., 2000). It is in this dimension, the dimension
of symbolic cues, which fear of crime may be most pervasive (Stober et al., 2000; Stober
& Muijs, 2001).
Just as scientists are able to condition fear response in animals, they are able to
distinguish between that response and the experience of anxiety before or after the
physiological reaction (Davis et al., 1997). Tension and apprehension in anticipation of
fear producing treatment was apparent in conditioning phases and residual in
extinguishing phases. Further, successful pharmaceutical intervention depends on the
ability to distinguish between physiological and psychological fear-anxiety responses
(Ressler et al., 2004).
2.4.2 Typology of Aggression
Aggression is as complex as fear. While the term conjures ideas of anger, threat of
harm or invasive action, aggressive behavior can be positive and productive in the social
environment as a means to insure expansion, achievement, and status. Aggression related
to criminal behavior, however innovative the substance of the criminal act, is
distinguished from positive aggression as well as among types of aggression based on
physiological processes.

24
2.4.2.1 Covert Aggression
Covert aggression, commonly mis-interpreted as passive aggressive behavior, is
the type of aggression demonstrated in acts of interpersonal manipulation and emotional
abuse (Zhu, 2004). Covert aggression may be demonstrated among individuals who have
physiological markers for hostile aggression or instrumental aggression, but have been
successfully conditioned to refrain from overt acts of physical violence (Vaillancourt,
Brendgen, Boivin, & Tremblay, 2003).
Passive aggressive behaviors are a type of covert aggression that is demonstrated
through obstructive or destructive behavior that results from deliberate neglect,
interference, or passive refusal to cooperate. The earmark of passive aggressive behavior
is that on the face of the situation the individual demonstrates agreement and good will,
while neglecting to take action to prevent harmful consequences or actively insure an
expected positive outcome (Zhu, 2004).
2.4.2.2 Reactive Aggression
Reactive aggression, also referenced as affect aggression or defensive aggression,
is aggressive behavior ignited as a product of the flight or fight mechanism activated
during autonomic fear response (Blank, 2005, Liu, 2004). Although it appears to be a
reasoned response, it is within the same definition perplexing because of its integral
relationship with the autonomic fear response. As a product of fear, reactive aggression
involves reasoning based upon a limited number of options for self preservation, namely
proximity and means for successful escape from harm (Liu, 2004). When preceded by
autonomic fear response, the heart rate and muscle hydration activated by infusions of
25
adrenalin and noradrenalin (also known as epinephrine and nor epinephrine) are in
proportion to perception of danger. That infusion signals the degree of urgency, the
mandate for immediacy and the frame of time allowed for ponder. The options, however,
are fixed as fight or flight and although it may occur with lightning speed, the decision is
based upon a survey of the circumstances in a state of heightened anxiety (Goleman,
1995). Residual anxiety is determined by the speed with which serotonin floods the brain
with a calming effect. Restricted, slow, or reduced infusion of serotonin may allow for
prolonged symptoms of residual anxiety, and repeated occurrences may lead to
negative affect anxiety and spontaneous aggression (Liu, 2004).
2.4.2.3 Hostile Aggression
Hostile aggression is also referenced as a type of reactive aggression, but rather
than engaged as a response to fear, is rather considered to be a reaction to anger or rage,
and is identifiable by particular characteristics in the grey matter of the prefrontal cortex
region of the brain, as well as the grey matter of the neural limbic system (Raine, 2000).
It is within the context of hostile aggression that anger and violent behavior are regularly
associated and therapeutic apparatus is employed to treat anger as a pre-emptive measure
against violent aggressive behavior. Hostile aggression is characterized as hot-blooded
violent aggression often associated with crimes of passion and vengeance (Liu, 2004).
2.4.2.4 Instrumental Aggression
Cold-blooded violent aggression, coined as predatory or premeditated aggression,
is violent aggressive behavior that is neither a product of the fear response nor a reaction
to anger (Blank, 2005; Liu, 2004). Instrumental aggression is characterized by coherent,
26
calculated, planned, and systematically executed acts of violent aggression generally
believed to be uninhibited by fear or anxiety. It is within this type of aggression that
many serial killers, paid executioners, and syndicated crime agents are classified. It is this
type of aggressive behavior that is characterized by studies conducted at the genetic level
of mitochondrial DNA involving monoamine oxydase (MAO) imbalances and trace
copper (Raine, 2002; Stalenheim, 2003).
2.5 Causal Arguments
Bio-criminological theorists argue the root of the crime problem. That is not
meant to promote biological theories to the exclusion of all others, only to identify the
human biological nature of our species prerequisite to social behavior. It is important,
however, to differentiate that which is biological from that which is psychological or
sociological. For the limited scope of this review, biological refers to human behavior as
instinctive or autonomic processes and an integral physiological part of the greater
terrestrial environment, psychology to that which is cognitive or affective (learned or
conditioned processes), and sociology to the many and various components of human
social interaction.
2.5.1 Millennial Validation of Early Ideology
Aristotle (350 B.C.E), Brown (1642), Darwin (1872), Lombroso (1876), Sheldon
(1940), Neilsen (1970), among a list of others have been as close as they could get to
revealing evidence of the cause of violent aggression with the tools available to them in
their time. Physiognomy has been supported by modern research that links hormones to
bone and musculature development; the same enzymes and amino acids that modulate

27
testosterone, estrogen and progesterone have been credited with influence on the
development of skeletal and musculature structures—Sheldon’s (1940) somatotypology--
and neurally transmitted information that impacts glandular function including the
pituitary gland, thyroid gland and adrenal glands (Stalenheim, 2003; Volavka, 1999).
Similarly, those enzymes, amino acids and hormones are found to be active in both fear
and aggression, although they may travel varied pathways and may be subject to
interaction with alternative translators along the way, experiencing changes in properties
(Eriksson, Berggren, Fahlke, Engel & Balldin, 2005; Volavka, 1999).
In recent decades, millennial technological advancement has ushered in a new
range of possibilities for bio-criminological research. CT, PET, and MRI remain
important tools for learning about neural processes that influence behavior, yet
increasingly more information is gleaned from new research in nuclear medicine,
nanotechnology and genetic mapping. Because of millennial technology, criminologists
are finding new interest in biological theories of crime and deviance (Ellis & Walsh in
Cullen &Agnew, 2006). Through recent studies, research has revealed a wealth of
information hearkening back to ideas pursued by Lombroso and the Italian School of
Criminology over a hundred years ago (Ellis & Walsh in Cullen &Agnew, 2006).
Correlations between physical characteristics and hormones, hormones and
aggressive behavior, and reduction in violent aggressive behavior as a result of hormone
therapy drive research toward more substantial indices of interactive physiological
relationships (Vold, Bernard, & Snipes, 2002). Consequently, strong evidence of
interaction between the hypothalamus, the pituitary and the thyroid that account for

28
characteristic features and behaviors consistent with those identified by both Lombroso
and Sheldon such as bone structure, facial features, and mesomorphic somatotype (In
Vold, Bernard and Snipes, 2002).
Such evidence still only hints at the substance of aggressive behavior, and
provides only little more than early twentieth century interpretations provided then. It is,
however, the ability to look inside the body, inside the brain, and into the genetic
materials that identify individuals, that allows researchers to begin to reveal the
possibilities of neuro-genetic causes for emotion.
It is an understanding of the way these components work together or fail to co-
operate that provides evidence to link amino acids, enzymes, neurotransmitters and
hormones to violent aggression and the fear response it inspires. It is understandings of
the ways in which sub nuclear excesses and deficiencies influence neural transmissions
and the impact of neuro-biological dysfunction on cognitive and affective behavior as
well as the ways in which psycho-social influences are received that allow researchers to
define limitations of bio-criminology.
Biological theorists argue that aggressive behavior in humans is rooted in some
component of the physical body. Although bio-criminological research seems to begin or
end with neurological processes, many studies focus on research that provides
information about the ways in which many different physiological functions contribute to
interpretation of symbolic triggers and expression of fear and aggression. Some modern
theories support nutritional deficits and some trace metal imbalance (Kollerstrom, 2006;
Walsh, Isaacson, Rehman & Hall, 1996), while others offer hormonal instability (Brooks-

29
Gunn, Graber , & Paikoff , 1994), inhibitions or lack of inhibition to neural pathways,
restriction or hyperactivity among neural transmitters, delayed synapse, or reduced grey
matter and low activity in the various lobes of the human brain (Raine, 2002). Still others
propose genetic differences that influence the normal process of inciting, interpreting,
managing and releasing aggression through over or under modulated release of amino
acids and enzymes, failure to inhibit or excite neurotransmitters, or failure to excite
neural receptors (Volavka, 1999).
Although some evidence has been supported to the contrary (Paus, 2005), most
biological theorists tend to agree that regardless of the base origin, disposition toward
violent, aggressive, or even thrill-seeking acts can occur in response to dysfunction at a
variety of neuro-physiological intersections (Raine, 2002). Similarly, biological theorists
also support psycho-social theories of crime as well as sociological perspectives. In many
cases, neuro-researchers agree that biological traits leading to crime require the symbolic
trigger that is most often conditioned and activated in the social environment (Raine,
2002).
Some confusion occurs, however, between the various disciplines that seek to
define the reasons people commit crime. After a detailed review of available literature, it
appears that each discipline performs a significant function. Geneticists investigate the
causes of behavior at the most intimate level of human physiology, the genes that
cooperate to make us what we are. Neuroscience seems to take a more pragmatic
approach, looking for variables specific to distinct regions of brain and spinal function,
values specific to those variables, and peculiar interaction of those variables to the degree

30
prescribed by their respective values. Neuropsychology assesses the impact of
neurological functions on cognitive development, cognitive inhibition, and the
relationship between cognitive expression and that of the autonomic nervous system,
while neuro-philosophical research looks at the consciousness or reasoning functions of
the subject, alternative research, and the prospects for future hypotheses and their
consequences.
Sociology observes in aggregate; whether the view is from micro or macro level
perspectives, the aggregate-conscious variables almost always include age, gender,
education, race, and socioeconomic status, the demographic benchmarks of social
sciences. Socio-criminology, the social science specific to the study of crime and criminal
behavior, takes much from its sociological parent. While socio-criminologists recognize
the necessity of investigating individual motivations to criminal behavior, focus remains
on the aggregate, demographic variables, and conceptualization of crime that weighs
heavily on fear of victimization. Socio-criminologists have been reticent to embrace
modern biological theory, integrate biological variables with sociological ones, or adopt
the language of bio-criminological research (Raine, 2002).
2.6 Summary of Research
2.6.1 Social Science Studies
Social science research designs vary. Among those reviewed, most were cross
sectional. Surveys or questionnaires were most often included in studies at various
intervals, while secondary source analyses, personal interviews and environmental
proximity observations were often reported in triangulated studies
31
2.6.1.1 Distinguishing Emotional Taxonomies
Kemper (1987) conducted studies based on secondary source analyses. The
purpose was to determine how many underlying autonomic possibilities exist, and the
number of differentiations linked to them. Kemper created a relative association between
primary and secondary emotional responses based on a desire to develop a syncretic
solution to constructionalist and positivist approaches.
2.6.1.2 Distinguishing Fear and Aggression Typologies
Ben Zur (2002) conducted a one shot case study (nonexperimental, no control
group and no pre or post test) among a convenience sample of 572 Hebrew speaking
college students. The survey was administered in two parts consisting of a personality
inventory and a behavior pattern questionnaire designed to measure any relationship
between Type A Behavior Personalities (DV) and anxiety, anger and fear (IVs). They
were administered in the Hebrew language native to the college either in groups or
individually. Students were compensated.
2.6.1.3 Perceptions of Symbolic Guardianship
Tewksbury and Mustaine (2003) conducted a one shot case study among a
convenience sample of 1513 college students across nine college campuses in eight
states. The purpose was to explore fear of crime through the capable guardian condition
of routine activities theory. Questionnaires comprised of 95 items were administered
among intro-level sociology and criminal justice classes representing contemporary
college students as defined by demographic variables. The questionnaire was designed to
measure the possession and carrying of self-protective measures. The level of measure
32
was dichotomous. Internal threat may be present in the manner in which capable
guardianship measured as dichotomous.
Tewksbury and Mustaine (2003) found that students were more fearful and likely
to possess and carry self-protective devices in the course of their daily routine activities
than they were to carry the devices on weekends while participating in more high risk
activities or traveling to more high risk locations.
2.6.1.4 Correlation between Actual Victimization and Fear of Crime
Wilcox et al. (2007) sampled only women. 1010 female students were surveyed
by telephone. Trained interviewers used computer assisted telephone survey procedures
which included a skip pattern to prevent participants from receiving any questions that
did not apply, based on their answers. A random sample was generated from a university-
provided list of telephone numbers belonging to female students. The purpose of the
study was to determine whether there was a correlation between actual victimization (IV)
and fear of crime (DV).
Several screening questions included query about previous victimization. Fear of
crime was operationalized as a series of questions asking about various levels of worry
over specific crimes. Its unclear how Wilcox et al. (2007) arrived at a sample size of 1010
from a list of 7,875. Since the sample is large, it may be highly representative of the
female population on that campus.
Wilcox et al. found that a high rate of fear of victimization among women on
college campuses may be due to a fear of rape, their perceptions drawn from an elevated
incidence of unreported sexual assault among their peers.
33
2.6.2 Neuro-psychological and Psycho-social Studies
Long and tedious scientific terminology is referenced to describe the research
designs employed in neuro-psychological and psycho-social studies. Detailed
explanations of medical technique and instrumentation are beyond the scope of this
review. Suffice to say that experiments indigenous to those respective fields are a
combination of cross sectional and longitudinal studies. They are true experiments in that
the designs are based on random selection, involve treatment groups and control groups,
administer pre tests and post tests, and control for spurious effects. They report the
methodology with hard science precision and clearly define limitations. One such
limitation is that in some studies, experiments are limited to animals other than humans
(Boissy & Bouissou, 1994; Davis et al., 1997; Weiss et al., 1969). Research findings
based on outcomes from studies utilizing rats and cows are generalized to possibilities for
application to humans. Most used some form of diagnostic apparatus as well as a variety
of measurement instruments including magnetic resonance imaging (Isenberg et al.,
1999), and D.A.V.I.D. (Leonard et al., 2000).
2.6.2.1 Heavy Metals and Trace Metal Imbalances
Between 1987 and 2004, Ward conducted a series of studies examining trace
metal excess and deficiencies in incarcerated criminals and ADHD children in the United
Kingdom (UK). In 2006, Kollerstrom wrote a summary review of Ward’s work.
According to Kollerstrom, Ward’s findings came from 68 incarcerated youth between the
ages of 16 and 19 years of age, 28 of whom committed crimes that involved violence. A
control group was used, consisting of a group matched for age, sex and geographical

34
location. In this study, Ward observed eleven metals per sample. Ward found striking
evidence that trace metal imbalances were significant among the samples. Although
Ward recognized the high levels of aluminum and lead in conjunction with low levels of
chromium, selenium and zinc, his charts also indicate an imbalance between copper and
zinc.
In Ward’s study of ADHD children, he found similar yet more clearly defined
results. The samples taken from the children supported the earlier findings with the
caveat that the excess of aluminum and lead was higher among the criminals
(Kollerstrom, 2006). Kollerstrom (2006) also reports on a follow-up study conducted by
an ex-police officer in 2002. Kollerstrom (2006) points out that in this replication some
variation in the findings emphasized the synergy between the elements.
Results of Ward’s findings supported dietary adjustment for incarcerated
criminals in the UK. When that adjustment was implemented, a significant decrease in
antisocial behavior resulted (Kollerstrom, 2006).
In 1994, Walsh et al. (1997) conducted an experiment on 153 young males to see
if there was a correlation between high copper/zinc ratios and violent aggressive
behavior. 135 of the subjects were between the ages of three and twenty years old and
selected from a group who were first time appointments at a behavior treatment center. A
control group consisted of 18 of the 153 male youths. The 18 youths had no history of
aggressive behavior. Findings supported the hypothesis that assaultive young males have
elevated copper/zinc ratios compared to non-aggressive youth. In their conclusion,
Walsh, et al.(1997) noted that in four separate outcomes studies indicated that nutrient

35
rich treatment to normalize copper/zinc in assaultive young males significantly improved
behavior, not unlike the experience of Ward’s group.
2.6.2.2 Hormones
At about the same time, Brooks-Gunn, Graber and Paikoff (1994) tested
interactions between biological and psychological development using seven models. The
purpose was to determine whether support could be found for the hypothesis that links
existed between hormones and negative affect. Brooks-Gunn et al. (1994) found that
there was support, noting that hormone changes during puberty are related to
development of aggressive behavior in preadolescent and adolescent females. This
finding offered some direction for findings of other studies that proposed a late-onset
aggression in females when compared to earlier onset of aggression found in males. In
addition, results indicated that aggression and depression varied depending on the type of
hormone involved.
2.6.2.3 Prefrontal Grey Matter
Raine et al. (2000) assessed prefrontal white and grey matter in the prefrontal
cortex of the brains of 21 community volunteers with Antisocial Personality Disorder
using structural magnetic resonance imaging. In addition, 2 control groups using 34
healthy subjects were used as well as a substance-dependent group of 26 subjects and 21
psychiatric controls. Heart rate and skin conductivity was also measured (autonomic
activity) during the administration of the stressor (participants gave a videotaped speech
on their faults). Results showed an 11% reduction in prefrontal grey matter among the
APD group and reduced autonomic activity during the stressor. Findings of this test are

36
believed to provide the first evidence for structural brain deficit among APD groups
Raine et al. (2000).
2.6.3 Genetic Studies
Genetic studies favor support for the origin of both the instrumental aggression
and fear behaviors at the short rod of the X chromosome, the genetic origin of
monoamine oxydase or MAO (Eriksson et al., 2005). While researchers of the 1960s
thought they found the answer to violent criminal behavior among males in what they
would come to call XYY syndrome (Baron, 2001), they were only a rod away from the
discovery of the MAO effect.
2.6.3.1 Monoamine Oxydase (MAO)
Most recently, two subtypes of Monoamine oxydase (MAO) have been
recognized; MAO-A and MAO-B (Raine, 2002). While studies support a relationship
between low levels of MAO-A and aggressive behavior in humans (Alia-Klein et al.,
2008; Eriksson et al., 2005; Raine, 2002; Volavka, 1999), studies also support a
relationship between MAO-B and fear (iThyroid, 2009; Raine, 2002). The hypothesis is
that low levels of MAO-A present together with low levels of MAO-B produces high
aggression and low fear, which results in elevated probability of violent criminal activity
(iThyroid, 2009; Raine, 2002). Further, MAO-A shares a commonality with low grey
matter in the frontal lobe in that untreated the violent aggression will continue regardless
of conditioning, and is hypothesized to predict recidivism among violent offenders
(Raine, Lencz, Bihrle, LaCasse & Colletti, 2000).

37
Finally, in terms of trace metals, nutrition and thyroid function, it is unclear
whether MAO is a balancing agent for a variety of trace metals—specifically copper—or
whether the trace metals are instrumental to MAOs, yet evidence supports that a balance
is necessary to transition hormones that integrate copper and iron and to insure against
excessive levels of manganese (iThyroid, 2009; Raine, 2002, Stalenheim, 2003).
Excesses of manganese, copper and iron imbalances, as well as an imbalance of copper
and zinc have shown a positive relationship to aggressive behavior (Kollerstrom, 2006;
Raine, 2002; Walsh, Isaacson, Rehman and Hall, 1997)
The thyroid relationship occurs when low levels of copper increase
hyperthyroidism. Increasing copper levels decrease symptoms of hyperthyroidism
because it is essential for production of MAOs. MAOs deactivate the thyroid hormones
regulating thyroid activity. (Upadhyaya, Agrawal, Dubey & Udupa, 1992).
2.6.3.2 Hippocampus Pituitary Thyroid (HPT) Axis
Following up a forensic psychiatric sub-population six to eight years after
forensic psychiatric evaluation, Stalenheim (2003) investigated values of triiodothyronine
(T3), free thyroxin (FT4), and platelet monoamine oxydase (MAO) activity in criminal
recidivists, violent recidivists and normal controls. Findings confirmed relationships of
T3 levels and platelet MAO activity with personality traits in criminal recidivists and
suggested that the validity of biological markers of psychopathy is stable over time.
Results of Stalenheim’s (2003) follow-up investigation are important for a variety of
reasons extending beyond MAO activity as a predictor of violent behavior. It serves two
important purposes. First, the results of this study provide evidence in favor of an HPT

38
(Hippocampus-Pituitary-Thyroid) axis involvement in criminal behavior. Such evidence
links the thrill-seeking or risk-taking component required to explain MAO involvement
in non-violent criminal behavior (Stalenheim, 2003). Second, a link is established
between MAO activity and thyroid hormones, which opens a portal to question whether
increased heart rate and skin conductivity are actually autonomic responses, or whether
they are engaged as a byproduct of hyper or hypo thyroid activity associated with
transitional enzymes and amino acids (Raine, 2002; Stalenheim, 2003).
2.6.3.3 Critique of MAO Involvement
Reports of landmark findings from high tech experimentation involving brain-
behavior hypotheses has met with some criticism of the context in which neuro-scientific
studies define aggression. Paus (2005) conducted an overview of basic principles guiding
brain-behavior and relationships and the ways in which they are applied to studies of
human aggression. According to Paus (2005), studies focus on aggressive behavior in the
context of overt antisocial actions rather than the context of reconciliation and conflict
resolution. He further recommends more study focused on the relationship between gene
encoding of MAO-A and maltreatment at home among young individuals who
demonstrate antisocial behavior. Paus (2005) offers that future studies may trend in favor
of investigation of reconciliation and conflict resolution deficits rather than aggression
excesses.
2.6.4 Relationship between MAO Genotype and Environmental Stressors
Alia-Klein, et al. (2008) conducted a study of healthy non-smoking males using
Positron Emission Tomography (PET) in order to expand on previous studies showing

39
evidence that links MAO-A genotype with violent behavior through interaction with
severe environmental stressors during childhood. Alia-Klein, et al. (2008) hypothesized
that it is the product of MAO-A in the brain of the healthy adult male that is associated
with trait aggression rather than the gene per se. Results supported the hypothesis,
validating that MAO-A is a neuro-chemical substrate of abhorrent aggression.
2.6.5 Processes and Effects
A variety of other studies show the ways in which components from each of these
summarized investigations are related. For example, trace metals such as copper and zinc
are instrumental in the transition of enzymes and amino acids to hormones (Kollerstrom,
2006; Stalenheim, 2003). Studies indicate that MAOs share a relationship with trace
copper (Raine, 2002; Upadhyaya et al., 1992). Whether copper is essential to the
production of MAOs or whether MAOs subsume copper is unclear. Nevertheless, copper
somehow functions with MAOs. Similarly, trace copper and zinc are instrumental in
converting the T hormones to niacin and then to serotonin (iThyroid, 2009; Stalinheim,
2003). Holistic remedies for hypo and hyper thyroidism recommend dietary adjustments
to balance trace copper and to balance niacin in order to increase or decrease thyroid
hormones and balance thyroid function (iThyroid, 2009; Stalinheim, 2003).
Seratonin is required to calm fight or flight responses as well as mediate
aggressive tendencies (Eriksson et al., 2005; Goleman, 1995; Stalenheim, 2003). Low
copper levels inhibit the production of serotonin. Evidence supports a causal link between
low copper/zinc ratios and athsma as well (iThyroid, 2009). Copper rich foods may be
recommended for athsma sufferers including lobster, peanuts, beans and chocolate

40
(iThyroid, 2009). Finally, heavy and trace metal imbalances that impact MAOs may
affect inflammation of the colon, certain cysts and tumors (Feldman, 1985; Feldman,
Ferrell & Wells, 1979; iThyroid, 2009) as well as general intolerance, irritability, and
depression( Kollerstrom, 2006). Links between reduction in activity of grey matter brain
tissue and MAOs have not yet been clearly established, however hypotheses include the
possibility that reduced grey matter in the various areas of the brain may be more related
to an inability to mediate or reconcile aggressive behavior than it is to incite it (Paus,
1995; Volavka, 1999 ). Further, recognition of fear/aggression non-verbal signals is
shown to be processed in the amygdala (Anderson & Phelps, 2000; Goleman, 1995);
therefore, grey matter reduction in the limbic region relative to activity in the amygdala
may have negative affect on fear/aggression triggers (Raine et al., 2000; Volavka, 1999).
2.7 Limitations
One peculiarity occurs in fear of crime studies conducted by social scientists,
especially with regard to establishing a relationship between fear and symbolic triggers.
That is, in order to establish a temporal relationship between residual effects of cognitive
fear response and excitement of that response triggered by reminders, or the time order in
which negative effect anxiety and cognitive fear response are related, the social scientist
must rely on some degree of retrospective analysis.
The socio-criminological researcher is not likely to test blood specimen, examine
neural activity through magnetic resonance, or conduct hormonal infusion to the human
brain. Nor is that researcher necessarily inclined to embark on an expensive and complex
longitudinal study to map and track fear indicators which can be provided by more aptly
41
endowed medical research. Therefore, survey instruments, interview dialogue, and
secondary source information often relies heavily on respondent’s memory of actual
victimization or interaction with symbolic cues in order to establish a base line for fear
triggers.
2.7.1 Weaknesses
A few weaknesses of the biological studies presented include the relative absence
of studies with racial comparisons, female subjects, studies involving subsets of the
population other than those with recognizable antisocial personality disorders, and
comparisons across geographical locations and socio-economic strata. It is important to
understand whether a biological trait basis for criminal behavior is more or less common
among any particular group, whether it is peculiar to environmental or ecological
conditions, and whether symbolic triggers are universal in nature or culturally specific.
In addition, many studies deploying new-age technology like PET, MRI, blood
platelet analysis, and neuro-genetic determination are conducted by medical researchers.
In most cases, criminologists are social scientists or natural scientists who have little
experience in the hard science world of medicine. Current evidence of biological
causality infers a demand for criminologists to adapt. It is unlikely that socio-criminology
will transform into a hard science any time soon, but immediate steps toward integrating
medical terminology, interpreting hard science measurements, and reviewing neuro-
philosophical propositions have become essential to understanding biological
characteristics of criminal behavior.

42
That is not to say that causes of crime are purported to be exclusive to biological
factors. Indeed, supporters of biological trait theory support integration of theories.
Cognitive or social learning theories, social structure theories, environmental theories, as
well a variety of theories from among diverse disciplines are also supported by bio-theory
research. It is important to know how biological factors are nurtured or suppressed, how
they are managed or channeled in some, and how they are accepted or rejected in the
social community. Discipline specific studies among biological researchers may tend to
discount those factors.
2.8 Implications
2.8.1 Research
The unique nature of this study could have far reaching implications for the way
fear of crime is examined by social scientists in the future (Kemper, 1987). Symbolic
triggers for fear, anxiety, worry and concern are highly subjective. Once symbolic
patterns are identified and understood as an integrated process--one that is simultaneously
biological, psychological and sociological—and distinctions between the characteristics
of fear, anxiety, worry, and concern are shown to be responses autonomic to each,
criminological research will realize a new paradigm. Future studies could revisit the
relationship between fear and aggression, reassess the influence of passive symbolism in
restricted environments, or explore mass fear conditioning among children, through a
multifaceted lens focused on symbolic fear triggers.
43
2.8.2 Practice
Although millennial biological theories of crime may provide many of the
answers criminologists seek, they also present some of the gravest challenges. First,
strong temptation to assume prematurely that individuals will behave in some
stereotypically criminal manner based on inherent traits must be overcome. If criminality
is inherent to some humans, how will society deal with offenders? Will criminality
become something to fix, segregate, sterilize, or exterminate? Will all those who are so
marked be singled out? It is human history to do all of those things when society
perceives threat.
For that reason it is important to emphasize that biological theories can only be an
explanation of a root cause of criminal behavior. Whether that root develops is subject to
a variety of other factors including ecological, psychological, and sociological influences.
2.8.3 Consequences
A consequence of disconnect between disciplines may be that few are assembling
the pieces that comprise the big picture. Socio-criminologists are left asking why some
members of high risk demographic groups commit crime when others of the same group
don’t, while biological science proposes to answer that question without benefit of
sociological indicators.
It is, perhaps, an oversight among social scientists to assume that because fear and
aggression are presumed to be intrinsic to human behavior that they are limited to
delineation, and that social science is pretty much stuck with that (Kemper, 1987).
Neurological and psychological research unravels dimensions of fear and aggression that
44
are concise, and to which attributes can be fixed across diverse fields of study (Davis,
Walker & Lee, 1997; Holihan, 1986; Leonard, Telch & Owen, 2000; Ressler et al.,
2004). It is unnecessary for social scientists to continue to fumble with an unwieldy
mechanism repeatedly subject to threat by idiosyncratic variability (Kemper, 1987;
Gabriel & Greve, 2003; Isenberg et al., 1999). According to Raine and Sanmartin (2001),
aggression cannot be understood without considering biological forces. It is necessary to
examine a variety of biological, psychological, and sociological influences in order to
understand the violent offender.
Consequences of failing to recognize interaction between symbolic references and
biological traits as a cause of crime are apparent in the current American criminal justice
system. High rates of incarceration without relative decrease in crime, high rates of
recidivism, increasing rates of antisocial personality disorder in children, and decreased
impact of socio-structural influence on criminal behavior all attest to the inadequacy of a
system based on outdated capitalist-industrialist principles of free will, rational choice
and costs/benefits analysis.
2.8.4 Policy
Modern biological theories threaten the status quo of the current criminal justice
system (Raine, 2002). Biological implications to criminal activity have long been met
with opposition among conservatives who favor a punitive crime control model over a
more compassionate due process model. According to Raine (2002), biological theories
challenge free will and rational choice ideologies carried over from classical criminology
and de-bunk neo-classical costs/benefits analysis ideology. When an offending

45
population is neither possessed of free will nor capable of rational choice and that same
offending population is not capable of reasoning a cost/benefit analysis of deviant acts,
the offenders that comprise that population cannot be held accountable under the laws
that prevail in the United States today. Without the ability to exercise free will or rational
choice, and without understanding of consequences, inability to consciously behave
according to social norms interrupts responsibility for crimes.
Biological theory forces the criminal justice system to look more closely at the
more compassionate due process or rehabilitative model of correcting our offenders.
Treatment, aggression management, skills based programming, social support and
medical or nutritional therapy may be renewed on the horizon. Yet, that is not the only
option. Another option is to impose even harsher punishment. If it is the greater social
perception that punishment will not serve general or specific deterrence, then Americans
may opt to permanently segregate, incapacitate or exterminate genetically (deficient)
offenders ( Rafter, 2008; Raine, 2002). Finally, a third option exists. Court mandated
genetic intervention for at risk individuals, at birth or prenatally, could be considered as
could sterilization (Rafter, 2008). Certainly these are not the only options that exist, but
they serve as a broad overview of possibilities worthy of attention.
Therefore, danger exists in evidence of biological causality. First and foremost is
the danger that crime control mentality will advocate for segregation, sterilization,
incapacitation, or extermination of those demonstrating a genetic or biological
predisposition to crime. Next, the same mentality may mandate the testing and
subsequent labeling of the genetic anomaly as a defect (Rafter, 2008; Raine 2002). What
46
will be society’s response if MAO studies reveal that law enforcement crime- fighter-
types or lifetime soldier heroes are aggressive thrill-seekers who may be predisposed to
property crimes or violent aggression?
Finally, those labeled as genetically defective may be marginalized or ostracized
within their communities. Equal dangers may exist in rehabilitative mentality. In attempts
to treat, reform, or cure biological (defects) harm may be imposed through the
prescription of experimental pharmaceuticals, inadequately supervised programming,
cost reducing alternatives to best practices, and unreasonable expectations for individual
improvement and reduction in crime rates (Rafter, 2008; Raine, 2002) .
Much of the evidence is not conclusive, however, and for that reason extreme or
abrupt policy changes should be carefully weighed against all research including both
support and opposition to the validity and reliability of the findings. In truth, most
biological researchers caution against generalizing study findings to other sub-
populations or the population at large until a series of follow-up or replication studies
have been completed.
2.8.5 Therapeutic Programming
Although the investigations cited in this review are only a sample of those
recently published hinting evidence of a causal link between human biological factors
and criminal behavior, they serve to represent a trend toward renewed interest in
biological trait theory. There is little doubt that this revival has been spurred by
millennial technological advances in science and medicine. Moreover, new-age
technology has also enabled researchers to develop, apply, and track treatment. When
47
treatment results are favorable, support for research evidence is reinforced. Support for
biological causes of criminal behavior is reinforced through dietary adjustments
implementing micronutrients that include trace minerals and essential metals as well as
dietary and environmental controls that reduce heavy metals such as lead, aluminum, and
cadmium. Results of dietary adjustments and environmental controls support research
data.
Pharmaceutical interventions have proved successful in reducing aggressive
behaviors with MAO inhibitors, beta blockers, anti-psychotics, benzodiazepines and
hormone accelerators. This success also validates that research is making progress. Other
indicators in pharmaceutical innovation alert research to possible errors or gaps. Side
effects of pharmaceutical therapies may indicate that further studies should be conducted.
While the primary objective to reduce antisocial behavior might be accomplished, side
effects indicate that some treatment may be no more compatible with the biological
composition of the human body than was the problem it attempted to resolve.
Immediate action in the form of therapeutic programming for violent offenders
that includes a combination of biological testing and neuro-biological supervision by a
reputable credentialed specialist, validated pharmaceutical conditioning, dietary
adjustment, and psycho-social structured interaction may be promoted based on the
current body of research supporting biological causes of antisocial behavior.
2.9 Conclusion
In conclusion, an integrated approach that includes sociological perceptions of
symbolic interaction, psychological principles of cognitive responses, and precepts of

48
neuro-genetic influences may answer the question: What is the difference between the
person who commits crime and the one who does not, that transcends all demographic
variables and integrates with all the various social theories of causation?
Research studies examining fear of crime have consistently failed to reveal a
significant positive relationship between perceived risk of victimization and fear of crime
among some high risk demographic groups. Conversely, other demographic groups show
an exaggerated relationship. Although the findings are consistent among many studies,
research has not yet revealed the reasons for such outcomes. This is problematic because
unofficial inquiries tend to suggest that a significant positive relationship does exist
across most demographic groups at a similar rate.
Through integrating theoretical framework of medical science, psychology, and
sociology in order to achieve a more informed foundation for research, the opportunity
exists to coax out a new paradigm for the study of the relationship between fear,
aggression, and criminal behavior.
The hypotheses that emerge after a review of the literature are as follow:
1. An instrument constructed from among a variety of concepts representing the
broad range of disciplines which investigate emotive responses in human
behavior, specifically fear and aggression, should serve to add new insight into
perceptions of emotional triggers.
2. Given a choice of typologically defined options, respondents will most frequently
select options other than ―fear‖ or ―hostility‖.

49
3. Perceptions of emotionally charged symbols will not vary among race/ethnicity
groups.
In Chapter 3, the researcher will explain the process by which the hypotheses
were tested. The research design will be discussed as will the methodology and
limitations. In Chapter 4, the researcher will present an analysis of the data from the
study, and in Chapter 5 the researcher interprets the illustrations, concluding with
implications and limitations of those findings, as well as opportunities to expand on
current research through future studies

50
CHAPTER 3
METHODOLOGY
3.1 Institutional Review Board (IRB)
The protocol required before the survey ―Typological Emotive Responses to
Textual Symbols‖ could be distributed was submitted to the UT Arlington Institutional
Review Board, Office of Research Compliance on October 6, 2009. After minor
revisions, the protocol was approved on October 28, 2009 through email correspondence.
The researcher was cautioned, however, to wait for the final approval letter, which was
presented to the researcher on November 9, 2009.
In the protocol, the current researcher, Donna Salazar, was recorded as the student
researcher. Alejandro del Carmen, Ph.D. was recorded as the faculty advisor to the
current research.
3.2 Design
The design for this study was a one shot case study design. The case study design
was selected because the intention of the research is to examine the specific units, fear
and aggression, within an integrated framework constructed from neuro-psychological,
psycho-social and criminological variables. One Shot was selected because no control
group is included.
The dependent variables were measured based on analysis of responses provided
by all participants. The study is ideographic in that was conducted in an attempt to apply

51
many different independent variables in order to observe any relationship that may occur
between perceptions of fear, aggression and social symbols.
The purpose of using these methods was to examine correlations, if any, in
responses to fear or aggression when the dependent variables--fear and aggression-- are
conceptualized in typologies rather than degrees, and independent variables are
operationalized as symbolically criminogenic triggers delivered in virtual format.
3.3 Method
The method consisted of a triangulation including preliminary field interviews,
secondary source review, and a self administered paper questionnaire.
3.3.1 Conceptualization of Dependent and Independent Variables
Initiation of the first phase of this study, conceptualization of symbolic triggers,
was dependent upon identifying fear and aggression trigger symbols among various
groups. This was achieved by simply asking individuals structured open-ended questions
in an informal manner in casual field interviews. Simple questions like ―what object do
you most identify with fear‖ or ―what color most reminds you of violence‖ provided a
comprehensive list of contextual symbols to further examine in the next step.
Field interviews were conducted as a quota sample split into five separate and
distinct locations reflecting characteristics of five stratified socio-economic demographic
data sub sets. Selected locations included homeless, urban, suburban, rural, and
collegiate lifestyles. Representative participants were selected in equal numbers of no less
than 20 per area, according to the ways in which they represent the characteristics of the
larger population with respect to the demographic variables established for this study.

52
Each participant remains anonymous, and each response is recorded in a dedicated field
observation journal.
3.3.2 Validating Conceptualizations
Secondary source reviews were the next step of the first phase in order to evaluate
strength, weakness and pervasiveness of symbols most commonly associated with
eliciting negative effect anxiety or cognitive fear response. Sources included findings
from scholarly studies, print media news publications, as well as broadcast news,
television news magazines, movies, video games and internet web based media.
In consideration of the large circulation of vast quantities of available media, for
the purpose of this study samples were limited to the most popular in each category
except scholarly studies. News publications from each of print, broadcast, and web-based
sub-categories available in the Dallas -- Fort Worth Metroplex were selected. They were
reviewed for a period of seven consecutive publications, maintaining a log of the number
of times each symbol occurred in headline, sub-title, or front page articles. Official crime
reports involving that symbol were also included in the review. Video games and movies
were selected based on popularity by circulation, and only the cover was assessed for
content. Scholarly studies were utilized to develop typologies of fear and aggression as
well as symbolic values
3.3.3 Dependent and Independent Variables
The frequency with which the symbol was present in conjunction with crime, the
position of the symbol and the context in which it appeared were compared to those
acquired in the field interviews. A complete list was compiled from all of the symbols,
53
and then organized according to categories defined as color, object, and condition
(behavior). Each symbol was weighted according to frequency with which it occurred,
revealed by the findings of the secondary source review. Those symbols ranking highest
in frequency, products of an inductive process, served as independent variables in the
current study while the typologies of fear and aggression, and their recognized sub-types
served as the dependent variables.
Types of fear and aggression were selected based on those described in the
literature to be characterized by neuro-psychological responses thought to be specific to
each, and their subtypes were selected based on the idea that they were of the similar or
same type, but representative of a variation in intensity. For example, Panic may be
identified as an intensified subtype of anxiety based on shared neuropsychological
processes, where terror may be identified as an intensified subtype of fear based on
shared neuropsychological processes that may be different from those of anxiety and
panic.
One particularly notable challenge occurred in operationalizing the word
president among the independent variables. Much consideration was paid before the
decision to include it in some form. Since the President of the United States symbolizes
authority and is perceived to be empowered to negotiate symbolic values that may incite
emotional responses among the population, consideration included the argument that
affect synapse may be indirect rather than direct. Peculiarities among presidents also
present some elements of confusion. Therefore, the word president was conceptualized as
Obama, the current president, in order to limit confusion and establish a more direct

54
response.
3.3.4 Sample
In the second phase, implementation of the electronic instrument, the sample was
a convenience sample. The criterion for the sampling frame was that the participant be at
least 18 years of age. A primary sampling frame was drawn from the University of Texas,
Arlington main campus population which is anticipated to be approximately 26,000
students, staff, faculty and administrators. The unit of analysis was the individual
respondent.
3.3.5 Distribution and Data Collection
A pre-test of the electronic instrument was conducted from November 13 through
November 14, 2009, during which time both the data and the instrument were tested for
possible errors and malfunction. Both the researcher and the electronic format specialist
completed the survey several times. Pre-test results indicated that no adjustments were
necessary. Data from the pre-test was noted, the active URL was reset to reflect no
responses, and the site was locked until the date of distribution.
The electronic questionnaire was circulated through available listserv data bases.
Invitations to participate in the study by completing the survey questionnaire were
delivered by email to listserv subscribers among those departments whose chairs agreed
to the distribution. Those departments included the Department of Criminology and
Criminal Justice in the College of Liberal Arts, the Psychology Department in the School
of Natural Sciences, the Department of Business Economics in the College of Business
Administration, and the School of Education.

55
In addition, a listserv was compiled from the University of Texas at Arlington
public directory which included students, faculty, staff, and administrators outside the
participating departments. That listserv was compiled by selecting all listings from the
first two columns of each alphabetical category, then eliminating any listing associated
with participant departments.
Selected email recipients were invited to participate, offered an active link to a
standardized informed consent page, and an additional active link to the electronic survey
instrument. The exact number of electronic invitations delivered is unknown. However,
the estimated number of attempts is 1250, and the number of respondents completing the
questionnaire was 113.
Each completed response provided data directly and anonymously to an
electronically dedicated SPSS data base appropriate to statistical analysis, allowing
access only to the primary investigator and those authorized by that person to format or
process data. Departmental listservs remain confidential, and the listserv compiled from
the public directory by the principal investigator remains a secure and undisclosed
electronic file.
3.3.6 Survey Instrument
The instrument for the second phase of this study was the electronic
questionnaire. Parts 1-A and 1-B were inspired by the Fear Survey Structure III (FSS III)
(Wolpe & Lang, 1969, 1977). The FSS III is commonly recognized as an instrument
designed to assess phobic behaviors, and has met with both praise and criticism. In
review of the instrument, praise for its value and critique of its shortcomings, it provided
56
the best opportunity for modifications and provided a format for exploration of any
relationships that may have occurred among a matrix of variables included in this study.
Original FSS III variables were replaced by those specific to symbolic
representations (independent variables) and typologies of fear and aggression (dependent
variables). Additionally, the original instrument was designed to section variables for
examination in groups, a feature that was retained for the purposes of this study.
However, independent variables were not sectioned in the distribution of the current
questionnaire in attempt to prevent syntactic word association processes among the
independent variables. Instead, the responses were coded in sections labeled color, object,
and behavior prior to analysis.
Original design of the instrument included the delivery of the survey in a face-to-
face structured interview conducted in a clinical environment. This application was
necessary for researchers since they included a component that assessed physiological
expressions as perceived by the investigator. For the purposes of the current study, that
face-to-face structured interview process was modified to an electronic means of
delivery, in order to conform as much as possible to the way symbolic information is
received in a comfortable environment through modern technology, insure that the
process is as private as possible, and avoid responses colored by spurious phenomenon.
The newly constructed survey was converted to electronic format for internet
distribution by an electronic format specialist. The specialist agreed to insure anonymity
and confidentiality, provide a private URL, convert the instrument to electronic format,
and deliver secure data by email in SPSS format.

57
Respondents were provided an electronic invitation linked to an informed consent
face sheet and instructions which will contain an active URL to connect the respondent to
the interactive electronic instrument as well as an opportunity to exit the program. By
clicking on the active URL respondents agreed to the terms of consent. If the respondent
agreed to continue to the survey, they were connected to definitions and instructions for
Part 1-A of the survey.
3.3.6.1 Part 1-A
In Part 1-A, a list of 60 textual symbols in the form of words represented colors,
objects, and behaviors. The symbols were arranged in such a manner that colors, objects,
and behaviors will be separated for the test in order to avoid word association among the
symbols, situational inferences, or any impression of rank order. Each symbol was rated
by the respondent according to the type of fear relationship it is perceived to elicit. The
dependent variable fear is demonstrated in terms of typology and related sub-types.
Rather than rating fear based on a scale or degree of fear, the choices represent distinct
types of fear responses as distinguished in scholarly literature, with 0 representing none,
and 9 representing terror, and measured as nominal. Respondents were informed that
they may exit the program at any time, or choose not to answer any or all questions and
proceed to definitions and instructions for the next part which was Part 1-B.
3.3.6.2 Part 1-B
Part 1-B also includes 60 possible responses and is arranged in the same manner
as 1-A. The difference between the two is that the dependent variable in Part 1-B is
aggression typology and sub-types rather than fear. In Part 1-B, many of the symbols

58
remain the same, while others vary in order to measure both similarities and differences
in perceptions of fear and aggression emotional responses.
3.3.6.3 Part 2
At the end of Part 1-B, the respondent was given the instructions for part 2. Part 2
consists of demographic variables that provide data for controls. Among those were race
and gender measured at the nominal level as well as a major field of interest write-in
option. Age, income, and education were measured at the ordinal level to define risk
group and socio-economic status.
Although not included in the original plan, review of the literature revealed a need
to control for spuriousness that may occur through intervening variables. Those variables
are included in Part 2. One question asked respondents to identify their general
occupation category including a write-in other category. The other asked respondents
whether they have ever been a member of the armed forces or a law enforcement agency,
with a dichotomous response. Responses for each were measured on a nominal level.
3.3.6.4 Part 3
Finally, Part 3 was prefaced with its own brief instructions. Part 3 consisted of a
list of words in paragraph format that are not intended to make sensible word strings, or
represent form either syntactic or semantic. Instead, the paragraph form is comprised of
two kinds of words; words considered to be emotionally charged and words considered to
be neutral (Shaver, Schwartz, Kirkson, & O’Connor, 1987).
Part 3 was inspired by a similar test administered by Raine & Sanmartin (2001) to
explore whether or not some respondents may be less able to distinguish between

59
emotional and neutral words. Raine found that some remembered many neutral words,
but did not remember emotional words, indicating a lapse in ability to identify emotion.
While Raine and Sanmartin’s (2001) instrument may differ somewhat in application, the
modified version provides the structure and content required for purposes of the current
study.
The purpose Served by Part 3 was to examine whether such a component can be
implemented as a control for high or low fear and aggression scores. It was administered
last in order to separate it from the matrix questions and maximize the opportunity for
response without influence of fear and aggression responses of Parts 1-A and 1-B. The
instructions for this part of the survey note that the paragraph was comprised of unrelated
words, and asked the respondent to read the paragraph carefully and then proceed to the
next page for further instructions.
In the Part 3 group of words, it was important for the researcher to note whether
any have been previously used in parts 1 or 2 of the questionnaire. When the respondent
arrived at the next set of instructions, the respondent was asked to type in as many of the
words as they remembered without looking back, and as quickly as possible, then
proceed to the next page. The next page was the last page, thanking the respondent and
providing contact information.
3.3.7 Instrument Analyses Design
Data collected using the current instrument could be subject to a variety of
analyses. Processes included frequencies and cross-tabulation, as well as Pearson’s r to
analyze any correlations that may be revealed among the data collected. The instrument

60
design allowed for an adjustment to the original nominal measures by combining types of
each of fear and aggression variables with their sub-type variables, totaling the number of
response selections in each condensed category, and coding those totals in interval
groups. Adjusted variables were then re-named and Pearson’s r could be engaged to
investigate the possibility of any relationships that may occur among response selections
between fear and aggression variables.
Part 3 word memory responses could be analyzed through frequencies and cross-
tabulation after a similar adjustment. Responses could be counted for each respondent
and coded to an interval group based on the number of words the respondent provided.
The interval groups could be labeled from lowest to highest respectively, and compared
with the intervals of selected responses from among the adjusted fear and aggression
variables.
The researcher also allowed for a matrix or index score, a sum of individual
response selections for each variable, and for each matrix, providing for a broad
comparison among the total scores between fear and aggression, their types and subtypes.
3.4 Timeline
Based on the design and sampling frame for this study, the target date for
beginning the field interviews was Fall, 2009. It was important in sampling a university
campus to keep in mind that enrollment may be larger in the fall semester and there are
likely to be fewer weather delays. At the same time, the researcher must take into
account the academic calendar since students, staff and faculty are preoccupied with term
papers, final exams, and registration after the third week in November which could

61
reduce response rate.
The study proceeded in the step-by step fashion previously described, however,
with a delay that extended into the second week of November. The instrument was made
available for a period of three weeks, with a reminder notice at the end of the second
week. Distribution began on November 16, 2009 and continued through December 6,
2009. Data analysis began the second week in December and continued through January
with a target date of February 15, 2010 for preliminary reports. The final analysis was
scheduled for March 30, 2010.
3.5 Limitations
The researcher realizes some limitations to the current study. First, the instrument
design reflects an integrated approach to measuring types of fear and aggression and may
seem unfamiliar to the reader. Second, validity depends on whether symbolic values are
shared between the campus population completing the survey, and those participants
among the greater public who provided emotionally charged symbolic values in informal
interviews during the construction of the survey instrument. Third, construction of the
sampling frame is limited to the population of a regionally-specific university campus.
Fourth, a limitation is recognized in the number who agreed to provide responses.
In addition, because this is a non-experimental design, some argue that scientific
value is limited. It is argued that the current study is subject to all confounding effects of
non-experimental studies including endogenous change and history effect. In addition,
little control exists over whether the person who receives the invitation to participate will
be the same one who completes the electronic questionnaire.

62
The objective, however, is not to meet pretest post test experimental conditions,
or to evaluate treatment, but rather to utilize the survey to explore responses to
textualized symbols, in a format consistent with that of systematic exposure on a daily
basis. The value exists in examining the typologically distinguished responses to textual
symbols, and analyzing the data to reveal whether correlation occurs between fear and
aggression variables, as well as whether typological distinction yields a different response
pattern than that of fear and aggression measured on a scale of intensity.
In the following chapter, the researcher will review the findings of the analysis
using illustrations and tables to demonstrate data. The researcher will discuss in Chapter
5 the interpretation of the analysis, implications and limitations of those findings, and
include suggestions for opportunities to expand on current research through future
studies.

63
CHAPTER 4
ANALYSIS
In this chapter, the researcher provides a review of the research data organized in
tables, matrices, and figures. Tables 1 through 5 include Part 2 demographic data which
reflects race/ethnicity, gender, age, income, and occupation of respondents. In Table 6,
the researcher illustrates most and least frequent responses to textual symbols in Parts 1-
A (Fear) and 1-B (Aggression) of the survey. In Table 7 the researcher expands most and
least frequent responses to textual symbols in Parts 1-A and 1-B to illustrate differences
in most and least frequent responses between Non-White and White respondents. Tables
4.8, 4.9, and 4.10 represent the researcher’s comparison of the frequencies with which
answer groups in Parts 1-A and 1-B were selected by respondents, and then an expansion
of the data to further illustrate difference in responses between non-white and white
respondents.
The researcher utilizes a series of matrices to demonstrate correlations among
answer groups from Parts 1-A and 1-B, and compare correlations between non-white and
white respondents. Table 4.11 represents correlations from Parts 1-A and 1-B data of all
survey respondents, while Tables 4.12 and 4.13 represent correlations from Parts 1-A and
1-B data of non-white and white respondents respectively.
Finally, in Figures 1 and 2, the researcher compares data groups from Parts 1-A
and 1-B to data from Part 3 (word memory).

64
4.1 Part 2 Demographics
Table 4.1 Part 2 Question 2 Race/Ethnicity of Responses (in percentages)
n=113
In Table 4.1 the researcher shows that 24% of survey respondents identified their
race/ethnicity as Non-White, including 1% Asian, 8% Black, Hispanic/ Latino, as well as
4% Native American/American Eskimo. 76% of respondents identified their
race/ethnicity to be White. The greatest percentage of respondents identified as White,
while the smallest percentage of respondents identified as Asian.
Percentages were rounded to the nearest whole number. The total number of
respondents who provided a response was 113.
Table 4.2 Part 2 Questions 2 & 3 Non White and White Respondents
by Gender (in percentages)
*Totals may exceed 100% due to rounding
n=113
The researcher provides data in Table 4.2 that defines Non White and White
respondents according to gender. About 17% of respondents who identified as Non white
also identified as Female, and about 7% identified as Male. About 47% of white
respondents identified as Female, while about 29% identified as Male.
Race/ Ethnicity Percent
Asian 1
Black 8
Hispanic/Latino 11
Native American/American Eskimo 4
White 76
Female Male Total
Non White 17 7 24
White 47 29 76
Total 64 36 100

65
Respondents who identified as White responded more than three times as often as
those who identified as Non-White, and Females responded about 56% more often than
Males. The largest percentage of respondents identified as both White and Female, while
the smallest percentage of respondents identified as both Non-White and Male.
Percentages were rounded to the nearest whole number. The total number of
respondents who provided a response was 113.
Table 4.3 Part 2 Questions 1 & 2 Respondents’ Age by Race/Ethnicity (in percentages)
*Totals may exceed 100% due to rounding n = 112 missing = 1
The age of the respondents is reflected in percentages according to race/ethnicity
in Table 4.3. Among those who claimed to be age 18-26, about 9% identified as Non
White, and about 13% as White, for a total of 22% in that age category. Among those
who claimed to be 27-35, about 4% identified as Non White, while about 17% identified
as White, for a total of 21% in that age category. About 4% of those who identified as
Non White claimed to be between the ages of 36 and 44, 4% between the ages of 45 and
53, 3% between the ages of 54 and 62, and none claimed to be 63 and over.
About 19% of respondents who identified as White claimed to be between the
ages of 36 and 44, 12% between the ages of 45 and 53, 13% between the ages 54 and 62,
Age Non White White Total
18-26 9 13 22
27-35 4 17 21
36-44 4 19 23
45-53 4 12 16
54-62 3 13 16
63 and over 0 3 3
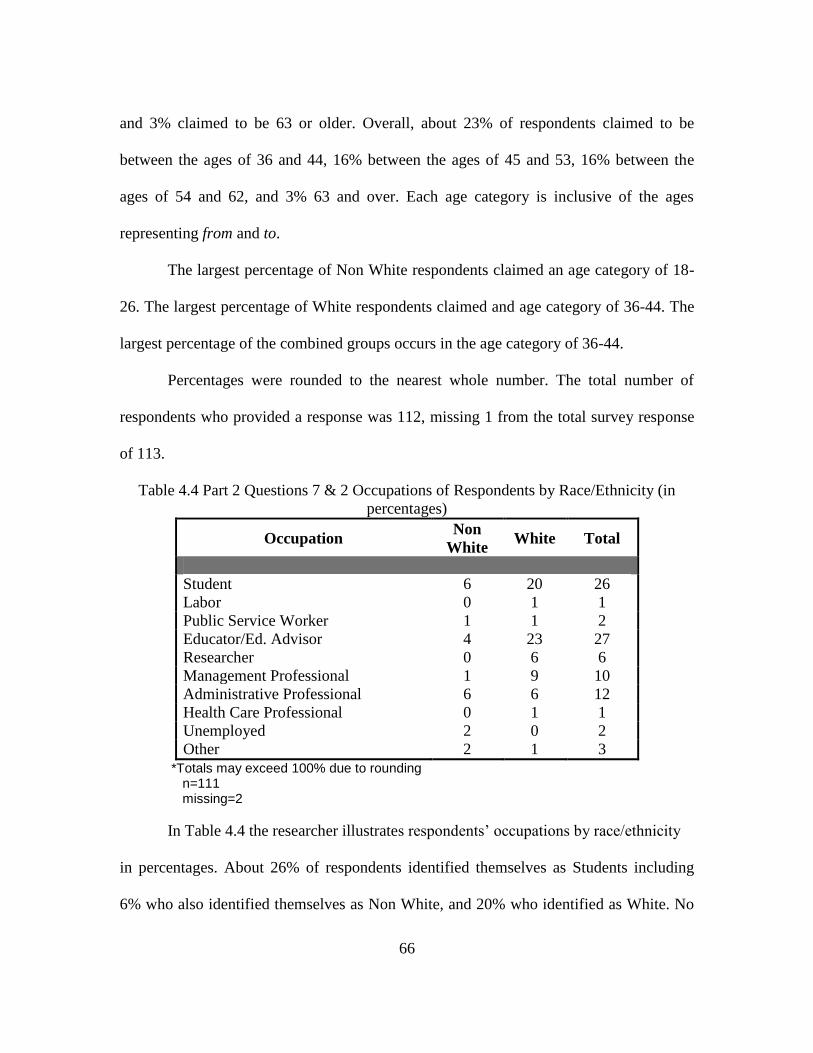
66
and 3% claimed to be 63 or older. Overall, about 23% of respondents claimed to be
between the ages of 36 and 44, 16% between the ages of 45 and 53, 16% between the
ages of 54 and 62, and 3% 63 and over. Each age category is inclusive of the ages
representing from and to.
The largest percentage of Non White respondents claimed an age category of 18-
26. The largest percentage of White respondents claimed and age category of 36-44. The
largest percentage of the combined groups occurs in the age category of 36-44.
Percentages were rounded to the nearest whole number. The total number of
respondents who provided a response was 112, missing 1 from the total survey response
of 113.
Table 4.4 Part 2 Questions 7 & 2 Occupations of Respondents by Race/Ethnicity (in
percentages)
Occupation Non
White White Total
Student 6 20 26
Labor 0 1 1
Public Service Worker 1 1 2
Educator/Ed. Advisor 4 23 27
Researcher 0 6 6
Management Professional 1 9 10
Administrative Professional 6 6 12
Health Care Professional 0 1 1
Unemployed 2 0 2
Other 2 1 3
*Totals may exceed 100% due to rounding n=111 missing=2
In Table 4.4 the researcher illustrates respondents’ occupations by race/ethnicity
in percentages. About 26% of respondents identified themselves as Students including
6% who also identified themselves as Non White, and 20% who identified as White. No

67
Non White respondents claimed to be Laborers, while about 1% of White respondents
claimed to work as Laborers, totaling about 1% of respondents. About 1% of each Non
White and White respondents identified themselves as Public Service Workers totaling
about 2% of respondents, and 6% of each identified themselves as Administrative
Professionals totaling 12% of respondents. Among 27% of respondents who identified as
Educator/Ed. Advisor, 4% identified as Non White, while 23% identified as White. No
Non White respondent claimed an occupation as a researcher or a health care
professional. Among White respondents 6% claimed an occupation as a researcher and
about 1% claimed health care professional, for a total of 6% and about 1% respectively.
While about 1% of Non White respondents claimed an occupation of
Management Professional, 9% of White respondents claimed that occupation for a total
of about 10%. About 2% of Non White respondents identified as Unemployed, and no
White respondents identified as Unemployed, for a total of about 2% of respondents
identifying their occupation as Unemployed. Finally, about 2% of Non White
respondents claimed occupations other than the choices offered, as did about 1% of
White respondents for a total of about 3%.
Public Service Worker and Administrative Professional occupations were about
the same percentages between White respondents and Non-White respondents, and only
Non-White respondents identified themselves as unemployed. The majority of
respondents identified themselves as educator/ed.advisor, including the greater
percentage of White respondents, followed closely by those who identified as students of
which 20% out of 26% also identified their race/ethnicity as White.

68
Percentages were rounded to the nearest whole number. The total number of
respondents who provided a response was 111, missing 2 from the total number of survey
respondents.
Table 4.5 Questions 7 & 2 Income of Respondents by Race/Ethnicity (in percentages)
Income Non White White Total
$ 0-12,000 4 9 13
$12,001-19,000 0 6 6
$19,001-26,000 2 1 3
$26,001-39,000 7 7 14
$39,001-62,000 4 21 25
$62,001-96,000 4 20 24
Over $96,000 2 13 15
*Total may exceed 100% due to rounding n=112 missing =1
Income levels of respondents by race/ethnicity are demonstrated by the researcher
using percentages in Table 4.5. Among 13% of respondents who claimed an annual
income level of $0-12,000, about 4% identified themselves as Non White while about 9%
identified themselves as White. In the range of $12,001-19,000, no respondent identified
as Non White and 6% identified as White. About 2% of respondents identified as Non
White and about 1% as White in the income range of $19001-26,000, while 7% identified
as Non White and 7% identified as White in the $26,001-39,000 income range. In the
income range of $39,000-62,000, about 4% of respondents identified as Non White while
21% of respondents identified as White.
69
About 4% of respondents also identified as Non White in the income range of
$62,001-96,000, and 20% identified as White. The percentage of respondents claiming an
annual income of over $96,000 was 15%, including 2% who identified as Non White and
13% who identified as White.
The largest percentage of respondents claimed an annual income range of
$39,001-62,000, followed closely buy those who claimed an annual income range of
$62,001-96,000. In both income ranges, respondents were about five times more often
identified as White. In the income range of over $96,000, respondents were about six
times more often identified as White. Respondents who claimed an annual income range
of $19,001-26,000 identified as Non White about twice as often as respondents identified
as White. Among the 14% of respondents who claimed an annual income range of
$26,001-39,000, the percentage was even between those who identified as Non White
and those who identified as White. Percentages were rounded to the nearest whole
number. The total number of respondents who provided a response was 112, missing 1
from the total number of survey respondents.

70
4.2 Part 1-A and Part 1-B Frequencies
Table 4.6 Part 1-A & Part 1-B Most and Least Often Responses Overall
Fear Types Aggression Types
Q Symbol Most Least Q Symbol Most Least
Color
Color
11 Red N F 10 Red N H
16 Brown N FT 17 Brown N A
31 Yellow N F 31 Yellow N A
37 White N FA 36 White N HAD
41 Green N FA 40 Green N HAD
45 Grey N FAT 44 Grey N HAD
50 Orange N F 49 Orange N A
Object Object
9 Gun NT F 8 Gun N H
14 Confederate Flag N F 13 Confederate Flag N A
21 Unattended Packages N F 20 Unattended Packages D H
24 Knife N F *
* 24 Weapon D H
27 Swastika T F 27 Swastika D H
36 Tattoos N F 35 Tattoos N A
Conditions Conditions
3 Pickpocket T F 2 Pickpocket D N
5 Noose N F 4 Noose N H
8 Dead People T F 7 Dead People N H
12 Intruder T N 11 Intruder D N
13 Reckless Driver T N 12 Reckless Driver D N
15 Falling T F *
32 Rape T N 31 Rape A N
35 Obama N A 34 Obama N H
44 Al Qaeda T F 43 Al Qaeda A H
46 Bad Odors T F 45 Bad Odors D A
47 Osama bin Laden T FA 46 Osama bin Laden A H
48 Loud Noises T F 48 Loud Noises N A
54 Airplanes N F *
55 Spiders N F *
* 56 Cheating D N
* 57 Stupid People H A
60 Fire T F 60 Fire D H
*No equivalent symbol offered Values do not represent statistical significance
Key: Part 1-A (Fear) N=None T=Tension A= Anxiety F=Fear
Part 1-B (Aggression) N=None D=Defensive A=Anger H=Hostility
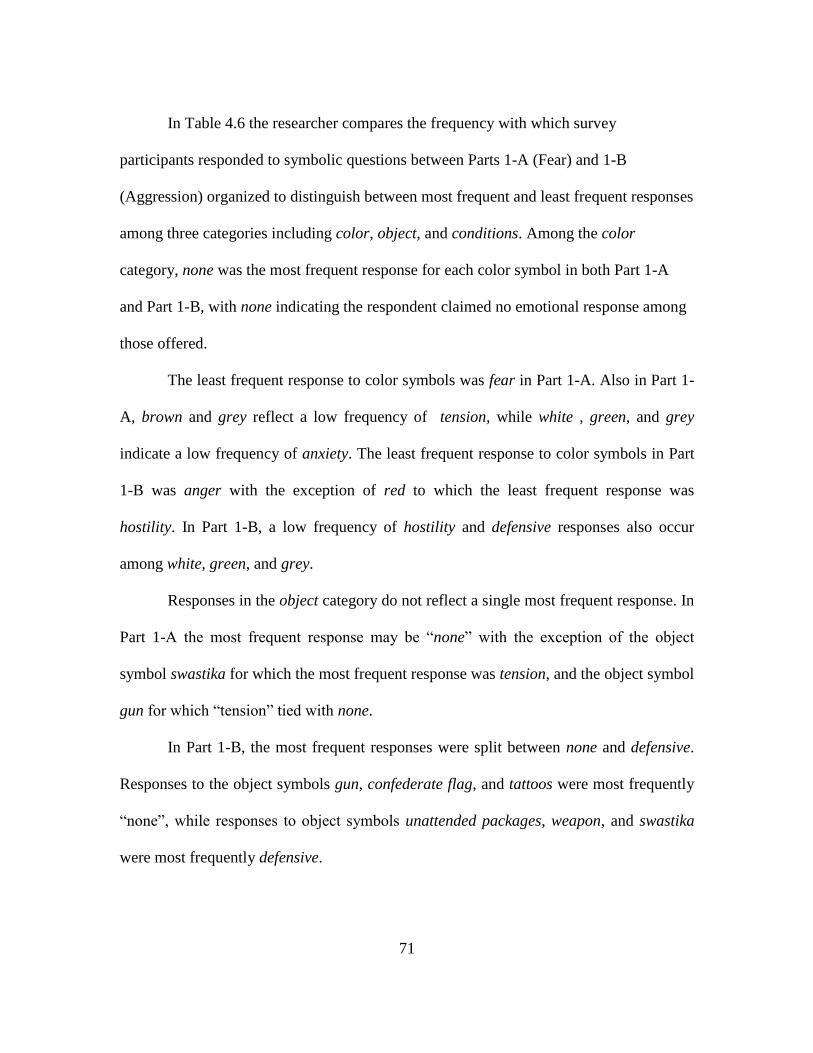
71
In Table 4.6 the researcher compares the frequency with which survey
participants responded to symbolic questions between Parts 1-A (Fear) and 1-B
(Aggression) organized to distinguish between most frequent and least frequent responses
among three categories including color, object, and conditions. Among the color
category, none was the most frequent response for each color symbol in both Part 1-A
and Part 1-B, with none indicating the respondent claimed no emotional response among
those offered.
The least frequent response to color symbols was fear in Part 1-A. Also in Part 1-
A, brown and grey reflect a low frequency of tension, while white , green, and grey
indicate a low frequency of anxiety. The least frequent response to color symbols in Part
1-B was anger with the exception of red to which the least frequent response was
hostility. In Part 1-B, a low frequency of hostility and defensive responses also occur
among white, green, and grey.
Responses in the object category do not reflect a single most frequent response. In
Part 1-A the most frequent response may be ―none‖ with the exception of the object
symbol swastika for which the most frequent response was tension, and the object symbol
gun for which ―tension‖ tied with none.
In Part 1-B, the most frequent responses were split between none and defensive.
Responses to the object symbols gun, confederate flag, and tattoos were most frequently
―none‖, while responses to object symbols unattended packages, weapon, and swastika
were most frequently defensive.

72
The single least frequent response to object symbols in Part 1-A was fear. In Part
1-B, least frequent responses to object symbols included hostility for gun, unattended
packages, weapon, and swastika, as well as anger for confederate flag and tattoos.
Among the categories, the condition category appears to be the most varied
among most and least frequent responses. In Part 1-A, the most frequent response to
condition symbols is tension except for noose, Obama, airplanes, and spiders, for which
the most frequent response is none. In Part 1-B, the most frequent response was none for
noose, dead people, Obama, and loud noises. The most frequent response was defensive
for pick pocket, intruder, reckless driver, bad odors, cheating, and fire. Anger was the
most frequent response for rape, al Qaeda‖ and Osama bin Laden.
Least frequent response to condition symbols in Part 1-A was fear, with the
exceptions of intruder, reckless driver, and rape for which the least frequent response
was none, as well as Obama for which the least frequent response was anxiety. Least
frequent response for Osama bin Laden was split between none and anxiety. Least
frequent responses to condition symbols in Part 1-B included none for pick pocket,
intruder, reckless driver, rape, and cheating. Least frequent responses to condition
symbols in Part 1-B also included hostility for noose‖, dead people, Obama, al Qaeda,
Osama bin Laden, and fire, as well as anger for bad odors, loud noises, and stupid
people.
The color symbol grey shows little or no emotional response from either Part 1-A
or Part 1-B. Color symbols white or green show little or no emotional responses from
Part 1-B. Most respondents indicate they feel tension over the object symbol swastika and
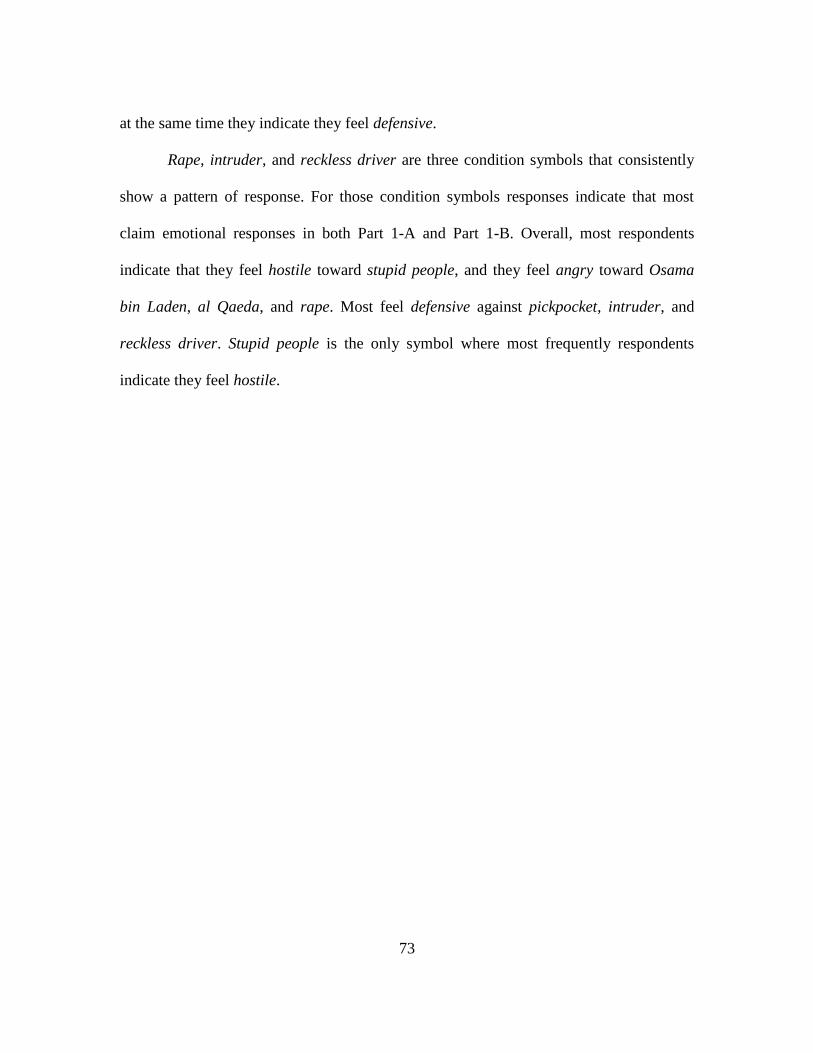
73
at the same time they indicate they feel defensive.
Rape, intruder, and reckless driver are three condition symbols that consistently
show a pattern of response. For those condition symbols responses indicate that most
claim emotional responses in both Part 1-A and Part 1-B. Overall, most respondents
indicate that they feel hostile toward stupid people, and they feel angry toward Osama
bin Laden, al Qaeda, and rape. Most feel defensive against pickpocket, intruder, and
reckless driver. Stupid people is the only symbol where most frequently respondents
indicate they feel hostile.

74
4.3 Part 1-A and Part 1-B Cross-tabulations
Table 4.7 Part 1-A and Part 1-B Most and Least Frequent Responses by Race/Ethnicity
Fear Types Aggression Types
Q Symbol NW W NW W Q Symbol NW W NW W
Most Most Least Least Most Most Least Least
2 Open Wounds ** ** ** ** 1 Open Wounds ND D ** **
3 Pick Pocket ** ** ** ** 2 Pickpocket ** ** A N
5 Noose T N ** ** 4 Noose ** ** ** **
8 Dead People N T ** ** 7 Dead People ** ** ** **
9 Gun N T ** ** 8 Gun D N ** **
12 Intruder A T N N 11 Intruder ** ** ** **
13 Reckless
Driver A T N N 12 Reckless Driver ** ** ** **
* 14 Failure N D ** **
15 Falling N T ** ** *
18 Deformities ** ** ** ** 17 Deformities ** ** D HA
19 Caucasian
Males ** ** A F 19
Caucasian
Males ** ** ** **
21 Unattended
Packages N T ** ** 20
Unattended
Packages ** ** ** **
24 Knife TN N ** ** *
27 Swastika ** ** ** ** 27 Swastika ** ** A H

75
Table 4.7 continued
31 Yellow ** ** ** ** 30 Yellow ** ** HAD A
32 Rape A T N N 31 Rape A D ** **
33 Large Open
Spaces ** ** ** ** 32
Large Open
Spaces ** ** A H
34 Being
Watched ** ** ** ** 33 Being Watched NA D ** **
35 Obama ** ** F A 34 Obama ** ** HD H
43 Confinement ** ** ** ** 42 Confinement ** ** A H
44 Al Qaeda NAT T F FA 43 Al Qaeda N A HD N
46 Bad Odors NT T ** ** 45 Bad Odors ** ** A H
47 Osama ** ** F N 46 Osama NA A D H
48 Loud Noises N T ** ** 47 Loud Noises N D ** **
51 Fighting ** ** ** ** 50 Fighting ** ** A H
* 54 Mistakes ** ** A H
* 56 Cheating ** ** A N
* 57 Stupid People N D ** **
*No equivalent offered
**Response showed little or no difference
Values do not represent statistical significance
Key: NW=Non-White W=White
Part 1-A (Fear) N=None T=Tension A= Anxiety F=Fear
Part 1-B (Aggression) N=None D=Defensive A=Anger H=Hostility

76
In Table 4.7 the researcher expands the analysis of the frequency with which
survey participants responded to symbolic questions of Parts 1-A (fear) and 1-B
(aggression) organizing responses to distinguish between most frequent and least
frequent among race/ethnicity. Race/ethnicity is characterized as Non-White (NW) or
White (W) based on whether respondents identified themselves as Asian, Black,
Hispanic/Latino, American Indian/American Eskimo, White, or other. No respondent
claimed other. Respondents who identified as White are represented as such.
Respondents who identified as Asian, Black, Hispanic/Latino or American
Indian/American Eskimo, are represented as Non-White. Only those symbols which
indicate distinguishably different responses or distinguishably similar responses among
both Non-Whites and Whites are included.
Non-White and White respondents provided similar responses to open wounds in
Part 1-A; however, in Part 1-B White respondents most often indicated that they felt
defensive, whereas Non-White respondents were most frequently split between feeling
defensive and feeling none of the choices offered. Non-Whites and Whites also provided
similar responses to pick pocket in Part 1-A, yet in Part 1-B Non-White respondents least
frequently responded that they felt anger, while White respondents least frequently
responded that they felt none of the choices offered.
In Part 1-A, the most frequent response among Non-White respondents to the
symbol noose was tension, while the most frequent response to the same symbol among
White respondents was none. For dead people, the most frequent response among Non-
White respondents was none, while the most frequent response among White respondents

77
was tension. Non-White respondents most frequently responded none to the symbol gun,
and White respondents most frequently responded tension. However, In Part 1-B Non-
White respondents most frequently responded defensive while White respondents most
often responded none.
In Part 1-B, Non-White respondents and White respondents most frequently
responded similarly to the symbols intruder, reckless driver, and rape. In Part 1-A, least
frequent responses of Non-White and White respondents were also similar, those being
none. Most frequent responses differed between the groups with Non-White respondents
most frequently responding with ―anger‖ and White respondents most frequently
responding with ―tension‖.
For the symbol ―Obama‖, In Part 1-A, Non White respondents least frequently
responded ―fear‖ while Whites least frequently responded ―anxiety‖. In Part 1-B, Non-
White respondents least frequently responded ―hostility‖ or defensive‖.
For al-Qaeda, in Part 1-A, Non-Whites were evenly split in most frequent
responses between none, anxiety, and tension, while White respondents most frequently
responded tension. In Part 1-B, Non-White respondents most frequently provided the
answer none and least frequently provided the answer hostile or defensive. White
respondents most often provided the answer anger for al Qaeda in Part 1-B, and least
often provided the answer none.
Non-White respondents least often responded fear to Osama bin Laden in Part 1-
A; White respondents least often responded none. In Part 1-B, Non-White respondents
most frequently responded none‖ or anger to Osama bin Laden, and White respondents

78
most often responded anger. Least frequently, Non-White respondents provided the
answer defensive, while White respondents least frequently provided the answer hostile to
Osama bin Laden in Part 1-B.
Responses for ―loud noises‖ also varied between Non-White and White
respondents. In Part 1-A, Non-White respondents most frequently answered none; White
respondents answered tension. In Part 1-B, Non-White respondents most frequently
answered none, and White respondents most frequently answered defensive.
Finally, in Part 1-B, Non-White respondents most frequently responded none to
stupid people. White respondents most often responded defensive.
4.4 Part 1-A and Part 1-B Comparisons
Table 4.8 Part 1-A and Part 1-B Comparison of Frequencies between
Fear and Aggression (in percentages)
Number of
Times
Responded
A-
NON TENS ANX FEA
B-
NON DEF ANG HOS
0 0 0 8 50 1 2 18 18
1-10 0 18 79 49 0 16 74 77
11-20 5 66 12 1 2 58 9 5
21-30 15 17 1 1 20 23 0 0
31-40 45 0 0 0 60 1 0 0
41-50 31 0 0 0 16 0 0 0
51-60 4 0 0 0 2 0 0 0 *Totals may exceed 100% due to rounding n=113
Key: Part 1-A (Fear) A-NON =None TENS=Tension ANX= Anxiety FEA=Fear
Part 1-B (Aggression) B-NON=None DEF=Defensive ANG=Anger HOS=Hostility
Table 4.8 reflects the frequencies with which respondents selected each possible option
illustrated in percentages. The number of times responded have been grouped in intervals
beginning with 0, and proceeding 1-10, 11-20, 21-30, 31-40, 41-50, and 51-60. All
possible response options include Part 1-A A-NON (none), TENS (tension), ANX
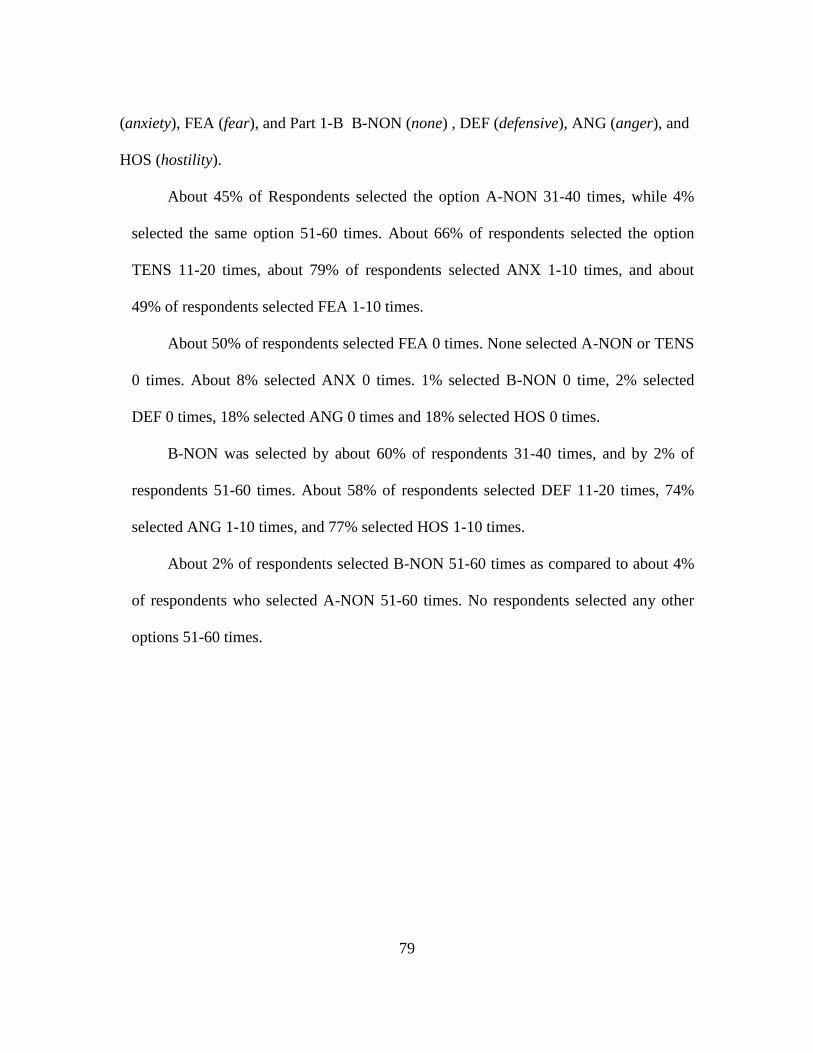
79
(anxiety), FEA (fear), and Part 1-B B-NON (none) , DEF (defensive), ANG (anger), and
HOS (hostility).
About 45% of Respondents selected the option A-NON 31-40 times, while 4%
selected the same option 51-60 times. About 66% of respondents selected the option
TENS 11-20 times, about 79% of respondents selected ANX 1-10 times, and about
49% of respondents selected FEA 1-10 times.
About 50% of respondents selected FEA 0 times. None selected A-NON or TENS
0 times. About 8% selected ANX 0 times. 1% selected B-NON 0 time, 2% selected
DEF 0 times, 18% selected ANG 0 times and 18% selected HOS 0 times.
B-NON was selected by about 60% of respondents 31-40 times, and by 2% of
respondents 51-60 times. About 58% of respondents selected DEF 11-20 times, 74%
selected ANG 1-10 times, and 77% selected HOS 1-10 times.
About 2% of respondents selected B-NON 51-60 times as compared to about 4%
of respondents who selected A-NON 51-60 times. No respondents selected any other
options 51-60 times.

80
Table 4.9 Part 1-A and Part 1-B Comparison of Frequencies between
Fear and Aggression by Race/Ethnicity (in percentages) -- Non White
*Totals may exceed 100% due to rounding n=27
Key: Part 1-A (Fear) A-NON =None TENS=Tension ANX= Anxiety FEA=Fear
Part 1-B (Aggression) B-NON=None DEF=Defensive ANG=Anger HOS=Hostility
Table 4.9 is an expansion of the reflections of frequencies in Table 4.8. In Table
4.9 the researcher reveals frequencies by race/ethnicity with which respondents who
identified as Non-White selected each possible option illustrated in percentages. The
number of times responded have been grouped in intervals beginning with 0, and
proceeding 1-10, 11-20, 21-30, 31-40, 41-50, and 51-60. All possible response options
include Part 1-A A-NON (none), TENS (tension), ANX (anxiety), FEA (fear), and Part
1-B B-NON (none) , DEF (defensive), ANG (anger), and HOS (hostility).
About 56% of Non-White respondents selected the option A-NON 31-40 times,
while 4% selected the same option 51-60 times. About 67% of Non-White respondents
selected the option TENS 11-20 times, 74% of Non-White respondents selected ANX
1-10 times, and 56% of Non-White respondents selected FEA 1-10 times.
About 41% of Non-White respondents selected FEA 0 times. None selected A-
NON or TENS 0 times. About 7% selected ANX 0 times. None of Non-White
Number of
Times
Responded
A-
NON TENS ANX FEA
B-
NON DEF ANG HOS
0 0 0 7 41 0 4 7 15
1-10 0 19 74 56 0 22 93 74
11-20 4 67 19 4 0 59 0 11
21-30 11 15 0 0 15 15 0 0
31-40 56 0 0 0 59 0 0 0
41-50 26 0 0 0 19 0 0 0
51-60 4 0 0 0 7 0 0 0

81
respondents selected B-NON 0 times, 4% selected DEF 0 times, 7% selected ANG 0
times and 15% selected HOS 0 times.
B-NON was selected by about 59% of respondents 31-40 times, and by 7% of
respondents 51-60 times. About 59% of respondents selected DEF 11-20 times, 93%
selected ANG 1-10 times, and 74% selected HOS 1-10 times.
About 4% of respondents selected B-NON 51-60 times as compared to about 7%
of respondents who selected A-NON 51-60 times. No respondents selected any other
options 51-60 times.
Table 4.10 Part 1-A and Part 1-B Comparison of Frequencies between
Fear and Aggression by Race/Ethnicity (in percentages) --White
*Totals may exceed 100% due to rounding n=86 Key: Part 1-A (Fear) A-NON =None TENS=Tension ANX= Anxiety FEA=Fear
Part 1-B (Aggression) B-NON=None DEF=Defensive ANG=Anger HOS=Hostility
Similar to Table 4.9, Table 4.10 is also an expansion of the reflections of
frequencies in Table 4.8. In Table 4.10 the researcher reveals frequencies by
race/ethnicity with which respondents who identified as White selected each possible
option illustrated in percentages. The number of times responded have been grouped in
intervals beginning with 0, and proceeding 1-10, 11-20, 21-30, 31-40, 41-50, and 51-
Number of
Times
Responded
A-
NON TENS ANX FEA
B-
NON DEF ANG HOS
0 0 0 8 52 1 1 21 19
1-10 0 17 80 47 0 14 64 78
11-20 6 65 11 1 2 58 12 4
21-30 16 17 1 0 21 26 0 0
31-40 42 0 0 0 61 1 0 0
41-50 33 0 0 0 15 0 0 0
51-60 4 0 0 0 0 0 0 0
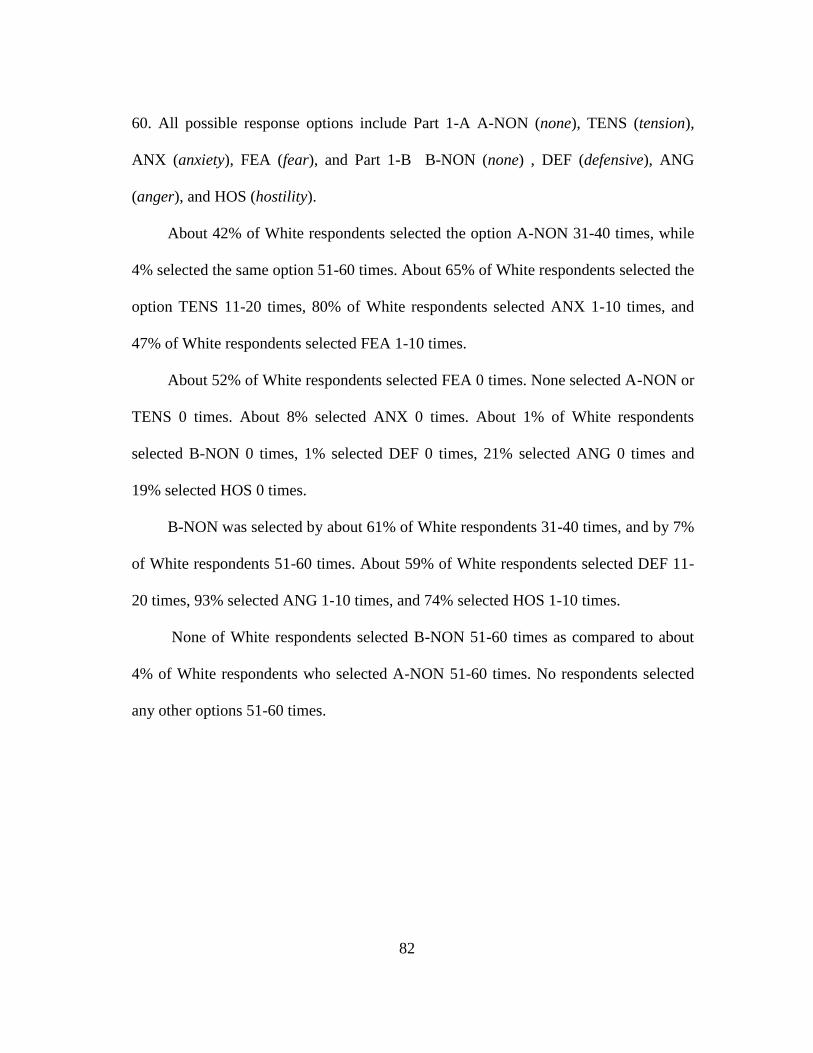
82
60. All possible response options include Part 1-A A-NON (none), TENS (tension),
ANX (anxiety), FEA (fear), and Part 1-B B-NON (none) , DEF (defensive), ANG
(anger), and HOS (hostility).
About 42% of White respondents selected the option A-NON 31-40 times, while
4% selected the same option 51-60 times. About 65% of White respondents selected the
option TENS 11-20 times, 80% of White respondents selected ANX 1-10 times, and
47% of White respondents selected FEA 1-10 times.
About 52% of White respondents selected FEA 0 times. None selected A-NON or
TENS 0 times. About 8% selected ANX 0 times. About 1% of White respondents
selected B-NON 0 times, 1% selected DEF 0 times, 21% selected ANG 0 times and
19% selected HOS 0 times.
B-NON was selected by about 61% of White respondents 31-40 times, and by 7%
of White respondents 51-60 times. About 59% of White respondents selected DEF 11-
20 times, 93% selected ANG 1-10 times, and 74% selected HOS 1-10 times.
None of White respondents selected B-NON 51-60 times as compared to about
4% of White respondents who selected A-NON 51-60 times. No respondents selected
any other options 51-60 times.

83
4.5 Part 1-A and Part 1-B Correlations
Table 4.11 Part 1-A and Part 1-B Correlations among Number of Times Responded
Overall
** Correlation is significant at the 0.01 level * Correlation is significant at the 0.05 level
Key: Part 1-A (Fear) A-NON =None TENS=Tension ANX= Anxiety FEA=Fear
Part 1-B (Aggression) B-NON=None DEF=Defensive ANG=Anger HOS=Hostility
In Table 4.11 the researcher uses a matrix to demonstrate relationships among
adjusted variables. Adjusted variables represent the numbers of times respondents
selected each possible option. The number of times responded have been grouped in
intervals beginning with 0, and proceeding 1-10, 11-20, 21-30, 31-40, 41-50, and 51-
60. All possible response options include Part 1-A A-NON (none), TENS (tension),
ANX (anxiety), FEA (fear), and Part 1-B B-NON (none) , DEF (defensive), ANG
(anger), and HOS (hostility).
A correlation between A-NON and B-NON is significant at the .01 level. A
correlation between ANX and ANG is significant at the .01 level. A correlation
between FEA and ANG is significant at the .01 level.
An inverse correlation between A-NON and DEF is significant at the .01 level.
An inverse correlation between A-NON and ANG is significant at the .01 level. An
inverse correlation between A-NON and ANG is significant at the .01 level. A
Groups B-NON DEF ANG HOS
A-NON .448** -.264** -.249** -.134
TENS -.153 .237* .086 .191*
ANX -.379** .224* .310** .074
FEA -.290** .221* .318** .015
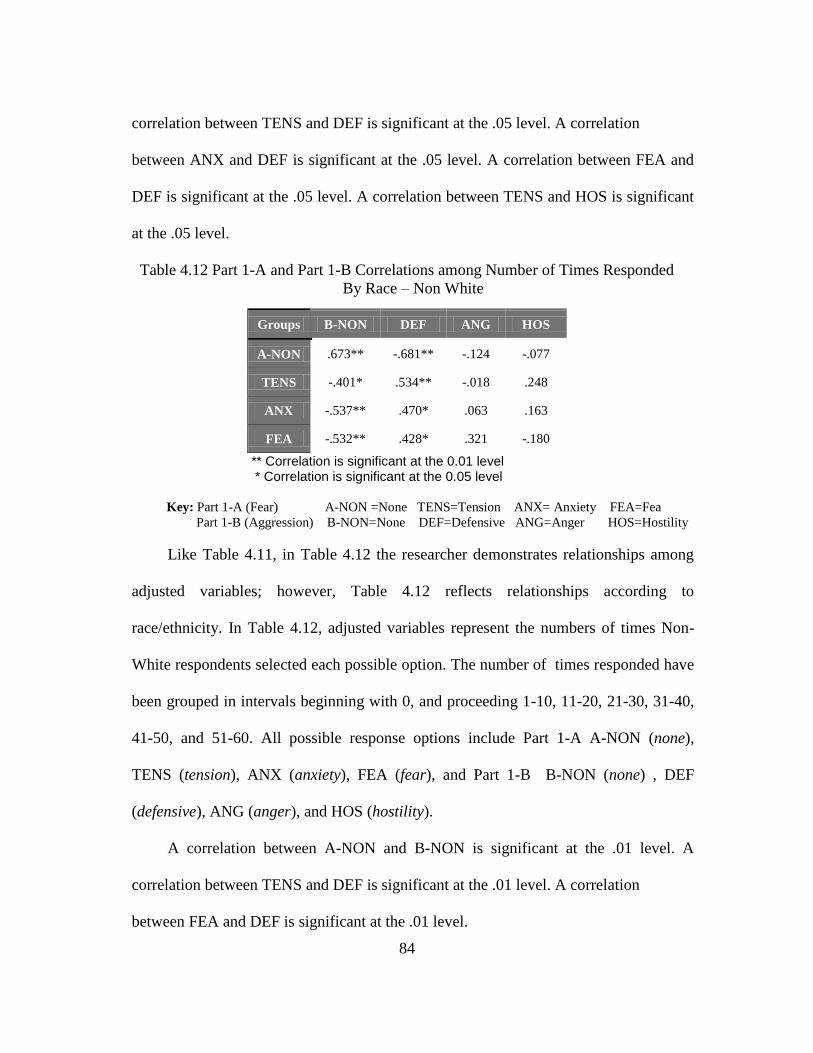
84
correlation between TENS and DEF is significant at the .05 level. A correlation
between ANX and DEF is significant at the .05 level. A correlation between FEA and
DEF is significant at the .05 level. A correlation between TENS and HOS is significant
at the .05 level.
Table 4.12 Part 1-A and Part 1-B Correlations among Number of Times Responded
By Race – Non White
** Correlation is significant at the 0.01 level * Correlation is significant at the 0.05 level
Key: Part 1-A (Fear) A-NON =None TENS=Tension ANX= Anxiety FEA=Fea
Part 1-B (Aggression) B-NON=None DEF=Defensive ANG=Anger HOS=Hostility
Like Table 4.11, in Table 4.12 the researcher demonstrates relationships among
adjusted variables; however, Table 4.12 reflects relationships according to
race/ethnicity. In Table 4.12, adjusted variables represent the numbers of times Non-
White respondents selected each possible option. The number of times responded have
been grouped in intervals beginning with 0, and proceeding 1-10, 11-20, 21-30, 31-40,
41-50, and 51-60. All possible response options include Part 1-A A-NON (none),
TENS (tension), ANX (anxiety), FEA (fear), and Part 1-B B-NON (none) , DEF
(defensive), ANG (anger), and HOS (hostility).
A correlation between A-NON and B-NON is significant at the .01 level. A
correlation between TENS and DEF is significant at the .01 level. A correlation
between FEA and DEF is significant at the .01 level.
Groups B-NON DEF ANG HOS
A-NON .673** -.681** -.124 -.077
TENS -.401* .534** -.018 .248
ANX -.537** .470* .063 .163
FEA -.532** .428* .321 -.180

85
An inverse correlation between A-NON and DEF is significant at the .01 level.
An inverse correlation between ANX and B-NON is significant at the .01 level. An
inverse correlation between FEA and B-NON is significant at the .01 level
A correlation between TENS and B-NON is significant at the .05 level. A
correlation between ANX and DEF is significant at the .05 level.
Table 4.13 Part 1-A and Part 1-B Correlations among Number of Times Responded
By Race – White
** Correlation is significant at the 0.01 level
* Correlation is significant at the 0.05 level
Key: Part 1-A (Fear) A-NON =None TENS=Tension ANX= Anxiety FEA=Fea
Part 1-B (Aggression) B-NON=None DEF=Defensive ANG=Anger HOS=Hostility
Like Table 4.12, Table 4.13 reflects relationships among adjusted variables by
race/ethnicity; however, in Table 4.13, adjusted variables reflect the numbers of times
White respondents selected each possible option. The number of times responded have
been grouped in intervals beginning with 0, and proceeding 1-10, 11-20, 21-30, 31-40,
41-50, and 51-60. All possible response options include Part 1-A A-NON (none),
TENS (tension), ANX (anxiety), FEA (fear), and Part 1-B B-NON (none) , DEF
(defensive), ANG (anger), and HOS (hostility).
Groups B-NON DEF ANG HOS
A-NON .394** -.150 -.271* -.156
TENS -.075 .143 .105 .177
ANX -.352** .159 .360** .033
FEA -.249* .209 .329** .069

86
A correlation between A-NON and B-NON is significant at the .01 level. A
correlation between ANX and ANG is significant at the .01 level. A correlation
between FEA and ANG is significant at the .01 level.
An inverse correlation between ANX and B-NON is significant at the .01 level.
An inverse correlation between FEA and B-NON is significant at the .05 level. An
inverse correlation between A-NON and ANG is significant at the .05 level.
4.6 Part 3 Cross-tabulations
70
80
70
90
44
77
62
40
50
89
81
43
0
10
20
30
40
50
60
70
80
90
100
A-None 31-40 A-Tension 11-20 A-Anxiety 1-10 A- Fear 0
Lowest
Low
Moderate
n=98
Missing 15
Figure 4.1 Part 3 Responses by Highest Percentage of Part 1-A Responses
(in percentages)

87
In figure 4.1 the researcher illustrates Part 3 responses to memory of emotionally
charged words compared to the highest number of Part 1-A responses for each of the
adjusted variables. For the adjusted variables, the number of times responded have been
grouped in intervals beginning with 0, and proceeding 1-10, 11-20, 21-30, 31-40, 41-50,
and 51-60. All possible response options include Part 1-A none, tension, anxiety, and
fear. Only the interval of the most frequent responses was selected.
For the word responses, the numbers of words have been grouped into 4 intervals
beginning with 0-1 as lowest and 8-9 as highest. The bars show the percentages of
respondents who provided responses in the most frequent interval for each variable by the
word memory intervals. No respondent provided enough emotionally charged words in
their response to rank in the highest interval, and only one respondent provided enough
words in the response to rank in the high interval. Because those words appeared to be
copied, rather than memorized, that response was excluded. The number of respondents
who provided responses to the Part 3 word memory section was 98, missing 15 of the
total number of survey respondents.
About 90% of those respondents who ranked in the lowest interval for memory of
emotionally charged words selected none 31-40 times in Part 1-A, about 70% selected
tension 11-20 times, about 80% selected anxiety 1-10 times, and about 70% selected fear
0 times.
Of those respondents who ranked in the low interval for memory of emotionally
charged words, about 40% selected none 31-40 times, about 62% selected tension 11-20
times, about 77% selected anxiety 1-10 times, and about 44% selected fear 0 times.

88
Respondents ranking in the moderate interval for memory of emotionally charged
words varied from those in the lowest and low intervals. About 43% selected none 31-40
times, 81% selected tension 11-20 times, 89% selected anxiety 1-10 times, and about
50% selected fear 0 times.
80
62
50
70
62
50
80
71
7780
75
80
0
10
20
30
40
50
60
70
80
B None 31-40 B Defensive 11-
20
B Anger 1-10 B Hostility 1-10
Lowest
Low
Moderate
n=98
Missing 15
Figure 4.2 Part 3 Responses by Highest Percentage of Part 1-B Responses
In figure 4.2 the researcher illustrates Part 3 responses to memory of emotionally
charged words compared to the highest number of Part 1-B responses for each of the
adjusted variables. For the adjusted variables, the number of times responded have been
grouped in intervals beginning with 0, and proceeding 1-10, 11-20, 21-30, 31-40, 41-50,
89
and 51-60. All possible response options include Part 1-A none, tension, anxiety, and
fear. Only the intervals of the most frequent responses were selected for each.
For the word responses, the numbers of words have been grouped into 4 intervals
beginning with 0-1 as lowest and 8-9 as highest. The bars show the percentages of
respondents who provided responses in the most frequent interval for each variable by the
word memory intervals. No respondent provided enough emotionally charged words in
their response to rank in the highest interval, and only one respondent provided enough
words in the response to rank in the high interval. Because those words appeared to be
copied, rather than memorized, that response was excluded. The number of respondents
who provided responses to the Part 3 word memory section was 98, missing 15 of the
total number of survey respondents.
About 80% of those respondents who ranked in the lowest interval for memory of
emotionally charged words selected none 31-40 times in Part 1-B, about 70% selected
defensive 11-20 times, about 80% selected anger 1-10 times, and about 80% selected
hostility 1-10 times.
Of those respondents who ranked in the low interval for memory of emotionally
charged words, about 62% selected none 31-40 times, about 62% selected defensive 11-
20 times, 71% selected anger 1-10 times, and about 75% selected hostility 1-10 times.
Respondents ranking in the ―moderate” interval for memory of emotionally
charged words varied from those in the lowest and low intervals. About 50% selected
none 31-40 times, 50% selected defensive 11-20 times, 77% selected anger 1-10 times,
and about 80% selected hostility 1-10 times.
90
Neither values nor intervals represented in Figures 1 and 2 are intended to infer
statistical significance, but rather to illustrate comparisons of data between Parts 1 A and
B and Part 3. Further, illustrations are intended to represent real value rather than
expected value. Accordingly the researcher is justified in electing not to re-assign interval
values to compensate for invalid or absent responses in the highest and high intervals,
and to exclude those intervals from the illustration.
The researcher will interpret findings in the following chapter as well as offer
suggestions for implications and limitations of those findings, and include suggestions for
opportunities to expand on current research through future studies. Chapter 5 will also
include the conclusion to this study.
91
CHAPTER 5
FINDINGS
In this chapter, the researcher will review the data from chapter 4 and provide an
interpretation of tables, matrices, and figures. The researcher will also discuss limitations
of the study, as well as policy implications and possibilities for public impact. Finally, the
researcher will offer recommendations for future studies and draw the study to
conclusion.
5.1 Interpretation of Data
5.1.1 Demographics
In the current study, conducted on the University of Texas at Arlington campus in
North Texas, demographic data collected from students, staff, faculty, and administrators,
suggested that most respondents could be characterized as middle to upper middle class
white female under the age of 44, claiming an occupation of either educator/ed. advisor
or student. The same data suggested that respondents may be least likely to be
characterized as non-white, particularly Asian or other, under-class male 63 years of age
or older, claiming an occupation of labor, researcher, or health care professional.
Most respondents identified as non-white may be Hispanic/Latino female
claiming an occupation of student or administrative professional, and an annual income
under $39,001 per year. Additionally, only non-white respondents claimed to be
unemployed, while whites claimed poverty-level income more often than non-whites.
92
Demographic data suggested that the majority of responses are likely to reflect
perceptions of females who are predominantly middle-class white children or
grandchildren of the baby boomer generation. Such characterization is important because
boomers are often defined by social values peculiar to their generation in which
perceptions of fear and aggression may have been propagated and reinforced by mass
media through symbolic realities rather than experiential realities. The effects of
symbolic reality were introduced in the review of the literature chastising the industry for
neglecting to use fear appeal in mass marketing strategies, as the boomer generation was
approaching a peak era of consumerism.
The second greatest number of responses was likely to reflect perspectives among
white upper class males of various ages and occupations, and the third greatest number
reflected Hispanic/Latino female perspectives. Asian, Black, and Native
American/American Eskimo perspectives were also represented, each as a clear minority,
and more likely to be female than male.
Based on the characterizations, demographic data indicated that the current study
reflects to some degree the stereotypical notions of diversity in the larger American
society. White females may be characteristically neither very rich nor very poor, and they
may outnumber their male counterparts. White men may be characterized across age
categories as elitist. Hispanic/Latina females may be characterized as working hard and
working cheap to achieve American middle-class status. Black women may be more
predominant than black men, and black men may be characterized as low-participant.
Asian groups may be characterized as few, and isolated, while the American

93
Indian/Eskimo population may actually be depleted or diluted to the point that very few
are necessary to represent the perspectives of their ethnic majority. Therefore, it may be
argued that the sample for the current study should be representative of the perspectives
of the greater University of Texas at Arlington campus population.
5.1.1.1 Validity
The goal of the current research was not, however, to challenge stereotypical
characterizations of any particular group. The goal was to explore emotive responses
commonly understood as fear and aggression, and to examine research data to discover
whether a relationship might be revealed between specific types of fear and aggression
when confronted with emotionally charged symbols. This was an important step in the
process of investigating the possibility that perceptions may validate the idea that neuro-
biological processes presented in the literature defining variations in emotional responses,
measured in conjunction with cognitive or learned emotive values attached to symbols,
may serve as predictors of violent criminal behavior or, conversely, predictors of non-
violent or non-criminal behavior. Moreover, the researcher expanded the goal to include
distinctions between non-white and white respondents in order to reveal whether
differences are evident in perceptions of types of emotive responses or whether
relationships between fear and aggression types vary – if any relationships are apparent --
between non-white and white respondents.
Survey data from the current research suggested that overall, the target population
is able to differentiate between types of emotive responses commonly collected under the
broader term of fear, as well as those commonly collected under the term of aggression,

94
after reading the simple definitions provided in the instructions for each of parts 1-A and
1-B of the survey. The definitions were constructed from a simplification of those
provided in the current review of the literature (see Appendix 1).
5.2 Patterns of Fear and Aggression
5.2.1 Symbols
Overall, data in Table 4.6 suggested that respondents were not fearful, but were
rather tense or anxious, and they were not often hostile or angry, but rather defensive
when presented with emotionally charged symbols. Data further suggested that, overall,
most respondents shared perceptions of color and object symbols more than they did
condition symbols, except in the case of conditions that represented a personal and local
threat.
5.2.1.1 Color Symbols
Evidence of the ability to understand and differentiate fear and aggression types
was indicated in some particularly interesting patterns revealed by both non-whites and
whites in their responses to color symbols, object symbols, and condition symbols. For
example, the color grey was the only color symbol for which respondents were most
likely to indicate that they felt no emotional response at all, neither among fear types nor
aggression types. Some respondents indicated, however, that among red, yellow, and
orange color symbols, they felt some tension or anxiety among fear types, and some
indicated that they felt defensive or felt anger or hostility among aggression types.

95
5.2.1.2 Object Symbols
Among the object symbols, responses to the swastika symbol indicated that
although most claimed to feel tension, some also claimed to feel anxiety among the fear
types, and among aggression types most claimed to feel defensive, while some felt anger.
It was important to notice that among object symbols listed in Table 4.6, most frequent
and least frequent responses provided some interesting information, but the from
responses to those symbols a more important picture begins to develop around those
types that are neither most or least frequent, but lie at the heart of the study. Among
object symbols in fear types, none and fear were the most and least frequent responses,
respectively. What lay between were the responses that revealed tension and anxiety
among some respondents.
5.2.1.3 Condition Symbols
More varied claims of emotional responses appeared among the condition
symbols in both fear and aggression types. Respondents were more likely to answer
condition symbols with tension among the fear types, and claim feeling defensive or
angry among the aggression types. An example of the beginning of a pattern among
condition symbols was revealed by responses to intruder, reckless driver, and rape. To
all three condition symbols, the least frequent response was none among both fear types
and aggression types, which means that most claimed to perceive some emotional
response to all three.
The only other condition symbols to which respondents least frequently selected
none were the pickpocket symbol and the cheating symbol, and in both cases none was

96
among the aggression types. This meant that respondents claimed to associate some
aggressive emotion with the symbol.
5.2.2 Controlling for Race/Ethnicity
5.2.2.1 Frequencies
When data was examined controlling for race/ethnicity, patterns begin to emerge
that suggest differences in emotional responses between non-white and white respondents
as illustrated in Table 4.7. While both groups most often claimed an emotional response
among both fear types and aggression types when presented with the condition symbols
intruder, reckless driver, and rape, non-white respondents were more likely to claim they
felt anxiety, while white respondents were more likely to claim they felt tension. In
addition, non-white respondents were likely to claim they felt angry about rape, whereas
white respondents were more likely to claim they felt defensive. According to current
literature, that should reveal that non-white respondents were more likely to claim a
passionate response (anger) that is only loosely interpreted as a reactive type of
aggression, while white respondents were more likely to claim a type of aggression
interpreted as strictly reactive to perceptions of threat.
Non-white respondents were likely to be split between no emotional response,
anxiety, and tension when confronted with al Qaeda, and were most likely to claim no
feelings of aggression. In contrast, white respondents were likely to claim tension and
anger. When presented with Osama bin Laden, non-white respondents were least likely to
be fearful, and split between no aggressive response and anger, while white respondents
were likely to claim a range of emotional responses and feelings of anger. Loud noises,

97
lazy people, and stupid people did not seem to elicit an emotional response from non-
white respondents, but most white respondents claim to feel tension and defensive.
Distinctions between perceptions of non-white and white respondents were also
revealed among fear type responses to a variety of other symbols such as noose, gun,
unattended packages, Obama, bad odors and Caucasian males. Additionally, distinctions
were revealed among aggression type responses to symbols such as open wounds,
pickpocket, gun, failure, people with deformities, swastika, the color yellow, large open
spaces, fighting, cheating, mistakes, confinement, and being watched.
5.2.2.2 Cross-tabulations
Differences in responses between non-white and white respondents were further
supported in Tables 4.8, 4.9, and 4.10. Overall, the patterns seemed similar: the highest
percentages of respondents responded less often as perceptions of emotional intensity
increased. The same pattern emerges for both fear types and aggression types. Among the
types, the greatest percentage of respondents who claimed no emotional response in Parts
1A and 1-B did so 31-40 times in each. Among types, the greatest percentage of
respondents claiming fear did so 1-10 times, the same as the greatest percentage of those
who claimed anger as well as those who claimed hostility.
5.2.2.3 Comparisons
The differences were reflected in the size of the percentages of respondents that
represented the greatest percentage of those who claimed the particular type. For
example, in Table 4.9, 93% of non-white respondents who claimed anger did so 1-10
times while in Table 4.10, 64% of whites who claimed anger did so 1-10 times. The
98
question then becomes, if a smaller percentage of white respondents claimed anger 1-10
times than did non-white respondents, where is the difference; did other white
respondents answer anger more times or fewer times than non-white respondents?
According to the data in table 4.10, the difference in the percentage can be found in 0
number of times responded which means that more white respondents were likely to
claim anger 0 times than non-whites, and less often claimed anger 1-10 times.
On the other end of the measure, 4% of each non-white and white respondents
claimed no emotional response among fear types 51-60 times. However, 7% of non-white
claimed no emotional response among aggression types 51-60 times as compared to 0%
of white respondents.
5.2.2.4 Correlations
Findings from frequencies, cross-tabulations, and comparisons already discussed
were further supported by correlations. Relationships between Part1-A variables and
Part1-B variables differed when controlled for race/ethnicity. As the researcher
demonstrates in Table 4.11, overall data indicates that a strong correlation seemed to
occur between none in both Parts 1-A and 1-B. Strong correlations were also suggested
between anxiety in Part 1-A and anger in Part 1-B, as well as fear in Part 1-A and anger
in Part 1-B. Strong inverse correlations seemed to occur between none in Part 1-A and
defensive I Part 1-B, as well as none in Part 1-A and anger in Part 1-B.
In light of demographic data, it was not surprising that correlations for white
respondents reported in Table 4.13 followed closely those reported in Table 4.11
considering the larger percentage of white respondents when compared to percentages of

99
non-white respondents. One difference that stood out among those identified as white
was that while positive correlations remain unchanged, the only strong inverse correlation
seemed to occur between anxiety in Part 1-A and none in Part 1-B.
Correlations of responses among non-white respondents indicated little in
common with the others. The three shared the correlation that seemed to occur between
none I Part 1-A and none in Part 1-B. Non-white and white respondents shared an inverse
correlation that seemed to occur between anxiety in Part 1-A and none in Part 1-B. For
non-white responses, strong correlation seemed to occur between fear in Part 1-A and
none in Part 1-B as well as between tension, anxiety, and fear in Part 1-A, and defensive
in Part 1-B.
For respondents overall, non-white and white, analysis of the data suggested it
may be likely that when respondents do not experience a fear type response they do not
experience an aggression type response. For non-whites and whites, perhaps low
percentages of anxiety responses in Part 1-A accounted for higher percentages of none
responses in Part 1-B.
More important, however, were those relationships that were not shared; those
different correlations that occurred between non-white and white responses that may be
helpful in understanding differing emotive responses and the ways specific relationships
between types of fear and types of aggression may predict differences in violent behavior
in non-white and white groups. In Table 4.13, strong correlations suggested that those
who identified as non-white may be more likely to feel defensive when they experience
tension, anxiety, or fear, while those who identified as white may be more likely to feel

100
anger when they experience anxiety or fear.
The difference in the way non-white groups and white groups responded to fear
type stimuli is important. The literature revealed that neuro-physiological processes are
different for defensive aggression than they are for angry aggression. Similarly, the cycle
of the emotional process varies among aggression types as does the pattern of
involvement among the organs of the human brain.
5.2.3 Structural Control
One area where race/ethnicity was not a consideration was in the analyses of Part
3 data. Part 3 data was constructed to serve as a structural control. According to the
literature, some individuals are unable to process the concept of emotion. Fearful or
aggressive behavior among such individuals is thought to be instrumental, a learned or
predetermined non-affective behavior for which symbolic triggers are not a function.
As illustrated in Figure 4.1, among fear types the largest percentage of those who
scored among the lowest in the word memory exercise, also selected none in Part 1-A 31-
40 times. From the same group, the largest percentage also selected fear 0 times. Among
aggression types as illustrated in Figure 4.2, the largest percentage of those who scored
among the lowest in the word memory exercise also selected ―none in Part 1-B 31-40
times, a percentage 20 points higher than those who scored among low, and 40
percentage points higher than those who scored ―moderate in the Part 3 word memory
exercise. However, contrary to the results in Part 1-A, the greatest percentage of those
who scored among the lowest in the Part 3 word memory exercise also selected defensive
11-20 times, anger 1-10 times, and hostility 1-10 times.

101
The large percentage of those who scored among the lowest in the Part 3 word
memory exercise who also selected none in each of Parts 1-A and 1-B 31-40 times, as
well as selecting fear in Part 1-A 0 times, suggested a possibility that none responses and
0 fear responses may be due to some respondents’ neuro-biological inability to process
the concept of emotion, and more definitively, failure to respond to symbolic stimuli. It is
unclear whether the possibility was supported in part 1-B since the largest percentage of
those who scored among the lowest in the Part 3 word memory exercise also selected
emotional aggression.
5.3 Policy Implications
5.3.1 Current Assumptions
Arguably, biological theories of criminal aggression present challenges to the
American criminal justice system. The American system is founded on the three part
assumption the researcher refers to as the three pronged fork of damnation. The three
pronged fork of damnation refers to the classical theories of criminology in assuming that
most humans are endowed with the capability to make rational choices, exercise free will
in their decision-making processes, and abide by those choices over time as in consent to
contractual agreements.
Biological theories of criminal behavior attempt to chip away at that assumption,
slowly revealing ways in which humans are separated from rational choice, free will, or
the ability to comprehend agreements or consequences over time. Currently, mental
illness, mental retardation, and youthful age categories are recognized in the American
justice system as conditions likely to interrupt any one or all three of the processes.

102
Crimes of passion are judged based on their likelihood of interrupting the process of
weighing the consequences, and defensive crimes are mitigated according to the
circumstances of the necessity to defend one’s self, one’s family, one’s property, or an
innocent other who might be in jeopardy of great harm or loss of life, because some
understanding is accepted that defense is an autonomic function of fear.
5.3.1.1 Weakening Assumptions
Biological theories of innocence have gained acceptance over the past 2 decades
in death penalty cases where genetic evidence in the form of deoxyribonucleic acid
(DNA) is tested to support or reject evidence of a crime, and substantiate or exonerate the
conviction of the accused. Utilization of DNA testing changed death penalty perceptions
among the public and within the justice system, as well as both conviction and sentencing
procedures in many areas of the United States.
Criminological research is not yet at the point where biological evidence predicts
conclusively that some particular physiological variable causes criminal aggression.
However, current literature appears to support the argument that some biological
processes may affect criminal behavior.
5.3.2. Call for Reform
Explanations for criminal behavior that are neuro-genetic, neuro-psychological ,or
even neuro-philosophical threaten to call for reform to the current system, suggesting that
the current crime control model supported by the three pronged fork of damnation be
abandoned in favor of revival of a new and modern rehabilitation model. Ideally,
rehabilitation could benefit the justice system and its agencies, as well as the offender.

103
Appropriate medical, psychological and social strategies, combined with pharmaceutical
intervention may serve to successfully treat symptoms of aggressive behavior, and allow
offenders to remain in their familiar social environments under the care of rehabilitation
professionals rather than in prisons. They may live in the care of their friend or relatives,
or they may be self-sufficient, participate in meaningful work, and achieve status in their
communities, ultimately relieving taxpayers of retributive as well as financial burdens
imposed in a punishment model.
5.3.3 Deterrence
This researcher would be remiss not to mention that biological causation could
dispel any proposition that punishment serves as a general or specific deterrent if death as
punishment is excluded. Although deterrence is commonly a subject of debate, an
offender for whom criminal behavior is a biological symptom may not be deterred by
means other than medical, psychiatric, or pharmaceutical intervention, and may require
rehabilitative social conditioning to overcome negative affect biological impulses.
5.4 Public Impact
The current literature supports the possibility that policy implications may be less
rehabilitation-friendly if the social climate is unforgiving. The danger lies in the
possibility that if biological causes of criminal behavior could be proven, offenders could
be permanently removed from the public, abused, mutilated, or executed. Worse,
ostracization, abuse, mutilation, or legal homicide could become measures to prevent
those who are diagnosed with symptoms defined as causal to criminal behavior from
committing crimes in the future. Worst of all, preventative practices could extend to

104
relatives and unborn children, implemented as preemptive measures against anyone who
may be diagnosed with a pre-disposition to criminal behavior.
Imposing biological pre-disposition to crime as a means of crime control could
have the effect of increasing the number of inmates serving extended sentences at an
increased cost to taxpayers, increasing demands on law enforcement and justice agencies
by charging practitioners with the responsibility to identify possible biological symptoms,
and implementation of pre-emptive strategies. Moreover, a diagnosis of biological pre-
disposition to criminal behavior could have the opposite effect of biological proof of
actual innocence. Innocent members of society could be pre-emptively deprived of
liberty, or even life, convicted without ever being accused of committing a criminal act.
Additional negative policy implications could attach to variations in biological
evidence by race or ethnicity. One could argue against controlling for race or ethnicity in
pursuit of evidence of biological causes of criminal behavior, and indeed, the current
literature does not review such controls. Allegations of disparity with regard to race and
ethnicity among the various agencies and processes of the American justice system
remain widespread in the first decade of the millennium, even though guarantees against
discrimination have been in place in America since the 1960s. Arguably, evidence of
biological causality of criminal behavior, especially violent aggression, among one
race/ethnicity or another, could trigger acts of mass containment, exile, neglect, or even
genocide against the at risk group.

105
5.5 Suggestions for Future Studies
The current research did not expand to analyze the relationship between fear and
aggression type responses and word memory responses controlling for race/ethnicity.
Future research could benefit from expanding on current data for that purpose or
collecting new data to explore whether differences occur in responses between the
groups.
Another capability of the instrument design is that a total matrix fear score and a
total matrix aggression score may be summed for comparison among the Parts. That
process was not completed for this study; perhaps it would be interesting to provide that
analysis in the future.
Much could also be learned from an analysis of the current data controlling for
gender, to learn whether responses among groups of females and groups of males indicate
consistency with current perceptions of female fear and aggression, as well as male fear
and aggression. Additionally, controlling for age could render suggestions about whether
fear and aggression types may be prevalent at one age or another, and controlling for
socio-economic status could reveal suggestions about types of fear and aggression among
groups in various income levels that could lead either to environmental inferences or
negative affect impact on status.
In the future, the survey could be distributed to a larger population, a general
population, or a different specific population. It may be of interest to distribute the survey
to a prison population and a justice system agency population in order to compare the
results. It may also be of interest to distribute the current instrument simultaneously with
106
one substituting a likert-type scale for the fear and aggression types in order to compare
results.
5.6 Conclusion
In conclusion, it can be argued that the current research supported the need
expressed in current literature to measure fear and aggression in terms of their respective
types, rather than across the broader concept. Further, responses indicated that typologies
were not unfamiliar to respondents and they were able to identify their perceptions based
on a brief definition. They also appeared to be capable of differentiating between
perceptions associated with fear types and those associated with aggression types.
More specifically, the current research reflects important perceptions of symbolic
triggers for fear and aggression types. Fear, as a type, was virtually ignored meaning that
overall, respondents claimed they were not afraid when confronted with symbolic triggers
previously thought to elicit a fear response. Respondents did feel tension and they felt
defensive, meaning they felt worried, apprehensive or tense, and a need may arise to
prepare to defend themselves against the possibility of threat they perceived from the
symbolic trigger.
Perhaps even more important, responses reflected more pronounced variations
when the data was controlled for race/ethnicity. Feelings of anxiety and anger emerged,
in definable patterns. Those variations reflected a marked difference in the way non-
white and white groups perceive symbolic triggers, and their reactions when confronted
with threat. Moreover, differences were not isolated to those symbols considered to be
racially charged.

107
It is unlikely that findings such as those presented in the current research could be
replicated without typologies, or without symbolic triggers. Further, the likert-type scales
common to perceptual data collection among socio-criminological researchers is unlikely
to provide a concise measurement of negative affect response when typologies are
condensed into one generalized concept such as occurs when utilizing the terms fear or
aggression. Further, if, as the literature suggests, a possibility exists that that some
humans are incapable of experiencing or identifying emotion, typologies and symbolic
triggers are key to structural control in order to consider which types some may or may
not recognize, and the percentages of those who cannot.
That is not to say that the general terms are void of value, or that likert-type scales
are obsolete or invalid. Rather, that the general terms as well as the likert-type scale serve
an important purpose, but should not be implemented as a staple package because it is
familiar or popular. Over use could be like continually trying to force the ears of Mills’
(2000) proverbial elephant onto its rear end and not understanding why the part doesn’t
quite fit.
If humans experience a typolologically distinct negative affect response to
emotionally charged stimuli, and if those responses vary among races/ethnicities as the
current research reflects, then perhaps social science has arrived at the door step of a new
paradigm in criminological research, one that may facilitate a revelation about the long
unanswered question posed in the introduction to this study, why some humans commit
crimes while others do not.
108
APPENDIX A
PRELIMINARY INFORMAL PERSONAL INTERVIEW QUESTIONNAIRE

109
Preliminary Informal Personal Interview Questionnaire
1. What symbol, if any, is most likely to incite feelings related to fear or anxiety?
2. What behavior, if any, is most likely to incite feelings related to fear or anxiety?
3. What color, if any, is most likely to incite feelings related to fear or anxiety?
4. What symbol, if any, is most likely to incite feelings related to anger or violence?
5. What behavior, if any, is most likely to incite feelings related to anger or violence?
6. What color, if any, is most likely to incite feelings related to anger or violence?

110
APPENDIX B
FEAR AND AGGRESSION TYPOLOGICAL SURVEY INSTRUMENT

111
Dear Respondent,
You are invited to participate in a research project that will explore perceptions of
emotional reference symbols. This study is conducted by a University of Texas,
Arlington graduate student as a required component of a thesis Master of Arts degree in
the Department of Criminology and Criminal Justice.
The information gathered in this study will provide the framework for a series of
analyses. First, the data from the surveys will be analyzed to reveal whether a
relationship occurs between any of the several variables. Second, the data set will be
examined to learn whether a correlation is evidenced between the fear and aggression
variables. Third, the overall fear and aggression scores will be compared in order to
assess whether one is more heavily weighted than another. In final analysis, data will be
reviewed controlling for age, gender, race/ethnicity, and socioeconomic status in order to
determine whether results are consistent with contemporary ideology.
Should you choose to participate, my hope is that I will be able to include your
responses in order to better understand perceptions of reference symbols as they pertain
to types of fear and aggression. Findings may be published as part of a thesis, included in
scholarly journals, and posted on the World Wide Web.
There are no known risks to you if you participate in this study. Responses to this
questionnaire are anonymous. The survey will in no way be identified with you
personally, nor will the survey personally identify you with any other respondent. In
order to assure your anonymity, you should not enter your name or email address on the
questionnaire.
Your participation is voluntary. We hope you will choose to take a few minutes
to complete the survey. There is no penalty if you choose not to participate. You may
exit the survey at any time by closing the window.
If you would like information regarding the general results of this study, or if you have
questions or concerns, please contact:
Donna Salazar A. del Carmen, PhD
[email protected] [email protected]
or contact
IRB, UT Arlington at 817-272-3729.
This project has been approved by the University of Texas at Arlington Institutional
Review Board.
By following this link,
you are providing your implied consent
to participate in this survey.
(Link Here)

112
Thank you for your willingness to participate.
This study involves no known risk to you as a participant
Responses to this questionnaire are anonymous.
The survey will in no way be identified with you personally, nor will the survey personally identify you with any other respondent. In order to assure your anonymity, you should not enter your name or email address on the questionnaire.
Your participation is voluntary.
There is no penalty if you choose not to participate. Should you choose to participate, you have the option not answer any question that makes you feel uncomfortable, or to quit at any time during the questionnaire without any consequence to you by simply closing the window.
It is our hope that we will be able to include your responses in order to better serve the UT Arlington community. Findings will be made public and published in UTAPD annual reports.
This questionnaire should take approximately 20 minutes to complete. A link to the survey form has been activated for your convenience. If you are at least 18 years of age, and choose to participate, please click on the link below. Clicking on the link will initiate the voluntary survey form.
If you have any questions or concerns regarding this survey please contact:
Donna Salazar A. del Carmen, PhD [email protected] [email protected]
Or contact
IRB, UT Arlington at 817-272-3729.
This project has been approved by The University of Texas at Arlington Institutional Review Board
(Participants must be at least 18 years old to participate in this survey)
By following this link you are providing your implied consent to participate. (link here)

113
Self Administered Electronic Questionnaire
Fear and Aggression: Typological Emotive Responses to Textual Symbols
Instructions for Part 1 -A:
Please read the following definitions:
0. None-none of the available responses
1. Interest- you would like to know more about it
2. Concern- it bothers you
3. Worry-it bothers you a lot and it bothers you often
4. Apprehension- something bad might happen
5. Tension-your face or body feels tight when you think about it
6. Anxiety-you feel that you must defend yourself or escape
7. Fear-your heart races, you may have a cold sweat, you seem paralyzed
8. Panic- your heart races, you may have a cold sweat, you seem paralyzed, you feel you cannot defend yourself or escape
9. Terror- your heart races, you may have a cold sweat, paralysis, cannot recover clear thought process
Please read the following words or phrases. Then fill in the bubble that best represents the way you feel about that
word or phrase. Please choose only one answer for each.
Please do not spend too much time on any one response. It is important that you answer quickly, not spending more
than 10 seconds on each.
Example:
101. Dog

114
None Interest Concern Worry Apprehension Tension Anxiety Fear Panic Terror
1. Open wounds
2. Pick-pocket
3. Being alone
4. Noose
5. Hispanic Males
6. Purple
7. Dead people
8. Gun
9. Caucasian Females
10. Red
11. Intruder
12. Reckless Driver
13. Confederate Flag
14. Falling
15. African American Males
16. Brown
17. People with deformities
18. Caucasian Males
19. War
Part 1-A

115
20. Unattended packages
21. Native American Males
22. Blue
None Interest Concern Worry Apprehension Tension Anxiety Fear Panic Terror
23. Profanity
24. Knife
25. Darkness
26. Asian Females
27. Swastika
28. Failure
29. Strangers
30. Sword
31. Yellow
32. Rape
33. Large open spaces
34. Being watched
35. Obama
36. Tattoos
37. White
38. Hispanic Females
39. Strange shapes
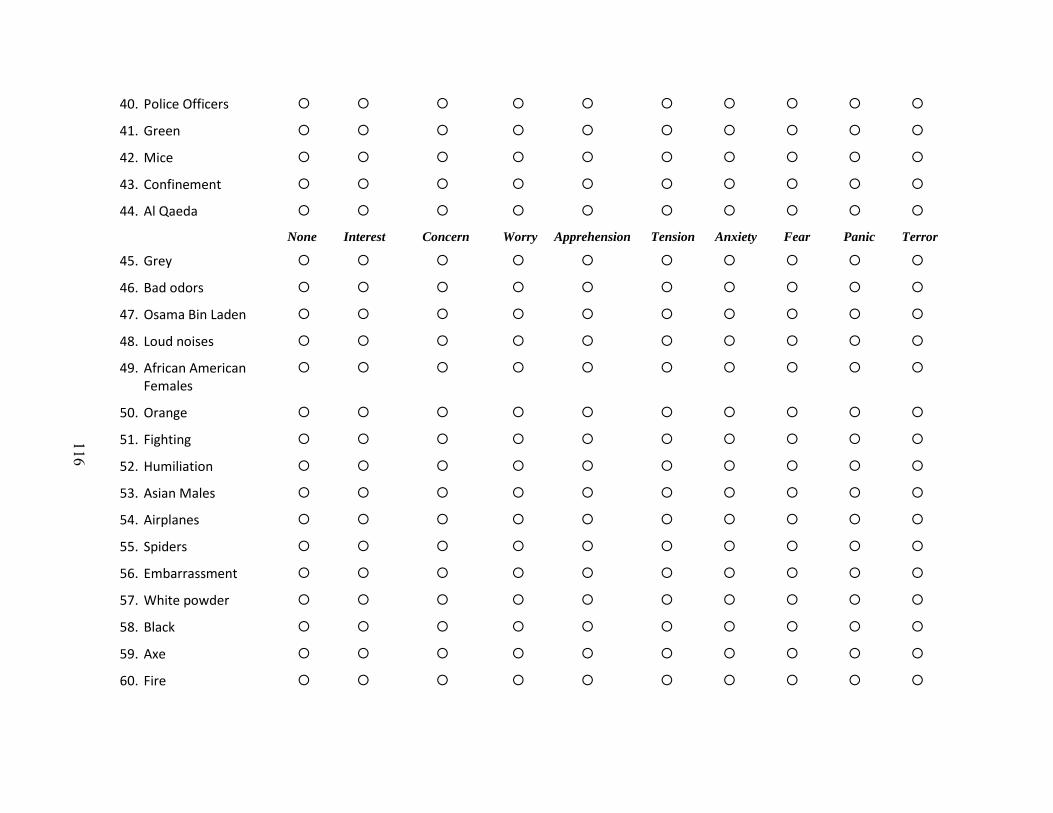
116
40. Police Officers
41. Green
42. Mice
43. Confinement
44. Al Qaeda
None Interest Concern Worry Apprehension Tension Anxiety Fear Panic Terror
45. Grey
46. Bad odors
47. Osama Bin Laden
48. Loud noises
49. African American Females
50. Orange
51. Fighting
52. Humiliation
53. Asian Males
54. Airplanes
55. Spiders
56. Embarrassment
57. White powder
58. Black
59. Axe
60. Fire
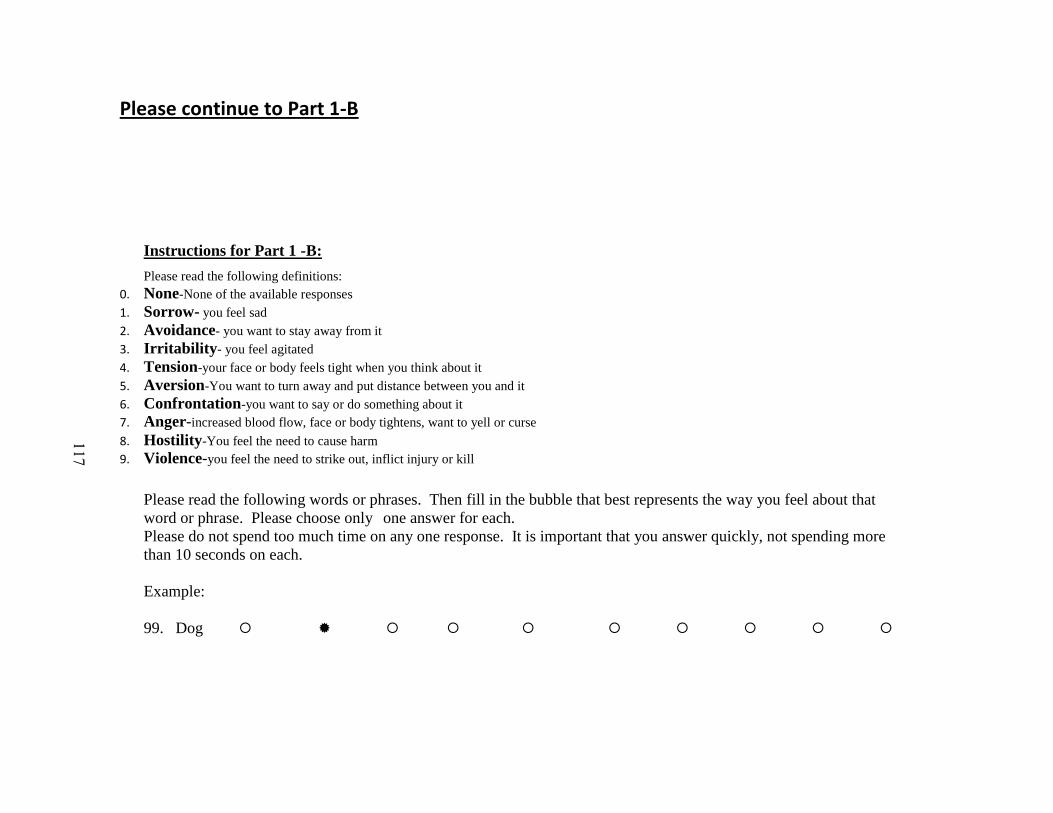
117
Please continue to Part 1-B
Instructions for Part 1 -B:
Please read the following definitions:
0. None-None of the available responses
1. Sorrow- you feel sad
2. Avoidance- you want to stay away from it
3. Irritability- you feel agitated
4. Tension-your face or body feels tight when you think about it
5. Aversion-You want to turn away and put distance between you and it
6. Confrontation-you want to say or do something about it
7. Anger-increased blood flow, face or body tightens, want to yell or curse
8. Hostility-You feel the need to cause harm
9. Violence-you feel the need to strike out, inflict injury or kill
Please read the following words or phrases. Then fill in the bubble that best represents the way you feel about that
word or phrase. Please choose only one answer for each.
Please do not spend too much time on any one response. It is important that you answer quickly, not spending more
than 10 seconds on each.
Example:
99. Dog

118
None Sorrow Avoidance Irritability Tension Aversion Confrontation Anger Hostility Violence
1. Open wounds
2. Pick-pocket
3. Being alone
4. Noose
5. Hispanic males
6. Purple
7. Dead people
8. Gun
9. Caucasian females
10. Red
11. Intruder
12. Reckless drivers
13. Confederate Flag
14. Failure
15. African American males
16. Brown
17. People with deformities
18. Caucasian males
19. War
20. Unattended packages
Part 1-B
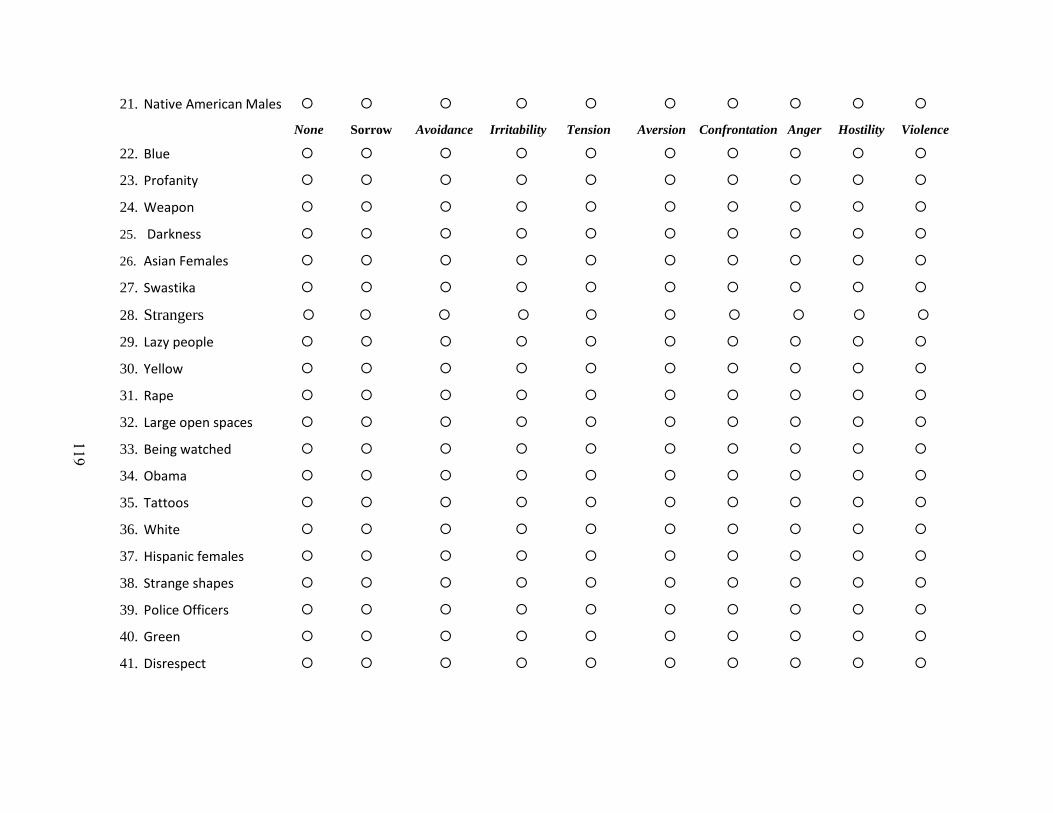
119
21. Native American Males
None Sorrow Avoidance Irritability Tension Aversion Confrontation Anger Hostility Violence
22. Blue
23. Profanity
24. Weapon
25. Darkness
26. Asian Females
27. Swastika
28. Strangers
29. Lazy people
30. Yellow
31. Rape
32. Large open spaces
33. Being watched
34. Obama
35. Tattoos
36. White
37. Hispanic females
38. Strange shapes
39. Police Officers
40. Green
41. Disrespect

120
42. Confinement
43. Al Qaeda
None Sorrow Avoidance Irritability Tension Aversion Confrontation Anger Hostility Violence
44. Grey
45. Bad odors
46. Osama Bin Laden
47. Loud noises
48. African American
Females
49. Orange
50. Fighting
51. Humiliation
52. Asian Males
53. Cop
54. Mistakes
55. Black
56. Cheating
57. Stupid people
58. Arrogance
59. Pink
60. Fire
Please continue to Part 2

121
Instructions for Part 2:
Please read question. Then fill in the bubble that best describes you. Please choose only one answer for each question.
1. What is your age group?
18-26
27-35
36-44
45-53
54-62
Over 63
2. Which of the following best describes your race/ethnicity?
Asian
Black
Hispanic/Latino
Native American/American Eskimo
White
Other (please specify)________________________
Part 2

122
3. What is your gender?
Female
Male
4. Which of the following best describes your annual gross income?
0-$12,000
$12,001-$19,000
$19,001-$26,000
$26,001-$39,000
$39,001-$62,000
$62,001-$96,000
over $96,000
5. Which of the following includes the highest grade or degree you completed in school?
0-8th grade
9th -12th grade
Associates Degree
Bachelors Degree
Masters Degree
Terminal Degree (such as PhD, JD, MD, etc.)

123
6. What is your major field of interest?
(please specify)_____________________________________
7. Which of the following best describes your current occupation?
Student
Unemployed
Laborer
Service Worker
Public Service Worker
Educator
Researcher
Management Professional
Administrative Professional
Other (Please Specify)___________________________
8. Are you now, or have you ever been a member of the armed forces or any law enforcement agency?
Yes
No
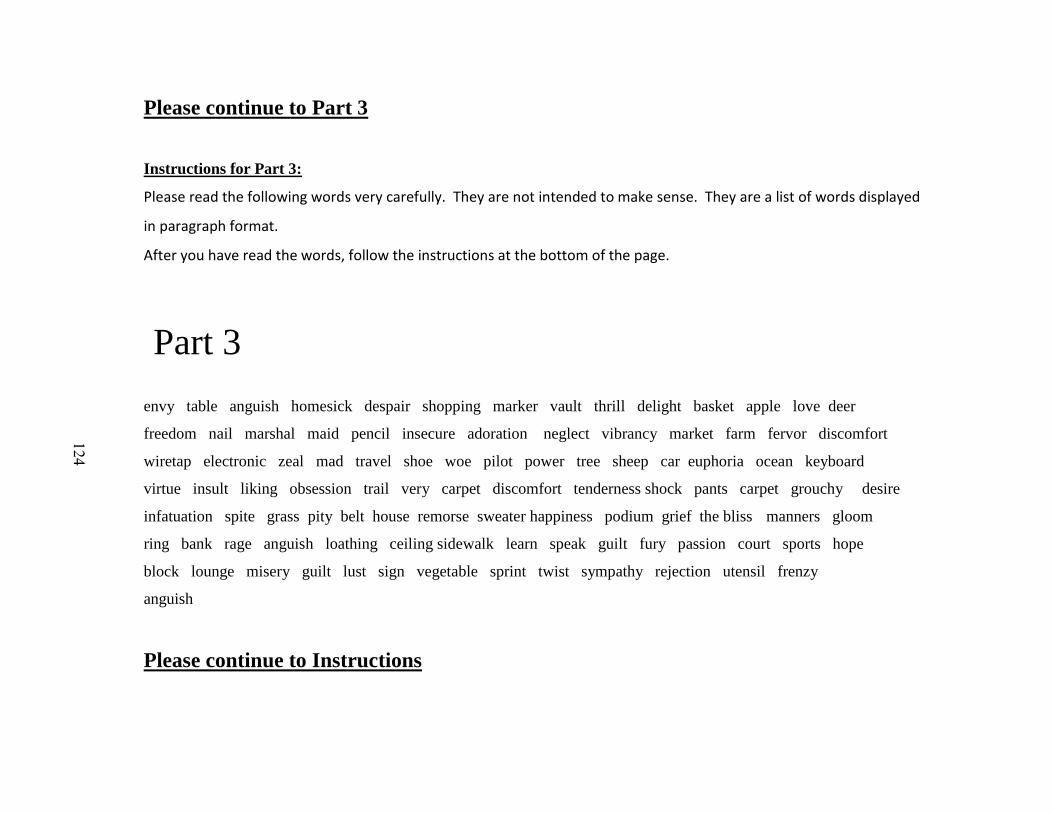
124
Please continue to Part 3
Instructions for Part 3:
Please read the following words very carefully. They are not intended to make sense. They are a list of words displayed
in paragraph format.
After you have read the words, follow the instructions at the bottom of the page.
envy table anguish homesick despair shopping marker vault thrill delight basket apple love deer
freedom nail marshal maid pencil insecure adoration neglect vibrancy market farm fervor discomfort
wiretap electronic zeal mad travel shoe woe pilot power tree sheep car euphoria ocean keyboard
virtue insult liking obsession trail very carpet discomfort tenderness shock pants carpet grouchy desire
infatuation spite grass pity belt house remorse sweater happiness podium grief the bliss manners gloom
ring bank rage anguish loathing ceiling sidewalk learn speak guilt fury passion court sports hope
block lounge misery guilt lust sign vegetable sprint twist sympathy rejection utensil frenzy
anguish
Please continue to Instructions
Part 3
125
Instructions for completing Part 3
Once you have reached this page, please do not go back and reread the words in the previous exercise. In the space
provided below, please write as many words as you can remember from the paragraph.
Please do not refer back to the paragraph.
There is no right or wrong word and there is no right or wrong number of words. You are encouraged to write as
many words as you think you may have read.
Please continue to FINISH
(Please type words here)
126
Your survey is now complete!
Thank you for taking the time to participate. Your responses are very important to us.
Should you have any questions or concerns about this survey or the information it will provide, please do not hesitate to contact us at:
Donna Salazar A. del Carmen, PhD
[email protected] [email protected]
or contact IRB, UT Arlington at 817-272-3729.
You may exit this survey by closing this window
127
REFERENCES
American HeritageDictionary, (2003). The American heritage dictionary of the english
language, (4th
ed.). Boston, MA: Houghton Mifflin Company.
Alia-Klein, N., Goldstien, R.Z., Kriplani, A., Logan, J., Tomasi, D., & Williams, B.
(2008). Brain monoamine oxidase A activity predicts trait aggression. The
Journal of Neuroscience. 28(19), 5099-5104.
Anderson, A.K., & Phelps, E.A. (2000). Expression without recognition: Contributions of
the human amygdala to emotional communication. American Psychological
Society. II(2), 106-111.
Aristotle, (350 B.C. E). Prior Analytics. trans. A.J. Jenkinson: Greece.
Ax, A.F. (1953).The physiological differentiation between fear and anger in humans.
Psychomatic Medicine. 15, 433-442.
Baron, M. (2001).Chapter 8. In D.T. Wasserman, & R.S. Wachbrait (Eds.), Genetics and
criminal behavior. New York, NY: Cambridge University Press.
Belk, R.W., Bahn, K.D., & Mayer, R.N. (1982). Developmental recognition of
consumption symbolism. The Journal of Consumer Research. 9(1), 4-17.
Ben Zur, H. (2002).Associations of Type A behavior with the emotional traits of anger
and curiosity. Anxiety Stress and Coping. 15(1), 95-104.
Blank, R.H. (2005). The brain, aggression, and public policy. Politics and the Life
Sciences. 24 (1/2), 12-21.

128
Blumer, Herbert. 1969. Symbolic Interactionism: Perspective and Method. Englewood
Cliffs, NJ: Prentice-Hall.
Boissy, A. (1995).Fear and fearfulness in animals. The Quarterly Review of Biology.
70(2), 165-191.
Boissy, A., & Bouissou, M.F. (1994). Effects of androgen treatment on behavioral and
physiological responses of heifers to fear eliciting situations. Hormones and
Behavior. 28, 66-83.
Bower, B. (2000).Mass illness tied to contagious fear. Science News. 157, 37.
Brooks-Gunn, J., Graber, J.A., & Paikoff, R.L. (1994). Studying links between hormones
and negative affect models and measures. Journal of Research on Adolescence.
4(4), 469-486.
Brown, T. (1642). Religio Medici. New York, NY: Cambridge University Press.
Clark, M.J. (1986). Illusion and delusion: The media and the natural scientist. Leonardo.
19(1), 65-70.
Cohen, L.E., & Felson, M. (1979). Social change and crime rate trends: A routine activity
approach. American Sociological Review. 44(4), 588-608. Readings, Third
Edition. Oxford University Press, 2006.
Darwin, C. (1872). The Expression of the Emotions in Man and Animals. New York, NY:
D. Appleton & Co.
Davis, M., Walker, D.L., & Lee, Y. (1997). Amygdala and bed nucleus of the stria
terminalis: Differential roles in fear and anxiety measured with the acoustic startle
reflex. Phil. Trans. R. Soc. Lond. B. 352, 1675-1687.
Denton, R.E. (2004).Language, symbols, and media. Society. 42(1), 12-18.

129
Ellis, L. & Walsh, A. (2006). Gene-based evolutionary theories in criminology. In F.T.
Cullen and R. Agnew (Eds.), Criminological theory: Past to present essential
readings, (3rd
ed.). New York, NY: Oxford University Press, Inc.
Eriksson, M., Berggren, C., Fahlke, J., Engel, J., & Balldin, J. (2006). Platelet
monoamine oxidase B (MAO-B) activity and its relationship to DL-fenfluramine-
induced prolactin response in healthy men. Journal of Neural Transmission. 113,
33-41.
Feldman, J.M. (1985).Monoamine and diamine oxidase activity in the diagnosis of
carcinoid tumors. Cancer. 56(12), 2855-2860.
Feldman, J.M., Farrell, R.E., & Wells, S.A. (1979). Seratonon metabolism and platelet
monoamine oxidase activity in patients with medullary carcinoma of the thyroid
and pheochromocytoma. American Journal of Medical Science. 278(1), 39-48.
Ferrell, J. (1999).Cultural criminology. Annual Review of Sociology. 25, 395-418.
Fisher, B. (1995).Crime and fear on campus. Annals, American Academy of Political and
Social Science. 539, 85-101.
Gabriel, U., & Greve, W. (2003). The psychology of fear of crime. British Joutrnal of
Criminology. 43, 600-614.
Goleman, D. (1995). Emotional Intelligence. Philadelphia, PA: Bantam Doubleday Dell
Publishing Group.
Holahan, C.J. (1986).Environmental psychology. Annual Reviews Psychology. 37, 381-
407.
Hollway, W., & Jefferson, T. (1997). The risk society in an age of anxiety: Situating fear
of crime. The British Journal of Sociology. 48(2), 255-266.

130
Isenberg, N., Silbersweig, D., Engelein, A., Emmerich, S., Malvade, K., & Beattie, B.
Leon, A.C., & Stern, E.(1999). Linguistic threat activates the human amygdala.
Proc. of the. National Academy of Science USA. 96, 10456-10459.
Ivan Pavlov Website. (2008). Retrieved on November 25, 2008 from
http://www.ivanpavlov.com.
iThyroid. (2009). Retrieved on 04 April, 2009 from
http://www.ithyroid.com/mao_and_maoi.htm
Jeffery, C. R. (1990). Criminology: An interdisciplinary approach. Englewood Cliffs, NJ:
Prentice Hall, Inc.
Kemper, T. (1987). How many emotions are there? Wedding the social and autonomic
components. American Journal of Sociology. 93(2), 263-289.
Kleck, G. & Gertz, M. (1995). Armed resistance to crime: The prevalence and nature of
self-defense with a gun. The Journal of Criminal Law and Criminology. 86(1),
150-187.
Kollerstrom, N. (2006).Violent crime, hyperactivity and metal imbalance. The Nutrition
Practitioner. Summer, 1-8.
Leonard, K.N., Telch, M.J., & Owen, K.K. (2000). Fear response to dissociation
challenge. Anxiety, Stress, and Coping. 13, 355-369.
Liu, J. (2004). Concept analysis: Aggression. Issues in Mental Health Nursing. 25(7),
693-674.
Loewenstein, J.P. (1941).The swastika: Its history and meaning. Man. 41, 48-55.
Lombroso, C. (1876). Criminal Man. Italy: unknown.
131
Maybin, J. (1994). In J. Maybin (Ed.) Language and literacy in social practice: A reader.
Bristol, UK: Multilingual Matters.
Mills, C.W. (2000). The Sociological Imagination, fortieth anniversary edition. New
York, NY: Oxford University Press, Inc.
Neilsen, J. (1970).Criminality among patients with Kleinfelters syndrome and the XYY
syndrome. The British Journal of Psychiatry. 117, 365-369.
Northwestern Law. (1978).The Constitutional protection of the swastika. The Journal of
Law and Criminology. 69(3), 367-371.
Paus, T. (2005).Mapping brain development and aggression. The Canadian Child and
Adolescent Review. 14(1), 10-15.
Pavlov, I.P. (1941). Lectures on Conditioned Reflexes, Volume II: Conditioned Reflexes
and Psychiatry. W. Horsley Gantt, Lawrence & Wishart Ltd. (eds.), London, UK.
Retrieved on April 2, 2008 from http://www.heretical.com/pavlov/chap-56.html
Pick, D. (1986). The faces of anarchy: Lombroso and the politics of criminal science in
post-unification Italy. History Workshop. 21, 60-86.
Rafter, N. (2008). The criminal brain: Understanding biological theories of crime. New
York, NY: New York University Press.
Raine, A., Lencz, T., Bihrle, S., LaCasse, L., & Colletti, P. (2000). Reduced prefrontal
grey matter volume and reduced autonomic activity in antisocial personality
disorder. Archives of General Psychiatry. 57, 119-127.
Raine, A. & Sanmartin, J. (2001). In A, Raine & J. Sanmartin (Eds.), Violence and
psychopathy. New York, NY: Plenum Publishers.
132
Raine, A. (2002). The biological basis of crime. In J.Q. Wilson, & J. Petersilia (Eds.),
Crime: Public policies for crime control. Oakland, CA: ICS Press.
Ray, M.L., & Wilkie, W.L. (1970). The potential of an appeal neglected by marketing.
The Journal of Marketing. 34(1), 54-62.
Reiss, S. (1991).Expectancy model of fear, anxiety, and panic. Annual Reviews of
Psychology. 11, 141-153.
Ressler, K.J., Rothbaum, B.O., Tannenbaum, L., Anderson, P., Graap, K., & Zimand, E.,
Hodges, L., & Davis, M. (2004). Cognitive enhancers as adjuncts to
psychotherapy: Use of D-Cycloserine in phobic individuals to facilitate extinction
of fear. Archives of General Psychiatry. 61, 1136-1144.
Seppa, N. (2005). Heartfelt fear: Findings link stress and cardiac symptoms. Science
News. 167, 100-101.
Shaver, P., Schwartz, J., Kirkson, D., & O’Connor, C. (1987). Emotion knowledge:
Further exploration of a prototype approach. Journal of Personality and Social
Psychology. 52, 1061-1086.
Sheldon, W. (1940). The varieties of human physique: An introduction to constitutional
psychology. New York, NY: Harper.
Soanes, C. (Ed.). (2003). Compact Oxford English dictionary, (2nd ed. Revised). Oxford,
U.K.: Oxford University Press.
Stalenheim, E.G. (2003).Long-term validity of biological markers of psychopathy and
criminal recidivism: Follow-up 6--8 years after forensic psychiatric investigation.
PsychiatryResearch. 121, 281-291.

133
Stober, J., & Muijs, M. (2001). Patterns of situational appraisal in experiences of worry
and anxiety. Anxiety, Stress, and Coping. 14, 367-390.
Stober, J., Tepperwein, S., & Staak, M. (2000). Worrying leads to reduced concreteness
of problem elaborations: Evidence for the avoidance theory of worry. Anxiety,
Stress, and Coping. 13, 217-227.
Surette, R. (2007). Media, crime, and criminal justice: Images and realities, (3rd. ed.).
Belmont, CA: Thompson Wadsworth.
Tewksbury, R., & Mustaine, E.E. (2003). College students' lifestyles and self-protective
behaviors. Criminal Justice and Behavior. 30, 302-324.
Travis, J. (2004). Fear not: Scientists are learning how people can unlearn fear. Science
News. 165, 42-44.
Upadhyaya, I., Agrawal, J.K., Dubey, G.P., & Udupa, K.N. (1992). Monoamine oxidase
(MAO) and monoamine oxidase inhibitors (MAOIs). Acta Endoccinology,
126(4), 315-118.
Vakratsas, D., & Ambler, T. (1999). How advertising works: What do we really know?
The Journal of Marketing. 63(1), 26-43.
Vaillancourt, T., Brendgen, M., Boivin, M., & Tremblay, R.E. (2003). A longitudinal
confirmatory factor analysis of indirect and physical aggression: Evidence of two
factors over time? Child Development. 74(6), 1628-1638.
Volavka, J. (1999).The neurobiology of violence: An update. Journal of Neuropsychiatry
and Clinical Neurosciences. 11(3), 307-314.
Vold, G.B., Bernard, T.J., & Snipes, J.B. (2002). Theoretical Criminology, (fifth ed.).
New York, NY: Oxford University Press, Inc.

134
Walsh, W.J., Isaacson, H.R., Rehman, F., & Hall, A. (1997). Elevated blood copper/zinc
ratios in assaultive young males. Physiological Behavior, 62(2), 327-329.
Weiss, J.M., McEwen, B.S., Silva, M.T.A., & Kalkut, M.F. (1969). Pituitary-adrenal
influences on fear responses. Science News, 163, 197-199.
Wilcox, P., Jordan, C.E., & Pritchard, A.J. (2007). A multidimensional examination of
campus safety: Victimization, perceptions of danger, worry about crime, and
precautionary behavior among college women in the post-Clery era. Crime &
Delinquency. 53, 219-254.
Wolpe, J., & Lang, P. J. (1969).Manual for the Fear Survey Schedule. San Diego, CA:
Educational and Industrial Testing Service.
Wolpe, J., & Lang, P. J. (1977).Manual for the Fear Survey Schedule (revised). San
Diego, CA: Educational and Industrial Testing Service.
Zhu, J. (2004). Passive action and causalism. Philosophical Studies: An International
Journal for Philosophy in the Analytic Tradition. 119(3), 295-314.

135
BIOGRAPHICAL INFORMATION
Donna earned both her Bachelor of Arts degree and her Master of Arts degree in
Criminology and Criminal Justice at the University of Texas at Arlington. Her research
interests include integrated theories of criminal behavior and biological theory, as well as
conflict theory and controlology. In addition, Donna is interested in wrongful
convictions, terrorism, and white collar crime.