Village Arlington Heights Annual 2022 Budget
488
VILLAGE OF ARLINGTON HEIGHTS, ILLINOIS OPERATING BUDGET 2022 Beginning January 1, 2022 PROPOSED VILLAGE OF ARLINGTON HEIGHTS, ILLINOIS 33 S. Arlington Heights Road Arlington Heights, Illinois 60005-1499
-
Upload
khangminh22 -
Category
Documents
-
view
1 -
download
0
Transcript of Village Arlington Heights Annual 2022 Budget

VILLAGE OF ARLINGTON HEIGHTS, ILLINOIS
OPERATING BUDGET 2022
Beginning January 1, 2022
PROPOSED
VILLAGE OF ARLINGTON HEIGHTS, ILLINOIS 33 S. Arlington Heights Road
Arlington Heights, Illinois 60005-1499

VILLAGE OF ARLINGTON HEIGHTS
OPERATING BUDGET 2022
Beginning January 1, 2022
PROPOSED
VILLAGE BOARD Thomas W. Hayes, Village President
Richard Baldino, Trustee Robin La Bedz, Trustee James J. Bertucci, Trustee John Scaletta, Trustee Mary Beth Canty, Trustee Thomas F. Schwingbeck Jr., Trustee Nicole Grasse, Trustee Jim Tinaglia, Trustee
VILLAGE MANAGER Randall R. Recklaus
FINANCE DIRECTOR/TREASURER Thomas F. Kuehne

TABLE OF CONTENTS INTRODUCTION
Village Administration ........................................................................................................................................................ i
Organizational Chart ........................................................................................................................................................ ii
2022-2023 Strategic Priorities ......................................................................................................................................... iii
Transmittal Letter from the Village Manager ................................................................................................................... iv
Budget & Financial Plan Calendar ................................................................................................................................. xx
Community Revenue Survey ........................................................................................................................................ xxi
GFOA Distinguished Budget Presentation Award ........................................................................................................ xxii
Financial Performance Goals ....................................................................................................................................... xxiii
Budget Document Purpose & Content ........................................................................................................................ xxvii
Department/Fund Relationship .................................................................................................................................... xxx
FINANCIAL SUMMARIES All Funds Summary .......................................................................................................................................................... 1
Fund Balance Summary ................................................................................................................................................... 2
All Funds Revenues and Expenditures ............................................................................................................................ 4
All Funds Graph – Where the Money Comes From ......................................................................................................... 5
All Funds Graph – Where the Money Goes ..................................................................................................................... 6
Property Tax Bill .............................................................................................................................................................. 7
General Fund Graph – Where the Money Comes From .................................................................................................. 8
General Fund Graph – Where the Money Goes .............................................................................................................. 9
Water & Sewer Fund Graph – Where the Money Comes From ..................................................................................... 10
Water & Sewer Fund Graph – Where the Money Goes ................................................................................................. 11
Employee Census .......................................................................................................................................................... 12
Expenditures & Staffing Summary by Operation ............................................................................................................ 13
Interfund Transfers Detail ............................................................................................................................................... 14
CIP / DEBT SERVICE Capital Improvement Program Summary ....................................................................................................................... 15
CIP Five Year Spending and Funding Summary ........................................................................................................... 16
CIP Impact on Operating Budget ................................................................................................................................... 19
Debt Summary ............................................................................................................................................................... 20
Summary of Outstanding Bond Issues / Annual Debt Service Requirements ............................................................... 23

TABLE OF CONTENTS (Continued)
GENERAL FUND ........................................................................................................................................................................ 25
Fund at a Glance ............................................................................................................................................................ 25 General Fund Expenditure Summary & Graph .............................................................................................................. 27 General Fund Revenues ................................................................................................................................................ 28 General Fund Revenue - Notes ..................................................................................................................................... 31
Board of Trustees ........................................................................................................................................................ 41 Narrative, Goals & Objectives and Performance Measures ........................................................................... 42 Operation Summary ....................................................................................................................................... 43 Expenditures ................................................................................................................................................... 44 Expenditure Detail .......................................................................................................................................... 45
Integrated Services ...................................................................................................................................................... 47 Narrative, Goals & Objectives and Performance Measures ........................................................................... 48 Operation Summary ....................................................................................................................................... 53
Personnel Summary ....................................................................................................................................... 54 Expenditures ................................................................................................................................................... 55 Expenditure Detail .......................................................................................................................................... 56
Human Resources Department ................................................................................................................................... 59 Narrative, Goals & Objectives and Performance Measures ........................................................................... 60 Operation Summary ....................................................................................................................................... 64 Personnel Summary ....................................................................................................................................... 65 Expenditures ................................................................................................................................................... 66 Expenditure Detail .......................................................................................................................................... 67
Legal Department ......................................................................................................................................................... 69 Narrative, Goals & Objectives and Performance Measures ........................................................................... 70 Operation Summary ....................................................................................................................................... 72 Personnel Summary ....................................................................................................................................... 73 Expenditures ................................................................................................................................................... 74 Expenditure Detail .......................................................................................................................................... 75
Finance Department ..................................................................................................................................................... 77 Narrative, Goals & Objectives and Performance Measures ........................................................................... 78 Operation Summary ....................................................................................................................................... 83 Personnel Summary ....................................................................................................................................... 84 Expenditures ................................................................................................................................................... 85 Expenditure Detail .......................................................................................................................................... 86
Boards & Commissions ............................................................................................................................................... 89 Narrative ......................................................................................................................................................... 90 Operation Summary ....................................................................................................................................... 91 Expenditures ................................................................................................................................................... 92 Expenditure Detail Administration ....................................................................................................................................... 100 Zoning Board of Appeals ...................................................................................................................... 100 Board of Fire and Police Commissioners ............................................................................................. 101 Plan Commission ................................................................................................................................. 101 Environmental Commission .................................................................................................................. 102 Housing Commission ........................................................................................................................... 102 Senior Citizens Commission ................................................................................................................ 103 Youth Commission ............................................................................................................................... 103 Design Commission ............................................................................................................................. 104 Commission for Citizens with Disabilities ............................................................................................. 104 Special Events Commission ................................................................................................................. 105

TABLE OF CONTENTS (Continued)
Bicycle & Pedestrian Advisory Commission ......................................................................................... 105 The Arlington Economic Alliance .......................................................................................................... 106 Arts Commission .................................................................................................................................. 106
Police Department ...................................................................................................................................................... 107 Narrative, Goals & Objectives and Performance Measures ......................................................................... 108 Operation Summary ..................................................................................................................................... 114 Personnel Summary – Police ....................................................................................................................... 115 Personnel Summary – Police Grant ............................................................................................................. 116 Expenditures – Police ................................................................................................................................... 117 Expenditures – Police Grant ......................................................................................................................... 118 Expenditure Detail – Police .......................................................................................................................... 119 Expenditure Detail – Police Grant ................................................................................................................ 124
Fire Department .......................................................................................................................................................... 125 Narrative, Goals & Objectives and Performance Measures ......................................................................... 126 Operation Summary ..................................................................................................................................... 130 Personnel Summary ..................................................................................................................................... 131 Expenditures ................................................................................................................................................. 132 Expenditure Detail ........................................................................................................................................ 133
Planning & Community Development Department ................................................................................................. 137 Narrative, Goals & Objectives and Performance Measures ......................................................................... 138 Operation Summary ..................................................................................................................................... 143 Personnel Summary ..................................................................................................................................... 144 Expenditures ................................................................................................................................................. 145 Expenditure Detail ........................................................................................................................................ 146 Building Services ....................................................................................................................................................... 149 Narrative, Goals & Objectives and Performance Measures ......................................................................... 150 Operation Summary ..................................................................................................................................... 156 Personnel Summary ..................................................................................................................................... 157 Expenditures ................................................................................................................................................. 158 Expenditure Detail ........................................................................................................................................ 159
Health & Human Services Department Health Services .................................................................................................................................................. 161 Health & Senior Services Department Operation Summary ......................................................................... 162 Narrative, Goals & Objectives and Performance Measures ......................................................................... 163 Operation Summary ..................................................................................................................................... 169 Personnel Summary ..................................................................................................................................... 170 Expenditures ................................................................................................................................................. 171 Expenditure Detail ........................................................................................................................................ 172
Senior Services .................................................................................................................................................. 175 Narrative, Goals & Objectives and Performance Measures ......................................................................... 176 Operation Summary ..................................................................................................................................... 178 Personnel Summary ..................................................................................................................................... 179 Expenditures ................................................................................................................................................. 180 Expenditure Detail ........................................................................................................................................ 181 Public Works Department ......................................................................................................................................... 183 Narrative, Goals & Objectives and Performance Measures ........................................................................ 184 Operation Summary ..................................................................................................................................... 193 Personnel Summary ..................................................................................................................................... 194 Expenditures ................................................................................................................................................. 195 Expenditure Detail ........................................................................................................................................ 196

TABLE OF CONTENTS (Continued)
Non-Operating ............................................................................................................................................................ 201 Expenditures ................................................................................................................................................. 202 Expenditure Detail ........................................................................................................................................ 203
MOTOR FUEL TAX FUND .......................................................................................................................................................... 205 Fund at a Glance .......................................................................................................................................................... 206 Five Year Capital Improvement Program ..................................................................................................................... 207 Revenues ..................................................................................................................................................................... 208 Expenditures ................................................................................................................................................................ 208 Expenditure Detail
Public Works ........................................................................................................................................................ 209
COMMUNITY DEVELOPMENT BLOCK GRANT (CDBG) FUND .............................................................................................. 211 Fund at a Glance .......................................................................................................................................................... 212 Personnel Summary ..................................................................................................................................................... 213 Revenues ..................................................................................................................................................................... 214 Expenditures ................................................................................................................................................................ 215 Expenditure Detail
Planning & Community Development .................................................................................................................. 216 CDBG Program .................................................................................................................................................... 216
MUNICIPAL PARKING FUND .................................................................................................................................................... 219 Fund at a Glance .......................................................................................................................................................... 220 Five Year Capital Improvement Program ..................................................................................................................... 222 Revenues ..................................................................................................................................................................... 223 Personnel Summary – Police ....................................................................................................................................... 224 Expenditures ................................................................................................................................................................ 225 Expenditure Detail
Police ................................................................................................................................................................... 228 Planning ............................................................................................................................................................... 229 Public Works ........................................................................................................................................................ 229 Municipal Parking Operations .............................................................................................................................. 230 Vail Avenue Garage ............................................................................................................................................. 231 North Garage ....................................................................................................................................................... 232 Evergreen Street Garage ..................................................................................................................................... 233
TIF DISTRICT FUNDS ................................................................................................................................................................. 235 TIF IV Fund
Fund at a Glance .......................................................................................................................................... 236 Five Year Capital Improvement Program ..................................................................................................... 237 Revenues ..................................................................................................................................................... 238 Expenditures ................................................................................................................................................. 238 Expenditure Detail
Planning & Community Development ................................................................................................... 239
TIF V Fund Fund at a Glance .......................................................................................................................................... 240 Five Year Capital Improvement Program ..................................................................................................... 241 Revenues ..................................................................................................................................................... 242 Expenditures ................................................................................................................................................. 242 Expenditure Detail
Planning & Community Development ................................................................................................... 243

TABLE OF CONTENTS (Continued)
HICKORY/KENSINGTON TIF Fund Fund at a Glance .......................................................................................................................................... 244 Five Year Capital Improvement Program ..................................................................................................... 245 Revenues ..................................................................................................................................................... 246 Expenditures ................................................................................................................................................. 246 Expenditure Detail Planning & Community Development ................................................................................................... 247
S ARLINGTON HEIGHTS RD TIF Fund Fund at a Glance .......................................................................................................................................... 248 Five Year Capital Improvement Program ..................................................................................................... 249 Revenues ..................................................................................................................................................... 250 Expenditures ................................................................................................................................................. 250 Expenditure Detail Planning & Community Development ................................................................................................... 251
DEBT SERVICE FUND ............................................................................................................................................................... 253 Fund at a Glance .......................................................................................................................................................... 254 Revenues ..................................................................................................................................................................... 256 Expenditures ................................................................................................................................................................ 257 Debt Service Schedule
Summary of Debt Service ............................................................................................................................. 260 Self-Supported General Obligation Debt ...................................................................................................... 261 Tax-Supported General Obligation Debt ...................................................................................................... 262
CAPITAL PROJECT FUNDS ...................................................................................................................................................... 265
Capital Projects Fund Fund at a Glance .......................................................................................................................................... 266 Five Year Capital Improvement Program ..................................................................................................... 267 Revenues ..................................................................................................................................................... 269 Expenditures ................................................................................................................................................. 270 Expenditure Detail Finance ................................................................................................................................................. 274 IT .......................................................................................................................................................... 274 Police .................................................................................................................................................... 274 Fire ....................................................................................................................................................... 275 Planning & Community Development ................................................................................................... 275 Senior Services .................................................................................................................................... 276 Public Works ........................................................................................................................................ 276 Municipal Fleet Services ...................................................................................................................... 278 Non-Operating ...................................................................................................................................... 278 Storm Water Control Fund Fund at a Glance .......................................................................................................................................... 279 Five Year Capital Improvement Plan ............................................................................................................ 281 Revenues ..................................................................................................................................................... 282 Expenditures ................................................................................................................................................. 282 Expenditure Detail Public Works ........................................................................................................................................ 283 Non-Operating ...................................................................................................................................... 283
WATER & SEWER FUND ........................................................................................................................................................... 285 Fund at a Glance .......................................................................................................................................................... 286 Five Year Capital Improvement Plan ........................................................................................................................... 289

TABLE OF CONTENTS (Continued)
Revenues ..................................................................................................................................................................... 290 Water & Sewer Revenue Notes ................................................................................................................................... 291 Personnel Summary – Finance .................................................................................................................................... 294 Personnel Summary – Water Utility Operations ........................................................................................................... 295 Expenditures ................................................................................................................................................................ 296 Expenditure Detail Finance ......................................................................................................................................................... 299 Water Utility Operations ................................................................................................................................ 300 Capital Projects ............................................................................................................................................ 304 Non-Operating .............................................................................................................................................. 305 ARTS, ENTERTAINMENT & EVENTS FUND ............................................................................................................................ 307 Fund at a Glance .......................................................................................................................................................... 308 Five Year Financial Plan .............................................................................................................................................. 309 Revenues ..................................................................................................................................................................... 311 Special Events Operations with Dedicated Revenues ................................................................................................. 311 Expenditures ................................................................................................................................................................ 312 Expenditure Detail Board of Trustees ......................................................................................................................................... 315 Integrated Services ....................................................................................................................................... 315 Special Events Commission ......................................................................................................................... 315 Arts Commission .......................................................................................................................................... 316 Metropolis Theater ........................................................................................................................................ 316 Police ............................................................................................................................................................ 317 Fire ............................................................................................................................................................... 317 Planning ........................................................................................................................................................ 318 Public Works ................................................................................................................................................. 318 Non-Operating .............................................................................................................................................. 319 Special Events Cost by Event ............................................................................................................................................... 320 Cost by Department ...................................................................................................................................... 322 SELF-INSURANCE FUNDS ........................................................................................................................................................ 323
Charges to Operations Table ....................................................................................................................................... 324 Health Insurance Fund Fund at a Glance .......................................................................................................................................... 325 Revenues ..................................................................................................................................................... 326 Personnel Summary ..................................................................................................................................... 327 Expenditures ................................................................................................................................................. 328 Expenditure Detail Human Resources ................................................................................................................................ 329 General Liability Fund Fund at a Glance .......................................................................................................................................... 331 Revenues ..................................................................................................................................................... 334 Expenditures ................................................................................................................................................. 334 Expenditure Detail Finance ................................................................................................................................................. 335

TABLE OF CONTENTS (Continued)
Workers' Compensation Fund Fund at a Glance .......................................................................................................................................... 336 Revenues ..................................................................................................................................................... 338 Personnel Summary ..................................................................................................................................... 339 Expenditures ................................................................................................................................................. 340 Expenditure Detail Human Resources ................................................................................................................................ 341
FLEET OPERATIONS FUND ...................................................................................................................................................... 343 Fund at a Glance .......................................................................................................................................................... 344
Five Year Capital Improvement Plan ........................................................................................................................... 346 Revenues ..................................................................................................................................................................... 347 Charges to Operations Summary ................................................................................................................................. 348 Personnel Summary ..................................................................................................................................................... 349 Expenditures ................................................................................................................................................................ 350 Expenditure Detail Municipal Fleet Services ...................................................................................................................................... 352 Equipment ............................................................................................................................................................ 354 TECHNOLOGY FUND ................................................................................................................................................................. 357
Fund at a Glance .......................................................................................................................................................... 358 Five Year Capital Improvement Plan ........................................................................................................................... 362 Revenues ..................................................................................................................................................................... 363 Charges to Operations Summary ................................................................................................................................. 364 Personnel Summary ..................................................................................................................................................... 365 Expenditures ................................................................................................................................................................ 366 Expenditure Detail ........................................................................................................................................................ 367
PENSION FUNDS ...................................................................................................................................................................... 369
Police Pension Fund Fund at a Glance .......................................................................................................................................... 370 Revenues ..................................................................................................................................................... 372 Expenditures ................................................................................................................................................. 373 Expenditure Detail ........................................................................................................................................ 374
Fire Pension Fund Fund at a Glance .......................................................................................................................................... 375 Revenues ..................................................................................................................................................... 377 Expenditures ................................................................................................................................................. 378 Expenditure Detail ........................................................................................................................................ 379
OTHER FUNDS Affordable Housing Fund .......................................................................................................................................... 381 Fund at a Glance .......................................................................................................................................... 382 Revenues ..................................................................................................................................................... 383 Expenditures ................................................................................................................................................. 383 Expenditure Detail ........................................................................................................................................ 384 Zero Interest Loan Fund ............................................................................................................................................ 385 Fund at a Glance .......................................................................................................................................... 386 Revenues ..................................................................................................................................................... 387 Expenditures ................................................................................................................................................. 387 Expenditure Detail ........................................................................................................................................ 388
TABLE OF CONTENTS (Continued)
Foreign Fire Insurance Tax Fund ............................................................................................................................. 389 Fund at a Glance .......................................................................................................................................... 390 Revenues ..................................................................................................................................................... 391 Expenditures ................................................................................................................................................. 391 Expenditure Detail ........................................................................................................................................ 392 Criminal Investigation Fund ...................................................................................................................................... 393 Fund at a Glance .......................................................................................................................................... 394
Five Year Financial Plan ............................................................................................................................... 395 Revenues ..................................................................................................................................................... 396 Expenditures ................................................................................................................................................. 396 Expenditure Detail ........................................................................................................................................ 397
Solid Waste Fund ....................................................................................................................................................... 399 Fund at a Glance .......................................................................................................................................... 400 Revenues ..................................................................................................................................................... 401 Expenditures ................................................................................................................................................. 402 Expenditure Detail Special Events Commission ................................................................................................................. 403 Public Works ........................................................................................................................................ 403 Solid Waste Disposal ........................................................................................................................... 403 Non-Operating ...................................................................................................................................... 404
ARLINGTON HEIGHTS MEMORIAL LIBRARY ......................................................................................................................... 405 Organization Structure ................................................................................................................................................. 406 MEMORIAL LIBRARY FUND Fund at a Glance .................................................................................................................................................. 407 Revenues ............................................................................................................................................................. 412 Expenditures ........................................................................................................................................................ 413 LIBRARY CAPITAL PROJECTS FUND Fund Summary ..................................................................................................................................................... 430 Revenues ............................................................................................................................................................. 431 Expenditures ........................................................................................................................................................ 431 APPENDIX ................................................................................................................................................................................. 433 Community Profile ........................................................................................................................................................ 434 Budget Glossary ........................................................................................................................................................... 438 Acronyms ..................................................................................................................................................................... 447
VILLAGE ADMINISTRATION
Central Administration
Village Manager Randall R. Recklaus Assistant Village Manager Diana Mikula Prosecuting Attorney Ernest R. Blomquist Village Attorney Hart M. Passman Village Clerk Becky Hume Finance Director/Treasurer Thomas F. Kuehne Director of Human Resources Mary Rath
Public Safety
Chief of Police Nicholas Pecora Fire Chief Andrew Larson
Economic & Community Development
Director of Planning & Community Development Charles Witherington-Perkins
Services
Director of Building Services Jorge Torres Director of Health and Human Services James McCalister Public Works Director Cris Papierniak
Budget Preparation
Finance Director/Treasurer Thomas F. Kuehne Assistant Finance Director Mary Juarez Accountant/Budget Coordinator Kevin Baumgartner
i

Citizens of Arlington Heights
Village Attorney and
Village Prosecutor
Boards and
Commissions
Village President and
Board of Trustees
Village Manager (1.00 FTE)
Building & Life Safety (19.00 FTE)
Finance Department (16.50 FTE)
Fire Department (110.00 FTE)
Health & Human
Services (13.25 FTE)
Human Resources Department
(4.00 FTE)
Legal Department
(1.75 FTE)
Planning & Community
Development (10.00 FTE)
Police Department (139.00 FTE)
VILLAGE OF ARLINGTON HEIGHTS (428.5 FTE) ORGANIZATION STRUCTURE
Integrated Services
Department (11.50 FTE)
Public Works
Department (102.50 FTE)
ii

2022-2023 Strategic Priorities These priorities and sub-priorities reflect the views of the Village Board identified at the July 12, 2021 Village Board goal setting session: 1. Facilitate a Balanced and Continuous Community and Organizational Post-COVID-19 Recovery
2. Expand Efforts to Embrace Diversity, Equity, and Inclusion within the Community and the Village
Government
3. Work to Ensure the Redevelopment of Arlington Park Meets Community Standards and Provides a One of a Kind Regional Destination Worthy of the Property’s Legacy
4. Identify, Explore, and Implement Sustainable and Green Initiatives
5. Ensure Revenue Sources are applied rationally across sectors while Monitoring the Overall Community
Tax Burden
6. Ensure the Organization has the Resources and Training to Maintain Focus on Consistent High-Quality Core Services and Infrastructure
7. Seek Opportunities to make the Community more Livable by increasing Pedestrian and Bicycle Options
for Residents
8. Improve Communications with Residents and Businesses
9. Seek and Maintain Attainable Housing while Continuing to Review Affordable Housing Strategies
iii

Village of Arlington Heights 33 S. Arlington Heights Road Arlington Heights, IL 60005-1499 (847-368-5000) Website: www.vah.com October 29, 2021 Dear President Hayes and Trustees: I am hereby transmitting the Proposed Budget for calendar year 2022. Over the past two years, the Village undertook a number of measures to respond to the Covid-19 pandemic and resulting economic downturn. These included holding open various vacant positions, the deferral of tax and fee payments, and the use of local and federal funds to help residents and businesses in need. Business processes and service models had to be rethought given the conditions, resulting in a number of innovations such as increased provision of online services and even Arlington Alfresco. While some effects of the pandemic still linger, throughout 2021, the economy improved at a faster pace than expected, resulting in significant growth in a number of the Village’s key revenue sources such as Sales, Home-rule Sales, and Income tax receipts. However, other revenues such as Hotel taxes, Parking fee revenues, and Interest Income have continued to lag behind prior year results. During 2021 the Village also received half of its portion of the federal American Rescue Plan Act (ARPA) grant funds. The total grant, after next year’s final payment is received, will amount to $6.78 million. The intent of this funding through the federal government was to provide additional economic stimulus, and to help state and local governments recover more quickly from the adverse financial effects of the Pandemic. The Village has continued to adapt its COVID response as a better understanding of the Pandemic has developed, and vaccination rates have improved. However, variants of the coronavirus represent an ongoing threat to the country’s return to normalcy. Even with these challenges, during 2021 Staff continued to work on the Village’s 2020-2021 Business Plan. The Village-wide Diversity Initiative continued as the Diversity, Equity, and Inclusion (DEI) audit and planning process was completed, and an internal DEI workgroup was created. As part of this program, Departments will look for ongoing ways to incorporate DEI into their workplans. The Village has begun working with other government entities to implement more meaningful ways to conduct outreach with resident groups that have not traditionally been engaged in public processes, to ensure their voices are heard and included in decision making. The Village also completed its analysis of competing Enterprise Resource Planning (ERP) software proposals, which will result in a complete overhaul of the Village’s operating software. In partnership with the ERP Consultant, Plante Moran, Tyler was chosen as the Village’s next software provider. This software will include the base internal service activities such as accounting, budgeting, payroll, purchasing, and cash receipts. It will also provide centralized capabilities for Human Resources, Building and Planning approval processes, and coordination with the Village’s website. The Village’s current ERP system was installed in 1996. Although it has been updated over the years, newer software providers offer much more proven capabilities that the Village needs, in order to offer the efficiency and online services that are now expected by our residents. The implementation of the
iv
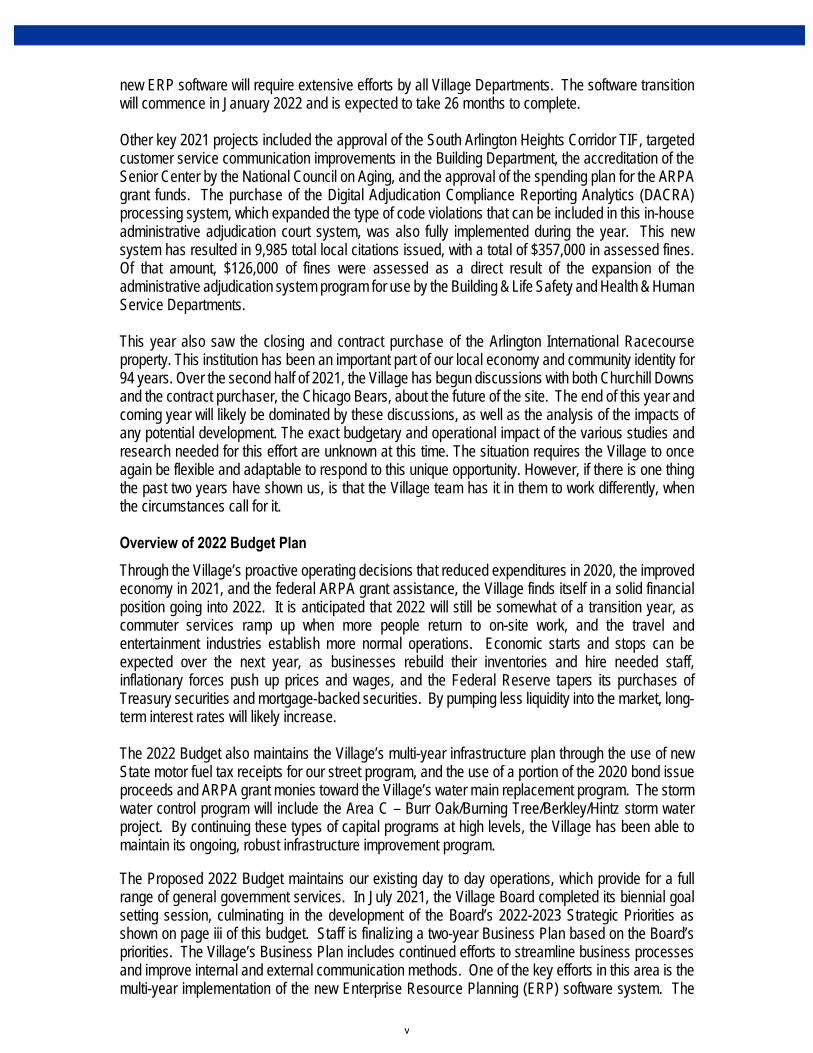
new ERP software will require extensive efforts by all Village Departments. The software transition will commence in January 2022 and is expected to take 26 months to complete. Other key 2021 projects included the approval of the South Arlington Heights Corridor TIF, targeted customer service communication improvements in the Building Department, the accreditation of the Senior Center by the National Council on Aging, and the approval of the spending plan for the ARPA grant funds. The purchase of the Digital Adjudication Compliance Reporting Analytics (DACRA) processing system, which expanded the type of code violations that can be included in this in-house administrative adjudication court system, was also fully implemented during the year. This new system has resulted in 9,985 total local citations issued, with a total of $357,000 in assessed fines. Of that amount, $126,000 of fines were assessed as a direct result of the expansion of the administrative adjudication system program for use by the Building & Life Safety and Health & Human Service Departments. This year also saw the closing and contract purchase of the Arlington International Racecourse property. This institution has been an important part of our local economy and community identity for 94 years. Over the second half of 2021, the Village has begun discussions with both Churchill Downs and the contract purchaser, the Chicago Bears, about the future of the site. The end of this year and coming year will likely be dominated by these discussions, as well as the analysis of the impacts of any potential development. The exact budgetary and operational impact of the various studies and research needed for this effort are unknown at this time. The situation requires the Village to once again be flexible and adaptable to respond to this unique opportunity. However, if there is one thing the past two years have shown us, is that the Village team has it in them to work differently, when the circumstances call for it. Overview of 2022 Budget Plan Through the Village’s proactive operating decisions that reduced expenditures in 2020, the improved economy in 2021, and the federal ARPA grant assistance, the Village finds itself in a solid financial position going into 2022. It is anticipated that 2022 will still be somewhat of a transition year, as commuter services ramp up when more people return to on-site work, and the travel and entertainment industries establish more normal operations. Economic starts and stops can be expected over the next year, as businesses rebuild their inventories and hire needed staff, inflationary forces push up prices and wages, and the Federal Reserve tapers its purchases of Treasury securities and mortgage-backed securities. By pumping less liquidity into the market, long-term interest rates will likely increase. The 2022 Budget also maintains the Village’s multi-year infrastructure plan through the use of new State motor fuel tax receipts for our street program, and the use of a portion of the 2020 bond issue proceeds and ARPA grant monies toward the Village’s water main replacement program. The storm water control program will include the Area C – Burr Oak/Burning Tree/Berkley/Hintz storm water project. By continuing these types of capital programs at high levels, the Village has been able to maintain its ongoing, robust infrastructure improvement program. The Proposed 2022 Budget maintains our existing day to day operations, which provide for a full range of general government services. In July 2021, the Village Board completed its biennial goal setting session, culminating in the development of the Board’s 2022-2023 Strategic Priorities as shown on page iii of this budget. Staff is finalizing a two-year Business Plan based on the Board’s priorities. The Village’s Business Plan includes continued efforts to streamline business processes and improve internal and external communication methods. One of the key efforts in this area is the multi-year implementation of the new Enterprise Resource Planning (ERP) software system. The
v

plan also calls for the management of the racetrack redevelopment project, and the expansion of Village efforts to embrace diversity, equity, and inclusion within the community. A number of other projects will also be tackled during 2022 In June 2021 the Village Board reviewed and approved changes to year-two of the detailed five-year Capital Improvement Plan (CIP). This plan is completed on a biennial basis with special emphasis on the first two years of the plan. The second year of the CIP as revised has been incorporated into the 2022 Budget. The Village continues to prudently plan for the future by investing in our infrastructure in order to maintain safe, reliable roads, water mains and sewer lines. Key multi-year infrastructure projects that are part of the Proposed 2022 Budget include the following:
- A street resurfacing and street rehabilitation program totaling over $11.5 million. In 2022, the Village will receive the third and final $1.65 million grant for street rehabilitation work through the State’s capital grant program. In addition, the State increased the gas tax in 2020, and the Village’s Motor Fuel Tax (MFT) allotment has increased from about $1.9 million in 2018 to an estimated $3 million per year in 2022.
- The fifth year of a multi-year plan to implement storm water control projects throughout the Village. In 2018 the Village sold a $10 million bond issue to fund these projects. In addition, in 2019 the Metropolitan Water Reclamation District (MWRD) approved a $1.8 million grant for the Downtown area’s Campbell/Sigwalt sewer project, and in 2021 the Illinois Department of Commerce & Economic Opportunity (DCEO) approved a $1 million grant for the Area C – Burr Oak/Burning Tree/Berkley/Hintz Road project. The 2022 Budget includes $3.7 million in storm water control projects for the coming year.
- In 2020 the Village sold a bond issue that generated $13.7 million in proceeds. $9 million of the bond proceeds was allocated to the Water & Sewer Fund as part of the Village’s plan to maintain a water main replacement program of at least $4 million, or the industry standard of 1% of our water main system on an annual basis. The 2022 Budget includes $4.1 million for the annual watermain replacement program.
The Village develops its operating and capital budget based on a conservative forecast of revenues, and does not consider new revenues from growth unless the development is completed and has provided a historical basis for a new projection. A normal operating expense cycle is anticipated and includes expenditure increase assumptions. The Village also has access to its reserves, which help provide a source of funds for unanticipated but necessary expenses, such as costs related to storms or other emergencies, to cover extraordinary self-insurance losses, and to provide a buffer during economic downturns. The presence of the reserves also helps ensure our excellent bond rating, and lower interest charges associated with that rating. The Village’s minimum fund balance policy is to maintain a year-end balance of at least 25% of General Fund expenditures. Being near or above this level is even more important for Arlington Heights due to our reliance on sales and income tax receipts which are subject to economic cycles. The 2022 Budget will allow the Village to maintain a fund balance in excess of 25% of a typical year’s General Fund expenditures. The Village of Arlington Heights’ mission is to provide high quality services to the community in a fiscally responsible manner. These services are provided to enhance the safety, health and general welfare of the citizens and businesses within the community. The Village’s service oriented philosophy continues to balance various community needs with municipal resources through a planned approach to the governance process. As a result of conservative budgeting practices, the Village is fortunate to remain in a strong financial position.
vi

2021 Property Tax Levy Payable in 2022 One of the Village’s key goals has been to keep any property tax increase as low as possible. A second key Village goal is to ensure that sufficient funds are available to provide a consistent, high-level of Village services each and every year. For the third consecutive year, the total 2021 property tax levy collected in 2022 reflects a 0% increase over the prior year extended levy. For the most part, this was enabled by the quick economic recovery which increased Village operating revenues. The first step in developing the Village’s property tax levy is entering the known debt service payment requirements and the annual required contributions for the Police and Fire Pension levies. Due to positive interest earnings in 2020, the Village actuary’s calculation of the annual required contribution for the Police and Fire Pension funds showed a decrease in the required 2021 tax levies for these funds. However, the Village was able to maintain prior tax levy levels, which will help in the future when the stock market inevitably changes its course. The Capital Improvement levy is based primarily on the street program needs identified through the five-year capital improvement plan. Last year, the capital levy was decreased by $1.1 million in order to help balance-out the effects of the Pandemic on the General Fund. Over the next few years, the Village will need to continue to increase the capital levy to ensure that there is a sustainable level of ongoing funding for the annual street program. The FICA and IMRF levies are derived from the detailed wage sheets prepared for 2022. Once all revenue projections for the General Fund are completed, the remaining gap between the General Fund’s projected revenues and expenditures is divided equally between the Fire and Police Protection levies. Due to the large increase in operating revenues compared to the prior year, the Village is able to show a decrease in these levies and a large increase in the Capital levy to help offset a large portion of the prior year’s action. The total 2021 property tax levy including the Library’s levy increases by 0% and is summarized as follows: Extended 2021 Levy Dollar % 2020 Levy For 2022 Change Change Village Debt Service $ 6,563,542 $ 6,498,700 $ -64,842 -.99% Police Pension $ 4,113,730 $ 4,114,000 $ 270 .01% Fire Pension $ 4,962,130 $ 4,962,000 $ -130 0% Capital Improvement $ 4,444,000 $ 5,250,000 $ 806,000 18.14% FICA $ 1,517,020 $ 1,534,400 $ 17,380 1.15% IMRF $ 1,854,158 $ 1,708,500 $ -145,390 -7.86% Police Protection $ 7,105,754 $ 6,799,200 $ -306,554 -4.31% Fire Protection $ 7,105,754 $ 6,799,200 $ -306,554 -4.31% Total Estimated Village Levy $37,666,088 $37,666,000 $ -88 0% Library $14,680,922 $14,680,922 $ 0 0% Grand Total Tax Levy $52,347,010 $52,346,922 $ -88 0% Budget Summary – All Funds The budget is comprised of operating, capital, internal service and other miscellaneous funds. The Village’s operating funds account for the day-to-day expenditures for a variety of services. Among these are police and fire protection, water and sewer services, public parking, building, code review, planning, health, general services, public infrastructure maintenance and many other services.
vii

These basic Village services are funded through user fees, taxes, licenses, permits and other charges. The total amount budgeted for the Village’s capital needs can vary from year to year depending on the timing and implementation of replacement and construction schedules. Capital expenditures are funded through bond issues, user fees, designated taxes and the budgeted use of accumulated savings. The total budgeted expenditures for all operating, capital and other funds for 2022, not including the Arlington Heights Memorial Library, comes to $191,467,900, a decrease of 4.6% or about $9.2 million compared to the 2021 Budget. This decrease is primarily attributable to the following capital and interfund transfer-out changes from 2021 to 2022:
- The 2022 Budget for the Storm Water Control Fund decreases by $4.4 million compared to the 2021 Budget. The 2021 budget included the completion of the large $3.5 million Area D – Greenbrier/Roanoke/Wilke storm water project. The Storm Sewer Rehab/Replacement program was also budgeted $960,000 higher in 2021 than the 2022 Budget, as the Village worked to keep the completion of the storm sewer televising project on target.
- The Technology Fund budget for 2022 shows a $3.4 million decrease compared to the prior
year. The total cost of the ERP project was budgeted in 2021 in order to provide a transparent view of the total costs for this new software. As the project unfolds over the next two years, the actual costs will be rebudgeted and accounted for through encumbrance rollovers. The actual combined cost of the software and consultant (needs assessment, RFP preparation, implementation assistance) came in under budget, and totals $2.7 million exclusive of annual maintenance costs.
- Interfund transfers-out for 2022 decreased by $3.2 million, as the Village closed the Public Building Fund in 2021 after its creation twelve years prior. The fund was established to account for the construction of the new Public Works, Fire Station 1, Village Hall and Police facilities. The 2021 Budget included interfund transfers-out of $3.29 million in remaining funds to the following Village funds:
1. $2 million transfer-out to the Technology Fund to help cover the cost of the new Enterprise Resource Planning (ERP) software.
2. $650,000 transfer-out to the Arts, Entertainment and Events (A & E) Fund. The coronavirus recession resulted in a 25% decrease in Food & Beverage (FBT) taxes from 2019 to 2020, which is the primary revenue source for this fund. FBT revenues aren’t expected to reach 2019 levels again until 2022. In addition, the Village, as one of the five commercial condominium unit owners of the Metropolis Building, will be required to help fund required infrastructure improvements at this twenty-two-year-old building.
3. $644,000 transfer-out to the Municipal Parking Fund to account for 2020 lost
revenue due to the Pandemic.
The 2021 and 2022 Budgets also show the receipt of the ARPA grant funds. As noted earlier, $3.39 million will be received in each year for a total of $6.78 million in federal grant funds. The Village Board approved the following uses of these funds:
- Water & Sewer Fund Infrastructure ($2,500,000 in 2021): In addition to the water main replacement program, the Village will be replacing residential and commercial water meters
viii

over the next few years. The 2022 water tank repainting project also saw a significant increase when it was determined that Well #17 last painted 24 years ago, shows significant corrosion of the steel securing the rafters and purlins.
- Arlington Heights Park District Capital Projects ($500,000 in 2021): Under the ARPA grant
rules, the Village can allocate direct funds to other government agencies within its jurisdiction to help offset that government’s revenue losses due to the Pandemic. The Arlington Heights Park District made such a request. Unlike the Village, which had to continue to provide services during the Pandemic, the Park District cancelled programs, closed recreational facilities, and deferred capital projects. The Park District was also one of the few local governments that weren’t eligible for ARPA funding or other significant federal Pandemic-related grants.
- Capital Projects Fund ($390,000 in 2021 and $890,000 in 2022): During the 2021 Budget process, one of the steps the Village took to ensure a zero percent property tax increase was to shift $1.1 million in annual property tax levy to the General Fund to cover ongoing expenditures. The goal was then to increase the Capital Projects Fund property tax levy over the next few years to bring it back to its prior level. The ARPA grant funds help bridge the gap to a sustainable funding level for this fund in the future.
- Police and Fire Vehicle Purchases, Fleet Fund ($2.5 million in 2022): The Fleet Fund internal service charge to the General Fund is based on the depreciation schedule of the purchased vehicles. Vehicle replacement costs are typically higher than the original vehicle, but the interest income earned by the fund is intended to cover this increased cost. However, over the last decade, interest rate levels have been kept near zero through actions by the Federal Reserve. Support for public safety operations is explicitly identified as an allowable cost for the use of ARPA grant funds. By covering a portion of the cost of upcoming Police and Fire vehicle purchases over the next three years with ARPA grant funds, the Village will improve the funding position for the Fleet Fund to 75%. This funding improvement will then be accomplished without having to increase significantly General Fund vehicle/equipment use charges which would put pressure on property taxes.
Personnel Changes As a service organization, Village employees are our most important assets. The 2022 total payroll cost is projected to increase 2.63% over the prior year’s wage base, including all scheduled wage adjustments in all departments. The Village expects a continued challenge to find and hire top level talent, as 30% of our current employees will be eligible to retire in 2022 and 33% will be eligible in 2023. Thirty-six full-time positions (including promotions) have been filled in the organization in 2021 to date, underscoring the transition period that is now underway. Whenever vacancies occur, Staff reviews whether the position is still needed at all, should be modified, or whether another department has greater current needs for that slot. Such adjustments occur throughout the year as opportunities present themselves. The 2022 Budget includes an increase in staffing levels of two full-time equivalents. This increase includes two new budgeted employee positions; one each in the IT and Building & Life Safety Departments. The Village’s new ERP software will be much more comprehensive in its capabilities and communication interconnections than our current legacy system. To administer this more robust system and to help with other IT needs, an additional IT Enterprise Systems Analyst position is proposed. The Building & Life Safety Department budget reflects the proposed addition of a Property Maintenance Inspector. The increase in building activity in recent years has increased the amount
ix

of permit revenue the Village receives; however, it has also reduced the amount of time inspectors have to engage in proactive community code enforcement. This new position will allow the Department to provide more consistent, thorough, and timely enforcement of community standards. During the off-season, this Inspector would be used to improve customer service and departmental efficiency by following-up on all open permit submittals including approved drawings without a paid permit, revised submittals that never responded back, and work to close permits that never called for a final inspection.
During the budget review process the Planning Department noted the large number of major development projects, and increased permit reviews, code enforcement, and complex Plan Commission applications. In lieu of proposing an additional Planning staff person at this time, the Proposed 2022 Budget includes an additional $50,000 budgeted for professional services in the Zero-Interest Loan Fund. Finally, the number of retirees in the Police Pension Fund also increased substantially going from 124 retirees in 2021 to 130 projected retirees in 2022.
Employee benefit coverage is an essential part of both attaining and retaining great employees. To be conservative the Village’s long-term projections typically assume an increase in health insurance costs of 8% per year. Through negotiations between the Village and its Broker with Blue Cross Blue Shield, the blended increase for the Village and Library PPO and HMO medical plans will only be 2.6% in 2022. The projected increase for the PPO plan is 7.2% and the HMO plan is 0%. The PPO increase maintains a 2% margin that was built-in to the base to help offset potential adverse claims experience. It should be noted that employee contributions towards medical rates for both plans are increasing in 2022 from 12% to 14%. This contribution increase was written into the latest bargaining agreements with our unions, and still reflects a competitive public sector employee contribution rate.
Pension benefits for Village employees are separate from the underfunded State of Illinois pension plans. Village pension plans are covered through the Police Pension Fund, the Firefighters’ Pension Fund, and the Illinois Municipal Retirement Fund (IMRF). Per new State law, during 2022 all downstate public safety pension plan investments, including the Arlington Heights Police and Firefighter Pension Fund investments, will be combined into two separate state-wide (except Chicago) Police and Firefighter investment plans. The intent is to provide more investment diversity and higher investment earning potential for these funds. Through the years, the Village has continued to pay the actuarially required contribution for each of these funds. It should be noted that in 2010 the State Legislature mandated a two-tier pension system for IMRF and all municipal Police and Fire pension plans. The intent of the new two-tier pension system is to reduce the long-term pension liability for employers who have employees covered under these plans. The percent of Village staff enrolled in the Tier 2 system increased from 25% in 2016 to 43% in 2021. Given the high number of retirements the Village is experiencing, the percentage of Tier 2 employees is expected to continue to increase substantially in coming years.
The balance of this budget message identifies the process that has been followed to prepare this financial plan for 2022, a detailed review of the General Fund, as well as budget narrative on other Village funds. Additional charts and graphs on the budget as a whole and on selected funds can be found in the Financial Summaries section of the budget.
Explanation of the Budget Process The Village of Arlington Heights operates under the Budget Officer Act as outlined in the Illinois Compiled Statutes. Under this law the Village Board is required to adopt the budget prior to the beginning of the fiscal year to which it applies. The law also provides that the budget shall serve as the Village’s annual appropriation ordinance. After the local election process that occurs every two
x

years, each Department Director presents an outline of their Department’s services, workload indicators, key accomplishments, and new initiatives to the “new” Village Board. This is followed by the Village Board’s biennial goal setting process during June of that year. After the Board’s goals and objectives are established, Staff develops a two-year business plan that reflects the Board’s stated goals. In even-numbered years, a detailed five-year Capital Improvement Program (CIP) is developed with special emphasis on the first two years of the plan. This reflects the multi-year nature of many of the capital projects that are included in the CIP. During the years when there isn’t a detailed CIP being presented to the Board, Staff provides the Board with a summary update showing any changes in estimated costs from the prior year. By June of each year, multi-year projections are provided to the Board for the General and Water & Sewer Funds, which are the Village’s largest operating funds. These projections include an estimated property tax levy amount. Based on these projections, the Board sets budget ceilings which each department uses as an upper limit when developing its proposed spending plans. As the proposed budget is developed, the estimated property tax levy may be increased or decreased depending on budget proposals for the Village Board’s review. During September and October, the budget team consisting of the Village Manager, Assistant Village Manager, Finance Director, Assistant Finance Director, and Accountant/Budget Coordinator, meets with representatives of each Department to review their operating and capital spending proposals, and to review how these proposals meet the Village Board’s strategic priorities. As a result of these meetings and based on available resources, a proposed budget is prepared for review by the Village Board. During November, the Village holds public budget meetings at the Committee-of-the-Whole level. The Village Board subsequently holds a Public Hearing prior to adopting the annual budget in December of each year. A detailed calendar of the budget process immediately follows this transmittal letter. Under the Budget Officer Act and the Village’s purchasing guidelines, the budget may be amended by the Village Manager in the form of transfers between line items up to $25,000. Budget transfers above this amount require the approval of the Village Board. This allows the Village the flexibility it needs to operate efficiently due to the scope of its operations. This also serves to increase the accountability of Department Directors by encouraging them to budget realistically and to keep a close watch on each expenditure line item during the year. The budget ceilings approved by the Village Board for the General and Water & Sewer Funds at the beginning of the current budget process for these funds are shown here compared to the proposed expenditures for those funds: Water & General Fund Sewer Fund Budget Ceiling $81,592,500 $25,035,500 Budget $81,287,700 $25,924,300 Over (Under) Ceiling $ (304,800) $ 888,800 During the Department reviews, the budget team and Department Directors worked to prepare a budget at or below the budget ceilings. The 2022 budget for the General Fund is lower than the budget ceiling established by the Village Board in June 2021. The key reasons for this decrease are: lower health insurance costs than assumed, lower legal expenditures, and savings from lower charges for Northwest Central Dispatch services. The 2022 Water & Sewer Fund budget is higher than the budget ceiling amount, due primarily to re-budgeting the replacement of the $922,000 Emergency Generator. Formal bids for this unit were rejected in 2021 due to higher than anticipated bid amounts, due in part to the effects of the Pandemic
xi

on labor and parts costs. Water and Sewer Staff will review the requirements for this unit and rebid the generator during 2022. It is expected that the 2022 Budget of $922,000 will result in generator bids that meet the Village’s requirements. General Fund The General Fund is the all-purpose governmental fund, which handles the operations of the Village not accounted for in a separate fund. Most of the expenditures for Village services are budgeted and accounted for in this fund, except for water and sewer expenses. There are three key revenue sources, which account for 67% of the total General Fund revenues: - Property Tax 32% of revenues - Sales Tax (including Home Rule) 24% - Income Tax 11% The revenues listed above represent the General Fund’s primary growth revenues, which generally pay for annual cost increases. The Pandemic has had a clear impact on state and municipal revenues. As noted earlier, a number of revenues decreased significantly in 2020 at the onset of the Pandemic. However, many of these revenues have come back quickly during 2021. Communities that rely on sales tax revenues have been affected even more than others by the downturn. The Village of Arlington Heights’ sales tax receipts are a significant source of revenue to the Village, but we have a more balanced array of revenue sources than some other local communities. Due to our partial reliance on sales tax receipts, the Village has worked to maintain solid reserves that can be used to help us weather extraordinary events. The Village’s latest projections for Sales and Home-Rule Sales tax receipts reflect a 11% to 12% increase from 2021 Budget to the 2022 Budget. Income tax receipts reflect a 21% increase compared to last year. The 2021 Budget included a projection that income tax receipts would decrease significantly, but this did not materialize as work from home arrangements and enhanced unemployment benefits continued to buoy Illinois residents’ incomes. Local Use tax receipts have done well over the last couple of years, but are now projected to decrease by 2.6% in 2022. Over the last decade there has been downward pressure on sales tax receipts due to the expansion of online retail sales, and the closure of brick and mortar businesses. In November 2019, the amended “Leveling the Playing Field for Illinois Retail Act” was passed by the State’s General Assembly to require both remote retailers and marketplace facilitators to collect and remit the state and locally-imposed sales taxes for where the product is delivered. The law requires remote retailers (who either meet a threshold of 200 transactions annually or $100,000 in annual gross receipts) selling to Illinois residents to collect these sales taxes starting January 1, 2021. While it has taken some time during 2021 for the provisions of this law to unfold, we are now seeing larger increases in sales and home-rule sales tax receipts, and expect local use tax receipts to decrease over the next few years. Over time, having the large internet retailers and marketplace facilitators collect and remit sales and home-rule sales taxes, should generate more revenue than the Village’s per capita portion of the State’s local use tax. In September 2020, the Village Board approved the sale of adult use recreational cannabis which was expected to generate new revenues. As of January 2021, the new 3% cannabis tax was in effect. Upon approval, the Village Board had also directed Staff to bring this issue back for Board review in 18 months, which will occur in the spring of 2022. To date, the single adult-use cannabis vendor in the Village is performing as expected with no outstanding issues. Disruptive technologies continue to significantly alter the way that businesses and entire industries operate. Some innovations are having a direct effect on the Village’s revenue base. As noted above, the growth in Local Use tax receipts over the prior few years reflects the ongoing rise of e-commerce.
xii
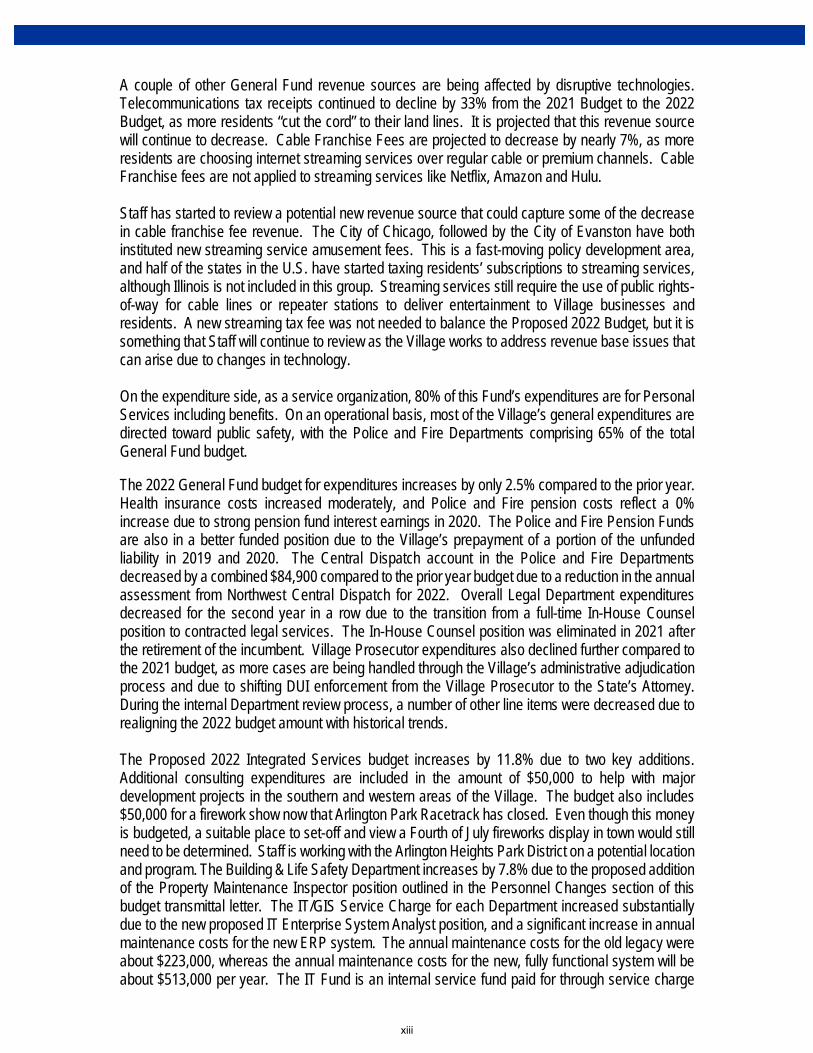
A couple of other General Fund revenue sources are being affected by disruptive technologies. Telecommunications tax receipts continued to decline by 33% from the 2021 Budget to the 2022 Budget, as more residents “cut the cord” to their land lines. It is projected that this revenue source will continue to decrease. Cable Franchise Fees are projected to decrease by nearly 7%, as more residents are choosing internet streaming services over regular cable or premium channels. Cable Franchise fees are not applied to streaming services like Netflix, Amazon and Hulu. Staff has started to review a potential new revenue source that could capture some of the decrease in cable franchise fee revenue. The City of Chicago, followed by the City of Evanston have both instituted new streaming service amusement fees. This is a fast-moving policy development area, and half of the states in the U.S. have started taxing residents’ subscriptions to streaming services, although Illinois is not included in this group. Streaming services still require the use of public rights-of-way for cable lines or repeater stations to deliver entertainment to Village businesses and residents. A new streaming tax fee was not needed to balance the Proposed 2022 Budget, but it is something that Staff will continue to review as the Village works to address revenue base issues that can arise due to changes in technology. On the expenditure side, as a service organization, 80% of this Fund’s expenditures are for Personal Services including benefits. On an operational basis, most of the Village’s general expenditures are directed toward public safety, with the Police and Fire Departments comprising 65% of the total General Fund budget. The 2022 General Fund budget for expenditures increases by only 2.5% compared to the prior year. Health insurance costs increased moderately, and Police and Fire pension costs reflect a 0% increase due to strong pension fund interest earnings in 2020. The Police and Fire Pension Funds are also in a better funded position due to the Village’s prepayment of a portion of the unfunded liability in 2019 and 2020. The Central Dispatch account in the Police and Fire Departments decreased by a combined $84,900 compared to the prior year budget due to a reduction in the annual assessment from Northwest Central Dispatch for 2022. Overall Legal Department expenditures decreased for the second year in a row due to the transition from a full-time In-House Counsel position to contracted legal services. The In-House Counsel position was eliminated in 2021 after the retirement of the incumbent. Village Prosecutor expenditures also declined further compared to the 2021 budget, as more cases are being handled through the Village’s administrative adjudication process and due to shifting DUI enforcement from the Village Prosecutor to the State’s Attorney. During the internal Department review process, a number of other line items were decreased due to realigning the 2022 budget amount with historical trends. The Proposed 2022 Integrated Services budget increases by 11.8% due to two key additions. Additional consulting expenditures are included in the amount of $50,000 to help with major development projects in the southern and western areas of the Village. The budget also includes $50,000 for a firework show now that Arlington Park Racetrack has closed. Even though this money is budgeted, a suitable place to set-off and view a Fourth of July fireworks display in town would still need to be determined. Staff is working with the Arlington Heights Park District on a potential location and program. The Building & Life Safety Department increases by 7.8% due to the proposed addition of the Property Maintenance Inspector position outlined in the Personnel Changes section of this budget transmittal letter. The IT/GIS Service Charge for each Department increased substantially due to the new proposed IT Enterprise System Analyst position, and a significant increase in annual maintenance costs for the new ERP system. The annual maintenance costs for the old legacy were about $223,000, whereas the annual maintenance costs for the new, fully functional system will be about $513,000 per year. The IT Fund is an internal service fund paid for through service charge
xiii

allocations to the operating Departments, which are based on the number of personal computers and laptops assigned to each Department. Other expenditures for the other Departments were fairly consistent compared to the prior year. Future General Fund Issues: State of Illinois – over the past year, the State has benefitted financially from federal Pandemic grants. The State budget for 2021-2022 was also approved on-time this past year. However, the State’s long-term fiscal issues and questions about a sustainable revenue base remain in place. Sale of the Arlington Park Racetrack Property – During 2021, Churchill Downs Incorporated (CDI) the owner of the racetrack, decided to end live racing operations at the end of the racing season and sell the 326-acre site for the highest and best use of the property. After securing a number of competitive bid proposals for the purchase of the property over the past summer, CDI recently announced that it and the Chicago Bears Football Club signed a Purchase and Sale Agreement (PSA) for the entire Arlington Park land parcel. Much work will still need to be done between the Village, surrounding communities, other government entities, CDI, community stakeholders, and the Bears organization before the property sale is finalized. As per the 2022-23 Business Plan, the Village will continue to work with the various parties and the community during this process, and the Village’s costs and benefits of this development will continue to be reviewed carefully. Water & Sewer Fund The Water & Sewer Fund’s working cash reserves have continued to be challenged by decreased water usage due in part to wetter spring/summer weather. This has resulted in lower water and sewer revenues than budgeted. In addition, there are more efficient plumbing systems installed in residential and commercial properties, and a greater awareness by the public of water conservation methods. As a result, estimates are now based on water usage which is lower than the 15-year average. In October 2019 the Village Board approved a five-year water and sewer rate adjustment plan that allowed the Village to increase the amount spent on its water main replacement program. The Village’s water and sanitary sewer infrastructure is aging, and the average number of water main breaks are two to three times that of comparable communities. The Village’s residential and commercial water meters are also older, and the five-year capital plan includes the replacement of these meters. In 2015 the Village was spending about $500,000 per year on water main replacement. Due to the five-year rate plan, as well as the $9 million in 2020 bond proceeds allocated to the Water & Sewer Fund, the Village is now planning on replacing at least $4 million, or 1% of our water mains on an annual basis. Water main breaks are used as an indicator of system condition. According to the American Water Works Association, water utilities should strive for between 25 and 30 water main breaks per 100 miles of water main per year. In 2018 the six-year average for Village main breaks was 88 breaks per 100 miles of water main, but as of 2021 that average decreased to 75 breaks per 100 miles of water main. Beyond the water main replacement program, the Village has also developed several programs over the years which should help decrease water main breaks. These include an aggressive leak detection program and a surge suppressor program. The Village has also installed variable frequency drives at our booster stations to reduce strain on the system. Although these programs have been successful, they are preventative measures only and aid in extending the life of our water mains. As such, these efforts are not a substitute for needed water main replacement.
xiv

The Proposed 2022 Budget also includes the beginning of a multi-year plan to replace the Automated Meter Reading (AMR) system, and the residential and commercial water meters. The current system is over 15 years old, and as meters age they slow down and start to under-read actual usage. Over the next few years, more accurate meter reads and less water loss due to main breaks should start to improve the Water & Sewer Fund’s revenue receipts. Future Water & Sewer Fund Issues: Working Cash Balance – in order to continue to maintain an adequate working cash balance in the Water & Sewer Fund, future rate adjustments will likely need to be considered. Fortunately, the Village’s average water and sewer rates still compare fairly to our neighboring communities. However, the Village plans on sustaining aggressive water main replacement, water tank painting, and meter replacement programs over the next five years and beyond. The next water and sewer rate study is currently scheduled for late 2024. Lead Water Line Replacement – In some sections of the Village’s water system, lead services are fairly common due to the age of construction. The Village continues to be in full compliance with all regulations due to our treatment program that effectively coats the inside of all water lines, both private and public. Every year, the Village completes, tests and passes the required lead testing program through the IEPA. However, the Federal and State Governments recently passed legislation that will require all lead lines to be phased out of service by the year 2044. This is a very expensive requirement that will likely require federal and state assistance. The Village is currently completing an inventory of the existing lead lines located on private and public property. Capital Improvement Program (CIP) The Village of Arlington Heights has historically been diligent in maintaining its roads, providing a drainage system that mitigates flooding in the community, and maintaining its buildings, emergency apparatus, and facilities required to perform essential services. Over the years, Federal and State financial assistance has dwindled thereby expanding local responsibilities in the program area of public infrastructure. More recently, the State’s capital program and Federal Pandemic assistance has helped bolster available capital resources. The prior lack of State and Federal resources has been compounded by new regulations governing the health and environmental standards that regulate design and operations. Balancing the competing demands for limited resources is important to maintain a healthy, safe, viable, and physically attractive community. The Capital Improvement Program includes a process whereby citizens are asked for input on a biennial basis. By communicating through the Village website, citizens are afforded the opportunity to complete a short form describing the type of capital projects they would like the Village to consider in the next five years. The top two capital infrastructure issues identified through the community response process has consistently been for street and storm water control projects. Village staff analyzed the cost and eligibility of all the proposed projects, and the Board subsequently examined the requests along with staff recommendations. Certain capital projects are considered only if the persons and property owners are agreeable to special assessment or special service area financing. In other cases, projects are included in the CIP since they would benefit the community as a whole. In June 2021, the Village Board reviewed and approved adjustments to the second year of the five-year Capital Improvement Plan for 2021 - 2025. The next biennial CIP process will be undertaken in 2022. The capital projects outlined in the CIP are budgeted in a variety of Village funds, depending on the source of revenue. The second year of the 2021-2025 capital plan has been incorporated into the 2022 Budget. The “CIP/Debt Service” section of the budget shows a summary of the entire five-year
xv

capital spending and funding plan. The key 2022 capital projects, outside of the water and sewer projects that were identified earlier, include the following: Tax Increment Financing (TIF) Fund Projects – The Village currently has four active TIF Districts. TIF projects are typically financed through a pay as you go mechanism or through issuing debt based on future property tax increment revenue streams. The difference in property tax revenues received in the base year of a TIF District versus the increased property taxes received in subsequent years after improvements are made, result in a property tax increment. In the 2022 Budget, TIF IV (Arlington Heights/Golf Roads) shows budgets of $1.5 million for redevelopment and $127,000 for green corridor beautification crosswalks. In TIF V (Arlington Heights/Rand Roads) $850,000 is budgeted for redevelopment at Southpoint Shopping Center, and $233,000 is budgeted for the multi-year Rand Road corridor identification project. The Hickory/Kensington TIF includes $1,025,000 for the construction of public infrastructure associated with the development of a new apartment building. The South Arlington Heights Road TIF was established in 2020 and includes $55,000 toward initial development costs. There are no other large capital projects currently scheduled for the TIF Districts during the 2022 Budget period. However, if a developer brings forth a viable project during the fiscal year, the Village would amend the budget accordingly. Capital Projects Fund – This Fund accounts for a variety of capital improvement projects including road improvements, sidewalk repair/replacement, equipment, traffic signals, and other miscellaneous projects. Financing for this Fund is provided primarily by property taxes, a ¼% home-rule sales tax, and grant revenues. Based on the Village Board’s capital spending priorities, the spending plan continues the Village’s efforts for street resurfacing and reconstruction. The 2022 street program includes the following expenditures: Street Program ($5,600,000 – Capital Projects Fund) – This is an ongoing program to resurface or rehabilitate existing deteriorated street pavement and curbs. Street Rehabilitation Program ($4,000,000 – MFT Fund) – This is an ongoing street rehabilitation program consisting of the reconstruction of significantly deteriorated street pavement, curbs, and concrete panels. The 2022 Budget for this program is $1,600,000 higher than the 2019 budget due to the increase in the State’s gas tax which was part of the new State capital plan. Beginning July 1, 2019, the Motor Fuel Tax law was amended to impose a tax rate increase from 19 cents to 38 cents per gallon on motor fuel which will be adjusted annually, if any, on July 1st of each year based on the Consumer Price Index. In addition, the Village received MFT grants of $1.65 million per year in 2020 and 2021, and will receive a final installment in 2022 as part of the State’s capital program. Some of the other major projects included in the 2022 Capital Projects Fund budget are: Sidewalk & Curb Replacement ($415,000) and Paver Brick Maintenance ($400,000) – This program covers the Village’s ongoing efforts to repair possible trip hazards, and to reduce the Village’s liability exposure to trips and falls. The Paver Brick Maintenance program is scheduled to decrease to $100,000 per year in 2023 after completion in 2022 of a multi-year Downtown paver brick replacement program. Downtown Streetscape Improvements ($200,000) – A multi-year plan to improve the pedestrian environment and safety in the Downtown by creating bump-outs and mid-block crossings. The next scheduled phase is to provide a pedestrian crossing on Campbell west of Vail. Rand Road Corridor Identification Enhancement ($140,400) – This is a multi-year plan to create a separate unifying identity for this shopping district. The first phase entailed initial preliminary design,
xvi

and funds have been re-budgeted pending receiving approval from the Illinois Department of Transportation. Surface Treatment - Streets ($300,000) – Since 2016 the Village has used an application of asphalt emulsions to extend the life of Village streets. Due to the success of this program, during the last biennial CIP process, funding for the program was planned to be increased from $150,000 to $300,000 as of 2022 and thereafter. Wilke Road Resurfacing & Multi-Use Path Extension ($170,000) – First year of a multi-year project to resurface Wilke Road, provide ADA improvements, and extend the multi-use path along the east side from the southern boundary to Sunset Meadows Park. The Village of Rolling Meadows will be billed for their 20% portion of the construction costs. Sustainability/Green Aggregation Projects ($105,000) – this is the first year of a multi-year program to complete sustainable/green projects through the use of electric aggregation rebates from Eligo and MC Squared. The Village will be receiving electric aggregation rebates for four years from 2020 through 2023, which are projected to total about $625,000. Based on this limited dedicated revenue source, that Village has started to identify one-time projects that promote sustainability. The 2022 Budget includes funds for a limited number of EV charging stations downtown, increasing the Village’s EV fleet, and miscellaneous bike and pedestrian crosswalk projects. Staff is also looking into leveraging the aggregation funding in a future year for a Vail Avenue permeable paver grant match. During the 2022 CIP process, Staff will develop other proposed sustainable projects for the Village Board’s consideration. Storm Water Control Fund – In 2018 the Village sold a $10 million bond issue to pay for a number of storm water infrastructure projects over the next five years. The principal and interest on these bonds is being covered by storm water utility fees that were implemented in late 2017. In addition to this revenue source, the Village continues to actively seek out grant funding opportunities. The Village was fortunate to have been selected for grant funding assistance from the Metropolitan Water Reclamation District of Greater Chicago (MWRD). This grant covered $1.8 million of the $4.2 million Downtown sewer project (Area 4 – Street Ponding Campbell/Sigwalt). In 2021, the Illinois Department of Commerce & Economic Opportunity (DCEO) approved a $1 million grant for the Area C – Burr Oak/Burning Tree/Berkley/Hintz Road project. The receipt of grant funds has allowed the Village to include additional storm water control projects on the five-year infrastructure spending plan, which is included in the Storm Water Control Fund section of the budget. The 2022 Budget includes the following significant flood control projects: Backyard Drainage Improvements ($400,000) – This program budget provides funds for public drainage improvements allowing new or improved access for residents to Village storm sewers. The program only covers work on public right-of-way, or within public utility and drainage easements. Any connections or work on private property not within public easements, is the responsibility of the property owner. The 2022 Backyard Drainage Improvement project will focus on installing storm sewers on Evergreen Avenue and Maude Avenue. This project has been identified as a recipient of an Illinois Department of Commerce and Economic Opportunity (DCEO) grant in the amount of $400,000. However, delays in grant funding are anticipated due to the State’s current focus on COVID-related grants. Storm Water Rehabilitation/Replacement Program ($500,000) - The budget includes the seventh-year costs of a multi-year program to lightly clean, televise, and analyze the condition of the Village’s system. This portion of the program will take about eight years to complete, after which the budget
xvii

for this program will be devoted to storm rehabilitation and replacement work identified by televising the system. Enhanced Overhead Sewer Program ($250,000) - The overhead sewer program (OHS) is designed to offer a rebate to single-family homeowners of the direct costs of converting an existing gravity sewer system to an overhead system. The average cost to install a sewer back-up system can range from $10,000 to $15,000. The standard program offers a rebate paid to the owner by the Village for up to 50%, not to exceed $7,500 of these costs. The Village authorized an enhanced program as of October 1, 2017, which allows the first 400 applicants to receive a rebate of 75%, not to exceed $11,250 of the direct costs of converting the system. Permit fees associated with these direct costs will also be waived. Installing a sewer back-up system increases an owner’s property value, but the significant out-of-pocket expense has prohibited some residents from participating in the program. From the inception of the program in FY2007 through October 2020, there have been 256 rebates paid (including 60 from the enhanced program) to single-family homeowners for a total cost to date of $1.6 million. Area C - Burr Oak/Burning Tree/Berkley/Hintz Road ($2,672,000) – This project includes storm sewer improvements, street reconstruction, water main replacement, sidewalk and curb restoration, and landscaping restoration at two separate locations in the Berkley Square Subdivision. The first location is the northwest area of the subdivision and will include the installation of new storm sewer that diverts floodwater to a proposed storage basin on the western side of Raven Park. The second location is in the southeast area of the subdivision, and proposed improvements include the installation of a new upsized storm sewer line. This project has been approved as a recipient of an Illinois Department of Commerce and Economic Opportunity (DCEO) grant in the amount of $1,000,000. Criminal Investigations Fund – The Proposed 2022 Budget includes $300,000 per year (5-year contract) for a new Body Worn Camera (BWC)/Dash Cam System. There are sufficient funds for 2022, but unless the Criminal Investigation Fund receives significant seizure fund revenues during 2022, this fund will be in a deficit position as of 2023. A backlog within the U.S. Department of Justice dating back to the beginning of 2019 has further impacted seizure imbursements under this account. If sufficient funds are not released in time and amount, this annual expenditure would have to be moved to the Capital Projects Fund, which could crowd out other projects unless additional tax dollars were generated in this fund by 2023. Extensive research and field testing of various body worn cameras was conducted by the Police Department during 2021. While cost of standalone BWC systems did not vary significantly between manufacturers, it was readily apparent implementation, consolidation of current technologies and operational procedures were substantially dissimilar. A single manufacturer, Axon Enterprises Inc., presented a comprehensive platform which seamlessly integrated BWC technology with police dash camera systems and conducted electrical weapons (TASER), both currently utilized by police. Existing TASER weapons are scheduled for replacement in 2023. Dash cameras currently follow a similar replacement schedule. While there is an increased cost due to the consolidation of these current systems, long-term benefits are unmistakable with this approach. The solution avoids maintenance of multiple data silos, incompatible software systems, and disjointed evidence management while merging existing expenditures and maintenance agreements. The system also includes robust video redaction software necessary for Freedom of Information Act (FOIA) requests, and a full cloud-based digital evidence storage system. The mandate to implement a BWC system for the Arlington Heights Police Department is not required by State statute until January 1, 2024. However, implementation at a sooner date will afford an
xviii

opportunity to capture unbiased, real-time evidence to defend an Officer or the Village against an unjustified complaint or civil action. The BWC requirement is an unfunded mandate, and the Illinois Chiefs of Police are working with Illinois Legislators to help identify and secure a funding source for body cameras. Additionally, the Police Department applied and is awaiting notice of potential grant funding in the amount of $250,000 through the U.S. Department of Justice. Arts, Entertainment & Events (A & E) Fund – The Pandemic resulted in a significant 16% decrease in 2020 in Food & Beverage (FBT) taxes, which is the primary revenue source for this fund. FBT revenues have rebounded nicely in 2021, but are not projected to reach 2019 levels again until 2022. In addition, as one of five owners of commercial condominium units in the Metropolis Building, the Village’s portion of the 2022 monthly building reserve charge will increase by over $41,000 per year over the 2020 amount. This large increase reflects the results of a building reserve study completed in 2020, which calls for the roof to be replaced in 2024. In addition, the Commercial Condominium Board just received a large quote to repair or replace the main 22-year-old air-conditioning unit. The one-time transfer-in of $650,000 from the Public Building Fund, fills the immediate funding gap caused by lower FBT revenues, and provides funds to cover the Village’s portion of the immediate and future infrastructure needs at this building. To cover the existing projected expenses of the Village’s existing art and entertainment events that are run through this fund, as well as the Village’s portion of the higher building reserve costs, the proposed 2022 A & E Fund revenue includes a change to the Food & Beverage Tax allocation from 25% to 26%. This would provide the fund with a sustainable amount of funding in future years. The 2022 Budget for the A & E Fund also reflects a new proposed Alfresco FBT paid by the patrons of the restaurants located in the Alfresco zone. It takes a significant amount of Village resources to set up, maintain, and take down the Alfresco area each year. Under this proposal, Alfresco restaurants would add an additional targeted .5% to the current 1.25%, or a 1.75 % total FBT tax paid by their patrons. By collecting this additional amount on a year-round basis, it is projected to generate the nearly $90,000 it would take to cover the Village’s estimated annual Alfresco expenses. The Village is also looking into the possibility of expanding parking options on private property lots. This would require financial incentives to the private lot owners, which may result in a higher proposed targeted FBT amount. Although this proposal is included in the Proposed 2022 Budget for planning purposes, the Village Board isn’t scheduled for an in-depth review of the proposal until after the budget is approved. Acknowledgements The 2022 Budget continues the Village’s commitment to its ongoing capital improvement program and the provision of quality municipal services. I would like to thank the entire staff and especially the budget team consisting of Tom Kuehne, Mary Ellen Juarez, Kevin Baumgartner, and Diana Mikula for their efforts. Thanks as well to the Village Board for its ongoing support during the budget cycle and throughout the year. Sincerely,
Randall R. Recklaus Village Manager
xix

BUDGET CALENDAR For Preparation of 2022 Budget
(January 1, 2021 – December 31, 2021)
DATE DAY ACTIVITY March - June, 2021 – Capital Improvement Project Recap prepared.
June 23, 2021 Wednesday Operating fund overview, recommended budget ceilings and proposed 2021 tax levy released to Village Board for discussion at June 28th Committee-of-the-Whole meeting. CIP recap released to Village Board for discussion at June 28th Committee-of-the-Whole.
June 28, 2021 Monday Committee-of-the-Whole reviews audit, Capital Improvement Program Recap, and discusses the Operating Fund Overview, Recommended 2022 Budget Ceilings, and proposed 2022 tax levy.
July 6, 2021 Tuesday Board considers any motions stemming from June 28th Committee-of-the-Whole meeting regarding the recommended 2022 Budget Ceilings.
July 9, 2021 Friday Budget worksheets are forwarded to departments. Departments prepare detailed budgets.
August 10, 2021 Tuesday Department budget requests and projections due.
Aug 10 – Sep 3, 2021 – Finance Department compiles departmental budget submissions.
September 3, 2021 Friday First draft of 2022 Budget forwarded to Village Manager, Budget Team and all departments for review.
Sep 13 – Sep 15, 2021 – Departments meet with Village Manager and Budget Team.
Sep 15 – Oct 22, 2021 – Final draft of 2022 budget prepared.
October 29, 2021 Friday Release final draft of 2022 Budget to Village Board.
November 8, 2021 Monday 1st Budget Meeting – AH Memorial Library, Budget Overview, Budgets for Board of Trustees, Integrated Services, Legal, Health & Human Services, HR, Finance, Building Services, and Police
November 10, 2021 Wednesday 2nd Budget Meeting – Budgets for Metropolis Theater, Boards & Commissions, Planning & Community Development, Public Works, Water & Sewer, Parking Operations, Fleet Services, and Fire
November 16, 2021 Tuesday 3rd Budget Meeting – If needed
November 17, 2021 Wednesday Notice of Public Hearing on 2022 Budget published in newspaper.
December 6, 2021 Monday Board approves 2021 Tax Levy and Abatement Ordinances.
Public Hearing on 2022 Budget. Approval of 2022 Budget at formal meeting.
xx

SU
RV
EY
OF
CO
MP
AR
AB
LE
MU
NIC
IPA
LIT
IES
ES
TIM
AT
ED
AN
NU
AL
RE
VE
NU
ES
RE
CE
IVE
D F
RO
M A
N A
VE
RA
GE
HO
ME
AU
GU
ST
202
1
AN
NU
AL
ES
TIM
AT
ED
PA
YM
EN
TS
:
Mu
nic
ipal
ity
2021
Pas
sen
ger
Veh
. Sti
cker
s
Gar
bag
e
Bill
*
Yar
d
Was
te
Bill
Co
mb
ined
**
Res
iden
tial
Wat
er &
Sew
er B
ill
Sto
rm
Wat
er F
ee
Ho
me*
**
Ru
le
Sal
es T
ax
Fo
od
&
Bev
erag
e S
ales
Tax
Mu
nic
ipal
Mo
tor
Fu
el
Tax
En
tert
ain
. T
ax
Ele
ctri
c
Uti
lity
Tax
Gas
Uti
lity
Tax
Tel
eco
m
Tax
2020
****
Mu
nic
ipal
Pro
per
ty
Tax
To
tal
Est
imat
ed
An
nu
al
Ho
meo
wn
er
Co
sts
12,3
001,
700
kWh/
Yr
ther
ms/
Yr
Ass
umpt
ions
for
212
4814
4,00
0E
stim
ated
$6,0
00$3
,000
650
$2,4
00$1
,400
$1,6
50$1
,200
$92,
100
Ave
rage
Fam
ilyC
ars
/Yr
Bag
s/Y
rG
allo
ns/Y
r/Y
ear
/Yea
r G
allo
ns/Y
r/Y
ear
/Yea
r /Y
ear
/Yea
r E
AV
1.R
ollin
g M
eado
ws
0.00
$359
.40
$0.0
02,
337.
1257
.12
60.0
060
.00
26.0
00.
0075
.03
85.0
072
.00
1483
.73
$4,6
15.4
02.
Hof
fman
Est
ates
0.00
$146
.52
$144
.00
1,94
9.88
24.0
060
.00
60.0
016
.25
0.00
69.0
085
.00
60.0
013
08.7
4$3
,923
.39
3.M
ount
Pro
spec
t90
.00
$253
.80
$0.0
02,
204.
160.
0060
.00
30.0
026
.00
0.0
043
.17
24.9
972
.00
900.
74$3
,704
.86
4.W
heel
ing
0.00
$276
.12
$0.0
01,
212.
8439
.00
60.0
030
.00
0.00
96.0
075
.03
85.0
072
.00
1402
.68
$3,3
48.6
75.
Elk
Gro
ve V
illag
e0.
0024
6.12
$144
.00
1,72
8.00
0.00
60.0
030
.00
0.00
0.0
075
.03
85.0
072
.00
761.
67$3
,201
.82
6.A
rlin
gto
n H
eig
hts
60.0
0$2
07.6
0$1
17.6
01,
350.
2475
.00
60.0
037
.50
0.00
0.00
75.0
385
.00
72.0
010
24.1
5$3
,164
.12
7.B
uffa
lo G
rove
0.00
$279
.60
$0.0
01,
267.
0860
.96
60.0
030
.00
0.00
0.00
75.
0385
.00
72.0
010
72.9
7$3
,002
.64
8.D
es P
lain
es0.
00$2
12.4
0$0
.00
1,39
1.83
0.00
60.0
030
.00
45.5
00.
0070
.23
42.5
072
.00
1014
.02
$2,9
38.4
89.
Sch
aum
burg
0.00
$0.0
0$0
.00
2,02
9.92
0.00
60.0
060
.00
19.5
012
0.00
0.00
0.00
72.0
046
3.26
$2,8
24.6
810
.Par
k R
idge
90.0
0$0
.00
$0.0
01,
544.
040.
0060
.00
30.0
026
.00
0.00
68.6
334
.00
72.0
074
2.33
$2,6
67.0
011
.Pal
atin
e60
.00
$258
.00
$0.0
093
4.44
60.0
060
.00
30.0
00.
000.
0075
.03
0.0
072
.00
1043
.49
$2,5
92.9
6
*Rat
es in
clud
e ca
rts
and/
or S
WA
NC
C fe
es w
here
app
licab
le.
** R
ate/
100
cubi
c ft.
x 1
.336
7197
= r
ate/
1000
gal
s.**
*Hom
e/R
ules
Sal
es T
axes
are
on
gene
ral m
erch
andi
se o
nly,
not
app
lied
agai
nst v
ehic
les
or q
ualif
ying
food
, dru
gs, o
r m
edic
al a
pplia
nces
.**
**M
unic
ipal
tax
only
, doe
s no
t inc
lude
libr
arie
s, s
choo
ls, s
pec
ial d
istr
icts
, or
othe
r ta
aut
horit
ies.
Sou
rces
: Sur
veys
: Arli
ngto
n H
eigh
ts (
08/2
1), /
Coo
k C
ount
y C
lerk
web
site
/ M
unic
ipal
web
site
s / C
odes
xxi

PRESENTED TO
Village of Arlington Heights Illinois
For the Fiscal Year Beginning
January 01, 2021
Executive Director
GOVERNMENT FINANCE OFFICERS ASSOCIATION
Distinguished Budget Presentation
Award
xxii

FINANCIAL PERFORMANCE GOALS The Financial Performance Goals represent an initial effort to establish written policies for guiding the Village's financial management practices. While some of the performance goals are specific and will limit certain types of financial activity, the goal statements are not intended to restrict the Village President and Board of Trustees' ability and responsibility to respond to emergency or service delivery needs above or beyond the limitations established by the Financial Performance Goals. REVENUE PERFORMANCE GOALS The Village will maintain a diversified and stable revenue system as protection from short-run fluctuations. The Village will estimate annual revenues on an objective and reasonable basis. The Village will develop a method of projecting revenues on a multi-year basis. The Village will use one-time or special source revenue for capital expenditures or for expenditures incurred in generating the revenue, not to subsidize recurring personnel, operation and maintenance costs. The Village will establish, and annually re-evaluate, all user charges and fees at a level related to the cost of providing the services. The Village will endeavor to reduce reliance on the property tax by seeking and developing additional revenue sources. The Village will designate a specific revenue source to be used for ongoing funding of capital projects. The Village will attempt to limit property tax increases, when such increases are needed, to no more than 105% of the previous year's extension as calculated for Truth in Taxation purposes. OPERATION EXPENDITURES PERFORMANCE GOALS The Village Manager and Finance Director will propose and the Village Board will adopt and maintain a balanced budget in which expenditures will not be allowed to exceed reasonably estimated revenues and other available funds at the same time maintaining recommended fund balance reserves. The Village will pay for all current operation and maintenance expenses from current revenue. The operating budget will provide for the adequate maintenance of capital assets and equipment. The budget will provide for adequate funding of all employee benefit programs and retirement systems. The Village will maintain an encumbrance accounting system which will allow it to closely monitor the adopted budget as it may be amended from time to time pursuant to Village code. The Village will prepare and maintain a system of regular monthly reports comparing actual revenues and expenditures to budgeted amounts.
xxiii

FINANCIAL PERFORMANCE GOALS (Continued) The Village will maintain an effective risk management program to minimize losses and reduce costs. The Village Board will ensure that adequate insurance or self-insured programs are in place. The Village will encourage delivery of services by other public and private organizations whenever and wherever greater efficiency and effectiveness can be expected as well as develop and internally use technology and productivity advancements that will help reduce or avoid increasing personnel costs. The intent is to control personnel costs as a proportion of the total budget, to more productively and creatively use available resources and to avoid duplication of effort and use of resources. RESERVE PERFORMANCE GOALS The Village will maintain a minimum undesignated General Fund balance of 25% of annual operating expenditures before transfers-out in order to:
A. Provide adequate cash flow and to prevent the demand for short term borrowing;
B. Provide for temporary funding of unforeseen needs of an emergency or non-recurring nature;
C. Provide for orderly budgetary adjustments when revenues are lost through the actions of other governmental bodies;
D. Provide the local match for public or private grants;
E. Provide for unexpected, small increases in service delivery costs;
F. Provide for unanticipated revenue shortfalls.
Any General Fund balance exceeding 25% of annual operating expenditures is available to be transferred to the Capital Projects Fund, the Fleet Operations Fund, or other funds depending on need. The Village will maintain a permanent self-insurance reserve in an amount necessary to fund the estimated future claims for general liability, workers' compensation and employee health insurance to prevent the need for short and long term borrowing to fund these claims. At a minimum, the level of this reserve will be equivalent to the amount of reserves as estimated by the Village's third party claims administrator. INVESTMENT PERFORMANCE GOALS The Village will develop a cash flow analysis of all funds on a regular basis. Collections, deposits and disbursements of all funds will be scheduled to ensure maximum cash availability. The Village will identify and invest cash not immediately needed to achieve the highest return subject to safeguarding principal, maintenance of necessary liquidity, maintenance of public confidence and compliance with all Village, State and Federal regulations. The Village will follow the Investment and Depository Policy approved by the Village Board on September 21, 1999. Any changes to that policy must be approved by the Village Board of Trustees.
xxiv

FINANCIAL PERFORMANCE GOALS (Continued) The Village will maintain a system of internal controls and procedures which shall be documented. The controls shall be designed to prevent losses of Village assets arising from fraud, employee error, misrepresentation by third parties, unanticipated changes in financial markets, or imprudent actions by employees. The Finance Department will provide monthly information to the Village President and Board of Trustees concerning investment performance. CAPITAL IMPROVEMENT PERFORMANCE GOALS Capital improvements will be based on long range projected needs rather than on immediate needs in order to minimize future maintenance, replacement and capital costs. The Village shall maintain a five year capital improvement program and all capital improvements will be made in accordance with that plan. The capital improvement program shall be updated annually. The development of the capital improvement program will be coordinated with the operating budget in order to maintain a reasonably stable total tax levy. The Village will identify the estimated cost and potential funding sources for each capital project proposed before submission to reviewing bodies and to the Village President and Board of Trustees. Future operating costs associated with a proposed capital improvement will be estimated before a decision is made to implement a project. Federal, State and other intergovernmental and private funding sources of a special revenue nature shall be sought out and used as available to assist in financing capital improvements. DEBT PERFORMANCE GOALS The Village will limit long-term debt to those capital improvements that cannot be financed from current revenues. The maturity date for any debt will not exceed the reasonable expected useful life of the project to be funded or negatively impact the marketability of the bonds. The Village will avoid the issuance of Budget, Tax and Revenue Anticipation Notes. The Village will use special assessments, revenue bonds, and/or any other available self-liquidating debt measures instead of general obligation bonds where and when possible, applicable and practicable. The Village shall develop and maintain good relations with financial and bond rating agencies, and will follow a policy of full and open disclosure on every financial report and bond prospectus. When issuing new debt, the Village will endeavor to maintain medium credit industry benchmarks as published annually by Moody's Investors Service.
xxv

FINANCIAL PERFORMANCE GOALS (Continued) The Village will develop a Debt Management Policy to help ensure the Village's credit worthiness and to provide a functional tool for debt management and capital planning. FINANCIAL REPORTING PERFORMANCE GOALS The Village will adhere to a policy of full and open public disclosure of all financial operations. The proposed budget will be prepared in a manner maximizing its understanding by citizens and elected officials. Copies of financial documents will be made available to all interested parties. Opportunities will be provided for full citizen participation prior to final adoption of the budget. The Village's accounting system will maintain records on a basis consistent with generally accepted accounting principles. The Finance Director will prepare regular quarterly and annual financial reports presenting a summary of financial activity by major types of funds and programs. The Village will prepare a Comprehensive Annual Financial Report in conformity with generally accepted accounting principles and financial reporting practices. The Village will employ an independent public accounting firm to perform an annual audit of all funds, authorities, agencies and grant programs, and will make the annual audited report available to the general public, bond and financial consultants and other interested citizens and organizations. The audit shall be completed and submitted to the Village President and Board of Trustees within 180 days of the close of the Village's fiscal year.
xxvi

BUDGET DOCUMENT PURPOSE & CONTENT PURPOSE This budget represents the Village’s plan for allocating resources. These resources include time, manpower and money and are allocated to accomplish the planned objectives set forth in the strategic plan. The budget document is a planning, control and measurement tool of the Village. It is a comprehensive financial plan adopted annually by the Village Board, with a fiscal year starting January 1st and ending December 31st. The budget calendar identifies the timing, responsibility and duration of the budget process. Generally, the budget process begins in July and the budget is adopted in December. Once adopted, the control and measurement process of budget administration continues until fiscal year end, at which time, the external independent annual audit provides a review of the Village’s budget performance. Therefore, the true budget process does not end when the budget is adopted, but is a year-round concern of the Village Board and staff. CONTENT This budget document utilizes a pyramid approach to provide its readers with varied levels of detail. This budget document is more than a financial plan. It is intended to fulfill four major functions through its role as:
► a policy document ► an operations guide ► a communication medium ► a financial plan
The presentation of the budget document can be summarized as follows: INTRODUCTION & FINANCIAL SUMMARIES – This section provides for a transmittal letter which highlights the significant elements of the budget. Within this section is a "BUDGET AT A GLANCE" presentation which has various tables and charts to provide the reader an overview of the budget at the highest level of reporting. These schedules combine all funds and cross reference each individual fund and operation. Each type of user requires differing levels of detail depending on the level and type of decision making. Also, various tables are incorporated into the budget document to present general, financial, socio-economic, and other pertinent data to give the reader historical and factual data that enhances their understanding of the direction the Village is heading. Generally speaking, these few pages provide the general public (and the press) a sufficient understanding of the budget document and serves most purposes. INDIVIDUAL FUND BY FUND PRESENTATION – At the next lower level of reporting, each fund presentation begins with "Fund at a Glance" introduction which highlights the major revenues (sources) and the major expenditures (uses) in a basic format. A "Fund Summary" follows which illustrates two previous years’ actuals, the projected actual as compared to budget for the current fiscal year, and the new budget year's effect on the financial position of the fund. This allows the reader an overview of the fund without necessarily reviewing the next lower level of reporting.
xxvii
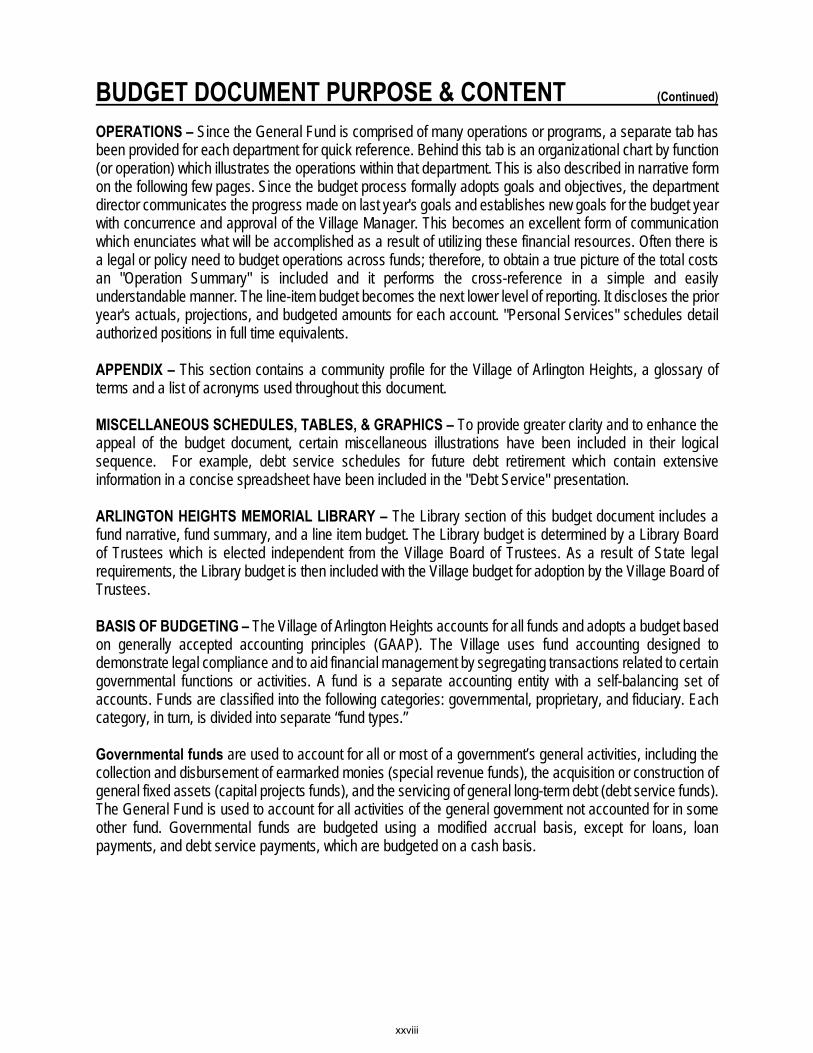
BUDGET DOCUMENT PURPOSE & CONTENT (Continued) OPERATIONS – Since the General Fund is comprised of many operations or programs, a separate tab has been provided for each department for quick reference. Behind this tab is an organizational chart by function (or operation) which illustrates the operations within that department. This is also described in narrative form on the following few pages. Since the budget process formally adopts goals and objectives, the department director communicates the progress made on last year's goals and establishes new goals for the budget year with concurrence and approval of the Village Manager. This becomes an excellent form of communication which enunciates what will be accomplished as a result of utilizing these financial resources. Often there is a legal or policy need to budget operations across funds; therefore, to obtain a true picture of the total costs an "Operation Summary" is included and it performs the cross-reference in a simple and easily understandable manner. The line-item budget becomes the next lower level of reporting. It discloses the prior year's actuals, projections, and budgeted amounts for each account. "Personal Services" schedules detail authorized positions in full time equivalents. APPENDIX – This section contains a community profile for the Village of Arlington Heights, a glossary of terms and a list of acronyms used throughout this document. MISCELLANEOUS SCHEDULES, TABLES, & GRAPHICS – To provide greater clarity and to enhance the appeal of the budget document, certain miscellaneous illustrations have been included in their logical sequence. For example, debt service schedules for future debt retirement which contain extensive information in a concise spreadsheet have been included in the "Debt Service" presentation. ARLINGTON HEIGHTS MEMORIAL LIBRARY – The Library section of this budget document includes a fund narrative, fund summary, and a line item budget. The Library budget is determined by a Library Board of Trustees which is elected independent from the Village Board of Trustees. As a result of State legal requirements, the Library budget is then included with the Village budget for adoption by the Village Board of Trustees. BASIS OF BUDGETING – The Village of Arlington Heights accounts for all funds and adopts a budget based on generally accepted accounting principles (GAAP). The Village uses fund accounting designed to demonstrate legal compliance and to aid financial management by segregating transactions related to certain governmental functions or activities. A fund is a separate accounting entity with a self-balancing set of accounts. Funds are classified into the following categories: governmental, proprietary, and fiduciary. Each category, in turn, is divided into separate “fund types.” Governmental funds are used to account for all or most of a government’s general activities, including the collection and disbursement of earmarked monies (special revenue funds), the acquisition or construction of general fixed assets (capital projects funds), and the servicing of general long-term debt (debt service funds). The General Fund is used to account for all activities of the general government not accounted for in some other fund. Governmental funds are budgeted using a modified accrual basis, except for loans, loan payments, and debt service payments, which are budgeted on a cash basis.
xxviii

BUDGET DOCUMENT PURPOSE & CONTENT (Continued)
Proprietary funds are used to account for activities similar to those found in the private sector, where the determination of net income is necessary or useful to sound financial administration. Goods or services from such activities can be provided either to outside parties (enterprise funds) or to other departments or agencies primarily within the government (internal service funds). Proprietary funds are budgeted using an accrual basis, except for loans, loan payments, capital expenditures, depreciation, and debt service payments which are budgeted on a cash basis.
Fiduciary funds are used to account for assets held on behalf of outside parties, including other governments, or on behalf of other funds within the government. When these assets are held under the terms of a formal trust agreement, either a pension trust fund, a nonexpendable trust fund, or an expendable trust fund is used. The terms “nonexpendable” and “expendable” refer to whether or not the government is under an obligation to maintain the trust principal. Agency funds generally are used to account for assets that the government holds on behalf of others as their agent. Expendable trust and agency funds are budgeted on a modified accrual basis, and the nonexpendable trust and pension funds are budgeted on an accrual basis.
xxix

VILLAGE OF ARLINGTON HEIGHTS
Capital Water Afford. Zero Foreign Criminal Municipal Storm Solid SelfGeneral Projects & Sewer MFT Housing Int. Loan CDBG Fire Ins. Inv. Parking TIF Water Ctrl Waste A&E Insurance Fleet Technology
DEPARTMENT Fund Fund Fund Fund Fund Fund Fund Fund Fund Fund Funds Fund Fund Fund Funds Fund Fund
Board of Trustees √
Integrated Services √ √ √
Human Resources √ √
Legal √
Finance √ √ √ √
IT / GIS √ √
Boards & Commissions √ √ √
Police/Police Grant √ √ √ √ √
Fire √ √ √ √
Planning √ √ √ √ √ √ √ √
Building Services √
Health Services √
Senior Services √
Public Works √ √ √ √ √ √ √
Water Utility √
Municipal Fleet Services √ √
DEPARTMENT/FUND RELATIONSHIP
MAJOR FUNDS NON MAJOR FUNDS INTERNAL SERVICES
xxx

VILLAGE OF ARLINGTON HEIGHTS
ALL FUNDS SUMMARY2019 2020 2021 2021 2022 $ %
FUND REVENUES Actual Actual Est. Actual Budget Budget Change Change
101 GENERAL 78,759,674 75,280,095 80,799,700 78,528,400 81,376,100 2,847,700 3.6%211 MOTOR FUEL TAX 2,479,042 4,391,431 4,651,000 4,654,000 4,654,000 0 0.0%215 CDBG 379,583 443,390 565,200 921,200 879,200 (42,000) (4.6%)217 AFFORDABLE HOUSING FUND 314,524 132,320 112,300 150,000 150,000 0 0.0%225 ZERO INTEREST LOAN FUND 457,690 274,405 306,300 311,700 300,000 (11,700) (3.8%)227 FOREIGN FIRE INSURANCE TAX 145,668 153,118 130,400 132,500 132,500 0 0.0%231 CRIMINAL INVESTIGATIONS 210,041 31,564 37,600 103,700 103,700 0 0.0%235 MUNICIPAL PARKING 1,469,402 2,615,082 1,670,375 1,627,000 1,331,000 (296,000) (18.2%)263 TIF IV 658,790 773,359 574,300 591,300 591,300 0 0.0%264 TIF V 772,100 999,052 740,600 746,200 746,200 0 0.0%266 HICKORY/KENSINGTON TIF 551,651 818,167 561,000 568,500 660,000 91,500 16.1%267 S AH RD TIF 0 0 100,000 100,000 100,000 0 0.0%301 DEBT SERVICE 17,350,183 7,583,611 7,481,800 7,525,600 7,528,100 2,500 0.0%401 CAPITAL PROJECTS 9,071,105 19,948,049 10,055,000 9,931,300 11,021,100 1,089,800 11.0%426 STORM WATER CONTROL 3,994,970 1,652,292 1,636,500 2,661,400 2,661,400 0 0.0%431 PUBLIC BUILDING 266,179 207,989 1,018 0 0 0 N/A505 WATER & SEWER 20,266,521 30,659,981 24,298,400 24,591,200 22,741,800 (1,849,400) (7.5%)511 SOLID WASTE DISPOSAL 2,057,864 1,934,818 2,032,600 1,960,000 2,040,000 80,000 4.1%515 ARTS, ENTERTAINMENT & EVENTS 861,341 595,243 1,516,500 1,434,100 1,005,200 (428,900) (29.9%)605 HEALTH INSURANCE 14,834,668 14,005,590 13,564,100 13,459,600 13,974,400 514,800 3.8%611 GENERAL LIABILITY INSURANCE 995,216 884,368 854,700 875,800 625,800 (250,000) (28.5%)615 WORKERS' COMPENSATION 2,937,893 2,683,478 2,377,600 2,288,800 2,538,800 250,000 10.9%621 FLEET OPERATIONS 4,091,361 3,796,511 3,857,500 3,916,300 6,477,700 2,561,400 65.4%625 TECHNOLOGY 1,759,240 1,873,486 3,888,100 3,891,600 2,340,200 (1,551,400) (39.9%)705 POLICE PENSION 33,049,273 24,079,444 24,873,000 9,633,000 10,014,000 381,000 4.0%711 FIRE PENSION 24,605,251 20,177,963 16,836,062 9,813,000 9,862,000 49,000 0.5%
TOTAL REVENUES 222,339,230 215,994,806 203,521,655 180,416,200 183,854,500 3,438,300 1.9%
2019 2020 2021 2021 2022 $ %FUND EXPENDITURES Actual Actual Est. Actual Budget Budget Change Change
101 GENERAL 78,586,185 75,571,855 78,664,200 79,403,734 81,376,100 1,972,366 2.5%211 MOTOR FUEL TAX 1,873,979 2,371,133 4,232,200 4,232,220 4,116,800 (115,420) (2.7%)215 CDBG 379,583 443,390 565,200 949,050 879,200 (69,850) (7.4%)217 AFFORDABLE HOUSING FUND 0 0 25,000 25,000 25,000 0 0.0%225 ZERO INTEREST LOAN FUND 48,300 170,084 60,000 250,000 150,000 (100,000) (40.0%)227 FOREIGN FIRE INSURANCE TAX 162,350 91,427 250,000 250,000 250,000 0 0.0%231 CRIMINAL INVESTIGATIONS 522,946 300,759 346,700 346,758 789,900 443,142 127.8%235 MUNICIPAL PARKING 1,548,506 1,637,994 1,772,800 1,815,825 1,928,800 112,975 6.2%263 TIF IV 58,789 68,883 635,800 610,839 1,727,000 1,116,161 182.7%264 TIF V 13,609 738 1,887,500 2,487,469 1,228,000 (1,259,469) (50.6%)266 HICKORY/KENSINGTON TIF 30,000 15,000 715,000 1,590,000 1,115,000 (475,000) (29.9%)267 S AH RD TIF 0 0 120,400 70,800 195,000 124,200 175.4%301 DEBT SERVICE 17,365,175 7,667,546 7,483,600 7,483,600 7,486,200 2,600 0.0%401 CAPITAL PROJECTS 8,665,502 14,310,309 11,594,200 13,722,104 12,131,700 (1,590,404) (11.6%)426 STORM WATER CONTROL 8,944,698 1,663,882 6,307,800 8,896,394 4,515,300 (4,381,094) (49.2%)431 PUBLIC BUILDING 884,362 0 3,294,375 3,353,967 0 (3,353,967) (100.0%)505 WATER & SEWER 21,550,764 22,190,642 24,180,300 25,390,156 25,924,300 534,144 2.1%511 SOLID WASTE DISPOSAL 1,968,304 2,022,125 2,100,000 2,086,600 2,149,400 62,800 3.0%515 ARTS, ENTERTAINMENT & EVENTS 851,786 382,093 1,425,400 1,402,528 1,013,100 (389,428) (27.8%)605 HEALTH INSURANCE 14,400,294 13,009,046 13,361,400 13,596,500 14,065,600 469,100 3.5%611 GENERAL LIABILITY INSURANCE 538,495 464,422 540,900 873,000 623,000 (250,000) (28.6%)615 WORKERS' COMPENSATION 2,891,814 2,449,656 2,701,500 2,812,000 2,809,700 (2,300) (0.1%)621 FLEET OPERATIONS 3,627,157 3,165,498 4,383,100 4,377,898 5,031,500 653,602 14.9%625 TECHNOLOGY 1,522,609 1,769,494 4,406,600 5,919,555 2,563,300 (3,356,255) (56.7%)705 POLICE PENSION 8,469,326 9,265,972 10,810,900 10,039,100 10,835,500 796,400 7.9%711 FIRE PENSION 7,451,501 7,862,849 8,349,400 8,645,500 8,538,500 (107,000) (1.2%)
TOTAL EXPENDITURES 182,356,034 166,894,797 190,214,275 200,630,597 191,467,900 (9,162,697) (4.6%)
1

VILLAGE OF ARLINGTON HEIGHTS
FUND BALANCE SUMMARY 2022
Fund Fund Name
1/01/22ProjectedBeginning
Fund Balance (Deficit)
2022Revenues & Transfers In
2022Expenditures & Transfers Out
2022Revenues
Over (Under)Expenditures
12/31/22Estimated
EndingFund Balance
(Deficit)
101 General $32,722,474 $81,376,100 $81,376,100 $0 $32,722,474211 Motor Fuel Tax 5,344,906 4,654,000 4,116,800 537,200 5,882,106215 CDBG 0 879,200 879,200 0 0217 Affordable Housing 534,144 150,000 25,000 125,000 659,144225 Zero Interest Loan 760,011 300,000 150,000 150,000 910,011227 Foreign Fire Insurance Tax 367,197 132,500 250,000 (117,500) 249,697231 Criminal Investigations 1,124,979 103,700 789,900 (686,200) 438,779235 Municipal Parking 5,510,543 1,331,000 1,928,800 (597,800) 4,912,743263 TIF IV 3,464,395 591,300 1,727,000 (1,135,700) 2,328,695264 TIF V 2,014,256 746,200 1,228,000 (481,800) 1,532,456266 Hickory/Kensington TIF 2,326,599 660,000 1,115,000 (455,000) 1,871,599267 S AH Rd TIF (20,400) 100,000 195,000 (95,000) (115,400)301 Debt Service 2,096,300 7,528,100 7,486,200 41,900 2,138,200401 Capital Projects 15,199,238 11,021,100 12,131,700 (1,110,600) 14,088,638426 Storm Water Control 5,255,288 2,661,400 4,515,300 (1,853,900) 3,401,388505 Water & Sewer 9,862,832 22,741,800 25,924,300 (3,182,500) 6,680,332511 Solid Waste Disposal 3,744,268 2,040,000 2,149,400 (109,400) 3,634,868515 Arts, Entertainment & Events 242,545 1,005,200 1,013,100 (7,900) 234,645605 Health Insurance 5,002,272 13,974,400 14,065,600 (91,200) 4,911,072611 General Liability Insurance 4,459,537 625,800 623,000 2,800 4,462,337615 Workers' Compensation Insurance 4,273,264 2,538,800 2,809,700 (270,900) 4,002,364621 Fleet Operations 7,932,507 6,477,700 5,031,500 1,446,200 9,378,707625 Technology 2,292,369 2,340,200 2,563,300 (223,100) 2,069,269705 Police Pension 177,221,779 10,014,000 10,835,500 (821,500) 176,400,279711 Fire Pension 144,685,473 9,862,000 8,538,500 1,323,500 146,008,973
TOTAL ALL VILLAGE FUNDS $436,416,776 $183,854,500 $191,467,900 ($7,613,400) $428,803,376
1 Fund Summaries.xls - all funds 436,416,776 183,854,500 191,467,900 (7,613,400) 428,803,376difference should be zero-----------> 0 0 0 0 0
1.
2.
3.
4.
5.
6.
7.
The General Fund shows a balanced 2022 Budget. The current financial condition of the fund is healthy as it continues to maintain a fund balance over 25% of annual expenditures.
The Motor Fuel Tax Fund shows a planned surplus due to additional funding from the Rebuild Illinois Bond Grant to complete various road improvements throughout the Village.
Criminal Investigations Fund - Assets seized under State and Federal statutes are accounted for in this fund and used for the advancement of law enforcement. These funds are not budgeted for day-to-day Police Department operations but are generally one time capital expenditures of current and prior year revenues.
Affordable Housing Fund accounts for cash payments received in lieu of constructing affordable housing. These funds will be usedto create and preserve permanent attainable housing.
Zero Interest Loan Fund is designed to provide financial assistant to prospective and existing businesses within the Village of Arlington Heights. The program is intended to assist companies' growth within the Village.
Foreign Fire Insurance Tax Fund - Insurance companies that do not maintain offices within the State but market fire insurance policies within the State pay an additional tax of 2% to the municipality where the policy is written. These funds are used for the betterment of the fire services and are controlled by a separate Board of Directors including the Fire Chief and firefighters per State Statute. Prior year revenues are being expensed this year, creating the operating deficit.
Municipal Parking Fund - Primarily, commuter parking for train travel to and from Chicago is provided for in this fund. With Downtown redevelopment, resident parking for large apartment complexes and off-street shopper parking was included. Substantial fund balance is maintained for future parking garage maintenance and repairs, which will provide a service life of 40 to 50 years for the four parking structures.
2

VILLAGE OF ARLINGTON HEIGHTS
FUND BALANCE SUMMARY 2022
8.
9.
10.
11.
12.
13.
14.
15.
16.
17.
18.
19.
20.
21.
22.
23.
24. The Fire Pension Fund is budgeting positive results for operations this year. Funding for future liabilities of the Fire Pension Fund is currently 79.6%. Per current State Statute, 90% funding must be reached by 2040.
The Water & Sewer Fund shows a planned operating deficit due to planned projects outpacing revenue. The planned service rate increase for 2022 is 5%.
The Fleet Operations Fund provides for major capital replacements. Service charges over the useful life of the equipment will replenish reserves. A healthy fund balance is maintained for vehicle and equipment replacement.
The Storm Water Control Fund has a planned deficit as scheduled programs improving the Village's storm water infrastructure drawdown funds from a general obligation bond issued in 2018.
TIF V shows a deficit as planned improvement projects are expected to outpace current year revenue.
Hickory/Kensington TIF shows a deficit as planned improvement projects are expected to outpace current year revenue.
S Arlington Heights Rd TIF shows a deficit as planned improvement projects are expected to outpace current year revenue.
The Capital Projects Fund shows a deficit in operations primarily as a result of current year costs outpacing current year revenues dedicated to this fund.
TIF IV shows a deficit as planned improvement projects are expected to outpace current year revenue.
The Debt Service Fund accounts for all debt service payments from general obligation bond issuances except those in the Storm Water Control Fund.
The Police Pension Fund shows a deficit as planned pension payments are expected to outpace current year revenue. Funding for future liabilities of the Police Pension Fund is currently at 84.7%. Per current State Statute, 90% funding must be reached by 2040.
The General Liability Insurance Fund covers the first $100,000 per claim before IRMA coverage takes effect. Charges to operating departments are used to fund this insurance coverage. Past claims have been varied and actual experience is generally more favorable than budgeted.
The Technology Fund provides for the operation of the Village's computer network infrastructure and equipment replacement. Service charges to departments are used to fund these operations. The operating deficit is the result of the fund drawing down its reserves to pay for annual CentralSquare software maintenance; the other funds will be charged for the new annual Tyler software maintenance
Solid Waste Disposal Fund - The operations of the Government Joint Venture Solid Waste Agency of Northern Cook County are provided for in this fund. Efforts to reduce solid waste removal costs and maximize disposal facility useful lives are primary objectives.
The Workers' Compensation Insurance Fund claims are handled the same as General Liability claims noted above.
The Arts, Entertainment & Events Fund is designed for funding special events and the operation of the Metropolis Performing Arts Theater. The primary funding source is 26% of the Village's 1.25% Food & Beverage Tax on prepared food.
The Health Insurance Fund has a slight planned operating deficit due to the potential of large health insurance claims. Actual year end results generally come in better than budgeted. This fund is operated on a pay as you go basis with a reserve for large claims.
3
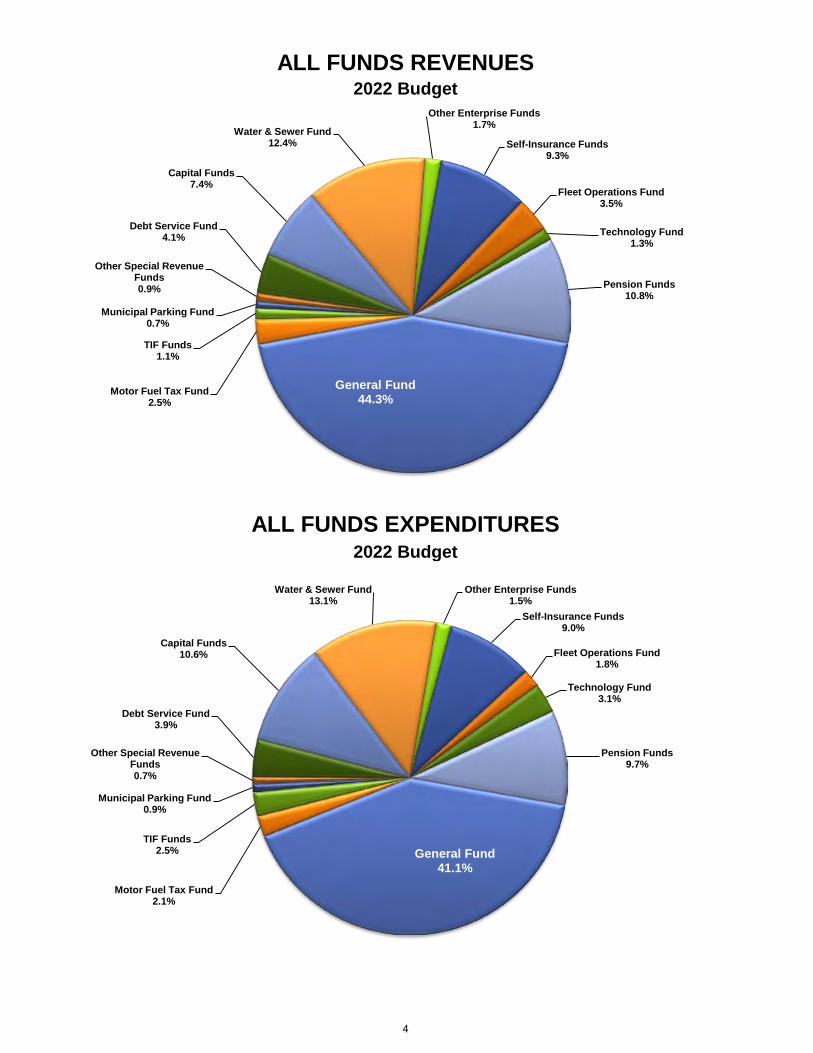
ALL FUNDS REVENUES2022 Budget
ALL FUNDS EXPENDITURES2022 Budget
General Fund44.3%
Motor Fuel Tax Fund2.5%
TIF Funds1.1%
Municipal Parking Fund0.7%
Other Special Revenue Funds0.9%
Debt Service Fund4.1%
Capital Funds7.4%
Water & Sewer Fund12.4%
Other Enterprise Funds1.7%
Self-Insurance Funds9.3%
Fleet Operations Fund3.5%
Technology Fund1.3%
Pension Funds10.8%
General Fund41.1%
Motor Fuel Tax Fund2.1%
TIF Funds2.5%
Municipal Parking Fund0.9%
Other Special Revenue Funds0.7%
Debt Service Fund3.9%
Capital Funds10.6%
Water & Sewer Fund13.1%
Other Enterprise Funds1.5%
Self-Insurance Funds9.0%
Fleet Operations Fund1.8%
Technology Fund3.1%
Pension Funds9.7%
4
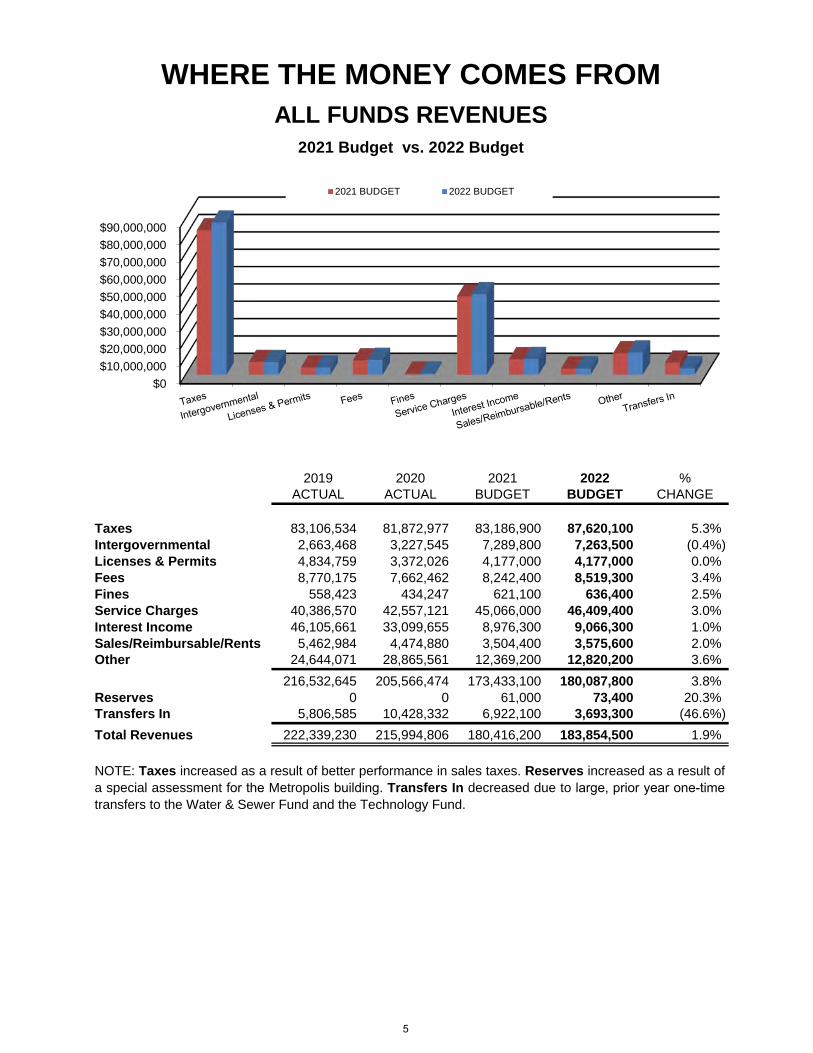
2019 2020 2021 2022 %ACTUAL ACTUAL BUDGET BUDGET CHANGE
Taxes 83,106,534 81,872,977 83,186,900 87,620,100 5.3%Intergovernmental 2,663,468 3,227,545 7,289,800 7,263,500 (0.4%)Licenses & Permits 4,834,759 3,372,026 4,177,000 4,177,000 0.0%Fees 8,770,175 7,662,462 8,242,400 8,519,300 3.4%Fines 558,423 434,247 621,100 636,400 2.5%Service Charges 40,386,570 42,557,121 45,066,000 46,409,400 3.0%Interest Income 46,105,661 33,099,655 8,976,300 9,066,300 1.0%Sales/Reimbursable/Rents 5,462,984 4,474,880 3,504,400 3,575,600 2.0%Other 24,644,071 28,865,561 12,369,200 12,820,200 3.6%
216,532,645 205,566,474 173,433,100 180,087,800 3.8%Reserves 0 0 61,000 73,400 20.3%Transfers In 5,806,585 10,428,332 6,922,100 3,693,300 (46.6%)Total Revenues 222,339,230 215,994,806 180,416,200 183,854,500 1.9%
WHERE THE MONEY COMES FROMALL FUNDS REVENUES
2021 Budget vs. 2022 Budget
NOTE: Taxes increased as a result of better performance in sales taxes. Reserves increased as a result of a special assessment for the Metropolis building. Transfers In decreased due to large, prior year one-time transfers to the Water & Sewer Fund and the Technology Fund.
$0$10,000,000$20,000,000$30,000,000$40,000,000$50,000,000$60,000,000$70,000,000$80,000,000$90,000,000
2021 BUDGET 2022 BUDGET
5

2019 2020 2021 2022 %ACTUAL ACTUAL BUDGET BUDGET CHANGE
Personal Services 85,060,490 87,517,277 92,739,100 96,031,800 3.6%Contractual Services 27,513,237 27,735,951 30,036,249 30,349,900 1.0%Commodities 4,072,480 2,880,802 3,968,225 3,979,900 0.3%Other Charges 15,974,173 13,082,756 16,755,292 16,294,800 (2.7%)Capital Items 27,036,661 17,732,133 42,726,031 33,632,000 (21.3%)Debt Service 17,254,423 7,667,546 7,483,600 7,486,200 0.0%
176,911,464 156,616,465 193,708,497 187,774,600 (3.1%)Transfers Out 5,444,570 10,278,332 6,922,100 3,693,300 (46.6%)
Total Expenditures 182,356,034 166,894,797 200,630,597 191,467,900 (4.6%)
NOTE: Capital Items decreased due to the completion in 2021 of some Storm Water Control Projects. Transfers Out decreased due to large, prior year one-time transfers to the Water & Sewer Fund and the Technology Fund.
WHERE THE MONEY GOESALL FUNDS EXPENDITURES
2021 Budget vs. 2022 Budget
$0$10,000,000$20,000,000$30,000,000$40,000,000$50,000,000$60,000,000$70,000,000$80,000,000$90,000,000
$100,000,000
2021 BUDGET 2022 BUDGET
6

Elementary School District 25
36.7%Secondary School
District 21426.2%
Harper Community
College4.5%VILLAGE OF
ARLINGTON HEIGHTS
12.2%
Library4.8%
Park District5.1%
Other4.3%
WheelingTownship
0.6%
Cook County5.6%
Arlington Heights
(Depicts the "most" common tax bill, assuming School District 25.Depends on School District and Township boundaries.)
2020 PROPERTY TAX BILL
AS THE ABOVE PIE CHART ILLUSTRATES, THE VILLAGE OF ARLINGTON HEIGHTS CONSISTS OF 12.2% OF THE ENTIRE PROPERTY TAX BILL.
Education - 67.4%
Other Taxing Bodies - 20.4%
Village of Arlington Heights - 12.2%
7

2019 2020 2021 2022 %ACTUAL ACTUAL BUDGET BUDGET CHANGE
Taxes 64,139,809 62,383,378 64,951,600 68,000,500 4.7%Intergovernmental 321,524 1,204,293 382,300 398,000 4.1%Licenses & Permits 4,834,759 3,372,026 4,177,000 4,177,000 0.0%Fees 5,398,268 4,789,468 5,213,600 5,151,000 (1.2%)Fines 488,364 395,265 546,100 546,100 0.0%Service Charges 2,112,976 2,141,521 2,203,800 2,260,400 2.6%Interest Income 676,476 138,914 370,000 160,000 (56.8%)Sales/Reimb/Rents 118,549 137,821 130,000 125,000 (3.8%)Other 468,949 367,409 354,000 358,100 1.2%Other Financing 200,000 350,000 200,000 200,000 0.0%
Total Revenue 78,759,674 75,280,095 78,528,400 81,376,100 3.6%
2022GENERAL FUND REVENUES
WHERE THE MONEY COMES FROM
NOTE: Interest Income has been decreased to match actual earnings.
Other <1%
Sales/Reimb/Rents <1%Interest Income <1%
Services Charges 3%Fines <1%
Fees 6%
Licenses/Permits 5%
Intergovernmental <1%Property Tax 31.8%
Sales Tax 16.8%
Home Rule Sales Tax 6.9%
Income Tax 11.4%Food & Beverage Tax 2.5%Telecom. Tax 1.7%Utility Taxes 6.5%Other Taxes 5.9%
Taxes 84%
8

2019 2020 2021 2022 %ACTUAL ACTUAL BUDGET BUDGET CHANGE
Personal Services 60,136,434 61,434,656 63,683,500 65,342,200 2.6%Contractual Services 11,571,570 11,349,113 12,050,003 12,282,700 1.9%Commodities 2,470,770 1,972,364 2,520,475 2,509,100 (0.5%)Other Charges 954,741 815,722 974,756 1,042,100 6.9%Contingency 0 0 175,000 200,000 14.3%Transfers Out 3,452,670 0 0 0 0.0%
Total Expenditures 78,586,185 75,571,855 79,403,734 81,376,100 2.5%
WHERE THE MONEY GOESGENERAL FUND EXPENDITURES
2022
NOTE: Other Charges increased as a result of an increase in the budgets for sales tax abatements and the Library's portion of the Personal Property Replacement Tax. Contingency is budgeted each year but if used, is classified as an expenditure type. If not used it becomes part of available reserves. As of the date of this writing, the year ending December 31, 2021 budget shows that there is $175,000 remaining of the $200,000 contingency budget.
Personal Services80.3%
Contractual15.1%
Commodities3.1%
Other Charges1.3%Contingency
<1%
9

2019 2020 2021 2022 %ACTUAL ACTUAL BUDGET BUDGET CHANGE
Services Charges 18,454,496 19,958,979 21,953,200 22,275,200 1.5%Interest Income 43,175 4,489 20,000 20,000 0.0%Sales/Reimbursable/Rent 144,533 52,274 98,000 98,000 0.0%Other 1,578,435 1,599,007 20,000 348,600 1643.0%Transfers In 45,882 9,045,232 2,500,000 0 0.0%
Total Revenues 20,266,521 30,659,981 24,591,200 22,741,800 (7.5%)
WHERE THE MONEY COMES FROM
WATER & SEWER FUND REVENUES
2022
NOTE: Service Charges include sales for water and sewer service. Water consumption has been projected based on the anticipated usage, which has been trending lower. A combined water and sewer rate increase of 5% previously approved is effective as of January 1, 2022. Other increased from a budgeted Northwest Water Commission rebate.
Services Charges97.9%
Interest Income0.1%
Sales/Reimbursable/Rent0.4%Other
1.5%
10
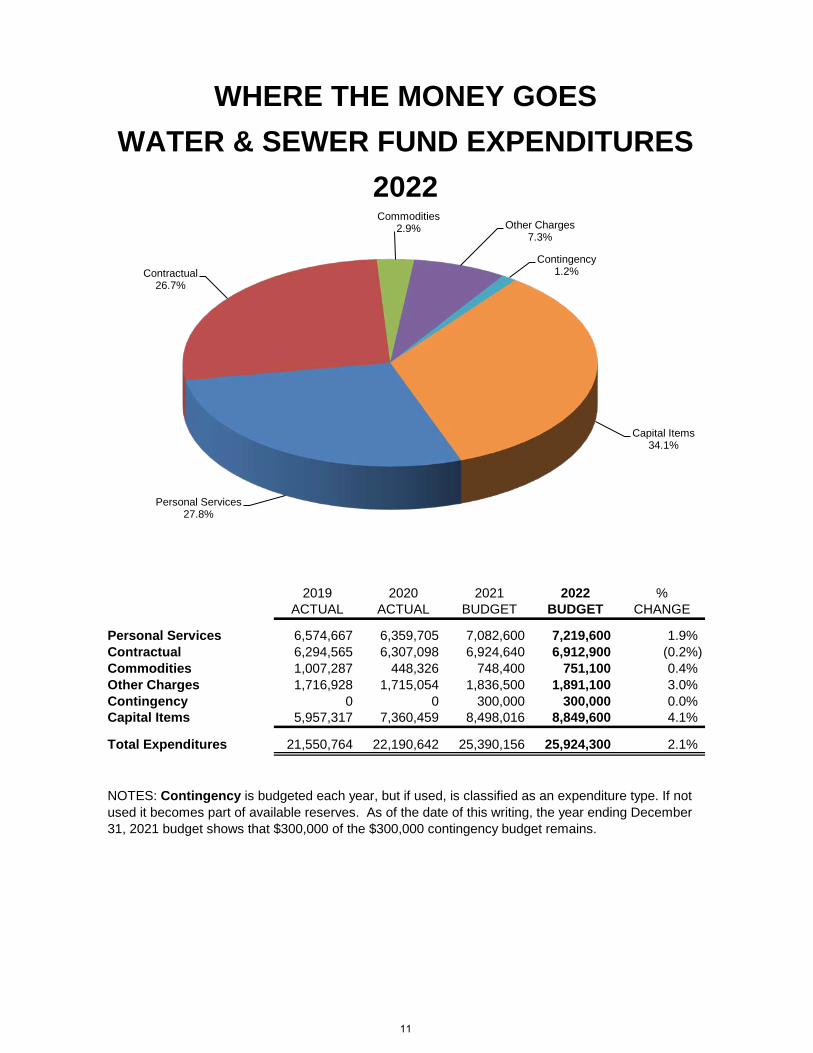
2019 2020 2021 2022 %ACTUAL ACTUAL BUDGET BUDGET CHANGE
Personal Services 6,574,667 6,359,705 7,082,600 7,219,600 1.9%Contractual 6,294,565 6,307,098 6,924,640 6,912,900 (0.2%)Commodities 1,007,287 448,326 748,400 751,100 0.4%Other Charges 1,716,928 1,715,054 1,836,500 1,891,100 3.0%Contingency 0 0 300,000 300,000 0.0%Capital Items 5,957,317 7,360,459 8,498,016 8,849,600 4.1%
Total Expenditures 21,550,764 22,190,642 25,390,156 25,924,300 2.1%
WHERE THE MONEY GOESWATER & SEWER FUND EXPENDITURES
2022
NOTES: Contingency is budgeted each year, but if used, is classified as an expenditure type. If not used it becomes part of available reserves. As of the date of this writing, the year ending December 31, 2021 budget shows that $300,000 of the $300,000 contingency budget remains.
Personal Services27.8%
Contractual26.7%
Commodities2.9% Other Charges
7.3%
Contingency1.2%
Capital Items34.1%
11

VILLAGE OF ARLINGTON HEIGHTS
EMPLOYEE CENSUSTen Year Analysis
8 Mon. Per.Ending
DEPARTMENT FY2014 FY2015 Dec. 2015 2016 2017 2018 2019 2020 2021 2022
Integrated Services Full-Time 6.00 5.00 11.00 11.00 11.00 10.00 10.00 11.00 11.00 12.00Part-Time 0.00 0.00 0.00 0.00 1.00 1.00 1.00 1.00 1.00 1.00
Human Resources Full-Time 4.00 4.00 4.00 4.00 4.00 4.00 4.00 4.00 4.00 4.00Part-Time 0.00 0.00 0.00 0.00 0.00 0.00 0.00 0.00 0.00 0.00
Legal Full-Time 1.00 1.00 1.00 1.00 1.00 1.00 1.00 1.00 0.00 0.00Part-Time 3.00 3.00 3.00 3.00 3.00 3.00 3.00 3.00 3.00 3.00
Finance Full-Time 17.00 18.00 18.00 18.00 17.00 17.00 16.00 16.00 15.00 15.00Part-Time 1.00 0.00 0.00 0.00 1.00 1.00 2.00 2.00 3.00 3.00
IT/GIS Full-Time 6.00 6.00 0.00 0.00 0.00 0.00 0.00 0.00 0.00 0.00Part-Time 0.00 0.00 0.00 0.00 0.00 0.00 0.00 0.00 0.00 0.00
Police Full-Time 137.00 137.00 137.00 137.00 137.00 137.00 137.00 137.00 137.00 137.00Part-Time 2.00 2.00 2.00 2.00 2.00 2.00 2.00 2.00 2.00 2.00
Police Grant Full-Time 1.00 1.00 1.00 1.00 1.00 1.00 1.00 1.00 1.00 1.00Part-Time 0.00 0.00 0.00 0.00 0.00 0.00 0.00 0.00 0.00 0.00
Fire Full-Time 109.00 109.00 109.00 109.00 109.00 109.00 109.00 109.00 109.00 109.00Part-Time 3.00 3.00 3.00 3.00 2.00 2.00 2.00 2.00 2.00 2.00
Planning & Comm Devlp Full-Time 9.00 9.00 9.00 9.00 10.00 10.00 10.00 10.00 10.00 10.00Part-Time 0.00 0.00 0.00 0.00 0.00 0.00 0.00 0.00 0.00 0.00
Building Services Full-Time 14.50 16.50 16.50 16.50 17.00 17.00 17.00 18.00 18.00 19.00Part-Time 3.00 0.00 0.00 0.00 0.00 1.00 1.00 0.00 0.00 0.00
Health Services Full-Time 9.50 9.50 9.50 9.50 9.00 9.00 9.00 9.00 9.00 9.00Part-Time 0.00 0.00 0.00 0.00 1.00 1.00 1.00 1.00 1.00 1.00
Senior Services Full-Time 1.00 1.00 2.00 2.00 2.00 2.00 2.00 2.00 3.00 3.00Part-Time 5.00 5.00 3.00 3.00 3.00 3.00 3.00 3.00 2.00 2.00
Engineering Full-Time 10.00 10.00 10.00 10.00 10.00 10.00 0.00 0.00 0.00 0.00 (1)Part-Time 0.00 0.00 0.00 0.00 0.00 0.00 0.00 0.00 0.00 0.00
Public Works Full-Time 42.00 42.00 42.00 42.00 42.00 41.00 51.00 51.00 51.00 51.00Part-Time 1.00 1.00 1.00 1.00 1.00 1.00 1.00 1.00 1.00 1.00 (2)
Water Utility Operations Full-Time 40.00 40.00 40.00 40.00 40.00 40.00 40.00 40.00 40.00 40.00Part-Time 1.00 1.00 1.00 1.00 1.00 1.00 1.00 1.00 1.00 1.00
Fleet Services Full-Time 10.00 10.00 10.00 10.00 10.00 10.00 10.00 10.00 10.00 10.00Part-Time 1.00 1.00 1.00 1.00 1.00 1.00 1.00 1.00 1.00 1.00
TOTAL Full-Time 417.00 419.00 420.00 420.00 420.00 418.00 417.00 419.00 418.00 420.00Part-Time 20.00 16.00 14.00 14.00 16.00 17.00 18.00 17.00 17.00 17.00
TOTAL EMPLOYEES 437.00 435.00 434.00 434.00 436.00 435.00 435.00 436.00 435.00 437.00
INCREASE (DECREASE) 0.00 (2.00) (1.00) 0.00 2.00 (1.00) 0.00 1.00 (1.00) 2.00
FULL-TIME EQUIVALENTS (FTE) 427.25 427.25 427.25 427.25 428.25 426.75 426.25 427.75 426.50 428.50
INCREASE (DECREASE) 0.00 0.00 0.00 0.00 1.00 (1.50) (0.50) 1.50 (1.25) 2.00
(1) The reduction in Engineering staff is the result of the department merging into Public Works.
(2) A part-time employee is shared between Public Works and Water Utility Operations and is shown only in Public Works so as not to skew the total count.
12

VILLAGE OF ARLINGTON HEIGHTS
2021 2022 2021 2022 $ %Budget Budget Inc (Dec) Budget Budget Inc (Dec) Inc (Dec)
Board of Trustees 0.00 0.00 $178,900 $176,200 ($2,700) (1.5%)Integrated Services 11.50 12.50 1.00 7,139,355 3,923,100 (3,216,255) (45.0%)Human Resources 4.00 4.00 16,843,500 17,311,200 467,700 2.8%Legal 1.75 1.75 744,700 716,100 (28,600) (3.8%)Finance 16.50 16.50 3,836,500 3,659,000 (177,500) (4.6%)Boards & Commissions 0.00 0.00 253,728 195,700 (58,028) (22.9%)Metropolis Theater 0.00 0.00 370,000 388,400 18,400 5.0%Police/Police Grant 139.00 139.00 28,063,953 28,765,000 701,047 2.5%Fire 110.00 110.00 24,343,784 24,901,300 557,516 2.3%Planning & Community Development 10.00 10.00 7,539,024 6,806,100 (732,924) (9.7%)Building Services 18.00 19.00 1.00 2,815,300 3,036,200 220,900 7.8%Health & Human Services 13.25 13.25 2,475,900 2,530,700 54,800 2.2%Public Works 51.25 51.25 38,152,824 33,198,900 (4,953,924) (13.0%)Criminal Investigations 0.00 0.00 346,758 789,900 443,142 127.8%Foreign Fire Insurance Tax 0.00 0.00 250,000 250,000 0 0.0%Comm Development Block Grant Progra 0.00 0.00 886,550 814,900 (71,650) (8.1%)Water Utility Operations 40.75 40.75 16,831,028 16,820,400 (10,628) (0.1%)Parking Operations 0.00 0.00 695,600 670,200 (25,400) (3.7%)Solid Waste Disposal 0.00 0.00 1,580,300 1,643,100 62,800 4.0%Municipal Fleet Services 10.50 10.50 2,599,600 2,507,600 (92,000) (3.5%)Pensions 0.00 0.00 18,684,600 19,374,000 689,400 3.7%Capital Projects - Water/Sewer 0.00 0.00 7,141,728 7,647,300 505,572 7.1%Capital Projects - Equipment 0.00 0.00 1,856,498 2,562,100 705,602 38.0%Capital Projects - Public Buildings 0.00 0.00 123,967 0 (123,967) (100.0%)Debt Service 0.00 0.00 7,483,600 7,486,200 2,600 0.0%
Sub-Total 426.50 428.50 2.00 $191,237,697 $186,173,600 ($5,064,097) (2.6%)
Non-Operating & Transfers Out N/A N/A N/A 9,392,900 5,294,300 (4,098,600) (43.6%)
TOTAL 426.50 428.50 2.00 $200,630,597 $191,467,900 ($9,162,697) (4.6%)
EXPENDITURES AND STAFFING SUMMARY BY OPERATION 2022
OPERATION
EXPENDITURESSTAFFING
13

VILLAGE OF ARLINGTON HEIGHTS
INTERFUND TRANSFERS 2022
FUND IN OUT PURPOSE
101 General (Corporate) Fund 200,000 SWANCC (from Fund 511)
200,000$ -$
301 Debt Service Fund 693,300 Storm Water Control (from 426)
693,300$ -$
401 Capital Projects Fund 300,000 SWANCC (from Fund 511)2,500,000 Fleet Fund (to Fund 621)
300,000$ 2,500,000$
426 Storm Water Control Fund 693,300 Debt Service for GO Bond (to Fund 301)
-$ 693,300$
511 SWANCC Fund 200,000 General Fund (to Fund 101)300,000 Capital Projects (to Fund 401)
-$ 500,000$
621 Fleet Fund 2,500,000 Capital Projects Fund (from Fund 401)
2,500,000$ -$
TOTAL 3,693,300$ 3,693,300$
14

VILLAGE OF ARLINGTON HEIGHTS CAPITAL IMPROVEMENT PROGRAM SUMMARY
The Village of Arlington Heights prepares annually a Capital Improvement Program (CIP) for the five-year period beginning with the next fiscal year. The CIP is a planning document which is reviewed by the Village Board and is prepared by the Village Manager and Finance Director with the assistance of all Department Heads. Included are capital expenditures projected to cost in excess of $10,000 and have an expected lifetime of one or more years. The CIP is subject to further review and approval by the Village Board during the final budget process, based on available resources and expenditure requirements of the operations budget. What follows is a summary of all CIP expenditures and projects included in the 2022 budget.
Building & Land 4,977,800$ Equipment 2,733,800 Signals 169,100 Storm Water Control 3,822,000 Streets 12,131,400 Sewer 475,000 Vehicles 2,562,100 Water 7,172,300 TOTAL 34,043,500$
Capital Projects Fund 9,431,700$ Motor Fuel Tax Fund 4,116,800 Storm Water Control Fund 3,822,000 Water & Sewer Fund 8,849,600 Municipal Parking Operations Fund 611,500 TIF Funds 3,790,000 Arts, Entertainment & Events Fund 106,500 Fleet Operations Fund 2,562,100 Technology Fund 241,800 Criminal Investigation Fund 411,500 Foreign Fire Insurance Tax Fund 100,000 TOTAL 34,043,500$
CAPITAL SPENDING
CAPITAL FUNDING
15

CAPITAL IMPROVEMENT PROGRAM (CIP)FIVE YEAR SPENDING AND FUNDING SUMMARY
2021 2021 2022 2023 2024 2025 2026CAPITAL SPENDING FUND PROJ # EST ACTUAL BUDGET BUDGET BUDGET BUDGET BUDGET BUDGET
Building & LandParking Structure Maintenance/Repairs Parking BL-00-06 289,000 289,000 548,500 920,400 296,500 594,500 0Police Station - Architect Cap Proj BL-16-01 0 0 124,000 0 0 0 0Police Station - Architect Pub Bld BL-16-01 0 123,967 0 0 0 0 0TIF IV Redevelopment TIF IV BL-16-05 525,000 500,000 1,500,000 500,000 500,000 500,000 500,000Metropolis Theater - Replace Flooring MPAC A&E BL-17-06 40,000 36,000 0 0 0 0 0Hickory Kensington TIF District Redevelopment TIF HK BL-18-01 700,000 1,500,000 1,025,000 500,000 500,000 500,000 500,000IRMA Compliance Upgrades Water BL-19-02 5,200 5,222 0 0 0 0 0LED Parking Garage Lighting Conversions Parking BL-19-03 97,200 97,247 48,000 48,000 0 0 0Downtown Parking Signs Parking BL-19-06 95,000 90,878 0 0 0 0 0Senior Center Study Cap Proj BL-20-02 60,000 60,000 0 0 0 0 0Seized Vehicle & Long-Term Bulk Evidence Storage Struc. Crim Inv BL-21-01 0 0 0 362,300 0 0 0Municipal Parking Lot Improvements Parking BL-21-02 0 0 0 200,000 30,000 25,000 90,000TIF V Redevelopment TIF V BL-21-03 1,400,000 2,000,000 850,000 0 0 0 0Electric Vehicle Charging Cap Proj BL-22-01 0 0 35,000 37,000 0 38,000 0Overhead Door Replacement/Repair Cap Proj BL-90-04 20,000 20,000 20,000 20,000 35,000 30,000 30,000Overhead Door Replacement/Repair Water BL-90-04 0 10,000 10,000 10,000 10,000 10,000 10,000Public Works Annex Improvements Cap Proj BL-93-02 10,000 10,000 24,000 10,000 10,000 10,000 10,000Public Works Annex Improvements Water BL-93-02 0 20,000 19,000 19,000 19,000 350,000 19,000Building Equipment Replacement Cap Proj BL-95-04 30,000 30,000 27,900 107,500 38,000 30,000 30,000Municipal Buildings Refurbishing Cap Proj BL-95-05 63,000 63,015 316,400 178,200 40,000 100,000 120,000Municipal Buildings Refurbishing Fleet BL-95-05 53,000 53,000 0 0 0 0 0Roof Maintenance Program Cap Proj BL-95-06 0 0 0 515,000 600,000 492,500 653,000Roof Maintenance Program Water BL-95-06 0 0 0 0 600,000 492,500 0Heating Plant/Air Conditioner Replacement Cap Proj BL-96-01 81,000 65,000 240,000 75,000 95,000 130,000 85,000Ongoing Maintenance to Brick Exteriors Cap Proj BL-96-03 38,700 38,650 160,000 30,000 30,000 40,000 40,000Ongoing Maintenance to Brick Exteriors Parking BL-96-03 10,000 10,000 5,000 5,000 5,000 5,000 5,000Historical Society Museum - Building Repairs Cap Proj BL-96-04 66,300 66,300 25,000 25,000 45,000 45,000 25,000
Sub-Total Building & Land 3,583,400 5,088,279 4,977,800 3,562,400 2,853,500 3,392,500 2,117,000
EquipmentOperational Equipment - Public Works Cap Proj EQ-94-01 49,700 49,700 38,400 50,000 396,700 108,000 83,700Operational Equipment - Public Works Water EQ-94-01 193,700 193,666 108,000 112,000 142,000 159,000 111,000Operational Equipment - Police Department Cap Proj EQ-95-01 57,800 57,775 46,000 261,000 47,000 47,000 47,000Operational Equipment - Police Department Crim Inv EQ-95-01 100,000 100,000 100,000 100,000 160,000 127,000 127,000Operational Equipment - Fire Department Cap Proj EQ-95-02 77,500 121,202 277,000 321,000 326,500 919,000 140,000Operational Equipment - Fire Department FFIT EQ-95-02 100,000 100,000 100,000 100,000 100,000 100,000 100,000Office Equipment Cap Proj EQ-95-03 128,600 133,565 88,000 45,000 35,000 30,000 30,000Office Equipment Water EQ-95-03 15,000 15,000 15,000 15,000 15,000 15,000 15,000Operational Equipment - Municipal Fleet Services Cap Proj EQ-97-01 78,200 78,200 38,200 3,500 61,000 91,000 67,000IT Equipment Replacement IT EQ-97-08 245,500 245,540 241,800 241,800 241,800 241,800 241,800Emergency Generator Upgrades and Replacement Water EQ-99-02 0 922,400 922,400 521,900 0 0 0Operational Equipment - Information Technology Cap Proj EQ-01-03 126,500 126,500 141,500 191,500 126,500 126,500 126,500Metropolis Theater Capital Equipment A&E EQ-06-03 39,000 39,000 40,000 41,000 42,000 43,000 44,000Patrol Vehicle Equipment Replacement Program Cap Proj EQ-08-03 30,000 30,000 51,600 34,400 60,200 43,000 51,600Patrol Vehicle Equipment Replacement Program Crim Inv EQ-08-03 11,500 11,500 11,500 0 12,000 0 0Operational Equipment - Municipal Parking Fund Parking EQ-09-01 10,000 10,000 10,000 10,000 10,000 10,000 10,000SCADA Enhancements Water EQ-15-25 61,500 61,500 63,300 65,200 30,000 75,000 61,500Pumps & Motor Controls Rehab and Replacement Water EQ-15-30 128,500 128,500 64,600 94,600 90,000 100,000 60,000Metropolis Theater Clearcom Equipment A&E EQ-17-03 0 0 12,000 0 0 0 0Metropolis Theater Replace Smoke Detectors A&E EQ-17-10 25,000 25,000 0 0 0 0 0Metropolis Theater LED Series 2 A&E EQ-17-11 0 0 27,500 0 0 0 0Lighting Fixtures in Theater A&E EQ-18-03 0 0 0 35,000 35,000 0 0Wireless Microphones A&E EQ-18-05 0 0 14,000 0 0 0 0Village ERP Software Replacement IT EQ-19-04 2,551,000 4,018,965 0 0 0 0 0Phone System Upgrade Cap Proj EQ-21-01 175,000 175,000 0 0 0 0 0Metropolis Theater - Wireless Headsets/Base A&E EQ-21-03 0 0 13,000 0 0 0 0A/V System Upgrades Cap Proj EQ-21-02 227,800 227,800 0 120,000 0 0 0Body Worn CamerasDash Cams Crim Inv EQ-22-01 0 0 300,000 300,000 300,000 300,000 300,000Metropolis Theater Building Infrastructure Updates A&E EQ-22-02 0 0 0 30,000 30,000 65,000 65,000Electric Vehicle Fleet Upgrades Cap Proj EQ-22-03 0 0 10,000 8,000 8,500 40,000 25,000
Sub-Total Equipment 4,431,800 6,870,813 2,733,800 2,700,900 2,269,200 2,640,300 1,706,100
SignalsTraffic Signal Maintenance MFT SG-03-02 114,500 114,500 116,800 119,100 121,400 123,700 126,200Traffic Signal Improvements at Northwest Hwy/Wilke Rd Cap Proj SG-08-02 0 36,211 0 0 0 0 0Traffic Signal Pedestrian Upgrade - Central Rd/Arthur Ave Cap Proj SG-14-10 0 52,260 52,300 0 0 0 0Algonquin Rd. and New Wilke Rd Intersection Impr. Cap Proj SG-17-01 43,600 123,641 0 35,000 380,000 0 0Pedestrian/Bicycle crossing Lake-Cook Rd./Wilke Rd. Cap Proj SG-18-01 30,000 67,400 0 0 0 0 0
Sub-Total Signals 188,100 394,012 169,100 154,100 501,400 123,700 126,200
16

CAPITAL IMPROVEMENT PROGRAM (CIP)FIVE YEAR SPENDING AND FUNDING SUMMARY
2021 2021 2022 2023 2024 2025 2026CAPITAL SPENDING FUND PROJ # EST ACTUAL BUDGET BUDGET BUDGET BUDGET BUDGET BUDGET
StreetsStreet Light Cable Replacement Cap Proj ST-00-01 10,000 10,000 10,000 10,000 20,000 20,000 20,000Paver Brick Maintenance Cap Proj ST-05-01 457,100 457,100 400,000 100,000 100,000 100,000 100,000Downtown Street Furniture Cap Proj ST-14-01 15,200 15,211 10,000 10,000 10,000 10,000 10,000Downtown Streetscape Improvements Cap Proj ST-15-35 0 200,000 200,000 95,000 0 0 0Northwest Highway (Rt. 14) Corridor Landscaping Impr. Cap Proj ST-16-20 114,900 114,871 75,000 77,000 0 0 0Davis Street/Sigwalt Street Fencing/Landscape Upgrade Cap Proj ST-17-02 9,000 9,000 0 0 0 0 0Rand Road Corridor Identification Enhancement Cap Proj ST-17-20 237,200 237,200 140,400 226,200 43,000 80,000 0Rand Road Corridor Identification Enhancement TIF V ST-17-20 342,500 342,469 233,000 28,800 101,800 170,000 0Downtown Outdoor Living Room Cap Proj ST-17-25 0 0 20,000 0 0 0 0Downtown Light Ceiling Cap Proj ST-17-26 0 0 0 0 0 0 0Kensington Road & Multi-Use Path Improvements Cap Proj ST-18-01 200,000 300,000 0 0 0 0 0Surface Treatment - Streets Cap Proj ST-18-02 150,000 150,000 300,000 300,000 300,000 300,000 300,000LED Street Lighting Conversions Cap Proj ST-19-01 64,000 64,000 64,000 64,000 64,000 64,000 64,000South Arlington Heights Road Corridor Cap Proj ST-19-03 13,100 13,136 0 0 0 0 0South Arlington Heights Road Corridor TIF S AH Rd ST-19-03 105,400 55,800 55,000 0 0 0 0Bike Plan/Bike Route Pavement Marking Cap Proj ST-19-04 0 20,000 20,000 20,000 20,000 20,000 20,000Windsor Drive Road Diet Cap Proj ST-21-01 50,000 50,000 0 0 0 0 0Weber Dr/Old Wilke Rd Street Reconstruction Cap Proj ST-21-02 25,000 52,000 32,000 160,000 0 0 0Wilke Road Resurfacing & Multi-Use Path Extension Cap Proj ST-21-03 50,000 75,000 170,000 855,000 0 0 0Sustainable Bike Plan Improvements Cap Proj ST-22-01 0 0 15,000 0 0 0 0Vail Ave Permeable Paver Match Cap Proj ST-22-02 0 0 0 235,000 48,000 0 0Other Sustainable Initiatives Cap Proj ST-22-03 0 0 45,000 0 0 0 0Street Program Cap Proj ST-90-08 5,000,000 6,517,367 5,600,000 5,600,000 5,600,000 5,600,000 5,600,000Street Rehabilitation Program MFT ST-90-09 4,117,700 4,117,720 4,000,000 3,800,000 3,800,000 3,800,000 3,800,000Sidewalk & Curb Replacement Cap Proj ST-90-11 405,000 405,000 415,000 425,000 435,000 445,000 455,000Pavement Crack Sealing Program Cap Proj ST-92-01 200,000 200,000 200,000 200,000 200,000 200,000 200,000Green Corridor Beautification TIF IV ST-99-03 0 0 127,000 0 0 0 0
Sub-Total Streets 11,566,100 13,405,874 12,131,400 12,206,000 10,741,800 10,809,000 10,569,000
SewersSewer Rehab/Replacement Program Water SW-90-01 485,000 485,450 475,000 475,000 475,000 475,000 475,000Area F - Forrest Ave Stormwater Improvements Storm Water SW-21-01 0 0 0 1,200,000 0 0 0Manhole Rehabilitation Water SW-20-04 0 0 0 25,000 50,000 50,000 50,000St. Ponding Area - Race Ave & Chicago Ave Storm Water SW-20-03 0 0 0 0 800,000 0 0Area C/SE - Hintz Rd W of AH Rd Storm Water SW-20-02 0 216,566 0 0 0 0 0Area C/NW Burr Oak Burning Tree & C/SE Berkley/Hintz Storm Water SW-20-01 50,000 2,285,000 2,672,000 0 0 0 0Greenbriar/ Roanoke/ Wilke Storm Water SW-18-03 3,484,900 3,484,942 0 0 0 0 0Storm Water Control - Cypress Detention Basin/Lift Station Storm Water SW-18-02 109,200 109,168 0 0 0 0 0Enhanced Overhead Sewer Program Storm Water SW-18-01 250,000 250,000 250,000 135,000 135,000 75,000 75,000Storm Sewer Rehab/Replacement Program Storm Water SW-15-20 1,458,600 1,458,618 500,000 500,000 500,000 500,000 500,000Backyard Drainage Improvements Storm Water SW-11-02 263,000 400,000 400,000 0 300,000 300,000 300,000
Sub-Total Sewers 6,100,700 8,689,744 4,297,000 2,335,000 2,260,000 1,400,000 1,400,000
VehiclesVehicle and Special Equipment Repl. - Public Works Fleet VH-95-01 1,156,700 1,156,661 745,100 1,241,300 897,100 1,965,400 1,377,800Vehicle and Special Equipment Repl. - Water & Sewer Fleet VH-95-02 118,900 118,936 311,900 30,100 501,700 1,367,900 126,900Vehicle Replacement - Police Department Fleet VH-95-03 365,700 365,701 283,600 210,400 526,800 359,600 432,600Vehicle Replacement - Fire Department Fleet VH-95-04 58,200 58,200 1,179,200 1,598,500 710,500 1,215,600 28,900Vehicle Replacement - Municipal Fleet Services Fleet VH-95-06 48,000 48,000 0 0 58,500 0 0Vehicle Replacement - Municipal Parking Operations Fleet VH-95-08 109,000 109,000 0 0 0 67,000 0Vehicle Replacement - Building & Health Services Dept. Fleet VH-95-10 0 0 42,300 119,700 0 99,300 102,300Vehicle Replacement - Planning Fleet VH-95-12 0 0 0 0 25,500 0 0
Sub-Total Vehicles 1,856,500 1,856,498 2,562,100 3,200,000 2,720,100 5,074,800 2,068,500
WaterResidential Meter & AMR System Replacement Water WA-03-02 9,200 9,180 1,037,300 1,050,000 1,050,000 1,050,000 1,050,000Water Tank Repainting Water WA-11-01 2,093,000 1,820,000 1,715,000 1,816,800 727,600 1,468,800 739,700Deep Well Rehabilitation Water WA-11-02 0 0 0 15,000 15,000 0 0Commercial Meter Replacements Water WA-20-01 0 0 300,000 300,000 300,000 300,000 300,000Risk & Resiliency Plan Water WA-21-01 786,000 786,000 20,000 85,600 21,200 21,900 0Watermain Replacement Program Water WA-90-01 4,041,100 4,041,098 4,100,000 4,100,000 4,100,000 4,100,000 4,100,000
Sub-Total Water 6,929,300 6,656,278 7,172,300 7,367,400 6,213,800 6,940,700 6,189,700
34,655,900 42,961,498 34,043,500 31,525,800 27,559,800 30,381,000 24,176,500
17

CAPITAL IMPROVEMENT PROGRAM (CIP)FIVE YEAR SPENDING AND FUNDING SUMMARY
2021 2021 2022 2023 2024 2025 2026EST ACTUAL BUDGET BUDGET BUDGET BUDGET BUDGET BUDGET
Capital Projects Fund 8,394,200 10,522,104 9,431,700 10,444,300 9,174,400 9,159,000 8,332,800Water & Sewer Fund 7,818,200 8,498,016 8,849,600 8,705,100 7,644,800 8,667,200 6,991,200Motor Fuel Tax Fund 4,232,200 4,232,220 4,116,800 3,919,100 3,921,400 3,923,700 3,926,200Criminal Investigation Fund 111,500 111,500 411,500 762,300 472,000 427,000 427,000Municipal Parking Operations Fund 501,200 497,125 611,500 1,183,400 341,500 634,500 105,000TIF Funds 3,072,900 4,398,269 3,790,000 1,028,800 1,101,800 1,170,000 1,000,000Storm Water Control Fund 5,615,700 8,204,294 3,822,000 1,835,000 1,735,000 875,000 875,000Public Buildings Fund 0 123,967 0 0 0 0 0Arts, Entertainment & Events Fund 104,000 100,000 106,500 106,000 107,000 108,000 109,000Fleet Operations Fund 1,909,500 1,909,498 2,562,100 3,200,000 2,720,100 5,074,800 2,068,500Technology Fund 2,796,500 4,264,505 241,800 241,800 241,800 241,800 241,800Foreign Fire Insurance Tax Fund 100,000 100,000 100,000 100,000 100,000 100,000 100,000
Total Capital Funding 34,655,900 42,961,498 34,043,500 31,525,800 27,559,800 30,381,000 24,176,5000 0 0 0 0 0 0
2021 2021 2022 2023 2024 2025 2026EST ACTUAL BUDGET BUDGET BUDGET BUDGET BUDGET BUDGET
Charges to Operations 4,706,000 6,174,003 2,803,900 3,441,800 2,961,900 5,316,600 2,310,300Motor Fuel Tax Allotment 3,000,000 3,000,000 3,000,000 3,000,000 3,000,000 3,000,000 3,000,000Taxes
Food & Beverage Tax 104,000 100,000 106,500 106,000 107,000 108,000 109,000Property Tax 4,400,000 4,400,000 5,250,000 5,400,000 5,600,000 5,700,000 5,800,000Property Tax Increment 3,072,900 4,398,269 3,790,000 1,028,800 1,101,800 1,170,000 1,000,000Home Rule Sales Tax 1,829,900 1,645,000 1,884,800 1,941,300 1,999,500 2,059,500 2,121,300
Water Sales 7,818,200 8,498,016 8,849,600 8,705,100 7,644,800 8,667,200 6,991,200Other (including parking fees & interest income) 6,909,000 8,493,519 4,226,800 3,812,300 2,866,700 2,300,200 1,775,200Grants/State/Federal/County/Private 5,036,300 6,036,300 6,036,300 0 0 0 0Cash on Hand/Reserves (2,220,400) 216,391 (1,904,400) 4,090,500 2,278,100 2,059,500 1,069,500
Total Capital Funding 34,655,900 42,961,498 34,043,500 31,525,800 27,559,800 30,381,000 24,176,500
CAPITAL FUNDING BY REVENUE SOURCE
CAPITAL FUNDING BY FUND
18

CAPITAL IMPROVEMENT PROGRAM (CIP) IMPACT ON THE 2022 OPERATING BUDGET
Most of the capital improvement projects listed in the Village’s CIP Five Year Spending and Funding Summary will not cause an increase or a decrease in operating expenses. There are two projects, however, that will affect operating expenses. Details on these projects:
STREETS
Project Name: LED Street Light Conversions
Description: Replacement of current street lights with efficient LED lights.
Budget: $64,000 per year
Operating Budget Impact: Additional overtime by Public Works personnel will be required to install these new lights. The 2022 Budget includes an annual increase in Public Works overtime. However, the new LED lights will last much longer and use less energy, reducing long-term electricity and labor costs.
WATER
Project Name: Watermain Replacement Program
Description: Replacement of aging watermain throughout the Village.
Budget: $4,100,000
Operating Budget Impact: By increasing the annual funding for the annual watermain replacement over the next few years, the Village should be able to reduce overtime costs for broken watermain calls.
19

DEBT SUMMARY
OVERVIEW AND DEBT FINANCING PRINCIPLES The Village of Arlington Heights has historically taken a conservative approach to debt financing. The goal of the Village’s debt policy is to maintain the ability to provide high quality essential village services in a cost-effective manner. Policy makers weigh this goal against maintaining the ability to borrow at the lowest possible rates. The Village has used the following guidelines before financing projects with long-term debt:
- Staff conservatively projects the revenue sources to pay off the debt. - The financing of the improvement will not exceed its useful life. - The benefits of the improvement must outweigh its costs, including the interest costs of
financing. Through the application of these guidelines, the Village Board tests any demand on debt financing. Furthermore, the Village uses debt only to provide financing for essential and necessary capital projects. The chart below shows a brief history of the Village’s outstanding bond debt.
20

DEBT SUMMARY
The Village will continue paying down its debt aggressively over the next few years as is show below:
Total Principal & Interest Outstanding 2021 through 2038
Includes Self-Supported (NWCD & Storm Sewer) and Tax Supported Debt
LEGAL DEBT MARGIN The Village is a home rule municipality.
Article VII, Section 6(k) of the 1970 Illinois Constitution governs computation of the legal debt margin. “The General Assembly may limit by law the amount and require referendum approval of debt to be incurred by home rule municipalities, payable from ad valorem property tax receipts, only in excess of the following percentages of the assessed value of its taxable property:..(2) if its population is more than 25,000 and less than 500,000 an aggregate of one percent: …Indebtedness which is outstanding on the effective day (July, 1971) of this Constitution or which is thereafter approved by referendum…shall not be included in the foregoing percentage amounts.”
To date the General Assembly has set no limits for home rule municipalities. TYPES OF VILLAGE DEBT The Village’s general obligation bond rating is Aa1 from Moody’s Investors Service. A general obligation bond has the full faith and credit of the Village pledged. The general obligation alternate revenue bonds, which are a pledge of a specific revenue source, (i.e. utility taxes, sales taxes, water revenues) and a tax levy, carry the same rating. However, all other types of debt instruments are of a lesser credit quality and therefore have higher relative interest rates. An approximate ranking is as follows: General Obligation/General Obligation Alternate Revenue Water and Sewer Revenue Installment Contract Special Service Area Special Assessment
21

DEBT SUMMARY
The chart below will help us visualize and manage our annual tax supported debt service:
Tax Supported Debt Service Payments by Fiscal Year 2021 Through 2036
CONCLUSION The Village issues new debt only after careful consideration of the benefits of the capital project being financed and a conservative analysis of the revenue sources required to pay off the debt. By following these practices and by monitoring the total debt burden, the Village has been able to maintain a high bond rating, which equates to lower interest costs. The Village’s overall financial health is good, and by following sound financial and management policies, the Village’s Board and staff will emphasize continued efforts toward maintaining and improving the Village’s financial performance in the coming years. The schedules on the following page provide summaries of outstanding bond issues and future debt service requirements.
22

VILLAGE OF ARLINGTON HEIGHTS
SUMMARY OF OUTSTANDING BOND ISSUESAS OF December 31, 2021
AMOUNT MATURITY PRINCIPALISSUE ISSUED DATE OUTSTANDING
2010 G. O. Refunding Bonds Refunding of 2002A NW Central Dispatch Bonds 2,855,000 12/1/2022 280,000
2012A G. O. Refunding Bonds Partial Refunding of 2004 Public Building Bonds 9,670,000 12/1/2022 1,375,000
2016 G. O. Police Station Bonds Design and build new police station 32,900,000 12/1/2036 27,765,000
2018 G. O. Storm Sewer Bonds Improvement of storm sewer infrastructure 9,530,000 12/1/2038 8,615,000
2019 G. O. Refunding Bonds Partial Refunding of 2011 Refunding Bonds 7,985,000 12/1/2026 7,985,000
2020 G. O. Water Main, St., Parking Bonds Water Main replacement, street and parking infrastructure 13,700,000 12/1/2030 10,920,000
TOTAL ALL BONDS 56,940,000
ANNUAL DEBT SERVICE REQUIREMENTS(PRINCIPAL AND INTEREST)
2018 2019 2020 2021 2022ISSUE FUNDING SOURCE ACTUAL ACTUAL ACTUAL ACTUAL BUDGET
2006A Refunding of 1997C & 1998A Property Tax 358,800 0 0 0 02011 Partial Refunding of 2004 Public Bldg Property Tax 442,650 187,931 0 0 02012A Partial Refunding of 2004 Public Bldg Property Tax 1,150,400 1,130,400 2,110,400 2,215,400 1,402,5002013 Partial Refunding of 2006 Public Bldg Property Tax 1,671,200 2,080,000 0 0 02014 Road Improvements Property Tax 1,500,550 1,503,850 885,800 0 02016 Police Building Property Tax 1,759,200 1,719,250 3,294,900 2,572,700 2,535,1502019 Partial Refunding of 2011 Partial RefundingProperty Tax 0 80,959 399,250 399,250 1,039,2502020 Water Main, Streets, & Parking Property Tax 0 0 0 1,311,206 1,521,800
SUBTOTAL - PROPERTY TAX 6,882,800 6,702,390 6,690,350 6,498,556 6,498,700
2010 Refunding of 2002A NWCDS Building Northwest Central Dispatch Rent 285,675 288,325 285,675 287,875 289,1002018 Storm Sewer Improvements Storm Water Utility Fee 0 690,878 689,300 691,100 692,300
SUBTOTAL - OPERATING REVENUE 285,675 979,203 974,975 978,975 981,400
TOTAL 7,168,475 7,681,593 7,665,325 7,477,531 7,480,100
PURPOSE
23

THIS PAGE LEFT BLANK
24
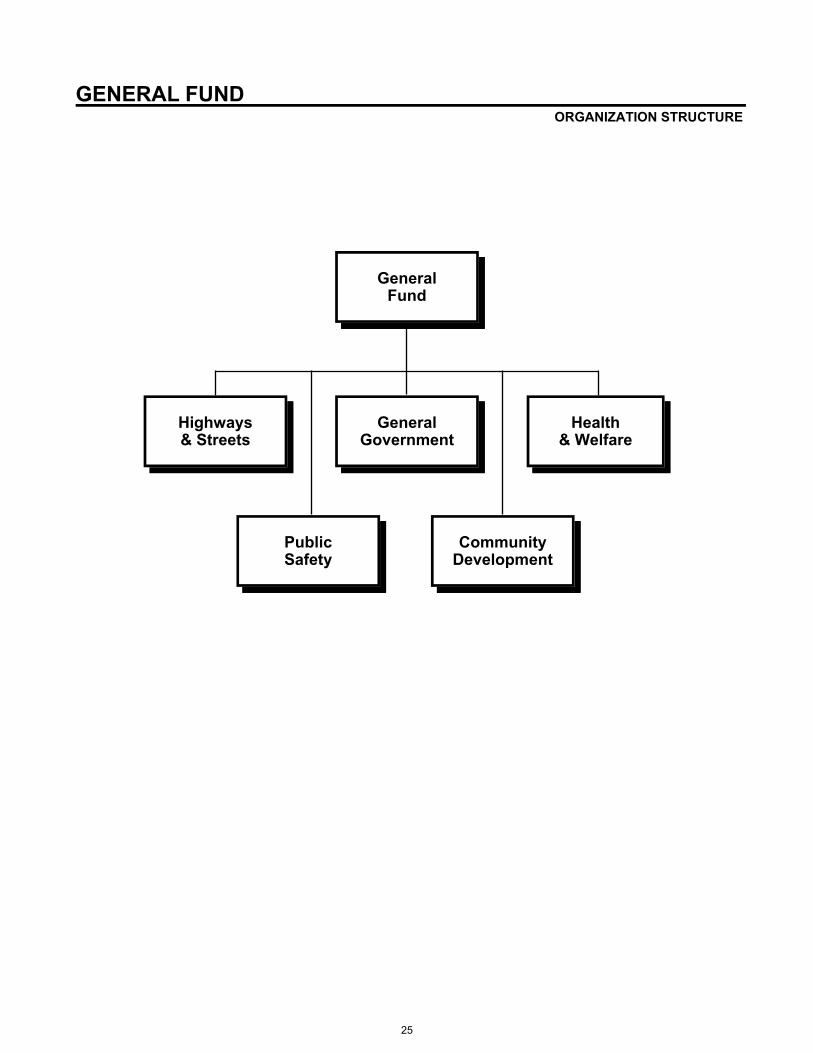
General Fund
Highways & Streets
General Government
Health & Welfare
Public Safety
Community Development
GENERAL FUND ORGANIZATION STRUCTURE
25

GENERAL FUND 101 Fund at a Glance
This is the major operating fund of the Village. It accounts for Police, Fire, Public Works and other administrative and support operations. Restrictions: Except where either State or Federal law requires funds to be segregated into a separate fund, the General Fund becomes the major operating fund of the Village and includes everything that is not required to be accounted for in a separate fund in accordance with Generally Accepted Accounting Principles.
Fund Summary
2019 2020 2021 2021 2022 $ %Actual Actual Est. Actual Budget Budget Change Change
RevenuesTaxes $64,139,809 $62,383,378 $67,480,100 $64,951,600 $68,000,500 $3,048,900 4.7%Intergovernmental 321,524 1,204,293 392,300 382,300 398,000 15,700 4.1%Licenses & Permits 4,834,759 3,372,026 4,177,000 4,177,000 4,177,000 0 0.0%Fees 5,398,268 4,789,468 5,078,000 5,213,600 5,151,000 (62,600) (1.2%)Fines 488,364 395,265 546,100 546,100 546,100 0 0.0%Service Charges 2,112,976 2,141,521 2,205,800 2,203,800 2,260,400 56,600 2.6%Interest Income 676,476 138,914 245,000 370,000 160,000 (210,000) (56.8%)Sales/Reimbursable/Rents 118,549 137,821 125,000 130,000 125,000 (5,000) (3.8%)Other 468,949 367,409 350,400 354,000 358,100 4,100 1.2%
Total Revenues $78,559,674 $74,930,095 $80,599,700 $78,328,400 $81,176,100 $2,847,700 3.6%Interfund Transfers In 200,000 350,000 200,000 200,000 200,000 0 0.0%
Total Revenues andInterfund Transfers In $78,759,674 $75,280,095 $80,799,700 $78,528,400 $81,376,100 $2,847,700 3.6%
ExpendituresPersonal Services $60,136,434 $61,434,656 $63,030,800 $63,683,500 $65,342,200 $1,658,700 2.6%Contractual Services 11,571,570 11,349,113 11,953,700 12,050,003 12,282,700 232,697 1.9%Commodities 2,470,770 1,972,364 2,519,300 2,520,475 2,509,100 (11,375) (0.5%)Other Charges 954,741 815,722 1,160,400 1,149,756 1,242,100 92,344 8.0%
Total Expenditures $75,133,515 $75,571,855 $78,664,200 $79,403,734 $81,376,100 $1,972,366 2.5%Interfund Transfers Out 3,452,670 0 0 0 0 0 N/A
Total Expenditures andInterfund Transfers Out $78,586,185 $75,571,855 $78,664,200 $79,403,734 $81,376,100 $1,972,366 2.5%
Revenues over(under) Expenditures $173,489 ($291,760) $2,135,500 ($875,334) $0 $875,334 (100.0%)
BEGINNING FUND BALANCE 30,705,245 30,878,734 30,586,974 30,586,974 32,722,474 2,135,500 7.0%
ENDING FUND BALANCE $30,878,734 $30,586,974 $32,722,474 $29,711,640 $32,722,474 $3,010,834 10.1%
26

GENERAL FUND EXPENDITURE SUMMARY 101
ProjectedDept Actual Actual Actual Budget Budget $ %No. General Fund 2018 2019 2020 2020 2021 Inc / (Dec) Inc / (Dec)
0101 Board of Trustees 166,110 143,798 172,900 172,900 176,200 3,300 1.9%0201 Integrated Services 972,263 1,029,750 1,014,600 1,062,000 1,187,000 125,000 11.8%0301 Human Resources 405,787 390,502 435,800 435,000 435,900 900 0.2%0401 Legal 816,300 801,878 736,900 744,700 716,100 (28,600) (3.8%)0501 Finance 1,685,823 1,739,455 1,796,200 1,810,100 1,859,400 49,300 2.7%1001 Boards & Commissions 158,835 168,043 195,200 202,900 147,700 (55,200) (27.2%)3001 Police/Police Grant 25,823,223 25,771,270 26,846,200 27,312,278 27,989,000 676,722 2.5%3501 Fire 23,087,932 23,848,142 24,239,700 24,132,817 24,557,200 424,383 1.8%4001 Planning 1,696,833 1,733,623 1,944,000 1,978,080 1,934,400 (43,680) (2.2%)4501 Building Services 2,619,758 2,745,590 2,697,500 2,815,300 3,036,200 220,900 7.8%7001 Health Services 1,687,437 1,704,099 1,850,900 1,849,500 1,881,500 32,000 1.7%7007 Senior Services 552,560 573,349 606,200 621,400 649,200 27,800 4.5%7101 Public Works 14,753,358 14,301,998 15,350,100 15,533,759 15,974,300 440,541 2.8%9901 Non-Operating 4,159,966 620,358 778,000 733,000 832,000 99,000 13.5%
TOTAL EXPENDITURES 78,586,185 75,571,855 78,664,200 79,403,734 81,376,100 1,972,366 2.5%
TOTAL REVENUES 78,759,674 75,280,095 80,499,700 78,528,400 81,376,100 2,847,700 3.6%
SURPLUS (DEFICIT) 173,489 (291,760) 1,835,500 (875,334) 0 875,334 (100.0%)
BEGINNING FUND BALANCE 30,705,245 30,878,734 30,586,974 30,586,974 32,422,474 1,835,500 6.0%
ENDING FUND BALANCE 30,878,734 30,586,974 32,422,474 29,711,640 32,422,474 2,710,834 9.1%
MANAGER / HR / LEGAL / FINANCE 5.2%
BOARD OF TRUSTEES BOARDS & COMMISSIONS
.4%
POLICE34.4%
FIRE30.2%
PLANNING & COMMUNITY DEVELOPMENT
2.3%
BUILDING & LIFE SAFETY
3.7%
HEALTH & SENIOR SERVICES
3.1%
PUBLIC WORKS 19.7%
NON-OPERATING1%
27

GENERAL FUNDREVENUES
Account Account Actual Actual Proj Actual Budget Budget $ %Number Description 2019 2020 2021 2021 2022 Inc (Dec) Inc (Dec)
101-0000-401.03-00 Real Estate Tax IMRF 1,359,463 1,788,580 1,835,800 1,835,800 1,708,500 (127,300) (6.9%)101-0000-401.04-00 Real Estate Tax FICA 1,398,672 1,455,246 1,502,000 1,502,000 1,534,400 32,400 2.2%101-0000-401.10-00 Police Pension 3,920,380 4,125,459 4,073,000 4,073,000 4,114,000 41,000 1.0%101-0000-401.11-00 Fire Pension 4,827,024 5,042,871 4,913,000 4,913,000 4,962,000 49,000 1.0%101-0000-401.12-00 Police Protection 6,121,026 5,946,659 7,035,400 7,035,400 6,799,200 (236,200) (3.4%)101-0000-401.13-00 Fire Protection 6,121,026 5,946,659 7,035,400 7,035,400 6,799,200 (236,200) (3.4%)
Real Estate Taxes 23,747,591 24,305,474 26,394,600 26,394,600 25,917,300 (477,300) (1.8%)
101-0000-402.10-00 Hotel Tax 1,109,349 408,888 450,000 975,000 975,000 0 0.0%101-0000-402.15-00 Admissions Tax 24,161 0 15,000 20,000 0 (20,000) (100.0%)101-0000-402.25-00 Food & Beverage Tax 2,079,454 1,577,787 1,996,500 1,780,000 2,009,800 229,800 12.9%101-0000-402.30-00 Sales Tax Home Rule 5,401,119 4,654,737 5,480,000 5,061,000 5,600,000 539,000 10.7%101-0000-402.35-00 Road & Bridge Tax 251,894 257,693 250,000 240,000 250,000 10,000 4.2%101-0000-402.45-00 Telecommunications Tax 2,356,604 1,868,788 1,560,000 2,090,000 1,371,400 (718,600) (34.4%)101-0000-402.50-00 Electric Utility Tax 2,900,788 2,830,115 2,843,000 3,100,000 3,100,000 0 0.0%101-0000-402.55-00 Natural Gas Utility Tax 2,319,957 2,062,240 2,133,000 2,200,000 2,200,000 0 0.0%
Business Taxes 16,443,326 13,660,248 14,727,500 15,466,000 15,506,200 40,200 0.3%
101-0000-403.05-00 Sales Tax 12,914,676 12,480,915 13,600,000 12,212,000 13,700,000 1,488,000 12.2%101-0000-403.06-00 Local Use Tax 2,488,121 3,290,912 3,200,000 3,079,000 3,000,000 (79,000) (2.6%)101-0000-403.10-00 Auto Rental Tax 29,263 14,591 20,000 28,000 28,000 0 0.0%101-0000-403.15-00 State Income Tax 7,993,678 8,161,144 8,900,000 7,322,000 9,299,000 1,977,000 27.0%101-0000-403.25-00 Replacement Tax 523,154 470,094 638,000 450,000 550,000 100,000 22.2%
Intergovernmental Taxes 23,948,892 24,417,656 26,358,000 23,091,000 26,577,000 3,486,000 15.1%
Total Taxes 64,139,809 62,383,378 67,480,100 64,951,600 68,000,500 3,048,900 4.7%
101-0000-411.35-00 Training Reimbursement 33,582 71,645 35,000 20,000 35,000 15,000 75.0%101-0000-411.36-00 Task Force Reimbursement 41,670 19,001 25,000 25,000 25,000 0 0.0%101-0000-411.53-00 State Charitable Game Tax 7,880 5,518 10,000 15,000 10,000 (5,000) (33.3%)101-0000-411.70-00 Other Grants 215,392 978,862 170,000 170,000 170,000 0 0.0%101-0000-411.80-00 Counselor in the Park 23,000 0 23,000 23,000 23,000 0 0.0%101-0000-411.81-00 Services for Library 0 129,267 129,300 129,300 135,000 5,700 4.4%
Total Intergovernmental 321,524 1,204,293 392,300 382,300 398,000 10,000 4.1%
101-0000-421.05-00 Vehicle License 1,764,964 1,237,102 1,430,000 1,430,000 1,430,000 0 0.0%101-0000-421.10-00 Business License 637,785 623,075 650,000 650,000 650,000 0 0.0%101-0000-421.15-00 Dog License 64,590 65,306 65,000 62,000 65,000 3,000 4.8%101-0000-421.20-00 Liquor License 409,173 245,204 425,000 425,000 425,000 0 0.0%101-0000-421.25-00 Public Chauffeur License 960 160 500 500 500 0 0.0%101-0000-421.30-00 Multiple Dwelling License 63,077 76,448 70,000 70,000 70,000 0 0.0%101-0000-421.99-00 Misc License Revenue 37,319 (49,237) 0 0 0 0 N/A
Licenses 2,977,868 2,198,058 2,640,500 2,637,500 2,640,500 3,000 0.1%
28

GENERAL FUNDREVENUES
Account Account Actual Actual Proj Actual Budget Budget $ %Number Description 2019 2020 2021 2021 2022 Inc (Dec) Inc (Dec)
101-0000-422.05-00 Building Permits 1,393,546 920,457 1,200,000 1,200,000 1,200,000 0 0.0%101-0000-422.07-00 Foundation Only Permits 300 0 0 0 0 0 N/A101-0000-422.10-00 Electrical Permits 193,132 88,565 115,000 115,000 115,000 0 0.0%101-0000-422.15-00 Plumbing Permits 119,065 59,573 90,000 90,000 90,000 0 0.0%101-0000-422.20-00 Sign Permits 11,760 12,000 13,000 13,000 13,000 0 0.0%101-0000-422.25-00 Elevator Permits 62,468 53,610 60,000 65,000 60,000 (5,000) (7.7%)101-0000-422.30-00 Occupancy Permits 27,330 7,320 25,000 25,000 25,000 0 0.0%101-0000-422.35-00 Driveway Permits 3,102 187 6,000 6,000 6,000 0 0.0%101-0000-422.45-00 Air Conditioning Permits 32,893 12,423 14,000 14,000 14,000 0 0.0%101-0000-422.50-00 Swimming Pool Permits 1,899 7,143 2,000 1,000 2,000 1,000 100.0%101-0000-422.60-00 Chimney Permits 2,520 1,900 2,000 2,000 2,000 0 0.0%101-0000-422.65-00 Wrecking Permits 6,828 7,625 7,500 7,500 7,500 0 0.0%101-0000-422.70-00 Other Permits 2,048 3,165 2,000 1,000 2,000 1,000 100.0%
Permits 1,856,891 1,173,968 1,536,500 1,539,500 1,536,500 (3,000) (0.2%)
Total Licenses & Permits 4,834,759 3,372,026 4,177,000 4,177,000 4,177,000 0 0.0%
101-0000-431.34-00 Cable Franchise Fees 1,444,171 1,381,140 1,400,000 1,500,000 1,400,000 (100,000) (6.7%)101-0000-431.38-01 FOIA Photocopy Fees 37 0 0 0 0 0 N/A101-0000-431.40-00 Other Fees 55,089 26,945 40,000 40,000 40,000 0 0.0%101-0000-431.50-00 Special PW Detail Fees 13,635 2,878 12,000 7,900 10,000 2,100 26.6%
General Govern Fees 1,512,932 1,410,963 1,452,000 1,547,900 1,450,000 (97,900) (6.3%)
101-0000-432.02-00 Plan Commission Hearing 18,950 17,985 20,000 20,000 20,000 0 0.0%101-0000-432.06-00 Rezoning Zoning Variation 7,176 10,340 10,000 10,000 10,000 0 0.0%101-0000-432.08-00 Plan Examination Fees 117,966 80,283 100,000 100,000 100,000 0 0.0%101-0000-432.09-00 Fire Plan Examination Fee 45,276 40,570 42,000 42,000 42,000 0 0.0%101-0000-432.12-00 Engineering Service Fees 192,235 166,062 110,000 110,000 110,000 0 0.0%
Comm Develop Fees 381,603 315,240 282,000 282,000 282,000 0 0.0%
101-0000-433.14-00 Ambulance Service Fees 2,724,531 2,581,259 2,725,000 2,650,000 2,750,000 100,000 3.8%101-0000-433.16-00 Special Police Detail Fee 245,280 74,702 150,000 242,700 200,000 (42,700) (17.6%)101-0000-433.18-00 Police Counselor Fees 348,755 302,614 325,000 325,000 325,000 0 0.0%101-0000-433.19-00 Police Records Fees 15,417 11,311 10,000 10,000 10,000 0 0.0%101-0000-433.20-00 Special Fire Detail Fees 41,330 7,364 40,000 50,000 40,000 (10,000) (20.0%)101-0000-433.22-00 False Alarm Fees 19,750 14,650 20,000 30,000 20,000 (10,000) (33.3%)101-0000-433.24-00 Chemical Users Fee 10,380 9,990 10,000 12,000 10,000 (2,000) (16.7%)101-0000-433.26-00 DUI Administrative Fee 91,200 59,600 60,000 60,000 60,000 0 0.0%
Public Safety Fees 3,496,643 3,061,490 3,340,000 3,379,700 3,415,000 35,300 1.0%
101-0000-434.28-00 Weed Cutting Fees 7,040 1,600 4,000 4,000 4,000 0 0.0%101-0000-434.32-00 Animal Detention Fees 50 175 0 0 0 0 N/A
Health & Welfare Fees 7,090 1,775 4,000 4,000 4,000 0 0.0%
Total Fees 5,398,268 4,789,468 5,078,000 5,213,600 5,151,000 (62,600) (1.2%)
101-0000-441.05-00 Traffic Court Fines 203,795 201,138 260,000 260,000 260,000 0 0.0%101-0000-441.10-00 Dog Fines 0 0 100 100 100 0 0.0%101-0000-441.15-00 Parking Fines 190,322 135,057 205,000 205,000 205,000 0 0.0%101-0000-441.15-01 Parking Fines Amnesty 13,907 3,395 15,000 20,000 15,000 (5,000) (25.0%)101-0000-441.22-00 Compliance Ticket Fines 7,271 3,930 6,000 6,000 6,000 0 0.0%101-0000-441.25-00 Ordinance Ticket Fines 58,490 50,280 55,000 50,000 55,000 5,000 10.0%101-0000-441.35-00 Other Fines 14,579 1,465 5,000 5,000 5,000 0 0.0%
Total Fines 488,364 395,265 546,100 546,100 546,100 0 0.0%
29

GENERAL FUNDREVENUES
Account Account Actual Actual Proj Actual Budget Budget $ %Number Description 2019 2020 2021 2021 2022 Inc (Dec) Inc (Dec)
101-0000-451.05-00 Service Charge Escrow 23,066 14,060 12,000 10,000 12,000 2,000 20.0%101-0000-451.10-00 Service Charge Guaranty 11,310 6,761 5,000 5,000 5,000 0 0.0%101-0000-451.15-00 Service Charge Parking 281,700 287,300 287,300 287,300 287,300 0 0.0%101-0000-451.30-00 Service Charge Water 1,716,900 1,768,400 1,821,500 1,821,500 1,876,100 54,600 3.0%101-0000-451.35-00 Service Charge TIF 80,000 65,000 80,000 80,000 80,000 0 0.0%
Total Charges for Services 2,112,976 2,141,521 2,205,800 2,203,800 2,260,400 56,600 2.6%
101-0000-461.02-00 Interest on Investments 494,075 108,128 150,000 250,000 100,000 (150,000) (60.0%)101-0000-462.10-00 Market Value Adjustments 182,401 30,786 95,000 120,000 60,000 (60,000) (50.0%)
Total Interest Income 676,476 138,914 245,000 370,000 160,000 (210,000) (56.8%)
101-0000-471.14-00 Property Damage Claims 4,383 0 0 0 0 0 N/A101-0000-471.16-00 Damage to Lights Signs 30,487 45,861 45,000 50,000 45,000 (5,000) (10.0%)101-0000-471.18-00 Damage to Trees 1,795 1,535 3,000 3,000 3,000 0 0.0%
Property Damage 36,665 47,396 48,000 53,000 48,000 (5,000) (9.4%)
101-0000-472.24-00 Sale of Equipment 6,083 29,352 5,000 5,000 5,000 0 0.0%101-0000-472.28-00 Sale of Scrap 3,787 1,522 2,000 2,000 2,000 0 0.0%101-0000-472.36-00 Sale of Plans Bid Specs 880 1,260 2,000 2,000 2,000 0 0.0%101-0000-472.82-00 Rents and Concessions 23,912 23,912 24,000 24,000 24,000 0 0.0%101-0000-472.82-01 Train Station Rents 13,289 2,604 10,000 10,000 10,000 0 0.0%
Sales & Rents 47,951 58,650 43,000 43,000 43,000 0 0.0%
101-0000-473.05-00 Traffic Signal Control Maint 33,933 31,775 34,000 34,000 34,000 0 0.0%Reimbursables 33,933 31,775 34,000 34,000 34,000 0 0.0%
Total Sales/Reimbursables 118,549 137,821 125,000 130,000 125,000 (5,000) (3.8%)
101-0000-481.50-00 Hearts of Gold Awards Dinner 0 13,860 15,000 19,000 15,000 (4,000) (21.1%)101-0000-481.55-00 Spec Events Prem Sponsor 0 7,500 0 0 0 0 N/A
Special Events 0 21,360 15,000 19,000 15,000 (4,000) (21.1%)
101-0000-483.10-00 NWCH in Lieu of RE Tax 236,891 248,736 256,100 256,100 263,800 7,700 3.0%101-0000-483.46-00 Senior Center 6,822 1,351 7,000 7,000 7,000 0 0.0%101-0000-483.59-00 Disabled Citizen Donation 1,101 947 500 100 500 400 400.0%
Donations 244,814 251,034 263,600 263,200 271,300 8,100 3.1%
101-0000-484.47-00 Radon Testing 0 10 0 0 0 0 N/A101-0000-484.48-00 Wellness Programs 6,286 3,676 6,000 6,000 6,000 0 0.0%101-0000-484.49-00 Wellness Home Visits 2,872 3,116 2,800 2,800 2,800 0 0.0%101-0000-484.61-00 A H Emergency Assistance 26,095 29,323 23,000 23,000 23,000 0 0.0%
Special Operations 35,253 36,125 31,800 31,800 31,800 0 0.0%
101-0000-489.85-00 Bad Debt Recovery 15,672 23,311 10,000 10,000 10,000 0 0.0%101-0000-489.90-00 Other Income 173,210 35,579 30,000 30,000 30,000 0 0.0%
Other 188,882 58,890 40,000 40,000 40,000 0 0.0%
Total Other 468,949 367,409 350,400 354,000 358,100 4,100 1.2%
101-0000-491.05-00 Operating Transfer In 200,000 350,000 200,000 200,000 200,000 0 0.0%Total Other Financing 200,000 350,000 200,000 200,000 200,000 0 0.0%
Total General Fund 78,759,674 75,280,095 80,799,700 78,528,400 81,376,100 2,842,000 3.6%
30

GENERAL FUND REVENUE - Notes
ANALYSIS OF GENERAL FUND REVENUES Summary The Village of Arlington Heights has worked to maintain a strong General Fund balance over the years. This has helped the Village preserve a higher credit rating by having monies available to fund extraordinary expenditures or losses. Since sales and income tax receipts represent such a significant portion of the Village’s General Fund revenues and can vary significantly depending on the conditions of the economy, maintaining an adequate fund balance level is important. The Village’s financial policies include a provision to maintain at least a 25% reserve in the General Fund. The fund balance as of the end of 2022 is projected to be 40% of General Fund expenditures. There are a couple of other revenue sources which the Village has yet to enact and which could conservatively produce an additional $4.375 million per year as shown below:
► The existing Home Rule Sales Tax of 1% could be increased ¼% to produce approximately $1,750,000 of additional revenue on an annual basis.
► A Real Estate Transfer Tax at the rate of $3.00 for each $1,000 of value could produce at least
$1,125,000 of additional revenue on an annual basis.
► The Food & Beverage Tax of 1.25% could be increased to 2% and would produce at least $1,500,000 of additional revenue on an annual basis.
Property Tax32%
Sales Tax17%Home Rule Sales
Tax7%
Income Tax11%
Telecommunications Tax2%
Other Taxes15%
Licenses/Permits5%
Fees/Fines7%
Service Charges3%
Other1%
31

GENERAL FUND REVENUE - Notes (Continued)
Annually, fees for Village services are reviewed to insure charges are adequate to offset the cost of providing these services to residents and the general public. 401.03 – 401.11 Real Estate Tax Property tax receipts represent about 32% of the Village’s General Fund income and 28.5% of the Village’s total income from all funds. The Village’s levy represents only 12.3% of a property owner’s total property tax bill.
As shown above, the Village’s estimated 2021 tax rate payable in 2022 is 1.112 per $100 of equalized assessed valuation (EAV). The tax rate may fluctuate due to assessed value changes by Cook County.
0.00
0.20
0.40
0.60
0.80
1.00
1.20
1.40
1.60
0.755
0.8660.955
1.062
1.270 1.269
1.359
1.182 1.217
1.265
1.108 1.112 1.112
Tax
Rat
e P
er $
100
EA
V
REAL ESTATE PROPERTY TAX RATE
32

GENERAL FUND REVENUE - Notes (Continued)
EQUALIZED ASSESSED VALUE
The levy, which corresponds to this 2022 Budget, will be levied in December 2021. Property owners will pay this tax in two installments in March and September 2022. A breakdown of the Village’s total tax levy is as follows:
0
500,000,000
1,000,000,000
1,500,000,000
2,000,000,000
2,500,000,000
3,000,000,000
3,500,000,000
3,09
3,76
8,98
9
2,85
9,95
8,55
5
2,47
7,91
3,48
6
2,50
4,21
9,76
9
2,44
7,05
1,75
9
2,89
6,91
7,16
2
2,94
6,52
7,92
2
2,91
8,93
4,76
1
3,36
6,66
7,58
1
3,38
7,80
3,76
5
3,38
7,80
3,76
5
EA
V
Extended Proposed2020 Levy 2021 Levy
For 2021 For 2022 ChangeVillage
Police Protection 7,105,754 6,799,200 -4.31%Fire Protection 7,105,754 6,799,200 -4.31%IMRF 1,854,158 1,708,500 -7.86%FICA 1,517,020 1,534,400 1.15%Police Pension 4,113,730 4,114,000 0.01%
Fire Pension 4,962,130 4,962,000 0.00%Capital Improvement 4,444,000 5,250,000 18.14%Debt Service 6,563,542 6,498,700 -0.99%
Total Village Tax Levy 37,666,088 37,666,000 0.00%
Library 14,680,922 14,680,922 0.00%
Total Tax Levy 52,347,010 52,346,922 0.00%
TAX LEVY YEAR: 2011 2012 2013 2014 2015 2016 2017 2018 2019 2020 2021
33

GENERAL FUND REVENUE - Notes (Continued)
The Village and Library’s total 2021 property tax levy that will be accounted for in 2022 reflects a 0% percent increase. The Village’s annual tax levy is comprised of discretionary and non-discretionary components. The pension levies including IMRF, Social Security, Police Pension and Fire Pension are mandated by the State or required by federal law. The IMRF and Police and Fire Pension levies are calculated by outside actuaries to determine annual required payments to cover current and unfunded pension obligations. The debt service levy is another non-discretionary levy that reflects the annual principal and interest the Village is obligated to pay on its outstanding bonds. The only discretionary levies that the Village can realistically control on an annual basis are the Police and Fire Protection levies in the General Fund and the Capital Improvement levy. The Capital Improvement levy is a revenue source for the Village’s capital program, and about 59% of the 2022 Capital Projects Fund budget is proposed to be used for street projects. 402.10 Hotel Tax This tax is administered by the Village of Arlington Heights through its Home Rule powers. From FY1997 through FY2009, 10% of all prior year hotel tax collections were invested in the Meet Chicago Northwest regional convention bureau to facilitate future hotel bookings. Due to the Village’s financial constraints this amount was reduced in FY2010 to 6%. This percentage was increased to 7% in FY2013 and increased to 8% in FY2014. The 2021 budget is at the current rate 8%. 402.25 Food & Beverage Tax Retail sale of prepared food and liquor, which includes all liquor sold at retail either for consumption on premises or sold in its original packaging for consumption off premises, and all food including alcoholic and non-alcoholic beverages which is prepared for immediate consumption and which may be consumed either on and/or off the premises is subject to a 1.25% tax in addition to general sales taxes. This tax was created by the Village’s Home Rule powers and 26% of this tax rate is accounted for in the Arts, Entertainment & Events Fund as a dedicated funding source. 402.35 Road & Bridge Tax This tax is levied through the Township and by State Statute. Half of the levy is distributed to municipalities within the township based on assessed values. 402.45 Telecommunications Tax As of January 2003, all telecommunication providers were required to charge a 1% to 6% telecommunications tax based on the individual municipalities local ordinances and the fee was renamed the Simplified Municipal Telecommunications Tax. This fee is then remitted to the State, which distributes the funds to the municipalities after subtracting an administrative charge. The Village Board chose to increase this tax to 6% effective January 2003.
34

GENERAL FUND REVENUE - Notes (Continued)
402.50 Electric Utility Tax and 402.55 Natural Gas Utility Tax The Village’s electric and natural gas utility taxes are imposed upon the privilege of using or consuming electricity or natural gas acquired in a purchase at retail and used or consumed within the corporate limits of the Village. The utility taxes are calculated based on kilowatt hours or therms used. 403.05 Sales Tax and 402.30 Home Rule Sales Tax
Sales Tax and Home Rule Sales Tax revenues represent the second largest revenue source or about 24% of the Village’s General Fund income. Items, except food and drugs, in Arlington Heights are subjected to a 10.00% sales tax. Sales taxes are imposed upon all retail sales and upon all persons engaged in the business of making sales of services within the Village’s corporate limits. These taxes are collected by the State and divided among the taxing districts as follows:
Sales Tax Amount % Inc (Dec)8-Mo. Dec. 2015 (Actual) 8,423,387 (30.2%)2016 (Actual) 12,377,718 2.6%2017 (Actual) 12,064,683 (2.5%)2018 (Actual) 12,787,847 6.0%2019 (Actual) 12,914,676 1.0%2020 (Actual) 12,480,915 (3.4%)2021 (Proj. Actual) 13,600,000 9.0%2022 (Budget) 13,700,000 0.7%
Home Rule Sales Tax(General Fund Portion) Amount % Inc (Dec)8-Mo. Dec. 2015 (Actual) 3,829,608 (30.2%)2016 (Actual) 5,242,770 (4.4%)2017 (Actual) 5,000,579 (4.6%)2018 (Actual) 5,366,766 7.3%2019 (Actual) 5,401,119 0.6%2020 (Actual) 4,654,737 (13.8%)2021 (Proj. Actual) 5,480,000 17.7%2022 (Budget) 5,600,000 2.2%
35

GENERAL FUND REVENUE - Notes (Continued)
Sales Tax by Source Calendar Year 2020
Budget Assumptions – 2021 sales tax receipts (excluding home rule sales tax) are coming in higher than the prior year’s receipts due to the economic recovery from the coronavirus pandemic. The 2022 Budget projects continued improvement in sales tax receipts. In 2020, the Village approved an existing medical marijuana dispensary to allow recreational sales at its location for a period of time as a pilot program. A tax is imposed at a rate of 3% of the gross receipts from all cannabis sales other than those purchased under the Compassionate Use of Medical Cannabis Pilot Program Act. These revenues are included with other municipal sales taxes. 403.06 Local Use Tax The Village receives a share of the total collections of the State use tax that is extended to items purchased outside of Illinois. The State distributes this tax on a per capita basis.
State Tax 5.25%Village Tax*
Municipal 1.00%Home Rule 1.00%
Cook County Tax 1.75%RTA Tax 1.00%Total 10.00%
GENERALMERCHANDISE
4.4%FOOD15.9%
DRINKING & EATING PLACES11.4%
APPAREL1.7%
FURNITURE, HOUSEHOLD & RADIO
6.5%LUMBER, BUILDING & HARDWARE
5.6%
AUTOMOTIVE & FILLING STATIONS
25.5%
DRUGS & MISCELLANEOUS
RETAIL18.6%
AGRICULTURAL & ALL OTHERS
8.9%
MANUFACTURES1.4%
*Note: The municipal tax is credited to the General Fund. 75% of the home rule tax is credited to the General Fund and 25% of the home rule tax is credited to the Capital Projects Fund.
36

GENERAL FUND REVENUE - Notes (Continued)
403.15 State Income Tax
Income tax receipts represent approximately 11% of the Village’s General Fund income. Budget Assumptions – To prepare the 2022 budget for income tax receipts, three key elements were assumed:
Population – Income tax receipts are distributed based on the Village’s population in proportion to the total state population. Arlington Heights’ most recent population used by the State is 77,676 (2020 Census). Municipality’s share of income tax receipts – Beginning August 1, 2017, local governments receive 6.06 percent of the net collections of all income tax received from individuals, trusts, and estates, and 6.85 percent of the net collections of all income tax received from corporations (35 ILCS 5/901 b). Inflation – A State wage inflation rate of 4.5% is projected for 2022.
403.25 Replacement Tax
The Personal Property Replacement Tax (PPRT) is received directly from the State. It is derived from corporate income and as such is directly related to the economy. 421.05 Vehicle License
The State of Illinois is somewhat unique in that it granted all municipalities the ability to license or tax vehicles regardless of Home Rule authority. The Village license for a passenger car is $30. Various other license categories exist depending on the type of vehicle and the status of its operator. 421.10 Business License
All businesses, with the exception of those professions licensed by the State (doctors, lawyers, real estate agents) are required to be licensed. The license fee is based on a sliding scale according to the square footage of the business site.
101-0000-403.15-00 State Income TaxAmount % Inc (Dec)
8-Mo. Dec. 2015 (Actual) 5,254,518 (28.6%)2016 (Actual) 7,310,634 (0.6%)2017 (Actual) 6,897,965 (5.6%)2018 (Actual) 7,192,128 4.3%2019 (Actual) 7,993,678 11.1%2020 (Actual) 8,161,144 2.1%2021 (Proj. Actual) 8,900,000 9.1%2022 (Budget) 9,299,000 4.5%
37

GENERAL FUND REVENUE - Notes (Continued)
421.30 Multiple Dwelling License
This fee is for the Village’s multiple family dwelling license and inspection program. An annual license fee consisting of $13 per unit or a minimum of $60 per building is assessed. 422.05 Building Permits, 422.10 Electrical & 422.15 Plumbing Permits
These permits are activity-based and as such, are subject to economic conditions. The Village has taken a conservative approach to budgeting for these revenues. Historically, additions and renovations generate a fairly flat but consistent revenue stream. 422.25 Elevator Permits
In addition to the new construction of elevators, the Village or its contractor annually inspect all elevators in the Village for safety and compliance purposes. The annual permit fee is $100 per elevator. 422.30 Occupancy Permits
At the conclusion of new construction, before individuals may use a new structure, a final inspection must be completed by the Building Department. Approval by the Building Department to “occupy” a structure for its intended use generates an occupancy permit at a cost of $60 for single-family homes and $120 for multi-family, commercial and industrial structures. 431.34 Cable Franchise Fees
Arlington Heights is fortunate to have three cable TV providers for its residents to choose from. Currently, Wide Open West, Comcast and AT&T are the service providers. A 5% fee on gross revenues of the provider allows that provider to use Village right-of-way for installation of cable wire to provide service. 432.08 Plan Examination Fees
Before building permits can be issued for construction, plans or drawings must be reviewed by the Building Department or its contractor. These fees are based on the complexity of the structure and have a minimum fee of $30. 432.12 Engineering Service Fees
In addition to the Building Department overseeing construction activities, the Public Works Engineering Division assists on matters concerning elevation, drainage, water detention and sewer transmission. These fees are calculated at the permit issuance stage and collected in advance. Inspections are completed as needed until construction is finished. 433.14 Ambulance Service Fees
Arlington Heights maintains four ambulance companies on a 24-hour, seven-day-a-week basis. Fees for this service help offset the cost of providing the equipment and personnel necessary. A flat rate of $1,500 per transport and $12 per mile is billed to the recipient. This rate was increased as of 2018. Health insurance
38

GENERAL FUND REVENUE - Notes (Continued)
deductibles, co-payments, mileage, and any other associated costs are waived for Village residents. Medicare and Medicaid assignments are accepted from service recipients. 433.16 Special Police Detail Fee
Private institutions may request special police services at their expense. These instances are usually for traffic or crowd control. The cost of providing the service is reimbursed to the Village. 433.18 Police Counselor Fees
In conjunction with School District 214, two and one half police officers are assigned to a high school or alternative learning center within Village boundaries. The Northwest Suburban Special Education Organization (NSSEO) also has one Police Officer assigned to Timber Ridge School. Both of these organizations reimburse the Village based on the average salary of police officers in the surrounding areas. 433.22 False Alarm Fees
Malfunctioning commercial and residential alarm systems cause public safety personnel delayed response times to emergencies. Fines from $25 to $500 are assessed against repeat offenders in an effort to have alarms maintained in good working order. 433.26 DUI Administrative Fee
The added requirements to complete the administrative process on these types of violations will incur a $500 fee per occurrence. 441.05 Traffic Court Fines
The fines are collected by the Circuit Court of Cook County and distributed to the municipality issuing the citation. On a monthly basis, fines are distributed to municipalities after the County deducts a service charge. 441.15 Parking Fines
Citations issued for illegal parking that are not contested in court are recorded in this account. Handicap parking space violations are currently $250 per State Statute. Time violation and commuter pay box violation fines are recorded in the Parking Fund. Typical parking fines begin at $25. 441.22 Compliance Ticket Fines
Citations issued for vehicular equipment failure are recorded in this account. No fine is assessed if the equipment is repaired in a timely manner. Only after non-compliance does the fee take effect. 441.25 Ordinance Ticket Fines
Violations of Village ordinances, other than of a vehicle nature, are recorded here. Local ordinances regulate activities ranging from trash pickup to animal nuisance complaints.
39

GENERAL FUND REVENUE - Notes (Continued)
451.05 Service Charge – Escrow Deposits
Escrow funds are collected from developers to insure the successful completion of construction projects and public improvements (streets, sidewalks, sewers). Interest on these deposits is recorded in this account, as the Village is not required to pay interest to the owner while holding the deposit. 451.10 Service Charge – Guaranty Deposits
Guaranty Deposits are similar to escrow deposits above except they are generally for single-family home improvements. Again, interest on deposits is credited to the Village and the initial deposit is returned to the homeowner after successful completion of the project. 451.15 – 451.35 Service Charge – Parking, Water, TIF
These service charges cover an allocation for administrative and operating expenditures paid out of the General Fund. Staff completely dedicated to a specific operation are charged directly to that fund/operation. 461.02 Interest on Investments
The Village participates in a number of investment pools and owns a number of Certificates of Deposit and U.S. Treasury Securities to safeguard funds for reserve and daily operations. All funds not needed for operations are invested on a “prudent man” concept. 472.82 Rents & Concessions
Village owned property not immediately needed for Village operations is leased to private parties at market rates. Charges for apparatus affixed to public buildings are recorded here. Businesses operating in Village owned facilities are assessed a rental fee. 483.10 NWCH in Lieu of RE Tax
Per an agreement with the non-profit Northwest Community Hospital, the hospital contributes an amount based on what its property tax payment would have been to the Village of Arlington Heights had the hospital been a “for profit” operation. By agreement the amount is increased 3% each year. 484.48 Wellness Programs
An endowment of $25,000 was received from the Moelhing Family for the perpetuation of health related tests, screenings and equipment. Interest on the principal and minor service charges to recipients are recorded in this account and used for ongoing programs. 489.85 Bad Debt Recovery
Any unpaid invoice or citation issued by the Village is referred to a collection agency after 90 days for further collection efforts.
40

Citizens of Arlington Heights
Village Board
Village Manager
Boards & Commissions
Village Prosecutor
Village Attorney
BOARD OF TRUSTEES ORGANIZATION STRUCTURE
41

BOARD OF TRUSTEES Eight Trustees and the Village President comprise the Village Board. The President and Trustees are the elected representatives of the citizens of Arlington Heights. The Trustees and Village President are elected at large for four years with staggered terms. The Village Board meets formally on the first and third Monday of each month. The Board meets informally on the second Monday of the month and on other occasions as needed. 2022 Strategic Priorities These priorities and sub-priorities reflect the views of the Village Board identified at the July 12, 2021 Village Board goal setting session: 1. Facilitate a Balanced and Continuous Community and Organizational Post-COVID-19 Recovery
2. Expand Efforts to Embrace Diversity, Equity, and Inclusion within the Community and the Village
Government
3. Work to Ensure the Redevelopment of Arlington Park Meets Community Standards and Provides a One of a Kind Regional Destination Worthy of the Property’s Legacy
4. Identify, Explore, and Implement Sustainable and Green Initiatives
5. Ensure Revenue Sources are applied rationally across sectors while Monitoring the Overall Community
Tax Burden
6. Ensure the Organization has the Resources and Training to Maintain Focus on Consistent High-Quality Core Services and Infrastructure
7. Seek Opportunities to make the Community more Livable by increasing Pedestrian and Bicycle Options
for Residents
8. Improve Communications with Residents and Businesses
9. Seek and Maintain Attainable Housing while Continuing to Review Affordable Housing Strategies
42

OPERATION SUMMARY
BOARD OF TRUSTEES2019 2020 2021 2021 2022 $ %
Actual Actual Est. Actual Budget Budget Change Change
Authorized Positions in F-T-E 0.00 0.00 0.00 0.00 0.00 0.00 N/A
Expenditures Personal Services $33,964 $33,182 $34,400 $34,400 $34,300 ($100) (0.3%) Contractual Services 130,698 109,529 137,000 137,000 140,400 3,400 2.5% Commodities 1,448 1,087 1,500 1,500 1,500 0 0.0% Other Charges 4,186 0 0 6,000 0 (6,000) (100.0%)
Total Expenditures $170,296 $143,798 $172,900 $178,900 $176,200 ($2,700) (1.5%)
CROSS REFERENCE TO FUNDS
2019 2020 2021 2021 2022 $ %Actual Actual Est. Actual Budget Budget Change Change
General Fund $166,110 $143,798 $172,900 $172,900 $176,200 $3,300 1.9%A & E Fund 4,186 0 0 6,000 0 (6,000) (100.0%)
Total Expenditures $170,296 $143,798 $172,900 $178,900 $176,200 ($2,700) (1.5%)
43

BOARD OF TRUSTEESGENERAL FUND EXPENDITURES
Account Account Actual Actual Proj. Act. Budget Budget $ %Number Description 2019 2020 2021 2021 2022 Inc (Dec) Inc (Dec)
101-0101-501.10-02 Elected Officials 30,666 29,733 30,900 30,900 30,900 0 0.0%
Salaries 30,666 29,733 30,900 30,900 30,900 0 0.0%
101-0101-501.19-01 Workers Compensation 100 100 100 100 100 0 0.0%101-0101-501.19-10 IMRF 851 1,074 1,100 1,100 1,000 (100) (9.1%)101-0101-501.19-11 Social Security 1,903 1,844 1,900 1,900 1,900 0 0.0%101-0101-501.19-12 Medicare 444 431 400 400 400 0 0.0%
Fringe Benefits 3,298 3,449 3,500 3,500 3,400 (100) (2.9%)
101-0101-501.21-65 Other Services 70,048 59,900 80,300 80,300 80,800 500 0.6%101-0101-501.22-02 Dues 47,068 38,743 44,400 44,400 44,800 400 0.9%101-0101-501.22-03 Training 1,832 1,350 2,500 2,500 2,500 0 0.0%101-0101-501.22-05 Postage 150 236 300 300 300 0 0.0%101-0101-501.22-25 IT/GIS Service Charge 11,600 9,300 9,500 9,500 12,000 2,500 26.3%
Contractual Services 130,698 109,529 137,000 137,000 140,400 3,400 2.5%
101-0101-501.30-01 Publications Periodicals 90 197 200 200 200 0 0.0%101-0101-501.30-05 Office Supplies & Equip 1,358 890 1,300 1,300 1,300 0 0.0%
Commodities 1,448 1,087 1,500 1,500 1,500 0 0.0%
Total Board of Trustees 166,110 143,798 172,900 172,900 176,200 3,300 1.9%
44

BOARD OF TRUSTEESGENERAL FUND EXPENDITURE DETAIL
AccountNumber Account Title Description
SALARIES:
101-0101-501.10-02 Elected Officials President 8,500 8,5008 Trustees @ $2,800 each 22,400 30,900 22,400 30,900
TOTAL SALARIES 30,900 30,900
FRINGE BENEFITS:
101-0101-501.19-01 Workers' Compensation Workers' Compensation Insurance 100 100
101-0101-501.19-10 IMRF IMRF 1,100 1,000
101-0101-501.19-11 Social Security Social Security 1,900 1,900
101-0101-501.19-12 Medicare Medicare 400 400
TOTAL FRINGE BENEFITS 3,500 3,400
CONTRACTUAL SERVICES:
101-0101-501.21-65 Other Services Plaques, certificates of recognition andappreciation, mementos for dignitaries 6,500 6,500
Cable access channel programs & videos 66,000 66,000Informational/Public Service Announcement 4,200 4,200Contributions to post-prom events 600 600Miscellaneous 3,000 80,300 3,500 80,800
101-0101-501.22-02 Dues Northwest Municipal Conference 27,800 28,200Chicago Metropolitan Agency for
Planning (CMAP) 2,900 2,900Illinois Municipal League 5,000 5,000U.S. Conference of Mayors 5,300 5,300Metropolitan Mayors Caucus 3,400 44,400 3,400 44,800
101-0101-501.22-03 Training Illinois Municipal League meeting andother related meetings 2,500 2,500
101-0101-501.22-05 Postage Postage 300 300
101-0101-501.22-25 IT/GIS Service Charge Information Technology/GIS service charge 9,500 12,000
TOTAL CONTRACTUAL SERVICES 137,000 140,400
COMMODITIES:
101-0101-501.30-01 Publications/Periodicals Miscellaneous publications 200 200
101-0101-501.30-05 Office Supplies & Equip Miscellaneous office supplies 1,300 1,300
TOTAL COMMODITIES 1,500 1,500
TOTAL BOARD OF TRUSTEES 172,900 176,200
Budget20222021
Budget
45

THIS PAGE LEFT BLANK
46

Village Manager
I.T. Division
INTEGRATED SERVICES (12.50 FTE) ORGANIZATION STRUCTURE
Communications
Legislative Support
Administration
Assistant Village
Manager
Integrated Services
Department
47

INTEGRATED SERVICES DEPARTMENT The Integrated Services Department (ISD) includes the Village Manager’s Office, Communications, the Information Technology Division and the Legal Division. The purpose of the department is to exercise administrative and operational oversight over all departments, ensure the achievement of Village Board goals and objectives, optimize interdepartmental processes, and lead in the development of organizational efficiencies. The ISD serves as the focal point for the executive leadership and direction of the organization. Overview of ISD: In addition to overseeing the Village Manager’s Office function, the department aims to increase the Village government’s focus on four key areas:
• Utilization of Information Technology - Involvement of IT early in technology planning and project decisions in order to leverage technology as much as possible to optimize operations. ISD is responsible for the development, maintenance, and administration of the ERP system. Through embracing technological solutions, ISD leads in adapting to current events and needs of both internal and external stakeholders.
• Communications & Outreach - Oversee timely and accurate information through Village communication platforms: social media, website, e-news blasts, civic sign, press releases, and Arlington Alert; the Village’s mass notification system. Performs proactive communication and assists with community outreach and engagement. Oversees the Village’s special events.
• “One Village Voice” - Work with Village Staff to continue promoting the “One Village Voice” motto in a way that is clear, consistent and courteous throughout our communications and citizen engagement efforts.
• Customer Service - Explore new ways to enhance customer service and have it be a priority for the organization. Adapt to the changing needs and concerns of residents and businesses by providing customer forcused solutions.
2021 Accomplishments • Diversity, Equity, & Inclusion (DEI) –
o DEI Audit Complete
o Regional Law Enforcement Taskforce recruitment event held
o DEI Taskforce being planned
o DEI now part of the Village's Performance Evaluation Process
o Communications and Outreach Coordinator Position Job Description Adjusted
o Village Manager joined MMC DEI Taskforce
o Frank White Project work with the Historical Musuem and Planning & Community Development Department
• Legal Division Incorporated into ISD – After a thorough six month review of the Legal Division by
Assistant Village Manager Mikula, the Legal Division was incorporated as a division of the Intergrated Services Department.
• COVID-19 Response – The Integrated Services Department continued to lead the Village’s response to the COVID-19 pandemic for both internal and external operations. By streamlining and automating processes, Village staff were able to provide quality services safely to residents and businesses.
48
INTEGRATED SERVICES DEPARTMENT (Continued)
o ISD kept an updated or up to date informational article on COVID-19 as the main news story on the Village’s Home Page. This news article was updated with any changes to the State’s Restore Illinois Plan, testing sites, health guidelines and financial assistance.
o Online applications for outdoor dining and liquor licenses were created and updated for virtual
access.
o ISD collaborated with the Planning & Community Development Department on providing information to downtown residents and businesses about Arlington Alfresco and also on promoting Arlington Alfresco on the website and social media platforms.
o Continual social media messages and messages for the Community Events Sign were posted to
remind residents of the importance of COVID-19 testing, vaccination opportunities, social distancing, wearing a face covering, etc.
o The deadline for Liquor License renewals were deferred from April to June in an effort to assist
license holders experiencing difficulties during the pandemic.
o Internally, the Village Manager’s Office worked with departments on how to safely allocate staffing to abide by social distancing, without sacrificing Village productivity and efficiency. In addition, staff served on a committee to determine rules and protocols to safely reopen Village Hall.
o ISD oversaw the return of Special Events under Phase 5 of the Governor’s Restore Illinois.
• ERP – The Village selected Tyler Technologies, as the new ERP system that will enhance the
employee, resident, and business experience. The Village can look forward to services such as paperless procurement, online permit processing and payment, and one centralized location for Village informational assets.
• New Trustee Orientation & Onboarding – ISD had the priviledge to assist in the orientation of newly elected trustees. Meeting with all departments, providing necessary materials, and mentoring throughout the trustee’s tenrue were the main goals of acclimating the Trustees to their new role.
• Streamlining and Automating Processes – The Village Manager’s Office automated cross department processes. In addition, online applications were developed for the Senior Center, social services, disability services, and planning services.
• Village Board Goal Setting – In July 2021, staff conducted a Goal Setting Session with the new Village
Board. The new established goals will result in the creation of new Stratefic Priorities and updated Staff Business Plan.
• Liquor License Renewal – 105 liquor licenses were processed and renewed.
• Special Events – Sounds of Summer concert series returned in late summer. The Village hosted 10
bands over 5 weeks within the Al Fresco Zone.
• Electric Aggregation – Ongoing assessment of the electric aggregation occurred throughout 2021. Due to the pandemic; huge shifts in consumption patterns and a change in a regulatory price impacted cost and volume dynamics in the power market resulting in participating customers to return to ComEd. ISD responded to provide thorough communication and customer service to impacted residents.
• Communications & Outreach Coordinator – In August a new employee, Avis Meade, began
employment as the Village’s Communications & Outreach Coordinator.
49

INTEGRATED SERVICES DEPARTMENT (Continued) • Arlington Park - The Village adopted a new overlay district and negative use ordinance for the
racetrack site. Discussion occurred throughout the year with Churchill Downs representatives and potential user groups to help express the Village’s goals and viewpoints.
2022 Strategic Priorities & Key Projects 1. ERP Integration Strategic Priority #6: Ensure that Organization has the Resources and Training to Maintain Focus on Consistent High-Quality Core Services & Infrastructure The Village will begin to implement the new Enterprise Resource Planning System, Tyler Technologies, throughout the Village. Enterprise Resource Planning (ERP) is an information technology industry term for software— typically a suite of integrated applications— that an organization uses to capture, track, report, interpret and share data across the organization. The Village will be implementing new Financial, Human Resources, Community Development, and Utility Billing modules throughout the organization. The Village’s previous ERP software, SunGard HTE/Central Square, was in use since 1996. The ERP could not properly respond to internal, residential and business needs for billing, procurement, permits, licenses, etc. Factors such as inadequate reporting, limited and outdated payroll functionality, limited integration with cashiering, difficulty processing credit card payments, and concern that support and service by the software provider will be discontinued, all have contributed to the Village’s decision to replace this software and implement the new Tyler solution. As the need for streamlined business processes, new and improved communication methods increase, the new ERP system will properly respond to internal, resident and business needs. Billing, procurement, permits, licenses, and customer service enhancements are able to efficiently evolve and improve under the new ERP system. Project Lead: Diana Mikula, Assistant Village Manager 2. Enhance and Grow Arlington Alert Strategic Priority #8: Improve Communications with Residents and Businesses Continue to grow the use of Arlington Alert and increase resident buy-in. Attend training and learning opportunities with Everbridge to connect and learn more about Everbridge possibilities. Consistent marketing communications will be promoted throughout the Village. Project Lead: Sarah Fitzgibbons, Management Analyst II 3. Arlington Racetrack Project Strategic Priority #3: Work to Ensure the Redevelopment of Arlington Park Meets Community Standards and Provides a One of a Kind Regional Destination Worthy of the Property’s Legacy Staff will work with would be purchasers on a land use plan for the site that will address all Village concerns, take into consideration the perspectives of all stakeholders, and provide for a unique one of a kind development worthy of the site’s legacy to our community and the region. Project Lead: Randy Recklaus, Village Manager
50

INTEGRATED SERVICES DEPARTMENT (Continued) 4. Develop and Implement DEI Taskforce with Community Partners Strategic Priority #2: Expand DEI Efforts Staff will work with fellow governments and other community partners to create a new taskforce workgroup that will aim to engage in outreach with more community voices and ensure that Village services are reaching all groups and are appropriately calibrated to meet the needs of residents in all areas of our community. Project Lead: Randy Recklaus, Village Manager 5. Village Website Improvement Project Strategic Priority #8: Improve Communications with Residents and Businesses and Strategic Priority #6: Ensure that Organization has the Resources and Training to Maintain Focus on Consistent High-Quality Core Services & Infrastructure Assess the Village’s current website for areas of improvements and scheduled contractual update. Efforts will focus on evaluating the website’s usability and user experience to determine the continuation of the contract or to explore potential website options. Project Lead: Avis Meade, Communications and Outreach Coordinator 6. Expand the Village of Arlington Height’s Social Media Presence and Reach Strategic Priority #8: Improve Communications with Residents and Businesses Social media continues to be an evolving resource that provides the Village with a unique opportunity to reach residents and visitors about Village initiatives and community events. A strong social media presence is vital in building a strong Village reputation, supporting transparency, and in reaching new or hard to reach communities within the Village and beyond. Project Lead: Avis Meade, Communications and Outreach Coordinator 7. Internal and External Communications Outreach Strategic Priority #8: Improve Communications with Residents and Businesses To support an inclusive community, staff will seek out opportunities to increase and promote community interactions. Project Lead: Avis Meade, Communications and Outreach Coordinator 8. Evaluate Internal Communications Policies and Procedures Strategic Priority #8: Improve Communications with Residents and Businesses The Village of Arlington Heights seeks to communicate with a “one voice” approach. Determining set policies and guidelines and developing “best practices” training for employees is the most direct approach in achieving the “one voice” goal. Project Lead: Avis Meade, Communications and Outreach Coordinator
51

INTEGRATED SERVICES DEPARTMENT (Continued) 9. Exploration of 2022 Fourth of July Fireworks Strategic Priority #6: Ensure that Organization has the Resources and Training to Maintain Focus on Consistent High-Quality Core Services & Infrastructure In the wake of the sale of the Arlington Race Track, the Village will explore alternative options for a 2022 Fourth of July fireworks. Project Leads: Diana Mikula, Assistant Village Manager and Avis Meade, Communications and Outreach Coordinator
52

OPERATION SUMMARY
INTEGRATED SERVICES2019 2020 2021 2021 2022 $ %
Actual Actual Est. Actual Budget Budget Change Change
Authorized Positions in F-T-EGeneral Fund 5.50 5.50 5.50 5.50 5.50 0.00 0.0%Technology Fund 5.00 5.00 6.00 6.00 7.00 1.00 16.7%
Total F-T-E 10.50 10.50 11.50 11.50 12.50 1.00 8.7%
Expenditures Personal Services $1,583,536 $1,790,468 $1,765,800 $1,853,200 $2,006,000 $152,800 8.2% Contractual Services 703,263 674,305 775,400 775,400 1,371,600 596,200 76.9% Commodities 67,468 76,118 83,500 83,450 78,900 (4,550) (5.5%) Other Charges 33,106 0 31,300 36,300 83,300 47,000 129.5% Capital Items 260,498 353,763 2,923,000 4,391,005 383,300 (4,007,705) (91.3%)
Total Expenditures $2,647,871 $2,894,654 $5,579,000 $7,139,355 $3,923,100 ($3,216,255) (45.0%)
CROSS REFERENCE TO FUNDS
2019 2020 2021 2021 2022 $ %Actual Actual Est. Actual Budget Budget Change Change
General Fund $972,263 $1,029,750 $1,014,600 $1,062,000 $1,187,000 $125,000 11.8%Capital Projects Fund 119,893 95,410 126,500 126,500 141,500 15,000 11.9%A & E Fund 33,106 0 31,300 31,300 31,300 0 0.0%Technology Fund 1,522,609 1,769,494 4,406,600 5,919,555 2,563,300 (3,356,255) (56.7%)
Total Expenditures $2,647,871 $2,894,654 $5,579,000 $7,139,355 $3,923,100 ($3,216,255) (45.0%)
Paste Chart Here
6.0 6.0 6.0 5.0
11.0 11.0
11.0 10.5 11.5
10.5 11.5
12.5
4.0
6.0
8.0
10.0
12.0
FY12 FY13 FY14 FY15 2015 2016 2017 2018 2018 2019 2021 2022
FT
E
STAFFING HISTORY
53

INTEGRATED SERVICES General Fund
Class
Code Title Grade 2021 2022 + (-)
Village Manager 1.00 1.00
Assistant Village Manager 12 1.00 1.00
Communications & Outreach Coordinator 6 1.00 1.00
Management Analyst II 6 1.00 1.00
Administrative Assistant 2 1.50 1.50
Total F-T-E 5.50 5.50 0.00
Code Fund 2021 2022 + (-)
101 General Fund 5.50 5.50
625 Technology Fund 6.00 7.00 1.00
Total F-T-E All Funds 11.50 12.50 1.00
PERSONNEL SUMMARY
Authorized Positions in F-T-E
Integrated Services DepartmentCross Reference to All Funds
Authorized Positions in F-T-E
54
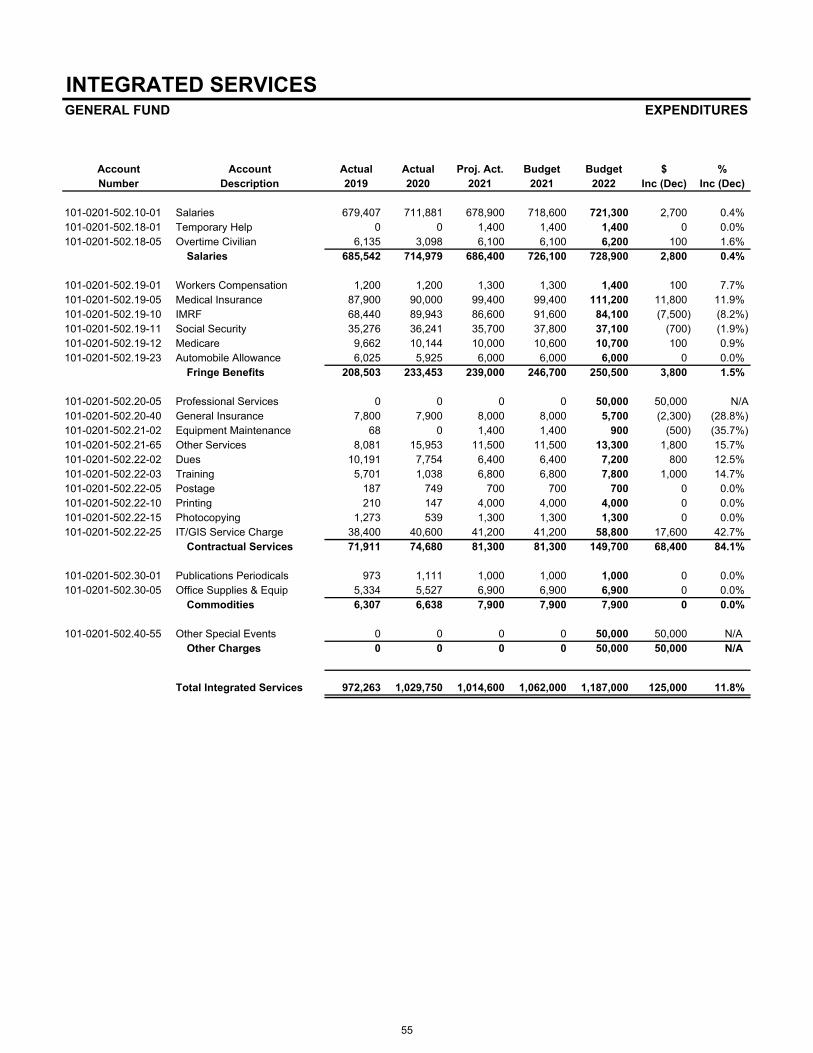
INTEGRATED SERVICESGENERAL FUND EXPENDITURES
Account Account Actual Actual Proj. Act. Budget Budget $ %Number Description 2019 2020 2021 2021 2022 Inc (Dec) Inc (Dec)
101-0201-502.10-01 Salaries 679,407 711,881 678,900 718,600 721,300 2,700 0.4%101-0201-502.18-01 Temporary Help 0 0 1,400 1,400 1,400 0 0.0%101-0201-502.18-05 Overtime Civilian 6,135 3,098 6,100 6,100 6,200 100 1.6%
Salaries 685,542 714,979 686,400 726,100 728,900 2,800 0.4%
101-0201-502.19-01 Workers Compensation 1,200 1,200 1,300 1,300 1,400 100 7.7%101-0201-502.19-05 Medical Insurance 87,900 90,000 99,400 99,400 111,200 11,800 11.9%101-0201-502.19-10 IMRF 68,440 89,943 86,600 91,600 84,100 (7,500) (8.2%)101-0201-502.19-11 Social Security 35,276 36,241 35,700 37,800 37,100 (700) (1.9%)101-0201-502.19-12 Medicare 9,662 10,144 10,000 10,600 10,700 100 0.9%101-0201-502.19-23 Automobile Allowance 6,025 5,925 6,000 6,000 6,000 0 0.0%
Fringe Benefits 208,503 233,453 239,000 246,700 250,500 3,800 1.5%
101-0201-502.20-05 Professional Services 0 0 0 0 50,000 50,000 N/A101-0201-502.20-40 General Insurance 7,800 7,900 8,000 8,000 5,700 (2,300) (28.8%)101-0201-502.21-02 Equipment Maintenance 68 0 1,400 1,400 900 (500) (35.7%)101-0201-502.21-65 Other Services 8,081 15,953 11,500 11,500 13,300 1,800 15.7%101-0201-502.22-02 Dues 10,191 7,754 6,400 6,400 7,200 800 12.5%101-0201-502.22-03 Training 5,701 1,038 6,800 6,800 7,800 1,000 14.7%101-0201-502.22-05 Postage 187 749 700 700 700 0 0.0%101-0201-502.22-10 Printing 210 147 4,000 4,000 4,000 0 0.0%101-0201-502.22-15 Photocopying 1,273 539 1,300 1,300 1,300 0 0.0%101-0201-502.22-25 IT/GIS Service Charge 38,400 40,600 41,200 41,200 58,800 17,600 42.7%
Contractual Services 71,911 74,680 81,300 81,300 149,700 68,400 84.1%
101-0201-502.30-01 Publications Periodicals 973 1,111 1,000 1,000 1,000 0 0.0%101-0201-502.30-05 Office Supplies & Equip 5,334 5,527 6,900 6,900 6,900 0 0.0%
Commodities 6,307 6,638 7,900 7,900 7,900 0 0.0%
101-0201-502.40-55 Other Special Events 0 0 0 0 50,000 50,000 N/AOther Charges 0 0 0 0 50,000 50,000 N/A
Total Integrated Services 972,263 1,029,750 1,014,600 1,062,000 1,187,000 125,000 11.8%
55

INTEGRATED SERVICESGENERAL FUND EXPENDITURE DETAIL
AccountNumber Account Title Description
SALARIES:
101-0201-502.10-01 Salaries Salaries 718,600 721,300
101-0201-502.18-01 Temporary Help Temporary Help 1,400 1,400
101-0201-502.18-05 Overtime Civilian Overtime Civilian 6,100 6,200
TOTAL SALARIES 726,100 728,900
FRINGE BENEFITS:
101-0201-502.19-01 Workers' Compensation Workers' Compensation Insurance 1,300 1,400
101-0201-502.19-05 Medical Insurance Medical Insurance 99,400 111,200
101-0201-502.19-10 IMRF IMRF 91,600 84,100
101-0201-502.19-11 Social Security Social Security 37,800 37,100
101-0201-502.19-12 Medicare Medicare 10,600 10,700
101-0201-502.19-23 Automobile Allowance Automobile Allowance 6,000 6,000
TOTAL FRINGE BENEFITS 246,700 250,500
CONTRACTUAL SERVICES:
101-0201-502.20-05 Professional Services Euclid media project 0 50,000
101-0201-502.20-40 General Insurance Liability and property insurance 8,000 5,700
101-0201-502.21-02 Equipment Maintenance Maintenance of printers & computers 200 200Civic Event Sign repair 1,200 1,400 700 900
101-0201-502.21-65 Other Services Contractual services, online tools,miscellaneous services 2,400 3,000
Cell phone usage/wireless connectivity 2,300 2,900Enhancements to Village website 2,000 2,000Archive Social subscription 4,800 4,800Adobe Cloud Suite 0 11,500 600 13,300
101-0201-502.22-02 Dues Dues 6,400 7,200
101-0201-502.22-03 Training ICMA Annual Conference 4,600 4,600Illinois Municipal League, Northwest
Municipal Conference, IAMMA, ILCMAwebinars & miscellaneous meetings 2,200 6,800 3,200 7,800
101-0201-502.22-05 Postage General postage including residential mailers and special notices 700 700
101-0201-502.22-10 Printing Liquor license materials 300 300Miscellaneous printing including brochures,
flyers, special notices, post cards, booklets, ads, and photos 3,700 4,000 3,700 4,000
Budget20222021
Budget
56

INTEGRATED SERVICESGENERAL FUND EXPENDITURE DETAIL
AccountNumber Account Title Description
Budget20222021
Budget
101-0201-502.22-15 Photocopying Photocopies & supplies Maintenance agreement Xerox 5150 1,300 1,300
101-0201-502.22-25 IT/GIS Service Charge Information Technology/GIS service charge 41,200 58,800
TOTAL CONTRACTUAL SERVICES 81,300 149,700
COMMODITIES:
101-0201-502.30-01 Publications/Periodicals Miscellaneous publications 1,000 1,000
101-0201-502.30-05 Office Supplies & Equip Printer cartridges/toner, stationery, pens, etc. 6,900 6,900
TOTAL COMMODITIES 7,900 7,900
OTHER CHARGES:
101-0201-502.40-55 Other Special Events Fireworks (AE2103) 0 50,000
TOTAL COMMODITIES 0 50,000
TOTAL INTEGRATED SERVICES 1,062,000 1,187,000
57

THIS PAGE LEFT BLANK
58
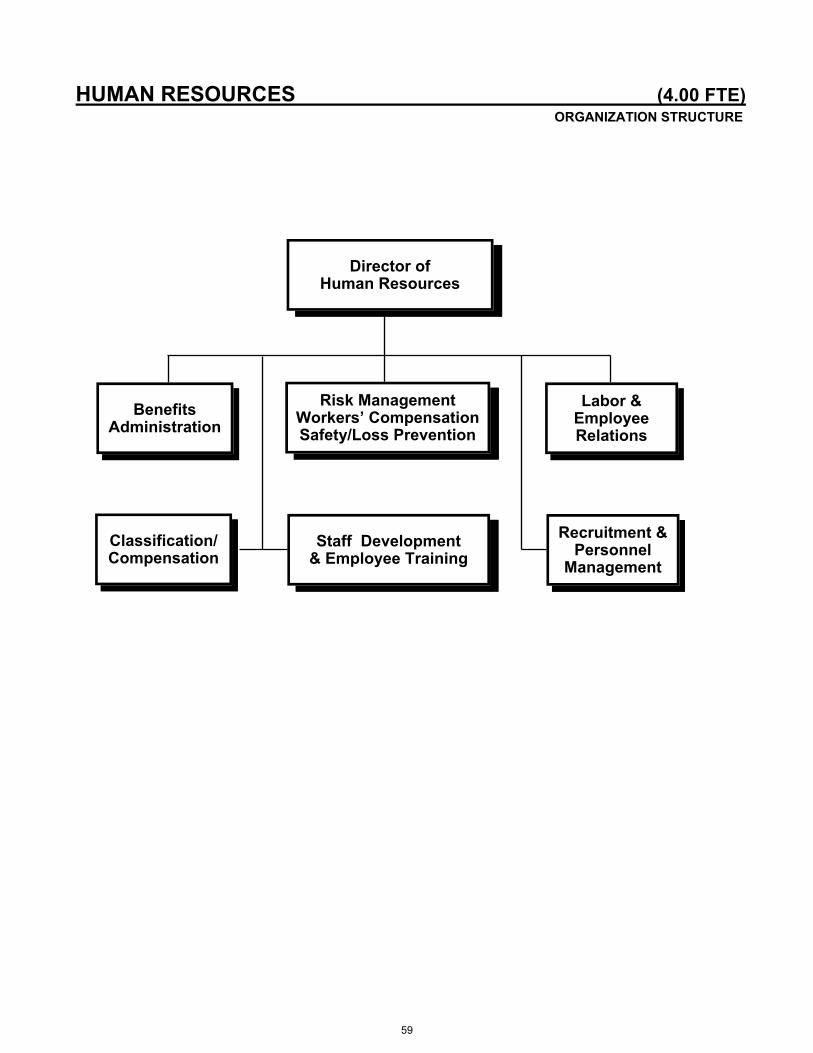
HUMAN RESOURCES (4.00 FTE) ORGANIZATION STRUCTURE
Director of Human Resources
Risk Management Workers’ Compensation Safety/Loss Prevention
Benefits Administration
Labor & Employee Relations
Classification/ Compensation
Staff Development & Employee Training
Recruitment & Personnel
Management
59

HUMAN RESOURCES The Human Resources Department administers and manages the Village’s diverse human resources program. This includes recruitment, testing, selection, personnel management including; staff development and training, maintenance of the classification and pay plans, management of employee benefit and risk management programs including the villages workers' compensation program. Employee benefit programs include medical insurance, life insurance, wellness programs, pension programs, unemployment compensation, deferred income programs, vacation, sick leave, longevity and holiday pay programs. The Department is responsible for collective bargaining activities with employee unions and associations, including administration of the Villages personnel policies and procedures. The Department also provides many other vital services for the village’s employees from their first day of work through separation and retirement This department also serves as the liaison to the Village’s Board of Fire and Police Commissioners. Duties entail assisting the Commission in the recruitment, testing, interviewing and establishment of eligibility lists for all non-exempt sworn fire and police classifications of work. Additional responsibilities include administrative and management studies and projects assigned to the Department by the Village Manager. 2021 Accomplishments • The Supporting a Welcoming Community: Village Wide Diversity Initiative project continues:
o Recruitment: The Human Resources Department continues to evaluate recruitment process and
sources to expand diversity Village wide while partnering with both community and expanded other recruitment resources.
An internal Employee Diversity, Equity, and Inclusion (DEI) employee Workgroup has been created to seek views, perspectives and provide recommendations related to the Villages DEI strategic goal.
Performance evaluations have been reimagined to include a DEI component. The Villages employee exit interview form has been revised to include questions on
inclusivity. A survey was conducted to determine the demographics of the Villages Board and
Commission members.
o Audit- Internal Disability Accommodation: The Human Resources Department partnered with the Villages Disability Services
Coordinator to design and implement an ongoing assessment. Disability sensitively training was virtually conducted in the Spring of 2021. The Village employment application has been reviewed by disability employment
placement agencies providing valuable feedback to reflect a more inclusive culture. The review of employment and retention practices continues.
• The Human Resources Audit Continues for all process and procedures:
o The recruitment process has been streamlined thereby processing candidates more effectively and efficiently.
o A review and analysis of offering expanded family forming benefits is currently under evaluation. o A voluntary employee paid Long Term Care benefit will be offered to all Village employees. o The Department completed the review of the entire Personnel Policy manual evaluating and
updating Village policies to reflect best practices o The pandemic provided opportunities to integrate technology where in the past we had relied on
paper, this has enhanced collaborations with other Departments. o Virtual training sessions through Target Solutions and Safety National provide further
opportunities to offer training to all Village staff given variable work schedules. o Virtual open enrollment will continue due to the success of its implementation in the 2021 benefit
plan year.
60

HUMAN RESOURCES (Continued)
2022 Strategic Priorities & Key Projects
1. Village Wide Diversity Recruitment Initiative continuesStrategic Priority: #2 Expand Efforts to Embrace Diversity, Equity, and Inclusion within the Community and the Village Government
The recommendations from the Supporting a Welcoming Community project will be ongoing.
Enhanced recruitment and selection strategies that attract and retain highly diverse qualified candidates while ensuring equal employment opportunities in accordance with the Village’s Equal Opportunity Policy continues.
Project Leads: Mary Rath, Director of Human Resources
2. Continuation of Internal Disability Accommodation AssessmentStrategic Priority #2: Expand Efforts to Embrace Diversity, Equity, and Inclusion within the Community and the Village Government
Continue to evaluate all employment activities to identify potential enhancements to ensure otherwise qualified individuals with disabilities are afforded equal opportunities.
Project Leads: Mary Rath, Director of Human Resources
3. ERP Integration- Module Specific to Department ResponsibilitiesStrategic Priority #6: Ensure that Organization has the Resources and Training to Maintain Focus on Consistent High-Quality Core Services & Infrastructure
Lead by the Integrated Services, all Department Staff will assist in the implementation of department and module specific processes.
Project Lead: Diana Mikula, Assistant Village Manager- Integrated Services Department
4. Continuation of Supervisory Training OpportunitiesStrategic Priority #6: Ensure that the Organization has the Resources and Training to Maintain Focus on Consistent High-Quality Core Services and Infrastructure.
Additional training opportunities for supervisory staff will be sought and implemented, as needed.
Project Leads: Mary Rath, Director of Human Resources
Performance Measures2018 2019 2020
1. Employee Benefits – Reduce Medical Costs
Research and implement strategies to help control health risks and costs
a) Medicare Retiree Drug Subsidy received $121,678 $124,736 $105,225
2. Employee Benefits – Deferred Income Programs
a) Number of dollars pledged in Section 125 $316,017 $254,376 $240,110
b) Number of employees contributing to ICMA-RC 420 433 435
61

HUMAN RESOURCES (Continued) Performance Measures (cont.) 2018 2019 2020 3. Risk Management – Workers Compensation Enhance our loss prevention efforts to become more proactive with safety and loss prevention programs throughout the Village in order to reduce the cost of workers' compensation.
a) Number of claims forwarded to the Third Party Administrator (TPA) within 48 hours of the accident
b) Number of claims submitted to the Third Party Administrator (TPA) where employees missed work due to their Workers’ Compensation injury
40 out of 46
20
30 out of 33
15
37 out of 42
23
c) Number of work days lost to Workers’ Compensation injury 437 285 456
PD 83 shift days
FD 217
shift days
PW 156 days
d) Number of pro se settlements 5 out of 7 4 out of 12 6 out of 8
e) Number of safety measures implemented 4 4 5
4. Risk Management – Loss Prevention
a) Number of accidents reviewed 72 78 57 b) Number of safety training programs offered to employees
sponsored through Human Resources
4 9 3
5. Maintenance of Classification and Compensation Program Maintain and make necessary modifications to the Village's Classification Plan to ensure all employees are appropriately classified.
a) Number of job audits conducted b) Number of surveys conducted
4 79
9 57
9
59
6. Personnel Management – Compliance Review personnel policies and related forms in order to ensure they are in compliance with applicable laws.
a) Number of personnel policies revised/created
2
12
45
62
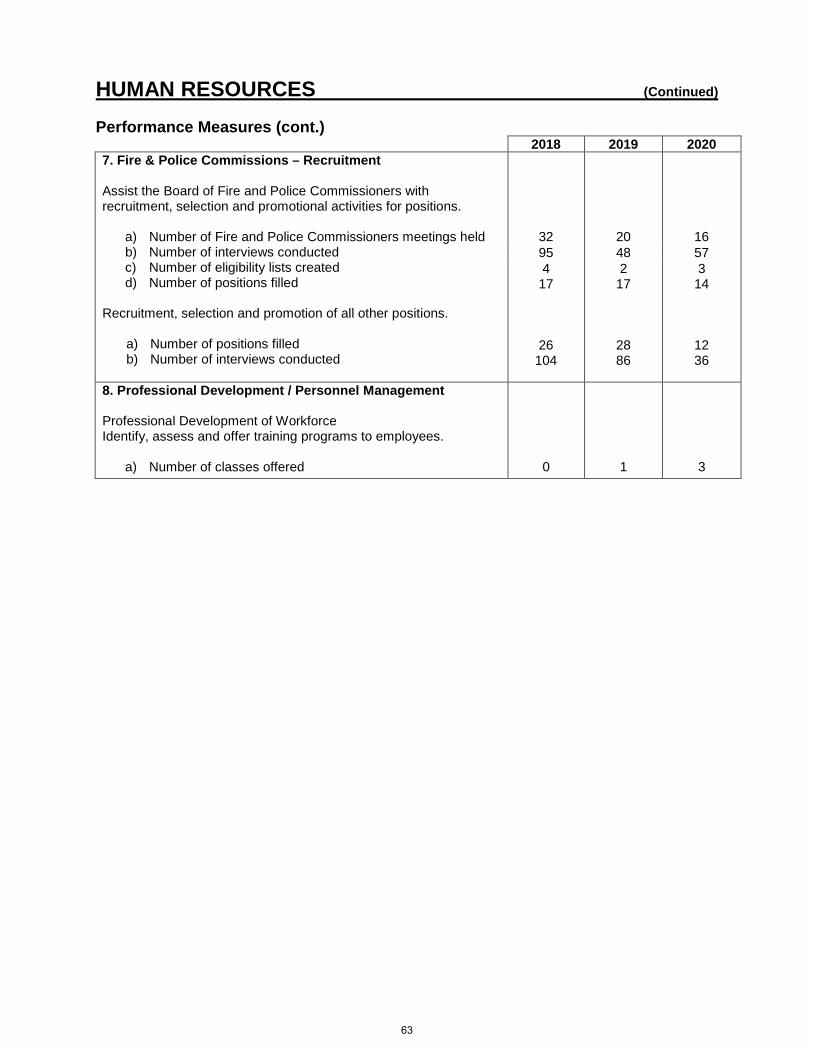
HUMAN RESOURCES (Continued) Performance Measures (cont.) 2018 2019 2020 7. Fire & Police Commissions – Recruitment Assist the Board of Fire and Police Commissioners with recruitment, selection and promotional activities for positions.
a) Number of Fire and Police Commissioners meetings held b) Number of interviews conducted c) Number of eligibility lists created d) Number of positions filled
Recruitment, selection and promotion of all other positions.
a) Number of positions filled b) Number of interviews conducted
32
20
16 95 48 57 4
17
26 104
2 17
28 86
3 14
12 36
8. Professional Development / Personnel Management Professional Development of Workforce Identify, assess and offer training programs to employees.
a) Number of classes offered
0
1
3
63

OPERATION SUMMARY
HUMAN RESOURCES2019 2020 2021 2021 2022 $ %
Actual Actual Est. Actual Budget Budget Change Change
Authorized Positions in F-T-EGeneral Fund 2.00 2.00 2.00 2.00 2.00 0.00 0.0%Health Insurance Fund 1.00 1.00 1.00 1.00 1.00 0.00 0.0%Worker's Comp Fund 1.00 1.00 1.00 1.00 1.00 0.00 0.0%
Total F-T-E 4.00 4.00 4.00 4.00 4.00 0.00 0.0%
Expenditures Personal Services $613,538 $635,385 $1,091,600 $1,092,000 $1,161,000 $69,000 6.3% Contractual Services 5,796,207 6,381,093 6,325,300 6,623,400 6,630,300 6,900 0.1% Commodities 3,759 3,879 4,800 4,900 4,900 0 0.0% Other Charges 11,284,391 8,828,847 9,077,000 9,123,200 9,515,000 391,800 4.3%
Total Expenditures $17,697,895 $15,849,204 $16,498,700 $16,843,500 $17,311,200 $467,700 2.8%
CROSS REFERENCE TO FUNDS
2019 2020 2021 2021 2022 $ %Actual Actual Est. Actual Budget Budget Change Change
General Fund $405,787 $390,502 $435,800 $435,000 $435,900 $900 0.2%Health Insurance Fund 14,400,294 13,009,046 13,361,400 13,596,500 14,065,600 469,100 3.5%Worker's Comp Fund 2,891,814 2,449,656 2,701,500 2,812,000 2,809,700 (2,300) (0.1%)
Total Expenditures $17,697,895 $15,849,204 $16,498,700 $16,843,500 $17,311,200 $467,700 2.8%
Paste Chart Here
4.0 4.0 4.0 4.0 4.0 4.0 4.0 4.0 4.0 4.0 4.0 4.0
2.0
3.0
4.0
5.0
6.0
7.0
8.0
FY12 FY13 FY14 FY15 2015 2016 2017 2018 2018 2019 2021 2022
FT
E
STAFFING HISTORY
64

HUMAN RESOURCES General Fund
PERSONNEL SUMMARY
Class
Code Title Grade 2021 2022 + (-)
Director of Human Resources 11 1.00 1.00
Administrative Assistant 2 1.00 1.00
Total F-T-E 2.00 2.00 0.00
Code Fund 2021 2022 + (-)
101 General Fund 2.00 2.00
605 Health Insurance Fund 1.00 1.00
615 Workers' Compensation Fund 1.00 1.00
Total F-T-E All Funds 4.00 4.00 0.00
Human Resources DepartmentCross Reference to All Funds
Authorized Positions in F-T-E
Authorized Positions in F-T-E
65

HUMAN RESOURCES GENERAL FUND EXPENDITURES
Account Account Actual Actual Proj. Act. Budget Budget $ %Number Description 2019 2020 2021 2021 2022 Inc (Dec) Inc (Dec)
101-0301-503.10-01 Salaries 226,314 234,992 241,400 240,700 252,700 12,000 5.0%101-0301-503.18-01 Temporary Help 10,579 6,892 7,800 7,800 8,000 200 2.6%101-0301-503.18-05 Overtime Civilian 479 47 700 700 700 0 0.0%
Salaries 237,372 241,931 249,900 249,200 261,400 12,200 4.9%
101-0301-503.19-01 Workers Compensation 500 500 500 500 600 100 20.0%101-0301-503.19-05 Medical Insurance 52,225 53,600 54,500 54,500 41,800 (12,700) (23.3%)101-0301-503.19-10 IMRF 23,173 29,871 30,400 30,300 29,100 (1,200) (4.0%)101-0301-503.19-11 Social Security 13,604 13,721 14,300 14,300 14,700 400 2.8%101-0301-503.19-12 Medicare 3,267 3,350 3,600 3,600 3,800 200 5.6%
Fringe Benefits 92,769 101,042 103,300 103,200 90,000 (13,200) (12.8%)
101-0301-503.20-05 Professional Services 0 1,188 3,400 3,400 3,500 100 2.9%101-0301-503.20-40 General Insurance 6,600 6,700 6,800 6,800 4,800 (2,000) (29.4%)101-0301-503.20-75 Examinations 15,098 1,200 8,000 8,000 8,000 0 0.0%101-0301-503.21-65 Other Services 1,846 1,471 1,600 1,600 1,600 0 0.0%101-0301-503.22-01 Advertising 1,431 2,625 1,200 1,200 1,800 600 50.0%101-0301-503.22-02 Dues 1,247 1,064 1,500 1,500 1,500 0 0.0%101-0301-503.22-03 Training 2,652 305 3,000 3,000 3,100 100 3.3%101-0301-503.22-05 Postage 438 497 500 500 500 0 0.0%101-0301-503.22-10 Printing 134 57 200 200 200 0 0.0%101-0301-503.22-15 Photocopying 1,529 807 2,500 2,500 2,000 (500) (20.0%)101-0301-503.22-25 IT/GIS Service Charge 26,100 27,900 28,400 28,400 32,000 3,600 12.7%
Contractual Services 57,075 43,814 57,100 57,100 59,000 1,900 3.3%
101-0301-503.30-01 Publications Periodicals 302 150 600 600 600 0 0.0%101-0301-503.30-05 Office Supplies & Equip 2,030 3,032 2,200 2,200 2,200 0 0.0%
Commodities 2,332 3,182 2,800 2,800 2,800 0 0.0%
101-0301-503.40-70 Employee Recognition Program 16,239 533 22,700 22,700 22,700 0 0.0%Other Charges 16,239 533 22,700 22,700 22,700 0 0.0%
Total Human Resources 405,787 390,502 435,800 435,000 435,900 900 0.2%
66

HUMAN RESOURCESGENERAL FUND EXPENDITURE DETAIL
AccountNumber Account Title Description
SALARIES:
101-0301-503.10-01 Salaries Salaries 240,700 252,700
101-0301-503.18-01 Temporary Help Temporary Help 7,800 8,000
101-0301-503.18-05 Overtime Civilian Overtime Civilian 700 700
TOTAL SALARIES 249,200 261,400
FRINGE BENEFITS:
101-0301-503.19-01 Workers' Compensation Workers' Compensation Insurance 500 600
101-0301-503.19-05 Medical Insurance Medical Insurance 54,500 41,800
101-0301-503.19-10 IMRF IMRF 30,300 29,100
101-0301-503.19-11 Social Security Social Security 14,300 14,700
101-0301-503.19-12 Medicare Medicare 3,600 3,800
TOTAL FRINGE BENEFITS 103,200 90,000
CONTRACTUAL SERVICES:
101-0301-503.20-05 Professional Services Training programs 3,400 3,500
101-0301-503.20-40 General Insurance Liability and property insurance 6,800 4,800
101-0301-503.20-75 Examinations Promotional exams/candidate testing 8,000 8,000
101-0301-503.21-65 Other Services Cell phone usage/wireless connectivity 1,600 1,600
101-0301-503.22-01 Advertising Advertising 1,200 1,800
101-0301-503.22-02 Dues Dues 1,500 1,500
101-0301-503.22-03 Training Seminars & tuition reimbursement 3,000 3,100
101-0301-503.22-05 Postage Postage 500 500
101-0301-503.22-10 Printing Printing of forms and manuals 200 200
101-0301-503.22-15 Photocopying Photocopies & supplies 1,500 1,000Maintenance agreement Xerox 5150 1,000 2,500 1,000 2,000
101-0301-503.22-25 IT/GIS Service Charge Information Technology service charge 28,400 32,000
TOTAL CONTRACTUAL SERVICES 57,100 59,000
COMMODITIES:
101-0301-503.30-01 Publications/Periodicals Miscellaneous publications 600 600
101-0301-503.30-05 Office Supplies & Equip General office supplies 2,200 2,200
TOTAL COMMODITIES 2,800 2,800
Budget20222021
Budget
67

HUMAN RESOURCESGENERAL FUND EXPENDITURE DETAIL
AccountNumber Account Title Description
Budget20222021
Budget
OTHER CHARGES:
101-0301-503.40-70 Employee Recognition Prg Service awards & forum for recognitionof employees, DEI initiatives 22,700 22,700
TOTAL OTHER CHARGES 22,700 22,700
TOTAL HUMAN RESOURCES 435,000 435,900
68

Assistant Village Manager
Civil Litigation
Internal Services Prosecution
LEGAL (1.75 FTE) ORGANIZATION STRUCTURE
69

LEGAL The Legal Division provides legal advice to elected and appointed officers and employees of the Village with respect to formulation, implementation, and enforcement of the policy decisions of the Board of Trustees, and represents the Village in court or at administrative proceedings. These services are by a combination of inside and outside advisors.
The in-house Part-Time Staff Attorney and support personnel, are appointed by the Village Manager and overseen by the Assistant Village Manager. The Village Attorney, and Village Prosecutor, are appointed by the President and Board of Trustees.
The Legal Department is responsible for: • Research and preparation - Ordinances as requested by the Village Board, the Village Manager,
Village departments or on the initiative of the Legal Department.• Interpretation and application - Ordinances, statutes and judicial decisions to particular situations,
including HIPAA, FOIA and OMA.• Drafting and reviewing - Documents related to transactions to which the Village is a party.• Village’s Interests - Action dealing with the Village’s interest in real and personal property, including
the sale and purchase of property and the vacation of rights-of-way.• Compliance - Ensuring that the Village consistently complies with existing and newly passed federal
and state laws.
The Village is represented in court or before administrative agencies with quasi-judicial functions by the Village Attorney, Village Prosecutor, attorneys in the department or outside counsel as may be required. Prosecution of traffic, misdemeanor and general municipal ordinance violations, and defense of suits against the Village are common types of litigation handled or overseen by the Department.
2021 Accomplishments
1. Significant Contract Review and Approval• Enterprise Resource Planning (ERP)• Administrative Adjudication Hearing Officer• BKV Group for the Senior Center Needs Assessment• Harmony Fest & Sounds of Summer Performer and Vendor Agreements
2022 Strategic Priorities & Key Projects
1. Select and implement a FOIA SystemStrategic Priority #8: Improve Communications with Residents and Businesses
As the number of Freedom of Information Act requests continues to increase, the current process is very manual and occupies a great deal of staff time. Implementing a FOIA system will streamline the process thus reducing staff time required. A FOIA System can direct requesters to the Village’s website for records available there, can include access to FOIA responses already provided (that do not involve or include any sensitive or private information) and can include automatic reminders so that responses are completed in a timely manner. Staff will review FOIA system vendors, select a system and move toward implementation and training across all departments.
Project Lead: Lisa Farrington, Staff Attorney
2. Implement the use of Elrod Friedman’s contract forms and processStrategic Priority #6: Ensure that Organization has the Resources and Training to Maintain Focus on Consistent High-Quality Core Services & Infrastructure
Village Attorney Hart Passman has recommended that the Village use Elrod Friedman’s contract forms and
70

LEGAL (Continued)
process for approval. Use of the forms and the system will streamline processes and ensure that the Clerk has a record of fully signed contracts. Staff will work on the transition with all departments and provide training/guidance.
Project Lead: Lisa Farrington, Staff Attorney
3. Review the Website to Add Additional RecordsStrategic Priority #8: Improve Communications with Residents and Businesses
Adding additional records will provide helpful information to residents in an efficient manner. Staff will review records available on the Village’s website, review records available on other municipalities’ websites and consult with departments on records that may be added.
Project Lead: Lisa Farrington, Staff Attorney
4. Liquor Code UpdateStrategic Priority #6: Ensure that Organization has the Resources and Training to Maintain Focus on Consistent High-Quality Core Services & Infrastructure
Review Chapter 13 of the Village Code and liquor license processes to determine if there are areas of improvements or deficits. Also review liquor license classifications to adjust or create new classifications.
Project Lead: Diana Mikula, Assistant Village Manager
Performance Measures2018 2019 2020
1. Number of Code amendment packets issued 5 3 3
2. Number of Code sections amended 258 36 112
3. Number of ordinances amending the Code 15 14 10
4. Number of ordinances prepared and adopted 52 54 46
5. Number of resolutions prepared and adopted 26 40 34
6. Number of agreements prepared and adopted 37 56 86
7. Number of FOIA requests processed 1,556 1,565 1,476
8. Number of FOIA appeals 2 3 4
9. Number of FOIA denials in whole or in part 362 373 392
10. Number of new foreclosures processed 48 58 23
11. Number of liquor license hearings prosecuted 0 14 0
71

OPERATION SUMMARY
LEGAL2019 2020 2021 2021 2022 $ %
Actual Actual Est. Actual Budget Budget Change Change
Authorized Positions in F-T-E 2.75 2.75 1.75 1.75 1.75 0.00 0.0%
Expenditures Personal Services $500,625 $524,848 $320,500 $320,800 $335,000 $14,200 4.4% Contractual Services 305,971 269,610 404,900 412,400 370,400 (42,000) (10.2%) Commodities 9,704 7,420 11,500 11,500 10,700 (800) (7.0%)
Total Expenditures $816,300 $801,878 $736,900 $744,700 $716,100 ($28,600) (3.8%)
CROSS REFERENCE TO FUNDS
2019 2020 2021 2021 2022 $ %Actual Actual Est. Actual Budget Budget Change Change
General Fund $816,300 $801,878 $736,900 $744,700 $716,100 ($28,600) (3.8%)
Total Expenditures $816,300 $801,878 $736,900 $744,700 $716,100 ($28,600) (3.8%)
Paste Chart Here
2.75 2.75 2.75 2.75 2.75 2.75 2.75 2.75 2.75 2.75
1.75 1.75
0.0
1.0
2.0
3.0
4.0
5.0
FY12 FY13 FY14 FY15 2015 2016 2017 2018 2018 2019 2021 2022
FT
E
STAFFING HISTORY
72

LEGAL General Fund
PERSONNEL SUMMARY
Class
Code Title Grade 2021 2022 + (-)
Staff Attorney 8 0.50 0.50
Paralegal 3 0.50 0.50
Administrative Assistant 2 0.75 0.75
Total F-T-E 1.75 1.75 0.00
Code Fund 2021 2022 + (-)
101 General Fund 1.75 1.75
Total F-T-E All Funds 1.75 1.75 0.00
Authorized Positions in F-T-E
Legal DepartmentCross Reference to All Funds
Authorized Positions in F-T-E
73

LEGAL GENERAL FUND EXPENDITURES
Account Account Actual Actual Proj. Act. Budget Budget $ %Number Description 2019 2020 2021 2021 2022 Inc (Dec) Inc (Dec)
101-0401-503.10-01 Salaries 371,525 383,413 221,100 221,400 226,100 4,700 2.1%101-0401-503.18-01 Temporary Help 1,800 0 0 0 0 0 N/A
Salaries 373,325 383,413 221,100 221,400 226,100 4,700 2.1%
101-0401-503.19-01 Workers Compensation 600 600 600 600 700 100 16.7%101-0401-503.19-05 Medical Insurance 64,100 66,000 54,500 54,500 65,400 10,900 20.0%101-0401-503.19-10 IMRF 37,407 48,460 27,500 27,500 25,700 (1,800) (6.5%)101-0401-503.19-11 Social Security 19,980 21,015 13,600 13,600 13,900 300 2.2%101-0401-503.19-12 Medicare 5,213 5,360 3,200 3,200 3,200 0 0.0%
Fringe Benefits 127,300 141,435 99,400 99,400 108,900 9,500 9.6%
101-0401-503.20-10 Village Attorney Legal Services 837 0 175,000 228,000 180,000 (48,000) (21.1%)101-0401-503.20-15 Village Prosecutor Legal Services 148,911 106,076 55,500 70,000 50,100 (19,900) (28.4%)101-0401-503.20-20 Other Legal Services 92,111 122,276 120,000 60,000 100,000 40,000 66.7%101-0401-503.20-40 General Insurance 3,300 3,300 3,300 3,300 2,300 (1,000) (30.3%)101-0401-503.21-02 Equipment Maintenance 34 34 100 100 100 0 0.0%101-0401-503.21-65 Other Services 36,899 17,000 24,000 24,000 10,000 (14,000) (58.3%)101-0401-503.22-02 Dues 3,315 2,485 3,200 3,200 2,000 (1,200) (37.5%)101-0401-503.22-03 Training 3,177 270 4,500 4,500 2,500 (2,000) (44.4%)101-0401-503.22-05 Postage 740 714 1,000 1,000 900 (100) (10.0%)101-0401-503.22-15 Photocopying 2,147 1,955 2,500 2,500 2,500 0 0.0%101-0401-503.22-25 IT/GIS Service Charge 14,500 15,500 15,800 15,800 20,000 4,200 26.6%
Contractual Services 305,971 269,610 404,900 412,400 370,400 (42,000) (10.2%)
101-0401-503.30-01 Publications Periodicals 900 0 500 500 500 0 0.0%101-0401-503.30-05 Office Supplies & Equip 3,181 1,533 3,200 3,200 3,200 0 0.0%101-0401-503.33-05 Other Supplies 5,623 5,887 7,800 7,800 7,000 (800) (10.3%)
Commodities 9,704 7,420 11,500 11,500 10,700 (800) (7.0%)
Total Legal 816,300 801,878 736,900 744,700 716,100 (28,600) (3.8%)
74

LEGALGENERAL FUND EXPENDITURE DETAIL
AccountNumber Account Title Description
SALARIES:
101-0401-503.10-01 Salaries Salaries 221,400 226,100
TOTAL SALARIES 221,400 226,100
FRINGE BENEFITS:
101-0401-503.19-01 Workers' Compensation Workers' Compensation Insurance 600 700
101-0401-503.19-05 Medical Insurance Medical Insurance 54,500 65,400
101-0401-503.19-10 IMRF IMRF 27,500 25,700
101-0401-503.19-11 Social Security Social Security 13,600 13,900
101-0401-503.19-12 Medicare Medicare 3,200 3,200
TOTAL FRINGE BENEFITS 99,400 108,900
CONTRACTUAL SERVICES:
101-0401-503.20-10 Village Attorney Legal ServicCounsel to Village Board 228,000 180,000
101-0401-503.20-15 Village Prosecutor Legal Ser Retainer for five sessions monthly inCook County District Court in RollingMeadows for prosecution of traffic calls 50,100 50,100
Charges for additional legal services provided by Village Prosecutor 19,900 70,000 0 50,100
101-0401-503.20-20 Legal Services Litigation and other outside counsel 60,000 100,000
101-0401-503.20-40 General Insurance Liability and property insurance 3,300 2,300
101-0401-503.21-02 Equipment Maintenance Maintenance of typewriter 100 100
101-0401-503.21-65 Other Services Transcripts, appraisals, recording fees,title searches, miscellaneous services 10,000 10,000
Court reporters - DUI cases 14,000 24,000 0 10,000
101-0401-503.22-02 Dues Dues 3,200 2,000
101-0401-503.22-03 Training Seminars and meetings 1,500 1,000Conference 3,000 4,500 1,500 2,500
101-0401-503.22-05 Postage Correspondence and notices 1,000 900
101-0401-503.22-15 Photocopying Photocopies & supplies 800 800Maintenance agreement Xerox 5150 1,700 2,500 1,700 2,500
101-0401-503.22-25 IT/GIS Service Charge Information Technology service charge 15,800 20,000
TOTAL CONTRACTUAL SERVICES 412,400 370,400
COMMODITIES:
101-0401-503.30-01 Publications/Periodicals Miscellaneous publications 500 500
Budget20222021
Budget
75

LEGALGENERAL FUND EXPENDITURE DETAIL
AccountNumber Account Title Description
Budget20222021
Budget
101-0401-503.30-05 Office Supplies & Equip General office supplies 3,200 3,200
101-0401-503.33-05 Other Supplies & Equip Legal books, including statutes,digests and citations 7,800 7,000
TOTAL COMMODITIES 11,500 10,700
TOTAL LEGAL 744,700 716,100
76

Finance Director
Accounting & Financial Reporting
Water Billing/ Cashiering Purchasing
Budgeting Treasury Management Village Clerk
Customer Service
Representative
FINANCE (16.50 FTE) ORGANIZATION STRUCTURE
General Liability
Insurance
77

FINANCE
The Finance Department provides professional financial management for the Village. The scope of its responsibilities covers the following functions: Accounting and Financial Reporting – Accounting records are maintained in accordance with generally accepted accounting principles (GAAP) for governments. Appropriate financial reports are regularly produced. Village financial reports regularly win national awards for excellence. All financial records of the Village are audited by external auditors on an annual basis.
Budgeting – The preparation of the annual budget includes the planning as well as the necessary financial analysis and actual budget production. The Department assists other Village departments with their respective budget requests. This function also includes on-going maintenance and monitoring of the budget.
Treasury Management – Village funds are invested to produce maximum income consistent with preservation of principal. Treasury Management includes monitoring receipts and disbursements and overseeing a control system of checks and balances. Treasury Management also includes follow-up on unpaid bills using a variety of methods including legal remedies. The Village has an investment policy that it follows which gives guidance to the Treasurer.
Payroll Services – Complete payroll services are provided including payroll services for the Library.
Purchasing – This function provides for the purchasing of services and goods at the lowest responsible price, frequently using formal or informal competitive bid processes. Procedures provide for review that legal requirements have been met in acquiring the goods and services. Accounts Payable/Accounts Receivable – This function provides for timely payment by the Village for goods and services received, and prompt billing for amounts due to the Village. Payment procedures require appropriate controls to ensure that goods and services have been received. Billings for Village services, including water, vehicle license fees and other miscellaneous revenues, are issued and controlled by the Department.
Village Clerk – This position is appointed by the Village Manager and overall management and supervision has been delegated to the Finance Director. The Administrative Assistant II in the Finance Department also acts as the Deputy Village Clerk, handling the Village Clerk’s duties in the Clerk’s absence.
• Municipal Records – The Village Clerk prepares the official minutes of the Board of Trustees and
arranges for the necessary publication and document filing actions resulting from Board action. The Clerk is also responsible for the management, indexing, and safeguarding of Village records.
• Elections and Voter Registration – The Village Clerk registers residents to vote and distributes absentee voting applications for all elections. The Clerk also accepts nominating petitions from Village candidates and certifies the Village election ballot.
• Business License – The Village Clerk’s Office receives all business license applications. Applications are routed to the respective departments within the Village for comments and approvals.
Customer Service Representatives – Front-line phone and in-person interaction with the Village’s customers. Provides answers to basic questions and forwards other questions and issues to the appropriate departments.
General Liability Insurance – The Finance Director is responsible for the administration of the Village’s insurance program for general liability insurance.
78

FINANCE (Continued)
Water Billing & Cashiering – This function provides for the billing and collection of bi-monthly water and sewer bills. Front Desk personnel handle the in-person or internet payment of fees, fines, and other charges.
2021 Accomplishments
• Updated Capital Asset Policy – Redefined the Village’s Capital Account and Budget Definition. Fornumerous years the Village had defined a capital purchase as an expenditure of $10,000 with anexpected life of one or more years. The Village Board reviewed and approved the new threshold of$25,000 for machinery, equipment, and vehicle asset classes; and $200,000 for buildings, easements,improvements, infrastructure, and software.
• Planned Spending Proposal for American Rescue Plan Grant – The American Rescue Plan Act of2021 was a $1.9 trillion economic stimulus bill passed by Congress to speed up the recovery from theeconomic and health consequences of the COVID19 pandemic. The Village will receive $6.78 millionover two years as part of this stimulus. The Finance Department submitted a spending proposal whichaugments the financial position of various Village funds. The proposal was approved by the VillageBoard.
• Revised & Automated the Travel & Training Form – To increase efficiency and improve the internalreview and approval process for travel and training requests the paper form was replaced with arevised, automated form.
• Developed a Financing Plan for the Alfresco Program – The cost to provide set up andmaintenance activities for an annual Alfresco program, required the consideration and implementationof an additional targeted Food & Beverage tax.
• Purchasing Diversity, Equity, & Inclusion (DEI) Data Collection Initiative – Reviewed ways togather and report DEI purchasing data.
2022 Strategic Priorities & Key Projects
1. Continue to Implement the Five-Year Fee & Fine Increase PlanStrategic Priority #5: Ensure Revenue Sources are applied rationally across sectors while Monitoring the Overall Community Tax Burden
The Village Board directed staff to maintain a five-year fee and fine increase plan in order to provide for smaller but more frequent increases. The goal is to help temper property tax increases.
Project Leads: Tom Kuehne, Finance Director and Mary Ellen Juarez, Assistant Finance Director
2. Implement a DEI Data Collection Procedure for Village Vendors, Suppliers, and Contractors Strategic Priority #2: Expand Efforts to Embrace Diversity, Equity, and Inclusion within the Community and the Village Government
As part of the Village Board’s 2021 position statement on diversity, equity, and inclusion, it states that the Village of Arlington Heights’ diversity initiatives are applicable, but not limited, to policies and strategies on government operations.
Project Leads: Tom Kuehne, Finance Director and Mary Ellen Juarez, Assistant Finance Director
79

FINANCE (Continued)
3. ERP Integration- Module Specific to Department ResponsibilitiesStrategic Priority #6: Ensure that Organization has the Resources and Training to Maintain Focus on Consistent High-Quality Core Services & Infrastructure
Lead by the Integrated Services, all Department Staff will assist in the implementation of department and module specific processes.
Project Lead: Diana Mikula, Assistant Village Manager- Integrated Services Department
4. Arlington Racetrack Project- Specific to Department ResponsibilitiesStrategic Priority #3: Work to Ensure the Redevelopment of Arlington Park Meets Community Standards and Provides a One of a Kind Regional Destination Worthy of the Property’s Legacy
Staff will work with would be purchasers on a land use plan for the site that will address all Village concerns, take into consideration the perspectives of all stakeholders, and provide for a unique one of a kind development worthy of the site’s legacy to our community and the region. Departments, including Fire, Police, Public Works, Finance, Planning & Community Development, Building & Life Safety, and Integrated Services, will work on cross-department initiatives to support this project.
Project Lead: Randy Recklaus, Village Manager- Integrated Services Department
Performance Measures2018 2019 2020
1. Number & Type of Payment TransactionsVehicle Stickers Sold
In-Person / Dropbox / Mail 39,809 53,707 39,699 Internet Payments 3,386 5,374 5,350 Through Banks / Currency Exchanges 1,728 1,112 733
Total Number of Vehicle Stickers Sold 44,923 60,193 45,782
Water Bill Transactions By Direct Bank Debit (ACH) 47,430 49,470 51,366 Electronic Lockbox (ACH) 24,279 28,370 28,344 Internet Payments 13,262 18,860 23,892 In-Person / Dropbox / Mail 67,617 69,248 68,502
Total Water Bill Transactions 152,588 165,948 172,104
% of Water Bills - Bank Debit (ACH) 33% 30% 30% % of Water Bills - Electronic Lockbox (ACH) 17% 17% 17% % of Water Bills - Internet 9% 12% 14% % of Water Bills - In-Person / Dropbox / Mail 47% 42% 40%
Parking Ticket Transactions In-Person / Dropbox / Mail 7,776 9,740 6,348 Internet Payments 4,167 3,709 3,164
Total Parking Ticket Transactions 11,943 13,449 9,512
80

FINANCE (Continued)
Performance Measures (cont.) 2018 2019 2020 2. Credit Card Payments
# of Transactions 39,252 54,045 54,872 Total Payments $ 5,635,718 $ 6,728,421 $ 6,996,476 Total Fees $ 102,250 $ 167,124 $ 155,139 Average Fee % 1.81% 2.48% 2.22% Average Payment Transaction Amount $ 143.58 $ 124.50 $ 127.51
3. Water Billing Activity # of Metered Accounts 21,112 21,121 21,137 Water Consumption Billed (in 1,000s of Gallons)
Residential 1,409,317 1,336,266 1,491,692 Commercial 236,518 219,346 203,179 Industrial 302,563 279,650 220,263 Apartments 289,940 287,690 292,669
Total Consumption Billed 2,238,338 2,122,952 2,207,803
Water / Sewer Revenues $ 17,004,943 $ 17,274,521 $ 18,886,650 4. Cash & Investments
Cash $ 12,450,890 $ 13,138,267 $ 12,073,126 Investments $110,977,593 $ 97,138,290 $110,099,939
Total $123,428,483 $110,276,557 $122,173,065 # of Funds Invested 89.9% 88.1% 90.1%
5. Purchasing
# of Purchase Orders Processed 503 531 497 # of Field Purchase Orders Processed 5,228 5,547 5,265
Amount of Purchase Orders Processed $ 23,684,163 $ 37,088,926 $ 22,176,139 Amount of Field Purchase Orders Processed $ 2,477,387 $ 2,875,542 $ 2,839,524
Total Amount of Purchase Orders $ 26,161,550 $ 39,964,468 $ 25,015,663
# of Formal Bids / RFPs 25 35 24 Amount of Formal Bids / RFPs $ 779,068 $ 25,358,926 $ 13,022,102 % Amount of Formal Bids / RFPs 37% 63% 58%
6. Checks Issued
Accounts Payable Checks Issued 6,068 5,795 5,384 Payroll Checks Issued 2,426 2,275 1,658
# of Direct Deposits 16,022 16,472 16,599 Total Payroll Payments 18,448 18,747 18,257 % of Payroll as Direct Deposits 87% 88% 91%
81

FINANCE (Continued)
Performance Measures (cont.) 2018 2019 2020
7. Ambulance Billing & Collections # of Bills 4,900 4,342 4,384 Amount Billed $ 4,071,438 $ 2,951,436 $ 2,086,972 Amount of Payments $ 2,141,657 $ 2,712,498 $ 2,375,421 Amount of Current Receivable $ 1,371,084 $ 1,634,484 $ 1,372,406 Amount Past Due / In-Collections $ 612,183 $ 848,562 $ 1,056,021
Billing Rates Village Charges / Medicare Allows (VAH / MED)
Basic Life Support 1,500 / 375 1,500 / 384 1,500 / 389 Advanced Life Support 1,500 / 446 1,500 / 456 1,500 / 462 Advanced Life Support 2 1,500 / 645 1,500 / 660 1,500 / 668
8. Village Clerk
Processing Of: Ordinances 52 54 51 Resolutions 26 40 31 Agreements 36 56 78 Ethics Forms 167 168 155 Business Licenses:
New Businesses 152 139 101 Renewals 1,659 1,643 1,597
Transcribing of Village Board Minutes 27 23 18 Transcribing of Closed Session Minutes 8 7 4 Notarizations 247 262 111 Citizen Inquiries 1,065 868 1,389 Scanned Documents 242 222 213
9. GFOA Certifications
Certificate of Achievement for Excellence in Financial Reporting Received Received Received
Distinguished Budget Presentation Award Received Received Received
82

OPERATION SUMMARY
FINANCE 2019 2020 2021 2021 2022 $ %
Actual Actual Est. Actual Budget Budget Change Change
Authorized Positions in F-T-EGeneral Fund 9.50 9.50 9.50 9.50 9.50 0.00 0.0%Water & Sewer Fund 8.00 7.50 7.00 7.00 7.00 0.00 0.0%
Total F-T-E 17.50 17.00 16.50 16.50 16.50 0.00 0.0%
Expenditures Personal Services $2,105,093 $2,200,430 $2,251,200 $2,301,600 $2,340,500 $38,900 1.7% Contractual Services 949,175 977,141 948,500 965,700 1,015,700 50,000 5.2% Commodities 35,887 29,726 32,100 33,200 32,800 (400) (1.2%) Other Charges 220,947 96,178 201,000 500,000 250,000 (250,000) (50.0%) Capital Items 0 0 36,000 36,000 20,000 (16,000) (44.4%)
Total Expenditures $3,311,102 $3,303,475 $3,468,800 $3,836,500 $3,659,000 ($177,500) (4.6%)
CROSS REFERENCE TO FUNDS
2019 2020 2021 2021 2022 $ %Actual Actual Est. Actual Budget Budget Change Change
General Fund $1,685,823 $1,739,455 $1,796,200 $1,810,100 $1,859,400 $49,300 2.7%Capital Projects Fund 0 0 36,000 36,000 20,000 (16,000) (44.4%)Water & Sewer Fund 1,086,784 1,099,598 1,095,700 1,117,400 1,156,600 39,200 3.5%General Liability Ins Fund 538,495 464,422 540,900 873,000 623,000 (250,000) (28.6%)
Total Expenditures $3,311,102 $3,303,475 $3,468,800 $3,836,500 $3,659,000 ($177,500) (4.6%)
23.5 23.5 23.5 24.0
18.0 18.0 17.5 17.5 17.0 17.0 16.5 16.5
15.017.019.021.023.025.027.029.0
FY12 FY13 FY14 FY15 2015 2016 2017 2018 2019 2020 2021 2022
FT
E
STAFFING HISTORY
83

FINANCE General Fund
PERSONNEL SUMMARY
Class
Code Title Grade 2021 2022 + (-)
Finance Director 12 1.00 1.00
Assistant Finance Director 9 1.00 1.00
Accounting Manager 7 1.00 1.00
Payroll Coordinator 5 1.00 1.00
Purchasing Coordinator 5 1.00 1.00
Accountant / Budget Coordinator 5 1.00 1.00
Village Clerk 4 1.00 1.00
Accounting Assistant 2 1.00 1.00
Account Clerk 1 0.50 0.50
Customer Service Representative 1 1.00 1.00
Total F-T-E 9.50 9.50 0.00
Code Fund 2021 2022 + (-)
101 General Fund 9.50 9.50
505 Water & Sewer Fund 7.00 7.00
Total F-T-E All Funds 16.50 16.50 0.00
Finance DepartmentCross Reference to All Funds
Authorized Positions in F-T-E
Authorized Positions in F-T-E
84

FINANCEGENERAL FUND EXPENDITURES
Account Account Actual Actual Proj. Act. Budget Budget $ %Number Description 2019 2020 2021 2021 2022 Inc (Dec) Inc (Dec)
101-0501-503.10-01 Salaries 938,884 959,606 1,007,600 1,014,100 1,029,200 15,100 1.5%101-0501-503.18-01 Temporary Help 0 0 1,500 1,500 1,500 0 0.0%101-0501-503.18-05 Overtime Civilian 13,208 18,168 6,100 6,100 6,200 100 1.6%
Salaries 952,092 977,774 1,015,200 1,021,700 1,036,900 15,200 1.5%
101-0501-503.19-01 Workers Compensation 3,100 3,200 3,400 3,400 3,800 400 11.8%101-0501-503.19-05 Medical Insurance 179,900 229,600 210,900 210,900 245,300 34,400 16.3%101-0501-503.19-10 IMRF 96,273 124,508 127,100 127,900 118,800 (9,100) (7.1%)101-0501-503.19-11 Social Security 53,909 55,387 58,600 59,000 60,200 1,200 2.0%101-0501-503.19-12 Medicare 13,325 13,758 14,700 14,800 15,000 200 1.4%
Fringe Benefits 346,507 426,453 414,700 416,000 443,100 27,100 6.5%
101-0501-503.20-05 Professional Services 51,573 55,784 52,800 52,800 53,300 500 0.9%101-0501-503.20-40 General Insurance 20,400 20,600 20,800 20,800 14,700 (6,100) (29.3%)101-0501-503.21-02 Equipment Maintenance 8,414 9,657 6,200 6,200 6,300 100 1.6%101-0501-503.21-65 Other Services 156,342 141,990 133,300 133,300 140,000 6,700 5.0%101-0501-503.22-01 Advertising 4,485 3,357 5,100 5,100 5,200 100 2.0%101-0501-503.22-02 Dues 2,851 3,153 3,500 3,500 3,500 0 0.0%101-0501-503.22-03 Training 6,559 416 8,300 8,300 8,400 100 1.2%101-0501-503.22-05 Postage 42,945 18,712 40,000 41,900 40,000 (1,900) (4.5%)101-0501-503.22-10 Printing 17,205 8,032 20,000 24,200 21,300 (2,900) (12.0%)101-0501-503.22-15 Photocopying 4,772 6,109 6,100 6,100 6,100 0 0.0%101-0501-503.22-25 IT/GIS Service Charge 34,800 37,300 37,900 37,900 48,000 10,100 26.6%101-0501-503.22-30 Claims & Refunds 0 0 300 300 300 0 0.0%
Contractual Services 350,346 305,110 334,300 340,400 347,100 6,700 2.0%
101-0501-503.30-01 Publications Periodicals 2,599 4,859 2,600 2,600 2,600 0 0.0%101-0501-503.30-05 Office Supplies & Equip 12,521 14,947 18,800 18,800 19,000 200 1.1%101-0501-503.30-25 Licensing Supplies 20,079 9,807 10,100 10,100 10,200 100 1.0%101-0501-503.33-05 Other Supplies 212 102 500 500 500 0 0.0%
Commodities 35,411 29,715 32,000 32,000 32,300 300 0.9%
101-0501-503.40-97 Inventory Short and Over 1,467 403 0 0 0 0 N/AOther Charges 1,467 403 0 0 0 0 N/A
Total Finance 1,685,823 1,739,455 1,796,200 1,810,100 1,859,400 49,300 2.7%
85

FINANCEGENERAL FUND EXPENDITURE DETAIL
AccountNumber Account Title Description
SALARIES:
101-0501-503.10-01 Salaries Salaries 1,014,100 1,029,200
101-0501-503.18-01 Temporary Help Temporary Help 1,500 1,500
101-0501-503.18-05 Overtime Civilian Overtime Civilian 6,100 6,200
TOTAL SALARIES 1,021,700 1,036,900
FRINGE BENEFITS:
101-0501-503.19-01 Workers' Compensation Workers' Compensation Insurance 3,400 3,800
101-0501-503.19-05 Medical Insurance Medical Insurance 210,900 245,300
101-0501-503.19-10 IMRF IMRF 127,900 118,800
101-0501-503.19-11 Social Security Social Security 59,000 60,200
101-0501-503.19-12 Medicare Medicare 14,800 15,000
TOTAL FRINGE BENEFITS 416,000 443,100
CONTRACTUAL SERVICES:
101-0501-503.20-05 Professional Services Pension actuarial 14,300 14,400Annual audit (governmental funds share) 31,400 31,700Annual actuarial valuation of post
employment benefits (governmentalfunds share) 7,100 52,800 7,200 53,300
101-0501-503.20-40 General Insurance Liability and property insurance 20,800 14,700
101-0501-503.21-02 Equipment Maintenance Postage scale & postage meter 1,800 1,800Folder/inserter 2,500 2,600Alarm, check signer, typewriters, binding
machine and archive storage system 1,900 6,200 1,900 6,300
101-0501-503.21-65 Other Services GFOA CAFR certificate fee 700 700GFOA budget certificate fee 600 600Tracker annual fee 2,000 2,100Title searches 500 500Cell phone charges 800 800Credit card processing fees 22,200 23,300Bank service fees 13,200 13,900Ambulance billing services 92,000 96,700Miscellaneous 1,300 133,300 1,400 140,000
101-0501-503.22-01 Advertising Bid advertising 2,100 2,200Hearing notices 1,800 1,800Annual Treasurers Report 1,200 5,100 1,200 5,200
101-0501-503.22-02 Dues GFOA, IGFOA, CPA, AICPA, IMTA andother organizations for Finance,Purchasing, Payroll and Village Clerk 3,500 3,500
Budget2022
Budget2021
86

FINANCEGENERAL FUND EXPENDITURE DETAIL
AccountNumber Account Title Description
Budget2022
Budget2021
101-0501-503.22-03 Training GFOA and IGFOA programs 2,500 2,600Purchasing programs 600 600National GFOA Committee 1,000 1,000Tuition reimbursement 2,000 2,000Municipal Clerks' Conference 1,000 1,000Seminars & webinars 1,200 8,300 1,200 8,400
101-0501-503.22-05 Postage Vehicle licenses, disbursement checks,purchase orders, bids, billings, specialassessments, business licenses,& miscellaneous 41,900 40,000
101-0501-503.22-10 Printing Comprehensive Annual Financial Report 2,000 1,700Annual Budget 2,700 2,300Forms, checks, notices, envelopes, report
covers, ordinances and misc. printing 2,500 2,000Vehicle/animal applications 17,000 24,200 15,300 21,300
101-0501-503.22-15 Photocopying Photocopies & supplies 4,800 4,800Maintenance agreement Xerox 5150 1,100 1,100Maintenance agreement Xerox WC4118P 200 6,100 200 6,100
101-0501-503.22-25 IT/GIS Service Charge Information Technology/GIS service charge 37,900 48,000
101-0501-503.22-30 Claims & Refunds Claims and refunds 300 300
TOTAL CONTRACTUAL SERVICES 340,400 347,100
COMMODITIES:
101-0501-503.30-01 Publications/Periodicals Miscellaneous publications 2,600 2,600
101-0501-503.30-05 Office Supplies & Equip General office supplies and small equipment 18,800 19,000
101-0501-503.30-25 Licensing Supplies Vehicle stickers 7,700 7,800Dog tags & motorcycle tags 1,200 1,200Taxi licensing supplies 1,200 10,100 1,200 10,200
101-0501-503.33-05 Other Supplies & Equip Miscellaneous commodities 500 500
TOTAL COMMODITIES 32,000 32,300
TOTAL FINANCE 1,810,100 1,859,400
87

THIS PAGE LEFT BLANK
88

Village Board
Arts Commission
Commission for Citizens with Disabilities
Bicycle & Pedestrian
Advisory Com.
Board of Local
Improvements
Youth Commission
Board of Health
Design Commission
Zoning Board of Appeals
Board of Fire & Police Commissioners
The Arlington Economic Alliance
Housing Commission
Building Code Review Board
Senior Citizens
Commission
Special Events
Commission
Environmental Commission
Plan Commission
BOARDS & COMMISSIONS ORGANIZATION STRUCTURE
89

BOARDS & COMMISSIONS The boards and commissions of the Village promote citizen involvement and utilize the expertise and ideas of the citizens of Arlington Heights. They include: Appointive Boards & Commissions
• Plan Commission: Holds public hearings and makes recommendations to the Village Board of
Trustees relating to zoning, subdivision and planned development of land. • Zoning Board of Appeals: May grant variances from zoning regulations. • Board of Health: Protect health and prevent the spread of disease. • Board of Local Improvements: Makes recommendations with regard to local improvements. • Board of Fire and Police Commissioners: Appoints officers and sworn members of Fire and Police
Departments, except chiefs and deputy chiefs.
Other Boards & Commissions
• Design Commission: Reviews architectural elements for the Plan Commission, building permits, Zoning Board of Appeals and Downtown signs and sign variations.
• Building Code Review Board: Recommends variations from, and amendments to, the Building Code. • Environmental Commission: Promotes the preservation and enhancement of the physical
environment. • Housing Commission: Recommends housing policies for the Village. • The Arlington Economic Alliance: Provides advice to Village Board of Trustees on matters of
business recruitment and retention. • Senior Citizens Commission: Recommends programs for senior citizen welfare. • Youth Commission: Recommends programs for youth welfare. • Commission for Citizens with Disabilities: Recommends removal of barriers to handicapped citizens
and otherwise identifies the needs of the disabled. • Bicycle & Pedestrian Advisory Commission: Assists in the development of comprehensive plans for
bikeways within the Village. • Special Events Commission: Plans Village's special events. • Arts Commission: Makes recommendations to the Village Board of Trustees on matters of culture and
fine arts within the Village of Arlington Heights.
90

OPERATION SUMMARY
BOARDS & COMMISSIONS2019 2020 2021 2021 2022 $ %
Actual Actual Est. Actual Budget Budget Change Change
Authorized Positions in F-T-E 0.00 0.00 0.00 0.00 0.00 0.00 N/A
Expenditures Personal Services $4,829 $0 $0 $0 $0 $0 N/A Contractual Services 138,940 140,673 140,600 145,800 89,800 (56,000) (38.4%) Commodities 2,237 495 2,500 3,700 3,500 (200) (5.4%) Other Charges 73,214 36,551 85,100 104,228 102,400 (1,828) (1.8%)
Total Expenditures $219,220 $177,719 $228,200 $253,728 $195,700 ($58,028) (22.9%)
CROSS REFERENCE TO FUNDS
2019 2020 2021 2021 2022 $ %Actual Actual Est. Actual Budget Budget Change Change
General Fund $158,835 $168,043 $195,200 $202,900 $147,700 ($55,200) (27.2%)SWANCC Fund 0 0 0 5,000 5,000 0 0.0%A & E Fund 60,385 9,676 33,000 45,828 43,000 (2,828) (6.2%)
Total Expenditures $219,220 $177,719 $228,200 $253,728 $195,700 ($58,028) (22.9%)
91

BOARDS & COMMISSIONS - ADMINISTRATIONGENERAL FUND EXPENDITURES
Account Account Actual Actual Proj. Act. Budget Budget $ %Number Description 2019 2020 2021 2021 2022 Inc (Dec) Inc (Dec)
101-1001-502.20-40 General Insurance 3,200 3,200 3,200 3,200 2,300 (900) (28.1%)101-1001-502.22-02 Dues - Meet Chicago Northwest 83,500 86,300 88,700 88,700 32,700 (56,000) (63.1%)
Contractual Services 86,700 89,500 91,900 91,900 35,000 (56,900) (61.9%)
101-1001-502.40-05 Grants - Arl Hts Com Con Band 7,300 7,400 7,400 7,400 7,400 0 0.0%101-1001-502.40-70 B & C Recognition Program 0 0 10,000 10,000 10,000 0 0.0%
Other Charges 7,300 7,400 17,400 17,400 17,400 0 0.0%
Total B & C Administration 94,000 96,900 109,300 109,300 52,400 (56,900) (52.1%)
ZONING BOARD OF APPEALSGENERAL FUND EXPENDITURES
Account Account Actual Actual Proj. Act. Budget Budget $ %Number Description 2019 2020 2021 2021 2022 Inc (Dec) Inc (Dec)
101-1003-502.10-03 Boards and Commissions 890 0 0 0 0 0 N/ASalaries 890 0 0 0 0 0 N/A
101-1003-502.19-11 Social Security 54 0 0 0 0 0 N/A101-1003-502.19-12 Medicare 13 0 0 0 0 0 N/A
Fringe Benefits 67 0 0 0 0 0 N/A
101-1003-502.22-15 Photocopying 0 0 0 200 0 (200) (100.0%)Contractual Services 0 0 0 200 0 (200) (100.0%)
101-1003-502.30-05 Office Supplies & Equip 45 0 100 100 100 0 0.0%Commodities 45 0 100 100 100 0 0.0%
Total Zoning Brd of Appeals 1,002 0 100 300 100 (200) (66.7%)
92

BUILDING CODE REVIEW BOARD GENERAL FUND EXPENDITURES
Account Account Actual Actual Proj. Act. Budget Budget $ %Number Description 2019 2020 2021 2021 2022 Inc (Dec) Inc (Dec)
101-1004-502.10-03 Boards and Commissions 125 0 0 0 0 0 N/ASalaries 125 0 0 0 0 0 N/A
101-1004-502.19-11 Social Security 8 0 0 0 0 0 N/A101-1004-502.19-12 Medicare 2 0 0 0 0 0 N/A
Fringe Benefits 10 0 0 0 0 0 N/A
Total Bldg Code Review Brd 135 0 0 0 0 0 N/A
BOARD OF LOCAL IMPROVEMENTS GENERAL FUND EXPENDITURES
Account Account Actual Actual Proj. Act. Budget Budget $ %Number Description 2019 2020 2021 2021 2022 Inc (Dec) Inc (Dec)
101-1007-502.10-03 Boards and Commissions 50 0 0 0 0 0 N/ASalaries 50 0 0 0 0 0 N/A
101-1007-502.19-11 Social Security 3 0 0 0 0 0 N/A101-1007-502.19-12 Medicare 1 0 0 0 0 0 N/A
Fringe Benefits 4 0 0 0 0 0 N/A
Total Brd of Local Improv 54 0 0 0 0 0 N/A
93

BOARD OF FIRE AND POLICE COMMISSIONERSGENERAL FUND EXPENDITURES
Account Account Actual Actual Proj. Act. Budget Budget $ %Number Description 2019 2020 2021 2021 2022 Inc (Dec) Inc (Dec)
101-1008-502.10-03 Boards and Commissions 985 0 0 0 0 0 N/ASalaries 985 0 0 0 0 0 N/A
101-1008-502.19-11 Social Security 61 0 0 0 0 0 N/A101-1008-502.19-12 Medicare 14 0 0 0 0 0 N/A
Fringe Benefits 75 0 0 0 0 0 N/A
101-1008-502.20-75 Examinations 45,782 48,803 40,000 40,000 42,000 2,000 5.0%101-1008-502.22-01 Advertising 498 1,554 1,900 1,500 1,500 0 0.0%101-1008-502.22-02 Dues 375 375 400 400 400 0 0.0%101-1008-502.22-05 Postage 0 0 100 100 100 0 0.0%
Contractual Services 46,655 50,732 42,400 42,000 44,000 2,000 4.8%
Total Fire & Police Comm 47,715 50,732 42,400 42,000 44,000 2,000 4.8%
PLAN COMMISSION GENERAL FUND EXPENDITURES
Account Account Actual Actual Proj. Act. Budget Budget $ %Number Description 2019 2020 2021 2021 2022 Inc (Dec) Inc (Dec)
101-1009-502.10-03 Boards and Commissions 1,535 0 0 0 0 0 N/ASalaries 1,535 0 0 0 0 0 N/A
101-1009-502.19-11 Social Security 95 0 0 0 0 0 N/A101-1009-502.19-12 Medicare 22 0 0 0 0 0 N/A
Fringe Benefits 117 0 0 0 0 0 N/A
101-1009-502.22-02 Dues 0 0 200 200 200 0 0.0%101-1009-502.22-03 Training 0 0 0 300 300 0 0.0%101-1009-502.22-15 Photocopying 0 0 0 300 0 (300) (100.0%)
Contractual Services 0 0 200 800 500 (300) (37.5%)
Total Plan Commission 1,652 0 200 800 500 (300) (37.5%)
94

ENVIRONMENTAL COMMISSION GENERAL FUND EXPENDITURES
Account Account Actual Actual Proj. Act. Budget Budget $ %Number Description 2019 2020 2021 2021 2022 Inc (Dec) Inc (Dec)
101-1010-502.10-03 Boards and Commissions 902 0 0 0 0 0 N/ASalaries 902 0 0 0 0 0 N/A
101-1010-502.19-11 Social Security 56 0 0 0 0 0 N/A101-1010-502.19-12 Medicare 13 0 0 0 0 0 N/A
Fringe Benefits 69 0 0 0 0 0 N/A
101-1010-502.22-05 Postage 0 0 100 100 100 0 0.0%101-1010-502.22-10 Printing 760 0 400 400 400 0 0.0%101-1010-502.22-15 Photocopying 0 0 100 100 100 0 0.0%
Contractual Services 760 0 600 600 600 0 0.0%
101-1010-502.30-05 Office Supplies & Equip 0 0 100 100 100 0 0.0%Commodities 0 0 100 100 100 0 0.0%
Total Environmental Commission 1,731 0 700 700 700 0 0.0%
HOUSING COMMISSIONGENERAL FUND EXPENDITURES
Account Account Actual Actual Proj. Act. Budget Budget $ %Number Description 2019 2020 2021 2021 2022 Inc (Dec) Inc (Dec)
101-1011-502.22-05 Postage 943 0 100 100 100 0 0.0%101-1011-502.22-15 Photocopying 0 0 100 100 100 0 0.0%
Contractual Services 943 0 200 200 200 0 0.0%
101-1011-502.33-05 Other Supplies 0 0 1,100 1,100 1,100 0 0.0%Commodities 0 0 1,100 1,100 1,100 0 0.0%
Total Housing Commission 943 0 1,300 1,300 1,300 0 0.0%
95

SENIOR CITIZENS COMMISSIONGENERAL FUND EXPENDITURES
Account Account Actual Actual Proj. Act. Budget Budget $ %Number Description 2019 2020 2021 2021 2022 Inc (Dec) Inc (Dec)
101-1013-502.22-01 Advertising 0 0 100 100 500 400 400.0%101-1013-502.22-03 Training 0 0 500 500 500 0 0.0%101-1013-502.22-05 Postage 262 0 400 400 200 (200) (50.0%)101-1013-502.22-15 Photocopying 205 0 200 200 200 0 0.0%
Contractual Services 467 0 1,200 1,200 1,400 200 16.7%
101-1013-502.30-05 Office Supplies & Equip 0 0 200 200 200 0 0.0%101-1013-502.33-05 Other Supplies 457 0 500 500 300 (200) (40.0%)
Commodities 457 0 700 700 500 (200) (28.6%)
Total Senior Citizen Comm 924 0 1,900 1,900 1,900 0 0.0%
YOUTH COMMISSION GENERAL FUND EXPENDITURES
Account Account Actual Actual Proj. Act. Budget Budget $ %Number Description 2019 2020 2021 2021 2022 Inc (Dec) Inc (Dec)
101-1014-502.22-05 Postage 0 0 100 100 100 0 0.0%101-1014-502.22-10 Printing 0 0 100 100 100 0 0.0%101-1014-502.22-15 Photocopying 0 0 100 100 100 0 0.0%
Contractual Services 0 0 300 300 300 0 0.0%
101-1014-502.33-05 Other Supplies 288 0 100 100 100 0 0.0%Commodities 288 0 100 100 100 0 0.0%
Total Youth Commission 288 0 400 400 400 0 0.0%
96

DESIGN COMMISSION GENERAL FUND EXPENDITURES
Account Account Actual Actual Proj. Act. Budget Budget $ %Number Description 2019 2020 2021 2021 2022 Inc (Dec) Inc (Dec)
101-1015-502.22-15 Photocopying 0 0 100 100 100 0 0.0%Contractual Services 0 0 100 100 100 0 0.0%
101-1015-502.30-05 Office Supplies & Equip 350 359 400 400 400 0 0.0%Commodities 350 359 400 400 400 0 0.0%
Total Design Commission 350 359 500 500 500 0 0.0%
COMMISSION FOR CITIZENS WITH DISABILITIESGENERAL FUND EXPENDITURES
Account Account Actual Actual Proj. Act. Budget Budget $ %Number Description 2019 2020 2021 2021 2022 Inc (Dec) Inc (Dec)
101-1017-502.20-24 Disabled Citizen Programs 951 70 100 1,900 1,900 0 0.0%101-1017-502.22-03 Training 0 0 0 300 300 0 0.0%101-1017-502.22-05 Postage 363 178 400 500 500 0 0.0%101-1017-502.22-15 Photocopying 178 36 200 300 300 0 0.0%
Contractual Services 1,492 284 700 3,000 3,000 0 0.0%
101-1017-502.33-05 Other Supplies 206 0 0 200 200 0 0.0%Commodities 206 0 0 200 200 0 0.0%
101-1017-502.40-55 Special Events 0 0 0 100 100 0 0.0%101-1017-502.40-58 Disabled Citizen Donation 1,000 0 0 1,000 1,000 0 0.0%
Other Charges 1,000 0 0 1,100 1,100 0 0.0%
Total Disabilities Comm 2,698 284 700 4,300 4,300 0 0.0%
97

SPECIAL EVENTS COMMISSIONGENERAL FUND EXPENDITURES
Account Account Actual Actual Proj. Act. Budget Budget $ %Number Description 2019 2020 2021 2021 2022 Inc (Dec) Inc (Dec)
101-1018-502.21-65 Other Services 1,094 0 1,500 1,500 1,500 0 0.0%101-1018-502.22-05 Postage 138 0 100 100 200 100 100.0%101-1018-502.22-10 Printing 0 0 600 600 0 (600) (100.0%)
Contractual Services 1,232 0 2,200 2,200 1,700 (500) (22.7%)
101-1018-502.40-55 Special Events 0 19,411 19,000 19,000 20,000 1,000 5.3%Special Events 0 19,411 19,000 19,000 20,000 1,000 5.3%
Total Special Events Comm 1,232 19,411 21,200 21,200 21,700 500 2.4%
BICYCLE & PEDESTRIAN ADVISORY COMMISSION GENERAL FUND EXPENDITURES
Account Account Actual Actual Proj. Act. Budget Budget $ %Number Description 2019 2020 2021 2021 2022 Inc (Dec) Inc (Dec)
101-1019-502.22-02 Dues 455 0 500 500 500 0 0.0%101-1019-502.22-03 Training 0 0 0 400 400 0 0.0%101-1019-502.22-10 Printing 0 0 0 700 700 0 0.0%101-1019-502.22-15 Photocopying 0 0 0 100 100 0 0.0%
Contractual Services 455 0 500 1,700 1,700 0 0.0%
101-1019-502.40-55 Special Events 9 0 0 200 200 0 0.0%Other Charges 9 0 0 200 200 0 0.0%
Total Bicycle & Pedestrian Advisory Commission 464 0 500 1,900 1,900 0 0.0%
98

THE ARLINGTON ECONOMIC ALLIANCE GENERAL FUND EXPENDITURES
Account Account Actual Actual Proj. Act. Budget Budget $ %Number Description 2019 2020 2021 2021 2022 Inc (Dec) Inc (Dec)
101-1021-502.22-15 Photocopying 0 0 300 300 300 0 0.0%Contractual Services 0 0 300 300 300 0 0.0%
101-1021-502.40-40 Promote Economic Bus Dev 4,520 64 15,700 15,700 15,700 0 0.0%Other Charges 4,520 64 15,700 15,700 15,700 0 0.0%
Total Arl Economic Alliance 4,520 64 16,000 16,000 16,000 0 0.0%
ARTS COMMISSION GENERAL FUND EXPENDITURES
Account Account Actual Actual Proj. Act. Budget Budget $ %Number Description 2019 2020 2021 2021 2022 Inc (Dec) Inc (Dec)
101-1022-502.22-05 Postage 175 152 0 800 500 (300) (37.5%)101-1022-502.22-15 Photocopying 61 5 0 500 500 0 0.0%
Contractual Services 236 157 0 1,300 1,000 (300) (23.1%)
101-1022-502.33-05 Other Supplies 891 136 0 1,000 1,000 0 0.0%Commodities 891 136 0 1,000 1,000 0 0.0%
Total Arts Commission 1,127 293 0 2,300 2,000 (300) (13.0%)
TOTAL BRDS & COMM 158,835 168,043 195,200 202,900 147,700 (55,200) (27.2%)
99

BOARDS & COMMISSIONS - ADMINISTRATIONGENERAL FUND EXPENDITURE DETAIL
AccountNumber Account Title Description
CONTRACTUAL SERVICES:
101-1001-502.20-40 General Insurance Insurance for Boards and Commissions and Historical Museum 3,200 2,300
101-1001-502.22-02 Dues Meet Chicago Northwest(2022 based on 8% of the 2020
Hotel Tax receipts) 88,700 32,700
TOTAL CONTRACTUAL SERVICES 91,900 35,000
OTHER CHARGES:
101-1001-502.40-05 Grants Arlington Heights Community Concert Band 7,400 7,400
101-1001-502.40-70 B & C Recognition Prog. Boards & Commissions RecognitionProgram 10,000 10,000
TOTAL OTHER CHARGES 17,400 17,400
TOTAL B&C ADMINISTRATION 109,300 52,400
ZONING BOARD OF APPEALSGENERAL FUND EXPENDITURE DETAIL
AccountNumber Account Title Description
CONTRACTUAL SERVICES:
101-1003-502.22-15 Photocopying Photocopying 200 0
TOTAL CONTRACTUAL SERVICES 200 0
COMMODITIES:
101-1003-502.30-05 Office Supplies & Equip Miscellaneous office supplies 100 100
TOTAL COMMODITIES 100 100
TOTAL ZONING BOARD OF APPEALS 300 100
2022
Budget2022
Budget
Budget2021
2021Budget
100

BOARD OF FIRE AND POLICE COMMISSIONERSGENERAL FUND EXPENDITURE DETAIL
AccountNumber Account Title Description
CONTRACTUAL SERVICES:
101-1008-502.20-75 Examinations Examinations 40,000 42,000
101-1008-502.22-01 Advertising Advertising 1,500 1,500
101-1008-502.22-02 Dues Fire/Police Comm. State membership 400 400
101-1008-502.22-05 Postage Postage 100 100
TOTAL CONTRACTUAL SERVICES 42,000 44,000
TOTAL BRD. OF POL. & FIRE COMM. 42,000 44,000
PLAN COMMISSIONGENERAL FUND EXPENDITURE DETAIL
AccountNumber Account Title Description
CONTRACTUAL SERVICES:
101-1009-502.22-02 Dues APA membership dues 200 200
101-1009-502.22-03 Training Educational and training materials 300 300
101-1009-502.22-15 Photocopying Photocopying of minutes & agendas 300 0
TOTAL CONTRACTUAL SERVICES 800 500
TOTAL PLAN COMMISSION 800 500
2022
Budget2022
Budget
Budget2021
2021Budget
101

ENVIRONMENTAL COMMISSIONGENERAL FUND EXPENDITURE DETAIL
AccountNumber Account Title Description
CONTRACTUAL SERVICES:
101-1010-502.22-05 Postage Postage 100 100
101-1010-502.22-10 Printing Printing of promotional materials 400 400
101-1010-502.22-15 Photocopying Photocopying 100 100
TOTAL CONTRACTUAL SERVICES 600 600
COMMODITIES:
101-1010-502.30-05 Office Supplies & Equip Office supplies; awards 100 100
TOTAL COMMODITIES 100 100
TOTAL ENVIRONMENTAL COMMISSION 700 700
HOUSING COMMISSIONGENERAL FUND EXPENDITURE DETAIL
AccountNumber Account Title Description
CONTRACTUAL SERVICES:
101-1011-502.22-05 Postage Postage 100 100
101-1011-502.22-15 Photocopying Photocopying 100 100
TOTAL CONTRACTUAL SERVICES 200 200
COMMODITIES:
101-1011-502.33-05 Other Supplies Program marketing 1,100 1,100
TOTAL COMMODITIES 1,100 1,100
TOTAL HOUSING COMMISSION 1,300 1,300
Budget2022
Budget2022
Budget2021
Budget2021
102

SENIOR CITIZENS COMMISSIONGENERAL FUND EXPENDITURE DETAIL
AccountNumber Account Title Description
CONTRACTUAL SERVICES:
101-1013-502.22-01 Advertising Outreach/marketing/advertising 100 500
101-1013-502.22-03 Training Senior Citizen Commission 500 500
101-1013-502.22-05 Postage Postage 400 200
101-1013-502.22-15 Photocopying Photocopying 200 200
TOTAL CONTRACTUAL SERVICES 1,200 1,400
COMMODITIES:
101-1013-502.30-05 Office Supplies & Equip Office supplies for public meetings 200 200
101-1013-502.33-05 Other Supplies & Equip Commissioner pins, memorials, etc. 500 300
TOTAL COMMODITIES 700 500
TOTAL SENIOR CITIZENS COMM. 1,900 1,900
YOUTH COMMISSIONGENERAL FUND EXPENDITURE DETAIL
AccountNumber Account Title Description
CONTRACTUAL SERVICES:
101-1014-502.22-05 Postage Postage 100 100
101-1014-502.22.10 Printing Printing (Folders) 100 100
101-1014-502.22-15 Photocopying Photocopying 100 100
TOTAL CONTRACTUAL SERVICES 300 300
COMMODITIES:
101-1014-502.33-05 Other Supplies & Equip Teen Job Fair supplies & food 100 100
TOTAL COMMODITIES 100 100
TOTAL YOUTH COMMISSION 400 400
Budget2022
Budget2022
Budget2021
Budget2021
103

DESIGN COMMISSIONGENERAL FUND EXPENDITURE DETAIL
AccountNumber Account Title Description
CONTRACTUAL SERVICES:
101-1015-502.22-15 Photocopying Photocopying 100 100
TOTAL CONTRACTUAL SERVICES 100 100
COMMODITIES:
101-1015-502.30-05 Office Supplies & Equip Award plaques 400 400
TOTAL COMMODITIES 400 400
TOTAL DESIGN COMMISSION 500 500
COMMISSION FOR CITIZENS WITH DISABILITIESGENERAL FUND EXPENDITURE DETAIL
AccountNumber Account Title Description
CONTRACTUAL SERVICES:
101-1017-502.20-24 Disabled Citizen Program Disabled Citizens CommunityAwareness Projects 1,900 1,900
101-1017-502.22-03 Training Local seminars, expos & conferences 300 300
101-1017-502.22-05 Postage Postage 500 500
101-1017-502.22-15 Photocopying Newletters 300 300
TOTAL CONTRACTUAL SERVICES 3,000 3,000
COMMODITIES:
101-1017-502.33-05 Other Supplies & Equip Misc. supplies including instant film forDisabilities Carnival (funded by donations) 200 200
TOTAL COMMODITIES 200 200
OTHER CHARGES:
101-1017-502.40-55 Special Events Disabled Citizens Event 100 100
101-1017-502.40-58 Disabled Citizen Donations Disability Carnival Sponsorship(funded entirely by donations) 1,000 1,000
TOTAL OTHER CHARGES 1,100 1,100
TOTAL COM. FOR CITIZENS W/DISAB 4,300 4,300
2022
Budget2022
BudgetBudget2021
Budget2021
104

SPECIAL EVENTS COMMISSIONGENERAL FUND EXPENDITURE DETAIL
AccountNumber Account Title Description
CONTRACTUAL SERVICES:
101-1018-502.21-65 Other Services Awards & plaques 1,500 1,500
101-1018-502.22-05 Postage Postage 100 200
101-1018-502.22-10 Printing Printing 600 0
TOTAL CONTRACTUAL SERVICES 2,200 1,700
SPECIAL EVENTS:
101-1018-502.40-55 Special Events Hearts of Gold (AE0622) 19,000 20,000
TOTAL SPECIAL EVENTS 19,000 20,000
TOTAL SPECIAL EVENTS COMM. 21,200 21,700
BICYCLE & PEDESTRIAN ADVISORY COMMISSIONGENERAL FUND EXPENDITURE DETAIL
AccountNumber Account Title Description
CONTRACTUAL SERVICES:
101-1019-502.22-02 Dues Membership dues 500 500
101-1019-502.22-03 Training Education 400 400
101-1019-502.22-10 Printing Printing of educational material, bike maps 700 700
101-1019-502.22-15 Photocopying Photocopying 100 100
TOTAL CONTRACTUAL SERVICES 1,700 1,700
OTHER CHARGES:
101-1019-502.40-55 Special Events Bike Arlington Heights community event(shirts, printing, food, misc supplies) 200 200
TOTAL OTHER CHARGES 200 200TOTAL BICYCLE & PEDESTRIAN ADVISORY COMMISSION 1,900 1,900
Budget2022
Budget2022
Budget
Budget
2021
2021
105

THE ARLINGTON ECONOMIC ALLIANCEGENERAL FUND EXPENDITURE DETAIL
AccountNumber Account Title Description
CONTRACTUAL SERVICES:
101-1021-502.22-15 Photocopying Photocopying 300 300
TOTAL CONTRACTUAL SERVICES 300 300
OTHER CHARGES:
101-1021-502.40-40 Promote Econ & Bus Devlp Business Retention Outreach -used for one-on-one and groupmeetings with businesses (includesEconomic Outreach Breakfasts) 10,700 10,700
Marketing & Communications 5,000 15,700 5,000 15,700
TOTAL OTHER CHARGES 15,700 15,700
TOTAL ARL. ECONOMIC ALLIANCE 16,000 16,000
ARTS COMMISSIONGENERAL FUND EXPENDITURE DETAIL
AccountNumber Account Title Description
CONTRACTUAL SERVICES:
101-1022-502.22-05 Postage Postage 800 500
101-1022-502.22-15 Photocopying Photocopying 500 500
TOTAL CONTRACTUAL SERVICES 1,300 1,000
COMMODITIES:
101-1022-502.33-05 Other Supplies & Equip Awards, other supplies 1,000 1,000
TOTAL COMMODITIES 1,000 1,000
TOTAL ARTS COMMISSION 2,300 2,000
TOTAL BOARDS & COMMISSIONS 202,900 147,700
Budget2022
Budget20222021
Budget
2021Budget
106

Chief of
Police
Administrative Services Division
Patrol Division
Criminal Investigation
Community Services Division
POLICE (139.00 FTE) ORGANIZATION STRUCTURE
107
POLICE The Police Department is comprised of three Divisions.
ADMINISTRATIVE SERVICES DIVISION: This Division consists of the Records Bureau and the Support Bureau, which coordinate all support activity relative to the overall needs of the Police Department. Records Bureau • Automated Data Processing, Networking and Records Management System Coordination:
Manages police networking and communication systems.
• Identification Services: Identification and processing of arrestees' records and photographs.
• Records Management and Crime Analysis: The administrative processing and storage of police records/reports and computing of crime statistical data.
Support Bureau
• Budgetary Preparation and Fiscal Management: Facilitates purchasing, payroll and reconciliatory
budget activity.
• Commission on Accreditation for Law Enforcement Agencies: Maintains and ensures compliance in standards set by the Commission on Accreditation for Law Enforcement Agencies.
• Court Liaison: Provides supervision and coordination of cases prosecuted through the Court.
• Emergency Operations Planning: Coordinates disaster planning, Homeland Security and civil defense assistance.
• Evidence/Property Management: Controls evidence and property held by the Department.
• Grant Preparation: Conducts research and develops grant opportunities.
• I.T. Support: Coordinates technical support for computer and communication equipment.
• Professional Standards-Internal Affairs: Investigates citizen inquiries and complaints regarding procedural and operational issues.
• Training: Facilitates formal and in-service training programs. CRIMINAL INVESTIGATION/COMMUNITY SERVICES DIVISION: The function of this Division is to provide both criminal and juvenile investigation/enforcement while responding to the needs of the community. This Division includes the Criminal Investigation Bureau and the Community Services Bureau. Criminal Investigation Bureau • Adult Investigations: Investigates unsolved crimes, conducts follow-up investigations on calls for
service, conducts financial crimes investigations, gathers intelligence, performs sex offender registration and monitoring, and initiates special investigations.
• North Central Narcotics Task Force: One officer assigned to the North Central Narcotics Task Force
(NCNTF) for regional drug enforcement in Northwest Cook County.
• Drug Enforcement Administration Task Force: An officer assigned to the DEA Task Force for drug enforcement and asset forfeitures.
108

POLICE (Continued) • High School Liaison: Officers assigned to area high schools for direct counseling and intervention.
• Juvenile Investigations: Prevention of youthful involvement in criminal activity through counseling
services, Peer Jury, investigation and apprehension of juvenile offenders.
• Gang Crimes: Gang deterrence through investigation, intervention, education and community interaction.
Community Services Bureau
• Crime Prevention: Pro-active approach to crime prevention and community relations. Community
based and long-term collaborative problem-solving management.
• Problem Oriented Policing: Group initiative to address complex issues before they develop.
• School Safety Planning: Liaison with school districts to develop and implement plans and procedures for addressing both man-made and natural disasters.
• Special Event Planning: Security and planning of special events conducted in the community.
• Victim Services: Formal assistance for victims of domestic violence and violent crimes. PATROL DIVISION: The Patrol Division is responsible for the initial delivery of police services to the community. The Division includes the Patrol Bureau and the Traffic Bureau. Patrol Bureau • Evidence Collection and Preservation: Forensic technician program to recover evidence.
• Field Training: Coordination of the field training officers and process.
• Park Counselor Program: Coordination of the park counselor summer program.
• Preventative Patrol: Car, motorcycle, bicycle and foot patrol of the community.
• Traffic Crash Investigation/Analysis: Traffic crash investigation and reconstruction.
• Police Information Desk: Citizen assistance and direction provided at the reception desk.
• K-9 Program: Dual-Purpose Narcotic Dogs/Handlers to assist with searches and tracking.
Traffic Bureau • Animal Welfare: Program for the control of domestic and wild animals within the limits of the Village.
• Overweight Truck Enforcement: Selective enforcement of vehicle weight-limit violations.
• Parking Enforcement: Responsible for the enforcement of parking ordinances.
• Traffic Enforcement: Responsible for selective enforcement to address the on-going traffic concerns
of the community.
109

POLICE (Continued) 2021 Accomplishments
• Explored Alternative Funding Sources for CARE (Community Addiction Recovery Effort) Program
o The Village was awarded, by the Illinois Criminal Justice Information Authority (ICJIA), $129,893 to continue the operation of the CARE program through the Community-Law and Deflection Program (CLEDP) grant. The length of the award corresponds with the State’s fiscal year, July 1, 2020 through June 30, 2021.
• Implementation of License Plate Reader (LPR) Technology o The LPR system was implemented and has, thus far, proved highly efficient and effective.
The LPR has captured a significantly higher number of violations, specifically time zones, as compared to traditional enforcement methods.
o The technology has allowed the Department to reallocate staff hours for other parking enforcement priorities. In addition to enforcement efficiencies, the technology also allows for a more robust review and analysis of parking-related behavior in the central business district.
• Exploration of Public Service Officers (PSOs) Taking Non-Criminal Police Reports o A comprehensive review of all police call types, as well as their dispatch priority, were
reviewed and amended to reflect those calls for service that could be facilitated by a PSO. o Training was conducted to include, traffic crash reporting, management of traffic data
sampling devices, LPR technology, traffic direction, non-emergency public service calls (such as found property, animal complaints, roadway hazard responses), and forensic training.
• Identify External & Internal Services/Processes that can be transitioned to See-Click-Fix or CityWorks
o See-Click-Fix was expanded to allow residents to request child safety seat inspections which integrated with the CityWorks platform.
o The Department received positive feedback from residents and staff regarding the enhanced customer service experience.
• Implementation of Computer-Aided-Dispatch (CAD) and Records Management System (RMS) Software
o Motorola’s Premier One CAD/RMS software was implemented at the end of the first quarter of 2021.The project was spearheaded by Northwest Central Dispatch (NWCD) with input from representatives of member agencies. The Department started an extensive training program for personnel during the fourth quarter of 2020 in preparation for the transition.
• Creation of a Cannabis Task Force o The impact of recreational cannabis on police services has not been significant in relative
terms. The community has experienced no spikes in crimes or calls for service related to the sale and/or legal consumption of cannabis in either the medicinal or the recreational sense.
• Prioritizing Diversity for Sworn Officer Recruitment o The Department worked with Human Resources, Village Manager’s Office, and the
Northwest Suburban working group of municipal managers and Chiefs to review existing police workforce demographic data, research recruitment opportunities, connect with minority organizations and other activities to assist in recruiting diverse candidates for law enforcement.
o The Village, along with the Northwest Suburban working group, executed an agreement with Harper College to host a daylong workshop in March 2021 regarding the entry-level test and other expectations of becoming a police officer. The event was considered a success based on positive feedback from attendees and the Department hopes the workshop will lead to increased minority participation in the next entry-level exam.
110

POLICE (Continued) 2022 Strategic Priorities & Key Projects 1. Assess Citizen & Business Satisfaction Survey Results to Enhance Public Safety
Communication Strategic Priority #8: Improve Communications with Residents and Businesses Citizen and business satisfaction surveys were recently conducted and compiled by Loyola University of Chicago. These results will be assessed to determine areas of focus for public safety related communications. Once these areas of focus have been identified, the Department will coordinate with the Village to enhance public outreach. Communication will be multi-faceted to include, but not limited to, social media, in-person presentations, and participation in community events. Project Lead: Joseph Pinnello, Commander 2. Enhance Educational Pedestrian & Bicycle Safety Programs Strategic Priority #7: Seek Opportunities to make the Community more Livable by Increasing Pedestrian and Bicycle Options for Residents New and innovative initiatives will be explored to supplement our existing pedestrian and bicycle safety program. The Department’s Bicycle Unit will be proactive in seeking opportunities to engage the public, including young and inexperienced bicyclists. Partnerships with resident bicycle clubs and businesses will be established in order to expand outreach. Educational presentations and materials will strive to create a culture of pedestrian and bicycle safety throughout the community. Project Lead: Russell Mandel, Sergeant 3. Pursue Training Curriculum & Resources that Enhances Core Traffic Safety Initiatives Strategic Priority #6: Ensure that the Organization has the Resources and Training to Maintain Focus on Consistent High-Quality Core Services and Infrastructure The Department actively participates in the Illinois Department of Transportation’s Sustained Traffic Enforcement Program (STEP) and has been a top recipient of the Illinois Association of Chiefs of Police’s Illinois Traffic Safety Award for the past several years. During the third quarter of 2021, the Department was awarded grant funding in the amount of $107,184 to continue traffic enforcement in four core areas. These include impaired driving, occupant protection, distracted driving, and speed enforcement. Training curriculum and resources will focus on aligning with these core traffic safety areas. Project Lead: Greg Czernecki, Deputy Chief 4. Explore Opportunities for Increasing Diversity in Certified Sworn Officer Recruitment Strategic Priority #2: Continue and Expand Efforts that Embrace Diversity, Equity, and Inclusion within the Community and the Village Government The Department’s Certified Officer Entry Program allows current sworn law enforcement officers the opportunity to apply year-round through a streamlined hiring process. Recruitment efforts are prioritized to these candidates during the year in between entry-level exams. The Department will expand recruitment efforts to not only increase volume, but also explore methods to enhance the diversity of certified applicants. Project Lead: Greg Czernecki, Deputy Chief
111

POLICE (Continued)
5. ERP Integration- Module Specific to Department ResponsibilitiesStrategic Priority #6: Ensure that Organization has the Resources and Training to Maintain Focus on Consistent High-Quality Core Services & Infrastructure
Lead by the Integrated Services, all Department Staff will assist in the implementation of department and module specific processes.
Project Lead: Diana Mikula, Assistant Village Manager- Integrated Services Department
6. Arlington Racetrack Project- Specific to Department ResponsibilitiesStrategic Priority #3: Work to Ensure the Redevelopment of Arlington Park Meets Community Standards and Provides a One of a Kind Regional Destination Worthy of the Property’s Legacy
Staff will work with would be purchasers on a land use plan for the site that will address all Village concerns, take into consideration the perspectives of all stakeholders, and provide for a unique one of a kind development worthy of the site’s legacy to our community and the region. Departments, including Fire, Police, Public Works, Finance, Planning & Community Development, Building & Life Safety, and Integrated Services, will work on cross-department initiatives to support this project.
Project Lead: Randy Recklaus, Village Manager- Integrated Services Department
Performance Measures 2018 2019 2020
1. Overall Crash ExperiencePercent change
1,742 -7.6%
1,659 -4.8%
890 -46.4%
2. # of Citations Issued: State Citations and Local OrdinanceParking, Compliance, Animal & AdministrativeImpounds
Total Citations Issued
10,767
12,539 23,306
11,425
9,998 21,423
3,422
9,410 12,832
3. Part I CrimesPart II Crimes (all other offenses)
Total Crime Reported
685 1,253
1,938
643 1,406 2,049
580 1,035 1,615
4. Arrests:AdultJuvenile
Total Arrests
522 70
592
735 99 834
505 53 558
112

POLICE (Continued) On a triennial basis, the Arlington Heights Police Department coordinates with Loyola University of Chicago’s Center for Criminal Justice Research, Policy & Practice to distribute a survey to the residential and commercial stakeholders within the community. The surveys assist the Department in gauging the level of satisfaction with public safety services and identifies areas where the Department can improve. Below are the summaries of each of the respective survey results.
Business Satisfaction Survey
In the fall of 2018, the Arlington Heights Police Department distributed a survey to a sample of 1,200 business owners in the village. The goal of the survey was to obtain business owners’ feedback on their interactions with the police, gauge perceptions of the efforts and visibility of the Arlington Heights Police Department, and assess business owner perceptions of safety and concern about crime. Completed surveys were returned by 243 village business owners, and analyses of those completed surveys revealed the following:
• The majority of business owners who had contact with Arlington Heights Police Department officers rated the competence, demeanor, fairness and courtesy of the officers they encountered as “excellent;”
• Among both those who had direct contact with the police and those that did not, Arlington Heights business owners indicated a very high level of satisfaction with the Arlington Heights Police Department;
• Almost all respondents who had an opinion felt safe leaving their business alone at night: more
than one-half (50.6%) felt “very safe” and 46.4% felt “somewhat safe” leaving their place of business alone at night.
• The majority of respondents to the survey who had an opinion regarding being the victim of a serious crime indicated a low level of concern about victimization.
Citizen Satisfaction Survey
In the spring of 2021, the Arlington Heights Police Department distributed a survey to a sample of residents in the Village. The goal of the survey was to obtain resident feedback on their interactions with the police, gauge resident perceptions of the efforts and visibility of the Arlington Heights Police Department, and assess resident perceptions of neighborhood safety. Completed surveys were returned by more than 675 Village residents, and analyses of those completed surveys, each category revealed the following:
• Among both those who had direct contact with the police and those that did not, Arlington Heights residents indicated a very high level of satisfaction with their police department;
• The majority (89%) of residents who had contact with the police rated the competence, demeanor, fairness and courtesy of the officers as a combined “Excellent” or “Good” across each of these dimensions.
• Among all residents, the majority (85%) rated traffic enforcement, police visibility in the community,
and the overall services provided by the Arlington Heights Police Department as a combined “Excellent” or “Good.”
• In general, the majority (70%) of respondents to the survey indicated a low level of concern about
being the victim of a serious crime, which showed improvement from the 2017 survey, when 67 percent indicated a low level of concern about serious crime victimization.
• Each matrix represents a more favorable perspective by citizens as compared to the previous 2017 survey.
113

OPERATION SUMMARY
POLICE 2019 2020 2021 2021 2022 $ %
Actual Actual Est. Actual Budget Budget Change Change
Authorized Positions in F-T-EGeneral Fund - Police 133.00 133.00 133.00 133.00 133.00 0.00 0.0%General Fund - Police Grant 1.00 1.00 1.00 1.00 1.00 0.00 0.0%Municipal Park Opr Fund 5.00 5.00 5.00 5.00 5.00 0.00 0.0%
Total F-T-E 139.00 139.00 139.00 139.00 139.00 0.00 0.0%
Expenditures Personal Services 23,173,270$ 23,316,567$ 24,295,100$ 24,830,500$ 25,552,700$ 722,200$ 2.9% Contractual Services 2,722,537 2,557,052 2,618,400 2,618,400 2,596,500 (21,900) (0.8%) Commodities 503,976 399,298 522,900 522,278 513,200 (9,078) (1.7%) Capital Items 130,817 180,390 92,800 92,775 102,600 9,825 10.6%
Total Expenditures 26,530,600$ 26,453,307$ 27,529,200$ 28,063,953$ 28,765,000$ 701,047$ 2.5%
CROSS REFERENCE TO FUNDS
2019 2020 2021 2021 2022 $ %Actual Actual Est. Actual Budget Budget Change Change
General Fund - Police 25,700,853$ 25,641,739$ 26,713,400$ 27,178,678$ 27,853,200$ 674,522$ 2.5%General Fund - Police Grant 122,370 129,531 132,800 133,600 135,800 2,200 1.6%Municipal Park Opr Fund 503,960 501,647 555,000 594,100 611,700 17,600 3.0%Capital Projects Fund 130,817 180,390 92,800 92,775 102,600 9,825 10.6%A & E Fund 72,600 0 35,200 64,800 61,700 (3,100) (4.8%)
Total Expenditures 26,530,600$ 26,453,307$ 27,529,200$ 28,063,953$ 28,765,000$ 701,047$ 2.5%
Paste Chart Here
139.0 139.0 139.0 139.0 139.0 139.0 139.0 139.0 139.0 139.0 139.0 139.0
135.0137.0139.0141.0143.0145.0147.0149.0
FY12 FY13 FY14 FY15 2015 2016 2017 2018 2019 2020 2021 2022
FT
E
STAFFING HISTORY
114

POLICE General Fund
PERSONNEL SUMMARY
Class
Code Title Grade 2021 2022 + (-)
Chief of Police 12 1.00 1.00
Deputy Chief of Police 10 3.00 3.00
Police Commander 9 5.00 5.00
Police Sergeant 8 14.00 14.00
Police Officer -- 86.00 86.00
Records Supervisor 5 1.00 1.00
Operations Support Supervisor 5 1.00 1.00
Management Analyst I 4 1.00 1.00
Public Service Officer II 3 2.00 2.00
Police Fiscal Clerk 2 1.00 1.00
Public Service Officer 2 10.00 10.00
Administrative Services Officer 2 2.00 2.00
Administrative Assistant 2 2.00 2.00
Records Clerk 1 4.00 4.00
Total F-T-E 133.00 133.00 0.00
Code Fund 2021 2022 + (-)
101 General Fund
Police - Administration 133.00 133.00
Police Grant 1.00 1.00
235 Municipal Parking Fund 5.00 5.00
Total F-T-E All Funds 139.00 139.00 0.00
Authorized Positions in F-T-E
Police DepartmentCross Reference to All Funds
Authorized Positions in F-T-E
115

POLICE GRANT General Fund
PERSONNEL SUMMARY
Class
Code Title Grade 2021 2022 + (-)
Victim Services Coordinator 6 1.00 1.00
Total F-T-E 1.00 1.00 0.00
Code Fund 2021 2022 + (-)
101 General Fund
Police - Administration 133.00 133.00
Police Grant 1.00 1.00
235 Municipal Parking Fund 5.00 5.00
Total F-T-E All Funds 139.00 139.00 0.00
Authorized Positions in F-T-E
Police DepartmentCross Reference to All Funds
Authorized Positions in F-T-E
116

POLICE GENERAL FUND EXPENDITURES
Account Account Actual Actual Proj. Act. Budget Budget $ %Number Description 2019 2020 2021 2021 2022 Inc (Dec) Inc (Dec)
101-3001-511.10-01 Salaries 1,742,370 1,847,312 1,838,800 1,897,900 1,928,600 30,700 1.6%101-3001-511.11-61 Police Administration 1,229,796 1,329,072 1,393,700 1,405,100 1,427,600 22,500 1.6%101-3001-511.11-64 Police Supervision 1,794,593 1,809,803 1,826,200 1,854,500 1,900,900 46,400 2.5%101-3001-511.11-70 Police Officer 8,156,476 8,114,745 8,686,600 9,040,100 9,327,500 287,400 3.2%101-3001-511.18-01 Temporary Help 1,162 88 3,300 3,300 3,400 100 3.0%101-3001-511.18-03 Seasonal Help 144,479 107,575 173,100 173,100 177,000 3,900 2.3%101-3001-511.18-05 Overtime Civilian 35,497 41,402 68,300 68,300 69,800 1,500 2.2%101-3001-511.18-07 Overtime Sworn 973,518 796,259 940,000 757,200 774,200 17,000 2.2%101-3001-511.18-08 Overtime Sworn Court 127,122 58,328 60,000 130,000 132,900 2,900 2.2%101-3001-511.18-09 Holiday Sworn 130,659 140,413 144,200 144,200 147,400 3,200 2.2%101-3001-511.18-80 Special Detail 215,068 53,855 110,000 248,300 253,900 5,600 2.3%101-3001-511.18-81 Special Detail Grants 72,679 69,673 106,000 93,500 95,600 2,100 2.2%
Salaries 14,623,419 14,368,525 15,350,200 15,815,500 16,238,800 423,300 2.7%
101-3001-511.19-01 Workers Compensation 631,500 644,100 676,300 676,300 750,900 74,600 11.0%101-3001-511.19-05 Medical Insurance 2,750,000 2,955,700 2,905,900 2,905,900 3,081,200 175,300 6.0%101-3001-511.19-09 Public Safety Pension 4,017,000 4,209,000 4,073,000 4,073,000 4,114,000 41,000 1.0%101-3001-511.19-10 IMRF 170,631 228,026 246,600 246,600 229,200 (17,400) (7.1%)101-3001-511.19-11 Social Security 108,589 114,714 132,800 132,800 135,100 2,300 1.7%101-3001-511.19-12 Medicare 205,212 201,951 221,900 221,900 229,600 7,700 3.5%
Fringe Benefits 7,882,932 8,353,491 8,256,500 8,256,500 8,540,000 283,500 3.4%
101-3001-511.20-37 Central Dispatch 904,221 619,378 728,800 728,800 665,100 (63,700) (8.7%)101-3001-511.20-40 General Insurance 279,700 282,500 285,300 285,300 201,400 (83,900) (29.4%)101-3001-511.21-02 Equipment Maintenance 28,545 22,608 19,600 19,600 19,600 0 0.0%101-3001-511.21-65 Other Services 149,708 227,828 235,100 235,100 235,100 0 0.0%101-3001-511.22-02 Dues 13,139 13,155 17,400 17,400 17,400 0 0.0%101-3001-511.22-03 Training 113,437 94,762 112,100 112,100 112,100 0 0.0%101-3001-511.22-05 Postage 8,377 6,888 13,000 13,000 13,000 0 0.0%101-3001-511.22-10 Printing 8,189 9,349 10,200 10,200 10,200 0 0.0%101-3001-511.22-15 Photocopying 9,498 5,603 12,300 12,300 12,300 0 0.0%101-3001-511.22-25 IT/GIS Service Charge 516,200 626,400 635,600 635,600 733,500 97,900 15.4%101-3001-511.22-37 Vehicle/Equip Lease Charge 667,100 618,800 522,700 522,700 550,600 27,900 5.3%
Contractual Services 2,698,114 2,527,271 2,592,100 2,592,100 2,570,300 (21,800) (0.8%)
101-3001-511.30-01 Publications Periodicals 501 37 3,300 3,300 3,300 0 0.0%101-3001-511.30-05 Office Supplies & Equip 28,227 24,864 30,000 30,000 30,000 0 0.0%101-3001-511.30-20 Photographic Supplies 1,943 2,012 2,000 2,000 2,000 0 0.0%101-3001-511.30-35 Clothing 194,408 179,384 203,300 203,254 189,800 (13,454) (6.6%)101-3001-511.30-50 Petroleum Products 132,882 96,250 130,600 130,600 151,800 21,200 16.2%101-3001-511.33-05 Other Supplies 16,109 7,463 16,700 16,749 13,400 (3,349) (20.0%)101-3001-511.33-25 Operational Supplies 107,857 77,344 110,700 110,685 99,800 (10,885) (9.8%)101-3001-511.33-30 Community Service Supply 14,461 5,098 18,000 17,990 14,000 (3,990) (22.2%)
Commodities 496,388 392,452 514,600 514,578 504,100 (10,478) (2.0%)
Total Police Admin 25,700,853 25,641,739 26,713,400 27,178,678 27,853,200 674,522 2.5%
117

POLICE GRANT GENERAL FUND EXPENDITURES
Account Account Actual Actual Proj. Act. Budget Budget $ %Number Description 2019 2020 2021 2021 2022 Inc (Dec) Inc (Dec)
101-3005-511.10-01 Salaries 97,542 100,841 103,400 104,100 107,000 2,900 2.8%Salaries 97,542 100,841 103,400 104,100 107,000 2,900 2.8%
101-3005-511.19-01 Workers Compensation 300 300 300 300 300 0 0.0%101-3005-511.19-05 Medical Insurance 7,300 8,000 8,100 8,100 8,000 (100) (1.2%)101-3005-511.19-10 IMRF 9,832 12,745 13,000 13,100 12,300 (800) (6.1%)101-3005-511.19-11 Social Security 5,994 6,196 6,500 6,500 6,600 100 1.5%101-3005-511.19-12 Medicare 1,402 1,449 1,500 1,500 1,600 100 6.7%
Fringe Benefits 24,828 28,690 29,400 29,500 28,800 (700) (2.4%)
Total Police Grant 122,370 129,531 132,800 133,600 135,800 2,200 1.6%
Total Police Dept 25,823,223 25,771,270 26,846,200 27,312,278 27,989,000 676,722 2.5%
118

POLICEGENERAL FUND EXPENDITURE DETAIL
AccountNumber Account Title Description
SALARIES:
101-3001-511.10-01 Salaries Salaries 1,897,900 1,928,600
101-3001-511.11-61 Police Administration Police Administration 1,405,100 1,427,600
101-3001-511.11-64 Police Supervision Police Supervision 1,854,500 1,900,900
101-3001-511.11-70 Police Officer Police Officer 9,040,100 9,327,500
101-3001-511.18-01 Temporary Help Temporary Help 3,300 3,400
101-3001-511.18-03 Seasonal Help Seasonal Help 173,100 177,000
101-3001-511.18-05 Overtime Civilian Overtime Civilian 68,300 69,800
101-3001-511.18-07 Overtime Sworn Overtime Sworn 757,200 774,200
101-3001-511.18-08 Overtime Sworn Court Overtime Sworn Court 130,000 132,900
101-3001-511.18-09 Holiday Sworn Holiday Sworn 144,200 147,400
101-3001-511.18-80 Special Detail Special Detail 248,300 253,900
101-3001-511.18-81 Special Detail Grant Special Detail Grant 93,500 95,600
TOTAL SALARIES 15,815,500 16,238,800
FRINGE BENEFITS:
101-3001-511.19-01 Workers' Compensation Workers' Compensation Insurance 676,300 750,900
101-3001-511.19-05 Medical Insurance Medical Insurance 2,905,900 3,081,200
101-3001-511.19-09 Public Safety Pension Public Safety Pension 4,073,000 4,114,000
101-3001-511.19-10 IMRF IMRF 246,600 229,200
101-3001-511.19-11 Social Security Social Security 132,800 135,100
101-3001-511.19-12 Medicare Medicare 221,900 229,600
TOTAL FRINGE BENEFITS 8,256,500 8,540,000
CONTRACTUAL SERVICES:
101-3001-511.20-37 Central Dispatch Police Department portion (75%) of costsfor dispatching calls-for-servicethrough the Northwest CentralDispatch System 728,800 665,100
101-3001-511.20-40 General Insurance Liability and property insurance 285,300 201,400
Budget20222021
Budget
119

POLICEGENERAL FUND EXPENDITURE DETAIL
AccountNumber Account Title Description
Budget20222021
Budget
101-3001-511.21-02 Equipment Maintenance Office machine equipment maint. ContractsTypewriters 600 600Fax machines 300 300BEAST (property inventory system) 1,300 1,300
Portable radios, modems, ISPERN maintenance contracts 5,000 5,000
Radar, security door lock & intercomsystem (Front Desk) 2,000 2,000
Records Management System 0 0Miscellaneous equipment maintenance:
Breathalyzer 3,300 3,300Video maintenance (desk/ops cameras) 4,000 4,000Kodak I4200 Scanner 2,100 2,100Microfilm 1,000 19,600 1,000 19,600
101-3001-511.21-65 Other Services Cellular telephone service 35,000 35,000T1 Data Line (Criminal Apprehension &
Booking System) 12,000 12,000Prisoner food 2,000 2,000Bureau Investigation license applicants 1,100 1,100Department weapons repair 400 400Micro-film, duplication & shredding 2,500 2,500Officers badge, shield & leather repair 800 800Morgue transportation 7,500 7,500Animal Welfare Services:
Animal impounding fees 5,000 5,000Blood Borne Pathogen Program:
Equipment sterilization 2,000 2,000Background reports 3,000 3,000Language line 200 200Critical Reach Alert (Trak System) 1,200 1,200Annual software renewal/maintenance 13,000 13,000Administrative Hearing Officer Program 19,000 19,000Bio-hazard cleaning cell/squad car 2,000 2,000Village-use background checks for non-
criminal justice/criminal history inquires 2,000 2,000Prisoner drug prescriptions 1,000 1,000Secretary of State License Suspensions 2,000 2,000Ticket Scofflaw Program 9,800 9,800Cell phone forensic license renewal 3,300 3,300GPS Traker Data upgrades 2,000 2,000Processing fees - subpoena records 500 500Electronic file transfer fees 3,000 3,000Crash Data Recorder software renewal 2,000 2,000Forensic Computer software renewal 2,800 2,800DACRA fees 50,000 50,000CARE Grant 50,000 235,100 50,000 235,100
101-3001-511.22-02 Dues MCAT 3,100 3,100Northern Illinois Police Alarm System 6,800 6,800Other dues 7,500 17,400 7,500 17,400
120

POLICEGENERAL FUND EXPENDITURE DETAIL
AccountNumber Account Title Description
Budget20222021
Budget
101-3001-511.22-03 Training Course titles are listed as a selectiverepresentation of needed skills andspecialty training: Comprehensive Departmental Training 30,300 30,300
Northeast Multi-Regional training,Suburban Law Enforcement Academymemberships
Basic Recruit Training 12,800 12,800Field Operations 12,300 12,300
Accident InvestigationProcedural JusticeCivil RightsFirearms Instructor Law/Legal UpdatesMental Health AwarenessResponse to Resistance De-Escalation Cultural CompetencySexual Assault Trauma-Informed
ResponseOfficer WellnessChild Abuse and Neglect Traffic LawSensitivity RelationsStreet SurvivalTraffic Law EnforcementSearch and Seizure
Community Police Training 6,800 6,800Problem Oriented PolicingCultural and Ethnic AwarenessCommunity Policing Concepts
Technical Support 6,000 6,000Field Training OfficersBreathalyzerForensic TechnicianCrime LabPolice PhotographyProperty ManagementPolice Records Management
Records Management System 1,500 1,500Crime Analysis
Community Services 1,900 1,900Crime Prevention
Criminal Investigations 3,500 3,500Management of Criminal InvestigationsNarcotic and Dangerous DrugsHomicide, Suicide & Accidental DeathRape & Sexual Deviance InvestigationAdvd. Interrogations & InterviewingBurglary & Theft ReductionForgery, Fraud & White Collar CrimeDeath Investigations
Juvenile InvestigationsGang AwarenessLead Homicide Sex Crimes Investigations
Juvenile Investigations 2,100 2,100Gang AwarenessNarcotic and Dangerous Drugs
121
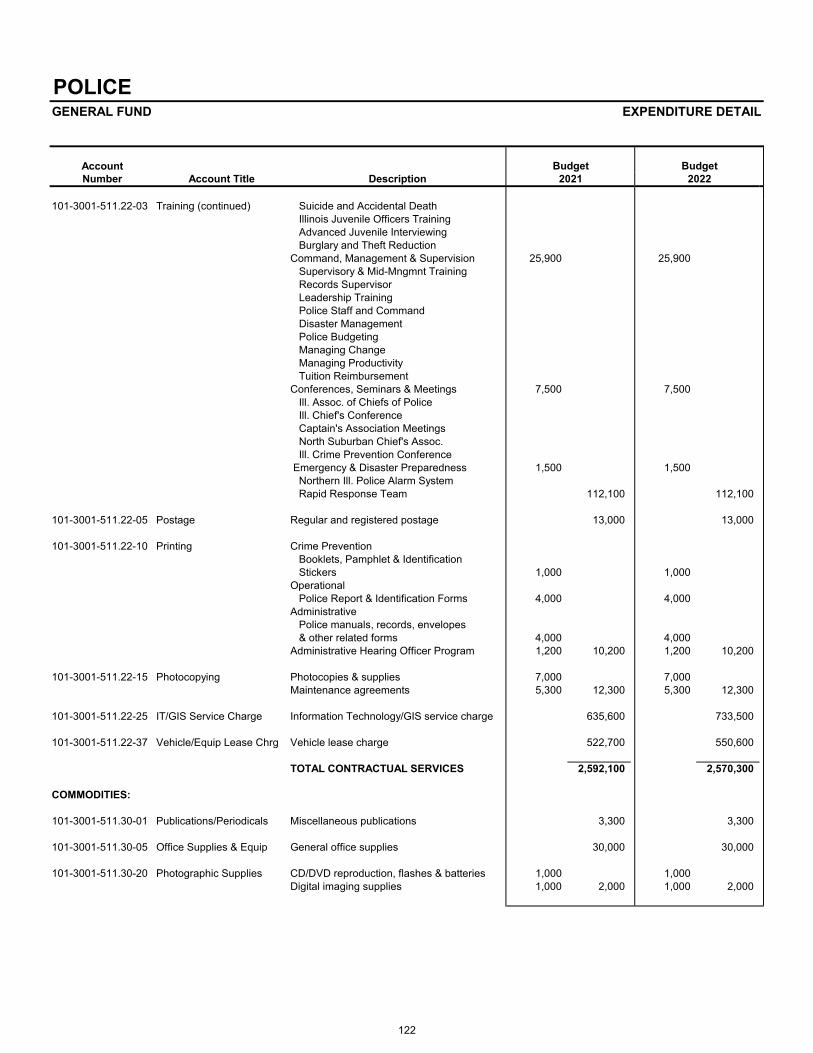
POLICEGENERAL FUND EXPENDITURE DETAIL
AccountNumber Account Title Description
Budget20222021
Budget
101-3001-511.22-03 Training (continued) Suicide and Accidental DeathIllinois Juvenile Officers TrainingAdvanced Juvenile InterviewingBurglary and Theft Reduction
Command, Management & Supervision 25,900 25,900Supervisory & Mid-Mngmnt TrainingRecords SupervisorLeadership TrainingPolice Staff and CommandDisaster ManagementPolice BudgetingManaging ChangeManaging ProductivityTuition Reimbursement
Conferences, Seminars & Meetings 7,500 7,500Ill. Assoc. of Chiefs of PoliceIll. Chief's ConferenceCaptain's Association MeetingsNorth Suburban Chief's Assoc.Ill. Crime Prevention Conference
Emergency & Disaster Preparedness 1,500 1,500Northern Ill. Police Alarm SystemRapid Response Team 112,100 112,100
101-3001-511.22-05 Postage Regular and registered postage 13,000 13,000
101-3001-511.22-10 Printing Crime PreventionBooklets, Pamphlet & IdentificationStickers 1,000 1,000
OperationalPolice Report & Identification Forms 4,000 4,000
AdministrativePolice manuals, records, envelopes& other related forms 4,000 4,000
Administrative Hearing Officer Program 1,200 10,200 1,200 10,200
101-3001-511.22-15 Photocopying Photocopies & supplies 7,000 7,000Maintenance agreements 5,300 12,300 5,300 12,300
101-3001-511.22-25 IT/GIS Service Charge Information Technology/GIS service charge 635,600 733,500
101-3001-511.22-37 Vehicle/Equip Lease Chrg Vehicle lease charge 522,700 550,600
TOTAL CONTRACTUAL SERVICES 2,592,100 2,570,300
COMMODITIES:
101-3001-511.30-01 Publications/Periodicals Miscellaneous publications 3,300 3,300
101-3001-511.30-05 Office Supplies & Equip General office supplies 30,000 30,000
101-3001-511.30-20 Photographic Supplies CD/DVD reproduction, flashes & batteries 1,000 1,000Digital imaging supplies 1,000 2,000 1,000 2,000
122

POLICEGENERAL FUND EXPENDITURE DETAIL
AccountNumber Account Title Description
Budget20222021
Budget
101-3001-511.30-35 Clothing Police PersonnelSworn Officers 149,000 149,000Sworn Officers - new hires 27,800 27,800Civilian Personnel 5,000 5,000
New and replacement badges, hat shields,and shoulder patches 3,500 3,500
Specialty clothingMotorcycle / Bicycle Officers / Northern
Illinois Police Alarm System 3,500 3,500Park Counselors 1,000 1,000
Prior Year Encumbrance Carryover 13,454 203,254 0 189,800
101-3001-511.30-50 Petroleum Products Gasoline for department vehicle(s) 130,600 151,800
101-3001-511.33-05 Other Supplies & Equip Computer hardware/software 6,800 6,800Employee recognition 6,600 6,600Prior Year Encumbrance Carryover 3,349 16,749 0 13,400
101-3001-511.33-25 Operational Supplies Ammunition 28,600 30,700Range safety equipment & supplies 3,100 5,000Evidence Processing/Property Security:
Property Management Section 1,500 3,000Identification Technicians 1,500 2,000Forensic Technicians 5,000 6,000Criminal Investigations Bureau 1,000 1,000
Emergency equipment for PatrolOperations: flares, flashlight batteries,traffic vests, fire extinguishers,first-aid equipment 4,600 4,600
Station operation & lock-up expenditures:Cell mattresses, blankets, personalhygiene items for prisoners &identification equipment 4,100 4,500
Community Policing supplies 1,500 1,500Motorola batteries 5,000 5,000Bullet proof vest replacement 18,000 18,000Taser accessories 9,500 9,500Animal welfare supplies 3,000 3,000Bio-hazard equipment & supplies 6,000 6,000Prior Year Encumbrance Carryover 18,285 110,685 0 99,800
101-3001-511.33-30 Community Service Supl Training aids 1,500 1,500Crime prevention specialty items 10,500 10,500Citizen Police Academy supplies 1,000 1,000Rockin with the Cops supplies 1,000 1,000Prior Year Encumbrance Carryover 3,990 17,990 0 14,000
TOTAL COMMODITIES 514,578 504,100TOTAL POLICE - ADMINISTRATION 27,178,678 27,853,200
123

POLICE GRANT *GENERAL FUND EXPENDITURE DETAIL
AccountNumber Account Title Description
SALARIES:
101-3005-511.10-01 Salaries Salaries 104,100 107,000
TOTAL SALARIES 104,100 107,000
FRINGE BENEFITS:
101-3005-511.19-01 Workers' Compensation Workers' Compensation Ins 300 300
101-3005-511.19-05 Medical Insurance Medical Insurance 8,100 8,000
101-3005-511.19-10 IMRF IMRF 13,100 12,300
101-3005-511.19-11 Social Security Social Security 6,500 6,600
101-3005-511.19-12 Medicare Medicare 1,500 1,600
TOTAL FRINGE BENEFITS 29,500 28,800
TOTAL POLICE GRANT 133,600 135,800
TOTAL POLICE DEPARTMENT 27,312,278 27,989,000
* Victim Services Grant
Budget20222021
Budget
124

Fire Chief
Emergency Management
Training Division
Emergency Medical
Public Education and Specialty
Teams
Fire Suppression
FIRE (110.00 FTE) ORGANIZATION STRUCTURE
125

FIRE Firefighting and support functions are comprised of five main divisions. Administrative Division: This division is responsible for providing administrative support to the Fire Department. In addition, Emergency Management Agency (EMA), Community Risk Reduction, Public Education, Hazardous Materials monitoring and Fire Investigations have been incorporated into this division.
Fire Suppression Division: This division is responsible for firefighting with three staffed engine companies and one truck company. During large-scale incidents, front-line equipment may be augmented by reserve apparatus staffed by off-duty personnel and the Mutual Aid Box Alarm System (MABAS) which is a multi-community, state-wide mutual aid system.
Emergency Medical Division: Four advanced life support (ALS) ambulances are operated along with two ALS rescue squads and three engines with ALS capability. The Department also maintains two reserve ALS ambulances, one reserve ALS rescue squad, and one reserve ALS engine. All firefighters are trained and certified as Emergency Medical Technicians and nearly two-thirds are trained and state-certified as paramedics. Both paramedics and EMTs are kept current through an extensive continuing education program facilitated by our system provider, Northwest Community Hospital.
Training Division: This division is responsible for the initial and ongoing training of all Fire personnel. The Fire Department participates in a State Certification Program whereby all personnel receive the basic, advanced and officer training necessary to achieve the required certification levels. Nearly all Village firefighting personnel have achieved advanced certification or higher.
Community Risk Reduction: Under supervision of the Fire Chief, the Fire Risk Reduction Officer is responsible for developing and implementing the department’s risk reduction / life safety strategies. This position is evolving in to the department’s Public Information Officer while coordinating timely safety messages to the community through multiple forms of media. This position is also working with our Recruitment / Diversity team in an effort to attract applicants that reflect the demographics of our community. Future focus areas will include: safety home inspections for independently living seniors, trip and fall prevention programs within our nursing homes, multi-lingual fire prevention programs for both students and residents, and mobile integrated health care.
These divisions work out of four well-equipped fire stations and an administrative headquarters.
The Fire Department responded to 9,689 calls for assistance in 2020. This included 1,957 fire and
emergency calls and 7,732 ambulance calls.
2021 Accomplishments • Rewrite of Fire Department General Orders and Standard Operating Guidelines • Firefighter Safety & Response during COVID-19 • Back-to-the Basic Training Initiative • Community Outreach
o CPR o Senior Home Safety o EMS Youth Program o Pop-up Block Parties o Safety Presentations and Educational Workshops
126

FIRE (Continued) 2022 Strategic Priorities & Key Projects 1. Replacement of Ambulance and Engine Purchase in 2022 Strategic Priority #6: Ensure the Organization has the Resources and Training to Maintain Focus on Consistent High-Quality Core Services and Infrastructure In 2022, the Fire Department will purchase a new ambulance and engine. Committees will be formed to identify needs, cost efficiency and idle reduction systems to reduce fuel and maintenance costs. The Fire Department will work in conjunction with Public Works to design and spec the vehicles for the current and future needs of the Fire Department. Project Lead: Curt Hanselman, Acting Deputy Fire Chief 2. High-Rise and Commercial Operating Guidelines / Policy Statements Development Strategic Priority #6: Ensure the Organization has the Resources and Training to Maintain Focus on Consistent High-Quality Core Services and Infrastructure Create High-Rise and Commercial Operating Guidelines / Policy Statements. With current and anticipated multi-family developments, the Fire Department through its revision and review process has identified that these policies require updating. The previous Standard Operating Guideline for High-Rise Structure Operations was written 15 years ago. The Department is researching and developing new techniques and equipment for operating in these types of structures.
Project Lead: Curt Hanselman, Acting Deputy Fire Chief 3. Expansion of Community Risk Division Strategic Priority #8: Improve Communications with Residents and Businesses
The Risk Reduction Division assisted the EMS Division with development of the Department’s COVID-19 Pandemic response. Risk Reduction enhanced the Public Education initiative by sharing safety messages via Social Media, a new platform for the Department. The Risk Reduction Division will work on providing programs and training to community stakeholders to include evacuation plans, providing information relative to natural disasters and life safety strategies.
Project Lead: David Roberts, Community Risk Reduction Division Chief 4. Succession Planning through Officer Development Staff Generated Project The Department continues to send members through the State of Illinois enhanced Company Fire Officer program (COFO), which is designed for Firefighters working toward promotion to Lieutenant and Chief Fire Officer (CFO), which is designed for the Administration team. The Fire Department will continue structured quarterly company officer training which focuses on leadership, emergency tactics, current events and administrative functions.
Project Lead: Curt Hanselman, Acting Deputy Fire Chief 5. Strategic Planning Staff Generated Project Members of the Command Staff along with various members of the Department of all ranks will complete a five (5) year plan to identify short- and long-term goals for the Department.
Project Lead: Chief Larson, Fire Chief
127

FIRE (Continued) 6. ERP Integration- Module Specific to Department Responsibilities Strategic Priority #6: Ensure that Organization has the Resources and Training to Maintain Focus on Consistent High-Quality Core Services & Infrastructure Lead by the Integrated Services, all Department Staff will assist in the implementation of department and module specific processes. Project Lead: Diana Mikula, Assistant Village Manager- Integrated Services Department 7. Arlington Racetrack Project- Specific to Department Responsibilities Strategic Priority #3: Work to Ensure the Redevelopment of Arlington Park Meets Community Standards and Provides a One of a Kind Regional Destination Worthy of the Property’s Legacy Staff will work with would be purchasers on a land use plan for the site that will address all Village concerns, take into consideration the perspectives of all stakeholders, and provide for a unique one of a kind development worthy of the site’s legacy to our community and the region. Departments, including Fire, Police, Public Works, Finance, Planning & Community Development, Building & Life Safety, and Integrated Services, will work on cross-department initiatives to support this project. Project Lead: Randy Recklaus, Village Manager- Integrated Services Department Performance Measures 2018 2019 2020 1. Service Calls: Fire EMS Hazardous Conditions Emergency Assists False Alarms Total Calls
153
7,515 448
1,048 _1,165 10,329
152
7,989 298
1,189 1,079 10,707
160
7,732 226 654
917 9,689
2. Mutual Aid / Auto Aid Responses: Calls Given Calls Received
1,101 1,079
1,135
915
663 677
3. % of Operational Personnel Meeting Minimum Training Standards
98%
98%
97%
4. ISO Rating: 1 1 1
128

FIRE (Continued) Performance Measures (cont.) 2018 2019 2020 5. Unit Responses: Ambulance 1 Ambulance 2 Ambulance 3 Ambulance 4 Ambulance 5 Subtotal Ambulances Squad 1 Squad 2 Subtotal Squads Engine 2 Engine 3 Engine 4 Subtotal Engines Boat 4 Battalion 1 Ladder Tower 1 Reserve Ambulance 1 Reserve Ambulance 2 Reserve Squad 2 Reserve Engine 1 Reserve Engine 2 Reserve Engine 3 Decontamination vehicle Dive van Total Unit Responses
2,332 2,292 1,935 1,535 0 8,094
2,642 2,712 5,354
1,365 1,904 1,553 4,822
0
1,022
1,216
3 9 2 1 0 0 2
2 20,527
2,423 2,545 2,042 1,630 84 8,724
2,756 2,903 5,659
1,412 1,416 1,574 4,902
2
1,055
1,195
2 12
0 1
12 0 1
1 21,566
2,233 2,405 1,952 1,579 17 8,186
2,557 2,856 5,413
1,276 1,926 1,411 4,613
2
951
1,168
1 4 1 0 0 3 0
0 20,342
129

OPERATION SUMMARY
FIRE2019 2020 2021 2021 2022 $ %
Actual Actual Est. Actual Budget Budget Change Change
Authorized Positions in F-T-E 110.00 110.00 110.00 110.00 110.00 0.00 0.0%
Expenditures Personal Services $20,995,973 $21,687,883 $21,827,100 $21,723,300 $22,123,300 $400,000 1.8% Contractual Services 1,783,612 1,807,549 2,064,600 2,064,630 2,111,400 46,770 2.3% Commodities 318,547 352,710 352,100 352,087 326,600 (25,487) (7.2%) Capital Items 501,550 226,187 160,100 203,767 340,000 136,233 66.9%
Total Expenditures $23,599,682 $24,074,329 $24,403,900 $24,343,784 $24,901,300 $557,516 2.3%
CROSS REFERENCE TO FUNDS
2019 2020 2021 2021 2022 $ %Actual Actual Est. Actual Budget Budget Change Change
General Fund $23,087,932 $23,848,142 $24,239,700 $24,132,817 $24,557,200 $424,383 1.8%Capital Projects Fund 501,550 226,187 160,100 203,767 340,000 136,233 66.9%A & E Fund 10,200 0 4,100 7,200 4,100 (3,100) (43.1%)
Total Expenditures $23,599,682 $24,074,329 $24,403,900 $24,343,784 $24,901,300 $557,516 2.3%
$0Total FireTotal Fire
110.5 110.5 110.5 110.5 110.5 110.5 110.0 110.0 110.0 110.0 110.0 110.0
102.0104.0106.0108.0110.0112.0114.0116.0118.0
FY12 FY13 FY14 FY15 2015 2016 2017 2018 2019 2020 2021 2022
FT
E
STAFFING HISTORY
130

FIRE General Fund
PERSONNEL SUMMARY
Class
Code Title Grade 2021 2022 + (-)
Fire Chief 12 1.00 1.00
Deputy Fire Chief 10 1.00 1.00
Battalion Chief 9 3.00 3.00
Division Chief 9 3.00 3.00
Fire Lieutenant -- 16.00 16.00
Firefighter II (Engineer) -- 12.00 12.00
Firefighter II (Paramedic) -- 67.00 67.00
Firefighter I -- 5.00 5.00
Administrative Assistant 2 1.00 1.00
Fire Fiscal Clerk 2 1.00 1.00
Total F-T-E 110.00 110.00 0.00
Code Fund 2021 2022 + (-)
101 General Fund 110.00 110.00
Total F-T-E All Funds 110.00 110.00 0.00
Authorized Positions in F-T-E
Fire DepartmentCross Reference to All Funds
Authorized Positions in F-T-E
131

FIRE GENERAL FUND EXPENDITURES
Account Account Actual Actual Proj. Act. Budget Budget $ %Number Description 2019 2020 2021 2021 2022 Inc (Dec) Inc (Dec)
101-3501-512.10-01 Salaries 175,652 169,058 179,800 182,000 186,200 4,200 2.3%101-3501-512.12-01 Fire Administration 1,086,256 1,122,531 1,157,900 1,176,900 1,198,300 21,400 1.8%101-3501-512.12-16 Fire Supervision 1,943,200 1,994,718 2,022,700 2,030,900 2,075,500 44,600 2.2%101-3501-512.12-21 Firefighter 8,469,475 8,673,941 9,080,500 9,217,400 9,414,500 197,100 2.1%101-3501-512.18-05 Overtime Civilian 0 0 500 500 500 0 0.0%101-3501-512.18-07 Overtime Sworn 824,082 1,003,253 660,000 420,800 430,300 9,500 2.3%101-3501-512.18-09 Holiday Sworn 192,424 190,048 177,000 194,500 198,900 4,400 2.3%101-3501-512.18-80 Special Detail 100,223 42,463 111,000 59,500 60,800 1,300 2.2%
Salaries 12,791,312 13,196,012 13,389,400 13,282,500 13,565,000 282,500 2.1%
101-3501-512.19-01 Workers Compensation 631,600 644,200 676,400 676,400 751,000 74,600 11.0%101-3501-512.19-05 Medical Insurance 2,403,300 2,501,600 2,619,700 2,619,700 2,613,900 (5,800) (0.2%)101-3501-512.19-09 Public Safety Pension 4,953,000 5,130,000 4,913,000 4,913,000 4,962,000 49,000 1.0%101-3501-512.19-10 IMRF 17,684 21,366 22,900 22,900 21,400 (1,500) (6.6%)101-3501-512.19-11 Social Security 10,685 10,249 11,300 11,300 11,600 300 2.7%101-3501-512.19-12 Medicare 178,192 184,456 190,300 190,300 194,300 4,000 2.1%
Fringe Benefits 8,194,461 8,491,871 8,433,600 8,433,600 8,554,200 120,600 1.4%
101-3501-512.20-37 Central Dispatch 320,974 228,291 260,400 260,400 243,900 (16,500) (6.3%)101-3501-512.20-40 General Insurance 233,000 235,300 237,700 237,700 167,900 (69,800) (29.4%)101-3501-512.21-02 Equipment Maintenance 33,695 57,012 19,300 19,300 28,600 9,300 48.2%101-3501-512.21-07 Vehicle Equip Maintenance 400 7 5,000 5,000 5,000 0 0.0%101-3501-512.21-11 Building Maintenance 0 0 19,400 19,400 19,400 0 0.0%101-3501-512.21-16 EMS Maintenance 0 0 68,500 68,500 69,000 500 0.7%101-3501-512.21-65 Other Services 29,407 42,307 54,800 54,800 58,700 3,900 7.1%101-3501-512.22-02 Dues 26,387 27,738 12,500 12,500 12,500 0 0.0%101-3501-512.22-03 Training 75,440 58,459 66,000 66,000 66,000 0 0.0%101-3501-512.22-05 Postage 400 534 2,000 2,000 2,000 0 0.0%101-3501-512.22-10 Printing 2,400 836 3,900 3,930 2,500 (1,430) (36.4%)101-3501-512.22-15 Photocopying 3,609 2,765 3,300 3,300 3,300 0 0.0%101-3501-512.22-25 IT/GIS Service Charge 214,700 234,000 237,400 237,400 319,000 81,600 34.4%101-3501-512.22-37 Vehicle/Equip Lease Charge 843,200 920,300 1,074,400 1,074,400 1,113,600 39,200 3.6%
Contractual Services 1,783,612 1,807,549 2,064,600 2,064,630 2,111,400 46,770 2.3%
101-3501-512.30-01 Publications Periodicals 1,096 1,077 1,100 1,100 1,100 0 0.0%101-3501-512.30-05 Office Supplies & Equip 5,630 9,813 9,000 9,000 9,000 0 0.0%101-3501-512.30-20 Photographic Supplies 0 10 100 100 100 0 0.0%101-3501-512.30-35 Clothing 91,424 120,212 95,700 95,650 87,700 (7,950) (8.3%)101-3501-512.30-50 Petroleum Products 71,577 53,836 69,100 69,100 83,200 14,100 20.4%101-3501-512.31-45 Janitorial Supplies 5,150 9,026 0 0 0 0 N/A101-3501-512.31-55 Building Supplies 156 996 0 0 0 0 N/A101-3501-512.31-60 Chemicals 5,384 8,914 5,000 5,000 5,000 0 0.0%101-3501-512.31-65 Other Equip & Supplies 28,177 21,287 19,900 19,941 15,100 (4,841) (24.3%)101-3501-512.31-85 Small Tools & Equipment 56,061 31,402 73,500 73,544 52,900 (20,644) (28.1%)101-3501-512.32-80 Books 6,096 3,402 5,700 5,700 5,700 0 0.0%101-3501-512.33-05 Other Supplies 10,584 8,391 8,000 8,000 8,000 0 0.0%101-3501-512.33-45 Comm Risk Reduction 0 0 19,200 19,200 19,200 0 0.0%101-3501-512.33-50 Medical Supplies 37,212 84,344 45,800 45,752 39,600 (6,152) (13.4%)
Commodities 318,547 352,710 352,100 352,087 326,600 (25,487) (7.2%)
Total Fire 23,087,932 23,848,142 24,239,700 24,132,817 24,557,200 424,383 1.8%
132

FIREGENERAL FUND EXPENDITURE DETAIL
AccountNumber Account Title Description
SALARIES:
101-3501-512.10-01 Salaries Salaries 182,000 186,200
101-3501-512.12-01 Fire Administration Fire Administration 1,176,900 1,198,300
101-3501-512.12-16 Fire Supervision Fire Supervision 2,030,900 2,075,500
101-3501-512.12-21 Firefighter Firefighter 9,217,400 9,414,500
101-3501-512.18-05 Overtime Civilian Overtime Civilian 500 500
101-3501-512.18-07 Overtime Sworn Overtime Sworn 420,800 430,300
101-3501-512.18-09 Holiday Sworn Holiday Sworn 194,500 198,900
101-3501-512.18-80 Special Detail Fireguard/ Ambulance Detail 24,000 24,400Fire Instruction 7,000 7,400MABAS Training (Reimbursable):
Fire Apparatus EngineeringSpecialized Rescue Classes 28,500 59,500 29,000 60,800
TOTAL SALARIES 13,282,500 13,565,000
FRINGE BENEFITS:
101-3501-512.19-01 Workers' Compensation Workers' Compensation Insurance 676,400 751,000
101-3501-512.19-05 Medical Insurance Medical Insurance 2,619,700 2,613,900
101-3501-512.19-09 Public Safety Pension Public Safety Pension 4,913,000 4,962,000
101-3501-512.19-10 IMRF IMRF 22,900 21,400. .
101-3501-512.19-11 Social Security Social Security 11,300 11,600
101-3501-512.19-12 Medicare Medicare 190,300 194,300
TOTAL FRINGE BENEFITS 8,433,600 8,554,200
CONTRACTUAL SERVICES:
101-3501-512.20-37 Central Dispatch Fire Department portion (25%)Communications Services 242,900 221,700
JEMC Annual Membership Fee 17,500 260,400 22,200 243,900
101-3501-512.20-40 General Insurance Liability and property insurance 237,700 167,900
101-3501-512.21-02 Equipment Maintenance Mobile, main, portable & pagerradio repairs 8,100 8,100
Hose Testing 0 6,600Ladder Testing 0 2,700Office equipment repairs 200 200Hose, nozzle & brass goods 500 500Academy - hose, nozzle & brass goods 1,000 1,000Station appliances 2,500 2,500Self-contained breathing apparatus
testing and repairs (IL OSHA) 5,000 5,000Small tools & equipment 500 500Academy - small tools & equipment 1,000 1,000
Budget20222021
Budget
133

FIREGENERAL FUND EXPENDITURE DETAIL
AccountNumber Account Title Description
Budget20222021
Budget
101-3501-512.21-02 Equipment Maint (cont) Test equipment repairs 500 19,300 500 28,600
101-3501-512.21-07 Vehicle Equip. Maint. Lettering and graphics 1,000 1,000Vehicle equipment changeovers 4,000 5,000 4,000 5,000
101-3501-512.21-11 Building Maintenance Miscellaneous janitorial supplies 7,900 7,900Miscellaneous building supplies (lumber,
paint and hardware) 2,500 2,500Fire Station Appliance Maintenance 5,000 5,000Fire Station Furniture Maintenance 4,000 19,400 4,000 19,400
101-3501-512.21-16 EMS Maintenance Medical telemetry repairs 1,000 1,000Medical equipment repairs 1,000 1,000Medical defibrillator service contract 22,000 22,500AED service contract 8,000 8,000Paramedic Continuing Education Classes 28,500 28,500Medical oxygen 6,000 6,000Telemetry & defibrillator batteries/parts 2,000 68,500 2,000 69,000
101-3501-512.21-65 Other Services Cellular phone contract 15,000 15,000Northwest Community Hospital
computerized reporting system 7,000 7,000Telestaff Scheduling Software-annual support 7,000 10,000Video-conferencing system - annual
maintenance & technical support 8,000 8,000Target Solutions Annual Maintenance 9,200 9,200Imagetrend Annual Maintenance 6,600 7,500Firehouse software license 2,000 54,800 2,000 58,700
101-3501-512.22-02 Dues Dues 2,500 2,500Paramedic/EMT License Renewal 5,000 5,000MABAS 5,000 12,500 5,000 12,500
101-3501-512.22-03 Training Firefighter/Officer Training:State Cert. Basic Firefighter Course (3) 10,700 10,700Fire Apparatus Engineer Cert. Class 2,000 2,000State Certified F/O Programs 7,600 7,600Mid-level Management Courses 5,000 5,000Chief Officer Courses 7,100 7,100Fire Dept. Instructors Conference 3,100 3,100Academy - Instructor Training Seminar 1,500 1,500Illinois Fire Chiefs Conferences 800 800Continuing Education-Local Colleges 6,000 6,000International Fire Chiefs Conference 1,000 1,000Paramedic Course NWCH 20,000 20,000ESDA meetings, courses & seminars 1,200 66,000 1,200 66,000
101-3501-512.22-05 Postage Regular and registered mail 2,000 2,000
101-3501-512.22-10 Printing Fire, investigation and emergencyincident reports 200 200
Ambulance reports 700 700Administration forms and reports 1,100 1,100Public education/ESDA 500 500Prior Year Encumbrance Carryover 1,430 3,930 0 2,500
101-3501-512.22-15 Photocopying Photocopies & supplies 200 200Maintenance agreement Xerox 5150 (#2) 700 700Maintenance agreement WC4118P (#2) 1,100 1,100Maintenance agreement WC4118P (#1) 500 500
134

FIREGENERAL FUND EXPENDITURE DETAIL
AccountNumber Account Title Description
Budget20222021
Budget
101-3501-512.22-15 Photocopying (cont.) Maintenance agreement WC4118P (#3) 400 400Maintenance agreement WC4118P (#4) 400 3,300 400 3,300
101-3501-512.22-25 IT/GIS Service Charge Information Technology/GIS service charge 237,400 319,000
101-3501-512.22-37 Vehicle/Equip Lease Chrg Vehicle lease charge 1,074,400 1,113,600
TOTAL CONTRACTUAL SERVICES 2,064,630 2,111,400COMMODITIES:
101-3501-512.30-01 Publications/Periodicals Miscellaneous publications 1,100 1,100
101-3501-512.30-05 Office Supplies & Equip General office supplies 6,000 6,000Academy - office supplies 1,000 1,000Administrative office furniture 2,000 9,000 2,000 9,000
101-3501-512.30-20 Photographic Supplies Misc. film, processing 100 100
101-3501-512.30-35 Clothing Clothing for officers 6,000 6,000Clothing for firefighters & paramedics 48,600 44,700Contractual employee uniform maintenance 37,000 37,000Prior Year Encumbrance Carryover 4,050 95,650 0 87,700
101-3501-512.30-50 Petroleum Products Gasoline for department vehicle(s) 69,100 83,200
101-3501-512.31-60 Chemicals Fire extinguisher recharging & testing 1,800 1,800Foam concentrates 3,200 5,000 3,200 5,000
101-3501-512.31-65 Other Equip. & Supplies Radio & pager batteries and parts 4,000 4,000Miscellaneous repairs to small equipment 4,600 4,600Filters for air purification compressors 2,000 2,000HAZ/MAT test sensors 2,500 2,500Emergency lighting and warning for vehicles 2,000 2,000Prior Year Encumbrance Carryover 4,841 19,941 0 15,100
101-3501-512.31-85 Small Tools and Equip. Fire hose 8,500 8,500Rope & related equipment 2,000 2,000Dive rescue equipment 2,000 2,000Hazmat equipment 3,000 3,000Nozzles, applicators, brass goods &
appliances 5,000 5,000Miscellaneous tools, lights, etc. 22,000 17,400Rescue equipment 5,000 5,000USAR equipment 3,000 3,000Radios, VHF portables 5,000 5,000Academy - tools and related equipment 2,000 2,000Prior Year Encumbrance Carryover 16,044 73,544 0 52,900
101-3501-512.32-80 Books Officer Training Series updates 300 300Advanced Firefighter Series 2,000 2,000Updating station training manuals 300 300Update maps and map books 100 100Academy - reference books 2,000 2,000Miscellaneous reference books 1,000 5,700 1,000 5,700
101-3501-512.33-05 Other Supplies & Equip Station supplies & materials 3,000 3,000Public education materials 5,000 8,000 5,000 8,000
135

FIREGENERAL FUND EXPENDITURE DETAIL
AccountNumber Account Title Description
Budget20222021
Budget
101-3501-512.33-45 Community Risk Reduction Emergency Operations Center/Emergency Management 1,900 1,900
ISO Tracking 600 600MyID Medical Identification System 5,500 5,500Smoke Alarm Program 3,300 3,300Public Education Trailer 1,900 1,900Public Education Program updates 1,100 1,100Safety Initiatives 3,800 3,800Misc. Programs 1,100 19,200 1,100 19,200
101-3501-512.33-50 Medical Supplies Expendable bandages, drugs and variousportable equipment 39,600 39,600
Prior Year Encumbrance Carryover 6,152 45,752 0 39,600
TOTAL COMMODITIES 352,087 326,600
TOTAL FIRE DEPARTMENT 24,132,817 24,557,200
136

PLANNING & COMMUNITY DEVELOPMENT (10.00 FTE) ORGANIZATION STRUCTURE
Director of Planning & Community Development
Planning Community
Development/ Redevelopment
Economic Development
Housing Zoning Urban Design
137

PLANNING & COMMUNITY DEVELOPMENT
The Planning & Community Development Department provides professional and technical assistance in the following areas: Planning and Management Assistance: Maintains and updates planning related data, responds to inquiries on planning, zoning, signage, and subdivision matters, and conducts studies which assist the decision-making process of Village development. Analyzes and interprets zoning for all properties in the Village, Planned Unit Developments (PUD's) and special uses. Long Range/Comprehensive Planning: Formulates policies affecting overall and long-term Village development; collects, analyzes and presents data to determine community goals, assists in their attainment and interprets the Comprehensive Plan and implements the Comprehensive Planning Program. Facilitates development of the Downtown Master Plan, Metra STAR Line Master Plan, Hickory Kensington Redevelopment Plan, Tax Increment Financing Districts, and coordinates its implementation.
Zoning and Development Review: Coordinates the Village's development review process for new development or redevelopment including PUD’s, rezoning, special uses, preliminary and final plats of subdivision, land use variations and zoning variations. Analyzes issues and formulates recommendations to the Plan Commission and Village Board regarding the Zoning and Subdivision Control Regulations to better implement the Comprehensive Plan. Review building permits for compliance with zoning & subdivision, and sign codes.
Housing and Community Development: Administers the various grant programs available from Federal agencies and provides assistance to qualified residents and public/private agencies in obtaining funds for eligible services from these programs. Prepares the Village’s 5-year Consolidated Plan, Annual Action Plans, and Fair Housing Plan, monitors legislation, and develops proposals and projects concerning affordable housing and other community development needs in the Village. Lead the Northwest Suburban Housing Collaborative in analyzing and addressing common housing issues of the Villages of Arlington Heights, Palatine, Buffalo Grove, Mount Prospect, and the City of Rolling Meadows.
Economic Development: Monitors community and economic development activities, and promotes and markets the Village to maintain and enhance its economic base. Coordinates the Business Retention and Attraction Programs and develops and coordinates the Discover Arlington Marketing and the Village’s Economic Development Strategy.
Urban Design and Beautification: Oversees the review process for Design Commission applications, including single family homes, commercial development, variances for signage as well as administrative review of single-family homes, commercial administrative review and signs in the Downtown and Village-wide. Implement Design Guidelines and Sign Code Tool Kit. Works in conjunction with other Village Departments to design and develop Capital Improvement design projects including Downtown streetscape, beautification, pedestrian spaces, banners, signage, and Green corridors.
Redevelopment: Analyzes, defines, selects, and prepares specific area redevelopment studies including a systematic approach to Downtown revitalization. Administer the Village’s four Tax Increment Financing (TIF) Districts.
Boards and Commissions: Provides technical and administrative support, professional assistance and liaison to Boards and Commissions/Committees. Vision Statement A Planning & Community Development Department that is recognized as an award-winning professional department providing a pro-business environment while maintaining a superior quality of life and ensuring quality development that is balanced and meeting needs of the citizens of Arlington Heights. Mission Statement To ensure professional, courteous, consistent and reliable service through management and oversight of the divisions within the Planning & Community Development Department.
138

PLANNING & COMMUNITY DEVELOPMENT
2021 Accomplishments • COVID -19 Response
o COVID-19 Relief Zero Interest Loans o Covid-19 Forgivable Small Business Loan o Arlington Alfresco
• South Arlington Heights Road Corridor
• TIF Redevelopment Plan was approved
• Arlington 425 - Mixed use redevelopment of the block approved amended PUD
• Sigwalt 16 Development on southern ¼ of Block 425 approved and construction commenced
• Amazon Warehouse/Distribution facility was attracted and construction completed
• Downtown Parking Guidance system was bid and installed
• Northwest Crossing’s new tenant at 1501 W. Shure Drive occupancy
• Arlington Downs – PUD amendment ADR II completed
• Facilitated First Ascent Rock Climbing attraction and development
• Chez Hotel was approved and under construction
• Trammell Crow Senior Living facility approved
• Former AT&T property redevelopment pursue
• 4 N. Hickory mixed-use apartments redevelopment.
• Town & Country redevelopment agreement negotiated
• A Confidential Tax Base Expansion Report was completed and distributed to the Board
• Senior Center Feasibility Assessment 2022 Strategic Priorities & Key Projects 1. Business Spotlight Strategic Priority #2: Expand efforts to embrace diversity, equity, and inclusion within the community and the Village Government Explore the willingness of businesses to participate in and develop a program to highlight a “business spotlight” segment on the Village’s website and social media for businesses with ethnic and diverse backgrounds in the community. Project Lead: Michael Mertes, Business Development Manager
139

PLANNING & COMMUNITY DEVELOPMENT
2. Explore New Sustainability Initiatives Strategic Priority #4: Identify, Explore and Implement Sustainable and Green Initiatives Refine the Sustainable Initiatives Project Priorities based upon Board Feedback and Pursue Implementation of:
I. EV Charging Stations II. EV Fleet
III. Vail Avenue permeable paver project
Project Lead: Derek Mach, Landscape Planner and Jake Schmidt, Assistant Planner 3. Sustainability Redevelopment Projects Strategic Priority #4: Identify, Explore and Implement Sustainable and Green Initiatives Work with Developers to include sustainable features in Redevelopment Projects, in particular with projects within TIF Districts. Project Lead: Bill Enright, Assistant Director 4. Incentive Based Sustainable Features Strategic Priority #4: Identify, Explore and Implement Sustainable and Green Initiatives Explore incentive-based requirements for sustainable building improvements Project Lead: Michael Mertes, Business Development Manager 5. Create “Livable” Developments Strategic Priority #7: Seek Opportunities to make the Community more Livable by increasing Pedestrian and Bicycle Options for Residents Continue to work with developers in creating livable developments that include implementing the bike parking code along with improved access for bicycles and pedestrians along redevelopment corridors. Project Lead: Sam Hubbard, Development Planner 6. Southtown Corridor Study Strategic Priority #7: Seek Opportunities to make the Community more Livable by increasing Pedestrian and Bicycle Options for Residents Continue discussions with the major property owners along the south Arlington Heights Road corridor with respect to implementation of the corridor study and implementation of the Tax Increment Financing District. Project Lead: Bill Enright, Assistant Director 7. Uptown Corridor Study Strategic Priority #7: Seek Opportunities to make the Community more Livable by increasing Pedestrian and Bicycle Options for Residents Continue to pursue implementation of the Uptown Rand/Palatine/Arlington Heights Road corridor study. Focusing on a phased approach with gateway signage, corridor banners, enhance landscaping and improve pedestrian crossings. Project Lead: Derek Mach, Landscape Planner
140
PLANNING & COMMUNITY DEVELOPMENT
8. Northwest Highway Corridor Strategic Priority #7: Seek Opportunities to make the Community more Livable by increasing Pedestrian and Bicycle Options for Residents Continue implementation of the phased landscaping improvement along Northwest Highway corridor as approved in the corridor study. Project Lead: Derek Mach, Landscape Planner 9. New Business Development Portal Strategic Priority #8: Improve Communications with Residents and Businesses. Explore the reestablishment of the new business development portal on the Village’s website. Project Lead: Michael Mertes, Business Development Manager 10. Inclusionary Zoning Ordinance Strategic Priority #9: Seek and Maintain Attainable Housing while Continuing to Review Affordable Housing Strategies. Continue to implement the inclusionary zoning ordinance adopted August 2020. Project Lead: Nora Boyer, Housing Planner 11. Affordable Housing Trust Fund Program Strategic Priority #9: Seek and Maintain Attainable Housing while Continuing to Review Affordable Housing Strategies. Complete review and elevation of the affordable housing trust fund prioritization and pursue implementation of approved approach. Project Lead: Nora Boyer, Housing Planner 12. ERP Integration- Module Specific to Department Responsibilities Strategic Priority #6: Ensure that Organization has the Resources and Training to Maintain Focus on Consistent High-Quality Core Services & Infrastructure Lead by the Integrated Services, all Department Staff will assist in the implementation of department and module specific processes. Project Lead: Diana Mikula, Assistant Village Manager- Integrated Services Department
13. Arlington Racetrack Project- Specific to Department Responsibilities Strategic Priority #3: Work to Ensure the Redevelopment of Arlington Park Meets Community Standards and Provides a One of a Kind Regional Destination Worthy of the Property’s Legacy
Staff will work with would be purchasers on a land use plan for the site that will address all Village concerns, take into consideration the perspectives of all stakeholders, and provide for a unique one of a kind development worthy of the site’s legacy to our community and the region. Departments, including Fire, Police, Public Works, Finance, Planning & Community Development, Building & Life Safety, and Integrated Services, will work on cross-department initiatives to support this project. Project Lead: Randy Recklaus, Village Manager- Integrated Services Department
141

PLANNING & COMMUNITY DEVELOPMENT
Performance Measures 2018 2019 2020 1. Development – Plan Commission # of Temporary Files # of Conceptual Plan Reviews # of Comprehensive Plan Sub-Committees # of Ordinance Review Committee Cases # of Special Use Waiver Cases for Antennas # of Small Cell Antenna Reviews # of PC Applications
31 22
1 1
12
27
39 24
0 1
12
24
36 20
0 0 9
56 16
2. Development – Other # of all Zoning Reviews # of ZBA Applications/Reviewed # of Building Permit Reviews # of Business License Reviews # of Home Occupation Reviews # of FOIA Requests # of Special Use Waiver Restaurants # of Administrative Parking Waiver # of Landscaping Code Enforcement # of Zoning Code Enforcement # of Private Dining Waiver
1,490
41 1,237
99 9
108 4 1 6 2
N/A
1,499
31 1,254
128 13 86
3 6
21 8
N/A
2,124
38 1,921
106 9
81 3 1 5 3
24
3. Sign Permits 247 215 244
4. Community Development # CDBG Public Services Beneficiaries # Facility Improvement Projects
538
7
403
6
369
3
5. Business Development # Retention Business Visits # Leads from all Sources # Leads from ICSC Events # Total Recruitment Contacts # Chamber & Business Events Attended # New Business Welcome Letters Sent # Zero Interest Loans # Tax Abatement Reviews # Arlington Alfresco License Agreements
371 323 82
488 79 81
4 6
N/A
237 401 51
401 111 59
3 1
N/A
300 228
0 308 16 58 16
3 25
6. Design Review # of Reviews by Design Commission # of Administrative Review
70
148
50
155
37
121 8. # Special Projects # of Special Projects
38
38
36
142

OPERATION SUMMARY
PLANNING & COMMUNITY DEVELOPMENT2019 2020 2021 2021 2022 $ %
Actual Actual Est. Actual Budget Budget Change Change
Authorized Positions in F-T-EGeneral Fund 9.50 9.50 9.50 9.50 9.50 0.00 0.0%CDBG Fund 0.50 0.50 0.50 0.50 0.50 0.00 0.0%
Total F-T-E 10.00 10.00 10.00 10.00 10.00 0.00 0.0%
Expenditures Personal Services $1,515,863 $1,584,766 $1,635,000 $1,636,000 $1,656,200 $20,200 1.2% Contractual Services 113,439 131,040 251,500 324,525 493,900 169,375 52.2% Commodities 10,762 9,598 40,200 20,238 17,600 (2,638) (13.0%) Other Charges 271,928 322,686 472,600 695,656 488,000 (207,656) (29.9%) Capital Items 232,595 53,520 3,337,200 4,862,605 4,150,400 (712,205) (14.6%)
Total Expenditures $2,144,587 $2,101,610 $5,736,500 $7,539,024 $6,806,100 ($732,924) (9.7%)
CROSS REFERENCE TO FUNDS
2019 2020 2021 2021 2022 $ %Actual Actual Est. Actual Budget Budget Change Change
General Fund $1,696,833 $1,733,623 $1,944,000 $1,978,080 $1,934,400 ($43,680) (2.2%)CDBG Fund 68,000 60,500 62,500 62,500 64,300 1,800 2.9%Affordable Housing Fund 0 0 25,000 25,000 25,000 0 0.0%Zero Interest Loan Fund 48,300 170,084 60,000 250,000 150,000 (100,000) (40.0%)Municipal Park Opr Fund 9,270 0 2,000 0 2,000 2,000 N/ATIF IV Fund 58,789 68,883 635,800 610,839 1,727,000 1,116,161 182.7%TIF V Fund 13,609 738 1,887,500 2,487,469 1,228,000 (1,259,469) (50.6%)Hickory/Kensington TIF Fund 30,000 15,000 715,000 1,590,000 1,115,000 (475,000) (29.9%)S Arlington Heights Rd TIF Fund 0 0 120,400 70,800 195,000 124,200 175.4%Capital Projects Fund 219,786 52,782 264,300 464,336 360,400 (103,936) (22.4%)A & E Fund 0 0 20,000 0 5,000 5,000 N/A
Total Expenditures $2,144,587 $2,101,610 $5,736,500 $7,539,024 $6,806,100 ($732,924) (9.7%)
Paste Chart Here
9.00 9.00 9.00 9.00 9.00 9.0010.00 10.00 10.00 10.00 10.00 10.00
6.0
8.0
10.0
12.0
14.0
16.0
FY12 FY13 FY14 FY15 2015 2016 2017 2018 2019 2020 2021 2022
FT
E
STAFFING HISTORY
143

PLANNING General Fund
PERSONNEL SUMMARY
Class
Code Title Grade 2021 2022 + (-)
Director of Planning & Com Dvlp 11 1.00 1.00
Asst Dir of Plan & Com Dvlp 9 1.00 1.00
Business Development Manager 7 1.00 1.00
Planner II 7 3.50 3.50
Planning Assistant 2 1.00 1.00
Administrative Assistant 2 2.00 2.00
Total F-T-E 9.50 9.50 0.00
Code Fund 2021 2022 + (-)
101 General Fund 9.50 9.50
215 CDBG Fund 0.50 0.50
Total F-T-E All Funds 10.00 10.00 0.00
Planning DepartmentCross Reference to All Funds
Authorized Positions in F-T-E
Authorized Positions in F-T-E
144
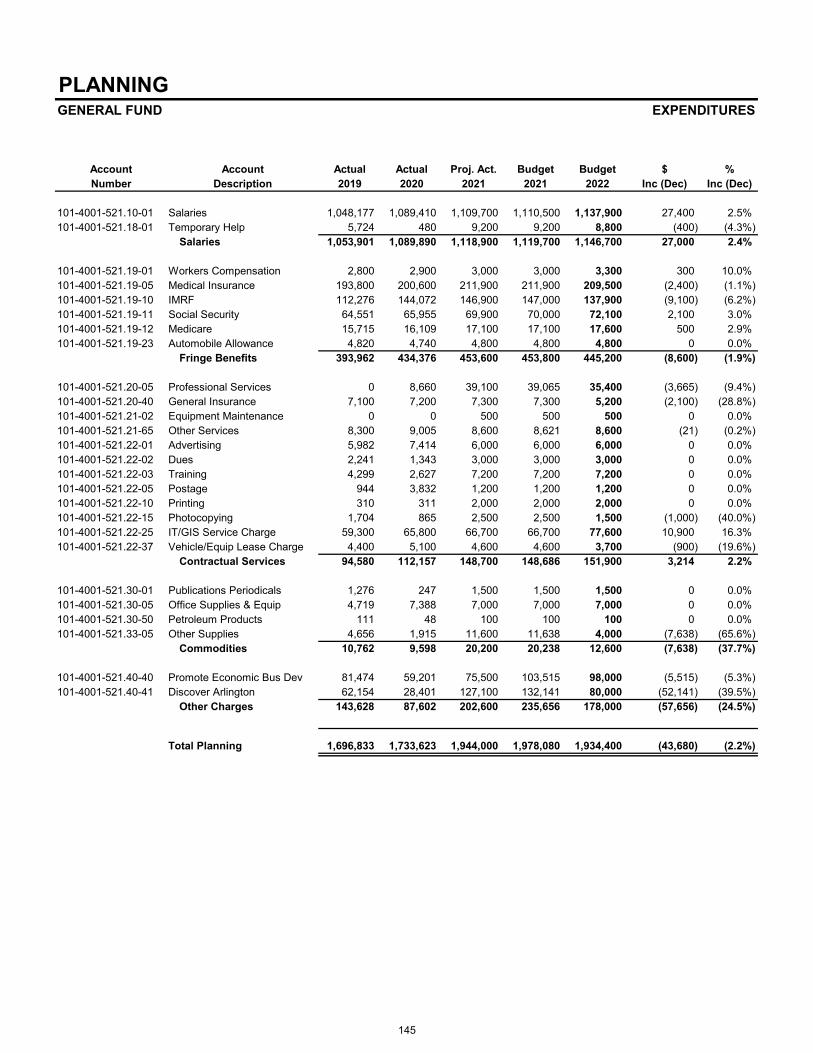
PLANNING GENERAL FUND EXPENDITURES
Account Account Actual Actual Proj. Act. Budget Budget $ %Number Description 2019 2020 2021 2021 2022 Inc (Dec) Inc (Dec)
101-4001-521.10-01 Salaries 1,048,177 1,089,410 1,109,700 1,110,500 1,137,900 27,400 2.5%101-4001-521.18-01 Temporary Help 5,724 480 9,200 9,200 8,800 (400) (4.3%)
Salaries 1,053,901 1,089,890 1,118,900 1,119,700 1,146,700 27,000 2.4%
101-4001-521.19-01 Workers Compensation 2,800 2,900 3,000 3,000 3,300 300 10.0%101-4001-521.19-05 Medical Insurance 193,800 200,600 211,900 211,900 209,500 (2,400) (1.1%)101-4001-521.19-10 IMRF 112,276 144,072 146,900 147,000 137,900 (9,100) (6.2%)101-4001-521.19-11 Social Security 64,551 65,955 69,900 70,000 72,100 2,100 3.0%101-4001-521.19-12 Medicare 15,715 16,109 17,100 17,100 17,600 500 2.9%101-4001-521.19-23 Automobile Allowance 4,820 4,740 4,800 4,800 4,800 0 0.0%
Fringe Benefits 393,962 434,376 453,600 453,800 445,200 (8,600) (1.9%)
101-4001-521.20-05 Professional Services 0 8,660 39,100 39,065 35,400 (3,665) (9.4%)101-4001-521.20-40 General Insurance 7,100 7,200 7,300 7,300 5,200 (2,100) (28.8%)101-4001-521.21-02 Equipment Maintenance 0 0 500 500 500 0 0.0%101-4001-521.21-65 Other Services 8,300 9,005 8,600 8,621 8,600 (21) (0.2%)101-4001-521.22-01 Advertising 5,982 7,414 6,000 6,000 6,000 0 0.0%101-4001-521.22-02 Dues 2,241 1,343 3,000 3,000 3,000 0 0.0%101-4001-521.22-03 Training 4,299 2,627 7,200 7,200 7,200 0 0.0%101-4001-521.22-05 Postage 944 3,832 1,200 1,200 1,200 0 0.0%101-4001-521.22-10 Printing 310 311 2,000 2,000 2,000 0 0.0%101-4001-521.22-15 Photocopying 1,704 865 2,500 2,500 1,500 (1,000) (40.0%)101-4001-521.22-25 IT/GIS Service Charge 59,300 65,800 66,700 66,700 77,600 10,900 16.3%101-4001-521.22-37 Vehicle/Equip Lease Charge 4,400 5,100 4,600 4,600 3,700 (900) (19.6%)
Contractual Services 94,580 112,157 148,700 148,686 151,900 3,214 2.2%
101-4001-521.30-01 Publications Periodicals 1,276 247 1,500 1,500 1,500 0 0.0%101-4001-521.30-05 Office Supplies & Equip 4,719 7,388 7,000 7,000 7,000 0 0.0%101-4001-521.30-50 Petroleum Products 111 48 100 100 100 0 0.0%101-4001-521.33-05 Other Supplies 4,656 1,915 11,600 11,638 4,000 (7,638) (65.6%)
Commodities 10,762 9,598 20,200 20,238 12,600 (7,638) (37.7%)
101-4001-521.40-40 Promote Economic Bus Dev 81,474 59,201 75,500 103,515 98,000 (5,515) (5.3%)101-4001-521.40-41 Discover Arlington 62,154 28,401 127,100 132,141 80,000 (52,141) (39.5%)
Other Charges 143,628 87,602 202,600 235,656 178,000 (57,656) (24.5%)
Total Planning 1,696,833 1,733,623 1,944,000 1,978,080 1,934,400 (43,680) (2.2%)
145

PLANNING GENERAL FUND EXPENDITURE DETAIL
AccountNumber Account Title Description
SALARIES:
101-4001-521.10-01 Salaries Salaries 1,110,500 1,137,900
101-4001-521.18-01 Temporary Help Temporary Help 9,200 8,800
TOTAL SALARIES 1,119,700 1,146,700
FRINGE BENEFITS:
101-4001-521.19-01 Workers' Compensation Workers' Compensation Insurance 3,000 3,300
101-4001-521.19-05 Medical Insurance Medical Insurance 211,900 209,500
101-4001-521.19-10 IMRF IMRF 147,000 137,900
101-4001-521.19-11 Social Security Social Security 70,000 72,100
101-4001-521.19-12 Medicare Medicare 17,100 17,600
101-4001-521.19-23 Automobile Allowance Automobile Allowance 4,800 4,800
TOTAL FRINGE BENEFITS 453,800 445,200
CONTRACTUAL SERVICES:
101-4001-521.20-05 Professional Services Contractual planning services 5,000 15,400Laserfiche scanning ZBA/Design Comm. 28,000 20,000Prior Year Encumbrance Carryover 6,065 39,065 0 35,400
101-4001-521.20-40 General Insurance Liability and property insurance 7,300 5,200
101-4001-521.21-02 Equipment Maintenance Office equipment and computers 500 500
101-4001-521.21-65 Other Services Cell phone charges 1,200 1,200Plan Commission transcribing 7,300 7,400Prior Year Encumbrance Carryover 121 8,621 0 8,600
101-4001-521.22-01 Advertising Plan Commission notices and otheradvertisements 3,000 3,000
Zoning Board of Appeals legal ads 3,000 6,000 3,000 6,000
101-4001-521.22-02 Dues Dues 3,000 3,000
101-4001-521.22-03 Training APA Convention 3,000 3,000Upper Mid-West Conference 1,000 1,000State & local meetings, court, CMAP, etc. 1,500 1,500Continuing education/certification 1,700 7,200 1,700 7,200
101-4001-521.22-05 Postage Mailing charges including mailing costs for survey and marketing mailings 1,200 1,200
101-4001-521.22-10 Printing Reprint planning documents,reports, studies, etc. 2,000 2,000
101-4001-521.22-15 Photocopying Photocopies & supplies Maintenance agreement Minolta BH362 2,500 1,500
Budget20222021
Budget
146

PLANNING GENERAL FUND EXPENDITURE DETAIL
AccountNumber Account Title Description
Budget20222021
Budget
101-4001-521.22-25 IT/GIS Service Charge Information Technology/GIS service charge 66,700 77,600
101-4001-521.22-37 Vehicle/Equip Lease Chrg Vehicle lease charge 4,600 3,700
TOTAL CONTRACTUAL SERVICES 148,686 151,900
COMMODITIES:
101-4001-521.30-01 Publications/Periodicals Miscellaneous publications 1,500 1,500
101-4001-521.30-05 Office Supplies & Equip Stationery, file folders, pens, drafting materials and supplies 7,000 7,000
101-4001-521.30-50 Petroleum Products Gasoline for department vehicle(s) 100 100
101-4001-521.33-05 Other Supplies & Equip Specialized software 3,000 3,000Miscellaneous materials 1,000 1,000Prior Year Encumbrance Carryover 7,638 11,638 0 4,000
TOTAL COMMODITIES 20,238 12,600
OTHER CHARGES:
101-4001-521.40-40 Promote Econ & Business Promote economic development meetings,Development expos, conference, workshop display,
space, equipment and rental, Costar 17,500 17,500Special targeted marketing project
e.g. market segment retail - vacant storefront, hotel concierge, direct mailtarget attractions 25,000 25,000
Business attraction/trade advertising 21,000 21,000Trade shows 11,000 11,000New marketing materials/re-print 11,000 11,000Business Retention - open house, survey,
Chamber of Commerce meetings 4,000 4,000Chamber of Commerce funding 8,500 8,500Prior Year Encumbrance Carryover 5,515 103,515 0 98,000
101-4001-521.40-41 Discover Arlington Discover Arlington Heights Program 80,000 80,000Prior Year Encumbrance Carryover 52,141 132,141 0 80,000
TOTAL OTHER CHARGES 235,656 178,000
TOTAL PLANNING 1,978,080 1,934,400
147

THIS PAGE LEFT BLANK
148
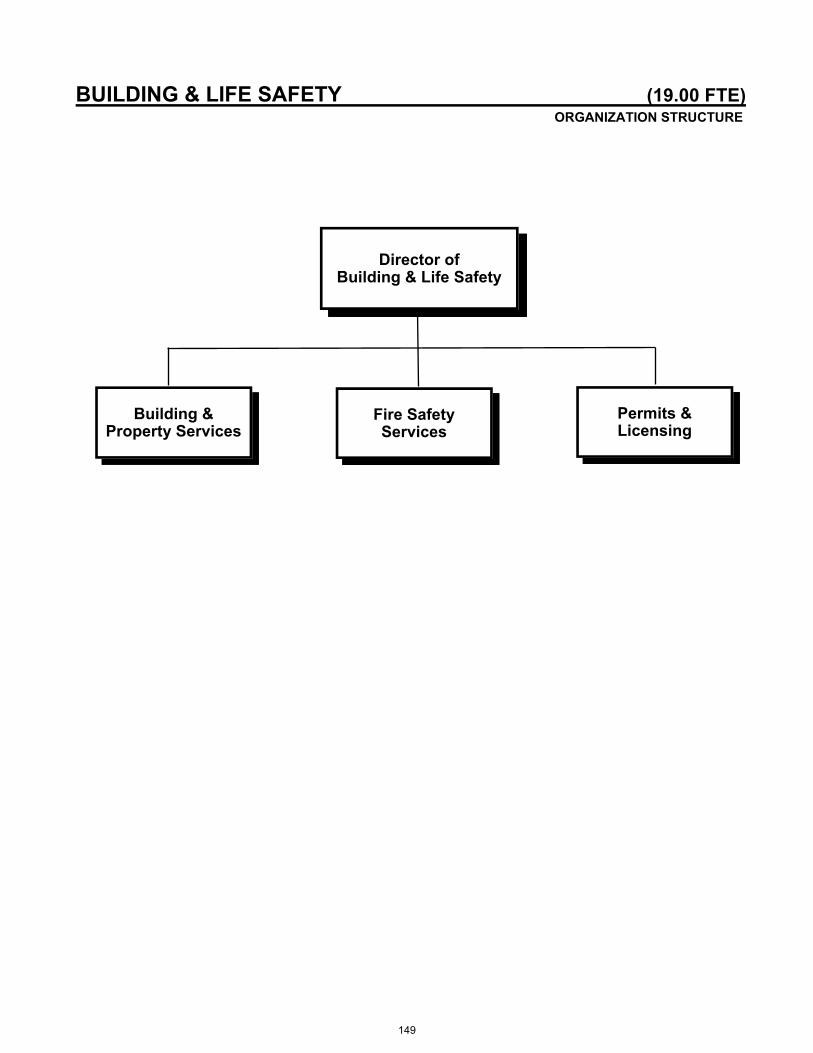
BUILDING & LIFE SAFETY (19.00 FTE) ORGANIZATION STRUCTURE
Director of Building & Life Safety
Building & Property Services
Fire Safety Services
Permits & Licensing
149

BUILDING & LIFE SAFETY The Building & Life Safety Department (B&LS) regulates Building Construction, Use, and Maintenance as well as interfaces with the Building Code Review Board. B&LS accomplishes regulation through a permitting process for construction, a licensing process for businesses, and a periodic inspection process for maintenance; use of buildings is verified during each of these processes. PERMITTING PROCESS:
• Coordination: B&LS receives applications for construction and special events permits, and routes
documents to appropriate departments of the Village. Once approved, final plans are organized, fees are calculated, contractors’ licensing is verified and permits are issued.
• Plan Review: Plans are reviewed for building code compliance. This includes, but is not necessarily
limited to, structural integrity, use, exiting, electrical, plumbing, HVAC, elevators, and Fire Department access, fire sprinklers, and fire alarms. Also, new buildings are assigned street addresses which are communicated to multiple departments and agencies.
• Inspections: Site inspections validate code compliance for building, electrical, plumbing, HVAC, fire
protection, elevators, and other systems. • Certificate of Occupancy: New construction, major remodels, and change of use receive a certificate
of occupancy once all work associated with a project has been completed and approved. BUSINESS LICENSING: B&LS directly oversees licensing of construction contractors, verifying required licenses to perform particular types of work are current; also, the Department coordinates with the Village Clerk to perform plan review and inspection of proposed brick and mortar businesses within the Village. CODE ENFORCEMENT AND MAINTENANCE: B&LS oversees code compliance and maintenance of buildings through several programs. • Periodic Business Inspections: Fire Inspectors visit businesses on a periodic basis to assure they
are operating in a safe manner.
• Fire Systems Testing Monitoring: The Department monitors fire life safety systems, such as fire sprinklers and fire alarms, that require periodic testing to assure their efficacy.
• Elevator Inspection: Elevators are inspected annually to assure they remain in safe operating
condition.
• General Code Enforcement: Buildings and properties are visited on an as need basis to address property maintenance, work without permit, signage, emergency/disaster call-outs, and similar events.
INTERFACE WITH BOARDS AND COMMISSIONS: The Director’s office interfaces with the Building Code Review Board (BCRB). The recommendations made by the BCRB and subsequently approved by the Village Board for buildings, structures, and premises are enforced. • Referrals and Support to the BCRB: B&LS makes recommendations and provides support to the
BCRB where applicants encounter unusual hardships in meeting the codes.
• Code proposals for review by the BCRB: B&LS analyzes code provisions and makes code change recommendations.
150

BUILDING & LIFE SAFETY (Continued)
2021 Accomplishments • Reorganization of Electronic Records into Centralized System
• In 2020 a significant amount of existing paper and electronic records were scanned and incorporated into the Village-wide centralized system - Laserfiche.
• Reorganization of Department Staff
• Staffing levels, duties, and roles were reorganized to optimize service offerings. • An additional Plan Reviewer position was added to improve return-time on plan reviews.
• Targeted Communication of Customer Service Improvements and Initiatives
• SurveyMonkey- Better formalize the customer service survey process. This includes surveys being emailed both immediately prior to permit issuance and then at the beginning of the month following permit issuance. A final survey would then be emailed following the completion of the permitted project.
• Stakeholders quarterly virtual meetings - B&LS Director and appropriate staff convene user service with specific user groups – architects/design professionals, contractors, permit applicants – to obtain input related to their experience with the department as well as educate them on our processes for their projects. This specific user group workshop is being held quarterly.
• B&LS Director and/or Supervisors meet with appropriate staff from other Village Departments – Public Works, Planning & Community Development, Finance, Health & Human Services on a semi regular as needed basis, to foster communication and better understanding of departmental related activities.
• Pre-Construction virtual meeting are being held for all major projects, basically to go over all the procedures and to control expectation on both sides.
• Reduced internal plan review deadlines for BLS only residential plan reviews (projects that do not need to be reviewed by other departments) from 10 to 5 business days.
• All permit application materials were updated in the first half of the year. Along with the updates, project type (sheds, fences, additions, remodeling, new construction, etc.) packets were developed and made available on the village web site. This has been an ongoing project with continual improvements to the forms and packets trying to make them user friendly and updated as to the changes in the way we are doing business today.
• We have started to develop “How-To” videos for homeowners, on how to submit plans for a permit, using a fence permit as an example. This is a step by step video explaining what forms need to be filled out. Where to get the forms on line, what other information is required for this permit, and how to submit this information to the BLS Department.
2022 Strategic Priorities & Key Projects 1. Analyze Electronic Plan Review Potential Strategic Priority #6: Ensure that Organization has the Resources and Training to Maintain Focus on Consistent High-Quality Core Services and Infrastructure In exploration with the new ERP, evaluate the potential for implementing an electronic plan review management system. This will be done in conjunction with analysis of new permitting software. Project Lead: Michael Boyle, Permits Supervisor
151

BUILDING & LIFE SAFETY (Continued)
2. Evaluate New Permitting Software Strategic Priority #6: Ensure that Organization has the Resources and Training to Maintain Focus on Consistent High-Quality Core Services and Infrastructure In exploration with the new ERP, analyze new potential permitting software. Project Lead: Michael Boyle, Permits Supervisor 3. Improve Building & Life Safety Department Web Page(s) Structure, Information, Etc. Strategic Priority #6: Ensure that Organization has the Resources and Training to Maintain Focus on Consistent High-Quality Core Services and Infrastructure Continue to update and keep current the B&LS web pages by restructuring and improving information. This includes existing handouts, checklists, applications, and all other information available to the public. Project Lead: Michael Boyle, Permits Supervisor 4. Critical Risk Assessment (CRA) and Community Risk Reduction (CRR) Plan Update Strategic Priority #6: Ensure that Organization has the Resources and Training to Maintain Focus on Consistent High-Quality Core Services and Infrastructure Evaluate the existing Critical Risk Assessment and if necessary, update the Community Risk Reduction Plan. Project Lead: Jorge Torres, Director 5. Remote Virtual Inspections Strategic Priority #6: Ensure that Organization has the Resources and Training to Maintain Focus on Consistent High-Quality Core Services and Infrastructure Use visual or electronic aids that allow inspectors to observe specific construction projects, products or materials from a distance. These remote inspections are beneficial when the materials or buildings are inaccessible, in dangerous environments, or in other circumstances, prevent an in-person inspection. The implementation of remote virtual inspections can save the department time and money as there is no longer a need for inspectors to travel to and from sites. Setting up a virtual inspection process and determine a list of project types that can be virtually inspected. For example, the following will be eligible for virtual inspections: electrical panel changeouts, water heaters, HVAC changeouts, sewer connections, minor footings, gas lines, patio/decks, and re-inspections. Some projects are not conducive to virtual inspection. The Department would determine which live video applications it will use. Options include Google Duo, Facetime, Skype, Zoom, WhatsApp and WebEx. Some services may only work on some types of phones (e.g., Apple Facetime) and some may require the download of stand-alone apps while others can operate directly from any web browser. Project Lead: Jorge Torres, Director 6. Inspector Cross Training Strategic Priority #6: Ensure that Organization has the Resources and Training to Maintain Focus on Consistent High-Quality Core Services and Infrastructure During slow building seasons, two building inspectors will be performing life safety inspections along with the fire inspectors- the goal being that all commercial/industrial buildings shall be inspected annually. Project Lead: Jorge Torres, Director
152

BUILDING & LIFE SAFETY (Continued)
7. Implement on line credit card payments for permits and inspection Scheduling. Strategic Priority #6: Ensure that Organization has the Resources and Training to Maintain Focus on Consistent High-Quality Core Services and Infrastructure Currently the applicant receives a “Permit Ready for Pick Up” notice with their invoice attached. The applicant then calls BLS and a credit card form is completed by staff over the phone. Time spent on this volume of calls to provide us a credit card number, address and permit information is at least 5-10 minutes on the phone, not including risk of error in transposing a number and having to call back and start over again due to wrong information. Staff then takes this information to finance for processing, at times waiting in line, before finalizing and sending the permit via email. Offer a better customer service by having the option for the applicant to schedule their inspection online 24/7 without calling the office Project Lead: Michael Boyle, Permits Supervisor 8.Fee Analysis, Restructuring and Updating Strategic Priority #6: Ensure that Organization has the Resources and Training to Maintain Focus on Consistent High-Quality Core Services and Infrastructure
Analyze existing fee structure, design new structure and to simplify the usage for both the applicant and staff.
Project Lead: Jorge Torres, Director 9. ERP Integration- Module Specific to Department Responsibilities Strategic Priority #6: Ensure that Organization has the Resources and Training to Maintain Focus on Consistent High-Quality Core Services & Infrastructure
Lead by the Integrated Services, all Department Staff will assist in the implementation of department and module specific processes. Project Lead: Diana Mikula, Assistant Village Manager- Integrated Services Department 10. Arlington Racetrack Project- Specific to Department Responsibilities Strategic Priority #3: Work to Ensure the Redevelopment of Arlington Park Meets Community Standards and Provides a One of a Kind Regional Destination Worthy of the Property’s Legacy Staff will work with would be purchasers on a land use plan for the site that will address all Village concerns, take into consideration the perspectives of all stakeholders, and provide for a unique one of a kind development worthy of the site’s legacy to our community and the region. Departments, including Fire, Police, Public Works, Finance, Planning & Community Development, Building & Life Safety, and Integrated Services, will work on cross-department initiatives to support this project. Project Lead: Randy Recklaus, Village Manager- Integrated Services Department
153

BUILDING & LIFE SAFETY (Continued)
Performance Measures 2018 2019 2020
Permit Applications Residential 3,489 3,766 3208 Commercial 1,192 1,010 858 TOTAL: 4,681 4,776 4066
Permit Plan Reviews Building/HVAC/Energy 3,185 3,966 3,722 Electric 1,468 1,585 1,149 Plumbing 770 832 755 Fire Life Safety 294 249 203
Fire Alarm 159 145 105
Fire Suppression/Hood & Duct 55 71 56 Structural Consultant 57 53 53 Elevator Consultant 36 33 17 TOTAL: 6,024 6,934 6,060 Permit Inspections Building 8,739 9,169 9,342 Electric 2,930 2,993 2,941 HVAC 1,024 1,079 1,077
Plumbing 2,142 2,118 1,889 Fire Systems 574 637 753
TOTAL: 15,411 15,887 15,858
Fire Safety Inspections Initial Periodic 1,219 1,676 1,183
Re-inspection Periodic 523 653 440
Business License 108 139 89
Miscellaneous 1,044 922 871
TOTAL: 2,894 3,390 2,583 Elevator Inspections Annual Initial Inspections 486 474 472
Annual Re-inspections 83 141 67
Permit Initial Inspections 31 33 14
Permit Re-inspections 8 23 6
TOTAL: 608 671 559
New Elevators NA 10 3
Licenses Contractor Renewals 1,869 1,700 1064
New Contractors 636 696 127
TOTAL: 2,505 2,396 1191 Citizen Contacts FOIA Responses 627 600 523
154

BUILDING & LIFE SAFETY (Continued)
Three Year Comparison of Construction Values Type of Permit 2018 2019 2020
One- & Two-Family Structures: Alterations, Additions, & New Const. $50,325,067 $53,756,553 $39,355,606.00
Commercial & Multi-Family Structures: Alterations, Additions, & New Const. $109,953,360 $140,251,289 $46,135,938.00
Miscellaneous $11,020,309 $11,463,907 $13,602,268.00
TOTAL: $171,298,736 $205,471,749
$99,093,812.00
Revenue Generated by Permits and Licensing Fees
Type of Permit 2018 2019 2020
Construction Permit Fees $1,815,778 $1,856,891 $1,173,967.00 Business License Fees $714,343 $637,785 $623,074.00
TOTAL: $2,530,121 $2,494,676 $1,797,041.00 Operating Budget $2,623,400 $2,667,800 $2,789,700.00 Revenue/Budget 96.44% 93.51% 64.41%
155

OPERATION SUMMARY
BUILDING SERVICES2019 2020 2021 2021 2022 $ %
Actual Actual Est. Actual Budget Budget Change Change
Authorized Positions in F-T-E 17.50 17.50 18.00 18.00 19.00 1.00 0.1
Expenditures Personal Services $2,190,609 $2,345,099 $2,391,700 $2,432,000 $2,658,500 $226,500 9.3% Contractual Services 399,192 373,879 280,500 358,000 350,600 (7,400) (2.1%) Commodities 29,957 26,612 25,300 25,300 27,100 1,800 7.1% Capital Items 11,695 5,000 0 0 0 0 N/A
Total Expenditures $2,631,453 $2,750,590 $2,697,500 $2,815,300 $3,036,200 $220,900 7.8%
CROSS REFERENCE TO FUNDS
2019 2020 2021 2021 2022 $ %Actual Actual Est. Actual Budget Budget Change Change
General Fund $2,619,758 $2,745,590 $2,697,500 $2,815,300 $3,036,200 $220,900 7.8%Capital Projects Fund 11,695 5,000 0 0 0 0 N/A
Total Expenditures $2,631,453 $2,750,590 $2,697,500 $2,815,300 $3,036,200 $220,900 7.8%
Paste Chart Here
16.0 16.0 16.0 16.5 16.5 16.5 17.0 17.5 17.5 18.0 18.019.0
14.0
16.0
18.0
20.0
22.0
24.0
FY12 FY13 FY14 FY15 2015 2016 2017 2018 2019 2020 2021 2022
FT
E
STAFFING HISTORY
156

BUILDING & LIFE SAFETY General Fund
PERSONNEL SUMMARY
Class
Code Title Grade 2021 2022 + (-)
Director of Building Services 11 1.00 1.00
Assistant Building Official 9 1.00 1.00
Property Maintenance Inspector 5 0.00 1.00 1.00
Permits Supervisor 5 1.00 1.00
Building & Property Inspector 5 3.00 3.00
Fire Safety Inspector 5 3.00 3.00
Electrical Inspector 5 1.00 1.00
Plumbing Inspector 5 1.00 1.00
Plan Reviewer 4 2.00 2.00
Permits, Inspect & Licensing Coord. 3 1.00 1.00
Permits Technician 2 3.00 3.00
Administrative Assistant 2 1.00 1.00
Total F-T-E 18.00 19.00 1.00
Code Fund 2021 2022 + (-)
101 General Fund 18.00 19.00 1.00
Total F-T-E All Funds 18.00 19.00 1.00
Authorized Positions in F-T-E
Building & Life Safety DepartmentCross Reference to All Funds
Authorized Positions in F-T-E
157

BUILDING & LIFE SAFETYGENERAL FUND EXPENDITURES
Account Account Actual Actual Proj. Act. Budget Budget $ %Number Description 2019 2020 2021 2021 2022 Inc (Dec) Inc (Dec)
101-4501-523.10-01 Salaries 1,575,496 1,665,483 1,711,600 1,753,700 1,841,700 88,000 5.0%101-4501-523.18-01 Temporary Help 3,102 2,888 12,000 2,600 30,000 27,400 1053.8%101-4501-523.18-05 Overtime Civilian 6,543 2,601 5,000 4,200 4,300 100 2.4%
Salaries 1,585,141 1,670,972 1,728,600 1,760,500 1,876,000 115,500 6.6%
101-4501-523.19-01 Workers Compensation 45,300 46,200 48,500 48,500 53,900 5,400 11.1%101-4501-523.19-05 Medical Insurance 284,800 294,600 272,500 272,500 377,500 105,000 38.5%101-4501-523.19-10 IMRF 156,933 208,779 215,100 220,400 211,700 (8,700) (3.9%)101-4501-523.19-11 Social Security 95,987 100,941 102,100 104,600 112,200 7,600 7.3%101-4501-523.19-12 Medicare 22,448 23,607 24,900 25,500 27,200 1,700 6.7%
Fringe Benefits 605,468 674,127 663,100 671,500 782,500 111,000 16.5%
101-4501-523.20-05 Professional Services 94,886 92,660 10,000 60,000 30,000 (30,000) (50.0%)101-4501-523.20-35 Reimbursable Plan Reviews 61,821 22,346 35,000 35,000 35,000 0 0.0%101-4501-523.20-40 General Insurance 12,900 13,000 13,100 13,100 9,300 (3,800) (29.0%)101-4501-523.21-02 Equipment Maintenance 0 0 600 600 600 0 0.0%101-4501-523.21-65 Other Services 56,649 82,182 40,000 67,500 52,500 (15,000) (22.2%)101-4501-523.22-02 Dues 1,621 2,454 2,500 2,500 2,500 0 0.0%101-4501-523.22-03 Training 8,892 4,046 12,000 12,000 12,000 0 0.0%101-4501-523.22-05 Postage 3,914 2,547 2,800 2,800 2,800 0 0.0%101-4501-523.22-10 Printing 6,571 3,005 7,500 7,500 7,500 0 0.0%101-4501-523.22-15 Photocopying 3,338 1,839 3,300 3,300 3,300 0 0.0%101-4501-523.22-25 IT/GIS Service Charge 95,600 100,500 101,800 101,800 147,100 45,300 44.5%101-4501-523.22-37 Vehicle/Equip Lease Charge 53,000 49,300 51,900 51,900 48,000 (3,900) (7.5%)
Contractual Services 399,192 373,879 280,500 358,000 350,600 (7,400) (2.1%)
101-4501-523.30-01 Publications Periodicals 3,782 4,008 3,000 3,000 3,000 0 0.0%101-4501-523.30-05 Office Supplies & Equip 16,305 15,416 13,000 13,000 13,000 0 0.0%101-4501-512.30-35 Clothing 3,121 1,804 3,000 3,000 3,000 0 0.0%101-4501-523.30-50 Petroleum Products 6,276 5,097 6,100 6,100 7,900 1,800 29.5%101-4501-523.33-05 Other Supplies 473 287 200 200 200 0 0.0%
Commodities 29,957 26,612 25,300 25,300 27,100 1,800 7.1%
Total Building & Life Safety 2,619,758 2,745,590 2,697,500 2,815,300 3,036,200 220,900 7.8%
158

BUILDING & LIFE SAFETYGENERAL FUND EXPENDITURE DETAIL
AccountNumber Account Title Description
SALARIES:
101-4501-523.10-01 Salaries Salaries 1,753,700 1,841,700
101-4501-523.18-01 Temporary Help On-call inspectors, summer interns, and data entry 2,600 30,000
101-4501-523.18-05 Overtime Civilian Overtime Civilian 4,200 4,300
TOTAL SALARIES 1,760,500 1,876,000
FRINGE BENEFITS:
101-4501-523.19-01 Workers' Compensation Workers' Compensation Insurance 48,500 53,900
101-4501-523.19-05 Medical Insurance Medical Insurance 272,500 377,500
101-4501-523.19-10 IMRF IMRF 220,400 211,700
101-4501-523.19-11 Social Security Social Security 104,600 112,200
101-4501-523.19-12 Medicare Medicare 25,500 27,200
TOTAL FRINGE BENEFITS 671,500 782,500
CONTRACTUAL SERVICES:
101-4501-523.20-05 Professional Services Contractual services 60,000 30,000
101-4501-523.20-35 Reimbursable Plan Reviews Contractual reviews of building plansfor fire, structural and other coderequirements 35,000 35,000
101-4501-523.20-40 General Insurance Liability and property insurance 13,100 9,300
101-4501-523.21-02 Equipment Maintenance Office equipment & computers 600 600
101-4501-523.21-65 Other Services Digital scanning of building, sign, fenceand air-conditioning permits 30,000 15,000
Cell phone and wireless charges 9,000 9,000Board-ups, fences and property cleanups 1,500 1,500Elevator inspections 27,000 67,500 27,000 52,500
101-4501-523.22-02 Dues Dues 2,500 2,500
101-4501-523.22-03 Training Conferences, training & seminars 10,000 10,000Metro travel, tolls, court, etc. 500 500Miscellaneous (Supervision, Administration) 1,500 12,000 1,500 12,000
101-4501-523.22-05 Postage Mailing business licenses, building &code related communications, sign,electrical & misc. correspondence 2,800 2,800
101-4501-523.22-10 Printing Misc. forms, cards, stickers, placards,and licenses 7,500 7,500
Budget20222021
Budget
159
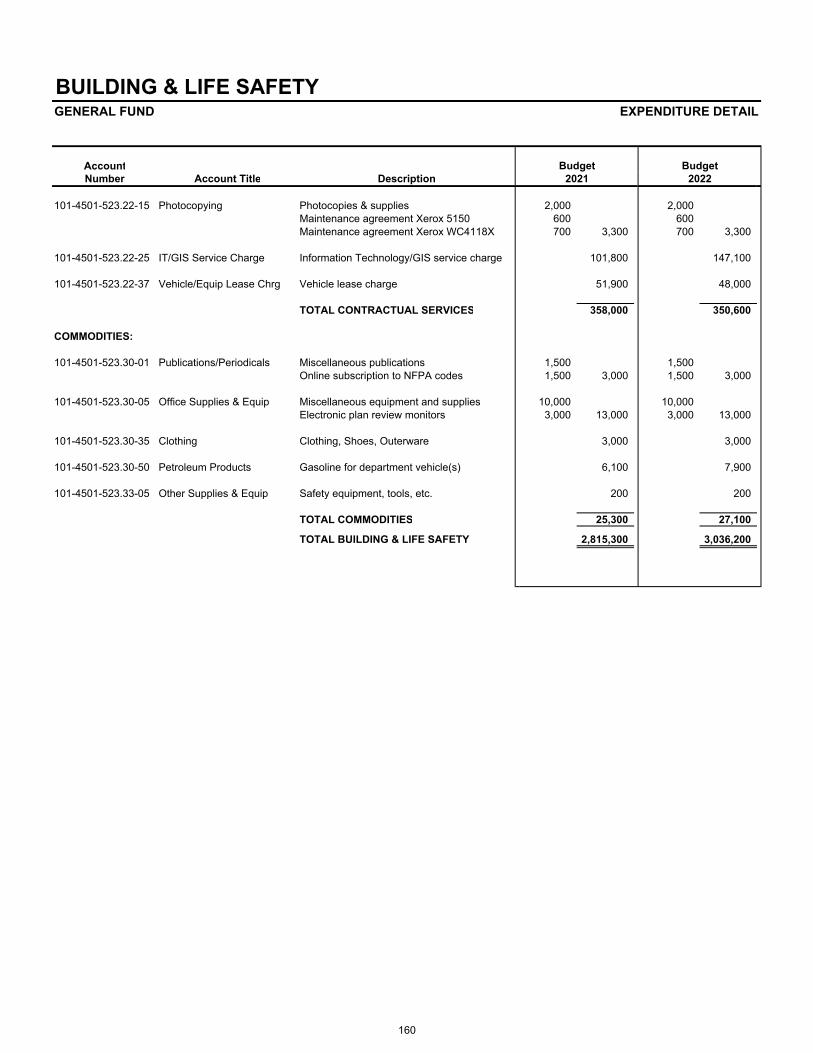
BUILDING & LIFE SAFETYGENERAL FUND EXPENDITURE DETAIL
AccountNumber Account Title Description
Budget20222021
Budget
101-4501-523.22-15 Photocopying Photocopies & supplies 2,000 2,000Maintenance agreement Xerox 5150 600 600Maintenance agreement Xerox WC4118X 700 3,300 700 3,300
101-4501-523.22-25 IT/GIS Service Charge Information Technology/GIS service charge 101,800 147,100
101-4501-523.22-37 Vehicle/Equip Lease Chrg Vehicle lease charge 51,900 48,000
TOTAL CONTRACTUAL SERVICES 358,000 350,600
COMMODITIES:
101-4501-523.30-01 Publications/Periodicals Miscellaneous publications 1,500 1,500Online subscription to NFPA codes 1,500 3,000 1,500 3,000
101-4501-523.30-05 Office Supplies & Equip Miscellaneous equipment and supplies 10,000 10,000Electronic plan review monitors 3,000 13,000 3,000 13,000
101-4501-523.30-35 Clothing Clothing, Shoes, Outerware 3,000 3,000
101-4501-523.30-50 Petroleum Products Gasoline for department vehicle(s) 6,100 7,900
101-4501-523.33-05 Other Supplies & Equip Safety equipment, tools, etc. 200 200
TOTAL COMMODITIES 25,300 27,100
TOTAL BUILDING & LIFE SAFETY 2,815,300 3,036,200
160

HEALTH & HUMAN SERVICES (13.25 FTE) ORGANIZATION STRUCTURE
Director Health & Human
Services
Senior Services (3.75 FTE)
Environmental Health
Public Health Nursing Services
Social Services
Health Services (9.50 FTE)
Facility Management
Services & Programs Coordination
Volunteer Services
161
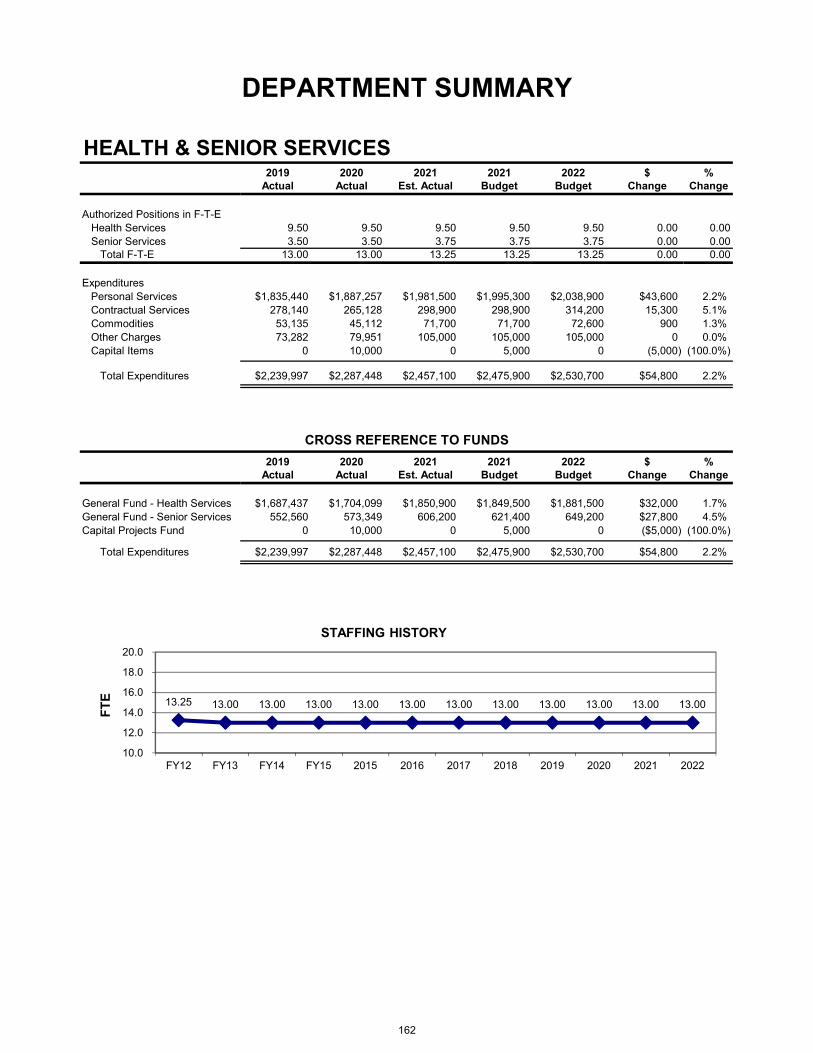
DEPARTMENT SUMMARY
HEALTH & SENIOR SERVICES2019 2020 2021 2021 2022 $ %
Actual Actual Est. Actual Budget Budget Change Change
Authorized Positions in F-T-EHealth Services 9.50 9.50 9.50 9.50 9.50 0.00 0.00Senior Services 3.50 3.50 3.75 3.75 3.75 0.00 0.00
Total F-T-E 13.00 13.00 13.25 13.25 13.25 0.00 0.00
Expenditures Personal Services $1,835,440 $1,887,257 $1,981,500 $1,995,300 $2,038,900 $43,600 2.2% Contractual Services 278,140 265,128 298,900 298,900 314,200 15,300 5.1% Commodities 53,135 45,112 71,700 71,700 72,600 900 1.3% Other Charges 73,282 79,951 105,000 105,000 105,000 0 0.0% Capital Items 0 10,000 0 5,000 0 (5,000) (100.0%)
Total Expenditures $2,239,997 $2,287,448 $2,457,100 $2,475,900 $2,530,700 $54,800 2.2%
CROSS REFERENCE TO FUNDS
2019 2020 2021 2021 2022 $ %Actual Actual Est. Actual Budget Budget Change Change
General Fund - Health Services $1,687,437 $1,704,099 $1,850,900 $1,849,500 $1,881,500 $32,000 1.7%General Fund - Senior Services 552,560 573,349 606,200 621,400 649,200 $27,800 4.5%Capital Projects Fund 0 10,000 0 5,000 0 ($5,000) (100.0%)
Total Expenditures $2,239,997 $2,287,448 $2,457,100 $2,475,900 $2,530,700 $54,800 2.2%
Paste Chart Here
13.25 13.00 13.00 13.00 13.00 13.00 13.00 13.00 13.00 13.00 13.00 13.00
10.0
12.0
14.0
16.0
18.0
20.0
FY12 FY13 FY14 FY15 2015 2016 2017 2018 2019 2020 2021 2022
FT
E
STAFFING HISTORY
162

HEALTH & HUMAN SERVICES Health & Human Services addresses the physical, environmental and social needs of the community through the divisions described below:
Environmental Health Services Three Licensed Environmental Health Practitioners monitor and inspect commercial, institutional and industrial sites, public food establishments, day care facilities and swimming pools, handle nuisance complaints, and perform other types of inspections as needed. This division also manages program areas including weed cutting, private well water and radon testing, foodservice education, and refuse, recycling and landscape waste.
Nursing Services Two registered nurses provide a Home Visit Program, serve as consultants to day cares, provide various low-cost health screening clinics and vaccinations. Nursing Services also provides CPR and AED instruction support for the Fire Department and community. Blood Borne Pathogen training is provided to mandated employees which include Police, Fire and certain Public Works employees. Consultation regarding health matter’s are available to all Village Employees. A close working relationship is maintained with the local hospitals, area municipalities, County and State government bodies and the Medical Reserve Corps Coordinator for disaster preparedness and communicable disease outbreaks. Vision and Hearing screening is provided to the parochial schools, as they do not have nurses IDPH certified in these screenings. First aid and blood pressure screenings are provided at non-profit community events when requested. Skilled nursing visits are provided to residents that are homebound which allow them to remain in their homes as long as they can safely do so. Adult vaccinations are provided to homebound residents as well.
Social Services The Social Services Division is responsible for providing disability and social services to residents. The division consists of a Social Services Coordinator, Disability Services Coordinator, and Social Services Case Worker. The Disability Services Coordinator (DSC) acts as the Village’s Americans with Disabilities Act (ADA) Compliance Coordinator and as a community resource related to disability issues. The division works to ensure all Village programs, services, activities, and modes of communication are accessible to persons with disabilities. As a community resource on disability issues, the DSC keeps current on Federal, State, and Local programs and services that benefit persons with disabilities and their families. The DSC also is a community resource to businesses regarding accessibility requirements of the ADA, Illinois Accessibility Code, Federal Fair Housing Amendments Act as well as local laws and ordinances. The DSC provides information and referrals to residents. Additionally, the DSC coordinates the Emergency 9-1-1 Registration, Vehicle Sticker Discount Program, Taxi Discount Program for low-income senior citizens and persons with disabilities and the Low-Income Refuse Discount Program. The Social Services Coordinator (SSC) evaluates, recommends, and coordinates social service programs for the Village. The SSC oversees the Emergency Assistance Fund and provides additional resources to residents struggling with financial health. Additionally, the SSC provides mental health services through holistic assessment, referrals, and when appropriate offers brief-strategic therapy. The SSC oversees the Counseling Subsidy Program, which provides sliding scale subsidy for mental health services with the intention of increasing health equity. The SSC performs crisis intervention services at the request of the Police & Fire Departments. Other services administered through the Social Services Division include the Children at Play Scholarship Program, the Arlington Heights Park District Scholarship Program, the Arlington Heights Ministerial Association Emergency Fund, the Salvation Army Service Extension Fund, the Village Holiday Assistance Program, and the Village Emergency Assistance Fund. The SSC acts as coordinator for Access to Care, the Nicor Share Program, and the Parish Emergency Assistance Resource
163

HEALTH & HUMAN SERVICES (Continued) (PEAR). The SSC is also the Liaison to Arlington Cares, NFP that fundraises for the Emergency Assistance Fund. Additional Services Health & Human Services staff provides liaison support for the Board of Health, Environmental Commission, Commission for Citizens with Disabilities, and Youth Commission. 2021 Accomplishments
• Nursing Services
o Nursing Services provided a total of 21 COVID-19 clinics for Village employees and residents.
o Nurses Lindsay Dohse and Mary Sterrenberg continued to provide consultation for employees who were either diagnosed with COVID-19 or had direct contact with someone with COVID-19. Antigen testing was provided for employees who had symptoms of COVID-19 or direct contact with someone who tested positive for the virus.
o Lindsay Dohse successfully completed the Designated Infection Control Officer course to better assist with employee exposures. Mary Sterrenberg recertified her CPR instructor status with the American Heart Association and vision and hearing requirements with the Illinois Department of Public Health (IDPH).
• Social Services o The Social Services Division provided $139,226.84 in financial assistance to 315 residents
directly impacted by COVID-19 from March 31, 2020 through June 1, 2021. o Counseling Subsidy has been highly utilized during the pandemic and fortunately through
Village and Federal CDBG-CV funds, Social Services was able to meet the needs of residents.
• Environmental Health o Environmental Health staff continued to distribute special mailings in response to COVID-
19. These mailings went to food service establishments and swimming pool facilities to notify managers/owners of changes in the different phases of Restore Illinois.
o Environmental Health staff was responsible for responding to a large variety of complaints and/or general questions related to COVID-19, and the phases of Restore Illinois initiated by the Governor’s Office. Staff assisted the Cook County Department of Public Health (CCDPH) by notifying establishments that were violating state closure orders for indoor dining.
o A new solid waste collection agreement with Groot Industries, Inc. began in April 2021. New sustainability initiatives in the contract included eliminating twice a week collection and adding weekly curbside electronics collection.
o Environmental Health inspection reports for daycares and swimming facilities were transitioned to digital formats.
• Disability Services o The Arlington Heights Medical Reserve Corps (AHMRC) added 12 new volunteers for a
total of 31 active members. In 2021, AHMRC Volunteers helped out at five different vaccination events.
o The Disability Services Coordinator (DSC) purchased 1000 Emergency Information Packets which are adhered to residents’ refrigerators for first responders during a medical emergency.
o The DSC helped arrange a “JJ’s List” online Disability Awareness & Sensitivity Training for Department Directors on “Person Fist Language” and “Disability Etiquette.”
o Commission for Citizens with Disabilities hosted an online Disability Awareness & Sensitivity Training by Progress Center for Independent Living. The Commission plans to host a community presentation in the Spring of 2022.
164

HEALTH & HUMAN SERVICES (Continued)
2022 Strategic Priorities & Key Projects
1. Remain focused on the evolving COVID-19 pandemic and adjust to appropriate mitigationmeasures as determined by the Illinois Department of Public Health (IDPH)
Staff Generated Projects
Continue to support the Cook County Department of Public Health (CCDPH) as the local health department with vaccine distribution, contact tracing and unforeseen measures that may be needed to protect residents and employees.
Project Lead: Mary Sterrenberg, Nursing Supervisor Project Completion: 4Q 2022
2. Provide New Community Outreach EventsStaff Generated Projects
The Social Services Division plans to assist in creating new community outreach events to inform residents of services offered, engage new community members, and collaborate with Police, Fire and Community Partners.
Project Lead: Nicole Espinoza, Social Services Coordinator Project Completion: 4Q 2022
3. Host a Disability Awareness & Sensitivity Presentation for the PublicStaff Generated Projects
The Disability Services Coordinator with the Village’s Commission for Citizens with Disabilities will host a Disability Awareness & Sensitivity Presentation for the Public.
Project Lead: David Robb, Disability Services Coordinator Project Completion: 4Q 2022
4. Special Collection Waste Event EvaluationStaff Generated Projects
Staff will discuss options available for a special waste collection event with the single-family solid waste contractor, Groot Industries, Inc., the Solid Waste Agency of Northern Cook County (SWANCC) and Administration to determine an appropriate time-frame for the decided upon event.
Project Lead: Terese Biskner, Environmental Health Officer Project Completion: 4Q 2022
165

HEALTH & HUMAN SERVICES (Continued) Performance Measures 2018 2019 2020 1. Routine In-Service Food Service Inspections: High Risk Medium Risk Low Risk Seasonal Inspections Total Inspections Total Re-Inspections Temporary Food Inspections
333 249 47 69 698 176 261
305 259 51 *31 646 141 199
240 176 42 5 463 72 46
2. Routine Swimming Pool/Spa Inspections: 462 447 152 3. Routine Day Care Inspections 30 36 9 *Seasonal Inspections primarily include Park District concession stands and all food service operations at Arlington Park and Park District facilities. Prior to 2019, there were 22 inspection sites at Arlington Park (i.e. different kitchens, bars, etc.). In 2019, the new Executive Chef requested that the different inspection sites be grouped together by each manager. This grouping created a count of 7 inspections per visit rather than 22, even though 22 were inspected. Inspection totals in all Environmental Health areas were reduced in 2020 due to 15 weeks of not being able to complete inspections during the pandemic. The State of Illinois suspended food inspections for several weeks at the beginning of the pandemic, and many establishments remained closed when only to-go food was allowed. Swimming facilities were closed by State order for several months and several remained closed after the State allowed some facilities to open, such as hot tubs. Day Care facilities were not inspected during COVID-19 to mitigate potential exposure to children and inspections resumed in Phase 5. 4. Nursing Services In-Home Visits
INR Injections Blood Pressure Readings Pulse Oximeter
851 292 87 851 712
773 255 63 773 597
612 284 59 612 440
5. Influenza vaccine 342 359 370
166

HEALTH & HUMAN SERVICES (Continued) Performance Measures (cont.) 2018 2019 2020 6. *Clinic Services:
Diabetic Screenings INR Injections Blood Pressure Readings Pulse Oximeter Cholesterol Screenings TB Skin Tests Community Events - blood pressure/body fat analysis
Total Clinical Services
227 90 34 2,318 2,186 178 176 69 5,595
217 73 63 2,139 1,772 163 140 494 5,061
118 78 39 773 653 81 57 0 1,799
*Clinics were closed due to COVID-19 and were safe to reopen in June 2020, but with limited capacity. *COVID-19 clinics began in 2021 when vaccine was received from the Cook County Department of Public Health (CCDPH).
# of COVID-19 Vaccination clinics # of COVID-19 Vaccinations given # of COVID-19 Vaccinations given during home visits
21 887 146
7. Park District Scholarship Program:
Total Applications Portion of applications for Children at Play (CAP)
108 17
84 12
*35 *3
*Park District Scholarship applicants reduced due to Park District closures and programs, such as the pool pass, being removed from the scholarship during 2020. CAP enrollment also significantly dropped due to school closings. 8. Emergency Assistance Fund: Residents Served Total Expenditures
408 $52,558
562 $56,305
631 $134,901
9. Holiday Assistance Program – Total Households Served 58 63 35
167

HEALTH & HUMAN SERVICES (Continued) Performance Measures (cont.) 2018 2019 2020 10. Mental Health Services Crisis Interventions (hours spent) Resource Referral *Counseling Subsidy Participants **Therapeutic Interventions (hours spent) **Community Addiction Recovery Effort (CARE) (hours spent)
238 394 18 178 n/a
157 474 22 108 94
171 648 23 45 18.5
*2021 Counseling Subsidy (as of 9/15/21) Total is more reflective of monthly budget from Finance as CDBG-CV funds are transferred periodically throughout the year. Usage of Counseling Subsidy funds has been greatly impacted by whether the economy is open or shut-down due to COVID-19. As such,
usage increased during 2020 and portions of 2021 while residents were unemployed and uninsured. CDBG-CV funding has substantially off-set the overall cost of the Counseling Subsidy Program since the majority of applicants were COVID impacted and could qualify for CDBG-CV funds. I am estimating Counseling Subsidy usage will be $2,970 monthly which is $11,880 in additional funds by the end of 2021. **2020 Mental Health data was impacted by a re-design of the client database, a reduction in data collection due to the Administrative Assistant position being vacant for three months, and the substantial amount of time that was reallocated to address the financial assistance needs during COVID-19. The CARE data reflects the amount of time the SSC spent on the program. In 2019, a substantial amount of time was spent designing the CARE program. In 2020, the program was implemented and thus necessitated less time. The program served 13 participants in 2019 and 170 participants in 2020.
11. Taxi Subsidy Rides 141 101 *80 *Taxi rides decreased due to COVID-19.
Total $17,907.00
CDBG-CV $11,880.00
Village $6,027.00
168

OPERATION SUMMARY
HEALTH SERVICES2019 2020 2021 2021 2022 $ %
Actual Actual Est. Actual Budget Budget Change Change
Authorized Positions in F-T-E 9.50 9.50 9.50 9.50 9.50 0.00 0.0%
Expenditures Personal Services $1,385,200 $1,407,479 $1,494,200 $1,492,800 $1,523,700 $30,900 2.1% Contractual Services 195,623 182,184 207,300 207,300 207,500 200 0.1% Commodities 33,332 34,485 44,400 44,400 45,300 900 2.0% Other Charges 73,282 79,951 105,000 105,000 105,000 0 0.0% Capital Items 0 5,000 0 0 0 0 N/A
Total Expenditures $1,687,437 $1,709,099 $1,850,900 $1,849,500 $1,881,500 $32,000 1.7%
CROSS REFERENCE TO FUNDS
2019 2020 2021 2021 2022 $ %Actual Actual Est. Actual Budget Budget Change Change
General Fund $1,687,437 $1,704,099 $1,850,900 $1,849,500 $1,881,500 $32,000 1.7%Capital Projects Fund 0 5,000 0 0 0 0 N/A
Total Expenditures $1,687,437 $1,709,099 $1,850,900 $1,849,500 $1,881,500 $32,000 1.7%
Paste Chart Here
9.5 9.5 9.5 9.5 9.5 9.5 9.5 9.5 9.5 9.5 9.5 9.5
7.0
9.0
11.0
13.0
15.0
FY12 FY13 FY14 FY15 2015 2016 2017 2018 2019 2020 2021 2022
FT
E
STAFFING HISTORY
169

HEALTH SERVICES General Fund
PERSONNEL SUMMARY
Class
Code Title Grade 2021 2022 + (-)
Director of Health & Human Services 11 1.00 1.00
Nursing Supervisor 8 1.00 1.00
Social Services Coordinator 7 1.00 1.00
Environmental Health Practitioner 6 3.00 3.00
Community Health Nurse 6 0.50 0.50
Disability Services Coordinator 5 1.00 1.00
Administrative Assistant 2 1.00 1.00
Social Services Case Worker 2 1.00 1.00
Total F-T-E 9.50 9.50 0.00
Code Fund 2021 2022 + (-)
101 General Fund
Health & Human Services
Health Services 9.50 9.50
Senior Services 3.75 3.75
Total F-T-E All Funds 13.25 13.25 0.00
Authorized Positions in F-T-E
Health & Senior Services DepartmentCross Reference to All Funds
Authorized Positions in F-T-E
170

HEALTH SERVICES GENERAL FUND EXPENDITURES
Account Account Actual Actual Proj. Act. Budget Budget $ %Number Description 2019 2020 2021 2021 2022 Inc (Dec) Inc (Dec)
101-7001-541.10-01 Salaries 1,008,630 992,098 1,059,100 1,057,900 1,091,800 33,900 3.2%101-7001-541.18-01 Temporary Help 9,593 12,712 14,500 14,500 14,800 300 2.1%101-7001-541.18-05 Overtime Civilian 0 0 300 300 300 0 0.0%
Salaries 1,018,223 1,004,810 1,073,900 1,072,700 1,106,900 34,200 3.2%
101-7001-541.19-01 Workers Compensation 18,800 19,200 20,200 20,200 22,400 2,200 10.9%101-7001-541.19-05 Medical Insurance 172,300 185,300 197,500 197,500 196,800 (700) (0.4%)101-7001-541.19-10 IMRF 101,660 125,359 125,800 125,700 118,500 (7,200) (5.7%)101-7001-541.19-11 Social Security 60,042 58,863 61,200 61,100 63,000 1,900 3.1%101-7001-541.19-12 Medicare 14,175 13,947 15,600 15,600 16,100 500 3.2%
Fringe Benefits 366,977 402,669 420,300 420,100 416,800 (3,300) (0.8%)
101-7001-541.20-25 Counseling Services 40,812 26,390 35,600 35,600 35,600 0 0.0%101-7001-541.20-40 General Insurance 20,500 20,700 20,900 20,900 14,800 (6,100) (29.2%)101-7001-541.21-02 Equipment Maintenance 490 1,355 2,000 2,000 2,000 0 0.0%101-7001-541.21-10 Property Maintenance 13,880 8,275 17,000 17,000 16,800 (200) (1.2%)101-7001-541.21-65 Other Services 6,255 5,401 6,400 6,400 6,700 300 4.7%101-7001-541.22-02 Dues 961 2,092 2,400 2,400 2,400 0 0.0%101-7001-541.22-03 Training 3,901 765 5,200 5,200 5,200 0 0.0%101-7001-541.22-05 Postage 1,108 2,555 2,500 2,500 2,500 0 0.0%101-7001-541.22-10 Printing 597 543 1,000 1,000 1,000 0 0.0%101-7001-541.22-15 Photocopying 2,619 2,091 2,600 2,600 2,600 0 0.0%101-7001-541.22-25 IT/GIS Service Charge 70,400 74,800 75,900 75,900 90,700 14,800 19.5%101-7001-541.22-37 Vehicle/Equip Lease Charge 34,100 36,800 33,400 33,400 24,800 (8,600) (25.7%)101-7001-541.22-40 Taxi Service Subsidy 0 417 2,400 2,400 2,400 0 0.0%
Contractual Services 195,623 182,184 207,300 207,300 207,500 200 0.1%
101-7001-541.30-01 Publications Periodicals 602 935 1,000 1,000 1,000 0 0.0%101-7001-541.30-05 Office Supplies & Equip 4,983 3,531 6,200 6,200 6,200 0 0.0%101-7001-541.30-35 Clothing 995 224 1,000 1,000 1,000 0 0.0%101-7001-541.30-50 Petroleum Products 1,381 728 1,300 1,300 1,100 (200) (15.4%)101-7001-541.33-05 Other Supplies 10,223 10,113 11,700 11,700 12,800 1,100 9.4%101-7001-541.33-10 Wellness Program Supplies 15,148 18,954 23,200 23,200 23,200 0 0.0%
Commodities 33,332 34,485 44,400 44,400 45,300 900 2.0%
101-7001-541.40-53 A H Emergency Assistance 40,000 40,000 55,000 55,000 55,000 0 0.0%101-7001-541.40-57 A H Emergency Asst Donations 5,800 24,278 20,000 20,000 20,000 0 0.0%101-7001-541.40-60 Rental Housing Assistance Prog 15,000 15,000 0 0 0 0 N/A101-7001-541.40-61 MRC Capacity Building Award 1,450 310 1,000 1,000 1,000 0 0.0%101-7001-541.41-16 CAP Program 11,032 363 29,000 29,000 29,000 0 0.0%
Other Charges 73,282 79,951 105,000 105,000 105,000 0 0.0%
Total Health Services 1,687,437 1,704,099 1,850,900 1,849,500 1,881,500 32,000 1.7%
171
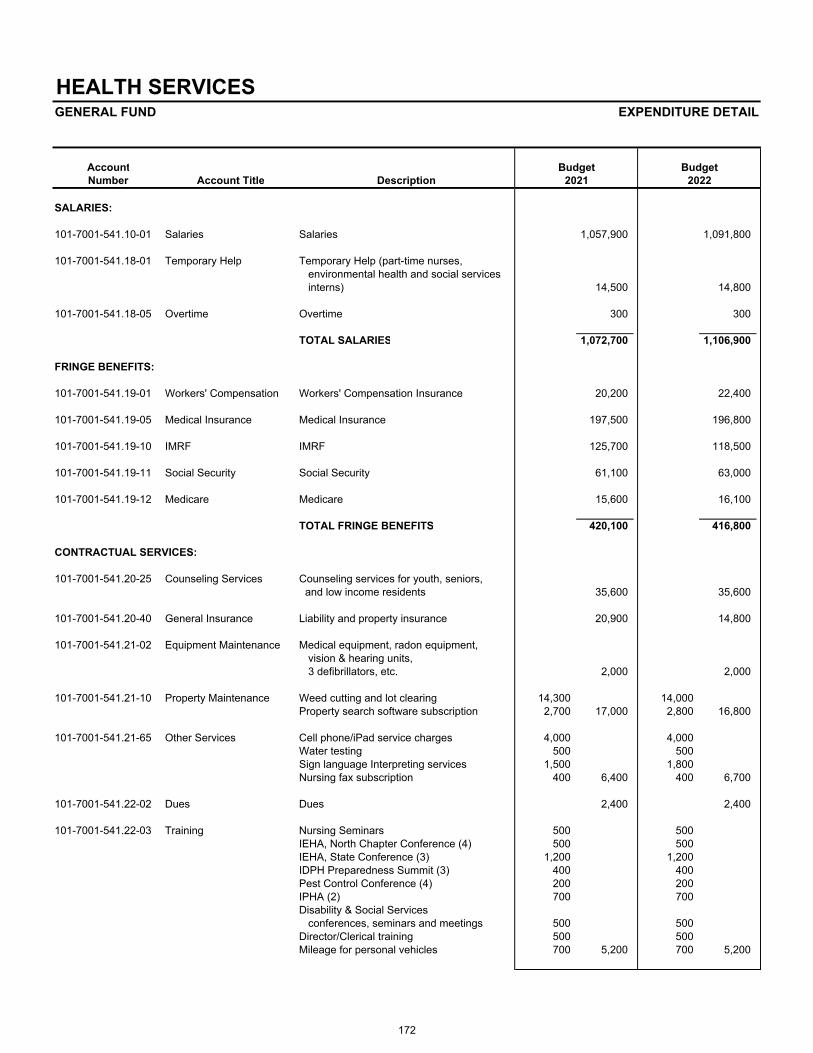
HEALTH SERVICESGENERAL FUND EXPENDITURE DETAIL
AccountNumber Account Title Description
SALARIES:
101-7001-541.10-01 Salaries Salaries 1,057,900 1,091,800
101-7001-541.18-01 Temporary Help Temporary Help (part-time nurses, environmental health and social services interns) 14,500 14,800
101-7001-541.18-05 Overtime Overtime 300 300
TOTAL SALARIES 1,072,700 1,106,900
FRINGE BENEFITS:
101-7001-541.19-01 Workers' Compensation Workers' Compensation Insurance 20,200 22,400
101-7001-541.19-05 Medical Insurance Medical Insurance 197,500 196,800
101-7001-541.19-10 IMRF IMRF 125,700 118,500
101-7001-541.19-11 Social Security Social Security 61,100 63,000
101-7001-541.19-12 Medicare Medicare 15,600 16,100
TOTAL FRINGE BENEFITS 420,100 416,800
CONTRACTUAL SERVICES:
101-7001-541.20-25 Counseling Services Counseling services for youth, seniors, and low income residents 35,600 35,600
101-7001-541.20-40 General Insurance Liability and property insurance 20,900 14,800
101-7001-541.21-02 Equipment Maintenance Medical equipment, radon equipment,vision & hearing units, 3 defibrillators, etc. 2,000 2,000
101-7001-541.21-10 Property Maintenance Weed cutting and lot clearing 14,300 14,000Property search software subscription 2,700 17,000 2,800 16,800
101-7001-541.21-65 Other Services Cell phone/iPad service charges 4,000 4,000Water testing 500 500Sign language Interpreting services 1,500 1,800Nursing fax subscription 400 6,400 400 6,700
101-7001-541.22-02 Dues Dues 2,400 2,400
101-7001-541.22-03 Training Nursing Seminars 500 500IEHA, North Chapter Conference (4) 500 500IEHA, State Conference (3) 1,200 1,200IDPH Preparedness Summit (3) 400 400Pest Control Conference (4) 200 200IPHA (2) 700 700Disability & Social Services
conferences, seminars and meetings 500 500Director/Clerical training 500 500Mileage for personal vehicles 700 5,200 700 5,200
Budget20222021
Budget
172

HEALTH SERVICESGENERAL FUND EXPENDITURE DETAIL
AccountNumber Account Title Description
Budget20222021
Budget
101-7001-541.22-05 Postage Mailings 2,500 2,500
101-7001-541.22-10 Printing Forms and reports 1,000 1,000
101-7001-541.22-15 Photocopying Photocopies & supplies 1,600 1,600Maintenance agreement Xerox 5150 1,000 2,600 1,000 2,600
101-7001-541.22-25 IT/GIS Service Charge Information Technology/GIS service charge 75,900 90,700
101-7001-541.22-37 Vehicle/Equip Lease Chrg Vehicle lease charge 33,400 24,800
101-7001-541.22-40 Taxi Service Subsidy Taxi Service Subsidy Program 2,400 2,400
TOTAL CONTRACTUAL SERVICES 207,300 207,500
COMMODITIES:
101-7001-541.30-01 Publications/Periodicals Miscellaneous publications 1,000 1,000
101-7001-541.30-05 Office Supplies & Equip General office supplies 6,200 6,200
101-7001-541.30-35 Clothing Uniforms & protective clothing 1,000 1,000
101-7001-541.30-50 Petroleum Products Gasoline for department vehicle(s) 1,300 1,100
101-7001-541.33-05 Other Supplies & Equip Swimming pool testing kits, film, smallhardware, cameras, radon kits, misc. 1,600 1,600
CDP software annual fee 10,100 11,700 11,200 12,800
101-7001-541.33-10 Wellness Program Immunization / Flu Clinics (WE9710) 10,000 10,000Festival First Aid (WE9713) 1,000 1,000Medical Waste Disposal (WE0201) 1,400 1,400Clinic Supplies (WE0601) 10,800 23,200 10,800 23,200
TOTAL COMMODITIES 44,400 45,300
OTHER CHARGES:
101-7001-541.40-53 AH Emergency Assist. Arlington Heights Emergency AssistanceProgram (general funds) 55,000 55,000
101-7001-541.40-57 AH Emerg Asst Donations Emergency assistance for ArlingtonHeights residents funded by donations 20,000 20,000
101-7001-541.40-61 MRC Capacity Bldg Award Medical Reserve Corps (MRC) supplies, training, and advertisement 1,000 1,000
101-7001-541.41-16 Children at Play Grant to Children at Play Program -subsidy for low income residents 29,000 29,000
TOTAL OTHER CHARGES 105,000 105,000
TOTAL HEALTH SERVICES 1,849,500 1,881,500
173

THIS PAGE LEFT BLANK
174

HEALTH & HUMAN SERVICES (13.25 FTE) ORGANIZATION STRUCTURE
Director Health & Human
Services
Senior Services (3.75 FTE)
Environmental Health
Public Health Nursing Services
Social Services
Health Services (9.50 FTE)
Facility Management
Services & Programs Coordination
Volunteer Services
175

SENIOR SERVICES The Arlington Heights Senior Center is the community focal point in which adults aged 55 and older determine their needs and interests, and work within the community to build services and programs addressing these needs. In addition, the Arlington Heights Senior Center serves as the fundamental resource for information on aging.
The services at the Senior Center may be provided by any one of the eight different agencies at the Senior Center and include Meals on Wheels, a congregate luncheon program, information and assistance, benefits access counseling, health, fitness, and wellness programs, transportation, volunteer and civic engagement opportunities, social and recreational programs, educational and creative arts programs and intergenerational programs.
2021 Accomplishments
• The Student Snow Removal Referral Program was spotlighted with a Daily Herald article notingsome of the student’s efforts. 37 middle and high school students and 195 residents participated inthe referral program.
• The Senior Center received official confirmation from the National Council on Aging’s (NCOA)Accreditation Board of accreditation status in February 2021. Some suggestions for the futureincluded implementing a participant database, create a website and Social Media options that areeasily visible on the Village of Arlington Height’s website.
• The Senior Center served as a host site for vaccinations two-two shot vaccination clinics workingwith the Village Health Nurses and the area agency on aging. The Senior Center staff gatheredcontact information from individuals who expressed they needed assistance in obtaining thevaccine.
• Director McCalister and Manager Colagrossi are part of the Executive Committee for the SeniorCenter Space Utilization, Modernization, and Program Plan study with an architectural firm. Thestudy encompassed interviews with stakeholders, focus groups, community survey, projectvisioning, program and architectural structure, concept plans and projected final decision in January 2022.
• The part-time Program Coordinator position was made into a full-time position with the retirementof Karie Van Grinsven’ in May. Sarah Adelphia joined the Senior Center team on July. Sarah hasvast experience in research, development, implementation, and evaluation for programs servingolder adults and reaching younger cohorts.
2022 Strategic Priorities & Key Projects
1. Age-Friendly Community CertificationStrategic Priority #2: Expand Efforts to Embrace Diversity, Equity, and Inclusion within the Community and Village Government.
A community survey was disseminated in late fall 2019. The Senior Citizens Commission evaluated the results and made recommendations to focus on affordable housing, safe and affordable transportation options, and improved communication programs and services. The Commission and staff have created an action plan addressing Housing, Safe and Affordable Transportation, and Communication to be presented and accepted by AARP and the World Health Organization for Age Friendly Certification.
Project Lead: Tracey Colagrossi, Senior Center Manager
176

SENIOR SERVICES (Continued)
2. Update the Senior CenterStaff Generated Projects
Conduct facility assessment based upon possible facility changes to meet future generation of older adult’s needs. Produce cosmetic, technology, and other changes which will increase comfort, use and encourage an energizing environment for patrons, volunteers and staff.
A Request for Proposal was made available in October 2020. The BKV Group was awarded the project and work began in June 2021. BKV conducted interviews with stakeholders, implemented a survey with over 600 responses, and completed focus groups that resulted in a presentation to the Board of Trustees in September. The second phase of the study works with the tenant agencies and Village staff to evaluate space utilization for program and service needs for now and the future. Floor plans will be drafted later in 2021 and presented to the board for a final decision in 2022. Funding and construction of recommendations will come in the following years.
Project Lead: James McCalister, Health & Human Services Director
3. Expand Outreach and Marketing Efforts of the Senior CenterStrategic Priority #8: Improve Communications with Residents and Businesses
Combine existing participant information to one master database and conduct outreach to expand awareness of the Senior Center and its services. Adhere to a marketing plan to recruit new participants at the Senior Center, evaluate for improvement. Ensure messaging and programs are diverse, promote inclusion and lifelong learning.
Project Lead: Tracey Colagrossi, Senior Center Manager
9. ERP Integration- Module Specific to Department ResponsibilitiesStrategic Priority #6: Ensure that Organization has the Resources and Training to Maintain Focus on Consistent High-Quality Core Services & Infrastructure
Lead by the Integrated Services, all Department Staff will assist in the implementation of department and module specific processes.
Project Lead: Diana Mikula, Assistant Village Manager- Integrated Services Department
Performance Measures
2018 2019 2020
1. Congregate Meals 5,750 6,966 7,539
2. Home Delivered Meals 42,036 48,832 62,293
3. Social Work Cases Opened 9,177 8,814 6,867
4. Recreation Participation - Attendance at ParkDistrict Programming at Senior Center 39,784 37,424 11,151
5. Senior Health Insurance Program Appointments 588 497 356
177

OPERATION SUMMARY
SENIOR SERVICES2019 2020 2021 2021 2022 $ %
Actual Actual Est. Actual Budget Budget Change Change
Authorized Positions in F-T-E 3.50 3.50 3.75 3.75 3.75 0.00 0.0%
Expenditures Personal Services $450,240 $479,778 $487,300 $502,500 $515,200 $12,700 2.5% Contractual Services 82,517 82,944 91,600 91,600 106,700 15,100 16.5% Commodities 19,803 10,627 27,300 27,300 27,300 0 0.0% Capital Items 0 5,000 0 5,000 0 (5,000) (100.0%)
Total Expenditures $552,560 $578,349 $606,200 $626,400 $649,200 $22,800 3.6%
CROSS REFERENCE TO FUNDS
2019 2020 2021 2021 2022 $ %Actual Actual Est. Actual Budget Budget Change Change
General Fund $552,560 $573,349 $606,200 $621,400 $649,200 $27,800 4.5%Capital Projects Fund 0 5,000 0 5,000 0 (5,000) (100.0%)
Total Expenditures $552,560 $578,349 $606,200 $626,400 $649,200 $22,800 3.6%
Paste Chart Here
3.75 3.50 3.50 3.50 3.50 3.50 3.50 3.50 3.50 3.50 3.75 3.75
2.0
3.0
4.0
5.0
6.0
7.0
FY12 FY13 FY14 FY15 2015 2016 2017 2018 2019 2020 2021 2022
FT
E
STAFFING HISTORY
178

SENIOR SERVICES General Fund
PERSONNEL SUMMARY
Class
Code Title Grade 2021 2022 + (-)
Senior Center Manager 9 1.00 1.00
Program Coordinator 5 1.00 1.00
Volunteer Coordinator 4 0.50 0.50
Administrative Assistant 2 1.00 1.00
Office Assistant 1 0.25 0.25
Total F-T-E 3.75 3.75 0.00
Code Fund 2021 2022 + (-)
101 General Fund
Health & Human Services
Health Services 9.50 9.50
Senior Services 3.75 3.75
Total F-T-E All Funds 13.25 13.25 0.00
Authorized Positions in F-T-E
Health & Senior Services DepartmentCross Reference to All Funds
Authorized Positions in F-T-E
179

SENIOR SERVICESGENERAL FUND EXPENDITURES
Account Account Actual Actual Proj. Act. Budget Budget $ %Number Description 2019 2020 2021 2021 2022 Inc (Dec) Inc (Dec)
101-7007-541.10-01 Salaries 328,396 355,140 327,200 340,000 347,000 7,000 2.1%101-7007-541.18-01 Temporary Help 13,573 5,861 18,000 18,000 18,400 400 2.2%101-7007-541.18-05 Overtime Civilian 0 0 200 200 200 0 0.0%
Salaries 341,969 361,001 345,400 358,200 365,600 7,400 2.1%
101-7007-541.19-01 Workers Compensation 500 500 500 500 600 100 20.0%101-7007-541.19-05 Medical Insurance 51,600 53,100 77,100 77,100 84,300 7,200 9.3%101-7007-541.19-10 IMRF 30,545 37,985 37,900 39,300 36,700 (2,600) (6.6%)101-7007-541.19-11 Social Security 20,769 22,038 21,400 22,200 22,700 500 2.3%101-7007-541.19-12 Medicare 4,857 5,154 5,000 5,200 5,300 100 1.9%
Fringe Benefits 108,271 118,777 141,900 144,300 149,600 5,300 3.7%
101-7007-541.20-40 General Insurance 11,800 11,900 12,000 12,000 8,500 (3,500) (29.2%)101-7007-541.21-02 Equipment Maintenance 3,567 1,539 4,500 4,500 4,500 0 0.0%101-7007-541.21-65 Other Services 14,872 11,323 15,600 15,600 15,800 200 1.3%101-7007-541.22-02 Dues 573 2,045 1,000 1,000 1,000 0 0.0%101-7007-541.22-03 Training 0 885 2,100 2,100 2,100 0 0.0%101-7007-541.22-05 Postage 0 1,196 1,300 1,300 1,300 0 0.0%101-7007-541.22-10 Printing 0 270 200 200 200 0 0.0%101-7007-541.22-15 Photocopying 1,580 986 1,300 1,300 1,300 0 0.0%101-7007-541.22-25 IT/GIS Service Charge 49,300 52,800 53,600 53,600 72,000 18,400 34.3%101-7007-541.22-40 Taxi Service Subsidy 825 0 0 0 0 0 0.0%
Contractual Services 82,517 82,944 91,600 91,600 106,700 15,100 16.5%
101-7007-541.30-05 Office Supplies & Equip 4,016 2,107 4,400 4,400 4,400 0 0.0%101-7007-541.31-65 Other Equip & Supplies 15,787 8,520 22,900 22,900 22,900 0 0.0%
Commodities 19,803 10,627 27,300 27,300 27,300 0 0.0%
Total Senior Services 552,560 573,349 606,200 621,400 649,200 27,800 4.5%
Total Health & Senior Serv 2,239,997 2,277,448 2,457,100 2,470,900 2,530,700 59,800 2.4%
180

SENIOR SERVICESGENERAL FUND EXPENDITURE DETAIL
AccountNumber Account Title Description
SALARIES:
101-7007-541.10-01 Salaries Salaries 340,000 347,000
101-7007-541.18-01 Temporary Help Temporary Help 18,000 18,400
101-7007-541.18-05 Overtime Overtime 200 200
TOTAL SALARIES 358,200 365,600
FRINGE BENEFITS:
101-7007-541.19-01 Workers' Compensation Workers' Compensation Insurance 500 600
101-7007-541.19-05 Medical Insurance Medical Insurance 77,100 84,300
101-7007-541.19-10 IMRF IMRF 39,300 36,700
101-7007-541.19-11 Social Security Social Security 22,200 22,700
101-7007-541.19-12 Medicare Medicare 5,200 5,300
TOTAL FRINGE BENEFITS 144,300 149,600
CONTRACTUAL SERVICES:
101-7007-541.20-40 General Insurance Liability and property insurance 12,000 8,500
101-7007-541.21-02 Equipment Maintenance Office, institutional equipment 200 200Billiard table maintenance 1,900 1,900Piano tuning 400 400Kitchen equipment repairs 2,000 4,500 2,000 4,500
101-7007-541.21-65 Other Services Online support 800 800Volunteer banquet-meal 8,200 8,200Volunteer banquet entertainment 500 300Classes & programs instructional fees 5,400 5,800Outreach/marketing/advertising for programs 400 400Intergenerational programs support services 300 15,600 300 15,800
101-7007-541.22-02 Dues Dues 1,000 1,000
101-7007-541.22-03 Training Gerontology or Volunteer conference 1,000 1,800Mileage 300 300National Institute for Senior Centers
Accreditation 800 2,100 0 2,100
101-7007-541.22-05 Postage General postage 1,000 1,000Volunteer banquet postage 300 1,300 300 1,300
101-7007-541.22-10 Printing Volunteer banquet invitations 200 200
101-7007-541.22-15 Photocopying Photocopies & supplies 1,300 1,300
101-7007-541.22-25 IT/GIS Service Charge Information Technology service charge 53,600 72,000
TOTAL CONTRACTUAL SERVICES 91,600 106,700
Budget20222021
Budget
181

SENIOR SERVICESGENERAL FUND EXPENDITURE DETAIL
AccountNumber Account Title Description
Budget20222021
Budget
COMMODITIES:
101-7007-541.30-05 Office Supplies & Equip General office supplies 4,100 4,100Software and software upgrades 300 4,400 300 4,400
101-7007-541.31-65 Other Equip & Supplies Small institutional and office equipment 1,300 800Clothing 0 500Volunteer banquet awards, decorations
and supplies 1,800 1,800Replacement tables 1,300 0
* Programs (Patio Cookouts and Barbecue) 3,600 3,600Series of Special Events 800 800Classes & programs supplies 3,800 6,400National Senior Fitness Day 600 600Coffee service 25¢ discount for volunteers 600 0Coffee service at Senior Center meetings 400 0Birthday cards for volunteers 300 0Program supplies for intergenerational
programs, interns, Eagle Scouts andlocal schools 1,000 1,000
Food purchases from private vendor for Caféoperation (offset by matching revenue) 7,400 22,900 7,400 22,900
TOTAL COMMODITIES 27,300 27,300
TOTAL SENIOR SERVICES 621,400 649,200
TOTAL HEALTH & SENIOR SERVICES 2,470,900 2,530,700
* Partial revenue returns specific to fees charged for these events are anticipated.
182

Public Works
Administration
Maintenance Division
Utility Division
Traffic Municipal Buildings
Forestry & Grounds
Streets
PUBLIC WORKS (102.50 FTE) ORGANIZATION STRUCTURE
Engineering Division
Public Development
Traffic Engineering
Private Development
183

PUBLIC WORKS The Public Works Department maintains all municipally owned streets and sidewalks, trees and landscaping, water and sewer systems, buildings and grounds, street lights and traffic signals, vehicle and equipment maintenance, and provides other necessities of suburban life such as street sweeping, snow removal and ice control. It also is responsible for planning, designing, and inspecting construction of public improvements and the infrastructure of the Village. The Public Works Department is also responsible for Fleet Operations, portions of the Motor Fuel Tax, Parking, Storm Water Control, and Arts, Entertainment, and Events Funds as well which appear elsewhere in the budget. Maintenance Division • Administration and Internal Services Unit – Provides direct and indirect management of all Public Works
Maintenance, Engineering, and Utility Divisions. Manage progress, payments, and completion of capital projects. Creates, procures, and oversees all contractual services. Responsible for regulatory requirements and conducting necessary staff training. Prepares agenda items and budget necessary for the operation of the division.
Reception and secretarial services maintain residential contacts and department records including service request systems and work management records, prepares analyses and recommendations for purchasing of equipment and supplies, maintains supplies and inventory controls.
• Street Unit – This unit repairs and maintains 230 miles of streets including 321 cul-de-sacs. Services include snow plowing and ice control, resurfacing and patching of streets, curbs, and sidewalks, and sweeping the equivalent of 10,000 curb miles of streets annually. Our Street Maintenance Program includes three phases of 6 to 8-foot-wide edge grinding on pavements where the center lane of streets is in a serviceable condition, but the edges are failing and allowing water to penetrate the subbase. The Street unit also assists with and coordinates the setup and planning of numerous Village-sponsored special events. Responsible for winter snow and ice control.
• Forestry & Grounds Unit – This unit is responsible for the maintenance and trimming of 36,000 parkway trees, and the selective removal and sustainable assessment of site appropriate plantings of approximately 500 parkway trees annually. The Forestry Unit oversees the planting and maintenance of three annual flower rotations in 31 urns/pots, 12 Arlington Alfresco planters, and nine planting beds. This unit oversees contracts for tree trimming and removal, disease control, mowing, weed spraying, and landscape maintenance of 209 acres of land. Unit personnel remove snow from sidewalks abutting Village owned and maintained sites. The Forestry Unit also assists with the setup and planning of Village-sponsored special events.
• Municipal Buildings Unit – This unit is responsible for maintaining 28 Village owned buildings. Maintenance
is provided for the building structures and for all mechanical equipment and includes providing custodial maintenance and day-to-day services in 546,500 square feet of occupied floor space. All heating and air conditioning systems are maintained by the staff, which also provide skilled work in minor building revisions and renovations, painting, electrical, plumbing and similar building and grounds related maintenance services. Major repairs, alterations and remodeling are accomplished through contract services when necessary. This unit is responsible for managing the Metropolis Theatre building. The Municipal Building Unit also assists with and coordinates the setup and planning of numerous Village-sponsored special events.
• Fleet Unit – The Village created an internal service fund for fleet operations. This allows departments
to "lease" their vehicles internally from the Fleet Operations Fund, and allows the Village to accumulate reserves for the maintenance and periodic replacement of the fleet.
Fleet Operations is organizationally within the Maintenance Division of the Public Works Department.
184

PUBLIC WORKS (Continued)
The unit is responsible for maintaining the 248 vehicles and 79 pieces of maintenance equipment operated by the various departments within the Village.
Preventive maintenance and most repairs are made by personnel assigned to the Fleet Unit. Repairs such as mufflers, front-end alignments, transmissions, body repairs and several other repairs, are contracted to local businesses when possible. All vehicle maintenance personnel are ASE certified; this is the same certification carried by repair personnel in car dealerships and franchise service stations.
Utilities Division The Water & Sewer Utility Operations are conducted within the Utilities Division of the Public Works Department. Responsibilities include the operations of the water distribution, production and storage system, water meters, the sanitary sewage collection system and the storm water collection system. Monies for the operations, maintenance and capital improvements of the water, sanitary, combined and storm sewer systems are generated by the sale of water and sewer use charges and charges made on new construction for capital improvements.
Potable water is delivered from Lake Michigan through the City of Evanston's filtration plant by way of the Northwest Water Commission transmission system. Six deep wells are maintained by the Village for standby emergency purposes only.
The operational units within the Utilities Division are as follows: • Administration and Internal Services Unit – Provides direct and indirect management of all Public Works
Maintenance and Utility Divisions. Manage progress, payments, and completion of all capital projects. Creates, procures, and oversees all contractual services. Prepares agenda items and budgets necessary for the operation of the division.
Reception and secretarial services maintain residential contacts and department records including service request systems and work management records, prepares analyses and recommendations for purchasing of equipment and supplies, maintains supplies and inventory controls.
• Traffic Unit – This unit maintains an estimated 3,900 street lights, 12 traffic signalized intersections, 6,900 traffic signs, 12 solar powered disaster warning sirens and the fare boxes for commuter parking facilities. The unit also provides electrical maintenance service for municipal buildings, parking garages, and parking lots.
• Water Production Unit – This unit is responsible for the operation and maintenance of six deep wells, ten storage reservoirs, four booster pumping stations, six sanitary sewer lift stations and five storm water pump stations, 24 facility generators, all electrical maintenance on water and sewer facilities, and daily required IEPA water testing. An average of 8.6 million gallons of water per day is pumped into the distribution system.
• Water Distribution Unit – This unit is responsible for the operation and maintenance of 232 miles of water main ranging in size from four inches to thirty inches in diameter, 2,400 valves, 2,700 fire hydrants, 21,300 individual water services and repairing an average of 225 water main breaks or leaks each year.
• Sewer Unit – This unit is responsible for the operation and maintenance of 193 miles of sanitary and combined sewer mains, 149 miles of storm sewer, 22 detention basins, 4,700 catch basins and 6,100 manholes. Sewer flushing and root cutting operations are performed on approximately 325,000 lineal feet of sewers each year and 2,900 catch basins are cleaned annually.
• Water Meter Unit – This unit is responsible for the repair and maintenance of all residential and commercial water meters. This unit also oversees Village-wide contracts for backflow preventer testing and larger commercial meter testing and repair as well as bi-monthly meter reading.
185

PUBLIC WORKS (Continued) Engineering Division The Engineering Division is responsible for planning, designing, and inspecting public improvements and the infrastructure of the Village.
The Division also responds to citizens' inquiries, advises developers with respect to engineering requirements of the Village, keeps Village maps current, determines plan review and inspection fees, and inspects private construction of public improvements to ensure that they meet Village requirements.
Engineering is made up of the following operational units: • Public Development Construction Inspection and Systems Design: This unit is responsible for the
preparation of plans, construction inspection and layout for all publicly funded municipal system projects, including flood control and road improvements; planning and administering the Village's infrastructure improvement program, including inventory, evaluation and construction; reviewing and approving all plans prepared by consulting engineers engaged by the Village in these activities; and performing all engineering services for the Board of Local Improvements.
• Private Development Construction Inspection and Systems Design: This unit is responsible for reviewing and approving all plans prepared by developers for privately funded municipal system projects and sites to be developed; inspecting the construction of these projects and sites; making bond release inspections; and responding to citizen inquiries on developments.
• Traffic Engineering: This unit is responsible for the compilation of traffic data for proposed traffic controls; investigating and evaluating requests and needs for traffic safety measures and traffic control devices; reviewing the traffic impact of new development; coordinating the installation of street lighting systems; coordinating school traffic sign installation and updates; preparing plans for traffic signal modifications and street lighting systems; coordinating the Village's involvement with proposals for improvements by the Illinois Department of Transportation and Cook County Highway Department; and performing long and short range transportation planning.
2021 Accomplishments • Water Main Replacement Program: The 2021 Water Main Replacement included 16,000 linear feet of
water main replacement within residential neighborhoods. The two major neighborhoods improved in 2021 were Greenbrier Park and Thomas Street near Arlington Heights Road.
• Cured-In-Place Pipe (CIPP) Lining: Sanitary sewer rehabilitation progresses at a steady pace through a process called Cured-In-Place Pipe (CIPP) Lining. This sustainable process is an ideal procedure that enables the Utilities Division to rehabilitate the existing sewer line, without the cost of excavation or road restoration, and the environmental impact of hauling all of the excavated material away from and to the site.
• Kensington Road Resurfacing and Multi-Use Path Improvements: This project is on the Northwest Council of Mayors Technical Committee’s MYB (un-programmed) list. This project received 75% Federal funding for construction and construction engineering.
• Buffalo Creek Multi-Use Trail Extension: The Buffalo Creek Multi-Use Trail Extension is complete and was opened to the public on June 8, 2021. The project provides a safer dedicated crossing of Lake Cook Road at the signalized intersection with Wilke Road, connecting the north side of Arlington Heights with the Buffalo Creek Preserve trails.
• Snow Plow Route Optimization: New snow plow routes were implemented in 2020. The new routes were completed with the assistance of the GIS Consortium. All zones were calculated to produce an equal route size for all 18 zones and the downtown business district including travel distance from home base.
• Arlington Alfresco: The Public Works Department was responsible for the daily operational necessities of the Alfresco event. These efforts included daily cleanups, scheduling contracted work inside the Alfresco space, and resolving business owner issues. In addition, Public Works have been available to the business owners within the Alfresco space via a direct cell number for any problems that may arise.
186

PUBLIC WORKS (Continued)
• COVID-19 Response: Public Works provided support to Village Departments by modifying working spacesto promote social distance, installed signage to remind patrons of pandemic protocols, provided PPE, andinstalled sanitizing stations.
• Paver Brick Maintenance: Public Works continues to improve paver brick walkways throughout thedowntown is order to reduce and eliminate trip hazards. In 2021, this project included the installation of themid-block pedestrian crossing on Evergreen Avenue.
• Parking Garage Rehabilitation: The top level of the municipal parking structure was improved with theaddition of a waterproof membrane to protect the steel within the structure from corrosion.
2022 Strategic Priorities & Key Projects
1. Water Main Replacement ProgramStrategic Priority #6: Ensure that Organization has the Resources and Training to Maintain Focus on Consistent High-Quality Core Services and Infrastructure
In October of 2019, the Village instituted a new five-year water and sewer rate schedule that will increase rates starting in 2020. The increase for the first year of the schedule will be 8.5% followed by an additional 5% increase per year for the remaining years of the schedule. The schedule will end in December of 2024. The industry standard for water main replacement is 1% per year, based upon the design life of a 100-year life span for existing and future pipe. The Village Board action included $9 million in bond proceeds that allowed us to begin spending the required $4 million per year to reach our goal of replacing 1% of water main.
Project Leads: Scott Schweda, Superintendent of Utilities; Dave Nordin, Water Distribution Foreman
2. Explore Use of Electric-Hybrid Vehicles and Alternate Fuels in the Village’s FleetStrategic Priority #4: Identify, Explore, and Implement Sustainable and Green Initiatives
Staff will continue to explore the use of electric-hybrid vehicles in all Village Departments. In 2021, the Village increased their hybrid usage in the Police Department when five non-hybrid vehicles were replaced with hybrid utility interceptors.
The Village also continues to use a higher blend of biodiesel fuel which is primarily made from soybeans, vegetable oils, and animal fats that are all produced in Illinois. Arlington Heights is only one of seven communities within Illinois to solely use such a blend. Staff estimates that by using this type of biodiesel, the Village fleet reduces their carbon dioxide emissions by 117 tons annually.
Project Leads: Cris Papierniak, Director of Public Works; Ray Salisbury, Fleet Foreman
3. Further Improve Communication on SeeClickFix and Other Social Media PlatformsStrategic Priority #8: Improve Communications with Residents and Businesses
Public Works continues to improve the SeeClickFix platform as a two-way communication tool between the department and the community. SeeClickFix receives 10% of the department’s requests and gives users the ability to report routine maintenance items through the framework of social media. This includes threaded communication and the ability to vote on which maintenance item should receive higher levels of attention. Public Works also continues to work with the Village Manager’s Office on scheduling posts through Facebook and Twitter as another means to engage the community.
Project Leads: Cris Papierniak, Director of Public Works; Steve Mullany, Services Coordinator; and Chester Gorecki, Management Analyst II
187

PUBLIC WORKS (Continued)
4. Water Meter – AMR UpdatesStrategic Priority #6: Ensure that Organization has the Resources and Training to Maintain Focus on Consistent High-Quality Core Services and Infrastructure
The Village will be starting the first phase of a four-year program to replace all residential water meter radios. New meters will have improved accuracy and offer additional conveniences for residents.
Project Leads: Cris Papierniak, Director of Public Works; Scott Schweda, Superintendent of Utilities; Mike Gilles, Water Meters Supervisor
5. ERP Integration- Module Specific to Department ResponsibilitiesStrategic Priority #6: Ensure that Organization has the Resources and Training to Maintain Focus on Consistent High-Quality Core Services & Infrastructure
Lead by the Integrated Services, all Department Staff will assist in the implementation of department and module specific processes.
Project Lead: Diana Mikula, Assistant Village Manager- Integrated Services Department
6. Arlington Racetrack Project- Specific to Department ResponsibilitiesStrategic Priority #3: Work to Ensure the Redevelopment of Arlington Park Meets Community Standards and Provides a One of a Kind Regional Destination Worthy of the Property’s Legacy
Staff will work with would be purchasers on a land use plan for the site that will address all Village concerns, take into consideration the perspectives of all stakeholders, and provide for a unique one of a kind development worthy of the site’s legacy to our community and the region. Departments, including Fire, Police, Public Works, Finance, Planning & Community Development, Building & Life Safety, and Integrated Services, will work on cross-department initiatives to support this project.
Project Lead: Randy Recklaus, Village Manager- Integrated Services Department
188

PUBLIC WORKS (Continued)
Performance Measures 2018 2019 2020
1. Traffic Unit:Traffic Signal Repairs Street Light Repairs Building Circuit Repairs Sign Maintenance Pavement Striping (In Linear Feet)
102 1,066
129 1,986 3,041
68 1,227
123 3,093 1,919
107 1,388
865 2,072 2,739
2. Street Unit:Snow Removal Cost Snow Removal Curb Miles Street Sweeping Curb Miles Asphalt Repairs (tons) In-House Paving Program (tons) In-House Paving Program (lin. ft.)
$ 1,232,879 60,762 9,336
220 4,049
38,934
$ 952,896 62,784 10,699
210 4,723
39,682
$ 686,779 25,604 11,473
220 2,897
28,695
3. Forestry Unit:Parkway Trees Trimmed by Contractor In-House Trees Trimmed Parkway Trees Removed Parkway Trees Planted Parkway Restorations Branch Pickup Requests Broken and Hanging Branch Removals
8,843 356 702 789
1,076 931 279
5,977 419 811 686 758 836 280
6,097 414 657 683 656
1,453 411
4. Building Maintenance Unit:Work Orders Completed 893 1,226 2,221
5. Administration:Service Requests Received Invoices Processed Incoming Phone Calls
4,413 5,863
11,470
6,484 6,145
17,378
9,458 6,279
12,631
189

PUBLIC WORKS (Continued)
Performance Measures (cont.) 2018 2019 2020
6. Private DevelopmentNumber of Inspections:
Pre-pour Final All Other
Total
Number of Service Requests Number of Permit Plan Reviews Number of Plan Commission Reviews
Number of ZBA Reviews MWRD Permit Application Reviews MWRD Final Inspections IEPA Water Permit Application Reviews IEPA Sanitary Permit Application Reviews
614 716 624
1,954
345 1,829
71 30 20 11
34
534 619 609
1,762
242 1,733
42 31 10 14
44
616 651 479
1,746
405 1,868
34 39
6831
7. Public DevelopmentMiles of streets resurfacedMiles of streets reconstructedMiles of streets rehabilitatedLinear feet of sidewalks replacedLinear feet of curb and gutter replacedMiles of streets treated with Reclamite
621
40,555 67,449
8.7
7.5 2.2
0 28,000 37,772
9.0
6.95 1.76
0 22,274 34,930
9.70
Rec'd Closed
In Progress
End of Year
Rec'd Closed
In Progress
End of Year
Rec'd Closed
In Progress
End of Year
Downspouts 20 11 14 13 13 14 8 22 0
Sump Pumps 50 29 40 52 49 43 29 67 5
Downspouts & Sump Pumps 14 4 14 11 8 17 10 27 0
Yard Flooding / Drainage 221 129 218 152 154 216 197 395 18
Grading Issue 3 3 3 14 9 8 8 15 1
Totals 308 176 289 242 233 298 252 526 24
DRAINAGE SERVICE REQUESTS
Drainage ServiceRequest Type
2018 2019 2020
190

PUBLIC WORKS (Continued)
Performance Measures (cont.)
Rec'd Closed
In Progress
End of Year
Rec'd Closed
In Progress
End of Year
Rec'd Closed
In Progress
End of Year
Lighting 5 2 6 2 4 4 4 4 4
Other Street Sign Request 13 6 32 22 50 4 20 18 6
Parking 0 0 2 7 7 2 10 6 6
Pedestrian Crossing 18 11 33 7 32 8 10 6 12
School 6 0 18 2 19 1 4 2 3
Sight Distance or Obstruction 20 4 28 37 60 5 79 65 19
Speed Request 4 1 18 11 18 11 13 9 15
Stop Sign Request 26 7 74 35 68 41 12 19 34
Traffic Signal 9 6 16 0 14 2 1 2 1
Totals 101 37 227 123 272 78 153 131 100
Traffic ServiceRequest Type
2018 2019 2020TRAFFIC SERVICE REQUESTS
191

PUBLIC WORKS (Continued)
Performance Measures (cont.) TURNAROUND TIME FOR PLAN COMMISSION REVIEWS
Plan Commission Review Turnaround
Time * (working days)
FY2018 FY2019 FY2020
# Plan Comm.
Reviews % of Total
# Plan Comm.
Reviews % of Total
# Plan Comm.
Reviews % of Total
0-5 Days 36 51%
94% 24 57
% 98%
17 50%
94% 6-10 days 31 44
% 17 40% 15 44
%
11-15 days 4 6% 6%
1 2% 2%
2 6% 6%
Over 15 days 0 0% 0 0% 0 0%
Total Number of Plan Commission
Reviews 71 100% 42 100% 34 100%
* The normal requested turnaround time is 10 days. The review time can vary widely and is directlydependent on the complexity of the project.
TURNAROUND TIME FOR PERMIT REVIEWS
Permit Review Turnaround Time
(working days)
FY2018 FY2019 FY2020
# Permits Completed % # Permits
Completed % # Permits Completed %
Same Day 604 33% 303 18% 234 13%
1 Day 530 29% 602 35% 403 22%
2 Days 238 13% 349 20% 268 14%
3 Days 128 7% 102 6% 220 12%
4 Days 73 4% 68 4% 184 10%
5 Days / + 256 14% 305 18% 559 30%
Total Number of Permit Reviews 1829 100
% 1729 100% 1868 100
%
192

OPERATION SUMMARY
PUBLIC WORKS (Including Water Utilities & Fleet Services)
2019 2020 2021 2021 2022 $ %Actual Actual Est. Actual Budget Budget Change Change
Authorized Positions in F-T-EGeneral Fund 41.25 51.25 51.25 51.25 51.25 0.00 0.0%Emerald Ash Borer Fund 0.00 0.00 0.00 0.00 0.00 0.00 N/AWater & Sewer Fund 40.75 40.75 40.75 40.75 40.75 0.00 0.0%Fleet Operations Fund 10.50 10.50 10.50 10.50 10.50 0.00 0.0%
Total F-T-E 92.50 102.50 102.50 102.50 102.50 0.00 0.0%
Expenditures Personal Services $15,331,780 $15,026,279 $16,249,500 $16,585,500 $16,995,200 $409,700 2.5% Contractual Services 11,692,536 11,580,762 12,158,600 12,514,727 12,655,100 140,373 1.1% Commodities 2,941,560 1,835,467 2,712,500 2,675,072 2,730,700 55,628 2.1% Other Charges 1,717,032 1,715,089 1,871,500 1,871,500 1,926,100 54,600 2.9% Capital Items 25,546,364 16,842,805 27,791,300 32,934,879 28,429,200 (4,505,679) (13.7%)
Total Expenditures $57,229,272 $47,000,402 $60,783,400 $66,581,678 $62,736,300 ($3,845,378) (5.8%)
CROSS REFERENCE TO FUNDS
2019 2020 2021 2021 2022 $ %Actual Actual Est. Actual Budget Budget Change Change
General Fund $14,753,358 $14,301,998 $15,350,100 $15,533,759 $15,974,300 $440,541 2.8%MFT Fund 1,873,979 2,371,133 4,232,200 4,232,220 4,116,800 (115,420) (2.7%)Municipal Park Opr Fund 434,484 580,687 530,200 526,125 644,900 118,775 22.6%Capital Projects Fund 7,681,761 4,516,460 7,714,500 9,593,726 8,467,200 (1,126,526) (11.7%)Storm Water Control Fund 8,252,798 973,582 5,615,700 8,204,294 3,822,000 (4,382,294) (53.4%)Water & Sewer Fund 20,463,980 21,091,044 22,784,600 23,972,756 24,467,700 494,944 2.1%SWANCC Fund 0 0 0 1,300 1,300 0 0.0%A & E Fund 141,755 0 173,000 139,600 210,600 71,000 50.9%Fleet Operations Fund 3,627,157 3,165,498 4,383,100 4,377,898 5,031,500 653,602 14.9%
Total Expenditures $57,229,272 $47,000,402 $60,783,400 $66,581,678 $62,736,300 ($3,845,378) (5.8%)
Paste Chart Here
93.0 93.5 93.5 93.5 93.5 93.5 93.5 92.5
102.5 102.5 102.5 102.5
90.0
94.0
98.0
102.0
106.0
FY12 FY13 FY14 FY15 2015 2016 2017 2018 2019 2020 2021 2022
FT
E
STAFFING HISTORY
193

PUBLIC WORKS General Fund
PERSONNEL SUMMARY
Class
Code Title Grade 2021 2022 + (-)
Public Works Director 12 1.00 1.00
Asst Director of Public Works 10 1.00 1.00
Village Engineer 10 1.00 1.00
Senior Civil Engineer 8 1.00 1.00
Foreman II 7 2.00 2.00
Forester 7 1.00 1.00
Crew Chief Electrical 7 1.00 1.00
Civil Engineer II 7 1.00 1.00
Crew Chief 6 4.00 4.00
Management Analyst II 6 1.00 1.00
Maintenance Mechanic II 6 2.00 2.00
Foreman I 6 1.00 1.00
Electrician II 6 3.00 3.00
Engineering Inspector 6 1.00 1.00
Civil Engineer I 5 3.00 3.00
Engineering Data Coordinator 5 1.00 1.00
Maintenance Worker II 4 19.00 19.00
Engineering Technician 3 1.00 1.00
Maintenance Worker I 2 2.00 2.00
Administrative Assistant 2 1.00 1.00
Custodian 1 3.00 3.00
Account Clerk 1 0.25 0.25
Total F-T-E 51.25 51.25 0.00
Code Fund 2021 2022 + (-)
101 General Fund 51.25 51.25
505 Water & Sewer Fund 40.75 40.75
621 Fleet Operations Fund 10.50 10.50
Total F-T-E All Funds 102.50 102.50 0.00
Authorized Positions in F-T-E
Public Works DepartmentCross Reference to All Funds
Authorized Positions in F-T-E
194
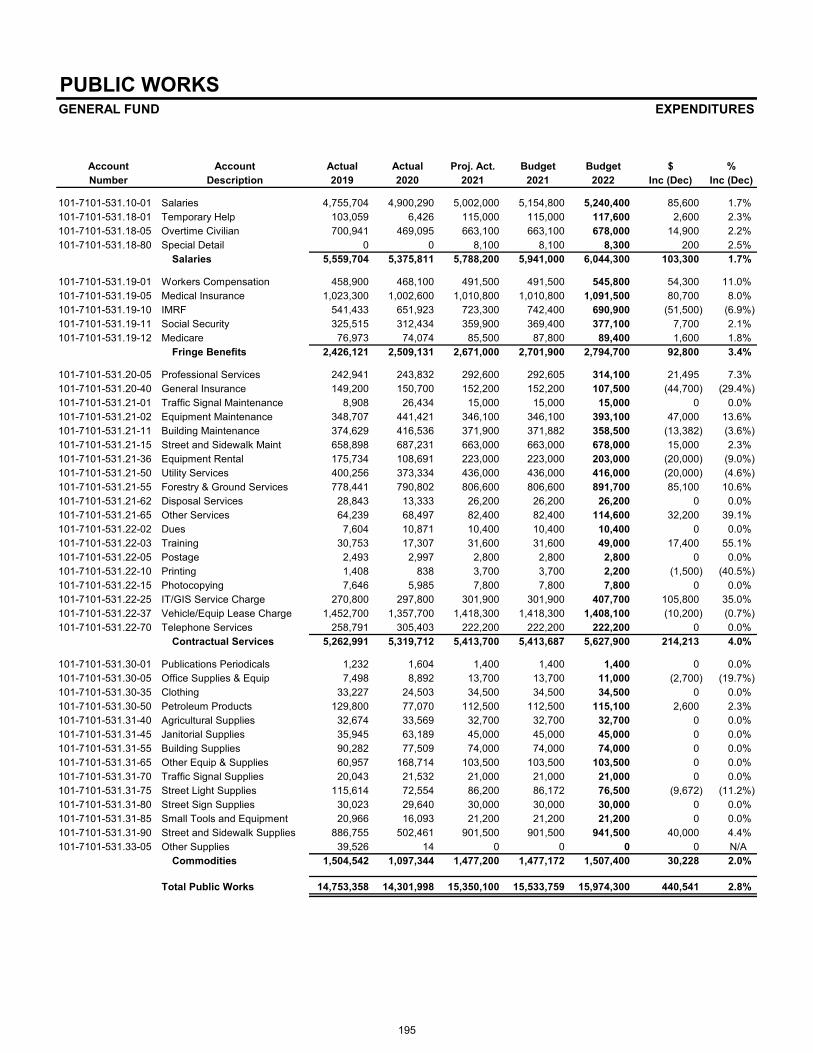
PUBLIC WORKSGENERAL FUND EXPENDITURES
Account Account Actual Actual Proj. Act. Budget Budget $ %Number Description 2019 2020 2021 2021 2022 Inc (Dec) Inc (Dec)
101-7101-531.10-01 Salaries 4,755,704 4,900,290 5,002,000 5,154,800 5,240,400 85,600 1.7%101-7101-531.18-01 Temporary Help 103,059 6,426 115,000 115,000 117,600 2,600 2.3%101-7101-531.18-05 Overtime Civilian 700,941 469,095 663,100 663,100 678,000 14,900 2.2%101-7101-531.18-80 Special Detail 0 0 8,100 8,100 8,300 200 2.5%
Salaries 5,559,704 5,375,811 5,788,200 5,941,000 6,044,300 103,300 1.7%
101-7101-531.19-01 Workers Compensation 458,900 468,100 491,500 491,500 545,800 54,300 11.0%101-7101-531.19-05 Medical Insurance 1,023,300 1,002,600 1,010,800 1,010,800 1,091,500 80,700 8.0%101-7101-531.19-10 IMRF 541,433 651,923 723,300 742,400 690,900 (51,500) (6.9%)101-7101-531.19-11 Social Security 325,515 312,434 359,900 369,400 377,100 7,700 2.1%101-7101-531.19-12 Medicare 76,973 74,074 85,500 87,800 89,400 1,600 1.8%
Fringe Benefits 2,426,121 2,509,131 2,671,000 2,701,900 2,794,700 92,800 3.4%
101-7101-531.20-05 Professional Services 242,941 243,832 292,600 292,605 314,100 21,495 7.3%101-7101-531.20-40 General Insurance 149,200 150,700 152,200 152,200 107,500 (44,700) (29.4%)101-7101-531.21-01 Traffic Signal Maintenance 8,908 26,434 15,000 15,000 15,000 0 0.0%101-7101-531.21-02 Equipment Maintenance 348,707 441,421 346,100 346,100 393,100 47,000 13.6%101-7101-531.21-11 Building Maintenance 374,629 416,536 371,900 371,882 358,500 (13,382) (3.6%)101-7101-531.21-15 Street and Sidewalk Maint 658,898 687,231 663,000 663,000 678,000 15,000 2.3%101-7101-531.21-36 Equipment Rental 175,734 108,691 223,000 223,000 203,000 (20,000) (9.0%)101-7101-531.21-50 Utility Services 400,256 373,334 436,000 436,000 416,000 (20,000) (4.6%)101-7101-531.21-55 Forestry & Ground Services 778,441 790,802 806,600 806,600 891,700 85,100 10.6%101-7101-531.21-62 Disposal Services 28,843 13,333 26,200 26,200 26,200 0 0.0%101-7101-531.21-65 Other Services 64,239 68,497 82,400 82,400 114,600 32,200 39.1%101-7101-531.22-02 Dues 7,604 10,871 10,400 10,400 10,400 0 0.0%101-7101-531.22-03 Training 30,753 17,307 31,600 31,600 49,000 17,400 55.1%101-7101-531.22-05 Postage 2,493 2,997 2,800 2,800 2,800 0 0.0%101-7101-531.22-10 Printing 1,408 838 3,700 3,700 2,200 (1,500) (40.5%)101-7101-531.22-15 Photocopying 7,646 5,985 7,800 7,800 7,800 0 0.0%101-7101-531.22-25 IT/GIS Service Charge 270,800 297,800 301,900 301,900 407,700 105,800 35.0%101-7101-531.22-37 Vehicle/Equip Lease Charge 1,452,700 1,357,700 1,418,300 1,418,300 1,408,100 (10,200) (0.7%)101-7101-531.22-70 Telephone Services 258,791 305,403 222,200 222,200 222,200 0 0.0%
Contractual Services 5,262,991 5,319,712 5,413,700 5,413,687 5,627,900 214,213 4.0%
101-7101-531.30-01 Publications Periodicals 1,232 1,604 1,400 1,400 1,400 0 0.0%101-7101-531.30-05 Office Supplies & Equip 7,498 8,892 13,700 13,700 11,000 (2,700) (19.7%)101-7101-531.30-35 Clothing 33,227 24,503 34,500 34,500 34,500 0 0.0%101-7101-531.30-50 Petroleum Products 129,800 77,070 112,500 112,500 115,100 2,600 2.3%101-7101-531.31-40 Agricultural Supplies 32,674 33,569 32,700 32,700 32,700 0 0.0%101-7101-531.31-45 Janitorial Supplies 35,945 63,189 45,000 45,000 45,000 0 0.0%101-7101-531.31-55 Building Supplies 90,282 77,509 74,000 74,000 74,000 0 0.0%101-7101-531.31-65 Other Equip & Supplies 60,957 168,714 103,500 103,500 103,500 0 0.0%101-7101-531.31-70 Traffic Signal Supplies 20,043 21,532 21,000 21,000 21,000 0 0.0%101-7101-531.31-75 Street Light Supplies 115,614 72,554 86,200 86,172 76,500 (9,672) (11.2%)101-7101-531.31-80 Street Sign Supplies 30,023 29,640 30,000 30,000 30,000 0 0.0%101-7101-531.31-85 Small Tools and Equipment 20,966 16,093 21,200 21,200 21,200 0 0.0%101-7101-531.31-90 Street and Sidewalk Supplies 886,755 502,461 901,500 901,500 941,500 40,000 4.4%101-7101-531.33-05 Other Supplies 39,526 14 0 0 0 0 N/A
Commodities 1,504,542 1,097,344 1,477,200 1,477,172 1,507,400 30,228 2.0%
Total Public Works 14,753,358 14,301,998 15,350,100 15,533,759 15,974,300 440,541 2.8%
195

PUBLIC WORKSGENERAL FUND EXPENDITURE DETAIL
AccountNumber Account Title Description
SALARIES:
101-7101-531.10-01 Salaries Salaries 5,154,800 5,240,400
101-7101-531.18-01 Temporary Help Temporary Help 115,000 117,600
101-7101-531.18-05 Overtime Civilian Overtime Civilian 663,100 678,000
101-7101-531.18-80 Special Detail Special Detail 8,100 8,300
TOTAL SALARIES 5,941,000 6,044,300
FRINGE BENEFITS:
101-7101-531.19-01 Workers' Compensation Workers' Compensation Insurance 491,500 545,800
101-7101-531.19-05 Medical Insurance Medical Insurance 1,010,800 1,091,500
101-7101-531.19-10 IMRF IMRF 742,400 690,900
101-7101-531.19-11 Social Security Social Security 369,400 377,100
101-7101-531.19-12 Medicare Medicare 87,800 89,400
TOTAL FRINGE BENEFITS 2,701,900 2,794,700
CONTRACTUAL SERVICES:
101-7101-531.20-05 Professional Services Consulting services (incl. storm warning) concrete testing and bid reviews, incld. 37,500 37,500Pavement Management Services 35,000 50,000Surveying Services 800 800Construction Inspection Services 155,800 155,800Traffic Data Analysis 2,700 35,000Plan Review Services 35,000 35,000Prior Year Encumbrance Carryover 25,805 292,605 0 314,100
101-7101-531.20-40 General Insurance Liability and property insurance 152,200 107,500
101-7101-531.21-01 Traffic Signal Maintenance Repairs to controllers and opticom 15,000 15,000
101-7101-531.21-02 Equipment Maintenance Maintenance of: office, electrical, shop andradio equipment; generators and
fire extinguishers 16,400 16,400Preventative maintenance, inspections,
repairs, and certifications of HVACsystems 236,800 296,800
Preventative maintenance, inspections, repairs, and certifications of elevators 22,000 22,000
Emergency siren upgrade (traffic) 15,000 15,000Preventative maintenance, inspections,
repair and certifications of life safety equip 20,500 20,500Water feature and irrigation system maint. 22,000 22,000Traffic counters & survey levels 400 400Prior Year Encumbrance Carryover 13,000 346,100 0 393,100
101-7101-531.21-11 Building Maintenance Custodial services for all municipal buildings, historical, police, fire, senior center and train station 236,000 236,000
Budget Budget2021 2022
196

PUBLIC WORKSGENERAL FUND EXPENDITURE DETAIL
AccountNumber Account Title Description
Budget Budget2021 2022
101-7101-531.21-11 Building Maint. (cont.) Misc. cleaning services for mats, windows,blinds and carpets 27,500 27,500
Repairs to roofs, doors, windows, plumbing, generators, and painting 58,000 58,000
Pest control 9,000 9,000Police firing range cleaning and lead
compliance testing 28,000 28,000Prior Year Encumbrance Carryover 13,382 371,882 0 358,500
101-7101-531.21-15 Street/ Sidewalk Maint. Asphalt 265,000 265,000Asphalt Spray Patching 90,000 85,000Concrete 185,000 185,000Pavement striping 75,000 75,000Paver Brick Repair 25,000 45,000Concrete Sidewalk Cutting 23,000 663,000 23,000 678,000
101-7101-531.21-36 Equipment Rental Small tool and equipment rental 10,000 10,000In-house paving program:
Asphalt grinder rental 28,000 28,000Asphalt trucking 165,000 165,000
Material hauling 20,000 223,000 0 203,000
101-7101-531.21-50 Utility Services Rental of Com. Ed. Co. street lights 114,000 114,000Electrical energy for Village owned street lights and traffic signals 131,000 121,000Electric excess facilities & charges for
usage of natural gas in excess offranchise agreement 191,000 436,000 181,000 416,000
101-7101-531.21-55 Forestry & Ground Srvs Forestry Services / Tree Maintenance:Tree trimming 250,000 275,000Tree and stump removals 125,000 125,000New planting 175,000 175,000
Landscape Maintenance:High Profile Site Maintenance 69,300 51,000Secondary Site Maintenance 31,100 82,500Grass Cutting 94,500 145,000Weed Control 29,400 22,200Gateway Sign Maintenance 2,000 2,000Parkway Restoration 5,300 2,000Corridor Landscape Maintenance 25,000 806,600 12,000 891,700
101-7101-531.21-62 Disposal Services Landfill charges (non-tree) and misc. 21,200 21,200Leaf composting/wood chips 5,000 26,200 5,000 26,200
101-7101-531.21-65 Other Services Special service, service calls,moving projects & material testing 22,600 22,600
Service Request Software 6,300 6,300Work Management Software 27,600 27,600SDS Database 500 500JULIE charge 6,600 6,600Digitizing of records 1,000 33,200Technical computer software 3,800 3,800Executime licensing 14,000 82,400 14,000 114,600
101-7101-531.22-02 Dues Dues 10,400 10,400
101-7101-531.22-03 Training Street Unit:APWA Snow Conference 0 1,500APWA Suburban Snow & Ice 0 600
197

PUBLIC WORKSGENERAL FUND EXPENDITURE DETAIL
AccountNumber Account Title Description
Budget Budget2021 2022
101-7101-531.22-03 Training (cont.) NIPSTA Training Courses & Misc 1,800 6,800Forestry Unit:
APWA Snow Conference 0 1,500Int'l Society Arborists 1,800 1,800Illinois Arborists Conference (5) 800 800iLandscape Show 400 400Arboricultural Skills Workshop 400 400Tree City Seminar 100 100Safety & training textbooks 100 100Illinois Landscape Contractors
Association Certification (1) 400 400Illinois Arborists Training & Workshops 700 700
Traffic Unit:IMSA/ITE Traffic Signal Maintenance
Certification 1,300 1,300
Administration:APWA Annual Conference (2) 0 4,800APWA Suburban Expo 900 900Illinois Public Service Institute 2,400 2,400In-service management training 400 400Tuition reimbursement 9,000 9,000Safety training materials - Fed requirement 1,600 1,600
Municipal Buildings Unit:A/C controls operation/maintenance 2,500 2,500APWA Suburban Expo 300 300Safety and training aids 100 100
Engineering:APWA Internat'l Congress (2) 0 4,000Short Courses APWA, University of
Wisconsin, ASCE, PCA, AWWA 6,600 31,600 6,600 49,000
101-7101-531.22-05 Postage Mailings 2,800 2,800
101-7101-531.22-10 Printing Printing of shop orders, time cards and miscellaneous forms 3,700 2,200
101-7101-531.22-15 Photocopying Photocopies & supplies 2,000 2,000Maintenance agreement Xerox WC5645 5,800 7,800 5,800 7,800
101-7101-531.22-25 IT/GIS Service Charge Information Technology/GIS service charge 301,900 407,700
101-7101-531.22-37 Vehicle/Equip Lease Chrg Vehicle lease charge 1,418,300 1,408,100
101-7101-531.22-70 Telephone Services Cell phone charges and telephonecharges for all service except forcommissions 183,000 183,000
EOC phone lines 11,000 11,000GPS-AVL data 15,000 15,000Fire Stations Optic Connection Upgrade 13,200 222,200 13,200 222,200
TOTAL CONTRACTUAL SERVICES 5,413,687 5,627,900
COMMODITIES:
101-7101-531.30-01 Publications/Periodicals Miscellaneous publications 1,400 1,400
101-7101-531.30-05 Office Supplies & Equip General office supplies 7,700 7,000Drafting supplies 2,500 2,000
198

PUBLIC WORKSGENERAL FUND EXPENDITURE DETAIL
AccountNumber Account Title Description
Budget Budget2021 2022
101-7101-531.30-05 Office Supplies (cont.) Misc. supplies for plan preparation 3,500 13,700 2,000 11,000
101-7101-531.30-35 Clothing Uniform rental and cleaning 6,500 6,500Boots and miscellaneous clothing 13,000 13,000Personal protective equipment 15,000 34,500 15,000 34,500
101-7101-531.30-50 Petroleum Products Gasoline for department vehicles 112,500 115,100
101-7101-531.31-40 Agricultural Supplies Materials for parkway and landscaperestoration and maintenance:Black dirt 3,700 3,700Sod & seeds 5,000 5,000Fertilizers & weed killers 4,000 4,000Compost 2,500 2,500Plants & materials 17,500 32,700 17,500 32,700
101-7101-531.31-45 Janitorial Supplies Custodial supplies not furnished bycontract maintenance service, includingpaper products, soap, etc. 45,000 45,000
101-7101-531.31-55 Building Supplies Electrical, plumbing & hardwaresupplies, lumber & paint for maintenance& repairs of Municipal Building 74,000 74,000
101-7101-531.31-65 Other Equip. & Supplies Saw blades, batteries, hose and misc.parts & supplies for small equipment 60,000 60,000
Marking Paint 2,500 2,500Holiday lighting & decorations 38,000 38,000Traffic Counter Supplies 1,000 1,000Flags 2,000 103,500 2,000 103,500
101-7101-531.31-70 Traffic Signal Supplies Poles, components, etc. 21,000 21,000
101-7101-531.31-75 Street Light Supplies Poles, fixtures, lamps & misc. materials 61,000 61,000Damage replacement (reimbursable) 15,500 15,500Prior Year Encumbrance Carryover 9,672 86,172 0 76,500
101-7101-531.31-80 Street Sign Supplies Blank signs, reflective sheeting,letters, numbers, adhesives, & misc. 20,000 20,000
Materials for thermoplastic marking 4,300 4,300Damage replacement (reimbursable) 2,700 2,700Bike Route Posts/Signs 3,000 30,000 3,000 30,000
101-7101-531.31-85 Small Tools & Equipment Misc. expendable hand tools & equipment 21,200 21,200
101-7101-531.31-90 Street & Sidewalk Supply Patching materials, gravel and sand 26,900 26,900Asphalt for In-house paving program. 317,000 317,000Concrete 20,000 20,000Rock salt 425,000 465,000Liquid calcium chloride 99,000 99,000Ice melt 10,000 10,000Forming materials and lumber 3,600 901,500 3,600 941,500
TOTAL COMMODITIES 1,477,172 1,507,400
TOTAL PUBLIC WORKS 15,533,759 15,974,300
199

THIS PAGE LEFT BLANK
200

NON-OPERATING
201

NON-OPERATING GENERAL FUND EXPENDITURES
Account Account Actual Actual Proj. Act. Budget Budget $ %Number Description 2019 2020 2021 2021 2022 Inc (Dec) Inc (Dec)
101-9901-591.40-89 Sales Tax Abatement 485,763 507,370 450,000 450,000 500,000 50,000 11.1%101-9901-591.40-93 PPRT to Library 0 112,988 153,000 108,000 132,000 24,000 22.2%101-9901-591.40-96 Operating Contingency 0 0 175,000 175,000 200,000 25,000 14.3%101-9901-591.40-99 Tax Rebates 221,533 0 0 0 0 0 N/A
Other Charges 707,296 620,358 778,000 733,000 832,000 99,000 13.5%
101-9901-591.90-05 Operating Transfer Out 3,452,670 0 0 0 0 0 N/ANon-Operating 3,452,670 0 0 0 0 0 0
Total Non-Operating 4,159,966 620,358 778,000 733,000 832,000 99,000 13.5%
Total General Fund 78,586,185 75,571,855 78,664,200 79,403,734 81,376,100 (71,787,540) 2.5%
202

NON-OPERATINGGENERAL FUND EXPENDITURE DETAIL
AccountNumber Account Title Description
101-9901-591.40-89 Sales Tax Abatements Sales tax abatement -Napleton/Lexus/Le Obsession 450,000 500,000
101-9901-591.40-93 PPRT to Library Library's Portion of PPRT Revenue (24%) 108,000 132,000
101-9901-591.40-96 Operating Contingency Operating Contingency 175,000 200,000
TOTAL OTHER CHARGES 733,000 832,000
TOTAL NON-OPERATING EXPENDITURES 733,000 832,000
TOTAL GENERAL FUND 79,403,734 81,376,100
Budget2022
Budget2021
203

THIS PAGE LEFT BLANK
204
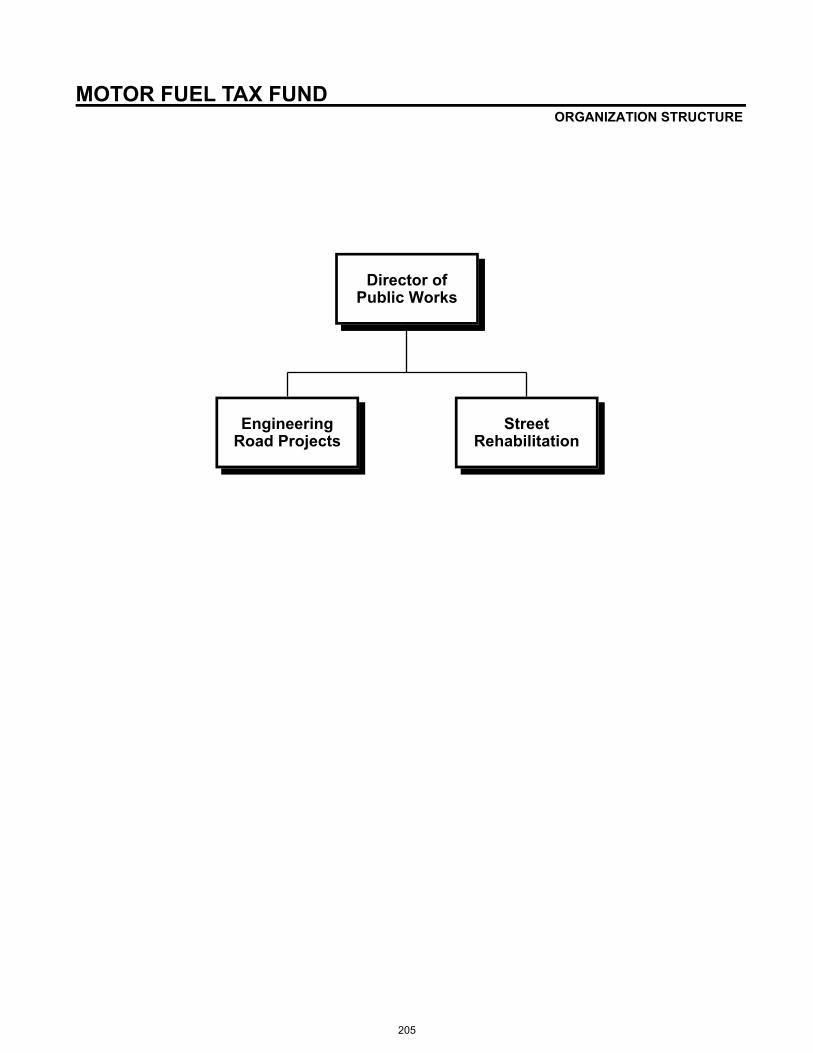
Director of Public Works
Engineering Road Projects
Street Rehabilitation
MOTOR FUEL TAX FUND ORGANIZATION STRUCTURE
205

MOTOR FUEL TAX FUND 211 Fund at a Glance
Separate funds are received from the State of Illinois during a per capita distribution of the taxes we pay at the gas pump. There are only certain legal purposes for the use of these funds as prescribed. Basically, the Village is using this fund for the resurfacing and rehabilitation of our deteriorating streets and roads. Restrictions: STATE LAW – The statutes are very specific as to how these funds are to be spent. Eligibility includes programs such as: storm water management, pavement repair or reconstruction, snow & ice removal, parkway maintenance, traffic control, street lighting, traffic signal maintenance, etc. Fund Summary
2019 2020 2021 2021 2022 $ %Actual Actual Est. Actual Budget Budget Change Change
RevenuesTaxes $2,463,757 $2,733,024 $3,000,000 $3,000,000 $3,000,000 $0 0.0%Intergovernmenta l 0 1,649,817 1,650,000 1,650,000 1,650,000 0 0.0%Interest Income 15,285 8,590 1,000 4,000 4,000 0 0.0%
Total Revenues $2,479,042 $4,391,431 $4,651,000 $4,654,000 $4,654,000 $0 0.0%Interfund Transfers In 0 0 0 0 0 0 N/A
Total Revenues andInterfund Transfers In $2,479,042 $4,391,431 $4,651,000 $4,654,000 $4,654,000 $0 0.0%
ExpendituresCapita l Items 1,873,979 2,371,133 4,232,200 4,232,220 4,116,800 (115,420) (2.7%)
Total Expenditures $1,873,979 $2,371,133 $4,232,200 $4,232,220 $4,116,800 ($115,420) (2.7%)Interfund Transfers Out 0 0 0 0 0 0 N/A
Total Expenditures andInterfund Transfers Out $1,873,979 $2,371,133 $4,232,200 $4,232,220 $4,116,800 ($115,420) (2.7%)
Revenues over(under) Expenditures $605,063 $2,020,298 $418,800 $421,780 $537,200 $115,420 27.4%
BEGINNING FUND BALANCE 2,300,745 2,905,808 4,926,106 4,926,106 5,344,906 418,800 8.5%
ENDING FUND BALANCE $2,905,808 $4,926,106 $5,344,906 $5,347,886 $5,882,106 $534,220 10.0%
206
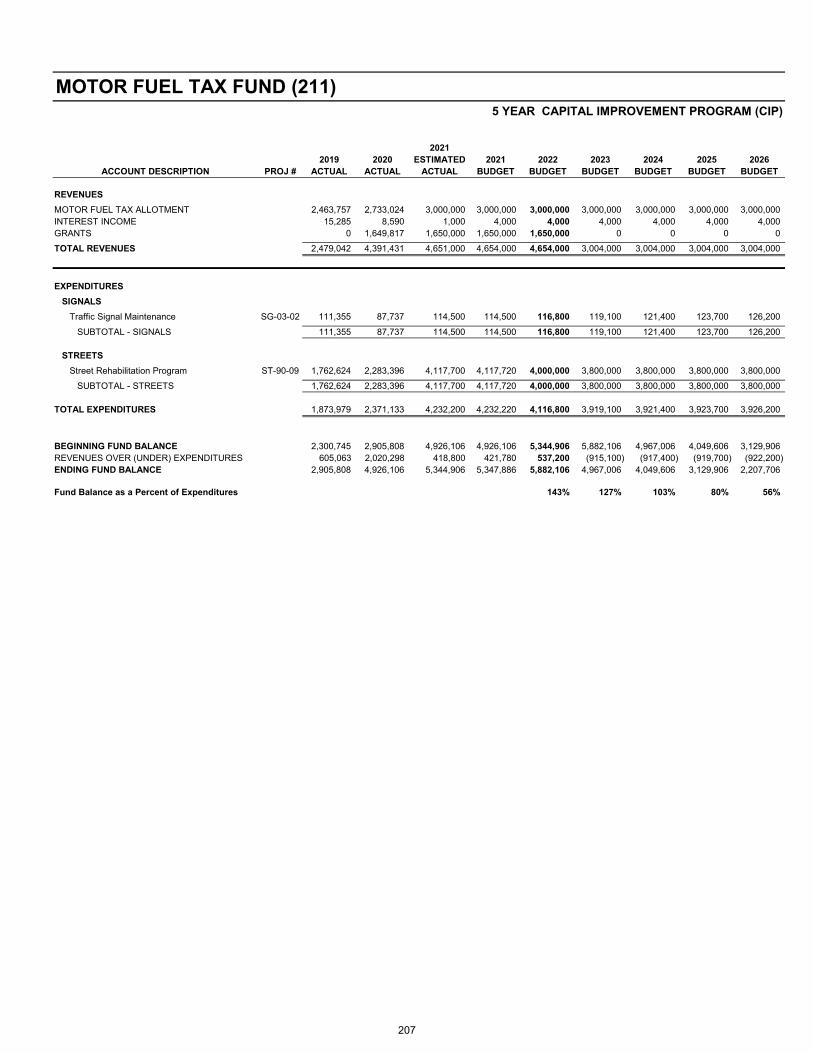
67%
20212019 2020 ESTIMATED 2021 2022 2023 2024 2025 2026
ACCOUNT DESCRIPTION PROJ # ACTUAL ACTUAL ACTUAL BUDGET BUDGET BUDGET BUDGET BUDGET BUDGET
REVENUES
MOTOR FUEL TAX ALLOTMENT 2,463,757 2,733,024 3,000,000 3,000,000 3,000,000 3,000,000 3,000,000 3,000,000 3,000,000INTEREST INCOME 15,285 8,590 1,000 4,000 4,000 4,000 4,000 4,000 4,000GRANTS 0 1,649,817 1,650,000 1,650,000 1,650,000 0 0 0 0
TOTAL REVENUES 2,479,042 4,391,431 4,651,000 4,654,000 4,654,000 3,004,000 3,004,000 3,004,000 3,004,000
EXPENDITURES
SIGNALS
Traffic Signal Maintenance SG-03-02 111,355 87,737 114,500 114,500 116,800 119,100 121,400 123,700 126,200
SUBTOTAL - SIGNALS 111,355 87,737 114,500 114,500 116,800 119,100 121,400 123,700 126,200
STREETS
Street Rehabilitation Program ST-90-09 1,762,624 2,283,396 4,117,700 4,117,720 4,000,000 3,800,000 3,800,000 3,800,000 3,800,000
SUBTOTAL - STREETS 1,762,624 2,283,396 4,117,700 4,117,720 4,000,000 3,800,000 3,800,000 3,800,000 3,800,000 TOTAL EXPENDITURES 1,873,979 2,371,133 4,232,200 4,232,220 4,116,800 3,919,100 3,921,400 3,923,700 3,926,200
BEGINNING FUND BALANCE 2,300,745 2,905,808 4,926,106 4,926,106 5,344,906 5,882,106 4,967,006 4,049,606 3,129,906REVENUES OVER (UNDER) EXPENDITURES 605,063 2,020,298 418,800 421,780 537,200 (915,100) (917,400) (919,700) (922,200)ENDING FUND BALANCE 2,905,808 4,926,106 5,344,906 5,347,886 5,882,106 4,967,006 4,049,606 3,129,906 2,207,706
Fund Balance as a Percent of Expenditures 143% 127% 103% 80% 56%
MOTOR FUEL TAX FUND (211)5 YEAR CAPITAL IMPROVEMENT PROGRAM (CIP)
207

MOTOR FUEL TAX FUND REVENUES
Account Account Actual Actual Proj Actual Budget Budget $ %Number Description 2019 2020 2021 2021 2022 Inc (Dec) Inc (Dec)
211-0000-403.20-00 Motor Fuel Tax Allotment 2,463,757 2,733,024 3,000,000 3,000,000 3,000,000 0 0.0%Intergovernmental Taxes 2,463,757 2,733,024 3,000,000 3,000,000 3,000,000 0 0.0%
211-0000-411.55-00 State Grants 0 1,649,817 1,650,000 1,650,000 1,650,000 0 0.0%Intergovernmental 0 1,649,817 1,650,000 1,650,000 1,650,000 0 0.0%
211-0000-461.02-00 Interest on Investments 15,285 8,590 1,000 4,000 4,000 0 0.0%Interest Income 15,285 8,590 1,000 4,000 4,000 0 0.0%
Total MFT Fund 2,479,042 4,391,431 4,651,000 4,654,000 4,654,000 0 0.0%
EXPENDITURES
Public Works 7101
Account Account Actual Actual Proj. Act. Budget Budget $ %Number Description 2019 2020 2021 2021 2022 Inc (Dec) Inc (Dec)
211-7101-571.50-40 MFT Programs 1,873,979 2,371,133 4,232,200 4,232,220 4,116,800 (115,420) (2.7%)Capital Outlay 1,873,979 2,371,133 4,232,200 4,232,220 4,116,800 (115,420) (2.7%)
Total Public Works 1,873,979 2,371,133 4,232,200 4,232,220 4,116,800 (115,420) (2.7%)Total MFT Fund 1,873,979 2,371,133 4,232,200 4,232,220 4,116,800 (115,420) (2.7%)
208

MOTOR FUEL TAX FUNDEXPENDITURE DETAIL
PUBLIC WORKS 7101
AccountNumber Account Title Description
CAPITAL OUTLAY:
211-7101-571.50-40 MFT Programs Contract maintenance of traffic signalcontrollers on IDOT and CCHD
roadways (SG0302) 114,500 116,800
Street Rehabilitation Program (ST9009) 4,000,000 4,000,000Prior Year Encumbrance Carryover 117,720 4,232,220 0 4,116,800
TOTAL CAPITAL OUTLAY 4,232,220 4,116,800
TOTAL PUBLIC WORKS 4,232,220 4,116,800
TOTAL MOTOR FUEL TAX FUND 4,232,220 4,116,800
2021Budget
2022Budget
209

THIS PAGE LEFT BLANK
210

Director of Planning & Community Development
Community Development Block Grant
Administration Public Service Construction
COMMUNITY DEVELOPMENT BLOCK GRANT ORGANIZATION STRUCTURE
211

CDBG FUND 215 Fund at a Glance
Federal monies are made available to the Village to provide benefits for low to moderate income residents of the community. There are specific federal guidelines that must be followed in appropriating these funds. A separate tracking of revenues and expenditures are accounted for in this fund. Restrictions: FEDERAL LAW – The law was written to charge the Department of Housing and Urban Development with administering these funds. In general, the funds must be targeted to benefit low to moderate income residents. Fund Summary
2019 2020 2021 2021 2022 $ %Actual Actual Est. Actual Budget Budget Change Change
RevenuesIntergovernmenta l $340,801 $356,951 $510,400 $871,200 $829,200 ($42,000) (4.8%)Other 38,782 43,639 54,800 50,000 50,000 0 0.0%
Total Revenues $379,583 $400,590 $565,200 $921,200 $879,200 ($42,000) (4.6%)Interfund Transfers In 0 42,800 0 0 0 0 N/A
Total Revenues andInterfund Transfers In $379,583 $443,390 $565,200 $921,200 $879,200 ($42,000) (4.6%)
ExpendituresPersonal Services $68,000 $60,500 $62,500 $62,500 $64,300 $1,800 2.9%Other Charges 311,583 382,890 502,700 886,550 814,900 (71,650) (8.1%)
Total Expenditures $379,583 $443,390 $565,200 $949,050 $879,200 ($69,850) (7.4%)Interfund Transfers Out 0 0 0 0 0 0 N/A
Total Expenditures andInterfund Transfers Out $379,583 $443,390 $565,200 $949,050 $879,200 ($69,850) (7.4%)
Revenues over(under) Expenditures $0 $0 $0 ($27,850) $0 $27,850 (100.0%)
BEGINNING FUND BALANCE 0 0 0 0 0 0 N/A
ENDING FUND BALANCE $0 $0 $0 ($27,850) $0 $27,850 (100.0%)
212

PLANNING CDBG Fund
Class
Code Title Grade 2021 2022 + (-)
Planner II 7 0.50 0.50
Total F-T-E 0.50 0.50 0.00
Code Fund 2021 2022 + (-)
101 General Fund 9.50 9.50
215 CDBG Fund 0.50 0.50
Total F-T-E All Funds 10.00 10.00 0.00
PERSONNEL SUMMARY
Authorized Positions in F-T-E
Planning DepartmentCross Reference to All Funds
Authorized Positions in F-T-E
213

CDBG FUNDREVENUES
Account Account Actual Actual Proj Actual Budget Budget $ %Number Description 2019 2020 2021 2021 2022 Inc (Dec) Inc (Dec)
215-0000-411.40-00 CDBG Allotment - Current YR 340,801 356,951 396,300 373,200 395,300 22,100 5.9%215-0000-411.48-00 CDBG-CV Allotment - Curr YR 0 0 114,100 498,000 433,900 (64,100) (12.9%)
Intergovernmental Revenue 340,801 356,951 510,400 871,200 829,200 22,100 (4.8%)
215-0000-484.92-00 Project Income 38,782 43,639 54,800 50,000 50,000 0 0.0%Special Operations 38,782 43,639 54,800 50,000 50,000 0 0.0%
215-0000-491.05-00 Operating Transfer In 0 42,800 0 0 0 0 N/AOther Financing Sources 0 42,800 0 0 0 0 N/A
Total CDBG Fund 379,583 443,390 565,200 921,200 879,200 (9,950) (4.6%)
214
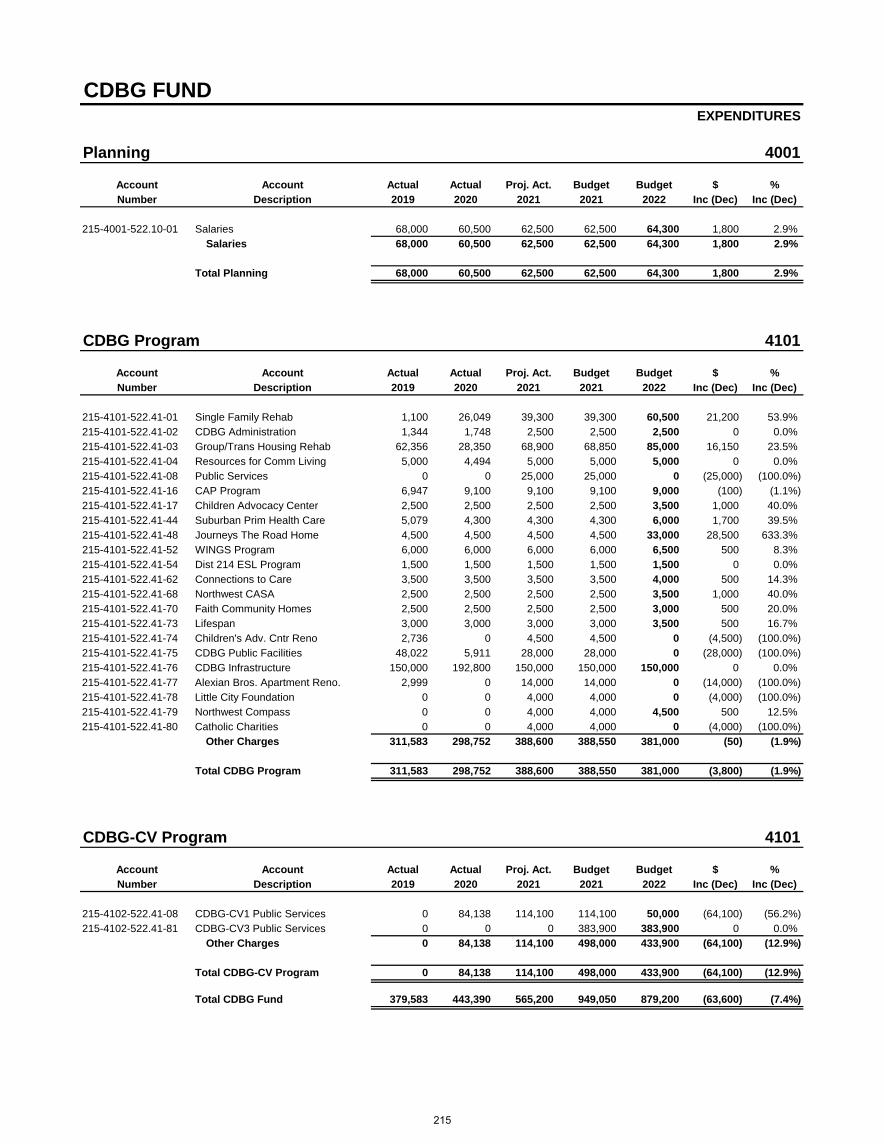
CDBG FUNDEXPENDITURES
Planning 4001
Account Account Actual Actual Proj. Act. Budget Budget $ %Number Description 2019 2020 2021 2021 2022 Inc (Dec) Inc (Dec)
215-4001-522.10-01 Salaries 68,000 60,500 62,500 62,500 64,300 1,800 2.9%Salaries 68,000 60,500 62,500 62,500 64,300 1,800 2.9%
Total Planning 68,000 60,500 62,500 62,500 64,300 1,800 2.9%
CDBG Program 4101
Account Account Actual Actual Proj. Act. Budget Budget $ %Number Description 2019 2020 2021 2021 2022 Inc (Dec) Inc (Dec)
215-4101-522.41-01 Single Family Rehab 1,100 26,049 39,300 39,300 60,500 21,200 53.9%215-4101-522.41-02 CDBG Administration 1,344 1,748 2,500 2,500 2,500 0 0.0%215-4101-522.41-03 Group/Trans Housing Rehab 62,356 28,350 68,900 68,850 85,000 16,150 23.5%215-4101-522.41-04 Resources for Comm Living 5,000 4,494 5,000 5,000 5,000 0 0.0%215-4101-522.41-08 Public Services 0 0 25,000 25,000 0 (25,000) (100.0%)215-4101-522.41-16 CAP Program 6,947 9,100 9,100 9,100 9,000 (100) (1.1%)215-4101-522.41-17 Children Advocacy Center 2,500 2,500 2,500 2,500 3,500 1,000 40.0%215-4101-522.41-44 Suburban Prim Health Care 5,079 4,300 4,300 4,300 6,000 1,700 39.5%215-4101-522.41-48 Journeys The Road Home 4,500 4,500 4,500 4,500 33,000 28,500 633.3%215-4101-522.41-52 WINGS Program 6,000 6,000 6,000 6,000 6,500 500 8.3%215-4101-522.41-54 Dist 214 ESL Program 1,500 1,500 1,500 1,500 1,500 0 0.0%215-4101-522.41-62 Connections to Care 3,500 3,500 3,500 3,500 4,000 500 14.3%215-4101-522.41-68 Northwest CASA 2,500 2,500 2,500 2,500 3,500 1,000 40.0%215-4101-522.41-70 Faith Community Homes 2,500 2,500 2,500 2,500 3,000 500 20.0%215-4101-522.41-73 Lifespan 3,000 3,000 3,000 3,000 3,500 500 16.7%215-4101-522.41-74 Children's Adv. Cntr Reno 2,736 0 4,500 4,500 0 (4,500) (100.0%)215-4101-522.41-75 CDBG Public Facilities 48,022 5,911 28,000 28,000 0 (28,000) (100.0%)215-4101-522.41-76 CDBG Infrastructure 150,000 192,800 150,000 150,000 150,000 0 0.0%215-4101-522.41-77 Alexian Bros. Apartment Reno. 2,999 0 14,000 14,000 0 (14,000) (100.0%)215-4101-522.41-78 Little City Foundation 0 0 4,000 4,000 0 (4,000) (100.0%)215-4101-522.41-79 Northwest Compass 0 0 4,000 4,000 4,500 500 12.5%215-4101-522.41-80 Catholic Charities 0 0 4,000 4,000 0 (4,000) (100.0%)
Other Charges 311,583 298,752 388,600 388,550 381,000 (50) (1.9%)
Total CDBG Program 311,583 298,752 388,600 388,550 381,000 (3,800) (1.9%)
CDBG-CV Program 4101
Account Account Actual Actual Proj. Act. Budget Budget $ %Number Description 2019 2020 2021 2021 2022 Inc (Dec) Inc (Dec)
215-4102-522.41-08 CDBG-CV1 Public Services 0 84,138 114,100 114,100 50,000 (64,100) (56.2%)215-4102-522.41-81 CDBG-CV3 Public Services 0 0 0 383,900 383,900 0 0.0%
Other Charges 0 84,138 114,100 498,000 433,900 (64,100) (12.9%)
Total CDBG-CV Program 0 84,138 114,100 498,000 433,900 (64,100) (12.9%)
Total CDBG Fund 379,583 443,390 565,200 949,050 879,200 (63,600) (7.4%)
215

CDBG FUNDEXPENDITURE DETAIL
PLANNING 4001
AccountNumber Account Title Description
SALARIES:
215-4001-522.10-01 Salaries Salaries 62,500 64,300
TOTAL SALARIES 62,500 64,300
TOTAL PLANNING 62,500 64,300
CDBG PROGRAM 4101
AccountNumber Account Title Description
OTHER CHARGES:
215-4101-522.41-01 Single Family Rehab Interest free loans to low income propertyowners for home rehabilitation whichbecomes a lien on property andrecovered upon sale of home 39,300 60,500
215-4101-522.41-02 CDBG Admin/Audit Audit, legal ads, misc. costs 2,500 2,500
215-4101-522.41-03 Group/Trans Housing Rehab Group Residence/Transitional HousingRehab Grant Program 41,000 85,000
Prior Year Encumbrance Carryover 27,850 68,850 0 85,000
215-4101-522.41-04 Resources for Comm Living Shared housing for special populations 5,000 5,000
215-4101-522.41-08 Public Services COVID19 Related Public Services 25,000 0
215-4101-522.41-16 Children at Play Grant to Children at Play (CAP) Program -subsidy for low income participants 9,100 9,000
215-4101-522.41-17 Children Advocacy Center Child Abuse Services 2,500 3,500
215-4101-522.41-44 Sub Prim Health Care Grant to Suburban Primary Health CareCouncil - Access to Care Program 4,300 6,000
215-4101-522.41-48 Journeys The Road Home Journeys The Road HomeHomeless services 4,500 5,000
Rebudget capital expenditures 0 4,500 28,000 33,000
215-4101-522.41-52 WINGS Program Traditional Housing and Safe HousePublic Service 6,000 6,500
215-4101-522.41-54 Dist. 214 ESL Program District 214 Beginning English as aSecond Language Program 1,500 1,500
215-4101-522.41.62 Connections to Care Medical Transportation for Seniors 3,500 4,000
215-4101-522.41-68 Northwest CASA Sexual assault counseling, crisisintervention and advocacy 2,500 3,500
215-4101-522.41-70 Faith Community Homes Supportive housing 2,500 3,000
Budget2021
Budget2021
Budget2022
Budget2022
216

CDBG FUNDEXPENDITURE DETAIL
CDBG PROGRAM (cont.) 4101
AccountNumber Account Title Description
215-4101-522.41-73 Lifespan Services to Victims of Domestic Violence and Sexual Assault 3,000 3,500
215-4101-522.41-74 Children's Adv. Cntr Reno Prior Year Encumbrance Carryover 4,500 0
215-4101-522.41-75 CDBG Public Facilities ADA Electric Doors and Security Cameras 28,000 0Prior Year Encumbrance Carryover
215-4101-522.41-76 CDBG Infrastructure ADA or Low/Mod Area Infrastructure 150,000 150,000
215-4101-522.41-77 Alexian Bros. Apartment Reno. 14,000 0
215-4101-522.41-78 Little City Foundation 4,000 0
215-4101-522.41-79 Northwest Compass 4,000 4,500
215-4101-522.41-80 Catholic Charities 4,000 0
TOTAL OTHER CHARGES 388,550 381,000TOTAL CDBG PROGRAM 388,550 381,000
CDBG-CV PROGRAM 4101
AccountNumber Account Title Description
OTHER CHARGES:
215-4102-522.41-08 CDBG-CV Public Services COVID19 Related Expenses 114,100 50,000
215-4102-522.41-81 CDBG-CV3 Public Services COVID19 Related Expenses 383,900 383,900
TOTAL OTHER CHARGES 498,000 433,900
TOTAL CDBG-CV PROGRAM 498,000 433,900TOTAL CDBG FUND 949,050 879,200
Budget Budget2021 2022
Budget2021
Budget2022
217

THIS PAGE LEFT BLANK
218

Public Works Administration
Parking Operations
Commuter Parking
North Garage
South Garage
Evergreen Garage
MUNICIPAL PARKING FUND ORGANIZATION STRUCTURE
219

MUNICIPAL PARKING FUND 235 Fund at a Glance
The Village has been very responsive in providing parking for commuters as well as Downtown merchants, their employees and shoppers. As a result, a major investment by this community was made in the construction of many commuter lots and parking garages providing available parking for the redevelopment of the Downtown. Major improvements resulting from the creation of TIF Districts I and II were the construction of the North Garage, the Vail Avenue Garage and the Evergreen Underground Garage below the Arlington Towne Square development. In 2007, a 317-space addition was completed in the Vail Avenue Garage. After having a consultant analyze the condition of all four parking garages, a four-year program was developed to rehabilitate all four garages. Phase 1 included the rehabilitation of the entire Village Hall Municipal Garage, and the roofs of the North Garage and Vail Garage. Phase 2 was the rehabilitation of the remaining floors in the North Garage. Phase 3 will complete the Vail Garage. Phase 4 will address minor issues in the Evergreen Garage. Commuters pay either monthly or daily user fees to pay for the costs associated with operation of these garages. Separate operations are maintained to show the results of operation of the North Garage, Vail Avenue Garage, Evergreen Underground Garage and the other commuter parking lots. Restrictions: VILLAGE POLICY – The Village finances parking operations by the user fee concept. Since October 1, 2017, the monthly commuter permit rate is $40 for residents and the daily rate is $2.00. Twenty-four hour parking permits range from $40 to $50 and have restrictions for their use based on agreement.
220
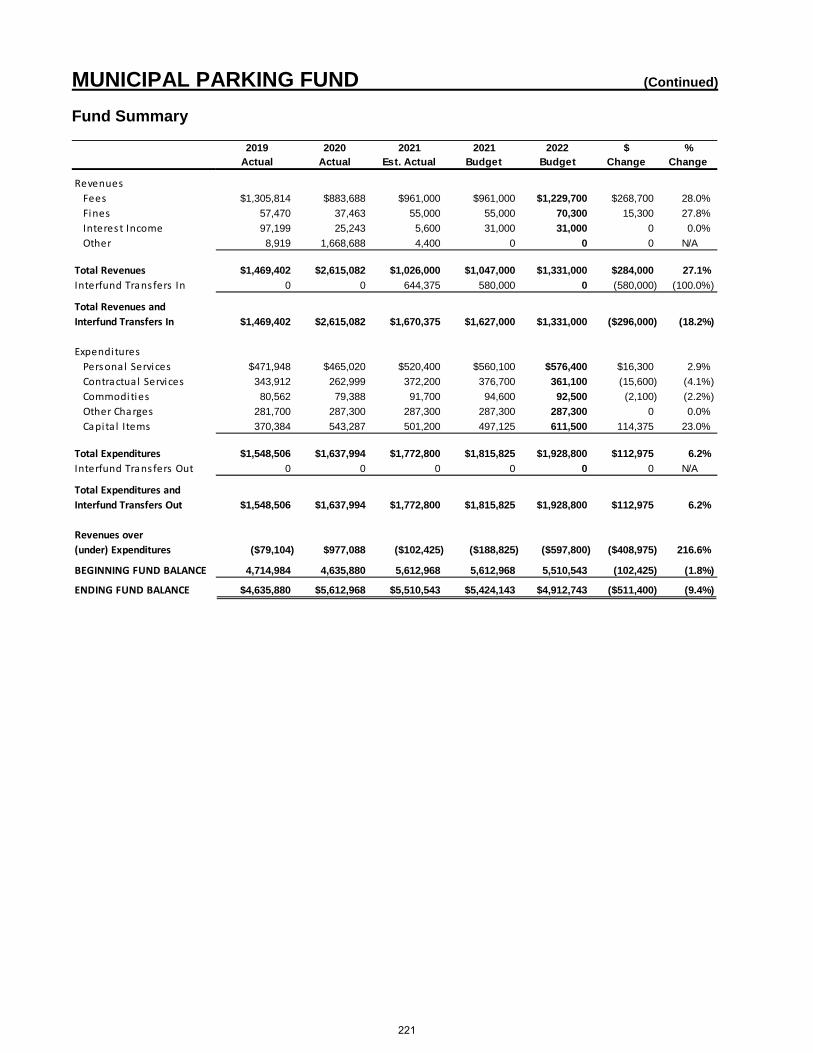
MUNICIPAL PARKING FUND (Continued) Fund Summary
2019 2020 2021 2021 2022 $ %Actual Actual Est. Actual Budget Budget Change Change
RevenuesFees $1,305,814 $883,688 $961,000 $961,000 $1,229,700 $268,700 28.0%Fines 57,470 37,463 55,000 55,000 70,300 15,300 27.8%Interest Income 97,199 25,243 5,600 31,000 31,000 0 0.0%Other 8,919 1,668,688 4,400 0 0 0 N/A
Total Revenues $1,469,402 $2,615,082 $1,026,000 $1,047,000 $1,331,000 $284,000 27.1%Interfund Transfers In 0 0 644,375 580,000 0 (580,000) (100.0%)
Total Revenues andInterfund Transfers In $1,469,402 $2,615,082 $1,670,375 $1,627,000 $1,331,000 ($296,000) (18.2%)
ExpendituresPersonal Services $471,948 $465,020 $520,400 $560,100 $576,400 $16,300 2.9%Contractual Services 343,912 262,999 372,200 376,700 361,100 (15,600) (4.1%)Commodities 80,562 79,388 91,700 94,600 92,500 (2,100) (2.2%)Other Charges 281,700 287,300 287,300 287,300 287,300 0 0.0%Capita l Items 370,384 543,287 501,200 497,125 611,500 114,375 23.0%
Total Expenditures $1,548,506 $1,637,994 $1,772,800 $1,815,825 $1,928,800 $112,975 6.2%Interfund Transfers Out 0 0 0 0 0 0 N/A
Total Expenditures andInterfund Transfers Out $1,548,506 $1,637,994 $1,772,800 $1,815,825 $1,928,800 $112,975 6.2%
Revenues over(under) Expenditures ($79,104) $977,088 ($102,425) ($188,825) ($597,800) ($408,975) 216.6%
BEGINNING FUND BALANCE 4,714,984 4,635,880 5,612,968 5,612,968 5,510,543 (102,425) (1.8%)
ENDING FUND BALANCE $4,635,880 $5,612,968 $5,510,543 $5,424,143 $4,912,743 ($511,400) (9.4%)
221

5 YEAR CAPITAL IMPROVEMENT PROGRAM (CIP)
67%
20212019 2020 ESTIMATED 2021 2022 2023 2024 2025 2026
ACCOUNT DESCRIPTION Note PROJ # ACTUAL ACTUAL ACTUAL BUDGET BUDGET BUDGET BUDGET BUDGET BUDGET
REVENUES
FEES & FINES 1,363,284 921,151 1,016,000 1,016,000 1,300,000 1,300,000 1,300,000 1,300,000 1,300,000INTEREST INCOME 106,118 25,243 5,600 31,000 31,000 31,000 31,000 31,000 31,000OTHER INCOME 0 5,548 4,400 0 0 0 0 0 0BOND PROCEEDS 0 1,663,140 0 0 0 0 0 0 0TRANSFER IN FROM PUBLIC BUILDING FUND 0 0 644,375 580,000 0 0 0 0 0
TOTAL REVENUES 1,469,402 2,615,082 1,670,375 1,627,000 1,331,000 1,331,000 1,331,000 1,331,000 1,331,000
EXPENDITURES
OPERATING EXPENDITURES
Personal Services 471,949 465,020 520,400 560,100 576,400 610,300 624,000 638,000 652,400Contractual Services 343,911 262,999 372,200 376,700 361,100 364,700 368,300 372,000 375,700Commodities 80,562 79,388 91,700 94,600 92,500 93,400 94,300 95,200 96,200Other Charges 281,700 287,300 287,300 287,300 287,300 290,200 293,100 296,000 299,000
SUBTOTAL - OPERATING EXPENDITURES 1,178,122 1,094,707 1,271,600 1,318,700 1,317,300 1,358,600 1,379,700 1,401,200 1,423,300
BUILDING & LAND
Ongoing Maintenance to Brick Exterior (1) BL-96-03 0 0 10,000 10,000 5,000 5,000 5,000 5,000 5,000Parking Structure Maintenance/Repairs BL-00-06 82,521 199,730 289,000 289,000 548,500 920,400 296,500 594,500 0LED Parking Garage Lighting Conversions BL-19-03 43,141 0 97,200 97,247 48,000 48,000 0 0 0Vail Garage Parking Guidance System BL-19-05 244,722 244,722 0 0 0 0 0 0 0Downtown Parking Signs BL-19-06 0 98,828 95,000 90,878 0 0 0 0 0Municipal Parking Lot Improvements BL-21-02 0 0 0 0 0 200,000 30,000 25,000 90,000
SUBTOTAL - BLDG & LAND 370,384 543,280 491,200 487,125 601,500 1,173,400 331,500 624,500 95,000
EQUIPMENT
Operational Equipment - Municipal Parking Fund EQ-09-01 0 7 10,000 10,000 10,000 10,000 10,000 10,000 10,000
SUBTOTAL - EQUIPMENT 0 7 10,000 10,000 10,000 10,000 10,000 10,000 10,000
TOTAL EXPENDITURES 1,548,506 1,637,994 1,772,800 1,815,825 1,928,800 2,542,000 1,721,200 2,035,700 1,528,300
BEGINNING FUND BALANCE 4,714,984 4,635,880 5,612,968 5,612,968 5,510,543 4,912,743 3,701,743 3,311,543 2,606,843REVENUES OVER (UNDER) EXPENDITURES (79,104) 977,088 (102,425) (188,825) (597,800) (1,211,000) (390,200) (704,700) (197,300)ENDING FUND BALANCE 4,635,880 5,612,968 5,510,543 5,424,143 4,912,743 3,701,743 3,311,543 2,606,843 2,409,543
Fund Balance as a Percent of Expenditures 255% 146% 192% 128% 158%
MUNICIPAL PARKING OPERATIONS FUND (235)
222

MUNICIPAL PARKING FUNDREVENUES
Account Account Actual Actual Proj Actual Budget Budget $ %Number Description 2019 2020 2021 2021 2022 Inc (Dec) Inc (Dec)
235-0000-435.54-00 Parking Lot A Daily Fees 27,006 11,348 21,700 21,700 27,700 6,000 27.6%235-0000-435.60-00 Parking Lot E Daily Fees 11,565 2,526 9,000 9,000 11,500 2,500 27.8%235-0000-435.62-00 Parking Lot N Daily Fees 0 16 0 0 0 0 N/A235-0000-435.64-01 Municipal Garage Daily Fees 12,870 3,357 14,700 14,700 18,800 4,100 27.9%235-0000-435.64-02 Vail Street Gar Daily Fees 36,793 10,567 30,200 30,200 38,600 8,400 27.8%235-0000-435.64-03 North Garage Daily Fees 81,402 17,363 65,000 65,000 83,200 18,200 28.0%235-0000-435.65-02 Vail Street Gar Monthly Fees 490,096 367,522 325,000 325,000 416,000 91,000 28.0%235-0000-435.65-03 North Garage Monthly Fees 433,544 378,807 318,000 318,000 407,000 89,000 28.0%235-0000-435.66-00 Parking Lot P Daily Fees 49,937 11,631 41,000 41,000 52,400 11,400 27.8%235-0000-435.68-00 Parking Lot S Daily Fees 74,518 16,764 63,000 63,000 80,600 17,600 27.9%235-0000-435.70-00 Parking Lot T Daily Fees 1,628 418 800 800 1,000 200 25.0%235-0000-435.72-00 Evergreen Garage U Fees 81,912 62,208 69,000 69,000 88,300 19,300 28.0%235-0000-435.74-00 Parking Lot O Daily Fees 4,543 1,161 3,600 3,600 4,600 1,000 27.8%
Parking Fees 1,305,814 883,688 961,000 961,000 1,229,700 268,700 28.0%
235-0000-441.15-00 Parking Fines 57,470 37,463 55,000 55,000 70,300 15,300 27.8%Fines 57,470 37,463 55,000 55,000 70,300 15,300 27.8%
235-0000-461.02-00 Interest on Investments 70,450 20,049 3,200 27,000 27,000 0 0.0%235-0000-462.10-00 Market Value Adjustments 26,749 5,194 2,400 4,000 4,000 0 0.0%
Interest Income 97,199 25,243 5,600 31,000 31,000 0 0.0%
235-0000-489.90-00 Other Income 8,919 5,548 4,400 0 0 0 N/AOther 8,919 5,548 4,400 0 0 0 N/A
235-0000-491.05-00 Operating Transfer In 0 0 644,375 580,000 0 (580,000) (100.0%)235-0000-491.15-00 Bond Proceeds 0 1,398,000 0 0 0 0 N/A235-0000-491.16-00 Bond Premium Proceeds 0 265,140 0 0 0 0 N/A
Other Financing Sources 0 1,663,140 644,375 580,000 0 (580,000) (100.0%)
Total Municipal Parking Fund 1,469,402 2,615,082 1,670,375 1,627,000 1,331,000 (296,000) (18.2%)
223

POLICE Municipal Parking Fund
Class
Code Title Grade 2021 2022 + (-)
Public Service Officer 2 4.00 4.00
Records Clerk 1 1.00 1.00
Total F-T-E 5.00 5.00 0.00
Code Fund 2021 2022 + (-)
101 General Fund
Police - Administration 133.00 133.00
Police Grant 1.00 1.00
235 Municipal Parking Fund 5.00 5.00
Total F-T-E All Funds 139.00 139.00 0.00
PERSONNEL SUMMARY
Authorized Positions in F-T-E
Police DepartmentCross Reference to All Funds
Authorized Positions in F-T-E
224

MUNICIPAL PARKING FUND EXPENDITURES
Police 3001
Account Account Actual Actual Proj. Act. Budget Budget $ %Number Description 2019 2020 2021 2021 2022 Inc (Dec) Inc (Dec)
235-3001-532.10-01 Salaries 314,999 298,903 337,500 370,600 379,600 9,000 2.4%235-3001-532.18-05 Overtime Civilian 0 0 6,000 6,000 6,100 100 1.7%
Salaries 314,999 298,903 343,500 376,600 385,700 9,100 2.4%
235-3001-532.19-01 Workers Compensation 9,800 10,000 10,500 10,500 11,700 1,200 11.4%235-3001-532.19-05 Medical Insurance 90,400 95,600 97,000 97,000 105,300 8,300 8.6%235-3001-532.19-10 IMRF 32,800 38,289 43,100 47,200 44,200 (3,000) (6.4%)235-3001-532.19-11 Social Security 19,410 18,015 21,300 23,300 23,900 600 2.6%235-3001-532.19-12 Medicare 4,539 4,213 5,000 5,500 5,600 100 1.8%
Fringe Benefits 156,949 166,117 176,900 183,500 190,700 7,200 3.9%
235-3001-532.20-40 General Insurance 10,300 10,600 10,700 10,700 7,600 (3,100) (29.0%)235-3001-532.22-10 Printing 3,023 6,581 4,000 4,000 4,000 0 0.0%235-3001-532.22-25 IT/GIS Service Charge 2,900 3,100 3,200 3,200 8,000 4,800 150.0%235-3001-532.22-37 Vehicle/Equip Lease Chrg 8,200 9,500 8,400 8,400 6,600 (1,800) (21.4%)
Contractual Services 24,423 29,781 26,300 26,300 26,200 (100) (0.4%)
235-3001-532.30-35 Clothing 2,310 1,799 2,500 2,500 2,500 0 0.0%235-3001-532.30-50 Petroleum Products 3,458 2,128 2,200 1,600 3,000 1,400 87.5%235-3001-532.33-05 Other Supplies 1,821 2,919 3,600 3,600 3,600 0 0.0%
Commodities 7,589 6,846 8,300 7,700 9,100 1,400 18.2%
Total Police Department 503,960 501,647 555,000 594,100 611,700 17,600 3.0%
Planning 4001
Account Account Actual Actual Proj. Act. Budget Budget $ %Number Description 2019 2020 2021 2021 2022 Inc (Dec) Inc (Dec)
235-4001-532.20-05 Professional Services 9,270 0 0 0 0 0 N/A235-4001-532.21-65 Other Services 0 0 2,000 0 2,000 2,000 N/A
Contractual Services 9,270 0 2,000 0 2,000 2,000 N/A
Total Planning 9,270 0 2,000 0 2,000 2,000 N/A
225

MUNICIPAL PARKING FUND EXPENDITURES
Public Works 7101
Account Account Actual Actual Proj. Act. Budget Budget $ %Number Description 2019 2020 2021 2021 2022 Inc (Dec) Inc (Dec)
235-7101-532.22-37 Vehicle/Equip Lease Chrg 64,100 37,400 29,000 29,000 33,400 4,400 15.2%Contractual Services 64,100 37,400 29,000 29,000 33,400 4,400 15.2%
235-7101-571.50-20 Building Improvements 0 0 10,000 10,000 5,000 (5,000) (50.0%)235-7101-571.50-25 Construction in Progress 370,384 543,280 481,200 477,125 596,500 119,375 25.0%235-7101-572.50-15 Other Equipment 0 7 10,000 10,000 10,000 0 0.0%
Capital Outlay 370,384 543,287 501,200 497,125 611,500 114,375 23.0%
Total Public Works 434,484 580,687 530,200 526,125 644,900 118,775 22.6%
Parking Operations 7301
Account Account Actual Actual Proj. Act. Budget Budget $ %Number Description 2019 2020 2021 2021 2022 Inc (Dec) Inc (Dec)
235-7301-532.21-11 Building Maintenance 4,944 5,481 9,000 9,000 9,000 0 0.0%235-7301-532.21-40 Lease Expense 16,481 3,790 17,500 17,500 17,500 0 0.0%235-7301-532.21-50 Utility Services 14,538 12,994 13,000 11,400 13,000 1,600 14.0%235-7301-532.22-03 Training 0 0 0 1,500 1,500 0 0.0%
Contractual Services 35,963 22,265 39,500 39,400 41,000 1,600 4.1%
235-7301-532.31-65 Other Equip & Supplies 3 2,444 2,900 2,900 2,900 0 0.0%235-7301-532.31-90 Street and Sidewalk Sup 16,638 14,000 14,000 14,000 14,000 0 0.0%
Commodities 16,641 16,444 16,900 16,900 16,900 0 0.0%
235-7301-532.40-75 Administrative Serv Charge 71,500 72,900 72,900 72,900 72,900 0 0.0%Other Charges 71,500 72,900 72,900 72,900 72,900 0 0.0%
Total Parking Operations 124,104 111,609 129,300 129,200 130,800 1,600 1.2%
Vail Avenue Garage Operation 7302
Account Account Actual Actual Proj. Act. Budget Budget $ %Number Description 2019 2020 2021 2021 2022 Inc (Dec) Inc (Dec)
235-7302-532.21-02 Equipment Maintenance 14,144 14,576 25,600 25,200 24,000 (1,200) (4.8%)235-7302-532.21-11 Building Maintenance 16,817 14,089 36,200 36,200 31,400 (4,800) (13.3%)235-7302-532.21-50 Utility Services 54,177 28,631 52,000 52,000 52,000 0 0.0%235-7302-532.22-10 Printing 0 4,253 4,300 3,800 4,300 500 13.2%
Contractual Services 85,138 61,549 118,100 117,200 111,700 (5,500) (4.7%)
235-7302-532.31-65 Other Equip & Supplies 471 935 5,000 5,000 5,000 0 0.0%235-7302-532.31-90 Street and Sidewalk Sup 30,464 29,393 30,300 30,300 30,300 0 0.0%
Commodities 30,935 30,328 35,300 35,300 35,300 0 0.0%
235-7302-532.40-75 Administrative Serv Charge 90,300 92,100 92,100 92,100 92,100 0 0.0%Other Charges 90,300 92,100 92,100 92,100 92,100 0 0.0%
Total Vail Street Garage 206,373 183,977 245,500 244,600 239,100 (5,500) (2.2%)
226

MUNICIPAL PARKING FUND EXPENDITURES
North Garage Operation 7303
Account Account Actual Actual Proj. Act. Budget Budget $ %Number Description 2019 2020 2021 2021 2022 Inc (Dec) Inc (Dec)
235-7303-532.21-02 Equipment Maintenance 6,432 970 20,000 20,000 10,000 (10,000) (50.0%)235-7303-532.21-11 Building Maintenance 24,258 16,945 26,200 31,000 26,200 (4,800) (15.5%)235-7303-532.21-50 Utility Services 53,087 36,989 50,000 50,000 50,000 0 0.0%235-7303-532.22-10 Printing 0 2,653 3,000 3,500 3,000 (500) (14.3%)
Contractual Services 83,777 57,557 99,200 104,500 89,200 (15,300) (14.6%)
235-7303-532.31-65 Other Equip & Supplies 93 2,964 5,000 7,000 5,000 (2,000) (28.6%)235-7303-532.31-90 Street and Sidewalk Sup 23,701 22,784 23,700 23,700 23,700 0 0.0%
Commodities 23,794 25,748 28,700 30,700 28,700 (2,000) (6.5%)
235-7303-532.40-75 Administrative Serv Charge 93,800 95,700 95,700 95,700 95,700 0 0.0%Other Charges 93,800 95,700 95,700 95,700 95,700 0 0.0%
Total North Garage 201,371 179,005 223,600 230,900 213,600 (17,300) (7.5%)
Evergreen Underground Garage Operation 7304
Account Account Actual Actual Proj. Act. Budget Budget $ %Number Description 2019 2020 2021 2021 2022 Inc (Dec) Inc (Dec)
235-7304-532.21-02 Equipment Maintenance 10,484 13,306 15,000 15,000 15,000 0 0.0%235-7304-532.21-11 Building Maintenance 4,109 4,518 10,000 9,500 9,500 0 0.0%235-7304-532.21-50 Utility Services 26,648 15,145 30,000 32,700 30,000 (2,700) (8.3%)235-7304-532.22-10 Printing 0 2,926 3,100 3,100 3,100 0 0.0%
Contractual Services 41,241 35,895 58,100 60,300 57,600 (2,700) (4.5%)
235-7304-532.31-65 Other Equip & Supplies 1,119 22 2,500 4,000 2,500 (1,500) (37.5%)235-7304-532.33-05 Other Supplies 484 0 0 0 0 0 N/A
Commodities 1,603 22 2,500 4,000 2,500 (1,500) (37.5%)
235-7304-532.40-75 Administrative Serv Charge 26,100 26,600 26,600 26,600 26,600 0 0.0%Other Charges 26,100 26,600 26,600 26,600 26,600 0 0.0%
Total Evergreen Street Garage 68,944 62,517 87,200 90,900 86,700 (4,200) (4.6%)
Debt Service 9558
Account Account Actual Actual Proj. Act. Budget Budget $ %Number Description 2019 2020 2021 2021 2022 Inc (Dec) Inc (Dec)
235-9558-583.20-06 Bond Issuance Costs 0 18,552 0 0 0 0 N/AContractual Services 0 18,552 0 0 0 0 N/A
Total Debt Service 0 18,552 0 0 0 0 N/A
Total Municipal Parking Fund 1,548,506 1,637,994 1,772,800 1,815,825 1,928,800 112,975 6.2%
227

MUNICIPAL PARKING FUNDEXPENDITURE DETAIL
POLICE 3001
AccountNumber Account Title Description
SALARIES:
235-3001-532.10-01 Salaries Salaries 370,600 379,600
235-3001-532.18-05 Overtime Civilian Overtime Civilian 6,000 6,100
TOTAL SALARIES 376,600 385,700
FRINGE BENEFITS:
235-3001-532.19-01 Workers' Compensation Workers' Compensation Insurance 10,500 11,700
235-3001-532.19-05 Medical Insurance Medical Insurance 97,000 105,300
235-3001-532.19-10 IMRF IMRF 47,200 44,200
235-3001-532.19-11 Social Security Social Security 23,300 23,900
235-3001-532.19-12 Medicare Medicare 5,500 5,600
TOTAL FRINGE BENEFITS 183,500 190,700
CONTRACTUAL SERVICES:
235-3001-532.20-40 General Insurance Liability and property insurance 10,700 7,600
235-3001-532.22-10 Printing Parking tickets 4,000 4,000
235-3001-532.22-25 IT/GIS Service Charge Information Technology/GIS service charge 3,200 8,000
235-3001-532.22-37 Vehicle/Equip Lease Chrg Vehicle lease charge 8,400 6,600
TOTAL CONTRACTUAL SERVICES 26,300 26,200
COMMODITIES:
235-3001-532.30-35 Clothing PSO clothing 2,500 2,500
235-3001-532.30-50 Petroleum Products Gasoline for department vehicle(s) 1,600 3,000
235-3001-532.33-05 Other Supplies Batteries 200 200Tablet data plan 700 700Miscellaneaous supplies 2,700 3,600 2,700 3,600
TOTAL COMMODITIES 7,700 9,100
TOTAL POLICE 594,100 611,700
Budget2021
Budget2022
228

MUNICIPAL PARKING FUNDEXPENDITURE DETAIL
PLANNING 4001
AccountNumber Account Title Description
CONTRACTUAL SERVICES:
235-4001-532.21-65 Other Services Electric Vehicle Charging Licenses 0 2,000
TOTAL CONTRACTUAL SERVICES 0 2,000
PUBLIC WORKS 7101
AccountNumber Account Title Description
CONTRACTUAL SERVICES:
235-7101-532.22-37 Vehicle/Equip Lease Chrg Vehicle Lease Charge 29,000 33,400
TOTAL CONTRACTUAL SERVICES 29,000 33,400
CAPITAL OUTLAY:
235-7101-571.50-20 Building Improvements Exterior Brick Maintenance (BL9603) 5,000 5,000Prior Year Encumbrance Carryover 5,000 10,000 0 5,000
235-7101-571.50-25 Construction in Progress Parking Structure Maint/Repairs (BL0006) 283,500 548,500Prior Year Encumbrance Carryover 5,500 0
LED Parking Garage Lighting (BL1903) 48,000 48,000Prior Year Encumbrance Carryover 49,247 0
Downtown Parking Signs (BL1906) 0 0Prior Year Encumbrance Carryover 90,878 477,125 0 596,500
235-7101-572.50-15 Other Equipment Pay Box Refurbish, All Garages (EQ0901) 10,000 10,000
TOTAL CAPITAL OUTLAY 497,125 611,500
TOTAL PUBLIC WORKS 526,125 644,900
2021Budget
Budget2021
2022Budget
Budget2022
229

MUNICIPAL PARKING FUNDEXPENDITURE DETAIL
MUNICIPAL PARKING OPERATIONS 7301
AccountNumber Account Title Description
CONTRACTUAL SERVICES:
235-7301-532.21-11 Building Maintenance Glass and door repairs; replacement ofof fire doors and frames 9,000 9,000
235-7301-532.21-40 Lease Expense 1/3 of revenue from Parking Lots P & Tper agreement 17,500 17,500
235-7301-532.21-50 Utility Services Energy for lighting parking lotsand garage 11,400 13,000
235-7301-532.22-03 Training Int'l Municipal Parking Association 1,500 1,500
TOTAL CONTRACTUAL SERVICES 39,400 41,000
COMMODITIES:
235-7301-532.31-65 Other Equip. & Supplies Signs & lighting repair parts 2,900 2,900
235-7301-532.31-90 Street & Sidewalk Supplies De-icing agent for parking structure 14,000 14,000
TOTAL COMMODITIES 16,900 16,900
OTHER CHARGES:
235-7301-532.40-75 Admin. Service Charge To General Fund for service includingsweeping, snow and ice control,
washdowns, and administration 72,900 72,900
TOTAL OTHER CHARGES 72,900 72,900
TOTAL MUNICIPAL PARKING OPERATION 129,200 130,800
Budget2021
Budget2022
230

MUNICIPAL PARKING FUNDEXPENDITURE DETAIL
VAIL AVENUE GARAGE OPERATION 7302
AccountNumber Account Title Description
CONTRACTUAL SERVICES:
235-7302-532.21-02 Equipment Maintenance Elevator maintenance 12,000 10,000Parking Guidance Software 13,200 25,200 14,000 24,000
235-7302-532.21-11 Building Maintenance Cleaning service (windows, stairwell, elev) 26,000 26,000General maintenance 5,400 5,400Prior Year Encumbrance Carryover 4,800 36,200 0 31,400
235-7302-532.21-50 Utility Services Electricity & telephone 52,000 52,000
235-7302-532.22-10 Printing Parking permits and share of tickets 3,800 4,300
TOTAL CONTRACTUAL SERVICES 117,200 111,700
COMMODITIES:
235-7302-532.31-65 Other Equip. & Supplies Signs & lighting repair parts 5,000 5,000
235-7302-532.31-90 Street & Sidewalk Supplies De-icing agent for parking structure 30,300 30,300
TOTAL COMMODITIES 35,300 35,300
OTHER CHARGES:
235-7302-532.40-75 Admin. Service Charge To General Fund for service includingsweeping, snow and ice control,
washdowns, and administration 92,100 92,100
TOTAL OTHER CHARGES 92,100 92,100
TOTAL VAIL ST. GARAGE OPERATION 244,600 239,100
Budget2021
Budget2022
231
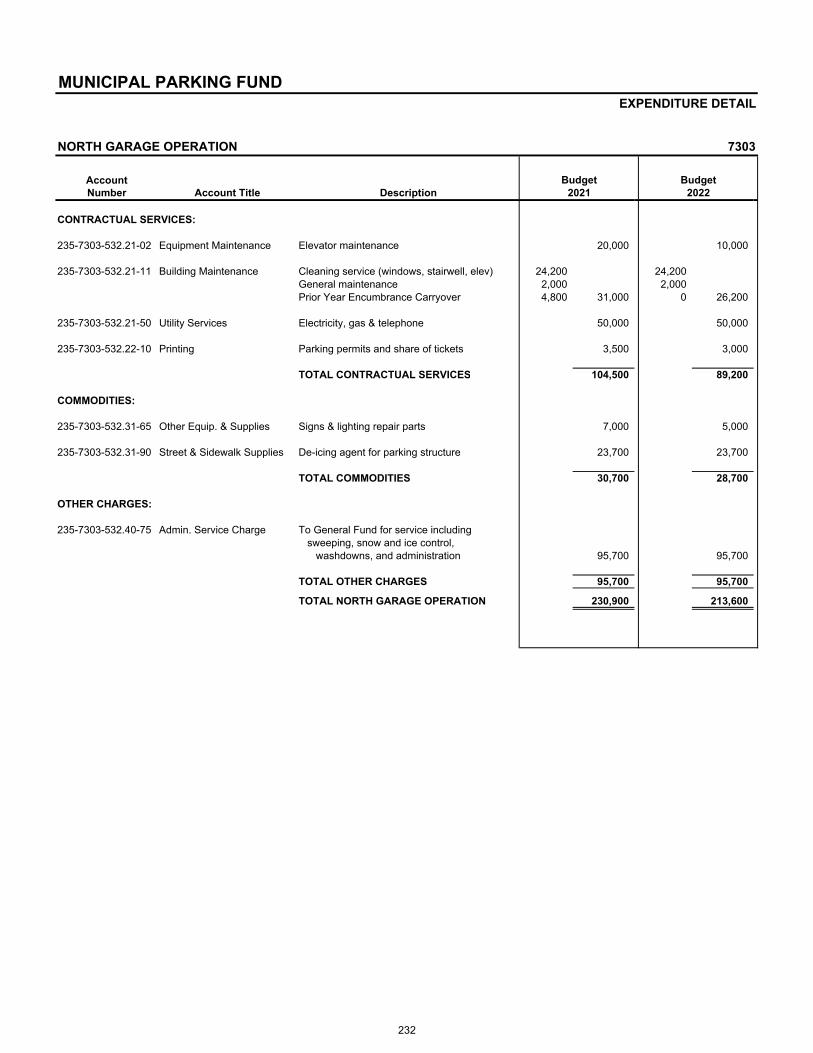
MUNICIPAL PARKING FUNDEXPENDITURE DETAIL
NORTH GARAGE OPERATION 7303
AccountNumber Account Title Description
CONTRACTUAL SERVICES:
235-7303-532.21-02 Equipment Maintenance Elevator maintenance 20,000 10,000
235-7303-532.21-11 Building Maintenance Cleaning service (windows, stairwell, elev) 24,200 24,200General maintenance 2,000 2,000Prior Year Encumbrance Carryover 4,800 31,000 0 26,200
235-7303-532.21-50 Utility Services Electricity, gas & telephone 50,000 50,000
235-7303-532.22-10 Printing Parking permits and share of tickets 3,500 3,000
TOTAL CONTRACTUAL SERVICES 104,500 89,200
COMMODITIES:
235-7303-532.31-65 Other Equip. & Supplies Signs & lighting repair parts 7,000 5,000
235-7303-532.31-90 Street & Sidewalk Supplies De-icing agent for parking structure 23,700 23,700
TOTAL COMMODITIES 30,700 28,700
OTHER CHARGES:
235-7303-532.40-75 Admin. Service Charge To General Fund for service includingsweeping, snow and ice control,
washdowns, and administration 95,700 95,700
TOTAL OTHER CHARGES 95,700 95,700
TOTAL NORTH GARAGE OPERATION 230,900 213,600
2021Budget Budget
2022
232

MUNICIPAL PARKING FUNDEXPENDITURE DETAIL
EVERGREEN UNDERGROUND GARAGE OPERATION 7304
AccountNumber Account Title Description
CONTRACTUAL SERVICES:
235-7304-532.21-02 Equipment Maintenance Elevator maintenance 12,000 12,000General equipment maintenance 3,000 15,000 3,000 15,000
235-7304-532.21-11 Building Maintenance Cleaning service (windows, stairwell, elev) 8,000 8,000General Maintenance 1,500 9,500 1,500 9,500
235-7304-532.21-50 Utility Services Utilities (Electricity, Gas, Telephone) 32,700 30,000
235-7304-532.22-10 Printing Parking permits and share of tickets 3,100 3,100
TOTAL CONTRACTUAL SERVICES 60,300 57,600
COMMODITIES:
235-7304-532.31-65 Other Equip. & Supplies Signs & lighting repair parts 4,000 2,500
TOTAL COMMODITIES 4,000 2,500
OTHER CHARGES:
235-7304-532.40-75 Admin. Service Charge To General Fund for service includingsweeping, snow and ice control,
washdowns, and administration 26,600 26,600
TOTAL OTHER CHARGES 26,600 26,600
TOTAL EVERGREEN GARAGE OPERATION 90,900 86,700
TOTAL MUNICIPAL PARKING FUND 1,815,825 1,928,800
Budget2021 2022
Budget
233

THIS PAGE LEFT BLANK
234

TIF Districts
TIF V
2005-2028
HICKORY/ KENSINGTON TIF
2014-2037
TIF IV
2002-2037
TIF DISTRICT FUNDS ORGANIZATION STRUCTURE
S ARLINGTON HEIGHTS RD TIF
2020-2042
235

TIF IV FUND (2002 – 2037) 263 Fund at a Glance
This fund was established as a result of creating a Tax Increment Financing District which lies on the northeast corner of Arlington Heights Road and Golf Road, containing approximately 35 acres of land. As a result of proposed new development, the valuation of the district will rise, thereby generating more property tax revenues and sales tax revenues. These funds are then used to pay off bonds that will be issued to fund development improvements. This TIF will expire in tax year 2037.
Restrictions:
STATE LAW – The Tax Increment Financing legislation allows for certain improvements to be considered eligible. Although the redevelopment efforts may continue, the incremental revenues must support the debt service on the bonds.
Fund Summary
2019 2020 2021 2021 2022 $ %Actual Actual Est. Actual Budget Budget Change Change
RevenuesTaxes $594,782 $756,181 $571,800 $571,800 $571,800 $0 0.0%Interest Income 60,403 17,178 2,500 19,500 19,500 0 0.0%Other 3,605 0 0 0 0 0 N/A
Total Revenues $658,790 $773,359 $574,300 $591,300 $591,300 $0 0.0%Interfund Transfers In 0 0 0 0 0 0 N/A
Total Revenues andInterfund Transfers In $658,790 $773,359 $574,300 $591,300 $591,300 $0 0.0%
ExpendituresContractual Services $8,789 $18,883 $60,800 $60,839 $50,000 ($10,839) (17.8%)Other Charges 50,000 50,000 50,000 50,000 50,000 0 0.0%Capita l Items 0 0 525,000 500,000 1,627,000 1,127,000 225.4%
Total Expenditures $58,789 $68,883 $635,800 $610,839 $1,727,000 $1,116,161 182.7%Interfund Transfers Out 0 0 0 0 0 0 N/A
Total Expenditures andInterfund Transfers Out $58,789 $68,883 $635,800 $610,839 $1,727,000 $1,116,161 182.7%
Revenues over(under) Expenditures $600,001 $704,476 ($61,500) ($19,539) ($1,135,700) ($1,116,161) 5712.5%
BEGINNING FUND BALANCE 2,221,418 2,821,419 3,525,895 3,525,895 3,464,395 (61,500) (1.7%)
ENDING FUND BALANCE $2,821,419 $3,525,895 $3,464,395 $3,506,356 $2,328,695 ($1,177,661) (33.6%)
236

July 2008 rolled to FY10-14 5 YEAR FINANCIAL PLAN
67%
Aug 2008 - Actual FY08 updated 20212019 2020 ESTIMATED 2021 2022 2023 2024 2025 2026
ACCOUNT DESCRIPTION PROJ # ACTUAL ACTUAL ACTUAL BUDGET BUDGET BUDGET BUDGET BUDGET BUDGET
REVENUESTAXES - PROPERTY TAXES 594,782 756,181 571,800 571,800 571,800 571,800 571,800 571,800 571,800INTEREST INCOME 60,403 17,178 2,500 19,500 19,500 19,500 19,500 19,500 19,500OTHER INCOME 3,605 0 0 0 0 0 0 0 0TOTAL REVENUES 658,790 773,359 574,300 591,300 591,300 591,300 591,300 591,300 591,300
EXPENDITURESOPERATING EXPENDITURES
Professional Services 20-05 8,789 18,883 60,800 60,839 50,000 50,000 50,000 50,000 50,000Administrative Service Charge 40-75 50,000 50,000 50,000 50,000 50,000 50,000 50,000 50,000 50,000
SUBTOTAL - OPERATING EXPENDITURES 58,789 68,883 110,800 110,839 100,000 100,000 100,000 100,000 100,000
BUILDING & LANDTIF IV Redevelopment BL-16-05 0 0 525,000 500,000 1,500,000 500,000 500,000 500,000 500,000
SUBTOTAL - BUILDING & LAND 0 0 525,000 500,000 1,500,000 500,000 500,000 500,000 500,000
STREETSGreen Corridor Beautification ST-99-03 0 0 0 0 127,000 0 0 0 0
SUBTOTAL - STREETS 0 0 0 0 127,000 0 0 0 0
TOTAL EXPENDITURES 58,789 68,883 635,800 610,839 1,727,000 600,000 600,000 600,000 600,000
BEGINNING FUND BALANCE 2,221,418 2,821,419 3,525,895 3,525,895 3,464,395 2,328,695 2,319,995 2,311,295 2,302,595REVENUES OVER (UNDER) EXPENDITURES 600,001 704,476 (61,500) (19,539) (1,135,700) (8,700) (8,700) (8,700) (8,700)ENDING FUND BALANCE 2,821,419 3,525,895 3,464,395 3,506,356 2,328,695 2,319,995 2,311,295 2,302,595 2,293,895
Fund Balance as a Percent of Expenditures 135% 387% 385% 384% 382%
TIF IV FUND (263)
237

TIF IV FUND (2002 – 2037)REVENUES
Account Account Actual Actual Proj Actual Budget Budget $ %Number Description 2019 2020 2021 2021 2022 Inc (Dec) Inc (Dec)
263-0000-401.07-00 TIF Real Estate Tax 594,782 756,181 571,800 571,800 571,800 0 0.0%Real Estate Taxes 594,782 756,181 571,800 571,800 571,800 0 0.0%
263-0000-461.02-00 Interest on Investments 44,543 14,840 1,000 12,000 12,000 0 0.0%263-0000-462.10-00 Market Value Adjustments 15,860 2,338 1,500 7,500 7,500 0 0.0%
Interest Income 60,403 17,178 2,500 19,500 19,500 0 0.0%
263-0000-489-90-00 Other Income 3,605 0 0 0 0 0 N/AOther 3,605 0 0 0 0 0 N/A
Total TIF IV Fund 658,790 773,359 574,300 591,300 591,300 0 0.0%
EXPENDITURES
Planning 4001
Account Account Actual Actual Proj. Act. Budget Budget $ %Number Description 2019 2020 2021 2021 2022 Inc (Dec) Inc (Dec)
263-4001-571.20-05 Professional Services 8,789 18,883 60,800 60,839 50,000 (10,839) (17.8%)Contractual Services 8,789 18,883 60,800 60,839 50,000 (10,839) (17.8%)
263-4001-571.40-75 Administrative Serv Charge 50,000 50,000 50,000 50,000 50,000 0 0.0%Other Charges 50,000 50,000 50,000 50,000 50,000 0 0.0%
263-4001-571.50-25 Construction in Progress 0 0 525,000 500,000 1,500,000 1,000,000 200.0%263-4001-571.50-30 Road Projects 0 0 0 0 127,000 127,000 N/A
Capital Outlay 0 0 525,000 500,000 1,627,000 127,000 225.4%
Total Planning 58,789 68,883 635,800 610,839 1,727,000 616,161 182.7%
238
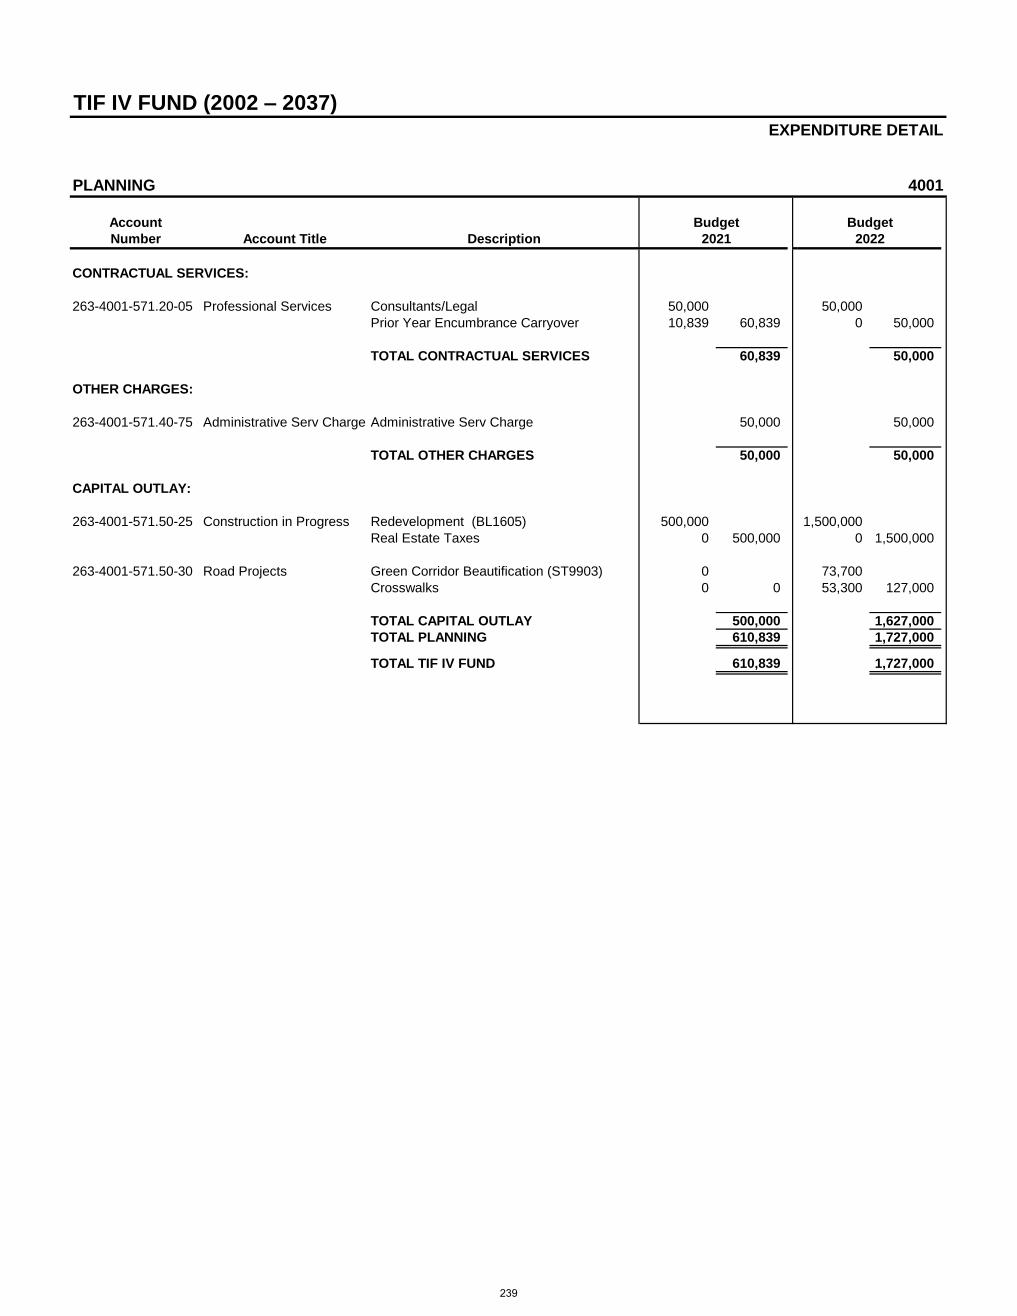
TIF IV FUND (2002 – 2037)EXPENDITURE DETAIL
PLANNING 4001
AccountNumber Account Title Description
CONTRACTUAL SERVICES:
263-4001-571.20-05 Professional Services Consultants/Legal 50,000 50,000Prior Year Encumbrance Carryover 10,839 60,839 0 50,000
TOTAL CONTRACTUAL SERVICES 60,839 50,000
OTHER CHARGES:
263-4001-571.40-75 Administrative Serv Charge Administrative Serv Charge 50,000 50,000
TOTAL OTHER CHARGES 50,000 50,000
CAPITAL OUTLAY:
263-4001-571.50-25 Construction in Progress Redevelopment (BL1605) 500,000 1,500,000Real Estate Taxes 0 500,000 0 1,500,000
263-4001-571.50-30 Road Projects Green Corridor Beautification (ST9903) 0 73,700Crosswalks 0 0 53,300 127,000
TOTAL CAPITAL OUTLAY 500,000 1,627,000TOTAL PLANNING 610,839 1,727,000
TOTAL TIF IV FUND 610,839 1,727,000
Budget2022
Budget2021
239
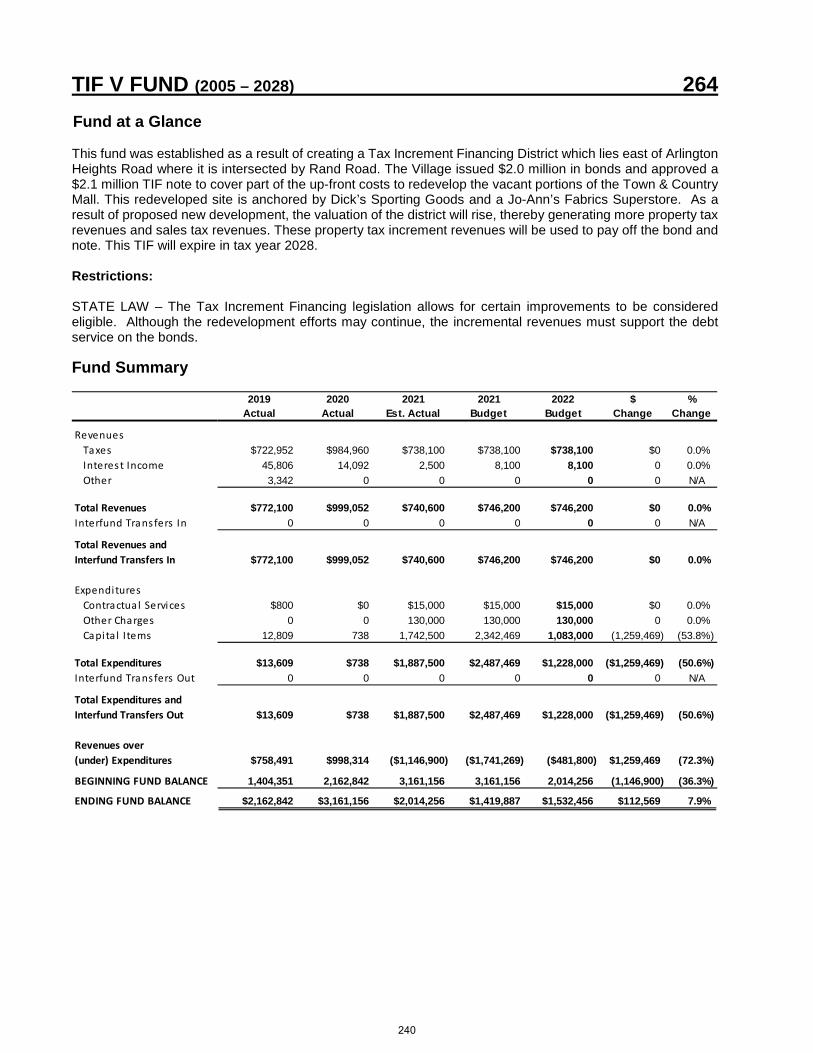
TIF V FUND (2005 – 2028) 264 Fund at a Glance
This fund was established as a result of creating a Tax Increment Financing District which lies east of Arlington Heights Road where it is intersected by Rand Road. The Village issued $2.0 million in bonds and approved a $2.1 million TIF note to cover part of the up-front costs to redevelop the vacant portions of the Town & Country Mall. This redeveloped site is anchored by Dick’s Sporting Goods and a Jo-Ann’s Fabrics Superstore. As a result of proposed new development, the valuation of the district will rise, thereby generating more property tax revenues and sales tax revenues. These property tax increment revenues will be used to pay off the bond and note. This TIF will expire in tax year 2028.
Restrictions:
STATE LAW – The Tax Increment Financing legislation allows for certain improvements to be considered eligible. Although the redevelopment efforts may continue, the incremental revenues must support the debt service on the bonds.
Fund Summary
2019 2020 2021 2021 2022 $ %Actual Actual Est. Actual Budget Budget Change Change
RevenuesTaxes $722,952 $984,960 $738,100 $738,100 $738,100 $0 0.0%Interest Income 45,806 14,092 2,500 8,100 8,100 0 0.0%Other 3,342 0 0 0 0 0 N/A
Total Revenues $772,100 $999,052 $740,600 $746,200 $746,200 $0 0.0%Interfund Transfers In 0 0 0 0 0 0 N/A
Total Revenues andInterfund Transfers In $772,100 $999,052 $740,600 $746,200 $746,200 $0 0.0%
ExpendituresContractual Services $800 $0 $15,000 $15,000 $15,000 $0 0.0%Other Charges 0 0 130,000 130,000 130,000 0 0.0%Capita l Items 12,809 738 1,742,500 2,342,469 1,083,000 (1,259,469) (53.8%)
Total Expenditures $13,609 $738 $1,887,500 $2,487,469 $1,228,000 ($1,259,469) (50.6%)Interfund Transfers Out 0 0 0 0 0 0 N/A
Total Expenditures andInterfund Transfers Out $13,609 $738 $1,887,500 $2,487,469 $1,228,000 ($1,259,469) (50.6%)
Revenues over(under) Expenditures $758,491 $998,314 ($1,146,900) ($1,741,269) ($481,800) $1,259,469 (72.3%)
BEGINNING FUND BALANCE 1,404,351 2,162,842 3,161,156 3,161,156 2,014,256 (1,146,900) (36.3%)
ENDING FUND BALANCE $2,162,842 $3,161,156 $2,014,256 $1,419,887 $1,532,456 $112,569 7.9%
240

July 2008 rolled to FY10-14 5 YEAR FINANCIAL PLAN
67%
Aug 2008 - Actual FY08 updated 20212019 2020 ESTIMATED 2021 2022 2023 2024 2025 2026
ACCOUNT DESCRIPTION Note PROJ # ACTUAL ACTUAL ACTUAL BUDGET BUDGET BUDGET BUDGET BUDGET BUDGET
REVENUES
TAXES - PROPERTY TAXES 722,952 984,960 738,100 738,100 738,100 738,100 738,100 738,100 738,100INTEREST INCOME 45,806 14,092 2,500 8,100 8,100 8,100 8,100 8,100 8,100OTHER INCOME 3,342 0 0 0 0 0 0 0 0
TOTAL REVENUES 772,100 999,052 740,600 746,200 746,200 746,200 746,200 746,200 746,200
EXPENDITURES
OPERATING EXPENDITURES
Professional Services 20-05 800 0 15,000 15,000 15,000 15,000 15,000 15,000 15,000Administrative Service Charge 40-75 0 0 30,000 30,000 30,000 0 0 0 0Reserve for Tax Refunds 0 0 100,000 100,000 100,000 0 0 0 0
SUBTOTAL - OPERATING EXPENDITURES 800 0 145,000 15,000 145,000 15,000 15,000 15,000 15,000
BUILDING & LAND
Redevelopment BL-21-03 0 0 1,400,000 2,000,000 850,000 0 0 0 0
SUBTOTAL - BUILDING & LAND 0 0 1,400,000 2,000,000 850,000 0 0 0 0
STREETS
Rand Road Corridor Identification Enhancement (1) ST-17-20 12,809 738 342,500 342,469 233,000 28,800 101,800 170,000 0
SUBTOTAL - STREETS 12,809 738 342,500 342,469 233,000 28,800 101,800 170,000 0
TOTAL EXPENDITURES 13,609 738 1,887,500 2,357,469 1,228,000 43,800 116,800 185,000 15,000
BEGINNING FUND BALANCE 1,404,351 2,162,842 3,161,156 3,161,156 2,014,256 1,532,456 2,234,856 2,864,256 3,425,456REVENUES OVER (UNDER) EXPENDITURES 758,491 998,314 (1,146,900) (1,611,269) (481,800) 702,400 629,400 561,200 731,200ENDING FUND BALANCE 2,162,842 3,161,156 2,014,256 1,549,887 1,532,456 2,234,856 2,864,256 3,425,456 4,156,656
Fund Balance as a Percent of Expenditures 125% 5102% 2452% 1852% 27711%
TIF V FUND (264) (2005 – 2028)
241

TIF V FUND (2005 – 2028)REVENUES
Account Account Actual Actual Proj Actual Budget Budget $ %Number Description 2019 2020 2021 2021 2022 Inc (Dec) Inc (Dec)
264-0000-401.07-00 TIF Real Estate Tax 722,952 984,960 738,100 738,100 738,100 0 0.0%Real Estate Taxes 722,952 984,960 738,100 738,100 738,100 0 0.0%
264-0000-461.02-00 Interest on Investments 34,223 12,322 1,000 5,000 5,000 0 0.0%264-0000-462.10-00 Market Value Adjustments 11,583 1,770 1,500 3,100 3,100 0 0.0%
Interest Income 45,806 14,092 2,500 8,100 8,100 0 0.0%
264-0000-489-90-00 Other Income 3,342 0 0 0 0 0 N/AOther 3,342 0 0 0 0 0 N/A
Total TIF V Fund 772,100 999,052 740,600 746,200 746,200 0 0.0%
EXPENDITURES
Planning 4001
Account Account Actual Actual Proj. Act. Budget Budget $ %Number Description 2019 2020 2021 2021 2022 Inc (Dec) Inc (Dec)
264-4001-571.20-05 Professional Services 800 0 15,000 15,000 15,000 0 0.0%Contractual Services 800 0 15,000 15,000 15,000 0 0.0%
264-4001-571.40-75 Administrative Serv Charge 0 0 30,000 30,000 30,000 0 0.0%264-4001-571.40-86 Reserve for Tax Refunds 0 0 100,000 100,000 100,000 0 0.0%
Other Charges 0 0 130,000 130,000 130,000 0 0.0%
264-4001-571.50-25 Construction in Progress 0 0 1,400,000 2,000,000 850,000 (1,150,000) (57.5%)264-4001-571.50-30 Road Projects 12,809 738 342,500 342,469 233,000 (109,469) (32.0%)
Capital Outlay 12,809 738 1,742,500 2,342,469 1,083,000 (1,259,469) (53.8%)
Total Planning 13,609 738 1,887,500 2,487,469 1,228,000 (1,259,469) (50.6%)
242
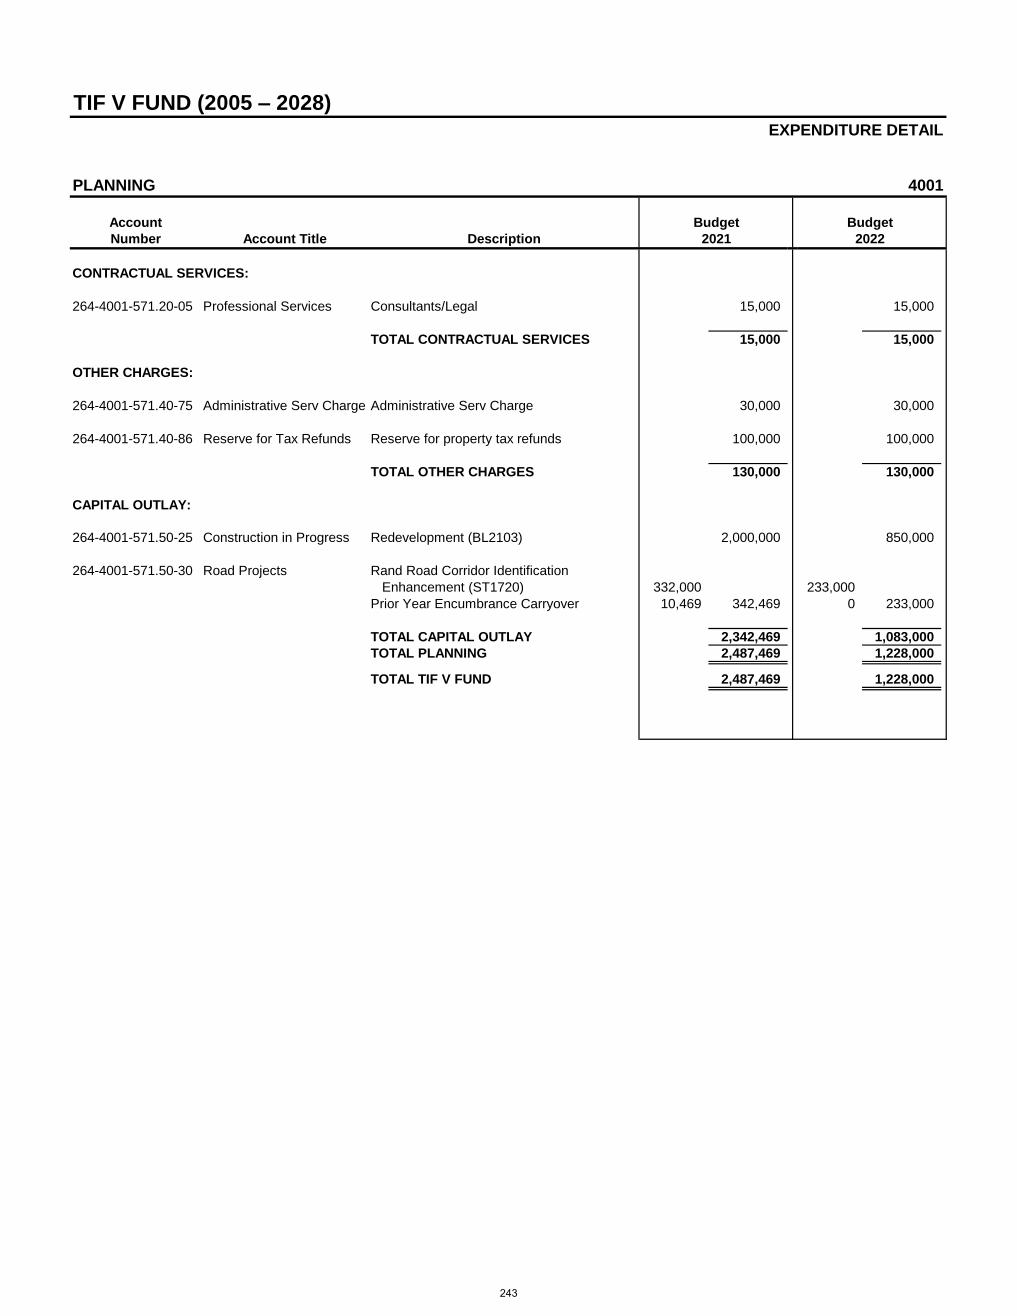
TIF V FUND (2005 – 2028)EXPENDITURE DETAIL
PLANNING 4001
AccountNumber Account Title Description
CONTRACTUAL SERVICES:
264-4001-571.20-05 Professional Services Consultants/Legal 15,000 15,000
TOTAL CONTRACTUAL SERVICES 15,000 15,000
OTHER CHARGES:
264-4001-571.40-75 Administrative Serv Charge Administrative Serv Charge 30,000 30,000
264-4001-571.40-86 Reserve for Tax Refunds Reserve for property tax refunds 100,000 100,000
TOTAL OTHER CHARGES 130,000 130,000
CAPITAL OUTLAY:
264-4001-571.50-25 Construction in Progress Redevelopment (BL2103) 2,000,000 850,000
264-4001-571.50-30 Road Projects Rand Road Corridor IdentificationEnhancement (ST1720) 332,000 233,000
Prior Year Encumbrance Carryover 10,469 342,469 0 233,000
TOTAL CAPITAL OUTLAY 2,342,469 1,083,000TOTAL PLANNING 2,487,469 1,228,000
TOTAL TIF V FUND 2,487,469 1,228,000
Budget2021
Budget2022
243
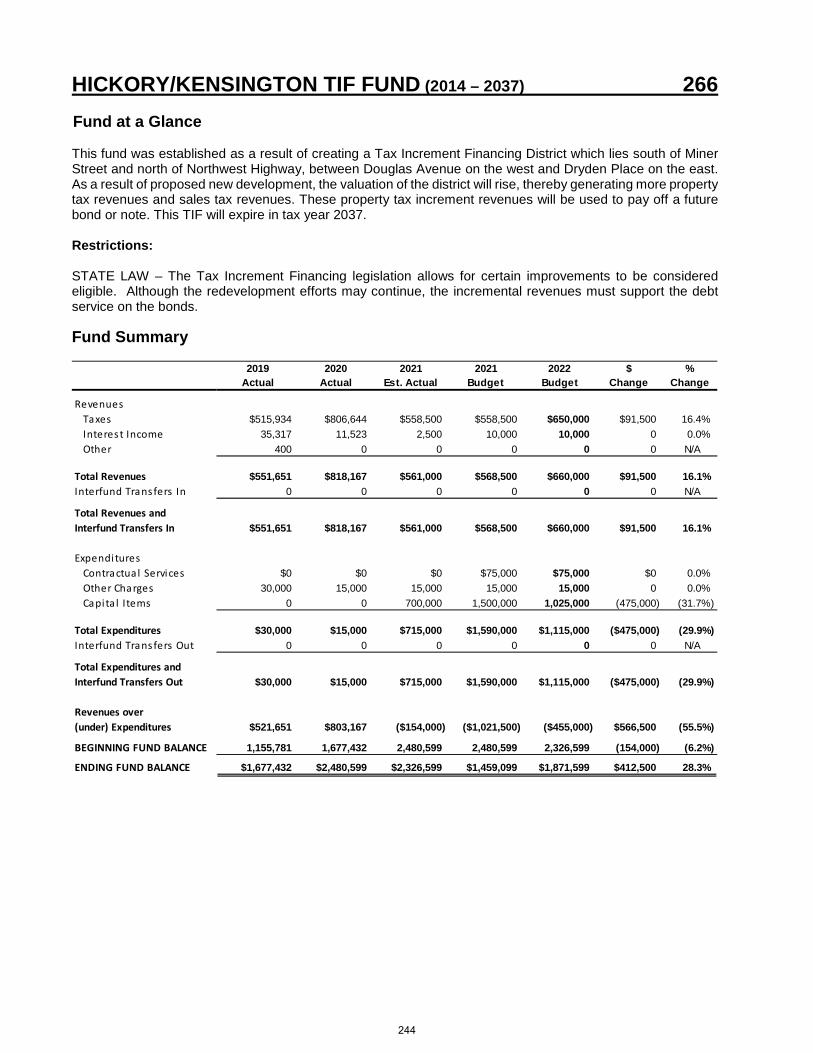
HICKORY/KENSINGTON TIF FUND (2014 – 2037) 266 Fund at a Glance
This fund was established as a result of creating a Tax Increment Financing District which lies south of Miner Street and north of Northwest Highway, between Douglas Avenue on the west and Dryden Place on the east. As a result of proposed new development, the valuation of the district will rise, thereby generating more property tax revenues and sales tax revenues. These property tax increment revenues will be used to pay off a future bond or note. This TIF will expire in tax year 2037. Restrictions: STATE LAW – The Tax Increment Financing legislation allows for certain improvements to be considered eligible. Although the redevelopment efforts may continue, the incremental revenues must support the debt service on the bonds. Fund Summary
2019 2020 2021 2021 2022 $ %Actual Actual Est. Actual Budget Budget Change Change
RevenuesTaxes $515,934 $806,644 $558,500 $558,500 $650,000 $91,500 16.4%Interest Income 35,317 11,523 2,500 10,000 10,000 0 0.0%Other 400 0 0 0 0 0 N/A
Total Revenues $551,651 $818,167 $561,000 $568,500 $660,000 $91,500 16.1%Interfund Transfers In 0 0 0 0 0 0 N/A
Total Revenues andInterfund Transfers In $551,651 $818,167 $561,000 $568,500 $660,000 $91,500 16.1%
ExpendituresContractual Services $0 $0 $0 $75,000 $75,000 $0 0.0%Other Charges 30,000 15,000 15,000 15,000 15,000 0 0.0%Capita l Items 0 0 700,000 1,500,000 1,025,000 (475,000) (31.7%)
Total Expenditures $30,000 $15,000 $715,000 $1,590,000 $1,115,000 ($475,000) (29.9%)Interfund Transfers Out 0 0 0 0 0 0 N/A
Total Expenditures andInterfund Transfers Out $30,000 $15,000 $715,000 $1,590,000 $1,115,000 ($475,000) (29.9%)
Revenues over(under) Expenditures $521,651 $803,167 ($154,000) ($1,021,500) ($455,000) $566,500 (55.5%)
BEGINNING FUND BALANCE 1,155,781 1,677,432 2,480,599 2,480,599 2,326,599 (154,000) (6.2%)
ENDING FUND BALANCE $1,677,432 $2,480,599 $2,326,599 $1,459,099 $1,871,599 $412,500 28.3%
244

July 2008 rolled to FY10-14 5 YEAR FINANCIAL PLAN
67%
Aug 2008 - Actual FY08 updated 20212019 2020 ESTIMATED 2021 2022 2023 2024 2025 2026
ACCOUNT DESCRIPTION PROJ # ACTUAL ACTUAL ACTUAL BUDGET BUDGET BUDGET BUDGET BUDGET BUDGET
REVENUESTAXES - PROPERTY TAXES 515,934 806,644 558,500 558,500 650,000 650,000 650,000 650,000 650,000INTEREST INCOME 35,317 11,523 2,500 10,000 10,000 10,000 10,000 10,000 10,000OTHER INCOME 400 0 0 0 0 0 0 0 0TOTAL REVENUES 551,651 818,167 561,000 568,500 660,000 660,000 660,000 660,000 660,000
EXPENDITURESOPERATING EXPENDITURES
Professional Services 20-05 0 0 0 75,000 75,000 0 0 0 0Administrative Service Charge 40-75 30,000 15,000 15,000 15,000 15,000 15,000 15,000 15,000 15,000
SUBTOTAL - OPERATING EXPENDITURES 30,000 15,000 15,000 90,000 90,000 15,000 15,000 15,000 15,000
BUILDING & LANDTIF HK Redevelopment BL-18-01 0 0 700,000 1,500,000 1,025,000 500,000 500,000 500,000 500,000
SUBTOTAL - BUILDING & LAND 0 0 700,000 1,500,000 1,025,000 500,000 500,000 500,000 500,000
TOTAL EXPENDITURES 30,000 15,000 715,000 1,590,000 1,115,000 515,000 515,000 515,000 515,000
BEGINNING FUND BALANCE 1,155,781 1,677,432 2,480,599 2,480,599 2,326,599 1,871,599 2,016,599 2,161,599 2,306,599REVENUES OVER (UNDER) EXPENDITURES 521,651 803,167 (154,000) (1,021,500) (455,000) 145,000 145,000 145,000 145,000ENDING FUND BALANCE 1,677,432 2,480,599 2,326,599 1,459,099 1,871,599 2,016,599 2,161,599 2,306,599 2,451,599
Fund Balance as a Percent of Expenditures 168% 392% 420% 448% 476%
TIF HICKORY/ KENSINGTON FUND (266)
245

HICKORY/KENSINGTON TIF FUND (2014 – 2037)REVENUES
Account Account Actual Actual Proj Actual Budget Budget $ %Number Description 2019 2020 2021 2021 2022 Inc (Dec) Inc (Dec)
266-0000-401.07-00 TIF Real Estate Tax 515,934 806,644 558,500 558,500 650,000 91,500 16.4%Real Estate Taxes 515,934 806,644 558,500 558,500 650,000 91,500 16.4%
266-0000-461.02-00 Interest on Investments 26,403 9,358 1,000 6,500 6,500 0 0.0%266-0000-462.10-00 Market Value Adjustments 8,914 2,165 1,500 3,500 3,500 0 0.0%
Interest Income 35,317 11,523 2,500 10,000 10,000 0 0.0%
266-0000-489-90-00 Other Income 400 0 0 0 0 0 N/AOther 400 0 0 0 0 0 N/A
Total Hickory/Kensington TIF Fund 551,651 818,167 561,000 568,500 660,000 91,500 16.1%
EXPENDITURES
Planning 4001
Account Account Actual Actual Proj. Act. Budget Budget $ %Number Description 2019 2020 2021 2021 2022 Inc (Dec) Inc (Dec)
266-4001-571.20-05 Professional Services 0 0 0 75,000 75,000 0 0.0%Contractual Services 0 0 0 75,000 75,000 0 0.0%
266-4001-571.40-75 Administrative Serv Charge 30,000 15,000 15,000 15,000 15,000 0 0.0%Other Charges 30,000 15,000 15,000 15,000 15,000 0 0.0%
266-4001-571.50-25 Construction in Progress 0 0 700,000 1,500,000 1,025,000 (475,000) (31.7%)Capital Outlay 0 0 700,000 1,500,000 1,025,000 (475,000) (31.7%)
Total Planning 30,000 15,000 715,000 1,590,000 1,115,000 (475,000) (29.9%)
Total Hickory/Kensington TIF30,000 15,000 715,000 1,590,000 1,115,000 (475,000) (29.9%)
246

HICKORY/KENSINGTON TIF FUND (2014 – 2037)EXPENDITURE DETAIL
PLANNING 4001
AccountNumber Account Title Description
CONTRACTUAL SERVICES:
266-4001-571.20-05 Professional Services Consultants/Legal 75,000 75,000
TOTAL CONTRACTUAL SERVICES 75,000 75,000
OTHER CHARGES:
266-4001-571.40-75 Administrative Serv Charge Administrative Service Charge 15,000 15,000
TOTAL OTHER CHARGES 15,000 15,000
CAPITAL OUTLAY:
266-4001-571.50-25 Construction in Progress Redevelopment (BL1801) 1,500,000 1,025,000
TOTAL CAPITAL OUTLAY 1,500,000 1,025,000
TOTAL PLANNING 1,590,000 1,115,000
TOTAL HICKORY/KENSINGTON TIF FUND 1,590,000 1,115,000
Budget2022
Budget2021
247

S ARLINGTON HEIGHTS RD TIF FUND (2020 – 2042) 267 Fund at a Glance
This fund was established as a result of creating a Tax Increment Financing District which lies along South Arlington Heights Road from Seegers Road to the I-90 Tollway, primarily on the east side of Arlington Heights Road. As a result of proposed new development, the valuation of the district will rise, thereby generating more property tax revenues and sales tax revenues. These property tax increment revenues will be used to pay off a future bond or note. This TIF will expire in tax year 2042.
Restrictions:
STATE LAW – The Tax Increment Financing legislation allows for certain improvements to be considered eligible. Although the redevelopment efforts may continue, the incremental revenues must support the debt service on the bonds.
Fund Summary
2019 2020 2021 2021 2022 $ %Actual Actual Est. Actual Budget Budget Change Change
RevenuesTaxes $0 $0 $100,000 $100,000 $100,000 $0 0.0%
Total Revenues $0 $0 $100,000 $100,000 $100,000 $0 0.0%Interfund Transfers In 0 0 0 0 0 0 N/A
Total Revenues andInterfund Transfers In $0 $0 $100,000 $100,000 $100,000 $0 0.0%
ExpendituresContractual Services $0 $0 $0 $0 $125,000 $125,000 N/AOther Charges 0 0 15,000 15,000 15,000 0 0.0%Capita l Items 0 0 105,400 55,800 55,000 (800) (1.4%)
Total Expenditures $0 $0 $120,400 $70,800 $195,000 $124,200 175.4%Interfund Transfers Out 0 0 0 0 0 0 N/A
Total Expenditures andInterfund Transfers Out $0 $0 $120,400 $70,800 $195,000 $124,200 175.4%
Revenues over(under) Expenditures $0 $0 ($20,400) $29,200 ($95,000) ($124,200) (425.3%)
BEGINNING FUND BALANCE 0 0 0 0 (20,400) (20,400) N/A
ENDING FUND BALANCE $0 $0 ($20,400) $29,200 ($115,400) ($144,600) (495.2%)
248

July 2008 rolled to FY10-14 5 YEAR FINANCIAL PLAN
67%
Aug 2008 - Actual FY08 updated 20212019 2020 ESTIMATED 2021 2022 2023 2024 2025 2026
ACCOUNT DESCRIPTION PROJ # ACTUAL ACTUAL ACTUAL BUDGET BUDGET BUDGET BUDGET BUDGET BUDGET
REVENUES
TAXES - PROPERTY TAXES 0 0 100,000 100,000 100,000 0 0 0 0
TOTAL REVENUES 0 0 100,000 100,000 100,000 0 0 0 0
EXPENDITURES
OPERATING EXPENDITURES
Professional Services 20-05 0 0 0 0 125,000 0 0 0 0Administrative Service Charge 20-05 0 0 15,000 15,000 15,000 0 0 0 0
SUBTOTAL - OPERATING EXPENDITURES 0 0 15,000 15,000 140,000 0 0 0 0
STREETS
S AH Rd Redevelopment ST-19-03 0 0 105,400 55,800 55,000 0 0 0 0
SUBTOTAL - STREETS 0 0 105,400 55,800 55,000 0 0 0 0
TOTAL EXPENDITURES 0 0 120,400 70,800 195,000 0 0 0 0
BEGINNING FUND BALANCE 0 0 0 0 (20,400) (115,400) (115,400) (115,400) (115,400)REVENUES OVER (UNDER) EXPENDITURES 0 0 (20,400) 29,200 (95,000) 0 0 0 0ENDING FUND BALANCE 0 0 (20,400) 29,200 (115,400) (115,400) (115,400) (115,400) (115,400)
Fund Balance as a Percent of Expenditures (59%)
TIF S ARLINGTON HEIGHTS RD FUND (267) (2020 – 2042)
249

SOUTH ARLINGTON HEIGHTS RD TIF FUND (2020 – 2042)REVENUES
Account Account Actual Actual Proj Actual Budget Budget $ %Number Description 2019 2020 2021 2021 2022 Inc (Dec) Inc (Dec)
267-0000-401.07-00 TIF Real Estate Tax 0 0 100,000 100,000 100,000 0 0.0%Real Estate Taxes 0 0 100,000 100,000 100,000 0 0.0%
Total S AH Rd TIF Fund 0 0 100,000 100,000 100,000 0 0.0%
EXPENDITURES
Planning 4001
Account Account Actual Actual Proj. Act. Budget Budget $ %Number Description 2019 2020 2021 2021 2022 Inc (Dec) Inc (Dec)
267-4001-571.20-05 Professional Services 0 0 0 0 125,000 125,000 N/AContractual Services 0 0 0 0 125,000 125,000 N/A
267-4001-571.40-75 Administrative Serv Charge 0 0 15,000 15,000 15,000 0 0.0%Other Charges 0 0 15,000 15,000 15,000 0 0.0%
267-4001-571.50-25 Construction in Progress 0 0 105,400 55,800 55,000 (800) (1.4%)Capital Outlay 0 0 105,400 55,800 55,000 (800) (1.4%)
Total Planning 0 0 120,400 70,800 195,000 124,200 175.4%Total S AH Rd TIF Fund 0 0 120,400 70,800 195,000 124,200 175.4%
250
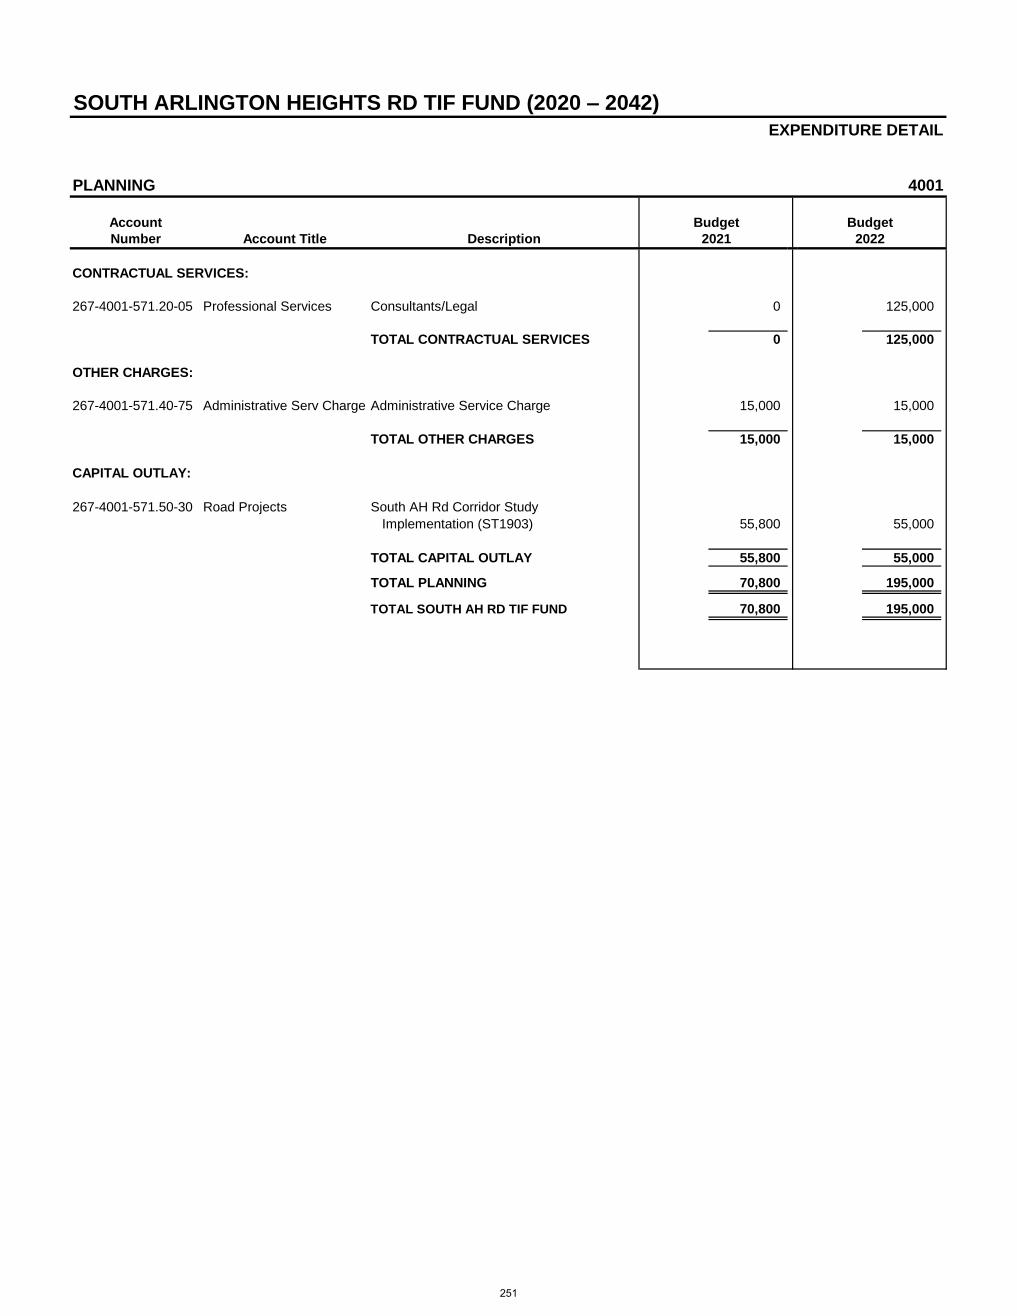
SOUTH ARLINGTON HEIGHTS RD TIF FUND (2020 – 2042)EXPENDITURE DETAIL
PLANNING 4001
AccountNumber Account Title Description
CONTRACTUAL SERVICES:
267-4001-571.20-05 Professional Services Consultants/Legal 0 125,000
TOTAL CONTRACTUAL SERVICES 0 125,000
OTHER CHARGES:
267-4001-571.40-75 Administrative Serv Charge Administrative Service Charge 15,000 15,000
TOTAL OTHER CHARGES 15,000 15,000
CAPITAL OUTLAY:
267-4001-571.50-30 Road Projects South AH Rd Corridor StudyImplementation (ST1903) 55,800 55,000
TOTAL CAPITAL OUTLAY 55,800 55,000
TOTAL PLANNING 70,800 195,000
TOTAL SOUTH AH RD TIF FUND 70,800 195,000
Budget Budget2021 2022
251

THIS PAGE LEFT BLANK
252

DEBT SERVICE FUND ORGANIZATION STRUCTURE
Outstanding Bonds
Self- Supporting
2010 Refunding of 2002A (NWCDS Building)
Fund 301-9550
General Purpose
Tax Supported
TIF General Purpose
2012A Refunding (Partial) of 2004 Public Buildings
Fund 301-9552
2016 Police Building Fund 301-9555
2018
Storm Water Improvement
Fund 301-9556
2019 Refunding (Partial) of
2011 Refunding Fund 301-9557
2020 Water Mains, Streets,
& Parking Fund 301-9558
253

DEBT SERVICE FUND 301 Fund at a Glance
The Debt Service Fund accounts for the costs for the payment of the principal and interest on all outstanding Village debt. The Village is a “home rule” community and is presently not subject to debt limitations. Currently, all outstanding Village debt is general obligation bond debt, meaning that it is backed by the full faith and credit (and taxing power) of the Village. There are no revenue bonds which are considered outstanding for financial reporting purposes. The Village has used general obligation (GO) bonds exclusively in recent years because of the most favorable interest rates offered on GO bonds and thus, lower cost. A portion of Arlington Heights’ debt is self-supporting; that is, it is paid for by sources other than a direct levy of property taxes. As of December 31, 2021, the Village had a total of $56,940,000 in outstanding bonds. Of that amount, $8,895,000 (16%) was self-supported. The following is a table of outstanding debt, the debt per capita and debt as a percent of estimated property values as of December 31, 2021:
OUTSTANDING DEBT AS OF 12/31/2021
Outstanding Per
Capita % of Value of
Taxable Property Tax Supported $ 48,045,000 $ 619 1.418% Self-Supported 8,895,000 114 0.263%
Total $ 56,940,000 $ 733 1.681% Note: Self-supported debt is debt for which property taxes are typically abated. The debt service is paid from other sources. The estimated 2022 value of all property in the Village is $10.2 billion (equalized assessed value of $3.39 billion). The population is 77,676 based on the 2020 census. A portion of the property taxes for debt service has been abated (reduced from the original property tax levy amount). It is the intent of the Village to continue to abate property taxes on the following bond issues: 2010 Refunding of 2002A NWCDS Building – The 2002A bonds to renovate and expand the existing NWCDS Building were refunded. 100% of the debt service will be paid by Northwest Central Dispatch Services Agency. 2018 Storm Water Control – This $9,530,000 bond issue is used to pay for storm water control infrastructure projects. 100% of the debt service will be paid through a transfer-in from the Storm Water Control Fund. In total, the Village will abate $981,400 in property taxes in calendar year 2022. The Village budgets for debt service by setting up a separate operation for each bond issue in the Debt Service Fund. This is done for efficiency and analysis purposes.
254
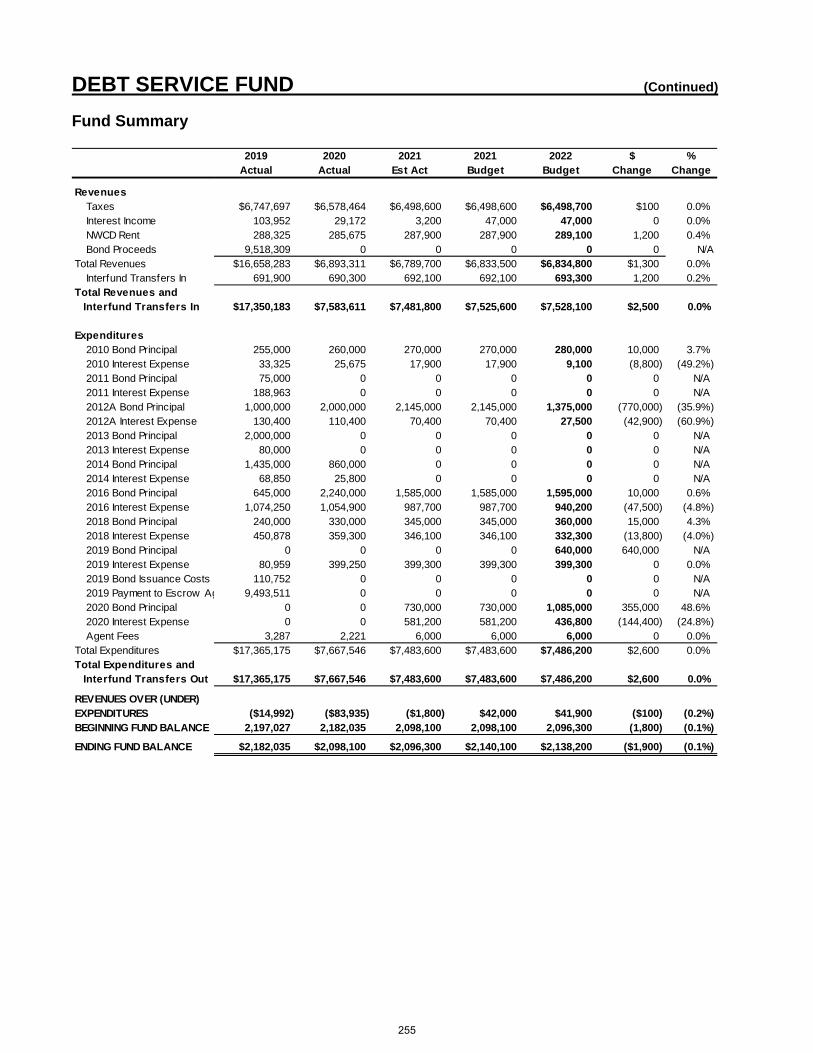
DEBT SERVICE FUND (Continued) Fund Summary
2019 2020 2021 2021 2022 $ %Actual Actual Est Act Budget Budget Change Change
RevenuesTaxes $6,747,697 $6,578,464 $6,498,600 $6,498,600 $6,498,700 $100 0.0%Interest Income 103,952 29,172 3,200 47,000 47,000 0 0.0%NWCD Rent 288,325 285,675 287,900 287,900 289,100 1,200 0.4%Bond Proceeds 9,518,309 0 0 0 0 0 N/A
Total Revenues $16,658,283 $6,893,311 $6,789,700 $6,833,500 $6,834,800 $1,300 0.0%Interfund Transfers In 691,900 690,300 692,100 692,100 693,300 1,200 0.2%
Total Revenues and Interfund Transfers In $17,350,183 $7,583,611 $7,481,800 $7,525,600 $7,528,100 $2,500 0.0%
Expenditures2010 Bond Principal 255,000 260,000 270,000 270,000 280,000 10,000 3.7%2010 Interest Expense 33,325 25,675 17,900 17,900 9,100 (8,800) (49.2%)2011 Bond Principal 75,000 0 0 0 0 0 N/A2011 Interest Expense 188,963 0 0 0 0 0 N/A2012A Bond Principal 1,000,000 2,000,000 2,145,000 2,145,000 1,375,000 (770,000) (35.9%)2012A Interest Expense 130,400 110,400 70,400 70,400 27,500 (42,900) (60.9%)2013 Bond Principal 2,000,000 0 0 0 0 0 N/A2013 Interest Expense 80,000 0 0 0 0 0 N/A2014 Bond Principal 1,435,000 860,000 0 0 0 0 N/A2014 Interest Expense 68,850 25,800 0 0 0 0 N/A2016 Bond Principal 645,000 2,240,000 1,585,000 1,585,000 1,595,000 10,000 0.6%2016 Interest Expense 1,074,250 1,054,900 987,700 987,700 940,200 (47,500) (4.8%)2018 Bond Principal 240,000 330,000 345,000 345,000 360,000 15,000 4.3%2018 Interest Expense 450,878 359,300 346,100 346,100 332,300 (13,800) (4.0%)2019 Bond Principal 0 0 0 0 640,000 640,000 N/A2019 Interest Expense 80,959 399,250 399,300 399,300 399,300 0 0.0%2019 Bond Issuance Costs 110,752 0 0 0 0 0 N/A2019 Payment to Escrow Ag 9,493,511 0 0 0 0 0 N/A2020 Bond Principal 0 0 730,000 730,000 1,085,000 355,000 48.6%2020 Interest Expense 0 0 581,200 581,200 436,800 (144,400) (24.8%)Agent Fees 3,287 2,221 6,000 6,000 6,000 0 0.0%
Total Expenditures $17,365,175 $7,667,546 $7,483,600 $7,483,600 $7,486,200 $2,600 0.0%Total Expenditures and Interfund Transfers Out $17,365,175 $7,667,546 $7,483,600 $7,483,600 $7,486,200 $2,600 0.0%
REVENUES OVER (UNDER)EXPENDITURES ($14,992) ($83,935) ($1,800) $42,000 $41,900 ($100) (0.2%)BEGINNING FUND BALANCE 2,197,027 2,182,035 2,098,100 2,098,100 2,096,300 (1,800) (0.1%)
ENDING FUND BALANCE $2,182,035 $2,098,100 $2,096,300 $2,140,100 $2,138,200 ($1,900) (0.1%)
255

DEBT SERVICE FUND REVENUES
Account Account Actual Actual Proj Actual Budget Budget $ %Number Description 2019 2020 2021 2021 2022 Inc (Dec) Inc (Dec)
301-0000-401.05-00 Real Estate Tax 6,747,697 6,578,464 6,498,600 6,498,600 6,498,700 100 0.0%Real Estate Taxes 6,747,697 6,578,464 6,498,600 6,498,600 6,498,700 100 0.0%
301-0000-461.02-00 Interest on Investments 71,296 24,742 1,200 30,000 30,000 0 0.0%301-0000-462.10-00 Market Value Adjustments 32,656 4,430 2,000 17,000 17,000 0 0.0%
Interest Income 103,952 29,172 3,200 47,000 47,000 0 0.0%
301-0000-472.56-00 NWCDS Building Rent 288,325 285,675 287,900 287,900 289,100 1,200 0.4%Sales & Rents 288,325 285,675 287,900 287,900 289,100 1,200 0.4%
301-0000-489-90-00 Other Income 16,783 0 0 0 0 0 N/AOther 16,783 0 0 0 0 0 N/A
301-0000-491.05-00 Operating Transfer In 691,900 690,300 692,100 692,100 693,300 1,200 0.2%301-0000-491.15-00 Bond Proceeds 7,985,000 0 0 0 0 0 N/A301-0000-491.16-00 Bond Premium Proceeds 1,516,526 0 0 0 0 0 N/A
Other Financing Sources 10,193,426 690,300 692,100 692,100 693,300 1,200 0.2%
Total Debt Service Fund 17,350,183 7,583,611 7,481,800 7,525,600 7,528,100 2,500 0.0%
256

DEBT SERVICE FUNDEXPENDITURES
Refunding 2010 (Refunding of NWCDS Building 2002) 9550
Account Account Actual Actual Proj. Act. Budget Budget $ %Number Description 2019 2020 2021 2021 2022 Inc (Dec) Inc (Dec)
301-9550-581.60-05 Bond Principal 255,000 260,000 270,000 270,000 280,000 10,000 3.7%301-9550-582.60-15 Interest Expense 33,325 25,675 17,900 17,900 9,100 (8,800) (49.2%)301-9550-582.60-20 Agent Fees 802 803 1,000 1,000 1,000 0 0.0%
Debt Service 289,127 286,478 288,900 288,900 290,100 1,200 0.4%
Total Refunding 2010 289,127 286,478 288,900 288,900 290,100 1,200 0.4%
Refunding 2011 (Partial Refunding of Public Buildings 2004) 9551
Account Account Actual Actual Proj. Act. Budget Budget $ %Number Description 2019 2020 2021 2021 2022 Inc (Dec) Inc (Dec)
301-9551-581.60-05 Bond Principal 75,000 0 0 0 0 0 N/A301-9551-582.60-15 Interest Expense 188,963 0 0 0 0 0 N/A301-9551-582.60-20 Agent Fees 803 0 0 0 0 0 N/A
Debt Service 264,766 0 0 0 0 0 N/A
Total Refunding 2011 264,766 0 0 0 0 0 N/A
Refunding 2012A (Partial Refunding of Public Buildings 2004) 9552
Account Account Actual Actual Proj. Act. Budget Budget $ %Number Description 2019 2020 2021 2021 2022 Inc (Dec) Inc (Dec)
301-9552-581.60-05 Bond Principal 1,000,000 2,000,000 2,145,000 2,145,000 1,375,000 (770,000) (35.9%)301-9552-582.60-15 Interest Expense 130,400 110,400 70,400 70,400 27,500 (42,900) (60.9%)301-9552-582.60-20 Agent Fees 0 428 1,000 1,000 1,000 0 0.0%
Debt Service 1,130,400 2,110,828 2,216,400 2,216,400 1,403,500 (812,900) (36.7%)
Total Refunding 2012A 1,130,400 2,110,828 2,216,400 2,216,400 1,403,500 (812,900) (36.7%)
Refunding 2013 (Partial Refunding of Public Buildings 2006) 9553
Account Account Actual Actual Proj. Act. Budget Budget $ %Number Description 2019 2020 2021 2021 2022 Inc (Dec) Inc (Dec)
301-9553-581.60-05 Bond Principal 2,000,000 0 0 0 0 0 N/A301-9553-582.60-15 Interest Expense 80,000 0 0 0 0 0 N/A301-9553-582.60-20 Agent Fees 428 0 0 0 0 0 N/A
Debt Service 2,080,428 0 0 0 0 0 N/A
Total Refunding 2013 2,080,428 0 0 0 0 0 N/A
257

DEBT SERVICE FUNDEXPENDITURES
Road Improvements 2014 9554
Account Account Actual Actual Proj. Act. Budget Budget $ %Number Description 2019 2020 2021 2021 2022 Inc (Dec) Inc (Dec)
301-9554-581.60-05 Bond Principal 1,435,000 860,000 0 0 0 0 N/A301-9554-582.60-15 Interest Expense 68,850 25,800 0 0 0 0 N/A301-9554-582.60-20 Agent Fees 318 372 0 0 0 0 N/A
Debt Service 1,504,168 886,172 0 0 0 0 N/A
Total Road Imprv 2014 1,504,168 886,172 0 0 0 0 N/A
Police Building 2016 9555
Account Account Actual Actual Proj. Act. Budget Budget $ %Number Description 2019 2020 2021 2021 2022 Inc (Dec) Inc (Dec)
301-9555-581.60-05 Bond Principal 645,000 2,240,000 1,585,000 1,585,000 1,595,000 10,000 0.6%301-9555-582.60-15 Interest Expense 1,074,250 1,054,900 987,700 987,700 940,200 (47,500) (4.8%)301-9555-582.60-20 Agent Fees 636 0 1,000 1,000 1,000 0 0.0%
Debt Service 1,719,886 3,294,900 2,573,700 2,573,700 2,536,200 (37,500) (1.5%)
Total Police Building 2016 1,719,886 3,294,900 2,573,700 2,573,700 2,536,200 (37,500) (1.5%)
Storm Water Control 2018 9556
Account Account Actual Actual Proj. Act. Budget Budget $ %Number Description 2019 2020 2021 2021 2022 Inc (Dec) Inc (Dec)
301-9556-581.60-05 Bond Principal 240,000 330,000 345,000 345,000 360,000 15,000 4.3%301-9556-582.60-15 Interest Expense 450,878 359,300 346,100 346,100 332,300 (13,800) (4.0%)301-9556-582.60-20 Agent Fees 300 300 1,000 1,000 1,000 0 0.0%
Debt Service 691,178 689,600 692,100 692,100 693,300 1,200 0.2%
Total Storm Water Ctrl 2018 691,178 689,600 692,100 692,100 693,300 1,200 0.2%
Refunding 2019 (Partial Refunding on Refunding 2011) 9557
Account Account Actual Actual Proj. Act. Budget Budget $ %Number Description 2019 2020 2021 2021 2022 Inc (Dec) Inc (Dec)
301-9557-581.60-05 Bond Principal 0 0 0 0 640,000 640,000 N/A301-9557-582.60-15 Interest Expense 80,959 399,250 399,300 399,300 399,300 0 0.0%301-9557-582.60-20 Agent Fees 0 318 1,000 1,000 1,000 0 0.0%301-9557-583.20-06 Bond Issuance Costs 110,752 0 0 0 0 0 N/A301-9557-583.90-98 Payment to Escrow Agent 9,493,511 0 0 0 0 0 N/A
Debt Service 9,685,222 399,568 400,300 400,300 1,040,300 640,000 159.9%
Total Refunding 2019 9,685,222 399,568 400,300 400,300 1,040,300 640,000 159.9%
258
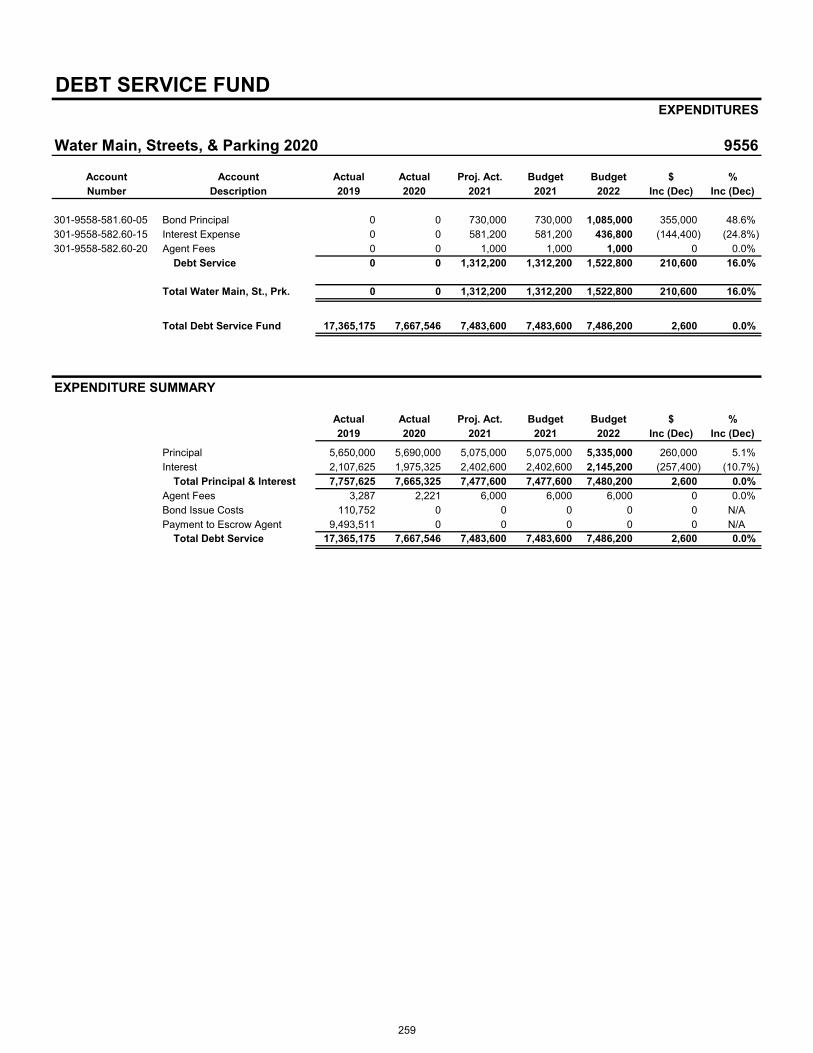
DEBT SERVICE FUNDEXPENDITURES
Water Main, Streets, & Parking 2020 9556
Account Account Actual Actual Proj. Act. Budget Budget $ %Number Description 2019 2020 2021 2021 2022 Inc (Dec) Inc (Dec)
301-9558-581.60-05 Bond Principal 0 0 730,000 730,000 1,085,000 355,000 48.6%301-9558-582.60-15 Interest Expense 0 0 581,200 581,200 436,800 (144,400) (24.8%)301-9558-582.60-20 Agent Fees 0 0 1,000 1,000 1,000 0 0.0%
Debt Service 0 0 1,312,200 1,312,200 1,522,800 210,600 16.0%
Total Water Main, St., Prk. 0 0 1,312,200 1,312,200 1,522,800 210,600 16.0%
Total Debt Service Fund 17,365,175 7,667,546 7,483,600 7,483,600 7,486,200 2,600 0.0%
EXPENDITURE SUMMARY EXPENDITURE SUMMARY
Actual Actual Proj. Act. Budget Budget $ %2019 2020 2021 2021 2022 Inc (Dec) Inc (Dec)
Principal 5,650,000 5,690,000 5,075,000 5,075,000 5,335,000 260,000 5.1%Interest 2,107,625 1,975,325 2,402,600 2,402,600 2,145,200 (257,400) (10.7%)
Total Principal & Interest 7,757,625 7,665,325 7,477,600 7,477,600 7,480,200 2,600 0.0%Agent Fees 3,287 2,221 6,000 6,000 6,000 0 0.0%Bond Issue Costs 110,752 0 0 0 0 0 N/APayment to Escrow Agent 9,493,511 0 0 0 0 0 N/A
Total Debt Service 17,365,175 7,667,546 7,483,600 7,483,600 7,486,200 2,600 0.0%
259

SUMMARY OF DEBT SERVICE
SUMMARY OF ANNUAL DEBT SERVICE PAYMENTSDEBT (PRINCIPAL)
Tax Levy Calendar Fiscal -----------------Tax Supported----------------- -----------------Self Supported----------------- GRAND Tax SelfYear Year Year PRINCIPAL INTEREST TOTAL PRINCIPAL INTEREST TOTAL TOTAL Supported Supported Total
2020 2021 2021 4,460,000 2,038,556 6,498,556 615,000 363,975 978,975 7,477,531 52,505,000 9,510,000 62,015,0002021 2022 2022 4,695,000 1,803,700 6,498,700 640,000 341,400 981,400 7,480,100 48,045,000 8,895,000 56,940,0002022 2023 2023 4,845,000 1,652,950 6,497,950 375,000 317,900 692,900 7,190,850 43,350,000 8,255,000 51,605,0002023 2024 2024 5,045,000 1,452,600 6,497,600 390,000 299,150 689,150 7,186,750 38,505,000 7,880,000 46,385,0002024 2025 2025 3,925,000 1,244,200 5,169,200 410,000 279,650 689,650 5,858,850 33,460,000 7,490,000 40,950,0002025 2026 2026 3,585,000 1,086,500 4,671,500 435,000 259,150 694,150 5,365,650 29,535,000 7,080,000 36,615,0002026 2027 2027 3,525,000 947,350 4,472,350 455,000 237,400 692,400 5,164,750 25,950,000 6,645,000 32,595,0002027 2028 2028 3,650,000 823,450 4,473,450 470,000 221,475 691,475 5,164,925 22,425,000 6,190,000 28,615,0002028 2029 2029 3,770,000 695,050 4,465,050 485,000 205,025 690,025 5,155,075 18,775,000 5,720,000 24,495,0002029 2030 2030 2,365,000 562,350 2,927,350 505,000 188,050 693,050 3,620,400 15,005,000 5,235,000 20,240,0002030 2031 2031 1,920,000 486,400 2,406,400 520,000 170,375 690,375 3,096,775 12,640,000 4,730,000 17,370,0002031 2032 2032 1,980,000 428,800 2,408,800 540,000 152,175 692,175 3,100,975 10,720,000 4,210,000 14,930,0002032 2033 2033 2,060,000 349,600 2,409,600 560,000 133,275 693,275 3,102,875 8,740,000 3,670,000 12,410,0002033 2034 2034 2,140,000 267,200 2,407,200 580,000 113,675 693,675 3,100,875 6,680,000 3,110,000 9,790,0002034 2035 2035 2,225,000 181,600 2,406,600 600,000 93,375 693,375 3,099,975 4,540,000 2,530,000 7,070,0002035 2036 2036 2,315,000 92,600 2,407,600 620,000 72,375 692,375 3,099,975 2,315,000 1,930,000 4,245,0002036 2037 2037 0 0 0 645,000 49,125 694,125 694,125 0 1,310,000 1,310,0002037 2038 2038 0 0 0 665,000 24,938 689,938 689,938 0 665,000 665,000
52,505,000 14,112,906 66,617,906 9,510,000 3,522,488 13,032,488 79,650,393
SUMMARY OF OUTSTANDING
260

SELF SUPPORTED GENERAL OBLIGATION DEBT
Fund 301-9550 Fund 301-95562010 2018
Tax Levy Calendar Fiscal Refunding of 2002A (NWCDS Building) 2018 Storm Sewer Improvements TOTAL SELF SUPPORTEDYear Year Year PRINCIPAL INTEREST PRINCIPAL INTEREST PRINCIPAL INTEREST TOTAL
2020 2021 2021 270,000.00 17,875.00 345,000.00 346,100.00 615,000.00 363,975.00 978,975.002021 2022 2022 280,000.00 9,100.00 360,000.00 332,300.00 640,000.00 341,400.00 981,400.002022 2023 2023 0.00 0.00 375,000.00 317,900.00 375,000.00 317,900.00 692,900.002023 2024 2024 0.00 0.00 390,000.00 299,150.00 390,000.00 299,150.00 689,150.002024 2025 2025 0.00 0.00 410,000.00 279,650.00 410,000.00 279,650.00 689,650.002025 2026 2026 0.00 0.00 435,000.00 259,150.00 435,000.00 259,150.00 694,150.002026 2027 2027 0.00 0.00 455,000.00 237,400.00 455,000.00 237,400.00 692,400.002027 2028 2028 0.00 0.00 470,000.00 221,475.00 470,000.00 221,475.00 691,475.002028 2029 2029 0.00 0.00 485,000.00 205,025.00 485,000.00 205,025.00 690,025.002029 2030 2030 0.00 0.00 505,000.00 188,050.00 505,000.00 188,050.00 693,050.002030 2031 2031 0.00 0.00 520,000.00 170,375.00 520,000.00 170,375.00 690,375.002031 2032 2032 0.00 0.00 540,000.00 152,175.00 540,000.00 152,175.00 692,175.002032 2033 2033 0.00 0.00 560,000.00 133,275.00 560,000.00 133,275.00 693,275.002033 2034 2034 0.00 0.00 580,000.00 113,675.00 580,000.00 113,675.00 693,675.002034 2035 2035 0.00 0.00 600,000.00 93,375.00 600,000.00 93,375.00 693,375.002035 2036 2036 0.00 0.00 620,000.00 72,375.00 620,000.00 72,375.00 692,375.002036 2037 2037 0.00 0.00 645,000.00 49,125.00 645,000.00 49,125.00 694,125.002037 2038 2038 0.00 0.00 665,000.00 24,937.50 665,000.00 24,937.50 689,937.50
550,000.00 26,975.00 8,960,000.00 3,495,512.50 9,510,000.00 3,522,487.50 13,032,487.50
Purpose of Issue: Refunding of 2002A To Finance Village-wide stormNWCDS Building addition sewer infrastructure projects.
Support Type: 100% Self Supported 100% Self SupportedGO Bonds intended to be GO Bonds intended to bepaid from NWCDS rent paid from Storm Sewer fees.
Financial Classification: General Obligation General Obligation
Interest Dates: June and December June and December
Date of Issue: September 22, 2010 September 11, 2018
Interest Rate: 1.50% to 3.25% 3.50% to 5.00%
Amount of Issue: $2,855,000 $9,530,000
Call Date: December 1, 2018 December 1, 2026
Paying Agent: The Bank of New York Mellon UMB Bank
261

TAX SUPPORTED GENERAL OBLIGATION DEBT
Tax Levy Calendar FiscalYear Year Year PRINCIPAL INTEREST PRINCIPAL INTEREST PRINCIPAL INTEREST
2020 2021 2021 2,145,000.00 70,400.00 1,585,000.00 987,700.00 0.00 399,250.002021 2022 2022 1,375,000.00 27,500.00 1,595,000.00 940,150.00 640,000.00 399,250.002022 2023 2023 0.00 0.00 1,530,000.00 892,300.00 2,185,000.00 367,250.002023 2024 2024 0.00 0.00 1,605,000.00 846,400.00 2,265,000.00 258,000.002024 2025 2025 0.00 0.00 1,580,000.00 798,250.00 1,650,000.00 144,750.002025 2026 2026 0.00 0.00 1,670,000.00 750,850.00 1,245,000.00 62,250.002026 2027 2027 0.00 0.00 1,710,000.00 700,750.00 0.00 0.002027 2028 2028 0.00 0.00 1,760,000.00 649,450.00 0.00 0.002028 2029 2029 0.00 0.00 1,810,000.00 596,650.00 0.00 0.002029 2030 2030 0.00 0.00 1,865,000.00 542,350.00 0.00 0.002030 2031 2031 0.00 0.00 1,920,000.00 486,400.00 0.00 0.002031 2032 2032 0.00 0.00 1,980,000.00 428,800.00 0.00 0.002032 2033 2033 0.00 0.00 2,060,000.00 349,600.00 0.00 0.002033 2034 2034 0.00 0.00 2,140,000.00 267,200.00 0.00 0.002034 2035 2035 0.00 0.00 2,225,000.00 181,600.00 0.00 0.002035 2036 2036 0.00 0.00 2,315,000.00 92,600.00 0.00 0.00
3,520,000.00 97,900.00 29,350,000.00 9,511,050.00 7,985,000.00 1,630,750.00
Purpose of Issue: Partial refunding of 2004 Public Funding to build new Partial refunding of 2004 Public BuildingBuilding Projects included L.A. Hanson police station Projects included L.A. Hanson PublicPublic Works Facility, Municipal Works Facility, Municipal Building Building Complex and Fire Station #1 Complex and Fire Station #1
Support Type: 100% tax supported 100% tax supported 100% tax supported
Financial Classification: General Obligation General Obligation General Obligation
Interest Dates: June and December June and December June and DecemberBeginning Dec 2016
Date of Issue: February 1, 2012 January 19, 2016 September 18, 2019
Interest Rate: 2.00% 2.9365% 1.515%
Call Date: December 1, 2019 December 1, 2025 Noncallable
Amount of Issue: $9,670,000 $32,900,000 $7,985,000
Paying Agent: The Bank of New York Mellon UMB Bank UMB Bank
Fund 301-95522012A
Partial Refunding of 2004 (Public Bldgs)
Fund 301-95572019
Partial Refunding of 2011 (Public Bldgs)
Fund 301-95552016
2016 Police Station
262

TAX SUPPORTED GENERAL OBLIGATION DEBT
Tax Levy Calendar Fiscal TOTAL TAX SUPPORTEDYear Year Year PRINCIPAL INTEREST PRINCIPAL INTEREST TOTAL
2020 2021 2021 730,000.00 581,205.56 4,460,000.00 2,038,555.56 6,498,555.562021 2022 2022 1,085,000.00 436,800.00 4,695,000.00 1,803,700.00 6,498,700.002022 2023 2023 1,130,000.00 393,400.00 4,845,000.00 1,652,950.00 6,497,950.002023 2024 2024 1,175,000.00 348,200.00 5,045,000.00 1,452,600.00 6,497,600.002024 2025 2025 695,000.00 301,200.00 3,925,000.00 1,244,200.00 5,169,200.002025 2026 2026 670,000.00 273,400.00 3,585,000.00 1,086,500.00 4,671,500.002026 2027 2027 1,815,000.00 246,600.00 3,525,000.00 947,350.00 4,472,350.002027 2028 2028 1,890,000.00 174,000.00 3,650,000.00 823,450.00 4,473,450.002028 2029 2029 1,960,000.00 98,400.00 3,770,000.00 695,050.00 4,465,050.002029 2030 2030 500,000.00 20,000.00 2,365,000.00 562,350.00 2,927,350.002030 2031 2031 0.00 0.00 1,920,000.00 486,400.00 2,406,400.002031 2032 2032 0.00 0.00 1,980,000.00 428,800.00 2,408,800.002032 2033 2033 0.00 0.00 2,060,000.00 349,600.00 2,409,600.002033 2034 2034 0.00 0.00 2,140,000.00 267,200.00 2,407,200.002034 2035 2035 0.00 0.00 2,225,000.00 181,600.00 2,406,600.002035 2036 2036 0.00 0.00 2,315,000.00 92,600.00 2,407,600.00
11,650,000.00 2,873,205.56 52,505,000.00 14,112,905.56 66,617,905.56
Purpose of Issue: Funding for Water Main ReplacementsStreets Program, and Parking Lotinfrastructure improvements.
Support Type: 100% tax supported
Financial Classification: General Obligation
Interest Dates: June and December
Date of Issue: September 2, 2020
Interest Rate: 1.005%
Call Date: Noncallable
Amount of Issue: $13,700,000
Paying Agent: UMB Bank
Fund 301-95582020
2020 Water Main, Streets, & Parking
263

THIS PAGE LEFT BLANK
264

CAPITAL PROJECT FUNDS ORGANIZATION STRUCTURE
Capital Projects
Capital Projects Storm Water Control
265

CAPITAL PROJECTS FUND 401 Fund at a Glance
This fund accounts for capital acquisitions and construction projects of a significant nature, as well as scheduled replacement of fixed assets other than vehicles. Restrictions: VILLAGE POLICY – The Village's policy requires one time revenues to be used for one time expenditures. Fund Summary
2019 2020 2021 2021 2022 $ %Actual Actual Est. Actual Budget Budget Change Change
RevenuesTaxes $7,093,173 $6,959,600 $6,229,900 $6,045,000 $7,134,800 $1,089,800 18.0%Intergovernmenta l 31,143 16,484 3,386,300 3,386,300 3,386,300 0 0.0%Interest Income 273,920 69,871 18,800 80,000 80,000 0 0.0%Sales/Reimbursable/Rents 4,346 14,049 0 0 0 0 N/AOther 68,523 12,588,045 120,000 120,000 120,000 0 0.0%
Total Revenues $7,471,105 $19,648,049 $9,755,000 $9,631,300 $10,721,100 $1,089,800 11.3%Interfund Transfers In 1,600,000 300,000 300,000 300,000 300,000 0 0.0%
Total Revenues andInterfund Transfers In $9,071,105 $19,948,049 $10,055,000 $9,931,300 $11,021,100 $1,089,800 11.0%
ExpendituresContractual Services 28,258 141,116 0 0 0 0 N/AOther Charges 0 0 700,000 700,000 200,000 (500,000) (71.4%)Capita l Items 8,637,244 5,081,161 8,394,200 10,522,104 9,431,700 (1,090,404) (10.4%)
Total Expenditures $8,665,502 $5,222,277 $9,094,200 $11,222,104 $9,631,700 ($1,590,404) (14.2%)Interfund Transfers Out 0 9,088,032 2,500,000 2,500,000 2,500,000 0 0.0%
Total Expenditures andInterfund Transfers Out $8,665,502 $14,310,309 $11,594,200 $13,722,104 $12,131,700 ($1,590,404) (11.6%)
Revenues over(under) Expenditures $405,603 $5,637,740 ($1,539,200) ($3,790,804) ($1,110,600) $2,680,204 (70.7%)
BEGINNING FUND BALANCE 10,695,095 11,100,698 16,738,438 16,738,438 15,199,238 (1,539,200) (9.2%)
ENDING FUND BALANCE $11,100,698 $16,738,438 $15,199,238 $12,947,634 $14,088,638 $1,141,004 8.8%
266

20212019 2020 ESTIMATED 2021 2022 2023 2024 2025 2026
ACCOUNT DESCRIPTION PROJ # ACTUAL ACTUAL ACTUAL BUDGET BUDGET BUDGET BUDGET BUDGET BUDGETREVENUES TAXES - PROPERTY TAXES 5,292,801 5,408,020 4,400,000 4,400,000 5,250,000 5,400,000 5,600,000 5,700,000 5,800,000
HOME RULE SALES TAX 1,800,372 1,551,580 1,829,900 1,645,000 1,884,800 1,941,300 1,999,500 2,059,500 2,121,300GRANTS 31,143 16,484 3,386,300 3,386,300 3,386,300 0 0 0 0INTEREST INCOME 273,920 69,871 18,800 80,000 80,000 80,000 80,000 80,000 80,000FORFEITURES 20,745 0 0 0 0 0 0 0 0OTHER 52,124 140,774 0 0 0 171,000 0 0 0ELECTRIC AGGREGATION REBATES 0 264,963 120,000 120,000 120,000 120,000 0 0 0BOND PROCEEDS 0 12,196,357 0 0 0 0 0 0 0TRANSFER IN FROM GENERAL FUND 500,000 0 0 0 0 0 0 0 0TRANSFER IN FROM PUBLIC BUILDING FUND 800,000 0 0 0 0 0 0 0 0TRANSFER IN FROM SWANCC FUND 300,000 300,000 300,000 300,000 300,000 300,000 300,000 300,000 300,000
TOTAL REVENUES 9,071,105 19,948,049 10,055,000 9,931,300 11,021,100 8,012,300 7,979,500 8,139,500 8,301,300
EXPENDITURESBUILDING & LAND
Overhead Door Replacement BL-90-04 24,411 19,514 20,000 20,000 20,000 20,000 35,000 30,000 30,000Public Works Annex Improvements BL-93-02 9,417 3,428 10,000 10,000 24,000 10,000 10,000 10,000 10,000Building Equipment Replacement BL-95-04 60,830 35,886 30,000 30,000 27,900 107,500 38,000 30,000 30,000Municipal Buildings Refurbishing BL-95-05 140,966 100,389 63,000 63,015 316,400 178,200 40,000 100,000 120,000Roof Maintenance Program BL-95-06 173,510 15,000 0 0 0 515,000 600,000 492,500 653,000Heating Plant/Air Conditioner Replacement BL-96-01 0 120,905 81,000 65,000 240,000 75,000 95,000 130,000 85,000Ongoing Maintenance to Brick Exteriors BL-96-03 13,275 17,042 38,700 38,650 160,000 30,000 30,000 40,000 40,000Historical Society Museum - Building Repairs BL-96-04 15,871 11,628 66,300 66,300 25,000 25,000 45,000 45,000 25,000Police Station - Architect BL-16-01 0 0 0 0 124,000 0 0 0 0LED Village Hall Clock Tower Lighting BL-19-01 17,507 0 0 0 0 0 0 0Senior Center Study BL-20-02 0 0 60,000 60,000 0 0 0 0 0Electric Vehicle Charging BL-22-01 0 0 0 0 35,000 37,000 0 38,000 0 SUBTOTAL - BLDG & LAND 455,787 323,792 369,000 352,965 972,300 997,700 893,000 915,500 993,000
EQUIPMENTOperational Equipment - Public Works EQ-94-01 77,199 77,705 49,700 49,700 38,400 50,000 396,700 108,000 83,700Operational Equipment - Police Department EQ-95-01 54,142 86,030 57,800 57,775 46,000 261,000 47,000 47,000 47,000Operational Equipment - Fire Department EQ-95-02 474,711 221,187 77,500 121,202 277,000 321,000 326,500 919,000 140,000Office Equipment EQ-95-03 65,295 34,920 128,600 133,565 88,000 45,000 35,000 30,000 30,000Operational Equipment - Municipal Fleet Services EQ-97-01 56,115 40,338 78,200 78,200 38,200 3,500 61,000 91,000 67,000Operational Equipment - Information Technology EQ-01-03 82,533 90,342 126,500 126,500 141,500 191,500 126,500 126,500 126,500Patrol Vehicle Equipment Replacement Program EQ-08-03 60,139 79,440 30,000 30,000 51,600 34,400 60,200 43,000 51,600Cable Access Broadcast & Video Streaming EQ-16-07 4,102 0 0 0 0 0 0 0 0Phone System Upgrade EQ-21-01 0 0 175,000 175,000 0 0 0 0 0A/V System Upgrades EQ-21-02 0 0 227,800 227,800 0 120,000 0 0 0Electric Vehicle Fleet Upgrades EQ-22-03 0 0 0 0 10,000 8,000 8,500 40,000 25,000
SUBTOTAL - EQUIPMENT 874,236 629,962 951,100 999,742 690,700 1,034,400 1,061,400 1,404,500 570,800
SIGNALSTraffic Signal Imprv at Northwest Hwy/Wilke SG-08-02 (34,415) 0 0 36,211 0 0 0 0 0Dundee Rd/Kennicott Ave Pedestrian Actuation SG-14-05 41,740 0 0 0 0 0 0 0 0Traffic Signal Pedestrian Upgrade - Central at Arthur SG-14-10 0 0 0 52,260 52,300 0 0 0 0Algonquin and New Wilke Intersection Improvement SG-17-01 0 27,693 43,600 123,641 0 35,000 380,000 0 0Pedestrian/ Bicycle Crossing - Lake Cook/ Wilke Rd SG-18-01 0 2,920 30,000 67,400 0 0 0 0 0
SUBTOTAL - SIGNALS 7,325 30,613 73,600 279,512 52,300 35,000 380,000 0 0
STREETSStreet Program ST-90-08 5,602,120 3,141,665 5,000,000 6,517,367 5,600,000 5,600,000 5,600,000 5,600,000 5,600,000Sidewalk & Curb Replacement ST-90-11 381,209 431,567 405,000 405,000 415,000 425,000 435,000 445,000 455,000Pavement Crack Sealing Program ST-92-01 200,000 200,000 200,000 200,000 200,000 200,000 200,000 200,000 200,000Street Light Cable Replacement ST-00-01 6,557 9,661 10,000 10,000 10,000 10,000 20,000 20,000 20,000Paver Brick Maintenance ST-05-01 802,928 47,070 457,100 457,100 400,000 100,000 100,000 100,000 100,000Northwest Hwy/Davis Street/Arthur Avenue ST-05-03 (184,854) 0 0 0 0 0 0 0 0Downtown Street Furniture ST-14-01 12,055 4,424 15,200 15,211 10,000 10,000 10,000 10,000 10,000Downtown Streetscape Improvements ST-15-35 172,960 2,977 0 200,000 200,000 95,000 0 0 0Northwest Hwy (Rt. 14) Corridor Landscaping Impr ST-16-20 48,964 13,245 114,900 114,871 75,000 77,000 0 0 0Davis/Sigwalt Streets Fencing/Landscape Upgrade ST-17-02 4,698 0 9,000 9,000 0 0 0 0 0Rand Road Corridor Identification Enhancement ST-17-20 8,711 475 237,200 237,200 140,400 226,200 43,000 80,000 0Downtown Outdoor Living Room ST-17-25 0 0 0 0 20,000 0 0 0 0Downtown Light Ceiling ST-17-26 14,380 0 0 0 0 0 0 0 0Kensington Road & Multi Use Path Improvements ST-18-01 0 0 200,000 300,000 0 0 0 0 0Surface Treatment - Streets (NEW) ST-18-02 146,559 132,011 150,000 150,000 300,000 300,000 300,000 300,000 300,000LED Street Light Conversions ST-19-01 64,572 64,369 64,000 64,000 64,000 64,000 64,000 64,000 64,000South Arlington Heights Road Corridor ST-19-03 19,037 40,130 13,100 13,136 0 0 0 0 0Bike Plan/Bike Route Pavement Marking ST-19-04 0 0 0 20,000 20,000 20,000 20,000 20,000 20,000
CAPITAL PROJECTS FUND (401) 5 YEAR CAPITAL IMPROVEMENT PROGRAM (CIP)
267

20212019 2020 ESTIMATED 2021 2022 2023 2024 2025 2026
ACCOUNT DESCRIPTION PROJ # ACTUAL ACTUAL ACTUAL BUDGET BUDGET BUDGET BUDGET BUDGET BUDGET
CAPITAL PROJECTS FUND (401) 5 YEAR CAPITAL IMPROVEMENT PROGRAM (CIP)
STREETS (continued)Vail Ave Permeable Paver / Ped. Mall Prelim. Eng. ST-20-01 0 9,200 0 0 0 0 0 0 0Windsor Drive Road Diet ST-21-01 0 0 50,000 50,000 0 0 0 0 0Weber Dr/Old Wilke Rd Street Reconstruction ST-21-02 0 0 25,000 52,000 32,000 160,000 0 0 0Wilke Road Resurfacing & Multi-Use Path Ext. ST-21-03 0 0 50,000 75,000 170,000 855,000 0 0 0Sustainable Bike Plan Improvements ST-22-01 0 0 0 0 15,000 0 0 0 0Vail Ave Permeable Paver Match ST-22-02 0 0 0 0 0 235,000 48,000 0 0Other Sustainable Initiatives ST-22-03 0 0 0 0 45,000 0 0 0 0
SUBTOTAL - STREETS 7,299,896 4,096,794 7,000,500 8,889,885 7,716,400 8,377,200 6,840,000 6,839,000 6,769,000
TOTAL CAPITAL EXPENDITURES 8,637,244 5,081,161 8,394,200 10,522,104 9,431,700 10,444,300 9,174,400 9,159,000 8,332,800
BOND ISSUANCE COSTS 0 136,048 0 0 0 0 0 0 0Lobbyist LB-19-01 28,258 5,068 0 0 0 0 0 0 0OPERATING TRANSFER OUT 0 9,088,032 2,500,000 2,500,000 2,500,000 0 0 0 0ARPA Grant - Park District 500,000 500,000 0 0 0 0 0OPERATING CONTINGENCY 0 0 200,000 200,000 200,000 0 0 0 0
TOTAL EXPENDITURES 8,665,502 14,310,309 11,594,200 13,722,104 12,131,700 10,444,300 9,174,400 9,159,000 8,332,800
BEGINNING FUND BALANCE 10,695,095 11,100,698 16,738,438 16,738,438 15,199,238 14,088,638 11,656,638 10,461,738 9,442,238REVENUES OVER (UNDER) EXPENDITURES 405,603 5,637,740 (1,539,200) (3,790,804) (1,110,600) (2,432,000) (1,194,900) (1,019,500) (31,500)ENDING FUND BALANCE 11,100,698 16,738,438 15,199,238 12,947,634 14,088,638 11,656,638 10,461,738 9,442,238 9,410,738
Fund Balance as a Percent of Expenditures 116% 112% 114% 103% 113%
268

CAPITAL PROJECTS FUNDREVENUES
Account Account Actual Actual Proj Actual Budget Budget $ %Number Description 2019 2020 2021 2021 2022 Inc (Dec) Inc (Dec)
401-0000-401.05-00 Real Estate Tax 5,292,801 5,408,020 4,400,000 4,400,000 5,250,000 850,000 19.3%Real Estate Taxes 5,292,801 5,408,020 4,400,000 4,400,000 5,250,000 850,000 19.3%
401-0000-402.30-00 Sales Tax Home Rule 1,800,372 1,551,580 1,829,900 1,645,000 1,884,800 239,800 14.6%Business Taxes 1,800,372 1,551,580 1,829,900 1,645,000 1,884,800 239,800 14.6%
401-0000-411.54-00 EE&C Block Grant (EECBG) 0 1,425 0 0 0 0 N/A401-0000-411.70-00 Other Grants 31,143 15,059 3,386,300 3,386,300 3,386,300 0 0.0%
Intergovernmental 31,143 16,484 3,386,300 3,386,300 3,386,300 0 0.0%
401-0000-461.02-00 Interest on Investments 197,247 55,775 10,800 60,000 60,000 0 0.0%401-0000-462.10-00 Market Value Adjustments 76,673 14,096 8,000 20,000 20,000 0 0.0%
Interest Income 273,920 69,871 18,800 80,000 80,000 0 0.0%
401-0000-472.24-00 Sale of Equipment 3,142 12,042 0 0 0 0 N/A401-0000-472.42-00 Reimbursed Activity 1,204 2,007 0 0 0 0 N/A
Sales & Rents 4,346 14,049 0 0 0 0 N/A
401-0000-489.89-00 Electric Aggregation Rebates 0 264,963 120,000 120,000 120,000 0.0%401-0000-489.90-00 Other Income 47,778 55,689 0 0 0 0 N/A401-0000-489.92-00 Bond Forfeitures 20,745 71,036 0 0 0 0 N/A
Other 68,523 391,688 120,000 120,000 120,000 0 0.0%
401-0000-491.05-00 Operating Transfer In 1,600,000 300,000 300,000 300,000 300,000 0 0.0%401-0000-491.15-00 Bond Proceeds 0 10,252,000 0 0 0 0 N/A401-0000-491.16-00 Bond Premium Proceeds 0 1,944,357 0 0 0 0 N/A
Other Financing Sources 1,600,000 12,496,357 300,000 300,000 300,000 0 0.0%
Total Capital Projects Fund 9,071,105 19,948,049 10,055,000 9,931,300 11,021,100 1,089,800 11.0%
269

CAPITAL PROJECTS FUNDEXPENDITURES
Integrated Services 0201
Account Account Actual Actual Proj. Act. Budget Budget $ %Number Description 2019 2020 2021 2021 2022 Inc (Dec) Inc (Dec)
401-0201-572.20-05 Professional Services 28,258 5,068 0 0 0 0 N/AContractual Services 28,258 5,068 0 0 0 0 N/A
401-0201-572.50-10 Office Equipment 5,000 0 0 0 0 0 N/ACapital Outlay 5,000 0 0 0 0 0 N/A
Total Village Manager 33,258 5,068 0 0 0 0 N/A
Finance 0501
Account Account Actual Actual Proj. Act. Budget Budget $ %Number Description 2019 2020 2021 2021 2022 Inc (Dec) Inc (Dec)
401-0501-572.50-10 Office Equipment 0 0 36,000 36,000 20,000 (16,000) (44.4%)Capital Outlay 0 0 36,000 36,000 20,000 (16,000) (44.4%)
Total Finance 0 0 36,000 36,000 20,000 (16,000) (44.4%)
IT 0601
Account Account Actual Actual Proj. Act. Budget Budget $ %Number Description 2019 2020 2021 2021 2022 Inc (Dec) Inc (Dec)
401-0601-572.50-15 Other Equipment 86,635 90,342 126,500 126,500 141,500 15,000 11.9%Capital Outlay 86,635 90,342 126,500 126,500 141,500 15,000 11.9%
Total IT 86,635 90,342 126,500 126,500 141,500 15,000 11.9%
Police 3001
Account Account Actual Actual Proj. Act. Budget Budget $ %Number Description 2019 2020 2021 2021 2022 Inc (Dec) Inc (Dec)
401-3001-572.50-10 Office Equipment 16,536 14,920 5,000 5,000 5,000 0 0.0%401-3001-572.50-15 Other Equipment 114,281 165,470 87,800 87,775 97,600 9,825 11.2%
Capital Outlay 130,817 180,390 92,800 92,775 102,600 9,825 10.6%
Total Police 130,817 180,390 92,800 92,775 102,600 9,825 10.6%
270

CAPITAL PROJECTS FUNDEXPENDITURES
Fire 3501
Account Account Actual Actual Proj. Act. Budget Budget $ %Number Description 2019 2020 2021 2021 2022 Inc (Dec) Inc (Dec)
401-3501-572.50-10 Office Equipment 26,839 5,000 82,600 82,565 63,000 (19,565) (23.7%)401-3501-572.50-15 Other Equipment 474,711 221,187 77,500 121,202 277,000 155,798 128.5%
Capital Outlay 501,550 226,187 160,100 203,767 340,000 136,233 66.9%
Total Fire 501,550 226,187 160,100 203,767 340,000 136,233 66.9%
Planning 4001
Account Account Actual Actual Proj. Act. Budget Budget $ %Number Description 2019 2020 2021 2021 2022 Inc (Dec) Inc (Dec)
401-4001-572.50-10 Office Equipment 0 0 5,000 5,000 0 (5,000) (100.0%)401-4001-571.50-30 Road Projects 219,786 52,782 259,300 459,336 360,400 (98,936) (21.5%)
Capital Outlay 219,786 52,782 264,300 464,336 360,400 (103,936) (22.4%)
Total Planning 219,786 52,782 264,300 464,336 360,400 (103,936) (22.4%)
Building & Life Safety 4501
Account Account Actual Actual Proj. Act. Budget Budget $ %Number Description 2019 2020 2021 2021 2022 Inc (Dec) Inc (Dec)
401-4501-572.50-10 Office Equipment 11,695 5,000 0 0 0 0 N/ACapital Outlay 11,695 5,000 0 0 0 0 N/A
Total Building Services 11,695 5,000 0 0 0 0 N/A
Health Services 7001
Account Account Actual Actual Proj. Act. Budget Budget $ %Number Description 2019 2020 2021 2021 2022 Inc (Dec) Inc (Dec)
401-7001-572.50-10 Office Equipment 0 5,000 0 0 0 0 N/ACapital Outlay 0 5,000 0 0 0 0 N/A
Total Health Services 0 5,000 0 0 0 0 N/A
271

CAPITAL PROJECTS FUNDEXPENDITURES
Senior Services 7007
Account Account Actual Actual Proj. Act. Budget Budget $ %Number Description 2019 2020 2021 2021 2022 Inc (Dec) Inc (Dec)
401-7007-572.50-10 Office Equipment 0 5,000 0 5,000 0 (5,000) (100.0%)Capital Outlay 0 5,000 0 5,000 0 (5,000) (100.0%)
Total Senior Services 0 5,000 0 5,000 0 (5,000) (100.0%)
Public Works 7101
Account Account Actual Actual Proj. Act. Budget Budget $ %Number Description 2019 2020 2021 2021 2022 Inc (Dec) Inc (Dec)
401-7101-571.50-20 Building Improvements 455,787 323,792 771,800 755,765 937,300 181,535 24.0%401-7101-571.50-30 Road Projects 6,506,226 3,443,058 6,209,800 8,105,061 6,733,300 (1,371,761) (16.9%)401-7101-571.50-40 Pavement Crack Seal Project 200,000 200,000 200,000 200,000 200,000 0 0.0%401-7101-571.50-45 Sidewalk Program 381,209 431,567 405,000 405,000 415,000 10,000 2.5%401-7101-571.50-60 Sustainability Projects 0 0 0 0 105,000 105,000 N/A401-7101-572.50-10 Office Equipment 5,225 0 0 0 0 0 N/A401-7101-572.50-15 Other Equipment 77,199 77,705 49,700 49,700 38,400 (11,300) (22.7%)
Capital Outlay 7,625,646 4,476,122 7,636,300 9,515,526 8,429,000 (1,190,226) (11.4%)
Total Public Works 7,625,646 4,476,122 7,636,300 9,515,526 8,429,000 (1,138,376) (11.4%)
Municipal Fleet Services 7501
Account Account Actual Actual Proj. Act. Budget Budget $ %Number Description 2019 2020 2021 2021 2022 Inc (Dec) Inc (Dec)
401-7501-572.50-15 Other Equipment 56,115 40,338 78,200 78,200 38,200 (40,000) (51.2%)Capital Outlay 56,115 40,338 78,200 78,200 38,200 (40,000) (51.2%)
Total Municipal Fleet Serv 56,115 40,338 78,200 78,200 38,200 (40,000) (51.2%)
Debt Service 9554
Account Account Actual Actual Proj. Act. Budget Budget $ %Number Description 2019 2020 2021 2021 2022 Inc (Dec) Inc (Dec)
401-9554-583-20-06 Bond Issurance Costs 0 136,048 0 0 0 0 N/AOther Charges 0 136,048 0 0 0 0 N/A
Total Debt Service 0 136,048 0 0 0 0 N/A
272

CAPITAL PROJECTS FUNDEXPENDITURES
Non-Operating 9901
Account Account Actual Actual Proj. Act. Budget Budget $ %Number Description 2019 2020 2021 2021 2022 Inc (Dec) Inc (Dec)
401-9901-571.40-96 Operating Contingency 0 0 200,000 200,000 200,000 0 0.0%Other Charges 0 0 200,000 200,000 200,000 0 0.0%
401-9901-591.90-05 Operating Transfer Out 0 9,088,032 2,500,000 2,500,000 2,500,000 0 0.0%401-9901-591.90-06 ARPA Grant-Park District 0 0 500,000 500,000 0 (500,000) (100.0%)
Other Financing Uses 0 9,088,032 3,000,000 3,000,000 2,500,000 (500,000) (16.7%)
Total Non-Operating 0 9,088,032 3,200,000 3,200,000 2,700,000 (500,000) (15.6%)
Total Capital Projects Fund 8,665,502 14,310,309 11,594,200 13,722,104 12,131,700 (1,642,254) (11.6%)
273
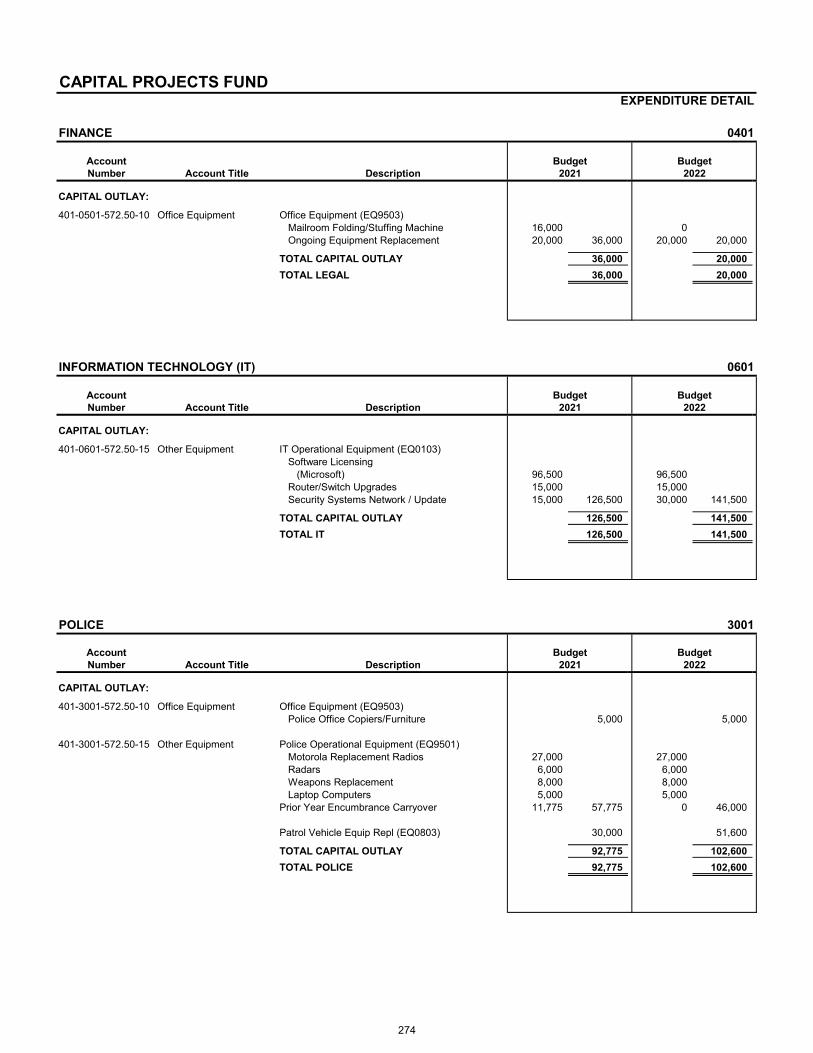
CAPITAL PROJECTS FUNDEXPENDITURE DETAIL
FINANCE 0401
AccountNumber Account Title Description
CAPITAL OUTLAY:
401-0501-572.50-10 Office Equipment Office Equipment (EQ9503)Mailroom Folding/Stuffing Machine 16,000 0Ongoing Equipment Replacement 20,000 36,000 20,000 20,000
TOTAL CAPITAL OUTLAY 36,000 20,000
TOTAL LEGAL 36,000 20,000
INFORMATION TECHNOLOGY (IT) 0601
AccountNumber Account Title Description
CAPITAL OUTLAY:
401-0601-572.50-15 Other Equipment IT Operational Equipment (EQ0103)Software Licensing
(Microsoft) 96,500 96,500Router/Switch Upgrades 15,000 15,000Security Systems Network / Update 15,000 126,500 30,000 141,500
TOTAL CAPITAL OUTLAY 126,500 141,500
TOTAL IT 126,500 141,500
POLICE 3001
AccountNumber Account Title Description
CAPITAL OUTLAY:
401-3001-572.50-10 Office Equipment Office Equipment (EQ9503)Police Office Copiers/Furniture 5,000 5,000
401-3001-572.50-15 Other Equipment Police Operational Equipment (EQ9501)Motorola Replacement Radios 27,000 27,000Radars 6,000 6,000Weapons Replacement 8,000 8,000Laptop Computers 5,000 5,000
Prior Year Encumbrance Carryover 11,775 57,775 0 46,000
Patrol Vehicle Equip Repl (EQ0803) 30,000 51,600
TOTAL CAPITAL OUTLAY 92,775 102,600
TOTAL POLICE 92,775 102,600
2021Budget
2021
Budget Budget2021 2022
Budget
Budget
2022Budget
2022
274

CAPITAL PROJECTS FUNDEXPENDITURE DETAIL
FIRE 3501
AccountNumber Account Title Description
CAPITAL OUTLAY:
401-3501-572.50-10 Office Equipment Office Equipment (EQ9503) Fire AdminEquip/Furniture Sta #2 & #3, Fit Test Sta #4 24,000 0Kitchen for Station 3 0 40,000Furniture/Equipment Stations 1 & 4 0 13,000Fit Testing Machine 0 10,000
Prior Year Encumbrance Carryover 58,565 82,565 0 63,000
401-3501-572.50-15 Other Equipment Fire Operational Equipment (EQ9502)Defib & Comm Package 38,000 126,000Equipment for New Engine 0 25,000Command Van Lights & Equipment 0 11,000Re-Build Interior of Dive Squad 0 50,000Station Alerting-Station 4 Dorm Remotes 0 25,000Surface Supply Lines 18,000 0Firefighter Turnout Gear Replacement Program 59,500 40,000
Prior Year Encumbrance Carryover 5,702 121,202 0 277,000
TOTAL CAPITAL OUTLAY 203,767 340,000
TOTAL FIRE 203,767 340,000
PLANNING 4001
AccountNumber Account Title Description
CAPITAL OUTLAY:
401-4001-572.50-10 Office Equipment Office Equipment (EQ9503)Replacement Copier 5,000 0
401-4001-571.50-30 Road Projects Downtown Streetscape Imprv (ST1535) 200,000 200,000
Rand Road Corridor IdentificationEnhancement (ST1720) 230,000 140,400
Prior Year Encumbrance Carryover 7,200 0
Davis/Sigwalt Fence (ST1702) 0 0Prior Year Encumbrance Carryover 9,000 0
South AH Rd Corridor StudyImplementation (ST1903) 0 0
Prior Year Encumbrance Carryover 13,136 0
Downtown Outdoor Living Room (ST1725) 0 459,336 20,000 360,400
TOTAL CAPITAL OUTLAY 464,336 360,400
TOTAL PLANNING 464,336 360,400
Budget2022
Budget
2021 2022Budget Budget
2021
275

CAPITAL PROJECTS FUNDEXPENDITURE DETAIL
SENIOR CENTER 7001
AccountNumber Account Title Description
CAPITAL OUTLAY:
401-7007-572.50-10 Office Equipment Office Equipment (EQ9503)Replacement Copier 5,000 0
TOTAL CAPITAL OUTLAY 5,000 0
TOTAL HEALTH SERVICES 5,000 0
PUBLIC WORKS 7101
AccountNumber Account Title Description
CAPITAL OUTLAY:
401-7101-571.50-20 Building Improvements Overhead Door Repl/Repair (BL9004) 20,000 755,765 20,000 937,300
Public Works Annex Improv. (BL9302) 10,000 24,000
Building Equipment Replacement (BL9504) 30,000 27,900
Municipal Buildings Refurbishing (BL9505) 44,000 316,400Prior Year Encumbrance Carryover 19,015 0
Heating Plant/Air Conditioner Repl (BL9601)* 65,000 240,000
Ongoing Maint. of Brick Exteriors (BL9603) 30,000 160,000Prior Yr Encumbrance Carryover 8,650 0
Historical Soc. Building Repairs (BL9604) 50,500 25,000Prior Yr Encumbrance Carryover 15,800 0
Phone System Upgrade (EQ2101) 175,000 0
A/V System Upgrades (EQ2102) 227,800 0
Senior Center Study (BL2002) 60,000 0
Police Station - Architect 0 124,000
401-7101-571.50-30 Road Projects Street Resurfacing Program (ST9008) 6,517,367 8,105,061 5,600,000 6,733,300Street Resurfacing 1,117,900
Construction Inspection Services 20,000Material Inspection Services 40,000
Street Rehabilitation 0Construction Inspection Services 20,000Material Inspection Services 40,000Surveys for 2021 Program Design 50,000
Work on Vail w/ IDOT Resurfacing NW Hwy 0Sidewalk, Driveway, & Curb Reimbursements 60,000Buffalo Creek Crossing 0Area D: Greenbriar Pavement 2,700,000Area C: Berkley/Hintz Pavement 1,700,000Kensington Rd & Multi-Use Path 452,100
Prior Year Encumbrance Carryover 317,367
Street Light Cable Replacement (ST0001) 10,000 10,000
Paver Brick Maintenance (ST0501) 412,000 400,000Prior Year Encumbrance Carryover 45,100 0
Downtown Street Furniture (ST1401) 10,000 10,000Prior Year Encumbrance Carryover 5,211 0
2021
Budget2021
Budget2022
Budget2022
Budget
276

CAPITAL PROJECTS FUNDEXPENDITURE DETAIL
PUBLIC WORKS (con't) 7101
AccountNumber Account Title Description
401-7101-571.50-30 Road Projects Kensington Road & Multi-Use PathImprovements (ST1801) 300,000 0
Surface Treatments - Streetsat Windsor Drive (ST1802) 150,000 300,000
LED Street Light Conversions (ST1901) 64,000 64,000
Traffic Signal Improvements at NorthwestHighway/Wilke Road (SG0802) 0 0
Prior Year Encumbrance Carryover 36,211 0
Traffic Signal Pedestrian UpgradeCentral at Arthur (SG1410) 0 52,300
Prior Year Encumbrance Carryover 52,260 0
Algonquin & New Wilke IntersectionImprovement (SG1701) 80,000 0
Prior Year Encumbrance Carryover 43,641 0
Pedestrian/ Bicycle Crossing - Lake Cook /Wilke Road (SG1801) 0 0
Prior Year Encumbrance Carryover 67,400 0
Bike Plan/Bike Route PavementMarkings (ST1904) 20,000 20,000
Northwest Highway Landscape (ST1620) 101,000 75,000Prior Year Encumbrance Carryover 13,871 0
Windsor Drive Road Diet (ST2101) 50,000 0
Weber Dr/Old Wilke Rd Street Reconstruction(ST2102) 52,000 32,000
Wilke Road Resurfacing & Multi-Use Path Ext.(ST2103) 75,000 170,000
401-7101-571.50-40 Pavement Crack Sealing Pavement Crack Sealing Prog (ST9201) 200,000 200,000
401-7101-571.50-45 Sidewalk Program Sidewalk & Curb Replacement (ST9011) 405,000 415,000Prior Year Encumbrance Carryover
401-7101-571.50-60 Sustainability Projects Sustainable Bike Plan Improvements (ST2201) 0 0 15,000 105,000
Electric Vehicle Charging (BL2201) 0 35,000
Electric Vehicle Fleet Upgrades (EQ2201) 0 10,000
Other Sustainable Initiatives (ST2203) 0 45,000
401-7101-572.50-10 Office Equipment Office Equipment (EQ9503)New Copier 0
401-7101-572.50-15 Other Equipment PW Operational Equipment (EQ9401)Traffic:
Emergency Siren Upgrade 10,000 10,000Street Light Controller 12,000 0Vehicle Detection Upgrades 5,000 5,000Street Light Cabinet 0 12,000
Street:Winter Maint. Operations Upgrades 10,000 0
Forestry:Large Chainsaws (3) 3,300 0Small Chainsaws (6) 3,300 0Portable Generator 1,100 0Snow Blowers 0 1,900Senior Center Water Fountain 0 4,500
Engineering:AutoCAD/GIS System 5,000 0
2021 2022Budget Budget
277

CAPITAL PROJECTS FUNDEXPENDITURE DETAIL
PUBLIC WORKS (con't) 7101
AccountNumber Account Title Description
401-7101-572.50-15 Other Equipment (cont.) Survey Equipment Upgrade 0 49,700 5,000 38,400
TOTAL CAPITAL OUTLAY 9,515,526 8,429,000TOTAL PUBLIC WORKS 9,515,526 8,429,000
MUNICIPAL FLEET SERVICES 7501
AccountNumber Account Title Description
CAPITAL OUTLAY:
401-7501-572.50-15 Other Equipment Municipal Fleet Services OperationalEquipment (EQ9701)
Diagnostic tools 3,200 3,200Wheel Balancer/Wheel Weight Assortment 0 10,000Tire Changer (Car/Light Truck) 0 15,000Diesel Exhaust Fluid Dispenser 0 10,000Replace fuel dispensers 75,000 78,200 0 38,200
TOTAL CAPITAL OUTLAY 78,200 38,200
TOTAL MUNICIPAL FLEET SERVICES 78,200 38,200
NON-OPERATING 9901
AccountNumber Account Title Description
OTHER CHARGES:
401-9901-571.40-96 Operating Contingency Operating Contingency 200,000 200,000
TOTAL OTHER CHARGES 200,000 200,000
NON-OPERATING:
401-9901-591.90-05 Operating Transfer Out Operating Transfer OutTo Fleet Fund 0 2,500,000To Water & Sewer Fund 2,500,000 2,500,000 0 2,500,000
401-9901-591.90-06 ARPA Grant-Park District Transfer to Arlington Heights Park District 500,000 0
TOTAL NON-OPERATING 3,200,000 2,700,000
TOTAL CAPITAL PROJECTS FUND 13,722,104 12,131,700
Budget Budget2021 2022
2021
2021
Budget
Budget2022
2022Budget
Budget
278

STORM WATER CONTROL FUND 426 Fund at a Glance
The Storm Water Control Fund is used to account for the Neighborhood Drainage Improvement program, flood studies and utility modeling, the Storm Water Rehabilitation/Replacement program, and the storm water projects identified in the two flood studies.
• Neighborhood Drainage Improvements – This budget provides funds for public drainage improvements
allowing new or improved access for residents to Village storm sewers. The program only covers work on public right-of-way with any connections or work on private property being the responsibility of the property owner.
• Storm Water Rehabilitation/Replacement Program – The budget includes the costs of a multi-year program to lightly clean, televise, and analyze the condition of the Village’s storm sewer system. This portion of the program will take about eight years to complete, after which the budget for this program will be devoted to storm rehabilitation and replacement work identified by televising the system.
• Sewer Back-up Rebate Program – Through this program the Village continues to encourage resident participation in its Overhead Sewer/Backup Control Cost Sharing Program. Overhead Sewer installation isolate private sanitary sewers from our system and provide full protection against basement backups. Rebates are budgeted in the Water and Sewer Fund.
• Storm Water Control Improvements – This program was created after the approval the storm water utility fee in 2017. The projects were identified in the two flood studies completed in 2016.
2021 Accomplishments 1. Greenbrier Park, Roanoke Drive, Wilke Road, Drainage Improvements Strategic Priority #7: Continue Infrastructure Improvement Efforts The area received an enlarged, improved detention pond and new storm sewers to meet current design standards. Construction was completed in 2021. 2. Storm Water Assessment Strategic Priority #7: Continue Infrastructure Improvement Efforts Inspected, televised, and cleaned the Village’s storm water system to verify its capacity and condition. The results were incorporated into the Village GIS. 2022 Strategic Priorities & Key Projects 1. Berkley/Hintz Stormwater Improvements Strategic Priority #6: Ensure that Organization has the Resources and Training to Maintain Focus on Consistent High-Quality Core Services and Infrastructure The Village will be making stormwater improvements in two sections of the Berkley Square subdivision. The Northwest section will have new storm sewers and the development of a detention pond in cooperation with the Arlington Heights Park District. The Southeast section will receive new storm sewers. The improvements will bring the area to current design standards. Project Leader: Cris Papierniak, Director of Public Works; Scott Schweda, Superintendent of Utilities; Jim Zaharopoulos, Sewer Foreman Project Completion: Ongoing through 2022
279
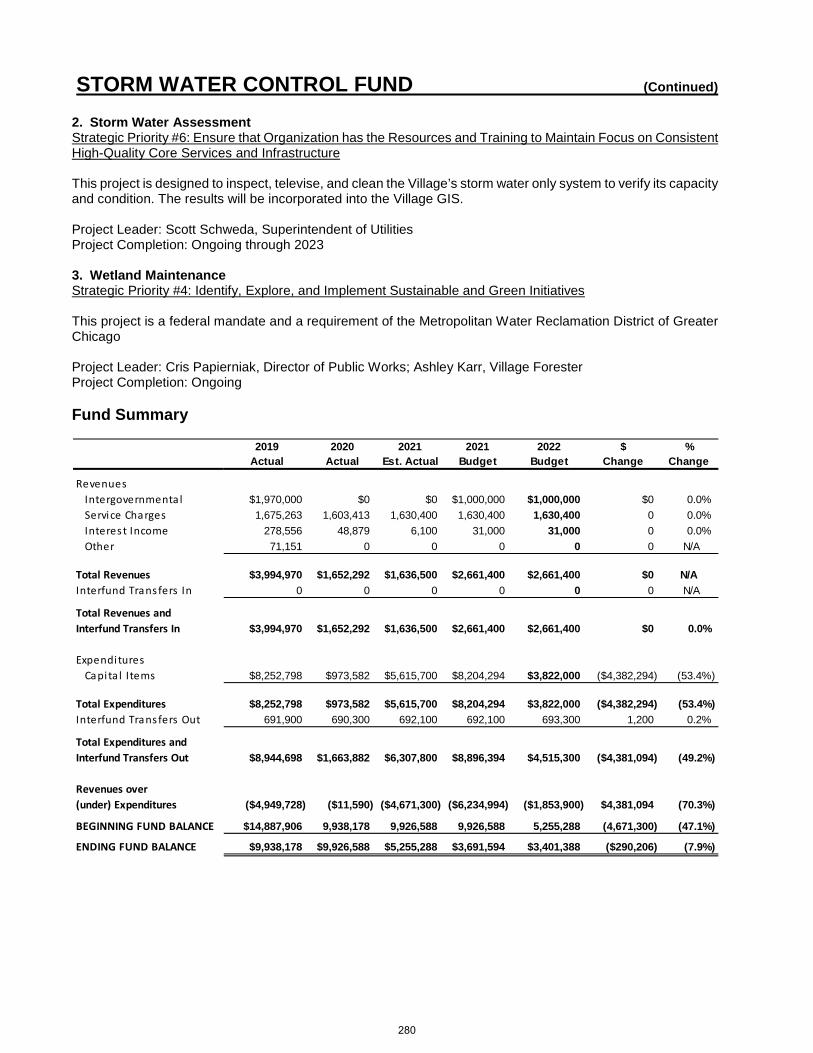
STORM WATER CONTROL FUND (Continued) 2. Storm Water Assessment Strategic Priority #6: Ensure that Organization has the Resources and Training to Maintain Focus on Consistent High-Quality Core Services and Infrastructure This project is designed to inspect, televise, and clean the Village’s storm water only system to verify its capacity and condition. The results will be incorporated into the Village GIS. Project Leader: Scott Schweda, Superintendent of Utilities Project Completion: Ongoing through 2023 3. Wetland Maintenance Strategic Priority #4: Identify, Explore, and Implement Sustainable and Green Initiatives This project is a federal mandate and a requirement of the Metropolitan Water Reclamation District of Greater Chicago Project Leader: Cris Papierniak, Director of Public Works; Ashley Karr, Village Forester Project Completion: Ongoing Fund Summary
2019 2020 2021 2021 2022 $ %Actual Actual Est. Actual Budget Budget Change Change
RevenuesIntergovernmenta l $1,970,000 $0 $0 $1,000,000 $1,000,000 $0 0.0%Service Charges 1,675,263 1,603,413 1,630,400 1,630,400 1,630,400 0 0.0%Interest Income 278,556 48,879 6,100 31,000 31,000 0 0.0%Other 71,151 0 0 0 0 0 N/A
Total Revenues $3,994,970 $1,652,292 $1,636,500 $2,661,400 $2,661,400 $0 N/AInterfund Transfers In 0 0 0 0 0 0 N/A
Total Revenues andInterfund Transfers In $3,994,970 $1,652,292 $1,636,500 $2,661,400 $2,661,400 $0 0.0%
ExpendituresCapita l Items $8,252,798 $973,582 $5,615,700 $8,204,294 $3,822,000 ($4,382,294) (53.4%)
Total Expenditures $8,252,798 $973,582 $5,615,700 $8,204,294 $3,822,000 ($4,382,294) (53.4%)Interfund Transfers Out 691,900 690,300 692,100 692,100 693,300 1,200 0.2%
Total Expenditures andInterfund Transfers Out $8,944,698 $1,663,882 $6,307,800 $8,896,394 $4,515,300 ($4,381,094) (49.2%)
Revenues over(under) Expenditures ($4,949,728) ($11,590) ($4,671,300) ($6,234,994) ($1,853,900) $4,381,094 (70.3%)
BEGINNING FUND BALANCE $14,887,906 9,938,178 9,926,588 9,926,588 5,255,288 (4,671,300) (47.1%)
ENDING FUND BALANCE $9,938,178 $9,926,588 $5,255,288 $3,691,594 $3,401,388 ($290,206) (7.9%)
280

20212019 2020 ESTIMATED 2021 2022 2023 2024 2025 2026
ACCOUNT DESCRIPTION PROJ # ACTUAL ACTUAL ACTUAL BUDGET BUDGET BUDGET BUDGET BUDGET BUDGET
REVENUESSTORMWATER UTILITY FEE 1,675,263 1,603,413 1,630,400 1,630,400 1,630,400 1,630,400 1,630,400 1,630,400 1,630,400GRANT 1,970,000 0 0 1,000,000 1,000,000 0 0 0 0INTEREST INCOME 278,556 48,879 6,100 31,000 31,000 31,000 31,000 31,000 31,000OTHER INCOME 71,151 0 0 0 0 0 0 0 0TOTAL REVENUES 3,994,970 1,652,292 1,636,500 2,661,400 2,661,400 1,661,400 1,661,400 1,661,400 1,661,400
EXPENDITURESSEWERS
Backyard Drainage Improvements SW-11-02 678,386 0 263,000 400,000 400,000 0 300,000 300,000 300,000Storm Sewer Rehab/Replacement Program SW-15-20 164,151 228,135 1,458,600 1,458,618 500,000 500,000 500,000 500,000 500,000Enhanced Overhead Sewer Program SW-18-01 59,503 135,098 250,000 250,000 250,000 135,000 135,000 75,000 75,000Cypress Detention Basin SW-18-02 3,516,773 65,549 109,200 109,168 0 0 0 0 0Area D - Greenbrier/Roanoke/Wilke SW-18-03 49,271 184,894 3,484,900 3,484,942 0 0 0 0 0Area 4 - Campbell/Sigwalt SW-18-04 3,784,714 233,038 0 0 0 0 0 0Area C/NW & C/SE - Burr Oak/Burning Tree/Berkley/Hintz SW-20-01 0 0 50,000 2,285,000 2,672,000 0 0 0 0Area C/SE - Hintz Rd west of Arl Hts Rd SW-20-02 0 126,868 0 216,566 0 0 0 0 0St. Ponding Area - Race Ave & Chicago Ave SW-20-03 0 0 0 0 0 0 800,000 0 0Area F - Forrest Ave Stormwater Improvements SW-21-01 0 0 0 0 0 1,200,000 0 0 0
SUBTOTAL - SEWERS 8,252,798 973,582 5,615,700 8,204,294 3,822,000 1,835,000 1,735,000 875,000 875,000
OTHER EXPENSETransfer to Debt Service 691,900 690,300 692,100 692,100 693,300 693,900 690,200 690,700 695,200
SUBTOTAL - Other Expense 691,900 690,300 692,100 692,100 693,300 693,900 690,200 690,700 695,200
TOTAL EXPENDITURES 8,944,698 1,663,882 6,307,800 8,896,394 4,515,300 2,528,900 2,425,200 1,565,700 1,570,200
BEGINNING FUND BALANCE 14,887,906 9,938,178 9,926,588 9,926,588 5,255,288 3,401,388 2,533,888 1,770,088 1,865,788REVENUES OVER (UNDER) EXPENDITURES (4,949,728) (11,590) (4,671,300) (6,234,994) (1,853,900) (867,500) (763,800) 95,700 91,200ENDING FUND BALANCE 9,938,178 9,926,588 5,255,288 3,691,594 3,401,388 2,533,888 1,770,088 1,865,788 1,956,988
Fund Balance as a Percent of Expenditures 75% 100% 73% 119% 125%
STORM WATER CONTROL FUND (426)5 YEAR CAPITAL IMPROVEMENT PROGRAM (CIP)
281
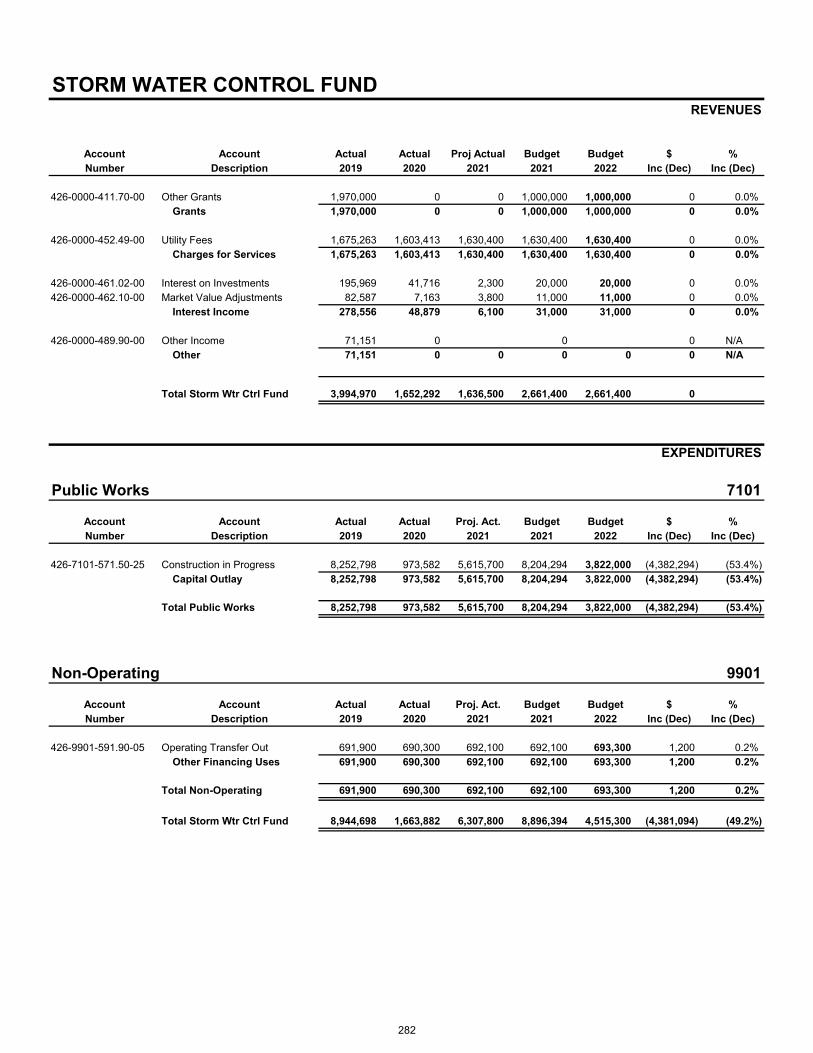
STORM WATER CONTROL FUNDREVENUES
Account Account Actual Actual Proj Actual Budget Budget $ %Number Description 2019 2020 2021 2021 2022 Inc (Dec) Inc (Dec)
426-0000-411.70-00 Other Grants 1,970,000 0 0 1,000,000 1,000,000 0 0.0%Grants 1,970,000 0 0 1,000,000 1,000,000 0 0.0%
426-0000-452.49-00 Utility Fees 1,675,263 1,603,413 1,630,400 1,630,400 1,630,400 0 0.0%Charges for Services 1,675,263 1,603,413 1,630,400 1,630,400 1,630,400 0 0.0%
426-0000-461.02-00 Interest on Investments 195,969 41,716 2,300 20,000 20,000 0 0.0%426-0000-462.10-00 Market Value Adjustments 82,587 7,163 3,800 11,000 11,000 0 0.0%
Interest Income 278,556 48,879 6,100 31,000 31,000 0 0.0%
426-0000-489.90-00 Other Income 71,151 0 0 0 N/AOther 71,151 0 0 0 0 0 N/A
Total Storm Wtr Ctrl Fund 3,994,970 1,652,292 1,636,500 2,661,400 2,661,400 0 0.0%
EXPENDITURES
Public Works 7101
Account Account Actual Actual Proj. Act. Budget Budget $ %Number Description 2019 2020 2021 2021 2022 Inc (Dec) Inc (Dec)
426-7101-571.50-25 Construction in Progress 8,252,798 973,582 5,615,700 8,204,294 3,822,000 (4,382,294) (53.4%)Capital Outlay 8,252,798 973,582 5,615,700 8,204,294 3,822,000 (4,382,294) (53.4%)
Total Public Works 8,252,798 973,582 5,615,700 8,204,294 3,822,000 (4,382,294) (53.4%)
Non-Operating 9901
Account Account Actual Actual Proj. Act. Budget Budget $ %Number Description 2019 2020 2021 2021 2022 Inc (Dec) Inc (Dec)
426-9901-591.90-05 Operating Transfer Out 691,900 690,300 692,100 692,100 693,300 1,200 0.2%Other Financing Uses 691,900 690,300 692,100 692,100 693,300 1,200 0.2%
Total Non-Operating 691,900 690,300 692,100 692,100 693,300 1,200 0.2%
Total Storm Wtr Ctrl Fund 8,944,698 1,663,882 6,307,800 8,896,394 4,515,300 (4,381,094) (49.2%)
282

STORM WATER CONTROL FUNDEXPENDITURE DETAIL
PUBLIC WORKS 7101
AccountNumber Account Title Description
CAPITAL OUTLAY:
426-7101-571.50-25 Construction in Progress Backyard Drainage Imprv (SW1102) 400,000 8,204,294 400,000 3,822,000
Storm Water Rehabilitation/Replacement Program (SW1520) 500,000 500,000
Prior Year Encumbrance Carryover 958,618 0
Enhanced Overhead SewerProgram (SW1801) 250,000 250,000
Cypress Detention Basin / Lift Station (SW1802) 0 0
Prior Year Encumbrance Carryover 109,168 0
Area D - Geenbrier / Roanoke /Wilke (SW1803) 3,191,600 0
Prior Year Encumbrance Carryover 293,342 0
Area C/NW - Burr Oak / Burning Tree(SW2001) 2,285,000 2,672,000
Area C/SE - Hintz Rd / W of ArlingtonHeights Rd (SW2002) 0 0
Prior Year Encumbrance Carryover 216,566 0
TOTAL CAPITAL OUTLAY 8,204,294 3,822,000
TOTAL PUBLIC WORKS 8,204,294 3,822,000
NON-OPERATING 9901
AccountNumber Account Title Description
NON-OPERATING:
426-9901-591.90-05 Operating Transfer Out Transfer to Debt Service Fund 692,100 693,300
TOTAL NON-OPERATING 692,100 693,300TOTAL STORM WTR CTRL FUND 8,896,394 4,515,300
Budget Budget2021 2022
Budget Budget2021 2022
283

THIS PAGE LEFT BLANK
284

Utility Division
Public Works
Administration
WATER & SEWER FUND ORGANIZATION STRUCTURE
Finance Director
Water Billing/ Cashiering
Water Production
Water Distribution Sewer
Water Meter
285

WATER & SEWER FUND 505 Fund at a Glance
The Water & Sewer Utility Operations are conducted within the Utilities Division of the Public Works Department. Responsibilities include the operations of the water distribution, production and storage system, the Village water meters, the sanitary sewage collection system and the storm water collection system. Monies for the operations, maintenance and capital improvements of the water, sanitary, combined and storm sewer systems are generated by the sale of water and sewer use charges, storm water utility fees, and charges made on new construction for capital improvements.
Potable water is delivered from Lake Michigan through the City of Evanston's filtration plant by way of the Northwest Water Commission transmission system. Six deep wells are maintained by the Village for standby emergency purposes only.
The operational units within the Utilities Division are as follows:
Administration and Internal Services Unit – Provides direct and indirect management of all Public Works Maintenance and Utility Divisions. Manage progress, payments, and completion of call capital projects. Creates, procures, and oversees all contractual services. Prepares agenda items and budget necessary for the operation of the division.
Reception and secretarial services maintain department records including service request systems and work management records, prepares analyses and recommendations for purchasing of equipment and supplies, maintains supplies and inventory controls.
Water Production Unit – This unit is responsible for the operation and maintenance of six deep wells, ten storage reservoirs, four booster pumping stations, six sanitary sewer lift stations and five storm water pump stations. An average of 7.4 million gallons of water per day is pumped into the distribution system.
Water Distribution Unit – This unit is responsible for the operation and maintenance of 260 miles of water main ranging in size from four inches to thirty inches in diameter, 3318 VAHPW maintained hydrants and auxiliary valves, 846 privately maintained hydrants and auxiliary valves, 21,300 individual water services and repairing an average of 225 water main breaks or leaks each year. The unit also provides assistance in snow and ice control operations and other emergencies.
Sewer Unit – This unit is responsible for the operation and maintenance of 255 miles of sanitary and combined sewer mains, 213 miles of storm sewer, 56 detention basins, 6,020 catch basins and 8,880 manholes. Sewer flushing and root cutting operations are performed on approximately 325,000 lineal feet of sewers each year and 2,900 catch basins are cleaned annually. This unit also provides assistance in snow and ice control operations and other emergencies.
Water Meter Unit – This unit is responsible for the repair and maintenance of all residential and commercial water meters. This unit also oversees Village-wide contracts for backflow preventer testing and larger commercial meter testing and repair.
Performance Measures 2018 2019 2020
1. Water Distribution(a) Main breaks(b) Service repairs(c) Utility locates
244 556
19,794
261 492
14,158
163 338
15,859
286

WATER & SEWER FUND (Continued)
Performance Measures (cont.) 2018 2019 2020
2. Water Production(a) Off-hour service calls (duty man callouts)(b) Phone systems (buildings / voice mail / cell)(c) Security systems (SCADA / key scan / camera)(d) Water system repairs (valves / pumps / starts)(e) Water samples collected(f) Emergency generators (exercise / clean / repair / maint.)
941 1,138
174 260
1,855 1,193
746 417 202 281
1,874 1,294
765 293 173 248
1724 1320
3. Sewer(a) Root cutting (linear feet)
• Sanitary• Storm
(b) Flushing (linear feet)• Sanitary• Storm
(c) Televising (linear feet)• Sanitary• Storm
(d) Catch basin repair(e) Catch basin cleaning(f) Sewer lining (linear feet)
8”10”12”
179,363 6,523
50,787 2,671
10,855 218 57
277 14,546 9,548 2,246 2,034
249,269 2,629
41,470 890
19,848 260 54
335 14,765 11,096 2,351
683
269,379 804
10,369 620
3,071 2,995
94 239
12,487 7,783 4,704
0
4. Water Billing Activity# of Metered AccountsWater Consumption Billed (1,000 gallons)
Residential Commercial Industrial Apartments
21,112
1,409,317 236,518 302,563 289,940
21,121
1,336,266 219,346 279,650 287,690
21,137
1,491,692 203,179 220,263 292,669
Total Consumption Billed
Water / Sewer Revenues
2,238,338
$17,004,943
2,122,952
$17,274,521
2,207,803
$18,886,650
5. Water Meter ServicesFinal readsMiscellaneous readsCommercial readsResidential readsMeter repairsMeter exchangesHigh bill work ordersLow consumption work ordersAppointments
1,313 3,567
13,907 111,690
480 N/A 664 571 520
1,080 1,229 7,506
119,304 341 131 490 142 820
1,411 1,320 7,524
119,310 1,153
258 1,039
160 655
287

WATER & SEWER FUND (Continued)
Fund Summary
2019 2020 2021 2021 2022 $ %Actual Actual Est. Actual Budget Budget Change Change
RevenuesService Charges $18,454,496 $19,958,979 $21,285,200 $21,953,200 $22,275,200 $322,000 1.5%Interest Income 43,175 4,489 8,200 20,000 20,000 0 0.0%Sales/Reimbursable/Rents 144,533 52,274 102,100 98,000 98,000 0 0.0%Other 1,578,435 1,599,007 402,900 20,000 348,600 328,600 1643.0%
Total Revenues $20,220,639 $21,614,749 $21,798,400 $22,091,200 $22,741,800 $650,600 2.9%Interfund Transfers In 45,882 9,045,232 2,500,000 2,500,000 0 (2,500,000) (100.0%)
Total Revenues andInterfund Transfers In $20,266,521 $30,659,981 $24,298,400 $24,591,200 $22,741,800 ($1,849,400) (7.5%)
ExpendituresPersonal Services $6,574,667 $6,359,705 $6,889,900 $7,082,600 $7,219,600 $137,000 1.9%Contractual Services 6,294,565 6,307,098 6,590,500 6,924,640 6,912,900 (11,740) (0.2%)Commodities 1,007,287 448,326 745,200 748,400 751,100 2,700 0.4%Other Charges 1,716,928 1,715,054 2,136,500 2,136,500 2,191,100 54,600 2.6%Capita l Items 5,957,317 7,360,459 7,818,200 8,498,016 8,849,600 351,584 4.1%
Total Expenditures $21,550,764 $22,190,642 $24,180,300 $25,390,156 $25,924,300 $534,144 2.1%Interfund Transfers Out 0 0 0 0 0 0 N/A
Total Expenditures andInterfund Transfers Out $21,550,764 $22,190,642 $24,180,300 $25,390,156 $25,924,300 $534,144 2.1%
Revenues over(under) Expenditures ($1,284,243) $8,469,339 $118,100 ($798,956) ($3,182,500) ($2,383,544) 298.3%
BEGINNING WORKING CASH 2,559,636 1,275,393 9,744,732 9,744,732 9,862,832 118,100 1.2%
ENDING WORKING CASH $1,275,393 $9,744,732 $9,862,832 $8,945,776 $6,680,332 ($2,265,444) (25.3%)
288
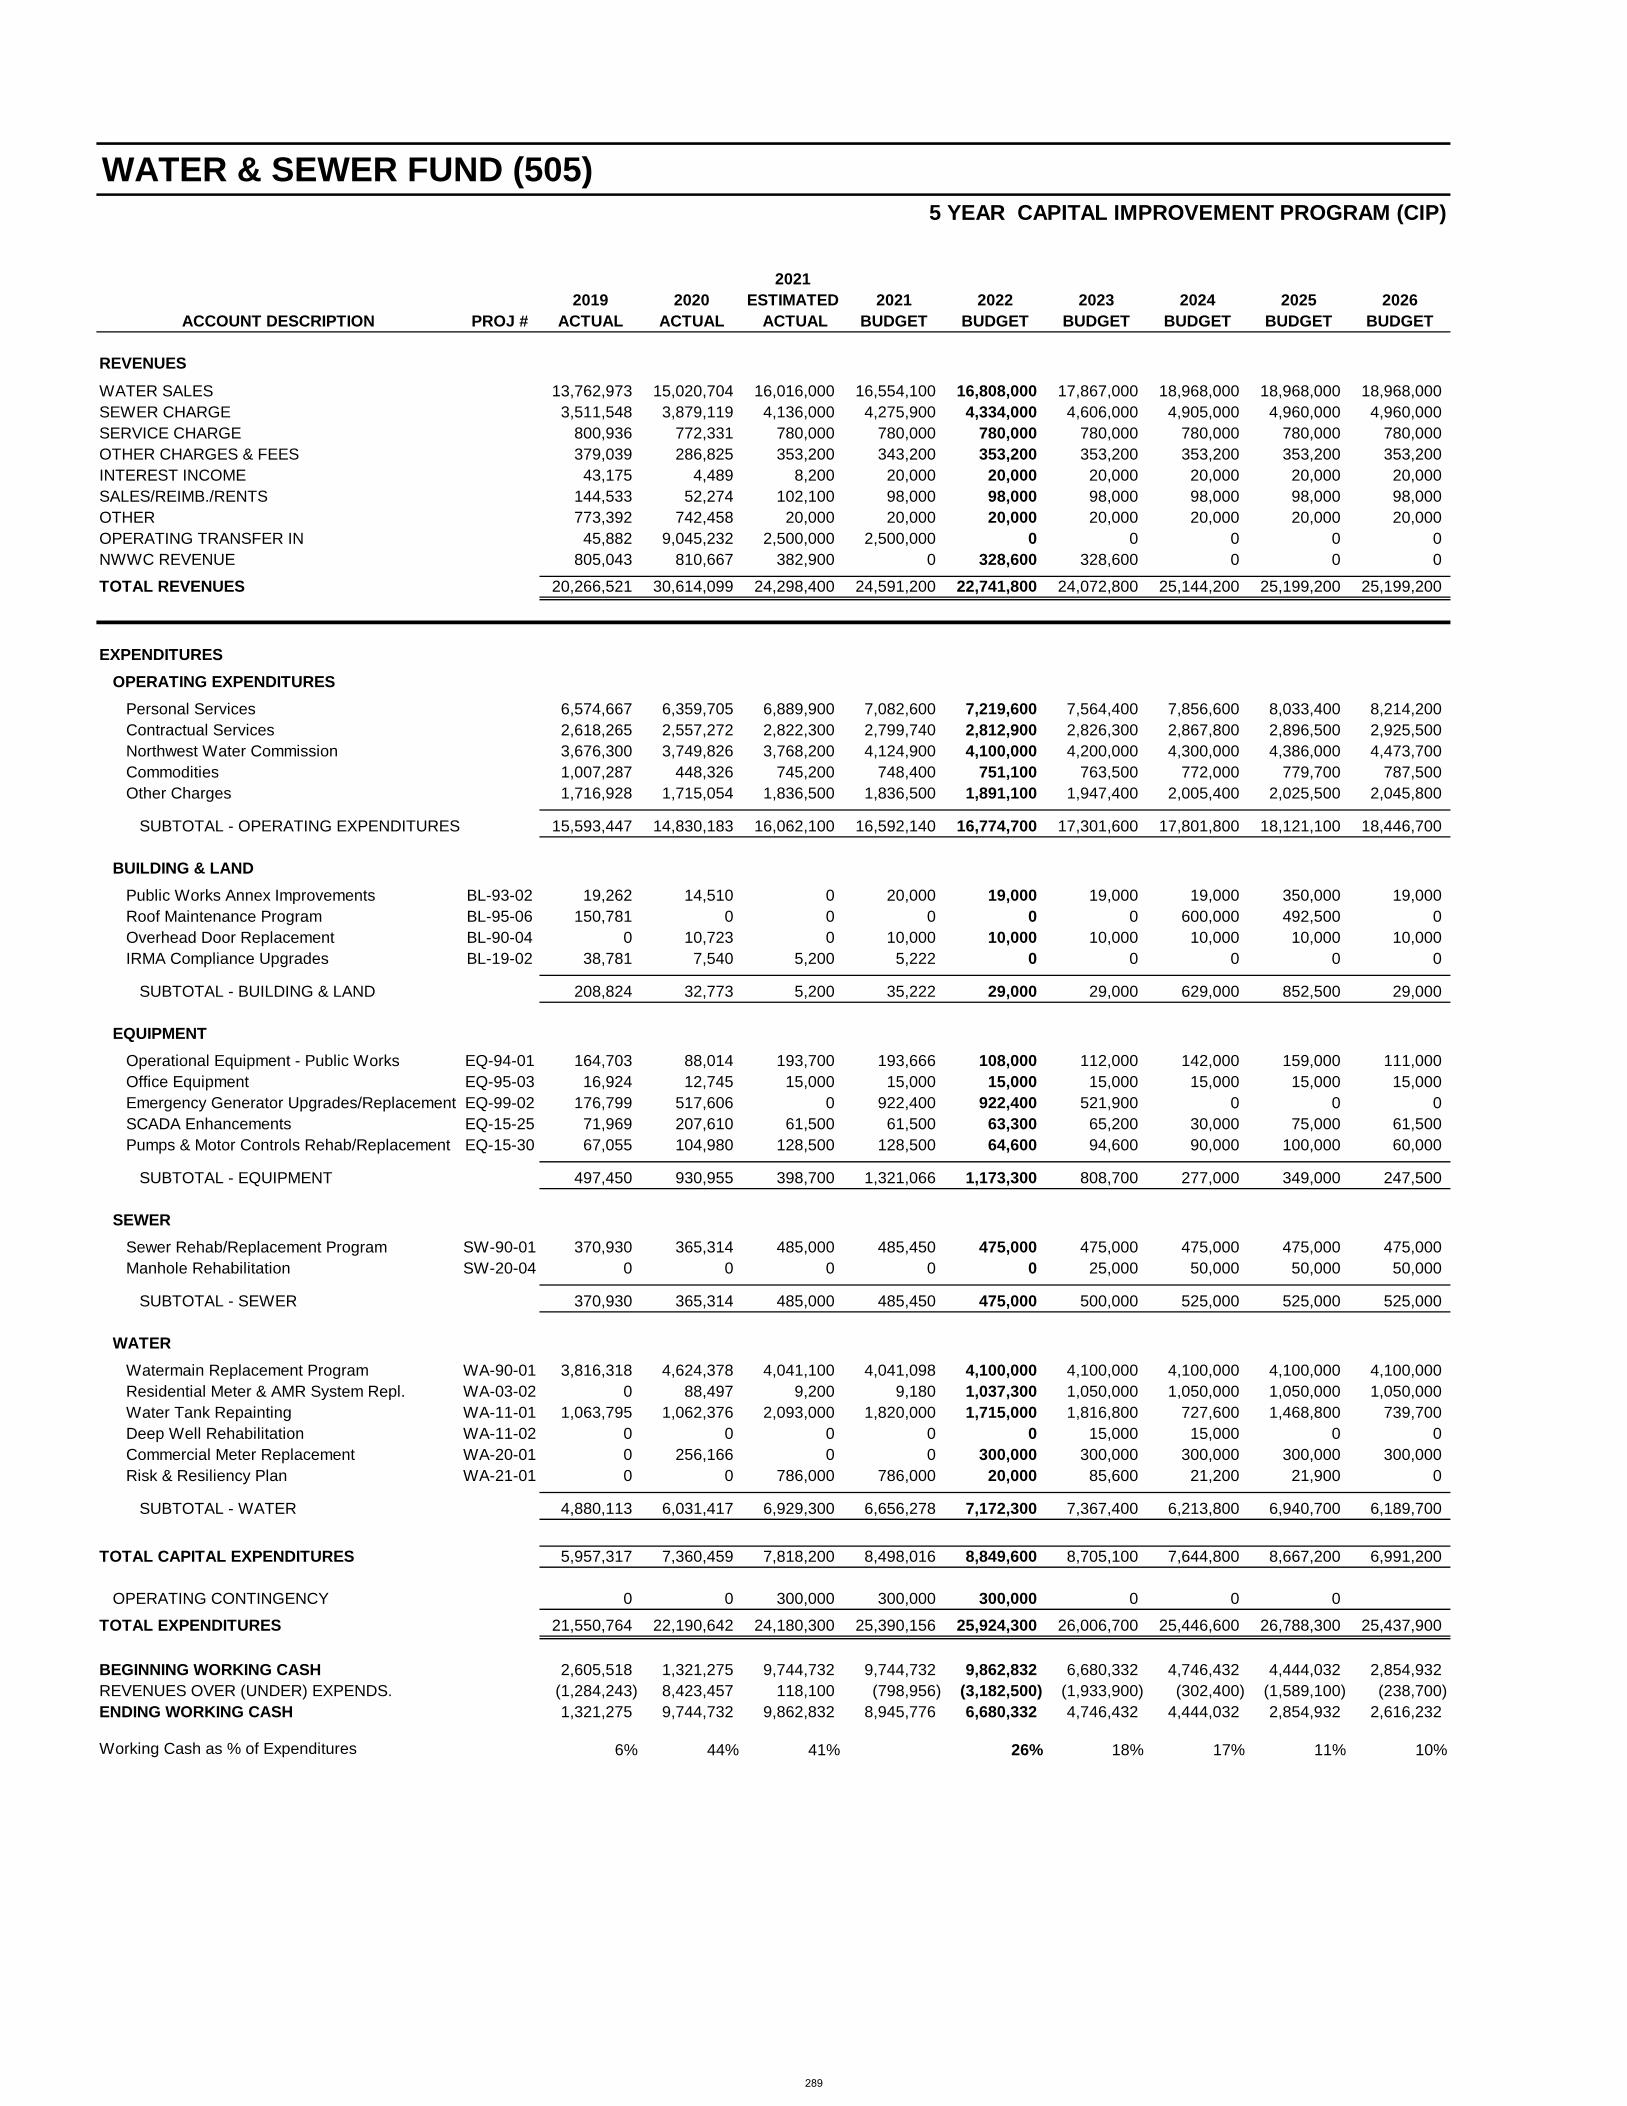
5 YEAR CAPITAL IMPROVEMENT PROGRAM (CIP)
20212019 2020 ESTIMATED 2021 2022 2023 2024 2025 2026
ACCOUNT DESCRIPTION PROJ # ACTUAL ACTUAL ACTUAL BUDGET BUDGET BUDGET BUDGET BUDGET BUDGET
REVENUESWATER SALES 13,762,973 15,020,704 16,016,000 16,554,100 16,808,000 17,867,000 18,968,000 18,968,000 18,968,000SEWER CHARGE 3,511,548 3,879,119 4,136,000 4,275,900 4,334,000 4,606,000 4,905,000 4,960,000 4,960,000SERVICE CHARGE 800,936 772,331 780,000 780,000 780,000 780,000 780,000 780,000 780,000OTHER CHARGES & FEES 379,039 286,825 353,200 343,200 353,200 353,200 353,200 353,200 353,200INTEREST INCOME 43,175 4,489 8,200 20,000 20,000 20,000 20,000 20,000 20,000SALES/REIMB./RENTS 144,533 52,274 102,100 98,000 98,000 98,000 98,000 98,000 98,000OTHER 773,392 742,458 20,000 20,000 20,000 20,000 20,000 20,000 20,000OPERATING TRANSFER IN 45,882 9,045,232 2,500,000 2,500,000 0 0 0 0 0NWWC REVENUE 805,043 810,667 382,900 0 328,600 328,600 0 0 0TOTAL REVENUES 20,266,521 30,614,099 24,298,400 24,591,200 22,741,800 24,072,800 25,144,200 25,199,200 25,199,200
EXPENDITURESOPERATING EXPENDITURES
Personal Services 6,574,667 6,359,705 6,889,900 7,082,600 7,219,600 7,564,400 7,856,600 8,033,400 8,214,200Contractual Services 2,618,265 2,557,272 2,822,300 2,799,740 2,812,900 2,826,300 2,867,800 2,896,500 2,925,500Northwest Water Commission 3,676,300 3,749,826 3,768,200 4,124,900 4,100,000 4,200,000 4,300,000 4,386,000 4,473,700Commodities 1,007,287 448,326 745,200 748,400 751,100 763,500 772,000 779,700 787,500Other Charges 1,716,928 1,715,054 1,836,500 1,836,500 1,891,100 1,947,400 2,005,400 2,025,500 2,045,800
SUBTOTAL - OPERATING EXPENDITURES 15,593,447 14,830,183 16,062,100 16,592,140 16,774,700 17,301,600 17,801,800 18,121,100 18,446,700
BUILDING & LANDPublic Works Annex Improvements BL-93-02 19,262 14,510 0 20,000 19,000 19,000 19,000 350,000 19,000Roof Maintenance Program BL-95-06 150,781 0 0 0 0 0 600,000 492,500 0Overhead Door Replacement BL-90-04 0 10,723 0 10,000 10,000 10,000 10,000 10,000 10,000IRMA Compliance Upgrades BL-19-02 38,781 7,540 5,200 5,222 0 0 0 0 0
SUBTOTAL - BUILDING & LAND 208,824 32,773 5,200 35,222 29,000 29,000 629,000 852,500 29,000
EQUIPMENTOperational Equipment - Public Works EQ-94-01 164,703 88,014 193,700 193,666 108,000 112,000 142,000 159,000 111,000Office Equipment EQ-95-03 16,924 12,745 15,000 15,000 15,000 15,000 15,000 15,000 15,000Emergency Generator Upgrades/Replacement EQ-99-02 176,799 517,606 0 922,400 922,400 521,900 0 0 0SCADA Enhancements EQ-15-25 71,969 207,610 61,500 61,500 63,300 65,200 30,000 75,000 61,500Pumps & Motor Controls Rehab/Replacement EQ-15-30 67,055 104,980 128,500 128,500 64,600 94,600 90,000 100,000 60,000
SUBTOTAL - EQUIPMENT 497,450 930,955 398,700 1,321,066 1,173,300 808,700 277,000 349,000 247,500
SEWERSewer Rehab/Replacement Program SW-90-01 370,930 365,314 485,000 485,450 475,000 475,000 475,000 475,000 475,000Manhole Rehabilitation SW-20-04 0 0 0 0 0 25,000 50,000 50,000 50,000
SUBTOTAL - SEWER 370,930 365,314 485,000 485,450 475,000 500,000 525,000 525,000 525,000
WATERWatermain Replacement Program WA-90-01 3,816,318 4,624,378 4,041,100 4,041,098 4,100,000 4,100,000 4,100,000 4,100,000 4,100,000Residential Meter & AMR System Repl. WA-03-02 0 88,497 9,200 9,180 1,037,300 1,050,000 1,050,000 1,050,000 1,050,000Water Tank Repainting WA-11-01 1,063,795 1,062,376 2,093,000 1,820,000 1,715,000 1,816,800 727,600 1,468,800 739,700Deep Well Rehabilitation WA-11-02 0 0 0 0 0 15,000 15,000 0 0Commercial Meter Replacement WA-20-01 0 256,166 0 0 300,000 300,000 300,000 300,000 300,000Risk & Resiliency Plan WA-21-01 0 0 786,000 786,000 20,000 85,600 21,200 21,900 0
SUBTOTAL - WATER 4,880,113 6,031,417 6,929,300 6,656,278 7,172,300 7,367,400 6,213,800 6,940,700 6,189,700
TOTAL CAPITAL EXPENDITURES 5,957,317 7,360,459 7,818,200 8,498,016 8,849,600 8,705,100 7,644,800 8,667,200 6,991,200
OPERATING CONTINGENCY 0 0 300,000 300,000 300,000 0 0 0TOTAL EXPENDITURES 21,550,764 22,190,642 24,180,300 25,390,156 25,924,300 26,006,700 25,446,600 26,788,300 25,437,900
BEGINNING WORKING CASH 2,605,518 1,321,275 9,744,732 9,744,732 9,862,832 6,680,332 4,746,432 4,444,032 2,854,932REVENUES OVER (UNDER) EXPENDS. (1,284,243) 8,423,457 118,100 (798,956) (3,182,500) (1,933,900) (302,400) (1,589,100) (238,700)ENDING WORKING CASH 1,321,275 9,744,732 9,862,832 8,945,776 6,680,332 4,746,432 4,444,032 2,854,932 2,616,232
Working Cash as % of Expenditures 6% 44% 41% 26% 18% 17% 11% 10%
WATER & SEWER FUND (505)
289
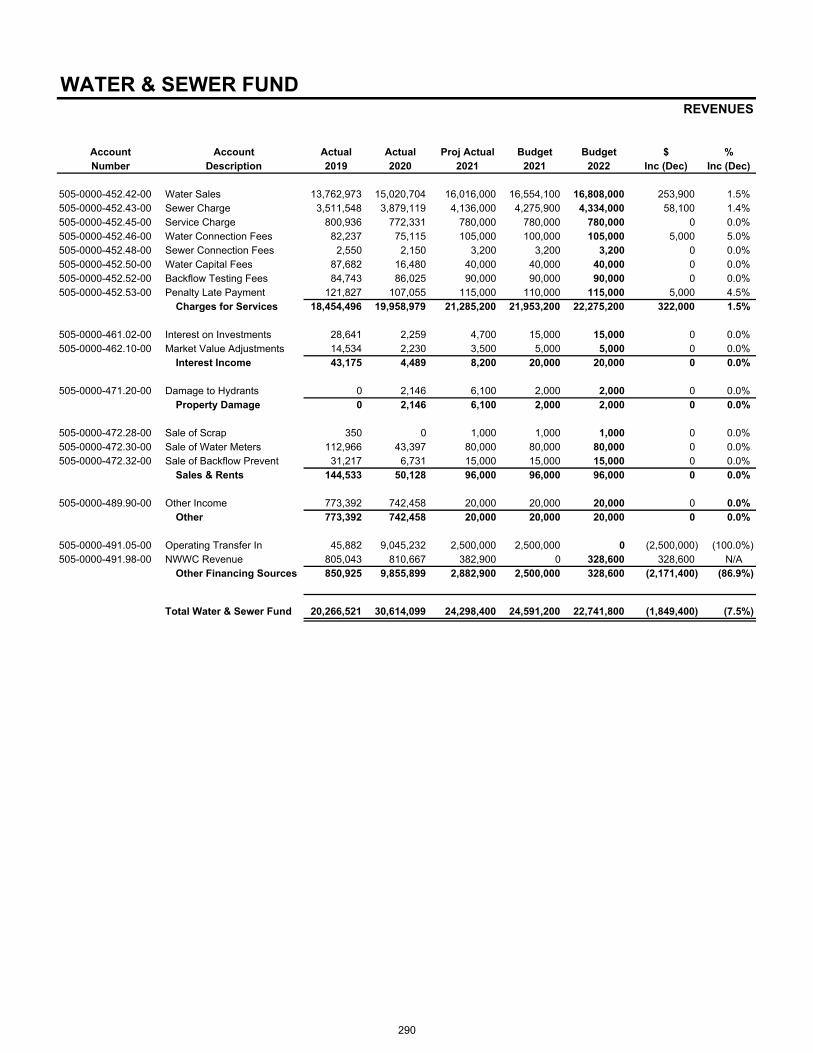
WATER & SEWER FUND REVENUES
Account Account Actual Actual Proj Actual Budget Budget $ %Number Description 2019 2020 2021 2021 2022 Inc (Dec) Inc (Dec)
505-0000-452.42-00 Water Sales 13,762,973 15,020,704 16,016,000 16,554,100 16,808,000 253,900 1.5%505-0000-452.43-00 Sewer Charge 3,511,548 3,879,119 4,136,000 4,275,900 4,334,000 58,100 1.4%505-0000-452.45-00 Service Charge 800,936 772,331 780,000 780,000 780,000 0 0.0%505-0000-452.46-00 Water Connection Fees 82,237 75,115 105,000 100,000 105,000 5,000 5.0%505-0000-452.48-00 Sewer Connection Fees 2,550 2,150 3,200 3,200 3,200 0 0.0%505-0000-452.50-00 Water Capital Fees 87,682 16,480 40,000 40,000 40,000 0 0.0%505-0000-452.52-00 Backflow Testing Fees 84,743 86,025 90,000 90,000 90,000 0 0.0%505-0000-452.53-00 Penalty Late Payment 121,827 107,055 115,000 110,000 115,000 5,000 4.5%
Charges for Services 18,454,496 19,958,979 21,285,200 21,953,200 22,275,200 322,000 1.5%
505-0000-461.02-00 Interest on Investments 28,641 2,259 4,700 15,000 15,000 0 0.0%505-0000-462.10-00 Market Value Adjustments 14,534 2,230 3,500 5,000 5,000 0 0.0%
Interest Income 43,175 4,489 8,200 20,000 20,000 0 0.0%
505-0000-471.20-00 Damage to Hydrants 0 2,146 6,100 2,000 2,000 0 0.0%Property Damage 0 2,146 6,100 2,000 2,000 0 0.0%
505-0000-472.28-00 Sale of Scrap 350 0 1,000 1,000 1,000 0 0.0%505-0000-472.30-00 Sale of Water Meters 112,966 43,397 80,000 80,000 80,000 0 0.0%505-0000-472.32-00 Sale of Backflow Prevent 31,217 6,731 15,000 15,000 15,000 0 0.0%
Sales & Rents 144,533 50,128 96,000 96,000 96,000 0 0.0%
505-0000-489.90-00 Other Income 773,392 742,458 20,000 20,000 20,000 0 0.0%Other 773,392 742,458 20,000 20,000 20,000 0 0.0%
505-0000-491.05-00 Operating Transfer In 45,882 9,045,232 2,500,000 2,500,000 0 (2,500,000) (100.0%)505-0000-491.98-00 NWWC Revenue 805,043 810,667 382,900 0 328,600 328,600 N/A
Other Financing Sources 850,925 9,855,899 2,882,900 2,500,000 328,600 (2,171,400) (86.9%)
Total Water & Sewer Fund 20,266,521 30,614,099 24,298,400 24,591,200 22,741,800 (1,849,400) (7.5%)
290

WATER & SEWER FUND REVENUE - Notes
ANALYSIS OF WATER & SEWER FUND REVENUES
Summary
The Water & Sewer Fund is operated primarily from user fees. In a normal year, approximately 96% of the operating revenue is generated by water sales which also includes a sewer charge and a service charge. Water rates are determined by operating costs, capital improvement costs and debt service costs.
The biggest fluctuation in water sales revenue annually is due to the weather during the summer months when outdoor water consumption is greatest. When drought-like conditions are experienced and rainfall is less than average, water sales can easily increase 10% or $1,000,000 over annual average sales amounts. Only a couple of weeks without rainfall can trigger increased consumption in the form of lawn watering. The addition of new consumers also creates increases in revenue. The Village of Arlington Heights is essentially built-out; vacant, undeveloped land is scarce. Some residences and a few businesses continue to maintain private wells. When large consumers convert or abandon these private wells and connect to the Village’s water system, a consistent increase in revenue can be realized. Redevelopment of single family home sites to multi-family or mixed use (residential and commercial) areas can also increase water sales although not to the extent a large subdivision on previously vacant land can.
As needed, water rate studies are conducted to insure adequate system maintenance and improvements are provided for. Effective January 1, 2022 water rates increased 36¢ per 1,000 gallons and sewer rates increased 9¢ per 1,000 gallons. Reserve balances are also reviewed so that emergency situations can be accommodated and uninterrupted service can be provided to the residents of Arlington Heights.
452.42 Water Sales
Fresh potable water is delivered from Lake Michigan and sold to customers at a rate of $7.64/1,000 gallons for 2022. Residential and commercial water meters located on the customer’s property are read electronically
Water Sales73.9%
Sewer Charge19.1%
Service Charge3.4%
Other3.6%
291

WATER & SEWER FUND REVENUE - Notes (Continued)
by radio frequency and billed on a bi-monthly basis. There is no minimum charge for water consumption. Only water consumed is billed to the customer.
GALLONS SOLD
452.43 Sewer Charge
Waste water is conveyed through underground conduits to the Metropolitan Water Reclamation District of Greater Chicago (MWRDGC) for treatment. The MWRDGC is funded by real estate taxes and is a separate governmental agency. The underground piping or conveyance system is constructed and maintained by the Village of Arlington Heights for its customers. The 2022 sewer charge is $1.97/1,000 gallons of fresh water consumed during a billing cycle.
452.45 Service Charge
A service charge is included on each bill based on the size of the water service to the property. Generally, the average homeowner’s service size is 5/8" or 3/4" and therefore is charged $5.20. This service charge helps defray the cost of providing water service regardless of consumption levels.
FiscalYear
WaterSales
SewerCharge
ServiceCharge Total
$ Inc(Dec)
% Inc(Dec)
8-Mo.Dec. 2015 Actual 7,523,396 1,917,699 515,201 9,956,296 (3,700,738) (27.10%)2016 Actual 12,728,223 3,289,570 775,687 16,793,480 6,837,184 68.67%2017 Actual 13,146,982 3,413,202 782,204 17,342,388 548,908 3.27%2018 Actual 13,489,654 3,515,289 784,433 17,789,376 446,988 2.58%2019 Actual 13,762,973 3,511,548 800,936 18,075,457 286,081 1.61%2020 Actual 15,020,704 3,879,119 772,331 19,672,154 1,596,697 8.83%2021 Proj. Actual 16,016,000 4,136,000 780,000 20,932,000 1,259,846 6.40%2022 Budget 16,808,000 4,334,000 780,000 21,922,000 990,000 4.73%
2,000,000,000
2,100,000,000
2,200,000,000
2,300,000,000
2,400,000,000
2,500,000,000
292

WATER & SEWER FUND REVENUE - Notes (Continued)
452.46 – 452.48 Water & Sewer Connection Fees
Per Village ordinance any new service that is added to the Village-wide water and sewer system is required to contribute to the existing system as well as bear the cost of physically connecting to that system. Fees vary depending on the number and size of the connections.
452.52 Backflow Testing Fees
Backflow devices prevent private water sources from entering and contaminating the Village’s water system. The cost to maintain these devices is born solely by the customer as this is not a system-wide requirement. Backflow devices are tested by Village staff to insure system integrity.
452.53 Penalty Late Payment
Bills for service are issued bi-monthly reflecting approximately 60 days of water consumption activity. Customers are given 20 days after the bill date to satisfy their account. When a bill becomes past due a 10% late charge is added to the account. If an account remains unpaid, service is suspended.
461.02 Interest on Investments
The Village participates in a number of investment pools and owns a number of Certificates of Deposit to safeguard funds for reserve and daily operations. All funds not immediately needed for operations are invested on a “prudent man” concept.
472.30 Sale of Water Meters
All water meters are the property of the Village. The initial purchase of a new meter is charged to the property owner but then it is the Village’s responsibility to maintain or replace the meter. New meters are ordered by the Village for installation on private property to insure all metering devices are compatible with the Village’s water system.
472.32 Sale of Backflow Preventers
Similar to new water meters described above, when required, backflow preventers are ordered by the Village and sold to the customer upon any new or initial installation. Backflow preventers stop water from other sources, mainly underground wells, from entering the Village’s water system. This is to prevent any contamination of the Village’s water system from private wells or other sources.
293

FINANCE Water & Sewer Fund
Class
Code Title Grade 2021 2022 + (-)
Customer Service Supervisor 4 1.00 1.00
Administrative Assistant 2 0.50 0.50
Financial Assistant 2 2.00 2.00
Water Billing Clerk 2 2.00 2.00
Customer Support Assistant 2 1.00 1.00
Account Clerk 1 0.50 0.50
Total F-T-E 7.00 7.00 0.00
Code Fund 2021 2022 + (-)
101 General Fund 9.50 9.50
505 Water & Sewer Fund 7.00 7.00
Total F-T-E All Funds 16.50 16.50 0.00
PERSONNEL SUMMARY
Authorized Positions in F-T-E
Finance DepartmentCross Reference to All Funds
Authorized Positions in F-T-E
294

WATER UTILITY Water & Sewer Fund
Class
Code Title Grade 2021 2022 + (-)
Supt. of Utilities 9 1.00 1.00
Water Production Foreman II 8 1.00 1.00
Public Works Services Coordinator 7 1.00 1.00
Foreman II 7 1.00 1.00
Foreman I 6 1.00 1.00
Crew Chief 6 3.00 3.00
Water Services Supervisor 6 1.00 1.00
Electronics Technician 5 1.00 1.00
Pump Operator 4 5.00 5.00
Maintenance Worker II 4 12.00 12.00
Administrative Support Coordinator 4 1.00 1.00
Electrician I 3 1.00 1.00
Utility Technician 3 1.00 1.00
Maintenance Worker I 2 6.00 6.00
Water Meter Technician 2 2.00 2.00
Administrative Assistant 2 2.00 2.00
Water Meter Reader 1 0.50 0.50
Account Clerk 1 0.25 0.25
Total F-T-E 40.75 40.75 0.00
Code Fund 2021 2022 + (-)
101 General Fund 51.25 51.25
505 Water & Sewer Fund 40.75 40.75
621 Fleet Operations Fund 10.50 10.50
Total F-T-E All Funds 102.50 102.50 0.00
PERSONNEL SUMMARY
Authorized Positions in F-T-E
Public Works DepartmentCross Reference to All Funds
Authorized Positions in F-T-E
295

WATER & SEWER FUNDEXPENDITURES
Finance 0501
Account Account Actual Actual Proj. Act. Budget Budget $ %Number Description 2019 2020 2021 2021 2022 Inc (Dec) Inc (Dec)
505-0501-503.10-01 Salaries 552,787 556,068 549,900 585,400 578,200 (7,200) (1.2%)505-0501-503.18-01 Temporary Help 5,115 0 1,100 1,100 1,100 0 0.0%505-0501-503.18-05 Overtime Civilian 0 0 500 500 500 0 0.0%
Salaries 557,902 556,068 551,500 587,000 579,800 (7,200) (1.2%)
505-0501-503.19-01 Workers Compensation 1,200 1,200 1,300 1,300 1,400 100 7.7%505-0501-503.19-05 Medical Insurance 151,600 128,500 157,200 157,200 168,600 11,400 7.3%505-0501-503.19-10 IMRF 55,539 70,279 69,100 73,500 66,400 (7,100) (9.7%)505-0501-503.19-11 Social Security 32,624 32,545 34,200 36,400 35,900 (500) (1.4%)505-0501-503.19-12 Medicare 7,630 7,611 8,000 8,500 8,400 (100) (1.2%)
Fringe Benefits 248,592 240,135 269,800 276,900 280,700 3,800 1.4%
505-0501-503.20-05 Professional Services 13,875 13,175 14,000 15,500 14,000 (1,500) (9.7%)505-0501-503.21-65 Other Services 129,921 143,802 120,000 91,900 130,000 38,100 41.5%505-0501-503.22-03 Training 0 0 0 1,000 1,000 0 0.0%505-0501-503.22-05 Postage 66,723 81,745 72,700 72,700 73,400 700 1.0%505-0501-503.22-10 Printing 14,395 7,661 10,000 13,600 10,000 (3,600) (26.5%)505-0501-503.22-25 IT/GIS Service Charge 54,900 57,000 57,600 57,600 67,200 9,600 16.7%
Contractual Services 279,814 303,383 274,300 252,300 295,600 43,300 17.2%
505-0501-503.30-05 Office Supplies & Equip 475 12 100 1,200 500 (700) (58.3%)Commodities 475 12 100 1,200 500 (700) (58.3%)
Total Finance 1,086,784 1,099,598 1,095,700 1,117,400 1,156,600 39,200 3.5%
Water Utility Operations 7201
Account Account Actual Actual Proj. Act. Budget Budget $ %Number Description 2019 2020 2021 2021 2022 Inc (Dec) Inc (Dec)
505-7201-561.10-01 Salaries 3,588,710 3,620,245 3,663,400 3,788,400 3,880,500 92,100 2.4%505-7201-561.18-01 Temporary Help 31,430 26,113 32,300 32,300 33,000 700 2.2%505-7201-561.18-05 Overtime Civilian 441,746 300,196 441,000 441,000 450,900 9,900 2.2%
Salaries 4,061,886 3,946,554 4,136,700 4,261,700 4,364,400 102,700 2.4%
505-7201-561.19-01 Workers Compensation 258,100 263,300 276,500 276,500 307,000 30,500 11.0%505-7201-561.19-05 Medical Insurance 713,900 851,200 824,600 824,600 857,000 32,400 3.9%505-7201-561.19-10 IMRF 422,142 162,014 514,800 530,400 496,800 (33,600) (6.3%)505-7201-561.19-11 Social Security 252,649 241,683 256,000 263,700 270,600 6,900 2.6%505-7201-561.19-12 Medicare 59,495 56,563 60,000 61,800 63,300 1,500 2.4%505-7201-561.19-15 Compensated Absences 0 42,188 0 0 0 0 N/A
Fringe Benefits 1,706,286 1,616,948 1,931,900 1,957,000 1,994,700 37,700 1.9%
505-7201-561.20-05 Professional Services 60,942 77,709 275,400 275,440 66,500 (208,940) (75.9%)505-7201-561.20-40 General Insurance 63,800 64,400 65,000 65,000 45,900 (19,100) (29.4%)505-7201-561.21-02 Equipment Maintenance 49,101 50,203 52,800 52,800 52,800 0 0.0%505-7201-561.21-11 Building Maintenance 5,714 8,899 10,000 10,000 10,000 0 0.0%505-7201-561.21-20 Pumping Station Maint 19,318 3,500 20,000 20,000 20,000 0 0.0%505-7201-561.21-25 Sewer Collection System 27,849 13,168 12,500 12,500 37,500 25,000 200.0%505-7201-561.21-30 Water Distribution System 378,377 382,132 382,800 382,800 524,800 142,000 37.1%505-7201-561.21-35 Meter Installation 242,360 300,482 300,500 300,500 300,500 0 0.0%505-7201-561.21-36 Equipment Rental 177,609 148,503 206,000 206,000 190,000 (16,000) (7.8%)505-7201-561.21-50 Utility Services 431,707 389,946 296,000 296,000 296,000 0 0.0%505-7201-561.21-53 Northwest Water Com 3,676,300 3,749,826 3,768,200 4,124,900 4,100,000 (24,900) (0.6%)505-7201-561.21-62 Disposal Services 39,798 31,628 52,400 52,400 48,000 (4,400) (8.4%)
296

WATER & SEWER FUNDEXPENDITURES
Water Utility Operations (continued) 7201
Account Account Actual Actual Proj. Act. Budget Budget $ %Number Description 2019 2020 2021 2021 2022 Inc (Dec) Inc (Dec)
Contractual Services (continued)
505-7201-561.21-65 Other Services 53,897 54,661 66,700 66,700 66,700 0 0.0%505-7201-561.22-02 Dues 3,875 5,127 5,000 5,000 5,000 0 0.0%505-7201-561.22-03 Training 15,568 2,302 20,900 20,300 20,900 600 3.0%505-7201-561.22-05 Postage 5,040 688 1,500 1,500 1,500 0 0.0%505-7201-561.22-10 Printing 4,360 0 6,500 6,500 6,000 (500) (7.7%)505-7201-561.22-20 Annual Consumer Report 0 1,921 3,000 3,000 3,000 0 0.0%505-7201-561.22-25 IT/GIS Service Charge 172,300 175,600 178,000 178,000 192,600 14,600 8.2%505-7201-561.22-30 Claims & Refunds 0 0 10,000 10,000 10,000 0 0.0%505-7201-561.22-37 Vehicle/Equip Lease Chrg 525,600 480,900 530,900 530,900 567,500 36,600 6.9%505-7201-561.22-70 Telephone Services 61,236 62,120 52,100 52,100 52,100 0 0.0%
Contractual Services 6,014,751 6,003,715 6,316,200 6,672,340 6,617,300 173,000 (0.8%)
505-7201-561.30-01 Publications Periodicals 554 102 500 500 500 0 0.0%505-7201-561.30-05 Office Supplies & Equip 4,760 1,931 5,200 5,200 5,200 0 0.0%505-7201-561.30-30 Data System Supplies 3,223 0 7,200 7,200 7,200 0 0.0%505-7201-561.30-35 Clothing 25,865 20,718 24,700 24,700 24,700 0 0.0%505-7201-561.30-50 Petroleum Products 68,929 51,295 66,800 66,800 72,300 5,500 8.2%505-7201-561.31-01 Water Distribution Sup 337,658 48,244 166,000 166,000 166,000 0 0.0%505-7201-561.31-02 Meters Backflow Devices 247,187 66,738 152,000 152,000 152,000 0 0.0%505-7201-561.31-05 Pumping and Storage Sup 12,905 14,218 25,000 25,000 25,000 0 0.0%505-7201-561.31-07 Sewer Collection Supplies 26,993 24,359 30,000 31,000 30,000 (1,000) (3.2%)505-7201-561.31-40 Agricultural Supplies 2,720 2,025 10,000 13,300 10,000 (3,300) (24.8%)505-7201-561.31-55 Building Supplies 15,666 13,749 13,500 13,500 13,500 0 0.0%505-7201-561.31-60 Chemicals 14,015 14,574 12,200 10,000 12,200 2,200 22.0%505-7201-561.31-65 Other Equip & Supplies 69,490 78,454 91,500 78,500 91,500 13,000 16.6%505-7201-561.31-85 Small Tools and Equipment 18,219 18,802 15,500 15,500 15,500 0 0.0%505-7201-561.31-90 Street and Sidewalk Sup 146,217 80,551 125,000 125,000 125,000 0 0.0%505-7201-561.33-05 Other Supplies 12,411 12,554 0 13,000 0 (13,000) (100.0%)
Commodities 1,006,812 448,314 745,100 747,200 750,600 3,400 0.5%
505-7201-561.40-75 Administrative Serv Charge 1,716,900 1,768,400 1,821,500 1,821,500 1,876,100 54,600 3.0%505-7201-561.40-77 Bad Debt Expense 28 56 0 0 0 0 N/A505-7201-561.42-79 OPEB Liability Expense 0 (53,402) 15,000 15,000 15,000 0 0.0%
Other Charges 1,716,928 1,715,054 1,836,500 1,836,500 1,891,100 54,600 3.0%
505-7201-561.50-10 Office Equipment 16,924 12,745 15,000 15,000 15,000 0 0.0%505-7201-561.50-15 Other Equipment 480,526 918,210 388,900 1,311,288 1,158,300 (152,988) (11.7%)505-7201-561.50-20 Building Improvements 208,824 32,773 0 30,000 29,000 (1,000) (3.3%)
Capital Outlay 706,274 963,728 403,900 1,356,288 1,202,300 (153,988) (11.4%)
Total Water Utility Operations 15,212,937 14,694,313 15,370,300 16,831,028 16,820,400 103,392 (0.1%)
Capital Projects 9001
Account Account Actual Actual Proj. Act. Budget Budget $ %Number Description 2019 2020 2021 2021 2022 Inc (Dec) Inc (Dec)
505-9001-571.50-25 Construction in Progress 5,251,043 6,396,731 7,414,300 7,141,728 7,647,300 505,572 7.1%Capital Outlay 5,251,043 6,396,731 7,414,300 7,141,728 7,647,300 505,572 7.1%
Total Capital Projects 5,251,043 6,396,731 7,414,300 7,141,728 7,647,300 505,572 7.1%
297

WATER & SEWER FUNDEXPENDITURES
Non-Operating 9901
Account Account Actual Actual Proj. Act. Budget Budget $ %Number Description 2019 2020 2021 2021 2022 Inc (Dec) Inc (Dec)
505-9901-591.40-96 Operating Contingency 0 0 300,000 300,000 300,000 0 0.0%Other Financing Uses 0 0 300,000 300,000 300,000 0 0.0%
Total Non-Operating 0 0 300,000 300,000 300,000 0 0.0%
Total Water & Sewer Fund 21,550,764 22,190,642 24,180,300 25,390,156 25,924,300 648,164 2.1%
298

WATER & SEWER FUND EXPENDITURE DETAIL
FINANCE 0501
AccountNumber Account Title Description
SALARIES:
505-0501-503.10-01 Salaries Salaries 585,400 578,200
505-0501-503.18-01 Temporary Help Temporary Help 1,100 1,100
505-0501-503.18-05 Overtime Civilian Overtime Civilian 500 500
TOTAL SALARIES 587,000 579,800
FRINGE BENEFITS:
505-0501-503.19-01 Workers' Compensation Workers' Compensation Insurance 1,300 1,400
505-0501-503.19-05 Medical Insurance Medical Insurance 157,200 168,600
505-0501-503.19-10 IMRF IMRF 73,500 66,400
505-0501-503.19-11 Social Security Social Security 36,400 35,900
505-0501-503.19-12 Medicare Medicare 8,500 8,400
TOTAL FRINGE BENEFITS 276,900 280,700
CONTRACTUAL SERVICES:
505-0501-503.20-05 Professional Services Annual audit (30% share) 13,300 12,000Annual actuarial valuation of post
employment benefits (30% share) 2,200 15,500 2,000 14,000
505-0501-503.21-65 Other Services Outsourcing of water billing services 12,600 13,800Bank fees for credit card payment program 66,600 102,300Bank service charges, lien filing and
processing 12,700 91,900 13,900 130,000
505-0501-503.22-03 Training GFOA programs 1,000 1,000
505-0501-503.22-05 Postage Mailing of water bills and notices 72,700 73,400
505-0501-503.22-10 Printing Water bills, envelopes and shut off notices 13,600 10,000
505-0501-503.22-25 IT/GIS Service Charge Information Technology/GIS service charge 57,600 67,200
TOTAL CONTRACTUAL SERVICES 252,300 295,600
COMMODITIES:
505-0501-503.30-05 Office Supplies & Equip Miscellaneous supplies & equipment 1,200 500
TOTAL COMMODITIES 1,200 500
TOTAL FINANCE 1,117,400 1,156,600
Budget2022
Budget2021
299

WATER & SEWER FUND EXPENDITURE DETAIL
WATER UTILITY OPERATIONS 7201
AccountNumber Account Title Description
SALARIES:
505-7201-561.10-01 Salaries Salaries 3,788,400 3,880,500
505-7201-561.18-01 Temporary Help Temporary Help 32,300 33,000
505-7201-561.18-05 Overtime Civilian Overtime Civilian 441,000 450,900
TOTAL SALARIES 4,261,700 4,364,400
FRINGE BENEFITS:
505-7201-561.19-01 Workers' Compensation Workers' Compensation Insurance 276,500 307,000
505-7201-561.19-05 Medical Insurance Medical Insurance 824,600 857,000
505-7201-561.19-10 IMRF IMRF 530,400 496,800
505-7201-561.19-11 Social Security Social Security 263,700 270,600
505-7201-561.19-12 Medicare Medicare 61,800 63,300
TOTAL FRINGE BENEFITS 1,957,000 1,994,700
CONTRACTUAL SERVICES:
505-7201-561.20-05 Professional Services Samples - Environmental ProtectionAgency & others, incl. lead sampling 28,100 34,800
Consulting engineer studies 31,700 31,700Leak Detection Surveys 125,000 0Prior Year Encumbrance Carryover 90,640 275,440 0 66,500
505-7201-561.20-40 General Insurance Liability and property insurance 65,000 45,900
505-7201-561.21-02 Equipment Maintenance Maintenance of water & sewer controland information system, cathodic
protection, chemical feed equipment, office equipment,
tracers and detectors 30,900 30,900Emergency generator maintenance 11,000 11,000AMR support 10,900 52,800 10,900 52,800
505-7201-561.21-11 Building Maintenance Miscellaneous building repairs 10,000 10,000
505-7201-561.21-20 Pumping Station Maint Miscellaneous pump repairs 20,000 20,000
505-7201-561.21-25 Sewer Collection Systems Emergency repairs 12,500 12,500Root foaming 0 12,500 25,000 37,500
505-7201-561.21-30 Water Distribution System Contract landscape repairs formain break damage 12,500 12,500
Contract roadway repairs formain break damage 355,300 355,300
Emergency repairs 15,000 15,000Leak detection survey 0 35,000Hydrant painting 0 67,000Valve excercising 0 382,800 40,000 524,800
Budget2022
Budget2021
300

WATER & SEWER FUND EXPENDITURE DETAIL
WATER UTILITY OPERATIONS (cont.) 7201
AccountNumber Account Title Description
505-7201-561.21-35 Meter Installation Installation of replacement meters, testing and repair of larger meters 174,300 174,300
Installation, replacement, and testing ofbackflow devices 126,200 300,500 126,200 300,500
505-7201-561.21-36 Equipment Rental Misc. rental of tapping equipment,tools, etc. 4,300 4,000
Debris and spoil hauling 151,700 145,000Heavy equipment rental 50,000 206,000 41,000 190,000
505-7201-561.21-50 Utility Services Electrical energy for pumping water,operating lift stations & misc. uses;
natural gas for standby power (minimum charges) 296,000 296,000
505-7201-561.21-53 Northwest Water Comm Contribution per Commission agreement 4,124,900 4,100,000
505-7201-561.21-62 Disposal Services Disposal and landfill 52,400 48,000
505-7201-561.21-65 Other Services JULIE charge 13,400 13,400State of Illinois NPDES permit fees (State
mandate) 21,400 21,400SDS database 500 500Work Management Software 25,500 25,500Service Request Software 5,900 66,700 5,900 66,700
505-7201-561.22-02 Dues Dues 5,000 5,000
505-7201-561.22-03 Training Production UnitIllinois Section AWWA Annual Meeting 1,800 1,800Continuing education for licensed
water operators 1,000 1,000
Sewer UnitGIS Training 2,000 2,000APWA Training 2,400 2,400NASSCO Certification 2,000 2,000Professional licensing 0 600
Meters UnitIllinois AWWA Training/Backflow Courses 400 400
Distribution UnitAWWA Training 2,200 2,200
AdministrationIllinois Public Service Institute 1,100 1,100Illinois Section AWWA Annual Meeting 3,000 3,000AWWA Annual conference 2,400 2,400APWA Conference 2,000 20,300 2,000 20,900
505-7201-561.22-05 Postage Misc. postage and freight charges 1,500 1,500
505-7201-561.22-10 Printing Misc. notices, door hangers, envelopes,work management sheets 6,500 6,000
505-7201-561.22-20 Annual Consumer Report Publication of "Consumer ConfidenceReport" (Federal mandate) 3,000 3,000
2022BudgetBudget
2021
301

WATER & SEWER FUND EXPENDITURE DETAIL
WATER UTILITY OPERATIONS (cont.) 7201
AccountNumber Account Title Description
505-7201-561.22-25 IT/GIS Service Charge IT/GIS service charge 178,000 192,600
505-7201-561.22-30 Claims and Refunds Overpayment refunds, damage claims,reimbursement for maintenance due to
system malfunctions 10,000 10,000
505-7201-561.22-37 Vehicle/Equip Lease Chrg Vehicle lease charge 530,900 567,500
505-7201-561.22-70 Telephone Services Leased lines for monitoring utilitysystem; cell phone charges 41,000 42,700
Smart Cover System 1,000 1,000Sewer Televising Data 400 400TopCon GIS Data 1,700 0GPS-AVL data 8,000 52,100 8,000 52,100
TOTAL CONTRACTUAL SERVICES 6,672,340 6,617,300
COMMODITIES:
505-7201-561.30-01 Publications/Periodicals Miscellaneous publications 500 500
505-7201-561.30-05 Office Supplies & Equip. General office supplies 5,200 5,200
505-7201-561.30-30 Data Systems Supplies Charts, paper, mag tapes 700 700Control boards 300 300Security Systems 5,000 5,000Miscellaneous electronic supplies 1,200 7,200 1,200 7,200
505-7201-561.30-35 Clothing Uniform rental and cleaning 3,700 3,700Miscellaneous clothing 10,400 10,400Personal Protective Equipment 10,600 24,700 10,600 24,700
505-7201-561.30-50 Petroleum Products Fuel for vehicles and equipment 66,800 72,300
505-7201-561.31-01 Water Distrib Supplies Clamps and cut-in-sleeves 138,500 138,500Service supplies 15,000 15,000Damage repair (reimbursable) 3,500 3,500New water tap & water service (resale) 9,000 166,000 9,000 166,000
505-7201-561.31-02 Meters/Backflow Devices Meter repair parts 40,000 40,000Backflow prevention 25,000 25,000Meters (exchange/replace) 56,000 56,000Water meters (resale) 25,000 25,000Backflow (resale) 6,000 152,000 6,000 152,000
505-7201-561.31-05 Pumping/Storage Supplies Replacement materials for pipes,pumps, pump parts, etc. 25,000 25,000
505-7201-561.31-07 Sewer Collection Supplies Sewer pipe, manholes, catch basins 5,500 5,000Sand, brick, cement, rings 6,000 6,000Sanitary Sewer Patches 7,500 7,000Sewer clamps and covers 6,000 6,000Frames and grates 6,000 31,000 6,000 30,000
Budget2022
Budget2021
302

WATER & SEWER FUND EXPENDITURE DETAIL
WATER UTILITY OPERATIONS (cont.) 7201
AccountNumber Account Title Description
505-7201-561.31-40 Agricultural Supplies Materials for repairing parkways due tomain breaks and sewer blockages and
for maintaining well sites:Black dirt 8,200 6,000Sod, seed and plants 4,100 3,000Fertilizers and chemicals 1,000 13,300 1,000 10,000
505-7201-561.31-55 Building Supplies Electrical, plumbing & hardwaresupplies, lumber & paint for
maintenance & building repairs 13,500 13,500
505-7201-561.31-60 Chemicals Chlorine gas 3,900 4,000Test kits, buffer solution & misc supplies 3,900 6,000Grease emulsifier 2,200 10,000 2,200 12,200
505-7201-561.31-65 Other Equip. & Supplies Telemetry cabinet modifications 5,000 5,000Pump controller/sequencer modifications 2,000 2,000Electrical control parts, breakers 5,000 5,000Engine/generator supplies 8,000 8,000Electric cables 2,000 2,000Batteries 8,000 8,000Hoses (sewer flusher) 7,500 7,500Miscellaneous supplies 5,500 5,500Concrete blades 5,000 5,000Sewer televising system supplies 5,000 5,000Root cutters, blades & shoes 7,000 7,000Chlorine system components 7,000 7,000Magnetic valve box locators (2) 1,500 1,500SCADA computer 7,000 7,000Transducers 3,000 3,000Misc. equipment and supplies 13,000 91,500 13,000 91,500
505-7201-561.31-85 Small Tools & Equipment Misc. expendable hand tools & equipment 15,500 15,500
505-7201-561.31-90 Street & Sidewalk Supplies Materials for restoration of streets andparkways due to water main breaks
and repairs: Asphalt 15,000 15,000 Concrete 28,000 28,000 Gravel 75,000 75,000 Miscellaneous materials 7,000 125,000 7,000 125,000
TOTAL COMMODITIES 747,200 750,600
OTHER CHARGES:
505-7201-561.40-75 Admin Service Charge Costs of personal services and materialspurchased from General Fund but
benefiting Water Utility Operations 1,821,500 1,876,100
505-7201-561.42-79 OPEB Liability Expense OPEB liability expense 15,000 15,000
TOTAL OTHER CHARGES 1,836,500 1,891,100
Budget2022
Budget2021
303

WATER & SEWER FUND EXPENDITURE DETAIL
WATER UTILITY OPERATIONS (cont.) 7201
AccountNumber Account Title Description
CAPITAL OUTLAY:
505-7201-561.50-10 Office Equipment Desk, chair & file cabinet repl (EQ9503) 15,000 15,000
505-7201-561.50-15 Other Equipment Water Operational Equipment (EQ9401) 147,000 108,000Prior Year Encumbrance Carryover 46,666 0
Emergency Generator Upgradesand Replacement (EQ9902) 922,400 922,400
SCADA Enhancements (EQ1525) 61,500 63,300
Pump & Motor Controls Rehaband Replacement (EQ1530) 106,000 64,600
Prior Year Encumbrance Carryover 22,500 1,306,066 0 1,158,300
505-7201-561.50-20 Building Improvements PW Annex improvements (BL9302) 20,000 19,000
IRMA Complaince (BL1902) 0 0Prior Year Encumbrance Carryover 5,222 0
Overhead Door replacement/repair (BL9004) 10,000 35,222 10,000 29,000
TOTAL CAPITAL OUTLAY 1,356,288 1,202,300
TOTAL WATER UTILITY 16,831,028 16,820,400
CAPITAL PROJECTS 9001
AccountNumber Account Title Description
CAPITAL OUTLAY:
505-9001-571.50-25 Construction in Progress Sewer Rehab/ReplacementProgram (SW9001) 450,000 475,000
Prior Year Encumbrance Carryover 35,450 0
Residential Meter & AMR SystemReplacement (WA0302) 0 1,037,300
Prior Year Encumbrance Carryover 9,180 0
Watermain ReplacementProgram (WA9001) 4,000,000 4,100,000
Prior Year Encumbrance Carryover 41,098 0
Water Tank Repainting (WA1101) 1,820,000 1,715,000
Commerical Meter Replacements (WA2001) 0 300,000
Budget2022
Budget2022
Budget2021
Budget2021
304

WATER & SEWER FUND EXPENDITURE DETAIL
CAPITAL PROJECTS 9001
AccountNumber Account Title Description
505-9001-571.50-25 Construction in Prog (cont.) Risk & Resiliency Plan (WA2101) 786,000 7,141,728 20,000 7,647,300
TOTAL CAPITAL OUTLAY 7,141,728 7,647,300
TOTAL CAPITAL PROJECTS 7,141,728 7,647,300
NON-OPERATING 9901
AccountNumber Account Title Description
OTHER FINANCING USES:
505-9901-591.40-96 Operating Contingency Operating Contingency 300,000 300,000
TOTAL NON-OPERATING 300,000 300,000
TOTAL WATER & SEWER FUND 25,390,156 25,924,300
2022Budget
Budget2022
2021Budget
Budget2021
305

THIS PAGE LEFT BLANK
306

ARTS, ENTERTAINMENT & EVENTS FUND
307

ARTS, ENTERTAINMENT & EVENTS FUND 515
Fund at a Glance
The Arts, Entertainment & Events (A&E) Fund was established to account for the overtime and extraordinary costs associated with Village presentation and participation in arts, theatrical and other community events. 25% of the Village’s 1.25% Food & Beverage Tax (FBT) is used as a dedicated source of revenue for this fund. These events should promote the Village and help generate opportunities for local businesses.
Restrictions:
VILLAGE POLICY – The Village finances the items listed in this fund through a portion of the Food & Beverage Tax (FBT). Effective September 2004, the Village’s total FBT was raised from 1% to 1.25%. Initially, .25% or 20% of the FBT was deposited directly into the A&E Fund. In 2015 the Village Board approved increasing the amount of the FBT that is allocated to the A & E Fund to 25%. The Proposed 2022 Budget increases this allocation to 26%.
Fund Summary
2019 2020 2021 2021 2022 $ %Actual Actual Est. Actual Budget Budget Change Change
RevenuesTaxes $693,535 $519,327 $665,500 $593,300 $796,200 $202,900 34.2%Fees 100,678 73,690 106,000 102,800 108,600 5,800 5.6%Interest Income 10,292 2,226 600 4,500 4,500 0 0.0%Other 36,824 0 22,500 22,500 22,500 0 0.0%
Total Revenues $841,329 $595,243 $794,600 $723,100 $931,800 $208,700 28.9%Interfund Transfers In 20,012 0 650,000 650,000 0 (650,000) (100.0%)Capita l Reserves 0 0 71,900 61,000 73,400 12,400 20.3%Total Revenues andInterfund Transfers In $861,341 $595,243 $1,516,500 $1,434,100 $1,005,200 ($428,900) (29.9%)
ExpendituresPersonal Services $188,400 $0 $133,300 $172,100 $193,100 $21,000 12.2%Commodities 36,155 0 99,000 39,500 88,300 48,800 123.5%Other Charges 471,263 369,167 1,089,100 1,090,928 625,200 (465,728) (42.7%)Capita l Items 155,968 12,926 104,000 100,000 106,500 6,500 6.5%
Total Expenditures $851,786 $382,093 $1,425,400 $1,402,528 $1,013,100 ($389,428) (27.8%)Interfund Transfers Out 0 0 0 0 0 0 N/A
Total Expenditures andInterfund Transfers Out $851,786 $382,093 $1,425,400 $1,402,528 $1,013,100 ($389,428) (27.8%)
Revenues over(under) Expenditures $9,555 $213,150 $91,100 $31,572 ($7,900) ($39,472) (125.0%)
BEGINNING WORKING CASH (71,260) (61,705) 151,445 151,445 242,545 91,100 60.2%
ENDING WORKING CASH ($61,705) $151,445 $242,545 $183,017 $234,645 $51,628 28.2%
308
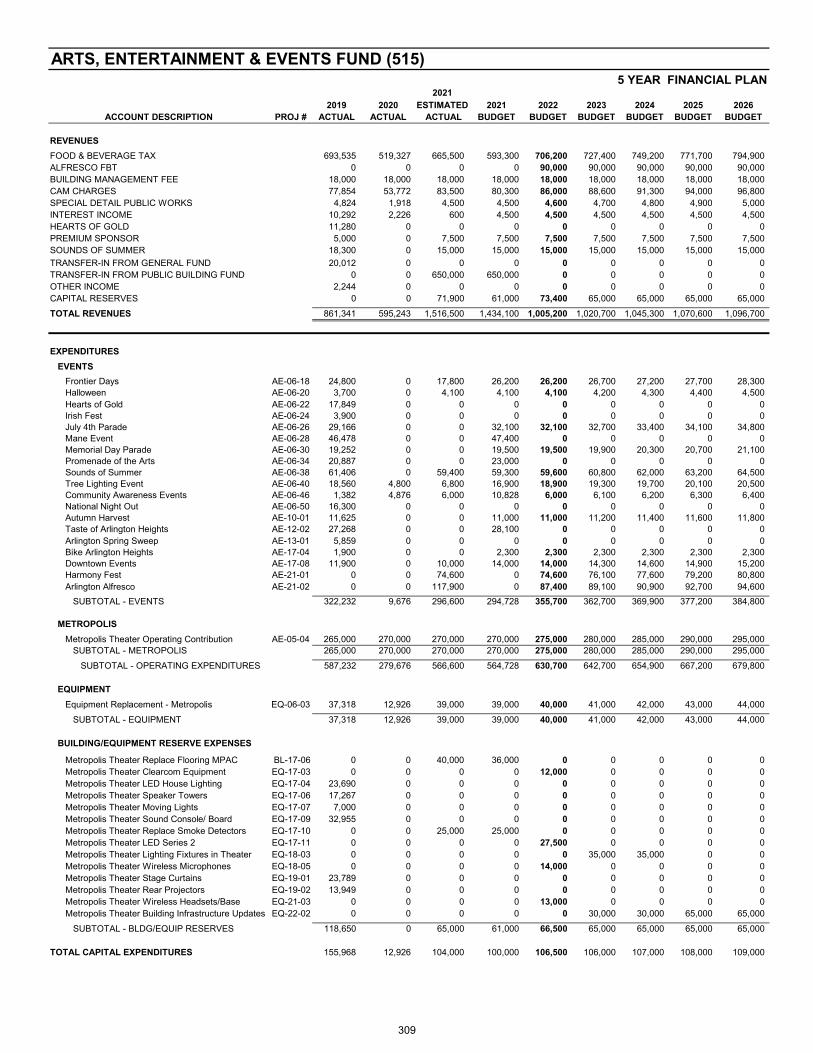
5 YEAR FINANCIAL PLAN2021
2019 2020 ESTIMATED 2021 2022 2023 2024 2025 2026ACCOUNT DESCRIPTION PROJ # ACTUAL ACTUAL ACTUAL BUDGET BUDGET BUDGET BUDGET BUDGET BUDGET
REVENUES
FOOD & BEVERAGE TAX 693,535 519,327 665,500 593,300 706,200 727,400 749,200 771,700 794,900ALFRESCO FBT 0 0 0 0 90,000 90,000 90,000 90,000 90,000BUILDING MANAGEMENT FEE 18,000 18,000 18,000 18,000 18,000 18,000 18,000 18,000 18,000CAM CHARGES 77,854 53,772 83,500 80,300 86,000 88,600 91,300 94,000 96,800SPECIAL DETAIL PUBLIC WORKS 4,824 1,918 4,500 4,500 4,600 4,700 4,800 4,900 5,000INTEREST INCOME 10,292 2,226 600 4,500 4,500 4,500 4,500 4,500 4,500HEARTS OF GOLD 11,280 0 0 0 0 0 0 0 0PREMIUM SPONSOR 5,000 0 7,500 7,500 7,500 7,500 7,500 7,500 7,500SOUNDS OF SUMMER 18,300 0 15,000 15,000 15,000 15,000 15,000 15,000 15,000
TRANSFER-IN FROM GENERAL FUND 20,012 0 0 0 0 0 0 0 0TRANSFER-IN FROM PUBLIC BUILDING FUND 0 0 650,000 650,000 0 0 0 0 0OTHER INCOME 2,244 0 0 0 0 0 0 0 0CAPITAL RESERVES 0 0 71,900 61,000 73,400 65,000 65,000 65,000 65,000
TOTAL REVENUES 861,341 595,243 1,516,500 1,434,100 1,005,200 1,020,700 1,045,300 1,070,600 1,096,700
EXPENDITURES
EVENTS
Frontier Days AE-06-18 24,800 0 17,800 26,200 26,200 26,700 27,200 27,700 28,300Halloween AE-06-20 3,700 0 4,100 4,100 4,100 4,200 4,300 4,400 4,500Hearts of Gold AE-06-22 17,849 0 0 0 0 0 0 0 0Irish Fest AE-06-24 3,900 0 0 0 0 0 0 0 0July 4th Parade AE-06-26 29,166 0 0 32,100 32,100 32,700 33,400 34,100 34,800Mane Event AE-06-28 46,478 0 0 47,400 0 0 0 0 0Memorial Day Parade AE-06-30 19,252 0 0 19,500 19,500 19,900 20,300 20,700 21,100Promenade of the Arts AE-06-34 20,887 0 0 23,000 0 0 0 0 0Sounds of Summer AE-06-38 61,406 0 59,400 59,300 59,600 60,800 62,000 63,200 64,500Tree Lighting Event AE-06-40 18,560 4,800 6,800 16,900 18,900 19,300 19,700 20,100 20,500Community Awareness Events AE-06-46 1,382 4,876 6,000 10,828 6,000 6,100 6,200 6,300 6,400National Night Out AE-06-50 16,300 0 0 0 0 0 0 0 0Autumn Harvest AE-10-01 11,625 0 0 11,000 11,000 11,200 11,400 11,600 11,800Taste of Arlington Heights AE-12-02 27,268 0 0 28,100 0 0 0 0 0Arlington Spring Sweep AE-13-01 5,859 0 0 0 0 0 0 0 0Bike Arlington Heights AE-17-04 1,900 0 0 2,300 2,300 2,300 2,300 2,300 2,300Downtown Events AE-17-08 11,900 0 10,000 14,000 14,000 14,300 14,600 14,900 15,200Harmony Fest AE-21-01 0 0 74,600 0 74,600 76,100 77,600 79,200 80,800Arlington Alfresco AE-21-02 0 0 117,900 0 87,400 89,100 90,900 92,700 94,600
SUBTOTAL - EVENTS 322,232 9,676 296,600 294,728 355,700 362,700 369,900 377,200 384,800
METROPOLIS
Metropolis Theater Operating Contribution AE-05-04 265,000 270,000 270,000 270,000 275,000 280,000 285,000 290,000 295,000SUBTOTAL - METROPOLIS 265,000 270,000 270,000 270,000 275,000 280,000 285,000 290,000 295,000
SUBTOTAL - OPERATING EXPENDITURES 587,232 279,676 566,600 564,728 630,700 642,700 654,900 667,200 679,800
EQUIPMENT
Equipment Replacement - Metropolis EQ-06-03 37,318 12,926 39,000 39,000 40,000 41,000 42,000 43,000 44,000
SUBTOTAL - EQUIPMENT 37,318 12,926 39,000 39,000 40,000 41,000 42,000 43,000 44,000
BUILDING/EQUIPMENT RESERVE EXPENSES
Metropolis Theater Replace Flooring MPAC BL-17-06 0 0 40,000 36,000 0 0 0 0 0Metropolis Theater Clearcom Equipment EQ-17-03 0 0 0 0 12,000 0 0 0 0Metropolis Theater LED House Lighting EQ-17-04 23,690 0 0 0 0 0 0 0 0Metropolis Theater Speaker Towers EQ-17-06 17,267 0 0 0 0 0 0 0 0Metropolis Theater Moving Lights EQ-17-07 7,000 0 0 0 0 0 0 0 0Metropolis Theater Sound Console/ Board EQ-17-09 32,955 0 0 0 0 0 0 0 0Metropolis Theater Replace Smoke Detectors EQ-17-10 0 0 25,000 25,000 0 0 0 0 0Metropolis Theater LED Series 2 EQ-17-11 0 0 0 0 27,500 0 0 0 0Metropolis Theater Lighting Fixtures in Theater EQ-18-03 0 0 0 0 0 35,000 35,000 0 0Metropolis Theater Wireless Microphones EQ-18-05 0 0 0 0 14,000 0 0 0 0Metropolis Theater Stage Curtains EQ-19-01 23,789 0 0 0 0 0 0 0 0Metropolis Theater Rear Projectors EQ-19-02 13,949 0 0 0 0 0 0 0 0Metropolis Theater Wireless Headsets/Base EQ-21-03 0 0 0 0 13,000 0 0 0 0Metropolis Theater Building Infrastructure Updates EQ-22-02 0 0 0 0 0 30,000 30,000 65,000 65,000
SUBTOTAL - BLDG/EQUIP RESERVES 118,650 0 65,000 61,000 66,500 65,000 65,000 65,000 65,000
TOTAL CAPITAL EXPENDITURES 155,968 12,926 104,000 100,000 106,500 106,000 107,000 108,000 109,000
ARTS, ENTERTAINMENT & EVENTS FUND (515)
309

5 YEAR FINANCIAL PLAN2021
2019 2020 ESTIMATED 2021 2022 2023 2024 2025 2026ACCOUNT DESCRIPTION PROJ # ACTUAL ACTUAL ACTUAL BUDGET BUDGET BUDGET BUDGET BUDGET BUDGET
ARTS, ENTERTAINMENT & EVENTS FUND (515)
OPERATING
Reserve for Restricted Contribution (Metropolis) 19,170 0 55,000 55,000 56,000 57,000 58,000 59,000 60,000
NON-OPERATING
Reserve for Replacement (Metropolis) 0 0 575,000 575,000 75,000 75,000 75,000 75,000 75,000Metropolis Special Assessments 0 0 6,900 0 6,900 0 0 0 0Building Reserve - MCCA 9,968 10,723 34,400 27,500 52,000 57,700 57,700 57,700 57,700Common Area Maintenance (CAM) Fees - MCCA 79,448 78,768 83,500 80,300 86,000 88,600 91,300 94,000 96,800
SUBTOTAL - NON-OPERATING 89,416 89,491 699,800 682,800 219,900 221,300 224,000 226,700 229,500
TOTAL EXPENDITURES 851,786 382,093 1,425,400 1,402,528 1,013,100 1,027,000 1,043,900 1,060,900 1,078,300
BEGINNING WORKING CASH (71,260) (61,705) 151,445 151,445 242,545 234,645 228,345 229,745 239,445REVENUES OVER (UNDER) EXPENDS. 9,555 213,150 91,100 31,572 (7,900) (6,300) 1,400 9,700 18,400ENDING WORKING CASH (61,705) 151,445 242,545 183,017 234,645 228,345 229,745 239,445 257,845
Fund Balance as a Percent of Expenditures 23% 22% 22% 23% 24%
(1) Note: As of 4/30/08 the working cash calculation equals current assets less liabilities less a subtraction for the reserve for replacement. This provides a building/
equipment reserve for future major repairs and improvements to the Metropolis Theater. The building/equipment reserve is shown as a net asset in the Village's CAFR
and will be increased each year by $75,000, unless some or all of the reserve funds are used with the advice of the theater operator, PAM, and per Village Board direction.
(2) Note: As of 12/31/15 the working cash calculation includes an additional subtraction for the restricted contribution to Metropolis. This represents a contribution
to the Theater that is being held by the Village as the Theater demonstrates balanced budget and actual results.
2022 2023 2024 2025 20262020 BUDGET BUDGET BUDGET BUDGET BUDGET
current assets 667,769 EQ 66,500 65,000 65,000 65,000 65,000 minus current liabilities 0
667,769Less Reserve for Replacement (306,024) reserve for replacement - Increase by $75,000 each year FY08 75,000
Less Restricted Contribution (210,300) FY09 150,000 ending working cash 151,445 FY10 225,000
FY11 300,000 FY12 375,000
Metropolis FY13 450,000 Build/Equip Resv FY14 525,000
Reduced by: 124,905 FY14 400,095 FY15 475,095
Reduced by: 250,000 FY15 225,095 8-Month 300,095
Reduced by: 17,072 8-Month 283,023 2016 358,023
Reduced by: 58,176 2016 299,847 2017 374,847
Reduced by: 82,651 2017 292,196 50k res, incr. W. cash 2018 342,196
Reduced by: 67,522 2018 274,674 2019 349,674
Reduced by: 118,650 2019 231,024 2020 306,024
Reduced by: 0 2020 306,024 575k reserve incr. 2021 881,024
Reduced by: 71,900 2021 809,124
reserve for restricted contribution:8-Month 18,500
2016 68,500 2017 119,500
Reduced by: 49,000 2017 70,500 2018 122,500 2019 175,500
Reduced by: 19,200 2019 156,300 2020 210,300 2021 265,300
CUMULATIVE RESERVE FOR REPLACEMENT
CUMULATIVE RESTRICTED CONTRIBUTION
310

ARTS, ENTERTAINMENT & EVENTS FUNDREVENUES
Account Account Actual Actual Proj Actual Budget Budget $ %Number Description 2019 2020 2021 2021 2022 Inc (Dec) Inc (Dec)
515-0000-402.25-00 Food & Beverage Tax (AE0502) 693,535 519,327 665,500 593,300 706,200 112,900 19.0%515-0000-402.26-00 Alfresco Food & Beverage Tax 0 0 0 0 90,000 90,000 N/A
Business Taxes 693,535 519,327 665,500 593,300 796,200 202,900 34.2%
515-0000-431.45-00 Building Management Fee 18,000 18,000 18,000 18,000 18,000 0 0.0%515-0000-431.46-00 CAM Charges 77,854 53,772 83,500 80,300 86,000 5,700 7.1%515-0000-431.50-00 Special PW Detail Fee 4,824 1,918 4,500 4,500 4,600 100 2.2%
Fees 100,678 73,690 106,000 102,800 108,600 5,800 5.6%
515-0000-461.02-00 Interest on Investments 7,410 2,090 200 4,500 4,500 0 0.0%515-0000-462.10-00 Market Value Adjustments 2,882 136 400 0 0 0 N/A
Interest Income 10,292 2,226 600 4,500 4,500 0 0.0%
515-0000-481.50-00 Hearts of Gold Awards Dinner (AE0622) 11,280 0 0 0 0 0 N/A515-0000-481.55-00 Premium Sponsors 5,000 0 7,500 7,500 7,500 0 0.0%515-0000-481.65-00 Sounds of Summer (AE0638) 18,300 0 15,000 15,000 15,000 0 0.0%
Special Events 34,580 0 22,500 22,500 22,500 0 0.0%
515-0000-489-90-00 Other Income 2,244 0 0 0 0 0 N/AOther 2,244 0 0 0 0 0 N/A
515-0000-491.05-00 Operating Transfer In 20,012 0 650,000 650,000 0 (650,000) (100.0%)515-0000-491.10-00 Use of Capital Reserves 0 0 71,900 61,000 73,400 12,400 20.3%
Other Financing Sources 20,012 0 721,900 711,000 73,400 (637,600) (89.7%)
Total Arts, Ent. & Events Fund 861,341 595,243 1,516,500 1,434,100 1,005,200 (428,900) (29.9%)
CAFR 861,3410 595,243
Sounds ofSummer
OtherEvents TOTAL
Event RevenueSounds of Summer 15,000 15,000Premium Sponsors 7,500 7,500
Total Event Revenue 15,000 7,500 22,500
Event ExpendituresSounds of Summer 59,600 59,600Other Special Events Commission Events 37,000 37,000
Total Event Expenditures 59,600 37,000 96,600
Dedicated Revenues over/(under) Expenditures* (44,600) (29,500) (74,100)
* The balance of these events and all other A&E Fund events are funded with Food & Beverage Tax revenue.
SPECIAL EVENTS OPERATIONS WITH DEDICATED REVENUE
BUDGET FOR 2022
311

ARTS, ENTERTAINMENT & EVENTS FUNDEXPENDITURES
Board of Trustees 0101
Account Account Actual Actual Proj. Act. Budget Budget $ %Number Description 2019 2020 2021 2021 2022 Inc (Dec) Inc (Dec)
515-0101-525.40-55 Special Events 4,186 0 0 6,000 0 (6,000) (100.0%)Other Charges 4,186 0 0 6,000 0 (6,000) (100.0%)
Total Board of Trustees 4,186 0 0 6,000 0 (6,000) (100.0%)
Integrated Services 0201
Account Account Actual Actual Proj. Act. Budget Budget $ %Number Description 2019 2020 2021 2021 2022 Inc (Dec) Inc (Dec)
515-0201-525.40-55 Special Events * 33,106 0 31,300 31,300 31,300 0 0.0%Other Charges 33,106 0 31,300 31,300 31,300 0 0.0%
Total Integrated Services 33,106 0 31,300 31,300 31,300 0 0.0%
Special Events Commission 1018
Account Account Actual Actual Proj. Act. Budget Budget $ %Number Description 2019 2020 2021 2021 2022 Inc (Dec) Inc (Dec)
515-1018-525.40-55 Special Events 59,003 4,800 27,000 35,000 37,000 2,000 5.7%Other Charges 59,003 4,800 27,000 35,000 37,000 2,000 5.7%
Total Special Events Comm 59,003 4,800 27,000 35,000 37,000 2,000 5.7%
Arts Commission 1022
Account Account Actual Actual Proj. Act. Budget Budget $ %Number Description 2019 2020 2021 2021 2022 Inc (Dec) Inc (Dec)
515-1022-525.40-55 Special Events 1,382 4,876 6,000 10,828 6,000 (4,828) (44.6%)Other Charges 1,382 4,876 6,000 10,828 6,000 (4,828) (44.6%)
Total Arts Commission 1,382 4,876 6,000 10,828 6,000 (4,828) (44.6%)
* The amount of Village funds committed to Sounds of Summer events is $21,300. Total expenditures are budgeted at $36,300 based onanticipated sponsorship revenue of $15,000. In the event sponsorship dollars are less than anticipated, the event programming will be reducedaccordingly.
Please Note: SOS sponsorships for 2019 were $15,000. The sponsorships are subtracted from the net expenses for the event programming. Village's net expense was $10,206 for entertainment costs only.
312

ARTS, ENTERTAINMENT & EVENTS FUNDEXPENDITURES
Metropolis Theater 2005
Account Account Actual Actual Proj. Act. Budget Budget $ %Number Description 2019 2020 2021 2021 2022 Inc (Dec) Inc (Dec)
515-2005-525.40-81 Operating Contribution 265,000 270,000 270,000 270,000 275,000 5,000 1.9%515-2005-525.40-85 Special Assessments 0 0 6,900 0 6,900 6,900 N/A
Other Charges 265,000 270,000 276,900 270,000 281,900 11,900 4.4%
515-2005-525.50-55 Other Capital Outlay 155,968 12,926 104,000 100,000 106,500 6,500 6.5%Capital Outlay 155,968 12,926 104,000 100,000 106,500 6,500 6.5%
Total Metropolis Theater 420,968 282,926 380,900 370,000 388,400 18,400 5.0%
Police 3001
Account Account Actual Actual Proj. Act. Budget Budget $ %Number Description 2019 2020 2021 2021 2022 Inc (Dec) Inc (Dec)
515-3001-525.18-07 Overtime Sworn 72,600 0 35,200 64,800 61,700 (3,100) (4.8%)Salaries 72,600 0 35,200 64,800 61,700 (3,100) (4.8%)
Total Police 72,600 0 35,200 64,800 61,700 (3,100) (4.8%)
Fire 3501
Account Account Actual Actual Proj. Act. Budget Budget $ %Number Description 2019 2020 2021 2021 2022 Inc (Dec) Inc (Dec)
515-3501-525.18-07 Overtime Sworn 10,200 0 4,100 7,200 4,100 (3,100) (43.1%)Salaries 10,200 0 4,100 7,200 4,100 (3,100) (43.1%)
Total Fire 10,200 0 4,100 7,200 4,100 (3,100) (43.1%)
Planning 4001
Account Account Actual Actual Proj. Act. Budget Budget $ %Number Description 2019 2020 2021 2021 2022 Inc (Dec) Inc (Dec)
515-4001-525.33-05 Other Supplies 0 0 20,000 0 5,000 5,000 N/ASalaries 0 0 20,000 0 5,000 5,000 N/A
Total Planning 0 0 20,000 0 5,000 5,000 N/A
313

ARTS, ENTERTAINMENT & EVENTS FUNDEXPENDITURES
Public Works 7101
Account Account Actual Actual Proj. Act. Budget Budget $ %Number Description 2019 2020 2021 2021 2022 Inc (Dec) Inc (Dec)
515-7101-525.18-05 Overtime Civilian 97,700 0 94,000 92,200 127,300 35,100 38.1%515-7101-525.18-80 Special Detail 7,900 0 0 7,900 0 (7,900) (100.0%)
Salaries 105,600 0 94,000 100,100 127,300 27,200 27.2%
515-7101-525.33-05 Other Supplies 36,155 0 79,000 39,500 83,300 43,800 110.9%Commodities 36,155 0 79,000 39,500 83,300 43,800 110.9%
Total Public Works 141,755 0 173,000 139,600 210,600 71,000 50.9%
Non-Operating 9901
Account Account Actual Actual Proj. Act. Budget Budget $ %Number Description 2019 2020 2021 2021 2022 Inc (Dec) Inc (Dec)
515-9901-525.40-83 CAM Fees - MCCA 79,448 78,768 83,500 80,300 86,000 5,700 7.1%515-9901-525.40-84 Restricted Reserve 19,170 0 55,000 55,000 56,000 1,000 1.8%515-9901-525.40-91 Reserve for Replacement 0 0 575,000 575,000 75,000 (500,000) (87.0%)515-9901-525.40-92 Building Reserve - MCCA 9,968 10,723 34,400 27,500 52,000 24,500 89.1%
Other Financing Uses 108,586 89,491 747,900 737,800 269,000 (468,800) (63.5%)
Total Non-Operating 108,586 89,491 747,900 737,800 269,000 (468,800) (63.5%)
Total Arts, Ent. & Events Fund 851,786 382,093 1,425,400 1,402,528 1,013,100 (389,428) (27.8%)
314

ARTS, ENTERTAINMENT & EVENTS FUNDEXPENDITURE DETAIL
BOARD OF TRUSTEES 0101
AccountNumber Account Title Description
OTHER CHARGES:
515-0101-525.40-55 Special Events Promenade of Art (AE0634) 6,000 0
TOTAL OTHER CHARGES 6,000 0
TOTAL BOARD OF TRUSTEES 6,000 0
INTERGRATED SERVICES 0201
AccountNumber Account Title Description
OTHER CHARGES:
515-0201-525.40-55 Special Events Promotional events includingSounds of Summer (AE0638) 21,300 21,300Downtown Events (AE1708) 10,000 31,300 10,000 31,300
TOTAL OTHER CHARGES 31,300 31,300
TOTAL INTEGRATED SERVICES 31,300 31,300
SPECIAL EVENTS COMMISSION 1018
AccountNumber Account Title Description
OTHER CHARGES:
515-1018-525.40-55 Special Events Mane Event (AE0628) 22,000 0Tree Lighting Event (AE0640) 3,000 5,000Autumn Harvest (AE1001) 10,000 10,000Harmony Fest (AE2102) 0 35,000 22,000 37,000
TOTAL OTHER CHARGES 35,000 37,000TOTAL SPECIAL EVENTS COMM 35,000 37,000
2021
Budget2021
Budget2021
Budget
Budget2022
2022
Budget2022
Budget
315
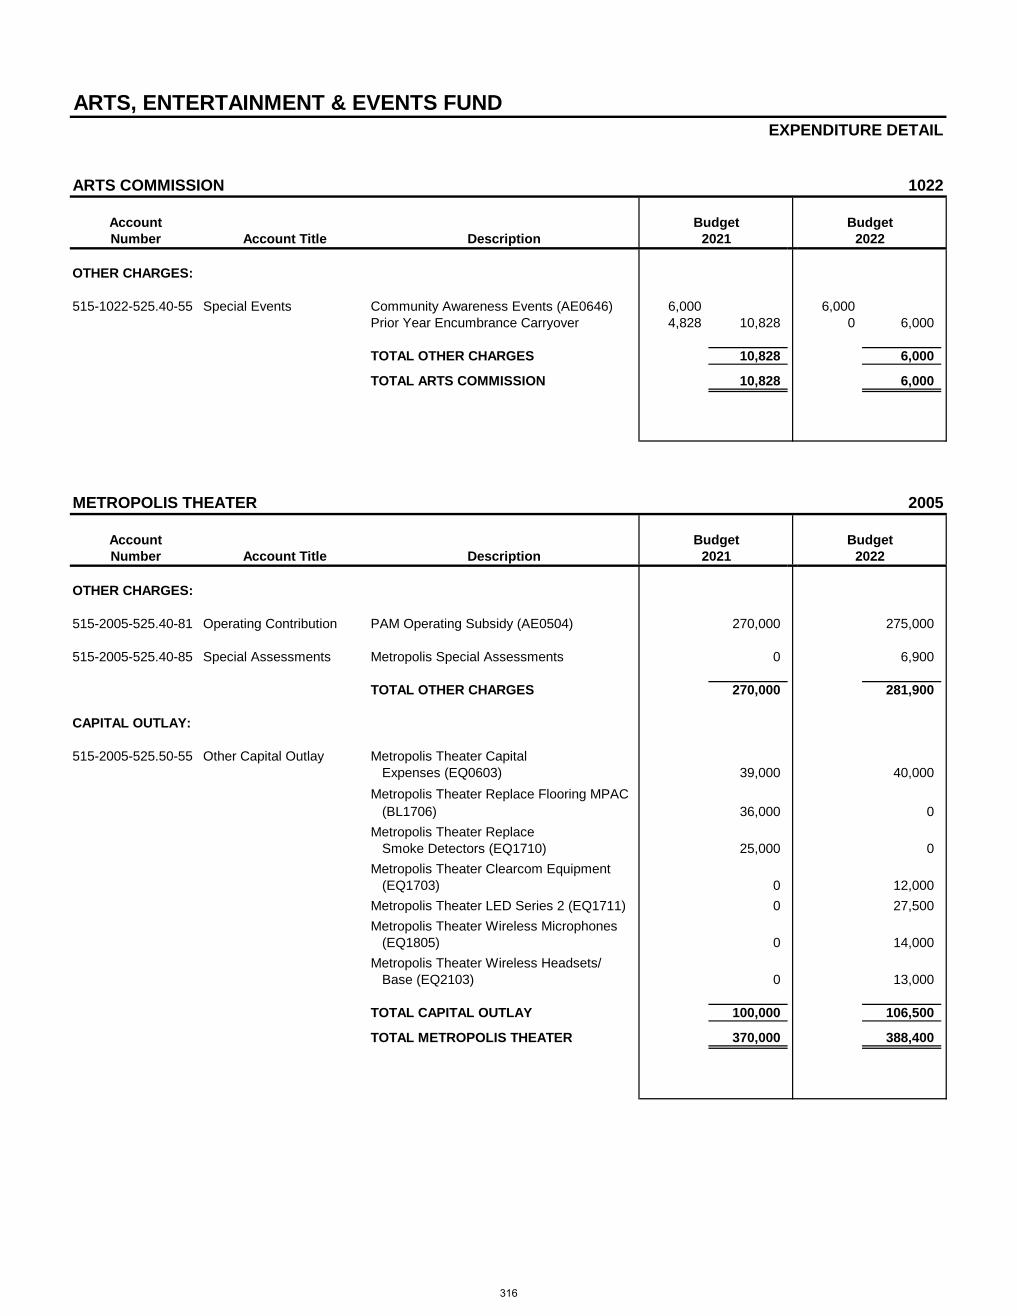
ARTS, ENTERTAINMENT & EVENTS FUNDEXPENDITURE DETAIL
ARTS COMMISSION 1022
AccountNumber Account Title Description
OTHER CHARGES:
515-1022-525.40-55 Special Events Community Awareness Events (AE0646) 6,000 6,000Prior Year Encumbrance Carryover 4,828 10,828 0 6,000
TOTAL OTHER CHARGES 10,828 6,000
TOTAL ARTS COMMISSION 10,828 6,000
METROPOLIS THEATER 2005
AccountNumber Account Title Description
OTHER CHARGES:
515-2005-525.40-81 Operating Contribution PAM Operating Subsidy (AE0504) 270,000 275,000
515-2005-525.40-85 Special Assessments Metropolis Special Assessments 0 6,900
TOTAL OTHER CHARGES 270,000 281,900
CAPITAL OUTLAY:
515-2005-525.50-55 Other Capital Outlay Metropolis Theater Capital Expenses (EQ0603) 39,000 40,000
Metropolis Theater Replace Flooring MPAC(BL1706) 36,000 0
Metropolis Theater Replace Smoke Detectors (EQ1710) 25,000 0
Metropolis Theater Clearcom Equipment(EQ1703) 0 12,000
Metropolis Theater LED Series 2 (EQ1711) 0 27,500Metropolis Theater Wireless Microphones
(EQ1805) 0 14,000Metropolis Theater Wireless Headsets/
Base (EQ2103) 0 13,000
TOTAL CAPITAL OUTLAY 100,000 106,500
TOTAL METROPOLIS THEATER 370,000 388,400
Budget2021
Budget2021
Budget2022
Budget2022
316

ARTS, ENTERTAINMENT & EVENTS FUNDEXPENDITURE DETAIL
POLICE 3001
AccountNumber Account Title Description
SALARIES:
515-3001-525.18-07 Overtime Sworn Frontier Days (AE0618) 25,400 25,400Halloween (AE0620) 4,100 4,100July 4th Parade (AE0626) 9,200 9,200Mane Event (AE0628) 4,100 0Memorial Day Parade (AE0630) 7,200 7,200Promenade of Art (AE0634) 3,400 0Sounds of Summer (AE0638) 2,100 2,400Tree Lighting Event (AE0640) 1,800 1,800Taste of Arlington (AE1202) 5,200 0Bike Arlington Heights (AE1704) 2,300 2,300Harmony Fest (AE2101) 0 64,800 9,300 61,700
TOTAL SALARIES 64,800 61,700
TOTAL POLICE 64,800 61,700
FIRE 3501
AccountNumber Account Title Description
SALARIES:
515-3501-525.18-07 Overtime Sworn Mane Event (AE0628) 2,000 0Promenade of Art (AE0634) 3,100 0Taste of Arlington (AE1202) 2,100 0Harmony Fest (AE2101) 0 7,200 4,100 4,100
TOTAL SALARIES 7,200 4,100
TOTAL FIRE 7,200 4,100
Budget2021
Budget2021
Budget2022
2022Budget
317

ARTS, ENTERTAINMENT & EVENTS FUNDEXPENDITURE DETAIL
PLANNING 4001
AccountNumber Account Title Description
OTHER CHARGES:
515-4001-525.33-05 Other Supplies Arlington Alfresco (AE2102) 0 5,000
TOTAL OTHER CHARGES 0 5,000
TOTAL PLANNING 0 5,000
PUBLIC WORKS 7101
AccountNumber Account Title Description
SALARIES:
515-7101-525.18-05 Overtime Civilian Frontier Days (AE0618) 800 800July 4th Parade (AE0626) 19,900 19,900Mane Event (AE0628) 14,200 0Memorial Day Parade (AE0630) 11,000 11,000Promenade of Art (AE0634) (Village 70%) 7,300 0Sounds of Summer (AE0638) 10,900 10,900Tree Lighting Event (AE0640) 12,100 12,100Autumn Harvest (AE1001) 1,000 1,000Taste of Arlington (AE1202) (Village 70%) 11,000 0Downtown Events (AE1708) 4,000 4,000Arlington Alfresco (AE2102) 0 42,400Harmony Fest (AE2101) 0 92,200 25,200 127,300
515-7101-525.18-80 Special Detail Promenade of Art (AE0634) (Amdur 30%) 3,200 0Taste of Arlington (AE1202) (Chamber 30%) 4,700 7,900 0 0
TOTAL SALARIES 100,100 127,300
COMMODITIES:
515-7101-525.33-05 Other Supplies Mane Event (AE0628) - fence, signs,barricade rental, etc. 5,100 0
Taste of Arlington (AE1202) - fence, signs,barricade rental, etc. 5,100 0
Memorial Day (AE0630) 1,300 1,300July 4th Parade (AE0626) 3,000 3,000Sounds of Summer (AE0638) - stage,
skirt, tent rental, etc. 25,000 25,000Arlington Alfresco (AE2102) 0 40,000Harmony Fest (AE2101) 0 39,500 14,000 83,300
TOTAL COMMODITIES 39,500 83,300
TOTAL PUBLIC WORKS 139,600 210,600
Budget2021
Budget2021
Budget2022
Budget2022
318

ARTS, ENTERTAINMENT & EVENTS FUNDEXPENDITURE DETAIL
NON-OPERATING 9901
AccountNumber Account Title Description
NON-OPERATING:
515-2005-525.40-83 CAM Fees - MCCA Common Area Maintenance (CAM) 80,300 86,000
515-9901-525.40-84 Restricted Reserve Metropolis Theater 55,000 56,000
515-9901-525.40-91 Reserve for Replacement Depreciation 575,000 75,000
515-9901-525.40-92 Building Reserves - MCCA Building Reserve - Condo Association 27,500 52,000
TOTAL NON-OPERATING 737,800 269,000
TOTAL ARTS, ENTERT. & EVENTS FUND 1,402,528 1,013,100
Budget2021 2022
Budget
319

SPECIAL EVENTS - Cost by Event
2021 2021 2022Event Project # Department Expense Description Budget Proj Act Budget
Autumn Harvest AE-10-01 Special Events Com Special Events 10,000 0 10,000Public Works Overtime 1,000 0 1,000
11,000 0 11,000
Community Awareness Events AE-06-46 Arts Commission Special Events 10,828 6,000 6,00010,828 6,000 6,000
Downtown Events AE-17-08 Integrated Services Special Events 10,000 10,000 10,000Public Works Overtime 4,000 0 4,000
14,000 10,000 14,000
Frontier Days AE-06-18 Police Overtime 25,400 17,800 25,400Public Works Overtime 800 0 800
26,200 17,800 26,200
Halloween AE-06-20 Police Overtime 4,100 4,100 4,1004,100 4,100 4,100
July 4th Parade AE-06-26 Police Overtime 9,200 0 9,200Public Works Overtime 19,900 0 19,900Public Works Event supplies 3,000 0 3,000
32,100 0 32,100
Mane Event AE-06-28 Special Events Com Special Events 22,000 0 0Police Overtime 4,100 0 0Fire Overtime 2,000 0 0Public Works Overtime 14,200 0 0Public Works Barricade rental, signs, etc. 5,100 0 0
47,400 0 0
Memorial Day Parade AE-06-30 Police Overtime 7,200 0 7,200Public Works Overtime 11,000 0 11,000Public Works Event supplies 1,300 0 1,300
19,500 0 19,500
Promenade of Art AE-06-34 Board of Trustees Special Events 6,000 0 0Police Overtime 3,400 0 0Fire Overtime 3,100 0 0Public Works Overtime - Village share 70% 7,300 0 0Public Works (1) Overtime - Amdur share 30% 3,200 0 0
23,000 0 0
Sounds of Summer AE-06-38 Integrated Services Entertainment 21,300 21,300 21,300Police Overtime 2,100 2,200 2,400Public Works Overtime 10,900 10,900 10,900Public Works Stage, skirt, tent rental, etc. 25,000 25,000 25,000
59,300 59,400 59,600
Taste of Arlington AE-12-02 Police Overtime 5,200 0 0Fire Overtime 2,100 0 0Public Works Overtime - Village share 70% 11,000 0 0Public Works (2) Overtime - Chamber share 30% 4,700 0 0Public Works Lighting, fencing, sanitation 5,100 0 0
28,100 0 0
Tree Lighting Event AE-06-40 Special Events Com Special Events 3,000 5,000 5,000Police Overtime 1,800 1,800 1,800Public Works Overtime 12,100 0 12,100
16,900 6,800 18,900
Bike Arlington Heights AE-17-04 Police Overtime 2,300 0 2,3002,300 0 2,300
320

SPECIAL EVENTS - Cost by Event
2021 2021 2022Event Project # Department Expense Description Budget Proj Act Budget
Harmoney Fest AE-21-01 Public Works Overtime 0 25,200 25,200Public Works Lighting, fencing, sanitation 0 14,000 14,000Police Overtime 0 9,300 9,300Fire Overtime 0 4,100 4,100Special Events Com Special Events 0 22,000 22,000
0 74,600 74,600
Arlington Alfresco AE-21-02 Public Works Overtime 0 57,900 42,400Public Works Lighting, fencing, sanitation 0 40,000 40,000Planning Materials 0 20,000 5,000
0 117,900 87,400
TOTAL SPECIAL EVENTS - COST BY EVENT 294,728 296,600 355,700
321

SPECIAL EVENTS - Cost by Department
2021 2021 2022
Department Event Project # Expense Description Budget Proj Act Budget
Board of Trustees Promenade of Art AE-06-34 Special Events 6,000 0 06,000 0 0
Integrated Services Downtown Events AE-17-08 Special Events 10,000 10,000 10,000Sounds of Summer AE-06-38 Entertainment 21,300 21,300 21,300
31,300 31,300 31,300
Special Events Com Autumn Harvest AE-10-01 Special Events 10,000 0 10,000Mane Event AE-06-28 Special Events 22,000 0 0Tree Lighting Event AE-06-40 Special Events 3,000 5,000 5,000Harmony Fest AE-21-02 Special Events 0 22,000 22,000
35,000 27,000 37,000
Arts Commission Community Awareness Events AE-06-46 Special Events 10,828 6,000 6,00010,828 6,000 6,000
Police Bike Arlington AE-17-04 Overtime 2,300 0 2,300Frontier Days AE-06-18 Overtime 25,400 17,800 25,400Halloween AE-06-20 Overtime 4,100 4,100 4,100July 4th Parade AE-06-26 Overtime 9,200 0 9,200Mane Event AE-06-28 Overtime 4,100 0 0Memorial Day Parade AE-06-30 Overtime 7,200 0 7,200Promenade of Art AE-06-34 Overtime 3,400 0 0Sound of Summer AE-06-38 Overtime 2,100 2,200 2,400Taste of Arlington AE-12-02 Overtime 5,200 0 0Tree Lighting Event AE-06-40 Overtime 1,800 1,800 1,800Harmony Fest AE-21-01 Overtime 0 9,300 9,300
64,800 35,200 61,700
Fire Mane Event AE-06-28 Overtime 2,000 0 0Promenade of Art AE-06-34 Overtime 3,100 0 0Taste of Arlington AE-12-02 Overtime 2,100 0 0Harmony Fest AE-21-01 Overtime 0 4,100 4,100
7,200 4,100 4,100
Planning Arlington Alfresco AE-21-02 Materials 0 20,000 5,0000 20,000 5,000
Public Works/Water Autumn Harvest AE-10-01 Overtime 1,000 0 1,000Frontier Days AE-06-18 Overtime 800 0 800July 4th Parade AE-06-26 Overtime 19,900 0 19,900July 4th Parade AE-06-26 Barricade rental, signs, etc. 3,000 0 3,000Mane Event AE-06-28 Overtime 14,200 0 0Mane Event AE-06-28 Barricade rental, signs, etc. 5,100 0 0Memorial Day Parade AE-06-30 Overtime 11,000 0 11,000Memorial Day Parade AE-06-30 Barricade rental, signs, etc. 1,300 0 1,300Promenade of Art AE-06-34 Overtime - Village share 70% 7,300 0 0Promenade of Art AE-06-34 Overtime - Amdur share 30% 3,200 0 0Sounds of Summer AE-06-38 Overtime 10,900 10,900 10,900Sounds of Summer AE-06-38 Stage, skirt, tent rental, etc. 25,000 25,000 25,000Taste of Arlington AE-12-02 Overtime - Village share 70% 11,000 0 0Taste of Arlington AE-12-02 Overtime - Chamber share 30% 4,700 0 0Taste of Arlington AE-12-02 Lighting, fencing, sanitation 5,100 0 0Tree Lighting Event AE-06-40 Overtime 12,100 0 12,100Downtown Events AE-17-08 Overtime 4,000 0 4,000Arlington Alfresco AE-21-02 Overtime 0 57,900 42,400Arlington Alfresco AE-21-02 Materials 0 40,000 40,000Harmony Fest AE-21-01 Overtime 0 25,200 25,200Harmony Fest AE-21-01 Lighting, fencing, sanitation 0 14,000 14,000
139,600 173,000 210,600
TOTAL SPECIAL EVENTS - COST BY DEPARTMENT 294,728 296,600 355,700
322

Self-Insurance
General Liability
Insurance
Workers’ Compensation
Insurance
Health Insurance
SELF INSURANCE FUNDSORGANIZATION STRUCTURE
323

VILLAGE OF ARLINGTON HEIGHTS
2022 CHARGES TO OPERATIONS FOR INSURANCE101% 101%
MEDICAL INSURANCE GENERAL INSURANCE WORKERS' COMPENSATIONA/C #1905 A/C #2040 A/C #1901
FUND OPERATION 2021 2022 VARIANCE 2021 2022 VARIANCE 2021 2022 VARIANCE
101 0101-501 Board of Trustees -$ -$ -$ -$ -$ -$ 100$ 100$ -$ 101 0201-502 Integrated Services 99,400 111,200 11,800 8,000 5,700 (2,300) 1,300 1,400 100 101 0301-503 Human Resources 54,500 41,800 (12,700) 6,800 4,800 (2,000) 500 600 100 101 0401-503 Legal 67,100 65,400 (1,700) 3,300 2,300 (1,000) 600 700 100 101 0501-503 Finance 210,900 245,300 34,400 20,800 14,700 (6,100) 3,400 3,800 400 101 1001-502 Boards & Commissions - - - 3,200 2,300 (900) - - - 101 3001-511 Police 2,905,900 3,081,200 175,300 285,300 201,400 (83,900) 676,300 750,900 74,600 101 3005-511 Police Grant 8,100 8,000 (100) - - - 300 300 - 101 3501-512 Fire 2,619,700 2,613,900 (5,800) 237,700 167,900 (69,800) 676,400 751,000 74,600 101 4001-521 Planning & Comm Devlp 211,900 209,500 (2,400) 7,300 5,200 (2,100) 3,000 3,300 300 101 4501-523 Building & Life Safety 272,500 377,500 105,000 13,100 9,300 (3,800) 48,500 53,900 5,400 101 7001-523 Health Services 197,500 196,800 (700) 20,900 14,800 (6,100) 20,200 22,400 2,200 101 7007-523 Senior Services 77,100 84,300 7,200 12,000 8,500 (3,500) 500 600 100 101 7101-531 Public Works 1,010,800 1,091,500 80,700 152,200 107,500 (44,700) 491,500 545,800 54,300
Sub-Total General Fund 7,735,400$ 8,126,400$ 391,000$ 770,600$ 544,400$ (226,200)$ 1,922,600$ 2,134,800$ 212,200$
235 3001-532 Police 97,000$ 105,300$ 8,300$ 10,700$ 7,600$ (3,100)$ 10,500$ 11,700$ 1,200$ 505 0501-503 Finance 157,200 168,600 11,400 - - - 1,300 1,400 100 505 7201-561 Water Utilities Operation 824,600 857,000 32,400 65,000 45,900 (19,100) 276,500 307,000 30,500 605 0301-552 Human Resources 27,300 28,600 1,300 - - - 100 100 - 615 0301-552 Human Resources 26,700 28,000 1,300 - - - 100 100 - 621 7501-551 Municipal Fleet Services 204,900 212,900 8,000 - - - 53,100 59,000 5,900 625 0601-553 IT 119,600 166,300 46,700 5,500 3,900 (1,600) 600 700 100
Sub-Total Other Funds 1,457,300$ 1,566,700$ 109,400$ 81,200$ 57,400$ (23,800)$ 342,200$ 380,000$ 37,800$
TOTAL ALL FUNDS 9,192,700$ 9,693,100$ 500,400$ 851,800$ 601,800$ (250,000)$ 2,264,800$ 2,514,800$ 250,000$
291 6001-601 Memorial Library 1,386,400 1,325,800 (60,600) - -
TOTAL CHARGES 10,579,100$ 11,018,900$ 439,800$ 851,800$ 601,800$ (250,000)$ 2,264,800$ 2,514,800$ 250,000$
324

HEALTH INSURANCE FUND 605 Fund at a Glance
The Village is self-insured and separately tracks the revenues and expenditures for employee health insurance and related benefits. In distributing costs, formulas are developed to charge the appropriate amount back to the fund where the cost is associated. For example, the Village charges back to the fund/operation where the employees are accounted; costs are charged based on the type of elected coverage (health and dental, single or dependent, HMO or PPO). Because we are self-insured, we monitor these costs in a single fund presentation for the purpose of financial analysis.
Restrictions:
VILLAGE POLICY – The Village has decided to self-insure these costs. Personnel policy regulates the level of the employee's share of the cost benefits for non-union employees. Labor contracts govern the level and employee's share of the cost of benefits for the police and fire unions.
Fund Summary
2019 2020 2021 2021 2022 $ %Actual Actual Est. Actual Budget Budget Change Change
RevenuesService Charges $9,822,435 $10,465,408 $10,579,100 $10,579,100 $11,018,900 $439,800 4.2%Interest Income 88,184 31,043 4,300 22,000 22,000 0 0.0%Sales/Reimbursable/Rents 4,474,766 3,385,218 2,873,700 2,858,500 2,933,500 75,000 2.6%Other 133,150 123,921 107,000 0 0 0 N/A
Total Revenues $14,518,535 $14,005,590 $13,564,100 $13,459,600 $13,974,400 $514,800 3.8%Interfund Transfers In 316,133 0 0 0 0 0 N/A
Total Revenues andInterfund Transfers In $14,834,668 $14,005,590 $13,564,100 $13,459,600 $13,974,400 $514,800 3.8%
ExpendituresPersonal Services $151,257 $144,169 $565,000 $565,600 $628,700 $63,100 11.2%Contractual Services 4,753,760 5,246,166 5,216,600 5,414,900 5,419,100 4,200 0.1%Commodities 498 367 500 500 500 0 0.0%Other Charges 9,494,779 7,618,344 7,579,300 7,615,500 8,017,300 401,800 5.3%
Total Expenditures $14,400,294 $13,009,046 $13,361,400 $13,596,500 $14,065,600 $469,100 3.5%Interfund Transfers Out 0 0 0 0 0 0 N/A
Total Expenditures andInterfund Transfers Out $14,400,294 $13,009,046 $13,361,400 $13,596,500 $14,065,600 $469,100 3.5%
Revenues over(under) Expenditures $434,374 $996,544 $202,700 ($136,900) ($91,200) $45,700 (33.4%)
BEGINNING WORKING CASH 3,368,654 3,803,028 4,799,572 4,799,572 5,002,272 202,700 4.2%
ENDING WORKING CASH $3,803,028 $4,799,572 $5,002,272 $4,662,672 $4,911,072 $248,400 5.3%
325

HEALTH INSURANCE FUNDREVENUES
Account Account Actual Actual Proj Actual Budget Budget $ %Number Description 2019 2020 2021 2021 2022 Inc (Dec) Inc (Dec)
605-0000-451.68-00 Charges To Operations 8,555,100 9,118,400 9,192,700 9,192,700 9,693,100 500,400 5.4%605-0000-451.70-00 Library Health Charge 1,267,335 1,347,008 1,386,400 1,386,400 1,325,800 (60,600) (4.4%)
Charges for Services 9,822,435 10,465,408 10,579,100 10,579,100 11,018,900 439,800 4.2%
605-0000-461.02-00 Interest on Investments 69,255 24,929 1,600 17,000 17,000 0 0.0%605-0000-462.10-00 Market Value Adjustments 18,929 6,114 2,700 5,000 5,000 0 0.0%
Interest Income 88,184 31,043 4,300 22,000 22,000 0 0.0%
605-0000-471.10-00 Retiree Insurance Payment 1,773,602 824,346 821,000 821,000 821,000 0 0.0%605-0000-471.11-00 Cobra Payments 5,158 12,726 15,200 0 0 0 N/A605-0000-471.12-00 Employee Contrib Health 1,089,380 1,196,339 1,284,000 1,284,000 1,348,200 64,200 5.0%605-0000-471.13-00 Employee Contrib Dental 211,879 225,573 216,000 216,000 226,800 10,800 5.0%605-0000-471.19-00 Employee Contrib Life 41,697 40,262 37,500 37,500 37,500 0 0.0%605-0000-471.23-00 Aggregate Loss Proceeds 1,353,050 1,085,972 500,000 500,000 500,000 0 0.0%
Insurance 4,474,766 3,385,218 2,873,700 2,858,500 2,933,500 75,000 2.6%
605-0000-489.90-00 Other Income 133,150 123,921 107,000 0 0 0 N/AOther 133,150 123,921 107,000 0 0 0 N/A
605-0000-491.05-00 Operating Transfer In 316,133 0 0 0 0 0 N/AOther Financing Sources 316,133 0 0 0 0 0 N/A
Total Health Insurance Fund 14,834,668 14,005,590 13,564,100 13,459,600 13,974,400 514,800 3.8%
326

HUMAN RESOURCES Health Insurance Fund
Class
Code Title Grade 2021 2022 + (-)
Employee Benefits Coordinator 6 1.00 1.00
Total F-T-E 1.00 1.00 0.00
Code Fund 2021 2022 + (-)
101 General Fund 2.00 2.00
605 Health Insurance Fund 1.00 1.00
615 Workers' Compensation Fund 1.00 1.00
Total F-T-E All Funds 4.00 4.00 0.00
PERSONNEL SUMMARY
Authorized Positions in F-T-E
Human Resources DepartmentCross Reference to All Funds
Authorized Positions in F-T-E
327

HEALTH INSURANCE FUND EXPENDITURES
Human Resources 0301
Account Account Actual Actual Proj. Act. Budget Budget $ %Number Description 2019 2020 2021 2021 2022 Inc (Dec) Inc (Dec)
605-0301-552.10-01 Salaries 106,646 85,714 111,400 111,900 115,300 3,400 3.0%605-0301-552.18-01 Temporary Help 0 10,131 1,700 1,700 1,700 0 0.0%
Salaries 106,646 95,845 113,100 113,600 117,000 3,400 3.0%
605-0301-552.19-01 Workers Compensation 100 100 100 100 100 0 0.0%605-0301-552.19-05 Medical Insurance 26,100 26,800 27,300 27,300 28,600 1,300 4.8%605-0301-552.19-06 Med Ins - P&F Duty Disability 0 0 400,000 400,000 458,800 58,800 14.7%605-0301-552.19-10 IMRF 10,749 12,113 13,900 14,000 13,200 (800) (5.7%)605-0301-552.19-11 Social Security 6,210 5,551 7,000 7,000 7,300 300 4.3%605-0301-552.19-12 Medicare 1,452 1,298 1,600 1,600 1,700 100 6.3%605-0301-552.19-15 Compensated Absences 0 2,462 2,000 2,000 2,000 0 0.0%
Fringe Benefits 44,611 48,324 451,900 452,000 511,700 59,700 13.2%
605-0301-552.20-05 Professional Services 15,982 24,772 22,000 22,000 22,000 0 0.0%605-0301-552.20-44 Flexible Spending Admin 8,104 6,928 9,600 9,600 9,600 0 0.0%605-0301-552.20-45 Claims Administration 352,595 122,054 105,000 115,000 105,000 (10,000) (8.7%)605-0301-552.20-50 Loss Prevention Program 154,761 93,336 132,500 132,500 132,500 0 0.0%605-0301-552.20-55 Health Insurance Premiums 297,913 1,052,511 1,050,000 1,060,300 1,252,100 191,800 18.1%605-0301-552.20-60 HMO Insurance Premiums 3,822,307 3,836,757 3,789,000 3,967,000 3,789,000 (178,000) (4.5%)605-0301-552.20-65 Life Insurance Employer 57,021 93,757 55,000 75,000 55,000 (20,000) (26.7%)605-0301-552.20-66 Supple Life Employee 40,332 9,367 45,000 25,000 45,000 20,000 80.0%605-0301-552.22-02 Dues 320 528 500 500 500 0 0.0%605-0301-552.22-03 Training 589 379 1,000 1,000 1,000 0 0.0%605-0301-552.22-05 Postage 936 769 1,500 1,500 1,000 (500) (33.3%)605-0301-552.22-15 Photocopying 0 0 100 100 100 0 0.0%605-0301-552.22-25 IT/GIS Service Charge 2,900 3,100 3,200 3,200 4,000 800 25.0%605-0301-552.22-26 ACA Fees 0 1,908 2,200 2,200 2,300 100 4.5%
Contractual Services 4,753,761 5,246,166 5,216,600 5,414,900 5,419,100 4,200 0.1%
605-0301-552.33-05 Other Supplies 498 367 500 500 500 0 0.0%Commodities 498 367 500 500 500 0 0.0%
605-0301-552.42-75 Claims Medical Loss 8,898,877 7,161,601 7,000,000 7,034,200 7,386,000 351,800 5.0%605-0301-552.42-77 Claims Dental Loss 595,902 456,743 578,000 580,000 630,000 50,000 8.6%605-0301-552.42-79 OPEB Liability Expense 0 0 1,300 1,300 1,300 0 0.0%
Other Charges 9,494,779 7,618,344 7,579,300 7,615,500 8,017,300 401,800 5.3%
Total Human Resources 14,400,294 13,009,046 13,361,400 13,596,500 14,065,600 469,100 3.5%
Total Health Insurance Fund 14,400,294 13,009,046 13,361,400 13,596,500 14,065,600 469,100 3.5%
328

HEALTH INSURANCE FUNDEXPENDITURE DETAIL
HUMAN RESOURCES 0301
AccountNumber Account Title Description
SALARIES:
605-0301-552.10-01 Salaries Salaries 111,900 115,300
605-0301-552.18-01 Temporary Help Temporary Help 1,700 1,700
TOTAL SALARIES 113,600 117,000
FRINGE BENEFITS:
605-0301-552.19-01 Workers' Compensation Workers' Compensation Insurance 100 100
605-0301-552.19-05 Medical Insurance Medical Insurance 27,300 28,600
605-0301-552.19-06 Med Ins On Duty Injury Medical insurance premium for Police and Fire on duty Injury per PSEBA
Police (6) 124,000 182,200Fire (9) 276,000 400,000 276,600 458,800
605-0301-552.19-10 IMRF IMRF 14,000 13,200
605-0301-552.19-11 Social Security Social Security 7,000 7,300
605-0301-552.19-12 Medicare Medicare 1,600 1,700
605-0301-552.19-15 Compensated Absences Compensated Absences 2,000 2,000
TOTAL FRINGE BENEFITS 452,000 511,700
CONTRACTUAL SERVICES:
605-0301-552.20-05 Professional Services Legal and consultant fees 22,000 22,000
605-0301-552.20-44 Flexible Spend Admin Fee charges 9,600 9,600
605-0301-552.20-45 Claims Administration Fee charged for processing claims andadministering contracts, including
utilization review 115,000 105,000
605-0301-552.20-50 Loss Prevention/Program Employee Assistance Program 13,500 13,500Wellness Program 17,000 17,000Employee physical exams 102,000 132,500 102,000 132,500
605-0301-552.20-55 Health Insurance Prem Stop loss (145,000 per claim) 1,060,300 1,252,100
605-0301-552.20-60 HMO Insurance Premium HMO medical coverage 3,967,000 3,789,000
605-0301-552.20-65 Life Ins Prem - Employer Life and accidental death and dis- memberment insurance coverage 75,000 55,000
605-0301-552.20-66 Supplemental Life-Employee Supplemental life additional at the employee's expense 25,000 45,000
605-0301-552.22-02 Dues Dues 500 500
605-0301-552.22-03 Training Training 1,000 1,000
Budget2022
Budget2021
329

HEALTH INSURANCE FUNDEXPENDITURE DETAIL
HUMAN RESOURCES (cont.) 0301
Account Budget BudgetNumber Account Title Description 2021 2022
605-0301-552.22-05 Postage Postage 1,500 1,000
605-0301-552.22-15 Photocopying Photocopies & supplies 100 100
605-0301-552.22-25 IT/GIS Service Charge IT/GIS Service Charge 3,200 4,000
605-0301-552.22-26 ACA Fees Affordable Care Act fees 2,200 2,300
TOTAL CONTRACTUAL SERVICES 5,414,900 5,419,100
COMMODITIES:
605-0301-552.33-05 Other Supplies Miscellaneous office supplies 500 500
TOTAL COMMODITIES 500 500
OTHER CHARGES:
605-0301-552.42-75 Claims-Medical Loss Self-funded maximum claims of employees using conventional (PPO)
health insurance (net of individualstop loss) 7,034,200 7,386,000
605-0301-552.42-77 Claims-Dental Loss Self-funded expected dental claims 580,000 630,000
605-0301-552.42-79 OPEB Liability Expense OPEB liability expense 1,300 1,300
TOTAL OTHER CHARGES 7,615,500 8,017,300
TOTAL HUMAN RESOURCES 13,596,500 14,065,600
TOTAL HEALTH INSURANCE FUND 13,596,500 14,065,600
330

GENERAL LIABILITY INSURANCE FUND 611 Fund at a Glance
As of June 2017, the Village began transitioning from being self-insured up to $1 million to joining the Intergovernmental Risk Management Agency (IRMA). IRMA is an intergovernmental insurance cooperative which consolidates general liability and workers’ compensation insurance, as well as claims administration for its 82 members. By joining IRMA, the Village was able to reduce its overall insurance costs and reduced its liability exposure from $1 million per claim to $100,000 per claim. The last existing general liability coverage for high excess claims provided through HELP will expire as of April 2018.
Restrictions:
VILLAGE POLICY – The Village has joined a multi-jurisdictional pooled arrangement to provide for general liability insurance coverage through the Intergovernmental Risk Management Agency (IRMA).
Performance Measures
331
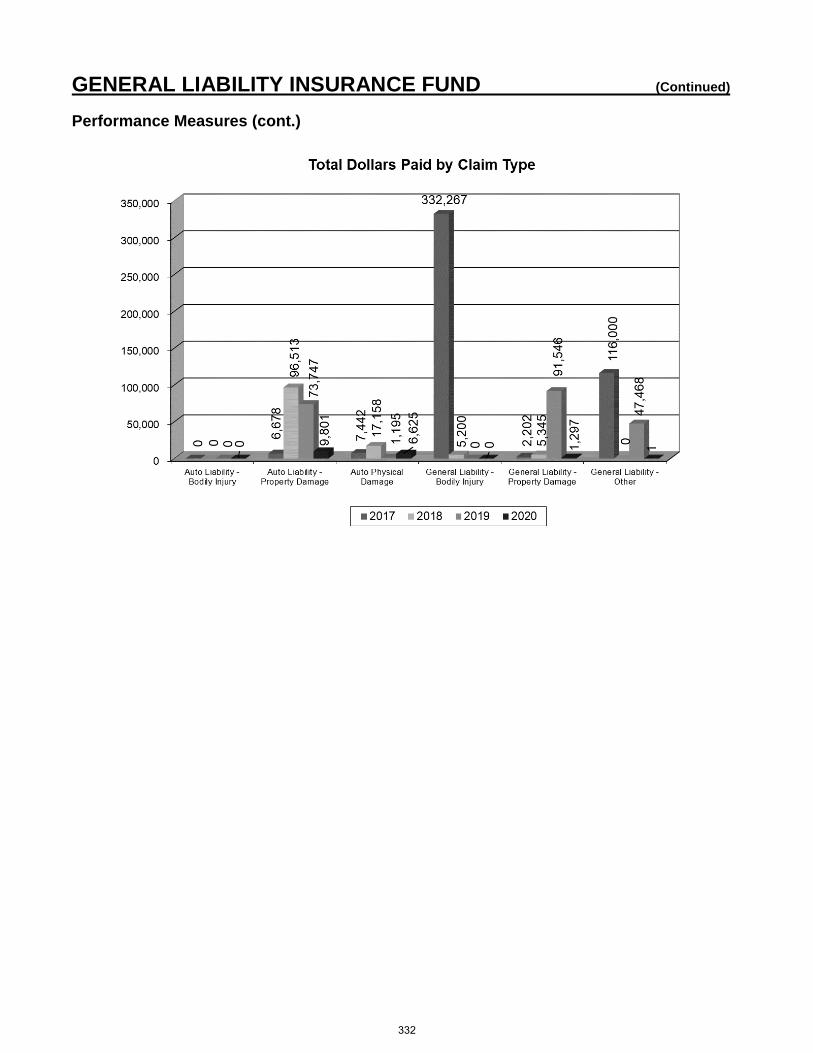
GENERAL LIABILITY INSURANCE FUND (Continued)
Performance Measures (cont.)
332

GENERAL LIABILITY INSURANCE FUND (Continued)
Fund Summary
2019 2020 2021 2021 2022 $ %Actual Actual Est. Actual Budget Budget Change Change
RevenuesService Charges $834,900 $843,400 $851,800 $851,800 $601,800 ($250,000) (29.3%)Interest Income 80,826 19,297 2,900 24,000 24,000 0 0.0%Other 79,490 21,671 0 0 0 0 N/A
Total Revenues $995,216 $884,368 $854,700 $875,800 $625,800 ($250,000) (28.5%)Interfund Transfers In 0 0 0 0 0 0 N/A
Total Revenues andInterfund Transfers In $995,216 $884,368 $854,700 $875,800 $625,800 ($250,000) (28.5%)
ExpendituresContractual Services $319,015 $368,647 $339,900 $373,000 $373,000 $0 0.0%Other Charges 219,480 95,775 201,000 500,000 250,000 (250,000) (50.0%)
Total Expenditures $538,495 $464,422 $540,900 $873,000 $623,000 ($250,000) (28.6%)Interfund Transfers Out 0 0 0 0 0 0 N/A
Total Expenditures andInterfund Transfers Out $538,495 $464,422 $540,900 $873,000 $623,000 ($250,000) (28.6%)
Revenues over(under) Expenditures $456,721 $419,946 $313,800 $2,800 $2,800 $0 0.0%
BEGINNING WORKING CASH 3,269,070 3,725,791 4,145,737 4,145,737 4,459,537 313,800 7.6%
ENDING WORKING CASH $3,725,791 $4,145,737 $4,459,537 $4,148,537 $4,462,337 $313,800 7.6%
333

GENERAL LIABILITY INSURANCE FUNDREVENUES
Account Account Actual Actual Proj Actual Budget Budget $ %Number Description 2019 2020 2021 2021 2022 Inc (Dec) Inc (Dec)
611-0000-451.68-00 Charges To Operations 834,900 843,400 851,800 851,800 601,800 (250,000) (29.3%)Charges for Services 834,900 843,400 851,800 851,800 601,800 (250,000) (29.3%)
611-0000-461.02-00 Interest on Investments 59,427 15,164 1,100 24,000 24,000 0 0.0%611-0000-462.10-00 Market Value Adjustments 21,399 4,133 1,800 0 0 0 N/A
Interest Income 80,826 19,297 2,900 24,000 24,000 0 0.0%
611-0000-489.90-00 Other Income 79,490 21,671 0 0 0 0 N/AOther 79,490 21,671 0 0 0 0 N/A
Total General Liability Ins Fund 995,216 884,368 854,700 875,800 625,800 (250,000) (28.5%)
EXPENDITURES
Finance 0501
Account Account Actual Actual Proj. Act. Budget Budget $ %Number Description 2019 2020 2021 2021 2022 Inc (Dec) Inc (Dec)
611-0501-552.20-45 Claims Administration 1,390 1,390 3,000 3,000 3,000 0 0.0%611-0501-552.20-70 Insurance Premiums 317,625 350,812 336,900 370,000 370,000 0 0.0%611-0501-552.21-65 Other Services 0 16,445 0 0 0 0 N/A
Contractual Services 319,015 368,647 339,900 373,000 373,000 0 0.0%
611-0501-552.42-60 Liability Losses 32,042 33,060 90,000 0 0 0 N/A611-0501-552.42-61 IRMA Liability Deductible 187,438 62,715 111,000 500,000 250,000 (250,000) (50.0%)
Other Charges 219,480 95,775 201,000 500,000 250,000 (250,000) (50.0%)
Total Finance 538,495 464,422 540,900 873,000 623,000 (250,000) (28.6%)
Total General Liability Ins Fund 538,495 464,422 540,900 873,000 623,000 (250,000) (28.6%)
334

GENERAL LIABILITY INSURANCE FUNDEXPENDITURE DETAIL
FINANCE 0501
AccountNumber Account Title Description
CONTRACTUAL SERVICES:
611-0501-552.20-45 Claims Administration Claims administration 3,000 3,000
611-0501-552.20-70 Insurance Premiums IRMA Contribution (25%) 370,000 370,000
TOTAL CONTRACTUAL SERVICES 373,000 373,000
OTHER CHARGES:
611-0501-552.42-61 IRMA Deductible IRMA General Liability Deductible 500,000 250,000
TOTAL OTHER CHARGES 500,000 250,000
TOTAL FINANCE 873,000 623,000
TOTAL GENERAL LIABILITY INS FUND 873,000 623,000
Budget2022
Budget2021
335
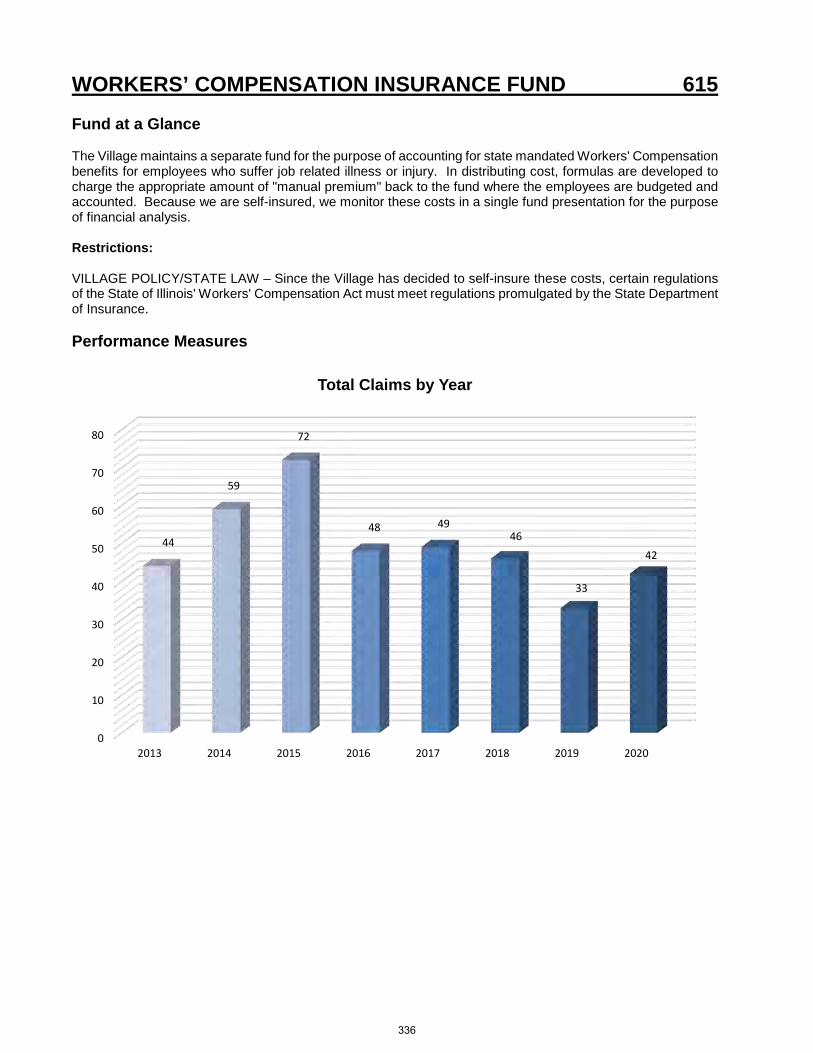
WORKERS’ COMPENSATION INSURANCE FUND 615 Fund at a Glance
The Village maintains a separate fund for the purpose of accounting for state mandated Workers' Compensation benefits for employees who suffer job related illness or injury. In distributing cost, formulas are developed to charge the appropriate amount of "manual premium" back to the fund where the employees are budgeted and accounted. Because we are self-insured, we monitor these costs in a single fund presentation for the purpose of financial analysis.
Restrictions:
VILLAGE POLICY/STATE LAW – Since the Village has decided to self-insure these costs, certain regulations of the State of Illinois' Workers' Compensation Act must meet regulations promulgated by the State Department of Insurance.
Performance Measures
0
10
20
30
40
50
60
70
80
2013 2014 2015 2016 2017 2018 2019 2020
44
59
72
48 4946
33
42
Total Claims by Year
336
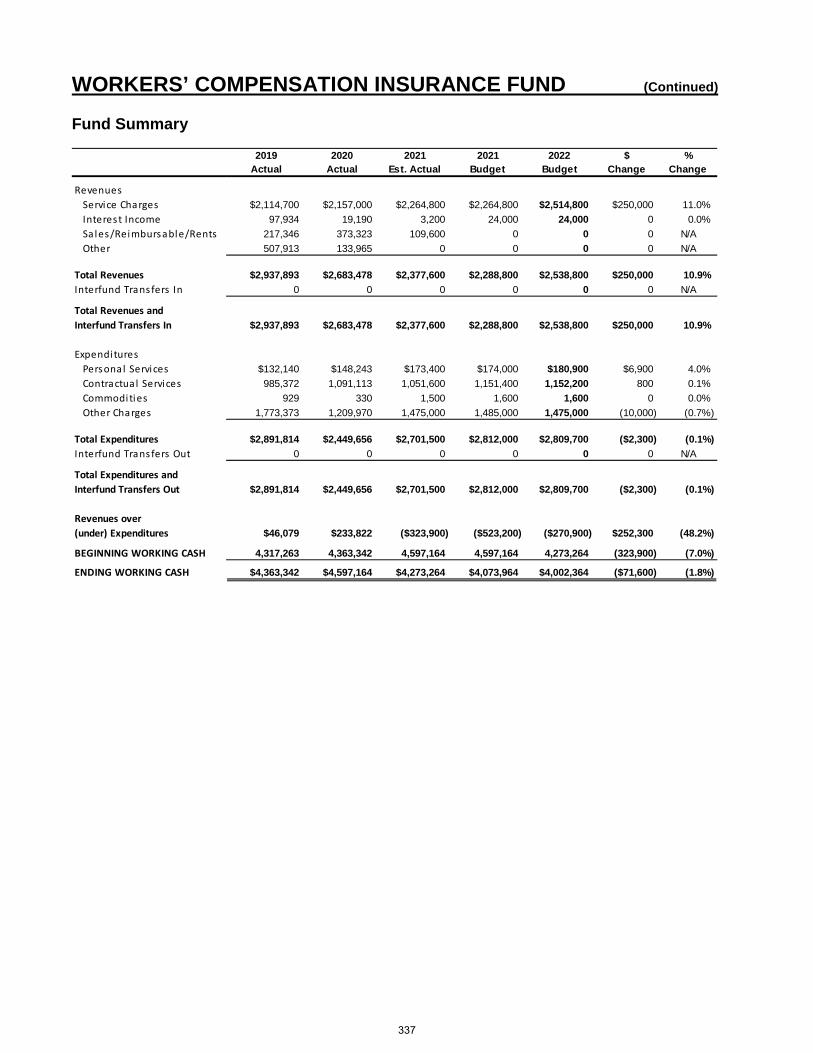
WORKERS’ COMPENSATION INSURANCE FUND (Continued)
Fund Summary
2019 2020 2021 2021 2022 $ %Actual Actual Est. Actual Budget Budget Change Change
RevenuesService Charges $2,114,700 $2,157,000 $2,264,800 $2,264,800 $2,514,800 $250,000 11.0%Interest Income 97,934 19,190 3,200 24,000 24,000 0 0.0%Sales/Reimbursable/Rents 217,346 373,323 109,600 0 0 0 N/AOther 507,913 133,965 0 0 0 0 N/A
Total Revenues $2,937,893 $2,683,478 $2,377,600 $2,288,800 $2,538,800 $250,000 10.9%Interfund Transfers In 0 0 0 0 0 0 N/A
Total Revenues andInterfund Transfers In $2,937,893 $2,683,478 $2,377,600 $2,288,800 $2,538,800 $250,000 10.9%
ExpendituresPersonal Services $132,140 $148,243 $173,400 $174,000 $180,900 $6,900 4.0%Contractual Services 985,372 1,091,113 1,051,600 1,151,400 1,152,200 800 0.1%Commodities 929 330 1,500 1,600 1,600 0 0.0%Other Charges 1,773,373 1,209,970 1,475,000 1,485,000 1,475,000 (10,000) (0.7%)
Total Expenditures $2,891,814 $2,449,656 $2,701,500 $2,812,000 $2,809,700 ($2,300) (0.1%)Interfund Transfers Out 0 0 0 0 0 0 N/A
Total Expenditures andInterfund Transfers Out $2,891,814 $2,449,656 $2,701,500 $2,812,000 $2,809,700 ($2,300) (0.1%)
Revenues over(under) Expenditures $46,079 $233,822 ($323,900) ($523,200) ($270,900) $252,300 (48.2%)
BEGINNING WORKING CASH 4,317,263 4,363,342 4,597,164 4,597,164 4,273,264 (323,900) (7.0%)
ENDING WORKING CASH $4,363,342 $4,597,164 $4,273,264 $4,073,964 $4,002,364 ($71,600) (1.8%)
337

WORKERS' COMPENSATION INSURANCE FUNDREVENUES
Account Account Actual Actual Proj Actual Budget Budget $ %Number Description 2019 2020 2021 2021 2022 Inc (Dec) Inc (Dec)
615-0000-451.68-00 Charges To Operations 2,114,700 2,157,000 2,264,800 2,264,800 2,514,800 250,000 11.0%Charges for Services 2,114,700 2,157,000 2,264,800 2,264,800 2,514,800 250,000 11.0%
615-0000-461.02-00 Interest on Investments 71,599 14,478 1,200 24,000 24,000 0 0.0%615-0000-462.10-00 Market Value Adjustments 26,335 4,712 2,000 0 0 0 N/A
Interest Income 97,934 19,190 3,200 24,000 24,000 0 0.0%
615-0000-471.22-00 Workers Comp Reimburse 217,346 373,323 109,600 0 0 0 N/AInsurance 217,346 373,323 109,600 0 0 0 N/A
615-0000-489.90-00 Other Income 507,913 133,965 0 0 0 0 N/AOther 507,913 133,965 0 0 0 0 N/A
Total Workers' Comp Ins Fund 2,937,893 2,683,478 2,377,600 2,288,800 2,538,800 250,000 10.9%
338

HUMAN RESOURCES Workers' Compensation Fund
Class
Code Title Grade 2021 2022 + (-)
Asst Director of Human Resources 8 1.00 1.00
Total F-T-E 1.00 1.00 0.00
Code Fund 2021 2022 + (-)
101 General Fund 2.00 2.00
605 Health Insurance Fund 1.00 1.00
615 Workers' Compensation Fund 1.00 1.00
Total F-T-E All Funds 4.00 4.00 0.00
PERSONNEL SUMMARY
Authorized Positions in F-T-E
Human Resources DepartmentCross Reference to All Funds
Authorized Positions in F-T-E
339

WORKERS' COMPENSATION INSURANCE FUNDEXPENDITURES
Human Resources 0301
Account Account Actual Actual Proj. Act. Budget Budget $ %Number Description 2019 2020 2021 2021 2022 Inc (Dec) Inc (Dec)
615-0301-552.10-01 Salaries 100,357 102,015 104,800 105,300 108,400 3,100 2.9%615-0301-552.18-01 Temporary Help 0 579 4,300 4,300 4,400 100 2.3%615-0301-552.18-80 Special Detail 0 0 5,000 5,000 7,500 2,500 50.0%
Salaries 100,357 102,594 114,100 114,600 120,300 5,700 5.0%
615-0301-552.19-01 Workers Compensation 100 100 100 100 100 0 0.0%615-0301-552.19-05 Medical Insurance 11,800 12,200 26,700 26,700 28,000 1,300 4.9%615-0301-552.19-10 IMRF 10,114 12,893 13,700 13,800 13,300 (500) (3.6%)615-0301-552.19-11 Social Security 6,085 6,109 7,100 7,100 7,500 400 5.6%615-0301-552.19-12 Medicare 1,423 1,429 1,700 1,700 1,700 0 0.0%615-0301-552.19-15 Compensated Absences 0 1,973 0 0 0 0 N/A615-0301-552.19-30 Unemployment Benefits 2,261 10,945 10,000 10,000 10,000 0 0.0%
Fringe Benefits 31,783 45,649 59,300 59,400 60,600 1,200 2.0%
615-0301-552.20-20 Legal Services 0 0 4,000 4,700 4,700 0 0.0%615-0301-552.20-45 Claims Administration 15,115 10,287 15,000 25,000 25,000 0 0.0%615-0301-552.20-50 Loss Prevention Program 5,724 22,092 15,000 15,000 15,000 0 0.0%615-0301-552.20-70 Insurance Premiums 960,973 1,053,414 1,011,000 1,100,000 1,100,000 0 0.0%615-0301-552.21-65 Other Services 0 0 400 500 500 0 0.0%615-0301-552.22-02 Dues 439 449 500 500 500 0 0.0%615-0301-552.22-03 Training 221 1,771 2,500 2,500 2,500 0 0.0%615-0301-552.22-25 IT/GIS Service Charge 2,900 3,100 3,200 3,200 4,000 800 25.0%
Contractual Services 985,372 1,091,113 1,051,600 1,151,400 1,152,200 800 0.1%
615-0301-552.30-01 Publications Periodicals 170 170 400 500 500 0 0.0%615-0301-552.30-05 Office Supplies & Equip 759 94 800 800 800 0 0.0%615-0301-552.33-05 Other Supplies 0 66 300 300 300 0 0.0%
Commodities 929 330 1,500 1,600 1,600 0 0.0%
615-0301-552.42-75 Claims Medical Loss 401,749 98,954 75,000 75,000 75,000 0 0.0%615-0301-552.42-80 Claims WC Salary Replace 381,649 210,751 400,000 410,000 400,000 (10,000) (2.4%)615-0301-552.42-81 IRMA Medical Loss Deductible 989,975 900,265 1,000,000 1,000,000 1,000,000 0 0.0%
Other Charges 1,773,373 1,209,970 1,475,000 1,485,000 1,475,000 (10,000) (0.7%)
Total Human Resources 2,891,814 2,449,656 2,701,500 2,812,000 2,809,700 (2,300) (0.1%)
Total Workers' Comp Ins Fund 2,891,814 2,449,656 2,701,500 2,812,000 2,809,700 (2,300) (0.1%)
340

WORKERS' COMPENSATION INSURANCE FUNDEXPENDITURE DETAIL
HUMAN RESOURCES 0301
AccountNumber Account Title Description
SALARIES:
615-0301-552.10-01 Salaries Salaries 105,300 108,400
615-0301-552.18-01 Temporary Help Temporary Help 4,300 4,400
615-0301-552.18-80 Special Detail Special details by trained Villagepersonnel acting as instructors for
the Driver Safety Program 5,000 7,500
TOTAL SALARIES 114,600 120,300
FRINGE BENEFITS:
615-0301-552.19-01 Workers' Compensation Workers' Compensation Insurance 100 100
615-0301-552.19-05 Medical Insurance Medical Insurance 26,700 28,000
615-0301-552.19-10 IMRF IMRF 13,800 13,300
615-0301-552.19-11 Social Security Social Security 7,100 7,500
615-0301-552.19-12 Medicare Medicare 1,700 1,700
615-0301-552.19-30 Unemployment Benefits Unemployment benefits 10,000 10,000
TOTAL FRINGE BENEFITS 59,400 60,600
CONTRACTUAL SERVICES:
615-0301-552.20-20 Legal Services Legal Services 4,700 4,700
615-0301-552.20-45 Claims Administration Claims administration / Loss Control Service 25,000 25,000
615-0301-552.20-50 Loss Prevention/Program Risk Mgmt Prevention and Training 15,000 15,000
615-0301-552.20-70 Insurance Premiums IRMA Contribution (75%) 1,100,000 1,100,000
615-0301-552.21-65 Other Services Miscellaneous services 500 500
615-0301-552.22-02 Dues Dues 500 500
615-0301-552.22-03 Training Training 2,500 2,500
615-0301-552.22-25 IT/GIS Service Charge IT/GIS Service Charge 3,200 4,000
TOTAL CONTRACTUAL SERVICES 1,151,400 1,152,200
COMMODITIES:
615-0301-552.30-01 Publications/Periodicals Miscellaneous publications 500 500
615-0301-552.30-05 Office Supplies & Equip. General office supplies 800 800
615-0301-552.33-05 Other Supplies Other Commodities 300 300
TOTAL COMMODITIES 1,600 1,600
Budget2022
Budget2021
341

WORKERS' COMPENSATION INSURANCE FUNDEXPENDITURE DETAIL
HUMAN RESOURCES (cont.) 0301
AccountNumber Account Title Description
OTHER CHARGES:
615-0301-552.42-75 Claims Medical Losses Employee medical claims 75,000 75,000
615-0301-552.42-80 Claims WC Sal. Rpl/Indem Salary replacement, final settlements 410,000 400,000
615-0301-552.42-81 IRMA Deductible - Medical IRMA Medical Loss Deductible 1,000,000 1,000,000
TOTAL OTHER CHARGES 1,485,000 1,475,000
TOTAL HUMAN RESOURCES 2,812,000 2,809,700
TOTAL WORKERS' COMP INS FUND 2,812,000 2,809,700
2022Budget
2021Budget
342
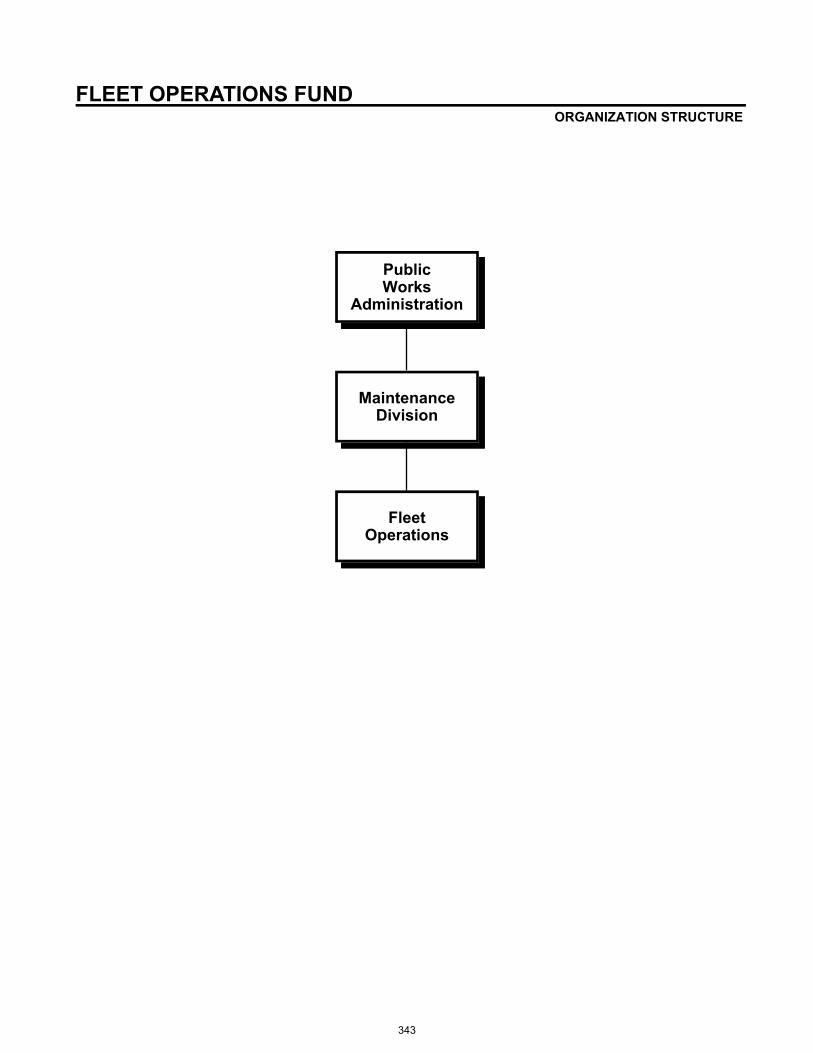
Public Works
Administration
Maintenance Division
Fleet Operations
FLEET OPERATIONS FUND ORGANIZATION STRUCTURE
343

FLEET OPERATIONS FUND 621 Fund at a Glance
The Village created an internal service fund for fleet operations. This allows departments to "lease" their vehicles internally from the Fleet Operations Fund, and allows the Village to accumulate reserves for the maintenance and periodic replacement of the fleet.
Fleet Operations is organizationally within the Maintenance Division of the Public Works Department. The unit is responsible for maintaining the 248 vehicles and 79 pieces of maintenance equipment operated by the various departments within the Village. The unit also provides maintenance for ten buses operated by Wheeling Township for the Senior Citizen Dial-a-Ride. Costs associated with maintenance, repair and fueling are maintained in a PC based fleet management program.
Preventive maintenance and most repairs are made by personnel assigned to the Fleet Unit. Repairs such as mufflers, front-end alignments, transmissions, body repairs and several other repairs, are contracted to local businesses. All vehicle maintenance personnel are ASE certified. This is the same certification carried by repair personnel in car dealerships and franchise service stations.
Performance Measures2018 2019 2020
1. Vehicles/equipment maintained 327 327 327
2. Work orders completed* 1,904 1,373 1053
3. Fleet availability 99.27% 99.2% 99.3%
4. Technician Productivity - - 71%
344

FLEET OPERATIONS FUND (Continued)
Fund Summary
2019 2020 2021 2021 2022 $ %Actual Actual Est. Actual Budget Budget Change Change
RevenuesFees 166 0 0 15,000 0 (15,000) (100.0%)Fines 12,589 1,519 300 20,000 20,000 0 0.0%Service Charges 3,677,200 3,528,700 3,697,300 3,697,300 3,773,700 76,400 2.1%Interest Income 178,514 39,739 6,100 54,000 54,000 0 0.0%Sales/Reimbursable/Rents 215,119 226,520 153,800 130,000 130,000 0 0.0%Other 7,773 33 0 0 0 0 N/A
Total Revenues $4,091,361 $3,796,511 $3,857,500 $3,916,300 $3,977,700 $61,400 1.6%Interfund Transfers In 0 0 0 0 2,500,000 2,500,000 N/A
Total Revenues andInterfund Transfers In $4,091,361 $3,796,511 $3,857,500 $3,916,300 $6,477,700 $2,561,400 65.4%
ExpendituresPersonal Services $1,472,183 $1,577,835 $1,627,700 $1,622,500 $1,668,500 $46,000 2.8%Contractual Services 350,694 219,935 399,700 399,700 376,500 (23,200) (5.8%)Commodities 394,051 289,809 411,200 411,200 389,400 (21,800) (5.3%)Other Charges 104 35 35,000 35,000 35,000 0 0.0%Capita l Items 1,410,125 1,077,884 1,909,500 1,909,498 2,562,100 652,602 34.2%
Total Expenditures $3,627,157 $3,165,498 $4,383,100 $4,377,898 $5,031,500 $653,602 14.9%Interfund Transfers Out 0 0 0 0 0 0 N/A
Total Expenditures andInterfund Transfers Out $3,627,157 $3,165,498 $4,383,100 $4,377,898 $5,031,500 $653,602 14.9%
Revenues over(under) Expenditures $464,204 $631,013 ($525,600) ($461,598) $1,446,200 $1,907,798 (413.3%)
BEGINNING WORKING CASH 7,362,890 7,827,094 8,458,107 8,458,107 7,932,507 (525,600) (6.2%)
ENDING WORKING CASH $7,827,094 $8,458,107 $7,932,507 $7,996,509 $9,378,707 $1,382,198 17.3%
345

5 YEAR CAPITAL IMPROVEMENT PROGRAM (CIP)
20212019 2020 ESTIMATED 2021 2022 2023 2024 2025 2026
ACCOUNT DESCRIPTION PROJ # ACTUAL ACTUAL ACTUAL BUDGET BUDGET BUDGET BUDGET BUDGET BUDGET
REVENUESCHARGES TO OPERATIONS 3,677,200 3,528,700 3,697,300 3,697,300 3,773,700 3,962,400 4,160,500 4,368,500 4,586,900FINES 12,589 1,519 300 20,000 20,000 20,000 20,000 20,000 20,000WHEELING BUS MAINTENANCE 166 0 0 15,000 0 0 0 0 0INTEREST INCOME 178,514 39,739 6,100 54,000 54,000 54,000 54,000 54,000 54,000SALES/REIMB/RENTS 215,119 226,520 153,800 130,000 130,000 130,000 130,000 130,000 130,000OTHER 7,773 33 0 0 0 0 0 0 0OPERATING TRANSFER IN 0 0 0 0 2,500,000 0 0 0 0TOTAL REVENUES 4,091,361 3,796,511 3,857,500 3,916,300 6,477,700 4,166,400 4,364,500 4,572,500 4,790,900
EXPENDITURESOPERATING EXPENDITURES
Personal Services 1,472,183 1,577,835 1,627,700 1,622,500 1,668,500 1,785,300 1,825,500 1,866,600 1,908,600Contractual Services 350,693 219,935 399,700 399,700 376,500 380,300 384,100 387,900 391,800Commodities 394,051 289,809 411,200 411,200 389,400 393,300 397,200 401,200 405,200Other Charges 104 35 5,000 5,000 5,000 5,000 5,000 5,000 5,000
SUBTOTAL - OPERATING EXPENDITURES 2,217,032 2,087,614 2,443,600 2,438,400 2,439,400 2,563,900 2,611,800 2,660,700 2,710,600
BUILDING & LANDBuildings Refurbishing (Electrical Upgrade to Garage) BL-95-05 0 0 53,000 53,000 0 0 0 0 0
SUBTOTAL - BUILDING & LAND 0 0 53,000 53,000 0 0 0 0 0
VEHICLESVehicle and Special Equipment Repl - PW VH-95-01 442,282 746,967 1,156,700 1,156,661 745,100 1,241,300 897,100 1,965,400 1,377,800Vehicle and Special Equipment Repl - W&S VH-95-02 146,982 117,984 118,900 118,936 311,900 30,100 501,700 1,367,900 126,900Vehicle Replacement - Police Department VH-95-03 501,361 173,859 365,700 365,701 283,600 210,400 526,800 359,600 432,600Vehicle Replacement - Fire Department VH-95-04 319,500 39,074 58,200 58,200 1,179,200 1,598,500 710,500 1,215,600 28,900Vehicle Replacement - Municipal Fleet Services VH-95-06 0 0 48,000 48,000 0 0 58,500 0 0Vehicle Replacement - Municipal Parking Operations VH-95-08 0 0 109,000 109,000 0 0 0 67,000 0Vehicle Replacement - Building & Health Services VH-95-10 0 0 0 0 42,300 119,700 0 99,300 102,300Vehicle Replacement - Planning Department VH-95-12 0 0 0 0 0 0 25,500 0 0
SUBTOTAL - VEHICLES 1,410,125 1,077,884 1,856,500 1,856,498 2,562,100 3,200,000 2,720,100 5,074,800 2,068,500
OPERATING CONTINGENCY 0 0 30,000 30,000 30,000 0 0 0 0TOTAL EXPENDITURES 3,627,157 3,165,498 4,383,100 4,377,898 5,031,500 5,763,900 5,331,900 7,735,500 4,779,100
BEGINNING WORKING CASH 7,362,890 7,827,094 8,458,107 8,458,107 7,932,507 9,378,707 7,781,207 6,813,807 3,650,807REVENUES OVER (UNDER) EXPENDITURES 464,204 631,013 (525,600) (461,598) 1,446,200 (1,597,500) (967,400) (3,163,000) 11,800ENDING WORKING CASH 7,827,094 8,458,107 7,932,507 7,996,509 9,378,707 7,781,207 6,813,807 3,650,807 3,662,607
Fund Balance as a Percent of Expenditures 186% 135% 128% 47% 77%
FLEET OPERATIONS FUND (621)
346

FLEET OPERATIONS FUNDREVENUES
Account Account Actual Actual Proj Actual Budget Budget $ %Number Description 2019 2020 2021 2021 2022 Inc (Dec) Inc (Dec)
621-0000-431.24-00 Wheeling Bus Maintenance 166 0 0 15,000 0 (15,000) (100.0%)General Government Fees 166 0 0 15,000 0 (15,000) (100.0%)
621-0000-441.20-00 Vehicle Code Violation Fines 12,589 1,519 300 20,000 20,000 0 0.0%Fines 12,589 1,519 300 20,000 20,000 0 0.0%
621-0000-451.68-00 Charges To Operations 3,677,200 3,528,700 3,697,300 3,697,300 3,773,700 76,400 2.1%Charges for Services 3,677,200 3,528,700 3,697,300 3,697,300 3,773,700 76,400 2.1%
621-0000-461.02-00 Interest on Investments 130,169 34,629 2,300 49,000 49,000 0 0.0%621-0000-462.10-00 Market Value Adjustments 48,345 5,110 3,800 5,000 5,000 0 0.0%
Interest Income 178,514 39,739 6,100 54,000 54,000 0 0.0%
621-0000-471.15-00 Property Damage G B Pay 14,539 20,725 13,300 0 0 0 N/AInsurance/Property Damage 14,539 20,725 13,300 0 0 0 N/A
621-0000-472.24-00 Sale of Equipment 73,960 129,202 50,000 0 0 0 N/A621-0000-472.26-00 Non Village Fuel Sales 126,620 76,593 90,500 130,000 130,000 0 0.0%
Sales 200,580 205,795 140,500 130,000 130,000 0 0.0%
621-0000-489.90-00 Other Income 7,773 33 0 0 0 0 N/AOther 7,773 33 0 0 0 0 N/A
621-0000-491.05-00 Operating Transfer In 0 0 0 0 2,500,000 2,500,000 N/AOther Financing Sources 0 0 0 0 2,500,000 2,500,000 N/A
Total Fleet Operations Fund 4,091,361 3,796,511 3,857,500 3,916,300 6,477,700 2,561,400 65.4%
347

VILLAGE OF ARLINGTON HEIGHTS
2022 CHARGES TO OPERATIONS FOR VEHICLE LEASE CHARGESTOTAL CHARGES
MAINTENANCE FEE DEPRECIATION
FUND DEPT OPERATION 2021 2022 VARIANCE 2021 2022 VARIANCE 2021 2022 VARIANCE
101 3001-511 Police $377,900 $418,200 $40,300 $144,800 $132,400 ($12,400) $522,700 $550,600 $27,900
101 3501-512 Fire 639,400 685,100 45,700 435,000 428,500 (6,500) 1,074,400 1,113,600 39,200
101 4001-521 Planning & Community Devlp 3,100 2,200 (900) 1,500 1,500 0 4,600 3,700 (900)
101 4501-523 Building & Life Safety 37,900 35,300 (2,600) 14,100 12,700 (1,400) 52,000 48,000 (4,000)
101 7001-523 Health Services 24,600 19,600 (5,000) 8,800 5,200 (3,600) 33,400 24,800 (8,600)
101 7101-531 Public Works 928,800 902,000 (26,800) 489,500 506,100 16,600 1,418,300 1,408,100 (10,200)
Sub-Total General Fund $2,011,700 $2,062,400 $50,700 $1,093,700 $1,086,400 ($7,300) $3,105,400 $3,148,800 $43,400
235 3001-532 Police 6,200 4,400 (1,800) 2,300 2,300 0 8,500 6,700 (1,800)
235 7101-532 Public Works 24,200 28,200 4,000 11,700 5,200 (6,500) 35,900 33,400 (2,500)
505 7201-561 Water Utilities 333,700 347,800 14,100 197,200 219,600 22,400 530,900 567,400 36,500
621 7501-551 Municipal Fleet Services 10,600 13,000 2,400 1,200 1,200 0 11,800 14,200 2,400
625 0601-553 IT 3,000 3,200 200 1,800 0 (1,800) 4,800 3,200 (1,600)
Sub-Total Other Funds $377,700 $396,600 $18,900 $214,200 $228,300 $14,100 $591,900 $624,900 $33,000
TOTAL CHARGES ALL FUNDS $2,389,400 $2,459,000 $69,600 $1,307,900 $1,314,700 $6,800 $3,697,300 $3,773,700 $76,400
VEHICLE/EQUIP LEASE CHARGE
348

FLEET SERVICES Fleet Operations Fund
Class
Code Title Grade 2021 2022 + (-)
Vehicle Maintenance Foreman II 7 1.00 1.00
Lead Automotive Technician 7 1.00 1.00
Automotive Technician II 6 3.00 3.00
Automotive Technician I 5 2.00 2.00
Storekeeper Supervisor 3 1.00 1.00
Welder 3 1.00 1.00
Storekeeper 1 1.00 1.00
Store Clerk 1 0.50 0.50
Total F-T-E 10.50 10.50 0.00
Code Fund 2021 2022 + (-)
101 General Fund 51.25 51.25
505 Water & Sewer Fund 40.75 40.75
621 Fleet Operations Fund 10.50 10.50
Total F-T-E All Funds 102.50 102.50 0.00
PERSONNEL SUMMARY
Authorized Positions in F-T-E
Public Works DepartmentCross Reference to All Funds
Authorized Positions in F-T-E
349

FLEET OPERATIONS FUNDEXPENDITURES
Municipal Fleet Services 7501
Account Account Actual Actual Proj. Act. Budget Budget $ %Number Description 2019 2020 2021 2021 2022 Inc (Dec) Inc (Dec)
621-7501-551.10-01 Salaries 999,201 1,034,620 1,074,700 1,070,400 1,105,700 35,300 3.3%621-7501-551.18-01 Temporary Help 4,192 1,120 9,300 9,300 9,500 200 2.2%621-7501-551.18-05 Overtime Civilian 47,397 37,497 60,100 60,100 61,500 1,400 2.3%
Salaries 1,050,790 1,073,237 1,144,100 1,139,800 1,176,700 36,900 3.2%
621-7501-551.19-01 Workers Compensation 49,600 50,600 53,100 53,100 59,000 5,900 11.1%621-7501-551.19-05 Medical Insurance 189,700 230,800 204,900 204,900 212,900 8,000 3.9%621-7501-551.19-10 IMRF 103,498 132,819 138,000 137,500 129,800 (7,700) (5.6%)621-7501-551.19-11 Social Security 63,698 65,069 71,000 70,700 73,000 2,300 3.3%621-7501-551.19-12 Medicare 14,897 15,218 16,600 16,500 17,100 600 3.6%621-7501-551.19-15 Compensated Absences 0 10,092 0 0 0 0 N/A
Fringe Benefits 421,393 504,598 483,600 482,700 491,800 9,100 1.9%
621-7501-551.21-02 Equipment Maintenance 21,476 11,622 38,800 38,800 25,200 (13,600) (35.1%)621-7501-551.21-07 Vehicle Equipment Maint 239,323 145,062 267,000 267,000 250,000 (17,000) (6.4%)621-7501-551.21-08 Vehicle Damage 26,671 9,765 35,000 35,000 35,000 0 0.0%621-7501-551.21-36 Equipment Rental 1,996 1,957 3,000 3,000 2,500 (500) (16.7%)621-7501-551.21-62 Disposal Services 3,118 1,786 2,000 2,000 2,000 0 0.0%621-7501-551.21-65 Other Services 40 0 0 0 0 0 N/A621-7501-551.22-02 Dues 281 2,419 1,500 1,500 1,500 0 0.0%621-7501-551.22-03 Training 5,866 4,543 5,200 5,200 5,400 200 3.8%621-7501-551.22-05 Postage 175 141 300 300 300 0 0.0%621-7501-551.22-10 Printing 48 40 400 400 400 0 0.0%621-7501-551.22-25 IT/GIS Service Charge 31,900 34,100 34,700 34,700 40,000 5,300 15.3%621-7501-551.22-37 Vehicle/Equip Lease Chrg 19,800 8,500 11,800 11,800 14,200 2,400 20.3%
Contractual Services 350,694 219,935 399,700 399,700 376,500 (23,200) (5.8%)
621-7501-551.30-01 Publications Periodicals 64 0 100 100 100 0 0.0%621-7501-551.30-05 Office Supplies & Equip 175 366 700 700 500 (200) (28.6%)621-7501-551.30-35 Clothing 5,498 5,134 6,400 6,400 6,400 0 0.0%621-7501-551.30-50 Petroleum Products 2,084 7,354 2,100 2,100 2,600 500 23.8%621-7501-551.30-55 Non Village Fuel Resale 108,647 60,013 121,000 121,000 99,000 (22,000) (18.2%)621-7501-551.31-50 Vehicle Maintenance Sup 262,606 191,918 262,500 262,500 262,500 0 0.0%621-7501-551.31-65 Other Equip & Supplies 12,489 16,093 14,200 14,200 14,100 (100) (0.7%)621-7501-551.31-85 Small Tools and Equipment 2,446 6,851 4,200 4,200 4,200 0 0.0%621-7501-551.33-05 Other Supplies 42 2,080 0 0 0 0 N/A
Commodities 394,051 289,809 411,200 411,200 389,400 (21,800) (5.3%)
621-7501-551.40-95 Wheeling Bus Maintenance 104 35 0 0 0 0 N/A621-7501-551.40-96 Operating Contingency 0 0 30,000 30,000 30,000 0 0.0%621-7501-551.42-79 OPEB Liability Expense 0 0 5,000 5,000 5,000 0 0.0%
Other Charges 104 35 35,000 35,000 35,000 0 0.0%
621-7501-551.50-20 Building Improvements 0 0 53,000 53,000 0 (53,000) (100.0%)Other Charges 0 0 53,000 53,000 0 (53,000) (100.0%)
Total Mun. Fleet Services 2,217,032 2,087,614 2,526,600 2,521,400 2,469,400 1,000 (2.1%)
350

FLEET OPERATIONS FUNDEXPENDITURES
Equipment 9003
Account Account Actual Actual Proj. Act. Budget Budget $ %Number Description 2019 2020 2021 2021 2022 Inc (Dec) Inc (Dec)
621-9003-572.50-05 Vehicle Equipment 1,410,125 1,077,884 1,856,500 1,856,498 2,562,100 705,602 38.0%Capital Outlay 1,410,125 1,077,884 1,856,500 1,856,498 2,562,100 705,602 38.0%
Total Equipment 1,410,125 1,077,884 1,856,500 1,856,498 2,562,100 705,602 38.0%
Total Fleet Operations Fund 3,627,157 3,165,498 4,383,100 4,377,898 5,031,500 706,602 14.9%
351

FLEET OPERATIONS FUNDEXPENDITURE DETAIL
MUNICIPAL FLEET SERVICES 7501
AccountNumber Account Title Description
SALARIES:
621-7501-551.10-01 Salaries Salaries 1,070,400 1,105,700
621-7501-551.18-01 Temporary Help Temporary Help 9,300 9,500
621-7501-551.18-05 Overtime Civilian Overtime Civilian 60,100 61,500
TOTAL SALARIES 1,139,800 1,176,700
FRINGE BENEFITS:
621-7501-551.19-01 Workers' Compensation Workers' Compensation Insurance 53,100 59,000
621-7501-551.19-05 Medical Insurance Medical Insurance 204,900 212,900
621-7501-551.19-10 IMRF IMRF 137,500 129,800
621-7501-551.19-11 Social Security Social Security 70,700 73,000
621-7501-551.19-12 Medicare Medicare 16,500 17,100
TOTAL FRINGE BENEFITS 482,700 491,800
CONTRACTUAL SERVICES:
621-7501-551.21-02 Equipment Maintenance Fleet/ Inv. Software Support & Subscriptions 12,000 12,000Fuel Master 10,000 10,000Diagnostic equipment 2,500 2,500Overhead crane 700 700Prior Year Encumbrance Carryover 13,600 38,800 0 25,200
621-7501-551.21-07 Vehicle Equip. Maint. Vehicle equipment maintenancePolice 25,000 20,000Fire 110,000 110,000Building 7,000 5,000Health 7,000 5,000IT 7,000 4,500Planning 7,000 5,000PW Maint 80,000 80,000PW Utility 10,000 10,000PW Fleet 7,000 5,500Parking 7,000 267,000 5,000 250,000
621-7501-551.21-08 Vehicle Damage Vehicle accident repair 35,000 35,000
621-7501-551.21-36 Equipment Rental Monthly pressure cylinders 3,000 2,500
621-7501-551.21-62 Disposal Services Removal of special and hazardous waste and scrap tires 2,000 2,000
621-7501-551.22-02 Dues Dues 1,500 1,500
Budget2022
Budget2021
352

FLEET OPERATIONS FUNDEXPENDITURE DETAIL
MUNICIPAL FLEET SERVICES (cont.) 7501
AccountNumber Account Title Description
621-7501-551.22-03 Training Elect. and Computer Cntrl. 500 500Mechanic Test (ASE) 1,000 1,000In-service Training 500 500APWA (10 @ 20) 400 500Fleet Management Program 700 800Police and Fire Equipment Training 2,100 5,200 2,100 5,400
621-7501-551.22-05 Postage Postage 300 300
621-7501-551.22-10 Printing Shop orders, time cards, decals 400 400
621-7501-551.22-25 IT/GIS Service Charge IT/GIS Service Charge 34,700 40,000
621-7501-551.22-37 Vehicle/Equip Lease Chrg Vehicle lease charge 11,800 14,200
TOTAL CONTRACTUAL SERVICES 399,700 376,500
COMMODITIES:
621-7501-551.30-01 Publications/Periodicals Miscellaneous publications 100 100
621-7501-551.30-05 Office Supplies & Equip. General office supplies 700 500
621-7501-551.30-35 Clothing Uniform rental 2,800 2,800Boots, rainwear, gloves & misc. clothing 2,500 2,500Safety glasses, goggles, safety shoes, hard hats & misc. safety equipment 1,100 6,400 1,100 6,400
621-7501-551.30-50 Petroleum Products Gasoline for department vehicle(s) 2,100 2,600
621-7501-551.30-55 Non-Village Petro Resale Non-Village Petroleum Resale 121,000 99,000
621-7501-551.31-50 Vehicle Maintenance Supl Public Works Maintenance 100,000 100,000Public Works Fleet 2,500 2,500Manager's Office / IT 700 700Police 56,000 56,000Fire 35,000 35,000Planning & Community Development 800 800Building Services 5,000 5,000Health Services 2,500 2,500Water/Sewer - PW Utility 55,000 55,000Parking 5,000 262,500 5,000 262,500
621-7501-551.31-65 Other Equip. & Supplies Drill bits and hoses 2,000 2,000General Maintenance Materials 6,000 6,000Welding supplies 4,000 4,000Tire repair supplies 800 800Wiping rags, first aid & misc. supplies 1,400 14,200 1,300 14,100
621-7501-551.31-85 Small Tools & Equipment Misc. small tools & equipment 4,200 4,200
TOTAL COMMODITIES 411,200 389,400
2022BudgetBudget
2022
353
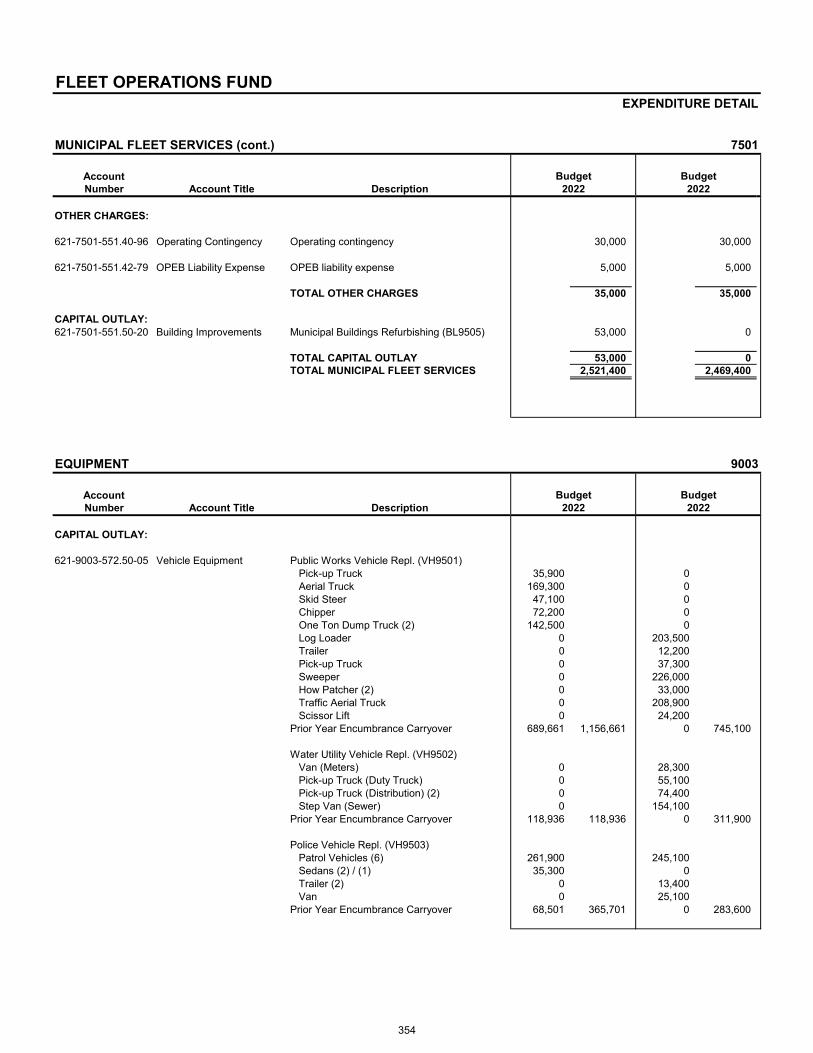
FLEET OPERATIONS FUNDEXPENDITURE DETAIL
MUNICIPAL FLEET SERVICES (cont.) 7501
AccountNumber Account Title Description
OTHER CHARGES:
621-7501-551.40-96 Operating Contingency Operating contingency 30,000 30,000
621-7501-551.42-79 OPEB Liability Expense OPEB liability expense 5,000 5,000
TOTAL OTHER CHARGES 35,000 35,000
CAPITAL OUTLAY:621-7501-551.50-20 Building Improvements Municipal Buildings Refurbishing (BL9505) 53,000 0
TOTAL CAPITAL OUTLAY 53,000 0TOTAL MUNICIPAL FLEET SERVICES 2,521,400 2,469,400
EQUIPMENT 9003
AccountNumber Account Title Description
CAPITAL OUTLAY:
621-9003-572.50-05 Vehicle Equipment Public Works Vehicle Repl. (VH9501)Pick-up Truck 35,900 0Aerial Truck 169,300 0Skid Steer 47,100 0Chipper 72,200 0One Ton Dump Truck (2) 142,500 0Log Loader 0 203,500Trailer 0 12,200Pick-up Truck 0 37,300Sweeper 0 226,000How Patcher (2) 0 33,000Traffic Aerial Truck 0 208,900Scissor Lift 0 24,200
Prior Year Encumbrance Carryover 689,661 1,156,661 0 745,100
Water Utility Vehicle Repl. (VH9502)Van (Meters) 0 28,300Pick-up Truck (Duty Truck) 0 55,100Pick-up Truck (Distribution) (2) 0 74,400Step Van (Sewer) 0 154,100
Prior Year Encumbrance Carryover 118,936 118,936 0 311,900
Police Vehicle Repl. (VH9503)Patrol Vehicles (6) 261,900 245,100Sedans (2) / (1) 35,300 0Trailer (2) 0 13,400Van 0 25,100
Prior Year Encumbrance Carryover 68,501 365,701 0 283,600
Budget2022
Budget2022
Budget2022
Budget2022
354

FLEET OPERATIONS FUNDEXPENDITURE DETAIL
EQUIPMENT (cont.) 9003
AccountNumber Account Title Description
Fire Vehicle Repl. (VH9504)Pick-up Truck 38,200 0Trailer 20,000 0Command Van 0 52,800Fire Engine 0 791,500Ambulance 0 58,200 334,900 1,179,200
Public Works Fleet Vehicle Repl. (VH9506)Utility Body 48,000 0
Municipal Parking Vehicle Repl. (VH9508)Sweeper Small 109,000 0
Building & Health Vehicle Repl. (VH9510)Hybrid SUV 0 42,300
TOTAL CAPITAL OUTLAY 1,856,498 2,562,100TOTAL EQUIPMENT 1,856,498 2,562,100
TOTAL FLEET OPERATIONS FUND 4,377,898 5,031,500
Budget Budget2022 2022
355

THIS PAGE LEFT BLANK
356

IT Manager
Assistant Village Manager
Administration Systems Network GIS
TECHNOLOGY FUND ORGANIZATION STRUCTURE
357

TECHNOLOGY FUND 625 Fund at a Glance
This fund was created to accumulate the costs of providing technology services to all departments and operations of the Village. There are currently two divisions in the Technology Fund, Information Technology (IT) and Geographic Information Systems (GIS). The Technology Fund falls under the general management of the Assistant Village Manager, but daily operations are managed by the IT Manager.
Restrictions: VILLAGE POLICY – It is the intent of the Village to charge each fund and department for its share of the costs of providing technology services. Costs are allocated among individual departments in the General, Health Insurance, Fleet, and Water & Sewer Funds for IT and GIS activities based on the number of computers used in each department.
Information Technology Division
The Information Technology (IT) operation is responsible for managing all computer and information system operations of the Village, except for specialized uses, which are handled through the NWCDS police and fire dispatching cooperative. Each department is responsible for the operation and ongoing training needed to utilize their specific software applications.
The IT Division consists of six technical staff. In addition to managing computer systems for the Village, the IT Manager provides for periodic review of Village and departmental operations to ensure they are effectively utilizing automation.
Computer services for the Village are provided through the following services and equipment:
Enterprise Resource Planning (ERP) system – An in-house computer system provides software to support the Village’s financial, utility billing and land management needs. This system utilizes an IBM iSeries computer and HTE Municipal software. Based on the Village’s new high-speed internet contract with Comcast, the Village moved to a cloud computing service with H.T.E.
Computer Network Infrastructure – A high-speed computer network utilizing Microsoft network protocol supports PCs and related peripheral equipment at the Village Hall and seven remote sites. There are 507 personal computers that provide access to financial, administrative and office automation applications. These personal computers also provide word processing, spreadsheet and database capabilities, as well as specialized department specific applications.
Police and Fire Dispatching and Routing – The Village jointly owns with twelve other communities a cooperative dispatch system called the Northwest Central Dispatch Service (NWCDS) to provide Fire and Police dispatch services.
Geographic Information Systems (GIS)
Geographic Information Systems (GIS) is a computer-based information system, which captures, stores, manipulates, analyzes and displays spatially referenced and associated attribute data for solving complex research, planning and management problems.
The Village is a member of the GIS Consortium, which is an organization of Chicago-area communities unified by a common goal: to share resources, information, staffing, and technology so that municipalities can optimize the value of geographic information systems (GIS). The day-to-day GIS activities are performed by GIS Consortium service provider (MGP Inc.) staff member. The oversight of the village GIS System is jointly shared by between IT Manager and the Assist Village Manager.
358

TECHNOLOGY FUND (Continued)
2021 Accomplishments
NWCD Motorola Project - Worked with Police and Fire Departments during various stage of the project to ensure a successful transaction to the new Motorola CAD dispatching system for the entire fleet of 120 Public Safety computers.
Replacement of the Village Virtual Server Infrastructure - In an effort to keep the Village IT systems running with minimal downtime, the virtual server infrastructure hardware has been refreshed as it reached manufactures end of support timeframe. This infrastructure is responsible for hosting all Village virtual servers and applications used by all departments.
2022 Strategic Priorities & Key Projects
1. Internal Technology Consulting and Departmental AssessmentsStrategic Priority #6: Ensure that Organization has the Resources and Training to Maintain Focus onConsistent High-Quality Core Services & Infrastructure
Continue to provide technical assistance and expertise on various department projects to better leverage technology in their day to day operation. Anticipated major projects for 2022 that IT will be involved including: ERP implementation, Police Body Camera deployment, and Smart Water Meter Replacement project.
Project Lead: Robert Taraszka, IT Manager
2. Microsoft Teams and OneDriveStrategic Priority #6: Ensure that Organization has the Resources and Training to Maintain Focus onConsistent High-Quality Core Services & Infrastructure
IT Staff will continue to work with staff to help them adapt the OneDrive and Teams technologies.
Project Lead: Robert Taraszka, IT Manager
Performance Measures 2018 2019 2020
1. Total # of PC’s/Laptops/Tablets# of PC’s/Laptops replaced% of PC’s/Laptops replaced
492 84
17.07%
507 61
12.03%
527 83
15.78%
2. Total # of printers# of printers replaced% of printers replaced
171 12
7.01%
177 12
6.77%
180 11
6.15%
3. # of Help Desk service calls 2,840 3,223 3613
359

TECHNOLOGY FUND (Continued)
Hardware Inventory
*Includes IT loaners temporarily assigned to that department
Department Computer Printers Servers Switches Routers Mayor/Board of Trustees 4 0 n/a n/a n/a Manager’s Office 12 4 n/a n/a n/a Human Resources 11* 7 n/a n/a n/a Legal 3 2 n/a n/a n/a Finance 23* 22 n/a n/a n/a Police 166* 43 n/a n/a n/a Fire 64* 25 n/a n/a n/a Planning 16* 5 n/a n/a n/a Building Services 28* 12 n/a n/a n/a Health Services 16* 10 n/a n/a n/a Senior Services 18 13 n/a n/a n/a Engineering 19* 7 n/a n/a n/a Public Works 86 21 n/a n/a n/a Sub-Total: Depts. not incl. IT/GIS 466 171 n/a n/a n/a IT/GIS
User & Testing Workstations 16 8 55 37 5 Training Room 13 1 n/a n/a n/a Fire Station #2 EOC 12 0 n/a 1 n/a Loaners/Spare (remaining in IT) 20 0 n/a n/a n/a
Sub-Total: IT/GIS 61 9 55 37 5 Total 526 180 55 37 5
307 284 262 306 282 255 264 235 214 306 222 247
360252 320 300 326 349 260 241 313
313278 301
278237
350 394 279 275279
Number of IT Requests per Month
No. of Support Calls 2019 No. of Support Calls 2020 No. of Support Calls 2021
360

TECHNOLOGY FUND (Continued)
Fund Summary
2019 2020 2021 2021 2022 $ %Actual Actual Est. Actual Budget Budget Change Change
RevenuesService Charges $1,694,600 $1,858,700 $1,885,600 $1,885,600 $2,334,200 $448,600 23.8%Interest Income 60,404 14,786 2,500 6,000 6,000 0 0.0%Other 4,236 0 0 0 0 0 N/A
Total Revenues $1,759,240 $1,873,486 $1,888,100 $1,891,600 $2,340,200 $448,600 23.7%Interfund Transfers In 0 0 2,000,000 2,000,000 0 (2,000,000) (100.0%)
Total Revenues andInterfund Transfers In $1,759,240 $1,873,486 $3,888,100 $3,891,600 $2,340,200 ($1,551,400) (39.9%)
ExpendituresPersonal Services $689,491 $842,036 $840,400 $880,400 $1,026,600 $146,200 16.6%Contractual Services 603,094 594,557 694,100 694,100 1,221,900 527,800 76.0%Commodities 61,161 69,480 75,600 75,550 71,000 (4,550) (6.0%)Other Charges 0 0 0 5,000 2,000 (3,000) (60.0%)Capital Items 168,863 263,421 2,796,500 4,264,505 241,800 (4,022,705) (94.3%)
Total Expenditures $1,522,609 $1,769,494 $4,406,600 $5,919,555 $2,563,300 ($3,356,255) (56.7%)Interfund Transfers Out 0 0 0 0 0 0 N/A
Total Expenditures andInterfund Transfers Out $1,522,609 $1,769,494 $4,406,600 $5,919,555 $2,563,300 ($3,356,255) (56.7%)
Revenues over(under) Expenditures $236,631 $103,992 ($518,500) ($2,027,955) ($223,100) $1,804,855 (89.0%)
BEGINNING WORKING CASH 2,470,246 2,706,877 2,810,869 2,810,869 2,292,369 (518,500) (18.4%)
ENDING WORKING CASH $2,706,877 $2,810,869 $2,292,369 $782,914 $2,069,269 $1,286,355 164.3%
361

5 YEAR CAPITAL IMPROVEMENT PROGRAM (CIP)actuals 67%
20212019 2020 ESTIMATED 2021 2022 2023 2024 2025 2026
ACCOUNT DESCRIPTION PROJ # ACTUAL ACTUAL ACTUAL BUDGET BUDGET BUDGET BUDGET BUDGET BUDGET
REVENUESCHARGES TO OPERATIONS 1,669,500 1,858,700 1,885,600 1,885,600 2,334,200 2,385,900 2,432,500 2,345,200 2,379,000CHARGES TO OPERATIONS - LIBRARY 25,100 0 0 0 0 0 0 0 0INTEREST INCOME 60,404 14,786 2,500 6,000 6,000 6,000 6,000 6,000 6,000OTHER INCOME 4,236 0 0 0 0 0 0 0 0OPERATING TRANSFER IN 0 0 2,000,000 2,000,000 0 0 0 0 0TOTAL REVENUES 1,759,240 1,873,486 3,888,100 3,891,600 2,340,200 2,391,900 2,438,500 2,351,200 2,385,000
EXPENDITURESOPERATING EXPENDITURES
Personal Services 689,491 842,036 840,400 880,400 1,026,600 1,073,100 1,114,200 1,016,100 1,039,000Contractual Services 603,094 594,557 694,100 694,100 1,221,900 1,239,600 1,010,100 1,020,200 1,030,400Commodities 61,161 69,480 75,600 75,550 71,000 71,700 72,400 73,100 73,800Other Charges 0 0 0 5,000 2,000 0 0 0 0
SUBTOTAL - OPERATING EXPENDITURES 1,353,746 1,506,073 1,610,100 1,655,050 2,321,500 2,384,400 2,196,700 2,109,400 2,143,200
EQUIPMENTIT Equipment Replacement EQ-97-08 168,863 145,385 245,500 245,540 241,800 241,800 241,800 241,800 241,800Village ERP Software Replacement EQ-19-04 0 118,036 2,551,000 4,018,965 0 0 0 0 0
SUBTOTAL - EQUIPMENT 168,863 263,421 2,796,500 4,264,505 241,800 241,800 241,800 241,800 241,800
TOTAL EXPENDITURES 1,522,609 1,769,494 4,406,600 5,919,555 2,563,300 2,626,200 2,438,500 2,351,200 2,385,000
BEGINNING WORKING CASH 2,470,246 2,706,877 2,810,869 2,810,869 2,292,369 2,069,269 1,834,969 1,834,969 1,834,969REVENUES OVER (UNDER) EXPENDS. 236,631 103,992 (518,500) (2,027,955) (223,100) (234,300) 0 0 0ENDING WORKING CASH 2,706,877 2,810,869 2,292,369 782,914 2,069,269 1,834,969 1,834,969 1,834,969 1,834,969
Fund Balance as a Percent of Expenditures 81% 70% 75% 78% 77%
TECHNOLOGY FUND (625)
362
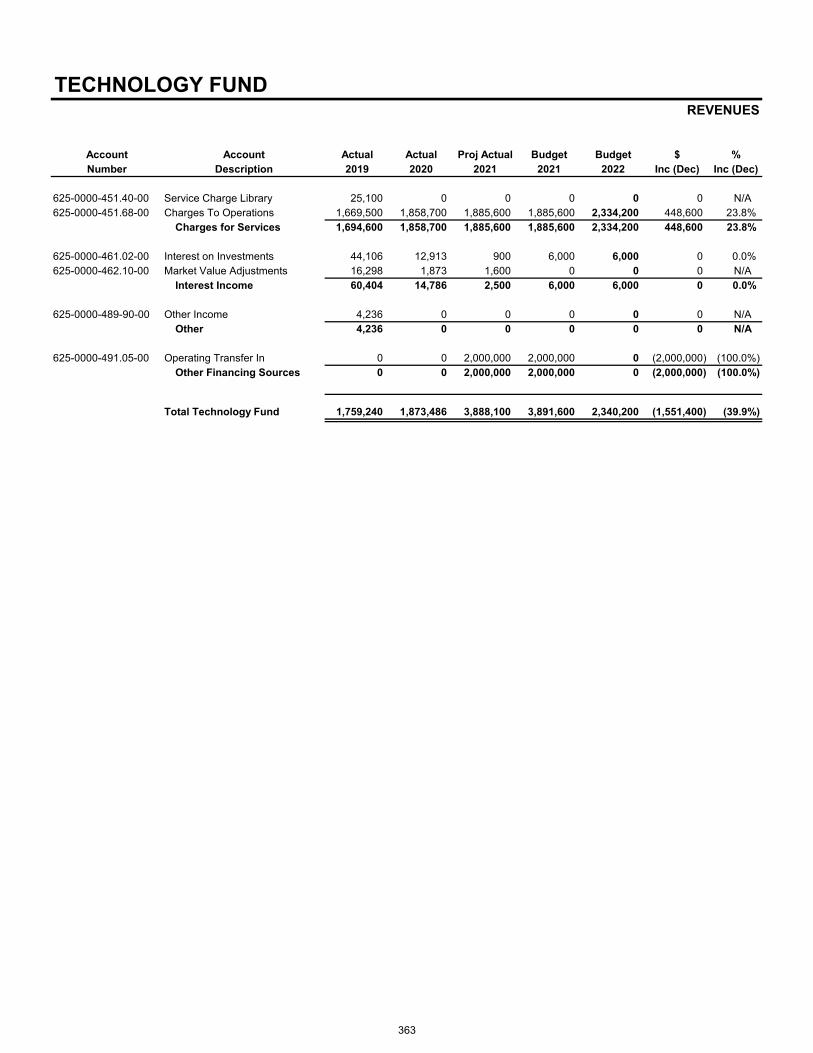
TECHNOLOGY FUNDREVENUES
Account Account Actual Actual Proj Actual Budget Budget $ %Number Description 2019 2020 2021 2021 2022 Inc (Dec) Inc (Dec)
625-0000-451.40-00 Service Charge Library 25,100 0 0 0 0 0 N/A625-0000-451.68-00 Charges To Operations 1,669,500 1,858,700 1,885,600 1,885,600 2,334,200 448,600 23.8%
Charges for Services 1,694,600 1,858,700 1,885,600 1,885,600 2,334,200 448,600 23.8%
625-0000-461.02-00 Interest on Investments 44,106 12,913 900 6,000 6,000 0 0.0%625-0000-462.10-00 Market Value Adjustments 16,298 1,873 1,600 0 0 0 N/A
Interest Income 60,404 14,786 2,500 6,000 6,000 0 0.0%
625-0000-489-90-00 Other Income 4,236 0 0 0 0 0 N/AOther 4,236 0 0 0 0 0 N/A
625-0000-491.05-00 Operating Transfer In 0 0 2,000,000 2,000,000 0 (2,000,000) (100.0%)Other Financing Sources 0 0 2,000,000 2,000,000 0 (2,000,000) (100.0%)
Total Technology Fund 1,759,240 1,873,486 3,888,100 3,891,600 2,340,200 (1,551,400) (39.9%)
363

VILLAGE OF ARLINGTON HEIGHTS
2022 CHARGES TO OPERATIONS FOR IT/GIS SERVICES
IT/GIS SERVICE CHARGE
FUND OPERATION 2021 2022 VARIANCE
101 0101-501 Board of Trustees 9,500 12,000 2,500
101 0201-502 Integrated Services 41,200 58,800 17,600
101 0301-503 Human Resources 28,400 32,000 3,600
101 0401-503 Legal Department 15,800 20,000 4,200
101 0501-503 Finance Department 37,900 48,000 10,100
101 3001-511 Police Department 635,600 733,500 97,900
101 3501-512 Fire Department 237,400 319,000 81,600
101 4001-521 Planning & Community Development 66,700 77,600 10,900
101 4501-523 Building & Life Safety 101,800 147,100 45,300
101 7001-541 Health Services 75,900 90,700 14,800
101 7007-541 Senior Services 53,600 72,000 18,400
101 7101-531 Public Works Department 301,900 407,700 105,800
Sub-Total General Fund $1,605,700 $2,018,400 $412,700
235 3001-532 Parking - Police 3,200 8,000 4,800
505 0501-503 Water & Sewer - Finance Department 57,600 67,200 9,600
505 7201-561 Water & Sewer - Water Utility 178,000 192,600 14,600
605 0301-552 Health Insurance - Human Resources 3,200 4,000 800
615 0301-552 Workers' Comp - Human Resources 3,200 4,000 800
621 7501-551 Fleet Operations - Mun. Fleet Services 34,700 40,000 5,300
Sub-Total Other Funds $279,900 $315,800 $35,900
TOTAL VILLAGE $1,885,600 $2,334,200 $448,600
291 6008-601 Memorial Library $0 $0 $0
TOTAL VILLAGE & LIBRARY $1,885,600 $2,334,200 $448,600
Note: Village IT/GIS service charges are calculated as follows: The number of computers inventoried in each cost center at a point in time is divided by the total number of computers at the same point in time. The resulting percentage is multiplied by the total IT portion of the proposed budget (including the IT Equipment Replacement Program) which is calculated by subtracting the GIS portion of the budget from the total IT/GIS budget. The GIS level of support percentage is assigned to each cost center (not all cost centers are charged for GIS services) as provided by the GIS Manager. The percentage is multiplied by the total GIS portion of the proposed budget. These two caculations for each cost center are added together for the IT/GIS Service Charge.
364

IT Technology Fund
Class
Code Title Grade 2021 2022 + (-)
IT Manager 10 1.00 1.00
Systems Engineer 8 1.00 1.00
Enterprise Systems Analyst 5 1.00 2.00 1.00
Applications Programmer 5 1.00 1.00
IT Support Analyst 4 1.00 1.00
IT Specialist 4 1.00 1.00
Total F-T-E 6.00 7.00 1.00
Code Fund 2021 2022 + (-)
101 General Fund 5.50 5.50
625 Technology Fund 6.00 7.00 1.00
Total F-T-E All Funds 11.50 12.50 1.00
PERSONNEL SUMMARY
Authorized Positions in F-T-E
Integrated Services DepartmentCross Reference to All Funds
Authorized Positions in F-T-E
365

TECHNOLOGY FUNDEXPENDITURES
Information Technology / GIS 0601
Account Account Actual Actual Proj. Act. Budget Budget $ %Number Description 2019 2020 2021 2021 2022 Inc (Dec) Inc (Dec)
625-0601-553.10-01 Salaries 504,556 571,383 585,700 619,000 707,700 88,700 14.3%625-0601-553.18-01 Temporary Help 0 0 10,500 10,500 10,700 200 1.9%625-0601-553.18-05 Overtime Civilian 0 0 4,100 4,100 4,200 100 2.4%
Salaries 504,556 571,383 600,300 633,600 722,600 89,000 14.0%
625-0601-553.19-01 Workers Compensation 600 600 600 600 700 100 16.7%625-0601-553.19-05 Medical Insurance 101,100 132,600 119,600 119,600 166,300 46,700 39.0%625-0601-553.19-10 IMRF 50,861 72,214 74,000 78,100 81,700 3,600 4.6%625-0601-553.19-11 Social Security 29,905 34,153 37,200 39,300 44,800 5,500 14.0%625-0601-553.19-12 Medicare 6,994 7,987 8,700 9,200 10,500 1,300 14.1%625-0601-553.19-15 Compensated Absences (4,525) 23,099 0 0 0 0 N/A
Fringe Benefits 184,935 270,653 240,100 246,800 304,000 57,200 23.2%
625-0601-553.20-05 Professional Services 218,281 193,077 217,000 217,000 219,200 2,200 1.0%625-0601-553.20-39 Data Processing Services 254,661 244,077 283,200 283,200 810,200 527,000 186.1%625-0601-553.20-40 General Insurance 5,300 5,400 5,500 5,500 3,900 (1,600) (29.1%)625-0601-553.21-02 Equipment Maintenance 28,092 36,040 44,100 44,100 44,500 400 0.9%625-0601-553.21-65 Other Services 88,051 101,154 124,500 124,500 125,700 1,200 1.0%625-0601-553.22-02 Dues 475 475 1,100 1,100 1,100 0 0.0%625-0601-553.22-03 Training 3,155 9,322 12,000 12,000 12,100 100 0.8%625-0601-553.22-05 Postage 66 543 1,000 1,000 1,000 0 0.0%625-0601-553.22-15 Photocopying 13 69 1,000 1,000 1,000 0 0.0%625-0601-553.22-37 Vehicle/Equip Lease Chrg 5,000 4,400 4,700 4,700 3,200 (1,500) (31.9%)
Contractual Services 603,094 594,557 694,100 694,100 1,221,900 527,800 76.0%
625-0601-553.30-01 Publications Periodicals 0 0 3,300 3,300 3,300 0 0.0%625-0601-553.30-05 Office Supplies & Equip 1,743 3,126 5,000 5,000 5,000 0 0.0%625-0601-553.30-50 Petroleum Products 59 40 100 100 100 0 0.0%625-0601-553.33-05 Other Supplies 59,359 66,314 67,200 67,150 62,600 (4,550) (6.8%)
Commodities 61,161 69,480 75,600 75,550 71,000 (4,550) (6.0%)
625-0601-553.42-79 OPEB Liability Expense 0 0 0 5,000 2,000 (3,000) (60.0%)Other Charges 0 0 0 5,000 2,000 (3,000) (60.0%)
625-0601-572.50-10 Office Equipment 168,863 263,421 2,796,500 4,264,505 241,800 (4,022,705) (94.3%)Capital Outlay 168,863 263,421 2,796,500 4,264,505 241,800 (4,022,705) (94.3%)
Total Technology Fund 1,522,609 1,769,494 4,406,600 5,919,555 2,563,300 (3,356,255) (56.7%)
366

TECHNOLOGY FUNDEXPENDITURE DETAIL
INFORMATION TECHNOLOGY / GEOGRAPHIC INFORMATION SYSTEMS 0601
AccountNumber Account Title Description
SALARIES:
625-0601-553.10-01 Salaries Salaries 619,000 707,700
625-0601-553.18-01 Temporary Help Temporary Help 10,500 10,700
625-0601-553.18-05 Overtime Civilian Overtime Civilian 4,100 4,200
TOTAL SALARIES 633,600 722,600
FRINGE BENEFITS:
625-0601-553.19-01 Workers' Compensation Workers' Compensation Insurance 600 700
625-0601-553.19-05 Medical Insurance Medical Insurance 119,600 166,300
625-0601-553.19-10 IMRF IMRF 78,100 81,700
625-0601-553.19-11 Social Security Social Security 39,300 44,800
625-0601-553.19-12 Medicare Medicare 9,200 10,500
TOTAL FRINGE BENEFITS 246,800 304,000
CONTRACTUAL SERVICES:
625-0601-553.20-05 Professional Services GIS Consortium 217,000 219,200
625-0601-553.20-39 Data Processing Services Programming/support services:Disaster Recovery Project 12,400 12,500Web Maintenance Project 12,200 12,300HTE services (ASP) 221,700 223,100
Prior Year Encumbrance CarryoverTwo-Factor Maintenance Renewal 6,000 6,100Business Process Improvement 11,500 11,600NovusAGENDA electronic packets 19,400 19,600Tyler Services 0 283,200 525,000 810,200
625-0601-553.20-40 General Insurance Liability and property insurance 5,500 3,900
625-0601-553.21-02 Equipment Maintenance Mini-computer and support equipmentmaintenance
GIS 23,200 23,200Printers 7,000 7,000Routers/Switches 5,000 5,200Network 8,900 44,100 9,100 44,500
625-0601-553.21-65 Other Services Internet services 80,000 80,000Seamless Gov - Interactive Forms for Web 8,500 8,500Police squad car wireless service 18,000 18,300Fire vehicles wireless service 5,000 5,200Cell Phone Charges 5,000 5,200Laserfiche Licenses 8,000 124,500 8,500 125,700
625-0601-553.22-02 Dues Dues and professional membershipsIT (GMIS) 700 700GIS (ILGISA/URISA/AAG) 400 1,100 400 1,100
Budget2021
Budget2022
367

TECHNOLOGY FUNDEXPENDITURE DETAIL
INFORMATION TECHNOLOGY / GEOGRAPHIC INFORMATION SYSTEMS (cont.) 0601
AccountNumber Account Title Description
625-0601-553.22-03 Training Seminars and specialized trainingConferences 1,000 1,000Technical seminars & webinars 2,000 2,000End-user training 4,000 4,100User group seminars 1,500 1,500Tuition reimbursement 2,000 2,000Miscellaneous 1,500 12,000 1,500 12,100
625-0601-553.22-05 Postage Postage 1,000 1,000
625-0601-553.22-15 Photocopying Photocopies, supplies & maintenance 1,000 1,000
625-0601-553.22-37 Vehicle/Equip Lease Chrg Vehicle lease charge 4,700 3,200
TOTAL CONTRACTUAL SERVICES 694,100 1,221,900
COMMODITIES:
625-0601-553.30-01 Publications/Periodicals Periodicals and booksIT 3,300 3,300
625-0601-553.30-05 Office Supplies & Equip. General office suppliesIT 1,000 1,000GIS (includes media & cartriges for
Canon plotter and printer) 4,000 5,000 4,000 5,000
625-0601-553.30-50 Petroleum Products Gasoline for department vehicle(s) 100 100
625-0601-553.33-05 Other Supplies Computer software, etc.IT 61,900 62,600
Prior Year Encumbrance Carryover 5,250 67,150 0 62,600
TOTAL COMMODITIES 75,550 71,000
OTHER CHARGES:
625-0601-553.42-79 OPEB Liability Expense OPEB liability expense 5,000 2,000
TOTAL OTHER CHARGES 5,000 2,000
CAPITAL OUTLAY:
625-0601-572.50-10 Office Equipment IT Equipment Repl Program (EQ9708)PC, printer & server replacement 96,800 96,800Public Safety vehicle computer systems 145,000 145,000
Prior Year Encumbrance Carryover 3,740 245,540 0 241,800
Village ERP Software Replacement (EQ1904) 4,000,000 0Prior Year Encumbrance Carryover 18,965 4,018,965 0 0
TOTAL CAPITAL OUTLAY 4,264,505 241,800
TOTAL TECHNOLOGY FUND 5,919,555 2,563,300
2021Budget
2022Budget
368

Pensions
Police Pension Fund
Fire Pension Fund
PENSION FUNDS ORGANIZATION STRUCTURE
369

POLICE PENSION FUND 705 Fund at a Glance
The Village has been mandated by state law to provide for a separate Police Pension Plan. This fund is created for the purpose of providing for the retirement pensions for our police officers. The fund is administered locally and the fiduciary responsibility is placed upon the Village Treasurer and the Board of Trustees of the Police Pension Fund.
Restrictions:
State Law – The Police Pension Fund is locally administered as prescribed in Chapter 40 of the Illinois State Statutes. This fund must be separately accounted for and not commingled with other Village funds. The Village contracts for independent actuarial services.
Performance Measures 2018 2019 2020
1. # of Active Participants
# of Retired ParticipantsRegular Pensioners Duty Disability Pensioners Non-Duty Disability Pensioners Surviving Spouses
107
101 76
8 1
16
107
111 86
8 1
16
102
119 92
9 1
17
2. Actuarial Value of Fund Assets at December 31 $123,766,362 $148,346,308 $163,159,680
3. Total Actuarial Liability $167,769,855 $175,091,359 $182,236,547
4. Funded Ratio 73.77% 84.73% 89.53%
5. Annual Actuarial Investment Return As Percentageof Fund Assets at Dec 31 (4.79%) 19.97% 12.97%
6. Employer Annual Actuarial Funding Requirements $4,209,000 $4,073,000 $3,750,000
370

POLICE PENSION FUND (Continued)
Fund Summary
2019 2020 2021 2021 2022 $ %Actual Actual Est. Actual Budget Budget Change Change
RevenuesInterest Income $26,471,642 $18,659,137 $19,600,000 $4,400,000 $4,700,000 $300,000 6.8%Other 5,327,631 5,420,307 5,273,000 5,233,000 5,314,000 81,000 1.5%
Total Revenues $31,799,273 $24,079,444 $24,873,000 $9,633,000 $10,014,000 $381,000 4.0%Interfund Transfers In 1,250,000 0 0 0 0 0 N/A
Total Revenues andInterfund Transfers In $33,049,273 $24,079,444 $24,873,000 $9,633,000 $10,014,000 $381,000 4.0%
ExpendituresPersonal Services $7,965,693 $8,876,971 $10,327,300 $9,588,000 $10,702,400 $1,114,400 11.6%Contractual Services 404,460 346,027 483,300 424,500 107,500 (317,000) (74.7%)Commodities 197 0 300 600 600 0 0.0%Other Charges 98,976 42,974 0 26,000 25,000 (1,000) (3.8%)
Total Expenditures $8,469,326 $9,265,972 $10,810,900 $10,039,100 $10,835,500 $796,400 7.9%Interfund Transfers Out 0 0 0 0 0 0 N/A
Total Expenditures andInterfund Transfers Out $8,469,326 $9,265,972 $10,810,900 $10,039,100 $10,835,500 $796,400 7.9%
Revenues over(under) Expenditures $24,579,947 $14,813,472 $14,062,100 ($406,100) ($821,500) ($415,400) 102.3%
BEGINNING FUND BALANCE 123,766,260 148,346,207 163,159,679 163,159,679 177,221,779 14,062,100 8.6%
ENDING FUND BALANCE $148,346,207 $163,159,679 $177,221,779 $162,753,579 $176,400,279 $13,646,700 8.4%
371

POLICE PENSION FUNDREVENUES
Account Account Actual Actual Proj Actual Budget Budget $ %Number Description 2019 2020 2021 2021 2022 Inc (Dec) Inc (Dec)
705-0000-461.02-00 Interest on Investments 940,461 1,092,632 1,000,000 1,400,000 1,200,000 (200,000) (14.3%)Interest Income 940,461 1,092,632 1,000,000 1,400,000 1,200,000 (200,000) (14.3%)
705-0000-462.10-00 Market Value Adjustments 23,962,559 15,920,924 17,000,000 2,000,000 2,000,000 0 0.0%705-0000-462.11-00 Dividend Income 1,568,622 1,645,581 1,600,000 1,000,000 1,500,000 500,000 50.0%
Investment Income 25,531,181 17,566,505 18,600,000 3,000,000 3,500,000 500,000 16.7%
705-0000-485.86-00 Contributions Participant 1,104,071 1,171,314 1,200,000 1,160,000 1,200,000 40,000 3.4%705-0000-485.87-00 Contribution R/E Tax 4,017,000 4,209,000 4,073,000 4,073,000 4,114,000 41,000 1.0%705-0000-485.88-00 Portability Payments 200,910 39,245 0 0 0 0 N/A
Pension Contributions 5,321,981 5,419,559 5,273,000 5,233,000 5,314,000 81,000 1.5%
705-0000-489.90-00 Other Income 5,650 748 0 0 0 0 N/AOther 5,650 748 0 0 0 0 N/A
705-0000-491.05-00 Operating Transfer In 1,250,000 0 0 0 0 0 N/AOther Financing Sources 1,250,000 0 0 0 0 0 N/A
Total Police Pension Fund 33,049,273 24,079,444 24,873,000 9,633,000 10,014,000 381,000 4.0%
372

EXPENDITURES
Pensions 8001
Account Account Actual Actual Proj. Act. Budget Budget $ %Number Description 2019 2020 2021 2021 2022 Inc (Dec) Inc (Dec)
705-8001-631.15-01 Service Pensions 6,768,000 7,548,558 8,792,600 8,130,500 9,059,100 928,600 11.4%705-8001-631.15-02 Non-Duty Disability Pension 42,529 42,529 42,500 42,500 42,500 0 0.0%705-8001-631.15-03 Duty Disability Pension 412,437 441,235 647,600 570,000 706,500 136,500 23.9%705-8001-631.15-04 Surviving Spouse Pension 742,727 844,649 844,600 845,000 894,300 49,300 5.8%
Salaries 7,965,693 8,876,971 10,327,300 9,588,000 10,702,400 1,114,400 11.6%
705-8001-631.20-20 Legal Services 9,551 17,102 19,000 12,000 17,000 5,000 41.7%705-8001-631.20-21 Invest Manager Services 367,491 287,140 365,000 365,000 50,000 (315,000) (86.3%)705-8001-631.20-22 Investment Custodian 0 4,991 60,000 3,000 3,000 0 0.0%705-8001-631.20-23 Bank Services 25 386 0 1,000 0 (1,000) (100.0%)705-8001-631.20-75 Examinations 2,880 8,271 12,000 10,000 10,000 0 0.0%705-8001-631.21-65 Other Services 17,170 25,940 25,000 25,000 25,000 0 0.0%705-8001-631.22-02 Dues 795 1,455 1,000 1,000 1,000 0 0.0%705-8001-631.22-03 Training 6,223 485 1,000 7,000 1,000 (6,000) (85.7%)705-8001-631.22-05 Postage 325 257 300 500 500 0 0.0%
Contractual Services 404,461 346,027 483,300 424,500 107,500 (317,000) (74.7%)
705-8001-631.30-01 Publications Periodicals 0 0 0 100 100 0 0.0%705-8001-631.30-05 Office Supplies & Equip 197 0 300 500 500 0 0.0%
Commodities 197 0 300 600 600 0 0.0%
705-8001-631.40-65 Pension Refunds 98,976 42,974 0 25,000 25,000 0 0.0%705-8001-631.40-93 Foreign Taxes Paid 0 0 0 1,000 0 (1,000) (100.0%)
Other Charges 98,976 42,974 0 26,000 25,000 (1,000) (3.8%)
Total Expenditures 8,469,326 9,265,972 10,810,900 10,039,100 10,835,500 796,400 7.9%
Total Police Pension Fund 8,469,326 9,265,972 10,810,900 10,039,100 10,835,500 796,400 7.9%
POLICE PENSION FUND
373

POLICE PENSION FUND EXPENDITURE DETAIL
PENSIONS 8001
AccountNumber Account Title Description
SALARIES:
705-8001-631.15-01 Service Pensions Service Pensions 8,130,500 9,059,100
705-8001-631.15-02 Non-Duty Disability Pens Non-Duty Disability Pension 42,500 42,500
705-8001-631.15-03 Duty Disability Pension Duty Disability Pension 570,000 706,500
705-8001-631.15-04 Surviving Spouse Pension Surviving Spouse Pension 845,000 894,300
TOTAL SALARIES 9,588,000 10,702,400
CONTRACTUAL SERVICES:
705-8001-631.20-20 Legal Services Legal services 12,000 17,000
705-8001-631.20-21 Invest Manager Services Investment manager services 365,000 50,000
705-8001-631.20-22 Investment Custodian Investment custodian services 3,000 3,000
705-8001-631.20-23 Bank Services Bank services 1,000 0
705-8001-631.20-75 Examinations Examinations 10,000 10,000
705-8001-631.21-65 Other Services Tracker annual fee 2,300 2,300DOI Filing Fee 8,000 8,000Fiduciary Insurance 7,500 7,500Other services 7,200 25,000 7,200 25,000
705-8001-631.22-02 Dues Dues 1,000 1,000
705-8001-631.22-03 Training Training 7,000 1,000
705-8001-631.22-05 Postage Postage 500 500
TOTAL CONTRACTUAL SERVICES 424,500 107,500
COMMODITIES:
705-8001-631.30-01 Publications Periodicals Publications 100 100
705-8001-631.30-05 Office Supplies & Equip. General office supplies 500 500
TOTAL COMMODITIES 600 600
OTHER CHARGES:
705-8001-631.40-65 Pension Refunds Refunds of contributions upon withdrawal 25,000 25,000
705-8001-631.40-93 Foreign Taxes Paid Investment activity 1,000 0
TOTAL OTHER CHARGES 26,000 25,000
TOTAL PENSIONS 10,039,100 10,835,500
TOTAL POLICE PENSION FUND 10,039,100 10,835,500
Budget2022
Budget2021
374

FIRE PENSION FUND 711 Fund at a Glance
The Village has been mandated by state law to provide for a separate Fire Pension Plan. This fund is created for the purpose of providing for the retirement pensions of our firefighters. The fund is administered locally and the fiduciary responsibility is placed upon the Village Treasurer and the Board of Trustees of the Fire Pension Fund.
Restrictions:
STATE LAW – The Fire Pension Fund is locally administered as prescribed in Chapter 40 of the Illinois State Statutes. This fund must be separately accounted for and not commingled with other Village funds. The Village contracts for independent actuarial services.
Performance Measures 2018 2019 2020
1. # of Active Participants
# of Retired ParticipantsRegular Pensioners Duty Disability Pensioners Non-Duty Disability Pensioners Surviving Spouses
110
105 60 26
1 18
103
106 65 25
1 15
103
104 62 25
1 16
2. Actuarial Value of Fund Assets at December 31 $106,729,945 $123,883,698 $136,198,812
3. Total Actuarial Liability $154,033,679 $159,001,921 $163,873,563
4. Funded Ratio 69.29% 77.91% 83.11%
5. Annual Actuarial Investment Return As Percentageof Fund Assets at December 31 (3.4%) 15.11% 11.2%
6. Employer Annual Actuarial Funding Requirements $5,130,000 $4,913,000 $4,829,000
375

FIRE PENSION FUND (Continued)
Fund Summary
2019 2020 2021 2021 2022 $ %Actual Actual Est. Actual Budget Budget Change Change
RevenuesInterest Income $17,303,474 $13,900,629 $10,730,000 $3,800,000 $3,800,000 $0 0.0%Other 6,051,777 6,277,334 6,106,062 6,013,000 6,062,000 49,000 0.8%
Total Revenues $23,355,251 $20,177,963 $16,836,062 $9,813,000 $9,862,000 $49,000 0.5%Interfund Transfers In 1,250,000 0 0 0 0 0 N/A
Total Revenues andInterfund Transfers In $24,605,251 $20,177,963 $16,836,062 $9,813,000 $9,862,000 $49,000 0.5%
ExpendituresPersonal Services $7,210,277 $7,608,142 $8,041,800 $8,346,500 $8,427,800 $81,300 1.0%Contractual Services 240,922 244,912 307,000 272,200 84,900 (187,300) (68.8%)Commodities 302 113 400 800 800 0 0.0%Other Charges 0 9,682 200 26,000 25,000 (1,000) (3.8%)
Total Expenditures $7,451,501 $7,862,849 $8,349,400 $8,645,500 $8,538,500 ($107,000) (1.2%)Interfund Transfers Out 0 0 0 0 0 0 N/A
Total Expenditures andInterfund Transfers Out $7,451,501 $7,862,849 $8,349,400 $8,645,500 $8,538,500 ($107,000) (1.2%)
Revenues over(under) Expenditures $17,153,750 $12,315,114 $8,486,662 $1,167,500 $1,323,500 $156,000 13.4%
BEGINNING FUND BALANCE 106,729,947 123,883,697 136,198,811 136,198,811 144,685,473 8,486,662 6.2%
ENDING FUND BALANCE $123,883,697 $136,198,811 $144,685,473 $137,366,311 $146,008,973 $8,642,662 6.3%
376

FIRE PENSION FUND REVENUES
Account Account Actual Actual Proj Actual Budget Budget $ %Number Description 2019 2020 2021 2021 2022 Inc (Dec) Inc (Dec)
711-0000-461.02-00 Interest on Investments 1,076,566 1,077,248 930,000 900,000 900,000 0 0.0%Interest Income 1,076,566 1,077,248 930,000 900,000 900,000 0 0.0%
711-0000-462.10-00 Market Value Adjustments 14,962,233 11,745,221 8,900,000 2,000,000 2,000,000 0 0.0%711-0000-462.11-00 Dividend Income 1,264,675 1,078,160 900,000 900,000 900,000 0 0.0%
Investment Income 16,226,908 12,823,381 9,800,000 2,900,000 2,900,000 0 0.0%
711-0000-485.86-00 Contributions Participant 1,097,478 1,141,126 1,100,000 1,100,000 1,100,000 0 0.0%711-0000-485.87-00 Contribution R/E Tax 4,953,000 5,130,000 4,913,000 4,913,000 4,962,000 49,000 1.0%711-0000-485.88-00 Portability Payments 0 0 91,705 0 0 0 N/A
Pension Contributions 6,050,478 6,271,126 6,104,705 6,013,000 6,062,000 49,000 0.8%
711-0000-489.90-00 Other Income 1,299 6,208 1,357 0 0 0 N/AOther 1,299 6,208 1,357 0 0 0 N/A
711-0000-491.05-00 Operating Transfer In 1,250,000 0 0 0 0 0 N/AOther Financing Sources 1,250,000 0 0 0 0 0 N/A
Total Fire Pension Fund 24,605,251 20,177,963 16,836,062 9,813,000 9,862,000 49,000 0.5%
377

FIRE PENSION FUNDEXPENDITURES
Pensions 8001
Account Account Actual Actual Proj. Act. Budget Budget $ %Number Description 2019 2020 2021 2021 2022 Inc (Dec) Inc (Dec)
711-8001-631.15-01 Service Pensions 4,897,471 5,113,785 5,339,200 5,844,100 5,601,800 (242,300) (4.1%)711-8001-631.15-02 Non-Duty Disability Pension 30,823 31,325 32,300 31,800 32,300 500 1.6%711-8001-631.15-03 Duty Disability Pension 1,306,862 1,274,436 1,323,200 1,272,400 1,389,300 116,900 9.2%711-8001-631.15-04 Surviving Spouse Pension 741,342 951,791 1,089,900 958,400 1,147,200 188,800 19.7%711-8001-631.15-05 Occupational Disease Pens 233,779 236,805 257,200 239,800 257,200 17,400 7.3%
Salaries 7,210,277 7,608,142 8,041,800 8,346,500 8,427,800 81,300 1.0%
711-8001-631.20-20 Legal Services 7,058 7,977 40,000 17,000 25,000 8,000 47.1%711-8001-631.20-21 Invest Manager Services 202,180 205,998 222,700 210,000 25,000 (185,000) (88.1%)711-8001-631.20-22 Investment Custodian 10,638 10,911 11,900 11,000 1,000 (10,000) (90.9%)711-8001-631.20-23 Bank Services 0 0 0 300 0 (300) (100.0%)711-8001-631.20-75 Examinations 4,250 3,610 10,000 10,000 10,000 0 0.0%711-8001-631.21-65 Other Services 14,082 14,419 20,000 20,000 20,000 0 0.0%711-8001-631.22-02 Dues 1,590 1,295 1,500 1,500 1,500 0 0.0%711-8001-631.22-03 Training 814 375 500 2,000 2,000 0 0.0%711-8001-631.22-05 Postage 310 327 400 400 400 0 0.0%
Contractual Services 240,922 244,912 307,000 272,200 84,900 (187,300) (68.8%)
711-8001-631.30-01 Publications Periodicals 0 35 100 500 500 0 0.0%711-8001-631.30-05 Office Supplies & Equip 302 78 300 300 300 0 0.0%
Commodities 302 113 400 800 800 0 0.0%
711-8001-631.40-65 Pension Refunds 0 9,682 0 25,000 25,000 0 0.0%711-8001-631.40-93 Foreign Taxes Paid 0 0 200 1,000 0 (1,000) (100.0%)
Other Charges 0 9,682 200 26,000 25,000 (1,000) (3.8%)
Total Pensions 7,451,501 7,862,849 8,349,400 8,645,500 8,538,500 (107,000) (1.2%)
Total Fire Pension Fund 7,451,501 7,862,849 8,349,400 8,645,500 8,538,500 (107,000) (1.2%)
378

FIRE PENSION FUNDEXPENDITURE DETAIL
PENSIONS 8001
AccountNumber Account Title Description
SALARIES:
711-8001-631.15-01 Service Pensions Service Pensions 5,844,100 5,601,800
711-8001-631.15-02 Non-Duty Disability Pens Non-Duty Disability Pension 31,800 32,300
711-8001-631.15-03 Duty Disability Pension Duty Disability Pension 1,272,400 1,389,300
711-8001-631.15-04 Surviving Spouse Pension Surviving Spouse Pension 958,400 1,147,200
711-8001-631.15-05 Occupational Disease Pen Occupational Disease Pension 239,800 257,200
TOTAL SALARIES 8,346,500 8,427,800
CONTRACTUAL SERVICES:
711-8001-631.20-20 Legal Services Legal services 17,000 25,000
711-8001-631.20-21 Invest Manager Services Investment manager services 160,000 15,000Investment advisor 50,000 210,000 10,000 25,000
711-8001-631.20-22 Investment Custodian Investment custodian 11,000 1,000
711-8001-631.20-23 Bank Services Bank services 300 0
711-8001-631.20-75 Examinations Examinations 10,000 10,000
711-8001-631.21-65 Other Services Tracker annual fee 2,300 2,300DOI filing fee 8,000 8,000Secretarial 1,500 1,500Fiduciary Insurance 5,200 5,200Court Reporter 2,200 2,200Miscellaneous 800 20,000 800 20,000
711-8001-631.22-02 Dues Dues 1,500 1,500
711-8001-631.22-03 Training Training 2,000 2,000
711-8001-631.22-05 Postage Postage 400 400
TOTAL CONTRACTUAL SERVICES 272,200 84,900
COMMODITIES:
711-8001-631.30-01 Publications/Periodicals Publications and periodicals 500 500
711-8001-631.30-05 Office Supplies & Equip. General office supplies 300 300
TOTAL COMMODITIES 800 800
OTHER CHARGES:
711-8001-631.40-65 Pension Refunds Refunds of contributions upon withdrawal 25,000 25,000
Budget2021
Budget2022
379
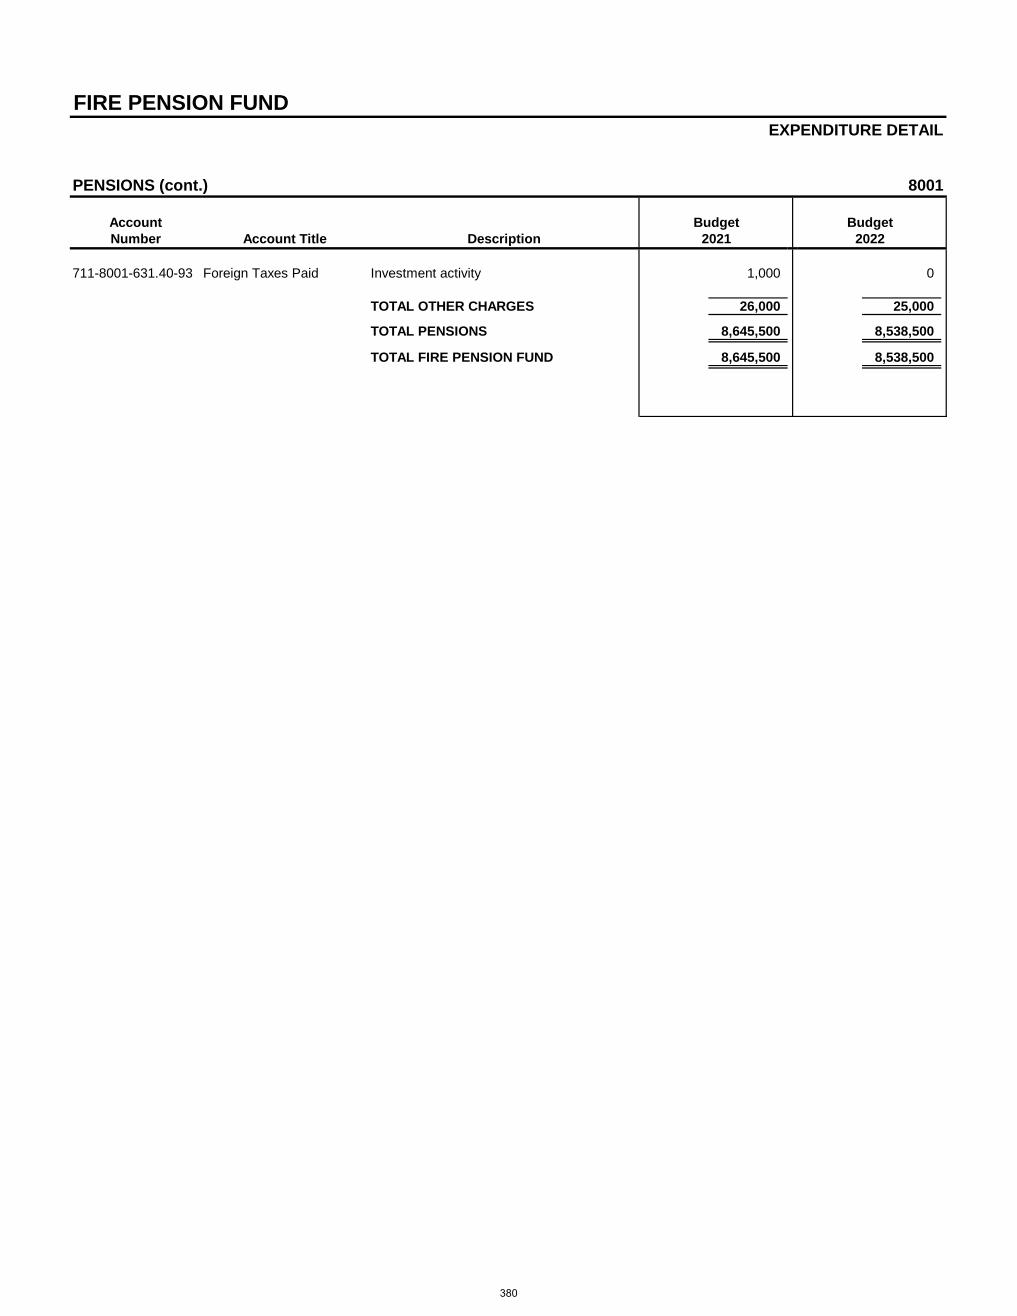
FIRE PENSION FUNDEXPENDITURE DETAIL
PENSIONS (cont.) 8001
AccountNumber Account Title Description
711-8001-631.40-93 Foreign Taxes Paid Investment activity 1,000 0
TOTAL OTHER CHARGES 26,000 25,000
TOTAL PENSIONS 8,645,500 8,538,500
TOTAL FIRE PENSION FUND 8,645,500 8,538,500
2021Budget
2022Budget
380

AFFORDABLE HOUSING FUND
381

AFFORDABLE HOUSING FUND 217
Fund at a Glance
In July 2013 the Village Board adopted the Affordable Housing Trust Fund. The Trust Fund Ordinance delineates the purpose, procedures, sources of funds, and eligibility requirement for use of funds. Sources of funds as delineated in the ordinance, are from three primary sources:
1. Cash payments in lieu of constructing affordable units.
2. Income from fees collected from the Village’s transfer of Industrial Revenue Bond Cap
3. 1% of all gaming revenue received annually by the Village after the first full fiscal year the Village ofArlington Heights receives any gaming revenue as well 10% of any gaming revenue from slot machinesreceived by the Village in the full first year.
The Trust Fund Ordinance establishes eligibility of requirements for use of the funds as follows: the use of Housing Trust Fund resources shall be limited to supporting, in whole or in part, one or more of the following Eligible Activities:
1. Creation and preservation of Attainable Housing including, without limitations, new construction,rehabilitation, and adaptive reuse;
2. Acquisition and disposition, including without limitation, vacant land, single family homes, multi-unitbuildings, and other existing structures that may be used in whole or part to provide AttainableHousing;
3. Payments for costs incurred in connection with administering the Housing Trust Fund. No costs shallbe reimbursed except pursuant to a written agreement between the Village and any third-partyapproved by the Village to administer a program or a funded program.
Fund Summary
2019 2020 2021 2021 2022 $ %Actual Actual Est. Actual Budget Budget Change Change
RevenuesOther 122,550 130,500 112,000 150,000 150,000 0 0.0%
Total Revenues $125,651 $132,320 $112,300 $150,000 $150,000 $0 0.0%Interfund Transfers In 188,873 0 0 0 0 0 N/A
Total Revenues andInterfund Transfers In $314,524 $132,320 $112,300 $150,000 $150,000 $0 0.0%
ExpendituresContractual Services 0 0 25,000 25,000 25,000 0 0.0%
Total Expenditures $0 $0 $25,000 $25,000 $25,000 $0 0.0%Interfund Transfers Out 0 0 0 0 0 0 N/A
Total Expenditures andInterfund Transfers Out $0 $0 $25,000 $25,000 $25,000 $0 0.0%
Revenues over(under) Expenditures $314,524 $132,320 $87,300 $125,000 $125,000 $0 0.0%
BEGINNING FUND BALANCE 0 314,524 446,844 446,844 534,144 87,300 19.5%
ENDING FUND BALANCE $314,524 $446,844 $534,144 $571,844 $659,144 $87,300 15.3%
382

AFFORDABLE HOUSING FUNDREVENUES
Account Account Actual Actual Proj Actual Budget Budget $ %Number Description 2019 2020 2021 2021 2022 Inc (Dec) Inc (Dec)
217-0000-461.02-00 Interest on Investments 2,688 1,444 100 0 0 0 N/A217-0000-462.10-00 Investment Income 413 376 200 0 0 0 N/A
Interest Income 3,101 1,820 300 0 0 0 N/A
217-0000-484.50-00 Affordable Housing Trust 122,550 130,500 112,000 150,000 150,000 0 0.0%Other Income 122,550 130,500 112,000 150,000 150,000 0 0.0%
217-0000-491.05-00 Operating Transfer In 188,873 0 0 0 0 0 N/AOther Financing Sources 188,873 0 0 0 0 0 N/A
Total Affordable Housing Fund 314,524 132,320 112,300 150,000 150,000 0 0.0%
EXPENDITURES
Planning 4001
Account Account Actual Actual Proj. Act. Budget Budget $ %Number Description 2019 2020 2021 2021 2022 Inc (Dec) Inc (Dec)
217-4001-521.20-05 Professional Services 0 0 25,000 25,000 25,000 0 0.0%Contractual Services 0 0 25,000 25,000 25,000 0 0.0%
Total Planning 0 0 25,000 25,000 25,000 0 0.0%
383

AFFORDABLE HOUSING FUNDEXPENDITURE DETAIL
PLANNING 4001
AccountNumber Account Title Description
CONTRACTUAL SERVICES:
217-4001-521.20-05 Professional Services Consultants/Legal 25,000 25,000
TOTAL CONTRACTUAL SERVICES 25,000 25,000
TOTAL PLANNING 25,000 25,000
TOTAL AFFORDABLE HOUSING FUND 25,000 25,000
Budget Budget2021 2022
384

ZERO INTEREST LOAN FUND
385

ZERO INTEREST LOAN FUND 225
Fund at a Glance
The Zero Interest Loan Program was approved by the Village Board in April 2014, and is designed to provide financial assistance to prospective and existing businesses, commercial/industrial properties and tenant spaces, and to fund other potential economic development projects within the Village of Arlington Heights. Revenue for the program comes from the Cook County Class 6/7 property tax abatements in two ways:
1. A $1,000 application fee for municipal consideration of the tax abatement
2. A rebate to the Village of 10% of savings under the abatement over the first:a. 5 years for the Class 6b programb. 3 years for the Class 7c program
Primary goals of the Zero Interest Loan Program include assisting with company growth, improving the appearance and function of sites and buildings, and helping fund other economic development projects and programs.
Fund Summary
2019 2020 2021 2021 2022 $ %Actual Actual Est. Actual Budget Budget Change Change
RevenuesInterest Income 3,936 2,486 300 0 0 0 N/AOther 209,969 271,919 306,000 311,700 300,000 (11,700) (3.8%)
Total Revenues $213,905 $274,405 $306,300 $311,700 $300,000 ($11,700) (3.8%)Interfund Transfers In 243,785 0 0 0 0 0 N/A
Total Revenues andInterfund Transfers In $457,690 $274,405 $306,300 $311,700 $300,000 ($11,700) (3.8%)
ExpendituresContractual Services 0 0 0 0 50,000 50,000 N/AOther Charges 48,300 170,084 60,000 250,000 100,000 (150,000) (60.0%)
Total Expenditures $48,300 $170,084 $60,000 $250,000 $150,000 ($100,000) (40.0%)Interfund Transfers Out 0 0 0 0 0 0 N/A
Total Expenditures andInterfund Transfers Out $48,300 $170,084 $60,000 $250,000 $150,000 ($100,000) (40.0%)
Revenues over(under) Expenditures $409,390 $104,321 $246,300 $61,700 $150,000 $88,300 143.1%
BEGINNING FUND BALANCE 0 409,390 513,711 513,711 760,011 246,300 47.9%
ENDING FUND BALANCE $409,390 $513,711 $760,011 $575,411 $910,011 $334,600 58.1%
386

ZERO INTEREST LOAN FUNDREVENUES
Account Account Actual Actual Proj Actual Budget Budget $ %Number Description 2019 2020 2021 2021 2022 Inc (Dec) Inc (Dec)
225-0000-461.02-00 Interest on Investments 3,448 2,008 100 0 0 0 N/A225-0000-462.10-00 Investment Income 488 478 200 0 0 0 N/A
Interest Income 3,936 2,486 300 0 0 0 N/A
225-0000-484.16-00 Class 6/7 Tax Rebates 184,064 228,858 200,000 190,000 200,000 10,000 5.3%225-0000-484.93-00 Loan Repayments 25,905 43,061 104,000 121,700 100,000 (21,700) (17.8%)225-0000-489.90-00 Other Income 0 0 2,000 0 0 0 N/A
Other Income 209,969 271,919 306,000 311,700 300,000 (11,700) (3.8%)
225-0000-491.05-00 Operating Transfer In 243,785 0 0 0 0 0 N/AOther Financing Sources 243,785 0 0 0 0 0 N/A
Total Zero Interest Loan Fund 457,690 274,405 306,300 311,700 300,000 (11,700) (3.8%)
EXPENDITURES
Planning 4001
Account Account Actual Actual Proj. Act. Budget Budget $ %Number Description 2019 2020 2021 2021 2022 Inc (Dec) Inc (Dec)
225-4001.521.20-05 Professional Services 0 0 0 0 50,000 50,000 N/AContractual Charges 0 0 0 0 50,000 50,000 N/A
225-4001.521.40-43 Zero Interest Loan Program 48,300 170,084 60,000 250,000 100,000 (150,000) (60.0%)Other Charges 48,300 170,084 60,000 250,000 100,000 (150,000) (60.0%)
Total Planning 48,300 170,084 60,000 250,000 150,000 (150,000) (40.0%)
387
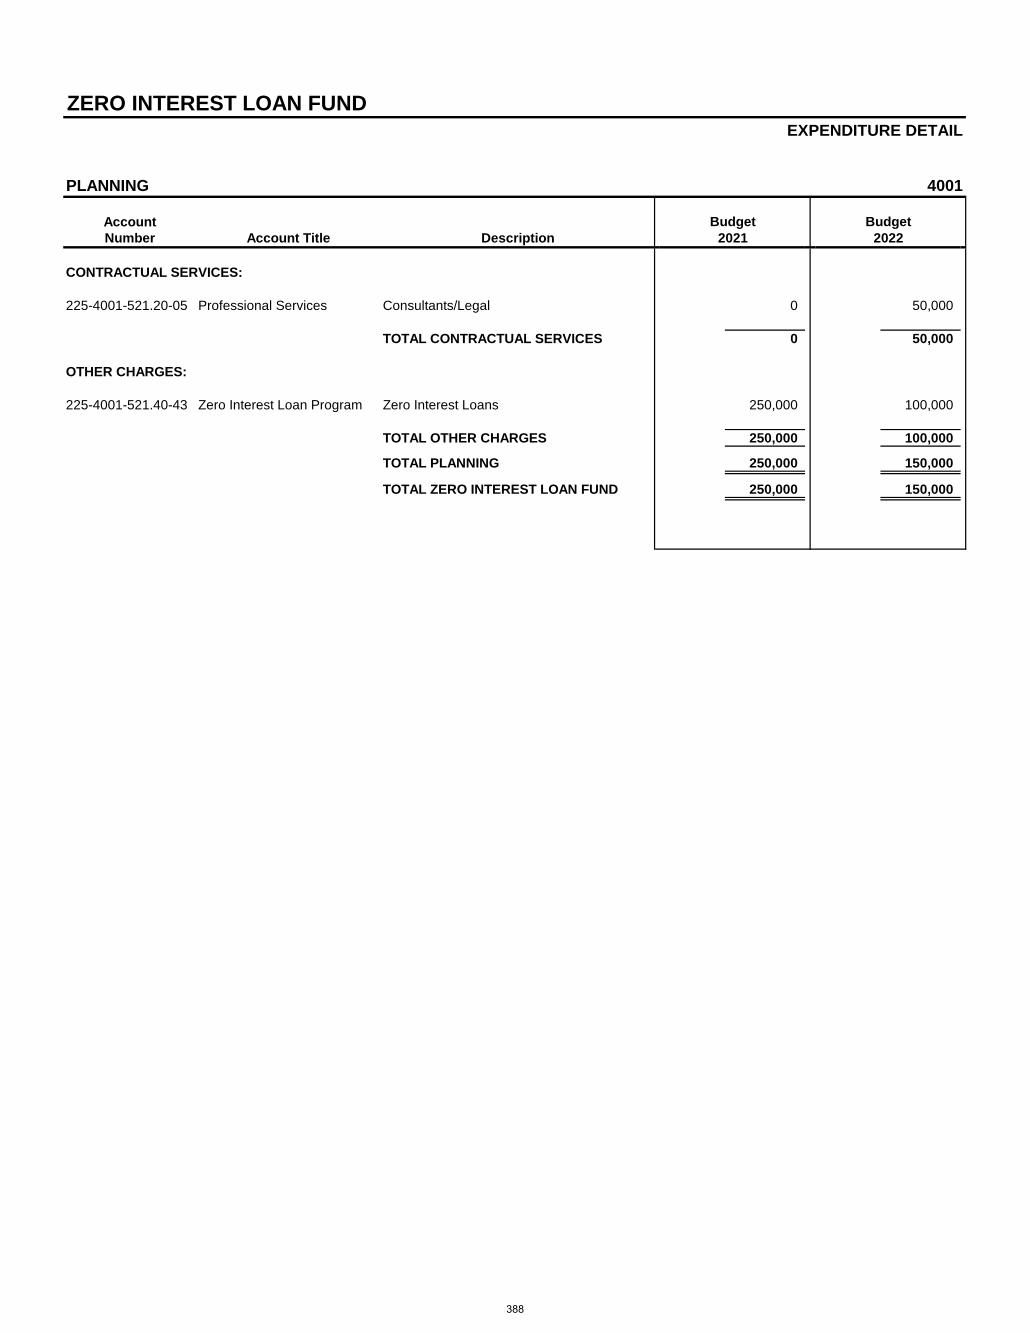
ZERO INTEREST LOAN FUNDEXPENDITURE DETAIL
PLANNING 4001
AccountNumber Account Title Description
CONTRACTUAL SERVICES:
225-4001-521.20-05 Professional Services Consultants/Legal 0 50,000
TOTAL CONTRACTUAL SERVICES 0 50,000
OTHER CHARGES:
225-4001-521.40-43 Zero Interest Loan Program Zero Interest Loans 250,000 100,000
TOTAL OTHER CHARGES 250,000 100,000
TOTAL PLANNING 250,000 150,000
TOTAL ZERO INTEREST LOAN FUND 250,000 150,000
Budget Budget2021 2022
388

FOREIGN FIRE INSURANCE TAX FUND
389

FOREIGN FIRE INSURANCE TAX FUND 227
Fund at a Glance
Each Village that has a fire department shall receive a 2% tax of the gross receipts received from every corporation, company and association which is not incorporated under the laws of the State of Illinois and which are engaged in effecting fire insurance in their Village. This tax is due by the 15th day of July and is collected by the Illinois Municipal League and subsequently distributed on a per capita basis to eligible municipalities or fire protection districts.
Restrictions:
STATE LAW – State Law ILCS 5/11-10-1 through 10-3 requires municipalities to pass the proceeds of this tax to the treasurer of the fire department for the maintenance, use, and benefit of the department. Arlington Heights has designated a "Board" to administer these funds.
Fund Summary
2019 2020 2021 2021 2022 $ %Actual Actual Est. Actual Budget Budget Change Change
RevenuesTaxes $134,895 $151,399 $130,000 $130,000 $130,000 $0 0.0%Interest Income 9,918 1,719 400 2,500 2,500 0 0.0%
Total Revenues $145,668 $153,118 $130,400 $132,500 $132,500 $0 0.0%Interfund Transfers In 0 0 0 0 0 0 N/A
Total Revenues andInterfund Transfers In $145,668 $153,118 $130,400 $132,500 $132,500 $0 0.0%
ExpendituresContractual Services $28,970 $23,260 $75,000 $75,000 $75,000 $0 0.0%Commodities 20,568 20,625 75,000 75,000 75,000 0 0.0%Capita l Items 112,812 47,542 100,000 100,000 100,000 0 0.0%
Total Expenditures $162,350 $91,427 $250,000 $250,000 $250,000 $0 0.0%Interfund Transfers Out 0 0 0 0 0 0 N/A
Total Expenditures andInterfund Transfers Out $162,350 $91,427 $250,000 $250,000 $250,000 $0 0.0%
Revenues over(under) Expenditures ($16,682) $61,691 ($119,600) ($117,500) ($117,500) $0 0.0%
BEGINNING FUND BALANCE 441,788 425,106 486,797 486,797 367,197 (119,600) (24.6%)
ENDING FUND BALANCE $425,106 $486,797 $367,197 $369,297 $249,697 ($119,600) (32.4%)
390

FOREIGN FIRE INSURANCE TAX FUNDREVENUES
Account Account Actual Actual Proj Actual Budget Budget $ %Number Description 2019 2020 2021 2021 2022 Inc (Dec) Inc (Dec)
227-0000-403.30-00 Foreign Fire Insurance Tax 134,895 151,399 130,000 130,000 130,000 0 0.0%Intergovernmental Taxes 134,895 151,399 130,000 130,000 130,000 0 0.0%
227-0000-461.02-00 Interest on Investments 7,269 1,482 200 2,500 2,500 0 0.0%227-0000-462.10-00 Market Value Adjustments 2,649 237 200 0 0 0 N/A
Interest Income 9,918 1,719 400 2,500 2,500 0 0.0%
227-0000-489.90-00 Other Income 855 0 0 0 0 0 N/AOther 855 0 0 0 0 0 N/A
Total Foreign Fire Insurance 145,668 153,118 130,400 132,500 132,500 0 0.0%
EXPENDITURES
Foreign Fire Insurance 3701
Account Account Actual Actual Proj. Act. Budget Budget $ %Number Description 2019 2020 2021 2021 2022 Inc (Dec) Inc (Dec)
227-3701-512.22-03 Training 28,970 23,260 75,000 75,000 75,000 0 0.0%Contractual Services 28,970 23,260 75,000 75,000 75,000 0 0.0%
227-3701-512.30-35 Clothing 20,568 20,625 75,000 75,000 75,000 0 0.0%Commodities 20,568 20,625 75,000 75,000 75,000 0 0.0%
227-3701-512.50-15 Other Equipment 112,812 47,542 100,000 100,000 100,000 0 0.0%Capital Outlay 112,812 47,542 100,000 100,000 100,000 0 0.0%
Total Foreign Fire Insurance 162,350 91,427 250,000 250,000 250,000 0 0.0%
Total Foreign Fire Ins Tax Fund 162,350 91,427 250,000 250,000 250,000 0 0.0%
391

FOREIGN FIRE INSURANCE TAX FUNDEXPENDITURE DETAIL
FOREIGN FIRE INSURANCE 3701
AccountNumber Account Title Description
CONTRACTUAL SERVICES:
227-3701-512.22-03 Training Training 75,000 75,000
TOTAL CONTRACTUAL SERVICES 75,000 75,000
COMMODITIES:
227-3701-512.30-35 Clothing Clothing 75,000 75,000
TOTAL COMMODITIES 75,000 75,000
CAPITAL OUTLAY:
227-3701-512.50-15 Other Equipment Other Equipment 100,000 100,000
TOTAL CAPITAL OUTLAY 100,000 100,000
TOTAL FOREIGN FIRE INSURANCE 250,000 250,000
TOTAL FOREIGN FIRE INS. TAX FUND 250,000 250,000
Budget2022
Budget2021
392

CRIMINAL INVESTIGATION FUND
393

CRIMINAL INVESTIGATION FUND 231
Fund at a Glance
State and Federal statutes allow for the seizure of assets used in criminal activities. Assets can be money, real estate or automobiles. After the courts award the assets to the Police Department they are recorded in this fund for future police expenditures.
Restrictions:
FEDERAL LAW – Requires all confiscated and court awarded assets obtained under Federal statues be expended for any general law enforcement purposes.
STATE LAW – Requires all confiscated and court awarded assets obtained under State statutes be expended for drug enforcement purposes.
Fund Summary
2019 2020 2021 2021 2022 $ %Actual Actual Est. Actual Budget Budget Change Change
RevenuesInterest Income $13,755 $2,547 $500 $8,700 $8,700 $0 0.0%Other - Deferred Revenue 196,286 29,017 37,100 95,000 95,000 0 0.0%
Total Revenues $210,041 $31,564 $37,600 $103,700 $103,700 $0 0.0%Interfund Transfers In 0 0 0 0 0 0 N/A
Total Revenues andInterfund Transfers In $210,041 $31,564 $37,600 $103,700 $103,700 $0 0.0%
ExpendituresOther Charges 522,946 300,759 346,700 346,758 789,900 443,142 127.8%
Total Expenditures $522,946 $300,759 $346,700 $346,758 $789,900 $443,142 127.8%Interfund Transfers Out 0 0 0 0 0 0 N/A
Total Expenditures andInterfund Transfers Out $522,946 $300,759 $346,700 $346,758 $789,900 $443,142 127.8%
Revenues over(under) Expenditures ($312,905) ($269,195) ($309,100) ($243,058) ($686,200) ($443,142) 182.3%
BEGINNING FUND BALANCE 2,016,179 1,703,274 1,434,079 1,434,079 1,124,979 (309,100) (21.6%)
ENDING FUND BALANCE $1,703,274 $1,434,079 $1,124,979 $1,191,021 $438,779 ($752,242) (63.2%)
394

July 2008 rolled to FY10-14 5 YEAR FINANCIAL PLAN
67%
Aug 2008 - Actual FY08 updated 20212019 2020 ESTIMATED 2021 2022 2023 2024 2025 2026
ACCOUNT DESCRIPTION PROJ # ACTUAL ACTUAL ACTUAL BUDGET BUDGET BUDGET BUDGET BUDGET BUDGET
REVENUESINTEREST INCOME 13,755 2,547 500 8,700 8,700 0 0 0 0OTHER - DEFERRED REVENUE 196,286 29,017 37,100 95,000 95,000 0 0 0 0TOTAL REVENUES 210,041 31,564 37,600 103,700 103,700 0 0 0 0
EXPENDITURESOPERATING EXPENDITURES
Other Expenditures 40-75 404,245 239,520 235,200 235,258 218,400 218,400 218,400 218,400 218,400SUBTOTAL - OPERATING EXPENDITURES 404,245 239,520 235,200 235,258 218,400 218,400 218,400 218,400 218,400
BUILDING & LANDSeized Vehicle & LT Evidence Storage Structure BL-21-01 0 0 0 0 0 362,300 0 0 0
SUBTOTAL - BUILDING & LAND 0 0 0 0 0 362,300 0 0 0
EQUIPMENTOperational Equipment - Police Department EQ-95-01 118,701 61,239 100,000 100,000 100,000 100,000 160,000 127,000 127,000Patrol Vehicle Equipment Replacement Program EQ-08-03 0 0 11,500 11,500 11,500 0 12,000 0 0Body Worn Cameras/Dash Cams EQ-22-01 0 0 0 0 300,000 300,000 300,000 300,000 300,000
SUBTOTAL - EQUIPMENT 118,701 61,239 111,500 111,500 411,500 400,000 472,000 427,000 427,000
VEHICLESSurveillance Van VH-22-01 0 0 0 0 160,000 0 0 0 0
SUBTOTAL - VEHICLES 0 0 0 0 160,000 0 0 0 0
TOTAL EXPENDITURES 522,946 300,759 346,700 346,758 789,900 980,700 690,400 645,400 645,400
BEGINNING FUND BALANCE 2,016,179 1,703,274 1,434,079 1,434,079 1,124,979 438,779 (541,921) (1,232,321) (1,877,721)REVENUES OVER (UNDER) EXPENDITURES (312,905) (269,195) (309,100) (243,058) (686,200) (980,700) (690,400) (645,400) (645,400)ENDING FUND BALANCE 1,703,274 1,434,079 1,124,979 1,191,021 438,779 (541,921) (1,232,321) (1,877,721) (2,523,121)
Fund Balance as a Percent of Expenditures 56% (55%) (178%) (291%) (391%)
CRIMINAL INVESTIGATION FUND (231)
395
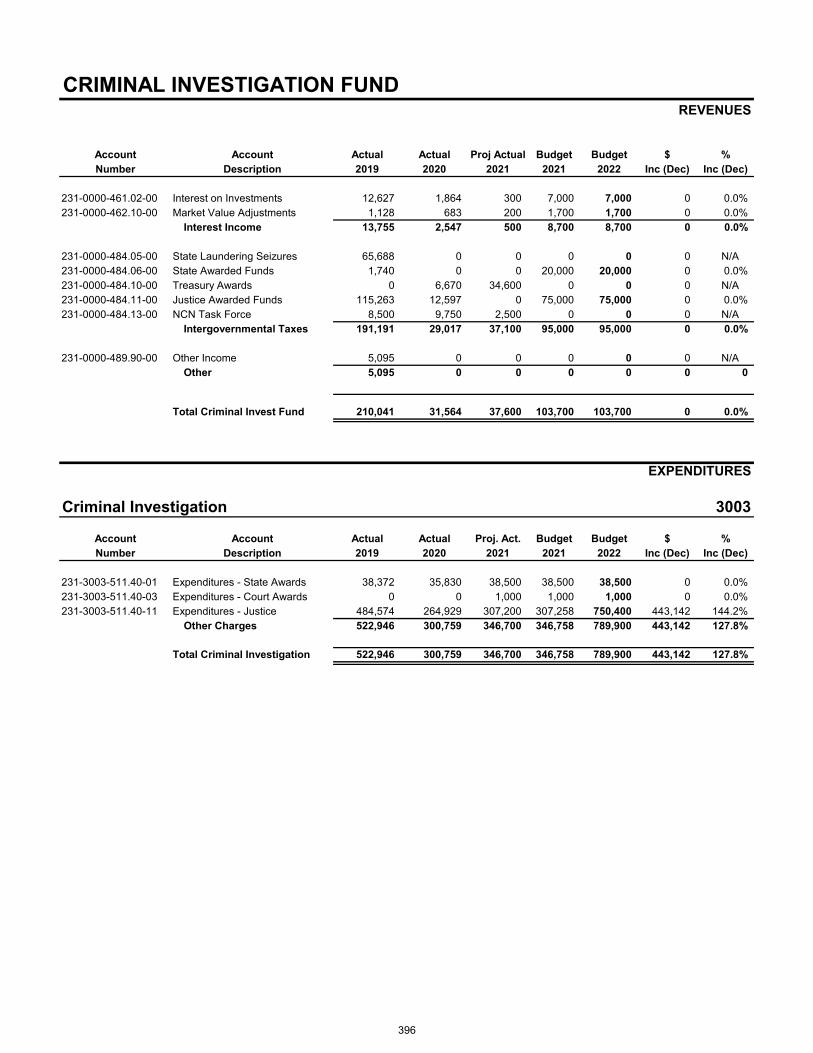
CRIMINAL INVESTIGATION FUND REVENUES
Account Account Actual Actual Proj Actual Budget Budget $ %Number Description 2019 2020 2021 2021 2022 Inc (Dec) Inc (Dec)
231-0000-461.02-00 Interest on Investments 12,627 1,864 300 7,000 7,000 0 0.0%231-0000-462.10-00 Market Value Adjustments 1,128 683 200 1,700 1,700 0 0.0%
Interest Income 13,755 2,547 500 8,700 8,700 0 0.0%
231-0000-484.05-00 State Laundering Seizures 65,688 0 0 0 0 0 N/A231-0000-484.06-00 State Awarded Funds 1,740 0 0 20,000 20,000 0 0.0%231-0000-484.10-00 Treasury Awards 0 6,670 34,600 0 0 0 N/A231-0000-484.11-00 Justice Awarded Funds 115,263 12,597 0 75,000 75,000 0 0.0%231-0000-484.13-00 NCN Task Force 8,500 9,750 2,500 0 0 0 N/A
Intergovernmental Taxes 191,191 29,017 37,100 95,000 95,000 0 0.0%
231-0000-489.90-00 Other Income 5,095 0 0 0 0 0 N/AOther 5,095 0 0 0 0 0 0
Total Criminal Invest Fund 210,041 31,564 37,600 103,700 103,700 0 0.0%
EXPENDITURES
Criminal Investigation 3003
Account Account Actual Actual Proj. Act. Budget Budget $ %Number Description 2019 2020 2021 2021 2022 Inc (Dec) Inc (Dec)
231-3003-511.40-01 Expenditures - State Awards 38,372 35,830 38,500 38,500 38,500 0 0.0%231-3003-511.40-03 Expenditures - Court Awards 0 0 1,000 1,000 1,000 0 0.0%231-3003-511.40-11 Expenditures - Justice 484,574 264,929 307,200 307,258 750,400 443,142 144.2%
Other Charges 522,946 300,759 346,700 346,758 789,900 443,142 127.8%
Total Criminal Investigation 522,946 300,759 346,700 346,758 789,900 443,142 127.8%
396

CRIMINAL INVESTIGATION FUNDEXPENDITURE DETAIL
3003
AccountNumber Account Title Description
OTHER CHARGES:
231-3003-511.40-01 Expend - State Awards Drug lab equipment & supplies 1,000 1,000Canine Program 24,000 24,000Replenish official advance funds 2,000 2,000
Project EQ-08-03:Patrol Vehicle Equipment Replacement 11,500 38,500 11,500 38,500
231-3003-511.40-03 Expend - Court Awards Expend - Court Awards 1,000 1,000
231-3003-511.40-11 Expend - Justice Police community events 10,000 10,000Northern IL Regional Crime Lab Membership 108,000 109,500Commission of Accreditation for Law
Enforcement Agencies Program 13,000 13,000Illinois State Police Wireless Information
Network Fee 2,000 0Specialized police training 30,000 30,000Citizen Observer 2,800 5,900LEADS OnLine Program 7,000 7,000Rental car - covert surveillance 3,000 3,000Tasers Maintenance 10,000 10,000Replenish official advance funds 2,000 2,000Prior Year Encumbrance Carryover 19,458 0
Project VH-22-01:Surveillance Van 0 160,000Project EQ-22-01:Body Worn/Dash Cameras 0 300,000Project EQ-95-01:Police Equipment 100,000 307,258 100,000 750,400
TOTAL OTHER CHARGES 346,758 789,900
TOTAL CRIMINAL INVESTIGATION 346,758 789,900
TOTAL CRIMINAL INVESTIGATION FUND 346,758 789,900
Budget2022
Budget2021
397

THIS PAGE LEFT BLANK
398

SOLID WASTE FUND — SWANCC
399

SOLID WASTE FUND – SWANCC 511
Fund at a Glance
The Village of Arlington Heights, along with 22 other North and Northwest Suburban Cook County municipalities, has entered into an intergovernmental agreement thereby creating the "Solid Waste Agency of Northern Cook County" (S.W.A.N.C.C.) to provide an efficient and environmentally sound municipal solid waste disposal system. The Village contractor is required to pay to the Village a predetermined municipal disposal fee and must utilize the transfer station owned and operated by S.W.A.N.C.C. The Village has set up an enterprise fund to account for the "user charges" collected from the hauler and further paid to S.W.A.N.C.C. at a set price per ton.
Restrictions:
The intergovernmental agreements and project use agreement governs the financing of the S.W.A.N.C.C. operation. A Board of Directors of the member municipalities is charged with the responsibility of its future operations and contract negotiations with its members. To account for the garbage trucks’ wear and tear on Village streets, on an annual basis $200,000 is transferred to the General Fund for the street patching program and $300,000 to the Capital Projects Fund for street work.
Fund Summary
2019 2020 2021 2021 2022 $ %Actual Actual Est. Actual Budget Budget Change Change
RevenuesFees $1,965,249 $1,915,616 $2,030,000 $1,950,000 $2,030,000 $80,000 4.1%Interest Income 85,577 19,202 2,600 10,000 10,000 0 0.0%Other 7,038 0 0 0 0 0 N/A
Total Revenues $2,057,864 $1,934,818 $2,032,600 $1,960,000 $2,040,000 $80,000 4.1%Interfund Transfers In 0 0 0 0 0 0 N/A
Total Revenues andInterfund Transfers In $2,057,864 $1,934,818 $2,032,600 $1,960,000 $2,040,000 $80,000 4.1%
ExpendituresContractual Services $1,468,304 $1,522,125 $1,600,000 $1,580,300 $1,643,100 $62,800 4.0%
Total Expenditures $1,468,304 $1,522,125 $1,600,000 $1,586,600 $1,649,400 $62,800 4.0%Interfund Transfers Out 500,000 500,000 500,000 500,000 500,000 0 0.0%
Total Expenditures andInterfund Transfers Out $1,968,304 $2,022,125 $2,100,000 $2,086,600 $2,149,400 $62,800 3.0%
Revenues over(under) Expenditures $89,560 ($87,307) ($67,400) ($126,600) ($109,400) $17,200 (13.6%)
BEGINNING WORKING CASH 3,809,415 3,898,975 3,811,668 3,811,668 3,744,268 (67,400) (1.8%)
ENDING WORKING CASH $3,898,975 $3,811,668 $3,744,268 $3,685,068 $3,634,868 ($50,200) (1.4%)
400

SOLID WASTE FUND - SWANCC REVENUES
Account Account Actual Actual Proj Actual Budget Budget $ %Number Description 2019 2020 2021 2021 2022 Inc (Dec) Inc (Dec)
511-0000-437.81-00 Solid Waste Disposal Fees 1,285,991 1,284,955 1,380,000 1,380,000 1,380,000 0 0.0%511-0000-437.83-00 Solid Waste Fee Multi-Family 679,258 630,661 650,000 560,000 650,000 90,000 16.1%511-0000-437.85-00 Recycling Program 0 0 0 10,000 0 (10,000) (100.0%)
SWANCC Fees 1,965,249 1,915,616 2,030,000 1,950,000 2,030,000 80,000 4.1%
511-0000-461.02-00 Interest on Investments 61,284 17,149 1,000 10,000 10,000 0 0.0%511-0000-462.10-00 Market Value Adjustments 24,293 2,053 1,600 0 0 0 N/A511-0000-489.90-00 Other Income 7,038 0 0 0 0 0 N/A
Interest Income 92,615 19,202 2,600 10,000 10,000 0 0.0%
Total SWANCC Fund Revenue 2,057,864 1,934,818 2,032,600 1,960,000 2,040,000 80,000 4.1%
401

SOLID WASTE FUND - SWANCCEXPENDITURES
Special Events Commission 1018
Account Account Actual Actual Proj. Act. Budget Budget $ %Number Description 2019 2020 2021 2021 2022 Inc (Dec) Inc (Dec)
511-1018-525.40-55 Special Events 0 0 0 5,000 5,000 0 0.0%Special Events 0 0 0 5,000 5,000 0 0.0%
Total Special Events Comm. 0 0 0 5,000 5,000 0 0
Public Works 7101
Account Account Actual Actual Proj. Act. Budget Budget $ %Number Description 2019 2020 2021 2021 2022 Inc (Dec) Inc (Dec)
511-7101-525.18-05 Overtime Civilian 0 0 0 1,300 1,300 0 0.0%Salaries 0 0 0 1,300 1,300 0 0.0%
Total Public Works 0 0 0 1,300 1,300 0 0
Solid Waste Disposal 7401
Account Account Actual Actual Proj. Act. Budget Budget $ %Number Description 2019 2020 2021 2021 2022 Inc (Dec) Inc (Dec)
511-7401-562.21-54 Solid Waste Disp SWANCC 1,468,304 1,522,125 1,600,000 1,580,300 1,643,100 62,800 4.0%Contractual Services 1,468,304 1,522,125 1,600,000 1,580,300 1,643,100 62,800 4.0%
Total Solid Waste Disposal 1,468,304 1,522,125 1,600,000 1,580,300 1,643,100 62,800 4.0%
Non-Operating 9901
Account Account Actual Actual Proj. Act. Budget Budget $ %Number Description 2019 2020 2021 2021 2022 Inc (Dec) Inc (Dec)
511-9901-591.90-05 Operating Transfer Out 500,000 500,000 500,000 500,000 500,000 0 0.0%Other Charges 500,000 500,000 500,000 500,000 500,000 0 0.0%
Total Non-Operating 500,000 500,000 500,000 500,000 500,000 0 0.0%
Total SWANCC Fund 1,968,304 2,022,125 2,100,000 2,086,600 2,149,400 62,800 3.0%
402

SOLID WASTE FUND - SWANCCEXPENDITURE DETAIL
SPECIAL EVENTS COMMISSION 1018
AccountNumber Account Title Description
SPECIAL EVENTS:
511-1018-525.40-55 Special Events Arlington Spring Sweep (AE1301) 5,000 5,000
TOTAL SPECIAL EVENTS 5,000 5,000
TOTAL SPECIAL EVENTS COMM. 5,000 5,000
PUBLIC WORKS 7101
AccountNumber Account Title Description
SALARIES:
511-7101-525.18-05 Overtime Civilian Arlington Spring Sweep (AE1301) 1,300 1,300
TOTAL SALARIES 1,300 1,300
TOTAL PUBLIC WORKS 1,300 1,300
SOLID WASTE DISPOSAL 7401
AccountNumber Account Title Description
CONTRACTUAL SERVICES:
511-7401-562.21-54 Solid Waste Disp SWANCC Single family refuse disposal (estimated tons 18,112 @ 50.20/ton) 909,200 0Multi-family refuse disposal (estimated tons 13,368 @ 50.20/ton) 671,100 0
Single family refuse disposal (estimated tons 18,611 @ 50.80/ton) 0 945,400Multi-family refuse disposal (estimated tons 13,735 @ 50.80/ton) 0 697,700
TOTAL CONTRACTUAL SERVICES 1,580,300 1,643,100
TOTAL SOLID WASTE DISPOSAL 1,580,300 1,643,100
Budget
Budget2022
Budget2021
Budget2021 2022
Budget Budget2021 2022
403
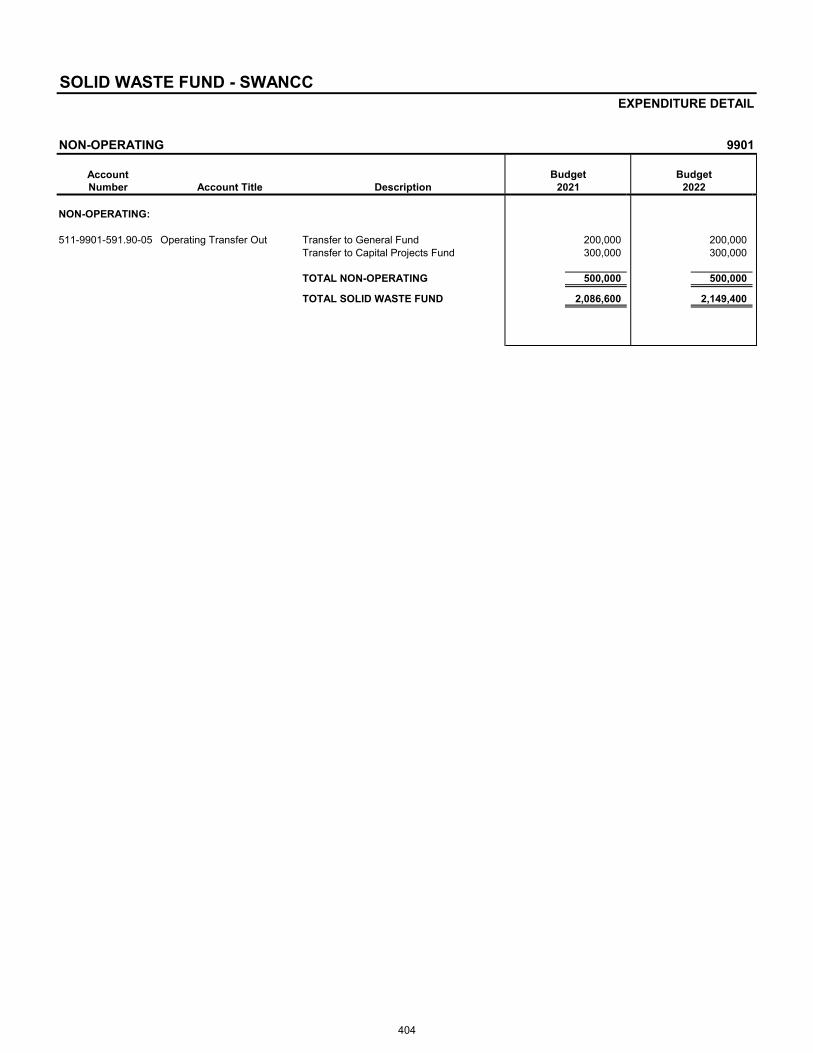
SOLID WASTE FUND - SWANCCEXPENDITURE DETAIL
NON-OPERATING 9901
AccountNumber Account Title Description
NON-OPERATING:
511-9901-591.90-05 Operating Transfer Out Transfer to General Fund 200,000 200,000Transfer to Capital Projects Fund 300,000 300,000
TOTAL NON-OPERATING 500,000 500,000
TOTAL SOLID WASTE FUND 2,086,600 2,149,400
Budget Budget2021 2022
404

ARLINGTON HEIGHTS MEMORIAL LIBRARY
OPERATING BUDGET FOR THE FISCAL YEAR 2022
BEGINNING JANUARY 1, 2022
LIBRARY BOARD Sarah Galla
Carole Medal Andi Ruhl
Debbie Smart Amy Somary John Supplitt
Greg Zyck
EXECUTIVE DIRECTOR Michael Driskell
405
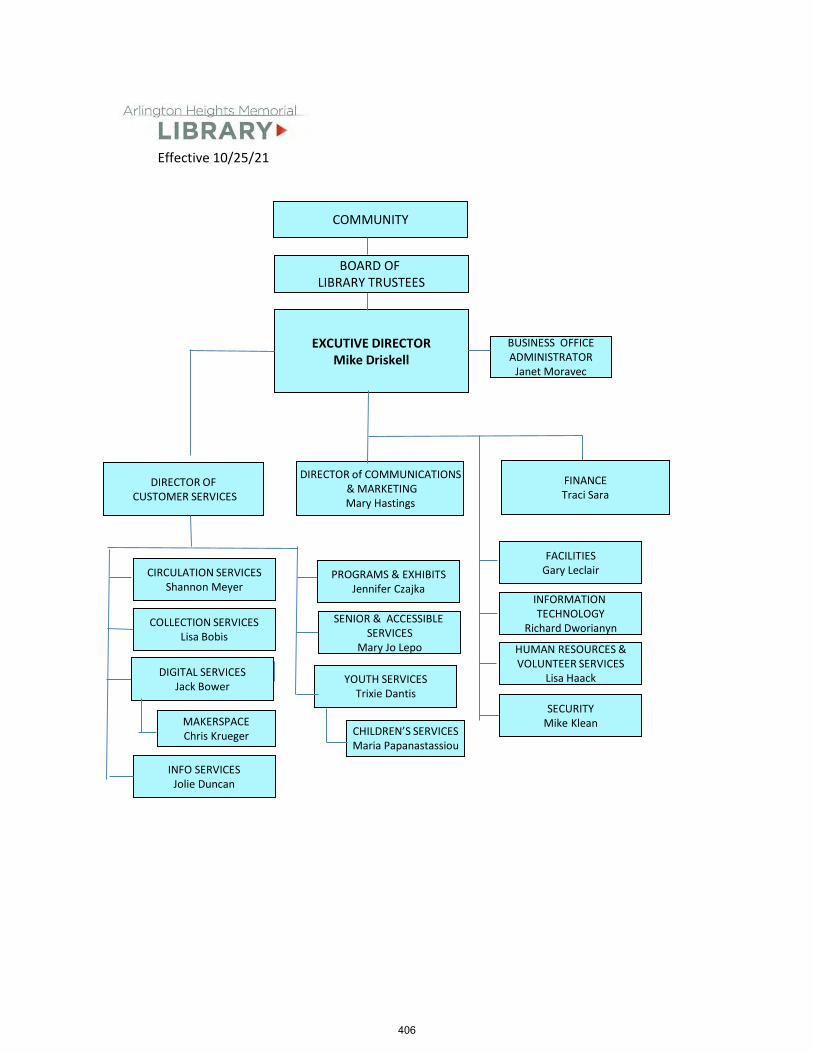
COMMUNITY
EXCUTIVE DIRECTORMike Driskell
BUSINESS OFFICEADMINISTRATOR
Janet Moravec
DIRECTOR OFCUSTOMER SERVICES
FACILITIESGary Leclair
CHILDREN’S SERVICESMaria Papanastassiou
DIRECTOR of COMMUNICATIONS& MARKETINGMary Hastings
BOARD OF LIBRARY TRUSTEES
FINANCETraci Sara
INFORMATION TECHNOLOGY
Richard Dworianyn
HUMAN RESOURCES &VOLUNTEER SERVICES
Lisa Haack
SECURITYMike Klean
YOUTH SERVICESTrixie Dantis
SENIOR & ACCESSIBLE SERVICES
Mary Jo Lepo
INFO SERVICESJolie Duncan
DIGITAL SERVICESJack Bower
COLLECTION SERVICESLisa Bobis
CIRCULATION SERVICESShannon Meyer
Effective 10/25/21
MAKERSPACEChris Krueger
PROGRAMS & EXHIBITSJennifer Czajka
406

MEMORIAL LIBRARY FUND 291 and 491Fund at a Glance
The Arlington Heights Memorial Library uses two funds to account for its expenditures. The General Fund (291) is a subcategory of the special revenue fund type and is reported under Special Revenues in the Village of Arlington Heights' financial statements. The Capital Fund (491) accounts for a variety of capital improvements listed in the library’s Long Range Fiscal Plan. The Memorial Library General and Capital Funds are for the operations of the library. No current debt service or capital expenditures are associated with bond issues by the village for library purposes.
Since 1926, library funding has been derived from a special revenue tax fund set up for the purpose of maintaining a library for village residents. For the most recent fiscal year ended December 31, 2020, the library received 95.2% of its total revenue from property taxes.
LIBRARY GOVERNANCE AND STAFF
• The library is governed by a seven-member Board of Library Trustees: Greg Zyck, (president), CaroleMedal (vice president/secretary), John Supplitt, (treasurer), Sarah Galla, Andi Ruhl, Debbie Smart andAmy Somary.
• The Board of Library Trustees regularly meets twice monthly. Board meeting are held on the third Tuesdayof each month and Committee of the Whole meetings are held on the first Monday; all meetings are opento the public.
• As of December 31, 2020, the library had 24 full-time librarians. As of December 31, 2020, the total full-time equivalent (FTE) of employees was 144.65. 166.41 FTEs were budgeted in 2020.
LIBRARY VISION AND VALUES
Our Vision The Arlington Heights Memorial Library strives to add value in our customers’ lives by:
• partnering with them to develop skills they need to succeed in all stages of their lives;• helping local businesses and community agencies thrive;• inspiring understanding by creating occasions for the exchange of ideas, cultural experiences, and
discovery; and• offering opportunities in Arlington Heights for gathering, learning, contemplating, creating, and finding
inspiration.
Our Values We believe in:
• Unparalleled Customer Service: our best-in-class staff strives for continuous improvement by identifyingand providing the services our residents and businesses need most.
• Free and Equal Access: all individuals have the right to choose for themselves what to read, hear, orview.
• Diversity and Inclusion: we cultivate an inclusive atmosphere, celebrate our diversity, and create anenvironment for the open exchange of differing ideas and points of view.
• Fiscal Responsibility: all decisions are weighed against the value added to the lives of our customers.• A Focus on Arlington Heights: we are a part of the fabric of our community; all services are tailored to the
unique needs of our residents and businesses.
407

MEMORIAL LIBRARY FUND (Continued)
LIBRARY FACILITY
Located at 500 North Dunton Avenue, the main library is 132,000 square feet. Renovations in 1968 added 40,000 square feet. An additional 76,000 square feet was added in a 1978 renovation. In 1992, voter approval was given to build a 56,000-square-foot addition and included renovation of the original facility. The library's second-floor addition opened in September of 1994, and renovation of the original building was completed in 1995.
A second renovation of the first and second floors was completed in the spring of 2013. This renovation added a teen area, ten more small conference rooms, a digital media lab, a genealogy room, a lounge area with a fireplace, the new and popular materials section and space for exhibits and programs.
The main floor has service areas for adults, teens and children, including selections of books, movies, magazines, computers, quiet areas, CDs and a café. A computer training lab and a digital media lab are available for public classes for individuals and the business community. The Literacy/ESL (English as a Second Language) office moved to the main floor in 2021.
The second floor contains 14 small conference/study rooms, the Richard Frisbee board room, the Hendrickson room (with a maximum capacity of 200) available for library programs, meetings, and for use by eligible community groups, administrative offices and a staff room.
The lower level of the building includes parking, a Friends of the Library book sorting and storage area, a book drop, a Friends of the Library donation drop box, a drive-up window and maintenance areas, including heating and ventilating equipment.
• During Phase 5 of the COVID pandemic, library hours were:9 a.m. - 8 p.m. Monday – Friday, 9 a.m.- 5 p.m. Saturdays, and 11 a.m.-5 p.m. Sundays.As of October 18, 2021, the Arlington Heights Memorial Library will be open 74 hours weekly: 9 a.m.–9p.m. weekdays, 9 a.m.– 5:00 p.m. Saturdays, and 12 p.m.– 6:00 p.m. Sundays. The drive-up windowopens one hour earlier (8 a.m.) than the library on weekdays, operations match library hours on theweekend.
• The service point at the Arlington Heights Senior Center, located at 1801 West Central Road, ArlingtonHeights, is open 37.5 hours per week.
• The Makerplace service point opened September 21, 2021 and is located at 112 North Belmont Avenue.The facility is open to the public 40 hours per week.
• In 2020, 377,960 people visited the library.
• The library issued 3,387 resident library cards in 2020. 694 non-resident cards were issued. Three librarycards were purchased.
LIBRARY COLLECTION AND EQUIPMENT
• The library’s physical collection had 301,887 as of December 31, 2020. This includes books, magazines,equipment, games, toys and audiovisual items. The library has 938,152 virtual titles offered both in thelibrary and remotely. These items include eBooks, eAudiobooks, music and movies as well as businessinformation and magazine indexes with full-text options.
• The total circulation for the fiscal year ended December 31, 2020, was 1,250,344 items.
• Other items in the Library of Things Collection include:o Arts and crafts equipmento Assistive deviceso Audio equipment
408

MEMORIAL LIBRARY FUND (Continued)
o Cameras and accessorieso Entertainment deviceso Technology and digital deviceso Gameso Toolso Musical instrumentso Children’s toys and learning devices
• The library provides access to:o Over 100 personal computers with Internet access and office softwareo Two 3-D printerso Photocopiers, a color copier, scanner, fax machines and microform reader/printerso An Optelec machine for the visually impaired, a TTY for communication for people with hearing
impairments, three public computers with magnification software, walkers, and motorized scooters
LIBRARY PROGRAMS AND SERVICES
The library adds value to the lives of residents by offering:
• Resources and classes for small businesses
• The Studio, a digital media lab consisting of a production studio and three smaller post-production rooms.Customers can create media projects for home, school or business. There is equipment for scanningphotos, creating and scanning video, and recording voice or music.
• In 2020, 1,832 in-person and virtual programs and events were held for children, teens and adults includingstorytimes, lectures, book discussions, and concerts with a total attendance of 51,877. The library alsofacilitated 184 passive programs with a total attendance of 38,565.
• The 2020 summer reading program saw 983 registrants for the youth summer reading program: 765participants birth-grade 5 and 218 participants grades 6-12. Adult participation was 278, and 26 staffmembers participating in summer leisure and skill-building reading. The library continues to partner withthe Arlington Heights Park District, expanding the reach of this popular program to include park district daycamps.
• The library’s ESL/Literacy Office served 265 adult students and held 386 ESL sessions in 2020 with anaverage of 8 people per session. The library is a community partner for Read to Learn, an adultliteracy/volunteer program through District 214 Community Education, which served 505 participants in2020 at the library.
• A Reference Question is a request for information or referral by a library patron in contact with a library staffmember who facilitates answering the patron’s inquiry by using information sources. In 2020, 99,382reference questions were answered.
• 105 instructional technology programs were offered in 2020.
• Fourteen conference rooms were utilized 4,428 times in 2020.
• In 2020, One Book, One Village, the library’s seventh community reading initiative featured, The SecretsWe Kept, by Lara Prescott. Circulation for the book was 1,950. 959 people attended related programs andbook discussions during the 9-week program. 391 people attended the virtual author event. The 2021 OneBook, One Village book has been chosen, Braiding Sweetgrass: Indigenous Wisdom, Scientific Knowledge,and the Teachings of Plants by Robin Wall Kimmerer.
• The Makerplace opened to the public September 21, 2021. This 8,000 square foot makerspace allows
409

MEMORIAL LIBRARY FUND (Continued)
customers to create, explore, tinker, and collaborate with equipment including 3D printers, electronic cutting machines, a laser cutter, a commercial kitchen, sewing machines, and more.
LIBRARY OUTREACH
Beyond its physical locations, the library provides:
• Access to the online catalog, library accounts, full-text newspaper and magazines articles and online chatservice, 24 hours a day, 7 days a week at ahml.info.
• Resources for learning a new language
• Access to marketing demographics - essential for business, especially startups
• Real-time homework assistance on a wide variety of school subjects, both in English and Spanish
• Answers to reference questions by phone, instant messaging, email or via the website at ahml.info
• A newsletter highlighting services and programs is mailed to all village residences and businesses ten timesa year, in addition to frequent updates on social media.
• Bookmobile service at 27 stops throughout the community and outreach services to apartment complexes,health care sites, senior independent living complexes, adult education centers, schools and to residentsof the Backstretch at Arlington Park
• Home delivery of material for residents who are permanently or temporarily homebound
LIBRARY COLLABORATION
• The library is a member of the Reaching Across Illinois Library System (RAILS), a cooperative withapproximately 1,300 public, academic, special and school library members. Through interlibrary loan,residents have access to vast library collections throughout the country. As a benefit of system membership,residents have reciprocal borrowing privileges with neighboring public libraries throughout Illinois.
• The library is a service partner at the Arlington Heights Senior Center, operating a reading room andcomputer lab at the center. Features include a collection of popular materials to check out, programs,computer classes, discussion groups and free access to computers with Internet.
• The library is a LINKin partner through a shared catalog with nine other local libraries providing expeditedand cost-effective access to a greatly expanded collection of material.
• The library is partnering with the Arlington Heights Park District to provide exterior book drops at Camelotand Frontier Parks and at the Arlington Heights Senior Center, giving residents in the northern and southernparts of Arlington Heights a more convenient way to return library items.
• Each year library trustees and staff members meet with their counterparts in the Village and the Park Districtto provide updates on current projects and discuss opportunities for resource sharing.
• For over 25 years, the library has partnered with schools to present a district-wide show of studentartwork at the library. In 2020, we did not present the art show due to the COVID-19 pandemic.
410

MEMORIAL LIBRARY FUND (Continued)
Fund Summary
2019 2020 2021 2021 2022 $ %Actual Actual Est. Actual Budget Budget Change Change
BEGINNING FUND BALANCE $7,426,652 $8,023,494 $9,179,111 $9,179,111 $11,167,184 $1,988,073 21.7%
RevenuesTaxes $13,927,291 $14,474,088 $14,646,085 $14,852,098 $14,827,802 ($24,296) (0.2%)Intergovernmenta l 95,987 207,465 265,643 61,063 110,774 49,711 81.4%Fees 52,900 24,347 26,296 53,000 26,296 (26,704) (50.4%)Fines 107,550 41,493 9,564 20,922 9,564 (11,358) (54.3%)Interest Income 125,204 (35,927) 3,520 9,000 3,520 (5,480) (60.9%)Other 112,873 61,169 126,430 45,000 70,000 25,000 55.6%
Total Revenues $14,421,805 $14,772,635 $15,077,538 $15,041,083 $15,047,956 $6,873 0.0%
ExpendituresPersonal Services $10,189,335 $10,338,185 $9,466,091 $11,115,272 $11,217,307 $102,035 0.9%Contractual Services 1,460,728 1,276,453 1,392,587 1,673,336 1,786,266 112,930 6.7%Commodities 2,071,837 1,891,140 2,124,745 2,330,279 2,297,553 (32,726) (1.4%)Other Charges 34,192 47,595 44,350 49,350 51,350 2,000 4.1%Property 68,871 63,645 61,692 94,790 111,611 16,821 17.7%
Total Expenditures $13,824,963 $13,617,018 $13,089,465 $15,263,027 $15,464,087 $201,060 1.3%
Revenues over(under) Expenditures $596,842 $1,155,617 $1,988,073 ($221,944) ($416,131) ($194,187) 87.5%
Interfund Transfers Out 0 0 0 0 0 0 N/A
ENDING FUND BALANCE $8,023,494 $9,179,111 $11,167,184 $8,957,167 $10,751,053 $1,793,886 20.0%
411

MEMORIAL LIBRARY FUNDREVENUES
Account Actual Actual Proj Actual Budget Budget $ %No. Account Description 2019 2020 2021 2021 2022 Inc / (Dec) Inc / (Dec)
291-0000-401.03-00 Real Estate Tax IMRF 782,009 1,035,550 920,462 929,760 869,788 (59,972) (6.5%)291-0000-401.04-00 Real Estate Tax FICA 484,338 634,086 610,983 617,155 663,141 45,986 7.5%291-0000-401.05-00 Real Estate Tax 12,660,944 12,469,931 12,858,764 12,988,650 13,147,993 159,343 1.2%
Real Estate Taxes 13,927,291 14,139,567 14,390,209 14,535,565 14,680,922 145,357 1.0%
291-0000-403.25-00 Replacement Tax 0 334,521 255,876 316,533 146,880 (169,653) (53.6%)Intergovernmental Taxes 0 334,521 255,876 316,533 146,880 (24,296) (53.6%)
291-0000-411.65-00 Per Capita Grant & Gifts 93,876 93,876 110,774 61,063 110,774 49,711 81.4%291-0000-411.70-00 Other Grants 0 52,000 150,000 0 0 0 N/A291-0000-411.90-00 Contribution Ord. Library 2,111 61,589 4,869 0 0 0 N/A
Intergovernmental 95,987 207,465 265,643 61,063 110,774 49,711 81.4%
291-0000-436.72-00 Non Resident Fees 2,206 892 300 2,500 600 (1,900) (76.0%)291-0000-436.74-00 Copier/Reader Printer Fees 46,794 23,010 25,896 47,500 25,296 (22,204) (46.7%)291-0000-436.75-00 Meeting Room Fees 3,900 445 100 3,000 400 (2,600) (86.7%)
Library Fees 52,900 24,347 26,296 53,000 26,296 (26,704) (50.4%)
291-0000-442.20-00 Late Charges 91,676 31,698 0 0 0 0 N/A291-0000-442.25-00 Lost Item Charges 15,874 9,795 9,564 20,922 9,564 (11,358) (54.3%)
Library Fines 107,550 41,493 9,564 20,922 9,564 (11,358) (54.3%)
291-0000-461.02-00 Interest on Investments 101,804 (36,734) 3,520 9,000 3,520 (5,480) (60.9%)291-0000-462.10-00 Market Value Adjustments 23,400 807 0 0 0 0 N/A
Interest Income 125,204 (35,927) 3,520 9,000 3,520 (5,480) (60.9%)
291-0000-483.70-00 Donations - Library 7,400 11,813 25,000 15,000 15,000 0 0.0%291-0000-489.90-00 Other Income 20,445 47,371 76,430 5,000 5,000 0 0.0%291-0000-489.94-00 FOL Reimbursements 85,028 1,985 25,000 25,000 50,000 25,000 100.0%
Other 112,873 61,169 126,430 45,000 70,000 25,000 55.6%
Total Memorial Library Fund 14,421,805 14,772,635 15,077,538 15,041,083 15,047,956 176,526 0.0%
412

MEMORIAL LIBRARY FUND EXPENDITURES
Administration 6001
Account Actual Actual Proj. Act. Budget Budget $ %Number Account Description 2019 2020 2021 2021 2022 Inc / (Dec) Inc / (Dec)
291-6001-601.16-85 Salaries 339,509 353,532 321,450 350,214 377,496 27,282 7.8%291-6001-601.16-92 Achievement Awards 2,000 2,500 1,000 4,000 3,000 (1,000) (25.0%)291-6001-601.18-05 Overtime Civilian 1,599 1,120 252 1,000 1,000 0 0.0%
Salaries 343,108 357,152 322,702 355,214 381,496 26,282 7.4%
291-6001-601.19-05 Medical Insurance 57,043 86,507 36,992 36,977 39,421 2,444 6.6%291-6001-601.19-10 IMRF 34,638 44,828 40,241 44,544 43,299 (1,245) (2.8%)291-6001-601.19-11 Social Security 20,716 21,127 19,551 22,023 23,405 1,382 6.3%291-6001-601.19-12 Medicare 4,845 5,062 4,572 5,151 5,474 323 6.3%291-6001-601.19-53 Flexible Spending 2,006 8,235 1,853 2,329 3,000 671 28.8%291-6001-601.19-55 Unemployment Compensation 4,628 0 3,216 6,432 6,432 0 0.0%
Fringe Benefits 123,876 165,759 106,425 117,456 121,031 3,575 3.0%
291-6001-601.20-05 Professional Services 0 6,000 4,600 8,500 20,500 12,000 141.2%291-6001-601.20-08 Consulting Services Library 0 1,650 11,000 12,000 42,000 30,000 250.0%291-6001-601.20-20 Legal Services 22,952 14,063 13,575 16,000 16,000 0 0.0%291-6001-601.20-40 General Insurance 107,028 120,958 143,223 178,780 178,780 0 0.0%291-6001-601.20-81 OCLC Services 61,271 0 0 0 0 0 N/A291-6001-601.21-65 Other Services 11,442 3,738 3,000 3,000 3,000 0 0.0%291-6001-601.22-01 Advertising 135 483 385 600 600 0 0.0%291-6001-601.22-02 Dues 4,722 5,024 6,215 6,675 5,729 (946) (14.2%)291-6001-601.22-03 Training 77,282 45,751 30,000 95,508 103,128 7,620 8.0%291-6001-601.22-05 Postage 40,534 27,082 39,767 40,045 40,500 455 1.1%291-6001-601.22-42 Internet Access 28,528 0 0 0 0 0 N/A291-6001-601.22-70 Telephone Services 93,529 62,212 0 0 5,000 5,000 N/A
Contractual Services 447,423 286,961 251,765 361,108 415,237 54,129 15.0%
291-6001-601.30-05 Office Supplies & Equipment 5,674 7,361 6,260 10,105 13,795 3,690 36.5%291-6001-601.31-85 Small Tools & Equipment 1,050 1,986 1,250 2,500 2,500 0 0.0%291-6001-601.32-02 Program Events 0 0 90 0 0 0 N/A291-6001-601.32-72 Special Events 915 0 850 850 850 0 0.0%291-6001-601.32-99 Items Reimbursed by Employees (42) 0 0 0 0 0 N/A
Commodities 7,597 9,347 8,450 13,455 17,145 3,690 27.4%
291-6001-601.40-96 Operating Contingency 0 4,149 5,000 5,000 5,000 0 0.0%Other Charges 0 4,149 5,000 5,000 5,000 0 0.0%
291-6001-601.50-15 Other Equipment 31,992 9,283 6,902 25,000 25,000 0 0.0%Property 31,992 9,283 6,902 25,000 25,000 0 0.0%
Total Administration 953,996 832,651 701,244 877,233 964,909 87,676 10.0%
413

MEMORIAL LIBRARY FUNDEXPENDITURES
Communications & Marketing 6002
Account Actual Actual Proj. Act. Budget Budget $ %Number Account Description 2019 2020 2021 2021 2022 Inc / (Dec) Inc / (Dec)
291-6002-601.16-85 Salaries 384,696 415,233 383,427 420,651 439,144 18,493 4.4%291-6002-601.18-05 Overtime Civilian 120 832 159 100 1,200 1,100 1100.0%
Salaries 384,816 416,065 383,586 420,751 440,344 19,593 4.7%
291-6002-601.19-05 Medical Insurance 79,184 66,675 80,176 80,176 84,621 4,445 5.5%291-6002-601.19-10 IMRF 39,098 52,793 48,102 52,762 50,496 (2,266) (4.3%)291-6002-601.19-11 Social Security 23,252 25,178 22,934 26,087 27,295 1,208 4.6%291-6002-601.19-12 Medicare 5,438 5,888 5,364 6,101 6,384 283 4.6%
Fringe Benefits 146,972 150,534 156,576 165,126 168,796 3,670 2.2%
291-6002-601.20-05 Professional Services 3,257 1,812 1,500 4,000 3,000 (1,000) (25.0%)291-6002-601.21-02 Equipment Maintenance 1,760 1,320 1,360 1,710 1,710 0 0.0%291-6002-601.21-65 Other Services 6,604 7,668 14,000 16,700 15,075 (1,625) (9.7%)291-6002-601.22-02 Dues 628 225 675 270 945 675 250.0%291-6002-601.22-03 Training 53 0 0 50 50 0 0.0%291-6002-601.22-10 Printing 186,767 89,434 150,000 171,583 162,450 (9,133) (5.3%)
Contractual Services 199,069 100,459 167,535 194,313 183,230 (11,083) (5.7%)
291-6002-601.30-05 Office Supplies & Equipment 17,738 12,759 10,500 15,579 15,579 0 0.0%291-6002-601.31-85 Small Tools & Equipment 5,111 5,538 3,900 6,000 6,000 0 0.0%291-6002-601.32-01 Program Supplies 0 444 0 0 0 0 N/A291-6002-601.32-72 Special Events 4,435 1,887 16,073 16,073 16,073 0 0.0%
Commodities 27,284 20,628 30,473 37,652 37,652 0 0.0%
Total Communications & Marketing 758,141 687,686 738,170 817,842 830,022 12,180 1.5%
414

MEMORIAL LIBRARY FUNDEXPENDITURES
Human Resources 6003
Account Actual Actual Proj. Act. Budget Budget $ %Number Account Description 2019 2020 2021 2021 2022 Inc / (Dec) Inc / (Dec)
291-6003-601.16-85 Salaries 165,451 170,654 157,370 171,895 180,373 8,478 4.9%291-6003-601.18-05 Overtime Civilian 725 32 216 300 300 0 0.0%
Salaries 166,176 170,686 157,586 172,195 180,673 8,478 4.9%
291-6003-601.19-05 Medical Insurance 47,485 46,257 46,555 46,555 47,145 590 1.3%291-6003-601.19-10 IMRF 16,501 21,582 19,761 21,593 20,689 (904) (4.2%)291-6003-601.19-11 Social Security 9,515 9,804 8,959 10,676 11,183 507 4.8%291-6003-601.19-12 Medicare 2,225 2,293 2,095 2,497 2,615 118 4.7%291-6003-601.19-50 Employee Asst. Program 5,820 5,836 5,366 6,000 6,000 0 0.0%
Fringe Benefits 81,546 85,772 82,736 87,321 87,632 311 0.4%
291-6003-601.21-65 Other Services 9,614 5,043 6,700 9,800 35,500 25,700 262.2%291-6003-601.22-01 Advertising 245 95 200 1,300 1,300 0 0.0%291-6003-601.22-02 Dues 2,659 2,989 3,383 3,300 3,558 258 7.8%291-6003-601.22-03 Training 1,224 561 800 1,300 1,300 0 0.0%291-6003-601.22-55 In Service Training 7,898 7,683 7,100 10,000 10,000 0 0.0%
Contractual Services 21,640 16,371 18,183 25,700 51,658 25,958 101.0%
291-6003-601.32-01 Program Supplies 0 57 100 400 400 0 0.0%Commodities 0 57 100 400 400 0 0.0%
291-6003-601.40-62 Tuition Reimbursement 20,123 25,000 20,000 25,000 25,000 0 0.0%291-6003-601.40-70 Employee Recognition Program 14,069 18,446 19,350 19,350 21,350 2,000 10.3%
Other Charges 34,192 43,446 39,350 44,350 46,350 2,000 4.5%
Total Human Resources 303,554 316,332 297,955 329,966 366,713 36,747 11.1%
415

MEMORIAL LIBRARY FUNDEXPENDITURES
Paid by Gifts and Grants 6004
Account Actual Actual Proj. Act. Budget Budget $ %Number Account Description 2019 2020 2021 2021 2022 Inc / (Dec) Inc / (Dec)
291-6004-601.20-05 Professional Services 798 219 0 0 300 300 N/A291-6004-601.21-65 Other Services 10,197 5,571 3,519 2,000 2,125 125 6.3%291-6004-601.22-02 Dues 0 346 0 0 500 500 N/A291-6004-601.22-10 Printing 343 403 1,000 0 500 500 N/A291-6004-601.22-18 Other Services - Programs/Exhib 35,347 29,386 5,000 20,000 20,000 0 0.0%
Contractual Services 46,685 35,925 9,519 22,000 23,425 1,425 6.5%
291-6004-601.31-85 Small Tools and Equipment 0 1,073 0 2,000 1,000 (1,000) (50.0%)291-6004-601.32-01 Program Supplies 343 230 1,000 2,500 3,000 500 20.0%291-6004-601.32-02 Program Events 7,972 2,997 1,000 2,500 5,835 3,335 133.4%291-6004-601.32-32 Software 0 0 1,000 500 3,500 3,000 600.0%291-6004-601.32-72 Special Events 19,122 1,814 0 5,000 500 (4,500) (90.0%)291-6004-601.32-75 Audio Visual 740 1,520 2,500 500 16,000 15,500 3100.0%291-6004-601.32-78 Electronic Resources 0 0 400 1,500 500 (1,000) (66.7%)291-6004-601.32-80 Books 605 4,504 0 5,000 1,500 (3,500) (70.0%)291-6004-601.32-90 Circulation Supplies 890 0 5,000 0 2,000 2,000 N/A
Commodities 29,672 12,138 10,900 19,500 33,835 14,335 73.5%
291-6004-601.50-15 Other Equipment 2,624 17,619 5,000 2,500 2,500 0 0.0%291-6004-600.50.55 Other Capital Outlay 0 0 0 2,500 2,500 0 0.0%
Property 2,624 17,619 5,000 5,000 5,000 0 0.0%
Total Paid by Gifts and Grants 78,981 65,682 25,419 46,500 62,260 15,760 33.9%
416

MEMORIAL LIBRARY FUNDEXPENDITURES
Finance 6008
Account Actual Actual Proj. Act. Budget Budget $ %Number Account Description 2019 2020 2021 2021 2022 Inc / (Dec) Inc / (Dec)
291-6008-601.16-85 Salaries 225,474 227,510 212,958 229,214 235,552 6,338 2.8%291-6008-601.18-05 Overtime Civilian 13 56 41 100 250 150 150.0%
Salaries 225,487 227,566 212,999 229,314 235,802 6,488 2.8%
291-6008-601.19-05 Medical Insurance 77,885 66,082 65,664 65,664 54,220 (11,444) (17.4%)291-6008-601.19-10 IMRF 22,874 28,891 26,723 28,756 27,018 (1,738) (6.0%)291-6008-601.19-11 Social Security 13,229 13,502 12,698 14,217 14,604 387 2.7%291-6008-601.19-12 Medicare 3,094 3,157 2,970 3,325 3,416 91 2.7%
Fringe Benefits 117,082 111,632 108,055 111,962 99,258 (12,704) (11.3%)
291-6008-601.20-05 Professional Services 5,400 8,300 7,875 7,875 7,875 0 0.0%291-6008-601.21-36 Equipment Rental 1,376 1,502 1,636 1,326 1,639 313 23.6%291-6008-601.21-65 Other Services 0 5,277 6,189 6,189 6,189 0 0.0%291-6008-601.22-02 Dues 100 673 800 825 825 0 0.0%291-6008-601.22-03 Training 1,154 78 900 1,200 1,200 0 0.0%291-6008-601.22-25 IT Service Charge 25,100 129,267 129,267 129,267 133,145 3,878 3.0%
Contractual Services 33,130 145,097 146,667 146,682 150,873 4,191 2.9%
Total Finance 375,699 484,295 467,721 487,958 485,933 (2,025) (0.4%)
417

MEMORIAL LIBRARY FUNDEXPENDITURES
Information Technology 6010
Account Actual Actual Proj. Act. Budget Budget $ %Number Account Description 2019 2020 2021 2021 2022 Inc / (Dec) Inc / (Dec)
291-6010-601.16-85 Salaries 683,473 628,463 568,716 632,483 651,505 19,022 3.0%291-6010-601.18-05 Overtime Civilian 234 131 97 250 250 0 0.0%
Salaries 683,707 628,594 568,813 632,733 651,755 19,022 3.0%
291-6010-601.19-05 Medical Insurance 139,502 148,311 146,844 146,844 158,638 11,794 8.0%291-6010-601.19-10 IMRF 66,409 76,738 69,397 79,345 72,747 (6,598) (8.3%)291-6010-601.19-11 Social Security 41,097 37,597 33,744 39,229 40,393 1,164 3.0%291-6010-601.19-12 Medicare 9,611 8,793 7,892 9,175 9,447 272 3.0%
Fringe Benefits 256,619 271,439 257,877 274,593 281,225 6,632 2.4%
291-6010-601.20-05 Professional Services 7,662 3,131 4,500 7,022 5,895 (1,127) (16.0%)291-6010-601.20-08 Consulting Services Library 0 1,446 3,500 4,545 3,590 (955) (21.0%)291-6010-601.21-02 Equipment Maintenance 158,972 155,560 169,375 169,375 170,989 1,614 1.0%291-6010-601.22-03 Travel & Training 232 50 0 6,450 6,450 0 0.0%291-6010-601.22-42 Internet Access 0 26,104 41,846 41,846 57,667 15,821 37.8%
Contractual Services 166,866 186,291 219,221 229,238 244,591 15,353 6.7%
291-6010-601.30-05 Office Supplies & Equipment 339 749 375 375 683 308 82.1%291-6010-601.30-30 Data System Supplies 26,133 17,235 25,204 25,204 25,204 0 0.0%291-6010-601.30-32 Software Library 120,957 91,103 160,102 160,102 146,292 (13,810) (8.6%)291-6010-601.30-33 Documentation Library 0 0 0 100 100 0 0.0%291-6010-601.31-85 Small Tools and Equipment 8,022 11,926 13,226 13,226 13,226 0 0.0%291-6010-601.32-05 Processing Supplies 12 224 0 300 300 0 0.0%291-6010-601.32-32 Software 7,787 8,379 0 10,887 10,887 0 0.0%
Commodities 163,250 129,616 198,907 210,194 196,692 (13,502) (6.4%)
291-6010-601.50-12 Computer Equipment 27,796 25,653 34,790 34,790 31,790 (3,000) (8.6%)291-6010-601.50-15 Other Equipment 144 0 0 0 12,600 12,600 N/A
Property 27,940 25,653 34,790 34,790 44,390 9,600 27.6%
Total Information Technology 1,298,382 1,241,593 1,279,608 1,381,548 1,418,653 37,105 2.7%
418

MEMORIAL LIBRARY FUNDEXPENDITURES
Security 6015
Account Actual Actual Proj. Act. Budget Budget $ %Number Account Description 2019 2020 2021 2021 2022 Inc / (Dec) Inc / (Dec)
291-6015-601.16-85 Salaries 271,051 260,996 228,883 260,077 263,937 3,860 1.5%291-6015-601.18-05 Overtime Civilian 2,196 711 94 2,000 2,000 0 0.0%
Salaries 273,247 261,707 228,977 262,077 265,937 3,860 1.5%
291-6015-601.19-05 Medical Insurance 60,433 80,031 80,152 80,152 83,155 3,003 3.7%291-6015-601.19-10 IMRF 24,671 30,261 26,771 28,946 28,462 (484) (1.7%)291-6015-601.19-11 Social Security 16,048 15,322 13,265 16,249 16,104 (145) (0.9%)291-6015-601.19-12 Medicare 3,753 3,584 3,102 3,800 3,766 (34) (0.9%)
Fringe Benefits 104,905 129,198 123,290 129,147 131,487 2,340 1.8%
291-6015-601.22-03 Training 855 0 300 500 1,500 1,000 200.0%Contractual Services 855 0 300 500 1,500 1,000 200.0%
291-6015-601.30-05 Office Supplies & Equipment 31 225 100 435 435 0 0.0%Commodities 31 225 100 435 435 0 0.0%
Total Security 379,038 391,130 352,667 392,159 399,359 7,200 1.8%
419

MEMORIAL LIBRARY FUNDEXPENDITURES
Facilities 6020
Account Actual Actual Proj. Act. Budget Budget $ %Number Account Description 2019 2020 2021 2021 2022 Inc / (Dec) Inc / (Dec)
291-6020-601.16-85 Salaries 386,776 382,606 349,704 398,347 402,462 4,115 1.0%291-6020-601.18-05 Overtime Civilian 4,477 2,071 4,163 4,500 4,500 0 0.0%
Salaries 391,253 384,677 353,867 402,847 406,962 4,115 1.0%
291-6020-601.19-05 Medical Insurance 100,970 106,784 106,826 106,826 106,451 (375) (0.4%)291-6020-601.19-10 IMRF 35,926 45,262 41,857 43,676 43,110 (566) (1.3%)291-6020-601.19-11 Social Security 22,919 22,437 20,437 24,977 24,953 (24) (0.1%)291-6020-601.19-12 Medicare 5,360 5,247 4,780 5,841 5,836 (5) (0.1%)
Fringe Benefits 165,175 179,730 173,900 181,320 180,350 (970) (0.5%)
291-6020-601.21-02 Equipment Maintenance 27,973 57,932 48,799 39,456 40,976 1,520 3.9%291-6020-601.21-07 Vehicle Maintenance 7,657 6,646 8,694 9,121 9,121 0 0.0%291-6020-601.21-11 Building Maintenance 263,520 196,435 240,124 211,802 207,066 (4,736) (2.2%)291-6020-601.21-36 Equipment Rental 870 408 800 1,000 1,000 0 0.0%291-6020-601.21-60 Water and Sewer Service 19,310 17,411 8,500 16,472 16,472 0 0.0%291-6020-601.22-03 Travel & Training 0 395 432 432 432 0 0.0%
Contractual Services 319,330 279,227 307,349 278,283 275,067 (3,216) (1.2%)
291-6020-601.30-05 Office Supplies 0 0 0 0 100 100 N/A291-6020-601.30-50 Petroleum Products 4,043 2,190 2,500 10,000 4,000 (6,000) (60.0%)291-6020-601.30-51 Heating Fuel 45,734 47,699 51,000 62,537 62,537 0 0.0%291-6020-601.31-45 Janitorial Supplies 25,287 17,049 23,000 23,387 23,387 0 0.0%
Commodities 75,064 66,938 76,500 95,924 90,024 (5,900) (6.2%)
291-6020-601.50-15 Other Equipment 3,361 9,186 10,000 20,000 20,000 0 0.0%Property 3,361 9,186 10,000 20,000 20,000 0 0.0%
Total Facilities 954,183 919,758 921,616 978,374 972,403 (5,971) (0.6%)
Total Admin Support Services 5,101,974 4,939,127 4,784,400 5,311,580 5,500,252 188,672 3.6%
420

MEMORIAL LIBRARY FUNDEXPENDITURES
Youth Services 6401
Account Actual Actual Proj. Act. Budget Budget $ %Number Account Description 2019 2020 2021 2021 2022 Inc / (Dec) Inc / (Dec)
291-6401-601.16-85 Salaries 929,016 917,108 804,312 966,557 1,012,329 45,772 4.7%291-6401-601.18-05 Overtime Civilian 0 0 300 2,000 2,000 0 0.0%
Salaries 929,016 917,108 804,612 968,557 1,014,329 45,772 4.7%
291-6401-601.19-05 Medical Insurance 118,861 122,997 126,637 126,637 164,662 38,025 30.0%291-6401-601.19-10 IMRF 84,715 108,586 94,497 110,668 104,084 (6,584) (5.9%)291-6401-601.19-11 Social Security 56,805 55,380 47,820 58,919 62,764 3,845 6.5%291-6401-601.19-12 Medicare 13,285 12,951 11,184 13,780 14,679 899 6.5%
Fringe Benefits 273,666 299,914 280,138 310,004 346,189 36,185 11.7%
291-6401-601.21-02 Equipment Maintenance 143 0 0 0 0 0 N/A291-6401-601.22-02 Dues 3,155 3,604 4,478 4,478 4,548 70 1.6%291-6401-601.22-03 Travel & Training 2,163 823 1,000 3,979 3,979 0 0.0%291-6401-601.22-18 Contracted Programs & Exhibits 0 8,176 9,000 18,980 17,480 (1,500) (7.9%)
Contractual Services 5,461 12,603 14,478 27,437 26,007 (1,430) (5.2%)
291-6401-601.30-05 Office Supplies & Equipment 1,732 1,229 1,500 2,438 2,819 381 15.6%291-6401-601.32-01 Program Supplies 10,201 4,133 8,000 10,948 10,948 0 0.0%291-6401-601.32-02 Program Events 20,106 10,619 16,000 33,930 30,930 (3,000) (8.8%)291-6401-601.32-90 Circulation Supplies 4,004 3,345 4,477 4,477 8,427 3,950 88.2%
Commodities 36,043 19,326 29,977 51,793 53,124 1,331 2.6%
Total Youth Services 1,244,186 1,248,951 1,129,205 1,357,791 1,439,649 81,858 6.0%
421

MEMORIAL LIBRARY FUNDEXPENDITURES
Specialty Info Services 6405
Account Actual Actual Proj. Act. Budget Budget $ %Number Account Description 2019 2020 2021 2021 2022 Inc / (Dec) Inc / (Dec)
291-6405-601.16-85 Salaries 428,756 33 0 0 0 0 N/A291-6405-601.18-05 Overtime Civilian 60 0 0 0 0 0 N/A
Salaries 428,816 33 0 0 0 0 N/A
291-6405-601.19-05 Medical Insurance 99,536 0 0 0 0 0 N/A291-6405-601.19-10 IMRF 42,939 (561) 0 0 0 0 N/A291-6405-601.19-11 Social Security 25,173 (275) 0 0 0 0 N/A291-6405-601.19-12 Medicare 5,887 (64) 0 0 0 0 N/A
Fringe Benefits 173,535 (900) 0 0 0 0 N/A
291-6405-601.22-02 Dues 1,396 0 0 0 0 0 N/A291-6405-601.22-03 Travel & Training 1,781 0 0 0 0 0 N/A291-6405-601.22-18 Contracted Programs & Exhibits 4,710 0 0 0 0 0 N/A
Contractual Services 7,887 0 0 0 0 0 N/A
291-6405-601.30-05 Office Supplies & Equipment 1,796 0 0 0 0 0 N/A291-6405-601.32-01 Program Supplies 1,112 0 0 0 0 0 N/A291-6405-601.32-02 Program Events 324 0 0 0 0 0 N/A291-6405-601.32-90 Circulation Supplies 111 0 0 0 0 0 N/A
Commodities 3,343 0 0 0 0 0 N/A
Total Specialty Info Services 613,581 (867) 0 0 0 0 N/A
422

MEMORIAL LIBRARY FUNDEXPENDITURES
Info Services 6410
Account Actual Actual Proj. Act. Budget Budget $ %Number Account Description 2019 2020 2021 2021 2022 Inc / (Dec) Inc / (Dec)
291-6410-601.16-85 Salaries 798,726 1,038,547 891,781 1,113,836 1,102,307 (11,529) (1.0%)291-6410-601.18-05 Overtime Civilian 432 468 516 1,000 1,000 0 0.0%
Salaries 799,158 1,039,015 892,297 1,114,836 1,103,307 (11,529) (1.0%)
291-6410-601.19-05 Medical Insurance 89,431 153,347 153,022 153,021 147,736 (5,285) (3.5%)291-6410-601.19-10 IMRF 64,544 115,231 99,089 115,962 111,098 (4,864) (4.2%)291-6410-601.19-11 Social Security 48,494 62,759 53,446 67,899 68,343 444 0.7%291-6410-601.19-12 Medicare 11,341 14,677 12,499 15,879 15,983 104 0.7%
Fringe Benefits 213,810 346,014 318,056 352,761 343,160 (9,601) (2.7%)
291-6410-601.22-02 Dues 420 1,984 2,000 2,900 2,802 (98) (3.4%)291-6410-601.22-03 Travel & Training 1,521 942 1,300 3,300 3,300 0 0.0%291-6410-601.22-18 Contracted Programs & Exhibits 0 1,170 2,000 5,760 5,760 0 0.0%
Contractual Services 1,941 4,096 5,300 11,960 11,862 (98) (0.8%)
291-6410-601.30-05 Office Supplies & Equipment 1,358 1,285 1,200 1,888 1,888 0 0.0%291-6410-601.32-01 Program Supplies 345 543 2,250 2,750 2,750 0 0.0%291-6410-601.32-90 Circulation Supplies 0 651 1,500 2,095 2,095 0 0.0%
Commodities 1,703 2,479 4,950 6,733 6,733 0 0.0%
Total Info Services 1,016,612 1,391,604 1,220,603 1,486,290 1,465,062 (21,228) (1.4%)
423

MEMORIAL LIBRARY FUNDEXPENDITURES
Circulation 6420
Account Actual Actual Proj. Act. Budget Budget $ %Number Account Description 2019 2020 2021 2021 2022 Inc / (Dec) Inc / (Dec)
291-6420-601.16-85 Salaries 1,201,969 1,268,989 1,093,002 1,410,112 1,380,472 (29,640) (2.1%)291-6420-601.18-05 Overtime Civilian 95 109 213 1,000 1,000 0 0.0%
Salaries 1,202,064 1,269,098 1,093,215 1,411,112 1,381,472 (29,640) (2.1%)
291-6420-601.19-05 Medical Insurance 89,524 120,853 141,472 141,472 116,828 (24,644) (17.4%)291-6420-601.19-10 IMRF 93,242 129,042 115,479 141,120 131,907 (9,213) (6.5%)291-6420-601.19-11 Social Security 72,871 77,588 66,576 85,992 85,589 (403) (0.5%)291-6420-601.19-12 Medicare 17,043 18,145 15,570 20,111 20,017 (94) (0.5%)
Fringe Benefits 272,680 345,628 339,097 388,695 354,341 (34,354) (8.8%)
291-6420-601.21-65 Other Services 6,844 416 3,513 3,513 3,513 0 0.0%291-6420-601.22-02 Dues 260 333 1,000 1,441 1,505 64 4.4%291-6420-601.22-03 Travel & Training 962 1,134 400 2,773 2,773 0 0.0%
Contractual Services 8,066 1,883 4,913 7,727 7,791 64 0.8%
291-6420-601.30-05 Office Supplies & Equipment 1,213 2,078 1,500 2,033 2,033 0 0.0%291-6420-601.30-07 Supplies Reimbursed by Patron 1,977 0 0 0 0 0 N/A291-6420-601.32-01 Program Supplies 0 634 500 1,000 1,000 0 0.0%291-6420-601.32-90 Circulation Supplies 7,848 6,705 8,660 8,574 8,660 86 1.0%
Commodities 11,038 9,417 10,660 11,607 11,693 86 0.7%
Total Circulation 1,493,848 1,626,026 1,447,885 1,819,141 1,755,297 (63,844) (3.5%)
424

MEMORIAL LIBRARY FUNDEXPENDITURES
Senior and Accessibility Services (SAS) 6430
Account Actual Actual Proj. Act. Budget Budget $ %Number Account Description 2019 2020 2021 2021 2022 Inc / (Dec) Inc / (Dec)
291-6430-601.16-85 Salaries 198,419 221,914 197,895 224,475 239,959 15,484 6.9%291-6430-601.18-05 Overtime Civilian 1 0 0 0 0 0 N/A
Salaries 198,420 221,914 197,895 224,475 239,959 15,484 6.9%
291-6430-601.19-05 Medical Insurance 15,082 11,681 11,386 11,386 12,495 1,109 9.7%291-6430-601.19-10 IMRF 19,676 26,406 23,979 26,060 27,030 970 3.7%291-6430-601.19-11 Social Security 11,788 13,244 11,737 13,691 14,875 1,184 8.6%291-6430-601.19-12 Medicare 2,757 3,098 2,745 3,202 3,479 277 8.7%
Fringe Benefits 49,303 54,429 49,847 54,339 57,879 3,540 6.5%
291-6430-601.22-02 Dues 0 295 270 518 518 0 0.0%291-6430-601.22-03 Travel & Training 336 524 500 930 930 0 0.0%291-6430-601.22-18 Contracted Programs & Exhibits 0 6,424 8,400 9,590 9,590 0 0.0%
Contractual Services 336 7,243 9,170 11,038 11,038 0 0.0%
291-6430-601.30-05 Office Supplies & Equipment 291 465 500 500 500 0 0.0%291-6430-601.32-01 Program Supplies 0 1,814 1,820 1,820 1,820 0 0.0%291-6430-601.32-02 Program Events 0 565 600 600 600 0 0.0%291-6430-601.32-90 Circulation Supplies 933 987 1,050 1,050 1,050 0 0.0%
Commodities 1,224 3,831 3,970 3,970 3,970 0 0.0%
Total SAS 249,283 287,417 260,882 293,822 312,846 19,024 6.5%
425

MEMORIAL LIBRARY FUNDEXPENDITURES
Programs and Exhibits 6440
Account Actual Actual Proj. Act. Budget Budget $ %Number Account Description 2019 2020 2021 2021 2022 Inc / (Dec) Inc / (Dec)
291-6440-601.16-85 Salaries 204,918 225,754 157,727 242,139 243,924 1,785 0.7%291-6440-601.18-05 Overtime Civilian 86 331 236 200 250 50 25.0%
Salaries 205,004 226,085 157,963 242,339 244,174 1,835 0.8%
291-6440-601.19-05 Medical Insurance 57,932 59,809 64,410 64,410 47,336 (17,074) (26.5%)291-6440-601.19-10 IMRF 20,916 28,592 19,808 28,994 28,007 (987) (3.4%)291-6440-601.19-11 Social Security 12,053 13,320 9,229 14,746 15,123 377 2.6%291-6440-601.19-12 Medicare 2,819 3,115 2,158 3,449 3,537 88 2.6%
Fringe Benefits 93,720 104,836 95,605 111,599 94,003 (17,596) (15.8%)
291-6440-601.22-02 Dues 1,006 593 851 1,145 1,156 11 1.0%291-6440-601.22-03 Travel & Training 1,181 276 600 1,414 1,428 14 1.0%291-6440-601.22-18 Contracted Programs & Exhibits 91,369 38,553 55,000 103,007 88,213 (14,794) (14.4%)
Contractual Services 93,556 39,422 56,451 105,566 90,797 (14,769) (14.0%)
291-6440-601.32-01 Program Supplies 58 41 57 0 0 0 N/A291-6440-601.32-02 Program Events 30,022 16,945 8,138 8,058 8,138 80 1.0%
Commodities 30,080 16,986 8,195 8,058 8,138 80 1.0%
Total Programs and Exhibits 422,360 387,329 318,214 467,562 437,112 (30,450) (6.5%)
426

MEMORIAL LIBRARY FUNDEXPENDITURES
Digital Services 6450
Account Actual Actual Proj. Act. Budget Budget $ %Number Account Description 2019 2020 2021 2021 2022 Inc / (Dec) Inc / (Dec)
291-6450-601.16-85 Salaries 523,784 510,282 452,631 528,322 542,823 14,501 2.7%Salaries 523,784 510,282 452,631 528,322 542,823 14,501 2.7%
291-6450-601.19-05 Medical Insurance 53,443 55,627 50,191 50,191 52,569 2,378 4.7%291-6450-601.19-10 IMRF 47,772 61,612 53,300 59,234 55,387 (3,847) (6.5%)291-6450-601.19-11 Social Security 31,761 31,123 27,170 32,251 33,655 1,404 4.4%291-6450-601.19-12 Medicare 7,428 7,279 6,355 7,543 7,871 328 4.3%
Fringe Benefits 140,404 155,641 137,016 149,219 149,481 262 0.2%
291-6450-601.22-02 Dues 1,744 1,548 1,597 2,246 1,995 (251) (11.2%)291-6450-601.22-03 Travel & Training 314 0 350 500 500 0 0.0%291-6450-601.22-42 Internet Access 0 2,520 3,480 3,840 3,840 0 0.0%291-6450-601.22-66 Outside Reference Service 2,774 2,873 2,974 2,973 3,078 105 3.5%
Contractual Services 4,832 6,941 8,401 9,559 9,413 (146) (1.5%)
291-6450-601.30-05 Office Supplies & Equipment 571 427 600 700 700 0 0.0%291-6450-601.30-07 Supplies Reimbursed by Patron 425 501 600 600 550 (50) (8.3%)291-6450-601.31-85 Small Tools and Equipment 5,218 4,271 4,000 5,000 6,200 1,200 24.0%291-6450-601.32-01 Program Supplies 572 323 200 700 700 0 0.0%291-6450-601.32-78 Electronic Resources 340,500 337,387 363,247 374,867 375,497 630 0.2%291-6450-601.32-90 Circulation Supplies 1,575 1,380 1,500 1,575 1,575 0 0.0%
Commodities 348,861 344,289 370,147 383,442 385,222 1,780 0.5%
291-6450-601.50-15 Other Equipment 2,954 464 0 0 0 0 N/AProperty 2,954 464 0 0 0 0 N/A
Total Digital Services 1,020,835 1,017,617 968,195 1,070,542 1,086,940 16,398 1.5%
427
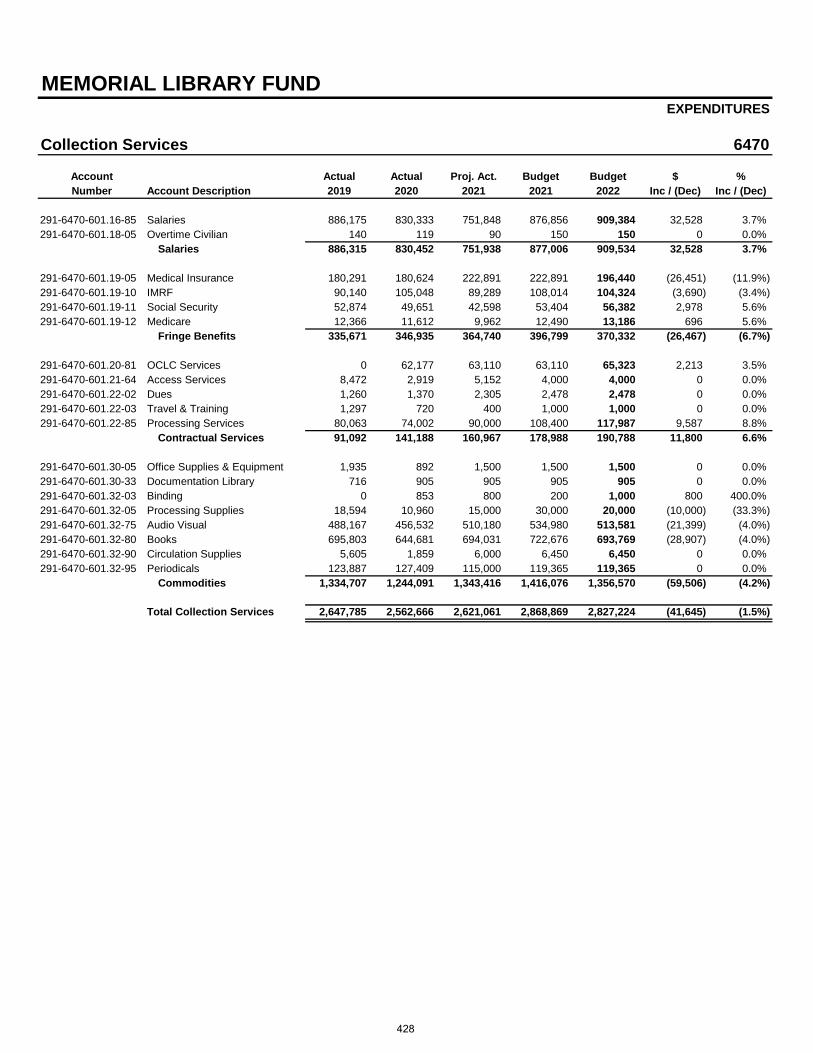
MEMORIAL LIBRARY FUNDEXPENDITURES
Collection Services 6470
Account Actual Actual Proj. Act. Budget Budget $ %Number Account Description 2019 2020 2021 2021 2022 Inc / (Dec) Inc / (Dec)
291-6470-601.16-85 Salaries 886,175 830,333 751,848 876,856 909,384 32,528 3.7%291-6470-601.18-05 Overtime Civilian 140 119 90 150 150 0 0.0%
Salaries 886,315 830,452 751,938 877,006 909,534 32,528 3.7%
291-6470-601.19-05 Medical Insurance 180,291 180,624 222,891 222,891 196,440 (26,451) (11.9%)291-6470-601.19-10 IMRF 90,140 105,048 89,289 108,014 104,324 (3,690) (3.4%)291-6470-601.19-11 Social Security 52,874 49,651 42,598 53,404 56,382 2,978 5.6%291-6470-601.19-12 Medicare 12,366 11,612 9,962 12,490 13,186 696 5.6%
Fringe Benefits 335,671 346,935 364,740 396,799 370,332 (26,467) (6.7%)
291-6470-601.20-81 OCLC Services 0 62,177 63,110 63,110 65,323 2,213 3.5%291-6470-601.21-64 Access Services 8,472 2,919 5,152 4,000 4,000 0 0.0%291-6470-601.22-02 Dues 1,260 1,370 2,305 2,478 2,478 0 0.0%291-6470-601.22-03 Travel & Training 1,297 720 400 1,000 1,000 0 0.0%291-6470-601.22-85 Processing Services 80,063 74,002 90,000 108,400 117,987 9,587 8.8%
Contractual Services 91,092 141,188 160,967 178,988 190,788 11,800 6.6%
291-6470-601.30-05 Office Supplies & Equipment 1,935 892 1,500 1,500 1,500 0 0.0%291-6470-601.30-33 Documentation Library 716 905 905 905 905 0 0.0%291-6470-601.32-03 Binding 0 853 800 200 1,000 800 400.0%291-6470-601.32-05 Processing Supplies 18,594 10,960 15,000 30,000 20,000 (10,000) (33.3%)291-6470-601.32-75 Audio Visual 488,167 456,532 510,180 534,980 513,581 (21,399) (4.0%)291-6470-601.32-80 Books 695,803 644,681 694,031 722,676 693,769 (28,907) (4.0%)291-6470-601.32-90 Circulation Supplies 5,605 1,859 6,000 6,450 6,450 0 0.0%291-6470-601.32-95 Periodicals 123,887 127,409 115,000 119,365 119,365 0 0.0%
Commodities 1,334,707 1,244,091 1,343,416 1,416,076 1,356,570 (59,506) (4.2%)
Total Collection Services 2,647,785 2,562,666 2,621,061 2,868,869 2,827,224 (41,645) (1.5%)
428

MEMORIAL LIBRARY FUNDEXPENDITURES
Belmont Makerspace 6480
Account Actual Actual Proj. Act. Budget Budget $ %Number Account Description 2019 2020 2021 2021 2022 Inc / (Dec) Inc / (Dec)
291-6480-601.16-85 Salaries 0 75,390 200,000 325,231 353,626 28,395 8.7%291-6480-601.18-05 Overtime Civilian 0 0 75 200 250 50 25.0%
Salaries 0 75,390 200,075 325,431 353,876 28,445 8.7%
291-6480-601.19-05 Medical Insurance 0 40,540 53,182 53,182 14,084 (39,098) (73.5%)291-6480-601.19-10 IMRF 0 9,537 25,089 40,086 38,562 (1,524) (3.8%)291-6480-601.19-11 Social Security 0 4,638 12,405 19,819 21,925 2,106 10.6%291-6480-601.19-12 Medicare 0 1,085 2,901 4,635 5,128 493 10.6%
Fringe Benefits 0 55,800 93,577 117,722 79,699 (38,023) (32.3%)
291-6480-601.20-05 Professional Services 10,266 1,250 0 10,000 0 (10,000) (100.0%)291-6480-601.20-20 Legal Services 0 0 0 5,000 0 (5,000) (100.0%)291-6480-601.20-40 General Insurance 423 390 1,288 216 216 0 0.0%291-6480-601.21-02 Equipment Maintenance 0 3,591 5,000 6,980 7,530 550 7.9%291-6480-601.21-11 Building Maintenance 1,840 5,436 3,000 26,866 55,366 28,500 106.1%291-6480-601.21-36 Equipment Rental 0 0 0 1,000 1,000 0 0.0%291-6480-601.21-60 Water and Sewer Service 0 344 500 1,200 1,200 0 0.0%291-6480-601.21-65 Bank Fees 30 1,106 100 100 300 200 200.0%291-6480-601.22-02 Dues 0 0 680 1,575 802 (773) (49.1%)291-6480-601.22-03 Travel & Training 0 629 1,000 1,000 1,000 0 0.0%291-6480-601.22-28 Contracted Programs & Exhibits - Adult 0 0 0 7,800 21,000 13,200 169.2%291-6480-601.22-38 Contracted Programs & Exhibits - Youth 0 0 0 1,500 1,500 N/A291-6480-601.22-42 Internet Access 0 0 800 1,500 3,075 1,575 105.0%
Contractual Services 12,559 12,746 12,368 63,237 92,989 29,752 47.0%
291-6480-601.30-05 Office Supplies & Equipment 0 1,026 2,000 2,000 2,000 0 0.0%291-6480-601.30-07 Supplies Reimbursed by Patrons 0 5,835 7,500 7,500 8,231 731 9.7%291-6480-601.30-32 Software Library 0 0 0 0 6,750 6,750 N/A291-6480-601.30-51 Heating Fuel & Electric 1,908 526 8,000 40,140 40,140 0 0.0%291-6480-601.31-45 Janitorial Supplies 0 0 2,500 7,400 8,270 870 11.8%291-6480-601.31-85 Small Tools & Equipment 32 4,385 5,000 5,000 12,529 7,529 150.6%291-6480-601.32-12 Program Events - Adult 0 0 3,000 9,000 15,000 6,000 66.7%291-6480-601.32-22 Program Events - Youth 0 0 0 0 3,000 3,000 N/A
Commodities 1,940 11,772 28,000 71,040 95,920 15,880 35.0%
291-6480-601.50-12 Computer Equipment 0 0 0 0 2,000 2,000 N/A291-6480-601.50-15 Other Equipment 0 1,440 5,000 10,000 15,221 5,221 52.2%
Property 0 1,440 5,000 10,000 17,221 7,221 72.2%
Total Belmont Makerspace 14,499 157,148 339,020 587,430 639,705 43,275 8.9%
Total User Services 8,722,989 8,677,891 8,305,065 9,951,447 9,963,835 3,388 0.1%
Total Memorial Library Fund 13,824,963 13,617,018 13,089,465 15,263,027 15,464,087 201,060 1.3%
429

LIBRARY CAPITAL PROJECTS FUND 491Fund Summary
2019 2020 2021 2021 2022 $ %Actual Actual Est. Actual Budget Budget Change Change
BEGINNING FUND BALANCE $4,673,543 $4,703,700 $4,493,915 $4,493,915 $3,430,979 ($1,062,936) (23.7%)
RevenuesInterest Income 110,158 49,468 3,000 0 5,000 5,000 N/A
Total Revenues $110,158 $49,468 $3,300 $0 $5,000 $5,000 N/A
ExpendituresCapita l Items 80,001 259,253 1,066,236 2,066,236 1,493,926 (572,310) (27.7%)
Total Expenditures $80,001 $259,253 $1,066,236 $2,066,236 $1,493,926 ($572,310) (27.7%)
Revenues over(under) Expenditures $30,157 ($209,785) ($1,062,936) ($2,066,236) ($1,488,926) $577,310 (27.9%)
Interfund Transfers In 0 0 0 0 0 0 N/A
ENDING FUND BALANCE $4,703,700 $4,493,915 $3,430,979 $2,427,679 $1,942,053 ($485,626) (20.0%)
430

LIBRARY CAPITAL PROJECTS FUNDREVENUES
Account Actual Actual Proj Actual Budget Budget $ %No. Account Description 2019 2020 2021 2021 2022 Inc / (Dec) Inc / (Dec)
491-0000-461.02-00 Interest on Investments 73,311 42,167 3,000 0 5,000 5,000 N/A491-0000-462.10-00 Market Value Adjustments 36,847 7,301 0 0 0 0 N/A
110,158 49,468 3,000 0 5,000 5,000 N/A
491-0000-489.90-00 Other Income 0 0 300 0 0 0 N/AOther Financing Sources 0 0 300 0 0 0 N/A
Total Library Capital Projects Fund 110,158 49,468 3,300 0 5,000 5,000 N/A
EXPENDITURES
Administration 6001
Account Actual Actual Proj. Act. Budget Budget $ %Number Account Description 2019 2020 2021 2021 2022 Inc / (Dec) Inc / (Dec)
491-6001-601.50-55 Other Capital Outlay 0 53,023 25,000 25,000 400,000 375,000 1500.0%Capital Outlay 0 53,023 25,000 25,000 400,000 375,000 1500.0%
Total Administration 0 53,023 25,000 25,000 400,000 375,000 1500.0%
Paid by Gifts and Grants 6004
Account Actual Actual 2021 Budget Budget $ %Number Account Description 2019 2020 2021 2021 2022 Inc / (Dec) Inc / (Dec)
491-6004-601.50-55 Other Capital Outlay 0 37,831 0 0 0 0 N/ACapital Outlay 0 37,831 0 0 0 0 N/A
Total Paid by Gifts and Grants 0 37,831 0 0 0 0 N/A
Facilities 6020
Account Actual Actual 2021 Budget Budget $ %Number Account Description 2019 2020 2021 2021 2022 Inc / (Dec) Inc / (Dec)
491-6020-601.50-15 Other Equipment 17,475 18,998 0 0 1,028,926 1,028,926 N/A491-6020-601.50-55 Other Capital Outlay 48,690 0 0 0 0 0 N/A
Capital Outlay 66,165 18,998 0 0 1,028,926 1,028,926 N/A
Total Facilities 66,165 18,998 0 0 1,028,926 1,028,926 N/A
Belmont Makerspace 6480
Account Actual Actual 2021 Budget Budget $ %Number Account Description 2019 2020 2021 2021 2022 Inc / (Dec) Inc / (Dec)
491-6480-601.50-12 Computer Equipment 0 40,094 0 0 0 0 N/A491-6480-601.50-55 Other Capital Outlay 13,836 109,307 1,041,236 1,041,236 65,000 (976,236) (93.8%)
Capital Outlay 13,836 149,401 1,041,236 1,041,236 65,000 (976,236) (93.8%)
Total Belmont Makerspace 13,836 149,401 1,041,236 1,041,236 65,000 (976,236) (93.8%)
Total Memorial Library Capital Projects Fund 80,001 259,253 1,066,236 1,066,236 1,493,926 427,690 40.1%
431

THIS PAGE LEFT BLANK
432

APPENDIX
433

COMMUNITY PROFILE GOVERNMENT
Incorporated January 18, 1887
The Village is a home-rule municipality governed by a nine-member Board consisting of eight Trustees and one Village President, commonly referred to as Mayor. The Board is elected at large for staggered four-year terms.
The Mayor, with approval of the Village Board, appoints the Village Manager.
The Village employs 419 full-time and 18 part-time employees in 10 operating departments: Integrated Services, Human Resources, Legal, Finance, Police, Fire, Planning & Community Development, Building & Life Safety, Health & Senior Services, & Public Works (including Water Utility Operations, Engineering, and Municipal Fleet Services).
In addition, the Village has the following advisory boards and commissions that advise the Village Board on various issues and proposals under review. The Mayor, with the consent of the Board of Trustees, appoints members to the commissions.
Plan Commission Zoning Board of Appeals Board of Health Board of Local Improvements Board of Fire & Police Commissioners Design Commission Building Code Review Board Environmental Commission Housing Commission The Arlington Economic Alliance Senior Citizens Commission Youth Commission Commission for Citizens with Disabilities Bicycle & Pedestrian Advisory Commission Special Events Commission Arts Commission
GOVERNMENT (Continued)
The Village also operates a public access cable television channel and televises most Board meetings.
Village Website: www.vah.com Additional Website: www.discoverarlington.com
Elections Number of Registered Voters 65,547 Number of Ballots Cast in Last Municipal Election 4-6-21 9,440
Village Bond Rating Aa1
Fire ISO Rating 1 (2016)
Various Taxes Sales Tax 10.00% Prepared Food & Beverage Tax 1.25% Telecommunications Tax 6.00% Hotel Tax 5.00% Utility Tax (gas/electric) 5.00%
DEMOGRAPHICS
The Village is comprised of approximately 16.6 square miles.
The Village is located in Cook County, approximately 25 miles northwest of the Chicago loop business district. The Village is home to beautiful Arlington Park Race Track, the world-famous thoroughbred racing destination. Adjacent to the Village to the west are the communities of Palatine and Rolling Meadows; to the east are Wheeling, Prospect Heights, and Mount Prospect; to the north is Buffalo Grove; to the south is Elk Grove Village. O’Hare International Airport is approximately 15 miles southeast of the Village, a 20-minute drive by expressway.
434

COMMUNITY PROFILE (Continued)
DEMOGRAPHICS (Continued)
Weather Conditions Average Winter (Daytime) 35º F Average Summer (Daytime) 81º F Average Annual Rainfall 36 Inches Average Annual Snowfall 36 Inches
Population 1970 64,884 1980 66,116 1990 75,460 2005 (f) 76,943 2010 (a) 75,101 2020 (g) 77,676
Age 0 – 19 17,935 20 – 24 3,400 25 – 34 8,511 35 – 49 16,224 50 – 64 16,111 65 & over 12,920
Ethnic Makeup (a) White 84.2% African American 1.8% American Indian/Alaskan Native 0.1% Asian/Pacific Islander 10.2% Some Other Race 0.1% Two or More Races 1.8% Hispanic or Latino 6.3% NOTE: Hispanic/Latino ethnicity overlaps categories therefore figures do not add up to 100%
Other Household and Resident Data (a,g) Total Households 30,838 Median Household Income $96,340 Per Capita Income $51,450 Median Age 44 % of population over 65 19.8% Education (population 25 years & older)
High school graduate or higher 96.0% Bachelor’s degree or higher 57.9%
Unemployment Percentage (12/2018) (b) 3.0%
DEMOGRAPHICS (Continued)
Home Value (a) Median Home Value $358,300 Median Gross Rent $1,368
$0 to $99,999 1,547 $100,000 to $149,999 1,734 $150,000 to $199,999 1,458 $200,000 to $299,999 4,377 $300,000 to $499,000 10,061 $500,000 to $999,999 3,660 $1,000,000 or more 318
Land Use (c) Acres % Residential 5,279 50.4 Commercial 505 4.9 Office Only 225 2.2 R&D, Manufacturing, Warehousing 590 5.7 Institutional 285 2.7 Mixed Use 398 3.8 Parks/Schools/Government 1,082 10.3 Streets 2,000 19.0 Open 100 1.0 Total 10,464 100.0
Property Value (d) Estimated Total Property Value (2019) $10,100,098,716 Equalized Assessed Valuation (EAV) (2019) $3,366,699,572
2019 EAV % of TotalResidential $2,418,574,182 71.838%Farm 31,991 0.001%Commercial 794,052,203 23.585%Industrial 152,530,437 4.531%Railroad 1,510,759 0.045%
$3,366,699,572 100.000%
435

COMMUNITY PROFILE (Continued)
DEMOGRAPHICS (Continued)
Top Five Property Taxpayers (d) Luther Village Retirement Facility Town & Country Mall Shopping Northpoint Shopping Center Shopping Arlington Plaza Shopping Annex of Arlington Shopping
Other (d) Miles of Streets 241 Water Information: Municipal water system main water supply
Lake Michigan water through the Northwest Water Commission (All wells are secondary and backup sources)
Miles of Water Mains 260 Number of Water Customers 21,119 Capacity of Waterworks 36,000,000 gal/per day Number of Storage Tanks 10 Storage Capacity 31,000,000 gal.
Sewer Information: Miles of Storm Sewers 213 Miles of Sanitary & Combined Sewers 255 Number of Retention/Detention Basins 56 Sewage Treatment – Metropolitan Water Reclamation District
Number of Fire Stations 4
School Districts 15, 21, 23, 25, 59 and 214 serve the students of the Village of Arlington Heights and neighboring communities.
Library Number of Sites 1 (plus Bookmobile) Number of Volumes 305,928 Number of Registered Borrowers 76,653 FY2019 Total Circulation 1,917,129
BUSINESS The Village has 1,844 businesses paying sales taxes.
2020 Kind of Business Report (e)
Major Employers (500 Employees or more)
Northwest Community Healthcare 3,600 Arlington Heights High School Dist. 214 1,700 HSBC 1,500 Lutheran Home 800 Paddock Publications 500 Alexian Brothers Health System 500
Sales Category Sales Volume %General Merchandise 532,479$ 4.4%Food 1,935,251 15.9%Restaurant Dining 1,382,789 11.4%Apparel 211,499 1.7%Furniture, Household 795,424 6.5%Lumber/Building/Hardware 684,603 5.6%Automotive/Filling Stations 3,096,329 25.5%Drugs & Misc. Retail 2,263,633 18.6%Agriculture & All Others 1,079,490 8.9%Manufacturers 165,142 1.4%
Total 12,146,639$ 100.0%
436

COMMUNITY PROFILE (Continued)
AWARDS & RECOGNITIONS
GFOA Certificate of Achievement or Excellence in Financial Reporting .......... Annually Since 1988
GFOA Distinguished Budget Presentation Award .................................. Annually Since 2005
Certified Tree City U.S.A. .... Annually Since 1985
Daniel Burnham Award for Excellence In Planning for Timber Court Condominium Project (affordable housing) .......................... 2008
President’s Arts Friendly Community Award ........................................................... 2008
Association of Illinois Senior Centers’ Awards for Senior Center Program of the Year and Senior Center Director of the Year ........................... 2008
Chaddick Municipal Development Process Award ............................................. 2010
Designated as a Member of the Safe Communities America Program ........... 2010-2015
CALEA Accreditation of Police Dept. ............ 2018
Governor’s Sustainability Award ................... 2013
Community Partnership Award .................... 2013
IRMA Management Assessment Program Accreditation ................................................. 2017
Notes: (a) 2010 Census & US Census Bureau Website(b) Illinois Department of Employment Security(c) Village of Arlington Hts Comprehensive Plan(d) Village of Arlington Hts & Cook County Records(e) Illinois Department of Revenue(f) Special Census(g) 2020 Census & US Census Bureau Website
437
GLOSSARY The Annual Budget and Financial Plan contains specialized and technical terminology that is unique to public finance and budgeting. To assist the reader of the Financial Plan document in understanding these terms, a glossary has been included in the document.
ABATEMENT A complete or partial cancellation of a levy imposed by a government. Abatements usually apply to tax levies, special assessments, and service charges.
ACCRUAL BASIS A basis of accounting in which revenues are recognized in the period in which they are earned and become measurable; expenses are recognized in the period incurred, if measurable.
ACTUARIAL / ACTUARY A person or methodology that makes determinations of required contributions to achieve future funding levels that address risk and time.
AGENCY FUND A fund established to account for assets held by the Village as a collection of paying agent for individuals, private organizations, other governmental units or other funds.
APPROPRIATION A legal authorization made by the Village Board which permits the Village to incur obligations and to make expenditures for specific purposes.
ASSESSED VALUATION A percent of appraisal value assigned to real estate and certain personal property for use as a basis for levying property taxes. In the Village of Arlington Heights the assessed valuation is 33% of appraised value.
ASSETS Property owned by a government which has a monetary value.
AUDIT An independent, objective evaluation of the fairness by which a company’s financial reports are presented by its management.
BALANCE SHEET A financial statement that discloses the assets, liabilities, reserves and balances of a specific governmental fund as of a specific date.
BALANCED BUDGET A budget in which total expenditure allocations do not exceed total available resources.
438

GLOSSARY (Continued)
BOND A written promise to pay a sum of money on a specific date at a specified interest rate. The interest payments and the repayment of the principal are detailed in a bond ordinance. The most common types of bonds are general obligation and revenue bonds. These are most frequently used for construction of large projects, such as buildings, streets and bridges.
BUDGET A plan of financial operation embodying an estimate of proposed revenue and expenditures for a specific period of time (budget fiscal year).
BUDGET ADJUSTMENT A legal procedure utilized by the Village staff and Village Board to revise the budget.
BUDGET AUTHORITY Authority provided by law that permits Village departments to incur obligations requiring either immediate or future payment of money.
BUDGET MESSAGE The opening section of the budget which provides the Village Board and the public with a general summary of the most important aspects of the budget, changes from the current and previous fiscal years, and the views and recommendations of the Village Manager.
BUDGET ORDINANCE The official enactment by the Village Board to legally authorize Village staff to obligate and expend resources.
BUDGETARY CONTROL The control or management of a governmental unit or enterprise in accordance with an approved budget for the purpose of keeping expenditures within the limitations of available appropriations and available revenues.
CAPITAL IMPROVEMENT PROGRAM (CIP) A plan for capital expenditures to be incurred each year over a fixed period of years to meet capital needs arising from the long-term work plan or otherwise. It sets forth each project and specifies the full resources estimated to be available to finance the projected expenditures.
CAPITAL OUTLAY Expenditures which result in the acquisition of or addition to fixed assets.
CASH BASIS A basis of accounting in which transactions are recognized only when cash is increased or decreased.
439

GLOSSARY (Continued)
CASH MANAGEMENT The management of cash necessary to pay for government services while investing temporary cash excesses in order to earn interest revenue. Cash management refers to the activities of forecasting the inflows and outflows of cash, mobilizing cash to improve its availability for investment, establishing and maintaining banking relationships, and investing funds in order to achieve the highest interest and return available for temporary cash balances.
CERTIFICATE OF DEPOSIT A negotiable or non-negotiable receipt of monies deposited in a bank or financial institution for a specific period for a specified rate of interest.
COMMODITIES All expenditures for materials, parts and supplies except those incidentally used by outside firms performing contractual services for the Village.
COMMUNITY DEVELOPMENT BLOCK GRANT (CDBG) A federal entitlement grant distributed to municipalities on the basis of a formula that considers population, housing conditions, and poverty. CDBG funds are then distributed by the Village for activities that benefit low and moderate income families.
COMMISSION ON ACCREDITATION FOR LAW ENFORECEMENT AGENCIES (CALEA) CALEA was created in 1979. The purpose of CALEA’s Accreditation Programs is to improve the delivery of public safety services, primarily by: maintaining a body of standards, developed by public safety practitioners, covering a wide range of up-to-date public safety initiatives; establishing and administering an accreditation process; and recognizing professional excellence.
COMPREHENSIVE ANNUAL FINANCIAL REPORT (CAFR) This official annual report presents the status of the Village’s finances in a standardized format. The CAFR is organized by fund and contains two basic types of information: a balance sheet that compares assets with liabilities and fund balance; and an operating statement that compares revenues and expenditures.
CONTINGENCY An appropriation of funds to cover unforeseen events that occur during the fiscal year, such as emergencies, federal mandates, shortfalls in revenue, and similar eventualities.
CONTRACTUAL SERVICES Expenditures for services from outside vendors that are obtained by an express or implied contract.
DEBT SERVICE The expenditure for principal and interest payments on loans, notes, and bonds.
DEBT SERVICE FUND A fund established to account for the accumulation of resources for, and the payment of, general long-term debt principal, interest, and related costs.
440

GLOSSARY (Continued)
DEFICIT (1) The excess of an entity’s liabilities over its assets. (2) The excess of expenditures or expenses overrevenues during a single accounting period.
DELINQUENT TAXES Taxes that remain unpaid on and after the date on which a penalty for non-payment is attached.
DEPARTMENT A major administrative division of the Village which indicates overall management responsibility for an operation or a group of related operations within a functional area.
DEPRECIATION Expiration in the service life of capital assets purchased within Internal Service and Enterprise Funds, to account for wear and tear, deterioration, action of physical elements, inadequacy or obsolescence.
DISBURSEMENT Payment for goods and services by cash or check.
ENCUMBRANCE The commitment of budgeted funds to purchase an item or service. To encumber funds means to set aside or commit funds for a future expenditure.
ENTERPRISE FUND A governmental accounting fund in which services provided are financed and operated similar to those of a private business--where the intent is that the costs (expenses, including depreciation or debt service payments) of providing goods and services be financed or recovered through user fees.
EQUALIZED ASSESSED VALUATION The total taxable property value. It is a combination of the market value of a property as determined by the county assessor, multiplied by a fraction depending on the classification of the property and adjusted by a multiplier determined by the state to equalize valuations across the state. It is the final value against which the total tax rate is multiplied to determine the property taxes due.
ESTIMATED REVENUE The amount of projected revenue to be collected during the fiscal year. The amount of revenue budgeted is the amount approved by the Village Board.
EXPENDITURE Decreases in net total assets. Expenses represent the total cost of operations during a period of time regardless of the timing of the related expenditures. Note: An encumbrance is not an expenditure, but reserves funds to be expended.
441

GLOSSARY (Continued)
FIDUCIARY FUNDS Funds used to account for assets held on behalf of outside parties, including other governments, or on behalf of other funds within the government. These include Expendable Trust, Nonexpendable Trust, Pension Trust and Agency Trust. Expendable trust and agency funds are budgeted on a modified accrual basis, and the nonexpendable trust and pension funds are budgeted on an accrual basis
FINANCIAL PLAN A multi-year, long-range, approach to assessing the Village’s revenue and expenditure needs which becomes the basis for formulating the annual budget which by law must be adopted. The plan is developed by utilizing existing policies, objectives, assumptions, and accepted benchmarks and activity measures.
FISCAL YEAR The time period designated by the Village signifying the beginning and ending period for recording financial transactions. The Village of Arlington Heights has specified the calendar as its fiscal year that begins January 1 and ends December 31.
FIXED ASSETS Assets of a long-term character which are intended to continue to be held or used, such as land, buildings, improvements other than buildings, machinery and equipment. The Village has established a level of $1,000 for an item to be considered an asset; below $1,000, the item is considered to be an operating expense.
FREEDOM OF INFORMATION ACT (FOIA) A state law governing the timing and cost of responding to requests for public information.
FULL FAITH AND CREDIT A pledge of the general taxing power of government to repay debt obligations (typically used in reference to general obligation bonds).
FULL-TIME EQUIVALENT (FTE) The number of positions calculated on a basis that one FTE equates to a 40-hour workweek for 12 months. For example, two part-time positions working 20 hours for 12 months equals one FTE.
FUND An accounting entity that has a set of self-balancing accounts and that records all financial transactions for specific activities or functions.
FUND ACCOUNTING The accounts of the Village are organized on the basis of funds and account groups, each of which is considered a separate accounting entity. The operations of a fund are accounted for with separate sets of self-balancing accounts that comprise its assets, liabilities, fund equity, revenues, and expenditures, as appropriated. Government resources are allocated to and accounted for in individual funds based upon the purpose for which they are to be spent and the means by which spending activities are controlled.
442

GLOSSARY (Continued)
FUND BALANCE Fund balance refers to the difference between current financial assets and liabilities reported in a governmental fund. Also known as surplus funds.
FUND TYPE In governmental accounting, all funds are classified into seven generic fund types: General, Special Revenue, Debt Service, Capital Projects, Enterprise, Internal Service, and Trust and Agency.
GENERALLY ACCEPTED ACCOUNTING PRINCIPLES (GAAP) Uniform minimum standards for financial accounting and recording, encompassing the conventions, rules, and procedures that define accepted accounting principles.
GENERAL FUND The General Fund is the general operating fund of the Village. This fund used to account for all financial resources except those required to be accounted for in another fund.
GENERAL OBLIGATION BONDS Bonds that finance a variety of public projects such as streets, buildings, and improvements. These bonds are backed by the full faith and credit of the issuing government.
GOAL A statement of board direction, purpose, or intent based on the needs of the community.
GOVERNMENTAL FUNDS Funds used to account for all or most of a government’s general activities, including the collection and disbursement of earmarked monies (special revenue funds), the acquisition or construction of general fixed assets (capital projects funds), and the servicing of general long-term debt (debt service funds).
GRANT A contribution by a government or other organization to support a particular function. Grants may be classified as either categorical or block depending upon the amount of discretion allowed the grantee.
HOME RULE A status granted by the Illinois Constitution which gives cities of a certain size board powers not otherwise available to local municipalities. For instance, there is no statutory limit to the property tax levy nor is there any requirement to seek referendum approval for increasing the levy or issuing debt.
HOME RULE SALES TAX An additional tax levied by the home rule municipality on retail sales within its jurisdiction. The tax, levied in 0.25% increments with no limit, is on all items except those that have a title (autos, boats, etc.) and groceries and drugs. It is collected by the state from the retailer and returned to the municipality.
443

GLOSSARY (Continued)
ILLINOIS MUNICIPAL RETIREMENT FUND (IMRF) This retirement fund, established under State statutes, provides employees of local governments (excluding police and firefighters) in Illinois with a system for the payment of retirement annuities, disability, and death benefits. All employees (other than those covered by the Police or Firefighter’s plans) hired in positions that meet or exceed an annual hourly standard (1,000 hours) must be enrolled in IMRF as participating members. Participating members of IMRF must contribute 4.5% of their salary to the pension fund. The employer pays a percentage that varies each year and is dependent on a report prepared by a professional actuary.
INFRASTRUCTURE The physical assets of the Village (streets, water, sewer, and public buildings).
INTERGOVERNMENTAL REVENUE Revenue received from or through the Federal, State or County government.
INTERGOVERNMENTAL RISK MANAGEMENT AGENCY (IRMA) An intergovernmental insurance cooperative that pools risk for general liability and workers’ compensations insurance coverages.
INTERNAL SERVICE FUND A fund used to account for the financing of goods or services provided by one department to another department on a cost reimbursement basis.
LEVY An imposing and collecting of a tax. In Illinois, the property tax is determined by the local unit of government, levied by the county clerk, and collected by the county treasurer. Taxes levied for any particular year are collected in the following calendar year.
LIABILITY Debt or other legal obligations arising out of transactions in the past which must be liquidated, renewed, or refunded at some future date.
LONG-TERM DEBT Debt with a maturity of more than one year after the date of issuance.
MAJOR FUND A major fund is (1) the main operating fund (the general fund or its equivalent which should always be reported separately); (2) other governmental funds and proprietary funds if the total assets, liabilities, revenues. or expenditures/ expenses of that individual fund are at least 10 percent of the corresponding total (assets, liabilities, and so forth) for the relevant fund category (governmental fund or proprietary funds) and at least 5 percent of the corresponding total for all governmental and proprietary funds combined; or (3) any other funds that public official believe are particularly important to financial statement users
MANDATE A requirement from a higher level of government that a lower level of government perform a task in a particular way or by a particular standard.
444

GLOSSARY (Continued)
MODIFIED ACCRUAL BASIS A method of accounting used to recognize revenue and expenditures. Funds that use the modified accrual basis of accounting recognize revenues when measurable and available (i.e. collectible within the current period or soon enough thereafter to be used to pay liabilities of the current period). Expenditures are recognized (with some exceptions) when the related liability is incurred.
MOTOR FUEL TAX (MFT) The State returns a portion of the gas tax to the municipalities on a per capita basis for use in the maintenance and construction of public roads.
NET ASSETS Net Assets refers to the difference between assets and liabilities reported in a proprietary fund and may be considered a measure of net worth.
OPERATING BUDGET The portion of the budget that pertains to daily operations that provide basic governmental services. The operating budget contains appropriations for such expenditures as personnel, supplies, utilities, materials, travel and fuel.
OTHER POST EMPLOYMENT BENEFITS (OPEB) OPEB is an accounting concept created by the Governmental Accounting Standards Board (GASB) by pronouncements designed to address expenses that entities may or may not be legally bound to pay, but pay as a moral obligation.
PERFORMANCE MEASURES Specific quantitative and qualitative measures of work performed as an objective of the department.
PERSONNEL SERVICES Costs related to compensating Village employees, including salaries, wages and benefits.
PROPERTY TAX Property taxes are levied on real property according to the property’s valuation and the tax rate.
PROPRIETARY FUNDS Funds used to account for activities similar to those found in the private sector, where the determination of net income is necessary for sound financial administration. Goods or services from such activities can be provided either to outside parties (enterprise funds) or to other departments or agencies primarily within the government (internal service funds). Example of proprietary funds are the Water & Sewer Fund and the Technology Fund.
PUBLIC SAFETY EMPLOYEE BENEFITS ACT (PSEBA) PSEBA provides for free health insurance to a public safety officer who is catastrophically injured or killed in the line of duty. The officer’s spouse and minor children are also entitled to free health insurance coverage under the Act. The health insurance must be provided by the employer for the remainder of the lives of the officer and spouse (or until the spouse remarries).
445

GLOSSARY (Continued)
REVENUE Money received into a fund from outside the fund that, together with fund balances, provides the financial resources for a given year.
REVENUE BONDS This type of bond is backed only by revenues from a specific enterprise or project.
SOLID WASTE AGENCY OF NORTHERN COOK COUNTY (SWANCC) An intergovernmental agency formed to dispose of residential household solid waste generated by its municipal members.
SPECIAL ASSESSMENT AREA A method used for the purpose of financing public improvements in a designated area. Although a portion of special assessment project costs are borne by a group of specifically benefited owners, the project usually has some value to the general public, in which case the general government may bear a portion of the project cost. The general government frequently pays for the entire project up front, and finances the cost through a bond issue. The individual owners in the special assessment area pay the general government their proportional share of the total owner cost. The payment is then used to cover annual debt service costs of the bond issue. Payments can be set up on a lump sum or a periodic basis.
SPECIAL REVENUE FUND A fund created when the Village receives revenue from a special source designated to be used for a specific purpose.
SPECIAL SERVICE AREA A method used for the purpose of financing public improvements in a designated area. This is handled in the same manner as a Special Assessment Area, except that the individual owners’ portions are paid through annual property tax assessments. (See also Special Assessment Area).
TAX INCREMENT FINANCING (TIF) This type of financing typically pays for infrastructure and capital improvements in a designated area or district. The difference in property tax revenues received in a base year versus the increased property taxes received in subsequent years after improvements are made, results in a property tax increment which is used to finance the improvements.
TAX LEVY The resultant product when the tax rate per one hundred dollars is multiplied by the tax base.
TAX RATE The amount of tax stated in terms of a unit of tax base. In Illinois, the tax rate is per $100 of equalized assessed value.
WORKING CASH / CAPITAL Working cash (or capital) is the difference between current assets and current liabilities reported in a proprietary fund. This measure indicates relative liquidity.
446
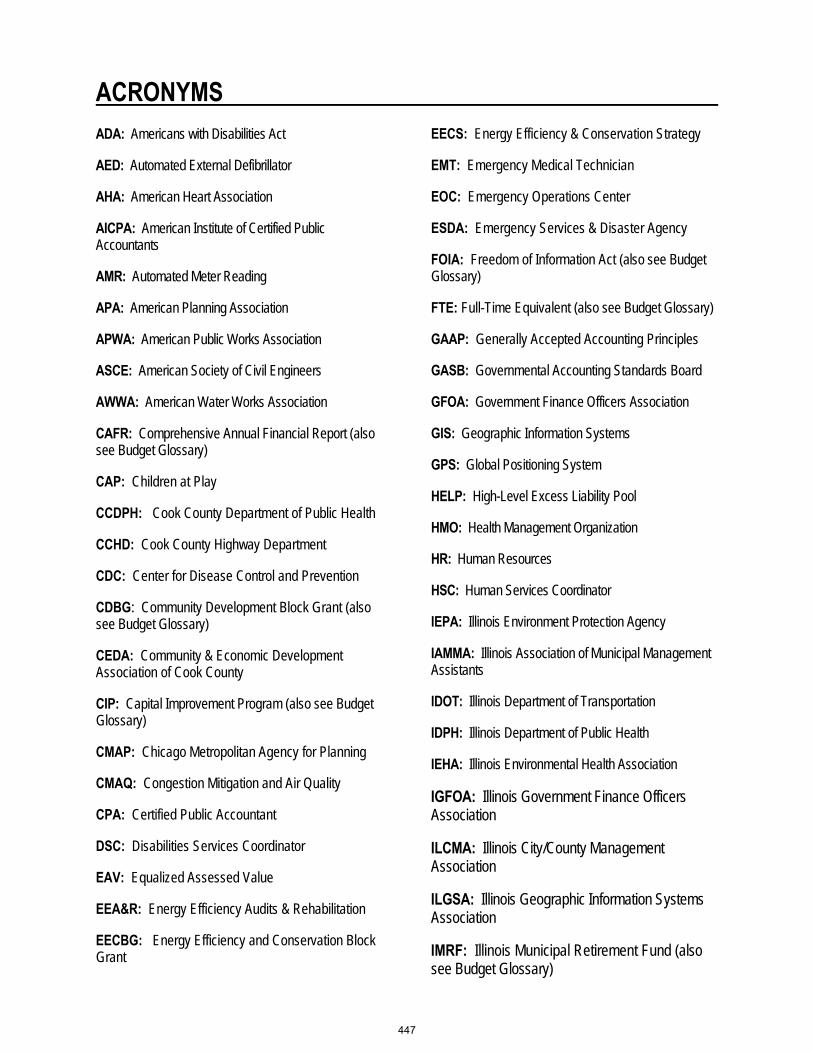
ACRONYMS ADA: Americans with Disabilities Act
AED: Automated External Defibrillator
AHA: American Heart Association
AICPA: American Institute of Certified Public Accountants
AMR: Automated Meter Reading
APA: American Planning Association
APWA: American Public Works Association
ASCE: American Society of Civil Engineers
AWWA: American Water Works Association
CAFR: Comprehensive Annual Financial Report (also see Budget Glossary)
CAP: Children at Play
CCDPH: Cook County Department of Public Health
CCHD: Cook County Highway Department
CDC: Center for Disease Control and Prevention
CDBG: Community Development Block Grant (also see Budget Glossary)
CEDA: Community & Economic Development Association of Cook County
CIP: Capital Improvement Program (also see Budget Glossary)
CMAP: Chicago Metropolitan Agency for Planning
CMAQ: Congestion Mitigation and Air Quality
CPA: Certified Public Accountant
DSC: Disabilities Services Coordinator
EAV: Equalized Assessed Value
EEA&R: Energy Efficiency Audits & Rehabilitation
EECBG: Energy Efficiency and Conservation Block Grant
EECS: Energy Efficiency & Conservation Strategy
EMT: Emergency Medical Technician
EOC: Emergency Operations Center
ESDA: Emergency Services & Disaster Agency
FOIA: Freedom of Information Act (also see Budget Glossary)
FTE: Full-Time Equivalent (also see Budget Glossary)
GAAP: Generally Accepted Accounting Principles
GASB: Governmental Accounting Standards Board
GFOA: Government Finance Officers Association
GIS: Geographic Information Systems
GPS: Global Positioning System
HELP: High-Level Excess Liability Pool
HMO: Health Management Organization
HR: Human Resources
HSC: Human Services Coordinator
IEPA: Illinois Environment Protection Agency
IAMMA: Illinois Association of Municipal Management Assistants
IDOT: Illinois Department of Transportation
IDPH: Illinois Department of Public Health
IEHA: Illinois Environmental Health Association
IGFOA: Illinois Government Finance Officers Association
ILCMA: Illinois City/County Management Association
ILGSA: Illinois Geographic Information Systems Association
IMRF: Illinois Municipal Retirement Fund (also see Budget Glossary)
447

ACRONYMS Continued)
IMSA: International Municipal Signal Association
IMTA: Illinois Municipal Treasurers Association
IRMA: Intergovernmental Risk Management Agency
ISPERN: Illinois State Police Emergency Radio Network
IT: Information Technology
ITEP: Illinois Transportation Enhancement Program
ITE: Institute of Transportation Engineers
JULIE: Joint Utility Locating Information for Excavators
LEADS: Law Enforcement Agencies Data System
LGDF: Local Government Distribution Fund
MABAS: Mutual Aid Box Alarm System
MAP: Metropolitan Alliance of Police
MCAT: Major Case Assistance Team
MRC: Medical Reserve Corps
MFT: Motor Fuel Tax (also see Budget Glossary)
NACCHO: National Association of County and City Health Officials
NFPA: National Fire Protection Association
NIGP: National Institute of Government Purchasing
NIPAS: Northern Illinois Police Alarm System
NIPSTA: Northeastern Illinois Public Safety Training Academy
NLRCL: Northern Illinois Regional Crime Lab
NPDES: National Pollutant Discharge Elimination System
NWCD: Northwest Central Dispatch
NWWC: Northwest Water Commission
OPEB: Other Postemployment Benefits
OSHA: Occupational Safety & Health Act (or Association)
PCA: Portland Cement Association
PEAR: Parish Emergency Assistance Resources
POD: point of distribution
PPO: Preferred Provider Organization
PSO: Public Safety Officer
PSEBA: Public Safety Employee Benefits Act (also see Budget Glossary)
PUD: Planned Unit Development
PW: Public Works
SBOC: Suburban Building Officials Conference
SCADA: Supervisory Control and Data Acquisition
SCBA: Self Contained Breathing Apparatus
SHIP: Senior Health Insurance Program
SWANCC: Solid Waste Agency of Northern Cook County (also see Budget Glossary)
TIF: Tax Increment Financing (also see Budget Glossary)
USEPA: United States Environmental Protection Agency
USRA: Urban Search and Rescue
VHF: Very High Frequency
448