Application of the mass action law to describe ion exchange equilibrium in a fixed-bed column
9
Chemical Engineering Journal 172 (2011) 312–320 Contents lists available at ScienceDirect Chemical Engineering Journal jo u r n al hom epage: www.elsevier.com/locate/cej Application of the mass action law to describe ion exchange equilibrium in a fixed-bed column C.E. Borba a,∗ , E.A. Silva a , S. Spohr a , G.H.F. Santos a , R. Guirardello b a School of Chemical Engineering, West Parana State University, UNIOESTE, 85903-000, Toledo, PR, Brazil b School of Chemical Engineering, State University of Campinas, UNICAMP, 13083-872, Campinas, SP, Brazil a r t i c l e i n f o Article history: Received 14 March 2011 Received in revised form 1 June 2011 Accepted 2 June 2011 Keywords: Fixed bed Ion exchange Mass action law a b s t r a c t Ion exchange experiments were carried out in a fixed-bed column employing the binary systems Cu 2+ –Na + and Zn 2+ –Na + . Amberlite IR 120 was used as the ion exchange resin. The ion exchange dynamics within the column was described by a model considering the external mass transfer and the diffusion within the particle. A linear driving force model was used to represent the mass transfer within the resin particles. The model considered the thermodynamic equilibrium on the liquid–solid interface, which was described by the Langmuir isotherm and by the mass action law. The results indicate that both models represent well the ion exchange dynamics in all cases. © 2011 Elsevier B.V. All rights reserved. 1. Introduction Industrial facilities have increasingly generated wastewaters contaminated with heavy metals. These effluents need to be treated before being disposed of to the environment and fixed-bed columns can be used effectively to remove these contaminants in a final treatment stage. Most metal-rich effluents possess a wide range of metals and the design of treatment systems requires equilibrium data in order to calculate the removal capacity and selectivity. The design of ion exchange columns requires data on the diffusion and convective processes occurring within the columns. Mathematical models are important, since they help to reduce the cost associated with experiments. Once the model is validated against laboratory experimental data, it can be used in the design and optimization of an industrial-scale process. In order to describe the dynamics of the ion exchange in a fixed-bed column, mathe- matical models are required to represent the breakthrough curves. These mathematical models require equations which adequately describe the ion exchange equilibrium and mass transfer mecha- nisms. The representation of the equilibrium data is a crucial step that directly affects the quality of the results of the dynamic simula- tion of the column [1]. Adsorption isotherms and the mass action law (MAL) have been used to represent the ion exchange equilib- rium. According to Sircar [2], a model should forecast precisely ∗ Corresponding author. Tel.: +55 45 3379 7092; fax: +55 45 3379 7092. E-mail address: borba [email protected] (C.E. Borba). the multicomponent ion exchange equilibrium using data on the monocomponent adsorption equilibrium and binary system equi- librium only. Several investigations [3–7] have shown the ability of the MAL to represent the ion exchange equilibrium of ternary systems based on data on binary systems. Some investigations have presented the mathematical model- ing of the dynamics of ion exchange in fixed-bed columns. The models differ in terms of the mass transfer effects and equilibrium model employed. Some investigations [8–11] have considered ion exchange as an adsorption process, while others [12–15] view it as an ion exchange process. Hamdaoui [10] studied the removal of Cu 2+ by Purolite C100-MB resin in packed bed columns. To predict the breakthrough curves four models were used: the Bohart–Adams, bed depth service time (BDST), Clark and Wolborska models. These models have analyti- cal solutions and can only be used for monocomponent systems. Moreover, some assumptions need to be made in order to achieve an analytical solution. Latheef et al. [8] presented a mathematical model to simulate the removal of Cs by an ion exchange resin (UOP IONSIV IE-911). The equilibrium was described by the Langmuir isotherm and the film mass-transfer resistance was considered as the limiting step. Shebil et al. [9] used a mass transfer model to describe the removal of Ca 2+ ions using Amberlite IR120. The Langmuir isotherm model has been used to represent column equi- librium data and the internal and external mass transfer limitations were considered. Ostrosky et al. [11] investigated the removal of Fe 3+ and Zn 2+ ions by NaY zeolite. In the mathematical modeling, Freundlich and Langmuir isotherm models were used to represent the column equilibrium data and the intraparticle mass transfer 1385-8947/$ – see front matter © 2011 Elsevier B.V. All rights reserved. doi:10.1016/j.cej.2011.06.002
-
Upload
independent -
Category
Documents
-
view
0 -
download
0
Transcript of Application of the mass action law to describe ion exchange equilibrium in a fixed-bed column

Afi
Ca
b
a
ARRA
KFIM
1
cbctmddc
taatmTdn
dtlr
1d
Chemical Engineering Journal 172 (2011) 312– 320
Contents lists available at ScienceDirect
Chemical Engineering Journal
jo u r n al hom epage: www.elsev ier .com/ locate /ce j
pplication of the mass action law to describe ion exchange equilibrium in axed-bed column
.E. Borbaa,∗, E.A. Silvaa, S. Spohra, G.H.F. Santosa, R. Guirardellob
School of Chemical Engineering, West Parana State University, UNIOESTE, 85903-000, Toledo, PR, BrazilSchool of Chemical Engineering, State University of Campinas, UNICAMP, 13083-872, Campinas, SP, Brazil
r t i c l e i n f o
rticle history:eceived 14 March 2011
a b s t r a c t
Ion exchange experiments were carried out in a fixed-bed column employing the binary systems Cu2+–Na+
and Zn2+–Na+. Amberlite IR 120 was used as the ion exchange resin. The ion exchange dynamics within
eceived in revised form 1 June 2011ccepted 2 June 2011eywords:ixed bedon exchange
ass action law
the column was described by a model considering the external mass transfer and the diffusion within theparticle. A linear driving force model was used to represent the mass transfer within the resin particles.The model considered the thermodynamic equilibrium on the liquid–solid interface, which was describedby the Langmuir isotherm and by the mass action law. The results indicate that both models representwell the ion exchange dynamics in all cases.
© 2011 Elsevier B.V. All rights reserved.
. Introduction
Industrial facilities have increasingly generated wastewatersontaminated with heavy metals. These effluents need to be treatedefore being disposed of to the environment and fixed-bed columnsan be used effectively to remove these contaminants in a finalreatment stage. Most metal-rich effluents possess a wide range of
etals and the design of treatment systems requires equilibriumata in order to calculate the removal capacity and selectivity. Theesign of ion exchange columns requires data on the diffusion andonvective processes occurring within the columns.
Mathematical models are important, since they help to reducehe cost associated with experiments. Once the model is validatedgainst laboratory experimental data, it can be used in the designnd optimization of an industrial-scale process. In order to describehe dynamics of the ion exchange in a fixed-bed column, mathe-
atical models are required to represent the breakthrough curves.hese mathematical models require equations which adequatelyescribe the ion exchange equilibrium and mass transfer mecha-isms.
The representation of the equilibrium data is a crucial step thatirectly affects the quality of the results of the dynamic simula-
ion of the column [1]. Adsorption isotherms and the mass actionaw (MAL) have been used to represent the ion exchange equilib-ium. According to Sircar [2], a model should forecast precisely∗ Corresponding author. Tel.: +55 45 3379 7092; fax: +55 45 3379 7092.E-mail address: borba [email protected] (C.E. Borba).
385-8947/$ – see front matter © 2011 Elsevier B.V. All rights reserved.oi:10.1016/j.cej.2011.06.002
the multicomponent ion exchange equilibrium using data on themonocomponent adsorption equilibrium and binary system equi-librium only. Several investigations [3–7] have shown the abilityof the MAL to represent the ion exchange equilibrium of ternarysystems based on data on binary systems.
Some investigations have presented the mathematical model-ing of the dynamics of ion exchange in fixed-bed columns. Themodels differ in terms of the mass transfer effects and equilibriummodel employed. Some investigations [8–11] have considered ionexchange as an adsorption process, while others [12–15] view it asan ion exchange process.
Hamdaoui [10] studied the removal of Cu2+ by Purolite C100-MBresin in packed bed columns. To predict the breakthrough curvesfour models were used: the Bohart–Adams, bed depth service time(BDST), Clark and Wolborska models. These models have analyti-cal solutions and can only be used for monocomponent systems.Moreover, some assumptions need to be made in order to achievean analytical solution. Latheef et al. [8] presented a mathematicalmodel to simulate the removal of Cs by an ion exchange resin (UOPIONSIV IE-911). The equilibrium was described by the Langmuirisotherm and the film mass-transfer resistance was consideredas the limiting step. Shebil et al. [9] used a mass transfer modelto describe the removal of Ca2+ ions using Amberlite IR120. TheLangmuir isotherm model has been used to represent column equi-librium data and the internal and external mass transfer limitations
were considered. Ostrosky et al. [11] investigated the removal ofFe3+ and Zn2+ ions by NaY zeolite. In the mathematical modeling,Freundlich and Langmuir isotherm models were used to representthe column equilibrium data and the intraparticle mass transfer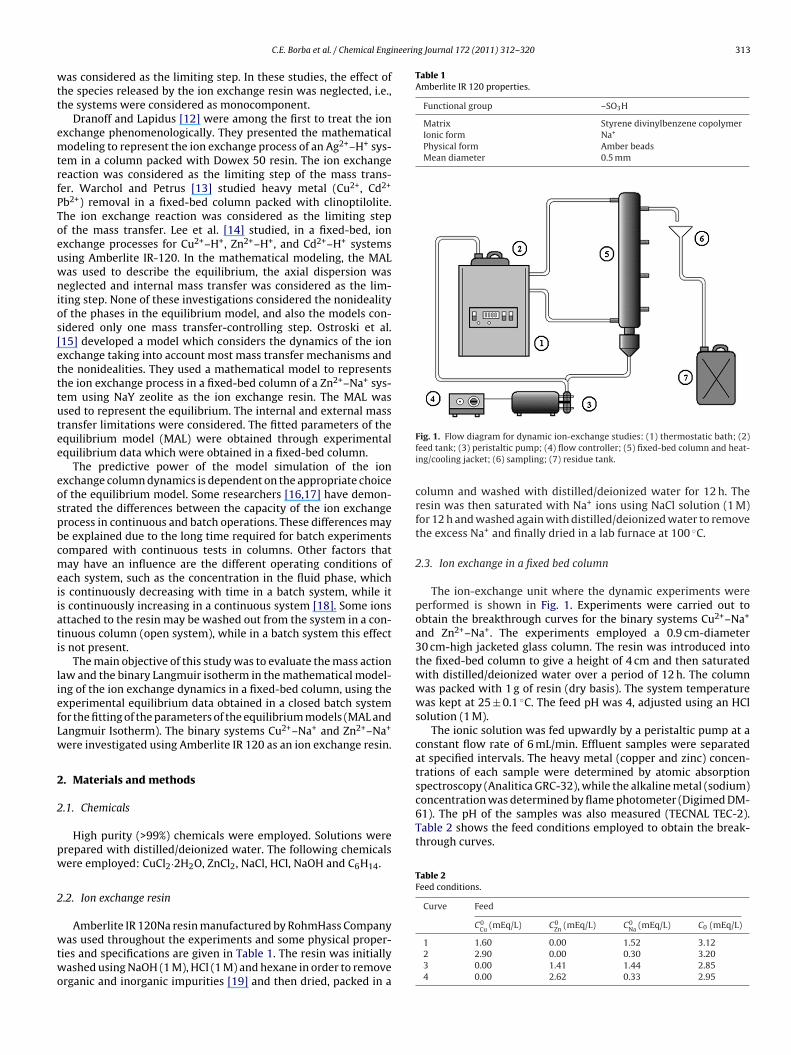
neering Journal 172 (2011) 312– 320 313
wtt
emtrfPToeuwnios[etttutee
eospbcmeiiati
liefLw
2
2
pw
2
wtwo
Table 1Amberlite IR 120 properties.
Functional group –SO3H
Matrix Styrene divinylbenzene copolymerIonic form Na+
Physical form Amber beadsMean diameter 0.5 mm
61). The pH of the samples was also measured (TECNAL TEC-2).Table 2 shows the feed conditions employed to obtain the break-through curves.
Table 2Feed conditions.
Curve Feed
C0Cu (mEq/L) C0
Zn (mEq/L) C0Na (mEq/L) C0 (mEq/L)
C.E. Borba et al. / Chemical Engi
as considered as the limiting step. In these studies, the effect ofhe species released by the ion exchange resin was neglected, i.e.,he systems were considered as monocomponent.
Dranoff and Lapidus [12] were among the first to treat the ionxchange phenomenologically. They presented the mathematicalodeling to represent the ion exchange process of an Ag2+–H+ sys-
em in a column packed with Dowex 50 resin. The ion exchangeeaction was considered as the limiting step of the mass trans-er. Warchol and Petrus [13] studied heavy metal (Cu2+, Cd2+
b2+) removal in a fixed-bed column packed with clinoptilolite.he ion exchange reaction was considered as the limiting stepf the mass transfer. Lee et al. [14] studied, in a fixed-bed, ionxchange processes for Cu2+–H+, Zn2+–H+, and Cd2+–H+ systemssing Amberlite IR-120. In the mathematical modeling, the MALas used to describe the equilibrium, the axial dispersion waseglected and internal mass transfer was considered as the lim-
ting step. None of these investigations considered the nonidealityf the phases in the equilibrium model, and also the models con-idered only one mass transfer-controlling step. Ostroski et al.15] developed a model which considers the dynamics of the ionxchange taking into account most mass transfer mechanisms andhe nonidealities. They used a mathematical model to representshe ion exchange process in a fixed-bed column of a Zn2+–Na+ sys-em using NaY zeolite as the ion exchange resin. The MAL wassed to represent the equilibrium. The internal and external massransfer limitations were considered. The fitted parameters of thequilibrium model (MAL) were obtained through experimentalquilibrium data which were obtained in a fixed-bed column.
The predictive power of the model simulation of the ionxchange column dynamics is dependent on the appropriate choicef the equilibrium model. Some researchers [16,17] have demon-trated the differences between the capacity of the ion exchangerocess in continuous and batch operations. These differences maye explained due to the long time required for batch experimentsompared with continuous tests in columns. Other factors thatay have an influence are the different operating conditions of
ach system, such as the concentration in the fluid phase, whichs continuously decreasing with time in a batch system, while its continuously increasing in a continuous system [18]. Some ionsttached to the resin may be washed out from the system in a con-inuous column (open system), while in a batch system this effects not present.
The main objective of this study was to evaluate the mass actionaw and the binary Langmuir isotherm in the mathematical model-ng of the ion exchange dynamics in a fixed-bed column, using thexperimental equilibrium data obtained in a closed batch systemor the fitting of the parameters of the equilibrium models (MAL andangmuir Isotherm). The binary systems Cu2+–Na+ and Zn2+–Na+
ere investigated using Amberlite IR 120 as an ion exchange resin.
. Materials and methods
.1. Chemicals
High purity (>99%) chemicals were employed. Solutions wererepared with distilled/deionized water. The following chemicalsere employed: CuCl2·2H2O, ZnCl2, NaCl, HCl, NaOH and C6H14.
.2. Ion exchange resin
Amberlite IR 120Na resin manufactured by RohmHass Company
as used throughout the experiments and some physical proper-ies and specifications are given in Table 1. The resin was initiallyashed using NaOH (1 M), HCl (1 M) and hexane in order to remove
rganic and inorganic impurities [19] and then dried, packed in a
Fig. 1. Flow diagram for dynamic ion-exchange studies: (1) thermostatic bath; (2)feed tank; (3) peristaltic pump; (4) flow controller; (5) fixed-bed column and heat-ing/cooling jacket; (6) sampling; (7) residue tank.
column and washed with distilled/deionized water for 12 h. Theresin was then saturated with Na+ ions using NaCl solution (1 M)for 12 h and washed again with distilled/deionized water to removethe excess Na+ and finally dried in a lab furnace at 100 ◦C.
2.3. Ion exchange in a fixed bed column
The ion-exchange unit where the dynamic experiments wereperformed is shown in Fig. 1. Experiments were carried out toobtain the breakthrough curves for the binary systems Cu2+–Na+
and Zn2+–Na+. The experiments employed a 0.9 cm-diameter30 cm-high jacketed glass column. The resin was introduced intothe fixed-bed column to give a height of 4 cm and then saturatedwith distilled/deionized water over a period of 12 h. The columnwas packed with 1 g of resin (dry basis). The system temperaturewas kept at 25 ± 0.1 ◦C. The feed pH was 4, adjusted using an HClsolution (1 M).
The ionic solution was fed upwardly by a peristaltic pump at aconstant flow rate of 6 mL/min. Effluent samples were separatedat specified intervals. The heavy metal (copper and zinc) concen-trations of each sample were determined by atomic absorptionspectroscopy (Analitica GRC-32), while the alkaline metal (sodium)concentration was determined by flame photometer (Digimed DM-
1 1.60 0.00 1.52 3.122 2.90 0.00 0.30 3.203 0.00 1.41 1.44 2.854 0.00 2.62 0.33 2.95

3 ineerin
2
eftddva
ε
i
2
rbe
q
q
iro
irb(
3
elnwindH
iw
i(ip
(i
s
14 C.E. Borba et al. / Chemical Eng
.3.1. Determination of the bed void fractionThe total bed void fraction (ε) was determined at the end of each
xperiment, after the ionic solution had been completely drainedrom the column bottom for 24 h. Distilled/deionized water was fedo the column until the bed was completely filled. The amount ofistilled/deionized water which was used to fill the bed (VV) wasetermined from the difference between the initial and the finalolume in the recipient, and the bed void fraction (ε) was calculateds follows:
= VV
VL(1)
n which VL is the bed volume.
.3.2. Ion concentration in the resin at equilibriumThe copper and zinc ion concentrations at equilibrium in the
esin were calculated from the experimental breakthrough curves,y means of Eq. (2). The sodium ion concentration in the resin atquilibrium was calculated using Eq. (3).
∗j =
CFj
Q
mr
∫ tsat
0
(1 − Cj
∣∣z=L
/CFj
)dt −
VLεCFj
mr(2)
∗Na = CTC −
(CF
jQ
mr
∫ tsat
0
(1 − Cj
∣∣z=L
/CFj
)dt −
VLεCFj
mr
)(3)
n which q∗j
is the concentration of species j in the resin at equilib-ium (mEq/g), Cj | is the concentration of species j at the columnutlet, CF
jis the concentration of species j in the feed (mEq/L), Q
s the volumetric flow rate (cm3/L), t is time (min), tsat is the timeequired to saturate the bed (min), mr is the resin mass (g), ε is theed voidage and CTC is the total ionic exchange capacity of the resinmEq/g).
. Mathematical modeling
The dynamic ionic exchange capacity in the fixed bed was mod-led considering the following: thermodynamic equilibrium at theiquid–solid interface; external mass transfer resistance and inter-al diffusion resistance (resistances in series); concentration profileithin the pores described by the linear driving force (LDF) model;
sothermal and isobaric process; constant resin physical properties;egligible radial dispersion within the column; homogeneouslyistributed sites available for exchange; and negligible uptake of+ ions by the resin.
Ion mass balances were then carried out in the liquid phase andn the resin. The equations employed to describe the ionic exchange
ithin the fixed bed are given below.The liquid phase mass balance for species j is:
∂Cj
∂t+ �L
ε
∂qj
∂t= −u0
∂Cj
∂z+ Daxj
∂2Cj
∂z2(4)
n which Cj is the concentration of species j in the liquid phasemEq/L), qj is the concentration of species j in the resin (mEq/g), �L
s the bed density (g/L), u0 is the interstitial velocity of the liquidhase (cm/min), Daxj
is the axial dispersion mass transfer coefficient
cm2/min), ε is the total bed voidage, t is the time (min) and z (cm)s the space coordinate.
The following equation gives the external film mass transfer of
pecies j (Cu2+ or Zn2+):∂qj
∂t|film =
KFjε
�L(Cj − Cj
∗) (5)
g Journal 172 (2011) 312– 320
in which KFjis the external liquid film mass transfer coefficient
(min−1) and C∗j
is the concentration of species j in the liquid phaseat equilibrium (mEq/L).
In order to ensure the solution electroneutrality, the followingequation was used to represent the mass transfer rate of Na+ insidethe particles:
∂qNa
∂t|film = −∂qj
∂t|film (6)
To describe the diffusion of species j (Cu2+ or Zn2+) within theparticles, a linear driving force model was used, given by the fol-lowing equation:
∂qj
∂t| = KSj
(qj∗ − qj) (7)
in which KSjis mass transfer coefficient in the resin (min−1) and q∗
j
is the concentration of species j in the resin at equilibrium (mEq/g).To guarantee electroneutrality within the resin, the following
equation was used to describe the diffusion rate of Na+ within theparticles:
∂qNa
∂t| = −∂qj
∂t| (8)
The continuity condition between the sequential external masstransfer and the diffusion mass transfer is described by the equa-tions:
KFjε
�L(Cj − Cj
∗) = KSj(qj
∗ − qj) (9)
∂qNa
∂t| = ∂qNa
∂t| (10)
The initial concentration of each species in the liquid phase isgiven by:
Cj(z, 0) = 0 (11)
The initial concentrations of Cu2+ and Zn2+ in the resin are givenby Eq. (12) and for Na+ the initial concentration is given by Eq. (13).
qj(z, 0) = 0 (12)
qNa(z, 0) = CTC (13)
For all species, the boundary conditions suggested by Danckw-erts [20] were used.
Daxj
∂Cj
∂z= u0(Cj(t, 0) − CF
j ) where z = 0 (14)
∂Cj
∂z= 0 where z = L (15)
The mass transfer rate is dependent on the equilibrium betweenthe phases. The Langmuir isotherm and the MAL were used torepresent the equilibrium at the liquid–solid interface, given by,respectively:
q∗j =
qmax bj C∗j
1 +∑m
i=1bi C∗i
(16)
KM–Na =(
y∗M�RM
C∗M�SM
) (C∗
Na�SNa
y∗Na�RNa
)2
(17)
in which qmax and b are the Langmuir isotherm parameters, m isthe number of species, y∗
M and y∗Na are the equivalent fractions of
species M and Na+ in the resin, C∗M and C∗
Na are the concentrations of
species M and Na+ in the liquid phase, �SM and �SNa are the activitycoefficients of species M and Na+ in the liquid phase and �RM and�RNa are the activity coefficients of species M and Na+ in the resin.The subscript M refers to species Cu2+ or Zn2+.
neerin
B(rd
ciuefpow
CwmEE
msrrcb
tolte�
omcl
i
ii
cG
J
i
J
K
a
wcvp
C.E. Borba et al. / Chemical Engi
Eq. (17) requires the activity coefficients for both phases. Theromley model [21], which considers the effect of all speciesanions and cations), was employed for the liquid phase. For theesin, the Wilson model [22] was used. These models have beenescribed in detail by Borba et al. [7].
Eq. (16) represents the Langmuir adsorption isotherm. In thisase, the equilibrium concentration of species j in the resin (q∗
j)
s an explicit function of the equilibrium concentrations of all liq-id phase species (C∗
1, C∗2, C∗
3, . . . , C∗N). In the case of the MAL, the
quilibrium concentration of species j in the resin is not an explicitunction of the equilibrium concentration of species in the liquidhase and it is therefore necessary to use a numerical method tobtain the roots of the function. To this aim, the bisection methodas used.
To describe the ion exchange dynamics for the binary systemsu2+–Na+ and Zn2+–Na+ two mathematical methods were usedhich differ in terms of the equilibrium relationship used (Lang-uir isotherm or MAL). In the first case, the model is made up of
qs. (4)–(6) and (9)–(16) while in the second case Eq. (17) replacesq. (16).
The mathematical model was solved by the finite volumeethod as described by Maliska [23]. The differential equation
ystem was discretized with respect to the space coordinate z,esulting in a system of ordinary differential equations (ODEs) withespect to time. This system of ODEs, with the boundary and initialonditions, was solved by a Fortran DASSL subroutine, developedy Petzold [24].
The parameters involved in the model may be classified intohree groups. The first in which the values are experimentallybtained: �L, ε, u0, the second which includes parameters calcu-ated from empirical relations: KFj
, Daxj, and the third in which
he parameters are obtained through a nonlinear procedure usingxperimental data and the least squares statistical method: �Zn–Na,Na–Zn, KZn–Na, �Cu–Na, �Na–Cu, KCu–Na, KSj
. The parameter KSjwas
btained from the experimental breakthrough curve. The Wilsonodel interaction parameters and the thermodynamic equilibrium
onstants were obtained by Borba et al. [7] from experimental equi-ibrium data.
The axial dispersion coefficient was estimated using the follow-ng correlation [25]:
Daxj
u0dp= 20
ε
(Dmj
u0dp
)+ 1
2(18)
n which Dmjis the molecular diffusion of species j in water and dp
s the average particle diameter of the resin.The external mass transfer coefficient (KFj
) of the liquid film wasalculated through the following equation, proposed by Wilson andeankoplis [26]:
D = 1.09ε
(Re)−2/3 (19)
n which:
D =kfj
u0(Sc)2/3 (20)
Fj= ae kfj
(21)
e = 6(1 − ε)dp
(22)
here JD is the Chilton–Colburn factor, kfjis the mass transfer
oefficient in the liquid film, Sc is the Schimdt number, KFjis the
olumetric mass transfer coefficient in the liquid film and ae is thearticle specific area.
g Journal 172 (2011) 312– 320 315
3.1. Parameter identification method
The model parameters were estimated through a nonlin-ear identification procedure using experimental data and theleast squares method to form the objective function (criterion).The parameters of the equilibrium models (MAL and Langmuirisotherm) were obtained through experimental equilibrium dataand during the search for the minimum objective function, rep-resented by Eq. (23). The experimental equilibrium data wereobtained from Borba et al. [7].
FOBJ =N∑
i=1
⎡⎣ M∑
j=1
(y∗ expji
− y∗modji )
2
⎤⎦ (23)
in which M is the number of the set of equilibrium data, N is thenumber of cationic species, and y∗ exp
jiand y∗mod
jiare the equivalent
fractions of species in the resin obtained experimentally and by themodel, respectively.
The experimental breakthrough curves and the objective func-tion, represented by Eq. (24) were used to obtain the value for themass transfer coefficient within the resin (KSj
).
FOBJ =ne∑
j=1
(Cexp
j
C0−
Cmodj
C0
)2
(24)
in which ne is the number of experimental data obtained fromthe breakthrough curve, Cexp
jis the experimentally obtained con-
centration of component j at the column outlet, Cmodj
is theconcentration of component j at the column outlet calculated bythe model and C0 is the total feed concentration.
In the search procedure, the optimization method of Nelder andMead [27], coded in Fortran, was used.
4. Results and discussion
4.1. pH results
When an MxXm salt is dissolved in an aqueous solution, not allmolecules dissociate into ions, i.e., not all species are in solution inthe form of free ions and available to participate in the ion exchangeprocess. The amount of free ions in solution is dependent on thepH [6]. In this work, the initial pH was set to 4. In the ion exchangeexperiments in the fixed-bed column the pH of the solution at theoutlet of the column was monitored. In Figs. 2 and 3 the variations inthe solution pH versus experiment time are shown. For the systemsCu2+–Na+ and Zn2+–Na+ the pH values were in the ranges 3.55–4.16and 3.65–4.25, respectively. At equilibrium, the solution pH at theoutlet of the column was equal to the feed pH (pH = 4).
This variance was not significant, and thus it can be consideredthat the uptake of H+ ions is negligible. In addition, based on thespeciation diagram presented by Borba et al. [7], in the pH rangein which the experiments were carried out, the predominant ionicforms were Cu+2, Zn+2 and Na+ (close to 100%).
4.2. Equilibrium
The experimental equilibrium data presented by Borba et al. [7]were used to obtain the adjustable parameters of the equilibriummodels (Mass action law and Langmuir isotherm). The numer-ical values of the parameters used in the Bromley model were
A = 0.5162, BZnCl2 = 0.0364, BZnCl2 = 0.0654 and BNaCl = 0.0574 at25 ◦C. The parameter values are reported and tabulated by Bromley[21]. In Table 3 the fitted parameters of the equilibrium models arepresented for each binary system.
316 C.E. Borba et al. / Chemical Engineerin
F
tMcKcac
F
TF
ig. 2. pH variation in solution in the outlet of the column for Cu2+–Na+ system.
Valverde et al. [28] obtained experimental equilibrium data forhe systems Cu+2–Na+ and Zn+2–Na+ using Amberlite IR120. The
AL was used to describe the equilibrium data. The equilibriumonstants were: KCu–Na(283 K) = 0.1770, KCu–Na(303 K) = 0.1121,
Zn–Na(283 K)= 0.1015, KZn–Na(303 K) = 0.0670. The equilibriumonstant values for the binary systems are of the same orders the constants presented in Table 3. The differences observedan be attributed to the ranges of concentration and temper-ig. 3. pH variation in solution at the outlet of the column for Zn2+–Na+ system.
able 3itted parameters of the equilibrium models.
System Cu2+–Na+
Mass action law
KCu–Na �Cu–Na �Na–Cu
0.3258 ± 0.0152 2.7286 ± 0.1231 0.3666 ± 0.0532
System Zn2+–Na+
Mass action law
KZn–Na �Zn–Na �Na–Zn
0.3782 ± 0.0201 2.0750 ± 0.1035 1.0485 ± 0.0397
g Journal 172 (2011) 312– 320
ature studied and the salt used to prepare solutions of Cu2+
and Zn2+. Valverde et al. [28] obtained the experimental dataat 283 and 303 K, in total concentrations of 50 and 100 mEq/Land, nitrate salts were used to prepare the solutions of heavymetals. The concentration range investigated by Valverde et al.[28] is very wide, since the ion exchange process is, preferably,applied to dilute systems. Demirbas et al. [29] obtained exper-imental equilibrium data for the metals Cu2+ and Zn2+ usingAmberlite IR120 in H+ form. The mono-component Langmuirisotherm was used to describe of the equilibrium. The effect of theion release by resin was negligible. The fitted parameters were:Cu2+–qCu2+
max = 0.172 mEq/g; bCu = 7265 L/mEq and Zn2+–qZn2+max =
0.657 mEq/g; bZn = 1690 L/mEq. Jha et al. [30] investigated theequilibrium of the system Cu2+–Amberlite IR120 Na+. The treat-ment of the equilibrium data was the same as in the workof Demirbas et al. [29]. The fitted parameters were: qCu2+
max =3.38 mEq/g and bCu = 1.28 × 10⁴ L/mEq. Demirbas et al. [29] andJha et al. [30] regarded the maximum adsorption capacity (qmax)as an adjustable parameter. However, this parameter must beobtained experimentally. Moreover, its value should be indepen-dent of the species. In our study, qmax = CTC = 5.13 mEq/g wasconsidered. This value was obtained experimentally by Borbaet al. [7] and is close to the value specified by the supplier(5 mEq/g).
4.3. Ion exchange in fixed bed column
Two runs were carried out in the fixed bed column for theCu2+–Na+ system and two runs were carried out for the Zn2+–Na+
system. The experimental conditions are listed in Table 4.From the experimental breakthrough curves, the concentra-
tions at equilibrium in the resin were calculated using Eqs. (2)and (3). These calculations can be performed as long as the out-let concentrations are equal to those at the inlet. Table 5 shows theconcentrations in the resin obtained experimentally and calculatedby the MAL and Langmuir isotherm. Table 5 indicates that the devi-ations are low for heavy metals and, thus, both models are able todescribe satisfactorily the ion exchange dynamics in the column.The high deviations presented by the Na+ ion do not affect signifi-cantly the equilibrium representation, since the amount of Na+ inthe resin at equilibrium is small compared to the heavy metals.
Table 6 presents the fitted values for the model parameter (KSj)
and the parameter values calculated through correlations (KFjand
Daxj). The film mass transfer coefficient was calculated using Eq.(21) and the axial dispersion coefficient applying Eq. (18). Thefollowing values were used: � = 0.51 g cm−1 min−1, �F = 1 g cm−3,DmCu=8.45×10⁻⁴ cm2 min−1, DmZn = 8.44 × 10⁻⁴ cm2 min−1
[31].
The experimental and results and the concentrations at thecolumn outlet as well as the curves produced by the models arepresented in Figs. 4–7. The parameter values used to produce thebreakthrough curves are listed in Table 6.
Langmuir isotherm
bCu bNa
2.97 × 10³ ± 1.40 × 10² 0.82 × 10² ± 0.23 × 10²
Langmuir isotherm
bZn bNa
5.22 × 10² ± 1.08 × 10² 0.13 × 10² ± 0.50 × 101

C.E. Borba et al. / Chemical Engineering Journal 172 (2011) 312– 320 317
Table 4Operating conditions and bed properties.
Experiment System Cu2+–Na+
C0 (mEq/L) C0Cu (mEq/L) C0
Na (mEq/L) �L (g/L) ε
i 3.12 1.60 1.52 449.11 0.30ii 3.20 2.90 0.30 449.11 0.32
Experiment System Zn2+–Na+
C0 (mEq/L) C0Zn (mEq/L) C0
Na (mEq/L) �L (g/L) ε
i 2.85 1.41 1.44 449.11 0.31ii 2.95 2.62 0.33 449.11 0.29
Table 5Experimental and calculated concentrations in the resin at equilibrium.
Experiment for Cu2+–Na+ system q∗j
(mEq/g)
Experimental MAL Langmuir isotherm
Cu2+ Na+ Cu2+ Na+ Cu2+ Na+
i 4.84 0.29 4.58 (5.3%) 0.54 (88.5%) 5.03 (3.8%) 0.10 (63.4%)ii 4.96 0.17 5.03 (1.3%) 0.10 (38.7%) 5.12 (3.20%) 0.08 (51.3%)
Experiment for Zn2+–Na+ system q∗j
(mEq/g)
Experimental MAL Langmuir isotherm
Zn2+ Na+ Zn2+ Na+ Zn2+ Na+
i 4.61 0.52 4.47 (3.1%) 0.69 (27.9%) 5.02 (8.9%) 0.09 (82.5%)ii 4.90 0.23 4.98 (1.6%) 0.16 (32.8%) 5.11 (4.3%) 0.07 (67.8%)
Table 6Estimated model parameter values for the Cu2+–Na+ and Zn2+–Na+ systems in the fixed column.
Experiment for Cu2+–Na+ system C0 (mEq/L) C0Cu (mEq/L) C0
Na (mEq/L) Dax (cm2/min) KFCu (min−1) KSCu (min−1)
i 3.12 1.60 1.52 0.87 93.96 0.0182 ± 0.0012ii 3.20 2.90 0.30 0.87 93.96 0.0182 ± 0.0018
Experiment for Zn2+–Na+ system C0 (mEq/L) C0Zn (mEq/L) C0
Na (mEq/L) Dax (cm2/min) KFZn (min−1) KSZn (min−1)
i 2.85 1.41 1.44 0.87 93.00 0.0224 ± 0.00150.33
ab(wtt
tcT
TS
ii 2.95 2.62
Table 7 presents the statistical analysis aiming to determine theccuracy of the fitting of the model results to the experimentalreakthrough curve results. Values for the objective function, Eq.23), and for the coefficients of determination (R2) and variance (s2)ere calculated. The model that best described the Cu2+–Na+ sys-
em was the Langmuir isotherm and for the Zn2+–Na+ system it washe MAL.
The effect of the model parameters (KS, KF, Dax) on the break-
hrough curves was evaluated by sensitivity analysis. This analysisonsisted of changing only one parameter in each simulation.he parameters values presented in Table 6 were used as a refer-able 7tatistics for the dynamic model: Cu2+–Na+ and Zn2+–Na+ systems.
Experiment for Cu2+–Na+ system Langmuir isotherm
FOBJ R2
i 0.0617 0.9550
ii 0.0600 0.9835
Experiment for Zn2+–Na+ system Langmuir isotherm
FOBJ R2
i 0.1905 0.8553
ii 0.0600 0.9851
0.87 93.00 0.0224 ± 0.0011
ence. The experimental operating conditions used in simulationswere: C0 = 3.20 mEq/L, C0
Cu = 2.90 mEq/L, C0Na = 0.30 mEq/L. In
Figs. 8–10 are shown the simulation of the breakthrough curvesfor different values of resin mass transfer coefficient, externalliquid film mass transfer coefficient and axial dispersion coef-ficient, respectively. The model was more sensitive to the resinmass transfer coefficient and external liquid film mass transfercoefficient, since perturbations in these parameters values caused
significant changes on the shape of the breakthrough curve. It canbe observed that the model was not very sensitive to the axialdispersion coefficient.MAL
s2 FOBJ R2 s2
0.0385 0.1557 0.8973 0.04000.1402 0.1045 0.9702 0.1213
MAL
s2 FOBJ R2 s2
0.0331 0.0671 0.9497 0.03730.1483 0.0791 0.9774 0.1222

318 C.E. Borba et al. / Chemical Engineering Journal 172 (2011) 312– 320
Fig. 4. Experimental and calculated breakthrough curves for the binary systemCu2+–Na+ (C0 = 3.12 mEq/L; C0
Cu = 1.60 mEq/L; C0Na = 1.52 mEq/L).
Fig. 5. Experimental and calculated breakthrough curves for the binary systemCu2+–Na+ (C0 = 3.20 mEq/L; C0
Cu = 2.90 mEq/L; C0Na = 0.30 mEq/L).
Fig. 6. Experimental and calculated breakthrough curves for the binary systemZn2+–Na+ (C0 = 2.85 mEq/L; C0
Zn = 1.41 mEq/L; C0Na = 1.44 mEq/L).
Fig. 7. Experimental and calculated breakthrough curves for the binary systemZn2+–Na+ (C0 = 2.95 mEq/L; C0
Zn = 2.62 mEq/L; C0Na = 0.33 mEq/L).
Fig. 8. Effect of the resin mass transfer coefficient on the model.
Fig. 9. Effect of the external liquid film mass transfer coefficient on the model.

C.E. Borba et al. / Chemical Engineerin
4e
meeaimterscttcTepr
sctpuc
1
Fig. 10. Effect of the axial dispersion coefficient on the model.
.3.1. Considerations on the mathematical modeling of the ionxchange
Although the Langmuir isotherm described well the experi-ental data, it does not provide an acceptable mechanism for the
xchange. The Langmuir isotherm is frequently used for simplexpressions and can provide the adsorbed species concentrationst equilibrium from explicit equilibrium concentrations of speciesn the liquid phase. Several studies [9,11,32–35] have used this
odel to describe the equilibrium ion exchange. When adsorp-ion isotherms are employed to represent equilibrium in an ionxchange process, two approaches may be adopted: (i) specieseleased by the resin do not affect the removal of ions in theolution. This simplifies the model, since it is not necessary toonsider this effect in the model. In this case, for a binary sys-em, the monocomponent Langmuir isotherm could be used; (ii)he ion exchange is a competitive process. In this case the multi-omponent Langmuir isotherm could be used for a binary system.he effect of the species released by the resin should be consid-red. Neither of these mechanisms represents the ion exchangerocess, as they do not take into account the electroneutrality of theesin.
The MAL represents the ion exchange mechanism and also con-iders the deviation from ideality by calculating the species activityoefficients in the phases. The calculation of the species concen-ration in the resin from the species concentration in the liquidhase requires the solution of a non-linear implicit equation. These of MAL to represent the ion exchange equilibrium in a fixed bedolumn presents two problems:
. The electroneutrality condition is not satisfied while the operat-ing time is less than the ion residence time within the column.For instance, for the binary system Cu2+–Na+ the initial condi-tion in the column is that all ionic concentrations are zero, andthe column has only distilled/deionized water. At the columnstart-up, Cu2+ is adsorbed by the column close to the entranceand release of Na+ occurs simultaneously. Therefore, at this time,both ion concentrations in the solution at the column outlet arezero. Close to the residence time, the Na+ concentration increasessubstantially up to the initial feed concentration. Later the Cu2+
concentration at the outlet increases up to the feed concentra-tion. The concentration of the Na+ ion is inversely proportional tothat of Cu2+. Therefore, while the operating time is shorter thanthe residence time, the electroneutrality requirement is not sat-
g Journal 172 (2011) 312– 320 319
isfied in the solution, making the MAL inconsistent. However,since in this case the operating time is much longer than theresidence time, this could be neglected.
2. The MAL equation may have multiple roots. It is necessary toobtain a good initial estimate in order for Eq. (17) to converge toa meaningful value. This work considered the Langmuir isothermresult as the starting point for the MAL.
Table 6 shows the mass transfer coefficients for Cu2+ (KSCu ) andZn2+ (KSZn ). Valverde et al. [36] developed a generalized theoreticalmodel for the measurement of the effective diffusion coefficients ofheterovalent ions in ion exchange resins (Amberlite IR120) by thezero-length column method. The model included the resistance tomass transfer both in the particle and in the film and described ionfluxes with Nernst–Planck equations. The values for the intraparti-cle diffusivity of Cu2+, Cd2+, Zn2+, and H+ on commercial AmberliteIR-120 were obtained by non-linear regression. The values for theintraparticle diffusivity of Cu2+ and Zn2+ were 1.51 × 10⁻¹¹ and1.49 × 10−11 m2 s−1, respectively. Using Eq. (2) and the KSj
values(see Table 6) the following values were obtained for the intra-particle diffusivity of Cu2+ and Zn2+, respectively: 0.13 × 10⁻¹¹
and 0.15 × 10⁻¹¹ m2 s−1. These values agree fairly well with datareported by Valverde et al. [36]. Hence, in the ion exchange pro-cess in a fixed-bed column where Amberlite IR 120 is used as the“adsorbent”, the application of the LDF model appears to be a goodalternative for process modeling. This approximation is valid for aparabolic concentration profile. A detailed description of the modelsimplification can be found in the paper published by Cruz et al.[37].
In addition, the results presented in Table 6 indicate that theKSj
value was not affected by the heavy metal concentrations inthe feed. Some investigations [10,11,33] have modeled the ionexchange dynamics in a fixed bed using the linear driving forceto represent the mass transfer within the resin. The results of thesestudies showed little effect of the feed concentration on the coeffi-cients (KSj
).
Barros et al. [33] studied the removal of Cr3+ by NaX zeolite.The experimental data for the breakthrough curve were obtainedfor different feed concentrations. The ion removal dynamics con-sidered the diffusion as the controlling step. The KSCr values wereestimated by fitting the model to the experimental data of thebreakthrough curve. At feed concentrations of 0.29, 0.48, 0.95 and1.45 mEq/L the KSCr values were, respectively, 0.0178, 0.0170, 2460.0183 and 0.0202 min−1. Ostrosky et al. [11] studied the removalof Cu2+ and of Zn2+ by NaY zeolite. Experimental breakthroughcurve data were obtained for different feed concentrations. The ionremoval dynamics was represented by the same model used by Bar-ros et al. [11]. The KSj
values were obtained by fitting the model to
experimental breakthrough curve data. At Zn2+ feed concentrationsof 1.38, 1.91 and 2.45 mEq/L, the KSZn values were, respectively,0.0355, 0.0385 and 0.0398 min−1. At Cu2+ feed concentrations of0.11 and 0.78 mEq/L, KSCu values were, respectively, 0.0054 and0.0055 min−1. Hamdaoui [10] studied the removal of Cu2+ using theresin Purolite C100-MB. At feed concentrations of 4.70, 6.30 and7.90 mEq/L, the KSCu values were, respectively, 0.00049, 0.00055and 0.00064 min−1.
Finally, when both mathematical models are compared, it isclear that the model which uses the Langmuir isotherm as theequilibrium relationship is more appropriate for obtaining the ionequilibrium concentrations within the resin. However, unfortu-nately, this does not provide information on the ion exchange
mechanism. On the other hand, the MAL model, although more dif-ficult to use, does present the mechanism. Furthermore, the MALallows the possibility to describe ternary systems from binary con-stitutive systems.
3 ineerin
5
twitIaMcfimbmstomlm
R
[
[
[
[
[
[
[
[
[
[
[
[
[
[
[
[
[
[
[
[
[
[
[
[
[
[
[
20 C.E. Borba et al. / Chemical Eng
. Conclusions
A mathematical model describing the ion exchange dynamics ofhe binary systems Cu+2–Na+ and Zn+2–Na+ in a fixed bed columnas used to obtain the Cu+2 and Zn+2 mass transfer coefficients,
n the concentration range investigated. The values showed thathe ion exchange rate of Zn2+ ions is higher than that of Cu2+ ions.t was observed that these parameters were not affected by themount of heavy metals in the feed. Furthermore, the Nelder andead method was shown to be a satisfactory parameter identifi-
ation procedure, according to the indicators of the goodness oft. It was found that the MAL and Langmuir isotherm using in theathematical modeling of the column represented satisfactory the
reakthrough curve, even with the parameters of the equilibriumodels fitted using experimental data obtained in a closed batch
ystem. The sensitivity analysis of the model parameters showedhe importance of the internal and external mass transfer effectsn the column dynamic simulation. Moreover, the mathematicalethods can be used to design a fixed-bed column using Amber-
ite IR120 resin to remove the species Cu+2 and Zn+2 from aqueousedia.
eferences
[1] M.V. Ernest Jr., R.D. Whitley, Z. Ma, N.H. Linda Wang, Effects of mass actionequilibria in fixed bed multicomponent ion exchange dynamics, Ind. Eng. Chem.Res. 36 (1997) 212–226.
[2] S. Sircar, Role of adsorbent heterogeneity on mixed gas adsorption, Ind. Eng.Chem. Res. 30 (1991) 1032–1039.
[3] R.P. Smith, E.T. Woodburn, Prediction of multicomponent ion exchange equilib-ria for the ternary system SO4−–NO3−–Cl− from data of binary systems, AIChEJ. 24 (1978) 577–586.
[4] G.V. Vazquez Una, R.M. Pampin, R.B. Caeiro, Prediction del equilíbrio em sis-temas ternários de intercambio iônico, An. Quim. A 81 (1985) 141–145.
[5] M.A. Mehablia, D.C. Shallcross, G.W. Stevens, Prediction of multicomponent ionexchange equilibria, Chem. Eng. Sci. 49 (1994) 2277–2286.
[6] B.S. Vo, D.C. Shalcross, Ion exchange equilibria data for systems involving H+,Na+, K+, Mg+, and Ca+2 ions, J. Chem. Eng. Data 50 (2005) 1018–1102.
[7] C.E. Borba, E.A. Silva, S. Spohr, G.H.F. Santos, R. Guirardello, Ion exchange equi-librium prediction for the system Cu2+–Zn2+–Na+, J. Chem. Eng. Data 55 (2010)1333–1341.
[8] I.M. Latheef, M.E. Huckman, R.G. Anthony, Modeling cesium ion exchange onfixed bed columns of crystalline silicotitanate granules, Ind. Eng. Chem. Res. 39(2000) 1356–1363.
[9] S.B. Shebil, A.A. Sungur, A.R. Ozdural, Fixed-bed ion exchange columnsoperating under non-equilibrium conditions: estimation of mass transferproperties via non-equilibrium modeling, React. Funct. Polym. 67 (2007)1540–1547.
10] O. Hamdaoui, Removal of copper(II) from aqueous phase by Purolite C100-MBcation exchange resin in fixed bed columns: modeling, J. Hazard. Mater. 161(2009) 737–746.
11] I.C. Ostroski, M.A.S.D. Barros, E.A. Silva, J.H. Dantas, P.A. Arroyo, O.C.M. Lima, Acomparative study for the ion exchange of Fe(III) and Zn(II) on zeolite NaY, J.Hazard. Mater. 161 (2009) 1404–1412.
12] J. Dranoff, L. Lapidus, Multicomponent ion exchange column calculations, Ind.Eng. Chem. 50 (1958) 1648–1653.
[
g Journal 172 (2011) 312– 320
13] J. Warchol, R. Petrus, Modeling of heavy metal removal dynamics in clinop-tilolita packed beds, Micropor. Mesopor. Mater. 93 (2006) 29–39.
14] I.H. Lee, Y.C. Kuan, J.M. Churn, Prediction of ion-exchange column break-through curves by constant-pattern wave approach, J. Hazard. Mater. 152(2008) 241–249.
15] I.C. Ostroski, C.E. Borba, E.A. Silva, P.A. Arroyo, R. Guirardello, M.A.S.D. Barros,Mass transfer mechanism of ion exchange in fixed bed columns, J. Chem. Eng.Data 56 (3) (2011) 375–382.
16] W.J. Weber Jr., C.K.A. Wang, Microscale system for estimation of model param-eters for fixed bed adsorbers, Environ. Sci. Technol. 21 (1987) 1050–1096.
17] H. Yoshida, M. Yoshikawa, T. Kataoka, Parallel transport of BSA by surface andpore diffusion in strongly basic chitosan, AIChE J. 40 (1994) 2034–2044.
18] D.C.K. Ko, J.F. Poter, G. Mackay, Film-pore diffusion model for the fixed bed sorp-tion of copper and cadmium onto bone char, Water Res. 36 (2001) 3786–3886.
19] R.S. Juang, S.H. Lin, T.Y. Wang, Removal of metal ions from the complexed solu-tions in fixed bed using a strong-acid ion exchange resin, Chemosphere 53(2003) 1221–1228.
20] P.V. Danckwerts, Continuous flow systems: distribution of residence times,Chem. Eng. Sci. 2 (1953) 1–13.
21] L.A. Bromley, Thermodynamic properties of strong electrolytes in aqueous solu-tions, AIChE J. 19 (1973) 313–320.
22] G.M. Wilson, Vapor–liquid equilibria XI. A new expression for the excess freeenergy of mixing, J. Am. Chem. Soc. 86 (1964) 127–130.
23] C.R. Maliska, Transferência de Calor e Mecânica dos Fluidos Computacional,Livros Técnicos e Científicos Editora S.A., Rio de Janeiro, 1995.
24] L.R. Petzold, A Description of DASSL: A Differential/Algebraic Equation SystemSolver, STR, Livermore, 1982.
25] D.M. Ruthven, Principles of Adsorption and Adsorption Process, John Wiley &Sons, New York, 1984.
26] E.J. Wilson, C.J. Geankoplis, Liquid mass transfer at very low Reynolds numbersin packed beds, Ind. Eng. Chem. Fundam. 5 (1966) 9–14.
27] J.A. Nelder, R. Mead, A simplex method for function minimization, Comput. J. 7(1965) 308–315.
28] J.L. Valverde, A. de Lucas, M.G. onzalez, J.F. Rodríguez, Ion-exchange equilibriaof Cu2+, Cd2+, Zn2+, and Na+ ions on the cationic exchanger Amberlite IR-120, J.Chem. Eng. Data 46 (2001) 1404–1409.
29] A. Demirbas, E. Pehlivan, F. Gode, T. Altun, G. Arslan, Adsorption of Cu(II), Zn(II),Ni(II), Pb(II), and Cd(II) from aqueous solution on Amberlite IR-120 syntheticresin, J. Colloid Interface Sci. 282 (2005) 20–25.
30] M.K. Jha, N. Van Nguyen, J.C. Lee, J. Jeong, J.M. Yoo, Adsorption of copper fromthe sulphate solution of low copper contents using the cationic resin AmberliteIR 120, J. Hazard. Mater. 164 (2009) 948–953.
31] D.R. Lide, H.V. Kehiaian, CRC Handbook of Chemistry and Physics, seventh ed.,CRC Press, 1996–1997.
32] F.J. Alguacil, M. Alonso, L.J. Lozano, Chromium (III) recovery from waste acidsolution by ion exchange processing using Amberlite IR-120 resin: batch andcontinuous ion exchange modeling, Chemosphere 57 (2004) 789–793.
33] M.A.S.D. Barros, E.A. Silva, P.A. Arroyo, C.R.G. Tavares, R.M. Schneider, M. Suszek,E.F. Sousa-Aguiar, Removal of Cr (III) in the fixed bed column and batch reactorsusing as adsorbent zeolite NaX, Chem. Eng. Sci. 59 (2004) 5959–5966.
34] L.C. Lin, R.S. Juang, Ion-exchange equilibria of Cu(II) and Zn(II) from aqueoussolutions with Chelex 100 and Amberlite IRC 748 resins, Chem. Eng. J. 112(2005) 211–218.
35] R.S. Juang, H.C. Kao, W. Chen, Column removal of Ni(II) from synthetic electro-plating waste water using a strong-acid resin, Sep. Purif. Technol. 49 (2006)36–42.
36] J.L. Valverde, A. de Lucas, M. Carmona, M. González, J.F. Rodríguez, A generalizedmodel for the measurement of effective diffusion coefficients of heterovalent
ions in ion exchangers by the zero-length column method, Chem. Eng. Sci. 59(2004) 71–79.37] P. Cruz, F.D. Magalhaes, A. Mendes, Generalized linear driving force approxi-mation for adsorption of multicomponent mixtures, Chem. Eng. Sci. 61 (2006)3519–3531.