Redefining the Standard Compaction Test to Better Describe ...
Upload
independentCategory
view
0download
0
ww.sciencedirect.com
wat e r r e s e a r c h 6 6 ( 2 0 1 4 ) 4 4 7e4 5 8
Available online at w
ScienceDirect
journal homepage: www.elsevier .com/locate/watres
A new settling velocity model to describesecondary sedimentation
Elham Ramin a,*, Dorottya S. W�agner a, Lars Yde b, Philip J. Binning a,Michael R. Rasmussen c, Peter Steen Mikkelsen a, Benedek Gy. Pl�osz a,*
a Department of Environmental Engineering, Technical University of Denmark, Miljøvej, Building 113, 2800 Kgs.
Lyngby, Denmarkb DHI Water & Environment (S) Pte Ltd, Singapore 63714, Singaporec Department of Civil Engineering, Aalborg University, Sohngaardsholmsvej 57, 9000 Aalborg, Denmark
a r t i c l e i n f o
Article history:
Received 31 March 2014
Received in revised form
25 July 2014
Accepted 23 August 2014
Available online 3 September 2014
Keywords:
Activated sludge
Compression
Calibration
Computational fluid dynamics
Rheology
Monte Carlo Markov Chain
* Corresponding authors. Tel.: þ45 45 25 16 9E-mail addresses: [email protected] (E. Ra
Binning), [email protected] (M.R. Rasmussen)http://dx.doi.org/10.1016/j.watres.2014.08.0340043-1354/© 2014 Elsevier Ltd. All rights rese
a b s t r a c t
Secondary settling tanks (SSTs) are the most hydraulically sensitive unit operations in
biological wastewater treatment plants. The maximum permissible inflow to the plant
depends on the efficiency of SSTs in separating and thickening the activated sludge. The
flow conditions and solids distribution in SSTs can be predicted using computational fluid
dynamics (CFD) tools. Despite extensive studies on the compression settling behaviour of
activated sludge and the development of advanced settling velocity models for use in SST
simulations, these models are not often used, due to the challenges associated with their
calibration. In this study, we developed a new settling velocity model, including hindered,
transient and compression settling, and showed that it can be calibrated to data from a
simple, novel settling column experimental set-up using the Bayesian optimization
method DREAM(ZS). In addition, correlations between the Herschel-Bulkley rheological
model parameters and sludge concentration were identified with data from batch rheo-
logical experiments. A 2-D axisymmetric CFD model of a circular SST containing the new
settling velocity and rheological model was validated with full-scale measurements.
Finally, it was shown that the representation of compression settling in the CFD model can
significantly influence the prediction of sludge distribution in the SSTs under dry- and wet-
weather flow conditions.
© 2014 Elsevier Ltd. All rights reserved.
1. Introduction
In conventional wastewater treatment plants (WWTPs), bio-
reactors are connected to secondary settling tanks (SSTs) to
separate the suspended biomass from treatedwater bymeans
4.min), [email protected], [email protected] (P.S. M
rved.
of gravity sedimentation. The thickening and clarification ef-
ficiency of SSTs is significantly influenced by hydraulic dis-
turbances during wet-weather flow conditions. This is of
particular concern due to the increasing frequency of hy-
draulic shock-loads fromurban run-offs toWWTPs associated
with the effect of climate change on peak rainfall intensities
(D.S. W�agner), [email protected] (L. Yde), [email protected] (P.J.ikkelsen), [email protected] (B.Gy. Pl�osz).

Table 1 e The description of WWTPs and the list ofcorresponding experiments.
Parameters LundtofteWWTP
Lynetten WWTP
aPE 135,000 750,000bSRT [d] 31 29
SST type circular rectangularcDSVI [ml/g] 125 90
SST design
Clarifier diameter [m] 24.5 Not investigated
Depth of outer wall [m] 3.48
Bottom slope [%] 7.66
Centre wall diameter [m] 3
Centre wall depth [m] 6.2
Inlet surface area [m2] 4.24
Recycle surface area [m2] 3.96
Tank surface area [m2] 470
Sludge removal mechanism scraper
Experiments
Settling x x
Rheology x e
Full-scale measurements x e
a Population equivalent (design).b Sludge retention time (design).c Diluted sludge volume index of the sampled sludge.
wat e r r e s e a r c h 6 6 ( 2 0 1 4 ) 4 4 7e4 5 8448
(Larsen et al., 2009; Pl�osz et al., 2009). When examining SSTs
performance, it is important to consider the non-Newtonian
(rheological) and settling behaviour of activated sludge
because they have significant impacts on the overall transport
and removal of solids (Ekama et al., 1997; Lakehal et al., 1999;
De Clercq, 2003). To predict the internal flow field and solids
distribution, complex computational fluid dynamics (CFD)
models of SSTs have been developed (Larsen, 1977; Imam
et al., 1983; Dahl, 1993). CFD models are based on the
NaviereStokes equations and are computationally
demanding. Nevertheless, they are cost effective because
validated CFD models can be employed instead of field ex-
periments to generate data for the calibration and validation
of simpler one-dimensional (1-D) SST models for WWTP
simulations under a range of boundary conditions (De Clercq,
2003; Pl�osz et al., 2007).
Since the first CFD model of an SST was developed by
Larsen (1977), research has mostly aimed to improve the
prediction accuracy of the CFD models by optimizing the
mathematical structure of the turbulence and buoyant flow
modelling components (Adams and Rodi, 1990; Bretscher
et al., 1992; Lakehal et al., 1999; De Clercq, 2003; Weiss et al.,
2007). Currently, despite significant advancements in the
research on the settling and rheological characteristics of
activated sludge, their representation in CFDmodels of SSTs is
not well-established.
Concerning the settling velocity models, the recent devel-
opment of phenomenological sedimentation-consolidation
theory has led to extensive studies on the compression
settling behaviour of activated sludge, and has subsequently
been expressed in settling velocity models (Burger, 2000;
Kinnear, 2002; De Clercq et al., 2008). The proposed calibration
methods for these models, however, require non-destructive
monitoring of dynamic settling profiles during batch experi-
ments such as radiotracer tests (De Clercq et al., 2005) and are
not simple to do in practice. Therefore, the application of
compression settlingmodels is limited to a few cases of 1-D SST
modelling (De Clercq et al., 2008; Burger et al., 2011). Most of the
CFD studies consider only the hindered (and flocculent) settling
regimes using the empirical formulation of Tak�acs et al. (1991).
To encourage a broader application of compression settling
models for numerical modelling of SSTs, there is a need for a
simple but robust experimental methodology.
Regarding the rheological models for activated sludge,
Ratkovich et al. (2013) were critical about the procedures
currently used to select and calibrate them. They demon-
strated the need for high quality measurements and stressed
the importance of good modelling practice in rheological
modelling. These factors need to be considered in CFD
modelling of SSTs, where the rheological model of activated
sludge plays an important role in accurate prediction of hy-
drodynamics in SSTs.
This paper aims to (i) l set-up and use the obtained data to
evaluate the accuracy of current settling velocity models and
propose a new settling velocity model that describes the
experimental observations more accurately; (ii) perform
rheological measurements to obtain high quality data for
selection and calibration of a rheological model for activated
sludge, and establish correlations between rheological model
parameters and sludge concentration; and finally, (iii)
perform simulations with a 2-D axisymmetric CFD model
with the new settling and rheological models and validate
the CFD model with full-scale measurements. In addition, an
assessment is conducted of the influence of omitting the
transient and compression settling from the CFD model
when using Tak�acs hindered (and flocculent) settling velocity
model.
2. Materials and methods
2.1. Case study
The SST studied is located in Lundtofte WWTP (Lyngby,
Denmark). It is a circular centre-feed conical tank. During the
measurement campaign, the SST was operated with 100 m3/h
average overflow rate, 1.45 recycle ratio, and 5.64 kg/
m3average feed sludge concentration. An activated sludge
sample was collected from the combined recycle flow channel
of Lundtofte WWTP on the day of the settling experiments.
Sludge samples taken were aerated overnight with coarse air
bubbles and the sampled effluent SST was stored at 4 �C for
the rheological experiments conducted on the following day.
To validate the settling velocitymodel, another sludge sample
was collected from a different WWTP (Lynetten). The
description of the two WWTPs, the detailed design of the
Lundtofte SST, and the list of corresponding experiments are
given in Table 1.
2.2. Experiments
2.2.1. Settling column testsWe developed a simple laboratory set-up, consisting of a glass
column (Fig. 1a) with a Solitax® total suspended solids (TSS)

a
b
c
d
Fig. 1 e Settling column (a), with a Solitax TSS sensor
installed at the bottom of the column (b). Evolution of the
sludge blanket height SBH (c), and the sludge concentration
measured in the bottom of the column Xb (d), for different
initial sludge concentrations (Lundtofte WWTP sludge).
wat e r r e s e a r c h 6 6 ( 2 0 1 4 ) 4 4 7e4 5 8 449
sensor (Hach Lange, Germany) installed at the bottom (Fig. 1b).
A series of batch settling tests were performed using the
sludge samples diluted with SST effluent over a concentration
range of 1.7e5.1 kg/m3, which is typical for feed concentration
into SSTs. Before each settling test, the sludge sample was
homogenized in the column with coarse air bubbles. The TSS
sensorwas validated in-situ by comparing themeasured initial
sludge concentration at the start of each test to the values
obtained from gravimetric analysis. The evolution of sludge
blanket height, SBH (Fig. 1c), and sludge concentration at the
bottom, Xb (Fig. 1d) were recorded over the 60 min duration of
each test.
2.2.2. Rheological experimentsThe non-Newtonian behaviour of the sampled sludge from
the Lundtofte WWTP was studied using laboratory shear
stress-controlledmeasurements in a rotational rheometer (AR
2000, TA Instruments, USA), with concentric conical-
cylindrical geometry. To avoid breakage of flocs, the annular
gap size was set to 5.92 mm, which is larger than the
maximum floc size reported in literature (Li and Ganczarczyk,
1991). A Smart Swap™-based Peltier Plate temperature system
was used to perform measurements under different
isothermal conditions (10, 15, 20 �C) typically observed at
WWTPs under seasonal temperature variations. The sludge
sample was diluted with SST effluent to 5e13 kg/m3 concen-
tration range, which is typically found in the vicinity of the
sludge blanket in SSTs where the rheological behaviour of
sludge significantly impacts the flow field (Ratkovich et al.,
2013). Besides the overnight aeration with the coarse air
bubbles, no pre-shearing was applied to the sludge sample.
The diluted sludge samplewas replacedwith a new aliquot for
each experiment to minimize the uncertainty associated with
the changes in sludge characteristics. By applying the
decreasing shear stress mode in through consecutive experi-
ments (starting from the maximum value corresponding to
shear rate of around 250 s�1 with the frequency of 10 points
per decade on a logarithmic scale), we could minimize sludge
settling. The flow in the gap was assumed laminar during the
measurements. The conversion equations of torque and
angular velocity to shear stress and shear rate, respectively,
are described in the Supporting Information.
2.2.3. Full-scale measurementsFull-scale measurements were performed at Lundtofte SST to
validate the CFD model. The sludge concentration and veloc-
ity profiles were measured at four different radial distances
from the centre of the tank using a Solitax® TSS sensor and a
Vectrino® 3-D acoustic Doppler velocimeter (Nortek BV, the
Netherlands) simultaneously (see Fig. S2 in the Supporting
Information). The Vectrino® receivers were located 20 cm
below the Solitax® sensor to avoid flow disturbance during
velocity measurements.
2.3. Calibration of the settling velocity models
To calibrate the selected settling velocitymodels (presented in
section 3.1) to the settling measurements, they were imple-
mented in a dynamic 1-D model of the settling column (Pl�osz
et al., 2007, 2011). For calibration, the adaptive Markov Chain
Monte Carlo (MCMC) Bayesian global optimization method
DREAM(ZS) (Laloy and Vrugt, 2012) was used. The 1-D model
calculates the total solids flux for a finite number of equally
thick horizontal layers. 60 layers were found to be optimal in
order for model predictions to be independent of the number
of layers, and enabling efficient calibration using the
DREAM(ZS) algorithm which required a high number of simu-
lations (over 5000). The minimization function in the
DREAM(ZS) algorithm was defined as an averaged non-
dimensional sum of squared errors (Marler and Arora, 2004).
SSEN ¼ 1n�m
Xni¼1
Xmj¼1
yi;j � byi;j
�q�
yi;j
!2
(1)
where n is the number ofmeasured time-series (including SBH
alone or both SBH and Xb); m is the number of data points in
each time-series; y is the measured values; byðqÞ is the model
prediction with the parameter set q. Prediction uncertainty for
the estimated parameters is provided by the posterior
parameter distributions.
2.4. Numerical modelling of the SST
2.4.1. Hydrodynamics and solids transportThe CFD modelling was performed in the open source CFD
toolbox OpenFOAM® (OpenCFD, 2012) and with the set-
tlingFoam solver (Brennan, 2001). The hydrodynamics solver
employs the averaged form of the Eulerian two-phase flow,
where the mixture is considered as a whole rather than two
separate phases. The turbulence was modelled using the

wat e r r e s e a r c h 6 6 ( 2 0 1 4 ) 4 4 7e4 5 8450
buoyancy modified k-ε model (with k as the turbulent kinetic
energy, and ε as the dissipation rate of k), accounting for
density stratification (Dahl, 1993; Rodi, 1993). The CFD simu-
lationmodel solves the convection-diffusion equation derived
from the continuity equation for the solid phase to predict the
distribution of solids (drift flux model). The hydrodynamics
and transport equations are provided in the Supporting
Information.
2.4.2. Computational domain and boundary conditionsThe flow in the circular SST was assumed to be axisymmetric,
thus only a segment of the tank was modelled and discretized
in radial and depth directions using the polyhedral mesh type.
Mesh-independence was investigated for the CFD model by
comparing the velocity and sludge concentrations profiles
simulated with 5816 (coarse), 15292 (medium) and 22906 (fine)
grids. The simulation results of the CFDmodel with the coarse
mesh did not diverge significantly from the cases with me-
dium and fine mesh (data not shown), and thus we used the
coarsemeshing in our simulations. The geometry andmesh of
the SST model is illustrated later in the results section along
with the CFD simulation results (Fig. 7a).
Regarding the boundary conditions, we assumed a fric-
tionless boundary at the tank bottom to simulate the influ-
ence of an ideal “scraper” in overcoming the wall stress,
Fig. 2 e Settling phases observed from the batch measurements
at the bottom Xb (b), for X0 ¼ 2.7 kg/m3 (Lundtofte WWTP sludg
measurements (c), and evaluating their prediction of Xb (d).
facilitating sludge flow to the hopper for removal, as proposed
by Deininger et al. (1998). The free water surface was consid-
ered to be a symmetrical plane. The remaining walls were
considered to be non-slip boundaries with standard wall-
functions to estimate the mean fluid velocity near the wall
(Brennan, 2001).
3. Results and discussion
3.1. Settling velocity model
In this section, experimental observations are presented
(Fig. 2a,b) and are used to evaluate currently available settling
velocity models, which then motivated the development of a
new settling velocity model (Fig. 2c,d). The estimated param-
eter values of the settling velocity models are provided in the
Supporting Information (Tables S1eS3).
3.1.1. Experimental observationsThe SBH measurements in the settling column (Fig. 2a)
allowed identification of the four different settling regimes
typically observed during batch activated sludge settling col-
umn tests: lag, hindered, transient, and compression (Ekama
et al., 1997). The lag period observed at the beginning of the
of sludge blanket height SBH (a), and sludge concentration
e). Calibrating different settling velocity models to the SBH

wat e r r e s e a r c h 6 6 ( 2 0 1 4 ) 4 4 7e4 5 8 451
experiment resulted from the dissipation of kinetic energy
introducedwith coarse air bubbles used to homogenize sludge
in the column before measurements start. The subsequent
period of constant descent of the liquid/solid interface corre-
sponds to the hindered settling regime, where the mixture
settles as a whole with a concentration equal to the initial
value of sludge (X0). The particles entering the bottom of the
column encounter compressive solids stress and settle slower
than in the hindered regime.
Based only on SBH measurements in conventional settling
experiments, the observation of the transition of settling
regime from hindered to compression is limited, and can only
be observed when the accumulation of sludge at the bottom
propagates upwards and meets the liquid/solid interface. By
additionally measuring Xb using the novel setup presented in
this paper, the onset of the transient and the compression
regimes can be observed more clearly (Fig. 2b). The hindered
regime is absent in the Xb time series as a result of the im-
mediate accumulation of sludge at the bottom of the column.
Possibly, as a result of the faster dissipation of kinetic energy
at the bottom of the column, no lag period can be detected in
the Xb measurements.
3.1.2. Evaluation of state-of-the-art settling velocity modelsFig. 2c,d shows a comparison of the state-of-the-art settling
velocity functions to predict SBH and Xb measurements. The
lag period was excluded from the SBH measurements (Fig. 2c)
since it does not occur in continuous settlers (De Clercq, 2006).
We first employed the hindered settling velocity model (vh) of
Tak�acs et al. (1991).
vh ¼ v0
�e�rHX � e�rPX
�(2)
where v0 is the maximum settling velocity; rH and rP are the
hindered and low concentration indices, respectively; X is the
sludge concentration. This settling velocity model could very
well describe the hindered settling regime; however, as ex-
pected, SBH and Xb predictions diverged from the measure-
ments during the transient and compression settling regime
(dotted line in Fig. 2c,d). To address this problem, we tested a
settling velocity model that includes a mechanistic compres-
sion settling velocity, vc (Burger, 2000; Kinnear, 2002; De Clercq
et al., 2008).
vc ¼ vh
0@1� rS�rS � rf
�gX
dsdX
dXdz
1A (3)
with the effective solids stress (s) gradient formulation
developed by De Clercq et al. (2008).
dsdX
¼8<:
0 X<XC
a
X� XC þ bX � XC
(4)
where vh is the hindered settling velocity (Eq. (2)), rs and rf are
the sludge and water density, respectively; g denotes the
gravity constant; z is depth in the settling column; a and b are
compression parameters; XC is the threshold compression
concentration. Unfortunately, this model over-predicted the
Xb data (dash-dotted line in Fig. 2d) when it was calibrated to
the SBH data (dash-dotted line in Fig. 2c). This outcome
indicates that calibrating the settling velocity model to only
the SBH measurements does not correctly predict all the
settling regimes. Furthermore, the discontinuity in the
mathematical formulation of s gradient (Eq. (4)) makes the
computation time of parameter estimation with DREAM(ZS)
inefficient.
3.1.3. Settling velocity model developmentTo improve the prediction of the settling velocity model (Eqs.
(2)e(4)), we investigated alternative formulations for the
effective solids stress gradient (data not shown). By replacing
the power formulation (Eq. (5)) with the formulation of De
Clercq et al. (2008) in Eq. (4), we can achieve more accurate
predictions of Xb (dashed line in Fig. 2d).
dsdX
¼
8><>:0 X<XC�
X� XC
C1
�C2
X � XC
(5)
where C1 and C2 are the parameters in the new compression
settling model. This formulation is a modified form of similar
power formulations for effective solids stress proposed in
literature (Holdich and Butt, 1997; Burger, 2000). With the new
formulation for the effective solids stress (Eq. (5)), the
discontinuity in the mathematical formulation of settling
velocity is avoided, which significantly increased the speed of
the simulation and optimization process (data not shown).We
could further improve the prediction of Xb in the compression
settling regime (solid line in Fig. 2d) by applying the following
transient velocity formulation accounting immediately after
hindered settling, i.e. X > X0.
vt ¼ v0;te�rtX (6)
where v0,t and rt are the transient settling parameters. This
new exponential transient formulation was chosen analogous
to the hindered settling velocity formulation (Eq. (2)). To avoid
discontinuity in the transition from the hindered to the tran-
sient regime, the settling velocities were set to be equal at the
transition point, i.e. vh ¼ vt at X ¼ X0. We could then calculate
one of the transient settling parameters as
v0;t ¼ v0e�rHX0
e�rtX0(7)
and reduce the number of calibration parameters to rt, XC, C1,
and C2. The complete formulation of the new settling velocity
model is as follows
vS ¼
8>>>><>>>>:v0e
�rH$X � v0e�rP$X X � X0
v0;te�rtX X0 <X<XC
v0;te�rtX
�1� fC
dXdz
�X � XC
(8)
where the compression factor fC is defined as
fC ¼ rS�rS � rf
�gX
�X� XC
C1
�C2
(9)
In this paper, Eq. (8), which includes Hindered, Transient
and Compression settling velocity formulations, is referred to
as the HTC settling velocity model.
wat e r r e s e a r c h 6 6 ( 2 0 1 4 ) 4 4 7e4 5 8452
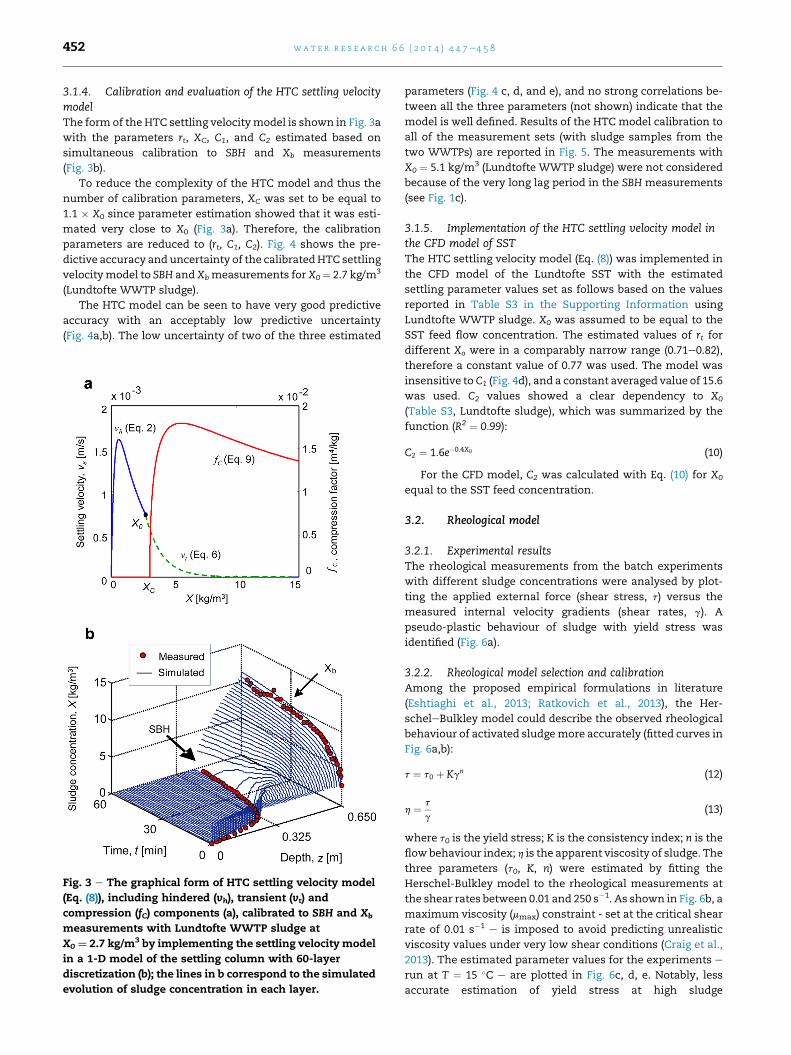
3.1.4. Calibration and evaluation of the HTC settling velocitymodelThe form of the HTC settling velocitymodel is shown in Fig. 3a
with the parameters rt, XC, C1, and C2 estimated based on
simultaneous calibration to SBH and Xb measurements
(Fig. 3b).
To reduce the complexity of the HTC model and thus the
number of calibration parameters, XC was set to be equal to
1.1 � X0 since parameter estimation showed that it was esti-
mated very close to X0 (Fig. 3a). Therefore, the calibration
parameters are reduced to (rt, C1, C2). Fig. 4 shows the pre-
dictive accuracy and uncertainty of the calibratedHTC settling
velocitymodel to SBH andXbmeasurements for X0¼ 2.7 kg/m3
(Lundtofte WWTP sludge).
The HTC model can be seen to have very good predictive
accuracy with an acceptably low predictive uncertainty
(Fig. 4a,b). The low uncertainty of two of the three estimated
Fig. 3 e The graphical form of HTC settling velocity model
(Eq. (8)), including hindered (vh), transient (vt) and
compression (fC) components (a), calibrated to SBH and Xb
measurements with Lundtofte WWTP sludge at
X0 ¼ 2.7 kg/m3 by implementing the settling velocitymodel
in a 1-D model of the settling column with 60-layer
discretization (b); the lines in b correspond to the simulated
evolution of sludge concentration in each layer.
parameters (Fig. 4 c, d, and e), and no strong correlations be-
tween all the three parameters (not shown) indicate that the
model is well defined. Results of the HTC model calibration to
all of the measurement sets (with sludge samples from the
two WWTPs) are reported in Fig. 5. The measurements with
X0 ¼ 5.1 kg/m3 (Lundtofte WWTP sludge) were not considered
because of the very long lag period in the SBH measurements
(see Fig. 1c).
3.1.5. Implementation of the HTC settling velocity model inthe CFD model of SSTThe HTC settling velocity model (Eq. (8)) was implemented in
the CFD model of the Lundtofte SST with the estimated
settling parameter values set as follows based on the values
reported in Table S3 in the Supporting Information using
Lundtofte WWTP sludge. X0 was assumed to be equal to the
SST feed flow concentration. The estimated values of rt for
different Xo were in a comparably narrow range (0.71e0.82),
therefore a constant value of 0.77 was used. The model was
insensitive to C1 (Fig. 4d), and a constant averaged value of 15.6
was used. C2 values showed a clear dependency to X0
(Table S3, Lundtofte sludge), which was summarized by the
function (R2 ¼ 0.99):
C2 ¼ 1:6e�0:4X0 (10)
For the CFD model, C2 was calculated with Eq. (10) for X0
equal to the SST feed concentration.
3.2. Rheological model
3.2.1. Experimental resultsThe rheological measurements from the batch experiments
with different sludge concentrations were analysed by plot-
ting the applied external force (shear stress, t) versus the
measured internal velocity gradients (shear rates, g). A
pseudo-plastic behaviour of sludge with yield stress was
identified (Fig. 6a).
3.2.2. Rheological model selection and calibrationAmong the proposed empirical formulations in literature
(Eshtiaghi et al., 2013; Ratkovich et al., 2013), the Her-
scheleBulkley model could describe the observed rheological
behaviour of activated sludgemore accurately (fitted curves in
Fig. 6a,b):
t ¼ t0 þ Kgn (12)
h ¼ t
g(13)
where t0 is the yield stress; K is the consistency index; n is the
flowbehaviour index; h is the apparent viscosity of sludge. The
three parameters (t0, K, n) were estimated by fitting the
Herschel-Bulkley model to the rheological measurements at
the shear rates between 0.01 and 250 s�1. As shown in Fig. 6b, a
maximum viscosity (mmax) constraint - set at the critical shear
rate of 0.01 s�1 e is imposed to avoid predicting unrealistic
viscosity values under very low shear conditions (Craig et al.,
2013). The estimated parameter values for the experiments e
run at T ¼ 15 �C e are plotted in Fig. 6c, d, e. Notably, less
accurate estimation of yield stress at high sludge

Fig. 4 e Predictive accuracy and uncertainty (95% confidence intervals of the model prediction due to parameter uncertainty)
of the HTC settling velocity model with the estimated parameters (rt, C1, C2) for X0 ¼ 2.7 kg/m3 (Lundtofte WWTP sludge) (a,
b). The histograms (c, d, and e) show the posterior distribution of the three parameters estimated using DREAM(ZS), with a
fitted Gaussian distribution (red curves). (For interpretation of the references to colour in this figure legend, the reader is
referred to the web version of this article.)
wat e r r e s e a r c h 6 6 ( 2 0 1 4 ) 4 4 7e4 5 8 453
concentrations (Fig. 6a) resulted in a comparably large vari-
ance in the estimated yield stress values (error lines in Fig. 6c).
The estimated rheology parameter values are comparable for
the three different temperature conditions (Table 2), which
suggests that the typical seasonal temperature variation in
the bioreactors in WWTPs may not have significant “direct”
impact on the rheological behaviour of activated sludge. We
note that this result does not take into account the fact that
the seasonal temperature variations can impact the microbial
composition of activated sludge, which may influence the
rheological behaviour of activated sludge in the SST. Never-
theless, the parameter values obtained at T ¼ 15 �C were used
in the CFD model, which was the average temperature degree
detected by the Vectrino® sensor during the full-scale profile
measurements.
3.2.3. Implementation of the rheological model in the CFDmodel of SSTThe three estimated HerscheleBulkley model parameters (t0,
K, n) were found to be dependent on the sludge concentration
of the samples, X (Fig. 6c, d, and e). To implement this de-
pendency in the CFD model, three relations were established
(fitted curves in Fig. 6c, d, and e). Other alternative correlation
formulations for the yield stress (t0) and the consistency index
(K) have been previously reported (De Clercq, 2003; Eshtiaghi
et al., 2012). Based on the correlations in Fig. 6c, d, e, the
apparent viscosity of the sludge mixture correctly converges
to water viscosity at very low sludge concentrations; i.e. if
X / 0, then t0 / 0, K / mw (viscosity of water), and n / 1.
3.3. CFD simulations of the SST
Fig. 7 shows the steady-state simulation results of two CFD
models using the calibrated HerscheleBulkley rheological
model in combination with: (i) the HTC settling velocitymodel
(Eq. (8)), and (ii) Tak�acs settling velocity model (Eq. (2)). The
simulation results are compared with the full-scale measured
vertical velocity and sludge concentration profiles, at four
different radial distances from the centre of the tank.
3.3.1. Validation of the developed CFD modelIn Fig. 7a, the predictions of the CFD model developed using
the new HTC settling velocity model and the identified rheo-
logical correlations show an overall close agreement with the
measured profiles, particularly in terms of sludge distribution
in the tank. The sludge blanket height is predicted with high
accuracy. Prediction of the sludge concentration at the bottom
cannot be validated since the TSS sensor was constrained by
the velocimeter to reach the bottom of the tank.
The CFD-predicted velocity field show a strong density
current also captured by the velocity measurements just over
the sludge blanket, which result in a counter current in the
upper part of the tank (Fig. 7b). Moreover, the peak velocity
magnitudes predicted at the 3, 7, and 10 m radial distances
from the center (Fig. 7b) are in close agreement with the
measured data. However, according to Fig. 7b (lower part), the
developed CFD model over predicts the velocity of the dense
mixture flowing to the hopper over the inclined bottom. This
can be due to the underestimation of yield stress at high

Fig. 5 e Predictive uncertainty (95% confidence intervals of the model prediction due to parameter uncertainty) of the HTC
settling velocity model calibrated to the measurements with the Lundtofte (a, b) and Lynetten (c, d) WWTP sludge using
DREAM(ZS) optimization algorithm. The total predictive accuracy of the two measured time series (SBH and Xb) are shown in
b and d based on SSEN (Eq. (1)).
wat e r r e s e a r c h 6 6 ( 2 0 1 4 ) 4 4 7e4 5 8454
sludge concentrations (see Fig. 7c), which can effectively in-
crease the flowability of viscous sludge to the hopper.
Fig. 8 illustrates the geometry and mesh of the CFD model
of the Lundtofte SST (Fig. 8a), as well as the distributions of
the sludge concentration (Fig. 8b), the magnitude of the
convective velocity and the settling velocity (Fig. 8c and d,
respectively), and the turbulence and molecular viscosities
(Fig. 8e and f, respectively) computed in the numerical
domain for average operating boundary conditions
(Qoverflow ¼ 100 m3/h, R ¼ 1.42, XFeed ¼ 5.64 kg/m3) during the
measurement campaign. These figures show the complexity
of the predicted flow field in the SST and the high gradients
particularly in case of sludge concentration and molecular
viscosity. The velocity magnitude (Fig. 8c) shows the strong
horizontal density current and several recirculation zones in
the tank. The significance of the estimated apparent molec-
ular viscosity with the rheological model on the dampening
of turbulence viscosity can be clearly observed in Fig. 8e and
f, in the vicinity of the sludge blanket, where the molecular
viscosity is estimated orders of magnitude higher than the
turbulent viscosity.
3.3.2. Relative impact of settling velocity model on CFDpredictionsIn Fig. 7a, comparing the simulation results of the two CFD
models to the measurements indicates that the error in
underestimating SBH is significantly higher when using the
Tak�acs settling velocity model (see errors reported in Fig. 7a).
The CFD-predicted flow-field is also influenced by the per-
formance of the settling velocity model (Fig. 7b). These results
indicate the benefit of including transient and compression
settling by employing the new HTC settling velocity model for
the simulation of sludge distribution in SSTs using CFD
modelling.
We further assessed the influence of the settling velocity
model on the CFD predictions under wet-weather flow con-
ditions, i.e. where there is increased hydraulic load to the
WWTP and thus to the SST. We performed simulations using
the CFD model with the HTC and Tak�acs settling velocity
models, under a constant wet-weather flow rate, for three
hours real time. The wet-weather condition was simulated
based on the ATV design standards for peak wet-weather flow
rate (Ekama et al., 1997), where the actual overflow rate was
increased by a factor of 2.39 and the recycle ratio was
decreased to 0.75. The initial conditions were set to the
steady-state simulation results under the average operational
condition (Fig. 7). Fig. 9 shows the results, and demonstrates
that the omission of transient and compression settling ve-
locity in the CFD domain can significantly influence the pre-
dicted SST behaviour, in terms of thickening and storage
capacity, under wet-weather conditions. Predictions made by
explicitly accounting for hindered, transient and compression

Fig. 6 e Prediction of rheological measurements at T ¼ 15 �C with the HerscheleBulkley model (a). A maximum viscosity
(mmax) constraint was set for g < 0.01 s¡1 to avoid unrealistic viscosity values predicted by the model under very low shear
conditions (b). Mean and standard deviation of the estimated Herschel-Bulkley model parameters and their dependency on
the concentration of sludge samples X (c, d, and e); A¼ 0.00066 [kg1¡B m3£B¡1s¡2], B¼ 2.18 [e], C¼ 0.28 [m3/kg], D¼ 0.00083
[m3£E kg¡E], E ¼ 2.57 [e].
wat e r r e s e a r c h 6 6 ( 2 0 1 4 ) 4 4 7e4 5 8 455
settling in the CFD model (i.e. employing the HTC settling
function, Fig. 9a), are 92% higher SBH and 20% lower TSSrecycledvalues than that obtained with the domain, only representing
hindered (and flocculant) settling using the Tak�acs settling
velocity model. This model structural uncertainty can signif-
icantly hinder decision makings when assessing SST storage
capacity under wet weather flow conditions.
3.4. Outlook and perspectives
Besides CFDmodelling, the new settling velocitymodel can be
used explicitly in simpler 1-D SST models for integrated
WWTP modelling. Moreover, the efficiency in its calibration
using the new experimental set-up combined with the
Bayesian optimization method makes it useful in engineering
practice e.g., for on-line control purposes.
Our results indicate that the CFD model developed using
the new settling and rheology functions, can predict the
sludge distribution in the SST with fairly good accuracy. This
is achieved without any arbitrary adjustment of the param-
eters and boundary conditions. Therefore, the relative
impact of improving the settling velocity model on the CFD
predictions could be assessed. The accuracy of CFD pre-
dictions could be further increased by assessing the un-
certainties associated with the simplifications in the
boundary condition (e.g. 2D axisymmetric, slip bottom) or
measurements such as rheological laboratory experiments
(sampling, storage, and instrument) and full-scale profiling
in SST with the Vectrino® sensor (may require different
calibration when used for measurements in the clarification
zone and in the sludge blanket due to sound speed difference
in different media).
4. Conclusion
In this study, we presented a straightforward experimental-
modelling methodology using a simple, novel batch settling
column experimental set-up combined with a Bayesian opti-
mization method to identify a new settling velocity model for
activated sludge. Additionally, rheological correlations for
activated sludge were identified using data from batch labo-
ratory experiments.
� Based on the evaluation of the state-of-the-art settling
velocity models, a new settling velocity model was devel-
oped, which accounts for hindered, transient and
compression settling regimes of activated sludge. We
showed that this model can be calibrated to data from the
novel settling column experimental set-up presented in
this study using a Bayesian optimization algorithm. The
proposed settling velocity model was validated with

Fig. 7 e Vertical profiles (normalized height) of sludge concentration X (a), and radial velocity (b). Measurements (thin
marked lines) at four different radial distances from the centre of the tank. CFD model predictions with the HTC settling
velocity model (solid line), and CFD model predictions using Tak�acs settling velocity model (dashed line).
wat e r r e s e a r c h 6 6 ( 2 0 1 4 ) 4 4 7e4 5 8456
measurements using activated sludge samples from two
different WWTPs and at different dilutions.
� A pseudo-plastic behaviour of activated sludge with yield
stress was identified based on measurements from rheo-
logical batch experiments. The HerscheleBulkley rheolog-
ical model could effectively describe the measurements.
We identified correlations to describe the strong de-
pendency of rheological model parameters to sludge con-
centration. The direct effect of temperature change (10, 15,
and 20 �C, as typical seasonal temperature variations in
SSTs) on the rheology of activated sludge was found
insignificant.
� A 2-D axisymmetric CFD model of the circular conical SST
(Lundtofte WWTP) was developed, including the new
Table 2 e The estimated parameters of the Herschel-Bulkley rsludge concentrations (X) at three different temperature condi
X [kg/m3] t0 [Pa]
10 �C 15 �C 20 �C 10 �C
12.79 0.20 0.17 0.19 0.047
9.95 0.10 0.10 0.10 0.024
8.53 0.07 0.07 0.06 0.012
7.10 0.05 0.05 0.04 0.006
4.97 0.03 0.02 0.02 0.002
settling velocity model and the calibrated rheological cor-
relations. The CFD model could describe the full-scale
measurements with fairly good accuracy and was further
used to assess the relative impact of the new settling ve-
locity model on the prediction of sludge distribution in
SSTs. In this regards, we compared the simulation results
of the CFD model using the new settling velocity model,
which includes hindered, transient, and compression
settling, and the widely used Tak�acs settling velocity
model, which only accounts for hindered (and flocculent)
settling. The results showed that the representation of
transient and compression settling in the CFD model can
significantly improve the prediction of sludge distribution
in the SSTs. Moreover, by performing CFD simulations of
heological model from measurements with five differenttions.
K [Pa sn] n [e]
15 �C 20 �C 10 �C 15 �C 20 �C
0.044 0.035 0.67 0.65 0.68
0.019 0.018 0.72 0.74 0.74
0.010 0.010 0.81 0.82 0.82
0.006 0.005 0.90 0.88 0.89
0.003 0.002 1.02 1.00 1.00

Fig. 8 e The CFD simulation results of the SST for the averaged operating conditions (Qoverflow ¼ 100 m3/h, R ¼ 1.42,
XFeed ¼ 5.64 kg/m3) during the measurement campaign. For clear illustration, the values are shown in logarithmic scale.
wat e r r e s e a r c h 6 6 ( 2 0 1 4 ) 4 4 7e4 5 8 457
the SST under wet-weather flow condition, using Tak�acs
settling velocity model resulted in 92% underestimation of
SBH and 20% overestimation of TSSrecycled as compared to
when the proposed settling velocity model was used. This
Fig. 9 e Predicted sludge distributions with CFD
simulations under constant wet-weather flow conditions
(Qin ¼ 414 m3/h, R ¼ 0.75, XFeed ¼ 5.64 kg/m3) for three
hours real time using the HTC settling velocity model (a),
and Tak�acs settling velocity model (b).
model structural uncertainty can significantly affect the
accurate assessment of SST storage capacity under wet-
weather flow conditions.
Acknowledgments
The research was financially supported by the Danish Council
for Strategic Research, Programme Commission on Sustain-
able Energy and Environment, as part of the Storm and
Wastewater Informatics (SWI) project (http://www.swi.env.
dtu.dk). The authors would like to thank Associate Professor
Thomas Ruby Bentzen from Aalborg University for his valu-
able comments on the manuscript.
Appendix A. Supplementary data
Supplementary data related to this article can be found at
http://dx.doi.org/10.1016/j.watres.2014.08.034.
r e f e r e n c e s
Adams, E.W., Rodi, W., 1990. Modeling flow and mixing insedimentation tanks. J. Hyd. Eng. 116 (7), 895e913.
Brennan, D., 2001. The Numerical Simulation of Two-phase Flowsin Settling Tanks. Ph.D. Dissertation. Imperial College,London.

wat e r r e s e a r c h 6 6 ( 2 0 1 4 ) 4 4 7e4 5 8458
Bretscher, U., Krebs, P., Hager, W.H., 1992. Improvement of flow infinal settling tanks. J. Environ. Eng. 118 (3), 307e321.
Burger, R., 2000. Phenomenological foundation and mathematicaltheory of sedimentationeconsolidation processes. Chem. Eng.J. 80, 177e188.
Burger, R., Diehl, S., Nopens, I., 2011. A consistent modellingmethodology for secondary settling tanks in wastewatertreatment. Water Res. 45 (6), 2247e2260.
Craig, K.J., Nieuwoudt, M.N., Niemand, L.J., 2013. CFD simulationof anaerobic digester with variable sewage sludge rheology.Water Res. 47 (13), 4485e4497.
De Clercq, B., 2003. Computational Fluid Dynamics of SettlingTanks: Development of Experiments and Rheological, Settling,and Scraper Submodels. Ph.D. Dissertation. University of Gent,Belgium.
De Clercq, J., Jacobs, F., Kinnear, D.J., Nopens, I., Dierckx, R.A.,Defrancq, J., Vanrolleghem, P.A., 2005. Detailed spatio-temporal solids concentration profiling during batch settlingof activated sludge using a radiotracer. Water Res. 39 (10),2125e2135.
De Clercq, J., 2006. Batch and Continuous Settling of ActivatedSludge: In-depth Monitoring and 1D Compression Modelling.Ph.D. Dissertation. University of Gent, Belgium.
De Clercq, J., Nopens, I., Defrancq, J., Vanrolleghem, P.A., 2008.Extending and calibrating a mechanistic hindered andcompression settling model for activated sludge using in-depth batch experiments. Water Res. 42 (3), 781e791.
Dahl, C.P., 1993. Modelling of Flow Field and Settling in SecondarySettling Tanks. Ph.D. Dissertation. University of Aalborg,Denmark.
Deininger, A., Holthausen, E., Wilderer, P.A., 1998. Velocity andsolids distribution in circular secondary clarifiers: full scalemeasurements and numerical modelling. Water Res. 32 (10),2951e2958.
Ekama, G.A., Barnard, G.L., Gunthert, F.W., Krebs, P.,McCorquodale, J.A., Parker, D.S., Wahlberg, E.J., 1997.Secondary Settling Tanks: Theory, Modelling, Design andOperation. International Association on Water Quality,London, UK.
Eshtiaghi, N., Markis, F., Slatter, P., 2012. The laminar/turbulenttransition in a sludge pipeline. Water Sci. Technol. 65 (4),697e702.
Eshtiaghi, N., Markis, F., Yap, S.D., Baudez, J.-C., Slatter, P., 2013.Rheological characterisation of municipal sludge: a review.Water Res. 47 (15), 5493e5510.
Holdich, R.G., Butt, G., 1997. Experimental and numerical analysisof a sedimentation forming compressible compacts. Sep. Sci.Technol. 32 (13), 2149e2171.
Imam, E., McCorquodale, J., Bewtra, J., 1983. Numerical modelingof sedimentation tanks. J. Hyd. Eng. 109 (12), 1740e1754.
Kinnear, D.J., 2002. Biological Solids Sedimentation: a ModelIncorporating Fundamental Settling Parameters. PhDdissertation. University of Utah, Salt Lake City, UT.
Lakehal, D., Krebs, P., Krijgsman, J., Rodi, W., 1999. Computingshear flow and sludge blanket in secondary clarifiers. J. Hyd.Eng. 125 (3), 253e262.
Laloy, E., Vrugt, J.A., 2012. High-dimensional posterior explorationof hydrologic models using multiple-try DREAM (ZS) and high-performance computing. Water Resour. Res. 48 (1), W01526.
Larsen, A.N., Gregersen, I.B., Christensen, O.B., Linde, J.J.,Mikkelsen, P.S., 2009. Potential future increase in extremeone-hour precipitation events over Europe due to climatechange. Water Sci. Technol. 60 (9), 2205e2216.
Larsen, P., 1977. On the Hydraulics of Rectangular Settling Basins,Experimental and Theoretical Studies. Report No. 1001. WaterResearch Engineering, Lund Institute of Technology, Lund.
Li, D., Ganczarczyk, J., 1991. Size distribution of activated sludgeflocs. Res. J. Water Pollut. Control Fed. 63 (5), 806e814.
Marler, R.T., Arora, J.S., 2004. Survey of multi-objectiveoptimization methods for engineering. Struct. Multidiscip.Optim. 26 (6), 369e395.
Pl�osz, B.G., Weiss, M., Printemps, C., Essemiani, K., Meinhold, J.,2007. One-dimensional modelling of the secondary clarifier-factors affecting simulation in the clarification zone and theassessment of the thickening flow dependence. Water Res. 41(15), 3359e3371.
Pl�osz, B.G., Liltved, H., Ratnaweera, H., 2009. Climate changeimpacts on activated sludge wastewater treatment: a casestudy from Norway. Water Sci. Technol. 60 (2), 533e541.
Pl�osz, B.G., De Clercq, J., Nopens, I., Benedetti, L.,Vanrolleghem, P.A., 2011. Shall we upgrade one-dimensionalsecondary settler models used in WWTP simulators?eAnassessment of model structure uncertainty and itspropagation. Water Sci. Technol. 63 (8), 1726e1738.
Ratkovich, N., Horn, W., Helmus, F.P., Rosenberger, S.,Naessens, W., Nopens, I., Bentzen, T.R., 2013. Activated sludgerheology: a critical review on data collection and modelling.Water Res. 47 (2), 463e482.
Rodi, W., 1993. Turbulence Models and Their Application inHydraulics, third ed. Balkema, Rotterdam, The Netherlands.
Tak�acs, I., Patry, G., Nolasco, D., 1991. A dynamic model of theclarification-thickening process. Water Res. 25 (10), 1263e1271.
Weiss, M., Pl�osz, B.G., Essemiani, K., Meinhold, J., 2007. Suction-lift sludge removal and non-Newtonian flow behaviour incircular secondary clarifiers: numerical modelling andmeasurements. Chem. Eng. J. 132 (1e3), 241e255.
Copyright © 2022 FDOKUMEN