evidence from fixed bed column and batch scale studies - PeerJ
26
Efficient sequestration of lead from aqueous systems by peanut shells and compost: evidence from fixed bed column and batch scale studies Ghulam Mustafa Shah, Muhammad Imran, Umme Aiman, Muhammad Mohsin Iqbal, Muhammad Akram, Hafiz Muhammad Rashad Javeed, Atika Waqar and Faiz Rabbani Environmental Sciences, COMSATS University Islamabad, Vehari, Punjab, Pakistan ABSTRACT Lead (Pb) is a pervasive contaminant and poses a serious threat to living beings. The present study aims at batch and fixed bed column scale potential of commercial compost (CCB) and peanut shells biosorbents (PSB) for the sequestration of Pb from contaminated aqueous systems. The PSB and CCB were characterized with FTIR, SEM and Brunauer Emmett-Teller (BET) to get insight of the adsorption behavior of both materials. Fixed bed column scale experiments were performed at steady state flow (2.5 and 5.0 mL/min), initial Pb concentrations (25 and 50 mg/L) and dosage of each adsorbent (3.0 and 6.0 g/column). Columns packed (15.9 cm 2 ) with PSB and CCB have revealed excellent adsorption of Pb with PSB as compared with CCB. The total volume of injected contaminated water was 1,500 mL and 3,000 mL at 2.5 and 5.0 mL/min, respectively while total bed volume number was 157. A series of batch experiments with CCB and PSB was conducted at adsorbent dosage (1.25–5.0 g/L), initial Pb level (25–100 mg/L), interaction time (0–180 min) and solution pH (4–10) at room temperature. Batch scale results revealed that PSB removed 92% Pb from water at 25 mg Pb/L concentration as compared with CCB (79%). The presence of competing ions in groundwater showed less Pb removal as compared with synthetic water. The experimental data were simulated with equilibrium isothermal models: Langmuir, Freundlich, and kinetic models: pseudo first order, pseudo second order and intra-particle diffusion. The Freundlich and pseudo second order models better described the equilibrium and kinetic experimental data, respectively with maximum sorption of 42.5 mg/g by PSB which is also evident from FTIR functional groups and SEM results. While equilibrium sorption of Pb onto CCB was equally explained by Freundlich and Langmuir models. These findings indicate that PSB could be an active and ecofriendly biosorbent for the sequestration of metals from contaminated aqueous systems. Subjects Physical Chemistry (other), Surfaces and Interfaces, Transport Phenomena Keywords Fixed bed column, Biosorption, Lead sequestration, Peanut shells, Reusability, Kinetics How to cite this article Mustafa Shah G, Imran M, Aiman U, Mohsin Iqbal M, Akram M, Javeed HMR, Waqar A, Rabbani F. 2022. Efficient sequestration of lead from aqueous systems by peanut shells and compost: evidence from fixed bed column and batch scale studies. PeerJ Physical Chemistry 4:e21 DOI 10.7717/peerj-pchem.21 Submitted 19 August 2021 Accepted 19 December 2021 Published 21 January 2022 Corresponding author Muhammad Imran, [email protected] Academic editor Claudio Della Volpe Additional Information and Declarations can be found on page 21 DOI 10.7717/peerj-pchem.21 Copyright 2022 Mustafa Shah et al. Distributed under Creative Commons CC-BY 4.0
-
Upload
khangminh22 -
Category
Documents
-
view
0 -
download
0
Transcript of evidence from fixed bed column and batch scale studies - PeerJ

Efficient sequestration of lead fromaqueous systems by peanut shells andcompost: evidence from fixed bed columnand batch scale studiesGhulam Mustafa Shah, Muhammad Imran, Umme Aiman,Muhammad Mohsin Iqbal, Muhammad Akram, Hafiz MuhammadRashad Javeed, Atika Waqar and Faiz Rabbani
Environmental Sciences, COMSATS University Islamabad, Vehari, Punjab, Pakistan
ABSTRACTLead (Pb) is a pervasive contaminant and poses a serious threat to living beings.The present study aims at batch and fixed bed column scale potential of commercialcompost (CCB) and peanut shells biosorbents (PSB) for the sequestration of Pb fromcontaminated aqueous systems. The PSB and CCB were characterized with FTIR,SEM and Brunauer Emmett-Teller (BET) to get insight of the adsorption behavior ofboth materials. Fixed bed column scale experiments were performed at steady stateflow (2.5 and 5.0 mL/min), initial Pb concentrations (25 and 50 mg/L) and dosageof each adsorbent (3.0 and 6.0 g/column). Columns packed (15.9 cm2) with PSB andCCB have revealed excellent adsorption of Pb with PSB as compared with CCB.The total volume of injected contaminated water was 1,500 mL and 3,000 mL at2.5 and 5.0 mL/min, respectively while total bed volume number was 157. A seriesof batch experiments with CCB and PSB was conducted at adsorbent dosage(1.25–5.0 g/L), initial Pb level (25–100 mg/L), interaction time (0–180 min) andsolution pH (4–10) at room temperature. Batch scale results revealed that PSBremoved 92% Pb from water at 25 mg Pb/L concentration as compared with CCB(79%). The presence of competing ions in groundwater showed less Pb removalas compared with synthetic water. The experimental data were simulated withequilibrium isothermal models: Langmuir, Freundlich, and kinetic models: pseudofirst order, pseudo second order and intra-particle diffusion. The Freundlichand pseudo second order models better described the equilibrium and kineticexperimental data, respectively with maximum sorption of 42.5 mg/g by PSB which isalso evident from FTIR functional groups and SEM results. While equilibriumsorption of Pb onto CCB was equally explained by Freundlich and Langmuir models.These findings indicate that PSB could be an active and ecofriendly biosorbent for thesequestration of metals from contaminated aqueous systems.
Subjects Physical Chemistry (other), Surfaces and Interfaces, Transport PhenomenaKeywords Fixed bed column, Biosorption, Lead sequestration, Peanut shells, Reusability, Kinetics
How to cite this article Mustafa Shah G, Imran M, Aiman U, Mohsin Iqbal M, Akram M, Javeed HMR, Waqar A, Rabbani F. 2022.Efficient sequestration of lead from aqueous systems by peanut shells and compost: evidence from fixed bed column and batch scale studies.PeerJ Physical Chemistry 4:e21 DOI 10.7717/peerj-pchem.21
Submitted 19 August 2021Accepted 19 December 2021Published 21 January 2022
Corresponding authorMuhammad Imran,[email protected]
Academic editorClaudio Della Volpe
Additional Information andDeclarations can be found onpage 21
DOI 10.7717/peerj-pchem.21
Copyright2022 Mustafa Shah et al.
Distributed underCreative Commons CC-BY 4.0

INTRODUCTIONWater is very crucial for all the living organisms and is a basic requirement of life. Safedrinking water is essential for sustaining life (Shahid et al., 2021; Natasha et al., 2021).With the passage of time, many natural and anthropogenic activities are pollutingfreshwater bodies. Several organic and inorganic pollutants are continuously dischargedinto surface and subsurface water bodies, thereby adversely affecting the ecosystem.In comparison of these water pollutants, heavy metal (HMs) contamination is a majorconcern. Heavy metals are known as dangerous metals having 63.5–200.6 g atomic weightand five times higher density than water (Izah, Bassey & Ohimain, 2018). Because of theirtoxicity to plants, animals, and humans, HMs are categorized under environmentalpollutants. Heavy metals like Lead, Cadmium, Chromium, Mercury, Arsenic, and Nickelcause a serious threat to human health. These HMs are highly soluble and enter the foodchain in variety of ways. These are non-degradable and persistence in nature. Natural(weathering of rocks, volcanos, floods etc.) and human activities (mining, petroleumrefining, tanneries, battery production, metal plating, glass production and pesticidesproduction etc.) induce accumulation of these HMs into the environment (Kadirvelu,Thamaraiselvi & Namasivayam, 2001).
Lead (Pb) is an abundant pollutant in the environment and due to its implications itbecomes a major concern worldwide. In America, Pb is ranked 2nd position among allknown hazardous substances (ATSDR, 2007). Some sources of Pb in wastewater areeffluents from smelting, tanneries, metal plating, radiator manufacturing, alloy, andbattery industries (Kadirvelu, Thamaraiselvi & Namasivayam, 2001). In drinking water,acceptable level of Pb is 0.05 mg/L set by WHO and EPA (Arbabi, Hemati & Amiri, 2015).Moreover, effluents from manufacturing process such as pigments, television tubes,fuel, paints, explosives are also causes of the water contamination with Pb (Ahalya,Kanamadi & Ramachandra, 2005). When this Pb contaminated water interacts withecosystem, the metal ions can accumulate into human body through the consumption ofPb contaminated food chain or water (Abdel-Salam, 2018). A small amount of Pbcontinuously accumulating for extended period results in chronic toxicity and damages toorgans (Badmus, Audu & Anyata, 2007). Moreover, Pb causes kidney damage,reproductive system, and central nervous system (CNS) in human and causes oxidativestress, damages photosynthetic pigments etc. in plants.
Many approaches have been introduced to remove Pb from wastewater. Among thesetechniques, ion exchange (Da̧browski et al., 2004), electrolysis, electro-coagulation(Al Hawli, Benamor & Hawari, 2019), chemical precipitation (Charerntanyarak, 1999),solvent extraction, and adsorption (Iqbal et al., 2021; Imran et al., 2020) etc. are commonlyused. Moreover, most of these treatment technologies are expensive, generate secondarypollution, require large number of workers and experts, and show less effectiveness (Izah,Bassey & Ohimain, 2018). However, adsorption is efficient for the sequestration of HMsfrom contaminated water (Imran et al., 2019).
Mustafa Shah et al. (2022), PeerJ Physical Chemistry, DOI 10.7717/peerj-pchem.21 2/26
Metal ions can be removed from wastewater by the adsorption process due to itseffective sequestration on the surface of an adsorbent materials (Tariq et al., 2020; Imranet al., 2021). In this phenomenon, low-cost adsorbents that have higher adsorptionpotential are utilized. A diversity of indigenously available constituents, e.g., agriculturalwastes, natural wastes, and industrial by-products can be employed as economicaladsorbents (Abdel-Salam, 2018). Okoye, Ejikeme & Onukwuli (2010) reported thatactivated carbon has been extensively employed as an adsorbent for the sequestration of Pbfrom contaminated aqueous systems. Activated carbon, on the other hand, is still a costlymaterial due to its widespread application in water and wastewater treatment sectors (Iqbalet al., 2021)). Therefore, for this purpose, more efficient, economically feasible andenvironment-friendly adsorbents are required. Several scientists have attempted batchscale experiments to examine the adsorption capacity of orange peels (Adesanmi et al.,2020), cocoa shells (Meunier et al., 2003), banana peels (Annadurai, Juang & Lee, 2003),rice husks (Elham, Hossein & Mahnoosh, 2010), saponified melon peels (Chaudhary &Ijaz, 2014), eggshell (Hussain & Shariff, 2014) and bentonite (Naseem & Tahir, 2001) forthe elimination of Pb from polluted water. However, literature shows that there are limitedstudies performed on column scale for the remediation of Pb from contaminated water.
Peanut shells (PS) are thrown away as waste product all over the world. They arepermeable and contain (hemi)cellulose material, lignin, pectin and slight amount ofprotein as well as a very complicated combination of polymeric organic compoundsand have high electrolytic ability (Shah et al., 2018; Kocasoy & Güvener, 2009). Theseproperties can make them effective biosorbent. These shells are plentiful, affordable, easyto process, and incredibly efficient constituents. According to Chaudhary & Ijaz (2014),cost effective adsorbents should be commonly accessible with high selectivity and largecapacity for the sequestration of contaminants. Other criteria that is often overlookedis that no or slightly harmful and toxic chemicals are used in the synthesis of thesebiosorbents. Solid wastes e.g., compost and PS can be used to obtain all these benefits.Furthermore, reuse of these solid wastes for the sequestration of HMs ions can eliminatethe issue of disposal of hazardous effluents while also increasing economic benefits(Tahiruddin & Ab Rahman, 2013). The goals of present study were to: (i) assess the solidwastes (i.e., peanut shells and commercial compost to remove Pb from wastewater)adsorption potential and (ii) evaluate adsorption of Pb by using these wastes at column andbatch scale under variety of adsorbate concentrations, adsorbent dosage, and solution pHand interaction time.
MATERIALS AND METHODSPreparation of adsorbentsThe peanut shells (PS) were gathered from the local market in Vehari. The PS were rinsedwith distilled water to get rid of the adhered particles and dust. The PS were dried in anoven at 70 �C for 36 h. Subsequently, the PS were grounded and sieved (1 mm mesh).The ground material (peanut shells as biosorbent: PSB) was stored in plastic container forfurther applications. The commercial compost biosorbent (CCB) was obtained from a
Mustafa Shah et al. (2022), PeerJ Physical Chemistry, DOI 10.7717/peerj-pchem.21 3/26

company “PlantFert”. The CCB was prepared from vegetables waste as per companyinstructions.
Characterization of adsorbentsRepresentative samples of PSB and CCB were characterized using Fourier transforminfrared (FTIR) spectroscopy for functional groups determination (Imran et al., 2021).The surface morphology of PSB and CCB was obtained with scanning electron microscopy(SEM) while the adsorbent samples were analyzed with Brunauer Emmett-Teller (BET) tofind pore volume and surface area from N2 adsorption/desorption isotherms.
Infrared spectra of pristine PSB and CCB were obtained in absorbance mode fromwavenumber 700–4,000 cm−1 at resolution of 2 cm−1
. The FTIR spectra were achievedusing a Matson Polaris FTIR spectrophotometer. Prior to FTIR analysis, PSB and CCBwere milled with KBr to form fine powder and compressed into thin pellets. The SEMimages for surface morphology were obtained using a TESCANVega TS 5136LM at 20 kV.The samples for SEM analysis were coated in gold with a Balzers’ Spluttering device.The Brunauer-Emmett-Teller (BET) surface area and pores related information of bothPSB and CCB were measured with a Tristar 3000 (Micromeritics, Norcross, GA, USA)analyzer. Porosity (%) of the PSB and CCB was measured following Shah et al. (2019).
Preparation of synthetic wastewaterLead nitrate (Pb (NO3)2) salt was used for the preparation of Pb stock solution.For 1,000 mg/L Pb stock solution in a 1,000 mL volumetric flask, 1.60 g of Pb (NO3)2 wasthoroughly mixed in 500 mL distilled water and final volume was made 1 L. Differentsub-stocks of 25–100 mg/L were prepared from this stock solution. For the pH adjustment,a few drops of 0.5 M NaOH/HCl solution were added to maintain the pH 6.0. Becausedissolved Pb ions precipitate at high pH, maximal adsorption of Pb occurs at 6.0 pH(Imran et al., 2020; Ahmed et al., 2016).
Fixed bed column scale removal of Pb and reusability of PSBThe fixed bed column scale experiments for Pb removal were carried out in plexiglasscolumns. The experiment was conducted at steady state in duplicate sets. The column scalearrangement with the dimensions (14.5 cm length and 4.5 cm internal diameter) ispresented in Fig. 1. The adsorbent biomass (3.0 and 6.0 g/column) was packed as a centrallayer between acid-washed quartz sand (0.1–0.2 mm). Wet packing was adopted to releasethe trapped air between the particles and to get rid of disturbance during flow ofcontaminated water in the column. At the inner bottom and topmost position, clothfilter was used to improve the flow distribution, prevent adsorbent loss, and avoid cloggingof the openings used for capillaries carrying Pb contaminated water at inlet and effluentat outlet. Filter was also used at the bottom and top of the adsorbent layer as shown inFig. 1. At the start, distilled water was run for 30 min through the columns to flush thecolumns. Two different initial concentrations of Pb (25 and 50 mg/L) were injectedthrough the columns at flow rate 2.5 and 5.0 mL/min at pH 6 (optimum pH level at batchscale). At outlet side, effluent was collected in plastic bottles by gravity. The effluent
Mustafa Shah et al. (2022), PeerJ Physical Chemistry, DOI 10.7717/peerj-pchem.21 4/26

was collected after 15, 30, 60, 120, 180, 240, 300, 360, 420, 480, 540 and 600 min todetermine the residual Pb concentration in the water after attachment of Pb at PSB andCCB surface. A peristaltic pump was used to inject contaminated water at a uniform flowrate at inlet side while at outside pump was not used just effluent was collected by gravity.In Fig. 1, acronym R1 represents replication one and R2 indicates replication two of thecolumn experimentation. To estimate the reusability of PSB and CCB, the columnswere emptied after experimental run at 25 mg/L and the used PSB and CCB were rinsedwith 2% HCl solution, filtered by adding distilled water and used for repacking beforestarting injection of 25 mg/L concentration again in the columns. The column scaleremoval and reusability of PSB and CCB for Pb sequestration were calculated based on theresidual concentration and initial concentration of Pb in water.
Batch experimentsBatch experiments were performed in the Environmental Sciences laboratory ofCOMSATS University Islamabad (CUI), Vehari Campus. Digital weighing balance wasused to weigh three different adsorbent doses (1.25, 2.5, and 5.0 g/L) of both adsorbents(PSB and CCB). In 250 mL conical flasks, 100 mL of different concentrations (25, 50,75, and 100 mg/L) of Pb contaminated solution and weighed doses of adsorbents wereadded. Duplicate sets were prepared and placed on a mechanical shaker at 150 rpm
Figure 1 Schematic representation of column scale arrangement for Pb removal from water.Full-size DOI: 10.7717/peerj-pchem.21/fig-1
Mustafa Shah et al. (2022), PeerJ Physical Chemistry, DOI 10.7717/peerj-pchem.21 5/26

and room temperature (28 �C). At different time intervals (15, 30, 60, and 120 min),samples were taken and filtered using Whatman filter papers-42. The filtered samples wereused to determine the residual concentration of Pb in water samples. Samples of initialconcentrations of sub solution (without addition of biosorbents) were also stored foranalysis. For the determination of pH effect on the sequestration of Pb from contaminatedwater, different pH values (4–10) were adjusted using 0.5 M NaOH/HCl solutions restwhile of the parameters e.g., initial concentration (IC), temperature and adsorbent dosewere kept constant. Atomic Absorption Spectrophotometer (AAS) was used to measurethe concentration of residual Pb in samples.
Impact of coexisting ions on Pb removal from waterIn groundwater and wastewater, there exists several other ions which interfere in theadsorption of contaminant from water onto the adsorbent surface. Therefore, in thepresent study two groundwater samples (GW1 and GW2) having different concentrationof cations and anions collected from Vehari were used to evaluate the impact of coexistingions in water for the sequestration of Pb. The groundwater samples were analysed forelectrical conductivity (EC), total dissolved salts (TDS), pH, sodium (Na), potassium (K),calcium (Ca), magnesium (Mg), carbonate (CO3), bicarbonate (HCO3), Chlorine (Cl),sulphate (SO4), nitrate (NO3) and Pb. The EC, TDS and pH were measured withrespective EC, TDS, and pH meters. The Na, K and Ca were measured using Flamephotometer while SO4 and NO3 concentration was measured with calorimetric method.The concentration of Cl, CO3 and HCO3 was measured with titration method Estefan,Sommer & Ryan (2013) while Mg and Pb were measured using atomic absorptionspectrophotometer.
First groundwaters containing Pb (GW1 = 80 ug/L, GW2 = 57 ug/L) were treatedwith PSB and CCB at optimum conditions and subsequently Pb concentration (25 mg/L)was developed in both groundwater samples and Pb removal was evaluated in the presence
Table 1 Characteristics of groundwater samples (GW1 and GW2) used to evaluate the impact ofinterfering inorganic ions on the removal of Pb (II) from contaminated water.
Parameter Units GW1 GW2
EC dS m−1 1.85 ± 0.15 0.9 ± 0.05
TDS mg L−1 850 ± 10.1 495 ± 8.1
Mg mg L−1 25.5 ± 1.7 37 ± 2
Na mg L−1 245 ± 5.3 60 ± 3
K mg L−1 5.1 ± 1.1 4 ± 0.2
Ca mg L−1 65 ± 2.1 30.2 ± 4
CO3 mg L−1 80 ± 3.1 45 ± 4
HCO3 mg L−1 570 ± 7 232 ± 8.4
Cl mg L−1 690 ± 8.5 490.4 ± 8
SO4 mg L−1 430 ± 6 355 ± 7.5
NO3 mg L−1 30.5 ± 3.4 45.3 ± 5
Pb (II) µg L−1 80 ± 1.6 57 ± 3.2
Mustafa Shah et al. (2022), PeerJ Physical Chemistry, DOI 10.7717/peerj-pchem.21 6/26
of different cations and anions in water. The characteristics of GW1 and GW2 havebeen presented in Table 1. The results of batch scale adsorption experiments carried outin distilled water (DW) and groundwater samples at Pb concentration (25 mg/L and50 mg/L) were compared to evaluate the impact of competing ions in water on Pb removal.
Data analysisThe initial and final concentrations of Pb ions in water samples were measured using AAS.The equilibrium adsorption qe (mg/g) of Pb ions onto PSB and CCB was estimated withEq. (1) (Imran et al., 2021; Shah et al., 2019; Edokpayi et al., 2015).
qe ¼ Ci � Ce
W
� �� V (1)
In Eq. (1), Ci is the IC and Ce is the residual concertation (mg/L) of Pb ions in water, Vis the volume of Pb contaminated water (L), W is the mass (g) of the adsorbents (PSBand CCB) and qe represents the amount of adsorbate (Pb) ions attached on the surface ofPSB and CCB at equilibrium. To determine the kinetic adsorption qt at time t, Ce in Eq. (1)was replaced with residual concentration (Ct) at time t.
The percentage removal (R%) of Pb ions from contaminated water by PSB and CCBat column and batch scale was found from initial and final concentration (Cf ) of Pb usingEq. (2)
Rð%Þ ¼ Ci � Cf
Ci
� �� 100 (2)
The total volume of Pb containing solution ðVtÞ injected to each column was calculatedfrom the multiplication of flow rate ðQÞ and total injection time ttotal (Vt ¼ Qttotal).The total mass ðmtotalÞ of metal ions (mg) injected to the column was found using Eq. (3)while column scale adsorption was estimated from Eq. (1) by replacing V with Qttotal.
mtotal ¼ CiQttotal1000
(3)
Adsorption kinetics modelingKinetic studies are employed for the optimization of different operating conditions for theadosorption process. Literature shows that different kinetic models are proposed to explainthe reaction sequence and adsorption behavior (Imran et al., 2020; Iqbal et al., 2021).In the present study, pseudo first order (PFO), pseudo-second order (PSO), andintra-particle diffusion (IPD) kinetic models were used for the kinetics of Pb ionsadsorption onto PSB and CCB. The correlation coefficients (R2) were used to determinethe applicability of these kinetic models. The model is most relevant to data when the R2
value is high (close to 1.0) (Imran et al., 2019).The PFO kinetic model is based on the notion that the change in contaminant
concentration overtime is proportional to power one which has been presented in linearform (Eq. 4).
Mustafa Shah et al. (2022), PeerJ Physical Chemistry, DOI 10.7717/peerj-pchem.21 7/26
log qe � qt� � ¼ logqe þ kt
2:303t (4)
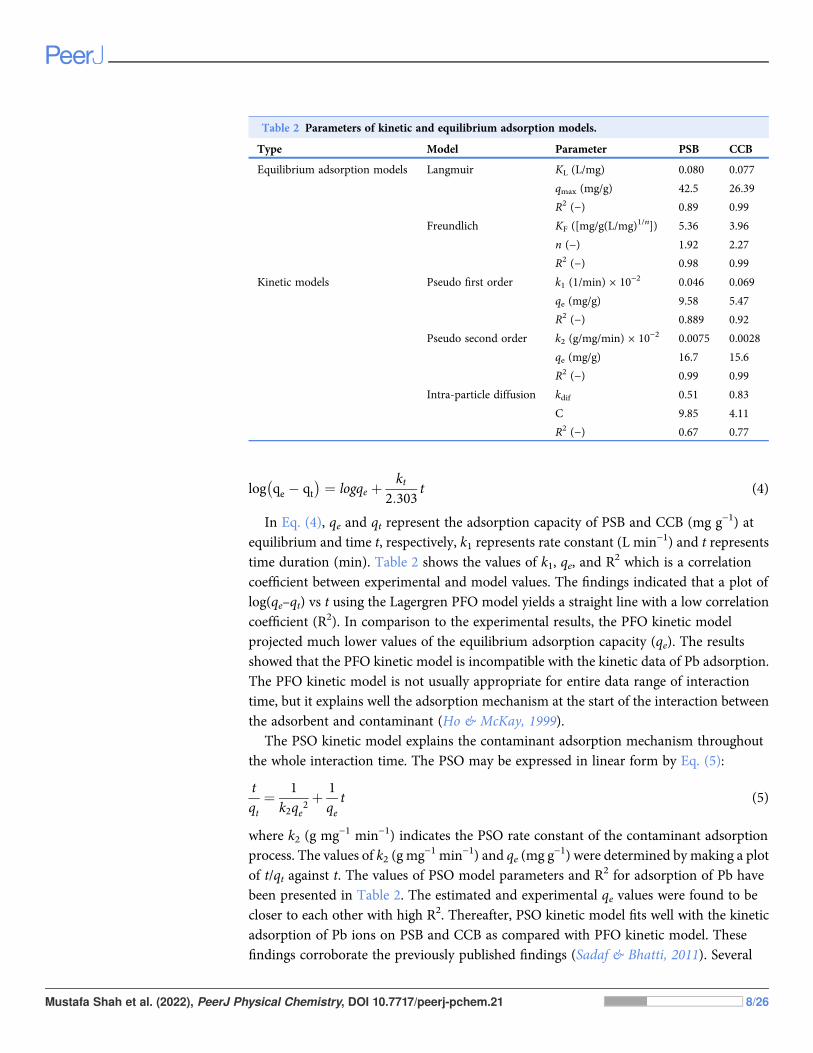
In Eq. (4), qe and qt represent the adsorption capacity of PSB and CCB (mg g−1) atequilibrium and time t, respectively, k1 represents rate constant (L min−1) and t representstime duration (min). Table 2 shows the values of k1, qe, and R2 which is a correlationcoefficient between experimental and model values. The findings indicated that a plot oflog(qe–qt) vs t using the Lagergren PFO model yields a straight line with a low correlationcoefficient (R2). In comparison to the experimental results, the PFO kinetic modelprojected much lower values of the equilibrium adsorption capacity (qe). The resultsshowed that the PFO kinetic model is incompatible with the kinetic data of Pb adsorption.The PFO kinetic model is not usually appropriate for entire data range of interactiontime, but it explains well the adsorption mechanism at the start of the interaction betweenthe adsorbent and contaminant (Ho & McKay, 1999).
The PSO kinetic model explains the contaminant adsorption mechanism throughoutthe whole interaction time. The PSO may be expressed in linear form by Eq. (5):
tqt
¼ 1k2qe
2þ 1qet (5)
where k2 (g mg−1 min−1) indicates the PSO rate constant of the contaminant adsorptionprocess. The values of k2 (g mg−1 min−1) and qe (mg g−1) were determined by making a plotof t/qt against t. The values of PSO model parameters and R2 for adsorption of Pb havebeen presented in Table 2. The estimated and experimental qe values were found to becloser to each other with high R2. Thereafter, PSO kinetic model fits well with the kineticadsorption of Pb ions on PSB and CCB as compared with PFO kinetic model. Thesefindings corroborate the previously published findings (Sadaf & Bhatti, 2011). Several
Table 2 Parameters of kinetic and equilibrium adsorption models.
Type Model Parameter PSB CCB
Equilibrium adsorption models Langmuir KL (L/mg) 0.080 0.077
qmax (mg/g) 42.5 26.39
R2 (−) 0.89 0.99
Freundlich KF ([mg/g(L/mg)1/n]) 5.36 3.96
n (−) 1.92 2.27
R2 (−) 0.98 0.99
Kinetic models Pseudo first order k1 (1/min) × 10−2 0.046 0.069
qe (mg/g) 9.58 5.47
R2 (−) 0.889 0.92
Pseudo second order k2 (g/mg/min) × 10−2 0.0075 0.0028
qe (mg/g) 16.7 15.6
R2 (−) 0.99 0.99
Intra-particle diffusion kdif 0.51 0.83
C 9.85 4.11
R2 (−) 0.67 0.77
Mustafa Shah et al. (2022), PeerJ Physical Chemistry, DOI 10.7717/peerj-pchem.21 8/26

stages are involved in the attachment of Pb molecules from contaminated water to thesurface of adsorbent materials. The rate-controlling step in a batch experiment systemincludes quick and continuous stirring might be film diffusion, intra-particle diffusion(Eq. 6), or a combination of both processes.
qt ¼ Kdif t0:5 þ C (6)
In Eq. (6), C = intercept which characterizes boundary layer thickness andkdif (mg g−1 min−1/2) = IPD rate constant. Table 2 shows the kdif and C values for Pbadsorption onto PSB and CCB. According to IPD hypothesis, curve between qt and t0.5
should be linear. If IPD is involved in the adsorption of a contaminant, there exists straightline between a plot of contaminant adsorbed per unit mass of biosorbent (qt) and t0.5
(Gupta & Bhattacharyya, 2006). The low value of R2 suggests that the Pb ion attachmentonto the PSB and CCB is not influenced IPD.
Adsorption equilibrium isothermsThe adsorption isotherms are employed to test the adsorbents adsorption capacity for acertain contaminant (Imran et al., 2020). The adsorption isotherm is a property of a systemat a given temperature (Iqbal et al., 2021; Shah et al., 2019; Poulopoulos & Inglezakis, 2006).Adsorption isotherms may be predicted using a variety of models. Langmuir andFreundlich equilibrium sorption isotherms are the most widely utilized models forpollutant adsorption from wastewater (Tariq et al., 2020).
In Langmuir isotherm (Eq. 7), monolayer adsorption of a contaminant onto the surfacewith a limited number of sites available for contaminant adsorption is considered.
qe¼qmaxKLCe
1þ KLCe(7)
where qmax represents the maximum adsorption of Pb ions onto PSB and CCB,KL = Langmuir model constant and Ce = Pb concentration in solution (mg/L) at equilibrium.
Langmuir isothermmodel in linearized form has been given in Eq. (8) to find the modelparameters. The values of the Langmuir model parameters, qmax and KL were found byusing the slope and intercept of the linear plot of Ce/qe vs Ce.
Ce
qe¼ 1
qmaxKLþ 1qmaxCe
(8)
The biosorbent surface might be monolayer or/and multilayer. It is reported thatFreundlich isotherm model (Eq. 9) is applicable for multilayer adsorption and it assumescontaminant interaction with a heterogeneous surface having a non-uniform sorptionenergy distribution throughout the surface.
qe ¼ Kf Ce1=n (9)
where qe = equilibrium sorption of Pb per mass of the PSB and CCB (mg/g), Ce = aqueousconcentration of Pb at equilibrium (mg/L), Kf and n are Freundlich model constantsrelated to the adsorption capacity and the adsorption intensity, respectively.
Mustafa Shah et al. (2022), PeerJ Physical Chemistry, DOI 10.7717/peerj-pchem.21 9/26

To determine the values of model parameters, linearized form of Freundlich isotherm(Eq. 10) model was used. The slope and intercept of the curve of ln qe vs ln Ce wereconsidered to derive the Freundlich equilibrium constants Kf and n.
ln qe ¼ lnKf þ 1nlnCe (10)
RESULTS AND DISCUSSIONCharacterization of adsorbentsThe surface morphology of PSB and CCB using scanning electron microscope has beenpresented in Figs. 2A and 2B. The SEM results illustrated that PSB and CCB have poroussurface with pores having variation in size and possessed irregular shapes containing
Figure 2 SEM image of Peanut shells (A), CCB (B) and (C) FTIR spectra of both adsorbents, (D) N2 adsorption/desorption during BETanalysis of both CCB and PSB used for the removal of Pb from water at fixed bed column scale and batch scale.
Full-size DOI: 10.7717/peerj-pchem.21/fig-2
Mustafa Shah et al. (2022), PeerJ Physical Chemistry, DOI 10.7717/peerj-pchem.21 10/26

capillary tubes that might help to trap metal ions through diffusion. Overall, there is moreaggregation of particles in case of CCB as compared with PSB which might lead to lower Pbadsorption by CCB.
Figure 2C displays the Fourier transform infrared (FTIR) spectroscopic results to findthe functional groups existing on PSB and CCB surface. As shown in Fig. 2C, theFTIR spectra indicated broad band at 3,308 cm−1 which represented −OH groups.The absorbance peak observed at wavenumber 2,920–2,849 cm−1 indicates aliphaticC–H group. The one peak observed at 1,400 cm−1 represents alkanes (C–H) bending.The absorption peaks observed at wavenumber 1,518–1,634 cm−1 represent stretching ofC=C. The presence of these functional groups on PSB and CCB surface is responsiblefor the Pb adsorption from contaminated water. However, there is difference inabsorbance peak and wavenumber between PSB and CCB which might help in theirdifferent Pb adsorption potential.
Brunauer Emmet-Teller (BET) analysis was performed to find the surface area andpore size of PSB and CCB adsorbents. The N2-adsorption/desorption isotherms obtainedfrom BET analysis were used to determine the pores related information (size, volume,porosity) and BET surface area of PSB and CCB (Fig. 2D). There is difference inadsorption/desorption curves which reveals the porous nature of both adsorbents.The BET results revealed that PSB exhibits surface area of 226.8 m2/g. The average particleand pore size of PSB was 26.5 and 3.3 nm, respectively. While PSB has 5.11% porositywhich contributes in the electrostatic attachment and diffusive movement of Pb onto PSBsurface. The surface area of CCB was 126.1 m2/g with particle size of 45 nm and pore sizeof 3.5 nm.
Breakthrough curves for Pb removal at fixed bed columnIt was important to assess the impact of controlling parameters on the removal of Pb fromfixed bed column with both adsorbents. The column scale removal of contaminants isgoverned by flow rate, inlet concentration, bed depth and inner diameter of the column(Canteli et al., 2014). In the present study, the impact of flow rate (2.5 and 5.0 mL/L), initialconcentration of Pb (25 and 50 mg/L) and dose (bed height = 0.65 and 1.2 cm/column)of PSB and CCB (3.0 and 6.0 g/column) was evaluated on the shape of breakthroughcurves.
Impact of flow rate on column scale Pb sequestrationFigure 3A presents the breakthrough curves for the removal of Pb onto PSB and CCB attwo different flow rates (2.5 and 5 mL/min) while other parameters; dose of PSB andCCB was 3.0 g/column (0.65 cm/column) were kept constant constant. The resultsrevealed that when flow rate is increased, there is decline in the uptake of Pb ions by bothadsorbents (PSB and CCB) due to negative effect of flow rate on mass transfer efficiency.The volume of injected Pb containing water at 2.5 and 5.0 mL/min was 1,500 mL and3,000 mL, respectively. While bed volume (BV) number which is the ratio of total
Mustafa Shah et al. (2022), PeerJ Physical Chemistry, DOI 10.7717/peerj-pchem.21 11/26

volume of contaminated water fed to the column and volume of adsorbent bed was 157.The results show that volume of treated effluent is reduced at higher flow rate becausebreakthrough curve is obtained earlier, and adsorbents get saturated in short time at highflow rate of injected water. It is attributed to the low interaction time between theadsorbent material and Pb ions which ultimately prevents complete saturation of the activesites thereby leading a decline in adsorption of Pb ions. Similar trend was reportedby other investigators in literature (Naeem et al., 2019; Cantelli et al., 2014; Caprineet al., 2013). The results show that Pb ions adsorption on PSB strongly depends on the flowrate at which contaminated water is being injected to the column. The PSB and CCBtakes more time to get saturated when there is low flow rate and sorption increased steadilyas compared with injection of Pb containing water at high flow rate. The injection timemust be extended when contaminant is injected at low flow rate because adsorption sites
Figure 3 Breakthrough curves obtained from fixed bed column scale removal of Pb using Peanut shells (PSB) and commercial compostbiosorbent (CCB); (A) effect of flow rate (2.5 and 5.0 mL/min) when dose of PSB and CCB is 3.0 g/column pH-6 and Ci = 25 mg/L,(B) impact of initial concentrations of Pb (25 and 50 mg/L) on its removal, (C) impact of biomass of PSB and CCB when flow rate is2.5 ml/min and pH-6. Full-size DOI: 10.7717/peerj-pchem.21/fig-3
Mustafa Shah et al. (2022), PeerJ Physical Chemistry, DOI 10.7717/peerj-pchem.21 12/26

are saturated gradually (Naeem et al., 2019). Overall, PSB showed more removal of Pbions as compared with CCB. At the start, there is negligible difference in Pb removal byPSB and CCB (first 30 min) while later on e.g. at 300 min, PSB removed 47% Pb andCCB removed 32.4% Pb from contaminated water at constant flow rate (2.5 mL/min).However, results showed that at the same (300 min) PSB and CCB showed just 23.7% and2.5% removal, respectively when at flow rate 5.0 mL/min. Similarly, Yahya et al. (2020)studied that the decline in metal ions onto the cashew nutshell adsorbent was observedwhen flow rate was increased at a fixed adsorbent bed. It is due to the less time availablebetween adsorbents (PSB and CCB) and metal ions for interaction which reduces theadsorbent saturation. While at lower flow rate metal ions were removed efficiently. Xu, Cai& Pan (2013) reported that at lower flow rate film resistance and thickness was increasedwhich contributes to higher metal removal from contaminated water. Swapna Priya &Radha (2016) reported that the adsorption was significantly affected by varying flow rate.As flow rate increases the film resistance is decreased which reduces the sequestration ofcontaminants from aqueous systems.
Effect of initial concentration of Pb on column scale sequestrationFigure 3B displays the effect of Pb initial concentration (25 and 50 mg/L) on its removalby PSB and CCB at column scale when flow rate is 2.5 mL/min, bed height is 0.65 cm(3.0 g/column) and pH of Pb containing water is pH-6. The mass of Pb fed to theadsorbents was 37.5 mg and 150 mg when water was injected at 25 and 50 mg/L,respectively. The results show that the change in concentration gradient hassignificant impact on the saturation of PSB and CCB and their Pb removal (%) fromcontaminated water. There is decline in Pb removal when its concentration was changedfrom 25–50 mg/L. This decline in Pb removal at elevated concentration of Pb (50 mg/L)is accredited to the saturation of available sorption sites on PSB and CCB beyond acertain initial level of metal ions. At time 240 min, PSB and CCB showed 63.4% and 50.8%Pb removal, respectively when initial Pb concentration was 25 mg/L while these adsorbentsshowed 54.8% and 43.2% Pb removal, respectively at the same time (240 min) but at50 mg/L initial Pb concentration. However, Pb adsorption onto PSB and CCB increasedwith increase in initial concentration of Pb in water. This enhanced Pb adsorption atelevated initial Pb level is because of higher utilization of active sites at elevated Pbconcentration. This earlier exhaustion of the PSB and CBB active sites at elevated Pblevel is attributed to the fact that high Pb concentration caused quick saturation of thesorbent. Results (Fig. 3B) reveal that the shape of curves by PSB and CCB at higherconcentration (50 mg/L) is more pronounced and steepness of the slope is also increased.Swapna Priya & Radha (2016) reported that the adsorption capacity decreased from10.26 to 9.90 mg g−1 when the solution initial concentration decreased from 600 to200 mg L−1. However, there is slower saturation of adsorbent materials at lower initialconcentration as compared with high initial concentration. Similarly, Bharathi &Ramesh (2013) reported the removal of contaminant decreased with increasing initialconcentration which is due to decline in exhaustion and breakthrough time. Dorado et al.(2014) reported that the breakthrough time is decreased at enhanced metal concentration.
Mustafa Shah et al. (2022), PeerJ Physical Chemistry, DOI 10.7717/peerj-pchem.21 13/26

Effect of dose (bed height) on column scale Pb removalFigure 3C presents the impact of bed height of PSB and CCB filled in the column for Pbremoval at steady state (constant flow rate) when column was wet packed with 3.0 g and6.0 g PSB and CCB separately. The impact of bed height was evaluated at constantinitial Pb concentration (25 mg/L) and flow rate 2.5 mL/min. The results revealed thatwhen dose was changed from 3.0 to 6.0 g/column, there was improvement in Pb removal ata given time which is attributed to higher number of adsorption sites and more height ofbed for the attachment of Pb at higher dosage (6.0 g/column which is equal to 1.2 cm bedheight) as compared with 3.0 g/column which is equal to 0.65 cm/column. The PSBand CCB showed 63.4% and 50.8% Pb removal, respectively at dose 3.0 g/column while athigher dose (6.0 g/column), PSB and CCB showed higher removal (73.2% and 59.3%,respectively). The increase in bed height results in more service time for breakthroughcurve and exhaustion time for a given concentration (Naeem et al., 2019; Imran et al., 2021;Canteli et al., 2014). Bharathi & Ramesh (2013) reported that the removal increased withincreasing bed height/dose. It is attributed to more adsorption sites available for thecontaminant sequestration. El Mouhri et al. (2020) observed that the removal enhancedfrom 95.4% to 97.4% when the bed height was increased from 3 to 5 cm. The increase inremoval percentage is attributed to the active sites and interaction time available for thecontaminant with the adsorbent material. Swapna Priya & Radha (2016) studied that thequantity of adsorbent is very crucial for the breakthrough point because adsorbentquantity determines the bed height. As bed height is increased, the breakthrough wouldalso be higher because increase in bed height increases the surface area significantly whichfavors the adsorption.
Batch scale Pb sequestration from contaminated waterImpact of initial Pb level on its adsorption and removalThe impact of various concentrations of Pb with constant adsorbent mass on Pb removal(%) are shown in Fig. 4A. Figure 4A depicted that the Pb removal decreased with theincreasing initial Pb concentration in contaminated water. For PSB, a sharp decreasewas observed from 90.0% to 79.8% when the solution initial concentration was changedfrom 25 to 50 mg/L. While for CCB under same conditions, a decline in Pb removal from79.2-52.5% was observed. It was attributed to the limited number of active availablesites for the removal of Pb from contaminated water. As the solution initial concentrationincreased, there is more competition between adsorbent and adsorbate. At lower initialconcentration, the removal was highest because PSB contains enough available spacesthat favors the adsorption of Pb on PSB and CCB. While at higher concentration, theavailable spaces become saturated with Pb ions and no more sites are available for theadsorption of Pb ions. The decline in the Pb removal with increasing solutionconcentration is attributed to the concentration gradient or split in the flux in soluteconcentration and sorbent surface. The decline in removal with increasing concentrationwas due to the decline in available sorption sites (Boudrahem et al., 2019). Alatabe &Al-Sharify (2019) reported that the rapid adsorption of Pb at lower concentration. Whilewith the increasing concentration of Pb the adsorption decreased, which is due to the Pb
Mustafa Shah et al. (2022), PeerJ Physical Chemistry, DOI 10.7717/peerj-pchem.21 14/26

ions adsorbed on the outer surface of the adsorbent. Furthermore, enhanced initialsolution concentration of Pb resulted into fast saturation of sorbent materials.
Impact of adsorbent dose on Pb removalFigure 4B depicts that effect of PSB and CCB adsorbents dose for the removal of Pb fromcontaminated water by varying adsorbent dose from 1.25 to 5.0 g/L of contaminated waterwhen Pb initial concertation was 50 mg/L. Results revealed a clear impact of PSB and CCBbiomass on Pb removal (Fig. 4B). The maximum values of Pb ion sorbed on PSB and CCBsurface were found at mass of 1.25 g/L of contaminated water. Overall, Pb adsorptionshowed a decline with the increase when adsorbent dose was increased. As adsorbent doseis increased, surface area also increases and the interaction between Pb and adsorbentbecomes strong therefore, the removal increased with increasing adsorbent dosage.Initially, a sharp increase (45.4% to 79.8%) in Pb removal was observed By PSB whendosage was changed from 1.25 to 2.5 g/L of Pb contaminated water. While with the furtherincrease in adsorbent dosage the impact was small (79.8–87.6%) which is due to the
Figure 4 (A) Effect of initial concentration of Pb (25–100 mg/L) on its removal (%) at equilibrium,pH-6, dose 0.5 g/L and room temperature; (B) impact of PSB and CCB dose on Pb removal atequilibrium, Ci = 50 mg/L, pH-6. Full-size DOI: 10.7717/peerj-pchem.21/fig-4
Mustafa Shah et al. (2022), PeerJ Physical Chemistry, DOI 10.7717/peerj-pchem.21 15/26

possible aggregation of adsorbent particles at higher dose (Imran et al., 2021). Similarly,Iqbal et al. (2021) reported that with the addition of adsorbent dosage the removal waselevated which is attributed to the competition between adsorbent and adsorbate. Initiallythere are limited number of active available sites and higher number of contaminantions therefore, the removal was decreased. Moreover, at lower adsorbent dosage the activesites becomes saturated with contaminant earlier (Imran et al., 2020). At higher adsorbentdosage, the removal was not significantly increased which is due to the overlapping/aggregation of adsorbent material at higher concentration of dose (Wang et al., 2018).Similar results were reported by many researchers (Adenuga et al., 2019; Heraldy et al.,2018; Iqbal et al., 2021; Kostić et al., 2014).
Effect of interaction time on Pb removalEffective adsorption is reflected when the equilibrium is attained with adsorbent andadsorbate. Furthermore, a certain time is crucial that confirms that the equilibrium has
Figure 5 Effect of interaction time on, (A) Pb removal when Ci = 50 ppm, PSB dose = 0.5 g/100 mL), (B) impact of solution pH ofcontaminated water on Pb removal at equilibrium, dose 0.5 g/100 mL, Ci = 50 mg/L, (C) impact of competing ions in groundwatersample on Pb removal at 25 and 50 mg/L, and pH-6. Full-size DOI: 10.7717/peerj-pchem.21/fig-5
Mustafa Shah et al. (2022), PeerJ Physical Chemistry, DOI 10.7717/peerj-pchem.21 16/26

been attained (Dakhil, 2015). Therefore, impact of interaction time was evaluated as a mainparameter that affects the adsorption capacity of PSB and CCB adsorbents. Figure 5Adisplays the behavior of Pb removal with different time interval on PSB and CCB atconstant pH-6, dose 2.5 g/L, and concentration 50 mg/L. Adsorption of Pb increased wheninteraction time was increased but a significant changes happened in first 30 min,subsequently minor variations in adsorption were noted. The adsorption of Pb ionsbecame constant when at equilibrium (60 min) by both PSB and CCB adsorbents.At equilibrium, highest Pb ions removal efficiency was 79.8% when 50 mg Pb/L interactedwith PSB and CCB showed 48.80% removal under same conditions. The increase inremoval with increasing interaction time is attributed to the interaction time betweenadsorbent and Pb ions. Initially the adsorption sharply increased but with the passage oftime, the Pb removal was slower than initial period of time. After 60 min, change inremoval is low due to occupation of most of the adsorption sites during first 60 min.The removal onto PSB increased from 49.4% to 73.0% when the interaction time waschanged from 15 to 60 min. Results show that when interaction time further increasedfrom 60 to 180 min, only 6.8% more Pb was removed. Therefore, experiment was runfor 180 min to attain equilibrium. Mukherjee et al. (2020) reported that the Pb and Cdremoval gradually increased with increasing interaction time and then a sharp declinewas noticed after 30 min, which is due to the intra-particle diffusion process. Similarly,Gaur et al. (2018) reported that the equilibrium was attained in first 60 min for theadsorption of Pb and As by using soya been biosorbent. The results were also consistentwith other relevant studies (Arimurti, Heraldy & Lestari, 2016; Ben-Ali et al., 2017;Yogeshwaran & Priya, 2021).
Effect of solution pH on Pb removalIn adsorption studies, pH plays an important role for the removal of contaminants fromwastewater. The impact of pH for the removal Pb onto PSB and CCB from contaminatedwater was evaluated. Therefore, the solution pH was changed from 4 to 10, while allother parameters were kept constant (50 mg/L). Figure 5B demonstrates the impact of pHon Pb removal from contaminated water. It was noticed that with the increase in pH, theremoval percentage also increased. The removal percentage with PSB changed from62.0–79.9% when the solution pH was increased from 4 to 6. The increase in removalpercentage is due to fluctuations in pH which might result from the surface properties ofthe adsorbent material as well as contaminant molecules. Heraldy et al. (2018) reportedthat the removal enhanced with the increasing pH of the Pb contaminated solution.Previously reported that the effectiveness of the adsorbent materials were low at lower pHand increased with increasing pH (Pang et al., 2011). This might be due to the fact thatlower pH can charge the active sites with H+ ions and makes the adsorbent surface morepositive that cause electrostatic repulsion between adsorbent and Pb ions. Moreover, atbasic pH electrostatic attraction occurred between adsorbent and adsorbate and enhancedremoval was obtained (Hafshejani et al., 2015; Taşar, Kaya & Özer, 2014). When thesolution pH > 6, the Pb hydrolysis and precipitation occurs as Pb hydroxides (Heraldyet al., 2018). As pH was further changed from 6 to 10, there is improvement of Pb removal
Mustafa Shah et al. (2022), PeerJ Physical Chemistry, DOI 10.7717/peerj-pchem.21 17/26

but removal at pH beyond 6 is attributed to Pb precipitation in solution as we observedclear precipitates at this higher pH (8 and 10). So, pH-6 was selected as optimum pHand all other cases were conducted at this pH.
Impact of coexisting ions on Pb removalThe presence of competing ions in water may affect the contaminant removal onto theadsorbent surface (Imran et al., 2019; Vilvanathan & Shanthakumar, 2015). Figure 5Cpresents the results regarding the impact of cations and anions on the removal of Pbwhen initial Pb concentrations (25 and 50 mg/L) were developed in two groundwatersamples (GW1 and GW2). The characteristics of GW1 and GW2 are given in Table 1.The results (Fig, 5C) reveal that Pb removal with DW, GW1 and GW2 onto PSB at25 mg/L was 90%, 85.2% and 88.4%, respectively while PSB showed 79.8%, 71.0% and75.8% Pb removal in DW, GW1 and GW2, respectively at 50 mg/L. The GW1 andGW2 showed 4.8% and 1.6% lower Pb removal than DW when experiment was run at25 mg/L while GW1 and GW2 showed 8.8% and 4.0% less Pb removal as compared withDW at 50 mg/L. Similarly, Pb removal with DW, GW1 and GW2 onto CCB at 25 mg/Lwas 70.2, 71.6 and 75.42, respectively while CCB showed 69.8%, 60.0% and 64.4% Pbremoval in DW, GW1 and GW2, respectively at 50 mg/L. The GW1 and GW2 showed7.6% and 4.0% lower Pb removal than DW when experiment was run at 25 mg/Lwhile GW1 and GW2 showed 9.8% and 5.4% less Pb removal as compared with DW at50 mg/L. The GW1 showed more difference in Pb removal onto both PSB and CCB ascompared with GW2. This higher difference in Pb removal by GW2 is attributed to higherconcentration of cations (Na, K, Ca, andMg) as compared with GW1 (Table 1). The higherconcentration of coexisting cations (especially Ca and Mg) competed for adsorptionsites with Pb ions (Imran et al., 2019; Meseguer et al. 2016) to occupy the surface of PSBand CCB adsorbents. Similar response of competing ions in groundwater was found byImran et al. (2019) on the removal of Pb from contaminated water. Likewise, many otherstudies have reported that with increasing ionic strength the removal decreased (Imranet al., 2020, 2021; Kariuki, Kiptoo & Onyancha, 2017).
Equilibrium and kinetic isotherms for Pb adsorption onto PSBThe equilibrium data for Pb adsorption by PSB and CCB was mathematically explained byadsorption isotherm models as described earlier in Methodology section. The kineticadsorption data obtained at 50 mg Pb/L was validated with PFO, PSO and Intra-particlediffusion model. The fitting behavior of kinetic models has been displayed in Figs. 6A–6C.The comparison of modeling results with kinetic experimental data shows that pseudosecond order well explained the kinetic adsorption of Pb onto PSB and CCB as is evidentfrom the value of coefficient of determination (R2) which is 0.99 for Pseudo second ordermodel. The values of kinetic and equilibrium model parameters have been shown inTable 1. For equilibrium data, values of coefficient of determination show that Pb ionsorption well fitted with Freundlich adsorption isotherm (R2 = 0.98, Table 1). The fittingbehavior of equilibrium models (Langmuir and Freundlich) has been presented in
Mustafa Shah et al. (2022), PeerJ Physical Chemistry, DOI 10.7717/peerj-pchem.21 18/26

Figs. 6D–6E. The respective values of coefficient of determination R2 in case of Langmuiradsorption isotherm fitted with PSB was 0.89 while adsorption by CCB was equallyfitted with Langmuir model as its R2 = 0.98. The value of qmax for PSB and CCB as per
Figure 6 Correlation of experimental data with kinetic adsorption models: Pseudo first order (A), pseudo second order (B) and intra-particlediffusion (C); equilibrium adsorption isotherms: Langmuir (D), Freundlich (E). Full-size DOI: 10.7717/peerj-pchem.21/fig-6
Mustafa Shah et al. (2022), PeerJ Physical Chemistry, DOI 10.7717/peerj-pchem.21 19/26

Langmuir model was 42.05 mg/g and 26.39 mg/g, respectively. Moreover, respective nvalues of Freundlich model for PSB and CCB was 1.92 and 2.27.
Comparison of Pb removal by PSB with literatureA comparison of Pb adsorption onto PSB and CCB with previous studies is important todetermine the effectiveness and real time applications of proposed materials. Table 3highlights the comparison of PSB and CCB with previous studies. Current study depictedthat the adsorption of Pb was 50.0 mg/g. Hence, it was noticed that the proposed material(PSB) is more efficient than other adsorbents such as corncobs (Mendoza-Castillo et al.,2015), soya bean (Gaur et al., 2018), Eupatorium adenophorum spreng (Guo et al.,2009), Okra waste (Hashem, 2007), Tea waste (Mondal, 2010), and Agave sisalana (DosSantosa et al., 2011). It was also noticed that many other adsorbents are available that havebeen more efficient such as tomato waste and apple juice residue (Heraldy et al., 2018),lignin biosorbent (Klapiszewski et al., 2017), Pineapple waste (Mopoung & Kengkhetkit,2016), Palm fruit fiber (Ideriah, David & Ogbonna, 2012) etc. than PSB. However, theavailability and cost effectiveness of the adsorbent materials is also very important.Although many adsorbents are more efficient, but the process and cost effectiveness makesPSB attractive for the remediation of Pb from contaminated water.
CONCLUSIONSIn the present work, the fixed bed column and batch scale adsorption potential of Peanutshells and commercial compost as biosorbents (PSB and CCB) were successfully evaluatedfor the sequestration of Pb from contaminated work. The maximum adsorption of Pbonto PSB (42.5 mg/g) was higher than CCB (26.39 mg/g) at optimum dose and pH,which is better than several previously explored adsorbents. The more Pb sequestrationonto PSB is attributed to its improved surface characterization (SEM, FTIR, and BET)as compared with CCB under same conditions. The presence of competing ions ingroundwater (GW1 and GW2) showed 9.8% and 5.4% lower, Pb removal by CCB as
Table 3 Comparison of different adsorbents for the removal of Pb from contaminated water.
No. Materials Adsorption/Removal References
1 lignin biosorbent 89.02 mg/g Klapiszewski et al. (2017)
2 soya bean 0.72 mg/g Gaur et al. (2018)
3 Pineapple waste 77.16 mg/g Mopoung & Kengkhetkit (2016)
4 Melon peel 72 mg/g Gour et al. (2016)
5 Palm fruit fiber 73 mg/g Ideriah, David & Ogbonna (2012)
6 metallothionein 39.02 mg/g Mwandira et al. (2020)
7 Modified corncobs 4.34 mg/g Mendoza-Castillo et al. (2015)
8 Okra waste 5.00 mg/g Hashem (2007)
9 Agave sisalana 1.34 mg/g Dos Santosa et al. (2011)
10 Tea waste 1.35 mg/g Mondal (2010)
11 Eupatorium adenophorum spreng 3.46 mg/g Guo et al. (2009)
12 Peanut shells biosorbent 50.0 mg/g Current study
Mustafa Shah et al. (2022), PeerJ Physical Chemistry, DOI 10.7717/peerj-pchem.21 20/26

compared with distilled water while this difference was 8.8% and 4.0% by PSB when50 mg Pb/L was used under optimal conditions. The kinetic behavior of Pb adsorptiononto the adsorbents showed best fit with pseudo second order kinetic model (R2 = 0.99)while isothermal equilibrium adsorption onto PSB was best explained with Freundlichmodel (R2 = 0.98), however, Pb adsorption onto CCB was equally well explained withLangmuir and Freundlich adsorption models. Column experiments showed excellentretention of Pb especially on PSB under different flow rates, initial Pb concentration anddose of the adsorbents. It is concluded that PSB is more effective and environment friendlyat both column and batch scale for the removal of Pb as compared with CCB.
ACKNOWLEDGEMENTSAuthors are thankful to COMSATS University Islamabad (CUI), Vehari Campus toproviding research facility and technical expertise. We are equally indebted to IRCBM,CUI Lahore-Campus for the characterization of the biosorbents.
ADDITIONAL INFORMATION AND DECLARATIONS
FundingThe authors did not receive funding for this work.
Competing InterestsThe authors declare that they have no competing interests.
Author Contributions� Ghulam Mustafa Shah conceived and designed the experiments, authored or revieweddrafts of the paper, and approved the final draft.
� Muhammad Imran conceived and designed the experiments, analyzed the data,prepared figures and/or tables, and approved the final draft.
� Umme Aiman performed the experiments, prepared figures and/or tables, and approvedthe final draft.
� Muhammad Mohsin Iqbal performed the computation work, authored or revieweddrafts of the paper, and approved the final draft.
� Muhammad Akram analyzed the data, performed the computation work, authored orreviewed drafts of the paper, and approved the final draft.
� Hafiz Muhammad Rashad Javeed conceived and designed the experiments, preparedfigures and/or tables, and approved the final draft.
� AtikaWaqar performed the computation work, authored or reviewed drafts of the paper,and approved the final draft.
� Faiz Rabbani analyzed the data, prepared figures and/or tables, and approved the finaldraft.
Data AvailabilityThe following information was supplied regarding data availability:
The raw data is available in the Supplemental Files.
Mustafa Shah et al. (2022), PeerJ Physical Chemistry, DOI 10.7717/peerj-pchem.21 21/26

Supplemental InformationSupplemental information for this article can be found online at http://dx.doi.org/10.7717/peerj-pchem.21#supplemental-information.
REFERENCESAbdel-Salam M. 2018. Remediation of a Pb-Contaminated Soil Cultivated with Rose Geranium
(Pelargonium graveolens) Using Nano-Zeolite. Journal of Soil Sciences and AgriculturalEngineering 9:473–479.
Adenuga AA, Amos OD, Oyekunle JAO, Umukoro EH. 2019. Adsorption performance andmechanism of a low-cost biosorbent from spent seedcake of Calophyllum inophyllum insimultaneous cleanup of potentially toxic metals from industrial wastewater. Journal ofEnvironmental Chemical Engineering 7(5):103317 DOI 10.1016/j.jece.2019.103317.
Adesanmi A, Evuti A, Aladeitan Y, Abba A. 2020. Utilization of waste in solving environmentalproblem: Application of banana and orange peels for the removal of lead (II) ions from aqueoussolution of lead nitrate. Nigeria Journal of Engineering Science and Technology Research 6:18–33.
Ahalya N, Kanamadi R, Ramachandra T. 2005. Biosorption of chromium (VI) from aqueoussolutions by the husk of Bengal gram (Cicer arientinum). Electronic Journal of Biotechnology 8.
Ahmed OA, Derriche Z, Kameche M, Bahmani A, Souli H, Dubujet P, Fleureau J. 2016. Electro-remediation of lead contaminated kaolinite: An electro-kinetic treatment. Chemical Engineeringand Processing: Process Intensification 100:37–48.
Al Hawli B, Benamor A, Hawari AA. 2019. A hybrid electro-coagulation/forward osmosis systemfor treatment of produced water. Chemical Engineering and Processing-Process Intensification143:107621.
Alatabe MJA, Al-Sharify ZT. 2019. Utilization of low cost adsorbents for the adsorption process oflead ions. International Journal of Modern Research in Engineering Technology 4:29–48.
Annadurai G, Juang R-S, Lee D. 2003. Adsorption of heavy metals from water using banana andorange peels. Water Science and Technology 47:185–190.
Arbabi M, Hemati S, Amiri M. 2015. Removal of lead ions from industrial wastewater: A review ofremoval methods. International Journal of Epidemiologic Research 2:105–109.
Arimurti DD, Heraldy E, Lestari WW. 2016. Biosorption of lead (II) ions by NaOH-activatedapple (Malus domestica) juice residue. In: AIP Conference Proceedings, Vol. 1710. Melville: AIPPublishing LLC, 30036.
ATSDR U. 2007. CERCLA priority list of hazardous substances. Available at http://www.atsdr.cdc.gov/cercla/07list.html.
BadmusM, Audu T, Anyata B. 2007. Removal of lead ion from industrial wastewaters by activatedcarbon prepared from periwinkle shells (Typanotonus fuscatus). Turkish Journal of Engineeringand Environmental Sciences 31:251–263.
Ben-Ali S, Jaouali I, Souissi-Najar S, Ouederni A. 2017. Characterization and adsorption capacityof raw pomegranate peel biosorbent for copper removal. Journal of Cleaner Production142:3809–3821 DOI 10.1016/j.jclepro.2016.10.081.
Bharathi KS, Ramesh SPT. 2013. Fixed-bed column studies on biosorption of crystal violet fromaqueous solution by Citrullus lanatus rind and Cyperus rotundus. Applied Water Science3(4):673–687 DOI 10.1007/s13201-013-0103-4.
Boudrahem F, Aissani-Benissad F, Audonnet F, Vial C. 2019. Effects of acid-basic treatments ofdate stones on lead (II) adsorption. Separation Science Technology 54(11):1749–1763DOI 10.1080/01496395.2018.1538240.
Mustafa Shah et al. (2022), PeerJ Physical Chemistry, DOI 10.7717/peerj-pchem.21 22/26

Canteli AMD, Carpiné D, de Paula Scheer A, Mafra MR, Igarashi-Mafra L. 2014. Fixed-bedcolumn adsorption of the coffee aroma compound benzaldehyde from aqueous solution ontogranular activated carbon from coconut husk. LWT-Food Science and Technology 59:1025–1032.
Chaudhary H, Ijaz M. 2014. Removal of lead from wastewater by adsorption on Saponified melonpeels gel. Science International 26:705–708.
Charerntanyarak L. 1999.Heavy metals removal by chemical coagulation and precipitation.WaterScience and Technology 39:135–138.
Da̧browski A, Hubicki Z, Podkościelny P, Robens E. 2004. Selective removal of the heavy metalions from waters and industrial wastewaters by ion-exchange method. Chemosphere 56:91–106.
Dakhil IH. 2015. Adsorption of lead from industrial effluents using rice husk. International Journalof Engineering Management Research 5:109–116.
Dorado AD, Gamisans X, Valderrama C, Solé M, Lao C. 2014. Cr (III) removal from aqueoussolutions: a straightforward model approaching of the adsorption in a fixed-bed column. Journalof Environmental Science Health, Part A 49(2):179–186 DOI 10.1080/10934529.2013.838855.
Dos Santosa W, Cavalcante D, Da Silva E, Das Virgens C, de Souza Dias F. 2011. Biosorption ofPb (II) and Cd (II) ions by Agave sisalana (sisalv fiber). Microchemical Journal 97(2):269–273DOI 10.1016/j.microc.2010.09.014.
Edokpayi JN, Odiyo JO, Msagati TA, Popoola EO. 2015. A Novel Approach for the removal oflead (II) ion from wastewater using mucilaginous leaves of diceriocaryum eriocarpum plant.Sustainability 7:14026–14041.
El Mouhri G, Merzouki M, Belhassan H, Miyah Y, Amakdouf H, Elmountassir R, Lahrichi A.2020. Continuous adsorption modeling and fixed bed column studies: adsorption of tannerywastewater pollutants using beach sand. Journal of Chemistry 2020:1–9DOI 10.1155/2020/7613484.
Elham A, Hossein T, Mahnoosh H. 2010. Removal of Zn (II) and Pb (II) ions using rice husk infood industrial wastewater. Journal of Applied Sciences and Environmental Management 14.
Estefan G, Sommer R, Ryan J. 2013. Methods of soil, plant, and water analysis. A manual for theWest Asia and North Africa region 3:65–119.
Gaur N, Kukreja A, Yadav M, Tiwari A. 2018. Adsorptive removal of lead and arsenic fromaqueous solution using soya bean as a novel biosorbent: equilibrium isotherm and thermalstability studies. Applied Water Science 8(4):1–12 DOI 10.1007/s13201-018-0743-5.
Gour A, Sharma AK, Sharma S, Verma S. 2016. Removal of Lead from aqueous solutions byadsorption on melon peel. International Journal Conservation Science 4:123–125.
Gupta SS, Bhattacharyya KG. 2006. Adsorption of Ni (II) on clays. Journal of Colloid and InterfaceScience 295:21–32.
Guo S, Li W, Zhang L, Peng J, Xia H, Zhang S. 2009. Kinetics and equilibrium adsorption study oflead (II) onto the low cost adsorbent—Eupatorium adenophorum spreng. Process SafetyEnvironmental Protection 87(5):343–351 DOI 10.1016/j.psep.2009.06.003.
Hafshejani LD, Nasab SB, Gholami RM, Moradzadeh M, Izadpanah Z, Hafshejani SB,Bhatnagar A. 2015. Removal of zinc and lead from aqueous solution by nanostructured cedarleaf ash as biosorbent. Journal of Molecular Liquids 211:448–456DOI 10.1016/j.molliq.2015.07.044.
Hashem MA. 2007. Adsorption of lead ions from aqueous fromsolution by okra wastes.International Journal of Physical Sciences 2:178–184 DOI 10.5897/IJPS.9000050.
Mustafa Shah et al. (2022), PeerJ Physical Chemistry, DOI 10.7717/peerj-pchem.21 23/26

Heraldy E, Lestari WW, Permatasari D, Arimurti DD. 2018. Biosorbent from tomato waste andapple juice residue for lead removal. Journal of Environmental Chemical Engineering6(1):1201–1208 DOI 10.1016/j.jece.2017.12.026.
Ho Y-S, McKay G. 1999. Pseudo-second order model for sorption processes. Process Biochemistry34:451–465.
Hussain AZ, Sheriff KM. 2014. Removal of heavy metals from wastewater using low costadsorbents. Archives of Applied Science Research 6:52–54.
Ideriah T, David O, Ogbonna D. 2012. Removal of heavy metal ions in aqueous solutions usingpalm fruit fibre as adsorbent. Journal of Environmental Chemistry and Ecotoxicology 4:82–90DOI 10.5897/JECE11.058.
Imran M, Suddique M, Shah G, Ahmad I, Murtaza B, Shah N, Mubeen M, Ahmad S, Zakir A,Schotting R. 2019. Kinetic and equilibrium studies for cadmium biosorption fromcontaminated water using Cassia fistula biomass. International Journal of Environmental Scienceand Technology 16:3099–3108.
Imran M, Iqbal MM, Iqbal J, Shah NS, Khan ZUH, Murtaza B, Amjad M, Ali S, Rizwan M.2021. Synthesis, characterization and application of novel MnO and CuO impregnated biocharcomposites to sequester arsenic (As) from water: modeling, thermodynamics and reusability.Journal of Hazardous Materials 401:123338 DOI 10.1016/j.jhazmat.2020.123338.
Imran M, Khan ZUH, Iqbal MM, Iqbal J, Shah NS, Munawar S, Ali S, Murtaza B, Naeem MA,Rizwan M. 2020. Effect of biochar modified with magnetite nanoparticles and HNO3 forefficient removal of Cr (VI) from contaminated water: a batch and column scale study.Environmental Pollution 261:114231 DOI 10.1016/j.envpol.2020.114231.
Iqbal MM, Imran M, Ali B, Nawaz M, Siddique MH, Al-Kahtani AA, Hussain K, Murtaza B,Shah NS, Khan ZUH, Rizwan M, Ali S. 2021. Nanocomposites of sedimentary material withZnO and magnetite for the effective sequestration of arsenic from aqueous systems: reusability,modeling and kinetics. Environmental Technology Innovation 21(13147):101298DOI 10.1016/j.eti.2020.101298.
Izah SC, Bassey SE, Ohimain EI. 2018. Ecological risk assessment of heavy metals in cassava milleffluents contaminated soil in a rural community in the Niger Delta Region of Nigeria.MolecularSoil Biology 9(1):1–11.
Kadirvelu K, Thamaraiselvi K, Namasivayam C. 2001. Adsorption of nickel (II) from aqueoussolution onto activated carbon prepared from coirpith. Separation and Purification Technology24:497–505.
Kariuki Z, Kiptoo J, Onyancha D. 2017. Biosorption studies of lead and copper using rogersmushroom biomass ‘Lepiota hystrix’. South African Journal of Chemical Engineering23(2):62–70 DOI 10.1016/j.sajce.2017.02.001.
Klapiszewski Ł, Bartczak P, Szatkowski T, Jesionowski T. 2017. Removal of lead (II) ions by anadsorption process with the use of an advanced SiO2/lignin biosorbent. Polish Journal ofChemical Technology 19(1):48–53 DOI 10.1515/pjct-2017-0007.
Kocasoy G, Güvener Z. 2009. Efficiency of compost in the removal of heavy metals from theindustrial wastewater. Environmental Geology 57:291.
Kostić M, Radović M, Mitrović J, Antonijević M, Bojić D, Petrović M, Bojić A. 2014. Usingxanthated Lagenaria vulgaris shell biosorbent for removal of Pb (II) ions from wastewater.Journal of the Iranian Chemical Society 11(2):565–578 DOI 10.1007/s13738-013-0326-1.
Mendoza-Castillo D, Rojas-Mayorga C, García-Martínez I, Pérez-Cruz M,Hernández-Montoya V, Bonilla-Petriciolet A, Montes-Morán MA. 2015. Removal of
Mustafa Shah et al. (2022), PeerJ Physical Chemistry, DOI 10.7717/peerj-pchem.21 24/26

heavy metals and arsenic from aqueous solution using textile wastes from denim industry.International Journal of Environmental Studies 12:1657–1668 DOI 10.1007/s13762-014-0553-8.
Meseguer VF, Ortuño JF, Aguilar MI, Pinzón-Bedoya ML, Lloréns M, Sáez J, Pérez-Marín AB.2016. Biosorption of cadmium (II) from aqueous solutions by natural and modified non-livingleaves of Posidonia oceanica. Environmental Science and Pollution Research 23:24032–24046.
Meunier N, Laroulandie Jm, Blais J-F, Tyagi RD. 2003. Lead removal from acidic solutions bysorption on cocoa shells: effect of some parameters. Journal of Environmental Engineering129:693–698.
Mondal MK. 2010. Removal of Pb (II) from aqueous solution by adsorption using activated teawaste. Korean Journal of Chemical Engineering 27(1):144–151 DOI 10.1007/s11814-009-0304-6.
Mopoung R, Kengkhetkit N. 2016. Lead and cadmium fromremoval efficiency from aqueoussolution by NaOH treated pineapple waste. International Journal of Applied Chemistry 12:23–35.
Mukherjee S, Kumari D, Joshi M, An AK, Kumar M. 2020. Low-cost bio-based sustainableremoval of lead and cadmium using a polyphenolic bioactive Indian curry leaf (Murrayakoengii) powder. International Journal of Hygiene Environmental Health Engineering226(1):113471 DOI 10.1016/j.ijheh.2020.113471.
Mwandira W, Nakashima K, Togo Y, Sato T, Kawasaki S. 2020. Cellulose-metallothioneinbiosorbent for removal of Pb (II) and Zn (II) from polluted water. Chemosphere 246:125733DOI 10.1016/j.chemosphere.2019.125733.
NaeemMA, Imran M, Amjad M, Abbas G, Tahir M, Murtaza B, Zakir A, Shahid M, Bulgariu L,Ahmad I. 2019. Batch and column scale removal of cadmium from water using raw and acidactivated wheat straw biochar. Water 11:1438.
Naseem R, Tahir S. 2001. Removal of Pb (II) from aqueous/acidic solutions by using bentonite asan adsorbent. Water Research 35:3982–3986.
Natasha, Bibi I, Shahid M, Niazi NK, Younas F, Naqvi SR, Shaheen SM, Imran M, Wang H,Hussaini KM, Zhang H. 2021. Hydrogeochemical and health risk evaluation of arsenic inshallow and deep aquifers along the different floodplains of Punjab, Pakistan. Journal ofHazardous Materials 402:124074.
Okoye A, Ejikeme P, Onukwuli O. 2010. Lead removal from wastewater using fluted pumpkinseed shell activated carbon: Adsorption modeling and kinetics. International Journal ofEnvironmental Science & Technology 7:793–800.
Pang Y, Zeng G, Tang L, Zhang Y, Liu Y, Lei X, Li Z, Zhang J, Xie G. 2011. PEI-grafted magneticporous powder for highly effective adsorption of heavy metal ions. Desalination 281:278–284DOI 10.1016/j.desal.2011.08.001.
Poulopoulos S, Inglezakis V. 2006. Adsorption, ion exchange and catalysis: design of operationsand environmental applications. Elsevier.
Sadaf S, Bhatti HN. 2011. Biosorption of Foron turquoise SBLN using mixed biomass of white rotfungi from synthetic effluents. African Journal of Biotechnology 10:13548–13554.
Shah GM, Nasir M, Imran M, Bakhat HF, Rabbani F, Sajjad M, Farooq ABU, Ahmad S, Song L.2018. Biosorption potential of natural, pyrolysed and acid-assisted pyrolysed sugarcane bagassefor the removal of lead from contaminated water. PeerJ 6:e5672 DOI 10.7717/peerj.5672.
Shah SM, Makhdoom A, Su X, Faheem M, Irfan M, Irfan M, Wang G, Gao Y. 2019. Synthesis ofsulphonic acid functionalized magnetic mesoporous silica for Cu (II) and Co (II) adsorption.Microchemical Journal 151:104194.
Shahid M, Khalid S, Niazi NK, Murtaza B, Ahmad N, Farooq A, Zakir A, Imran M, Abbas G.2021.Health risks of arsenic buildup in soil and food crops after wastewater irrigation. Science ofthe Total Environment 772:145266.
Mustafa Shah et al. (2022), PeerJ Physical Chemistry, DOI 10.7717/peerj-pchem.21 25/26

Swapna Priya S, Radha K. 2016. Fixed-bed column dynamics of tetracycline hydrochloride usingcommercial grade activated carbon: comparison of linear and nonlinear mathematical modelingstudies. Desalination Water Treatment 57(40):18964–18980DOI 10.1080/19443994.2015.1096829.
Tahiruddin NSM, Ab Rahman SZ. 2013. Adsorption of lead in aqueous solution by a mixture ofactivated charcoal and peanut shell. World Journal of Science and Technology Research1:102–109.
Tariq MA, NadeemM, Iqbal MM, Imran M, Siddique MH, Iqbal Z, Amjad M, Rizwan M, Ali S.2020. Effective sequestration of Cr (VI) from wastewater using nanocomposite of ZnO withcotton stalks biochar: modeling, kinetics, and reusability. Environmental Science and PollutionResearch 27:33821–33834.
Taşar Ş, Kaya F, Özer A. 2014. Biosorption of lead (II) ions from aqueous solution by peanutshells: equilibrium, thermodynamic and kinetic studies. Journal of Environmental ChemicalEngineering 2(2):1018–1026 DOI 10.1016/j.jece.2014.03.015.
Vilvanathan S, Shanthakumar S. 2015. Biosorption of Co (II) ions from aqueous solution usingChrysanthemum indicum: kinetics, equilibrium and thermodynamics. Process Safety andEnvironmental Protection 96:98–110.
Wang G, Zhang S, Yao P, Chen Y, Xu X, Li T, Gong G. 2018. Removal of Pb (II) from aqueoussolutions by Phytolacca americana L. biomass as a low cost biosorbent. Arabian Journal ofChemistry 11(1):99–110 DOI 10.1016/j.arabjc.2015.06.011.
Xu Z, Cai JG, Pan BC. 2013. Mathematically modeling fixed-bed adsorption in aqueous systems.Journal of Zhejiang University Science A 14(3):155–176 DOI 10.1631/jzus.A1300029.
Yahya M, Aliyu A, Obayomi K, Olugbenga A, Abdullahi U. 2020. Column adsorption study forthe removal of chromium and manganese ions from electroplating wastewater using cashewnutshell adsorbent. Cogent Engineering 7(1):1748470 DOI 10.1080/23311916.2020.1748470.
Yogeshwaran V, Priya A. 2021. Adsorption of lead ion concentration from the aqueous solutionusing tobacco leaves. Materials Today: Proceedings 37:489–496DOI 10.1016/j.matpr.2020.05.467.
Mustafa Shah et al. (2022), PeerJ Physical Chemistry, DOI 10.7717/peerj-pchem.21 26/26