Describe questions - Isaac Newton Academy
20
Describe questions Instructions: 1. Look carefully at the first set of information and data 2. Design a possible ‘describe’ question for that set of data 3. Check the actual question that went with that data to see how close you were (question 1 relates to data set 1, question 2 to data set 2, and so on). It doesn’t necessarily matter if your question was the same or not but you should find that you get closer to the actual question the more you do. 4. Attempt the actual question. 5. Mark your answer using the mark scheme at the end. 6. Repeat for the second set of information and data Trust this method. Don’t jump straight to answering the questions.
-
Upload
khangminh22 -
Category
Documents
-
view
1 -
download
0
Transcript of Describe questions - Isaac Newton Academy

Describe questions Instructions:
1. Look carefully at the first set of information and data 2. Design a possible ‘describe’ question for that set of data 3. Check the actual question that went with that data to see how close you were (question 1 relates
to data set 1, question 2 to data set 2, and so on). It doesn’t necessarily matter if your question was the same or not but you should find that you get closer to the actual question the more you do.
4. Attempt the actual question. 5. Mark your answer using the mark scheme at the end. 6. Repeat for the second set of information and data
Trust this method. Don’t jump straight to answering the questions.
Data and opportunities to design questions 1. Herbicides are substances that kill weeds. Three farmers wanted to know which herbicide to use to control weeds in fields of barley. They chose eleven fields of barley and used a different herbicide in each field. Four weeks later they collected, counted and weighed the weeds in each field. Their results are shown in figure 1 and 2.
Figure 1
Figure 2
Describe… .........................................................................................................................................
.........................................................................................................................................
(2 marks)
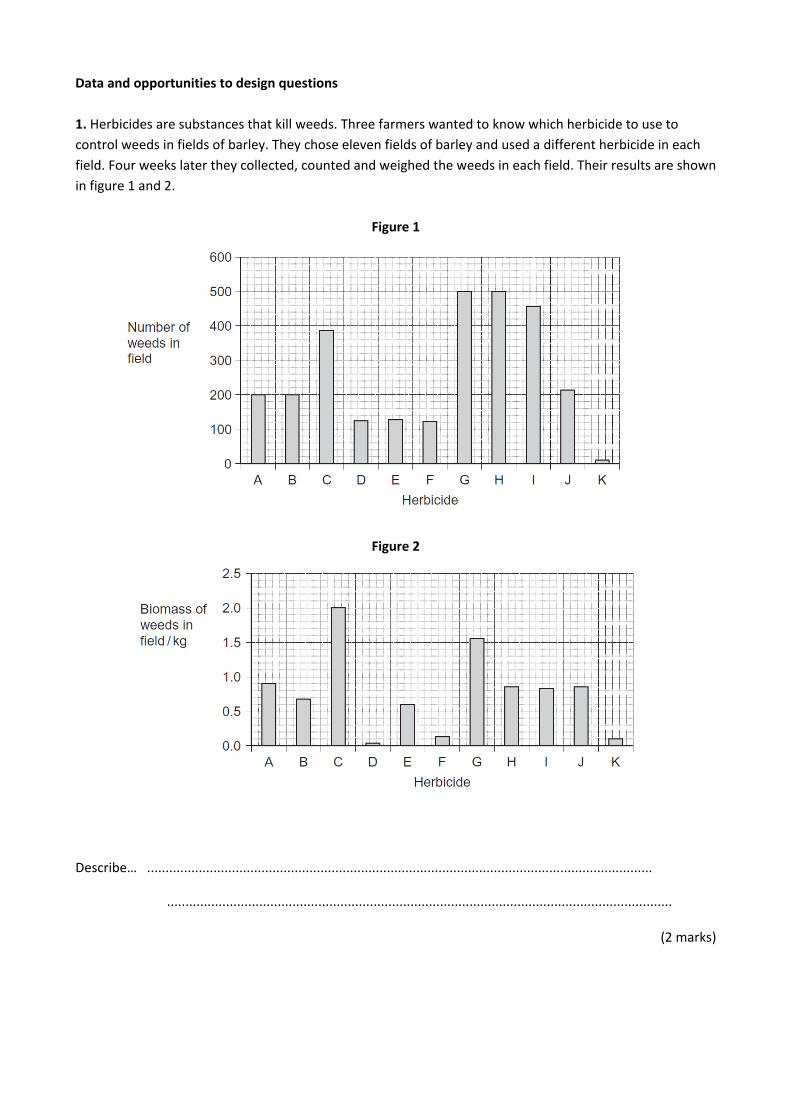
2. When most people fold their arms, they either always have their left arm on top (L) or always have their right arm on top (R). A geneticist investigated this characteristic on five small islands, A, B, C, D and E. Her results are shown in the figure below.
Describe… .........................................................................................................................................
......................................................................................................................................... (2 marks)
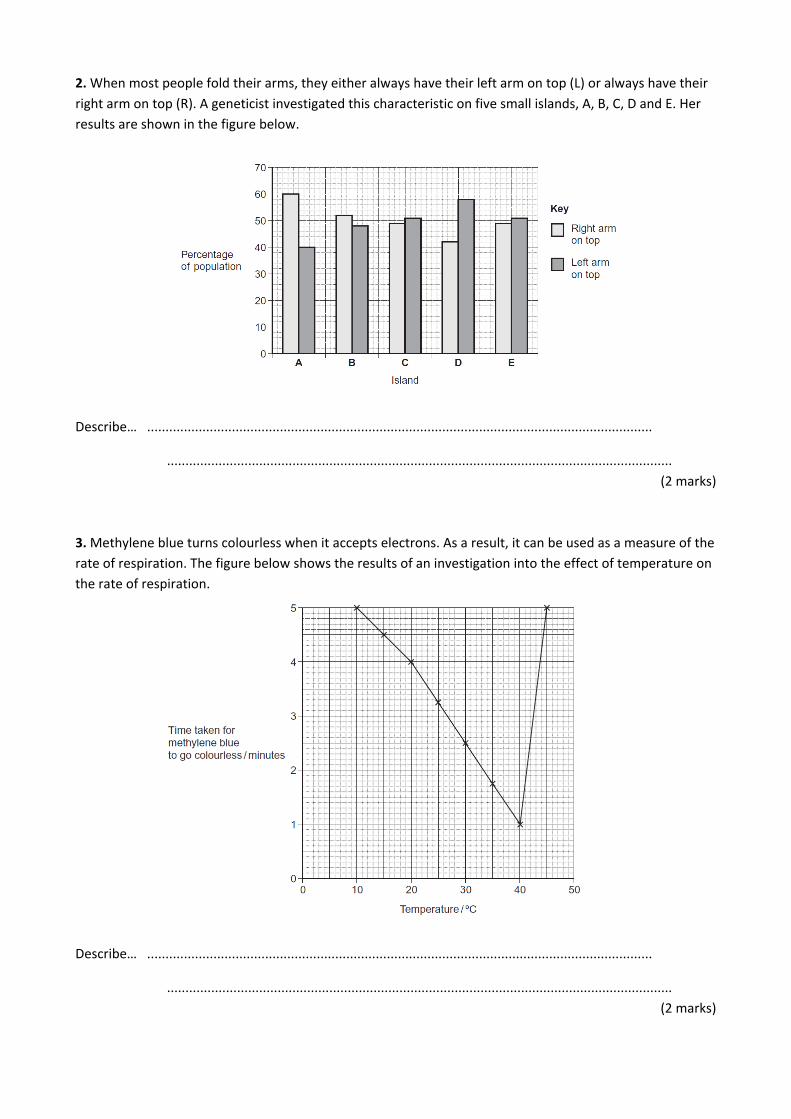
3. Methylene blue turns colourless when it accepts electrons. As a result, it can be used as a measure of the rate of respiration. The figure below shows the results of an investigation into the effect of temperature on the rate of respiration.
Describe… .........................................................................................................................................
......................................................................................................................................... (2 marks)
4. Phenolphthalein turns colourless in an acidic solution. Scientists investigated the effect of different combinations of lipase, bile salts and water on the breakdown of lipids found in milk. Their results are shown in the table below.
Describe… .........................................................................................................................................
......................................................................................................................................... (2 marks)
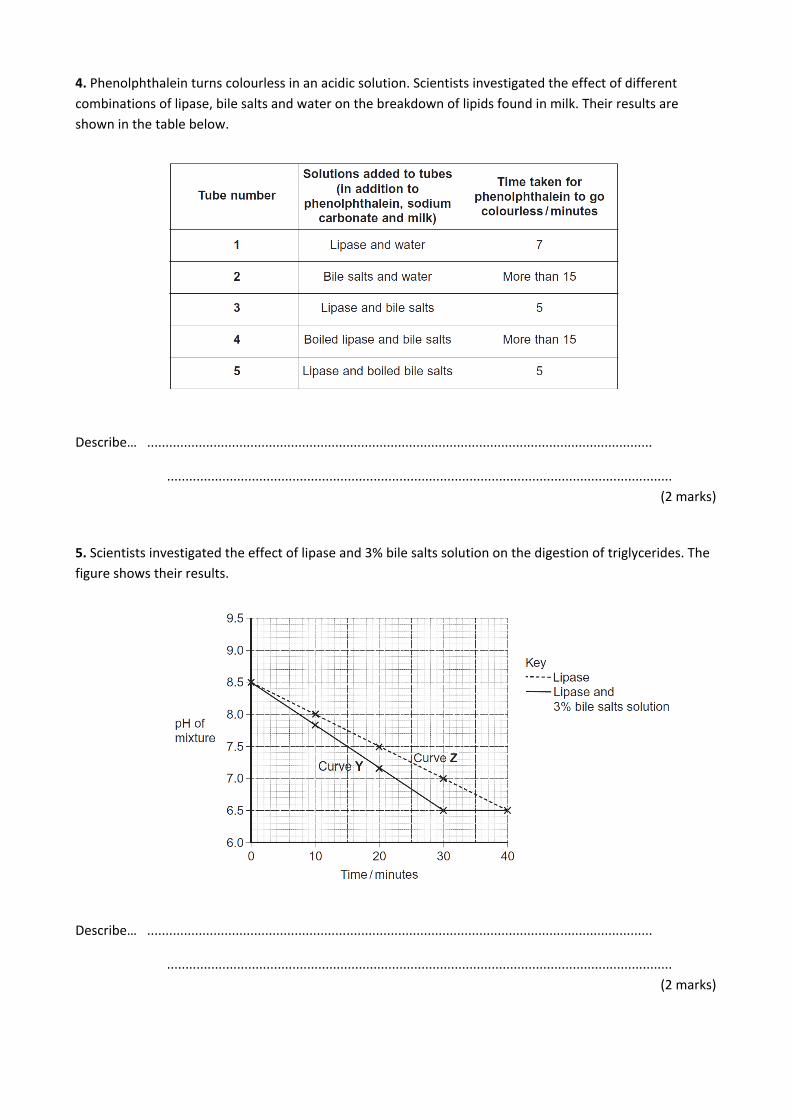
5. Scientists investigated the effect of lipase and 3% bile salts solution on the digestion of triglycerides. The figure shows their results.
Describe… .........................................................................................................................................
......................................................................................................................................... (2 marks)
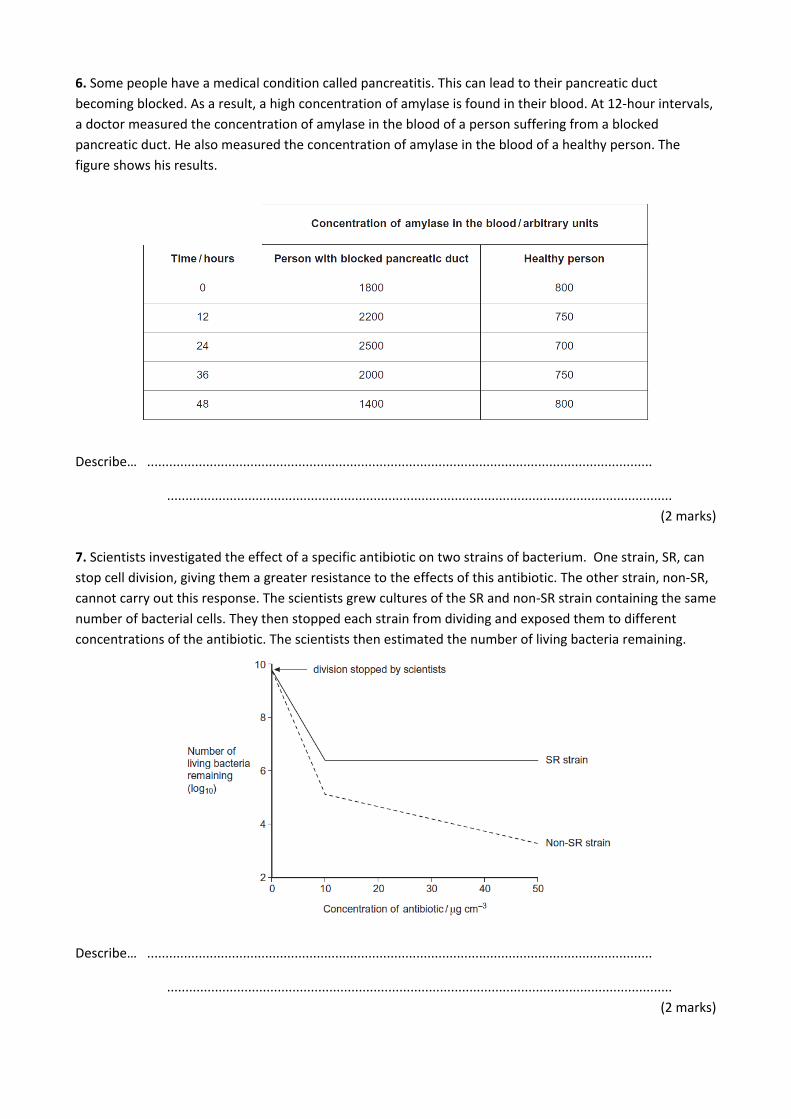
6. Some people have a medical condition called pancreatitis. This can lead to their pancreatic duct becoming blocked. As a result, a high concentration of amylase is found in their blood. At 12-hour intervals, a doctor measured the concentration of amylase in the blood of a person suffering from a blocked pancreatic duct. He also measured the concentration of amylase in the blood of a healthy person. The figure shows his results.
Describe… .........................................................................................................................................
......................................................................................................................................... (2 marks)
7. Scientists investigated the effect of a specific antibiotic on two strains of bacterium. One strain, SR, can stop cell division, giving them a greater resistance to the effects of this antibiotic. The other strain, non-SR, cannot carry out this response. The scientists grew cultures of the SR and non-SR strain containing the same number of bacterial cells. They then stopped each strain from dividing and exposed them to different concentrations of the antibiotic. The scientists then estimated the number of living bacteria remaining.
Describe… .........................................................................................................................................
......................................................................................................................................... (2 marks)
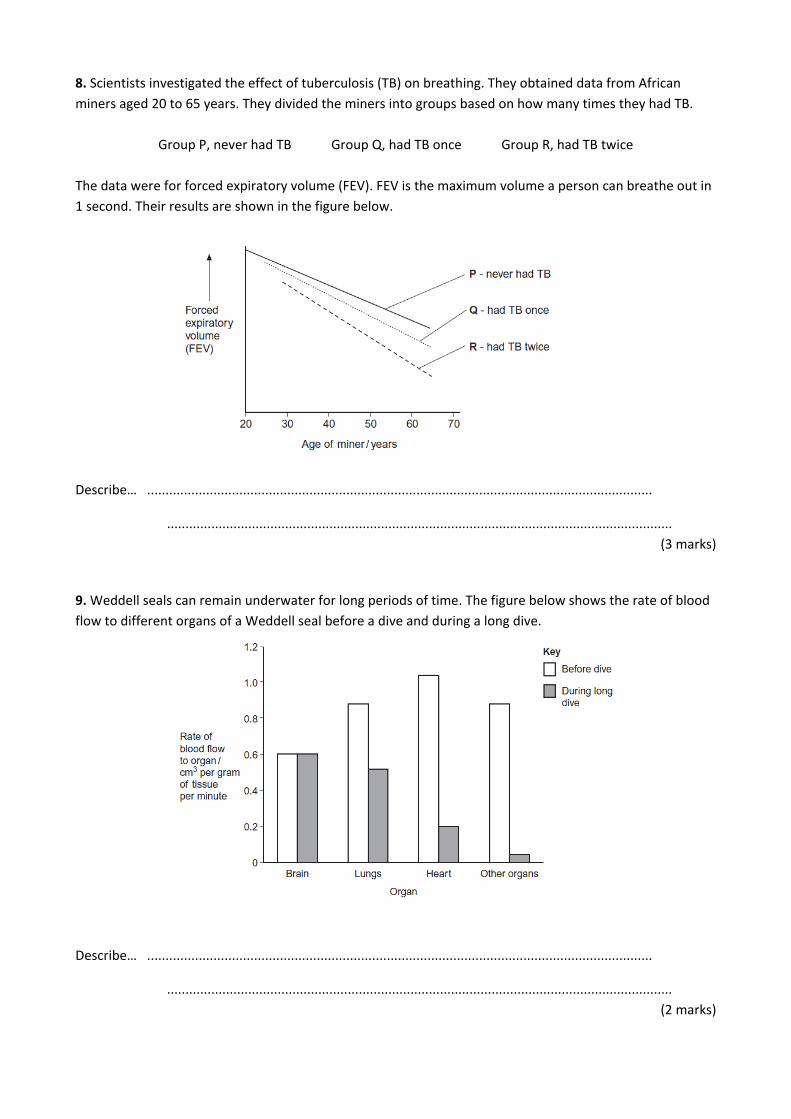
8. Scientists investigated the effect of tuberculosis (TB) on breathing. They obtained data from African miners aged 20 to 65 years. They divided the miners into groups based on how many times they had TB.
Group P, never had TB Group Q, had TB once Group R, had TB twice The data were for forced expiratory volume (FEV). FEV is the maximum volume a person can breathe out in 1 second. Their results are shown in the figure below.
Describe… .........................................................................................................................................
......................................................................................................................................... (3 marks)
9. Weddell seals can remain underwater for long periods of time. The figure below shows the rate of blood flow to different organs of a Weddell seal before a dive and during a long dive.
Describe… .........................................................................................................................................
......................................................................................................................................... (2 marks)
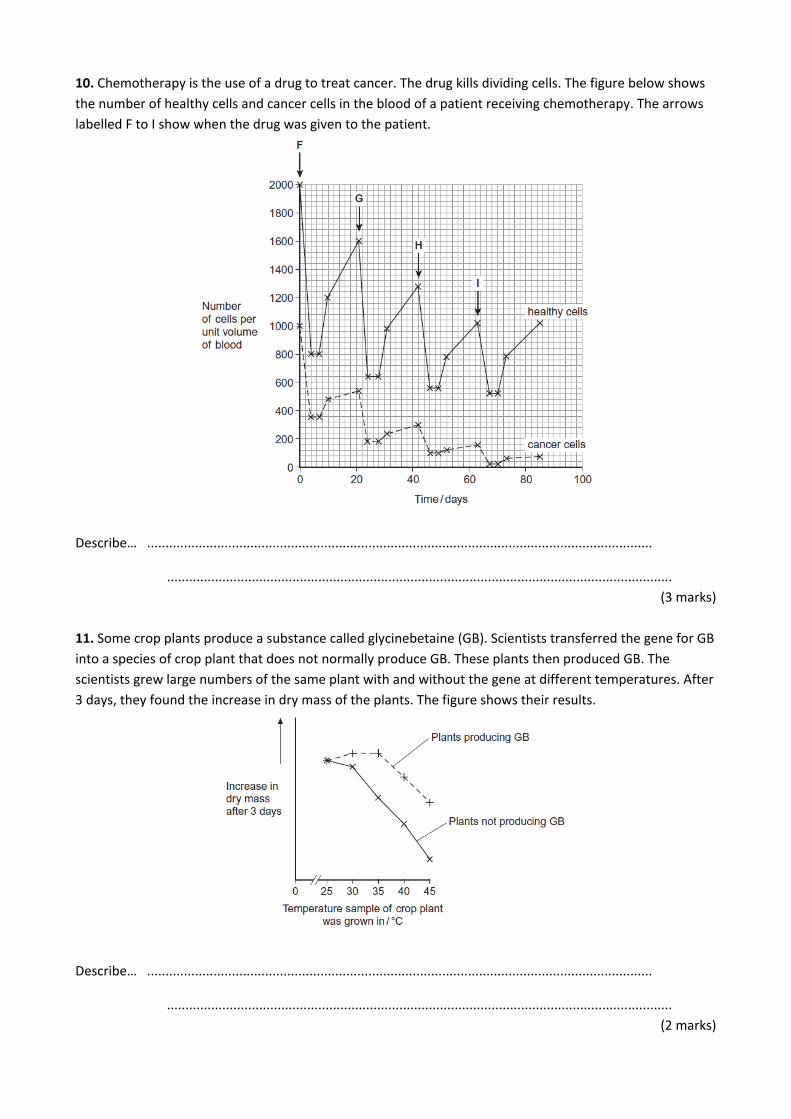
10. Chemotherapy is the use of a drug to treat cancer. The drug kills dividing cells. The figure below shows the number of healthy cells and cancer cells in the blood of a patient receiving chemotherapy. The arrows labelled F to I show when the drug was given to the patient.
Describe… .........................................................................................................................................
......................................................................................................................................... (3 marks)
11. Some crop plants produce a substance called glycinebetaine (GB). Scientists transferred the gene for GB into a species of crop plant that does not normally produce GB. These plants then produced GB. The scientists grew large numbers of the same plant with and without the gene at different temperatures. After 3 days, they found the increase in dry mass of the plants. The figure shows their results.
Describe… .........................................................................................................................................
......................................................................................................................................... (2 marks)
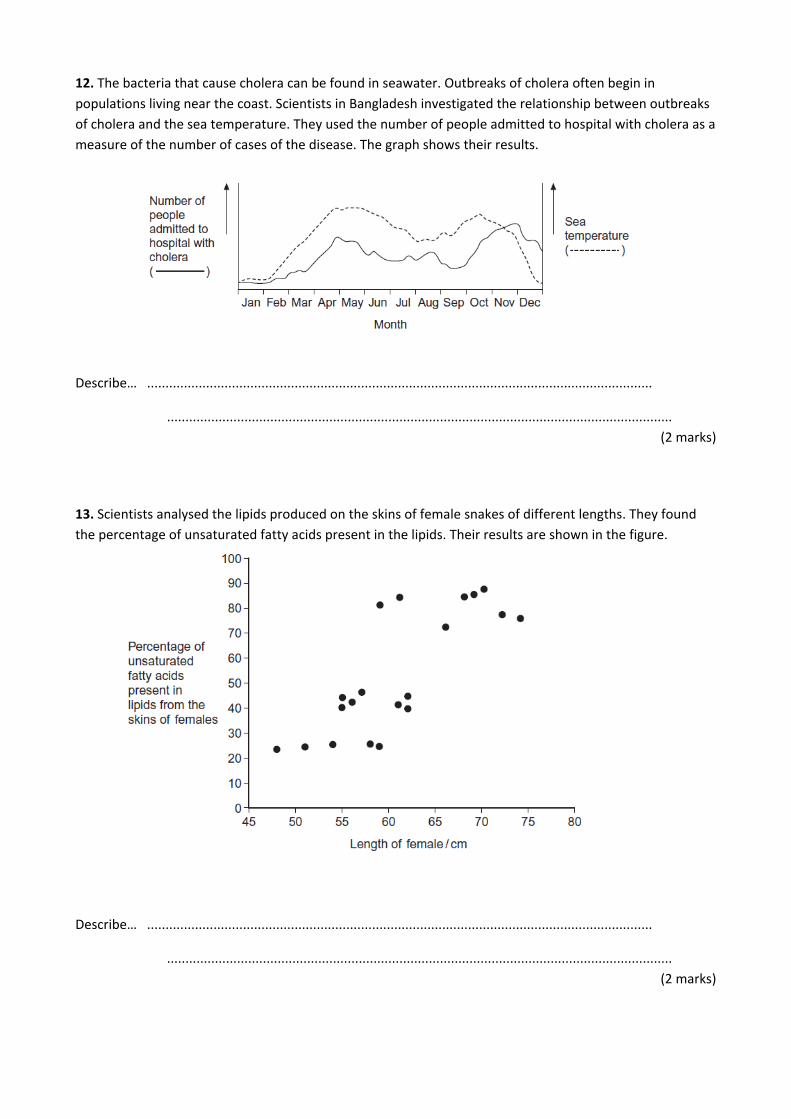
12. The bacteria that cause cholera can be found in seawater. Outbreaks of cholera often begin in populations living near the coast. Scientists in Bangladesh investigated the relationship between outbreaks of cholera and the sea temperature. They used the number of people admitted to hospital with cholera as a measure of the number of cases of the disease. The graph shows their results.
Describe… .........................................................................................................................................
......................................................................................................................................... (2 marks)
13. Scientists analysed the lipids produced on the skins of female snakes of different lengths. They found the percentage of unsaturated fatty acids present in the lipids. Their results are shown in the figure.
Describe… .........................................................................................................................................
......................................................................................................................................... (2 marks)
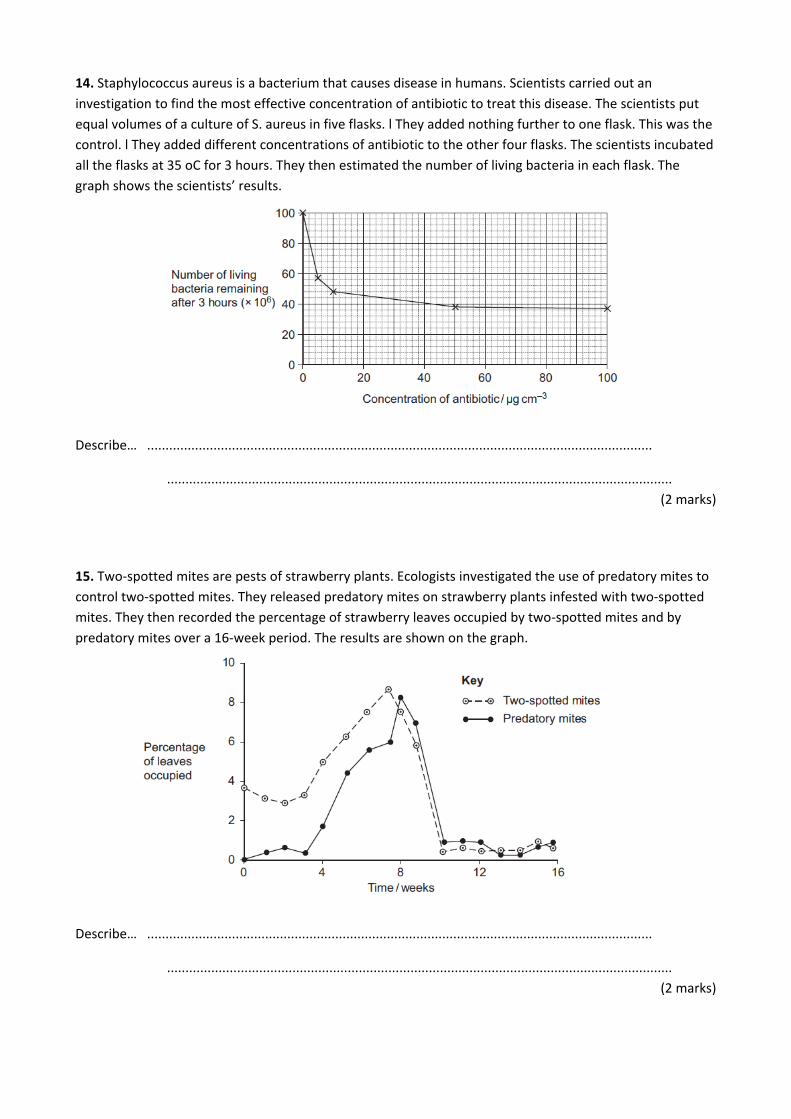
14. Staphylococcus aureus is a bacterium that causes disease in humans. Scientists carried out an investigation to find the most effective concentration of antibiotic to treat this disease. The scientists put equal volumes of a culture of S. aureus in five flasks. l They added nothing further to one flask. This was the control. l They added different concentrations of antibiotic to the other four flasks. The scientists incubated all the flasks at 35 oC for 3 hours. They then estimated the number of living bacteria in each flask. The graph shows the scientists’ results.
Describe… .........................................................................................................................................
......................................................................................................................................... (2 marks)
15. Two-spotted mites are pests of strawberry plants. Ecologists investigated the use of predatory mites to control two-spotted mites. They released predatory mites on strawberry plants infested with two-spotted mites. They then recorded the percentage of strawberry leaves occupied by two-spotted mites and by predatory mites over a 16-week period. The results are shown on the graph.
Describe… .........................................................................................................................................
......................................................................................................................................... (2 marks)

The actual questions
1. Describe the difference in biomass of each of the weed plants in fields treated with herbicides G and H..
.........................................................................................................................................
.........................................................................................................................................
.........................................................................................................................................
.........................................................................................................................................
.........................................................................................................................................
(2 marks)
2. Use information from the figure to describe the results she obtained
.........................................................................................................................................
.........................................................................................................................................
.........................................................................................................................................
.........................................................................................................................................
.........................................................................................................................................
(2 marks)
3. Use the graph to describe the effect of temperature on the rate of respiration.
.........................................................................................................................................
.........................................................................................................................................
.........................................................................................................................................
.........................................................................................................................................
.........................................................................................................................................
.........................................................................................................................................
(2 marks)
4. Describe what the table shows about the effect of bile salts on the digestion of triglycerides. Give the evidence from the table that supports your answer.
.........................................................................................................................................
.........................................................................................................................................
.........................................................................................................................................
.........................................................................................................................................
.........................................................................................................................................
(2 marks)
5. Describe what curve Y shows about the effect of lipase and bile salts on the pH of the mixture.
.........................................................................................................................................
.........................................................................................................................................
.........................................................................................................................................
.........................................................................................................................................
.........................................................................................................................................
(2 marks)
6. The changes in concentration of amylase in the blood of a person with a blocked pancreatic duct are different from those of a healthy person during the period shown in the figure. Describe two of these differences.
.........................................................................................................................................
.........................................................................................................................................
.........................................................................................................................................
.........................................................................................................................................
.........................................................................................................................................
(2 marks)
7. Describe differences in the effect of increasing the concentration of antibiotic on the SR strain and the non-SR strain.
.........................................................................................................................................
.........................................................................................................................................
.........................................................................................................................................
.........................................................................................................................................
.........................................................................................................................................
(2 marks)
8. Describe the results.
.........................................................................................................................................
.........................................................................................................................................
.........................................................................................................................................
.........................................................................................................................................
.........................................................................................................................................
.........................................................................................................................................
.........................................................................................................................................
(3 marks)
9. Describe the changes in the rate of blood flow to the different organs during a long dive.
.........................................................................................................................................
.........................................................................................................................................
.........................................................................................................................................
.........................................................................................................................................
.........................................................................................................................................
(2 marks)
10. Describe similarities and differences in the response of healthy cells and cancer cells to the drug between times F and G.
.........................................................................................................................................
.........................................................................................................................................
.........................................................................................................................................
.........................................................................................................................................
.........................................................................................................................................
.........................................................................................................................................
.........................................................................................................................................
(3 marks)
11. Describe the effect on growth of transferring the gene for GB into this plant.
.........................................................................................................................................
.........................................................................................................................................
.........................................................................................................................................
.........................................................................................................................................
.........................................................................................................................................
(2 marks)
12. Describe the relationship between sea temperature and the number of people admitted to hospital with cholera between January and June.
.........................................................................................................................................
.........................................................................................................................................
.........................................................................................................................................
.........................................................................................................................................
.........................................................................................................................................
(2 marks)
13. Describe how the figure could be used to predict the percentage of unsaturated fatty acids produced by female garter snakes of body length greater than 75 cm.
.........................................................................................................................................
.........................................................................................................................................
.........................................................................................................................................
.........................................................................................................................................
.........................................................................................................................................
(2 marks)

14. Describe the pattern of results shown in the graph.
.........................................................................................................................................
.........................................................................................................................................
.........................................................................................................................................
.........................................................................................................................................
.........................................................................................................................................
(2 marks)
15. Describe how the percentage of leaves occupied by predatory mites changed during the period of this investigation.
.........................................................................................................................................
.........................................................................................................................................
.........................................................................................................................................
.........................................................................................................................................
.........................................................................................................................................
(2 marks)
Markscheme 1. Same number of plants for G and H but total biomass larger in G; So biomass of each plant greater when treated with herbicide G; [2] 2. No overall pattern / pattern (of right or left most common) is not the same for all islands; For (B) C and E there is little difference; Large differences on A and D and opposite ways (to each other). [2 max] 3. Increase in temperature causes increase in respiration rate between 10 and 40oC; Fastest rate at 40oC; Rapid decrease in rate between 40 and 45oC. [2 max] 4. From tube 2, bile salts do not digest triglyceride; From tubes 3 and 1, bile salts speed up action of lipase; From tube 5, bile salts not an enzyme / protein / is not denatured; Assume ‘they’ refer to bile salts [2 max] 5. pH goes down and levels out; after 30 min / pH 6.5; [2]
6. For person with pancreatitis/blocked pancreatic duct: 1. At 0 h/start higher than healthy person / higher than healthy person throughout; 2. Rises then falls whereas healthy person falls then rises; 3. At 48 h/end, below the starting value whereas healthy person is the same (as at start); Differences required for all points [2 max] 7. 1. Non-SR strain falls more/SR strain falls less/up to 10(μg/cm–3); 2. Above 10(μg/cm–3), SR strain levels out/offand non-SR strain continues to decrease; 3. Greater difference between strains with increasing concentration of antibiotic; [2 max] 8. 1. FEV falls / drops with age (even without TB); 2. FEV falls faster / drops further / is lower (with age) with TB / greater drop in FEV with TB; 3. FEV falls fastest / drops furthest / is lowest in those who had TB twice (R); 4. Results for TB once (Q) start in early twenties and for TB twice (R) in late twenties / from 30; [3 max] 9. Brain is the same; All others fall; Lungs fall the least / all other organs fall the most. [2 max]
10. (Similarities): 1. Same/similar pattern / both decrease, stay the same then increase; 2. Number of cells stays the same for same length of time; (Differences): (Per unit volume of blood) 3. Greater/faster decrease in number of healthy cells / more healthy cells killed / healthy cells killed faster; 4. Greater/faster increase in number of healthy cells / more healthy cells replaced/divide / healthy cells replaced/divide faster; [3 max] 11. 1. No effect at 25oC; 2. Keeps growing at 30oC and 35oC/up to 35oC (more than without GB); 3. Above 35oC, falls but grows more than plant without GB; [2 max] 12. 1. Both show little/no increase/remain constant in January/February; 2. (Up to May) sea temperature rises more quickly/before increase in cholera; 3. Both reach a peak in/decline after April/May; [2 max] 13. 1. Draw a line of best fit; 2. Extrapolation / extend line; [2] 14. 1. Falls steeply then levels out / less steep; 2. Fall is less steep after 5-10(μgcm-3 / levels out at / after 50 μgcm-3; [2] 15. 1. Increases, rapid decrease, constant/level/fluctuates; 2. Accept any one of increases at 3/4 weeks / increases to 8 weeks / peaks at 8 weeks / levels at 10 weeks; [2]