Application of the k0 method in neutron activation analysis ...
12
Radiochim. Acta 100, 687–698 (2012) / DOI 10.1524/ract.2012.1957 © by Oldenbourg Wissenschaftsverlag, München Application of the k 0 method in neutron activation analysis and in prompt gamma activation analysis By Zs. R´ evay 1 , ∗ and G. Kennedy 2 1 Technische Universität München, Forschungsneutronenquelle Heinz Maier-Leibnitz (FRM II), 85747 Garching, Germany 2 Ecole Polytechnique, Montreal, Quebec, H3C 3A7, Canada (Received January 31, 2012; accepted in revised form February 17, 2012) (Published online June 25, 2012) k 0 method / Standardization / Neutron activation analysis / Prompt gamma activation analysis Summary. The k 0 method is a highly successful standard- ization method developed for Neutron Activation Analysis (NAA), later also introduced in Prompt Gamma Activation Analysis (PGAA). After the careful calibration of the irradi- ation and counting facilities, the k 0 method makes the use of elemental standards unnecessary. Masses of the components are determined relative to the flux monitor, or, in the case of PGAA, to other known components of the sample. The devel- opment of the method is summarized in this review together with the description of methods implemented at different laboratories. The activities carried out in the laboratories of the authors are described as examples for the successful implementation of the k 0 approach to activation analysis. 1. Introduction Activation with neutrons results in two distinct reaction pro- cesses: immediately after neutron capture, prompt gamma radiation is emitted, and in cases when radioactive nuclides are formed, delayed beta and gamma radiation is also re- leased. The detection of the neutron-induced radioactivity was first recommended for chemical analysis by György Hevesy (in international literature George de Hevesy) in 1936, just a few years after the discovery of neutrons [1]. In the same decade, the prompt activation of nuclei was also discovered [2, 3]. From the early 1960s, neutron activation analysis (NAA) was a quickly developing technique at the first generation of research reactors. Since then, NAA has become one of the most reliable methods for trace-element analysis. The first reactor-based prompt gamma activation analytical (PGAA) experiment was performed at the Institut Laue-Langevin (Grenoble, France) using a chopped neutron beam from a reactor and detecting the gamma rays with a NaI(Tl) detector in 1966 [4, 5]. In the same year, neutron guides were proposed for neutron capture measurements [6], and in just a few years, the first in-beam PGAA measure- ments were performed in Garching and Saclay [7, 8]. How- ever, the real development of the method started only two *Author for correspondence (E-mail: [email protected]). decades later. Since the 1970s, high-resolution semiconduc- tor detectors, nowadays high-purity germanium (HPGe) de- tectors, have been used to acquire gamma spectra. Though there are now many competitors of the nuclear analytical techniques, both activation-analysis techniques have their advantages, which will ensure their positions in the most important neutron research centers. At many laboratories, both PGAA and NAA have been performed using the relative method: the gamma spectra of the irradiated samples are compared to those of similarly prepared standards containing the elements in question. For one analysis, several measurements have to be performed, and this may require a huge collection of expensive refer- ence materials. The standardization of the method became increasingly important in order to make the reliability of the method independent of the practices followed at the different laboratories. In this paper, we deal with the most successful standardization technique, the k 0 method, as applied to both techniques. 2. Theory Both neutrons and gamma photons have a relatively long mean free path in matter (typically of the order of centime- ters in H-free matrices), that is why NAA or PGAA provide information on the whole irradiated volume. In practice, the ideal conditions can be approximated well enough when the illumination of the sample can be regarded as uniform and the emitted gamma radiation is detected without signifi- cant self-absorption. In other words, the obtained signal is fairly matrix-independent. A method like this is an obvious target for standardization, because the intensity of the meas- ured signal can be derived from physical models: from the well-understood laws of neutron capture (or the (n,γ ) reac- tion), nuclear de-excitation and radioactive decay, as well as the principles of radiation detection. The most complete de- scription of k 0 standardization of NAA can be found in [9]. The equivalent equations for PGAA can be found in [10]. In this paper, we start with the description of PGAA, and then NAA will be discussed, as the first one does not involve the correction for radioactive decay, but otherwise the basic equations are the same for both techniques. - 10.1524/ract.2012.1957 Downloaded from De Gruyter Online at 09/28/2016 10:10:58PM via Technische Universität München
-
Upload
khangminh22 -
Category
Documents
-
view
1 -
download
0
Transcript of Application of the k0 method in neutron activation analysis ...

Radiochim. Acta 100, 687–698 (2012) / DOI 10.1524/ract.2012.1957© by Oldenbourg Wissenschaftsverlag, München
Application of the k0 method in neutron activation analysisand in prompt gamma activation analysis
By Zs. Revay1,∗ and G. Kennedy2
1 Technische Universität München, Forschungsneutronenquelle Heinz Maier-Leibnitz (FRM II), 85747 Garching, Germany2 Ecole Polytechnique, Montreal, Quebec, H3C 3A7, Canada
(Received January 31, 2012; accepted in revised form February 17, 2012)(Published online June 25, 2012)
k0 method / Standardization / Neutron activation analysis /Prompt gamma activation analysis
Summary. The k0 method is a highly successful standard-ization method developed for Neutron Activation Analysis(NAA), later also introduced in Prompt Gamma ActivationAnalysis (PGAA). After the careful calibration of the irradi-ation and counting facilities, the k0 method makes the use ofelemental standards unnecessary. Masses of the componentsare determined relative to the flux monitor, or, in the case ofPGAA, to other known components of the sample. The devel-opment of the method is summarized in this review togetherwith the description of methods implemented at differentlaboratories. The activities carried out in the laboratories ofthe authors are described as examples for the successfulimplementation of the k0 approach to activation analysis.
1. Introduction
Activation with neutrons results in two distinct reaction pro-cesses: immediately after neutron capture, prompt gammaradiation is emitted, and in cases when radioactive nuclidesare formed, delayed beta and gamma radiation is also re-leased. The detection of the neutron-induced radioactivitywas first recommended for chemical analysis by GyörgyHevesy (in international literature George de Hevesy) in1936, just a few years after the discovery of neutrons [1]. Inthe same decade, the prompt activation of nuclei was alsodiscovered [2, 3]. From the early 1960s, neutron activationanalysis (NAA) was a quickly developing technique at thefirst generation of research reactors. Since then, NAA hasbecome one of the most reliable methods for trace-elementanalysis. The first reactor-based prompt gamma activationanalytical (PGAA) experiment was performed at the InstitutLaue-Langevin (Grenoble, France) using a chopped neutronbeam from a reactor and detecting the gamma rays witha NaI(Tl) detector in 1966 [4, 5]. In the same year, neutronguides were proposed for neutron capture measurements [6],and in just a few years, the first in-beam PGAA measure-ments were performed in Garching and Saclay [7, 8]. How-ever, the real development of the method started only two
*Author for correspondence (E-mail: [email protected]).
decades later. Since the 1970s, high-resolution semiconduc-tor detectors, nowadays high-purity germanium (HPGe) de-tectors, have been used to acquire gamma spectra.
Though there are now many competitors of the nuclearanalytical techniques, both activation-analysis techniqueshave their advantages, which will ensure their positions inthe most important neutron research centers.
At many laboratories, both PGAA and NAA have beenperformed using the relative method: the gamma spectra ofthe irradiated samples are compared to those of similarlyprepared standards containing the elements in question. Forone analysis, several measurements have to be performed,and this may require a huge collection of expensive refer-ence materials. The standardization of the method becameincreasingly important in order to make the reliability of themethod independent of the practices followed at the differentlaboratories. In this paper, we deal with the most successfulstandardization technique, the k0 method, as applied to bothtechniques.
2. Theory
Both neutrons and gamma photons have a relatively longmean free path in matter (typically of the order of centime-ters in H-free matrices), that is why NAA or PGAA provideinformation on the whole irradiated volume. In practice, theideal conditions can be approximated well enough whenthe illumination of the sample can be regarded as uniformand the emitted gamma radiation is detected without signifi-cant self-absorption. In other words, the obtained signal isfairly matrix-independent. A method like this is an obvioustarget for standardization, because the intensity of the meas-ured signal can be derived from physical models: from thewell-understood laws of neutron capture (or the (n, γ ) reac-tion), nuclear de-excitation and radioactive decay, as well asthe principles of radiation detection. The most complete de-scription of k0 standardization of NAA can be found in [9].The equivalent equations for PGAA can be found in [10].In this paper, we start with the description of PGAA, andthen NAA will be discussed, as the first one does not involvethe correction for radioactive decay, but otherwise the basicequations are the same for both techniques.
- 10.1524/ract.2012.1957Downloaded from De Gruyter Online at 09/28/2016 10:10:58PM
via Technische Universität München
688 Zs. Revay and G. Kennedy
2.1 History
Already before 1970, several researchers had devised stan-dardization techniques for various projects, where calibra-tion factors, sometimes called k factors, were measured forthe gamma rays of the desired elements for specific irradi-ation and counting conditions. It was very convenient tocontinue using these k factors as long as the conditions didnot change [11].
In the early 1970s, Andras Simonits was conducting re-search at the laboratory of Julien Hoste in Gent, Belgium.He proposed to Frans De Corte the development of a stan-dardization of NAA using “universal k factors”, where theessential information for a gamma ray emitted by any nu-clide produced by neutron activation would be contained ina universal constant, the k0 factor, and all the factors depend-ing on the specific irradiation and counting conditions wouldbe calculated by models. Thus, multi-element analysis couldbe performed with the same amount of work as was previ-ously needed for single-element analysis [12].
Following the publication where the k0 method was in-troduced, the development of the method required manyyears of hard work. The k0,Au values relative to the gener-ally used gold flux monitor were accurately measured for thegamma rays of practically all nuclides produced by neutronirradiation, as were the other activation and decay proper-ties mainly at Budapest and Gent [13, 14]. The validated k0
dataset can be found in [15].The first datasets proposed for PGAA did not meet the re-
quirements of chemical analysis [16], and the listed elemen-tal cross-sections and emission probabilities were all biasedwith serious systematic errors [17]. During the 1990s, the k0
standardization was encouraged by Andras Simonits in Bu-dapest, when the new PGAA facility started its operation.The k0 approach was introduced in this technique by Lind-strom et al. [18].
In PGAA, first chlorine was used as a comparator be-cause it has a relatively simple prompt gamma spectrumwith distinct and strong lines, and many elements have stoi-chiometric compounds with chlorine. Titanium as a promptflux monitor was also used at some laboratories. Later, hy-drogen became the ultimate comparator for PGAA, as manyelements could be standardized to it directly when usingstoichiometric compounds or water solutions. Hydrogen hasone characteristic line, its natural form can practically be re-garded as a monoisotopic element, and its cross-section aswell as its characteristic energy has been determined veryaccurately. The first analytical datasets still listed k0,Cl ork0,H values. The final convention uses another composite nu-clear constant, the so-called partial gamma-ray productioncross-section. This cross-section is still determined relativeto a comparator (ultimately to hydrogen), and the wholemethod is still based on the k0 principle, but using cross-sections instead of the ratios of cross-sections, i.e. the k0
factors.A systematic series of measurements was performed in
Budapest from 1997 to 2000, in which the energies andpartial cross-sections of the most important characteristicgamma lines for all naturally occurring elements were de-termined. After an evaluation, the data are now available forusers [19, 20].
2.2 Activation
The basic equation of activation is very simple: the reac-tion rate (R) induced by mono-energetic neutrons is as fol-lows [10]:
R = NσΦ (1)
where N is the number of atoms of the irradiated nuclide,Φ is the neutron flux, and σ is its neutron capture cross-section at the given energy of the neutrons. Eq. (1) is validat any neutron energy, but in neutron capture, the basis isalways the thermal energy: 0.0253 eV. For cross-sectionsmeasured at this energy, we use the name thermal cross-section, denoted by σ0. Most of the nuclides follow the so-called 1/v law for thermal neutrons, thus their cross-sectionswill change equally in different-temperature neutron fields.
In the case of prompt gamma activation, R is the inducedactivity during the irradiation, while the activity of radioac-tive nuclides depends on their half-lives (see later).
In activation analysis, gamma spectra are always col-lected using multi-channel analyzers (MCA-s). First, thegamma detection has to be calibrated by measuring calibra-tion sources with accurately known activities. Once we havethe count-rate-to-activity function, we can determine the ac-tivity of the sample from the areas of characteristic gammapeaks:
A
εt= m
MNAθσPγ Φ (2)
where A is the net peak area of the given gamma line, t is themeasurement time (live time, see below), and ε is the count-ing efficiency at the measured gamma energy; the number ofatoms of interest is the product of the mass of the irradiatedelement m over its molar mass M, the Avogadro constantNA, and the abundance of the target isotope θ; σ is the neu-tron capture cross-section and Pγ is the emission probabilityfrom the transition resulting in the given gamma photon. Theexpression on the left-hand side equals the number of givenenergy photons emitted per unit time, which we will callgamma activity for short in our explanations.
Note that it is assumed that the peak areas have alreadybeen corrected for count-rate dependent random countinglosses, whether they are caused by pulse pile-up or analog-to-digital converter (ADC) dead-time. Since modern spec-trometers have quite accurate live-time clocks, this correc-tion is usually achieved simply by using the live-time inthe factor A/t. In the case of highly varying count rate andsignificant decay of the nuclide during the counting period,typical in certain NAA measurements, it may be more accu-rately done by a real-time correction method, such as loss-free counting, or zero dead-time [21].
The neutron flux depends on the neutron energy, and sodoes the capture cross-section. In principle, the product ofthe flux and the cross-section in the above equations has tobe replaced by the integral of the energy dependent cross-section multiplied by the flux distribution:∫
thermal
σ(En)Φ(En)dEn = Φ0σ0 (3)
where En is the neutron energy. In the case of pure ther-mal neutron fields the integral simplifies to the product of
- 10.1524/ract.2012.1957Downloaded from De Gruyter Online at 09/28/2016 10:10:58PM
via Technische Universität München
Application of k0 in NAA and PGAA 689
an average quantity, the so-called thermal flux (Φ0) and thethermal cross-section (σ0), introduced already above. Thisconvention can be extended to irradiations with cold neutronbeams, too, where all reaction rates are higher thanks to theincreased cross-sections (due to the 1/v law). If we use ther-mal cross-sections (σ0) in our calculations, with an increasedthermal flux (also called thermal equivalent flux, Φ0) we getthe proper reaction rates.
It is advantageous to introduce the so-called partialgamma-ray production cross-section, the product of theabundance, the capture cross-section, and the emission prob-ability:
σγ = θσ0 Pγ (4)
In thermal beams, we still can use Eq. (1) with thermalcross-section and flux [10].
2.3 PGAA
In PGAA, the sample irradiation and the counting of thegamma spectrum take place at the same time. At researchreactors, the sample is placed in a directed neutron beam,and the gamma radiation is detected perpendicular to thatbeam. In pure thermal or cold neutron beams, the followingequation can be used:
A
εt= m
MNAσγΦ0 (5)
where σγ is the partial gamma-ray production cross-section(at thermal neutron energy). This equation can be used forthe determination of m, σγ , or Φ0, if the detector is cali-brated, i.e. its counting efficiency (ε) is known. First, usinga monitor with a known mass and cross-section, the thermalflux can be determined. Then using a standard with a knownmass, the partial cross-section for the studied element can bemeasured. Finally, one can perform the analysis, i.e. deter-mine the mass using the flux and the cross-section.
In collimated beams, higher-energy neutron componentsfrom the reactor may also appear. They are generally at-tenuated with sapphire or bismuth single-crystal filters, sothat their contribution to activation is regarded as negligible.Curved neutron guides provide pure thermal or cold neutronbeams.
The actual flux inside the sample may not always be ac-curately known due to the possibly inhomogeneous beamprofile and neutron scattering, especially when measuringbulk samples. Instead of using a flux monitor, in the case ofhomogeneous samples one can compare the peak area to thatof another component in the same material:
A1/ε1
A2/ε2
= m1
m2
M2
M1
σγ,1
σγ,2
= n1
n2
σγ,1
σγ,2
(6)
Other quantities (measurement time, flux, and the Avogadroconstant) cancel. The mass ratio weighted by the molarmasses can also be replaced with the ratio of the stoi-chiometric coefficients (n). In other words, the ratio of thegamma activities equals the ratio of partial cross-sectiontimes the ratio of the stoichiometric coefficients. This equa-tion is the basis of the accurate quantitative analysis inPGAA, following the k0 approach [10, 22].
In PGAA, it often can be assumed that all major and mi-nor components emit detectable prompt gamma radiations,which allows their determination with reasonable accura-cies. Using the above approach, the composition of suchsamples can be determined in one measurement without theuse of standards or monitors [22].
When irradiating in beam, radioactive nuclides are alsoactivated, whose delayed gamma radiation certainly can beused for elemental analysis. It is especially true for quasi-prompt gamma lines, i.e. those with half-lives in the rangeof seconds or less. Longer-lived nuclides can also have sig-nificant peaks in the spectra. The peak areas of such decaylines have to be corrected for saturation using the followingfactor:
B = 1− 1− e−λt
λt(7)
where λ is the decay constant, t is the measurement time(true time). Nuclear data for short-lived nuclides can be de-termined more accurately in neutron beams than with de-layed radioactivity measurements when the half-life is veryshort [23, 24].
The cross-sections of certain nuclides (133Cd, 157Gd,149Sm, 176Lu) do not follow the 1/v law in the thermalenergy region. This irregular behavior disappears in coldneutron beams and is mostly insignificant in guided beams,too. The increased activation of the irregular nuclides can becorrected for using the so-called Westcott g factors, whichcan be as high as 2–3, when irradiating in collimated thermalbeams [25].
Gamma-ray self-absorption and neutron self-shieldingmay play an important role in PGAA, especially when bulksamples are analyzed. In the case of homogeneous samples,neutron self-shielding will lower the induced activity of allelements to the same extent, so it does not affect the calcu-lation of the mass ratios. The gamma self-absorption, on theother hand, has to be corrected for, because the lower-energygamma rays which are absorbed more strongly would yieldlower masses in the calculation. An analytical formula canbe found for a homogeneous slab sample with thickness d,and with an angle α between the beam and the slab:
A
A0
=d∫
0
e−x(µγ
cos α + µnsin α ) = 1− e−d(
µγcos α + µn
sin α )
µγ
cos α+ µn
sin α
(8)
where A0 would be the ideal peak area with no self-shieldingand self-absorption, µγ is the linear absorption coefficientfor gamma rays, which can be found in publicly availabledatabases [26], µn is the same for neutrons, and it can be cal-culated from the density, the Avogadro constant, the capturecross-section, and the molar mass as: µn = ρNAσ/M. Notethat in this case one has to use the real cross-section, whichcan be calculated from the thermal value based on the 1/v
law, e.g. from the effective beam temperature σ0(Teff/T0)1/2 .
The actual linear absorption coefficients are sums of those ofthe elements weighted with concentration (mass fractions),i.e. they depend on the result of the analysis. The correctionfactor thus can be determined in an iterative way. Normally,one step of iteration is enough [22].
- 10.1524/ract.2012.1957Downloaded from De Gruyter Online at 09/28/2016 10:10:58PM
via Technische Universität München
690 Zs. Revay and G. Kennedy
2.4 NAA
In the case of NAA, the irradiation takes place in the nearlyisotropic field of neutrons in an irradiation channel insidea research reactor, where the other components of the neu-tron spectrum also take part in the activation. Activation bythermal neutrons is usually the most important process. Withthe capture of epithermal neutrons, the same radioactive nu-clides are formed, which emit the same decay gamma rays.Fast neutrons open other reaction channels. The nuclide pro-duced by an (n, p) reaction may be the same as the oneproduced by an (n, γ ) reaction on an isotope of a differentelement, resulting in an interference; the correction for theseinterferences is not discussed here.
When irradiating in research reactors, the increased activ-ities due to the epithermal activation have to be taken into ac-count. The Høgdahl convention [27], used in k0 standardiza-tion, separates the neutron spectrum into two regions, aboveand below the cadmium cut-off energy, 0.55 eV: a cadmiumcover of 0.5 mm absorbs almost all the neutrons below thisenergy. In reactor activation, Eqs. (1) and (3) can be modi-fied like this:
R = N∫
thermal+epithermal
σ(En)Φ(En)dEn = N (Φsσ0 +Φe I0)
= NΦsσ0
(1+ Q0
f
),
Re = N∫
epithermal
σ(En)Φ(En)dEn = NΦe I0 = NΦsσ0
Q0
f(9)
Φs (practically equals Φ0) and Φe are the sub-cadmium andthe epi-cadmium flux, usually simply called the thermal andepithermal flux, while σ0 and I0 are the thermal cross-sectionand the so-called resonance integral, respectively. I0 is theaverage cross-section weighted with a neutron spectrum fol-lowing the theoretical 1/En function between the cadmiumcut-off and the fast neutrons. In this region, many nuclideshave a huge number of resonances, all contributing to I0. Q0
is the ratio of the resonance integral to the thermal cross-section, and f is the ratio of thermal to epithermal flux forthe irradiation channel. Based on the above equations, onecan calculate the activation of the samples in reactors.
After the irradiation, the sample is transferred to a low-background counting facility, where the gamma radiation iscollected by a spectrometer in an energy spectrum. The elec-tronic pulses from the gamma ray detector are sorted by theiramplitudes into the typically 8192 channels of a multichan-nel analyzer (MCA). The net areas of the peaks have to bedivided by the product of the saturation, the decay, and thecounting factors below, to correct for the radioactive decayduring the irradiation, the cooling, and the counting, respec-tively:
S = 1− e−λtirr , D = e−λtd , C = 1− e−λtc
λtc
(10)
where tirr, td, tc are the irradiation, the decay (cooling), andthe counting times (true times), respectively, and λ is the de-cay constant. These factors have also been formalized by thedevelopers of the k0 method for all the more complicatedcases of decay [15]. Thus the detected peak areas, measuredbare and cadmium-covered, can be expressed as:
A
εtSDC= mNA
MθPγσ0Φs
(1+ Q0
f
),
(A)Cd
εtSDC= mNA
MθPγσ0Φs
Q0
f(11)
On the left-hand side, the gamma activities are given, as cal-culated from the peak area and corrected for decay. Thisequation can be directly used for quantitative analysis (deter-mination of m) if the flux-related quantities (Φs, f ), as wellas the cross-section-related and other physical data (M, θ,Pγ , σ0, Q0) are known. These physical data can be found inthe literature, but their accuracies do not meet the require-ments of chemical analysis. The intention of the inventorsof the k0 method was to avoid these inaccuracies when per-forming activation analysis.
A composite nuclear constant, the k0 factor, was intro-duced in the standardization of NAA:
k0,c(x) = Mc
Mx
θxσ0,x Pγ,x
θcσ0,c Pγ,c
(12)
where x denotes the investigated element, and c the com-parator (the cross-section standard, which is 198Au, as will bediscussed later). It can be seen that the k0 is the ratio of thepartial gamma-ray production cross-section (Eq. 4) dividedby the molar mass. Using Eqs. (9) and (11), the k0 factor canbe expressed in another way, too:
k0,c(x) =
(A
mεtSDC
)x
−(
A
mεtSDC
)Cd,x(
A
mεtSDC
)c
−(
A
mεtSDC
)Cd,c
(13)
This expression does not contain physical constants, butexperimental data: peak areas, measurement times andother time-related quantities, counting efficiency and samplemasses. The four terms in parentheses are the gamma activ-ities divided by the mass of the irradiated element, what iscalled specific activity in the k0 literature. The terms with Cdsubscript subtract the epithermal contribution from the spe-cific activity measured without cadmium cover; thus the k0
factor is the ratio of specific activities calculated for thermalactivation. The k0 value can thus be thought of as the numberof gamma rays emitted per unit mass of the element, acti-vated in unit thermal neutron fluence, relative to the similarquantity of the flux monitor.
The k0 factor is a nuclear constant, which can also be de-termined from measured quantities and other experimentaldata. While deriving it from other nuclear data would resultin a rather inaccurate number, its derivation from areas ofspectral peaks and samples masses may be performed veryaccurately, meeting the requirements of chemical analysis.
Q0 values can be determined using the cadmium-ratiomethod, derived from Eq. (11):
Q0 = f(A
mtSDC
)(
A
mtSDC
)Cd
−1
(14)
where f is the thermal-to-epithermal flux ratio, predeter-mined during the calibration of the irradiation channel, and
- 10.1524/ract.2012.1957Downloaded from De Gruyter Online at 09/28/2016 10:10:58PM
via Technische Universität München
Application of k0 in NAA and PGAA 691
in the denominator the ratio of the specific activities meas-ured bare and with cadmium-cover can be seen. (Since wecount the same gamma line in both cases, the efficiency can-cels from the ratio).
A cadmium cover does not perfectly separate the activa-tion in the two energy regions. When resonances of the in-vestigated nuclide coincide with those of cadmium at certainenergies, then the cadmium cover will not transmit 100%of epithermal neutrons. The specific activities determinedwith cadmium cover must be corrected for this using thecadmium transmission factors FCd. Since some of the FCd
factors are not known with the required accuracy, some re-searchers feel that it is preferable not to use Cd covers.
Q0 values can be determined without the use of cadmiumcovers by irradiating in two different channels with highlydiffering f values [28], i.e. using the so-called two-channelmethod. The accuracy attainable is comparable to that of thecadmium-ratio method.
The k0 factor can also be determined without the use ofcadmium covers, once the irradiation channel is calibrated,and if the Q0 value is also known:
k0,c(x) =
(A
mεtSDC
)x(
A
mεtSDC
)c
1+ Q0,c
f
1+ Q0,x
f
(15)
The developers of the k0 method decided to use gold (198Au)
as the comparator, because it has been widely used as a fluxmonitor, and its nuclear data are known with a high accuracy(σ0 = 98.65 ±0.9 barn, I0 = 1550 ±28 barn, Q0 = 15.71±0.28 [29, 30]). Over the years, accurate k0,Au and Q0 valueshave been measured relative to the 64-h half-life, 411-keVgamma line of 198Au for more than 400 gamma rays emittedby more than 122 nuclides, essentially all the gamma raysused in NAA. (In this convention, k0,Au(Au) = 1 [13–15].)
The Høgdahl convention also assumes that in the epither-mal neutron region, the neutron spectrum varies with energyas 1/En. This might not be strictly true from thermal ener-gies up to fast-neutron energies, and even small deviationsfrom this model result in significant systematic errors whenthe nuclide has a high Q0 value. Thus a modification be-came necessary to keep the universality of the method. Theneutron spectrum proved to be described satisfactorily withthe model function 1/E1+α. The shape parameter α can bedetermined with nuclides having greatly differing resonanceenergies, which are thus highly sensitive to the variation ofthe spectrum shape [31].
The resonance integral, and thus the Q0 value, varies withα. It varies most for the reactions which have resonances athigh neutron energies. In the k0 method, the calculation ofQ0(α) is simplified by using the concept of mean resonanceenergy, where the contribution to the resonance integral ofall the resonances is approximated by one resonance situ-ated at the effective mean energy. Then, knowing α, one cancalculate Q0(α) by a theoretical formula:
Q0 (α) = (Q0 −0.429) E−α
r + 0.429
(2α+1)0.55α(16)
The mean resonance energies have been calculated by Jo-vanovic, by integrating over all the resonances available in
the literature for all the (n, γ ) reactions used in neutron ac-tivation analysis [32].
When performing k0 NAA, one has to calibrate carefullythe irradiation and counting facilities first, which means thedetermination of Φs, f , α, and ε. In fact, the thermal fluxmay change from irradiation to irradiation, so a flux moni-tor should be co-irradiated with the sample(s). The masses ofthe elements in the sample can then be determined using thisequation:
mx =
(A
tSDC
)x(
A
mtSDC
)c
1
k0,x
1+ Q0,c(α)
f
1+ Q0,x(α)
f
(17)
The subscripts x and c refer to the unknown and the com-parator, respectively.
The developers of the k0 method emphasized the needto take into account neutron self-shielding, both for thermaland epithermal neutrons. With the self-shielding correctionfactors, the above equation becomes:
mx =
(A
tSDC
)x(
A
mtSDC
)c
1
k0,x
G th,c + Gepi,cQ0,c(α)
f
G th,x + Gepi,xQ0,x (α)
f
(18)
The thermal and epithermal self-shielding factors, G th andGepi, are very close to unity for most activation reactions inmost samples, such as biological materials, and can be ig-nored. But the self-shielding effect is important for samplescontaining large amounts of nuclides with high neutron cap-ture cross sections. Historically, the calculation of G th andGepi was extremely difficult, and it was recommended to di-lute the samples to avoid self-shielding. Now, G th and Gepi
can be calculated easily and accurately with an analyticalformula (see later) [33].
The cross-sections of certain nuclides (like 176Lu and151Eu) do not strictly follow the 1/v law due to low-energyresonances. These nuclides will be activated somewhat dif-ferently in different reactors, depending on the temperaturesof the irradiation channels. In this paper we do not discussthis in detail.
3. Methods
3.1 PGAA
3.1.1 Getting started, spectrum evaluation
PGAA can be best performed in neutron beams. When the k0
approach of PGAA is applied, the composition can be deter-mined without knowing the flux or the mass of the sample.In this case, the calibration of the facility means the deter-mination of the counting efficiency only. The sensitivities,however, are affected by the neutron flux and the samplemass.
After the acquisition of the spectra, one needs spectrum-evaluation software that can fit asymmetric peaks and mul-tiplets from several overlapping peaks. There are not toomany software packages that can do that well. One of them
- 10.1524/ract.2012.1957Downloaded from De Gruyter Online at 09/28/2016 10:10:58PM
via Technische Universität München
692 Zs. Revay and G. Kennedy
is Hypermet [34], which used to be available in many nu-clear laboratories since the 1970s. Its further developed ver-sion with a graphical interface and with calibration routines,Hypermet-PC, became available in 1994, and is still beingused in many laboratories [35, 36].
For the analysis, one needs the spectroscopic database.The most complete and most accurate one has been estab-lished for analytical purposes in Budapest [19]. It is alsoavailable through the IAEA [20].
3.1.2 Flux and flux profile
If the beam is collimated, then the neutron spectrum origi-nally is the same as that inside the reactor. To lower unde-sired reactions, epithermal and fast neutrons are attenuatedwith filters. The neutron spectrum will thus consist of a dom-inant thermal component (Maxwellian with a temperature ofabout 300–320 K) and a much lower epithermal componentwith an f of the order of several hundred.
In the case of guided neutron beams, the thermal spec-trum is strongly distorted, as neutron guides transmit lower-energy neutrons much better. As a result of that, the orig-inally nearly-Maxwellian thermal component becomes sig-nificantly colder (the effective temperature will be typicallybelow 100 K), but the distribution covers a much broaderenergy range from thermal to cold neutrons. Epithermal neu-trons are not guided; thus f increases with the length of theguide, and it is typically above 1000. Curved neutron guidestransmit pure slow (thermal or cold) neutrons.
The performance of the neutron beam can be best charac-terized by the thermal flux. The f value is used for checkingif the epithermal activation is really insignificant. The inho-mogeneity of the beam may be interesting, especially wheninhomogeneous samples are measured. The beam profile canbe studied with an x-ray film, or by mapping the flux acrossthe beam using a small piece of monitor material. When ana-lyzing homogeneous samples using the k0 approach, neitherthe flux, nor its inhomogeneity is important, as they cancelin the calculation.
3.1.3 Efficiency and energy calibration
The most important part of the calibration is the determin-ation of the detector efficiency. The samples are countedduring the irradiation, which can only be performed usinga relatively large sample-to-detector distance. That is whycorrections for coincidence summing are not necessary.
The prompt gamma peaks cover a very broad range ofenergies, typically between 50 keV up to 11 MeV, so theefficiency cannot be determined using a single calibrationsource. Standard radioactive sources are used at lower ener-gies, while above the energies of radioactive decay, promptgamma lines have to be applied. The efficiency calibrationroutine of Hypermet-PC is capable of combining datasetsfrom several measurements and normalizing them together,fitting a 6th –8th-order polynomial to sometimes more thana hundred points [37].
In PGAA, a lower amplifier gain is used than in NAA:one channel in the spectrum equals about 0.7 keV. Anynon-linearity in the channel-to-energy function or a slightchange in the gain may result in significant deviations whenpeak energies are determined. The nonlinearity is an in-
herent characteristic of the spectrometer, which does notchange considerably with time. Using a nonlinearity correc-tion, together with a two-point energy calibration of eachspectrum, reliable energy data can be obtained. At lowenergies, accuracies are typically near 0.01 keV, while atthe highest prompt gamma energies about 0.1 keV can beachieved, which is enough for the identification of peaks.The non-linearity function can be determined by comparingpeak positions to those calculated from a two-point energycalibration. This calibration can also be performed usingHypermet-PC in a similar routine to that of the efficiencycalibration [35].
3.1.4 Analysis
The analysis in PGAA, in principle, is the following: ina carefully calibrated spectrum, the identification of theemitter elements can be performed based on the energies,while the qualitative analysis uses the peak areas. In a typicalprompt gamma spectrum, hundreds, sometimes more thana thousand characteristic peaks appear. So, the chance ofpeak overlaps is rather high. In such a spectrum, the energycannot be the only criterion for qualitative analysis. Hence,a method is needed that examines the energies and the rela-tive intensities of the peaks at the same time. An element canbe regarded as detected only when the matching peaks showa similar intensity pattern as that in the spectrum of the pureelement. The best way to do that is the statistical analysis ofpeak energies and areas.
The ProSpeRo program, developed in Budapest and alsoused in Garching lists all possible matches with the databaseof prompt gamma lines [22] and calculates the masses ofthe elements. The selection of elements is done automat-ically (based on statistical qualifiers like Z scores and χ2
values), but it can be corrected manually. The program alsocorrects for interferences from other components, neutronself-shielding and gamma-ray self-absorption (according toEq. 8), as well as radioactive decay (Eq. 7).
The final mass values and their uncertainties are de-termined as weighted averages from the individual massvalues, calculated for the selected peaks. The major and mi-nor components in most cases are detected with PGAA, sothe composition of the sample can be directly calculatedfrom the peak area ratios.
Oxygen, one of the most abundant components of manynatural materials, has a very low cross-section. Though itcan be analyzed with PGAA, its uncertainty calculated fromthe peak areas is too large, so it may destroy the accuracy ofthe other components. That is why it is advantageous to cal-culate the oxygen content from the stoichiometry, assumingall possible elements as oxides.
The accuracy of the mass values is mainly determined bythose of the peak areas and of the spectroscopy data. For themost abundant elements, uncertainties of about 1% can bereached [22].
3.2 NAA
3.2.1 Getting started, software issues
The essentials of the k0 method are: knowledge of the ther-mal neutron flux, f and α, and detection efficiencies for
- 10.1524/ract.2012.1957Downloaded from De Gruyter Online at 09/28/2016 10:10:58PM
via Technische Universität München
Application of k0 in NAA and PGAA 693
all counting geometries used. Since the calculations for thederivation and the use of these parameters are extensive,a software package is needed. One can begin a collaborationwith one of the many laboratories using the k0 method andadopt their method of calculation and their software. Twosoftware packages are now readily available to all potentialusers. The KAYZERO Software [37] performs the calcula-tions in the well-understood classical manner. It is widelyused and has been well tested over many years. The k0-IAEASoftware [38] uses a holistic approach, making the best pos-sible use of all available information, and benefits from thesupport of the IAEA. The maintainers of both packages alsoprovide training.
The instructions with the software package usually indi-cate how to determine f and α, how to measure the param-eters of the efficiency calibration of the detector and how toconvert it to specific counting geometries, and how to con-vert the peak areas into the concentrations of the elements.These software packages have a library of all the k0, Q0
values, mean resonance energies, half-lives, decay types andthe details of the decay schemes needed for true coincidencesumming calculations.
3.2.2 Measuring f and α
Many methods have been developed to determine f and α.They all involve the activation and counting of a number ofnuclides having a range of Q0 values and mean resonanceenergies. The most accurate measurements of α use irra-diations under cadmium cover to activate with epithermalneutrons only. Most laboratories do not require such high ac-curacy or may not be permitted to irradiate under cadmiumcover. Bare irradiations have been shown to give sufficientaccuracy if done carefully. Since the parameters are deter-mined by subtraction of the thermal-neutron-induced activ-ity from the total activity, two possibly similar quantities,accurate element masses, peak areas and detection efficien-cies are needed. The minimum number of monitors whichneed to be irradiated for the simultaneous determination ofthe Φs, f and α is three. One of the most convenient triosof monitor elements is Cr, Au and Mo [39]. Earlier, the trioconsisting of two isotopes of natural Zr and Au was recom-mended [40].
3.2.3 Detection efficiency ε
Detection efficiencies appear to play only a minor role in theactivation equations, but in fact, their determination is by farthe most difficult aspect of k0 NAA. When using the relativestandardization method, the counting geometry for the un-known is maintained almost identical to that of the standard,and only a small correction factor needs to be calculated.But with the k0 method, for greater flexibility, the count-ing geometry for the unknown may be completely differentfrom that of the monitor, and the comparison is between twodifferent nuclides. It may be straightforward to determinea relative efficiency curve, efficiency vs. gamma-ray energy,for a point source far from the germanium detector, but es-sentially required are efficiencies for small or large samples,most often counted very close to the detector.
The efficiency-calculation routine, a major part of any k0
software package, may use a physical or parametric model,
which calculates the gamma ray detection probability asa function of the position of the emitting nuclide relative tothe centre of the face of the detector. This is integrated overthe volume of the sample, taking into account gamma atten-uation in the sample and its support. Using calibrated anduncalibrated sources, for absolute and relative efficiencies,the user will perform the measurements necessary to deter-mine the parameters of the model; the measured dimensionsof the detector may also be used. Then the parameters of themodel are fine-tuned, using further measurements in typicalcounting geometries.
A huge complication is coincidence summing of gammarays. This is negligible when using the relative method, be-cause the standard and the unknown are the same nuclideand the effect is the same for both. With the k0 method, thesoftware must have the decay schemes of all the nuclidesused, to determine the probability of each decay path in-volving the gamma ray of interest, and the probability, foreach counting geometry, of summing with the gamma raysemitted simultaneously along each decay path. Many rou-tines have been developed to perform coincidence summingcalculations. Three of the routines used with the k0 methodwere compared for the case of a small sample counted closeto the detector [41]. The reduction in detection efficiencydue to summing-out was as high as 30% for some nuclides.Discrepancies between the three routines were as high as10% in some cases and they were corrected.
Not all the routines correct for coincidence summingwith x-rays. This may be important, especially for heavy nu-clides, but it is difficult to correct accurately because it variesgreatly with detector window thickness and sample thick-ness. For this reason, detectors with thin beryllium windowsshould not be used with k0 NAA, unless samples are countedat distances of 10 cm or more. None of the routines correctfor coincidence summing with beta rays. This may be im-portant for some short-lived light nuclides which emit highenergy betas in coincidence with the gamma rays. In thesecases a 4 mm thick plastic absorber should be placed be-tween sample and detector.
3.2.4 Accuracy
In 1987, the developers of the k0 method estimated that theaccuracy was typically 3.8% [42]. Since then, several ex-pert labs have made a considerable effort to understand themethod completely, to determine the causes of their inac-curacies and to eliminate them. These labs now routinelyachieve 2% accuracy under favorable conditions, such ascounting the samples far from the detector. However, fornew labs adopting the method, a large number of paperscomparing results with the accurately known concentrationsin certified reference materials show many deviations be-tween 5 and 10%. These papers did not identify the likelycauses of these deviations and it is unlikely that these labswill ever have the resources necessary to find the causes.Thus, it must be concluded that new labs adopting themethod should expect accuracies of the order of 5%.
An important step towards improved quality assuranceis the development of the SMELS material [43]. There arethree types, SMELS I, II and III, which when activated pro-duce nuclides with short, medium and long half-lives. In
- 10.1524/ract.2012.1957Downloaded from De Gruyter Online at 09/28/2016 10:10:58PM
via Technische Universität München
694 Zs. Revay and G. Kennedy
each of the three spectra one obtains many clear gammaray peaks over the entire energy range, emitted by at leasta dozen nuclides produced by (n, γ ) reactions with low andhigh Q0 values. These stable, homogeneous materials withwell known concentrations of all the elements are very use-ful in verifying the method. In spite of their popularity,the three materials are still available from the developer.SMELS I and II can be recycled after the decay of the nu-clides. The intended use of this material is to verify if the k0
method is being carried out correctly. If discrepancies withthe expected concentrations are observed, the user shoulddetermine the cause and correct it. Since the SMELS mate-rial was originally characterized using mainly the k0 method,it can not be used as an absolute confirmation of the accu-racy of measured concentrations, nor to verify the accuracyof published k0 values.
There is a continuing effort to improve the nuclear database, containing k0 values, Q0 values, mean resonance ener-gies and half-lives. This will make a difference for a few nu-clides for which the currently used k0 and Q0 values may bein error by as much as 10% [28, 44]. The international com-mittee updating the database hopes to recommend new k0
values for all the nuclides for which there is a doubt whetherthe current values are accurate to better than 2% [45].
4. Experimental
4.1 Installation of a PGAA laboratory
A PGAA facility has the simplest equipment among theinstruments installed at a neutron beam. The simplest fa-cilities consist of a beam shutter, a sample holder, a beamstop, and a high-purity germanium detector. Since the ir-radiation and the counting are performed simultaneously,the most important task is the proper arrangement of theshielding against neutrons and gamma rays. Against fastneutrons, boron-loaded polyethylene (or paraffin) can beused; thermal or cold neutrons can be stopped efficientlywith boron-, or lithium-containing materials. Boron pro-duces 478-keV gamma rays, which can be shielded mucheasier than the high-energy prompt gamma radiation fromhigh-cross-section metals like Cd or Gd. Lithium was con-sidered to be the ideal shielding material against slow neu-trons; however, the fast neutron production due to secondaryreactions may cause detector damage. Hence, in high-fluxbeams, the use of lithium has to be avoided, and a combi-nation of boron and lead has to be applied instead. Againstgamma radiation, a massive lead shielding has to be built.The most efficient shielding arrangement is when the differ-ent components (sample, beam stop, and detector) of the in-strument are covered with almost closed lead chambers linedwith the proper neutron shielding sheets, with the smallestpossible apertures in the directions of the beam and detec-tor [46–48].
The sample holder and other structural componentsaround the sample have to be as light as possible, and bemade of low-cross-section materials. Teflon or FEP (con-sisting of carbon and fluorine), aluminum, and lead arepreferred. Plastic because of its hydrogen content or steelhas to be avoided. Samples may be held in the beam usingTeflon strings, and, if necessary, they can be sealed in bags
made of FEP foil. The samples can also be changed manu-ally. In high-flux beams, the sample chamber has to beevacuated to minimize the count rate from the nitrogen con-tent of the air [49].
The detector has to be surrounded with lead shield-ing with a thickness of 10–20 cm to obtain the lowestpossible spectral background. Active background reductiontechniques are also preferred. The best Compton-suppresseddetector system consists of a 25–50-% relative-efficiencyHPGe detector surrounded by a bismuth germanate (BGO)scintillator annulus. Whenever scattered photons are de-tected by the BGO, their signal in the HPGe detector isrejected; thus the characteristic peaks collected without anyenergy loss are detected with a much higher probability,which results in a significant reduction of the spectral back-ground [49].
4.2 Applications of PGAA
PGAA is usually used for the determination of the averagecomposition of the irradiated sample. It is more sensitivethan NAA to the major elements of the matrix; however,certain trace elements can be analyzed with reasonable sen-sitivity. Thus, it is complementary to NAA, which can beregarded as a trace-element analytical technique.
This technique is mainly used for the analysis of sampleswith light-element matrices, and provides a unique opportu-nity for the determination of hydrogen and boron. Minerals,cement, concrete, glass, and ceramic are ideal samples forPGAA, but metals can also be analyzed.
A comprehensive summary of applications is givenin [50]. Here, a few typical measurements will be mentionedmainly performed at Budapest and Garching.
k0-PGAA has been used for the analysis of all types ofgeological samples. For instance, boron was analyzed involcanic rocks together with the determination of the com-position [51]. PGAA has been used extensively in archeol-ogy in Budapest. Various types of prehistoric and polishedstone tools were analyzed and classified based on the re-sults [52, 53]. Inka-period ceramics from the Paria Basin(Dept. Oruro, Bolivia) were also studied [54]. Roman silver-copper coins were analyzed with PGAA, and based on thebulk composition; it was shown that the silver content grad-ually decreased during the period 119–194 AD [55].
PGAA proved to be efficient in the analysis of differ-ent materials in containers with wall thicknesses of severalmillimeters. Nuclear materials were successfully detected inlead containers [56]. When placing a tube-enclosed chem-ical reactor in the beam, the composition of the reactantsinside the irradiated volume can be monitored. The amountof hydrogen during the hydrogenation of n-pentynes on pal-ladium catalysts, varying in the range of 5–50 ppm wasmeasured in situ [57–59].
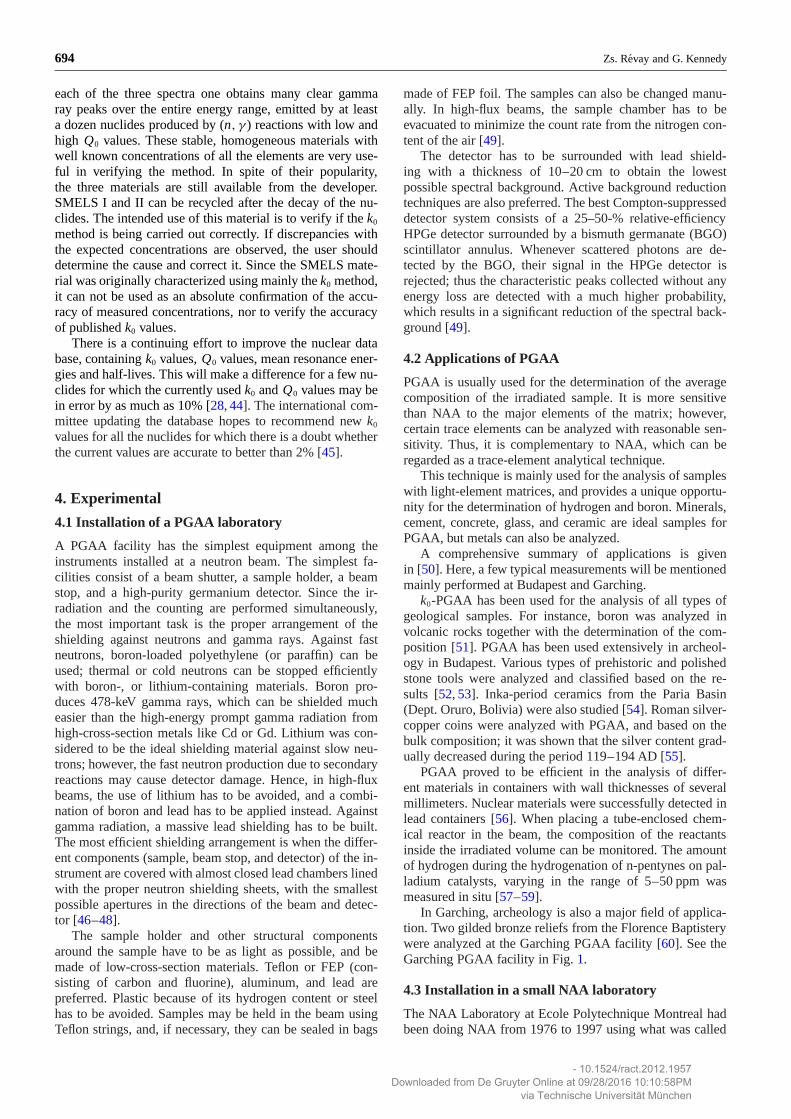
In Garching, archeology is also a major field of applica-tion. Two gilded bronze reliefs from the Florence Baptisterywere analyzed at the Garching PGAA facility [60]. See theGarching PGAA facility in Fig. 1.
4.3 Installation in a small NAA laboratory
The NAA Laboratory at Ecole Polytechnique Montreal hadbeen doing NAA from 1976 to 1997 using what was called
- 10.1524/ract.2012.1957Downloaded from De Gruyter Online at 09/28/2016 10:10:58PM
via Technische Universität München
Application of k0 in NAA and PGAA 695
Fig. 1. The PGAA facility at Garching. Lower right corner: shieldingof the beam stop, left side: shielding and dewar of the detector, in themiddle: sample chamber tube.
the Improved Relative Method with the EPAA software [44].Since the gamma-ray detection efficiencies and the neutronflux of the SLOWPOKE reactor were reproducible to about1 or 2%, it was decided to standardize once and for all forthe gamma-rays of all the nuclides used and for a small num-ber of sample sizes and counting geometries. This approachwas very convenient as it eliminated the need to prepare newstandards for every batch of samples analyzed, but it had twodrawbacks. First, many of the standards prepared and usedat that time were of questionable quality and the sensitivityconstants which were determined from them sometimes haderrors greater than 10%. Second, the method lacked flexi-bility. Measurements were limited to the sample sizes anddensities and counting geometries already standardized anda complete re-standardization was necessary for every reac-tor fuel change (done in 1997), new irradiation channel (twowere installed in 1997) and new germanium detector (typic-ally one every five years).
Thus, in 1997, it was decided to install and adopt the k0
method at the NAA Laboratory. There were several thingsto do: acquire k0 software and the k0 database, measurethe neutron spectrum parameters and measure the param-eters needed for the germanium detector efficiency model.Two major decisions were made. First, it was decided notto use the k0 method in the classical manner, irradiating fluxmonitors with every batch of samples and performing theneutron spectrum calculation and detector efficiency calcu-lation for every sample. Instead, it was decided to retainthe advantages of the convenient Improved Relative Methodand calculate sensitivity constants for each nuclide and fora small number of irradiation channels and counting ge-ometries [61]. A simple spreadsheet was used for this; itused k0 values and other data collected from the publishedliterature.
The second major decision was not to adopt the de-tector efficiency software which was readily available:KAYZERO/SOLCOI Software [44]. The reason was thatwe were using small and large cylindrical irradiation/count-ing vials placed on their sides usually very close to thedetector, dictated by the relatively low neutron flux of theSLOWPOKE reactor. This was not the counting geometry
envisaged when the SOLCOI Software was developed. Ourown detector efficiency model was therefore developed [61].It was found to work well for our purposes. However, the ne-cessary coincidence summing calculations for all nuclideswere found to be extremely complex and long to program.They were finally verified and validated [28].
The measurement of the neutron spectrum parameterswas relatively easy. The bare-triple-monitor method using197Au, 94Zr and 96Zr gave reasonable and reproducible valuesfor f and α. Later, using the more accurate cadmium ratiofor multi-monitor method, it was found that the values of fobtained with the Au-Zr trio were always about 10% high.The recently developed trio of monitor elements Cr, Au andMo [39] was found to be very convenient and gave essen-tially the same values of f and α as the cadmium ratio formulti-monitor method.
Our earliest experience with the use of the k0 method(1997–2001) was very satisfying. For the first time it waspossible to analyze any material for any element with-out having the need for a standard of each element whichmatched the unknown samples. We were able to offer usersan analysis service guaranteeing fast, accurate results.
The development of the k0 method did not cease. Whengood standards became available they were used to verifythe accuracy of the results obtained with the k0 method [41]and in a few cases new k0 and Q0 values were proposed [28].
With the k0 method now working extremely well, it wasfound the analysis results were almost always of high accu-racy, usually between 2 and 5%, for small and large samplesof all types of materials, except for those which containedsevere neutron absorbers causing significant neutron self-shielding. Methods were available for estimating and cor-recting thermal neutron self-shielding but none for epither-mal neutron self-shielding except very difficult Monte-Carlocalculations. Then it was discovered that other researchershad an idea [62] for an analytical formula for epithermalself-shielding with only one nuclear constant to be deter-mined for each nuclide. This was developed at Montreal byChilian et al. [33] and now the effective self-shielding factor,Geff, which is a combination of the thermal and epither-mal self-shielding factors, G th and Gep, can be calculated forcylindrical samples easily and accurately with the followingformula:
Geff = f
f + Q0(α)
⎛⎜⎜⎜⎜⎜⎝
1.00
1+(
NAkth
r(r +h)
∑i
miσabs,i
Mi
)0.964
⎞⎟⎟⎟⎟⎟⎠
+ Q0(α)
f + Q0(α)
⎛⎜⎜⎜⎝ 0.94
1+(
mNAkepσabs,ep
r(r +h)M
)0.82 +0.06
⎞⎟⎟⎟⎠ (19)
with NA Avogadro constant, kth thermal self-shielding con-stant, r and h radius and height of the cylinder, mi massof element i , σabs,i thermal neutron absorption cross-sectionfor element i , Mi molar mass of element i , m mass of theelement, kep epithermal self-shielding constant, σabs,ep ep-
- 10.1524/ract.2012.1957Downloaded from De Gruyter Online at 09/28/2016 10:10:58PM
via Technische Universität München
696 Zs. Revay and G. Kennedy
ithermal neutron absorption cross-section, M molar mass ofthe element.
The thermal neutron absorption cross-sections are wellknown and the recently defined epithermal neutron absorp-tion cross-sections have now been determined for all nu-clides used in NAA [33]. For the analysis of unknownsamples, the normal situation in NAA, the amounts ofthe elements are not known in advance. Therefore, Geff iscalculated with the above formula using first the uncor-rected measured amounts, and the final values of Geff andthe amounts of the elements are obtained by an iterativeprocedure [33].
Another often overlooked benefit of the k0 method is thatit forces the user to understand the models for the neutronirradiation and gamma-ray detection processes. This under-standing, besides making NAA more interesting, is of greatbenefit when analyzing difficult or unusual samples. Theuser better understands what is happening and can make thekey measurements or corrections necessary to achieve accu-rate results.
4.4 Application of k0 NAA at Ecole PolytechniqueMontreal
The k0 method is most useful for multi-element NAA, butalso for single-element NAA when it is inconvenient to pre-pare a good standard of that element that matches the sam-ples in terms of size, density and chemical composition.
At Ecole Polytechnique Montreal, the staff of two orthree performs approximately 1000 multi-element analysesand 3000 single-element analyses per year for researchersand for industry, which enabled the NAA Laboratory to be-come financially self-sufficient. It should be mentioned thatone of the main reasons for this success was the use ofthe very convenient EPAA software. EPAA does the peakarea calculations from the gamma-ray spectrum and alsothe calculation of the concentrations of the elements of in-terest using sensitivity constants derived from k0 and Q0
values, as well as f and α and detection efficiencies for thecounting geometry used. Combining the two steps, peak areacalculation and concentration calculation, allows the ana-
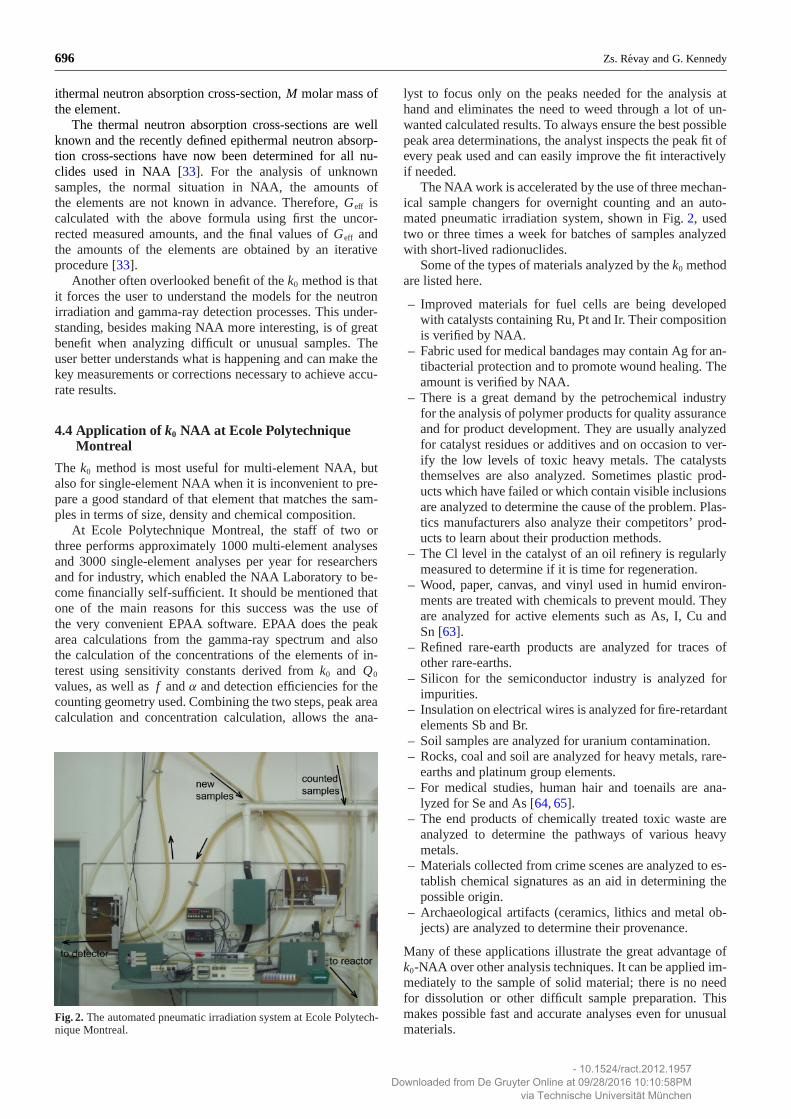
Fig. 2. The automated pneumatic irradiation system at Ecole Polytech-nique Montreal.
lyst to focus only on the peaks needed for the analysis athand and eliminates the need to weed through a lot of un-wanted calculated results. To always ensure the best possiblepeak area determinations, the analyst inspects the peak fit ofevery peak used and can easily improve the fit interactivelyif needed.
The NAA work is accelerated by the use of three mechan-ical sample changers for overnight counting and an auto-mated pneumatic irradiation system, shown in Fig. 2, usedtwo or three times a week for batches of samples analyzedwith short-lived radionuclides.
Some of the types of materials analyzed by the k0 methodare listed here.
– Improved materials for fuel cells are being developedwith catalysts containing Ru, Pt and Ir. Their compositionis verified by NAA.
– Fabric used for medical bandages may contain Ag for an-tibacterial protection and to promote wound healing. Theamount is verified by NAA.
– There is a great demand by the petrochemical industryfor the analysis of polymer products for quality assuranceand for product development. They are usually analyzedfor catalyst residues or additives and on occasion to ver-ify the low levels of toxic heavy metals. The catalyststhemselves are also analyzed. Sometimes plastic prod-ucts which have failed or which contain visible inclusionsare analyzed to determine the cause of the problem. Plas-tics manufacturers also analyze their competitors’ prod-ucts to learn about their production methods.
– The Cl level in the catalyst of an oil refinery is regularlymeasured to determine if it is time for regeneration.
– Wood, paper, canvas, and vinyl used in humid environ-ments are treated with chemicals to prevent mould. Theyare analyzed for active elements such as As, I, Cu andSn [63].
– Refined rare-earth products are analyzed for traces ofother rare-earths.
– Silicon for the semiconductor industry is analyzed forimpurities.
– Insulation on electrical wires is analyzed for fire-retardantelements Sb and Br.
– Soil samples are analyzed for uranium contamination.– Rocks, coal and soil are analyzed for heavy metals, rare-
earths and platinum group elements.– For medical studies, human hair and toenails are ana-
lyzed for Se and As [64, 65].– The end products of chemically treated toxic waste are
analyzed to determine the pathways of various heavymetals.
– Materials collected from crime scenes are analyzed to es-tablish chemical signatures as an aid in determining thepossible origin.
– Archaeological artifacts (ceramics, lithics and metal ob-jects) are analyzed to determine their provenance.
Many of these applications illustrate the great advantage ofk0-NAA over other analysis techniques. It can be applied im-mediately to the sample of solid material; there is no needfor dissolution or other difficult sample preparation. Thismakes possible fast and accurate analyses even for unusualmaterials.
- 10.1524/ract.2012.1957Downloaded from De Gruyter Online at 09/28/2016 10:10:58PM
via Technische Universität München
Application of k0 in NAA and PGAA 697
5. Conclusion
The k0 approach has proved to be a successful method ofstandardization of both prompt gamma activation analysisand neutron activation analysis. During the standardization,the physical processes of neutron capture, de-excitation,and detection have been studied thoroughly, and the resultswere implemented in the methods. Reliable spectroscopydatabases have been established, which are available and cannow be used for chemical analysis. The k0 method has beenintroduced at many NAA and also PGAA laboratories, pro-viding an important step towards laboratory-independent,highly reliable analytical results.
Acknowledgment. The shared knowledge of Andras Simonits on thehistory of the k0 method is appreciated. The help by Zsolt Kasztovszkyin the compilation of the archeological applications of PGAA is alsoacknowledged.
References
1. Hevesy, Gy., Levi, H.: Det. Kgl. Dan. Vidensk. Selskab. Math.-Fys. Medd. Ser. 14, 3 (1936).
2. Amaldi, E., d. Agostino, O., Pontecorvo, B., Segre, E.: RecercaSci. 2, 467 (1934).
3. Lea, D. E.: Nature 133, 24 (1934).4. Isenhour, T. L., Morrison, G. H.: Anal. Chem. 38, 162 (1966).5. Isenhour, T. L., Morrison, G. H.: Anal. Chem. 38, 167 (1966).6. Maier-Leibnitz, H.: Nukleonik 8, 61 (1966).7. Comar, D., Crouzel, C., Chasteland, Riviere, R., Kellershohn, C.:
Nucl. Appl. 6, 344 (1969).8. Henkelmann, R., Born, H. J.: Angew. Chem. 81, 921 (1969).9. De Corte, F.: The k0-standardization method, a move to the opti-
mization of neutron activation analysis. Habilitation Thesis, Uni-versity of Gent, Belgium (1987).
10. Revay, Zs., Belgya, T.: Principles of PGAA. In: Prompt GammaActivation Analysis with Neutron Beams. (Molnar, G. L., ed.)Kluwer Academic Publishers, Dordrecht (2004), p. 1.
11. Girardi, F., Guzzi, G., Pauly, J.: Anal. Chem. 36, 1588 (1964).12. Simonits, A., De Corte, F., Hoste, J.: J. Radioanal. Chem. 24, 31
(1975).13. De Corte, F., Simonits, A., De Wispelaere, A., Elek, A.: J. Ra-
dioanal. Nucl. Chem. Art. 133, 3 (1989).14. De Corte, F., Simonits, A.: J. Radioanal. Nucl. Chem. Art. 133, 43
(1989).15. De Corte, F., Simonits, A.: At. Data Nucl. Data Tables 85, 47
(2003).16. Lone, M. A., Leavitt, R. A., Harrison, D. A.: At. Data Nucl. Data
Tables 26, 511 (1981).17. Molnar, G. L.: J. Radioanal. Nucl. Chem. 244, 27 (2000).18. Lindstrom, R. M., Fleming, R. F., Paul, R. L., Mackey, E. A.: The
k0 Approach in Cold-neutron Prompt-gamma Activation Analysis.In: Proc. Int. k0 Users Workshop (De Corte, F., ed.) UniversiteitGent, Gent (1992), p. 121.
19. Choi, H. D., Firestone, R. B., Lindstrom, R. M., Molnar, G. L.,Mughabghab, S. F., Paviotti-Corcuera, R., Revay, Zs., Trkov, A.,Zerkin, V., Chunmei, Z.: Database of prompt gamma rays fromslow neutron capture for elemental analysis. International AtomicEnergy Agency, Vienna (2007).
20. Revay, Zs., Firestone, R. B., Molnar, G. L., Belgya, T.: Catalogand atlas of prompt gamma rays. In: Prompt Gamma ActivationAnalysis with Neutron Beams. (Molnar, G. L., ed.) Kluwer Aca-demic Publishers, Dordrecht (2004), p. 173.
21. Pomme, S.: Nucl. Instrum. Methods Phys. Res. A 474, 245(2001).
22. Revay, Zs.: Anal. Chem. 81, 6851 (2009).23. Szentmiklosi, L., Revay, Zs., Belgya, T.: Nucl. Instrum. Methods
Phys. Res. 564, 655 (2006).24. Revay, Zs., Molnar, G. L., Belgya, T., Kasztovszky, Zs.: J. Ra-
dioanal. Nucl. Chem. 257, 561 (2003).25. Revay, Zs.: Nucl. Instrum. Methods Phys. Res. B 263, 79 (2007).
26. Hubbell, J. H.: Appl. Radiat. Isot. 33, 1269 (1982), available at:http://www.nist.gov/pml/data/xraycoef/.
27. Høgdahl, O. T.: In: Proceed. Symp. Radiochemical Methods ofAnalysis, Salzburg, 19–23 October 1964, IAEA, Vienna (1965),p. 23.
28. St-Pierre, J., Kennedy, G.: Nucl. Instrum. Methods Phys. Res. A564, 669 (2006).
29. Mughabghab, S. F.: Neutron Cross Sections, Part B: Z = 61–100.Acad. Press, New York (1984).
30. Holden, N. E.: Report BNL-NCS-36965. Brookhaven NationalLaboratory, Brookhaven (1985).
31. de Corte, F., Moens, L., Simonits, A., de Wispelaere, A., Hoste, J.:J. Radioanal. Nucl. Chem. 52, 295 (1979).
32. Jovanovic, S., de Corte, F., Simonits, A., Moens, L., Vukotic, P.,Hoste, J.: J. Radioanal. Nucl. Chem. 113, 177 (1987).
33. Chilian, C., St-Pierre, J., Kennedy, G.: J. Radioanal. Nucl. Chem.278, 745 (2008).
34. Phillips, G. W., Marlow, K. W.: Nucl. Instrum. Methods 137, 525(1976).
35. Fazekas, B., Östör, J., Kis, Z., Molnar, G. L., Simonits, A.: Thenew features of Hypermet-PC. (Molnar, G., Belgya, T., Revay, Zs.,eds.) in: Proc. 9th International Symposium on Capture Gamma-Ray Spectroscopy and Related Topics, Budapest, Hungary, 8–12October 1997, Springer Verlag, Budapest/Berlin/Heidelberg(1997), p. 774.
36. Revay, Zs., Belgya, T., Molnar, G. L.: J. Radioanal. Nucl. Chem.265, 261 (2005).
37. KAYZERO/SOLCOI: PC software package. DSM Research, POB18, 6160 MD Geleen, The Netherlands (1996).
38. Rossbach, M., Blaauw, M., Bacchi, M. A., Xilei, L.: J. Radioanal.Nucl. Chem. 274, 657 (2007).
39. Koster-Ammerlaan, M. J. J., Bacchi, M. A., Bode, P., Fernan-des, E. A. D. N.: Apppl. Radiat. Isot. 66, 1964 (2008).
40. de Corte, F., Moens, L., Sordo-El Hammami, K., Simonits, A.,Hoste, J.: J. Radioanal. Nucl. Chem. 52, 305 (1979).
41. van Sluijs, R., Bossus, D., Blaauw, M., Kennedy, G., De Wis-pelaere, A., van Lierde, S., De Corte, F., J. Radioanal. Nucl.Chem. 244, 675 (2000).
42. De Corte, F., Simonits, A., De Wispelaere, A., Hoste, J.: J. Ra-dioanal. Nucl. Chem. Art. 113, 145 (1987).
43. Vermaercke, P., Robouch, P., Eguskiza, M., De Corte, F., Kenne-dy, G., Smodis, B., Jacimovic, R., Yonezawa, C., Matsue, H.,Lin, X., Blaauw, M., Kucera, J.: Nucl. Instrum. Methods Phys.Res. A 564, 675 (2006).
44. Kennedy, G., St-Pierre, J.: J. Radioanal. Nucl. Chem. 257, 475(2003).
45. http://www.kayzero.com/k0naa/k0naa/k0-International_Scientific_Committee.html.
46. Revay, Zs., Harrison, R. K., Alvarez, E., Biegalski, S. R., Lands-berger, S.: Nucl. Instrum. Methods Phys. Res. A 577, 611 (2007).
47. Molnar, G. L., Revay, Zs., Belgya, T.: Nucl. Instrum. MethodsPhys. Res. A 489, 140 (2002).
48. Revay, Zs., Belgya, T., Kasztovszky, Zs., Weil, J. L., Molnar, G. L.:Nucl. Instrum. Methods Phys. Res. B 213, 385 (2004).
49. Lindstrom, R. M., Revay, Zs.: Beams and facilities.. In: Hand-book of Prompt Gamma Activation Analysis with Neutron Beams.(Molnar, G. L., ed.) Kluwer Academic Publishers, Dordrecht(2004), p. 31.
50. Anderson, D. L., Kasztovszky, Zs.: Applications of PGAA withneutron beams. In: Handbook of Prompt Gamma Activation An-alysis with Neutron Beams. (Molnar, G. L., ed.) Kluwer AcademicPublishers, Dordrecht (2004), p. 137.
51. Gmeling, K., Harangi, Sz., Kasztovszky, Zs.: J. Radioanal. Nucl.Chem. 265, 201 (2005).
52. Kasztovszky, Zs., Biro, K. T., Marko, A., Dobosi, V.: Archaeo-metry 50, 12 (2008).
53. Szakmany, Gy., Kasztovszky, Zs., Szilagyi, V., Starnini, E., Frie-del, O., Biro, K. T.: Eur. J. Mineral. 23, 883 (2011).
54. Szilagyi, V., Gyarmati, J., Toth, M., Taubald, H., Balla, M.,Kasztovszky, Zs., Szakmany, Gy.: J. South Am. Earth Sci. 36, 1(2012).
55. Kasztovszky, Zs., Panczyk, E., Fedorowicz, W., Revay, Zs., Sar-towska, B.: J. Radioanal. Nucl. Chem 265, 193 (2005).
56. Revay, Zs.: J. Radioanal. Nucl. Chem. 276, 825 (2008).
- 10.1524/ract.2012.1957Downloaded from De Gruyter Online at 09/28/2016 10:10:58PM
via Technische Universität München
698 Zs. Revay and G. Kennedy
57. Teschner, D., Borsodi, J., Wootsch, A., Revay, Zs., Havecker, M.,Knop-Gericke, A., Jackson, S. D., Schlogl, R.: Science 320, 86(2008).
58. Teschner, D., Revay, Zs., Borsodi, J., Havecker, M., Knop-Geric-ke, A., Schlogl, R., Milroy, D., Jackson, S. D., Torres, D., Sautet,P.: Angew. Chem. Int. Ed. 47, 9274 (2008).
59. Revay, Zs., Belgya, T., Szentmiklosi, L., Kis, Z., Wootsch, A.,Teschner, D., Swoboda, M., Schlogl, R., Borsodi, J., Zepernick, R.:Anal. Chem. 80, 6066 (2008).
60. Festa, G., Andreani, C., De Pascale, M. P., Senesi, R., Vitali, G.,Porcinai, S., Giusti, A. M., Schulze, R., Canella, L., Kudejova, P.,Muhlbauer, M., Schillinger, B.: J. Appl. Phys. 106, 074909 (2009).
61. Kennedy, G., St-Pierre, J., Wang, K., Zhang, Y., Preston, J.,Grant, C., Vutchkov, M.: J. Radioanal. Nucl. Chem. 245, 167(2000).
62. Martinho, E., Gonçalves, I. F., Salgado, J.: Appl. Radiat. Isot. 58,371 (2003).
63. Kennedy, G.: Treating wood with chemical preservatives. In: An-alytical Applications of Nuclear Techniques. (Rossbach, M., ed.),IAEA Publications, Vienna (2004), p. 123.
64. Foster, H., Kennedy, G., Maisonneuve, P., Krewski, D., Ghadirian,P.: Trends Cancer Res. 4, 15 (2008).
65. Noisel, N., Bouchard, M., Carrier, G.: Environ. Toxicol. Pharma-col. 29, 252 (2010).
- 10.1524/ract.2012.1957Downloaded from De Gruyter Online at 09/28/2016 10:10:58PM
via Technische Universität München