Application of retracked satellite altimetry for inland hydrologic studies
17
Application of retracked satellite altimetry for inland hydrologic studies MANMAN ZHANG†, HYONGKI LEE†, C. K. SHUM†, DOUG ALSDORF†, FRANK SCHWARTZ†, KUO-HSIN TSENG†, YUCHAN YI†, CHUNG-YEN KUO*‡, HONG-ZENG TSENG‡, ALEXANDER BRAUN§, STE ´ PHANE CALMANT¶, NAZIANO FILIZOLAj and FREDERIQUE SEYLER†† †Geodetic Science School of Earth Sciences, The Ohio State University, Columbus, Ohio, USA ‡Department of Geomatics, National Cheng Kung University, No.1, Ta-Hsueh Road, Tainan 701, Taiwan, ROC §Department of Geosciences, University of Texas at Dallas, Richardson, Texas, USA ¶Universite ´ de Toulouse, LEGOS UMR CNRS/UT3/CNES/IRD, Brasilia, Brazil jUniversidade Estadual de Amazonas, Manaus, Brazil ††Universite ´ de Toulouse, LMTG UMR CNRS/UT3/IRD, Brasilia, Brazil We explored the application of satellite radar altimetry for the monitoring of small inland bodies of water and hydrologic studies using a water-detection algorithm, optimally retracked TOPEX/POSEIDON data at 10-Hz sampling, and investi- gated the use of radar backscatter to improve land cover classification. The procedure was demonstrated over Manitoba and south-western (SW) Ontario, and the Amazon River Basin study regions. Compared with an L-band synthetic aperture radar data generated water-land cover mask, the water-detection algo- rithm detected more water points over the Amazon basin. High correlation of 0.98 between the retracked 10-Hz altimetry and the gauge measurements in Manitoba confirmed that the retracked TOPEX data are more accurate than the non- retracked data, and with higher along-track spatial resolution by virtue of its higher sampling at 10 Hz. 1. Introduction There are hundreds of thousands of reservoirs and millions of lakes in the world. However, it is still unclear how the storage of these bodies of water changes seasonally and interannually, and how they interact with global climate change. Although water level measurements are critical to hydrological, hydraulic and climatologic studies, their availability is hindered by the limitation of the traditional hydrological obser- ving tools—in situ gauge measurements. The stage gauge measurements are only available at limited sites within a watershed and are especially restricted by the inaccessibility of remote study regions. The availability of in situ data is limited by logistical problems or political reasons resulting in the unavailability of hydrologic data to users. Satellite measurements, in particular active remote-sensing measure- ments such as satellite altimetry, have been demonstrated to be effective for hydro- logic studies over a large basin or at the global scale with adequate temporal and spatial resolutions. *Corresponding author. Email: [email protected] International Journal of Remote Sensing ISSN 0143-1161 print/ISSN 1366-5901 online # 2010 Taylor & Francis http://www.tandf.co.uk/journals DOI: 10.1080/01431161.2010.483495 International Journal of Remote Sensing Vol. 31, No. 14, 20 July 2010, 3913–3929 Downloaded By: [Calmant, Stéphane] At: 15:16 9 August 2010
Transcript of Application of retracked satellite altimetry for inland hydrologic studies

Application of retracked satellite altimetry for inland hydrologic studies
MANMAN ZHANG†, HYONGKI LEE†, C. K. SHUM†, DOUG ALSDORF†,
FRANK SCHWARTZ†, KUO-HSIN TSENG†, YUCHAN YI†,
CHUNG-YEN KUO*‡, HONG-ZENG TSENG‡, ALEXANDER BRAUN§,
STEPHANE CALMANT¶, NAZIANO FILIZOLAjand FREDERIQUE SEYLER††
†Geodetic Science School of Earth Sciences, The Ohio State University, Columbus, Ohio, USA
‡Department of Geomatics, National Cheng Kung University, No.1, Ta-Hsueh Road, Tainan
701, Taiwan, ROC
§Department of Geosciences, University of Texas at Dallas, Richardson, Texas, USA
¶Universite de Toulouse, LEGOS UMR CNRS/UT3/CNES/IRD, Brasilia, Brazil
jUniversidade Estadual de Amazonas, Manaus, Brazil
††Universite de Toulouse, LMTG UMR CNRS/UT3/IRD, Brasilia, Brazil
We explored the application of satellite radar altimetry for the monitoring of small
inland bodies of water and hydrologic studies using a water-detection algorithm,
optimally retracked TOPEX/POSEIDON data at 10-Hz sampling, and investi-
gated the use of radar backscatter to improve land cover classification. The
procedure was demonstrated over Manitoba and south-western (SW) Ontario,
and the Amazon River Basin study regions. Compared with an L-band synthetic
aperture radar data generated water-land cover mask, the water-detection algo-
rithm detected more water points over the Amazon basin. High correlation of 0.98
between the retracked 10-Hz altimetry and the gauge measurements in Manitoba
confirmed that the retracked TOPEX data are more accurate than the non-
retracked data, and with higher along-track spatial resolution by virtue of its
higher sampling at 10 Hz.
1. Introduction
There are hundreds of thousands of reservoirs and millions of lakes in the world.
However, it is still unclear how the storage of these bodies of water changes seasonally
and interannually, and how they interact with global climate change. Although water
level measurements are critical to hydrological, hydraulic and climatologic studies,
their availability is hindered by the limitation of the traditional hydrological obser-
ving tools—in situ gauge measurements. The stage gauge measurements are onlyavailable at limited sites within a watershed and are especially restricted by the
inaccessibility of remote study regions. The availability of in situ data is limited by
logistical problems or political reasons resulting in the unavailability of hydrologic
data to users. Satellite measurements, in particular active remote-sensing measure-
ments such as satellite altimetry, have been demonstrated to be effective for hydro-
logic studies over a large basin or at the global scale with adequate temporal and
spatial resolutions.
*Corresponding author. Email: [email protected]
International Journal of Remote SensingISSN 0143-1161 print/ISSN 1366-5901 online # 2010 Taylor & Francis
http://www.tandf.co.uk/journalsDOI: 10.1080/01431161.2010.483495
International Journal of Remote Sensing
Vol. 31, No. 14, 20 July 2010, 3913–3929
Downloaded By: [Calmant, Stéphane] At: 15:16 9 August 2010
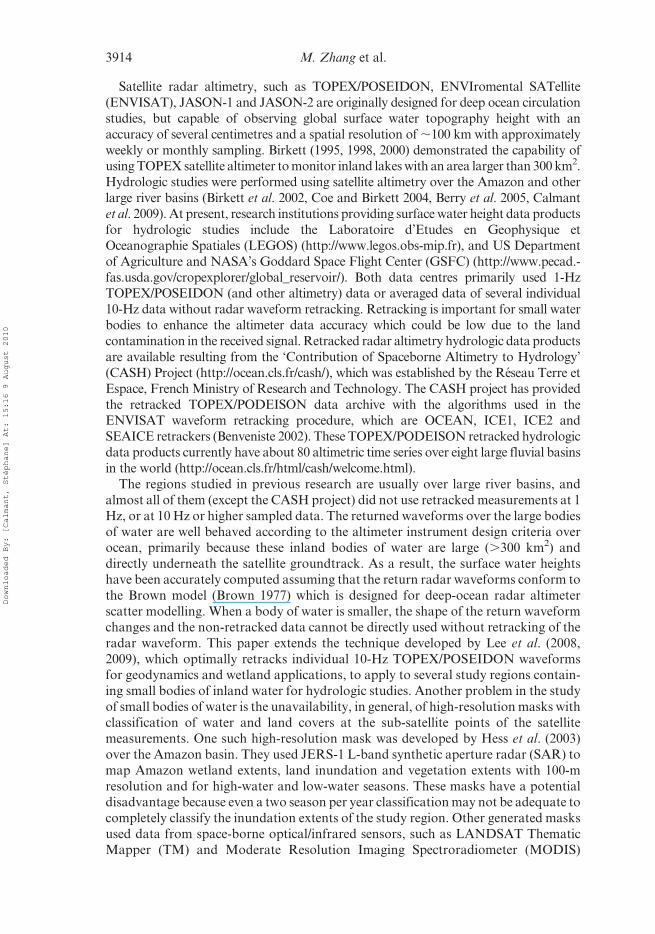
Satellite radar altimetry, such as TOPEX/POSEIDON, ENVIromental SATellite
(ENVISAT), JASON-1 and JASON-2 are originally designed for deep ocean circulation
studies, but capable of observing global surface water topography height with an
accuracy of several centimetres and a spatial resolution of ,100 km with approximately
weekly or monthly sampling. Birkett (1995, 1998, 2000) demonstrated the capability ofusing TOPEX satellite altimeter to monitor inland lakes with an area larger than 300 km2.
Hydrologic studies were performed using satellite altimetry over the Amazon and other
large river basins (Birkett et al. 2002, Coe and Birkett 2004, Berry et al. 2005, Calmant
et al. 2009). At present, research institutions providing surface water height data products
for hydrologic studies include the Laboratoire d’Etudes en Geophysique et
Oceanographie Spatiales (LEGOS) (http://www.legos.obs-mip.fr), and US Department
of Agriculture and NASA’s Goddard Space Flight Center (GSFC) (http://www.pecad.-
fas.usda.gov/cropexplorer/global_reservoir/). Both data centres primarily used 1-HzTOPEX/POSEIDON (and other altimetry) data or averaged data of several individual
10-Hz data without radar waveform retracking. Retracking is important for small water
bodies to enhance the altimeter data accuracy which could be low due to the land
contamination in the received signal. Retracked radar altimetry hydrologic data products
are available resulting from the ‘Contribution of Spaceborne Altimetry to Hydrology’
(CASH) Project (http://ocean.cls.fr/cash/), which was established by the Reseau Terre et
Espace, French Ministry of Research and Technology. The CASH project has provided
the retracked TOPEX/PODEISON data archive with the algorithms used in theENVISAT waveform retracking procedure, which are OCEAN, ICE1, ICE2 and
SEAICE retrackers (Benveniste 2002). These TOPEX/PODEISON retracked hydrologic
data products currently have about 80 altimetric time series over eight large fluvial basins
in the world (http://ocean.cls.fr/html/cash/welcome.html).
The regions studied in previous research are usually over large river basins, and
almost all of them (except the CASH project) did not use retracked measurements at 1
Hz, or at 10 Hz or higher sampled data. The returned waveforms over the large bodies
of water are well behaved according to the altimeter instrument design criteria overocean, primarily because these inland bodies of water are large (.300 km2) and
directly underneath the satellite groundtrack. As a result, the surface water heights
have been accurately computed assuming that the return radar waveforms conform to
the Brown model (Brown 1977) which is designed for deep-ocean radar altimeter
scatter modelling. When a body of water is smaller, the shape of the return waveform
changes and the non-retracked data cannot be directly used without retracking of the
radar waveform. This paper extends the technique developed by Lee et al. (2008,
2009), which optimally retracks individual 10-Hz TOPEX/POSEIDON waveformsfor geodynamics and wetland applications, to apply to several study regions contain-
ing small bodies of inland water for hydrologic studies. Another problem in the study
of small bodies of water is the unavailability, in general, of high-resolution masks with
classification of water and land covers at the sub-satellite points of the satellite
measurements. One such high-resolution mask was developed by Hess et al. (2003)
over the Amazon basin. They used JERS-1 L-band synthetic aperture radar (SAR) to
map Amazon wetland extents, land inundation and vegetation extents with 100-m
resolution and for high-water and low-water seasons. These masks have a potentialdisadvantage because even a two season per year classification may not be adequate to
completely classify the inundation extents of the study region. Other generated masks
used data from space-borne optical/infrared sensors, such as LANDSAT Thematic
Mapper (TM) and Moderate Resolution Imaging Spectroradiometer (MODIS)
3914 M. Zhang et al.
Downloaded By: [Calmant, Stéphane] At: 15:16 9 August 2010

images (Enjolras and Rodriguez 2009), which often have problems with cloud and
smoke cover contaminations, or problems from the canopy above the water area.
Generation of masks is usually tedious and thus global high-resolution (,100 m)
masks are in general unavailable. A potential new classification method using infor-
mation from one satellite system, i.e. satellite radar altimetry, to classify the waterfrom other land covers using radar backscatter has been demonstrated by Papa et al.
(2003) using TOPEX/POSEIDON radar altimetry.
In this paper we propose an algorithm for semi-automated water-detection and
retrieval of accurate surface water height measurement by retracking of TOPEX radar
altimeter measurements, land cover classification using radar backscatter coefficients,
and based on the statistics of the generated water height inferred by radar altimetry.
The algorithm is tested in two study regions as a demonstration: one region covering
Manitoba and SW Ontario, and another covering the Amazon basin. Each of theseregions is distinct in its climatology, land cover and the size of water inundation areas.
The objective is to test the developed algorithm to detect and obtain accurate surface
water height measurements over the relatively small bodies of water. The combination
of the semi-automated classification method and the optimally 10-Hz retracked
measurement explores the potential of the application of satellite altimetry over
small terrestrial bodies of water, which can maximize the usage of satellite radar
altimetry to study surface water hydrology.
2. Method
One of the challenges in this study is to observe or to predict land surface character-
istics using satellite data. In particular, there is a need for robust classification between
water and non-water regions using satellite radar altimetry data. Prior to this work,
the procedure to accomplish this task included investigation of land cover character-
istics using satellite image or existing land cover maps, retrieving the satellite data at
the candidate points, and investigating the validity of the measurement at the candi-date points manually. This procedure is time-consuming, making it practically impos-
sible for large-scale studies. Moreover, the dependence on a priori information of land
properties from maps/masks could result in the loss of valuable measurement of the
bodies of water due to the limitation of the resolution or the inappropriate collection
time of the map. For example, in the Amazon region, there is a body of water with
seasonally varying extents and not detectable by satellite optical images as ‘water’, but
is verified by the detailed in situ hydrological map, as will be shown in this paper. Even
using a high-resolution Amazon mask—we used the high-water mask from the dual-season masks—developed using L-band SAR (Hess et al. 2003), as shown in the
paper, could miss water classifications presumably because of the more frequent
fluctuations of inundation extents, which may happen more than twice a year. In
this paper, the algorithm/procedure is developed and tested for semi-automatically
detecting water and extracting surface water height measurements over relatively
small inland bodies of water in two example study regions.
Here, we use TOPEX/POSEIDON data primarily for demonstration purposes. The
methodology is developed to use satellite radar altimeter data over small bodies ofwater. To take advantage of the repeat track property of satellite tracks, the data are
reorganized in a high-level product, called the stackfile (Kruizinga 1997, Yi 2000), to
allow efficient access and accumulation of the data or the water level time series. The
data processing and water-classification procedure is described here. First, the
Satellite-based observations of hydrological processes 3915
Downloaded By: [Calmant, Stéphane] At: 15:16 9 August 2010

skeleton of a 1-Hz regional stackfile database is built. Then, the 1-Hz regional
stackfile database is densified to build the 10-Hz (or higher sampled) and
retracked satellite altimetry stackfile (Lee et al. 2008, 2009). The retrieved surface
water height is referenced to the so-called TOPEX reference ellipsoid with a mean
equatorial radius of 6378.1363 km and an inverse flattening of 1/298.257. Whenaltimetry measured water height is compared with stage measurement, we used
water level anomaly, which is the height with respect to the averaged water height.
In this study, the along-track and cross-track gradient corrections (Yi 2000, Lee
et al. 2008) are not applied in the stackfile generation to retrieve the water level
time series. In the study regions, gradient corrections are found to be small and
thus are not applied.
To find water measurements, all of the available bins in the stackfile are first
automatically selected to find the location where satellite altimeter data is availablewithin the given area. Each bin represents a specific location for particular 1-Hz data.
Then, within each selected bin, the data are further organized into groups by their
individual 10-Hz number from 1 to 10, denoting the first to the 10th 10-Hz data point
within the bin. Thus, each 1-Hz bin is divided into 10 locations corresponding to the
10-Hz data. For each of the 10-Hz locations, data from all cycles are analysed. The
interval between each TOPEX repeat cycle is 10 days, and thus for 10 years there are
about 360 cycles to analyse a particular 10-Hz location. Three iterations are carried
out consecutively to select the location as described below. During the first iteration,the measurements with missing or extremely large height value, or with the back-
scatter coefficient s0 ,5 dB (Birkett 2000) are edited. Following that, the mean value
is computed for the standard deviation computation in the next step. During the
second iteration, for each fixed location, the difference between the mean and the data
of each cycle is computed, then the proportion of the data with difference smaller than
M1 is investigated for the same location. We select the location if the proportion is
larger than N1 and the standard deviation of data from all cycles is smaller than S1.
During the third iteration, the proportion of the data with difference smaller than M2is investigated for each fixed location, and we select the location if the proportion is
larger than N2. Finally, the locations whose time series show good seasonality are
selected. The details of the procedure are shown in figure 1. The estimated parameter
values corresponding to M1, N1, S1, M2 and N2 are found to be 38%, 68%, 20 m, 2 m
and 4 m, respectively. These values have been chosen to optimally select over-water
altimetry data for the study regions: Manitoba and SW Ontario, and the Amazon
river basin.
3. Results
We apply the algorithm/procedure to two different study regions: Manitoba and SW
Ontario, and the Amazon River Basin. The retrieved TOPEX water level time series are
compared with the available in situ stage gauge measurements from U. S. Geological
Survey (USGS), Agencia Nacional de Aguas (ANA) Brazil, Environment Canada as
well as radar altimeter derived water height data products from LEGOS, U.S.Department of Agriculture (USDA) and CASH. The performance of the algorithm
for water-point detection is then compared with the results using the high-water mask
obtained by L-band JERS-1 SAR data over the Amazon River Basin (Hess et al. 2003)
along TOPEX tracks.
3916 M. Zhang et al.
Downloaded By: [Calmant, Stéphane] At: 15:16 9 August 2010

3.1 Results for Manitoba and SW Ontario
There are a huge number of lakes smaller than 400 km2 in Canada, in particular 3883small lakes in Ontario (Environment Canada, http://scitech.pyr.ec.gc.ca/waterweb).
The observation of these small lakes is important for the usage of these water
resources. Here, we present results of the small inland bodies of water in Manitoba
and SW Ontario detected by satellite altimetry using the algorithm. To show that our
individual 10-Hz retracked measurement has great potential for accurate stage esti-
mation, we demonstrate that our data can improve the spatial resolution and accu-
racy of the traditional 1-Hz or the average of several 10-Hz altimetry measurements.
Firstly, to assess the improvement of the accuracy of our individual 10-Hz retrackedsatellite altimetry measurement, we retrieved the TOPEX/POSEIDON data at the
locations where the stage measurements are available for a comparison study. The
retrieved water level measurements, located in large Lakes in Manitoba and SW
Ontario, are compared with the gauge measurements available from Environment
Canada (http://scitech.pyr.ec.gc.ca/waterweb). Although these example TOPEX time
series are located in large lakes, we conduct the study primarily due to the availability
of gauge data in these lakes, which enables us to validate the technique by quantifying
the improvement of the accuracy and by showing higher spatial resolution. Wecompare both the retracked and non-retracked TOPEX altimetry water level mea-
surements in regions containing numerous small bodies of water in Manitoba and SW
Ontario. We then compare our retrieved data with data available from other investi-
gators, including LEGOS, USDA and NASA/GSFC and CASH. Finally, we study the
use of 10-Hz automatic gain control (AGC) and retrieved water height measurement
for the smaller body of water where the stage measurements are not available. The
locations of the identified water points are shown in figure 2 and table 1.
OSU stackfile
(Kruizinga 1997, Yi 2000)
Basic cell: Bin addressed by row# & column#,Row# denotes latitude, Column# denotes pass
Find automatically
all the bins within
the given region
Iterations for each bin within the region: Extract 10-Hz retracked data (Lee et al.2008) from TOPEX Geophysical DataRecords (GDR) and Sensor Data Records (SDR)
For every 10-Hz location in each bin:
Do 3 iterations for all cycles
Iteration 1: edit data (σ0 < 5 dB), compute mean.
Iteration 2: compute standard deviation (std) and #
of cycles in which the height deviates from mean
height < M1, select the location if the proportion
of # > N1 and std < S1.
Iteration 3: compute # of cycles in which the height
deviates from mean height <M2, select the location
if the proportion of # > N2.
Column#
Row#bin
Each Bin includes data from all cycles for fixed 1-Hz location ;
#;
Figure 1. Water detection algorithm flowchart.
Satellite-based observations of hydrological processes 3917
Downloaded By: [Calmant, Stéphane] At: 15:16 9 August 2010

Figure 3 shows that we are able to detect the water surface and construct a TOPEX
water level time series in the Reindeer Lake in Manitoba, Canada, while there is no
satellite data available from the published USDA and NASA/GSFC or from the
CASH data site. We compare the TOPEX water level time series with the stage data
from Environment Canada after the data been interpolated to the same observational
Figure 2. Location of the example water points in large lakes used in the comparison and thedetected bodies of water in Manitoba and Western Ontario, Canada. The large red circlesdenote the TOPEX altimeter data locations used in the comparison, the purple triangles are theavailable stage gauges used for the comparison, the red points are detected bodies of wateralong the satellite tracks, and the small purple box denotes the region used to study the 10-HzAGC and the retrieved height measurement over the small body of water.
Table 1. Locations of water points in lakes in Manitoba and SW Ontario, Canada.
TOPEX data Gauge data
Longitude (�) Latitude (�) Longitude (�) Latitude (�)
Reindeer Lake 258.3661 57.8550 258.3333 57.8806Cedar Lake 259.8181 53.2113 259.8539 53.9394Lake of Woods 264.9846 49.0674 265.1906 49.7102
3918 M. Zhang et al.
Downloaded By: [Calmant, Stéphane] At: 15:16 9 August 2010

Fig
ure
3.
Sta
ge
ga
ug
eti
me
seri
esco
mp
are
dw
ith
1-H
zn
on
-ret
rack
ed(G
DR
)a
nd
ind
ivid
ua
l1
0-H
zre
tra
cked
da
taa
tR
ein
dee
rL
ak
e,B
roch
et,M
an
ito
ba
,C
an
ad
a.
Satellite-based observations of hydrological processes 3919
Downloaded By: [Calmant, Stéphane] At: 15:16 9 August 2010
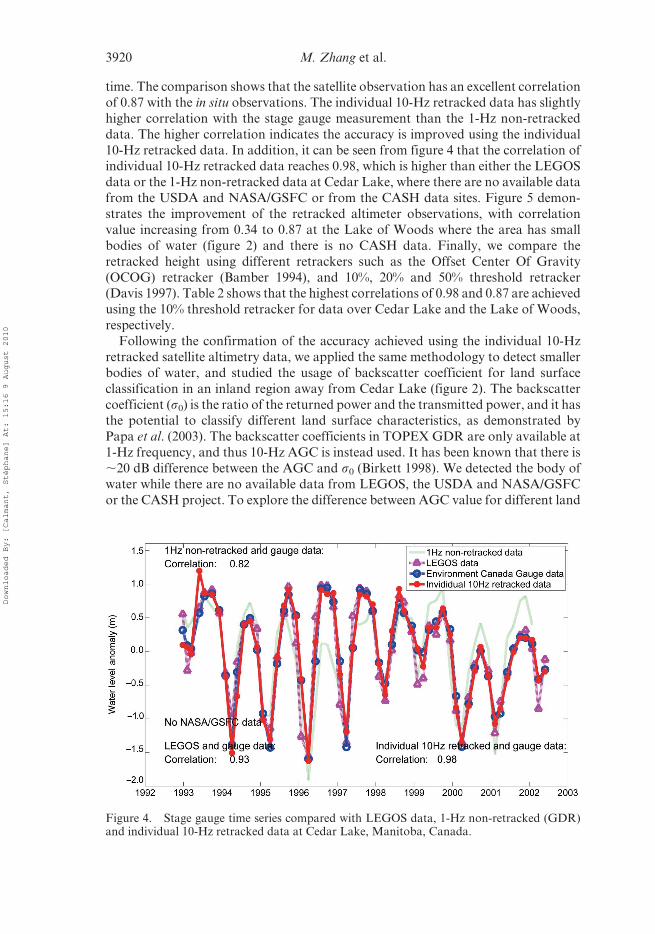
time. The comparison shows that the satellite observation has an excellent correlation
of 0.87 with the in situ observations. The individual 10-Hz retracked data has slightly
higher correlation with the stage gauge measurement than the 1-Hz non-retracked
data. The higher correlation indicates the accuracy is improved using the individual
10-Hz retracked data. In addition, it can be seen from figure 4 that the correlation ofindividual 10-Hz retracked data reaches 0.98, which is higher than either the LEGOS
data or the 1-Hz non-retracked data at Cedar Lake, where there are no available data
from the USDA and NASA/GSFC or from the CASH data sites. Figure 5 demon-
strates the improvement of the retracked altimeter observations, with correlation
value increasing from 0.34 to 0.87 at the Lake of Woods where the area has small
bodies of water (figure 2) and there is no CASH data. Finally, we compare the
retracked height using different retrackers such as the Offset Center Of Gravity
(OCOG) retracker (Bamber 1994), and 10%, 20% and 50% threshold retracker(Davis 1997). Table 2 shows that the highest correlations of 0.98 and 0.87 are achieved
using the 10% threshold retracker for data over Cedar Lake and the Lake of Woods,
respectively.
Following the confirmation of the accuracy achieved using the individual 10-Hz
retracked satellite altimetry data, we applied the same methodology to detect smaller
bodies of water, and studied the usage of backscatter coefficient for land surface
classification in an inland region away from Cedar Lake (figure 2). The backscatter
coefficient (s0) is the ratio of the returned power and the transmitted power, and it hasthe potential to classify different land surface characteristics, as demonstrated by
Papa et al. (2003). The backscatter coefficients in TOPEX GDR are only available at
1-Hz frequency, and thus 10-Hz AGC is instead used. It has been known that there is
,20 dB difference between the AGC and s0 (Birkett 1998). We detected the body of
water while there are no available data from LEGOS, the USDA and NASA/GSFC
or the CASH project. To explore the difference between AGC value for different land
Figure 4. Stage gauge time series compared with LEGOS data, 1-Hz non-retracked (GDR)and individual 10-Hz retracked data at Cedar Lake, Manitoba, Canada.
3920 M. Zhang et al.
Downloaded By: [Calmant, Stéphane] At: 15:16 9 August 2010

properties and varying water level, we extract the AGC value during winter and
summer. The results are shown in figure 6. From the upper left plot, we can see the
10-Hz AGC value along TOPEX pass #178 in the chosen region is low during the
winter season when there is snow coverage. The corresponding water height is also very
low, as shown in the lower panel. These demonstrate that the low AGC value indicates
snow coverage or low water level in this region. Therefore, this indicates the advantageof our algorithm in high-latitude lakes where the AGC value cannot be used to classify
water signals during the winter season due to snow attenuation. The upper right plot
illustrates that AGC is high during the summer. As shown in the lower panel of figure 6,
at that time the water level is very high possibly leading to large inundated areas. Hence,
the high AGC value could be used to detect inland flooded regions.
3.2 Results for the Amazon River Basin
The Amazon River, with more than 1100 tributaries, is the world’s largest river in
terms of water volume, and seven of its tributaries are more than 1600 km (Alsdorf
Figure 5. Stage gauge time series compared with 1-Hz non-retracked (GDR) and retrackedTOPEX data at the Lake of Woods, SW Ontario, Canada.
Table 2. Comparison of the correlation coefficients between the gauge measurement anddifferent retracked water heights for the Lake of Woods, SW Ontario, Canada and Reindeer
Lake and Cedar Lake, Manitoba, Canada.
Retracker
Gauge OCOG 10% threshold 20% threshold 50% threshold
Lake of Woods 0.76 0.87 0.84 0.80Reindeer Lake 0.85 0.83 0.87 0.79Cedar Lake 0.88 0.98 0.97 0.91
Satellite-based observations of hydrological processes 3921
Downloaded By: [Calmant, Stéphane] At: 15:16 9 August 2010

et al. 2001). About 20% of world’s river water flowing into oceans is the discharge
from Amazon River into the Atlantic Ocean, which is about five times that of the
Congo River, and 10 times that of the Mississippi River. Due to the massiveness of the
water basin and the prohibitive costs of obtaining stage data, scientists have used
satellite radar altimetry to study Amazon hydrology (Birkett et al. 2002, Berry et al.
2005).We demonstrate here the potential of satellite altimetry to study smaller rivers with
higher spatial resolution using retracked individual 10-Hz TOPEX data, by applying
the algorithm to detect smaller bodies of water. The Amazon mask we used (Hess
et al. 2003) was made from L-band SAR imageries with a resolution of 100 m for dual-
season, including high-water and low-water conditions. After delineation of the wet-
land, land surface properties are classified into nine categories (Hess et al. 2003) using
pixel attributes. Among the nine levels of classifications, open water, aquatic
TOPEX 10-Hz AGC at 20:38:23~20:38:29 on 12 January 1996 TOPEX 10-Hz AGC at 4:8:56:~4:9:03 on 29 July 1996
Figure 6. The retrieved decadal water height for the small body of water denoted by the purplestar point and the 10-Hz AGC along TOPEX pass #178 when the water level is low (12 January1996) and when the water level is high (29 July 1996). The AGC measurement times are denotedby the red circles in the time series plot. This study region is away from Cedar Lake, Manitoba,as denoted by the purple box in figure 2.
3922 M. Zhang et al.
Downloaded By: [Calmant, Stéphane] At: 15:16 9 August 2010
macrophyte (floating grass), flooded shrub, flooded woodland and flooded forest are
considered as water. All other non-flooded and unclassified areas are excluded as non-
water surface in the comparison.
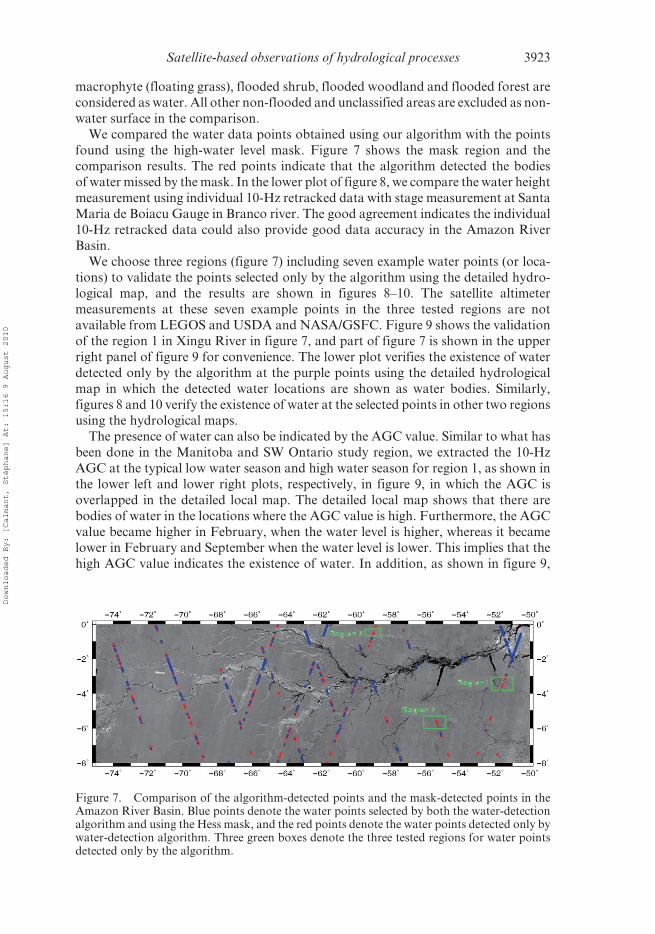
We compared the water data points obtained using our algorithm with the points
found using the high-water level mask. Figure 7 shows the mask region and thecomparison results. The red points indicate that the algorithm detected the bodies
of water missed by the mask. In the lower plot of figure 8, we compare the water height
measurement using individual 10-Hz retracked data with stage measurement at Santa
Maria de Boiacu Gauge in Branco river. The good agreement indicates the individual
10-Hz retracked data could also provide good data accuracy in the Amazon River
Basin.
We choose three regions (figure 7) including seven example water points (or loca-
tions) to validate the points selected only by the algorithm using the detailed hydro-logical map, and the results are shown in figures 8–10. The satellite altimeter
measurements at these seven example points in the three tested regions are not
available from LEGOS and USDA and NASA/GSFC. Figure 9 shows the validation
of the region 1 in Xingu River in figure 7, and part of figure 7 is shown in the upper
right panel of figure 9 for convenience. The lower plot verifies the existence of water
detected only by the algorithm at the purple points using the detailed hydrological
map in which the detected water locations are shown as water bodies. Similarly,
figures 8 and 10 verify the existence of water at the selected points in other two regionsusing the hydrological maps.
The presence of water can also be indicated by the AGC value. Similar to what has
been done in the Manitoba and SW Ontario study region, we extracted the 10-Hz
AGC at the typical low water season and high water season for region 1, as shown in
the lower left and lower right plots, respectively, in figure 9, in which the AGC is
overlapped in the detailed local map. The detailed local map shows that there are
bodies of water in the locations where the AGC value is high. Furthermore, the AGC
value became higher in February, when the water level is higher, whereas it becamelower in February and September when the water level is lower. This implies that the
high AGC value indicates the existence of water. In addition, as shown in figure 9,
Figure 7. Comparison of the algorithm-detected points and the mask-detected points in theAmazon River Basin. Blue points denote the water points selected by both the water-detectionalgorithm and using the Hess mask, and the red points denote the water points detected only bywater-detection algorithm. Three green boxes denote the three tested regions for water pointsdetected only by the algorithm.
Satellite-based observations of hydrological processes 3923
Downloaded By: [Calmant, Stéphane] At: 15:16 9 August 2010

another body of water detected only by the algorithm, denoted by the uppermost
purple point along pass #37, has a relatively low AGC value. This may indicate thatthe low AGC value cannot be used to verify the non-existence of water because the
low AGC value could be obtained over the small body of water surrounded by
vegetation (Papa et al., 2003). Overall, when the AGC value is high, the existence of
Figure 8. Validation of region 3 in the Amazon basin. The mid-left plot is a detailed local mapused to verify the existence of water at the purple points selected only by the algorithm. The redpoints denote the stage gauge closest to the detected points. The stage gauge Katuema does nothave data during the TOPEX/POSEIDON operation time (1992–2002). The mid-right plot is toshow the location of the detailed local map in figure 7. The upper plots are example time seriesof altimeter measurement. The lower plot is the comparison of gauge measurement and TOPEXmeasurement at Santa Maria de Boiacu Gauge and shows excellent agreement.
3924 M. Zhang et al.
Downloaded By: [Calmant, Stéphane] At: 15:16 9 August 2010

TOP
EX
10-
Hz
AG
C a
t 8:1
4:42
~8:1
5:2
on 1
Sep
tem
ber
1996
TO
PE
X 1
0-H
z A
GC
at 2
1:49
:39~
21:4
9:59
on
16 F
ebru
ary
1997
Water level anomaly (m)
Fig
ure
9.
Va
lid
ati
on
of
reg
ion
1in
the
Am
azo
nb
asi
n.T
he
up
per
rig
ht
plo
tsh
ow
sth
elo
cati
on
of
the
det
ail
edlo
calm
ap
(reg
ion
1)
infi
gu
re7
.Th
elo
wer
left
an
dlo
wer
rig
ht
plo
tsp
rese
nt
the
10
-Hz
AG
Ca
lon
gT
OP
EX
pa
ss#
37
inth
ed
eta
iled
loca
lm
ap
at
dry
sea
son
(1S
epte
mb
er1
99
6)
an
dw
etse
aso
n(1
6F
ebru
ary
19
97
),re
spec
tiv
ely
,an
dth
eti
mes
are
als
oin
dic
ate
db
yth
ere
dci
rcle
sin
the
up
per
left
plo
t.T
he
up
per
left
plo
tis
the
retr
iev
edT
OP
EX
wa
ter
hei
gh
tm
easu
rem
ent
at
the
low
erp
urp
lep
oin
ta
lon
gp
ass
#3
7.
Th
est
ag
em
easu
rem
ent
isco
mp
are
dw
ith
the
TO
PE
Xa
ltim
eter
mea
sure
men
ta
nd
sho
ws
go
od
sea
son
ala
gre
emen
t.T
he
det
ail
edlo
calm
ap
inth
elo
wer
plo
tsv
erif
ies
the
exis
ten
ceo
fw
ate
ra
tth
ep
urp
lep
oin
tsd
eno
tin
gth
eb
od
yo
fw
ate
rse
lect
edo
nly
by
the
alg
ori
thm
,an
dth
ere
dp
oin
tsin
the
det
ail
edlo
calm
ap
den
ote
the
sta
ge
ga
ug
escl
ose
stto
the
det
ecte
dp
oin
ts.T
he
sta
ge
ga
ug
eF
aze
nd
aC
ipa
ub
ad
oes
no
th
av
ed
ata
du
rin
gth
eT
OP
EX
/PO
SE
IDO
No
per
ati
on
tim
e(1
99
2–
20
02
).T
he
up
per
mid
dle
plo
tis
an
oth
erex
am
ple
tim
ese
ries
of
alt
imet
erm
easu
rem
ent
at
the
up
per
mo
stp
urp
lep
oin
ta
lon
gT
OP
EX
pa
ss#
37
.
Satellite-based observations of hydrological processes 3925
Downloaded By: [Calmant, Stéphane] At: 15:16 9 August 2010

the body of water can be inferred, but when the AGC value is low, it could not be used
to confirm the non-existence of water.
The upper left plot of figure 9 compares the altimeter data with the stage data at
Altamira, which is one of the two stage data available during TOPEX/POSEIDON
operation time (1992–2002) over the study region. Unlike the good amplitude agree-
ment at Santa Maria de Boiacu Gauge, where the location of the altimeter and gaugedata is exactly the same, as shown in the lower part of figure 8, this 10-Hz retracked
data location, detected only by the algorithm, is far away from the Altamira gauge,
which is on the main stem, as shown in the lower left plot of figure 9. Consequently,
there is an amplitude difference between altimeter and gauge data. However, because
the two locations belong to the same tributary, as shown in the local detailed map, the
altimeter data agrees well with the stage gauge measurement in terms of the seasonal
variation, except around 1998. The satellite altimeter measurement was edited out
during 1998 when relatively lower water level can be observed from the stage data,which results in data loss due to the contamination of water return by the surrounding
topography.
As in the Manitoba and SW Ontario study region, we compare different retrackers
in the Amazon River Basin. The correlation coefficients between the stage and the
retracked water height measurements were 0.56, 0.31 and 0.45 using OCOG, 20% and
50% threshold retrackers, respectively. Compared with the results over the Manitoba
and SW Ontario region, the correlation coefficients are relatively low and there are
obvious amplitude differences between altimeter and gauge datasets. This could be
Figure 10. Validation of region 2 in the Amazon basin. The upper left plot is the detailed localmap used to verify the existence of water at the purple points selected only by the algorithm. Thered points denote the stage gauge closest to the detected points. The middle right plot is to showthe location of the detailed local map in figure 7. Other plots are example time series of altimetermeasurement.
3926 M. Zhang et al.
Downloaded By: [Calmant, Stéphane] At: 15:16 9 August 2010

due to the fact that the gauge station is located in the stem of the river while the
altimeter track point is passing across the river (figure 7), thus measuring the stage
variations in the inundation area connected to the river. Such inundation areas
usually present reduced water stage variations compared to the river, as found in
this study. Moreover, the OCOG retracker seems to be the optimal retracker over theAmazon, which agrees with Frappart et al. (2006), whereas the 10% threshold
retracker performed better in the Manitoba and SW Ontario study region. This
indicates that waveform retrackers could perform differently and care must be
taken to identify the best radar altimeter waveform retrackers for different regions.
4. Conclusions
To expand the application of satellite altimetry in the inland hydrological study, we
have developed a procedure to detect the inland small bodies of water using retrackedhigh-spatial sampling (10 Hz) TOPEX/POSEIDON satellite altimeter range and AGC
measurements. We applied the methodology over two climatically different study
regions: Manitoba and SW Ontario in Canada, and the Amazon River Basin. The
algorithm is based on the backscatter coefficients and the statistical analysis of altimetry
water level measurements. The TOPEX water level time series for small bodies of water
over the two study regions are retrieved using the individually retracked 10-Hz data
with spatial resolution of about 680 m along the satellite ground track.
In the Manitoba and SW Ontario study region, the retrieved 10-Hz water heightmeasurements are compared with available stage measurements as well as altimetry
products from LEGOS and USDA. This has shown that the 10-Hz waveform retrack-
ing obviously improved the correlation coefficient (for example, from 0.34 to 0.87 for
Lake of Woods). The individual 10-Hz retracked measurement also provides higher
correlation with stage measurement than using 1-Hz non-retracked data directly from
the geophysical data record (GDR). This demonstrates that the data accuracy could
be substantially improved by retracking technique. In the Amazon region, we
detected small bodies of water, validated using the detailed hydrological map; theseare not detected using the Hess et al. (2001) Amazon basin high-water mask generated
using L-band SAR. In addition to being capable of detecting more water bodies using
our technique, the measurement from TOPEX shows excellent agreement in season-
ality with stage data over small bodies of water. The usage of individual 10-Hz
retracked measurement selected by the algorithm improved the quantity and quality
of the data over the GDR or other publicly available data products. The combination
of the developed algorithm, optimal waveform retracking of the 10-Hz TOPEX data
and the radar backscatter data enabled detection of more small water bodies andachieved higher data accuracy, which could potentially greatly improve our ability to
quantify water level variation over small water bodies and thus to understand their
hydrology.
Acknowledgements
This research is funded by grants from NSF’s Hydrology program, NGA’s NURI
program, and the Ohio State University Climate, Water and Carbon Program. We
acknowledge NASA and CNES for providing the TOPEX/POSEIDON (GDR and
Satellite-based observations of hydrological processes 3927
Downloaded By: [Calmant, Stéphane] At: 15:16 9 August 2010

SDR) data products; LEGOS, USDA and NASA/GSFC for providing high-level
radar altimetry data products; ANA Brazil and Environment Canada for providing
the river stage gauge data used for the study. We thank Mike Durand, the guest editor,
and an anonymous reviewer for the constructive comments which improved the
manuscript.
References
ALSDORF, D., BIRKETT, C., DUNNE, T., MELACK, J. and HESS, L., 2001, Water level changes in a
large Amazon lake measured with spaceborne radar interferometry and altimetry.
Geophysical Research Letters, 28, pp. 2671–2674.
BAMBER, J.L., 1994. Ice sheet altimeter processing scheme. International Journal of Remote
Sensing, 15, 925–938.
BENVENISTE, J., 2002, ENVISAT RA-2/MWR Product Handbook, Issue 1.2, PO-TN-ESR-RA-
0050 (Frascati, Italy: European Space Agency).
BERRY, P.A.M., GARLICK, J.D., FREEMAN, J.A. and MATHERS, E.L., 2005, Global inland water
monitoring from multi-mission altimetry. Geophysical Research Letters, 32, L16401,
doi:10.1029/2005GL022814.
BROWN, G.S., 1977, The average impulse response of a rough surface and its applications. IEEE
Transactions on Antennas and Propagation, 25, pp. 67–74.
BIRKETT, C.M., 1995, The contribution of TOPEX/POSEIDON to the global monitoring of
climatically sensitive lakes. Journal of Geophysical Research, 100, pp. 25, 179–25, 204.
BIRKETT, C.M., 1998, Contribution of the TOPEX NASA radar altimeter to the global mon-
itoring of large rivers and lakes. Water Resources Research, 34, pp. 1223–1239.
BIRKETT, C.M., 2000, Synergistic remote sensing of lake Chas: Variability of basin inundation.
Remote Sensing of Environment, 72, pp. 218–236.
BIRKETT, C.M., MERTES, L.A.K., DUNNE, T., COSTA, M.H. and JASINSKI, M.J., 2002, Surface
water dynamics in the Amazon Basin: Application of satellite radar altimetry. Journal
of Geophysical Research, 107, LBA 26–1, doi:10.1029/2001JD000609.
CALMANT, S., SEYLER, F., and CRETAUX, J., 2009, Monitoring continental surface waters by
satellite altimetry. Surveys in Geophysics, 29, pp. 247–269.
COE, M.T. and BIRKETT, C.M., 2004, Calculation of river discharge and prediction of lake
height from satellite radar altimetry: Example for the Lake Chad Basin. Water
Resources Research Journal, 40, W10205.
DAVIS, C., 1997, A robust threshold retracking algorithm for measuring ice-sheet surface
elevation change from satellite Radar Altimeters. IEEE Transactions on Geoscience
and Remote Sensing, 35, pp. 974–979.
ENJOLRAS, V. and RODRIGUEZ, E., 2009, Using altimetry waveform data and ancillary informa-
tion from SRTM, Landsat and MODIS to retrieve river characteristics. IEEE
Transactions on Geoscience and Remote Sensing, 47, pp. 1869–1881.
FRAPPART, F., CALMANT, S., CAUHOPE, M., SEYLER, F. and CAZENAVE, A., 2006, Preliminary
results of ENVISAT RA-2-derived water levels validation over the Amazon basin.
Remote Sensing of Environment, 100, pp. 252–264.
HESS, L.L, MELACK, J.M., NOVO, E.M., BARBOSA, C.F. and GASTIL, M., 2003, Dual-season
mapping of wetland inundation and vegetation for the central Amazon basin. Remote
Sensing of Environment, 87, pp. 404–428.
KRUIZINGA, G.L., 1997, Validation and applications of satellite radar altimetry. Ph.D. Dissertation,
the University of Texas, Austin, Texas, USA.
LEE, H., SHUM, C., YI, Y., BRAUN, A. and KUO, C.-Y., 2008, Laurentia crustal uplift observed
using TOPEX/POSEIDON radar altimetry over land. Journal of Geodynamics, 46, pp.
182–193.
3928 M. Zhang et al.
Downloaded By: [Calmant, Stéphane] At: 15:16 9 August 2010

LEE, H., SHUM, C., YI, Y., IBARAKI, M., KIM, J.-W., BRAUN, A., KUO, C.-Y. and LU, Z., 2009,
Louisiana wetland water level monitoring using retracked TOPEX/POSEIDON alti-
metry. Marine Geodesy, 32, pp. 284–302.
PAPA, F., LEGRESY, B. and REMY, F., 2003, Use of the Topex-Poseidon dual-frequency radear
altimeter over land surfaces. Remote Sensing of Environment, 87, pp. 136–147.
YI, Y., 2000, The Ohio State Univeristy stackfiles for satellite radar altimeter data. Geodetic
Science Report No. 495, The Ohio State University, Columbus, Ohio, USA, reprinted
May 2010.
Satellite-based observations of hydrological processes 3929
Downloaded By: [Calmant, Stéphane] At: 15:16 9 August 2010