Application of Quality Function Deployment in an Engineering College Using Analytical Hierarchy...
12
Dr. Devendra S. Verma et al Int. Journal of Engineering Research and Application www.ijera.com ISSN : 2248-9622, Vol. 3, Issue 5, Sep-Oct 2013, pp.1993-2004 www.ijera.com 1993 | Page Application of Quality Function Deployment in an Engineering College Using Analytical Hierarchy Process Dr. Devendra S. Verma 1 , Raymal Dawar 2 1 Department of Mechanical Engineering Institute of Engineering and Technology, DAVV Indore, India 2 Department of Mechanical Engineering Institute of Engineering and Technology, DAVV Indore, India Abstract Quality Function Deployment (QFD) technique as a TQM tool, has found wide applications in manufacturing as well as service industries. However its application and practice in educational institutes is still not popular. This paper based on the study in an engineering college is an attempt to demonstrate and encourage the application of QFD for planning and improvement of quality to gain competitive edge by satisfying student needs. The responses of 329 students and 35 faculties were obtained through a questionnaire. Importance ratings for student needs were calculated using AHP and pair wise comparison. These ratings were used for construction of relationship and correlation ship matrices and construction of HOQ. Goals for each customer requirements (CR) and technical requirements (TR) were set after competitive assessment of four other local colleges. All the four phases of QFD from planning to design, delivery and control were constructed. The outcomes of each HOQ suggest “How’s” for each “What” and the importance rating for each of them, which can be used for reforming the quality of engineering education in the college under study. Key Words- Quality Function Deployment, Customer’s (Students/Faculty) Need Analysis, Prioritization of CR, House of Quality I. INTRODUCTION Quality is now a key competitive weapon to serve and attract primary customers (students) in engineering education due to the stiff challenge from the increasing number of domestic and foreign institutions. But quality is fuzzy as it means differently to different people at different times and in different environment. As a result any endeavor to improve quality becomes attractive and different Starting early at stone age tools, customized production of earth ware to inspection of mass produced items to quality assurance and quality of design, the history of quality improvement has matured with tools and techniques of TQM. Of the various quality tools and techniques, Quality Function Deployment (QFD) appeals most as a systematic and simple application to incorporate student needs in quality of education. Traditionally, in most nations, the needs of the students are planned at the highest level in the government. In India, the Ministry of Human Resource Development and its constituent bodies like University Grants Commission (UGC), All India Council of Technical Education (AICTE) and National Board of Accreditation (NBA) are the policy makers. National Policy on Education (NPE) 1986, revised 1997, includes the policies for technical education for the nation. AICTE lays down the norms like infrastructure, facilities, number of faculties, their qualifications, laboratories, equipment and other amenities in the college. Universities input the knowledge and know-how in the curriculum and other regulations for conduct of the programs. As per Myron Tribus [11] these are the features of the designed quality for the technical colleges. However, quality is the way the features are delivered. Laboratories may be unkempt, equipment may not always work, and instructions may be poor It is the delivered quality that differentiates one college from the other. Tribus[11] is still right today about his observation that, though educators are among the first to write about new ideas, they are almost always the last to apply them to their own activities. Colleges of management remain ill managed and engineering institutions do not apply engineering methods to their own operations. Therefore the quality movement has still not made a dent in the universities and colleges. This study attempts to demonstrate application of QFD in an engineering college. II. LITERATURE REVIEW A. Concept of Quality Function Deployment (QFD) Quality is generally viewed as "conformance to specifications or norms". The QFD philosophy moves away from this traditional view that "we know best what the students want" to a new culture of "let's hear the voice of the students” This allows the colleges to become more proactive rather than waiting for student complaints and doing crisis management. It also provides for comparison with other colleges (competitors) thus helping to establish RESEARCH ARTICLE OPEN ACCESS
Transcript of Application of Quality Function Deployment in an Engineering College Using Analytical Hierarchy...
Dr. Devendra S. Verma et al Int. Journal of Engineering Research and Application www.ijera.com
ISSN : 2248-9622, Vol. 3, Issue 5, Sep-Oct 2013, pp.1993-2004
www.ijera.com 1993 | P a g e
Application of Quality Function Deployment in an Engineering
College Using Analytical Hierarchy Process
Dr. Devendra S. Verma1, Raymal Dawar
2
1Department of Mechanical Engineering Institute of Engineering and Technology, DAVV Indore, India
2Department of Mechanical Engineering Institute of Engineering and Technology, DAVV Indore, India
Abstract Quality Function Deployment (QFD) technique as a TQM tool, has found wide applications in manufacturing as
well as service industries. However its application and practice in educational institutes is still not popular. This
paper based on the study in an engineering college is an attempt to demonstrate and encourage the application of
QFD for planning and improvement of quality to gain competitive edge by satisfying student needs. The
responses of 329 students and 35 faculties were obtained through a questionnaire. Importance ratings for student
needs were calculated using AHP and pair wise comparison. These ratings were used for construction of
relationship and correlation ship matrices and construction of HOQ. Goals for each customer requirements (CR)
and technical requirements (TR) were set after competitive assessment of four other local colleges. All the four
phases of QFD from planning to design, delivery and control were constructed. The outcomes of each HOQ
suggest “How’s” for each “What” and the importance rating for each of them, which can be used for reforming
the quality of engineering education in the college under study.
Key Words- Quality Function Deployment, Customer’s (Students/Faculty) Need Analysis, Prioritization of
CR, House of Quality
I. INTRODUCTION
Quality is now a key competitive weapon
to serve and attract primary customers (students) in
engineering education due to the stiff challenge
from the increasing number of domestic and foreign
institutions. But quality is fuzzy as it means
differently to different people at different times and
in different environment. As a result any endeavor to
improve quality becomes attractive and different
Starting early at stone age tools, customized
production of earth ware to inspection of mass
produced items to quality assurance and quality of
design, the history of quality improvement has
matured with tools and techniques of TQM. Of the
various quality tools and techniques, Quality
Function Deployment (QFD) appeals most as a
systematic and simple application to incorporate
student needs in quality of education. Traditionally,
in most nations, the needs of the students are planned
at the highest level in the government. In India, the
Ministry of Human Resource Development and its
constituent bodies like University Grants
Commission (UGC), All India Council of Technical
Education (AICTE) and National Board of
Accreditation (NBA) are the policy makers. National
Policy on Education (NPE) 1986, revised 1997,
includes the policies for technical education for the
nation. AICTE lays down the norms like
infrastructure, facilities, number of faculties, their
qualifications, laboratories, equipment and other
amenities in the college. Universities input the
knowledge and know-how in the curriculum and
other regulations for conduct of the programs. As per
Myron Tribus [11] these are the features of the
designed quality for the technical colleges. However,
quality is the way the features are delivered.
Laboratories may be unkempt, equipment may not
always work, and instructions may be poor It is the
delivered quality that differentiates one college from
the other. Tribus[11] is still right today about his
observation that, though educators are among the
first to write about new ideas, they are almost always
the last to apply them to their own activities.
Colleges of management remain ill managed and
engineering institutions do not apply engineering
methods to their own operations. Therefore the
quality movement has still not made a dent in the
universities and colleges. This study attempts to
demonstrate application of QFD in an engineering
college.
II. LITERATURE REVIEW A. Concept of Quality Function Deployment
(QFD)
Quality is generally viewed as
"conformance to specifications or norms". The QFD
philosophy moves away from this traditional view
that "we know best what the students want" to a new
culture of "let's hear the voice of the students” This
allows the colleges to become more proactive rather
than waiting for student complaints and doing crisis
management. It also provides for comparison with
other colleges (competitors) thus helping to establish
RESEARCH ARTICLE OPEN ACCESS
Dr. Devendra S. Verma et al Int. Journal of Engineering Research and Application www.ijera.com
ISSN : 2248-9622, Vol. 3, Issue 5, Sep-Oct 2013, pp.1993-2004
www.ijera.com 1994 | P a g e
a competitive edge. To build or improve quality of
education, the student requirements have to be
considered and addressed. This needs shifting of
primary focus from
service delivery to upstream at the service
design stage. Student needs are expressed as what
they want, usually in their own language without any
implications of its feasibility. The college must
figure out how these what’s can be translated into
how’s, which are quantitative, measurable and
actionable specifications. QFD is a technique that
does this in a systematic way, using quality tools.
QFD was developed by Yoji Akao, during
late 1960s in Japan with a purpose to satisfy
customers (quality) by translating their needs into a
design and assuring that all organizational units
(function) work together to systematically break
down their activities into finer and finer details that
can be quantified and controlled (deployment).
Glenn Mazur[1993], a pioneer in extending the
application of QFD to service industries, brings out
differences between traditional and modern quality
systems and the importance of QFD. Traditional
approach of ensuring “nothing wrong” does not
mean that “everything is right”. For example if there
are no suggestions from the students it does not
mean they are satisfied. The modern quality system
maximizes positive qualities to create value through
the use of Kano model and suggests tools for service
QFD like matrices, cause and affect analysis,
affinity/relationship diagrams, Pareto diagram, AHP
etc. QFD focuses on delivering value by seeking
both spoken and unspoken needs, translating them
into specifications and communicating them
throughout the institute. QFD also allows students to
prioritize their requirements, benchmark with
competitors and optimize to gain greatest
competitive advantage. Maguad, Ben A[[10]
demonstrates the application of QFD in design of an
undergraduate business program and insists that the
college must first identify the customers (students,
parents, faculty and other stakeholders), understand
their expectations, and then serve them in
meaningful ways. The voice of the students must be
incorporated into the design and translated into
academic specifications so that everybody can
understand and uses it to align the processes to meet
the needs of students first time and every time.
Vivienne Bouchereau [18] views QFD as a visual
connective process to help teams focus on the needs
of the customers throughout the total development
cycle of a product or service
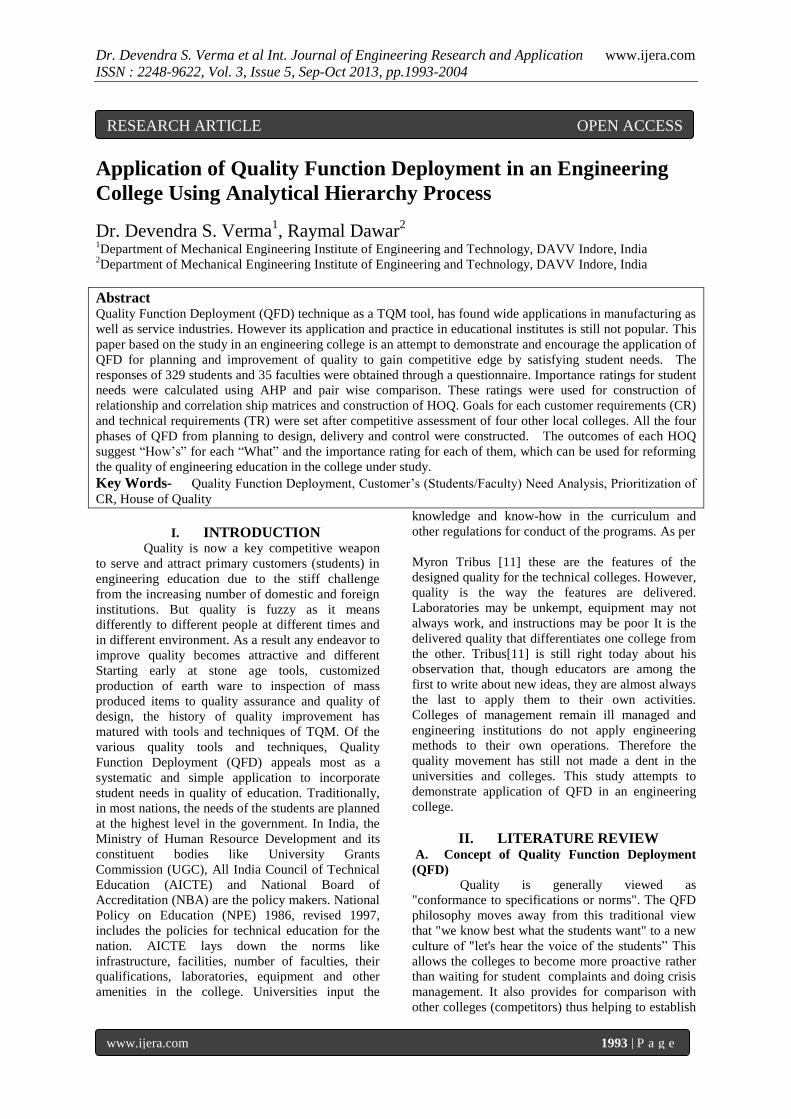
B .Process of QFD and the House of Quality
(HOQ)
Step 1 Student’s requirement. The starting
point of any QFD is CR or SR (student’s
requirement) which is often non-measurable, such as
academic environment/culture, teaching methods etc.
These are prioritized and converted into technical
specifications.
It is a matrix consisting of a vertical column
of what’s and a horizontal row of How’s. What’s are
SR and How’s are ways of achieving them. The
matrix is generally known as the HOQ due to its
Imp
rovem
en
t F
acto
r
Sa
les
poin
t
D
em
an
ded
qu
ali
ty
Figure: 1 Conceptual
Model of the House
of Quality
Raw weight
Technical
Specifications How’s
Importance rating of
How’s
Co
mp
etit
ive
Eva
lua
tio
n
Relationship matrix
between the
What’s
And How’s Imp
orta
nce
ra
tin
gs
of
Wh
at’
s
CR
Or
What’s
Target
goa
ls
Technical
competitive assessment of How’s
Correlation
matrix
How’s
Target Goals of
How’s
Dr. Devendra S. Verma et al Int. Journal of Engineering Research and Application www.ijera.com
ISSN : 2248-9622, Vol. 3, Issue 5, Sep-Oct 2013, pp.1993-2004
www.ijera.com 1995 | P a g e
shape. The general QFD model includes the
components shown in Fig1.
Step 2 Students importance ratings. The
students provide numerical rankings to these what’s
in terms of their importance to them. A numerical
ranking of 1-3-5- 9 is often used, where number 9
represents the most important and 1 the least. To
cater for inconsistencies in human judgment,
normally AHP with pair wise comparison or other
methods can be used to convert rankings into
importance ratings.
Step 3 Competitive evaluation A
comparison is made between the own college and the
competitors. Ranking scale of 1 -3- 9 or 1-3-5 is used
which serve as the benchmark to establish a goal that
we want to achieve for each SR. Dividing goal rating
(where we want to be) by our current ranking (where
we are now), an improvement ratio is calculated for
each SR. Sales point is another weighting factor that
shows which SR has more important effect on the
marketing image of our college to ensure
competitive advantage. By multiplying the
importance rating with improvement factor and the
sales point we can calculate raw (absolute) weight
and then converting them into percentage we get the
demanded quality for each SR.
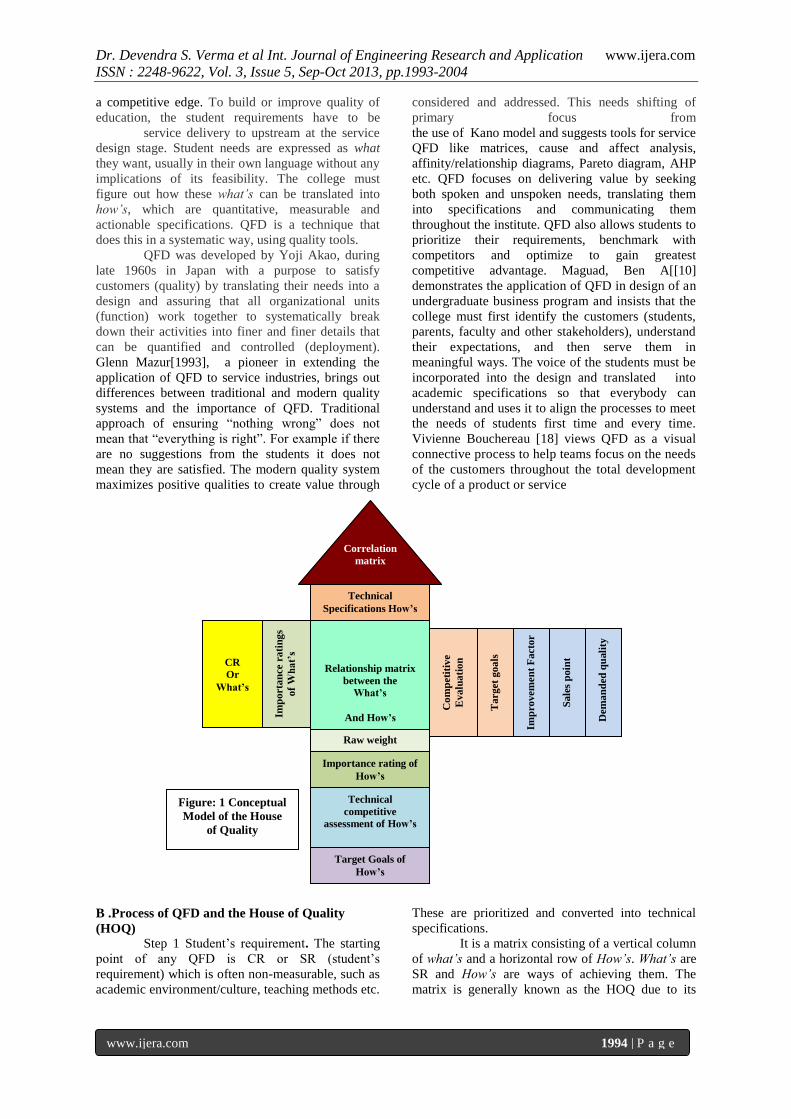
Step 4 Technical requirements (TR) They
are the specifications that are to be built into a
service to satisfy SR.
Referred as How’s they are the answers to SR as to
how can the requirements be satisfied.
Step 5 Relationship matrix shows the
relationship between SR and TR i.e. what’s versus
How’s. It is the centre part of HOQ A weight of 1-3-
9 or 1-3-5 is often used for representation of
relationship. Graphical symbols may also be used.
Step 6 Correlation matrix is the the roof of
the HOQ and is used to identify which How’s are
support each another and which are in conflict..
Negative correlation represents situation that will
probably require trade-offs. The positive and
negative ratings are usually quantified using 2, 1, -1,
and -2 ratings or by symbols.
Step7 Importance ratings of How.’ For
each column, sum all the row-numbers, each of
which is equal to the product of relationship rating
and student’s important rating. This is called raw
weight which can be converted into relative weight
(%) and importance ranking (1-3-5-7-9).
Step 8 Technical competitive evaluation is
similar to SR evaluation used for comparing own
college with the competitors to find out if these TR
are better or worse than competitors. Again, 1 to 5 or
1 to 9 ratings are used.
Step 9 Target goals of How’s provide
specific guidance for what have to be achieved and
are quantified in order to be specific and actionable.
The complete QFD process involves four phases
as shown at Fig: 2
C. The Customers of Engineering Education
An important step in QFD is identifying
customers of education. There is however little
agreement between the experts as to who are the true
customers (students, faculty, parents or the
employers). According to Vikram Singh [17] the
commercial view that “customer (student) is always
right” is not taken appropriately by the faculty as
‘satisfaction of wants’ does not necessarily lead to
high quality education. This belief is based on the
assumption that a happy student may be the one who
just wants to pass and graduate, as opposed to
actually learning and growing (long-term gain).
Figure: 2 Four phases of the House of Quality, adapted from Vivienne Bouchereau et al [2000]
Dr. Devendra S. Verma et al Int. Journal of Engineering Research and Application www.ijera.com
ISSN : 2248-9622, Vol. 3, Issue 5, Sep-Oct 2013, pp.1993-2004
www.ijera.com 1996 | P a g e
Despite the term we choose to use, the
student is the primary component of the customers
served by the college. However the other
stakeholders must receive recognition and respect in
the provider/consumer chain i.e. faculty, parents and
the industry (employer or colleges of higher studies)
D. Quality of Engineering Education
The literature in the field of education is
rich in information about quality of education. As
per
Nina Becket et [13] there is still no
consensus on how best to measure and manage
quality within higher education institutions because
quality has different meanings for different
stakeholders. While external stake holders are
interested in quality assurance, the internal
stakeholders value enhancement which is ‘the
process of taking deliberate steps at college level to
improve the quality of learning opportunities’. G.
Srikanthan and Dalrymple [6], are of the view that
TQM model cannot be out rightly applied to
Education and stress on the distinction between the
two types of processes. First, is the services to the
students from academic (like library, enrolment,
examination) and general administration function
(security, amenities, recreation, cafeteria). For these
areas TQM is appropriate model similar to other
services like banking or travel. Second, the teaching
and learning functions for which TQM is
inappropriate.
Anil R Sahu [1] holds the view that quality
of technical education has two important aspects first
– Design or inbuilt quality which includes
curriculum and course material and second
Manufactured or Delivered quality that depends on
faculty’s personal qualities, competence and
performance learning and teaching activity.
E .Student’s Need Analysis
Like any other service organization, the
student needs vary and must be analyzed and
structured for generating solutions. AICTE/NBA
have identified eight parameters and given them
weight ages to grade the institutes. These address the
needs of the students as well as the quality of the
education to be maintained by the colleges. Many
authors have also researched this issue and listed the
requirements as a measure of education quality. S.
S. Mahapatra and M. S. Khan [15] have identified
28 attributes of quality under six dimensions based
on the data collected across the country (India)
from different institutes and the stakeholders like
students, parents, recruiters through survey. These
secondary data are quite useful in need analysis.
However it is necessary to collect primary data from
a particular college to get a more realistic
information.
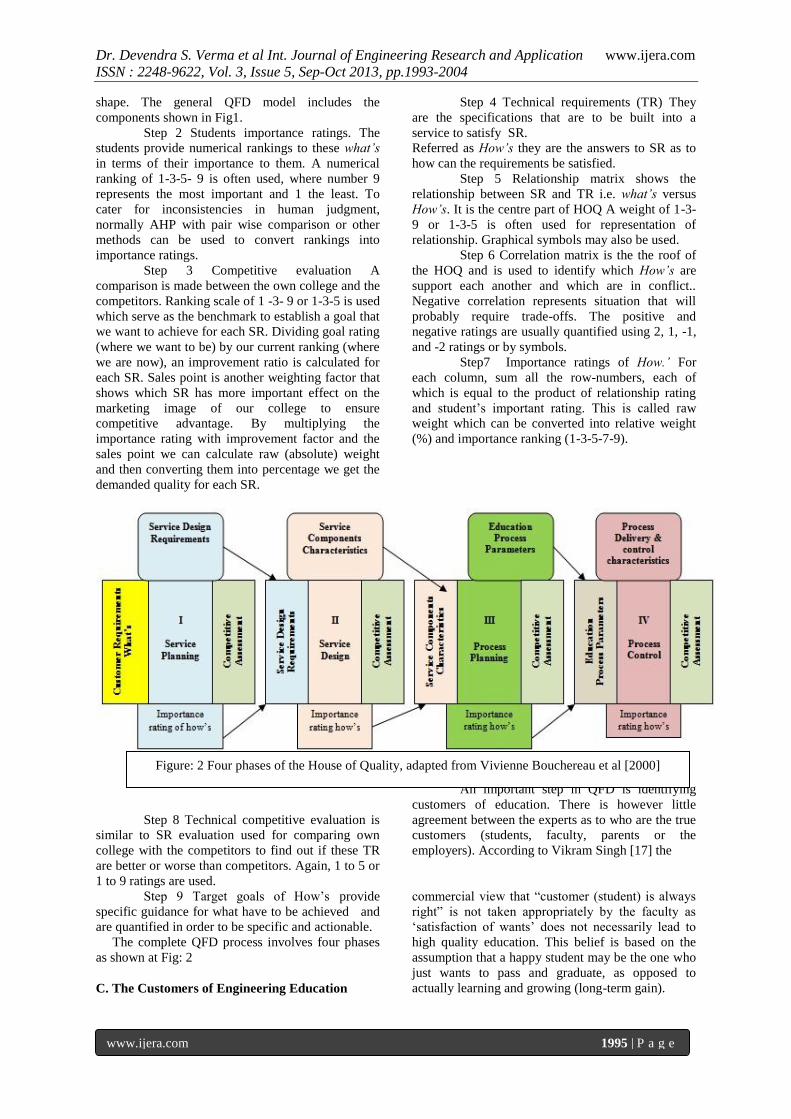
F. Affinity Diagram
During the literature review and
brainstorming sessions with the experts and other
functions it was soon realized that the student needs
may be quite large in numbers, which can make the
exercise of construction of matrices too cumbersome
and unwieldy. So these were organized and group
them under six dimensions using affinity diagram
(Fig 3).
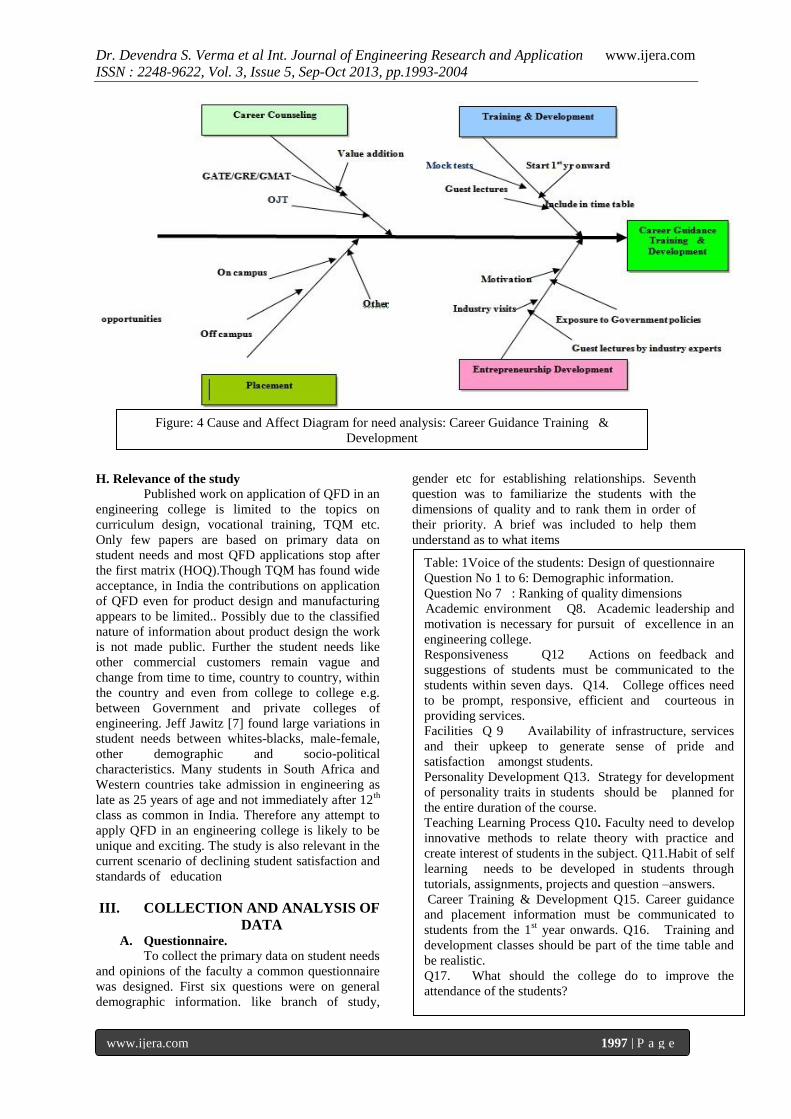
G. Cause and Effect (CE) Diagrams
Glenn Mazur [4] argued that if causes of
negative outcomes could be diagrammed, why can’t
the design elements that contribute to positive
outcomes, such as customer needs, be identified the
same way. This concept was used to analyze the
student needs using cause and effect diagrams for six
dimensions of quality, treating them as effect
(positive quality) and finding out the causes through
Cause (needs) to fulfill them. For example, to have
good ‘career guidance training and placement’
students may demand continuous training and
development, career counseling, entrepreneurship
development and opportunities for placement.
Further each of these four causes may have sub
causes as shown in Fig 4. Similar diagrams were
drawn for other five dimensions of quality to identify
needs. However due to space constraint only one
diagram has been shown here.
Fig: 3 Affinity diagram
Dr. Devendra S. Verma et al Int. Journal of Engineering Research and Application www.ijera.com
ISSN : 2248-9622, Vol. 3, Issue 5, Sep-Oct 2013, pp.1993-2004
www.ijera.com 1997 | P a g e
H. Relevance of the study
Published work on application of QFD in an
engineering college is limited to the topics on
curriculum design, vocational training, TQM etc.
Only few papers are based on primary data on
student needs and most QFD applications stop after
the first matrix (HOQ).Though TQM has found wide
acceptance, in India the contributions on application
of QFD even for product design and manufacturing
appears to be limited.. Possibly due to the classified
nature of information about product design the work
is not made public. Further the student needs like
other commercial customers remain vague and
change from time to time, country to country, within
the country and even from college to college e.g.
between Government and private colleges of
engineering. Jeff Jawitz [7] found large variations in
student needs between whites-blacks, male-female,
other demographic and socio-political
characteristics. Many students in South Africa and
Western countries take admission in engineering as
late as 25 years of age and not immediately after 12th
class as common in India. Therefore any attempt to
apply QFD in an engineering college is likely to be
unique and exciting. The study is also relevant in the
current scenario of declining student satisfaction and
standards of education
III. COLLECTION AND ANALYSIS OF
DATA A. Questionnaire.
To collect the primary data on student needs
and opinions of the faculty a common questionnaire
was designed. First six questions were on general
demographic information. like branch of study,
gender etc for establishing relationships. Seventh
question was to familiarize the students with the
dimensions of quality and to rank them in order of
their priority. A brief was included to help them
understand as to what items
Table: 1Voice of the students: Design of questionnaire
Question No 1 to 6: Demographic information.
Question No 7 : Ranking of quality dimensions
A academic Academic environment Q8. Academic leadership and
motivation is necessary for pursuit of excellence in an
engineering college.
Responsiveness Q12 Actions on feedback and
suggestions of students must be communicated to the
students within seven days. Q14. College offices need
to be prompt, responsive, efficient and courteous in
providing services.
Facilities Q 9 Availability of infrastructure, services
and their upkeep to generate sense of pride and
satisfaction amongst students.
Personality Development Q13. Strategy for development
of personality traits in students should be planned for
the entire duration of the course.
Teaching Learning Process Q10. Faculty need to develop
innovative methods to relate theory with practice and
create interest of students in the subject. Q11.Habit of self
learning needs to be developed in students through
tutorials, assignments, projects and question –answers.
Career Training & Development Q15. Career guidance
and placement information must be communicated to
students from the 1st year onwards. Q16. Training and
development classes should be part of the time table and
be realistic.
Q17. What should the college do to improve the
attendance of the students?
Figure: 4 Cause and Affect Diagram for need analysis: Career Guidance Training &
Development

Dr. Devendra S. Verma et al Int. Journal of Engineering Research and Application www.ijera.com
ISSN : 2248-9622, Vol. 3, Issue 5, Sep-Oct 2013, pp.1993-2004
www.ijera.com 1998 | P a g e
contribute to these dimensions. Nine closed
questions (No 8 to16) were asked for identifying the
needs, where respondents were required to mark
their choice on a scale, 1 to 9, one being strongly
unfavorable (strongly disagree) and nine being
strongly favorable (strongly agree). Last question,
No 17 was open ended seeking their suggestions to
improve the attendance of the students. Refer table 1.
Questionnaire was tested on randomly chosen ten
students and five faculties and was found
appropriate.
B. Sampling Plan.
Universe to be covered was limited to 1375
students of one engineering college, from first year
to final year covering all branches of engineering
available in the college e.g. mechanical, civil,
electronics & communication, computer science &
engineering and information technology. Sample
frame considered was year wise students. Sampling
unit was ‘the student/faculty’ and method used was
simple random.. Calculation of minimum sample
size was done as per formula below: S Shajahan
[21].
n = p % x q % x [z/e %]² . Where n-
minimum sample size p- Proportion of abnormal
response (specified category), q- Proportion of
normal response., z -Value corresponding to level of
confidence 95% = 1.96, e- Margin of error 5%,
n = 20 X 80 x [1.96/5]² = 245, Actual Samples
collected- 329
Out of 329 responses, the gender distribution was
223 male and 106 female all under the age of 22.
Majority of students (257) belonged to urban area,
with only 72 students from rural background.
Similarly only 30% students had taken loan for their
study. The students were selected at random about
15 from each class of 60 students. Brief information
about the purpose of study and the questionnaire was
mentioned before taking responses.
Tables 2 and 3 show the responses of the
students and faculty to the questionnaire no 8 to 16.
We find differences in perceptions between faculty
and the students especially on need question
numbers 9, 12, and 14 (infrastructure, feedback and
responsiveness).While students may have taken them
as normal expectations from the college, the faculty
take them as most important. Lower ranking of Q No
12 ‘response to student’s feedback’ by the faculty is
a matter of concern. This is may be due to the fear of
accepting criticism.
B. Prioritization of customer requirements
Determination of correct importance to SR is
essential as they affect the target values of
How’s, the service characteristics. Prioritization
of SR can be viewed as complex multi-criteria-
decision making problem. Many methods have
been devised to find importance rating. Simplest
method is to get the ranking of importance from
the students on a point scoring scale. However
this method has been criticized as being too
qualitative and not able to capture human
perception effectively. Among the many multi
criteria decision making techniques, like
conjoint analysis, artificial neural network,
fuzzy logic, AHP is more popular due to lesser
complexity.
Table: 2 Student’s Response to Need Questionnaire
(Ranking scale 1 to 9)
Needs
Year
Q8
A
CA
D
LE
AD
ER
SH
IP
Q9
INF
RA
-
ST
RU
CT
UR
E
Q1
0
ME
TH
OD
S
OF
TE
AC
HIN
G
Q1
1
SE
LF
LE
AR
NIN
G
Q1
2
ST
UD
EN
T'S
FE
ED
BA
CK
Q1
3
PD
ST
RA
TE
GIE
S
Q1
4
RE
SP
ON
SIV
E A
DM
IN
Q1
5 P
LA
CE
-
ME
NT
IN
FO
Q1
6
RE
AL
IST
IC
TR
G &
DE
VP
1st 528 546 580 576 526 552 548 596 524
Ranking
1 3 7 5 1 5 3 9 1
2 nd 586 520 656 554 638 604 628 656 878
Ranking
3 1 7 3 5 5 5 7 9
3rd 663 721 745 605 701 673 687 725 660
Ranking
3 7 9 1 7 5 5 9 3
4 th 455 464 547 441 523 521 527 545 213
Ranking
5 5 9 3 7 7 7 9 1
Total
Points
2232 2251 2528 2176 2388 2350 2390 2522 2492
Ranking
3 3 9 1 5 5 5 9 7
Dr. Devendra S. Verma et al Int. Journal of Engineering Research and Application www.ijera.com
ISSN : 2248-9622, Vol. 3, Issue 5, Sep-Oct 2013, pp.1993-2004
www.ijera.com 1999 | P a g e
.
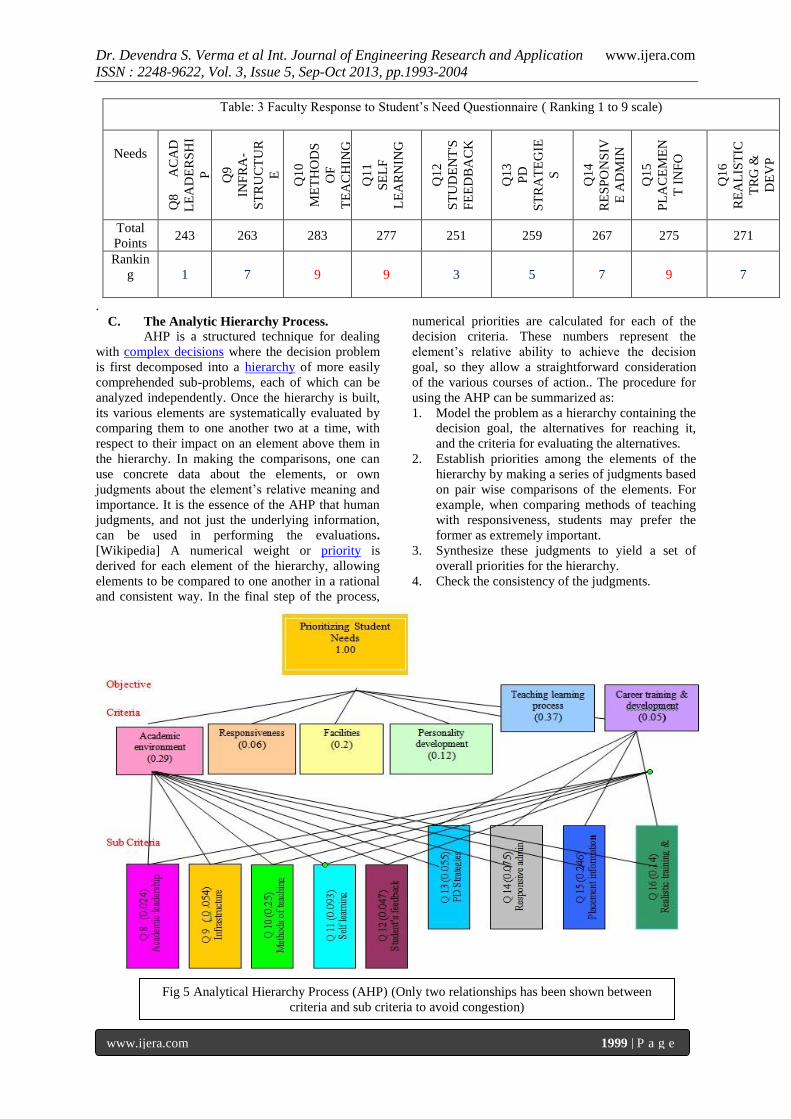
C. The Analytic Hierarchy Process.
AHP is a structured technique for dealing
with complex decisions where the decision problem
is first decomposed into a hierarchy of more easily
comprehended sub-problems, each of which can be
analyzed independently. Once the hierarchy is built,
its various elements are systematically evaluated by
comparing them to one another two at a time, with
respect to their impact on an element above them in
the hierarchy. In making the comparisons, one can
use concrete data about the elements, or own
judgments about the element’s relative meaning and
importance. It is the essence of the AHP that human
judgments, and not just the underlying information,
can be used in performing the evaluations.
[Wikipedia] A numerical weight or priority is
derived for each element of the hierarchy, allowing
elements to be compared to one another in a rational
and consistent way. In the final step of the process,
numerical priorities are calculated for each of the
decision criteria. These numbers represent the
element’s relative ability to achieve the decision
goal, so they allow a straightforward consideration
of the various courses of action.. The procedure for
using the AHP can be summarized as:
1. Model the problem as a hierarchy containing the
decision goal, the alternatives for reaching it,
and the criteria for evaluating the alternatives.
2. Establish priorities among the elements of the
hierarchy by making a series of judgments based
on pair wise comparisons of the elements. For
example, when comparing methods of teaching
with responsiveness, students may prefer the
former as extremely important.
3. Synthesize these judgments to yield a set of
overall priorities for the hierarchy.
4. Check the consistency of the judgments.
Table: 3 Faculty Response to Student’s Need Questionnaire ( Ranking 1 to 9 scale)
Needs
Q
8
A
CA
D
LE
AD
ER
SH
I
P
Q9
INF
RA
-
ST
RU
CT
UR
E
Q1
0
ME
TH
OD
S
OF
TE
AC
HIN
G
Q1
1
SE
LF
LE
AR
NIN
G
Q1
2
ST
UD
EN
T'S
FE
ED
BA
CK
Q1
3
PD
ST
RA
TE
GIE
S
Q1
4
RE
SP
ON
SIV
E A
DM
IN
Q1
5
PL
AC
EM
EN
T I
NF
O
Q1
6
RE
AL
IST
IC
TR
G &
DE
VP
Total
Points 243 263 283 277 251 259 267 275 271
Rankin
g
1 7 9 9 3 5 7 9 7
Fig 5 Analytical Hierarchy Process (AHP) (Only two relationships has been shown between
criteria and sub criteria to avoid congestion)
Dr. Devendra S. Verma et al Int. Journal of Engineering Research and Application www.ijera.com
ISSN : 2248-9622, Vol. 3, Issue 5, Sep-Oct 2013, pp.1993-2004
www.ijera.com 2000 | P a g e
In the context of this study, as the first step
in the AHP, prioritizing student needs, the overall
goal, was modeled as a hierarchy. In doing this, six
dimensions of education were taken as the criteria
for needs, and responses to the nine survey
questions were formed as sub criteria Fig 5.
The hierarchy was analyzed through a series
of pair wise comparisons. The criteria were pair wise
compared against the goal for importance. The sub
criteria were also pair wise compared against each of
the criteria for preference. The comparisons were
processed mathematically, and priorities were
derived for each node. Priorities are numbers
associated with the nodes of hierarchy. Like
probabilities, priorities are absolute numbers
between zero and one, without units or dimensions.
For example a node with priority .200 is twice more
importance than the one with priority .100, ten times
the weight of one with priority .020, and so forth.
Priorities are distributed over a hierarchy according
to its architecture. Priorities of the Goal, the Criteria,
and the Sub criteria are intimately related but need to
be considered separately.
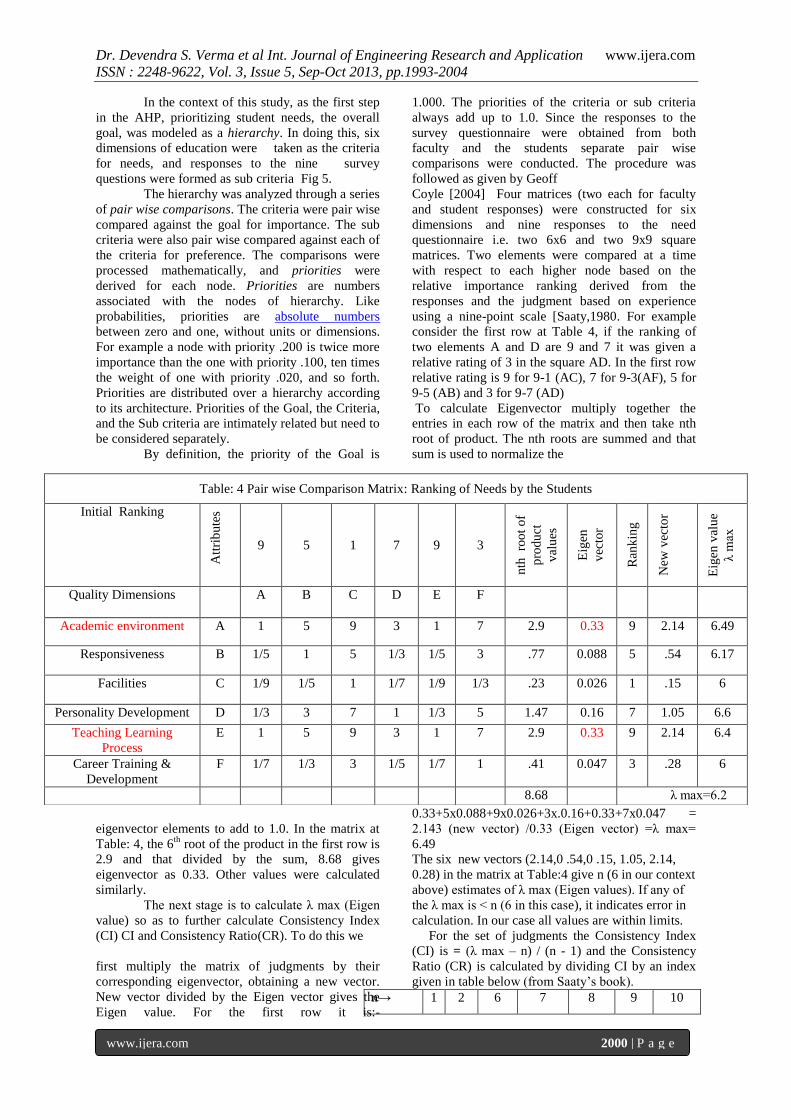
By definition, the priority of the Goal is
1.000. The priorities of the criteria or sub criteria
always add up to 1.0. Since the responses to the
survey questionnaire were obtained from both
faculty and the students separate pair wise
comparisons were conducted. The procedure was
followed as given by Geoff
Coyle [2004] Four matrices (two each for faculty
and student responses) were constructed for six
dimensions and nine responses to the need
questionnaire i.e. two 6x6 and two 9x9 square
matrices. Two elements were compared at a time
with respect to each higher node based on the
relative importance ranking derived from the
responses and the judgment based on experience
using a nine-point scale [Saaty,1980. For example
consider the first row at Table 4, if the ranking of
two elements A and D are 9 and 7 it was given a
relative rating of 3 in the square AD. In the first row
relative rating is 9 for 9-1 (AC), 7 for 9-3(AF), 5 for
9-5 (AB) and 3 for 9-7 (AD)
To calculate Eigenvector multiply together the
entries in each row of the matrix and then take nth
root of product. The nth roots are summed and that
sum is used to normalize the
eigenvector elements to add to 1.0. In the matrix at
Table: 4, the 6th
root of the product in the first row is
2.9 and that divided by the sum, 8.68 gives
eigenvector as 0.33. Other values were calculated
similarly.
The next stage is to calculate λ max (Eigen
value) so as to further calculate Consistency Index
(CI) CI and Consistency Ratio(CR). To do this we
first multiply the matrix of judgments by their
corresponding eigenvector, obtaining a new vector.
New vector divided by the Eigen vector gives the
Eigen value. For the first row it is:-
0.33+5x0.088+9x0.026+3x.0.16+0.33+7x0.047 =
2.143 (new vector) /0.33 (Eigen vector) =λ max=
6.49
The six new vectors (2.14,0 .54,0 .15, 1.05, 2.14,
0.28) in the matrix at Table:4 give n (6 in our context
above) estimates of λ max (Eigen values). If any of
the λ max is < n (6 in this case), it indicates error in
calculation. In our case all values are within limits.
For the set of judgments the Consistency Index
(CI) is = (λ max – n) / (n - 1) and the Consistency
Ratio (CR) is calculated by dividing CI by an index
given in table below (from Saaty’s book).
n→ 1 2 6 7 8 9 10
Table: 4 Pair wise Comparison Matrix: Ranking of Needs by the Students
Initial Ranking
Att
rib
ute
s
9 5 1 7 9 3
nth
ro
ot
of
pro
du
ct
val
ues
Eig
en
vec
tor
Ran
kin
g
New
vec
tor
Eig
en v
alu
e
λ m
ax
Quality Dimensions
A B C D E F
Academic environment A 1 5 9 3 1 7 2.9 0.33 9 2.14 6.49
Responsiveness B 1/5 1 5 1/3 1/5 3 .77 0.088 5 .54 6.17
Facilities C 1/9 1/5 1 1/7 1/9 1/3 .23 0.026 1 .15 6
Personality Development D 1/3 3 7 1 1/3 5 1.47 0.16 7 1.05 6.6
Teaching Learning
Process
E 1 5 9 3 1 7 2.9 0.33 9 2.14 6.4
Career Training &
Development
F 1/7 1/3 3 1/5 1/7 1 .41 0.047 3 .28 6
8.68 λ max=6.2

Dr. Devendra S. Verma et al Int. Journal of Engineering Research and Application www.ijera.com
ISSN : 2248-9622, Vol. 3, Issue 5, Sep-Oct 2013, pp.1993-2004
www.ijera.com 2001 | P a g e
Index 0 0 1.24 1.32 1.41 1.45 1.49
Table: 5 Final weighted rating of Student Needs
Saaty [1980] argues that a CR > 0.1
indicates that the judgments are inconsistent and CR
as high as 0.9 would mean
that the pair wise judgments are completely
untrustworthy. Only one matrix of the pair wise
comparisons has been shown here, however in all the
four pair wise comparisons the Consistency Ratio
was found well within the limit.
The values of Eigen vectors calculated for
the faculty and the students responses are the
importance ratings, which were weighted, in the
ratio of 40:60 (faculty: student) after pair wise
comparisons, to calculate the final rating. Refer
Table 5 and Fig5 - AHP diagram. The final ratings of
the student needs were used in construction of VOS
matrix of the HOQ.
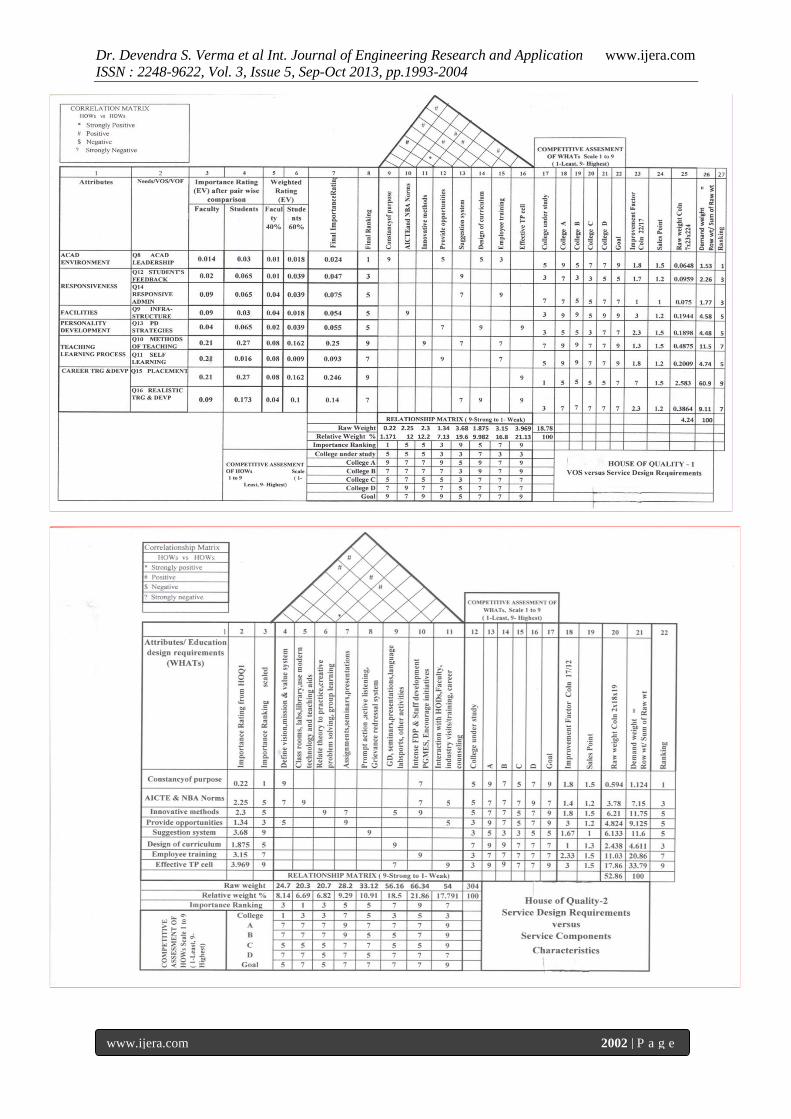
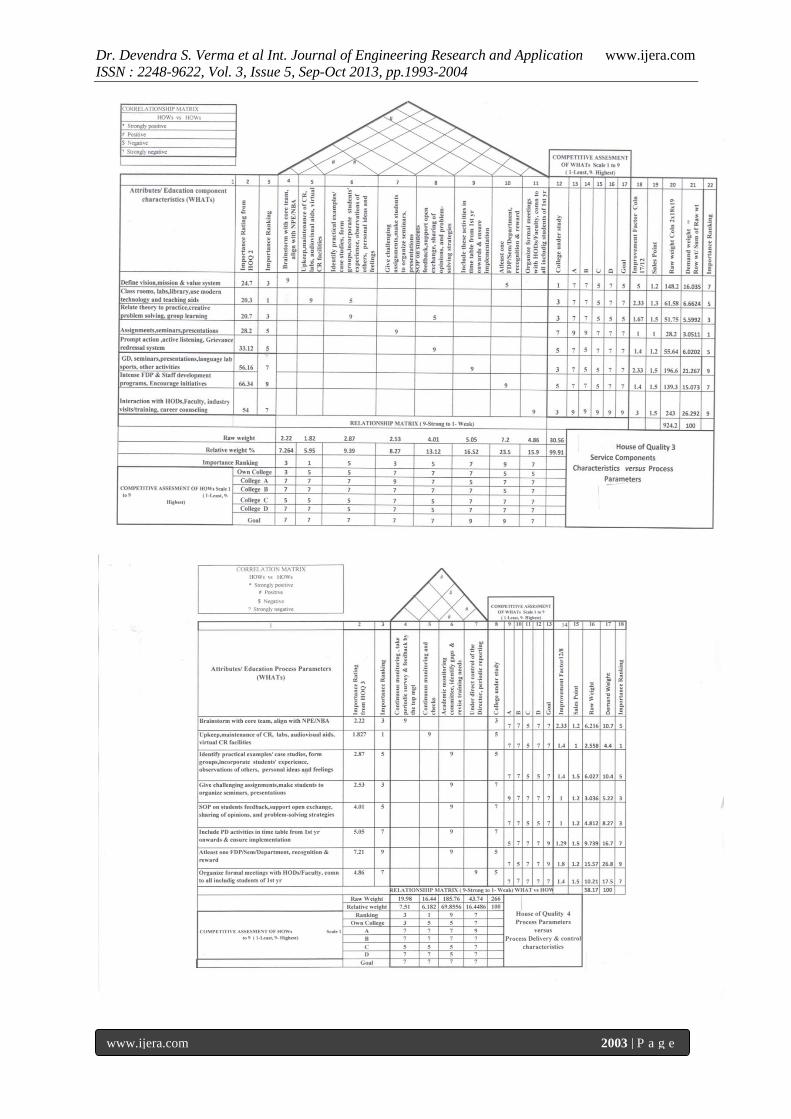
IV. THE HOUSE OF QUALITY Construction of the matrices of the HOQ is
the most cumbersome process of calculations and
iterations. Thanks to MS Excel 97 tool that it makes
it easier than the time consuming manual process.
Steps given in QFD process were followed for
construction of the four HOQ 1 to 4. Note that
how’s of the first HOQ become what’s for the next
HOQ and Raw weights of TR in each house is used
as importance ratings for the next HOQ.
A .Outcomes of the Study
One of the major gains of this study was in
generating and bringing together large amounts of
useful data which could be organized in a structured
and logical way. The word quality has been so
extensively used every where in education from top
to bottom that its appeal has diminished. What most
experts strongly focus is on the ‘designed quality’
i.e. the curriculum, standards and norms,
infrastructure, facilities, and grandeur of the
buildings while the main purpose the teaching –
learning process and the student’s character building
continues to suffer. Myron Tribus [11] is no wrong
when he says ‘what students actually expect is
knowledge, know-how, wisdom and character’. It is
so heartening that the outcomes of this study support
his concept. The students have clearly mandated
teaching- learning process, academic environment
and the personality development on top of their
expectations from the college. Students, like any
customers in the commercial world, exactly know
what they want from the education. Their responses
to the questionnaire have been indeed very wise and
mature.
The Voice of Students (VOS) has been
identified explicitly as a result of structured analysis
and prioritization of needs. Application of AHP and
pair wise comparison provides good measure of
consistency as CR were well within the limits,
proving that the judgment ratings given by the
students and the faculty were quite valid.
The study has highlighted the areas which need
to be addressed on priority to attain a competitive
advantage as well as the requirement of continuous
assessment of the competitors and continuous
improvement to delight the customers. The following
needs of the students must be addressed on priority :
1. Career guidance and placement information
must be continuously communicated to students
from the 1st year onwards.(Importance ranking
9)
2. Ensure effectiveness of TP Cell (ranking 9).
3. TP Cell should interact with HOD and faculty
on regular basis. Organize industry visits,
training and career counseling for students.(
ranking 9).
4. Plan and conduct GD/seminars/presentations/
language labs /sports and other activities on
regular basis (ranking 9).
5. Conduct at least one FDP/staff development
programs and encourage initiatives (ranking 9).
6. Training and development classes should be part
of the time table and be realistic ( ranking 7).
Nee
ds/
Att
rib
ute
s
Rating after
pair wise
comparison
(EV)
Weighted
Rating
(EV)
Fin
al R
atin
g
(EV
)
Fac
ult
y
Stu
den
ts
Fac
ult
y
40
%
Stu
den
ts
60
%
Q8 Academic
Leadership .014 .03 .0056 .018 0.024
Q9
Infrastructure .09 .03 .036 .018 0.054
Q10 Methods
of Teaching .21 .27 .084 .162 0.25
Q11 Self
Learning .21 .016 .084 .009 0.093
Q12 Student’s
Feedback .02 .065 .008 .039 0.047
Q13 PD
Strategies .04 .065 .016 .039 0.055
Q14
Responsive
Administration
.09 .065 .036 .039 0.075
Q15 Placement
Information .21 .27 .084 .162 0.246
Q16 Realistic
Training and
Development
.09 .173 .036 .1 0.14
Dr. Devendra S. Verma et al Int. Journal of Engineering Research and Application www.ijera.com
ISSN : 2248-9622, Vol. 3, Issue 5, Sep-Oct 2013, pp.1993-2004
www.ijera.com 2002 | P a g e
Dr. Devendra S. Verma et al Int. Journal of Engineering Research and Application www.ijera.com
ISSN : 2248-9622, Vol. 3, Issue 5, Sep-Oct 2013, pp.1993-2004
www.ijera.com 2003 | P a g e
Dr. Devendra S. Verma et al Int. Journal of Engineering Research and Application www.ijera.com
ISSN : 2248-9622, Vol. 3, Issue 5, Sep-Oct 2013, pp.1993-2004
www.ijera.com 2004 | P a g e
7. Faculty should develop innovative methods to
relate theory with practice and create interest of
students in the subject. (ranking 7).
8. Employee training (ranking 7).
9. Define vision, mission and value system of the
college (ranking 7).
10. Achieve these actionable goals through
delegation and continuous monitoring and
establishing control points.
V. CONCLUSION QFD is a customer driven approach to
quality planning and development. It can be applied to
both to the product development and the services.
QFD can be used to improve all university and college
level education activities from course design to
delivery of the teaching. The study has demonstrated
that the concepts of QFD can be well applied to the
services and in particular to engineering education to
plan, design, deliver and control various parameters to
enhance satisfaction, delight the students and gain
competitive advantage. The student’s need analysis
and HOQ developed can help a college set priorities
for subsequent improvement. QFD considers both
tangible and intangible aspects and results can be
utilized for academic reforms in any educational
institute
REFERENCES [1] Anil R Sahu et al [2008], Key Factors
affecting the effectiveness of Technical
Education- An Indian perspective,
Proceedings of the World Congress on
Engineering, Vol II, July 2-4, 2004 UK.
[2] Arash Shahin [2008], TQM, Contemporary
Perspectives and Cases, Icfai University
Press(TQM-pp 47-72).
[3] Geoff Coyle [2004], The Analytical
Hierarchy Process, Practical strategy: Open
Access Material on internet, Pearson
Education Limited 2004.
[4] Glenn H Mazur [1993], QFD for Service
Industries, From VOC to Task Deployment,
original article included in QFD Hand Book.
[5] Glenn H Mazur [2008], Delighting
Customers into QFD, VOC meets Voice of
Process, 14th International Symposium at
QFD Institute.
[6] G Srikanthan et al [2002], Developing a
holistic model for quality in Higher
Education, 71 CIT-2002, RMIT University
Melbourne.
[7] Jeff Javitz et al [1998], Exploring the
reasons South African students give for
studying engineering, International Journal
of Engineering Education, Vol 14 No. 4 PP
235-240,
[8] J R Sharma et al [2007], Prioritizing
Customers Requirements in QFD by
Integrating their Interrelationship with the
Raw Weights, IE(I) Journal(PR)Vol88,
Sep,2007.
[9] John J Cristiano et al [2001], Key factors in
successful application of QFD, IEEE
Transactions on engineering management,
vol 48,No 1, Feb 2001.
[10] Maguad Ben A [2009], Using QFD to
integrate the VOC into Academic Planning
Process, Andrews University, (ASBBS
Annual Conference Las Vegas Vol 16 No 1)
[11] Myron Tribes, TQM In schools of Business
& Engineering.
[12] National Board of Accreditation, Oct 2008,
Evaluation guidelines for undergraduate
engineering programs, open access on
internet.
[13] Nina Becket et al [1994], Quality
Management practice in HE. What quality
are we enhancing? JOHLSTE Vol 7, No.1
ISSN: 1473-8376.
[14] Ontario Jose De Oliveira [2009], Adaptation
and Application of SERVQUAL scale n
Higher Education POMS 28th
Annual
Conference Florida May 2009.
[15] S S Mahapatra et al [2007], A framework
for analyzing quality in education setting,
European Journal of Engineering Education,
vol 32, No 2, May 2007.
[16] Tracee Walker Gilbert et al [2010], Student
success oriented need analysis conceptual
framework, ASEE Southeast Section
Conference, 2010.
[17] Vikram Singh et Al [2008], Evaluation of
Quality in Educational Institute: a QFD
approach, Educational Research & Review
Vol 3 (4) PP 162-168 May 2008.
[18] Vivienne Bouchereau et. al.[2000] Methods
and Techniques to help QFD, Benchmarking
- An international journal Vol 7, No 1,
2000, PP 8-19.
[19] K Sridhar Bhatt [2002], TQM Text and
cases, edition 2010, pp 260, Himalaya
Publishing House
[20] R P Mohanty and R R Lakhe [2006], TQM
in the service sector, pp 401-438, JAICO
Publishing house, Mumbai
[21] S Shajahan [2007], Research methods for
management, JAICO Publishing house,
Mumbai
[22] TP Rajmanohar [2008], TQM Contemporary
perspective and cases, Icfai University Press
(TQM-pp 47-72),