Amperometric Biosensors for Lactate, Alcohols and Glycerol ...
Upload
independentCategory
view
1download
0
This article appeared in a journal published by Elsevier. The attachedcopy is furnished to the author for internal non-commercial researchand education use, including for instruction at the authors institution
and sharing with colleagues.
Other uses, including reproduction and distribution, or selling orlicensing copies, or posting to personal, institutional or third party
websites are prohibited.
In most cases authors are permitted to post their version of thearticle (e.g. in Word or Tex form) to their personal website orinstitutional repository. Authors requiring further information
regarding Elsevier’s archiving and manuscript policies areencouraged to visit:
http://www.elsevier.com/copyright
Author's personal copy
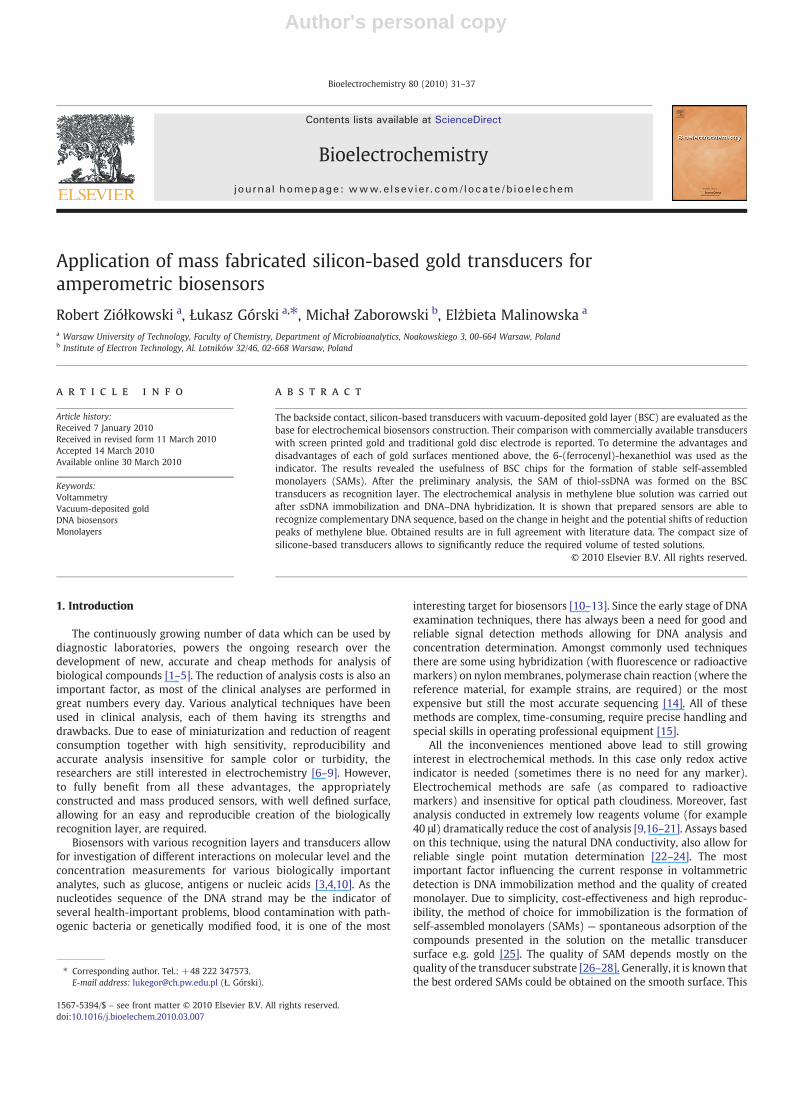
Application of mass fabricated silicon-based gold transducers foramperometric biosensors
Robert Ziółkowski a, Łukasz Górski a,⁎, Michał Zaborowski b, Elżbieta Malinowska a
a Warsaw University of Technology, Faculty of Chemistry, Department of Microbioanalytics, Noakowskiego 3, 00-664 Warsaw, Polandb Institute of Electron Technology, Al. Lotników 32/46, 02-668 Warsaw, Poland
a b s t r a c ta r t i c l e i n f o
Article history:Received 7 January 2010Received in revised form 11 March 2010Accepted 14 March 2010Available online 30 March 2010
Keywords:VoltammetryVacuum-deposited goldDNA biosensorsMonolayers
The backside contact, silicon-based transducers with vacuum-deposited gold layer (BSC) are evaluated as thebase for electrochemical biosensors construction. Their comparison with commercially available transducerswith screen printed gold and traditional gold disc electrode is reported. To determine the advantages anddisadvantages of each of gold surfaces mentioned above, the 6-(ferrocenyl)-hexanethiol was used as theindicator. The results revealed the usefulness of BSC chips for the formation of stable self-assembledmonolayers (SAMs). After the preliminary analysis, the SAM of thiol-ssDNA was formed on the BSCtransducers as recognition layer. The electrochemical analysis in methylene blue solution was carried outafter ssDNA immobilization and DNA–DNA hybridization. It is shown that prepared sensors are able torecognize complementary DNA sequence, based on the change in height and the potential shifts of reductionpeaks of methylene blue. Obtained results are in full agreement with literature data. The compact size ofsilicone-based transducers allows to significantly reduce the required volume of tested solutions.
© 2010 Elsevier B.V. All rights reserved.
1. Introduction
The continuously growing number of data which can be used bydiagnostic laboratories, powers the ongoing research over thedevelopment of new, accurate and cheap methods for analysis ofbiological compounds [1–5]. The reduction of analysis costs is also animportant factor, as most of the clinical analyses are performed ingreat numbers every day. Various analytical techniques have beenused in clinical analysis, each of them having its strengths anddrawbacks. Due to ease of miniaturization and reduction of reagentconsumption together with high sensitivity, reproducibility andaccurate analysis insensitive for sample color or turbidity, theresearchers are still interested in electrochemistry [6–9]. However,to fully benefit from all these advantages, the appropriatelyconstructed and mass produced sensors, with well defined surface,allowing for an easy and reproducible creation of the biologicallyrecognition layer, are required.
Biosensors with various recognition layers and transducers allowfor investigation of different interactions on molecular level and theconcentration measurements for various biologically importantanalytes, such as glucose, antigens or nucleic acids [3,4,10]. As thenucleotides sequence of the DNA strand may be the indicator ofseveral health-important problems, blood contamination with path-ogenic bacteria or genetically modified food, it is one of the most
interesting target for biosensors [10–13]. Since the early stage of DNAexamination techniques, there has always been a need for good andreliable signal detection methods allowing for DNA analysis andconcentration determination. Amongst commonly used techniquesthere are some using hybridization (with fluorescence or radioactivemarkers) on nylonmembranes, polymerase chain reaction (where thereference material, for example strains, are required) or the mostexpensive but still the most accurate sequencing [14]. All of thesemethods are complex, time-consuming, require precise handling andspecial skills in operating professional equipment [15].
All the inconveniences mentioned above lead to still growinginterest in electrochemical methods. In this case only redox activeindicator is needed (sometimes there is no need for any marker).Electrochemical methods are safe (as compared to radioactivemarkers) and insensitive for optical path cloudiness. Moreover, fastanalysis conducted in extremely low reagents volume (for example40 μl) dramatically reduce the cost of analysis [9,16–21]. Assays basedon this technique, using the natural DNA conductivity, also allow forreliable single point mutation determination [22–24]. The mostimportant factor influencing the current response in voltammetricdetection is DNA immobilization method and the quality of createdmonolayer. Due to simplicity, cost-effectiveness and high reproduc-ibility, the method of choice for immobilization is the formation ofself-assembled monolayers (SAMs) — spontaneous adsorption of thecompounds presented in the solution on the metallic transducersurface e.g. gold [25]. The quality of SAM depends mostly on thequality of the transducer substrate [26–28]. Generally, it is known thatthe best ordered SAMs could be obtained on the smooth surface. This
Bioelectrochemistry 80 (2010) 31–37
⁎ Corresponding author. Tel.: +48 222 347573.E-mail address: [email protected] (Ł. Górski).
1567-5394/$ – see front matter © 2010 Elsevier B.V. All rights reserved.doi:10.1016/j.bioelechem.2010.03.007
Contents lists available at ScienceDirect
Bioelectrochemistry
j ourna l homepage: www.e lsev ie r.com/ locate /b ioe lechem

Author's personal copy
is because there are grains of larger sizes with fewer imperfections. Asthe SAM is formed, in the flat regions the appropriate interactions cantake place over entiremolecule length, leading to greater resistance todegradation as large fragments of SAM have to be removed to destroythe monolayer [29,30].
In the presented work the usefulness of the silicon-basedtransducers with vacuum-deposited gold for the construction ofamperometric DNA biosensors was evaluated. The three types of goldelectrode surfaces have been examined: commercially available chipswith screen printed gold layer [31]; silicon chips with vacuumsputter-deposited thin gold layer and gold backside contact [32] andtypical gold disc electrode. For the preliminary examination of thesurface roughness, 6-(ferrocenyl)-hexanethiol was chosen as theindicator. Based on obtained results, confirmed by electron micros-copy pictures showing the roughness of the substrate, transducerswith the vacuum-deposited gold layer were chosen for the furthermodification with ssDNA probes in order to prepare voltammetricDNA biosensors.
The redox signal of methylene blue, the organic dye and cationicredox active intercalator from the phenothiazine family, was used asindication of immobilization and hybridization for the experimentswith constructed voltammetric DNA biosensor [33]. There are threepossible modes for binding of small compound with DNA, includingelectrostatic, groove and intercalative binding [34]. Different behaviorof methylene blue in the presence of nucleic acid was observed,however it is generally accepted that this compound interacts withguanine bases of DNA. Ozsoz et al. noticed the decrease ofelectrochemical signal after hybridization [35] which was explainedby the higher affinity of MB to ssDNA than to dsDNA. Erdem et al.suggested that the hybridization limits the interaction betweenguanine and MB [36]. The decrease in affinity after hybridizationcan be observed despite well known intercalative properties ofmethylene blue [37,38]. Nevertheless, Zhu et al. observed the currentincrease after the hybridization, in comparison with ssDNA modifiedelectrode [39]. According to the authors, both electrostatic interac-tions and the intercalation into the double helix of immobilizeddsDNA is responsible for such behavior, leading to concentrationincrease of methylene blue on the electrode surface, which results ingreater redox peak. Similar results were reported by Gu et al. [40] foryeast DNA analysis. Moreover, Gooding et al. [41] noticed currentincrease frommethylene blue with a growing contribution of guaninebases in DNA strand. Nevertheless, all reports confirm the shift ofredox potential to the more negative values after immobilization andhybridization.
2. Experimental
2.1. Apparatus
Electrochemical measurements were conducted with a CHI 660Aelectrochemical workstation (CH Instruments, USA). Voltammetricexperiments were carried out with a three-electrode system consistingof: bare or modified gold working electrode, a gold auxiliary electrodeand anAg/AgCl/1.0 MKCl reference electrode (Mineral, Poland). 40 μl ofsample solutionwas placed betweenworking and reference electrodes.All potentials are reported versus Ag/AgCl reference electrode at roomtemperature. The sample solutions were deoxygenated with argon forapproximately 15min prior to data acquisition and were blanketedunder an argon atmosphere during the entire experimental period. Ifnot stated otherwise, the cyclic voltammetry (CV) was conducted at asweep rate of 100 mVs−1, while the square wave voltammetry (SWV)was conducted at a pulse amplitude of 25 mV, step of 1 mV andfrequency of 25 Hz. The potentials of chronoamperometry (CA) assaywere changed from the initial E=−200 mV to E=900mV and it waskept constant for 0.5 s. The surface pictures were taken by the TM-1000electron microscope (HITACHI, Japan) and the stereomicroscope
SZX10 (Olympus, Japan) coupled with CCD color camera ColorView(Olympus, Japan).
Three different types of gold electrodes were used (Fig. 1): 1) typicalgold disc electrode (Mineral, Poland)—GDE (not shown); 2) transducerwith screen printed gold (BVT Technologies, Czech Republic) — SPG(Fig. 1, a); 3) silicon-based gold transducers with back side contactandvacuum-deposited gold (Institute of Electron Technology, Poland)—BSC (Fig. 1, b). For fabrication of BSC transducers, a planar CMOS-compatible process was used. More than one hundred devices couldbe preparedwith eachSiwafer (Fig. 1b). The (100)oriented opticallyflatheavy doped (high conductive) Si wafers formed a main body ofthe transducers [32]. A square 1mm×1 mmCr/Au electrodewas placedin a top surface of each device. The electrode has been surrounded by aSiO2/Si3N4 sandwich layer, which isolates electrically the silicon body.A bottom surface of the transducer was covered with a similar Cr/Aulayer. Thicknesses of the chromium adhesion layer and the gold elec-trode layer are 10 nm and 500 nm, respectively. A 340 °C thermaltreatment was used to improve contact resistance of the transducer.
2.2. Reagents
Reagent-grade K4Fe(CN)6, K3Fe(CN)6, KCl, K2HPO4, KH2PO4, NaCl,NaOH, HCl, Tris–HCl, methylene blue and 6-(ferrocenyl)-hexanethiolwere purchased from Aldrich Chemicals. Absolute ethanol waspurchased from POCh, Poland. All reagents were used without furtherpurification. All solutions were prepared using Milli-Q water. Milli-Qwater and all buffers were sterilized using an autoclave. The 20-merdeoxyoligonucleotides were purchased from Genomed Sp. z o. o.,Poland. The base sequences were as follows: thiolated DNA probe: 5′-SH-(CH2)6-TCCAACACTCCGAGACGGGG-3′ (20-base probe sequence—A)and complementary DNA target to sequence A: 5′-CCCCGTCTCGGAGTGTTGGA-3′ (20-base probe sequence — A1).
All oligonucleotide stock solutions were prepared with 10 mMTris–HCl, (pH 7.5) and stored in a −20 °C freezer before use.
Fig. 1. Transducer with screen printed gold — SPG (BVT Technologies; Czech Republic)(I) and silicon-based gold transducers with back side contact and vacuum-depositedgold — BSC (Institute of Electron Technology, Poland) (II).
32 R. Ziółkowski et al. / Bioelectrochemistry 80 (2010) 31–37

Author's personal copy
2.3. Solutions
The following solutions were prepared: 0.01 M 6-(ferrocenyl)-hexanethiol solution; piranha solution (H2O2:H2SO4; 3:1); 0.01 Msolution of K4Fe(CN)6 and K3Fe(CN)6 in 0.1 M KCl; immobilizationbuffer solution containing 1 M KH2PO4 (pH 4.5); hybridization buffersolution containing 10 mM Tris–HCl and 1 M NaCl (pH 7.0). Buffersolution for electrochemical measurements was composed of 0.05 MK2HPO4/KH2PO4 and 0.3 M NaCl (pH 7.0). The 10 μM methylene bluestock solution was prepared in the electrochemical buffer. The pHwasadjusted with either NaOH or HCl solution.
2.4. Methods
The pictures of the surfaces were taken according to themicroscope producer instructions (HITACHI, Olympus, Japan).
The redox activemonolayer composed of 6-(ferrocenyl)-hexanethiolwas deposited from 0.01 M 6-(ferrocenyl)-hexanethiol solution inabsolute ethanol for a 24 h in ambient temperature. Before that, thegold electrodes were cleaned with piranha solution and electrochem-ically prepared by cycling the potential scan between−0.6 and 1.8 V atthe scan rate of 0.1 V s−1 in electrochemical buffer until the character-istic cyclic voltammogram (CV) for a clean electrodewas obtained. Afterelectrode removal from deposition solution, the electrodes were thor-oughly rinsed with absolute ethanol to remove the physically adsorbedspecies.
The real surface areawas calculated using the Cottrell equation [42]with the data from chronoamperometric experiments.
The DNA recognition interface was prepared according to Goodinget al. [43]. Briefly, the chips were prepared with piranha solution andelectrochemical cycling as described above. Subsequently, a 5 μl dropof 4 μM thiolated ssDNA probe in immobilization buffer was placed onthe electrode surface and the whole chip was placed in the Petri dishlined with a blotting paper soaked with immobilization buffer. Theimmobilization was carried on for 90 min at room temperature. Thisrecognition interface was then electrochemically examined withmethylene blue solution [33]. After analysis, the methylene blue waswashed away and the modified gold electrode was exposed to 4 μMtarget oligomer A1 solution. The hybridization was carried out for150 min at ambient temperature. After that time, chips were rinsedwith phosphate buffer and again the electrochemical examination inmethylene blue solution was conducted.
2.5. Results and discussion
To evaluate whether the proposed silicon-based gold transducers(BSC) are suitable for construction of electrochemical biosensors withself organized recognition layer, the 6-(ferrocenyl)-hexanethiol wasused as the test compound. The obtained results were compared withdata obtained for commercially available sensor with screen printedgold (SPG) and traditional gold disc electrode (GDE). The cleaned andelectrochemically prepared gold transducers were placed in a 0.01 Methanolic solution of test redox compound for 24 h in ambienttemperature. After that time they were rinsed in copious amount ofabsolute ethanol and the electrochemical measurements were con-ducted. In all cases the obtained SWVs (data not shown) and CVs(Fig. 2) showedwell developed peaks around 450 mV versus Ag/AgCl,as expected for such a system. This was the indicator of self-assembledmonolayer creation. Comparing CVs of gold electrode registered be-fore and after subjecting it to the redox compound solution, it can beclearly seen that in all cases (Fig. 2), obtained graphs are significantlydifferent. The biggest current was observed for GDE (Fig. 2I) and forSPG (b) (Fig. 2II). In all cases the differences between oxidation andreduction potentials were characteristic for reversible electrochemicalreaction (Fig. 2).
As the current obtained for the redox layer corresponds to theamount of compound immobilized on gold electrode surface, it maybe concluded that the surface of GDE is the largest one [9]. Thegeometric areas of gold layers are as follows: 1 mm2 for BSC,0.785 mm2 for GDE, 0.785 mm2 for SPG (Table 1). It can be clearly
Fig. 2. CVs of redox active monolayer composed of 6-(ferrocenyl)-hexanethiol createdon the gold disc electrode (I); commercially available sensor with screen printed gold(II); silicon-based gold transducers (III); scans carried out before (a) and after (b) SAMformation. All potentials are reported versus Ag/AgCl reference electrode.
33R. Ziółkowski et al. / Bioelectrochemistry 80 (2010) 31–37

Author's personal copy
seen that the geometric surface areas do not correspond to theobtained values of recorded current.
To obtain information on the surface structure of tested electrodes,optical and electron microscopy was employed. The pictures fromelectron microscope showed the heterogeneity of the electrode in thecase of SPG sensors and the smoothness and integrity in the case ofBSC (Fig. 3). For the classical gold disc electrode, only optical pictureswere taken (data not shown), showing its significant unevenness,clearly visible even at relatively low (10×) magnification. The ap-parent heterogeneity and roughness of the electrode surfaces led tothe much greater real area of gold surface, as compared to the surfacecalculated from geometric dimensions. Accordingly, electrode areawas measured using chronoamperometry in K4Fe(CN)6/K3Fe(CN)6solution [42]. Obtained results confirmed that gold disc electrode hasthe highest surface, which is 3.45 times larger than the geometricarea, followed by the area of screen printed gold electrode, 2.61 timeslarger than the geometric area. The smallest area was measured forBSC electrode, only 1.75 times larger than the geometric area,indicating its smoothest surface among tested transducers (Table 1).
As it was mentioned above, the current intensity of SAM varieddepending on the transducer used, not strictly depending on thegeometric surface area of electrode. Information about the real goldarea and surface roughness can be the ground for explanation of suchdiscrepancies. As broadly accepted, the quality of the SAMs formed
from solution is strongly influenced by the smoothness of thesubstrate. The best monolayer integrity can be obtained only forvery smooth surfaces [9,29,30]. It has been revealed that in our case,the most important factor in fabricating a defect-free SAM is thenumber of grain boundaries which can be clearly seen on the picturestaken using the electron microscope (Fig. 3a). The smoother surfacehave grains of larger sizes with fewer imperfections and hence, theSAMs formed on these surfaces have fewer defects. The abundance ofpinholes on uneven surface promotes the electron transfer from redoxactive compound to electrode. In the case of smooth electrode, thewell ordered SAM is formed which may restrain electron transfer[29,44]. This can result in discrepancies between real gold electrodearea (Table 1) and the current intensity of redox active SAM (Fig. 2).The ratio of real gold surfaces (from chronoamperometric measure-ments) for GDE and SPG is 1.32 and the ratio of the voltammetricsignals measured for redox SAM on these electrodes is 1.39, which is aclear indication of free electron transfer from the ferrocene toelectrode. The analogous ratios for GDE and BSC are 1.54 (surfaces)and 2.4 (current). This suggests that the electron transfer from redoxactive species is hindered by the well organized SAM on the smoothsurface of BSC transducer [29,44].
Moreover, smoother substrates also appear to be more robustwith regard to resistance against desorption, as it is confirmed withresults presented in Fig. 4. As was shown by Gooding et al. [29], thehydrophobic interactions between the molecules are responsible formaintaining the integrity of SAM on the smooth substrate with largesurfaces of atomically flat regions, allowing for organization of largeareas of SAM. The overcoming of these hydrophobic forces is requiredto disrupt the SAM in this areas or entire domain must be removed asa single sheet. Such hydrophobic interactions ensure greater resis-tance of these domains to degradation, as compared to domains withpoorly associated compounds on more rough surface. For all types of
Table 1Comparison of the geometric and real surface areas of electrodes used in this work.
Electrode Geometric area [mm2] Real surface area [mm2]
SPG 0.785 2.05GDE 0.785 2.71BSC 1 1.75
Fig. 3. The electron microscope pictures of gold electrode surfaces: I) commercially available sensor with screen printed gold; II) silicon-based gold transducers.
34 R. Ziółkowski et al. / Bioelectrochemistry 80 (2010) 31–37

Author's personal copy
sensors presented in Fig. 4 (scanning from positive to negativepotentials), the difference between first and second voltammograms,resulting from desorption of SAM, was the greatest. However, smallerbut still clearly formed peaks were recorded at the same potentialduring next scans. This is because of SAMs large fragments oxidativere-adsorption after the end of the analysis. After each subsequentanalysis, the size of the peak continues to decrease as less and less 6-(ferrocenyl)-hexanethiol re-adsorbs on the surface. In case of golddisc electrode and commercially available sensor with screen printedgold, the peak is more distorted and the redox potential of the re-adsorbed molecules is more negative [45,46]. The best integrationand, consequently, the best potential stability is observed for the goldtransducers fabricated using polished mono-silicon wafers as sub-strates [32]. Moreover, this is clearly seen on the graph (Fig. 4), wherechanges of the integrated signal are the smallest and the signalstabilizes much faster than in other cases. 0.5 μm thick gold layerfollows a profile of the silicon surface, which indicates its smoothnessand, accordingly, their usefulness as transducers for sensors with self-assembled monolayers.
To show the feasibility of DNA biosensor construction withproposed BSC chips as transducers, the immobilization of ssDNAand subsequent hybridization with complementary strand wasconducted. The gold electrode was prepared according to proceduredescribed in experimental section. Electrochemical examinations
were run either in electrochemical buffer with methylene blue or inpure electrochemical buffer.
The results obtained for electrochemical examination of bare andDNA modified gold electrode in 10 μM methylene blue solution arepresented in Fig. 5. These data confirm the immobilization of ssDNAon the gold surface. This is clearly indicated by redox potential shift(from −0.232 V±0.0066 (n=3) for bare gold to −0.245 V±0.0116(n=3)) and the current increase (Fig. 5a) and b)). The successivecurrent signal growth and the further shift in redox potential (from−0.245 V±0.0116 to −0.273 V±0.0113 (n=3), Fig. 5c) confirmsthat hybridization of receptor ssDNA with sample ssDNA takes place[39,40]. These results are in good agreement with previously reported,where in all cases the redox potential shifted after ssDNA immobi-lization and DNA–DNA hybridization. Based on observed potentialshifts, the construction of DNA biosensors can be envisioned based onBSC transducers.
3. Conclusions
The comparison of three different gold substrates revealed that thesilicon-based transducers with vacuum-deposited gold layer are themost appropriate for the electrochemical DNA biosensor construction.Their smoothness allows for the organization of well integrated andstabile SAMs, compared to other transducers. The immobilization and
Fig. 4. The changes of SWVs voltammograms of 6-(ferrocenyl)-hexanethiol redox active monolayer with subsequent scans: I) gold disc electrode; II) commercially available sensorwith screen printed gold; III) silicon-based gold transducers [Δ1 — differences in current values between first and second scans]; IV) the comparison of peak area change versus timefor tested electrodes (■ — GDE; ▲ — BSC; ♦ — SPG).
35R. Ziółkowski et al. / Bioelectrochemistry 80 (2010) 31–37

Author's personal copy
subsequent hybridization of DNA on the surface was confirmed withelectrochemical analysis in methylene blue. This fact and the compactsize of our transducers, which allow for significant reduction ofreagent waste, are the main factors supporting their usefulness forfabrication of DNA biosensors.
Acknowledgment
This work was co-financed by the Polish Ministry of Science andHigher Education (research project No. N204 125237) and WarsawUniversity of Technology.
References
[1] J.H.T. Luong, K.B. Male, J.D. Glennon, Biosensor technology: technology pushversus market pull, Biotechnol. Adv. 26 (2008) 492–500.
[2] S. Andreescu, O.A. Sadik, Trends and challenges in biochemical sensors for clinicaland environmental monitoring, Pure Appl. Chem. 76 (2004) 861–878.
[3] J.P. Chambers, B.P. Arulanandam, L.L. Matta, A. Weis, J.J. Valdes, Biosensorrecognition elements, Curr. Issues Mol. Biol. 10 (2008) 1–12.
[4] I. Karube, Y. Nomura, Enzyme sensors for environmental analysis, J. Mol. Catal. B:Enzym. 10 (2000) 177–181.
[5] A. Sassolas, B.D. Leca-Bouvier, L.J. Blum, DNA biosensors and microarrays, Chem.Rev. 108 (2008) 109–139.
[6] M. Badihi-Mossberg, V. Buchner, J. Rishpon, Electrochemical biosensors forpollutants in the environment, Electroanalysis 19 (2007) 2015–2028.
[7] Q. Xu, A.-J. Yuan, R. Zhang, X. Bian, D. Chen, X. Hu, Application of electrochemicalmethods for pharmaceutical and drug analysis, Curr. Pharm. Anal. 5 (2009)144–155.
[8] B. Dogan, A. Golcu, M. Dolaz, S.A. Ozkan, Electrochemical behaviour of thebactericidal cefoperazone and its selective voltammetric determination inpharmaceutical dosage forms and human serum, Curr. Pharm. Anal. 5 (2009)179–189.
[9] J. Wang, et al., Analytical Electrochemistry, Wiley-VCH, New York, 2000 250 p.[10] T. Hianik, J. Wang, Electrochemical aptasensors — recent achievements and
perspectives, Electroanalysis 21 (2009) 1223–1235.[11] G. Sánchez-Pomales, L. Santiago-Rodríguez, C.R. Cabrera, DNA-functionalized
carbon nanotubes for biosensing applications, J. Nanosci. Nanotechnol. 9 (2009)2175–2188.
[12] F.R.R. Teles, L.P. Fonseca, Trends in DNA biosensors, Talanta 77 (2008) 606–623.[13] [13] Regulation (EC) No 1830/2003 of the European Parliament and of the Council.[14] J. Sambrook, Molecular Cloning: A Laboratory Manual3 rd ed, CSH Press, New
York, 2001 2344 p.[15] R.-P. Vonberg, P. Gastmeier, Hospital-acquired infections related to contaminated
substances, J. Hosp. Infect. 65 (2007) 15–23.[16] E. Souteyrand, J.P. Cloarec, J.R. Martin, C. Wilson, I. Lawrence, S. Mikkelsen, M.F.
Lawrence, Direct detection of the hybridization of synthetic homo-oligomer dnasequences by field effect, J. Phys. Chem. B 101 (1997) 2980–2985.
[17] J. Wang, A.-N. Kawde, A. Erdem, M. Salazar, Magnetic bead-based label-freeelectrochemical detection of DNA hybridization, Analyst 126 (2001) 2020–2024.
[18] K.M. Millan, S.R. Mikkelsen, Sequence-selective biosensor for DNA based onelectroactive hybridization indicators, Anal. Chem. 65 (1993) 2317–2323.
[19] M. Dequaire, A. Heller, Screen printing of nucleic acid detecting carbon electrodes,Anal. Chem. 74 (2002) 4370–4377.
[20] C.S. Ah, Y.J. Yun, H.J. Park, S.K. Jung, W.-J. Kim, D.H. Ha, W.S. Yun, Electric detectionof DNA hybridization by nanoparticle nanoswitch, Curr. Appl Phys. 6 (SUPPL. 1)(2006) e157–e160.
[21] E.L.S. Wong, J.J. Gooding, Charge transfer through DNA: a selective electrochem-ical DNA biosensor, Anal. Chem. 78 (2006) 2138–2144.
[22] I. Tessmer, Y. Yang, J. Zhai, C. Du, P. Hsieh, M.M. Hingorani, D.A. Erie, Mechanism ofMutS searching for DNA mismatches and signaling repair, J. Biol. Chem. 283(2008) 36646–36654.
[23] M. Masařík, K. Cahová, R. Kizek, E. Paleček, M. Fojta, Label-free voltammetricdetection of single-nucleotide mismatches recognized by the protein MutS, Anal.Bioanal.Chem. 388 (2007) 259–270.
[24] I. Babic, S.E. Andrew, F.R. Jirik, MutS interaction with mismatch and alkylated basecontaining DNA molecules detected by optical biosensor, Mutat. Res./Fundam.Mol. Mech. Mutagen 372 (1996) 87–96.
[25] A. Ulman, Formation and structure of self-assembled monolayers, Chem. Rev. 96(1996) 1533–1554.
[26] H. Wackerbarth, R. Marie, M. Grubb, J. Zhang, A.G. Hansen, I. Chorkendorff, C.B.V.Christensen, J. Ulstrup, Thiol- and disulfide-modified oligonucleotide monolayerstructures on polycrystalline and single-crystal Au(111) surfaces, J. Solid StateElectrochem. 8 (2004) 474–481.
[27] F. Luderer, U. Walschus, Immobilization of oligonucleotides for biochemicalsensing by self-assembled monolayers: thiol-organic bonding on gold andsilanization on silica surfaces, Top. Curr. Chem. 260 (2005) 37–56.
[28] G. Sánchez-Pomales, L. Santiago-Rodríguez, N.E. Rivera-Vélez, C.R. Cabrera,Control of DNA self-assembled monolayers surface coverage by electrochemicaldesorption, J. Electroanal. Chem. 611 (2007) 80–86.
[29] D. Losic, J.G. Shapter, J.J. Gooding, Influence of surface topography on alkanethiolSAMs assembled from solution and bymicrocontact printing, Langmuir 17 (2001)3307–3316.
[30] E.F. Jr, P.F.Driscoll Douglass, D. Liu, N.A. Burnham, C.R. Lambert, W.G. McGimpsey,Effect of electrode roughness on the capacitive behavior of self-assembledmonolayers, Anal. Chem. 80 (2008) 7670–7677.
[31] http://www.bvt.cz.[32] M. Zaborowski, B. Jaroszewicz, D. Tomaszewski, P. Prokaryn, E. Malinowska, E.
Grygołowicz-Pawlak, P. Grabiec, Fabrication of MOS-compatible ion-sensitivedevices for water pollution monitoring (warmer), Proceedings of the 14thInternational Conference Mixed Design of Integrated Circuits and Systems 2007,Ciechocinek, 21-23.06.2007 r, IEEE, Łódź, 2007, pp. 477–481.
[33] S.O. Kelley, J.K. Barton, N.M. Jackson, M.G. Hill, Electrochemistry of methylene bluebound to a DNA-modified electrode, Bioconjugate Chem. 8 (1997) 31–37.
[34] A. Erdem, M. Ozsoz, Electrochemical DNA biosensors based on DNA–druginteractions, Electroanalysis 14 (2002) 965–974.
[35] A. Erdem, K. Kerman, B. Meric, M. Ozsoz, Methylene blue as a novelelectrochemical hybridization indicator, Electroanalysis 13 (2001) 219–223.
[36] A. Erdem, K. Kerman, B. Meric, U.S. Akarca, M. Ozsoz, Novel hybridization indicatormethylene blue for the electrochemical detection of short DNA sequences relatedto the hepatitis B virus, Anal. Chim. Acta 422 (2000) 139–149.
[37] E. Tuite, B. Norden, Sequence-specific interactions of methylene blue with polynucleo-tides and DNA: a spectroscopic study, J. Am. Chem. Soc. 116 (1994) 7548–7556.
[38] S.O. Kelley, E.M. Boon, J.K. Barton, N.M. Jackson, M.G. Hill, Single-base mismatchdetection based on charge transduction through DNA, Nucleic Acids Res. 27(1999) 4830–4837.
[39] L. Zhu, R. Zhao, K. Wang, H. Xiang, Z. Shang, W. Sun, Electrochemical behaviors ofmethylene blue on DNA modified electrode and its application to the detection ofPCR product from NOS sequence, Sensors 8 (2008) 5649–5660.
[40] J. Gu, X. Lu, H. Ju, DNA sensor for recognition of native yeast DNA sequence withmethylene blue as an electrochemical hybridization indicator, Electroanal. 14(2002) 949–954.
Fig. 5. I) results for electrochemical analysis of 10 μM methylene blue solution onvacuum-deposited gold electrode a) bare, b) ssDNA modified, c) dsDNA modified.Potentials are reported versus Ag/AgCl reference electrode. The picture II) is themagnification of the scan a).
36 R. Ziółkowski et al. / Bioelectrochemistry 80 (2010) 31–37

Author's personal copy
[41] W. Yang, M. Ozsoz, D.B. Hibbert, J.J. Gooding, Evidence for the direct interactionbetween methylene blue and guanine bases using DNA-modified carbon pasteelectrodes, Electroanal. 14 (2002) 1299–1302.
[42] A.J. Bard, L.R. Faulkne, Electrochemical Methods. Fundamentals And Applications2nd ed, Wiley-VCH, NJ, 2001 833 p.
[43] E.L.S. Wong, J.J. Gooding, Electronic detection of target nucleic acids by a 2, 6-disulfonic acid anthraquinone intercalator, Anal. Chem. 75 (2003) 3845–3852.
[44] A.L. Eckermann, D.J. Feld, J.A. Shaw, T.J. Meade, Electrochemistry of redox-activeself-assembled monolayers, Coord. Chem. Rev. (10.1016/j.ccr.2009.12.023)(2010).
[45] M.M. Walczak, C.A. Alves, B.D. Lamp, M.D.J. Porter, Electrochemical and X-rayphotoelectron spectroscopic evidence for differences in the binding sites ofalkanethiolate monolayers chemisorbed at gold, J. Electroanal. Chem. 396 (1995)103–114.
[46] M.M. Walczak, D.D. Popenoe, R.S. Deinhammer, B.D. Lamp, C. Chung, M.D. Porter,Reductive desorption of alkanethiolate monolayers at gold: a measure of surfacecoverage, Langmuir 7 (1991) 2687–2693.
37R. Ziółkowski et al. / Bioelectrochemistry 80 (2010) 31–37
Copyright © 2022 FDOKUMEN