Development of instrumentation for amperometric and coulometric detection using ultramicroelectrodes
11
Article J. Braz. Chem. Soc., Vol. 19, No. 1, 131-139, 2008. Printed in Brazil - ©2008 Sociedade Brasileira de Química 0103 - 5053 $6.00+0.00 *e-mail: [email protected] Development of Instrumentation for Amperometric and Coulometric Detection using Ultramicroelectrodes Cláudia F. B. Coutinho,* ,a Lincoln F. M. Coutinho, a Fernando M. Lanças, a Carlos A. P. Câmara, b Suzana L. Nixdorf b and Luiz H. Mazo a a Instituto de Química de São Carlos,Universidade de São Paulo, Av. Trabalhador Sãocarlense, 400, CP 780, 13566-590 São Carlos-SP, Brazil b Departamento de Química, Universidade Estadual de Londrina, Rodovia Celso Garcia Cid, Km 380, Campus Universitário, CP 6001, 86051-990 Londrina-PR, Brazil Neste trabalho é apresentado o desenvolvimento de uma instrumentação simples, portátil e de baixo custo para detecção amperométrica e coulométrica usando ultramicroeletrodos em diferentes sistemas analíticos. O programa, desenvolvido em LabVIEW 7.1 TM , é capaz de realizar três modos de detecção (amperométrico, coulométrico e amperométrico pulsado) e voltametria cíclica. A instrumentação desenvolvida foi avaliada utilizando os seguintes sistemas: voltametria cíclica de eletrodos metálicos em solução alcalina, detecção eletroquímica em fluxo de glicose e glicina, e também na determinação direta do herbicida glifosato (detecção eletroquímica aliada à cromatografia líquida de alta eficiência, CLAE). In this work it is presented the development of a simple, portable and inexpensive instrumentation for amperometric and coulometric detection in different analytical instrumentation systems utilizing ultramicroelectrodes. The software, developed in LabVIEW 7.1 TM , is capable to carry out three main detection techniques (amperometric, pulsed amperometric and coulometric detection) and a voltammetric technique (cyclic voltammetry). The instrumentation was successfully evaluated using the following systems: cyclic voltammograms of metallic electrodes in alkaline solutions, flow electrochemical detection of glucose and glycine and direct determination of herbicide glyphosate (electrochemical detection coupled to HPLC). Keywords: instrumentation, portable, electrochemical detection, ultramicroelectrodes, flow system Introduction Amperometry has become a widely used detection method for a variety of analytical techniques including flow injection analysis (FIA), high-performance liquid chromatography (HPLC), capillary liquid chromatography (cLC) and capillary electrophoresis (CE). 1,2 Its popularity stems from a combination of sensitivity, selectivity, and versatility. 3 Amperometric detection is usually performed at a solid electrode under constant applied potential, which is typically denoted as dc amperometry. Nowadays, constant potential amperometric detection of many compounds has been successfully accomplish using glassy carbon, Cu, Ni, Co, and others non-noble metal electrodes. 4 Numerous aromatic compounds (e.g., phenols, aminophenols, catecholamines, and other meta- bolic amines) are easily detected by anodic reactions in dc amperometry utilizing these electrodes. Electronic reso- nance in the aromatic compounds functions to stabilize the free-radical intermediate products of anodic oxidations and as a consequence, the activation barrier for electrochemical reaction is lowered significantly. 5 However, although the high electroactivity of the aro- matic compounds in the glassy carbon electrode, it does not
Transcript of Development of instrumentation for amperometric and coulometric detection using ultramicroelectrodes

Article
J. Braz. Chem. Soc., Vol. 19, No. 1, 131-139, 2008.Printed in Brazil - ©2008 Sociedade Brasileira de Química
0103 - 5053 $6.00+0.00
*e-mail: [email protected]
Development of Instrumentation for Amperometric and Coulometric Detection using Ultramicroelectrodes
Cláudia F. B. Coutinho,*,a Lincoln F. M. Coutinho,a Fernando M. Lanças,a Carlos A. P. Câmara,b
Suzana L. Nixdorf b and Luiz H. Mazoa
aInstituto de Química de São Carlos, Universidade de São Paulo, Av. Trabalhador Sãocarlense, 400, CP 780, 13566-590 São Carlos-SP, Brazil
bDepartamento de Química, Universidade Estadual de Londrina, Rodovia Celso Garcia Cid, Km 380, Campus Universitário, CP 6001, 86051-990 Londrina-PR, Brazil
Neste trabalho é apresentado o desenvolvimento de uma instrumentação simples, portátil e de baixo custo para detecção amperométrica e coulométrica usando ultramicroeletrodos em diferentes sistemas analíticos. O programa, desenvolvido em LabVIEW 7.1TM, é capaz de realizar três modos de detecção (amperométrico, coulométrico e amperométrico pulsado) e voltametria cíclica. A instrumentação desenvolvida foi avaliada utilizando os seguintes sistemas: voltametria cíclica de eletrodos metálicos em solução alcalina, detecção eletroquímica em fluxo de glicose e glicina, e também na determinação direta do herbicida glifosato (detecção eletroquímica aliada à cromatografia líquida de alta eficiência, CLAE).
In this work it is presented the development of a simple, portable and inexpensive instrumentation for amperometric and coulometric detection in different analytical instrumentation systems utilizing ultramicroelectrodes. The software, developed in LabVIEW 7.1TM, is capable to carry out three main detection techniques (amperometric, pulsed amperometric and coulometric detection) and a voltammetric technique (cyclic voltammetry). The instrumentation was successfully evaluated using the following systems: cyclic voltammograms of metallic electrodes in alkaline solutions, flow electrochemical detection of glucose and glycine and direct determination of herbicide glyphosate (electrochemical detection coupled to HPLC).
Keywords: instrumentation, portable, electrochemical detection, ultramicroelectrodes, flow system
Introduction
Amperometry has become a widely used detection method for a variety of analytical techniques including flow injection analysis (FIA), high-performance liquid chromatography (HPLC), capillary liquid chromatography (cLC) and capillary electrophoresis (CE).1,2 Its popularity stems from a combination of sensitivity, selectivity, and versatility.3 Amperometric detection is usually performed at a solid electrode under constant applied potential, which is typically denoted as dc amperometry.
Nowadays, constant potential amperometric detection of many compounds has been successfully accomplish using glassy carbon, Cu, Ni, Co, and others non-noble metal electrodes.4 Numerous aromatic compounds (e.g., phenols, aminophenols, catecholamines, and other meta-bolic amines) are easily detected by anodic reactions in dc amperometry utilizing these electrodes. Electronic reso-nance in the aromatic compounds functions to stabilize the free-radical intermediate products of anodic oxidations and as a consequence, the activation barrier for electrochemical reaction is lowered significantly.5
However, although the high electroactivity of the aro-matic compounds in the glassy carbon electrode, it does not
J. Braz. Chem. Soc.132 Development of Instrumentation for Amperometric and Coulometric Detection
enable the oxidation of some polar aliphatic compounds (e.g., carbohydrates, amines and alcohols). This is due the lack of a stabilization process of the free-radial intermedi-ate products of the anodic oxidation these compounds on the electrodic surface. On the other hand, unlike the glassy carbon electrode, the non-noble metal electrodes, such the Cu, Ni, and Co electrodes, can catalyze the oxidation process of polar aliphatic compounds through the forma-tion of species of Cu(III), Ni(III) and Co(III) which are commonly believed to act as a redox mediators between substrate and electrode.4,6,7
In noble metal electrodes, the existence of partial filled d-orbital promotes stabilization of free radicals and compounds with nonbonded electrons pair by adsorption at electrode surface. Unfortunately, this beneficial effect of adsorption (i.e., electrocatalytic activity) is accompanied by the undesirable tendency of the electrode surface to become fouled by the accumulation of adsorbed compounds. Thus, the constant potential amperometric detection of polar ali-phatic compounds at noble-electrodes, such as Au and Pt electrodes, generate a rapid loss of electrode response, and therefore, is required some form of cleaning. This is where pulsed amperometric detection (PAD) comes into play. This technique exploits the high electrocatalytic activity of noble metal electrodes by combining amperometric detection with pulsed potential cleaning. Fouling species adsorbed in the detection potential are oxidativelly desorbed quite efficiently from the electrode by the application of a large positive-potential pulse to generate surface oxide. After the anodic potential pulse, the oxide-covered electrode is inert and must be cathodically reduced by a negative-potential pulse to restore the native activity of the cleaned noble metal electrode surface.5
Ultramicroelectrodes (UME) have been recently used in analytical determinations as amperometric detectors in FIA, HPLC, cLC and CE,8 and can be applied to the direct, sensitive, and reproducible detection of a wide variety of aromatic and polar aliphatic compounds. In miniaturized systems such the cLC and CE, in order to maintain the separation efficiency it is crucial decrease the detection cell volume. Consequently, the use of UME should contribute for the miniaturization of the system.
UME present small physical size (0.5 to 60 m in diameter), which provides beneficial characteristics when compared to larger electrodes. These include improved measurement sensitivity, enhanced mass transport, incre-ased temporal resolution, low charging currents, greater signal-to-noise, and the ability to perform measurements in extremely small microenvironments or sub-microliter sample volumes.9 Another advantage of the UME when compared to conventional electrodes is the no requirement
of an electrochemical system of three-electrodes with a potentiostatic control. Due the small currents (picoam-pere or nanoampere), the ohmic drop do not distort the voltammetric waves as the microampere currents usually do, consequently, enable the experiments in high resistance and nonaqueous solvents, like that usually used in chroma-tographic methods.8
The most common type of UME is the disk electro-de, but other UME geometries have been developed and characterized, including hemispheres, disk arrays, rings, rings-disks, bands, and cylinders.9-11 The planar electrodes (disc, ring, and ring-disk) are most suitable for mechanical polishing and for this reason these electrode have been so popular in HPLC.5
A drawback of the UME is that necessary an appropriate instrumentation to measure the small current generated in the system. Thus, the aim of this work was to develop and evaluate a simple, portable and inexpensive instrumen-tation for amperometric detection in flow systems (FIA, chromatography, electrophoresis, etc) utilizing UME in a two electrodes flow cell.
Experimental
Reagents
Sodium hydroxide, glycine and glucose were purchased from Mallinckrodt AR (Xalostoc, Mexico), and used without further purification. The solutions were prepared using distilled water further purified in a Milli-Q system (Millipore Co.). All experiments were carried out at room temperature without previous deaeration.
Equipment
For data acquisition and signal generation was uti-lized a PCI-6014B multifunction data acquisition board, a SH6850 shielded cable, a SC-2050 cable adapter, and a CB-50LP terminal block (all National Instruments, Aus-tin, TX). The PCI-6014B multifunction board featuring 16 single-ended (or 8 differential) gain programmable analog inputs multiplexed to a 16-bit analog-to-digital converter (ADC), two 16-bit digital-to-analog converters (DAC), 8 digital I/O lines, two 24-bit counters/timers, digital trigger and one Direct Access Memory (DMA) channel shared by all resources on the device. The board is capable to acquire an analog signal in a frequency up to 200 kHz and generate an analog signal up to 10 kHz. The analog input can be configured to four input ranges: ± 50 mV, ± 500 mV, ± 5 V and ± 10 V. This board was interfaced to a 1.4 GHz Pentium 4 personal computer
133Coutinho et al.Vol. 19, No. 1, 2008
running LabVIEW 7.1 (National Instruments, Austin, TX) under Windows XP (Microsoft).
For amplification of the low currents generated in UME it was utilized a SR570 low-noise current preamplifier (Stanford Research System, Sunnyvale, CA). The SR570 has sensitivity settings from 1 pA V-1 to 1 mA V-1 that can be selected in a 1-2-5 sequence. A vernier gain adjust-ment is also provided that lets you select any sensitivity in between. The SR570 contains two first-order RC filters whose cutoff frequency and type can be configured from the front panel. Together, the filters can be configured as a 6 or 12 dB/oct rolloff low-pass or high-pass filter, or as a 6 dB/oct rolloff band-pass filter. Cutoff frequencies are adjustable from 0.03 Hz to 1 MHz in a 1-3-10 sequence. A filter reset button is included to shorten the overload recovery time of the instrument when long filter time con-stants are used. The RS570 provided an input offset-current adjustment to suppress any undesired DC background cur-rents. Offset currents can be specified from ±1 pA to ±1 mA in roughly 0.1 % increments. The SR570 also has an adjustable input DC bias voltage (±5 V) that allows you to directly sink current into a virtual null (analog ground) or a selected DC bias.22
The connection of the SR570 to the flow detector cell and to the PCI-6014B multifunction board was made by a labmade connector block. The connectors of this connector block were directly interconnected utilizing copper wires without any printed circuit.
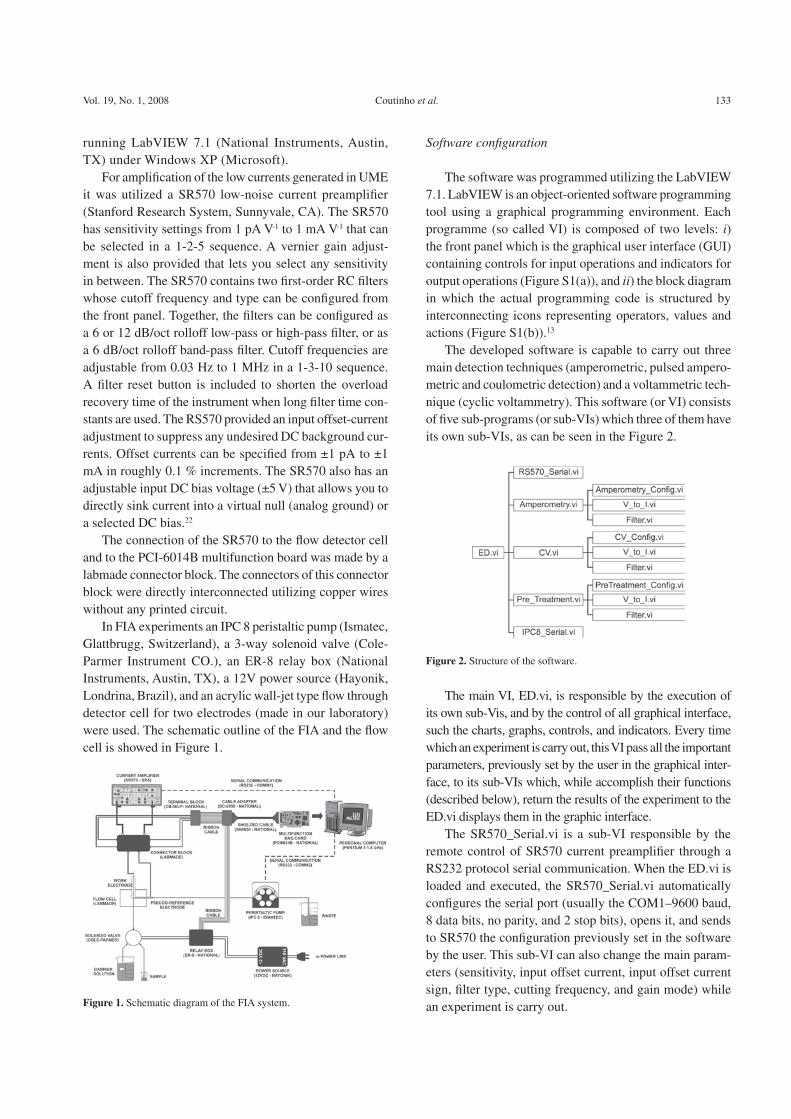
In FIA experiments an IPC 8 peristaltic pump (Ismatec, Glattbrugg, Switzerland), a 3-way solenoid valve (Cole-Parmer Instrument CO.), an ER-8 relay box (National Instruments, Austin, TX), a 12V power source (Hayonik, Londrina, Brazil), and an acrylic wall-jet type flow through detector cell for two electrodes (made in our laboratory) were used. The schematic outline of the FIA and the flow cell is showed in Figure 1.
Software configuration
The software was programmed utilizing the LabVIEW 7.1. LabVIEW is an object-oriented software programming tool using a graphical programming environment. Each programme (so called VI) is composed of two levels: i)the front panel which is the graphical user interface (GUI) containing controls for input operations and indicators for output operations (Figure S1(a)), and ii) the block diagram in which the actual programming code is structured by interconnecting icons representing operators, values and actions (Figure S1(b)).13
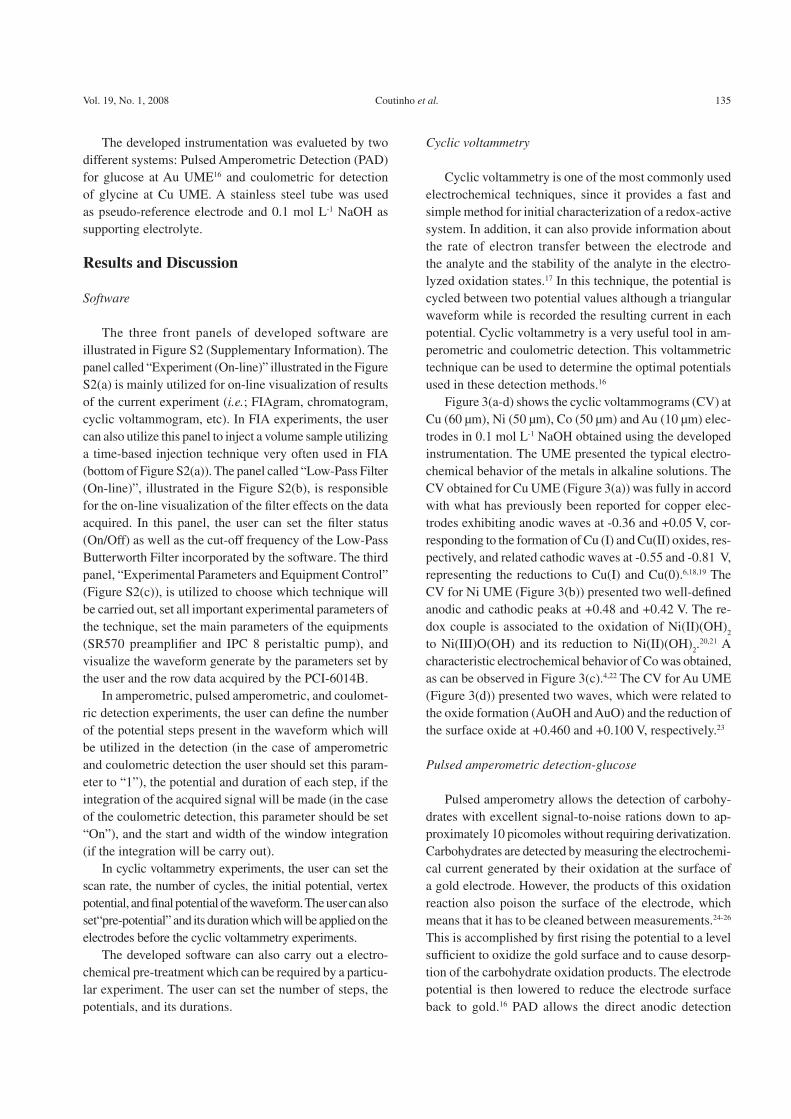
The developed software is capable to carry out three main detection techniques (amperometric, pulsed ampero-metric and coulometric detection) and a voltammetric tech-nique (cyclic voltammetry). This software (or VI) consists of five sub-programs (or sub-VIs) which three of them have its own sub-VIs, as can be seen in the Figure 2.
The main VI, ED.vi, is responsible by the execution of its own sub-Vis, and by the control of all graphical interface, such the charts, graphs, controls, and indicators. Every time which an experiment is carry out, this VI pass all the important parameters, previously set by the user in the graphical inter-face, to its sub-VIs which, while accomplish their functions (described below), return the results of the experiment to the ED.vi displays them in the graphic interface.
The SR570_Serial.vi is a sub-VI responsible by the remote control of SR570 current preamplifier through a RS232 protocol serial communication. When the ED.vi is loaded and executed, the SR570_Serial.vi automatically configures the serial port (usually the COM1–9600 baud, 8 data bits, no parity, and 2 stop bits), opens it, and sends to SR570 the configuration previously set in the software by the user. This sub-VI can also change the main param-eters (sensitivity, input offset current, input offset current sign, filter type, cutting frequency, and gain mode) while an experiment is carry out.Figure 1. Schematic diagram of the FIA system.
Figure 2. Structure of the software.

J. Braz. Chem. Soc.134 Development of Instrumentation for Amperometric and Coulometric Detection
The sub-VI IPC8_Serial.vi is responsible by the control of IPC 8 peristaltic pump. As well as the SR570_Serial.vi, when the ED.vi is loaded and executed, the IPC8_Serial.vi automatically configures another serial port (usually the COM2-9600 baud, 8 data bits, no parity, and 1 stop bits), opens it, and sends to IPC 8 the configuration previously set in the software by the user. This sub-VI can also change parameters such the flow rate of the carrier solution while an experiment is made.
The other three sub-VIs of ED.vi (Amperometry.vi, CV.vi, and Pre_Treatment.vi) control the amperometry and cyclic voltammetry experiments, and an electrochemical pre-treatment step which may be require by a particular electrode, respectively. All these three sub-VIs have their own three sub-VIs (Filter.vi, V_to_I.vi, and a sub-VI responsible by the hardware configuration required by the technique utilized) which will be discuss below.
Filter.vi utilizes a digital Butterworth Filter present in the standard library of the LabVIEW as a VI called “Butter-worth Filter.vi”. This filter is capable to remove selectively some frequency components which are attributed to the noise from the signal acquired.
The output of the SR570 current preamplifier is a voltage proportional to the current pass though the input of the equipment. Therefore, it is necessary the conversion of the output voltage acquired by the PCI-6014B from the SR570 to its corresponding current. To accomplish this task, it was created a sub-VI called V_to_I.vi. This sub-VI utilize the sensitivity set in the SR570 to properly convert the voltage output to it respective current value (for instance, in case of the voltage output be 2 volts and the sensitivity of the device be set to 20 nA/V, the V_to_I.vi will convert this voltage value to its corresponded current, which is 40 nA).
Amperometry_Config.vi, CV_Config.vi, and PreTreat-ment_Config.vi are utilized by Amperometry.vi, CV.vi, and Pre_Treatment.vi respectively, to configure the hardware (PCI-6014B) and synchronize the acquisition of the current with the applied potential through an internal digital trigger.
Amperometry.vi is the sub-VI responsible by the am-perometric, pulsed amperometric, and coulometric detection experiments. When executed by the ED.vi, this sub-VI: (i)execute the Amperometry_Config.vi which configure the hardware; (ii) create an array with the waveform defined by the user in the graphical interface; (iii) send this array to DAC of PCI-6014B generate the output (in a frequency of 1 kHz); (iv) acquire (in a frequency of 1 kHz) a set of data points of the signal amplified by the SR570 in synchronization with the potential applied; (v) execute the V_to_I.vi to convert the voltage value acquired to its corresponding current value; (vi)execute the Filter.vi for noise removal (if it was set “On” by
the user); (vii) if necessary, as in the case of coulometric detec-tion, perform the signal integration (charge calculation); (viii)transfer the results to the ED.vi show it in the chart and (ix)repeat the steps (iv) to (viii) until the experiment be ended.
CV.vi is the sub-VI responsible to perform the cyclic voltammetric experiments. When executed by the ED.vi, this sub-VI: (i) execute the CV_Config.vi which configure the hardware; (ii) create an array with the waveform defined by the user in the graphical interface; (iii) send this array to DAC of PCI-6014B generate the output (in a frequency of 100 Hz); (iv) acquire (in a frequency of 1 kHz) a set of 10 data points of the signal amplified by the SR570 in synchronization with the potential applied; (v) execute the V_to_I.vi to convert the voltage value acquired to its cor-responding current value, (vi) execute the Filter.vi for noise removal (if it was set “On” by the user); (vii) calculate the average calculus of the 10 data point acquired; (viii) pass the results to the ED.vi show it in the chart and (ix) repeat the steps (iv) to (viii) until the experiment be ended.
The last VI build by us, Pre_Treatment.vi, is the sub-VI responsible by an electrochemical pre-treatment step which may be required in some application. When executed by the ED.vi, this sub-VI: (i) execute the PreTreatment_Config.vi which configure the hardware; (ii) apply the potential of the first step of the electrochemical pre-treatment and wait by a time set by the user; (iii) acquire (in a frequency of 1 kHz) a set of 1000 data points of the signal amplified by the SR570 in synchronization with the potential applied; (iv) execute the V_to_I.vi to convert the voltage value ac-quired to its corresponding current value; (v) execute the Filter.vi for noise removal (if it was set “On” by the user); (vi) calculate the average of the 1000 data point acquired; (vii) pass the results to the ED.vi show it in the chart; (viii)apply the potential of the next step of the electrochemical pre-treatment and wait by a time set by the user (if a new step exists) and (ix) repeat the steps (iii) to (viii) until have no more steps in the electrochemical pre-treatment.
Procedure
The cyclic voltammetry experiments were carried out us-ing an electrochemical cell for two electrodes (20 mLl). The reference electrode utilized was an Ag/AgCl (labmade) and the working electrodes utilized were disks UMES: Cu (60 m), Ni (50 m), Au (10 m) and Co (50 m). The UME was made by sealing a microwire into a glass tube with epoxy resin, according to procedure described in the literature.10,14,15 The UME surfaces were clean using an emery papers in successive order of grit size (400, 600, 1200 and 2400), and rinsed with water. These UME were cycled in the 0.1 mol L-1 NaOH until to obtain stable cyclic voltammograms.
135Coutinho et al.Vol. 19, No. 1, 2008
The developed instrumentation was evalueted by two different systems: Pulsed Amperometric Detection (PAD) for glucose at Au UME16 and coulometric for detection of glycine at Cu UME. A stainless steel tube was used as pseudo-reference electrode and 0.1 mol L-1 NaOH as supporting electrolyte.
Results and Discussion
Software
The three front panels of developed software are illustrated in Figure S2 (Supplementary Information). The panel called “Experiment (On-line)” illustrated in the Figure S2(a) is mainly utilized for on-line visualization of results of the current experiment (i.e.; FIAgram, chromatogram, cyclic voltammogram, etc). In FIA experiments, the user can also utilize this panel to inject a volume sample utilizing a time-based injection technique very often used in FIA (bottom of Figure S2(a)). The panel called “Low-Pass Filter (On-line)”, illustrated in the Figure S2(b), is responsible for the on-line visualization of the filter effects on the data acquired. In this panel, the user can set the filter status (On/Off) as well as the cut-off frequency of the Low-Pass Butterworth Filter incorporated by the software. The third panel, “Experimental Parameters and Equipment Control” (Figure S2(c)), is utilized to choose which technique will be carried out, set all important experimental parameters of the technique, set the main parameters of the equipments (SR570 preamplifier and IPC 8 peristaltic pump), and visualize the waveform generate by the parameters set by the user and the row data acquired by the PCI-6014B.
In amperometric, pulsed amperometric, and coulomet-ric detection experiments, the user can define the number of the potential steps present in the waveform which will be utilized in the detection (in the case of amperometric and coulometric detection the user should set this param-eter to “1”), the potential and duration of each step, if the integration of the acquired signal will be made (in the case of the coulometric detection, this parameter should be set “On”), and the start and width of the window integration (if the integration will be carry out).
In cyclic voltammetry experiments, the user can set the scan rate, the number of cycles, the initial potential, vertex potential, and final potential of the waveform. The user can also set“pre-potential” and its duration which will be applied on the electrodes before the cyclic voltammetry experiments.
The developed software can also carry out a electro-chemical pre-treatment which can be required by a particu-lar experiment. The user can set the number of steps, the potentials, and its durations.
Cyclic voltammetry
Cyclic voltammetry is one of the most commonly used electrochemical techniques, since it provides a fast and simple method for initial characterization of a redox-active system. In addition, it can also provide information about the rate of electron transfer between the electrode and the analyte and the stability of the analyte in the electro-lyzed oxidation states.17 In this technique, the potential is cycled between two potential values although a triangular waveform while is recorded the resulting current in each potential. Cyclic voltammetry is a very useful tool in am-perometric and coulometric detection. This voltammetric technique can be used to determine the optimal potentials used in these detection methods.16
Figure 3(a-d) shows the cyclic voltammograms (CV) at Cu (60 µm), Ni (50 µm), Co (50 µm) and Au (10 µm) elec-trodes in 0.1 mol L-1 NaOH obtained using the developed instrumentation. The UME presented the typical electro-chemical behavior of the metals in alkaline solutions. The CV obtained for Cu UME (Figure 3(a)) was fully in accord with what has previously been reported for copper elec-trodes exhibiting anodic waves at -0.36 and +0.05 V, cor-responding to the formation of Cu (I) and Cu(II) oxides, res-pectively, and related cathodic waves at -0.55 and -0.81 V, representing the reductions to Cu(I) and Cu(0).6,18,19 The CV for Ni UME (Figure 3(b)) presented two well-defined anodic and cathodic peaks at +0.48 and +0.42 V. The re-dox couple is associated to the oxidation of Ni(II)(OH)
2
to Ni(III)O(OH) and its reduction to Ni(II)(OH)2.20,21 A
characteristic electrochemical behavior of Co was obtained, as can be observed in Figure 3(c).4,22 The CV for Au UME (Figure 3(d)) presented two waves, which were related to the oxide formation (AuOH and AuO) and the reduction of the surface oxide at +0.460 and +0.100 V, respectively.23
Pulsed amperometric detection-glucose
Pulsed amperometry allows the detection of carbohy-drates with excellent signal-to-noise rations down to ap-proximately 10 picomoles without requiring derivatization. Carbohydrates are detected by measuring the electrochemi-cal current generated by their oxidation at the surface of a gold electrode. However, the products of this oxidation reaction also poison the surface of the electrode, which means that it has to be cleaned between measurements.24-26
This is accomplished by first rising the potential to a level sufficient to oxidize the gold surface and to cause desorp-tion of the carbohydrate oxidation products. The electrode potential is then lowered to reduce the electrode surface back to gold.16 PAD allows the direct anodic detection

J. Braz. Chem. Soc.136 Development of Instrumentation for Amperometric and Coulometric Detection
of carbohydrates by application of a three-step potential waveform that incorporates the detection process with electrode reactivation. For the carbohydrates analysis, the initial (detection) potential (E
det) in the PAD waveform is
set at a value where the signal from carbohydrate oxidation is large for small time values and there is little background oxidation of the Au electrode. The current is sampled and integrated during a short time period after a delay time that allow the double-layer charging current decay to an insig-nificant value. The potential is then pulsed to a value (E
oxi) in
the vicinity of O2 evolution to achieve Au-oxide formation
with concurrent oxidative cleaning of the electrode surface. The final potential pulse is to a value (E
red) in the region of
O2 reduction with simultaneous regeneration of the reduced
Au surface.7 Figure 4 shows the sequence of potentials used in PAD and the current profile resulting.
Figure 5(a) shows the CV at Au UME in the absence and presence of glucose. In the absence of glucose (dashed line) the typical electrochemical behavior of this electrode, with the oxidation and reduction waves at +0.460 and +0.100 V, respectively, is observed. When glucose was present (solid line), its oxidation peak is observed at +0.39 V, which is also the potential at which formation of gold oxide begins.16
The glucose oxidation current drops as gold oxidation con-tinues to increase, demonstrating that the formation of gold oxide inhibits oxidation of glucose. On the reverse scan,
the current actually reverses from negative to positive at the onset of gold oxide reduction, further evidence of the inhibiting effect of gold oxide on the oxidation of glucose. It is thus important to use a measuring potential (E
det) below
that required for gold oxidation.16 Figure 5(b) shows the FIAgrams obtained for glucose using PAD at Au UME in 0.1 mol L-1 NaOH and the Table 1 shows the waveform specifications utilized. It can be seen in Figure 5(b) that the system presents a linear electrochemical response up to 1.0 10-3 mol L-1 glucose with a good reproducibility.
Figure 3. Cyclic voltammograms at (a) Cu (60 m), (b) Ni (50 m), (c) Co (50 m) and (d) Au (10 m) in 0.1 mol L-1 NaOH. Scan rate 100 mV s-1.
Figure 4. Diagram of the pulse sequence for carbohydrate detection.
137Coutinho et al.Vol. 19, No. 1, 2008
Coulometric detection-glycine
The constant potential detection of most aliphatic com-pounds has been achieved by oxidation at non-noble elec-trode such as Cu, Ni and Co.3,6,7 These metals can catalyze the electrode oxidation process through the formation of species of Cu(III), Ni(III) and Co(III) which are commonly believed to act as a redox mediators between substrate and electrode. The alkaline medium (pH >13) represents the main requirement to form and stabilize the catalytic spe-
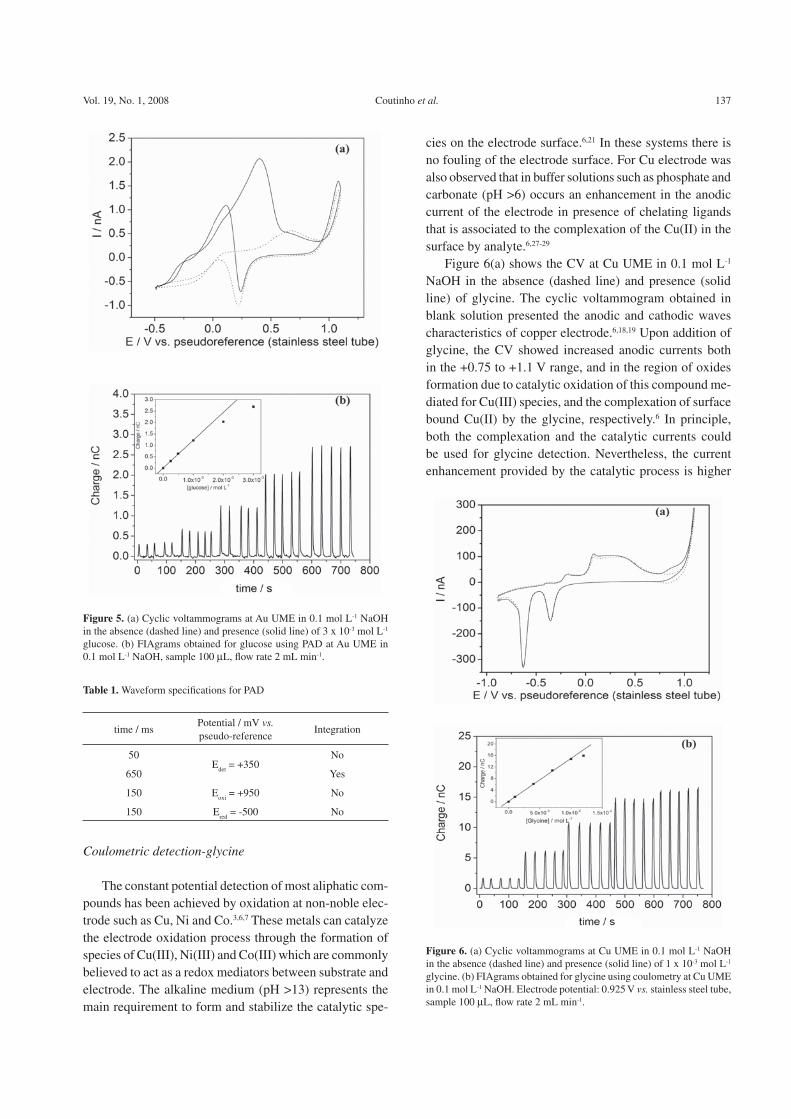
cies on the electrode surface.6,21 In these systems there is no fouling of the electrode surface. For Cu electrode was also observed that in buffer solutions such as phosphate and carbonate (pH >6) occurs an enhancement in the anodic current of the electrode in presence of chelating ligands that is associated to the complexation of the Cu(II) in the surface by analyte.6,27-29
Figure 6(a) shows the CV at Cu UME in 0.1 mol L-1
NaOH in the absence (dashed line) and presence (solid line) of glycine. The cyclic voltammogram obtained in blank solution presented the anodic and cathodic waves characteristics of copper electrode.6,18,19 Upon addition of glycine, the CV showed increased anodic currents both in the +0.75 to +1.1 V range, and in the region of oxides formation due to catalytic oxidation of this compound me-diated for Cu(III) species, and the complexation of surface bound Cu(II) by the glycine, respectively.6 In principle, both the complexation and the catalytic currents could be used for glycine detection. Nevertheless, the current enhancement provided by the catalytic process is higher
Table 1. Waveform specifications for PAD
time / msPotential / mV vs.pseudo-reference
Integration
50E
det = +350
No
650 Yes
150 Eoxi
= +950 No
150 Ered
= -500 No
Figure 5. (a) Cyclic voltammograms at Au UME in 0.1 mol L-1 NaOH in the absence (dashed line) and presence (solid line) of 3 x 10⁻³ mol L-1
glucose. (b) FIAgrams obtained for glucose using PAD at Au UME in 0.1 mol L-1 NaOH, sample 100 L, flow rate 2 mL min-1.
Figure 6. (a) Cyclic voltammograms at Cu UME in 0.1 mol L-1 NaOH in the absence (dashed line) and presence (solid line) of 1 x 10⁻³ mol L-1
glycine. (b) FIAgrams obtained for glycine using coulometry at Cu UME in 0.1 mol L-1 NaOH. Electrode potential: 0.925 V vs. stainless steel tube, sample 100 L, flow rate 2 mL min-1.

J. Braz. Chem. Soc.138 Development of Instrumentation for Amperometric and Coulometric Detection
then complexation; thus for analytical purpose the cata-lytic current was chosen. Figure 6(b) shows the FIAgrams obtained for glycine using coloumetric detection at Cu UME in 0.1 mol L-1 NaOH. The system presented a good reproducibility and linear electrochemical response up to 10 x 10-3 mol L-1 glycine.
Coulometric detection of glyphosate using copper micro-electrode and HLPC
The instrumentation developed in this paper was used with success in the determination of herbicide glyphosate using coulometric detection at copper microelectrode coupled to HPLC.30,31 The principle of detection is based on the enhancement of the anodic current of copper mi-croelectrode in the presence of complexing agents, such as glyphosate, with the formation of a soluble Cu(II) complex. Under optimized conditions, the limit of detection (S/R=3) for glyphosate was 0.59 µmol L-1. The present method was successfully applied to the determination of glyphosate in tomato juice without any kind of derivatization, extrac-tion, clean-up, or preconcentration step, with recovery of 88%.30
Conclusions
Ultramicroelectrodes have been used in analytical de-terminations as electrochemical detectors in FIA, HPLC, cLC and CE. However, there are only a few commercial equipments (which are quite complicate and high expen-sive) capable to successfully measure the small current generated in this system.
In this work it was presented the development of a simple, portable and inexpensive instrumentation for amperometric and coulometric detection in flow system utilizing ultramicroelectrodes. The software was capable to carry out three main detection techniques (amperometric, pulsed amperometric and coulometric detection) and a voltammetric technique (cyclic voltammetry), which was successfully applied on two well understood systems: cyclic voltammograms of metallic electrodes in alkaline solutions and flow electrochemical detection of glucose and glycine at gold and copper ultramicroelectrodes, respectively, and also in the direct determination of glyphosate using cou-lometric detection coupled to HPLC.
Acknowledgments
The authors thank Milenia Agrociências for providing the glyphosate, CAPES, CNPq, and FAPESP (Proc. No. 04/09384-7).
Supplementary Information
Supplementary data are available free of charge at http://jbcs.sbq.org.br, as PDF file.
References
1. Lunte, S. M.; Lunte, C. E.; Kissinger, P. T. In Laboratory Techniques
in Electroanalytical Chemistry; Kissinger, P. T.; Heineman, W. R.,
eds.; Marcel Dekker: New York, 1996, p. 813.
2. Nagy, L.; Nagy, G.; Hajós, P.; Sens. Actuators, B 2001, 76, 494.
3. Brooks, S. A.; Kennedy, R. T.; J. Electroanal. Chem. 1997, 436, 27.
4. Hidayat, A.; Hibbert, D. B.; Alexander, P. W.; Talanta 1997,
44, 239.
5. LaCourse, W. R. In Pulsed Electrochemical Detection in
High-Performed Liquid Chromatography; Wiley-Interscience:
Canada, 1997, pp. 60-120.
6. Luo, P.; Zhang, F.; Baldwin, R. P.; Anal. Chem. 1991, 63,
1702.
7. Sato, K.; Jin, J. Y.; Takeuchi, T.; Miwa, T.; Suenami, K.;
Takekoshi, Y.; Kanno, S.; Talanta 2000, 53, 1037.
8. Mori, V.; Bertotti, M.; Talanta 1998, 47, 651.
9. Kovalcik, K. D.; Kirchhoff, J. R.; Giolando, D. M.; Bozon, J.
P.; Anal. Chim. Acta 2004, 507, 237.
10. Rolison, D. R. In Ultramicroelectrodes; Fleischmann, M.; Pons,
S.; Rolison, D. R.; Schmith, P. P., eds.; Datatech, Morganton:
North Caroline, 1987, pp. 74-110.
11. Correia, A. N.; Mascaro, L. H.; Machado, S. A. S.; Mazo, L.
H.; Avaca, L. A.; Quim. Nova 1995, 18, 475.
12. http://www.thinksrs.com/products/SR570.htm, accessed in July
2007.
13. Economou, A.; Bolis, S. D.; Efstathiou, C. E.; Volikakis, G. J.;
Anal. Chim. Acta 2002, 467, 179.
14. Silva, S. M.; Alves, C. R.; Correia, A. N.; Martins, R. M.; Nobre,
A. L. R.; Machado, S. A. S.; Mazo, L. H.; Avaca, L. A.; Quim.
Nova 1998, 21, 78.
15. Zoski, C. G.; Electroanalysis 2002, 14, 1041.
16. www.dionex.com.cn/technic/Afiles/TN20.PDF, accessed in
July 2007.
17. Bard, A. J.; Faulkner, L. R.; Electrochemical Methods:
Fundamentals and Applications, John Wiley: NJ, 2001, p. 239.
18. Strehblow, H. H.; Maurice, V.; Marcus, P.; Electrochim. Acta
2001, 46, 3755.
19. Lorimer, J. P.; Mason, T. J.; Plattes, M.; Walton, D. J.; J.
Electroanal. Chem. 2004, 568, 379.
20. Luo, P. F.; Kuwana, T.; Anal. Chem. 1996, 68, 3330.
21. Casella, I. G.; Cataldi, T. R. I.; Salvi, A. M.; Desimoni, E.; Anal.
Chem. 1993, 65, 3143.
22. Cowling, R. D.; Riddiford, A. C.; Electrochim. Acta 1969, 14, 981.
23. Sato, K.; Jin, J. Y.; Takeuchi, T.; Miwa, T.; Suenami, K.;
Takekoshi, Y.; Kanno, S.; J. Chromatogr., A 2001, 919, 313.

139Coutinho et al.Vol. 19, No. 1, 2008
24. Neuburger, G. G.; Johnson, D. C.; Anal. Chim. Acta 1987, 192, 205.
25. Larew, L. A.; Johnson, D. C.; J. Electroanal. Chem. 1989, 262, 167.
26. Larew, L. A.; Johnson, D. C.; J. Electroanal. Chem. 1989, 264, 131.
27. Kok, W. Th.; Hanekamp, H. B.; Bos, P.; Frei, R. W.; Anal. Chim.
Acta 1982, 142, 31.
28. Coutinho, C. F. B; Silva, M. O.; Machado, S. A. S.; Mazo, L.
H.; Appl. Surf. Sci. 2007, 253, 3270.
29. Coutinho, C. F. B; Silva, M. O.; Calegaro, M. L.; Machado, S.
A. S.; Mazo, L. H.; Solid State Ionics 2007, 178, 161.
30. Coutinho, C. F. B.; Coutinho, L. F. M.; Lanças, F. M.; Mazo,
L. H.; Electroanalysis 2007, 19, 1223.
31. Coutinho, C. F. B.; Coutinho; L. F. M., Mazo, L. H.; Nixdorf, S. L.;
Camara, C. A. P.; Lanças, F. M.; Anal. Chim. Acta 2007, 592, 30.
Received: May 23, 2007
Published on the web: January 29, 2008
FAPESP helped in meeting the publication costs of this article.

Article
J. Braz. Chem. Soc., Vol. 19, No. 1, S1-S2, 2008.Printed in Brazil - ©2008 Sociedade Brasileira de Química
0103 - 5053 $6.00+0.00
Supplementary Inform
ation
Development of Instrumentation for Amperometric and Coulometric Detection using Ultramicroelectrodes
Cláudia F. B. Coutinho,*,a Lincoln F. M. Coutinho,a Fernando M. Lanças,a Carlos A. P. Câmara,b
Suzana L. Nixdorfb and Luiz H. Mazoa
aInstituto de Química de São Carlos, Universidade de São Paulo, Av. Trabalhador Sãocarlense, 400, CP 780, 13566-590 São Carlos-SP, Brazil
bDepartamento de Química, Universidade Estadual de Londrina, Rodovia Celso Garcia Cid, Km 380, Campus Universitário, CP 6001, 86051-990 Londrina-PR, Brazil
*e-mail: [email protected]
Figure S1. Graphical interface of the LabVIEW. a) Graphical user interface (GUI), and b) block diagram window.

Development of Instrumentation for Amperometric and Coulometric Detection using Ultramicroelectrodes J. Braz. Chem. Soc.S2
Figure S2. Front panel of the developed software. (a) “Experiment (On-line)” panel; (b) “Low-Pass Filter (On-line)” panel; (c) “Experimental Parameters and Equipment Control” panel.