Application of array CGH on archival formalin-fixed paraffin-embedded tissues including small...
15
Application of Array CGH on Archival Formalin-Fixed Paraffin- Embedded Tissues including small numbers of microdissected cells Nicola Johnson, Rifat Hamoudi, Koichi Ichimura, Lu Liu, Danita Pearson, V. Peter Collins, and Ming-Qing Du * Division of Molecular Histopathology, Department of Pathology, University of Cambridge, United Kingdom Abstract Array-based comparative genomic hybridisation (aCGH) has diverse applications in cancer gene discovery and translational research. Currently, aCGH is performed primarily using high molecular weight DNA samples and its application to formalin-fixed and paraffin-embedded (FFPE) tissues remains to be established. To explore how aCGH can be reliably applied to archival FFPE tissues and whether it is possible to apply aCGH to small numbers of cells microdissected from FFPE tissue sections, we have systematically performed aCGH on 15 pairs of matched frozen and FFPE glioblastoma tissues using a well established in-house human 1Mb BAC/PAC genomic array. By spiking glioblastoma DNA with normal DNA, we demonstrated that at least 70% of tumour DNA was required for reliable aCGH analysis. Using aCGH data from frozen tissue as a reference, it was found that only FFPE glioblastoma tissues that supported PCR amplification of >300bp DNA fragment provided high quality, reproducible aCGH data. The presence of necrosis in a tissue specimen had an adverse effect on the quality of aCGH, while fixation in formalin for up to 96 hours of fresh tissue did not appear to affect the quality of the result. As little as 10-20ng DNA from frozen or FFPE tissues could be readily used for aCGH analysis following whole genome amplification. Furthermore, as few as 2000 microdissected cells from haematoxylin stained slides of archival FFPE tissues could be successfully used for aCGH investigations when whole genome amplification was used. By careful assessment of DNA integrity and review of histology, to exclude necrosis and select specimens with a high proportion of tumour cells, it is feasible to pre-select archival FFPE tissues adequate for aCGH analysis. With the help of microdissection and whole genome amplification, it is also possible to apply aCGH to histologically defined lesions, such as carcinoma in situ. Keywords array CGH; archival fixed tissue; microdissection; whole genome amplification; glioblastoma Comparative genomic hybridisation (CGH) is a relatively new technology designed to allow high throughput screening of chromosomal gains and losses in diseases, particularly cancer. Traditionally, CGH was carried out by competitive in situ hybridisation of differentially labelled tumour and normal DNA to normal metaphase chromosome spreads. The advent of * Correspondence author: Ming-Qing Du, Professor of Oncological Pathology, Division of Molecular Histopathology, Department of Pathology, University of Cambridge, Box 231, Level 3 Lab Block, Addenbrooke’s Hospital, Hills Road, Cambridge, CB2 2QQ, United Kingdom, Tel: 01223 767092, Fax: 01223 586670, [email protected]. Duality of interest: None declared. Supplementary information is available at Laboratory Investigation's website. Europe PMC Funders Group Author Manuscript Lab Invest. Author manuscript; available in PMC 2010 February 03. Published in final edited form as: Lab Invest. 2006 September ; 86(9): 968–978. doi:10.1038/labinvest.3700441. Europe PMC Funders Author Manuscripts Europe PMC Funders Author Manuscripts
-
Upload
independent -
Category
Documents
-
view
0 -
download
0
Transcript of Application of array CGH on archival formalin-fixed paraffin-embedded tissues including small...
Application of Array CGH on Archival Formalin-Fixed Paraffin-Embedded Tissues including small numbers of microdissectedcells
Nicola Johnson, Rifat Hamoudi, Koichi Ichimura, Lu Liu, Danita Pearson, V. Peter Collins,and Ming-Qing Du*
Division of Molecular Histopathology, Department of Pathology, University of Cambridge, UnitedKingdom
AbstractArray-based comparative genomic hybridisation (aCGH) has diverse applications in cancer genediscovery and translational research. Currently, aCGH is performed primarily using highmolecular weight DNA samples and its application to formalin-fixed and paraffin-embedded(FFPE) tissues remains to be established. To explore how aCGH can be reliably applied toarchival FFPE tissues and whether it is possible to apply aCGH to small numbers of cellsmicrodissected from FFPE tissue sections, we have systematically performed aCGH on 15 pairs ofmatched frozen and FFPE glioblastoma tissues using a well established in-house human 1MbBAC/PAC genomic array. By spiking glioblastoma DNA with normal DNA, we demonstrated thatat least 70% of tumour DNA was required for reliable aCGH analysis. Using aCGH data fromfrozen tissue as a reference, it was found that only FFPE glioblastoma tissues that supported PCRamplification of >300bp DNA fragment provided high quality, reproducible aCGH data. Thepresence of necrosis in a tissue specimen had an adverse effect on the quality of aCGH, whilefixation in formalin for up to 96 hours of fresh tissue did not appear to affect the quality of theresult. As little as 10-20ng DNA from frozen or FFPE tissues could be readily used for aCGHanalysis following whole genome amplification. Furthermore, as few as 2000 microdissected cellsfrom haematoxylin stained slides of archival FFPE tissues could be successfully used for aCGHinvestigations when whole genome amplification was used. By careful assessment of DNAintegrity and review of histology, to exclude necrosis and select specimens with a high proportionof tumour cells, it is feasible to pre-select archival FFPE tissues adequate for aCGH analysis. Withthe help of microdissection and whole genome amplification, it is also possible to apply aCGH tohistologically defined lesions, such as carcinoma in situ.
Keywordsarray CGH; archival fixed tissue; microdissection; whole genome amplification; glioblastoma
Comparative genomic hybridisation (CGH) is a relatively new technology designed to allowhigh throughput screening of chromosomal gains and losses in diseases, particularly cancer.Traditionally, CGH was carried out by competitive in situ hybridisation of differentiallylabelled tumour and normal DNA to normal metaphase chromosome spreads. The advent of
*Correspondence author: Ming-Qing Du, Professor of Oncological Pathology, Division of Molecular Histopathology, Department ofPathology, University of Cambridge, Box 231, Level 3 Lab Block, Addenbrooke’s Hospital, Hills Road, Cambridge, CB2 2QQ,United Kingdom, Tel: 01223 767092, Fax: 01223 586670, [email protected].
Duality of interest: None declared.
Supplementary information is available at Laboratory Investigation's website.
Europe PMC Funders GroupAuthor ManuscriptLab Invest. Author manuscript; available in PMC 2010 February 03.
Published in final edited form as:Lab Invest. 2006 September ; 86(9): 968–978. doi:10.1038/labinvest.3700441.
Europe PM
C Funders A
uthor Manuscripts
Europe PM
C Funders A
uthor Manuscripts

array-based CGH (aCGH), which uses genome-mapped and sequence-verified genomicclones arrayed on glass slides as the hybridisation target, has radically transformed thistechnique. aCGH not only confers high resolution but is also exceptionally versatile in itsdesign and application. Essentially, the resolution of aCGH is determined by the size and/orgaps between genomic clones used for array construction. Genome-wide BAC arrays atmegabase (1Mb) or submegabase (100kb) size are now available for screening of genomicgains/losses (1, 2). Genomic copy number changes can be further characterised by use ofchromosome- specific or customised tiled arrays (3, 4), which can be tailor-made at anydesired resolution. In addition, chromosome-specific tiled arrays can be used forcharacterisation of chromosomal translocation breakpoints when the derivative chromosomeis isolated and used as the source of DNA (5). Clearly, aCGH has immense potential indisease gene discovery and translational research.
aCGH analyses were initially developed using high molecular weight DNA samples fromfresh/frozen tissues or cells. The use of FFPE tissues as a source of DNA has manyadvantages. Such tissues are available as a huge resource, with detailed histological andphenotypic characterisation and valuable clinical-pathological follow-up data. It would beimmensely beneficial if aCGH could be applied to such materials. So far, a few studies haveused FFPE-derived DNA for aCGH (6-9), and it may be realistic to use small amounts ofDNA extracted from whole tissue sections of frozen or FFPE specimens for aCGHfollowing whole genome amplification (WGA) (10-12). Nonetheless, several critical issuesremain to be investigated. Firstly, because DNA quality from FFPE tissues is variable, is itpossible to reliably identify suitable archival FFPE tissues for aCGH? Secondly, can aCGHbe applied to small numbers of cells microdissected from archival FFPE tissue samples?Thirdly, is it possible to distinguish true tumour-derived alterations from experimentalartefacts? To address these issues, we have systematically performed aCGH on 15 pairs ofmatched frozen and FFPE glioblastoma tissues and developed a practical protocol whichenables pre-selection of archival FFPE cases adequate for aCGH analysis and the successfulapplication of the technique to DNA samples extracted from as few as 2,000 microdissectedcells.
MATERIALS AND METHODSTumour tissues and fixation
The study was based on 15 pairs of matched fresh-frozen and FFPE glioblastoma tissues (11xenografts archived for six years and 4 primary glioblastomas archived for fifteen years).All FFPE tissues were fixed overnight in 10% buffered formalin, routinely processed andparaffin-embedded. Use of these archival tissues for research was approved by the EthicsCommittee of the Karolinska Hospital and Cambridge Local Research Ethics Committee.
In addition, to examine the effect of tissue fixation on aCGH, a glioblastoma xenografttissue sample, previously archived at −80°C for six years, was divided into five equal pieces,fixed in 10% buffered formalin at room temperature for various times (12, 24, 48, 72 and 96hrs), then routinely processed and paraffin-embedded.
Microdissection and DNA extractionDNA was extracted from fresh-frozen tumour tissues and blood samples as previouslydescribed. FFPE tissue sections were de-waxed twice in xylene, washed in 100% ethanol,and digested overnight with 1mg/ml proteinase K (Qiagen, Valencia, CA) at 56°C in a200μl reaction mixture containing 30mM Tris-Cl (pH 8.0), 10mM EDTA and 1% sodiumdodecyl sulphate. The sample was then mixed with an equal volume of phenol-chloroform-isoamyl (25:24:1) (pH 7.9) (Ambion, TX, USA) and centrifuged through a phase-lock heavy
Johnson et al. Page 2
Lab Invest. Author manuscript; available in PMC 2010 February 03.
Europe PM
C Funders A
uthor Manuscripts
Europe PM
C Funders A
uthor Manuscripts

gel (Eppendorf AG, Hamburg, Germany). DNA was ethanol precipitated overnight at −20°Cand dissolved in 20μl of 10mM Tris/1mM EDTA.
Crude microdissection was performed on freshly prepared haematoxylin stained slides toavoid necrotic areas or to isolate various numbers of tumour cells. Microdissected cells weresimilarly digested with proteinase K in a 25μl reaction mixture as above and DNA waspurified using a DNA micro-kit (Qiagen).
DNA concentration was determined using PicoGreen™ (Molecular Probes, Oregon, USA).
Assessment of DNA integrityThe integrity of DNA samples from FFPE tissue was assessed by PCR of variable sizedDNA fragments (100bp, 200bp, 300bp, 400bp and 600bp) in separate reactions using 10ngof template DNA as described previously (14). PCR products were analysed byelectrophoresis on 2% agarose gels.
Whole Genome Amplification (WGA)Various amounts (10-20ng) of DNA from fresh-frozen or FFPE tissue was amplified usingGenomePlex™ WGA kit (Rubicon Genomics, Ann Arbor, MI). Amplified genomic DNAwas purified using DNA Clean and Concentrator (Zymo Research, CA, USA) and quantifiedusing PicoGreen.
Array CGHCGH arrays were constructed in-house based on protocols used by the Wellcome TrustSanger Institute, Cambridge, UK (2) and comprised 3038 analysable BAC clones spaced atapproximately 1Mb intervals across the whole genome. Construction and validation of the1Mb genomic array has been previously described (2, 15). Briefly, clone DNA wasextracted and amplified using three DOP primers which were subsequently mixed andamplified using a 5′-amine modified universal primer. Amine-linked PCR products werearrayed onto amine-binding slides (CodeLink, Amersham Biosciences, Little Chalfont,Buckinghamshire, UK) in duplicate. Each array was composed of 24 blocks; Drosophilaclones and clones from individual chromosomes were evenly distributed throughout allblocks.
Labelling of test (tumour) and reference (control) DNA, array hybridisation and washingwere carried out essentially as previously described (3, 15). Briefly, 400ng of test (tumour)and reference DNA were labelled using a Bioprime Labelling Kit (Invitrogen, Carlsbad,CA) with a modified dNTP reaction mixture. Test DNA was hybridised with sex-mismatched reference DNA from samples of pooled blood from 20 normal males or 20normal females. Labelled and purified test and reference DNA were pooled and co-precipitated with 45μg Cot-1 DNA (Roche Diagnostics, Mannheim, Germany) and 400μgherring sperm DNA (Sigma-Aldrich, St Louis, MO). The precipitated DNA was dissolved inhybridisation buffer and hybridised to an array that had been pre-hybridised with 80μgCot-1 DNA and 400μg herring sperm DNA for 2 hours. Arrays were allowed to hybridiseovernight at 37°C then washed as described (3).
aCGH data analysisaCGH slides were scanned using an Axon 4100A scanner (Axon Instruments, Burlingame,CA). Scanned images were quantified using GenePix Pro 5.1 software (Axon Instruments)and primary data analysis and normalisation carried out using Microsoft Excel (3). Anaverage between the duplicate spotted BACs was calculated and results were analysed usingplots of log2-transformed normalised Cy5:Cy3 intensity ratios against clone position.
Johnson et al. Page 3
Lab Invest. Author manuscript; available in PMC 2010 February 03.
Europe PM
C Funders A
uthor Manuscripts
Europe PM
C Funders A
uthor Manuscripts

The mean and standard deviation (SD) used as the threshold value for identifying genomicgains and losses were determined from 4 normal male/female hybridisations. Mean ± 3SD(equivalent to log2 value ± 0.19) was used as the threshold for aCGH using DNA fromfrozen tissue. Systematic analysis of the mean ± various SD (3, 3.2, 3.4, 3.6, 3.8, 4) on 9good quality aCGH FFPE glioblastoma samples (5 xenograft and 4 primary) data was usedto determine the threshold value for aCGH with and without WGA. Altered clones wereidentified and percentages of concordance and non-concordance with those derived from thecorresponding frozen tissue were calculated. The mean ± 3.2SD (log2 value ± 0.20) andmean ± 3.4SD (log2 value ± 0.22) was chosen as the cut-off for FFPE tissue and FFPE withWGA respectively. The three cut-off values chosen allowed confident detection of singlecopy gain or loss since the imbalance involving single copy change as demonstrated bychromosome X clones between normal male / female hybridisations typically showed log2ratio changes in the range of 0.55-0.67. The suitability of these cut-off values was furtherverified by detection of single copy gains/losses even when the percentage of tumour cellswas at 75% (detailed in Results).
Alterations that involve consecutive clones are likely to represent true genomic alterationswhich commonly affect a relatively large chromosomal region (16). However, it is moredifficult to distinguish changes affecting single clones that may result from random orexperimental variations, such as mismapped clones or cross hybridisation due to repetitivesequences. To test this, we compared the reproducibility of aCGH changes in four replicateaCGH hybridisations, using a DNA sample from frozen xenograft tissue.
Statistics—Comparison of the aCGH data of the same specimen among differentexperimental conditions (Pearson’s correlation test) and unsupervised hierarchical clusteringwas carried out using stats package in R version 2.1.1 (17) http://www.R-project.org.
RESULTSReproducibility of aCGH changes involving consecutive clones or single clones
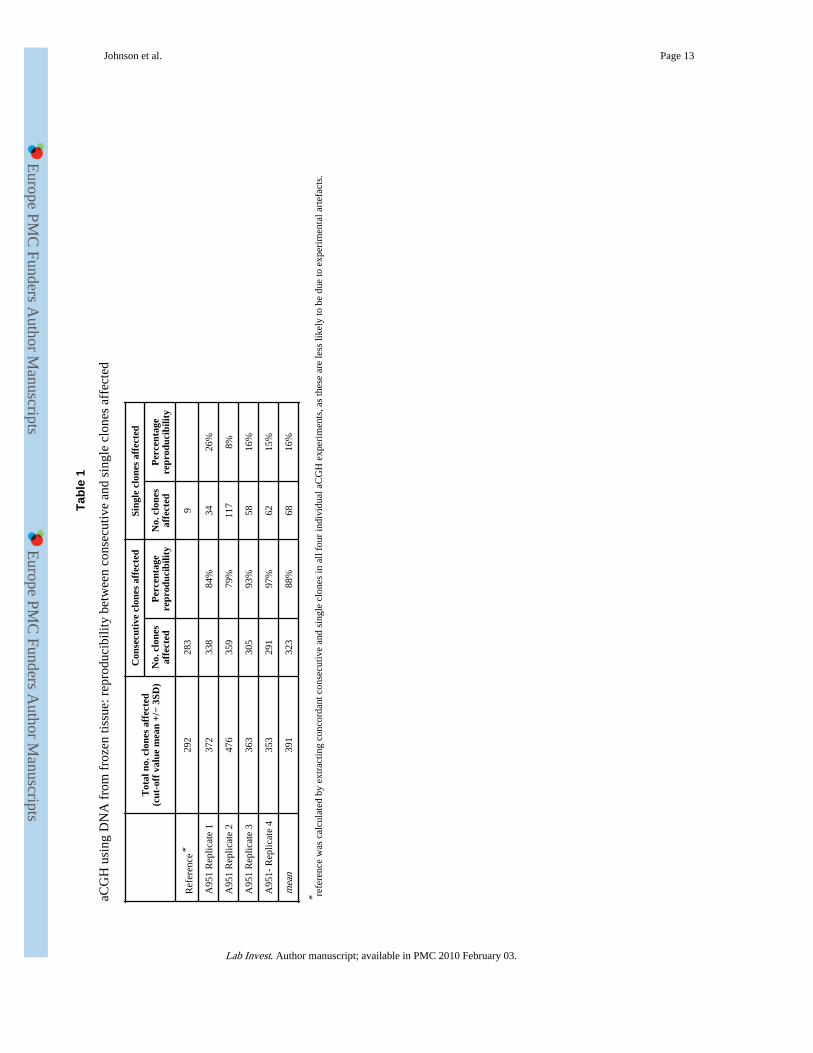
To compare the reproducibility of aCGH changes involving consecutive or single clones, weperformed 4 independent aCGH analyses using the same DNA sample from a frozenxenograft tissue. The concordant clones from all 4 independent experiments were used asreference to assess the reproducibility of each independent hybridisation. As expected,aCGH changes affecting two or more consecutive clones were highly reproducible (mean88%), while those involving single clones were not (mean 16%) (Table 1). Similar resultswere seen when using DNA from frozen and FFPE tissues of the same cases (Supplementaltable 1). This finding indicated that most of the changes affecting single clones were likelyto be the result of experimental artefacts. For this reason, assessment of concordancebetween frozen and FFPE tissue under various experimental conditions focused on changesinvolving two or more consecutive clones.
aCGH: minimum proportion of tumour DNA required for reliable aCGH analysisTumour tissues invariably contain non-neoplastic cells. To examine the minimal proportionof tumour DNA required for reliable aCGH analysis, a DNA sample with knownhomozygous and hemizygous deletions from one frozen glioblastoma xenograft (X1) wasmixed with various amounts of non-tumour DNA and then subjected to aCGH analyses. Theability of the aCGH technology to detect genomic gains/losses was shown to criticallydepend on the proportion of tumour DNA (Figure 1). When tumour DNA was ≤50%, bothchromosomal gain and loss (including those affecting relatively large regions) becamedifficult to recognise (Figure 1) and their concordance with aCGH data from 100% tumour
Johnson et al. Page 4
Lab Invest. Author manuscript; available in PMC 2010 February 03.
Europe PM
C Funders A
uthor Manuscripts
Europe PM
C Funders A
uthor Manuscripts

DNA was poor. Nonetheless, reliable CGH results could be obtained when the proportion oftumour DNA was ≥ 75%.
aCGH using DNA from FFPE tissues – effect of DNA integrity and necrosisTo examine to what extent archival FFPE tissues could be reliably used for aCGH analysis,DNA samples from whole tissue sections of archival FFPE glioblastoma xenografts weresubjected to aCGH analysis and the resulting data compared to that from correspondingfrozen tissues. The quality of aCGH data from FFPE tissues was then compared to theintegrity of DNA samples.
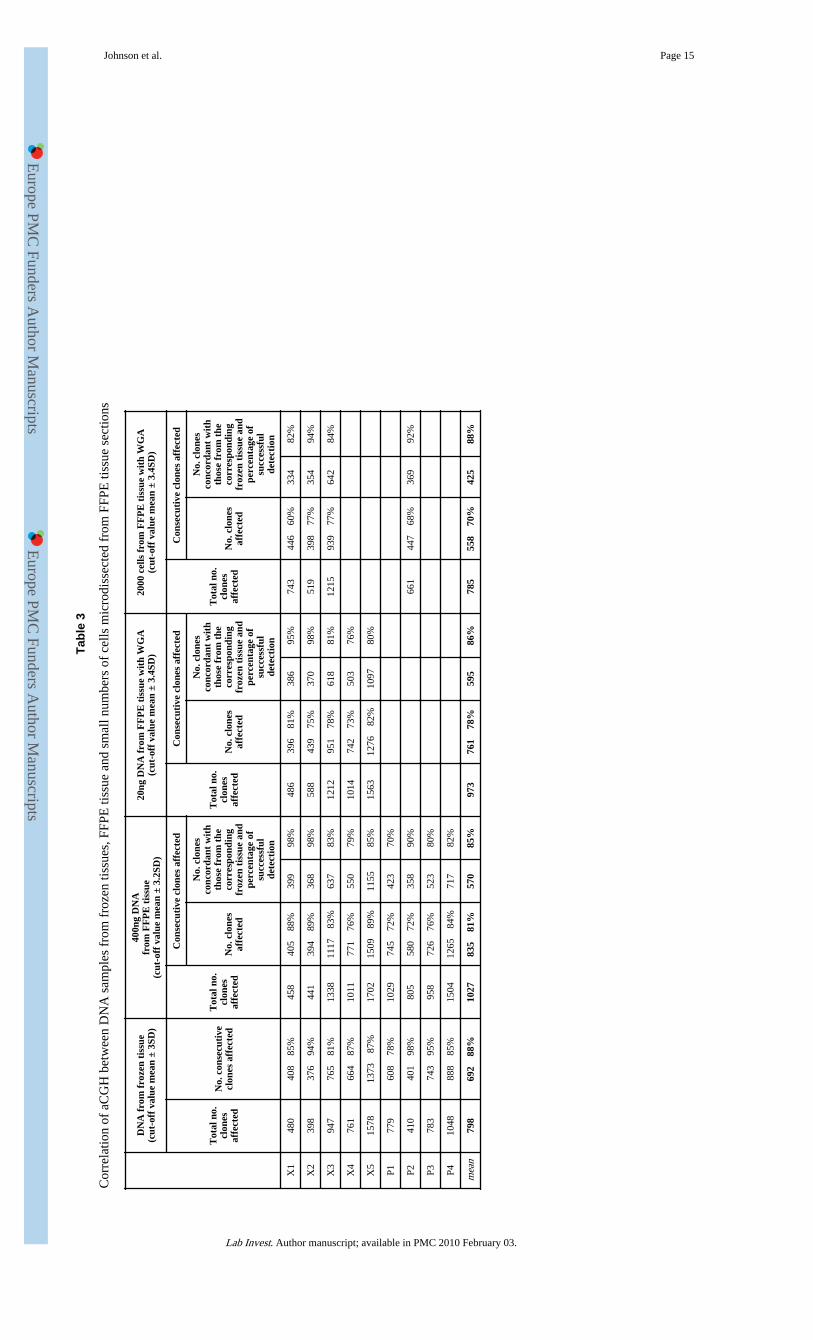
Of the 11 FFPE glioblastoma xenografts with matched frozen tissues, sufficient DNA foraCGH analysis could be extracted from 9 cases. All 9 cases yielded a quality DNA sample(as assessed spectrophotometrically) with a similar smear pattern on 1% agarose gels, butgave rise to dramatically variable aCGH data quality when compared to that from thecorresponding frozen tissue (Table 2, Figure 2). In 4 cases (X1, X3-5), a good correlation (r= 0.83-0.98) between data generated from FFPE and frozen tissues was obtained and79-98% of CGH changes involving 2 or more consecutive clones identified from DNAsamples of frozen tissues were seen when using DNA samples from FFPE tissue (Table3). Ithas to be stated that the true reproducibility of aCGH on FFPE tissue was most likelyunderestimated as 12% of aCGH changes involving 2 or more consecutive clones seen fromfrozen tissues were not reproducible (Table 1). In the remaining 5 cases, the quality ofaCGH data from FFPE tissues was poor (Table 2).
The quality of aCGH from FFPE tissues corresponded well to the integrity of the DNAsample as shown by PCR of variable sized gene fragments. All 4 FFPE DNA samples thatyielded representative aCGH data also supported amplification of a DNA fragment >300bp.Only 1 FFPE tissue specimens (X2) that produced poor quality data yielded a DNA samplethat showed PCR amplification of a DNA fragment >300bp (Table 2).
To examine why specimen X2, with relatively good DNA integrity, failed aCGH analysis,we reviewed the histology. X2 contained a prominent necrotic area (~20%), while all othercases displayed minimal necrotic regions (<5%) or no necrosis. To test whether the presenceof necrosis had an adverse effect on aCGH, we repeated aCGH using a DNA sampleprepared from the microdissected “viable” tumour cells, which resulted in high qualityaCGH results (Supplement figure 1), comparable to those from the corresponding frozentissue (r = 0.94).
aCGH using DNA from FFPE tissues – effect of formalin fixation and storage timeTo examine the effect of the length of formalin fixation on aCGH, tissue samples from onexenograft were fixed in 10% buffered formalin for various times, routinely processed andparaffin-embedded and subjected to aCGH. The aCGH data obtained was compared withthat from the corresponding frozen tissue (Supplement table 2). The results showed thatformalin fixation up to 96 hours did not have any major adverse effect on the quality ofaCGH. DNA samples prepared from these FFPE specimens showed PCR amplification of a400bp DNA fragment and a good correlation to aCGH results using DNA from thecorresponding frozen tissue.
To further examine the effect of storage time on aCGH, we performed aCGH on 4 archivalFFPE primary glioblastomas that had been stored for 15 years, and compared the data to thecorresponding frozen tumours. A good correlation between FFPE and frozen tissues wasseen in each case (Tables 2 and 3).
Johnson et al. Page 5
Lab Invest. Author manuscript; available in PMC 2010 February 03.
Europe PM
C Funders A
uthor Manuscripts
Europe PM
C Funders A
uthor Manuscripts

aCGH using minimum amount of DNATo explore the potential applications of aCGH to small tissue biopsies and microscopiclesions, we investigated the minimum amount of DNA required for aCGH analysis. We firsttested this by using DNA samples from the frozen glioblastoma xenografts. 10ng DNA fromcase X2 was amplified using GenomePlex™ WGA kit and subjected to aCGH. Correlationwith data from non-amplified DNA of the same source was high (r = 0.99) and nochromosome or gene specific bias could be observed from the linear plots.
We next tested the minimum amount of DNA from FFPE tissue required for representativeaCGH. This was carried out using 5 xenograft specimens that showed good quality aCGHdata from non-amplified DNA samples. In each case, representative data was obtained froma 20ng DNA template, as judged by comparison with data from the corresponding frozentissue (Tables 2 and 3, Figure 3).
aCGH using minimum number of cells microdissected from FFPE tissue sectionsTo investigate whether aCGH could be applied to small numbers of cells microdissectedfrom FFPE tissue sections, we microdissected and extracted DNA from various numbers(10,000, 5000, 2000 and 1000 cells) of cells from haematoxylin stained tissue sections,avoiding necrotic regions. Representative aCGH data was obtained from DNA samplesextracted from 2000 cells or above, as judged by comparison with data from thecorresponding frozen tissue (Tables 2 and 3, Figure 3).
Clustering of aCGH data from frozen, FFPE tissue and microdissected cellsUnsupervised hierarchical clustering analysis showed that all data sets from the samespecimen clustered together. This further demonstrated the similarity, thus reproducibility,of aCGH data between frozen, FFPE tissues and microdissected cells.
DISCUSSIONArchival FFPE tissues represent a rich resource of well-characterised pathologicalspecimens for genetic study of human disease, particularly cancer. By systematicinvestigations of matched frozen and FFPE glioblastoma tissues, we developed a practicalprotocol to apply archival FFPE tissues to aCGH. As the quality of aCGH critically dependson the integrity of DNA samples, it is possible to predict whether an archival FFPE tissuespecimen is suitable for aCGH analysis when extracted DNA supports PCR amplification of>300bp gene fragments. PCR-based DNA integrity assessment is superior to directexamination of the DNA sample on agarose gels, as it is more objective and uses only aminute amount of DNA. In our experience, direct analysis of DNA samples on agarose gelsdid not offer any value in the prediction of the suitability of a FFPE tissue sample for aCGH.
In general, aCGH alterations involving consecutive BAC clones are easily recognisable andmost likely derive from tumour cells rather than experimental artefacts. However,interpretation of aCGH changes affecting single clones is difficult and these sporadicchanges occur for DNA samples from both frozen and FFPE tissues, particularly the latter.In theory, alterations as a result of true genomic events should be reproducible and thosehighly associated with tumourigenesis and progression are likely recurrent. Conversely,changes due to experimental artefacts are largely random, although those resulting frommismapped clones or cross hybridisation of repetitive sequences may be reproducible. Suchassumptions were well supported by our experimental data, demonstrating that aCGHchanges involving two or more consecutive clones were highly reproducible, while thoseinvolving single sporadic clones were not. In view of this and the vast amount of datapotentially derived from an aCGH study, it is pertinent to focus on alterations involving
Johnson et al. Page 6
Lab Invest. Author manuscript; available in PMC 2010 February 03.
Europe PM
C Funders A
uthor Manuscripts
Europe PM
C Funders A
uthor Manuscripts
consecutive clones for any follow-up investigations. Nonetheless, genomic amplification/deletion occasionally involves a single gene locus: gene amplification can be readilyidentified by visual inspection of the aCGH profile, while deletion, if recurrent, should notbe neglected.
One of the other major factors affecting the quality of aCGH was the presence of necrosis intissue specimens. It is likely that the adverse effect of necrosis on aCGH is due to DNAdegradation of necrotic cells. However, such DNA degradation contributed by necrosiscould not be revealed by PCR-based assessment of DNA integrity, as it would be masked bythe relatively intact DNA from “viable” cells. However, necrosis is easily identified byhistological review and its adverse effect on aCGH can be eliminated by microdissection.
In line with loss of heterozygosity (LOH) analysis, sensitivity of aCGH in detection of DNAcopy number changes heavily depends on the proportion of tumour cells in a tissuespecimen (18). By spiking xenograft tumour DNA with normal DNA, we showed that atleast 70% tumour cells are required for reliable aCGH analysis. Together with the adverseeffect of necrosis, this emphasises the importance of routine histological review of tissuespecimens selected for aCGH.
With adequate quality control, it was also possible to apply aCGH to small numbers of cellsfrom FFPE tissue sections with a combination of microdissection and WGA. As shown inthe present study, we were able to use as few as 2000 cells microdissected fromhaematoxylin stained tissue sections for aCGH and to obtain results comparable to thosefrom frozen tissues. Therefore, it is possible to perform aCGH analysis on archival smalltissue biopsies and potentially histologically defined microscopic lesions, such as carcinomain situ. With the advantage of genomic arrays, particularly its versatile design, highthroughput and high resolution, application of aCGH on archival FFPE tissues, an immenseresource of well-documented pathological specimens, will no doubt play a significant role indisease gene discovery and translational research.
Supplementary MaterialRefer to Web version on PubMed Central for supplementary material.
AcknowledgmentsThe Du Lab was supported by research grants from Leukaemia Research Fund, United Kingdom. The Collins Labwas supported by research grants from Cancer Research UK. We wish to thank Martin McCabe for providing datapartially used to generate the reference data set.
The Du lab (M-Q Du, N. Johnson, R. Hamoudi) was supported by research grants from Leukaemia Research Fund,United Kingdom. The Collins Lab (V. Peter Collins, K. Ichimura, L. Liu, D. Pearson) was supported by researchgrants from Cancer Research UK.
References1. Ishkanian AS, Malloff CA, Watson SK, deLeeuw RJ, Chi B, Coe BP, et al. A tiling resolution DNA
microarray with complete coverage of the human genome. Nature Genetics. 2004; 36(3):299–303.[PubMed: 14981516]
2. Fiegler H, Carr P, Douglas EJ, Burford DC, Hunt S, Smith J, et al. DNA microarrays forcomparative genomic hybridisation based on DOP-PCR amplification of BAC and PAC clones.Genes, Chromosomes and Cancer. 2003; 36:361–374. [PubMed: 12619160]
3. Seng TJ, Ichimura K, Liu L, Tingby O, Pearson DM, Collins P. Complex chromosome 22rearrangements in astrocytic tumors identified using microsatellite and chromosome 22 tile patharray analysis. Genes, Chromosomes and Cancer. 2005; 43:181–193. [PubMed: 15770670]
Johnson et al. Page 7
Lab Invest. Author manuscript; available in PMC 2010 February 03.
Europe PM
C Funders A
uthor Manuscripts
Europe PM
C Funders A
uthor Manuscripts
4. Ichimura K, Mungall AJ, Fiegler H, Pearson DM, Dunham I, Carter NP, et al. Small regions ofoverlapping deletions on 6q26 in human astrocytic tumours identified using chromosome 6 tile patharray-CGH. Oncogene. 2006; 25(8):1261–1271. [PubMed: 16205629]
5. Gribble SM, Fiegler H, Burford DC, Prigmore E, Yang F, Carr P, et al. Applications of combinedDNA microarray and chromosome sorting technologies. Chromosome Research. 2004; 12(1):35–43. [PubMed: 14984100]
6. Nessling M, Richter K, Schwaenen C, Roerig P, Wrobel G, Wessendorf S, et al. Candidate Genes inBreast Cancer Revealed by Microarray-Based Comparative Genomic Hybridization of ArchivedTissue. Cancer Res. 2005; 65(2):439–447. [PubMed: 15695385]
7. Harvell JD, Kohler S, Zhu S, Hernandez-Boussard T, Pollack JR, van de Rijn M. High-resolutionarray-based comparative genomic hybridization for distinguishing paraffin-embedded Spitz neviand melanomas. Diagnostic Molecular Pathology. 2004; 13(1):22–25. [PubMed: 15163005]
8. Ried T, Just K, Holtgreve-Grez H, du Manoir S, Speicher M, Schrock E, et al. Comparativegenomic hybridization of formalin-fixed, paraffin-embedded breast tumors reveals different patternsof chromosomal gains and losses in fibroadenomas and diploid and aneuploid carcinomas. CancerRes. 1995; 55(22):5415–5423. [PubMed: 7585611]
9. Loo LWM, Grove DI, Williams EM, Neal CL, Cousens LA, Schubert EL, et al. Array ComparativeGenomic Hybridization Analysis of Genomic Alterations in Breast Cancer Subtypes. Cancer Res.2004; 64(23):8541–8549. [PubMed: 15574760]
10. Bredel M, Bredel C, Juric D, Kim Y, Vogel H, Harsh GR, et al. Amplification of Whole TumorGenomes and Gene-by-Gene Mapping of Genomic Aberrations from Limited Sources of Fresh-Frozen and Paraffin-Embedded DNA. J Mol Diagn. 2005; 7(2):171–182. [PubMed: 15858140]
11. Little SE, Vuononvirta R, Reis-Filho JS, Natrajan R, Iravani M, Fenwick K, et al. Array CGHusing whole genome amplification of fresh-frozen and formalin-fixed, paraffin-embedded tumorDNA. Genomics. 2006; 87(2):298–306. [PubMed: 16271290]
12. Liu D, Liu C, DeVries S, Waldman F, Cote RJ, Datar RH. LM-PCR permits highly representativewhole genome amplification of DNA isolated from small number of cells and paraffin-embeddedtumor tissue sections. Diagnostic Molecular Pathology. 2004; 13(2):105–115. [PubMed:15167012]
13. Ichimura K, Schmidt EE, Goike HM, Collins VP. Human glioblastomas with no alterations of theCDKN2A (p16INK4A, MTS1) and CDK4 genes have frequent mutations of the retinoblastomagene. Oncogene. 1996; 13(5):1065–1072. [PubMed: 8806696]
14. van Dongen JJ, Langerak AW, Bruggeman M, Evans PA, Hummel M, Lavender FL, et al. Designand standardization of PCR primers and protocols for detection of clonal immunoglobulin and T-cell receptor gene recombinations in suspect lymphoproliferations: report of the BIOMED-2Concerted Action BMH4-CT98-3936. Leukemia. 2003; 17(12):2257–2317. [PubMed: 14671650]
15. McCabe MG, Ichimura K, Liu L, Plant K, Pearson DM, Collins VP. High resolution array-basedcomparative genomic hybridisation of medulloblastomas and supra-tentorial primitiveneuroectodermal tumours. Journal of Neuropathology and Experimental Neurology. 2006 in press.
16. Chen W, Houldsworth J, Olshen AB, Nabjangud G, Chaganti S, Venkatraman ES, et al. Arraycomparative genomic hybridization reveals genomic copy number changes associated withoutcome in diffuse large B-cell lymphomas. Blood. 2005; 107(6):2477–2485. [PubMed:16317097]
17. R Development Core Team. R: A Language and Environment for Statistical Computing. 2005.
18. Liu J, Zabarovska VI, Braga E, Alimov A, Klein G, Zabarovsky ER. Loss of heterozygosity intumor cells requires re-evaluation: the data are biased by the size-dependent differential sensitivityof allele detection. FEBS Letters. 1999; 462(1-2):121–128. [PubMed: 10580104]
Johnson et al. Page 8
Lab Invest. Author manuscript; available in PMC 2010 February 03.
Europe PM
C Funders A
uthor Manuscripts
Europe PM
C Funders A
uthor Manuscripts

Figure 1.Sensitivity of aCGH. High molecular DNA from a frozen glioblastoma xenograft wasdiluted with DNA from normal blood samples at various ratios and subjected to 1Mb aCGHanalysis. The log2 ratio of tumour/reference fluorescence is shown for chromosomes 1 and9. Clones are arranged in genomic order from pter to qter. The data indicates that at least75% of tumour DNA is required for reliable aCGH analysis.
Johnson et al. Page 9
Lab Invest. Author manuscript; available in PMC 2010 February 03.
Europe PM
C Funders A
uthor Manuscripts
Europe PM
C Funders A
uthor Manuscripts

Figure 2.Effect of DNA integrity on aCGH analysis. DNA samples from matched frozen and FFPEglioblastoma xenograft are subjected to 1Mb aCGH analysis. The log2 ratio of tumour/reference fluorescence is shown for all BAC clones, which are arranged in genomic orderfrom 1pter to 22qter. In case X1, the DNA sample from the FFPE glioblastoma xenograft isof good integrity (amplifiable for 400bp fragment) and shows a highly reproducible CGHprofile as compared with the DNA from corresponding frozen tissue. Whereas in case X6,the DNA sample from the FFPE glioblastoma xenograft is of poor integrity (onlyamplifiable for 100bp fragment), displays a CGH profile with high background noise andfails to demonstrate the genomic aberrations seen from the DNA sample from thecorresponding frozen tissue.
Johnson et al. Page 10
Lab Invest. Author manuscript; available in PMC 2010 February 03.
Europe PM
C Funders A
uthor Manuscripts
Europe PM
C Funders A
uthor Manuscripts

Figure 3.aCGH using a minimum amount of DNA and ~2000 cells microdissected from a FFPEglioblastoma xenograft tissue slide. In case X2, 20ng DNA from the FFPE glioblastomaxenograft and the DNA sample prepared from 2000 cells microdissected from ahaematoxylin stained FFPE xenograft tissue slide are amplified using GenomePlex™ WGAkit and subjected to aCGH analysis. The log2 ratio of tumour/reference fluorescence isshown for all BAC clones, which are arranged in genomic order from 1pter to 22qter andhigh-resolution correlation is also shown for chromosomes 7 and 9. The data shows a highlyreproducible CGH profile from 20ng DNA from the FFPE xenograft tissue and the DNAsample from 2,000 cells microdissected from a FFPE xenograft tissue slide as comparedwith DNA sample from the corresponding frozen tumour tissue.
Johnson et al. Page 11
Lab Invest. Author manuscript; available in PMC 2010 February 03.
Europe PM
C Funders A
uthor Manuscripts
Europe PM
C Funders A
uthor Manuscripts

Figure 4.Unsupervised hierarchical clustering. The dendogram demonstrates that aCGH datagenerated from the same tissue source is clustered together irrespective of whether DNAused is from frozen or FFPE tissue, or amplified from small quantities of DNA or cells. wga,whole genome amplification; 12hr-96hr_fix denotes hours of fixation in formalin; ffpe,formalin-fixed paraffin-embedded, X, glioblastoma xenograft; P, primary glioblastoma.
Johnson et al. Page 12
Lab Invest. Author manuscript; available in PMC 2010 February 03.
Europe PM
C Funders A
uthor Manuscripts
Europe PM
C Funders A
uthor Manuscripts
Europe PM
C Funders A
uthor Manuscripts
Europe PM
C Funders A
uthor Manuscripts
Johnson et al. Page 13
Tabl
e 1
aCG
H u
sing
DN
A f
rom
fro
zen
tissu
e: r
epro
duci
bilit
y be
twee
n co
nsec
utiv
e an
d si
ngle
clo
nes
affe
cted
Tot
al n
o. c
lone
s af
fect
ed(c
ut-o
ff v
alue
mea
n +/
− 3S
D)
Con
secu
tive
clo
nes
affe
cted
Sing
le c
lone
s af
fect
ed
No.
clo
nes
affe
cted
Per
cent
age
repr
oduc
ibili
tyN
o. c
lone
saf
fect
edP
erce
ntag
ere
prod
ucib
ility
Ref
eren
ce*
292
283
9
A95
1 R
eplic
ate
137
233
884
%34
26%
A95
1 R
eplic
ate
247
635
979
%11
78%
A95
1 R
eplic
ate
336
330
593
%58
16%
A95
1- R
eplic
ate
435
329
197
%62
15%
mea
n39
132
388
%68
16%
* refe
renc
e w
as c
alcu
late
d by
ext
ract
ing
conc
orda
nt c
onse
cutiv
e an
d si
ngle
clo
nes
in a
ll fo
ur in
divi
dual
aC
GH
exp
erim
ents
, as
thes
e ar
e le
ss li
kely
to b
e du
e to
exp
erim
enta
l art
efac
ts.
Lab Invest. Author manuscript; available in PMC 2010 February 03.

Europe PM
C Funders A
uthor Manuscripts
Europe PM
C Funders A
uthor Manuscripts
Johnson et al. Page 14
Tabl
e 2
aCG
H u
sing
DN
A f
rom
FFP
E ti
ssue
: min
imum
req
uire
men
t for
DN
A in
tegr
ity, D
NA
qua
ntity
or
num
ber
of c
ells
Sam
ple
Max
imum
DN
Afr
agm
ent
(bp)
ampl
ifie
d
Qua
lity
of a
CG
H b
yvi
sual
insp
ecti
on
Pea
rson
’s c
orre
lati
on t
o aC
GH
dat
a fr
om c
orre
spon
ding
fro
zen
tiss
ue
400n
g D
NA
from
FF
PE
tis
sue
20ng
DN
A f
rom
FF
PE
tiss
ue w
ith
WG
A
2000
cel
ls f
rom
FF
PE
tis
sue
wit
hW
GA
Xen
ogra
fts
X1
400
good
0.98
0.96
0.91
X2
400
poor
0.51
*0.
900.
91
X3
400
good
0.88
0.88
0.93
X4
400
good
0.96
0.89
X5
300
good
0.83
0.82
X6
100
poor
0.72
X7
100
poor
0.77
X8
100
poor
0.50
X9
100
poor
0.51
X10
100
Faile
d to
labe
l
X11
100
Faile
d to
labe
l
Prim
ary
glio
blas
tom
a
P140
0go
od0.
91
P240
0go
od0.
870.
91
P330
0go
od0.
86
P430
0go
od0.
91
* poor
cor
rela
tion
was
due
to th
e pr
esen
ce o
f >
20%
nec
rosi
s.
Lab Invest. Author manuscript; available in PMC 2010 February 03.
Europe PM
C Funders A
uthor Manuscripts
Europe PM
C Funders A
uthor Manuscripts
Johnson et al. Page 15
Tabl
e 3
Cor
rela
tion
of a
CG
H b
etw
een
DN
A s
ampl
es f
rom
fro
zen
tissu
es, F
FPE
tiss
ue a
nd s
mal
l num
bers
of
cells
mic
rodi
ssec
ted
from
FFP
E ti
ssue
sec
tions
DN
A f
rom
fro
zen
tiss
ue(c
ut-o
ff v
alue
mea
n ±
3SD
)
400n
g D
NA
from
FF
PE
tis
sue
(cut
-off
val
ue m
ean
± 3.
2SD
)
20ng
DN
A f
rom
FF
PE
tis
sue
wit
h W
GA
(cut
-off
val
ue m
ean
± 3.
4SD
)20
00 c
ells
fro
m F
FP
E t
issu
e w
ith
WG
A(c
ut-o
ff v
alue
mea
n ±
3.4S
D)
Tot
al n
o.cl
ones
affe
cted
No.
con
secu
tive
clon
es a
ffec
ted
Tot
al n
o.cl
ones
affe
cted
Con
secu
tive
clo
nes
affe
cted
Tot
al n
o.cl
ones
affe
cted
Con
secu
tive
clo
nes
affe
cted
Tot
al n
o.cl
ones
affe
cted
Con
secu
tive
clo
nes
affe
cted
No.
clo
nes
affe
cted
No.
clo
nes
conc
orda
nt w
ith
thos
e fr
om t
heco
rres
pond
ing
froz
en t
issu
e an
dpe
rcen
tage
of
succ
essf
ulde
tect
ion
No.
clo
nes
affe
cted
No.
clo
nes
conc
orda
nt w
ith
thos
e fr
om t
heco
rres
pond
ing
froz
en t
issu
e an
dpe
rcen
tage
of
succ
essf
ulde
tect
ion
No.
clo
nes
affe
cted
No.
clo
nes
conc
orda
nt w
ith
thos
e fr
om t
heco
rres
pond
ing
froz
en t
issu
e an
dpe
rcen
tage
of
succ
essf
ulde
tect
ion
X1
480
408
85%
458
405
88%
399
98%
486
396
81%
386
95%
743
446
60%
334
82%
X2
398
376
94%
441
394
89%
368
98%
588
439
75%
370
98%
519
398
77%
354
94%
X3
947
765
81%
1338
1117
83
%63
783
%12
1295
1 78
%61
881
%12
1593
9 77
%64
284
%
X4
761
664
87%
1011
771
76%
550
79%
1014
742
73%
503
76%
X5
1578
1373
87
%17
0215
09
89%
1155
85%
1563
1276
82
%10
9780
%
P177
960
8 78
%10
2974
5 72
%42
370
%
P241
040
1 98
%80
558
0 72
%35
890
%66
144
7 68
%36
992
%
P378
374
3 95
%95
872
6 76
%52
380
%
P410
4888
8 85
%15
0412
65
84%
717
82%
mea
n79
869
2 88
%10
2783
5 81
%57
085
%97
376
1 78
%59
586
%78
555
8 70
%42
588
%
Lab Invest. Author manuscript; available in PMC 2010 February 03.