Sequence artefacts in a prospective series of formalin-fixed tumours tested for mutations in hotspot...
10
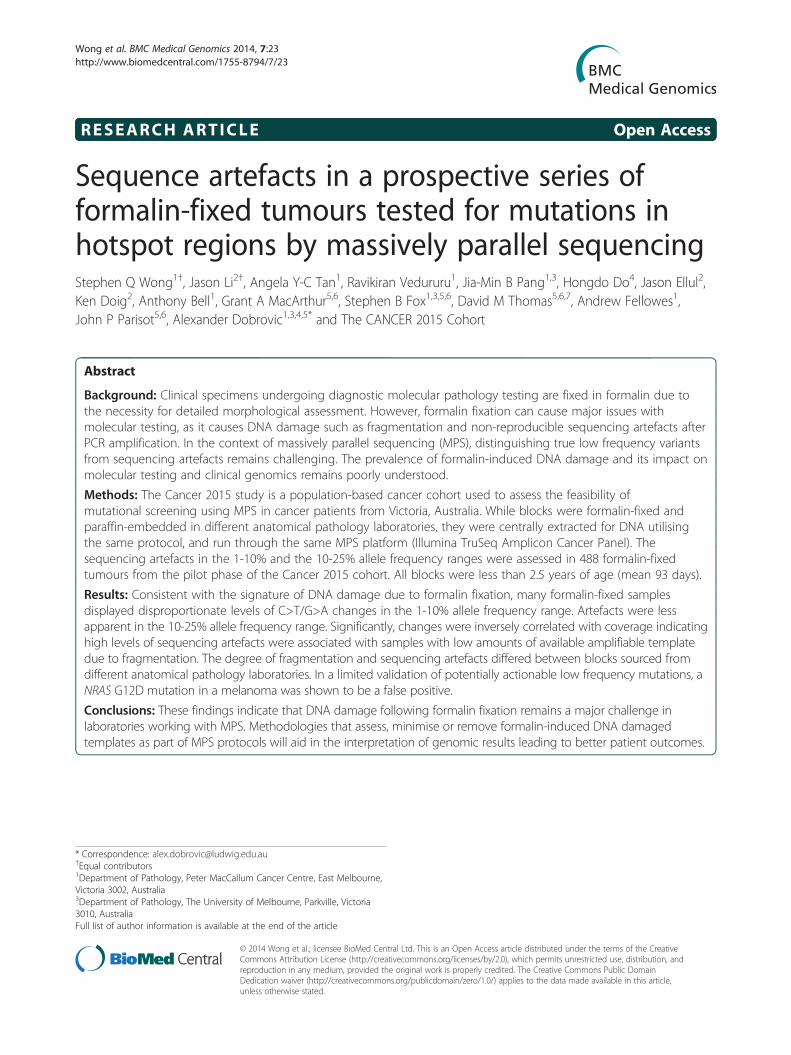
RESEARCH ARTICLE Open Access Sequence artefacts in a prospective series of formalin-fixed tumours tested for mutations in hotspot regions by massively parallel sequencing Stephen Q Wong 1† , Jason Li 2† , Angela Y-C Tan 1 , Ravikiran Vedururu 1 , Jia-Min B Pang 1,3 , Hongdo Do 4 , Jason Ellul 2 , Ken Doig 2 , Anthony Bell 1 , Grant A MacArthur 5,6 , Stephen B Fox 1,3,5,6 , David M Thomas 5,6,7 , Andrew Fellowes 1 , John P Parisot 5,6 , Alexander Dobrovic 1,3,4,5* and The CANCER 2015 Cohort Abstract Background: Clinical specimens undergoing diagnostic molecular pathology testing are fixed in formalin due to the necessity for detailed morphological assessment. However, formalin fixation can cause major issues with molecular testing, as it causes DNA damage such as fragmentation and non-reproducible sequencing artefacts after PCR amplification. In the context of massively parallel sequencing (MPS), distinguishing true low frequency variants from sequencing artefacts remains challenging. The prevalence of formalin-induced DNA damage and its impact on molecular testing and clinical genomics remains poorly understood. Methods: The Cancer 2015 study is a population-based cancer cohort used to assess the feasibility of mutational screening using MPS in cancer patients from Victoria, Australia. While blocks were formalin-fixed and paraffin-embedded in different anatomical pathology laboratories, they were centrally extracted for DNA utilising the same protocol, and run through the same MPS platform (Illumina TruSeq Amplicon Cancer Panel). The sequencing artefacts in the 1-10% and the 10-25% allele frequency ranges were assessed in 488 formalin-fixed tumours from the pilot phase of the Cancer 2015 cohort. All blocks were less than 2.5 years of age (mean 93 days). Results: Consistent with the signature of DNA damage due to formalin fixation, many formalin-fixed samples displayed disproportionate levels of C>T/G>A changes in the 1-10% allele frequency range. Artefacts were less apparent in the 10-25% allele frequency range. Significantly, changes were inversely correlated with coverage indicating high levels of sequencing artefacts were associated with samples with low amounts of available amplifiable template due to fragmentation. The degree of fragmentation and sequencing artefacts differed between blocks sourced from different anatomical pathology laboratories. In a limited validation of potentially actionable low frequency mutations, a NRAS G12D mutation in a melanoma was shown to be a false positive. Conclusions: These findings indicate that DNA damage following formalin fixation remains a major challenge in laboratories working with MPS. Methodologies that assess, minimise or remove formalin-induced DNA damaged templates as part of MPS protocols will aid in the interpretation of genomic results leading to better patient outcomes. * Correspondence: [email protected] † Equal contributors 1 Department of Pathology, Peter MacCallum Cancer Centre, East Melbourne, Victoria 3002, Australia 3 Department of Pathology, The University of Melbourne, Parkville, Victoria 3010, Australia Full list of author information is available at the end of the article © 2014 Wong et al.; licensee BioMed Central Ltd. This is an Open Access article distributed under the terms of the Creative Commons Attribution License (http://creativecommons.org/licenses/by/2.0), which permits unrestricted use, distribution, and reproduction in any medium, provided the original work is properly credited. The Creative Commons Public Domain Dedication waiver (http://creativecommons.org/publicdomain/zero/1.0/) applies to the data made available in this article, unless otherwise stated. Wong et al. BMC Medical Genomics 2014, 7:23 http://www.biomedcentral.com/1755-8794/7/23
Transcript of Sequence artefacts in a prospective series of formalin-fixed tumours tested for mutations in hotspot...
Wong et al. BMC Medical Genomics 2014, 7:23http://www.biomedcentral.com/1755-8794/7/23
RESEARCH ARTICLE Open Access
Sequence artefacts in a prospective series offormalin-fixed tumours tested for mutations inhotspot regions by massively parallel sequencingStephen Q Wong1†, Jason Li2†, Angela Y-C Tan1, Ravikiran Vedururu1, Jia-Min B Pang1,3, Hongdo Do4, Jason Ellul2,Ken Doig2, Anthony Bell1, Grant A MacArthur5,6, Stephen B Fox1,3,5,6, David M Thomas5,6,7, Andrew Fellowes1,John P Parisot5,6, Alexander Dobrovic1,3,4,5* and The CANCER 2015 Cohort
Abstract
Background: Clinical specimens undergoing diagnostic molecular pathology testing are fixed in formalin due tothe necessity for detailed morphological assessment. However, formalin fixation can cause major issues withmolecular testing, as it causes DNA damage such as fragmentation and non-reproducible sequencing artefacts afterPCR amplification. In the context of massively parallel sequencing (MPS), distinguishing true low frequency variantsfrom sequencing artefacts remains challenging. The prevalence of formalin-induced DNA damage and its impact onmolecular testing and clinical genomics remains poorly understood.
Methods: The Cancer 2015 study is a population-based cancer cohort used to assess the feasibility ofmutational screening using MPS in cancer patients from Victoria, Australia. While blocks were formalin-fixed andparaffin-embedded in different anatomical pathology laboratories, they were centrally extracted for DNA utilisingthe same protocol, and run through the same MPS platform (Illumina TruSeq Amplicon Cancer Panel). Thesequencing artefacts in the 1-10% and the 10-25% allele frequency ranges were assessed in 488 formalin-fixedtumours from the pilot phase of the Cancer 2015 cohort. All blocks were less than 2.5 years of age (mean 93 days).
Results: Consistent with the signature of DNA damage due to formalin fixation, many formalin-fixed samplesdisplayed disproportionate levels of C>T/G>A changes in the 1-10% allele frequency range. Artefacts were lessapparent in the 10-25% allele frequency range. Significantly, changes were inversely correlated with coverage indicatinghigh levels of sequencing artefacts were associated with samples with low amounts of available amplifiable templatedue to fragmentation. The degree of fragmentation and sequencing artefacts differed between blocks sourced fromdifferent anatomical pathology laboratories. In a limited validation of potentially actionable low frequency mutations, aNRAS G12D mutation in a melanoma was shown to be a false positive.
Conclusions: These findings indicate that DNA damage following formalin fixation remains a major challenge inlaboratories working with MPS. Methodologies that assess, minimise or remove formalin-induced DNA damagedtemplates as part of MPS protocols will aid in the interpretation of genomic results leading to better patient outcomes.
* Correspondence: [email protected]†Equal contributors1Department of Pathology, Peter MacCallum Cancer Centre, East Melbourne,Victoria 3002, Australia3Department of Pathology, The University of Melbourne, Parkville, Victoria3010, AustraliaFull list of author information is available at the end of the article
© 2014 Wong et al.; licensee BioMed Central Ltd. This is an Open Access article distributed under the terms of the CreativeCommons Attribution License (http://creativecommons.org/licenses/by/2.0), which permits unrestricted use, distribution, andreproduction in any medium, provided the original work is properly credited. The Creative Commons Public DomainDedication waiver (http://creativecommons.org/publicdomain/zero/1.0/) applies to the data made available in this article,unless otherwise stated.

Wong et al. BMC Medical Genomics 2014, 7:23 Page 2 of 10http://www.biomedcentral.com/1755-8794/7/23
BackgroundAdvances in genomic technologies are improving thecapability to arrive at a more informed decision on howto treat a patient [1,2]. In particular, a large number ofgenes can be screened for actionable changes using mas-sively parallel sequencing (MPS) approaches [3,4]. Ac-curate and reliable interpretation of this new type ofgenomic data is therefore critical in deciding the appro-priate course of management for patients.Most DNA for genetic testing from cancer patients is
extracted from formalin-fixed paraffin-embedded tumourbiopsies, where the primary intent is to preserve tumourcellular structure for histological examination and diagno-sis [5]. However, the formalin fixation process is detrimen-tal to downstream genomic applications, causing issues,such as DNA cross-linking to DNA and proteins, that canstall polymerases and DNA-DNA crosslinks that can in-hibit denaturation [6].A common form of DNA damage induced by formalin
fixation is fragmentation, which can lead to low amountsof amplifiable template for PCR amplification. Fragmen-tation of DNA is caused by a number of factors duringthe fixation process, e.g. low pH formalin over time in-creases the rate of apurinic/apyrimidinic site formationand eventually decomposition and fragmentation [7].Long-term storage of formalin-fixed blocks can also in-duce fragmentation due to exposure to environmentalconditions [8-10].Another prominent type of DNA damage that occurs
commonly in formalin-fixed tissues is the hydrolytic de-amination of cytosine to form uracil (or thymine if thecytosine is methylated). This results in non-reproducibleC>T/G>A sequencing artefacts that are observed afterPCR amplification when using formalin-fixed and paraffin-embedded (FFPE) DNA [11-13].Recently, we assessed an amplicon-based MPS tech-
nology and showed that C>T and G>A changes werethe most prominent sequence errors in three formalin-fixed lung squamous cell carcinoma samples [12]. Whilesuch artefacts occur in many formalin-fixed samples, wehave found this to be more pronounced in highly frag-mented samples. Due to stochastic effects, the low tem-plate numbers increase the probability of occurrence oftemplate artefacts [14].Many studies have reported the feasibility of using
DNA from formalin-fixed material using both conven-tional PCR-based and MPS technologies [4,15,16]. Frag-mentation can be a rate-limiting factor in amplicon-based approaches especially those that use longer ampli-cons. Shorter amplicons permit fragmented DNA fromformalin-fixed material to be used more successfully.Some studies have reported elevated numbers of se-
quence artefacts [12,16-19] whereas others reported littleevidence of artefacts appearing in FFPE samples [15,20].
The small number of samples assessed as well as thevarying age of biopsies, degree of fixation and sequen-cing technologies used makes it difficult to know howimportant sequence artefacts are as a source of error inrelatively fresh FFPE samples.This study assessed the prevalence of DNA fragmenta-
tion and sequencing artefacts from a large cohort ofFFPE tumours using a uniform approach whereby allblocks were of similar age, were extracted in the samemanner and were run through the same MPS platform.The originating anatomical pathology laboratory was alsorecorded to determine if variation in operating practicescould affect sequencing artefacts and DNA fragmentation.
MethodsPatients and cell linesCancer 2015 is a large-scale, prospective, longitudinal,multi-site cohort study of incident cancers in the Victorianpopulation. The aim of the Cancer 2015 study is to classifycancers molecularly using MPS to promote more targetedtreatment of cancer patients and improve patient survivaland outcomes. An initial pilot phase was established to de-termine the feasibility of adopting MPS for the diagnosticmutational profiling of tumours. This study was approvedby the Human Research Ethics Committees at the PeterMacCallum Cancer Centre, Royal Melbourne, Cabrini,Geelong and Warrnambool Hospitals, all located withinthe state of Victoria, Australia. All patients providedinformed consent to participate in this study. Formalin-fixed, paraffin-embedded (FFPE) tumour blocks or un-stained sections from FFPE tumour blocks were acquiredfrom anatomical pathology laboratories performing thediagnosis and sent to the Peter MacCallum Cancer CentrePathology department. Epidemiological and clinical vari-ables were collected from each patient. As controls repre-senting good quality DNA, the cell lines NCI-H1975(H1975) and HL-60 were also sequenced.
DNA extractionAll blocks/sections were received at the Peter MacCallumCancer Centre Pathology department for DNA extraction.The age of the blocks/sections was determined by identi-fying the duration between the date of fixation (date ofsurgery) and the date of extraction (arrival date at thePeter MacCallum Cancer Centre). Up to ten unstainedtumour sections of 5 microns thickness were cut fromeach block. DNA from FFPE sections and cell line sampleswere extracted using the DNeasy blood and tissue kit(Qiagen, Hilden, Germany) as per the manufacturer’s in-structions. DNA quantification was performed using theQubit dsDNA HS Assay kit for the Qubit 2.0 Fluorometer(Life Technologies, Carlsbad, CA). The Qubit readingswere used as a guideline for dilution of the DNA samples.
Wong et al. BMC Medical Genomics 2014, 7:23 Page 3 of 10http://www.biomedcentral.com/1755-8794/7/23
FTH1 Taqman assayFFPE derived DNA was checked for quality and concen-tration using an 180 bp FTH1 TaqMan assay (Life Tech-nologies). PCR was performed using the LightCycler 480(Roche Diagnostics, Penzberg, Germany). The reactionmixture included 1X TaqMan Gene Expression MasterMix (Life Technologies), 1X FTH1 TaqMan Assay la-beled with FAM (Life Technologies, # 4331182), 1 μL ofDNA and PCR grade water in a total volume of 11 μL.PCR conditions included an activation step of 10 min at95°C followed by 40 cycles of 95°C for 15 seconds andannealing for 60 sec at 60°C. Based on a standard curvegenerated from genomic DNA of known concentrationsof 50, 25, 12.5, 6.25, 3.13, 1.56 , 0.78 and 0.39 ng/μL andcopy numbers per μL of 16667, 8333, 4167, 2083, 1042,521, 260, 130 respectively, the copy numbers per μL foreach sample were calculated according to the Light-Cycler 480 software manufacturer’s instructions.
TruSeq amplicon cancer panelThe TruSeq Amplicon - Cancer Panel (TSACP) (Illumina,San Diego, CA) comprises 212 amplicons from 48 genesthat are simultaneously amplified in a single-tube reaction.We used 5 μL of each DNA sample (50 ng/μl) for the ex-periment according to the manufacturer’s instructions.We used the MiSeq system (Illumina) for paired end se-quencing with a v2 150-bp kit.
Uracil-DNA glycosylase treatmentFor samples treated with uracil-DNA glycosylase (UDG),FFPE DNA was dispensed and reduced to a final volumeof 2 μL by vacuum centrifugation. The DNA was incubatedwith 6.25 U (1 U/20 ng of DNA) UDG (New EnglandBiolabs, Ipswich, MA) in a final volume of 20 μL contain-ing 1 U UDG buffer. After an initial incubation at 37°C for2 h, the UDG enzyme was inactivated at 95°C for 10 min.UDG-treated FFPE DNAs were stored at 4°C before use inthe TSACP reactions. Before use in sequencing, the vol-ume of the reaction was reduced to a final volume of 5 μLby vacuum centrifugation.
NRAS mutation testingTo confirm the NRAS negative result in sample Ca97, asecond MPS method using deep sequencing was alsoused to assess exon 3 of the NRAS gene. Briefly, PCRwas performed on a Fluidigm Access Array according tostandard protocols [Access Array™ System for IlluminaSequencing Platform User Guide (PN 100–3770)] withthe same FFPE sample (50 ng/μl) loaded into one well ofthe Access Array. The primers were 5’-acactgacgacatggttctacaGAGACAGGATCAGGTCAGCG-3’ and 5’-tacggtagcagagacttggtctGATGTGGCTCGCCAATTAAC-3’, giv-ing an amplicon size of 253 bp (CS1 and CS2 tags areshown in lower case). After barcoding, the sample was
run on an Illumina Miseq according to the manufac-turer’s instructions (v2 150-bp kit).
BioinformaticsCASAVA v1.8.2 was used to perform sample de-multiplexing and to convert BCL files generated fromthe MiSeq instrument into Fastq files containing short-read data. Using the primer sequences that are presentin the data, short reads were first assigned to their respect-ive amplicon. Global alignment based on the Needleman–Wunsch algorithm was then performed between the readsand the amplicon reference sequences to identify se-quence variations. Likely true variants were identified bya) VarScan2 and b) a variant frequency of >10% and werenot included in the analysis of sequencing artefacts. Vari-ants with a frequency < 1% were assumed to be sequen-cing errors. The remaining base changes (i.e. all excepttrue biological variants and sequencing errors) werecounted and categorised into respective nucleotide groupsusing custom Python scripts. In addition to the 1-10% al-lele frequency range, the same pipeline was also used todetermine artefacts in the 10-25% allele frequency range.
Statistical analysisSpearman tests were used to examine associations be-tween continuous variables. The Kruskal–Wallis one-way analysis of variance followed by the Dunn’s post hoctest was used to test for associations between continuousvariables (C>T/G>A changes, FTH1 results) versus ana-tomical pathology laboratory and tumour type. All ana-lyses were performed using GraphPad Prism softwareversion 6.01.
ResultsCell lines and FFPE samplesThis study used the data from the first 488 patients re-cruited from the pilot phase of the Cancer 2015 study(Table 1). The FFPE samples analysed in this study wererelatively recent (median: 77 days, mean: 93.4 ± 77 days)with a range of 4 to 851 days post fixation (Additionalfile 1: Table S1). HL-60 cell line DNA was used in eachsequencing run and allowed run-to-run differences to becompared in terms of coverage and sequencing artefacts.
Assessment of fragmentation in FFPE samplesThe quality and quantity of DNA extracted from tumourbiopsies can vary substantially between samples. DNAfragmentation is a major form of DNA damage that canbe assessed through a number of quality control assaysthat measure if a minimal length of template can beamplified. Part of the pilot phase of the Cancer 2015study was to assess the feasibility of using FFPE DNAfor multiple parallel sequencing using the TSACP assay.The average length of amplicons in the assay is ~175 bp

Table 1 Summary of formalin-fixed samples
Tumour type Number of cases Percentage
Breast 81 16.6%
Head and neck 80 16.4%
Prostate 79 16.2%
Colorectal 52 10.7%
Lung 47 9.6%
Other* 42 8.6%
Cervical 25 5.1%
Bone and soft tissue 22 4.5%
Oesophagogastric 15 3.1%
Renal 14 2.9%
Central nervous system 12 2.5%
Melanoma 11 2.3%
Cancer of unknown primary 8 1.6%
*Represents other cancer types with smaller numbers including pancreatic,ovarian, thyroid, testicular, bladder, hepatic, endometrial, biliary and anal cancers.
Wong et al. BMC Medical Genomics 2014, 7:23 Page 4 of 10http://www.biomedcentral.com/1755-8794/7/23
(range 152–189 bp). A subset of samples (n = 253) wasassessed for amplifiable copy numbers using thecommercially available Taqman assay that measuresthe copies of the FTH1 sequence per microlitre of asample based on the amplification of an 180 bp product.As expected, FFPE samples showed a large spectrum inthe estimated number of copies of the FTH1 sequence(Figure 1 and Additional file 1: Table S1). The cell lineDNA samples showed good copy numbers on the
Tota
l co
vera
ge
( C
ou
nt
of
read
s) X
106
Copies p
0
10
20
30
40
50
60
70
80
90
100
0 50 100 150 200
Figure 1 Association of fragmentation of DNA in FFPE samples with lreads) versus the copies of the FTH1 gene as assessed by a Taqman PCR asbetween the FTH1 result and coverage (Spearman correlation, r = −0.29, p < 0allele frequency range are shown in red.
FTH1 assay (mean copies per microlitre were 152 and160 for the HL-60 and H-1975 cell lines respectively at50 ng/μl).Overall total coverage of a sample after sequencing
would be expected to be inversely associated with theamount of fragmentation whereby samples with highlevel of DNA fragmentation would have less amplifica-tion and therefore associated with lower coverage. Bycomparing both the FTH1 and coverage results for allFFPE samples, there was a weak but significant associ-ation between these two variables (r = 0.29, p < 0.0001,Spearman Rank correlation). Given a minimum of200,000 total reads to achieve a mean of ~1000X acrossall amplicons in a sample, 55/488 samples would notachieved this level of coverage.There were two outlier samples that displayed high
amounts of amplifiable template as measured by theFTH1 assay but resulted in low coverage (samples Ca23and Ca156). These samples however could have lowcoverage because of experimental error during the pro-cessing of the sample resulting in low coverage. How-ever, for the overwhelming majority of other samples,there was a noticeable trend with the degree of frag-mentation as measured by the FTH1 assay and theresulting coverage after sequencing. Importantly, thisindicates that significant fragmentation is present evenin relatively recently fixed biopsies and is an importantfactor leading to lower amounts of successful sequen-cing data.
er microlitre
250 300 350 400 450
ow sequencing coverage. Coverage of each sample (number ofsay (copies per microlitre). n = 253. There was a positive correlation.0001). The 50 samples with the highest C>T/G>A levels in the 1-10%
Wong et al. BMC Medical Genomics 2014, 7:23 Page 5 of 10http://www.biomedcentral.com/1755-8794/7/23
Assessment of sequencing artefacts in FFPE samplesWhile fragmentation is a well known form of DNA dam-age that is present in a large number of FFPE samples,sequencing artefacts as a result of PCR amplificationhave not been extensively studied, especially in relativelyrecent samples as would be used diagnostically.Hence, our next analysis was to determine if sequence
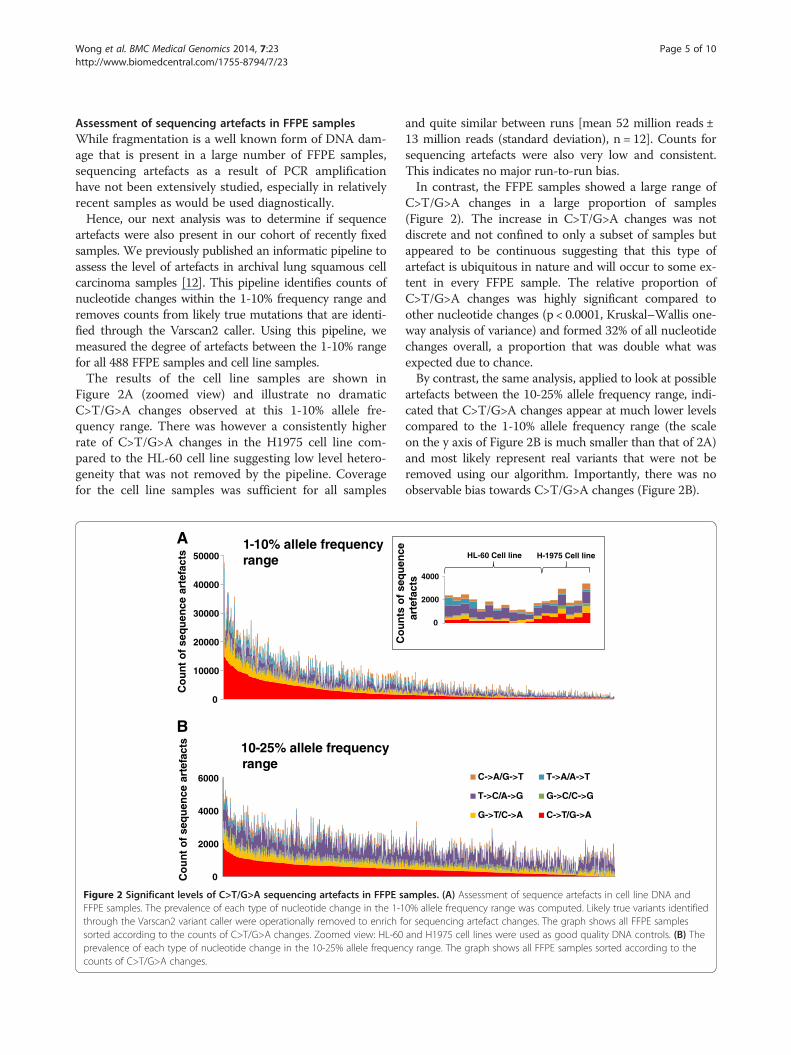
artefacts were also present in our cohort of recently fixedsamples. We previously published an informatic pipeline toassess the level of artefacts in archival lung squamous cellcarcinoma samples [12]. This pipeline identifies counts ofnucleotide changes within the 1-10% frequency range andremoves counts from likely true mutations that are identi-fied through the Varscan2 caller. Using this pipeline, wemeasured the degree of artefacts between the 1-10% rangefor all 488 FFPE samples and cell line samples.The results of the cell line samples are shown in
Figure 2A (zoomed view) and illustrate no dramaticC>T/G>A changes observed at this 1-10% allele fre-quency range. There was however a consistently higherrate of C>T/G>A changes in the H1975 cell line com-pared to the HL-60 cell line suggesting low level hetero-geneity that was not removed by the pipeline. Coveragefor the cell line samples was sufficient for all samples
Co
un
t o
f se
qu
ence
art
efac
ts
0
10000
20000
30000
40000
50000
0
2000
4000
6000
Co
un
t o
f se
qu
ence
art
efac
ts
A
B
1-10% allele frequency range
10-25% allele frequency range
Figure 2 Significant levels of C>T/G>A sequencing artefacts in FFPE sFFPE samples. The prevalence of each type of nucleotide change in the 1-1through the Varscan2 variant caller were operationally removed to enrich fsorted according to the counts of C>T/G>A changes. Zoomed view: HL-60prevalence of each type of nucleotide change in the 10-25% allele frequencounts of C>T/G>A changes.
and quite similar between runs [mean 52 million reads ±13 million reads (standard deviation), n = 12]. Counts forsequencing artefacts were also very low and consistent.This indicates no major run-to-run bias.In contrast, the FFPE samples showed a large range of
C>T/G>A changes in a large proportion of samples(Figure 2). The increase in C>T/G>A changes was notdiscrete and not confined to only a subset of samples butappeared to be continuous suggesting that this type ofartefact is ubiquitous in nature and will occur to some ex-tent in every FFPE sample. The relative proportion ofC>T/G>A changes was highly significant compared toother nucleotide changes (p < 0.0001, Kruskal–Wallis one-way analysis of variance) and formed 32% of all nucleotidechanges overall, a proportion that was double what wasexpected due to chance.By contrast, the same analysis, applied to look at possible
artefacts between the 10-25% allele frequency range, indi-cated that C>T/G>A changes appear at much lower levelscompared to the 1-10% allele frequency range (the scaleon the y axis of Figure 2B is much smaller than that of 2A)and most likely represent real variants that were not beremoved using our algorithm. Importantly, there was noobservable bias towards C>T/G>A changes (Figure 2B).
HL-60 Cell line H-1975 Cell line
Co
un
ts o
f se
qu
ence
ar
tefa
cts
0
2000
4000
C->A/G->T T->A/A->T
T->C/A->G G->C/C->G
G->T/C->A C->T/G->A
amples. (A) Assessment of sequence artefacts in cell line DNA and0% allele frequency range was computed. Likely true variants identifiedor sequencing artefact changes. The graph shows all FFPE samplesand H1975 cell lines were used as good quality DNA controls. (B) Thecy range. The graph shows all FFPE samples sorted according to the

Wong et al. BMC Medical Genomics 2014, 7:23 Page 6 of 10http://www.biomedcentral.com/1755-8794/7/23
Assuming that cell line DNA represents good qualityDNA that would display little or no artefacts, the me-dian C>T/G>A change count in the 1-10% allele fre-quency range was 272 contrasting to a much morehigher median C>T/G>A count in FFPE samples of1515. These findings not only confirm our original find-ings that C>T/G>A are the most predominant type ofsequencing artefact but also indicate that they occur inall FFPE samples to some degree.
Correlation of sequence artefacts with coverageAn interesting observation in samples with high C>T/G>A changes in the 1-10% range was a parallel increasein the number of other nucleotide changes. This couldbe due to the stochastic nature of low template sampleswhich increase the probability for not only C>T/G>A ar-tefacts but also other nucleotide artefacts to appear.To confirm this phenomenon, the coverage and counts
for C>T/G>A changes were graphed for each FFPE sam-ple (Figure 3). As expected, there was a significant asso-ciation between low coverage and high amounts of C>T/G>A changes in the 1-10% allele frequency range (r =−0.24, p < 0.0001, Spearman Rank correlation). This is alsoin line with the fragmentation measurements with the 50samples with the highest C>T/G>A levels strongly trend-ing towards having lower estimated template numbers inthe FTH1 assay (Figure 1). This indicates that despite thesame amount of DNA used for each sample that the re-duction of available templates caused by fragmentationcan lead to a higher probability for sequence artefacts tobe observed after PCR amplification.
Correlation of anatomical laboratory with sequenceartefacts and coverageWhile DNA was extracted at the same location with thesame protocol, the tissue blocks were formalin fixed and
C>T
/G>A
seq
uen
ce a
rtef
acts
an
d
tota
l co
vera
ge c
ou
nts
(X
106 )
0
200
400
600
800
1,000
1,200
1,400
1,600
1,800
2,000Coverage
C>T: G>A counts
Figure 3 Low coverage samples have higher rates of C>T/G>A seque(blue) and the counts of C>T/G>A sequencing artefacts (red) are plotted oand C>T/G>A sequence artefacts (Spearman correlation, r = −0.24, p < 0.00
paraffin embedded in different anatomical pathology la-boratories across Victoria, Australia. Since different ana-tomical laboratories might have different practicesregarding the fixation of tissues, we examined DNA dam-age in relation to the originating anatomical laboratory.There was a significant difference for both fragmentationand sequence artefacts between anatomical pathology(AP) laboratories (p < 0.0001, Kruskal-Wallis test). Dunn’sMultiple Comparison test indicated significant differencebetween AP7 versus AP22 and AP26 for fragmentationanalysis, and AP7 versus AP22 for sequencing artefacts(Additional file 2: Figure S1). Despite standardization,these results suggest that fixation processes may varyacross different labs. The age of the blocks or the tumourtype was not significantly correlated with the degree offragmentation or sequence artefacts.
Case studies: samples with potential false positive clinicalmutation callsTo determine if samples with high artefacts contain mu-tations that mimic actionable mutations, we selectively ex-amined the variant calls from samples with high artefactrates. From this, we found three samples that had action-able mutations with low frequencies and with enoughavailable DNA for further testing. We treated these sam-ples with uracil-DNA glycosylase (UDG), sequenced themusing the TSACP and then examined if the mutation wasstill present. As shown in Figure 4, PIK3CA mutations inthe two breast cancer cases (Ca309 and Ca285) were con-firmed to be real mutations as the identical mutation ofsimilar frequency was identified in each of these casesafter UDG treatment. PIK3CA mutations are positiveprognostic factors in breast cancer [21,22], supporting theclinical utility of MPS for the detection of clinically action-able mutations. It also illustrates that this platform can de-tect real mutations even at low frequencies.
ncing artefacts. For all FFPE samples (x-axis), values for coveragen the same y-axis. There was an inverse correlation between coverage01).

Figure 4 Uracil-DNA glycosylase treatment of FFPE DNA samples distinguishes true and false positive clinical relevant mutations.Integrative Genomic Viewer (IGV) screenshots of two breast cancers and one melanoma sample pre- and post- uracil-DNA glycosylase (UDG)treatment samples. The two breast cancer samples have confirmed PIK3CA mutations (E545K for Ca309 and H1047Y for Ca285) as these mutationswere still detected after UDG treatment. The NRAS G12D mutation identified in the pre-UDG sample (Ca97) was a false positive as it was notpresent after UDG treatment. The variant reads over the total reads and overall allele frequency (a.f.) are shown for each case.
Wong et al. BMC Medical Genomics 2014, 7:23 Page 7 of 10http://www.biomedcentral.com/1755-8794/7/23
In the case of a melanoma with an apparent NRASc.35 G>A, p.G12D mutation (Ca97), resequencing (afterUDG treatment) using the TSACP platform did not con-firm the same mutation. To further validate this result,the sample was tested by an orthogonal MPS method(Fluidigm Access Array microfluidic chip system) thatcovers the NRAS exon 2 region at extremely high cover-age (Additional file 2: Figure S2). This method also couldnot detect the mutation suggesting that the original callfor the mutation was a false positive.
DiscussionWhile the implementation of MPS into a clinical settingis currently in progress in numerous laboratories world-wide, there are still a number of challenges using DNAfrom FFPE cancer specimens for this application. Theprevalence of DNA damage associated with formalin fix-ation in clinical material has not been extensively stud-ied, particular in terms of cancer genomics. Mostgenomic studies dealing with FFPE DNA are relativelysmall in numbers with the archival status of specimensin most cases remaining unknown [4,16]. In contrast,this study had a relatively narrow window in which sam-ples were formalin-fixed and had a standardised andcentralised point of DNA extraction and sequencing.FFPE samples in this study therefore accurately repre-sent those that would enter a molecular diagnostic clin-ical workflow.To our knowledge, this study represents the largest as-
sessment of formalin induced fragmentation and sequen-cing artefacts using clinical FFPE samples. From our setof analyses, we have confirmed that both fragmentationand sequencing artefacts are common forms of DNAdamage from formalin-fixed material even if blocks are
relatively new. As a result, this work illustrates theseforms of DNA damage can have major consequences fordownstream interpretation as not all actionable muta-tions could be validated.There are a limited number of publications highlight-
ing the ability of amplicon-based MPS to identify clinic-ally relevant mutations or canonical mutations fromDNA obtained from various tumour types [23-26]. How-ever, these studies looked at a relatively small number ofcases, usually reported only canonical mutations, andwhere validation of variants was performed, demon-strated variation in the results obtained. For example, inthe study investigating the sensitivity of immunohisto-chemistry (IHC) versus Sanger sequencing to BRAFV600E mutations in FFPE derived DNA from papillarythyroid carcinoma specimens, Bullock and colleaguesutilised the TSACP as an alternative sequencing plat-form [23]. The TSACP was able to identify the BRAFV600E mutation in three out of 11 IHC positive caseswith variant frequencies of 10-32%, which Sanger se-quencing failed to detect. When DNA was then macro-dissected from the same tumour blocks, both sequencingand the TSACP analyses could now both detect theV600E mutation in seven cases (7/11). This confirmsthat the platform is comparatively more sensitive thanthe “gold standard” of Sanger sequencing for low fre-quency mutations.In this study we explored two common form of DNA
damage caused by formalin, i.e. fragmentation and se-quencing artefacts. Assessment of fragmentation wasperformed using a copy number assessment PCR priorto MPS. The weak association between total coveragecounts and the FTH1 results could be explained by thelimitations of the FTH1 assay. While the assay can

Wong et al. BMC Medical Genomics 2014, 7:23 Page 8 of 10http://www.biomedcentral.com/1755-8794/7/23
clearly discriminate between samples based on the de-gree of fragmentation, the assay is designed only arounda product of 180 bp and for only one locus. Conse-quently, the FTH1 assay cannot accurately assess the en-tire range of product sizes generated by the TSACPprotocol. Testing multiple loci across various fragmentlengths is therefore recommended for FFPE samples inMPS testing to predict poor quality amplifiable DNA [27].Interestingly, the degree of C>T/G>A artefacts forms a
continuum suggesting that the source of DNA damagecausing these changes occurs to some degree in everysample. Procedurally, although the practice of fixation oftumour specimens is standardised, the observation thatsamples processed from one anatomical pathology la-boratory (AP7) had a significantly higher rate of sequen-cing artefacts and fragmentation indicates that fixationprocesses may not actually be uniform between differentlaboratories.Assessment of other variables potentially involved in
DNA damage such as the duration of transport from pa-tient to the anatomical pathology laboratory, and size oftumour specimens could not be feasibly assessed in this
Type of DNA sample Pre-amplification P
•
•
•
•
•
•
•
•
•
•
•
Figure 5 Low template copies are associated with higher probabilityDNA from sources such as blood and fresh frozen tissue, fragmentation anamounts of amplifiable template increase the likelihood of accurately identstochastic enrichment of sequencing artefacts. In FFPE DNA with moderatesome formalin-induced uracil lesions being present in template DNA. Subseqtemplate numbers. Uracil lesions are also amplified, and due to the lower copG>A changes). These artefacts will be low in frequency. In the case of FFPE ware severely limited. An artefact in one of these templates can then appear assubsequently be interpreted as real mutations.
study. In addition, the degree and spectrum of DNAdamage from a formalin-fixed sample depends on envir-onmental factors such as exposure to heat, light and theconcentration and age of formalin used for fixation. Theage of blocks examined is another consideration as long-term storage in suboptimal environments can cause sig-nificant DNA damage. Further dissection of these factorsin a more controlled setting will provide significant ben-efits to the preservation of DNA for subsequent testing.Another consideration is the type of polymerase used
in this study. While the type of polymerase used in theTSACP was not disclosed due to commercial reasons itis probably not proofreading since proofreading enzymesare known to stall at uracil lesions and in effect, replicatethe effect of UDG treatment. Further examination ofpolymerases which increase correct sequence amplifica-tion but still maintain sufficient amplification for se-quencing are required.There is a possibility that some changes within the 1-
10% allele frequency do represent low-level heterogen-eity and were not detected by the Varscan2 variant callerand removed from our analysis of sequencing artefacts.
ost-amplification Result Legend
of sequencing artefacts post-PCR amplification. In good qualityd uracil lesions are present at very low levels. In this circumstance, highifying mutations due to high sequencing coverage with little or nofragmentation, the number of amplifiable templates is reduced, with
uently PCR amplification results in lower coverage due to less amplifiabley numbers, can appear as non-reproducible sequencing artefacts (C>T/ith high amounts of fragmentation, the numbers of amplifiable templatea moderate to high frequency sequencing variant. These can

Wong et al. BMC Medical Genomics 2014, 7:23 Page 9 of 10http://www.biomedcentral.com/1755-8794/7/23
Fresh frozen samples counterparts would be suitable forthis assessment but were not available for this study toconfirm this.In this study, we confirmed the detection of two low
frequency actionable mutations in the PIK3CA gene, inbreast carcinoma cases. These mutations remained afterthe sequencing was repeated (and after UDG treatment).Given the clinical context of these mutations in breastcancer, these mutations are of potential clinical benefitto the patient that may have implications for PIK3CA in-hibitors that target the PI3K/AKT/mTOR pathway[21,22]. It also illustrates that this platform can detectreal mutations even at low frequencies.In contrast, an activating NRAS G12D mutation dis-
covered originally in our first screen but not confirmedin the same DNA specimen by subsequent UDG treat-ment or MPS has major implications for the patient. Ac-tivating mutations in NRAS have been reported inapproximately 20% of all melanomas [28] and are poten-tially sensitive to therapeutics that target downstreamsignaling through mitogen-activated protein kinase kin-ase and phosphatidylinositol 3-OH kinase or AKT[29,30]. This is a clear demonstration of the dangers thatcan arise from MPS data without proper validation.Complete validation of all variants was not possible in
this study because of the extremely large number of var-iants detected and the lack of remaining DNA availablefor all samples. Undoubtedly a large number of thesevariants will be false positives, especially in the 1-10% al-lele frequency range. While validation of every variant isa laborious task costing time, material and expense, werecommend that validation of actionable mutations thatwill directly affect patient management be performed inthis kind of testing. We also propose that quality controlmeasures be adopted prior to sequencing including theimplementation of more efficient and accurate qualitycontrol assays that evaluate DNA concentration, frag-mentation and the presence of uracil lesions.While we have shown treatment with UDG is effective
in reducing artefactual variants, there are a number ofother strategies to minimise artefacts occurring, particu-larly those using non-capture based-technologies [31].This includes performing duplicate reactions for thesame sample or through internal validation by havingoverlapping amplicons covering the same loci (as is thecase in the newer TruSight™ version of the TSACP panelthat was released after this study was concluded).
ConclusionsDNA damage caused by formalin fixation appears to bevery common even in relatively recent samples. Thisstudy demonstrates that higher amounts of fragmenta-tion will increase the probability of higher rates of se-quencing artefacts. This is summarised in Figure 5. The
findings from this study not only have implications forMPS-based platforms but also conventional PCR-basedmethodologies which commonly use FFPE DNA as aninput such as HRM and Sanger sequencing. Sampleswith a high degree of DNA damage must be treated withcaution as potential false positives that can arise fromformalin damage may have major consequences fordownstream clinical decisions. As MPS becomes in-creasingly incorporated into clinical diagnostic work-flows, it is important to assess DNA damage caused byformalin fixation, as this will greatly optimise diagnosticworkflows, increase accuracy of results and lead to bet-ter outcomes for patients.
Additional files
Additional file 1: Table S1. Coverage, FTH1 results, counts of C>T/G>Achanges in the 1-10% allele frequency range, anatomical pathology lab,tumour type and age of block.
Additional file 2: Figure S1. Fragmentation and sequencing artefactsfor each anatomical pathology laboratory. Figure S2. Negative NRASexon 2 mutation result for a melanoma case.
Competing interestsGM has received commercial research funding from Pfizer, Novartis, andMillennium. AD has received commercial research funding from Pfizer.
Authors’ contributionsSW, HD, JP and AD conceived the study. SW, AT and RV performed theexperiments. SW, JL, JP, JE, KD and AD analysed the data. JP, SF, AF and ABprovided pathological interpretation and material support. GM and DTprovided the clinical interpretation. SW and AD wrote the manuscript. Allauthors contributed to revision of the manuscript and approved the finalversion.
AcknowledgementsThe Cancer 2015 study is supported by the Victorian Government throughthe Victorian Cancer Agency Translational Research Program. SW issupported by the Melbourne Melanoma Project funded by the VictorianCancer Agency Translational Research Program and established throughsupport of the Victor Smorgon Charitable Fund. We would like to thank allthe cancer patients who participated in the study. We gratefullyacknowledge the cooperation of the following Victorian institutions: TheAndrew Love Cancer Centre; Geelong Hospital, Barwon Health; WarrnamboolHospital; Southwest Health; The Peter MacCallum Cancer Centre; LudwigInstitute for Cancer Research, Austin Health; Royal Melbourne Hospital,Melbourne Health; Centre for Health Economics, Monash University;Department of Epidemiology and Preventative Medicine, The Alfred Centre,Monash University; Cabrini Health; Department of Pathology, University ofMelbourne and Monash Institute of Medical Research. We thank Mark Lucasfor assistance with the clinical database for Cancer 2015 patients.
Author details1Department of Pathology, Peter MacCallum Cancer Centre, East Melbourne,Victoria 3002, Australia. 2Bioinformatics, Cancer Research Division, PeterMacCallum Cancer Centre, East Melbourne, Victoria 3002, Australia.3Department of Pathology, The University of Melbourne, Parkville, Victoria3010, Australia. 4Translational Genomics and Epigenomics Laboratory, LudwigInstitute for Cancer Research, The Olivia Newton-John Cancer and WellnessCentre, Heidelberg, Victoria 3084, Australia. 5Sir Peter MacCallum Departmentof Oncology, The University of Melbourne, Parkville, Victoria 3010, Australia.6Division of Cancer Research, Peter MacCallum Cancer Centre, St AndrewsPlace, East Melbourne, Victoria 3002, Australia. 7The Kinghorn Cancer Centreand Garvan Institute, Victoria Street, Darlinghurst 2010, New South Wales,Australia.

Wong et al. BMC Medical Genomics 2014, 7:23 Page 10 of 10http://www.biomedcentral.com/1755-8794/7/23
Received: 18 January 2014 Accepted: 30 April 2014Published: 13 May 2014
References1. MacConaill LE, Campbell CD, Kehoe SM, Bass AJ, Hatton C, Niu L, Davis M,
Yao K, Hanna M, Mondal C, Luongo L, Emery CM, Baker AC, Philips J, GoffDJ, Fiorentino M, Rubin MA, Polyak K, Chan J, Wang Y, Fletcher JA,Santagata S, Corso G, Roviello F, Shivdasani R, Kieran MW, Ligon KL, StilesCD, Hahn WC, Meyerson ML, et al: Profiling critical cancer gene mutationsin clinical tumor samples. PloS one 2009, 4:e7887.
2. Macconaill LE, Garraway LA: Clinical implications of the cancer genome.J Clin Oncol 2010, 28(35):5219–5228.
3. Mar VJ, Wong SQ, Li J, Scolyer RA, McLean C, Papenfuss AT, Tothill RW,Kakavand H, Mann GJ, Thompson JF, Behren A, Cebon JS, Wolfe R, Kelly JW,Dobrovic A, McArthur GA: BRAF/NRAS wild-type melanomas have a highmutation load correlating with histologic and molecular signatures ofUV damage. Clin Cancer Res 2013, 19:4589–4598.
4. Wagle N, Berger MF, Davis MJ, Blumenstiel B, Defelice M, Pochanard P,Ducar M, Van Hummelen P, Macconaill LE, Hahn WC, Meyerson M, GabrielSB, Garraway LA: High-throughput detection of actionable genomicalterations in clinical tumor samples by targeted, massively parallelsequencing. Cancer discovery 2012, 2(1):82–93.
5. Berg D, Malinowsky K, Reischauer B, Wolff C, Becker KF: Use of formalin-fixed and paraffin-embedded tissues for diagnosis and therapy inroutine clinical settings. Methods Mol Biol 2011, 785:109–122.
6. Gilbert MT, Haselkorn T, Bunce M, Sanchez JJ, Lucas SB, Jewell LD, VanMarck E, Worobey M: The isolation of nucleic acids from fixed, paraffin-embedded tissues-which methods are useful when? PLoS One 2007,2(6):e537.
7. Sikorsky JA, Primerano DA, Fenger TW, Denvir J: DNA damage reduces TaqDNA polymerase fidelity and PCR amplification efficiency. BiochemBiophys Res Commun 2007, 355(2):431–437.
8. Bruskov VI, Malakhova LV, Masalimov ZK, Chernikov AV: Heat-inducedformation of reactive oxygen species and 8-oxoguanine, a biomarker ofdamage to DNA. Nucleic Acids Res 2002, 30(6):1354–1363.
9. Pfeifer GP, You YH, Besaratinia A: Mutations induced by ultraviolet light.Mutat Res 2005, 571(1–2):19–31.
10. Lindahl T: Instability and decay of the primary structure of DNA. Nature1993, 362(6422):709–715.
11. Do H, Dobrovic A: Dramatic reduction of sequence artefacts from DNAisolated from formalin-fixed cancer biopsies by treatment with uracil-DNA glycosylase. Oncotarget 2012, 3(5):546–558.
12. Do H, Wong SQ, Li J, Dobrovic A: Reducing sequence artifacts inamplicon-based massively parallel sequencing of formalin-fixed paraffin-embedded DNA by enzymatic depletion of uracil-containing templates.Clin Chem 2013, 59(9):1376–1383.
13. Hofreiter M, Jaenicke V, Serre D, von Haeseler A, Paabo S: DNA sequencesfrom multiple amplifications reveal artifacts induced by cytosinedeamination in ancient DNA. Nucleic Acids Res 2001, 29(23):4793–4799.
14. Do H, Dobrovic A: Limited copy number-high resolution melting (LCN-HRM) enables the detection and identification by sequencing of lowlevel mutations in cancer biopsies. Mol Canc 2009, 8:82.
15. Kerick M, Isau M, Timmermann B, Sultmann H, Herwig R, Krobitsch S,Schaefer G, Verdorfer I, Bartsch G, Klocker H, Lehrach H, Schweiger MR:Targeted high throughput sequencing in clinical cancer settings:formaldehyde fixed-paraffin embedded (FFPE) tumor tissues, inputamount and tumor heterogeneity. BMC Med Genomics 2011, 4:68.
16. Yost SE, Smith EN, Schwab RB, Bao L, Jung H, Wang X, Voest E, Pierce JP,Messer K, Parker BA, Harismendy O, Frazer KA: Identification of high-confidence somatic mutations in whole genome sequence of formalin-fixed breast cancer specimens. Nucleic Acids Res 2012, 40(14):e107.
17. Schmitt MW, Kennedy SR, Salk JJ, Fox EJ, Hiatt JB, Loeb LA: Detection ofultra-rare mutations by next-generation sequencing. Proc Natl Acad SciU S A 2012, 109(36):14508–14513.
18. Spencer DH, Sehn JK, Abel HJ, Watson MA, Pfeifer JD, Duncavage EJ:Comparison of clinical targeted next-generation sequence data fromformalin-fixed and fresh-frozen tissue specimens. J Mol Diagn 2013,15(5):623–633.
19. Anaka M, Hudson C, Lo PH, Do H, Caballero OL, Davis ID, Dobrovic A,Cebon J, Behren A: Intratumoral genetic heterogeneity in metastatic
melanoma is accompanied by variation in malignant behaviors. BMCMed Genomics 2013, 6:40.
20. Schweiger MR, Kerick M, Timmermann B, Albrecht MW, Borodina T,Parkhomchuk D, Zatloukal K, Lehrach H: Genome-wide massively parallelsequencing of formaldehyde fixed-paraffin embedded (FFPE) tumortissues for copy-number- and mutation-analysis. PLoS One 2009,4(5):e5548.
21. Cizkova M, Susini A, Vacher S, Cizeron-Clairac G, Andrieu C, Driouch K,Fourme E, Lidereau R, Bieche I: PIK3CA mutation impact on survival inbreast cancer patients and in ERalpha, PR and ERBB2-based subgroups.Breast Cancer Res 2012, 14(1):R28.
22. Janku F, Wheler JJ, Westin SN, Moulder SL, Naing A, Tsimberidou AM, Fu S,Falchook GS, Hong DS, Garrido-Laguna I, Luthra R, Lee JJ, Lu KH, Kurzrock R:PI3K/AKT/mTOR inhibitors in patients with breast and gynecologicmalignancies harboring PIK3CA mutations. J Clin Oncol 2012,30(8):777–782.
23. Bullock M, O'Neill C, Chou A, Clarkson A, Dodds T, Toon C, Sywak M, SidhuSB, Delbridge LW, Robinson BG, Learoyd DL, Capper D, von Deimling A,Clifton-Bligh RJ, Gill AJ: Utilization of a MAB for BRAF(V600E) detection inpapillary thyroid carcinoma. Endocr Relat Cancer 2012, 19:779–784.
24. Diaz-Padilla I, Hirte H, Oza AM, Clarke BA, Cohen B, Reedjik M, Zhang T,Kamel-Reid S, Ivy SP, Hotte SJ, Razak AA, Chen EX, Brana I, Wizemann M,Wang L, Siu LL, Bedard PL: A phase Ib combination study of RO4929097,a gamma-secretase inhibitor, and temsirolimus in patients withadvanced solid tumors. Invest New Drugs 2013, 31(5):1182–1191.
25. Hubers AJ, Heideman DA, Yatabe Y, Wood MD, Tull J, Taron M, Molina MA,Mayo C, Bertran-Alamillo J, Herder GJ, Koning R, Sie D: EGFR mutationanalysis in sputum of lung cancer patients: a multitechnique study. LungCancer 2013, 82(1):38–43.
26. Pemovska T, Kontro M, Yadav B, Edgren H, Eldfors S, Szwajda A, Almusa H,Bespalov MM, Ellonen P, Elonen E, Gjertsen BT, Karjalainen R, Kulesskiy E,Lagstrom S, Lehto A, Lepisto M, Lundan T, Majumder MM, Lopez Marti JM,Mattila P, Murumagi A, Mustjoki S, Palva A, Parsons A, Pirttinen T, Ramet ME,Suvela M, Turunen L, Vastrik I, Wolf M, et al: Individualized SystemsMedicine (ISM) strategy to tailor treatments for patients withchemorefractory acute myeloid leukemia. Canc Discov 2013,3(12):1416–4129.
27. Sah S, Chen L, Houghton J, Kemppainen J, Marko AC, Zeigler R, Latham GJ:Functional DNA quantification guides accurate next-generationsequencing mutation detection in formalin-fixed, paraffin-embeddedtumor biopsies. Genome Med 2013, 5(8):77.
28. Devitt B, Liu W, Salemi R, Wolfe R, Kelly J, Tzen CY, Dobrovic A, McArthur G:Clinical outcome and pathological features associated with NRASmutation in cutaneous melanoma. Pigment Cell Melanoma Res 2011,24(4):666–672.
29. Ascierto PA, Schadendorf D, Berking C, Agarwala SS, van Herpen CM,Queirolo P, Blank CU, Hauschild A, Beck JT, St-Pierre A, Niazi F, Wandel S,Peters M, Zubel A, Dummer R: MEK162 for patients with advancedmelanoma harbouring NRAS or Val600 BRAF mutations: a non-randomised, open-label phase 2 study. Lancet Oncol 2013, 14:249–256.
30. Kelleher FC, McArthur GA: Targeting NRAS in melanoma. Cancer J 2012,18(2):132–136.
31. Wong SQ, Li J, Salemi R, Sheppard KE, Hongdo D, Tothill RW, McArthur GA,Dobrovic A: Targeted-capture massively-parallel sequencing enablesrobust detection of clinically informative mutations from formalin-fixedtumours. Sci Rep 2013, 3:3494.
doi:10.1186/1755-8794-7-23Cite this article as: Wong et al.: Sequence artefacts in a prospectiveseries of formalin-fixed tumours tested for mutations in hotspot regionsby massively parallel sequencing. BMC Medical Genomics 2014 7:23.