APEC's Ease of Doing Business – Final Assessment 2015-2018
52
APEC's Ease of Doing Business – Final Assessment 2015-2018 APEC Policy Support Unit August 2019
-
Upload
khangminh22 -
Category
Documents
-
view
3 -
download
0
Transcript of APEC's Ease of Doing Business – Final Assessment 2015-2018
APEC's Ease of Doing Business –Final Assessment 2015-2018
APEC Policy Support UnitAugust 2019

Prepared by:
Carlos Kuriyama, Divya Sangaraju and Jason Carlo Carranceja*
Asia-Pacific Economic Cooperation Policy Support Unit
Asia-Pacific Economic Cooperation Secretariat
35 Heng Mui Keng Terrace
Tel: (65) 6891-9600 Fax: (65) 6891-9690
Email: [email protected] Website: www.apec.org
Produced for:
Asia-Pacific Economic Cooperation Policy Support Unit
Asia-Pacific Economic Cooperation Secretariat
35 Heng Mui Keng Terrace
Tel: (65) 6891-9500 Fax: (65) 6891-9690
Email: [email protected] Website: www.apec.org
APEC#219-SE-01.7
This work is licensed under the Creative Commons Attribution-NonCommercial-
ShareAlike 3.0 Singapore License. To view a copy of this license, visit
http://creativecommons.org/licenses/by-nc-sa/3.0/sg/.
* Carlos Kuriyama is a Senior Analyst, Divya Sangaraju and Jason Carlo Carranceja are both
Researchers at the APEC Policy Support Unit (PSU). The authors would like to thank the APEC
Economic Committee members for their valuable comments. The views expressed in this paper are
those of the authors and do not necessarily represent those of APEC Member Economies.

Table of Contents
i
TABLE OF CONTENTS
EXECUTIVE SUMMARY ..................................................................................................... 1
1. INTRODUCTION: APEC’S EASE OF DOING BUSINESS ................................... 4
A. HISTORY ........................................................................................................... 4
B. OVERALL TARGET ........................................................................................ 5
C. MEASUREMENT APPROACH ...................................................................... 5
2. APEC’S OVERALL PERFORMANCE ..................................................................... 7
3. APEC’S IMPROVEMENT’S BY PRIORITY AREAS ............................................ 9
A. STARTING A BUSINESS ................................................................................ 9
B. DEALING WITH CONSTRUCTION PERMITS ........................................ 14
C. GETTING CREDIT ........................................................................................ 20
D. TRADING ACROSS BORDERS ................................................................... 26
E. ENFORCING CONTRACTS ......................................................................... 32
4. ESTABLISHING AN EASE OF DOING BUSINESS AGENDA POST-2018 ..... 39
5. REFERENCES ............................................................................................................ 42
6. APPENDIX: METHODOLOGY .............................................................................. 43
LIST OF FIGURES
Figure 2.1: APEC - Accumulated Overall Progress in the Ease of Doing Business Initiative
(Average Values: Years 2016-2018) ......................................................................................... 7
Figure 2.2: APEC - Accumulated Overall Progress in the Ease of Doing Business Initiative
(Median Values: Years 2016-2018) ........................................................................................... 8
Figure 3.1: Average and Median Number of Procedures Required to Start a Business ............ 9
Figure 3.2: Average and Median Time in Days Required to Start a Business ........................ 10
Figure 3.3: Average and Median Cost (% of income per capita) to Start a Business .............. 10
Figure 3.4: Percentage Change in Average Values for Starting a Business Indicators between
2015 and 2018 .......................................................................................................................... 11
Figure 3.5: Percentage Change in Median Values for Starting a Business Indicators between
2015 and 2018 .......................................................................................................................... 12
Figure 3.6: Average and Median Procedures to deal with Construction Permits .................... 14
Figure 3.7: Average and Median Time in days to deal with Construction Permits ................. 15

Table of Contents
ii
Figure 3.8: Average and Median Cost (% of warehouse value) of dealing with Construction
Permits ..................................................................................................................................... 15
Figure 3.9: Average and Median Building Quality Control Index (DTF) ............................... 16
Figure 3.10: Percentage Change in Average Values for Dealing with Construction Permits
Indicators between 2015 and 2018 .......................................................................................... 16
Figure 3.11: Percentage Change in Median Values for Dealing with Construction Permits
Indicators between 2015 and 2018 .......................................................................................... 17
Figure 3.12: Average and Median Strength of Legal Rights Index for Getting Credit ........... 20
Figure 3.13: Average and Median Depth of Credit Information Index for Getting Credit ..... 21
Figure 3.14: Average and Median Public Credit Registry and Private Credit Bureau Coverage
.................................................................................................................................................. 21
Figure 3.15: Percentage Change in Average Values for Getting Credit between 2015 and 2018
.................................................................................................................................................. 22
Figure 3.16: Percentage Change in Median Values for Getting Credit between 2015 and 2018
.................................................................................................................................................. 23
Figure 3.17: Share of Credit Information Features Available in APEC and the Rest of the World
(ROW)...................................................................................................................................... 24
Figure 3.18: Share of Credit Information Features Available in APEC in 2017 and 2018 ..... 25
Figure 3.19: Average and Median Time to Export .................................................................. 26
Figure 3.20: Average and Median Time to Import .................................................................. 27
Figure 3.21: Average and Median Cost to Export ................................................................... 27
Figure 3.22: Average and Median Cost to Import ................................................................... 28
Figure 3.23: Percentage Change in Average Values for Trading Across Borders Indicators
between 2015 and 2018 ........................................................................................................... 28
Figure 3.24: Percentage Change in Median Values for Trading Across Borders Indicators
between 2015 and 2018 ........................................................................................................... 29
Figure 3.25: Average and Median Time for Enforcing Contracts ........................................... 32
Figure 3.26: Average and Median Cost of Enforcing Contracts ............................................. 33
Figure 3.27: Average and Median Values of the Quality of Judicial Processes Index for
Enforcing Contracts ................................................................................................................. 33
Figure 3.28: Percentage Change in Average Values for Enforcing Contracts Indicators between
2015 and 2018 .......................................................................................................................... 34
Figure 3.29: Percentage Change in Median Values for Enforcing Contracts Indicators between
2015 and 2018 .......................................................................................................................... 35
Figure 3.30: Share of ADR Features available in APEC and the Rest of the World (Year 2018)
.................................................................................................................................................. 37
Figure 3.31: Share of ADR Features available in APEC in 2017 and 2018 ............................ 37
Figure 4.1: Priority Areas in the APEC’s EoDB Second Action Plan..................................... 39
Figure 4.2: Possible Future EoDB Areas of Interest Post-2018 .............................................. 40
Table of Contents
iii
LIST OF TABLES
Table 3.1: Comparison of APEC’s Starting a Business Average Indicators with 2018 Targets
.................................................................................................................................................. 11
Table 3.2: Comparison of APEC’s Starting a Business Median Indicators with 2018 Targets
.................................................................................................................................................. 12
Table 3.3: Comparison of APEC’s Dealing with Construction Permits Average Indicators with
2018 targets .............................................................................................................................. 17
Table 3.4: Comparison of APEC’s Dealing with Construction Permits Median Indicators with
2018 Targets............................................................................................................................. 18
Table 3.5: Comparison of APEC’s Getting Credit Average Indicators with 2018 Targets ..... 22
Table 3.6: Comparison of APEC’s Getting Credit Median Indicators with 2018 Targets ...... 23
Table 3.7: Comparison of APEC’s Trading Across Borders Average Indicators with 2018
Targets...................................................................................................................................... 29
Table 3.8: Comparison of APEC’s Trading Across Borders Median Indicators with 2018
Targets...................................................................................................................................... 30
Table 3.9: Comparison of APEC’s Enforcing Contracts Average Indicators with 2018 Targets
.................................................................................................................................................. 34
Table 3.10: Comparison of APEC’s Enforcing Contracts Median Indicators with 2018 Targets
.................................................................................................................................................. 35
LIST OF BOXES
Box 3.1: Improvements to Facilitate Starting a Business and Assist SME’s in the APEC region
.................................................................................................................................................. 13
Box 3.2: Greater Ease in Obtaining Construction Permits ...................................................... 18
Box 3.3: Sharing Credit Information in the APEC region ....................................................... 24
Box 3.4: Improved Systems to Facilitate Obtaining Credit in APEC...................................... 25
Box 3.5: Single-Window Systems for Cross-Border Trade in APEC Economies .................. 30
Box 3.6: Harnessing Technology to Facilitate Enforcing Contracts ....................................... 36
Box 3.7: Alternative Dispute Resolutions in APEC ................................................................ 36
Executive Summary
1
EXECUTIVE SUMMARY
This report is the final assessment of APEC’s Ease of Doing Business (EoDB) Second Action
Plan 2016-2018. It takes into account indicators released by the World Bank in five priority
areas, namely: 1) Starting a Business; 2) Dealing with Construction Permits; 3) Getting Credit;
4) Trading Across Borders; and 5) Enforcing Contracts.
Using 2015 as a baseline year, this assessment compares the figures obtained by APEC in 2018
to those registered in the baseline year to determine whether APEC’s combined performance
achieved the overall target of 10% improvement across all priority areas for the period 2016-
2018.
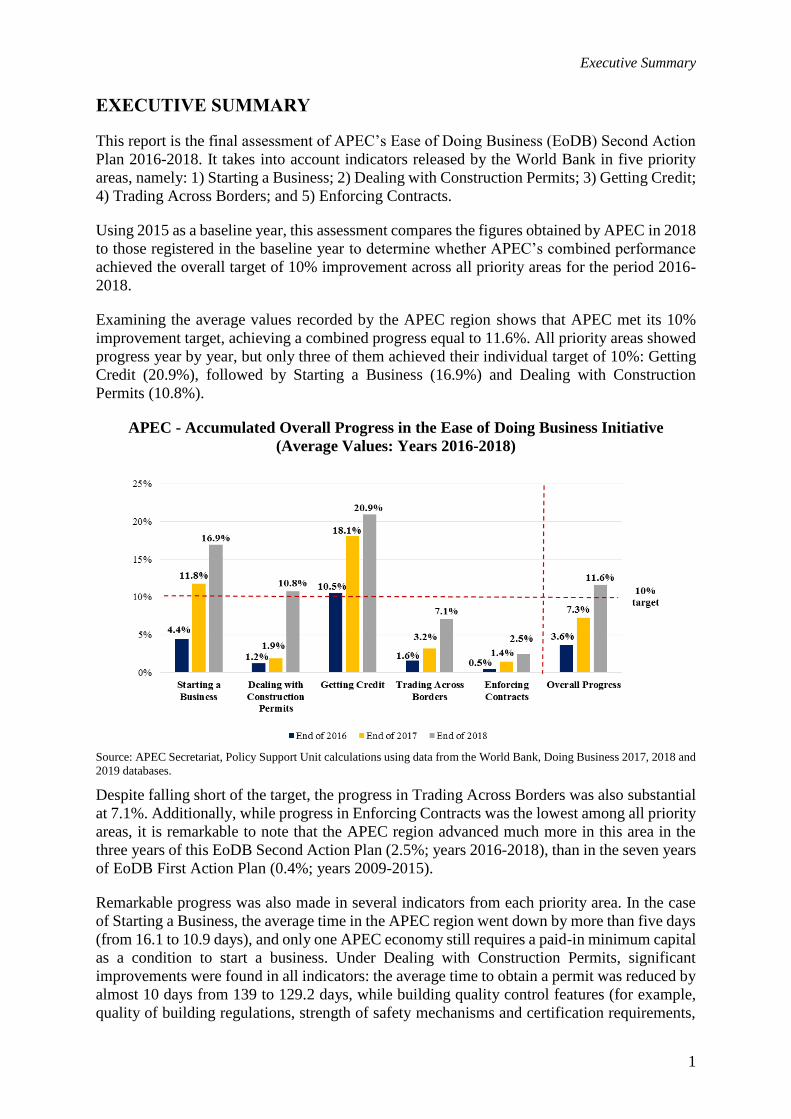
Examining the average values recorded by the APEC region shows that APEC met its 10%
improvement target, achieving a combined progress equal to 11.6%. All priority areas showed
progress year by year, but only three of them achieved their individual target of 10%: Getting
Credit (20.9%), followed by Starting a Business (16.9%) and Dealing with Construction
Permits (10.8%).
APEC - Accumulated Overall Progress in the Ease of Doing Business Initiative
(Average Values: Years 2016-2018)
Source: APEC Secretariat, Policy Support Unit calculations using data from the World Bank, Doing Business 2017, 2018 and
2019 databases.
Despite falling short of the target, the progress in Trading Across Borders was also substantial
at 7.1%. Additionally, while progress in Enforcing Contracts was the lowest among all priority
areas, it is remarkable to note that the APEC region advanced much more in this area in the
three years of this EoDB Second Action Plan (2.5%; years 2016-2018), than in the seven years
of EoDB First Action Plan (0.4%; years 2009-2015).
Remarkable progress was also made in several indicators from each priority area. In the case
of Starting a Business, the average time in the APEC region went down by more than five days
(from 16.1 to 10.9 days), and only one APEC economy still requires a paid-in minimum capital
as a condition to start a business. Under Dealing with Construction Permits, significant
improvements were found in all indicators: the average time to obtain a permit was reduced by
almost 10 days from 139 to 129.2 days, while building quality control features (for example,
quality of building regulations, strength of safety mechanisms and certification requirements,

Executive Summary
2
among others) were enhanced. On the other hand, progress in Getting Credit is explained by
stronger legal rights and deeper credit information systems. In fact, the coverage of the adult
population with their credit information available in public registries or private bureaus
increased on average from 73.7% to 78.2% in three years.
In Trading Across Borders, both the average time and cost needed to export and import in
APEC improved. It is now almost 7 days faster to export and 8 days faster to import than in
2015. Furthermore, the average cost of importing to the APEC region fell by 5.4% and the
average cost of exporting from the APEC region declined by 4% in the last three years. Finally,
with regards to Enforcing Contracts, more than a third of the APEC economies experienced an
improvement in the perceived quality of their judicial processes.
This final assessment also analyzes the performance of the region’s median values in the EoDB
indicators for the five aforementioned priority areas during the same time period. APEC’s
combined overall median improvement stood at 23.4%, greater than both the EoDB initiative’s
10% improvement target and APEC’s overall average improvement of 11.6%.
Most of the progress in APEC’s median performance was explained by improvements in the
median indicators for Getting Credit (67.3%) and Starting a Business (25.3%). The median
performance of Dealing with Construction Permits indicators also surpassed the 10%
improvement goal at 13.1%. However, as with APEC’s average progress in Trading Across
Borders and Enforcing Contracts, the median progress for these priority areas failed to meet
the 10% target. The collective median performance of Trading Across Borders indicators fell
slightly short of this goal by recording a 8.9% progress – although APEC‘s median time to
export and import declined by more than 10%, APEC’s median cost to export only dropped by
6.3% while median cost to import remain unchanged since 2015. Lastly, median improvement
for Enforcing Contracts clocked in at just 2.4%, which is still impressive given that in the five
years of EoDB First Action Plan (2009-2015), APEC only registered an improvement of 1.1%
in the same area.
APEC - Accumulated Overall Progress in the Ease of Doing Business Initiative (Median
Values: Years 2016-2018)
Source: APEC Secretariat, Policy Support Unit calculations using data from the World Bank, Doing Business 2017, 2018 and
2019 databases.

Executive Summary
3
Looking at both APEC’s average and median progress, it is noticeable that most of the
incremental change took place in 2018. Moreover, the fact that APEC’s median values
progressed more than average values in all priority areas – except Enforcing Contracts –
suggests that improvements were likely explained by the collective efforts of several APEC
economies. Had median improvements been much lower than average improvements, much of
the progress would probably have been explained by positive changes in just a few APEC
economies.
APEC has been able to achieve the 10% improvement target of the EoDB Second Action Plan
by the end of 2018. However, APEC economies can still do more to facilitate business
conditions as progress was uneven across all areas. Even in those individual priority areas
where APEC has achieved the target, there is room for improvement. For instance, in Starting
a Business, the time to start a business within the APEC region ranged from 0.5 day to 24.5
days. Also, in Dealing with Construction Permits, the minimum number of documents required
to obtain a construction permit in an APEC economy is 10, higher than the 7 documents
required by Marshall Islands and 8 documents needed in Montenegro and Sweden. Likewise,
in Getting Credit, only 10 out of 21 APEC economies have public registries or private bureaus
with credit information available regarding their entire adult populations.
In this regard, it is important for APEC economies to continue implementing reforms and
policies to improve their performance in several Ease of Doing Business areas. Considering
that the situation and characteristics of each APEC economy is different, this makes it
challenging to provide “one-size-fits-all” recommendations. However, it is worth for APEC
economies to examine measures from economies that have been successful in advancing
towards ways to make it more efficient to do business. Some examples are: facilitating
information exchange between business registry and tax authorities; increasing transparency of
relevant fee schedules and requirements for construction permits; guaranteeing borrowers’
right to inspect personal data; developing electronic document processing systems to streamline
export and import documentary compliance; and providing tax exemptions for arbitrators and
mediators.
Capacity-building activities will also be useful in closing the gap across economies. Such
pursuits are very relevant to APEC nowadays, as these will also complement efforts that
economies are doing to implement the Renewed APEC Agenda for Structural Reform
(RAASR) aiming to strengthen economic resilience. As the APEC’s EoDB Second Action Plan
draws to an end, this report outlines APEC’s achievements in enhancing the business
environment of the region as well as the areas left for improvement. Given the admirable
progress of APEC between 2015 and 2018 this is a good opportunity for APEC to keep the
momentum going. During 2019, APEC should discuss what sort of work can be done to further
improve the business environment. Among the possibilities include APEC extending an
initiative similar to the Second Action Plan and/or doing work in selected old and new priority
areas. Other options could include a new initiative complementing and going beyond Doing
Business indicators by focusing on sustainability of regulatory reforms, better regulation and
implementation of reforms.
Introduction
4
1. INTRODUCTION: APEC’S EASE OF DOING BUSINESS
A. HISTORY
The Second APEC’s Ease of Doing Business (EoDB) Action Plan is the continuation of the
initial EoDB initiative launched by APEC in November 2009, with the goal of improving the
business environment in the APEC region. Through regulatory reforms, APEC economies
endeavor to make it cheaper, faster and easier to do business1.
Based on the World Bank’s Doing Business program, this initiative focuses its attention in five
priority areas, namely: 1) Starting a Business; 2) Dealing with Construction Permits; 3) Getting
Credit; 4) Trading Across Borders; and 5) Enforcing Contracts.
Since the beginning, APEC’s EoDB initiative aims to make doing business more efficient
across the region. In this regard, APEC, with the support of champion economies in each
priority area, has been implementing a series of activities such as capacity-building events,
diagnostic studies, advisory services and guided visits to improve the competitiveness of its
members.
Despite the fact that APEC fell short of the overall target of 25% improvement during the First
APEC’s EoDB Action Plan for the period 2010-2015, the progress achieved then cannot be
ignored as the business conditions in the region have improved. Currently, it is cheaper, faster
and easier to do business than prior to the first Action Plan, benefitting both businesses and
customers. Additionally, this initiative has helped the APEC region “to formalize a space for
public discussion in order to identify and promote actions to improve the quality of
regulations”2.
The vast support by APEC economies to continue with this initiative motivated its extension
for three additional years until 2018. The Second APEC’s EoDB Action Plan for the period
2016-2018 focused on the same priority areas and emphasized capacity-building activities
tailored to address the main challenges faced by economies when implementing reforms.
Champion economies with successful experiences were in charge of organizing these capacity-
building activities. The following list shows those APEC champion economies with their
corresponding priority area:
Starting a Business: New Zealand and the United States
Dealing with Construction Permits: Singapore
Getting Credit: Mexico and the United States
Trading Across Borders: Malaysia and Singapore
Enforcing Contracts: Hong Kong, China and Korea
1 APEC (2009), “Discussion Paper on Ease of Doing Business (EoDB)”, 2009/SOM/023, Concluding Senior
Officials’ Meeting – Plenary Session, 9 November. 2 APEC Policy Support Unit (2016). “APEC’s Ease of Doing Business – Final Assessment 2009-2015”, APEC
Secretariat, APEC#216-SE-01.10, p. 33.
Introduction
5
B. OVERALL TARGET
The overall target for the Second APEC’s EoDB Action Plan 2016-2018 was a collective 10%
improvement across the five priority areas. The assessment used the results in year 2015 as
baseline to calculate the progress achieved by APEC on an annual basis.
The selection of this quantitative target, endorsed by the APEC Economic Committee, took
into account several factors. First, for credibility reasons, it was important to set a target that
was neither overambitious nor unimpressive. Second, the progress obtained during the First
APEC’s EoDB Action Plan highlighted that it is challenging for economies to maintain or
surpass the current improvement rates in the future: as economies upgrade their business
environments, it becomes more difficult for them to achieve any subsequent progress. Lastly,
the decision considered the views of APEC economies, many of which supported the
establishment of a quantitative target, as “governments could be more motivated to pursue
policies to get closer to the target”3.
Considering that APEC economies preferred to extend this initiative for three more years, it
was clear that it was not realistic to set a target of 5% improvement per year (15% improvement
for the whole period) based on the fact that APEC improved at an average rate of 2.5% per year
during the First APEC’s EoDB Action Plan. Similarly, a target of 2.5% per year (7.5%
improvement for three years) would have been deemed as not ambitious enough. In this sense,
establishing an overall target rate equivalent to a 10% improvement (i.e. 3.3% improvement
per year) was considered a suitable target for APEC member economies.
C. MEASUREMENT APPROACH
To assess the progress of the APEC region, this report calculated the APEC average annual
values of each indicator in the EoDB priority areas. Averages for year 2018 were compared
against those of the baseline year 2015 to calculate improvement rates for each indicator. In
each priority area, a combined improvement rate was computed by a simple average of the
improvement rates of indicators belonging to that priority area. The combined improvement
rates for the five priority areas were then simple averaged in order to obtain the overall progress
by the APEC region in the EoDB initiative for year 2018.
The assessment also included median values for a more comprehensive assessment. The
calculation of progress by comparing APEC’s median values was similar to the process
explained in the previous paragraph: improvement rates were calculated from the medians of
the same indicators in the baseline year 2015 and 2018. These improvement rates are then
averaged to find the combined improvement for each priority area, which are then referenced
to calculate the overall progress for the five priority areas. As noted in previous APEC’s EoDB
assessments, “the inclusion of median values is justified by the presence of extreme values
(outliers) in many of the EoDB indicators … median values provide a closer indication of the
trend that APEC members are collectively following in their EoDB indicators.”4
Compared to the final assessment of the First EoDB Action Plan, the Second EoDB Action
Plan’s final assessment includes some methodological changes. These changes are necessary
3 APEC Policy Support Unit (2015). “APEC’s Ease of Doing Business – Interim Assessment 2009-2014”, APEC
Secretariat, APEC#215-SE-01.17, p. 33. 4 Ibid, p. 6.
Introduction
6
due to modifications in the World Bank’s Doing Business database and widespread progress
achieved by APEC economies in one of the indicators.
In the Starting a Business priority area, this report does not include the progress made by APEC
in the indicator concerning the paid-in minimum capital required to initiate a business in the
calculations, as was done in the first EoDB Action Plan, because this requirement was already
abolished by all APEC economies – except one – as of 2018.
The priority areas Dealing with Construction Permits and Enforcing Contracts included new
indicators presented as indices5 to measure the availability of particular features in their
regulatory frameworks. These indices are included in the assessment and take a higher value
when economies incorporate more of those specific features. However, APEC’s progress in
these indices are calculated not by comparing their scores, but comparing the distance to
frontier in each of the indices between 2015 and 2018. The distance to frontier reflects the
difference between any index’s score and the maximum possible score.
Similarly, the Getting Credit priority area includes two indices: strength of legal rights and
depth of credit information. Progress in these two indices was also calculated by using the
distance to frontier methodology. Additionally, this priority area now includes a single
indicator reflecting the percentage of the adult population with their credit information
available in either public credit registries or private credit bureaus. In comparison, the
assessment of the First APEC’s EoDB Acton Plan included two separate indicators instead,
one regarding public credit registries and the other on private credit bureaus.
More details on the methodological changes can be found in the Appendix.
5 These new indicators are: building quality index for Dealing with Construction Permits and the quality of judicial
processes index for Enforcing Contracts.

APEC’s Overall Performance
7
2. APEC’S OVERALL PERFORMANCE
This final assessment of the APEC’s EoDB Second Action Plan compares the collective
performance of the APEC region between the baseline year 2015 and 2018 and determines the
level of progress achieved during the three years of coverage (2016-2018).
The APEC region achieved the 10% improvement target set for this Second Action Plan.
Examining APEC’s average values shows that the combined progress was equivalent to 11.6%.
All priority areas experienced progress year by year, but only three of them individually
achieved the target: Getting Credit (20.9%), Starting a Business (16.9%) and Dealing with
Construction Permits (10.8%). Progress in Trading Across Borders (7.1%) was significant but
fell short of the target, whereas Enforcing Contracts (2.5%) experienced the lowest rate of
progress among the priority areas.
Figure 2.1: APEC - Accumulated Overall Progress in the Ease of Doing Business
Initiative (Average Values: Years 2016-2018)
Source: APEC Secretariat, Policy Support Unit calculations using data from the World Bank, Doing Business 2017, 2018 and
2019 databases.
With respect to individual priority areas, progress in Getting Credit was explained by stronger
rules and practices affecting credit information, increased availability of credit information as
a percentage of the adult population, and improved legal rights systems. In the case of Starting
a Business, substantial reductions in the number of days and procedures helped to improve
APEC’s performance in this area. For Dealing with Construction Permits, most of the progress
is attributed to better building quality control systems and the cost reduction in obtaining a
permit.
Regarding Trading Across Borders, it is cheaper and faster to export and import in the APEC
region, but progress in time savings is more pronounced than improvements in cost efficiency.
In Enforcing Contracts, almost all of the progress made is explained by improvements in the
quality of judicial processes.
APEC’s Overall Performance
8
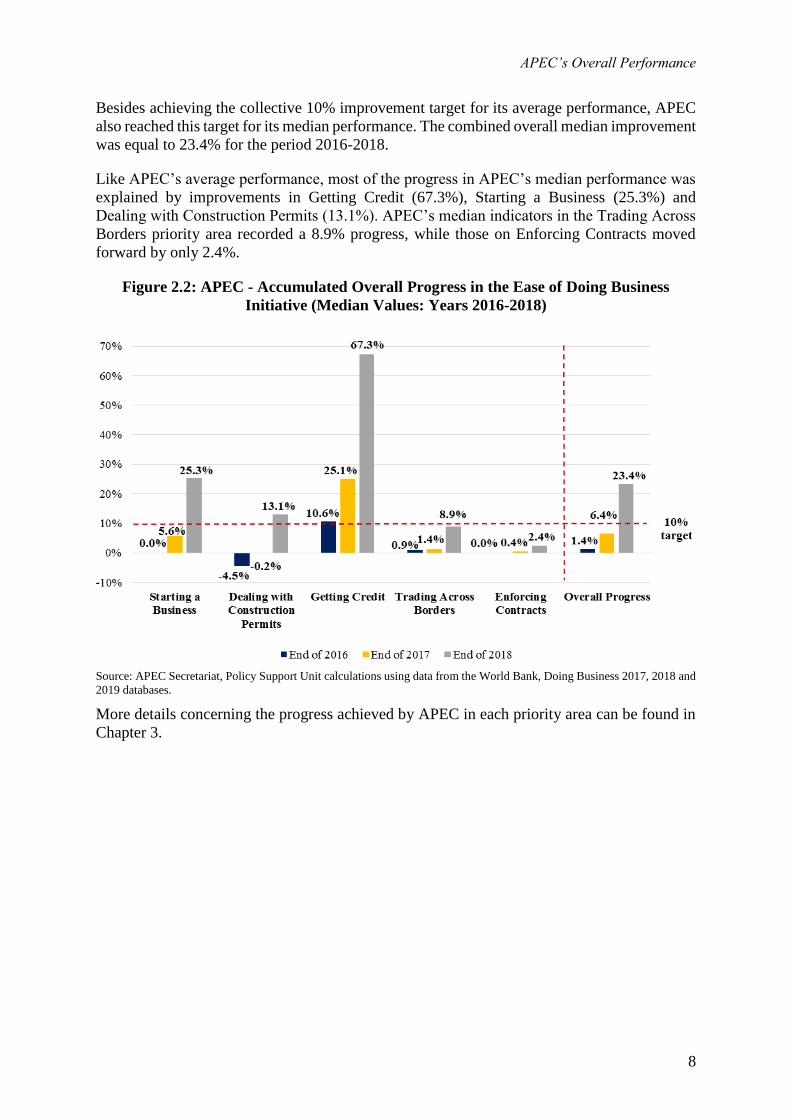
Besides achieving the collective 10% improvement target for its average performance, APEC
also reached this target for its median performance. The combined overall median improvement
was equal to 23.4% for the period 2016-2018.
Like APEC’s average performance, most of the progress in APEC’s median performance was
explained by improvements in Getting Credit (67.3%), Starting a Business (25.3%) and
Dealing with Construction Permits (13.1%). APEC’s median indicators in the Trading Across
Borders priority area recorded a 8.9% progress, while those on Enforcing Contracts moved
forward by only 2.4%.
Figure 2.2: APEC - Accumulated Overall Progress in the Ease of Doing Business
Initiative (Median Values: Years 2016-2018)
Source: APEC Secretariat, Policy Support Unit calculations using data from the World Bank, Doing Business 2017, 2018 and
2019 databases.
More details concerning the progress achieved by APEC in each priority area can be found in
Chapter 3.
APEC’s Improvements by Priority Areas – Starting a Business
9
3. APEC’S IMPROVEMENTS BY PRIORITY AREAS
A. STARTING A BUSINESS
The Starting a Business indicators provide a measure of the procedures officially required, or
commonly done in practice, for an entrepreneur to start up and formally operate an industrial
or commercial business, along with the time and cost to complete these procedures. Such
procedures may include the need to obtain necessary approvals, licenses, permits and
completing required notifications6. One of the Doing Business indicators regarding the paid-
in minimum capital requirements to start a business has been excluded from calculations as
only one economy still had this requirement in 20187.
In this priority area, APEC’s average and median combined progress were equal to 16.9% and
25.3% respectively, surpassing the overall 10% improvement target. Furthermore, APEC’s
average and median performances continued to outperform those of the Rest of the World
(ROW) across all three indicators.
Procedures Required to Start a Business
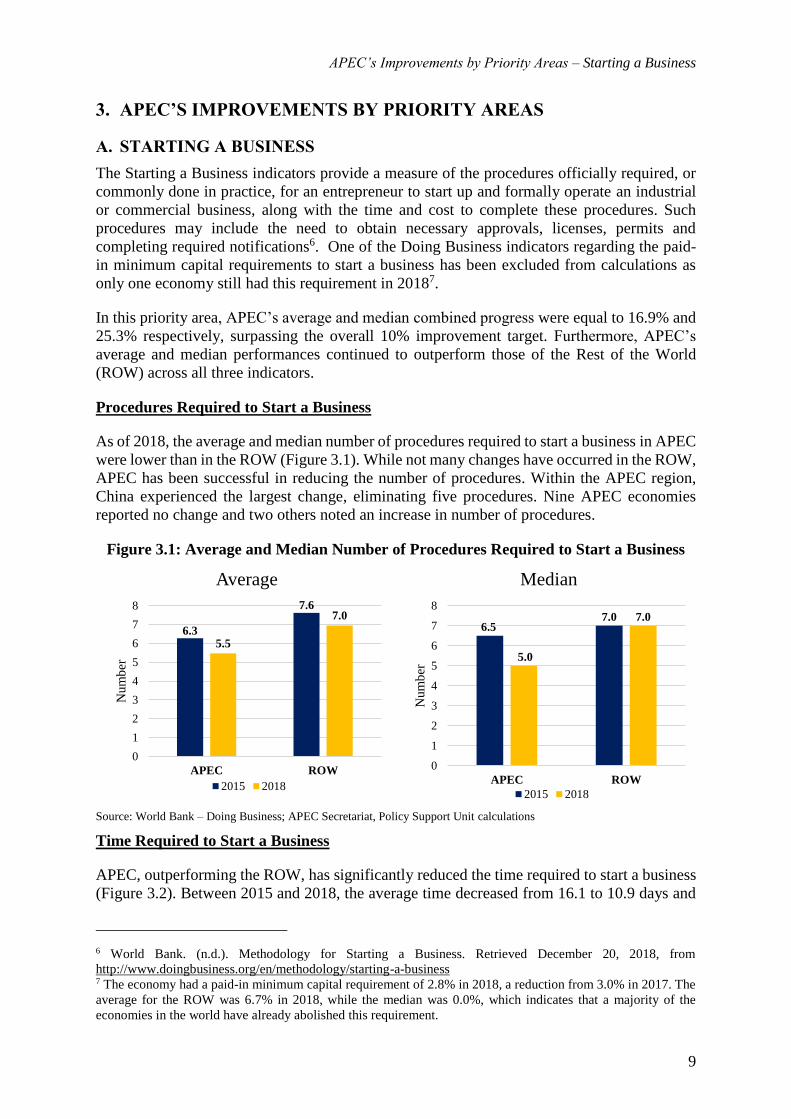
As of 2018, the average and median number of procedures required to start a business in APEC
were lower than in the ROW (Figure 3.1). While not many changes have occurred in the ROW,
APEC has been successful in reducing the number of procedures. Within the APEC region,
China experienced the largest change, eliminating five procedures. Nine APEC economies
reported no change and two others noted an increase in number of procedures.
Figure 3.1: Average and Median Number of Procedures Required to Start a Business
Source: World Bank – Doing Business; APEC Secretariat, Policy Support Unit calculations
Time Required to Start a Business
APEC, outperforming the ROW, has significantly reduced the time required to start a business
(Figure 3.2). Between 2015 and 2018, the average time decreased from 16.1 to 10.9 days and
6 World Bank. (n.d.). Methodology for Starting a Business. Retrieved December 20, 2018, from
http://www.doingbusiness.org/en/methodology/starting-a-business 7 The economy had a paid-in minimum capital requirement of 2.8% in 2018, a reduction from 3.0% in 2017. The
average for the ROW was 6.7% in 2018, while the median was 0.0%, which indicates that a majority of the
economies in the world have already abolished this requirement.
6.3
7.6
5.5
7.0
0
1
2
3
4
5
6
7
8
APEC ROW
Num
ber
Average
2015 2018
6.57.0
5.0
7.0
0
1
2
3
4
5
6
7
8
APEC ROW
Num
ber
Median
2015 2018
APEC’s Improvements by Priority Areas – Starting a Business
10
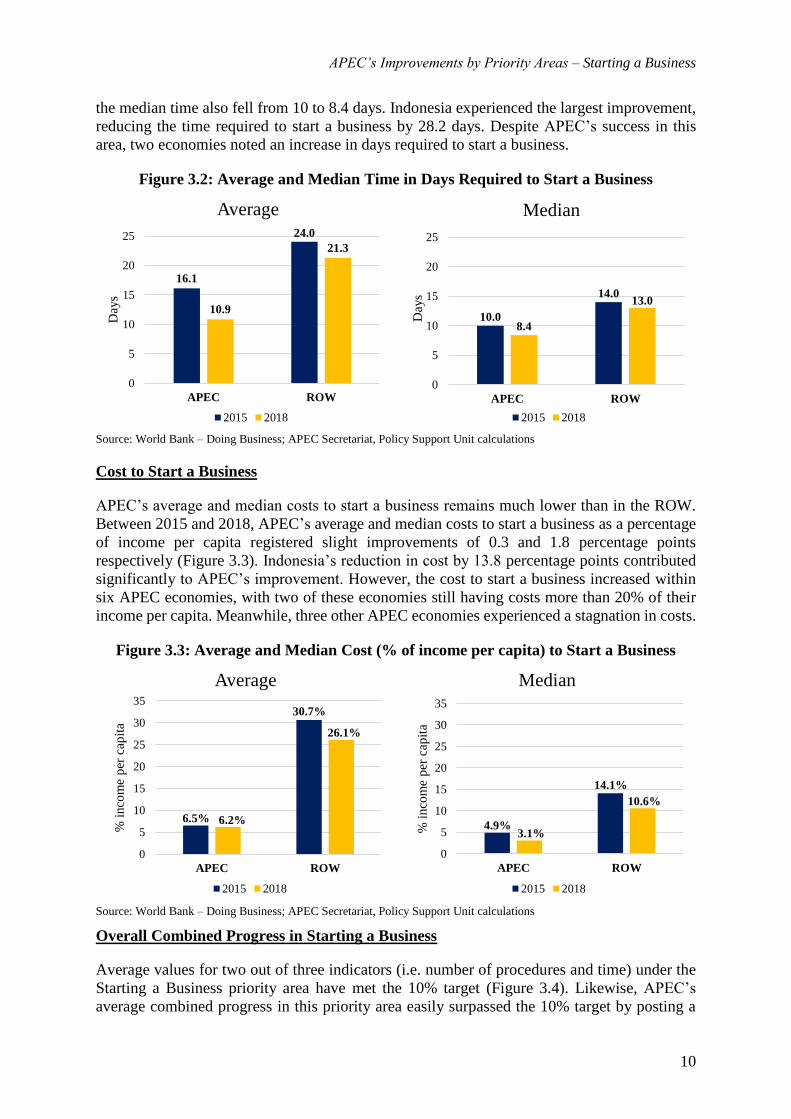
the median time also fell from 10 to 8.4 days. Indonesia experienced the largest improvement,
reducing the time required to start a business by 28.2 days. Despite APEC’s success in this
area, two economies noted an increase in days required to start a business.
Figure 3.2: Average and Median Time in Days Required to Start a Business
Source: World Bank – Doing Business; APEC Secretariat, Policy Support Unit calculations
Cost to Start a Business
APEC’s average and median costs to start a business remains much lower than in the ROW.
Between 2015 and 2018, APEC’s average and median costs to start a business as a percentage
of income per capita registered slight improvements of 0.3 and 1.8 percentage points
respectively (Figure 3.3). Indonesia’s reduction in cost by 13.8 percentage points contributed
significantly to APEC’s improvement. However, the cost to start a business increased within
six APEC economies, with two of these economies still having costs more than 20% of their
income per capita. Meanwhile, three other APEC economies experienced a stagnation in costs.
Figure 3.3: Average and Median Cost (% of income per capita) to Start a Business
Source: World Bank – Doing Business; APEC Secretariat, Policy Support Unit calculations
Overall Combined Progress in Starting a Business
Average values for two out of three indicators (i.e. number of procedures and time) under the
Starting a Business priority area have met the 10% target (Figure 3.4). Likewise, APEC’s
average combined progress in this priority area easily surpassed the 10% target by posting a
16.1
24.0
10.9
21.3
0
5
10
15
20
25
APEC ROW
Day
s
Average
2015 2018
10.0
14.0
8.4
13.0
0
5
10
15
20
25
APEC ROW
Day
s
Median
2015 2018
6.5%
30.7%
6.2%
26.1%
0
5
10
15
20
25
30
35
APEC ROW
% i
nco
me
per
cap
ita
Average
2015 2018
4.9%
14.1%
3.1%
10.6%
0
5
10
15
20
25
30
35
APEC ROW
% i
nco
me
per
cap
ita
Median
2015 2018
APEC’s Improvements by Priority Areas – Starting a Business
11
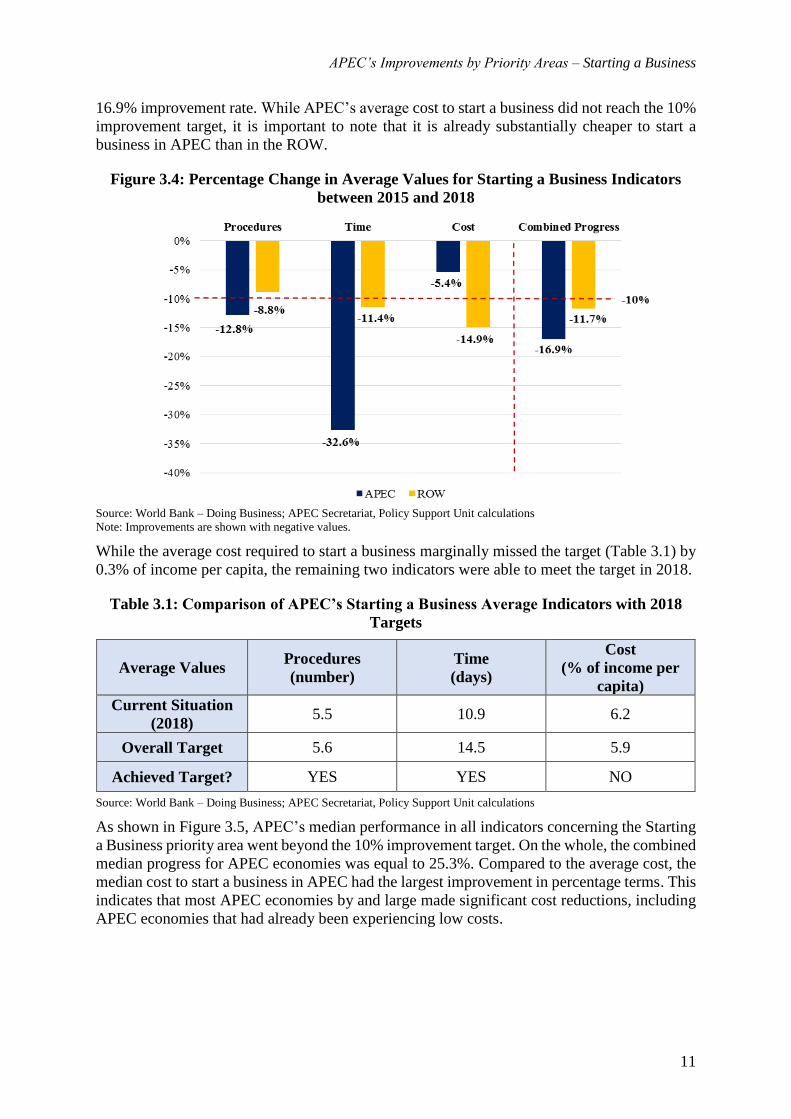
16.9% improvement rate. While APEC’s average cost to start a business did not reach the 10%
improvement target, it is important to note that it is already substantially cheaper to start a
business in APEC than in the ROW.
Figure 3.4: Percentage Change in Average Values for Starting a Business Indicators
between 2015 and 2018
Source: World Bank – Doing Business; APEC Secretariat, Policy Support Unit calculations
Note: Improvements are shown with negative values.
While the average cost required to start a business marginally missed the target (Table 3.1) by
0.3% of income per capita, the remaining two indicators were able to meet the target in 2018.
Table 3.1: Comparison of APEC’s Starting a Business Average Indicators with 2018
Targets
Average Values Procedures
(number)
Time
(days)
Cost
(% of income per
capita)
Current Situation
(2018) 5.5 10.9 6.2
Overall Target 5.6 14.5 5.9
Achieved Target? YES YES NO
Source: World Bank – Doing Business; APEC Secretariat, Policy Support Unit calculations
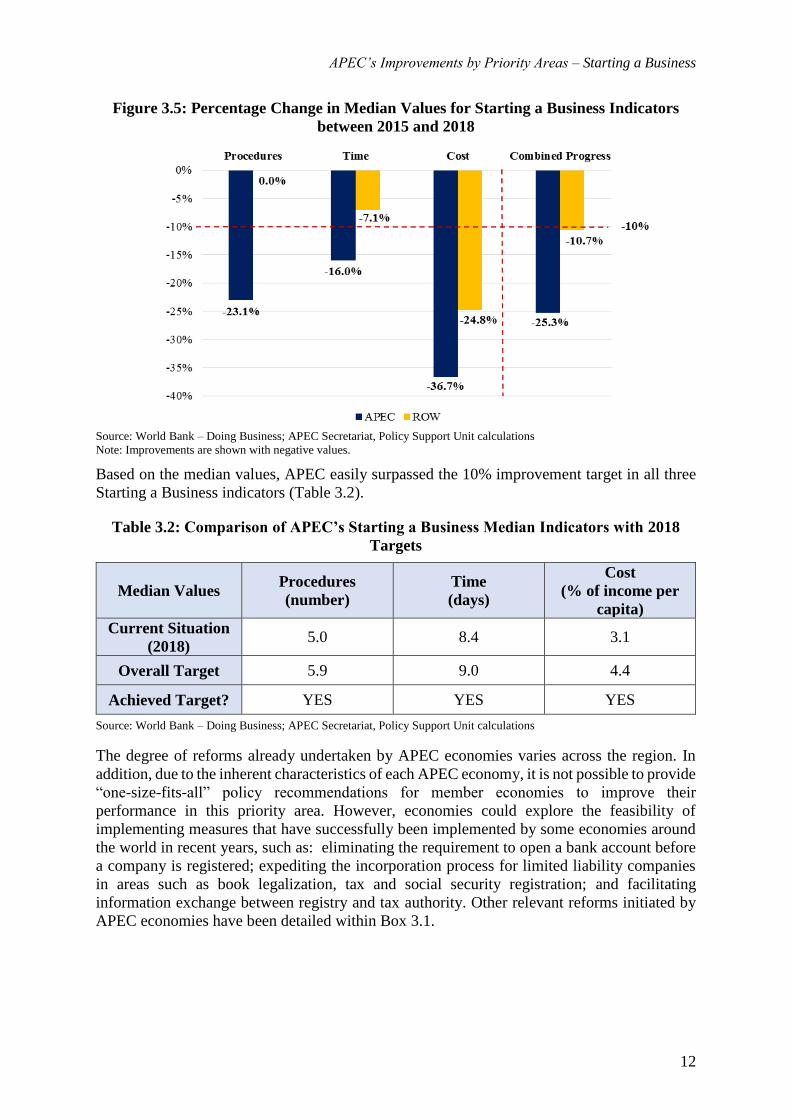
As shown in Figure 3.5, APEC’s median performance in all indicators concerning the Starting
a Business priority area went beyond the 10% improvement target. On the whole, the combined
median progress for APEC economies was equal to 25.3%. Compared to the average cost, the
median cost to start a business in APEC had the largest improvement in percentage terms. This
indicates that most APEC economies by and large made significant cost reductions, including
APEC economies that had already been experiencing low costs.
APEC’s Improvements by Priority Areas – Starting a Business
12
Figure 3.5: Percentage Change in Median Values for Starting a Business Indicators
between 2015 and 2018
Source: World Bank – Doing Business; APEC Secretariat, Policy Support Unit calculations
Note: Improvements are shown with negative values.
Based on the median values, APEC easily surpassed the 10% improvement target in all three
Starting a Business indicators (Table 3.2).
Table 3.2: Comparison of APEC’s Starting a Business Median Indicators with 2018
Targets
Median Values Procedures
(number)
Time
(days)
Cost
(% of income per
capita)
Current Situation
(2018) 5.0 8.4 3.1
Overall Target 5.9 9.0 4.4
Achieved Target? YES YES YES
Source: World Bank – Doing Business; APEC Secretariat, Policy Support Unit calculations
The degree of reforms already undertaken by APEC economies varies across the region. In
addition, due to the inherent characteristics of each APEC economy, it is not possible to provide
“one-size-fits-all” policy recommendations for member economies to improve their
performance in this priority area. However, economies could explore the feasibility of
implementing measures that have successfully been implemented by some economies around
the world in recent years, such as: eliminating the requirement to open a bank account before
a company is registered; expediting the incorporation process for limited liability companies
in areas such as book legalization, tax and social security registration; and facilitating
information exchange between registry and tax authority. Other relevant reforms initiated by
APEC economies have been detailed within Box 3.1.

APEC’s Improvements by Priority Areas – Starting a Business
13
Box 3.1: Improvements to Facilitate Starting a Business and Assist SME’s in the APEC
region
APEC has continually encouraged governments to implement measures that make it easier for
individuals to start a business. In this regard, several APEC economies have simplified procedures
and incorporated new tools to seek more efficiency in the process.
Many APEC economies in Southeast Asia have implemented recent measures aiming to reduce
documentation requirements and cut processing times. For example, Brunei Darussalam’s reforms to
the Registry of Companies and Business Names (ROCBN) merged the application for registering
companies with that for reserving names. Share certificates are no longer required to be stamped
upon company incorporation.
Indonesia launched an online business registration system that allows businesses to obtain some
major permits from the relevant agencies within an hour after submission. Thailand eliminated the
requirements to obtain a company’s seal and the need for approval from the Labor Department on
work regulation. In addition, incorporation fees have been reduced under the Smart MOC 4.0
initiative.
Finally, some APEC economies in Latin America have also implemented new procedures to facilitate
the start of new businesses. For instance, since February 2018, in Chile it is mandatory for all
businesses to use electronic invoices, because of the Law 20.727, published in January 2014.
Likewise, as of February 2019, it is possible to register most businesses completely online. Similarly,
Peru reduced the time needed to obtain a municipal license and a building safety technical inspection
from the district council.
Sources:
Borneo Bulletin. (2018). Brunei leaps to 55th place in World Bank’s Doing Business
Report. Retrieved from https://borneobulletin.com.bn/brunei-leaps-to-55th-place-in-world-banks-
doing-business-report/
Nikkei Asian Review. (2018). Indonesia starts online business registration with one-hour permit.
Retrieved from https://asia.nikkei.com/Economy/Indonesia-starts-online-business-registration-with-
one-hour-permit
Bangkok Post. (2017). Leap to 26th in ease of business. Retrieved from
https://www.bangkokpost.com/business/news/1352935/leap-to-26th-in-ease-of-business
Mondaq. (2019). UK: Thailand's Steps Towards Global Competitiveness. Retrieved from
http://www.mondaq.com/uk/x/767284/Constitutional%20Administrative%20Law/Thailands%20Ste
ps%20Towards%20Global%20Competitiveness
Servicio de Impuestos Internos. (2018). A partir de hoy todas los empresas del país deben facturar
electrónicamente. Retrieved from http://www.sii.cl/noticias/2018/010218noti01er.htm
Andina. (2018). WBG: Peru implements reforms to improve business environment. Retrieved from
https://andina.pe/ingles/noticia-wbg-peru-implements-reforms-to-improve-business-environment-
731337.aspx
APEC’s Improvements by Priority Areas – Dealing with Construction Permits
14
B. DEALING WITH CONSTRUCTION PERMITS
The indicators within this priority area assess the procedures required for a business in the
construction industry to build a warehouse, the time and cost required to obtain construction
permits, as well as the quality control of buildings. The building quality control index is an
index ranging from 0 to 15, with higher values indicating better regulations and practices
pertaining to building quality. This index is the sum of the scores of six other indicators: the
quality of building regulations; the strength of quality control and safety mechanism before,
during and after construction; liability and insurance regimes; and professional certification
requirements8.
APEC’s combined progress in Dealing with Construction Permits has met the 10%
improvement targets for both average and median values. Between 2015 and 2018, APEC’s
average and median indicators in this priority area improved by 10.8% and 13.1% respectively.
This achievement is particularly commendable as the bulk of the progress only took place in
2018. Most of this progress can be attributed to improvements in building quality control.
Procedures Required to Obtain a Construction Permit
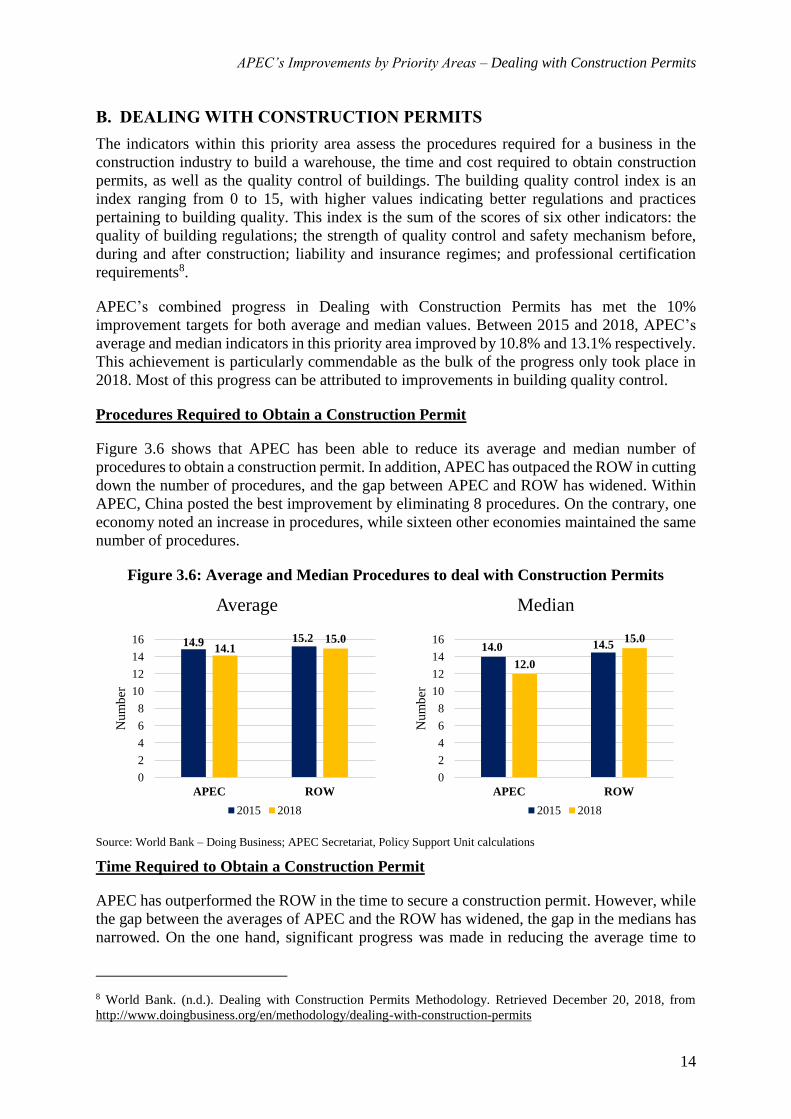
Figure 3.6 shows that APEC has been able to reduce its average and median number of
procedures to obtain a construction permit. In addition, APEC has outpaced the ROW in cutting
down the number of procedures, and the gap between APEC and ROW has widened. Within
APEC, China posted the best improvement by eliminating 8 procedures. On the contrary, one
economy noted an increase in procedures, while sixteen other economies maintained the same
number of procedures.
Figure 3.6: Average and Median Procedures to deal with Construction Permits
Source: World Bank – Doing Business; APEC Secretariat, Policy Support Unit calculations
Time Required to Obtain a Construction Permit
APEC has outperformed the ROW in the time to secure a construction permit. However, while
the gap between the averages of APEC and the ROW has widened, the gap in the medians has
narrowed. On the one hand, significant progress was made in reducing the average time to
8 World Bank. (n.d.). Dealing with Construction Permits Methodology. Retrieved December 20, 2018, from
http://www.doingbusiness.org/en/methodology/dealing-with-construction-permits
14.9 15.214.1
15.0
0
2
4
6
8
10
12
14
16
APEC ROW
Num
ber
Average
2015 2018
14.0 14.5
12.0
15.0
0
2
4
6
8
10
12
14
16
APEC ROW
Num
ber
Median
2015 2018
APEC’s Improvements by Priority Areas – Dealing with Construction Permits
15
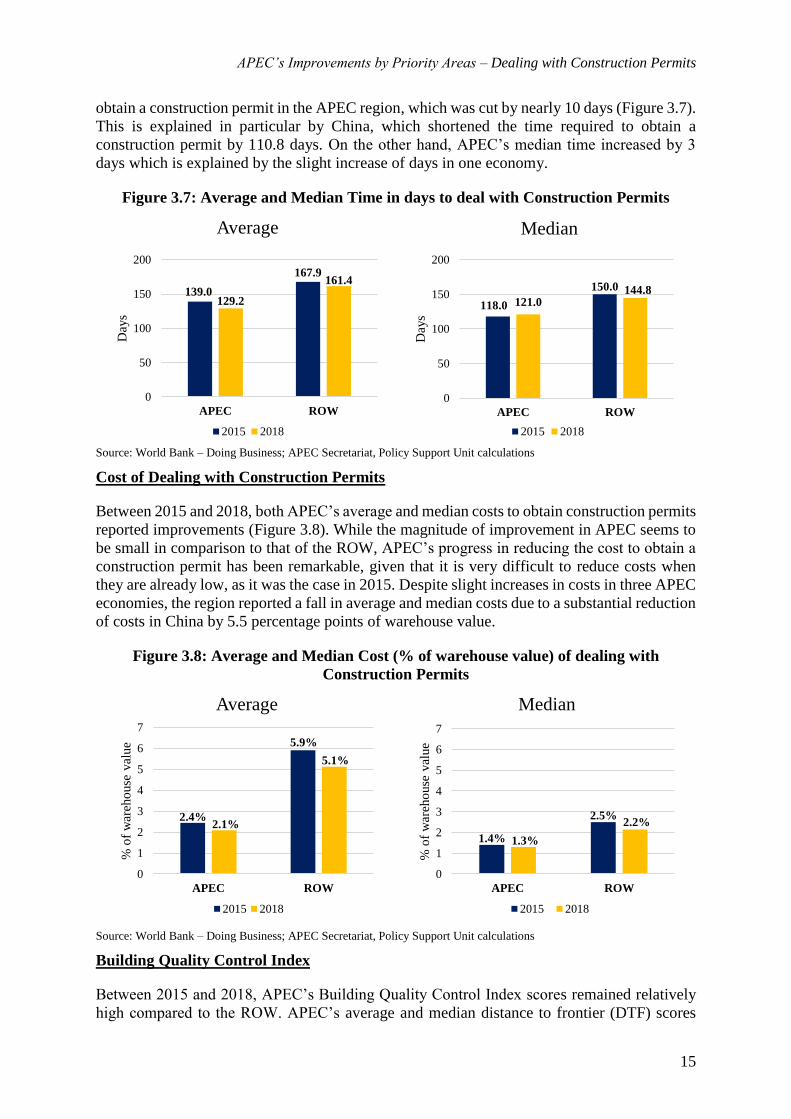
obtain a construction permit in the APEC region, which was cut by nearly 10 days (Figure 3.7).
This is explained in particular by China, which shortened the time required to obtain a
construction permit by 110.8 days. On the other hand, APEC’s median time increased by 3
days which is explained by the slight increase of days in one economy.
Figure 3.7: Average and Median Time in days to deal with Construction Permits
Source: World Bank – Doing Business; APEC Secretariat, Policy Support Unit calculations
Cost of Dealing with Construction Permits
Between 2015 and 2018, both APEC’s average and median costs to obtain construction permits
reported improvements (Figure 3.8). While the magnitude of improvement in APEC seems to
be small in comparison to that of the ROW, APEC’s progress in reducing the cost to obtain a
construction permit has been remarkable, given that it is very difficult to reduce costs when
they are already low, as it was the case in 2015. Despite slight increases in costs in three APEC
economies, the region reported a fall in average and median costs due to a substantial reduction
of costs in China by 5.5 percentage points of warehouse value.
Figure 3.8: Average and Median Cost (% of warehouse value) of dealing with
Construction Permits
Source: World Bank – Doing Business; APEC Secretariat, Policy Support Unit calculations
Building Quality Control Index
Between 2015 and 2018, APEC’s Building Quality Control Index scores remained relatively
high compared to the ROW. APEC’s average and median distance to frontier (DTF) scores
139.0
167.9
129.2
161.4
0
50
100
150
200
APEC ROW
Day
s
Average
2015 2018
118.0
150.0
121.0144.8
0
50
100
150
200
APEC ROWD
ays
Median
2015 2018
2.4%
5.9%
2.1%
5.1%
0
1
2
3
4
5
6
7
APEC ROW
% o
f w
areh
ouse
val
ue
Average
2015 2018
1.4%
2.5%
1.3%
2.2%
0
1
2
3
4
5
6
7
APEC ROW
% o
f w
areh
ouse
val
ue
Median
2015 2018

APEC’s Improvements by Priority Areas – Dealing with Construction Permits
16
improved by 0.5 and 1 point respectively (Figure 3.9). Six APEC economies posted
improvements, while the rest reported no changes. Korea experienced the largest improvement
with a reduction in its DTF score by 4 points. APEC significantly surpassed the ROW as their
scores were closer to the maximum achievable value of 15 than those of the ROW.
Figure 3.9: Average and Median Building Quality Control Index (DTF)
Source: World Bank – Doing Business; APEC Secretariat, Policy Support Unit calculations
Note: DTF refers to Distance to Frontier which denotes how far the indicator is from the maximum possible score.
Overall Combined Progress in Dealing with Construction Permits
APEC’s combined average progress of its Dealing with Construction Permits indicators
reached 10.8%. (Figure 3.10). While all average indicators in APEC made progress during the
period under evaluation, this achievement of the 10% target was mainly explained by
improvements in costs and building quality control. Most of this progress was achieved during
2018, the final year of the APEC’s EoDB Second Action Plan.
Figure 3.10: Percentage Change in Average Values for Dealing with Construction
Permits Indicators between 2015 and 2018
Source: World Bank – Doing Business; APEC Secretariat, Policy Support Unit calculations
Note: Improvements are shown with negative values.
Despite missing the 10% improvement targets for two indicators by 2018, namely the average
number of procedures and time to obtain a construction permit, the shortfall from the target –
12.0 12.59.3 9.7
3.0 2.55.7 5.3
0
5
10
15
2015 2018 2015 2018
APEC ROW
Average
Score DTF
12.0 13.010.0 10.0
3.0 2.05.0 5.0
0
5
10
15
2015 2018 2015 2018
APEC ROW
Median
Score DTF
APEC’s Improvements by Priority Areas – Dealing with Construction Permits
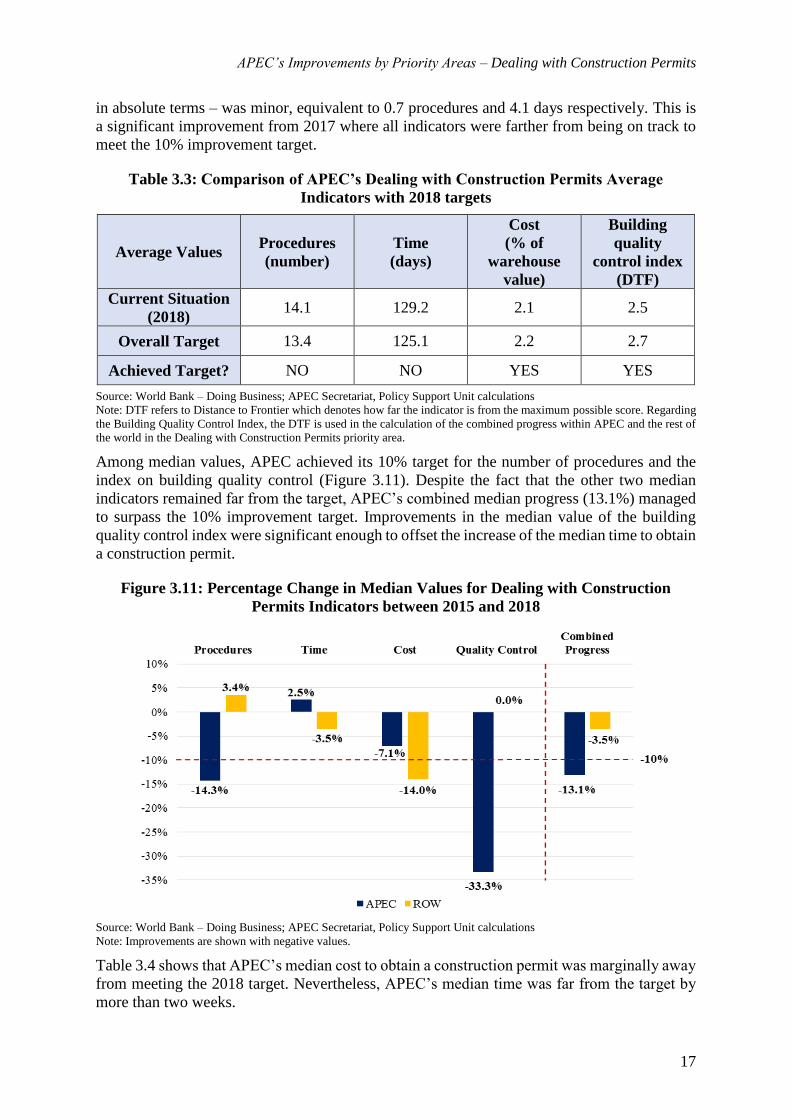
17
in absolute terms – was minor, equivalent to 0.7 procedures and 4.1 days respectively. This is
a significant improvement from 2017 where all indicators were farther from being on track to
meet the 10% improvement target.
Table 3.3: Comparison of APEC’s Dealing with Construction Permits Average
Indicators with 2018 targets
Average Values Procedures
(number)
Time
(days)
Cost
(% of
warehouse
value)
Building
quality
control index
(DTF)
Current Situation
(2018) 14.1 129.2 2.1 2.5
Overall Target 13.4 125.1 2.2 2.7
Achieved Target? NO NO YES YES
Source: World Bank – Doing Business; APEC Secretariat, Policy Support Unit calculations
Note: DTF refers to Distance to Frontier which denotes how far the indicator is from the maximum possible score. Regarding
the Building Quality Control Index, the DTF is used in the calculation of the combined progress within APEC and the rest of
the world in the Dealing with Construction Permits priority area.
Among median values, APEC achieved its 10% target for the number of procedures and the
index on building quality control (Figure 3.11). Despite the fact that the other two median
indicators remained far from the target, APEC’s combined median progress (13.1%) managed
to surpass the 10% improvement target. Improvements in the median value of the building
quality control index were significant enough to offset the increase of the median time to obtain
a construction permit.
Figure 3.11: Percentage Change in Median Values for Dealing with Construction
Permits Indicators between 2015 and 2018
Source: World Bank – Doing Business; APEC Secretariat, Policy Support Unit calculations
Note: Improvements are shown with negative values.
Table 3.4 shows that APEC’s median cost to obtain a construction permit was marginally away
from meeting the 2018 target. Nevertheless, APEC’s median time was far from the target by
more than two weeks.

APEC’s Improvements by Priority Areas – Dealing with Construction Permits
18
Table 3.4: Comparison of APEC’s Dealing with Construction Permits Median
Indicators with 2018 Targets
Median Values Procedures
(number)
Time
(days)
Cost
(% of
warehouse
value)
Building
quality
control index
(DTF)
Current Situation
(2018) 12.0 121.0 1.30 2.0
Overall Target 12.6 106.2 1.26 2.7
Achieved Target? YES NO NO YES
Source: World Bank – Doing Business; APEC Secretariat, Policy Support Unit calculations
Note: DTF refers to Distance to Frontier which denotes how far the indicator is from the maximum possible score. Regarding
the Building Quality Control Index, the DTF is used in the calculation of the combined progress within APEC and the rest of
the world in the Dealing with Construction Permits priority area.
Economies have undertaken several initiatives to reduce the cost and time required to deal with
construction permits as well as ensuring that sufficient building quality control regulations are
in place. Some examples includes increasing transparency of relevant fee schedules and
requirements, introducing a single window to streamline procedures and improving building
quality control through decennial liability insurance. Other reforms efforts undertaken by
economies such as Russia (as detailed in Box 3.2) have included risk-based inspection to
improve building quality control.
Box 3.2: Greater Ease in Obtaining Construction Permits
APEC economies have reformed regulations to reduce both the time and cost of obtaining permits.
This has also been accompanied by measures aiming to improve building quality control.
In 2018, China streamlined the construction permit process by implementing unified building review
platforms in Beijing and Shanghai. At the same time, China introduced stricter qualification
requirements for professionals in the construction sector and improved public access to information.
Malaysia streamlined the issuance of a building permits, which sharply reduced the time required to
complete procedures. At present, it takes 54 days to complete the procedures to construct a
warehouse, 24 days faster than in the past. Similarly, Russia made changes to facilitate the approval
of construction and occupancy permits and enhance quality control measures during construction
through risk-based inspections.
In the Philippines, a joint memorandum circular (JMC) issued in January 2018 provides guidelines
to streamline the processes for the issuance of building permits and certificates of occupancy. It
instructs local governments to allot a maximum of five working days in processing simple
applications for construction permits as well as to establish one-stop shops. The Bureau of Fire
Protection was also instructed to automate the processing of Fire Safety Insurance Certificate and
Fire Safety Evaluation Clearance.
Sources:
South China Morning Post. (2018). Hong Kong climbs to No 4 on World Bank’s list of easiest places
to do business. Retrieved from https://www.scmp.com/news/hong-kong/hong-kong-
economy/article/2171135/hong-kong-climbs-no-4-world-banks-list-easiest
Shine. (2018). China up in 'ease of doing business'. Retrieved from
https://www.shine.cn/biz/economy/1811014456/
APEC’s Improvements by Priority Areas – Dealing with Construction Permits
19
The Star Online. (2018). Malaysia moves up World Bank business index. Retrieved from
https://www.thestar.com.my/business/business-news/2018/11/02/malaysia-moves-up-world-bank-
business-index/
Interfax. (2018). Russia up four places in Doing Business: May Decree not fulfilled. Interfax: Russia
& CIS Business & Investment Weekly. Retrieved January 3, 2019.
Department of the Interior and Local Government. (2018). Guidelines in Streamlining the Processes
for the Issuance of Building Permits and Certificates of Occupancy - Issuances. Retrieved from
https://www.dilg.gov.ph/issuances/jc/Guidelines-in-Streamlining-the-Processes-for-the-Issuance-of-
Building-Permits-and-Certificates-of-Occupancy/87
APEC’s Improvements by Priority Areas – Getting Credit
20
C. GETTING CREDIT
The getting credit priority area appraises the availability of credit information and the strength
of legal systems in protecting creditors and debtors within an economy. The distance to frontier
(DTF) scores, calculated for each indicator in this priority area, were used to measure combined
progress in order to maintain consistency in the direction of the improvements. Therefore,
lower DTF scores across time reflect progress9.
This is the priority area in which APEC has achieved the most progress. In 2018, the region as
a whole transcended the 10% improvement target and posted an average and median combined
progress of 20.9% and 67.3% respectively. In particular, advancements in this area were
primarily led by the development of better credit information systems and increased availability
of credit information for APEC’s adult population.
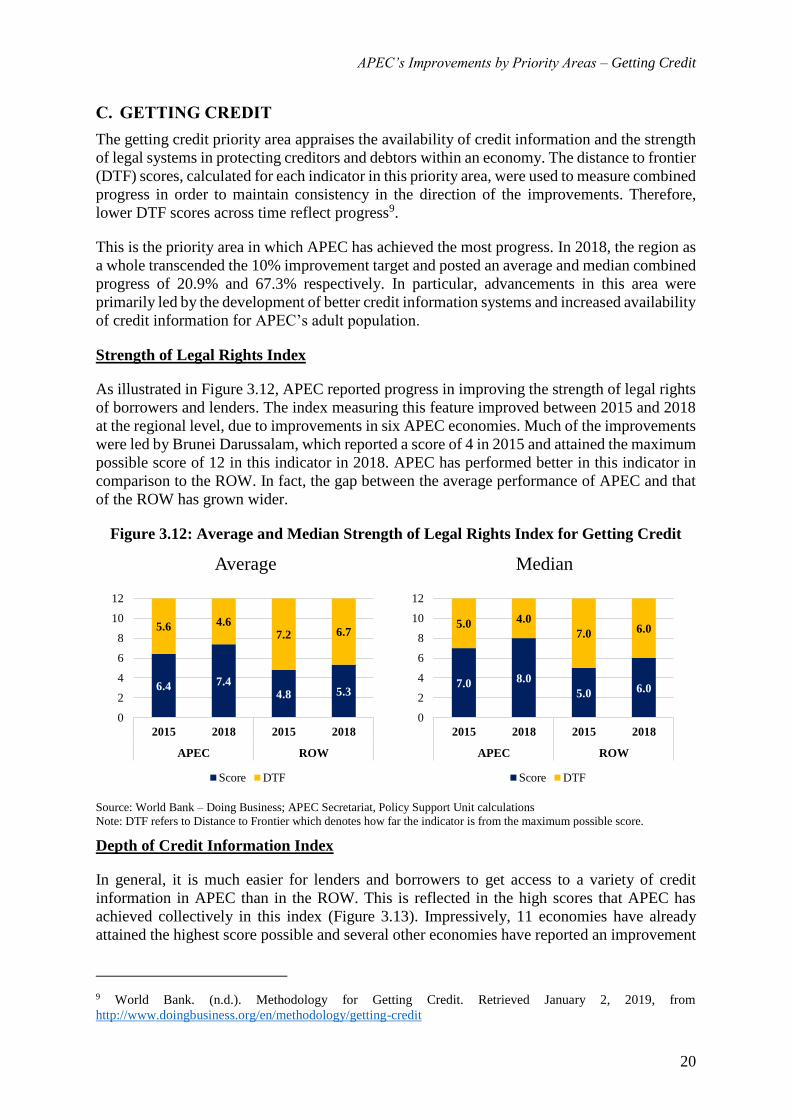
Strength of Legal Rights Index
As illustrated in Figure 3.12, APEC reported progress in improving the strength of legal rights
of borrowers and lenders. The index measuring this feature improved between 2015 and 2018
at the regional level, due to improvements in six APEC economies. Much of the improvements
were led by Brunei Darussalam, which reported a score of 4 in 2015 and attained the maximum
possible score of 12 in this indicator in 2018. APEC has performed better in this indicator in
comparison to the ROW. In fact, the gap between the average performance of APEC and that
of the ROW has grown wider.
Figure 3.12: Average and Median Strength of Legal Rights Index for Getting Credit
Source: World Bank – Doing Business; APEC Secretariat, Policy Support Unit calculations
Note: DTF refers to Distance to Frontier which denotes how far the indicator is from the maximum possible score.
Depth of Credit Information Index
In general, it is much easier for lenders and borrowers to get access to a variety of credit
information in APEC than in the ROW. This is reflected in the high scores that APEC has
achieved collectively in this index (Figure 3.13). Impressively, 11 economies have already
attained the highest score possible and several other economies have reported an improvement
9 World Bank. (n.d.). Methodology for Getting Credit. Retrieved January 2, 2019, from
http://www.doingbusiness.org/en/methodology/getting-credit
6.4 7.44.8 5.3
5.6 4.67.2 6.7
0
2
4
6
8
10
12
2015 2018 2015 2018
APEC ROW
Average
Score DTF
7.0 8.0
5.0 6.0
5.0 4.0
7.0 6.0
0
2
4
6
8
10
12
2015 2018 2015 2018
APEC ROW
Median
Score DTF

APEC’s Improvements by Priority Areas – Getting Credit
21
in this indicator. Likewise, it is encouraging that no APEC economy experienced a
deterioration of its index’s score.
Figure 3.13: Average and Median Depth of Credit Information Index for Getting Credit
Source: World Bank – Doing Business; APEC Secretariat, Policy Support Unit calculations
Note: DTF refers to Distance to Frontier which denotes how far the indicator is from the maximum possible score.
Public Credit Registry and Private Credit Bureau Coverage
The availability of credit information in the APEC region is very high, with coverage levels
more than double than that in the ROW. In 2018, APEC’s average and median coverage was
equal to 78.2% and 98.1% of the adult population respectively. In fact, ten APEC economies
have already attained full coverage. Progress has been significant in the APEC region in recent
years, with much progress recorded by Russia, Brunei Darussalam and Viet Nam, which
experienced the largest improvement in their coverage by 17.8, 14.0 and 13.3 percentage points
of the adult population respectively.
Figure 3.14: Average and Median Public Credit Registry and Private Credit Bureau
Coverage
Source: World Bank – Doing Business; APEC Secretariat, Policy Support Unit calculations
Note: DTF refers to Distance to Frontier which denotes how far the indicator is from the maximum possible score.
6.7 7.0
4.1 4.6
1.3 1.0
3.9 3.4
0
1
2
3
4
5
6
7
8
2015 2018 2015 2018
APEC ROW
Average
Score DTF
7.08.0
6.0 6.0
1.02.0 2.0
0
1
2
3
4
5
6
7
8
2015 2018 2015 2018
APEC ROW
Median
Score DTF
73.7 78.2
32.8 36.9
26.3 21.8
67.2 63.1
0%
10%
20%
30%
40%
50%
60%
70%
80%
90%
100%
2015 2018 2015 2018
APEC ROW
Average
Coverage DTF
89.598.1
20.9 27.3
10.5
1.9
79.1 72.7
0%
10%
20%
30%
40%
50%
60%
70%
80%
90%
100%
2015 2018 2015 2018
APEC ROW
Median
Coverage DTF

APEC’s Improvements by Priority Areas – Getting Credit
22
Overall Combined Progress in Getting Credit
As with previous years, APEC has been successful in reporting significant progress in all three
Getting Credit average indicators and in reaching the 10% improvement target (Figure 3.15).
Figure 3.15: Percentage Change in Average Values for Getting Credit between 2015 and
2018
Source: World Bank – Doing Business; APEC Secretariat, Policy Support Unit calculations
Note: Improvements are shown with negative values.
Table 3.5 shows all three indicators under Getting Credit easily surpassing the 10%
improvement targets.
Table 3.5: Comparison of APEC’s Getting Credit Average Indicators with 2018 Targets
Average Values Strength of Legal
Rights Index (DTF)
Depth of Credit
Information Index
(DTF)
Adults without
Credit Information
in Public Registries
or Private Bureaus
(% of adults)
Current Situation
(2018) 4.6 1.0 21.8
Overall Target 5.0 1.2 23.7
Achieved Target? YES YES YES
Source: World Bank – Doing Business; APEC Secretariat, Policy Support Unit calculations
Note: DTF refers to Distance to Frontier which denotes how far the indicator is from the maximum possible score. Regarding
the Strength of Legal Rights Index and the Depth of Credit Information Index, the DTF is used in the calculation of the
combined progress within APEC and the rest of the world in the Getting Credit priority area.
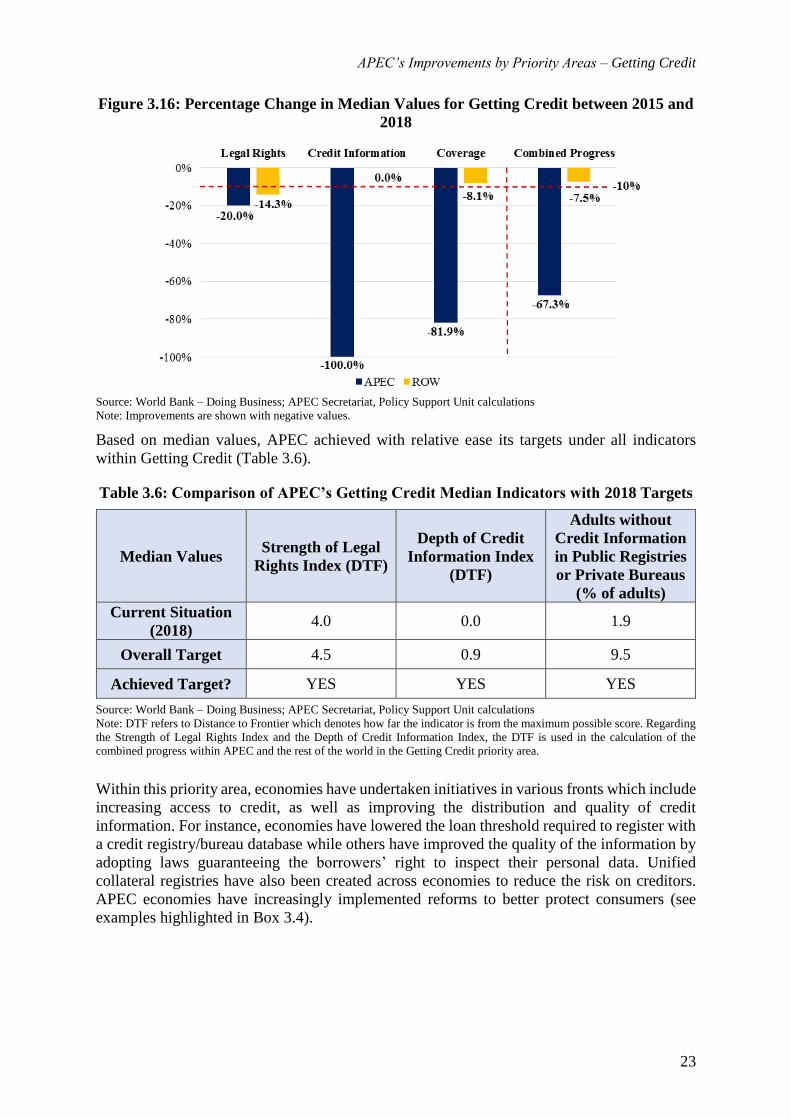
As illustrated in Figure 3.16, progress in median values for all three indicators has far exceeded
the 10% target. More than half of the APEC economies have already reported the
implementation of the most solid features in their credit information systems, which is reflected
by the 100% improvement of the median value of APEC’s Depth of Credit Information Index.
APEC’s Improvements by Priority Areas – Getting Credit
23
Figure 3.16: Percentage Change in Median Values for Getting Credit between 2015 and
2018
Source: World Bank – Doing Business; APEC Secretariat, Policy Support Unit calculations
Note: Improvements are shown with negative values.
Based on median values, APEC achieved with relative ease its targets under all indicators
within Getting Credit (Table 3.6).
Table 3.6: Comparison of APEC’s Getting Credit Median Indicators with 2018 Targets
Median Values Strength of Legal
Rights Index (DTF)
Depth of Credit
Information Index
(DTF)
Adults without
Credit Information
in Public Registries
or Private Bureaus
(% of adults)
Current Situation
(2018) 4.0 0.0 1.9
Overall Target 4.5 0.9 9.5
Achieved Target? YES YES YES
Source: World Bank – Doing Business; APEC Secretariat, Policy Support Unit calculations
Note: DTF refers to Distance to Frontier which denotes how far the indicator is from the maximum possible score. Regarding
the Strength of Legal Rights Index and the Depth of Credit Information Index, the DTF is used in the calculation of the
combined progress within APEC and the rest of the world in the Getting Credit priority area.
Within this priority area, economies have undertaken initiatives in various fronts which include
increasing access to credit, as well as improving the distribution and quality of credit
information. For instance, economies have lowered the loan threshold required to register with
a credit registry/bureau database while others have improved the quality of the information by
adopting laws guaranteeing the borrowers’ right to inspect their personal data. Unified
collateral registries have also been created across economies to reduce the risk on creditors.
APEC economies have increasingly implemented reforms to better protect consumers (see
examples highlighted in Box 3.4).
APEC’s Improvements by Priority Areas – Getting Credit
24
Box 3.3: Sharing Credit Information in the APEC region
Importance of Credit Information Systems
Credit information systems are an important aspect of the credit market. They help reduce
information asymmetry between the lender and the borrower in four main ways:
1. Countering adverse selection: Ensuring that information on borrowers are available to
lenders. Credit worthy individuals previously excluded from the market will be allowed to
participate more actively in the market.
2. Countering moral hazard: By sharing credit information among lenders, borrowers are
provided with more incentives to avoid defaulting on their loans as their ability to access
credit in the future is placed at stake.
3. Countering information monopoly: Unequal information based on previous relationships
allows one lender to make more informed decision as compared to another. As such,
ensuring lenders have similar information on a particular borrower allows for better
competition among lenders and could improve decision making for lenders across the
system.
4. Reducing over-indebtedness: Sharing information allows lenders to be aware of the
overall indebtedness of a particular borrower. This information prevents creditors from
extending loans to overly indebted individuals.
APEC economies are building more comprehensive credit information systems, gradually increasing
the coverage of the credit information. Every year, personal credit information for a larger share of
adults becomes available.
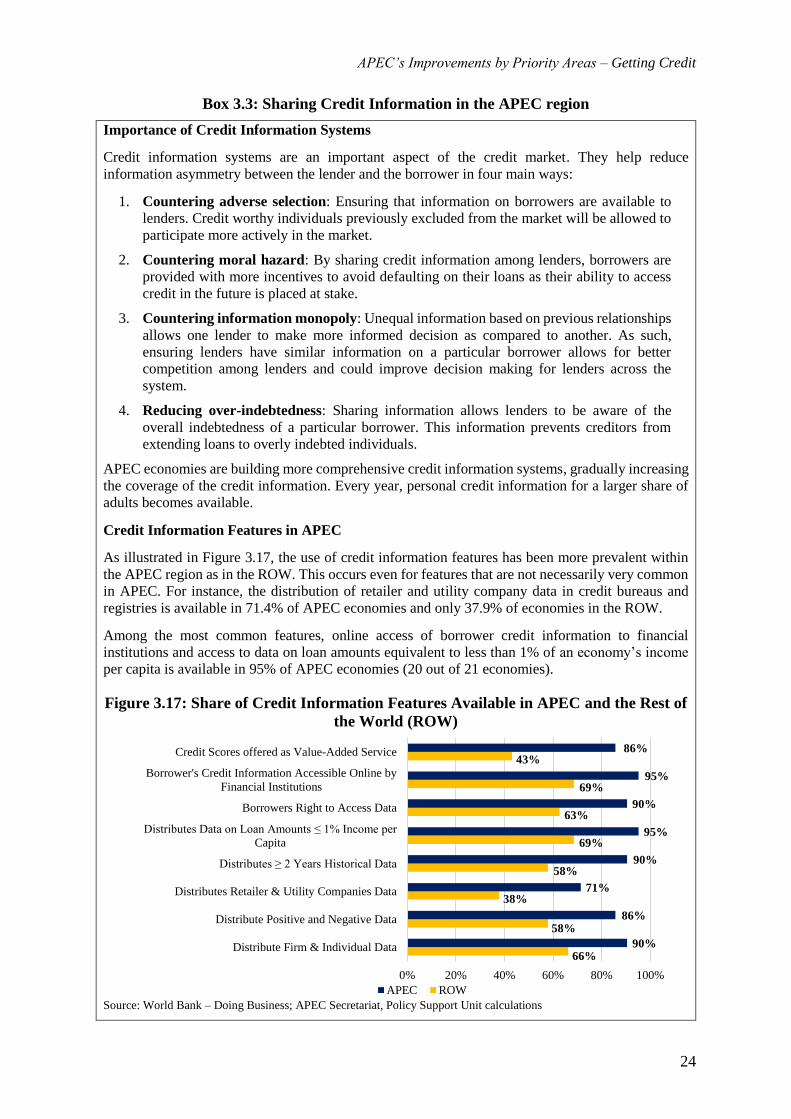
Credit Information Features in APEC
As illustrated in Figure 3.17, the use of credit information features has been more prevalent within
the APEC region as in the ROW. This occurs even for features that are not necessarily very common
in APEC. For instance, the distribution of retailer and utility company data in credit bureaus and
registries is available in 71.4% of APEC economies and only 37.9% of economies in the ROW.
Among the most common features, online access of borrower credit information to financial
institutions and access to data on loan amounts equivalent to less than 1% of an economy’s income
per capita is available in 95% of APEC economies (20 out of 21 economies).
Figure 3.17: Share of Credit Information Features Available in APEC and the Rest of
the World (ROW)
Source: World Bank – Doing Business; APEC Secretariat, Policy Support Unit calculations
66%
58%
38%
58%
69%
63%
69%
43%
90%
86%
71%
90%
95%
90%
95%
86%
0% 20% 40% 60% 80% 100%
Distribute Firm & Individual Data
Distribute Positive and Negative Data
Distributes Retailer & Utility Companies Data
Distributes ≥ 2 Years Historical Data
Distributes Data on Loan Amounts ≤ 1% Income per
Capita
Borrowers Right to Access Data
Borrower's Credit Information Accessible Online by
Financial Institutions
Credit Scores offered as Value-Added Service
APEC ROW

APEC’s Improvements by Priority Areas – Getting Credit
25
Compared to 2017, there have been some changes regarding the share of APEC economies using
certain credit information features (Figure 3.18). For instance, one economy had discontinued the use
of five credit features resulting in a slight decrease in regional coverage. On the other hand, APEC
has made improvements with more economies offering credit scores as a value added service and
distributing retailer and utility company data.
Figure 3.18: Share of Credit Information Features Available in APEC in 2017 and
2018
Source: World Bank – Doing Business; APEC Secretariat, Policy Support Unit calculations
Sources:
OECD. (n.d.). Discussion Paper on Credit Information Sharing. Retrieved from
http://www.oecd.org/global-relations/45370071.pdf
Box 3.4: Improved Systems to Facilitate Obtaining Credit in APEC
In order to improve credit information systems, governments and/or private sector players in APEC
economies have been incorporating practices to safeguard the rights of consumers. Among such
practices include protecting consumers against unforeseen circumstances and safeguarding their
personal information.
For instance, the agreement signed by Australia’s four major banks ensures consumers who have
faced hardship (e.g. job loss, sickness, natural disasters) will not be disadvantaged by the new
mandatory Comprehensive Credit Regime. The banks will exclude the credit history information of
customers with whom they have reached hardship arrangements with from their mandatory reports
during the first twelve months of this regime.
The United States have enhanced protection of borrowers by issuing guidance to safeguard credit
scores and addresses of borrowers. The measure seeks to disclose ranges instead of specific values
on information related to individual creditors such as applicant’s age, the amount of loan, and the
number of units in the dwelling.
Sources:
Australian Banking Corporation. (2018). Hardship customers protected in new credit regime.
Retrieved from https://www.ausbanking.org.au/media/media-releases/media-release-2018/hardship-
customers-protected-in-new-credit-regime
Inman. (2018). Government will restrict mortgage data in 2019 for safety, privacy. Retrieved from
https://www.inman.com/2018/12/26/government-will-release-less-mortgage-data-in-2019-for-
safety-privacy/
90%
86%
71%
90%
95%
90%
95%
86%
95%
90%
67%
90%
100%
95%
100%
76%
0% 20% 40% 60% 80% 100%
Distribute Firm & Individual Data
Distribute Positive and Negative Data
Distributes Retailer & Utility Companies Data
Distributes ≥ 2 Years Historical Data
Distributes Data on Loan Amounts ≤ 1% Income per
Capita
Borrowers Right to Access Data
Borrower's Credit Information Accessible Online by
Financial Institutions
Credit Scores offered as Value-Added Service
APEC 2017 APEC 2018

APEC’s Improvements by Priority Areas – Trading Across Borders
26
D. TRADING ACROSS BORDERS
Undeterred by recent trade tensions, international trade in the APEC region still became
cheaper and faster, strengthening the region’s competitiveness in trading across borders. Data
from the World Bank’s Doing Business show that the region as a whole experienced a
substantial reduction in both the time and cost involved in completing documentary and border
procedures10. However, despite APEC’s commendable progress in this priority area, the region
has not reached its overall target of 10% during the period 2015-2018.
Time to Export
Figure 3.19 compares the average and median time to export in 2015 and 2018 for APEC and
the rest of the world (ROW). The average time to export from APEC economies dropped
significantly from 68.4 to 61.9 hours. Meanwhile, the median time to export fell from 48 to
just 40 hours. The improvement in this indicator is ascribed to nine economies that successfully
reduced the time needed to export, particularly Chinese Taipei which more than halved its time
to export from 48 to 22 hours. While exporting from the APEC region remains roughly twice
as fast as the ROW, there remains the need to address the disparate time to export among APEC
economies, which ranged from a mere 2 to a staggering 272 hours.
Figure 3.19: Average and Median Time to Export
Source: World Bank – Doing Business; APEC Secretariat, Policy Support Unit calculations
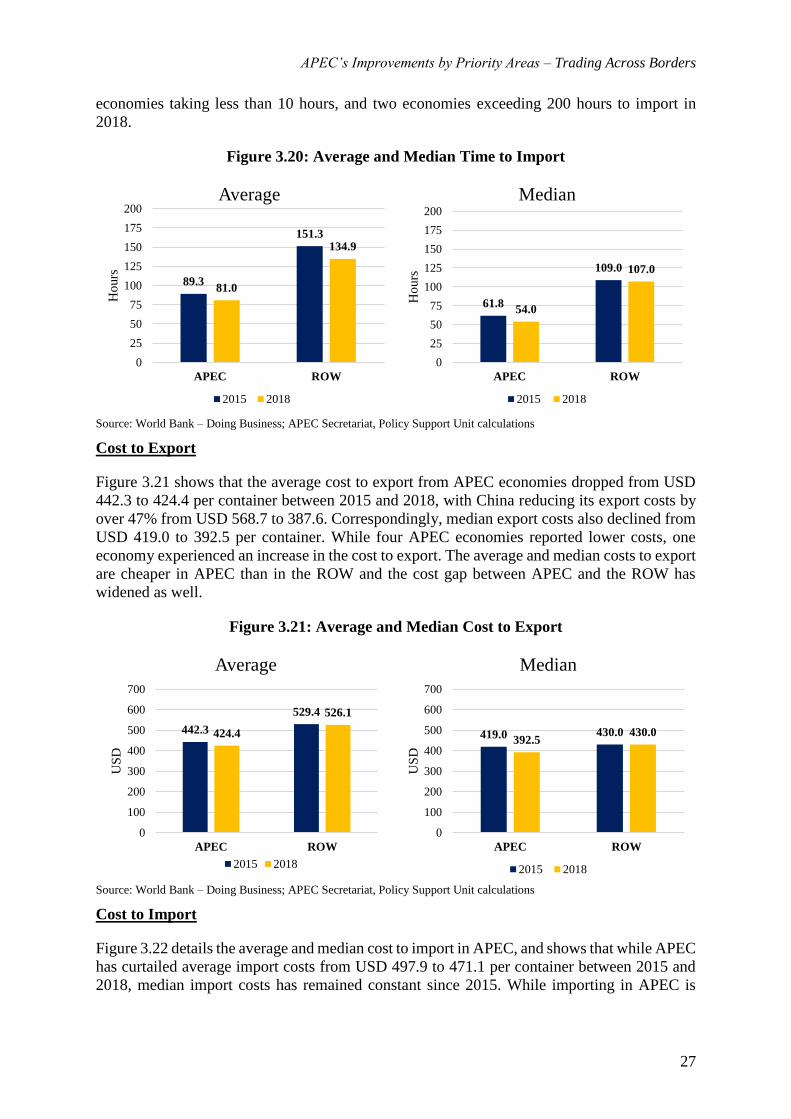
Time to Import
Albeit longer than APEC’s time to export, APEC’s time to import is still shorter than that of
the ROW. As in Figure 3.20, the average time to import from APEC economies was slashed
from 89.3 to 81 hours between 2015 and 2018, whereas the median time to import was cut from
61.8 to 54.0 hours. Seven economies, most notably China and Malaysia which each roughly
halved the time needed to import, explain most of the improvement in this indicator.
Nonetheless, a substantial rise in the time to import from one economy offset the overall
progress of the APEC region, falling short of the 10% improvement target. Furthermore, APEC
needs to address the wide disparity in the time to import among its economies, with three
10 The World Bank’s Doing Business reports the cost and time to export and import as the amount of USD and
number of hours, respectively, needed to finalize the documentations and border formalities. For simplicity, this
report assumes that documentary and border compliance cannot be performed simultaneously.
68.4
117.4
61.9
106.9
0
25
50
75
100
125
150
175
200
APEC ROW
Ho
urs
Average
2015 2018
48.0
92.0
40.0
87.0
0
25
50
75
100
125
150
175
200
APEC ROW
Ho
urs
Median
2015 2018
APEC’s Improvements by Priority Areas – Trading Across Borders
27
economies taking less than 10 hours, and two economies exceeding 200 hours to import in
2018.
Figure 3.20: Average and Median Time to Import
Source: World Bank – Doing Business; APEC Secretariat, Policy Support Unit calculations
Cost to Export
Figure 3.21 shows that the average cost to export from APEC economies dropped from USD
442.3 to 424.4 per container between 2015 and 2018, with China reducing its export costs by
over 47% from USD 568.7 to 387.6. Correspondingly, median export costs also declined from
USD 419.0 to 392.5 per container. While four APEC economies reported lower costs, one
economy experienced an increase in the cost to export. The average and median costs to export
are cheaper in APEC than in the ROW and the cost gap between APEC and the ROW has
widened as well.
Figure 3.21: Average and Median Cost to Export
Source: World Bank – Doing Business; APEC Secretariat, Policy Support Unit calculations
Cost to Import
Figure 3.22 details the average and median cost to import in APEC, and shows that while APEC
has curtailed average import costs from USD 497.9 to 471.1 per container between 2015 and
2018, median import costs has remained constant since 2015. While importing in APEC is
89.3
151.3
81.0
134.9
0
25
50
75
100
125
150
175
200
APEC ROW
Ho
urs
Average
2015 2018
61.8
109.0
54.0
107.0
0
25
50
75
100
125
150
175
200
APEC ROW
Ho
urs
Median
2015 2018
442.3
529.4
424.4
526.1
0
100
200
300
400
500
600
700
APEC ROW
US
D
Average
2015 2018
419.0 430.0392.5
430.0
0
100
200
300
400
500
600
700
APEC ROW
US
D
Median
2015 2018
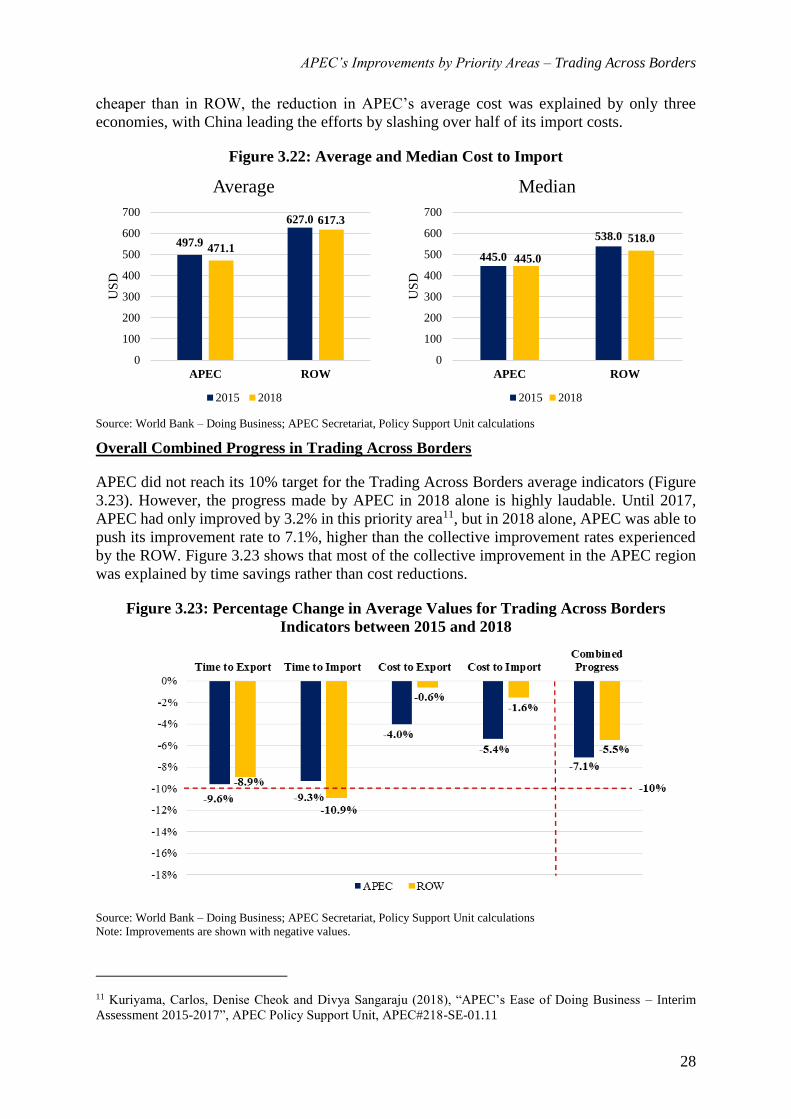
APEC’s Improvements by Priority Areas – Trading Across Borders
28
cheaper than in ROW, the reduction in APEC’s average cost was explained by only three
economies, with China leading the efforts by slashing over half of its import costs.
Figure 3.22: Average and Median Cost to Import
Source: World Bank – Doing Business; APEC Secretariat, Policy Support Unit calculations
Overall Combined Progress in Trading Across Borders
APEC did not reach its 10% target for the Trading Across Borders average indicators (Figure
3.23). However, the progress made by APEC in 2018 alone is highly laudable. Until 2017,
APEC had only improved by 3.2% in this priority area11, but in 2018 alone, APEC was able to
push its improvement rate to 7.1%, higher than the collective improvement rates experienced
by the ROW. Figure 3.23 shows that most of the collective improvement in the APEC region
was explained by time savings rather than cost reductions.
Figure 3.23: Percentage Change in Average Values for Trading Across Borders
Indicators between 2015 and 2018
Source: World Bank – Doing Business; APEC Secretariat, Policy Support Unit calculations
Note: Improvements are shown with negative values.
11 Kuriyama, Carlos, Denise Cheok and Divya Sangaraju (2018), “APEC’s Ease of Doing Business – Interim
Assessment 2015-2017”, APEC Policy Support Unit, APEC#218-SE-01.11
497.9
627.0
471.1
617.3
0
100
200
300
400
500
600
700
APEC ROW
US
D
Average
2015 2018
445.0
538.0
445.0
518.0
0
100
200
300
400
500
600
700
APEC ROW
US
D
Median
2015 2018
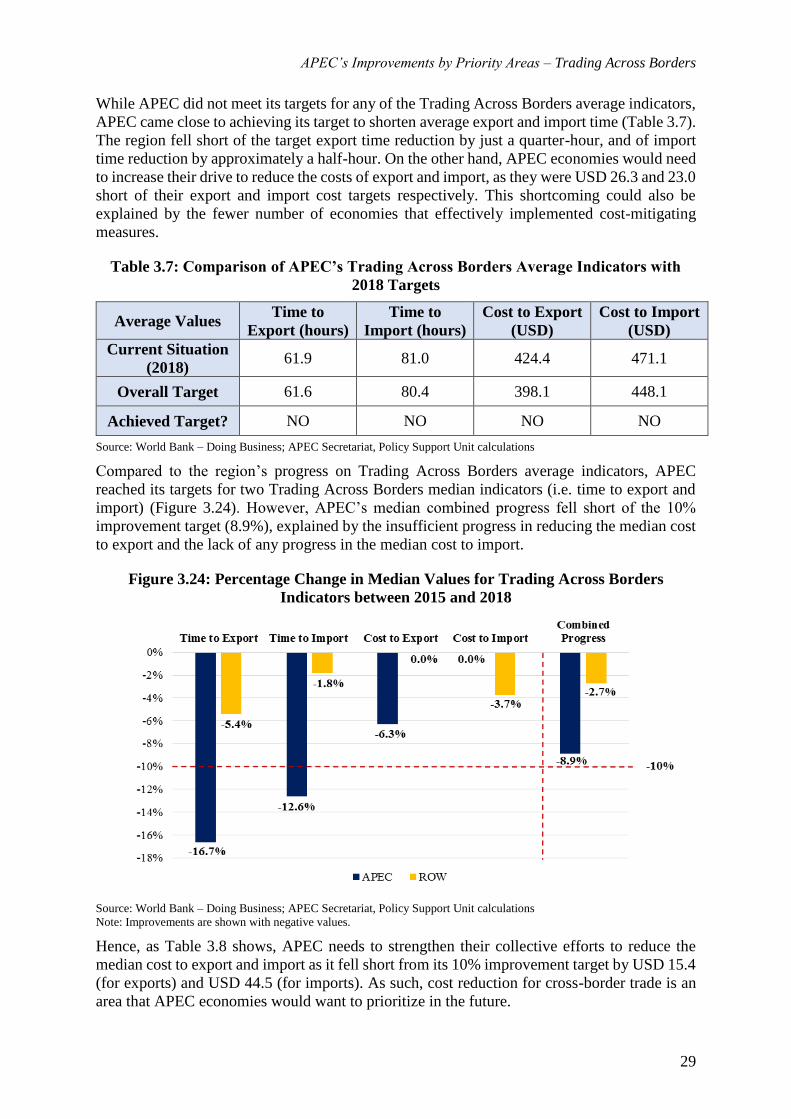
APEC’s Improvements by Priority Areas – Trading Across Borders
29
While APEC did not meet its targets for any of the Trading Across Borders average indicators,
APEC came close to achieving its target to shorten average export and import time (Table 3.7).
The region fell short of the target export time reduction by just a quarter-hour, and of import
time reduction by approximately a half-hour. On the other hand, APEC economies would need
to increase their drive to reduce the costs of export and import, as they were USD 26.3 and 23.0
short of their export and import cost targets respectively. This shortcoming could also be
explained by the fewer number of economies that effectively implemented cost-mitigating
measures.
Table 3.7: Comparison of APEC’s Trading Across Borders Average Indicators with
2018 Targets
Average Values Time to
Export (hours)
Time to
Import (hours)
Cost to Export
(USD)
Cost to Import
(USD)
Current Situation
(2018) 61.9 81.0 424.4 471.1
Overall Target 61.6 80.4 398.1 448.1
Achieved Target? NO NO NO NO
Source: World Bank – Doing Business; APEC Secretariat, Policy Support Unit calculations
Compared to the region’s progress on Trading Across Borders average indicators, APEC
reached its targets for two Trading Across Borders median indicators (i.e. time to export and
import) (Figure 3.24). However, APEC’s median combined progress fell short of the 10%
improvement target (8.9%), explained by the insufficient progress in reducing the median cost
to export and the lack of any progress in the median cost to import.
Figure 3.24: Percentage Change in Median Values for Trading Across Borders
Indicators between 2015 and 2018
Source: World Bank – Doing Business; APEC Secretariat, Policy Support Unit calculations
Note: Improvements are shown with negative values.
Hence, as Table 3.8 shows, APEC needs to strengthen their collective efforts to reduce the
median cost to export and import as it fell short from its 10% improvement target by USD 15.4
(for exports) and USD 44.5 (for imports). As such, cost reduction for cross-border trade is an
area that APEC economies would want to prioritize in the future.
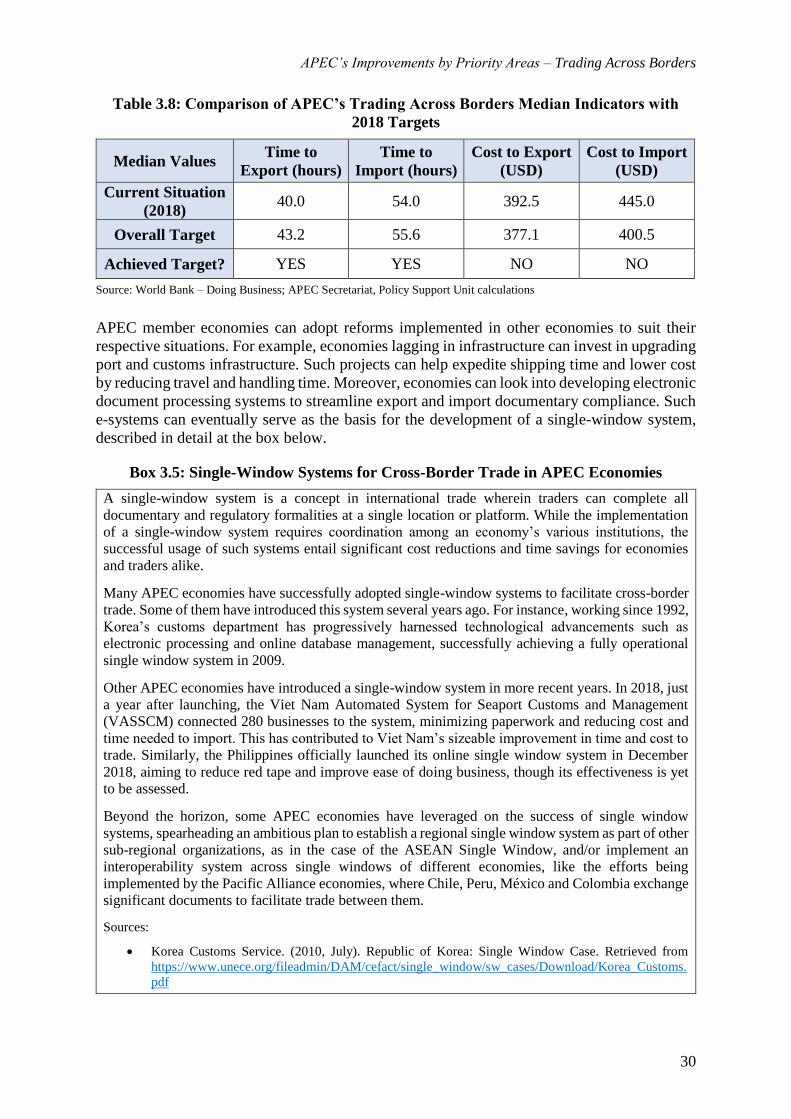
APEC’s Improvements by Priority Areas – Trading Across Borders
30
Table 3.8: Comparison of APEC’s Trading Across Borders Median Indicators with
2018 Targets
Median Values Time to
Export (hours)
Time to
Import (hours)
Cost to Export
(USD)
Cost to Import
(USD)
Current Situation
(2018) 40.0 54.0 392.5 445.0
Overall Target 43.2 55.6 377.1 400.5
Achieved Target? YES YES NO NO
Source: World Bank – Doing Business; APEC Secretariat, Policy Support Unit calculations
APEC member economies can adopt reforms implemented in other economies to suit their
respective situations. For example, economies lagging in infrastructure can invest in upgrading
port and customs infrastructure. Such projects can help expedite shipping time and lower cost
by reducing travel and handling time. Moreover, economies can look into developing electronic
document processing systems to streamline export and import documentary compliance. Such
e-systems can eventually serve as the basis for the development of a single-window system,
described in detail at the box below.
Box 3.5: Single-Window Systems for Cross-Border Trade in APEC Economies
A single-window system is a concept in international trade wherein traders can complete all
documentary and regulatory formalities at a single location or platform. While the implementation
of a single-window system requires coordination among an economy’s various institutions, the
successful usage of such systems entail significant cost reductions and time savings for economies
and traders alike.
Many APEC economies have successfully adopted single-window systems to facilitate cross-border
trade. Some of them have introduced this system several years ago. For instance, working since 1992,
Korea’s customs department has progressively harnessed technological advancements such as
electronic processing and online database management, successfully achieving a fully operational
single window system in 2009.
Other APEC economies have introduced a single-window system in more recent years. In 2018, just
a year after launching, the Viet Nam Automated System for Seaport Customs and Management
(VASSCM) connected 280 businesses to the system, minimizing paperwork and reducing cost and
time needed to import. This has contributed to Viet Nam’s sizeable improvement in time and cost to
trade. Similarly, the Philippines officially launched its online single window system in December
2018, aiming to reduce red tape and improve ease of doing business, though its effectiveness is yet
to be assessed.
Beyond the horizon, some APEC economies have leveraged on the success of single window
systems, spearheading an ambitious plan to establish a regional single window system as part of other
sub-regional organizations, as in the case of the ASEAN Single Window, and/or implement an
interoperability system across single windows of different economies, like the efforts being
implemented by the Pacific Alliance economies, where Chile, Peru, México and Colombia exchange
significant documents to facilitate trade between them.
Sources:
Korea Customs Service. (2010, July). Republic of Korea: Single Window Case. Retrieved from
https://www.unece.org/fileadmin/DAM/cefact/single_window/sw_cases/Download/Korea_Customs.

APEC’s Improvements by Priority Areas – Trading Across Borders
31
Việt Nam News. (2018, December 17). Automated customs system connects around 280 firms.
Retrieved January 21, 2019, from http://vietnamnews.vn/economy/482201/automated-customs-
system-connects-around-280-firms.html
Philippine News Agency. (2019, January 9). DOF sustains programs to cut red tape, improve EODB
in 2018. Retrieved January 21, 2019, from http://www.pna.gov.ph/articles/1058372
ASEAN. (n.d.). What is the ASEAN Single Window? Retrieved January 21, 2019, from
http://asw.asean.org/
APEC Secretariat - Policy Support Unit. (2018, August). Study on Single Window Systems’
International Interoperability: Key Issues for Its Implementation. Retrieved January 21, 2019, from
https://www.apec.org/Publications/2018/08/Study-on-Single-Window-Systems-International-
Interoperability
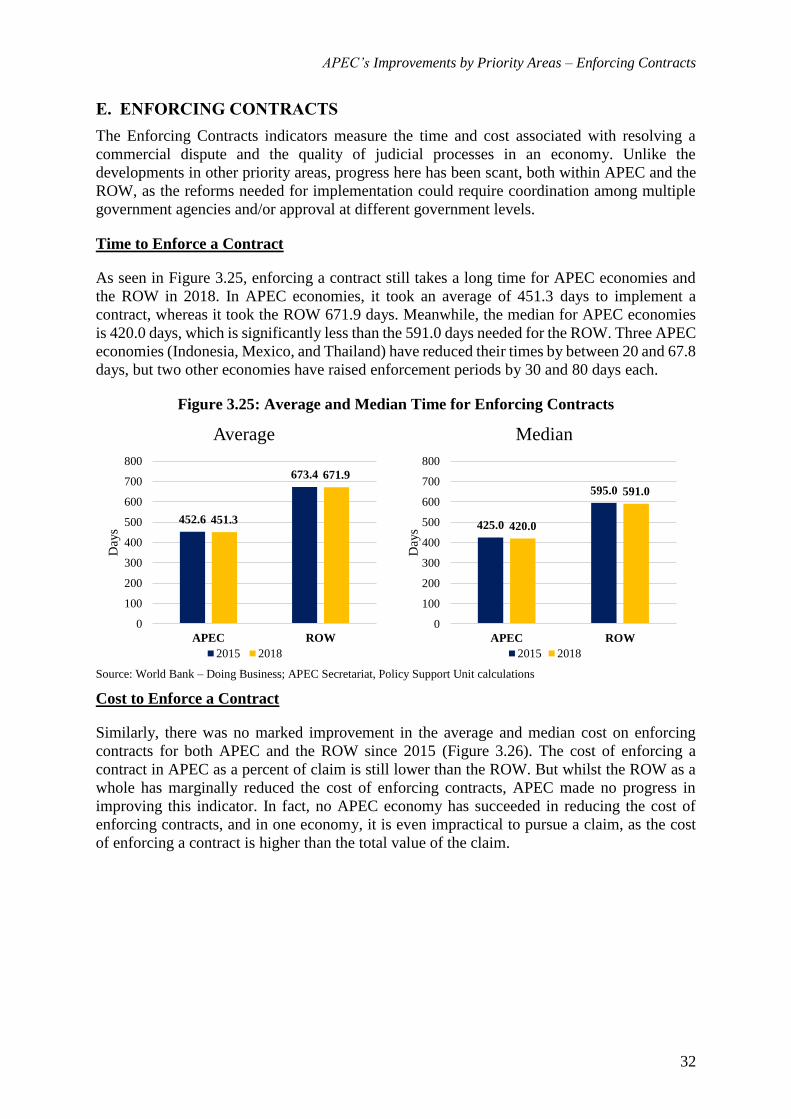
APEC’s Improvements by Priority Areas – Enforcing Contracts
32
E. ENFORCING CONTRACTS
The Enforcing Contracts indicators measure the time and cost associated with resolving a
commercial dispute and the quality of judicial processes in an economy. Unlike the
developments in other priority areas, progress here has been scant, both within APEC and the
ROW, as the reforms needed for implementation could require coordination among multiple
government agencies and/or approval at different government levels.
Time to Enforce a Contract
As seen in Figure 3.25, enforcing a contract still takes a long time for APEC economies and
the ROW in 2018. In APEC economies, it took an average of 451.3 days to implement a
contract, whereas it took the ROW 671.9 days. Meanwhile, the median for APEC economies
is 420.0 days, which is significantly less than the 591.0 days needed for the ROW. Three APEC
economies (Indonesia, Mexico, and Thailand) have reduced their times by between 20 and 67.8
days, but two other economies have raised enforcement periods by 30 and 80 days each.
Figure 3.25: Average and Median Time for Enforcing Contracts
Source: World Bank – Doing Business; APEC Secretariat, Policy Support Unit calculations
Cost to Enforce a Contract
Similarly, there was no marked improvement in the average and median cost on enforcing
contracts for both APEC and the ROW since 2015 (Figure 3.26). The cost of enforcing a
contract in APEC as a percent of claim is still lower than the ROW. But whilst the ROW as a
whole has marginally reduced the cost of enforcing contracts, APEC made no progress in
improving this indicator. In fact, no APEC economy has succeeded in reducing the cost of
enforcing contracts, and in one economy, it is even impractical to pursue a claim, as the cost
of enforcing a contract is higher than the total value of the claim.
452.6
673.4
451.3
671.9
0
100
200
300
400
500
600
700
800
APEC ROW
Day
s
Average
2015 2018
425.0
595.0
420.0
591.0
0
100
200
300
400
500
600
700
800
APEC ROW
Day
s
Median
2015 2018

APEC’s Improvements by Priority Areas – Enforcing Contracts
33
Figure 3.26: Average and Median Cost of Enforcing Contracts
Source: World Bank – Doing Business; APEC Secretariat, Policy Support Unit calculations
Quality of Judicial Processes Index
The last indicator, the quality of judicial processes index, measures the efficiency of the
commercial dispute resolution systems. The index is an aggregate value ranging from 0 to 18
of benchmark scores assessing court structure and proceedings, case management, court
automation, and alternative dispute resolution indices. The higher the score, the better and more
efficient the economy’s judicial processes are.
Both the average and median indices of APEC economies for 2018 are higher than those of the
ROW, which demonstrates that APEC economies are collectively perceived to have a better
quality of judicial processes than economies in the ROW (Figure 3.27). Moreover, both APEC
average and median indices have improved – nine economies have successfully raised the
quality of judicial processes indices, with Brunei Darussalam improving greatly by 4 points.
However, one economy experienced a decline in its index, slumping by 1.5 points.
Figure 3.27: Average and Median Values of the Quality of Judicial Processes Index for
Enforcing Contracts
Source: World Bank – Doing Business; APEC Secretariat, Policy Support Unit calculations
31.7%33.3%31.7% 33.2%
0%
5%
10%
15%
20%
25%
30%
35%
APEC ROW
% o
f cl
aim
Average
2015 2018
25.8%28.1%
25.8%27.5%
0%
5%
10%
15%
20%
25%
30%
35%
APEC ROW
% o
f cl
aim
Median
2015 2018
10.3 10.9
7.6 8.1
7.7 7.1
10.4 9.9
0
2
4
6
8
10
12
14
16
18
2015 2018 2015 2018
APEC ROW
Average
Score DTF
9.5 10.0
7.0 7.5
8.5 8.0
11.0 10.5
0
2
4
6
8
10
12
14
16
18
2015 2018 2015 2018
APEC ROW
Median
Score DTF
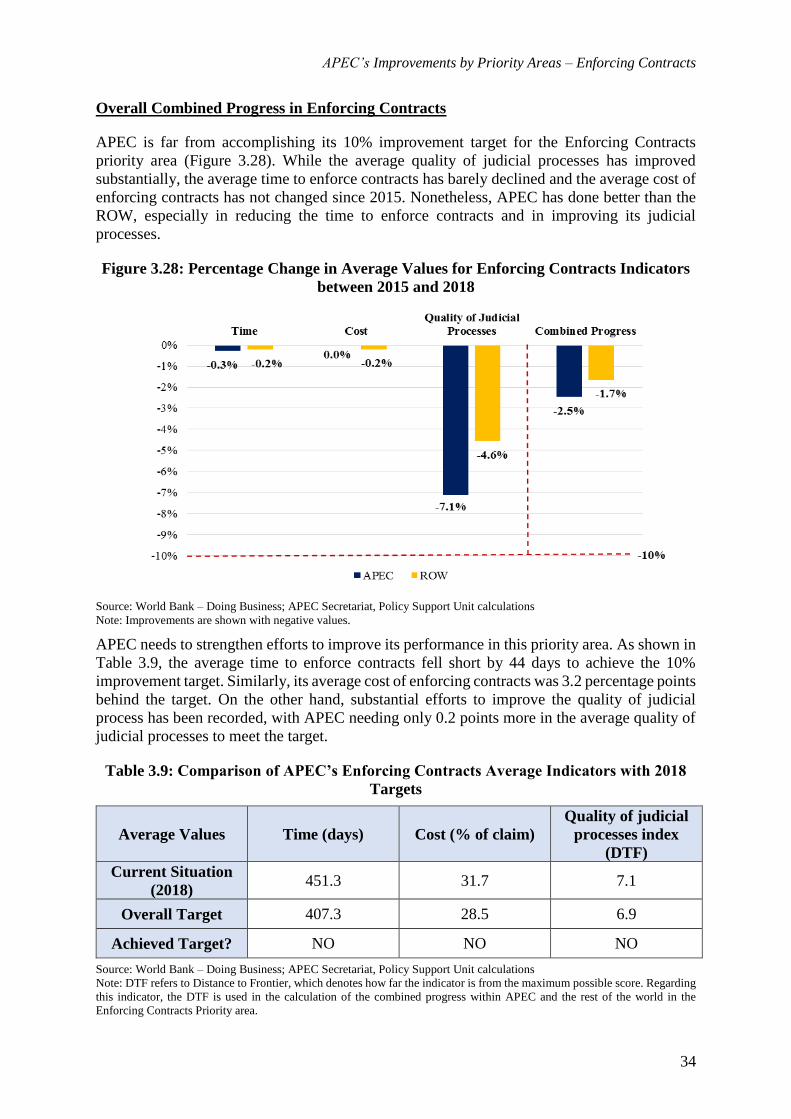
APEC’s Improvements by Priority Areas – Enforcing Contracts
34
Overall Combined Progress in Enforcing Contracts
APEC is far from accomplishing its 10% improvement target for the Enforcing Contracts
priority area (Figure 3.28). While the average quality of judicial processes has improved
substantially, the average time to enforce contracts has barely declined and the average cost of
enforcing contracts has not changed since 2015. Nonetheless, APEC has done better than the
ROW, especially in reducing the time to enforce contracts and in improving its judicial
processes.
Figure 3.28: Percentage Change in Average Values for Enforcing Contracts Indicators
between 2015 and 2018
Source: World Bank – Doing Business; APEC Secretariat, Policy Support Unit calculations
Note: Improvements are shown with negative values.
APEC needs to strengthen efforts to improve its performance in this priority area. As shown in
Table 3.9, the average time to enforce contracts fell short by 44 days to achieve the 10%
improvement target. Similarly, its average cost of enforcing contracts was 3.2 percentage points
behind the target. On the other hand, substantial efforts to improve the quality of judicial
process has been recorded, with APEC needing only 0.2 points more in the average quality of
judicial processes to meet the target.
Table 3.9: Comparison of APEC’s Enforcing Contracts Average Indicators with 2018
Targets
Average Values Time (days) Cost (% of claim)
Quality of judicial
processes index
(DTF)
Current Situation
(2018) 451.3 31.7 7.1
Overall Target 407.3 28.5 6.9
Achieved Target? NO NO NO
Source: World Bank – Doing Business; APEC Secretariat, Policy Support Unit calculations
Note: DTF refers to Distance to Frontier, which denotes how far the indicator is from the maximum possible score. Regarding
this indicator, the DTF is used in the calculation of the combined progress within APEC and the rest of the world in the
Enforcing Contracts Priority area.

APEC’s Improvements by Priority Areas – Enforcing Contracts
35
Similarly, none of APEC’s median Enforcing Contracts indicators achieved the 10%
improvement target (Figure 3.29). While APEC recorded positive changes in its median time
and quality of judicial processes, the ROW experienced a stronger combined median
improvement than APEC.
Figure 3.29: Percentage Change in Median Values for Enforcing Contracts Indicators
between 2015 and 2018
Source: World Bank – Doing Business; APEC Secretariat, Policy Support Unit calculations
Note: Improvements are shown with negative values.
Table 3.10 confirms that APEC still has a lot of work to do to improve its median indicators
within this priority area. APEC’s median time to enforce contracts is 37.5 days away from
reaching the 10% improvement target. A similar shortcoming occurs with the median cost to
enforce contracts, which is 2.6 percentage points away from the target. Likewise, the median
score of the quality of judicial processes index falls 0.3 points short of the target.
Table 3.10: Comparison of APEC’s Enforcing Contracts Median Indicators with 2018
Targets
Median Values Time (days) Cost (% of claim)
Quality of judicial
processes index
(DTF)
Current Situation
(2018) 420.0 25.8 8.0
Overall Target 382.5 23.2 7.7
Achieved Target? NO NO NO
Source: World Bank – Doing Business; APEC Secretariat, Policy Support Unit calculations
Note: DTF refers to Distance to Frontier, which denotes how far the indicator is from the maximum possible score. Regarding
this indicator, the DTF is used in the calculation of the combined progress within APEC and the rest of the world in the
Enforcing Contracts Priority area.
Economies aiming to improve the time needed to enforce contracts can introduce e-systems
that allow lawyers to manage cases electronically. Another potential reform is to introduce fast-
track simplified procedures for entities seeking smaller claims. To reduce the cost of claim,
economies can look into crafting alternative dispute resolutions, described in Box 3.7. While
APEC’s Improvements by Priority Areas – Enforcing Contracts
36
mediation as a form of alternative dispute resolution is already present in APEC, economies
might want to look into providing financial incentives for mediation. For example, economies
can provide tax exemptions for mediators to encourage them to help settle disputes between
companies, thus providing companies with more options outside of courts. Finally, with regards
to the quality of judicial processes index, some areas in this indicator that APEC needs to work
on are the availability of specialized commercial court, the setting of time standards, and
application of electronic systems to aid in court automation.
Box 3.6: Harnessing Technology to Facilitate Enforcing Contracts
APEC economies have introduced progressive changes to arbitration and legal procedures, which
help improve contract enforcement in the region. Central to such reforms are the incorporation of
technology in arbitration procedures, such as the establishment of a unified e-court platform.
For instance, Singapore has leveraged on e-filing systems to streamline requests for court litigation
procedures, and has required all small claims to be filed online since 2017. This helps increase the
efficiency of its courts, reducing waiting time for filing small claims to just 15 minutes, and
reallocating the resources of courts to other areas.
Chinese Taipei offers an e-filing system for intellectual property-related and tax-related
administrative suits since 2015. Building on the success of the platform, it has recently expanded its
e-filing system for litigation in 2017 to actions at the first, second and third instances, allowing
litigants to make and exchange submissions for further deliberations.
Sources:
Today. (2017, July 10). All small claims will now have to be filed online: State Courts. Retrieved
January 21, 2019, from https://www.todayonline.com/singapore/all-small-claims-will-now-have-to-
be-filed-online-state-courts
TIPLO Attorneys-at-Law. (2017, June). TIPLO News - June 2017 (E211). Retrieved January 21,
2019, from https://www.tiplo.com.tw/TIPLONews/E211-June2017.pdf
Box 3.7: Alternative Dispute Resolutions in APEC
Alternative dispute resolutions (ADRs) are mechanisms that enable businesses and individuals to
settle disputes outside of courts. Some prominent examples of ADRs include economy-wide
investment agencies or business associations that could resolve problems at the pre-court level. In
that way, businesses and individuals enjoy cost and time savings as it reduces the need to pay for and
wait for court proceedings. Moreover, it helps economies divert its judicial resources to more hotly
contested disputes that require court intervention.
Nonetheless, economies face some challenges in leveraging on ADR for dispute resolutions. It is
important to have guidelines for arbitration, mediation, and conciliation. Moreover, an effective court
that can enforce valid resolutions is crucial in order for ADR to be a credible and effective tool to
resolve disputes.
Figure 3.30 shows the proportion of economies within the APEC region and the ROW that have ADR
mechanisms. In general, APEC economies fare better than the ROW in the availability of ADR
features. Commercial arbitration is governed by a consolidated law, chapter, or section in all APEC
economies; and any commercial disputes can be submitted for arbitration in all but one economy
(95%). Similarly, courts have the power to enforce valid arbitration agreements in 20 out of 21 APEC
economies.
On the other hand, voluntary mediation and conciliation is available 95% of APEC economies,
compared to only 91% in the rest of the world. But, only 76% (16 out of 21) APEC economies and
60% in the rest of the world have mediation and conciliation procedures that are governed by a
consolidated law, chapter, or section. While financial incentives can stimulate parties to consider
https://www.todayonline.com/singapore/all-small-claims-will-now-have-to-be-filed-online-state-courts
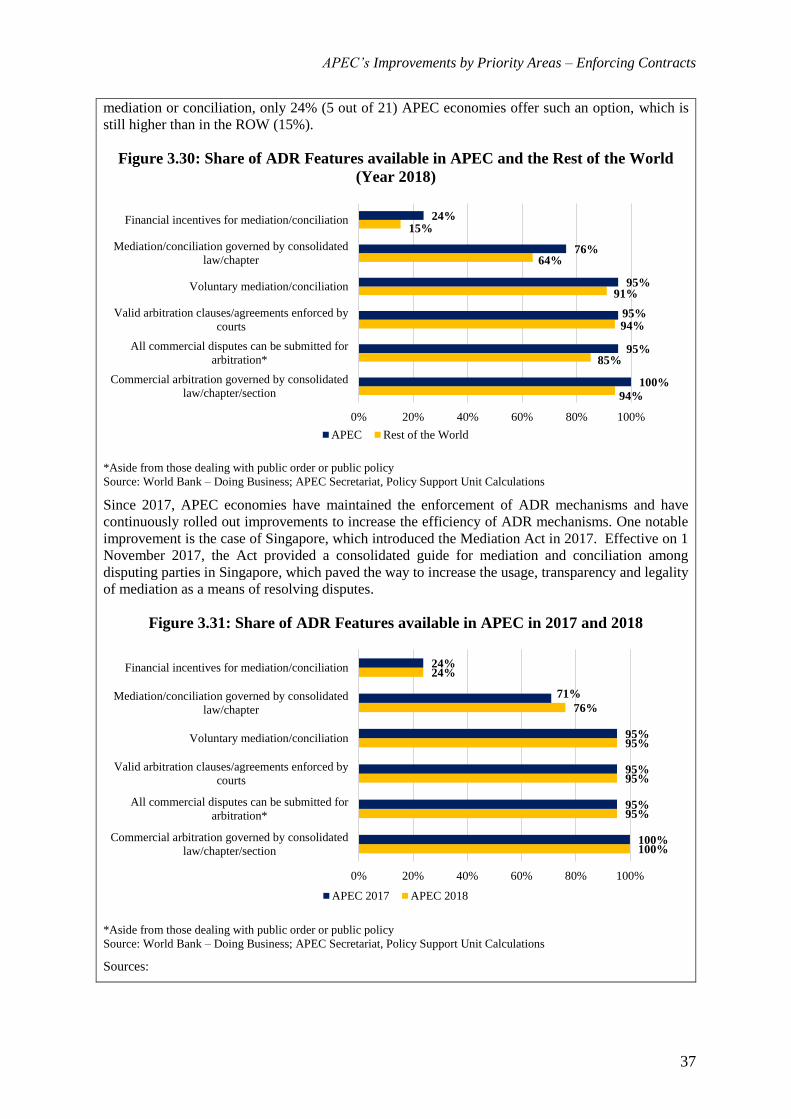
APEC’s Improvements by Priority Areas – Enforcing Contracts
37
mediation or conciliation, only 24% (5 out of 21) APEC economies offer such an option, which is
still higher than in the ROW (15%).
Figure 3.30: Share of ADR Features available in APEC and the Rest of the World
(Year 2018)
*Aside from those dealing with public order or public policy
Source: World Bank – Doing Business; APEC Secretariat, Policy Support Unit Calculations
Since 2017, APEC economies have maintained the enforcement of ADR mechanisms and have
continuously rolled out improvements to increase the efficiency of ADR mechanisms. One notable
improvement is the case of Singapore, which introduced the Mediation Act in 2017. Effective on 1
November 2017, the Act provided a consolidated guide for mediation and conciliation among
disputing parties in Singapore, which paved the way to increase the usage, transparency and legality
of mediation as a means of resolving disputes.
Figure 3.31: Share of ADR Features available in APEC in 2017 and 2018
*Aside from those dealing with public order or public policy
Source: World Bank – Doing Business; APEC Secretariat, Policy Support Unit Calculations
Sources:
94%
85%
94%
91%
64%
15%
100%
95%
95%
95%
76%
24%
0% 20% 40% 60% 80% 100%
Commercial arbitration governed by consolidated
law/chapter/section
All commercial disputes can be submitted for
arbitration*
Valid arbitration clauses/agreements enforced by
courts
Voluntary mediation/conciliation
Mediation/conciliation governed by consolidated
law/chapter
Financial incentives for mediation/conciliation
APEC Rest of the World
100%
95%
95%
95%
76%
24%
100%
95%
95%
95%
71%
24%
0% 20% 40% 60% 80% 100%
Commercial arbitration governed by consolidated
law/chapter/section
All commercial disputes can be submitted for
arbitration*
Valid arbitration clauses/agreements enforced by
courts
Voluntary mediation/conciliation
Mediation/conciliation governed by consolidated
law/chapter
Financial incentives for mediation/conciliation
APEC 2017 APEC 2018

APEC’s Improvements by Priority Areas – Enforcing Contracts
38
The World Bank Group. (2011). Alternative Dispute Resolution Guidelines (1st ed.). Washington
D.C.: The World Bank Group. Retrieved from
http://siteresources.worldbank.org/INTECA/Resources/15322_ADRG_Web.pdf
Singapore Statutes Online. (2017, January 10). Mediation Act 2017 - Singapore Statutes Online.
Retrieved January 21, 2019, from https://sso.agc.gov.sg/Act/MA2017
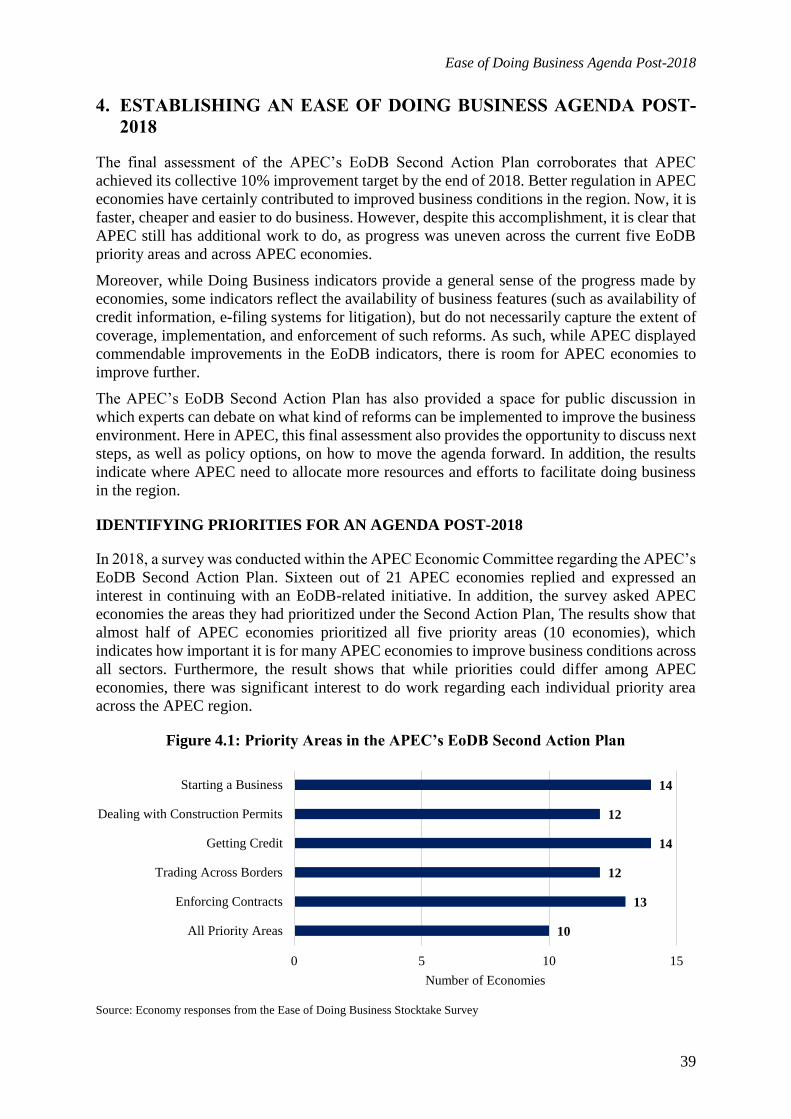
Ease of Doing Business Agenda Post-2018
39
4. ESTABLISHING AN EASE OF DOING BUSINESS AGENDA POST-
2018
The final assessment of the APEC’s EoDB Second Action Plan corroborates that APEC
achieved its collective 10% improvement target by the end of 2018. Better regulation in APEC
economies have certainly contributed to improved business conditions in the region. Now, it is
faster, cheaper and easier to do business. However, despite this accomplishment, it is clear that
APEC still has additional work to do, as progress was uneven across the current five EoDB
priority areas and across APEC economies.
Moreover, while Doing Business indicators provide a general sense of the progress made by
economies, some indicators reflect the availability of business features (such as availability of
credit information, e-filing systems for litigation), but do not necessarily capture the extent of
coverage, implementation, and enforcement of such reforms. As such, while APEC displayed
commendable improvements in the EoDB indicators, there is room for APEC economies to
improve further.
The APEC’s EoDB Second Action Plan has also provided a space for public discussion in
which experts can debate on what kind of reforms can be implemented to improve the business
environment. Here in APEC, this final assessment also provides the opportunity to discuss next
steps, as well as policy options, on how to move the agenda forward. In addition, the results
indicate where APEC need to allocate more resources and efforts to facilitate doing business
in the region.
IDENTIFYING PRIORITIES FOR AN AGENDA POST-2018
In 2018, a survey was conducted within the APEC Economic Committee regarding the APEC’s
EoDB Second Action Plan. Sixteen out of 21 APEC economies replied and expressed an
interest in continuing with an EoDB-related initiative. In addition, the survey asked APEC
economies the areas they had prioritized under the Second Action Plan, The results show that
almost half of APEC economies prioritized all five priority areas (10 economies), which
indicates how important it is for many APEC economies to improve business conditions across
all sectors. Furthermore, the result shows that while priorities could differ among APEC
economies, there was significant interest to do work regarding each individual priority area
across the APEC region.
Figure 4.1: Priority Areas in the APEC’s EoDB Second Action Plan
Source: Economy responses from the Ease of Doing Business Stocktake Survey
10
13
12
14
12
14
0 5 10 15
All Priority Areas
Enforcing Contracts
Trading Across Borders
Getting Credit
Dealing with Construction Permits
Starting a Business
Number of Economies
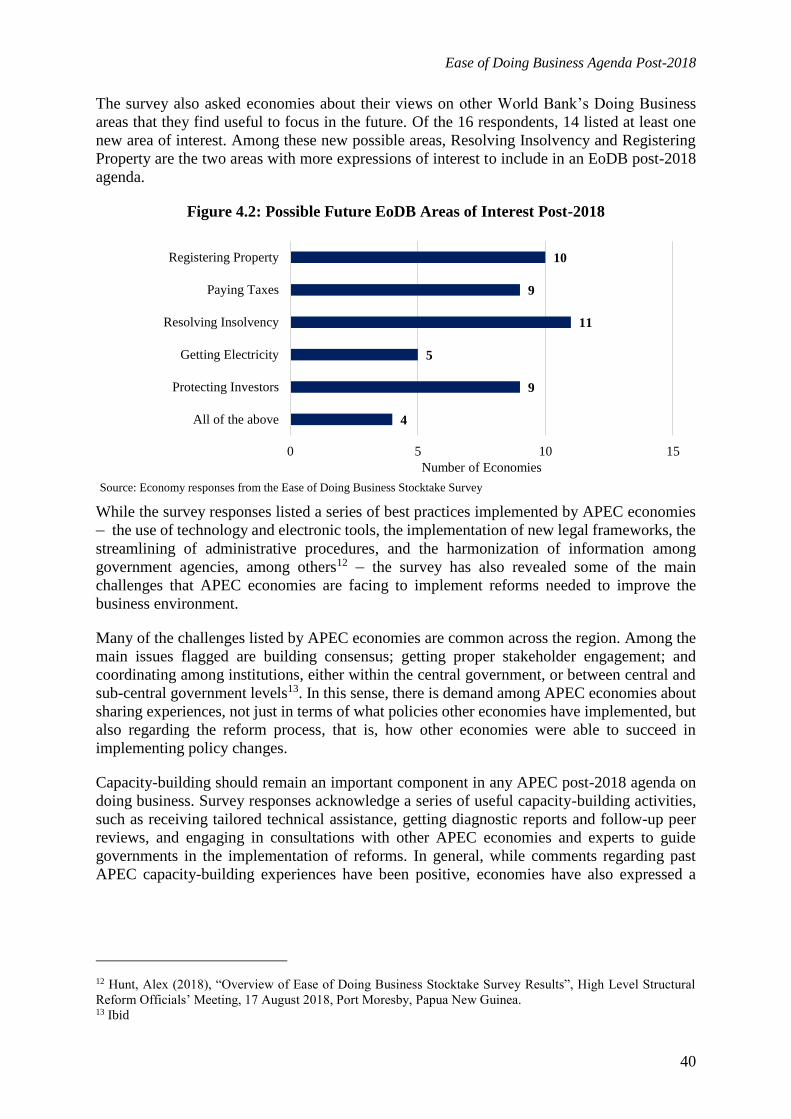
Ease of Doing Business Agenda Post-2018
40
The survey also asked economies about their views on other World Bank’s Doing Business
areas that they find useful to focus in the future. Of the 16 respondents, 14 listed at least one
new area of interest. Among these new possible areas, Resolving Insolvency and Registering
Property are the two areas with more expressions of interest to include in an EoDB post-2018
agenda.
Figure 4.2: Possible Future EoDB Areas of Interest Post-2018
Source: Economy responses from the Ease of Doing Business Stocktake Survey
While the survey responses listed a series of best practices implemented by APEC economies
– the use of technology and electronic tools, the implementation of new legal frameworks, the
streamlining of administrative procedures, and the harmonization of information among
government agencies, among others12 – the survey has also revealed some of the main
challenges that APEC economies are facing to implement reforms needed to improve the
business environment.
Many of the challenges listed by APEC economies are common across the region. Among the
main issues flagged are building consensus; getting proper stakeholder engagement; and
coordinating among institutions, either within the central government, or between central and
sub-central government levels13. In this sense, there is demand among APEC economies about
sharing experiences, not just in terms of what policies other economies have implemented, but
also regarding the reform process, that is, how other economies were able to succeed in
implementing policy changes.
Capacity-building should remain an important component in any APEC post-2018 agenda on
doing business. Survey responses acknowledge a series of useful capacity-building activities,
such as receiving tailored technical assistance, getting diagnostic reports and follow-up peer
reviews, and engaging in consultations with other APEC economies and experts to guide
governments in the implementation of reforms. In general, while comments regarding past
APEC capacity-building experiences have been positive, economies have also expressed a
12 Hunt, Alex (2018), “Overview of Ease of Doing Business Stocktake Survey Results”, High Level Structural
Reform Officials’ Meeting, 17 August 2018, Port Moresby, Papua New Guinea. 13 Ibid
4
9
5
11
9
10
0 5 10 15
All of the above
Protecting Investors
Getting Electricity
Resolving Insolvency
Paying Taxes
Registering Property
Number of Economies
Ease of Doing Business Agenda Post-2018
41
favorable opinion on seeking either bilateral cooperation or tapping on resources from other
international organizations14.
The decision on a post-2018 doing business-related agenda relies on APEC economies, but
positive survey responses indicate that it is worth for APEC to continue working on this matter
and a through discussion on a post-2018 agenda is pertinent. As explained in the APEC’s EoDB
Interim Assessment released last year, some of the options are related to: 1) keeping the existing
priority areas; 2) focusing on new areas only; 3) combining existing and new priority areas;
and 4) looking at an agenda beyond the World Bank’s Doing Business indicators and putting
further emphasis at qualitative aspects such as the sustainability of regulatory reforms and the
better implementation of those reforms15.
In addition, the discussion should take into account issues related to the time length of the new
initiative and the convenience of including a quantitative target, keeping in mind that it should
be something measurable within the scope of the initiative. Likewise, any target cannot be
overambitious or unimpressive due to credibility matters.
14 Ibid 15 Kuriyama, Carlos, Denise Cheok and Divya Sangaraju (2018), “APEC’s Ease of Doing Business – Interim
Assessment 2015-2017”, APEC Policy Support Unit, APEC#218-SE-01.11, p. 39-40.
References
42
5. REFERENCES
APEC (2009), “Discussion Paper on Ease of Doing Business (EoDB)”, 2009/SOM/023,
Concluding Senior Officials’ Meeting – Plenary Session, 9 November.
APEC Policy Support Unit (2015). “APEC’s Ease of Doing Business – Interim Assessment
2009-2014”, APEC Secretariat, APEC#215-SE-01.17.
APEC Policy Support Unit (2016). “APEC’s Ease of Doing Business – Final Assessment 2009-
2015”, APEC Secretariat, APEC#216-SE-01.10,
APEC Policy Support Unit (2017), “APEC’s Ease of Doing Business – Interim Assessment
2015-2017”. APEC Secretariat, APEC#218-SE-01.11
Hunt, Alex (2018), “Overview of Ease of Doing Business Stocktake Survey Results”, High
Level Structural Reform Officials’ Meeting, 17 August 2018, Port Moresby, Papua New
Guinea.
Kuriyama, Carlos, Denise Cheok and Divya Sangaraju (2018), “APEC’s Ease of Doing
Business – Interim Assessment 2015-2017”, APEC Policy Support Unit, APEC#218-SE-01.11
World Bank (2015), “Doing Business 2016 – Measuring Regulatory Quality and Efficiency”.
Washington: The World Bank and the International Finance Corporation.
World Bank (2016), “Doing Business 2017 – Equal Opportunity for All”. Washington: The
World Bank and the International Finance Corporation.
World Bank (2017), “Doing Business 2018 – Reforming to Create Jobs”. Washington: The
World Bank and the International Finance Corporation.
World Bank (2018), “Doing Business 2019 – Training for Reform”. Washington: The World
Bank and the International Finance Corporation.
World Bank. (n.d.). Dealing with Construction Permits Methodology. Retrieved December 20,
2018, from http://www.doingbusiness.org/en/methodology/dealing-with-construction-permits
World Bank. (n.d.). Methodology for Getting Credit. Retrieved January 2, 2019, from
http://www.doingbusiness.org/en/methodology/getting-credit
World Bank. (n.d.). Methodology for Starting a Business. Retrieved December 20, 2018, from
http://www.doingbusiness.org/en/methodology/starting-a-business
Appendix: Methodology
43
6. APPENDIX: METHODOLOGY
AVERAGE VALUES
The EoDB initiative requires not only credible targets, but also an assessment of the progress
made by the APEC region with a methodology that is easy to understand.
As the target establishes an APEC-wide target of 10% improvement by 2018, the methodology
should measure the evolution of APEC as a whole in the five EoDB priority areas. In this sense,
the assessment should compare across time the average values of APEC in the EoDB indicators
available from the World Bank Doing Business database.
The indicators included in this assessment, classified by priority areas, are the following ones:
1) Starting a Business
a) Procedures (number)
b) Time (days)
c) Cost (percentage of income per capita)
2) Dealing with Construction Permits
a) Procedures (number)
b) Time (days)
c) Cost (percentage of warehouse value)
d) Building Quality Control Index (from 0 to 15, 15 = the best quality)
3) Getting Credit
a) Strength of Legal Right Index (from 0 to 12, 12 = the strongest)
b) Depth of Credit Information Index (from 0 to 8, 8 = the deepest)
c) Coverage of Adults with Credit Information in Public Registries or Private
Bureaus (percentage of adults)
4) Trading Across Borders
a) Time to Export, documentation + border compliance (days)
b) Cost to Export, documentation + border compliance (USD per container)
c) Time to Import, documentation + border compliance (days)
d) Cost to Import, documentation + border compliance (USD per container)
5) Enforcing Contracts
a) Time (days)
b) Cost (percentage of claim)
c) Quality of Judicial Processes Index (from 0 to 18, 18 = the best quality)
Simple averages for the APEC region are calculated for each indicator. They provide a
transparent and straightforward method and they are simple to understand. By using simple
averages, all APEC members are treated equally. For example, the calculation of the average
number of procedures to start a business is calculated as follows:
APEC avg. procedures2018
=(Number of procedures in
Australia 2018+
Number of procedures in
Brunei Darussalam 2018+…+
Number of procedures in
Viet Nam 2018)
Number of APEC Economies
The APEC-wide annual rate of improvement (or decline) for the Second APEC’s EoDB Action
Plan can be calculated by comparing the average value in 2018 with the value obtained in 2015,
which was established as the benchmark year. Following the example of the number of

Appendix: Methodology
44
procedures in the Starting a Business priority area, the APEC-wide rate of improvement in this
indicator is equal to:
APEC-wide rate of improvement avg.procedures2015-2018
= [(APEC avg. procedures
2018
APEC avg. procedures2015
) -1] x 100
MEDIAN VALUES
In some indicators, the presence of outliers may provide a distorted picture of APEC and any
other region’s collective performance, if only the average values are taken into account.
Extreme values in some specific economies in any of those years may have pulled up or down
APEC’s averages and their improvement rates.
Hence, the inclusion of median values in this assessment can provide a more complete picture
of APEC’s performance. The median is the middle value in any data series, separating the
upper half of the values with the lower half of the values. In other words, in the case of APEC,
the median for any EoDB indicator is equivalent to the value registered by the economy located
in the 11th position. For example, the following table shows the time to import in each of the
21 APEC members:
APEC: Time to Import (Hours, 2019)
Position Hours
1st 3.0
2nd 7.0
3rd 9.0
4th 20.0
5th 26.0
6th 36.0
7th 43.0
8th 43.0
9th 43.0
10th 51.0
11th 54.0
12th 61.8
13th 72.0
14th 72.5
15th 90.0
16th 132.0
17th 144.0
18th 180.0
19th 192.0
20th 205.6
21st 216.0
Average 81.0
Median 54.0
Source: World Bank – Doing Business

Appendix: Methodology
45
In this example, the average is higher than the median, as the time taken to import by the APEC
economy in the 18th, 19th, 20th and 21st positions (180, 192, 205.6 and 219 hours, respectively)
pushed up the average value. Seven APEC members had longer average time to import than
the APEC’s average time equivalent to 81 hours. On the contrary, APEC’s median cost (54
hours) was not affected by the extreme values at the bottom end of the list, as 10 APEC
members had longer times than APEC’s median time and other 10 APEC members had shorter
times than APEC’s median time.
To summarize, the calculation of the APEC median regarding the time to import is as follows:
APEC median time to import2018
= 11th shortest time by an APEC member to import in 2018
The comparison of APEC median values in 2015 and 2018 provides another way to measure
improvement (or decline) in APEC’s priority areas during the full period concerning the
Second APEC’s EoDB Action Plan. Following the example of the APEC median time to
import, the APEC-wide rate of improvement is:
APEC-wide rate of improvement
median time to import2015-2018
= [(APEC median time to import
2018
APEC median time to import2015
) -1] x 100
DISTANCE TO FRONTIER
In the case of the indicators represented by indices, the annual rate of improvement in 2018 is
not calculated by comparing the indices’ scores from 2015 and 2018. Instead, the calculation
of the improvement rate utilizes the values of the distance to frontier (DTF) from those years.
The DTF denotes how far the indicator is from the maximum possible score. For example, in
the Getting Credit priority area, the Strength of the Legal Rights Index can take any value from
0 to 12 points, the higher the value, the stronger the legal rights system is. For APEC, the index
reported an average value of 7.38 points in 2018. The DTF for year 2018 is equal to 4.62 points
and it is calculated as follows:
APEC average DTF
Strength of Legal Rights Index2018
= Maximum possible score of the
Strength of Legal Rights Index-
APEC average
Strength of Legal Rights Index2018
APEC average DTF Strength of Legal Rights Index2018
= 12 - 7.38
= 4.62
In 2015, APEC’s average value of the Strength of Legal Rights Index was equal to 6.43 points.
Therefore, APEC’s average DTF for the Strength of Legal Rights Index was equivalent to 5.57
points (12 – 6.43 = 5.57 points).
The APEC-wide rate of improvement of this indicator in year 2018 was calculated by
comparing the average DTF values in APEC from 2015 and 2018:
APEC-wide rate of improvement
average Strength of Legal Rights Index2015-2018
= [(APEC average DTF Strength of Legal Rights Index
2018
APEC average DTF Strength of Legal Rights Index2015
) -1] x 100
APEC-wide rate of improvement
average Strength of Legal Rights Index2015-2018
= [(4.62
5.57 ) -1] x 100 = -17.1%
Appendix: Methodology
46
APEC’s average DTF in this indicator fell by 17.1% between 2015 and 2018. This means that
APEC’s average value of this index is 17.1% closer to the highest possible score of 12 points
in comparison to the its average value in 2015.
The DTF is used in all the EoDB indicators in which improvements are reflected with an
increase in their scores/values. For example, the Getting Credit indicator on the Coverage of
Adults with Credit Information in Public Registries or Private Bureaus (% of adult population)
improved its average in the APEC region from 73.7% to 78.2% of the adult population between
2015 and 2018. Since the maximum possible value of the indicator is 100% of the adult
population, then the APEC DTF for this indicator was equivalent to 100%-78.2% = 21.8% of
the adult population in 2018 and 100%-73.7% = 26.3% of the adult population in 2015.
CALCULATION OF THE COVERAGE OF ADULTS WITH CREDIT
INFORMATION IN PUBLIC REGISTRIES OR PRIVATE BUREAUS
The World Bank’s Doing Business provides two separate indicators to determine the coverage
of credit information from the adult population in each economy. One of the indicators show
the percentage of adults with their information available in public credit registries. The other
indicator measures the same, but in private credit bureaus. Both institutions, public credit
registries and private credit bureaus, seek to improve the availability of credit information in
order to facilitate decisions to lenders regarding loan applications.
Within the APEC region, credit information databases are available in all economies. While
private credit bureaus are available in 19 APEC economies, 8 economies have public credit
registries in place and 6 economies have both of them. Since most of the economies only have
in place one of these two systems, calculating the rate of progress in APEC of these two
indicators separately would not necessarily give a proper indication of the percentage of adults
whose credit information is available to lenders. Instead, this report combines both indicators,
by taking the highest value every year in each APEC economy. Those highest values in each
economy are taken into account to calculate this indicator’s average and median values for the
whole APEC region.
For example, Malaysia reported that the credit information coverage was equal to 66.3% of the
adult population in public credit registries and 86.6% in private credit bureaus in 2018. For that
year, the indicator in the assessment for Malaysia took the highest value of 86.6% of the adult
population, which is taken into account in the calculation of APEC’s average and median credit
information coverage.
OBTAINING THE APEC-WIDE RATE OF IMPROVEMENT BY
PRIORITY AREA AND APEC-WIDE OVERALL IMPROVEMENT
Since all the priority areas are comprised of indicators with different natures and units of
measurement (i.e. numbers, days and percentage of income per capita, among others), the
estimation of the APEC-wide rate of improvement in any priority area can be obtained by
calculating the simple average of the rates of improvement (or decline) in each of the indicators
belonging to the particular priority area. This can be calculated by using the rates of
improvement (or decline) for either APEC averages or APEC median values.
For example, the APEC-wide average rate of improvement in the Starting a Business priority
area in the period 2015-2018 can be obtained by using the rates of improvement (or decline)
of the averages in each of the three indicators belonging to this priority area:

Appendix: Methodology
47
APEC-wide
rate of improvement
(Starting a Business)2015-2018
=
(APEC-wide
rate of improvement
average procedures2015-2018
+
APEC-wide rate of improvement
average time2015-2018
+ APEC-wide
rate of improvement average cost
2015-2018
)
Number of Indicators
By using a simple average, the measurement gives the same importance to each of the
indicators within the specific priority area.
Similarly, the APEC-wide median rate of improvement in the Starting a Business priority area
can be obtained by averaging the rates of improvement (or decline) of APEC median values in
each of the three indicators that are part of this priority area:
APEC-wide
rate of improvement
(Starting a Business)2015-2018
=
(
APEC-wide rate of improvement
median procedures2015-2018
+ APEC-wide
rate of improvement
median time 2015-2018
+ APEC-wide
rate of improvement
median cost 2015-2018
)
Number of Indicators
The methodology allows the identification of the priority areas and indicators in which APEC
has met or surpassed its aspirational targets and assists APEC in recognizing areas where more
work is needed. The calculation of the APEC-wide rate of improvement in any priority area by
using average and median values separately also provides an indication whether the progress
in the priority areas’ indicators is explained by a small group of APEC members or is more
widespread amongst a larger group of economies.
This methodology also provides a measure of the overall APEC-wide rate of improvement for
the whole EoDB initiative. In this regard, this measure can be attained by combining the APEC-
wide rates of improvement in the five priority areas:
APEC-wide rate of
improvement EODB2015-2018
= (
APEC-wide rate of improvement
Starting a Business2015-2018
+
APEC-wide rate of improvement
Dealing with Construction Permits2015-2018
+
APEC-wide rate of improvement
Getting Credit2015-2018
+ APEC-wide
rate of improvement
Trading across Borders2015-2018
+ APEC-wide rate of improvement
Enforcing Contracts2015-2018 )
Number of Priority Areas
The APEC-wide rate of improvement in the EoDB initiative can be calculated by using either
the rates of improvement concerning APEC averages or those concerning APEC median
values.
The intention of the EoDB initiative is to reach an APEC-wide improvement of 10 percent by
2018. Measuring the overall improvement by using a simple average of the rates of
improvement (or decline) of the five priority areas reduces the subjectivity of the assessment
by considering all priority areas as equally important16.
16 If weighted averages are introduced, the overall results could be skewed toward the priority area assigned with
the greater weight. Assigning weights could introduce additional complications, such as the criteria to be used. It
is also possible that individual APEC economies differ on the importance to assign to each of the priority areas
based on their particular realities.