doing business - World Bank Document
108
2004 2013 2008 2007 2011 2006 2010 COMPARING BUSINESS REGULATIONS FOR DOMESTIC FIRMS IN THE EAST AFRICAN COMMUNITY AND WITH 185 ECONOMIES DOING BUSINESS IN THE EAST AFRICAN COMMUNITY 2013 Smarter Regulations for Small and Medium-Size Enterprises Public Disclosure Authorized Public Disclosure Authorized Public Disclosure Authorized Public Disclosure Authorized
-
Upload
khangminh22 -
Category
Documents
-
view
2 -
download
0
Transcript of doing business - World Bank Document
200420132008
2007
2011
2006 2010
COMPARING BUSINESS REGULATIONS FOR DOMESTIC FIRMS IN THE EAST AFRICAN COMMUNITY AND WITH 185 ECONOMIES
DOING BUSINESS IN THE EAST AFRICAN COMMUNITY 2013
Smarter Regulations for Small and Medium-Size Enterprises
Pub
lic D
iscl
osur
e A
utho
rized
Pub
lic D
iscl
osur
e A
utho
rized
Pub
lic D
iscl
osur
e A
utho
rized
Pub
lic D
iscl
osur
e A
utho
rized
WB456288
Typewritten Text
WB456288
Typewritten Text
80645
WB456288
Typewritten Text
WB456288
Typewritten Text
© 2013 International Bank for Reconstruction and Development / The World Bank
1818 H Street NW
Washington, DC 20433
Telephone: 202-473-1000
Internet: www.worldbank.org
Some rights reserved.
A copublication of The World Bank and the International Finance Corporation.
This work is a product of the staff of The World Bank with external contributions. Note that The World Bank
does not necessarily own each component of the content included in the work. The World Bank therefore
does not warrant that the use of the content contained in the work will not infringe on the rights of third
parties. The risk of claims resulting from such infringement rests solely with you.
The findings, interpretations, and conclusions expressed in this work do not necessarily reflect the views of
The World Bank, its Board of Executive Directors, or the governments they represent. The World Bank does
not guarantee the accuracy of the data included in this work. The boundaries, colors, denominations, and
other information shown on any map in this work do not imply any judgment on the part of The World Bank
concerning the legal status of any territory or the endorsement or acceptance of such boundaries.
Nothing herein shall constitute or be considered to be a limitation upon or waiver of the privileges and
immunities of The World Bank, all of which are specifically reserved.
Rights and Permissions
This work is available under the Creative Commons Attribution 3.0 Unported license (CC BY 3.0)
http://creativecommons.org/licenses/by/3.0. Under the Creative Commons Attribution license, you
are free to copy, distribute, transmit, and adapt this work, including for commercial purposes, under the
following conditions:
Attribution—Please cite the work as follows: World Bank. 2013. Doing Business in the East African Community
2013: Smarter Regulations for Small and Medium-Size Enterprises. Washington, DC: World Bank Group.
License: Creative Commons Attribution CC BY 3.0
Translations—If you create a translation of this work, please add the following disclaimer along with the
attribution: This translation was not created by The World Bank and should not be considered an official World
Bank translation. The World Bank shall not be liable for any content or error in this translation.
All queries on rights and licenses should be addressed to the Office of the Publisher, The World Bank, 1818
H Street NW, Washington, DC 20433, USA; fax: 202-522-2625; e-mail: [email protected].
Copies of all 10 editions of the global Doing Business report may be purchased at www.doingbusiness.org.
Other subnational and regional Doing Business studies can be downloaded at no charge at
www.doingbusiness.org/subnational.
Design and Layout: Corporate Visions, Inc.
A COPUBLICATION OF THE WORLD BANK AND THE INTERNATIONAL FINANCE CORPORATION
COMPARING BUSINESS REGULATIONS FOR DOMESTIC FIRMS IN THE EAST AFRICAN COMMUNITY AND WITH 185 ECONOMIES
DOING BUSINESS IN THE EAST AFRICAN COMMUNITY 2013
Smarter Regulations for Small and Medium-Size Enterprises
RESOURCES ON THE DOING BUSINESS WEBSITE
Current features
News on the Doing Business project
http://www.doingbusiness.org
Rankings
How economies rank—from 1 to 185
http://www.doingbusiness.org/rankings/
Data
All the data for 185 economies—topic rankings,
indicator values, lists of regulatory procedures and
details underlying indicators
http://www.doingbusiness.org/data/
Reports
Access to Doing Business reports as well as
subnational and regional reports, reform case
studies and customized economy and regional
profiles
http://www.doingbusiness.org/reports/
Methodology
The methodologies and research papers underlying
Doing Business
http://www.doingbusiness.org/methodology/
Research
Abstracts of papers on Doing Business topics and
related policy issueshttp://www.doingbusiness.org/
research/
Doing Business reforms
Short summaries of DB2013 business regulation
reforms, lists of reforms since DB2008 and a
ranking simulation tool
http://www.doingbusiness.org/reforms/
Historical data
Customized data sets since DB2004
http://www.doingbusiness.org/custom-query/
Law library
Online collection of business laws
and regulations relating to business and
gender issues
http://www.doingbusiness.org/law-library/
http://wbl.worldbank.org/
Contributors
More than 9,600 specialists in 185 economies
who participate in Doing Business
http://www.doingbusiness.org/contributors/
doing-business/
NEW! Entrepreneurship data
Data on business density for 130 economies
http://www.doingbusiness.org/data/exploretopics/
entrepreneurship/
Doing Business in the East African Community
2013 is the fourth in a series of regional re-
ports drawing on the global Doing Business
project and its database. The report also
draws on the findings of Doing Business
2013, the 10th in a series of annual reports
investigating the regulations that enhance
business activity and those that constrain
it. Doing Business presents quantitative
indicators on business regulation and the
protection of property rights that can be
compared across 185 economies—from
Afghanistan to Zimbabwe—and over time.
Regulations affecting 10 areas of the life of
a business are covered: starting a business,
dealing with construction permits, getting
electricity, registering property, getting
credit, protecting investors, paying taxes,
trading across borders, enforcing contracts
and resolving insolvency.
Data in Doing Business in the East African
Community 2013 are current as of June 1,
2012. The Doing Business indicators are
used to analyze economic outcomes and
identify what reforms of business regula-
tion have worked, where and why.
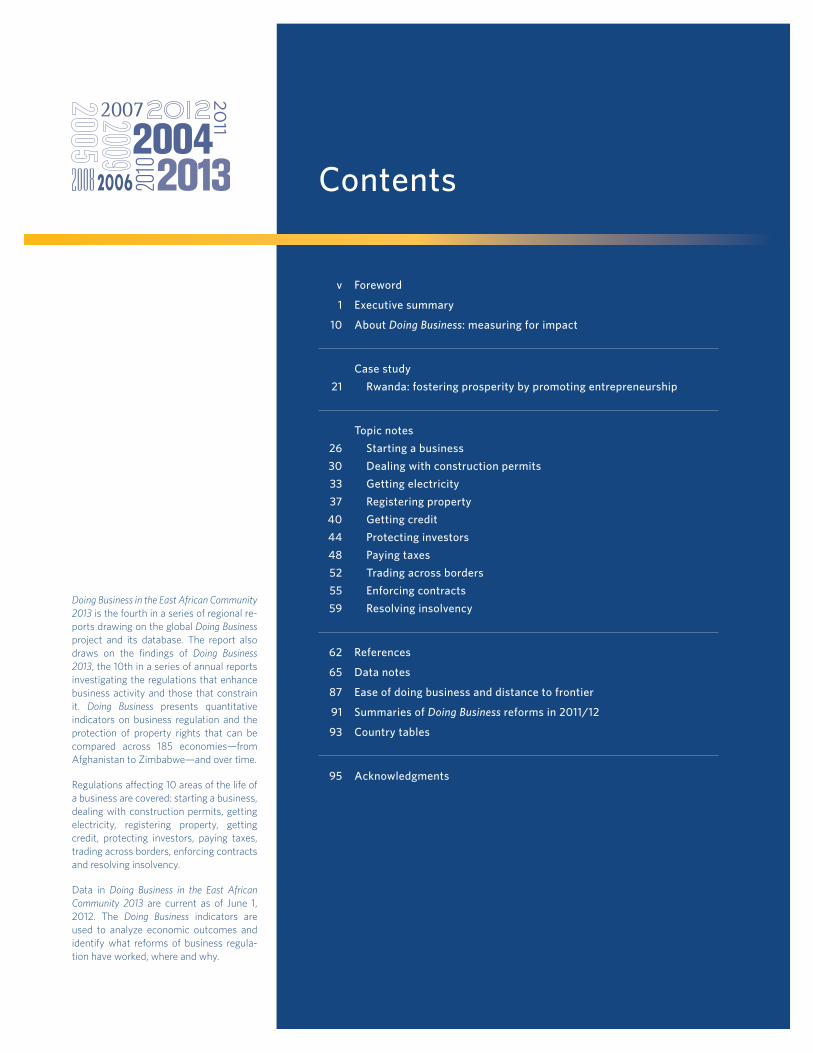
Contents
v Foreword
1 Executive summary
10 About Doing Business: measuring for impact
Case study
21 Rwanda: fostering prosperity by promoting entrepreneurship
Topic notes
26 Starting a business
30 Dealing with construction permits
33 Getting electricity
37 Registering property
40 Getting credit
44 Protecting investors
48 Paying taxes
52 Trading across borders
55 Enforcing contracts
59 Resolving insolvency
62 References
65 Data notes
87 Ease of doing business and distance to frontier
91 Summaries of Doing Business reforms in 2011/12
93 Country tables
95 Acknowledgments

In recent years the Doing Business project has helped put business regulatory reform
on the agenda of many countries—at all income levels. The project is premised on the
belief that good business regulation is of the utmost importance in spurring economic
growth, creating jobs and other opportunities and, ultimately, lifting people out of
poverty.
IFC’s East African Community Investment Climate Program and its partner in the pub-
lication of this report, TradeMark East Africa, are committed to helping countries in the
East African Community make regulation more efficient, transparent and predictable.
Creating an environment that enables the growth of small and medium-size enter-
prises is an integral part of the development agenda, with the ultimate goal being to lift
the standards of human development in the East African region.
With this in mind, we are pleased to present this report on doing business in the 5
economies of the East African Community, the fourth report in this series. Rapid inte-
gration presents an opportunity to boost competitiveness in each of these countries
and in the trading bloc as a whole. We hope that the report will be helpful for govern-
ments, the private sector and civil society in efforts to unleash the potential of the
private sector and regional integration in the fight against poverty.
Janamitra Devan
Vice President and Head of Network
Financial & Private Sector Development
World Bank Group
Frank Matsaert
Chief Executive Officer
TradeMark East Africa
Foreword
v

1
Executive summary
Over the past 8 years the 5 members of
the East African Community (EAC)—
Burundi, Kenya, Rwanda, Tanzania and
Uganda—have continued to take steps
to make it easier for local firms to start
up and operate (box 1.1). Driving these ef-
forts has been a recognition that regional
integration alone is not enough to spur
growth. The EAC needs an investment
climate—including a business regulatory
environment—that is well suited to scal-
ing up trade and investment and can act
as a catalyst to modernize the regional
economy. Improving the investment cli-
mate in the EAC is therefore an essential
ingredient for successful integration—the
foundation for expanding business activ-
ity, boosting competitiveness, spurring
growth and, ultimately, supporting hu-
man development.
Continual improvement of the business
environment is important for countries
seeking to benefit from greater trade and
investment through regional integration.
The common market protocol, which en-
tered into force in July 2010, is supposed
to be fully implemented by December
2015. By that time the EAC is expected
to have achieved the “4 freedoms”—free
movement of people, goods, services
and capital within the common market.
Several committees were set up to work
on realizing each of these freedoms, such
as the Monetary Affairs Committee,
which is overseeing the harmonization
of monetary and exchange rate policies,
and the Committee on Fiscal Affairs,
which is in charge of the harmonization
of both tax policy and administrative
processes. In addition, the secretariat is
working on a monitoring system to track
commitments made under the common
market protocol and flag areas where
implementation is slow.
Among the main tasks of the committees
is to set up and implement coherent,
broad-based regional reform programs to
improve the investment climate of the re-
gion as a whole and make it an attractive
destination for external investors. The
development of regional strategies and
frameworks that connect and streamline
national reform programs is an indis-
pensable condition for a well-functioning
common market that can attract foreign
investment. A lack of coordination among
All 5 economies of the East African Community (EAC) implemented institutional or regulatory reforms making it easier to do business in 2011/12—just as in the previous year. The 9 reforms were spread across 8 areas of regulation measured by Doing Business. Worldwide, 108 economies implemented 201 reforms making it easier to do business in 2011/12.
The EAC economies have an average ranking on the ease of doing business of 117 (among 185 economies globally). But there is great variation among them—from Rwanda at 52 in the global ranking to Burundi at 159. This wide variation in business regulations is among the issues that the EAC needs to tackle to achieve the desired level of integration.
While the regional average ranking is less than ideal, if a hypothetical EAC economy were to adopt the region’s best regulatory practices in each area measured by Doing Business, it would stand at 26 in the global ranking on the ease of doing business.
Burundi was among the world’s most active economies in implementing regulatory reforms in 2011/12. It implemented policy changes in 4 areas measured by Doing Business: starting a business, dealing with construction permits, registering property and trading across borders.
BOX 1.1 MAIN FINDINGS SINCE THE FIRST DOING BUSINESS REPORT
Over the past 8 years the 5 EAC economies implemented a total of 74 institutional
or regulatory reforms improving the business environment for local entrepreneurs.
Globally, business regulatory practices have been slowly converging as economies
with initially poor performance narrow the gap with better performers. Among the
50 economies with the biggest improvements since 2005, the largest share—a
third—are in Sub-Saharan Africa. Within the EAC, Rwanda is the country that has
narrowed the gap the most, followed by Burundi.
The EAC has achieved greater convergence in the complexity and cost of regulatory
processes than in the strength of legal institutions relevant to business regulation.
Of the 74 institutional or regulatory reforms implemented by EAC economies in
the past 8 years, the largest numbers were in the areas of starting a business (11),
registering property (9) and dealing with construction permits (8).
DOING BUSINESS IN THE EAST AFRICAN COMMUNITY 20132
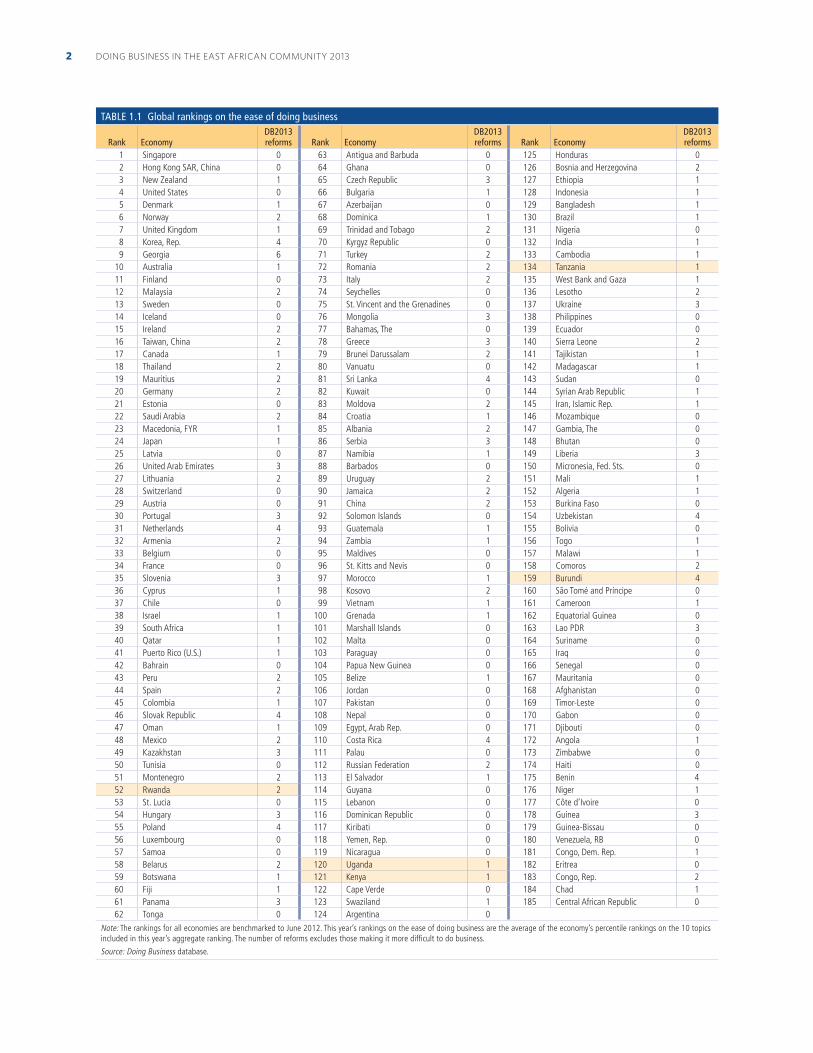
TABLE 1.1 Global rankings on the ease of doing business
Rank EconomyDB2013 reforms Rank Economy
DB2013 reforms Rank Economy
DB2013 reforms
1 Singapore 0 63 Antigua and Barbuda 0 125 Honduras 02 Hong Kong SAR, China 0 64 Ghana 0 126 Bosnia and Herzegovina 23 New Zealand 1 65 Czech Republic 3 127 Ethiopia 14 United States 0 66 Bulgaria 1 128 Indonesia 15 Denmark 1 67 Azerbaijan 0 129 Bangladesh 16 Norway 2 68 Dominica 1 130 Brazil 17 United Kingdom 1 69 Trinidad and Tobago 2 131 Nigeria 08 Korea, Rep. 4 70 Kyrgyz Republic 0 132 India 19 Georgia 6 71 Turkey 2 133 Cambodia 1
10 Australia 1 72 Romania 2 134 Tanzania 111 Finland 0 73 Italy 2 135 West Bank and Gaza 112 Malaysia 2 74 Seychelles 0 136 Lesotho 213 Sweden 0 75 St. Vincent and the Grenadines 0 137 Ukraine 314 Iceland 0 76 Mongolia 3 138 Philippines 015 Ireland 2 77 Bahamas, The 0 139 Ecuador 016 Taiwan, China 2 78 Greece 3 140 Sierra Leone 217 Canada 1 79 Brunei Darussalam 2 141 Tajikistan 118 Thailand 2 80 Vanuatu 0 142 Madagascar 119 Mauritius 2 81 Sri Lanka 4 143 Sudan 020 Germany 2 82 Kuwait 0 144 Syrian Arab Republic 121 Estonia 0 83 Moldova 2 145 Iran, Islamic Rep. 122 Saudi Arabia 2 84 Croatia 1 146 Mozambique 023 Macedonia, FYR 1 85 Albania 2 147 Gambia, The 024 Japan 1 86 Serbia 3 148 Bhutan 025 Latvia 0 87 Namibia 1 149 Liberia 326 United Arab Emirates 3 88 Barbados 0 150 Micronesia, Fed. Sts. 027 Lithuania 2 89 Uruguay 2 151 Mali 128 Switzerland 0 90 Jamaica 2 152 Algeria 129 Austria 0 91 China 2 153 Burkina Faso 030 Portugal 3 92 Solomon Islands 0 154 Uzbekistan 431 Netherlands 4 93 Guatemala 1 155 Bolivia 032 Armenia 2 94 Zambia 1 156 Togo 133 Belgium 0 95 Maldives 0 157 Malawi 134 France 0 96 St. Kitts and Nevis 0 158 Comoros 235 Slovenia 3 97 Morocco 1 159 Burundi 436 Cyprus 1 98 Kosovo 2 160 São Tomé and Príncipe 037 Chile 0 99 Vietnam 1 161 Cameroon 138 Israel 1 100 Grenada 1 162 Equatorial Guinea 039 South Africa 1 101 Marshall Islands 0 163 Lao PDR 340 Qatar 1 102 Malta 0 164 Suriname 041 Puerto Rico (U.S.) 1 103 Paraguay 0 165 Iraq 042 Bahrain 0 104 Papua New Guinea 0 166 Senegal 043 Peru 2 105 Belize 1 167 Mauritania 044 Spain 2 106 Jordan 0 168 Afghanistan 045 Colombia 1 107 Pakistan 0 169 Timor-Leste 046 Slovak Republic 4 108 Nepal 0 170 Gabon 047 Oman 1 109 Egypt, Arab Rep. 0 171 Djibouti 048 Mexico 2 110 Costa Rica 4 172 Angola 149 Kazakhstan 3 111 Palau 0 173 Zimbabwe 050 Tunisia 0 112 Russian Federation 2 174 Haiti 051 Montenegro 2 113 El Salvador 1 175 Benin 452 Rwanda 2 114 Guyana 0 176 Niger 153 St. Lucia 0 115 Lebanon 0 177 Côte d’Ivoire 054 Hungary 3 116 Dominican Republic 0 178 Guinea 355 Poland 4 117 Kiribati 0 179 Guinea-Bissau 056 Luxembourg 0 118 Yemen, Rep. 0 180 Venezuela, RB 057 Samoa 0 119 Nicaragua 0 181 Congo, Dem. Rep. 158 Belarus 2 120 Uganda 1 182 Eritrea 059 Botswana 1 121 Kenya 1 183 Congo, Rep. 260 Fiji 1 122 Cape Verde 0 184 Chad 161 Panama 3 123 Swaziland 1 185 Central African Republic 062 Tonga 0 124 Argentina 0
Note: The rankings for all economies are benchmarked to June 2012. This year’s rankings on the ease of doing business are the average of the economy’s percentile rankings on the 10 topics included in this year’s aggregate ranking. The number of reforms excludes those making it more difficult to do business.
Source: Doing Business database.
3EXECUTIVE SUMMARY
member countries and the implementa-
tion of “isolated” national reforms—which
often focus on short-term gains and fail to
consider the impact on the region—can
hinder progress in fully implementing the
common market. Conversely, continual
exchange among different authorities
across countries, the implementation of
an agreed-on regional reform agenda and
a focus on common goals and objectives
create synergies and help the region as a
whole to improve its investment climate.
Fostering economic growth by tapping
the potential of the private sector is
among the main objectives of the fourth
EAC development strategy.1 In addition
to increasing institutional coordination,
other important steps to achieve this
objective are better integrating small and
medium-size enterprises into the financial
sector and creating business-friendly ad-
ministrative structures and tax regimes.
Additional challenges are to ensure the
availability of reliable data and statistics
and to implement credible surveillance
and enforcement mechanisms, goals
restated at a January 2013 workshop in
Arusha, Tanzania, on the implications of
the planned monetary union for partner
states’ fiscal policies.
Recognizing the importance of creating
a well-functioning regulatory framework
that is transparent and not excessively
burdensome for companies, the EAC is
determined to continue its steady pace
of reform. This fourth edition of the Doing
Business in the East African Community
report shows that in 2011/12, for the sec-
ond year in a row, all 5 EAC economies
implemented at least 1 institutional or
regulatory reform making it easier to do
business—9 reforms in total (table 1.1).
In Sub-Saharan Africa 61% of economies
implemented reforms improving their
business regulatory environment as mea-
sured by Doing Business.
The Doing Business data can help inform
the policy debate around business regula-
tory reforms and within the context of
the common market. Through indicators
benchmarking 185 economies, Doing
Business measures and tracks changes in
the regulations applying to domestic small
and medium-size companies in 11 areas
in their life cycle. This year’s aggregate
ranking on the ease of doing business is
based on indicator sets that measure and
benchmark regulations affecting 10 of
those areas: starting a business, dealing
with construction permits, getting elec-
tricity, registering property, getting credit,
protecting investors, paying taxes, trading
across borders, enforcing contracts and
resolving insolvency. Doing Business also
documents regulations on employing
workers, which are not included in this
year’s aggregate ranking or in the count of
reforms. Regional Doing Business reports
capture differences in business regula-
tions and their enforcement across econ-
omies within a single region. They provide
data on the ease of doing business, rank
each economy and recommend reforms
to improve performance in each of the
areas measured by Doing Business.
The economies that rank highest on the
ease of doing business are not those
where there is no regulation—but those
where governments have managed to
create rules that facilitate interactions
in the marketplace without needlessly
hindering the development of the private
sector. In essence, Doing Business is
about SMART business regulations—
Streamlined, Meaningful, Adaptable,
Relevant, Transparent—not necessarily
fewer regulations (see figure 2.1 in the
chapter “About Doing Business”).
HOW DO EAC ECONOMIES COMPARE IN BUSINESS REGULATIONS?Doing Business encompasses 2 types of in-
dicators: indicators relating to the strength
of legal institutions relevant to business
regulation and indicators relating to the
complexity and cost of regulatory processes.
Those in the first group focus on the legal
and regulatory framework for getting
credit, protecting investors, enforcing
contracts and resolving insolvency. Those
in the second focus on the cost and effi-
ciency of regulatory processes for starting
a business, dealing with construction
permits, getting electricity, registering
property, paying taxes and trading across
borders. Based on time-and-motion case
studies from the perspective of the busi-
ness, these indicators measure the proce-
dures, time and cost required to complete
a transaction in accordance with relevant
regulations. (For a detailed explanation of
the Doing Business methodology, see the
data notes and the chapter “About Doing
Business.”)
Economies that rank high on the ease of
doing business tend to combine efficient
regulatory processes with strong legal
institutions that protect property and
investor rights. Entrepreneurs in the EAC
tend to face both weaker legal institutions
and more complex and costly regulatory
processes compared with global averages
and with averages for more developed
economies (figure 1.1). Yet EAC econo-
mies have stronger legal institutions for
enforcing contracts, protecting investors
and resolving insolvency on average than
the broader region of Sub-Saharan Africa.
Despite the reform efforts of all 5 member
economies, the EAC’s average ranking on
the ease of doing business has remained
fairly constant over the past 4 years, at
around 117. This is a clear indication that
critical obstacles to entrepreneurial activ-
ity remain and that economies in other re-
gions have picked up the pace in improving
business regulation. But good regulatory
practices do exist in the EAC. Indeed, if a
hypothetical EAC economy were to adopt
the best practices among partner states as
measured by all Doing Business indicators,
it would stand at 26 in the global ranking
on the ease of doing business.
Comparison of the performance of differ-
ent regional blocs on Doing Business indi-
cators may reveal unexpected strengths
in an area of business regulation—such
as a regulatory process that can be com-
pleted with a small number of procedures
in a few days and at a low cost. One area
where the EAC shows strong performance
is business start-up. To start a business in
the EAC requires only 8 procedures and
DOING BUSINESS IN THE EAST AFRICAN COMMUNITY 20134
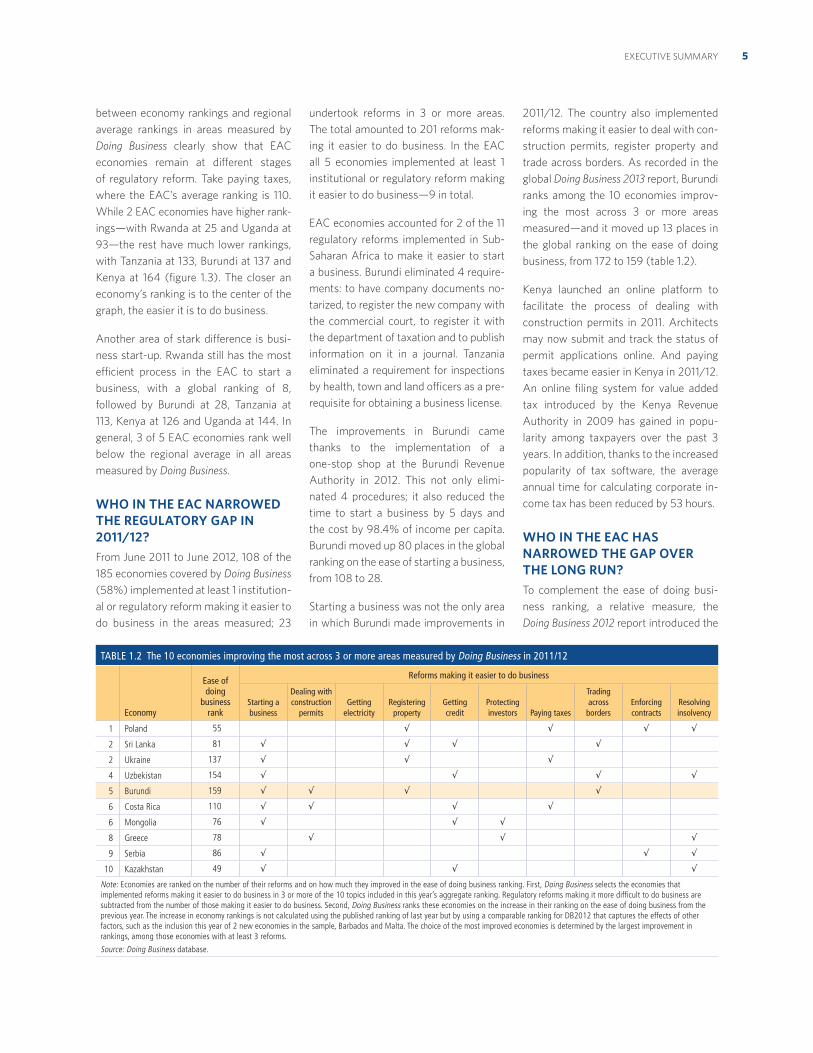
20 days on average. The EAC’s average
ranking on the ease of starting a business
is 84, higher than those of other regional
blocs in Africa—104 for the Southern
African Development Community (SADC),
110 for the Common Market for Eastern
and Southern Africa (COMESA) and 127
for the Economic Community of West
African States (ECOWAS) (figure 1.2).2
Comparison of the performance of
individual EAC economies with regional
average performance is also revealing.
The sometimes substantial differences
FIGURE 1.2 The EAC outperforms other regional blocs in Africa in some areas of regulation
Average global ranking, by Doing Business topic
Source: Doing Business database.
EAC
ECOWAS
SADC
Resolvinginsolvency
Enforcingcontracts
Tradingacrossborders
Payingtaxes
Protectinginvestors
Gettingcredit
Registeringproperty
Gettingelectricity
Dealingwith
constructionpermits
Startinga business
Ease of doing
business
1
185
EACSADC ECOWASCOMESA
COMESA
116
84112114115
120
111
74
10279 83
92
110
144
125103 107
125
127127
111122122
129
130
153
84103
135
106
112
112122
134
128
133133
127
104
110
127117128
151
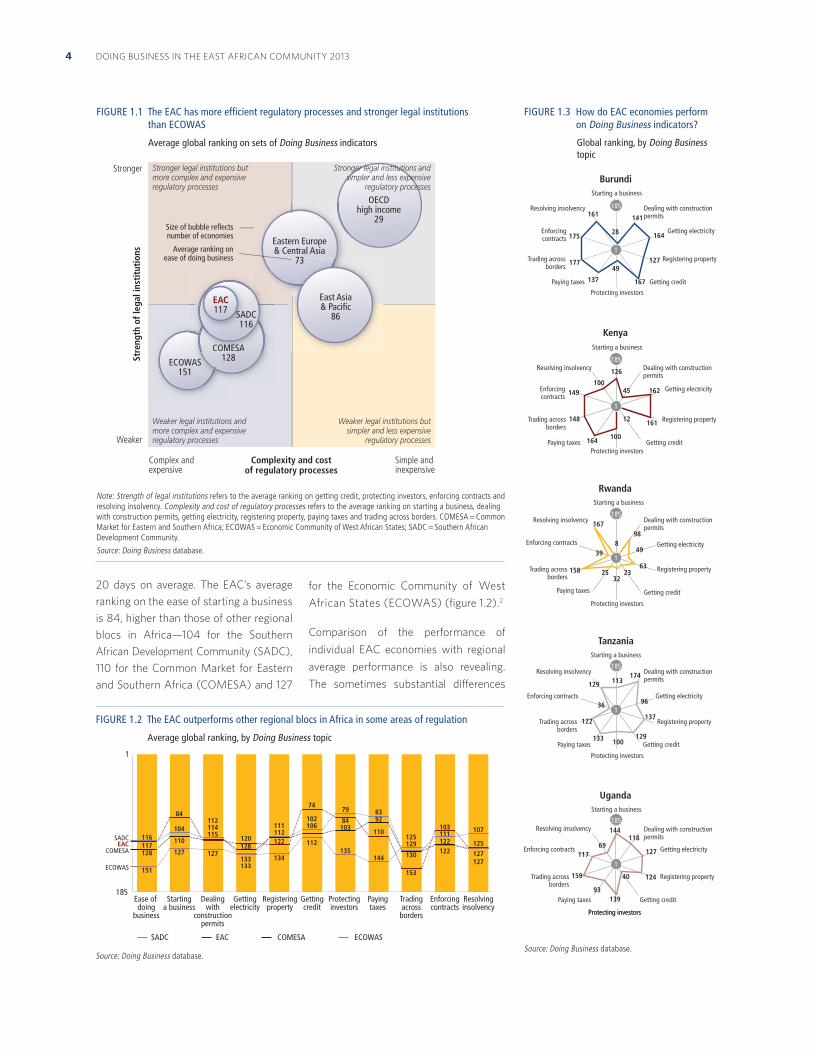
FIGURE 1.3 How do EAC economies perform on Doing Business indicators?
Global ranking, by Doing Business topic
Source: Doing Business database.
Uganda
185Starting a business
Protecting investors Protecting investors
Getting credit
Registering property
Dealing with construction permits
Getting electricity
Paying taxes
Trading acrossborders
Resolving insolvency
Enforcing contracts
144118
127
12440
13993
159
11769
1
185
Tanzania
185
Starting a business
Protecting investors
Getting credit
Registering property
Dealing with construction permits
Getting electricity
Paying taxes
Trading across borders
Resolving insolvency
Enforcing contracts
1
113174
96
137
129100133
122
36
129
1
185
RwandaStarting a business
Protecting investors
Getting credit
Registering property
Dealing with construction permits
Getting electricity
Paying taxes
Trading acrossborders
Resolving insolvency
Enforcing contracts
16798
49
6323
3225
398
158
1
185
KenyaStarting a business
Protecting investors Getting credit
Registering property
Dealing with construction permits
Getting electricity
Paying taxes
Trading acrossborders
Resolving insolvency
Enforcing contracts
1
126
45 162
16112
100164
148
149100
1
185
BurundiStarting a business
Protecting investors
Getting credit
Registering property
Dealing with construction permits
Getting electricity
Paying taxes
Trading acrossborders
Resolving insolvency
Enforcing contracts
1
161
28
141
164
127
167
49
137
177
175
185
FIGURE 1.1 The EAC has more efficient regulatory processes and stronger legal institutions than ECOWAS
Average global ranking on sets of Doing Business indicators
Note: Strength of legal institutions refers to the average ranking on getting credit, protecting investors, enforcing contracts and resolving insolvency. Complexity and cost of regulatory processes refers to the average ranking on starting a business, dealing with construction permits, getting electricity, registering property, paying taxes and trading across borders. COMESA = Common Market for Eastern and Southern Africa; ECOWAS = Economic Community of West African States; SADC = Southern African Development Community.
Source: Doing Business database.
Stre
ngth
of l
egal
inst
itut
ions
Complexity and costof regulatory processes
Weaker
Stronger
Simple and inexpensive
Complex andexpensive
Stronger legal institutions but more complex and expensiveregulatory processes
Weaker legal institutions butsimpler and less expensive
regulatory processes
Weaker legal institutions andmore complex and expensive regulatory processes
Size of bubble reflectsnumber of economies
Average ranking onease of doing business
ECOWAS151
COMESA128
COMESA
OECDhigh income
29
Eastern Europe& Central Asia
73
East Asia& Pacific
86
EAC117 SADC
116
Stronger legal institutions andsimpler and less expensive
regulatory processes
5EXECUTIVE SUMMARY
between economy rankings and regional
average rankings in areas measured by
Doing Business clearly show that EAC
economies remain at different stages
of regulatory reform. Take paying taxes,
where the EAC’s average ranking is 110.
While 2 EAC economies have higher rank-
ings—with Rwanda at 25 and Uganda at
93—the rest have much lower rankings,
with Tanzania at 133, Burundi at 137 and
Kenya at 164 (figure 1.3). The closer an
economy’s ranking is to the center of the
graph, the easier it is to do business.
Another area of stark difference is busi-
ness start-up. Rwanda still has the most
efficient process in the EAC to start a
business, with a global ranking of 8,
followed by Burundi at 28, Tanzania at
113, Kenya at 126 and Uganda at 144. In
general, 3 of 5 EAC economies rank well
below the regional average in all areas
measured by Doing Business.
WHO IN THE EAC NARROWED THE REGULATORY GAP IN 2011/12? From June 2011 to June 2012, 108 of the
185 economies covered by Doing Business
(58%) implemented at least 1 institution-
al or regulatory reform making it easier to
do business in the areas measured; 23
undertook reforms in 3 or more areas.
The total amounted to 201 reforms mak-
ing it easier to do business. In the EAC
all 5 economies implemented at least 1
institutional or regulatory reform making
it easier to do business—9 in total.
EAC economies accounted for 2 of the 11
regulatory reforms implemented in Sub-
Saharan Africa to make it easier to start
a business. Burundi eliminated 4 require-
ments: to have company documents no-
tarized, to register the new company with
the commercial court, to register it with
the department of taxation and to publish
information on it in a journal. Tanzania
eliminated a requirement for inspections
by health, town and land officers as a pre-
requisite for obtaining a business license.
The improvements in Burundi came
thanks to the implementation of a
one-stop shop at the Burundi Revenue
Authority in 2012. This not only elimi-
nated 4 procedures; it also reduced the
time to start a business by 5 days and
the cost by 98.4% of income per capita.
Burundi moved up 80 places in the global
ranking on the ease of starting a business,
from 108 to 28.
Starting a business was not the only area
in which Burundi made improvements in
2011/12. The country also implemented
reforms making it easier to deal with con-
struction permits, register property and
trade across borders. As recorded in the
global Doing Business 2013 report, Burundi
ranks among the 10 economies improv-
ing the most across 3 or more areas
measured—and it moved up 13 places in
the global ranking on the ease of doing
business, from 172 to 159 (table 1.2).
Kenya launched an online platform to
facilitate the process of dealing with
construction permits in 2011. Architects
may now submit and track the status of
permit applications online. And paying
taxes became easier in Kenya in 2011/12.
An online filing system for value added
tax introduced by the Kenya Revenue
Authority in 2009 has gained in popu-
larity among taxpayers over the past 3
years. In addition, thanks to the increased
popularity of tax software, the average
annual time for calculating corporate in-
come tax has been reduced by 53 hours.
WHO IN THE EAC HAS NARROWED THE GAP OVER THE LONG RUN?To complement the ease of doing busi-
ness ranking, a relative measure, the
Doing Business 2012 report introduced the
TABLE 1.2 The 10 economies improving the most across 3 or more areas measured by Doing Business in 2011/12
Economy
Ease of doing
business rank
Reforms making it easier to do business
Starting a business
Dealing with construction
permitsGetting
electricityRegistering
propertyGetting credit
Protecting investors Paying taxes
Trading across borders
Enforcing contracts
Resolving insolvency
1 Poland 55
2 Sri Lanka 81
2 Ukraine 137
4 Uzbekistan 154
5 Burundi 159
6 Costa Rica 110
6 Mongolia 76
8 Greece 78
9 Serbia 86
10 Kazakhstan 49
Note: Economies are ranked on the number of their reforms and on how much they improved in the ease of doing business ranking. First, Doing Business selects the economies that implemented reforms making it easier to do business in 3 or more of the 10 topics included in this year’s aggregate ranking. Regulatory reforms making it more difficult to do business are subtracted from the number of those making it easier to do business. Second, Doing Business ranks these economies on the increase in their ranking on the ease of doing business from the previous year. The increase in economy rankings is not calculated using the published ranking of last year but by using a comparable ranking for DB2012 that captures the effects of other factors, such as the inclusion this year of 2 new economies in the sample, Barbados and Malta. The choice of the most improved economies is determined by the largest improvement in rankings, among those economies with at least 3 reforms.
Source: Doing Business database.
DOING BUSINESS IN THE EAST AFRICAN COMMUNITY 20136
distance to frontier, an absolute measure
of business regulatory efficiency. This
measure aids in assessing how much the
regulatory environment for local entre-
preneurs improves in absolute terms over
time by showing the distance of each
economy to the “frontier,” which repre-
sents the best performance observed
on each of the Doing Business indicators
across all economies and years included
since 2005. The measure is normalized
to range between 0 and 100, with 100
representing the frontier. A higher score
therefore indicates a more efficient busi-
ness regulatory system (for a detailed
description of the methodology, see the
chapter on the ease of doing business and
distance to frontier).
Analysis based on the distance to fron-
tier measure shows that the burden of
regulation has declined since 2005 in
the areas measured by Doing Business.
On average the 174 economies covered
by Doing Business since that year are
today closer to the frontier in regulatory
practice. In 2005 these economies were
46 percentage points from the frontier
on average, with the closest economy 10
percentage points away and the furthest
one 74 percentage points away. Now
these 174 economies are 40 percentage
points from the frontier on average, with
the closest economy 8 percentage points
away and the furthest economy 69 per-
centage points away. OECD high-income
economies are closest to the frontier on
average. But other world regions are nar-
rowing the gap—and so are the EAC and
other African regional blocs (figure 1.4).
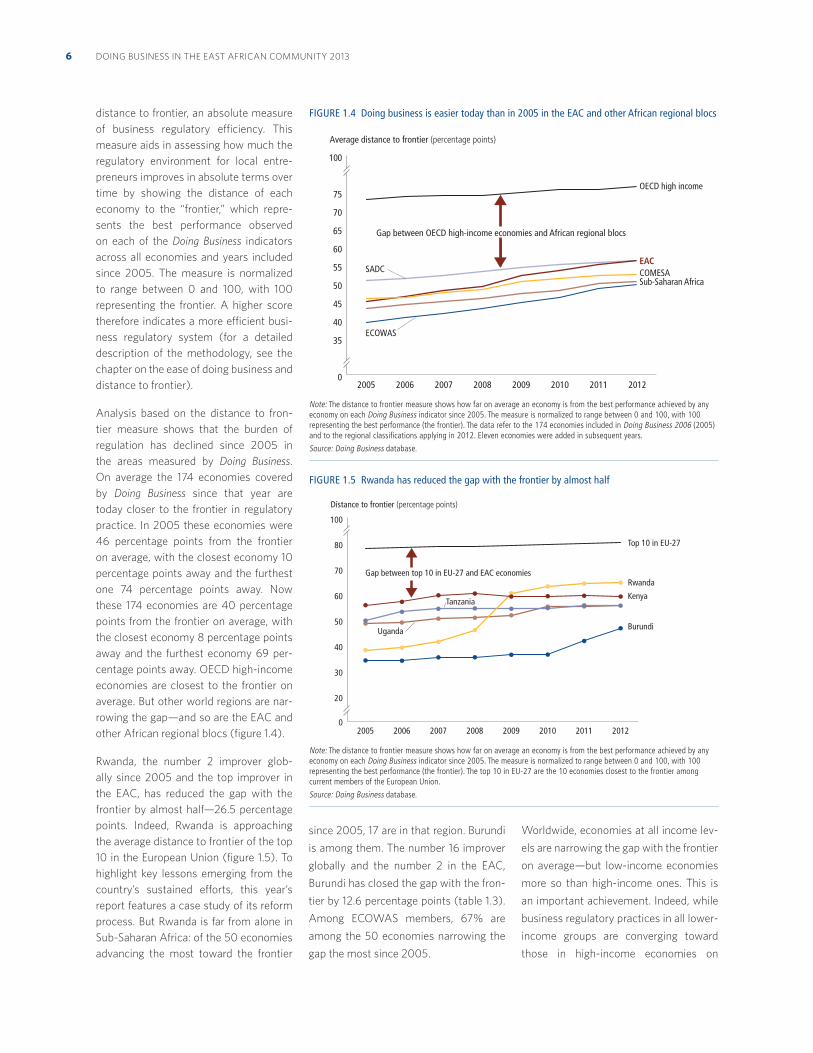
Rwanda, the number 2 improver glob-
ally since 2005 and the top improver in
the EAC, has reduced the gap with the
frontier by almost half—26.5 percentage
points. Indeed, Rwanda is approaching
the average distance to frontier of the top
10 in the European Union (figure 1.5). To
highlight key lessons emerging from the
country’s sustained efforts, this year’s
report features a case study of its reform
process. But Rwanda is far from alone in
Sub-Saharan Africa: of the 50 economies
advancing the most toward the frontier
since 2005, 17 are in that region. Burundi
is among them. The number 16 improver
globally and the number 2 in the EAC,
Burundi has closed the gap with the fron-
tier by 12.6 percentage points (table 1.3).
Among ECOWAS members, 67% are
among the 50 economies narrowing the
gap the most since 2005.
Worldwide, economies at all income lev-
els are narrowing the gap with the frontier
on average—but low-income economies
more so than high-income ones. This is
an important achievement. Indeed, while
business regulatory practices in all lower-
income groups are converging toward
those in high-income economies on
FIGURE 1.4 Doing business is easier today than in 2005 in the EAC and other African regional blocs
Note: The distance to frontier measure shows how far on average an economy is from the best performance achieved by any economy on each Doing Business indicator since 2005. The measure is normalized to range between 0 and 100, with 100 representing the best performance (the frontier). The data refer to the 174 economies included in Doing Business 2006 (2005) and to the regional classifications applying in 2012. Eleven economies were added in subsequent years.
Source: Doing Business database.
0
35
40
45
50
55
60
65
70
75
100
20122011201020092008200720062005
Gap between OECD high-income economies and African regional blocs
OECD high income
ECOWAS
COMESASADCEAC
Sub-Saharan Africa
Average distance to frontier (percentage points)
FIGURE 1.5 Rwanda has reduced the gap with the frontier by almost half
Note: The distance to frontier measure shows how far on average an economy is from the best performance achieved by any economy on each Doing Business indicator since 2005. The measure is normalized to range between 0 and 100, with 100 representing the best performance (the frontier). The top 10 in EU-27 are the 10 economies closest to the frontier among current members of the European Union.
Source: Doing Business database.
0
20
30
40
50
60
70
80
100
20122011201020092008200720062005
Gap between top 10 in EU-27 and EAC economies
Top 10 in EU-27
Rwanda
KenyaTanzania
Uganda Burundi
Distance to frontier (percentage points)
7EXECUTIVE SUMMARY
average, low-income economies have re-
duced the gap the most, by 4 percentage
points since 2005. Lower-middle-income
economies have closed the gap with
high-income economies by 3 percentage
points and upper-middle-income econo-
mies by 2 percentage points. This conver-
gence is far from complete, however.
In improving business regulatory practices
since 2005, the EAC has achieved greater
convergence in the complexity and cost of
regulatory processes than in the strength
of legal institutions relevant to business
regulation. Of the 74 institutional or
regulatory reforms implemented by EAC
economies in the past 8 years, the largest
numbers were in the areas of starting a
business (11), registering property (9) and
dealing with construction permits (8).
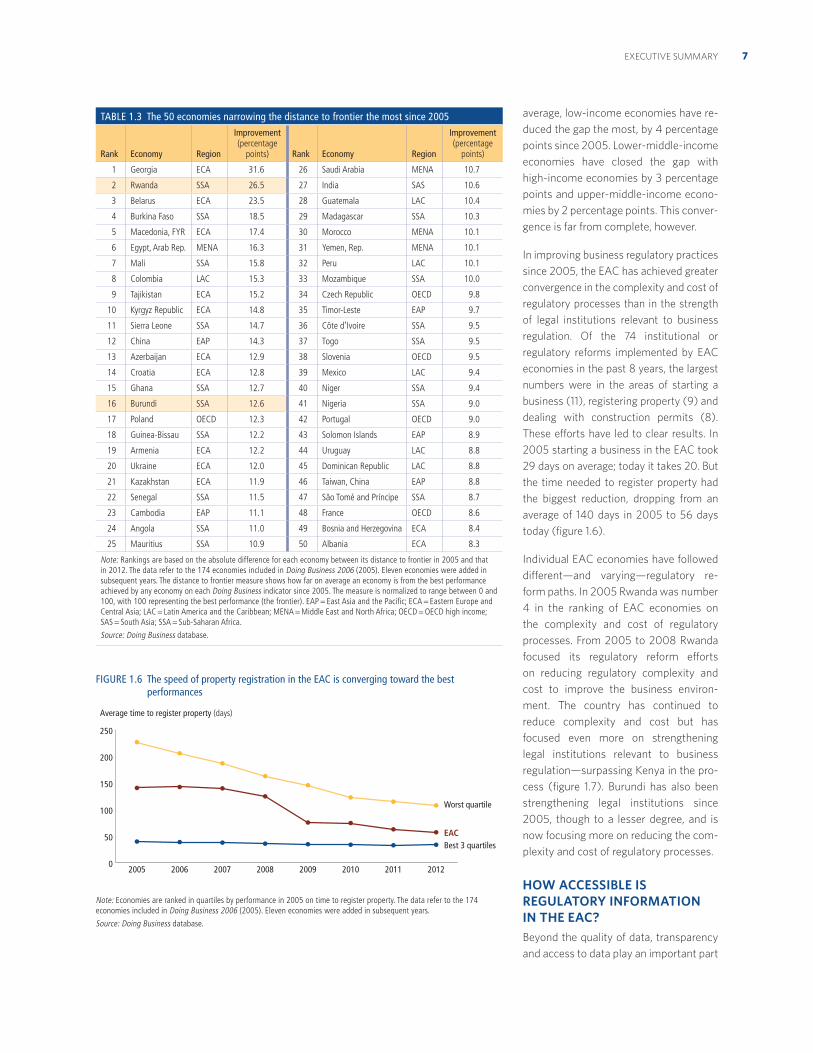
These efforts have led to clear results. In
2005 starting a business in the EAC took
29 days on average; today it takes 20. But
the time needed to register property had
the biggest reduction, dropping from an
average of 140 days in 2005 to 56 days
today (figure 1.6).
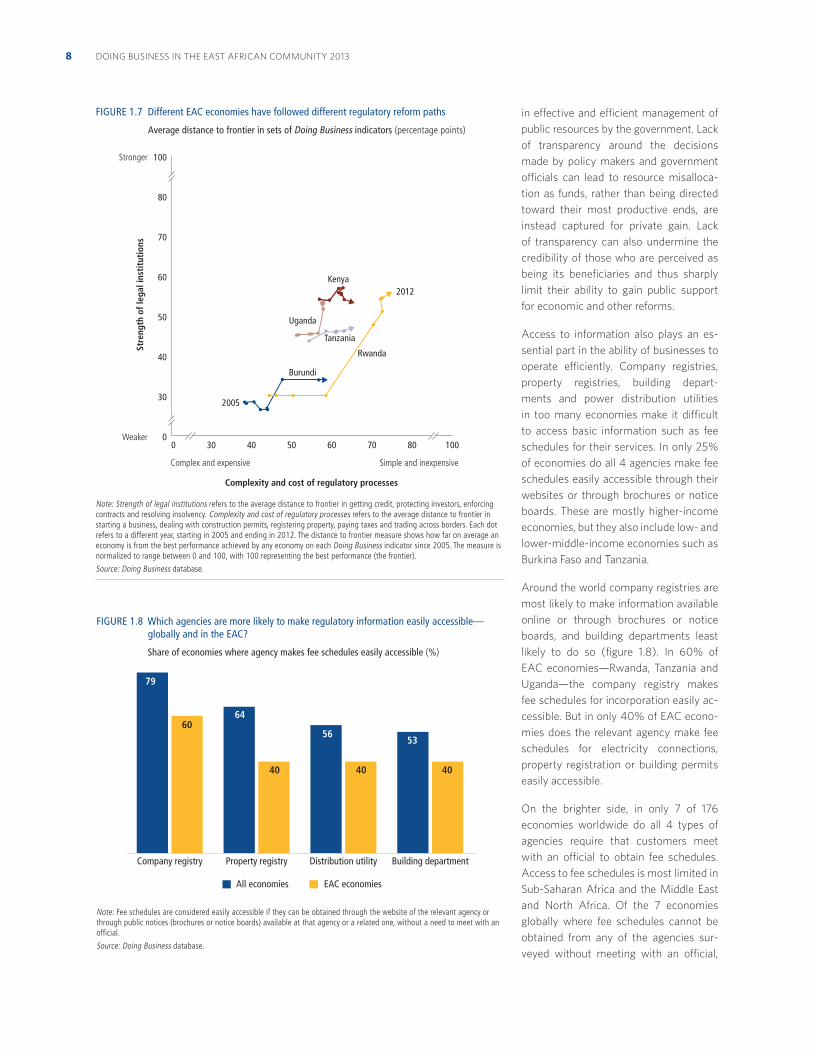
Individual EAC economies have followed
different—and varying—regulatory re-
form paths. In 2005 Rwanda was number
4 in the ranking of EAC economies on
the complexity and cost of regulatory
processes. From 2005 to 2008 Rwanda
focused its regulatory reform efforts
on reducing regulatory complexity and
cost to improve the business environ-
ment. The country has continued to
reduce complexity and cost but has
focused even more on strengthening
legal institutions relevant to business
regulation—surpassing Kenya in the pro-
cess (figure 1.7). Burundi has also been
strengthening legal institutions since
2005, though to a lesser degree, and is
now focusing more on reducing the com-
plexity and cost of regulatory processes.
HOW ACCESSIBLE IS REGULATORY INFORMATION IN THE EAC? Beyond the quality of data, transparency
and access to data play an important part
TABLE 1.3 The 50 economies narrowing the distance to frontier the most since 2005
Rank Economy Region
Improvement (percentage
points) Rank Economy Region
Improvement (percentage
points)
1 Georgia ECA 31.6 26 Saudi Arabia MENA 10.7
2 Rwanda SSA 26.5 27 India SAS 10.6
3 Belarus ECA 23.5 28 Guatemala LAC 10.4
4 Burkina Faso SSA 18.5 29 Madagascar SSA 10.3
5 Macedonia, FYR ECA 17.4 30 Morocco MENA 10.1
6 Egypt, Arab Rep. MENA 16.3 31 Yemen, Rep. MENA 10.1
7 Mali SSA 15.8 32 Peru LAC 10.1
8 Colombia LAC 15.3 33 Mozambique SSA 10.0
9 Tajikistan ECA 15.2 34 Czech Republic OECD 9.8
10 Kyrgyz Republic ECA 14.8 35 Timor-Leste EAP 9.7
11 Sierra Leone SSA 14.7 36 Côte d’Ivoire SSA 9.5
12 China EAP 14.3 37 Togo SSA 9.5
13 Azerbaijan ECA 12.9 38 Slovenia OECD 9.5
14 Croatia ECA 12.8 39 Mexico LAC 9.4
15 Ghana SSA 12.7 40 Niger SSA 9.4
16 Burundi SSA 12.6 41 Nigeria SSA 9.0
17 Poland OECD 12.3 42 Portugal OECD 9.0
18 Guinea-Bissau SSA 12.2 43 Solomon Islands EAP 8.9
19 Armenia ECA 12.2 44 Uruguay LAC 8.8
20 Ukraine ECA 12.0 45 Dominican Republic LAC 8.8
21 Kazakhstan ECA 11.9 46 Taiwan, China EAP 8.8
22 Senegal SSA 11.5 47 São Tomé and Príncipe SSA 8.7
23 Cambodia EAP 11.1 48 France OECD 8.6
24 Angola SSA 11.0 49 Bosnia and Herzegovina ECA 8.4
25 Mauritius SSA 10.9 50 Albania ECA 8.3
Note: Rankings are based on the absolute difference for each economy between its distance to frontier in 2005 and that in 2012. The data refer to the 174 economies included in Doing Business 2006 (2005). Eleven economies were added in subsequent years. The distance to frontier measure shows how far on average an economy is from the best performance achieved by any economy on each Doing Business indicator since 2005. The measure is normalized to range between 0 and 100, with 100 representing the best performance (the frontier). EAP = East Asia and the Pacific; ECA = Eastern Europe and Central Asia; LAC = Latin America and the Caribbean; MENA = Middle East and North Africa; OECD = OECD high income; SAS = South Asia; SSA = Sub-Saharan Africa.
Source: Doing Business database.
FIGURE 1.6 The speed of property registration in the EAC is converging toward the best performances
Note: Economies are ranked in quartiles by performance in 2005 on time to register property. The data refer to the 174 economies included in Doing Business 2006 (2005). Eleven economies were added in subsequent years.
Source: Doing Business database.
0
50
100
150
200
250
20122011201020092008200720062005
Average time to register property (days)
Worst quartile
Best 3 quartilesEAC
DOING BUSINESS IN THE EAST AFRICAN COMMUNITY 20138
in effective and efficient management of
public resources by the government. Lack
of transparency around the decisions
made by policy makers and government
officials can lead to resource misalloca-
tion as funds, rather than being directed
toward their most productive ends, are
instead captured for private gain. Lack
of transparency can also undermine the
credibility of those who are perceived as
being its beneficiaries and thus sharply
limit their ability to gain public support
for economic and other reforms.
Access to information also plays an es-
sential part in the ability of businesses to
operate efficiently. Company registries,
property registries, building depart-
ments and power distribution utilities
in too many economies make it difficult
to access basic information such as fee
schedules for their services. In only 25%
of economies do all 4 agencies make fee
schedules easily accessible through their
websites or through brochures or notice
boards. These are mostly higher-income
economies, but they also include low- and
lower-middle-income economies such as
Burkina Faso and Tanzania.
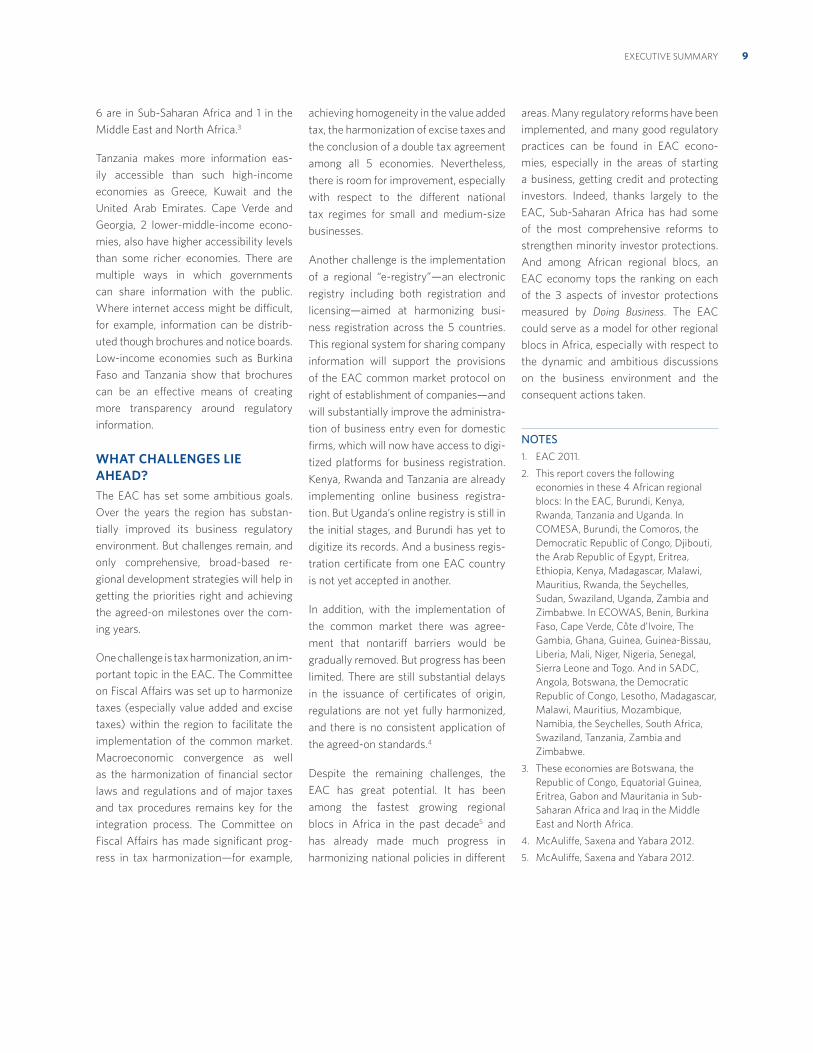
Around the world company registries are
most likely to make information available
online or through brochures or notice
boards, and building departments least
likely to do so (figure 1.8). In 60% of
EAC economies—Rwanda, Tanzania and
Uganda—the company registry makes
fee schedules for incorporation easily ac-
cessible. But in only 40% of EAC econo-
mies does the relevant agency make fee
schedules for electricity connections,
property registration or building permits
easily accessible.
On the brighter side, in only 7 of 176
economies worldwide do all 4 types of
agencies require that customers meet
with an official to obtain fee schedules.
Access to fee schedules is most limited in
Sub-Saharan Africa and the Middle East
and North Africa. Of the 7 economies
globally where fee schedules cannot be
obtained from any of the agencies sur-
veyed without meeting with an official,
FIGURE 1.7 Different EAC economies have followed different regulatory reform paths
Average distance to frontier in sets of Doing Business indicators (percentage points)
Note: Strength of legal institutions refers to the average distance to frontier in getting credit, protecting investors, enforcing contracts and resolving insolvency. Complexity and cost of regulatory processes refers to the average distance to frontier in starting a business, dealing with construction permits, registering property, paying taxes and trading across borders. Each dot refers to a different year, starting in 2005 and ending in 2012. The distance to frontier measure shows how far on average an economy is from the best performance achieved by any economy on each Doing Business indicator since 2005. The measure is normalized to range between 0 and 100, with 100 representing the best performance (the frontier).
Source: Doing Business database.
Stre
ngth
of l
egal
inst
itut
ions
Complexity and cost of regulatory processes
Weaker
Stronger
Simple and inexpensiveComplex and expensive
Uganda
2005
2012
Tanzania
Kenya
Burundi
0 30 40 50 60 70 80 1000
30
40
50
60
70
80
100
Rwanda
FIGURE 1.8 Which agencies are more likely to make regulatory information easily accessible—globally and in the EAC?
Share of economies where agency makes fee schedules easily accessible (%)
Note: Fee schedules are considered easily accessible if they can be obtained through the website of the relevant agency or through public notices (brochures or notice boards) available at that agency or a related one, without a need to meet with an official.
Source: Doing Business database.
Building departmentDistribution utilityProperty registryCompany registry
All economies EAC economies
79
6056
53
4040 40
64
9EXECUTIVE SUMMARY
6 are in Sub-Saharan Africa and 1 in the
Middle East and North Africa.3
Tanzania makes more information eas-
ily accessible than such high-income
economies as Greece, Kuwait and the
United Arab Emirates. Cape Verde and
Georgia, 2 lower-middle-income econo-
mies, also have higher accessibility levels
than some richer economies. There are
multiple ways in which governments
can share information with the public.
Where internet access might be difficult,
for example, information can be distrib-
uted though brochures and notice boards.
Low-income economies such as Burkina
Faso and Tanzania show that brochures
can be an effective means of creating
more transparency around regulatory
information.
WHAT CHALLENGES LIE AHEAD?The EAC has set some ambitious goals.
Over the years the region has substan-
tially improved its business regulatory
environment. But challenges remain, and
only comprehensive, broad-based re-
gional development strategies will help in
getting the priorities right and achieving
the agreed-on milestones over the com-
ing years.
One challenge is tax harmonization, an im-
portant topic in the EAC. The Committee
on Fiscal Affairs was set up to harmonize
taxes (especially value added and excise
taxes) within the region to facilitate the
implementation of the common market.
Macroeconomic convergence as well
as the harmonization of financial sector
laws and regulations and of major taxes
and tax procedures remains key for the
integration process. The Committee on
Fiscal Affairs has made significant prog-
ress in tax harmonization—for example,
achieving homogeneity in the value added
tax, the harmonization of excise taxes and
the conclusion of a double tax agreement
among all 5 economies. Nevertheless,
there is room for improvement, especially
with respect to the different national
tax regimes for small and medium-size
businesses.
Another challenge is the implementation
of a regional “e-registry”—an electronic
registry including both registration and
licensing—aimed at harmonizing busi-
ness registration across the 5 countries.
This regional system for sharing company
information will support the provisions
of the EAC common market protocol on
right of establishment of companies—and
will substantially improve the administra-
tion of business entry even for domestic
firms, which will now have access to digi-
tized platforms for business registration.
Kenya, Rwanda and Tanzania are already
implementing online business registra-
tion. But Uganda’s online registry is still in
the initial stages, and Burundi has yet to
digitize its records. And a business regis-
tration certificate from one EAC country
is not yet accepted in another.
In addition, with the implementation of
the common market there was agree-
ment that nontariff barriers would be
gradually removed. But progress has been
limited. There are still substantial delays
in the issuance of certificates of origin,
regulations are not yet fully harmonized,
and there is no consistent application of
the agreed-on standards.4
Despite the remaining challenges, the
EAC has great potential. It has been
among the fastest growing regional
blocs in Africa in the past decade5 and
has already made much progress in
harmonizing national policies in different
areas. Many regulatory reforms have been
implemented, and many good regulatory
practices can be found in EAC econo-
mies, especially in the areas of starting
a business, getting credit and protecting
investors. Indeed, thanks largely to the
EAC, Sub-Saharan Africa has had some
of the most comprehensive reforms to
strengthen minority investor protections.
And among African regional blocs, an
EAC economy tops the ranking on each
of the 3 aspects of investor protections
measured by Doing Business. The EAC
could serve as a model for other regional
blocs in Africa, especially with respect to
the dynamic and ambitious discussions
on the business environment and the
consequent actions taken.
NOTES
1. EAC 2011.
2. This report covers the following
economies in these 4 African regional
blocs: In the EAC, Burundi, Kenya,
Rwanda, Tanzania and Uganda. In
COMESA, Burundi, the Comoros, the
Democratic Republic of Congo, Djibouti,
the Arab Republic of Egypt, Eritrea,
Ethiopia, Kenya, Madagascar, Malawi,
Mauritius, Rwanda, the Seychelles,
Sudan, Swaziland, Uganda, Zambia and
Zimbabwe. In ECOWAS, Benin, Burkina
Faso, Cape Verde, Côte d’Ivoire, The
Gambia, Ghana, Guinea, Guinea-Bissau,
Liberia, Mali, Niger, Nigeria, Senegal,
Sierra Leone and Togo. And in SADC,
Angola, Botswana, the Democratic
Republic of Congo, Lesotho, Madagascar,
Malawi, Mauritius, Mozambique,
Namibia, the Seychelles, South Africa,
Swaziland, Tanzania, Zambia and
Zimbabwe.
3. These economies are Botswana, the
Republic of Congo, Equatorial Guinea,
Eritrea, Gabon and Mauritania in Sub-
Saharan Africa and Iraq in the Middle
East and North Africa.
4. McAuliffe, Saxena and Yabara 2012.
5. McAuliffe, Saxena and Yabara 2012.
10
About Doing Business:
measuring for impact
The private sector provides an estimated
90% of jobs in developing economies.1
Where government policies support a
dynamic business environment—with
firms making investments, creating jobs
and increasing productivity—all people
have greater opportunities. A growing
body of evidence suggests that policy
makers seeking to strengthen the private
sector need to pay attention not only to
macroeconomic factors but also to the
quality of laws, regulations and insti-
tutional arrangements that shape daily
economic life.2
Doing Business 2013 is the 10th in a series
of annual reports. When the first report
was produced, in 2003, there were few
globally available and regularly updated
indicators for monitoring such micro-
economic issues as business regulations
affecting local firms. Earlier efforts from
the 1980s drew on perceptions data, but
these expert or business surveys focused
on broad aspects of the business environ-
ment and often captured the experiences
of businesses. These surveys also lacked
the specificity and cross-country compa-
rability that Doing Business provides—by
focusing on well-defined transactions,
laws and institutions rather than generic,
perceptions-based questions on the busi-
ness environment.
Doing Business seeks to measure business
regulations for domestic firms through an
objective lens. The project looks primar-
ily at small and medium-size companies
in the largest business city. Based on
standardized case studies, it presents
quantitative indicators on the regulations
that apply to firms at different stages
of their life cycle. The results for each
economy can be compared with those for
184 other economies and over time.
Over the years the choice of indicators for
Doing Business has been guided by a rich
pool of data collected through the World
Bank Enterprise Surveys. These data
highlight the main obstacles to business
activity as reported by entrepreneurs in
well over 100 economies. Among the
factors that the surveys have identified as
important to businesses have been taxes
(tax administration as well as tax rates)
and electricity—inspiring the design of
the paying taxes and getting electricity
indicators. In addition, the design of the
Doing Business indicators has drawn
on theoretical insights gleaned from
extensive research literature.3 The Doing
Business methodology makes it possible
to update the indicators in a relatively
inexpensive and replicable way.
The Doing Business methodology is also
responsive to the needs of policy makers.
Rules and regulations are under the direct
control of policy makers—and policy
makers intending to change the experi-
ence and behavior of businesses will
often start by changing rules and regula-
tions that affect them. Doing Business
goes beyond identifying that a problem
exists and points to specific regulations
or regulatory procedures that may lend
themselves to regulatory reform. And
its quantitative measures of business
regulation enable research on how spe-
cific regulations affect firm behavior and
economic outcomes.
The first Doing Business report covered 5
topics and 133 economies. This year’s re-
port covers 11 topics and 185 economies.
11ABOUT DOING BUSINESS: MEASURING FOR IMPACT
Ten topics are included in the aggregate
ranking on the ease of doing business,
and 9 in the distance to frontier measure.4
The project has benefited from feedback
from governments, academics, practi-
tioners and reviewers.5 The initial goal
remains: to provide an objective basis for
understanding and improving the regula-
tory environment for business.
WHAT DOING BUSINESS COVERSDoing Business captures several important
dimensions of the regulatory environ-
ment as they apply to local firms. It
provides quantitative measures of regula-
tions for starting a business, dealing with
construction permits, getting electricity,
registering property, getting credit, pro-
tecting investors, paying taxes, trading
across borders, enforcing contracts and
resolving insolvency. Doing Business also
looks at regulations on employing work-
ers. Pending further progress on research
in this area, this year’s report does not
present rankings of economies on the
employing workers indicators or include
the topic in the aggregate ranking on the
ease of doing business. It does present the
data on the employing workers indicators.
Additional data on labor regulations col-
lected in 185 economies are available on
the Doing Business website.6
The foundation of Doing Business is the
notion that economic activity, particularly
private sector development, benefits from
clear and coherent rules: Rules that set out
and clarify property rights and facilitate
the resolution of disputes. And rules that
enhance the predictability of economic
interactions and provide contractual part-
ners with essential protections against
arbitrariness and abuse. Where such
rules are reasonably efficient in design,
are transparent and accessible to those
for whom they are intended and can be
implemented at a reasonable cost, they
are much more effective in shaping the
incentives of economic agents in ways
that promote growth and development.
The quality of the rules also has a crucial
bearing on how societies distribute the
benefits and bear the costs of develop-
ment strategies and policies.
Consistent with the view that rules mat-
ter, some Doing Business indicators give
a higher score for more regulation and
better-functioning institutions (such as
courts or credit bureaus). In the area of
protecting investors, for example, higher
scores are given for stricter disclosure re-
quirements for related-party transactions.
Higher scores are also given for a simpli-
fied way of applying regulation that keeps
compliance costs for firms low—such as
by allowing firms to comply with business
start-up formalities in a one-stop shop
or through a single online portal. Finally,
Doing Business scores reward economies
that apply a risk-based approach to
regulation as a way to address social
and environmental concerns—such as
by imposing a greater regulatory burden
on activities that pose a high risk to the
population and a lesser one on lower-risk
activities.
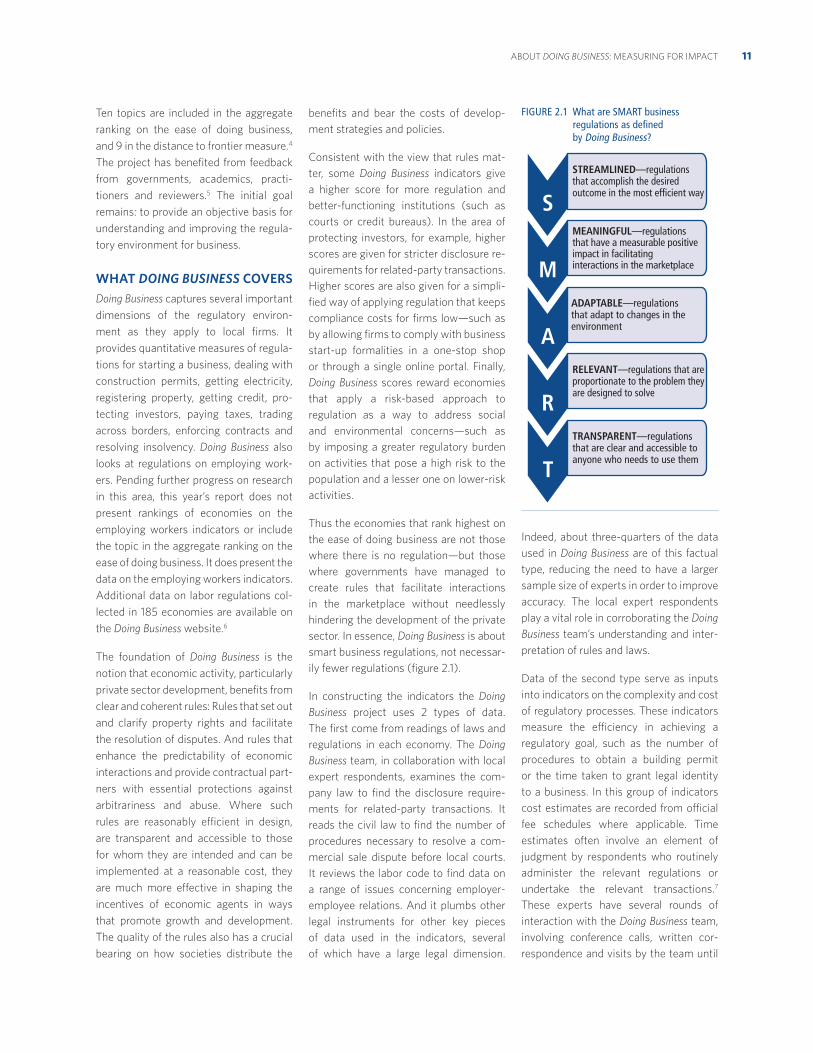
Thus the economies that rank highest on
the ease of doing business are not those
where there is no regulation—but those
where governments have managed to
create rules that facilitate interactions
in the marketplace without needlessly
hindering the development of the private
sector. In essence, Doing Business is about
smart business regulations, not necessar-
ily fewer regulations (figure 2.1).
In constructing the indicators the Doing
Business project uses 2 types of data.
The first come from readings of laws and
regulations in each economy. The Doing
Business team, in collaboration with local
expert respondents, examines the com-
pany law to find the disclosure require-
ments for related-party transactions. It
reads the civil law to find the number of
procedures necessary to resolve a com-
mercial sale dispute before local courts.
It reviews the labor code to find data on
a range of issues concerning employer-
employee relations. And it plumbs other
legal instruments for other key pieces
of data used in the indicators, several
of which have a large legal dimension.
Indeed, about three-quarters of the data
used in Doing Business are of this factual
type, reducing the need to have a larger
sample size of experts in order to improve
accuracy. The local expert respondents
play a vital role in corroborating the Doing
Business team’s understanding and inter-
pretation of rules and laws.
Data of the second type serve as inputs
into indicators on the complexity and cost
of regulatory processes. These indicators
measure the efficiency in achieving a
regulatory goal, such as the number of
procedures to obtain a building permit
or the time taken to grant legal identity
to a business. In this group of indicators
cost estimates are recorded from official
fee schedules where applicable. Time
estimates often involve an element of
judgment by respondents who routinely
administer the relevant regulations or
undertake the relevant transactions.7
These experts have several rounds of
interaction with the Doing Business team,
involving conference calls, written cor-
respondence and visits by the team until
FIGURE 2.1 What are SMART business regulations as defined by Doing Business?
S
M
A
R
T
STREAMLINED—regulations that accomplish the desired outcome in the most efficient way
MEANINGFUL—regulations that have a measurable positive impact in facilitating interactions in the marketplace
ADAPTABLE—regulations that adapt to changes in the environment
RELEVANT—regulations that are proportionate to the problem they are designed to solve
TRANSPARENT—regulations that are clear and accessible to anyone who needs to use them
DOING BUSINESS IN THE EAST AFRICAN COMMUNITY 201312
there is convergence on the final answer.
To construct the time indicators, a regula-
tory process such as starting a business
is broken down into clearly defined steps
and procedures (for more details, see
the discussion on methodology in this
chapter). Here Doing Business builds on
Hernando de Soto’s pioneering work in
applying the time-and-motion approach
in the 1980s to show the obstacles to set-
ting up a garment factory on the outskirts
of Lima.8
WHAT DOING BUSINESS DOES NOT COVERThe Doing Business data have key limita-
tions that should be kept in mind by those
who use them.
Limited in scopeThe Doing Business indicators are limited
in scope. In particular:
Doing Business does not measure the
full range of factors, policies and in-
stitutions that affect the quality of the
business environment in an economy
or its national competitiveness. It does
not, for example, capture aspects of
security, the prevalence of bribery
and corruption, market size, macro-
economic stability (including whether
the government manages its public fi-
nances in a sustainable way), the state
of the financial system or the level of
training and skills of the labor force.
Even within the relatively small set of
indicators included in Doing Business,
the focus is deliberately narrow. The
getting electricity indicators, for ex-
ample, capture the procedures, time
and cost involved for a business to ob-
tain a permanent electricity connection
to supply a standardized warehouse.
Through these indicators Doing
Business thus provides a narrow per-
spective on the range of infrastructure
challenges that firms face, particularly
in the developing world. It does not ad-
dress the extent to which inadequate
roads, rail, ports and communications
may add to firms’ costs and undermine
competitiveness. Doing Business cov-
ers 11 areas of a company’s life cycle,
through 11 specific sets of indicators
(table 2.1). Similar to the indicators
on getting electricity, those on start-
ing a business or protecting investors
do not cover all aspects of commercial
legislation. And those on employing
workers do not cover all areas of labor
regulation; for example, they do not
measure regulations addressing health
and safety issues at work or the right of
collective bargaining.
Doing Business does not attempt to
measure all costs and benefits of a
particular law or regulation to society
as a whole. The paying taxes indicators,
for example, measure the total tax rate,
which in isolation is a cost to the busi-
ness. The indicators do not measure,
nor are they intended to measure, the
benefits of the social and economic
programs funded through tax rev-
enues. Measuring business laws and
regulations provides one input into
the debate on the regulatory burden
associated with achieving regulatory
objectives. Those objectives can differ
across economies.
Limited to standardized case scenariosA key consideration for the Doing Business
indicators is that they should ensure
comparability of the data across a global
set of economies. The indicators are
therefore developed around standardized
case scenarios with specific assumptions.
One such assumption is the location of a
notional business in the largest business
city of the economy. The reality is that
business regulations and their enforce-
ment very often differ within a country,
particularly in federal states and large
economies. But gathering data for every
relevant jurisdiction in each of the 185
economies covered by Doing Business
would be far too costly.
Doing Business recognizes the limitations
of the standardized case scenarios and
assumptions. But while such assump-
tions come at the expense of generality,
they also help ensure the comparability
of data. For this reason it is common to
see limiting assumptions of this kind in
economic indicators. Inflation statistics,
for example, are often based on prices of
a set of consumer goods in a few urban
areas, since collecting nationally repre-
sentative price data at high frequencies
may be prohibitively costly in many coun-
tries. To capture regional variation in the
business environment within economies,
Doing Business has complemented its
global indicators with subnational studies
in some economies where resources and
interest have come together (box 2.1).
Some Doing Business topics include com-
plex and highly differentiated areas. Here
the standardized cases and assumptions
are carefully considered and defined. For
example, the standardized case scenario
usually involves a limited liability company
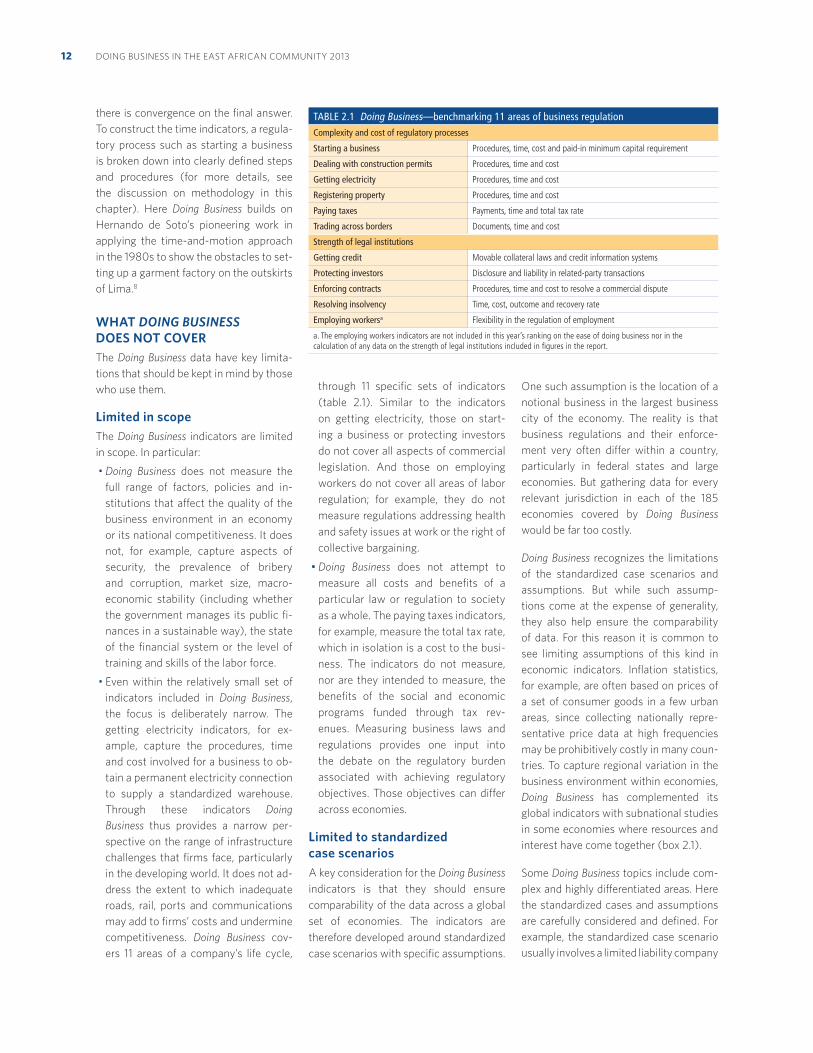
TABLE 2.1 Doing Business—benchmarking 11 areas of business regulationComplexity and cost of regulatory processes
Starting a business Procedures, time, cost and paid-in minimum capital requirement
Dealing with construction permits Procedures, time and cost
Getting electricity Procedures, time and cost
Registering property Procedures, time and cost
Paying taxes Payments, time and total tax rate
Trading across borders Documents, time and cost
Strength of legal institutions
Getting credit Movable collateral laws and credit information systems
Protecting investors Disclosure and liability in related-party transactions
Enforcing contracts Procedures, time and cost to resolve a commercial dispute
Resolving insolvency Time, cost, outcome and recovery rate
Employing workersa Flexibility in the regulation of employment
a. The employing workers indicators are not included in this year’s ranking on the ease of doing business nor in the calculation of any data on the strength of legal institutions included in figures in the report.
13ABOUT DOING BUSINESS: MEASURING FOR IMPACT
or its legal equivalent. The considerations
in defining this assumption are twofold.
First, private limited liability companies
are, empirically, the most prevalent busi-
ness form in many economies around
the world. Second, this choice reflects
the focus of Doing Business on expand-
ing opportunities for entrepreneurship:
investors are encouraged to venture into
business when potential losses are lim-
ited to their capital participation.
Limited to the formal sectorThe Doing Business indicators assume
that entrepreneurs have knowledge of
and comply with applicable regulations.
In practice, entrepreneurs may not know
what needs to be done or how to comply
and may lose considerable time in trying
to find out. Or they may deliberately avoid
compliance altogether—by not register-
ing for social security, for example. Where
regulation is particularly onerous, levels of
informality tend to be higher (figure 2.2).
Informality comes at a cost. Compared
with their formal sector counterparts,
firms in the informal sector typically grow
more slowly, have poorer access to credit
and employ fewer workers—and these
workers remain outside the protections of
labor law.9 All this may be even more so
for female-owned businesses, according
to country-specific research.10 Firms in
the informal sector are also less likely to
pay taxes.
Doing Business measures one set of factors
that help explain the occurrence of infor-
mality and give policy makers insights
into potential areas of reform. Gaining
a fuller understanding of the broader
business environment, and a broader
perspective on policy challenges, requires
combining insights from Doing Business
with data from other sources, such as the
World Bank Enterprise Surveys.11
WHY THIS FOCUS? Why does Doing Business focus on the
regulatory environment for small and me-
dium-size enterprises? These enterprises
are key drivers of competition, growth and
job creation, particularly in developing
economies. But in these economies up to
65% of economic activity takes place in
the informal sector, often because of ex-
cessive bureaucracy and regulation—and
in the informal sector firms lack access
to the opportunities and protections that
the law provides. Even firms operating in
the formal sector might not have equal
access to these opportunities and protec-
tions. Where regulation is burdensome
and competition limited, success tends to
depend on whom one knows. But where
regulation is transparent, efficient and
implemented in a simple way, it becomes
easier for aspiring entrepreneurs to com-
pete, innovate and grow.
BOX 2.1 COMPARING REGULATIONS AT THE LOCAL LEVEL: SUBNATIONAL DOING BUSINESS REPORTS
Subnational Doing Business reports expand the indicators beyond the largest busi-
ness city in an economy. They capture local differences in regulations or in the imple-
mentation of national regulations across cities within an economy (as in Colombia)
or region (as in South East Europe). Projects are undertaken at the request of central
governments, which often contribute financing, as in Mexico. In some cases local gov-
ernments also provide funding, as in the Russian Federation.
Subnational indicators provide governments with standard measures, based on laws
and regulations, that allow objective comparisons both domestically and internation-
ally. As a diagnostic tool, they identify bottlenecks as well as highlight good practices
that are easily replicable in other cities sharing a similar legal framework.
Governments take ownership of a subnational project by participating in all steps of
its design and implementation—choosing the cities to be benchmarked, the indicators
that can capture local differences and the frequency of benchmarking. All levels of
government are involved—national, regional and municipal.
Subnational projects create a space for discussing regulatory reform and provide
opportunities for governments and agencies to learn from one another, through the
report and through peer-to-peer learning workshops. Even after the report is launched,
knowledge sharing continues. In Mexico 28 of 32 states hold regular exchanges.
Repeated benchmarking creates healthy competition between cities to improve
their regulatory environment. The dissemination of the results reinforces this process
and gives cities an opportunity to tell their stories. Fifteen economies have requested
2 or more rounds of benchmarking since 2005 (including Colombia, Indonesia and
Nigeria), and many have expanded the geographic coverage to more cities (including
Russia). In Mexico each successive round has captured an increase in the number of
states improving their regulatory environment in each of the 4 indicator sets includ-
ed—reaching 100% of states in 2011.
Since 2005 subnational reports have covered 335 cities in 54 economies, including Brazil,
China, the Arab Republic of Egypt, India, Kenya, Morocco, Pakistan and the Philippines.1
This year studies were updated in Indonesia, Kenya, Mexico, Russia and the United
Arab Emirates. Studies are ongoing in Hargeisa (Somaliland) as well as in 23 cities and
4 ports in Colombia, 15 cities and 3 ports in Egypt and 13 cities and 7 ports in Italy. In
addition, 3 regional reports were published:
Doing Business in OHADA, comparing business regulations in 16 member states of
the Organization for the Harmonization of Business Law in Africa (Benin, Burkina
Faso, Cameroon, the Central African Republic, Chad, the Comoros, the Republic of
Congo, Côte d’Ivoire, Equatorial Guinea, Gabon, Guinea, Guinea-Bissau, Mali, Niger,
Senegal and Togo).
Doing Business in the East African Community, covering 5 economies (Burundi, Kenya,
Rwanda, Tanzania and Uganda).
Doing Business in the Arab World, covering 20 economies (Algeria, Bahrain, the
Comoros, Djibouti, Egypt, Iraq, Jordan, Kuwait, Lebanon, Mauritania, Morocco,
Oman, Qatar, Saudi Arabia, Sudan, the Syrian Arab Republic, Tunisia, the United
Arab Emirates, West Bank and Gaza, and the Republic of Yemen).
1. Subnational reports are available on the Doing Business website at http://www.doingbusiness
.org/subnational.
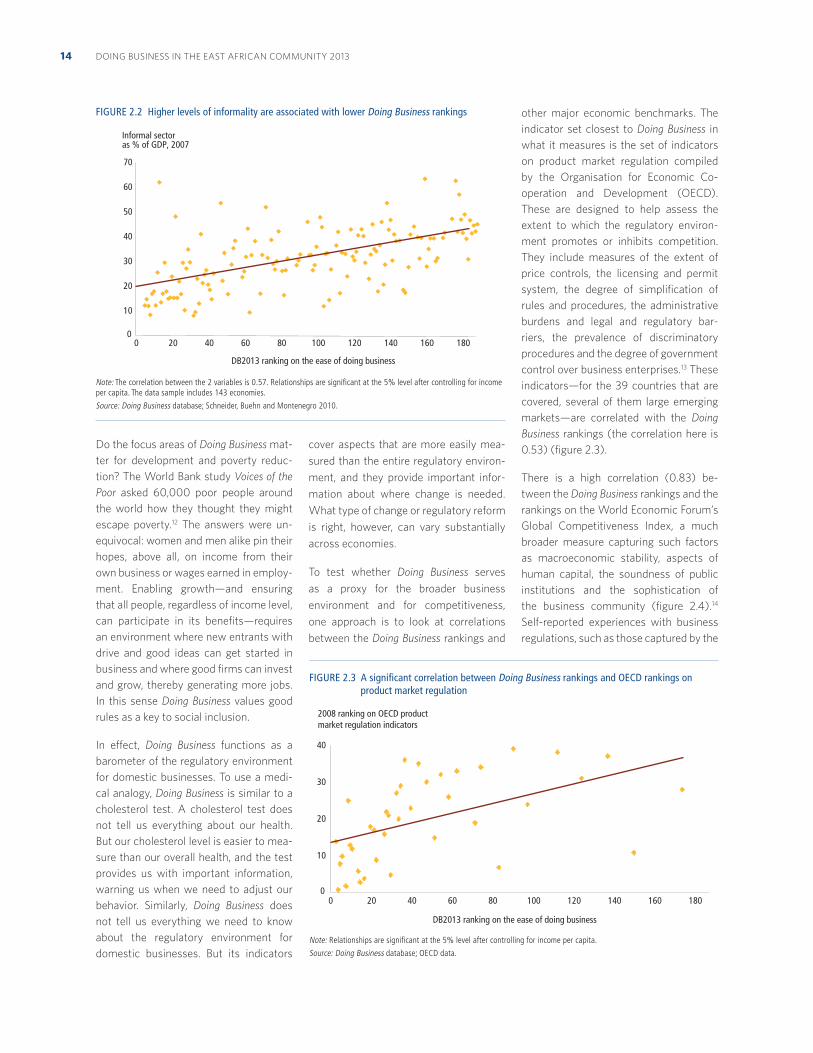
DOING BUSINESS IN THE EAST AFRICAN COMMUNITY 201314
Do the focus areas of Doing Business mat-
ter for development and poverty reduc-
tion? The World Bank study Voices of the
Poor asked 60,000 poor people around
the world how they thought they might
escape poverty.12 The answers were un-
equivocal: women and men alike pin their
hopes, above all, on income from their
own business or wages earned in employ-
ment. Enabling growth—and ensuring
that all people, regardless of income level,
can participate in its benefits—requires
an environment where new entrants with
drive and good ideas can get started in
business and where good firms can invest
and grow, thereby generating more jobs.
In this sense Doing Business values good
rules as a key to social inclusion.
In effect, Doing Business functions as a
barometer of the regulatory environment
for domestic businesses. To use a medi-
cal analogy, Doing Business is similar to a
cholesterol test. A cholesterol test does
not tell us everything about our health.
But our cholesterol level is easier to mea-
sure than our overall health, and the test
provides us with important information,
warning us when we need to adjust our
behavior. Similarly, Doing Business does
not tell us everything we need to know
about the regulatory environment for
domestic businesses. But its indicators
cover aspects that are more easily mea-
sured than the entire regulatory environ-
ment, and they provide important infor-
mation about where change is needed.
What type of change or regulatory reform
is right, however, can vary substantially
across economies.
To test whether Doing Business serves
as a proxy for the broader business
environment and for competitiveness,
one approach is to look at correlations
between the Doing Business rankings and
other major economic benchmarks. The
indicator set closest to Doing Business in
what it measures is the set of indicators
on product market regulation compiled
by the Organisation for Economic Co-
operation and Development (OECD).
These are designed to help assess the
extent to which the regulatory environ-
ment promotes or inhibits competition.
They include measures of the extent of
price controls, the licensing and permit
system, the degree of simplification of
rules and procedures, the administrative
burdens and legal and regulatory bar-
riers, the prevalence of discriminatory
procedures and the degree of government
control over business enterprises.13 These
indicators—for the 39 countries that are
covered, several of them large emerging
markets—are correlated with the Doing
Business rankings (the correlation here is
0.53) (figure 2.3).
There is a high correlation (0.83) be-
tween the Doing Business rankings and the
rankings on the World Economic Forum’s
Global Competitiveness Index, a much
broader measure capturing such factors
as macroeconomic stability, aspects of
human capital, the soundness of public
institutions and the sophistication of
the business community (figure 2.4).14
Self-reported experiences with business
regulations, such as those captured by the
FIGURE 2.2 Higher levels of informality are associated with lower Doing Business rankings
Note: The correlation between the 2 variables is 0.57. Relationships are significant at the 5% level after controlling for income per capita. The data sample includes 143 economies.
Source: Doing Business database; Schneider, Buehn and Montenegro 2010.
FIGURE 2.3 A significant correlation between Doing Business rankings and OECD rankings on product market regulation
Note: Relationships are significant at the 5% level after controlling for income per capita.
Source: Doing Business database; OECD data.
0
10
20
30
40
50
60
70
0 20 40 60 80 100 120 140 160 180
DB2013 ranking on the ease of doing business
Informal sector as % of GDP, 2007
0
10
20
30
40
0 20 40 60 80 100 120 140 160 180
2008 ranking on OECD product market regulation indicators
DB2013 ranking on the ease of doing business
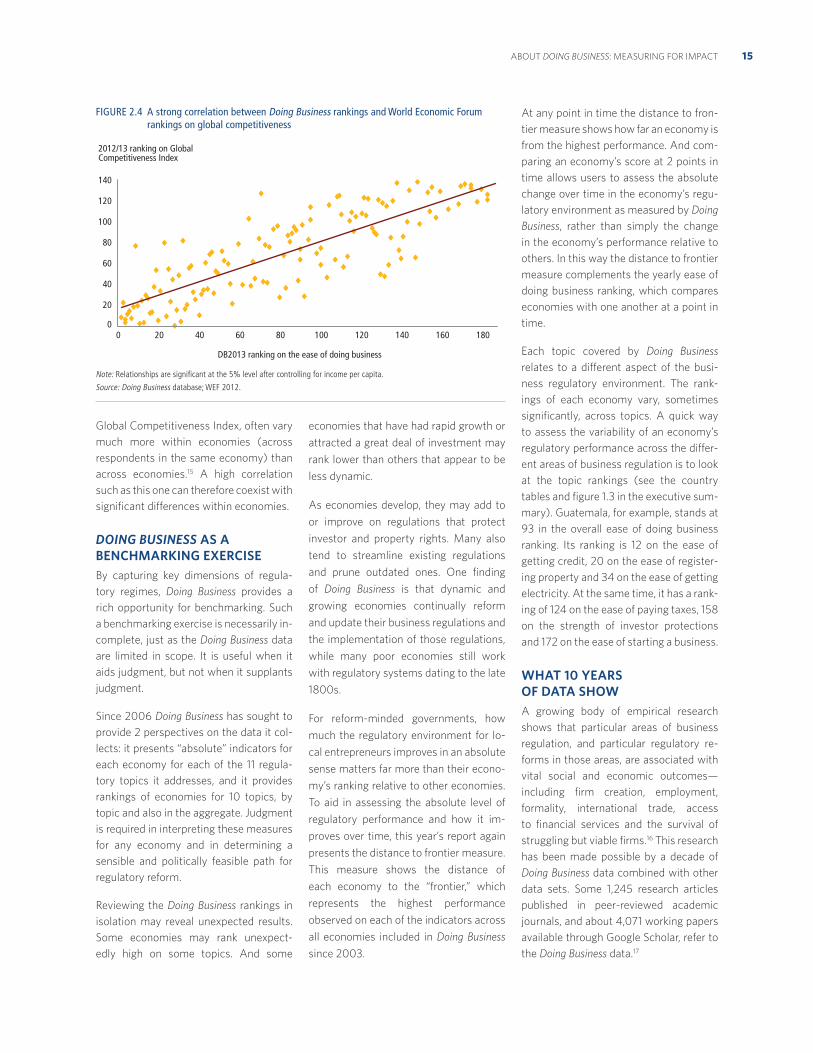
15ABOUT DOING BUSINESS: MEASURING FOR IMPACT
Global Competitiveness Index, often vary
much more within economies (across
respondents in the same economy) than
across economies.15 A high correlation
such as this one can therefore coexist with
significant differences within economies.
DOING BUSINESS AS A BENCHMARKING EXERCISEBy capturing key dimensions of regula-
tory regimes, Doing Business provides a
rich opportunity for benchmarking. Such
a benchmarking exercise is necessarily in-
complete, just as the Doing Business data
are limited in scope. It is useful when it
aids judgment, but not when it supplants
judgment.
Since 2006 Doing Business has sought to
provide 2 perspectives on the data it col-
lects: it presents “absolute” indicators for
each economy for each of the 11 regula-
tory topics it addresses, and it provides
rankings of economies for 10 topics, by
topic and also in the aggregate. Judgment
is required in interpreting these measures
for any economy and in determining a
sensible and politically feasible path for
regulatory reform.
Reviewing the Doing Business rankings in
isolation may reveal unexpected results.
Some economies may rank unexpect-
edly high on some topics. And some
economies that have had rapid growth or
attracted a great deal of investment may
rank lower than others that appear to be
less dynamic.
As economies develop, they may add to
or improve on regulations that protect
investor and property rights. Many also
tend to streamline existing regulations
and prune outdated ones. One finding
of Doing Business is that dynamic and
growing economies continually reform
and update their business regulations and
the implementation of those regulations,
while many poor economies still work
with regulatory systems dating to the late
1800s.
For reform-minded governments, how
much the regulatory environment for lo-
cal entrepreneurs improves in an absolute
sense matters far more than their econo-
my’s ranking relative to other economies.
To aid in assessing the absolute level of
regulatory performance and how it im-
proves over time, this year’s report again
presents the distance to frontier measure.
This measure shows the distance of
each economy to the “frontier,” which
represents the highest performance
observed on each of the indicators across
all economies included in Doing Business
since 2003.
At any point in time the distance to fron-
tier measure shows how far an economy is
from the highest performance. And com-
paring an economy’s score at 2 points in
time allows users to assess the absolute
change over time in the economy’s regu-
latory environment as measured by Doing
Business, rather than simply the change
in the economy’s performance relative to
others. In this way the distance to frontier
measure complements the yearly ease of
doing business ranking, which compares
economies with one another at a point in
time.
Each topic covered by Doing Business
relates to a different aspect of the busi-
ness regulatory environment. The rank-
ings of each economy vary, sometimes
significantly, across topics. A quick way
to assess the variability of an economy’s
regulatory performance across the differ-
ent areas of business regulation is to look
at the topic rankings (see the country
tables and figure 1.3 in the executive sum-
mary). Guatemala, for example, stands at
93 in the overall ease of doing business
ranking. Its ranking is 12 on the ease of
getting credit, 20 on the ease of register-
ing property and 34 on the ease of getting
electricity. At the same time, it has a rank-
ing of 124 on the ease of paying taxes, 158
on the strength of investor protections
and 172 on the ease of starting a business.
WHAT 10 YEARS OF DATA SHOWA growing body of empirical research
shows that particular areas of business
regulation, and particular regulatory re-
forms in those areas, are associated with
vital social and economic outcomes—
including firm creation, employment,
formality, international trade, access
to financial services and the survival of
struggling but viable firms.16 This research
has been made possible by a decade of
Doing Business data combined with other
data sets. Some 1,245 research articles
published in peer-reviewed academic
journals, and about 4,071 working papers
available through Google Scholar, refer to
the Doing Business data.17
FIGURE 2.4 A strong correlation between Doing Business rankings and World Economic Forum rankings on global competitiveness
Note: Relationships are significant at the 5% level after controlling for income per capita.
Source: Doing Business database; WEF 2012.
0
20
40
60
80
100
120
140
0 20 40 60 80 100 120 140 160 180
2012/13 ranking on Global Competitiveness Index
DB2013 ranking on the ease of doing business
DOING BUSINESS IN THE EAST AFRICAN COMMUNITY 201316
Determining the empirical impact of
regulatory reforms is not easy. One pos-
sible approach is cross-country correla-
tion analysis. But with this method it is
difficult to isolate the effect of a particular
regulatory reform because of all the other
factors that may vary across economies
and that may not have been taken into
account in the analysis. How then do
researchers determine whether social or
economic outcomes would have been
different without a specific regulatory re-
form? A growing number of studies have
been able to investigate such questions
by analyzing regulatory changes within a
country over time or by using panel esti-
mations. Others have focused on regula-
tory reforms relevant only for particular
firms or industries within a country. The
broader literature, using a range of differ-
ent empirical strategies, has produced a
number of interesting findings, including
those described below.
Smarter business regulation promotes
economic growth. Economies with better
business regulation grow faster. One
study found that for economies in the
best quartile of business regulation as
measured by Doing Business, the differ-
ence in business regulation with those
in the worst quartile is associated with a
2.3 percentage point increase in annual
growth rates.18 Another found that regula-
tory reforms making it easier to do busi-
ness in relatively low-income economies
are associated with an increase in growth
rates of 0.4 percentage point in the fol-
lowing year.19
Simpler business registration promotes
greater entrepreneurship and firm pro-
ductivity. Economies that have efficient
business registration also tend to have
a higher entry rate by new firms and
greater business density.20 Faster busi-
ness registration is associated with more
businesses registering in industries with
the strongest potential for growth, such
as those experiencing expansionary
global demand or technology shifts.21 And
easier start-up is associated with more
investment in industries often sheltered
from competition, including transport,
utilities and communications.22 Empirical
evidence also suggests that more effi-
cient business entry regulations improve
firm productivity and macroeconomic
performance.23
Lower costs for business registration improve
formal employment opportunities. Because
new firms are often set up by high-skilled
workers, lowering entry costs often leads
to higher take-up rates for education,
more jobs for high-skilled workers and
higher average productivity.24 And by
increasing formal registration, it can also
boost legal certainty—because the newly
formal firms are now covered by the legal
system, benefiting themselves as well as
their customers and suppliers.25
Country-specific studies confirm that
simplifying entry regulations can promote
the establishment of new formal sector
firms:
In Colombia the introduction of one-
stop shops for business registration in
different cities across the country was
followed by a 5.2% increase in new
firm registrations.26
In Mexico a study analyzing the effects
of a program simplifying municipal
licensing found that it led to a 5%
increase in the number of registered
businesses and a 2.2% increase in
employment. Moreover, competition
from new entrants lowered prices by
0.6% and the income of incumbent
businesses by 3.2%.27 A second study
found that the program was more
effective in municipalities with less
corruption and cheaper additional
registration procedures.28 Yet another
found that simpler licensing may result
in both more wage workers and more
formal enterprises, depending on the
personal characteristics of informal
business owners: those with charac-
teristics similar to wage workers were
more likely to become wage workers,
while those with characteristics similar
to entrepreneurs in the formal sector
were more likely to become formal
business owners.29
In India a study found that the pro-
gressive elimination of the “license
raj”—the system regulating entry and
production in industry—led to a 6%
increase in new firm registrations.30
Another study found that simpler entry
regulation and labor market flexibility
were complementary: in Indian states
with more flexible employment regula-
tions informal firms decreased by 25%
more, and real output grew by 18%
more, than in states with less flexible
regulations.31 A third study found that
the licensing reform resulted in an ag-
gregate productivity increase of 22%
among the firms affected.32
In Portugal the introduction of a one-
stop shop for businesses led to a 17%
increase in new firm registrations. The
reform favored mostly small-scale
entrepreneurs with low levels of educa-
tion operating in low-tech sectors such
as agriculture, construction and retail.33
An effective regulatory environment im-
proves trade performance. Strengthening
the institutional environment for
trade—such as by increasing customs
efficiency—can boost trade volumes.34
In Sub-Saharan Africa an inefficient trade
environment was found to be among the
main factors in poor trade performance.35
One study found that a 1-day reduction in
inland travel times leads to a 7% increase
in exports.36 Another found that among
the factors that improve trade perfor-
mance are access to finance, the quality
of infrastructure and the government’s
ability to formulate and implement sound
policies and regulations that promote
private sector development.37 The same
study showed that the more constrained
economies are in their access to foreign
markets, the more they can benefit from
improvements in the investment climate.
Yet another study found that improve-
ments in transport efficiency and the
business environment have a greater
marginal effect on exports in lower-
income economies than in high-income
ones.38 One study even suggests that
behind-the-border measures to improve
logistics performance and facilitate trade
17ABOUT DOING BUSINESS: MEASURING FOR IMPACT
may have a larger effect on trade, espe-
cially on exports, than tariff reduction
would.39
Other areas of regulation matter for trade
performance. Economies with good con-
tract enforcement tend to produce and
export more customized products than
those with poor contract enforcement.40
Since production of high-quality output
is a precondition for firms to become
exporters, reforms that lower the cost of
high-quality production increase the posi-
tive effect of trade reforms.41 Moreover,
reforms removing barriers to trade need
to be accompanied by other reforms,
such as those making labor markets more
flexible, to increase productivity and
growth.42
Sound financial market infrastructure—
including courts, creditor and insolvency
laws, and credit and collateral registries—
improves access to credit. Businesses
worldwide identify access to credit as one
of the main obstacles they face.43 Good
credit information systems and strong
collateral laws help overcome this ob-
stacle. An analysis of reforms improving
collateral law in 12 transition economies
concludes that they had a positive effect
on the volume of bank lending.44 Greater
information sharing through credit
bureaus is associated with higher bank
profitability and lower bank risk. And
stronger creditor rights and the existence
of public or private credit registries are
associated with a higher ratio of private
credit to GDP.45
Country-specific studies confirm that
efficient debt recovery and exit processes
are key in determining credit conditions
and in ensuring that less productive firms
are either restructured or exit the market:
In India the establishment of special-
ized debt recovery tribunals had a
range of positive effects, including
speeding up the resolution of debt re-
covery claims, allowing lenders to seize
more collateral on defaulting loans,
increasing the probability of repayment
by 28% and reducing interest rates on
loans by 1–2 percentage points.46
Brazil’s extensive bankruptcy reform
in 2005 was associated with a 22%
reduction in the cost of debt and a
39% increase in the aggregate level of
credit.47
Introducing streamlined mechanisms
for reorganization has been shown
to reduce the number of liquidations
because it encourages more viable
firms to opt for reorganization. Indeed,
it reduced the number of liquidations
by 14% in Colombia and by 8.4% in
Belgium.48 One important feature of
Colombia’s new system is that it bet-
ter distinguishes between viable and
nonviable firms, making it more likely
that financially distressed but funda-
mentally viable firms will survive.
Improving investor protections,
developing financial markets and
promoting more active markets for cor-
porate control reduce the persistence
of family-controlled firms over time,
expanding opportunity for firms with
more diversified capital structures.49
HOW GOVERNMENTS USE DOING BUSINESSDoing Business offers policy makers a
benchmarking tool useful in stimulating
policy debate, both by exposing poten-
tial challenges and by identifying good
practices and lessons learned. The initial
debate on the results highlighted by the
data typically turns into a deeper discus-
sion on the relevance of the data to the
economy and on areas where business
regulation reform is needed, including
areas well beyond those measured by
Doing Business.
Reform-minded governments seeking
success stories in business regulation
refer to Doing Business for examples (box
2.2). Saudi Arabia, for example, used
the company law of France as a model
for revising its own law. Many African
governments look to Mauritius—the
region’s strongest performer on Doing
Business indicators—as a source of good
practices to inspire regulatory reforms in
their own countries. Governments shared
knowledge of business regulations before
the Doing Business project began. But
Doing Business made it easier by creating
a common language comparing business
regulations around the world.
Over the past 10 years governments
worldwide have been actively improving
the regulatory environment for domestic
companies. Most reforms relating to
Doing Business topics have been nested
in broader reform programs aimed at
enhancing economic competitiveness, as
in Colombia, Kenya and Liberia. In struc-
turing reform programs for the business
environment, governments use multiple
data sources and indicators. This recog-
nizes the reality that the Doing Business
data on their own provide an incomplete
roadmap for successful business regula-
tion reforms.50 It also reflects the need to
respond to many stakeholders and inter-
est groups, all of whom bring important
issues and concerns to the reform debate.
When the World Bank Group engages with
governments on the subject of improving
the investment climate, the dialogue aims
to encourage the critical use of the Doing
Business data—to sharpen judgment
and promote broad-based reforms that
enhance the investment climate rather
than a narrow focus on improving the
Doing Business rankings. The World Bank
Group uses a vast range of indicators and
analytics in this policy dialogue, including
its Global Poverty Monitoring Indicators,
World Development Indicators, Logistics
Performance Indicators and many others.
The open data initiative has made data
for many such indicators conveniently
available to the public at http://data
.worldbank.org.
METHODOLOGY AND DATA The Doing Business data are based on
domestic laws and regulations as well
as administrative requirements. The data
cover 185 economies—including small
economies and some of the poorest
economies, for which little or no data
are available in other data sets. (For a
detailed explanation of the Doing Business
methodology, see the data notes.)
DOING BUSINESS IN THE EAST AFRICAN COMMUNITY 201318
Doing Business respondents Over the past 10 years more than 18,000
professionals in 185 economies have as-
sisted in providing the data that inform
the Doing Business indicators. This year’s
global report draws on the inputs of more
than 9,600 professionals.51 Table 14.2 in
the data notes lists the number of respon-
dents for each indicator set. The Doing
Business website shows the number of
respondents for each economy and each
indicator. Respondents are professionals
who routinely administer or advise on
the legal and regulatory requirements
covered in each Doing Business topic.
They are selected on the basis of their
expertise in the specific areas covered by
Doing Business. Because of the focus on
legal and regulatory arrangements, most
of the respondents are legal professionals
such as lawyers, judges or notaries. The
credit information survey is answered by
officials of the credit registry or bureau.
Freight forwarders, accountants, archi-
tects, engineers and other professionals
answer the surveys related to trading
across borders, taxes and construction
permits. Certain public officials (such as
registrars from the commercial or prop-
erty registry) also provide information
that is incorporated into the indicators.
Information sources for the dataMost of the Doing Business indicators
are based on laws and regulations. In
addition, most of the cost indicators are
backed by official fee schedules. Doing
Business respondents both fill out written
questionnaires and provide references
to the relevant laws, regulations and
fee schedules, aiding data checking and
quality assurance. Having representative
samples of respondents is not an issue, as
the texts of the relevant laws and regula-
tions are collected and answers checked
for accuracy.
For some indicators—for example,
those on dealing with construction per-
mits, enforcing contracts and resolving
insolvency—the time component and
part of the cost component (where fee
schedules are lacking) are based on ac-
tual practice rather than the law on the
books. This introduces a degree of judg-
ment. The Doing Business approach has
therefore been to work with legal prac-
titioners or professionals who regularly
undertake the transactions involved.
Following the standard methodological
approach for time-and-motion stud-
ies, Doing Business breaks down each
process or transaction, such as starting
a business or registering a building,
into separate steps to ensure a better
estimate of time. The time estimate for
each step is given by practitioners with
significant and routine experience in
the transaction. When time estimates
differ, further interactions with respon-
dents are pursued to converge on one
estimate that reflects the majority of
applicable cases.
The Doing Business approach to data col-
lection contrasts with that of firm surveys,
which capture perceptions and experi-
ences of businesses. A corporate lawyer
registering 100–150 businesses a year will
be more familiar with the process than an
entrepreneur, who will register a business
only once or maybe twice. A bankruptcy
attorney or judge dealing with dozens of
cases a year will have more insight into
bankruptcy than a company that may
undergo the process once.
Development of the methodologyThe methodology for calculating each
indicator is transparent, objective and
easily replicable. Leading academics
collaborate in the development of the
indicators, ensuring academic rigor. Eight
of the background papers underlying the
indicators have been published in leading
economic journals.52
Doing Business uses a simple averaging
approach for weighting component
indicators and calculating rankings and
the distance to frontier measure. Other
approaches were explored, including
using principal components and unob-
served components.53 They turn out to
BOX 2.2 HOW ECONOMIES HAVE USED DOING BUSINESS IN REGULATORY REFORM PROGRAMS
To ensure the coordination of efforts across agencies, such economies as Brunei
Darussalam, Colombia and Rwanda have formed regulatory reform committees, re-
porting directly to the president. These committees use the Doing Business indicators as
one input to inform their programs for improving the business environment. More than
35 other economies have formed such committees at the interministerial level. In East
and South Asia they include India; Korea; Malaysia; the Philippines; Taiwan, China; and
Vietnam. In the Middle East and North Africa: Morocco, Saudi Arabia and the United
Arab Emirates. In Eastern Europe and Central Asia: Georgia, Kazakhstan, Kosovo, the
Kyrgyz Republic, the former Yugoslav Republic of Macedonia, Moldova, Montenegro
and Tajikistan. In Sub-Saharan Africa: Botswana, Burundi, the Central African Republic,
the Comoros, the Democratic Republic of Congo, the Republic of Congo, Côte d’Ivoire,
Kenya, Liberia, Malawi, Mali, Nigeria, Sierra Leone, Togo and Zambia. And in Latin
America: Chile, the Dominican Republic, Guatemala, Mexico, Panama and Peru. Since
2003 governments have reported more than 350 regulatory reforms that have been
informed by Doing Business.1
Many economies share knowledge on the regulatory reform process related to the
areas measured in Doing Business. Among the most common venues for this knowl-
edge sharing are peer-to-peer learning events—workshops where officials from dif-
ferent governments across a region or even across the globe meet to discuss the chal-
lenges of regulatory reform and share their experiences. In recent years such events
have taken place in Colombia (for Latin America and the Caribbean), in Rwanda (for
Sub-Saharan Africa), in Georgia (for Eastern Europe and Central Asia), in Malaysia (for
East Asia and the Pacific) and in Morocco (for the Middle East and North Africa). In
addition, regional organizations such as APEC, featured in a case study in this year’s
global report, use the Doing Business data as a tool and common language to set an
agenda for business regulation reform.
1. These are reforms for which Doing Business is aware that information provided by the Doing
Business report was used in shaping the reform agenda.
19ABOUT DOING BUSINESS: MEASURING FOR IMPACT
yield results nearly identical to those
of simple averaging. In the absence of a
strong theoretical framework that assigns
different weights to the topics covered
for the 185 economies by Doing Business,
the simplest method is used: weighting
all topics equally and, within each topic,
giving equal weight to each of the topic
components (for more details, see the
chapter on the ease of doing business and
distance to frontier).54
Improvements to the methodologyThe methodology has undergone con-
tinual improvement over the years. For
enforcing contracts, for example, the
amount of the disputed claim in the case
study was increased from 50% of income
per capita to 200% after the first year of
data collection, as it became clear that
smaller claims were unlikely to go to
court.
Another change related to starting a
business. The minimum capital require-
ment can be an obstacle for potential
entrepreneurs. Doing Business measured
the required minimum capital regardless
of whether it had to be paid up front or
not. In many economies only part of the
minimum capital has to be paid up front.
To reflect the relevant barrier to entry, the
paid-in minimum capital has been used
rather than the required minimum capital.
This year’s report includes an update in
the ranking methodology for paying taxes.
Last year’s report introduced a threshold
for the total tax rate for the purpose of
calculating the ranking on the ease of pay-
ing taxes. This change came as a result of
consultations on the survey instrument
and methodology for the paying taxes
indicators with external stakeholders,
including participants in the International
Tax Dialogue. All economies with a total
tax rate below the threshold (which is
calculated and adjusted on a yearly basis)
now receive the same ranking on the total
tax rate indicator. This year’s threshold is
set at the 15th percentile of the total tax
rate distribution, which translates into a
threshold for the total tax rate of 25.7%.
Data adjustmentsAll changes in methodology are explained
in the data notes as well as on the Doing
Business website. In addition, data time
series for each indicator and economy are
available on the website, beginning with
the first year the indicator or economy
was included in the report. To provide a
comparable time series for research, the
data set is back-calculated to adjust for
changes in methodology and any revi-
sions in data due to corrections. The data
set is not back-calculated for year-to-year
revisions in income per capita data (that
is, when the income per capita data are
revised by the original data sources, Doing
Business does not update the cost mea-
sures for previous years). The website
also makes available all original data sets
used for background papers.
Information on data corrections is provid-
ed in the data notes and on the website. A
transparent complaint procedure allows
anyone to challenge the data. If errors
are confirmed after a data verification
process, they are expeditiously corrected.
NOTES
1. World Bank 2005; Stampini and others
2011.
2. See, for example, Alesina and others
(2005); Perotti and Volpin (2005);
Fisman and Sarria-Allende (2010);
Antunes and Cavalcanti (2007);
Barseghyan (2008); Klapper, Lewin
and Quesada Delgado (2009); Freund
and Bolaky (2008); Chang, Kaltani and
Loayza (2009); Helpman, Melitz and
Rubinstein (2008); Klapper, Laeven and
Rajan (2006); World Bank (2005); and
Ardagna and Lusardi (2010).
3. This includes Djankov and others
(2002); Djankov, McLiesh and Shleifer
(2007); Djankov, La Porta and others
(2008); Djankov, Freund and Pham
(2010); Djankov and others (2003);
Djankov, Hart and others (2008);
Botero and others (2004); and Djankov,
Ganser and others (2010).
4. For more details on how the aggregate
ranking is created, see the chapter on
the ease of doing business and distance
to frontier.
5. This has included a review by the World
Bank Independent Evaluation Group
(2008), input from the International
Tax Dialogue and regular input from the
Indicators Advisory Group.
6. http://www.doingbusiness.org.
7. Local experts in 185 economies are
surveyed annually to collect and
update the data. The local experts
for each economy are listed on the
Doing Business website (http://www
.doingbusiness.org) and in the
acknowledgments at the end of
this report.
8. De Soto 2000.
9. Schneider 2005; La Porta and Shleifer
2008.
10. Amin 2011.
11. http://www.enterprisesurveys.org.
12. Narayan and others 2000.
13. OECD, “Indicators of Product Market
Regulation,” http://www.oecd.org/.
The measures are aggregated into
3 broad families that capture state
control, barriers to entrepreneurship
and barriers to international trade and
investment. The 39 countries included
in the OECD market regulation indica-
tors are Australia, Austria, Belgium,
Brazil, Canada, Chile, China, the Czech
Republic, Denmark, Estonia, Finland,
France, Germany, Greece, Hungary,
Iceland, India, Ireland, Israel, Italy,
Japan, Korea, Luxembourg, Mexico, the
Netherlands, New Zealand, Norway,
Poland, Portugal, Russia, the Slovak
Republic, Slovenia, South Africa, Spain,
Sweden, Switzerland, Turkey, the United
Kingdom and the United States.
14. The World Economic Forum’s Global
Competitiveness Report uses Doing
Business data sets on starting a busi-
ness, employing workers, protecting
investors and getting credit (legal
rights), representing 7 of a total of 113
different indicators (or 6.19%).
15. Hallward-Driemeier, Khun-Jush and
Pritchett (2010), analyzing data from
World Bank Enterprise Surveys for
Sub-Saharan Africa, show that de
jure measures such as Doing Business
indicators are virtually uncorrelated
with ex post firm-level responses,
providing evidence that deals rather
than rules prevail in Africa. The authors
find that the gap between de jure and de
facto conditions grows with the formal
regulatory burden. The evidence also
shows that more burdensome processes
open up more space for making deals
and that firms may not incur the official
costs of compliance but still pay to
avoid them.
DOING BUSINESS IN THE EAST AFRICAN COMMUNITY 201320
16. Much attention has been given to
exploring links to microeconomic
outcomes, such as firm creation and
employment. Recent research focuses
on how business regulations affect the
behavior of firms by creating incentives
(or disincentives) to register and oper-
ate formally, to create jobs, to innovate
and to increase productivity. For details,
see Djankov and others (2002); Alesina
and others (2005); Banerjee and Duflo
(2005); Perotti and Volpin (2005);
Klapper, Laeven and Rajan (2006);
Fisman and Sarria-Allende (2010);
Antunes and Cavalcanti (2007);
Barseghyan (2008); Eifert (2009);
Klapper, Lewin and Quesada Delgado
(2009); Djankov, Freund and Pham
(2010); Klapper and Love (2011); Chari
(2011); and Bruhn (2011).
17. According to searches for citations of
the 9 background papers that serve as
the basis for the Doing Business indica-
tors in the Social Science Citation Index
and on Google Scholar (http://scholar
.google.com).
18. Djankov, McLiesh and Ramalho 2006.
19. Eifert 2009.
20. Klapper, Lewin and Quesada Delgado
2009. Entry rate refers to newly
registered firms as a percentage of total
registered firms. Business density is de-
fined as the total number of businesses
as a percentage of the working-age
population (ages 18–65).
21. Ciccone and Papaioannou 2007.
22. Alesina and others 2005.
23. Loayza, Oviedo and Servén 2005;
Barseghyan 2008.
24. Dulleck, Frijters and Winter-Ebmer
2006; Calderon, Chong and Leon 2007;
Micco and Pagés 2006.
25. Masatlioglu and Rigolini 2008; Djankov
2009.
26. Cardenas and Rozo 2009.
27. Bruhn 2011.
28. Kaplan, Piedra and Seira 2007.
29. Bruhn 2012.
30. Aghion and others 2008.
31. Sharma 2009.
32. Chari 2011.
33. Branstetter and others 2010.
34. Djankov, Freund and Pham 2010.
35. Iwanow and Kirkpatrick 2009.
36. Freund and Rocha 2011.
37. Seker 2011.
38. Portugal-Perez and Wilson 2011.
39. Hoekman and Nicita 2011.
40. Nunn 2007.
41. Rauch 2010.
42. Chang, Kaltani and Loayza 2009; Cuñat
and Melitz 2007.
43. http://www.enterprisesurveys.org.
44. Haselmann, Pistor and Vig 2010.
The countries studied were Bulgaria,
Croatia, the Czech Republic, Estonia,
Hungary, Latvia, Lithuania, Poland,
Romania, the Slovak Republic, Slovenia
and Ukraine.
45. Djankov, McLiesh and Shleifer 2007;
Houston and others 2010.
46. Visaria 2009. In a follow-up study, von
Lilienfeld-Toal, Mookherjee and Visaria
(2012) found that the average effects
identified by Visaria (2009) differ
between wealthy and poor borrowers
when the credit supply is inelastic
(because of limits in such resources
as funds, staff and information). In
particular, they found that in the short
term after the debt recovery tribunals
are introduced, borrowers with less
collateral may experience a reduction
in access to credit while those with
more collateral may experience an
increase. But the authors also point out
that this short-term effect disappears
over time as banks are able to increase
their resources and the credit supply
becomes elastic.
47. Funchal 2008.
48. Giné and Love (2010) on Colombia;
Dewaelheyns and Van Hulle (2008) on
Belgium.
49. Franks and others 2011.
50. One recent study using Doing Business
indicators illustrates the difficulties in
using highly disaggregated indicators
to identify reform priorities (Kraay and
Tawara 2011).
51. While about 9,600 contributors pro-
vided data for this year’s global report,
many of them completed a survey for
more than one Doing Business indicator
set. Indeed, the total number of surveys
completed for this year’s report is more
than 12,000, which represents a truer
measure of the inputs received. The
average number of surveys per indicator
set and economy is just under 6.
For more details, see http://www
.doingbusiness.org/contributors/
doing-business.
52. All background papers are available on
the Doing Business website (http://www
.doingbusiness.org).
53. For more details, see the chapter on the
ease of doing business and distance to
frontier.
54. A technical note on the different
aggregation and weighting methods is
available on the Doing Business website
(http://www.doingbusiness.org).
21
Rwanda: fostering
prosperity by promoting
entrepreneurship
Emerging from a decade marked by civil
war and political instability, Rwanda
began a comprehensive and ambitious
campaign in 2000 to rebuild, foster
national reconciliation and drastically
reduce poverty. The government’s
agenda gave priority to health, education,
infrastructure, and private and financial
sector development, showing a
commitment to improving citizens’ living
conditions and building a solid foundation
for reconciliation.
Starting early on in the reform campaign,
Rwanda has implemented many
business regulation reforms. These have
transformed the life of the private sector
and made it noticeably easier to do
business. While challenges remain, the
country has achieved much success in
its reform agenda since the early 2000s.
This success stems from many factors,
and Rwanda’s experience may provide
useful lessons for other nations seeking
to improve their business climate,
particularly for those coming out of
conflict.
DESIGNING A STRATEGYBetween 2005 and 2011 Rwanda’s real
GDP per capita grew by 4.5% a year,
reflecting a sustained expansion of
exports and domestic investment, with
inflows of foreign direct investment also
increasing substantially.1 In addition,
the government strengthened the
foundations of macroeconomic stability
by implementing cautious fiscal policies
supported by a number of structural and
institutional reforms. Underpinning this
policy stance was a strong and sustained
commitment by national authorities to
private sector development.
Building on a 2-year consultation process,
the government designed a long-term
development strategy, Rwanda Vision
2020, aimed at transforming Rwanda
into a middle-income economy by
raising income per capita from $290 to
$900 before 2020.2 Introduced in 2000,
the strategy recognized and sought to
overcome Rwanda’s multiple development
challenges—including past civil war,
poor governance, weak infrastructure,
underdeveloped financial and private
sectors, unemployment, overwhelming
public debt, a poorly developed education
system, HIV and the rapid growth of a
population expected to reach 13 million by
2020.
In 2001 the World Bank set up the
Competitiveness and Enterprise Develop-
ment Project, designed to help the
government establish an environment
conducive to private sector growth and
the emergence of a more competitive
investment climate. The project focused on
developing and updating the commercial
law and supporting the government’s
privatization program through technical
assistance, capacity building and advice
on bank restructuring. This program
contributed to an overhaul of the
country’s financial sector that led to the
recapitalization of banks, the establishment
of an insurance market and the introduction
of microfinance lenders. In addition,
the Competitiveness and Enterprise
Development Project collaborated with the
World Bank’s Rwanda Investment Climate
Reform Program to develop a robust reform
agenda. The project helped establish
the Doing Business Unit, the institution
responsible for spearheading Rwanda’s
reform initiatives, while the investment
Rwanda’s commitment to private sector development has facilitated growth in exports, domestic investment and foreign direct investment inflows—and the implementation of effective fiscal policies supported by structural and institutional reforms.
Starting in 2000, Rwanda developed a strong institutional pipeline for designing and implementing business regulation reforms.
Since 2004 Rwanda has substantially improved access to credit, streamlined procedures for starting a business, reduced the time to register property, simplified cross-border trade and made courts more accessible for resolving commercial disputes.
Rwanda is among more than 35 economies where the executive branch has made private sector development a priority by establishing institutions whose main purpose is to design and implement business regulation reforms.
DOING BUSINESS IN THE EAST AFRICAN COMMUNITY 201322
climate reform program provided technical
assistance and expertise to support the
implementation of planned legal, regulatory
and institutional reforms.
Rwanda’s 2007 Economic Development
and Poverty Reduction Strategy, like its
Vision 2020, emphasized private sector
development as the key to creating
jobs, bringing peace, generating wealth
and ultimately eliminating poverty.3 In
addition, aware of its scarce natural
resources and landlocked location,
Rwanda has focused on business
regulation reform to attract foreign
investment.
Dubbed “Africa’s new Singapore” by
The Economist for its positive economic
reforms,4 Rwanda has been effectively
learning from the success stories of
economies like Singapore since the early
2000s. And in 2007 it started using the
Doing Business report as a tool to identify
and learn from good practices in business
regulation and to monitor improvement.
Several elements of a successful reform
program were present, including political
will and commitment at the highest
level and a broadly appropriate set of
macroeconomic policies that created
room in the budget to invest in reforms
and gained strong support from the donor
community.
BUILDING AN EFFECTIVE REFORM PIPELINEGovernment responsibility for improving
the investment climate in Rwanda and
driving through the reforms has shifted
over time. The responsibility was initially
assigned to the Rwanda Investment
Promotion Agency. In August 2008 this
agency was joined by 7 others to create
the Rwanda Development Board.5
The board’s creation marked not only
a change in name and gains in size,
resources and efficiency but also a
fundamental increase in political will and
support. The president of Rwanda made
business regulation reform a priority,
as did the leaders of more than 35
other economies—including economies
that have made some of the biggest
improvements in the ease of doing
business, such as Burundi, Colombia
and Georgia.6 The approach has proved
effective in triggering reforms. In Rwanda
it helped put investment climate reforms
at the top of the economic policy agenda
for promoting private sector development
and helped consolidate and unify the
multiple reform efforts.
Since reforms to the investment climate
require changes across many areas
of government, the Doing Business
Steering Committee, bringing together
representatives from different ministries,
was created in early 2009 to lead the
reform efforts at the cabinet level. While
other countries have created similar
institutions to promote reform, Rwanda
has made effective use of the steering
committee in implementing successful
regulatory reforms (as detailed in the
following section).
Below the steering committee is a
technical task force made up of 6 working
groups focusing on business entry,
licensing reform, legislative changes,
taxes and trade logistics, construction
permits and property registration. One
key to the working groups’ effectiveness
has been their inclusion of private
sector representatives. This has helped
ensure private sector buy-in and allowed
participants to share their experiences
during discussions about reform design.
To ensure success, the organizational
structure still needed something to
bring all the pieces together. For this
purpose the Doing Business Unit was
created. A small, full-time team, this unit
links the working groups to the steering
committee, coordinates with donors
providing technical support, manages
development funding to ensure proper
use and promotes efforts to improve
the investment climate. It also advises
agencies, explains the reforms to the
private sector and monitors progress
through internal indicators.
The Doing Business Unit identifies reform
opportunities; the technical task force
and the steering committee approve the
reform proposals. The annual plan for
regulatory reforms is then communicated
to the cabinet. The steering committee
and the technical task force commit
to the new priorities that are agreed
on at the national leadership’s annual
retreats.7 The Doing Business Unit
monitors implementation and reports
to the steering committee and to
the prime minister, who is ultimately
responsible for ensuring the execution
of goals.8 Besides reporting directly to
the Rwanda Development Board, the unit
also periodically informs the head of the
Strategy and Policy Unit in the Office of
the President about reform progress.
Far from being rigid, this structure
has been further improved by the
involvement of other stakeholders. Ahead
of the promulgation of major pieces of
legislation, the Rwanda Development
Board has worked closely with the
parliament and the judiciary, both of
which have helped in meeting targets
and deadlines. Civil society, development
partners and institutions such as the
Presidential Advisory Council have also
provided crucial input in shaping the
reform agenda.9
LAUNCHING REGULATORY REFORMSEven as the internal organization was
evolving, the government was enacting
reforms: since 2005 Rwanda has
implemented 26 business regulation
reforms as recorded by Doing Business.
Improving access to creditA series of changes improved conditions
for getting credit. In 2005 the public
credit registry expanded its database of
financial institutions and improved the
content of its credit reporting system. In
2009 a new secured transactions law
was introduced, allowing a wider range
of assets to be used as collateral and
permitting out-of-court enforcement
proceedings.10
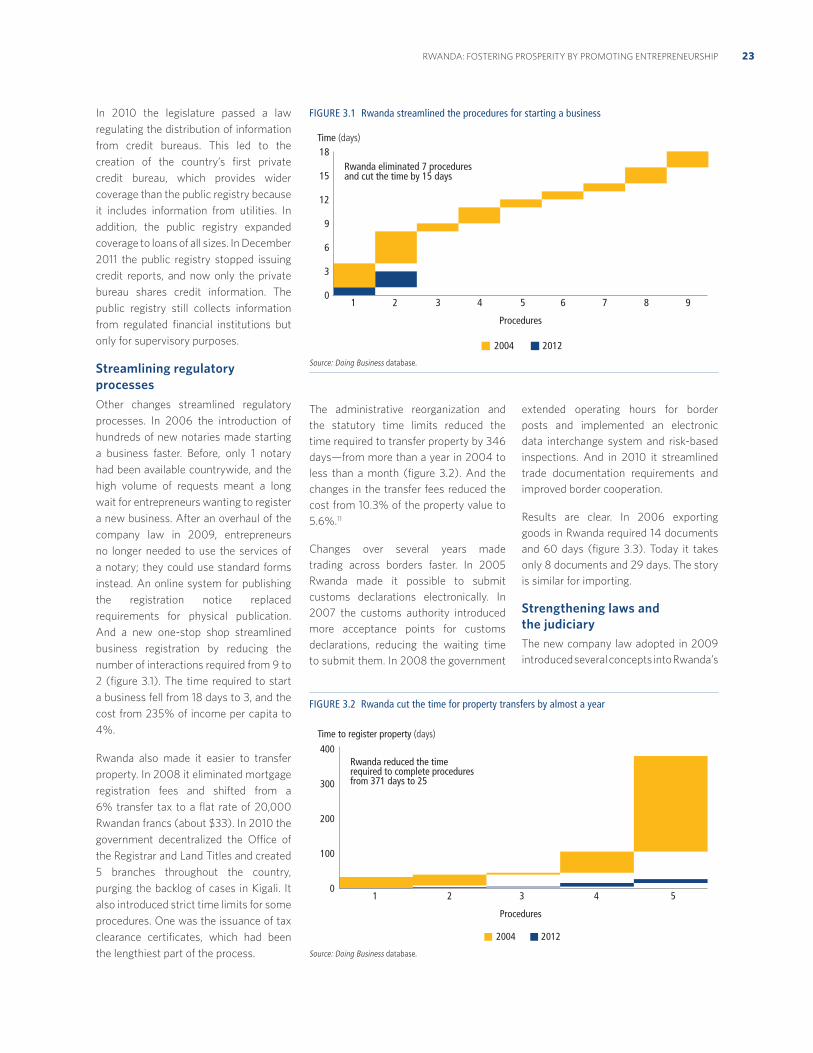
23RWANDA: FOSTERING PROSPERITY BY PROMOTING ENTREPRENEURSHIP
The administrative reorganization and
the statutory time limits reduced the
time required to transfer property by 346
days—from more than a year in 2004 to
less than a month (figure 3.2). And the
changes in the transfer fees reduced the
cost from 10.3% of the property value to
5.6%.11
Changes over several years made
trading across borders faster. In 2005
Rwanda made it possible to submit
customs declarations electronically. In
2007 the customs authority introduced
more acceptance points for customs
declarations, reducing the waiting time
to submit them. In 2008 the government
extended operating hours for border
posts and implemented an electronic
data interchange system and risk-based
inspections. And in 2010 it streamlined
trade documentation requirements and
improved border cooperation.
Results are clear. In 2006 exporting
goods in Rwanda required 14 documents
and 60 days (figure 3.3). Today it takes
only 8 documents and 29 days. The story
is similar for importing.
Strengthening laws and the judiciaryThe new company law adopted in 2009
introduced several concepts into Rwanda’s
FIGURE 3.2 Rwanda cut the time for property transfers by almost a year
Source: Doing Business database.
400
300
200
100
0
Time to register property (days)
1 2 3 4 5
Procedures
20122004
Rwanda reduced the time required to complete procedures from 371 days to 25
In 2010 the legislature passed a law
regulating the distribution of information
from credit bureaus. This led to the
creation of the country’s first private
credit bureau, which provides wider
coverage than the public registry because
it includes information from utilities. In
addition, the public registry expanded
coverage to loans of all sizes. In December
2011 the public registry stopped issuing
credit reports, and now only the private
bureau shares credit information. The
public registry still collects information
from regulated financial institutions but
only for supervisory purposes.
Streamlining regulatory processesOther changes streamlined regulatory
processes. In 2006 the introduction of
hundreds of new notaries made starting
a business faster. Before, only 1 notary
had been available countrywide, and the
high volume of requests meant a long
wait for entrepreneurs wanting to register
a new business. After an overhaul of the
company law in 2009, entrepreneurs
no longer needed to use the services of
a notary; they could use standard forms
instead. An online system for publishing
the registration notice replaced
requirements for physical publication.
And a new one-stop shop streamlined
business registration by reducing the
number of interactions required from 9 to
2 (figure 3.1). The time required to start
a business fell from 18 days to 3, and the
cost from 235% of income per capita to
4%.
Rwanda also made it easier to transfer
property. In 2008 it eliminated mortgage
registration fees and shifted from a
6% transfer tax to a flat rate of 20,000
Rwandan francs (about $33). In 2010 the
government decentralized the Office of
the Registrar and Land Titles and created
5 branches throughout the country,
purging the backlog of cases in Kigali. It
also introduced strict time limits for some
procedures. One was the issuance of tax
clearance certificates, which had been
the lengthiest part of the process.
FIGURE 3.1 Rwanda streamlined the procedures for starting a business
Source: Doing Business database.
1 2 3 4 5 6 7 8 9
18
15
12
9
6
3
0
Time (days)
Procedures
20122004
Rwanda eliminated 7 procedures and cut the time by 15 days
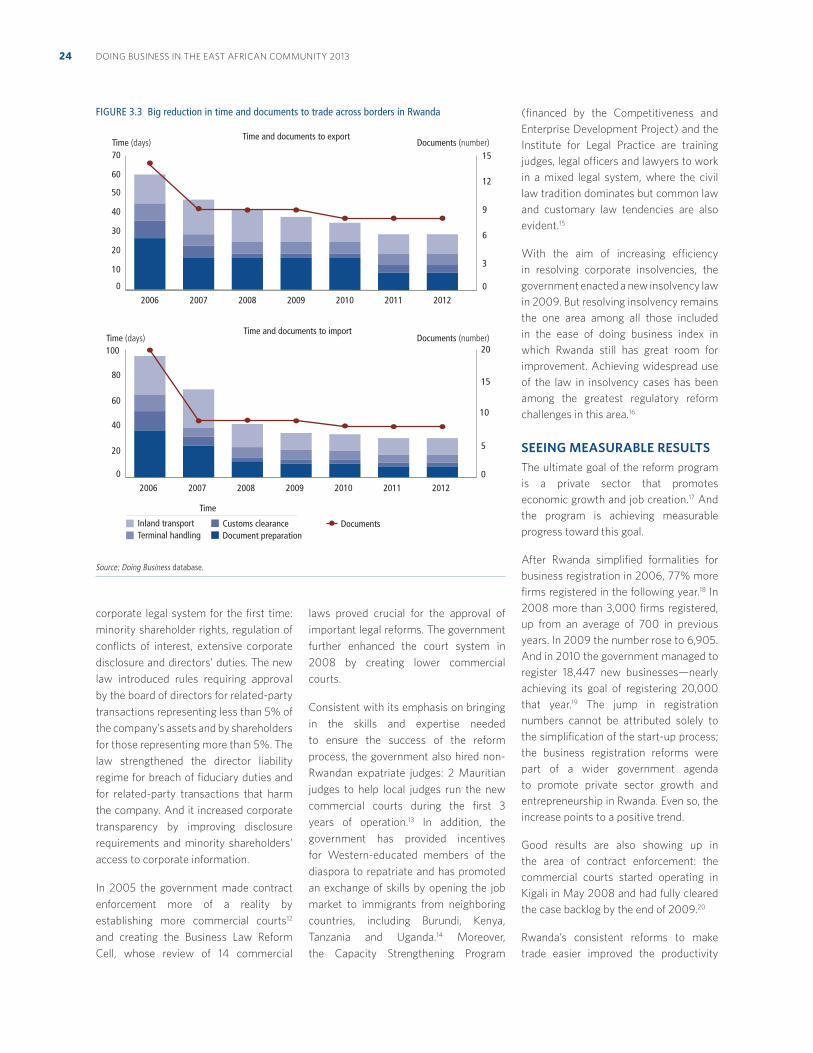
DOING BUSINESS IN THE EAST AFRICAN COMMUNITY 201324
corporate legal system for the first time:
minority shareholder rights, regulation of
conflicts of interest, extensive corporate
disclosure and directors’ duties. The new
law introduced rules requiring approval
by the board of directors for related-party
transactions representing less than 5% of
the company’s assets and by shareholders
for those representing more than 5%. The
law strengthened the director liability
regime for breach of fiduciary duties and
for related-party transactions that harm
the company. And it increased corporate
transparency by improving disclosure
requirements and minority shareholders’
access to corporate information.
In 2005 the government made contract
enforcement more of a reality by
establishing more commercial courts12
and creating the Business Law Reform
Cell, whose review of 14 commercial
laws proved crucial for the approval of
important legal reforms. The government
further enhanced the court system in
2008 by creating lower commercial
courts.
Consistent with its emphasis on bringing
in the skills and expertise needed
to ensure the success of the reform
process, the government also hired non-
Rwandan expatriate judges: 2 Mauritian
judges to help local judges run the new
commercial courts during the first 3
years of operation.13 In addition, the
government has provided incentives
for Western-educated members of the
diaspora to repatriate and has promoted
an exchange of skills by opening the job
market to immigrants from neighboring
countries, including Burundi, Kenya,
Tanzania and Uganda.14 Moreover,
the Capacity Strengthening Program
(financed by the Competitiveness and
Enterprise Development Project) and the
Institute for Legal Practice are training
judges, legal officers and lawyers to work
in a mixed legal system, where the civil
law tradition dominates but common law
and customary law tendencies are also
evident.15
With the aim of increasing efficiency
in resolving corporate insolvencies, the
government enacted a new insolvency law
in 2009. But resolving insolvency remains
the one area among all those included
in the ease of doing business index in
which Rwanda still has great room for
improvement. Achieving widespread use
of the law in insolvency cases has been
among the greatest regulatory reform
challenges in this area.16
SEEING MEASURABLE RESULTSThe ultimate goal of the reform program
is a private sector that promotes
economic growth and job creation.17 And
the program is achieving measurable
progress toward this goal.
After Rwanda simplified formalities for
business registration in 2006, 77% more
firms registered in the following year.18 In
2008 more than 3,000 firms registered,
up from an average of 700 in previous
years. In 2009 the number rose to 6,905.
And in 2010 the government managed to
register 18,447 new businesses—nearly
achieving its goal of registering 20,000
that year.19 The jump in registration
numbers cannot be attributed solely to
the simplification of the start-up process;
the business registration reforms were
part of a wider government agenda
to promote private sector growth and
entrepreneurship in Rwanda. Even so, the
increase points to a positive trend.
Good results are also showing up in
the area of contract enforcement: the
commercial courts started operating in
Kigali in May 2008 and had fully cleared
the case backlog by the end of 2009.20
Rwanda’s consistent reforms to make
trade easier improved the productivity
FIGURE 3.3 Big reduction in time and documents to trade across borders in Rwanda
Source: Doing Business database.
0
10
20
30
40
50
60
70
2012201120102009200820072006
0
20
40
60
80
100
2012201120102009200820072006
0
3
6
9
12
15
0
5
10
15
20
Time (days) Documents (number)
Time (days) Documents (number)
Time and documents to export
Time and documents to import
Inland transport Terminal handling
Time
DocumentsCustoms clearanceDocument preparation
25RWANDA: FOSTERING PROSPERITY BY PROMOTING ENTREPRENEURSHIP
of customs officials, who increased the
number of documents they cleared
annually by 39% between 2006 and
2009. And according to the Ministry of
Trade and Industry, Rwanda’s exports
rose from $147 million in 2006 to $193
million in 2009.
Rwanda recently adjusted some of the
targets set in Vision 2020. Most notably,
it raised the income per capita target from
$900 to $3,500. This brings the target
into line with levels in middle-income
economies today and reflects Rwanda’s
recent growth, which increased income
per capita to around $570 in 2011.21
CONCLUSIONEvery country faces different development
challenges. But Rwanda’s ambitious
and complex reform program may offer
lessons for others seeking to reform
through private sector development.
One key to its achievements has been
the strong commitment to reform shown
by Rwanda’s leaders and its citizens. The
government has established structures
for building a foundation for private
sector development and coordinating
government-wide reform efforts. And
it has created a well-defined, long-term
reform strategy that informs all of the
country’s short-term development goals.
The government entities involved in
the process have had clearly defined
roles and responsibilities, and they
have respected the goals set in initial
implementation strategy documents. The
Doing Business Unit has played a pivotal
role not only in ensuring coordination
within the government and between
the government and donors but also
in coordinating development funding
initiatives so as to avoid duplication.
The government has worked to meet the
needs of entrepreneurs by streamlining
regulatory processes involved in starting,
operating and closing a business. Beyond
undertaking legal and administrative
reforms, the government has invested
in training for professionals—including
lawyers and judges—to ensure
proper administration of the reforms.
Recognizing the benefits of a diverse
knowledge base, Rwanda has also
imported technical expertise from other
countries, to replicate good practices and
build capacity. And the government has
involved the private sector in the reform
process and maintained an open line of
communication to keep entrepreneurs,
civil society and other stakeholders
apprised of developments.
All these efforts are showing results in
Rwanda’s regulatory performance. And
Rwanda’s dedication to private sector
development, in triggering positive legal
reforms, has contributed substantially to
its overarching goal of promoting national
reconciliation and prosperity.
NOTES
This case study was written by Moussa
Traoré, Adrian Gonzalez, César Chaparro
Yedro, Jean Michel Lobet and Jonathan
Bailey.
1. World Bank, World Development
Indicators database, http://data
.worldbank.org/.
2. Rwanda, Ministry of Finance and
Economic Planning 2000.
3. Rwanda, Ministry of Finance and
Economic Planning 2007.
4. “Africa’s New Singapore?”
The Economist, February 25, 2012,
http://www.economist.com/.
5. The 7 agencies were Tourism and
Conservation, the Registrar General’s
Office, the Privatization Unit, Human
and Institutional Development, the
Center for the Support to Small and
Medium-Sized Enterprises (CAPMER),
the IT Agency and the National
Environment Management Authority.
6. See box 2.2 in the chapter “About Doing
Business” for a list of economies using
this approach.
7. These retreats, which gather about 300
top members of the administration,
have included Doing Business reforms on
the agenda since 2007.
8. Presentation by Emmanuel Hategeka,
permanent secretary, Ministry of Trade
and Industry, Kigali, March 16, 2011;
Karim 2011.
9. In particular, the U.K. Department for
International Development’s multiyear
program to support the Rwanda
Revenue Authority is considered a
success, enabling the agency both
to improve its tax collection rate
and to simplify its interactions with
businesses.
10. Legal changes often require only
modest investments. For the secured
transactions law, for example, Rwanda
invested $55,320 (excluding technical
assistance from donors) in the valida-
tion and translation of the new law as
well as in the legislative process.
11. World Bank 2010.
12. World Bank 2006.
13. Hertveldt 2008.
14. “Africa’s New Singapore?”
The Economist, February 25, 2012,
http://www.economist.com/.
15. The Institute for Legal Practice was
established by an organic law in 2006
and started to operate in May 2008.
16. “Rwanda: Country Struggles on
Insolvency Law,” East African Business
Week, May 13, 2012, http://allafrica
.com/.
17. Edmund Kagire, “New Reforms Set Up
to Boost Doing Business,” New Times
(Kigali), April 18, 2010.
18. World Bank 2010.
19. Frank Kanyesigye, “Rwanda
Development Board Targets to Register
20,000 New Businesses,” New Times
(Kigali), May 14, 2010.
20. Interview by Business Times (Kigali)
with Benoit Gatete, vice president of
the commercial high court, January 12,
2010, http://allafrica.com/.
21. “Government to Adjust Vision 2020,”
New Times (Kigali), February 25, 2010;
World Bank, World Development
Indicators database, http://data
.worldbank.org/.
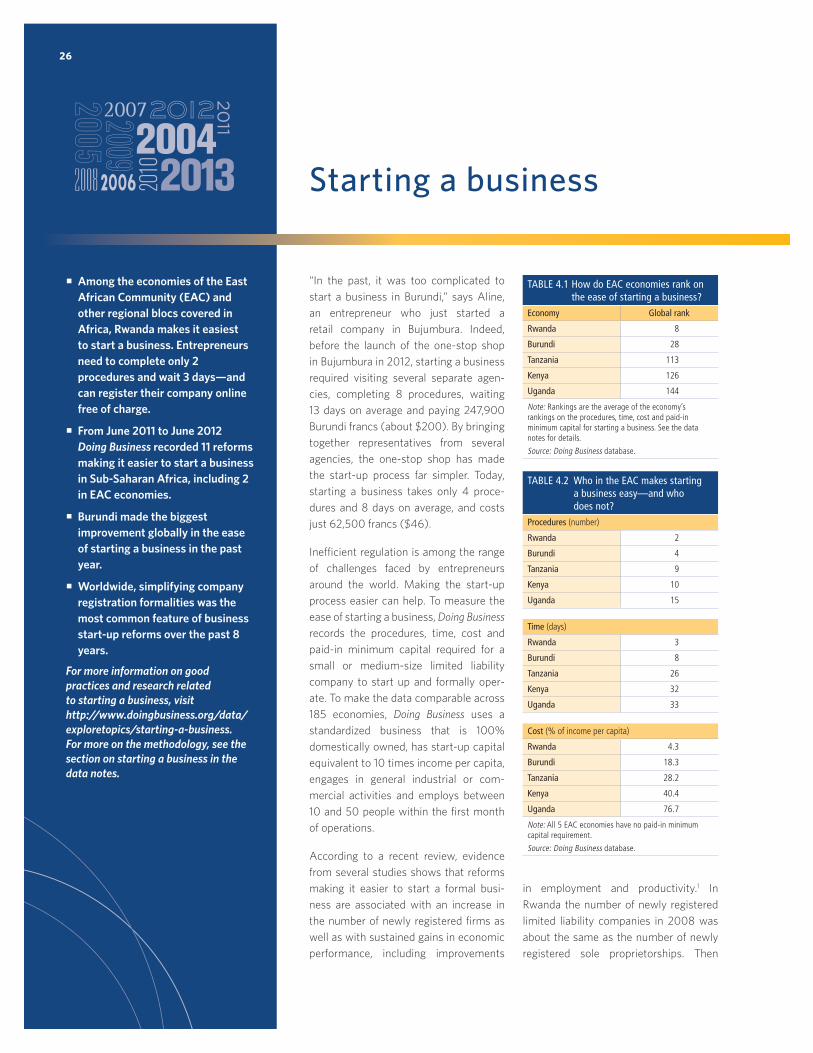
26
Starting a business
“In the past, it was too complicated to
start a business in Burundi,” says Aline,
an entrepreneur who just started a
retail company in Bujumbura. Indeed,
before the launch of the one-stop shop
in Bujumbura in 2012, starting a business
required visiting several separate agen-
cies, completing 8 procedures, waiting
13 days on average and paying 247,900
Burundi francs (about $200). By bringing
together representatives from several
agencies, the one-stop shop has made
the start-up process far simpler. Today,
starting a business takes only 4 proce-
dures and 8 days on average, and costs
just 62,500 francs ($46).
Inefficient regulation is among the range
of challenges faced by entrepreneurs
around the world. Making the start-up
process easier can help. To measure the
ease of starting a business, Doing Business
records the procedures, time, cost and
paid-in minimum capital required for a
small or medium-size limited liability
company to start up and formally oper-
ate. To make the data comparable across
185 economies, Doing Business uses a
standardized business that is 100%
domestically owned, has start-up capital
equivalent to 10 times income per capita,
engages in general industrial or com-
mercial activities and employs between
10 and 50 people within the first month
of operations.
According to a recent review, evidence
from several studies shows that reforms
making it easier to start a formal busi-
ness are associated with an increase in
the number of newly registered firms as
well as with sustained gains in economic
performance, including improvements
in employment and productivity.1 In
Rwanda the number of newly registered
limited liability companies in 2008 was
about the same as the number of newly
registered sole proprietorships. Then
Among the economies of the East African Community (EAC) and other regional blocs covered in Africa, Rwanda makes it easiest to start a business. Entrepreneurs need to complete only 2 procedures and wait 3 days—and can register their company online free of charge.
From June 2011 to June 2012 Doing Business recorded 11 reforms making it easier to start a business in Sub-Saharan Africa, including 2 in EAC economies.
Burundi made the biggest improvement globally in the ease of starting a business in the past year.
Worldwide, simplifying company registration formalities was the most common feature of business start-up reforms over the past 8 years.
For more information on good practices and research related to starting a business, visit http://www.doingbusiness.org/data/exploretopics/starting-a-business. For more on the methodology, see the section on starting a business in the data notes.
TABLE 4.1 How do EAC economies rank on the ease of starting a business?
Economy Global rank
Rwanda 8
Burundi 28
Tanzania 113
Kenya 126
Uganda 144
Note: Rankings are the average of the economy’s rankings on the procedures, time, cost and paid-in minimum capital for starting a business. See the data notes for details.
Source: Doing Business database.
TABLE 4.2 Who in the EAC makes starting a business easy—and who does not?
Procedures (number)
Rwanda 2
Burundi 4
Tanzania 9
Kenya 10
Uganda 15
Time (days)
Rwanda 3
Burundi 8
Tanzania 26
Kenya 32
Uganda 33
Cost (% of income per capita)
Rwanda 4.3
Burundi 18.3
Tanzania 28.2
Kenya 40.4
Uganda 76.7
Note: All 5 EAC economies have no paid-in minimum capital requirement.
Source: Doing Business database.
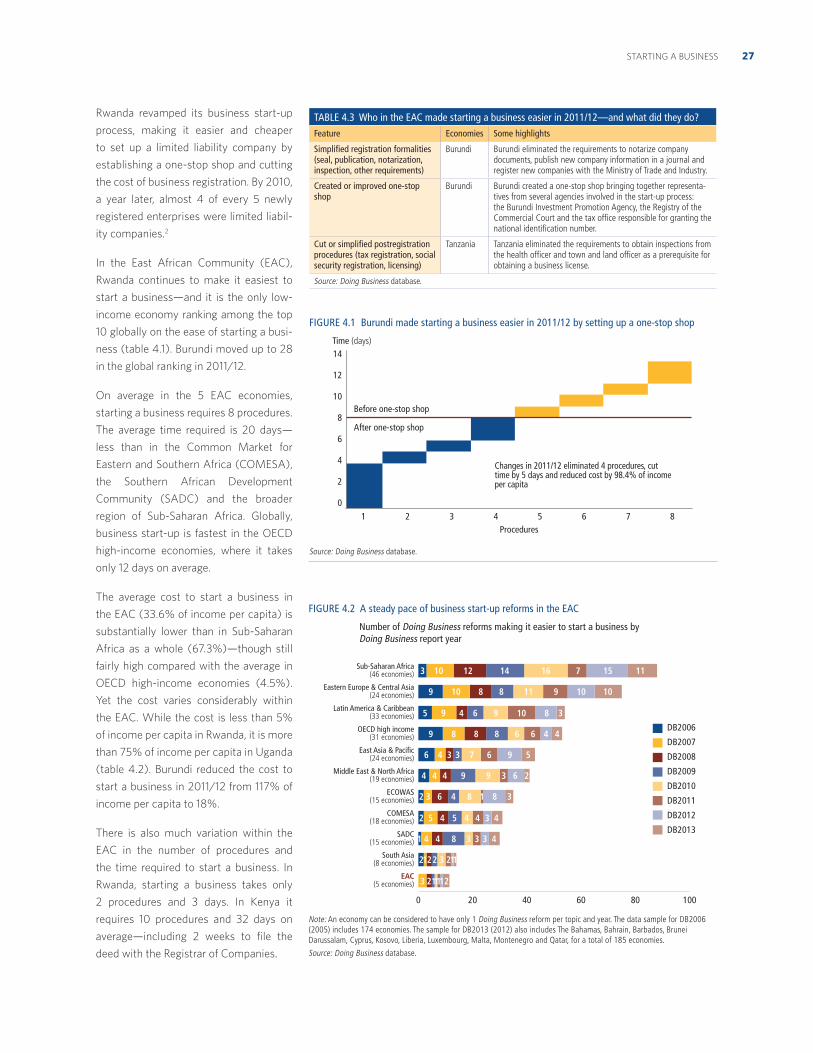
27STARTING A BUSINESS
Rwanda revamped its business start-up
process, making it easier and cheaper
to set up a limited liability company by
establishing a one-stop shop and cutting
the cost of business registration. By 2010,
a year later, almost 4 of every 5 newly
registered enterprises were limited liabil-
ity companies.2
In the East African Community (EAC),
Rwanda continues to make it easiest to
start a business—and it is the only low-
income economy ranking among the top
10 globally on the ease of starting a busi-
ness (table 4.1). Burundi moved up to 28
in the global ranking in 2011/12.
On average in the 5 EAC economies,
starting a business requires 8 procedures.
The average time required is 20 days—
less than in the Common Market for
Eastern and Southern Africa (COMESA),
the Southern African Development
Community (SADC) and the broader
region of Sub-Saharan Africa. Globally,
business start-up is fastest in the OECD
high-income economies, where it takes
only 12 days on average.
The average cost to start a business in
the EAC (33.6% of income per capita) is
substantially lower than in Sub-Saharan
Africa as a whole (67.3%)—though still
fairly high compared with the average in
OECD high-income economies (4.5%).
Yet the cost varies considerably within
the EAC. While the cost is less than 5%
of income per capita in Rwanda, it is more
than 75% of income per capita in Uganda
(table 4.2). Burundi reduced the cost to
start a business in 2011/12 from 117% of
income per capita to 18%.
There is also much variation within the
EAC in the number of procedures and
the time required to start a business. In
Rwanda, starting a business takes only
2 procedures and 3 days. In Kenya it
requires 10 procedures and 32 days on
average—including 2 weeks to file the
deed with the Registrar of Companies.
TABLE 4.3 Who in the EAC made starting a business easier in 2011/12—and what did they do?Feature Economies Some highlights
Simplified registration formalities (seal, publication, notarization, inspection, other requirements)
Burundi Burundi eliminated the requirements to notarize company documents, publish new company information in a journal and register new companies with the Ministry of Trade and Industry.
Created or improved one-stop shop
Burundi Burundi created a one-stop shop bringing together representa-tives from several agencies involved in the start-up process: the Burundi Investment Promotion Agency, the Registry of the Commercial Court and the tax office responsible for granting the national identification number.
Cut or simplified postregistration procedures (tax registration, social security registration, licensing)
Tanzania Tanzania eliminated the requirements to obtain inspections from the health officer and town and land officer as a prerequisite for obtaining a business license.
Source: Doing Business database.
FIGURE 4.2 A steady pace of business start-up reforms in the EAC
Number of Doing Business reforms making it easier to start a business by Doing Business report year
Note: An economy can be considered to have only 1 Doing Business reform per topic and year. The data sample for DB2006 (2005) includes 174 economies. The sample for DB2013 (2012) also includes The Bahamas, Bahrain, Barbados, Brunei Darussalam, Cyprus, Kosovo, Liberia, Luxembourg, Malta, Montenegro and Qatar, for a total of 185 economies.
Source: Doing Business database.
0 20 40 60 80 100
EAC (5 economies)
South Asia (8 economies)
SADC (15 economies)
COMESA (18 economies)
ECOWAS (15 economies)
Middle East & North Africa (19 economies)
East Asia & Pacific (24 economies)
OECD high income (31 economies)
Latin America & Caribbean (33 economies)
Eastern Europe & Central Asia (24 economies)
Sub-Saharan Africa (46 economies)
DB2006
DB2007
DB2008
DB2009
DB2010
DB2011
DB2012
DB2013
3 10 12 14 16 7 15 11
9 10 8 8 11 9 10 10
5 9 4 6 9 10 8 3
9 8 8 8 6 6 4 4
6 4 3 3 7 6 9 5
4 4 4 9 9 3 6 2
2 3 6 4 8 1 8 3
2 5 4 5 4 4 3 4
1 4 4 8 3 3 3 4
2 1 2 2 3 2 1 1
3 221111
FIGURE 4.1 Burundi made starting a business easier in 2011/12 by setting up a one-stop shop
Source: Doing Business database.
14
12
10
8
6
4
2
01 2 3 4 5 6 7 8
Changes in 2011/12 eliminated 4 procedures, cut time by 5 days and reduced cost by 98.4% of income per capita
Time (days)
Procedures
Before one-stop shop
After one-stop shop
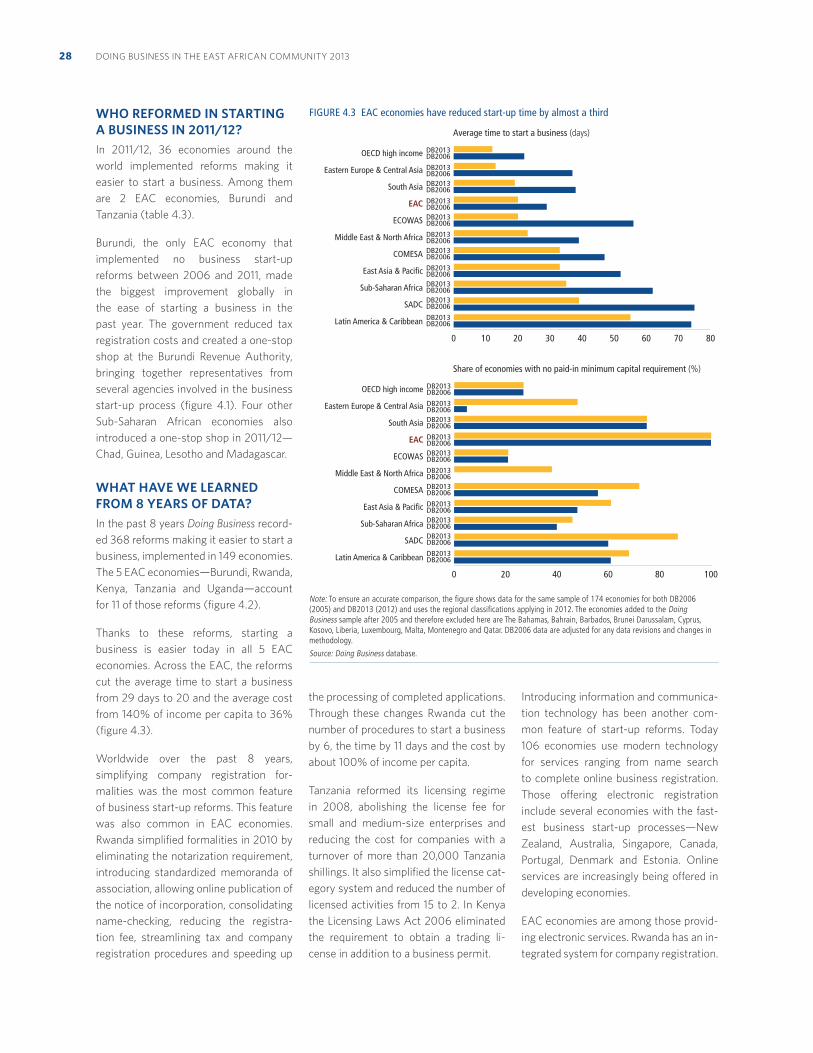
DOING BUSINESS IN THE EAST AFRICAN COMMUNITY 201328
WHO REFORMED IN STARTING A BUSINESS IN 2011/12?In 2011/12, 36 economies around the
world implemented reforms making it
easier to start a business. Among them
are 2 EAC economies, Burundi and
Tanzania (table 4.3).
Burundi, the only EAC economy that
implemented no business start-up
reforms between 2006 and 2011, made
the biggest improvement globally in
the ease of starting a business in the
past year. The government reduced tax
registration costs and created a one-stop
shop at the Burundi Revenue Authority,
bringing together representatives from
several agencies involved in the business
start-up process (figure 4.1). Four other
Sub-Saharan African economies also
introduced a one-stop shop in 2011/12—
Chad, Guinea, Lesotho and Madagascar.
WHAT HAVE WE LEARNED FROM 8 YEARS OF DATA?In the past 8 years Doing Business record-
ed 368 reforms making it easier to start a
business, implemented in 149 economies.
The 5 EAC economies—Burundi, Rwanda,
Kenya, Tanzania and Uganda—account
for 11 of those reforms (figure 4.2).
Thanks to these reforms, starting a
business is easier today in all 5 EAC
economies. Across the EAC, the reforms
cut the average time to start a business
from 29 days to 20 and the average cost
from 140% of income per capita to 36%
(figure 4.3).
Worldwide over the past 8 years,
simplifying company registration for-
malities was the most common feature
of business start-up reforms. This feature
was also common in EAC economies.
Rwanda simplified formalities in 2010 by
eliminating the notarization requirement,
introducing standardized memoranda of
association, allowing online publication of
the notice of incorporation, consolidating
name-checking, reducing the registra-
tion fee, streamlining tax and company
registration procedures and speeding up
the processing of completed applications.
Through these changes Rwanda cut the
number of procedures to start a business
by 6, the time by 11 days and the cost by
about 100% of income per capita.
Tanzania reformed its licensing regime
in 2008, abolishing the license fee for
small and medium-size enterprises and
reducing the cost for companies with a
turnover of more than 20,000 Tanzania
shillings. It also simplified the license cat-
egory system and reduced the number of
licensed activities from 15 to 2. In Kenya
the Licensing Laws Act 2006 eliminated
the requirement to obtain a trading li-
cense in addition to a business permit.
Introducing information and communica-
tion technology has been another com-
mon feature of start-up reforms. Today
106 economies use modern technology
for services ranging from name search
to complete online business registration.
Those offering electronic registration
include several economies with the fast-
est business start-up processes—New
Zealand, Australia, Singapore, Canada,
Portugal, Denmark and Estonia. Online
services are increasingly being offered in
developing economies.
EAC economies are among those provid-
ing electronic services. Rwanda has an in-
tegrated system for company registration.
FIGURE 4.3 EAC economies have reduced start-up time by almost a third
Note: To ensure an accurate comparison, the figure shows data for the same sample of 174 economies for both DB2006 (2005) and DB2013 (2012) and uses the regional classifications applying in 2012. The economies added to the Doing Business sample after 2005 and therefore excluded here are The Bahamas, Bahrain, Barbados, Brunei Darussalam, Cyprus, Kosovo, Liberia, Luxembourg, Malta, Montenegro and Qatar. DB2006 data are adjusted for any data revisions and changes in methodology.
Source: Doing Business database.
0 10 20 30 40 50 60 70 80
Latin America & Caribbean
SADC
Sub-Saharan Africa
East Asia & Pacific
COMESA
Middle East & North Africa
ECOWAS
EAC
South Asia
Eastern Europe & Central Asia
OECD high income
Average time to start a business (days)
DB2013DB2006
DB2013DB2006DB2013DB2006
DB2013DB2006DB2013DB2006
DB2013DB2006DB2013DB2006
DB2013DB2006DB2013DB2006DB2013DB2006
DB2013DB2006
0 20 40 60 80 100
Latin America & Caribbean
SADC
Sub-Saharan Africa
East Asia & Pacific
COMESA
Middle East & North Africa
ECOWAS
EAC
South Asia
Eastern Europe & Central Asia
OECD high income
Share of economies with no paid-in minimum capital requirement (%)
DB2013DB2006
DB2013DB2006DB2013DB2006
DB2013DB2006DB2013DB2006
DB2013DB2006DB2013DB2006
DB2013DB2006DB2013DB2006DB2013DB2006
DB2013DB2006
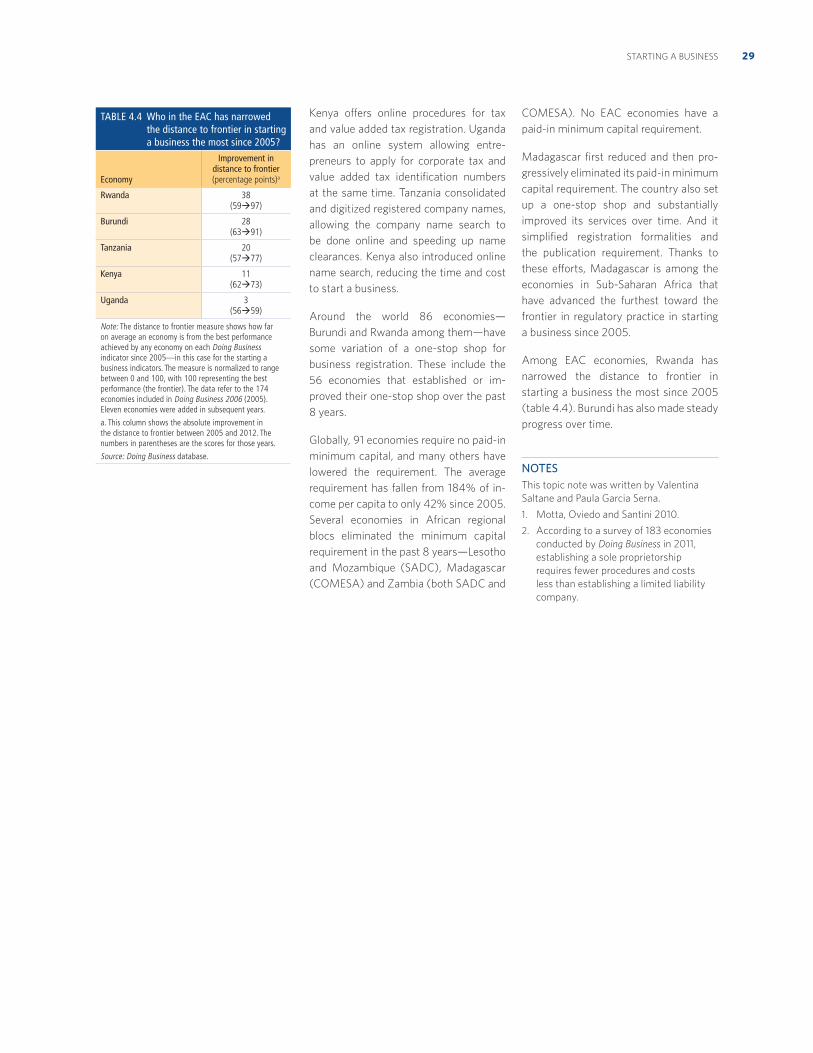
29STARTING A BUSINESS
Kenya offers online procedures for tax
and value added tax registration. Uganda
has an online system allowing entre-
preneurs to apply for corporate tax and
value added tax identification numbers
at the same time. Tanzania consolidated
and digitized registered company names,
allowing the company name search to
be done online and speeding up name
clearances. Kenya also introduced online
name search, reducing the time and cost
to start a business.
Around the world 86 economies—
Burundi and Rwanda among them—have
some variation of a one-stop shop for
business registration. These include the
56 economies that established or im-
proved their one-stop shop over the past
8 years.
Globally, 91 economies require no paid-in
minimum capital, and many others have
lowered the requirement. The average
requirement has fallen from 184% of in-
come per capita to only 42% since 2005.
Several economies in African regional
blocs eliminated the minimum capital
requirement in the past 8 years—Lesotho
and Mozambique (SADC), Madagascar
(COMESA) and Zambia (both SADC and
COMESA). No EAC economies have a
paid-in minimum capital requirement.
Madagascar first reduced and then pro-
gressively eliminated its paid-in minimum
capital requirement. The country also set
up a one-stop shop and substantially
improved its services over time. And it
simplified registration formalities and
the publication requirement. Thanks to
these efforts, Madagascar is among the
economies in Sub-Saharan Africa that
have advanced the furthest toward the
frontier in regulatory practice in starting
a business since 2005.
Among EAC economies, Rwanda has
narrowed the distance to frontier in
starting a business the most since 2005
(table 4.4). Burundi has also made steady
progress over time.
NOTES
This topic note was written by Valentina
Saltane and Paula Garcia Serna.
1. Motta, Oviedo and Santini 2010.
2. According to a survey of 183 economies
conducted by Doing Business in 2011,
establishing a sole proprietorship
requires fewer procedures and costs
less than establishing a limited liability
company.
TABLE 4.4 Who in the EAC has narrowed the distance to frontier in starting a business the most since 2005?
Economy
Improvement in distance to frontier (percentage points)a
Rwanda 38 (59 97)
Burundi 28 (63 91)
Tanzania 20 (57 77)
Kenya 11 (62 73)
Uganda 3 (56 59)
Note: The distance to frontier measure shows how far on average an economy is from the best performance achieved by any economy on each Doing Business indicator since 2005—in this case for the starting a business indicators. The measure is normalized to range between 0 and 100, with 100 representing the best performance (the frontier). The data refer to the 174 economies included in Doing Business 2006 (2005). Eleven economies were added in subsequent years.
a. This column shows the absolute improvement in the distance to frontier between 2005 and 2012. The numbers in parentheses are the scores for those years.
Source: Doing Business database.
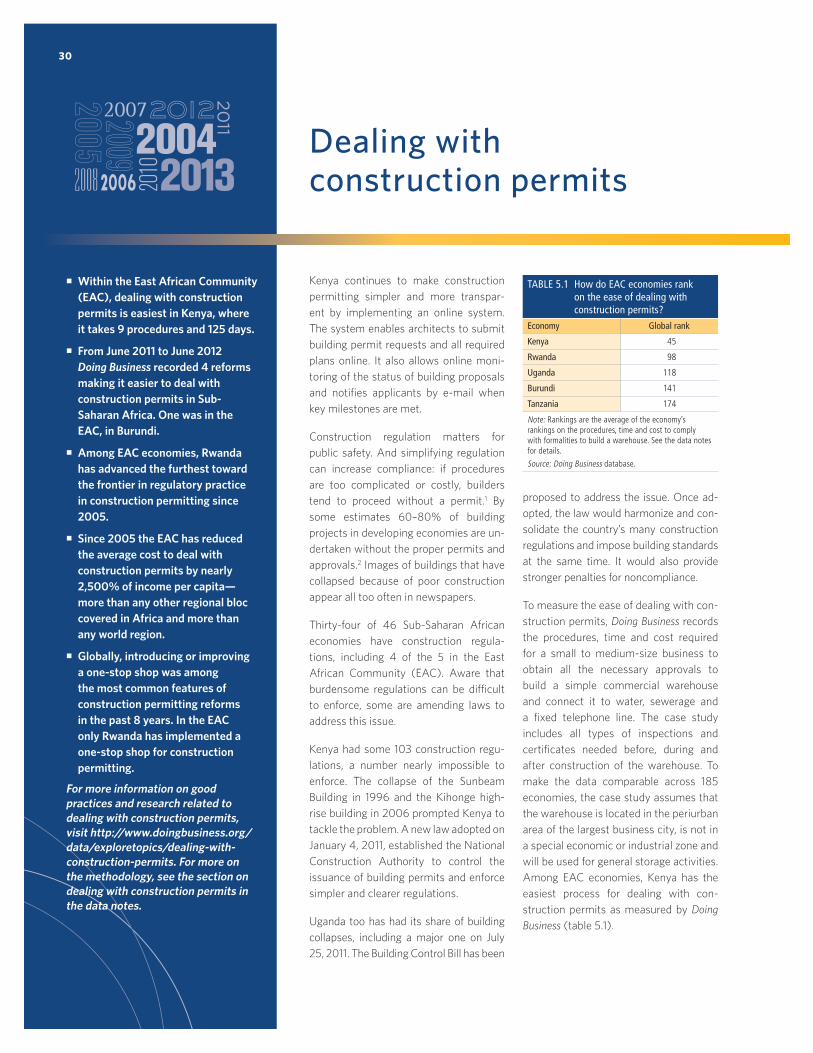
30
Dealing with
construction permits
Kenya continues to make construction
permitting simpler and more transpar-
ent by implementing an online system.
The system enables architects to submit
building permit requests and all required
plans online. It also allows online moni-
toring of the status of building proposals
and notifies applicants by e-mail when
key milestones are met.
Construction regulation matters for
public safety. And simplifying regulation
can increase compliance: if procedures
are too complicated or costly, builders
tend to proceed without a permit.1 By
some estimates 60–80% of building
projects in developing economies are un-
dertaken without the proper permits and
approvals.2 Images of buildings that have
collapsed because of poor construction
appear all too often in newspapers.
Thirty-four of 46 Sub-Saharan African
economies have construction regula-
tions, including 4 of the 5 in the East
African Community (EAC). Aware that
burdensome regulations can be difficult
to enforce, some are amending laws to
address this issue.
Kenya had some 103 construction regu-
lations, a number nearly impossible to
enforce. The collapse of the Sunbeam
Building in 1996 and the Kihonge high-
rise building in 2006 prompted Kenya to
tackle the problem. A new law adopted on
January 4, 2011, established the National
Construction Authority to control the
issuance of building permits and enforce
simpler and clearer regulations.
Uganda too has had its share of building
collapses, including a major one on July
25, 2011. The Building Control Bill has been
proposed to address the issue. Once ad-
opted, the law would harmonize and con-
solidate the country’s many construction
regulations and impose building standards
at the same time. It would also provide
stronger penalties for noncompliance.
To measure the ease of dealing with con-
struction permits, Doing Business records
the procedures, time and cost required
for a small to medium-size business to
obtain all the necessary approvals to
build a simple commercial warehouse
and connect it to water, sewerage and
a fixed telephone line. The case study
includes all types of inspections and
certificates needed before, during and
after construction of the warehouse. To
make the data comparable across 185
economies, the case study assumes that
the warehouse is located in the periurban
area of the largest business city, is not in
a special economic or industrial zone and
will be used for general storage activities.
Among EAC economies, Kenya has the
easiest process for dealing with con-
struction permits as measured by Doing
Business (table 5.1).
Within the East African Community (EAC), dealing with construction permits is easiest in Kenya, where it takes 9 procedures and 125 days.
From June 2011 to June 2012 Doing Business recorded 4 reforms making it easier to deal with construction permits in Sub-Saharan Africa. One was in the EAC, in Burundi.
Among EAC economies, Rwanda has advanced the furthest toward the frontier in regulatory practice in construction permitting since 2005.
Since 2005 the EAC has reduced the average cost to deal with construction permits by nearly 2,500% of income per capita—more than any other regional bloc covered in Africa and more than any world region.
Globally, introducing or improving a one-stop shop was among the most common features of construction permitting reforms in the past 8 years. In the EAC only Rwanda has implemented a one-stop shop for construction permitting.
For more information on good practices and research related to dealing with construction permits, visit http://www.doingbusiness.org/data/exploretopics/dealing-with-construction-permits. For more on the methodology, see the section on dealing with construction permits in the data notes.
TABLE 5.1 How do EAC economies rank on the ease of dealing with construction permits?
Economy Global rank
Kenya 45
Rwanda 98
Uganda 118
Burundi 141
Tanzania 174
Note: Rankings are the average of the economy’s rankings on the procedures, time and cost to comply with formalities to build a warehouse. See the data notes for details.
Source: Doing Business database.
31DEALING WITH CONSTRUCTION PERMITS
On average in the EAC, entrepreneurs
must go through 15 procedures to com-
plete all formalities required to build a
simple warehouse. Kenya has the fewest
procedures, with 9, and Burundi the most,
with 21 (table 5.2). Of the 21 procedures
required in Burundi, 16 relate to obtaining
postconstruction authorizations and util-
ity connections.
The average time required to deal with
construction permits in the EAC is
144 days—less than the 156 days in
the Common Market for Eastern and
Southern Africa (COMESA), 190 days in
the broader region of Sub-Saharan Africa
and 194 days in the Southern African
Development Community (SADC).
Indeed, the EAC average is almost the
same as the fastest worldwide average,
the 143 days in OECD high-income
economies.
Within the EAC, the process for dealing
with construction permits is fastest in
Burundi, where it takes 99 days, fol-
lowed by Kenya and Uganda, where it
takes 125. In Tanzania, with the slowest
process, it takes 206 days. The biggest
delay is due to a long wait to obtain the
building permit. Completing this single
procedure takes 90 days—compared
with 14 in Burundi, 30 in Kenya, 45 in
Rwanda and 60 in Uganda. On the time
required for the overall process of deal-
ing with construction permits, Burundi,
Kenya and Uganda compare well with the
regional average in Sub-Saharan Africa.
But there is still room for improvement: in
Singapore the process takes only 26 days.
Among the regional blocs covered in
Africa, the EAC has the highest average
cost to deal with construction permits,
764% of income per capita. The main
drivers of the higher costs in the EAC are
taxes and fees for preconstruction ap-
provals, which average 582.3% of income
per capita. Yet there are big differences
among EAC economies in the cost to deal
with construction permits. The cost is
highest in Burundi—at 1,912% of income
per capita, among the highest in the
world—and in Uganda (853% of income
per capita). It is lowest in Kenya (212% of
income per capita).
WHO REFORMED IN DEALING WITH CONSTRUCTION PERMITS IN 2011/12?From June 2011 to June 2012 Doing
Business recorded 4 reforms making it
easier to deal with construction permits
in Sub-Saharan Africa. Burundi was the
only EAC economy to implement a reform
(table 5.3). As of June 1, 2011, it abolished
a requirement to obtain approval from the
Ministry of Health before applying for a
building permit, reducing the number of
procedures by 2, the time by 5 days and
the cost by 143,066 Burundi francs ($95).
WHAT HAVE WE LEARNED FROM 8 YEARS OF DATA?In the past 8 years 83 economies around
the world implemented 146 reforms
making it easier to deal with construc-
tion permits (figure 5.1). Eastern Europe
and Central Asia had the most, with 39,
followed by Sub-Saharan Africa with 33.
COMESA had 21, and the EAC and SADC
10 each.
The EAC leads the way in reducing the cost
to deal with construction permits, slash-
ing it by an average 2,471% of income per
capita since 2005, followed by COMESA,
with an average reduction of 1,476% of
income per capita (figure 5.2). But there is
more room for improvement: the average
cost in the EAC remains higher than in any
world region except South Asia.
Among the most difficult changes to
implement in construction permitting
is the introduction or improvement of a
one-stop shop. Construction approval
systems usually involve many different
agencies. To prevent overlap in their roles
and ensure efficiency, many economies
have opted to put representatives from
many agencies in a single location. These
one-stop shops improve the organization
of the review process—not by reducing
the number of checks needed but by bet-
ter coordinating the efforts of the agencies
involved. Globally in the past 8 years, 18
regulatory reforms were implemented to
set up or improve a one-stop shop. Within
the EAC, only Rwanda has implemented
a one-stop shop. Besides Rwanda, 3
others in Sub-Saharan Africa have done
so—Benin, Burkina Faso and Mauritania.
Many economies have gone particularly
far in closing the gap with the most ef-
ficient regulatory systems for dealing
with construction permits, such as those
TABLE 5.3 Who in the EAC made dealing with construction permits easier in 2011/12—and what did they do?
Feature Economy Some highlights
Streamlined procedures and reduced time for processing permit applications
Burundi Burundi eliminated the requirement to obtain a clearance from the Ministry of Health and reduced the cost of the geotechnical study.
Source: Doing Business database.
TABLE 5.2 Who in the EAC makes dealing with construction permits easy—and who does not?
Procedures (number)
Kenya 9
Rwanda 12
Uganda 15
Tanzania 19
Burundi 21
Time (days)
Burundi 99
Kenya 125
Uganda 125
Rwanda 164
Tanzania 206
Cost (% of income per capita)
Kenya 211.9
Rwanda 278.4
Tanzania 564.6
Uganda 853.1
Burundi 1,911.9
Source: Doing Business database.
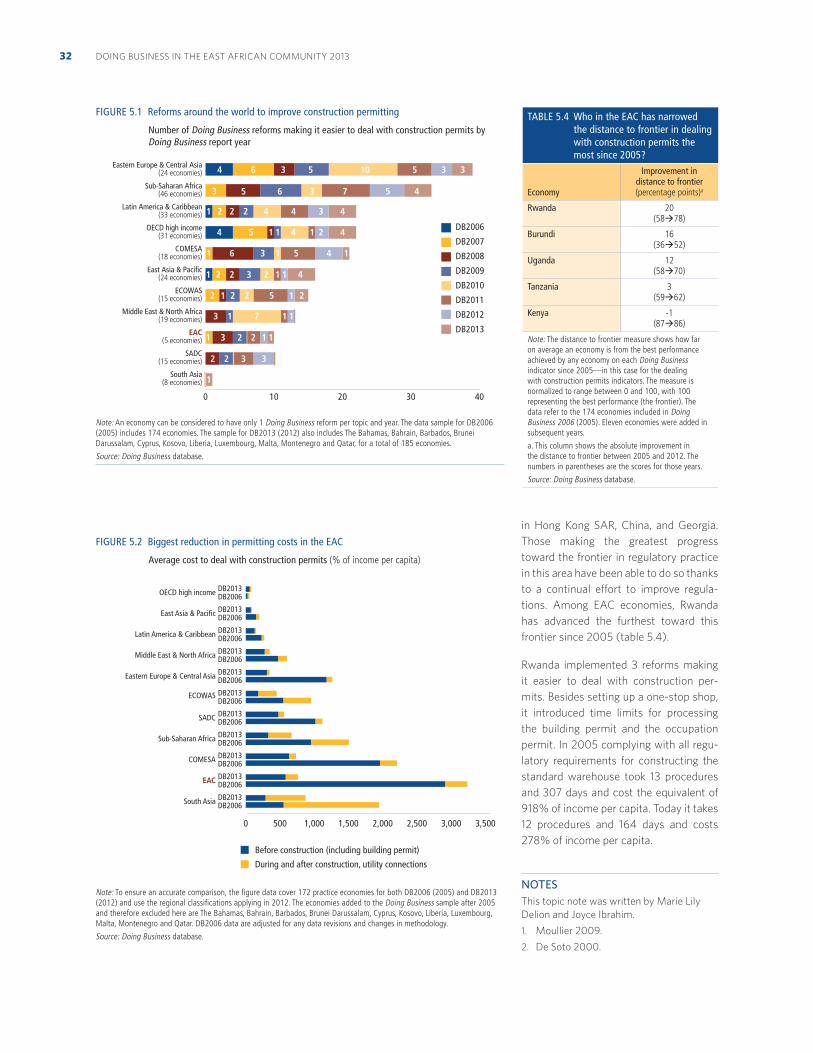
DOING BUSINESS IN THE EAST AFRICAN COMMUNITY 201332
in Hong Kong SAR, China, and Georgia.
Those making the greatest progress
toward the frontier in regulatory practice
in this area have been able to do so thanks
to a continual effort to improve regula-
tions. Among EAC economies, Rwanda
has advanced the furthest toward this
frontier since 2005 (table 5.4).
Rwanda implemented 3 reforms making
it easier to deal with construction per-
mits. Besides setting up a one-stop shop,
it introduced time limits for processing
the building permit and the occupation
permit. In 2005 complying with all regu-
latory requirements for constructing the
standard warehouse took 13 procedures
and 307 days and cost the equivalent of
918% of income per capita. Today it takes
12 procedures and 164 days and costs
278% of income per capita.
NOTES
This topic note was written by Marie Lily
Delion and Joyce Ibrahim.
1. Moullier 2009.
2. De Soto 2000.
FIGURE 5.1 Reforms around the world to improve construction permitting
Number of Doing Business reforms making it easier to deal with construction permits by Doing Business report year
Note: An economy can be considered to have only 1 Doing Business reform per topic and year. The data sample for DB2006 (2005) includes 174 economies. The sample for DB2013 (2012) also includes The Bahamas, Bahrain, Barbados, Brunei Darussalam, Cyprus, Kosovo, Liberia, Luxembourg, Malta, Montenegro and Qatar, for a total of 185 economies.
Source: Doing Business database.
FIGURE 5.2 Biggest reduction in permitting costs in the EAC
Average cost to deal with construction permits (% of income per capita)
Note: To ensure an accurate comparison, the figure data cover 172 practice economies for both DB2006 (2005) and DB2013 (2012) and use the regional classifications applying in 2012. The economies added to the Doing Business sample after 2005 and therefore excluded here are The Bahamas, Bahrain, Barbados, Brunei Darussalam, Cyprus, Kosovo, Liberia, Luxembourg, Malta, Montenegro and Qatar. DB2006 data are adjusted for any data revisions and changes in methodology.
Source: Doing Business database.
0 10 20 30 40
Eastern Europe & Central Asia(24 economies)
Sub-Saharan Africa(46 economies)
Latin America & Caribbean(33 economies)
OECD high income(31 economies)
COMESA(18 economies)
East Asia & Pacific(24 economies)
ECOWAS(15 economies)
Middle East & North Africa(19 economies)
EAC(5 economies)
SADC(15 economies)
South Asia(8 economies)
DB2006
DB2007
DB2008
DB2009
DB2010
DB2011
DB2012
DB2013
4 6 5 5 3 3103
3 5 6 7 5 43
1 2 2 2 4 4 3 4
4 5 11 4 1 2 4
1 6 3 1 5 4 1
1 2 2 2 1 1 43
2 1 2 2 5 1 2
3 1 7 1 1
1 3 2 2 1 1
2 2 3 3
1
0 500 1,000 1,500 2,000 2,500 3,000 3,500
During and after construction, utility connections
Before construction (including building permit)
DB2006South Asia DB2013
DB2006EAC DB2013
DB2006COMESA DB2013
DB2006Sub-Saharan Africa DB2013
DB2006SADC DB2013
DB2006ECOWAS DB2013
DB2006Eastern Europe & Central Asia DB2013
DB2006Middle East & North Africa DB2013
DB2006Latin America & Caribbean DB2013
DB2006East Asia & Pacific DB2013
DB2006OECD high income DB2013
TABLE 5.4 Who in the EAC has narrowed the distance to frontier in dealing with construction permits the most since 2005?
Economy
Improvement in distance to frontier (percentage points)a
Rwanda 20(58 78)
Burundi 16(36 52)
Uganda 12(58 70)
Tanzania 3(59 62)
Kenya -1(87 86)
Note: The distance to frontier measure shows how far on average an economy is from the best performance achieved by any economy on each Doing Business indicator since 2005—in this case for the dealing with construction permits indicators. The measure is normalized to range between 0 and 100, with 100 representing the best performance (the frontier). The data refer to the 174 economies included in Doing Business 2006 (2005). Eleven economies were added in subsequent years.
a. This column shows the absolute improvement in the distance to frontier between 2005 and 2012. The numbers in parentheses are the scores for those years.
Source: Doing Business database.
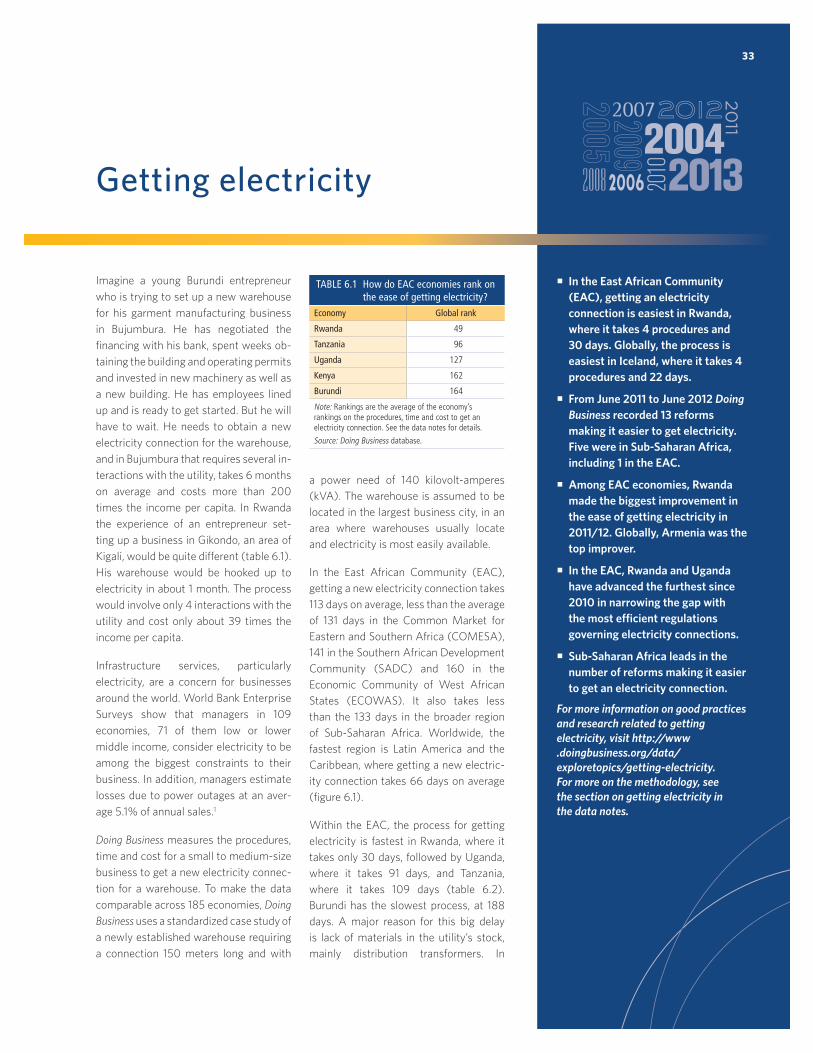
33
Getting electricity
Imagine a young Burundi entrepreneur
who is trying to set up a new warehouse
for his garment manufacturing business
in Bujumbura. He has negotiated the
financing with his bank, spent weeks ob-
taining the building and operating permits
and invested in new machinery as well as
a new building. He has employees lined
up and is ready to get started. But he will
have to wait. He needs to obtain a new
electricity connection for the warehouse,
and in Bujumbura that requires several in-
teractions with the utility, takes 6 months
on average and costs more than 200
times the income per capita. In Rwanda
the experience of an entrepreneur set-
ting up a business in Gikondo, an area of
Kigali, would be quite different (table 6.1).
His warehouse would be hooked up to
electricity in about 1 month. The process
would involve only 4 interactions with the
utility and cost only about 39 times the
income per capita.
Infrastructure services, particularly
electricity, are a concern for businesses
around the world. World Bank Enterprise
Surveys show that managers in 109
economies, 71 of them low or lower
middle income, consider electricity to be
among the biggest constraints to their
business. In addition, managers estimate
losses due to power outages at an aver-
age 5.1% of annual sales.1
Doing Business measures the procedures,
time and cost for a small to medium-size
business to get a new electricity connec-
tion for a warehouse. To make the data
comparable across 185 economies, Doing
Business uses a standardized case study of
a newly established warehouse requiring
a connection 150 meters long and with
a power need of 140 kilovolt-amperes
(kVA). The warehouse is assumed to be
located in the largest business city, in an
area where warehouses usually locate
and electricity is most easily available.
In the East African Community (EAC),
getting a new electricity connection takes
113 days on average, less than the average
of 131 days in the Common Market for
Eastern and Southern Africa (COMESA),
141 in the Southern African Development
Community (SADC) and 160 in the
Economic Community of West African
States (ECOWAS). It also takes less
than the 133 days in the broader region
of Sub-Saharan Africa. Worldwide, the
fastest region is Latin America and the
Caribbean, where getting a new electric-
ity connection takes 66 days on average
(figure 6.1).
Within the EAC, the process for getting
electricity is fastest in Rwanda, where it
takes only 30 days, followed by Uganda,
where it takes 91 days, and Tanzania,
where it takes 109 days (table 6.2).
Burundi has the slowest process, at 188
days. A major reason for this big delay
is lack of materials in the utility’s stock,
mainly distribution transformers. In
In the East African Community (EAC), getting an electricity connection is easiest in Rwanda, where it takes 4 procedures and 30 days. Globally, the process is easiest in Iceland, where it takes 4 procedures and 22 days.
From June 2011 to June 2012 Doing Business recorded 13 reforms making it easier to get electricity. Five were in Sub-Saharan Africa, including 1 in the EAC.
Among EAC economies, Rwanda made the biggest improvement in the ease of getting electricity in 2011/12. Globally, Armenia was the top improver.
In the EAC, Rwanda and Uganda have advanced the furthest since 2010 in narrowing the gap with the most efficient regulations governing electricity connections.
Sub-Saharan Africa leads in the number of reforms making it easier to get an electricity connection.
For more information on good practices and research related to getting electricity, visit http://www .doingbusiness.org/data/exploretopics/getting-electricity. For more on the methodology, see the section on getting electricity in the data notes.
TABLE 6.1 How do EAC economies rank on the ease of getting electricity?
Economy Global rank
Rwanda 49
Tanzania 96
Uganda 127
Kenya 162
Burundi 164
Note: Rankings are the average of the economy’s rankings on the procedures, time and cost to get an electricity connection. See the data notes for details.
Source: Doing Business database.
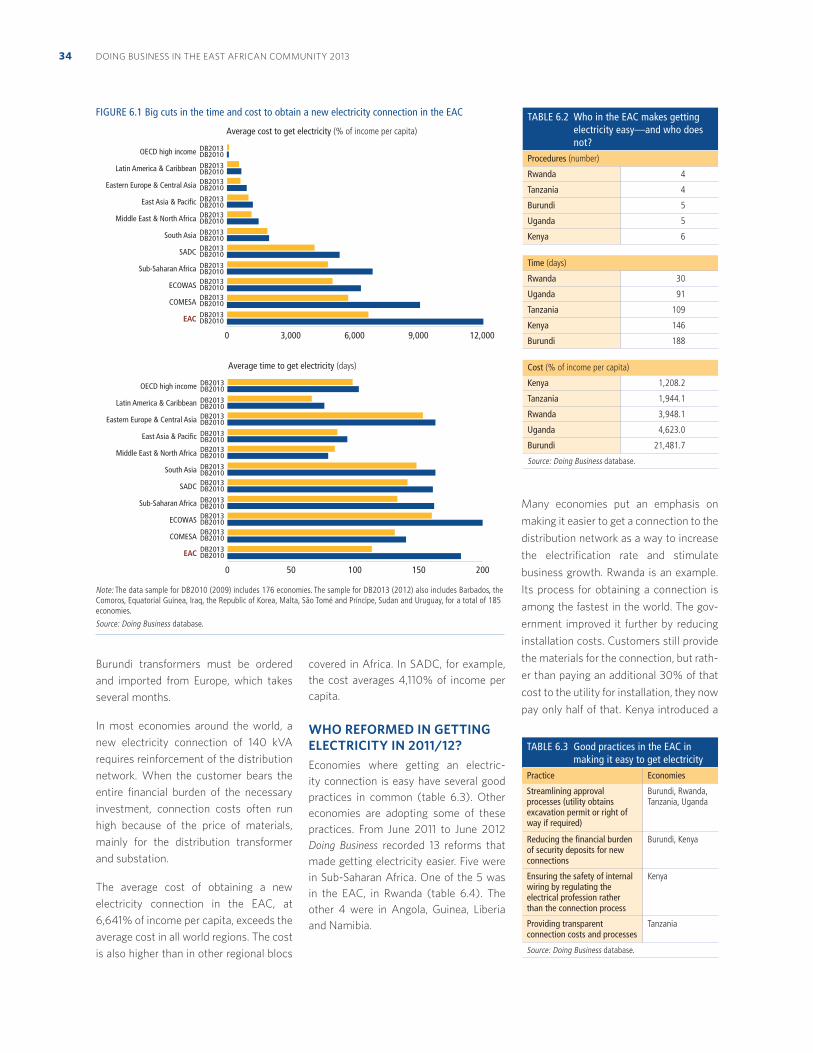
DOING BUSINESS IN THE EAST AFRICAN COMMUNITY 201334
Burundi transformers must be ordered
and imported from Europe, which takes
several months.
In most economies around the world, a
new electricity connection of 140 kVA
requires reinforcement of the distribution
network. When the customer bears the
entire financial burden of the necessary
investment, connection costs often run
high because of the price of materials,
mainly for the distribution transformer
and substation.
The average cost of obtaining a new
electricity connection in the EAC, at
6,641% of income per capita, exceeds the
average cost in all world regions. The cost
is also higher than in other regional blocs
covered in Africa. In SADC, for example,
the cost averages 4,110% of income per
capita.
WHO REFORMED IN GETTING ELECTRICITY IN 2011/12? Economies where getting an electric-
ity connection is easy have several good
practices in common (table 6.3). Other
economies are adopting some of these
practices. From June 2011 to June 2012
Doing Business recorded 13 reforms that
made getting electricity easier. Five were
in Sub-Saharan Africa. One of the 5 was
in the EAC, in Rwanda (table 6.4). The
other 4 were in Angola, Guinea, Liberia
and Namibia.
Many economies put an emphasis on
making it easier to get a connection to the
distribution network as a way to increase
the electrification rate and stimulate
business growth. Rwanda is an example.
Its process for obtaining a connection is
among the fastest in the world. The gov-
ernment improved it further by reducing
installation costs. Customers still provide
the materials for the connection, but rath-
er than paying an additional 30% of that
cost to the utility for installation, they now
pay only half of that. Kenya introduced a
TABLE 6.3 Good practices in the EAC in making it easy to get electricity
Practice Economies
Streamlining approval processes (utility obtains excavation permit or right of way if required)
Burundi, Rwanda, Tanzania, Uganda
Reducing the financial burden of security deposits for new connections
Burundi, Kenya
Ensuring the safety of internal wiring by regulating the electrical profession rather than the connection process
Kenya
Providing transparent connection costs and processes
Tanzania
Source: Doing Business database.
TABLE 6.2 Who in the EAC makes getting electricity easy—and who does not?
Procedures (number)
Rwanda 4
Tanzania 4
Burundi 5
Uganda 5
Kenya 6
Time (days)
Rwanda 30
Uganda 91
Tanzania 109
Kenya 146
Burundi 188
Cost (% of income per capita)
Kenya 1,208.2
Tanzania 1,944.1
Rwanda 3,948.1
Uganda 4,623.0
Burundi 21,481.7
Source: Doing Business database.
FIGURE 6.1 Big cuts in the time and cost to obtain a new electricity connection in the EAC
Note: The data sample for DB2010 (2009) includes 176 economies. The sample for DB2013 (2012) also includes Barbados, the Comoros, Equatorial Guinea, Iraq, the Republic of Korea, Malta, São Tomé and Príncipe, Sudan and Uruguay, for a total of 185 economies.
Source: Doing Business database.
0 3,000 6,000 9,000 12,000
EAC
COMESA
ECOWAS
Sub-Saharan Africa
SADC
South Asia
Middle East & North Africa
East Asia & Pacific
Eastern Europe & Central Asia
Latin America & Caribbean
OECD high income
Average cost to get electricity (% of income per capita)
DB2013DB2010
DB2013DB2010DB2013DB2010
DB2013DB2010DB2013DB2010
DB2013DB2010DB2013DB2010
DB2013DB2010DB2013DB2010DB2013DB2010
DB2013DB2010
0 50 100 150 200
EAC
COMESA
ECOWAS
Sub-Saharan Africa
SADC
South Asia
Middle East & North Africa
East Asia & Pacific
Eastern Europe & Central Asia
Latin America & Caribbean
OECD high income
Average time to get electricity (days)
DB2013DB2010
DB2013DB2010DB2013DB2010
DB2013DB2010DB2013DB2010
DB2013DB2010DB2013DB2010
DB2013DB2010DB2013DB2010DB2013DB2010
DB2013DB2010
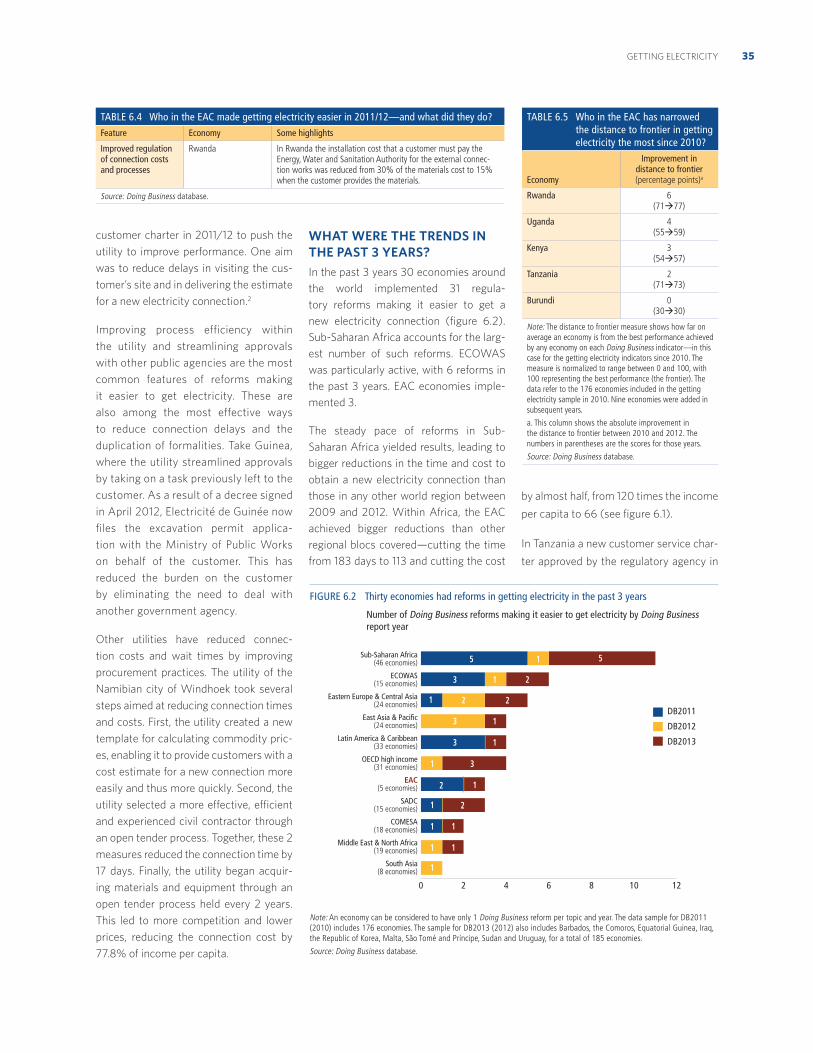
35GETTING ELECTRICITY
customer charter in 2011/12 to push the
utility to improve performance. One aim
was to reduce delays in visiting the cus-
tomer’s site and in delivering the estimate
for a new electricity connection.2
Improving process efficiency within
the utility and streamlining approvals
with other public agencies are the most
common features of reforms making
it easier to get electricity. These are
also among the most effective ways
to reduce connection delays and the
duplication of formalities. Take Guinea,
where the utility streamlined approvals
by taking on a task previously left to the
customer. As a result of a decree signed
in April 2012, Electricité de Guinée now
files the excavation permit applica-
tion with the Ministry of Public Works
on behalf of the customer. This has
reduced the burden on the customer
by eliminating the need to deal with
another government agency.
Other utilities have reduced connec-
tion costs and wait times by improving
procurement practices. The utility of the
Namibian city of Windhoek took several
steps aimed at reducing connection times
and costs. First, the utility created a new
template for calculating commodity pric-
es, enabling it to provide customers with a
cost estimate for a new connection more
easily and thus more quickly. Second, the
utility selected a more effective, efficient
and experienced civil contractor through
an open tender process. Together, these 2
measures reduced the connection time by
17 days. Finally, the utility began acquir-
ing materials and equipment through an
open tender process held every 2 years.
This led to more competition and lower
prices, reducing the connection cost by
77.8% of income per capita.
WHAT WERE THE TRENDS IN THE PAST 3 YEARS? In the past 3 years 30 economies around
the world implemented 31 regula-
tory reforms making it easier to get a
new electricity connection (figure 6.2).
Sub-Saharan Africa accounts for the larg-
est number of such reforms. ECOWAS
was particularly active, with 6 reforms in
the past 3 years. EAC economies imple-
mented 3.
The steady pace of reforms in Sub-
Saharan Africa yielded results, leading to
bigger reductions in the time and cost to
obtain a new electricity connection than
those in any other world region between
2009 and 2012. Within Africa, the EAC
achieved bigger reductions than other
regional blocs covered—cutting the time
from 183 days to 113 and cutting the cost
by almost half, from 120 times the income
per capita to 66 (see figure 6.1).
In Tanzania a new customer service char-
ter approved by the regulatory agency in
TABLE 6.5 Who in the EAC has narrowed the distance to frontier in getting electricity the most since 2010?
Economy
Improvement in distance to frontier (percentage points)a
Rwanda 6(71 77)
Uganda 4(55 59)
Kenya 3(54 57)
Tanzania 2(71 73)
Burundi 0(30 30)
Note: The distance to frontier measure shows how far on average an economy is from the best performance achieved by any economy on each Doing Business indicator—in this case for the getting electricity indicators since 2010. The measure is normalized to range between 0 and 100, with 100 representing the best performance (the frontier). The data refer to the 176 economies included in the getting electricity sample in 2010. Nine economies were added in subsequent years.
a. This column shows the absolute improvement in the distance to frontier between 2010 and 2012. The numbers in parentheses are the scores for those years.
Source: Doing Business database.
FIGURE 6.2 Thirty economies had reforms in getting electricity in the past 3 years
Number of Doing Business reforms making it easier to get electricity by Doing Business report year
Note: An economy can be considered to have only 1 Doing Business reform per topic and year. The data sample for DB2011 (2010) includes 176 economies. The sample for DB2013 (2012) also includes Barbados, the Comoros, Equatorial Guinea, Iraq, the Republic of Korea, Malta, São Tomé and Príncipe, Sudan and Uruguay, for a total of 185 economies.
Source: Doing Business database.
0 2 4 6 8 10 12
South Asia(8 economies)
Middle East & North Africa(19 economies)
COMESA(18 economies)
SADC(15 economies)
EAC(5 economies)
OECD high income(31 economies)
Latin America & Caribbean(33 economies)
East Asia & Pacific(24 economies)
Eastern Europe & Central Asia(24 economies)
ECOWAS(15 economies)
Sub-Saharan Africa(46 economies)
DB2011
DB2012
DB2013
515
3 2
2
1
3 1
3
3
1
1
1
1
1 1
1
1
1
2
2
2
1
TABLE 6.4 Who in the EAC made getting electricity easier in 2011/12—and what did they do?Feature Economy Some highlights
Improved regulation of connection costs and processes
Rwanda In Rwanda the installation cost that a customer must pay the Energy, Water and Sanitation Authority for the external connec-tion works was reduced from 30% of the materials cost to 15% when the customer provides the materials.
Source: Doing Business database.
DOING BUSINESS IN THE EAST AFRICAN COMMUNITY 201336
2010 reduced wait times for customers
by enforcing time frames for different
steps and streamlining internal processes.
In Uganda the utility reduced the time
required for completing external connec-
tion works by 60 days by outsourcing the
task to registered private firms. Among
EAC economies, Rwanda and Uganda
have advanced the most since 2010 in
narrowing the gap with the most efficient
regulatory practices for connecting new
customers (table 6.5).
NOTES
This topic note was written by Maya
Choueiri, Caroline Frontigny, Anastasia
Shegay and Jayashree Srinivasan.
1. The surveys are for various years in
2002–10. The data sample includes 113
economies.
2. In accordance with the getting electricity
methodology, the introduction of the
customer charter was not included in
the reform count because it had only a
minor impact on the time to obtain a new
electricity connection.
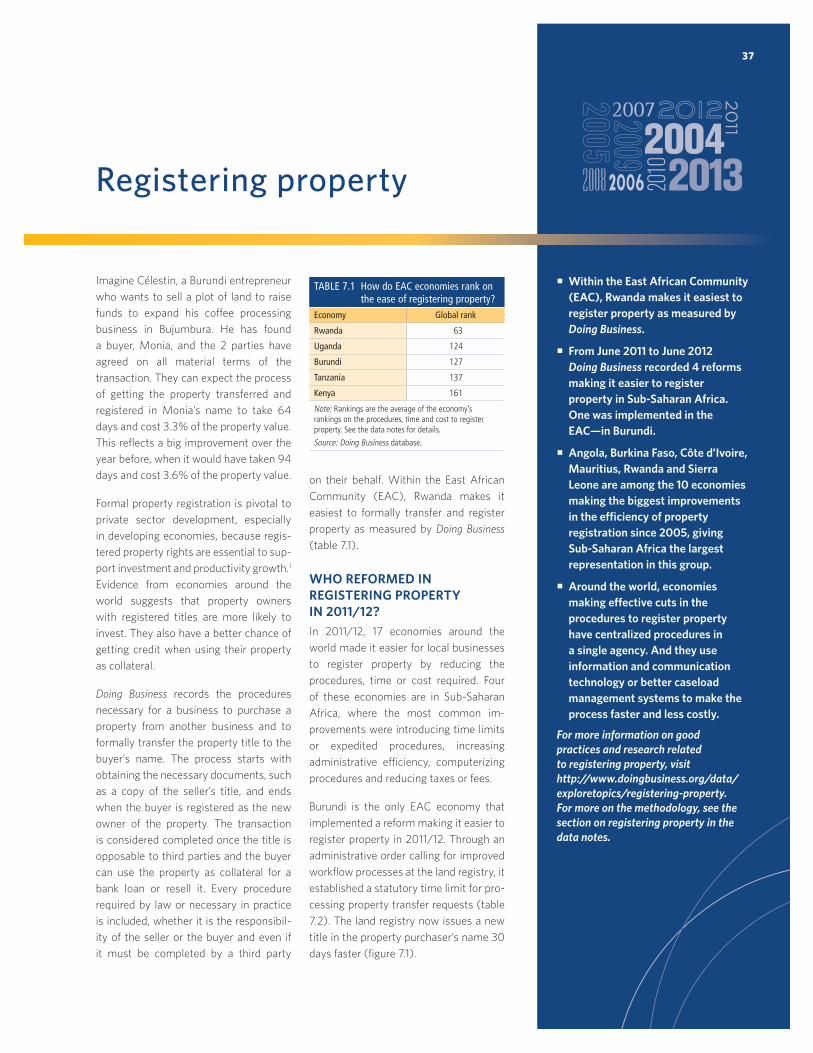
37
Registering property
Imagine Célestin, a Burundi entrepreneur
who wants to sell a plot of land to raise
funds to expand his coffee processing
business in Bujumbura. He has found
a buyer, Monia, and the 2 parties have
agreed on all material terms of the
transaction. They can expect the process
of getting the property transferred and
registered in Monia’s name to take 64
days and cost 3.3% of the property value.
This reflects a big improvement over the
year before, when it would have taken 94
days and cost 3.6% of the property value.
Formal property registration is pivotal to
private sector development, especially
in developing economies, because regis-
tered property rights are essential to sup-
port investment and productivity growth.1
Evidence from economies around the
world suggests that property owners
with registered titles are more likely to
invest. They also have a better chance of
getting credit when using their property
as collateral.
Doing Business records the procedures
necessary for a business to purchase a
property from another business and to
formally transfer the property title to the
buyer’s name. The process starts with
obtaining the necessary documents, such
as a copy of the seller’s title, and ends
when the buyer is registered as the new
owner of the property. The transaction
is considered completed once the title is
opposable to third parties and the buyer
can use the property as collateral for a
bank loan or resell it. Every procedure
required by law or necessary in practice
is included, whether it is the responsibil-
ity of the seller or the buyer and even if
it must be completed by a third party
on their behalf. Within the East African
Community (EAC), Rwanda makes it
easiest to formally transfer and register
property as measured by Doing Business
(table 7.1).
WHO REFORMED IN REGISTERING PROPERTY IN 2011/12?In 2011/12, 17 economies around the
world made it easier for local businesses
to register property by reducing the
procedures, time or cost required. Four
of these economies are in Sub-Saharan
Africa, where the most common im-
provements were introducing time limits
or expedited procedures, increasing
administrative efficiency, computerizing
procedures and reducing taxes or fees.
Burundi is the only EAC economy that
implemented a reform making it easier to
register property in 2011/12. Through an
administrative order calling for improved
workflow processes at the land registry, it
established a statutory time limit for pro-
cessing property transfer requests (table
7.2). The land registry now issues a new
title in the property purchaser’s name 30
days faster (figure 7.1).
Within the East African Community (EAC), Rwanda makes it easiest to register property as measured by Doing Business.
From June 2011 to June 2012 Doing Business recorded 4 reforms making it easier to register property in Sub-Saharan Africa. One was implemented in the EAC—in Burundi.
Angola, Burkina Faso, Côte d’Ivoire, Mauritius, Rwanda and Sierra Leone are among the 10 economies making the biggest improvements in the efficiency of property registration since 2005, giving Sub-Saharan Africa the largest representation in this group.
Around the world, economies making effective cuts in the procedures to register property have centralized procedures in a single agency. And they use information and communication technology or better caseload management systems to make the process faster and less costly.
For more information on good practices and research related to registering property, visit http://www.doingbusiness.org/data/exploretopics/registering-property. For more on the methodology, see the section on registering property in the data notes.
TABLE 7.1 How do EAC economies rank on the ease of registering property?
Economy Global rank
Rwanda 63
Uganda 124
Burundi 127
Tanzania 137
Kenya 161
Note: Rankings are the average of the economy’s rankings on the procedures, time and cost to register property. See the data notes for details.
Source: Doing Business database.
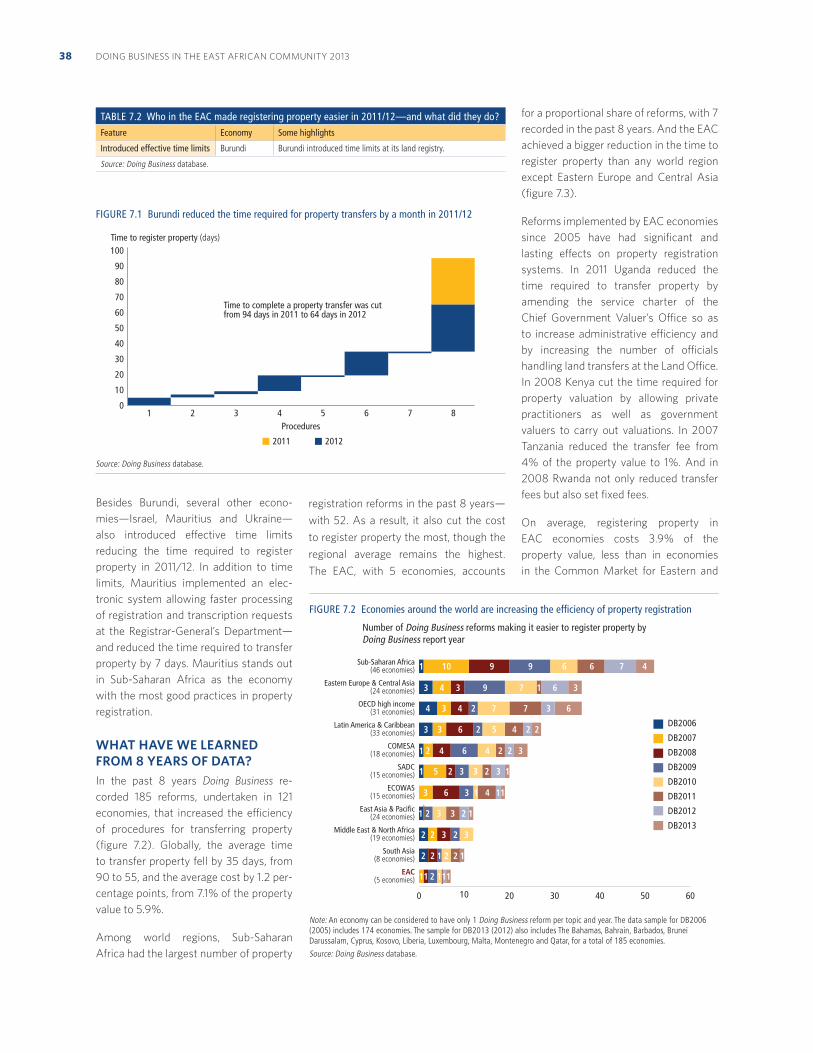
DOING BUSINESS IN THE EAST AFRICAN COMMUNITY 201338
Besides Burundi, several other econo-
mies—Israel, Mauritius and Ukraine—
also introduced effective time limits
reducing the time required to register
property in 2011/12. In addition to time
limits, Mauritius implemented an elec-
tronic system allowing faster processing
of registration and transcription requests
at the Registrar-General’s Department—
and reduced the time required to transfer
property by 7 days. Mauritius stands out
in Sub-Saharan Africa as the economy
with the most good practices in property
registration.
WHAT HAVE WE LEARNED FROM 8 YEARS OF DATA?In the past 8 years Doing Business re-
corded 185 reforms, undertaken in 121
economies, that increased the efficiency
of procedures for transferring property
(figure 7.2). Globally, the average time
to transfer property fell by 35 days, from
90 to 55, and the average cost by 1.2 per-
centage points, from 7.1% of the property
value to 5.9%.
Among world regions, Sub-Saharan
Africa had the largest number of property
registration reforms in the past 8 years—
with 52. As a result, it also cut the cost
to register property the most, though the
regional average remains the highest.
The EAC, with 5 economies, accounts
for a proportional share of reforms, with 7
recorded in the past 8 years. And the EAC
achieved a bigger reduction in the time to
register property than any world region
except Eastern Europe and Central Asia
(figure 7.3).
Reforms implemented by EAC economies
since 2005 have had significant and
lasting effects on property registration
systems. In 2011 Uganda reduced the
time required to transfer property by
amending the service charter of the
Chief Government Valuer’s Office so as
to increase administrative efficiency and
by increasing the number of officials
handling land transfers at the Land Office.
In 2008 Kenya cut the time required for
property valuation by allowing private
practitioners as well as government
valuers to carry out valuations. In 2007
Tanzania reduced the transfer fee from
4% of the property value to 1%. And in
2008 Rwanda not only reduced transfer
fees but also set fixed fees.
On average, registering property in
EAC economies costs 3.9% of the
property value, less than in economies
in the Common Market for Eastern and
TABLE 7.2 Who in the EAC made registering property easier in 2011/12—and what did they do?Feature Economy Some highlights
Introduced effective time limits Burundi Burundi introduced time limits at its land registry.
Source: Doing Business database.
FIGURE 7.2 Economies around the world are increasing the efficiency of property registration
Number of Doing Business reforms making it easier to register property by Doing Business report year
Note: An economy can be considered to have only 1 Doing Business reform per topic and year. The data sample for DB2006 (2005) includes 174 economies. The sample for DB2013 (2012) also includes The Bahamas, Bahrain, Barbados, Brunei Darussalam, Cyprus, Kosovo, Liberia, Luxembourg, Malta, Montenegro and Qatar, for a total of 185 economies.
Source: Doing Business database.
0 10 20 30 40 50 60
EAC(5 economies)
South Asia(8 economies)
Middle East & North Africa(19 economies)
East Asia & Pacific(24 economies)
ECOWAS(15 economies)
SADC(15 economies)
COMESA(18 economies)
Latin America & Caribbean(33 economies)
OECD high income(31 economies)
Eastern Europe & Central Asia(24 economies)
Sub-Saharan Africa(46 economies)
DB2006
DB2007
DB2008
DB2009
DB2010
DB2011
DB2012
DB2013
1 10 9 9 6 6 7 4
4 3 4 2 7 7 3 6
3 4 3 9 7 1 6 3
3 3 6 2 5 4 2 2
1 2 4 6 4 2 2 3
1 5 2 3 3 2 3 1
3 6 3 1 4 11
2 2 3 2 3 0 0 0
1 2 3 3 2 1
2 2 1 2 2 1
11 2 111
FIGURE 7.1 Burundi reduced the time required for property transfers by a month in 2011/12
Source: Doing Business database.
100
90
80
70
60
50
40
30
20
10
01 2 3 4 5 6 7 8
Time to complete a property transfer was cut from 94 days in 2011 to 64 days in 2012
Time to register property (days)
Procedures
2011 2012
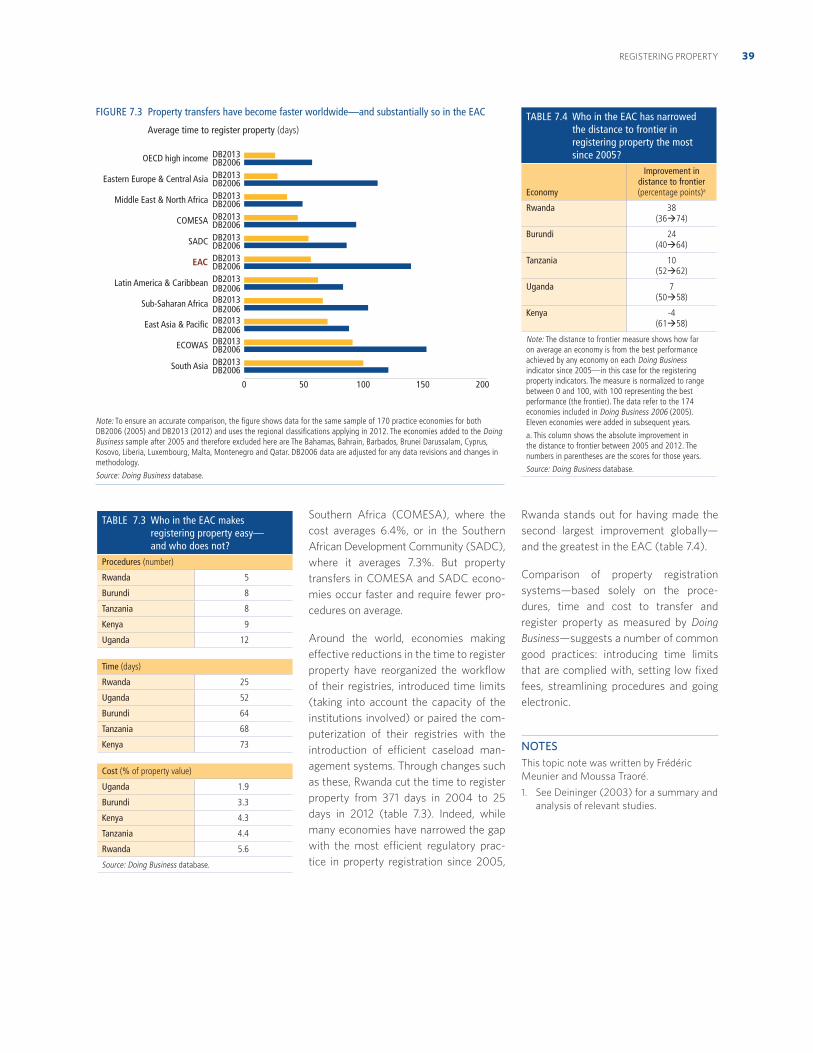
39REGISTERING PROPERTY
Southern Africa (COMESA), where the
cost averages 6.4%, or in the Southern
African Development Community (SADC),
where it averages 7.3%. But property
transfers in COMESA and SADC econo-
mies occur faster and require fewer pro-
cedures on average.
Around the world, economies making
effective reductions in the time to register
property have reorganized the workflow
of their registries, introduced time limits
(taking into account the capacity of the
institutions involved) or paired the com-
puterization of their registries with the
introduction of efficient caseload man-
agement systems. Through changes such
as these, Rwanda cut the time to register
property from 371 days in 2004 to 25
days in 2012 (table 7.3). Indeed, while
many economies have narrowed the gap
with the most efficient regulatory prac-
tice in property registration since 2005,
Rwanda stands out for having made the
second largest improvement globally—
and the greatest in the EAC (table 7.4).
Comparison of property registration
systems—based solely on the proce-
dures, time and cost to transfer and
register property as measured by Doing
Business—suggests a number of common
good practices: introducing time limits
that are complied with, setting low fixed
fees, streamlining procedures and going
electronic.
NOTES
This topic note was written by Frédéric
Meunier and Moussa Traoré.
1. See Deininger (2003) for a summary and
analysis of relevant studies.
TABLE 7.3 Who in the EAC makes registering property easy— and who does not?
Procedures (number)
Rwanda 5
Burundi 8
Tanzania 8
Kenya 9
Uganda 12
Time (days)
Rwanda 25
Uganda 52
Burundi 64
Tanzania 68
Kenya 73
Cost (% of property value)
Uganda 1.9
Burundi 3.3
Kenya 4.3
Tanzania 4.4
Rwanda 5.6
Source: Doing Business database.
FIGURE 7.3 Property transfers have become faster worldwide—and substantially so in the EAC
Average time to register property (days)
Note: To ensure an accurate comparison, the figure shows data for the same sample of 170 practice economies for both DB2006 (2005) and DB2013 (2012) and uses the regional classifications applying in 2012. The economies added to the Doing Business sample after 2005 and therefore excluded here are The Bahamas, Bahrain, Barbados, Brunei Darussalam, Cyprus, Kosovo, Liberia, Luxembourg, Malta, Montenegro and Qatar. DB2006 data are adjusted for any data revisions and changes in methodology.
Source: Doing Business database.
0 50 100 150 200
DB2006South Asia DB2013DB2006ECOWAS DB2013DB2006
East Asia & Pacific DB2013DB2006
Sub-Saharan Africa DB2013DB2006
Latin America & Caribbean DB2013DB2006EAC DB2013DB2006SADC DB2013DB2006COMESA DB2013DB2006Middle East & North Africa DB2013DB2006Eastern Europe & Central Asia DB2013DB2006OECD high income DB2013
TABLE 7.4 Who in the EAC has narrowed the distance to frontier in registering property the most since 2005?
Economy
Improvement in distance to frontier (percentage points)a
Rwanda 38 (36 74)
Burundi 24 (40 64)
Tanzania 10 (52 62)
Uganda 7 (50 58)
Kenya -4 (61 58)
Note: The distance to frontier measure shows how far on average an economy is from the best performance achieved by any economy on each Doing Business indicator since 2005—in this case for the registering property indicators. The measure is normalized to range between 0 and 100, with 100 representing the best performance (the frontier). The data refer to the 174 economies included in Doing Business 2006 (2005). Eleven economies were added in subsequent years.
a. This column shows the absolute improvement in the distance to frontier between 2005 and 2012. The numbers in parentheses are the scores for those years.
Source: Doing Business database.
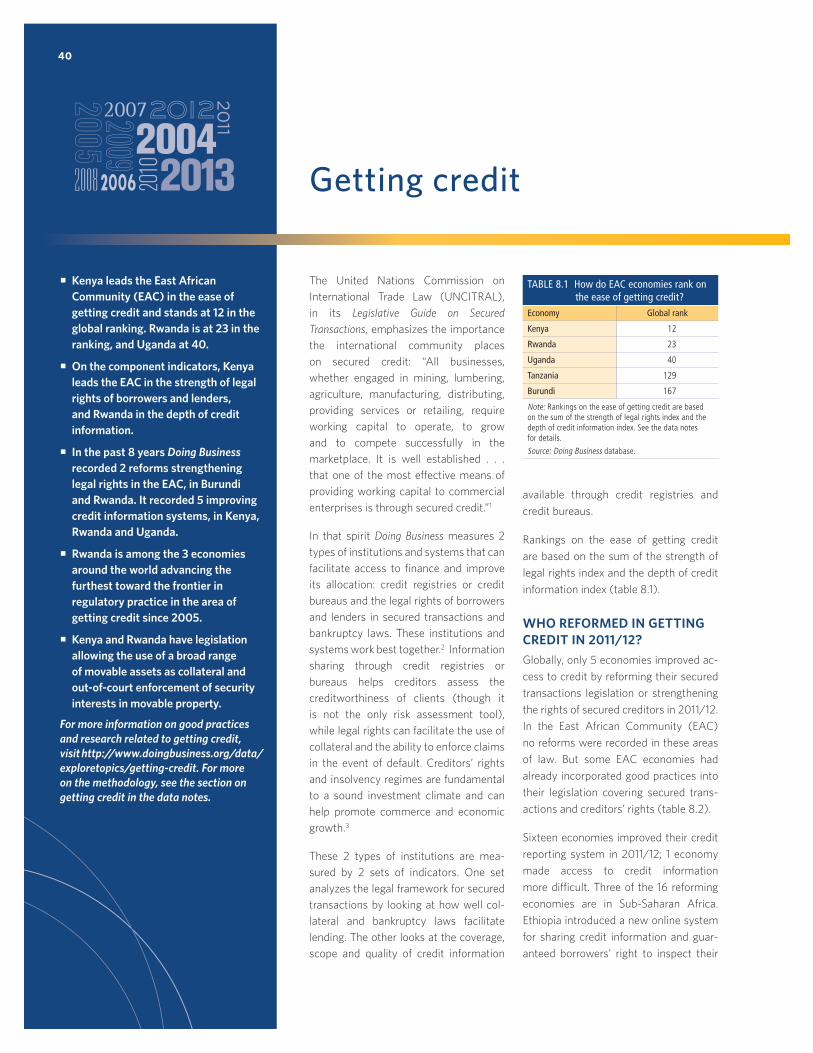
40
Getting credit
The United Nations Commission on
International Trade Law (UNCITRAL),
in its Legislative Guide on Secured
Transactions, emphasizes the importance
the international community places
on secured credit: “All businesses,
whether engaged in mining, lumbering,
agriculture, manufacturing, distributing,
providing services or retailing, require
working capital to operate, to grow
and to compete successfully in the
marketplace. It is well established . . .
that one of the most effective means of
providing working capital to commercial
enterprises is through secured credit.”1
In that spirit Doing Business measures 2
types of institutions and systems that can
facilitate access to finance and improve
its allocation: credit registries or credit
bureaus and the legal rights of borrowers
and lenders in secured transactions and
bankruptcy laws. These institutions and
systems work best together.2 Information
sharing through credit registries or
bureaus helps creditors assess the
creditworthiness of clients (though it
is not the only risk assessment tool),
while legal rights can facilitate the use of
collateral and the ability to enforce claims
in the event of default. Creditors’ rights
and insolvency regimes are fundamental
to a sound investment climate and can
help promote commerce and economic
growth.3
These 2 types of institutions are mea-
sured by 2 sets of indicators. One set
analyzes the legal framework for secured
transactions by looking at how well col-
lateral and bankruptcy laws facilitate
lending. The other looks at the coverage,
scope and quality of credit information
available through credit registries and
credit bureaus.
Rankings on the ease of getting credit
are based on the sum of the strength of
legal rights index and the depth of credit
information index (table 8.1).
WHO REFORMED IN GETTING CREDIT IN 2011/12?Globally, only 5 economies improved ac-
cess to credit by reforming their secured
transactions legislation or strengthening
the rights of secured creditors in 2011/12.
In the East African Community (EAC)
no reforms were recorded in these areas
of law. But some EAC economies had
already incorporated good practices into
their legislation covering secured trans-
actions and creditors’ rights (table 8.2).
Sixteen economies improved their credit
reporting system in 2011/12; 1 economy
made access to credit information
more difficult. Three of the 16 reforming
economies are in Sub-Saharan Africa.
Ethiopia introduced a new online system
for sharing credit information and guar-
anteed borrowers’ right to inspect their
TABLE 8.1 How do EAC economies rank on the ease of getting credit?
Economy Global rank
Kenya 12
Rwanda 23
Uganda 40
Tanzania 129
Burundi 167
Note: Rankings on the ease of getting credit are based on the sum of the strength of legal rights index and the depth of credit information index. See the data notes for details.
Source: Doing Business database.
Kenya leads the East African Community (EAC) in the ease of getting credit and stands at 12 in the global ranking. Rwanda is at 23 in the ranking, and Uganda at 40.
On the component indicators, Kenya leads the EAC in the strength of legal rights of borrowers and lenders, and Rwanda in the depth of credit information.
In the past 8 years Doing Business recorded 2 reforms strengthening legal rights in the EAC, in Burundi and Rwanda. It recorded 5 improving credit information systems, in Kenya, Rwanda and Uganda.
Rwanda is among the 3 economies around the world advancing the furthest toward the frontier in regulatory practice in the area of getting credit since 2005.
Kenya and Rwanda have legislation allowing the use of a broad range of movable assets as collateral and out-of-court enforcement of security interests in movable property.
For more information on good practices and research related to getting credit, visit http://www.doingbusiness.org/data/exploretopics/getting-credit. For more on the methodology, see the section on getting credit in the data notes.
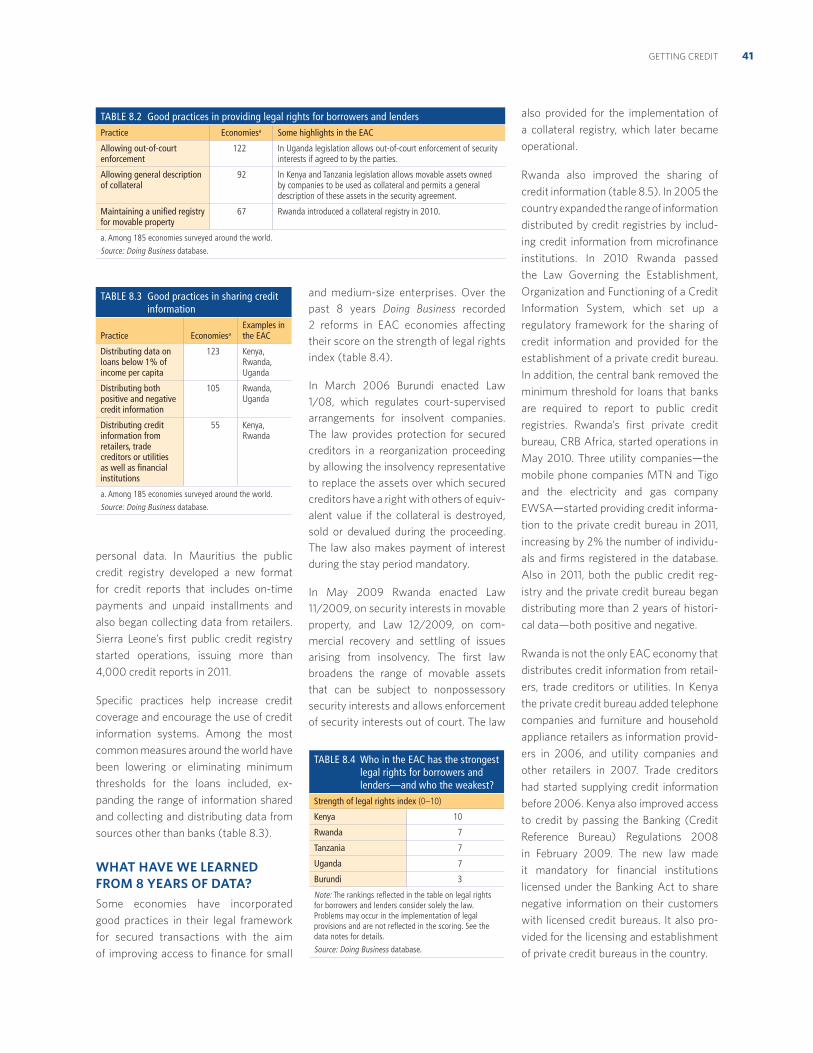
41GETTING CREDIT
personal data. In Mauritius the public
credit registry developed a new format
for credit reports that includes on-time
payments and unpaid installments and
also began collecting data from retailers.
Sierra Leone’s first public credit registry
started operations, issuing more than
4,000 credit reports in 2011.
Specific practices help increase credit
coverage and encourage the use of credit
information systems. Among the most
common measures around the world have
been lowering or eliminating minimum
thresholds for the loans included, ex-
panding the range of information shared
and collecting and distributing data from
sources other than banks (table 8.3).
WHAT HAVE WE LEARNED FROM 8 YEARS OF DATA? Some economies have incorporated
good practices in their legal framework
for secured transactions with the aim
of improving access to finance for small
and medium-size enterprises. Over the
past 8 years Doing Business recorded
2 reforms in EAC economies affecting
their score on the strength of legal rights
index (table 8.4).
In March 2006 Burundi enacted Law
1/08, which regulates court-supervised
arrangements for insolvent companies.
The law provides protection for secured
creditors in a reorganization proceeding
by allowing the insolvency representative
to replace the assets over which secured
creditors have a right with others of equiv-
alent value if the collateral is destroyed,
sold or devalued during the proceeding.
The law also makes payment of interest
during the stay period mandatory.
In May 2009 Rwanda enacted Law
11/2009, on security interests in movable
property, and Law 12/2009, on com-
mercial recovery and settling of issues
arising from insolvency. The first law
broadens the range of movable assets
that can be subject to nonpossessory
security interests and allows enforcement
of security interests out of court. The law
also provided for the implementation of
a collateral registry, which later became
operational.
Rwanda also improved the sharing of
credit information (table 8.5). In 2005 the
country expanded the range of information
distributed by credit registries by includ-
ing credit information from microfinance
institutions. In 2010 Rwanda passed
the Law Governing the Establishment,
Organization and Functioning of a Credit
Information System, which set up a
regulatory framework for the sharing of
credit information and provided for the
establishment of a private credit bureau.
In addition, the central bank removed the
minimum threshold for loans that banks
are required to report to public credit
registries. Rwanda’s first private credit
bureau, CRB Africa, started operations in
May 2010. Three utility companies—the
mobile phone companies MTN and Tigo
and the electricity and gas company
EWSA—started providing credit informa-
tion to the private credit bureau in 2011,
increasing by 2% the number of individu-
als and firms registered in the database.
Also in 2011, both the public credit reg-
istry and the private credit bureau began
distributing more than 2 years of histori-
cal data—both positive and negative.
Rwanda is not the only EAC economy that
distributes credit information from retail-
ers, trade creditors or utilities. In Kenya
the private credit bureau added telephone
companies and furniture and household
appliance retailers as information provid-
ers in 2006, and utility companies and
other retailers in 2007. Trade creditors
had started supplying credit information
before 2006. Kenya also improved access
to credit by passing the Banking (Credit
Reference Bureau) Regulations 2008
in February 2009. The new law made
it mandatory for financial institutions
licensed under the Banking Act to share
negative information on their customers
with licensed credit bureaus. It also pro-
vided for the licensing and establishment
of private credit bureaus in the country.
TABLE 8.4 Who in the EAC has the strongest legal rights for borrowers and lenders—and who the weakest?
Strength of legal rights index (0–10)
Kenya 10
Rwanda 7
Tanzania 7
Uganda 7
Burundi 3
Note: The rankings reflected in the table on legal rights for borrowers and lenders consider solely the law. Problems may occur in the implementation of legal provisions and are not reflected in the scoring. See the data notes for details.
Source: Doing Business database.
TABLE 8.2 Good practices in providing legal rights for borrowers and lendersPractice Economiesa Some highlights in the EAC
Allowing out-of-court enforcement
122 In Uganda legislation allows out-of-court enforcement of security interests if agreed to by the parties.
Allowing general description of collateral
92 In Kenya and Tanzania legislation allows movable assets owned by companies to be used as collateral and permits a general description of these assets in the security agreement.
Maintaining a unified registry for movable property
67 Rwanda introduced a collateral registry in 2010.
a. Among 185 economies surveyed around the world.
Source: Doing Business database.
TABLE 8.3 Good practices in sharing credit information
Practice Economiesa Examples in the EAC
Distributing data on loans below 1% of income per capita
123 Kenya, Rwanda, Uganda
Distributing both positive and negative credit information
105 Rwanda, Uganda
Distributing credit information from retailers, trade creditors or utilities as well as financial institutions
55 Kenya, Rwanda
a. Among 185 economies surveyed around the world.
Source: Doing Business database.
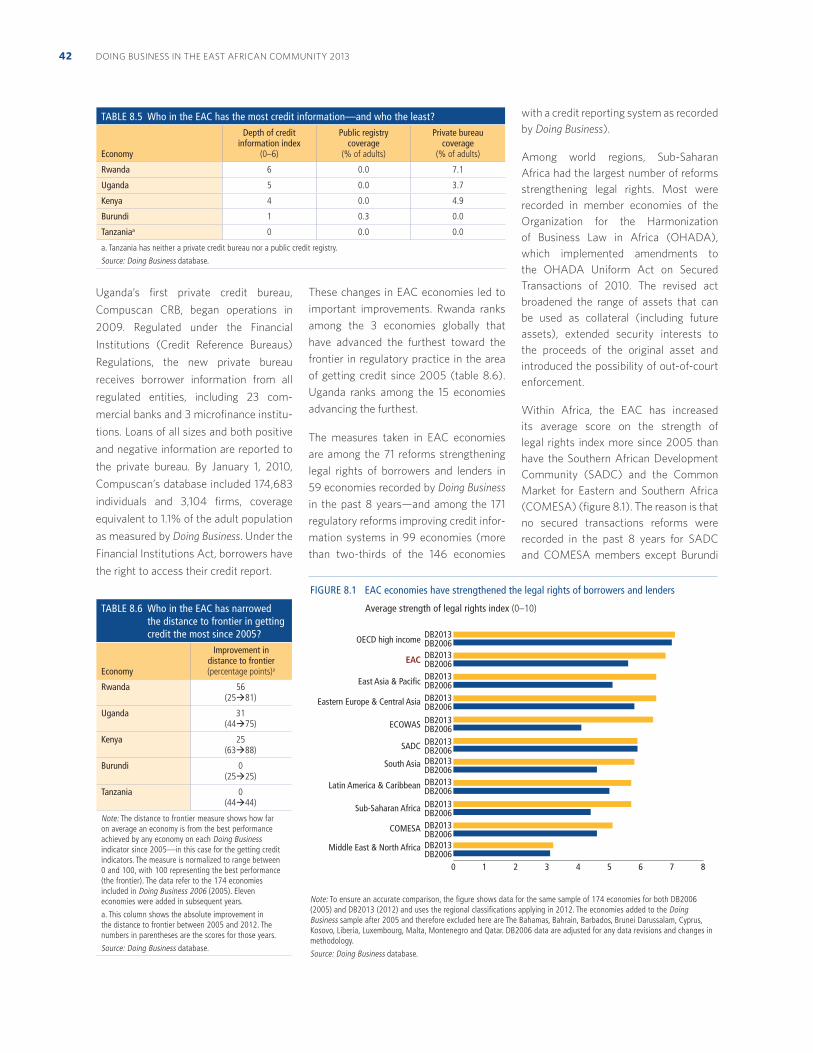
DOING BUSINESS IN THE EAST AFRICAN COMMUNITY 201342
Uganda’s first private credit bureau,
Compuscan CRB, began operations in
2009. Regulated under the Financial
Institutions (Credit Reference Bureaus)
Regulations, the new private bureau
receives borrower information from all
regulated entities, including 23 com-
mercial banks and 3 microfinance institu-
tions. Loans of all sizes and both positive
and negative information are reported to
the private bureau. By January 1, 2010,
Compuscan’s database included 174,683
individuals and 3,104 firms, coverage
equivalent to 1.1% of the adult population
as measured by Doing Business. Under the
Financial Institutions Act, borrowers have
the right to access their credit report.
These changes in EAC economies led to
important improvements. Rwanda ranks
among the 3 economies globally that
have advanced the furthest toward the
frontier in regulatory practice in the area
of getting credit since 2005 (table 8.6).
Uganda ranks among the 15 economies
advancing the furthest.
The measures taken in EAC economies
are among the 71 reforms strengthening
legal rights of borrowers and lenders in
59 economies recorded by Doing Business
in the past 8 years—and among the 171
regulatory reforms improving credit infor-
mation systems in 99 economies (more
than two-thirds of the 146 economies
with a credit reporting system as recorded
by Doing Business).
Among world regions, Sub-Saharan
Africa had the largest number of reforms
strengthening legal rights. Most were
recorded in member economies of the
Organization for the Harmonization
of Business Law in Africa (OHADA),
which implemented amendments to
the OHADA Uniform Act on Secured
Transactions of 2010. The revised act
broadened the range of assets that can
be used as collateral (including future
assets), extended security interests to
the proceeds of the original asset and
introduced the possibility of out-of-court
enforcement.
Within Africa, the EAC has increased
its average score on the strength of
legal rights index more since 2005 than
have the Southern African Development
Community (SADC) and the Common
Market for Eastern and Southern Africa
(COMESA) (figure 8.1). The reason is that
no secured transactions reforms were
recorded in the past 8 years for SADC
and COMESA members except Burundi
TABLE 8.6 Who in the EAC has narrowed the distance to frontier in getting credit the most since 2005?
Economy
Improvement in distance to frontier (percentage points)a
Rwanda 56(25 81)
Uganda 31(44 75)
Kenya 25(63 88)
Burundi 0(25 25)
Tanzania 0(44 44)
Note: The distance to frontier measure shows how far on average an economy is from the best performance achieved by any economy on each Doing Business indicator since 2005—in this case for the getting credit indicators. The measure is normalized to range between 0 and 100, with 100 representing the best performance (the frontier). The data refer to the 174 economies included in Doing Business 2006 (2005). Eleven economies were added in subsequent years.
a. This column shows the absolute improvement in the distance to frontier between 2005 and 2012. The numbers in parentheses are the scores for those years.
Source: Doing Business database.
TABLE 8.5 Who in the EAC has the most credit information—and who the least?
Economy
Depth of credit information index
(0–6)
Public registry coverage
(% of adults)
Private bureau coverage
(% of adults)
Rwanda 6 0.0 7.1
Uganda 5 0.0 3.7
Kenya 4 0.0 4.9
Burundi 1 0.3 0.0
Tanzaniaa 0 0.0 0.0
a. Tanzania has neither a private credit bureau nor a public credit registry.
Source: Doing Business database.
FIGURE 8.1 EAC economies have strengthened the legal rights of borrowers and lenders
Average strength of legal rights index (0–10)
Note: To ensure an accurate comparison, the figure shows data for the same sample of 174 economies for both DB2006 (2005) and DB2013 (2012) and uses the regional classifications applying in 2012. The economies added to the Doing Business sample after 2005 and therefore excluded here are The Bahamas, Bahrain, Barbados, Brunei Darussalam, Cyprus, Kosovo, Liberia, Luxembourg, Malta, Montenegro and Qatar. DB2006 data are adjusted for any data revisions and changes in methodology.
Source: Doing Business database.
0 1 2 3 4 5 6 7 8
Middle East & North Africa
COMESA
Sub-Saharan Africa
Latin America & Caribbean
South Asia
SADC
ECOWAS
Eastern Europe & Central Asia
East Asia & Pacific
EAC
OECD high income DB2013DB2006DB2013DB2006DB2013DB2006DB2013DB2006DB2013DB2006DB2013DB2006DB2013DB2006DB2013DB2006DB2013DB2006DB2013DB2006DB2013DB2006
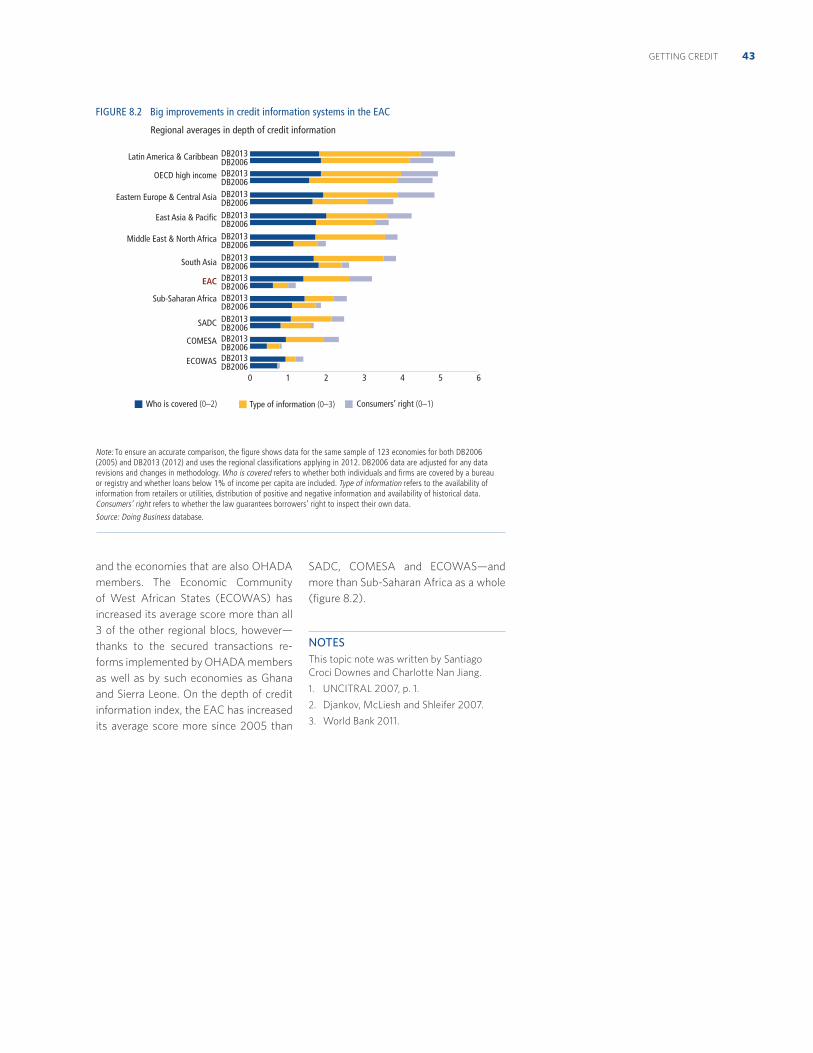
43GETTING CREDIT
and the economies that are also OHADA
members. The Economic Community
of West African States (ECOWAS) has
increased its average score more than all
3 of the other regional blocs, however—
thanks to the secured transactions re-
forms implemented by OHADA members
as well as by such economies as Ghana
and Sierra Leone. On the depth of credit
information index, the EAC has increased
its average score more since 2005 than
SADC, COMESA and ECOWAS—and
more than Sub-Saharan Africa as a whole
(figure 8.2).
NOTES
This topic note was written by Santiago
Croci Downes and Charlotte Nan Jiang.
1. UNCITRAL 2007, p. 1.
2. Djankov, McLiesh and Shleifer 2007.
3. World Bank 2011.
FIGURE 8.2 Big improvements in credit information systems in the EAC
Regional averages in depth of credit information
Note: To ensure an accurate comparison, the figure shows data for the same sample of 123 economies for both DB2006 (2005) and DB2013 (2012) and uses the regional classifications applying in 2012. DB2006 data are adjusted for any data revisions and changes in methodology. Who is covered refers to whether both individuals and firms are covered by a bureau or registry and whether loans below 1% of income per capita are included. Type of information refers to the availability of information from retailers or utilities, distribution of positive and negative information and availability of historical data. Consumers’ right refers to whether the law guarantees borrowers’ right to inspect their own data.
Source: Doing Business database.
0 1 2 3 4 5 6
EAC
OECD high income
South Asia
Eastern Europe & Central Asia
ECOWAS
East Asia & Pacific
SADC
Sub-Saharan Africa
Latin America & Caribbean
COMESA
Middle East & North Africa DB2013DB2006
DB2013DB2006
DB2013DB2006
DB2013DB2006
DB2013DB2006
Who is covered (0–2) Consumers’ right (0–1)Type of information (0–3)
DB2013DB2006
DB2013DB2006DB2013DB2006
DB2013DB2006
DB2013DB2006
DB2013DB2006
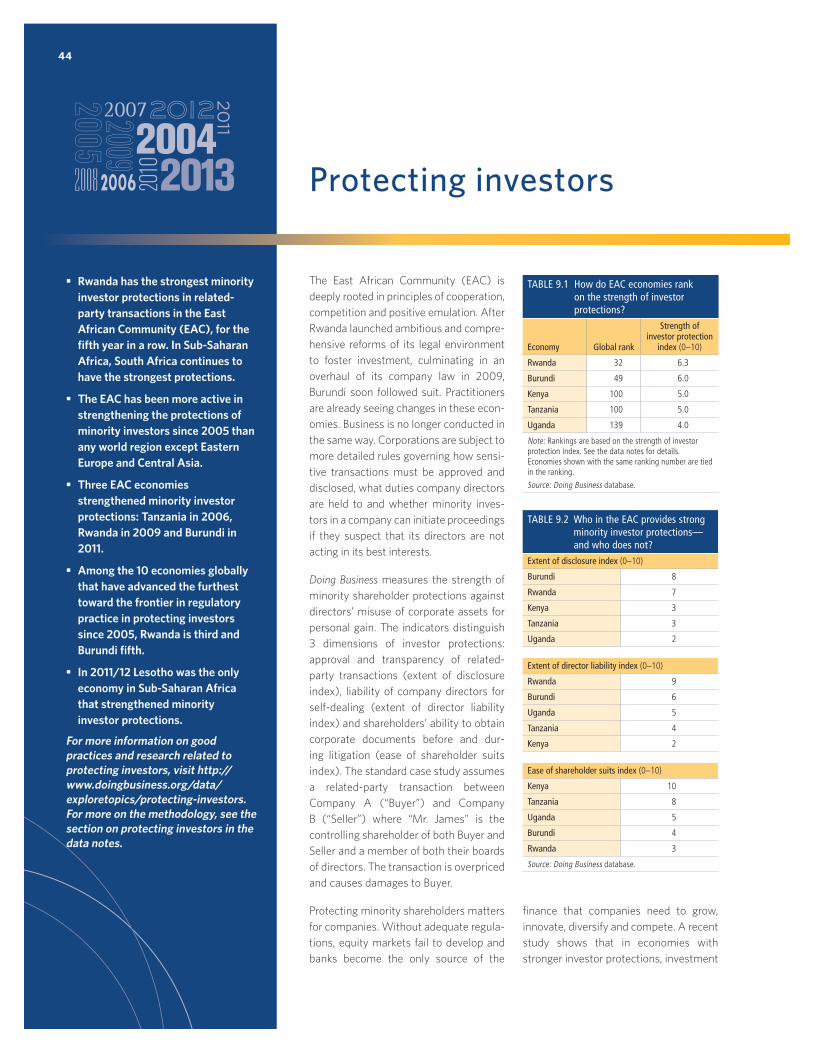
44
Protecting investors
The East African Community (EAC) is
deeply rooted in principles of cooperation,
competition and positive emulation. After
Rwanda launched ambitious and compre-
hensive reforms of its legal environment
to foster investment, culminating in an
overhaul of its company law in 2009,
Burundi soon followed suit. Practitioners
are already seeing changes in these econ-
omies. Business is no longer conducted in
the same way. Corporations are subject to
more detailed rules governing how sensi-
tive transactions must be approved and
disclosed, what duties company directors
are held to and whether minority inves-
tors in a company can initiate proceedings
if they suspect that its directors are not
acting in its best interests.
Doing Business measures the strength of
minority shareholder protections against
directors’ misuse of corporate assets for
personal gain. The indicators distinguish
3 dimensions of investor protections:
approval and transparency of related-
party transactions (extent of disclosure
index), liability of company directors for
self-dealing (extent of director liability
index) and shareholders’ ability to obtain
corporate documents before and dur-
ing litigation (ease of shareholder suits
index). The standard case study assumes
a related-party transaction between
Company A (“Buyer”) and Company
B (“Seller”) where “Mr. James” is the
controlling shareholder of both Buyer and
Seller and a member of both their boards
of directors. The transaction is overpriced
and causes damages to Buyer.
Protecting minority shareholders matters
for companies. Without adequate regula-
tions, equity markets fail to develop and
banks become the only source of the
finance that companies need to grow,
innovate, diversify and compete. A recent
study shows that in economies with
stronger investor protections, investment
Rwanda has the strongest minority investor protections in related-party transactions in the East African Community (EAC), for the fifth year in a row. In Sub-Saharan Africa, South Africa continues to have the strongest protections.
The EAC has been more active in strengthening the protections of minority investors since 2005 than any world region except Eastern Europe and Central Asia.
Three EAC economies strengthened minority investor protections: Tanzania in 2006, Rwanda in 2009 and Burundi in 2011.
Among the 10 economies globally that have advanced the furthest toward the frontier in regulatory practice in protecting investors since 2005, Rwanda is third and Burundi fifth.
In 2011/12 Lesotho was the only economy in Sub-Saharan Africa that strengthened minority investor protections.
For more information on good practices and research related to protecting investors, visit http://www.doingbusiness.org/data/exploretopics/protecting-investors. For more on the methodology, see the section on protecting investors in the data notes.
TABLE 9.1 How do EAC economies rank on the strength of investor protections?
Economy Global rank
Strength of investor protection
index (0–10)
Rwanda 32 6.3
Burundi 49 6.0
Kenya 100 5.0
Tanzania 100 5.0
Uganda 139 4.0
Note: Rankings are based on the strength of investor protection index. See the data notes for details. Economies shown with the same ranking number are tied in the ranking.
Source: Doing Business database.
TABLE 9.2 Who in the EAC provides strong minority investor protections—and who does not?
Extent of disclosure index (0–10)
Burundi 8
Rwanda 7
Kenya 3
Tanzania 3
Uganda 2
Extent of director liability index (0–10)
Rwanda 9
Burundi 6
Uganda 5
Tanzania 4
Kenya 2
Ease of shareholder suits index (0–10)
Kenya 10
Tanzania 8
Uganda 5
Burundi 4
Rwanda 3
Source: Doing Business database.
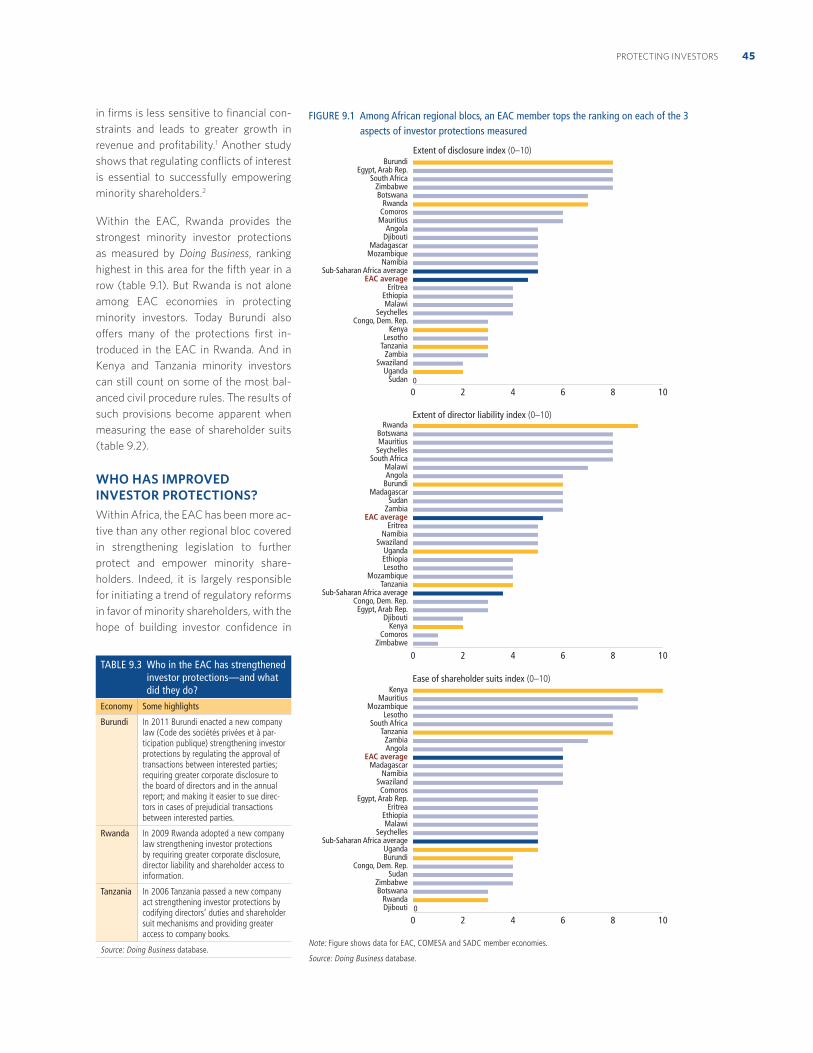
45PROTECTING INVESTORS
FIGURE 9.1 Among African regional blocs, an EAC member tops the ranking on each of the 3 aspects of investor protections measured
Note: Figure shows data for EAC, COMESA and SADC member economies.
Source: Doing Business database.
in firms is less sensitive to financial con-
straints and leads to greater growth in
revenue and profitability.1 Another study
shows that regulating conflicts of interest
is essential to successfully empowering
minority shareholders.2
Within the EAC, Rwanda provides the
strongest minority investor protections
as measured by Doing Business, ranking
highest in this area for the fifth year in a
row (table 9.1). But Rwanda is not alone
among EAC economies in protecting
minority investors. Today Burundi also
offers many of the protections first in-
troduced in the EAC in Rwanda. And in
Kenya and Tanzania minority investors
can still count on some of the most bal-
anced civil procedure rules. The results of
such provisions become apparent when
measuring the ease of shareholder suits
(table 9.2).
WHO HAS IMPROVED INVESTOR PROTECTIONS?Within Africa, the EAC has been more ac-
tive than any other regional bloc covered
in strengthening legislation to further
protect and empower minority share-
holders. Indeed, it is largely responsible
for initiating a trend of regulatory reforms
in favor of minority shareholders, with the
hope of building investor confidence in
TABLE 9.3 Who in the EAC has strengthened investor protections—and what did they do?
Economy Some highlights
Burundi In 2011 Burundi enacted a new company law (Code des sociétés privées et à par-ticipation publique) strengthening investor protections by regulating the approval of transactions between interested parties; requiring greater corporate disclosure to the board of directors and in the annual report; and making it easier to sue direc-tors in cases of prejudicial transactions between interested parties.
Rwanda In 2009 Rwanda adopted a new company law strengthening investor protections by requiring greater corporate disclosure, director liability and shareholder access to information.
Tanzania In 2006 Tanzania passed a new company act strengthening investor protections by codifying directors’ duties and shareholder suit mechanisms and providing greater access to company books.
Source: Doing Business database.
Extent of disclosure index (0–10)
Extent of director liability index (0–10)
Ease of shareholder suits index (0–10)
0 2 4 6 8 10Sudan
UgandaSwaziland
ZambiaTanzaniaLesotho
KenyaCongo, Dem. Rep.
SeychellesMalawi
EthiopiaEritrea
EAC averageSub-Saharan Africa average
NamibiaMozambiqueMadagascar
DjiboutiAngola
MauritiusComorosRwanda
BotswanaZimbabwe
South AfricaEgypt, Arab Rep.
Burundi
0 2 4 6 8 10Zimbabwe
ComorosKenya
DjiboutiEgypt, Arab Rep.
Congo, Dem. Rep.Sub-Saharan Africa average
TanzaniaMozambique
LesothoEthiopiaUganda
SwazilandNamibia
EritreaEAC average
ZambiaSudan
MadagascarBurundiAngolaMalawi
South AfricaSeychellesMauritiusBotswana
Rwanda
0 2 4 6 8 10DjiboutiRwanda
BotswanaZimbabwe
SudanCongo, Dem. Rep.
BurundiUganda
Sub-Saharan Africa averageSeychelles
MalawiEthiopia
EritreaEgypt, Arab Rep.
ComorosSwaziland
NamibiaMadagascar
EAC averageAngolaZambia
TanzaniaSouth Africa
LesothoMozambique
MauritiusKenya
0
0
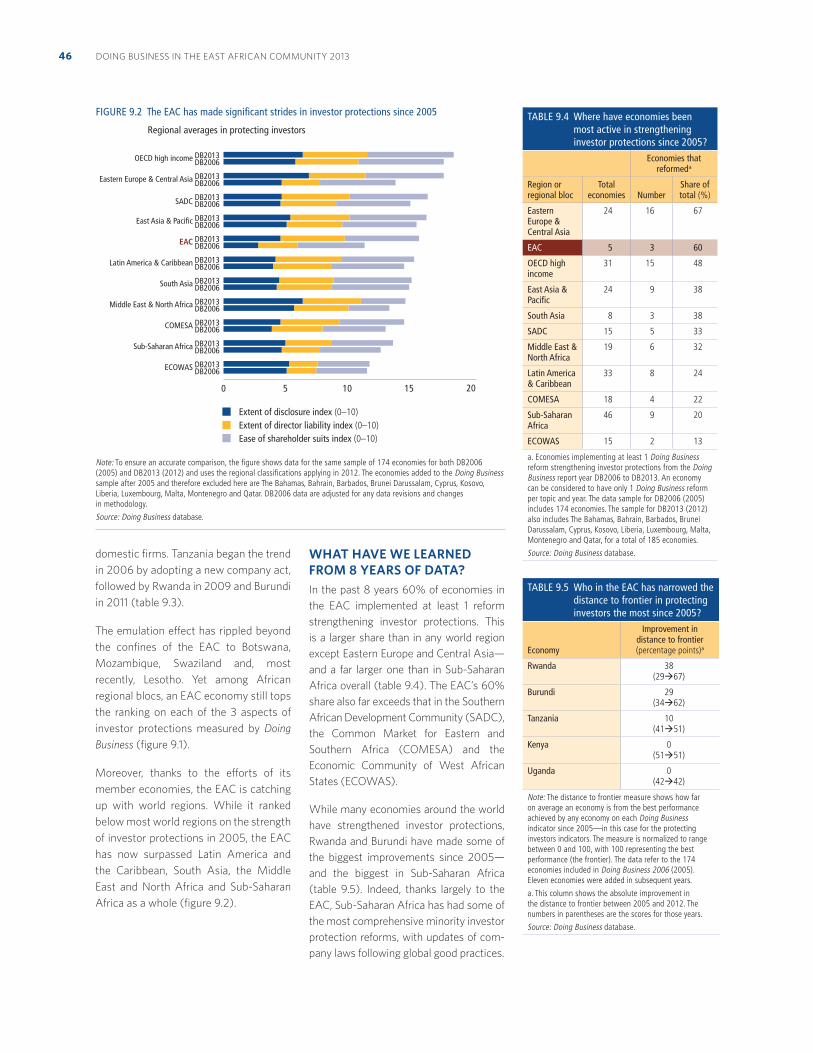
DOING BUSINESS IN THE EAST AFRICAN COMMUNITY 201346
domestic firms. Tanzania began the trend
in 2006 by adopting a new company act,
followed by Rwanda in 2009 and Burundi
in 2011 (table 9.3).
The emulation effect has rippled beyond
the confines of the EAC to Botswana,
Mozambique, Swaziland and, most
recently, Lesotho. Yet among African
regional blocs, an EAC economy still tops
the ranking on each of the 3 aspects of
investor protections measured by Doing
Business (figure 9.1).
Moreover, thanks to the efforts of its
member economies, the EAC is catching
up with world regions. While it ranked
below most world regions on the strength
of investor protections in 2005, the EAC
has now surpassed Latin America and
the Caribbean, South Asia, the Middle
East and North Africa and Sub-Saharan
Africa as a whole (figure 9.2).
WHAT HAVE WE LEARNED FROM 8 YEARS OF DATA?In the past 8 years 60% of economies in
the EAC implemented at least 1 reform
strengthening investor protections. This
is a larger share than in any world region
except Eastern Europe and Central Asia—
and a far larger one than in Sub-Saharan
Africa overall (table 9.4). The EAC’s 60%
share also far exceeds that in the Southern
African Development Community (SADC),
the Common Market for Eastern and
Southern Africa (COMESA) and the
Economic Community of West African
States (ECOWAS).
While many economies around the world
have strengthened investor protections,
Rwanda and Burundi have made some of
the biggest improvements since 2005—
and the biggest in Sub-Saharan Africa
(table 9.5). Indeed, thanks largely to the
EAC, Sub-Saharan Africa has had some of
the most comprehensive minority investor
protection reforms, with updates of com-
pany laws following global good practices.
FIGURE 9.2 The EAC has made significant strides in investor protections since 2005
Regional averages in protecting investors
Note: To ensure an accurate comparison, the figure shows data for the same sample of 174 economies for both DB2006 (2005) and DB2013 (2012) and uses the regional classifications applying in 2012. The economies added to the Doing Business sample after 2005 and therefore excluded here are The Bahamas, Bahrain, Barbados, Brunei Darussalam, Cyprus, Kosovo, Liberia, Luxembourg, Malta, Montenegro and Qatar. DB2006 data are adjusted for any data revisions and changes in methodology.
Source: Doing Business database.
0 5 10 15 20
DB2006ECOWAS DB2013
DB2006Sub-Saharan Africa DB2013
DB2006COMESA DB2013
DB2006Middle East & North Africa DB2013
DB2006South Asia DB2013
DB2006Latin America & Caribbean DB2013
DB2006EAC DB2013
DB2006East Asia & Pacific DB2013
DB2006SADC DB2013
DB2006Eastern Europe & Central Asia DB2013
DB2006OECD high income DB2013
Extent of disclosure index (0–10)Extent of director liability index (0–10)Ease of shareholder suits index (0–10)
TABLE 9.4 Where have economies been most active in strengthening investor protections since 2005?
Economies that reformeda
Region or regional bloc
Total economies Number
Share of total (%)
Eastern Europe & Central Asia
24 16 67
EAC 5 3 60
OECD high income
31 15 48
East Asia & Pacific
24 9 38
South Asia 8 3 38
SADC 15 5 33
Middle East & North Africa
19 6 32
Latin America & Caribbean
33 8 24
COMESA 18 4 22
Sub-Saharan Africa
46 9 20
ECOWAS 15 2 13
a. Economies implementing at least 1 Doing Business reform strengthening investor protections from the Doing Business report year DB2006 to DB2013. An economy can be considered to have only 1 Doing Business reform per topic and year. The data sample for DB2006 (2005) includes 174 economies. The sample for DB2013 (2012) also includes The Bahamas, Bahrain, Barbados, Brunei Darussalam, Cyprus, Kosovo, Liberia, Luxembourg, Malta, Montenegro and Qatar, for a total of 185 economies.
Source: Doing Business database.
TABLE 9.5 Who in the EAC has narrowed the distance to frontier in protecting investors the most since 2005?
Economy
Improvement in distance to frontier (percentage points)a
Rwanda 38 (29 67)
Burundi 29 (34 62)
Tanzania 10 (41 51)
Kenya 0 (51 51)
Uganda 0 (42 42)
Note: The distance to frontier measure shows how far on average an economy is from the best performance achieved by any economy on each Doing Business indicator since 2005—in this case for the protecting investors indicators. The measure is normalized to range between 0 and 100, with 100 representing the best performance (the frontier). The data refer to the 174 economies included in Doing Business 2006 (2005). Eleven economies were added in subsequent years.
a. This column shows the absolute improvement in the distance to frontier between 2005 and 2012. The numbers in parentheses are the scores for those years.
Source: Doing Business database.
47PROTECTING INVESTORS
Overall, smart, comprehensive regulations
have had the strongest lasting impact.
Economies undertaking a complete
overhaul of their corporate, securities and
civil procedure laws—such as Burundi and
Rwanda—have strengthened investor pro-
tections the most as measured by Doing
Business.
But updating decades-old corporate law
principles to address investor protections
is not simple. It requires a balancing act—
to more effectively protect minority share-
holders without creating undue burdens
on companies’ day-to-day operations.
Thus far the EAC has been successful at
maintaining this balance. Keeping this bal-
ance in mind will remain essential if Kenya,
Tanzania and Uganda pursue the initiatives
of Rwanda and Burundi.
NOTES
This topic note was written by Hervé
Kaddoura.
1. Mclean, Zhang and Zhao 2012.
2. Hamdani and Yafeh 2012.
48
Paying taxes
Taxes are essential: governments need
revenue to provide public services. But
meeting revenue targets while minimiz-
ing distortions is always a challenge.
Governments need to not only choose
appropriate tax rates within a broad-
based, fair and transparent tax system
but also design a tax compliance system
that does not discourage taxpayers from
participating.1
In recent years economies in the East
African Community (EAC) have under-
taken substantial efforts to improve their
tax systems—to make it easier to do
business while also increasing tax rev-
enue. For example, the Tanzania Revenue
Authority established tax service centers
in Dar es Salaam, intensified risk-based
and quality tax audits and encouraged
greater use of electronic filing and pay-
ment systems. These administrative
measures helped improve compliance,
and tax revenue rose relative to GDP in
each of the past 2 years.2 Similarly, in
Burundi tax revenue has almost doubled
since the 2009 reform of the revenue
administration, which included the es-
tablishment of the Office Burundais des
Recettes and focused on good gover-
nance, a streamlined tax environment
and stronger taxpayer services.3
Beyond measures by individual EAC
economies, initiatives are also taking
place at the regional level. The EAC has
identified regional tax harmonization
and greater cooperation on tax matters
among its members as key to economic
prosperity. The goal of the EAC members
in establishing the common market is to
enable businesses to operate unhindered
by national borders and to tap the huge
From June 2011 to June 2012 Doing Business recorded 31 reforms making it easier or less costly for companies to comply with taxes. One was in the East African Community (EAC)—in Kenya.
EAC economies have an average global ranking of 110 on the ease of paying taxes. But there is great variation among them on the underlying indicators—time, number of payments and total tax rate.
Among EAC economies, Burundi and Rwanda have advanced the furthest toward the frontier in regulatory practice in paying taxes since 2004.
Over the past 8 years 7 reforms making it easier or less costly to comply with taxes were recorded in the 5 EAC economies.
For more information on good practices and research related to paying taxes, visit http://www.doingbusiness.org/data/exploretopics/paying-taxes. For more on the methodology, see the section on paying taxes in the data notes.
potential arising from the regional ef-
forts to make it easier to do business.
The EAC has organized many activities
toward this end in recent years, includ-
ing technical workshops on income tax,
value added tax (VAT) and the exchange
of information among EAC members’
revenue authorities. Effective informa-
tion exchange is essential to ensure the
correct application of tax laws while
maintaining sovereignty over the applica-
tion and enforcement of these laws. And
the development of regional strategies
and frameworks for both tax policy and
administrative procedures is crucial for
the realization of the common market
because it creates synergies and removes
obstacles to cross-border trade within
the EAC.
Doing Business records the taxes and
mandatory contributions that a medium-
size company must pay in a given year
and also measures the administrative
burden of paying taxes and contributions.
It does this with 3 indicators: number of
payments, time and total tax rate for the
Doing Business case study firm. The num-
ber of payments indicates the frequency
with which the company has to file and
pay different types of taxes and contribu-
tions, adjusted for the way in which those
filings and payments are made. The time
indicator captures the number of hours
it takes to prepare, file and pay 3 major
types of taxes: profit taxes, consumption
taxes, and labor taxes and mandatory
contributions. The total tax rate measures
the tax cost (as a percentage of profit)
borne by the standard firm. The indica-
tors do not measure the fiscal health of
economies, the macroeconomic condi-
tions under which governments collect
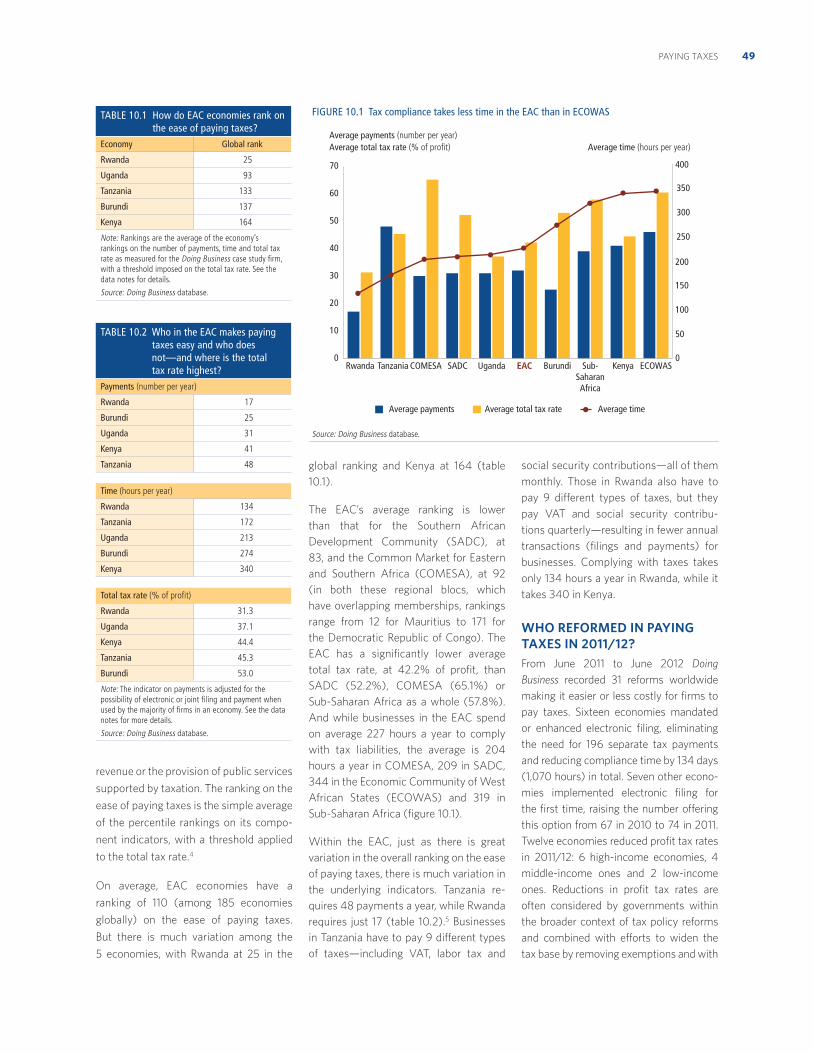
49PAYING TAXES
revenue or the provision of public services
supported by taxation. The ranking on the
ease of paying taxes is the simple average
of the percentile rankings on its compo-
nent indicators, with a threshold applied
to the total tax rate.4
On average, EAC economies have a
ranking of 110 (among 185 economies
globally) on the ease of paying taxes.
But there is much variation among the
5 economies, with Rwanda at 25 in the
global ranking and Kenya at 164 (table
10.1).
The EAC’s average ranking is lower
than that for the Southern African
Development Community (SADC), at
83, and the Common Market for Eastern
and Southern Africa (COMESA), at 92
(in both these regional blocs, which
have overlapping memberships, rankings
range from 12 for Mauritius to 171 for
the Democratic Republic of Congo). The
EAC has a significantly lower average
total tax rate, at 42.2% of profit, than
SADC (52.2%), COMESA (65.1%) or
Sub-Saharan Africa as a whole (57.8%).
And while businesses in the EAC spend
on average 227 hours a year to comply
with tax liabilities, the average is 204
hours a year in COMESA, 209 in SADC,
344 in the Economic Community of West
African States (ECOWAS) and 319 in
Sub-Saharan Africa (figure 10.1).
Within the EAC, just as there is great
variation in the overall ranking on the ease
of paying taxes, there is much variation in
the underlying indicators. Tanzania re-
quires 48 payments a year, while Rwanda
requires just 17 (table 10.2).5 Businesses
in Tanzania have to pay 9 different types
of taxes—including VAT, labor tax and
social security contributions—all of them
monthly. Those in Rwanda also have to
pay 9 different types of taxes, but they
pay VAT and social security contribu-
tions quarterly—resulting in fewer annual
transactions (filings and payments) for
businesses. Complying with taxes takes
only 134 hours a year in Rwanda, while it
takes 340 in Kenya.
WHO REFORMED IN PAYING TAXES IN 2011/12?From June 2011 to June 2012 Doing
Business recorded 31 reforms worldwide
making it easier or less costly for firms to
pay taxes. Sixteen economies mandated
or enhanced electronic filing, eliminating
the need for 196 separate tax payments
and reducing compliance time by 134 days
(1,070 hours) in total. Seven other econo-
mies implemented electronic filing for
the first time, raising the number offering
this option from 67 in 2010 to 74 in 2011.
Twelve economies reduced profit tax rates
in 2011/12: 6 high-income economies, 4
middle-income ones and 2 low-income
ones. Reductions in profit tax rates are
often considered by governments within
the broader context of tax policy reforms
and combined with efforts to widen the
tax base by removing exemptions and with
TABLE 10.1 How do EAC economies rank on the ease of paying taxes?
Economy Global rank
Rwanda 25
Uganda 93
Tanzania 133
Burundi 137
Kenya 164
Note: Rankings are the average of the economy’s rankings on the number of payments, time and total tax rate as measured for the Doing Business case study firm, with a threshold imposed on the total tax rate. See the data notes for details.
Source: Doing Business database.
FIGURE 10.1 Tax compliance takes less time in the EAC than in ECOWAS
Source: Doing Business database.
0
10
20
30
40
50
60
70
ECOWASKenyaSub-SaharanAfrica
BurundiEACUgandaSADC COMESATanzaniaRwanda0
50
100
150
200
250
300
350
400
Average payments (number per year) Average total tax rate (% of profit)
Average payments Average total tax rate Average time
Average time (hours per year)
TABLE 10.2 Who in the EAC makes paying taxes easy and who does not—and where is the total tax rate highest?
Payments (number per year)
Rwanda 17
Burundi 25
Uganda 31
Kenya 41
Tanzania 48
Time (hours per year)
Rwanda 134
Tanzania 172
Uganda 213
Burundi 274
Kenya 340
Total tax rate (% of profit)
Rwanda 31.3
Uganda 37.1
Kenya 44.4
Tanzania 45.3
Burundi 53.0
Note: The indicator on payments is adjusted for the possibility of electronic or joint filing and payment when used by the majority of firms in an economy. See the data notes for more details.
Source: Doing Business database.
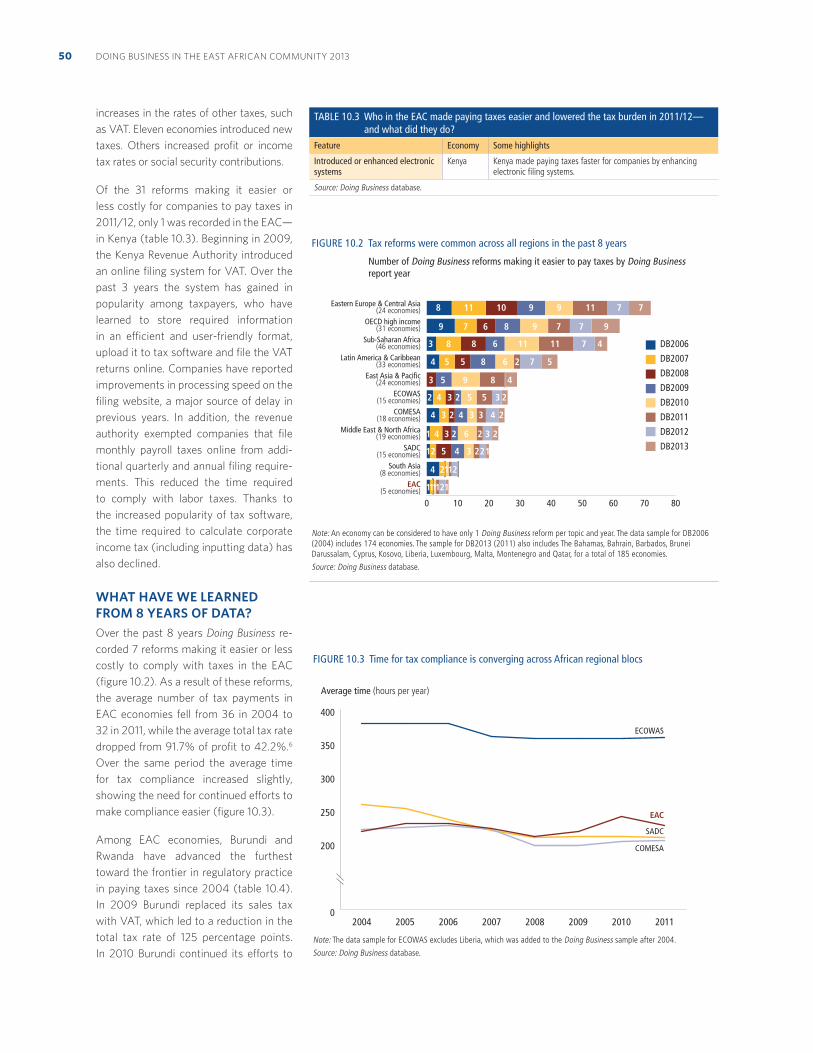
DOING BUSINESS IN THE EAST AFRICAN COMMUNITY 201350
increases in the rates of other taxes, such
as VAT. Eleven economies introduced new
taxes. Others increased profit or income
tax rates or social security contributions.
Of the 31 reforms making it easier or
less costly for companies to pay taxes in
2011/12, only 1 was recorded in the EAC—
in Kenya (table 10.3). Beginning in 2009,
the Kenya Revenue Authority introduced
an online filing system for VAT. Over the
past 3 years the system has gained in
popularity among taxpayers, who have
learned to store required information
in an efficient and user-friendly format,
upload it to tax software and file the VAT
returns online. Companies have reported
improvements in processing speed on the
filing website, a major source of delay in
previous years. In addition, the revenue
authority exempted companies that file
monthly payroll taxes online from addi-
tional quarterly and annual filing require-
ments. This reduced the time required
to comply with labor taxes. Thanks to
the increased popularity of tax software,
the time required to calculate corporate
income tax (including inputting data) has
also declined.
WHAT HAVE WE LEARNED FROM 8 YEARS OF DATA?Over the past 8 years Doing Business re-
corded 7 reforms making it easier or less
costly to comply with taxes in the EAC
(figure 10.2). As a result of these reforms,
the average number of tax payments in
EAC economies fell from 36 in 2004 to
32 in 2011, while the average total tax rate
dropped from 91.7% of profit to 42.2%.6
Over the same period the average time
for tax compliance increased slightly,
showing the need for continued efforts to
make compliance easier (figure 10.3).
Among EAC economies, Burundi and
Rwanda have advanced the furthest
toward the frontier in regulatory practice
in paying taxes since 2004 (table 10.4).
In 2009 Burundi replaced its sales tax
with VAT, which led to a reduction in the
total tax rate of 125 percentage points.
In 2010 Burundi continued its efforts to
FIGURE 10.2 Tax reforms were common across all regions in the past 8 years
Number of Doing Business reforms making it easier to pay taxes by Doing Business report year
Note: An economy can be considered to have only 1 Doing Business reform per topic and year. The data sample for DB2006 (2004) includes 174 economies. The sample for DB2013 (2011) also includes The Bahamas, Bahrain, Barbados, Brunei Darussalam, Cyprus, Kosovo, Liberia, Luxembourg, Malta, Montenegro and Qatar, for a total of 185 economies.
Source: Doing Business database.
DB2006
DB2007
DB2008
DB2009
DB2010
DB2011
DB2012
DB2013
0 10 20 30 40 50 60 70 80
8
9 7 6 8 9 7 7 9
3 8 8 6 11 11 7 4
4
4 3 2 4 3 3 4 2
5 5 8 6 2 7 5
3
2 4 3 2 5 5 3 2
5 9 8 4
1
1
1111
2 5 4 3 221
4 3 2 6 2 3 2
4 2
2
1
1
12
11 10 9 9 11 7 7Eastern Europe & Central Asia(24 economies)
OECD high income(31 economies)
Sub-Saharan Africa(46 economies)
Latin America & Caribbean(33 economies)
East Asia & Pacific(24 economies)
ECOWAS(15 economies)
COMESA(18 economies)
Middle East & North Africa(19 economies)
SADC(15 economies)
South Asia(8 economies)
EAC(5 economies)
TABLE 10.3 Who in the EAC made paying taxes easier and lowered the tax burden in 2011/12—and what did they do?
Feature Economy Some highlights
Introduced or enhanced electronic systems
Kenya Kenya made paying taxes faster for companies by enhancing electronic filing systems.
Source: Doing Business database.
FIGURE 10.3 Time for tax compliance is converging across African regional blocs
Note: The data sample for ECOWAS excludes Liberia, which was added to the Doing Business sample after 2004.
Source: Doing Business database.
0
200
250
300
350
400
20112010200920082007200620052004
Average time (hours per year)
ECOWAS
SADC
COMESA
EAC
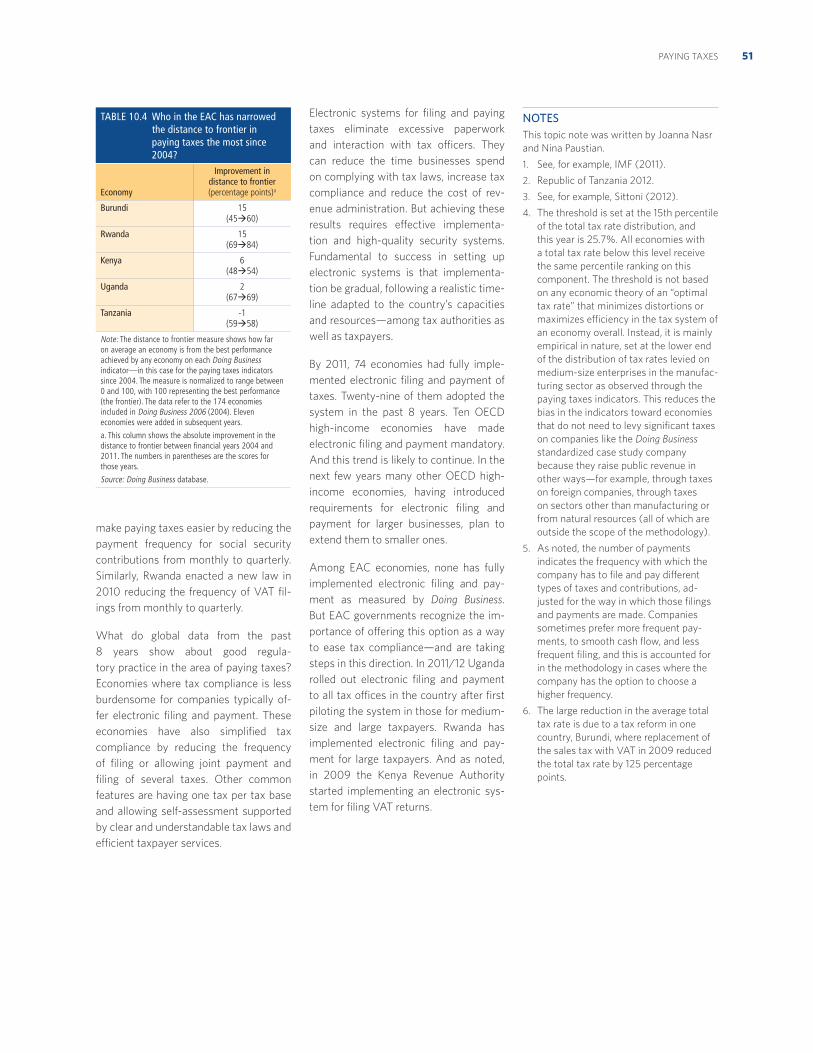
51PAYING TAXES
make paying taxes easier by reducing the
payment frequency for social security
contributions from monthly to quarterly.
Similarly, Rwanda enacted a new law in
2010 reducing the frequency of VAT fil-
ings from monthly to quarterly.
What do global data from the past
8 years show about good regula-
tory practice in the area of paying taxes?
Economies where tax compliance is less
burdensome for companies typically of-
fer electronic filing and payment. These
economies have also simplified tax
compliance by reducing the frequency
of filing or allowing joint payment and
filing of several taxes. Other common
features are having one tax per tax base
and allowing self-assessment supported
by clear and understandable tax laws and
efficient taxpayer services.
Electronic systems for filing and paying
taxes eliminate excessive paperwork
and interaction with tax officers. They
can reduce the time businesses spend
on complying with tax laws, increase tax
compliance and reduce the cost of rev-
enue administration. But achieving these
results requires effective implementa-
tion and high-quality security systems.
Fundamental to success in setting up
electronic systems is that implementa-
tion be gradual, following a realistic time-
line adapted to the country’s capacities
and resources—among tax authorities as
well as taxpayers.
By 2011, 74 economies had fully imple-
mented electronic filing and payment of
taxes. Twenty-nine of them adopted the
system in the past 8 years. Ten OECD
high-income economies have made
electronic filing and payment mandatory.
And this trend is likely to continue. In the
next few years many other OECD high-
income economies, having introduced
requirements for electronic filing and
payment for larger businesses, plan to
extend them to smaller ones.
Among EAC economies, none has fully
implemented electronic filing and pay-
ment as measured by Doing Business.
But EAC governments recognize the im-
portance of offering this option as a way
to ease tax compliance—and are taking
steps in this direction. In 2011/12 Uganda
rolled out electronic filing and payment
to all tax offices in the country after first
piloting the system in those for medium-
size and large taxpayers. Rwanda has
implemented electronic filing and pay-
ment for large taxpayers. And as noted,
in 2009 the Kenya Revenue Authority
started implementing an electronic sys-
tem for filing VAT returns.
NOTES
This topic note was written by Joanna Nasr
and Nina Paustian.
1. See, for example, IMF (2011).
2. Republic of Tanzania 2012.
3. See, for example, Sittoni (2012).
4. The threshold is set at the 15th percentile
of the total tax rate distribution, and
this year is 25.7%. All economies with
a total tax rate below this level receive
the same percentile ranking on this
component. The threshold is not based
on any economic theory of an “optimal
tax rate” that minimizes distortions or
maximizes efficiency in the tax system of
an economy overall. Instead, it is mainly
empirical in nature, set at the lower end
of the distribution of tax rates levied on
medium-size enterprises in the manufac-
turing sector as observed through the
paying taxes indicators. This reduces the
bias in the indicators toward economies
that do not need to levy significant taxes
on companies like the Doing Business
standardized case study company
because they raise public revenue in
other ways—for example, through taxes
on foreign companies, through taxes
on sectors other than manufacturing or
from natural resources (all of which are
outside the scope of the methodology).
5. As noted, the number of payments
indicates the frequency with which the
company has to file and pay different
types of taxes and contributions, ad-
justed for the way in which those filings
and payments are made. Companies
sometimes prefer more frequent pay-
ments, to smooth cash flow, and less
frequent filing, and this is accounted for
in the methodology in cases where the
company has the option to choose a
higher frequency.
6. The large reduction in the average total
tax rate is due to a tax reform in one
country, Burundi, where replacement of
the sales tax with VAT in 2009 reduced
the total tax rate by 125 percentage
points.
TABLE 10.4 Who in the EAC has narrowed the distance to frontier in paying taxes the most since 2004?
Economy
Improvement in distance to frontier (percentage points)a
Burundi 15 (45 60)
Rwanda 15 (69 84)
Kenya 6 (48 54)
Uganda 2 (67 69)
Tanzania -1 (59 58)
Note: The distance to frontier measure shows how far on average an economy is from the best performance achieved by any economy on each Doing Business indicator—in this case for the paying taxes indicators since 2004. The measure is normalized to range between 0 and 100, with 100 representing the best performance (the frontier). The data refer to the 174 economies included in Doing Business 2006 (2004). Eleven economies were added in subsequent years.
a. This column shows the absolute improvement in the distance to frontier between financial years 2004 and 2011. The numbers in parentheses are the scores for those years.
Source: Doing Business database.
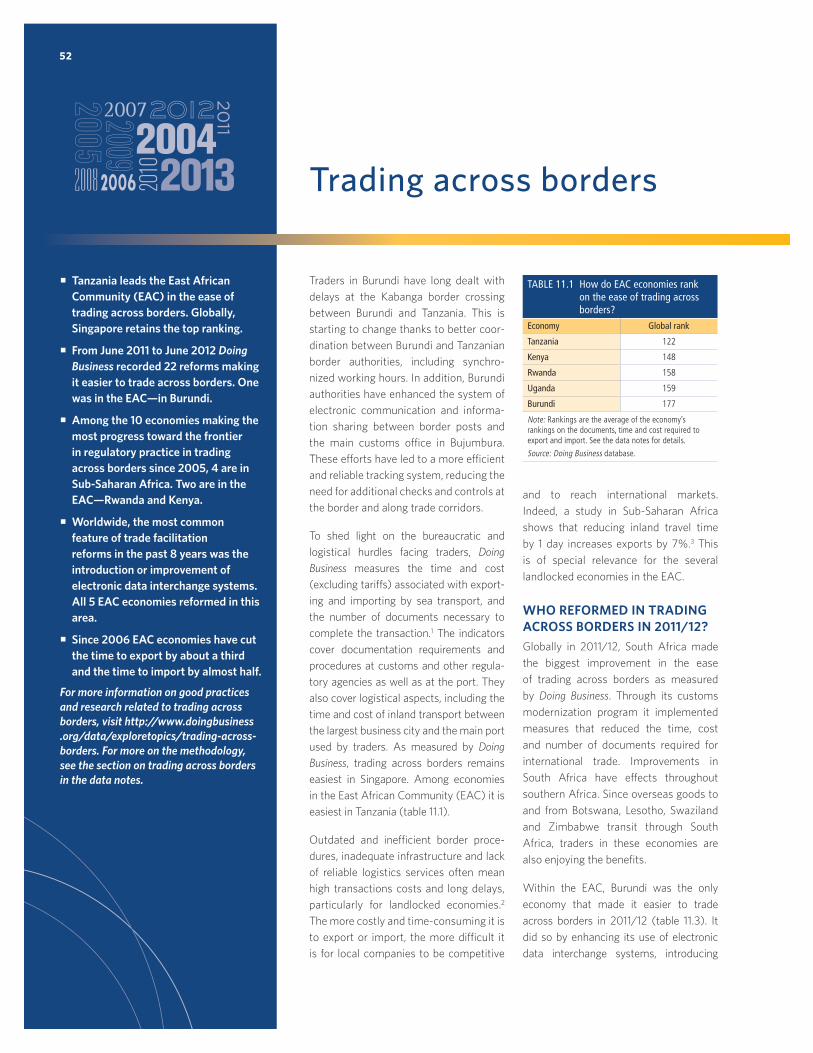
52
Trading across borders
Traders in Burundi have long dealt with
delays at the Kabanga border crossing
between Burundi and Tanzania. This is
starting to change thanks to better coor-
dination between Burundi and Tanzanian
border authorities, including synchro-
nized working hours. In addition, Burundi
authorities have enhanced the system of
electronic communication and informa-
tion sharing between border posts and
the main customs office in Bujumbura.
These efforts have led to a more efficient
and reliable tracking system, reducing the
need for additional checks and controls at
the border and along trade corridors.
To shed light on the bureaucratic and
logistical hurdles facing traders, Doing
Business measures the time and cost
(excluding tariffs) associated with export-
ing and importing by sea transport, and
the number of documents necessary to
complete the transaction.1 The indicators
cover documentation requirements and
procedures at customs and other regula-
tory agencies as well as at the port. They
also cover logistical aspects, including the
time and cost of inland transport between
the largest business city and the main port
used by traders. As measured by Doing
Business, trading across borders remains
easiest in Singapore. Among economies
in the East African Community (EAC) it is
easiest in Tanzania (table 11.1).
Outdated and inefficient border proce-
dures, inadequate infrastructure and lack
of reliable logistics services often mean
high transactions costs and long delays,
particularly for landlocked economies.2
The more costly and time-consuming it is
to export or import, the more difficult it
is for local companies to be competitive
and to reach international markets.
Indeed, a study in Sub-Saharan Africa
shows that reducing inland travel time
by 1 day increases exports by 7%.3 This
is of special relevance for the several
landlocked economies in the EAC.
WHO REFORMED IN TRADING ACROSS BORDERS IN 2011/12?Globally in 2011/12, South Africa made
the biggest improvement in the ease
of trading across borders as measured
by Doing Business. Through its customs
modernization program it implemented
measures that reduced the time, cost
and number of documents required for
international trade. Improvements in
South Africa have effects throughout
southern Africa. Since overseas goods to
and from Botswana, Lesotho, Swaziland
and Zimbabwe transit through South
Africa, traders in these economies are
also enjoying the benefits.
Within the EAC, Burundi was the only
economy that made it easier to trade
across borders in 2011/12 (table 11.3). It
did so by enhancing its use of electronic
data interchange systems, introducing
TABLE 11.1 How do EAC economies rank on the ease of trading across borders?
Economy Global rank
Tanzania 122
Kenya 148
Rwanda 158
Uganda 159
Burundi 177
Note: Rankings are the average of the economy’s rankings on the documents, time and cost required to export and import. See the data notes for details.
Source: Doing Business database.
Tanzania leads the East African Community (EAC) in the ease of trading across borders. Globally, Singapore retains the top ranking.
From June 2011 to June 2012 Doing Business recorded 22 reforms making it easier to trade across borders. One was in the EAC—in Burundi.
Among the 10 economies making the most progress toward the frontier in regulatory practice in trading across borders since 2005, 4 are in Sub-Saharan Africa. Two are in the EAC—Rwanda and Kenya.
Worldwide, the most common feature of trade facilitation reforms in the past 8 years was the introduction or improvement of electronic data interchange systems. All 5 EAC economies reformed in this area.
Since 2006 EAC economies have cut the time to export by about a third and the time to import by almost half.
For more information on good practices and research related to trading across borders, visit http://www.doingbusiness .org/data/exploretopics/trading-across-borders. For more on the methodology, see the section on trading across borders in the data notes.
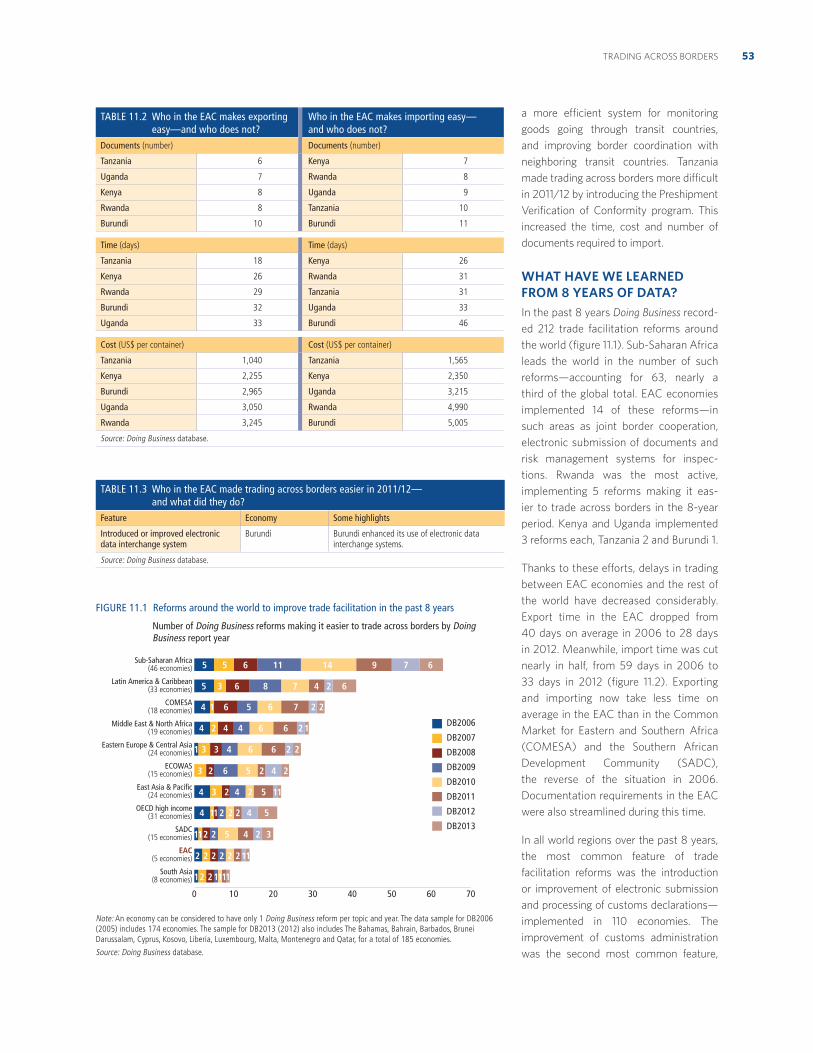
53TRADING ACROSS BORDERS
a more efficient system for monitoring
goods going through transit countries,
and improving border coordination with
neighboring transit countries. Tanzania
made trading across borders more difficult
in 2011/12 by introducing the Preshipment
Verification of Conformity program. This
increased the time, cost and number of
documents required to import.
WHAT HAVE WE LEARNED FROM 8 YEARS OF DATA?In the past 8 years Doing Business record-
ed 212 trade facilitation reforms around
the world (figure 11.1). Sub-Saharan Africa
leads the world in the number of such
reforms—accounting for 63, nearly a
third of the global total. EAC economies
implemented 14 of these reforms—in
such areas as joint border cooperation,
electronic submission of documents and
risk management systems for inspec-
tions. Rwanda was the most active,
implementing 5 reforms making it eas-
ier to trade across borders in the 8-year
period. Kenya and Uganda implemented
3 reforms each, Tanzania 2 and Burundi 1.
Thanks to these efforts, delays in trading
between EAC economies and the rest of
the world have decreased considerably.
Export time in the EAC dropped from
40 days on average in 2006 to 28 days
in 2012. Meanwhile, import time was cut
nearly in half, from 59 days in 2006 to
33 days in 2012 (figure 11.2). Exporting
and importing now take less time on
average in the EAC than in the Common
Market for Eastern and Southern Africa
(COMESA) and the Southern African
Development Community (SADC),
the reverse of the situation in 2006.
Documentation requirements in the EAC
were also streamlined during this time.
In all world regions over the past 8 years,
the most common feature of trade
facilitation reforms was the introduction
or improvement of electronic submission
and processing of customs declarations—
implemented in 110 economies. The
improvement of customs administration
was the second most common feature,
TABLE 11.3 Who in the EAC made trading across borders easier in 2011/12— and what did they do?
Feature Economy Some highlights
Introduced or improved electronic data interchange system
Burundi Burundi enhanced its use of electronic data interchange systems.
Source: Doing Business database.
FIGURE 11.1 Reforms around the world to improve trade facilitation in the past 8 years
Number of Doing Business reforms making it easier to trade across borders by Doing Business report year
Note: An economy can be considered to have only 1 Doing Business reform per topic and year. The data sample for DB2006 (2005) includes 174 economies. The sample for DB2013 (2012) also includes The Bahamas, Bahrain, Barbados, Brunei Darussalam, Cyprus, Kosovo, Liberia, Luxembourg, Malta, Montenegro and Qatar, for a total of 185 economies.
Source: Doing Business database.
0 10 20 30 40 50 60 70
DB2006
DB2007
DB2008
DB2009
DB2010
DB2011
DB2012
DB2013
5
5
4 1 6 6 7 2 25
3 6 8 7 4 2 6
4 2 4 4 6 6 2 1
1 3
3 2 6 5 2 4 2
3 4 6 6 2 2
34 2 4 2 5 11
4 112
11 2
22 2 2 2112
2 5 4 2 3
2 2 4 5
12 21111
5 6 11 14 9 7 6Sub-Saharan Africa(46 economies)
Latin America & Caribbean(33 economies)
COMESA(18 economies)
Middle East & North Africa(19 economies)
Eastern Europe & Central Asia(24 economies)
ECOWAS(15 economies)
East Asia & Pacific(24 economies)
OECD high income(31 economies)
SADC(15 economies)
EAC(5 economies)
South Asia(8 economies)
TABLE 11.2 Who in the EAC makes exporting easy—and who does not?
Who in the EAC makes importing easy— and who does not?
Documents (number) Documents (number)
Tanzania 6 Kenya 7
Uganda 7 Rwanda 8
Kenya 8 Uganda 9
Rwanda 8 Tanzania 10
Burundi 10 Burundi 11
Time (days) Time (days)
Tanzania 18 Kenya 26
Kenya 26 Rwanda 31
Rwanda 29 Tanzania 31
Burundi 32 Uganda 33
Uganda 33 Burundi 46
Cost (US$ per container) Cost (US$ per container)
Tanzania 1,040 Tanzania 1,565
Kenya 2,255 Kenya 2,350
Burundi 2,965 Uganda 3,215
Uganda 3,050 Rwanda 4,990
Rwanda 3,245 Burundi 5,005
Source: Doing Business database.
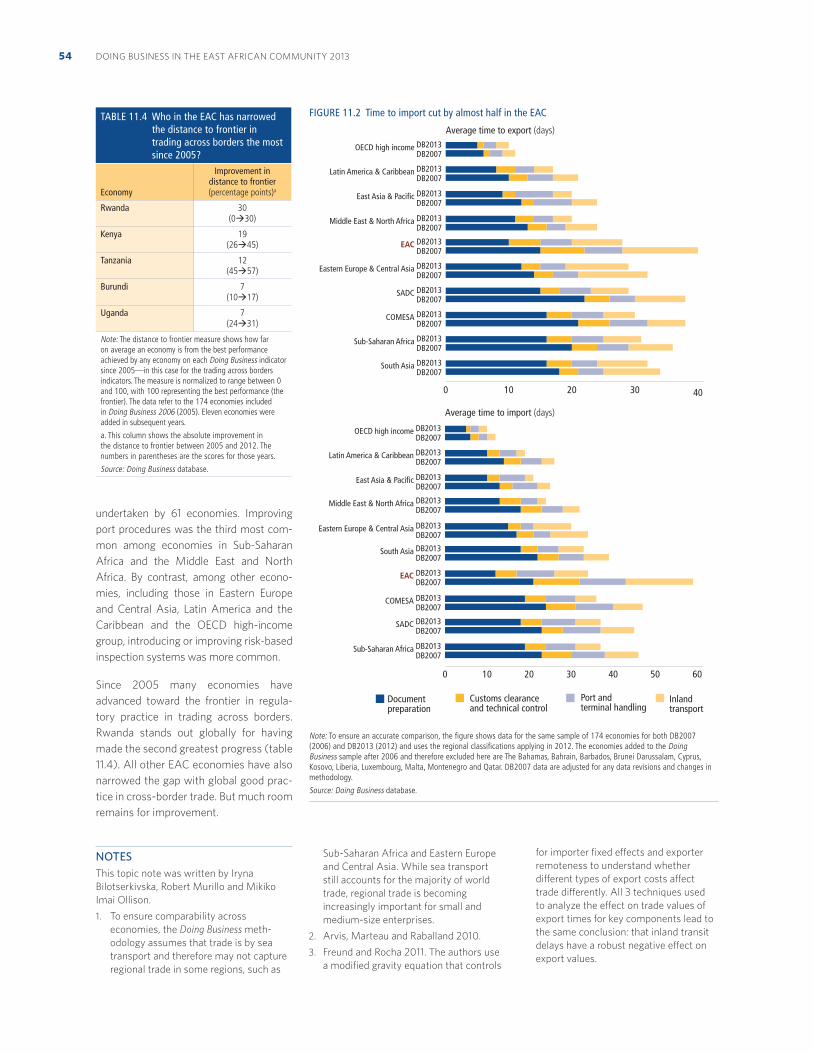
DOING BUSINESS IN THE EAST AFRICAN COMMUNITY 201354
undertaken by 61 economies. Improving
port procedures was the third most com-
mon among economies in Sub-Saharan
Africa and the Middle East and North
Africa. By contrast, among other econo-
mies, including those in Eastern Europe
and Central Asia, Latin America and the
Caribbean and the OECD high-income
group, introducing or improving risk-based
inspection systems was more common.
Since 2005 many economies have
advanced toward the frontier in regula-
tory practice in trading across borders.
Rwanda stands out globally for having
made the second greatest progress (table
11.4). All other EAC economies have also
narrowed the gap with global good prac-
tice in cross-border trade. But much room
remains for improvement.
NOTES
This topic note was written by Iryna
Bilotserkivska, Robert Murillo and Mikiko
Imai Ollison.
1. To ensure comparability across
economies, the Doing Business meth-
odology assumes that trade is by sea
transport and therefore may not capture
regional trade in some regions, such as
Sub-Saharan Africa and Eastern Europe
and Central Asia. While sea transport
still accounts for the majority of world
trade, regional trade is becoming
increasingly important for small and
medium-size enterprises.
2. Arvis, Marteau and Raballand 2010.
3. Freund and Rocha 2011. The authors use
a modified gravity equation that controls
for importer fixed effects and exporter
remoteness to understand whether
different types of export costs affect
trade differently. All 3 techniques used
to analyze the effect on trade values of
export times for key components lead to
the same conclusion: that inland transit
delays have a robust negative effect on
export values.
TABLE 11.4 Who in the EAC has narrowed the distance to frontier in trading across borders the most since 2005?
Economy
Improvement in distance to frontier (percentage points)a
Rwanda 30 (0 30)
Kenya 19 (26 45)
Tanzania 12 (45 57)
Burundi 7 (10 17)
Uganda 7 (24 31)
Note: The distance to frontier measure shows how far on average an economy is from the best performance achieved by any economy on each Doing Business indicator since 2005—in this case for the trading across borders indicators. The measure is normalized to range between 0 and 100, with 100 representing the best performance (the frontier). The data refer to the 174 economies included in Doing Business 2006 (2005). Eleven economies were added in subsequent years.
a. This column shows the absolute improvement in the distance to frontier between 2005 and 2012. The numbers in parentheses are the scores for those years.
Source: Doing Business database.
FIGURE 11.2 Time to import cut by almost half in the EAC
Note: To ensure an accurate comparison, the figure shows data for the same sample of 174 economies for both DB2007 (2006) and DB2013 (2012) and uses the regional classifications applying in 2012. The economies added to the Doing Business sample after 2006 and therefore excluded here are The Bahamas, Bahrain, Barbados, Brunei Darussalam, Cyprus, Kosovo, Liberia, Luxembourg, Malta, Montenegro and Qatar. DB2007 data are adjusted for any data revisions and changes in methodology.
Source: Doing Business database.
0 10 20 30 40
DB2007South Asia DB2013
DB2007Sub-Saharan Africa DB2013
DB2007COMESA DB2013
DB2007SADC DB2013
DB2007Eastern Europe & Central Asia DB2013
DB2007EAC DB2013
DB2007East Asia & Pacific DB2013
DB2007Middle East & North Africa DB2013
DB2007Latin America & Caribbean DB2013
DB2007OECD high income DB2013
0 10 20 30 40 50 60
DB2007South Asia DB2013
DB2007Sub-Saharan Africa DB2013
DB2007COMESA DB2013
DB2007SADC DB2013
DB2007Eastern Europe & Central Asia DB2013
DB2007EAC DB2013
DB2007East Asia & Pacific DB2013
DB2007Middle East & North Africa DB2013
DB2007Latin America & Caribbean DB2013
DB2007OECD high income DB2013
Average time to export (days)
Average time to import (days)
Inland transport
Port and terminal handling
Customs clearance and technical control
Document preparation
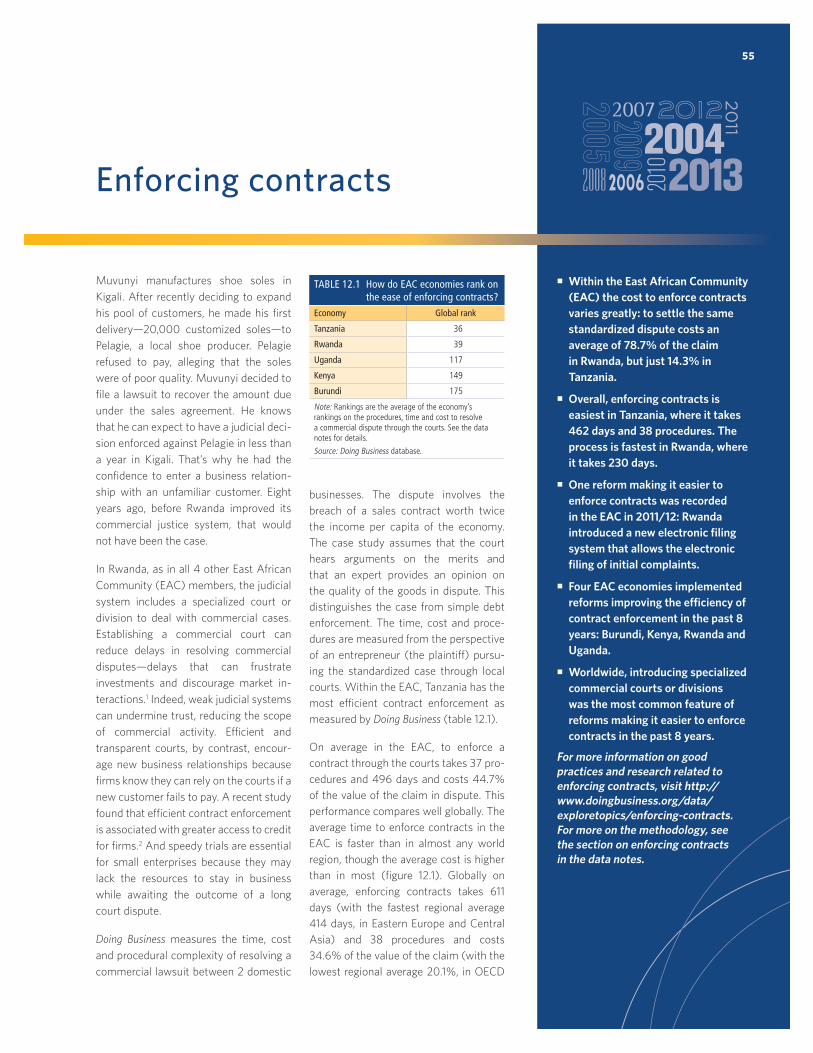
55
Enforcing contracts
Muvunyi manufactures shoe soles in
Kigali. After recently deciding to expand
his pool of customers, he made his first
delivery—20,000 customized soles—to
Pelagie, a local shoe producer. Pelagie
refused to pay, alleging that the soles
were of poor quality. Muvunyi decided to
file a lawsuit to recover the amount due
under the sales agreement. He knows
that he can expect to have a judicial deci-
sion enforced against Pelagie in less than
a year in Kigali. That’s why he had the
confidence to enter a business relation-
ship with an unfamiliar customer. Eight
years ago, before Rwanda improved its
commercial justice system, that would
not have been the case.
In Rwanda, as in all 4 other East African
Community (EAC) members, the judicial
system includes a specialized court or
division to deal with commercial cases.
Establishing a commercial court can
reduce delays in resolving commercial
disputes—delays that can frustrate
investments and discourage market in-
teractions.1 Indeed, weak judicial systems
can undermine trust, reducing the scope
of commercial activity. Efficient and
transparent courts, by contrast, encour-
age new business relationships because
firms know they can rely on the courts if a
new customer fails to pay. A recent study
found that efficient contract enforcement
is associated with greater access to credit
for firms.2 And speedy trials are essential
for small enterprises because they may
lack the resources to stay in business
while awaiting the outcome of a long
court dispute.
Doing Business measures the time, cost
and procedural complexity of resolving a
commercial lawsuit between 2 domestic
businesses. The dispute involves the
breach of a sales contract worth twice
the income per capita of the economy.
The case study assumes that the court
hears arguments on the merits and
that an expert provides an opinion on
the quality of the goods in dispute. This
distinguishes the case from simple debt
enforcement. The time, cost and proce-
dures are measured from the perspective
of an entrepreneur (the plaintiff) pursu-
ing the standardized case through local
courts. Within the EAC, Tanzania has the
most efficient contract enforcement as
measured by Doing Business (table 12.1).
On average in the EAC, to enforce a
contract through the courts takes 37 pro-
cedures and 496 days and costs 44.7%
of the value of the claim in dispute. This
performance compares well globally. The
average time to enforce contracts in the
EAC is faster than in almost any world
region, though the average cost is higher
than in most (figure 12.1). Globally on
average, enforcing contracts takes 611
days (with the fastest regional average
414 days, in Eastern Europe and Central
Asia) and 38 procedures and costs
34.6% of the value of the claim (with the
lowest regional average 20.1%, in OECD
Within the East African Community (EAC) the cost to enforce contracts varies greatly: to settle the same standardized dispute costs an average of 78.7% of the claim in Rwanda, but just 14.3% in Tanzania.
Overall, enforcing contracts is easiest in Tanzania, where it takes 462 days and 38 procedures. The process is fastest in Rwanda, where it takes 230 days.
One reform making it easier to enforce contracts was recorded in the EAC in 2011/12: Rwanda introduced a new electronic filing system that allows the electronic filing of initial complaints.
Four EAC economies implemented reforms improving the efficiency of contract enforcement in the past 8 years: Burundi, Kenya, Rwanda and Uganda.
Worldwide, introducing specialized commercial courts or divisions was the most common feature of reforms making it easier to enforce contracts in the past 8 years.
For more information on good practices and research related to enforcing contracts, visit http://www.doingbusiness.org/data/exploretopics/enforcing-contracts. For more on the methodology, see the section on enforcing contracts in the data notes.
TABLE 12.1 How do EAC economies rank on the ease of enforcing contracts?
Economy Global rank
Tanzania 36
Rwanda 39
Uganda 117
Kenya 149
Burundi 175
Note: Rankings are the average of the economy’s rankings on the procedures, time and cost to resolve a commercial dispute through the courts. See the data notes for details.
Source: Doing Business database.
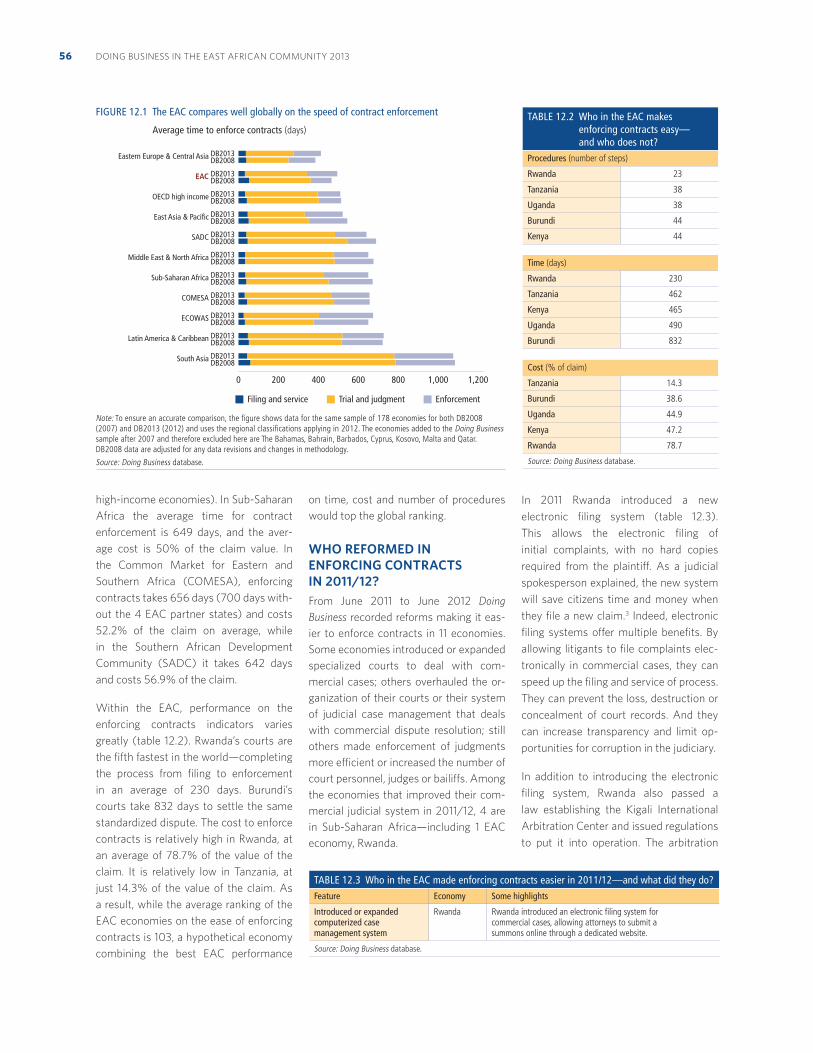
DOING BUSINESS IN THE EAST AFRICAN COMMUNITY 201356
high-income economies). In Sub-Saharan
Africa the average time for contract
enforcement is 649 days, and the aver-
age cost is 50% of the claim value. In
the Common Market for Eastern and
Southern Africa (COMESA), enforcing
contracts takes 656 days (700 days with-
out the 4 EAC partner states) and costs
52.2% of the claim on average, while
in the Southern African Development
Community (SADC) it takes 642 days
and costs 56.9% of the claim.
Within the EAC, performance on the
enforcing contracts indicators varies
greatly (table 12.2). Rwanda’s courts are
the fifth fastest in the world—completing
the process from filing to enforcement
in an average of 230 days. Burundi’s
courts take 832 days to settle the same
standardized dispute. The cost to enforce
contracts is relatively high in Rwanda, at
an average of 78.7% of the value of the
claim. It is relatively low in Tanzania, at
just 14.3% of the value of the claim. As
a result, while the average ranking of the
EAC economies on the ease of enforcing
contracts is 103, a hypothetical economy
combining the best EAC performance
on time, cost and number of procedures
would top the global ranking.
WHO REFORMED IN ENFORCING CONTRACTS IN 2011/12?From June 2011 to June 2012 Doing
Business recorded reforms making it eas-
ier to enforce contracts in 11 economies.
Some economies introduced or expanded
specialized courts to deal with com-
mercial cases; others overhauled the or-
ganization of their courts or their system
of judicial case management that deals
with commercial dispute resolution; still
others made enforcement of judgments
more efficient or increased the number of
court personnel, judges or bailiffs. Among
the economies that improved their com-
mercial judicial system in 2011/12, 4 are
in Sub-Saharan Africa—including 1 EAC
economy, Rwanda.
In 2011 Rwanda introduced a new
electronic filing system (table 12.3).
This allows the electronic filing of
initial complaints, with no hard copies
required from the plaintiff. As a judicial
spokesperson explained, the new system
will save citizens time and money when
they file a new claim.3 Indeed, electronic
filing systems offer multiple benefits. By
allowing litigants to file complaints elec-
tronically in commercial cases, they can
speed up the filing and service of process.
They can prevent the loss, destruction or
concealment of court records. And they
can increase transparency and limit op-
portunities for corruption in the judiciary.
In addition to introducing the electronic
filing system, Rwanda also passed a
law establishing the Kigali International
Arbitration Center and issued regulations
to put it into operation. The arbitration
FIGURE 12.1 The EAC compares well globally on the speed of contract enforcement
Average time to enforce contracts (days)
Note: To ensure an accurate comparison, the figure shows data for the same sample of 178 economies for both DB2008 (2007) and DB2013 (2012) and uses the regional classifications applying in 2012. The economies added to the Doing Business sample after 2007 and therefore excluded here are The Bahamas, Bahrain, Barbados, Cyprus, Kosovo, Malta and Qatar. DB2008 data are adjusted for any data revisions and changes in methodology.
Source: Doing Business database.
0 200 400 600 800 1,000 1,200
DB2008South Asia DB2013
DB2008Latin America & Caribbean DB2013
DB2008ECOWAS DB2013
DB2008COMESA DB2013
DB2008Sub-Saharan Africa DB2013
DB2008Middle East & North Africa DB2013
DB2008SADC DB2013
DB2008East Asia & Pacific DB2013
DB2008OECD high income DB2013
DB2008EAC DB2013
DB2008Eastern Europe & Central Asia DB2013
Filing and service Trial and judgment Enforcement
TABLE 12.3 Who in the EAC made enforcing contracts easier in 2011/12—and what did they do?Feature Economy Some highlights
Introduced or expanded computerized case management system
Rwanda Rwanda introduced an electronic filing system for commercial cases, allowing attorneys to submit a summons online through a dedicated website.
Source: Doing Business database.
TABLE 12.2 Who in the EAC makes enforcing contracts easy— and who does not?
Procedures (number of steps)
Rwanda 23
Tanzania 38
Uganda 38
Burundi 44
Kenya 44
Time (days)
Rwanda 230
Tanzania 462
Kenya 465
Uganda 490
Burundi 832
Cost (% of claim)
Tanzania 14.3
Burundi 38.6
Uganda 44.9
Kenya 47.2
Rwanda 78.7
Source: Doing Business database.
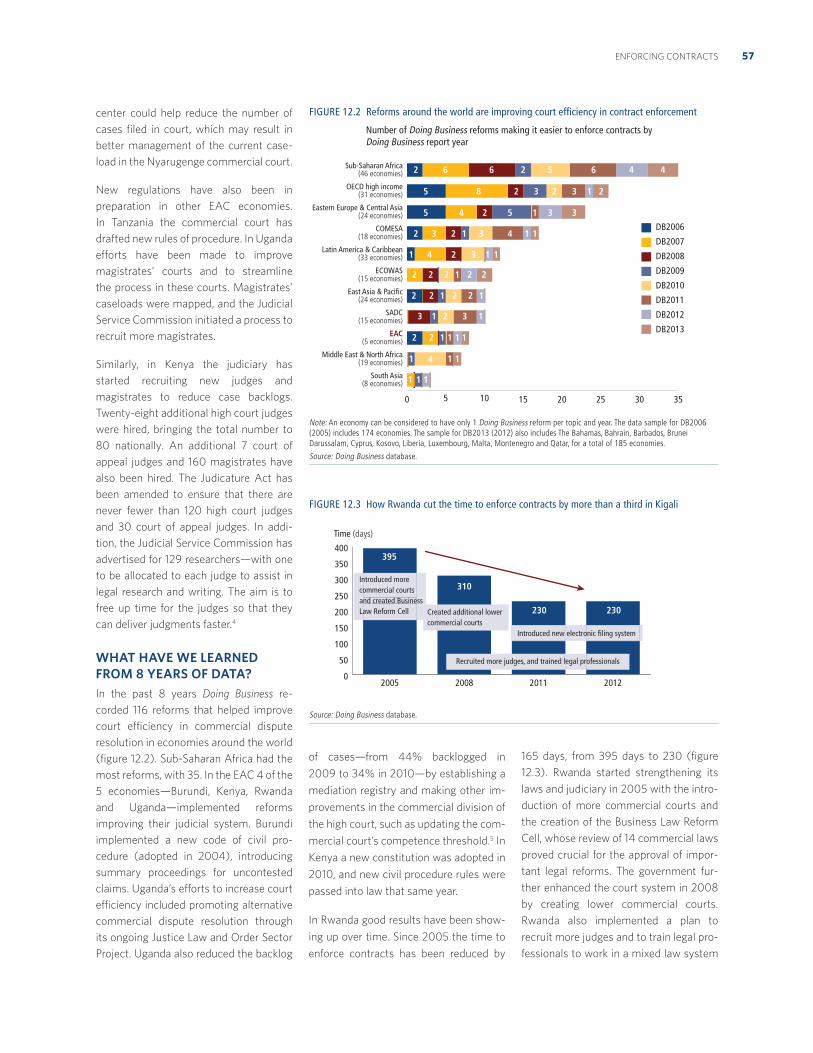
57ENFORCING CONTRACTS
center could help reduce the number of
cases filed in court, which may result in
better management of the current case-
load in the Nyarugenge commercial court.
New regulations have also been in
preparation in other EAC economies.
In Tanzania the commercial court has
drafted new rules of procedure. In Uganda
efforts have been made to improve
magistrates’ courts and to streamline
the process in these courts. Magistrates’
caseloads were mapped, and the Judicial
Service Commission initiated a process to
recruit more magistrates.
Similarly, in Kenya the judiciary has
started recruiting new judges and
magistrates to reduce case backlogs.
Twenty-eight additional high court judges
were hired, bringing the total number to
80 nationally. An additional 7 court of
appeal judges and 160 magistrates have
also been hired. The Judicature Act has
been amended to ensure that there are
never fewer than 120 high court judges
and 30 court of appeal judges. In addi-
tion, the Judicial Service Commission has
advertised for 129 researchers—with one
to be allocated to each judge to assist in
legal research and writing. The aim is to
free up time for the judges so that they
can deliver judgments faster.4
WHAT HAVE WE LEARNED FROM 8 YEARS OF DATA?In the past 8 years Doing Business re-
corded 116 reforms that helped improve
court efficiency in commercial dispute
resolution in economies around the world
(figure 12.2). Sub-Saharan Africa had the
most reforms, with 35. In the EAC 4 of the
5 economies—Burundi, Kenya, Rwanda
and Uganda—implemented reforms
improving their judicial system. Burundi
implemented a new code of civil pro-
cedure (adopted in 2004), introducing
summary proceedings for uncontested
claims. Uganda’s efforts to increase court
efficiency included promoting alternative
commercial dispute resolution through
its ongoing Justice Law and Order Sector
Project. Uganda also reduced the backlog
of cases—from 44% backlogged in
2009 to 34% in 2010—by establishing a
mediation registry and making other im-
provements in the commercial division of
the high court, such as updating the com-
mercial court’s competence threshold.5 In
Kenya a new constitution was adopted in
2010, and new civil procedure rules were
passed into law that same year.
In Rwanda good results have been show-
ing up over time. Since 2005 the time to
enforce contracts has been reduced by
165 days, from 395 days to 230 (figure
12.3). Rwanda started strengthening its
laws and judiciary in 2005 with the intro-
duction of more commercial courts and
the creation of the Business Law Reform
Cell, whose review of 14 commercial laws
proved crucial for the approval of impor-
tant legal reforms. The government fur-
ther enhanced the court system in 2008
by creating lower commercial courts.
Rwanda also implemented a plan to
recruit more judges and to train legal pro-
fessionals to work in a mixed law system
FIGURE 12.2 Reforms around the world are improving court efficiency in contract enforcement
Number of Doing Business reforms making it easier to enforce contracts by Doing Business report year
Note: An economy can be considered to have only 1 Doing Business reform per topic and year. The data sample for DB2006 (2005) includes 174 economies. The sample for DB2013 (2012) also includes The Bahamas, Bahrain, Barbados, Brunei Darussalam, Cyprus, Kosovo, Liberia, Luxembourg, Malta, Montenegro and Qatar, for a total of 185 economies.
Source: Doing Business database.
FIGURE 12.3 How Rwanda cut the time to enforce contracts by more than a third in Kigali
Source: Doing Business database.
0 5 10 15 20 25 30 35
South Asia(8 economies)
Middle East & North Africa(19 economies)
EAC(5 economies)
SADC(15 economies)
East Asia & Pacific(24 economies)
ECOWAS(15 economies)
Latin America & Caribbean(33 economies)
COMESA(18 economies)
Eastern Europe & Central Asia(24 economies)
OECD high income(31 economies)
Sub-Saharan Africa(46 economies)
DB2006
DB2007
DB2008
DB2009
DB2010
DB2011
DB2012
DB2013
2 26 6 65 4 4
5 8 3 1 42 32 2
5 4 2 5 1 3 3
14 112 23 3 4
1 4 2 3 1 1 4 1
12 2 2 2 42
2 12 2 12
3 1 3 12
1 1 12 2 1
4 1 11 3
1 1 1
0
50
100
150
200
250
300
350
400
2012201120082005
Time (days)
Introduced more commercial courts and created Business Law Reform Cell Created additional lower
commercial courts
Recruited more judges, and trained legal professionals
Introduced new electronic filing system
395
310
230 230
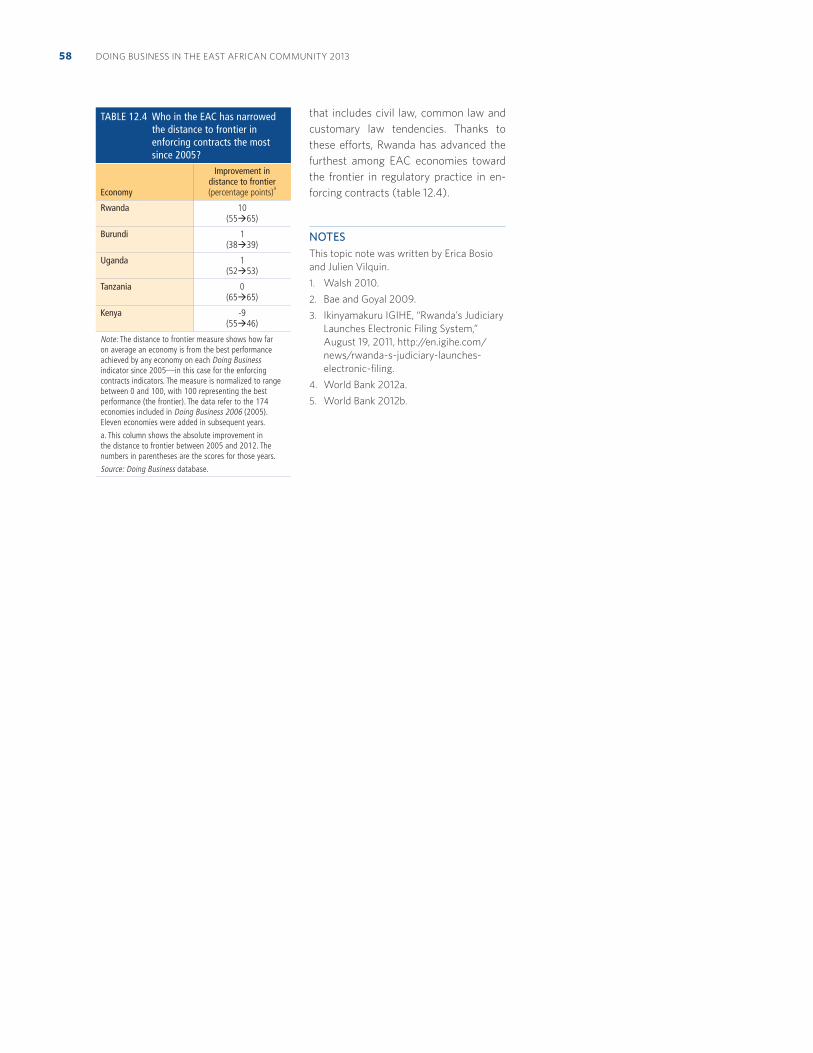
DOING BUSINESS IN THE EAST AFRICAN COMMUNITY 201358
that includes civil law, common law and
customary law tendencies. Thanks to
these efforts, Rwanda has advanced the
furthest among EAC economies toward
the frontier in regulatory practice in en-
forcing contracts (table 12.4).
NOTES
This topic note was written by Erica Bosio
and Julien Vilquin.
1. Walsh 2010.
2. Bae and Goyal 2009.
3. Ikinyamakuru IGIHE, “Rwanda’s Judiciary
Launches Electronic Filing System,”
August 19, 2011, http://en.igihe.com/
news/rwanda-s-judiciary-launches-
electronic-filing.
4. World Bank 2012a.
5. World Bank 2012b.
TABLE 12.4 Who in the EAC has narrowed the distance to frontier in enforcing contracts the most since 2005?
Economy
Improvement in distance to frontier (percentage points)
a
Rwanda 10 (55 65)
Burundi 1 (38 39)
Uganda 1 (52 53)
Tanzania 0 (65 65)
Kenya -9 (55 46)
Note: The distance to frontier measure shows how far on average an economy is from the best performance achieved by any economy on each Doing Business indicator since 2005—in this case for the enforcing contracts indicators. The measure is normalized to range between 0 and 100, with 100 representing the best performance (the frontier). The data refer to the 174 economies included in Doing Business 2006 (2005). Eleven economies were added in subsequent years.
a. This column shows the absolute improvement in the distance to frontier between 2005 and 2012. The numbers in parentheses are the scores for those years.
Source: Doing Business database.
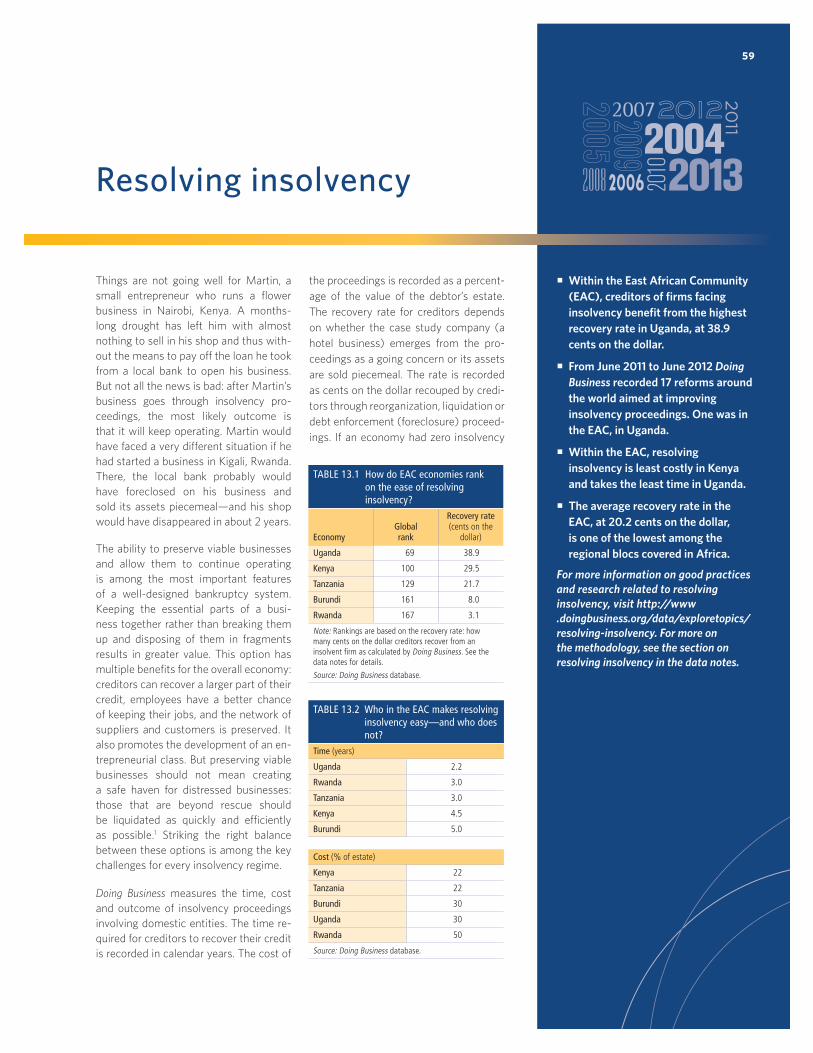
59
Resolving insolvency
Things are not going well for Martin, a
small entrepreneur who runs a flower
business in Nairobi, Kenya. A months-
long drought has left him with almost
nothing to sell in his shop and thus with-
out the means to pay off the loan he took
from a local bank to open his business.
But not all the news is bad: after Martin’s
business goes through insolvency pro-
ceedings, the most likely outcome is
that it will keep operating. Martin would
have faced a very different situation if he
had started a business in Kigali, Rwanda.
There, the local bank probably would
have foreclosed on his business and
sold its assets piecemeal—and his shop
would have disappeared in about 2 years.
The ability to preserve viable businesses
and allow them to continue operating
is among the most important features
of a well-designed bankruptcy system.
Keeping the essential parts of a busi-
ness together rather than breaking them
up and disposing of them in fragments
results in greater value. This option has
multiple benefits for the overall economy:
creditors can recover a larger part of their
credit, employees have a better chance
of keeping their jobs, and the network of
suppliers and customers is preserved. It
also promotes the development of an en-
trepreneurial class. But preserving viable
businesses should not mean creating
a safe haven for distressed businesses:
those that are beyond rescue should
be liquidated as quickly and efficiently
as possible.1 Striking the right balance
between these options is among the key
challenges for every insolvency regime.
Doing Business measures the time, cost
and outcome of insolvency proceedings
involving domestic entities. The time re-
quired for creditors to recover their credit
is recorded in calendar years. The cost of
the proceedings is recorded as a percent-
age of the value of the debtor’s estate.
The recovery rate for creditors depends
on whether the case study company (a
hotel business) emerges from the pro-
ceedings as a going concern or its assets
are sold piecemeal. The rate is recorded
as cents on the dollar recouped by credi-
tors through reorganization, liquidation or
debt enforcement (foreclosure) proceed-
ings. If an economy had zero insolvency
Within the East African Community (EAC), creditors of firms facing insolvency benefit from the highest recovery rate in Uganda, at 38.9 cents on the dollar.
From June 2011 to June 2012 Doing Business recorded 17 reforms around the world aimed at improving insolvency proceedings. One was in the EAC, in Uganda.
Within the EAC, resolving insolvency is least costly in Kenya and takes the least time in Uganda.
The average recovery rate in the EAC, at 20.2 cents on the dollar, is one of the lowest among the regional blocs covered in Africa.
For more information on good practices and research related to resolving insolvency, visit http://www .doingbusiness.org/data/exploretopics/resolving-insolvency. For more on the methodology, see the section on resolving insolvency in the data notes.
TABLE 13.1 How do EAC economies rank on the ease of resolving insolvency?
EconomyGlobal rank
Recovery rate (cents on the
dollar)
Uganda 69 38.9
Kenya 100 29.5
Tanzania 129 21.7
Burundi 161 8.0
Rwanda 167 3.1
Note: Rankings are based on the recovery rate: how many cents on the dollar creditors recover from an insolvent firm as calculated by Doing Business. See the data notes for details.
Source: Doing Business database.
TABLE 13.2 Who in the EAC makes resolving insolvency easy—and who does not?
Time (years)
Uganda 2.2
Rwanda 3.0
Tanzania 3.0
Kenya 4.5
Burundi 5.0
Cost (% of estate)
Kenya 22
Tanzania 22
Burundi 30
Uganda 30
Rwanda 50
Source: Doing Business database.
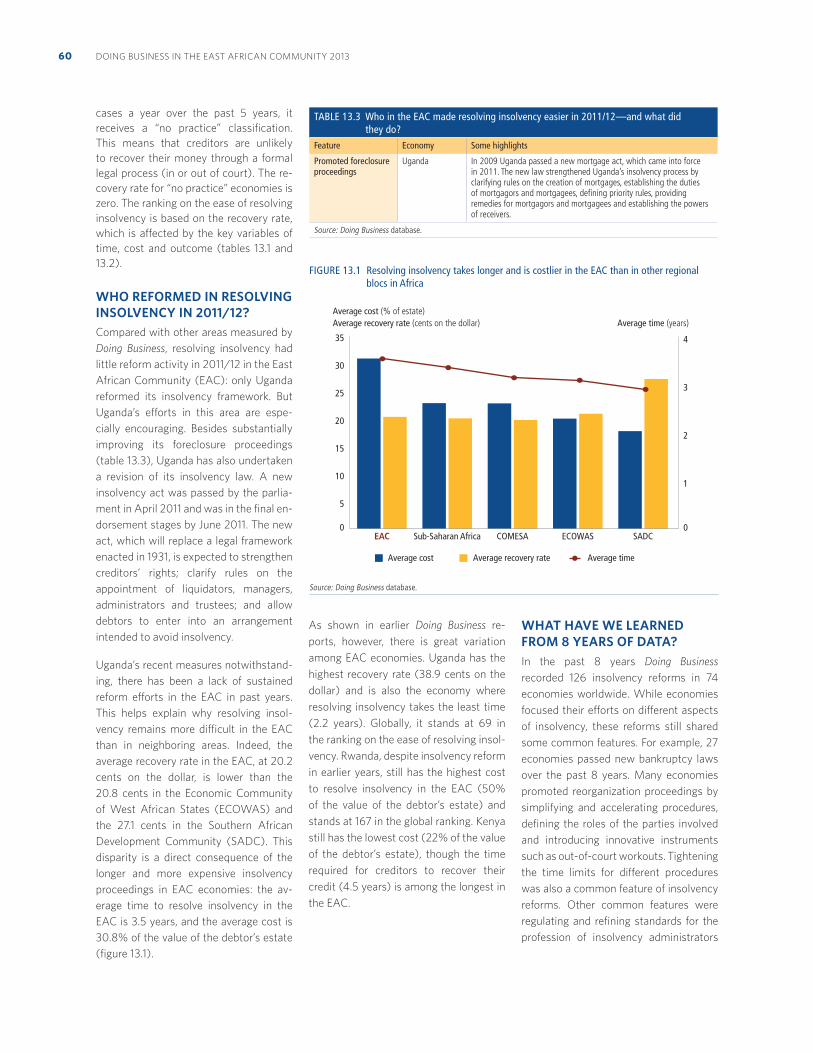
DOING BUSINESS IN THE EAST AFRICAN COMMUNITY 201360
cases a year over the past 5 years, it
receives a “no practice” classification.
This means that creditors are unlikely
to recover their money through a formal
legal process (in or out of court). The re-
covery rate for “no practice” economies is
zero. The ranking on the ease of resolving
insolvency is based on the recovery rate,
which is affected by the key variables of
time, cost and outcome (tables 13.1 and
13.2).
WHO REFORMED IN RESOLVING INSOLVENCY IN 2011/12?Compared with other areas measured by
Doing Business, resolving insolvency had
little reform activity in 2011/12 in the East
African Community (EAC): only Uganda
reformed its insolvency framework. But
Uganda’s efforts in this area are espe-
cially encouraging. Besides substantially
improving its foreclosure proceedings
(table 13.3), Uganda has also undertaken
a revision of its insolvency law. A new
insolvency act was passed by the parlia-
ment in April 2011 and was in the final en-
dorsement stages by June 2011. The new
act, which will replace a legal framework
enacted in 1931, is expected to strengthen
creditors’ rights; clarify rules on the
appointment of liquidators, managers,
administrators and trustees; and allow
debtors to enter into an arrangement
intended to avoid insolvency.
Uganda’s recent measures notwithstand-
ing, there has been a lack of sustained
reform efforts in the EAC in past years.
This helps explain why resolving insol-
vency remains more difficult in the EAC
than in neighboring areas. Indeed, the
average recovery rate in the EAC, at 20.2
cents on the dollar, is lower than the
20.8 cents in the Economic Community
of West African States (ECOWAS) and
the 27.1 cents in the Southern African
Development Community (SADC). This
disparity is a direct consequence of the
longer and more expensive insolvency
proceedings in EAC economies: the av-
erage time to resolve insolvency in the
EAC is 3.5 years, and the average cost is
30.8% of the value of the debtor’s estate
(figure 13.1).
As shown in earlier Doing Business re-
ports, however, there is great variation
among EAC economies. Uganda has the
highest recovery rate (38.9 cents on the
dollar) and is also the economy where
resolving insolvency takes the least time
(2.2 years). Globally, it stands at 69 in
the ranking on the ease of resolving insol-
vency. Rwanda, despite insolvency reform
in earlier years, still has the highest cost
to resolve insolvency in the EAC (50%
of the value of the debtor’s estate) and
stands at 167 in the global ranking. Kenya
still has the lowest cost (22% of the value
of the debtor’s estate), though the time
required for creditors to recover their
credit (4.5 years) is among the longest in
the EAC.
WHAT HAVE WE LEARNED FROM 8 YEARS OF DATA?In the past 8 years Doing Business
recorded 126 insolvency reforms in 74
economies worldwide. While economies
focused their efforts on different aspects
of insolvency, these reforms still shared
some common features. For example, 27
economies passed new bankruptcy laws
over the past 8 years. Many economies
promoted reorganization proceedings by
simplifying and accelerating procedures,
defining the roles of the parties involved
and introducing innovative instruments
such as out-of-court workouts. Tightening
the time limits for different procedures
was also a common feature of insolvency
reforms. Other common features were
regulating and refining standards for the
profession of insolvency administrators
TABLE 13.3 Who in the EAC made resolving insolvency easier in 2011/12—and what did they do?
Feature Economy Some highlights
Promoted foreclosure proceedings
Uganda In 2009 Uganda passed a new mortgage act, which came into force in 2011. The new law strengthened Uganda’s insolvency process by clarifying rules on the creation of mortgages, establishing the duties of mortgagors and mortgagees, defining priority rules, providing remedies for mortgagors and mortgagees and establishing the powers of receivers.
Source: Doing Business database.
FIGURE 13.1 Resolving insolvency takes longer and is costlier in the EAC than in other regional blocs in Africa
Source: Doing Business database.
0
5
10
15
20
25
30
35
SADCECOWASCOMESASub-Saharan AfricaEAC0
1
2
3
4
Average time (years)Average cost (% of estate) Average recovery rate (cents on the dollar)
Average cost Average timeAverage recovery rate
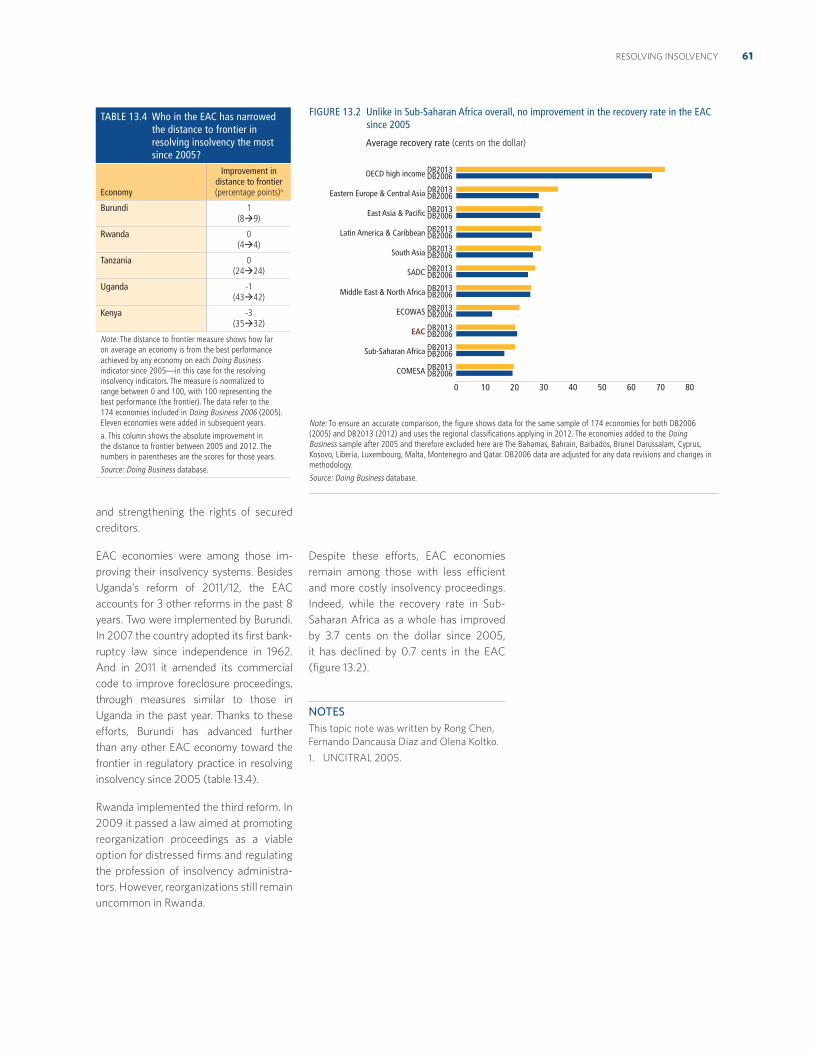
61RESOLVING INSOLVENCY
and strengthening the rights of secured
creditors.
EAC economies were among those im-
proving their insolvency systems. Besides
Uganda’s reform of 2011/12, the EAC
accounts for 3 other reforms in the past 8
years. Two were implemented by Burundi.
In 2007 the country adopted its first bank-
ruptcy law since independence in 1962.
And in 2011 it amended its commercial
code to improve foreclosure proceedings,
through measures similar to those in
Uganda in the past year. Thanks to these
efforts, Burundi has advanced further
than any other EAC economy toward the
frontier in regulatory practice in resolving
insolvency since 2005 (table 13.4).
Rwanda implemented the third reform. In
2009 it passed a law aimed at promoting
reorganization proceedings as a viable
option for distressed firms and regulating
the profession of insolvency administra-
tors. However, reorganizations still remain
uncommon in Rwanda.
Despite these efforts, EAC economies
remain among those with less efficient
and more costly insolvency proceedings.
Indeed, while the recovery rate in Sub-
Saharan Africa as a whole has improved
by 3.7 cents on the dollar since 2005,
it has declined by 0.7 cents in the EAC
(figure 13.2).
NOTES
This topic note was written by Rong Chen,
Fernando Dancausa Diaz and Olena Koltko.
1. UNCITRAL 2005.
TABLE 13.4 Who in the EAC has narrowed the distance to frontier in resolving insolvency the most since 2005?
Economy
Improvement in distance to frontier (percentage points)a
Burundi 1 (8 9)
Rwanda 0 (4 4)
Tanzania 0 (24 24)
Uganda -1 (43 42)
Kenya -3 (35 32)
Note: The distance to frontier measure shows how far on average an economy is from the best performance achieved by any economy on each Doing Business indicator since 2005—in this case for the resolving insolvency indicators. The measure is normalized to range between 0 and 100, with 100 representing the best performance (the frontier). The data refer to the 174 economies included in Doing Business 2006 (2005). Eleven economies were added in subsequent years.
a. This column shows the absolute improvement in the distance to frontier between 2005 and 2012. The numbers in parentheses are the scores for those years.
Source: Doing Business database.
FIGURE 13.2 Unlike in Sub-Saharan Africa overall, no improvement in the recovery rate in the EAC since 2005
Average recovery rate (cents on the dollar)
Note: To ensure an accurate comparison, the figure shows data for the same sample of 174 economies for both DB2006 (2005) and DB2013 (2012) and uses the regional classifications applying in 2012. The economies added to the Doing Business sample after 2005 and therefore excluded here are The Bahamas, Bahrain, Barbados, Brunei Darussalam, Cyprus, Kosovo, Liberia, Luxembourg, Malta, Montenegro and Qatar. DB2006 data are adjusted for any data revisions and changes in methodology.
Source: Doing Business database.
0 10 20 30 40 50 60 70 80
DB2006COMESA DB2013
DB2006Sub-Saharan Africa DB2013
DB2006EAC DB2013
DB2006ECOWAS DB2013
DB2006Middle East & North Africa DB2013
DB2006SADC DB2013
DB2006South Asia DB2013
DB2006Latin America & Caribbean DB2013
DB2006East Asia & Pacific DB2013
DB2006Eastern Europe & Central Asia DB2013
DB2006OECD high income DB2013
62
References
Aghion, Philippe, Robin Burgess, Stephen
Redding and Fabrizio Zilibotti. 2008.
“The Unequal Effects of Liberalization:
Evidence from Dismantling the License
Raj in India.” American Economic Review
98 (4): 1397–412.
Alesina, Alberto, Silvia Ardagna, Giuseppe
Nicoletti and Fabio Schiantarelli. 2005.
“Regulation and Investment.” Journal of
the European Economic Association 3 (4):
791–825.
Amin, Mohammad. 2011. “Labor
Productivity, Firm-Size and Gender: The
Case of Informal Firms in Argentina and
Peru.” Enterprise Note 22, Enterprise
Analysis Unit, World Bank Group,
Washington, DC. http://www
.enterprisesurveys.org/.
Antunes, Antonio, and Tiago Cavalcanti.
2007. “Start Up Costs, Limited
Enforcement, and the Hidden Economy.”
European Economic Review 51 (1): 203–24.
Ardagna, Silvia, and Annamaria Lusardi.
2010. “Explaining International
Differences in Entrepreneurship: The
Role of Individual Characteristics and
Regulatory Constraints.” In International
Differences in Entrepreneurship, edited
by Josh Lerner and Antoinette Schoar,
17–62. Chicago: University of Chicago
Press.
Arvis, Jean-François, Jean-François Marteau
and Gaël Raballand. 2010. The Cost of
Being Landlocked: Logistics Costs and
Supply Chain Reliability. Washington, DC:
World Bank.
Bae, Kee-Hong, and Vidhan K. Goyal. 2009.
“Creditor Rights, Enforcement, and
Bank Loans.” Journal of Finance 64 (2):
823–60.
Banerjee, Abhijit, and Esther Duflo. 2005.
“Growth Theory through the Lens of
Development Economics.” In Handbook
of Development Economics, edited by
Philippe Aghion and Steven Durlauf, vol.
1A: 473–552. Amsterdam: Elsevier.
Barseghyan, Levon. 2008. “Entry Costs
and Cross-Country Differences in
Productivity and Output.” Journal of
Economic Growth 13 (2): 145–67.
Botero, Juan Carlos, Simeon Djankov, Rafael
La Porta, Florencio López-de-Silanes and
Andrei Shleifer. 2004. “The Regulation of
Labor.” Quarterly Journal of Economics 119
(4): 1339–82.
Branstetter, Lee G., Francisco Lima,
Lowell J. Taylor and Ana Venâncio.
2010. “Do Entry Regulations Deter
Entrepreneurship and Job Creation?
Evidence from Recent Reforms in
Portugal.” NBER Working Paper 16473,
National Bureau of Economic Research,
Cambridge, MA.
Bruhn, Miriam. 2011. “License to Sell: The
Effect of Business Registration Reform
on Entrepreneurial Activity in Mexico.”
Review of Economics and Statistics 93 (1):
382–86.
___. 2012. “A Tale of Two Species: Revisiting
the Effect of Registration Reform on
Informal Business Owners in Mexico.”
Policy Research Working Paper 5971,
World Bank, Washington, DC.
Calderon, César, Alberto Chong and
Gianmarco Leon. 2007. “Institutional
Enforcement, Labor-Market Rigidities,
and Economic Performance.” Emerging
Markets Review 8 (1): 38–49.
Cardenas, Mauricio, and Sandra Rozo.
2009. “Firm Informality in Colombia:
Problems and Solutions.” Desarrollo y
Sociedad, no. 63: 211–43.
Chang, Roberto, Linda Kaltani and
Norman Loayza. 2009. “Openness
Can Be Good for Growth: The Role of
Policy Complementarities.” Journal of
Development Economics 90: 33–49.
Chari, Anusha. 2011. “Identifying the
Aggregate Productivity Effects of Entry
and Size Restrictions: An Empirical
Analysis of License Reform in India.”
American Economic Journal: Economic
Policy 3: 66–96.
Ciccone, Antonio, and Elias Papaioannou.
2007. “Red Tape and Delayed Entry.”
Journal of the European Economic
Association 5 (2–3): 444–58.
63REFERENCES
Cuñat, Alejandro, and Marc J. Melitz. 2007.
“Volatility, Labor Market Flexibility, and
the Pattern of Comparative Advantage.”
NBER Working Paper 13062, National
Bureau of Economic Research,
Cambridge, MA.
Deininger, Klaus. 2003. Land Policies for
Growth and Poverty Reduction. World
Bank Policy Research Report. New York:
Oxford University Press.
de Soto, Hernando. 2000. The Mystery of
Capital: Why Capitalism Triumphs in the
West and Fails Everywhere Else. New York:
Basic Books.
Dewaelheyns, Nico, and Cynthia Van Hulle.
2008. “Legal Reform and Aggregate
Small and Micro Business Bankruptcy
Rates: Evidence from the 1997 Belgian
Bankruptcy Code.” Small Business
Economics 31 (4): 409–24.
Djankov, Simeon. 2009. “The Regulation of
Entry: A Survey.” World Bank Research
Observer 24 (2): 183–203.
Djankov, Simeon, Caroline Freund and Cong
S. Pham. 2010. “Trading on Time.” Review
of Economics and Statistics 92 (1): 166–73.
Djankov, Simeon, Tim Ganser, Caralee
McLiesh, Rita Ramalho and Andrei
Shleifer. 2010. “The Effect of
Corporate Taxes on Investment and
Entrepreneurship.” American Economic
Journal: Macroeconomics 2 (3): 31–64.
Djankov, Simeon, Oliver Hart, Caralee
McLiesh and Andrei Shleifer. 2008.
“Debt Enforcement around the World.”
Journal of Political Economy 116 (6):
1105–49.
Djankov, Simeon, Rafael La Porta, Florencio
López-de-Silanes and Andrei Shleifer.
2002. “The Regulation of Entry.”
Quarterly Journal of Economics 117 (1):
1–37.
___. 2003. “Courts.” Quarterly Journal of
Economics 118 (2): 453–517.
___. 2008. “The Law and Economics of Self-
Dealing.” Journal of Financial Economics 88
(3): 430–65.
Djankov, Simeon, Darshini Manraj, Caralee
McLiesh and Rita Ramalho. 2005. “Doing
Business Indicators: Why Aggregate, and
How to Do It.” World Bank, Washington,
DC.
Djankov, Simeon, Caralee McLiesh and
Rita Ramalho. 2006. “Regulation and
Growth.” Economics Letters 92 (3):
395–401.
Djankov, Simeon, Caralee McLiesh and
Andrei Shleifer. 2007. “Private Credit
in 129 Countries.” Journal of Financial
Economics 84 (2): 299–329.
Dulleck, Uwe, Paul Frijters and R. Winter-
Ebmer. 2006. “Reducing Start-up Costs
for New Firms: The Double Dividend on
the Labor Market.” Scandinavian Journal of
Economics 108: 317–37.
EAC (East African Community). 2011. EAC
Development Strategy (2011/12–2015/16):
Deepening and Accelerating Integration.
Arusha, Tanzania: EAC.
Eifert, Benjamin. 2009. “Do Regulatory
Reforms Stimulate Investment and
Growth? Evidence from the Doing
Business Data, 2003–07.” Working Paper
159, Center for Global Development,
Washington, DC.
Fisman, Raymond, and Virginia Sarria-
Allende. 2010. “Regulation of Entry and
the Distortion of Industrial Organization.”
Journal of Applied Economics 13 (1):
91–120.
Franks, Julian, Colin Mayer, Paolo Volpin
and Hannes F. Wagner. 2011. “The Life
Cycle of Family Ownership: International
Evidence.” Review of Financial Studies 25
(8): 1–38.
Freund, Caroline, and Bineswaree Bolaky.
2008. “Trade, Regulations and Income.”
Journal of Development Economics 87:
309–21.
Freund, Caroline, and Nadia Rocha. 2011.
“What Constrains Africa’s Exports?”
World Bank Economic Review 25 (3):
361–86.
Funchal, Bruno. 2008. “The Effects of the
2005 Bankruptcy Reform in Brazil.”
Economics Letters 101: 84–86.
Giné, Xavier, and Inessa Love. 2010.
“Do Reorganization Costs Matter for
Efficiency? Evidence from a Bankruptcy
Reform in Colombia.” Journal of Law and
Economics 53 (4): 833–64.
Hallward-Driemeier, Mary, Gita Khun-Jush
and Lant Pritchett. 2010. “Deals versus
Rules: Policy Implementation Uncertainty
and Why Firms Hate It.” NBER Working
Paper 16001, National Bureau of
Economic Research, Cambridge, MA.
Hamdani, Assaf, and Yishay Yafeh. 2012.
“Institutional Investors as Minority
Shareholders.” Review of Finance.
Published online February 7. doi:10.1093/
rof/rfr039.
Haselmann, Rainer, Katharina Pistor and
Vikrant Vig. 2010. “How Law Affects
Lending.” Review of Financial Studies 23
(2): 549–80.
Helpman, Elhanan, Marc Melitz and Yona
Rubinstein. 2008. “Estimating Trade
Flows: Trading Partners and Trading
Volumes.” Quarterly Journal of Economics
123 (2): 441–87.
Hertveldt, Sabine. 2008. “Rwanda:
Pragmatism Leads the Way in Setting Up
Specialized Commercial Courts.” World
Bank Group, Washington, DC.
Hoekman, Bernard, and Alessandro Nicita.
2011. “Trade Policy, Trade Cost and
Developing Country Trade.” World
Development 39 (12): 2069–79.
Houston, Joel, Chen Lin, Ping Lin and Yue
Ma. 2010. “Creditor Rights, Information
Sharing, and Bank Risk Taking.” Journal of
Financial Economics 96 (3): 485–512.
IMF (International Monetary Fund). 2011.
“Revenue Mobilization in Developing
Countries.” Paper 030811, Fiscal Affairs
Department, IMF, Washington, DC.
Iwanow, Thomasz, and Colin Kirkpatrick.
2009. “Trade Facilitation and
Manufacturing Exports: Is Africa
Different?” World Development 37 (6):
1039–50.
Kaplan, David, Eduardo Piedra and Enrique
Seira. 2007. “Entry Regulation and
Business Start-Ups: Evidence from
Mexico.” Policy Research Working Paper
4322, World Bank, Washington, DC.
Klapper, Leora, Luc Laeven and Raghuram
Rajan. 2006. “Entry Regulation as a
Barrier to Entrepreneurship.” Journal of
Financial Economics 82 (3): 591–629.
Klapper, Leora, Anat Lewin and Juan
Manuel Quesada Delgado. 2009. “The
Impact of the Business Environment on
the Business Creation Process.” Policy
Research Working Paper 4937, World
Bank, Washington, DC.
Klapper, Leora, and Inessa Love. 2011. “The
Impact of Business Environment Reforms
on New Firm Registration.” Policy
Research Working Paper 5493, World
Bank, Washington, DC.
Kraay, Aart, and Norikazu Tawara. 2011.
“Can Disaggregated Indicators Identify
Governance Reform Priorities?” Policy
Research Working Paper 5254, World
Bank, Washington, DC.
La Porta, Rafael, and Andrei Shleifer. 2008.
“The Unofficial Economy and Economic
Development.” Tuck School of Business
Working Paper 2009-57. Available at
http://ssrn.com/abstract=1304760.
Loayza, Norman, Ana Maria Oviedo and
Luis Servén. 2005. “Regulation and
Macroeconomic Performance.” Policy
Research Working Paper 3469, World
Bank, Washington, DC.
Masatlioglu, Yusufcan, and Jamele Rigolini.
2008. “Informality Traps.” B.E. Journal of
Economic Analysis & Policy 8 (1).
McAuliffe, Catherine, Sweta C. Saxena
and Masafumi Yabara. 2012. “The East
DOING BUSINESS IN THE EAST AFRICAN COMMUNITY 201364
African Community: Prospects for
Sustained Growth.” IMF Working Paper
12/272, International Monetary Fund,
Washington, DC.
Mclean, R. D., T. Zhang and M. Zhao. 2012.
“Why Does the Law Matter? Investor
Protection and Its Effects on Investment,
Finance, and Growth.” Journal of Finance
67: 313–50.
Micco, Alejandro, and Carmen Pagés. 2006.
“The Economic Effects of Employment
Protection: Evidence from International
Industry-Level Data.” IZA Discussion
Paper 2433, Institute for the Study of
Labor (IZA), Bonn.
Motta, Marialisa, Ana Maria Oviedo and
Massimiliano Santini. 2010. “An Open
Door for Firms: The Impact of Business
Entry Reforms.” Viewpoint Note 323,
World Bank Group, Washington, DC.
Moullier, Thomas. 2009. “Reforming
Building Permits: Why Is It Important and
What Can IFC Really Do?” International
Finance Corporation, Washington, DC.
Narayan, Deepa, Robert Chambers, Meer
Kaul Shah and Patti Petesh. 2000.
Voices of the Poor: Crying Out for Change.
Washington, DC: World Bank.
Nunn, Nathan. 2007. “Relationship-
Specificity, Incomplete Contracts, and
the Pattern of Trade.” Quarterly Journal of
Economics 122 (2): 569–600.
Perotti, Enrico, and Paolo Volpin. 2005. “The
Political Economy of Entry: Lobbying and
Financial Development.” Paper presented
at the American Finance Association
2005 Philadelphia Meetings.
Portugal-Perez, Alberto, and John Wilson.
2011. “Export Performance and Trade
Facilitation Reform: Hard and Soft
Infrastructure.” World Development 40
(7): 1295–307.
Rauch, James. 2010. “Development
through Synergistic Reforms.” Journal of
Development Economics 93 (2): 153–61.
Republic of Tanzania. 2012. Letter of Intent
to the International Monetary Fund.
December 19. http://www.imf.org/
External/NP/LOI/2012/TZA/121912.pdf.
Rwanda, Ministry of Finance and Economic
Planning. 2000. Rwanda Vision 2020.
Available at http://www.gesci.org/.
___. 2007. Economic Development and Poverty
Reduction Strategy, 2008–2012. Available
at http://planipolis.iiep.unesco
.org/.
Schneider, Friedrich. 2005. “The Informal
Sector in 145 Countries.” Department of
Economics, University Linz, Austria.
Schneider, Friedrich, Andreas Buehn and
Claudio E. Montenegro. 2010. “New
Estimates for the Shadow Economies All
Over the World.” International Economic
Journal 24 (4): 443–61.
Seker, Murat. 2011. “Trade Policies,
Investment Climate, and Exports.” Policy
Research Working Paper 5654, World
Bank, Washington, DC.
Sharma, Siddharth. 2009. “Entry Regulation,
Labor Laws and Informality: Evidence
from India.” Enterprise Survey Working
Paper, Enterprise Analysis Unit, World
Bank Group, Washington, DC.
Sittoni, Pamella. 2012. “Countries with
Few Resources Need to Mobilise Tax
Revenue.” The East African, December 15.
http://www.theeastafrican.co.ke/.
Stampini, Marco, Ron Leung, Setou M.
Diarra and Lauréline Pla. 2011. “How
Large Is the Private Sector in Africa?
Evidence from National Accounts and
Labor Markets.” IZA Discussion Paper
6267, Institute for the Study of Labor
(IZA), Bonn.
UNCITRAL (United Nations Commission
on International Trade Law). 2005.
Legislative Guide on Insolvency Law. New
York: United Nations.
___. 2007. Legislative Guide on Secured
Transactions. New York: United Nations.
Visaria, Sujata. 2009. “Legal Reform and
Loan Repayment: The Microeconomic
Impact of Debt Recovery Tribunals in
India.” American Economic Journal: Applied
Economics 1 (3): 59–81.
von Lilienfeld-Toal, Ulf, Dilip Mookherjee and
Sujata Visaria. 2012. “The Distributive
Impact of Reforms in Credit Enforcement:
Evidence from Indian Debt Recovery
Tribunals.” Econometrica 80 (2):
497–558.
Walsh, Barry. 2010. In Search of Success:
Case Studies in Justice Sector Development
in Sub-Saharan Africa. Washington, DC:
World Bank.
WEF (World Economic Forum). 2012. The
Global Competitiveness Report 2012–2013.
Geneva: WEF.
World Bank. 2005. World Development
Report 2005: A Better Investment Climate
for Everyone. Washington, DC: World
Bank.
___. 2006. Doing Business in 2007: How to
Reform. Washington, DC: World Bank
Group.
___. 2010. Doing Business 2011: Making a
Difference for Entrepreneurs. Washington,
DC: World Bank Group.
___. 2011. “Principles for Effective Creditor
Rights and Insolvency Systems.” Revised
draft, January 20. http://www
.worldbank.org/ifa/rosc_icr.html.
___. 2012a. Doing Business in Kenya 2012.
Washington, DC: World Bank Group.
___. 2012b. Doing Business in the East African
Community 2012. Washington, DC: World
Bank Group.
___. 2012c. World Development Indicators
2012. Washington, DC: World Bank.
___. 2013. Doing Business 2013: Smarter
Regulations for Small and Medium-Size
Enterprises. Washington, DC: World Bank
Group.
World Bank Independent Evaluation Group.
2008. Doing Business: An Independent
Evaluation—Taking the Measure of the
World Bank–IFC Doing Business Indicators.
Washington, DC: World Bank.
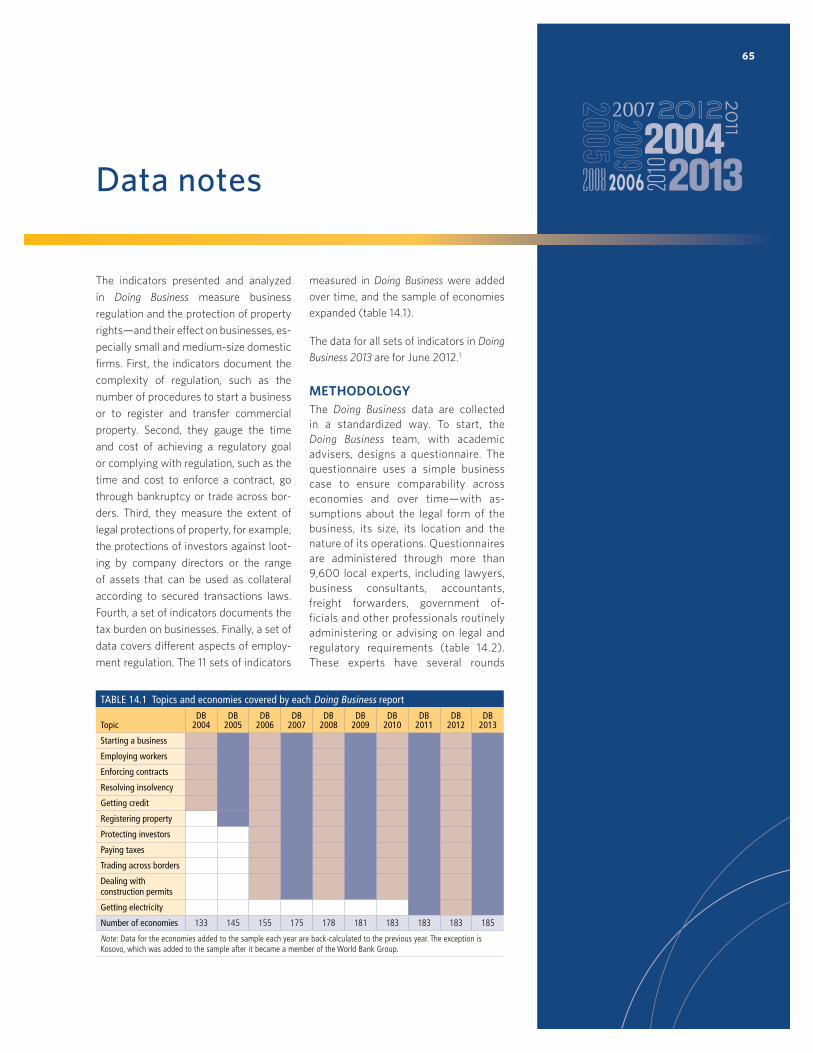
65
Data notes
The indicators presented and analyzed
in Doing Business measure business
regulation and the protection of property
rights—and their effect on businesses, es-
pecially small and medium-size domestic
firms. First, the indicators document the
complexity of regulation, such as the
number of procedures to start a business
or to register and transfer commercial
property. Second, they gauge the time
and cost of achieving a regulatory goal
or complying with regulation, such as the
time and cost to enforce a contract, go
through bankruptcy or trade across bor-
ders. Third, they measure the extent of
legal protections of property, for example,
the protections of investors against loot-
ing by company directors or the range
of assets that can be used as collateral
according to secured transactions laws.
Fourth, a set of indicators documents the
tax burden on businesses. Finally, a set of
data covers different aspects of employ-
ment regulation. The 11 sets of indicators
measured in Doing Business were added
over time, and the sample of economies
expanded (table 14.1).
The data for all sets of indicators in Doing
Business 2013 are for June 2012.1
METHODOLOGYThe Doing Business data are collected
in a standardized way. To start, the
Doing Business team, with academic
advisers, designs a questionnaire. The
questionnaire uses a simple business
case to ensure comparability across
economies and over time—with as-
sumptions about the legal form of the
business, its size, its location and the
nature of its operations. Questionnaires
are administered through more than
9,600 local experts, including lawyers,
business consultants, accountants,
freight forwarders, government of-
ficials and other professionals routinely
administering or advising on legal and
regulatory requirements (table 14.2).
These experts have several rounds
TABLE 14.1 Topics and economies covered by each Doing Business report
TopicDB
2004DB
2005DB
2006DB
2007DB
2008DB
2009DB
2010DB
2011DB
2012DB
2013
Starting a business
Employing workers
Enforcing contracts
Resolving insolvency
Getting credit
Registering property
Protecting investors
Paying taxes
Trading across borders
Dealing with construction permits
Getting electricity
Number of economies 133 145 155 175 178 181 183 183 183 185
Note: Data for the economies added to the sample each year are back-calculated to the previous year. The exception is Kosovo, which was added to the sample after it became a member of the World Bank Group.
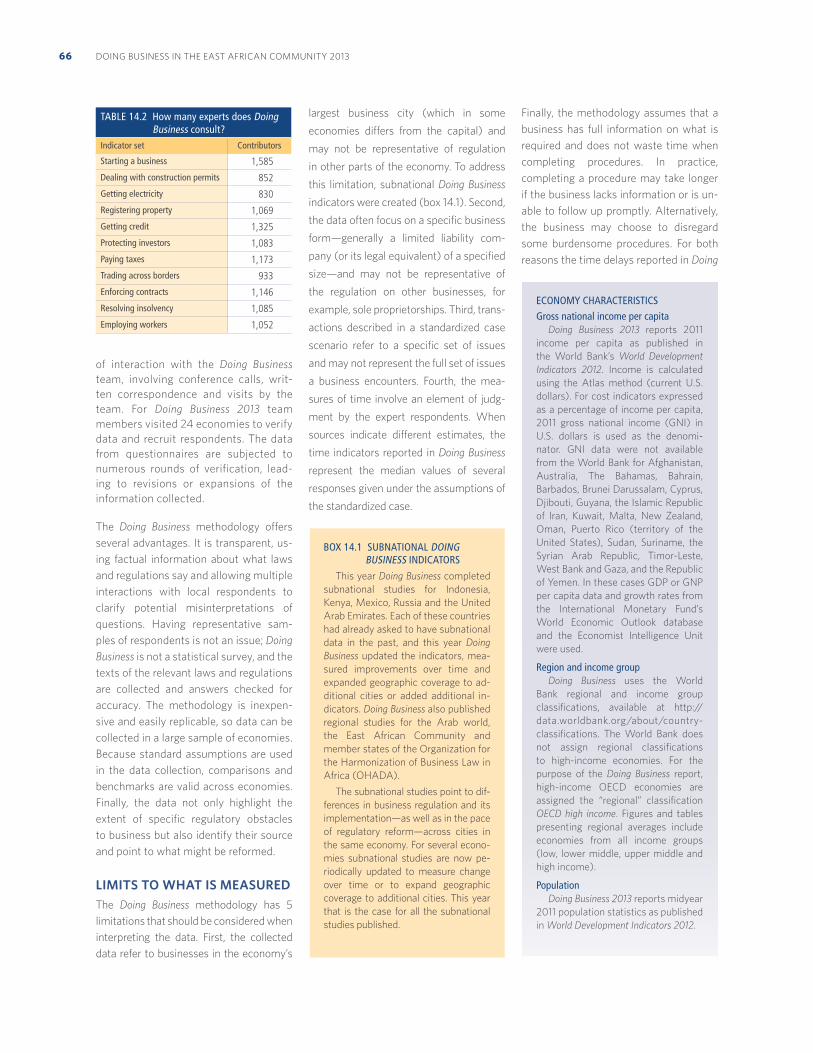
DOING BUSINESS IN THE EAST AFRICAN COMMUNITY 201366
of interaction with the Doing Business
team, involving conference calls, writ-
ten correspondence and visits by the
team. For Doing Business 2013 team
members visited 24 economies to verify
data and recruit respondents. The data
from questionnaires are subjected to
numerous rounds of verification, lead-
ing to revisions or expansions of the
information collected.
The Doing Business methodology offers
several advantages. It is transparent, us-
ing factual information about what laws
and regulations say and allowing multiple
interactions with local respondents to
clarify potential misinterpretations of
questions. Having representative sam-
ples of respondents is not an issue; Doing
Business is not a statistical survey, and the
texts of the relevant laws and regulations
are collected and answers checked for
accuracy. The methodology is inexpen-
sive and easily replicable, so data can be
collected in a large sample of economies.
Because standard assumptions are used
in the data collection, comparisons and
benchmarks are valid across economies.
Finally, the data not only highlight the
extent of specific regulatory obstacles
to business but also identify their source
and point to what might be reformed.
LIMITS TO WHAT IS MEASUREDThe Doing Business methodology has 5
limitations that should be considered when
interpreting the data. First, the collected
data refer to businesses in the economy’s
largest business city (which in some
economies differs from the capital) and
may not be representative of regulation
in other parts of the economy. To address
this limitation, subnational Doing Business
indicators were created (box 14.1). Second,
the data often focus on a specific business
form—generally a limited liability com-
pany (or its legal equivalent) of a specified
size—and may not be representative of
the regulation on other businesses, for
example, sole proprietorships. Third, trans-
actions described in a standardized case
scenario refer to a specific set of issues
and may not represent the full set of issues
a business encounters. Fourth, the mea-
sures of time involve an element of judg-
ment by the expert respondents. When
sources indicate different estimates, the
time indicators reported in Doing Business
represent the median values of several
responses given under the assumptions of
the standardized case.
Finally, the methodology assumes that a
business has full information on what is
required and does not waste time when
completing procedures. In practice,
completing a procedure may take longer
if the business lacks information or is un-
able to follow up promptly. Alternatively,
the business may choose to disregard
some burdensome procedures. For both
reasons the time delays reported in Doing
BOX 14.1 SUBNATIONAL DOING BUSINESS INDICATORS
This year Doing Business completed
subnational studies for Indonesia,
Kenya, Mexico, Russia and the United
Arab Emirates. Each of these countries
had already asked to have subnational
data in the past, and this year Doing
Business updated the indicators, mea-
sured improvements over time and
expanded geographic coverage to ad-
ditional cities or added additional in-
dicators. Doing Business also published
regional studies for the Arab world,
the East African Community and
member states of the Organization for
the Harmonization of Business Law in
Africa (OHADA).
The subnational studies point to dif-
ferences in business regulation and its
implementation—as well as in the pace
of regulatory reform—across cities in
the same economy. For several econo-
mies subnational studies are now pe-
riodically updated to measure change
over time or to expand geographic
coverage to additional cities. This year
that is the case for all the subnational
studies published.
TABLE 14.2 How many experts does Doing Business consult?
Indicator set Contributors
Starting a business 1,585
Dealing with construction permits 852
Getting electricity 830
Registering property 1,069
Getting credit 1,325
Protecting investors 1,083
Paying taxes 1,173
Trading across borders 933
Enforcing contracts 1,146
Resolving insolvency 1,085
Employing workers 1,052
ECONOMY CHARACTERISTICSGross national income per capita
Doing Business 2013 reports 2011
income per capita as published in
the World Bank’s World Development
Indicators 2012. Income is calculated
using the Atlas method (current U.S.
dollars). For cost indicators expressed
as a percentage of income per capita,
2011 gross national income (GNI) in
U.S. dollars is used as the denomi-
nator. GNI data were not available
from the World Bank for Afghanistan,
Australia, The Bahamas, Bahrain,
Barbados, Brunei Darussalam, Cyprus,
Djibouti, Guyana, the Islamic Republic
of Iran, Kuwait, Malta, New Zealand,
Oman, Puerto Rico (territory of the
United States), Sudan, Suriname, the
Syrian Arab Republic, Timor-Leste,
West Bank and Gaza, and the Republic
of Yemen. In these cases GDP or GNP
per capita data and growth rates from
the International Monetary Fund’s
World Economic Outlook database
and the Economist Intelligence Unit
were used.
Region and income group Doing Business uses the World
Bank regional and income group
classifications, available at http://
data.worldbank.org/about/country-
classifications. The World Bank does
not assign regional classifications
to high-income economies. For the
purpose of the Doing Business report,
high-income OECD economies are
assigned the “regional” classification
OECD high income. Figures and tables
presenting regional averages include
economies from all income groups
(low, lower middle, upper middle and
high income).
Population Doing Business 2013 reports midyear
2011 population statistics as published
in World Development Indicators 2012.
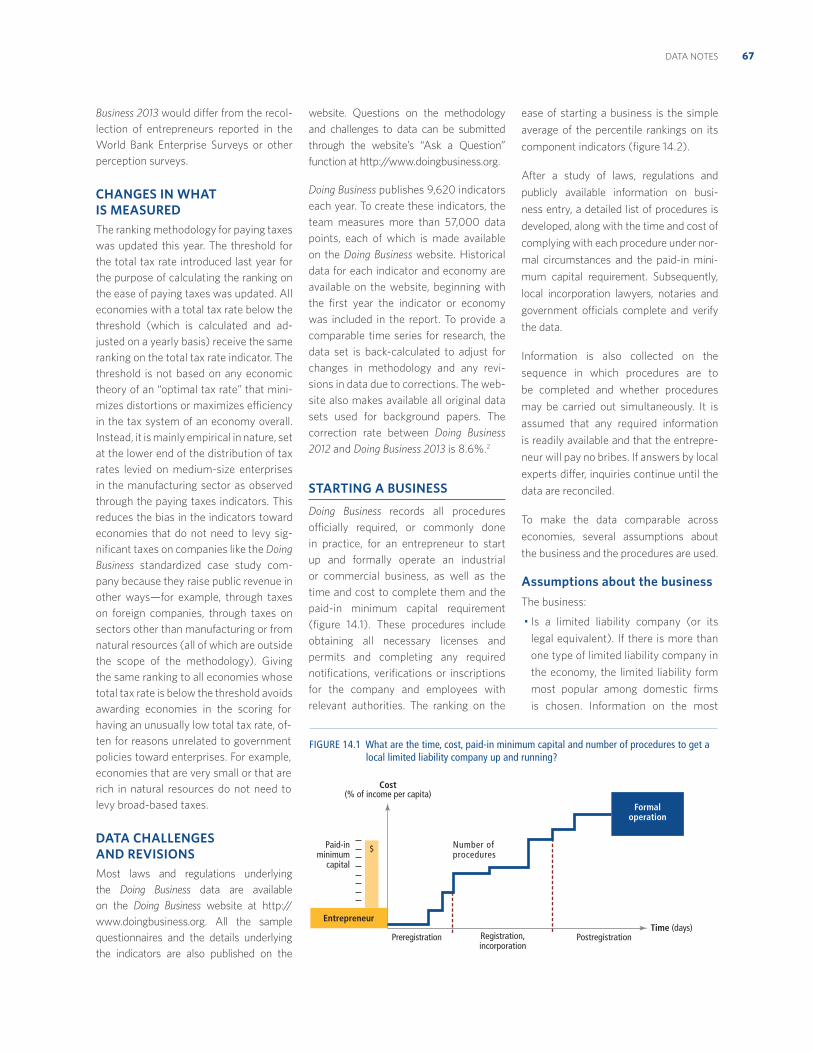
67DATA NOTES
Business 2013 would differ from the recol-
lection of entrepreneurs reported in the
World Bank Enterprise Surveys or other
perception surveys.
CHANGES IN WHAT IS MEASUREDThe ranking methodology for paying taxes
was updated this year. The threshold for
the total tax rate introduced last year for
the purpose of calculating the ranking on
the ease of paying taxes was updated. All
economies with a total tax rate below the
threshold (which is calculated and ad-
justed on a yearly basis) receive the same
ranking on the total tax rate indicator. The
threshold is not based on any economic
theory of an “optimal tax rate” that mini-
mizes distortions or maximizes efficiency
in the tax system of an economy overall.
Instead, it is mainly empirical in nature, set
at the lower end of the distribution of tax
rates levied on medium-size enterprises
in the manufacturing sector as observed
through the paying taxes indicators. This
reduces the bias in the indicators toward
economies that do not need to levy sig-
nificant taxes on companies like the Doing
Business standardized case study com-
pany because they raise public revenue in
other ways—for example, through taxes
on foreign companies, through taxes on
sectors other than manufacturing or from
natural resources (all of which are outside
the scope of the methodology). Giving
the same ranking to all economies whose
total tax rate is below the threshold avoids
awarding economies in the scoring for
having an unusually low total tax rate, of-
ten for reasons unrelated to government
policies toward enterprises. For example,
economies that are very small or that are
rich in natural resources do not need to
levy broad-based taxes.
DATA CHALLENGES AND REVISIONSMost laws and regulations underlying
the Doing Business data are available
on the Doing Business website at http://
www.doingbusiness.org. All the sample
questionnaires and the details underlying
the indicators are also published on the
website. Questions on the methodology
and challenges to data can be submitted
through the website’s “Ask a Question”
function at http://www.doingbusiness.org.
Doing Business publishes 9,620 indicators
each year. To create these indicators, the
team measures more than 57,000 data
points, each of which is made available
on the Doing Business website. Historical
data for each indicator and economy are
available on the website, beginning with
the first year the indicator or economy
was included in the report. To provide a
comparable time series for research, the
data set is back-calculated to adjust for
changes in methodology and any revi-
sions in data due to corrections. The web-
site also makes available all original data
sets used for background papers. The
correction rate between Doing Business
2012 and Doing Business 2013 is 8.6%.2
STARTING A BUSINESS
Doing Business records all procedures
officially required, or commonly done
in practice, for an entrepreneur to start
up and formally operate an industrial
or commercial business, as well as the
time and cost to complete them and the
paid-in minimum capital requirement
(figure 14.1). These procedures include
obtaining all necessary licenses and
permits and completing any required
notifications, verifications or inscriptions
for the company and employees with
relevant authorities. The ranking on the
ease of starting a business is the simple
average of the percentile rankings on its
component indicators (figure 14.2).
After a study of laws, regulations and
publicly available information on busi-
ness entry, a detailed list of procedures is
developed, along with the time and cost of
complying with each procedure under nor-
mal circumstances and the paid-in mini-
mum capital requirement. Subsequently,
local incorporation lawyers, notaries and
government officials complete and verify
the data.
Information is also collected on the
sequence in which procedures are to
be completed and whether procedures
may be carried out simultaneously. It is
assumed that any required information
is readily available and that the entrepre-
neur will pay no bribes. If answers by local
experts differ, inquiries continue until the
data are reconciled.
To make the data comparable across
economies, several assumptions about
the business and the procedures are used.
Assumptions about the businessThe business:
Is a limited liability company (or its
legal equivalent). If there is more than
one type of limited liability company in
the economy, the limited liability form
most popular among domestic firms
is chosen. Information on the most
EntrepreneurTime (days)
Preregistration Postregistration
$
Cost(% of income per capita)
Number of procedures
Paid-in minimum
capital
Registration,incorporation
Formaloperation
FIGURE 14.1 What are the time, cost, paid-in minimum capital and number of procedures to get a local limited liability company up and running?
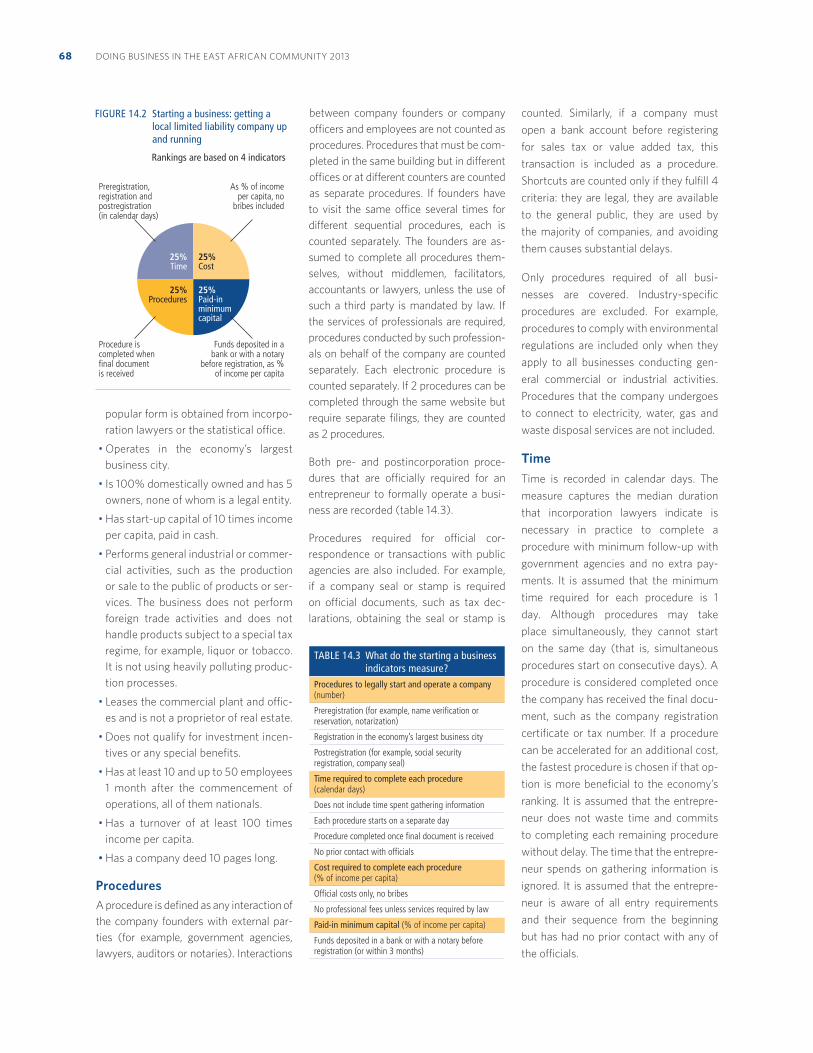
DOING BUSINESS IN THE EAST AFRICAN COMMUNITY 201368
popular form is obtained from incorpo-
ration lawyers or the statistical office.
Operates in the economy’s largest
business city.
Is 100% domestically owned and has 5
owners, none of whom is a legal entity.
Has start-up capital of 10 times income
per capita, paid in cash.
Performs general industrial or commer-
cial activities, such as the production
or sale to the public of products or ser-
vices. The business does not perform
foreign trade activities and does not
handle products subject to a special tax
regime, for example, liquor or tobacco.
It is not using heavily polluting produc-
tion processes.
Leases the commercial plant and offic-
es and is not a proprietor of real estate.
Does not qualify for investment incen-
tives or any special benefits.
Has at least 10 and up to 50 employees
1 month after the commencement of
operations, all of them nationals.
Has a turnover of at least 100 times
income per capita.
Has a company deed 10 pages long.
ProceduresA procedure is defined as any interaction of
the company founders with external par-
ties (for example, government agencies,
lawyers, auditors or notaries). Interactions
between company founders or company
officers and employees are not counted as
procedures. Procedures that must be com-
pleted in the same building but in different
offices or at different counters are counted
as separate procedures. If founders have
to visit the same office several times for
different sequential procedures, each is
counted separately. The founders are as-
sumed to complete all procedures them-
selves, without middlemen, facilitators,
accountants or lawyers, unless the use of
such a third party is mandated by law. If
the services of professionals are required,
procedures conducted by such profession-
als on behalf of the company are counted
separately. Each electronic procedure is
counted separately. If 2 procedures can be
completed through the same website but
require separate filings, they are counted
as 2 procedures.
Both pre- and postincorporation proce-
dures that are officially required for an
entrepreneur to formally operate a busi-
ness are recorded (table 14.3).
Procedures required for official cor-
respondence or transactions with public
agencies are also included. For example,
if a company seal or stamp is required
on official documents, such as tax dec-
larations, obtaining the seal or stamp is
counted. Similarly, if a company must
open a bank account before registering
for sales tax or value added tax, this
transaction is included as a procedure.
Shortcuts are counted only if they fulfill 4
criteria: they are legal, they are available
to the general public, they are used by
the majority of companies, and avoiding
them causes substantial delays.
Only procedures required of all busi-
nesses are covered. Industry-specific
procedures are excluded. For example,
procedures to comply with environmental
regulations are included only when they
apply to all businesses conducting gen-
eral commercial or industrial activities.
Procedures that the company undergoes
to connect to electricity, water, gas and
waste disposal services are not included.
TimeTime is recorded in calendar days. The
measure captures the median duration
that incorporation lawyers indicate is
necessary in practice to complete a
procedure with minimum follow-up with
government agencies and no extra pay-
ments. It is assumed that the minimum
time required for each procedure is 1
day. Although procedures may take
place simultaneously, they cannot start
on the same day (that is, simultaneous
procedures start on consecutive days). A
procedure is considered completed once
the company has received the final docu-
ment, such as the company registration
certificate or tax number. If a procedure
can be accelerated for an additional cost,
the fastest procedure is chosen if that op-
tion is more beneficial to the economy’s
ranking. It is assumed that the entrepre-
neur does not waste time and commits
to completing each remaining procedure
without delay. The time that the entrepre-
neur spends on gathering information is
ignored. It is assumed that the entrepre-
neur is aware of all entry requirements
and their sequence from the beginning
but has had no prior contact with any of
the officials.
TABLE 14.3 What do the starting a business indicators measure?
Procedures to legally start and operate a company (number)
Preregistration (for example, name verification or reservation, notarization)
Registration in the economy’s largest business city
Postregistration (for example, social security registration, company seal)
Time required to complete each procedure (calendar days)
Does not include time spent gathering information
Each procedure starts on a separate day
Procedure completed once final document is received
No prior contact with officials
Cost required to complete each procedure (% of income per capita)
Official costs only, no bribes
No professional fees unless services required by law
Paid-in minimum capital (% of income per capita)
Funds deposited in a bank or with a notary before registration (or within 3 months)
25%Time
25%Cost
25%Procedures
25%Paid-inminimumcapital
Funds deposited in a bank or with a notary
before registration, as % of income per capita
Procedure iscompleted whenfinal documentis received
As % of income per capita, no
bribes included
Preregistration,registration andpostregistration(in calendar days)
FIGURE 14.2 Starting a business: getting a local limited liability company up and running
Rankings are based on 4 indicators
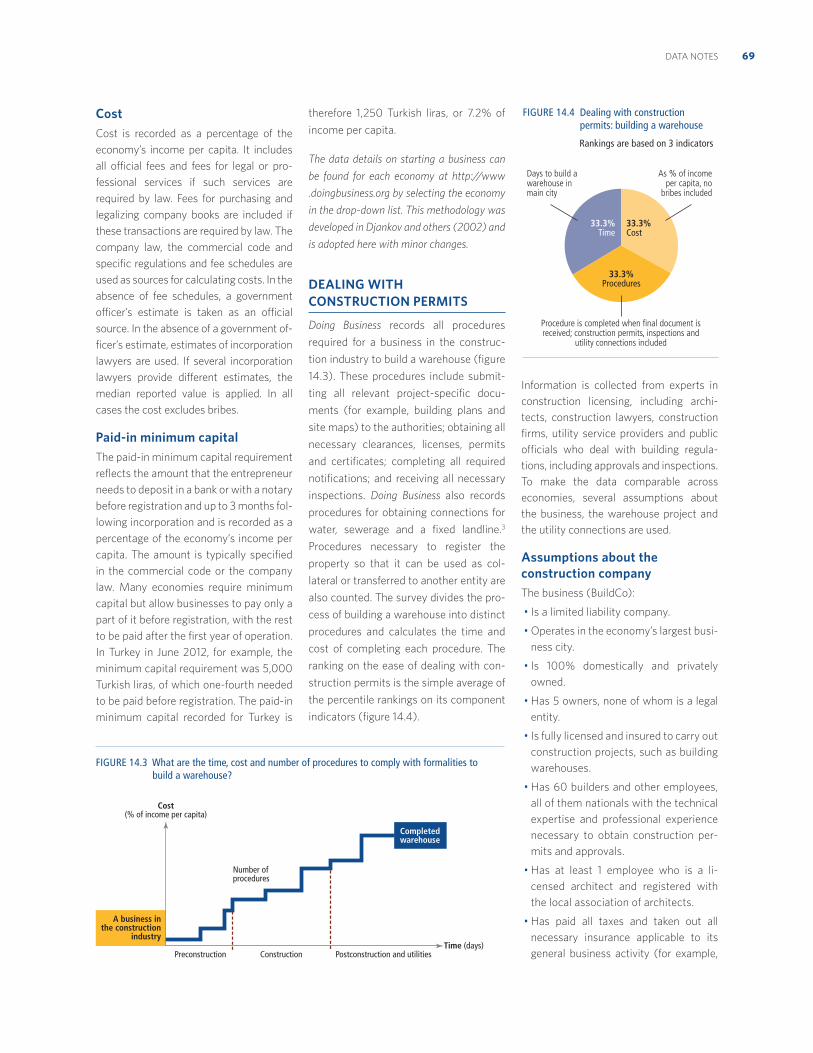
69DATA NOTES
CostCost is recorded as a percentage of the
economy’s income per capita. It includes
all official fees and fees for legal or pro-
fessional services if such services are
required by law. Fees for purchasing and
legalizing company books are included if
these transactions are required by law. The
company law, the commercial code and
specific regulations and fee schedules are
used as sources for calculating costs. In the
absence of fee schedules, a government
officer’s estimate is taken as an official
source. In the absence of a government of-
ficer’s estimate, estimates of incorporation
lawyers are used. If several incorporation
lawyers provide different estimates, the
median reported value is applied. In all
cases the cost excludes bribes.
Paid-in minimum capitalThe paid-in minimum capital requirement
reflects the amount that the entrepreneur
needs to deposit in a bank or with a notary
before registration and up to 3 months fol-
lowing incorporation and is recorded as a
percentage of the economy’s income per
capita. The amount is typically specified
in the commercial code or the company
law. Many economies require minimum
capital but allow businesses to pay only a
part of it before registration, with the rest
to be paid after the first year of operation.
In Turkey in June 2012, for example, the
minimum capital requirement was 5,000
Turkish liras, of which one-fourth needed
to be paid before registration. The paid-in
minimum capital recorded for Turkey is
therefore 1,250 Turkish liras, or 7.2% of
income per capita.
The data details on starting a business can
be found for each economy at http://www
.doingbusiness.org by selecting the economy
in the drop-down list. This methodology was
developed in Djankov and others (2002) and
is adopted here with minor changes.
DEALING WITH CONSTRUCTION PERMITS
Doing Business records all procedures
required for a business in the construc-
tion industry to build a warehouse (figure
14.3). These procedures include submit-
ting all relevant project-specific docu-
ments (for example, building plans and
site maps) to the authorities; obtaining all
necessary clearances, licenses, permits
and certificates; completing all required
notifications; and receiving all necessary
inspections. Doing Business also records
procedures for obtaining connections for
water, sewerage and a fixed landline.3
Procedures necessary to register the
property so that it can be used as col-
lateral or transferred to another entity are
also counted. The survey divides the pro-
cess of building a warehouse into distinct
procedures and calculates the time and
cost of completing each procedure. The
ranking on the ease of dealing with con-
struction permits is the simple average of
the percentile rankings on its component
indicators (figure 14.4).
Information is collected from experts in
construction licensing, including archi-
tects, construction lawyers, construction
firms, utility service providers and public
officials who deal with building regula-
tions, including approvals and inspections.
To make the data comparable across
economies, several assumptions about
the business, the warehouse project and
the utility connections are used.
Assumptions about the construction companyThe business (BuildCo):
Is a limited liability company.
Operates in the economy’s largest busi-
ness city.
Is 100% domestically and privately
owned.
Has 5 owners, none of whom is a legal
entity.
Is fully licensed and insured to carry out
construction projects, such as building
warehouses.
Has 60 builders and other employees,
all of them nationals with the technical
expertise and professional experience
necessary to obtain construction per-
mits and approvals.
Has at least 1 employee who is a li-
censed architect and registered with
the local association of architects.
Has paid all taxes and taken out all
necessary insurance applicable to its
general business activity (for example,
A business inthe construction
industry
Completedwarehouse
Cost(% of income per capita)
Number ofprocedures
Time (days)Preconstruction Postconstruction and utilitiesConstruction
FIGURE 14.3 What are the time, cost and number of procedures to comply with formalities to build a warehouse?
FIGURE 14.4 Dealing with construction permits: building a warehouse
Rankings are based on 3 indicators
Procedure is completed when final document is received; construction permits, inspections and
utility connections included
As % of income per capita, no
bribes included
Days to build a warehouse in main city
33.3%Time
33.3%Cost
33.3%Procedures
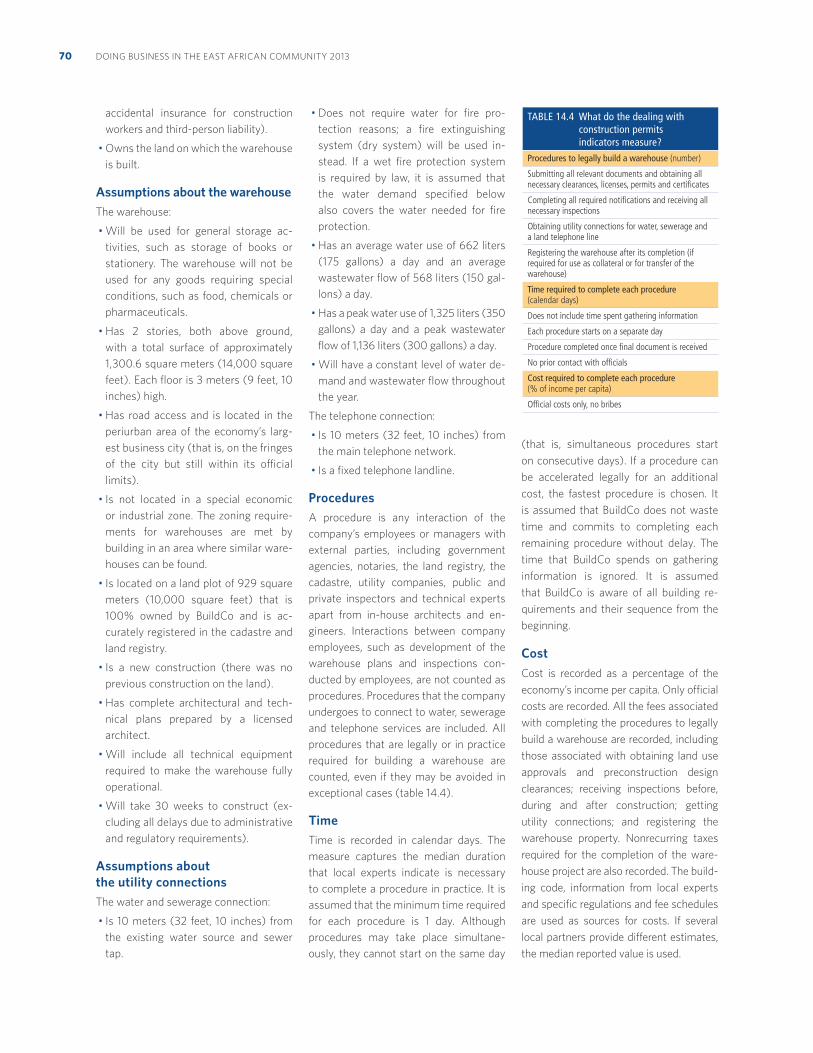
DOING BUSINESS IN THE EAST AFRICAN COMMUNITY 201370
accidental insurance for construction
workers and third-person liability).
Owns the land on which the warehouse
is built.
Assumptions about the warehouse The warehouse:
Will be used for general storage ac-
tivities, such as storage of books or
stationery. The warehouse will not be
used for any goods requiring special
conditions, such as food, chemicals or
pharmaceuticals.
Has 2 stories, both above ground,
with a total surface of approximately
1,300.6 square meters (14,000 square
feet). Each floor is 3 meters (9 feet, 10
inches) high.
Has road access and is located in the
periurban area of the economy’s larg-
est business city (that is, on the fringes
of the city but still within its official
limits).
Is not located in a special economic
or industrial zone. The zoning require-
ments for warehouses are met by
building in an area where similar ware-
houses can be found.
Is located on a land plot of 929 square
meters (10,000 square feet) that is
100% owned by BuildCo and is ac-
curately registered in the cadastre and
land registry.
Is a new construction (there was no
previous construction on the land).
Has complete architectural and tech-
nical plans prepared by a licensed
architect.
Will include all technical equipment
required to make the warehouse fully
operational.
Will take 30 weeks to construct (ex-
cluding all delays due to administrative
and regulatory requirements).
Assumptions about the utility connectionsThe water and sewerage connection:
Is 10 meters (32 feet, 10 inches) from
the existing water source and sewer
tap.
Does not require water for fire pro-
tection reasons; a fire extinguishing
system (dry system) will be used in-
stead. If a wet fire protection system
is required by law, it is assumed that
the water demand specified below
also covers the water needed for fire
protection.
Has an average water use of 662 liters
(175 gallons) a day and an average
wastewater flow of 568 liters (150 gal-
lons) a day.
Has a peak water use of 1,325 liters (350
gallons) a day and a peak wastewater
flow of 1,136 liters (300 gallons) a day.
Will have a constant level of water de-
mand and wastewater flow throughout
the year.
The telephone connection:
Is 10 meters (32 feet, 10 inches) from
the main telephone network.
Is a fixed telephone landline.
ProceduresA procedure is any interaction of the
company’s employees or managers with
external parties, including government
agencies, notaries, the land registry, the
cadastre, utility companies, public and
private inspectors and technical experts
apart from in-house architects and en-
gineers. Interactions between company
employees, such as development of the
warehouse plans and inspections con-
ducted by employees, are not counted as
procedures. Procedures that the company
undergoes to connect to water, sewerage
and telephone services are included. All
procedures that are legally or in practice
required for building a warehouse are
counted, even if they may be avoided in
exceptional cases (table 14.4).
TimeTime is recorded in calendar days. The
measure captures the median duration
that local experts indicate is necessary
to complete a procedure in practice. It is
assumed that the minimum time required
for each procedure is 1 day. Although
procedures may take place simultane-
ously, they cannot start on the same day
(that is, simultaneous procedures start
on consecutive days). If a procedure can
be accelerated legally for an additional
cost, the fastest procedure is chosen. It
is assumed that BuildCo does not waste
time and commits to completing each
remaining procedure without delay. The
time that BuildCo spends on gathering
information is ignored. It is assumed
that BuildCo is aware of all building re-
quirements and their sequence from the
beginning.
CostCost is recorded as a percentage of the
economy’s income per capita. Only official
costs are recorded. All the fees associated
with completing the procedures to legally
build a warehouse are recorded, including
those associated with obtaining land use
approvals and preconstruction design
clearances; receiving inspections before,
during and after construction; getting
utility connections; and registering the
warehouse property. Nonrecurring taxes
required for the completion of the ware-
house project are also recorded. The build-
ing code, information from local experts
and specific regulations and fee schedules
are used as sources for costs. If several
local partners provide different estimates,
the median reported value is used.
TABLE 14.4 What do the dealing with construction permits indicators measure?
Procedures to legally build a warehouse (number)
Submitting all relevant documents and obtaining all necessary clearances, licenses, permits and certificates
Completing all required notifications and receiving all necessary inspections
Obtaining utility connections for water, sewerage and a land telephone line
Registering the warehouse after its completion (if required for use as collateral or for transfer of the warehouse)
Time required to complete each procedure (calendar days)
Does not include time spent gathering information
Each procedure starts on a separate day
Procedure completed once final document is received
No prior contact with officials
Cost required to complete each procedure (% of income per capita)
Official costs only, no bribes
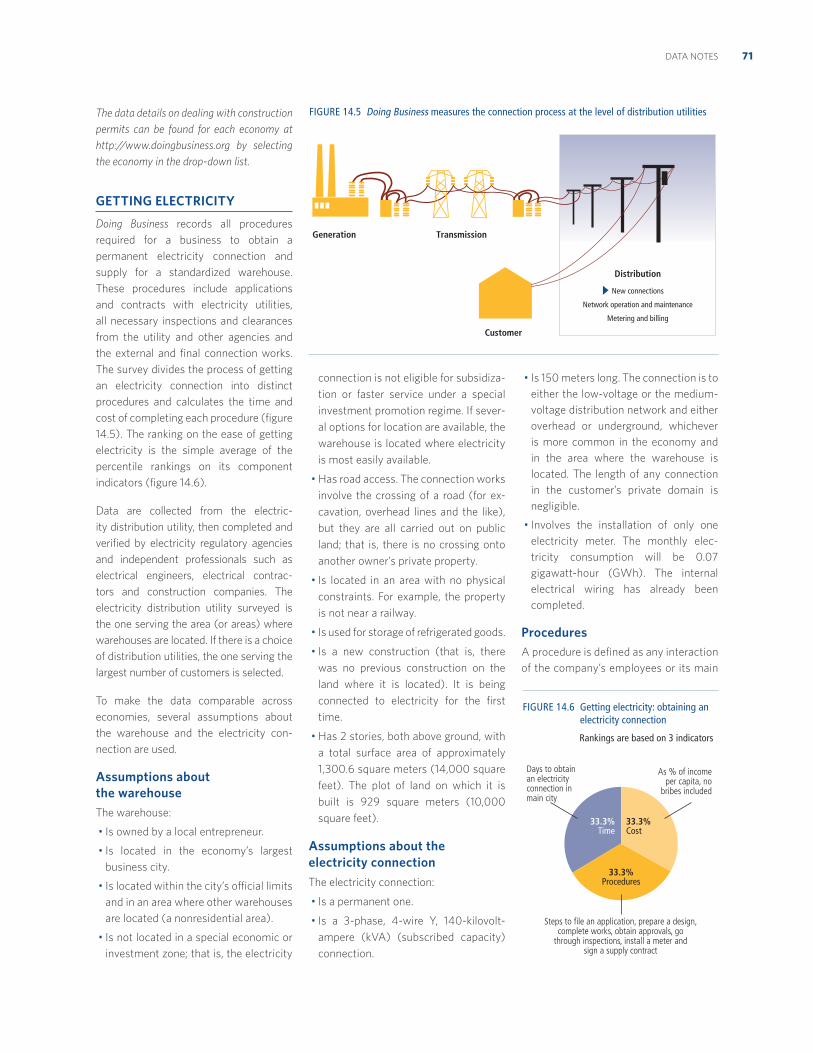
71DATA NOTES
The data details on dealing with construction
permits can be found for each economy at
http://www.doingbusiness.org by selecting
the economy in the drop-down list.
GETTING ELECTRICITY
Doing Business records all procedures
required for a business to obtain a
permanent electricity connection and
supply for a standardized warehouse.
These procedures include applications
and contracts with electricity utilities,
all necessary inspections and clearances
from the utility and other agencies and
the external and final connection works.
The survey divides the process of getting
an electricity connection into distinct
procedures and calculates the time and
cost of completing each procedure (figure
14.5). The ranking on the ease of getting
electricity is the simple average of the
percentile rankings on its component
indicators (figure 14.6).
Data are collected from the electric-
ity distribution utility, then completed and
verified by electricity regulatory agencies
and independent professionals such as
electrical engineers, electrical contrac-
tors and construction companies. The
electricity distribution utility surveyed is
the one serving the area (or areas) where
warehouses are located. If there is a choice
of distribution utilities, the one serving the
largest number of customers is selected.
To make the data comparable across
economies, several assumptions about
the warehouse and the electricity con-
nection are used.
Assumptions about the warehouseThe warehouse:
Is owned by a local entrepreneur.
Is located in the economy’s largest
business city.
Is located within the city’s official limits
and in an area where other warehouses
are located (a nonresidential area).
Is not located in a special economic or
investment zone; that is, the electricity
connection is not eligible for subsidiza-
tion or faster service under a special
investment promotion regime. If sever-
al options for location are available, the
warehouse is located where electricity
is most easily available.
Has road access. The connection works
involve the crossing of a road (for ex-
cavation, overhead lines and the like),
but they are all carried out on public
land; that is, there is no crossing onto
another owner’s private property.
Is located in an area with no physical
constraints. For example, the property
is not near a railway.
Is used for storage of refrigerated goods.
Is a new construction (that is, there
was no previous construction on the
land where it is located). It is being
connected to electricity for the first
time.
Has 2 stories, both above ground, with
a total surface area of approximately
1,300.6 square meters (14,000 square
feet). The plot of land on which it is
built is 929 square meters (10,000
square feet).
Assumptions about the electricity connection The electricity connection:
Is a permanent one.
Is a 3-phase, 4-wire Y, 140-kilovolt-
ampere (kVA) (subscribed capacity)
connection.
Is 150 meters long. The connection is to
either the low-voltage or the medium-
voltage distribution network and either
overhead or underground, whichever
is more common in the economy and
in the area where the warehouse is
located. The length of any connection
in the customer’s private domain is
negligible.
Involves the installation of only one
electricity meter. The monthly elec-
tricity consumption will be 0.07
gigawatt-hour (GWh). The internal
electrical wiring has already been
completed.
Procedures A procedure is defined as any interaction
of the company’s employees or its main
FIGURE 14.5 Doing Business measures the connection process at the level of distribution utilities
Distribution
Customer
Generation Transmission
New connections
Network operation and maintenance
Metering and billing
Steps to file an application, prepare a design, complete works, obtain approvals, go
through inspections, install a meter and sign a supply contract
As % of income per capita, no
bribes included
Days to obtain an electricity connection in main city
33.3%Time
33.3%Cost
33.3%Procedures
FIGURE 14.6 Getting electricity: obtaining an electricity connection
Rankings are based on 3 indicators
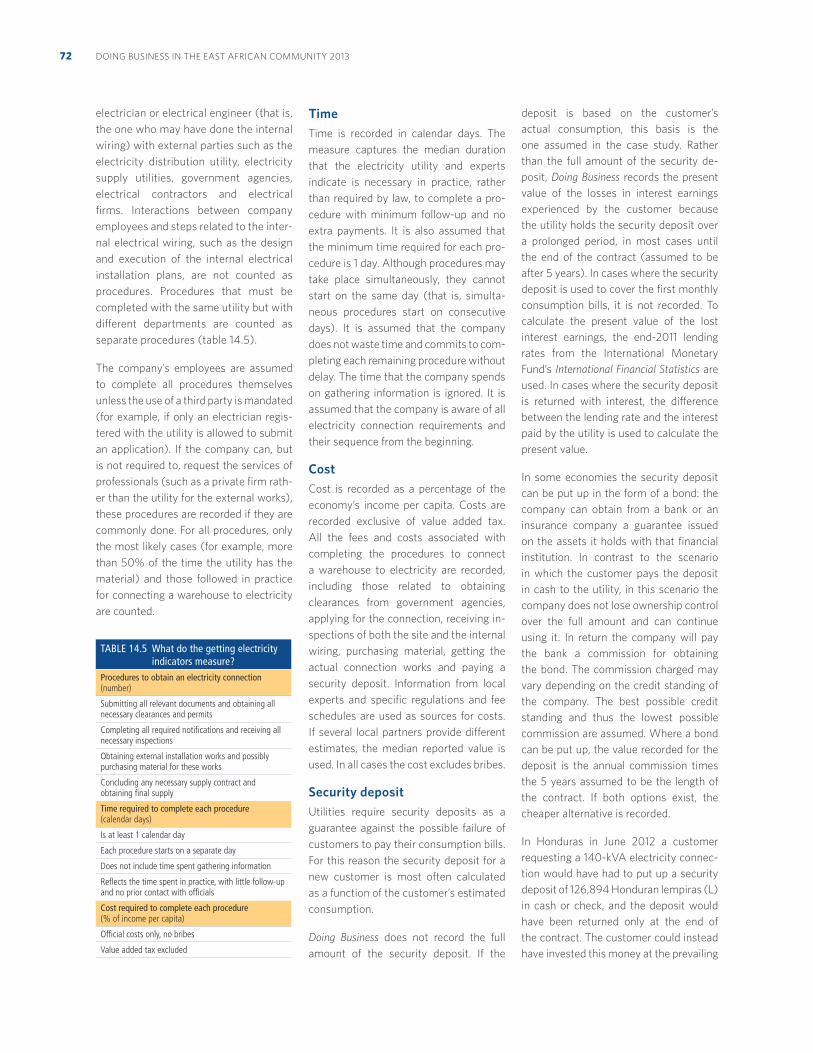
DOING BUSINESS IN THE EAST AFRICAN COMMUNITY 201372
electrician or electrical engineer (that is,
the one who may have done the internal
wiring) with external parties such as the
electricity distribution utility, electricity
supply utilities, government agencies,
electrical contractors and electrical
firms. Interactions between company
employees and steps related to the inter-
nal electrical wiring, such as the design
and execution of the internal electrical
installation plans, are not counted as
procedures. Procedures that must be
completed with the same utility but with
different departments are counted as
separate procedures (table 14.5).
The company’s employees are assumed
to complete all procedures themselves
unless the use of a third party is mandated
(for example, if only an electrician regis-
tered with the utility is allowed to submit
an application). If the company can, but
is not required to, request the services of
professionals (such as a private firm rath-
er than the utility for the external works),
these procedures are recorded if they are
commonly done. For all procedures, only
the most likely cases (for example, more
than 50% of the time the utility has the
material) and those followed in practice
for connecting a warehouse to electricity
are counted.
Time Time is recorded in calendar days. The
measure captures the median duration
that the electricity utility and experts
indicate is necessary in practice, rather
than required by law, to complete a pro-
cedure with minimum follow-up and no
extra payments. It is also assumed that
the minimum time required for each pro-
cedure is 1 day. Although procedures may
take place simultaneously, they cannot
start on the same day (that is, simulta-
neous procedures start on consecutive
days). It is assumed that the company
does not waste time and commits to com-
pleting each remaining procedure without
delay. The time that the company spends
on gathering information is ignored. It is
assumed that the company is aware of all
electricity connection requirements and
their sequence from the beginning.
Cost Cost is recorded as a percentage of the
economy’s income per capita. Costs are
recorded exclusive of value added tax.
All the fees and costs associated with
completing the procedures to connect
a warehouse to electricity are recorded,
including those related to obtaining
clearances from government agencies,
applying for the connection, receiving in-
spections of both the site and the internal
wiring, purchasing material, getting the
actual connection works and paying a
security deposit. Information from local
experts and specific regulations and fee
schedules are used as sources for costs.
If several local partners provide different
estimates, the median reported value is
used. In all cases the cost excludes bribes.
Security depositUtilities require security deposits as a
guarantee against the possible failure of
customers to pay their consumption bills.
For this reason the security deposit for a
new customer is most often calculated
as a function of the customer’s estimated
consumption.
Doing Business does not record the full
amount of the security deposit. If the
deposit is based on the customer’s
actual consumption, this basis is the
one assumed in the case study. Rather
than the full amount of the security de-
posit, Doing Business records the present
value of the losses in interest earnings
experienced by the customer because
the utility holds the security deposit over
a prolonged period, in most cases until
the end of the contract (assumed to be
after 5 years). In cases where the security
deposit is used to cover the first monthly
consumption bills, it is not recorded. To
calculate the present value of the lost
interest earnings, the end-2011 lending
rates from the International Monetary
Fund’s International Financial Statistics are
used. In cases where the security deposit
is returned with interest, the difference
between the lending rate and the interest
paid by the utility is used to calculate the
present value.
In some economies the security deposit
can be put up in the form of a bond: the
company can obtain from a bank or an
insurance company a guarantee issued
on the assets it holds with that financial
institution. In contrast to the scenario
in which the customer pays the deposit
in cash to the utility, in this scenario the
company does not lose ownership control
over the full amount and can continue
using it. In return the company will pay
the bank a commission for obtaining
the bond. The commission charged may
vary depending on the credit standing of
the company. The best possible credit
standing and thus the lowest possible
commission are assumed. Where a bond
can be put up, the value recorded for the
deposit is the annual commission times
the 5 years assumed to be the length of
the contract. If both options exist, the
cheaper alternative is recorded.
In Honduras in June 2012 a customer
requesting a 140-kVA electricity connec-
tion would have had to put up a security
deposit of 126,894 Honduran lempiras (L)
in cash or check, and the deposit would
have been returned only at the end of
the contract. The customer could instead
have invested this money at the prevailing
TABLE 14.5 What do the getting electricity indicators measure?
Procedures to obtain an electricity connection (number)
Submitting all relevant documents and obtaining all necessary clearances and permits
Completing all required notifications and receiving all necessary inspections
Obtaining external installation works and possibly purchasing material for these works
Concluding any necessary supply contract and obtaining final supply
Time required to complete each procedure (calendar days)
Is at least 1 calendar day
Each procedure starts on a separate day
Does not include time spent gathering information
Reflects the time spent in practice, with little follow-up and no prior contact with officials
Cost required to complete each procedure (% of income per capita)
Official costs only, no bribes
Value added tax excluded
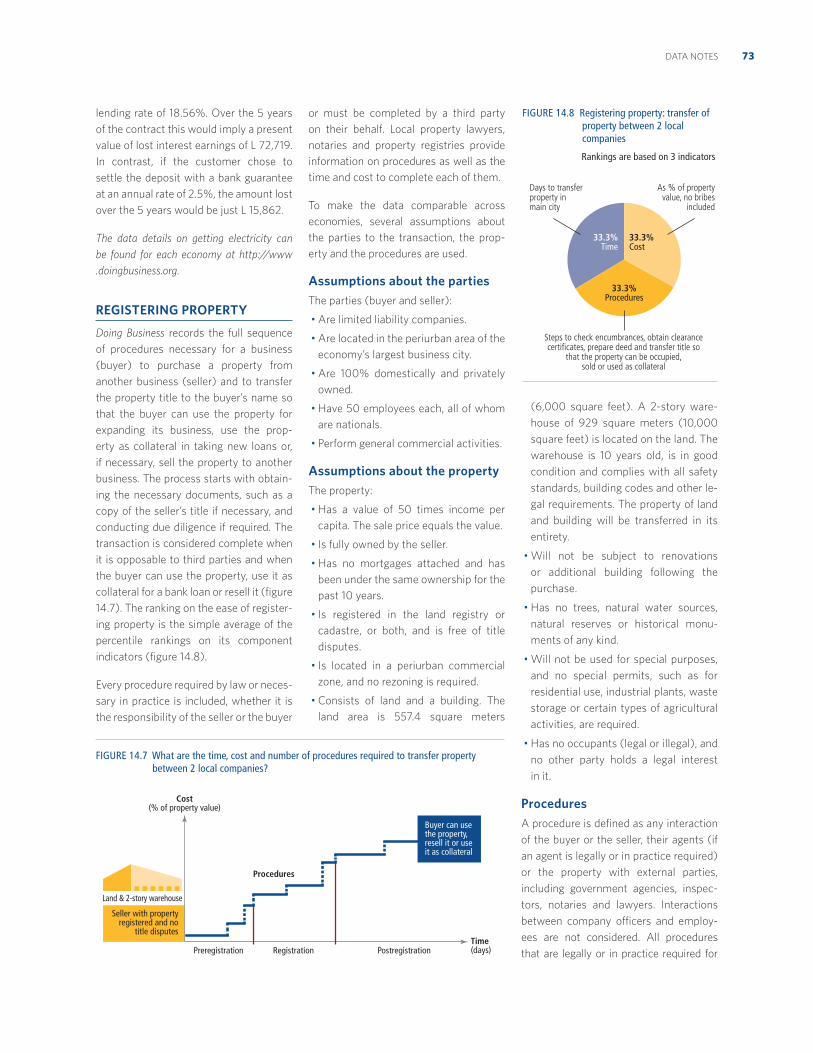
73DATA NOTES
lending rate of 18.56%. Over the 5 years
of the contract this would imply a present
value of lost interest earnings of L 72,719.
In contrast, if the customer chose to
settle the deposit with a bank guarantee
at an annual rate of 2.5%, the amount lost
over the 5 years would be just L 15,862.
The data details on getting electricity can
be found for each economy at http://www
.doingbusiness.org.
REGISTERING PROPERTY
Doing Business records the full sequence
of procedures necessary for a business
(buyer) to purchase a property from
another business (seller) and to transfer
the property title to the buyer’s name so
that the buyer can use the property for
expanding its business, use the prop-
erty as collateral in taking new loans or,
if necessary, sell the property to another
business. The process starts with obtain-
ing the necessary documents, such as a
copy of the seller’s title if necessary, and
conducting due diligence if required. The
transaction is considered complete when
it is opposable to third parties and when
the buyer can use the property, use it as
collateral for a bank loan or resell it (figure
14.7). The ranking on the ease of register-
ing property is the simple average of the
percentile rankings on its component
indicators (figure 14.8).
Every procedure required by law or neces-
sary in practice is included, whether it is
the responsibility of the seller or the buyer
or must be completed by a third party
on their behalf. Local property lawyers,
notaries and property registries provide
information on procedures as well as the
time and cost to complete each of them.
To make the data comparable across
economies, several assumptions about
the parties to the transaction, the prop-
erty and the procedures are used.
Assumptions about the partiesThe parties (buyer and seller):
Are limited liability companies.
Are located in the periurban area of the
economy’s largest business city.
Are 100% domestically and privately
owned.
Have 50 employees each, all of whom
are nationals.
Perform general commercial activities.
Assumptions about the propertyThe property:
Has a value of 50 times income per
capita. The sale price equals the value.
Is fully owned by the seller.
Has no mortgages attached and has
been under the same ownership for the
past 10 years.
Is registered in the land registry or
cadastre, or both, and is free of title
disputes.
Is located in a periurban commercial
zone, and no rezoning is required.
Consists of land and a building. The
land area is 557.4 square meters
(6,000 square feet). A 2-story ware-
house of 929 square meters (10,000
square feet) is located on the land. The
warehouse is 10 years old, is in good
condition and complies with all safety
standards, building codes and other le-
gal requirements. The property of land
and building will be transferred in its
entirety.
Will not be subject to renovations
or additional building following the
purchase.
Has no trees, natural water sources,
natural reserves or historical monu-
ments of any kind.
Will not be used for special purposes,
and no special permits, such as for
residential use, industrial plants, waste
storage or certain types of agricultural
activities, are required.
Has no occupants (legal or illegal), and
no other party holds a legal interest
in it.
ProceduresA procedure is defined as any interaction
of the buyer or the seller, their agents (if
an agent is legally or in practice required)
or the property with external parties,
including government agencies, inspec-
tors, notaries and lawyers. Interactions
between company officers and employ-
ees are not considered. All procedures
that are legally or in practice required for
FIGURE 14.7 What are the time, cost and number of procedures required to transfer property between 2 local companies?
Seller with propertyregistered and no
title disputes
Buyer can usethe property,resell it or useit as collateral
Cost(% of property value)
Procedures
Time (days)Preregistration
Land & 2-story warehouse
PostregistrationRegistration
FIGURE 14.8 Registering property: transfer of property between 2 local companies
Rankings are based on 3 indicators
Steps to check encumbrances, obtain clearance certificates, prepare deed and transfer title so
that the property can be occupied, sold or used as collateral
As % of property value, no bribes
included
Days to transfer property in main city
33.3%Time
33.3%Cost
33.3%Procedures
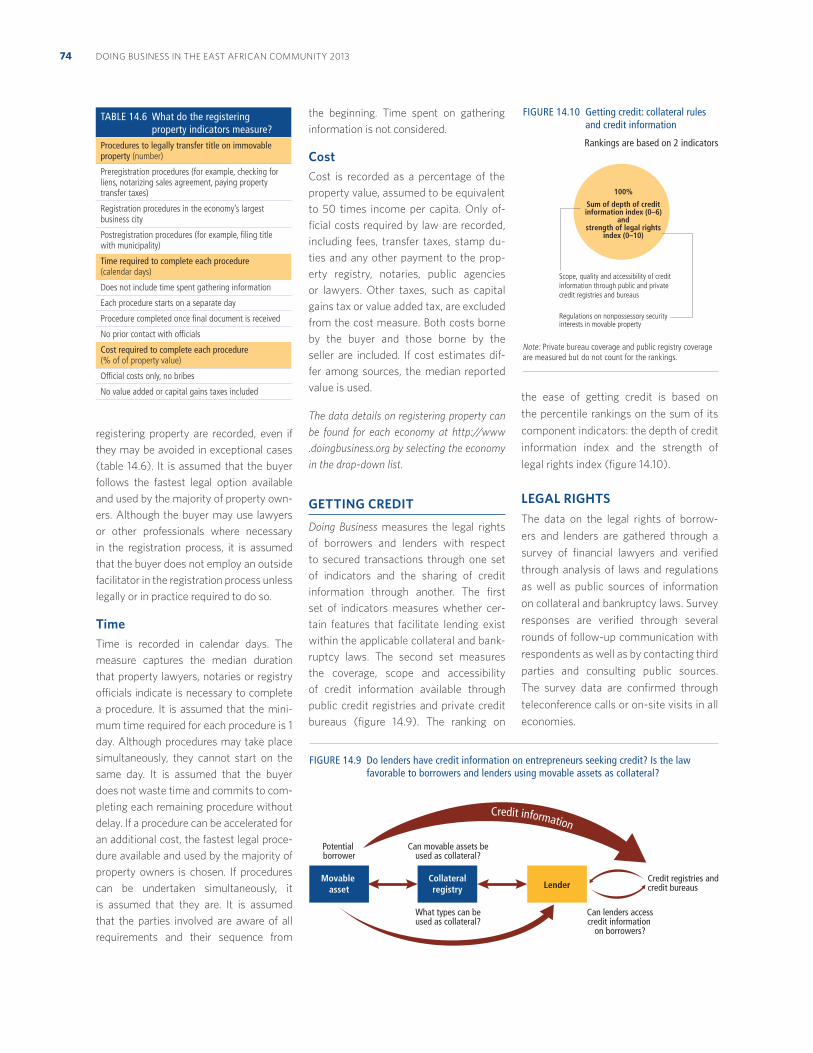
DOING BUSINESS IN THE EAST AFRICAN COMMUNITY 201374
registering property are recorded, even if
they may be avoided in exceptional cases
(table 14.6). It is assumed that the buyer
follows the fastest legal option available
and used by the majority of property own-
ers. Although the buyer may use lawyers
or other professionals where necessary
in the registration process, it is assumed
that the buyer does not employ an outside
facilitator in the registration process unless
legally or in practice required to do so.
TimeTime is recorded in calendar days. The
measure captures the median duration
that property lawyers, notaries or registry
officials indicate is necessary to complete
a procedure. It is assumed that the mini-
mum time required for each procedure is 1
day. Although procedures may take place
simultaneously, they cannot start on the
same day. It is assumed that the buyer
does not waste time and commits to com-
pleting each remaining procedure without
delay. If a procedure can be accelerated for
an additional cost, the fastest legal proce-
dure available and used by the majority of
property owners is chosen. If procedures
can be undertaken simultaneously, it
is assumed that they are. It is assumed
that the parties involved are aware of all
requirements and their sequence from
the beginning. Time spent on gathering
information is not considered.
CostCost is recorded as a percentage of the
property value, assumed to be equivalent
to 50 times income per capita. Only of-
ficial costs required by law are recorded,
including fees, transfer taxes, stamp du-
ties and any other payment to the prop-
erty registry, notaries, public agencies
or lawyers. Other taxes, such as capital
gains tax or value added tax, are excluded
from the cost measure. Both costs borne
by the buyer and those borne by the
seller are included. If cost estimates dif-
fer among sources, the median reported
value is used.
The data details on registering property can
be found for each economy at http://www
.doingbusiness.org by selecting the economy
in the drop-down list.
GETTING CREDIT
Doing Business measures the legal rights
of borrowers and lenders with respect
to secured transactions through one set
of indicators and the sharing of credit
information through another. The first
set of indicators measures whether cer-
tain features that facilitate lending exist
within the applicable collateral and bank-
ruptcy laws. The second set measures
the coverage, scope and accessibility
of credit information available through
public credit registries and private credit
bureaus (figure 14.9). The ranking on
the ease of getting credit is based on
the percentile rankings on the sum of its
component indicators: the depth of credit
information index and the strength of
legal rights index (figure 14.10).
LEGAL RIGHTSThe data on the legal rights of borrow-
ers and lenders are gathered through a
survey of financial lawyers and verified
through analysis of laws and regulations
as well as public sources of information
on collateral and bankruptcy laws. Survey
responses are verified through several
rounds of follow-up communication with
respondents as well as by contacting third
parties and consulting public sources.
The survey data are confirmed through
teleconference calls or on-site visits in all
economies.
FIGURE 14.9 Do lenders have credit information on entrepreneurs seeking credit? Is the law favorable to borrowers and lenders using movable assets as collateral?
Potential borrower
Can movable assets beused as collateral?
What types can beused as collateral?
Can lenders accesscredit information
on borrowers?
Credit information
Movable asset
Credit registries andcredit bureaus
Collateralregistry Lender
FIGURE 14.10 Getting credit: collateral rules and credit information
Rankings are based on 2 indicators
100%
Sum of depth of credit information index (0–6)
and strength of legal rights
index (0–10)
Scope, quality and accessibility of creditinformation through public and privatecredit registries and bureaus
Regulations on nonpossessory security interests in movable property
TABLE 14.6 What do the registering property indicators measure?
Procedures to legally transfer title on immovable property (number)
Preregistration procedures (for example, checking for liens, notarizing sales agreement, paying property transfer taxes)
Registration procedures in the economy’s largest business city
Postregistration procedures (for example, filing title with municipality)
Time required to complete each procedure (calendar days)
Does not include time spent gathering information
Each procedure starts on a separate day
Procedure completed once final document is received
No prior contact with officials
Cost required to complete each procedure (% of of property value)
Official costs only, no bribes
No value added or capital gains taxes included
Note: Private bureau coverage and public registry coverage are measured but do not count for the rankings.
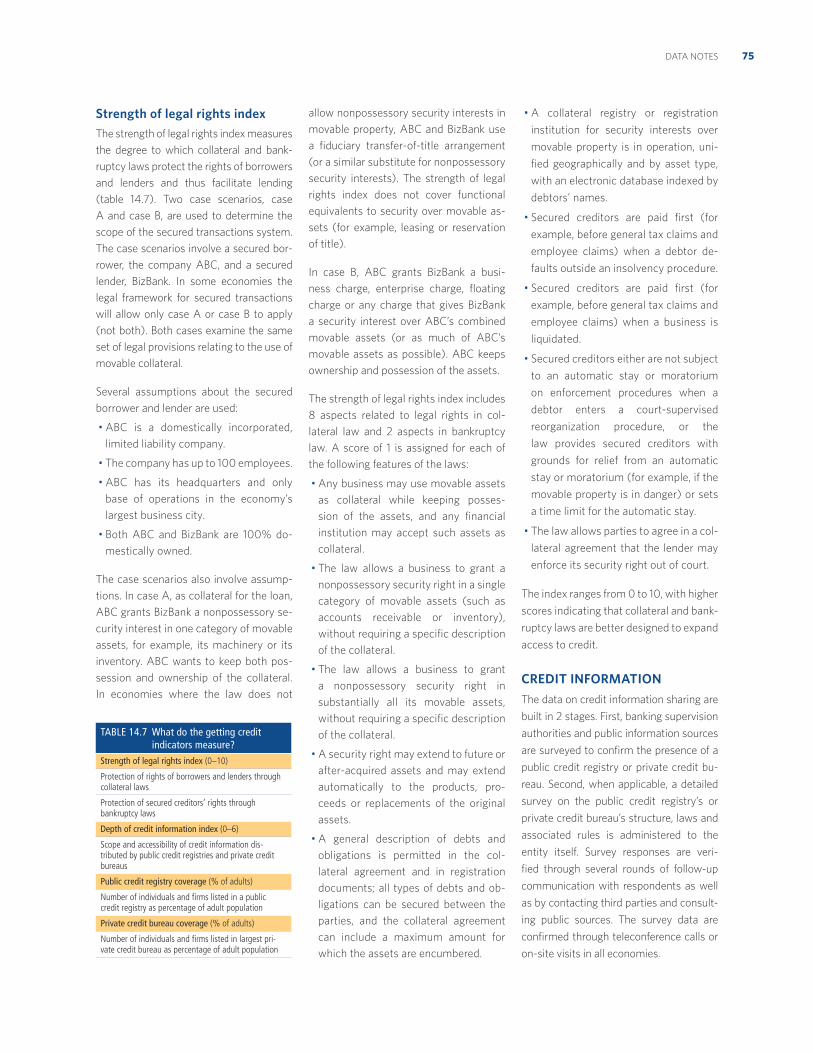
75DATA NOTES
Strength of legal rights indexThe strength of legal rights index measures
the degree to which collateral and bank-
ruptcy laws protect the rights of borrowers
and lenders and thus facilitate lending
(table 14.7). Two case scenarios, case
A and case B, are used to determine the
scope of the secured transactions system.
The case scenarios involve a secured bor-
rower, the company ABC, and a secured
lender, BizBank. In some economies the
legal framework for secured transactions
will allow only case A or case B to apply
(not both). Both cases examine the same
set of legal provisions relating to the use of
movable collateral.
Several assumptions about the secured
borrower and lender are used:
ABC is a domestically incorporated,
limited liability company.
The company has up to 100 employees.
ABC has its headquarters and only
base of operations in the economy’s
largest business city.
Both ABC and BizBank are 100% do-
mestically owned.
The case scenarios also involve assump-
tions. In case A, as collateral for the loan,
ABC grants BizBank a nonpossessory se-
curity interest in one category of movable
assets, for example, its machinery or its
inventory. ABC wants to keep both pos-
session and ownership of the collateral.
In economies where the law does not
allow nonpossessory security interests in
movable property, ABC and BizBank use
a fiduciary transfer-of-title arrangement
(or a similar substitute for nonpossessory
security interests). The strength of legal
rights index does not cover functional
equivalents to security over movable as-
sets (for example, leasing or reservation
of title).
In case B, ABC grants BizBank a busi-
ness charge, enterprise charge, floating
charge or any charge that gives BizBank
a security interest over ABC’s combined
movable assets (or as much of ABC’s
movable assets as possible). ABC keeps
ownership and possession of the assets.
The strength of legal rights index includes
8 aspects related to legal rights in col-
lateral law and 2 aspects in bankruptcy
law. A score of 1 is assigned for each of
the following features of the laws:
Any business may use movable assets
as collateral while keeping posses-
sion of the assets, and any financial
institution may accept such assets as
collateral.
The law allows a business to grant a
nonpossessory security right in a single
category of movable assets (such as
accounts receivable or inventory),
without requiring a specific description
of the collateral.
The law allows a business to grant
a nonpossessory security right in
substantially all its movable assets,
without requiring a specific description
of the collateral.
A security right may extend to future or
after-acquired assets and may extend
automatically to the products, pro-
ceeds or replacements of the original
assets.
A general description of debts and
obligations is permitted in the col-
lateral agreement and in registration
documents; all types of debts and ob-
ligations can be secured between the
parties, and the collateral agreement
can include a maximum amount for
which the assets are encumbered.
A collateral registry or registration
institution for security interests over
movable property is in operation, uni-
fied geographically and by asset type,
with an electronic database indexed by
debtors’ names.
Secured creditors are paid first (for
example, before general tax claims and
employee claims) when a debtor de-
faults outside an insolvency procedure.
Secured creditors are paid first (for
example, before general tax claims and
employee claims) when a business is
liquidated.
Secured creditors either are not subject
to an automatic stay or moratorium
on enforcement procedures when a
debtor enters a court-supervised
reorganization procedure, or the
law provides secured creditors with
grounds for relief from an automatic
stay or moratorium (for example, if the
movable property is in danger) or sets
a time limit for the automatic stay.
The law allows parties to agree in a col-
lateral agreement that the lender may
enforce its security right out of court.
The index ranges from 0 to 10, with higher
scores indicating that collateral and bank-
ruptcy laws are better designed to expand
access to credit.
CREDIT INFORMATIONThe data on credit information sharing are
built in 2 stages. First, banking supervision
authorities and public information sources
are surveyed to confirm the presence of a
public credit registry or private credit bu-
reau. Second, when applicable, a detailed
survey on the public credit registry’s or
private credit bureau’s structure, laws and
associated rules is administered to the
entity itself. Survey responses are veri-
fied through several rounds of follow-up
communication with respondents as well
as by contacting third parties and consult-
ing public sources. The survey data are
confirmed through teleconference calls or
on-site visits in all economies.
TABLE 14.7 What do the getting credit indicators measure?
Strength of legal rights index (0–10)
Protection of rights of borrowers and lenders through collateral laws
Protection of secured creditors’ rights through bankruptcy laws
Depth of credit information index (0–6)
Scope and accessibility of credit information dis-tributed by public credit registries and private credit bureaus
Public credit registry coverage (% of adults)
Number of individuals and firms listed in a public credit registry as percentage of adult population
Private credit bureau coverage (% of adults)
Number of individuals and firms listed in largest pri-vate credit bureau as percentage of adult population
DOING BUSINESS IN THE EAST AFRICAN COMMUNITY 201376
Depth of credit information indexThe depth of credit information index
measures rules and practices affecting
the coverage, scope and accessibility
of credit information available through
either a public credit registry or a private
credit bureau. A score of 1 is assigned for
each of the following 6 features of the
public credit registry or private credit
bureau (or both):
Data on both firms and individuals are
distributed.
Both positive credit information (for
example, outstanding loan amounts
and pattern of on-time repayments)
and negative information (for ex-
ample, late payments, and number and
amount of defaults and bankruptcies)
are distributed.
Data from retailers and utility compa-
nies as well as financial institutions are
distributed.
More than 2 years of historical data
are distributed. Credit registries and
bureaus that erase data on defaults as
soon as they are repaid obtain a score
of 0 for this indicator.
Data on loan amounts below 1% of
income per capita are distributed. Note
that a credit registry or bureau must
have a minimum coverage of 1% of the
adult population to score a 1 on this
indicator.
By law, borrowers have the right to
access their data in the largest credit
registry or bureau in the economy.
The index ranges from 0 to 6, with higher
values indicating the availability of more
credit information, from either a public
credit registry or a private credit bureau,
to facilitate lending decisions. If the credit
registry or bureau is not operational or
has a coverage of less than 0.1% of the
adult population, the score on the depth
of credit information index is 0.
In Lithuania, for example, both a public
credit registry and a private credit bureau
operate. Both distribute positive and
negative information (a score of 1). Both
distribute data on firms and individuals
(a score of 1). Both distribute more than
2 years of historical data (a score of 1).
Although the public credit registry does
not distribute data from retailers or
utilities, the private credit bureau does
do so (a score of 1). Although the public
credit registry has a threshold of 1,000
litai, the private credit bureau distributes
data on loans of any value (a score of 1).
Borrowers have the right to access their
data in both the public credit registry
and the private credit bureau (a score of
1). Summing across the indicators gives
Lithuania a total score of 6.
Public credit registry coverageThe public credit registry coverage indica-
tor reports the number of individuals and
firms listed in a public credit registry with
information on their borrowing history
from the past 5 years. The number is ex-
pressed as a percentage of the adult pop-
ulation (the population age 15 and above
in 2011 according to the World Bank’s
World Development Indicators). A public
credit registry is defined as a database
managed by the public sector, usually by
the central bank or the superintendent of
banks, that collects information on the
creditworthiness of borrowers (individu-
als or firms) in the financial system and
facilitates the exchange of credit informa-
tion among banks and other regulated
financial institutions. If no public registry
operates, the coverage value is 0.
Private credit bureau coverageThe private credit bureau coverage indi-
cator reports the number of individuals
and firms listed by a private credit bureau
with information on their borrowing his-
tory from the past 5 years. The number
is expressed as a percentage of the adult
population (the population age 15 and
above in 2011 according to the World
Bank’s World Development Indicators).
A private credit bureau is defined as a
private firm or nonprofit organization that
maintains a database on the creditworthi-
ness of borrowers (individuals or firms) in
the financial system and facilitates the
exchange of credit information among
creditors. Credit investigative bureaus
and credit reporting firms that do not
directly facilitate information exchange
among banks and other financial institu-
tions are not considered. If no private
bureau operates, the coverage value is 0.
The data details on getting credit can be
found for each economy at http://www
.doingbusiness.org by selecting the economy
in the drop-down list. This methodology was
developed in Djankov, McLiesh and Shleifer
(2007) and is adopted here with minor
changes.
PROTECTING INVESTORS
Doing Business measures the strength of
minority shareholder protections against
directors’ misuse of corporate assets for
personal gain. The indicators distinguish
3 dimensions of investor protections:
transparency of related-party transac-
tions (extent of disclosure index), liability
for self-dealing (extent of director liability
index) and shareholders’ ability to sue of-
ficers and directors for misconduct (ease
of shareholder suits index) (figure 14.11).
The data come from a survey of corporate
and securities lawyers and are based on
securities regulations, company laws,
civil procedure codes and court rules of
evidence. The ranking on the strength of
investor protection index is the simple
average of the percentile rankings on its
component indicators (figure 14.12).
To make the data comparable across
economies, several assumptions about
the business and the transaction are used.
Assumptions about the businessThe business (Buyer):
Is a publicly traded corporation listed
on the economy’s most important
stock exchange. If the number of pub-
licly traded companies listed on that
exchange is less than 10, or if there is
no stock exchange in the economy, it
is assumed that Buyer is a large private
company with multiple shareholders.
Has a board of directors and a chief ex-
ecutive officer (CEO) who may legally
act on behalf of Buyer where permitted,
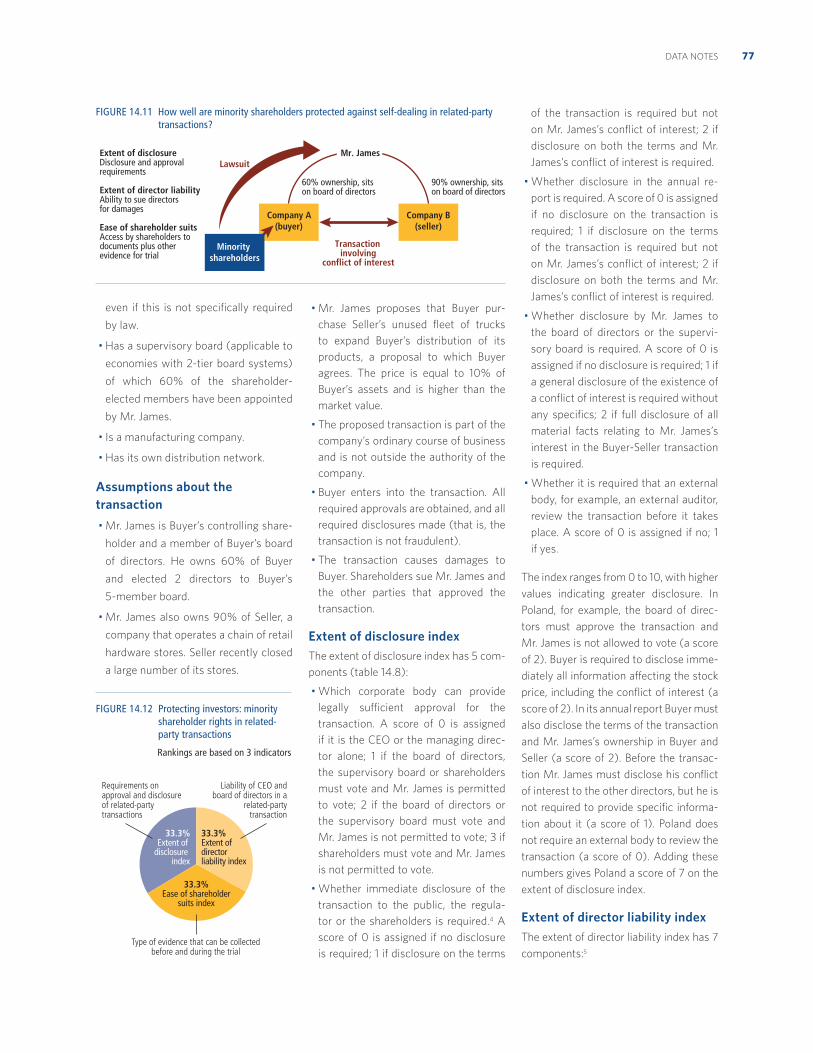
77DATA NOTES
even if this is not specifically required
by law.
Has a supervisory board (applicable to
economies with 2-tier board systems)
of which 60% of the shareholder-
elected members have been appointed
by Mr. James.
Is a manufacturing company.
Has its own distribution network.
Assumptions about the transaction
Mr. James is Buyer’s controlling share-
holder and a member of Buyer’s board
of directors. He owns 60% of Buyer
and elected 2 directors to Buyer’s
5-member board.
Mr. James also owns 90% of Seller, a
company that operates a chain of retail
hardware stores. Seller recently closed
a large number of its stores.
Mr. James proposes that Buyer pur-
chase Seller’s unused fleet of trucks
to expand Buyer’s distribution of its
products, a proposal to which Buyer
agrees. The price is equal to 10% of
Buyer’s assets and is higher than the
market value.
The proposed transaction is part of the
company’s ordinary course of business
and is not outside the authority of the
company.
Buyer enters into the transaction. All
required approvals are obtained, and all
required disclosures made (that is, the
transaction is not fraudulent).
The transaction causes damages to
Buyer. Shareholders sue Mr. James and
the other parties that approved the
transaction.
Extent of disclosure indexThe extent of disclosure index has 5 com-
ponents (table 14.8):
Which corporate body can provide
legally sufficient approval for the
transaction. A score of 0 is assigned
if it is the CEO or the managing direc-
tor alone; 1 if the board of directors,
the supervisory board or shareholders
must vote and Mr. James is permitted
to vote; 2 if the board of directors or
the supervisory board must vote and
Mr. James is not permitted to vote; 3 if
shareholders must vote and Mr. James
is not permitted to vote.
Whether immediate disclosure of the
transaction to the public, the regula-
tor or the shareholders is required.4 A
score of 0 is assigned if no disclosure
is required; 1 if disclosure on the terms
of the transaction is required but not
on Mr. James’s conflict of interest; 2 if
disclosure on both the terms and Mr.
James’s conflict of interest is required.
Whether disclosure in the annual re-
port is required. A score of 0 is assigned
if no disclosure on the transaction is
required; 1 if disclosure on the terms
of the transaction is required but not
on Mr. James’s conflict of interest; 2 if
disclosure on both the terms and Mr.
James’s conflict of interest is required.
Whether disclosure by Mr. James to
the board of directors or the supervi-
sory board is required. A score of 0 is
assigned if no disclosure is required; 1 if
a general disclosure of the existence of
a conflict of interest is required without
any specifics; 2 if full disclosure of all
material facts relating to Mr. James’s
interest in the Buyer-Seller transaction
is required.
Whether it is required that an external
body, for example, an external auditor,
review the transaction before it takes
place. A score of 0 is assigned if no; 1
if yes.
The index ranges from 0 to 10, with higher
values indicating greater disclosure. In
Poland, for example, the board of direc-
tors must approve the transaction and
Mr. James is not allowed to vote (a score
of 2). Buyer is required to disclose imme-
diately all information affecting the stock
price, including the conflict of interest (a
score of 2). In its annual report Buyer must
also disclose the terms of the transaction
and Mr. James’s ownership in Buyer and
Seller (a score of 2). Before the transac-
tion Mr. James must disclose his conflict
of interest to the other directors, but he is
not required to provide specific informa-
tion about it (a score of 1). Poland does
not require an external body to review the
transaction (a score of 0). Adding these
numbers gives Poland a score of 7 on the
extent of disclosure index.
Extent of director liability indexThe extent of director liability index has 7
components:5
Lawsuit
60% ownership, sits on board of directors
90% ownership, sits on board of directors
Transaction involving
conflict of interest
Company A(buyer)
Company B(seller)
Minority shareholders
Mr. JamesExtent of disclosureDisclosure and approvalrequirements
Extent of director liabilityAbility to sue directors for damages
Ease of shareholder suitsAccess by shareholders to documents plus other evidence for trial
FIGURE 14.11 How well are minority shareholders protected against self-dealing in related-party transactions?
FIGURE 14.12 Protecting investors: minority shareholder rights in related-party transactions
Rankings are based on 3 indicators
Type of evidence that can be collected before and during the trial
Liability of CEO and board of directors in a
related-party transaction
Requirements on approval and disclosure of related-party transactions
33.3%Extent of
disclosure index
33.3%Extent of director liability index
33.3%Ease of shareholder
suits index
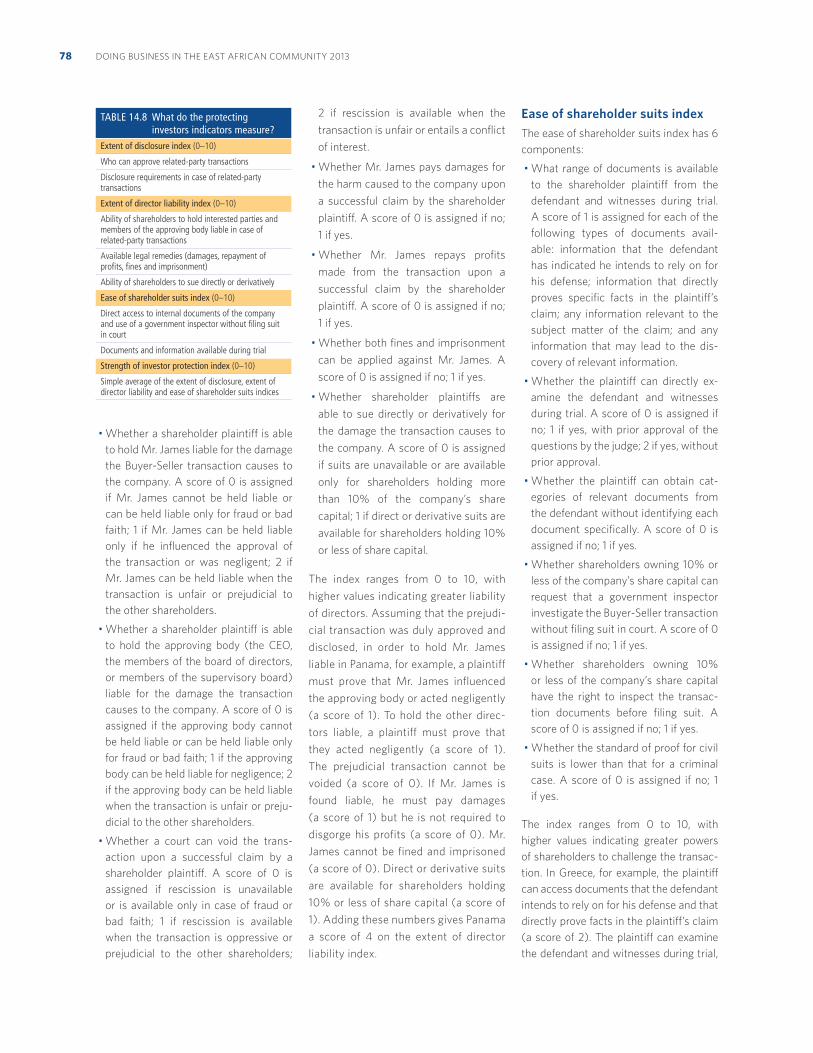
DOING BUSINESS IN THE EAST AFRICAN COMMUNITY 201378
Whether a shareholder plaintiff is able
to hold Mr. James liable for the damage
the Buyer-Seller transaction causes to
the company. A score of 0 is assigned
if Mr. James cannot be held liable or
can be held liable only for fraud or bad
faith; 1 if Mr. James can be held liable
only if he influenced the approval of
the transaction or was negligent; 2 if
Mr. James can be held liable when the
transaction is unfair or prejudicial to
the other shareholders.
Whether a shareholder plaintiff is able
to hold the approving body (the CEO,
the members of the board of directors,
or members of the supervisory board)
liable for the damage the transaction
causes to the company. A score of 0 is
assigned if the approving body cannot
be held liable or can be held liable only
for fraud or bad faith; 1 if the approving
body can be held liable for negligence; 2
if the approving body can be held liable
when the transaction is unfair or preju-
dicial to the other shareholders.
Whether a court can void the trans-
action upon a successful claim by a
shareholder plaintiff. A score of 0 is
assigned if rescission is unavailable
or is available only in case of fraud or
bad faith; 1 if rescission is available
when the transaction is oppressive or
prejudicial to the other shareholders;
2 if rescission is available when the
transaction is unfair or entails a conflict
of interest.
Whether Mr. James pays damages for
the harm caused to the company upon
a successful claim by the shareholder
plaintiff. A score of 0 is assigned if no;
1 if yes.
Whether Mr. James repays profits
made from the transaction upon a
successful claim by the shareholder
plaintiff. A score of 0 is assigned if no;
1 if yes.
Whether both fines and imprisonment
can be applied against Mr. James. A
score of 0 is assigned if no; 1 if yes.
Whether shareholder plaintiffs are
able to sue directly or derivatively for
the damage the transaction causes to
the company. A score of 0 is assigned
if suits are unavailable or are available
only for shareholders holding more
than 10% of the company’s share
capital; 1 if direct or derivative suits are
available for shareholders holding 10%
or less of share capital.
The index ranges from 0 to 10, with
higher values indicating greater liability
of directors. Assuming that the prejudi-
cial transaction was duly approved and
disclosed, in order to hold Mr. James
liable in Panama, for example, a plaintiff
must prove that Mr. James influenced
the approving body or acted negligently
(a score of 1). To hold the other direc-
tors liable, a plaintiff must prove that
they acted negligently (a score of 1).
The prejudicial transaction cannot be
voided (a score of 0). If Mr. James is
found liable, he must pay damages
(a score of 1) but he is not required to
disgorge his profits (a score of 0). Mr.
James cannot be fined and imprisoned
(a score of 0). Direct or derivative suits
are available for shareholders holding
10% or less of share capital (a score of
1). Adding these numbers gives Panama
a score of 4 on the extent of director
liability index.
Ease of shareholder suits indexThe ease of shareholder suits index has 6
components:
What range of documents is available
to the shareholder plaintiff from the
defendant and witnesses during trial.
A score of 1 is assigned for each of the
following types of documents avail-
able: information that the defendant
has indicated he intends to rely on for
his defense; information that directly
proves specific facts in the plaintiff’s
claim; any information relevant to the
subject matter of the claim; and any
information that may lead to the dis-
covery of relevant information.
Whether the plaintiff can directly ex-
amine the defendant and witnesses
during trial. A score of 0 is assigned if
no; 1 if yes, with prior approval of the
questions by the judge; 2 if yes, without
prior approval.
Whether the plaintiff can obtain cat-
egories of relevant documents from
the defendant without identifying each
document specifically. A score of 0 is
assigned if no; 1 if yes.
Whether shareholders owning 10% or
less of the company’s share capital can
request that a government inspector
investigate the Buyer-Seller transaction
without filing suit in court. A score of 0
is assigned if no; 1 if yes.
Whether shareholders owning 10%
or less of the company’s share capital
have the right to inspect the transac-
tion documents before filing suit. A
score of 0 is assigned if no; 1 if yes.
Whether the standard of proof for civil
suits is lower than that for a criminal
case. A score of 0 is assigned if no; 1
if yes.
The index ranges from 0 to 10, with
higher values indicating greater powers
of shareholders to challenge the transac-
tion. In Greece, for example, the plaintiff
can access documents that the defendant
intends to rely on for his defense and that
directly prove facts in the plaintiff’s claim
(a score of 2). The plaintiff can examine
the defendant and witnesses during trial,
TABLE 14.8 What do the protecting investors indicators measure?
Extent of disclosure index (0–10)
Who can approve related-party transactions
Disclosure requirements in case of related-party transactions
Extent of director liability index (0–10)
Ability of shareholders to hold interested parties and members of the approving body liable in case of related-party transactions
Available legal remedies (damages, repayment of profits, fines and imprisonment)
Ability of shareholders to sue directly or derivatively
Ease of shareholder suits index (0–10)
Direct access to internal documents of the company and use of a government inspector without filing suit in court
Documents and information available during trial
Strength of investor protection index (0–10)
Simple average of the extent of disclosure, extent of director liability and ease of shareholder suits indices
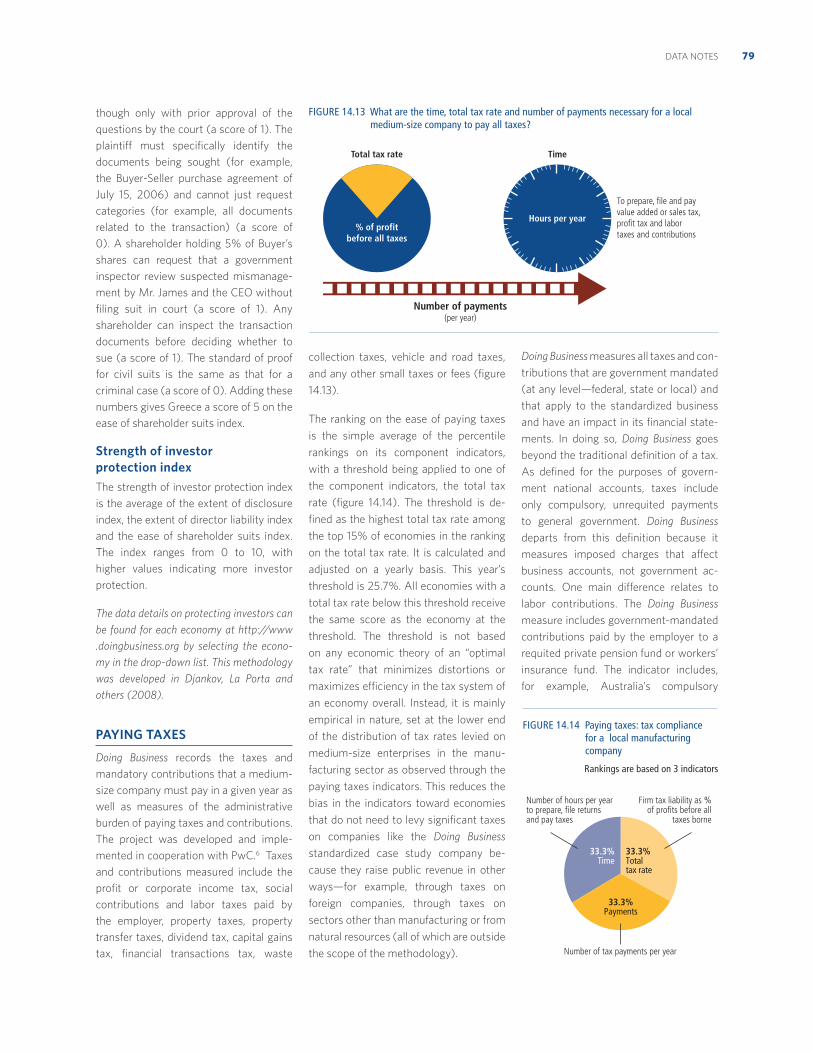
79DATA NOTES
though only with prior approval of the
questions by the court (a score of 1). The
plaintiff must specifically identify the
documents being sought (for example,
the Buyer-Seller purchase agreement of
July 15, 2006) and cannot just request
categories (for example, all documents
related to the transaction) (a score of
0). A shareholder holding 5% of Buyer’s
shares can request that a government
inspector review suspected mismanage-
ment by Mr. James and the CEO without
filing suit in court (a score of 1). Any
shareholder can inspect the transaction
documents before deciding whether to
sue (a score of 1). The standard of proof
for civil suits is the same as that for a
criminal case (a score of 0). Adding these
numbers gives Greece a score of 5 on the
ease of shareholder suits index.
Strength of investor protection indexThe strength of investor protection index
is the average of the extent of disclosure
index, the extent of director liability index
and the ease of shareholder suits index.
The index ranges from 0 to 10, with
higher values indicating more investor
protection.
The data details on protecting investors can
be found for each economy at http://www
.doingbusiness.org by selecting the econo-
my in the drop-down list. This methodology
was developed in Djankov, La Porta and
others (2008).
PAYING TAXES
Doing Business records the taxes and
mandatory contributions that a medium-
size company must pay in a given year as
well as measures of the administrative
burden of paying taxes and contributions.
The project was developed and imple-
mented in cooperation with PwC.6 Taxes
and contributions measured include the
profit or corporate income tax, social
contributions and labor taxes paid by
the employer, property taxes, property
transfer taxes, dividend tax, capital gains
tax, financial transactions tax, waste
collection taxes, vehicle and road taxes,
and any other small taxes or fees (figure
14.13).
The ranking on the ease of paying taxes
is the simple average of the percentile
rankings on its component indicators,
with a threshold being applied to one of
the component indicators, the total tax
rate (figure 14.14). The threshold is de-
fined as the highest total tax rate among
the top 15% of economies in the ranking
on the total tax rate. It is calculated and
adjusted on a yearly basis. This year’s
threshold is 25.7%. All economies with a
total tax rate below this threshold receive
the same score as the economy at the
threshold. The threshold is not based
on any economic theory of an “optimal
tax rate” that minimizes distortions or
maximizes efficiency in the tax system of
an economy overall. Instead, it is mainly
empirical in nature, set at the lower end
of the distribution of tax rates levied on
medium-size enterprises in the manu-
facturing sector as observed through the
paying taxes indicators. This reduces the
bias in the indicators toward economies
that do not need to levy significant taxes
on companies like the Doing Business
standardized case study company be-
cause they raise public revenue in other
ways—for example, through taxes on
foreign companies, through taxes on
sectors other than manufacturing or from
natural resources (all of which are outside
the scope of the methodology).
Doing Business measures all taxes and con-
tributions that are government mandated
(at any level—federal, state or local) and
that apply to the standardized business
and have an impact in its financial state-
ments. In doing so, Doing Business goes
beyond the traditional definition of a tax.
As defined for the purposes of govern-
ment national accounts, taxes include
only compulsory, unrequited payments
to general government. Doing Business
departs from this definition because it
measures imposed charges that affect
business accounts, not government ac-
counts. One main difference relates to
labor contributions. The Doing Business
measure includes government-mandated
contributions paid by the employer to a
requited private pension fund or workers’
insurance fund. The indicator includes,
for example, Australia’s compulsory
FIGURE 14.13 What are the time, total tax rate and number of payments necessary for a local medium-size company to pay all taxes?
Total tax rate Time
Number of payments(per year)
To prepare, file and payvalue added or sales tax,profit tax and labortaxes and contributions
Hours per year% of profit
before all taxes
FIGURE 14.14 Paying taxes: tax compliance for a local manufacturing company
Rankings are based on 3 indicators
Number of tax payments per year
Firm tax liability as % of profits before all
taxes borne
Number of hours per year to prepare, file returns and pay taxes
33.3%Time
33.3%Total tax rate
33.3%Payments
DOING BUSINESS IN THE EAST AFRICAN COMMUNITY 201380
superannuation guarantee and workers’
compensation insurance. For the purpose
of calculating the total tax rate (defined
below), only taxes borne are included. For
example, value added taxes are generally
excluded (provided they are not irrecov-
erable) because they do not affect the
accounting profits of the business—that
is, they are not reflected in the income
statement. They are, however, included
for the purpose of the compliance mea-
sures (time and payments), as they add
to the burden of complying with the tax
system.
Doing Business uses a case scenario to
measure the taxes and contributions
paid by a standardized business and the
complexity of an economy’s tax compli-
ance system. This case scenario uses a
set of financial statements and assump-
tions about transactions made over the
course of the year. In each economy tax
experts from a number of different firms
(in many economies these include PwC)
compute the taxes and mandatory con-
tributions due in their jurisdiction based
on the standardized case study facts.
Information is also compiled on the fre-
quency of filing and payments as well as
time taken to comply with tax laws in an
economy. To make the data comparable
across economies, several assumptions
about the business and the taxes and
contributions are used.
The methodology for the paying taxes
indicators has benefited from discussion
with members of the International Tax
Dialogue and other stakeholders, which
led to a refinement of the survey questions
on the time to pay taxes, the collection of
additional data on the labor tax wedge for
further research and the introduction of a
threshold applied to the total tax rate for
the purpose of calculating the ranking on
the ease of paying taxes.
Assumptions about the businessThe business:
Is a limited liability, taxable company. If
there is more than one type of limited
liability company in the economy, the
limited liability form most common
among domestic firms is chosen. The
most common form is reported by incor-
poration lawyers or the statistical office.
Started operations on January 1, 2010.
At that time the company purchased
all the assets shown in its balance
sheet and hired all its workers.
Operates in the economy’s largest
business city.
Is 100% domestically owned and has
5 owners, all of whom are natural
persons.
At the end of 2010, has a start-up capi-
tal of 102 times income per capita.
Performs general industrial or commer-
cial activities. Specifically, it produces
ceramic flowerpots and sells them at
retail. It does not participate in foreign
trade (no import or export) and does not
handle products subject to a special tax
regime, for example, liquor or tobacco.
At the beginning of 2011, owns 2 plots
of land, 1 building, machinery, office
equipment, computers and 1 truck and
leases 1 truck.
Does not qualify for investment incen-
tives or any benefits apart from those
related to the age or size of the company.
Has 60 employees—4 managers, 8
assistants and 48 workers. All are na-
tionals, and 1 manager is also an owner.
The company pays for additional medi-
cal insurance for employees (not
mandated by any law) as an additional
benefit. In addition, in some economies
reimbursable business travel and client
entertainment expenses are consid-
ered fringe benefits. When applicable,
it is assumed that the company pays
the fringe benefit tax on this expense
or that the benefit becomes taxable in-
come for the employee. The case study
assumes no additional salary additions
for meals, transportation, education
or others. Therefore, even when such
benefits are frequent, they are not
added to or removed from the taxable
gross salaries to arrive at the labor tax
or contribution calculation.
Has a turnover of 1,050 times income
per capita.
Makes a loss in the first year of
operation.
Has a gross margin (pretax) of 20%
(that is, sales are 120% of the cost of
goods sold).
Distributes 50% of its net profits as
dividends to the owners at the end of
the second year.
Sells one of its plots of land at a profit
at the beginning of the second year.
Has annual fuel costs for its trucks
equal to twice income per capita.
Is subject to a series of detailed assump-
tions on expenses and transactions to
further standardize the case. All financial
statement variables are proportional to
2005 income per capita. For example,
the owner who is also a manager spends
10% of income per capita on traveling
for the company (20% of this owner’s
expenses are purely private, 20% are
for entertaining customers and 60% for
business travel).
Assumptions about the taxes and contributions
All the taxes and contributions record-
ed are those paid in the second year of
operation (calendar year 2011). A tax
or contribution is considered distinct if
it has a different name or is collected by
a different agency. Taxes and contribu-
tions with the same name and agency,
but charged at different rates depend-
ing on the business, are counted as the
same tax or contribution.
The number of times the company
pays taxes and contributions in a year
is the number of different taxes or
contributions multiplied by the fre-
quency of payment (or withholding)
for each tax. The frequency of payment
includes advance payments (or with-
holding) as well as regular payments
(or withholding).
Tax paymentsThe tax payments indicator reflects the
total number of taxes and contributions
paid, the method of payment, the fre-
quency of payment, the frequency of fil-
ing and the number of agencies involved
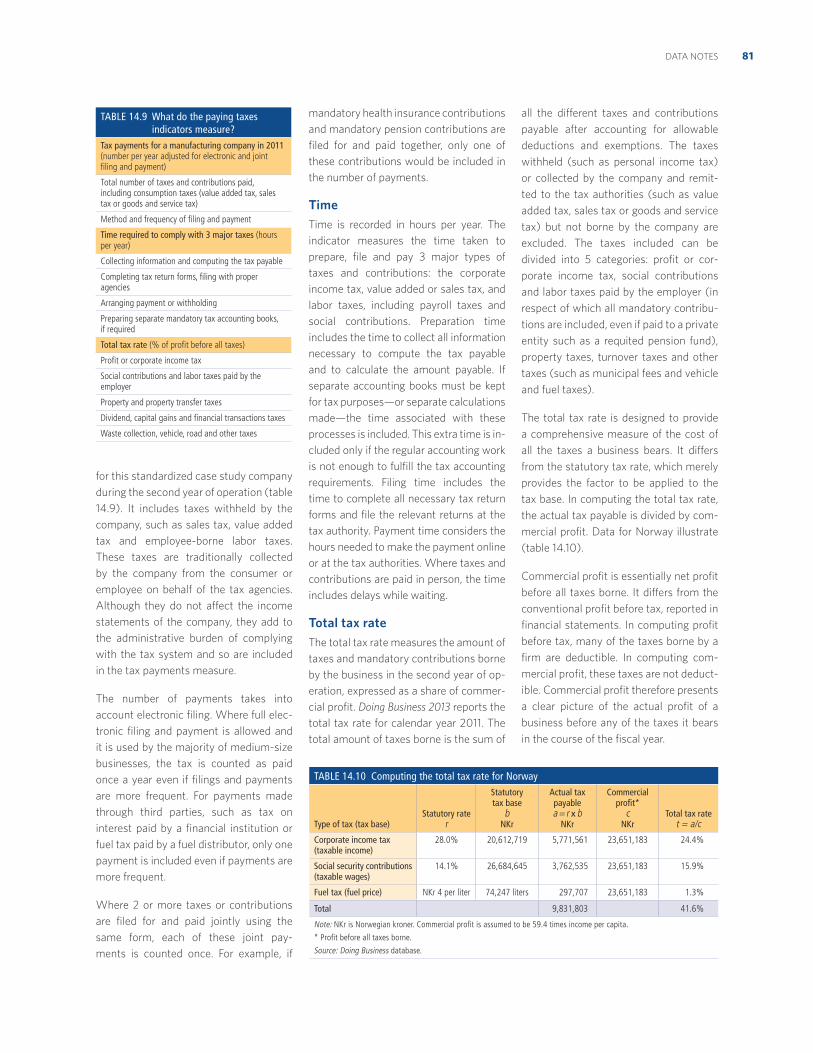
81DATA NOTES
for this standardized case study company
during the second year of operation (table
14.9). It includes taxes withheld by the
company, such as sales tax, value added
tax and employee-borne labor taxes.
These taxes are traditionally collected
by the company from the consumer or
employee on behalf of the tax agencies.
Although they do not affect the income
statements of the company, they add to
the administrative burden of complying
with the tax system and so are included
in the tax payments measure.
The number of payments takes into
account electronic filing. Where full elec-
tronic filing and payment is allowed and
it is used by the majority of medium-size
businesses, the tax is counted as paid
once a year even if filings and payments
are more frequent. For payments made
through third parties, such as tax on
interest paid by a financial institution or
fuel tax paid by a fuel distributor, only one
payment is included even if payments are
more frequent.
Where 2 or more taxes or contributions
are filed for and paid jointly using the
same form, each of these joint pay-
ments is counted once. For example, if
mandatory health insurance contributions
and mandatory pension contributions are
filed for and paid together, only one of
these contributions would be included in
the number of payments.
TimeTime is recorded in hours per year. The
indicator measures the time taken to
prepare, file and pay 3 major types of
taxes and contributions: the corporate
income tax, value added or sales tax, and
labor taxes, including payroll taxes and
social contributions. Preparation time
includes the time to collect all information
necessary to compute the tax payable
and to calculate the amount payable. If
separate accounting books must be kept
for tax purposes—or separate calculations
made—the time associated with these
processes is included. This extra time is in-
cluded only if the regular accounting work
is not enough to fulfill the tax accounting
requirements. Filing time includes the
time to complete all necessary tax return
forms and file the relevant returns at the
tax authority. Payment time considers the
hours needed to make the payment online
or at the tax authorities. Where taxes and
contributions are paid in person, the time
includes delays while waiting.
Total tax rateThe total tax rate measures the amount of
taxes and mandatory contributions borne
by the business in the second year of op-
eration, expressed as a share of commer-
cial profit. Doing Business 2013 reports the
total tax rate for calendar year 2011. The
total amount of taxes borne is the sum of
all the different taxes and contributions
payable after accounting for allowable
deductions and exemptions. The taxes
withheld (such as personal income tax)
or collected by the company and remit-
ted to the tax authorities (such as value
added tax, sales tax or goods and service
tax) but not borne by the company are
excluded. The taxes included can be
divided into 5 categories: profit or cor-
porate income tax, social contributions
and labor taxes paid by the employer (in
respect of which all mandatory contribu-
tions are included, even if paid to a private
entity such as a requited pension fund),
property taxes, turnover taxes and other
taxes (such as municipal fees and vehicle
and fuel taxes).
The total tax rate is designed to provide
a comprehensive measure of the cost of
all the taxes a business bears. It differs
from the statutory tax rate, which merely
provides the factor to be applied to the
tax base. In computing the total tax rate,
the actual tax payable is divided by com-
mercial profit. Data for Norway illustrate
(table 14.10).
Commercial profit is essentially net profit
before all taxes borne. It differs from the
conventional profit before tax, reported in
financial statements. In computing profit
before tax, many of the taxes borne by a
firm are deductible. In computing com-
mercial profit, these taxes are not deduct-
ible. Commercial profit therefore presents
a clear picture of the actual profit of a
business before any of the taxes it bears
in the course of the fiscal year.
TABLE 14.9 What do the paying taxes indicators measure?
Tax payments for a manufacturing company in 2011 (number per year adjusted for electronic and joint filing and payment)
Total number of taxes and contributions paid, including consumption taxes (value added tax, sales tax or goods and service tax)
Method and frequency of filing and payment
Time required to comply with 3 major taxes (hours per year)
Collecting information and computing the tax payable
Completing tax return forms, filing with proper agencies
Arranging payment or withholding
Preparing separate mandatory tax accounting books, if required
Total tax rate (% of profit before all taxes)
Profit or corporate income tax
Social contributions and labor taxes paid by the employer
Property and property transfer taxes
Dividend, capital gains and financial transactions taxes
Waste collection, vehicle, road and other taxes
TABLE 14.10 Computing the total tax rate for Norway
Type of tax (tax base)Statutory rate
r
Statutory tax base
bNKr
Actual tax payablea = r x b
NKr
Commercial profit*
cNKr
Total tax ratet = a/c
Corporate income tax (taxable income)
28.0% 20,612,719 5,771,561 23,651,183 24.4%
Social security contributions (taxable wages)
14.1% 26,684,645 3,762,535 23,651,183 15.9%
Fuel tax (fuel price) NKr 4 per liter 74,247 liters 297,707 23,651,183 1.3%
Total 9,831,803 41.6%
Note: NKr is Norwegian kroner. Commercial profit is assumed to be 59.4 times income per capita.
* Profit before all taxes borne.
Source: Doing Business database.
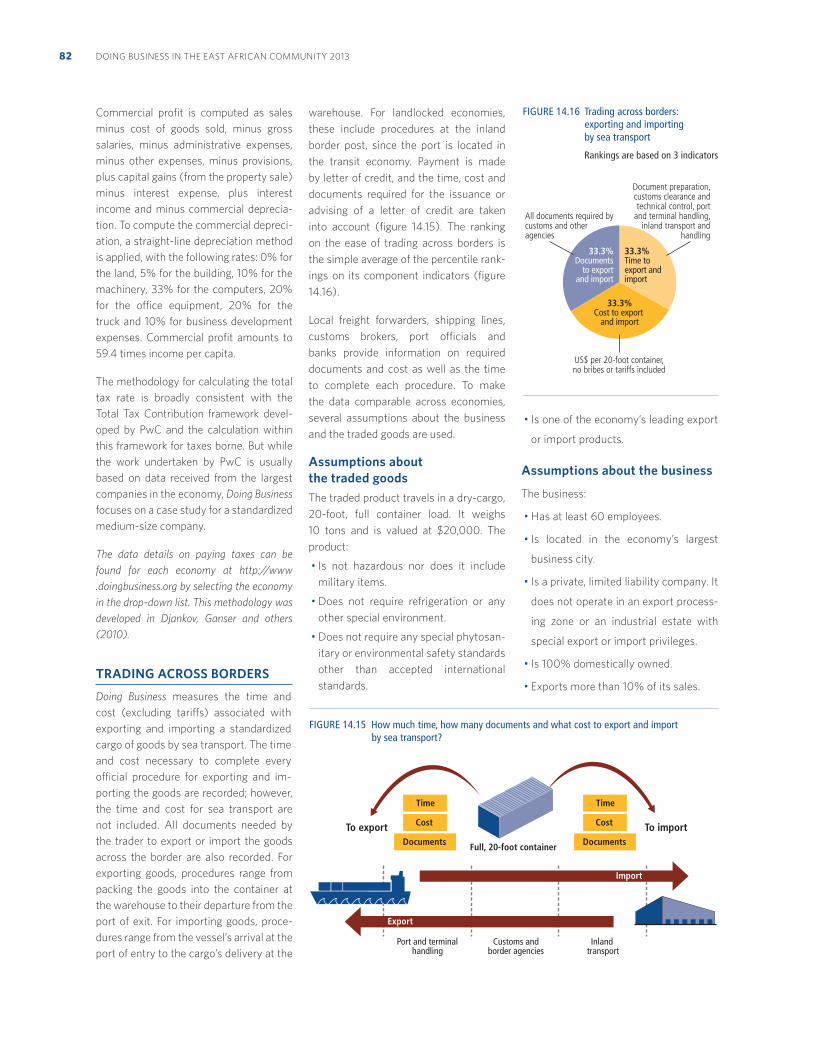
DOING BUSINESS IN THE EAST AFRICAN COMMUNITY 201382
Commercial profit is computed as sales
minus cost of goods sold, minus gross
salaries, minus administrative expenses,
minus other expenses, minus provisions,
plus capital gains (from the property sale)
minus interest expense, plus interest
income and minus commercial deprecia-
tion. To compute the commercial depreci-
ation, a straight-line depreciation method
is applied, with the following rates: 0% for
the land, 5% for the building, 10% for the
machinery, 33% for the computers, 20%
for the office equipment, 20% for the
truck and 10% for business development
expenses. Commercial profit amounts to
59.4 times income per capita.
The methodology for calculating the total
tax rate is broadly consistent with the
Total Tax Contribution framework devel-
oped by PwC and the calculation within
this framework for taxes borne. But while
the work undertaken by PwC is usually
based on data received from the largest
companies in the economy, Doing Business
focuses on a case study for a standardized
medium-size company.
The data details on paying taxes can be
found for each economy at http://www
.doingbusiness.org by selecting the economy
in the drop-down list. This methodology was
developed in Djankov, Ganser and others
(2010).
TRADING ACROSS BORDERS
Doing Business measures the time and
cost (excluding tariffs) associated with
exporting and importing a standardized
cargo of goods by sea transport. The time
and cost necessary to complete every
official procedure for exporting and im-
porting the goods are recorded; however,
the time and cost for sea transport are
not included. All documents needed by
the trader to export or import the goods
across the border are also recorded. For
exporting goods, procedures range from
packing the goods into the container at
the warehouse to their departure from the
port of exit. For importing goods, proce-
dures range from the vessel’s arrival at the
port of entry to the cargo’s delivery at the
warehouse. For landlocked economies,
these include procedures at the inland
border post, since the port is located in
the transit economy. Payment is made
by letter of credit, and the time, cost and
documents required for the issuance or
advising of a letter of credit are taken
into account (figure 14.15). The ranking
on the ease of trading across borders is
the simple average of the percentile rank-
ings on its component indicators (figure
14.16).
Local freight forwarders, shipping lines,
customs brokers, port officials and
banks provide information on required
documents and cost as well as the time
to complete each procedure. To make
the data comparable across economies,
several assumptions about the business
and the traded goods are used.
Assumptions about the traded goodsThe traded product travels in a dry-cargo,
20-foot, full container load. It weighs
10 tons and is valued at $20,000. The
product:
Is not hazardous nor does it include
military items.
Does not require refrigeration or any
other special environment.
Does not require any special phytosan-
itary or environmental safety standards
other than accepted international
standards.
Is one of the economy’s leading export
or import products.
Assumptions about the business
The business:
Has at least 60 employees.
Is located in the economy’s largest
business city.
Is a private, limited liability company. It
does not operate in an export process-
ing zone or an industrial estate with
special export or import privileges.
Is 100% domestically owned.
Exports more than 10% of its sales.
Time
Cost
Documents Full, 20-foot container
Port and terminalhandling
Customs andborder agencies
Inland transport
To export To import
Import
Export
Time
Cost
Documents
FIGURE 14.15 How much time, how many documents and what cost to export and import by sea transport?
FIGURE 14.16 Trading across borders: exporting and importing by sea transport
Rankings are based on 3 indicators
US$ per 20-foot container,no bribes or tariffs included
Document preparation, customs clearance and technical control, port
and terminal handling, inland transport and
handling
All documents required by customs and other agencies
33.3%Documents
to exportand import
33.3%Time to export and import
33.3%Cost to export
and import
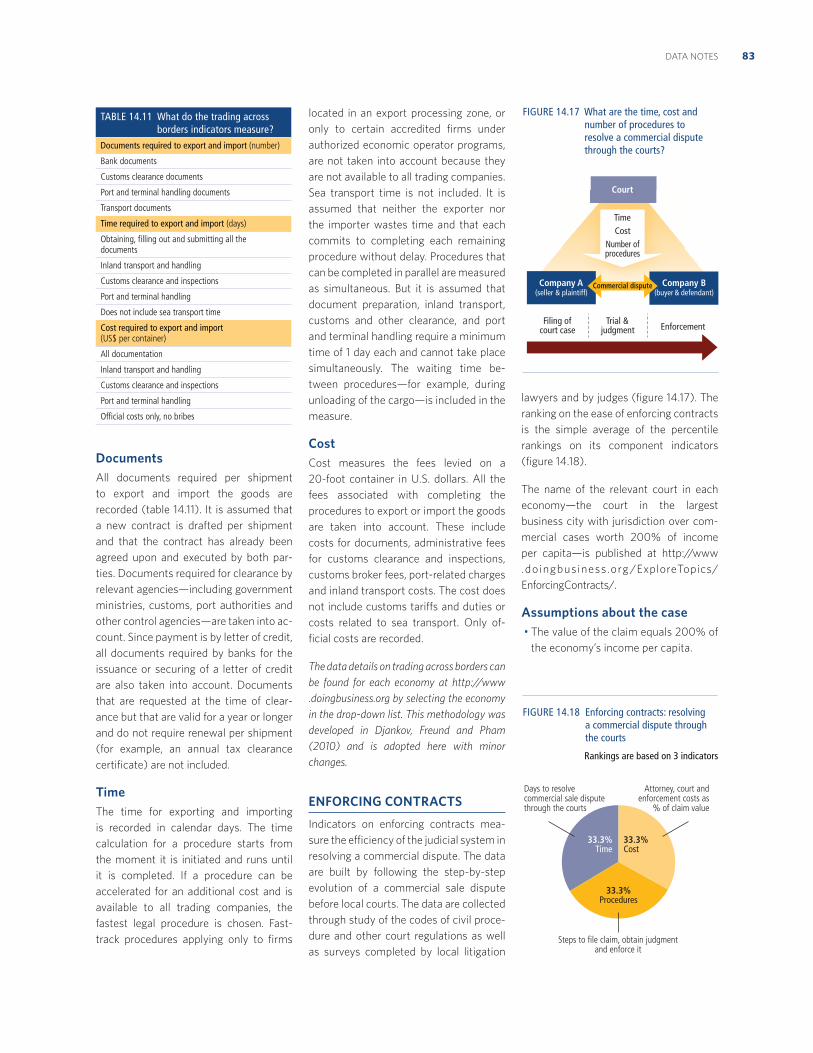
83DATA NOTES
DocumentsAll documents required per shipment
to export and import the goods are
recorded (table 14.11). It is assumed that
a new contract is drafted per shipment
and that the contract has already been
agreed upon and executed by both par-
ties. Documents required for clearance by
relevant agencies—including government
ministries, customs, port authorities and
other control agencies—are taken into ac-
count. Since payment is by letter of credit,
all documents required by banks for the
issuance or securing of a letter of credit
are also taken into account. Documents
that are requested at the time of clear-
ance but that are valid for a year or longer
and do not require renewal per shipment
(for example, an annual tax clearance
certificate) are not included.
TimeThe time for exporting and importing
is recorded in calendar days. The time
calculation for a procedure starts from
the moment it is initiated and runs until
it is completed. If a procedure can be
accelerated for an additional cost and is
available to all trading companies, the
fastest legal procedure is chosen. Fast-
track procedures applying only to firms
located in an export processing zone, or
only to certain accredited firms under
authorized economic operator programs,
are not taken into account because they
are not available to all trading companies.
Sea transport time is not included. It is
assumed that neither the exporter nor
the importer wastes time and that each
commits to completing each remaining
procedure without delay. Procedures that
can be completed in parallel are measured
as simultaneous. But it is assumed that
document preparation, inland transport,
customs and other clearance, and port
and terminal handling require a minimum
time of 1 day each and cannot take place
simultaneously. The waiting time be-
tween procedures—for example, during
unloading of the cargo—is included in the
measure.
CostCost measures the fees levied on a
20-foot container in U.S. dollars. All the
fees associated with completing the
procedures to export or import the goods
are taken into account. These include
costs for documents, administrative fees
for customs clearance and inspections,
customs broker fees, port-related charges
and inland transport costs. The cost does
not include customs tariffs and duties or
costs related to sea transport. Only of-
ficial costs are recorded.
The data details on trading across borders can
be found for each economy at http://www
.doingbusiness.org by selecting the economy
in the drop-down list. This methodology was
developed in Djankov, Freund and Pham
(2010) and is adopted here with minor
changes.
ENFORCING CONTRACTS
Indicators on enforcing contracts mea-
sure the efficiency of the judicial system in
resolving a commercial dispute. The data
are built by following the step-by-step
evolution of a commercial sale dispute
before local courts. The data are collected
through study of the codes of civil proce-
dure and other court regulations as well
as surveys completed by local litigation
lawyers and by judges (figure 14.17). The
ranking on the ease of enforcing contracts
is the simple average of the percentile
rankings on its component indicators
(figure 14.18).
The name of the relevant court in each
economy—the court in the largest
business city with jurisdiction over com-
mercial cases worth 200% of income
per capita—is published at http://www
.doingbusiness.org /ExploreTopics/
EnforcingContracts/.
Assumptions about the case The value of the claim equals 200% of
the economy’s income per capita.
TABLE 14.11 What do the trading across borders indicators measure?
Documents required to export and import (number)
Bank documents
Customs clearance documents
Port and terminal handling documents
Transport documents
Time required to export and import (days)
Obtaining, filling out and submitting all the documents
Inland transport and handling
Customs clearance and inspections
Port and terminal handling
Does not include sea transport time
Cost required to export and import (US$ per container)
All documentation
Inland transport and handling
Customs clearance and inspections
Port and terminal handling
Official costs only, no bribes
Company A(seller & plaintiff)
Filing ofcourt case
Trial &judgment
Commercial dispute
TimeCost
Number ofprocedures
Enforcement
Company B(buyer & defendant)
Court
FIGURE 14.17 What are the time, cost and number of procedures to resolve a commercial dispute through the courts?
FIGURE 14.18 Enforcing contracts: resolving a commercial dispute through the courts
Rankings are based on 3 indicators
Steps to file claim, obtain judgment and enforce it
Attorney, court and enforcement costs as
% of claim value
Days to resolve commercial sale dispute through the courts
33.3%Time
33.3%Cost
33.3%Procedures
DOING BUSINESS IN THE EAST AFRICAN COMMUNITY 201384
The dispute concerns a lawful trans-
action between 2 businesses (Seller
and Buyer), located in the economy’s
largest business city. Seller sells goods
worth 200% of the economy’s income
per capita to Buyer. After Seller deliv-
ers the goods to Buyer, Buyer refuses
to pay for the goods on the grounds
that the delivered goods were not of
adequate quality.
Seller (the plaintiff) sues Buyer (the
defendant) to recover the amount
under the sales agreement (that is,
200% of the economy’s income per
capita). Buyer opposes Seller’s claim,
saying that the quality of the goods is
not adequate. The claim is disputed on
the merits. The court cannot decide
the case on the basis of documentary
evidence or legal title alone.
A court in the economy’s largest
business city with jurisdiction over
commercial cases worth 200% of in-
come per capita decides the dispute.
Seller attaches Buyer’s movable assets
(for example, office equipment and
vehicles) before obtaining a judgment
because Seller fears that Buyer may
become insolvent.
An expert opinion is given on the
quality of the delivered goods. If it is
standard practice in the economy for
each party to call its own expert wit-
ness, the parties each call one expert
witness. If it is standard practice for the
judge to appoint an independent ex-
pert, the judge does so. In this case the
judge does not allow opposing expert
testimony.
The judgment is 100% in favor of Seller:
the judge decides that the goods are of
adequate quality and that Buyer must
pay the agreed price.
Buyer does not appeal the judgment.
Seller decides to start enforcing the
judgment as soon as the time allocated
by law for appeal expires.
Seller takes all required steps for
prompt enforcement of the judgment.
The money is successfully collected
through a public sale of Buyer’s
movable assets (for example, office
equipment and vehicles).
ProceduresThe list of procedural steps compiled for
each economy traces the chronology of
a commercial dispute before the relevant
court. A procedure is defined as any
interaction, required by law or commonly
used in practice, between the parties or
between them and the judge or court
officer. Other procedural steps, internal
to the court or between the parties and
their counsel, may be counted as well.
Procedural steps include steps to file and
serve the case, steps to assign the case to
a judge, steps for trial and judgment and
steps necessary to enforce the judgment
(table 14.12).
The survey allows respondents to record
procedures that exist in civil law but not
common law jurisdictions and vice versa.
For example, in civil law jurisdictions the
judge can appoint an independent expert,
while in common law jurisdictions each
party submits a list of expert witnesses
to the court. To indicate overall efficiency,
1 procedure is subtracted from the total
number for economies that have special-
ized commercial courts, and 1 procedure
for economies that allow electronic filing
of the initial complaint in court cases.
Some procedural steps that are part of
others are not counted in the total num-
ber of procedures.
TimeTime is recorded in calendar days,
counted from the moment the plaintiff
decides to file the lawsuit in court until
payment. This includes both the days
when actions take place and the waiting
periods between. The average duration
of different stages of dispute resolution
is recorded: the completion of service of
process (time to file and serve the case),
the issuance of judgment (time for the
trial and obtaining the judgment) and the
moment of payment (time for enforce-
ment of the judgment).
CostCost is recorded as a percentage of the
claim, assumed to be equivalent to 200%
of income per capita. No bribes are re-
corded. Three types of costs are recorded:
court costs, enforcement costs and average
attorney fees.
Court costs include all court costs that
Seller (plaintiff) must advance to the
court, regardless of the final cost to Seller.
Enforcement costs are all costs that Seller
(plaintiff) must advance to enforce the
judgment through a public sale of Buyer’s
movable assets, regardless of the final cost
to Seller. Average attorney fees are the
fees that Seller (plaintiff) must advance to
a local attorney to represent Seller in the
standardized case.
The data details on enforcing contracts can
be found for each economy at http://www
.doingbusiness.org by selecting the economy
in the drop-down list. This methodology was
developed in Djankov and others (2003) and
is adopted here with minor changes.
RESOLVING INSOLVENCY
Doing Business studies the time, cost
and outcome of insolvency proceedings
involving domestic entities. The name of
this indicator set was changed from closing a
business to resolving insolvency to more ac-
curately reflect the content of the indicators.
The indicators did not change in content or
TABLE 14.12 What do the enforcing contracts indicators measure?
Procedures to enforce a contract through the courts (number)
Any interaction between the parties in a commercial dispute, or between them and the judge or court officer
Steps to file and serve the case
Steps for trial and judgment
Steps to enforce the judgment
Time required to complete procedures (calendar days)
Time to file and serve the case
Time for trial and obtaining judgment
Time to enforce the judgment
Cost required to complete procedures (% of claim)
No bribes
Average attorney fees
Court costs
Enforcement costs
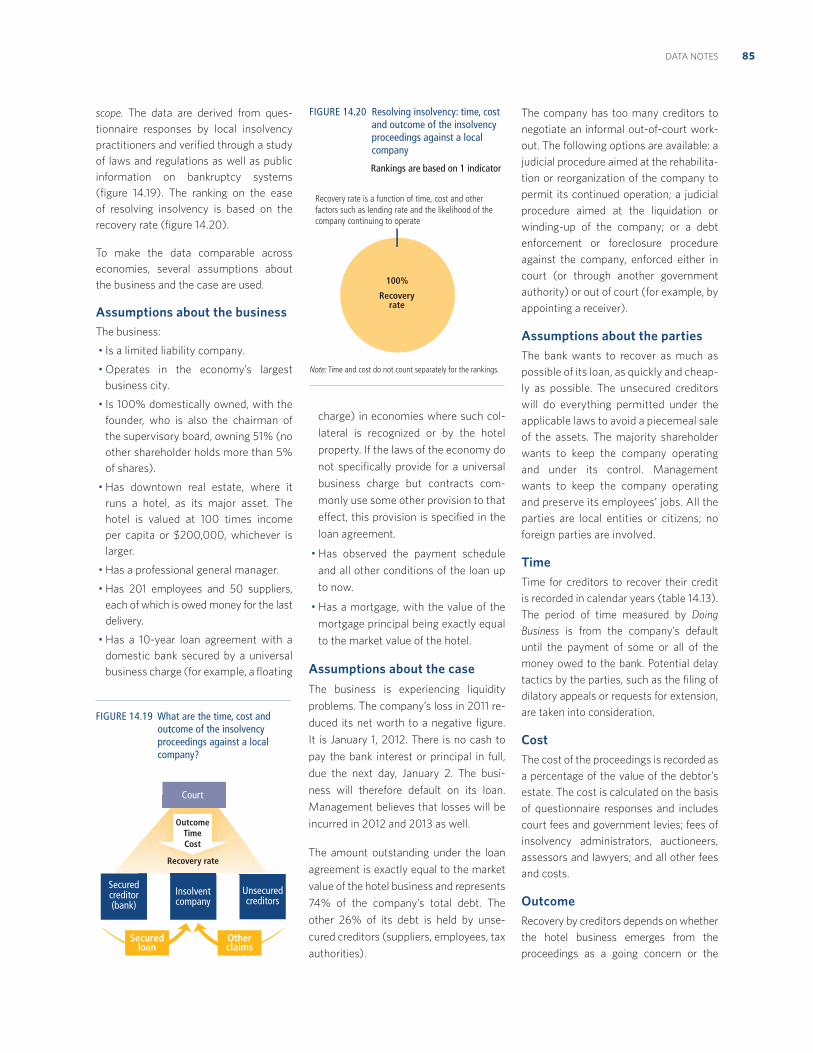
85DATA NOTES
scope. The data are derived from ques-
tionnaire responses by local insolvency
practitioners and verified through a study
of laws and regulations as well as public
information on bankruptcy systems
(figure 14.19). The ranking on the ease
of resolving insolvency is based on the
recovery rate (figure 14.20).
To make the data comparable across
economies, several assumptions about
the business and the case are used.
Assumptions about the businessThe business:
Is a limited liability company.
Operates in the economy’s largest
business city.
Is 100% domestically owned, with the
founder, who is also the chairman of
the supervisory board, owning 51% (no
other shareholder holds more than 5%
of shares).
Has downtown real estate, where it
runs a hotel, as its major asset. The
hotel is valued at 100 times income
per capita or $200,000, whichever is
larger.
Has a professional general manager.
Has 201 employees and 50 suppliers,
each of which is owed money for the last
delivery.
Has a 10-year loan agreement with a
domestic bank secured by a universal
business charge (for example, a floating
charge) in economies where such col-
lateral is recognized or by the hotel
property. If the laws of the economy do
not specifically provide for a universal
business charge but contracts com-
monly use some other provision to that
effect, this provision is specified in the
loan agreement.
Has observed the payment schedule
and all other conditions of the loan up
to now.
Has a mortgage, with the value of the
mortgage principal being exactly equal
to the market value of the hotel.
Assumptions about the caseThe business is experiencing liquidity
problems. The company’s loss in 2011 re-
duced its net worth to a negative figure.
It is January 1, 2012. There is no cash to
pay the bank interest or principal in full,
due the next day, January 2. The busi-
ness will therefore default on its loan.
Management believes that losses will be
incurred in 2012 and 2013 as well.
The amount outstanding under the loan
agreement is exactly equal to the market
value of the hotel business and represents
74% of the company’s total debt. The
other 26% of its debt is held by unse-
cured creditors (suppliers, employees, tax
authorities).
The company has too many creditors to
negotiate an informal out-of-court work-
out. The following options are available: a
judicial procedure aimed at the rehabilita-
tion or reorganization of the company to
permit its continued operation; a judicial
procedure aimed at the liquidation or
winding-up of the company; or a debt
enforcement or foreclosure procedure
against the company, enforced either in
court (or through another government
authority) or out of court (for example, by
appointing a receiver).
Assumptions about the partiesThe bank wants to recover as much as
possible of its loan, as quickly and cheap-
ly as possible. The unsecured creditors
will do everything permitted under the
applicable laws to avoid a piecemeal sale
of the assets. The majority shareholder
wants to keep the company operating
and under its control. Management
wants to keep the company operating
and preserve its employees’ jobs. All the
parties are local entities or citizens; no
foreign parties are involved.
TimeTime for creditors to recover their credit
is recorded in calendar years (table 14.13).
The period of time measured by Doing
Business is from the company’s default
until the payment of some or all of the
money owed to the bank. Potential delay
tactics by the parties, such as the filing of
dilatory appeals or requests for extension,
are taken into consideration.
CostThe cost of the proceedings is recorded as
a percentage of the value of the debtor’s
estate. The cost is calculated on the basis
of questionnaire responses and includes
court fees and government levies; fees of
insolvency administrators, auctioneers,
assessors and lawyers; and all other fees
and costs.
OutcomeRecovery by creditors depends on whether
the hotel business emerges from the
proceedings as a going concern or the
Securedcreditor(bank)
Unsecuredcreditors
Insolventcompany
Court
Securedloan
Otherclaims
OutcomeTimeCost
Recovery rate
FIGURE 14.19 What are the time, cost and outcome of the insolvency proceedings against a local company?
FIGURE 14.20 Resolving insolvency: time, cost and outcome of the insolvency proceedings against a local company
Rankings are based on 1 indicator
100%
Recovery rate
Recovery rate is a function of time, cost and other factors such as lending rate and the likelihood of the company continuing to operate
Note: Time and cost do not count separately for the rankings.
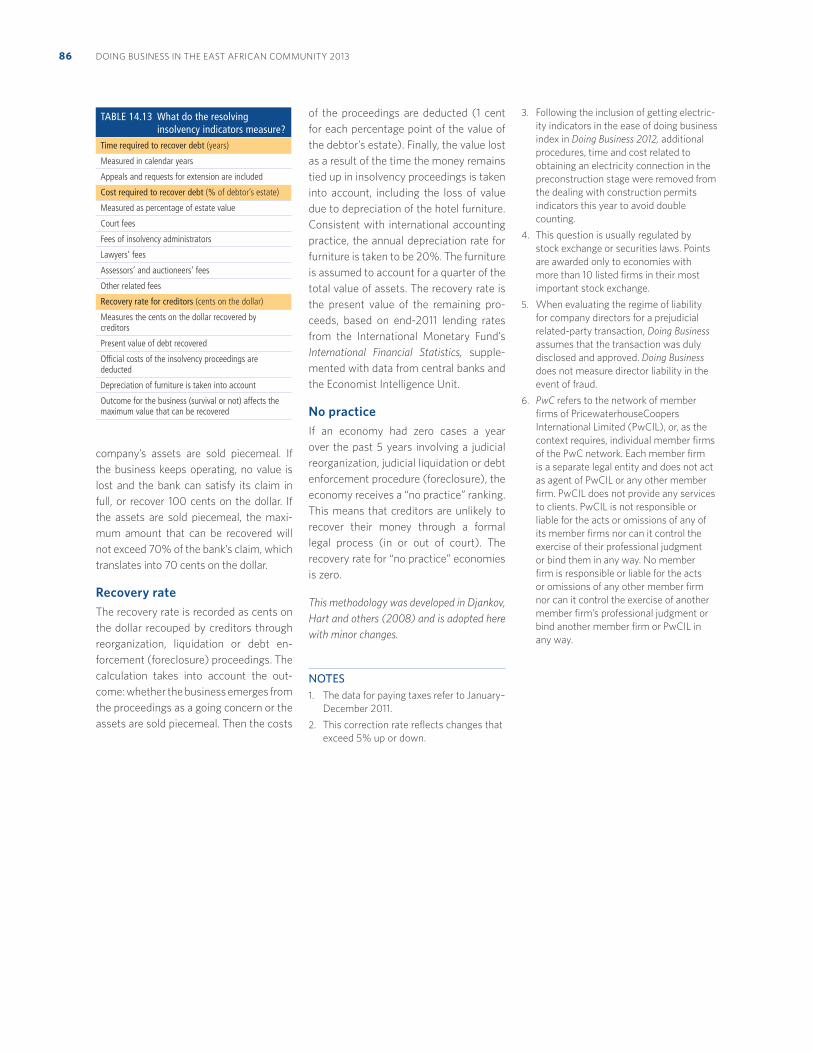
DOING BUSINESS IN THE EAST AFRICAN COMMUNITY 201386
company’s assets are sold piecemeal. If
the business keeps operating, no value is
lost and the bank can satisfy its claim in
full, or recover 100 cents on the dollar. If
the assets are sold piecemeal, the maxi-
mum amount that can be recovered will
not exceed 70% of the bank’s claim, which
translates into 70 cents on the dollar.
Recovery rateThe recovery rate is recorded as cents on
the dollar recouped by creditors through
reorganization, liquidation or debt en-
forcement (foreclosure) proceedings. The
calculation takes into account the out-
come: whether the business emerges from
the proceedings as a going concern or the
assets are sold piecemeal. Then the costs
of the proceedings are deducted (1 cent
for each percentage point of the value of
the debtor’s estate). Finally, the value lost
as a result of the time the money remains
tied up in insolvency proceedings is taken
into account, including the loss of value
due to depreciation of the hotel furniture.
Consistent with international accounting
practice, the annual depreciation rate for
furniture is taken to be 20%. The furniture
is assumed to account for a quarter of the
total value of assets. The recovery rate is
the present value of the remaining pro-
ceeds, based on end-2011 lending rates
from the International Monetary Fund’s
International Financial Statistics, supple-
mented with data from central banks and
the Economist Intelligence Unit.
No practice If an economy had zero cases a year
over the past 5 years involving a judicial
reorganization, judicial liquidation or debt
enforcement procedure (foreclosure), the
economy receives a “no practice” ranking.
This means that creditors are unlikely to
recover their money through a formal
legal process (in or out of court). The
recovery rate for “no practice” economies
is zero.
This methodology was developed in Djankov,
Hart and others (2008) and is adopted here
with minor changes.
NOTES
1. The data for paying taxes refer to January–
December 2011.
2. This correction rate reflects changes that
exceed 5% up or down.
3. Following the inclusion of getting electric-
ity indicators in the ease of doing business
index in Doing Business 2012, additional
procedures, time and cost related to
obtaining an electricity connection in the
preconstruction stage were removed from
the dealing with construction permits
indicators this year to avoid double
counting.
4. This question is usually regulated by
stock exchange or securities laws. Points
are awarded only to economies with
more than 10 listed firms in their most
important stock exchange.
5. When evaluating the regime of liability
for company directors for a prejudicial
related-party transaction, Doing Business
assumes that the transaction was duly
disclosed and approved. Doing Business
does not measure director liability in the
event of fraud.
6. PwC refers to the network of member
firms of PricewaterhouseCoopers
International Limited (PwCIL), or, as the
context requires, individual member firms
of the PwC network. Each member firm
is a separate legal entity and does not act
as agent of PwCIL or any other member
firm. PwCIL does not provide any services
to clients. PwCIL is not responsible or
liable for the acts or omissions of any of
its member firms nor can it control the
exercise of their professional judgment
or bind them in any way. No member
firm is responsible or liable for the acts
or omissions of any other member firm
nor can it control the exercise of another
member firm’s professional judgment or
bind another member firm or PwCIL in
any way.
TABLE 14.13 What do the resolving insolvency indicators measure?
Time required to recover debt (years)
Measured in calendar years
Appeals and requests for extension are included
Cost required to recover debt (% of debtor’s estate)
Measured as percentage of estate value
Court fees
Fees of insolvency administrators
Lawyers’ fees
Assessors’ and auctioneers’ fees
Other related fees
Recovery rate for creditors (cents on the dollar)
Measures the cents on the dollar recovered by creditors
Present value of debt recovered
Official costs of the insolvency proceedings are deducted
Depreciation of furniture is taken into account
Outcome for the business (survival or not) affects the maximum value that can be recovered
87
Ease of doing business
and distance to frontier
This year’s report presents results for 2
aggregate measures: the aggregate rank-
ing on the ease of doing business and the
distance to frontier measure. The ease of
doing business ranking compares econo-
mies with one another, while the distance
to frontier measure benchmarks econo-
mies to the frontier in regulatory practice,
measuring the absolute distance to the
best performance on each indicator. Both
measures can be used for comparisons
over time. When compared across years,
the distance to frontier measure shows
how much the regulatory environment
for local entrepreneurs in each economy
has changed over time in absolute terms,
while the ease of doing business ranking
can show only relative change.
EASE OF DOING BUSINESSThe ease of doing business index ranks
economies from 1 to 185. For each
economy the ranking is calculated as the
simple average of the percentile rankings
on each of the 10 topics included in the
index in Doing Business 2013: starting
a business, dealing with construction
permits, getting electricity, registering
property, getting credit, protecting inves-
tors, paying taxes, trading across borders,
enforcing contracts and resolving insol-
vency. The employing workers indicators
are not included in this year’s aggregate
ease of doing business ranking. In addi-
tion to this year’s ranking, Doing Business
presents a comparable ranking for the
previous year, adjusted for any changes
in methodology as well as additions of
economies or topics.1
Construction of the ease of doing business index Here is one example of how the ease of
doing business index is constructed. In
Finland it takes 3 procedures, 14 days
and 4% of the property value in fees to
register a property. On these 3 indicators
Finland ranks in the 6th, 16th and 39th
percentiles. So on average Finland ranks
in the 20th percentile on the ease of
registering property. It ranks in the 30th
percentile on starting a business, 28th
percentile on getting credit, 24th per-
centile on paying taxes, 13th percentile
on enforcing contracts, 5th percentile on
trading across borders and so on. Higher
rankings indicate simpler regulation and
stronger protection of property rights.
The simple average of Finland’s percentile
rankings on all topics is 21st. When all
economies are ordered by their average
percentile rankings, Finland stands at 11
in the aggregate ranking on the ease of
doing business.
More complex aggregation methods—
such as principal components and un-
observed components—yield a ranking
nearly identical to the simple average
used by Doing Business.2 Thus Doing
Business uses the simplest method:
weighting all topics equally and, within
each topic, giving equal weight to each of
the topic components.3
If an economy has no laws or regulations
covering a specific area—for example,
insolvency—it receives a “no practice”
mark. Similarly, an economy receives a “no
practice” or “not possible” mark if regula-
tion exists but is never used in practice or
if a competing regulation prohibits such
practice. Either way, a “no practice” mark
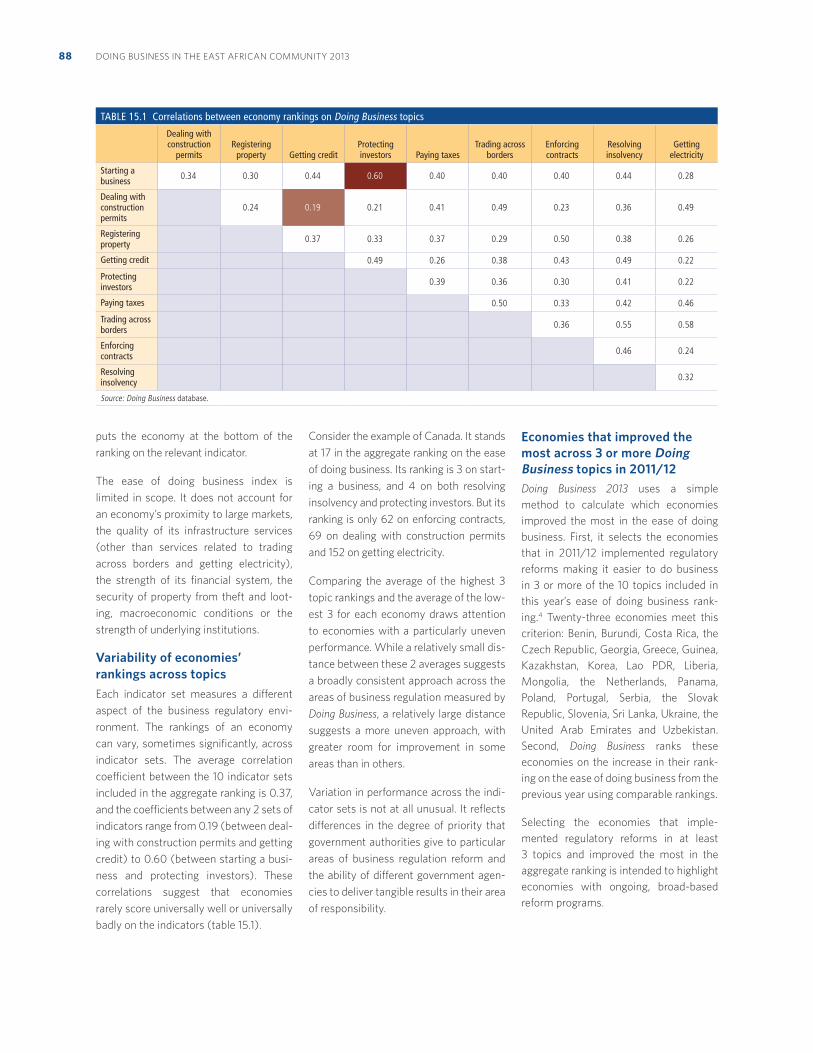
DOING BUSINESS IN THE EAST AFRICAN COMMUNITY 201388
puts the economy at the bottom of the
ranking on the relevant indicator.
The ease of doing business index is
limited in scope. It does not account for
an economy’s proximity to large markets,
the quality of its infrastructure services
(other than services related to trading
across borders and getting electricity),
the strength of its financial system, the
security of property from theft and loot-
ing, macroeconomic conditions or the
strength of underlying institutions.
Variability of economies’ rankings across topicsEach indicator set measures a different
aspect of the business regulatory envi-
ronment. The rankings of an economy
can vary, sometimes significantly, across
indicator sets. The average correlation
coefficient between the 10 indicator sets
included in the aggregate ranking is 0.37,
and the coefficients between any 2 sets of
indicators range from 0.19 (between deal-
ing with construction permits and getting
credit) to 0.60 (between starting a busi-
ness and protecting investors). These
correlations suggest that economies
rarely score universally well or universally
badly on the indicators (table 15.1).
Consider the example of Canada. It stands
at 17 in the aggregate ranking on the ease
of doing business. Its ranking is 3 on start-
ing a business, and 4 on both resolving
insolvency and protecting investors. But its
ranking is only 62 on enforcing contracts,
69 on dealing with construction permits
and 152 on getting electricity.
Comparing the average of the highest 3
topic rankings and the average of the low-
est 3 for each economy draws attention
to economies with a particularly uneven
performance. While a relatively small dis-
tance between these 2 averages suggests
a broadly consistent approach across the
areas of business regulation measured by
Doing Business, a relatively large distance
suggests a more uneven approach, with
greater room for improvement in some
areas than in others.
Variation in performance across the indi-
cator sets is not at all unusual. It reflects
differences in the degree of priority that
government authorities give to particular
areas of business regulation reform and
the ability of different government agen-
cies to deliver tangible results in their area
of responsibility.
Economies that improved the most across 3 or more Doing Business topics in 2011/12Doing Business 2013 uses a simple
method to calculate which economies
improved the most in the ease of doing
business. First, it selects the economies
that in 2011/12 implemented regulatory
reforms making it easier to do business
in 3 or more of the 10 topics included in
this year’s ease of doing business rank-
ing.4 Twenty-three economies meet this
criterion: Benin, Burundi, Costa Rica, the
Czech Republic, Georgia, Greece, Guinea,
Kazakhstan, Korea, Lao PDR, Liberia,
Mongolia, the Netherlands, Panama,
Poland, Portugal, Serbia, the Slovak
Republic, Slovenia, Sri Lanka, Ukraine, the
United Arab Emirates and Uzbekistan.
Second, Doing Business ranks these
economies on the increase in their rank-
ing on the ease of doing business from the
previous year using comparable rankings.
Selecting the economies that imple-
mented regulatory reforms in at least
3 topics and improved the most in the
aggregate ranking is intended to highlight
economies with ongoing, broad-based
reform programs.
TABLE 15.1 Correlations between economy rankings on Doing Business topics
Dealing with construction
permitsRegistering
property Getting creditProtecting investors Paying taxes
Trading across borders
Enforcing contracts
Resolving insolvency
Getting electricity
Starting a business 0.34 0.30 0.44 0.60 0.40 0.40 0.40 0.44 0.28
Dealing with construction permits
0.24 0.19 0.21 0.41 0.49 0.23 0.36 0.49
Registering property 0.37 0.33 0.37 0.29 0.50 0.38 0.26
Getting credit 0.49 0.26 0.38 0.43 0.49 0.22
Protecting investors 0.39 0.36 0.30 0.41 0.22
Paying taxes 0.50 0.33 0.42 0.46
Trading across borders 0.36 0.55 0.58
Enforcing contracts 0.46 0.24
Resolving insolvency 0.32
Source: Doing Business database.
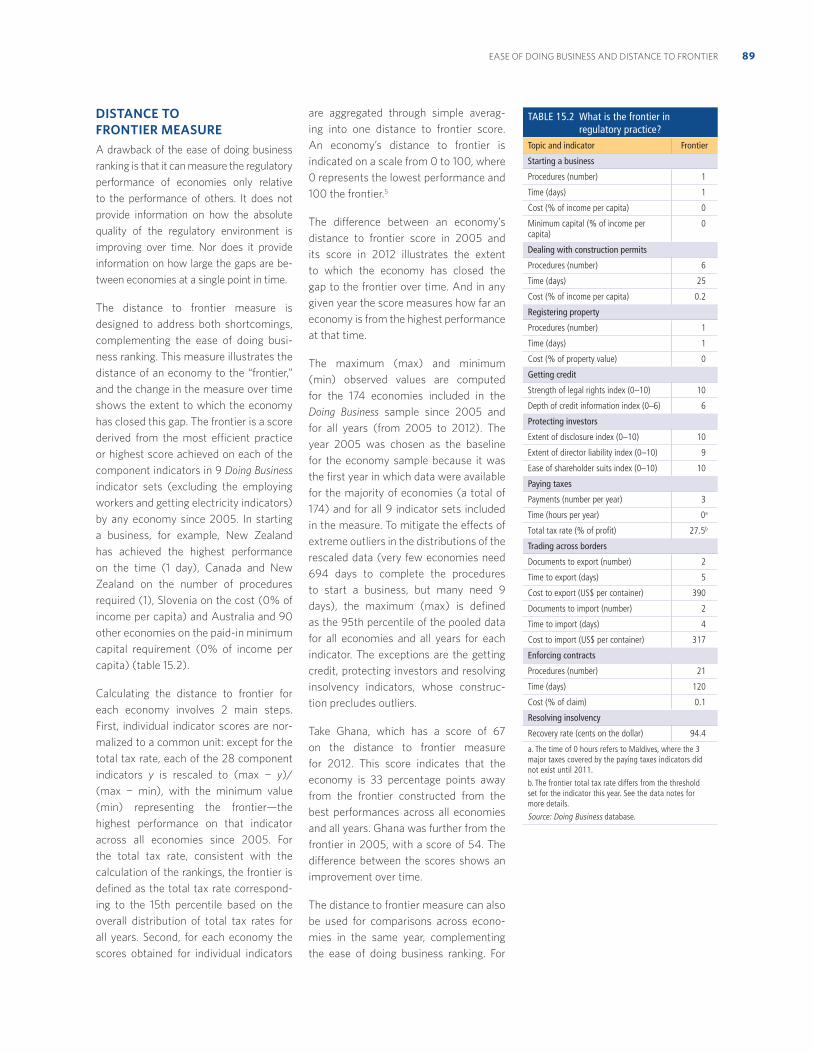
89EASE OF DOING BUSINESS AND DISTANCE TO FRONTIER
DISTANCE TO FRONTIER MEASURE A drawback of the ease of doing business
ranking is that it can measure the regulatory
performance of economies only relative
to the performance of others. It does not
provide information on how the absolute
quality of the regulatory environment is
improving over time. Nor does it provide
information on how large the gaps are be-
tween economies at a single point in time.
The distance to frontier measure is
designed to address both shortcomings,
complementing the ease of doing busi-
ness ranking. This measure illustrates the
distance of an economy to the “frontier,”
and the change in the measure over time
shows the extent to which the economy
has closed this gap. The frontier is a score
derived from the most efficient practice
or highest score achieved on each of the
component indicators in 9 Doing Business
indicator sets (excluding the employing
workers and getting electricity indicators)
by any economy since 2005. In starting
a business, for example, New Zealand
has achieved the highest performance
on the time (1 day), Canada and New
Zealand on the number of procedures
required (1), Slovenia on the cost (0% of
income per capita) and Australia and 90
other economies on the paid-in minimum
capital requirement (0% of income per
capita) (table 15.2).
Calculating the distance to frontier for
each economy involves 2 main steps.
First, individual indicator scores are nor-
malized to a common unit: except for the
total tax rate, each of the 28 component
indicators y is rescaled to (max − y)/
(max − min), with the minimum value
(min) representing the frontier—the
highest performance on that indicator
across all economies since 2005. For
the total tax rate, consistent with the
calculation of the rankings, the frontier is
defined as the total tax rate correspond-
ing to the 15th percentile based on the
overall distribution of total tax rates for
all years. Second, for each economy the
scores obtained for individual indicators
are aggregated through simple averag-
ing into one distance to frontier score.
An economy’s distance to frontier is
indicated on a scale from 0 to 100, where
0 represents the lowest performance and
100 the frontier.5
The difference between an economy’s
distance to frontier score in 2005 and
its score in 2012 illustrates the extent
to which the economy has closed the
gap to the frontier over time. And in any
given year the score measures how far an
economy is from the highest performance
at that time.
The maximum (max) and minimum
(min) observed values are computed
for the 174 economies included in the
Doing Business sample since 2005 and
for all years (from 2005 to 2012). The
year 2005 was chosen as the baseline
for the economy sample because it was
the first year in which data were available
for the majority of economies (a total of
174) and for all 9 indicator sets included
in the measure. To mitigate the effects of
extreme outliers in the distributions of the
rescaled data (very few economies need
694 days to complete the procedures
to start a business, but many need 9
days), the maximum (max) is defined
as the 95th percentile of the pooled data
for all economies and all years for each
indicator. The exceptions are the getting
credit, protecting investors and resolving
insolvency indicators, whose construc-
tion precludes outliers.
Take Ghana, which has a score of 67
on the distance to frontier measure
for 2012. This score indicates that the
economy is 33 percentage points away
from the frontier constructed from the
best performances across all economies
and all years. Ghana was further from the
frontier in 2005, with a score of 54. The
difference between the scores shows an
improvement over time.
The distance to frontier measure can also
be used for comparisons across econo-
mies in the same year, complementing
the ease of doing business ranking. For
TABLE 15.2 What is the frontier in regulatory practice?
Topic and indicator Frontier
Starting a business
Procedures (number) 1
Time (days) 1
Cost (% of income per capita) 0
Minimum capital (% of income per capita)
0
Dealing with construction permits
Procedures (number) 6
Time (days) 25
Cost (% of income per capita) 0.2
Registering property
Procedures (number) 1
Time (days) 1
Cost (% of property value) 0
Getting credit
Strength of legal rights index (0–10) 10
Depth of credit information index (0–6) 6
Protecting investors
Extent of disclosure index (0–10) 10
Extent of director liability index (0–10) 9
Ease of shareholder suits index (0–10) 10
Paying taxes
Payments (number per year) 3
Time (hours per year) 0a
Total tax rate (% of profit) 27.5b
Trading across borders
Documents to export (number) 2
Time to export (days) 5
Cost to export (US$ per container) 390
Documents to import (number) 2
Time to import (days) 4
Cost to import (US$ per container) 317
Enforcing contracts
Procedures (number) 21
Time (days) 120
Cost (% of claim) 0.1
Resolving insolvency
Recovery rate (cents on the dollar) 94.4
a. The time of 0 hours refers to Maldives, where the 3 major taxes covered by the paying taxes indicators did not exist until 2011.
b. The frontier total tax rate differs from the threshold set for the indicator this year. See the data notes for more details.
Source: Doing Business database.
DOING BUSINESS IN THE EAST AFRICAN COMMUNITY 201390
example, Ghana stands at 64 this year in
the ease of doing business ranking, while
Peru, which is 29 percentage points from
the frontier, stands at 43.
NOTES
1. In case of revisions to the methodology
or corrections to the underlying data,
the data are back-calculated to provide
a comparable time series since the year
the relevant economy or topic was first
included in the data set. The time series
is available on the Doing Business website
(http://www.doingbusiness.org). Six
topics and more than 50 economies
have been added since the inception
of the project. Earlier rankings on the
ease of doing business are therefore not
comparable.
2. See Djankov and others (2005). Principal
components and unobserved compo-
nents methods yield a ranking nearly
identical to that from the simple average
method because both these methods
assign roughly equal weights to the
topics, since the pairwise correlations
among indicators do not differ much. An
alternative to the simple average method
is to give different weights to the topics,
depending on which are considered of
more or less importance in the context of
a specific economy.
3. A technical note on the different
aggregation and weighting methods is
available on the Doing Business website
(http://www.doingbusiness.org).
4. Doing Business reforms making it more
difficult to do business are subtracted
from the total number of those making it
easier to do business.
5. This represents a change from last year’s
report, where 100 represented the lowest
performance and 0 the frontier.
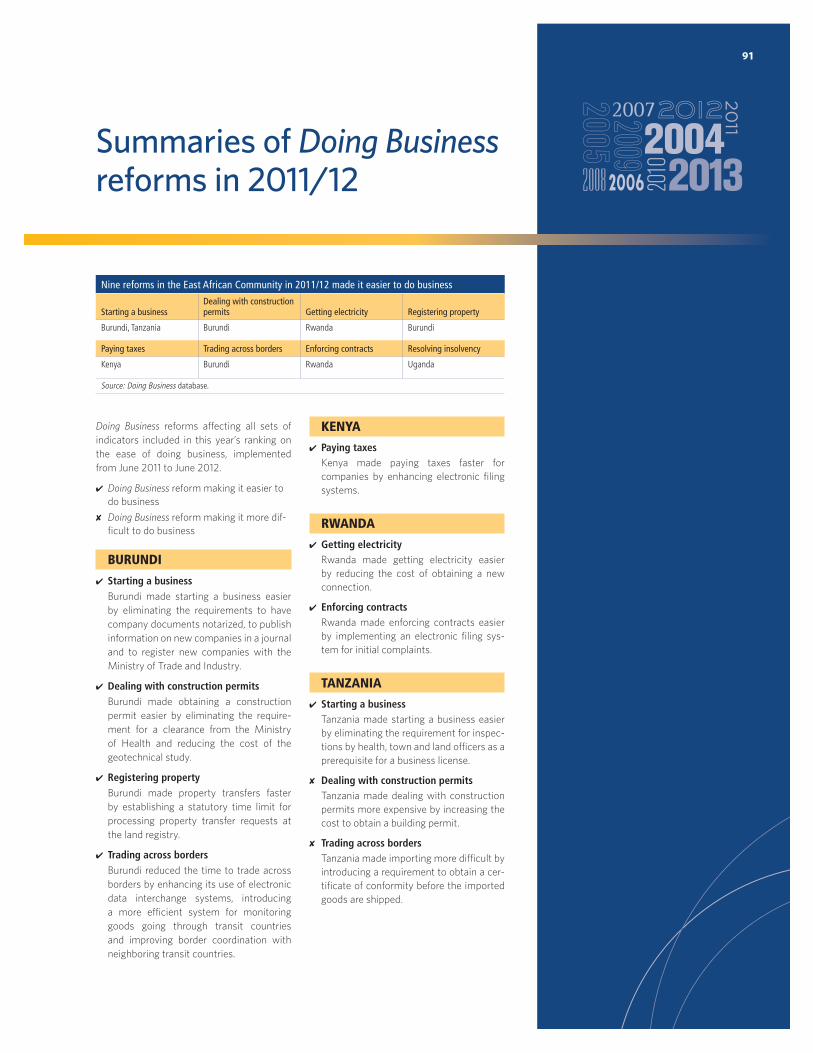
91
Summaries of Doing Businessreforms in 2011/12
Doing Business reforms affecting all sets of
indicators included in this year’s ranking on
the ease of doing business, implemented
from June 2011 to June 2012.
Doing Business reform making it easier to
do business
Doing Business reform making it more dif-
ficult to do business
BURUNDI
Starting a businessBurundi made starting a business easier
by eliminating the requirements to have
company documents notarized, to publish
information on new companies in a journal
and to register new companies with the
Ministry of Trade and Industry.
Dealing with construction permitsBurundi made obtaining a construction
permit easier by eliminating the require-
ment for a clearance from the Ministry
of Health and reducing the cost of the
geotechnical study.
Registering propertyBurundi made property transfers faster
by establishing a statutory time limit for
processing property transfer requests at
the land registry.
Trading across bordersBurundi reduced the time to trade across
borders by enhancing its use of electronic
data interchange systems, introducing
a more efficient system for monitoring
goods going through transit countries
and improving border coordination with
neighboring transit countries.
KENYA
Paying taxesKenya made paying taxes faster for
companies by enhancing electronic filing
systems.
RWANDA
Getting electricityRwanda made getting electricity easier
by reducing the cost of obtaining a new
connection.
Enforcing contractsRwanda made enforcing contracts easier
by implementing an electronic filing sys-
tem for initial complaints.
TANZANIA
Starting a businessTanzania made starting a business easier
by eliminating the requirement for inspec-
tions by health, town and land officers as a
prerequisite for a business license.
Dealing with construction permitsTanzania made dealing with construction
permits more expensive by increasing the
cost to obtain a building permit.
Trading across bordersTanzania made importing more difficult by
introducing a requirement to obtain a cer-
tificate of conformity before the imported
goods are shipped.
Nine reforms in the East African Community in 2011/12 made it easier to do business
Starting a businessDealing with construction permits Getting electricity Registering property
Burundi, Tanzania Burundi Rwanda Burundi
Paying taxes Trading across borders Enforcing contracts Resolving insolvency
Kenya Burundi Rwanda Uganda
Source: Doing Business database.
DOING BUSINESS IN THE EAST AFRICAN COMMUNITY 201392
UGANDARegistering propertyUganda made transferring property more
difficult by introducing a requirement for
property purchasers to obtain an income
tax certificate before registration, resulting
in delays at the Uganda Revenue Authority
and the Ministry of Finance. At the same
time, Uganda made it easier by digitizing
records at the title registry, increasing ef-
ficiency at the assessor’s office and making
it possible for more banks to accept the
stamp duty payment.
Resolving insolvencyUganda strengthened its insolvency
process by clarifying rules on the creation
of mortgages, establishing the duties of
mortgagors and mortgagees, defining
priority rules, providing remedies for mort-
gagors and mortgagees and establishing
the powers of receivers.
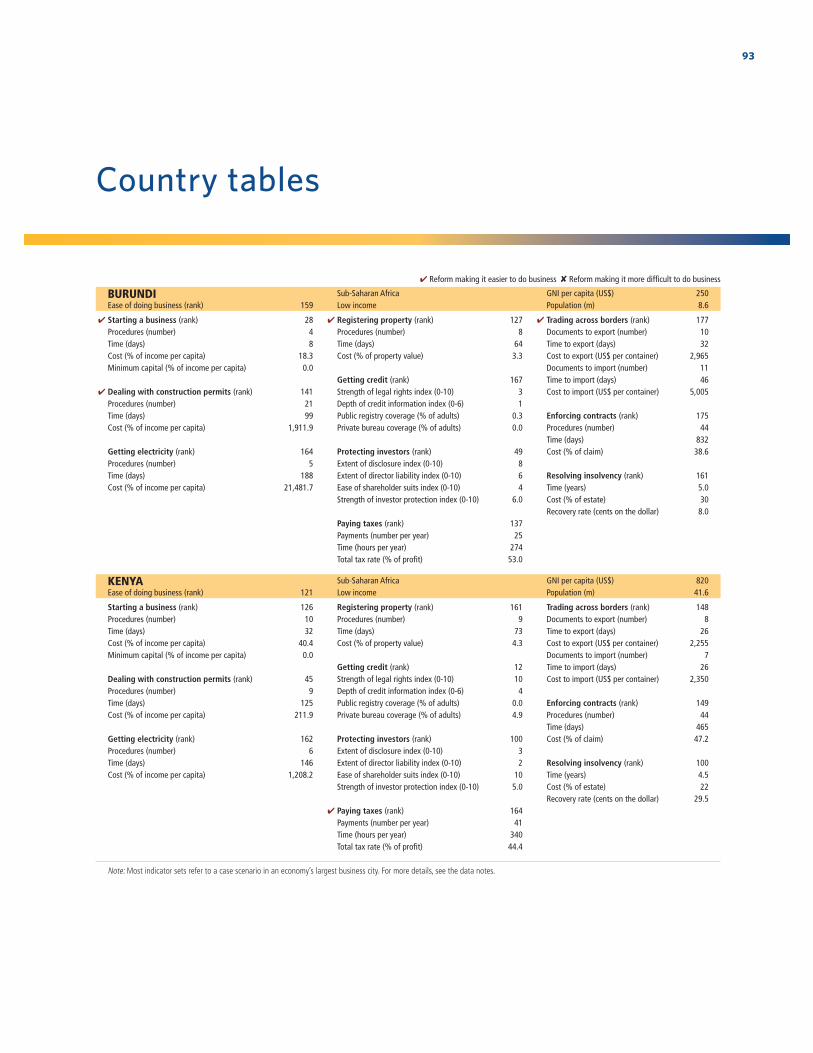
93
Country tables
Reform making it easier to do business Reform making it more difficult to do business
BURUNDI Sub-Saharan Africa GNI per capita (US$) 250Ease of doing business (rank) 159 Low income Population (m) 8.6
Starting a business (rank) 28 Registering property (rank) 127 Trading across borders (rank) 177Procedures (number) 4 Procedures (number) 8 Documents to export (number) 10Time (days) 8 Time (days) 64 Time to export (days) 32Cost (% of income per capita) 18.3 Cost (% of property value) 3.3 Cost to export (US$ per container) 2,965Minimum capital (% of income per capita) 0.0 Documents to import (number) 11
Getting credit (rank) 167 Time to import (days) 46Dealing with construction permits (rank) 141 Strength of legal rights index (0-10) 3 Cost to import (US$ per container) 5,005Procedures (number) 21 Depth of credit information index (0-6) 1Time (days) 99 Public registry coverage (% of adults) 0.3 Enforcing contracts (rank) 175Cost (% of income per capita) 1,911.9 Private bureau coverage (% of adults) 0.0 Procedures (number) 44
Time (days) 832 Getting electricity (rank) 164 Protecting investors (rank) 49 Cost (% of claim) 38.6Procedures (number) 5 Extent of disclosure index (0-10) 8Time (days) 188 Extent of director liability index (0-10) 6 Resolving insolvency (rank) 161Cost (% of income per capita) 21,481.7 Ease of shareholder suits index (0-10) 4 Time (years) 5.0
Strength of investor protection index (0-10) 6.0 Cost (% of estate) 30Recovery rate (cents on the dollar) 8.0
Paying taxes (rank) 137Payments (number per year) 25Time (hours per year) 274 Total tax rate (% of profit) 53.0
KENYA Sub-Saharan Africa GNI per capita (US$) 820Ease of doing business (rank) 121 Low income Population (m) 41.6
Starting a business (rank) 126 Registering property (rank) 161 Trading across borders (rank) 148Procedures (number) 10 Procedures (number) 9 Documents to export (number) 8Time (days) 32 Time (days) 73 Time to export (days) 26Cost (% of income per capita) 40.4 Cost (% of property value) 4.3 Cost to export (US$ per container) 2,255Minimum capital (% of income per capita) 0.0 Documents to import (number) 7
Getting credit (rank) 12 Time to import (days) 26Dealing with construction permits (rank) 45 Strength of legal rights index (0-10) 10 Cost to import (US$ per container) 2,350Procedures (number) 9 Depth of credit information index (0-6) 4Time (days) 125 Public registry coverage (% of adults) 0.0 Enforcing contracts (rank) 149Cost (% of income per capita) 211.9 Private bureau coverage (% of adults) 4.9 Procedures (number) 44
Time (days) 465 Getting electricity (rank) 162 Protecting investors (rank) 100 Cost (% of claim) 47.2Procedures (number) 6 Extent of disclosure index (0-10) 3Time (days) 146 Extent of director liability index (0-10) 2 Resolving insolvency (rank) 100Cost (% of income per capita) 1,208.2 Ease of shareholder suits index (0-10) 10 Time (years) 4.5
Strength of investor protection index (0-10) 5.0 Cost (% of estate) 22Recovery rate (cents on the dollar) 29.5
Paying taxes (rank) 164Payments (number per year) 41Time (hours per year) 340 Total tax rate (% of profit) 44.4
Note: Most indicator sets refer to a case scenario in an economy’s largest business city. For more details, see the data notes.
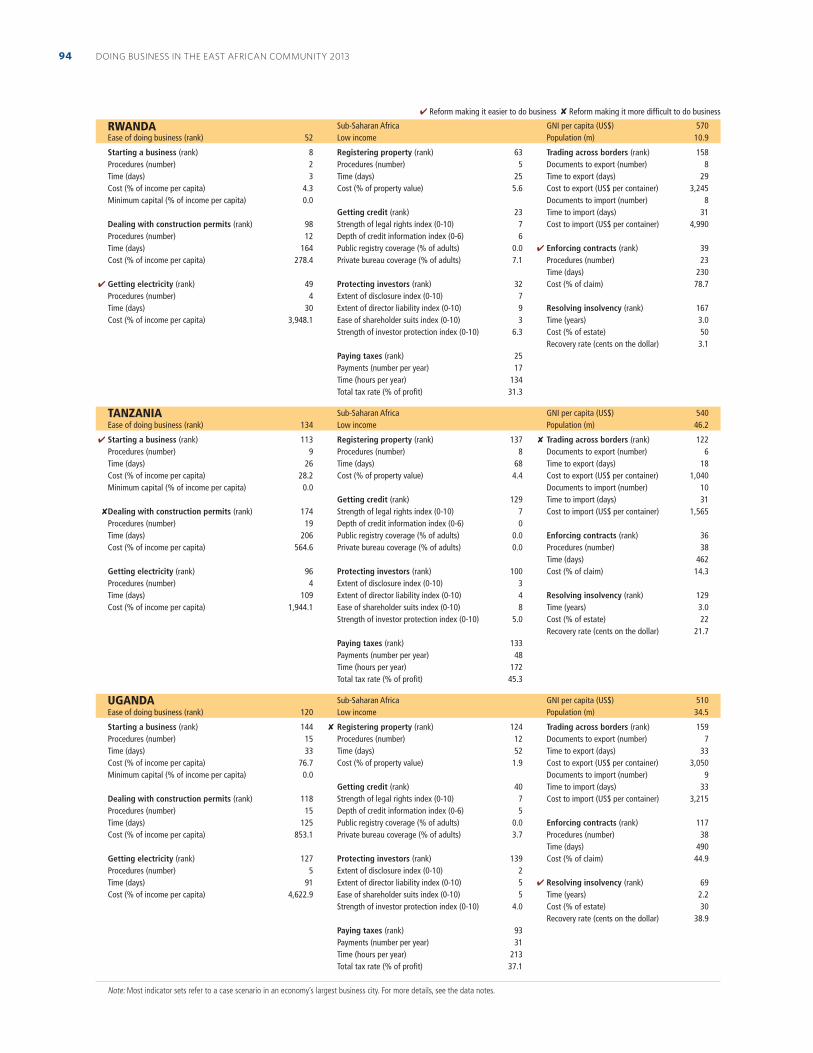
DOING BUSINESS IN THE EAST AFRICAN COMMUNITY 201394
Reform making it easier to do business Reform making it more difficult to do business
RWANDA Sub-Saharan Africa GNI per capita (US$) 570Ease of doing business (rank) 52 Low income Population (m) 10.9
Starting a business (rank) 8 Registering property (rank) 63 Trading across borders (rank) 158Procedures (number) 2 Procedures (number) 5 Documents to export (number) 8Time (days) 3 Time (days) 25 Time to export (days) 29Cost (% of income per capita) 4.3 Cost (% of property value) 5.6 Cost to export (US$ per container) 3,245Minimum capital (% of income per capita) 0.0 Documents to import (number) 8
Getting credit (rank) 23 Time to import (days) 31Dealing with construction permits (rank) 98 Strength of legal rights index (0-10) 7 Cost to import (US$ per container) 4,990Procedures (number) 12 Depth of credit information index (0-6) 6Time (days) 164 Public registry coverage (% of adults) 0.0 Enforcing contracts (rank) 39Cost (% of income per capita) 278.4 Private bureau coverage (% of adults) 7.1 Procedures (number) 23
Time (days) 230 Getting electricity (rank) 49 Protecting investors (rank) 32 Cost (% of claim) 78.7Procedures (number) 4 Extent of disclosure index (0-10) 7Time (days) 30 Extent of director liability index (0-10) 9 Resolving insolvency (rank) 167Cost (% of income per capita) 3,948.1 Ease of shareholder suits index (0-10) 3 Time (years) 3.0
Strength of investor protection index (0-10) 6.3 Cost (% of estate) 50Recovery rate (cents on the dollar) 3.1
Paying taxes (rank) 25Payments (number per year) 17Time (hours per year) 134 Total tax rate (% of profit) 31.3
TANZANIA Sub-Saharan Africa GNI per capita (US$) 540Ease of doing business (rank) 134 Low income Population (m) 46.2
Starting a business (rank) 113 Registering property (rank) 137 Trading across borders (rank) 122Procedures (number) 9 Procedures (number) 8 Documents to export (number) 6Time (days) 26 Time (days) 68 Time to export (days) 18Cost (% of income per capita) 28.2 Cost (% of property value) 4.4 Cost to export (US$ per container) 1,040Minimum capital (% of income per capita) 0.0 Documents to import (number) 10
Getting credit (rank) 129 Time to import (days) 31Dealing with construction permits (rank) 174 Strength of legal rights index (0-10) 7 Cost to import (US$ per container) 1,565Procedures (number) 19 Depth of credit information index (0-6) 0Time (days) 206 Public registry coverage (% of adults) 0.0 Enforcing contracts (rank) 36Cost (% of income per capita) 564.6 Private bureau coverage (% of adults) 0.0 Procedures (number) 38
Time (days) 462 Getting electricity (rank) 96 Protecting investors (rank) 100 Cost (% of claim) 14.3Procedures (number) 4 Extent of disclosure index (0-10) 3Time (days) 109 Extent of director liability index (0-10) 4 Resolving insolvency (rank) 129Cost (% of income per capita) 1,944.1 Ease of shareholder suits index (0-10) 8 Time (years) 3.0
Strength of investor protection index (0-10) 5.0 Cost (% of estate) 22Recovery rate (cents on the dollar) 21.7
Paying taxes (rank) 133Payments (number per year) 48Time (hours per year) 172 Total tax rate (% of profit) 45.3
UGANDA Sub-Saharan Africa GNI per capita (US$) 510Ease of doing business (rank) 120 Low income Population (m) 34.5
Starting a business (rank) 144 Registering property (rank) 124 Trading across borders (rank) 159Procedures (number) 15 Procedures (number) 12 Documents to export (number) 7Time (days) 33 Time (days) 52 Time to export (days) 33Cost (% of income per capita) 76.7 Cost (% of property value) 1.9 Cost to export (US$ per container) 3,050Minimum capital (% of income per capita) 0.0 Documents to import (number) 9
Getting credit (rank) 40 Time to import (days) 33Dealing with construction permits (rank) 118 Strength of legal rights index (0-10) 7 Cost to import (US$ per container) 3,215Procedures (number) 15 Depth of credit information index (0-6) 5Time (days) 125 Public registry coverage (% of adults) 0.0 Enforcing contracts (rank) 117Cost (% of income per capita) 853.1 Private bureau coverage (% of adults) 3.7 Procedures (number) 38
Time (days) 490 Getting electricity (rank) 127 Protecting investors (rank) 139 Cost (% of claim) 44.9Procedures (number) 5 Extent of disclosure index (0-10) 2Time (days) 91 Extent of director liability index (0-10) 5 Resolving insolvency (rank) 69Cost (% of income per capita) 4,622.9 Ease of shareholder suits index (0-10) 5 Time (years) 2.2
Strength of investor protection index (0-10) 4.0 Cost (% of estate) 30Recovery rate (cents on the dollar) 38.9
Paying taxes (rank) 93Payments (number per year) 31Time (hours per year) 213 Total tax rate (% of profit) 37.1
Note: Most indicator sets refer to a case scenario in an economy’s largest business city. For more details, see the data notes.
95
Acknowledgments
Doing Business in the East African
Community 2013 and associated activi-
ties were funded through contributions
from TradeMark East Africa (http://www
.trademarkea.com).
The report was prepared as part of IFC’s
East African Community Investment
Climate Program, which supports the
East African Community (EAC) mem-
ber states and the EAC Secretariat in
implementing the community’s com-
mon market. Further details about the
program, which was developed in close
collaboration with TradeMark East
Africa, are available at https://www
.wbginvestmentclimate.org/regions/
africa.cfm.
Doing Business in the East African
Community 2013 was prepared by a
team led by Marie Lily Delion and Nina
Paustian under the general direction of
Rita Ramalho, Peter Ladegaard and Alfred
Ombudo K’Ombudo.
The team is grateful for valuable com-
ments provided by colleagues across
the World Bank Group. Comments
were received from Rita Ramalho, Peter
Ladegaard, Alfred Ombudo K’Ombudo,
Antonia Preciosa, Rajul Awasthi, Richard
Stern, Laurent Olivier Corthay, Moses
Kajubi, Edward Mwachinga and Hadija
Murangwa.
Doing Business in the East African
Community 2013 is based on the global
Doing Business 2013 report, launched in
October 2012 (http://www.doingbusiness
.org). Data collection and analysis for
Doing Business 2013 were conducted
through the Global Indicators and Analysis
Department under the general direction
of Augusto Lopez-Claros. The project was
managed by Sylvia Solf and Rita Ramalho,
with the support of Carolin Geginat and
Adrian Gonzalez. Other team members
included Beatriz Mejia Asserias, Andres
Baquero Franco, Karim O. Belayachi,
Iryna Bilotserkivska, Mariana Carvalho,
Hayane Chang Dahmen, Rong Chen, Maya
Choueiri, Dariga Chukmaitova, Santiago
Croci Downes, Fernando Dancausa Diaz,
Marie Lily Delion, Raian Divanbeigi,
Alejandro Espinosa-Wang, Margherita
Fabbri, Caroline Frontigny, Betina Hennig,
Sarah Holmberg, Hussam Hussein, Joyce
Ibrahim, Ludmila Jantuan, Charlotte Nan
Jiang, Hervé Kaddoura, Paweł Kopko, Jean
Michel Lobet, Jean-Philippe Lodugnon-
Harding, Frédéric Meunier, Robert Murillo,
Joanna Nasr, Marie-Jeanne Ndiaye, Nuria
de Oca, Mikiko Imai Ollison, Nina Paustian,
Galina Rudenko, Valentina Saltane, Lucas
Seabra, Paula Garcia Serna, Anastasia
Shegay, Jayashree Srinivasan, Susanne
Szymanski, Moussa Traoré, Tea Trumbic,
Marina Turlakova, Julien Vilquin, Yasmin
Zand and Yucheng Zheng. The paying
taxes project was conducted in collabora-
tion with PwC, led by John Preston. The
development of the getting electricity
indicators was financed by the Norwegian
Trust Fund.
The online service of the Doing Business
database is managed by Andres Baquero
Franco, Varun Doiphode, Kunal Patel,
Mohan Pathapati, Vinod Thottikkatu and
Hashim Zia under the direction of Preeti
DOING BUSINESS IN THE EAST AFRICAN COMMUNITY 201396
Endlaw. The Doing Business 2013 report media and marketing
strategy is managed by Nadine Ghannam. The events and road-
show strategy is managed by Sushmitha Malini Narsiah.
Alison Strong copyedited the manuscript. Corporate Visions, Inc.
designed the report and the graphs.
The report was made possible by the generous contributions
of lawyers, accountants, judges, businesspeople and public of-
ficials in the 5 East African economies covered. The names of
those wishing to be acknowledged individually are listed below.
Contact details for local partners are available on the Doing
Business website at http://www.doingbusiness.org.
97ACKNOWLEDGMENTS
BURUNDIJoseph BahiziBANQUE DE LA RÉPUBLIQUE DU BURUNDI
Jean De Dieu BasabakwinshiIMATCO
Mélance BukeraBURUNDI GENERAL SERVICES
Ange GakundwakaziGPO PARTNERS BURUNDI CORRESPONDENT FIRM OF DELOITTE
Gerard HandikaGPO PARTNERS BURUNDI CORRESPONDENT FIRM OF DELOITTE
Augustin MabushiA & JN MABUSHI CABINET D’AVOCATS
René Claude MadebariMKONO & CO ADVOCATES
Rodrigue MajambereINTERCONTACT SERVICES
Trust ManjengwahWINTERTONS LAW FIRM
Anatole MiburoCABINET ANATOLE MIBURO
Ildephonse NahimanaBANQUE DE LA RÉPUBLIQUE DU BURUNDI
Patrick Ndayishimiye
Albert NdereyimanaGETRA
Gregoire NduwimanaSDV TRANSAMI BURUNDI
Bonaventure NicimpayeINTERCONTACT SERVICES
Lambert NigaruraMKONO & CO ADVOCATES
Charles Nihangaza
Montfort NininahazweSEACO
Gustave NiyonzimaMKONO & CO ADVOCATES
Prosper Niyoyankana
Jean-Marie NiyubahweSÉNAT DU BURUNDI
Jocelyne NtibanganaCABINET DE MAÎTRE NTIBANGANA
Antoine NtisiganaSODETRA LTD.
Happy NtwariMKONO & CO ADVOCATES
Patrick-Didier Nukuri
François NyamoyaAVOCAT À LA COUR
Gilbert L.P. NyatanyiMKONO & CO ADVOCATES
Déogratias NzembaAVOCAT À LA COUR
Willy RubeyaRUBEYA & CO - ADVOCATES
Benjamin RufagariGPO PARTNERS BURUNDI CORRESPONDENT FIRM OF DELOITTE
Thierry RujerwakaLABORATOIRE NATIONAL DU BÂTIMENT ET DES TRAVAUX PUBLICS (LNBTP) BURUNDI
Isaac RwankinezaENTREPRISE BTCE
Fabien SegatwaETUDE ME SEGATWA
Gabriel SinarinziCABINET ME GABRIEL SINARINZI
Audace SunzuREGIDESO
Egide UwimanaTRIBUNAL DU TRAVAIL DE BUJUMBURA
KENYAMETROPOL CORPORATION LTD.
Oliver FowlerKAPLAN & STRATTON
Peter GachuhiKAPLAN & STRATTON
Edmond GichuruPOST BANK
William Ikutha MaemaISEME, KAMAU & MAEMA ADVOCATES
Shellomith IrunguANJARWALLA & KHANNA ADVOCATES
Milly JalegaISEME, KAMAU & MAEMA ADVOCATES
Benson KamauPWC KENYA
Hamish KeithDALY & FIGGIS ADVOCATES
Peter KiaraARCHITECT
Jinaro KibetOCHIENG, ONYANGO, KIBET & OHAGA
Timothy KimanSIGINON FREIGHT LTD.
Morris KimuliB.M. MUSAU & CO. ADVOCATES
Meshack T. KipturgoSIGINON FREIGHT LTD.
Owen KoimburiKOKA KOIMBURI & CO., MEMBER OF MAZARS
David LekeraiISEME, KAMAU & MAEMA ADVOCATES
Victor MajaniCROWE HORWATH EA, MEMBER CROWE HORWATH INTERNATIONAL
Bakari MangaleNATIONAL ENVIRONMENT MANAGEMENT AUTHORITY
James Mburu KamauISEME, KAMAU & MAEMA ADVOCATES
Mansoor A. MohamedRUMAN SHIP CONTRACTORS LIMITED
Bernard MuangeANJARWALLA & KHANNA ADVOCATES
John MuoriaWARUHIU K’OWADE & NG’ANG’A ADVOCATES
Murigu MurithiARCS AFRICA
Benjamin MusauB.M. MUSAU & CO. ADVOCATES
Wachira NdegeCREDIT REFERENCE BUREAU AFRICA LTD.
Mbage Ng’ang’aWARUHIU K’OWADE & NG’ANG’A ADVOCATES
Joseph Ng’ang’iraDALY & FIGGIS ADVOCATES
Killian NgalaMEDITERRANEAN SHIPPING COMPANY (MSC), OCEANFREIGHT (E.A.) LTD.
James NgomeliTHE KENYA POWER AND LIGHTING COMPANY LTD.
Kenneth NjugunaPWC KENYA
Conrad NyukuriCHUNGA ASSOCIATES
Denis Augustine OnyangoFRONTIER DESIGNS
Cephas OsoroCROWE HORWATH EA, MEMBER CROWE HORWATH INTERNATIONAL
PrakashMASTER POWER SYSTEMS LTD.
Don PriestmanTHE KENYA POWER AND LIGHTING COMPANY LTD.
Sonal SejpalANJARWALLA & KHANNA ADVOCATES
Rajesh ShahPWC KENYA
Deepen ShahWALKER KONTOS ADVOCATES
David TankiLAN-X AFRICA LTD.
Joseph TarachaCENTRAL BANK OF KENYA
Harpreet UbhiDALY & FIGGIS ADVOCATES
Peter WahomePWC KENYA
Nicholas WambuaB.M. MUSAU & CO. ADVOCATES
Angela WaweruKAPLAN & STRATTON
RWANDABRALIRWA LTD.
NATIONAL BANK OF RWANDA
Alberto BasomingeraCABINET D’AVOCATS MHAYIMANA
Pierre Célestin BumbakareRWANDA REVENUE AUTHORITY
Eric CyagaK-SOLUTIONS AND PARTNERS
Claudine GasarabweGASARABWE CLAUDINE & ASSOCIES
Patrick GashagazaGPO PARTNERS RWANDA LIMITED, AN INDEPENDENT CORRESPONDENT FIRM OF DELOITTE TOUCHE TOHMATSU
Felix GatanaziEWSA
Jean HavugimanaECODESEP LTD.
Suzanne IyakaremyeSDV TRANSAMI
Francois Xavier KalindaUNIVERSITÉ NATIONALE DU RWANDA
Désiré KamanziKAMANZI, NTAGANIRA & ASSOCIATES
Marcellin KamanziBUREAU D’ETUDES D’ARCHITECTURE ET DE RÉALISATION (BEAR)
Julien KavarugandaK-SOLUTIONS AND PARTNERS
Rodolphe KembukuswaSDV TRANSAMI
Bernice KimaciaPWC
Isaïe MhayimanaCABINET D’AVOCATS MHAYIMANA
Joseph MpungaRWANDA DEVELOPMENT BOARD
Donatien MucyoMUCYO & ASSOCIÉS
Paul Frobisher MugambwaPWC UGANDA
Alexandre MugenzangaboMUCYO & ASSOCIÉS
Richard MugishaTRUST LAW CHAMBERS
Léopold MunderereCABINET D’AVOCATS-CONSEILS
Pothin Muvara
Ernest MwizaTOWN NICE VIEW
Jean Kizito NiyonshutiKAMANZI, NTAGANIRA & ASSOCIATES
Martin NkurunzizaGPO PARTNERS RWANDA LIMITED, AN INDEPENDENT CORRESPONDENT FIRM OF DELOITTE TOUCHE TOHMATSU
Marie Ange NsengimanaKAMANZI, NTAGANIRA & ASSOCIATES
Jean Claude NsengiyumvaTRIBUNAL DE COMMERCE DE NYARUGENGE
Paul PavlidisCREDIT REFERENCE BUREAU AFRICA LTD.
Lucien RuteranaEWSA
Etienne Ruzibiza
Sandrali SebakaraBUREAU D’ETUDES CAEDEC
Florence UmurungiFREIGHT LOGISTIC SERVICES LTD.
Ravi VadgamaCREDIT REFERENCE BUREAU AFRICA LTD.
TANZANIAERNST & YOUNG
ISHENGOMA, KARUME, MASHA & MAGAI ADVOCATES
Abdul AbdallahCRB AFRICA LEGAL
UmmiKulthum AbdallahAKO LAW IN ASSOCIATION WITH CLYDE & CO.
Zukra AllyPWC TANZANIA
Said AthumanTANZANIA REVENUE AUTHORITY
Aloys BahebeLA LAW ASSOCIATES ADVOCATES
Tadjidine Ben MohamedAVOCAT À LA COUR
Ibrahim BenderaM & B LAW CHAMBERS
Albina BurraMINISTRY OF LANDS & HUMAN SETTLEMENTS DEVELOPMENT
Vijendra J. CholeraPKF ACCOUNTANTS & BUSINESS ADVISOR TANZANIA
Magori CosmasTRADE FACILITATION UNIT, CUSTOMS
Moses DancanGAPCS
Theresia DominicUNIVERSITY OF DAR ES SALAAM
Esteriano Emmanuel MahingilaMINISTRY OF INDUSTRY & TRADE
Bosco R. GadiMINISTRY OF INDUSTRY & TRADE
Santosh GajjarSUMAR VARMA ASSOCIATES
Christopher GiattasREX ATTORNEYS
Syed HasanRAIS SHIPPING SERVICES (TANZANIA) LTD.
Beatus IdanaPKF ACCOUNTANTS & BUSINESS ADVISOR TANZANIA
Lincoln P. IrunguDL SHIPPING COMPANY LTD.
Protase R. G. IshengomaISHENGOMA, KARUME, MASHA & MAGAI ADVOCATES
Edward John UrioTANZANIA FREIGHT FORWARDERS ASSOCIATION
John R. KahyozaHIGH COURT OF TANZANIA COMMERCIAL DIVISION
Kamanga K. KapingaCRB AFRICA LEGAL
Wilbert B. KapingaMKONO & CO ADVOCATES
Edward KatekaCRB AFRICA LEGAL
David KibebeEPITOME ARCHITECTS
Shani KinswagaPWC TANZANIA
Barney LasekoPRIVATE SECTOR DEVELOPMENT AND INVESTMENT DIVISION, PRIME MINISTERS OFFICE
Simon LazaroMINISTRY OF LANDS & HUMAN SETTLEMENTS DEVELOPMENT
Amalia LuiFB ATTORNEYS
Christine M.S. ShekideleTANZANIA REVENUE AUTHORITY
Victoria MakaniVELMA LAW CHAMBERS
Robert MakarambaHIGH COURT OF TANZANIA COMMERCIAL DIVISION
Hyacintha Benedict MakileoNATIONAL CONSTRUCTION COUNCIL
G.O.L. MasangwaMOLLEL ELECTRICAL CONTRACTORS LTD.
Lydia MassaweBLUELINE ATTORNEYS
Peter S. MatindePSM ARCHITECTS CO. LTD.
Sophia MgonjaTANESCO LTD.
Nyaga MawallaMAWALLA & ASSOCIATES ADVOCATES
Ayoub MftayaNEXLAW ADVOCATES
Lucia MindeAKO LAW IN ASSOCIATION WITH CLYDE & CO.
Steven MloteENGINEERS REGISTRATION BOARD
Angela MndolwaAKO LAW IN ASSOCIATION WITH CLYDE & CO.
Chris MnyangaMINISTRY OF LANDS & HUMAN SETTLEMENTS DEVELOPMENT
George Mpeli KilinduREX ATTORNEYS
Khalfan MsumiM & B LAW CHAMBERS
PwC refers to the network of member firms of PricewaterhouseCoopers International Limited (PwCIL), or, as the context requires, individual member firms of the PwC network. Each member
firm is a separate legal entity and does not act as agent of PwCIL or any other member firm. PwCIL does not provide any services to clients. PwCIL is not responsible or liable for the acts or
omissions of any of its member firms nor can it control the exercise of their professional judgment or bind them in any way. No member firm is responsible or liable for the acts or omissions of
any other member firm nor can it control the exercise of another member firm’s professional judgment or bind another member firm or PwCIL in any way.
DOING BUSINESS IN THE EAST AFRICAN COMMUNITY 201398
Octavian MushukumaCRB AFRICA LEGAL
Bumi MwaisakaMINISTRY OF LANDS & HUMAN SETTLEMENTS DEVELOPMENT
Gerald MwakipesileMINISTRY OF LANDS & HUMAN SETTLEMENTS DEVELOPMENT
Lugano J.S. MwandamboREX ATTORNEYS
Shabani MwatawalaPSM ARCHITECTS CO. LTD.
Gerald NangiFB ATTORNEYS
Maningo NassoroNATIONAL CONSTRUCTION COUNCIL
Stephen NgatungaTANZANIA FREIGHT FORWARDERS ASSOCIATION
Alex Thomas NgulumaREX ATTORNEYS
Sweetbert NkubaLEXGLOBE LLP TANZANIA
Neema NyitiCRB AFRICA LEGAL
Cyril PeshaCRB AFRICA LEGAL
Katarina T. RevocatiHIGH COURT OF TANZANIA COMMERCIAL DIVISION
Frederick RingoADEPT CHAMBERS
Charles R.B. RwechunguraCRB AFRICA LEGAL
Emmy SalewiNORPLAN TANZANIA LIMITED
Amish ShahADEPT CHAMBERS
Rishit ShahPWC TANZANIA
Thadeus J. ShioCQS SERVICES LIMITED
Geoffrey SikiraCRB ATTORNEYS
Aliko SimonAKO LAW IN ASSOCIATION WITH CLYDE & CO.
Eve Hawa SinareREX ATTORNEYS
Richard SisaGAPCS
Joseph T. TangoCQS SERVICES LIMITED
David TarimoPWC TANZANIA
Reginald TarimoBANK OF TANZANIA
Mustafa TharooADEPT CHAMBERS
Joseph Thomas KlerruuMINISTRY OF LANDS & HUMAN SETTLEMENTS DEVELOPMENT
Sarah Thomas MassamuADEPT CHAMBERS
Irene Mutalemwa WoerleMKONO & CO ADVOCATES
Sinare ZaharanREX ATTORNEYS
UGANDAERNST & YOUNG
Claire AmanyaKAMPALA ASSOCIATED ADVOCATES
Leria ArinaitweSEBALU & LULE ADVOCATES AND LEGAL CONSULTANTS
Doreen AtuhurraPWC UGANDA
Justine BagyendaBANK OF UGANDA
Bernard BainganaPWC UGANDA
Matovu EmmyMARMA TECHNICAL SERVICES
Sarfaraz JiwaniSEYANI BROTHERS & CO. (U) LTD.
Lwanga John BoscoMARMA TECHNICAL SERVICES
Charles Kalu KalumiyaKAMPALA ASSOCIATED ADVOCATES
Francis KamulegeyaPWC UGANDA
Phillip KarugabaMMAKS ADVOCATES
Edwin KarugireKIWANUKA & KARUGIRE ADVOCATES
Baati KatendeKATENDE, SSEMPEBWA & CO. ADVOCATES
David KatendeENVIROKAD
Sim K. KatendeKATENDE, SSEMPEBWA & CO. ADVOCATES
Peter KaumaKIWANUKA & KARUGIRE ADVOCATES
Kiryowa KiwanukaKIWANUKA & KARUGIRE ADVOCATES
Brigitte Kusiima ByarugabaSHONUBI, MUSOKE & CO. ADVOCATES
Ida KussimaKATENDE, SSEMPEBWA & CO. ADVOCATES
Hakim LugemwaUGANDA ENTREPRENEURS BUSINESS FOUNDATION
Michael MalanCOMPUSCAN CRB LTD.
Paul MbugaSEBALU & LULE ADVOCATES AND LEGAL CONSULTANTS
John MpambalaKAMPALA CITY COUNCIL
Andrew Munanura KamuteeraSEBALU & LULE ADVOCATES AND LEGAL CONSULTANTS
Peters MusokeSHONUBI, MUSOKE & CO. ADVOCATES
Rachel Mwanje MusokeMMAKS ADVOCATES
Benon MutambiELECTRICITY REGULATORY AUTHORITY
Jimmy M. MuyanjaMUYANJA & ASSOCIATES
Noah MwesigwaSHONUBI, MUSOKE & CO. ADVOCATES
Plaxeda NamirimuPWC UGANDA
Sophia NampijjaKATENDE, SSEMPEBWA & CO. ADVOCATES
Kassim Ngude
Diana NinsiimaMMAKS ADVOCATES
James Kagiri NjorogePRICE & KING CERTIFIED PUBLIC ACCOUNTANTS
Eddie Nsamba-GayiiyaCONSULTANT SURVEYORS AND PLANNERS
William Okello
Silver Adowa OwaragaMAGEZI, IBALE & CO. ADVOCATES
Enoch SabiitiSTEMA ASSOCIATES
Moses SegawaSEBALU & LULE ADVOCATES AND LEGAL CONSULTANTS
Lawrence SengendoKAMPALA CITY COUNCIL
Alan ShonubiSHONUBI, MUSOKE & CO. ADVOCATES
Manish SiyaniSEYANI BROTHERS & CO. (U) LTD.
Charles Lwanga Ssemanda
Obed TindyebwaGRAND & NOBLE, CERTIFIED PUBLIC ACCOUNTANTS
Ambrose TuryahabweDHL GLOBAL FORWARDING (U) LTD.
Isaac WalukaggaMMAKS ADVOCATES


WWW.DOINGBUSINESS.ORG/EAC