Paying Taxes 2017 - Doing Business
148
Paying Taxes 2017 www.pwc.com/payingtaxes Now including a new measure: the post-filing index. +1
-
Upload
khangminh22 -
Category
Documents
-
view
0 -
download
0
Transcript of Paying Taxes 2017 - Doing Business
Paying Taxes 2017
www.pwc.com/payingtaxes
Now including a new measure: the post-filing index.
+1
2 Paying Taxes 2017
Contacts
PwC*
Stef van WeeghelLeader, Global Tax Policy and Administration NetworkPwC Netherlands+31 88 792 [email protected]
Andrew Packman Tax Transparency and Total Tax Contribution leaderPwC UK+44 1895 522 [email protected]
Neville Howlett Director External Relations, TaxPwC UK+44 20 7212 [email protected]
Tom DaneSenior Manager, TaxPwC UK +44 20 7804 7712 [email protected]
World Bank GroupAugusto Lopez-ClarosDirector Global Indicators Group+1 202 458 8945 [email protected]
Rita RamalhoManager Doing Business Unit+1 202 458 [email protected]
Joanna NasrPrivate Sector Development SpecialistDoing Business Unit+ 1 202 458 [email protected]
Hulya UlkuSenior Economist Doing Business Unit+ 603 2263 [email protected]
* PwC refers to the PwC network and/or one or more of its member firms, each of which is a separate legal entity. Please see www.pwc.com/structure for further details.
1Foreword
Contents
Foreword 2
Key findings 4
What this publication covers 12
World Bank Group commentary 18
PwC commentary 30
Country articles 58
Costa Rica – Digital innovation to increase voluntary compliance 60
Côte d’Ivoire – Achieving tax reform and broadening the taxable base 62
Ecuador – Pressures on government finances leading to increased tax regulation 64
Hungary – Slow but steady improvements to the tax system 66
Indonesia – Improvements realised and more to come 68
Beyond Paying Taxes: Tax policy and administration 70
A role for corporates in tax system reform 71
The rising importance of consumption taxes in government tax revenues 80
Methodology and example calculations for Paying Taxes sub-indicators 88
Economy sub-indicator results by region 102
The data tables 124
Chapter 1
Chapter 2
Chapter 3
Chapter 4
Appendix 1
Appendix 2
Appendix 3

2 Paying Taxes 2017
ForewordThis eleventh edition of Paying Taxes comes at a time when, with low commodity prices and continued weak economic growth, there is an increasing need to broaden tax bases, increase voluntary compliance and build tax capacity, particularly in developing economies. Everyone benefits if tax systems are well understood and are effective and efficient. To achieve this, systems need to minimise the administrative burden that they place upon governments and taxpayers while raising the revenues that are needed to fund public services.
The Paying Taxes study looks at how easy it is for a standardised, medium-sized domestic company to pay its taxes. By gathering and analysing comprehensive quantitative data to compare business taxation over time and across economies, Paying Taxes encourages economies to move towards more efficient systems, offers measurable benchmarks for reform, and serves as a resource for academics, journalists, private sector researchers and others interested in tax systems.
How easy it is to pay taxes is not just about the amount of tax paid. It also concerns the compliance and administrative requirements necessary to determine and pay the amount due. As in previous years, the study measures the amount of tax that the case study company bears and the time and effort required to deal with preparing and filing its tax returns. We can now look at trends in these measures over an eleven year period. In addition, this year, for the first time, the study includes a ‘post-filing index’ which measures certain processes that might take place after a tax return has been filed. For many companies these can represent the most complex interactions with a tax authority and in many economies the process of agreeing the final tax liabilities and, potentially, obtaining refunds of taxes paid, can be complex and time-consuming.
Andrew Packman
Tax Transparency and Total Tax Contribution leader
PwC UK
Augusto Lopez-Claros
Director, Global Indicators Group
The World Bank Group
3Foreword
The challenge has been to create some simple fact patterns which allow a like-for-like comparison to be made across as many economies as possible. To do this, we have created an index which measures two specific processes; obtaining a value-added tax (VAT) refund, and dealing with a voluntary correction of an inadvertent error in a corporate income tax (CIT) return, including dealing with an audit if applicable. Where these taxes do not exist in an economy, then the index simply does not measure the post-filing position for that type of tax in that economy.
Further details on how the new index is measured and its four components can be found in Appendix 1. For the VAT refund, the best performing economies are those which offer a cash refund in the shortest possible time, with the minimum amount of effort. Where the VAT refund claim is likely to trigger an audit, this is taken into account and will usually increase both the time to comply with the refund claim and the waiting time before the refund is received. For the correction of the CIT error, the best performing economies are those where the correction of the tax return is not expected to trigger an audit. In these cases, the index simply measures the time required to make the correction as there is no audit time to be taken into account.
Tax audits are an essential part of a properly functioning tax system as they help ensure that taxpayers meet their compliance obligations. There is however a balance to be struck between the extent and nature of a tax audit and the amounts of tax that are potentially being underpaid, to help ensure that the limited resources available to tax authorities are targeted at the areas which present the highest risk.
We have long advocated the introduction of good electronic systems for paying and filing tax returns. These benefit both taxpayers and tax authorities. Electronic systems provide vast amounts of data which tax authorities can analyse and correlate with other datasets to identify unusual transactions and patterns of behaviour and so assess the level of risk presented by individual companies.1 In countries where such electronic data is unavailable, or is unreliable, then more audits may be required than in economies with large electronic datasets and sophisticated data analysis tools. Care should therefore be taken when comparing the post-filing index scores of different economies which are at varying stages of economic development and which have differing levels of sophistication in their tax systems.
The introduction of the new post-filing index has been a significant challenge, but we hope that it provides valuable insight to you and we welcome suggestions for how the index can be improved.
This publication also includes two articles which look beyond the case study. The first article considers that while paying taxes is an important part of how companies contribute to society, companies may have more to offer. We explore the role corporates can play in reforming tax systems and consider some of the barriers that inhibit this. The second article looks at the rising importance of consumption taxes to governments and the challenges of creating effective and efficient VAT systems.
We hope that this publication continues to generate data and different perspectives that you find useful. Your comments and feedback are always very welcome and we would be delighted to hear from you.
Andrew Packman Augusto Lopez-Claros
In many economies, post-filing processes can be the most complex interactions between tax authorities and taxpayers.
1 Cleary, D. “Predictive Analytics in the Public Sector: Using Data Mining to Assist Better Target Selection for Audit” Electronic Journal of e-Government Volume 9 Issue 2 2011, (pp132 – 140), available online at www.ejeg.com/volume9/issue2
4 Paying Taxes 2017
Key findings from the Paying Taxes 2017 data
DownDown
Down
44Other taxes
Profit taxes
Labour taxes
Total Tax Rate
40.6%Time to comply
251hours
Number of payments
25New!Post-filing
index
838 24
0.1% 8 0.8
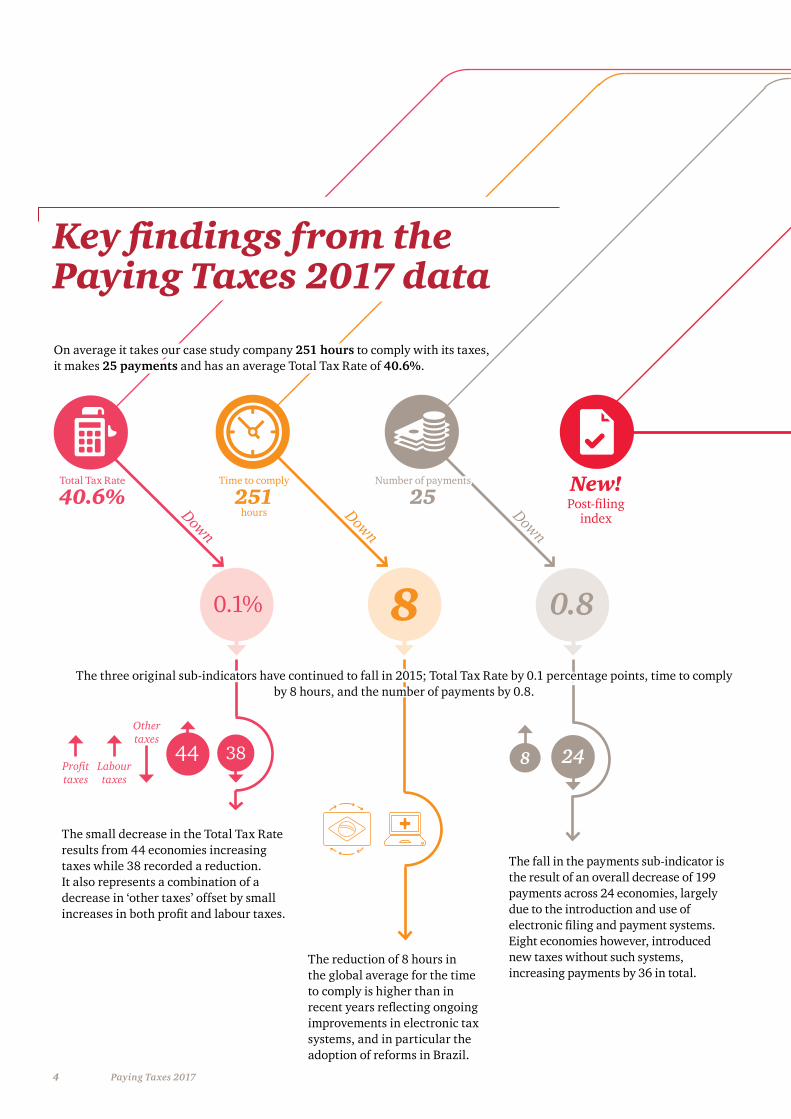
The three original sub-indicators have continued to fall in 2015; Total Tax Rate by 0.1 percentage points, time to comply by 8 hours, and the number of payments by 0.8.
The small decrease in the Total Tax Rate results from 44 economies increasing taxes while 38 recorded a reduction. It also represents a combination of a decrease in ‘other taxes’ offset by small increases in both profit and labour taxes.
The reduction of 8 hours in the global average for the time to comply is higher than in recent years reflecting ongoing improvements in electronic tax systems, and in particular the adoption of reforms in Brazil.
The fall in the payments sub-indicator is the result of an overall decrease of 199 payments across 24 economies, largely due to the introduction and use of electronic filing and payment systems. Eight economies however, introduced new taxes without such systems, increasing payments by 36 in total.
On average it takes our case study company 251 hours to comply with its taxes, it makes 25 payments and has an average Total Tax Rate of 40.6%.
5Key findings
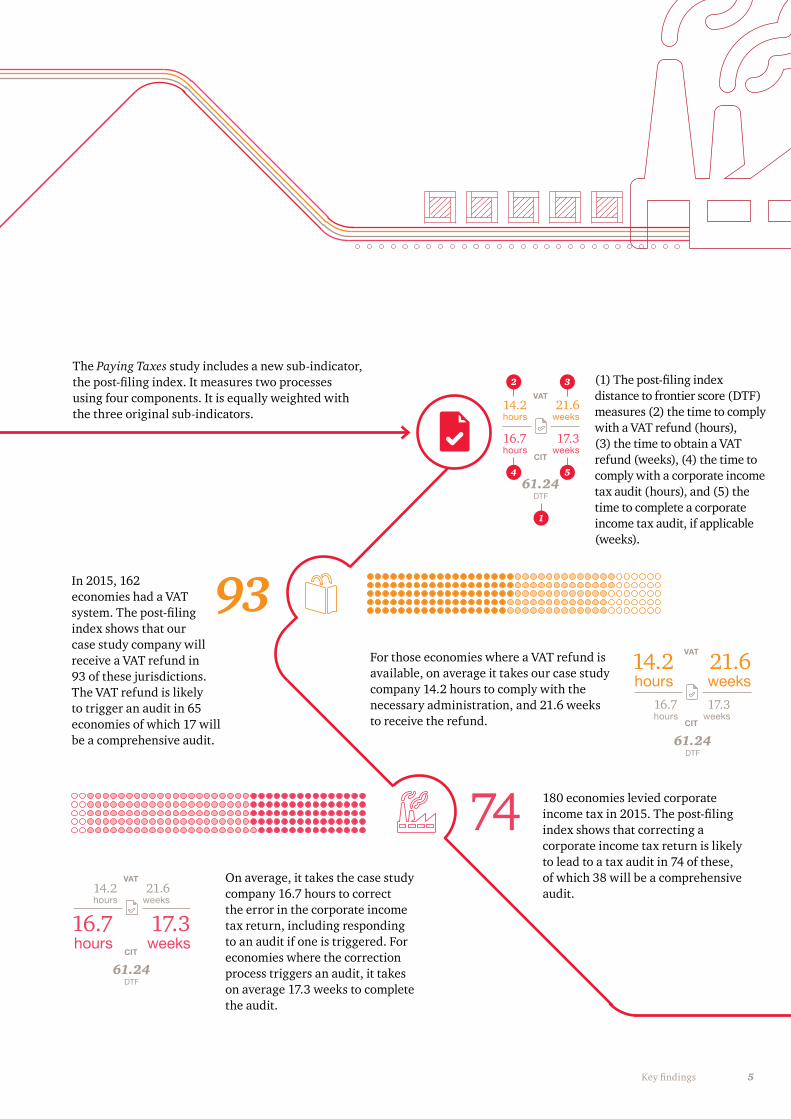
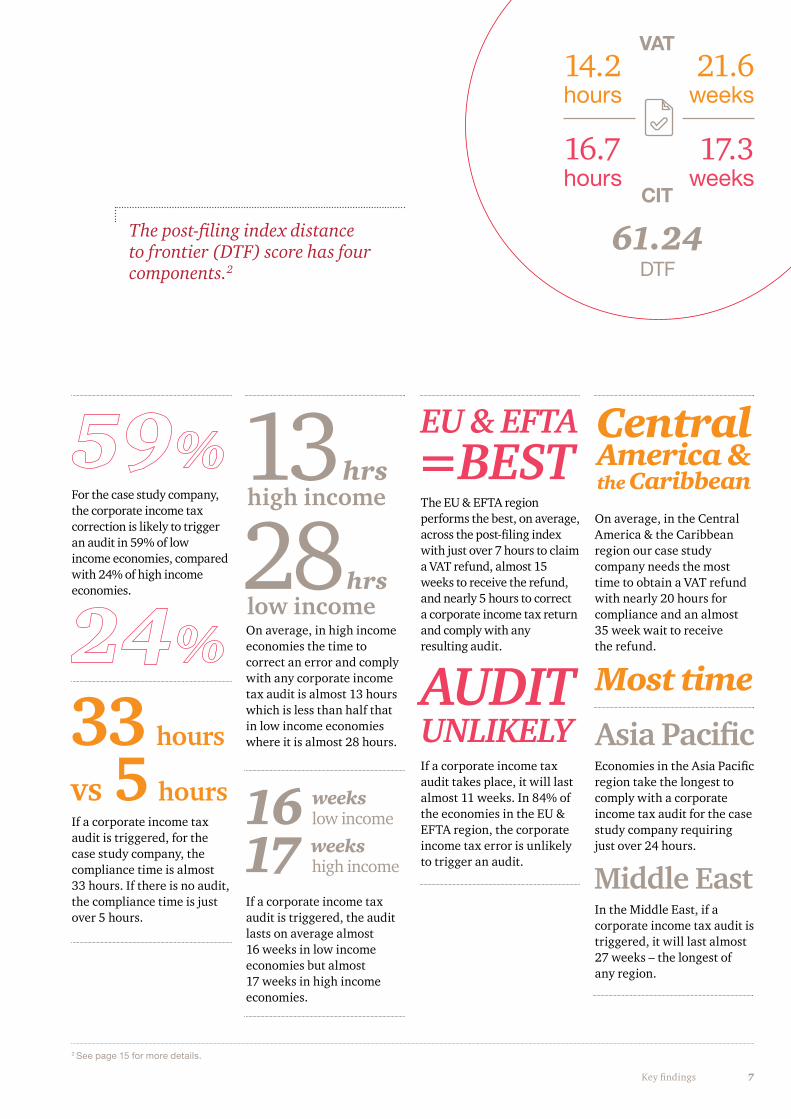
(1) The post-filing index distance to frontier score (DTF) measures (2) the time to comply with a VAT refund (hours), (3) the time to obtain a VAT refund (weeks), (4) the time to comply with a corporate income tax audit (hours), and (5) the time to complete a corporate income tax audit, if applicable (weeks).
The Paying Taxes study includes a new sub-indicator, the post-filing index. It measures two processes using four components. It is equally weighted with the three original sub-indicators.
For those economies where a VAT refund is available, on average it takes our case study company 14.2 hours to comply with the necessary administration, and 21.6 weeks to receive the refund.
180 economies levied corporate income tax in 2015. The post-filing index shows that correcting a corporate income tax return is likely to lead to a tax audit in 74 of these, of which 38 will be a comprehensive audit.
On average, it takes the case study company 16.7 hours to correct the error in the corporate income tax return, including responding to an audit if one is triggered. For economies where the correction process triggers an audit, it takes on average 17.3 weeks to complete the audit.
93
74
14.2 hours
21.6 weeks
16.7hours
17.3weeks
VAT
CIT
16.7 hours
17.3 weeks
14.2hours
21.6weeks
VAT
CIT
14.2hours
16.7hours
21.6weeks
17.3weeks
61.24DTF
VAT
CIT
61.24DTF
61.24DTF
2
4
1
3
5
In 2015, 162 economies had a VAT system. The post-filing index shows that our case study company will receive a VAT refund in 93 of these jurisdictions. The VAT refund is likely to trigger an audit in 65 economies of which 17 will be a comprehensive audit.
6 Paying Taxes 2017
On average it takes less time to comply with a VAT refund in high income economies, (almost 8 hours) than in low income economies (almost 27 hours).
In high income economies, our case study company will on average obtain a VAT refund more quickly (in almost 16 weeks) than low income economies (just over 28 weeks).
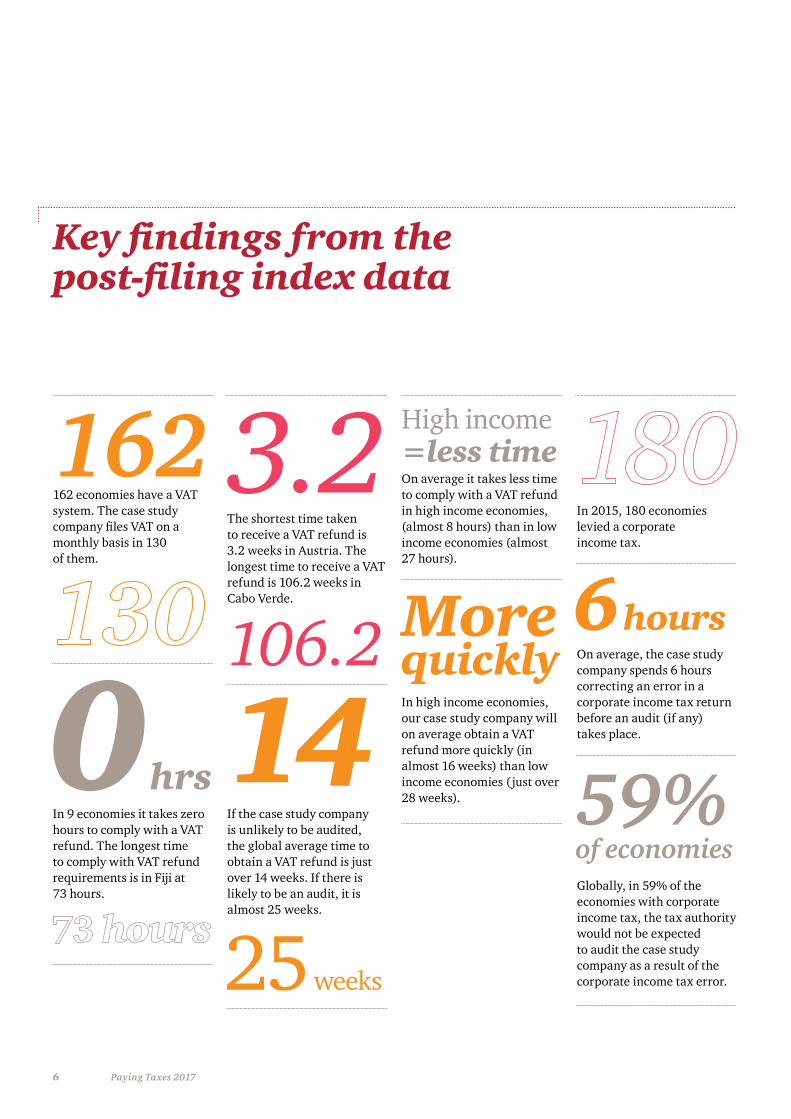
Key findings from the post-filing index data
162 economies have a VAT system. The case study company files VAT on a monthly basis in 130 of them.
In 9 economies it takes zero hours to comply with a VAT refund. The longest time to comply with VAT refund requirements is in Fiji at 73 hours.
The shortest time taken to receive a VAT refund is 3.2 weeks in Austria. The longest time to receive a VAT refund is 106.2 weeks in Cabo Verde.
If the case study company is unlikely to be audited, the global average time to obtain a VAT refund is just over 14 weeks. If there is likely to be an audit, it is almost 25 weeks.
In 2015, 180 economies levied a corporate income tax.
On average, the case study company spends 6 hours correcting an error in a corporate income tax return before an audit (if any) takes place.
Globally, in 59% of the economies with corporate income tax, the tax authority would not be expected to audit the case study company as a result of the corporate income tax error.
14
25 weeks
3.2
0hrs
162
More quickly
6 hours106.2
59% of economies
High income =less time
7Key findings
On average, in the Central America & the Caribbean region our case study company needs the most time to obtain a VAT refund with nearly 20 hours for compliance and an almost 35 week wait to receive the refund.
Economies in the Asia Pacific region take the longest to comply with a corporate income tax audit for the case study company requiring just over 24 hours.
In the Middle East, if a corporate income tax audit is triggered, it will last almost 27 weeks – the longest of any region.
For the case study company, the corporate income tax correction is likely to trigger an audit in 59% of low income economies, compared with 24% of high income economies.
If a corporate income tax audit is triggered, for the case study company, the compliance time is almost 33 hours. If there is no audit, the compliance time is just over 5 hours.
On average, in high income economies the time to correct an error and comply with any corporate income tax audit is almost 13 hours which is less than half that in low income economies where it is almost 28 hours.
If a corporate income tax audit is triggered, the audit lasts on average almost 16 weeks in low income economies but almost 17 weeks in high income economies.
The EU & EFTA region performs the best, on average, across the post-filing index with just over 7 hours to claim a VAT refund, almost 15 weeks to receive the refund, and nearly 5 hours to correct a corporate income tax return and comply with any resulting audit.
If a corporate income tax audit takes place, it will last almost 11 weeks. In 84% of the economies in the EU & EFTA region, the corporate income tax error is unlikely to trigger an audit.
33 hours
vs 5 hours
13 hrs high income
28 hrs low income
EU & EFTA =BEST
AUDIT UNLIKELY
Most time
Asia Pacific
Central America & the Caribbean
Middle East
16 weeks
17 weeks
low income
high income
14.2hours
16.7hours
21.6weeks
17.3weeks
61.24DTF
VAT
CIT
The post-filing index distance to frontier (DTF) score has four components.2
2 See page 15 for more details.
Key findings – the regional picture3
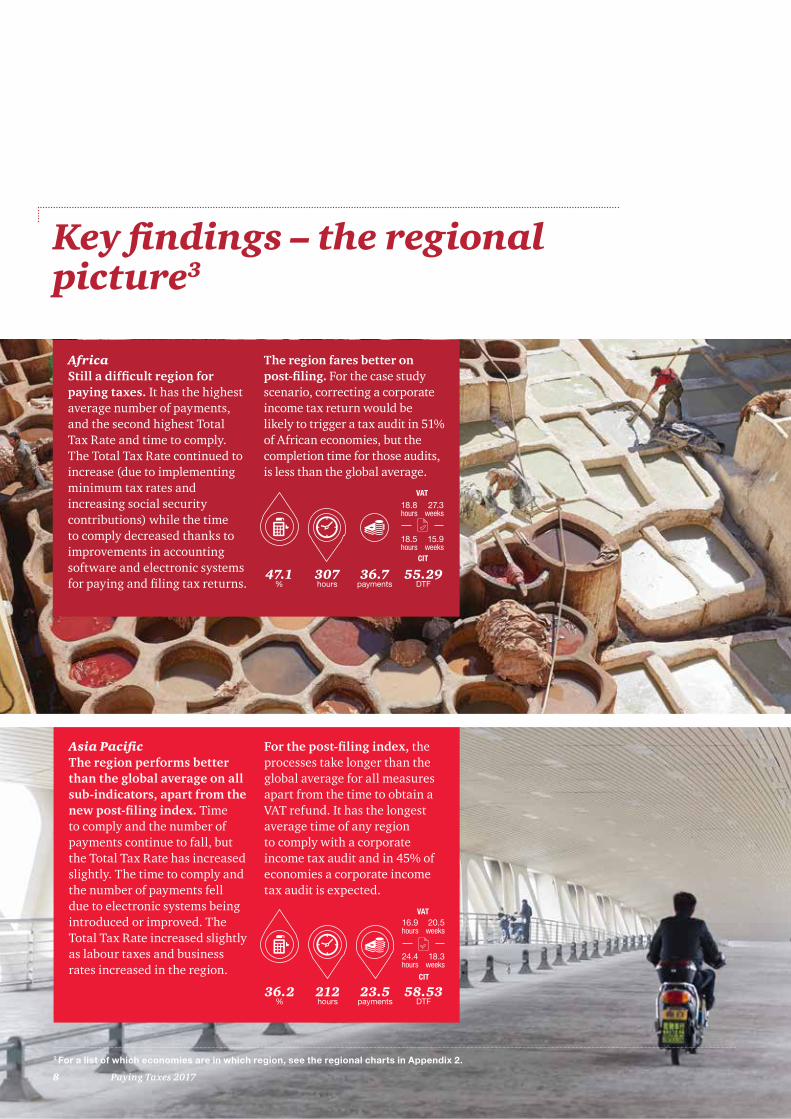
Africa Still a difficult region for paying taxes. It has the highest average number of payments, and the second highest Total Tax Rate and time to comply. The Total Tax Rate continued to increase (due to implementing minimum tax rates and increasing social security contributions) while the time to comply decreased thanks to improvements in accounting software and electronic systems for paying and filing tax returns.
The region fares better on post-filing. For the case study scenario, correcting a corporate income tax return would be likely to trigger a tax audit in 51% of African economies, but the completion time for those audits, is less than the global average.
36.7payments
55.29DTF
307hours
47.1%
18.8hours
18.5hours
VAT
CIT
27.3weeks
15.9weeks
Asia Pacific The region performs better than the global average on all sub-indicators, apart from the new post-filing index. Time to comply and the number of payments continue to fall, but the Total Tax Rate has increased slightly. The time to comply and the number of payments fell due to electronic systems being introduced or improved. The Total Tax Rate increased slightly as labour taxes and business rates increased in the region.
For the post-filing index, the processes take longer than the global average for all measures apart from the time to obtain a VAT refund. It has the longest average time of any region to comply with a corporate income tax audit and in 45% of economies a corporate income tax audit is expected.
23.5payments
58.53DTF
212hours
36.2%
16.9hours
24.4hours
20.5weeks
18.3weeks
VAT
CIT
8 Paying Taxes 2017
3 For a list of which economies are in which region, see the regional charts in Appendix 2.
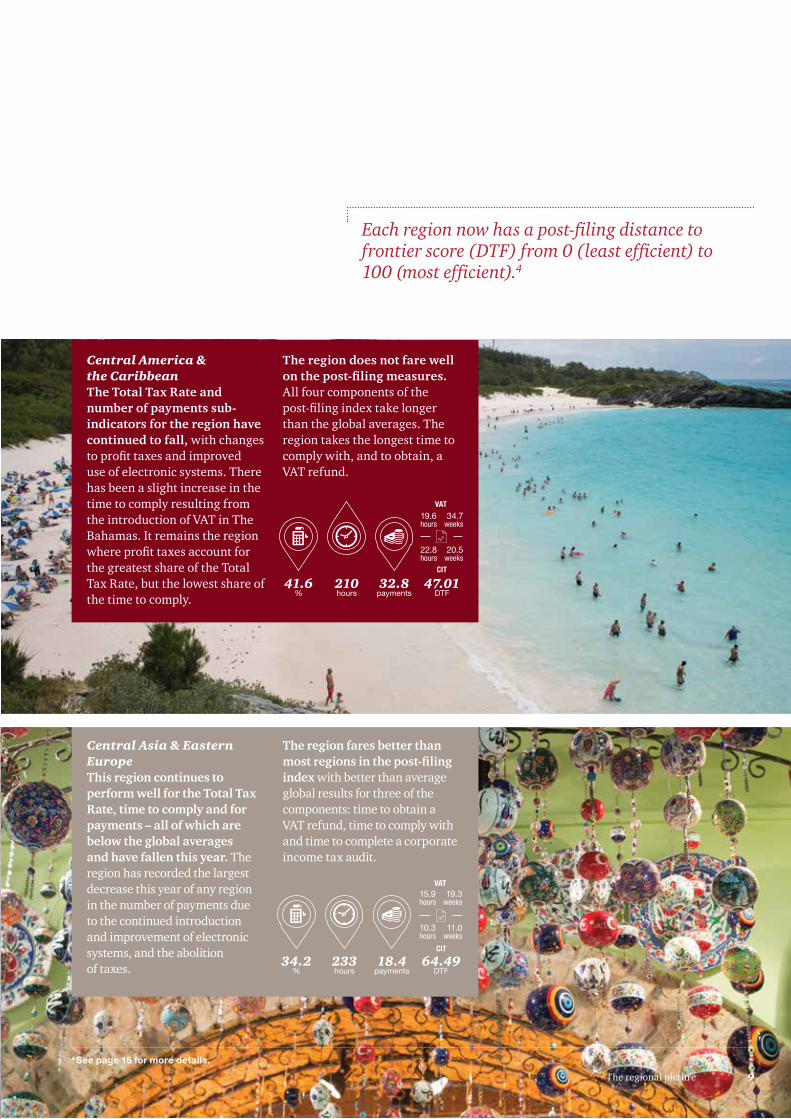
Each region now has a post-filing distance to frontier score (DTF) from 0 (least efficient) to 100 (most efficient).4
Central America & the Caribbean The Total Tax Rate and number of payments sub-indicators for the region have continued to fall, with changes to profit taxes and improved use of electronic systems. There has been a slight increase in the time to comply resulting from the introduction of VAT in The Bahamas. It remains the region where profit taxes account for the greatest share of the Total Tax Rate, but the lowest share of the time to comply.
The region does not fare well on the post-filing measures. All four components of the post-filing index take longer than the global averages. The region takes the longest time to comply with, and to obtain, a VAT refund.
32.8payments
47.01DTF
210hours
41.6%
19.6hours
22.8hours
34.7weeks
20.5weeks
Central Asia & Eastern Europe This region continues to perform well for the Total Tax Rate, time to comply and for payments – all of which are below the global averages and have fallen this year. The region has recorded the largest decrease this year of any region in the number of payments due to the continued introduction and improvement of electronic systems, and the abolition of taxes.
The region fares better than most regions in the post-filing index with better than average global results for three of the components: time to obtain a VAT refund, time to comply with and time to complete a corporate income tax audit.
18.4payments
64.49DTF
233hours
34.2%
15.9hours
10.3hours
19.3weeks
11.0weeks
VAT
CIT
VAT
CIT
9The regional picture
4 See page 15 for more details.
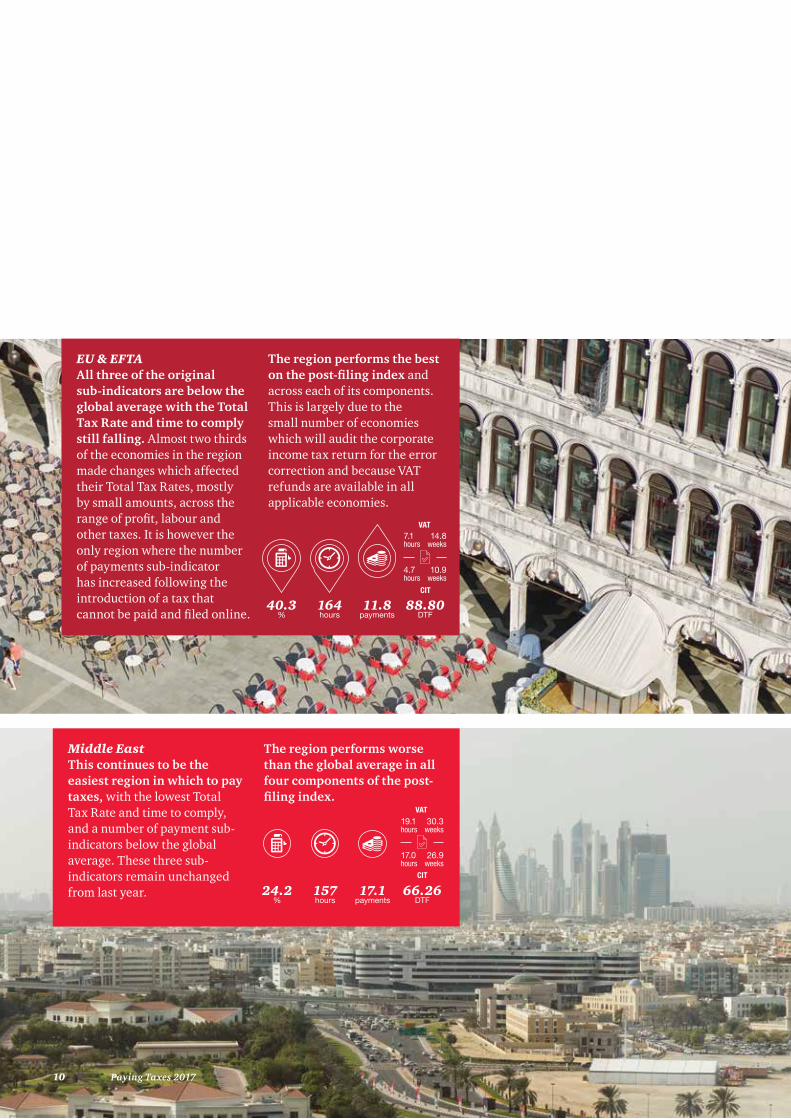
EU & EFTA All three of the original sub-indicators are below the global average with the Total Tax Rate and time to comply still falling. Almost two thirds of the economies in the region made changes which affected their Total Tax Rates, mostly by small amounts, across the range of profit, labour and other taxes. It is however the only region where the number of payments sub-indicator has increased following the introduction of a tax that cannot be paid and filed online.
The region performs the best on the post-filing index and across each of its components. This is largely due to the small number of economies which will audit the corporate income tax return for the error correction and because VAT refunds are available in all applicable economies.
Middle East This continues to be the easiest region in which to pay taxes, with the lowest Total Tax Rate and time to comply, and a number of payment sub- indicators below the global average. These three sub-indicators remain unchanged from last year.
The region performs worse than the global average in all four components of the post-filing index.
11.8payments
88.80 DTF
164hours
40.3%
7.1hours
4.7hours
14.8weeks
10.9weeks
17.1payments
66.26DTF
157hours
24.2 %
19.1hours
17.0hours
30.3weeks
26.9weeks
VAT
CIT
VAT
CIT
10 Paying Taxes 2017

The EU & EFTA region performs the best on the new post-filing index, and South America has the least efficient post-filing systems.
South America The region shows the greatest reduction in the Total Tax Rate and time to comply since last year, but these sub-indicators remain the highest of any region. The Total Tax Rate has fallen as the threshold rates for a turnover tax changed. The time to comply fell as the introduction and improvement of electronic systems across the region took effect which also kept the payment sub-indicator below the global average.
South America has the least efficient post-filing processes of all regions, predominantly because VAT refunds are not available to the case study company in any economy and the corporate income tax processes take longer than the global average.
8.2payments
70.73DTF
197hours
39.0%
13.8hours
13.2hours
23.5weeks
23.9weeks
22.6payments
33.00DTF
564hours
52.3%
N/Ahours
20.7hours
N/Aweeks
23.4weeks
VAT
CIT
VAT
CIT
11The regional picture
North AmericaThis region, with its three economies, still has the lowest payments sub-indicator and the time to comply also remains below the global average. Despite a small increase due to changes in property and labour taxes, the region’s Total Tax Rate remains below the global average.
The region scores well on the post-filing index largely because the case study company is unlikely to be audited as a result of the corporate income tax correction in the United States.

12 Paying Taxes 2017
What this publication covers
13What this publication covers
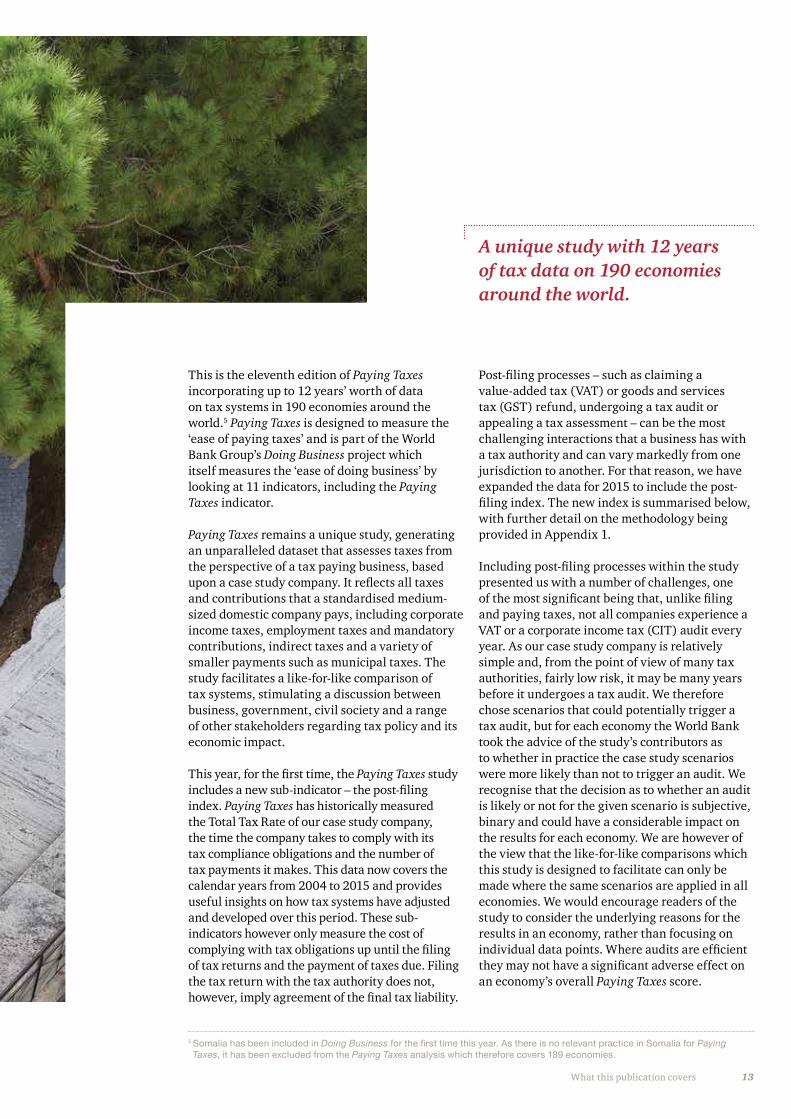
A unique study with 12 years of tax data on 190 economies around the world.
This is the eleventh edition of Paying Taxes incorporating up to 12 years’ worth of data on tax systems in 190 economies around the world.5 Paying Taxes is designed to measure the ‘ease of paying taxes’ and is part of the World Bank Group’s Doing Business project which itself measures the ‘ease of doing business’ by looking at 11 indicators, including the Paying Taxes indicator.
Paying Taxes remains a unique study, generating an unparalleled dataset that assesses taxes from the perspective of a tax paying business, based upon a case study company. It reflects all taxes and contributions that a standardised medium-sized domestic company pays, including corporate income taxes, employment taxes and mandatory contributions, indirect taxes and a variety of smaller payments such as municipal taxes. The study facilitates a like-for-like comparison of tax systems, stimulating a discussion between business, government, civil society and a range of other stakeholders regarding tax policy and its economic impact.
This year, for the first time, the Paying Taxes study includes a new sub-indicator – the post-filing index. Paying Taxes has historically measured the Total Tax Rate of our case study company, the time the company takes to comply with its tax compliance obligations and the number of tax payments it makes. This data now covers the calendar years from 2004 to 2015 and provides useful insights on how tax systems have adjusted and developed over this period. These sub-indicators however only measure the cost of complying with tax obligations up until the filing of tax returns and the payment of taxes due. Filing the tax return with the tax authority does not, however, imply agreement of the final tax liability.
Post-filing processes – such as claiming a value-added tax (VAT) or goods and services tax (GST) refund, undergoing a tax audit or appealing a tax assessment – can be the most challenging interactions that a business has with a tax authority and can vary markedly from one jurisdiction to another. For that reason, we have expanded the data for 2015 to include the post-filing index. The new index is summarised below, with further detail on the methodology being provided in Appendix 1.
Including post-filing processes within the study presented us with a number of challenges, one of the most significant being that, unlike filing and paying taxes, not all companies experience a VAT or a corporate income tax (CIT) audit every year. As our case study company is relatively simple and, from the point of view of many tax authorities, fairly low risk, it may be many years before it undergoes a tax audit. We therefore chose scenarios that could potentially trigger a tax audit, but for each economy the World Bank took the advice of the study’s contributors as to whether in practice the case study scenarios were more likely than not to trigger an audit. We recognise that the decision as to whether an audit is likely or not for the given scenario is subjective, binary and could have a considerable impact on the results for each economy. We are however of the view that the like-for-like comparisons which this study is designed to facilitate can only be made where the same scenarios are applied in all economies. We would encourage readers of the study to consider the underlying reasons for the results in an economy, rather than focusing on individual data points. Where audits are efficient they may not have a significant adverse effect on an economy’s overall Paying Taxes score.
5 Somalia has been included in Doing Business for the first time this year. As there is no relevant practice in Somalia for Paying Taxes, it has been excluded from the Paying Taxes analysis which therefore covers 189 economies.
14 Paying Taxes 2017
The objectives of the Paying Taxes study The objectives of the study are to:
• compare domestic tax systems on a like-for-like basis;
• facilitate the benchmarking of tax systems within relevant economic and geographical groupings, which provides an opportunity to learn from peer group economies;
• analyse data and identify good tax practices and reforms;
• generate robust tax data on 190 economies around the world, including how they have changed over time, which then can be used to inform tax policy decisions.6
The case study and data collection processPaying Taxes uses a case study company to measure the ease of paying taxes by evaluating the taxes and contributions paid by a medium-sized company and the compliance burden imposed by the tax system. The case study scenario is based upon a standardised set of financial statements with all items in the financial statements calculated as a fixed multiple of gross national income per capita (GNIpc) for each economy. There are also standard assumptions about transactions, employees, cross-border transactions and ownership. The case study company is not intended to be a representative company, but has been constructed to facilitate a comparison of the world’s tax systems on a like-for-like basis.
Data is gathered through a questionnaire which is completed by at least two tax specialists (contributors) within each economy, including PwC.7 The World Bank Group reviews and compares the data from the different contributors to reach a consensus view.
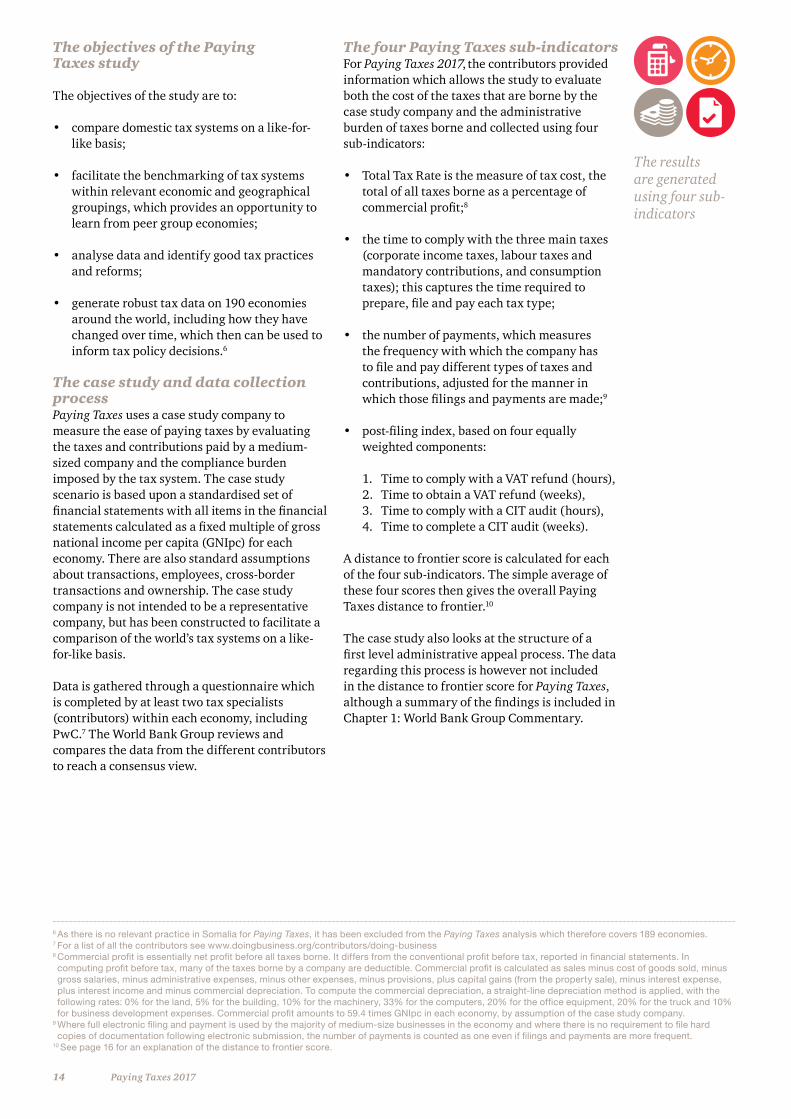
The four Paying Taxes sub-indicatorsFor Paying Taxes 2017, the contributors provided information which allows the study to evaluate both the cost of the taxes that are borne by the case study company and the administrative burden of taxes borne and collected using four sub-indicators:
• Total Tax Rate is the measure of tax cost, the total of all taxes borne as a percentage of commercial profit;8
• the time to comply with the three main taxes (corporate income taxes, labour taxes and mandatory contributions, and consumption taxes); this captures the time required to prepare, file and pay each tax type;
• the number of payments, which measures the frequency with which the company has to file and pay different types of taxes and contributions, adjusted for the manner in which those filings and payments are made;9
• post-filing index, based on four equally weighted components:
1. Time to comply with a VAT refund (hours), 2. Time to obtain a VAT refund (weeks),3. Time to comply with a CIT audit (hours), 4. Time to complete a CIT audit (weeks).
A distance to frontier score is calculated for each of the four sub-indicators. The simple average of these four scores then gives the overall Paying Taxes distance to frontier.10
The case study also looks at the structure of a first level administrative appeal process. The data regarding this process is however not included in the distance to frontier score for Paying Taxes, although a summary of the findings is included in Chapter 1: World Bank Group Commentary.
6 As there is no relevant practice in Somalia for Paying Taxes, it has been excluded from the Paying Taxes analysis which therefore covers 189 economies. 7 For a list of all the contributors see www.doingbusiness.org/contributors/doing-business8 Commercial profit is essentially net profit before all taxes borne. It differs from the conventional profit before tax, reported in financial statements. In computing profit before tax, many of the taxes borne by a company are deductible. Commercial profit is calculated as sales minus cost of goods sold, minus gross salaries, minus administrative expenses, minus other expenses, minus provisions, plus capital gains (from the property sale), minus interest expense, plus interest income and minus commercial depreciation. To compute the commercial depreciation, a straight-line depreciation method is applied, with the following rates: 0% for the land, 5% for the building, 10% for the machinery, 33% for the computers, 20% for the office equipment, 20% for the truck and 10% for business development expenses. Commercial profit amounts to 59.4 times GNIpc in each economy, by assumption of the case study company.
9 Where full electronic filing and payment is used by the majority of medium-size businesses in the economy and where there is no requirement to file hard copies of documentation following electronic submission, the number of payments is counted as one even if filings and payments are more frequent.
10 See page 16 for an explanation of the distance to frontier score.
The results are generated using four sub-indicators
15What this publication covers
The post-filing indexThe post-filing index is based on distance to frontier scores (see below) of 0-100 where 0 represents the least efficient process and 100 the most efficient. The index looks at two post-filing processes; claiming a VAT (or GST) refund and correcting a CIT return. Both processes may involve a tax audit. For each process there are two components giving the following four components in total:
1. Time to comply with a VAT (or GST) refund (hours). The time the company spends claiming a VAT (or GST) refund. If the refund is likely to trigger an audit, this also includes the time spent gathering and submitting information required by the tax authority as part of the audit.
2. Time to obtain a VAT (or GST) refund (weeks). The time that elapses between the submission of a VAT refund claim and either the receipt of the refund (plus an average waiting time before the refund can be submitted) or the time the audit, if applicable, is completed, if later.
3. Time to comply with a CIT audit (hours). The time the company spends correcting an error on the CIT return. If the correction is likely to trigger an audit, this also includes the time spent gathering and submitting information required by the tax authority as part of the audit. Where the correction is unlikely to trigger an audit, only the time needed to correct the error and make the additional payment of the balance due is included.
4. Time to complete a CIT audit (weeks). The time that elapses between the start of an audit process and its completion. If the correction is thought unlikely to trigger an audit, the time will be nil.
Each of the four components is converted to a distance to frontier score of 0-100 where 0 represents the least efficient process and 100 the most efficient. If both VAT and CIT apply, the post-filing index is the simple average of the distance to frontier scores for each of the four components.
If an economy has no VAT or CIT system, then the relevant components are ignored and the distance to frontier scores of the remaining components are averaged to give the post-filing index. If an economy has neither VAT nor CIT, then the post-filing index is ignored in determining the overall Paying Taxes distance to frontier score.
If a VAT (or GST) refund system does not exist in an economy, or is not available to the case study company, then the distance to frontier scores of the VAT components are each given a score of 0, being equal to the least efficient process. As explained in Chapter 1, an efficient refund system is a necessary element of a VAT system if the principle that the tax should be paid by consumers, but neutral for companies, is to be fully applied in practice.
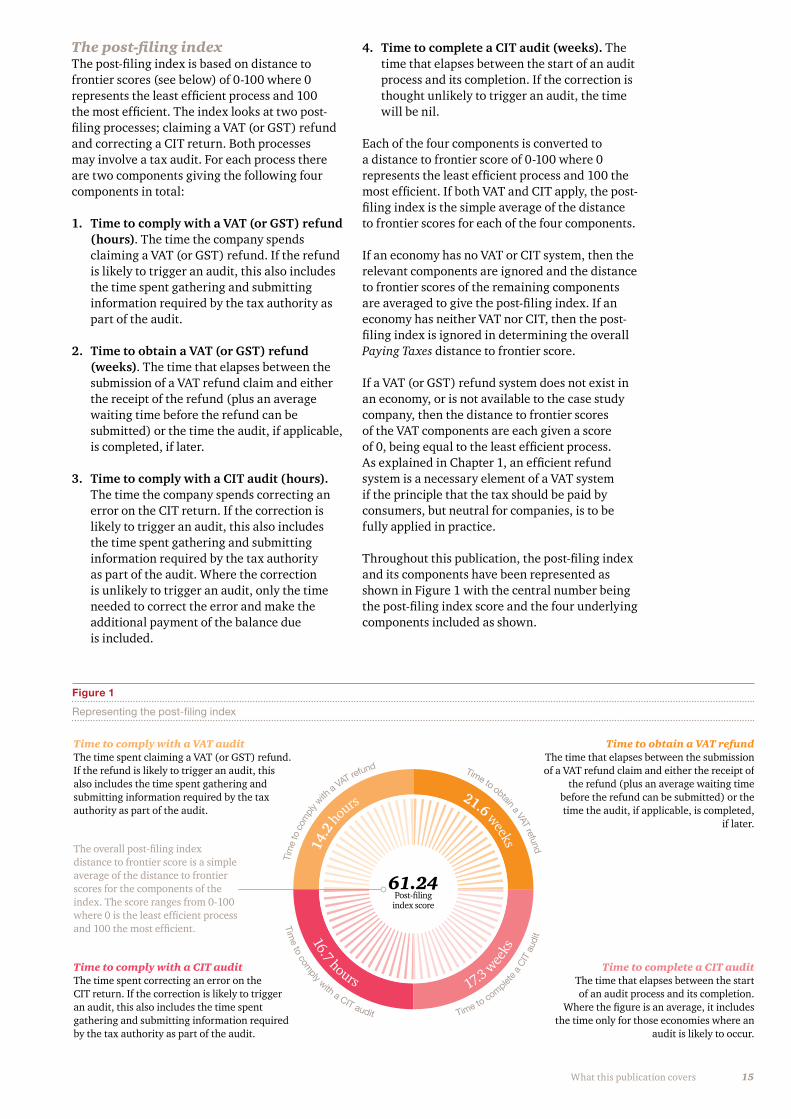
Throughout this publication, the post-filing index and its components have been represented as shown in Figure 1 with the central number being the post-filing index score and the four underlying components included as shown.
Figure 1
Representing the post-filing index
61.24Post-filing
index score
14.2
hours
21.6 weeks
16.7 hours 1
7.3 wee
ks
Tim
e to
com
ply w
ith a
VAT refund Time to obtain a VAT refund
Time to com
ply with a CIT audit Time to complet
e a
CIT
aud
it
Time to comply with a VAT audit The time spent claiming a VAT (or GST) refund. If the refund is likely to trigger an audit, this also includes the time spent gathering and submitting information required by the tax authority as part of the audit.
The overall post-filing index distance to frontier score is a simple average of the distance to frontier scores for the components of the index. The score ranges from 0-100 where 0 is the least efficient process and 100 the most efficient.
Time to obtain a VAT refund The time that elapses between the submission of a VAT refund claim and either the receipt of
the refund (plus an average waiting time before the refund can be submitted) or the time the audit, if applicable, is completed,
if later.
Time to comply with a CIT audit The time spent correcting an error on the CIT return. If the correction is likely to trigger an audit, this also includes the time spent gathering and submitting information required by the tax authority as part of the audit.
Time to complete a CIT auditThe time that elapses between the start of an audit process and its completion.
Where the figure is an average, it includes the time only for those economies where an
audit is likely to occur.
16 Paying Taxes 2017
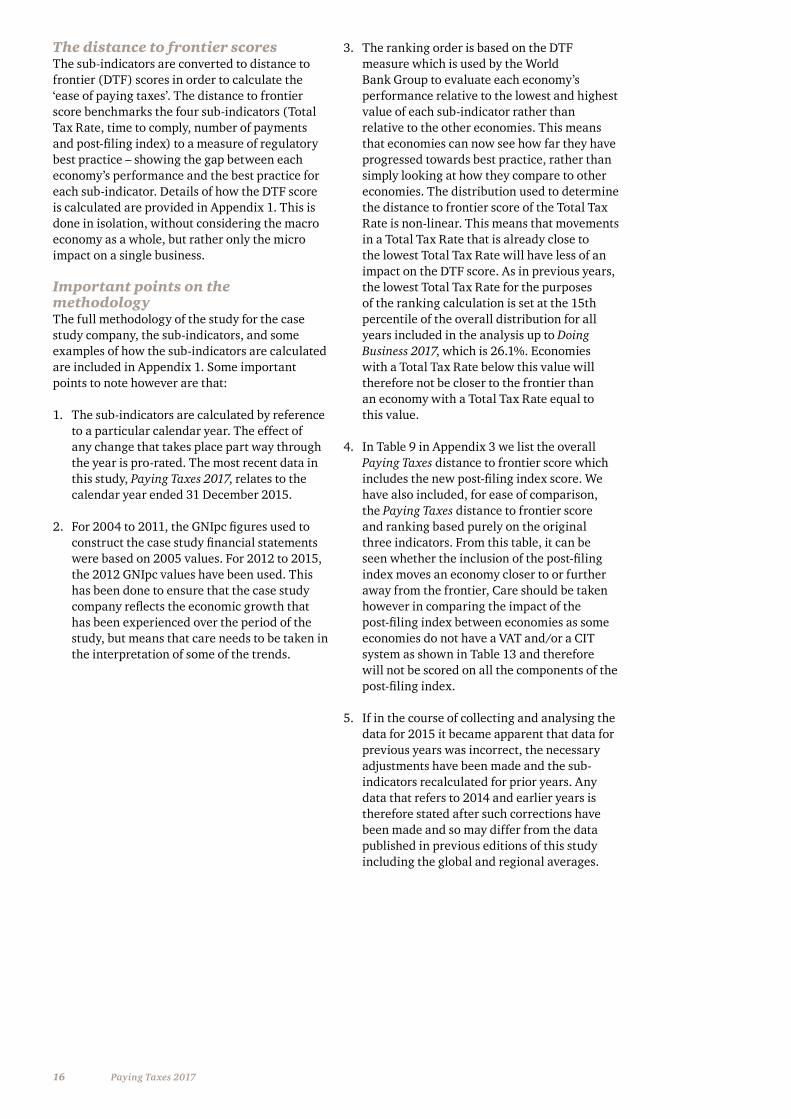
The distance to frontier scoresThe sub-indicators are converted to distance to frontier (DTF) scores in order to calculate the ‘ease of paying taxes’. The distance to frontier score benchmarks the four sub-indicators (Total Tax Rate, time to comply, number of payments and post-filing index) to a measure of regulatory best practice – showing the gap between each economy’s performance and the best practice for each sub-indicator. Details of how the DTF score is calculated are provided in Appendix 1. This is done in isolation, without considering the macro economy as a whole, but rather only the micro impact on a single business.
Important points on the methodologyThe full methodology of the study for the case study company, the sub-indicators, and some examples of how the sub-indicators are calculated are included in Appendix 1. Some important points to note however are that:
1. The sub-indicators are calculated by reference to a particular calendar year. The effect of any change that takes place part way through the year is pro-rated. The most recent data in this study, Paying Taxes 2017, relates to the calendar year ended 31 December 2015.
2. For 2004 to 2011, the GNIpc figures used to construct the case study financial statements were based on 2005 values. For 2012 to 2015, the 2012 GNIpc values have been used. This has been done to ensure that the case study company reflects the economic growth that has been experienced over the period of the study, but means that care needs to be taken in the interpretation of some of the trends.
3. The ranking order is based on the DTF measure which is used by the World Bank Group to evaluate each economy’s performance relative to the lowest and highest value of each sub-indicator rather than relative to the other economies. This means that economies can now see how far they have progressed towards best practice, rather than simply looking at how they compare to other economies. The distribution used to determine the distance to frontier score of the Total Tax Rate is non-linear. This means that movements in a Total Tax Rate that is already close to the lowest Total Tax Rate will have less of an impact on the DTF score. As in previous years, the lowest Total Tax Rate for the purposes of the ranking calculation is set at the 15th percentile of the overall distribution for all years included in the analysis up to Doing Business 2017, which is 26.1%. Economies with a Total Tax Rate below this value will therefore not be closer to the frontier than an economy with a Total Tax Rate equal to this value.
4. In Table 9 in Appendix 3 we list the overall Paying Taxes distance to frontier score which includes the new post-filing index score. We have also included, for ease of comparison, the Paying Taxes distance to frontier score and ranking based purely on the original three indicators. From this table, it can be seen whether the inclusion of the post-filing index moves an economy closer to or further away from the frontier, Care should be taken however in comparing the impact of the post-filing index between economies as some economies do not have a VAT and/or a CIT system as shown in Table 13 and therefore will not be scored on all the components of the post-filing index.
5. If in the course of collecting and analysing the data for 2015 it became apparent that data for previous years was incorrect, the necessary adjustments have been made and the sub- indicators recalculated for prior years. Any data that refers to 2014 and earlier years is therefore stated after such corrections have been made and so may differ from the data published in previous editions of this study including the global and regional averages.
17What this publication covers
Contents of the publicationChapter 1 of this year’s publication is the World Bank Group’s commentary on the background to the inclusion of the post-filing index in the study and provides overview of the results for the post-filing index.
Chapter 2 provides PwC’s analysis and commentary with a focus on the results for the current year across all four sub-indicators. We begin by looking at the global results for the year ending 31 December 2015. We then analyse the data points on the regions and how they compare with each other.
Chapter 3 provides country articles from PwC tax partners and staff in our regional launch locations; Costa Rica, Côte d’Ivoire, Ecuador, Hungary and Indonesia.
Chapter 4 includes two views on different aspects of global tax policy and administration:
• Amal Lahrlid and Simon Carey of PwC’s Global Fiscal Policy Advisory team looks at corporate social responsibility and asks whether there is a role for corporates in assisting with tax policy and tax administration capability.
• Jo Bello, PwC’s Global Indirect Tax Leader and Haider Hatteea, discuss trends in VAT, the increasing importance of VAT for government revenues, and an analysis of the way VAT compliance has an impact around the world.
Appendix 1 details the methodology of the study explaining the parameters of the case study company, what the sub-indicators measure (with examples) and explains how the raw data is converted into a distance to frontier score.
Appendix 2 and Appendix 3 contain this year’s data for each economy, including the four sub-indicators, distance to frontier score, and the rankings, along with a breakdown by region. Further details are available on the PwC and World Bank Group websites.
Explore the full data sets online at www.pwc.com/payingtaxes and www.doingbusiness.org

18 Paying Taxes 2017. World Bank Group commentary
Chapter 1 – World Bank Group commentary

19
Executive summary Up until Doing Business 2016, the Paying Taxes indicator measured the cost of complying with tax obligations up to the filing of tax returns and the payment of taxes due. Filing the return with the tax authority, however, does not imply agreement with the final tax liability. Post-filing processes – such as claiming a value-added tax (VAT) refund, undergoing a tax audit or appealing a tax assessment – can be the most challenging interactions that a business has with a tax authority. Doing Business 2017 expands the Paying Taxes sub-indicators to include a new measure on post-filing.
Doing Business data shows that OECD high-income economies process VAT refunds the most efficiently with an average of 14.4 weeks to reimburse the VAT refund. Economies in Europe and Central Asia also perform well with an average refund time of 16 weeks.
On average, businesses spend six hours correcting an error in an income tax return and preparing any additional documents, submitting the files and making additional payment. Even following immediate voluntary notification by the taxpayer, in 74 economies an error in the income tax return is likely to trigger an audit. In 38 economies this error will lead to a comprehensive audit of the tax return.11
OECD high-income economies as well as Europe and Central Asia economies have the easiest and simplest processes in place to correct a minor mistake in the corporate income tax return.
An internal administrative review process should be based on a transparent legal framework. This process should be independent and resolve disputes in a timely manner.
11 Comprehensive audits are those which are more extensive than limited scope audits or single issue audits.
20 Paying Taxes 2017. World Bank Group commentary
Why does Paying Taxes include a post-filing index?Taxes are important to the proper functioning of an economy. They are the main source of federal, state and local government revenues used to fund health care, education, public transport, unemployment benefits and pensions, among others. While the size of the tax cost imposed on businesses has implications for their ability to invest and grow, the efficiency of the tax administration system is also critical for businesses.12A low cost of tax compliance and efficient tax-related procedures are advantageous for firms. Overly complicated tax systems are associated with high levels of tax evasion, large informal sectors, more corruption and less investment.13 Tax compliance systems should be designed so as not to discourage businesses from participating in the formal economy.
Modern tax systems seek to optimise tax collections while minimising administrative and taxpayer compliance costs. The most cost-effective tax collection systems are those that encourage the vast majority of taxpayers to meet their tax obligations voluntarily, thereby allowing tax officials to concentrate their efforts on non-compliant taxpayers and other services provided by tax administrations.14 Taxpayers are more likely to comply voluntarily when a tax administration has established a transparent system that is regarded by taxpayers as being honest and fair.
12 For more on the World Bank Enterprise Surveys, see the website at http://www.enterprisesurveys.org.13 Djankov, Simeon, Tim Ganser, Caralee McLiesh, Rita Ramalho and Andrei Shleifer. 2010. “The Effect of Corporate Taxes on Investment and
Entrepreneurship.” American Economic Journal: Macroeconomics 2 (3): 31-64. 14 IMF (International Monetary Fund). 2015a. “Current Challenges in Revenue Mobilization: Improving Tax Compliance.” IMF Staff Report. IMF: Washington DC.
Total tax compliance costs include all major transactions that generate external costs to the taxpayer. Up until Doing Business 2016, the Paying Taxes indicator set measured only the cost of complying with tax obligations up until the filing of tax returns and the payment of taxes due. However, filing the tax return with the tax authority does not imply agreement with the final tax liability. Post-filing processes – such as claiming a value-added tax refund, undergoing a tax audit or appealing a tax assessment – can be the most challenging interactions that a business has with a tax authority.
Doing Business 2017 expands the Paying Taxes indicators to include a new measure of the time businesses spend complying with two post-filing processes: claiming a VAT refund and correcting a mistake in the corporate income tax return. This case study examines these two post-filing procedures across 190 economies and shows where post-filing processes and practices work efficiently and what drives the differences in the overall tax compliance cost across economies. This case study also includes a section on the structure of a first level administrative appeal process. The data on first level administrative appeal process is not included in the distance to frontier score for Paying Taxes.
Taxpayers are more likely to comply voluntarily when a tax administration has established a transparent system that is regarded by taxpayers as being honest and fair.
21
Why does the post-filing index look at VAT refunds?The VAT refund is an integral component of a modern VAT system. A discussion of the types of consumption tax systems is available in Chapter 4. In principle, the statutory incidence of VAT is on the final consumer, not on businesses. According to tax policy guidelines set out by the Organisation for Economic Co-operation and Development (OECD) a value-added tax system should be neutral and efficient.15 Some businesses will incur more VAT on their purchases than they collect on their taxable sales in a given tax period and therefore should be entitled to claim the difference from the tax authorities. When businesses incur VAT which is not refunded at all – or reclaimed with delays and large compliance costs – then the principles of neutrality and efficiency are undermined. This alters the nature of VAT by effectively making it a tax on production. Any tax that cannot be recovered by the business could have a distortionary effect on market prices and competition and consequently constrain economic growth.16
Refund processes can be a major weakness of VAT systems. This was the finding of a study that examined the VAT administration refund mechanism in 36 economies around the world.17 Even in economies where refund procedures are in place, businesses often find the complexity of the process challenging. The study examined the tax authorities’ treatment of excess VAT credits, the size of refund claims, the procedures followed by refund claimants and the time needed for the tax authorities to process refunds. The results showed that statutory time limits for making refunds are crucial but often not applied in practice.
Most VAT systems allow credit to be carried-forward for a specific period of time and offset against future net liabilities to reduce the number of refunds processed. The rationale is that excess VAT credits in one tax period would be followed by periods when net liabilities would absorb the credit brought forward, especially for businesses producing and selling in the domestic market. A refund is paid only if an amount of excess credit remains to be recovered by the taxpayer at the end of the carry-forward period. Some systems also allow a VAT credit in a given tax period to be offset against other current tax liabilities such as income tax. While the option of carry-forward is allowed in most VAT systems, it is good practice for economies to put in place an adequate VAT refund system. Because considerable differences in the efficiency of processing VAT cash refunds exist between economies, the Paying Taxes indicators focus on assessing VAT refund systems.
The International Monetary Fund’s (IMF) Tax Administration Diagnostic Assessment Tool (TADAT) provides an integrated monitoring framework to measure the performance of an economy’s tax administration system across different functions, including the adequacy of its VAT refund system. It does this by measuring the time taken to pay (or offset) refunds.18
Like any tax, VAT is prone to fraud and its refund mechanism may be open to abuse by taxpayers.19 Delays in processing refunds, therefore, may be the result of concerns over potential fraud. Even when claims reach the finance division responsible for approving them and making payment, there can be delays in transmission. Additional procedural checks at this stage – prompted by a fear of the system being abused – are common.
In some economies a claim for a VAT refund can automatically trigger a costly audit, undermining the overall effectiveness of the system.20 Effective audit programs and VAT refund payment systems are inextricably linked. Tax audits (direct and indirect) vary in their scope and complexity, ranging from a full audit – which typically entails a comprehensive examination of all information relevant to the calculation of a taxpayer’s tax liability in a given period – to a limited scope audit that is restricted to specific issues on the tax return or a single issue audit that is limited to one item.21
15,16 OECD (Organisation for Economic Co-operation and Development). 2014. “International VAT/GST Guidelines.” Global Forum on VAT. 17-18 April. OECD, Paris. Available at: http://drtp.ca/wp-content/uploads/2015/09/oecd-international-vat-gst-guidelines.pdf.
17 Harrison, Graham and Russell Krelove. 2005. “VAT Refunds: A Review of Country Experience,” IMF Working Paper 05/218, International Monetary Fund, Washington, DC..
18 For more information on the Tax Administration Diagnostic Assessment Tool (TADAT), see the website at http://www.tadat.org/.19 Keen, Michael, and Stephen Smith. 2007. “VAT Fraud and Evasion: What Do We Know, and What Can Be Done?” IMF Working Paper 07/31, International
Monetary Fund, Washington, DC.20 Harrison, Graham and Russell Krelove. 2005. “VAT Refunds: A Review of Country Experience,” IMF Working Paper 05/218, International Monetary Fund,
Washington, DC.21 OECD (Organisation for Economic Co-operation and Development). 2006. “Strengthening Tax Audit Capabilities: General Principles and Approaches.” OECD,
Center for Tax Policy and Administration, Paris, France: OECD.
22 Paying Taxes 2017. World Bank Group commentary
The VAT refund scenario for Paying TaxesThe transactions that lead to substantial VAT refund claims typically include exports, capital expenses, extraordinary losses and start-up operations.22 Through its Paying Taxes indicators, Doing Business measures the efficiency of VAT refunds by analysing the case of capital expenses.
The Doing Business case study company, TaxpayerCo, is a domestic business that does not participate in foreign trade. It performs a general industrial and commercial activity in the domestic market and is in its second year of operation. TaxpayerCo. meets the VAT threshold for registration and its monthly sales and operating expenses are fixed throughout the year resulting in a positive output VAT payable to the tax authorities within each accounting period. The case study scenario has been expanded to include a capital purchase of a machine in the month of June; this substantial capital expenditure results in input VAT exceeding output VAT in the month of June.
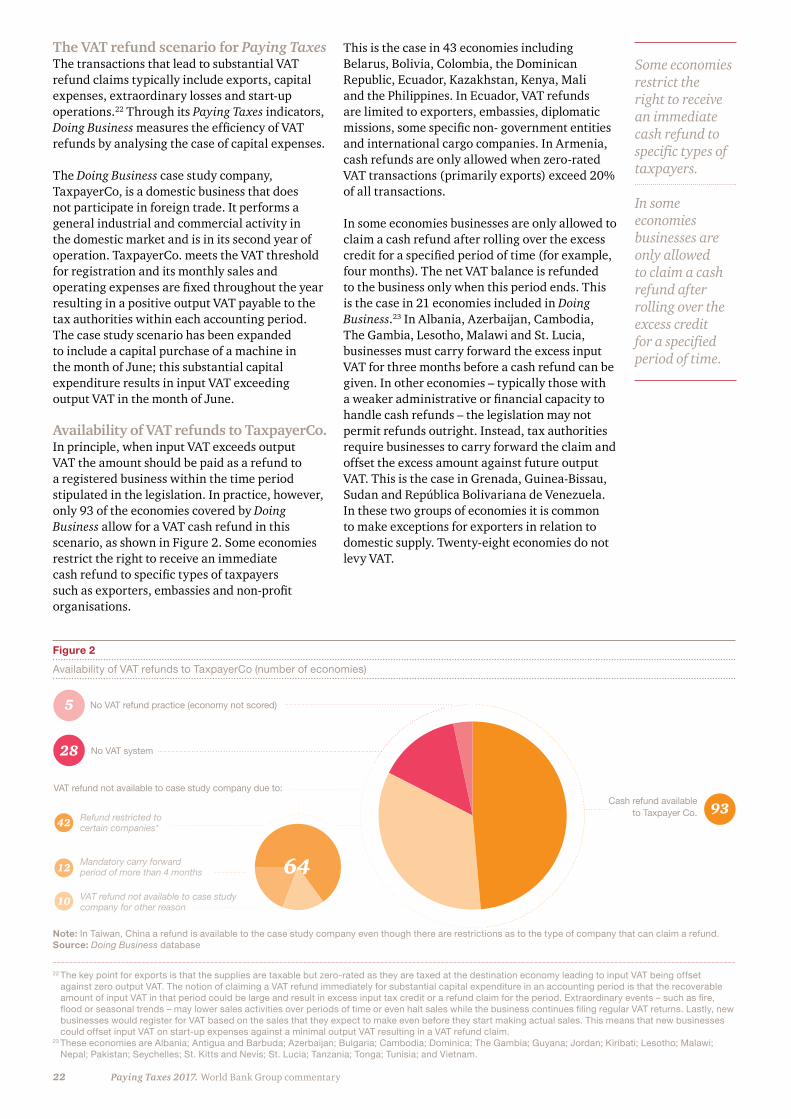
Availability of VAT refunds to TaxpayerCo.In principle, when input VAT exceeds output VAT the amount should be paid as a refund to a registered business within the time period stipulated in the legislation. In practice, however, only 93 of the economies covered by Doing Business allow for a VAT cash refund in this scenario, as shown in Figure 2. Some economies restrict the right to receive an immediate cash refund to specific types of taxpayers such as exporters, embassies and non-profit organisations.
This is the case in 43 economies including Belarus, Bolivia, Colombia, the Dominican Republic, Ecuador, Kazakhstan, Kenya, Mali and the Philippines. In Ecuador, VAT refunds are limited to exporters, embassies, diplomatic missions, some specific non- government entities and international cargo companies. In Armenia, cash refunds are only allowed when zero-rated VAT transactions (primarily exports) exceed 20% of all transactions.
In some economies businesses are only allowed to claim a cash refund after rolling over the excess credit for a specified period of time (for example, four months). The net VAT balance is refunded to the business only when this period ends. This is the case in 21 economies included in Doing Business.23 In Albania, Azerbaijan, Cambodia, The Gambia, Lesotho, Malawi and St. Lucia, businesses must carry forward the excess input VAT for three months before a cash refund can be given. In other economies – typically those with a weaker administrative or financial capacity to handle cash refunds – the legislation may not permit refunds outright. Instead, tax authorities require businesses to carry forward the claim and offset the excess amount against future output VAT. This is the case in Grenada, Guinea-Bissau, Sudan and República Bolivariana de Venezuela. In these two groups of economies it is common to make exceptions for exporters in relation to domestic supply. Twenty-eight economies do not levy VAT.
Note: In Taiwan, China a refund is available to the case study company even though there are restrictions as to the type of company that can claim a refund.Source: Doing Business database
Figure 2
Availability of VAT refunds to TaxpayerCo (number of economies)
No VAT system
VAT refund not available to case study company due to:
Mandatory carry forward period of more than 4 months
No VAT refund practice (economy not scored)
64
5
Cash refund available to Taxpayer Co. 93
28
64VAT refund not available to case study company for other reason
10
12
42 Refund restricted tocertain companies*
Some economies restrict the right to receive an immediate cash refund to specific types of taxpayers.
In some economies businesses are only allowed to claim a cash refund after rolling over the excess credit for a specified period of time.
22 The key point for exports is that the supplies are taxable but zero-rated as they are taxed at the destination economy leading to input VAT being offset against zero output VAT. The notion of claiming a VAT refund immediately for substantial capital expenditure in an accounting period is that the recoverable amount of input VAT in that period could be large and result in excess input tax credit or a refund claim for the period. Extraordinary events – such as fire, flood or seasonal trends – may lower sales activities over periods of time or even halt sales while the business continues filing regular VAT returns. Lastly, new businesses would register for VAT based on the sales that they expect to make even before they start making actual sales. This means that new businesses could offset input VAT on start-up expenses against a minimal output VAT resulting in a VAT refund claim.
23 These economies are Albania; Antigua and Barbuda; Azerbaijan; Bulgaria; Cambodia; Dominica; The Gambia; Guyana; Jordan; Kiribati; Lesotho; Malawi; Nepal; Pakistan; Seychelles; St. Kitts and Nevis; St. Lucia; Tanzania; Tonga; Tunisia; and Vietnam.
23
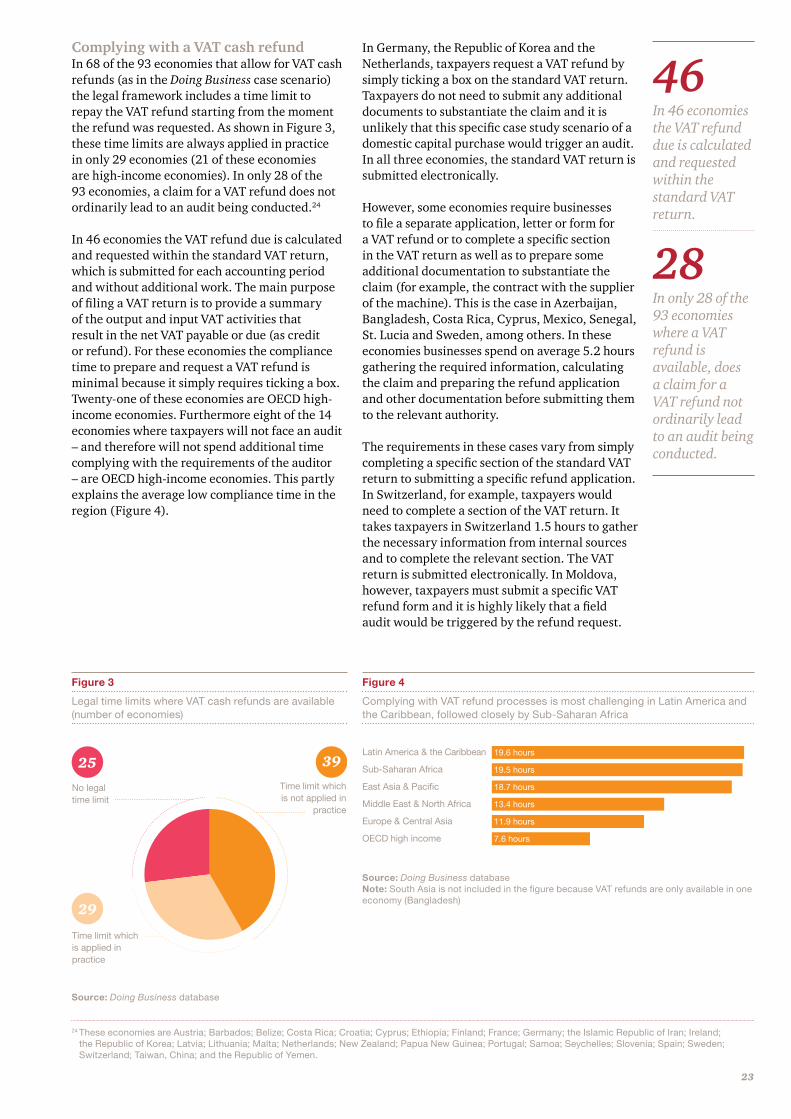
Complying with a VAT cash refundIn 68 of the 93 economies that allow for VAT cash refunds (as in the Doing Business case scenario) the legal framework includes a time limit to repay the VAT refund starting from the moment the refund was requested. As shown in Figure 3, these time limits are always applied in practice in only 29 economies (21 of these economies are high-income economies). In only 28 of the 93 economies, a claim for a VAT refund does not ordinarily lead to an audit being conducted.24
In 46 economies the VAT refund due is calculated and requested within the standard VAT return, which is submitted for each accounting period and without additional work. The main purpose of filing a VAT return is to provide a summary of the output and input VAT activities that result in the net VAT payable or due (as credit or refund). For these economies the compliance time to prepare and request a VAT refund is minimal because it simply requires ticking a box. Twenty-one of these economies are OECD high-income economies. Furthermore eight of the 14 economies where taxpayers will not face an audit – and therefore will not spend additional time complying with the requirements of the auditor – are OECD high-income economies. This partly explains the average low compliance time in the region (Figure 4).
In Germany, the Republic of Korea and the Netherlands, taxpayers request a VAT refund by simply ticking a box on the standard VAT return. Taxpayers do not need to submit any additional documents to substantiate the claim and it is unlikely that this specific case study scenario of a domestic capital purchase would trigger an audit. In all three economies, the standard VAT return is submitted electronically.
However, some economies require businesses to file a separate application, letter or form for a VAT refund or to complete a specific section in the VAT return as well as to prepare some additional documentation to substantiate the claim (for example, the contract with the supplier of the machine). This is the case in Azerbaijan, Bangladesh, Costa Rica, Cyprus, Mexico, Senegal, St. Lucia and Sweden, among others. In these economies businesses spend on average 5.2 hours gathering the required information, calculating the claim and preparing the refund application and other documentation before submitting them to the relevant authority.
The requirements in these cases vary from simply completing a specific section of the standard VAT return to submitting a specific refund application. In Switzerland, for example, taxpayers would need to complete a section of the VAT return. It takes taxpayers in Switzerland 1.5 hours to gather the necessary information from internal sources and to complete the relevant section. The VAT return is submitted electronically. In Moldova, however, taxpayers must submit a specific VAT refund form and it is highly likely that a field audit would be triggered by the refund request.
Source: Doing Business database
Source: Doing Business databaseNote: South Asia is not included in the figure because VAT refunds are only available in one economy (Bangladesh)
Figure 3
Legal time limits where VAT cash refunds are available (number of economies)
Figure 4
Complying with VAT refund processes is most challenging in Latin America and the Caribbean, followed closely by Sub-Saharan Africa
Time limit which is applied in practice
64
Time limit which is not applied in
practice
39
29
No legal time limit
25Latin America & the Caribbean
Sub-Saharan Africa
East Asia & Pacific
Middle East & North Africa
Europe & Central Asia
OECD high income
19.6 hours
19.5 hours
18.7 hours
13.4 hours
11.9 hours
7.6 hours
46 In 46 economies the VAT refund due is calculated and requested within the standard VAT return.
28 In only 28 of the 93 economies where a VAT refund is available, does a claim for a VAT refund not ordinarily lead to an audit being conducted.
24 These economies are Austria; Barbados; Belize; Costa Rica; Croatia; Cyprus; Ethiopia; Finland; France; Germany; the Islamic Republic of Iran; Ireland; the Republic of Korea; Latvia; Lithuania; Malta; Netherlands; New Zealand; Papua New Guinea; Portugal; Samoa; Seychelles; Slovenia; Spain; Sweden; Switzerland; Taiwan, China; and the Republic of Yemen.
24 Paying Taxes 2017. World Bank Group commentary
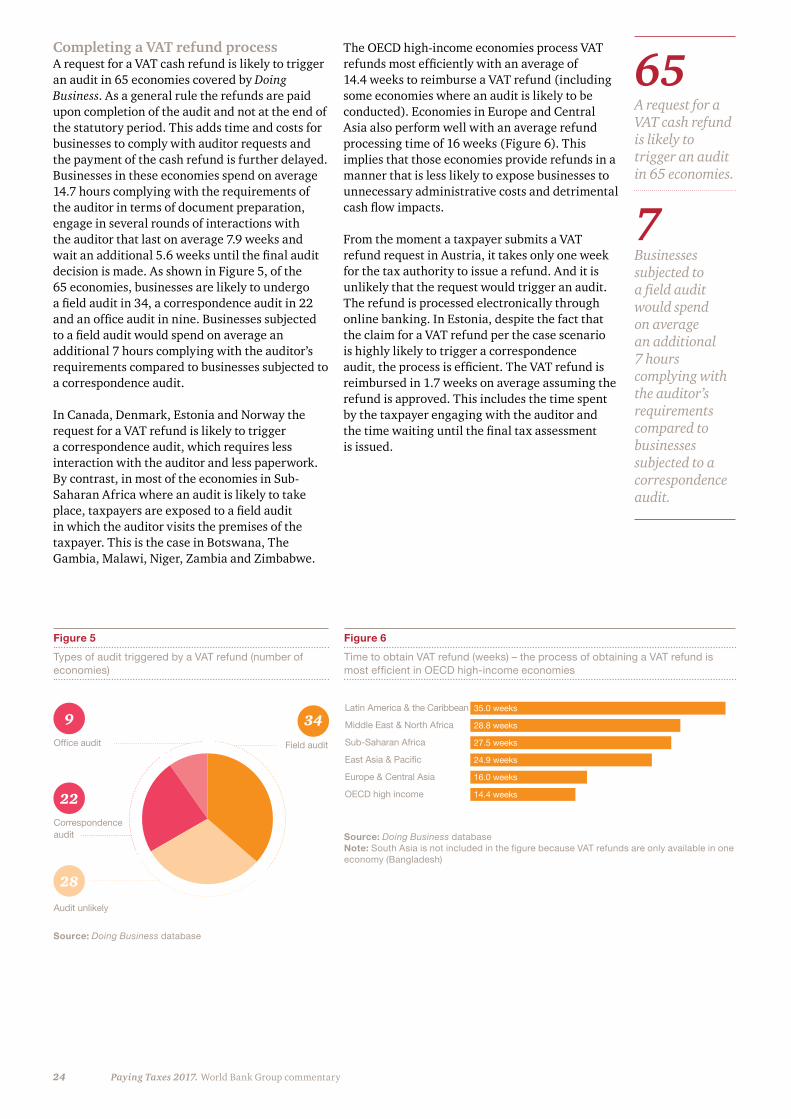
Completing a VAT refund processA request for a VAT cash refund is likely to trigger an audit in 65 economies covered by Doing Business. As a general rule the refunds are paid upon completion of the audit and not at the end of the statutory period. This adds time and costs for businesses to comply with auditor requests and the payment of the cash refund is further delayed. Businesses in these economies spend on average 14.7 hours complying with the requirements of the auditor in terms of document preparation, engage in several rounds of interactions with the auditor that last on average 7.9 weeks and wait an additional 5.6 weeks until the final audit decision is made. As shown in Figure 5, of the 65 economies, businesses are likely to undergo a field audit in 34, a correspondence audit in 22 and an office audit in nine. Businesses subjected to a field audit would spend on average an additional 7 hours complying with the auditor’s requirements compared to businesses subjected to a correspondence audit.
In Canada, Denmark, Estonia and Norway the request for a VAT refund is likely to trigger a correspondence audit, which requires less interaction with the auditor and less paperwork. By contrast, in most of the economies in Sub-Saharan Africa where an audit is likely to take place, taxpayers are exposed to a field audit in which the auditor visits the premises of the taxpayer. This is the case in Botswana, The Gambia, Malawi, Niger, Zambia and Zimbabwe.
The OECD high-income economies process VAT refunds most efficiently with an average of 14.4 weeks to reimburse a VAT refund (including some economies where an audit is likely to be conducted). Economies in Europe and Central Asia also perform well with an average refund processing time of 16 weeks (Figure 6). This implies that those economies provide refunds in a manner that is less likely to expose businesses to unnecessary administrative costs and detrimental cash flow impacts.
From the moment a taxpayer submits a VAT refund request in Austria, it takes only one week for the tax authority to issue a refund. And it is unlikely that the request would trigger an audit. The refund is processed electronically through online banking. In Estonia, despite the fact that the claim for a VAT refund per the case scenario is highly likely to trigger a correspondence audit, the process is efficient. The VAT refund is reimbursed in 1.7 weeks on average assuming the refund is approved. This includes the time spent by the taxpayer engaging with the auditor and the time waiting until the final tax assessment is issued.
Source: Doing Business database
Figure 5
Types of audit triggered by a VAT refund (number of economies)
Audit unlikely
64
Field audit
34
28
Office audit
9
Correspondence audit
22
Source: Doing Business databaseNote: South Asia is not included in the figure because VAT refunds are only available in one economy (Bangladesh)
Figure 6
Time to obtain VAT refund (weeks) – the process of obtaining a VAT refund is most efficient in OECD high-income economies
!"#$%&&!'$&(&#%&'%)"($(%#'")!'!!&("#&&'(&)!$)'#$$($$%()"#"*!)%"+
Latin America & the Caribbean
Middle East & North Africa
Sub-Saharan Africa
East Asia & Pacific
Europe & Central Asia
OECD high income
35.0 weeks
28.8 weeks
27.5 weeks
24.9 weeks
16.0 weeks
14.4 weeks
65 A request for a VAT cash refund is likely to trigger an audit in 65 economies.
7 Businesses subjected to a field audit would spend on average an additional 7 hours complying with the auditor’s requirements compared to businesses subjected to a correspondence audit.
25
The experience in economies in other regions is less favourable. Obtaining a VAT refund in Latin America & the Caribbean takes on average 35 weeks. In the Middle East & North Africa and Sub-Saharan Africa it takes on average 28.8 and 27.5 weeks, respectively, to obtain a VAT refund. The sample for Latin America & the Caribbean includes only nine economies (the other economies do not allow for VAT cash refund per the case study scenario). The Middle East & North Africa sample consists of only six economies as most economies in the region do not levy any type of consumption tax. However, in Sub-Saharan Africa the story is different: the refund waiting time is longer because in most of the economies in the region where cash refund is allowed, taxpayers are likely to be audited before the refund is approved.
Why are some refund processes more efficient?The efficiency of the VAT refund process in OECD high-income economies is partly attributable to the commitment of all OECD members to apply the OECD International VAT Guidelines.25 Furthermore, the binding nature of the 2010 European Union (EU) Directives on VAT implementation ensures that refunds are processed fully and efficiently.
A major determinant of the ability of revenue authorities to provide good standards of service for the repayment of VAT refund claims is the availability and use of modern electronic services (such as electronic filing, pre-population and
Source: Doing Business database
Figure 7
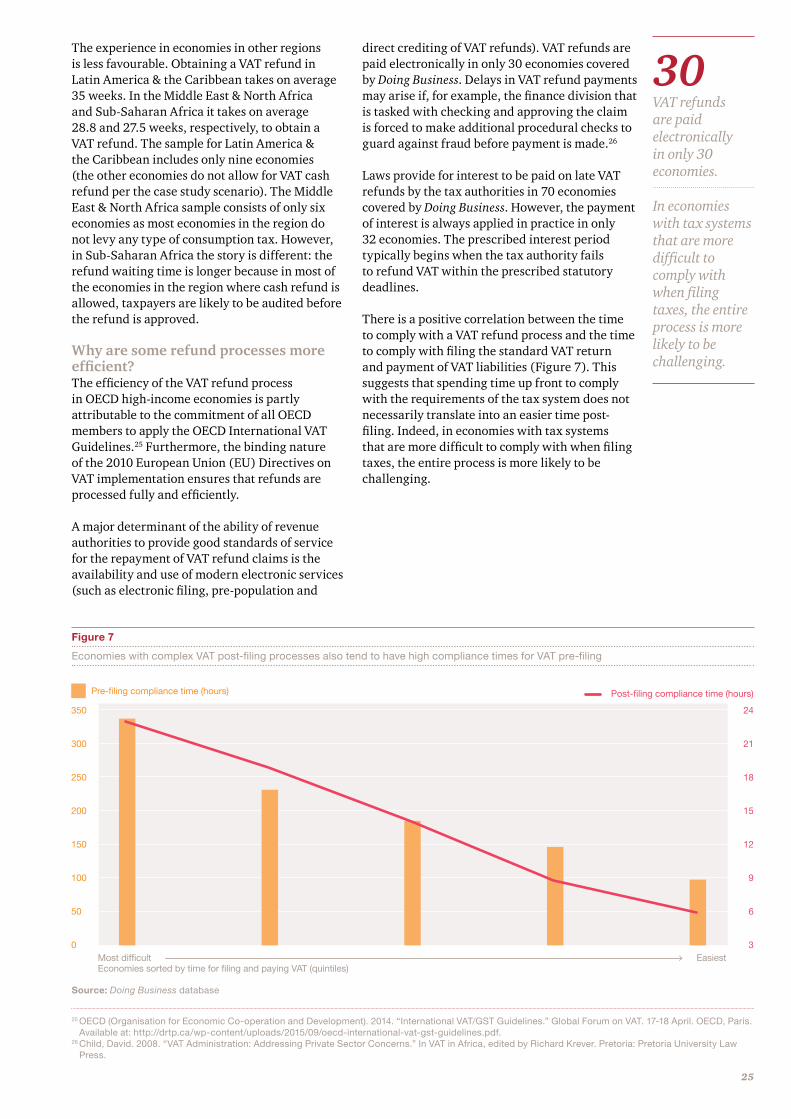
Economies with complex VAT post-filing processes also tend to have high compliance times for VAT pre-filing
350
300
250
200
150
100
50
0Most difficultEconomies sorted by time for filing and paying VAT (quintiles)
Pre-filing compliance time (hours) Post-filing compliance time (hours)
Easiest
24
21
18
15
12
9
6
3
direct crediting of VAT refunds). VAT refunds are paid electronically in only 30 economies covered by Doing Business. Delays in VAT refund payments may arise if, for example, the finance division that is tasked with checking and approving the claim is forced to make additional procedural checks to guard against fraud before payment is made.26
Laws provide for interest to be paid on late VAT refunds by the tax authorities in 70 economies covered by Doing Business. However, the payment of interest is always applied in practice in only 32 economies. The prescribed interest period typically begins when the tax authority fails to refund VAT within the prescribed statutory deadlines.
There is a positive correlation between the time to comply with a VAT refund process and the time to comply with filing the standard VAT return and payment of VAT liabilities (Figure 7). This suggests that spending time up front to comply with the requirements of the tax system does not necessarily translate into an easier time post-filing. Indeed, in economies with tax systems that are more difficult to comply with when filing taxes, the entire process is more likely to be challenging.
25 OECD (Organisation for Economic Co-operation and Development). 2014. “International VAT/GST Guidelines.” Global Forum on VAT. 17-18 April. OECD, Paris. Available at: http://drtp.ca/wp-content/uploads/2015/09/oecd-international-vat-gst-guidelines.pdf.
26 Child, David. 2008. “VAT Administration: Addressing Private Sector Concerns.” In VAT in Africa, edited by Richard Krever. Pretoria: Pretoria University Law Press.
30 VAT refunds are paid electronically in only 30 economies.
In economies with tax systems that are more difficult to comply with when filing taxes, the entire process is more likely to be challenging.
26 Paying Taxes 2017. World Bank Group commentary
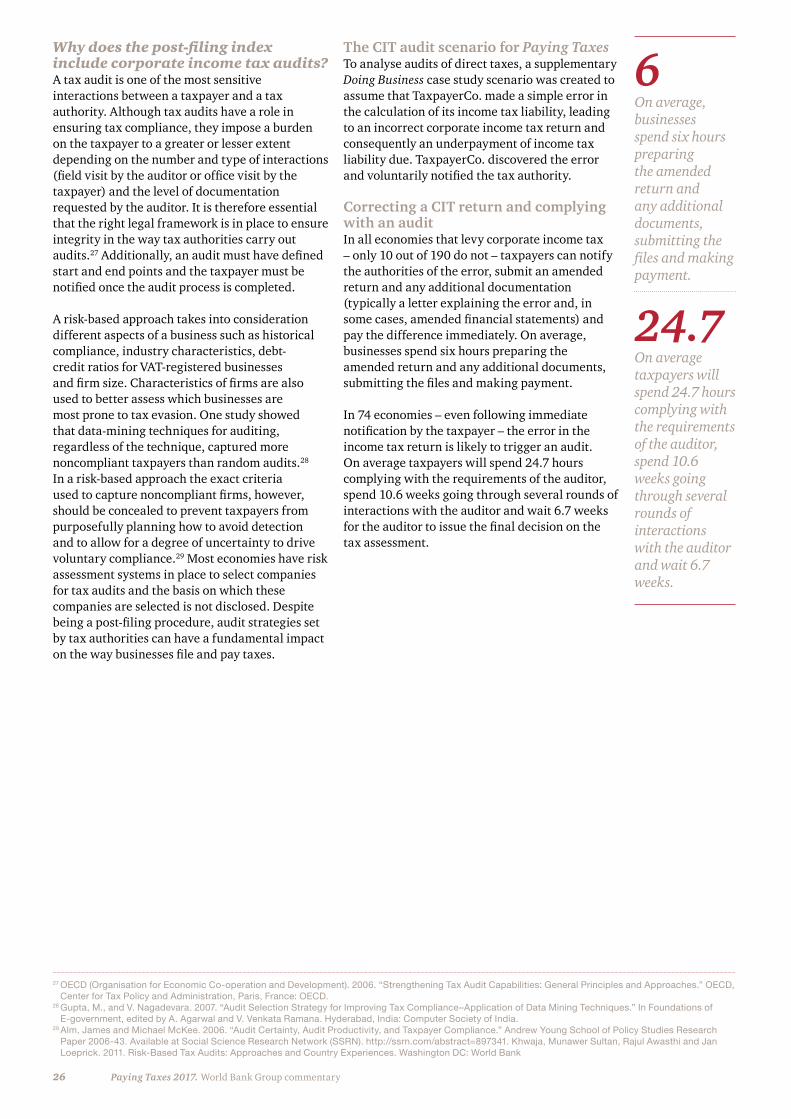
Why does the post-filing index include corporate income tax audits?A tax audit is one of the most sensitive interactions between a taxpayer and a tax authority. Although tax audits have a role in ensuring tax compliance, they impose a burden on the taxpayer to a greater or lesser extent depending on the number and type of interactions (field visit by the auditor or office visit by the taxpayer) and the level of documentation requested by the auditor. It is therefore essential that the right legal framework is in place to ensure integrity in the way tax authorities carry out audits.27 Additionally, an audit must have defined start and end points and the taxpayer must be notified once the audit process is completed.
A risk-based approach takes into consideration different aspects of a business such as historical compliance, industry characteristics, debt-credit ratios for VAT-registered businesses and firm size. Characteristics of firms are also used to better assess which businesses are most prone to tax evasion. One study showed that data-mining techniques for auditing, regardless of the technique, captured more noncompliant taxpayers than random audits.28 In a risk-based approach the exact criteria used to capture noncompliant firms, however, should be concealed to prevent taxpayers from purposefully planning how to avoid detection and to allow for a degree of uncertainty to drive voluntary compliance.29 Most economies have risk assessment systems in place to select companies for tax audits and the basis on which these companies are selected is not disclosed. Despite being a post-filing procedure, audit strategies set by tax authorities can have a fundamental impact on the way businesses file and pay taxes.
The CIT audit scenario for Paying TaxesTo analyse audits of direct taxes, a supplementary Doing Business case study scenario was created to assume that TaxpayerCo. made a simple error in the calculation of its income tax liability, leading to an incorrect corporate income tax return and consequently an underpayment of income tax liability due. TaxpayerCo. discovered the error and voluntarily notified the tax authority.
Correcting a CIT return and complying with an auditIn all economies that levy corporate income tax – only 10 out of 190 do not – taxpayers can notify the authorities of the error, submit an amended return and any additional documentation (typically a letter explaining the error and, in some cases, amended financial statements) and pay the difference immediately. On average, businesses spend six hours preparing the amended return and any additional documents, submitting the files and making payment.
In 74 economies – even following immediate notification by the taxpayer – the error in the income tax return is likely to trigger an audit. On average taxpayers will spend 24.7 hours complying with the requirements of the auditor, spend 10.6 weeks going through several rounds of interactions with the auditor and wait 6.7 weeks for the auditor to issue the final decision on the tax assessment.
27 OECD (Organisation for Economic Co-operation and Development). 2006. “Strengthening Tax Audit Capabilities: General Principles and Approaches.” OECD, Center for Tax Policy and Administration, Paris, France: OECD.
28 Gupta, M., and V. Nagadevara. 2007. “Audit Selection Strategy for Improving Tax Compliance–Application of Data Mining Techniques.” In Foundations of E-government, edited by A. Agarwal and V. Venkata Ramana. Hyderabad, India: Computer Society of India.
29 Alm, James and Michael McKee. 2006. “Audit Certainty, Audit Productivity, and Taxpayer Compliance.” Andrew Young School of Policy Studies Research Paper 2006-43. Available at Social Science Research Network (SSRN). http://ssrn.com/abstract=897341. Khwaja, Munawer Sultan, Rajul Awasthi and Jan Loeprick. 2011. Risk-Based Tax Audits: Approaches and Country Experiences. Washington DC: World Bank
6 On average, businesses spend six hours preparing the amended return and any additional documents, submitting the files and making payment.
24.7 On average taxpayers will spend 24.7 hours complying with the requirements of the auditor, spend 10.6 weeks going through several rounds of interactions with the auditor and wait 6.7 weeks.
27
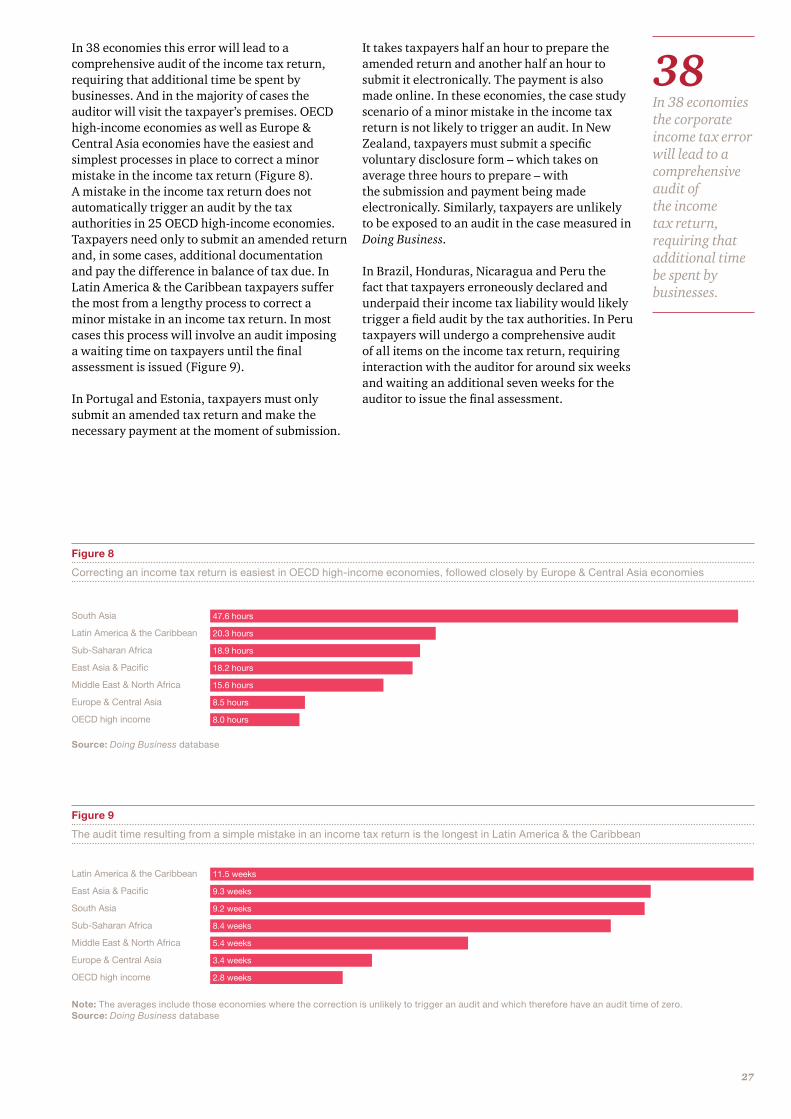
In 38 economies this error will lead to a comprehensive audit of the income tax return, requiring that additional time be spent by businesses. And in the majority of cases the auditor will visit the taxpayer’s premises. OECD high-income economies as well as Europe & Central Asia economies have the easiest and simplest processes in place to correct a minor mistake in the income tax return (Figure 8). A mistake in the income tax return does not automatically trigger an audit by the tax authorities in 25 OECD high-income economies. Taxpayers need only to submit an amended return and, in some cases, additional documentation and pay the difference in balance of tax due. In Latin America & the Caribbean taxpayers suffer the most from a lengthy process to correct a minor mistake in an income tax return. In most cases this process will involve an audit imposing a waiting time on taxpayers until the final assessment is issued (Figure 9).
In Portugal and Estonia, taxpayers must only submit an amended tax return and make the necessary payment at the moment of submission.
It takes taxpayers half an hour to prepare the amended return and another half an hour to submit it electronically. The payment is also made online. In these economies, the case study scenario of a minor mistake in the income tax return is not likely to trigger an audit. In New Zealand, taxpayers must submit a specific voluntary disclosure form – which takes on average three hours to prepare – with the submission and payment being made electronically. Similarly, taxpayers are unlikely to be exposed to an audit in the case measured in Doing Business.
In Brazil, Honduras, Nicaragua and Peru the fact that taxpayers erroneously declared and underpaid their income tax liability would likely trigger a field audit by the tax authorities. In Peru taxpayers will undergo a comprehensive audit of all items on the income tax return, requiring interaction with the auditor for around six weeks and waiting an additional seven weeks for the auditor to issue the final assessment.
Note: The averages include those economies where the correction is unlikely to trigger an audit and which therefore have an audit time of zero.Source: Doing Business database
Source: Doing Business database
Figure 9
The audit time resulting from a simple mistake in an income tax return is the longest in Latin America & the Caribbean
Figure 8
Correcting an income tax return is easiest in OECD high-income economies, followed closely by Europe & Central Asia economies
Latin America & the Caribbean
East Asia & Pacific
South Asia
Sub-Saharan Africa
Middle East & North Africa
Europe & Central Asia
OECD high income
11.5 weeks
9.3 weeks
9.2 weeks
8.4 weeks
5.4 weeks
3.4 weeks
2.8 weeks
South Asia
Latin America & the Caribbean
Sub-Saharan Africa
East Asia & Pacific
Middle East & North Africa
Europe & Central Asia
OECD high income
47.6 hours
20.3 hours
18.9 hours
18.2 hours
15.6 hours
8.5 hours
8.0 hours
38 In 38 economies the corporate income tax error will lead to a comprehensive audit of the income tax return, requiring that additional time be spent by businesses.
28 Paying Taxes 2017. World Bank Group commentary
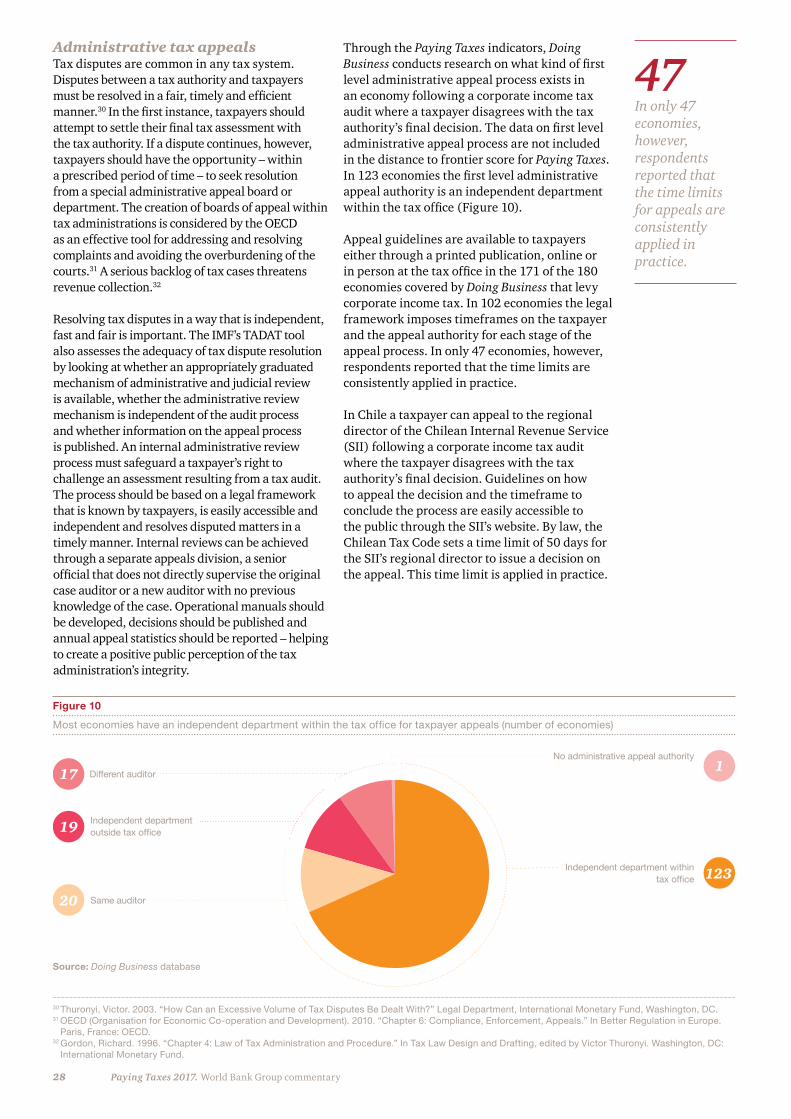
Administrative tax appealsTax disputes are common in any tax system. Disputes between a tax authority and taxpayers must be resolved in a fair, timely and efficient manner.30 In the first instance, taxpayers should attempt to settle their final tax assessment with the tax authority. If a dispute continues, however, taxpayers should have the opportunity – within a prescribed period of time – to seek resolution from a special administrative appeal board or department. The creation of boards of appeal within tax administrations is considered by the OECD as an effective tool for addressing and resolving complaints and avoiding the overburdening of the courts.31 A serious backlog of tax cases threatens revenue collection.32
Resolving tax disputes in a way that is independent, fast and fair is important. The IMF’s TADAT tool also assesses the adequacy of tax dispute resolution by looking at whether an appropriately graduated mechanism of administrative and judicial review is available, whether the administrative review mechanism is independent of the audit process and whether information on the appeal process is published. An internal administrative review process must safeguard a taxpayer’s right to challenge an assessment resulting from a tax audit. The process should be based on a legal framework that is known by taxpayers, is easily accessible and independent and resolves disputed matters in a timely manner. Internal reviews can be achieved through a separate appeals division, a senior official that does not directly supervise the original case auditor or a new auditor with no previous knowledge of the case. Operational manuals should be developed, decisions should be published and annual appeal statistics should be reported – helping to create a positive public perception of the tax administration’s integrity.
Through the Paying Taxes indicators, Doing Business conducts research on what kind of first level administrative appeal process exists in an economy following a corporate income tax audit where a taxpayer disagrees with the tax authority’s final decision. The data on first level administrative appeal process are not included in the distance to frontier score for Paying Taxes. In 123 economies the first level administrative appeal authority is an independent department within the tax office (Figure 10).
Appeal guidelines are available to taxpayers either through a printed publication, online or in person at the tax office in the 171 of the 180 economies covered by Doing Business that levy corporate income tax. In 102 economies the legal framework imposes timeframes on the taxpayer and the appeal authority for each stage of the appeal process. In only 47 economies, however, respondents reported that the time limits are consistently applied in practice.
In Chile a taxpayer can appeal to the regional director of the Chilean Internal Revenue Service (SII) following a corporate income tax audit where the taxpayer disagrees with the tax authority’s final decision. Guidelines on how to appeal the decision and the timeframe to conclude the process are easily accessible to the public through the SII’s website. By law, the Chilean Tax Code sets a time limit of 50 days for the SII’s regional director to issue a decision on the appeal. This time limit is applied in practice.
Figure 10
Most economies have an independent department within the tax office for taxpayer appeals (number of economies)
47 In only 47 economies, however, respondents reported that the time limits for appeals are consistently applied in practice.
30 Thuronyi, Victor. 2003. “How Can an Excessive Volume of Tax Disputes Be Dealt With?” Legal Department, International Monetary Fund, Washington, DC.31 OECD (Organisation for Economic Co-operation and Development). 2010. “Chapter 6: Compliance, Enforcement, Appeals.” In Better Regulation in Europe.
Paris, France: OECD.32 Gordon, Richard. 1996. “Chapter 4: Law of Tax Administration and Procedure.” In Tax Law Design and Drafting, edited by Victor Thuronyi. Washington, DC:
International Monetary Fund.
Source: Doing Business database
Different auditor
Independent department outside tax office
Same auditor
64
Independent department within tax office 123
17
19
20
No administrative appeal authority 1

29
ConclusionLittle is known about the tax compliance cost of post-filing procedures. This analysis is therefore intended to generate new research to better understand firms’ decisions and the dynamics in developing economies, to highlight which processes and practices work – and which do not – and, eventually, to induce governments to reform and enhance their post-filing processes.
The new indicator on the adequacy of post-filing processes provides policy makers who are dealing with the challenge of designing an optimal tax system with a broader dataset that allows them to benchmark their economy against others on the administrative burden of complying with post-filing procedures.
This analysis is intended to generate new research to better understand firms’ decisions and the dynamics in developing economies.
Authors
This case study was written by Emily Jane Bourke, Joanna Nasr, Nadia Novik and Rodrigo A. Sarmento de Beires.

30 Paying Taxes 2017
Chapter 2 – PwC commentary

31PwC commentary
This chapter starts with a consideration of the three original sub-indicators of Total Tax Rate, time to comply and the number of payments. We look at significant changes in the global averages for sub-indicators over the last year and at the trends since 2004. We also look at how they compare between regions.
We then focus on the new post-filing index, comparing how the different geographic regions perform on each component of the index, and on the overall index. We also examine the differences in the post-filing processes exhibited by economies in different income groupings.
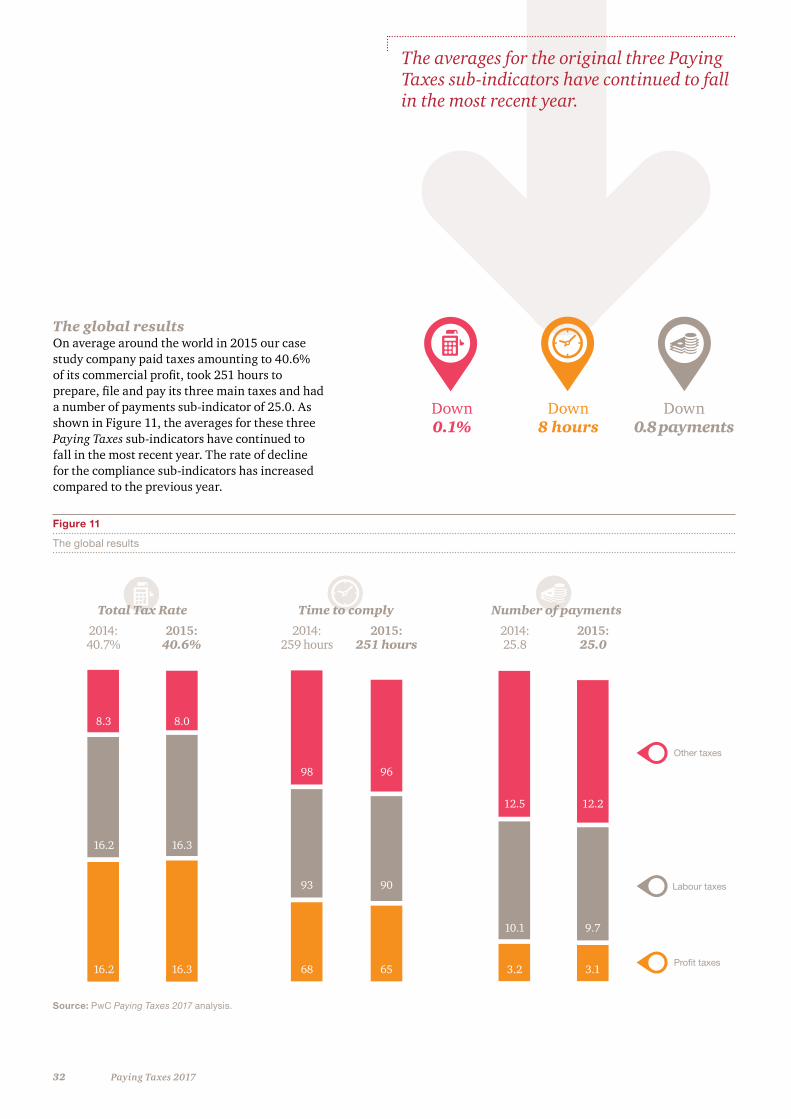
32 Paying Taxes 2017
The averages for the original three Paying Taxes sub-indicators have continued to fall in the most recent year.
Down0.1%
Down8 hours
Down0.8 payments
The global results On average around the world in 2015 our case study company paid taxes amounting to 40.6% of its commercial profit, took 251 hours to prepare, file and pay its three main taxes and had a number of payments sub-indicator of 25.0. As shown in Figure 11, the averages for these three Paying Taxes sub-indicators have continued to fall in the most recent year. The rate of decline for the compliance sub-indicators has increased compared to the previous year.
Total Tax Rate (%)
Time to comply (hours)
Number of payments
2013
2014
2013
2014
2013
2014Profit taxes
Labour taxes
Other taxes
Total Tax Rate
2015: 40.6%
2014: 40.7%
Time to comply
2015: 251 hours
2014: 259 hours
Number of payments
2015: 25.0
2014: 25.8
8.4 8.4 100 99 12.712.3
16.2 16.3
16.2 16.3
8.3 8.0
12.5 12.2
10.1 9.7
3.2 3.1
93 90
68 65
98 96
Figure 11
The global results
Source: PwC Paying Taxes 2017 analysis.
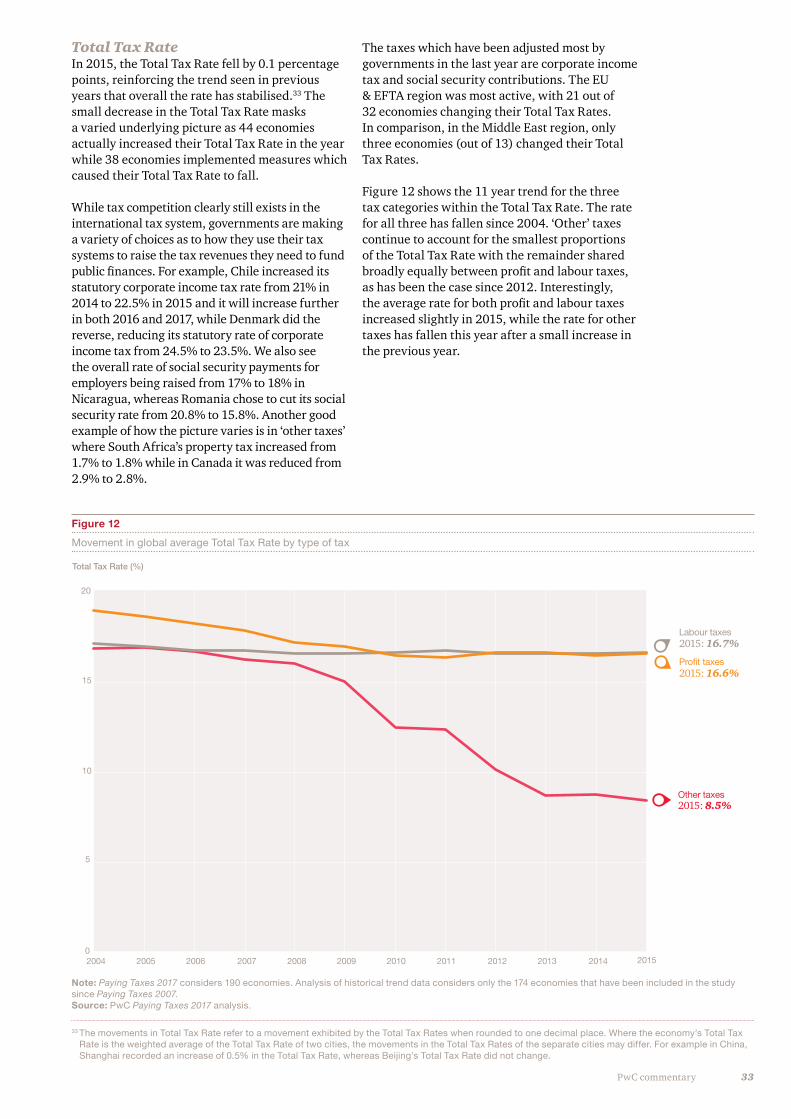
33PwC commentary
2015: 16.6%
2015: 8.5%
Profit taxes
2015: 16.7%Labour taxes
Other taxes
Total Tax Rate (%)
0
5
10
15
20
2004 2005 2006 2007 2008 2009 2010 2011 2012 2013 2014 2015
Total Tax Rate In 2015, the Total Tax Rate fell by 0.1 percentage points, reinforcing the trend seen in previous years that overall the rate has stabilised.33 The small decrease in the Total Tax Rate masks a varied underlying picture as 44 economies actually increased their Total Tax Rate in the year while 38 economies implemented measures which caused their Total Tax Rate to fall.
While tax competition clearly still exists in the international tax system, governments are making a variety of choices as to how they use their tax systems to raise the tax revenues they need to fund public finances. For example, Chile increased its statutory corporate income tax rate from 21% in 2014 to 22.5% in 2015 and it will increase further in both 2016 and 2017, while Denmark did the reverse, reducing its statutory rate of corporate income tax from 24.5% to 23.5%. We also see the overall rate of social security payments for employers being raised from 17% to 18% in Nicaragua, whereas Romania chose to cut its social security rate from 20.8% to 15.8%. Another good example of how the picture varies is in ‘other taxes’ where South Africa’s property tax increased from 1.7% to 1.8% while in Canada it was reduced from 2.9% to 2.8%.
The taxes which have been adjusted most by governments in the last year are corporate income tax and social security contributions. The EU & EFTA region was most active, with 21 out of 32 economies changing their Total Tax Rates. In comparison, in the Middle East region, only three economies (out of 13) changed their Total Tax Rates.
Figure 12 shows the 11 year trend for the three tax categories within the Total Tax Rate. The rate for all three has fallen since 2004. ‘Other’ taxes continue to account for the smallest proportions of the Total Tax Rate with the remainder shared broadly equally between profit and labour taxes, as has been the case since 2012. Interestingly, the average rate for both profit and labour taxes increased slightly in 2015, while the rate for other taxes has fallen this year after a small increase in the previous year.
Note: Paying Taxes 2017 considers 190 economies. Analysis of historical trend data considers only the 174 economies that have been included in the study since Paying Taxes 2007. Source: PwC Paying Taxes 2017 analysis.
Figure 12
Movement in global average Total Tax Rate by type of tax
33 The movements in Total Tax Rate refer to a movement exhibited by the Total Tax Rates when rounded to one decimal place. Where the economy’s Total Tax Rate is the weighted average of the Total Tax Rate of two cities, the movements in the Total Tax Rates of the separate cities may differ. For example in China, Shanghai recorded an increase of 0.5% in the Total Tax Rate, whereas Beijing’s Total Tax Rate did not change.
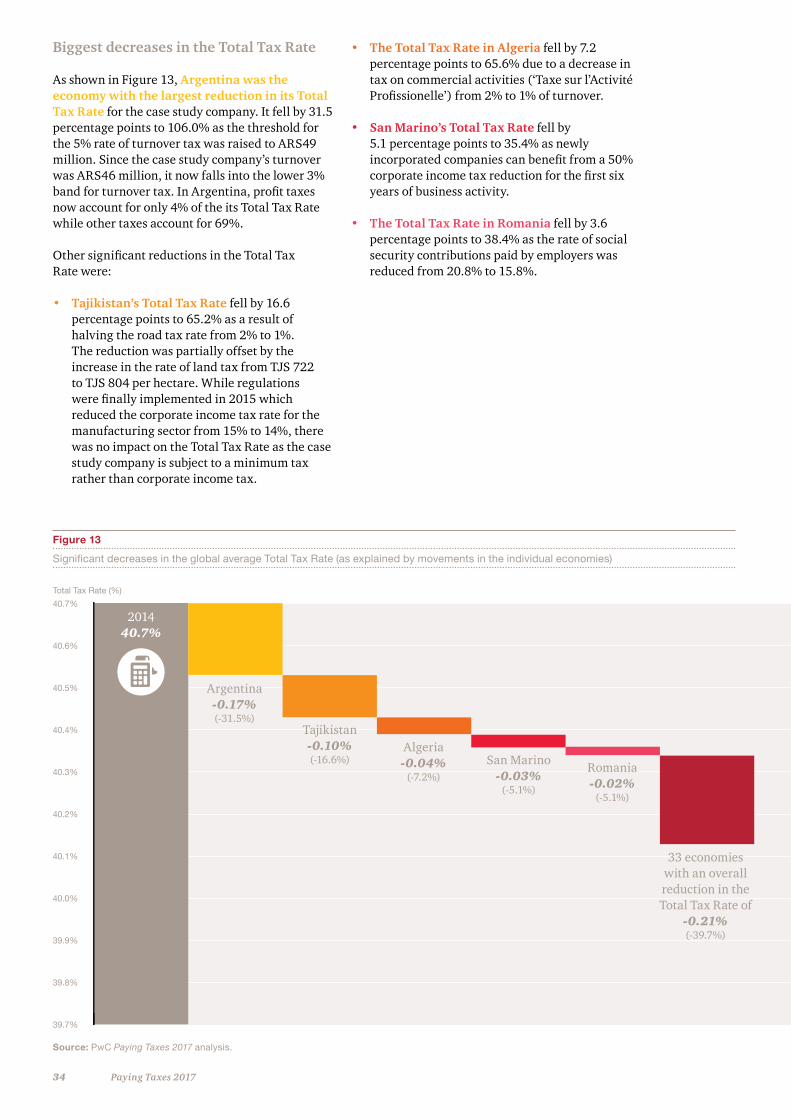
34 Paying Taxes 2017
Biggest decreases in the Total Tax Rate
As shown in Figure 13, Argentina was the economy with the largest reduction in its Total Tax Rate for the case study company. It fell by 31.5 percentage points to 106.0% as the threshold for the 5% rate of turnover tax was raised to ARS49 million. Since the case study company’s turnover was ARS46 million, it now falls into the lower 3% band for turnover tax. In Argentina, profit taxes now account for only 4% of the its Total Tax Rate while other taxes account for 69%.
Other significant reductions in the Total Tax Rate were:
• Tajikistan’s Total Tax Rate fell by 16.6 percentage points to 65.2% as a result of halving the road tax rate from 2% to 1%. The reduction was partially offset by the increase in the rate of land tax from TJS 722 to TJS 804 per hectare. While regulations were finally implemented in 2015 which reduced the corporate income tax rate for the manufacturing sector from 15% to 14%, there was no impact on the Total Tax Rate as the case study company is subject to a minimum tax rather than corporate income tax.
• The Total Tax Rate in Algeria fell by 7.2 percentage points to 65.6% due to a decrease in tax on commercial activities (‘Taxe sur l’Activité Profissionelle’) from 2% to 1% of turnover.
• San Marino’s Total Tax Rate fell by 5.1 percentage points to 35.4% as newly incorporated companies can benefit from a 50% corporate income tax reduction for the first six years of business activity.
• The Total Tax Rate in Romania fell by 3.6 percentage points to 38.4% as the rate of social security contributions paid by employers was reduced from 20.8% to 15.8%.
Figure 13
Significant decreases in the global average Total Tax Rate (as explained by movements in the individual economies)
Source: PwC Paying Taxes 2017 analysis.
Tax collections (AZN millions)
40.7%
40.6%
40.5%
40.4%
40.3%
40.2%
40.1%
40.0%
39.9%
39.8%
39.7%
40.7%
40.6%
40.5%
40.4%
40.3%
40.2%
40.1%
40.0%
39.9%
39.8%
39.7%
Total Tax Rate (%) Total Tax Rate (%)
Argentina-0.17%(-31.5%)
201440.7%
Tajikistan-0.10%(-16.6%)
Algeria-0.04%
(-7.2%)
San Marino-0.03%
(-5.1%)
Romania-0.02%
(-5.1%)
33 economies with an overall reduction in the Total Tax Rate of
-0.21%(-39.7%)
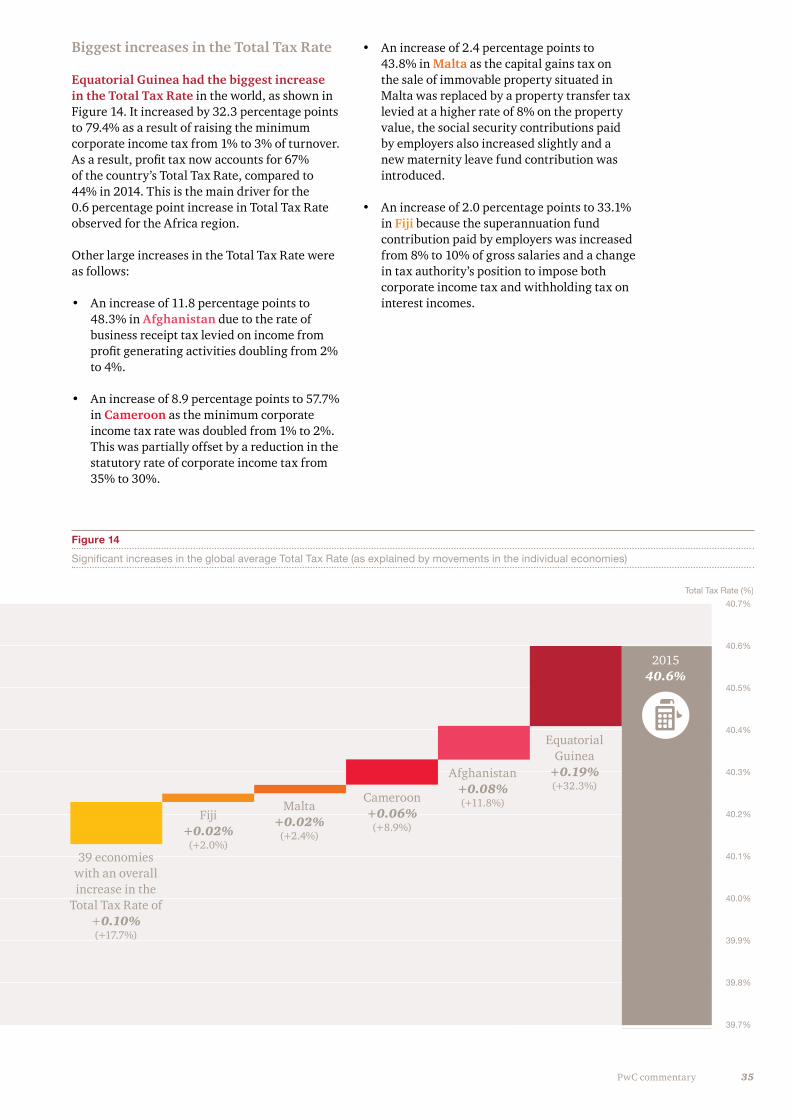
35PwC commentary
Figure 14
Significant increases in the global average Total Tax Rate (as explained by movements in the individual economies)
Biggest increases in the Total Tax Rate
Equatorial Guinea had the biggest increase in the Total Tax Rate in the world, as shown in Figure 14. It increased by 32.3 percentage points to 79.4% as a result of raising the minimum corporate income tax from 1% to 3% of turnover. As a result, profit tax now accounts for 67% of the country’s Total Tax Rate, compared to 44% in 2014. This is the main driver for the 0.6 percentage point increase in Total Tax Rate observed for the Africa region.
Other large increases in the Total Tax Rate were as follows:
• An increase of 11.8 percentage points to 48.3% in Afghanistan due to the rate of business receipt tax levied on income from profit generating activities doubling from 2% to 4%.
• An increase of 8.9 percentage points to 57.7% in Cameroon as the minimum corporate income tax rate was doubled from 1% to 2%. This was partially offset by a reduction in the statutory rate of corporate income tax from 35% to 30%.
• An increase of 2.4 percentage points to 43.8% in Malta as the capital gains tax on the sale of immovable property situated in Malta was replaced by a property transfer tax levied at a higher rate of 8% on the property value, the social security contributions paid by employers also increased slightly and a new maternity leave fund contribution was introduced.
• An increase of 2.0 percentage points to 33.1% in Fiji because the superannuation fund contribution paid by employers was increased from 8% to 10% of gross salaries and a change in tax authority’s position to impose both corporate income tax and withholding tax on interest incomes.
Tax collections (AZN millions)
40.7%
40.6%
40.5%
40.4%
40.3%
40.2%
40.1%
40.0%
39.9%
39.8%
39.7%
40.7%
40.6%
40.5%
40.4%
40.3%
40.2%
40.1%
40.0%
39.9%
39.8%
39.7%
Total Tax Rate (%) Total Tax Rate (%)
201540.6%
Fiji+0.02%
(+2.0%)
Malta+0.02%
(+2.4%)
Cameroon+0.06%
(+8.9%)
Afghanistan+0.08%(+11.8%)
Equatorial Guinea
+0.19%(+32.3%)
39 economies with an overall increase in the
Total Tax Rate of +0.10%(+17.7%)
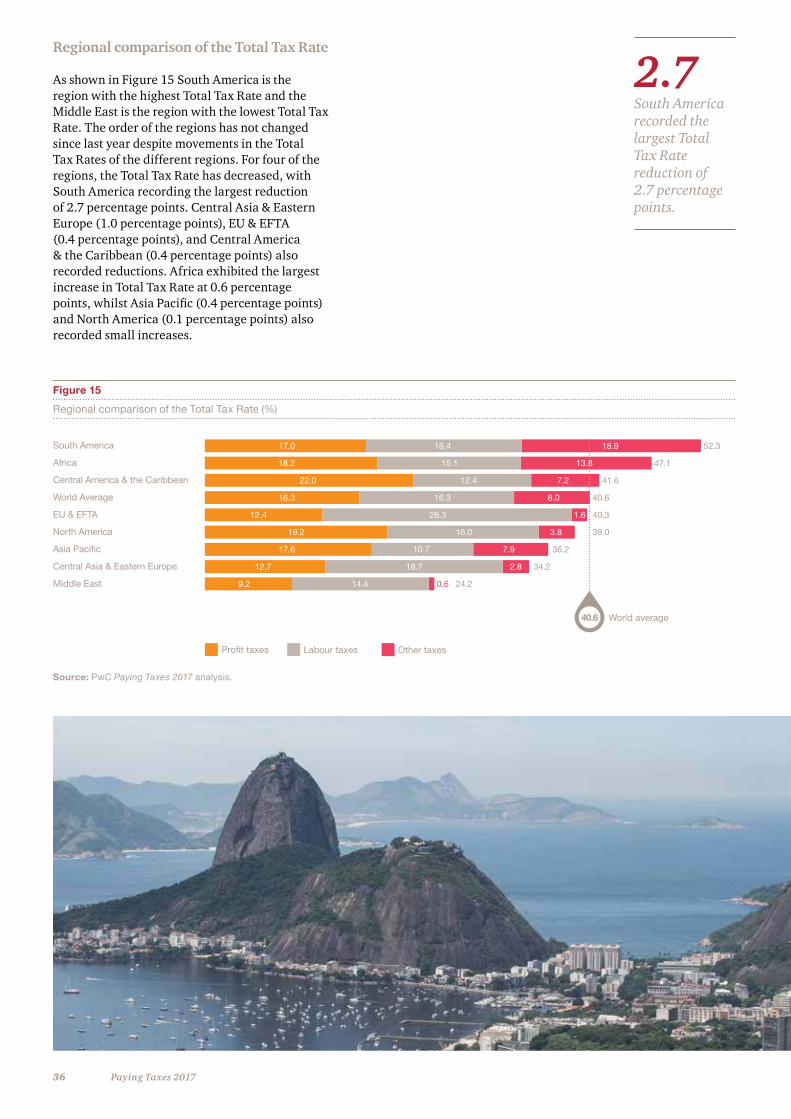
36 Paying Taxes 2017
Regional comparison of the Total Tax Rate As shown in Figure 15 South America is the region with the highest Total Tax Rate and the Middle East is the region with the lowest Total Tax Rate. The order of the regions has not changed since last year despite movements in the Total Tax Rates of the different regions. For four of the regions, the Total Tax Rate has decreased, with South America recording the largest reduction of 2.7 percentage points. Central Asia & Eastern Europe (1.0 percentage points), EU & EFTA (0.4 percentage points), and Central America & the Caribbean (0.4 percentage points) also recorded reductions. Africa exhibited the largest increase in Total Tax Rate at 0.6 percentage points, whilst Asia Pacific (0.4 percentage points) and North America (0.1 percentage points) also recorded small increases.
Figure 15
Regional comparison of the Total Tax Rate (%)
Source: PwC Paying Taxes 2017 analysis.
South America
Africa
Central America & the Caribbean
World Average
EU & EFTA
North America
Asia Pacific
Central Asia & Eastern Europe
Middle East
Profit taxes Labour taxes Other taxes
World average40.6
17.0 16.4 18.9 52.3
18.2 15.1 13.8 47.1
22.0 12.4 7.2 41.6
16.3 16.3 8.0 40.6
12.4 26.3 1.6 40.3
19.2 16.0 3.8 39.0
17.6 10.7 7.9 36.2
12.7 18.7 2.8 34.2
9.2 14.4 0.6 24.2
2.7
South America recorded the largest Total Tax Rate reduction of 2.7 percentage points.
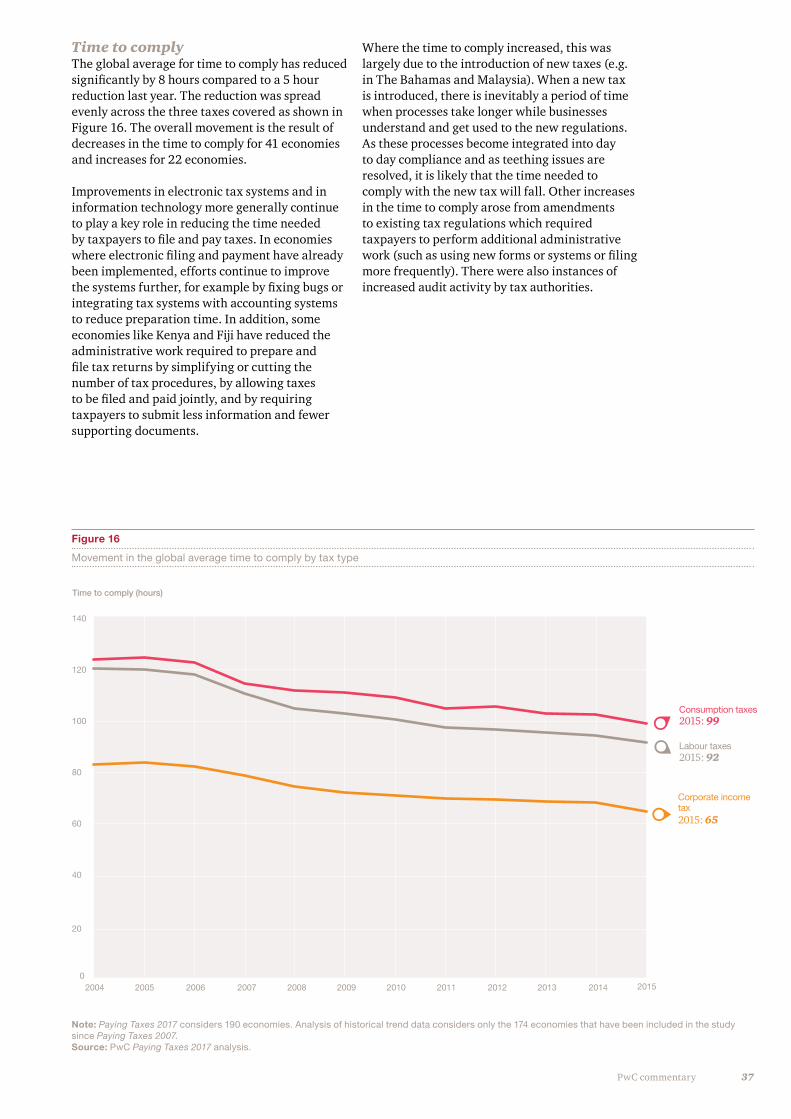
37PwC commentary
Time to comply The global average for time to comply has reduced significantly by 8 hours compared to a 5 hour reduction last year. The reduction was spread evenly across the three taxes covered as shown in Figure 16. The overall movement is the result of decreases in the time to comply for 41 economies and increases for 22 economies.
Improvements in electronic tax systems and in information technology more generally continue to play a key role in reducing the time needed by taxpayers to file and pay taxes. In economies where electronic filing and payment have already been implemented, efforts continue to improve the systems further, for example by fixing bugs or integrating tax systems with accounting systems to reduce preparation time. In addition, some economies like Kenya and Fiji have reduced the administrative work required to prepare and file tax returns by simplifying or cutting the number of tax procedures, by allowing taxes to be filed and paid jointly, and by requiring taxpayers to submit less information and fewer supporting documents.
Where the time to comply increased, this was largely due to the introduction of new taxes (e.g. in The Bahamas and Malaysia). When a new tax is introduced, there is inevitably a period of time when processes take longer while businesses understand and get used to the new regulations. As these processes become integrated into day to day compliance and as teething issues are resolved, it is likely that the time needed to comply with the new tax will fall. Other increases in the time to comply arose from amendments to existing tax regulations which required taxpayers to perform additional administrative work (such as using new forms or systems or filing more frequently). There were also instances of increased audit activity by tax authorities.
Figure 16
Movement in the global average time to comply by tax type
Note: Paying Taxes 2017 considers 190 economies. Analysis of historical trend data considers only the 174 economies that have been included in the study since Paying Taxes 2007. Source: PwC Paying Taxes 2017 analysis.
2015: 99
2015: 65
Consumption taxes
2015: 92Labour taxes
Corporate income tax
Time to comply (hours)
0
20
40
60
80
100
120
140
2004 2005 2006 2007 2008 2009 2010 2011 2012 2013 2014 2015
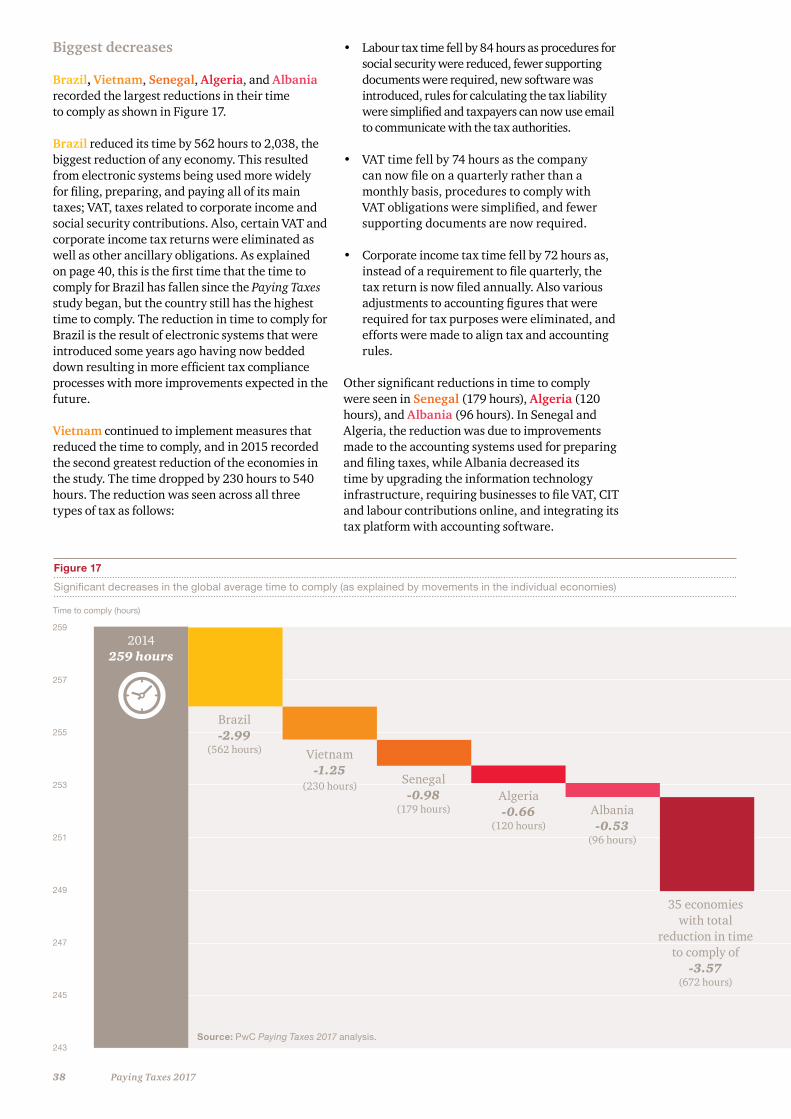
38 Paying Taxes 2017
Biggest decreases
Brazil, Vietnam, Senegal, Algeria, and Albania recorded the largest reductions in their time to comply as shown in Figure 17.
Brazil reduced its time by 562 hours to 2,038, the biggest reduction of any economy. This resulted from electronic systems being used more widely for filing, preparing, and paying all of its main taxes; VAT, taxes related to corporate income and social security contributions. Also, certain VAT and corporate income tax returns were eliminated as well as other ancillary obligations. As explained on page 40, this is the first time that the time to comply for Brazil has fallen since the Paying Taxes study began, but the country still has the highest time to comply. The reduction in time to comply for Brazil is the result of electronic systems that were introduced some years ago having now bedded down resulting in more efficient tax compliance processes with more improvements expected in the future.
Vietnam continued to implement measures that reduced the time to comply, and in 2015 recorded the second greatest reduction of the economies in the study. The time dropped by 230 hours to 540 hours. The reduction was seen across all three types of tax as follows:
• Labour tax time fell by 84 hours as procedures for social security were reduced, fewer supporting documents were required, new software was introduced, rules for calculating the tax liability were simplified and taxpayers can now use email to communicate with the tax authorities.
• VAT time fell by 74 hours as the company can now file on a quarterly rather than a monthly basis, procedures to comply with VAT obligations were simplified, and fewer supporting documents are now required.
• Corporate income tax time fell by 72 hours as, instead of a requirement to file quarterly, the tax return is now filed annually. Also various adjustments to accounting figures that were required for tax purposes were eliminated, and efforts were made to align tax and accounting rules.
Other significant reductions in time to comply were seen in Senegal (179 hours), Algeria (120 hours), and Albania (96 hours). In Senegal and Algeria, the reduction was due to improvements made to the accounting systems used for preparing and filing taxes, while Albania decreased its time by upgrading the information technology infrastructure, requiring businesses to file VAT, CIT and labour contributions online, and integrating its tax platform with accounting software.
Figure 17
Significant decreases in the global average time to comply (as explained by movements in the individual economies)
Tax collections (AZN millions)
259
257
255
253
251
249
247
245
243
259
257
255
253
251
249
247
245
243
Time to comply (hours) Time to comply (hours)
Brazil-2.99
(562 hours)
2014259 hours
Vietnam-1.25
(230 hours) Senegal-0.98
(179 hours)Algeria-0.66
(120 hours)Albania-0.53
(96 hours)
35 economies with total
reduction in time to comply of
-3.57(672 hours)
Source: PwC Paying Taxes 2017 analysis.
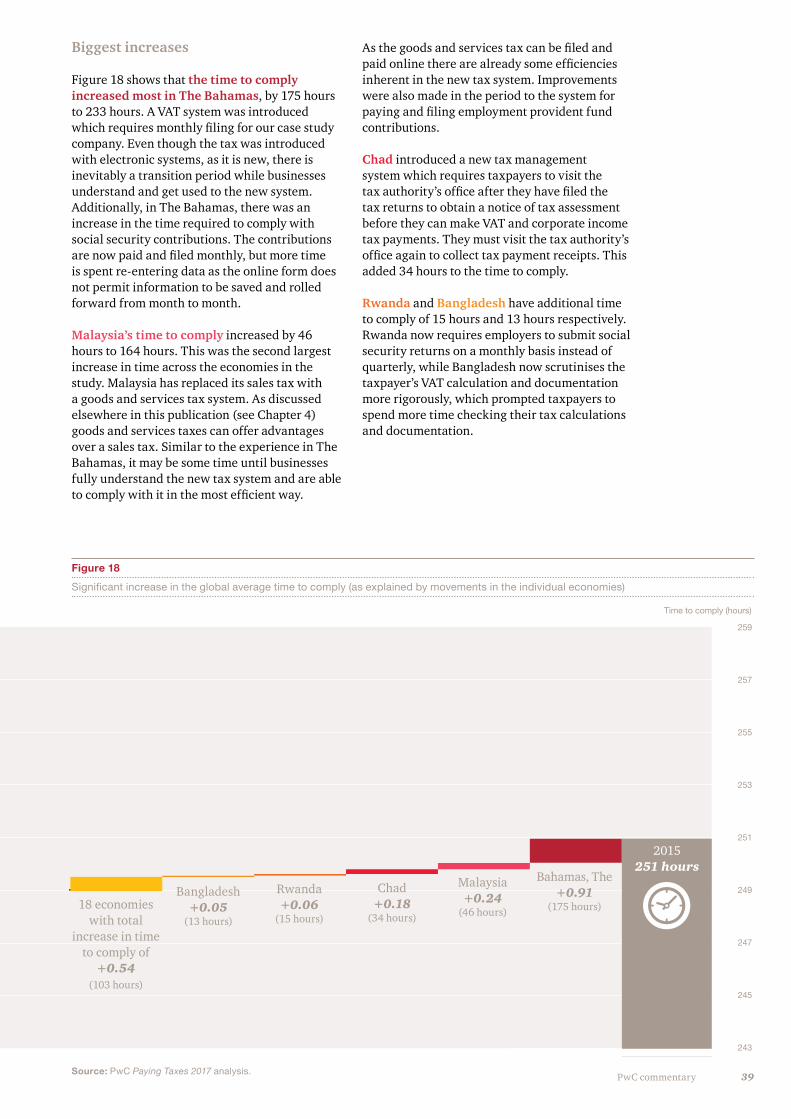
39PwC commentary
Biggest increases
Figure 18 shows that the time to comply increased most in The Bahamas, by 175 hours to 233 hours. A VAT system was introduced which requires monthly filing for our case study company. Even though the tax was introduced with electronic systems, as it is new, there is inevitably a transition period while businesses understand and get used to the new system. Additionally, in The Bahamas, there was an increase in the time required to comply with social security contributions. The contributions are now paid and filed monthly, but more time is spent re-entering data as the online form does not permit information to be saved and rolled forward from month to month.
Malaysia’s time to comply increased by 46 hours to 164 hours. This was the second largest increase in time across the economies in the study. Malaysia has replaced its sales tax with a goods and services tax system. As discussed elsewhere in this publication (see Chapter 4) goods and services taxes can offer advantages over a sales tax. Similar to the experience in The Bahamas, it may be some time until businesses fully understand the new tax system and are able to comply with it in the most efficient way.
As the goods and services tax can be filed and paid online there are already some efficiencies inherent in the new tax system. Improvements were also made in the period to the system for paying and filing employment provident fund contributions.
Chad introduced a new tax management system which requires taxpayers to visit the tax authority’s office after they have filed the tax returns to obtain a notice of tax assessment before they can make VAT and corporate income tax payments. They must visit the tax authority’s office again to collect tax payment receipts. This added 34 hours to the time to comply.
Rwanda and Bangladesh have additional time to comply of 15 hours and 13 hours respectively. Rwanda now requires employers to submit social security returns on a monthly basis instead of quarterly, while Bangladesh now scrutinises the taxpayer’s VAT calculation and documentation more rigorously, which prompted taxpayers to spend more time checking their tax calculations and documentation.
Figure 18
Significant increase in the global average time to comply (as explained by movements in the individual economies)
Source: PwC Paying Taxes 2017 analysis.
Tax collections (AZN millions)
259
257
255
253
251
249
247
245
243
259
257
255
253
251
249
247
245
243
Time to comply (hours) Time to comply (hours)
2015251 hours
Bangladesh+0.05
(13 hours)
Rwanda+0.06
(15 hours)
Chad+0.18
(34 hours)
Malaysia+0.24
(46 hours)
Bahamas, The+0.91
(175 hours)18 economies with total
increase in time to comply of
+0.54(103 hours)
Source: PwC Paying Taxes 2017 analysis.
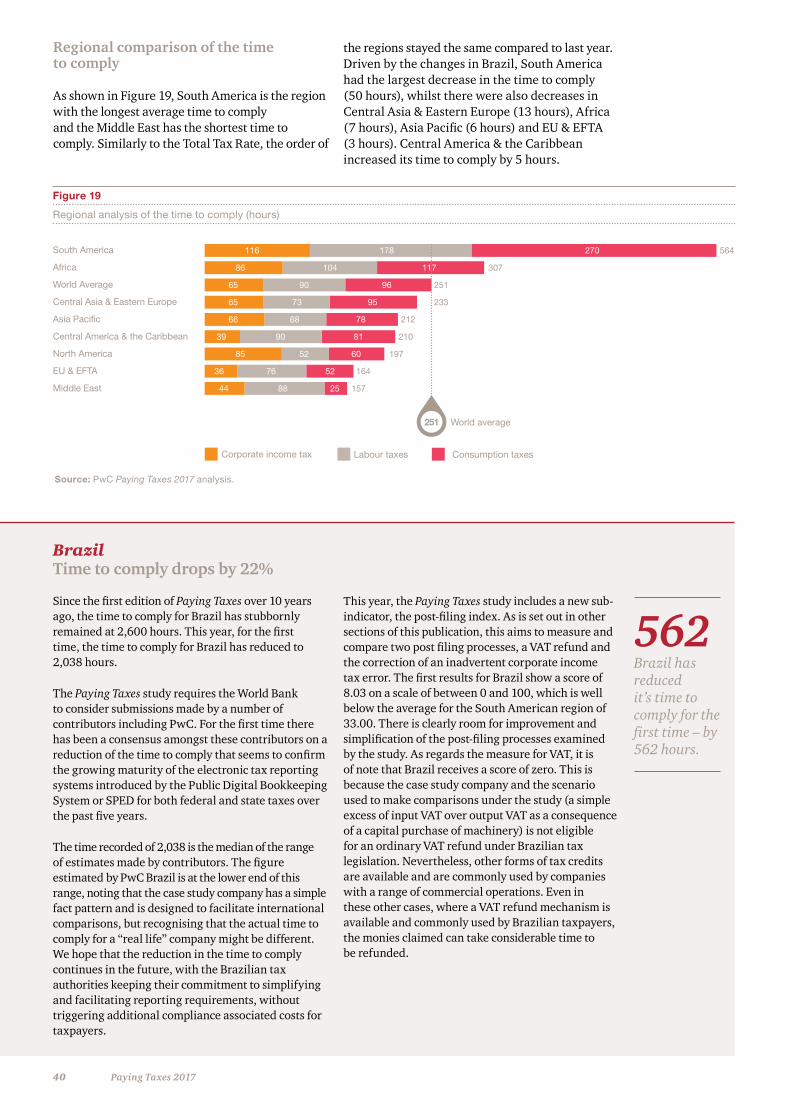
40 Paying Taxes 2017
Regional comparison of the time to comply
As shown in Figure 19, South America is the region with the longest average time to comply and the Middle East has the shortest time to comply. Similarly to the Total Tax Rate, the order of
Figure 19
Regional analysis of the time to comply (hours)
Source: PwC Paying Taxes 2017 analysis.
South America
Africa
World Average
Central Asia & Eastern Europe
Asia Pacific
Central America & the Caribbean
North America
EU & EFTA
Middle East
Corporate income tax Labour taxes Consumption taxes
World average251
116 178 270 564
86 104 117 307
65 90 96 251
65 73 95 233
66 68 78 212
39 90 81 210
85 52 60 197
36 76 52 164
44 88 25 157
the regions stayed the same compared to last year. Driven by the changes in Brazil, South America had the largest decrease in the time to comply (50 hours), whilst there were also decreases in Central Asia & Eastern Europe (13 hours), Africa (7 hours), Asia Pacific (6 hours) and EU & EFTA (3 hours). Central America & the Caribbean increased its time to comply by 5 hours.
BrazilTime to comply drops by 22%
Since the first edition of Paying Taxes over 10 years ago, the time to comply for Brazil has stubbornly remained at 2,600 hours. This year, for the first time, the time to comply for Brazil has reduced to 2,038 hours.
The Paying Taxes study requires the World Bank to consider submissions made by a number of contributors including PwC. For the first time there has been a consensus amongst these contributors on a reduction of the time to comply that seems to confirm the growing maturity of the electronic tax reporting systems introduced by the Public Digital Bookkeeping System or SPED for both federal and state taxes over the past five years.
The time recorded of 2,038 is the median of the range of estimates made by contributors. The figure estimated by PwC Brazil is at the lower end of this range, noting that the case study company has a simple fact pattern and is designed to facilitate international comparisons, but recognising that the actual time to comply for a “real life” company might be different. We hope that the reduction in the time to comply continues in the future, with the Brazilian tax authorities keeping their commitment to simplifying and facilitating reporting requirements, without triggering additional compliance associated costs for taxpayers.
This year, the Paying Taxes study includes a new sub-indicator, the post-filing index. As is set out in other sections of this publication, this aims to measure and compare two post filing processes, a VAT refund and the correction of an inadvertent corporate income tax error. The first results for Brazil show a score of 8.03 on a scale of between 0 and 100, which is well below the average for the South American region of 33.00. There is clearly room for improvement and simplification of the post-filing processes examined by the study. As regards the measure for VAT, it is of note that Brazil receives a score of zero. This is because the case study company and the scenario used to make comparisons under the study (a simple excess of input VAT over output VAT as a consequence of a capital purchase of machinery) is not eligible for an ordinary VAT refund under Brazilian tax legislation. Nevertheless, other forms of tax credits are available and are commonly used by companies with a range of commercial operations. Even in these other cases, where a VAT refund mechanism is available and commonly used by Brazilian taxpayers, the monies claimed can take considerable time to be refunded.
562
Brazil has reduced it’s time to comply for the first time – by 562 hours.
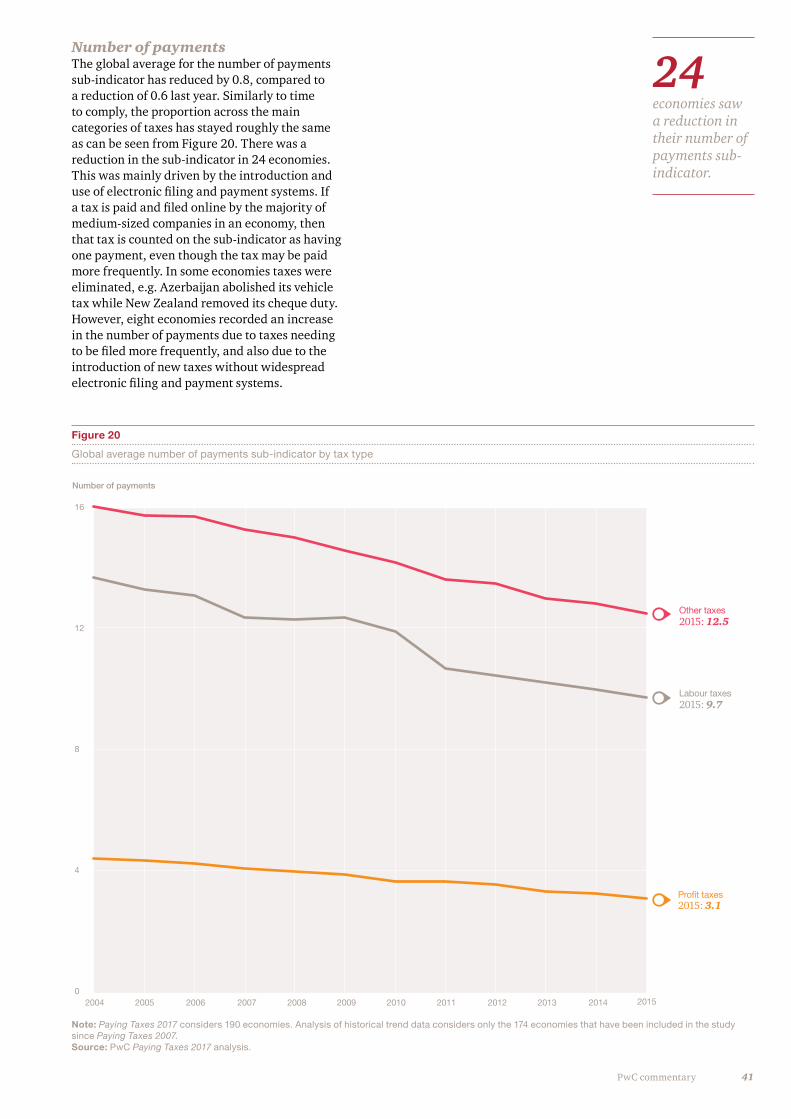
41PwC commentary
Number of payments The global average for the number of payments sub-indicator has reduced by 0.8, compared to a reduction of 0.6 last year. Similarly to time to comply, the proportion across the main categories of taxes has stayed roughly the same as can be seen from Figure 20. There was a reduction in the sub-indicator in 24 economies. This was mainly driven by the introduction and use of electronic filing and payment systems. If a tax is paid and filed online by the majority of medium-sized companies in an economy, then that tax is counted on the sub-indicator as having one payment, even though the tax may be paid more frequently. In some economies taxes were eliminated, e.g. Azerbaijan abolished its vehicle tax while New Zealand removed its cheque duty. However, eight economies recorded an increase in the number of payments due to taxes needing to be filed more frequently, and also due to the introduction of new taxes without widespread electronic filing and payment systems.
Figure 20
Global average number of payments sub-indicator by tax type
2015: 12.5
2015: 3.1
Other taxes
2015: 9.7Labour taxes
Profit taxes
Number of payments
2004 2005 2006 2007 2008 2009 2010 2011 2012 2013 2014 2015
16
12
8
4
0
24
economies saw a reduction in their number of payments sub-indicator.
Note: Paying Taxes 2017 considers 190 economies. Analysis of historical trend data considers only the 174 economies that have been included in the study since Paying Taxes 2007. Source: PwC Paying Taxes 2017 analysis.
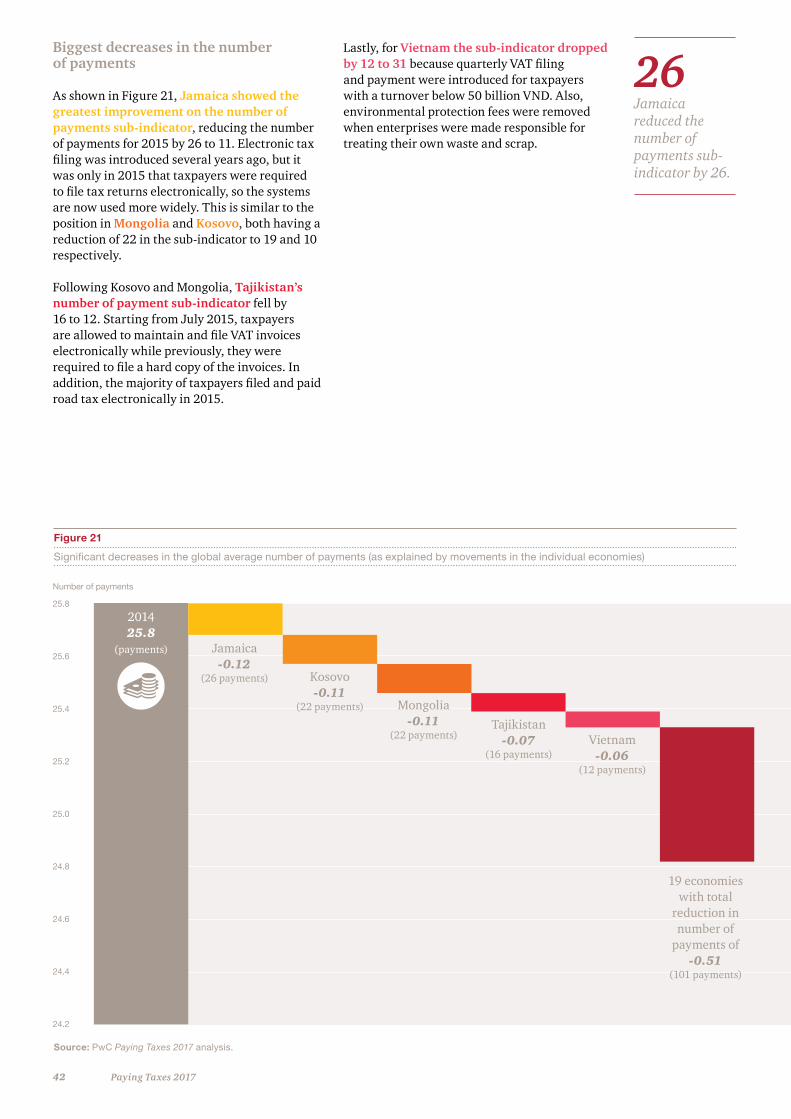
42 Paying Taxes 2017
Biggest decreases in the number of payments As shown in Figure 21, Jamaica showed the greatest improvement on the number of payments sub-indicator, reducing the number of payments for 2015 by 26 to 11. Electronic tax filing was introduced several years ago, but it was only in 2015 that taxpayers were required to file tax returns electronically, so the systems are now used more widely. This is similar to the position in Mongolia and Kosovo, both having a reduction of 22 in the sub-indicator to 19 and 10 respectively.
Following Kosovo and Mongolia, Tajikistan’s number of payment sub-indicator fell by 16 to 12. Starting from July 2015, taxpayers are allowed to maintain and file VAT invoices electronically while previously, they were required to file a hard copy of the invoices. In addition, the majority of taxpayers filed and paid road tax electronically in 2015.
Lastly, for Vietnam the sub-indicator dropped by 12 to 31 because quarterly VAT filing and payment were introduced for taxpayers with a turnover below 50 billion VND. Also, environmental protection fees were removed when enterprises were made responsible for treating their own waste and scrap.
Figure 21
Significant decreases in the global average number of payments (as explained by movements in the individual economies)
Source: PwC Paying Taxes 2017 analysis.
Tax collections (AZN millions)
25.8
25.6
25.4
25.2
25.0
24.8
24.6
24.4
24.2
25.8
25.6
25.4
25.2
25.0
24.8
24.6
24.4
24.2
Number of payments Number of payments
Jamaica-0.12
(26 payments)
201425.8
(payments)
Kosovo-0.11
(22 payments) Mongolia-0.11
(22 payments)Tajikistan
-0.07(16 payments)
Vietnam-0.06
(12 payments)
19 economies with total
reduction in number of
payments of -0.51
(101 payments)
26
Jamaica reduced the number of payments sub-indicator by 26.
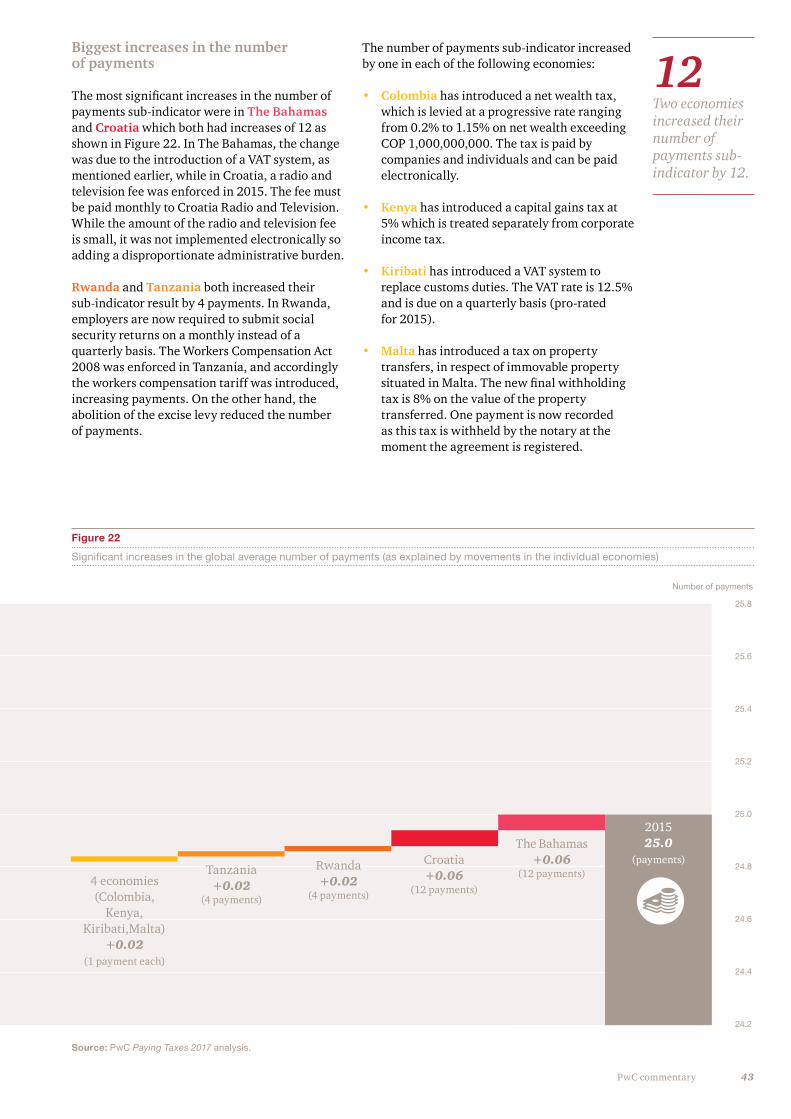
43PwC commentary
Biggest increases in the number of payments The most significant increases in the number of payments sub-indicator were in The Bahamas and Croatia which both had increases of 12 as shown in Figure 22. In The Bahamas, the change was due to the introduction of a VAT system, as mentioned earlier, while in Croatia, a radio and television fee was enforced in 2015. The fee must be paid monthly to Croatia Radio and Television. While the amount of the radio and television fee is small, it was not implemented electronically so adding a disproportionate administrative burden.
Rwanda and Tanzania both increased their sub-indicator result by 4 payments. In Rwanda, employers are now required to submit social security returns on a monthly instead of a quarterly basis. The Workers Compensation Act 2008 was enforced in Tanzania, and accordingly the workers compensation tariff was introduced, increasing payments. On the other hand, the abolition of the excise levy reduced the number of payments.
The number of payments sub-indicator increased by one in each of the following economies:
• Colombia has introduced a net wealth tax, which is levied at a progressive rate ranging from 0.2% to 1.15% on net wealth exceeding COP 1,000,000,000. The tax is paid by companies and individuals and can be paid electronically.
• Kenya has introduced a capital gains tax at 5% which is treated separately from corporate income tax.
• Kiribati has introduced a VAT system to replace customs duties. The VAT rate is 12.5% and is due on a quarterly basis (pro-rated for 2015).
• Malta has introduced a tax on property transfers, in respect of immovable property situated in Malta. The new final withholding tax is 8% on the value of the property transferred. One payment is now recorded as this tax is withheld by the notary at the moment the agreement is registered.
Figure 22
Significant increases in the global average number of payments (as explained by movements in the individual economies)
Source: PwC Paying Taxes 2017 analysis.
Tax collections (AZN millions)
25.8
25.6
25.4
25.2
25.0
24.8
24.6
24.4
24.2
25.8
25.6
25.4
25.2
25.0
24.8
24.6
24.4
24.2
Number of payments Number of payments
201525.0
(payments)Tanzania
+0.02(4 payments)
Rwanda+0.02
(4 payments)
Croatia+0.06
(12 payments)
The Bahamas+0.06
(12 payments)4 economies (Colombia,
Kenya, Kiribati,Malta)
+0.02(1 payment each)
12
Two economies increased their number of payments sub-indicator by 12.
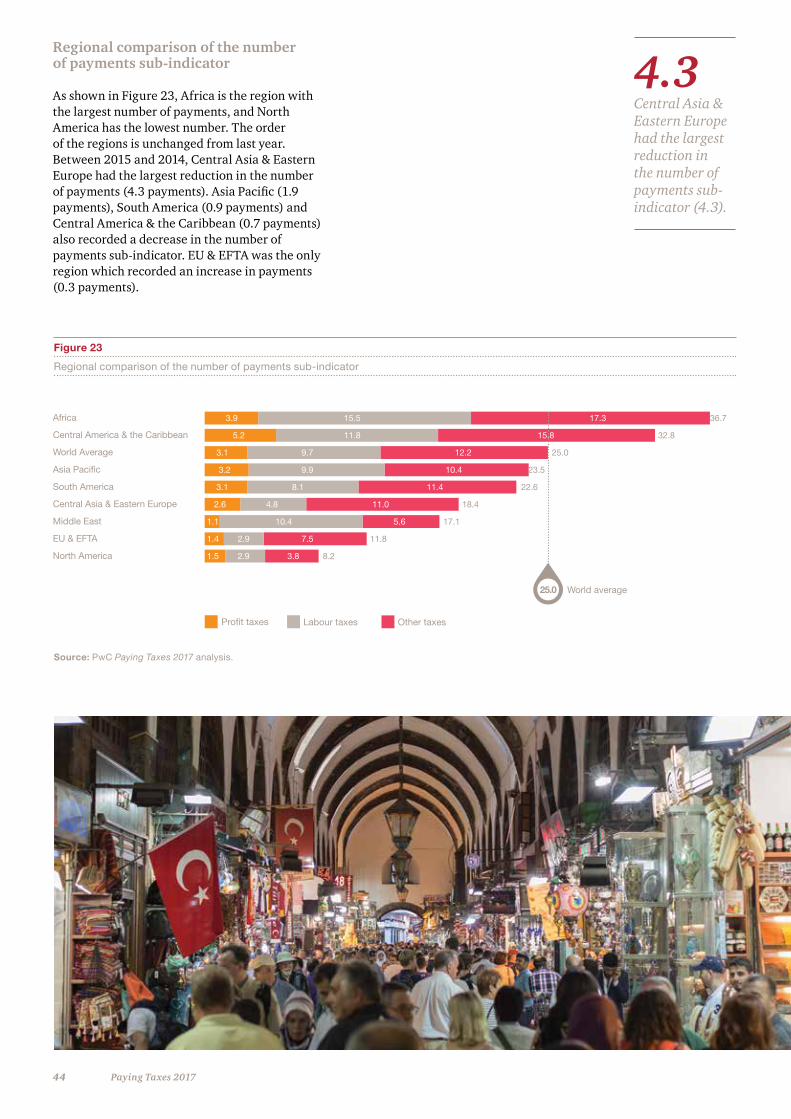
44 Paying Taxes 2017
Regional comparison of the number of payments sub-indicator
As shown in Figure 23, Africa is the region with the largest number of payments, and North America has the lowest number. The order of the regions is unchanged from last year. Between 2015 and 2014, Central Asia & Eastern Europe had the largest reduction in the number of payments (4.3 payments). Asia Pacific (1.9 payments), South America (0.9 payments) and Central America & the Caribbean (0.7 payments) also recorded a decrease in the number of payments sub-indicator. EU & EFTA was the only region which recorded an increase in payments (0.3 payments).
Figure 23
Regional comparison of the number of payments sub-indicator
Source: PwC Paying Taxes 2017 analysis.
Africa
Central America & the Caribbean
World Average
Asia Pacific
South America
Central Asia & Eastern Europe
Middle East
EU & EFTA
North America
Profit taxes Labour taxes Other taxes
World average25.0
3.9 15.5 17.3 36.7
5.2 11.8 15.8 32.8
3.1 9.7 12.2 25.0
3.2 9.9 10.4 23.5
3.1 8.1 11.4 22.6
2.6 4.8 11.0 18.4
1.1 10.4 5.6 17.1
1.4 2.9 7.5 11.8
1.5 2.9 3.8 8.2
4.3
Central Asia & Eastern Europe had the largest reduction in the number of payments sub-indicator (4.3).
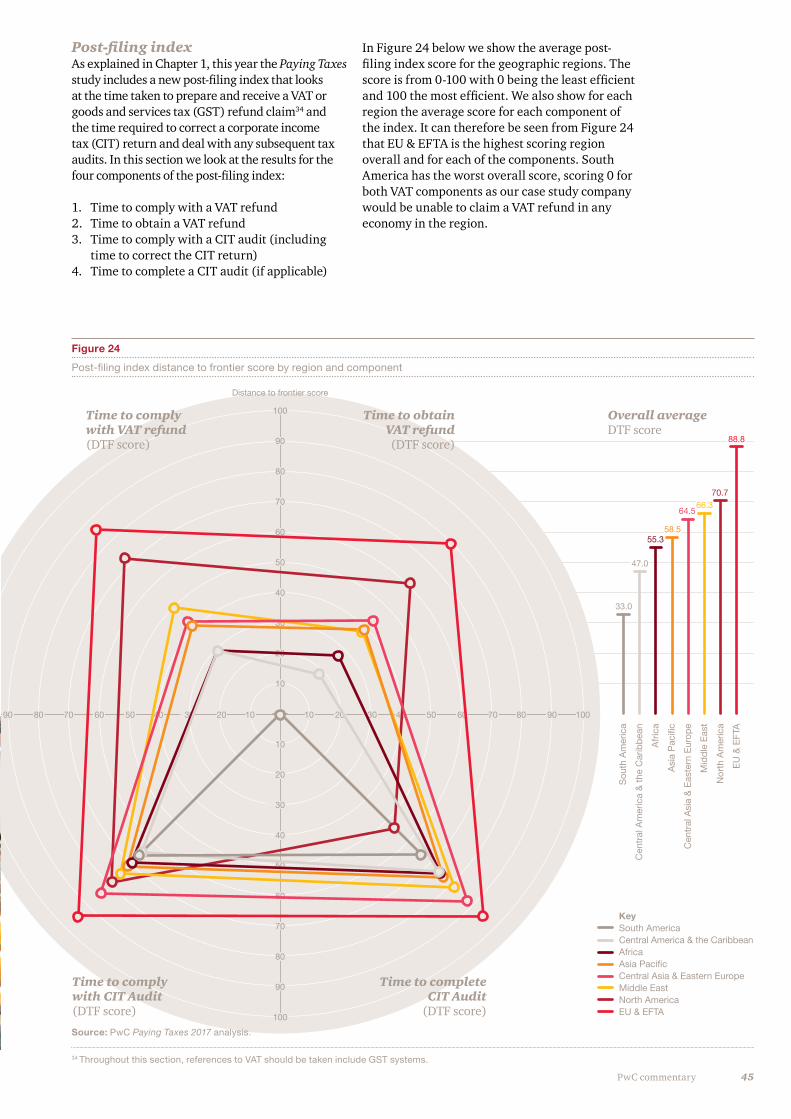
45PwC commentary
Figure 24
Post-filing index distance to frontier score by region and component
Post-filing indexAs explained in Chapter 1, this year the Paying Taxes study includes a new post-filing index that looks at the time taken to prepare and receive a VAT or goods and services tax (GST) refund claim34 and the time required to correct a corporate income tax (CIT) return and deal with any subsequent tax audits. In this section we look at the results for the four components of the post-filing index:
1. Time to comply with a VAT refund2. Time to obtain a VAT refund3. Time to comply with a CIT audit (including
time to correct the CIT return)4. Time to complete a CIT audit (if applicable)
KeySouth AmericaCentral America & the CaribbeanAfricaAsia PacificCentral Asia & Eastern EuropeMiddle EastNorth AmericaEU & EFTA
66.3
100
90
80
70
60
50
40
30
20
10
0
100
90
80
70
60
50
40
30
20
10
0
10
20
30
40
50
60
70
80
90
100
100 90 80 70 60 50 40 30 20 10 10 20 30 40 50 60 70 80 90 100
33.0
47.0
55.358.5
64.566.3
70.7
88.8
Time to comply with VAT refund(DTF score)
Time to obtain VAT refund(DTF score)
Overall averageDTF score
Time to complete CIT Audit
(DTF score)
Time to comply with CIT Audit (DTF score)
Distance to frontier score
100
90
80
70
60
50
40
30
20
10
0
10
20
30
40
50
60
70
80
90
100
100 90 80 70 60 50 40 30 20 10 10 20 30 40 50 60 70 80 90 100
Sou
th A
mer
ica
Cen
tral
Am
eric
a &
the
Car
ibbe
an
Afr
ica
Asi
a P
acifi
c
Cen
tral
Asi
a &
Eas
tern
Eur
ope
Mid
dle
Eas
t
Nor
th A
mer
ica
EU
& E
FTA
Source: PwC Paying Taxes 2017 analysis.
In Figure 24 below we show the average post-filing index score for the geographic regions. The score is from 0-100 with 0 being the least efficient and 100 the most efficient. We also show for each region the average score for each component of the index. It can therefore be seen from Figure 24 that EU & EFTA is the highest scoring region overall and for each of the components. South America has the worst overall score, scoring 0 for both VAT components as our case study company would be unable to claim a VAT refund in any economy in the region.
34 Throughout this section, references to VAT should be taken include GST systems.
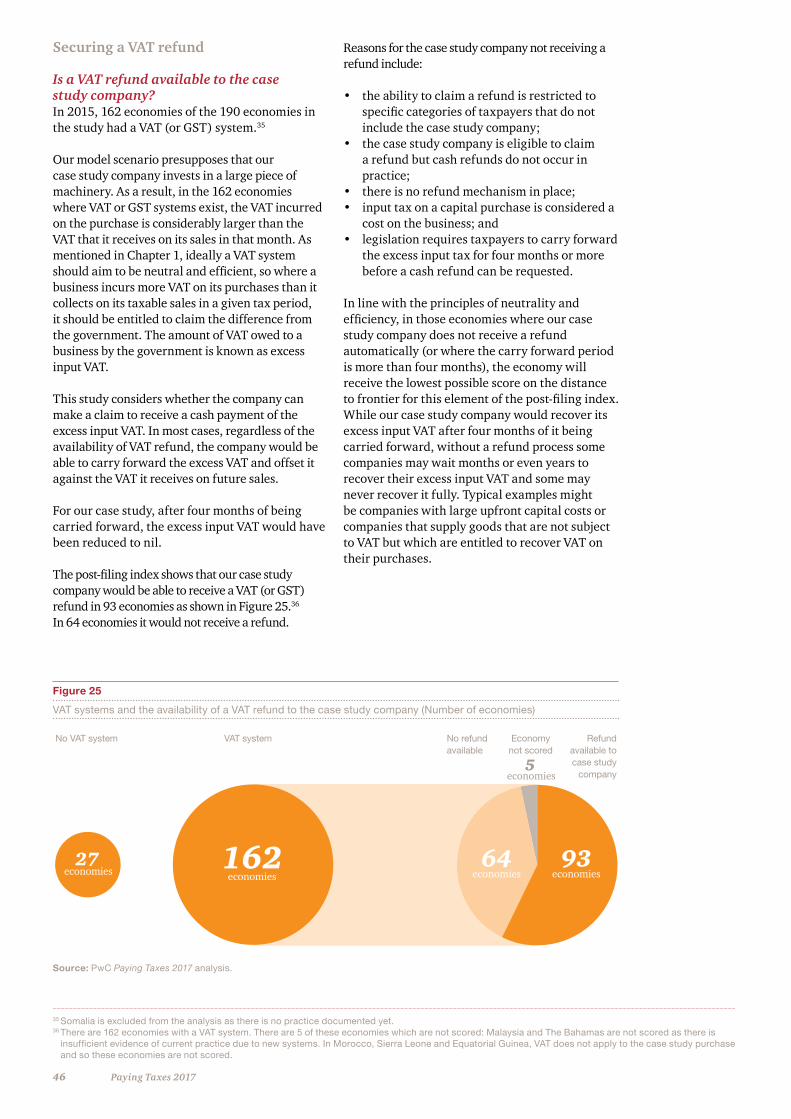
46 Paying Taxes 2017
Figure 25
VAT systems and the availability of a VAT refund to the case study company (Number of economies)
Source: PwC Paying Taxes 2017 analysis.
No VAT system VAT system Refund available to case study
company
No refund available
Economy not scored
27economies economies economies
economies
economies64
5
93162
35 Somalia is excluded from the analysis as there is no practice documented yet.36 There are 162 economies with a VAT system. There are 5 of these economies which are not scored: Malaysia and The Bahamas are not scored as there is
insufficient evidence of current practice due to new systems. In Morocco, Sierra Leone and Equatorial Guinea, VAT does not apply to the case study purchase and so these economies are not scored.
Securing a VAT refund
Is a VAT refund available to the case study company?In 2015, 162 economies of the 190 economies in the study had a VAT (or GST) system.35
Our model scenario presupposes that our case study company invests in a large piece of machinery. As a result, in the 162 economies where VAT or GST systems exist, the VAT incurred on the purchase is considerably larger than the VAT that it receives on its sales in that month. As mentioned in Chapter 1, ideally a VAT system should aim to be neutral and efficient, so where a business incurs more VAT on its purchases than it collects on its taxable sales in a given tax period, it should be entitled to claim the difference from the government. The amount of VAT owed to a business by the government is known as excess input VAT.
This study considers whether the company can make a claim to receive a cash payment of the excess input VAT. In most cases, regardless of the availability of VAT refund, the company would be able to carry forward the excess VAT and offset it against the VAT it receives on future sales.
For our case study, after four months of being carried forward, the excess input VAT would have been reduced to nil.
The post-filing index shows that our case study company would be able to receive a VAT (or GST) refund in 93 economies as shown in Figure 25.36 In 64 economies it would not receive a refund.
Reasons for the case study company not receiving a refund include:
• the ability to claim a refund is restricted to specific categories of taxpayers that do not include the case study company;
• the case study company is eligible to claim a refund but cash refunds do not occur in practice;
• there is no refund mechanism in place; • input tax on a capital purchase is considered a
cost on the business; and • legislation requires taxpayers to carry forward
the excess input tax for four months or more before a cash refund can be requested.
In line with the principles of neutrality and efficiency, in those economies where our case study company does not receive a refund automatically (or where the carry forward period is more than four months), the economy will receive the lowest possible score on the distance to frontier for this element of the post-filing index. While our case study company would recover its excess input VAT after four months of it being carried forward, without a refund process some companies may wait months or even years to recover their excess input VAT and some may never recover it fully. Typical examples might be companies with large upfront capital costs or companies that supply goods that are not subject to VAT but which are entitled to recover VAT on their purchases.
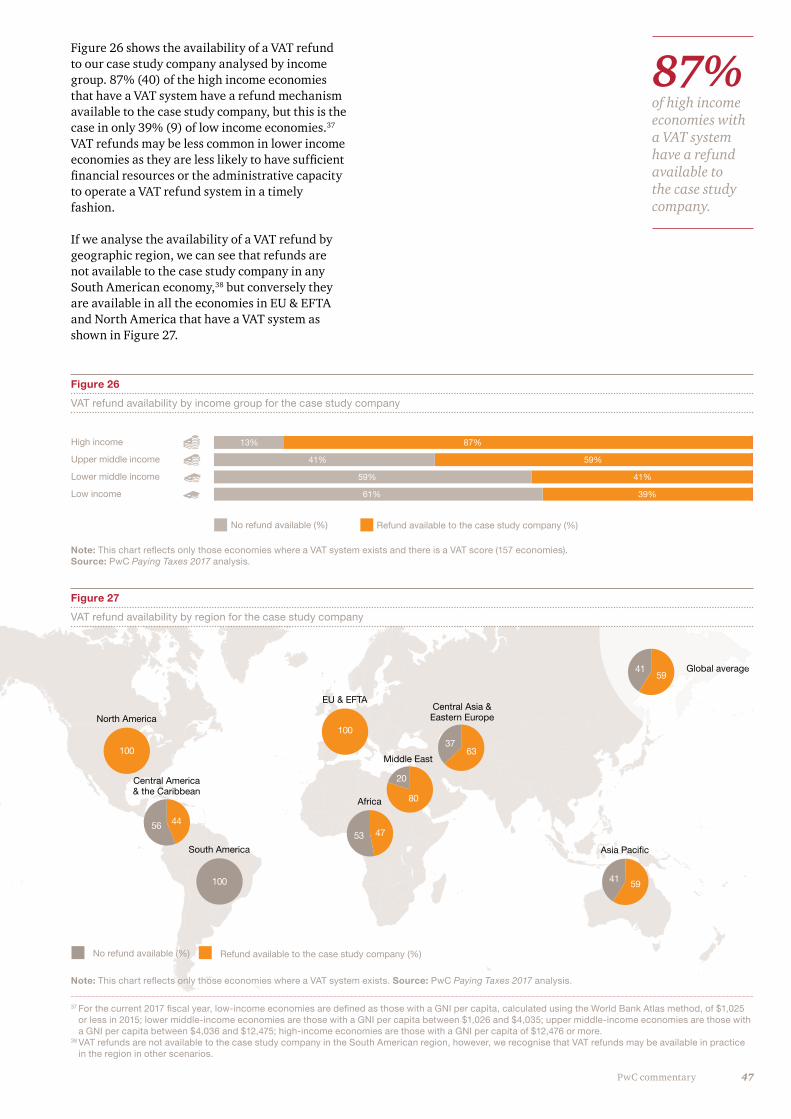
47PwC commentary
Figure 26 shows the availability of a VAT refund to our case study company analysed by income group. 87% (40) of the high income economies that have a VAT system have a refund mechanism available to the case study company, but this is the case in only 39% (9) of low income economies.37 VAT refunds may be less common in lower income economies as they are less likely to have sufficient financial resources or the administrative capacity to operate a VAT refund system in a timely fashion.
If we analyse the availability of a VAT refund by geographic region, we can see that refunds are not available to the case study company in any South American economy,38 but conversely they are available in all the economies in EU & EFTA and North America that have a VAT system as shown in Figure 27.
Figure 26
VAT refund availability by income group for the case study company
Note: This chart reflects only those economies where a VAT system exists and there is a VAT score (157 economies). Source: PwC Paying Taxes 2017 analysis.
High income
Upper middle income
Lower middle income
Low income
No refund available (%) Refund available to the case study company (%)
13% 87%
41% 59%
59% 41%
61% 39%
47
Africa
53
EU & EFTA
100North America
100
Central America & the Caribbean
4456
South America
100 59
Asia Pacific
41
80
Middle East
20
63
Central Asia & Eastern Europe
37
Global average59
41
No refund available (%) Refund available to the case study company (%)
Figure 27
VAT refund availability by region for the case study company
Note: This chart reflects only those economies where a VAT system exists. Source: PwC Paying Taxes 2017 analysis.
37 For the current 2017 fiscal year, low-income economies are defined as those with a GNI per capita, calculated using the World Bank Atlas method, of $1,025 or less in 2015; lower middle-income economies are those with a GNI per capita between $1,026 and $4,035; upper middle-income economies are those with a GNI per capita between $4,036 and $12,475; high-income economies are those with a GNI per capita of $12,476 or more.
38 VAT refunds are not available to the case study company in the South American region, however, we recognise that VAT refunds may be available in practice in the region in other scenarios.
87%
of high income economies with a VAT system have a refund available to the case study company.
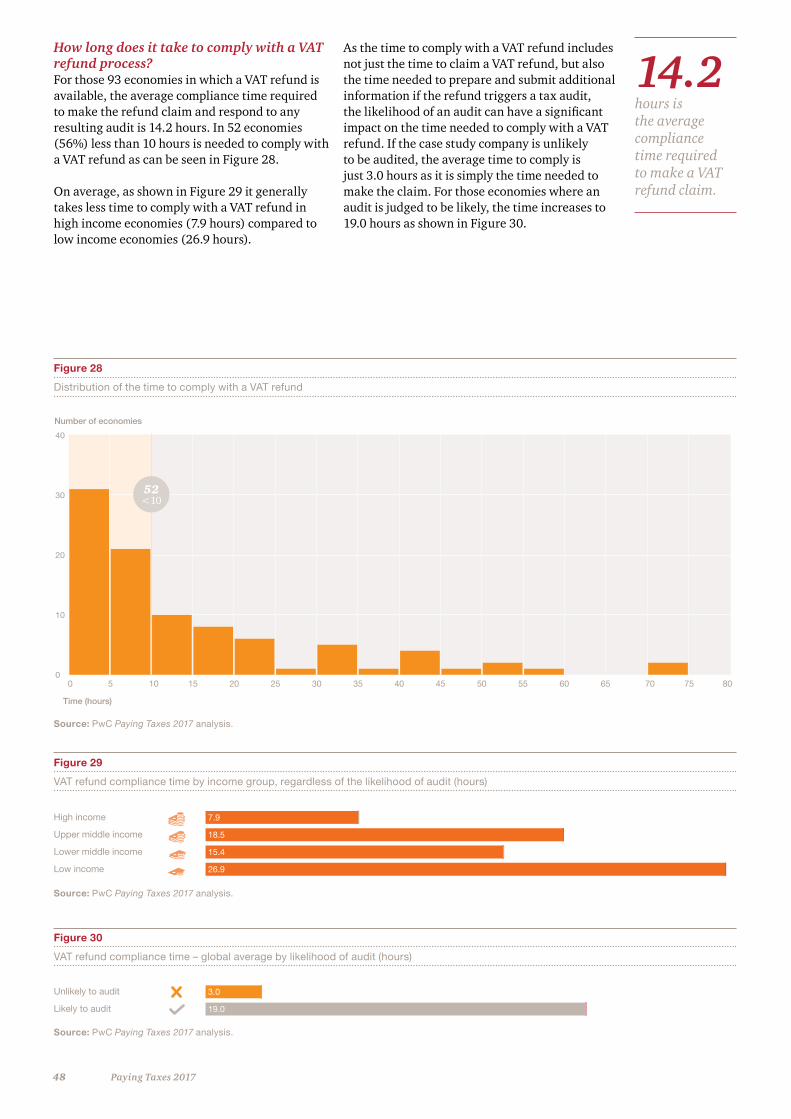
48 Paying Taxes 2017
Figure 28
Distribution of the time to comply with a VAT refund
Figure 30
VAT refund compliance time – global average by likelihood of audit (hours)
Figure 29
VAT refund compliance time by income group, regardless of the likelihood of audit (hours)
Source: PwC Paying Taxes 2017 analysis.
Source: PwC Paying Taxes 2017 analysis.
Source: PwC Paying Taxes 2017 analysis.
How long does it take to comply with a VAT refund process?For those 93 economies in which a VAT refund is available, the average compliance time required to make the refund claim and respond to any resulting audit is 14.2 hours. In 52 economies (56%) less than 10 hours is needed to comply with a VAT refund as can be seen in Figure 28.
On average, as shown in Figure 29 it generally takes less time to comply with a VAT refund in high income economies (7.9 hours) compared to low income economies (26.9 hours).
40
30
20
10
00 5 10 15 20 25 30 35 40 45 50 55 60 65 70 75 80
Number of economies
Time (hours)
52<10
Unlikely to audit
Likely to audit
High income
Upper middle income
Lower middle income
Low income
3.0
19.0
53% 47%
7.9 59%
18.5
15.4
26.9
100%
100%
Unlikely to audit
Likely to audit
High income
Upper middle income
Lower middle income
Low income
3.0
19.0
53% 47%
7.9 59%
18.5
15.4
26.9
100%
100%
14.2
hours is the average compliance time required to make a VAT refund claim.
As the time to comply with a VAT refund includes not just the time to claim a VAT refund, but also the time needed to prepare and submit additional information if the refund triggers a tax audit, the likelihood of an audit can have a significant impact on the time needed to comply with a VAT refund. If the case study company is unlikely to be audited, the average time to comply is just 3.0 hours as it is simply the time needed to make the claim. For those economies where an audit is judged to be likely, the time increases to 19.0 hours as shown in Figure 30.
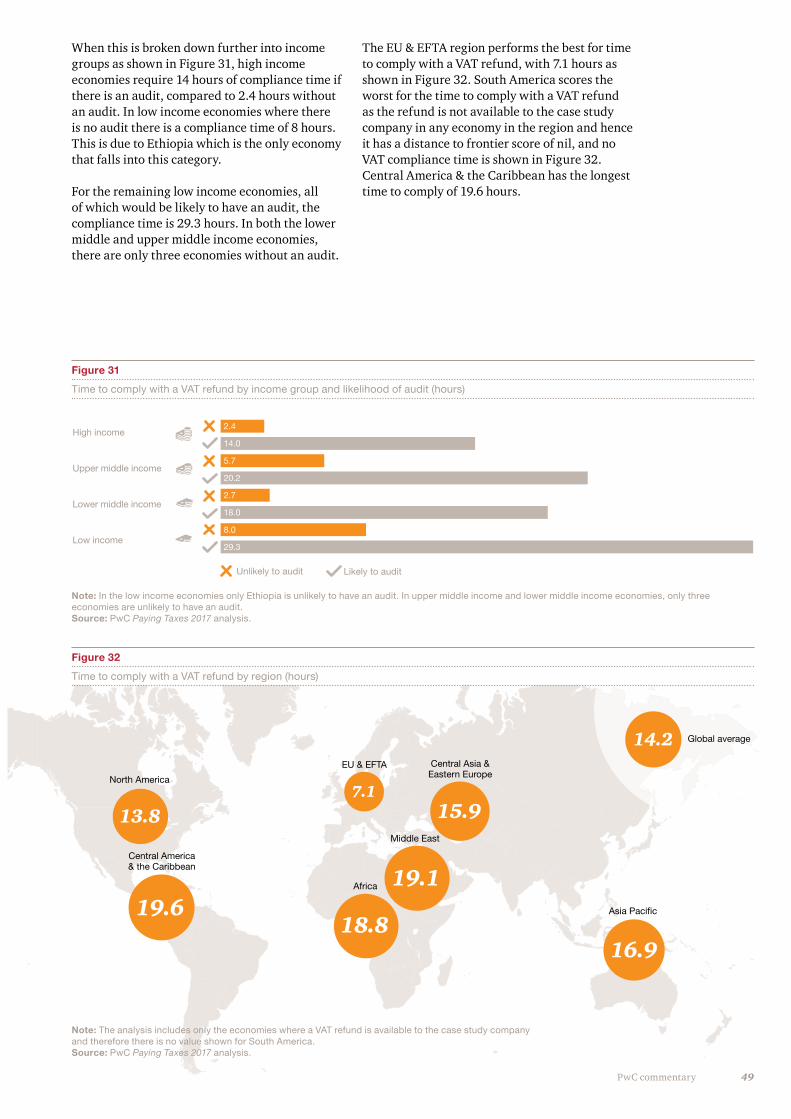
49PwC commentary
Global average
7.1
EU & EFTA
15.9
19.1
Central Asia & Eastern Europe
Middle East
18.8
Africa
19.6
Central America & the Caribbean
13.8
North America
14.2
16.9
Asia Pacific
When this is broken down further into income groups as shown in Figure 31, high income economies require 14 hours of compliance time if there is an audit, compared to 2.4 hours without an audit. In low income economies where there is no audit there is a compliance time of 8 hours. This is due to Ethiopia which is the only economy that falls into this category.
For the remaining low income economies, all of which would be likely to have an audit, the compliance time is 29.3 hours. In both the lower middle and upper middle income economies, there are only three economies without an audit.
The EU & EFTA region performs the best for time to comply with a VAT refund, with 7.1 hours as shown in Figure 32. South America scores the worst for the time to comply with a VAT refund as the refund is not available to the case study company in any economy in the region and hence it has a distance to frontier score of nil, and no VAT compliance time is shown in Figure 32. Central America & the Caribbean has the longest time to comply of 19.6 hours.
Figure 31
Time to comply with a VAT refund by income group and likelihood of audit (hours)
Figure 32
Time to comply with a VAT refund by region (hours)
Note: In the low income economies only Ethiopia is unlikely to have an audit. In upper middle income and lower middle income economies, only three economies are unlikely to have an audit. Source: PwC Paying Taxes 2017 analysis.
Note: The analysis includes only the economies where a VAT refund is available to the case study company and therefore there is no value shown for South America. Source: PwC Paying Taxes 2017 analysis.
High income
Upper middle income
Lower middle income
Low income
Unlikely to audit Likely to audit
2.4
14.0
5.7
20.2
2.7
18.0
8.0
29.3
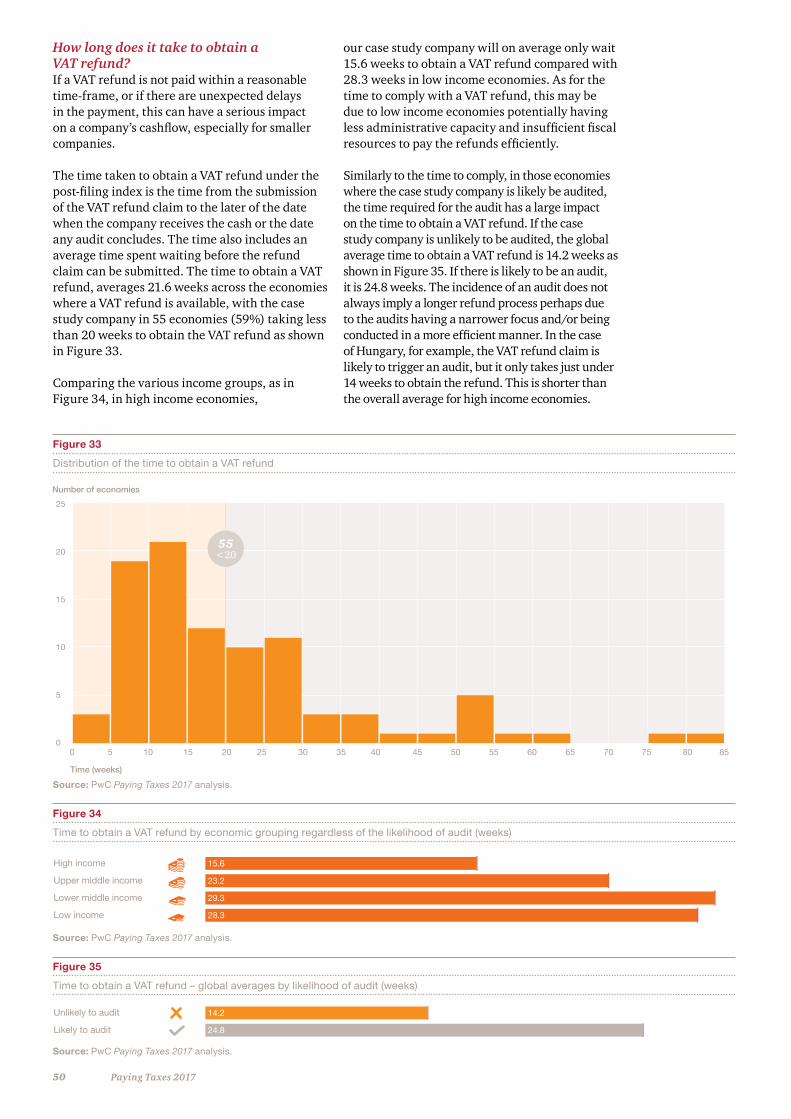
50 Paying Taxes 2017
Figure 33
Distribution of the time to obtain a VAT refund
Figure 35
Time to obtain a VAT refund – global averages by likelihood of audit (weeks)
Figure 34
Time to obtain a VAT refund by economic grouping regardless of the likelihood of audit (weeks)
Source: PwC Paying Taxes 2017 analysis.
How long does it take to obtain a VAT refund?If a VAT refund is not paid within a reasonable time-frame, or if there are unexpected delays in the payment, this can have a serious impact on a company’s cashflow, especially for smaller companies.
The time taken to obtain a VAT refund under the post-filing index is the time from the submission of the VAT refund claim to the later of the date when the company receives the cash or the date any audit concludes. The time also includes an average time spent waiting before the refund claim can be submitted. The time to obtain a VAT refund, averages 21.6 weeks across the economies where a VAT refund is available, with the case study company in 55 economies (59%) taking less than 20 weeks to obtain the VAT refund as shown in Figure 33.
Comparing the various income groups, as in Figure 34, in high income economies,
our case study company will on average only wait 15.6 weeks to obtain a VAT refund compared with 28.3 weeks in low income economies. As for the time to comply with a VAT refund, this may be due to low income economies potentially having less administrative capacity and insufficient fiscal resources to pay the refunds efficiently.
Similarly to the time to comply, in those economies where the case study company is likely be audited, the time required for the audit has a large impact on the time to obtain a VAT refund. If the case study company is unlikely to be audited, the global average time to obtain a VAT refund is 14.2 weeks as shown in Figure 35. If there is likely to be an audit, it is 24.8 weeks. The incidence of an audit does not always imply a longer refund process perhaps due to the audits having a narrower focus and/or being conducted in a more efficient manner. In the case of Hungary, for example, the VAT refund claim is likely to trigger an audit, but it only takes just under 14 weeks to obtain the refund. This is shorter than the overall average for high income economies.
0 5 10 15 20 25 30 35 40 45 50 55 60 65 70 8075 85
Number of economies
Time (weeks)
25
20
15
10
5
0
55<20
Source: PwC Paying Taxes 2017 analysis.
Source: PwC Paying Taxes 2017 analysis.
Unlikely to audit
Likely to audit
High income
Upper middle income
Lower middle income
Low income
14.2
24.8
53% 47%
15.6
23.2
29.3
28.3
100%
100%
Unlikely to audit
Likely to audit
High income
Upper middle income
Lower middle income
Low income
14.2
24.8
53% 47%
15.6
23.2
29.3
28.3
100%
100%
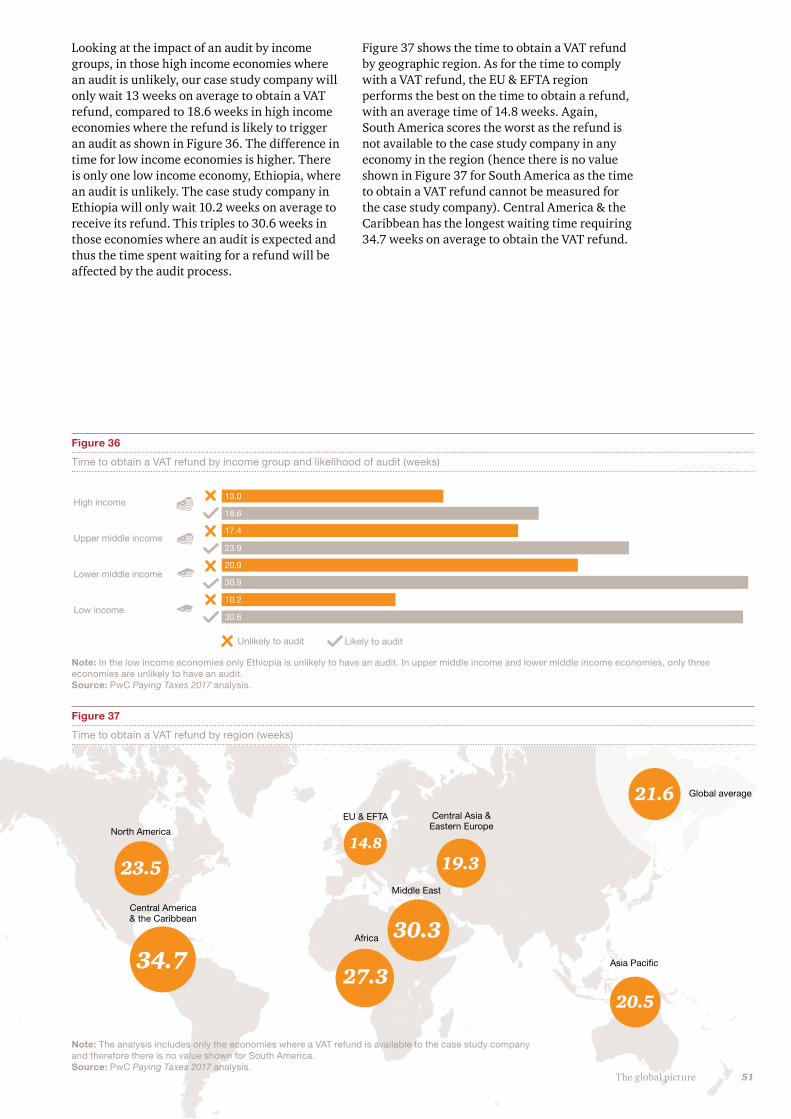
Global average
14.8
EU & EFTA
19.3
30.3
Central Asia & Eastern Europe
Middle East
27.3
Africa
34.7
Central America & the Caribbean
23.5
North America
21.6
20.5
Asia Pacific
Looking at the impact of an audit by income groups, in those high income economies where an audit is unlikely, our case study company will only wait 13 weeks on average to obtain a VAT refund, compared to 18.6 weeks in high income economies where the refund is likely to trigger an audit as shown in Figure 36. The difference in time for low income economies is higher. There is only one low income economy, Ethiopia, where an audit is unlikely. The case study company in Ethiopia will only wait 10.2 weeks on average to receive its refund. This triples to 30.6 weeks in those economies where an audit is expected and thus the time spent waiting for a refund will be affected by the audit process.
Figure 37 shows the time to obtain a VAT refund by geographic region. As for the time to comply with a VAT refund, the EU & EFTA region performs the best on the time to obtain a refund, with an average time of 14.8 weeks. Again, South America scores the worst as the refund is not available to the case study company in any economy in the region (hence there is no value shown in Figure 37 for South America as the time to obtain a VAT refund cannot be measured for the case study company). Central America & the Caribbean has the longest waiting time requiring 34.7 weeks on average to obtain the VAT refund.
Figure 36
Time to obtain a VAT refund by income group and likelihood of audit (weeks)
Figure 37
Time to obtain a VAT refund by region (weeks)
Note: In the low income economies only Ethiopia is unlikely to have an audit. In upper middle income and lower middle income economies, only three economies are unlikely to have an audit. Source: PwC Paying Taxes 2017 analysis.
Note: The analysis includes only the economies where a VAT refund is available to the case study company and therefore there is no value shown for South America. Source: PwC Paying Taxes 2017 analysis.
High income
Upper middle income
Lower middle income
Low income
Unlikely to audit Likely to audit
13.0
18.6
17.4
23.9
20.9
30.9
10.2
30.6
51The global picture
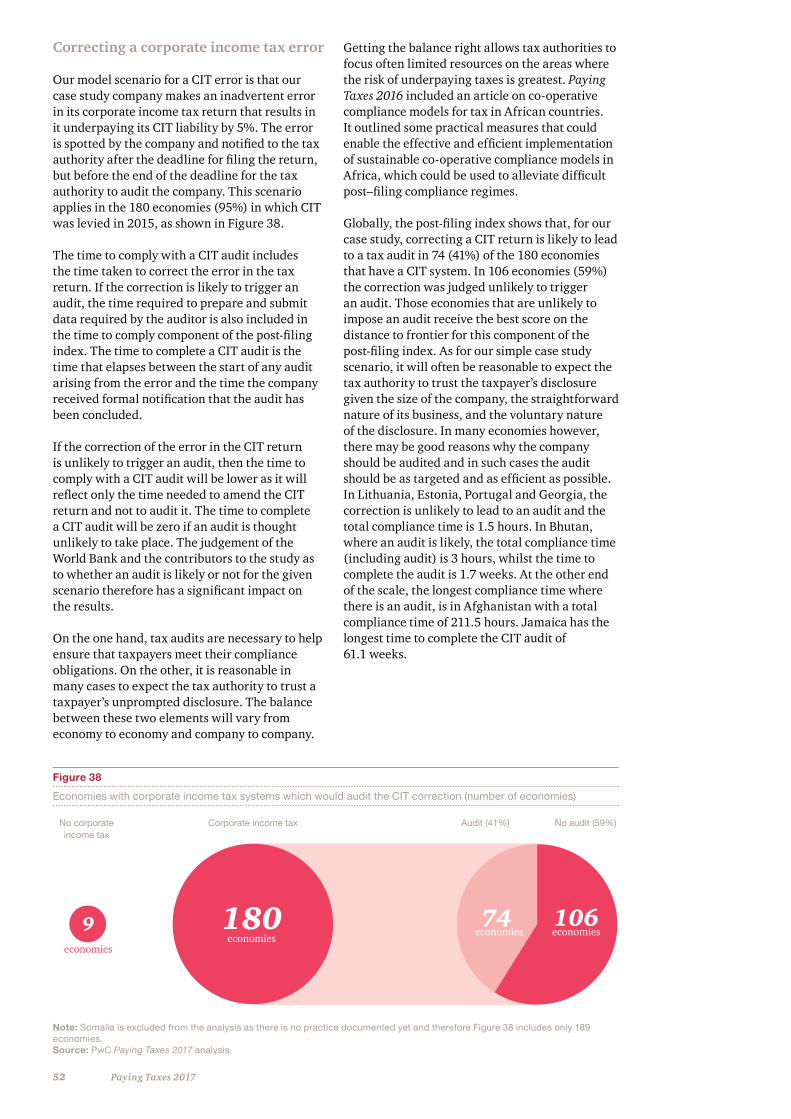
52 Paying Taxes 2017
Correcting a corporate income tax error
Our model scenario for a CIT error is that our case study company makes an inadvertent error in its corporate income tax return that results in it underpaying its CIT liability by 5%. The error is spotted by the company and notified to the tax authority after the deadline for filing the return, but before the end of the deadline for the tax authority to audit the company. This scenario applies in the 180 economies (95%) in which CIT was levied in 2015, as shown in Figure 38.
The time to comply with a CIT audit includes the time taken to correct the error in the tax return. If the correction is likely to trigger an audit, the time required to prepare and submit data required by the auditor is also included in the time to comply component of the post-filing index. The time to complete a CIT audit is the time that elapses between the start of any audit arising from the error and the time the company received formal notification that the audit has been concluded.
If the correction of the error in the CIT return is unlikely to trigger an audit, then the time to comply with a CIT audit will be lower as it will reflect only the time needed to amend the CIT return and not to audit it. The time to complete a CIT audit will be zero if an audit is thought unlikely to take place. The judgement of the World Bank and the contributors to the study as to whether an audit is likely or not for the given scenario therefore has a significant impact on the results.
On the one hand, tax audits are necessary to help ensure that taxpayers meet their compliance obligations. On the other, it is reasonable in many cases to expect the tax authority to trust a taxpayer’s unprompted disclosure. The balance between these two elements will vary from economy to economy and company to company.
Getting the balance right allows tax authorities to focus often limited resources on the areas where the risk of underpaying taxes is greatest. Paying Taxes 2016 included an article on co-operative compliance models for tax in African countries. It outlined some practical measures that could enable the effective and efficient implementation of sustainable co-operative compliance models in Africa, which could be used to alleviate difficult post–filing compliance regimes.
Globally, the post-filing index shows that, for our case study, correcting a CIT return is likely to lead to a tax audit in 74 (41%) of the 180 economies that have a CIT system. In 106 economies (59%) the correction was judged unlikely to trigger an audit. Those economies that are unlikely to impose an audit receive the best score on the distance to frontier for this component of the post-filing index. As for our simple case study scenario, it will often be reasonable to expect the tax authority to trust the taxpayer’s disclosure given the size of the company, the straightforward nature of its business, and the voluntary nature of the disclosure. In many economies however, there may be good reasons why the company should be audited and in such cases the audit should be as targeted and as efficient as possible. In Lithuania, Estonia, Portugal and Georgia, the correction is unlikely to lead to an audit and the total compliance time is 1.5 hours. In Bhutan, where an audit is likely, the total compliance time (including audit) is 3 hours, whilst the time to complete the audit is 1.7 weeks. At the other end of the scale, the longest compliance time where there is an audit, is in Afghanistan with a total compliance time of 211.5 hours. Jamaica has the longest time to complete the CIT audit of 61.1 weeks.
Note: Somalia is excluded from the analysis as there is no practice documented yet and therefore Figure 38 includes only 189 economies.Source: PwC Paying Taxes 2017 analysis.
Figure 38
Economies with corporate income tax systems which would audit the CIT correction (number of economies)
No corporate income tax
Corporate income tax No audit (59%)Audit (41%)
9 74 106180economies
economieseconomies economies
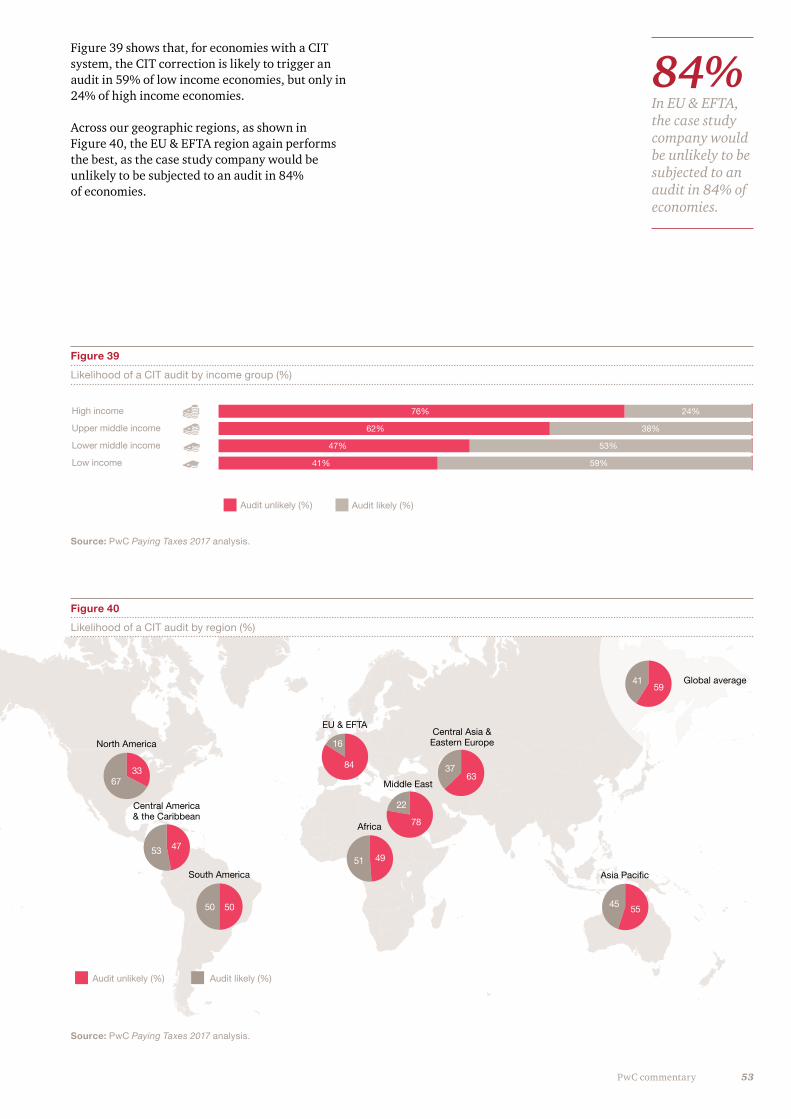
53PwC commentary
49
Africa
51
EU & EFTA
84
North America
33
Central America & the Caribbean
4753
South America
50 55
Asia Pacific
45
78
Middle East
22
63
Central Asia & Eastern Europe
37
Global average59
41
67
50
16
Audit likely (%)Audit unlikely (%)
Figure 39 shows that, for economies with a CIT system, the CIT correction is likely to trigger an audit in 59% of low income economies, but only in 24% of high income economies.
Across our geographic regions, as shown in Figure 40, the EU & EFTA region again performs the best, as the case study company would be unlikely to be subjected to an audit in 84% of economies.
Figure 39
Likelihood of a CIT audit by income group (%)
Figure 40
Likelihood of a CIT audit by region (%)
Source: PwC Paying Taxes 2017 analysis.
Source: PwC Paying Taxes 2017 analysis.
High income
Upper middle income
Lower middle income
Low income
Audit unlikely (%) Audit likely (%)
76% 24%
62% 38%
47% 53%
41% 59%
84%
In EU & EFTA, the case study company would be unlikely to be subjected to an audit in 84% of economies.
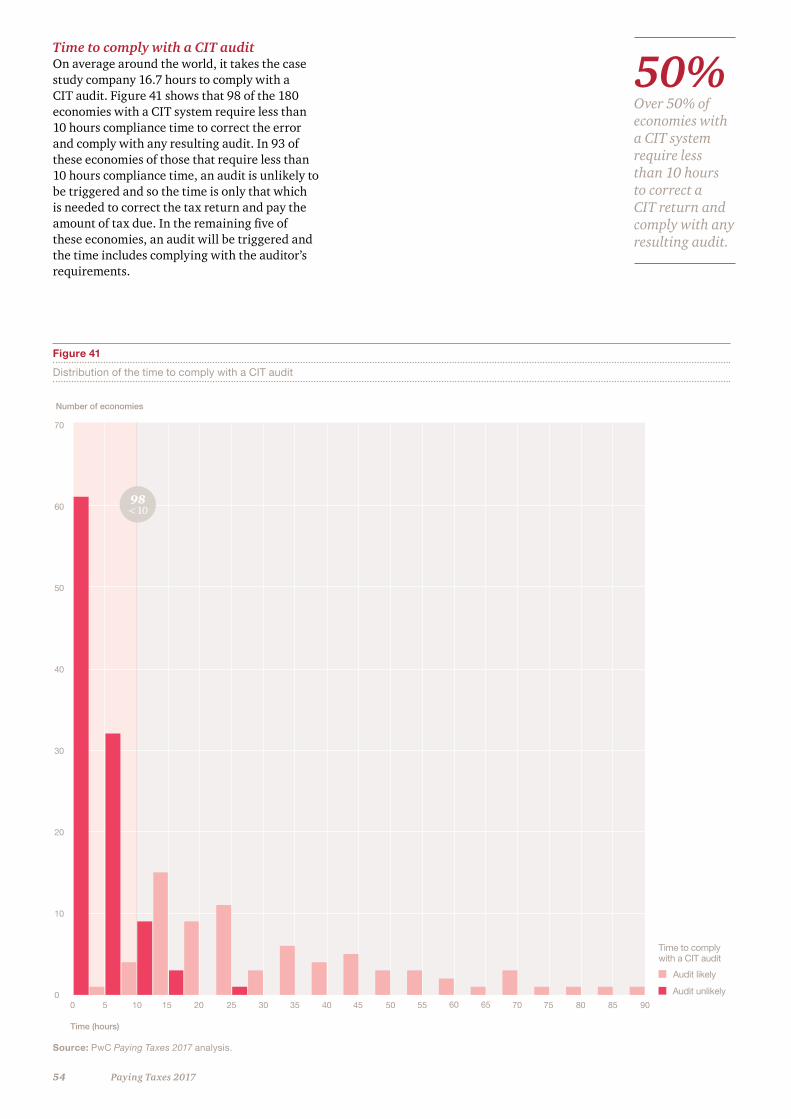
54 Paying Taxes 2017
Time to comply with a CIT auditOn average around the world, it takes the case study company 16.7 hours to comply with a CIT audit. Figure 41 shows that 98 of the 180 economies with a CIT system require less than 10 hours compliance time to correct the error and comply with any resulting audit. In 93 of these economies of those that require less than 10 hours compliance time, an audit is unlikely to be triggered and so the time is only that which is needed to correct the tax return and pay the amount of tax due. In the remaining five of these economies, an audit will be triggered and the time includes complying with the auditor’s requirements.
Figure 41
Distribution of the time to comply with a CIT audit
Source: PwC Paying Taxes 2017 analysis.
70
60
50
40
30
20
10
0
Number of economies
Time (hours)
50 10 15 20 25 30 35 40 45 50 55 60 65 70 75 80 85 90
98<10
Audit likely
Time to comply with a CIT audit
Audit unlikely
50%
Over 50% of economies with a CIT system require less than 10 hours to correct a CIT return and comply with any resulting audit.
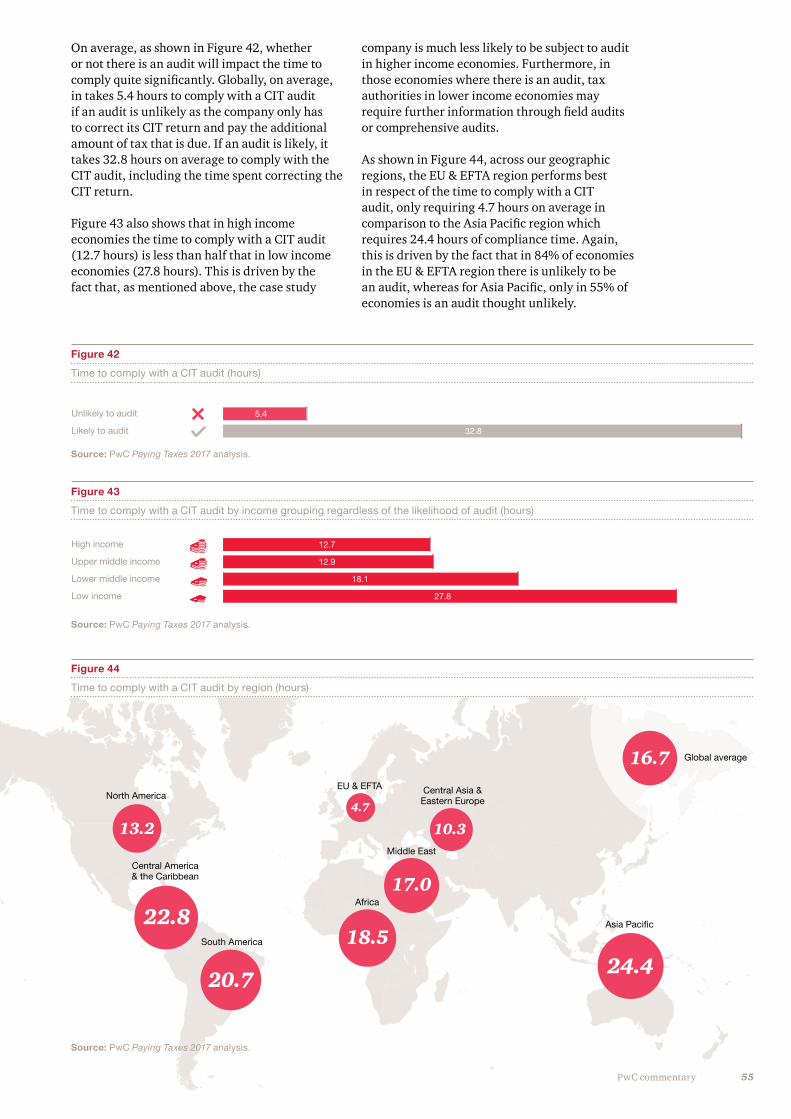
55PwC commentary
Global average
4.7
EU & EFTA
10.3
17.0
Central Asia & Eastern Europe
Middle East
18.5
Africa
20.7
South America
22.8
Central America & the Caribbean
13.2
North America
16.7
24.4
Asia Pacific
On average, as shown in Figure 42, whether or not there is an audit will impact the time to comply quite significantly. Globally, on average, in takes 5.4 hours to comply with a CIT audit if an audit is unlikely as the company only has to correct its CIT return and pay the additional amount of tax that is due. If an audit is likely, it takes 32.8 hours on average to comply with the CIT audit, including the time spent correcting the CIT return.
Figure 43 also shows that in high income economies the time to comply with a CIT audit (12.7 hours) is less than half that in low income economies (27.8 hours). This is driven by the fact that, as mentioned above, the case study
company is much less likely to be subject to audit in higher income economies. Furthermore, in those economies where there is an audit, tax authorities in lower income economies may require further information through field audits or comprehensive audits.
As shown in Figure 44, across our geographic regions, the EU & EFTA region performs best in respect of the time to comply with a CIT audit, only requiring 4.7 hours on average in comparison to the Asia Pacific region which requires 24.4 hours of compliance time. Again, this is driven by the fact that in 84% of economies in the EU & EFTA region there is unlikely to be an audit, whereas for Asia Pacific, only in 55% of economies is an audit thought unlikely.
Figure 42
Time to comply with a CIT audit (hours)
Figure 43
Time to comply with a CIT audit by income grouping regardless of the likelihood of audit (hours)
Figure 44
Time to comply with a CIT audit by region (hours)
Source: PwC Paying Taxes 2017 analysis.
Source: PwC Paying Taxes 2017 analysis.
Source: PwC Paying Taxes 2017 analysis.
Unlikely to audit
Likely to audit
High income
Upper middle income
Lower middle income
Low income
5.4
32.8
53% 47%
12.7 59%
12.9
18.1
27.8
100%
100%
Unlikely to audit
Likely to audit
High income
Upper middle income
Lower middle income
Low income
5.4
32.8
53% 47%
12.7 59%
12.9
18.1
27.8
100%
100%
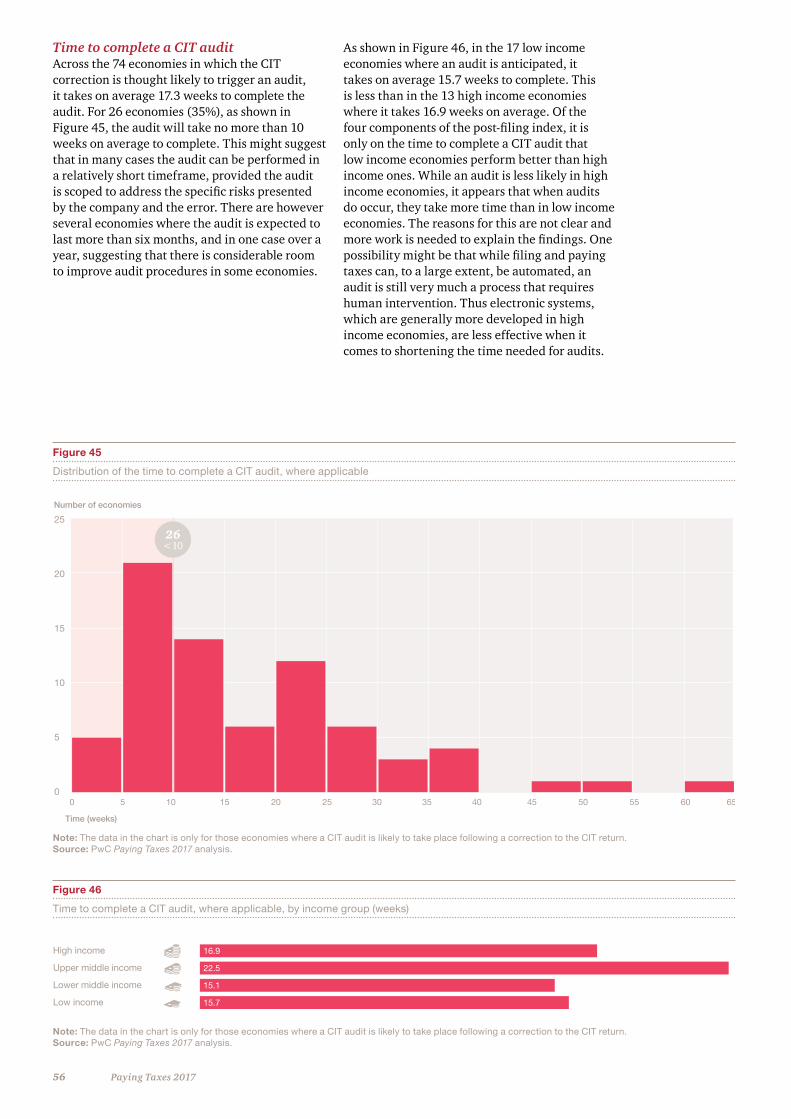
56 Paying Taxes 2017
Time to complete a CIT auditAcross the 74 economies in which the CIT correction is thought likely to trigger an audit, it takes on average 17.3 weeks to complete the audit. For 26 economies (35%), as shown in Figure 45, the audit will take no more than 10 weeks on average to complete. This might suggest that in many cases the audit can be performed in a relatively short timeframe, provided the audit is scoped to address the specific risks presented by the company and the error. There are however several economies where the audit is expected to last more than six months, and in one case over a year, suggesting that there is considerable room to improve audit procedures in some economies.
As shown in Figure 46, in the 17 low income economies where an audit is anticipated, it takes on average 15.7 weeks to complete. This is less than in the 13 high income economies where it takes 16.9 weeks on average. Of the four components of the post-filing index, it is only on the time to complete a CIT audit that low income economies perform better than high income ones. While an audit is less likely in high income economies, it appears that when audits do occur, they take more time than in low income economies. The reasons for this are not clear and more work is needed to explain the findings. One possibility might be that while filing and paying taxes can, to a large extent, be automated, an audit is still very much a process that requires human intervention. Thus electronic systems, which are generally more developed in high income economies, are less effective when it comes to shortening the time needed for audits.
Figure 46
Time to complete a CIT audit, where applicable, by income group (weeks)
Figure 45
Distribution of the time to complete a CIT audit, where applicable
Note: The data in the chart is only for those economies where a CIT audit is likely to take place following a correction to the CIT return. Source: PwC Paying Taxes 2017 analysis.
Note: The data in the chart is only for those economies where a CIT audit is likely to take place following a correction to the CIT return. Source: PwC Paying Taxes 2017 analysis.
High income
Upper middle income
Lower middle income
Low income
16.9
22.5
15.1
15.7
0 5 10 15 20 25 30 35 40 45 50 55 60 65
Number of economies
Time (weeks)
25
20
15
10
5
0
26<10
Global average
10.9
EU & EFTA
11.0
26.9
Central Asia & Eastern Europe
Middle East
15.9
Africa
23.4
South America
20.5
Central America & the Caribbean
23.9
North America
17.3
18.3
Asia Pacific
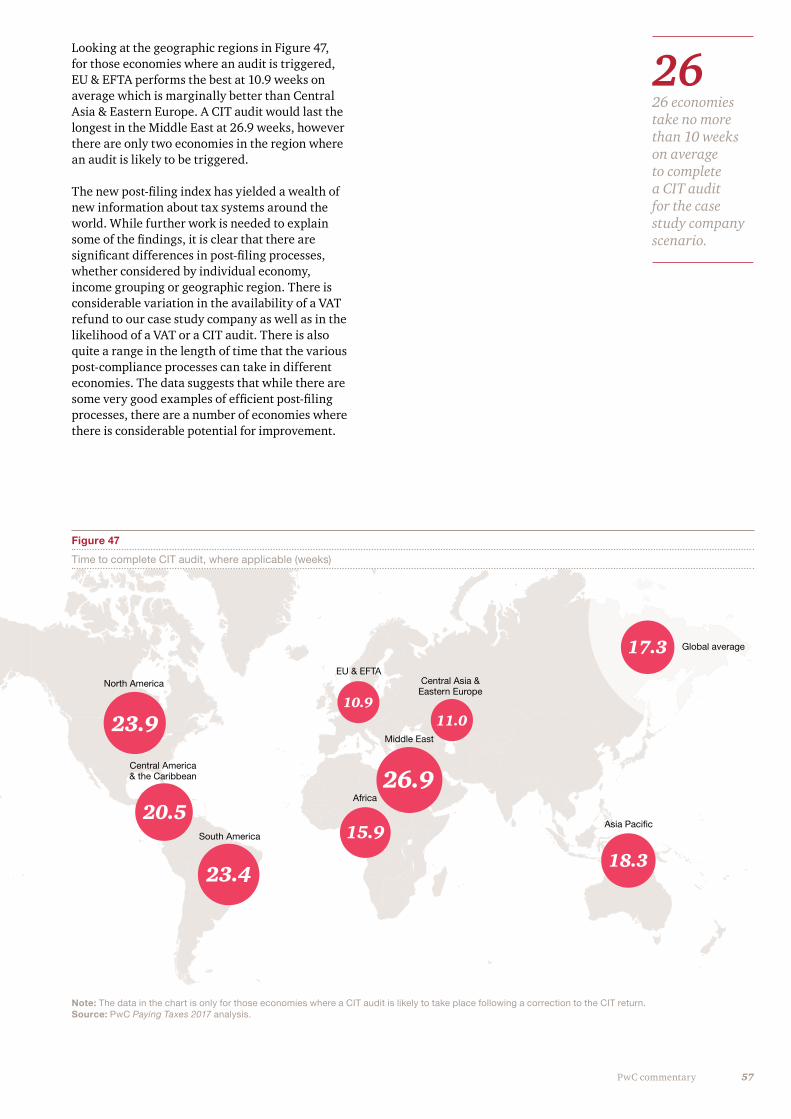
57PwC commentary
Figure 47
Time to complete CIT audit, where applicable (weeks)
Note: The data in the chart is only for those economies where a CIT audit is likely to take place following a correction to the CIT return. Source: PwC Paying Taxes 2017 analysis.
Global average
10.9
EU & EFTA
11.0
26.9
Central Asia & Eastern Europe
Middle East
15.9
Africa
23.4
South America
20.5
Central America & the Caribbean
23.9
North America
17.3
18.3
Asia Pacific
Looking at the geographic regions in Figure 47, for those economies where an audit is triggered, EU & EFTA performs the best at 10.9 weeks on average which is marginally better than Central Asia & Eastern Europe. A CIT audit would last the longest in the Middle East at 26.9 weeks, however there are only two economies in the region where an audit is likely to be triggered.
The new post-filing index has yielded a wealth of new information about tax systems around the world. While further work is needed to explain some of the findings, it is clear that there are significant differences in post-filing processes, whether considered by individual economy, income grouping or geographic region. There is considerable variation in the availability of a VAT refund to our case study company as well as in the likelihood of a VAT or a CIT audit. There is also quite a range in the length of time that the various post-compliance processes can take in different economies. The data suggests that while there are some very good examples of efficient post-filing processes, there are a number of economies where there is considerable potential for improvement.
26
26 economies take no more than 10 weeks on average to complete a CIT audit for the case study company scenario.

58 Paying Taxes 2017. Country articles
Chapter 3 – Country articles

59
This chapter looks at how the Paying Taxes sub-indicators have been affected by changes in tax systems in our regional launch locations of Costa Rica, Côte d’Ivoire, Ecuador, Hungary, and Indonesia.
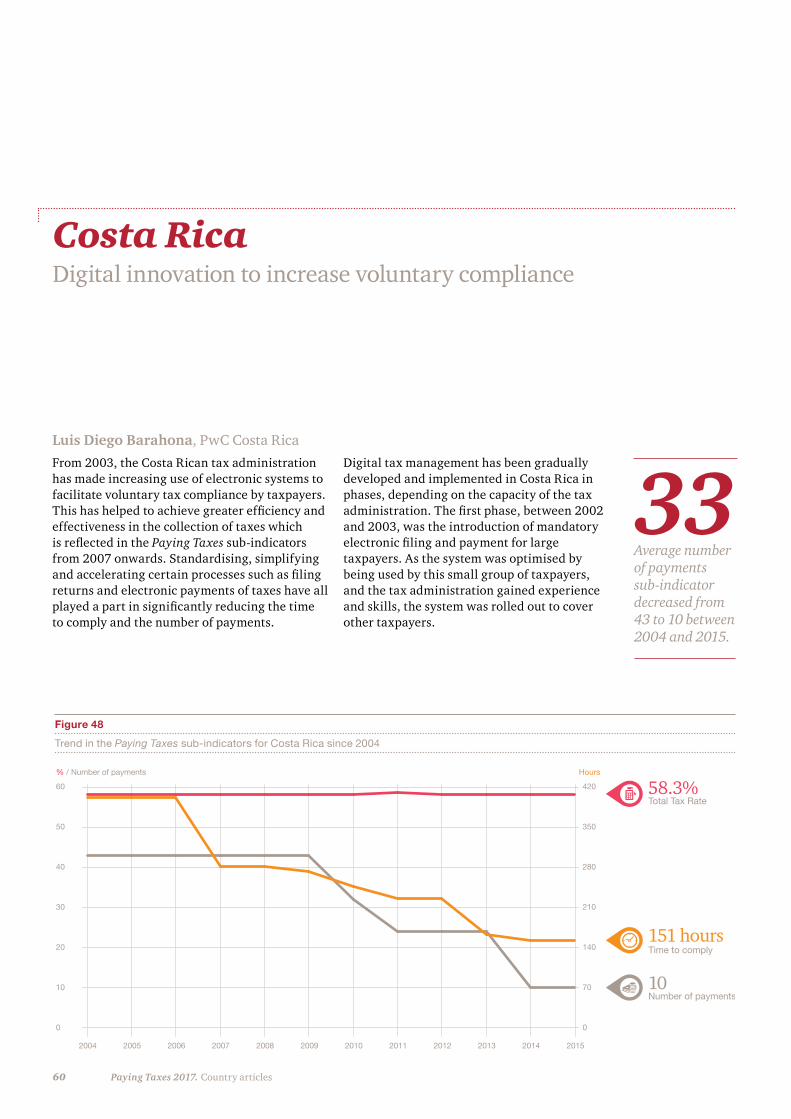
60 Paying Taxes 2017. Country articles
Figure 48
Trend in the Paying Taxes sub-indicators for Costa Rica since 2004
Total Tax Rate58.3%
Time to comply151 hours
Number of payments
2004
% / Number of payments Hours
2005 2006 2007 2008 2009 2010 2011 2012 2013 2014 2015
60
50
40
30
20
10
0
420
350
280
210
140
70
0
10
Costa RicaDigital innovation to increase voluntary compliance
From 2003, the Costa Rican tax administration has made increasing use of electronic systems to facilitate voluntary tax compliance by taxpayers. This has helped to achieve greater efficiency and effectiveness in the collection of taxes which is reflected in the Paying Taxes sub-indicators from 2007 onwards. Standardising, simplifying and accelerating certain processes such as filing returns and electronic payments of taxes have all played a part in significantly reducing the time to comply and the number of payments.
Digital tax management has been gradually developed and implemented in Costa Rica in phases, depending on the capacity of the tax administration. The first phase, between 2002 and 2003, was the introduction of mandatory electronic filing and payment for large taxpayers. As the system was optimised by being used by this small group of taxpayers, and the tax administration gained experience and skills, the system was rolled out to cover other taxpayers.
Luis Diego Barahona, PwC Costa Rica
Average number of payments sub-indicator decreased from 43 to 10 between 2004 and 2015.
33
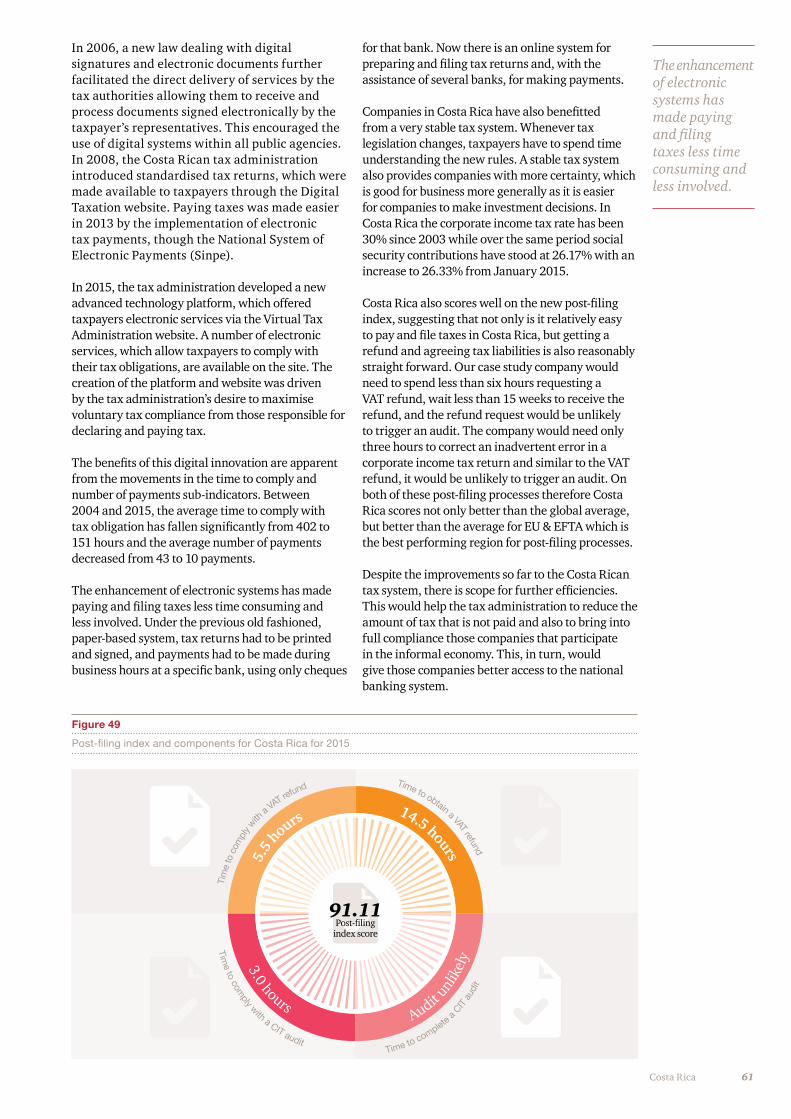
61Costa Rica
The enhancement of electronic systems has made paying and filing taxes less time consuming and less involved.
In 2006, a new law dealing with digital signatures and electronic documents further facilitated the direct delivery of services by the tax authorities allowing them to receive and process documents signed electronically by the taxpayer’s representatives. This encouraged the use of digital systems within all public agencies. In 2008, the Costa Rican tax administration introduced standardised tax returns, which were made available to taxpayers through the Digital Taxation website. Paying taxes was made easier in 2013 by the implementation of electronic tax payments, though the National System of Electronic Payments (Sinpe).
In 2015, the tax administration developed a new advanced technology platform, which offered taxpayers electronic services via the Virtual Tax Administration website. A number of electronic services, which allow taxpayers to comply with their tax obligations, are available on the site. The creation of the platform and website was driven by the tax administration’s desire to maximise voluntary tax compliance from those responsible for declaring and paying tax.
The benefits of this digital innovation are apparent from the movements in the time to comply and number of payments sub-indicators. Between 2004 and 2015, the average time to comply with tax obligation has fallen significantly from 402 to 151 hours and the average number of payments decreased from 43 to 10 payments.
The enhancement of electronic systems has made paying and filing taxes less time consuming and less involved. Under the previous old fashioned, paper-based system, tax returns had to be printed and signed, and payments had to be made during business hours at a specific bank, using only cheques
for that bank. Now there is an online system for preparing and filing tax returns and, with the assistance of several banks, for making payments.
Companies in Costa Rica have also benefitted from a very stable tax system. Whenever tax legislation changes, taxpayers have to spend time understanding the new rules. A stable tax system also provides companies with more certainty, which is good for business more generally as it is easier for companies to make investment decisions. In Costa Rica the corporate income tax rate has been 30% since 2003 while over the same period social security contributions have stood at 26.17% with an increase to 26.33% from January 2015.
Costa Rica also scores well on the new post-filing index, suggesting that not only is it relatively easy to pay and file taxes in Costa Rica, but getting a refund and agreeing tax liabilities is also reasonably straight forward. Our case study company would need to spend less than six hours requesting a VAT refund, wait less than 15 weeks to receive the refund, and the refund request would be unlikely to trigger an audit. The company would need only three hours to correct an inadvertent error in a corporate income tax return and similar to the VAT refund, it would be unlikely to trigger an audit. On both of these post-filing processes therefore Costa Rica scores not only better than the global average, but better than the average for EU & EFTA which is the best performing region for post-filing processes.
Despite the improvements so far to the Costa Rican tax system, there is scope for further efficiencies. This would help the tax administration to reduce the amount of tax that is not paid and also to bring into full compliance those companies that participate in the informal economy. This, in turn, would give those companies better access to the national banking system.
91.11Post-filing
index score
5.5
hours 14.5 hours
3.0 hours Audit u
nlikel
y
Tim
e to
com
ply w
ith a
VAT refund Time to obtain a VAT refund
Time to com
ply with a CIT audit Time to complete a C
IT a
udit
Figure 49
Post-filing index and components for Costa Rica for 2015
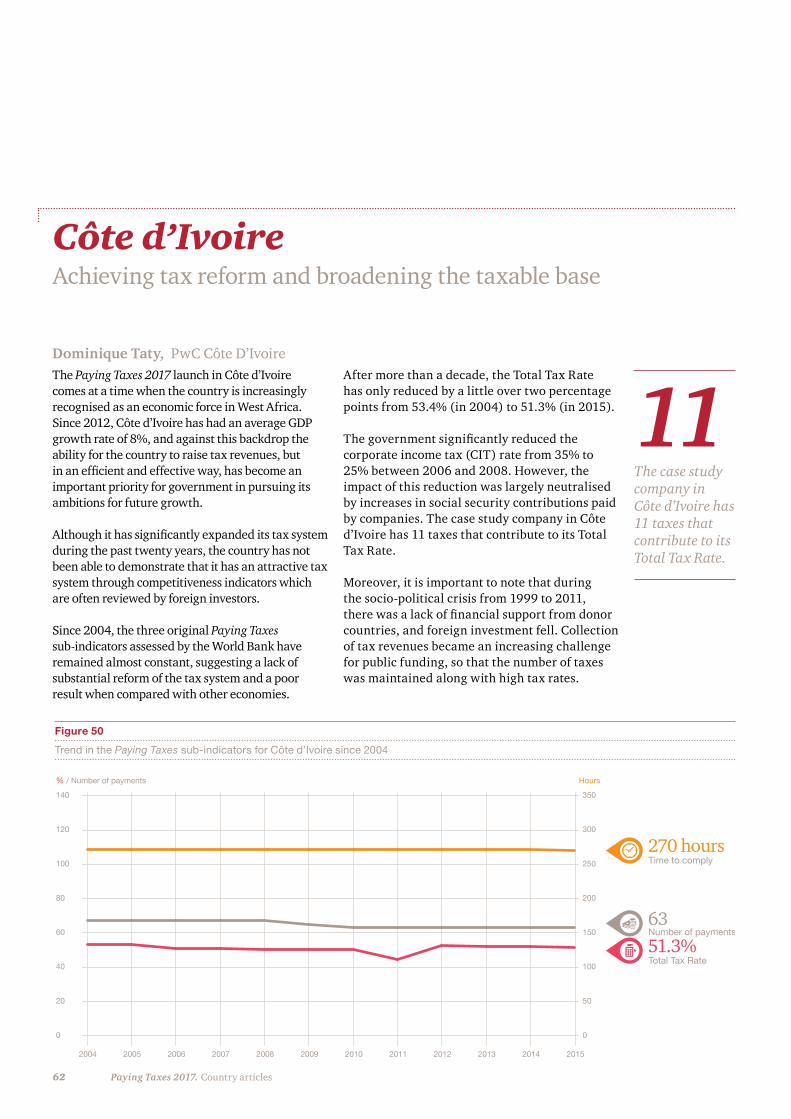
62 Paying Taxes 2017. Country articles
Figure 50
Trend in the Paying Taxes sub-indicators for Côte d’Ivoire since 2004
Total Tax Rate51.3%
Time to comply270 hours
Number of payments
2004
% / Number of payments Hours
2005 2006 2007 2008 2009 2010 2011 2012 2013 2014 2015
140
120
100
80
60
40
20
0
350
300
250
200
150
100
50
0
63
Côte d’IvoireAchieving tax reform and broadening the taxable base
The Paying Taxes 2017 launch in Côte d’Ivoire comes at a time when the country is increasingly recognised as an economic force in West Africa. Since 2012, Côte d’Ivoire has had an average GDP growth rate of 8%, and against this backdrop the ability for the country to raise tax revenues, but in an efficient and effective way, has become an important priority for government in pursuing its ambitions for future growth.
Although it has significantly expanded its tax system during the past twenty years, the country has not been able to demonstrate that it has an attractive tax system through competitiveness indicators which are often reviewed by foreign investors.
Since 2004, the three original Paying Taxes sub-indicators assessed by the World Bank have remained almost constant, suggesting a lack of substantial reform of the tax system and a poor result when compared with other economies.
After more than a decade, the Total Tax Rate has only reduced by a little over two percentage points from 53.4% (in 2004) to 51.3% (in 2015).
The government significantly reduced the corporate income tax (CIT) rate from 35% to 25% between 2006 and 2008. However, the impact of this reduction was largely neutralised by increases in social security contributions paid by companies. The case study company in Côte d’Ivoire has 11 taxes that contribute to its Total Tax Rate.
Moreover, it is important to note that during the socio-political crisis from 1999 to 2011, there was a lack of financial support from donor countries, and foreign investment fell. Collection of tax revenues became an increasing challenge for public funding, so that the number of taxes was maintained along with high tax rates.
The case study company in Côte d’Ivoire has 11 taxes that contribute to its Total Tax Rate.
Dominique Taty, PwC Côte D’Ivoire
11
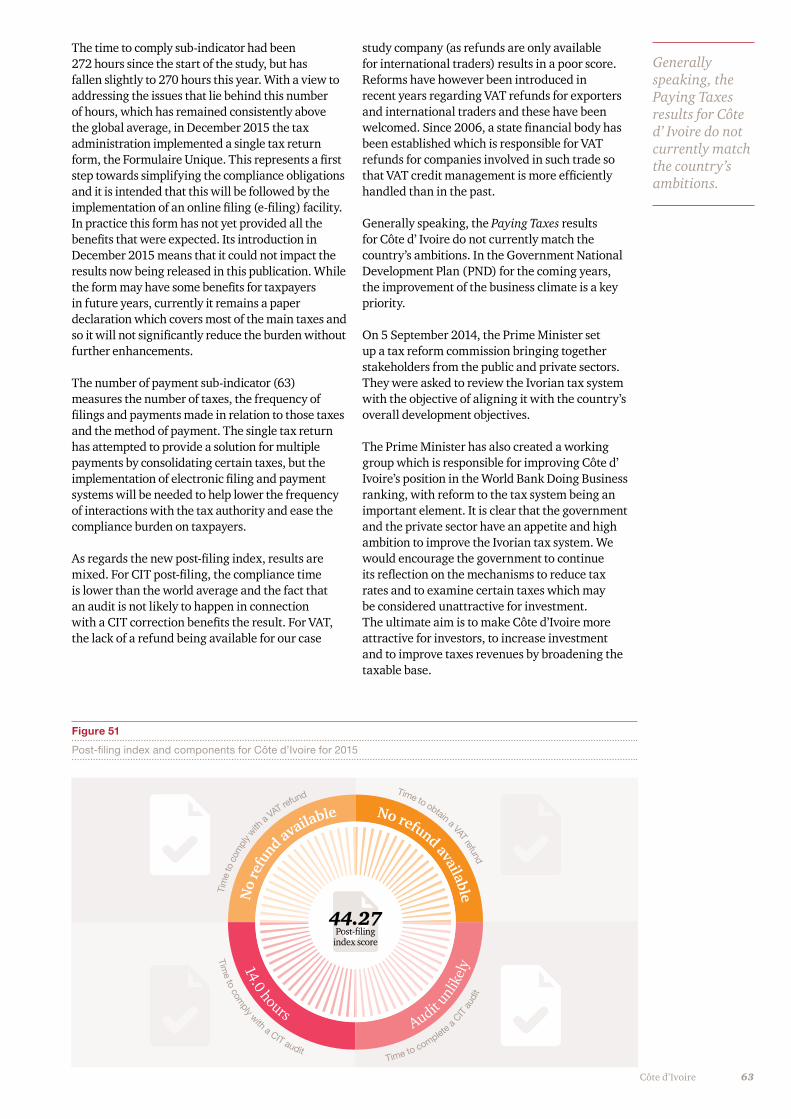
63Côte d’Ivoire
Generally speaking, the Paying Taxes results for Côte d’ Ivoire do not currently match the country’s ambitions.
The time to comply sub-indicator had been 272 hours since the start of the study, but has fallen slightly to 270 hours this year. With a view to addressing the issues that lie behind this number of hours, which has remained consistently above the global average, in December 2015 the tax administration implemented a single tax return form, the Formulaire Unique. This represents a first step towards simplifying the compliance obligations and it is intended that this will be followed by the implementation of an online filing (e-filing) facility. In practice this form has not yet provided all the benefits that were expected. Its introduction in December 2015 means that it could not impact the results now being released in this publication. While the form may have some benefits for taxpayers in future years, currently it remains a paper declaration which covers most of the main taxes and so it will not significantly reduce the burden without further enhancements.
The number of payment sub-indicator (63) measures the number of taxes, the frequency of filings and payments made in relation to those taxes and the method of payment. The single tax return has attempted to provide a solution for multiple payments by consolidating certain taxes, but the implementation of electronic filing and payment systems will be needed to help lower the frequency of interactions with the tax authority and ease the compliance burden on taxpayers.
As regards the new post-filing index, results are mixed. For CIT post-filing, the compliance time is lower than the world average and the fact that an audit is not likely to happen in connection with a CIT correction benefits the result. For VAT, the lack of a refund being available for our case
study company (as refunds are only available for international traders) results in a poor score. Reforms have however been introduced in recent years regarding VAT refunds for exporters and international traders and these have been welcomed. Since 2006, a state financial body has been established which is responsible for VAT refunds for companies involved in such trade so that VAT credit management is more efficiently handled than in the past.
Generally speaking, the Paying Taxes results for Côte d’ Ivoire do not currently match the country’s ambitions. In the Government National Development Plan (PND) for the coming years, the improvement of the business climate is a key priority.
On 5 September 2014, the Prime Minister set up a tax reform commission bringing together stakeholders from the public and private sectors. They were asked to review the Ivorian tax system with the objective of aligning it with the country’s overall development objectives.
The Prime Minister has also created a working group which is responsible for improving Côte d’ Ivoire’s position in the World Bank Doing Business ranking, with reform to the tax system being an important element. It is clear that the government and the private sector have an appetite and high ambition to improve the Ivorian tax system. We would encourage the government to continue its reflection on the mechanisms to reduce tax rates and to examine certain taxes which may be considered unattractive for investment. The ultimate aim is to make Côte d’Ivoire more attractive for investors, to increase investment and to improve taxes revenues by broadening the taxable base.
44.27Post-filing
index score
No
refu
nd available No refund available
14.0 hours Audit u
nlikel
y
Tim
e to
com
ply w
ith a
VAT refund Time to obtain a VAT refund
Time to com
ply with a CIT audit Time to complete a C
IT a
udit
Figure 51
Post-filing index and components for Côte d’Ivoire for 2015
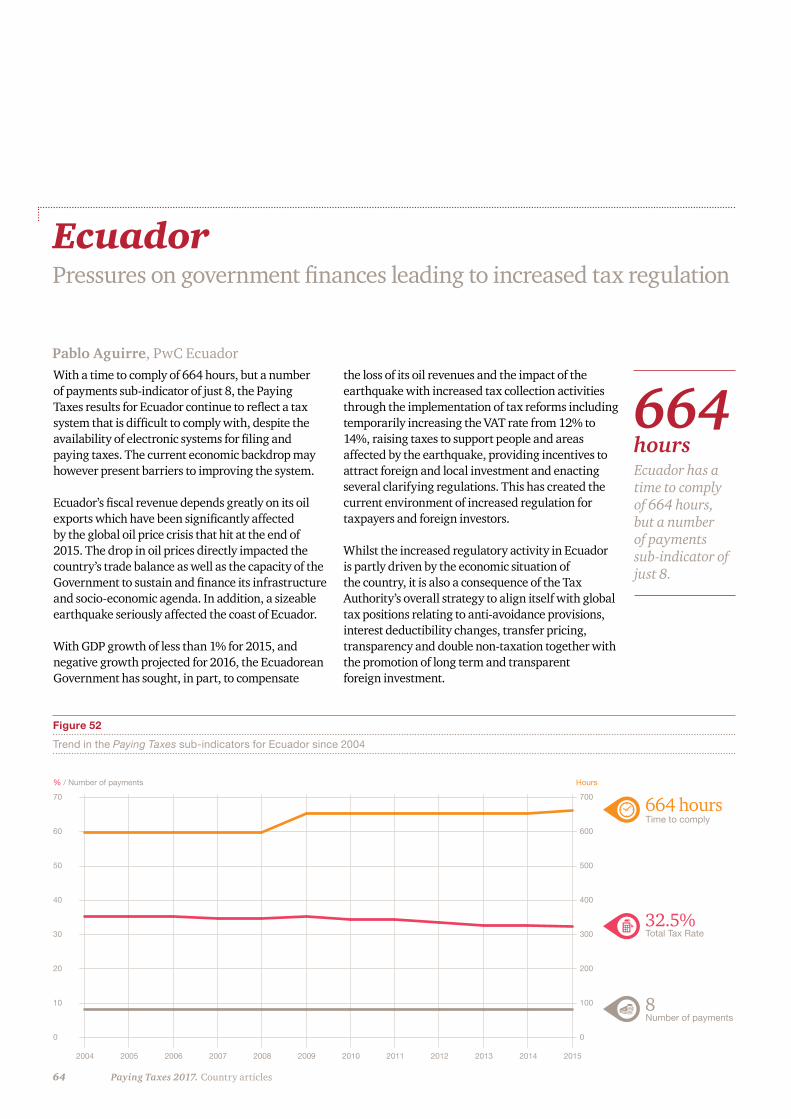
64 Paying Taxes 2017. Country articles
Figure 52
Trend in the Paying Taxes sub-indicators for Ecuador since 2004
Total Tax Rate32.5%
Time to comply664 hours
Number of payments
2004
% / Number of payments Hours
2005 2006 2007 2008 2009 2010 2011 2012 2013 2014 2015
70
60
50
40
30
20
10
0
700
600
500
400
300
200
100
0
8
EcuadorPressures on government finances leading to increased tax regulation
With a time to comply of 664 hours, but a number of payments sub-indicator of just 8, the Paying Taxes results for Ecuador continue to reflect a tax system that is difficult to comply with, despite the availability of electronic systems for filing and paying taxes. The current economic backdrop may however present barriers to improving the system.
Ecuador’s fiscal revenue depends greatly on its oil exports which have been significantly affected by the global oil price crisis that hit at the end of 2015. The drop in oil prices directly impacted the country’s trade balance as well as the capacity of the Government to sustain and finance its infrastructure and socio-economic agenda. In addition, a sizeable earthquake seriously affected the coast of Ecuador.
With GDP growth of less than 1% for 2015, and negative growth projected for 2016, the Ecuadorean Government has sought, in part, to compensate
the loss of its oil revenues and the impact of the earthquake with increased tax collection activities through the implementation of tax reforms including temporarily increasing the VAT rate from 12% to 14%, raising taxes to support people and areas affected by the earthquake, providing incentives to attract foreign and local investment and enacting several clarifying regulations. This has created the current environment of increased regulation for taxpayers and foreign investors.
Whilst the increased regulatory activity in Ecuador is partly driven by the economic situation of the country, it is also a consequence of the Tax Authority’s overall strategy to align itself with global tax positions relating to anti-avoidance provisions, interest deductibility changes, transfer pricing, transparency and double non-taxation together with the promotion of long term and transparent foreign investment.
Pablo Aguirre, PwC Ecuador
Ecuador has a time to comply of 664 hours, but a number of payments sub-indicator of just 8.
664hours
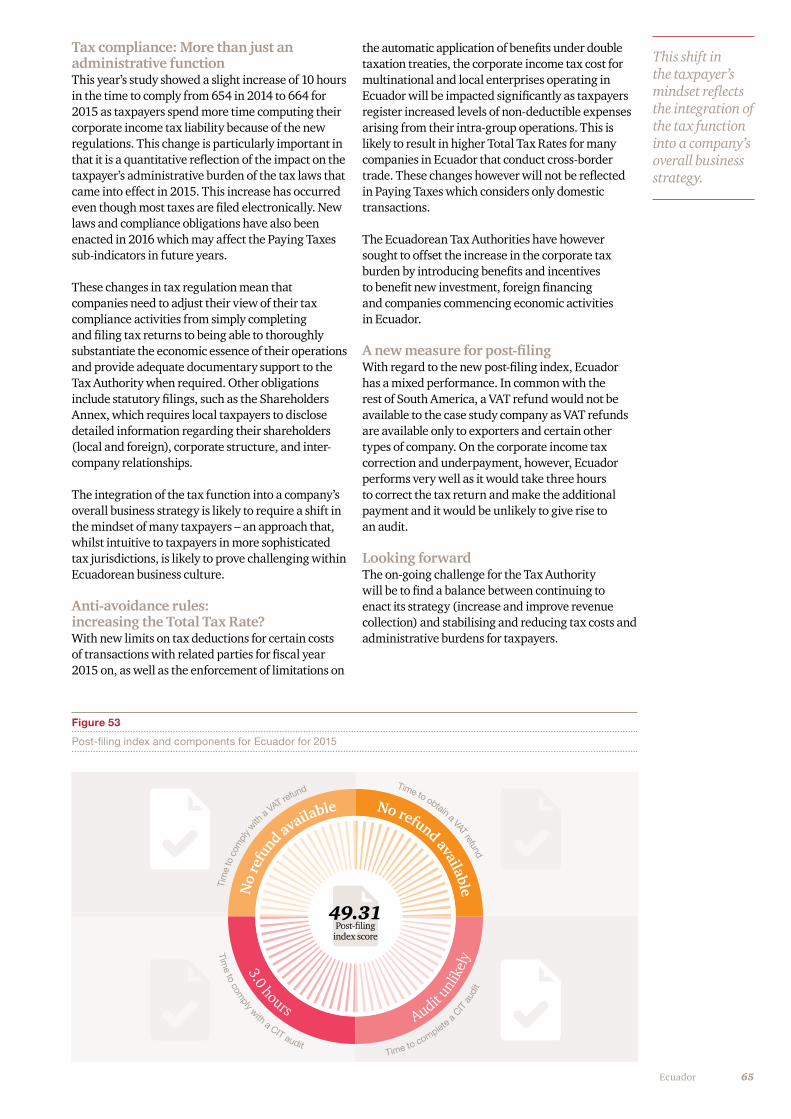
65Ecuador
This shift in the taxpayer’s mindset reflects the integration of the tax function into a company’s overall business strategy.
Tax compliance: More than just an administrative functionThis year’s study showed a slight increase of 10 hours in the time to comply from 654 in 2014 to 664 for 2015 as taxpayers spend more time computing their corporate income tax liability because of the new regulations. This change is particularly important in that it is a quantitative reflection of the impact on the taxpayer’s administrative burden of the tax laws that came into effect in 2015. This increase has occurred even though most taxes are filed electronically. New laws and compliance obligations have also been enacted in 2016 which may affect the Paying Taxes sub-indicators in future years.
These changes in tax regulation mean that companies need to adjust their view of their tax compliance activities from simply completing and filing tax returns to being able to thoroughly substantiate the economic essence of their operations and provide adequate documentary support to the Tax Authority when required. Other obligations include statutory filings, such as the Shareholders Annex, which requires local taxpayers to disclose detailed information regarding their shareholders (local and foreign), corporate structure, and inter-company relationships.
The integration of the tax function into a company’s overall business strategy is likely to require a shift in the mindset of many taxpayers – an approach that, whilst intuitive to taxpayers in more sophisticated tax jurisdictions, is likely to prove challenging within Ecuadorean business culture.
Anti-avoidance rules: increasing the Total Tax Rate?With new limits on tax deductions for certain costs of transactions with related parties for fiscal year 2015 on, as well as the enforcement of limitations on
the automatic application of benefits under double taxation treaties, the corporate income tax cost for multinational and local enterprises operating in Ecuador will be impacted significantly as taxpayers register increased levels of non-deductible expenses arising from their intra-group operations. This is likely to result in higher Total Tax Rates for many companies in Ecuador that conduct cross-border trade. These changes however will not be reflected in Paying Taxes which considers only domestic transactions.
The Ecuadorean Tax Authorities have however sought to offset the increase in the corporate tax burden by introducing benefits and incentives to benefit new investment, foreign financing and companies commencing economic activities in Ecuador.
A new measure for post-filingWith regard to the new post-filing index, Ecuador has a mixed performance. In common with the rest of South America, a VAT refund would not be available to the case study company as VAT refunds are available only to exporters and certain other types of company. On the corporate income tax correction and underpayment, however, Ecuador performs very well as it would take three hours to correct the tax return and make the additional payment and it would be unlikely to give rise to an audit.
Looking forward The on-going challenge for the Tax Authority will be to find a balance between continuing to enact its strategy (increase and improve revenue collection) and stabilising and reducing tax costs and administrative burdens for taxpayers.
49.31Post-filing
index score
No
refu
nd available No refund available
3.0 hours A
udit unl
ikel
y
Tim
e to
com
ply w
ith a
VAT refund Time to obtain a VAT refund
Time to com
ply with a CIT audit Time to complete a C
IT a
udit
Figure 53
Post-filing index and components for Ecuador for 2015
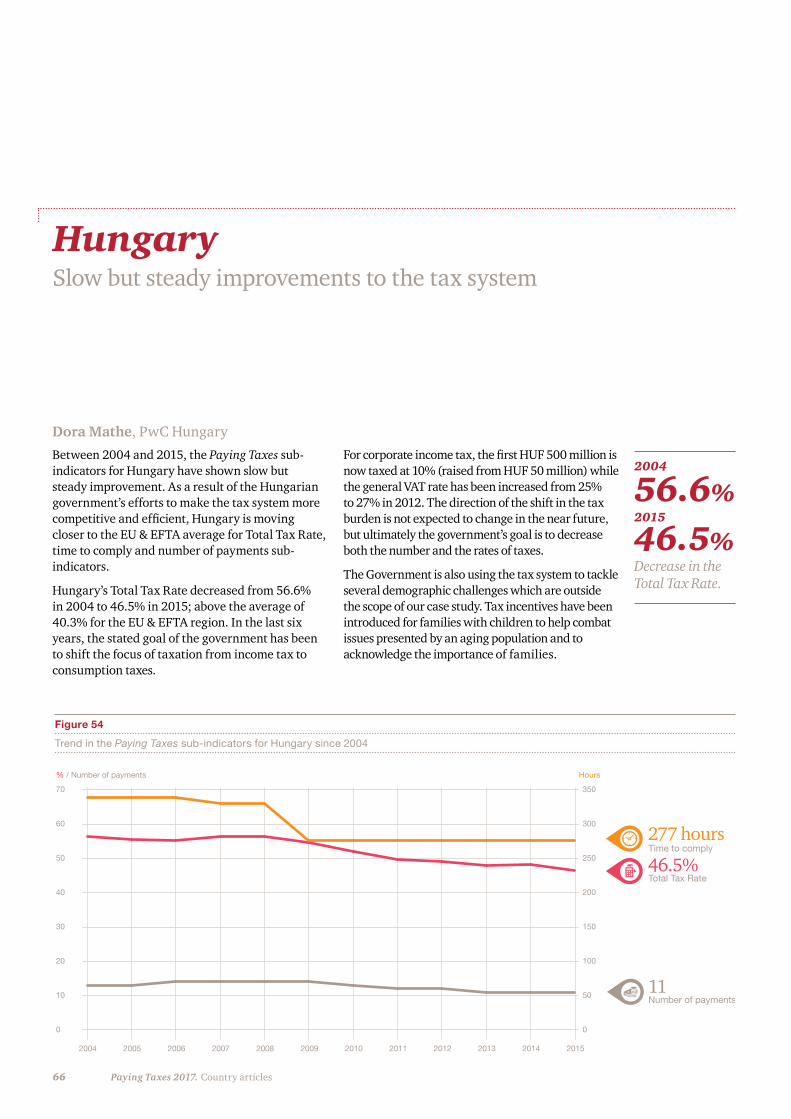
66 Paying Taxes 2017. Country articles
Figure 54
Trend in the Paying Taxes sub-indicators for Hungary since 2004
Total Tax Rate46.5%Time to comply277 hours
Number of payments
2004
% / Number of payments Hours
2005 2006 2007 2008 2009 2010 2011 2012 2013 2014 2015
70
60
50
40
30
20
10
0
350
300
250
200
150
100
50
0
11
HungarySlow but steady improvements to the tax system
Between 2004 and 2015, the Paying Taxes sub-indicators for Hungary have shown slow but steady improvement. As a result of the Hungarian government’s efforts to make the tax system more competitive and efficient, Hungary is moving closer to the EU & EFTA average for Total Tax Rate, time to comply and number of payments sub-indicators.
Hungary’s Total Tax Rate decreased from 56.6% in 2004 to 46.5% in 2015; above the average of 40.3% for the EU & EFTA region. In the last six years, the stated goal of the government has been to shift the focus of taxation from income tax to consumption taxes.
For corporate income tax, the first HUF 500 million is now taxed at 10% (raised from HUF 50 million) while the general VAT rate has been increased from 25% to 27% in 2012. The direction of the shift in the tax burden is not expected to change in the near future, but ultimately the government’s goal is to decrease both the number and the rates of taxes.
The Government is also using the tax system to tackle several demographic challenges which are outside the scope of our case study. Tax incentives have been introduced for families with children to help combat issues presented by an aging population and to acknowledge the importance of families.
Dora Mathe, PwC Hungary
Decrease in the Total Tax Rate.
56.6%
46.5%
2004
2015
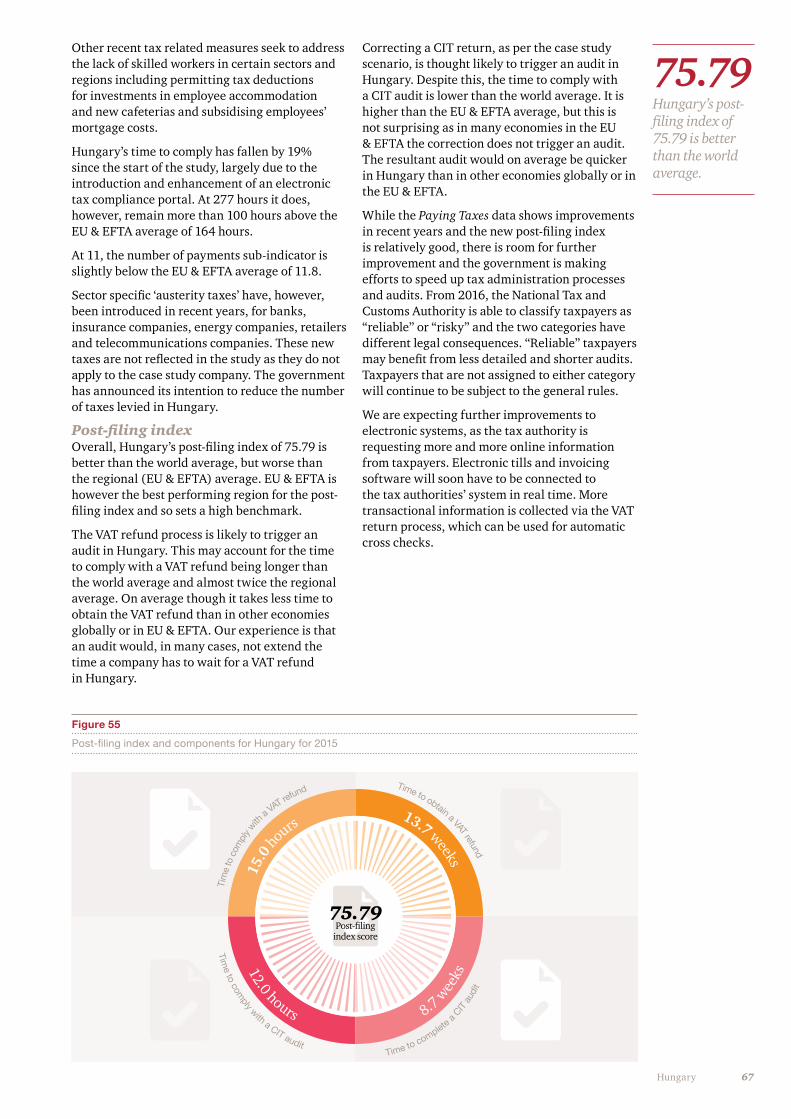
67Hungary
75.79
Hungary’s post-filing index of 75.79 is better than the world average.
Other recent tax related measures seek to address the lack of skilled workers in certain sectors and regions including permitting tax deductions for investments in employee accommodation and new cafeterias and subsidising employees’ mortgage costs.
Hungary’s time to comply has fallen by 19% since the start of the study, largely due to the introduction and enhancement of an electronic tax compliance portal. At 277 hours it does, however, remain more than 100 hours above the EU & EFTA average of 164 hours.
At 11, the number of payments sub-indicator is slightly below the EU & EFTA average of 11.8.
Sector specific ‘austerity taxes’ have, however, been introduced in recent years, for banks, insurance companies, energy companies, retailers and telecommunications companies. These new taxes are not reflected in the study as they do not apply to the case study company. The government has announced its intention to reduce the number of taxes levied in Hungary.
Post-filing indexOverall, Hungary’s post-filing index of 75.79 is better than the world average, but worse than the regional (EU & EFTA) average. EU & EFTA is however the best performing region for the post-filing index and so sets a high benchmark.
The VAT refund process is likely to trigger an audit in Hungary. This may account for the time to comply with a VAT refund being longer than the world average and almost twice the regional average. On average though it takes less time to obtain the VAT refund than in other economies globally or in EU & EFTA. Our experience is that an audit would, in many cases, not extend the time a company has to wait for a VAT refund in Hungary.
Correcting a CIT return, as per the case study scenario, is thought likely to trigger an audit in Hungary. Despite this, the time to comply with a CIT audit is lower than the world average. It is higher than the EU & EFTA average, but this is not surprising as in many economies in the EU & EFTA the correction does not trigger an audit. The resultant audit would on average be quicker in Hungary than in other economies globally or in the EU & EFTA.
While the Paying Taxes data shows improvements in recent years and the new post-filing index is relatively good, there is room for further improvement and the government is making efforts to speed up tax administration processes and audits. From 2016, the National Tax and Customs Authority is able to classify taxpayers as “reliable” or “risky” and the two categories have different legal consequences. “Reliable” taxpayers may benefit from less detailed and shorter audits. Taxpayers that are not assigned to either category will continue to be subject to the general rules.
We are expecting further improvements to electronic systems, as the tax authority is requesting more and more online information from taxpayers. Electronic tills and invoicing software will soon have to be connected to the tax authorities’ system in real time. More transactional information is collected via the VAT return process, which can be used for automatic cross checks.
75.79Post-filing
index score
15.0
hours
13.7 weeks
12.0 hours
8.7 wee
ks
Tim
e to
com
ply w
ith a
VAT refund Time to obtain a VAT refund
Time to com
ply with a CIT audit Time to complete a C
IT a
udit
Figure 55
Post-filing index and components for Hungary for 2015
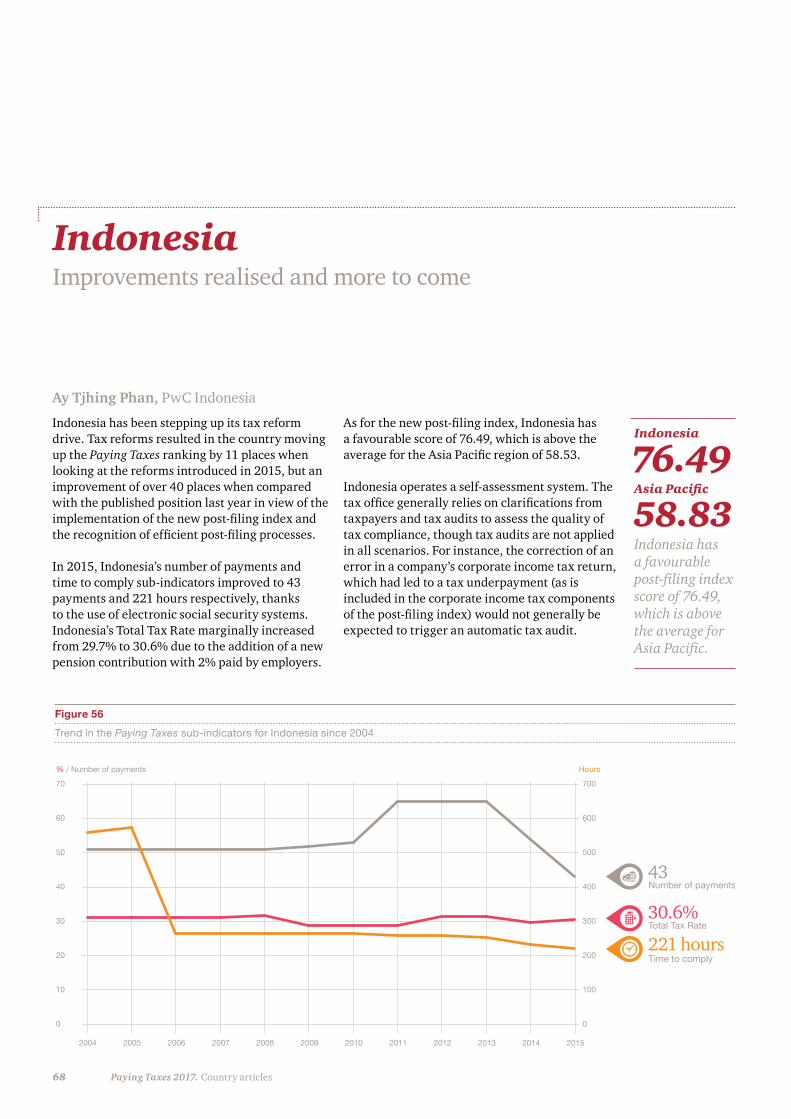
68 Paying Taxes 2017. Country articles
Figure 56
Trend in the Paying Taxes sub-indicators for Indonesia since 2004
Total Tax Rate30.6%
Time to comply221 hours
Number of payments
2004
% / Number of payments Hours
2005 2006 2007 2008 2009 2010 2011 2012 2013 2014 2015
70
60
50
40
30
20
10
0
700
600
500
400
300
200
100
0
43
IndonesiaImprovements realised and more to come
Indonesia has been stepping up its tax reform drive. Tax reforms resulted in the country moving up the Paying Taxes ranking by 11 places when looking at the reforms introduced in 2015, but an improvement of over 40 places when compared with the published position last year in view of the implementation of the new post-filing index and the recognition of efficient post-filing processes.
In 2015, Indonesia’s number of payments and time to comply sub-indicators improved to 43 payments and 221 hours respectively, thanks to the use of electronic social security systems. Indonesia’s Total Tax Rate marginally increased from 29.7% to 30.6% due to the addition of a new pension contribution with 2% paid by employers.
As for the new post-filing index, Indonesia has a favourable score of 76.49, which is above the average for the Asia Pacific region of 58.53.
Indonesia operates a self-assessment system. The tax office generally relies on clarifications from taxpayers and tax audits to assess the quality of tax compliance, though tax audits are not applied in all scenarios. For instance, the correction of an error in a company’s corporate income tax return, which had led to a tax underpayment (as is included in the corporate income tax components of the post-filing index) would not generally be expected to trigger an automatic tax audit.
Ay Tjhing Phan, PwC Indonesia
Indonesia has a favourable post-filing index score of 76.49, which is above the average for Asia Pacific.
76.4958.83
Indonesia
Asia Pacific
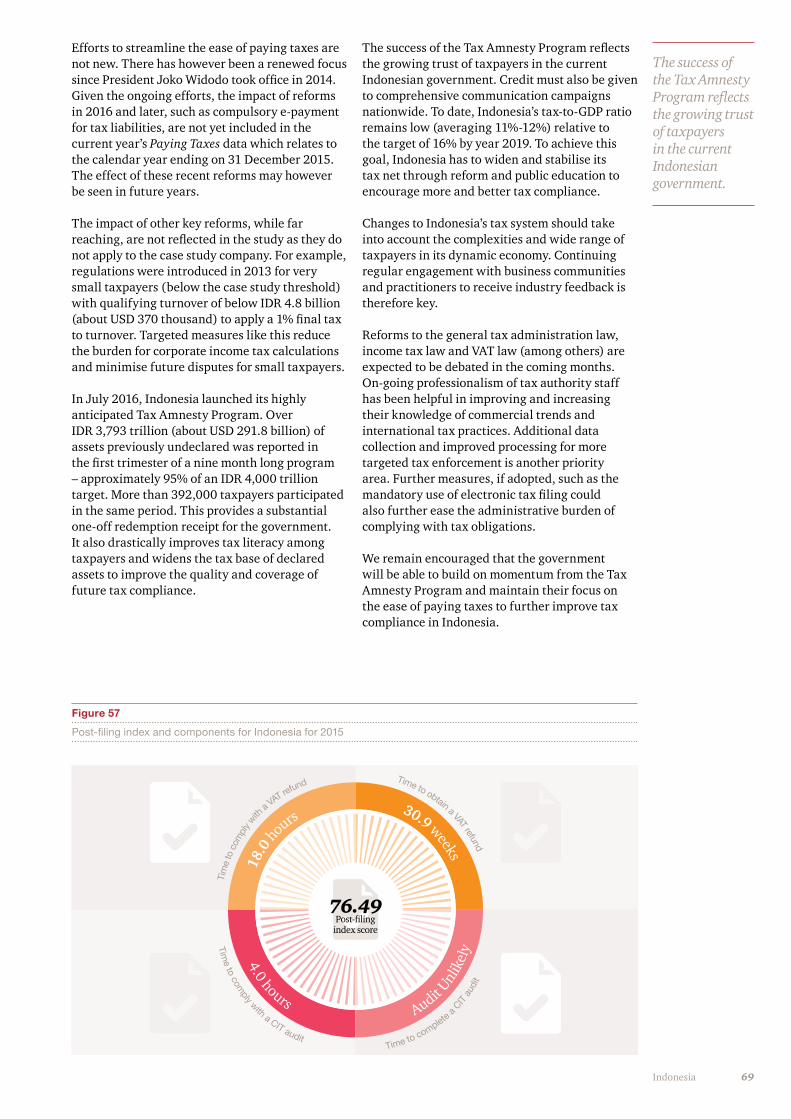
69Indonesia
The success of the Tax Amnesty Program reflects the growing trust of taxpayers in the current Indonesian government.
Efforts to streamline the ease of paying taxes are not new. There has however been a renewed focus since President Joko Widodo took office in 2014. Given the ongoing efforts, the impact of reforms in 2016 and later, such as compulsory e-payment for tax liabilities, are not yet included in the current year’s Paying Taxes data which relates to the calendar year ending on 31 December 2015. The effect of these recent reforms may however be seen in future years.
The impact of other key reforms, while far reaching, are not reflected in the study as they do not apply to the case study company. For example, regulations were introduced in 2013 for very small taxpayers (below the case study threshold) with qualifying turnover of below IDR 4.8 billion (about USD 370 thousand) to apply a 1% final tax to turnover. Targeted measures like this reduce the burden for corporate income tax calculations and minimise future disputes for small taxpayers.
In July 2016, Indonesia launched its highly anticipated Tax Amnesty Program. Over IDR 3,793 trillion (about USD 291.8 billion) of assets previously undeclared was reported in the first trimester of a nine month long program – approximately 95% of an IDR 4,000 trillion target. More than 392,000 taxpayers participated in the same period. This provides a substantial one-off redemption receipt for the government. It also drastically improves tax literacy among taxpayers and widens the tax base of declared assets to improve the quality and coverage of future tax compliance.
The success of the Tax Amnesty Program reflects the growing trust of taxpayers in the current Indonesian government. Credit must also be given to comprehensive communication campaigns nationwide. To date, Indonesia’s tax-to-GDP ratio remains low (averaging 11%-12%) relative to the target of 16% by year 2019. To achieve this goal, Indonesia has to widen and stabilise its tax net through reform and public education to encourage more and better tax compliance.
Changes to Indonesia’s tax system should take into account the complexities and wide range of taxpayers in its dynamic economy. Continuing regular engagement with business communities and practitioners to receive industry feedback is therefore key.
Reforms to the general tax administration law, income tax law and VAT law (among others) are expected to be debated in the coming months. On-going professionalism of tax authority staff has been helpful in improving and increasing their knowledge of commercial trends and international tax practices. Additional data collection and improved processing for more targeted tax enforcement is another priority area. Further measures, if adopted, such as the mandatory use of electronic tax filing could also further ease the administrative burden of complying with tax obligations.
We remain encouraged that the government will be able to build on momentum from the Tax Amnesty Program and maintain their focus on the ease of paying taxes to further improve tax compliance in Indonesia.
76.49Post-filing
index score
18.0
hours
30.9 weeks
4.0 hours A
udit Unl
ikel
y
Tim
e to
com
ply w
ith a
VAT refund Time to obtain a VAT refund
Time to com
ply with a CIT audit Time to complete a C
IT a
udit
Figure 57
Post-filing index and components for Indonesia for 2015

70 Paying Taxes 2017.
Chapter 4 – Beyond Paying Taxes: Tax policy and administration
71A role for corporates in tax system reform
A role for corporates in tax system reform
Tax and how tax systems operate has moved firmly up the agenda not only for governments, business and the media, but also for the general public. The Paying Taxes indicator provides robust information which enables tax systems around the world to be benchmarked. In doing so it provides a tool which assesses how easy governments make it for companies to pay their taxes and so can help to encourage reform and improvement especially around reducing the administrative burden of paying taxes and making compliance easier and more efficient for all.
But governments, particularly in the developing world, need assistance to make these reforms and to build effective, efficient tax systems. The private sector has the potential to offer this assistance and to play a much greater role in the worldwide development of strong tax systems; to do more than just paying its taxes. The private sector has access to resources, expertise and networks that can make a valuable contribution to the development of tax systems and the effective collection of tax revenues, but for this to happen there needs to be an appetite to offer such assistance and an acceptance by other stakeholders that such help is appropriate.
In this article we explore some aspects of corporate social responsibility and the role it can play in tax system reform. We identify the main barriers to effective cooperation in this area and some of the approaches to overcoming these barriers. This is based on international literature and insights gleaned from a series of interviews conducted with experts from multinational corporations, international financial institutions, tax authorities and non-governmental organisations (NGOs) during 2016. The authors are very grateful for the valuable insights these interviews provided.
Authors: Amal Larhlid (PwC UK) and Simon Carey (PwC UK)
72 Paying Taxes 2017.
For developing countries in particular, businesses provide 60% of economic output and 90% of jobs.
“ Ultimately, corporates can do well by doing good.”
Why would companies get involved?Many corporations are adopting and strengthening their CSR strategies in recognition of a range of benefits for companies; “ultimately, corporates can do well by doing good”.43 There can be lower costs to firms through greater operational efficiencies, reducing waste and costly energy consumption and removing inefficient capital expenditure. For example, in 2006 Wal-Mart reduced transportation costs by $3.5 million through one initiative to reduce packaging on toys.44 CSR strategies that focus on employees’ wellbeing and training can help retain more workers, enhance overall productivity, mitigate health and safety issues and other risks to the business.
By promoting and adopting considerate and responsible business attitudes, companies can engage positively with stakeholders, regulators and governments which can help with risk management and mitigation.45 In addition this can help change a reputation and can differentiate the business, lead to greater customer loyalty, stronger client relationships and create an attractive workplace for employees which are all indirectly linked to sustainable business success.46
What do we mean by corporate social responsibility?Corporate social responsibility (CSR) is “a concept whereby companies integrate social and environmental concerns in their business operations and in their interaction with their stakeholders on a voluntary basis”.40
Over the years, prevailing views on corporate responsibility have evolved. Companies continue to search for a competitive edge whilst trying to respond to new stakeholder demands and to demonstrate that the two need not be contradictory. A wider group of stakeholders now take a closer interest in companies’ impacts and can influence how company brands are regarded.
Part of this evolution in CSR can be attributed to significant shifts in public sentiment. Many companies now have sophisticated, comprehensive and publicised CSR strategies, often with a particular focus on issues like supply chain working conditions, and some have gone so far as to make advocacy for social responsibility a key point of differentiation.
Businesses can be powerful agents of change and their influence can be significant for economic and social development. For developing countries in particular, businesses provide 60% of economic output and 90% of jobs.41 The Addis Ababa Action agenda, agreed at the United Nations Third International Conference on Financing for Development in 2015, re-emphasised what they regard as the need for improved domestic resource mobilisation to “widen the revenue base, improve tax collection and combat tax evasion and illicit financial flows” 42 and highlighted the need for private business investment to help drive inclusive economic growth and job creation.
“ The field of CSR … is not a static set of practices, but a constantly evolving field which has been largely driven by business. CR used to be an "add-on," but has evolved to become a more integrated and disciplined field, increasingly managed and assessed as any other business function.” 39
Camilla Drejer, Corporate Responsibility Group
39 Department for Business, Innovation and Skills 2014. See page 79 for bibliography.
40 European Commission 2011. 41 OECD 2016a. 42 United Nations 2015.
43 OECD 2016b.44 Wal-Mart 2006. 45 Kytle and Ruggie 2005. 46 IISD 2016a.
73A role for corporates in tax system reform
What role does tax play in corporate social responsibility?A company’s tax strategy can play an important part in their approach to social responsibility. Tax raised in a particular country is an important source of finance for the government, enabling them to meet economic and social objectives and helping to secure overall prosperity and stability. While tax is a cost to business, some say that it could also be regarded an investment in the societies in which a company operates.47
In some parts of the world, companies are increasingly being asked to consider their strategic approach to tax taking into account a broader social responsibility agenda. Through social media and greater financial disclosure there has been increasing pressure from citizens, governments, NGOs and the media for companies to think more broadly when planning their tax affairs to consider the wider impacts of their decision-making, and to explain publically the taxes they pay.
This is a particular focus in the developing world, where tax provides the funds to expand much-needed public services such as healthcare and education, and to alleviate deprivation. This should also be complemented by reforms to combat corruption and inefficiency in the public sector, to help ensure the benefits of taxation are accruing to those most in need.
Companies may have more to contribute than just paying their taxes Companies potentially have more to offer than the contribution they make through paying taxes. They can also bring significant expertise and resource to bear on some of society’s biggest issues, which includes contributing to the development of effective tax systems and the building of capability in developing world tax administrations. This should be possible without compromising their commercial competitive advantage, provided certain barriers to their involvement can be overcome. We consider these barriers and how they could be addressed in the final section of this article.
By promoting and adopting considerate and responsible business attitudes, companies can engage positively with stakeholders, regulators and governments which can help with risk management and mitigation.
47 Action Aid 2015.
74 Paying Taxes 2017.
The different perspectives on CSRMany parties have an interest in corporate social responsibility – including businesses, the media, professional bodies, trade associations, universities, research institutes, NGOs, governments, employees and other groups of citizens – and these diverse groups all have different expectations of what corporate social responsibility should entail. The analysis below briefly explores some of these different perceptions with regard to tax.
Governments The government’s responsibility is to look after the collective interests of its citizens, providing an enabling environment for responsible business and making sure that it is equitably enforced.48 Governments cannot provide for all their citizen’s needs alone and must partner with other actors to leverage key resources. Some have an expectation that governments should create a responsible and attractive business environment – often a key factor in a company’s decision on whether or not to start doing business in a country.
In return, governments expect corporates to comply with their tax obligations. In some developed countries the input of corporates to the debate around tax policy is sought although to varying degrees, and in many developing and emerging countries governments will also seek the input of the private sector (either directly, or through international institutions and aid agencies) to advise on, and support, major tax system reforms.49
Non-governmental organisations (NGOs) NGOs play a role in international development and help to draw attention to the impact of businesses on society and the environment, in some cases campaigning against businesses that, in their view, could operate differently. The work of some NGOs has impacted consumer and governmental expectations on companies with regard to their approach to tax: “Multinational brands have been acutely susceptible to pressure from activists and from NGOs eager to challenge a company’s labour, environmental or human rights record”.50 This doesn’t just impact businesses that are directly manufacturing or selling highly visible branded goods it can also affect a broader range of companies and their stakeholders.51
A common perception among NGOs is that the role of corporates in supporting tax systems should be limited to paying taxes in accordance with the spirit of the law, and should not extend to support with setting and developing policies that corporates themselves will eventually have to comply with. The practical impact of this view is to discourage the potentially valuable involvement of corporates in other ways, such as the provision of expertise, technical assistance and resources.
The international community The international community – the United Nations, the OECD, the IMF and the World Bank, to name a few – have identified a major role for the private sector. International agencies themselves play a vital role in setting expectations for corporates to contribute to developing the countries in which they operate through responsible business practices. They play a key role in reshaping traditional perceptions of public and private sector roles by creating the conditions and tools for increased cooperation, such as common standards and best practice fora, in order to increase the access to expertise and information for governments and businesses to make informed decisions.
There is a risk that NGOs support too narrow a view of the role of corporates and discourage them from supporting tax development to their full extent.
48 OECD 2016c. 49 See, for example the work programmes of domestic aid agencies DFID, DANIDA and USAID, and international organisations such as the World Bank and
European Commission.50 IISD 2016b.51 IISD 2016b.
75A role for corporates in tax system reform
The international community also plays a key role in identifying global trends in foreign investment and aid, and coordinating global responses to policy priorities. International organisations expect companies to support development by respecting “both the letter and spirit of the tax laws and regulations of the countries in which they operate”52 and they may actively seek the input of the private sector to support tax system reforms.
CompaniesCompanies contribute to the societies in which they operate in a number of ways. In terms of public finances, it is not just taxes on corporate profits that support public expenditure, but also other taxes made possible by the economic activity they generate – such as value-added taxes and personal income taxes. There is now pressure from some stakeholders that they comply with the spirit and letter of relevant tax laws, and in many cases this means an expectation around both tax payments and the disclosure of relevant financial information.
A potential barrier to companies also contributing their expertise and resources to improve the local business environment in the developing world may be that the benefits of improvements will be shared with all other businesses (the free rider problem). However, evidence suggests that these barriers can be overcome.53 Acting collectively to provide support and capacity building can diminish the problem, also providing an opportunity to strengthen relationships. The reputational benefits of providing support can also be significant, and promoting a clear, public CSR strategy can ensure these reputational benefits are captured by the firm or firms actually providing the support.
How can companies better support tax reform in developing countries?A number of tax administrations in the developing world are looking for financial and expert support in reforming and strengthening their tax systems. Some corporates are interested in supporting these types of reforms but find that it is not always easy to know how to offer their support in a way that isn’t misinterpreted. These corporate stakeholders often have interests very closely aligned with those of the governments and donors, as it is in their shared interests for countries to have well-functioning tax and public finance systems – where the infrastructure is properly managed, people have money to spend and invest, and corruption is minimised. They also have expertise and financial resources that can be applied to help tax reform including the drafting and strengthening of tax policy, legislation and administration.
Companies’ involvement with governments of developing countries has historically been sensitive due to issues such as perceived conflicts of interest, criticism for interfering in developing countries’ tax affairs, and accusations of corruption and bribery. These barriers are not insurmountable, and as we describe below, companies are already beginning to overcome some of these obstacles in innovative ways, acknowledging the positive impact that they can have if involved in the right way.
The international community also plays a key role in identifying global trends in foreign investment and aid, and coordinating global responses to policy priorities.
52 OECD 2016c. 53 Porter and Kramer 2002.
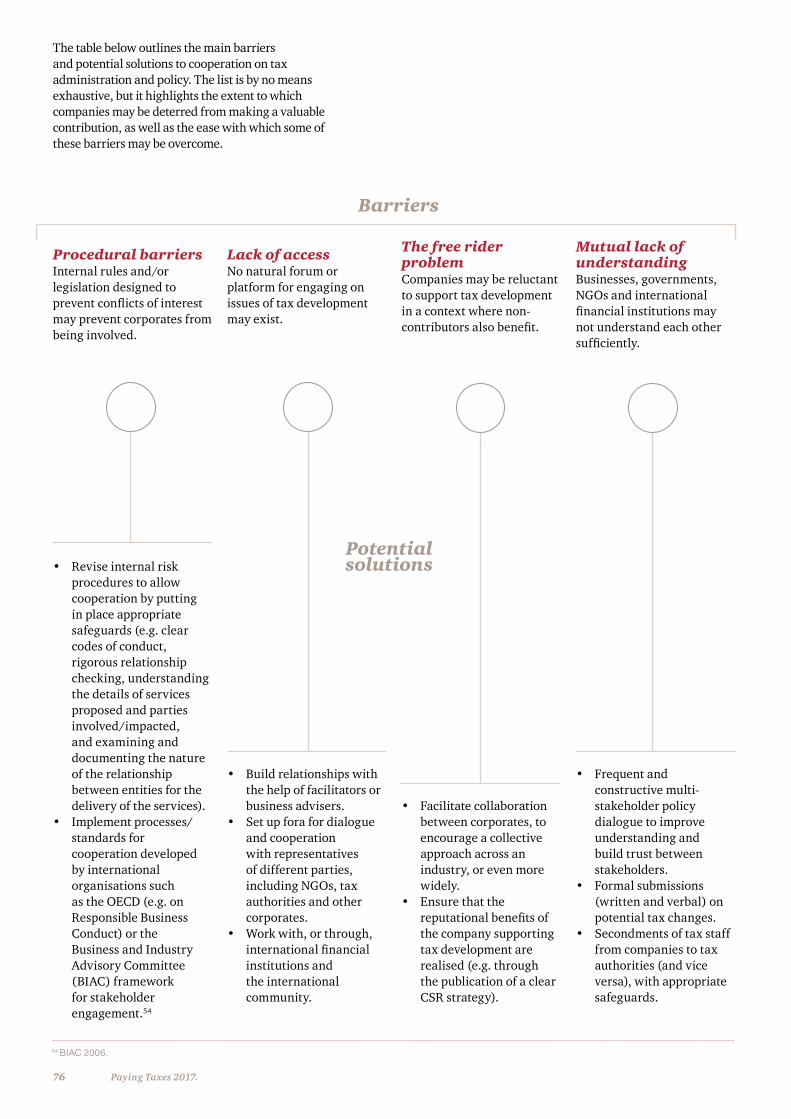
76 Paying Taxes 2017.
Procedural barriersInternal rules and/or legislation designed to prevent conflicts of interest may prevent corporates from being involved.
• Revise internal risk procedures to allow cooperation by putting in place appropriate safeguards (e.g. clear codes of conduct, rigorous relationship checking, understanding the details of services proposed and parties involved/impacted, and examining and documenting the nature of the relationship between entities for the delivery of the services).
• Implement processes/standards for cooperation developed by international organisations such as the OECD (e.g. on Responsible Business Conduct) or the Business and Industry Advisory Committee (BIAC) framework for stakeholder engagement.54
• Build relationships with the help of facilitators or business advisers.
• Set up fora for dialogue and cooperation with representatives of different parties, including NGOs, tax authorities and other corporates.
• Work with, or through, international financial institutions and the international community.
• Facilitate collaboration between corporates, to encourage a collective approach across an industry, or even more widely.
• Ensure that the reputational benefits of the company supporting tax development are realised (e.g. through the publication of a clear CSR strategy).
• Frequent and constructive multi-stakeholder policy dialogue to improve understanding and build trust between stakeholders.
• Formal submissions (written and verbal) on potential tax changes.
• Secondments of tax staff from companies to tax authorities (and vice versa), with appropriate safeguards.
Lack of accessNo natural forum or platform for engaging on issues of tax development may exist.
The free rider problem Companies may be reluctant to support tax development in a context where non-contributors also benefit.
Mutual lack of understanding Businesses, governments, NGOs and international financial institutions may not understand each other sufficiently.
Barriers
Potentialsolutions
The table below outlines the main barriers and potential solutions to cooperation on tax administration and policy. The list is by no means exhaustive, but it highlights the extent to which companies may be deterred from making a valuable contribution, as well as the ease with which some of these barriers may be overcome.
54 BIAC 2006.
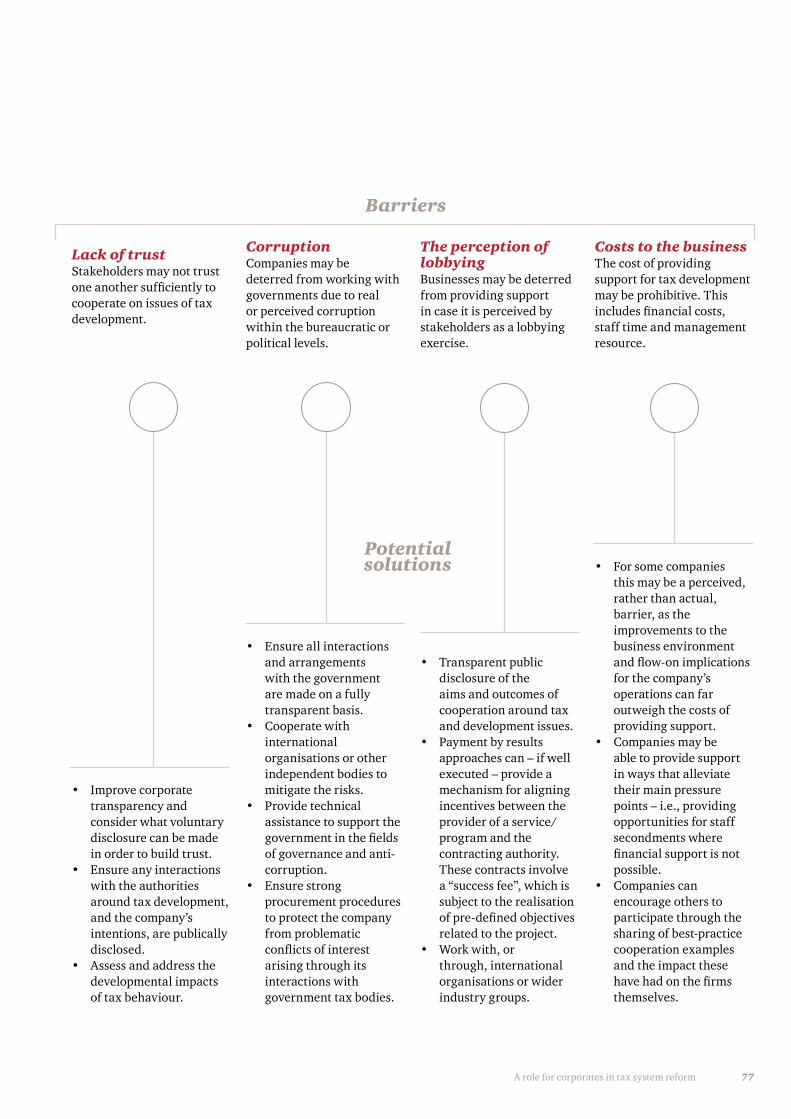
77A role for corporates in tax system reform
• Improve corporate transparency and consider what voluntary disclosure can be made in order to build trust.
• Ensure any interactions with the authorities around tax development, and the company’s intentions, are publically disclosed.
• Assess and address the developmental impacts of tax behaviour.
• Ensure all interactions and arrangements with the government are made on a fully transparent basis.
• Cooperate with international organisations or other independent bodies to mitigate the risks.
• Provide technical assistance to support the government in the fields of governance and anti-corruption.
• Ensure strong procurement procedures to protect the company from problematic conflicts of interest arising through its interactions with government tax bodies.
• Transparent public disclosure of the aims and outcomes of cooperation around tax and development issues.
• Payment by results approaches can – if well executed – provide a mechanism for aligning incentives between the provider of a service/program and the contracting authority. These contracts involve a “success fee”, which is subject to the realisation of pre-defined objectives related to the project.
• Work with, or through, international organisations or wider industry groups.
• For some companies this may be a perceived, rather than actual, barrier, as the improvements to the business environment and flow-on implications for the company’s operations can far outweigh the costs of providing support.
• Companies may be able to provide support in ways that alleviate their main pressure points – i.e., providing opportunities for staff secondments where financial support is not possible.
• Companies can encourage others to participate through the sharing of best-practice cooperation examples and the impact these have had on the firms themselves.
Lack of trust Stakeholders may not trust one another sufficiently to cooperate on issues of tax development.
CorruptionCompanies may be deterred from working with governments due to real or perceived corruption within the bureaucratic or political levels.
The perception of lobbyingBusinesses may be deterred from providing support in case it is perceived by stakeholders as a lobbying exercise.
Costs to the businessThe cost of providing support for tax development may be prohibitive. This includes financial costs, staff time and management resource.
Potentialsolutions
Barriers
78 Paying Taxes 2017.
This demonstrates that the barriers to corporates supporting the development of sound, well-functioning tax systems are not insurmountable, and a number of these potential solutions are already being utilised by companies and tax administrations around the world. As a final point, we highlight two of the key tools being used to overcome these constraints below.
A number of industry groups have been set up to overcome these obstacles in a collective way. One example of this is the Africa Industry Tax Association (AITA), a group of multinational corporations with significant operations in Africa. This group was formed as a structured, collective platform for engaging with African governments and revenue authorities on issues around tax policy, systems and administration, and has an active working relationship with the African Tax Administration Forum (ATAF). These groups may even be formally incorporated into the consultation processes of other stakeholders as is the case with the Business and Industry Advisory Committee to the OECD (BIAC), a group of multinational businesses who operate as a trusted partner to the OECD and other international institutions. Groups like these can be a powerful tool for promoting dialogue and building trust between governments and industry around tax affairs, mitigating the free rider concern and reducing the perception of lobbying for the advancement of company-specific benefits.
Blended finance is another collaborative approach to overcoming these barriers. It is defined by the World Economic Forum and OECD as “the strategic use of development finance and philanthropic funds to mobilize private capital flows to emerging and frontier markets”.55 At its core it is a way to channel private investment into sectors where the development needs are the greatest, by combining it with development finance and philanthropic funds to mitigate risk and ensure commercial returns. International financial institutions are already operating models like this as a way to mobilise resources for their global programmes, including specific funds established to assist with tax development. Both these approaches – as well as the tools and approaches listed above – are available to companies and governments looking to overcome the constraints to greater cooperation around issues of tax development.56
Concluding remarksGovernments worldwide are looking to their tax systems to generate the funds necessary to support vibrant, inclusive societies, but many countries remain unable to harness the revenues needed to provide even basic needs for their populations. Tackling corruption, improving the tax system, and making it easier for companies and individuals to pay their taxes are important roles of government, while companies are expected to pay their tax when and where it is due.
In addition to the taxes that a company pays, there is potential for companies to work in cooperation with governments and other stakeholders in support of broader development goals as well, including a role in the worldwide development of strong tax systems. The potential barriers to this cooperation, if addressed properly, need not prevent the experience, influence and resourcefulness of the private sector from playing their part in fulfilling these important goals.
55 OECD and World Economic Forum 2015. 56 Examples include a series of multi-donor funds operated by the World Bank, and the IMF’s Tax Policy and Administration Topical Trust Fund, launched in
2011 to help meet increased demand for technical assistance from developing countries in the area of revenue policy and administration (see IMF 2016b).
Tackling corruption, improving the tax system, and making it easier for companies and individuals to pay their taxes are important roles of government, while companies are expected to pay their tax when and where it is due.
AcknowledgementsThe authors would like to thank Claire Monari (PwC UK), Emily Macpherson (PwC UK intern), Gwendolin Chau (PwC UK) and Neville Howlett (PwC UK) for their support and contributions, and the numerous corporate, NGO, government and international financial institution representatives for their kind participation in the interviews that informed this article.
Bibliography
Action Aid. "Getting to Good: Towards Responsible Corporate Tax Behaviour." November 2015. Accessed 13 October 2016. https://www.actionaid.org.uk/sites/default/files/publications/getting_to_good_towards_responsible_corporate_tax_behaviour.pdf. Business and Industry Advisory Committee to the OECD. “Five Priorities for Stakeholder Engagement”. April 2016. Accessed 14 October 2016. http://biac.org/wp-content/uploads/2016/04/2016-04-08-BIAC-Priorities-on-Stakeholder-Engagement1.pdfDepartment for Business Innovation and Skills (UK). “Good for Business & Society: government response to call for views on corporate responsibility.” April 2014. Accessed 14 October 2016. https://www.gov.uk/government/uploads/system/uploads/attachment_data/file/300265/bis-14-651-good-for-business-and-society-government-response-to-call-for-views-on-corporate-responsibility.pdf.European Commission. “A renewed EU strategy 2011-14 for Corporate Social Responsibility” 2011. Accessed 14 October 2016. http://eur-lex.europa.eu/LexUriServ/LexUriServ.do?uri=COM:2011:0681:FIN:en:PDFHerrmann, Kristina K. "Corporate Social Responsibility and Sustainable Development: The European Union Initiative as a Case Study." Indiana Journal of Global Legal Studies 11, no. 2 (2004): 205-32. doi:10.1353/gls.2004.0013.International Institute for Sustainable Development (IISD). "Corporate Social Responsibility (CSR)." Accessed 13 October 2016. https://www.iisd.org/business/issues/sr.aspx. International Institute for Sustainable Development (IISD). "The Rise and Role of NGOs in Sustainable Development." Accessed 13 October 2016. https://www.iisd.org/business/ngo/roles.aspx. International Monetary Fund (IMF). "Fiscal Issues at the IMF: Fiscal Policies for Innovation and Growth." Accessed 13 October 2016. http://www.imf.org/external/np/exr/key/fiscal.htm.International Monetary Fund (IMF). "Revenue Mobilization Trust Fund" Trust Fund. Accessed 13 October 2016. http://www.imf.org/external/np/ins/english/rmtf.htm. Kytle and Ruggie. “Corporate Social Responsibility as Risk Management: A Model for Multinationals.” Corporate Social Responsibility Initiative Working Paper No. 10. 2005. Cambridge, MA: John F. Kennedy School of Government, Harvard University. http://www.ksg.harvard.edu/m-rcbg/CSRI/publications/workingpaper_10_kytle_ruggie.pdf
Ochieng, ZaCkayo. "The Potential Benefits of Corporate Social Responsibility to Organizations." 2016. Accessed 13 October 2016. https://www.linkedin.com/pulse/potential-benefits-corporate-social-responsibility-zackayo-ochieng.Organisation for Economic Co-operation and Development (OECD). "Development Co-operation Report 2016." Accessed 18 July 2016. doi:10.1787/dcr-2016-en. Organisation for Economic Co-operation and Development (OECD). "Development Co-operation Report 2016: The Sustainable Development Goals as Business Opportunities", July 2016Organisation for Economic Co-operation and Development (OECD). "Guidelines for Multinational Enterprises." Accessed 13 October 2016. http://www.oecd.org/daf/inv/mne/oecdguidelinesformultinationalenterprises.htm. Organisation for Economic Co-operation and Development (OECD). "Responsible Business Conduct." Accessed 13 October 2016. http://www.oecd.org/investment/toolkit/policyareas/responsiblebusinessconduct/. Organisation for Economic Co-operation and Development (OECD) & World Economic Forum. "A How-To Guide for Blended Finance." 2015. Accessed 13 October 2016. http://www3.weforum.org/docs/WEF_Blended_Finance_How_To_Guide.pdf. Porter, Michael E., and Mark R. Kramer. "The Competitive Advantage of Corporate Philanthropy." Harvard Business Review December 2002. Accessed 13 October 2016. https://hbr.org/2002/12/the-competitive-advantage-of-corporate-philanthropy. United Nations. "Addis Ababa Action Agenda of the Third International Conference on Financing for Development." July 2015. Accessed 13 October 2016. http://www.un.org/esa/ffd/wp-content/uploads/2015/08/AAAA_Outcome.pdf. United Nations. "Investing in the SDGs: An Action Plan for Promoting Private Sector Contributions." United Nations Conference on Trade and Development (UNCTAD) World Investment Report (WIR) World Investment Report 2014, 2014, 135-94. doi:10.18356/ca95f7ed-en. United Nations. "Sustainable Development Goals – Sustainable Development Knowledge Platform." UN News Center. Accessed 13 October 2016. https://sustainabledevelopment.un.org/?menu=1300. Wal-Mart. "Wal-Mart Launches 5-Year Plan to Reduce Packaging." 2006. Accessed 13 October 2016. http://corporate.walmart.com/_news_/news-archive/2006/09/22/wal-mart-launches-5-year-plan-to-reduce-packaging.
79A role for corporates in tax system reform
80 Paying Taxes 2017
The rising importance of consumption taxes in government tax revenues
81The rising importance of consumption taxes in government tax revenues
Executive Summary • Corporate income tax as a percentage of
governments’ tax revenues is continuing to fall at the same time as tax revenues from indirect taxes such as value-added tax (VAT)57 are increasing. This reflects a global trend of governments focusing on the certainty of revenues from VAT and using indirect taxation to achieve objectives beyond just raising tax revenue.
• The number of countries around the world with a VAT system is increasing. VAT in the OECD countries now accounts for around 20%58 of total tax revenues, a 70% greater share than in the mid-eighties.59
• Comparing VAT systems across the world shows that there is a clear tension between the need to reduce the possibility of non-compliance and ensuring that the burden of administration on taxpayers does not impair businesses’ competitiveness. There is some evidence to suggest that more recently implemented VAT systems in OECD countries have higher levels of compliance. This is because a single VAT rate is used with a broader VAT base with few exemptions. More research is needed to explore this further.
• Technology is playing an increasingly important role in the creation of efficient indirect tax systems and in improving their effectiveness by reducing the cost and administrative burden for both taxpayers and tax authorities. Examples of this will be seen next year in India where they will introduce a new goods and services tax and in Spain which will increase the use of ‘real time’ VAT reporting.
• Post-filing interactions with tax authorities for VAT can complicate the compliance process and increase costs for business. The new Paying Taxes 2017 post-filing index enables a comparison of these processes around the world.
57 We have used VAT (value-added tax) to cover similar consumption tax systems such as goods and services tax (GST). The US system of sales and use taxes is not a VAT (as not collected on the value added at each stage and is essentially collected at a single stage (retail)) however it remains a tax on consumption and not income.
58 OECD (2015), “Revenue Statistics: Comparative tables”, OECD Tax Statistics (database).59 OECD (2014), Consumption Tax Trends 2014 – Fig 1.3.
Authors: Jo Bello (PwC UK) and Haider Hatteea (PwC UK)
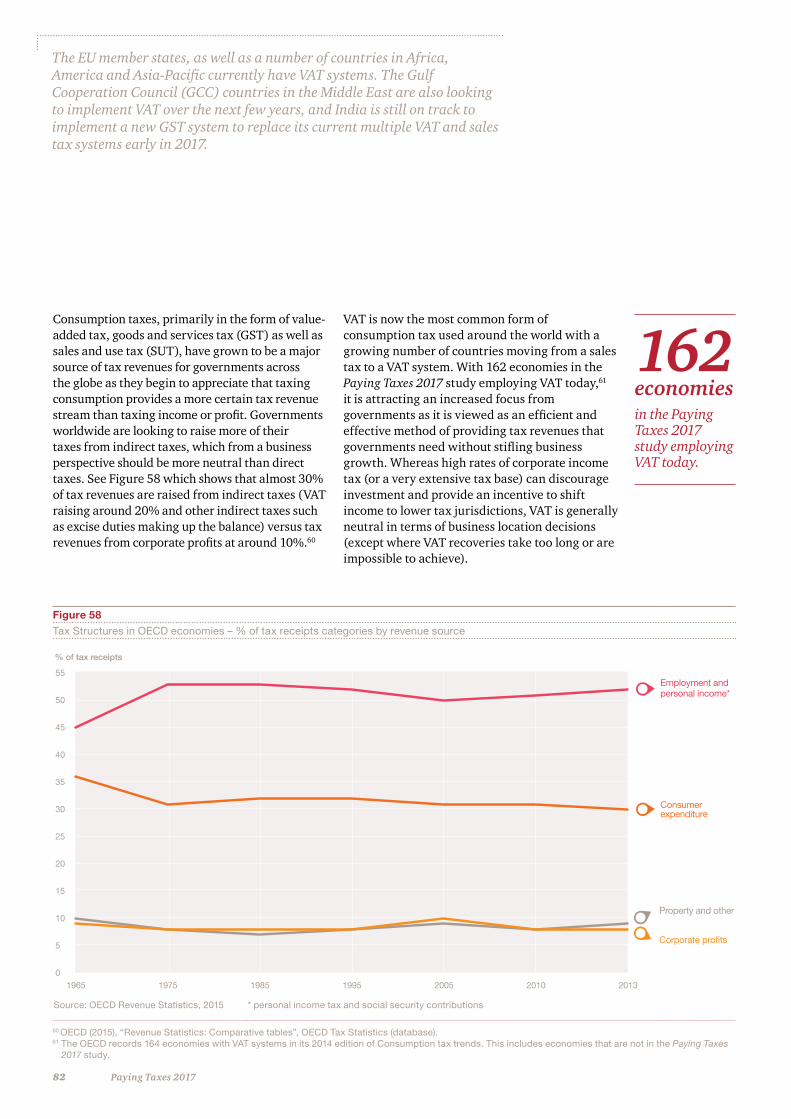
82 Paying Taxes 2017
Employment and personal income*
Consumer expenditure
Corporate profits
Property and other
% of tax receipts
1965 1975 1985 1995 2005 2010 2013
55
50
45
40
35
30
25
20
15
10
5
0
162 economies in the Paying Taxes 2017 study employing VAT today.
Consumption taxes, primarily in the form of value-added tax, goods and services tax (GST) as well as sales and use tax (SUT), have grown to be a major source of tax revenues for governments across the globe as they begin to appreciate that taxing consumption provides a more certain tax revenue stream than taxing income or profit. Governments worldwide are looking to raise more of their taxes from indirect taxes, which from a business perspective should be more neutral than direct taxes. See Figure 58 which shows that almost 30% of tax revenues are raised from indirect taxes (VAT raising around 20% and other indirect taxes such as excise duties making up the balance) versus tax revenues from corporate profits at around 10%.60
The EU member states, as well as a number of countries in Africa, America and Asia-Pacific currently have VAT systems. The Gulf Cooperation Council (GCC) countries in the Middle East are also looking to implement VAT over the next few years, and India is still on track to implement a new GST system to replace its current multiple VAT and sales tax systems early in 2017.
VAT is now the most common form of consumption tax used around the world with a growing number of countries moving from a sales tax to a VAT system. With 162 economies in the Paying Taxes 2017 study employing VAT today,61 it is attracting an increased focus from governments as it is viewed as an efficient and effective method of providing tax revenues that governments need without stifling business growth. Whereas high rates of corporate income tax (or a very extensive tax base) can discourage investment and provide an incentive to shift income to lower tax jurisdictions, VAT is generally neutral in terms of business location decisions (except where VAT recoveries take too long or are impossible to achieve).
Figure 58Tax Structures in OECD economies – % of tax receipts categories by revenue source
Source: OECD Revenue Statistics, 2015 * personal income tax and social security contributions
60 OECD (2015), “Revenue Statistics: Comparative tables”, OECD Tax Statistics (database).61 The OECD records 164 economies with VAT systems in its 2014 edition of Consumption tax trends. This includes economies that are not in the Paying Taxes
2017 study.
83The rising importance of consumption taxes in government tax revenues
What are the differences between the types of consumption taxes, VAT, GST and SUT?VAT and GST are designed to be a tax on final consumption. They are collected throughout the supply chain through a staged collection process. VAT and GST are levied on the supply of goods and services, as well as on the importation of goods and services. As a general principle, VAT and GST are imposed at every stage of the economic process and allow deduction of taxes on purchases by all but the final consumer, subject to some exceptions. The net effect of this is to spread the collection of the tax as buyers, suppliers, and consumers contribute only the incremental value they have provided in the supply chain under a credit or debit system where VAT/GST incurred on purchases is offset against the VAT/GST due on sales.
The EU member states, as well as a number of countries in Africa, America and Asia-Pacific currently have VAT systems. The Gulf Cooperation Council (GCC) countries in the Middle East are also looking to implement VAT over the next few years, and India is still on track to implement a new GST system to replace its current multiple VAT and sales tax systems early in 2017.
In comparison to mature VAT systems, such as in the EU, where newer VAT systems have been introduced, for example in Australia, New Zealand and Singapore, these countries apply VAT at a single rate of tax to a broad base of consumer spending, with few exemptions, and as a result are characterised by having a higher degree of compliance (and by implication a reduced cost of compliance for the taxpayer, i.e., the business) and sustained revenue raising.62 The EU VAT model has been part of the tax landscape in Europe since the first VAT Directive was adopted on 11 April 1967, and is characterised by having a far narrower tax base (due to the high use of exemptions and zero-ratings) which renders the EU VAT system more complex for business and tax administrations and increases the costs of compliance for both. It should be noted however that the Paying Taxes 2017 study’s simple fact pattern is not able to provide support for this position; further work will be undertaken to investigate this.
Whilst a VAT system requires all parties in the supply chain to collect and remit (a part of) the tax, this indirect tax system is often viewed as less open to fraud than retail sales taxes such as SUTs, for example, as in the US, which are collected in their entirety at the point of sale on the last sale in the supply chain (i.e., the retailer to consumer). In this regard, although both VAT and SUT are designed to tax the final consumption of a wide range of products, in practice, SUT places reliance on either the final supplier or end consumer remitting the entirety of the tax. To reduce the ‘cascade’ effect of such taxes, an exemption certification is often required through the supply chain. As a result of the non-compliance risks associated with the sales tax system, this can result in the tax revenue being at risk if either party is unaware of or does not fulfil its reporting obligations particularly in the case of the final transaction with the end consumer. The US is currently the only OECD country which employs SUTs as its principal tax on consumption.
62 The Anatomy of the VAT – Michael Keen IMF paper 13/111.
84 Paying Taxes 2017
24hrs It is interesting that the global average time to comply with consumption taxes in the Paying Taxes study has fallen from 123 hours in 2004 to 99 hours in 2015, for the case study company.
The spread of VAT/GST systems globallyThe number of VAT systems in the Paying Taxes 2017 study has continued to increase, rising from 153 economies in 2010 to 162 economies in 2015.63 Some of these are a new tax and some a replacement for other narrower forms of consumption tax. Some examples of how VAT systems are developing include China’s accelerated transition from business tax to a VAT system from 2012 which was substantially completed in 2016, the introduction of VAT in Malaysia on 1 April 2015 (which replaced its Sales and Services Tax system), and Egypt’s transition to a full VAT system in September 2016. VAT in the OECD countries now accounts for around 20% of total tax revenues, a 70% greater share than in the mid-eighties.
With the new GST expected to be implemented in India in April 2017 and the introduction of VAT in the GCC countries expected to occur in 2018, the number of countries with a VAT based system will continue to rise in the coming years. This will present a number of challenges as businesses operating in these markets adapt to a new tax system and consider the need to introduce automated tools to help them comply.
This need for “bedding-in a new VAT system” is evidenced in the Paying Taxes 2017 study by the introduction of VAT in The Bahamas in January 2015, where the time to comply for the case study company in dealing with consumption taxes increased the most by 157 hours as businesses adjusted to a new tax regime and the inherent additional processes. Similarly, Malaysian businesses’ time to comply for consumption taxes also increased by 58 hours and demonstrates the many challenges businesses can initially face when tax authorities change existing tax regimes.
There is also a rising number of countries with existing VAT based systems which have raised their standard rate at least once since 2010 (in the period 2008-2010, 13 countries out of the then 27 member states in the EU increased their rates)64 due to financial consolidation pressures caused by the global financial crisis. This resulted in businesses being required to adapt their IT systems and prices in advance of these changes creating additional compliance burdens.
The VAT compliance burdenIt is inherent in the way VAT is collected that businesses are unpaid tax collectors, as all parties in the supply chain are responsible for the extra VAT accounting required. This burden includes the cost of raising VAT invoices (in a VAT system) for each supply made, the cost of preparation and submission of VAT returns, and the frequent payment of the VAT due.
Variations in the time to comply (and the complexity of the compliance process) can even arise within a region where countries share the same underlying framework and compliance requirements. For example, in EU member states, where there is a common legal framework for the VAT system,65 the time needed annually to comply with the VAT obligations varies in the Paying Taxes 2017 study. The range is from 30 hours in Ireland to complete, submit and file a VAT return to 96 hours in Hungary. This may in part be explained by the difference in the level of information reported on the VAT return, where there is only a requirement to report VAT on sales and purchases and trade with other EU member states on the Irish VAT return, compared to up to 99 boxes to complete on the Hungarian VAT return. The amount of information and data on a VAT return may not just reflect the complexity of the system itself but in addition the use to which tax administrations put the data collected, e.g. desk based reviews and risk analyses.
63 Paying Taxes 2017. 64 The Anatomy of the VAT – Michael Keen IMF paper 13/111. 65 Directive 2006/112/EC
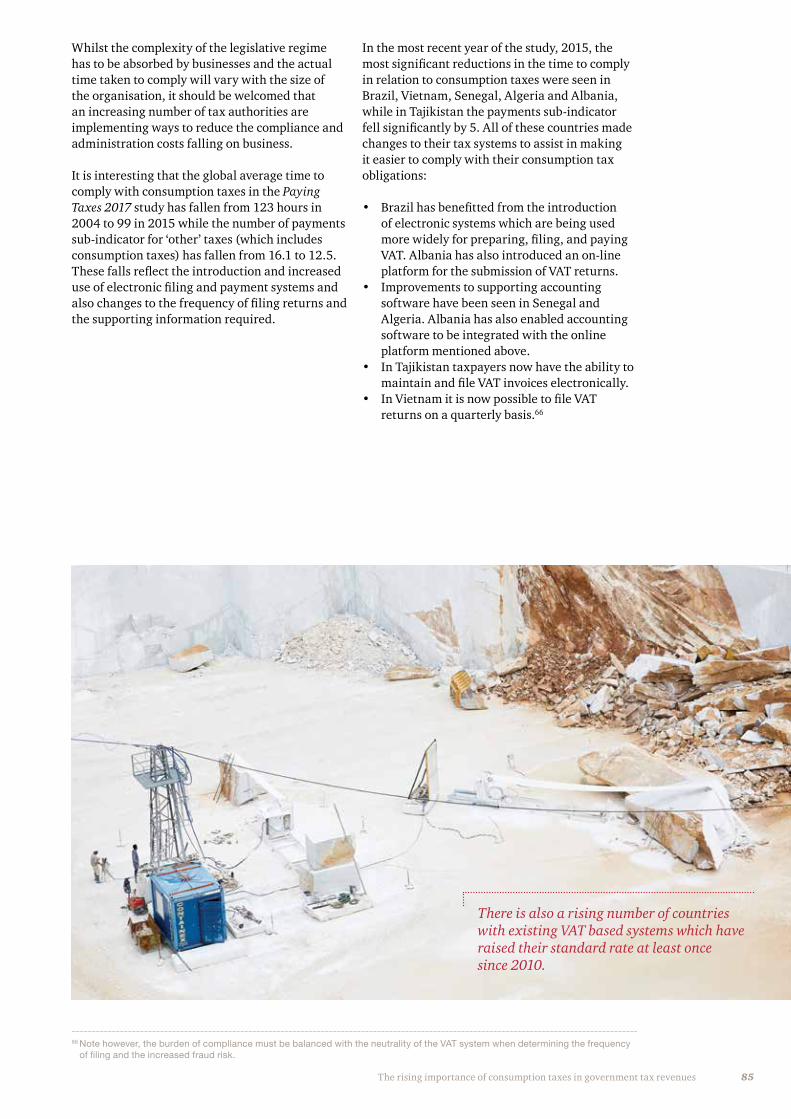
85The rising importance of consumption taxes in government tax revenues
Whilst the complexity of the legislative regime has to be absorbed by businesses and the actual time taken to comply will vary with the size of the organisation, it should be welcomed that an increasing number of tax authorities are implementing ways to reduce the compliance and administration costs falling on business.
It is interesting that the global average time to comply with consumption taxes in the Paying Taxes 2017 study has fallen from 123 hours in 2004 to 99 in 2015 while the number of payments sub-indicator for ‘other’ taxes (which includes consumption taxes) has fallen from 16.1 to 12.5. These falls reflect the introduction and increased use of electronic filing and payment systems and also changes to the frequency of filing returns and the supporting information required.
In the most recent year of the study, 2015, the most significant reductions in the time to comply in relation to consumption taxes were seen in Brazil, Vietnam, Senegal, Algeria and Albania, while in Tajikistan the payments sub-indicator fell significantly by 5. All of these countries made changes to their tax systems to assist in making it easier to comply with their consumption tax obligations:
• Brazil has benefitted from the introduction of electronic systems which are being used more widely for preparing, filing, and paying VAT. Albania has also introduced an on-line platform for the submission of VAT returns.
• Improvements to supporting accounting software have been seen in Senegal and Algeria. Albania has also enabled accounting software to be integrated with the online platform mentioned above.
• In Tajikistan taxpayers now have the ability to maintain and file VAT invoices electronically.
• In Vietnam it is now possible to file VAT returns on a quarterly basis.66
There is also a rising number of countries with existing VAT based systems which have raised their standard rate at least once since 2010.
66 Note however, the burden of compliance must be balanced with the neutrality of the VAT system when determining the frequency of filing and the increased fraud risk.
86 Paying Taxes 2017
Post-filing informationVAT is attracting more attention from tax authorities across the world due to its potential to be a simple and efficient means of tax collection and an important source of revenue for governments. SUT has its limits as it is not, unlike VAT, self-controlling and this explains in part why most SUT rates are far lower than VAT rates. Tax authorities are, in addition, increasing and improving their audit procedures in order to ensure that the correct amount of tax is paid at the right place and at the right time.
Whilst businesses have an element of control over the preparation and submission of VAT returns depending on the effectiveness of their tax function and the optimisation of the VAT technology used, the interactions which can potentially take place with a tax authority, for example, following a VAT refund claim can significantly complicate the compliance process and increase costs for businesses. In this regard, it is common in a number of jurisdictions that businesses seeking a refund of VAT can expect to be subject to an audit. With this in mind the fourth sub-indicator, the post-filing index, has been introduced to the Paying Taxes 2017 study this year which in part looks at VAT and dealing with a VAT refund claim.
VAT refund mechanismIt is common for the majority of VAT registered businesses to be in a VAT payment position. There are however occasions where businesses may be in a VAT repayment position. This can arise for a variety of reasons ranging from businesses being involved in export transactions where zero-rating or exemption from charging VAT is available or when companies make one-off large capital investments resulting in input taxes on purchases exceeding the tax on sales for one or several periods.
The mechanism by which VAT is refunded is an essential part of the VAT system. It is interesting to note, however, from the analysis carried out in Paying Taxes 2017 that of the 162 economies identified which had a VAT system in 2015, only 93 gave the facility for a VAT refund under the case study company scenario where VAT is payable on the purchase of capital equipment.
In 22 of the 162 economies which have VAT, taxpayers are required to carry forward the excess input tax for at least two months before a cash refund can be requested. In these 22 economies the average period of time needed before a request can be made for a cash refund is nearly five months, ranging from two months in Bulgaria, Seychelles and Tonga to twelve months in Vietnam.
In general, the ability to receive a VAT refund is challenging or, non-existent in certain countries in Africa, Asia Pacific, South America, Central America and the Caribbean. This primarily arises either because:
• the ability to claim a refund is restricted to specific categories of taxpayers such as international businesses involved in export transactions; or
• there is no mechanism to refund the VAT.
The Paying Taxes 2017 study has shown this year that governments around the world continue to implement reforms to improve how easy it is to comply with VAT systems.
7.9 hrs is the average time it takes the case study company to comply with a VAT refund in high income economies compared with
26.9 hrs in low income economies.
87The rising importance of consumption taxes in government tax revenues
Where a business is unable to obtain a VAT refund, there is a clear cost to the business. Our practical experience of this is that the cost can be so significant as to make transactions uncommercial and thus, business will often move, stop or change the transaction they carry out in a country where VAT recovery is potentially a problem or impossible.
On average, the Paying Taxes 2017 study finds that the EU performs the best on the post-filing index which includes 7.4 hours as the average time needed to comply with VAT refund requirements and 14.7 weeks to receive the refund.67 This can be attributed to the existing legal framework in place and the work undertaken by the EU Commission to both simplify the VAT system and ensure refunds are processed in a timely manner – even to taking legal action. Also of note is that the EU is one of the few regions which allows non-resident businesses (both other EU Member States and non-EU territories) to recover VAT incurred there (in certain circumstances).
Notwithstanding that 46% of the economies in the EU do not systematically undertake an audit as part of the VAT refund request procedure, the time to comply and the time to obtain the VAT refund are lower than the global average. This can be contrasted with the position in the Central America & the Caribbean region where, on average, it takes the longest time to obtain a VAT refund with businesses having to spend 19.6 hours on compliance and waiting 34.7 weeks to receive the refund.
Austria is shown to have the most efficient VAT refund system: the likelihood of receiving a VAT audit is low for our case study company in Austria and the time frame in which a VAT refund can expect to be received is also the shortest across all countries (approximately 3.2 weeks). This may, in part, be attributable to the Austrian Ministry of Finance being one of the first tax authorities to use a standard audit file format (Standard Audit File for Tax (SAF-T)) for the electronic exchange of reliable accounting data from organisations to a national tax authority.
When comparing the VAT refund process across the levels of economic development around the world, on average it takes less time to comply with a VAT refund in high income economies where it takes 7.9 hours for the case study company compared with 26.9 hours in low income economies. Furthermore, it takes 15.6 weeks to receive the refund in high income economies compared with 28.3 weeks in low income economies.
Some conclusions, and what nextIndirect taxation is increasingly being seen by governments as a cost effective way to raise taxation and has (as compared to corporate taxation) less of an impact on business performance and the relative attractiveness of a location.
The Paying Taxes 2017 study has shown this year that governments around the world continue to implement reforms to improve how easy it is to comply with VAT systems, but there continues to be a wide variety of complexity in VAT systems even between neighbours. There is also a general correlation between the efficiency and speed of the repayment of refund claims and a country’s general level of economic development.
There appears to be a correlation between a broad based single rate system and the level of compliance by business, with newer systems often inherently less complex thereby being easier to comply with. However further research is required to provide evidence of this as it is currently beyond the scope of the Paying Taxes 2017 study scenario due to its simple fact pattern.
Overall the aim should be to have simple systems which make the best use of information technology to minimise compliance times and the data elements required to find the right balance between reducing the burden of data provision requirements and the opportunity for fraud. There are many questions to consider as VAT systems evolve and governments seek to find the right balance – is all data collected by authorities actually effective in the fight against fraud? Is some data more important than others? Does a high quantity and frequency of data collection increase or reduce fraud in a country? What kind of automation and technology introduced by tax authorities will help reduce the time to comply and can it help in reducing fraud? Over the coming months we will be conducting further research to address these questions.
67 Please note that these averages are for the EU only. Paying Taxes 2017 refers to EU & EFTA which includes Iceland, Norway, Switzerland and San Marino.
Appendix 1
Methodology and example calculations for each of the Paying Taxes sub-indicators
88 Paying Taxes 2017. Appendix 1
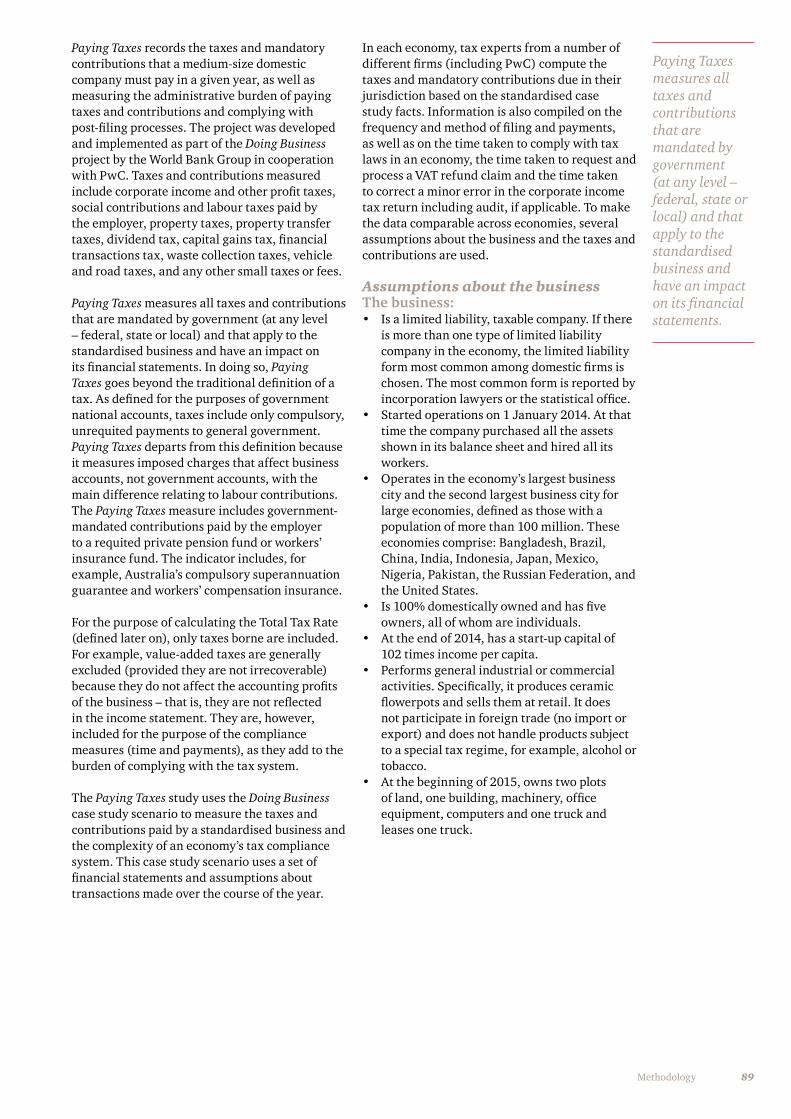
89Methodology
Paying Taxes records the taxes and mandatory contributions that a medium-size domestic company must pay in a given year, as well as measuring the administrative burden of paying taxes and contributions and complying with post-filing processes. The project was developed and implemented as part of the Doing Business project by the World Bank Group in cooperation with PwC. Taxes and contributions measured include corporate income and other profit taxes, social contributions and labour taxes paid by the employer, property taxes, property transfer taxes, dividend tax, capital gains tax, financial transactions tax, waste collection taxes, vehicle and road taxes, and any other small taxes or fees.
Paying Taxes measures all taxes and contributions that are mandated by government (at any level – federal, state or local) and that apply to the standardised business and have an impact on its financial statements. In doing so, Paying Taxes goes beyond the traditional definition of a tax. As defined for the purposes of government national accounts, taxes include only compulsory, unrequited payments to general government. Paying Taxes departs from this definition because it measures imposed charges that affect business accounts, not government accounts, with the main difference relating to labour contributions. The Paying Taxes measure includes government- mandated contributions paid by the employer to a requited private pension fund or workers’ insurance fund. The indicator includes, for example, Australia’s compulsory superannuation guarantee and workers’ compensation insurance.
For the purpose of calculating the Total Tax Rate (defined later on), only taxes borne are included.For example, value-added taxes are generally excluded (provided they are not irrecoverable) because they do not affect the accounting profits of the business – that is, they are not reflected in the income statement. They are, however, included for the purpose of the compliance measures (time and payments), as they add to the burden of complying with the tax system.
The Paying Taxes study uses the Doing Business case study scenario to measure the taxes and contributions paid by a standardised business and the complexity of an economy’s tax compliance system. This case study scenario uses a set of financial statements and assumptions about transactions made over the course of the year.
In each economy, tax experts from a number of different firms (including PwC) compute the taxes and mandatory contributions due in their jurisdiction based on the standardised case study facts. Information is also compiled on the frequency and method of filing and payments, as well as on the time taken to comply with tax laws in an economy, the time taken to request and process a VAT refund claim and the time taken to correct a minor error in the corporate income tax return including audit, if applicable. To make the data comparable across economies, several assumptions about the business and the taxes and contributions are used.
Assumptions about the businessThe business:• Is a limited liability, taxable company. If there
is more than one type of limited liability company in the economy, the limited liability form most common among domestic firms is chosen. The most common form is reported by incorporation lawyers or the statistical office.
• Started operations on 1 January 2014. At that time the company purchased all the assets shown in its balance sheet and hired all its workers.
• Operates in the economy’s largest business city and the second largest business city for large economies, defined as those with a population of more than 100 million. These economies comprise: Bangladesh, Brazil, China, India, Indonesia, Japan, Mexico, Nigeria, Pakistan, the Russian Federation, and the United States.
• Is 100% domestically owned and has five owners, all of whom are individuals.
• At the end of 2014, has a start-up capital of 102 times income per capita.
• Performs general industrial or commercial activities. Specifically, it produces ceramic flowerpots and sells them at retail. It does not participate in foreign trade (no import or export) and does not handle products subject to a special tax regime, for example, alcohol or tobacco.
• At the beginning of 2015, owns two plots of land, one building, machinery, office equipment, computers and one truck and leases one truck.
Paying Taxes measures all taxes and contributions that are mandated by government (at any level – federal, state or local) and that apply to the standardised business and have an impact on its financial statements.
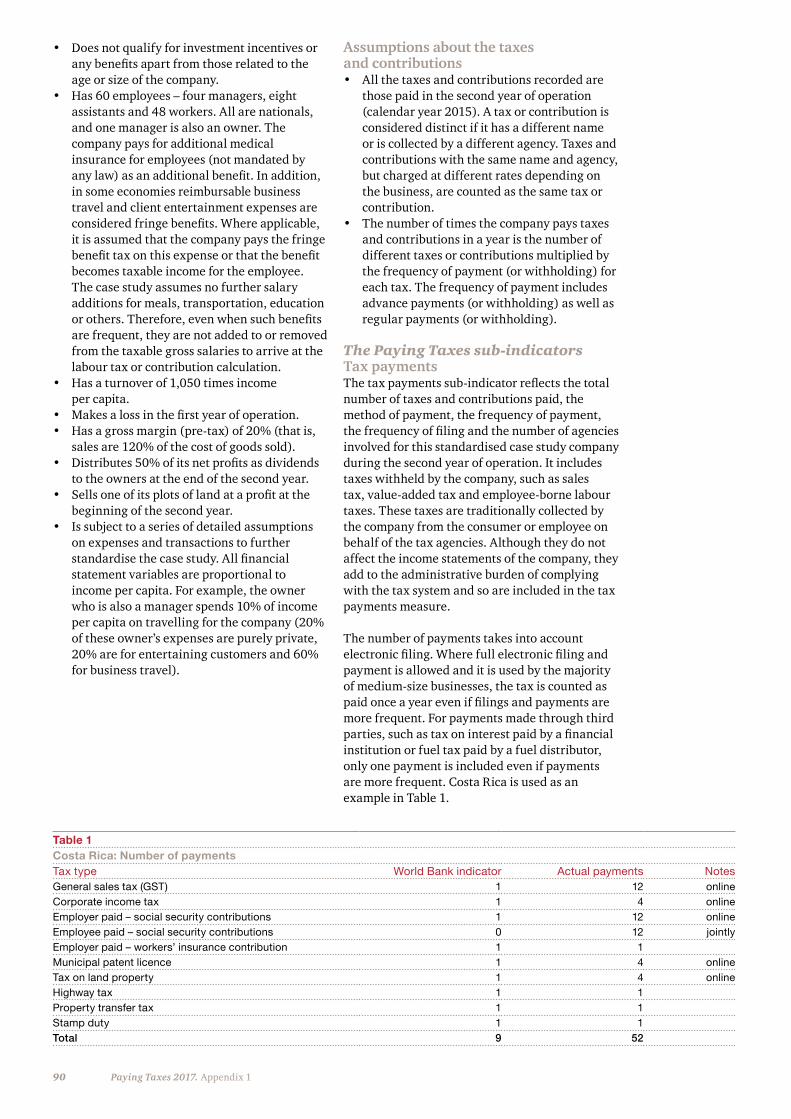
90 Paying Taxes 2017. Appendix 1
• Does not qualify for investment incentives or any benefits apart from those related to the age or size of the company.
• Has 60 employees – four managers, eight assistants and 48 workers. All are nationals, and one manager is also an owner. The company pays for additional medical insurance for employees (not mandated by any law) as an additional benefit. In addition, in some economies reimbursable business travel and client entertainment expenses are considered fringe benefits. Where applicable, it is assumed that the company pays the fringe benefit tax on this expense or that the benefit becomes taxable income for the employee. The case study assumes no further salary additions for meals, transportation, education or others. Therefore, even when such benefits are frequent, they are not added to or removed from the taxable gross salaries to arrive at the labour tax or contribution calculation.
• Has a turnover of 1,050 times income per capita.
• Makes a loss in the first year of operation.• Has a gross margin (pre-tax) of 20% (that is,
sales are 120% of the cost of goods sold).• Distributes 50% of its net profits as dividends
to the owners at the end of the second year.• Sells one of its plots of land at a profit at the
beginning of the second year.• Is subject to a series of detailed assumptions
on expenses and transactions to further standardise the case study. All financial statement variables are proportional to income per capita. For example, the owner who is also a manager spends 10% of income per capita on travelling for the company (20% of these owner’s expenses are purely private, 20% are for entertaining customers and 60% for business travel).
Assumptions about the taxes and contributions• All the taxes and contributions recorded are
those paid in the second year of operation (calendar year 2015). A tax or contribution is considered distinct if it has a different name or is collected by a different agency. Taxes and contributions with the same name and agency, but charged at different rates depending on the business, are counted as the same tax or contribution.
• The number of times the company pays taxes and contributions in a year is the number of different taxes or contributions multiplied by the frequency of payment (or withholding) for each tax. The frequency of payment includes advance payments (or withholding) as well as regular payments (or withholding).
The Paying Taxes sub-indicatorsTax paymentsThe tax payments sub-indicator reflects the total number of taxes and contributions paid, the method of payment, the frequency of payment, the frequency of filing and the number of agencies involved for this standardised case study company during the second year of operation. It includes taxes withheld by the company, such as sales tax, value-added tax and employee-borne labour taxes. These taxes are traditionally collected by the company from the consumer or employee on behalf of the tax agencies. Although they do not affect the income statements of the company, they add to the administrative burden of complying with the tax system and so are included in the tax payments measure.
The number of payments takes into account electronic filing. Where full electronic filing and payment is allowed and it is used by the majority of medium-size businesses, the tax is counted as paid once a year even if filings and payments are more frequent. For payments made through third parties, such as tax on interest paid by a financial institution or fuel tax paid by a fuel distributor, only one payment is included even if payments are more frequent. Costa Rica is used as an example in Table 1.
Table 1Costa Rica: Number of paymentsTax type World Bank indicator Actual payments NotesGeneral sales tax (GST) 1 12 onlineCorporate income tax 1 4 onlineEmployer paid – social security contributions 1 12 onlineEmployee paid – social security contributions 0 12 jointlyEmployer paid – workers’ insurance contribution 1 1Municipal patent licence 1 4 onlineTax on land property 1 4 onlineHighway tax 1 1Property transfer tax 1 1Stamp duty 1 1Total 9 52
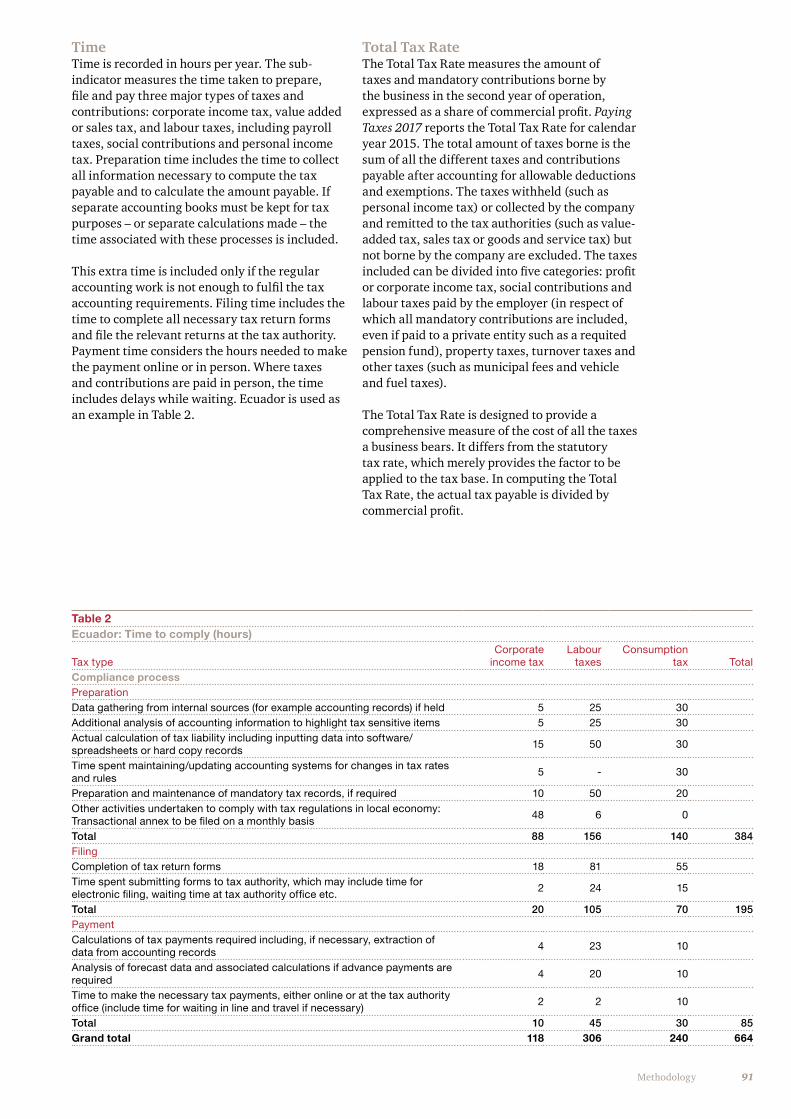
91Methodology
TimeTime is recorded in hours per year. The sub-indicator measures the time taken to prepare, file and pay three major types of taxes and contributions: corporate income tax, value added or sales tax, and labour taxes, including payroll taxes, social contributions and personal income tax. Preparation time includes the time to collect all information necessary to compute the tax payable and to calculate the amount payable. If separate accounting books must be kept for tax purposes – or separate calculations made – the time associated with these processes is included.
This extra time is included only if the regular accounting work is not enough to fulfil the tax accounting requirements. Filing time includes the time to complete all necessary tax return forms and file the relevant returns at the tax authority. Payment time considers the hours needed to make the payment online or in person. Where taxes and contributions are paid in person, the time includes delays while waiting. Ecuador is used as an example in Table 2.
Total Tax RateThe Total Tax Rate measures the amount of taxes and mandatory contributions borne by the business in the second year of operation, expressed as a share of commercial profit. Paying Taxes 2017 reports the Total Tax Rate for calendar year 2015. The total amount of taxes borne is the sum of all the different taxes and contributions payable after accounting for allowable deductions and exemptions. The taxes withheld (such as personal income tax) or collected by the company and remitted to the tax authorities (such as value-added tax, sales tax or goods and service tax) but not borne by the company are excluded. The taxes included can be divided into five categories: profit or corporate income tax, social contributions and labour taxes paid by the employer (in respect of which all mandatory contributions are included, even if paid to a private entity such as a requited pension fund), property taxes, turnover taxes and other taxes (such as municipal fees and vehicle and fuel taxes).
The Total Tax Rate is designed to provide a comprehensive measure of the cost of all the taxes a business bears. It differs from the statutory tax rate, which merely provides the factor to be applied to the tax base. In computing the Total Tax Rate, the actual tax payable is divided by commercial profit.
Table 2Ecuador: Time to comply (hours)
Tax typeCorporate
income taxLabour
taxesConsumption
tax Total Compliance process PreparationData gathering from internal sources (for example accounting records) if held 5 25 30Additional analysis of accounting information to highlight tax sensitive items 5 25 30Actual calculation of tax liability including inputting data into software/spreadsheets or hard copy records
15 50 30
Time spent maintaining/updating accounting systems for changes in tax rates and rules
5 - 30
Preparation and maintenance of mandatory tax records, if required 10 50 20Other activities undertaken to comply with tax regulations in local economy: Transactional annex to be filed on a monthly basis
48 6 0
Total 88 156 140 384FilingCompletion of tax return forms 18 81 55Time spent submitting forms to tax authority, which may include time for electronic filing, waiting time at tax authority office etc.
2 24 15
Total 20 105 70 195PaymentCalculations of tax payments required including, if necessary, extraction of data from accounting records
4 23 10
Analysis of forecast data and associated calculations if advance payments are required
4 20 10
Time to make the necessary tax payments, either online or at the tax authority office (include time for waiting in line and travel if necessary)
2 2 10
Total 10 45 30 85Grand total 118 306 240 664
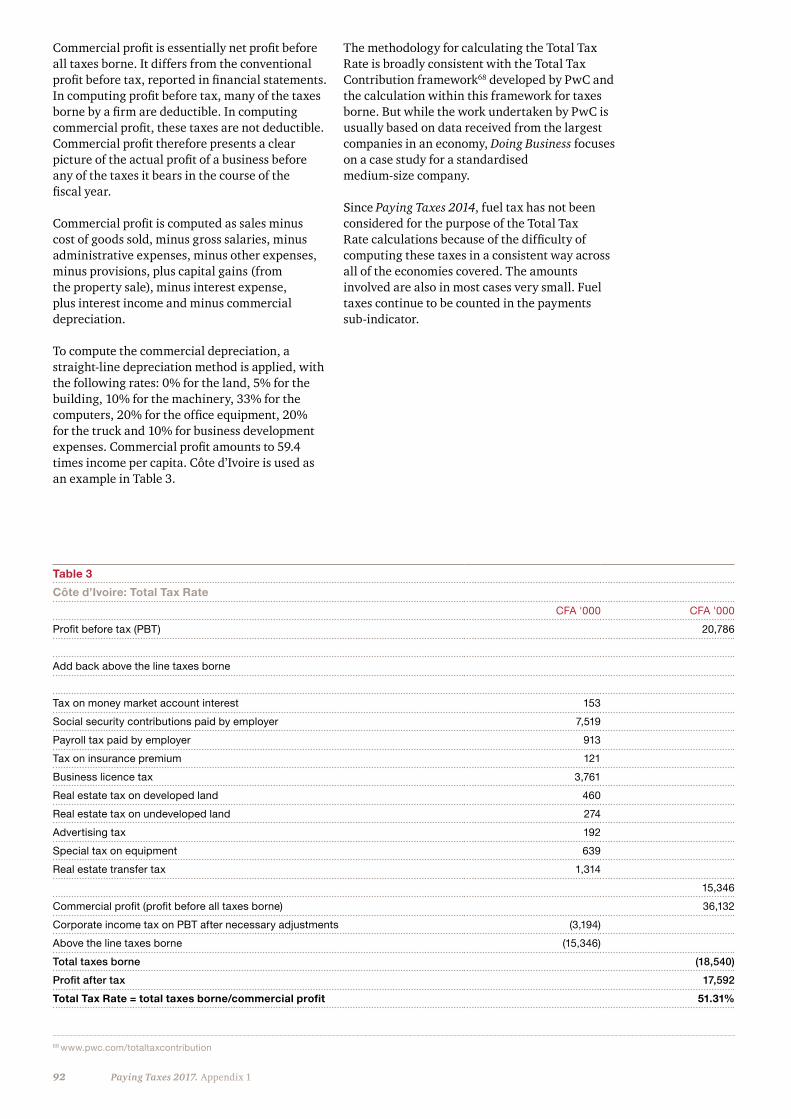
92 Paying Taxes 2017. Appendix 1
Commercial profit is essentially net profit before all taxes borne. It differs from the conventional profit before tax, reported in financial statements. In computing profit before tax, many of the taxes borne by a firm are deductible. In computing commercial profit, these taxes are not deductible. Commercial profit therefore presents a clear picture of the actual profit of a business before any of the taxes it bears in the course of the fiscal year.
Commercial profit is computed as sales minus cost of goods sold, minus gross salaries, minus administrative expenses, minus other expenses, minus provisions, plus capital gains (from the property sale), minus interest expense, plus interest income and minus commercial depreciation.
To compute the commercial depreciation, a straight-line depreciation method is applied, with the following rates: 0% for the land, 5% for the building, 10% for the machinery, 33% for the computers, 20% for the office equipment, 20% for the truck and 10% for business development expenses. Commercial profit amounts to 59.4 times income per capita. Côte d’Ivoire is used as an example in Table 3.
Table 3
Côte d’Ivoire: Total Tax Rate
CFA '000 CFA '000
Profit before tax (PBT) 20,786
Add back above the line taxes borne
Tax on money market account interest 153
Social security contributions paid by employer 7,519
Payroll tax paid by employer 913
Tax on insurance premium 121
Business licence tax 3,761
Real estate tax on developed land 460
Real estate tax on undeveloped land 274
Advertising tax 192
Special tax on equipment 639
Real estate transfer tax 1,314
15,346
Commercial profit (profit before all taxes borne) 36,132
Corporate income tax on PBT after necessary adjustments (3,194)
Above the line taxes borne (15,346)
Total taxes borne (18,540)
Profit after tax 17,592
Total Tax Rate = total taxes borne/commercial profit 51.31%
The methodology for calculating the Total Tax Rate is broadly consistent with the Total Tax Contribution framework68 developed by PwC and the calculation within this framework for taxes borne. But while the work undertaken by PwC is usually based on data received from the largest companies in an economy, Doing Business focuses on a case study for a standardised medium-size company.
Since Paying Taxes 2014, fuel tax has not been considered for the purpose of the Total Tax Rate calculations because of the difficulty of computing these taxes in a consistent way across all of the economies covered. The amounts involved are also in most cases very small. Fuel taxes continue to be counted in the payments sub-indicator.
68 www.pwc.com/totaltaxcontribution
93Methodology
Post-filing indexThe post-filing index measures two processes based on four components – time to comply with a VAT or GST refund, time to obtain VAT or GST refund, time to comply with the correction of an inadvertent corporate income tax error and the time to complete a corporate income tax audit if required. If both VAT (or GST) and corporate income tax apply, the post-filing index is the simple average of the distance to frontier scores for each of the four components. If only VAT (or GST) or corporate income tax applies, the post-filing index is the simple average of the scores for only the two components pertaining to the applicable tax. If neither VAT (or GST) nor corporate income tax applies, the post-filing index is not included in the ranking of the ease of paying taxes.
The value of each component is transformed into a distance to frontier score between 0 and 100 as explained later in this section. A score of 100 represents the most efficient process and a score of 0 the least efficient process. The overall post-filing index distance to frontier score is the average of the component scores.
The index is based on two additional separate scenarios for the case study with the following assumptions.
Assumptions about the VAT refund process• In June 2015, TaxpayerCo. makes a large
capital purchase: one additional machine for manufacturing pots.
• The value of the machine is 65 times income per capita of the economy.
• Sales are equally spread per month (that is, 1,050 times income per capita divided by 12).
• Cost of goods sold are equally expensed per month (that is, 875 times income per capita divided by 12).
• The seller of the machinery is registered for VAT or goods and services (GST).
• Input VAT will exceed output VAT in June 2015.
• Excess input VAT incurred in June will be fully recovered after four consecutive months if the VAT rate is the same for inputs, sales and the machine and the tax reporting period is every month.
Assumptions about the corporate income tax audit process• An error in the calculation of the income tax
liability (for example, use of incorrect tax depreciation rates, or incorrectly treating an expense as tax deductible) leads to an incorrect income tax return and consequently an underpayment of corporate income tax.
• TaxpayerCo. discovered the error and voluntarily notified the tax authority of the error in the corporate income tax return.
• The value of the underpaid income tax liability is 5% of the corporate income tax liability due.
• TaxpayerCo. submits the corrected information after the deadline for submitting the annual tax return, but within the tax assessment period.
Time to comply with a VAT refundTime is recorded in hours and covers two elements:• The process of claiming a VAT or GST
refund, including time spent by TaxpayerCo. on:
• gathering VAT information from internal sources;
• any additional analysis of accounting information;
• calculating the VAT refund amount;• preparing the VAT refund claim;• preparing any additional documents
needed to substantiate the VAT refund claim;
• making representation at the tax office, if required; and
• completing any other mandatory activities or tasks associated with the VAT or GST refund.
• The process of an audit (if the case scenario is likely to trigger an audit), including time spent by TaxpayerCo.in:
• gathering information required by the tax auditor;
• preparing any documentation (information such as receipts, financial statements, pay stubs) as required by the tax auditor; and
• submitting the documents requested by the auditor.
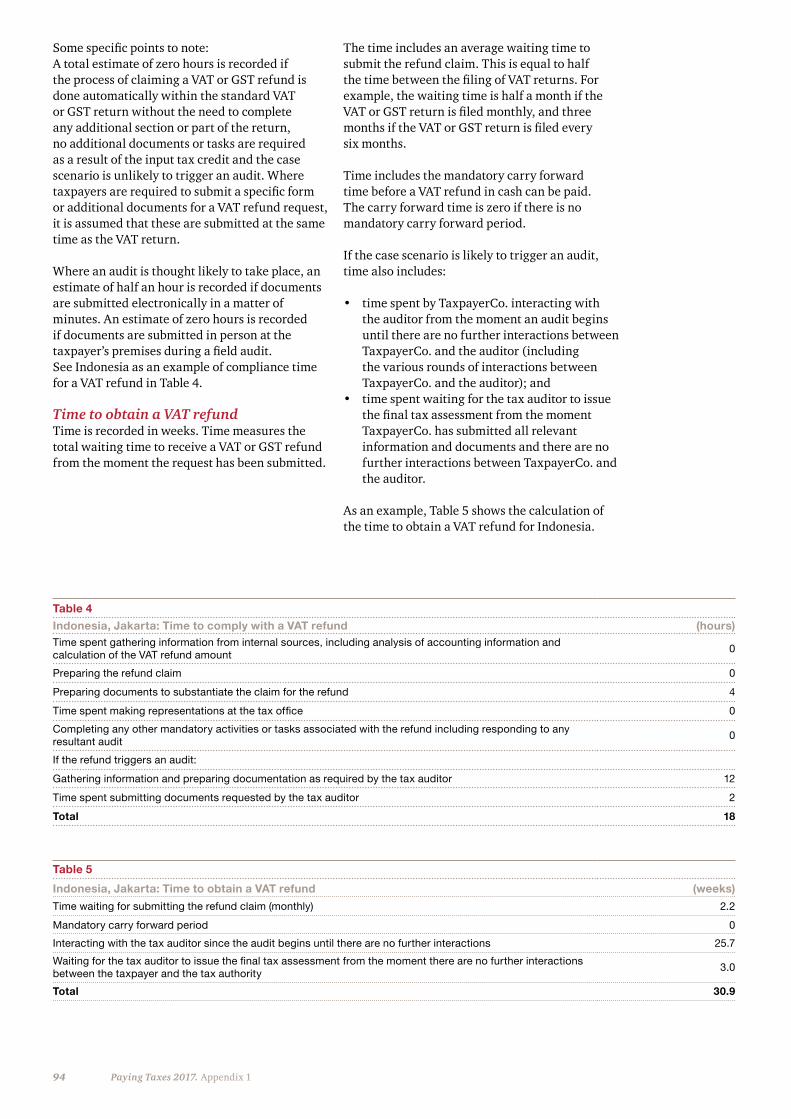
94 Paying Taxes 2017. Appendix 1
Some specific points to note:A total estimate of zero hours is recorded if the process of claiming a VAT or GST refund is done automatically within the standard VAT or GST return without the need to complete any additional section or part of the return, no additional documents or tasks are required as a result of the input tax credit and the case scenario is unlikely to trigger an audit. Where taxpayers are required to submit a specific form or additional documents for a VAT refund request, it is assumed that these are submitted at the same time as the VAT return.
Where an audit is thought likely to take place, an estimate of half an hour is recorded if documents are submitted electronically in a matter of minutes. An estimate of zero hours is recorded if documents are submitted in person at the taxpayer’s premises during a field audit. See Indonesia as an example of compliance time for a VAT refund in Table 4.
Time to obtain a VAT refundTime is recorded in weeks. Time measures the total waiting time to receive a VAT or GST refund from the moment the request has been submitted.
The time includes an average waiting time to submit the refund claim. This is equal to half the time between the filing of VAT returns. For example, the waiting time is half a month if the VAT or GST return is filed monthly, and three months if the VAT or GST return is filed every six months.
Time includes the mandatory carry forward time before a VAT refund in cash can be paid. The carry forward time is zero if there is no mandatory carry forward period.
If the case scenario is likely to trigger an audit, time also includes:
• time spent by TaxpayerCo. interacting with the auditor from the moment an audit begins until there are no further interactions between TaxpayerCo. and the auditor (including the various rounds of interactions between TaxpayerCo. and the auditor); and
• time spent waiting for the tax auditor to issue the final tax assessment from the moment TaxpayerCo. has submitted all relevant information and documents and there are no further interactions between TaxpayerCo. and the auditor.
As an example, Table 5 shows the calculation of the time to obtain a VAT refund for Indonesia.
Table 4
Indonesia, Jakarta: Time to comply with a VAT refund (hours)Time spent gathering information from internal sources, including analysis of accounting information and calculation of the VAT refund amount
0
Preparing the refund claim 0
Preparing documents to substantiate the claim for the refund 4
Time spent making representations at the tax office 0
Completing any other mandatory activities or tasks associated with the refund including responding to any resultant audit
0
If the refund triggers an audit:
Gathering information and preparing documentation as required by the tax auditor 12
Time spent submitting documents requested by the tax auditor 2
Total 18
Table 5
Indonesia, Jakarta: Time to obtain a VAT refund (weeks)
Time waiting for submitting the refund claim (monthly) 2.2
Mandatory carry forward period 0
Interacting with the tax auditor since the audit begins until there are no further interactions 25.7
Waiting for the tax auditor to issue the final tax assessment from the moment there are no further interactions between the taxpayer and the tax authority
3.0
Total 30.9
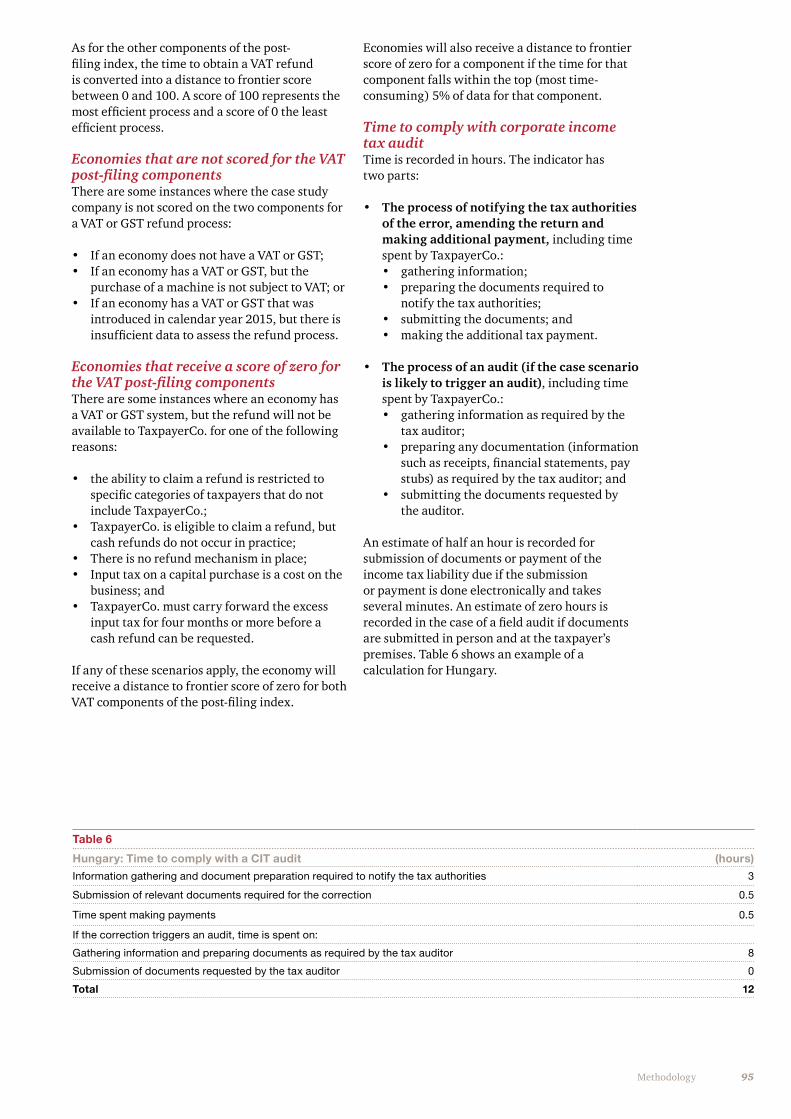
95Methodology
As for the other components of the post-filing index, the time to obtain a VAT refund is converted into a distance to frontier score between 0 and 100. A score of 100 represents the most efficient process and a score of 0 the least efficient process.
Economies that are not scored for the VAT post-filing components There are some instances where the case study company is not scored on the two components for a VAT or GST refund process:
• If an economy does not have a VAT or GST;• If an economy has a VAT or GST, but the
purchase of a machine is not subject to VAT; or • If an economy has a VAT or GST that was
introduced in calendar year 2015, but there is insufficient data to assess the refund process.
Economies that receive a score of zero for the VAT post-filing components There are some instances where an economy has a VAT or GST system, but the refund will not be available to TaxpayerCo. for one of the following reasons:
• the ability to claim a refund is restricted to specific categories of taxpayers that do not include TaxpayerCo.;
• TaxpayerCo. is eligible to claim a refund, but cash refunds do not occur in practice;
• There is no refund mechanism in place; • Input tax on a capital purchase is a cost on the
business; and • TaxpayerCo. must carry forward the excess
input tax for four months or more before a cash refund can be requested.
If any of these scenarios apply, the economy will receive a distance to frontier score of zero for both VAT components of the post-filing index.
Economies will also receive a distance to frontier score of zero for a component if the time for that component falls within the top (most time-consuming) 5% of data for that component.
Time to comply with corporate income tax auditTime is recorded in hours. The indicator has two parts:
• The process of notifying the tax authorities of the error, amending the return and making additional payment, including time spent by TaxpayerCo.:• gathering information;• preparing the documents required to
notify the tax authorities;• submitting the documents; and • making the additional tax payment.
• The process of an audit (if the case scenario is likely to trigger an audit), including time spent by TaxpayerCo.:• gathering information as required by the
tax auditor;• preparing any documentation (information
such as receipts, financial statements, pay stubs) as required by the tax auditor; and
• submitting the documents requested by the auditor.
An estimate of half an hour is recorded for submission of documents or payment of the income tax liability due if the submission or payment is done electronically and takes several minutes. An estimate of zero hours is recorded in the case of a field audit if documents are submitted in person and at the taxpayer’s premises. Table 6 shows an example of a calculation for Hungary.
Table 6
Hungary: Time to comply with a CIT audit (hours)
Information gathering and document preparation required to notify the tax authorities 3
Submission of relevant documents required for the correction 0.5
Time spent making payments 0.5
If the correction triggers an audit, time is spent on:
Gathering information and preparing documents as required by the tax auditor 8
Submission of documents requested by the tax auditor 0
Total 12
96 Paying Taxes 2017. Appendix 1
Time to complete a corporate income tax audit, where applicableTime is recorded in weeks. Time includes the time spent by TaxpayerCo. interacting with the auditor from the moment an audit begins until there are no further interactions between TaxpayerCo. and the auditor (including the various rounds of interactions between TaxpayerCo. and the auditor). Time also includes the time spent waiting for the tax auditor to issue the final tax assessment – from the moment TaxpayerCo. has submitted all relevant information and documents and there are no further interactions between TaxpayerCo. and the auditor.
If an economy does not levy corporate income tax, the economy will not be scored on the two corporate income tax components.
Time to complete a corporate income tax audit is recorded as zero if the case study scenario is unlikely to trigger an audit. Table 7 shows an example for Hungary.
Ranking calculation and the distance to frontier measureThis report presents in Appendix 3 the results for two aggregate benchmark measures: the World Bank’s distance to frontier (DTF) measure and the ease of doing business ranking, which since Paying Taxes 2015, has been based on the DTF measure.69 The ease of doing business ranking, including the ranking for Paying Taxes, compares economies with one another; while the DTF score benchmarks economies with respect to regulatory best practice, showing the absolute distance to the best performance on each Doing Business indicator. Both measures can be used for comparisons over time. When compared across years, the DTF measure shows how much the regulatory environment for local entrepreneurs in each economy has changed over time in absolute terms, while the ease of paying taxes ranking can show only how economies have changed relative to one another.
The ranking of economies on the ease of paying taxes is determined by sorting their DTF scores on paying taxes, rounded to 2 decimals. These scores are the simple average of the distance to frontier scores for each of the sub-indicators (number of payments, time, Total Tax Rate, and post-filing index) with a threshold being applied to the Total Tax Rate sub-indicator as explained below.
The frontier underlying each DTF score is derived from the most efficient practice or highest score achieved on the Paying Taxes sub-indicators by any economy for all years included in the analysis up to and including Doing Business 2015. In Paying Taxes, for example, Hong Kong SAR, (China) and Saudi Arabia have achieved the highest performance on the number of payments (3 payments), United Arab Emirates on time (12 hours) and Vanuatu on the Total Tax Rate (8.5%). For the distance to frontier score of the post-filing index, Barbados, Croatia and several other economies have the highest score for time to comply with VAT refund (100), Austria on the time to obtain a VAT refund (100), and Estonia, Lithuania, and several other economies on the time to comply with the corporate income tax return audit and time to complete the corporate income tax audit (100).
Calculating the distance to frontier score for each economy involves rescaling the four sub-indicators to a common unit as show below. The four scores are then averaged to give the overall DTF score.
Table 7
Hungary: Time to complete CIT audit (weeks)
Interacting with the tax auditor from the start of the audit until there are no further interactions 0.7
Waiting for the tax auditor to issue the final tax assessment from the moment of the last interaction between the taxpayer and the tax authority
8
Total 8.7
69 We have also included the distance to frontier score and the ease of doing business ranking without post-filing so as to provide an easier comparison with last year’s scores and rankings.
97Methodology
The worst performance for each sub-indicator is defined as the 95th percentile for each component of the pooled data for all economies for all the years included in the analysis. All distance to frontier calculations are based on a maximum of five decimals. However, the ease of paying taxes ranking calculation is based on two decimals.
The difference between an economy’s distance to frontier score in any previous year and its score on the Paying Taxes indicator for 2015 illustrates the extent to which the economy has closed the gap to the frontier over time. And in any given year the score measures how far an economy is from the highest performance. The distance to frontier measure can also be used for comparisons across economies in the same year, complementing the ease of paying taxes ranking.
The DTF score for the number of payments and time to comply sub-indicatorsThe Paying Taxes sub-indicators for the number of payments and time to comply are rescaled to a common unit using a linear transformation: (max – y)/(max – min), with the minimum value (min) representing the frontier – the highest performance on that sub-indicator across all economies for all years included in the analysis up to and including Doing Business 2015. For the time to pay taxes, the frontier is defined as the lowest time recorded among all economies that levy the three major taxes: profit tax, labour taxes and mandatory contributions, and value-added tax (VAT) or sales tax.
The DTF score for the Total Tax RateFor the Total Tax Rate, the frontier is defined as the Total Tax Rate at the 15th percentile of the overall distribution of Total Tax Rates for all years included in the analysis up to and including Doing Business 2015, which is 26.1%. All economies with a Total Tax Rate below this threshold receive the same score as the economy at the threshold. Additionally, above the threshold, the Total Tax Rate is included in the ranking in a non-linear fashion.
The Total Tax Rate threshold and the non-linear transformation are not based on any economic theory of an ‘optimal tax rate’ that minimises distortions or maximises efficiency in an economy’s overall tax system. Instead, they are largely empirical in nature, with the threshold set at the lower end of the distribution of tax rates levied on medium-size enterprises in the manufacturing sector as observed through the paying taxes indicators. These calculations reduce the bias in the Total Tax Rate sub-indicator toward economies that do not need to levy significant taxes on companies like the Doing Business standardised case study company because they raise public revenue in other ways – for example, through taxes on foreign companies, through taxes on sectors other than manufacturing or from natural resources (all of which are outside the scope of the methodology). They also take into account the needs of governments to collect taxes from all firms.
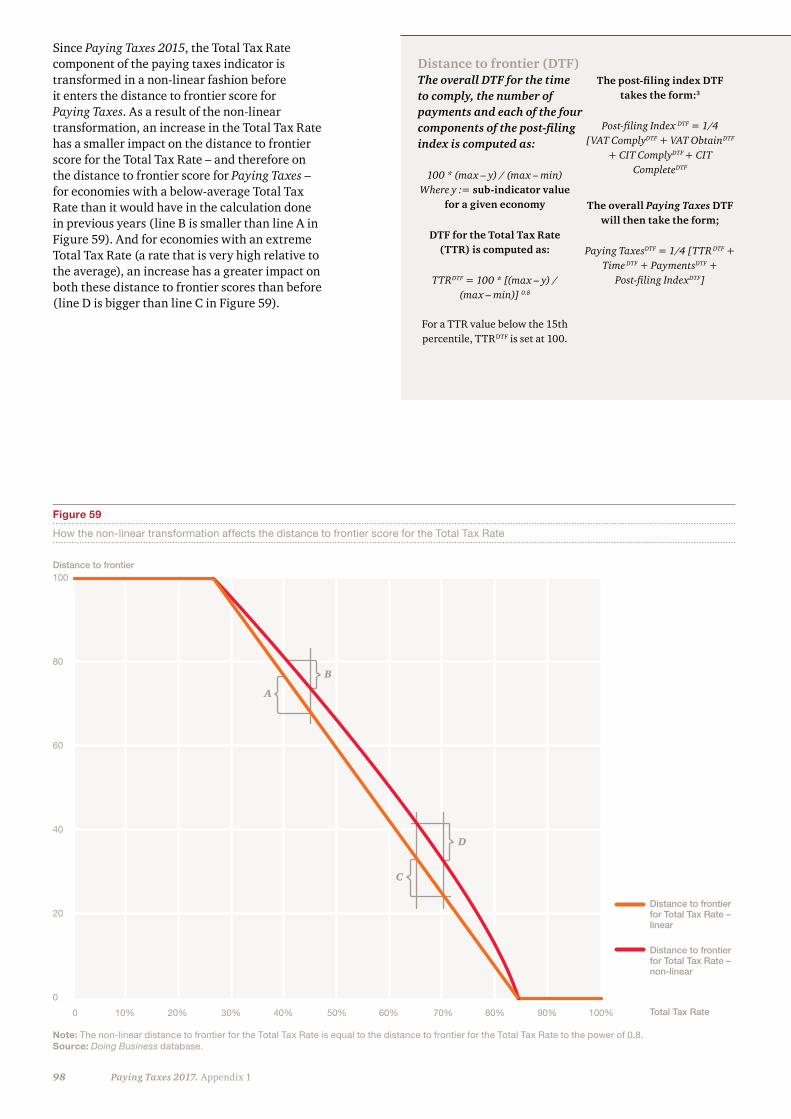
98 Paying Taxes 2017. Appendix 1
Since Paying Taxes 2015, the Total Tax Rate component of the paying taxes indicator is transformed in a non-linear fashion before it enters the distance to frontier score for Paying Taxes. As a result of the non-linear transformation, an increase in the Total Tax Rate has a smaller impact on the distance to frontier score for the Total Tax Rate – and therefore on the distance to frontier score for Paying Taxes – for economies with a below-average Total Tax Rate than it would have in the calculation done in previous years (line B is smaller than line A in Figure 59). And for economies with an extreme Total Tax Rate (a rate that is very high relative to the average), an increase has a greater impact on both these distance to frontier scores than before (line D is bigger than line C in Figure 59).
Figure 59
How the non-linear transformation affects the distance to frontier score for the Total Tax Rate
Note: The non-linear distance to frontier for the Total Tax Rate is equal to the distance to frontier for the Total Tax Rate to the power of 0.8. Source: Doing Business database.
100 * (max – y) / (max – min)Where y := sub-indicator value
for a given economy
DTF for the Total Tax Rate (TTR) is computed as:
TTRDTF = 100 * [(max – y) / (max – min)] 0.8
For a TTR value below the 15th percentile, TTRDTF is set at 100.
The post-filing index DTF takes the form:3
Post-filing Index DTF = 1/4 [VAT ComplyDTF + VAT ObtainDTF
+ CIT ComplyDTF + CIT CompleteDTF
The overall Paying Taxes DTF will then take the form;
Paying TaxesDTF = 1/4 [TTR DTF + Time DTF + PaymentsDTF +
Post-filing IndexDTF]
10%0 20% 30% 40% 50% 60% 70% 80% 90% 100%
Distance to frontier
A
C
B
D
Total Tax Rate
Distance to frontier for Total Tax Rate – linear
Distance to frontier for Total Tax Rate – non-linear
100
80
60
40
20
0
Distance to frontier (DTF)The overall DTF for the time to comply, the number of payments and each of the four components of the post-filing index is computed as:
99Methodology
The DTF score for the post-filing indexEach of the four components of the post-filing index is rescaled to a common unit using a linear transformation: (max – y)/(max – min), with the minimum value (min) representing the frontier – the highest performance on that component.
For each economy the scores obtained for the four indicators are aggregated through simple averaging into one distance to frontier score. An economy’s distance to frontier score is indicated on a scale from 0 to 100, where 0 represents the lowest performance and 100 the frontier. To mitigate the effects of extreme outliers in the distributions of the rescaled data, the worst performance (i.e. the max) is calculated after the removal of outliers which are defined as being in excess of the 95th percentile. This year, the max is defined as follows for the four components of the index:
• Time to comply with a VAT refund: 50 hours• Time to obtain a VAT refund: 55 weeks• Time to comply with a CIT audit: 56 hours• Time to complete a CIT audit: 32 weeks
Changes to Paying Taxes methodology over timeThe base for the financial statements and GNIpcThe case study company’s financial statements are based upon the gross national income per capita (GNIpc) in each economy. Turnover, for example, is assumed to be 1,050 times GNIpc giving, after deducting various expenses, a commercial profit of 59.4 times GNIpc. For the years 2004 to 2011 the GNIpc value for 2005 has been used.
For the years 2012 to 2015, the 2012 value in each economy has been used so that the study reflects more accurately the current economic conditions. In the future the GNIpc will be updated every three years.
In some economies, updating the GNIpc to the 2012 value was not sufficient to bring the salaries of all the case study employees up to the minimum wage thresholds that exist in those economies. In those instances an additional multiple of two or three times the GNIpc has been used.
Expanding the sample of cities covered for large economies. Since its inception the World Bank Group’s Doing Business study has focused on the largest business city of each economy. Depending on the indicator and the size of the economy, this focus can be a limitation in extrapolating results to the economy level. As the subnational Doing Business reports prepared by the World Bank have shown, the indicators measuring the procedures, time and cost to complete a transaction (such as the dealing with construction permits indicators) tend to show more variation across cities within an economy than do indicators capturing features of the law applicable nationwide (such as the protecting minority investors or resolving insolvency indicators). Moreover, this limitation is likely to be more important in larger economies:
• where the largest business city is likely to represent a smaller share of the overall economy, and
• and in those with greater regional diversity in business practices.
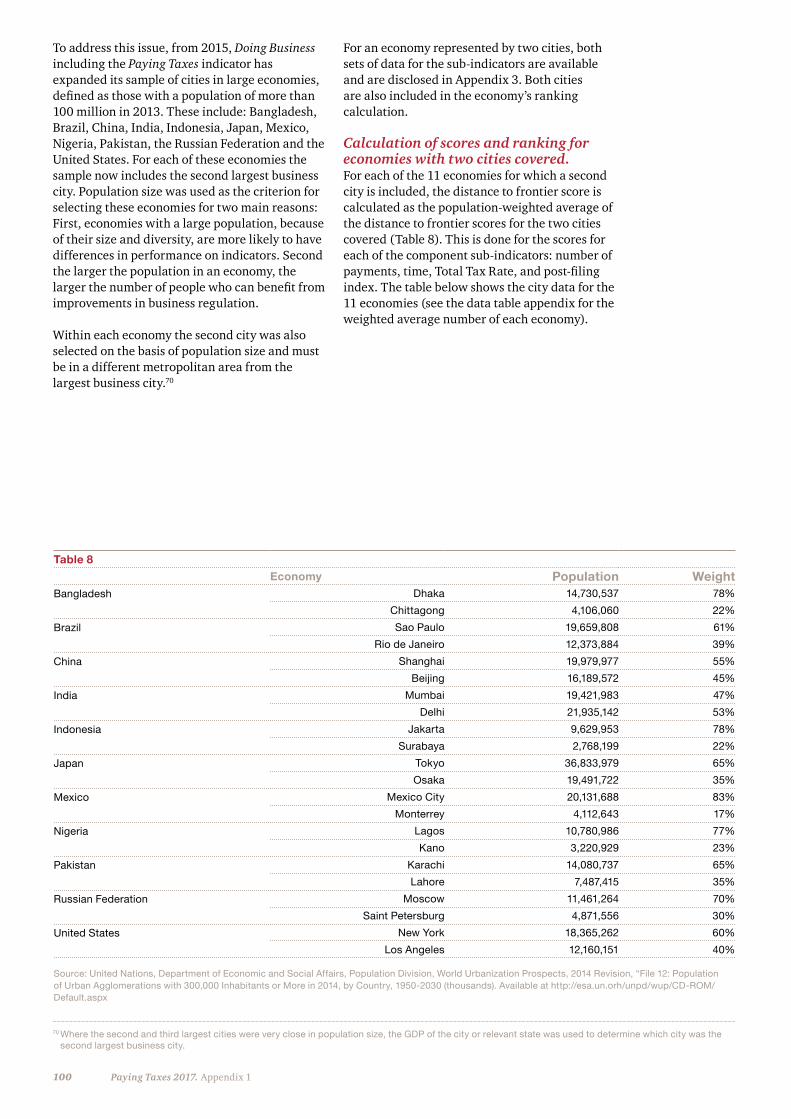
100 Paying Taxes 2017. Appendix 1
To address this issue, from 2015, Doing Business including the Paying Taxes indicator has expanded its sample of cities in large economies, defined as those with a population of more than 100 million in 2013. These include: Bangladesh, Brazil, China, India, Indonesia, Japan, Mexico, Nigeria, Pakistan, the Russian Federation and the United States. For each of these economies the sample now includes the second largest business city. Population size was used as the criterion for selecting these economies for two main reasons: First, economies with a large population, because of their size and diversity, are more likely to have differences in performance on indicators. Second the larger the population in an economy, the larger the number of people who can benefit from improvements in business regulation.
Within each economy the second city was also selected on the basis of population size and must be in a different metropolitan area from the largest business city.70
For an economy represented by two cities, both sets of data for the sub-indicators are available and are disclosed in Appendix 3. Both cities are also included in the economy’s ranking calculation.
Calculation of scores and ranking for economies with two cities covered. For each of the 11 economies for which a second city is included, the distance to frontier score is calculated as the population-weighted average of the distance to frontier scores for the two cities covered (Table 8). This is done for the scores for each of the component sub-indicators: number of payments, time, Total Tax Rate, and post-filing index. The table below shows the city data for the 11 economies (see the data table appendix for the weighted average number of each economy).
Table 8Economy Population Weight
Bangladesh Dhaka 14,730,537 78%
Chittagong 4,106,060 22%
Brazil Sao Paulo 19,659,808 61%
Rio de Janeiro 12,373,884 39%
China Shanghai 19,979,977 55%
Beijing 16,189,572 45%
India Mumbai 19,421,983 47%
Delhi 21,935,142 53%
Indonesia Jakarta 9,629,953 78%
Surabaya 2,768,199 22%
Japan Tokyo 36,833,979 65%
Osaka 19,491,722 35%
Mexico Mexico City 20,131,688 83%
Monterrey 4,112,643 17%
Nigeria Lagos 10,780,986 77%
Kano 3,220,929 23%
Pakistan Karachi 14,080,737 65%
Lahore 7,487,415 35%
Russian Federation Moscow 11,461,264 70%
Saint Petersburg 4,871,556 30%
United States New York 18,365,262 60%
Los Angeles 12,160,151 40%
Source: United Nations, Department of Economic and Social Affairs, Population Division, World Urbanization Prospects, 2014 Revision, “File 12: Population of Urban Agglomerations with 300,000 Inhabitants or More in 2014, by Country, 1950-2030 (thousands). Available at http://esa.un.orh/unpd/wup/CD-ROM/Default.aspx
70 Where the second and third largest cities were very close in population size, the GDP of the city or relevant state was used to determine which city was the second largest business city.

101Methodology
Appendix 2
Which economies are most relevant to you? Use our comparative modeller, www.pwc.com/payingtaxesmodeller to create your own comparisons from all the economies and regions.
Economy sub-indicator results by region
102 Paying Taxes 2017. Appendix 2
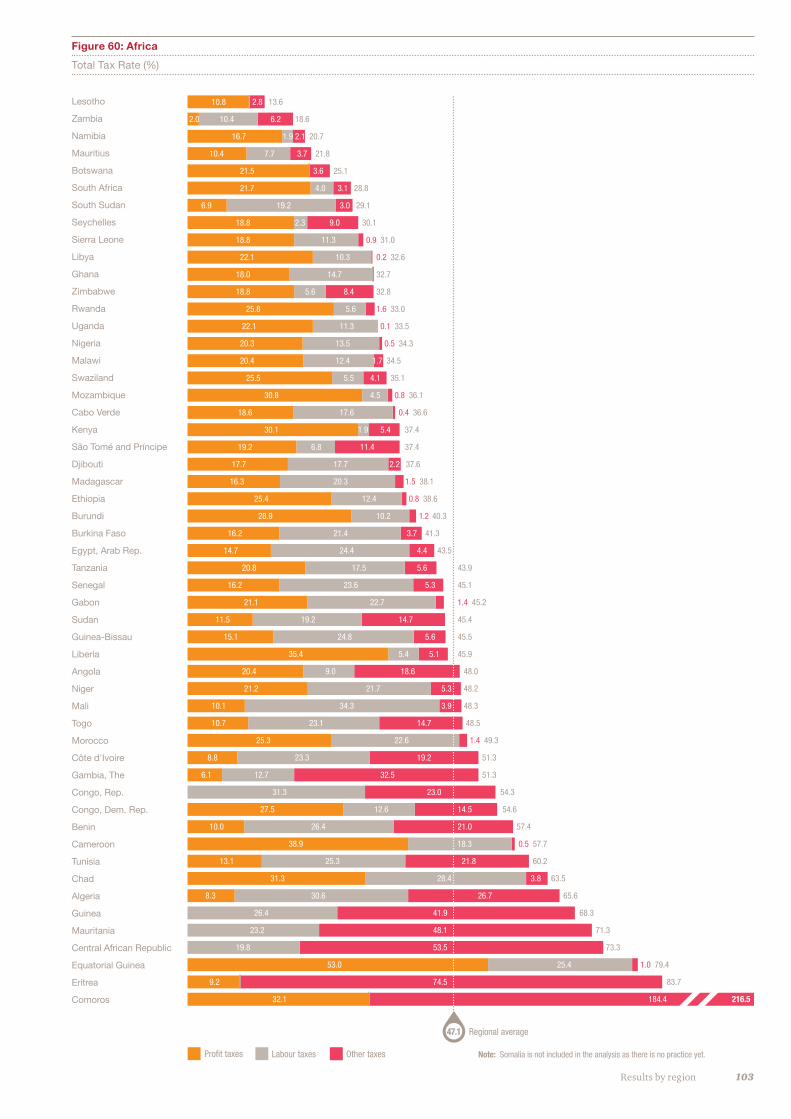
103Results by region
Figure 60: Africa
Total Tax Rate (%)
Note: Somalia is not included in the analysis as there is no practice yet.
Lesotho
Zambia
Namibia
Mauritius
Botswana
South Africa
South Sudan
Seychelles
Sierra Leone
Libya
Ghana
Zimbabwe
Rwanda
Uganda
Nigeria
Malawi
Swaziland
Mozambique
Cabo Verde
Kenya
São Tomé and Príncipe
Djibouti
Madagascar
Ethiopia
Burundi
Burkina Faso
Egypt, Arab Rep.
Tanzania
Senegal
Gabon
Sudan
Guinea-Bissau
Liberia
Angola
Niger
Mali
Togo
Morocco
Côte d'Ivoire
Gambia, The
Congo, Rep.
Congo, Dem. Rep.
Benin
Cameroon
Tunisia
Chad
Algeria
Guinea
Mauritania
Central African Republic
Equatorial Guinea
Eritrea
Comoros
10.8 2.8 13.6
2.0 10.4 6.2 18.6
16.7 1.9 2.1 20.7
10.4 7.7 3.7 21.8
21.5 3.6 25.1
21.7 4.0 3.1 28.8
6.9 19.2 3.0 29.1
18.8 2.3 9.0 30.1
18.8 11.3 0.9 31.0
22.1 10.3 0.2 32.6
18.0 14.7 32.7
18.8 5.6 8.4 32.8
25.8 5.6 1.6 33.0
22.1 11.3 0.1 33.5
20.3 13.5 0.5 34.3
20.4 12.4 1.7 34.5
25.5 5.5 4.1 35.1
30.8 4.5 0.8 36.1
18.6 17.6 0.4 36.6
30.1 1.9 5.4 37.4
19.2 6.8 11.4 37.4
17.7 17.7 2.2 37.6
16.3 20.3 1.5 38.1
25.4 12.4 0.8 38.6
28.9 10.2 1.2 40.3
16.2 21.4 3.7 41.3
14.7 24.4 4.4 43.5
20.8 17.5 5.6 43.9
16.2 23.6 5.3 45.1
21.1 22.7 1.4 45.2
11.5 19.2 14.7 45.4
15.1 24.8 5.6 45.5
35.4 5.4 5.1 45.9
20.4 9.0 18.6 48.0
21.2 21.7 5.3 48.2
10.1 34.3 3.9 48.3
10.7 23.1 14.7 48.5
25.3 22.6 1.4 49.3
8.8 23.3 19.2 51.3
6.1 12.7 32.5 51.3
31.3 23.0 54.3
27.5 12.6 14.5 54.6
10.0 26.4 21.0 57.4
38.9 18.3 0.5 57.7
13.1 25.3 21.8 60.2
31.3 28.4 3.8 63.5
8.3 30.6 26.7 65.6
26.4 41.9 68.3
23.2 48.1 71.3
19.8 53.5 73.3
53.0 25.4 1.0 79.4
9.2 74.5 83.7
32.1 184.4 216.5
Profit taxes Labour taxes Other taxes
Regional average47.1
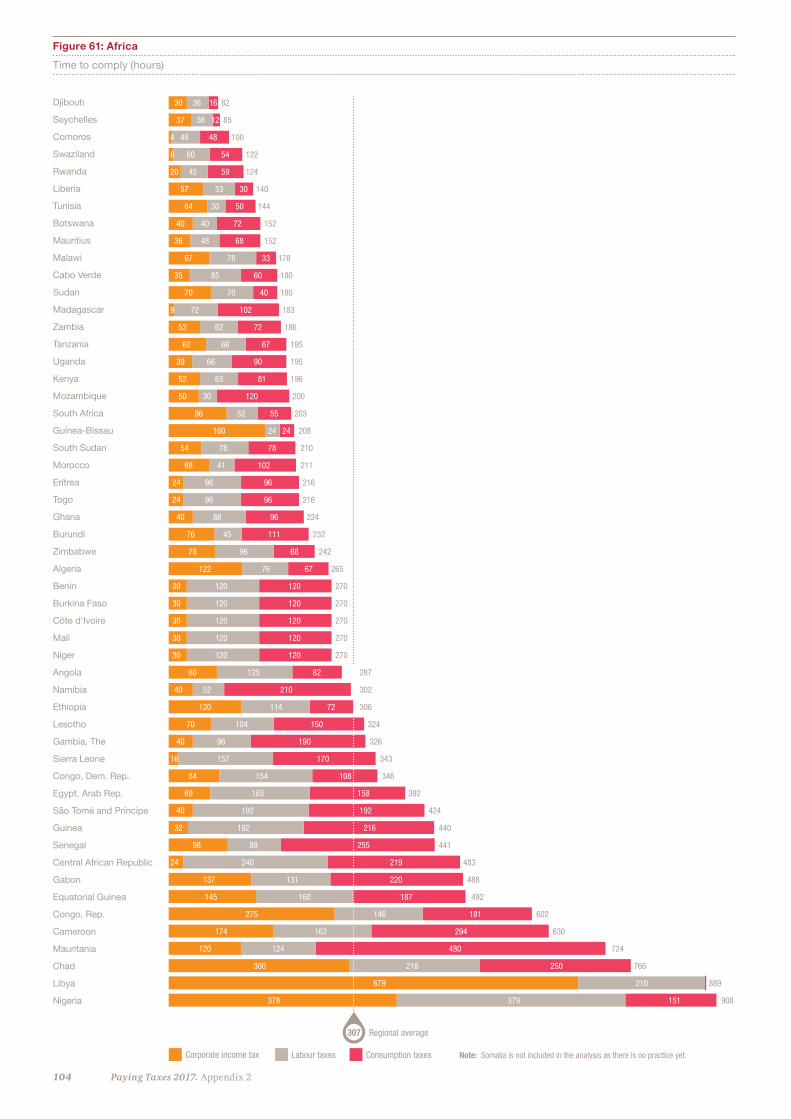
104 Paying Taxes 2017. Appendix 2
Figure 61: Africa
Time to comply (hours)
Djibouti
Seychelles
Comoros
Swaziland
Rwanda
Liberia
Tunisia
Botswana
Mauritius
Malawi
Cabo Verde
Sudan
Madagascar
Zambia
Tanzania
Uganda
Kenya
Mozambique
South Africa
Guinea-Bissau
South Sudan
Morocco
Eritrea
Togo
Ghana
Burundi
Zimbabwe
Algeria
Benin
Burkina Faso
Côte d'Ivoire
Mali
Niger
Angola
Namibia
Ethiopia
Lesotho
Gambia, The
Sierra Leone
Congo, Dem. Rep.
Egypt, Arab Rep.
São Tomé and Príncipe
Guinea
Senegal
Central African Republic
Gabon
Equatorial Guinea
Congo, Rep.
Cameroon
Mauritania
Chad
Libya
Nigeria
30 36 16 82
37 36 12 85
4 48 48 100
8 60 54 122
20 45 59 124
57 53 30 140
64 30 50 144
40 40 72 152
36 48 68 152
67 78 33 178
35 85 60 180
70 70 40 180
9 72 102 183
52 62 72 186
62 66 67 195
39 66 90 195
52 63 81 196
50 30 120 200
96 52 55 203
160 24 24 208
54 78 78 210
68 41 102 211
24 96 96 216
24 96 96 216
40 88 96 224
76 45 111 232
78 96 68 242
122 76 67 265
30 120 120 270
30 120 120 270
30 120 120 270
30 120 120 270
30 120 120 270
80 125 82 287
40 52 210 302
120 114 72 306
70 104 150 324
40 96 190 326
16 157 170 343
84 154 108 346
69 165 158 392
40 192 192 424
32 192 216 440
98 88 255 441
24 240 219 483
137 131 220 488
145 160 187 492
275 146 181 602
174 162 294 630
120 124 480 724
300 216 250 766
679 210 889
378 379 151 908
Regional average307
Corporate income tax Labour taxes Consumption taxes Note: Somalia is not included in the analysis as there is no practice yet.
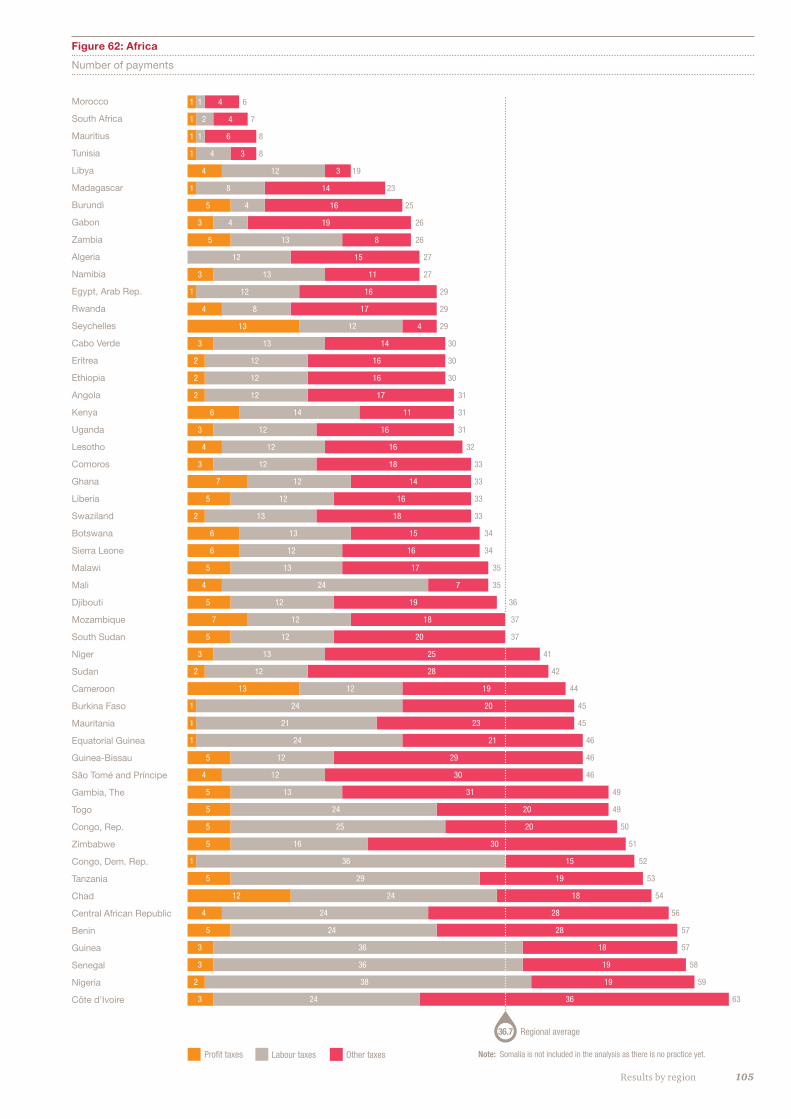
105Results by region
Figure 62: Africa
Number of payments
Morocco
South Africa
Mauritius
Tunisia
Libya
Madagascar
Burundi
Gabon
Zambia
Algeria
Namibia
Egypt, Arab Rep.
Rwanda
Seychelles
Cabo Verde
Eritrea
Ethiopia
Angola
Kenya
Uganda
Lesotho
Comoros
Ghana
Liberia
Swaziland
Botswana
Sierra Leone
Malawi
Mali
Djibouti
Mozambique
South Sudan
Niger
Sudan
Cameroon
Burkina Faso
Mauritania
Equatorial Guinea
Guinea-Bissau
São Tomé and Príncipe
Gambia, The
Togo
Congo, Rep.
Zimbabwe
Congo, Dem. Rep.
Tanzania
Chad
Central African Republic
Benin
Guinea
Senegal
Nigeria
Côte d'Ivoire
1 1 4 6
1 2 4 7
1 1 6 8
1 4 3 8
4 12 3 19
1 8 14 23
5 4 16 25
3 4 19 26
5 13 8 26
12 15 27
3 13 11 27
1 12 16 29
4 8 17 29
13 12 4 29
3 13 14 30
2 12 16 30
2 12 16 30
2 12 17 31
6 14 11 31
3 12 16 31
4 12 16 32
3 12 18 33
7 12 14 33
5 12 16 33
2 13 18 33
6 13 15 34
6 12 16 34
5 13 17 35
4 24 7 35
5 12 19 36
7 12 18 37
5 12 20 37
3 13 25 41
2 12 28 42
13 12 19 44
1 24 20 45
1 21 23 45
1 24 21 46
5 12 29 46
4 12 30 46
5 13 31 49
5 24 20 49
5 25 20 50
5 16 30 51
1 36 15 52
5 29 19 53
12 24 18 54
4 24 28 56
5 24 28 57
3 36 18 57
3 36 19 58
2 38 19 59
3 24 36 63
Profit taxes Labour taxes Other taxes
Regional average36.7
Note: Somalia is not included in the analysis as there is no practice yet.
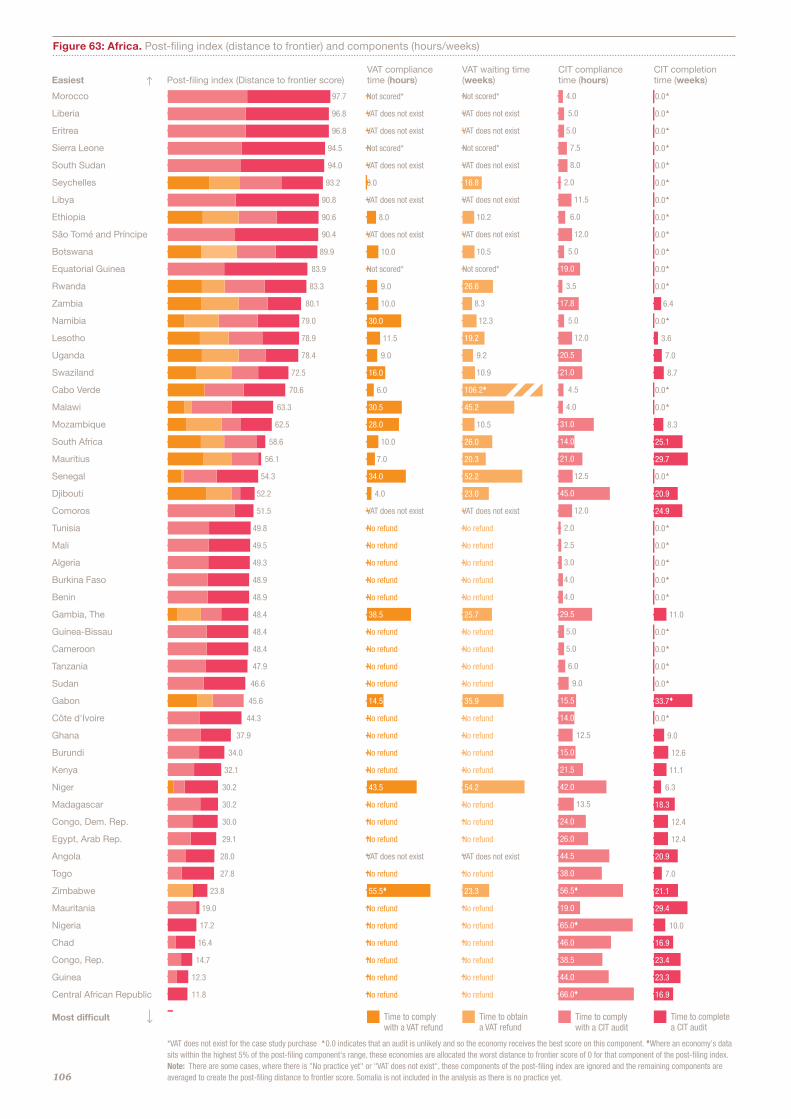
106
Figure 63: Africa. Post-filing index (distance to frontier) and components (hours/weeks)
Morocco
Liberia
Eritrea
Sierra Leone
South Sudan
Seychelles
Libya
Ethiopia
São Tomé and Príncipe
Botswana
Equatorial Guinea
Rwanda
Zambia
Namibia
Lesotho
Uganda
Swaziland
Cabo Verde
Malawi
Mozambique
South Africa
Mauritius
Senegal
Djibouti
Comoros
Tunisia
Mali
Algeria
Burkina Faso
Benin
Gambia, The
Guinea-Bissau
Cameroon
Tanzania
Sudan
Gabon
Côte d'Ivoire
Ghana
Burundi
Kenya
Niger
Madagascar
Congo, Dem. Rep.
Egypt, Arab Rep.
Angola
Togo
Zimbabwe
Mauritania
Nigeria
Chad
Congo, Rep.
Guinea
Central African Republic
Time to comply with a VAT refund
*VAT does not exist for the case study purchase �0.0 indicates that an audit is unlikely and so the economy receives the best score on this component. tWhere an economy's data sits within the highest 5% of the post-filing component's range, these economies are allocated the worst distance to frontier score of 0 for that component of the post-filing index. Note: There are some cases, where there is "No practice yet" or "VAT does not exist", these components of the post-filing index are ignored and the remaining components are averaged to create the post-filing distance to frontier score. Somalia is not included in the analysis as there is no practice yet.
VAT compliance time (hours)
VAT waiting time (weeks)
CIT compliance time (hours)
CIT completion time (weeks)Post-filing index (Distance to frontier score)Easiest
Most difficult
Not scored*
VAT does not exist
VAT does not exist
Not scored*
VAT does not exist
0.0
VAT does not exist
8.0
VAT does not exist
10.0
Not scored*
9.0
10.0
30.0
11.5
9.0
16.0
6.0
30.5
28.0
10.0
7.0
34.0
4.0
VAT does not exist
No refund
No refund
No refund
No refund
No refund
38.5
No refund
No refund
No refund
No refund
14.5
No refund
No refund
No refund
No refund
43.5
No refund
No refund
No refund
VAT does not exist
No refund
55.5t
No refund
No refund
No refund
No refund
No refund
No refund
50.0 97.7
96.8
96.8
94.5
94.0
93.2
90.8
90.6
90.4
89.9
83.9
83.3
80.1
79.0
78.9
78.4
72.5
70.6
63.3
62.5
58.6
56.1
54.3
52.2
51.5
49.8
49.5
49.3
48.9
48.9
48.4
48.4
48.4
47.9
46.6
45.6
44.3
37.9
34.0
32.1
30.2
30.2
30.0
29.1
28.0
27.8
23.8
19.0
17.2
16.4
14.7
12.3
11.8
Not scored*
VAT does not exist
VAT does not exist
Not scored*
VAT does not exist
16.8
VAT does not exist
10.2
VAT does not exist
10.5
Not scored*
26.6
8.3
12.3
19.2
9.2
10.9
106.2t
45.2
10.5
26.0
20.3
52.2
23.0
VAT does not exist
No refund
No refund
No refund
No refund
No refund
25.7
No refund
No refund
No refund
No refund
35.9
No refund
No refund
No refund
No refund
54.2
No refund
No refund
No refund
VAT does not exist
No refund
23.3
No refund
No refund
No refund
No refund
No refund
No refund
4.0
5.0
5.0
7.5
8.0
2.0
11.5
6.0
12.0
5.0
19.0
3.5
17.8
5.0
12.0
20.5
21.0
4.5
4.0
31.0
14.0
21.0
12.5
45.0
12.0
2.0
2.5
3.0
4.0
4.0
29.5
5.0
5.0
6.0
9.0
15.5
14.0
12.5
15.0
21.5
42.0
13.5
24.0
26.0
44.5
38.0
56.5t
19.0
65.0t
46.0
38.5
44.0
66.0t
0.0�
0.0�
0.0�
0.0�
0.0�
0.0�
0.0�
0.0�
0.0�
0.0�
0.0�
0.0�
6.4
0.0�
3.6
7.0
8.7
0.0�
0.0�
8.3
25.1
29.7
0.0�
20.9
24.9
0.0�
0.0�
0.0�
0.0�
0.0�
11.0
0.0�
0.0�
0.0�
0.0�
33.7t
0.0�
9.0
12.6
11.1
6.3
18.3
12.4
12.4
20.9
7.0
21.1
29.4
10.0
16.9
23.4
23.3
16.9
Other taxes
Time to obtain a VAT refund
Time to comply with a CIT audit
Time to complete a CIT audit
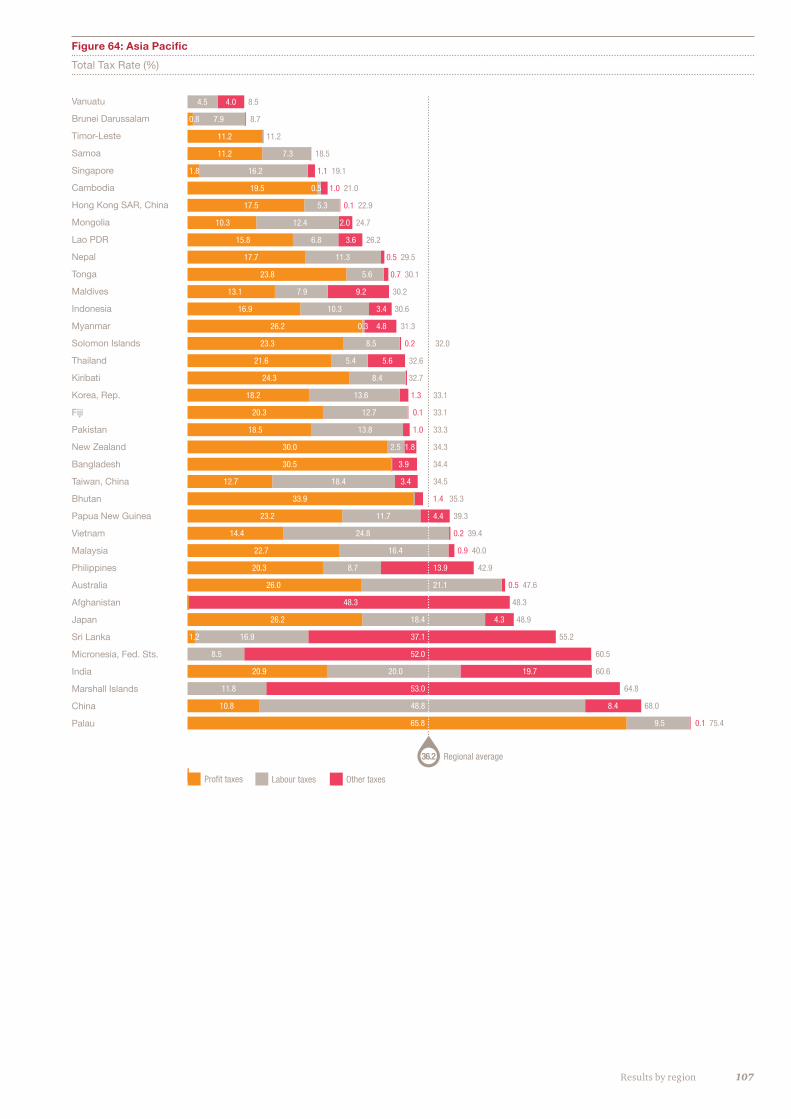
107Results by region
Figure 64: Asia Pacific
Total Tax Rate (%)
Vanuatu
Brunei Darussalam
Timor-Leste
Samoa
Singapore
Cambodia
Hong Kong SAR, China
Mongolia
Lao PDR
Nepal
Tonga
Maldives
Indonesia
Myanmar
Solomon Islands
Thailand
Kiribati
Korea, Rep.
Fiji
Pakistan
New Zealand
Bangladesh
Taiwan, China
Bhutan
Papua New Guinea
Vietnam
Malaysia
Philippines
Australia
Afghanistan
Japan
Sri Lanka
Micronesia, Fed. Sts.
India
Marshall Islands
China
Palau
4.5 4.0 8.5
0.8 7.9 8.7
11.2 11.2
11.2 7.3 18.5
1.8 16.2 1.1 19.1
19.5 0.5 1.0 21.0
17.5 5.3 0.1 22.9
10.3 12.4 2.0 24.7
15.8 6.8 3.6 26.2
17.7 11.3 0.5 29.5
23.8 5.6 0.7 30.1
13.1 7.9 9.2 30.2
16.9 10.3 3.4 30.6
26.2 0.3 4.8 31.3
23.3 8.5 0.2 32.0
21.6 5.4 5.6 32.6
24.3 8.4 32.7
18.2 13.6 1.3 33.1
20.3 12.7 0.1 33.1
18.5 13.8 1.0 33.3
30.0 2.5 1.8 34.3
30.5 3.9 34.4
12.7 18.4 3.4 34.5
33.9 1.4 35.3
23.2 11.7 4.4 39.3
14.4 24.8 0.2 39.4
22.7 16.4 0.9 40.0
20.3 8.7 13.9 42.9
26.0 21.1 0.5 47.6
48.3 48.3
26.2 18.4 4.3 48.9
1.2 16.9 37.1 55.2
8.5 52.0 60.5
20.9 20.0 19.7 60.6
11.8 53.0 64.8
10.8 48.8 8.4 68.0
65.8 9.5 0.1 75.4
Profit taxes Labour taxes Other taxes
Regional average36.2
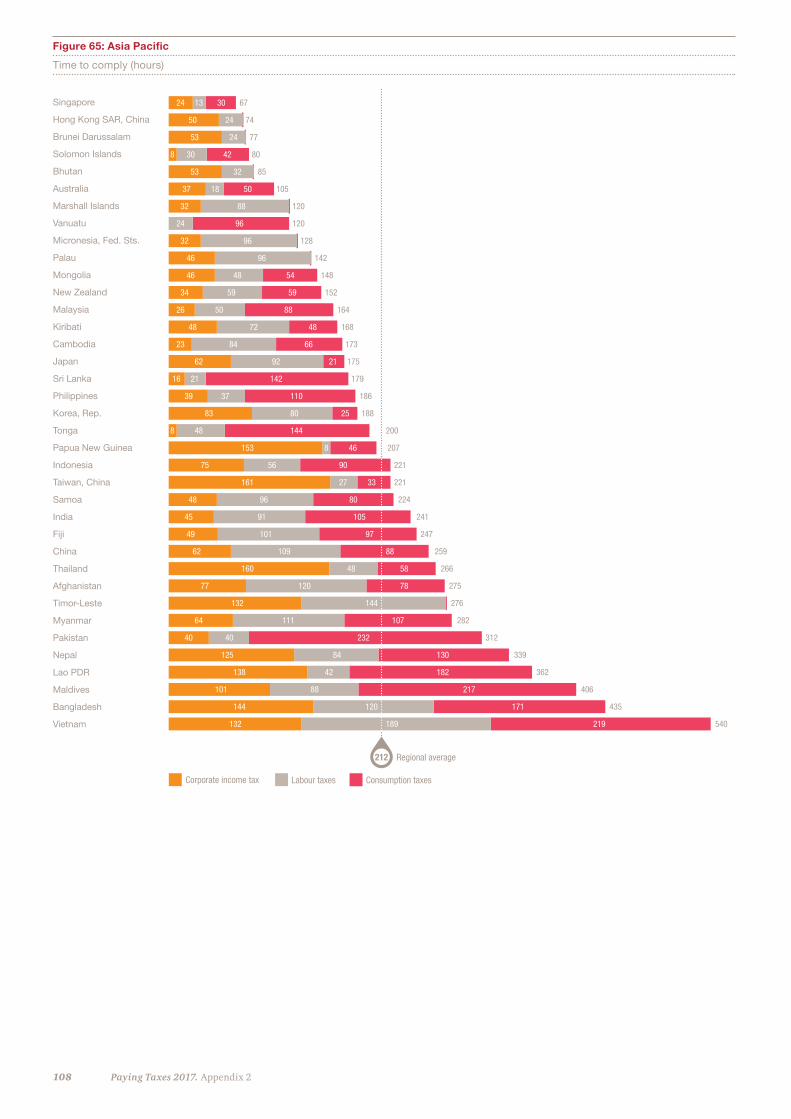
108 Paying Taxes 2017. Appendix 2
Figure 65: Asia Pacific
Time to comply (hours)
Singapore
Hong Kong SAR, China
Brunei Darussalam
Solomon Islands
Bhutan
Australia
Marshall Islands
Vanuatu
Micronesia, Fed. Sts.
Palau
Mongolia
New Zealand
Malaysia
Kiribati
Cambodia
Japan
Sri Lanka
Philippines
Korea, Rep.
Tonga
Papua New Guinea
Indonesia
Taiwan, China
Samoa
India
Fiji
China
Thailand
Afghanistan
Timor-Leste
Myanmar
Pakistan
Nepal
Lao PDR
Maldives
Bangladesh
Vietnam
24 13 30 67
50 24 74
53 24 77
8 30 42 80
53 32 85
37 18 50 105
32 88 120
24 96 120
32 96 128
46 96 142
46 48 54 148
34 59 59 152
26 50 88 164
48 72 48 168
23 84 66 173
62 92 21 175
16 21 142 179
39 37 110 186
83 80 25 188
8 48 144 200
153 8 46 207
75 56 90 221
161 27 33 221
48 96 80 224
45 91 105 241
49 101 97 247
62 109 88 259
160 48 58 266
77 120 78 275
132 144 276
64 111 107 282
40 40 232 312
125 84 130 339
138 42 182 362
101 88 217 406
144 120 171 435
132 189 219 540
Regional average212
Corporate income tax Labour taxes Consumption taxes
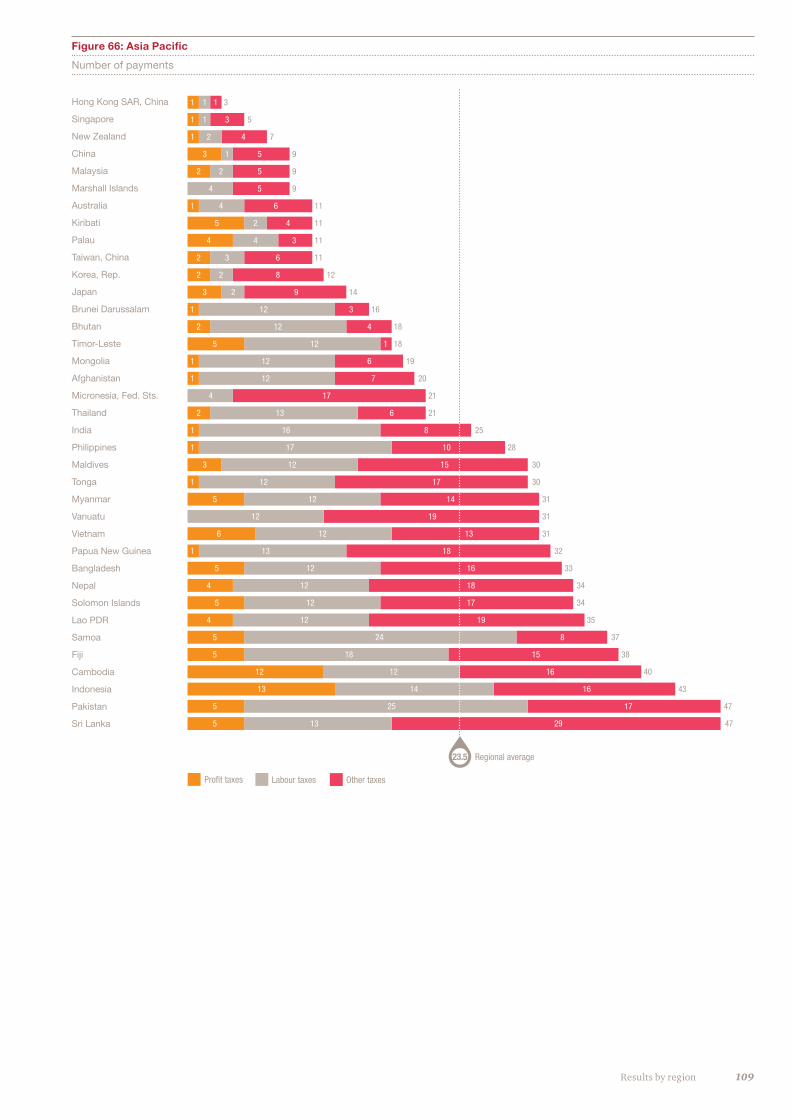
109Results by region
Figure 66: Asia Pacific
Number of payments
Hong Kong SAR, China
Singapore
New Zealand
China
Malaysia
Marshall Islands
Australia
Kiribati
Palau
Taiwan, China
Korea, Rep.
Japan
Brunei Darussalam
Bhutan
Timor-Leste
Mongolia
Afghanistan
Micronesia, Fed. Sts.
Thailand
India
Philippines
Maldives
Tonga
Myanmar
Vanuatu
Vietnam
Papua New Guinea
Bangladesh
Nepal
Solomon Islands
Lao PDR
Samoa
Fiji
Cambodia
Indonesia
Pakistan
Sri Lanka
1 1 1 3
1 1 3 5
1 2 4 7
3 1 5 9
2 2 5 9
4 5 9
1 4 6 11
5 2 4 11
4 4 3 11
2 3 6 11
2 2 8 12
3 2 9 14
1 12 3 16
2 12 4 18
5 12 1 18
1 12 6 19
1 12 7 20
4 17 21
2 13 6 21
1 16 8 25
1 17 10 28
3 12 15 30
1 12 17 30
5 12 14 31
12 19 31
6 12 13 31
1 13 18 32
5 12 16 33
4 12 18 34
5 12 17 34
4 12 19 35
5 24 8 37
5 18 15 38
12 12 16 40
13 14 16 43
5 25 17 47
5 13 29 47
Profit taxes Labour taxes Other taxes
Regional average23.5
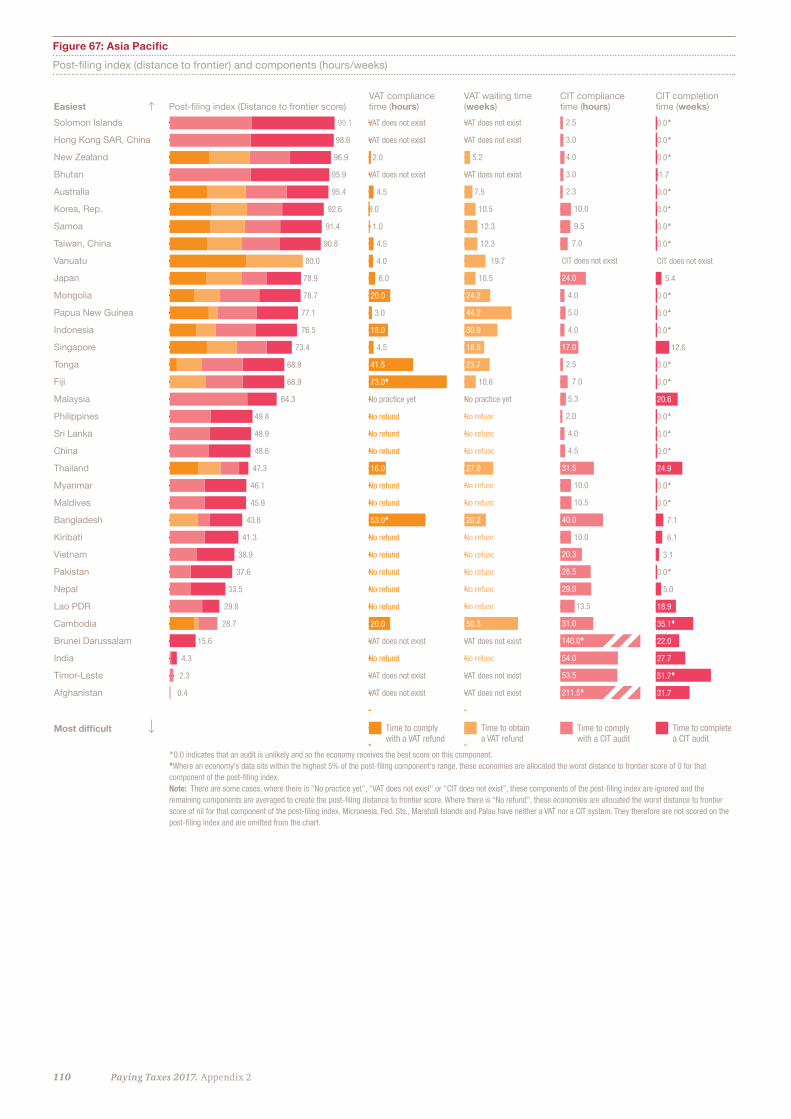
110 Paying Taxes 2017. Appendix 2
Figure 67: Asia Pacific
Post-filing index (distance to frontier) and components (hours/weeks)
Solomon Islands
Hong Kong SAR, China
New Zealand
Bhutan
Australia
Korea, Rep.
Samoa
Taiwan, China
Vanuatu
Japan
Mongolia
Papua New Guinea
Indonesia
Singapore
Tonga
Fiji
Malaysia
Philippines
Sri Lanka
China
Thailand
Myanmar
Maldives
Bangladesh
Kiribati
Vietnam
Pakistan
Nepal
Lao PDR
Cambodia
Brunei Darussalam
India
Timor-Leste
Afghanistan
�0.0 indicates that an audit is unlikely and so the economy receives the best score on this component.tWhere an economy's data sits within the highest 5% of the post-filing component's range, these economies are allocated the worst distance to frontier score of 0 for that component of the post-filing index.Note: There are some cases, where there is "No practice yet", "VAT does not exist" or "CIT does not exist", these components of the post-filing index are ignored and the remaining components are averaged to create the post-filing distance to frontier score. Where there is “No refund”, these economies are allocated the worst distance to frontier score of nil for that component of the post-filing index. Micronesia, Fed. Sts., Marshall Islands and Palau have neither a VAT nor a CIT system. They therefore are not scored on the post-filing index and are omitted from the chart.
VAT compliance time (hours)
VAT waiting time (weeks)
CIT compliance time (hours)
CIT completion time (weeks)Post-filing index (Distance to frontier score)Easiest
Most difficult
VAT does not exist
VAT does not exist
2.0
VAT does not exist
4.5
0.0
1.0
4.5
4.0
6.0
20.0
3.0
18.0
4.5
41.5
73.0t
No practice yet
No refund
No refund
No refund
16.0
No refund
No refund
53.0t
No refund
No refund
No refund
No refund
No refund
20.0
VAT does not exist
No refund
VAT does not exist
VAT does not exist
99.1
98.6
96.9
95.9
95.4
92.6
91.4
90.8
80.0
78.9
78.7
77.1
76.5
73.4
68.9
68.9
64.3
49.8
48.9
48.6
47.3
46.1
45.9
43.6
41.3
38.9
37.6
33.5
29.8
28.7
15.6
4.3
2.3
0.4
VAT does not exist
VAT does not exist
5.2
VAT does not exist
7.5
10.5
12.3
12.3
19.7
10.5
24.2
44.2
30.9
18.5
23.7
10.6
No practice yet
No refundN
No refundN
No refundN
27.0
No refundN
No refundN
20.2
No refundN
No refundN
No refundN
No refundN
No refundN
50.3
VAT does not exist
No refundN
VAT does not exist
VAT does not exist
2.5
3.0
4.0
3.0
2.3
10.0
9.5
7.0
CIT does not exist
24.0
4.0
5.0
4.0
17.0
2.5
7.0
5.3
2.0
4.0
4.5
31.5
10.0
10.5
40.0
10.0
20.3
28.5
29.0
13.5
31.0
140.0t
54.0
53.5
211.5t
0.0�
0.0�
0.0�
1.7
0.0�
0.0�
0.0�
0.0�
CIT does not exist
5.4
0.0�
0.0�
0.0�
12.6
0.0�
0.0�
20.6
0.0�
0.0�
0.0�
24.9
0.0�
0.0�
7.1
6.1
3.1
0.0�
5.0
18.9
35.1t
22.0
27.7
51.7t
31.7
Other taxes
Time to comply with a VAT refund
Time to obtain a VAT refund
Time to comply with a CIT audit
Time to complete a CIT audit
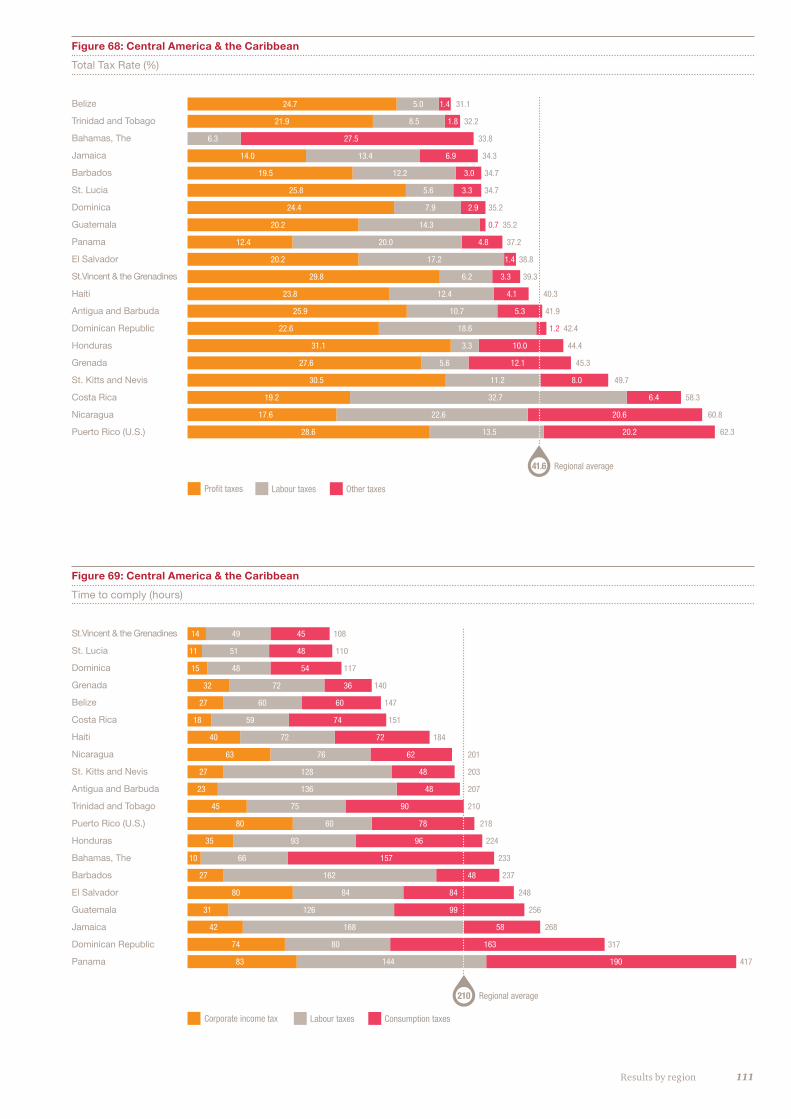
111Results by region
Figure 68: Central America & the Caribbean
Total Tax Rate (%)
Figure 69: Central America & the Caribbean
Time to comply (hours)
Belize
Trinidad and Tobago
Bahamas, The
Jamaica
Barbados
St. Lucia
Dominica
Guatemala
Panama
El Salvador
St.Vincent & the Grenadines
Haiti
Antigua and Barbuda
Dominican Republic
Honduras
Grenada
St. Kitts and Nevis
Costa Rica
Nicaragua
Puerto Rico (U.S.)
24.7 5.0 1.4 31.1
21.9 8.5 1.8 32.2
6.3 27.5 33.8
14.0 13.4 6.9 34.3
19.5 12.2 3.0 34.7
25.8 5.6 3.3 34.7
24.4 7.9 2.9 35.2
20.2 14.3 0.7 35.2
12.4 20.0 4.8 37.2
20.2 17.2 1.4 38.8
29.8 6.2 3.3 39.3
23.8 12.4 4.1 40.3
25.9 10.7 5.3 41.9
22.6 18.6 1.2 42.4
31.1 3.3 10.0 44.4
27.6 5.6 12.1 45.3
30.5 11.2 8.0 49.7
19.2 32.7 6.4 58.3
17.6 22.6 20.6 60.8
28.6 13.5 20.2 62.3
Profit taxes Labour taxes Other taxes
Regional average41.6
St.Vincent & the Grenadines
St. Lucia
Dominica
Grenada
Belize
Costa Rica
Haiti
Nicaragua
St. Kitts and Nevis
Antigua and Barbuda
Trinidad and Tobago
Puerto Rico (U.S.)
Honduras
Bahamas, The
Barbados
El Salvador
Guatemala
Jamaica
Dominican Republic
Panama
14 49 45 108
11 51 48 110
15 48 54 117
32 72 36 140
27 60 60 147
18 59 74 151
40 72 72 184
63 76 62 201
27 128 48 203
23 136 48 207
45 75 90 210
80 60 78 218
35 93 96 224
10 66 157 233
27 162 48 237
80 84 84 248
31 126 99 256
42 168 58 268
74 80 163 317
83 144 190 417
Regional average210
Corporate income tax Labour taxes Consumption taxes
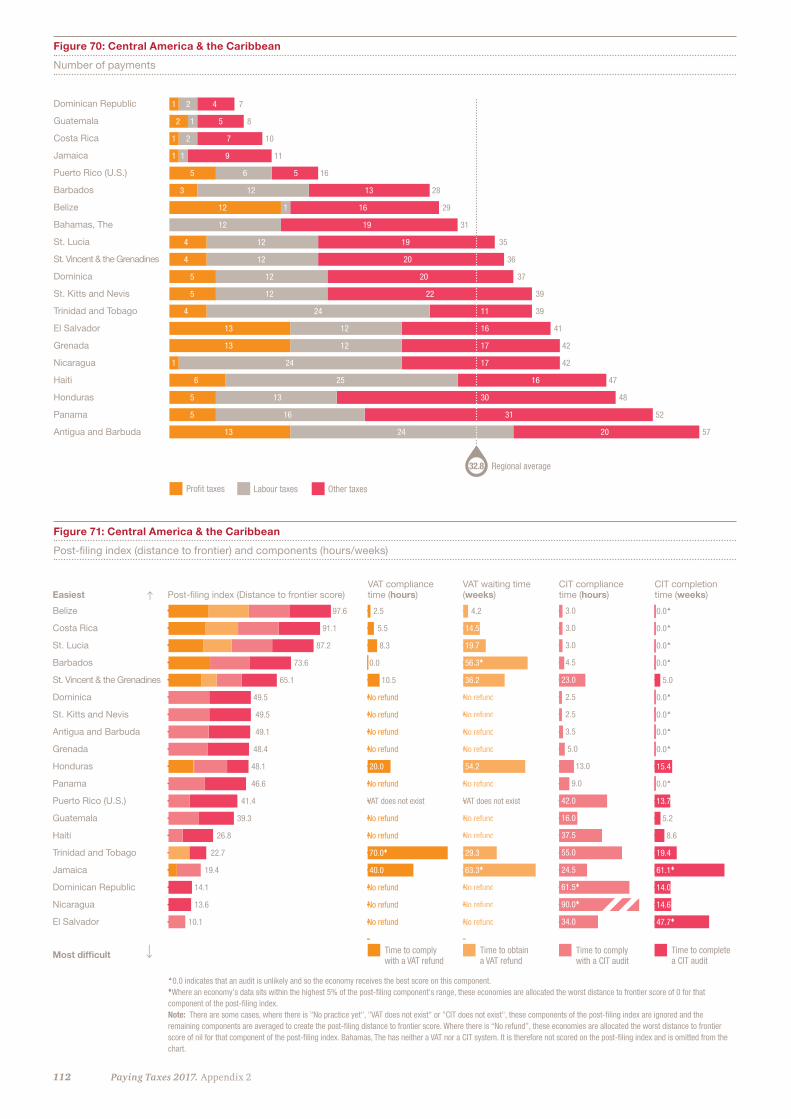
112 Paying Taxes 2017. Appendix 2
Figure 70: Central America & the Caribbean
Number of payments
Figure 71: Central America & the Caribbean
Post-filing index (distance to frontier) and components (hours/weeks)
Dominican Republic
Guatemala
Costa Rica
Jamaica
Puerto Rico (U.S.)
Barbados
Belize
Bahamas, The
St. Lucia
St. Vincent & the Grenadines
Dominica
St. Kitts and Nevis
Trinidad and Tobago
El Salvador
Grenada
Nicaragua
Haiti
Honduras
Panama
Antigua and Barbuda
1 2 4 7
2 1 5 8
1 2 7 10
1 1 9 11
5 6 5 16
3 12 13 28
12 1 16 29
12 19 31
4 12 19 35
4 12 20 36
5 12 20 37
5 12 22 39
4 24 11 39
13 12 16 41
13 12 17 42
1 24 17 42
6 25 16 47
5 13 30 48
5 16 31 52
13 24 20 57
Profit taxes Labour taxes Other taxes
Regional average32.8
Belize
Costa Rica
St. Lucia
Barbados
St. Vincent & the Grenadines
Dominica
St. Kitts and Nevis
Antigua and Barbuda
Grenada
Honduras
Panama
Puerto Rico (U.S.)
Guatemala
Haiti
Trinidad and Tobago
Jamaica
Dominican Republic
Nicaragua
El Salvador
�0.0 indicates that an audit is unlikely and so the economy receives the best score on this component.tWhere an economy's data sits within the highest 5% of the post-filing component's range, these economies are allocated the worst distance to frontier score of 0 for that component of the post-filing index. Note: There are some cases, where there is "No practice yet", "VAT does not exist" or "CIT does not exist", these components of the post-filing index are ignored and the remaining components are averaged to create the post-filing distance to frontier score. Where there is “No refund”, these economies are allocated the worst distance to frontier score of nil for that component of the post-filing index. Bahamas, The has neither a VAT nor a CIT system. It is therefore not scored on the post-filing index and is omitted from the chart.
VAT compliance time (hours)
VAT waiting time (weeks)
CIT compliance time (hours)
CIT completion time (weeks)Post-filing index (Distance to frontier score)Easiest
Most difficult
2.5
5.5
8.3
0.0
10.5
No refund
No refund
No refund
No refund
20.0
No refund
VAT does not exist
No refund
No refund
70.0t
40.0
No refund
No refund
No refund
97.6
91.1
87.2
73.6
65.1
49.5
49.5
49.1
48.4
48.1
46.6
41.4
39.3
26.8
22.7
19.4
14.1
13.6
10.1
4.2
14.5
19.7
56.3t
36.2
No refundN
No refundN
No refundN
No refundN
54.2
No refundN
VAT does not exist
No refundN
No refundN
29.3
63.3t
No refundN
No refundN
No refundN
3.0
3.0
3.0
4.5
23.0
2.5
2.5
3.5
5.0
13.0
9.0
42.0
16.0
37.5
55.0
24.5
61.5t
90.0t
34.0
0.0�
0.0�
0.0�
0.0�
5.0
0.0�
0.0�
0.0�
0.0�
15.4
0.0�
13.7
5.2
8.6
19.4
61.1t
14.0
14.6
47.7t
Other taxes
Time to comply with a VAT refund
Time to obtain a VAT refund
Time to comply with a CIT audit
Time to complete a CIT audit
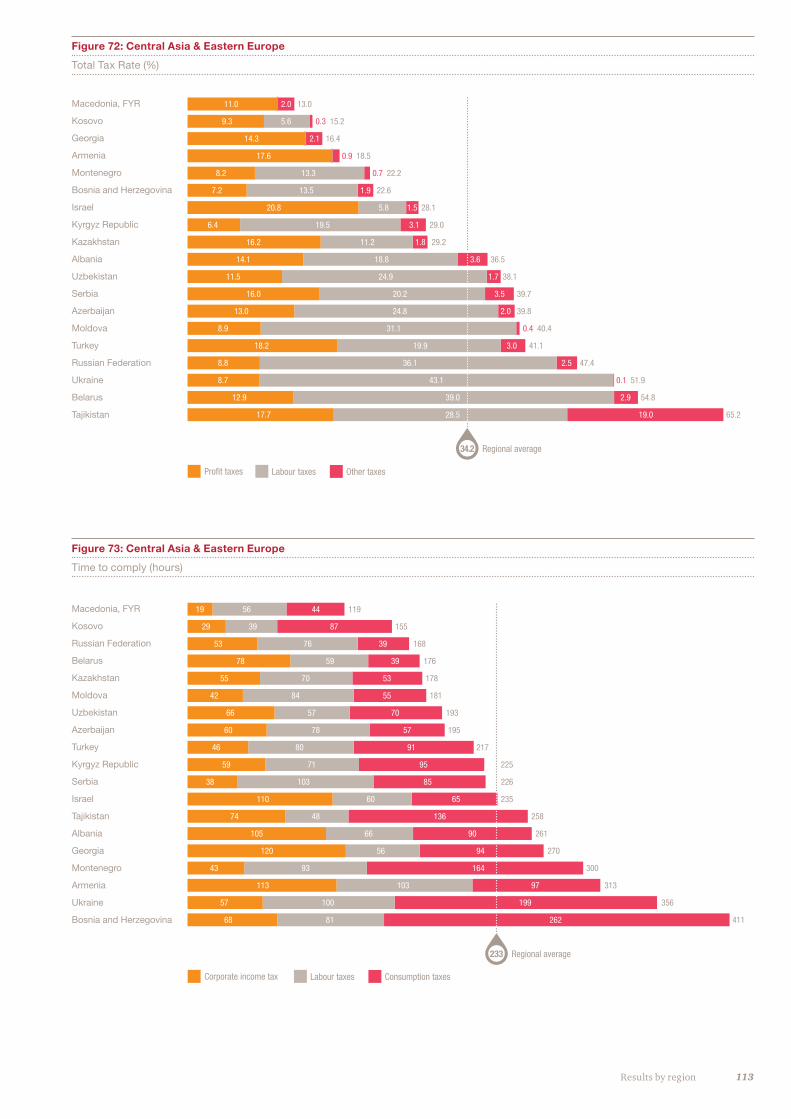
113Results by region
Figure 72: Central Asia & Eastern Europe
Total Tax Rate (%)
Figure 73: Central Asia & Eastern Europe
Time to comply (hours)
Macedonia, FYR
Kosovo
Georgia
Armenia
Montenegro
Bosnia and Herzegovina
Israel
Kyrgyz Republic
Kazakhstan
Albania
Uzbekistan
Serbia
Azerbaijan
Moldova
Turkey
Russian Federation
Ukraine
Belarus
Tajikistan
11.0 2.0 13.0
9.3 5.6 0.3 15.2
14.3 2.1 16.4
17.6 0.9 18.5
8.2 13.3 0.7 22.2
7.2 13.5 1.9 22.6
20.8 5.8 1.5 28.1
6.4 19.5 3.1 29.0
16.2 11.2 1.8 29.2
14.1 18.8 3.6 36.5
11.5 24.9 1.7 38.1
16.0 20.2 3.5 39.7
13.0 24.8 2.0 39.8
8.9 31.1 0.4 40.4
18.2 19.9 3.0 41.1
8.8 36.1 2.5 47.4
8.7 43.1 0.1 51.9
12.9 39.0 2.9 54.8
17.7 28.5 19.0 65.2
Profit taxes Labour taxes Other taxes
Regional average34.2
Macedonia, FYR
Kosovo
Russian Federation
Belarus
Kazakhstan
Moldova
Uzbekistan
Azerbaijan
Turkey
Kyrgyz Republic
Serbia
Israel
Tajikistan
Albania
Georgia
Montenegro
Armenia
Ukraine
Bosnia and Herzegovina
19 56 44 119
29 39 87 155
53 76 39 168
78 59 39 176
55 70 53 178
42 84 55 181
66 57 70 193
60 78 57 195
46 80 91 217
59 71 95 225
38 103 85 226
110 60 65 235
74 48 136 258
105 66 90 261
120 56 94 270
43 93 164 300
113 103 97 313
57 100 199 356
68 81 262 411
Regional average233
Corporate income tax Labour taxes Consumption taxes
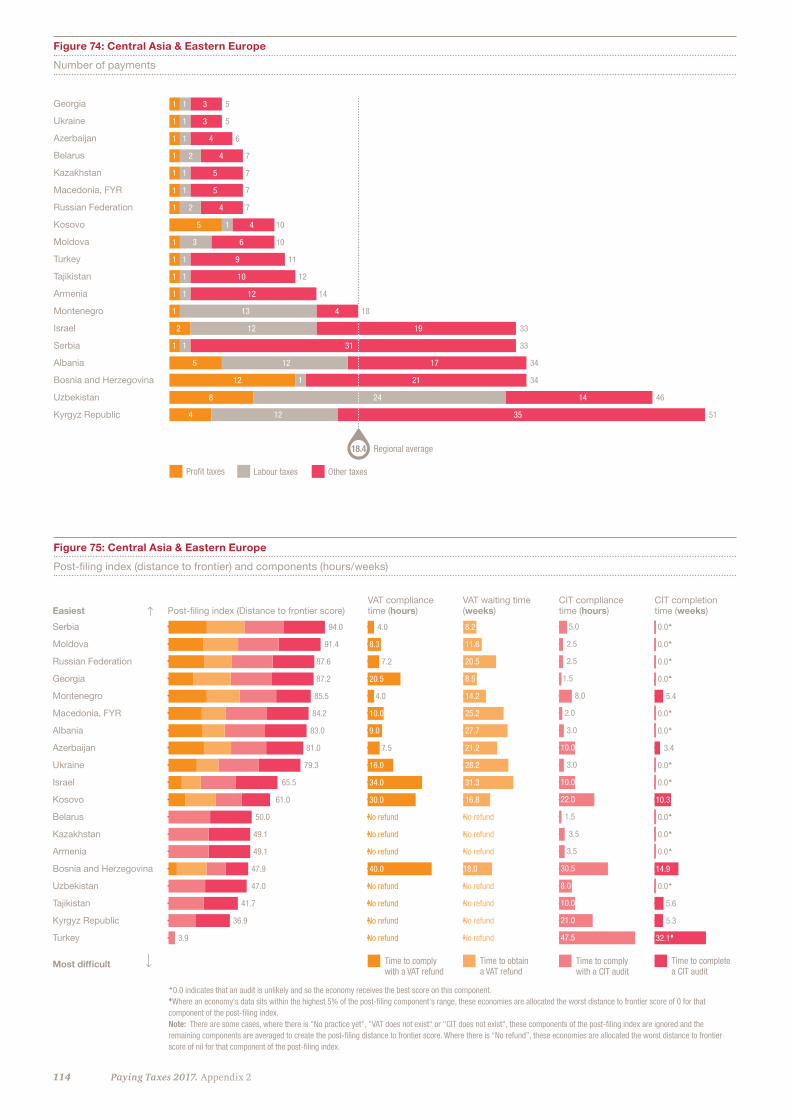
114 Paying Taxes 2017. Appendix 2
Figure 74: Central Asia & Eastern Europe
Number of payments
Figure 75: Central Asia & Eastern Europe
Post-filing index (distance to frontier) and components (hours/weeks)
Georgia
Ukraine
Azerbaijan
Belarus
Kazakhstan
Macedonia, FYR
Russian Federation
Kosovo
Moldova
Turkey
Tajikistan
Armenia
Montenegro
Israel
Serbia
Albania
Bosnia and Herzegovina
Uzbekistan
Kyrgyz Republic
1 1 3 5
1 1 3 5
1 1 4 6
1 2 4 7
1 1 5 7
1 1 5 7
1 2 4 7
5 1 4 10
1 3 6 10
1 1 9 11
1 1 10 12
1 1 12 14
1 13 4 18
2 12 19 33
1 1 31 33
5 12 17 34
12 1 21 34
8 24 14 46
4 12 35 51
Profit taxes Labour taxes Other taxes
Regional average18.4
Serbia
Moldova
Russian Federation
Georgia
Montenegro
Macedonia, FYR
Albania
Azerbaijan
Ukraine
Israel
Kosovo
Belarus
Kazakhstan
Armenia
Bosnia and Herzegovina
Uzbekistan
Tajikistan
Kyrgyz Republic
Turkey
�0.0 indicates that an audit is unlikely and so the economy receives the best score on this component.tWhere an economy's data sits within the highest 5% of the post-filing component's range, these economies are allocated the worst distance to frontier score of 0 for that component of the post-filing index. Note: There are some cases, where there is "No practice yet", "VAT does not exist" or "CIT does not exist", these components of the post-filing index are ignored and the remaining components are averaged to create the post-filing distance to frontier score. Where there is “No refund”, these economies are allocated the worst distance to frontier score of nil for that component of the post-filing index.
VAT compliance time (hours)
VAT waiting time (weeks)
CIT compliance time (hours)
CIT completion time (weeks)Post-filing index (Distance to frontier score)Easiest
Most difficult
4.0
8.3
7.2
20.5
4.0
10.0
9.0
7.5
16.0
34.0
30.0
No refund
No refund
No refund
40.0
No refund
No refund
No refund
No refund
94.0
91.4
87.6
87.2
85.5
84.2
83.0
81.0
79.3
65.5
61.0
50.0
49.1
49.1
47.9
47.0
41.7
36.9
3.9
8.2
11.6
20.5
8.5
14.2
25.2
27.7
21.2
28.2
31.3
16.8
No refund
No refund
No refund
18.0
No refund
No refund
No refund
No refund
5.0
2.5
2.5
1.5
8.0
2.0
3.0
10.0
3.0
10.0
22.0
1.5
3.5
3.5
30.5
8.0
10.0
21.0
47.5
0.0�
0.0�
0.0�
0.0�
5.4
0.0�
0.0�
3.4
0.0�
0.0�
10.3
0.0�
0.0�
0.0�
14.9
0.0�
5.6
5.3
32.1t
Other taxes
Time to comply with a VAT refund
Time to obtain a VAT refund
Time to comply with a CIT audit
Time to complete a CIT audit
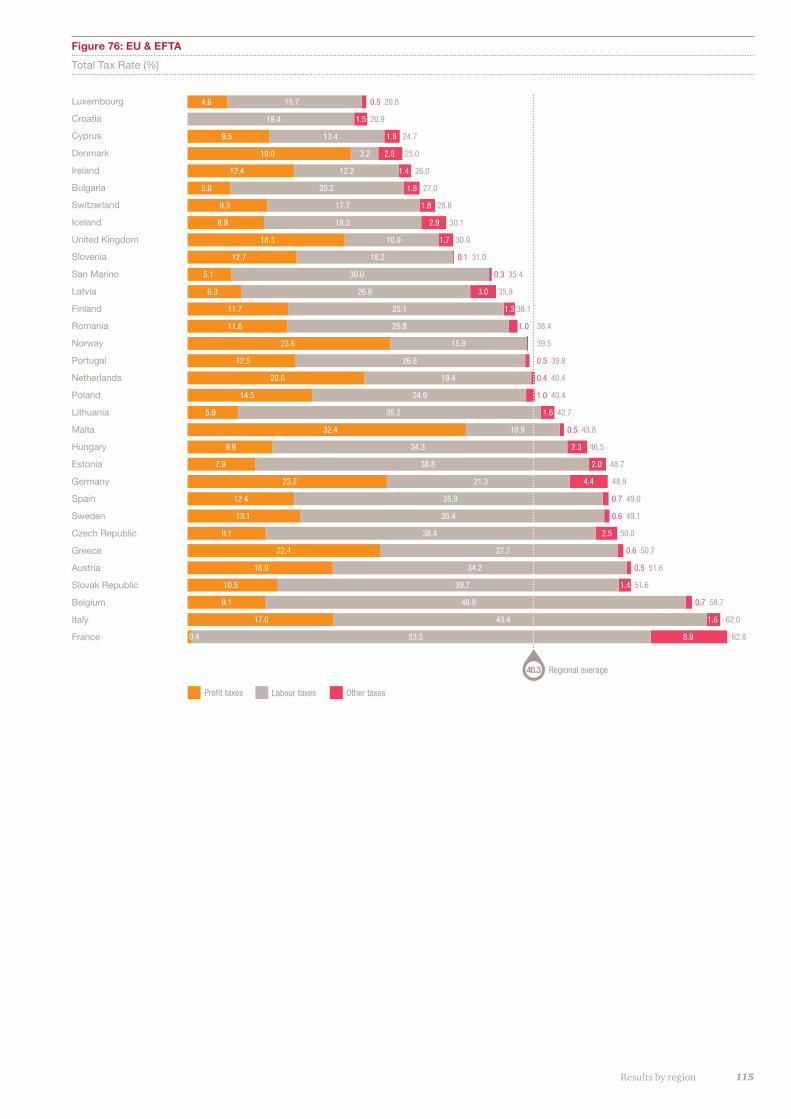
115Results by region
Figure 76: EU & EFTA
Total Tax Rate (%)
Luxembourg
Croatia
Cyprus
Denmark
Ireland
Bulgaria
Switzerland
Iceland
United Kingdom
Slovenia
San Marino
Latvia
Finland
Romania
Norway
Portugal
Netherlands
Poland
Lithuania
Malta
Hungary
Estonia
Germany
Spain
Sweden
Czech Republic
Greece
Austria
Slovak Republic
Belgium
Italy
France
4.6 15.7 0.5 20.8
19.4 1.5 20.9
9.5 13.4 1.8 24.7
19.0 3.2 2.8 25.0
12.4 12.2 1.4 26.0
5.0 20.2 1.8 27.0
9.3 17.7 1.8 28.8
8.9 18.3 2.9 30.1
18.3 10.9 1.7 30.9
12.7 18.2 0.1 31.0
5.1 30.0 0.3 35.4
6.3 26.6 3.0 35.9
11.7 25.1 1.3 38.1
11.6 25.8 1.0 38.4
23.6 15.9 39.5
12.5 26.8 0.5 39.8
20.6 19.4 0.4 40.4
14.5 24.9 1.0 40.4
5.9 35.2 1.6 42.7
32.4 10.9 0.5 43.8
9.9 34.3 2.3 46.5
7.9 38.8 2.0 48.7
23.2 21.3 4.4 48.9
12.4 35.9 0.7 49.0
13.1 35.4 0.6 49.1
9.1 38.4 2.5 50.0
22.4 27.7 0.6 50.7
16.9 34.2 0.5 51.6
10.5 39.7 1.4 51.6
9.1 48.9 0.7 58.7
17.0 43.4 1.6 62.0
0.4 53.5 8.9 62.8
Profit taxes Labour taxes Other taxes
Regional average40.3
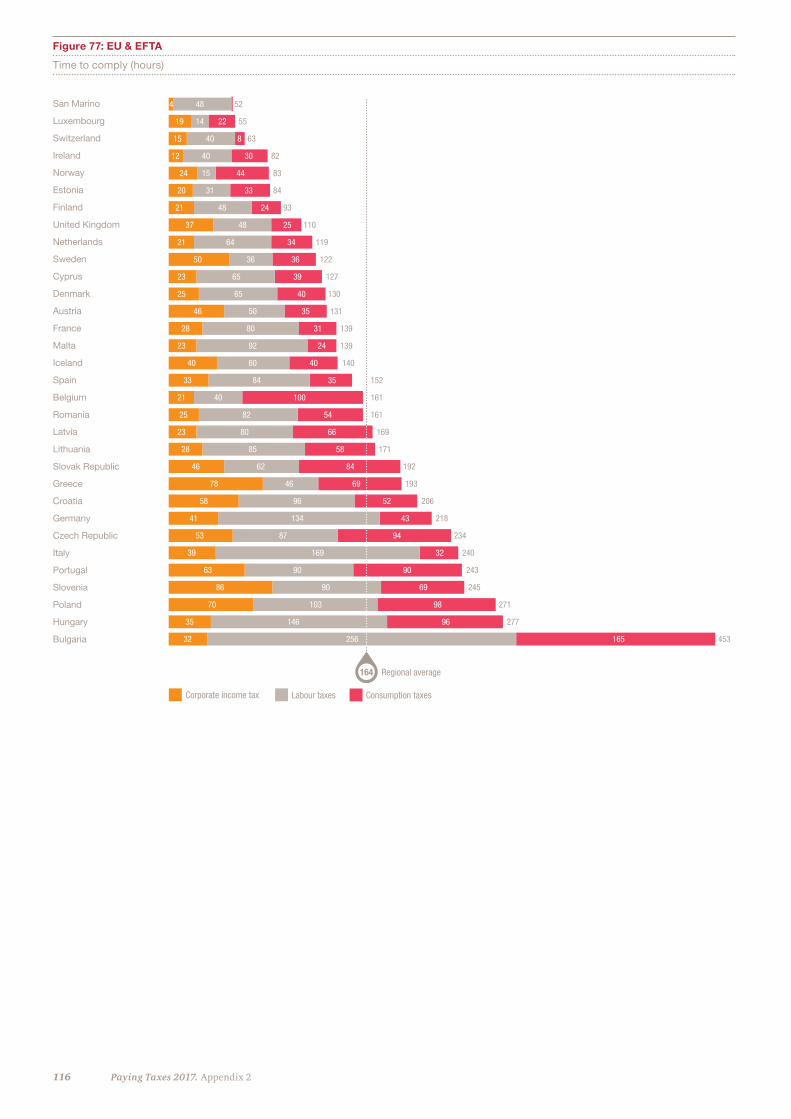
116 Paying Taxes 2017. Appendix 2
Figure 77: EU & EFTA
Time to comply (hours)
San Marino
Luxembourg
Switzerland
Ireland
Norway
Estonia
Finland
United Kingdom
Netherlands
Sweden
Cyprus
Denmark
Austria
France
Malta
Iceland
Spain
Belgium
Romania
Latvia
Lithuania
Slovak Republic
Greece
Croatia
Germany
Czech Republic
Italy
Portugal
Slovenia
Poland
Hungary
Bulgaria
4 48 52
19 14 22 55
15 40 8 63
12 40 30 82
24 15 44 83
20 31 33 84
21 48 24 93
37 48 25 110
21 64 34 119
50 36 36 122
23 65 39 127
25 65 40 130
46 50 35 131
28 80 31 139
23 92 24 139
40 60 40 140
33 84 35 152
21 40 100 161
25 82 54 161
23 80 66 169
28 85 58 171
46 62 84 192
78 46 69 193
58 96 52 206
41 134 43 218
53 87 94 234
39 169 32 240
63 90 90 243
86 90 69 245
70 103 98 271
35 146 96 277
32 256 165 453
Regional average164
Corporate income tax Labour taxes Consumption taxes
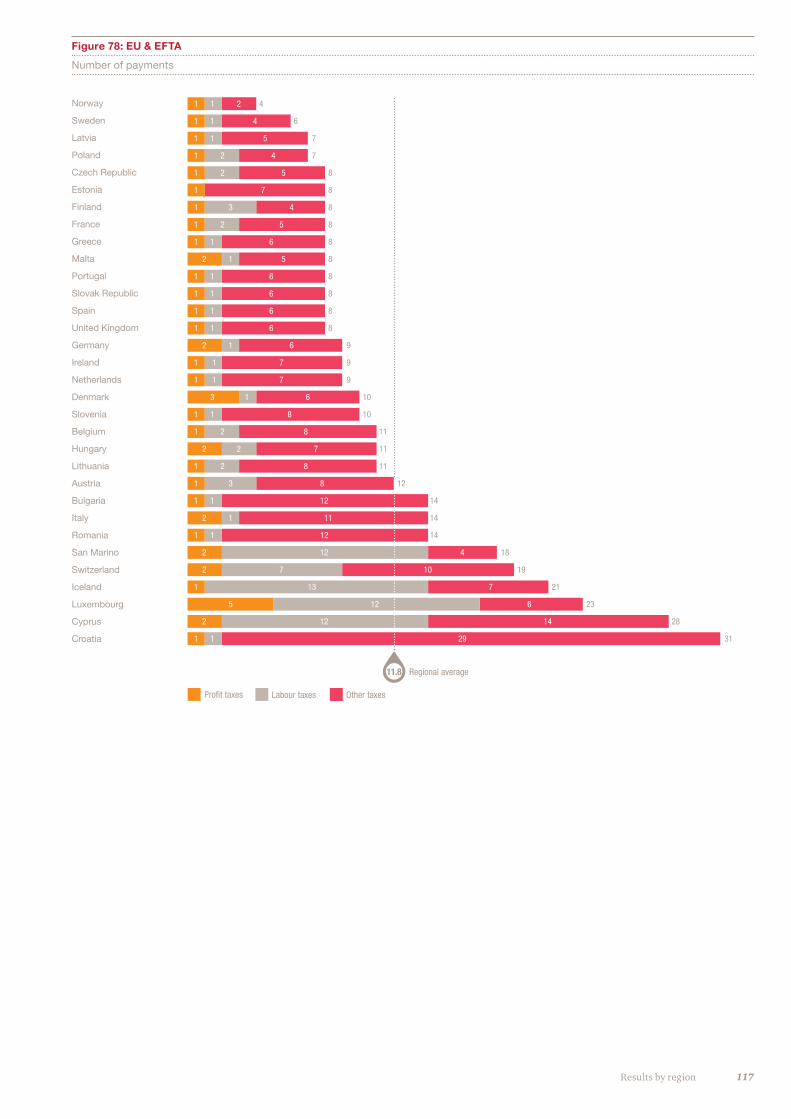
117Results by region
Figure 78: EU & EFTA
Number of payments
Norway
Sweden
Latvia
Poland
Czech Republic
Estonia
Finland
France
Greece
Malta
Portugal
Slovak Republic
Spain
United Kingdom
Germany
Ireland
Netherlands
Denmark
Slovenia
Belgium
Hungary
Lithuania
Austria
Bulgaria
Italy
Romania
San Marino
Switzerland
Iceland
Luxembourg
Cyprus
Croatia
1 1 2 4
1 1 4 6
1 1 5 7
1 2 4 7
1 2 5 8
1 7 8
1 3 4 8
1 2 5 8
1 1 6 8
2 1 5 8
1 1 6 8
1 1 6 8
1 1 6 8
1 1 6 8
2 1 6 9
1 1 7 9
1 1 7 9
3 1 6 10
1 1 8 10
1 2 8 11
2 2 7 11
1 2 8 11
1 3 8 12
1 1 12 14
2 1 11 14
1 1 12 14
2 12 4 18
2 7 10 19
1 13 7 21
5 12 6 23
2 12 14 28
1 1 29 31
Profit taxes Labour taxes Other taxes
Regional average11.8
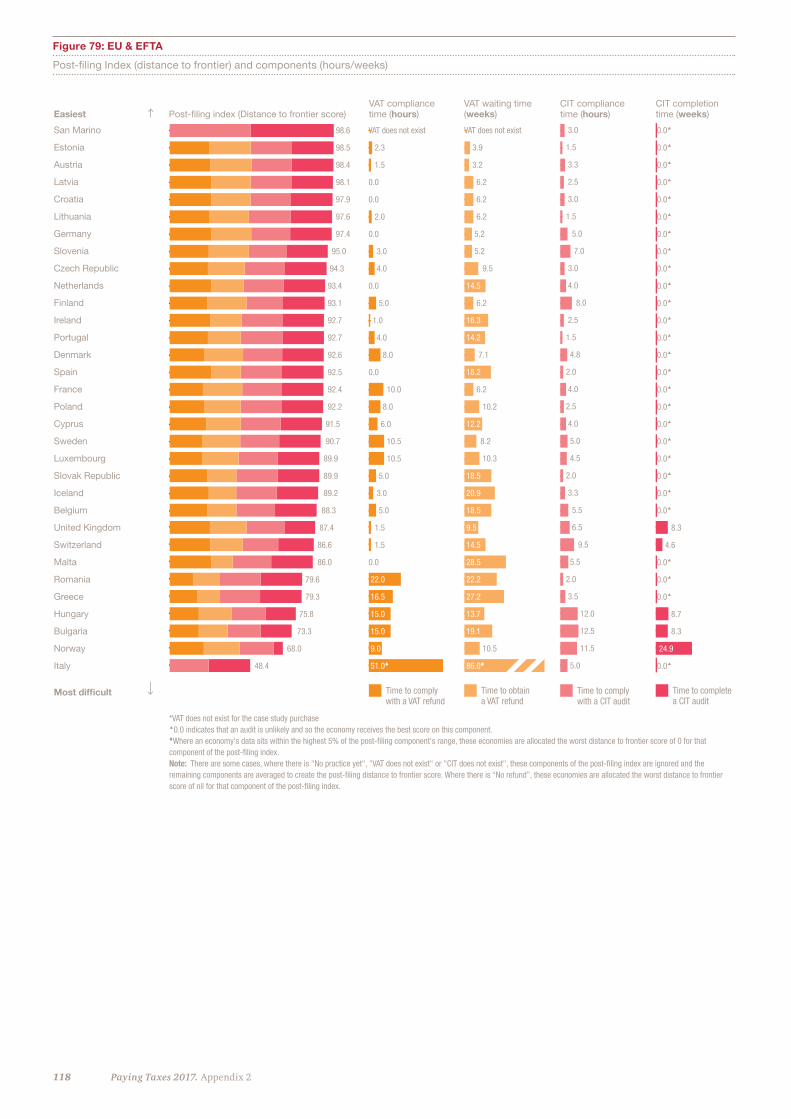
118 Paying Taxes 2017. Appendix 2
Figure 79: EU & EFTA
Post-filing Index (distance to frontier) and components (hours/weeks)
San Marino
Estonia
Austria
Latvia
Croatia
Lithuania
Germany
Slovenia
Czech Republic
Netherlands
Finland
Ireland
Portugal
Denmark
Spain
France
Poland
Cyprus
Sweden
Luxembourg
Slovak Republic
Iceland
Belgium
United Kingdom
Switzerland
Malta
Romania
Greece
Hungary
Bulgaria
Norway
Italy
*VAT does not exist for the case study purchase �0.0 indicates that an audit is unlikely and so the economy receives the best score on this component.tWhere an economy's data sits within the highest 5% of the post-filing component's range, these economies are allocated the worst distance to frontier score of 0 for that component of the post-filing index. Note: There are some cases, where there is "No practice yet", "VAT does not exist" or "CIT does not exist", these components of the post-filing index are ignored and the remaining components are averaged to create the post-filing distance to frontier score. Where there is “No refund”, these economies are allocated the worst distance to frontier score of nil for that component of the post-filing index.
VAT compliance time (hours)
VAT waiting time (weeks)
CIT compliance time (hours)
CIT completion time (weeks)Post-filing index (Distance to frontier score)Easiest
Most difficult
VAT does not exist
2.3
1.5
0.0
0.0
2.0
0.0
3.0
4.0
0.0
5.0
1.0
4.0
8.0
0.0
10.0
8.0
6.0
10.5
10.5
5.0
3.0
5.0
1.5
1.5
0.0
22.0
16.5
15.0
15.0
9.0
51.0t
98.6
98.5
98.4
98.1
97.9
97.6
97.4
95.0
94.3
93.4
93.1
92.7
92.7
92.6
92.5
92.4
92.2
91.5
90.7
89.9
89.9
89.2
88.3
87.4
86.6
86.0
79.6
79.3
75.8
73.3
68.0
48.4
VAT does not exist
3.9
3.2
6.2
6.2
6.2
5.2
5.2
9.5
14.5
6.2
16.3
14.2
7.1
18.2
6.2
10.2
12.2
8.2
10.3
18.5
20.9
18.5
9.5
14.5
28.5
22.2
27.2
13.7
19.1
10.5
86.0t
3.0
1.5
3.3
2.5
3.0
1.5
5.0
7.0
3.0
4.0
8.0
2.5
1.5
4.8
2.0
4.0
2.5
4.0
5.0
4.5
2.0
3.3
5.5
6.5
9.5
5.5
2.0
3.5
12.0
12.5
11.5
5.0
0.0�
0.0�
0.0�
0.0�
0.0�
0.0�
0.0�
0.0�
0.0�
0.0�
0.0�
0.0�
0.0�
0.0�
0.0�
0.0�
0.0�
0.0�
0.0�
0.0�
0.0�
0.0�
0.0�
8.3
4.6
0.0�
0.0�
0.0�
8.7
8.3
24.9
0.0�
Other taxes
Time to comply with a VAT refund
Time to obtain a VAT refund
Time to comply with a CIT audit
Time to complete a CIT audit
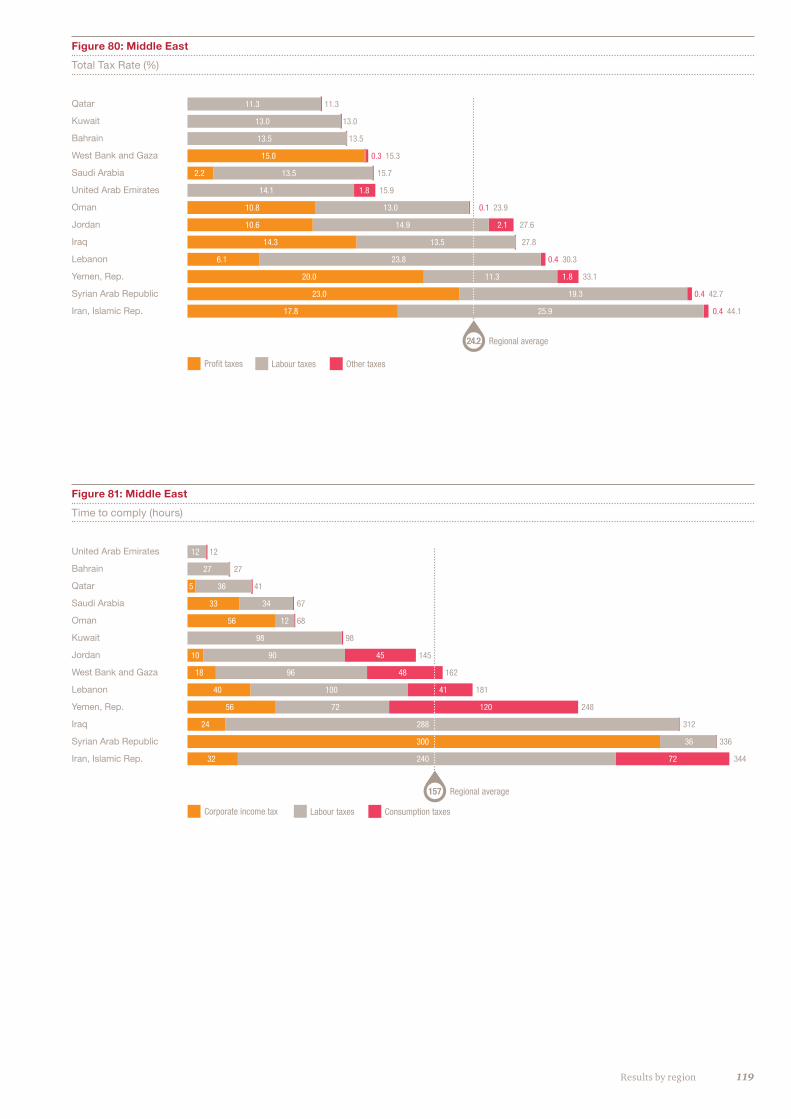
119Results by region
Figure 80: Middle East
Total Tax Rate (%)
Figure 81: Middle East
Time to comply (hours)
Qatar
Kuwait
Bahrain
West Bank and Gaza
Saudi Arabia
United Arab Emirates
Oman
Jordan
Iraq
Lebanon
Yemen, Rep.
Syrian Arab Republic
Iran, Islamic Rep.
11.3 11.3
13.0 13.0
13.5 13.5
15.0 0.3 15.3
2.2 13.5 15.7
14.1 1.8 15.9
10.8 13.0 0.1 23.9
10.6 14.9 2.1 27.6
14.3 13.5 27.8
6.1 23.8 0.4 30.3
20.0 11.3 1.8 33.1
23.0 19.3 0.4 42.7
17.8 25.9 0.4 44.1
Profit taxes Labour taxes Other taxes
Regional average24.2
United Arab Emirates
Bahrain
Qatar
Saudi Arabia
Oman
Kuwait
Jordan
West Bank and Gaza
Lebanon
Yemen, Rep.
Iraq
Syrian Arab Republic
Iran, Islamic Rep.
12 12
27 27
5 36 41
33 34 67
56 12 68
98 98
10 90 45 145
18 96 48 162
40 100 41 181
56 72 120 248
24 288 312
300 36 336
32 240 72 344
Regional average157
Corporate income tax Labour taxes Consumption taxes
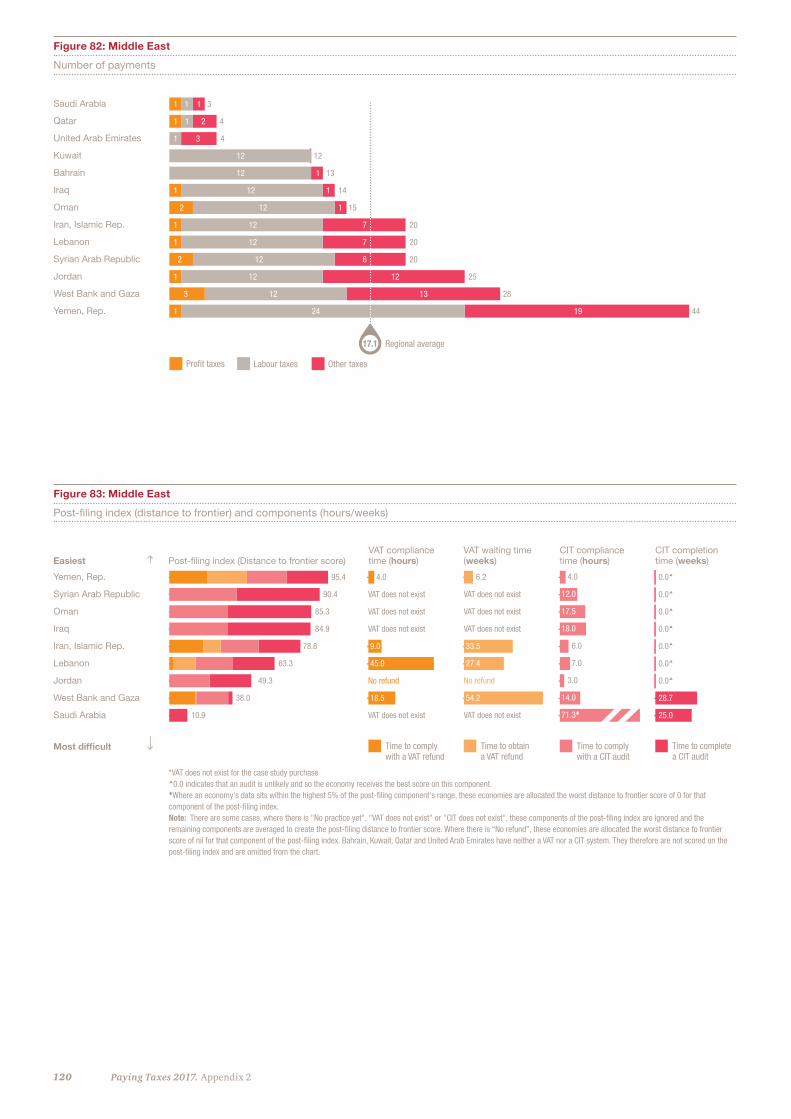
120 Paying Taxes 2017. Appendix 2
Figure 82: Middle East
Number of payments
Figure 83: Middle East
Post-filing index (distance to frontier) and components (hours/weeks)
Saudi Arabia
Qatar
United Arab Emirates
Kuwait
Bahrain
Iraq
Oman
Iran, Islamic Rep.
Lebanon
Syrian Arab Republic
Jordan
West Bank and Gaza
Yemen, Rep.
1 1 1 3
1 1 2 4
1 3 4
12 12
12 1 13
1 12 1 14
2 12 1 15
1 12 7 20
1 12 7 20
2 12 6 20
1 12 12 25
3 12 13 28
1 24 19 44
Profit taxes Labour taxes Other taxes
Regional average17.1
Yemen, Rep.
Syrian Arab Republic
Oman
Iraq
Iran, Islamic Rep.
Lebanon
Jordan
West Bank and Gaza
Saudi Arabia
*VAT does not exist for the case study purchase �0.0 indicates that an audit is unlikely and so the economy receives the best score on this component.tWhere an economy's data sits within the highest 5% of the post-filing component's range, these economies are allocated the worst distance to frontier score of 0 for that component of the post-filing index. Note: There are some cases, where there is "No practice yet", "VAT does not exist" or "CIT does not exist", these components of the post-filing index are ignored and the remaining components are averaged to create the post-filing distance to frontier score. Where there is “No refund”, these economies are allocated the worst distance to frontier score of nil for that component of the post-filing index. Bahrain, Kuwait, Qatar and United Arab Emirates have neither a VAT nor a CIT system. They therefore are not scored on the post-filing index and are omitted from the chart.
VAT compliance time (hours)
VAT waiting time (weeks)
CIT compliance time (hours)
CIT completion time (weeks)Post-filing index (Distance to frontier score)Easiest
Most difficult
4.0
VAT does not exist
VAT does not exist
VAT does not exist
9.0
45.0
No refund
18.5
VAT does not exist
95.4
90.4
85.3
84.9
78.8
63.3
49.3
38.0
10.9
6.2
VAT does not exist
VAT does not exist
VAT does not exist
33.5
27.4
No refund
54.2
VAT does not exist
4.0
12.0
17.5
18.0
6.0
7.0
3.0
14.0
71.3t
0.0�
0.0�
0.0�
0.0�
0.0�
0.0�
0.0�
28.7
25.0
Other taxes
Time to comply with a VAT refund
Time to obtain a VAT refund
Time to comply with a CIT audit
Time to complete a CIT audit
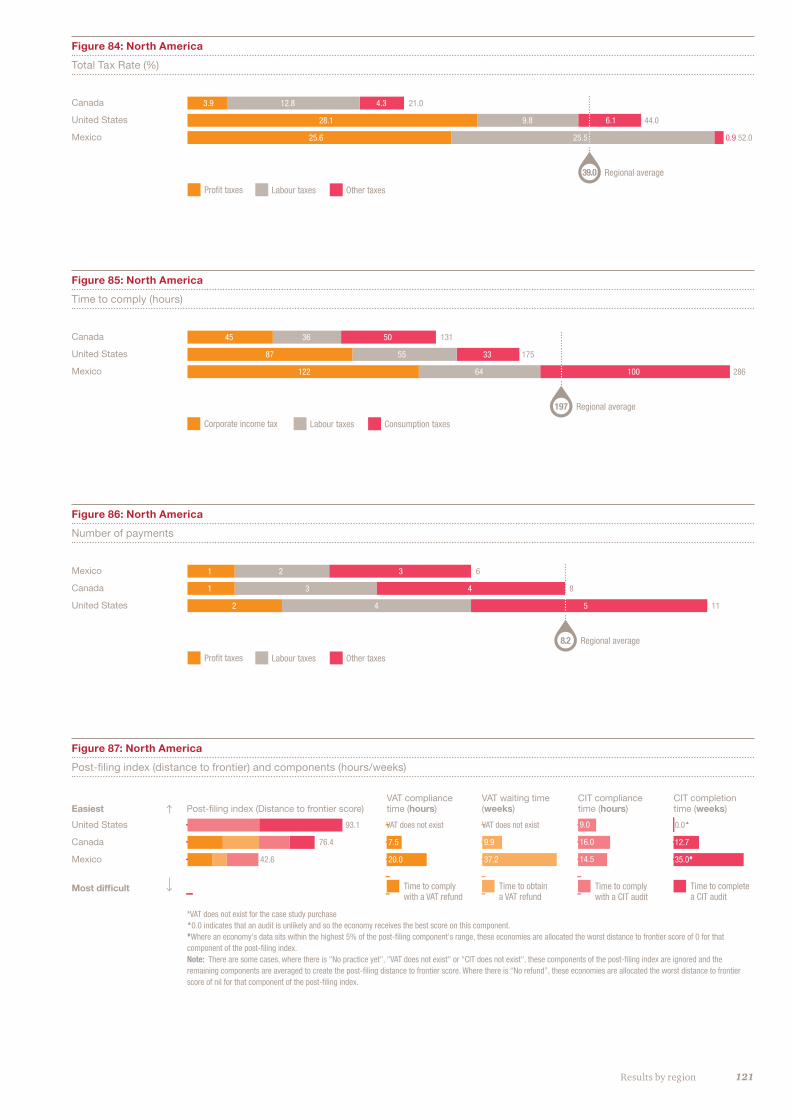
121Results by region
Figure 84: North America
Total Tax Rate (%)
Canada
United States
Mexico
3.9 12.8 4.3 21.0
28.1 9.8 6.1 44.0
25.6 25.5 0.9 52.0
Profit taxes Labour taxes Other taxes
Regional average39.0
Figure 85: North America
Time to comply (hours)
Canada
United States
Mexico
45 36 50 131
87 55 33 175
122 64 100 286
Regional average197
Corporate income tax Labour taxes Consumption taxes
Figure 86: North America
Number of payments
Mexico
Canada
United States
1 2 3 6
1 3 4 8
2 4 5 11
Profit taxes Labour taxes Other taxes
Regional average8.2
Figure 87: North America
Post-filing index (distance to frontier) and components (hours/weeks)
United States
Canada
Mexico
*VAT does not exist for the case study purchase �0.0 indicates that an audit is unlikely and so the economy receives the best score on this component.tWhere an economy's data sits within the highest 5% of the post-filing component's range, these economies are allocated the worst distance to frontier score of 0 for that component of the post-filing index. Note: There are some cases, where there is "No practice yet", "VAT does not exist" or "CIT does not exist", these components of the post-filing index are ignored and the remaining components are averaged to create the post-filing distance to frontier score. Where there is “No refund”, these economies are allocated the worst distance to frontier score of nil for that component of the post-filing index.
VAT compliance time (hours)
VAT waiting time (weeks)
CIT compliance time (hours)
CIT completion time (weeks)Post-filing index (Distance to frontier score)Easiest
Most difficult
VAT does not exist
7.5
20.0
93.1
76.4
42.6
VAT does not exist
9.9
37.2
9.0
16.0
14.5
0.0�
12.7
35.0t
Other taxes
Time to comply with a VAT refund
Time to obtain a VAT refund
Time to comply with a CIT audit
Time to complete a CIT audit
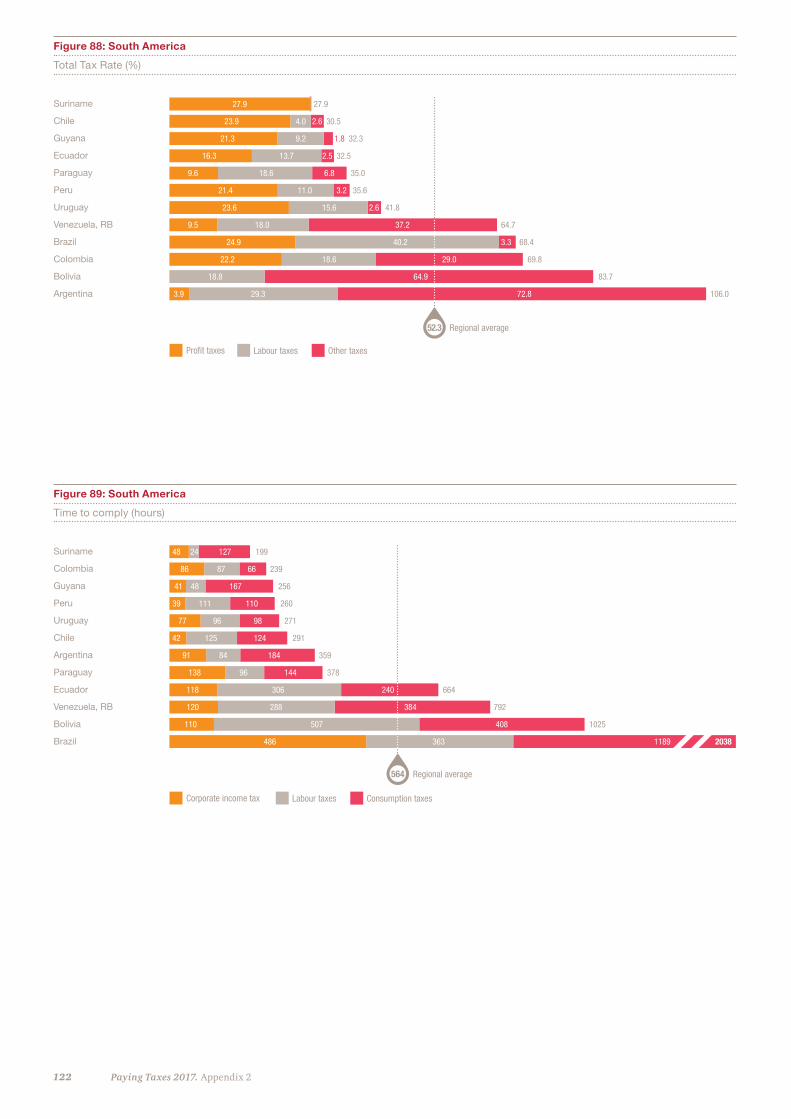
122 Paying Taxes 2017. Appendix 2
Figure 88: South America
Total Tax Rate (%)
Figure 89: South America
Time to comply (hours)
Suriname
Chile
Guyana
Ecuador
Paraguay
Peru
Uruguay
Venezuela, RB
Brazil
Colombia
Bolivia
Argentina
27.9 27.9
23.9 4.0 2.6 30.5
21.3 9.2 1.8 32.3
16.3 13.7 2.5 32.5
9.6 18.6 6.8 35.0
21.4 11.0 3.2 35.6
23.6 15.6 2.6 41.8
9.5 18.0 37.2 64.7
24.9 40.2 3.3 68.4
22.2 18.6 29.0 69.8
18.8 64.9 83.7
3.9 29.3 72.8 106.0
Profit taxes Labour taxes Other taxes
Regional average52.3
Suriname
Colombia
Guyana
Peru
Uruguay
Chile
Argentina
Paraguay
Ecuador
Venezuela, RB
Bolivia
Brazil
48 24 127 199
86 87 66 239
41 48 167 256
39 111 110 260
77 96 98 271
42 125 124 291
91 84 184 359
138 96 144 378
118 306 240 664
120 288 384 792
110 507 408 1025
486 363 1189 2038
Regional average564
Corporate income tax Labour taxes Consumption taxes
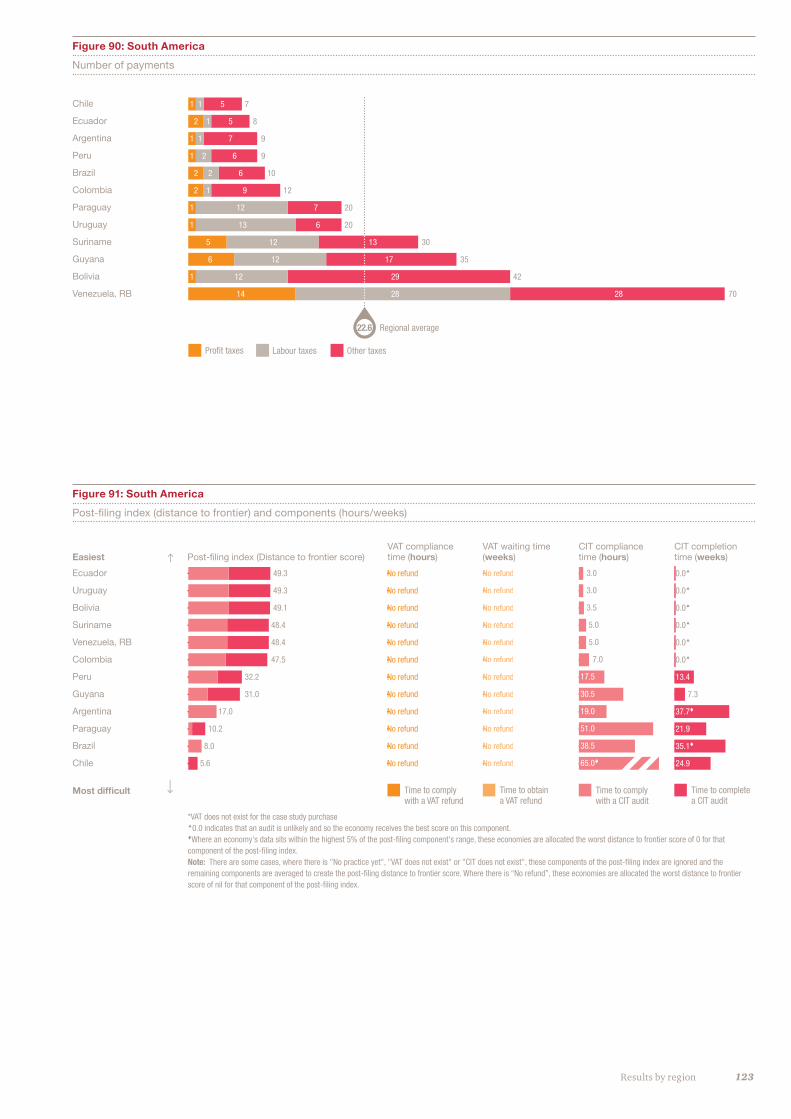
123Results by region
Figure 90: South America
Number of payments
Figure 91: South America
Post-filing index (distance to frontier) and components (hours/weeks)
Chile
Ecuador
Argentina
Peru
Brazil
Colombia
Paraguay
Uruguay
Suriname
Guyana
Bolivia
Venezuela, RB
1 1 5 7
2 1 5 8
1 1 7 9
1 2 6 9
2 2 6 10
2 1 9 12
1 12 7 20
1 13 6 20
5 12 13 30
6 12 17 35
1 12 29 42
14 28 28 70
Profit taxes Labour taxes Other taxes
Regional average22.6
Ecuador
Uruguay
Bolivia
Suriname
Venezuela, RB
Colombia
Peru
Guyana
Argentina
Paraguay
Brazil
Chile
*VAT does not exist for the case study purchase �0.0 indicates that an audit is unlikely and so the economy receives the best score on this component. tWhere an economy's data sits within the highest 5% of the post-filing component's range, these economies are allocated the worst distance to frontier score of 0 for that component of the post-filing index. Note: There are some cases, where there is "No practice yet", "VAT does not exist" or "CIT does not exist", these components of the post-filing index are ignored and the remaining components are averaged to create the post-filing distance to frontier score. Where there is “No refund”, these economies are allocated the worst distance to frontier score of nil for that component of the post-filing index.
VAT compliance time (hours)
VAT waiting time (weeks)
CIT compliance time (hours)
CIT completion time (weeks)Post-filing index (Distance to frontier score)Easiest
Most difficult
No refund
No refund
No refund
No refund
No refund
No refund
No refund
No refund
No refund
No refund
No refund
No refund
49.3
49.3
49.1
48.4
48.4
47.5
32.2
31.0
17.0
10.2
8.0
5.6
No refundN
No refundN
No refundN
No refundN
No refundN
No refundN
No refundN
No refundN
No refundN
No refundN
No refundN
No refundN
3.0
3.0
3.5
5.0
5.0
7.0
17.5
30.5
19.0
51.0
38.5
65.0t
0.0�
0.0�
0.0�
0.0�
0.0�
0.0�
13.4
7.3
37.7t
21.9
35.1t
24.9
Other taxes
Time to comply with a VAT refund
Time to obtain a VAT refund
Time to comply with a CIT audit
Time to complete a CIT audit
124 Paying Taxes 2017. Appendix 3
Table 9: Overall Paying Taxes ranking
Table 10: Total Tax Rate
Table 11: Time to comply
Table 12: Tax payments
Table 13: Post-filing index
The data tables
Appendix 3
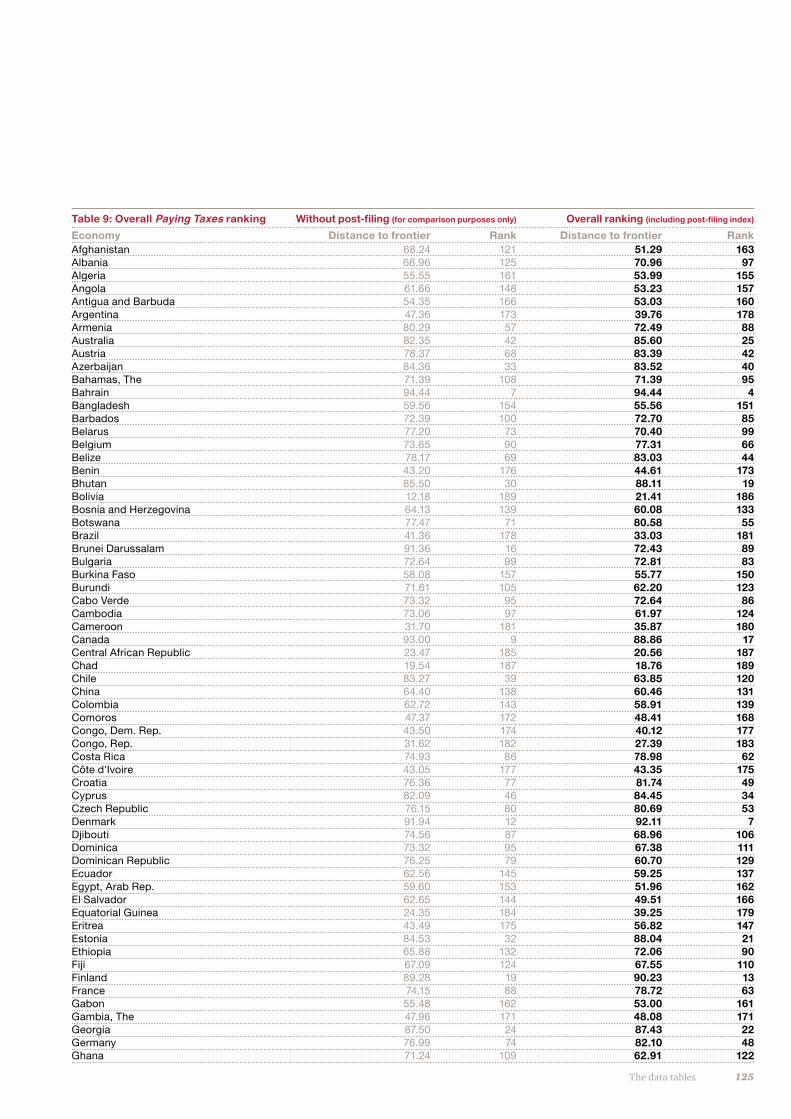
125The data tables
Table 9: Overall Paying Taxes ranking Without post-filing (for comparison purposes only) Overall ranking (including post-filing index)
Economy Distance to frontier Rank Distance to frontier Rank Afghanistan 68.24 121 51.29 163Albania 66.96 125 70.96 97Algeria 55.55 161 53.99 155Angola 61.66 148 53.23 157Antigua and Barbuda 54.35 166 53.03 160Argentina 47.36 173 39.76 178Armenia 80.29 57 72.49 88Australia 82.35 42 85.60 25Austria 78.37 68 83.39 42Azerbaijan 84.36 33 83.52 40Bahamas, The 71.39 108 71.39 95Bahrain 94.44 7 94.44 4Bangladesh 59.56 154 55.56 151Barbados 72.39 100 72.70 85Belarus 77.20 73 70.40 99Belgium 73.65 90 77.31 66Belize 78.17 69 83.03 44Benin 43.20 176 44.61 173Bhutan 85.50 30 88.11 19Bolivia 12.18 189 21.41 186Bosnia and Herzegovina 64.13 139 60.08 133Botswana 77.47 71 80.58 55Brazil 41.36 178 33.03 181Brunei Darussalam 91.36 16 72.43 89Bulgaria 72.64 99 72.81 83Burkina Faso 58.08 157 55.77 150Burundi 71.61 105 62.20 123Cabo Verde 73.32 95 72.64 86Cambodia 73.06 97 61.97 124Cameroon 31.70 181 35.87 180Canada 93.00 9 88.86 17Central African Republic 23.47 185 20.56 187Chad 19.54 187 18.76 189Chile 83.27 39 63.85 120China 64.40 138 60.46 131Colombia 62.72 143 58.91 139Comoros 47.37 172 48.41 168Congo, Dem. Rep. 43.50 174 40.12 177Congo, Rep. 31.62 182 27.39 183Costa Rica 74.93 86 78.98 62Côte d'Ivoire 43.05 177 43.35 175Croatia 76.36 77 81.74 49Cyprus 82.09 46 84.45 34Czech Republic 76.15 80 80.69 53Denmark 91.94 12 92.11 7Djibouti 74.56 87 68.96 106Dominica 73.32 95 67.38 111Dominican Republic 76.25 79 60.70 129Ecuador 62.56 145 59.25 137Egypt, Arab Rep. 59.60 153 51.96 162El Salvador 62.65 144 49.51 166Equatorial Guinea 24.35 184 39.25 179Eritrea 43.49 175 56.82 147Estonia 84.53 32 88.04 21Ethiopia 65.88 132 72.06 90Fiji 67.09 124 67.55 110Finland 89.28 19 90.23 13France 74.15 88 78.72 63Gabon 55.48 162 53.00 161Gambia, The 47.96 171 48.08 171Georgia 87.50 24 87.43 22Germany 76.99 74 82.10 48Ghana 71.24 109 62.91 122
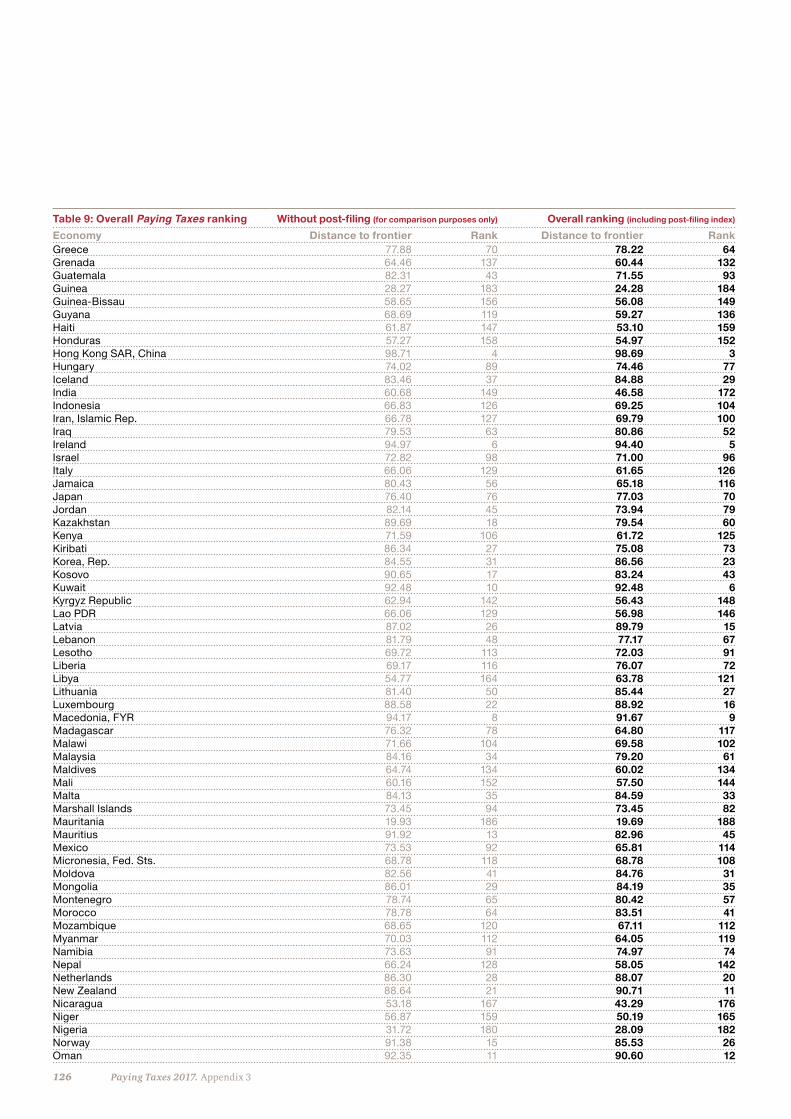
126 Paying Taxes 2017. Appendix 3
Table 9: Overall Paying Taxes ranking Without post-filing (for comparison purposes only) Overall ranking (including post-filing index)
Economy Distance to frontier Rank Distance to frontier Rank Greece 77.88 70 78.22 64Grenada 64.46 137 60.44 132Guatemala 82.31 43 71.55 93Guinea 28.27 183 24.28 184Guinea-Bissau 58.65 156 56.08 149Guyana 68.69 119 59.27 136Haiti 61.87 147 53.10 159Honduras 57.27 158 54.97 152Hong Kong SAR, China 98.71 4 98.69 3Hungary 74.02 89 74.46 77Iceland 83.46 37 84.88 29India 60.68 149 46.58 172Indonesia 66.83 126 69.25 104Iran, Islamic Rep. 66.78 127 69.79 100Iraq 79.53 63 80.86 52Ireland 94.97 6 94.40 5Israel 72.82 98 71.00 96Italy 66.06 129 61.65 126Jamaica 80.43 56 65.18 116Japan 76.40 76 77.03 70Jordan 82.14 45 73.94 79Kazakhstan 89.69 18 79.54 60Kenya 71.59 106 61.72 125Kiribati 86.34 27 75.08 73Korea, Rep. 84.55 31 86.56 23Kosovo 90.65 17 83.24 43Kuwait 92.48 10 92.48 6Kyrgyz Republic 62.94 142 56.43 148Lao PDR 66.06 129 56.98 146Latvia 87.02 26 89.79 15Lebanon 81.79 48 77.17 67Lesotho 69.72 113 72.03 91Liberia 69.17 116 76.07 72Libya 54.77 164 63.78 121Lithuania 81.40 50 85.44 27Luxembourg 88.58 22 88.92 16Macedonia, FYR 94.17 8 91.67 9Madagascar 76.32 78 64.80 117Malawi 71.66 104 69.58 102Malaysia 84.16 34 79.20 61Maldives 64.74 134 60.02 134Mali 60.16 152 57.50 144Malta 84.13 35 84.59 33Marshall Islands 73.45 94 73.45 82Mauritania 19.93 186 19.69 188Mauritius 91.92 13 82.96 45Mexico 73.53 92 65.81 114Micronesia, Fed. Sts. 68.78 118 68.78 108Moldova 82.56 41 84.76 31Mongolia 86.01 29 84.19 35Montenegro 78.74 65 80.42 57Morocco 78.78 64 83.51 41Mozambique 68.65 120 67.11 112Myanmar 70.03 112 64.05 119Namibia 73.63 91 74.97 74Nepal 66.24 128 58.05 142Netherlands 86.30 28 88.07 20New Zealand 88.64 21 90.71 11Nicaragua 53.18 167 43.29 176Niger 56.87 159 50.19 165Nigeria 31.72 180 28.09 182Norway 91.38 15 85.53 26Oman 92.35 11 90.60 12
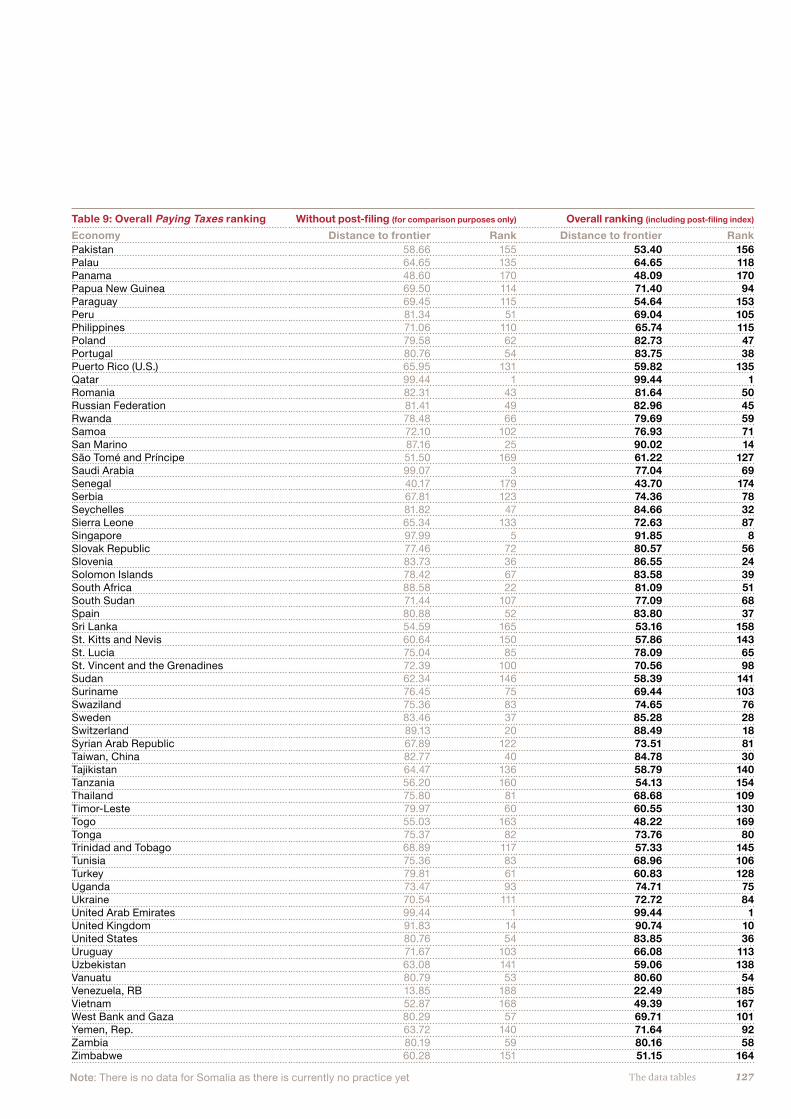
127The data tables
Table 9: Overall Paying Taxes ranking Without post-filing (for comparison purposes only) Overall ranking (including post-filing index)
Economy Distance to frontier Rank Distance to frontier Rank Pakistan 58.66 155 53.40 156Palau 64.65 135 64.65 118Panama 48.60 170 48.09 170Papua New Guinea 69.50 114 71.40 94Paraguay 69.45 115 54.64 153Peru 81.34 51 69.04 105Philippines 71.06 110 65.74 115Poland 79.58 62 82.73 47Portugal 80.76 54 83.75 38Puerto Rico (U.S.) 65.95 131 59.82 135Qatar 99.44 1 99.44 1Romania 82.31 43 81.64 50Russian Federation 81.41 49 82.96 45Rwanda 78.48 66 79.69 59Samoa 72.10 102 76.93 71San Marino 87.16 25 90.02 14São Tomé and Príncipe 51.50 169 61.22 127Saudi Arabia 99.07 3 77.04 69Senegal 40.17 179 43.70 174Serbia 67.81 123 74.36 78Seychelles 81.82 47 84.66 32Sierra Leone 65.34 133 72.63 87Singapore 97.99 5 91.85 8Slovak Republic 77.46 72 80.57 56Slovenia 83.73 36 86.55 24Solomon Islands 78.42 67 83.58 39South Africa 88.58 22 81.09 51South Sudan 71.44 107 77.09 68Spain 80.88 52 83.80 37Sri Lanka 54.59 165 53.16 158St. Kitts and Nevis 60.64 150 57.86 143St. Lucia 75.04 85 78.09 65St. Vincent and the Grenadines 72.39 100 70.56 98Sudan 62.34 146 58.39 141Suriname 76.45 75 69.44 103Swaziland 75.36 83 74.65 76Sweden 83.46 37 85.28 28Switzerland 89.13 20 88.49 18Syrian Arab Republic 67.89 122 73.51 81Taiwan, China 82.77 40 84.78 30Tajikistan 64.47 136 58.79 140Tanzania 56.20 160 54.13 154Thailand 75.80 81 68.68 109Timor-Leste 79.97 60 60.55 130Togo 55.03 163 48.22 169Tonga 75.37 82 73.76 80Trinidad and Tobago 68.89 117 57.33 145Tunisia 75.36 83 68.96 106Turkey 79.81 61 60.83 128Uganda 73.47 93 74.71 75Ukraine 70.54 111 72.72 84United Arab Emirates 99.44 1 99.44 1United Kingdom 91.83 14 90.74 10United States 80.76 54 83.85 36Uruguay 71.67 103 66.08 113Uzbekistan 63.08 141 59.06 138Vanuatu 80.79 53 80.60 54Venezuela, RB 13.85 188 22.49 185Vietnam 52.87 168 49.39 167West Bank and Gaza 80.29 57 69.71 101Yemen, Rep. 63.72 140 71.64 92Zambia 80.19 59 80.16 58Zimbabwe 60.28 151 51.15 164
Note: There is no data for Somalia as there is currently no practice yet
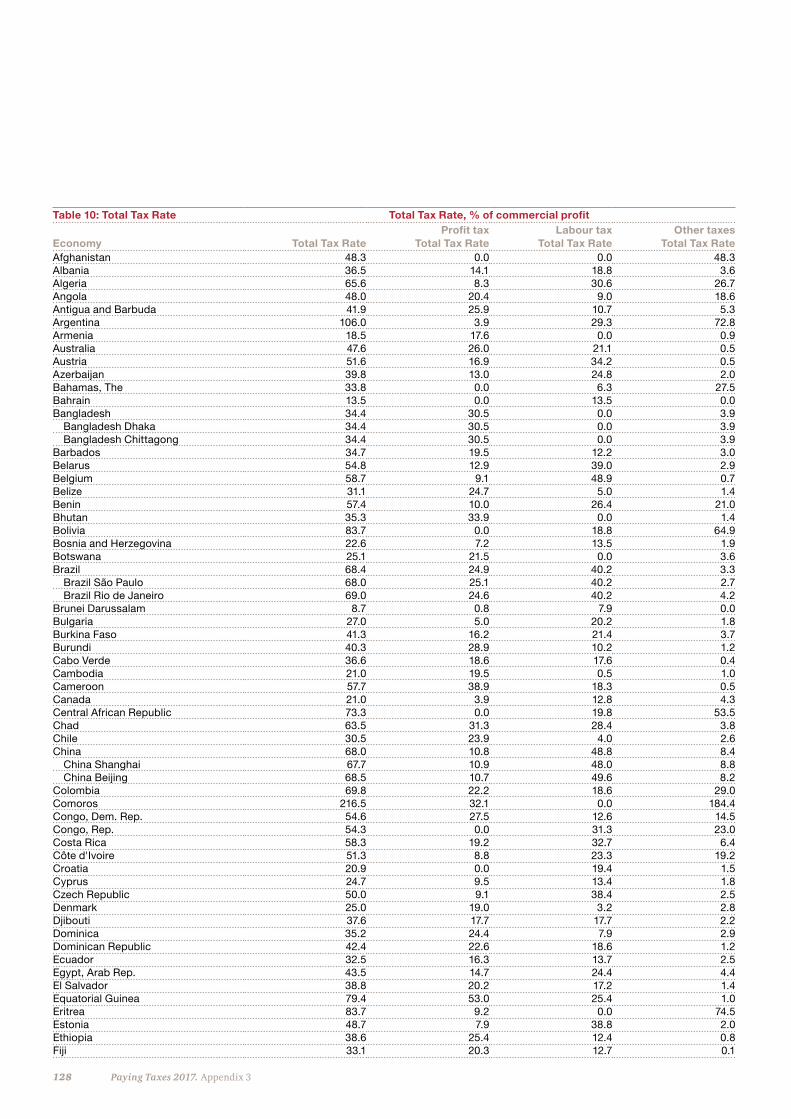
128 Paying Taxes 2017. Appendix 3
Table 10: Total Tax Rate Total Tax Rate, % of commercial profit
Economy Total Tax RateProfit tax
Total Tax RateLabour tax
Total Tax RateOther taxes
Total Tax RateAfghanistan 48.3 0.0 0.0 48.3Albania 36.5 14.1 18.8 3.6Algeria 65.6 8.3 30.6 26.7Angola 48.0 20.4 9.0 18.6Antigua and Barbuda 41.9 25.9 10.7 5.3Argentina 106.0 3.9 29.3 72.8Armenia 18.5 17.6 0.0 0.9Australia 47.6 26.0 21.1 0.5Austria 51.6 16.9 34.2 0.5Azerbaijan 39.8 13.0 24.8 2.0Bahamas, The 33.8 0.0 6.3 27.5Bahrain 13.5 0.0 13.5 0.0Bangladesh 34.4 30.5 0.0 3.9 Bangladesh Dhaka 34.4 30.5 0.0 3.9 Bangladesh Chittagong 34.4 30.5 0.0 3.9Barbados 34.7 19.5 12.2 3.0Belarus 54.8 12.9 39.0 2.9Belgium 58.7 9.1 48.9 0.7Belize 31.1 24.7 5.0 1.4Benin 57.4 10.0 26.4 21.0Bhutan 35.3 33.9 0.0 1.4Bolivia 83.7 0.0 18.8 64.9Bosnia and Herzegovina 22.6 7.2 13.5 1.9Botswana 25.1 21.5 0.0 3.6Brazil 68.4 24.9 40.2 3.3 Brazil São Paulo 68.0 25.1 40.2 2.7 Brazil Rio de Janeiro 69.0 24.6 40.2 4.2Brunei Darussalam 8.7 0.8 7.9 0.0Bulgaria 27.0 5.0 20.2 1.8Burkina Faso 41.3 16.2 21.4 3.7Burundi 40.3 28.9 10.2 1.2Cabo Verde 36.6 18.6 17.6 0.4Cambodia 21.0 19.5 0.5 1.0Cameroon 57.7 38.9 18.3 0.5Canada 21.0 3.9 12.8 4.3Central African Republic 73.3 0.0 19.8 53.5Chad 63.5 31.3 28.4 3.8Chile 30.5 23.9 4.0 2.6China 68.0 10.8 48.8 8.4 China Shanghai 67.7 10.9 48.0 8.8 China Beijing 68.5 10.7 49.6 8.2Colombia 69.8 22.2 18.6 29.0Comoros 216.5 32.1 0.0 184.4Congo, Dem. Rep. 54.6 27.5 12.6 14.5Congo, Rep. 54.3 0.0 31.3 23.0Costa Rica 58.3 19.2 32.7 6.4Côte d'Ivoire 51.3 8.8 23.3 19.2Croatia 20.9 0.0 19.4 1.5Cyprus 24.7 9.5 13.4 1.8Czech Republic 50.0 9.1 38.4 2.5Denmark 25.0 19.0 3.2 2.8Djibouti 37.6 17.7 17.7 2.2Dominica 35.2 24.4 7.9 2.9Dominican Republic 42.4 22.6 18.6 1.2Ecuador 32.5 16.3 13.7 2.5Egypt, Arab Rep. 43.5 14.7 24.4 4.4El Salvador 38.8 20.2 17.2 1.4Equatorial Guinea 79.4 53.0 25.4 1.0Eritrea 83.7 9.2 0.0 74.5Estonia 48.7 7.9 38.8 2.0Ethiopia 38.6 25.4 12.4 0.8Fiji 33.1 20.3 12.7 0.1
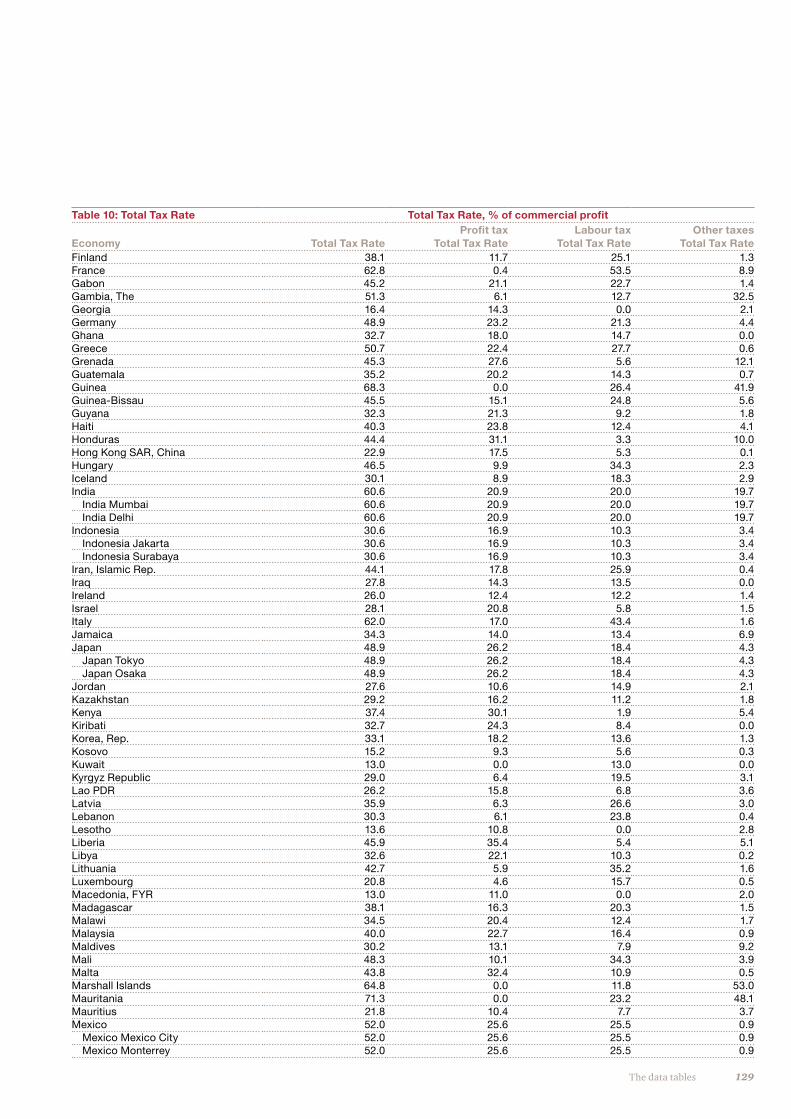
129The data tables
Table 10: Total Tax Rate Total Tax Rate, % of commercial profit
Economy Total Tax RateProfit tax
Total Tax RateLabour tax
Total Tax RateOther taxes
Total Tax RateFinland 38.1 11.7 25.1 1.3France 62.8 0.4 53.5 8.9Gabon 45.2 21.1 22.7 1.4Gambia, The 51.3 6.1 12.7 32.5Georgia 16.4 14.3 0.0 2.1Germany 48.9 23.2 21.3 4.4Ghana 32.7 18.0 14.7 0.0Greece 50.7 22.4 27.7 0.6Grenada 45.3 27.6 5.6 12.1Guatemala 35.2 20.2 14.3 0.7Guinea 68.3 0.0 26.4 41.9Guinea-Bissau 45.5 15.1 24.8 5.6Guyana 32.3 21.3 9.2 1.8Haiti 40.3 23.8 12.4 4.1Honduras 44.4 31.1 3.3 10.0Hong Kong SAR, China 22.9 17.5 5.3 0.1Hungary 46.5 9.9 34.3 2.3Iceland 30.1 8.9 18.3 2.9India 60.6 20.9 20.0 19.7 India Mumbai 60.6 20.9 20.0 19.7 India Delhi 60.6 20.9 20.0 19.7Indonesia 30.6 16.9 10.3 3.4 Indonesia Jakarta 30.6 16.9 10.3 3.4 Indonesia Surabaya 30.6 16.9 10.3 3.4Iran, Islamic Rep. 44.1 17.8 25.9 0.4Iraq 27.8 14.3 13.5 0.0Ireland 26.0 12.4 12.2 1.4Israel 28.1 20.8 5.8 1.5Italy 62.0 17.0 43.4 1.6Jamaica 34.3 14.0 13.4 6.9Japan 48.9 26.2 18.4 4.3 Japan Tokyo 48.9 26.2 18.4 4.3 Japan Osaka 48.9 26.2 18.4 4.3Jordan 27.6 10.6 14.9 2.1Kazakhstan 29.2 16.2 11.2 1.8Kenya 37.4 30.1 1.9 5.4Kiribati 32.7 24.3 8.4 0.0Korea, Rep. 33.1 18.2 13.6 1.3Kosovo 15.2 9.3 5.6 0.3Kuwait 13.0 0.0 13.0 0.0Kyrgyz Republic 29.0 6.4 19.5 3.1Lao PDR 26.2 15.8 6.8 3.6Latvia 35.9 6.3 26.6 3.0Lebanon 30.3 6.1 23.8 0.4Lesotho 13.6 10.8 0.0 2.8Liberia 45.9 35.4 5.4 5.1Libya 32.6 22.1 10.3 0.2Lithuania 42.7 5.9 35.2 1.6Luxembourg 20.8 4.6 15.7 0.5Macedonia, FYR 13.0 11.0 0.0 2.0Madagascar 38.1 16.3 20.3 1.5Malawi 34.5 20.4 12.4 1.7Malaysia 40.0 22.7 16.4 0.9Maldives 30.2 13.1 7.9 9.2Mali 48.3 10.1 34.3 3.9Malta 43.8 32.4 10.9 0.5Marshall Islands 64.8 0.0 11.8 53.0Mauritania 71.3 0.0 23.2 48.1Mauritius 21.8 10.4 7.7 3.7Mexico 52.0 25.6 25.5 0.9 Mexico Mexico City 52.0 25.6 25.5 0.9 Mexico Monterrey 52.0 25.6 25.5 0.9
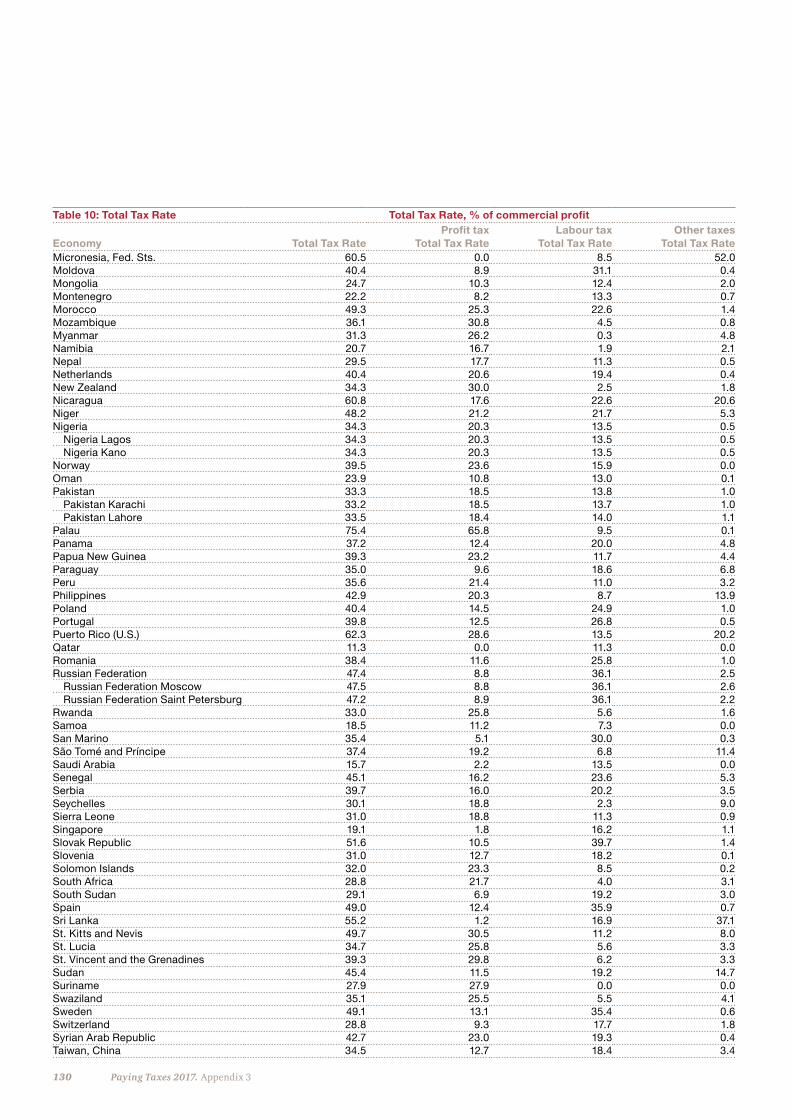
130 Paying Taxes 2017. Appendix 3
Table 10: Total Tax Rate Total Tax Rate, % of commercial profit
Economy Total Tax RateProfit tax
Total Tax RateLabour tax
Total Tax RateOther taxes
Total Tax RateMicronesia, Fed. Sts. 60.5 0.0 8.5 52.0Moldova 40.4 8.9 31.1 0.4Mongolia 24.7 10.3 12.4 2.0Montenegro 22.2 8.2 13.3 0.7Morocco 49.3 25.3 22.6 1.4Mozambique 36.1 30.8 4.5 0.8Myanmar 31.3 26.2 0.3 4.8Namibia 20.7 16.7 1.9 2.1Nepal 29.5 17.7 11.3 0.5Netherlands 40.4 20.6 19.4 0.4New Zealand 34.3 30.0 2.5 1.8Nicaragua 60.8 17.6 22.6 20.6Niger 48.2 21.2 21.7 5.3Nigeria 34.3 20.3 13.5 0.5 Nigeria Lagos 34.3 20.3 13.5 0.5 Nigeria Kano 34.3 20.3 13.5 0.5Norway 39.5 23.6 15.9 0.0Oman 23.9 10.8 13.0 0.1Pakistan 33.3 18.5 13.8 1.0 Pakistan Karachi 33.2 18.5 13.7 1.0 Pakistan Lahore 33.5 18.4 14.0 1.1Palau 75.4 65.8 9.5 0.1Panama 37.2 12.4 20.0 4.8Papua New Guinea 39.3 23.2 11.7 4.4Paraguay 35.0 9.6 18.6 6.8Peru 35.6 21.4 11.0 3.2Philippines 42.9 20.3 8.7 13.9Poland 40.4 14.5 24.9 1.0Portugal 39.8 12.5 26.8 0.5Puerto Rico (U.S.) 62.3 28.6 13.5 20.2Qatar 11.3 0.0 11.3 0.0Romania 38.4 11.6 25.8 1.0Russian Federation 47.4 8.8 36.1 2.5 Russian Federation Moscow 47.5 8.8 36.1 2.6 Russian Federation Saint Petersburg 47.2 8.9 36.1 2.2Rwanda 33.0 25.8 5.6 1.6Samoa 18.5 11.2 7.3 0.0San Marino 35.4 5.1 30.0 0.3São Tomé and Príncipe 37.4 19.2 6.8 11.4Saudi Arabia 15.7 2.2 13.5 0.0Senegal 45.1 16.2 23.6 5.3Serbia 39.7 16.0 20.2 3.5Seychelles 30.1 18.8 2.3 9.0Sierra Leone 31.0 18.8 11.3 0.9Singapore 19.1 1.8 16.2 1.1Slovak Republic 51.6 10.5 39.7 1.4Slovenia 31.0 12.7 18.2 0.1Solomon Islands 32.0 23.3 8.5 0.2South Africa 28.8 21.7 4.0 3.1South Sudan 29.1 6.9 19.2 3.0Spain 49.0 12.4 35.9 0.7Sri Lanka 55.2 1.2 16.9 37.1St. Kitts and Nevis 49.7 30.5 11.2 8.0St. Lucia 34.7 25.8 5.6 3.3St. Vincent and the Grenadines 39.3 29.8 6.2 3.3Sudan 45.4 11.5 19.2 14.7Suriname 27.9 27.9 0.0 0.0Swaziland 35.1 25.5 5.5 4.1Sweden 49.1 13.1 35.4 0.6Switzerland 28.8 9.3 17.7 1.8Syrian Arab Republic 42.7 23.0 19.3 0.4Taiwan, China 34.5 12.7 18.4 3.4
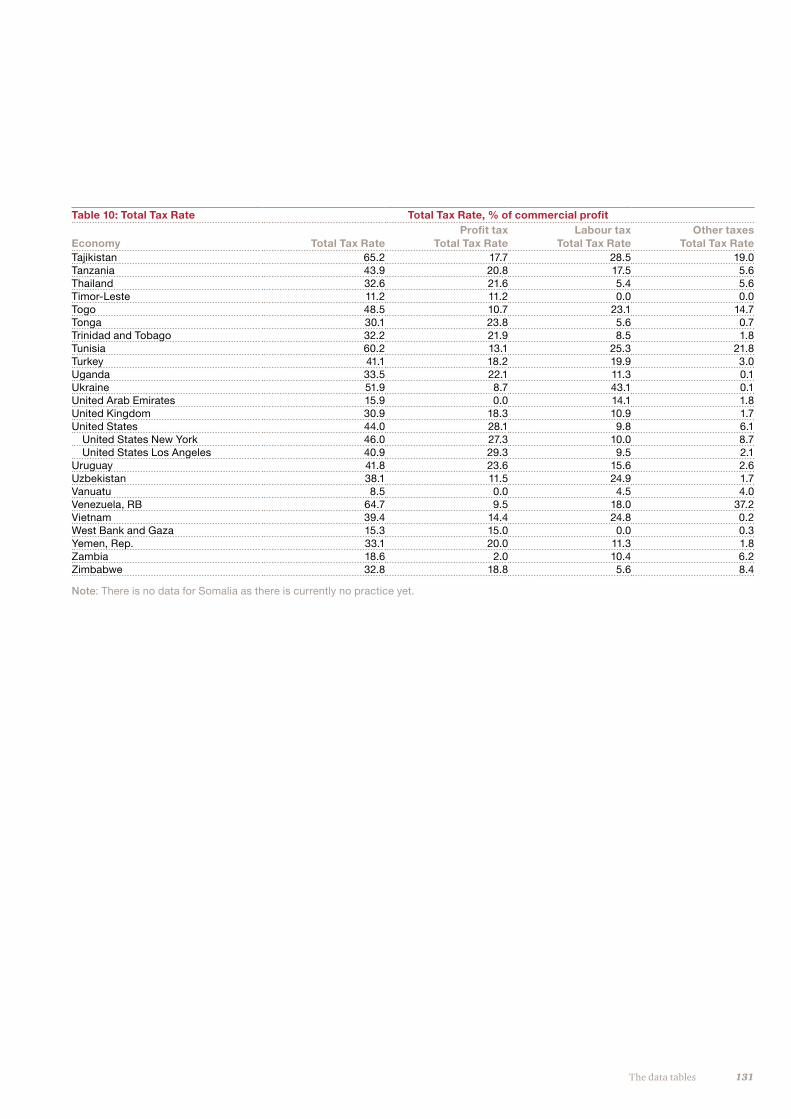
131The data tables
Table 10: Total Tax Rate Total Tax Rate, % of commercial profit
Economy Total Tax RateProfit tax
Total Tax RateLabour tax
Total Tax RateOther taxes
Total Tax RateTajikistan 65.2 17.7 28.5 19.0Tanzania 43.9 20.8 17.5 5.6Thailand 32.6 21.6 5.4 5.6Timor-Leste 11.2 11.2 0.0 0.0Togo 48.5 10.7 23.1 14.7Tonga 30.1 23.8 5.6 0.7Trinidad and Tobago 32.2 21.9 8.5 1.8Tunisia 60.2 13.1 25.3 21.8Turkey 41.1 18.2 19.9 3.0Uganda 33.5 22.1 11.3 0.1Ukraine 51.9 8.7 43.1 0.1United Arab Emirates 15.9 0.0 14.1 1.8United Kingdom 30.9 18.3 10.9 1.7United States 44.0 28.1 9.8 6.1 United States New York 46.0 27.3 10.0 8.7 United States Los Angeles 40.9 29.3 9.5 2.1Uruguay 41.8 23.6 15.6 2.6Uzbekistan 38.1 11.5 24.9 1.7Vanuatu 8.5 0.0 4.5 4.0Venezuela, RB 64.7 9.5 18.0 37.2Vietnam 39.4 14.4 24.8 0.2West Bank and Gaza 15.3 15.0 0.0 0.3Yemen, Rep. 33.1 20.0 11.3 1.8Zambia 18.6 2.0 10.4 6.2Zimbabwe 32.8 18.8 5.6 8.4
Note: There is no data for Somalia as there is currently no practice yet.
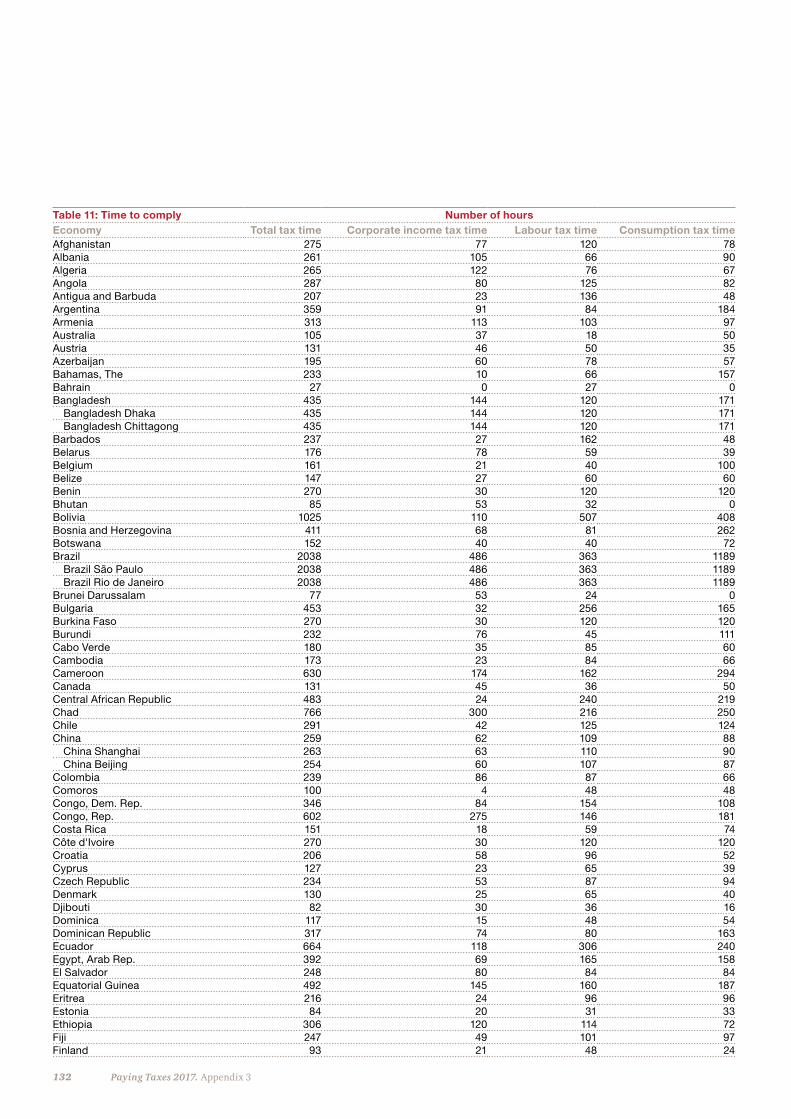
132 Paying Taxes 2017. Appendix 3
Table 11: Time to comply Number of hoursEconomy Total tax time Corporate income tax time Labour tax time Consumption tax time Afghanistan 275 77 120 78Albania 261 105 66 90Algeria 265 122 76 67Angola 287 80 125 82Antigua and Barbuda 207 23 136 48Argentina 359 91 84 184Armenia 313 113 103 97Australia 105 37 18 50Austria 131 46 50 35Azerbaijan 195 60 78 57Bahamas, The 233 10 66 157Bahrain 27 0 27 0Bangladesh 435 144 120 171 Bangladesh Dhaka 435 144 120 171 Bangladesh Chittagong 435 144 120 171Barbados 237 27 162 48Belarus 176 78 59 39Belgium 161 21 40 100Belize 147 27 60 60Benin 270 30 120 120Bhutan 85 53 32 0Bolivia 1025 110 507 408Bosnia and Herzegovina 411 68 81 262Botswana 152 40 40 72Brazil 2038 486 363 1189 Brazil São Paulo 2038 486 363 1189 Brazil Rio de Janeiro 2038 486 363 1189Brunei Darussalam 77 53 24 0Bulgaria 453 32 256 165Burkina Faso 270 30 120 120Burundi 232 76 45 111Cabo Verde 180 35 85 60Cambodia 173 23 84 66Cameroon 630 174 162 294Canada 131 45 36 50Central African Republic 483 24 240 219Chad 766 300 216 250Chile 291 42 125 124China 259 62 109 88 China Shanghai 263 63 110 90 China Beijing 254 60 107 87Colombia 239 86 87 66Comoros 100 4 48 48Congo, Dem. Rep. 346 84 154 108Congo, Rep. 602 275 146 181Costa Rica 151 18 59 74Côte d'Ivoire 270 30 120 120Croatia 206 58 96 52Cyprus 127 23 65 39Czech Republic 234 53 87 94Denmark 130 25 65 40Djibouti 82 30 36 16Dominica 117 15 48 54Dominican Republic 317 74 80 163Ecuador 664 118 306 240Egypt, Arab Rep. 392 69 165 158El Salvador 248 80 84 84Equatorial Guinea 492 145 160 187Eritrea 216 24 96 96Estonia 84 20 31 33Ethiopia 306 120 114 72Fiji 247 49 101 97Finland 93 21 48 24
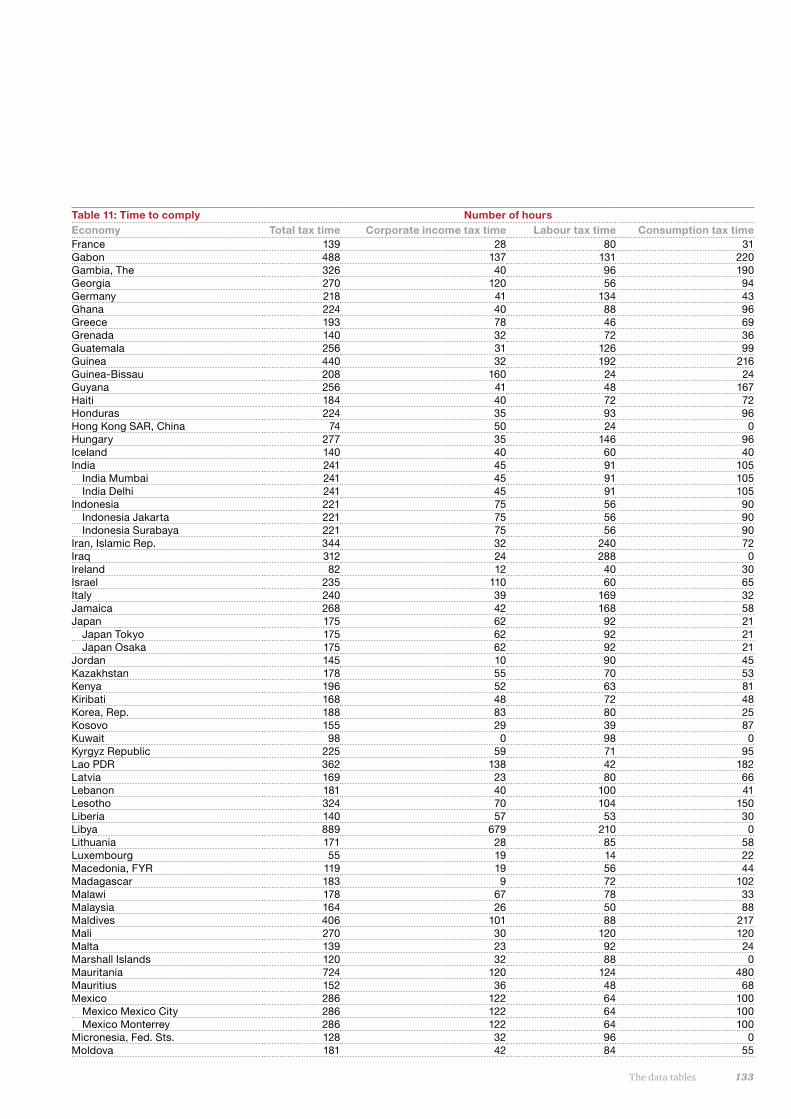
133The data tables
Table 11: Time to comply Number of hoursEconomy Total tax time Corporate income tax time Labour tax time Consumption tax time France 139 28 80 31Gabon 488 137 131 220Gambia, The 326 40 96 190Georgia 270 120 56 94Germany 218 41 134 43Ghana 224 40 88 96Greece 193 78 46 69Grenada 140 32 72 36Guatemala 256 31 126 99Guinea 440 32 192 216Guinea-Bissau 208 160 24 24Guyana 256 41 48 167Haiti 184 40 72 72Honduras 224 35 93 96Hong Kong SAR, China 74 50 24 0Hungary 277 35 146 96Iceland 140 40 60 40India 241 45 91 105 India Mumbai 241 45 91 105 India Delhi 241 45 91 105Indonesia 221 75 56 90 Indonesia Jakarta 221 75 56 90 Indonesia Surabaya 221 75 56 90Iran, Islamic Rep. 344 32 240 72Iraq 312 24 288 0Ireland 82 12 40 30Israel 235 110 60 65Italy 240 39 169 32Jamaica 268 42 168 58Japan 175 62 92 21 Japan Tokyo 175 62 92 21 Japan Osaka 175 62 92 21Jordan 145 10 90 45Kazakhstan 178 55 70 53Kenya 196 52 63 81Kiribati 168 48 72 48Korea, Rep. 188 83 80 25Kosovo 155 29 39 87Kuwait 98 0 98 0Kyrgyz Republic 225 59 71 95Lao PDR 362 138 42 182Latvia 169 23 80 66Lebanon 181 40 100 41Lesotho 324 70 104 150Liberia 140 57 53 30Libya 889 679 210 0Lithuania 171 28 85 58Luxembourg 55 19 14 22Macedonia, FYR 119 19 56 44Madagascar 183 9 72 102Malawi 178 67 78 33Malaysia 164 26 50 88Maldives 406 101 88 217Mali 270 30 120 120Malta 139 23 92 24Marshall Islands 120 32 88 0Mauritania 724 120 124 480Mauritius 152 36 48 68Mexico 286 122 64 100 Mexico Mexico City 286 122 64 100 Mexico Monterrey 286 122 64 100Micronesia, Fed. Sts. 128 32 96 0Moldova 181 42 84 55
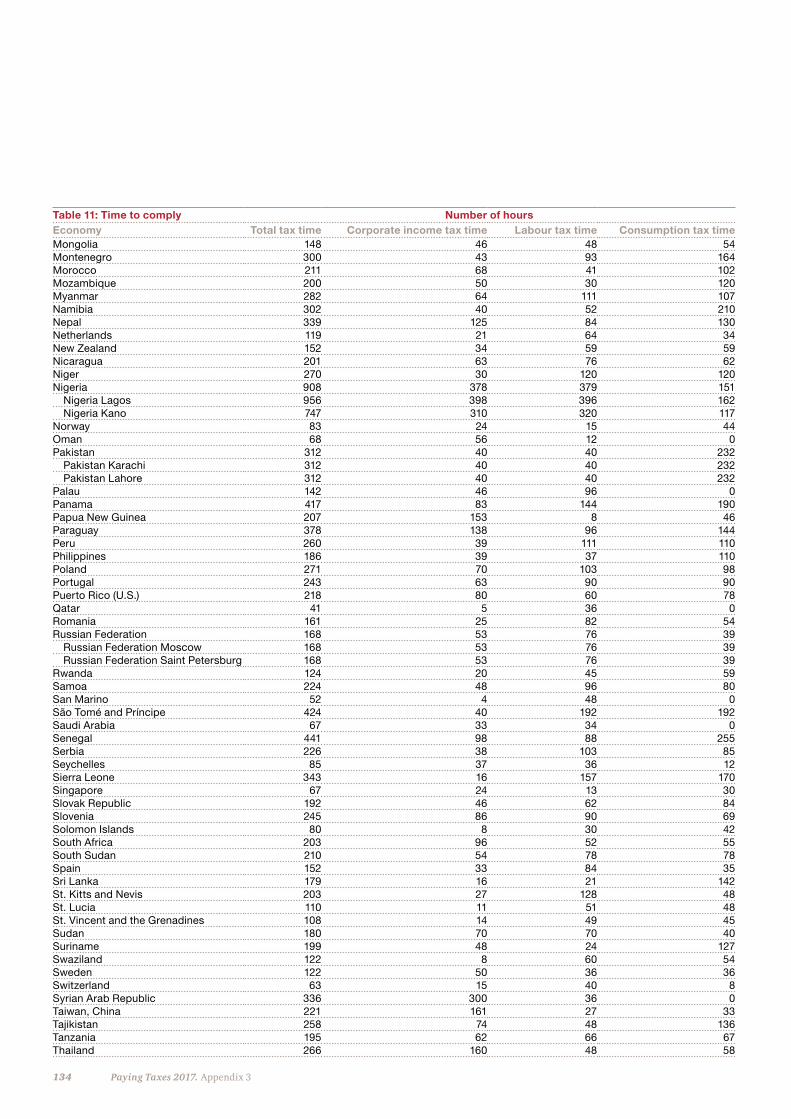
134 Paying Taxes 2017. Appendix 3
Table 11: Time to comply Number of hoursEconomy Total tax time Corporate income tax time Labour tax time Consumption tax time Mongolia 148 46 48 54Montenegro 300 43 93 164Morocco 211 68 41 102Mozambique 200 50 30 120Myanmar 282 64 111 107Namibia 302 40 52 210Nepal 339 125 84 130Netherlands 119 21 64 34New Zealand 152 34 59 59Nicaragua 201 63 76 62Niger 270 30 120 120Nigeria 908 378 379 151 Nigeria Lagos 956 398 396 162 Nigeria Kano 747 310 320 117Norway 83 24 15 44Oman 68 56 12 0Pakistan 312 40 40 232 Pakistan Karachi 312 40 40 232 Pakistan Lahore 312 40 40 232Palau 142 46 96 0Panama 417 83 144 190Papua New Guinea 207 153 8 46Paraguay 378 138 96 144Peru 260 39 111 110Philippines 186 39 37 110Poland 271 70 103 98Portugal 243 63 90 90Puerto Rico (U.S.) 218 80 60 78Qatar 41 5 36 0Romania 161 25 82 54Russian Federation 168 53 76 39 Russian Federation Moscow 168 53 76 39 Russian Federation Saint Petersburg 168 53 76 39Rwanda 124 20 45 59Samoa 224 48 96 80San Marino 52 4 48 0São Tomé and Príncipe 424 40 192 192Saudi Arabia 67 33 34 0Senegal 441 98 88 255Serbia 226 38 103 85Seychelles 85 37 36 12Sierra Leone 343 16 157 170Singapore 67 24 13 30Slovak Republic 192 46 62 84Slovenia 245 86 90 69Solomon Islands 80 8 30 42South Africa 203 96 52 55South Sudan 210 54 78 78Spain 152 33 84 35Sri Lanka 179 16 21 142St. Kitts and Nevis 203 27 128 48St. Lucia 110 11 51 48St. Vincent and the Grenadines 108 14 49 45Sudan 180 70 70 40Suriname 199 48 24 127Swaziland 122 8 60 54Sweden 122 50 36 36Switzerland 63 15 40 8Syrian Arab Republic 336 300 36 0Taiwan, China 221 161 27 33Tajikistan 258 74 48 136Tanzania 195 62 66 67Thailand 266 160 48 58
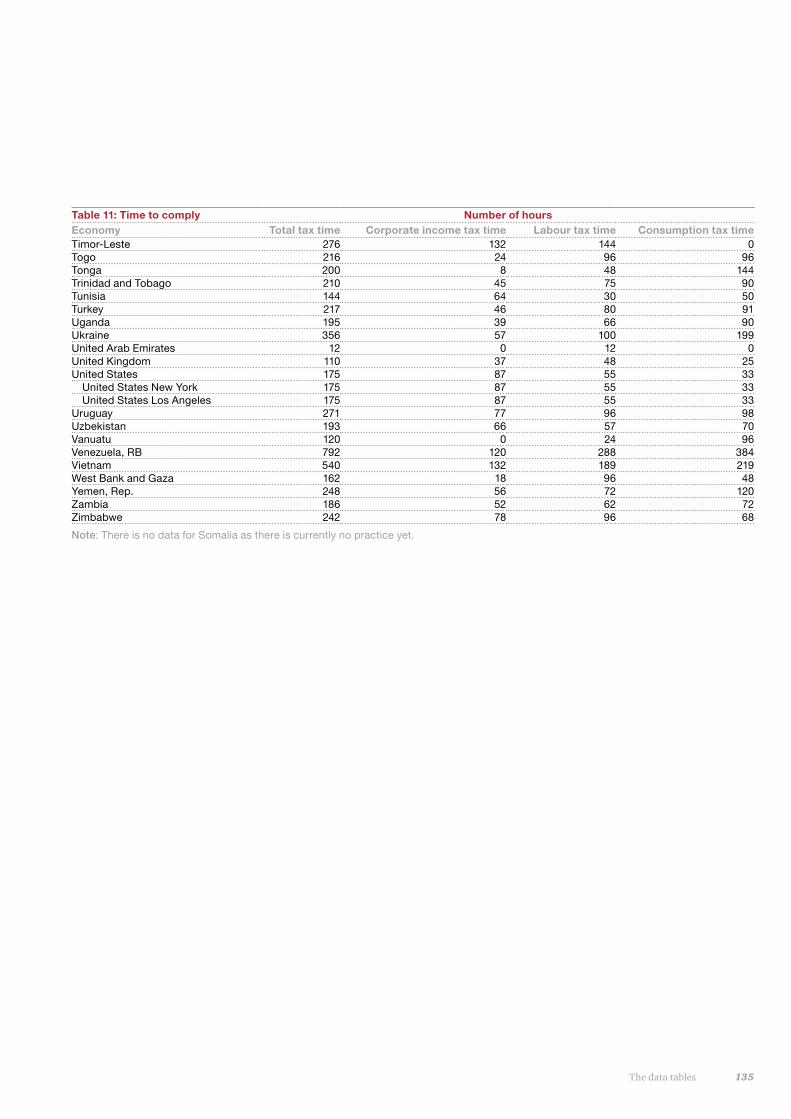
135The data tables
Table 11: Time to comply Number of hoursEconomy Total tax time Corporate income tax time Labour tax time Consumption tax time Timor-Leste 276 132 144 0Togo 216 24 96 96Tonga 200 8 48 144Trinidad and Tobago 210 45 75 90Tunisia 144 64 30 50Turkey 217 46 80 91Uganda 195 39 66 90Ukraine 356 57 100 199United Arab Emirates 12 0 12 0United Kingdom 110 37 48 25United States 175 87 55 33 United States New York 175 87 55 33 United States Los Angeles 175 87 55 33Uruguay 271 77 96 98Uzbekistan 193 66 57 70Vanuatu 120 0 24 96Venezuela, RB 792 120 288 384Vietnam 540 132 189 219West Bank and Gaza 162 18 96 48Yemen, Rep. 248 56 72 120Zambia 186 52 62 72Zimbabwe 242 78 96 68
Note: There is no data for Somalia as there is currently no practice yet.
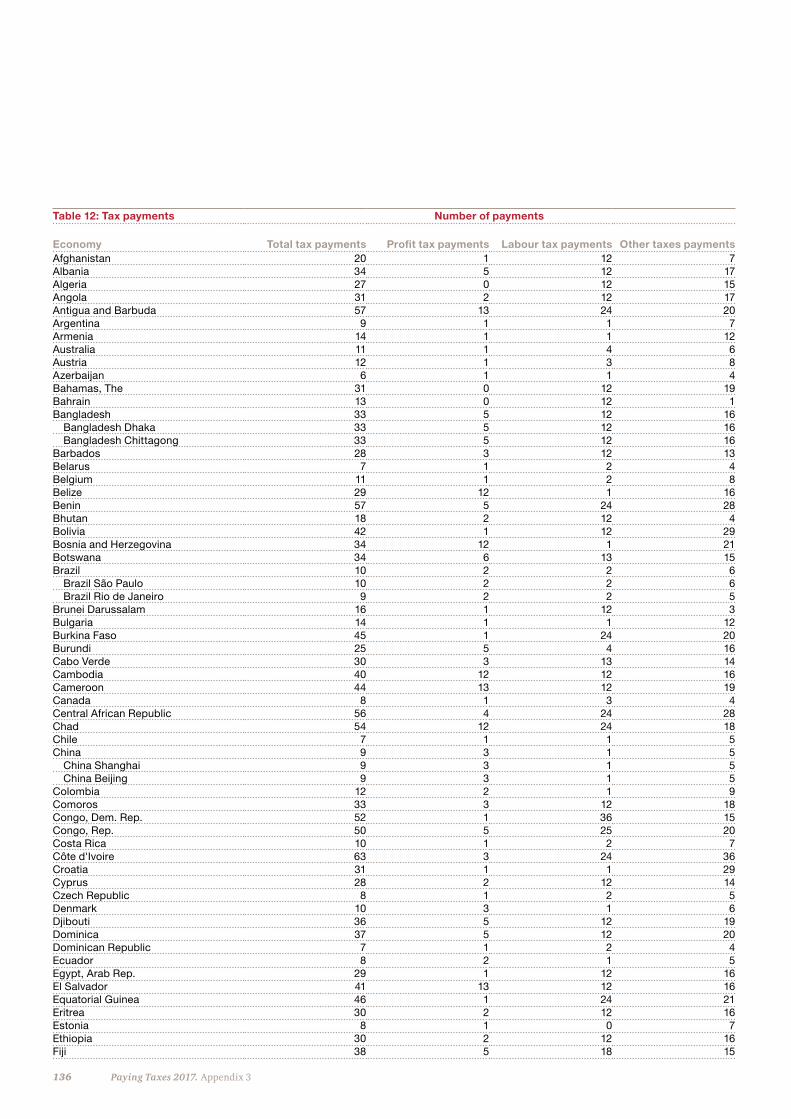
136 Paying Taxes 2017. Appendix 3
Table 12: Tax payments Number of payments
Economy Total tax payments Profit tax payments Labour tax payments Other taxes payments Afghanistan 20 1 12 7Albania 34 5 12 17Algeria 27 0 12 15Angola 31 2 12 17Antigua and Barbuda 57 13 24 20Argentina 9 1 1 7Armenia 14 1 1 12Australia 11 1 4 6Austria 12 1 3 8Azerbaijan 6 1 1 4Bahamas, The 31 0 12 19Bahrain 13 0 12 1Bangladesh 33 5 12 16 Bangladesh Dhaka 33 5 12 16 Bangladesh Chittagong 33 5 12 16Barbados 28 3 12 13Belarus 7 1 2 4Belgium 11 1 2 8Belize 29 12 1 16Benin 57 5 24 28Bhutan 18 2 12 4Bolivia 42 1 12 29Bosnia and Herzegovina 34 12 1 21Botswana 34 6 13 15Brazil 10 2 2 6 Brazil São Paulo 10 2 2 6 Brazil Rio de Janeiro 9 2 2 5Brunei Darussalam 16 1 12 3Bulgaria 14 1 1 12Burkina Faso 45 1 24 20Burundi 25 5 4 16Cabo Verde 30 3 13 14Cambodia 40 12 12 16Cameroon 44 13 12 19Canada 8 1 3 4Central African Republic 56 4 24 28Chad 54 12 24 18Chile 7 1 1 5China 9 3 1 5 China Shanghai 9 3 1 5 China Beijing 9 3 1 5Colombia 12 2 1 9Comoros 33 3 12 18Congo, Dem. Rep. 52 1 36 15Congo, Rep. 50 5 25 20Costa Rica 10 1 2 7Côte d'Ivoire 63 3 24 36Croatia 31 1 1 29Cyprus 28 2 12 14Czech Republic 8 1 2 5Denmark 10 3 1 6Djibouti 36 5 12 19Dominica 37 5 12 20Dominican Republic 7 1 2 4Ecuador 8 2 1 5Egypt, Arab Rep. 29 1 12 16El Salvador 41 13 12 16Equatorial Guinea 46 1 24 21Eritrea 30 2 12 16Estonia 8 1 0 7Ethiopia 30 2 12 16Fiji 38 5 18 15
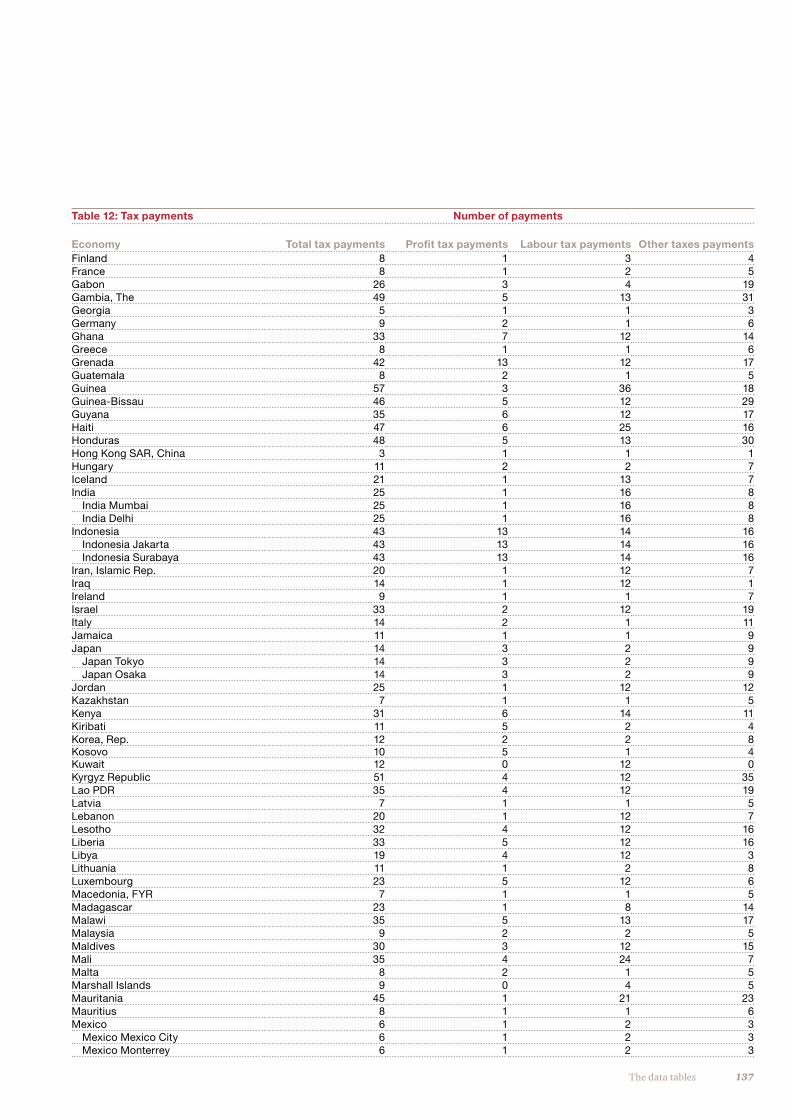
137The data tables
Table 12: Tax payments Number of payments
Economy Total tax payments Profit tax payments Labour tax payments Other taxes payments Finland 8 1 3 4France 8 1 2 5Gabon 26 3 4 19Gambia, The 49 5 13 31Georgia 5 1 1 3Germany 9 2 1 6Ghana 33 7 12 14Greece 8 1 1 6Grenada 42 13 12 17Guatemala 8 2 1 5Guinea 57 3 36 18Guinea-Bissau 46 5 12 29Guyana 35 6 12 17Haiti 47 6 25 16Honduras 48 5 13 30Hong Kong SAR, China 3 1 1 1Hungary 11 2 2 7Iceland 21 1 13 7India 25 1 16 8 India Mumbai 25 1 16 8 India Delhi 25 1 16 8Indonesia 43 13 14 16 Indonesia Jakarta 43 13 14 16 Indonesia Surabaya 43 13 14 16Iran, Islamic Rep. 20 1 12 7Iraq 14 1 12 1Ireland 9 1 1 7Israel 33 2 12 19Italy 14 2 1 11Jamaica 11 1 1 9Japan 14 3 2 9 Japan Tokyo 14 3 2 9 Japan Osaka 14 3 2 9Jordan 25 1 12 12Kazakhstan 7 1 1 5Kenya 31 6 14 11Kiribati 11 5 2 4Korea, Rep. 12 2 2 8Kosovo 10 5 1 4Kuwait 12 0 12 0Kyrgyz Republic 51 4 12 35Lao PDR 35 4 12 19Latvia 7 1 1 5Lebanon 20 1 12 7Lesotho 32 4 12 16Liberia 33 5 12 16Libya 19 4 12 3Lithuania 11 1 2 8Luxembourg 23 5 12 6Macedonia, FYR 7 1 1 5Madagascar 23 1 8 14Malawi 35 5 13 17Malaysia 9 2 2 5Maldives 30 3 12 15Mali 35 4 24 7Malta 8 2 1 5Marshall Islands 9 0 4 5Mauritania 45 1 21 23Mauritius 8 1 1 6Mexico 6 1 2 3 Mexico Mexico City 6 1 2 3 Mexico Monterrey 6 1 2 3
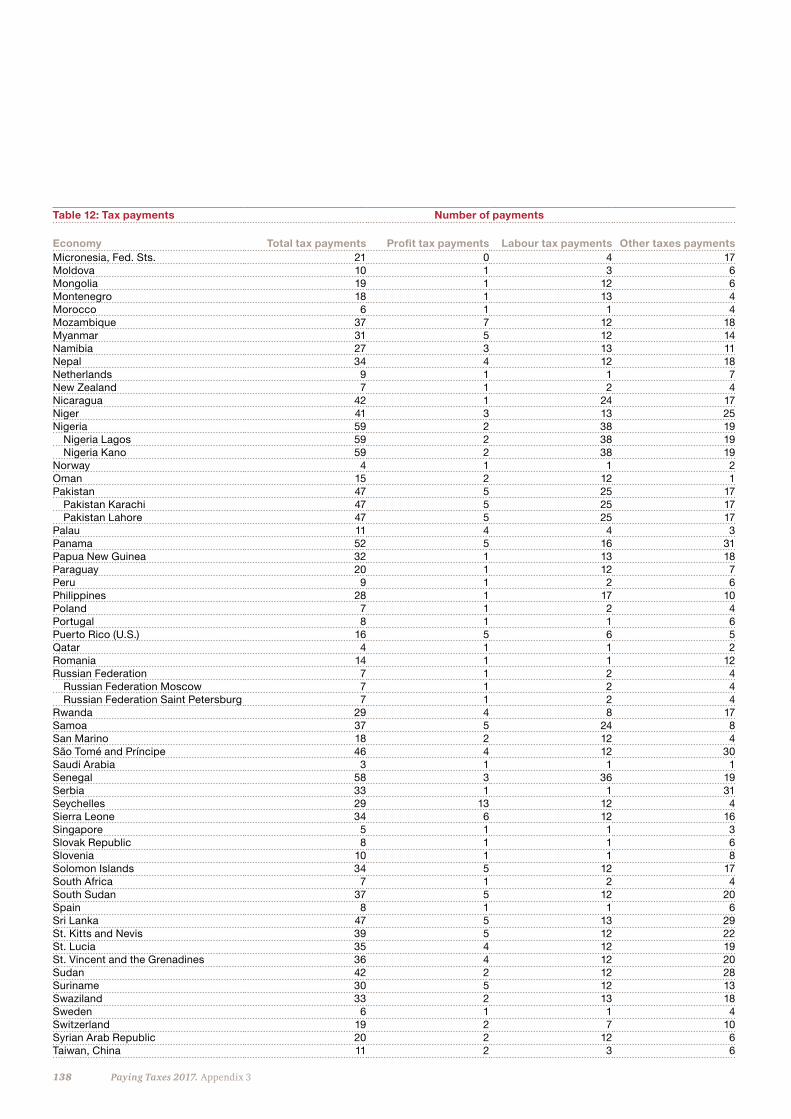
138 Paying Taxes 2017. Appendix 3
Table 12: Tax payments Number of payments
Economy Total tax payments Profit tax payments Labour tax payments Other taxes payments Micronesia, Fed. Sts. 21 0 4 17Moldova 10 1 3 6Mongolia 19 1 12 6Montenegro 18 1 13 4Morocco 6 1 1 4Mozambique 37 7 12 18Myanmar 31 5 12 14Namibia 27 3 13 11Nepal 34 4 12 18Netherlands 9 1 1 7New Zealand 7 1 2 4Nicaragua 42 1 24 17Niger 41 3 13 25Nigeria 59 2 38 19 Nigeria Lagos 59 2 38 19 Nigeria Kano 59 2 38 19Norway 4 1 1 2Oman 15 2 12 1Pakistan 47 5 25 17 Pakistan Karachi 47 5 25 17 Pakistan Lahore 47 5 25 17Palau 11 4 4 3Panama 52 5 16 31Papua New Guinea 32 1 13 18Paraguay 20 1 12 7Peru 9 1 2 6Philippines 28 1 17 10Poland 7 1 2 4Portugal 8 1 1 6Puerto Rico (U.S.) 16 5 6 5Qatar 4 1 1 2Romania 14 1 1 12Russian Federation 7 1 2 4 Russian Federation Moscow 7 1 2 4 Russian Federation Saint Petersburg 7 1 2 4Rwanda 29 4 8 17Samoa 37 5 24 8San Marino 18 2 12 4São Tomé and Príncipe 46 4 12 30Saudi Arabia 3 1 1 1Senegal 58 3 36 19Serbia 33 1 1 31Seychelles 29 13 12 4Sierra Leone 34 6 12 16Singapore 5 1 1 3Slovak Republic 8 1 1 6Slovenia 10 1 1 8Solomon Islands 34 5 12 17South Africa 7 1 2 4South Sudan 37 5 12 20Spain 8 1 1 6Sri Lanka 47 5 13 29St. Kitts and Nevis 39 5 12 22St. Lucia 35 4 12 19St. Vincent and the Grenadines 36 4 12 20Sudan 42 2 12 28Suriname 30 5 12 13Swaziland 33 2 13 18Sweden 6 1 1 4Switzerland 19 2 7 10Syrian Arab Republic 20 2 12 6Taiwan, China 11 2 3 6
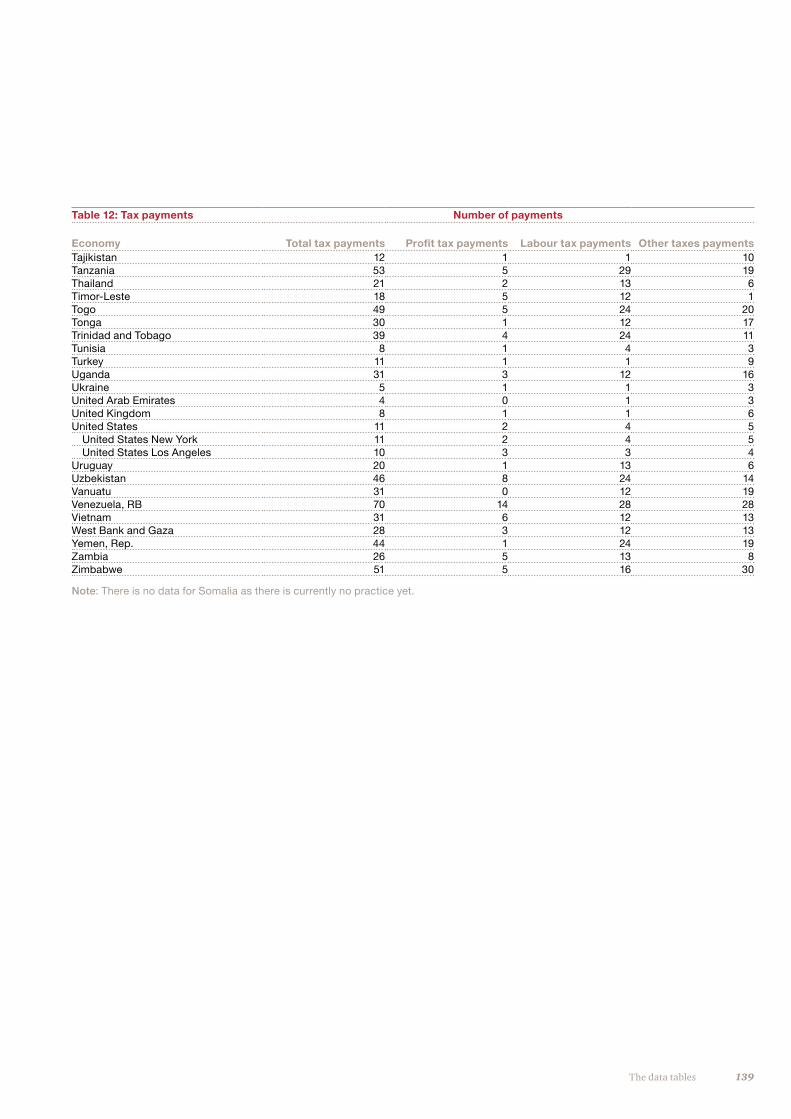
139The data tables
Table 12: Tax payments Number of payments
Economy Total tax payments Profit tax payments Labour tax payments Other taxes payments Tajikistan 12 1 1 10Tanzania 53 5 29 19Thailand 21 2 13 6Timor-Leste 18 5 12 1Togo 49 5 24 20Tonga 30 1 12 17Trinidad and Tobago 39 4 24 11Tunisia 8 1 4 3Turkey 11 1 1 9Uganda 31 3 12 16Ukraine 5 1 1 3United Arab Emirates 4 0 1 3United Kingdom 8 1 1 6United States 11 2 4 5 United States New York 11 2 4 5 United States Los Angeles 10 3 3 4Uruguay 20 1 13 6Uzbekistan 46 8 24 14Vanuatu 31 0 12 19Venezuela, RB 70 14 28 28Vietnam 31 6 12 13West Bank and Gaza 28 3 12 13Yemen, Rep. 44 1 24 19Zambia 26 5 13 8Zimbabwe 51 5 16 30
Note: There is no data for Somalia as there is currently no practice yet.
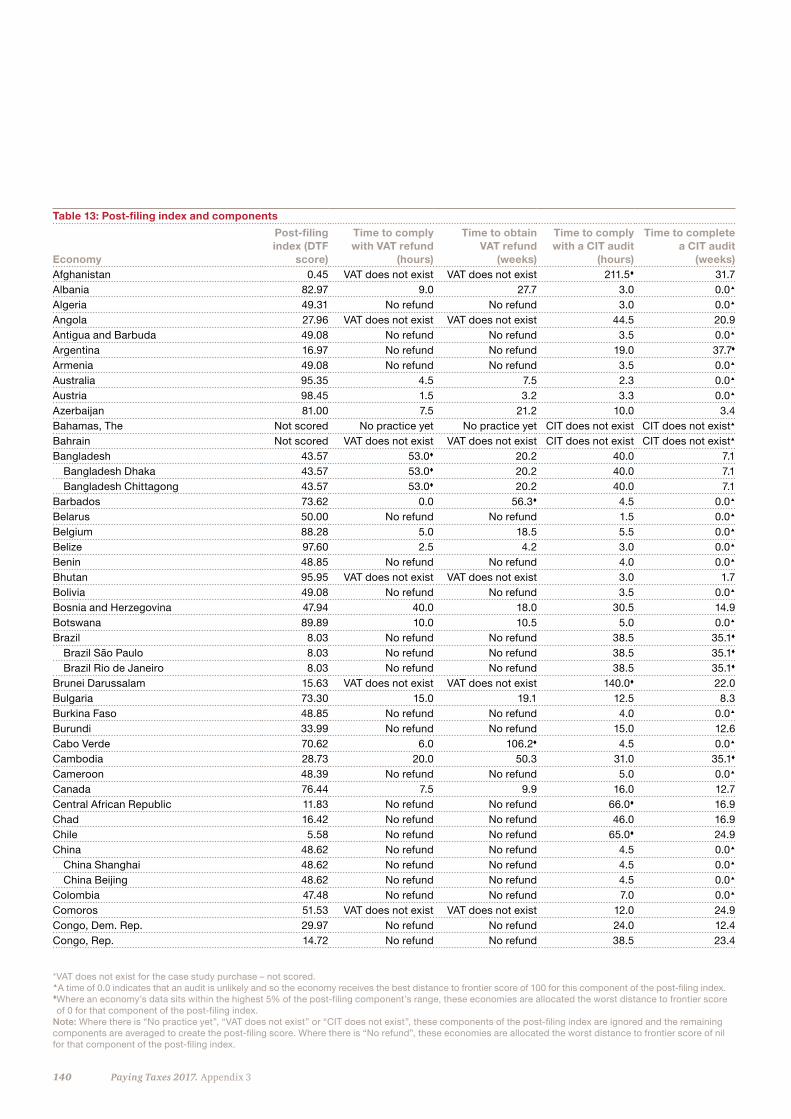
140 Paying Taxes 2017. Appendix 3
Table 13: Post-filing index and components
Economy
Post-filing index (DTF
score)
Time to comply with VAT refund
(hours)
Time to obtain VAT refund
(weeks)
Time to comply with a CIT audit
(hours)
Time to complete a CIT audit
(weeks)Afghanistan 0.45 VAT does not exist VAT does not exist 211.5 31.7 Albania 82.97 9.0 27.7 3.0 0.0
Algeria 49.31 No refund No refund 3.0 0.0
Angola 27.96 VAT does not exist VAT does not exist 44.5 20.9 Antigua and Barbuda 49.08 No refund No refund 3.5 0.0
Argentina 16.97 No refund No refund 19.0 37.7 Armenia 49.08 No refund No refund 3.5 0.0
Australia 95.35 4.5 7.5 2.3 0.0
Austria 98.45 1.5 3.2 3.3 0.0
Azerbaijan 81.00 7.5 21.2 10.0 3.4 Bahamas, The Not scored No practice yet No practice yet CIT does not exist CIT does not exist
Bahrain Not scored VAT does not exist VAT does not exist CIT does not exist CIT does not exist
Bangladesh 43.57 53.0 20.2 40.0 7.1 Bangladesh Dhaka 43.57 53.0 20.2 40.0 7.1 Bangladesh Chittagong 43.57 53.0 20.2 40.0 7.1 Barbados 73.62 0.0 56.3 4.5 0.0
Belarus 50.00 No refund No refund 1.5 0.0
Belgium 88.28 5.0 18.5 5.5 0.0
Belize 97.60 2.5 4.2 3.0 0.0
Benin 48.85 No refund No refund 4.0 0.0
Bhutan 95.95 VAT does not exist VAT does not exist 3.0 1.7 Bolivia 49.08 No refund No refund 3.5 0.0
Bosnia and Herzegovina 47.94 40.0 18.0 30.5 14.9 Botswana 89.89 10.0 10.5 5.0 0.0
Brazil 8.03 No refund No refund 38.5 35.1 Brazil São Paulo 8.03 No refund No refund 38.5 35.1 Brazil Rio de Janeiro 8.03 No refund No refund 38.5 35.1 Brunei Darussalam 15.63 VAT does not exist VAT does not exist 140.0 22.0 Bulgaria 73.30 15.0 19.1 12.5 8.3 Burkina Faso 48.85 No refund No refund 4.0 0.0
Burundi 33.99 No refund No refund 15.0 12.6 Cabo Verde 70.62 6.0 106.2 4.5 0.0
Cambodia 28.73 20.0 50.3 31.0 35.1 Cameroon 48.39 No refund No refund 5.0 0.0
Canada 76.44 7.5 9.9 16.0 12.7 Central African Republic 11.83 No refund No refund 66.0 16.9 Chad 16.42 No refund No refund 46.0 16.9 Chile 5.58 No refund No refund 65.0 24.9 China 48.62 No refund No refund 4.5 0.0
China Shanghai 48.62 No refund No refund 4.5 0.0
China Beijing 48.62 No refund No refund 4.5 0.0
Colombia 47.48 No refund No refund 7.0 0.0
Comoros 51.53 VAT does not exist VAT does not exist 12.0 24.9 Congo, Dem. Rep. 29.97 No refund No refund 24.0 12.4 Congo, Rep. 14.72 No refund No refund 38.5 23.4
*VAT does not exist for the case study purchase – not scored.A time of 0.0 indicates that an audit is unlikely and so the economy receives the best distance to frontier score of 100 for this component of the post-filing index.�Where an economy’s data sits within the highest 5% of the post-filing component’s range, these economies are allocated the worst distance to frontier score of 0 for that component of the post-filing index.
Note: Where there is “No practice yet”, “VAT does not exist” or “CIT does not exist”, these components of the post-filing index are ignored and the remaining components are averaged to create the post-filing score. Where there is “No refund”, these economies are allocated the worst distance to frontier score of nil for that component of the post-filing index.
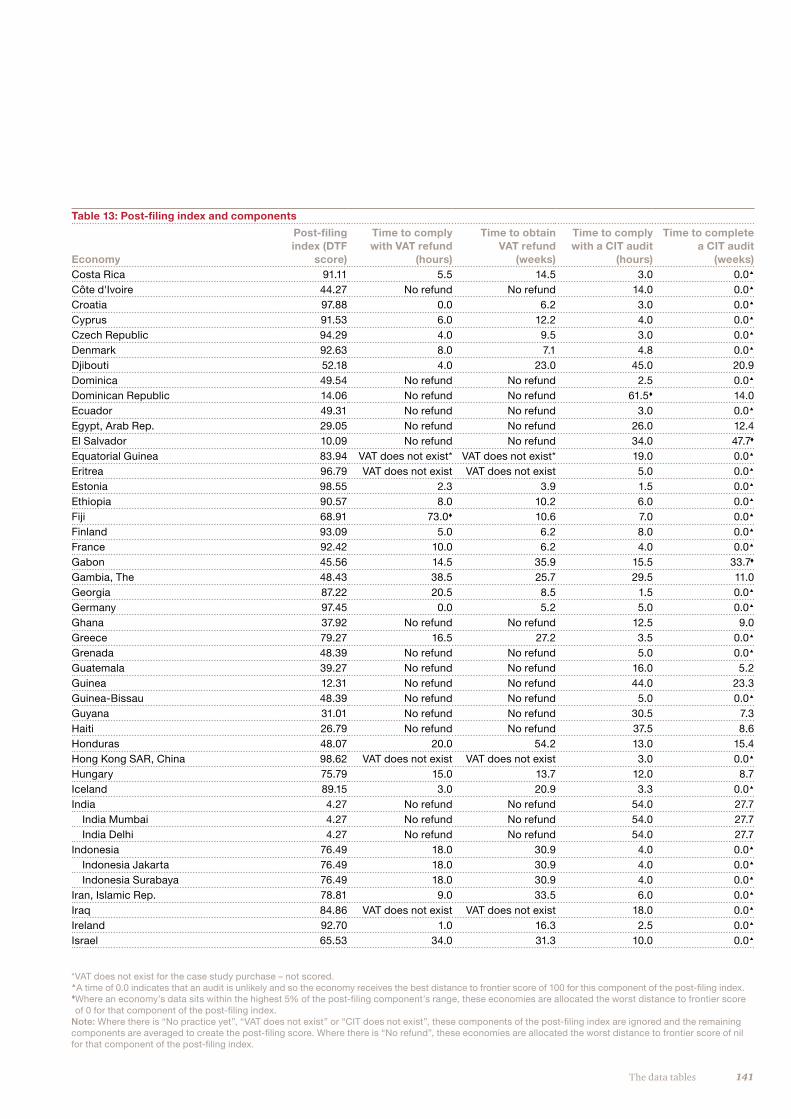
141The data tables
Table 13: Post-filing index and components
Economy
Post-filing index (DTF
score)
Time to comply with VAT refund
(hours)
Time to obtain VAT refund
(weeks)
Time to comply with a CIT audit
(hours)
Time to complete a CIT audit
(weeks)Costa Rica 91.11 5.5 14.5 3.0 0.0
Côte d'Ivoire 44.27 No refund No refund 14.0 0.0
Croatia 97.88 0.0 6.2 3.0 0.0
Cyprus 91.53 6.0 12.2 4.0 0.0
Czech Republic 94.29 4.0 9.5 3.0 0.0
Denmark 92.63 8.0 7.1 4.8 0.0
Djibouti 52.18 4.0 23.0 45.0 20.9 Dominica 49.54 No refund No refund 2.5 0.0
Dominican Republic 14.06 No refund No refund 61.5 14.0 Ecuador 49.31 No refund No refund 3.0 0.0
Egypt, Arab Rep. 29.05 No refund No refund 26.0 12.4 El Salvador 10.09 No refund No refund 34.0 47.7 Equatorial Guinea 83.94 VAT does not exist* VAT does not exist* 19.0 0.0
Eritrea 96.79 VAT does not exist VAT does not exist 5.0 0.0
Estonia 98.55 2.3 3.9 1.5 0.0
Ethiopia 90.57 8.0 10.2 6.0 0.0
Fiji 68.91 73.0 10.6 7.0 0.0
Finland 93.09 5.0 6.2 8.0 0.0
France 92.42 10.0 6.2 4.0 0.0
Gabon 45.56 14.5 35.9 15.5 33.7 Gambia, The 48.43 38.5 25.7 29.5 11.0 Georgia 87.22 20.5 8.5 1.5 0.0
Germany 97.45 0.0 5.2 5.0 0.0
Ghana 37.92 No refund No refund 12.5 9.0 Greece 79.27 16.5 27.2 3.5 0.0
Grenada 48.39 No refund No refund 5.0 0.0
Guatemala 39.27 No refund No refund 16.0 5.2 Guinea 12.31 No refund No refund 44.0 23.3 Guinea-Bissau 48.39 No refund No refund 5.0 0.0
Guyana 31.01 No refund No refund 30.5 7.3 Haiti 26.79 No refund No refund 37.5 8.6 Honduras 48.07 20.0 54.2 13.0 15.4 Hong Kong SAR, China 98.62 VAT does not exist VAT does not exist 3.0 0.0
Hungary 75.79 15.0 13.7 12.0 8.7 Iceland 89.15 3.0 20.9 3.3 0.0
India 4.27 No refund No refund 54.0 27.7 India Mumbai 4.27 No refund No refund 54.0 27.7 India Delhi 4.27 No refund No refund 54.0 27.7 Indonesia 76.49 18.0 30.9 4.0 0.0
Indonesia Jakarta 76.49 18.0 30.9 4.0 0.0
Indonesia Surabaya 76.49 18.0 30.9 4.0 0.0
Iran, Islamic Rep. 78.81 9.0 33.5 6.0 0.0
Iraq 84.86 VAT does not exist VAT does not exist 18.0 0.0
Ireland 92.70 1.0 16.3 2.5 0.0
Israel 65.53 34.0 31.3 10.0 0.0
*VAT does not exist for the case study purchase – not scored.A time of 0.0 indicates that an audit is unlikely and so the economy receives the best distance to frontier score of 100 for this component of the post-filing index.�Where an economy’s data sits within the highest 5% of the post-filing component’s range, these economies are allocated the worst distance to frontier score of 0 for that component of the post-filing index.
Note: Where there is “No practice yet”, “VAT does not exist” or “CIT does not exist”, these components of the post-filing index are ignored and the remaining components are averaged to create the post-filing score. Where there is “No refund”, these economies are allocated the worst distance to frontier score of nil for that component of the post-filing index.
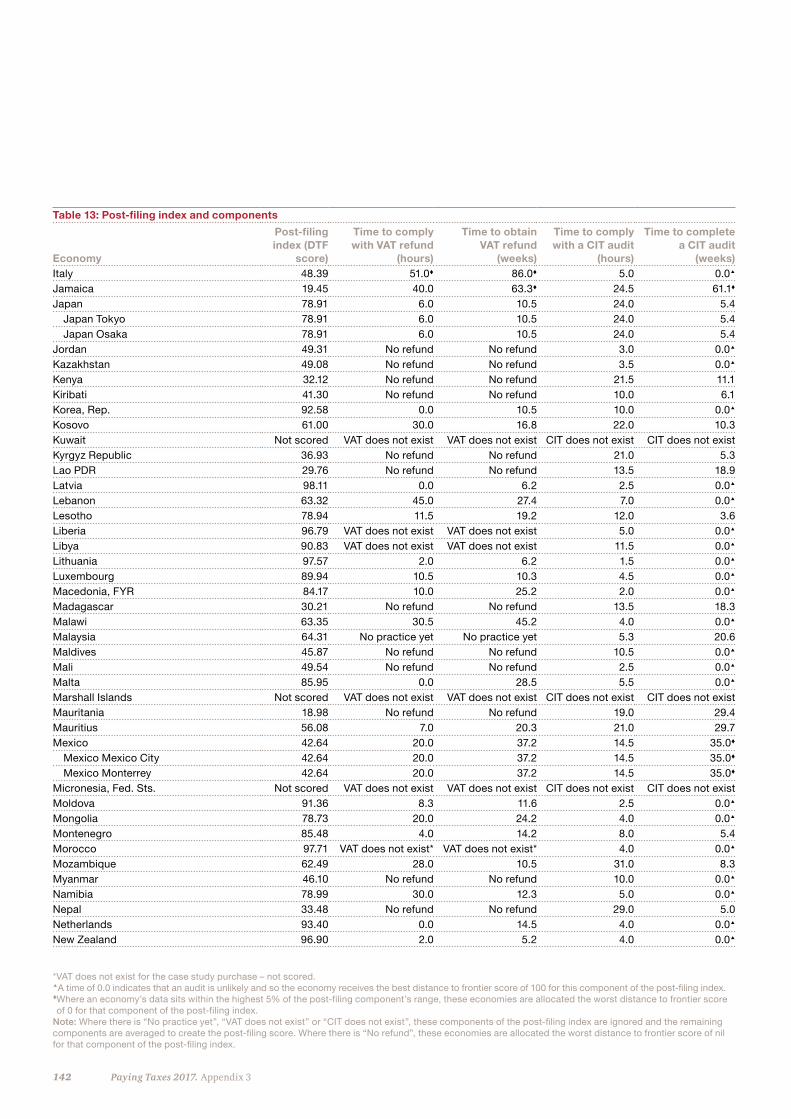
142 Paying Taxes 2017. Appendix 3
Table 13: Post-filing index and components
Economy
Post-filing index (DTF
score)
Time to comply with VAT refund
(hours)
Time to obtain VAT refund
(weeks)
Time to comply with a CIT audit
(hours)
Time to complete a CIT audit
(weeks)Italy 48.39 51.0 86.0 5.0 0.0
Jamaica 19.45 40.0 63.3 24.5 61.1 Japan 78.91 6.0 10.5 24.0 5.4 Japan Tokyo 78.91 6.0 10.5 24.0 5.4 Japan Osaka 78.91 6.0 10.5 24.0 5.4 Jordan 49.31 No refund No refund 3.0 0.0
Kazakhstan 49.08 No refund No refund 3.5 0.0
Kenya 32.12 No refund No refund 21.5 11.1 Kiribati 41.30 No refund No refund 10.0 6.1 Korea, Rep. 92.58 0.0 10.5 10.0 0.0
Kosovo 61.00 30.0 16.8 22.0 10.3 Kuwait Not scored VAT does not exist VAT does not exist CIT does not exist CIT does not existKyrgyz Republic 36.93 No refund No refund 21.0 5.3 Lao PDR 29.76 No refund No refund 13.5 18.9 Latvia 98.11 0.0 6.2 2.5 0.0
Lebanon 63.32 45.0 27.4 7.0 0.0
Lesotho 78.94 11.5 19.2 12.0 3.6 Liberia 96.79 VAT does not exist VAT does not exist 5.0 0.0
Libya 90.83 VAT does not exist VAT does not exist 11.5 0.0
Lithuania 97.57 2.0 6.2 1.5 0.0
Luxembourg 89.94 10.5 10.3 4.5 0.0
Macedonia, FYR 84.17 10.0 25.2 2.0 0.0
Madagascar 30.21 No refund No refund 13.5 18.3 Malawi 63.35 30.5 45.2 4.0 0.0
Malaysia 64.31 No practice yet No practice yet 5.3 20.6 Maldives 45.87 No refund No refund 10.5 0.0
Mali 49.54 No refund No refund 2.5 0.0
Malta 85.95 0.0 28.5 5.5 0.0
Marshall Islands Not scored VAT does not exist VAT does not exist CIT does not exist CIT does not existMauritania 18.98 No refund No refund 19.0 29.4 Mauritius 56.08 7.0 20.3 21.0 29.7 Mexico 42.64 20.0 37.2 14.5 35.0 Mexico Mexico City 42.64 20.0 37.2 14.5 35.0 Mexico Monterrey 42.64 20.0 37.2 14.5 35.0
Micronesia, Fed. Sts. Not scored VAT does not exist VAT does not exist CIT does not exist CIT does not existMoldova 91.36 8.3 11.6 2.5 0.0
Mongolia 78.73 20.0 24.2 4.0 0.0
Montenegro 85.48 4.0 14.2 8.0 5.4 Morocco 97.71 VAT does not exist* VAT does not exist* 4.0 0.0
Mozambique 62.49 28.0 10.5 31.0 8.3 Myanmar 46.10 No refund No refund 10.0 0.0
Namibia 78.99 30.0 12.3 5.0 0.0
Nepal 33.48 No refund No refund 29.0 5.0 Netherlands 93.40 0.0 14.5 4.0 0.0
New Zealand 96.90 2.0 5.2 4.0 0.0
*VAT does not exist for the case study purchase – not scored.A time of 0.0 indicates that an audit is unlikely and so the economy receives the best distance to frontier score of 100 for this component of the post-filing index.�Where an economy’s data sits within the highest 5% of the post-filing component’s range, these economies are allocated the worst distance to frontier score of 0 for that component of the post-filing index.
Note: Where there is “No practice yet”, “VAT does not exist” or “CIT does not exist”, these components of the post-filing index are ignored and the remaining components are averaged to create the post-filing score. Where there is “No refund”, these economies are allocated the worst distance to frontier score of nil for that component of the post-filing index.
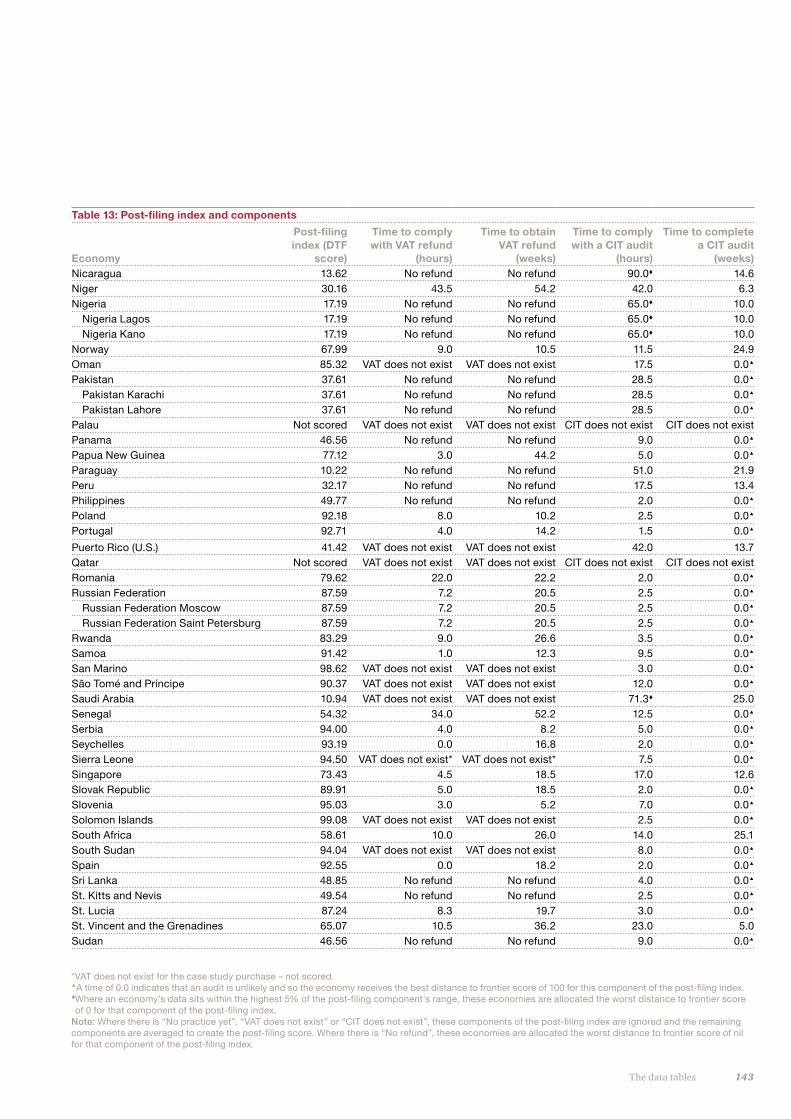
143The data tables
Table 13: Post-filing index and components
Economy
Post-filing index (DTF
score)
Time to comply with VAT refund
(hours)
Time to obtain VAT refund
(weeks)
Time to comply with a CIT audit
(hours)
Time to complete a CIT audit
(weeks)Nicaragua 13.62 No refund No refund 90.0 14.6 Niger 30.16 43.5 54.2 42.0 6.3 Nigeria 17.19 No refund No refund 65.0 10.0 Nigeria Lagos 17.19 No refund No refund 65.0 10.0 Nigeria Kano 17.19 No refund No refund 65.0 10.0 Norway 67.99 9.0 10.5 11.5 24.9 Oman 85.32 VAT does not exist VAT does not exist 17.5 0.0
Pakistan 37.61 No refund No refund 28.5 0.0
Pakistan Karachi 37.61 No refund No refund 28.5 0.0
Pakistan Lahore 37.61 No refund No refund 28.5 0.0
Palau Not scored VAT does not exist VAT does not exist CIT does not exist CIT does not existPanama 46.56 No refund No refund 9.0 0.0
Papua New Guinea 77.12 3.0 44.2 5.0 0.0
Paraguay 10.22 No refund No refund 51.0 21.9 Peru 32.17 No refund No refund 17.5 13.4 Philippines 49.77 No refund No refund 2.0 0.0
Poland 92.18 8.0 10.2 2.5 0.0
Portugal 92.71 4.0 14.2 1.5 0.0
Puerto Rico (U.S.) 41.42 VAT does not exist VAT does not exist 42.0 13.7 Qatar Not scored VAT does not exist VAT does not exist CIT does not exist CIT does not existRomania 79.62 22.0 22.2 2.0 0.0
Russian Federation 87.59 7.2 20.5 2.5 0.0
Russian Federation Moscow 87.59 7.2 20.5 2.5 0.0
Russian Federation Saint Petersburg 87.59 7.2 20.5 2.5 0.0
Rwanda 83.29 9.0 26.6 3.5 0.0
Samoa 91.42 1.0 12.3 9.5 0.0
San Marino 98.62 VAT does not exist VAT does not exist 3.0 0.0
São Tomé and Príncipe 90.37 VAT does not exist VAT does not exist 12.0 0.0
Saudi Arabia 10.94 VAT does not exist VAT does not exist 71.3 25.0 Senegal 54.32 34.0 52.2 12.5 0.0
Serbia 94.00 4.0 8.2 5.0 0.0
Seychelles 93.19 0.0 16.8 2.0 0.0
Sierra Leone 94.50 VAT does not exist* VAT does not exist* 7.5 0.0
Singapore 73.43 4.5 18.5 17.0 12.6 Slovak Republic 89.91 5.0 18.5 2.0 0.0
Slovenia 95.03 3.0 5.2 7.0 0.0
Solomon Islands 99.08 VAT does not exist VAT does not exist 2.5 0.0
South Africa 58.61 10.0 26.0 14.0 25.1 South Sudan 94.04 VAT does not exist VAT does not exist 8.0 0.0
Spain 92.55 0.0 18.2 2.0 0.0
Sri Lanka 48.85 No refund No refund 4.0 0.0
St. Kitts and Nevis 49.54 No refund No refund 2.5 0.0
St. Lucia 87.24 8.3 19.7 3.0 0.0
St. Vincent and the Grenadines 65.07 10.5 36.2 23.0 5.0 Sudan 46.56 No refund No refund 9.0 0.0
*VAT does not exist for the case study purchase – not scored.A time of 0.0 indicates that an audit is unlikely and so the economy receives the best distance to frontier score of 100 for this component of the post-filing index.�Where an economy’s data sits within the highest 5% of the post-filing component’s range, these economies are allocated the worst distance to frontier score of 0 for that component of the post-filing index.
Note: Where there is “No practice yet”, “VAT does not exist” or “CIT does not exist”, these components of the post-filing index are ignored and the remaining components are averaged to create the post-filing score. Where there is “No refund”, these economies are allocated the worst distance to frontier score of nil for that component of the post-filing index.
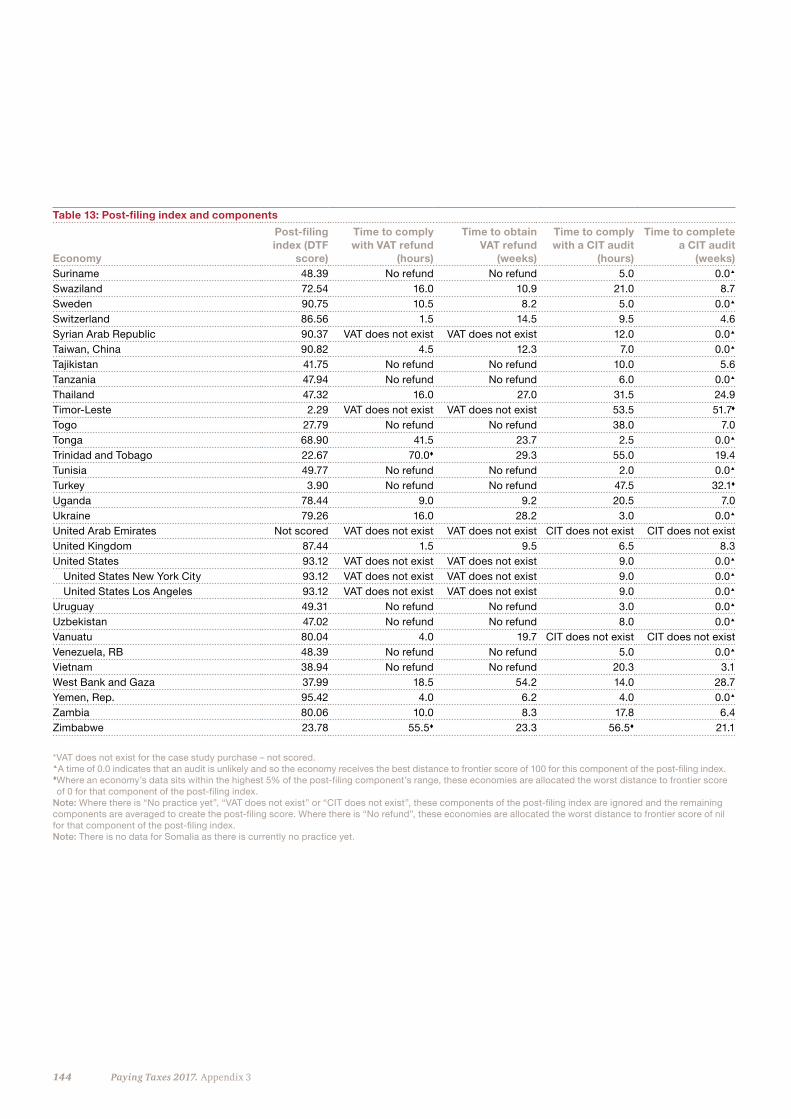
144 Paying Taxes 2017. Appendix 3
Table 13: Post-filing index and components
Economy
Post-filing index (DTF
score)
Time to comply with VAT refund
(hours)
Time to obtain VAT refund
(weeks)
Time to comply with a CIT audit
(hours)
Time to complete a CIT audit
(weeks)Suriname 48.39 No refund No refund 5.0 0.0
Swaziland 72.54 16.0 10.9 21.0 8.7 Sweden 90.75 10.5 8.2 5.0 0.0
Switzerland 86.56 1.5 14.5 9.5 4.6 Syrian Arab Republic 90.37 VAT does not exist VAT does not exist 12.0 0.0
Taiwan, China 90.82 4.5 12.3 7.0 0.0
Tajikistan 41.75 No refund No refund 10.0 5.6 Tanzania 47.94 No refund No refund 6.0 0.0
Thailand 47.32 16.0 27.0 31.5 24.9 Timor-Leste 2.29 VAT does not exist VAT does not exist 53.5 51.7 Togo 27.79 No refund No refund 38.0 7.0 Tonga 68.90 41.5 23.7 2.5 0.0
Trinidad and Tobago 22.67 70.0 29.3 55.0 19.4 Tunisia 49.77 No refund No refund 2.0 0.0
Turkey 3.90 No refund No refund 47.5 32.1 Uganda 78.44 9.0 9.2 20.5 7.0 Ukraine 79.26 16.0 28.2 3.0 0.0
United Arab Emirates Not scored VAT does not exist VAT does not exist CIT does not exist CIT does not existUnited Kingdom 87.44 1.5 9.5 6.5 8.3 United States 93.12 VAT does not exist VAT does not exist 9.0 0.0
United States New York City 93.12 VAT does not exist VAT does not exist 9.0 0.0
United States Los Angeles 93.12 VAT does not exist VAT does not exist 9.0 0.0
Uruguay 49.31 No refund No refund 3.0 0.0
Uzbekistan 47.02 No refund No refund 8.0 0.0
Vanuatu 80.04 4.0 19.7 CIT does not exist CIT does not exist Venezuela, RB 48.39 No refund No refund 5.0 0.0
Vietnam 38.94 No refund No refund 20.3 3.1 West Bank and Gaza 37.99 18.5 54.2 14.0 28.7 Yemen, Rep. 95.42 4.0 6.2 4.0 0.0
Zambia 80.06 10.0 8.3 17.8 6.4 Zimbabwe 23.78 55.5 23.3 56.5 21.1
*VAT does not exist for the case study purchase – not scored.A time of 0.0 indicates that an audit is unlikely and so the economy receives the best distance to frontier score of 100 for this component of the post-filing index.�Where an economy’s data sits within the highest 5% of the post-filing component’s range, these economies are allocated the worst distance to frontier score of 0 for that component of the post-filing index.
Note: Where there is “No practice yet”, “VAT does not exist” or “CIT does not exist”, these components of the post-filing index are ignored and the remaining components are averaged to create the post-filing score. Where there is “No refund”, these economies are allocated the worst distance to frontier score of nil for that component of the post-filing index.Note: There is no data for Somalia as there is currently no practice yet.
145The data tables
The Total Tax Rate included in the survey by the World Bank Group has been calculated using the broad principles of the PwC methodology. The application of these principles by the World Bank Group has not been verified, validated or audited by PwC, and therefore, PwC cannot make any representations or warranties with regard to the accuracy of the information generated by the World Bank Group’s models. In addition, the World Bank Group has not verified, validated or audited any information collected by PwC beyond the scope of Doing Business Paying Taxes data, and therefore, the World Bank Group cannot make any representations or warranties with regard to the accuracy of the information generated by PwC’s own research.
The World Bank Group’s Doing Business tax ranking indicator includes three components in addition to the Total Tax Rate. These estimate compliance costs by looking at hours spent on tax work, the number of tax payments made in a tax year, and evaluate and score certain post-filing compliance processes. These calculations do not follow any PwC methodology but do attempt to provide data which is consistent with the tax compliance cost aspect of the PwC Total Tax Contribution framework.
At PwC, our purpose is to build trust in society and solve important problems. We’re a network of firms in 157 countries with more than 223,000 people who are committed to delivering quality in assurance, advisory and tax services. Find out more and tell us what matters to you by visiting us at www.pwc.com.
This content is for general information purposes only, and should not be used as a substitute for consultation with professional advisors. No representation or warranty (express or implied) is given as to the accuracy or completeness of the information contained in this publication, and, to the extent permitted by law, neither PwC nor the World Bank Group accept or assume any liability, responsibility or duty of care for any consequences of anyone acting, or refraining to act, in reliance on the information contained in this publication or for any decision based on it. The World Bank Group does not guarantee the accuracy of the data included in this work. The boundaries, colours, denominations, and other information shown on any map in this work do not imply any judgment on the part of the World Bank Group concerning the legal status of any territory or the endorsement or acceptance of such boundaries. The findings, interpretations, and conclusions expressed herein are those of the author(s) and do not necessarily reflect the views of the World Bank Group and its Boards of Executive Directors or the governments they represent.
This publication may be copied and disseminated in its entirety, retaining all featured logos, names, copyright notice and disclaimers. Extracts from this publication may be copied and disseminated, including publication in other documentation, provided always that the said extracts are duly referenced, that the extract is clearly identified as such and that a source notice is used as follows: for extracts from any section of this publication except Chapter One, use the source notice: “© 2016 PwC. All rights reserved. Extract from “Paying Taxes 2017” publication, available on www.pwc.com/payingtaxes”. For extracts from Chapter One only, use the source notice: “© 2016 The World Bank and International Finance Corporation. All rights reserved. Extract from “Paying Taxes 2017” publication, available on www.pwc.com/payingtaxes”.
All other queries on rights and licenses should be addressed to World Bank Publications, The World Bank, 1818 H Street NW, Washington, DC 20433, USA; fax: 202- 522-2625; e-mail: [email protected].
© 2016 PwC, the World Bank and International Finance Corporation. All rights reserved. PwC refers to the PwC network and/or one or more of its member firms, each of which is a separate legal entity. The World Bank refers to the legally separate but affiliated international organizations: International Bank for Reconstruction and Development and International Development Association.
11/16. Design Services 30038.
World Bank Group Paying Taxes team
Rita RamalhoJoanna NasrNadia NovikEmily Jane Bourke Rodrigo A. Sarmento de Beires Edgar Chavez
PwC Paying Taxes team
Neville HowlettTom Dane Gwendolin ChauSopheaktra Meas

www.pwc.com/payingtaxes www.doingbusiness.org