Theme Chapter—Mobilizing Taxes for Development
74
ASIAN DEVELOPMENT BANK APRIL 2022 Theme Chapter of the Asian Development Outlook 2022 MOBILIZING TAXES FOR DEVELOPMENT
-
Upload
khangminh22 -
Category
Documents
-
view
1 -
download
0
Transcript of Theme Chapter—Mobilizing Taxes for Development
ASIAN DEVELOPMENT BANK
APRIL 2022
Theme Chapter of the Asian Development Outlook 2022
MOBILIZING TAXES FOR DEVELOPMENT


This chapter was written by Sam Hill, Yothin Jinjarak, Donghyun Park, and Shu Tian, with substantive contributions from Eugenia Go, Yuho Myoda, Pilipinas Quising, and Anton Miguel P. Ragos. We gratefully acknowledge the administrative support of Heili Ann D. Bravo and Oth Marulou M. Gagni, as well as background and other material provided by Eduardo Banzon, Sandeep Bhattacharya, Arin Dutta, Maria Hanna Jaber, Go Nagata, Daisuke Miura, Ashish Narain, Marcel Schroder, and Aiko Kikkawa Takenaka, and external consultants. The chapter benefited from comments received from colleagues across ADB. Strategic advice from Albert Park, Joseph Zveglich, and Abdul Abiad is gratefully acknowledged.
MOBILIZING TAXES FOR DEVELOPMENT
Achieving the Sustainable Development Goals (SDGs) for a greener and more inclusive future will require vast public spending in developing Asia. What currently adds urgency to fiscal resource mobilization is the need to restore fiscal sustainability in the wake of the Coronavirus Disease 2019 (COVID‑19) pandemic.
More efficient public spending can free up additional fiscal resources and promote inclusive development, but revenue mobilization remains essential to augment fiscal space across the region. Potential exists to increase tax revenue, with tax capacity estimates, which benchmark revenue against key economy characteristics, suggesting that developing Asia could increase tax revenue from a pre‑pandemic average of about 16% of gross domestic product (GDP) by 3–4 percentage points.
Opportunities to strengthen revenue will depend on economy-specific circumstances including institutional capacity. However, promising options across economies include better use of value‑added tax (VAT), rationalized tax exemptions, and appropriate taxation of the fast‑growing digital economy. Strengthening personal income and property taxes can boost their currently low revenue yield and make taxes more progressive.
Green and health taxes can both raise revenue and contribute directly to meeting SDGs. Environmental tax instruments continue to grow and guide investment and consumption behavior in developing Asia but could be better used. Asian economies have actively explored carbon pricing to curb emissions, and the region as a whole can draw valuable lessons from early adopters. Corrective health taxes, primarily on alcohol or tobacco, could raise additional tax revenue of up to 0.6% of GDP while improving health outcomes and cutting medical costs.
Tax reform to boost revenue is politically challenging, but global experience shows that strong leadership can inspire buy-in and bring success. Strengthening tax administration can help, including through better use of information and communication technology and improved services, and taxpayer morale can be buttressed by improving the quality of public spending. New analysis finds that cutting business registration costs can reduce the share of the economy occupied by the informal sector and boost tax revenue.
Taxes must be mobilized to support sustainable development
Developing Asia has a long history of prudent fiscal policy characterized by small governments and light tax burdens. Governments have channeled modest public resources toward investment in growth‑enhancing physical infrastructure, education, and other basic public services, while keeping public debt low (ADB 2014, 2020). This has supported high savings and investment while creating space for the private sector to flourish, with government playing a critical enabling role. Fiscal prudence has served the region well, promoting macroeconomic stability and stellar growth to drive down poverty and lift living standards.
However, Asia and the Pacific face significant spending pressure as the region transitions toward more sustainable and inclusive growth. Even before the COVID‑19 pandemic, the United Nations Economic and Social Commission for Asia and the Pacific estimated that achieving the SDGs by 2030 required the region to spend an additional $1.5 trillion annually, equal to 5% of GDP (UNESCAP 2019). This includes substantial amounts for education, health, energy, water supply and sanitation, and combating climate change. For a sample of Asian Development Bank (ADB) developing member countries, the International Monetary Fund estimated additional annual spending needs equal to about 9% of GDP on average (Figure 2.1.1). Adding to the challenge, additional spending needs are typically larger in the poorest countries (Gaspar et al. 2019). Moreover, COVID‑19 likely widens these shortfalls (Benedek et al. 2021).
Fiscal pressure on developing Asia will endure beyond 2030, the target year for the SDGs. Achieving net‑zero emissions by 2050 will require massive investment in clean energy (IEA 2021). An aging population will require higher spending on pensions and health care, while rising affluence may increase demand for public goods and services (Akitoby et al. 2006).
To meet vast spending demands, economies need to draw on the full range of public and private financial resources at their disposal. Private finance has a critical role to play, notably in providing green and social finance (ADB 2021a). However, private financial flows can be unreliable, and development assistance, concentrated in very poor economies, can suffer as policy priorities shift in development partners. The ability of governments to borrow varies, and revenue from state‑owned operations can be unreliable. For most governments, taxes are the primary source of revenue and stand alone as the best option to reliably expand government resources.
It is imperative for the region to mobilize tax revenue to finance the additional public spending required to meet social and other needs. Demand is especially great in the region’s poorest countries, where tax revenue remains very low. A central challenge is for governments to raise additional revenue without sacrificing the economic growth vital to further reduce poverty and raise living standards. As the region emerges from the COVID‑19 pandemic, now is an opportune time to take stock of tax challenges and explore options to mobilize taxes.
Taxes central to inclusive and sustainable developmentToward promoting sustainable and inclusive development, a fundamental role of government is to provide essential public goods and services and, where necessary, direct support to households to tackle poverty and meet redistribution goals. It falls to governments to provide public goods that would otherwise fall short if left to the private sector (Besley and Ghatak 2006). Social returns often exceed private returns on some necessary spending, notably on health care, education, and many types of physical infrastructure such as for water supply, sanitation, and mass transit.

Mobilizing taxes for development 3
Figure 2.1.1 Additional annual spending needed to achieve the SDGsDeveloping Asia faces vast spending needs to achieve the SDGs.
Pakistan
MyanmarUzbekistan
Cambodia
Viet Nam
IndonesiaDeveloping Asia simple average
% of GDP
Developing AsiaOther
0
15
30
45
GDP = gross domestic product, SDG = Sustainable Development Goal.Notes: Additional annual spending required to achieve the SDGs by 2030 is estimated using methodology detailed in Gaspar et al. (2019). Economies are included only if they have agreed to release their spending estimates and additional spending needs.Sources: Gaspar et al. 2019; International Monetary Fund. IMF SDG Costing Tool (second edition) (based on Gaspar et al. 2019).
Especially in developing countries with underdeveloped and constrained credit markets, poor households rely on the government to provide such essential goods and services.
Domestic resource mobilization—fundamentally adequate tax revenue efficiently spent—is central to domestic development. It is also a focus of international development efforts (Addison, Niño‑Zarazua, and Pirttila 2018). In 2015, the Third United Nations Conference on Financing for Development focused on mobilizing financial resources to meet development goals, concluding with the Addis Ababa Action Agenda. The agenda urges “the mobilization and effective use of domestic resources ... [in recognition] that domestic resources are first and foremost generated by economic growth, supported by an enabling environment at all levels” (UN 2015). Domestic resource mobilization can be conceptualized as a virtuous cycle of domestic revenue generation, its efficient and effective allocation, and the contribution this makes to sustainable economic growth and development (Figure 2.1.2). In this framework, tax revenue is a vital component of domestic resources.
Figure 2.1.2 The virtuous cycle of domestic resource mobilization
Tax revenue is a vital component of domestic resource mobilization.
Sustainableeconomic growthand development
Ecientand e�ectiveallocation of
domestic resources
Domestic resources:Tax revenue
Nontax revenuePublic borrowing
Source: Asian Development Outlook.

4 Asian Development Outlook 2022
A robust tax system is important not only to raise revenue to fund public spending. It is integral to building the capacity of the state to promote broader development (Besley and Persson 2014; Keen and Slemrod 2021). The authority to raise taxes is a defining feature of the modern state that underpins the contract between government and society and enables the development of strong legal frameworks. State institutions and tax systems evolve together to be mutually reinforcing, as stronger tax systems provide states with the resources to build strong institutions able to support development, which in turn encourages willing tax compliance and simplifies tax collection. Capacity to raise adequate taxes strengthens state sovereignty by reducing dependency.
Strong tax policy can also support specific public policy objectives and macroeconomic stability. While taxes generally distort economic activity and impose welfare costs, an efficient and equitable tax mix contributes to strong and inclusive economic growth (Box 2.1.1). Taxes can address negative externalities that cause social harm, such as environmental pollution and unhealthy lifestyle habits. Equally important is ensuring that government resources are competently deployed to minimize wasteful spending and tax burdens, support tax compliance, and avoid crowding out private expenditure. Adequate and efficient tax revenue, sound spending, and prudent use of public debt promote resilient government finance and enable effective fiscal policy for macroeconomic stabilization (Delong and Summers 2012; Cottarelli, Gerson, and Senhadji 2014).
Developing Asia’s tax and expenditure landscape before COVID-19In the 2 decades before COVID-19, tax revenue across developing Asia rose on average from about 14% of GDP to 16% (Figure 2.1.3). The increase was fast in the early 2000s, then slower during and after the global financial crisis of 2008–2009. Tax revenue in developing Asia reached levels similar to sub‑Saharan Africa but continued to lag Latin America, where revenue also rose. The ratio of tax to GDP in high‑income members of the Organisation for Economic Co‑operation and Development (OECD) stood at 26%, half again more than developing Asia collected.
These figures omit social security contributions, which, except most notably in the People’s Republic of China (PRC) and the Republic of Korea (ROK), are not large in developing Asia, reflecting underdeveloped social protection systems or reliance on general revenue to fund social protection. However, social security contributions can be significant, particularly in OECD countries, where they often equal 10% or more of GDP. The revenue gap between developing Asia and OECD countries is even greater when taking these contributions into account.
Encouragingly, over these 2 decades, tax revenue rose in most of developing Asia. Increases were particularly large in Cambodia, Georgia, and Nepal (Figure 2.1.4). Rapid economic growth across the region has underpinned improvement in tax revenue performance. Tax buoyancy has been strong in much of the region (Box 2.1.2). Asian economies with the highest tax revenue before COVID‑19, mostly in the Caucasus and Central and East Asia, collected tax revenue sometimes exceeding 20% of GDP, comparable to the United States.
Figure 2.1.3 Tax revenue in selected regionsIn developing Asia, tax revenue rose before COVID-19 but remained comparatively low.
Developing Asia Sub-SaharanAfrica
Latin America& the Caribbean
High-incomeOECD
% of GDP
2000–20042005–20092010–20142015–2019
0
5
10
15
20
25
30
GDP = gross domestic product, OECD = Organisation for Economic Co‑operation and Development.Notes: Twenty‑six economies in developing Asia, 28 in sub‑Saharan Africa, 27 in Latin America and the Caribbean, and 33 among high‑income OECD members. See Go et al. (2022) for details.Sources: OECD. Global Revenue Statistics Database; International Monetary Fund. Government Finance Statistics online database (both accessed 31 January 2022); Asian Development Bank estimates.

Mobilizing taxes for development 5
However, despite this progress, tax revenue in several economies in developing Asia remained very low by international standards. Indeed in some revenue was below an often‑applied minimum threshold of about 15% of GDP, which is associated with improved state capacity and growth acceleration (Gaspar, Jaramillo, and Wingender 2016b). Notable among them are Bangladesh, Indonesia, Pakistan, Papua New Guinea, and Sri Lanka, showing that tax revenue is lowest in some of the poorest economies in the region.
Developing Asia relies heavily on VAT introduced widely throughout the region since the 1980s and 1990s. Other consumption taxes including excises are also important (Figure 2.1.5). Consumption taxes account for a little under half of tax revenue in regional economies, on average, of which half is from VAT, making it the single most important tax category. These shares are comparable to those in other economies. In developing Asia, corporate income taxes account for about 21% of tax revenue, a little higher than in other developing regions and double the share in OECD countries. Personal income taxes account for 13% of tax revenue in developing Asia, in line with other developing regions but much lower than in OECD countries, where they account for over a third.
Figure 2.1.4 Average tax revenue in selected Asian economies, 2000–2004 versus 2015–2019Most economies in developing Asia boosted tax revenue before COVID-19, but in many it remained very low.
% of GDP
2015–2019
GEO FIJ ARM KGZ MLD PRC ROK NEP VIE IND THA VAN MON CAM KAZ AZE HKG PHI PNG SIN MAL BHU SRI INO PAK BAN0
5
10
15
20
25
30
2000–2004
ARM = Armenia, AZE = Azerbaijan, BAN = Bangladesh, BHU = Bhutan, CAM = Cambodia, FIJ = Fiji, GDP = gross domestic product, GEO = Georgia, HKG = Hong Kong, China, IND = India, INO = Indonesia, KAZ = Kazakhstan, KGZ = Kyrgyz Republic, MAL = Malaysia, MLD = Maldives, MON = Mongolia, NEP = Nepal, PAK = Pakistan, PHI = Philippines, PNG = Papua New Guinea, PRC = People’s Republic of China, ROK = Republic of Korea, SIN = Singapore, SRI = Sri Lanka, THA = Thailand, VAN = Vanuatu, VIE = Viet Nam.Note: See Go et al. (2022) for details.Sources: OECD. Global Revenue Statistics Database; International Monetary Fund. Government Finance Statistics online database (both accessed 31 January 2022); Asian Development Bank estimates.
Figure 2.1.5 Tax revenue share by source, average in 2015–2019
As do other developing regions, developing Asia relies heavily on consumption and corporate income tax.
Developing Asia Sub-SaharanAfrica
Latin America& the Caribbean
High-incomeOECD
% of tax revenue
Other taxInternational trade taxOther goods & services taxValue-added tax
Personal income taxCorporate income tax
0
20
40
60
80
100
OECD = Organisation for Economic Co‑operation and Development. Note: See Go et al. (2022) for details.Sources: OECD. Global Revenue Statistics Database; International Monetary Fund. Government Finance Statistics online database (both accessed 31 January 2022); Asian Development Bank estimates.
6 Asian Development Outlook 2022
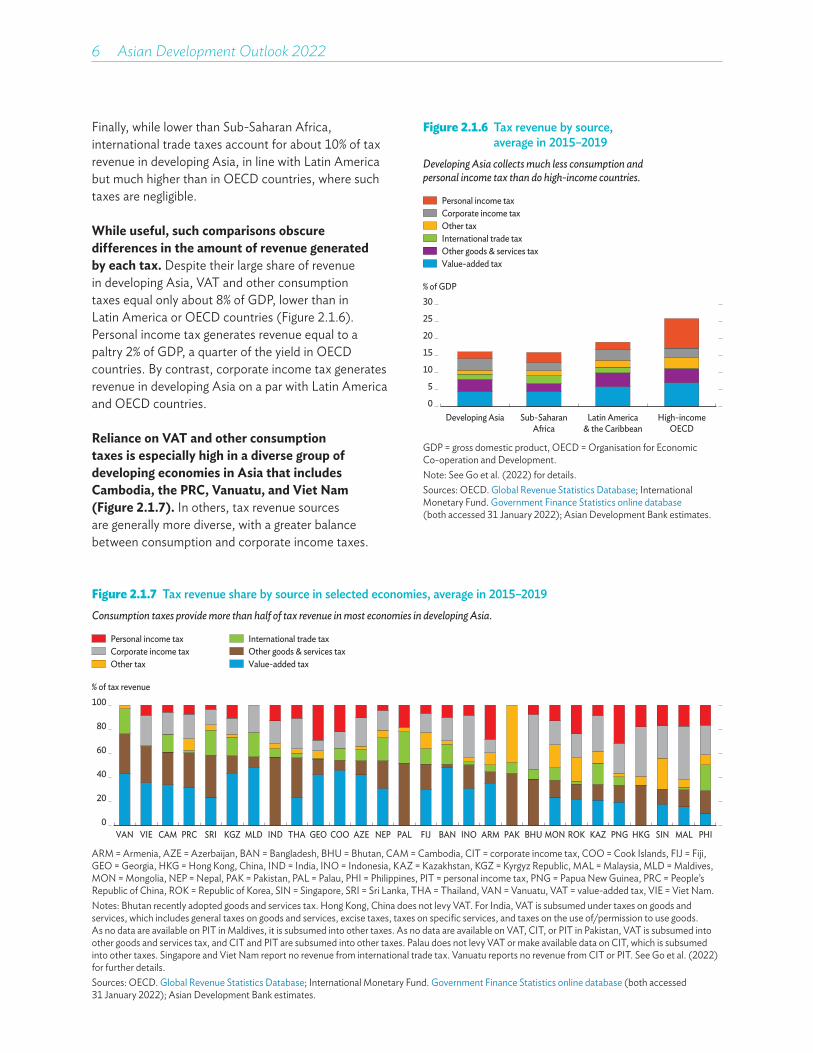
Finally, while lower than Sub‑Saharan Africa, international trade taxes account for about 10% of tax revenue in developing Asia, in line with Latin America but much higher than in OECD countries, where such taxes are negligible.
While useful, such comparisons obscure differences in the amount of revenue generated by each tax. Despite their large share of revenue in developing Asia, VAT and other consumption taxes equal only about 8% of GDP, lower than in Latin America or OECD countries (Figure 2.1.6). Personal income tax generates revenue equal to a paltry 2% of GDP, a quarter of the yield in OECD countries. By contrast, corporate income tax generates revenue in developing Asia on a par with Latin America and OECD countries.
Reliance on VAT and other consumption taxes is especially high in a diverse group of developing economies in Asia that includes Cambodia, the PRC, Vanuatu, and Viet Nam (Figure 2.1.7). In others, tax revenue sources are generally more diverse, with a greater balance between consumption and corporate income taxes.
Figure 2.1.6 Tax revenue by source, average in 2015–2019
Developing Asia collects much less consumption and personal income tax than do high-income countries.
Developing Asia Sub-SaharanAfrica
Latin America& the Caribbean
High-incomeOECD
% of GDP
Other taxInternational trade taxOther goods & services taxValue-added tax
Personal income taxCorporate income tax
0
5
10
15
20
25
30
GDP = gross domestic product, OECD = Organisation for Economic Co‑operation and Development.Note: See Go et al. (2022) for details.Sources: OECD. Global Revenue Statistics Database; International Monetary Fund. Government Finance Statistics online database (both accessed 31 January 2022); Asian Development Bank estimates.
Figure 2.1.7 Tax revenue share by source in selected economies, average in 2015–2019Consumption taxes provide more than half of tax revenue in most economies in developing Asia.
VAN VIE CAM PRC SRI KGZ MLD IND THA GEO COO AZE NEP PAL FIJ BAN INO ARM PAK BHU MON ROK KAZ PNG HKG SIN MAL PHI
% of tax revenue
International trade taxOther goods & services taxValue-added taxOther tax
Personal income taxCorporate income tax
0
20
40
60
80
100
ARM = Armenia, AZE = Azerbaijan, BAN = Bangladesh, BHU = Bhutan, CAM = Cambodia, CIT = corporate income tax, COO = Cook Islands, FIJ = Fiji, GEO = Georgia, HKG = Hong Kong, China, IND = India, INO = Indonesia, KAZ = Kazakhstan, KGZ = Kyrgyz Republic, MAL = Malaysia, MLD = Maldives, MON = Mongolia, NEP = Nepal, PAK = Pakistan, PAL = Palau, PHI = Philippines, PIT = personal income tax, PNG = Papua New Guinea, PRC = People’s Republic of China, ROK = Republic of Korea, SIN = Singapore, SRI = Sri Lanka, THA = Thailand, VAN = Vanuatu, VAT = value‑added tax, VIE = Viet Nam.Notes: Bhutan recently adopted goods and services tax. Hong Kong, China does not levy VAT. For India, VAT is subsumed under taxes on goods and services, which includes general taxes on goods and services, excise taxes, taxes on specific services, and taxes on the use of/permission to use goods. As no data are available on PIT in Maldives, it is subsumed into other taxes. As no data are available on VAT, CIT, or PIT in Pakistan, VAT is subsumed into other goods and services tax, and CIT and PIT are subsumed into other taxes. Palau does not levy VAT or make available data on CIT, which is subsumed into other taxes. Singapore and Viet Nam report no revenue from international trade tax. Vanuatu reports no revenue from CIT or PIT. See Go et al. (2022) for further details.Sources: OECD. Global Revenue Statistics Database; International Monetary Fund. Government Finance Statistics online database (both accessed 31 January 2022); Asian Development Bank estimates.
Mobilizing taxes for development 7
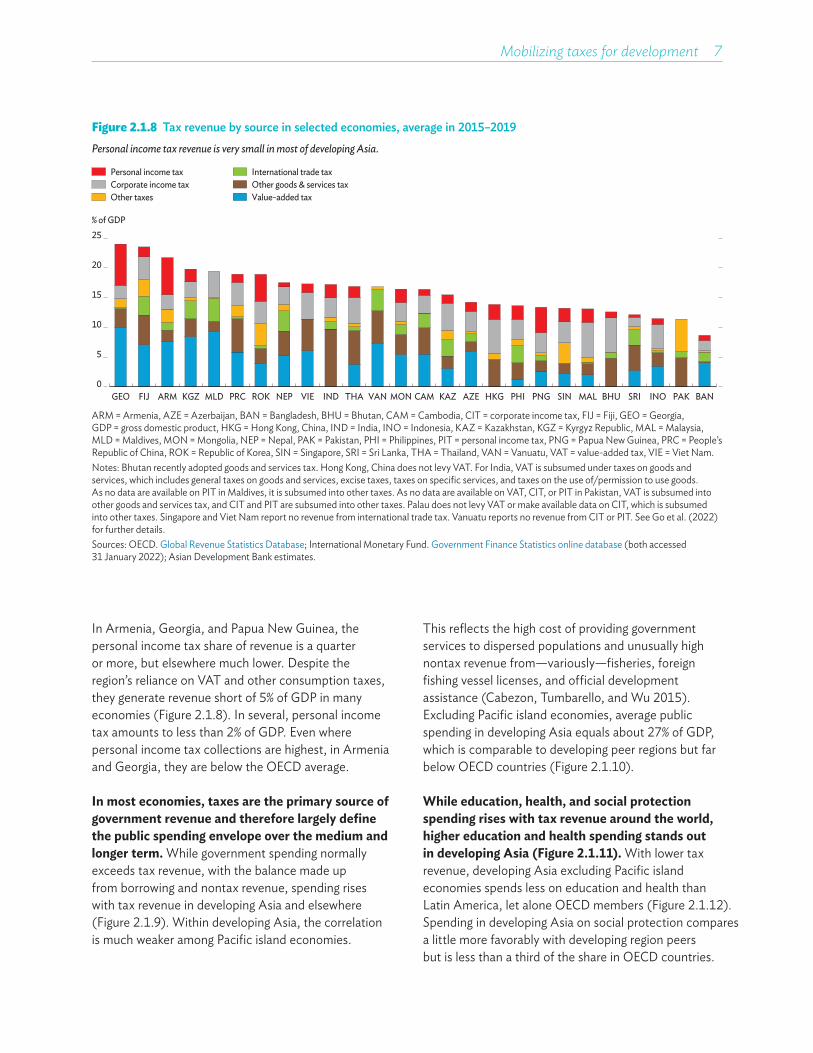
Figure 2.1.8 Tax revenue by source in selected economies, average in 2015–2019Personal income tax revenue is very small in most of developing Asia.
% of GDP
International trade taxOther goods & services taxValue-added taxOther taxes
Personal income taxCorporate income tax
GEO FIJ ARM KGZ MLD PRC ROK NEP VIE IND THA VAN MON CAM KAZ AZE HKG PHI PNG SIN MAL BHU SRI INO PAK BAN0
5
10
15
20
25
ARM = Armenia, AZE = Azerbaijan, BAN = Bangladesh, BHU = Bhutan, CAM = Cambodia, CIT = corporate income tax, FIJ = Fiji, GEO = Georgia, GDP = gross domestic product, HKG = Hong Kong, China, IND = India, INO = Indonesia, KAZ = Kazakhstan, KGZ = Kyrgyz Republic, MAL = Malaysia, MLD = Maldives, MON = Mongolia, NEP = Nepal, PAK = Pakistan, PHI = Philippines, PIT = personal income tax, PNG = Papua New Guinea, PRC = People’s Republic of China, ROK = Republic of Korea, SIN = Singapore, SRI = Sri Lanka, THA = Thailand, VAN = Vanuatu, VAT = value‑added tax, VIE = Viet Nam.Notes: Bhutan recently adopted goods and services tax. Hong Kong, China does not levy VAT. For India, VAT is subsumed under taxes on goods and services, which includes general taxes on goods and services, excise taxes, taxes on specific services, and taxes on the use of/permission to use goods. As no data are available on PIT in Maldives, it is subsumed into other taxes. As no data are available on VAT, CIT, or PIT in Pakistan, VAT is subsumed into other goods and services tax, and CIT and PIT are subsumed into other taxes. Palau does not levy VAT or make available data on CIT, which is subsumed into other taxes. Singapore and Viet Nam report no revenue from international trade tax. Vanuatu reports no revenue from CIT or PIT. See Go et al. (2022) for further details.Sources: OECD. Global Revenue Statistics Database; International Monetary Fund. Government Finance Statistics online database (both accessed 31 January 2022); Asian Development Bank estimates.
In Armenia, Georgia, and Papua New Guinea, the personal income tax share of revenue is a quarter or more, but elsewhere much lower. Despite the region’s reliance on VAT and other consumption taxes, they generate revenue short of 5% of GDP in many economies (Figure 2.1.8). In several, personal income tax amounts to less than 2% of GDP. Even where personal income tax collections are highest, in Armenia and Georgia, they are below the OECD average.
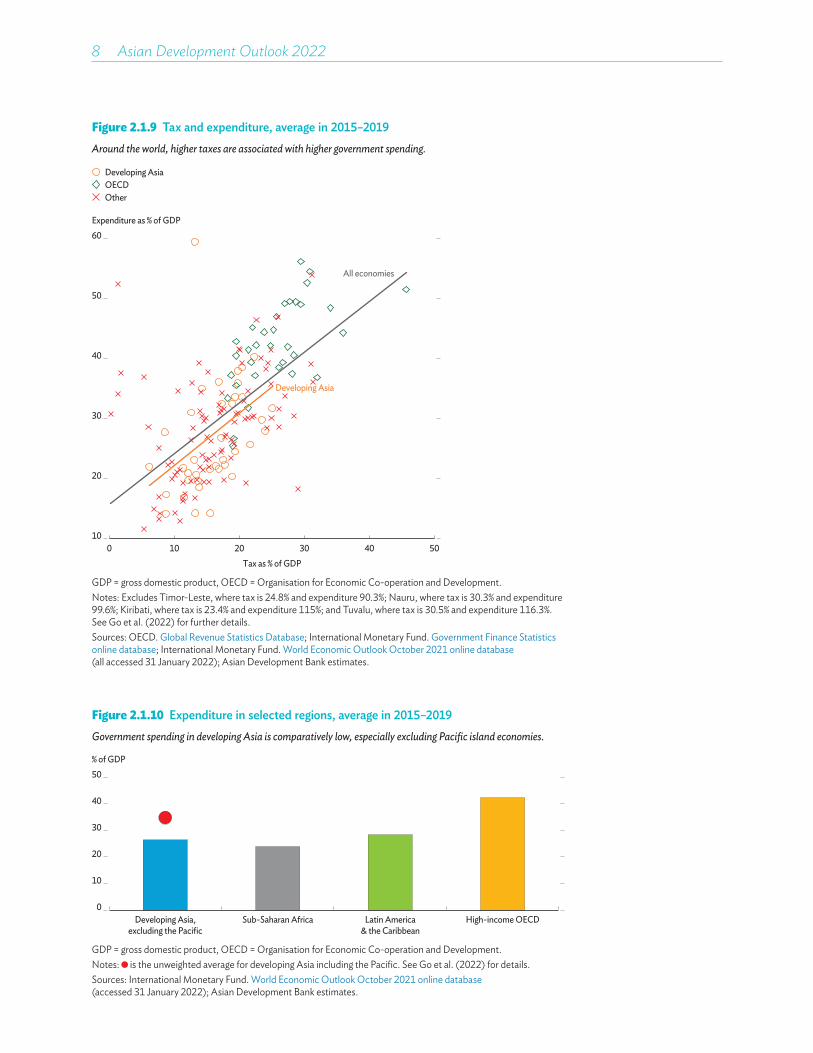
In most economies, taxes are the primary source of government revenue and therefore largely define the public spending envelope over the medium and longer term. While government spending normally exceeds tax revenue, with the balance made up from borrowing and nontax revenue, spending rises with tax revenue in developing Asia and elsewhere (Figure 2.1.9). Within developing Asia, the correlation is much weaker among Pacific island economies.
This reflects the high cost of providing government services to dispersed populations and unusually high nontax revenue from—variously—fisheries, foreign fishing vessel licenses, and official development assistance (Cabezon, Tumbarello, and Wu 2015). Excluding Pacific island economies, average public spending in developing Asia equals about 27% of GDP, which is comparable to developing peer regions but far below OECD countries (Figure 2.1.10).
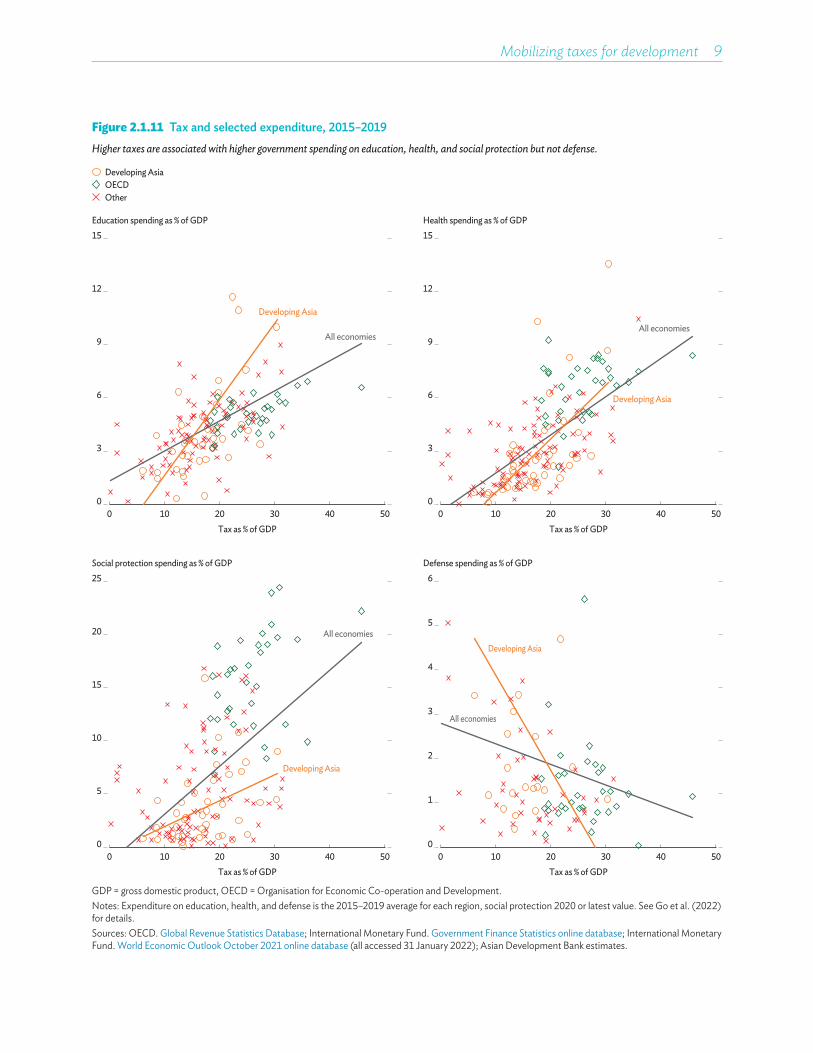
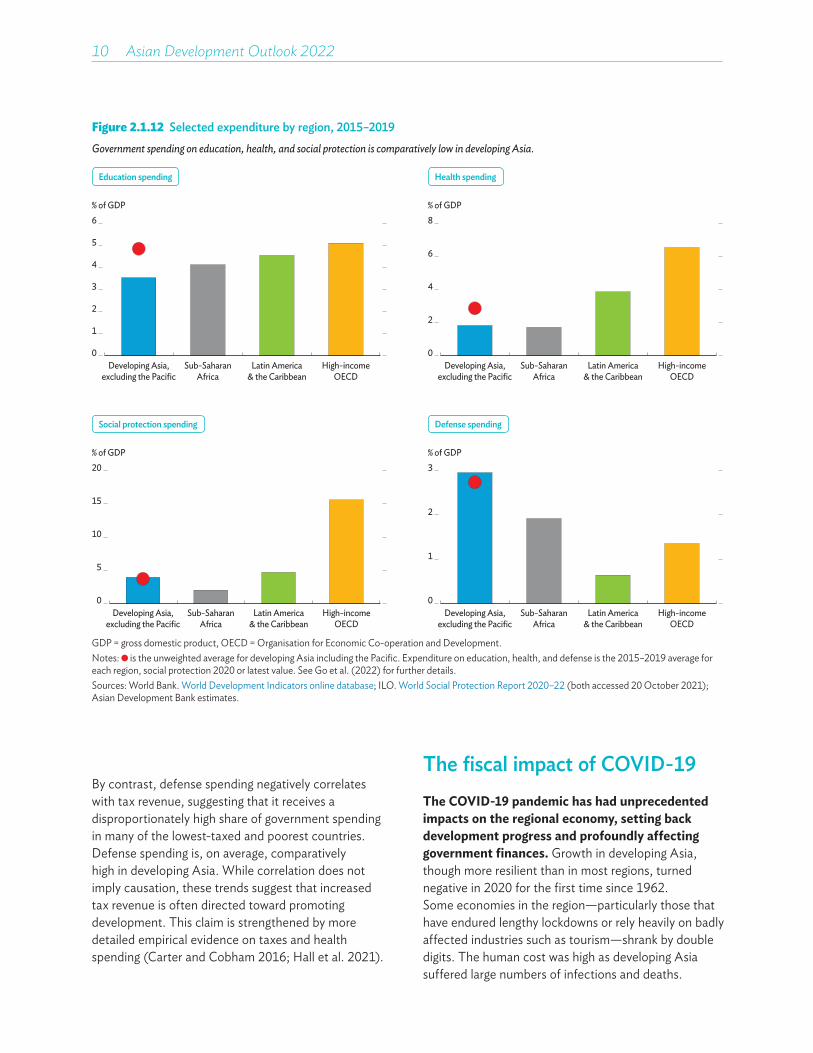
While education, health, and social protection spending rises with tax revenue around the world, higher education and health spending stands out in developing Asia (Figure 2.1.11). With lower tax revenue, developing Asia excluding Pacific island economies spends less on education and health than Latin America, let alone OECD members (Figure 2.1.12). Spending in developing Asia on social protection compares a little more favorably with developing region peers but is less than a third of the share in OECD countries.
8 Asian Development Outlook 2022
Figure 2.1.9 Tax and expenditure, average in 2015–2019Around the world, higher taxes are associated with higher government spending.
All economies
Developing Asia
0 10 20 30 40 50Tax as % of GDP
Expenditure as % of GDP
Other
Developing AsiaOECD
10
20
30
40
50
60
GDP = gross domestic product, OECD = Organisation for Economic Co‑operation and Development.Notes: Excludes Timor‑Leste, where tax is 24.8% and expenditure 90.3%; Nauru, where tax is 30.3% and expenditure 99.6%; Kiribati, where tax is 23.4% and expenditure 115%; and Tuvalu, where tax is 30.5% and expenditure 116.3%. See Go et al. (2022) for further details.Sources: OECD. Global Revenue Statistics Database; International Monetary Fund. Government Finance Statistics online database; International Monetary Fund. World Economic Outlook October 2021 online database (all accessed 31 January 2022); Asian Development Bank estimates.
Figure 2.1.10 Expenditure in selected regions, average in 2015–2019Government spending in developing Asia is comparatively low, especially excluding Pacific island economies.
Sub-Saharan Africa Latin America& the Caribbean
High-income OECD
% of GDP
0
10
20
30
40
50
Developing Asia,excluding the Pacific
GDP = gross domestic product, OECD = Organisation for Economic Co‑operation and Development.Notes: is the unweighted average for developing Asia including the Pacific. See Go et al. (2022) for details.Sources: International Monetary Fund. World Economic Outlook October 2021 online database (accessed 31 January 2022); Asian Development Bank estimates.
Mobilizing taxes for development 9
Figure 2.1.11 Tax and selected expenditure, 2015–2019Higher taxes are associated with higher government spending on education, health, and social protection but not defense.
0 10 20 30 40 50Tax as % of GDP
Education spending as % of GDP
Other
Developing AsiaOECD
00 10 20 30 40 50
Tax as % of GDP
Health spending as % of GDP
0
0 10 20 30 40 50Tax as % of GDP
Social protection spending as % of GDP
0
5
10
15
20
25
0 10 20 30 40 50Tax as % of GDP
Defense spending as % of GDP
0
2
3
4
5
6
3
6
9
12
15
All economies
Developing Asia
3
6
9
12
15
All economies
Developing Asia
All economies
Developing Asia
1
Developing Asia
All economies
GDP = gross domestic product, OECD = Organisation for Economic Co‑operation and Development.Notes: Expenditure on education, health, and defense is the 2015–2019 average for each region, social protection 2020 or latest value. See Go et al. (2022) for details.Sources: OECD. Global Revenue Statistics Database; International Monetary Fund. Government Finance Statistics online database; International Monetary Fund. World Economic Outlook October 2021 online database (all accessed 31 January 2022); Asian Development Bank estimates.
10 Asian Development Outlook 2022
Figure 2.1.12 Selected expenditure by region, 2015–2019Government spending on education, health, and social protection is comparatively low in developing Asia.
Developing Asia,excluding the Pacific
Sub-SaharanAfrica
Latin America& the Caribbean
High-incomeOECD
% of GDP
0
1
2
3
4
6
Education spending
5
Developing Asia,excluding the Pacific
Sub-SaharanAfrica
Latin America& the Caribbean
High-incomeOECD
% of GDP
0
2
4
8
Health spending
6
Developing Asia,excluding the Pacific
Sub-SaharanAfrica
Latin America& the Caribbean
High-incomeOECD
% of GDP
0
5
10
20
Social protection spending
15
Developing Asia,excluding the Pacific
Sub-SaharanAfrica
Latin America& the Caribbean
High-incomeOECD
% of GDP
0
1
3
2
Defense spending
GDP = gross domestic product, OECD = Organisation for Economic Co‑operation and Development.Notes: is the unweighted average for developing Asia including the Pacific. Expenditure on education, health, and defense is the 2015–2019 average for each region, social protection 2020 or latest value. See Go et al. (2022) for further details.Sources: World Bank. World Development Indicators online database; ILO. World Social Protection Report 2020–22 (both accessed 20 October 2021); Asian Development Bank estimates.
By contrast, defense spending negatively correlates with tax revenue, suggesting that it receives a disproportionately high share of government spending in many of the lowest‑taxed and poorest countries. Defense spending is, on average, comparatively high in developing Asia. While correlation does not imply causation, these trends suggest that increased tax revenue is often directed toward promoting development. This claim is strengthened by more detailed empirical evidence on taxes and health spending (Carter and Cobham 2016; Hall et al. 2021).
The fiscal impact of COVID-19The COVID-19 pandemic has had unprecedented impacts on the regional economy, setting back development progress and profoundly affecting government finances. Growth in developing Asia, though more resilient than in most regions, turned negative in 2020 for the first time since 1962. Some economies in the region—particularly those that have endured lengthy lockdowns or rely heavily on badly affected industries such as tourism—shrank by double digits. The human cost was high as developing Asia suffered large numbers of infections and deaths.
Mobilizing taxes for development 11
COVID‑19 adversely affected employment and incomes, hitting the poor hardest and slowing poverty reduction. The share of people in developing Asia living below the extreme poverty line of $1.90 per day rose by about 2 percentage points in 2020 compared with a scenario of no COVID‑19 (ADB 2021c). Aside from the direct health impact of COVID‑19, the pandemic disrupted health‑care systems and magnified food insecurity and malnutrition. School closures hindered learning, the future earnings losses from which are estimated to equal more than 13% of regional GDP in 2020 (see Part 1 of this report).
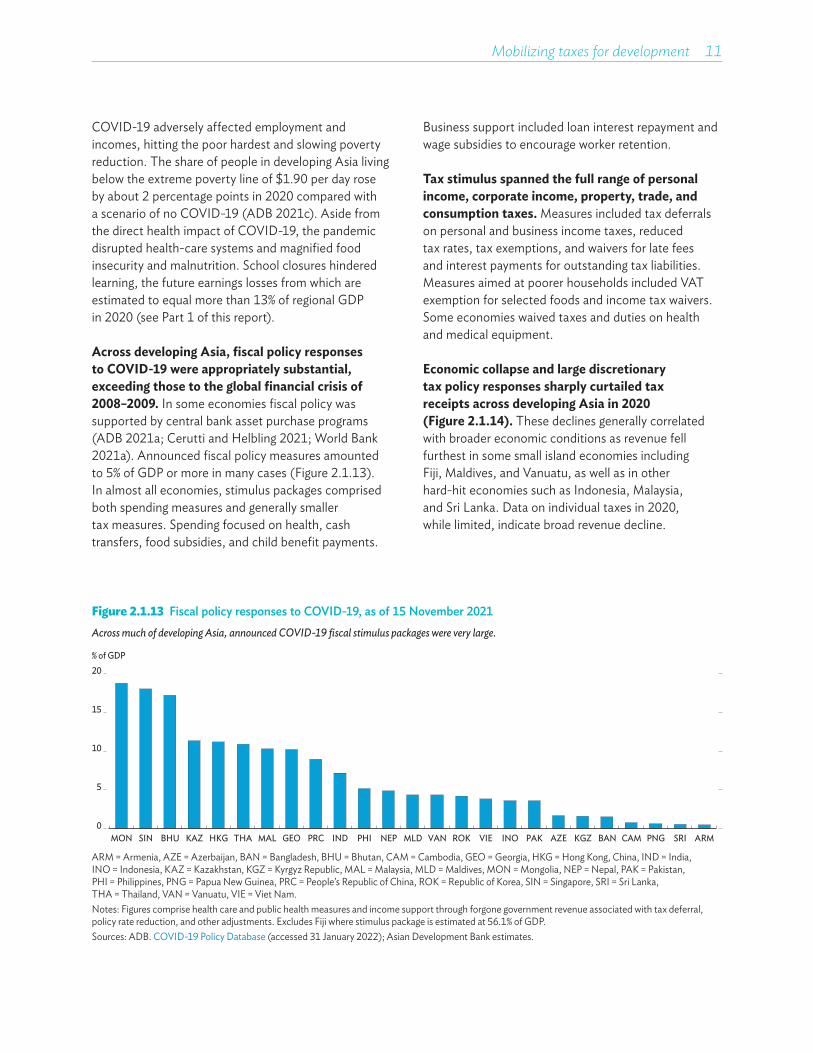
Across developing Asia, fiscal policy responses to COVID-19 were appropriately substantial, exceeding those to the global financial crisis of 2008–2009. In some economies fiscal policy was supported by central bank asset purchase programs (ADB 2021a; Cerutti and Helbling 2021; World Bank 2021a). Announced fiscal policy measures amounted to 5% of GDP or more in many cases (Figure 2.1.13). In almost all economies, stimulus packages comprised both spending measures and generally smaller tax measures. Spending focused on health, cash transfers, food subsidies, and child benefit payments.
Business support included loan interest repayment and wage subsidies to encourage worker retention.
Tax stimulus spanned the full range of personal income, corporate income, property, trade, and consumption taxes. Measures included tax deferrals on personal and business income taxes, reduced tax rates, tax exemptions, and waivers for late fees and interest payments for outstanding tax liabilities. Measures aimed at poorer households included VAT exemption for selected foods and income tax waivers. Some economies waived taxes and duties on health and medical equipment.
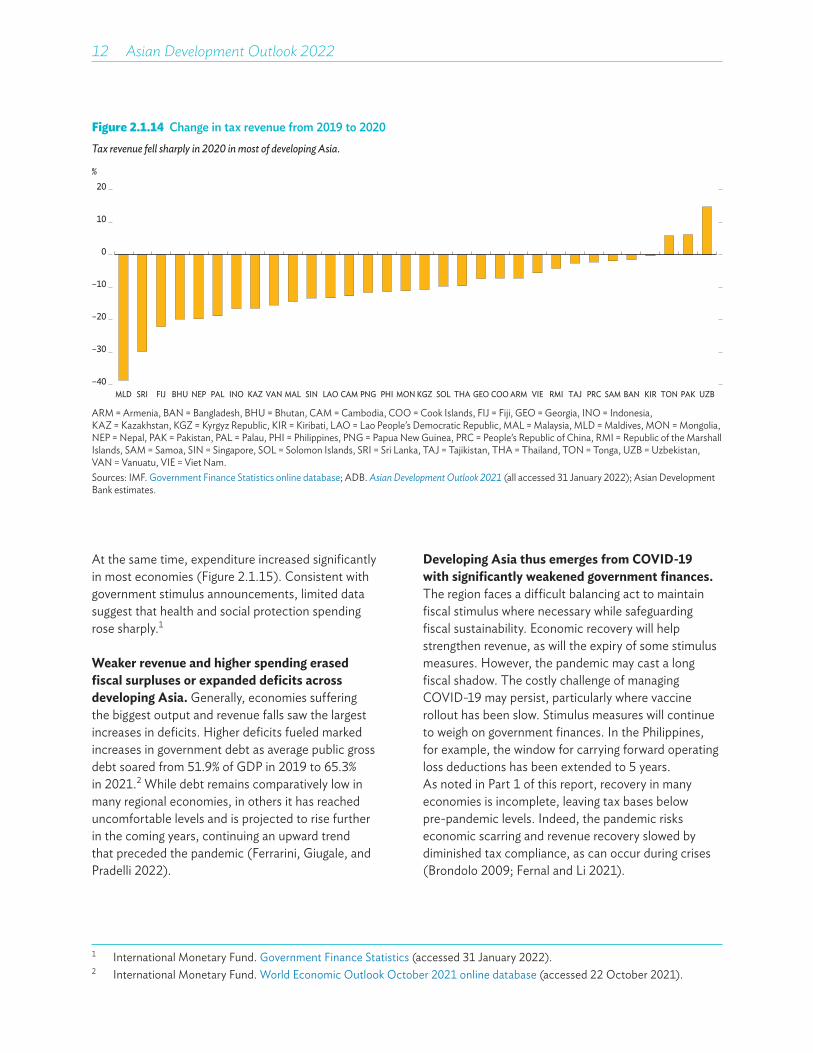
Economic collapse and large discretionary tax policy responses sharply curtailed tax receipts across developing Asia in 2020 (Figure 2.1.14). These declines generally correlated with broader economic conditions as revenue fell furthest in some small island economies including Fiji, Maldives, and Vanuatu, as well as in other hard‑hit economies such as Indonesia, Malaysia, and Sri Lanka. Data on individual taxes in 2020, while limited, indicate broad revenue decline.
Figure 2.1.13 Fiscal policy responses to COVID-19, as of 15 November 2021Across much of developing Asia, announced COVID-19 fiscal stimulus packages were very large.
% of GDP
0
5
10
15
20
MON SIN BHU KAZ HKG THA MAL GEO PRC IND PHI NEP MLD VAN ROK VIE INO PAK AZE KGZ BAN CAM PNG SRI ARM
ARM = Armenia, AZE = Azerbaijan, BAN = Bangladesh, BHU = Bhutan, CAM = Cambodia, GEO = Georgia, HKG = Hong Kong, China, IND = India, INO = Indonesia, KAZ = Kazakhstan, KGZ = Kyrgyz Republic, MAL = Malaysia, MLD = Maldives, MON = Mongolia, NEP = Nepal, PAK = Pakistan, PHI = Philippines, PNG = Papua New Guinea, PRC = People’s Republic of China, ROK = Republic of Korea, SIN = Singapore, SRI = Sri Lanka, THA = Thailand, VAN = Vanuatu, VIE = Viet Nam.Notes: Figures comprise health care and public health measures and income support through forgone government revenue associated with tax deferral, policy rate reduction, and other adjustments. Excludes Fiji where stimulus package is estimated at 56.1% of GDP.Sources: ADB. COVID‑19 Policy Database (accessed 31 January 2022); Asian Development Bank estimates.
12 Asian Development Outlook 2022
Figure 2.1.14 Change in tax revenue from 2019 to 2020Tax revenue fell sharply in 2020 in most of developing Asia.
%
MLD SRI FIJ BHU NEP PAL INO KAZ VAN MAL SIN LAO CAM PNG PHI MON KGZ SOL THA GEO COO ARM VIE RMI TAJ PRC SAM BAN KIR TON PAK UZB–40
–30
–20
–10
0
10
20
ARM = Armenia, BAN = Bangladesh, BHU = Bhutan, CAM = Cambodia, COO = Cook Islands, FIJ = Fiji, GEO = Georgia, INO = Indonesia, KAZ = Kazakhstan, KGZ = Kyrgyz Republic, KIR = Kiribati, LAO = Lao People’s Democratic Republic, MAL = Malaysia, MLD = Maldives, MON = Mongolia, NEP = Nepal, PAK = Pakistan, PAL = Palau, PHI = Philippines, PNG = Papua New Guinea, PRC = People’s Republic of China, RMI = Republic of the Marshall Islands, SAM = Samoa, SIN = Singapore, SOL = Solomon Islands, SRI = Sri Lanka, TAJ = Tajikistan, THA = Thailand, TON = Tonga, UZB = Uzbekistan, VAN = Vanuatu, VIE = Viet Nam.Sources: IMF. Government Finance Statistics online database; ADB. Asian Development Outlook 2021 (all accessed 31 January 2022); Asian Development Bank estimates.
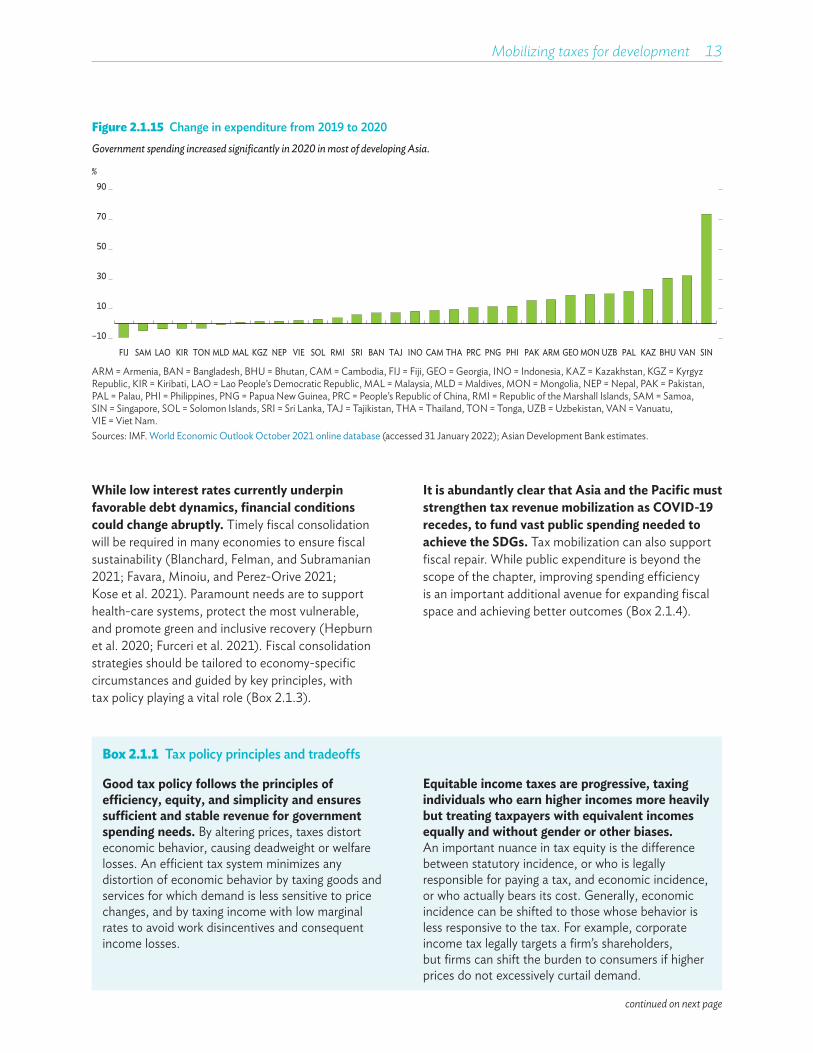
At the same time, expenditure increased significantly in most economies (Figure 2.1.15). Consistent with government stimulus announcements, limited data suggest that health and social protection spending rose sharply.1
Weaker revenue and higher spending erased fiscal surpluses or expanded deficits across developing Asia. Generally, economies suffering the biggest output and revenue falls saw the largest increases in deficits. Higher deficits fueled marked increases in government debt as average public gross debt soared from 51.9% of GDP in 2019 to 65.3% in 2021.2 While debt remains comparatively low in many regional economies, in others it has reached uncomfortable levels and is projected to rise further in the coming years, continuing an upward trend that preceded the pandemic (Ferrarini, Giugale, and Pradelli 2022).
Developing Asia thus emerges from COVID-19 with significantly weakened government finances. The region faces a difficult balancing act to maintain fiscal stimulus where necessary while safeguarding fiscal sustainability. Economic recovery will help strengthen revenue, as will the expiry of some stimulus measures. However, the pandemic may cast a long fiscal shadow. The costly challenge of managing COVID‑19 may persist, particularly where vaccine rollout has been slow. Stimulus measures will continue to weigh on government finances. In the Philippines, for example, the window for carrying forward operating loss deductions has been extended to 5 years. As noted in Part 1 of this report, recovery in many economies is incomplete, leaving tax bases below pre‑pandemic levels. Indeed, the pandemic risks economic scarring and revenue recovery slowed by diminished tax compliance, as can occur during crises (Brondolo 2009; Fernal and Li 2021).
1 International Monetary Fund. Government Finance Statistics (accessed 31 January 2022).2 International Monetary Fund. World Economic Outlook October 2021 online database (accessed 22 October 2021).
Mobilizing taxes for development 13
Figure 2.1.15 Change in expenditure from 2019 to 2020Government spending increased significantly in 2020 in most of developing Asia.
%
FIJ SAM LAO KIR TON MLD MAL KGZ NEP VIE SOL RMI SRI BAN TAJ INO CAM THA PRC PNG PHI PAK ARM GEO MON UZB PAL KAZ BHU VAN SIN
–10
10
30
50
70
90
ARM = Armenia, BAN = Bangladesh, BHU = Bhutan, CAM = Cambodia, FIJ = Fiji, GEO = Georgia, INO = Indonesia, KAZ = Kazakhstan, KGZ = Kyrgyz Republic, KIR = Kiribati, LAO = Lao People’s Democratic Republic, MAL = Malaysia, MLD = Maldives, MON = Mongolia, NEP = Nepal, PAK = Pakistan, PAL = Palau, PHI = Philippines, PNG = Papua New Guinea, PRC = People’s Republic of China, RMI = Republic of the Marshall Islands, SAM = Samoa, SIN = Singapore, SOL = Solomon Islands, SRI = Sri Lanka, TAJ = Tajikistan, THA = Thailand, TON = Tonga, UZB = Uzbekistan, VAN = Vanuatu, VIE = Viet Nam.Sources: IMF. World Economic Outlook October 2021 online database (accessed 31 January 2022); Asian Development Bank estimates.
While low interest rates currently underpin favorable debt dynamics, financial conditions could change abruptly. Timely fiscal consolidation will be required in many economies to ensure fiscal sustainability (Blanchard, Felman, and Subramanian 2021; Favara, Minoiu, and Perez‑Orive 2021; Kose et al. 2021). Paramount needs are to support health‑care systems, protect the most vulnerable, and promote green and inclusive recovery (Hepburn et al. 2020; Furceri et al. 2021). Fiscal consolidation strategies should be tailored to economy‑specific circumstances and guided by key principles, with tax policy playing a vital role (Box 2.1.3).
It is abundantly clear that Asia and the Pacific must strengthen tax revenue mobilization as COVID-19 recedes, to fund vast public spending needed to achieve the SDGs. Tax mobilization can also support fiscal repair. While public expenditure is beyond the scope of the chapter, improving spending efficiency is an important additional avenue for expanding fiscal space and achieving better outcomes (Box 2.1.4).
Box 2.1.1 Tax policy principles and tradeoffs
Good tax policy follows the principles of efficiency, equity, and simplicity and ensures sufficient and stable revenue for government spending needs. By altering prices, taxes distort economic behavior, causing deadweight or welfare losses. An efficient tax system minimizes any distortion of economic behavior by taxing goods and services for which demand is less sensitive to price changes, and by taxing income with low marginal rates to avoid work disincentives and consequent income losses.
Equitable income taxes are progressive, taxing individuals who earn higher incomes more heavily but treating taxpayers with equivalent incomes equally and without gender or other biases. An important nuance in tax equity is the difference between statutory incidence, or who is legally responsible for paying a tax, and economic incidence, or who actually bears its cost. Generally, economic incidence can be shifted to those whose behavior is less responsive to the tax. For example, corporate income tax legally targets a firm’s shareholders, but firms can shift the burden to consumers if higher prices do not excessively curtail demand.
continued on next page
14 Asian Development Outlook 2022
Box 2.1.1 Continued
Finally, the tax system should be as simple and transparent as possible to reduce compliance costs for taxpayers. Simplicity also reduces uncertainty and—importantly where institutional capacity is weak—tax administration cost and difficulties for governments. Further, simplicity reduces the risk that taxpayers exploit complicated tax rules in ways that undermine equity.
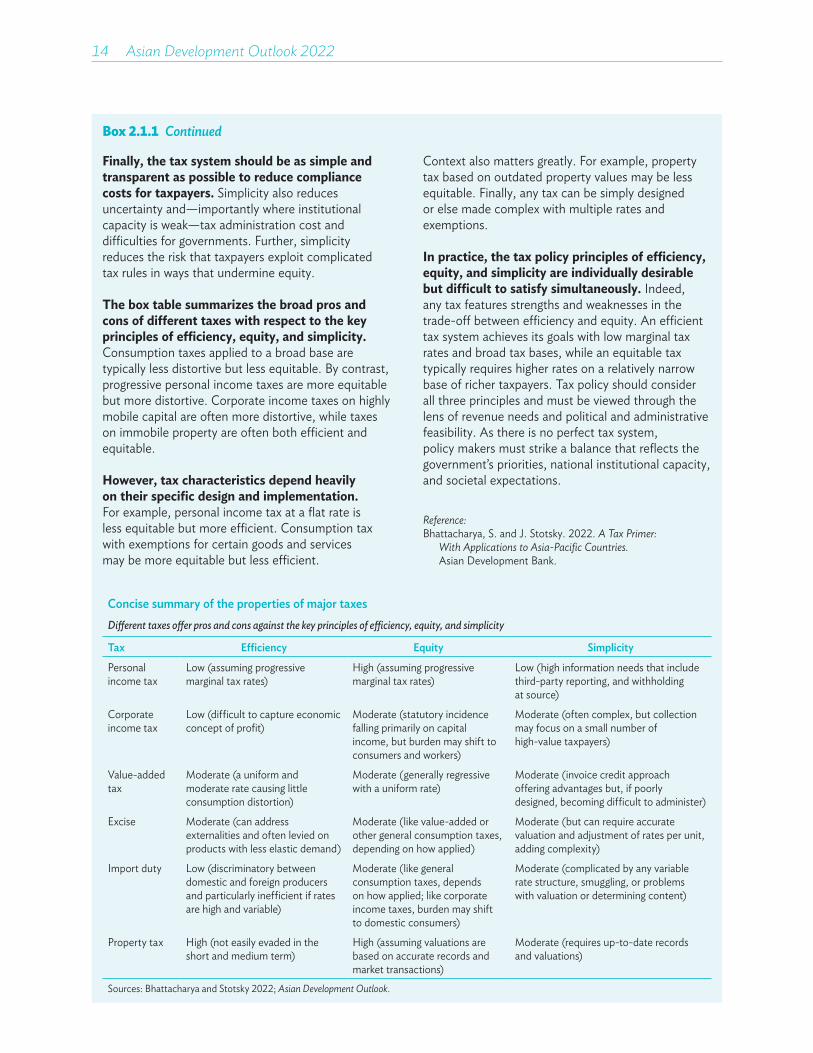
The box table summarizes the broad pros and cons of different taxes with respect to the key principles of efficiency, equity, and simplicity. Consumption taxes applied to a broad base are typically less distortive but less equitable. By contrast, progressive personal income taxes are more equitable but more distortive. Corporate income taxes on highly mobile capital are often more distortive, while taxes on immobile property are often both efficient and equitable.
However, tax characteristics depend heavily on their specific design and implementation. For example, personal income tax at a flat rate is less equitable but more efficient. Consumption tax with exemptions for certain goods and services may be more equitable but less efficient.
Context also matters greatly. For example, property tax based on outdated property values may be less equitable. Finally, any tax can be simply designed or else made complex with multiple rates and exemptions.
In practice, the tax policy principles of efficiency, equity, and simplicity are individually desirable but difficult to satisfy simultaneously. Indeed, any tax features strengths and weaknesses in the trade‑off between efficiency and equity. An efficient tax system achieves its goals with low marginal tax rates and broad tax bases, while an equitable tax typically requires higher rates on a relatively narrow base of richer taxpayers. Tax policy should consider all three principles and must be viewed through the lens of revenue needs and political and administrative feasibility. As there is no perfect tax system, policy makers must strike a balance that reflects the government’s priorities, national institutional capacity, and societal expectations.
Reference:Bhattacharya, S. and J. Stotsky. 2022. A Tax Primer:
With Applications to Asia-Pacific Countries. Asian Development Bank.
Concise summary of the properties of major taxesDifferent taxes offer pros and cons against the key principles of efficiency, equity, and simplicity
Tax Efficiency Equity Simplicity
Personal income tax
Low (assuming progressive marginal tax rates)
High (assuming progressive marginal tax rates)
Low (high information needs that include third‑party reporting, and withholding at source)
Corporate income tax
Low (difficult to capture economic concept of profit)
Moderate (statutory incidence falling primarily on capital income, but burden may shift to consumers and workers)
Moderate (often complex, but collection may focus on a small number of high‑value taxpayers)
Value‑added tax
Moderate (a uniform and moderate rate causing little consumption distortion)
Moderate (generally regressive with a uniform rate)
Moderate (invoice credit approach offering advantages but, if poorly designed, becoming difficult to administer)
Excise Moderate (can address externalities and often levied on products with less elastic demand)
Moderate (like value‑added or other general consumption taxes, depending on how applied)
Moderate (but can require accurate valuation and adjustment of rates per unit, adding complexity)
Import duty Low (discriminatory between domestic and foreign producers and particularly inefficient if rates are high and variable)
Moderate (like general consumption taxes, depends on how applied; like corporate income taxes, burden may shift to domestic consumers)
Moderate (complicated by any variable rate structure, smuggling, or problems with valuation or determining content)
Property tax High (not easily evaded in the short and medium term)
High (assuming valuations are based on accurate records and market transactions)
Moderate (requires up‑to‑date records and valuations)
Sources: Bhattacharya and Stotsky 2022; Asian Development Outlook.
Mobilizing taxes for development 15
Box 2.1.2 Tax buoyancy in developing Asia
Tax buoyancy, or how tax revenue responds to change in GDP, is crucial to understanding tax revenue performance and fiscal sustainability. It informs how tax revenue rises and falls in economic cycles and over the longer term. It further offers insights on the stabilizing role of taxes over the business cycle.
Buoyancy greater than one means tax revenue rises more than in proportion to increased GDP. Tax revenue thus structurally increases and is sufficient to support fiscal sustainability even with some increase in public spending. A buoyant tax system also helps stabilize output over the short run. During upturns, revenue increases more than GDP, dampening demand, and preventing overheating. During downturns, revenue decreases disproportionately, supporting economic activity. If, by contrast, tax buoyancy is less than one, tax revenue structurally decreases and threatens fiscal sustainability in the absence of spending cuts (Creedy and Gemmel 2008; Dudine and Jalles 2018; Gupta, Jalles, and Liu, forthcoming; Lagravinese, Liberati, and Sacchi 2020).
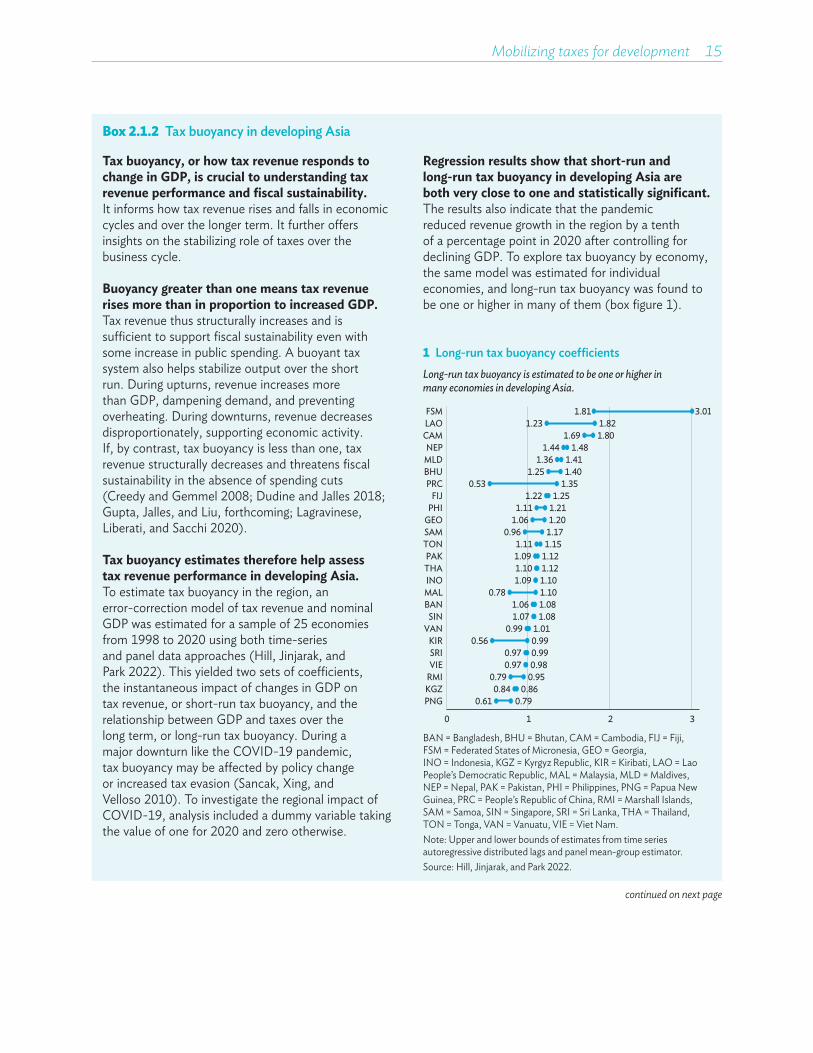
Tax buoyancy estimates therefore help assess tax revenue performance in developing Asia. To estimate tax buoyancy in the region, an error‑correction model of tax revenue and nominal GDP was estimated for a sample of 25 economies from 1998 to 2020 using both time‑series and panel data approaches (Hill, Jinjarak, and Park 2022). This yielded two sets of coefficients, the instantaneous impact of changes in GDP on tax revenue, or short‑run tax buoyancy, and the relationship between GDP and taxes over the long term, or long‑run tax buoyancy. During a major downturn like the COVID‑19 pandemic, tax buoyancy may be affected by policy change or increased tax evasion (Sancak, Xing, and Velloso 2010). To investigate the regional impact of COVID‑19, analysis included a dummy variable taking the value of one for 2020 and zero otherwise.
Regression results show that short-run and long-run tax buoyancy in developing Asia are both very close to one and statistically significant. The results also indicate that the pandemic reduced revenue growth in the region by a tenth of a percentage point in 2020 after controlling for declining GDP. To explore tax buoyancy by economy, the same model was estimated for individual economies, and long‑run tax buoyancy was found to be one or higher in many of them (box figure 1).
continued on next page
1 Long-run tax buoyancy coefficientsLong-run tax buoyancy is estimated to be one or higher in many economies in developing Asia.
0.610.84
0.790.970.97
0.560.99
1.071.06
0.781.091.101.091.11
0.961.06
1.111.22
0.531.25
1.361.44
1.691.23
1.81
0.790.86
0.950.980.990.991.01
1.081.081.101.101.121.121.151.171.201.211.25
1.351.401.41
1.481.801.82
3.01
0 1 2 3
PNGKGZRMIVIESRIKIR
VANSIN
BANMALINOTHAPAK
TONSAMGEOPHIFIJ
PRCBHUMLDNEP
CAMLAOFSM
BAN = Bangladesh, BHU = Bhutan, CAM = Cambodia, FIJ = Fiji, FSM = Federated States of Micronesia, GEO = Georgia, INO = Indonesia, KGZ = Kyrgyz Republic, KIR = Kiribati, LAO = Lao People’s Democratic Republic, MAL = Malaysia, MLD = Maldives, NEP = Nepal, PAK = Pakistan, PHI = Philippines, PNG = Papua New Guinea, PRC = People’s Republic of China, RMI = Marshall Islands, SAM = Samoa, SIN = Singapore, SRI = Sri Lanka, THA = Thailand, TON = Tonga, VAN = Vanuatu, VIE = Viet Nam.Note: Upper and lower bounds of estimates from time series autoregressive distributed lags and panel mean‑group estimator.Source: Hill, Jinjarak, and Park 2022.

16 Asian Development Outlook 2022
Box 2.1.2 Continued
2 Actual minus model-estimated 2020 taxes (% of 2019 GDP)
In 2020, tax revenue in developing Asia declined by more than expected from GDP change alone.
–8 –6 –4 –2 0INOBANCAMMALVANTHASINGEOLAOPNGKIRPAKPRCSAMVIERMINEPKGZSRIMLD
Developing Asia median
% of GDP
BAN = Bangladesh, CAM = Cambodia, GDP = gross domestic product, GEO = Georgia, INO = Indonesia, KGZ = Kyrgyz Republic, KIR = Kiribati, LAO = Lao People’s Democratic Republic, MAL = Malaysia, MLD = Maldives, NEP = Nepal, PAK = Pakistan, PNG = Papua New Guinea, PRC = People’s Republic of China, RMI = Marshall Islands, SAM = Samoa, SIN = Singapore, SRI = Sri Lanka, THA = Thailand, VAN = Vanuatu, VIE = Viet Nam.Notes: Negative values are tax loss beyond what would normally be expected in the GDP downturn. Excludes the Federated States of Micronesia, whose revenue loss is estimated equal to 19.8% of GDP.Source: Hill, Jinjarak, and Park 2022.
Analysis using the regression results further underscores adverse revenue implications of COVID-19. Using estimates from economy‑specific equations, a simple counterfactual analysis was undertaken to estimate excess tax revenue lost in 2020 from the pandemic over and above what would normally be expected in the GDP downturn. Excess revenue loss was estimated by subtracting model predicted revenue for 2020 from actual tax revenue. The median estimated excess tax revenue lost because of COVID‑19 equaled 0.7 percentage points of 2019 GDP, as shown in box figure 2. In summary, the results suggest that tax buoyancy in the region was generally strong before COVID‑19 and that subsequently revenue declined more than expected given the GDP downturn.
References:Creedy, J. and N. Gemmel. 2008. Corporation Tax Buoyancy
and Revenue Elasticity in the UK. Economic Modelling 25.Dudine, P. and J. Jalles. 2018. How Buoyant Is the Tax System?
New Evidence from a Large Heterogenous Panel. Journal of International Development 30.
Gupta, S., J. Tovar Jalles, and J. Liu. Forthcoming. Tax Buoyancy in Sub‑Saharan Africa and Its Determinants. International Tax and Public Finance.
Hill, S., Y. Jinjarak, and D. Park. 2022. How Do Tax Revenues Respond to GDP Growth? Evidence from Developing Asia, 1998–2020. Asian Development Bank.
Mobilizing taxes for development 17
Box 2.1.3 Strategies for successful fiscal consolidation
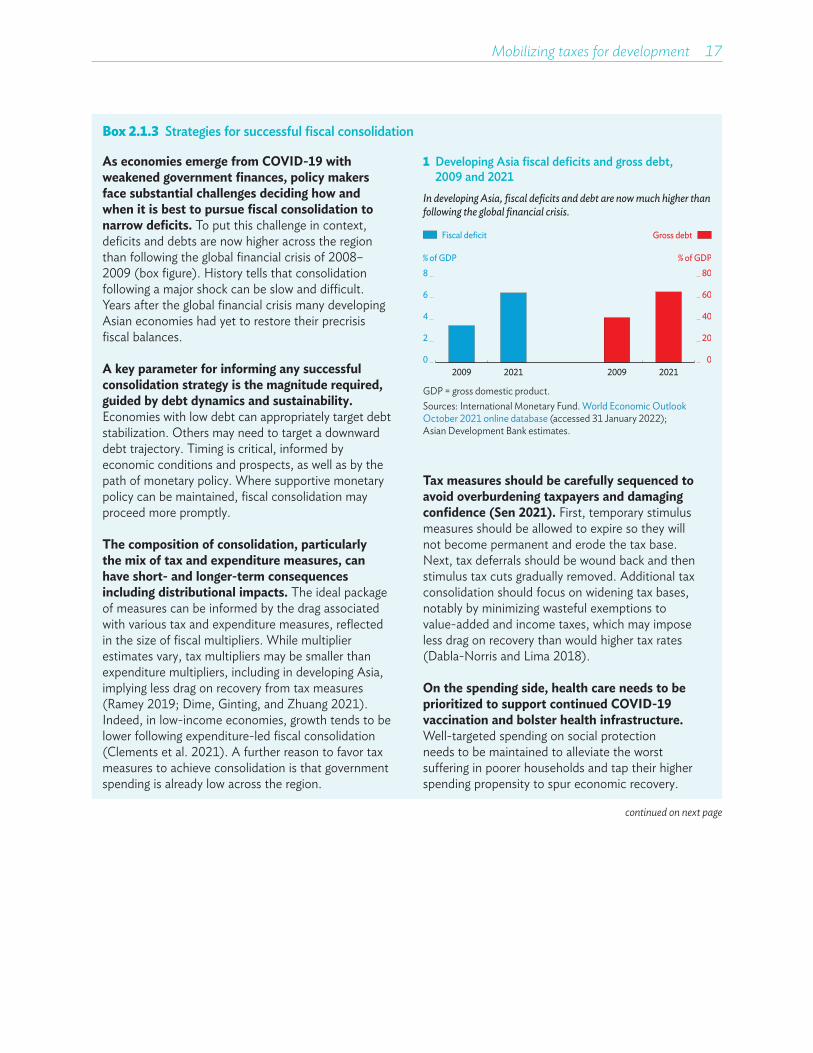
As economies emerge from COVID-19 with weakened government finances, policy makers face substantial challenges deciding how and when it is best to pursue fiscal consolidation to narrow deficits. To put this challenge in context, deficits and debts are now higher across the region than following the global financial crisis of 2008–2009 (box figure). History tells that consolidation following a major shock can be slow and difficult. Years after the global financial crisis many developing Asian economies had yet to restore their precrisis fiscal balances.
A key parameter for informing any successful consolidation strategy is the magnitude required, guided by debt dynamics and sustainability. Economies with low debt can appropriately target debt stabilization. Others may need to target a downward debt trajectory. Timing is critical, informed by economic conditions and prospects, as well as by the path of monetary policy. Where supportive monetary policy can be maintained, fiscal consolidation may proceed more promptly.
The composition of consolidation, particularly the mix of tax and expenditure measures, can have short- and longer-term consequences including distributional impacts. The ideal package of measures can be informed by the drag associated with various tax and expenditure measures, reflected in the size of fiscal multipliers. While multiplier estimates vary, tax multipliers may be smaller than expenditure multipliers, including in developing Asia, implying less drag on recovery from tax measures (Ramey 2019; Dime, Ginting, and Zhuang 2021). Indeed, in low‑income economies, growth tends to be lower following expenditure‑led fiscal consolidation (Clements et al. 2021). A further reason to favor tax measures to achieve consolidation is that government spending is already low across the region.
Tax measures should be carefully sequenced to avoid overburdening taxpayers and damaging confidence (Sen 2021). First, temporary stimulus measures should be allowed to expire so they will not become permanent and erode the tax base. Next, tax deferrals should be wound back and then stimulus tax cuts gradually removed. Additional tax consolidation should focus on widening tax bases, notably by minimizing wasteful exemptions to value‑added and income taxes, which may impose less drag on recovery than would higher tax rates (Dabla‑Norris and Lima 2018).
On the spending side, health care needs to be prioritized to support continued COVID-19 vaccination and bolster health infrastructure. Well‑targeted spending on social protection needs to be maintained to alleviate the worst suffering in poorer households and tap their higher spending propensity to spur economic recovery.
continued on next page
1 Developing Asia fiscal deficits and gross debt, 2009 and 2021
In developing Asia, fiscal deficits and debt are now much higher than following the global financial crisis.
Fiscal deficit Gross debt
0
20
40
60
80
0
2
4
2009 2021 2009 2021
6
8% of GDP% of GDP
GDP = gross domestic product.Sources: International Monetary Fund. World Economic Outlook October 2021 online database (accessed 31 January 2022); Asian Development Bank estimates.

18 Asian Development Outlook 2022
Box 2.1.3 Continued
Education spending is another priority because of long‑term scarring left by school closure. Governments need to spend efficiently despite politics playing a significant part in determining the size and composition of COVID‑19 fiscal programs (Aizenman et al. 2021). Recovery provides breathing space to seek savings without sacrificing service delivery or support for the poor. Pro‑poor fiscal adjustments include reducing subsidies that favor more affluent households, such as on energy use. Temporarily freezing civil service salaries or new hires may yield savings without sacrificing recovery.
Consolidation options may be more constrained for economies facing acute revenue shortfalls and macroeconomic instability. Revenue can be substantially boosted by reducing wasteful exemptions and raising rates on key taxes, notably value‑added tax, and some excises, especially on alcohol and tobacco. Eliminating inefficient spending is imperative. While usually difficult, such measures may be easier to justify during a crisis, when they credibly signal the government’s commitment to restore stability.
References:Aizenman, J. et al. 2021. The Political Economy of the
COVID‑19 Fiscal Stimulus Packages of 2020. NBER Working Paper No. 29360. National Bureau of Economic Research.
Clements, B. et al. 2021. Low‑Income Developing Countries Will Surely Need More Debt Relief Down the Line. Center for Global Development Blog.
Dabla‑Norris, E. and F. Lima. 2018. Macroeconomic Effects of Tax Rate and Base Changes: Evidence from Fiscal Consolidations. IMF Working Paper WP/18/220. International Monetary Fund.
Dime, R., E. Ginting, and J. Zhuang. 2021. Estimating Fiscal Multipliers in Selected Asian Economics. ADB Economics Working Paper No. 638. Asian Development Bank.
Ramey, V. A. 2019. Ten Years after the Financial Crisis: What Have We Learned from the Renaissance in Fiscal Research? Journal of Economic Perspectives 33(2).
Sen, T. 2021. Exit Strategy to Ease or Eliminate Tax Responses to the COVID‑19 Pandemic. The Governance Brief 43. Asian Development Bank.
Mobilizing taxes for development 19
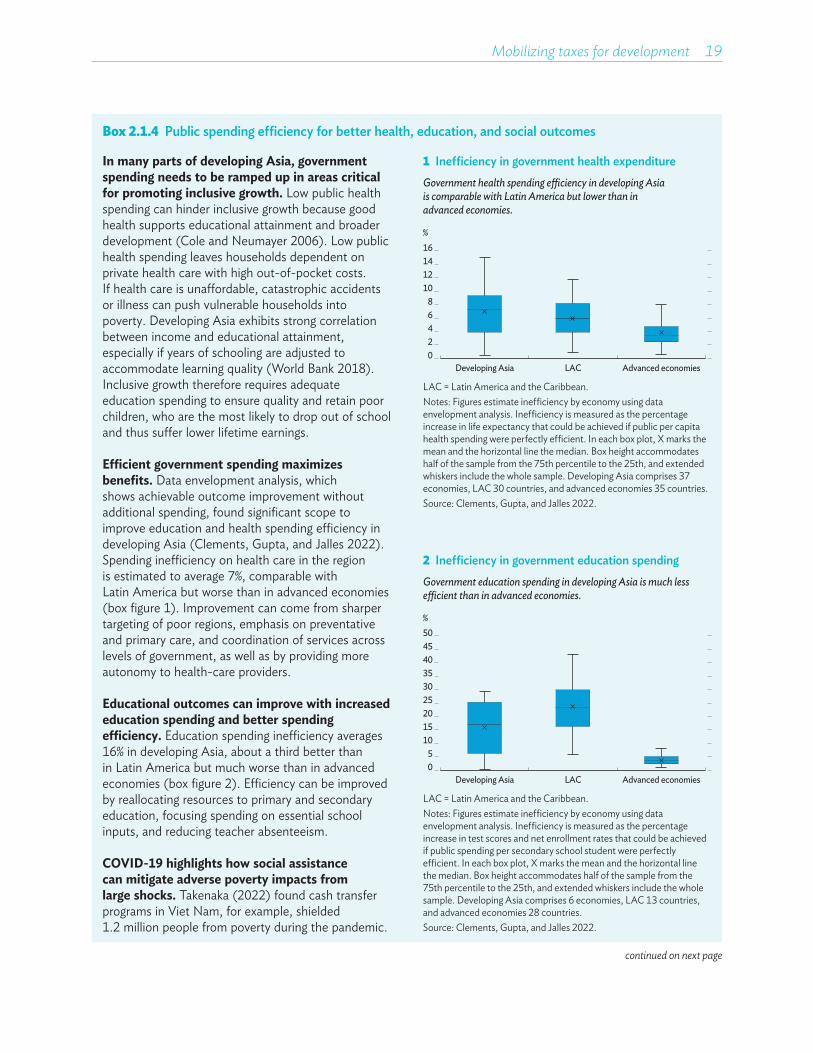
Box 2.1.4 Public spending efficiency for better health, education, and social outcomes
In many parts of developing Asia, government spending needs to be ramped up in areas critical for promoting inclusive growth. Low public health spending can hinder inclusive growth because good health supports educational attainment and broader development (Cole and Neumayer 2006). Low public health spending leaves households dependent on private health care with high out‑of‑pocket costs. If health care is unaffordable, catastrophic accidents or illness can push vulnerable households into poverty. Developing Asia exhibits strong correlation between income and educational attainment, especially if years of schooling are adjusted to accommodate learning quality (World Bank 2018). Inclusive growth therefore requires adequate education spending to ensure quality and retain poor children, who are the most likely to drop out of school and thus suffer lower lifetime earnings.
Efficient government spending maximizes benefits. Data envelopment analysis, which shows achievable outcome improvement without additional spending, found significant scope to improve education and health spending efficiency in developing Asia (Clements, Gupta, and Jalles 2022). Spending inefficiency on health care in the region is estimated to average 7%, comparable with Latin America but worse than in advanced economies (box figure 1). Improvement can come from sharper targeting of poor regions, emphasis on preventative and primary care, and coordination of services across levels of government, as well as by providing more autonomy to health‑care providers.
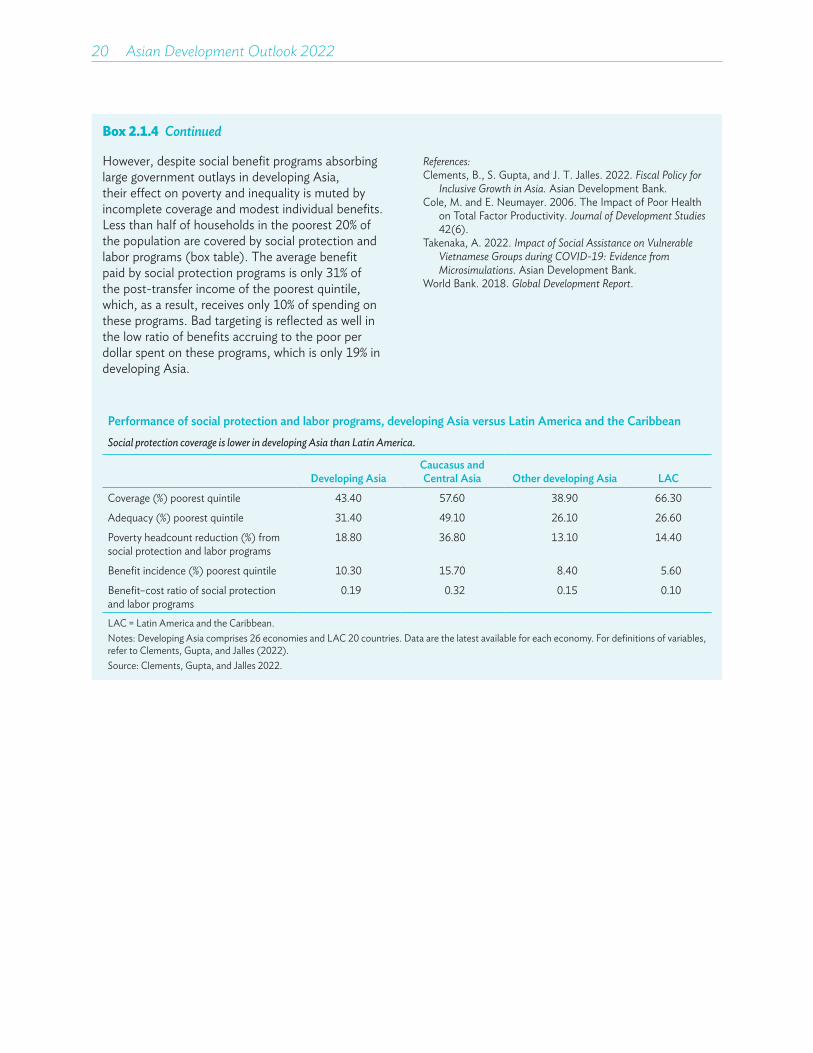
Educational outcomes can improve with increased education spending and better spending efficiency. Education spending inefficiency averages 16% in developing Asia, about a third better than in Latin America but much worse than in advanced economies (box figure 2). Efficiency can be improved by reallocating resources to primary and secondary education, focusing spending on essential school inputs, and reducing teacher absenteeism.
COVID-19 highlights how social assistance can mitigate adverse poverty impacts from large shocks. Takenaka (2022) found cash transfer programs in Viet Nam, for example, shielded 1.2 million people from poverty during the pandemic.
1 Inefficiency in government health expenditureGovernment health spending efficiency in developing Asia is comparable with Latin America but lower than in advanced economies.
02468
10
161412
%
LAC Advanced economiesDeveloping Asia
LAC = Latin America and the Caribbean.Notes: Figures estimate inefficiency by economy using data envelopment analysis. Inefficiency is measured as the percentage increase in life expectancy that could be achieved if public per capita health spending were perfectly efficient. In each box plot, X marks the mean and the horizontal line the median. Box height accommodates half of the sample from the 75th percentile to the 25th, and extended whiskers include the whole sample. Developing Asia comprises 37 economies, LAC 30 countries, and advanced economies 35 countries.Source: Clements, Gupta, and Jalles 2022.
2 Inefficiency in government education spendingGovernment education spending in developing Asia is much less efficient than in advanced economies.
05
10152025
403530
%
LAC Advanced economiesDeveloping Asia
5045
LAC = Latin America and the Caribbean. Notes: Figures estimate inefficiency by economy using data envelopment analysis. Inefficiency is measured as the percentage increase in test scores and net enrollment rates that could be achieved if public spending per secondary school student were perfectly efficient. In each box plot, X marks the mean and the horizontal line the median. Box height accommodates half of the sample from the 75th percentile to the 25th, and extended whiskers include the whole sample. Developing Asia comprises 6 economies, LAC 13 countries, and advanced economies 28 countries.Source: Clements, Gupta, and Jalles 2022.
continued on next page
20 Asian Development Outlook 2022
Box 2.1.4 Continued
However, despite social benefit programs absorbing large government outlays in developing Asia, their effect on poverty and inequality is muted by incomplete coverage and modest individual benefits. Less than half of households in the poorest 20% of the population are covered by social protection and labor programs (box table). The average benefit paid by social protection programs is only 31% of the post‑transfer income of the poorest quintile, which, as a result, receives only 10% of spending on these programs. Bad targeting is reflected as well in the low ratio of benefits accruing to the poor per dollar spent on these programs, which is only 19% in developing Asia.
References:Clements, B., S. Gupta, and J. T. Jalles. 2022. Fiscal Policy for
Inclusive Growth in Asia. Asian Development Bank.Cole, M. and E. Neumayer. 2006. The Impact of Poor Health
on Total Factor Productivity. Journal of Development Studies 42(6).
Takenaka, A. 2022. Impact of Social Assistance on Vulnerable Vietnamese Groups during COVID-19: Evidence from Microsimulations. Asian Development Bank.
World Bank. 2018. Global Development Report.
Performance of social protection and labor programs, developing Asia versus Latin America and the CaribbeanSocial protection coverage is lower in developing Asia than Latin America.
Developing AsiaCaucasus and Central Asia Other developing Asia LAC
Coverage (%) poorest quintile 43.40 57.60 38.90 66.30
Adequacy (%) poorest quintile 31.40 49.10 26.10 26.60
Poverty headcount reduction (%) from social protection and labor programs
18.80 36.80 13.10 14.40
Benefit incidence (%) poorest quintile 10.30 15.70 8.40 5.60
Benefit–cost ratio of social protection and labor programs
0.19 0.32 0.15 0.10
LAC = Latin America and the Caribbean.Notes: Developing Asia comprises 26 economies and LAC 20 countries. Data are the latest available for each economy. For definitions of variables, refer to Clements, Gupta, and Jalles (2022).Source: Clements, Gupta, and Jalles 2022.

Priorities for mobilizing tax revenue depend on economy-specific circumstances
Scope exists to mobilize tax revenue in developing Asia. It can be broadly assessed by estimating tax capacity and comparing it with current tax collection. Tax capacity is the theoretical maximum tax revenue an economy can mobilize given its characteristics, thus representing a revenue benchmark. Factors such as underdevelopment, low educational attainment, and a large agriculture sector tend to reduce tax capacity (Mawejje and Sebudde 2019). Tax effort is the ratio of actual tax revenue to tax capacity. High tax effort indicates actual tax collection close to tax capacity and thus less potential to increase revenue. Low effort indicates tax collection far short of tax capacity—possibly reflecting low tax rates, narrow tax bases, or poor compliance—and therefore strong potential for higher revenue.
Potential to increase developing Asia’s tax revenueNew indicative tax capacity estimates suggest that developing Asia can increase tax revenue on average by the equivalent of 3%–4% of GDP, which is significant given current low tax collection. This benchmark tax revenue is estimated controlling for GDP per capita, the size of the agriculture sector, education spending, and trade openness (Gupta and Jalles 2022). Substantial subregional variation exists in tax capacity and tax effort. Tax effort is low and the potential to increase taxes is correspondingly great in Southeast Asia, particularly in Malaysia and Thailand. By contrast, tax effort and actual revenue are relatively high in the PRC, the ROK, and some Pacific island economies. In a few economies, notably the Lao People’s Democratic Republic (Lao PDR), Papua New Guinea, and Timor‑Leste, tax effort is high despite low actual tax collection (Figure 2.2.1).
Figure 2.2.1 Tax potential in Asia: tax capacity and tax revenue, latest available yearPotential to raise tax revenue is generally high in Southeast Asia.
% of GDP Ratio
0
0.3
0.6
0.9
1.2
0
10
20
30
40
FSM THA MAL ROK SAM SOL FIJ PRC PHI SIN PAK CAM IND TON INO VAN VIE HKG PNG TIM LAO MYA
Tax capacityTax revenue Tax e�ort
CAM = Cambodia, FIJ = Fiji, FSM = Federated States of Micronesia, GDP = gross domestic product, HKG = Hong Kong, China, IND = India, INO = Indonesia, LAO = Lao People’s Democratic Republic, MAL = Malaysia, MYA = Myanmar, PAK = Pakistan, PHI = Philippines, PNG = Papua New Guinea, PRC = People’s Republic of China, ROK = Republic of Korea, SAM = Samoa, SIN = Singapore, SOL = Solomon Islands, THA = Thailand, TIM = Timor‑Leste, TON = Tonga, VAN = Vanuatu, VIE = Viet Nam.Source: Gupta and Jalles 2022.
22 Asian Development Outlook 2022
Regional variation underscores the need for economy‑specific approaches to increasing revenue while avoiding excessive tax burdens that stifle economic growth.
Tax policy priorities to reflect economy-specific circumstancesIncreasing tax revenue across developing Asia requires that governments make the most of key revenue sources—particularly VAT, personal and corporate income, and property taxes—in a manner consistent with local priorities and capacity. Some economies with very narrow tax bases have few options and need to carefully make the most of both tax and nontax revenue (Box 2.2.1). In many, weak enforcement capacity can be further hamstrung by scarce third‑party information on taxpayers from firms (Kleven et al. 2011; Kleven, Kreiner, and Saez 2016; Pomeranz and Vila‑Belda 2019). Acceleration in the digital economy under COVID‑19 is creating new economic opportunities but also significant tax challenges, especially in regard to cross‑border transactions.
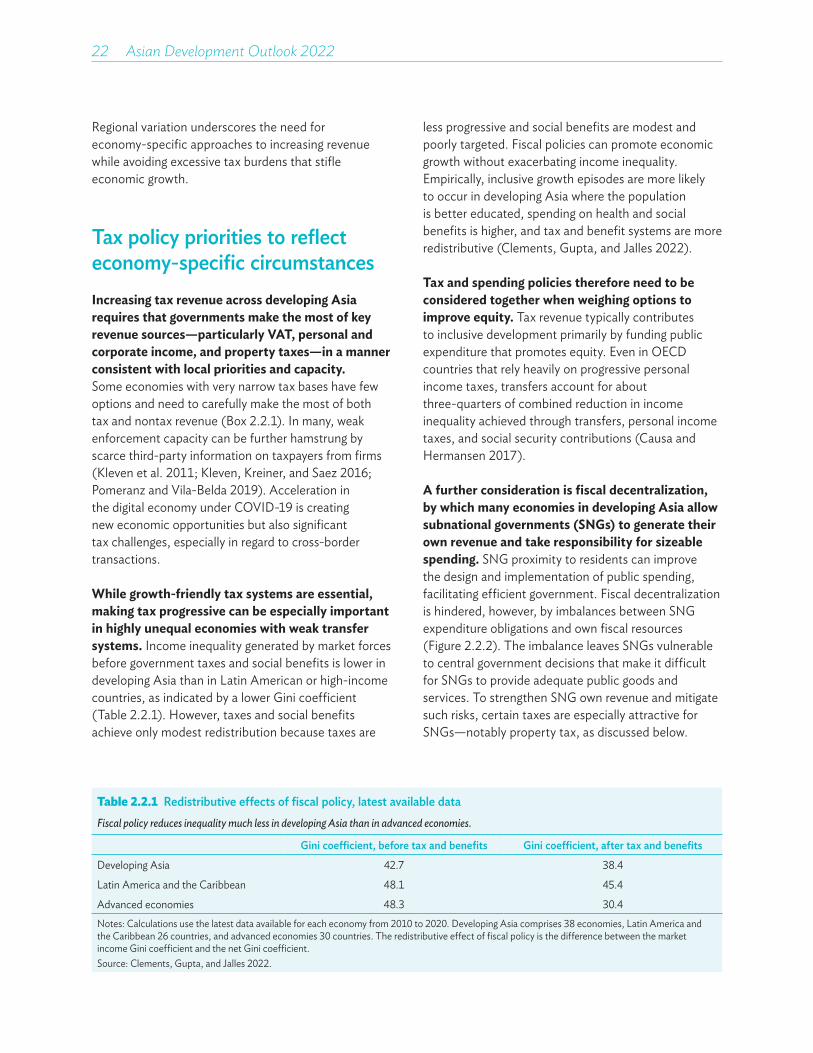
While growth-friendly tax systems are essential, making tax progressive can be especially important in highly unequal economies with weak transfer systems. Income inequality generated by market forces before government taxes and social benefits is lower in developing Asia than in Latin American or high‑income countries, as indicated by a lower Gini coefficient (Table 2.2.1). However, taxes and social benefits achieve only modest redistribution because taxes are
less progressive and social benefits are modest and poorly targeted. Fiscal policies can promote economic growth without exacerbating income inequality. Empirically, inclusive growth episodes are more likely to occur in developing Asia where the population is better educated, spending on health and social benefits is higher, and tax and benefit systems are more redistributive (Clements, Gupta, and Jalles 2022).
Tax and spending policies therefore need to be considered together when weighing options to improve equity. Tax revenue typically contributes to inclusive development primarily by funding public expenditure that promotes equity. Even in OECD countries that rely heavily on progressive personal income taxes, transfers account for about three‑quarters of combined reduction in income inequality achieved through transfers, personal income taxes, and social security contributions (Causa and Hermansen 2017).
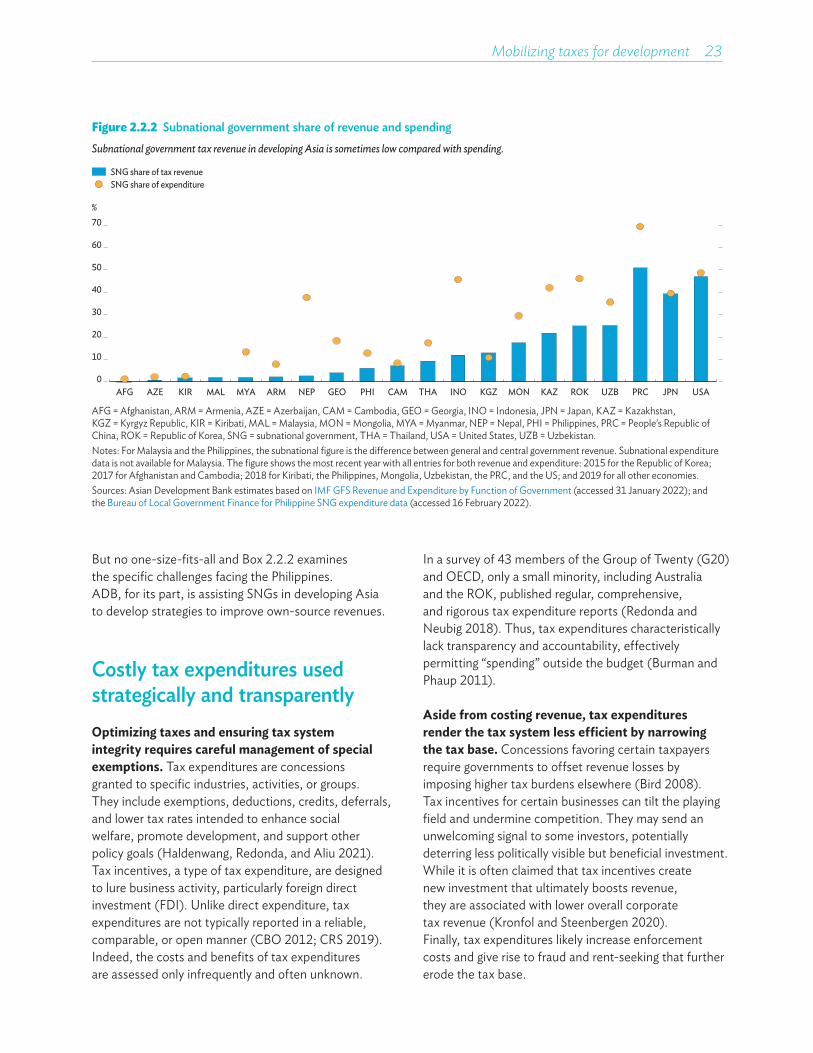
A further consideration is fiscal decentralization, by which many economies in developing Asia allow subnational governments (SNGs) to generate their own revenue and take responsibility for sizeable spending. SNG proximity to residents can improve the design and implementation of public spending, facilitating efficient government. Fiscal decentralization is hindered, however, by imbalances between SNG expenditure obligations and own fiscal resources (Figure 2.2.2). The imbalance leaves SNGs vulnerable to central government decisions that make it difficult for SNGs to provide adequate public goods and services. To strengthen SNG own revenue and mitigate such risks, certain taxes are especially attractive for SNGs—notably property tax, as discussed below.
Table 2.2.1 Redistributive effects of fiscal policy, latest available dataFiscal policy reduces inequality much less in developing Asia than in advanced economies.
Gini coefficient, before tax and benefits Gini coefficient, after tax and benefits
Developing Asia 42.7 38.4
Latin America and the Caribbean 48.1 45.4
Advanced economies 48.3 30.4Notes: Calculations use the latest data available for each economy from 2010 to 2020. Developing Asia comprises 38 economies, Latin America and the Caribbean 26 countries, and advanced economies 30 countries. The redistributive effect of fiscal policy is the difference between the market income Gini coefficient and the net Gini coefficient. Source: Clements, Gupta, and Jalles 2022.
Mobilizing taxes for development 23
Figure 2.2.2 Subnational government share of revenue and spendingSubnational government tax revenue in developing Asia is sometimes low compared with spending.
%
SNG share of tax revenueSNG share of expenditure
0
10
20
30
40
50
60
70
AFG AZE KIR MAL MYA ARM NEP GEO PHI CAM THA INO KGZ MON KAZ ROK UZB PRC JPN USA
AFG = Afghanistan, ARM = Armenia, AZE = Azerbaijan, CAM = Cambodia, GEO = Georgia, INO = Indonesia, JPN = Japan, KAZ = Kazakhstan, KGZ = Kyrgyz Republic, KIR = Kiribati, MAL = Malaysia, MON = Mongolia, MYA = Myanmar, NEP = Nepal, PHI = Philippines, PRC = People’s Republic of China, ROK = Republic of Korea, SNG = subnational government, THA = Thailand, USA = United States, UZB = Uzbekistan.Notes: For Malaysia and the Philippines, the subnational figure is the difference between general and central government revenue. Subnational expenditure data is not available for Malaysia. The figure shows the most recent year with all entries for both revenue and expenditure: 2015 for the Republic of Korea; 2017 for Afghanistan and Cambodia; 2018 for Kiribati, the Philippines, Mongolia, Uzbekistan, the PRC, and the US; and 2019 for all other economies.Sources: Asian Development Bank estimates based on IMF GFS Revenue and Expenditure by Function of Government (accessed 31 January 2022); and the Bureau of Local Government Finance for Philippine SNG expenditure data (accessed 16 February 2022).
But no one‑size‑fits‑all and Box 2.2.2 examines the specific challenges facing the Philippines. ADB, for its part, is assisting SNGs in developing Asia to develop strategies to improve own‑source revenues.
Costly tax expenditures used strategically and transparentlyOptimizing taxes and ensuring tax system integrity requires careful management of special exemptions. Tax expenditures are concessions granted to specific industries, activities, or groups. They include exemptions, deductions, credits, deferrals, and lower tax rates intended to enhance social welfare, promote development, and support other policy goals (Haldenwang, Redonda, and Aliu 2021). Tax incentives, a type of tax expenditure, are designed to lure business activity, particularly foreign direct investment (FDI). Unlike direct expenditure, tax expenditures are not typically reported in a reliable, comparable, or open manner (CBO 2012; CRS 2019). Indeed, the costs and benefits of tax expenditures are assessed only infrequently and often unknown.
In a survey of 43 members of the Group of Twenty (G20) and OECD, only a small minority, including Australia and the ROK, published regular, comprehensive, and rigorous tax expenditure reports (Redonda and Neubig 2018). Thus, tax expenditures characteristically lack transparency and accountability, effectively permitting “spending” outside the budget (Burman and Phaup 2011).
Aside from costing revenue, tax expenditures render the tax system less efficient by narrowing the tax base. Concessions favoring certain taxpayers require governments to offset revenue losses by imposing higher tax burdens elsewhere (Bird 2008). Tax incentives for certain businesses can tilt the playing field and undermine competition. They may send an unwelcoming signal to some investors, potentially deterring less politically visible but beneficial investment. While it is often claimed that tax incentives create new investment that ultimately boosts revenue, they are associated with lower overall corporate tax revenue (Kronfol and Steenbergen 2020). Finally, tax expenditures likely increase enforcement costs and give rise to fraud and rent‑seeking that further erode the tax base.
24 Asian Development Outlook 2022
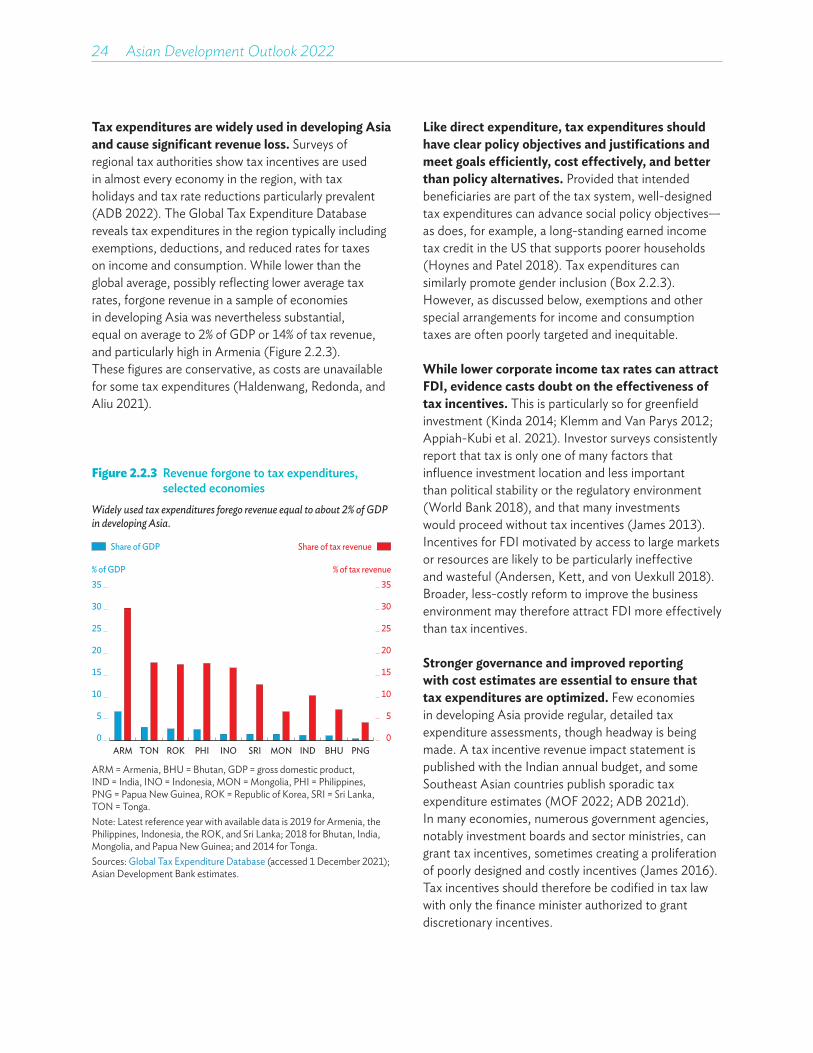
Tax expenditures are widely used in developing Asia and cause significant revenue loss. Surveys of regional tax authorities show tax incentives are used in almost every economy in the region, with tax holidays and tax rate reductions particularly prevalent (ADB 2022). The Global Tax Expenditure Database reveals tax expenditures in the region typically including exemptions, deductions, and reduced rates for taxes on income and consumption. While lower than the global average, possibly reflecting lower average tax rates, forgone revenue in a sample of economies in developing Asia was nevertheless substantial, equal on average to 2% of GDP or 14% of tax revenue, and particularly high in Armenia (Figure 2.2.3). These figures are conservative, as costs are unavailable for some tax expenditures (Haldenwang, Redonda, and Aliu 2021).
Like direct expenditure, tax expenditures should have clear policy objectives and justifications and meet goals efficiently, cost effectively, and better than policy alternatives. Provided that intended beneficiaries are part of the tax system, well‑designed tax expenditures can advance social policy objectives—as does, for example, a long‑standing earned income tax credit in the US that supports poorer households (Hoynes and Patel 2018). Tax expenditures can similarly promote gender inclusion (Box 2.2.3). However, as discussed below, exemptions and other special arrangements for income and consumption taxes are often poorly targeted and inequitable.
While lower corporate income tax rates can attract FDI, evidence casts doubt on the effectiveness of tax incentives. This is particularly so for greenfield investment (Kinda 2014; Klemm and Van Parys 2012; Appiah‑Kubi et al. 2021). Investor surveys consistently report that tax is only one of many factors that influence investment location and less important than political stability or the regulatory environment (World Bank 2018), and that many investments would proceed without tax incentives (James 2013). Incentives for FDI motivated by access to large markets or resources are likely to be particularly ineffective and wasteful (Andersen, Kett, and von Uexkull 2018). Broader, less‑costly reform to improve the business environment may therefore attract FDI more effectively than tax incentives.
Stronger governance and improved reporting with cost estimates are essential to ensure that tax expenditures are optimized. Few economies in developing Asia provide regular, detailed tax expenditure assessments, though headway is being made. A tax incentive revenue impact statement is published with the Indian annual budget, and some Southeast Asian countries publish sporadic tax expenditure estimates (MOF 2022; ADB 2021d). In many economies, numerous government agencies, notably investment boards and sector ministries, can grant tax incentives, sometimes creating a proliferation of poorly designed and costly incentives (James 2016). Tax incentives should therefore be codified in tax law with only the finance minister authorized to grant discretionary incentives.
Figure 2.2.3 Revenue forgone to tax expenditures, selected economies
Widely used tax expenditures forego revenue equal to about 2% of GDP in developing Asia.
% of GDP
ARM TON ROK PHI INO SRI MON IND BHU PNG0
5
10
20
25
35
Share of GDP
% of tax revenue
Share of tax revenue
0
35
15
30
5
10
20
25
15
30
ARM = Armenia, BHU = Bhutan, GDP = gross domestic product, IND = India, INO = Indonesia, MON = Mongolia, PHI = Philippines, PNG = Papua New Guinea, ROK = Republic of Korea, SRI = Sri Lanka, TON = Tonga.Note: Latest reference year with available data is 2019 for Armenia, the Philippines, Indonesia, the ROK, and Sri Lanka; 2018 for Bhutan, India, Mongolia, and Papua New Guinea; and 2014 for Tonga.Sources: Global Tax Expenditure Database (accessed 1 December 2021); Asian Development Bank estimates.
Mobilizing taxes for development 25
Value-added tax, a revenue mainstay to be optimizedRevenue from VAT, a relatively efficient tax, will likely remain a mainstay in developing Asia and therefore must be optimized. The self‑enforcement property of VAT adds to its value. Firms pay VAT only on the value‑added portion of their sales, with a tax deduction for inputs. To receive the deduction, firms require their suppliers to provide a receipt, creating an auditable paper trail and incentive for firms to report their activities correctly to tax authorities (Pomeranz 2015). Such self‑enforcement can be strengthened. In the PRC, for example, a new digital invoice system narrowed scope for misreporting input costs and substantially boosted VAT revenue (Fan et al. 2021).
VAT is often considered regressive because poorer households spend more of their income. However, this depends on consumption patterns and tax design. Exemptions and lower rates often apply to food and other necessities, and evidence on equity is mixed (Alavuotunki, Haapanen, and Pirttila 2019; IMF 2019). Further, many poor households grow their own food and purchase goods and services from small vendors, leaving much of their consumption beyond the VAT net.
After accounting for consumption patterns, VAT may even be progressive in developing countries (Bachas, Gadenne, and Jensen 2021).
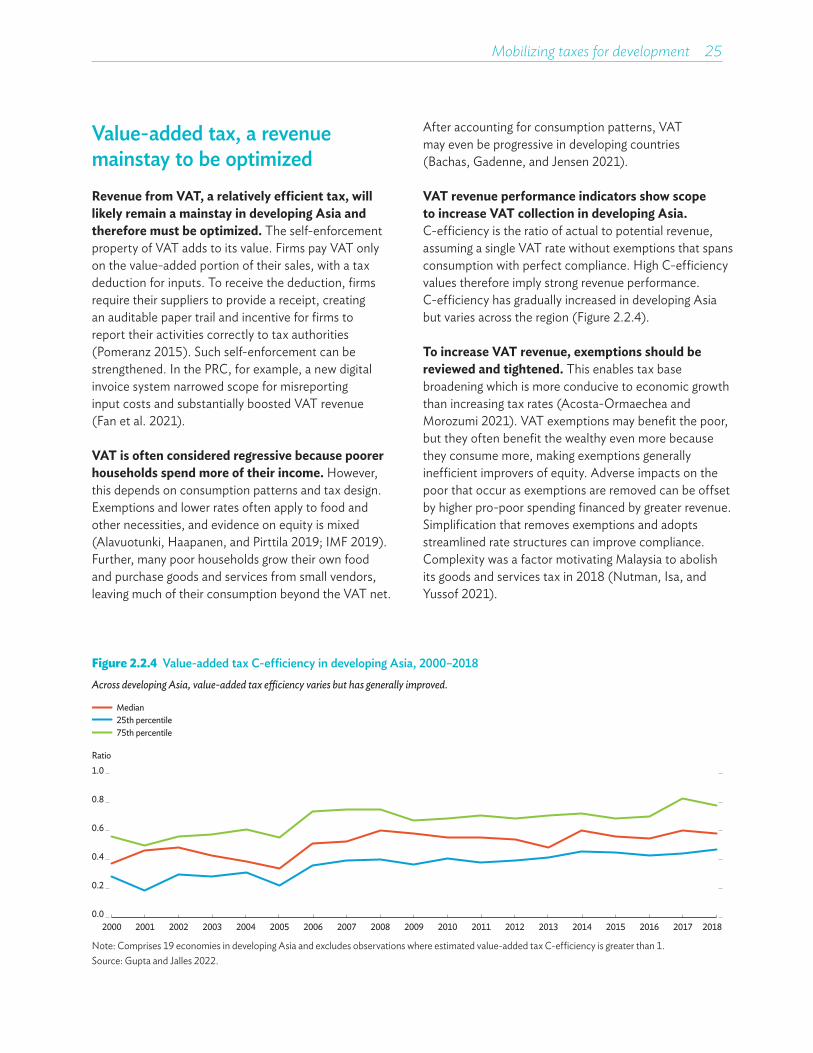
VAT revenue performance indicators show scope to increase VAT collection in developing Asia. C‑efficiency is the ratio of actual to potential revenue, assuming a single VAT rate without exemptions that spans consumption with perfect compliance. High C‑efficiency values therefore imply strong revenue performance. C‑efficiency has gradually increased in developing Asia but varies across the region (Figure 2.2.4).
To increase VAT revenue, exemptions should be reviewed and tightened. This enables tax base broadening which is more conducive to economic growth than increasing tax rates (Acosta‑Ormaechea and Morozumi 2021). VAT exemptions may benefit the poor, but they often benefit the wealthy even more because they consume more, making exemptions generally inefficient improvers of equity. Adverse impacts on the poor that occur as exemptions are removed can be offset by higher pro‑poor spending financed by greater revenue. Simplification that removes exemptions and adopts streamlined rate structures can improve compliance. Complexity was a factor motivating Malaysia to abolish its goods and services tax in 2018 (Nutman, Isa, and Yussof 2021).
Figure 2.2.4 Value-added tax C-efficiency in developing Asia, 2000–2018Across developing Asia, value-added tax efficiency varies but has generally improved.
Ratio
0.0
0.2
0.4
0.6
0.8
1.0
2000 2001 2002 2003 2004 2005 2006 2007 2008 2009 2010 2011 2012 2013 2014 2015 2016 2017 2018
Median25th percentile75th percentile
Note: Comprises 19 economies in developing Asia and excludes observations where estimated value‑added tax C‑efficiency is greater than 1.Source: Gupta and Jalles 2022.

26 Asian Development Outlook 2022
Across developing Asia, VAT rates average 11.9%, lower than 15.0% in Latin America and 19.7% in high-income OECD countries. At 10% or less, VAT rates are especially low in Maldives; Sri Lanka (lowered from 15% to 8% in 2019); Taipei,China; and Thailand (Figure 2.2.5). While less efficient than base broadening, raising VAT tax rates offers scope to lift revenue, particularly where existing rates are very low (Gunter et al. 2021). Indeed, as part of major tax reform to increase revenue, Indonesia hiked its VAT rate from 10% to 11% in 2022 and plans a further increase to 12% in 2025.
The VAT registration threshold for firms should balance revenue gains and compliance costs. A lower threshold supports revenue but increases compliance burdens for very small businesses and tax authorities, and it may encourage firms to underreport activity to stay small (Liu et al. 2021). This can have adverse consequences. In Thailand, unregistered firms had significantly lower growth rates than registered firms, especially those near registration thresholds (Muthitacharoen, Wanichthaworn, and Burong 2021).
Finally, rising digital commerce in the region needs careful management by tax authorities. VAT on imported goods can normally be collected at the border, but not for imported digital products delivered directly online to consumers. Foreign suppliers are often not required to register for or pay VAT. Further, imports may fall under VAT exemptions for low‑value imports. The sharing economy, in which transactions are mostly on digital platforms, poses another risk to VAT.
VAT on digital imports bolsters revenue, ensures a level playing field for domestic suppliers, and is gradually being introduced across developing Asia. Half of Asian economies with VAT have rules that apply it to the digital economy (Mullins 2022). However, at this stage, few economies have VAT rules for goods and services supplied via domestic digital platforms. India is one, requiring suppliers and platform operators to register for the goods and services tax, with the operator collecting tax from suppliers.
Figure 2.2.5 VAT rates in developing Asia and average rate in selected regionsAcross developing Asia, value-added tax rates are generally low.
Tax rate, %
ARM OECD IND AZE GEO PAK LAC TAJ TKM UZB PRC KAZ KGZ PHI INO CAM ROK LAO MON PNG VIE FIJ SRI SIN THA MLD TAP
Developing Asia average
0
5
10
15
20
25
ARM = Armenia, AZE = Azerbaijan, CAM = Cambodia, FIJ = Fiji, GEO = Georgia, IND = India, INO = Indonesia, KAZ = Kazakhstan, KGZ = Kyrgyz Republic, LAC = Latin America and the Caribbean, LAO = Lao People’s Democratic Republic, MLD = Maldives, MON = Mongolia, OECD = Organisation for Economic Co‑operation and Development, PAK = Pakistan, PHI = Philippines, PNG = Papua New Guinea, PRC = People’s Republic of China, ROK = Republic of Korea, SIN = Singapore, SRI = Sri Lanka, TAJ = Tajikistan, TAP = Taipei,China, THA = Thailand, TKM = Turkmenistan, UZB = Uzbekistan, VAT = value‑added tax, VIE = Viet Nam.Notes: General rate is shown for economies with multiple VAT rates. The Pakistan rate of 17% shown in the figure is the VAT on goods; 13% is levied on services. India has multiple VAT rates up to 28%, but the figure shows the general rate of 18%. Maldives has a general rate of 6% but imposes a higher rate of 12% on tourism goods and services.Sources: PricewaterhouseCoopers. World Tax Summary (accessed 24 January 2022); Asian Development Bank estimates.
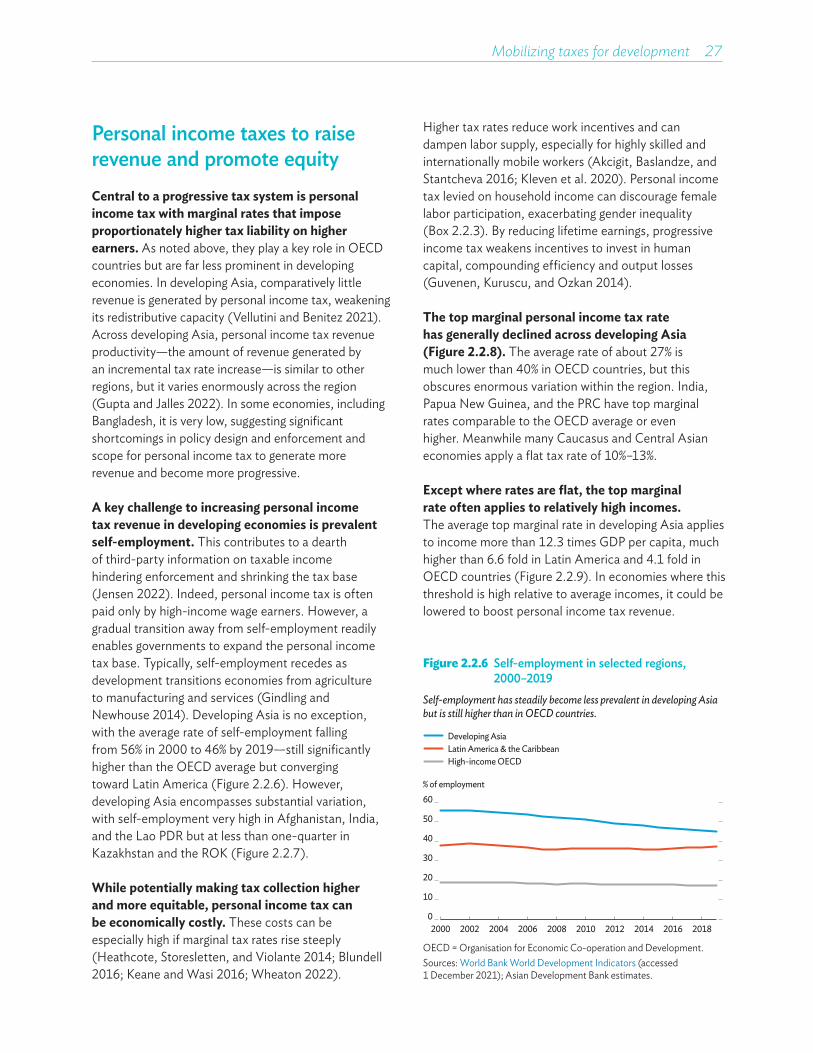
Mobilizing taxes for development 27
Personal income taxes to raise revenue and promote equityCentral to a progressive tax system is personal income tax with marginal rates that impose proportionately higher tax liability on higher earners. As noted above, they play a key role in OECD countries but are far less prominent in developing economies. In developing Asia, comparatively little revenue is generated by personal income tax, weakening its redistributive capacity (Vellutini and Benitez 2021). Across developing Asia, personal income tax revenue productivity—the amount of revenue generated by an incremental tax rate increase—is similar to other regions, but it varies enormously across the region (Gupta and Jalles 2022). In some economies, including Bangladesh, it is very low, suggesting significant shortcomings in policy design and enforcement and scope for personal income tax to generate more revenue and become more progressive.
A key challenge to increasing personal income tax revenue in developing economies is prevalent self-employment. This contributes to a dearth of third‑party information on taxable income hindering enforcement and shrinking the tax base (Jensen 2022). Indeed, personal income tax is often paid only by high‑income wage earners. However, a gradual transition away from self‑employment readily enables governments to expand the personal income tax base. Typically, self‑employment recedes as development transitions economies from agriculture to manufacturing and services (Gindling and Newhouse 2014). Developing Asia is no exception, with the average rate of self‑employment falling from 56% in 2000 to 46% by 2019—still significantly higher than the OECD average but converging toward Latin America (Figure 2.2.6). However, developing Asia encompasses substantial variation, with self‑employment very high in Afghanistan, India, and the Lao PDR but at less than one‑quarter in Kazakhstan and the ROK (Figure 2.2.7).
While potentially making tax collection higher and more equitable, personal income tax can be economically costly. These costs can be especially high if marginal tax rates rise steeply (Heathcote, Storesletten, and Violante 2014; Blundell 2016; Keane and Wasi 2016; Wheaton 2022).
Higher tax rates reduce work incentives and can dampen labor supply, especially for highly skilled and internationally mobile workers (Akcigit, Baslandze, and Stantcheva 2016; Kleven et al. 2020). Personal income tax levied on household income can discourage female labor participation, exacerbating gender inequality (Box 2.2.3). By reducing lifetime earnings, progressive income tax weakens incentives to invest in human capital, compounding efficiency and output losses (Guvenen, Kuruscu, and Ozkan 2014).
The top marginal personal income tax rate has generally declined across developing Asia (Figure 2.2.8). The average rate of about 27% is much lower than 40% in OECD countries, but this obscures enormous variation within the region. India, Papua New Guinea, and the PRC have top marginal rates comparable to the OECD average or even higher. Meanwhile many Caucasus and Central Asian economies apply a flat tax rate of 10%–13%.
Except where rates are flat, the top marginal rate often applies to relatively high incomes. The average top marginal rate in developing Asia applies to income more than 12.3 times GDP per capita, much higher than 6.6 fold in Latin America and 4.1 fold in OECD countries (Figure 2.2.9). In economies where this threshold is high relative to average incomes, it could be lowered to boost personal income tax revenue.
Figure 2.2.6 Self-employment in selected regions, 2000–2019
Self-employment has steadily become less prevalent in developing Asia but is still higher than in OECD countries.
Developing AsiaLatin America & the CaribbeanHigh-income OECD
% of employment
2000 2002 2004 2006 2008 2010 2012 2014 2016 20180
10
20
30
40
50
60
OECD = Organisation for Economic Co‑operation and Development.Sources: World Bank World Development Indicators (accessed 1 December 2021); Asian Development Bank estimates.
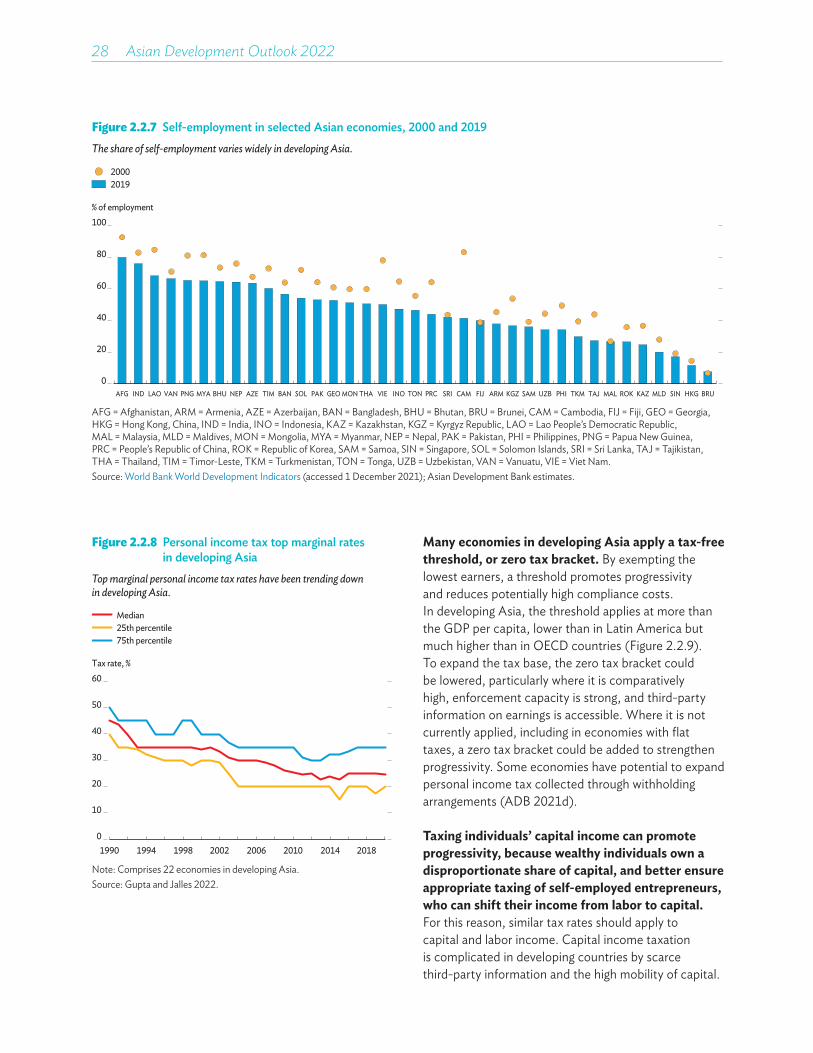
28 Asian Development Outlook 2022
Figure 2.2.7 Self-employment in selected Asian economies, 2000 and 2019The share of self-employment varies widely in developing Asia.
% of employment
20192000
0
20
40
60
80
100
AFG IND LAO VAN PNG MYA BHU NEP AZE TIM BAN SOL PAK GEO MON THA VIE INO TON PRC SRI CAM FIJ ARM KGZ SAM UZB PHI TKM TAJ MAL ROK KAZ MLD SIN HKG BRU
AFG = Afghanistan, ARM = Armenia, AZE = Azerbaijan, BAN = Bangladesh, BHU = Bhutan, BRU = Brunei, CAM = Cambodia, FIJ = Fiji, GEO = Georgia, HKG = Hong Kong, China, IND = India, INO = Indonesia, KAZ = Kazakhstan, KGZ = Kyrgyz Republic, LAO = Lao People’s Democratic Republic, MAL = Malaysia, MLD = Maldives, MON = Mongolia, MYA = Myanmar, NEP = Nepal, PAK = Pakistan, PHI = Philippines, PNG = Papua New Guinea, PRC = People’s Republic of China, ROK = Republic of Korea, SAM = Samoa, SIN = Singapore, SOL = Solomon Islands, SRI = Sri Lanka, TAJ = Tajikistan, THA = Thailand, TIM = Timor‑Leste, TKM = Turkmenistan, TON = Tonga, UZB = Uzbekistan, VAN = Vanuatu, VIE = Viet Nam.Source: World Bank World Development Indicators (accessed 1 December 2021); Asian Development Bank estimates.
Figure 2.2.8 Personal income tax top marginal rates in developing Asia
Top marginal personal income tax rates have been trending down in developing Asia.
Tax rate, %
Median25th percentile75th percentile
0
10
20
30
40
50
60
1990 1994 1998 2002 2006 2010 2014 2018
Note: Comprises 22 economies in developing Asia.Source: Gupta and Jalles 2022.
Many economies in developing Asia apply a tax-free threshold, or zero tax bracket. By exempting the lowest earners, a threshold promotes progressivity and reduces potentially high compliance costs. In developing Asia, the threshold applies at more than the GDP per capita, lower than in Latin America but much higher than in OECD countries (Figure 2.2.9). To expand the tax base, the zero tax bracket could be lowered, particularly where it is comparatively high, enforcement capacity is strong, and third‑party information on earnings is accessible. Where it is not currently applied, including in economies with flat taxes, a zero tax bracket could be added to strengthen progressivity. Some economies have potential to expand personal income tax collected through withholding arrangements (ADB 2021d).
Taxing individuals’ capital income can promote progressivity, because wealthy individuals own a disproportionate share of capital, and better ensure appropriate taxing of self-employed entrepreneurs, who can shift their income from labor to capital. For this reason, similar tax rates should apply to capital and labor income. Capital income taxation is complicated in developing countries by scarce third‑party information and the high mobility of capital.
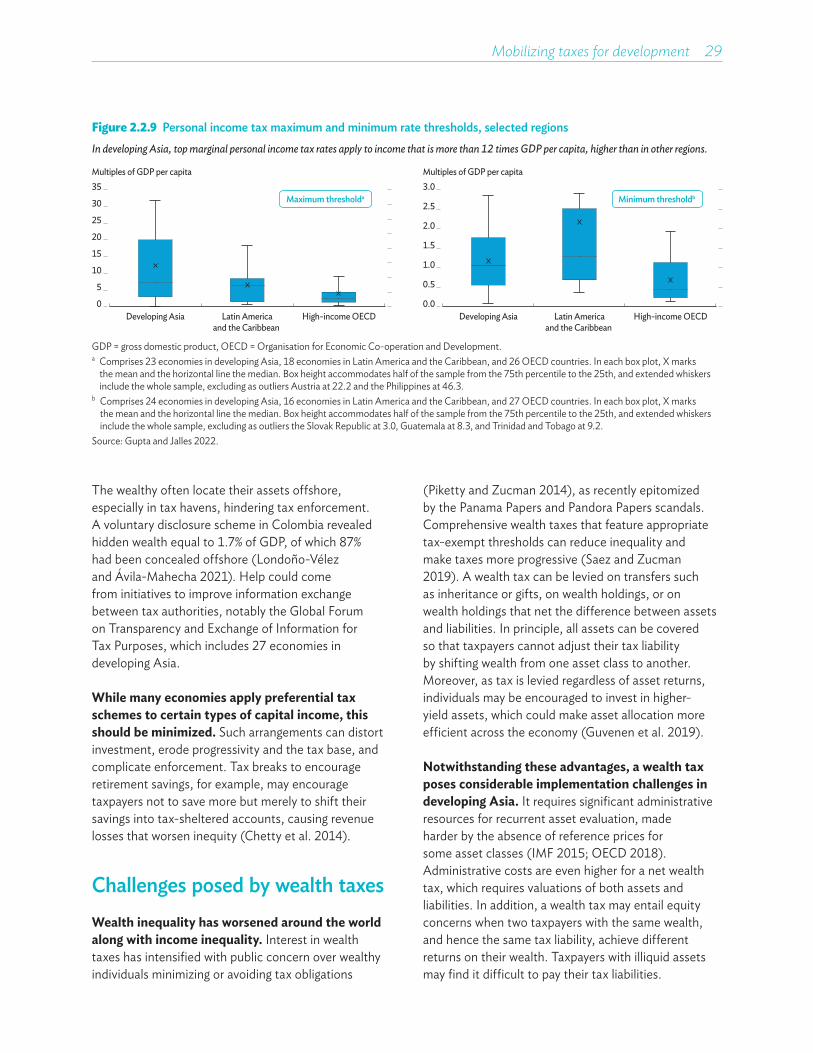
Mobilizing taxes for development 29
(Piketty and Zucman 2014), as recently epitomized by the Panama Papers and Pandora Papers scandals. Comprehensive wealth taxes that feature appropriate tax‑exempt thresholds can reduce inequality and make taxes more progressive (Saez and Zucman 2019). A wealth tax can be levied on transfers such as inheritance or gifts, on wealth holdings, or on wealth holdings that net the difference between assets and liabilities. In principle, all assets can be covered so that taxpayers cannot adjust their tax liability by shifting wealth from one asset class to another. Moreover, as tax is levied regardless of asset returns, individuals may be encouraged to invest in higher‑yield assets, which could make asset allocation more efficient across the economy (Guvenen et al. 2019).
Notwithstanding these advantages, a wealth tax poses considerable implementation challenges in developing Asia. It requires significant administrative resources for recurrent asset evaluation, made harder by the absence of reference prices for some asset classes (IMF 2015; OECD 2018). Administrative costs are even higher for a net wealth tax, which requires valuations of both assets and liabilities. In addition, a wealth tax may entail equity concerns when two taxpayers with the same wealth, and hence the same tax liability, achieve different returns on their wealth. Taxpayers with illiquid assets may find it difficult to pay their tax liabilities.
Figure 2.2.9 Personal income tax maximum and minimum rate thresholds, selected regionsIn developing Asia, top marginal personal income tax rates apply to income that is more than 12 times GDP per capita, higher than in other regions.
Multiples of GDP per capita
Latin Americaand the Caribbean
High-income OECDDeveloping Asia
Maximum thresholda
Multiples of GDP per capita
Latin Americaand the Caribbean
High-income OECDDeveloping Asia
Minimum thresholdb
0
5
10
15
20
25
35
30
0.0
0.5
1.0
1.5
2.0
2.5
3.0
GDP = gross domestic product, OECD = Organisation for Economic Co‑operation and Development.a Comprises 23 economies in developing Asia, 18 economies in Latin America and the Caribbean, and 26 OECD countries. In each box plot, X marks
the mean and the horizontal line the median. Box height accommodates half of the sample from the 75th percentile to the 25th, and extended whiskers include the whole sample, excluding as outliers Austria at 22.2 and the Philippines at 46.3.
b Comprises 24 economies in developing Asia, 16 economies in Latin America and the Caribbean, and 27 OECD countries. In each box plot, X marks the mean and the horizontal line the median. Box height accommodates half of the sample from the 75th percentile to the 25th, and extended whiskers include the whole sample, excluding as outliers the Slovak Republic at 3.0, Guatemala at 8.3, and Trinidad and Tobago at 9.2.
Source: Gupta and Jalles 2022.
The wealthy often locate their assets offshore, especially in tax havens, hindering tax enforcement. A voluntary disclosure scheme in Colombia revealed hidden wealth equal to 1.7% of GDP, of which 87% had been concealed offshore (Londoño‑Vélez and Ávila‑Mahecha 2021). Help could come from initiatives to improve information exchange between tax authorities, notably the Global Forum on Transparency and Exchange of Information for Tax Purposes, which includes 27 economies in developing Asia.
While many economies apply preferential tax schemes to certain types of capital income, this should be minimized. Such arrangements can distort investment, erode progressivity and the tax base, and complicate enforcement. Tax breaks to encourage retirement savings, for example, may encourage taxpayers not to save more but merely to shift their savings into tax‑sheltered accounts, causing revenue losses that worsen inequity (Chetty et al. 2014).
Challenges posed by wealth taxesWealth inequality has worsened around the world along with income inequality. Interest in wealth taxes has intensified with public concern over wealthy individuals minimizing or avoiding tax obligations
30 Asian Development Outlook 2022
The complexity of administering wealth taxes explains why they are used in only five countries: Colombia, France, Norway, Spain, and Switzerland. Moreover, even in these countries, which have strong administrative capacity, they generate little revenue, equal to about 0.5% of GDP in 2019 (OECD 2020). A few developing economies have experimented with wealth taxes, and their experiences cast further doubt on their potential in developing Asia (Scheuer and Slemrod 2021). India abolished its wealth tax in 2015 because of its high administrative cost and low revenue (The Hindu 2015). Given their low tax administration capacity, developing economies in Asia may be better off focusing on progressive taxes that are administratively simpler, particularly property taxes.
Property taxes similarly promoting equityIf well designed, property taxes are potentially progressive, efficient, and difficult to evade. Tax liability on immovable property cannot be readily shifted, making property tax less distortive than many others. The tax burden generally falls on property owners, who tend to be wealthier, though pass‑through to renters may be possible depending on market dynamics. Property taxes can be levied on buildings—or on property transfers, though this is less efficient and housing price cycles can make revenue volatile.
Property taxes can bolster revenue for subnational governments in particular. Therefore property taxes can also advance fiscal decentralization, which is a challenge in some parts of developing Asia, as noted above (Bahl and Bird 2018; McCluskey, Bahl, and Franzsen 2022). Across the region, property taxes are administered by central or local authorities or both, but revenue generally accrues to localities. Rapid urbanization lifts land values, which bodes well for property tax that can help fund urban services and infrastructure. Property taxes can encourage owners to use scarce urban land efficiently, reducing sprawl and making cities more livable, sustainable, and productive.
Most economies in developing Asia levy property taxes. However, they generally raise little revenue, on average equal to a few tenths of a percentage point of GDP (McCluskey, Bahl, and Franzsen 2022).
Revenue is greater, at about 1% of GDP or more, in a handful of economies in developing Asia including the PRC, Georgia, the ROK, Singapore, and Uzbekistan, and about 2% in OECD countries. Thus, substantial scope exists to increase property tax revenue in developing Asia.
Governments must improve property valuation to capture rising value and enable growth in the tax base. The ratio of assessed value to market value is estimated at only 30%–50% in low‑income countries (Kelly, White, and Anand 2020). Accurate property valuation is fair, and perceived subjectivity can subject valuation to criticism (Slack and Bird 2014). Broadly, valuation is determined by land area and the size of buildings or else uses market prices to estimate capital or rental values (Franzsen and McCluskey 2013).
Area valuation approaches are typically used where property markets are insufficiently developed to credibly determine value. While administratively simpler, they may unfairly fail to capture rising values or differences in property quality (McCluskey and Franzsen 2013; Rao 2008). Market valuation requires careful implementation, especially with frequent updating of market value, but in some economies in developing Asia several years may pass before revaluation (McCluskey, Bahl, and Franzsen 2022). Gradually shifting to more extensive use of market assessment as markets develop can strengthen property taxes, including in the Caucasus and Central Asia where, despite the rapid rise of private markets, area assessment continues to be widely used.
Technology can help keep property registers and values updated in a timely and cost-effective manner. Spatial data from remote imagery can be used to estimate building footprints and the built‑up area and, combined with land prices, enable mass appraisal of property taxes (Ali, Deininger, and Wild 2018). Where price data are scarce, prices can be estimated using models that draw on spatial data.
Finally, property tax rates need to be sufficiently high and tax bases sufficiently broad. Raising low property tax rates in developing economies could yield substantial revenue gains (Kalkuhl et al. 2018). In addition to accurate registers, a strong tax base requires strictly judicious use of exemptions and preferential tax treatment. In developing Asia, property taxes generally cover both land and buildings,
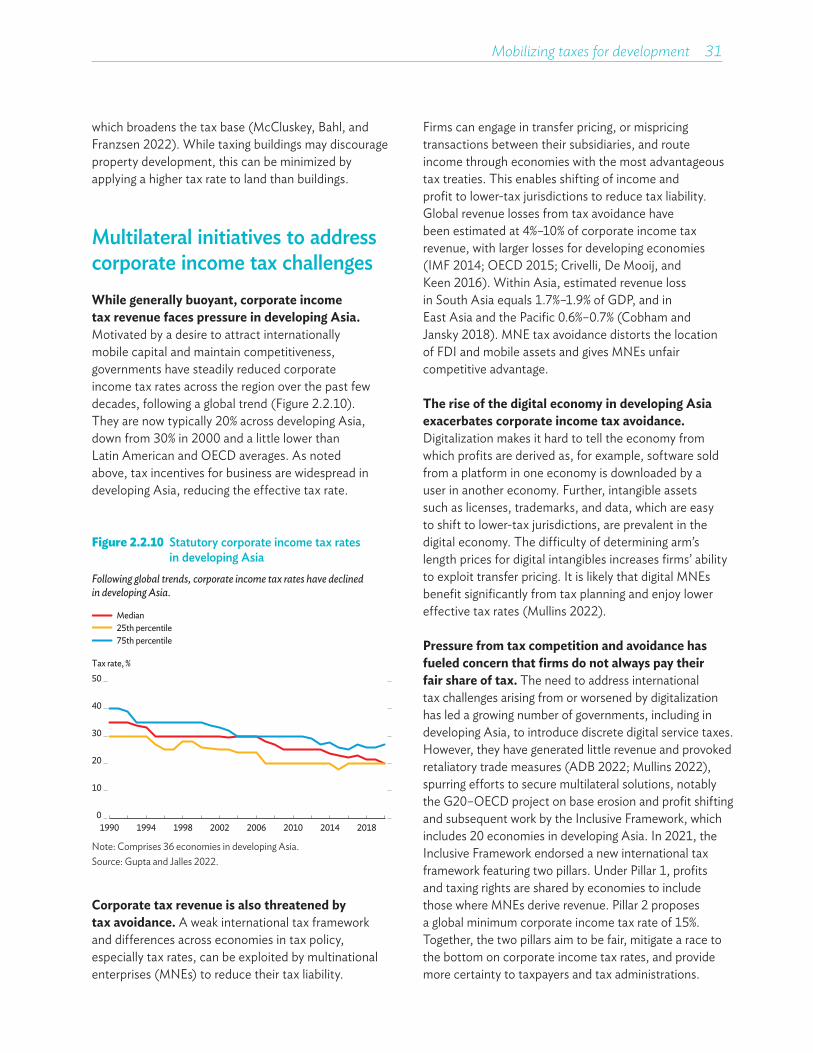
Mobilizing taxes for development 31
which broadens the tax base (McCluskey, Bahl, and Franzsen 2022). While taxing buildings may discourage property development, this can be minimized by applying a higher tax rate to land than buildings.
Multilateral initiatives to address corporate income tax challenges While generally buoyant, corporate income tax revenue faces pressure in developing Asia. Motivated by a desire to attract internationally mobile capital and maintain competitiveness, governments have steadily reduced corporate income tax rates across the region over the past few decades, following a global trend (Figure 2.2.10). They are now typically 20% across developing Asia, down from 30% in 2000 and a little lower than Latin American and OECD averages. As noted above, tax incentives for business are widespread in developing Asia, reducing the effective tax rate.
Firms can engage in transfer pricing, or mispricing transactions between their subsidiaries, and route income through economies with the most advantageous tax treaties. This enables shifting of income and profit to lower‑tax jurisdictions to reduce tax liability. Global revenue losses from tax avoidance have been estimated at 4%–10% of corporate income tax revenue, with larger losses for developing economies (IMF 2014; OECD 2015; Crivelli, De Mooij, and Keen 2016). Within Asia, estimated revenue loss in South Asia equals 1.7%–1.9% of GDP, and in East Asia and the Pacific 0.6%–0.7% (Cobham and Jansky 2018). MNE tax avoidance distorts the location of FDI and mobile assets and gives MNEs unfair competitive advantage.
The rise of the digital economy in developing Asia exacerbates corporate income tax avoidance. Digitalization makes it hard to tell the economy from which profits are derived as, for example, software sold from a platform in one economy is downloaded by a user in another economy. Further, intangible assets such as licenses, trademarks, and data, which are easy to shift to lower‑tax jurisdictions, are prevalent in the digital economy. The difficulty of determining arm’s length prices for digital intangibles increases firms’ ability to exploit transfer pricing. It is likely that digital MNEs benefit significantly from tax planning and enjoy lower effective tax rates (Mullins 2022).
Pressure from tax competition and avoidance has fueled concern that firms do not always pay their fair share of tax. The need to address international tax challenges arising from or worsened by digitalization has led a growing number of governments, including in developing Asia, to introduce discrete digital service taxes. However, they have generated little revenue and provoked retaliatory trade measures (ADB 2022; Mullins 2022), spurring efforts to secure multilateral solutions, notably the G20–OECD project on base erosion and profit shifting and subsequent work by the Inclusive Framework, which includes 20 economies in developing Asia. In 2021, the Inclusive Framework endorsed a new international tax framework featuring two pillars. Under Pillar 1, profits and taxing rights are shared by economies to include those where MNEs derive revenue. Pillar 2 proposes a global minimum corporate income tax rate of 15%. Together, the two pillars aim to be fair, mitigate a race to the bottom on corporate income tax rates, and provide more certainty to taxpayers and tax administrations.
Figure 2.2.10 Statutory corporate income tax rates in developing Asia
Following global trends, corporate income tax rates have declined in developing Asia.
Tax rate, %
Median25th percentile75th percentile
0
10
20
30
40
50
1990 1994 1998 2002 2006 2010 2014 2018
Note: Comprises 36 economies in developing Asia.Source: Gupta and Jalles 2022.
Corporate tax revenue is also threatened by tax avoidance. A weak international tax framework and differences across economies in tax policy, especially tax rates, can be exploited by multinational enterprises (MNEs) to reduce their tax liability.
32 Asian Development Outlook 2022
Revenue impact on developing Asia from the reallocation of taxable profits under Pillar 1 is expected to be small. For example, estimated revenue gains or losses for most economies in the region are generally around 0.01% of GDP (IMF 2021). Resource‑rich economies that host MNEs, such as Papua New Guinea, and larger economies such as the PRC and the ROK gain the most, while Singapore and Hong Kong, China lose the most in their roles as investment hubs. Additional global tax revenue from Pillar 2 is estimated at about $150 billion per year (OECD 2021a). Again, the immediate revenue impact on developing Asia will likely be modest because corporate income tax rates already exceed 15% in most regional economies. However, tax incentives that reduce the effective tax rate may be undone by the Pillar 2 minimum tax and hence should be reassessed.
Economies agreeing to the new rules will need to implement required changes to local laws. Those not agreeing have the option of waiting and ensuring that any commitment is consistent with domestic priorities and administrative capacity. Economies may retain their tax on digital services until Pillar 1 transition requirements are settled. Natural resource revenue—important in a small number of commodity‑rich economies in developing Asia—faces additional unique challenges that need to be carefully managed (Box 2.2.4).
Governments in developing Asia must mobilize tax revenue to fund the vast public spending needed to achieve the SDGs. At the same time, some taxes yield double dividends by contributing directly to the SDGs and raising revenues. The next section discusses two such taxes: green taxes that promote a cleaner environment, and corrective health taxes that encourage healthier lifestyles.
Box 2.2.1 Revenue-mobilizing priorities in small Pacific island economies and fragile and conflict-affected situations
Heterogenous developing Asia needs economy-specific approaches to mobilizing tax revenue, especially in Pacific island economies (PIEs) and fragile and conflict-affected situations (FCASs). These economies suffer sometimes low and volatile tax revenue and often rely on nontax revenue (box figure). In 2020, some of the steepest declines in tax revenue across Asia and the Pacific occurred in these economies. At the same time, they require significant public expenditure for infrastructure, health and education, and combating climate change.
The small and undiversified PIEs have narrow tax bases that rely heavily on tourism and fishing. Other challenges include large informal sectors and natural hazards. FCASs face serious challenges to tax collection, especially from poor security and frequent economic shocks. Moreover, implementing complex tax reform following conflict, when the state remains weak, poses major difficulties. A further complication is that often large official development assistance can weaken incentives for governments to mobilize domestic revenue (Thornton 2014; Benedek et al. 2014).
continued on next page
Given difficult circumstances and low institutional capacity in PIEs and FCASs, tax policy needs to be pragmatic. Revenue mobilization may require governments to resort to less efficient taxes, such as on trade, or rely heavily on fewer taxpayers, particularly large companies. In FCASs, the authorities must prioritize viable collection points such as border checkpoints and economic activity in large cities and other areas under government control (Mansour and Schneider 2019).
Despite the challenges, before COVID-19, PIEs were generally mobilizing revenue well—better than Caribbean island economies. Average ratios of tax to GDP rose from 18.2% early in the 2010s to 21.5% later in the decade. Encouragingly, this coincided with a shift from trade taxes to more efficient indirect taxes. Impressive gains were achieved as well in nontax revenue, especially license fees from foreign fishing vessels.

Mobilizing taxes for development 33
Box 2.2.1 Continued
How was this achieved? In the 2000s, PIEs embarked on several tax policy and administration reforms. Some introduced value‑added tax (VAT) or adjusted VAT rates. Vanuatu, for example, raised its VAT rate from 12.5% to 15.0% in 2018, boosting tax collection by over 15% in 2 years. The average VAT rate for PIEs is now about 12%, still somewhat lower than the global average. Many PIEs increased excise taxes on fuel, alcohol, tobacco, and unhealthy food. Importantly, Pacific economies strengthened their tax administration capacity with information technology and improved organizational capacity and planning.
FCASs similarly improved tax revenue before COVID-19, albeit from a low starting point. Reducing conflict intensity facilitates tax collection (Chowdhury and Murshed 2016), as does modernizing tax administrations. Reducing tax exemptions, prioritizing industries with high revenue potential, and increasing excises on alcohol, tobacco, and fuel can also help (Akitoby et al. 2020).
References:Akitoby, B. et al. 2020. Tax Revenue Mobilization Episodes in
Developing Countries. Policy Design and Practice 3(1).Benedek, D. et al. 2014. Foreign Aid and Revenue:
Still a Crowding‑Out Effect? FinanzArchiv/Public Finance Analysis 70. March.
Chowdhury, A. R. and S. M. Murshed. 2016. Conflict and Fiscal Capacity. Defence and Peace Economics 27.
Mansour, M., and J.‑L. Schneider. 2019. How to Design Tax Policy in Fragile States. IMF Note 19/04. International Monetary Fund.
Thornton, J. 2014. Does Foreign Aid Reduce Tax Revenue? Further Evidence. Applied Economics 46.
Ratio of tax to GDP in 2010–2019 and revenue composition in 2015–2019While tax collection in PIEs and FCASs has improved, nontax revenues remain vital.
% of GDP
%
Caribbean ADB PIEs ADB FCASs
81
316
62
19
19
40
39
21
Caribbean ADB PIEs ADB FCASs
2010–20142015–2019
Tax revenueNontax revenueGrants
0
5
10
15
20
25
0
100
20
40
60
80
ADB = Asian Development Bank, FCAS = fragile and conflict‑affected situation, PIE = Pacific island economy.Notes: The Caribbean is represented by nine economies. Ten countries in the Pacific, South Asia, and Southeast Asia are counted as FCASs, and seven countries in the Pacific as PIEs.Sources: OECD. Global Revenue Statistics Database; IMF. Government Finance Statistics online database (both accessed 31 January 2022); ADB staff estimates.

34 Asian Development Outlook 2022
Box 2.2.2 Local fiscal revenue mobilization in the Philippines
To fund local services, subnational governments in the Philippines, called local government units (LGUs), depend heavily on intergovernmental fiscal transfers. In particular, they rely on internal revenue allotments (IRA) from the central government (box figure). Raising revenue locally is challenged by low capacity for own‑sourced revenue mobilization, legal impediments, the disincentive effect of internal revenue allotments, and fiscal policy politics. The 1991 Local Government Code mandates LGUs to impose and collect various types of local taxes, but they still rely on allotments from the national government as their main income source, which inhibits fiscal responsibility and autonomy. Further, property taxes are low in most LGUs because property is undervalued, the values not updated regularly.
To strengthen the LGU framework, the President of the Philippines signed on 1 June 2021 Executive Order No. 138. This created a committee to devolve certain executive branch functions to LGUs in line with the Constitution and the 1991 Local Government Code. A Supreme Court ruling on the Mandanas–Garcia case in 2018, confirmed in 2019, mandates that the calculation of internal revenue allotment include not just taxes collected by the Bureau of Internal Revenue but all taxes and duties collected by government agencies including the Bureau of Customs. The order will (i) establish oversight and monitoring mechanisms
to resolve issues and concerns that may arise in implementing the Mandanas ruling; (ii) set up the Growth Equity Fund to address issues on marginalization, unequal development, high poverty incidence, and capacity disparity in LGUs; and (iii) adopt transition plans to ensure continuous service delivery by national government agencies and LGUs.
Various reforms aim to improve LGU resource mobilization. The government’s current reform of real property valuation and assessment aims to centralize real property valuation functions in the Bureau of Local Government Finance. With ADB support, a database will be established to make real property valuation more efficient and gradually bring taxable value closer to market value. LGUs will be expected to adhere to the bureau’s standardized schedule of market values to mitigate local political intervention that tends to keep taxable value artificially low. In addition, a mechanism has been developed to encourage LGUs to step up revenue performance. Under the Seal of Good Local Governance, the government has introduced minimum public financial performance standards, including own‑sourced revenue performance, and an incentive fund to provide additional fiscal resources to LGUs that pass annual evaluation exercises offered by the Department of the Interior and Local Government.
Sources of revenue for local government units in the Philippines in 2020, %Less than half of local government revenue comes from local taxes.
Extraordinaryreceipts, grants,
donations, and aid5.1
External sources69.5
Real property tax8.5
Tax on business13.4
Nontaxrevenue
7.5
Internal revenueallotment
61.8
Inter-local transfer0.6
Other shares fromnational tax collections
2.1
Local sources30.5
Externally sourcedrevenue Total revenue Locally sourced
revenue
Other taxes1.1
Note: Numbers may not add due to rounding.Source: Asian Development Bank estimates using data from the Bureau of Local Government Finance (accessed 12 February 2022).
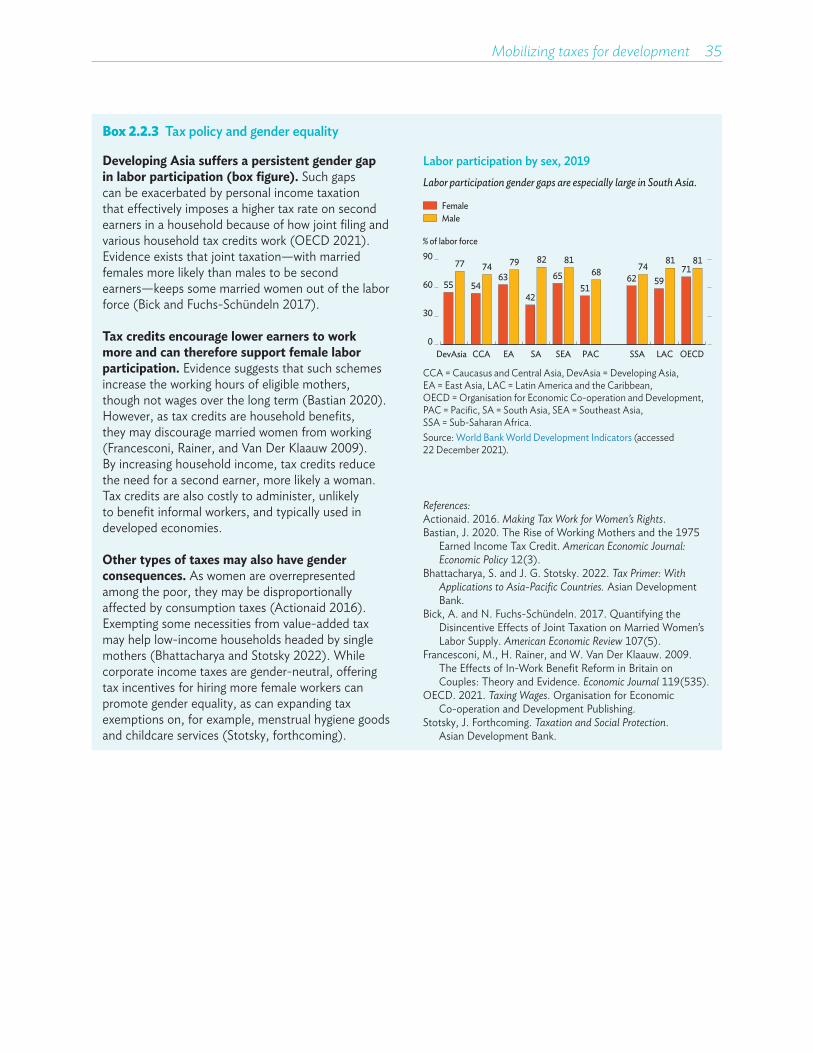
Mobilizing taxes for development 35
Box 2.2.3 Tax policy and gender equality
Developing Asia suffers a persistent gender gap in labor participation (box figure). Such gaps can be exacerbated by personal income taxation that effectively imposes a higher tax rate on second earners in a household because of how joint filing and various household tax credits work (OECD 2021). Evidence exists that joint taxation—with married females more likely than males to be second earners—keeps some married women out of the labor force (Bick and Fuchs‑Schündeln 2017).
Tax credits encourage lower earners to work more and can therefore support female labor participation. Evidence suggests that such schemes increase the working hours of eligible mothers, though not wages over the long term (Bastian 2020). However, as tax credits are household benefits, they may discourage married women from working (Francesconi, Rainer, and Van Der Klaauw 2009). By increasing household income, tax credits reduce the need for a second earner, more likely a woman. Tax credits are also costly to administer, unlikely to benefit informal workers, and typically used in developed economies.
Other types of taxes may also have gender consequences. As women are overrepresented among the poor, they may be disproportionally affected by consumption taxes (Actionaid 2016). Exempting some necessities from value‑added tax may help low‑income households headed by single mothers (Bhattacharya and Stotsky 2022). While corporate income taxes are gender‑neutral, offering tax incentives for hiring more female workers can promote gender equality, as can expanding tax exemptions on, for example, menstrual hygiene goods and childcare services (Stotsky, forthcoming).
Labor participation by sex, 2019Labor participation gender gaps are especially large in South Asia.
% of labor force
0
90
FemaleMale
DevAsia CCA EA SA SEA PAC SSA LAC OECD
30
60 55
77
54
7463
79
42
82
6581
51
68 6274
59
8171
81
CCA = Caucasus and Central Asia, DevAsia = Developing Asia, EA = East Asia, LAC = Latin America and the Caribbean, OECD = Organisation for Economic Co‑operation and Development, PAC = Pacific, SA = South Asia, SEA = Southeast Asia, SSA = Sub‑Saharan Africa.Source: World Bank World Development Indicators (accessed 22 December 2021).
References:Actionaid. 2016. Making Tax Work for Women’s Rights.Bastian, J. 2020. The Rise of Working Mothers and the 1975
Earned Income Tax Credit. American Economic Journal: Economic Policy 12(3).
Bhattacharya, S. and J. G. Stotsky. 2022. Tax Primer: With Applications to Asia-Pacific Countries. Asian Development Bank.
Bick, A. and N. Fuchs‑Schündeln. 2017. Quantifying the Disincentive Effects of Joint Taxation on Married Women’s Labor Supply. American Economic Review 107(5).
Francesconi, M., H. Rainer, and W. Van Der Klaauw. 2009. The Effects of In‑Work Benefit Reform in Britain on Couples: Theory and Evidence. Economic Journal 119(535).
OECD. 2021. Taxing Wages. Organisation for Economic Co‑operation and Development Publishing.
Stotsky, J. Forthcoming. Taxation and Social Protection. Asian Development Bank.

36 Asian Development Outlook 2022
Box 2.2.4 Raising revenue from natural resources
Natural resources provide a substantial share of government revenue in resource-rich developing economies, including some in developing Asia. This share exceeds 50% in most oil‑rich economies and about 10% in mining economies (IMF 2012; Baunsgaard and Devlin 2021). Appropriate tax design for this revenue is essential to ensure that nonrenewable natural resources support sustainable development (Calder 2014). Standard tax codes may not apply to large and profitable resource projects that involve powerful multinationals, which often enjoy greater bargaining power than host governments over resource rents (McMillan and Waxman 2007; Davies and Schröder 2019). Low administrative capacity and transparency, political imperatives and corruption, and urgent needs for government revenue can weaken government bargaining positions. By contrast, stable fiscal regimes and reliable adherence to agreements are attractive to foreign investors, improving governments’ bargaining power.
The “government take” from resource projects varies substantially within and between economies, reflecting bargaining power and other factors. The share of resource output accruing to the government—a crude proxy for its take—is on average higher in the region’s oil‑producing countries than in mining economies (box figure). It correlates positively with commodity prices as several tax instruments are based on profit, so government takes declined across economies with the end of the commodities super cycle in 2014 and the onset of COVID‑19 in 2020. The take also varies over the lifecycle of resource projects, tending to be low initially as investors recover their costs, rising in the mature stage with higher profits, and falling again toward the end as marginal costs increase.
Variations in government take over time can induce macroeconomic instability. For example, a fall in government take—as several regional economies have experienced since 2014—often requires painful reduction in fiscal spending and lower incomes. Even absent fiscal adjustment, currency overvaluation in real effective terms may reduce growth and employment.
Government take in selected economies in developing AsiaOil-rich economies have higher government takes, but they fluctuate with commodity cycles.
% of resource GDP
02005 2007 2009 2011 2013 2015 2017 2019
AzerbaijanIndonesiaKazakhstanTimor-Leste
15
30
45
60
75
90
A. Oil-rich economies
% of resource GDP
02005 2007 2009 2011 2013 2015 2017 2019
Papua New GuineaMongoliaLao People’s Democratic Republic
15
30
45
60
75
90
B. Mining economies
GDP = gross domestic product.Notes: No data on resource revenue are available for Azerbaijan in 2016. Papua New Guinea also produces oil and liquefied natural gas.Sources: CEIC Data Company; Haver Analytics; Australian National University Development Policy Centre. PNG Budget Database; National Statistics Office of Mongolia. Mongolian Statistical Information Service; International Centre for Tax and Development Government Revenue Dataset (all accessed October 2021).
continued on next page

Mobilizing taxes for development 37
Box 2.2.4 Continued
Aside from capturing a reasonable share of resource rents, an important design objective is smoothing government revenue over time. While the governments of resource‑rich developing economies cannot stabilize global commodity prices, they can avoid excessive backloading of revenue as is common in the life cycle of resource projects. This can be achieved by relying more on production levies or sales royalties than on profit‑based taxes. Such measures provide early revenue and are relatively stable during commodity price downturns.
Governments can also secure payments up front through lump-sum bonuses tied to specific events such as reaching certain production thresholds. Although some governments favor equity participation in resource projects—often for nonfiscal considerations such as wanting a “seat at the table” (IMF 2012)—this may significantly defer revenue if debt financing is involved. Further, tax incentives such as arrangements for accelerated depreciation or loss carried forward can exacerbate the challenge of backloaded revenue. Experience in Papua New Guinea highlights the importance of these issues. Falling commodity prices, generous tax concessions, and failure to capture early revenue from a large liquefied natural gas project have combined to cause a precipitous collapse in revenue.
Finally, resource sector tax compliance risks can be large. While they can be mitigated by international initiatives such as the Group of Twenty and Organisation for Economic Co‑operation and Development joint project on base erosion and profit shifting, governments need to pay careful attention to tax design strategies. Double tax treaties typically supersede domestic legislation and can feature tax concessions, creating “treaty shopping” risks.
To mitigate threats to revenue posed by transfer pricing, specific rules related to transfer pricing costs should be incorporated into tax legislation and investment agreements (Lemgruber and Shelton 2014). Appropriately designed ring‑fencing regimes are crucial to limit cost deductions for tax purposes across different projects of the same tax‑paying entity. Some economies ring‑fence license areas while others ring‑fence individual resource projects (Baunsgaard 2001; Calder 2014). In practice, administering ring‑fencing rules is complex, requiring adequate capacity building.
References:Baunsgaard, T. 2001. A Primer on Mineral Taxation.
IMF Working Paper No. 01/139. International Monetary Fund.
Baunsgaard, T. and D. Devlin. 2021. Resource‑Rich Developing Countries and International Tax Reforms. In R. de Mooij, A. Klemm, and V. Perry, eds. Corporate Income Taxes under Pressure: Why Reform Is Needed and How It Could Be Designed. International Monetary Fund.
Calder, J. 2014. Administering Fiscal Regimes for Extractive Industries: A Handbook. International Monetary Fund.
Davies, M. and M. Schröder. 2019. Does the PNG Government Get Its Fair Share from the Resource Sector? Presented at 2019 PNG Update.
IMF. 2012. Fiscal Regimes for Extractive Industries: Design and Implementation. International Monetary Fund.
Lemgruber, A. and S. Shelton. 2014. Revenue Administration: Administering Revenues from Natural Resources— A Short Primer. Technical Notes and Manuals No. 14/02. International Monetary Fund.
McMillan, M. and A. R. Waxman. 2007. Profit Sharing between Governments and Multinationals in Natural Resource Extraction: Evidence from a Firm‑Level Panel. Brookings Trade Forum Foreign Direct Investment. Brookings Institution Press.
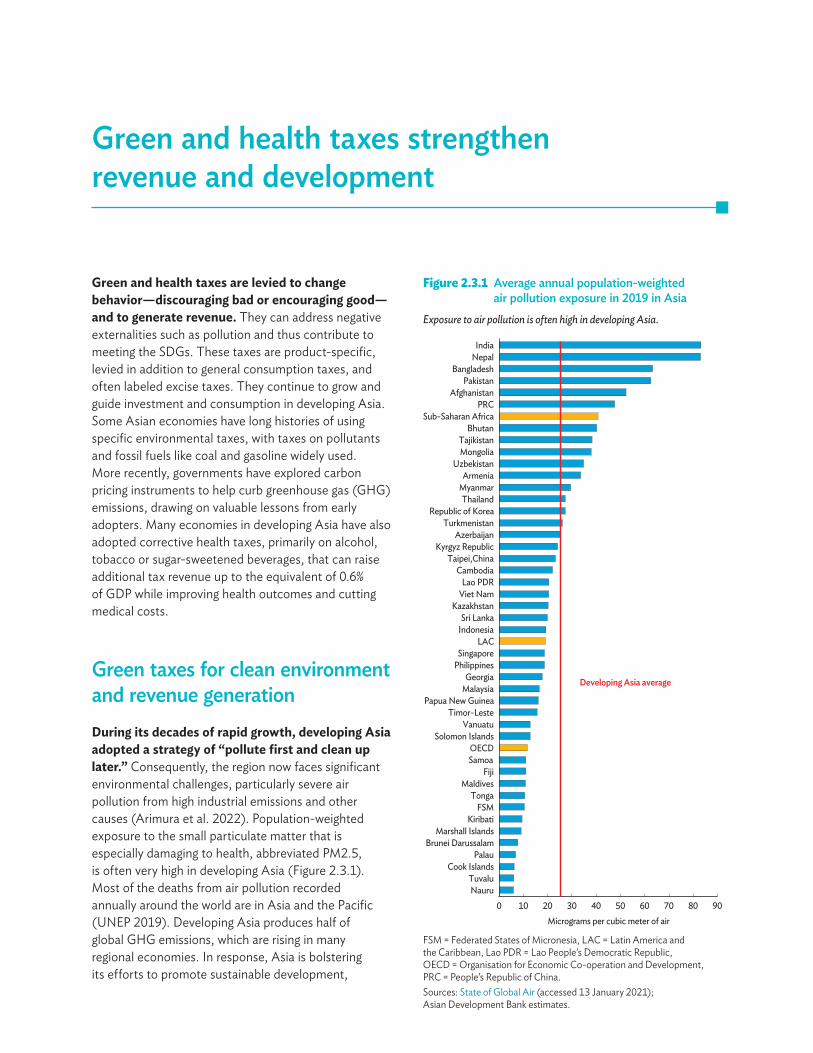
Green and health taxes strengthen revenue and development
Green and health taxes are levied to change behavior—discouraging bad or encouraging good—and to generate revenue. They can address negative externalities such as pollution and thus contribute to meeting the SDGs. These taxes are product-specific, levied in addition to general consumption taxes, and often labeled excise taxes. They continue to grow and guide investment and consumption in developing Asia. Some Asian economies have long histories of using specific environmental taxes, with taxes on pollutants and fossil fuels like coal and gasoline widely used. More recently, governments have explored carbon pricing instruments to help curb greenhouse gas (GHG) emissions, drawing on valuable lessons from early adopters. Many economies in developing Asia have also adopted corrective health taxes, primarily on alcohol, tobacco or sugar-sweetened beverages, that can raise additional tax revenue up to the equivalent of 0.6% of GDP while improving health outcomes and cutting medical costs.
Green taxes for clean environment and revenue generationDuring its decades of rapid growth, developing Asia adopted a strategy of “pollute first and clean up later.” Consequently, the region now faces significant environmental challenges, particularly severe air pollution from high industrial emissions and other causes (Arimura et al. 2022). Population-weighted exposure to the small particulate matter that is especially damaging to health, abbreviated PM2.5, is often very high in developing Asia (Figure 2.3.1). Most of the deaths from air pollution recorded annually around the world are in Asia and the Pacific (UNEP 2019). Developing Asia produces half of global GHG emissions, which are rising in many regional economies. In response, Asia is bolstering its efforts to promote sustainable development,
Figure 2.3.1 Average annual population-weighted air pollution exposure in 2019 in Asia
Exposure to air pollution is often high in developing Asia.
0 10 20 30 40 50 60 70 80 90Micrograms per cubic meter of air
Developing Asia average
FSM
OECD
LAC
Sub-Saharan AfricaPRC
Tajikistan
Cook Islands
Fiji
KiribatiMarshall Islands
Nauru
Palau
Papua New Guinea
Solomon Islands
Tonga
Tuvalu
Vanuatu
Afghanistan
Bangladesh
Bhutan
IndiaNepal
Pakistan
UzbekistanMongolia
ArmeniaMyanmar
Republic of KoreaThailand
Azerbaijan
Georgia
Kazakhstan
Kyrgyz Republic
Turkmenistan
Maldives
Sri Lanka
Brunei Darussalam
CambodiaTaipei,China
Indonesia
Lao PDR
Malaysia
PhilippinesSingapore
Timor-Leste
Viet Nam
Samoa
FSM = Federated States of Micronesia, LAC = Latin America and the Caribbean, Lao PDR = Lao People’s Democratic Republic, OECD = Organisation for Economic Co-operation and Development, PRC = People’s Republic of China.Sources: State of Global Air (accessed 13 January 2021); Asian Development Bank estimates.
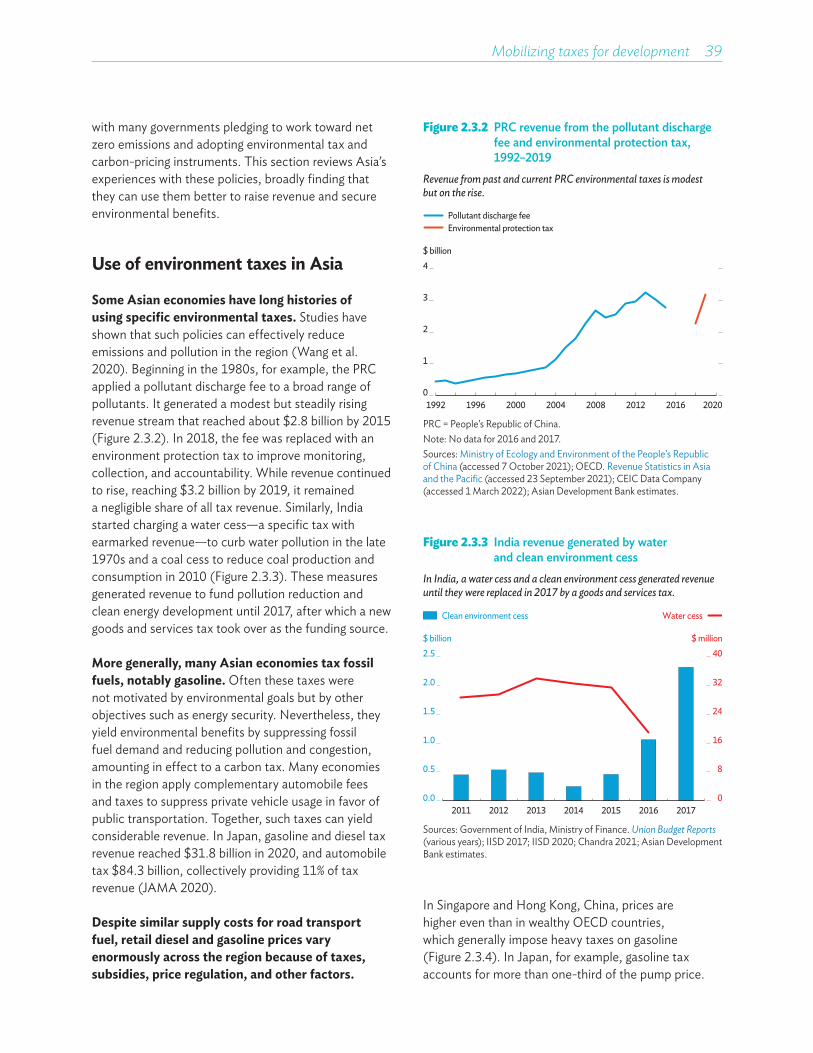
Mobilizing taxes for development 39
with many governments pledging to work toward net zero emissions and adopting environmental tax and carbon-pricing instruments. This section reviews Asia’s experiences with these policies, broadly finding that they can use them better to raise revenue and secure environmental benefits.
Use of environment taxes in Asia
Some Asian economies have long histories of using specific environmental taxes. Studies have shown that such policies can effectively reduce emissions and pollution in the region (Wang et al. 2020). Beginning in the 1980s, for example, the PRC applied a pollutant discharge fee to a broad range of pollutants. It generated a modest but steadily rising revenue stream that reached about $2.8 billion by 2015 (Figure 2.3.2). In 2018, the fee was replaced with an environment protection tax to improve monitoring, collection, and accountability. While revenue continued to rise, reaching $3.2 billion by 2019, it remained a negligible share of all tax revenue. Similarly, India started charging a water cess—a specific tax with earmarked revenue—to curb water pollution in the late 1970s and a coal cess to reduce coal production and consumption in 2010 (Figure 2.3.3). These measures generated revenue to fund pollution reduction and clean energy development until 2017, after which a new goods and services tax took over as the funding source.
More generally, many Asian economies tax fossil fuels, notably gasoline. Often these taxes were not motivated by environmental goals but by other objectives such as energy security. Nevertheless, they yield environmental benefits by suppressing fossil fuel demand and reducing pollution and congestion, amounting in effect to a carbon tax. Many economies in the region apply complementary automobile fees and taxes to suppress private vehicle usage in favor of public transportation. Together, such taxes can yield considerable revenue. In Japan, gasoline and diesel tax revenue reached $31.8 billion in 2020, and automobile tax $84.3 billion, collectively providing 11% of tax revenue (JAMA 2020).
Despite similar supply costs for road transport fuel, retail diesel and gasoline prices vary enormously across the region because of taxes, subsidies, price regulation, and other factors.
Figure 2.3.2 PRC revenue from the pollutant discharge fee and environmental protection tax, 1992–2019
Revenue from past and current PRC environmental taxes is modest but on the rise.
$ billion
1992 1996 2000 2004 2008 2012 2016 2020
Pollutant discharge feeEnvironmental protection tax
0
1
2
3
4
PRC = People’s Republic of China.Note: No data for 2016 and 2017. Sources: Ministry of Ecology and Environment of the People’s Republic of China (accessed 7 October 2021); OECD. Revenue Statistics in Asia and the Pacific (accessed 23 September 2021); CEIC Data Company (accessed 1 March 2022); Asian Development Bank estimates.
Figure 2.3.3 India revenue generated by water and clean environment cess
In India, a water cess and a clean environment cess generated revenue until they were replaced in 2017 by a goods and services tax.
$ billion
Clean environment cess Water cess
0
8
16
24
32
40
0.0
0.5
1.0
1.5
2.0
2.5
2011 2012 2013 2014 2015 2016 2017
$ million
Sources: Government of India, Ministry of Finance. Union Budget Reports (various years); IISD 2017; IISD 2020; Chandra 2021; Asian Development Bank estimates.
In Singapore and Hong Kong, China, prices are higher even than in wealthy OECD countries, which generally impose heavy taxes on gasoline (Figure 2.3.4). In Japan, for example, gasoline tax accounts for more than one-third of the pump price.
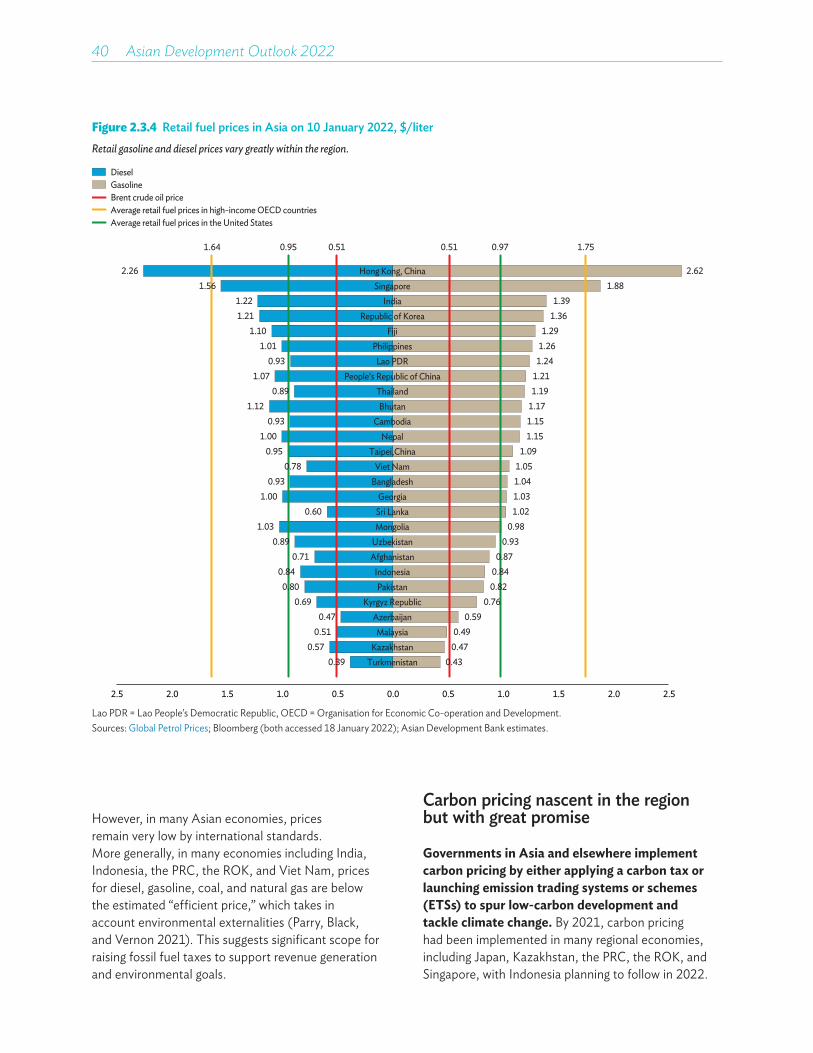
40 Asian Development Outlook 2022
Figure 2.3.4 Retail fuel prices in Asia on 10 January 2022, $/literRetail gasoline and diesel prices vary greatly within the region.
0.390.57
0.510.47
0.690.80
0.840.71
0.891.03
0.601.00
0.930.78
0.951.00
0.931.12
0.891.07
0.931.01
1.101.211.22
1.562.26
0.430.470.49
0.590.76
0.820.84
0.870.93
0.981.021.031.041.05
1.091.151.151.171.191.211.241.261.29
1.361.39
1.88
2.5 2.0 1.5 1.0 0.5 0.0 0.5 1.0 1.5 2.0 2.5
1.64 0.95 0.51 0.51 0.97 1.75
Brent crude oil priceGasolineDiesel
Average retail fuel prices in high-income OECD countriesAverage retail fuel prices in the United States
2.62Hong Kong, ChinaSingapore
IndiaRepublic of Korea
FijiPhilippines
Lao PDRPeople’s Republic of China
ThailandBhutan
CambodiaNepal
Taipei,ChinaViet Nam
BangladeshGeorgia
Sri LankaMongolia
UzbekistanAfghanistan
IndonesiaPakistan
Kyrgyz RepublicAzerbaijanMalaysia
KazakhstanTurkmenistan
Lao PDR = Lao People’s Democratic Republic, OECD = Organisation for Economic Co-operation and Development.Sources: Global Petrol Prices; Bloomberg (both accessed 18 January 2022); Asian Development Bank estimates.
However, in many Asian economies, prices remain very low by international standards. More generally, in many economies including India, Indonesia, the PRC, the ROK, and Viet Nam, prices for diesel, gasoline, coal, and natural gas are below the estimated “efficient price,” which takes in account environmental externalities (Parry, Black, and Vernon 2021). This suggests significant scope for raising fossil fuel taxes to support revenue generation and environmental goals.
Carbon pricing nascent in the region but with great promise
Governments in Asia and elsewhere implement carbon pricing by either applying a carbon tax or launching emission trading systems or schemes (ETSs) to spur low-carbon development and tackle climate change. By 2021, carbon pricing had been implemented in many regional economies, including Japan, Kazakhstan, the PRC, the ROK, and Singapore, with Indonesia planning to follow in 2022.
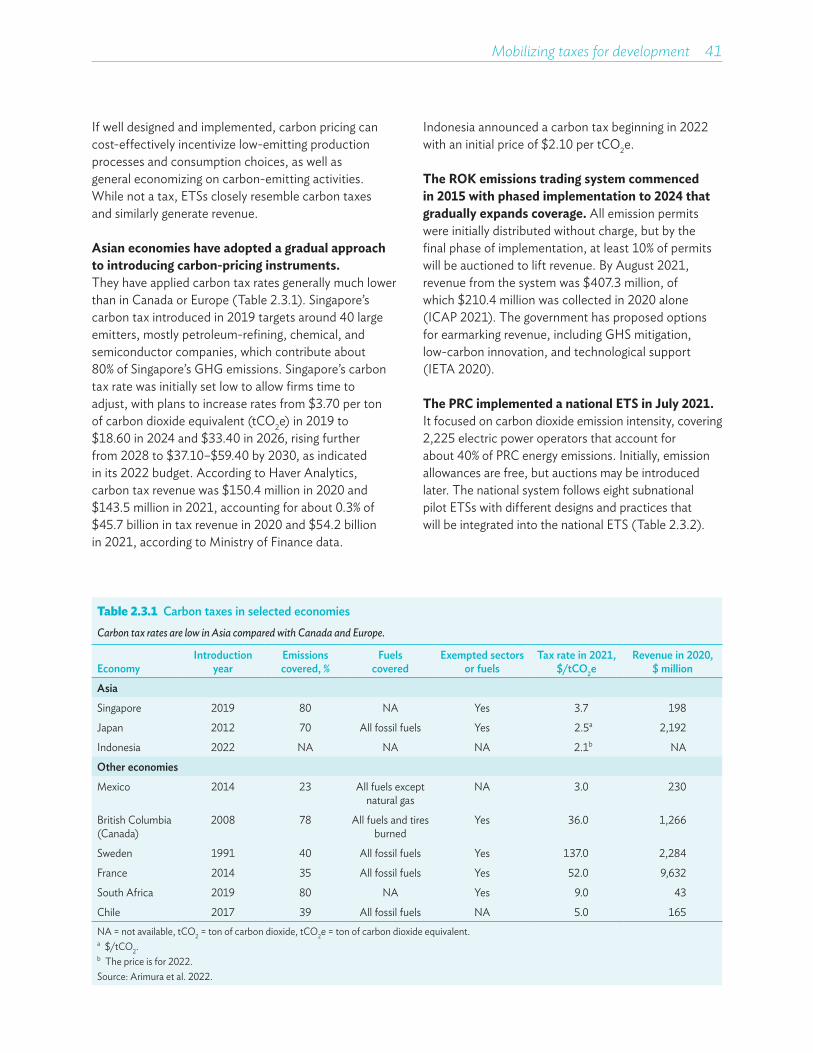
Mobilizing taxes for development 41
If well designed and implemented, carbon pricing can cost-effectively incentivize low-emitting production processes and consumption choices, as well as general economizing on carbon-emitting activities. While not a tax, ETSs closely resemble carbon taxes and similarly generate revenue.
Asian economies have adopted a gradual approach to introducing carbon-pricing instruments. They have applied carbon tax rates generally much lower than in Canada or Europe (Table 2.3.1). Singapore’s carbon tax introduced in 2019 targets around 40 large emitters, mostly petroleum-refining, chemical, and semiconductor companies, which contribute about 80% of Singapore’s GHG emissions. Singapore’s carbon tax rate was initially set low to allow firms time to adjust, with plans to increase rates from $3.70 per ton of carbon dioxide equivalent (tCO2e) in 2019 to $18.60 in 2024 and $33.40 in 2026, rising further from 2028 to $37.10–$59.40 by 2030, as indicated in its 2022 budget. According to Haver Analytics, carbon tax revenue was $150.4 million in 2020 and $143.5 million in 2021, accounting for about 0.3% of $45.7 billion in tax revenue in 2020 and $54.2 billion in 2021, according to Ministry of Finance data.
Indonesia announced a carbon tax beginning in 2022 with an initial price of $2.10 per tCO2e.
The ROK emissions trading system commenced in 2015 with phased implementation to 2024 that gradually expands coverage. All emission permits were initially distributed without charge, but by the final phase of implementation, at least 10% of permits will be auctioned to lift revenue. By August 2021, revenue from the system was $407.3 million, of which $210.4 million was collected in 2020 alone (ICAP 2021). The government has proposed options for earmarking revenue, including GHS mitigation, low-carbon innovation, and technological support (IETA 2020).
The PRC implemented a national ETS in July 2021. It focused on carbon dioxide emission intensity, covering 2,225 electric power operators that account for about 40% of PRC energy emissions. Initially, emission allowances are free, but auctions may be introduced later. The national system follows eight subnational pilot ETSs with different designs and practices that will be integrated into the national ETS (Table 2.3.2).
Table 2.3.1 Carbon taxes in selected economiesCarbon tax rates are low in Asia compared with Canada and Europe.
EconomyIntroduction
yearEmissions covered, %
Fuels covered
Exempted sectors or fuels
Tax rate in 2021, $/tCO2e
Revenue in 2020, $ million
Asia
Singapore 2019 80 NA Yes 3.7 198
Japan 2012 70 All fossil fuels Yes 2.5a 2,192
Indonesia 2022 NA NA NA 2.1b NA
Other economies
Mexico 2014 23 All fuels except natural gas
NA 3.0 230
British Columbia (Canada)
2008 78 All fuels and tires burned
Yes 36.0 1,266
Sweden 1991 40 All fossil fuels Yes 137.0 2,284
France 2014 35 All fossil fuels Yes 52.0 9,632
South Africa 2019 80 NA Yes 9.0 43
Chile 2017 39 All fossil fuels NA 5.0 165NA = not available, tCO2 = ton of carbon dioxide, tCO2e = ton of carbon dioxide equivalent.a $/tCO2.b The price is for 2022.Source: Arimura et al. 2022.
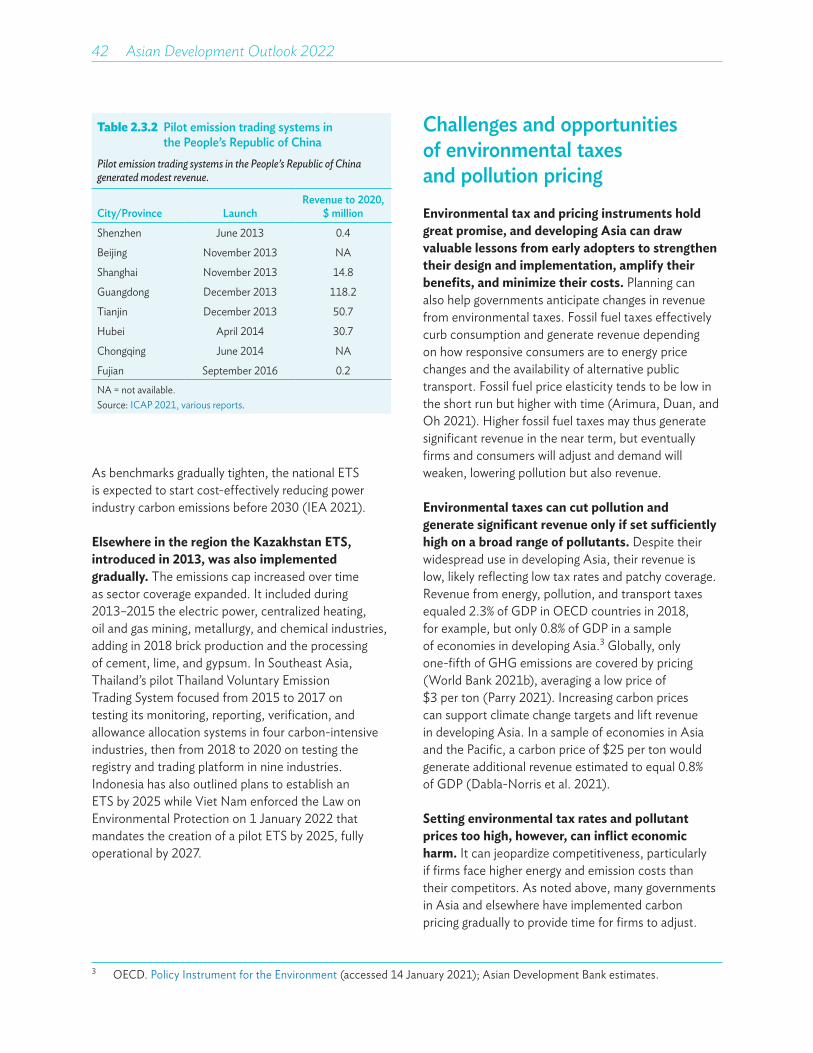
42 Asian Development Outlook 2022
Challenges and opportunities of environmental taxes and pollution pricingEnvironmental tax and pricing instruments hold great promise, and developing Asia can draw valuable lessons from early adopters to strengthen their design and implementation, amplify their benefits, and minimize their costs. Planning can also help governments anticipate changes in revenue from environmental taxes. Fossil fuel taxes effectively curb consumption and generate revenue depending on how responsive consumers are to energy price changes and the availability of alternative public transport. Fossil fuel price elasticity tends to be low in the short run but higher with time (Arimura, Duan, and Oh 2021). Higher fossil fuel taxes may thus generate significant revenue in the near term, but eventually firms and consumers will adjust and demand will weaken, lowering pollution but also revenue.
Environmental taxes can cut pollution and generate significant revenue only if set sufficiently high on a broad range of pollutants. Despite their widespread use in developing Asia, their revenue is low, likely reflecting low tax rates and patchy coverage. Revenue from energy, pollution, and transport taxes equaled 2.3% of GDP in OECD countries in 2018, for example, but only 0.8% of GDP in a sample of economies in developing Asia.3 Globally, only one-fifth of GHG emissions are covered by pricing (World Bank 2021b), averaging a low price of $3 per ton (Parry 2021). Increasing carbon prices can support climate change targets and lift revenue in developing Asia. In a sample of economies in Asia and the Pacific, a carbon price of $25 per ton would generate additional revenue estimated to equal 0.8% of GDP (Dabla-Norris et al. 2021).
Setting environmental tax rates and pollutant prices too high, however, can inflict economic harm. It can jeopardize competitiveness, particularly if firms face higher energy and emission costs than their competitors. As noted above, many governments in Asia and elsewhere have implemented carbon pricing gradually to provide time for firms to adjust.
3 OECD. Policy Instrument for the Environment (accessed 14 January 2021); Asian Development Bank estimates.
As benchmarks gradually tighten, the national ETS is expected to start cost-effectively reducing power industry carbon emissions before 2030 (IEA 2021).
Elsewhere in the region the Kazakhstan ETS, introduced in 2013, was also implemented gradually. The emissions cap increased over time as sector coverage expanded. It included during 2013–2015 the electric power, centralized heating, oil and gas mining, metallurgy, and chemical industries, adding in 2018 brick production and the processing of cement, lime, and gypsum. In Southeast Asia, Thailand’s pilot Thailand Voluntary Emission Trading System focused from 2015 to 2017 on testing its monitoring, reporting, verification, and allowance allocation systems in four carbon-intensive industries, then from 2018 to 2020 on testing the registry and trading platform in nine industries. Indonesia has also outlined plans to establish an ETS by 2025 while Viet Nam enforced the Law on Environmental Protection on 1 January 2022 that mandates the creation of a pilot ETS by 2025, fully operational by 2027.
Table 2.3.2 Pilot emission trading systems in the People’s Republic of China
Pilot emission trading systems in the People’s Republic of China generated modest revenue.
City/Province LaunchRevenue to 2020,
$ million
Shenzhen June 2013 0.4
Beijing November 2013 NA
Shanghai November 2013 14.8
Guangdong December 2013 118.2
Tianjin December 2013 50.7
Hubei April 2014 30.7
Chongqing June 2014 NA
Fujian September 2016 0.2NA = not available.Source: ICAP 2021, various reports.

Mobilizing taxes for development 43
Some have allowed exceptions. Japan, for example, exempts energy-intensive industries from carbon and energy taxes, and the European Union ETS offers those industries free allowances. Competitiveness concerns have prompted some governments to consider border adjustment mechanisms that introduce carbon tariffs or permits purchased at the border. For example, the European Union proposed in July 2021 the Carbon Border Adjustment Mechanism. While the mechanism needs further clarification under World Trade Organization rules, the need to adapt to it provides impetus for carbon pricing in developing Asia (Mehling et al. 2019). Like other charges, environmental taxes and carbon pricing have distributional effects that can hurt poorer households. In high-income economies, energy is a greater share of spending for the poor, making carbon taxes and pricing instruments likely regressive (Arimura et al. 2022). In developing economies, by contrast, the poor typically use proportionately less energy, making a moderate carbon price likely progressive in the poorest economies (Dorband et al. 2019).
Developing Asia should accelerate its use of environmental taxes and pollution-pricing instruments to address environmental challenges and lift revenue. Higher rates for fossil fuel taxes, which are often well established, easy to administer, and likely to generate more revenue in the short term than carbon pricing should be prioritized. Even in OECD and G20 countries, revenue from fossil fuel taxes is far greater than from carbon tax and ETSs (Martin and van Dender 2019). A related high priority is to phase out fossil fuel subsidies, which remain significant in some regional economies (Box 2.3.1).
Governments can tax pollutants directly, use ETSs, or both. Direct taxation offers greater price predictability and simpler administration. Carbon tax can be imposed on coal, natural gas, and liquid fuels on a relatively small number of upstream firms, either producers or at the border, to minimize compliance costs and opportunities for evasion (Stretton 2020). When implementing a carbon tax, governments need to ensure that related energy taxes are not unduly cut, which can undermine revenue, as experienced in Europe (Haites 2018). Effective implementation of an ETS requires a strong monitoring, reporting, and verification system to underpin the market for polluting permits.
Monitoring, reporting, and verification can pose challenges, as demonstrated by PRC pilot ETSs (Li et al. 2021). The private sector can play a critical role in monitoring and verifying emissions as independent third-party verifiers.
Asian governments need to carefully manage revenue generated from these instruments. Revenue can be earmarked to promote low-carbon technology, renewable energy, and energy efficiency, or to address environmental damage, as in Japan and Singapore. Japan has used a sulfur charge, for example, to compensate air pollution victims. Such approaches can build public acceptance. Where environmental taxes have adverse distributional effects, governments can implement offsetting revenue recycling transfers or rebates. These are widely used, as in Singapore, where rebates cushion price impacts from the carbon tax and gasoline duty. Where revenue is allocated to the general account, governments can lower other taxes or fund priority spending. This approach was adopted alongside the introduction of energy taxes (Goulder 1995) in Germany (Beuermann and Santarius 2006) and the United Kingdom (Agnolucci 2009). In Canadian British Columbia, carbon tax revenue recycling enabled both higher employment and lower emissions (Yamazaki 2017). No Asian economies have adopted this practice.
Finally, as pollution mitigation often entails significant investment, governments need to be clear about their policy frameworks. Where they intend to generate revenue from an ETS and initially allocate free permits, a clear transition to auctioned permits must be specified, as in the ROK. Equally, they need to review implementation to ensure consistency with policy goals and that revenue does not unintentionally erode over time. When Singapore recently reviewed its carbon tax, the government signaled that it may need to hasten tax rate adjustment to meet its commitments to tackle climate change (Tan 2021; Xu 2021).
While promising progress, environmental tax instruments, alone, cannot solve developing Asia’s daunting environmental challenges. Their scope is too small and some pollutants are difficult to price. Complementary regulation is needed to clean up Asia. For example, energy efficiency and other environmental standards are important and widely used in many high-income economies. Renewable energy is promoted by feed-in tariffs in the European Union and elsewhere, and by renewable portfolio standards in the US.
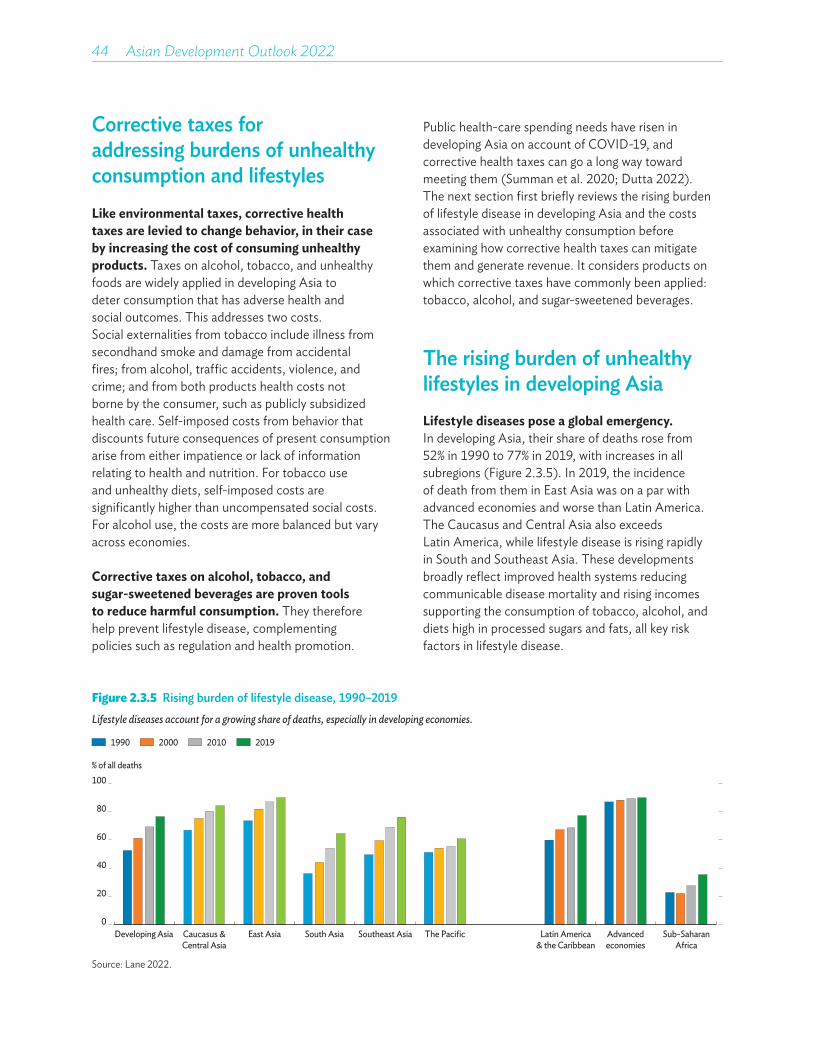
44 Asian Development Outlook 2022
Corrective taxes for addressing burdens of unhealthy consumption and lifestylesLike environmental taxes, corrective health taxes are levied to change behavior, in their case by increasing the cost of consuming unhealthy products. Taxes on alcohol, tobacco, and unhealthy foods are widely applied in developing Asia to deter consumption that has adverse health and social outcomes. This addresses two costs. Social externalities from tobacco include illness from secondhand smoke and damage from accidental fires; from alcohol, traffic accidents, violence, and crime; and from both products health costs not borne by the consumer, such as publicly subsidized health care. Self-imposed costs from behavior that discounts future consequences of present consumption arise from either impatience or lack of information relating to health and nutrition. For tobacco use and unhealthy diets, self-imposed costs are significantly higher than uncompensated social costs. For alcohol use, the costs are more balanced but vary across economies.
Corrective taxes on alcohol, tobacco, and sugar-sweetened beverages are proven tools to reduce harmful consumption. They therefore help prevent lifestyle disease, complementing policies such as regulation and health promotion.
Public health-care spending needs have risen in developing Asia on account of COVID-19, and corrective health taxes can go a long way toward meeting them (Summan et al. 2020; Dutta 2022). The next section first briefly reviews the rising burden of lifestyle disease in developing Asia and the costs associated with unhealthy consumption before examining how corrective health taxes can mitigate them and generate revenue. It considers products on which corrective taxes have commonly been applied: tobacco, alcohol, and sugar-sweetened beverages.
The rising burden of unhealthy lifestyles in developing AsiaLifestyle diseases pose a global emergency. In developing Asia, their share of deaths rose from 52% in 1990 to 77% in 2019, with increases in all subregions (Figure 2.3.5). In 2019, the incidence of death from them in East Asia was on a par with advanced economies and worse than Latin America. The Caucasus and Central Asia also exceeds Latin America, while lifestyle disease is rising rapidly in South and Southeast Asia. These developments broadly reflect improved health systems reducing communicable disease mortality and rising incomes supporting the consumption of tobacco, alcohol, and diets high in processed sugars and fats, all key risk factors in lifestyle disease.
Figure 2.3.5 Rising burden of lifestyle disease, 1990–2019Lifestyle diseases account for a growing share of deaths, especially in developing economies.
Developing Asia Caucasus &Central Asia
East Asia South Asia Southeast Asia The Pacific Latin America& the Caribbean
Advancedeconomies
Sub-SaharanAfrica
% of all deaths
2010 20191990 2000
0
20
40
60
80
100
Source: Lane 2022.
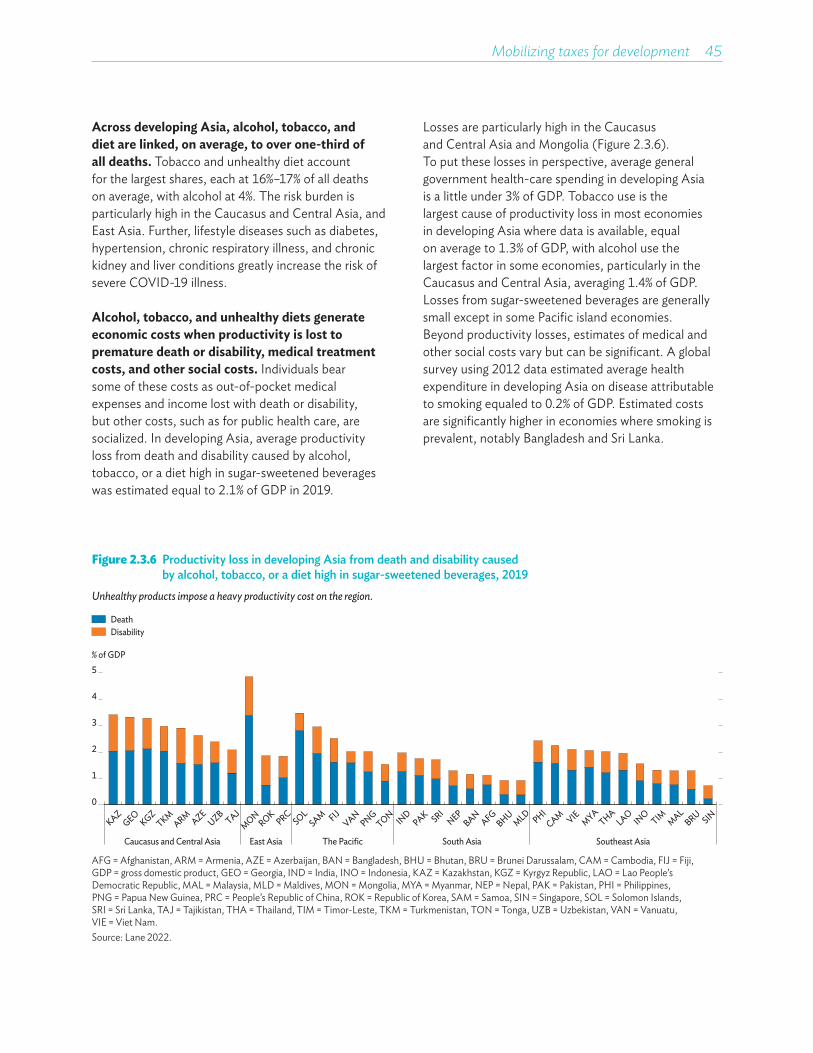
Mobilizing taxes for development 45
Across developing Asia, alcohol, tobacco, and diet are linked, on average, to over one-third of all deaths. Tobacco and unhealthy diet account for the largest shares, each at 16%–17% of all deaths on average, with alcohol at 4%. The risk burden is particularly high in the Caucasus and Central Asia, and East Asia. Further, lifestyle diseases such as diabetes, hypertension, chronic respiratory illness, and chronic kidney and liver conditions greatly increase the risk of severe COVID-19 illness.
Alcohol, tobacco, and unhealthy diets generate economic costs when productivity is lost to premature death or disability, medical treatment costs, and other social costs. Individuals bear some of these costs as out-of-pocket medical expenses and income lost with death or disability, but other costs, such as for public health care, are socialized. In developing Asia, average productivity loss from death and disability caused by alcohol, tobacco, or a diet high in sugar-sweetened beverages was estimated equal to 2.1% of GDP in 2019.
Losses are particularly high in the Caucasus and Central Asia and Mongolia (Figure 2.3.6). To put these losses in perspective, average general government health-care spending in developing Asia is a little under 3% of GDP. Tobacco use is the largest cause of productivity loss in most economies in developing Asia where data is available, equal on average to 1.3% of GDP, with alcohol use the largest factor in some economies, particularly in the Caucasus and Central Asia, averaging 1.4% of GDP. Losses from sugar-sweetened beverages are generally small except in some Pacific island economies. Beyond productivity losses, estimates of medical and other social costs vary but can be significant. A global survey using 2012 data estimated average health expenditure in developing Asia on disease attributable to smoking equaled to 0.2% of GDP. Estimated costs are significantly higher in economies where smoking is prevalent, notably Bangladesh and Sri Lanka.
Figure 2.3.6 Productivity loss in developing Asia from death and disability caused by alcohol, tobacco, or a diet high in sugar-sweetened beverages, 2019
Unhealthy products impose a heavy productivity cost on the region.
% of GDP
DeathDisability
0
1
2
3
4
5
Caucasus and Central Asia East Asia The Pacific South Asia Southeast Asia
KAZGEO
KGZTKM
ARM AZEUZB
TAJMON
ROKPRC
SOLSAM FIJ
VANPNG
TON IND
PAK SRINEP
BANAFG
BHUMLD PHI
CAM VIEMYA
THALAO
INO
TIM MALBRU SIN
AFG = Afghanistan, ARM = Armenia, AZE = Azerbaijan, BAN = Bangladesh, BHU = Bhutan, BRU = Brunei Darussalam, CAM = Cambodia, FIJ = Fiji, GDP = gross domestic product, GEO = Georgia, IND = India, INO = Indonesia, KAZ = Kazakhstan, KGZ = Kyrgyz Republic, LAO = Lao People’s Democratic Republic, MAL = Malaysia, MLD = Maldives, MON = Mongolia, MYA = Myanmar, NEP = Nepal, PAK = Pakistan, PHI = Philippines, PNG = Papua New Guinea, PRC = People’s Republic of China, ROK = Republic of Korea, SAM = Samoa, SIN = Singapore, SOL = Solomon Islands, SRI = Sri Lanka, TAJ = Tajikistan, THA = Thailand, TIM = Timor-Leste, TKM = Turkmenistan, TON = Tonga, UZB = Uzbekistan, VAN = Vanuatu, VIE = Viet Nam. Source: Lane 2022.
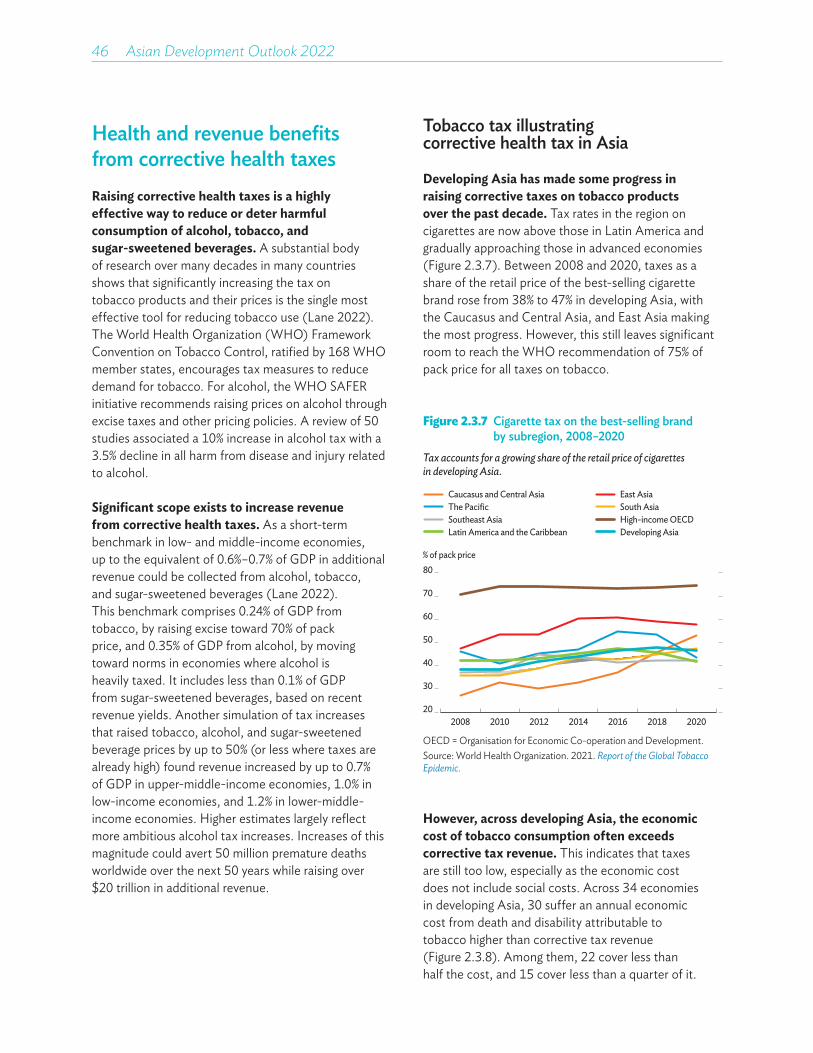
46 Asian Development Outlook 2022
Health and revenue benefits from corrective health taxesRaising corrective health taxes is a highly effective way to reduce or deter harmful consumption of alcohol, tobacco, and sugar-sweetened beverages. A substantial body of research over many decades in many countries shows that significantly increasing the tax on tobacco products and their prices is the single most effective tool for reducing tobacco use (Lane 2022). The World Health Organization (WHO) Framework Convention on Tobacco Control, ratified by 168 WHO member states, encourages tax measures to reduce demand for tobacco. For alcohol, the WHO SAFER initiative recommends raising prices on alcohol through excise taxes and other pricing policies. A review of 50 studies associated a 10% increase in alcohol tax with a 3.5% decline in all harm from disease and injury related to alcohol.
Significant scope exists to increase revenue from corrective health taxes. As a short-term benchmark in low- and middle-income economies, up to the equivalent of 0.6%–0.7% of GDP in additional revenue could be collected from alcohol, tobacco, and sugar-sweetened beverages (Lane 2022). This benchmark comprises 0.24% of GDP from tobacco, by raising excise toward 70% of pack price, and 0.35% of GDP from alcohol, by moving toward norms in economies where alcohol is heavily taxed. It includes less than 0.1% of GDP from sugar-sweetened beverages, based on recent revenue yields. Another simulation of tax increases that raised tobacco, alcohol, and sugar-sweetened beverage prices by up to 50% (or less where taxes are already high) found revenue increased by up to 0.7% of GDP in upper-middle-income economies, 1.0% in low-income economies, and 1.2% in lower-middle-income economies. Higher estimates largely reflect more ambitious alcohol tax increases. Increases of this magnitude could avert 50 million premature deaths worldwide over the next 50 years while raising over $20 trillion in additional revenue.
Tobacco tax illustrating corrective health tax in Asia
Developing Asia has made some progress in raising corrective taxes on tobacco products over the past decade. Tax rates in the region on cigarettes are now above those in Latin America and gradually approaching those in advanced economies (Figure 2.3.7). Between 2008 and 2020, taxes as a share of the retail price of the best-selling cigarette brand rose from 38% to 47% in developing Asia, with the Caucasus and Central Asia, and East Asia making the most progress. However, this still leaves significant room to reach the WHO recommendation of 75% of pack price for all taxes on tobacco.
Figure 2.3.7 Cigarette tax on the best-selling brand by subregion, 2008–2020
Tax accounts for a growing share of the retail price of cigarettes in developing Asia.
2008 2010 2012 2014 2016 2018 2020
% of pack price
Caucasus and Central AsiaThe PacificSoutheast AsiaLatin America and the Caribbean
East AsiaSouth AsiaHigh-income OECDDeveloping Asia
20
30
40
50
60
70
80
OECD = Organisation for Economic Co-operation and Development.Source: World Health Organization. 2021. Report of the Global Tobacco Epidemic.
However, across developing Asia, the economic cost of tobacco consumption often exceeds corrective tax revenue. This indicates that taxes are still too low, especially as the economic cost does not include social costs. Across 34 economies in developing Asia, 30 suffer an annual economic cost from death and disability attributable to tobacco higher than corrective tax revenue (Figure 2.3.8). Among them, 22 cover less than half the cost, and 15 cover less than a quarter of it.
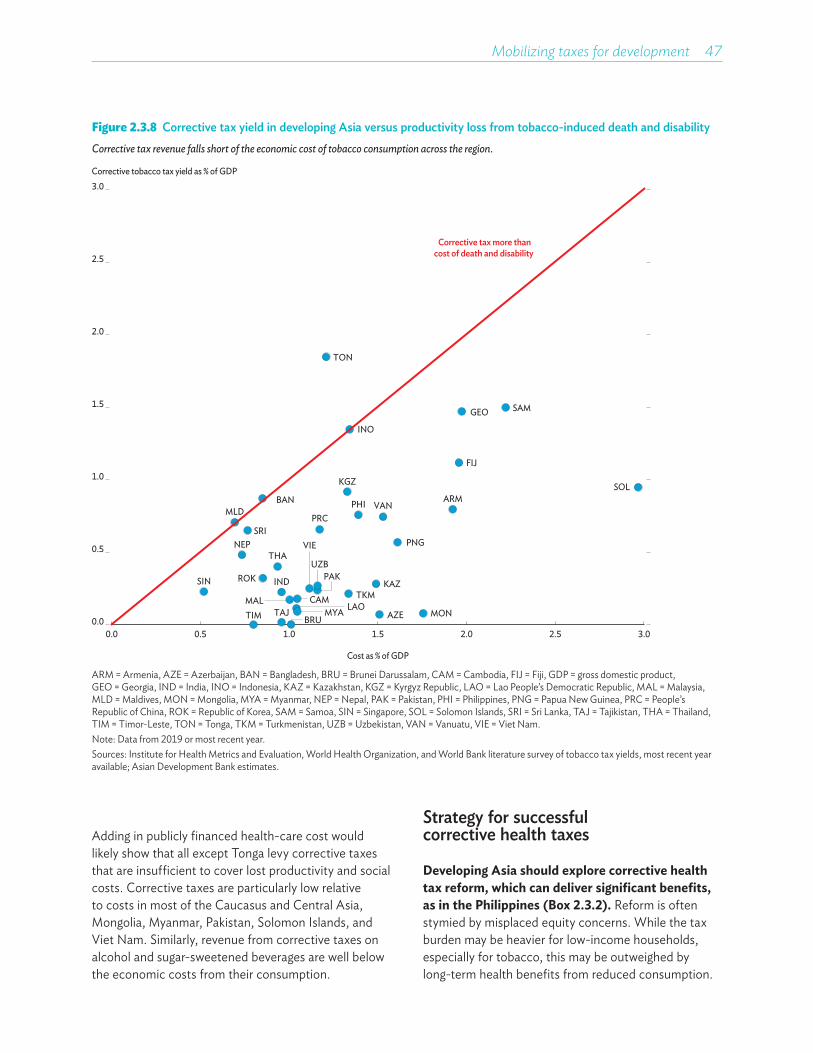
Mobilizing taxes for development 47
Figure 2.3.8 Corrective tax yield in developing Asia versus productivity loss from tobacco-induced death and disabilityCorrective tax revenue falls short of the economic cost of tobacco consumption across the region.
Corrective tobacco tax yield as % of GDP
0.0
0.5
1.0
1.5
2.0
2.5
3.0
ARM
AZE
BAN
BRU
CAM
PRC
FIJ
GEO
IND
INO
KAZROK
KGZ
MAL
MLD
MONMYA
NEP
PAK
PNG
PHI
SAM
SIN
SOL
SRI
TAJ
THA
TIM
TON
TKM
UZB
VAN
VIE
0.0 0.5 1.0 1.5 2.0 2.5 3.0
Cost as % of GDP
Corrective tax more thancost of death and disability
LAO
ARM = Armenia, AZE = Azerbaijan, BAN = Bangladesh, BRU = Brunei Darussalam, CAM = Cambodia, FIJ = Fiji, GDP = gross domestic product, GEO = Georgia, IND = India, INO = Indonesia, KAZ = Kazakhstan, KGZ = Kyrgyz Republic, LAO = Lao People’s Democratic Republic, MAL = Malaysia, MLD = Maldives, MON = Mongolia, MYA = Myanmar, NEP = Nepal, PAK = Pakistan, PHI = Philippines, PNG = Papua New Guinea, PRC = People’s Republic of China, ROK = Republic of Korea, SAM = Samoa, SIN = Singapore, SOL = Solomon Islands, SRI = Sri Lanka, TAJ = Tajikistan, THA = Thailand, TIM = Timor-Leste, TON = Tonga, TKM = Turkmenistan, UZB = Uzbekistan, VAN = Vanuatu, VIE = Viet Nam.Note: Data from 2019 or most recent year.Sources: Institute for Health Metrics and Evaluation, World Health Organization, and World Bank literature survey of tobacco tax yields, most recent year available; Asian Development Bank estimates.
Adding in publicly financed health-care cost would likely show that all except Tonga levy corrective taxes that are insufficient to cover lost productivity and social costs. Corrective taxes are particularly low relative to costs in most of the Caucasus and Central Asia, Mongolia, Myanmar, Pakistan, Solomon Islands, and Viet Nam. Similarly, revenue from corrective taxes on alcohol and sugar-sweetened beverages are well below the economic costs from their consumption.
Strategy for successful corrective health taxes
Developing Asia should explore corrective health tax reform, which can deliver significant benefits, as in the Philippines (Box 2.3.2). Reform is often stymied by misplaced equity concerns. While the tax burden may be heavier for low-income households, especially for tobacco, this may be outweighed by long-term health benefits from reduced consumption.
48 Asian Development Outlook 2022
Moreover, corrective tax revenue tends to come disproportionately from higher-income households, and its use can be pro-poor. Concerns about job losses in tobacco, alcohol, and sugary beverage industries must be weighed against the new jobs created by consumption shifting to healthier products, as well as jobs created by spending corrective tax revenue. Other concerns include overstated revenue and health gains, and increased illicit trade. However, experience indicates that taxes have little impact on illicit market share, which depends on other factors such as weak regulatory frameworks and social acceptance of black markets.
No single blueprint can guide the design and implementation of corrective tax reform in the region. However, a successful strategy must consider several factors, including the incidence of tax burdens and responses from firms. Implementation can be supported by marshalling best practice advice and successful international experience, and by publicizing the health and economic rationales for taxes. Another consideration is expenditure policy, as strong public health spending, especially for the poor, can secure political support for reform. Policy makers should note that, as with environmental taxes, they need to be alert to and plan for reduced revenue over the longer term as higher tax rates and prices succeed in driving down demand. As with other taxes, health tax collection can benefit from effective enforcement strategies to address noncompliance. Finally, corrective taxes and product regulation are complementary and mutually reinforcing, requiring close cooperation between finance and health ministries.
It matters how consumers react to price changes resulting from corrective taxes. Healthy substitution can support desired behavior change, and unhealthy substitution can undermine it, which may warrant uniform taxes across a broad range of products. High taxes may have only a muted impact on consumption if applied by value and tiered to protect low-cost production, inducing consumers to change to cheaper brands that pay less tax. In Tonga, for example, a nearly 50% increase in tax on imported cigarettes reduced tobacco consumption, especially in lower-income groups, but effects were muted by a shift to cheaper locally made cigarettes (ADB 2021d).
This section showed how environmental and corrective health taxes can both contribute directly to the SDGs and raise revenue. While the revenue potential from such taxes is not negligible, they can generate at best only a fraction of the vast fiscal resources that governments in developing Asia need to build a more sustainable future. The next section takes a deeper dive into reform options available to the region to secure those resources.
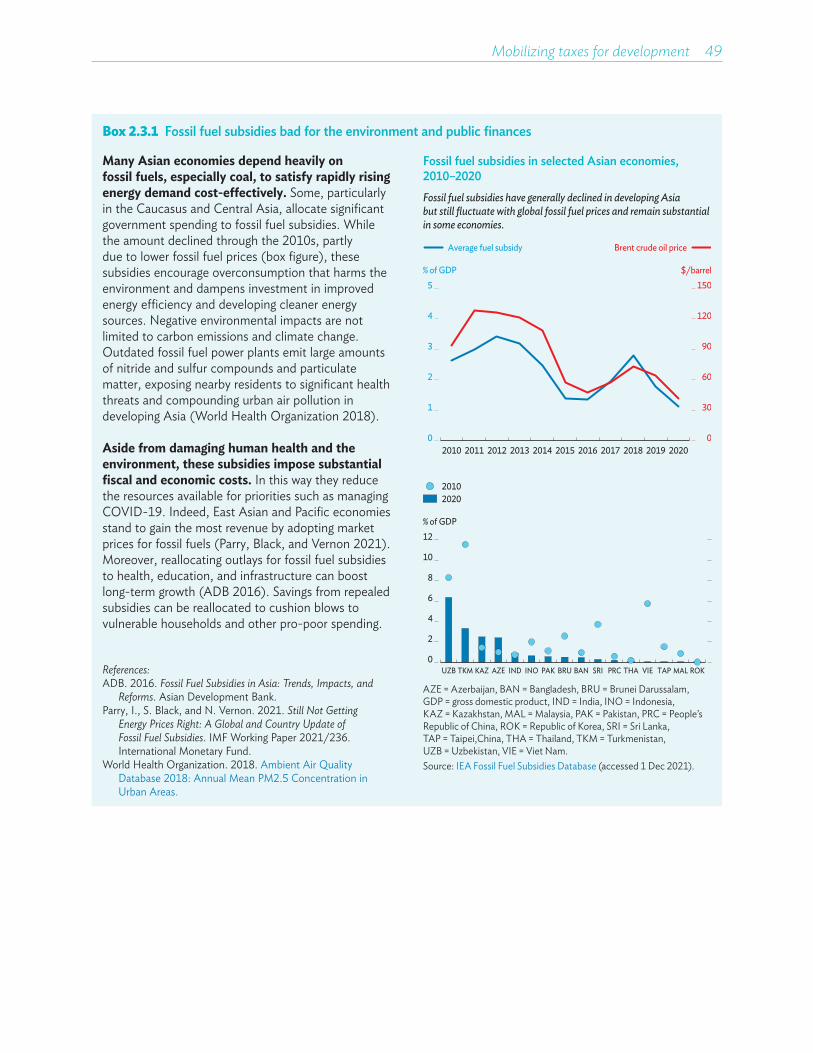
Mobilizing taxes for development 49
Box 2.3.1 Fossil fuel subsidies bad for the environment and public finances
Many Asian economies depend heavily on fossil fuels, especially coal, to satisfy rapidly rising energy demand cost-effectively. Some, particularly in the Caucasus and Central Asia, allocate significant government spending to fossil fuel subsidies. While the amount declined through the 2010s, partly due to lower fossil fuel prices (box figure), these subsidies encourage overconsumption that harms the environment and dampens investment in improved energy efficiency and developing cleaner energy sources. Negative environmental impacts are not limited to carbon emissions and climate change. Outdated fossil fuel power plants emit large amounts of nitride and sulfur compounds and particulate matter, exposing nearby residents to significant health threats and compounding urban air pollution in developing Asia (World Health Organization 2018).
Aside from damaging human health and the environment, these subsidies impose substantial fiscal and economic costs. In this way they reduce the resources available for priorities such as managing COVID-19. Indeed, East Asian and Pacific economies stand to gain the most revenue by adopting market prices for fossil fuels (Parry, Black, and Vernon 2021). Moreover, reallocating outlays for fossil fuel subsidies to health, education, and infrastructure can boost long-term growth (ADB 2016). Savings from repealed subsidies can be reallocated to cushion blows to vulnerable households and other pro-poor spending.
References:ADB. 2016. Fossil Fuel Subsidies in Asia: Trends, Impacts, and
Reforms. Asian Development Bank.Parry, I., S. Black, and N. Vernon. 2021. Still Not Getting
Energy Prices Right: A Global and Country Update of Fossil Fuel Subsidies. IMF Working Paper 2021/236. International Monetary Fund.
World Health Organization. 2018. Ambient Air Quality Database 2018: Annual Mean PM2.5 Concentration in Urban Areas.
Fossil fuel subsidies in selected Asian economies, 2010–2020Fossil fuel subsidies have generally declined in developing Asia but still fluctuate with global fossil fuel prices and remain substantial in some economies.
% of GDP
2
4
6
8
10
12
0
1
2
3
4
5
2010 2011 2012 2013 2014 2015 2016 2017 2018 2019 2020
$/barrel% of GDP
20202010
0
30
60
90
120
150
Average fuel subsidy Brent crude oil price
0UZB TKM KAZ AZE IND INO PAK BRU BAN SRI PRC THA VIE TAP MAL ROK
AZE = Azerbaijan, BAN = Bangladesh, BRU = Brunei Darussalam, GDP = gross domestic product, IND = India, INO = Indonesia, KAZ = Kazakhstan, MAL = Malaysia, PAK = Pakistan, PRC = People’s Republic of China, ROK = Republic of Korea, SRI = Sri Lanka, TAP = Taipei,China, THA = Thailand, TKM = Turkmenistan, UZB = Uzbekistan, VIE = Viet Nam. Source: IEA Fossil Fuel Subsidies Database (accessed 1 Dec 2021).
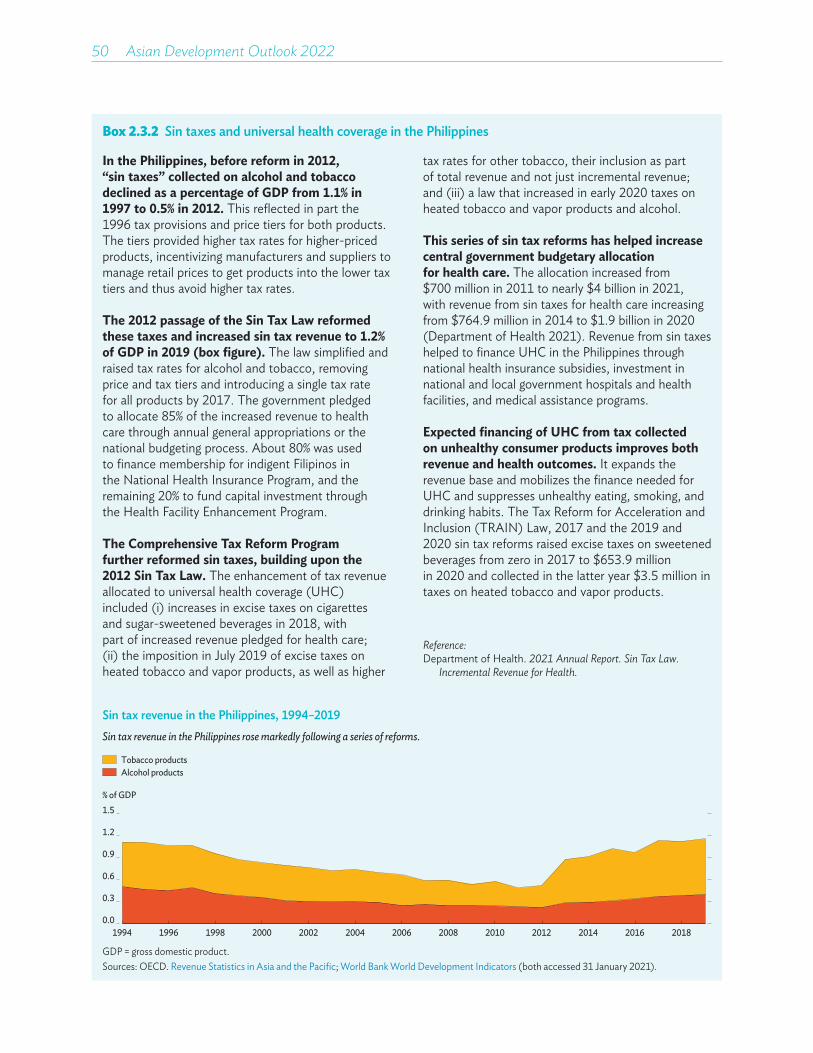
50 Asian Development Outlook 2022
Box 2.3.2 Sin taxes and universal health coverage in the Philippines
In the Philippines, before reform in 2012, “sin taxes” collected on alcohol and tobacco declined as a percentage of GDP from 1.1% in 1997 to 0.5% in 2012. This reflected in part the 1996 tax provisions and price tiers for both products. The tiers provided higher tax rates for higher-priced products, incentivizing manufacturers and suppliers to manage retail prices to get products into the lower tax tiers and thus avoid higher tax rates.
The 2012 passage of the Sin Tax Law reformed these taxes and increased sin tax revenue to 1.2% of GDP in 2019 (box figure). The law simplified and raised tax rates for alcohol and tobacco, removing price and tax tiers and introducing a single tax rate for all products by 2017. The government pledged to allocate 85% of the increased revenue to health care through annual general appropriations or the national budgeting process. About 80% was used to finance membership for indigent Filipinos in the National Health Insurance Program, and the remaining 20% to fund capital investment through the Health Facility Enhancement Program.
The Comprehensive Tax Reform Program further reformed sin taxes, building upon the 2012 Sin Tax Law. The enhancement of tax revenue allocated to universal health coverage (UHC) included (i) increases in excise taxes on cigarettes and sugar-sweetened beverages in 2018, with part of increased revenue pledged for health care; (ii) the imposition in July 2019 of excise taxes on heated tobacco and vapor products, as well as higher
tax rates for other tobacco, their inclusion as part of total revenue and not just incremental revenue; and (iii) a law that increased in early 2020 taxes on heated tobacco and vapor products and alcohol.
This series of sin tax reforms has helped increase central government budgetary allocation for health care. The allocation increased from $700 million in 2011 to nearly $4 billion in 2021, with revenue from sin taxes for health care increasing from $764.9 million in 2014 to $1.9 billion in 2020 (Department of Health 2021). Revenue from sin taxes helped to finance UHC in the Philippines through national health insurance subsidies, investment in national and local government hospitals and health facilities, and medical assistance programs.
Expected financing of UHC from tax collected on unhealthy consumer products improves both revenue and health outcomes. It expands the revenue base and mobilizes the finance needed for UHC and suppresses unhealthy eating, smoking, and drinking habits. The Tax Reform for Acceleration and Inclusion (TRAIN) Law, 2017 and the 2019 and 2020 sin tax reforms raised excise taxes on sweetened beverages from zero in 2017 to $653.9 million in 2020 and collected in the latter year $3.5 million in taxes on heated tobacco and vapor products.
Reference:Department of Health. 2021 Annual Report. Sin Tax Law.
Incremental Revenue for Health.
Sin tax revenue in the Philippines, 1994–2019Sin tax revenue in the Philippines rose markedly following a series of reforms.
1994 1996 1998 2000 2002 2004 2006 2008 2010 2012 2014 2016 2018
% of GDP
Tobacco productsAlcohol products
0.0
0.3
0.6
0.9
1.2
1.5
GDP = gross domestic product.Sources: OECD. Revenue Statistics in Asia and the Pacific; World Bank World Development Indicators (both accessed 31 January 2021).
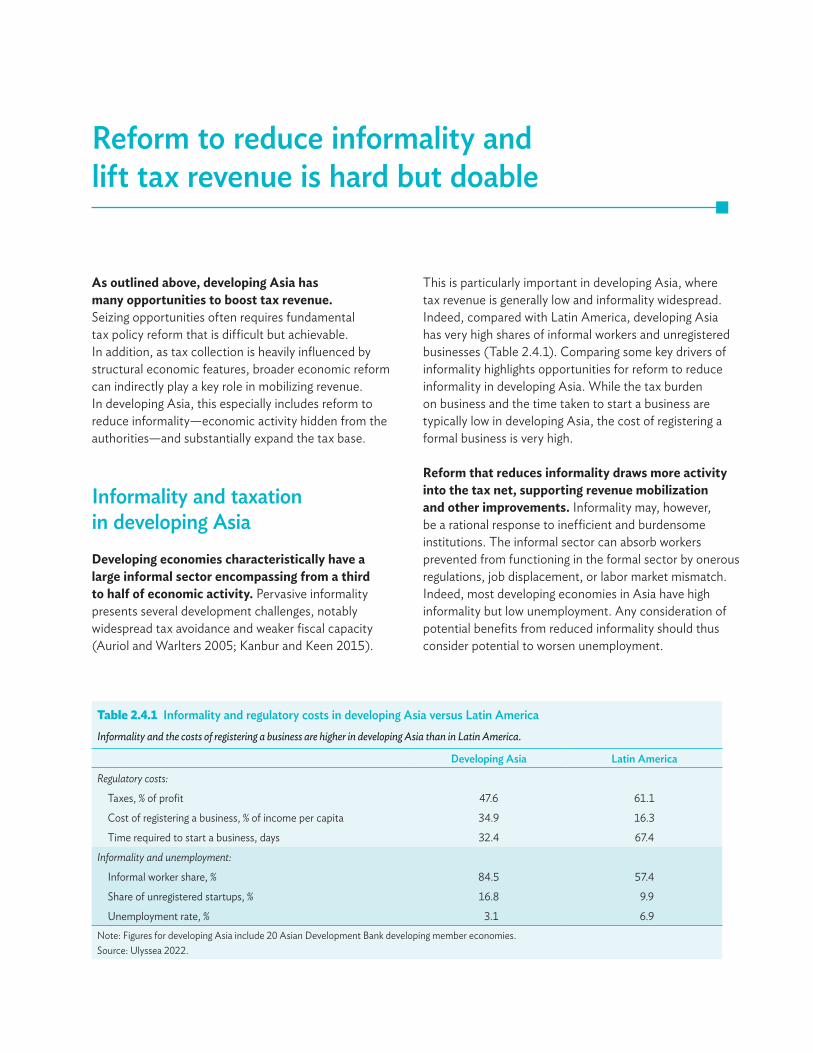
Reform to reduce informality and lift tax revenue is hard but doable
As outlined above, developing Asia has many opportunities to boost tax revenue. Seizing opportunities often requires fundamental tax policy reform that is difficult but achievable. In addition, as tax collection is heavily influenced by structural economic features, broader economic reform can indirectly play a key role in mobilizing revenue. In developing Asia, this especially includes reform to reduce informality—economic activity hidden from the authorities—and substantially expand the tax base.
Informality and taxation in developing AsiaDeveloping economies characteristically have a large informal sector encompassing from a third to half of economic activity. Pervasive informality presents several development challenges, notably widespread tax avoidance and weaker fiscal capacity (Auriol and Warlters 2005; Kanbur and Keen 2015).
This is particularly important in developing Asia, where tax revenue is generally low and informality widespread. Indeed, compared with Latin America, developing Asia has very high shares of informal workers and unregistered businesses (Table 2.4.1). Comparing some key drivers of informality highlights opportunities for reform to reduce informality in developing Asia. While the tax burden on business and the time taken to start a business are typically low in developing Asia, the cost of registering a formal business is very high.
Reform that reduces informality draws more activity into the tax net, supporting revenue mobilization and other improvements. Informality may, however, be a rational response to inefficient and burdensome institutions. The informal sector can absorb workers prevented from functioning in the formal sector by onerous regulations, job displacement, or labor market mismatch. Indeed, most developing economies in Asia have high informality but low unemployment. Any consideration of potential benefits from reduced informality should thus consider potential to worsen unemployment.
Table 2.4.1 Informality and regulatory costs in developing Asia versus Latin AmericaInformality and the costs of registering a business are higher in developing Asia than in Latin America.
Developing Asia Latin America
Regulatory costs:
Taxes, % of profit 47.6 61.1
Cost of registering a business, % of income per capita 34.9 16.3
Time required to start a business, days 32.4 67.4
Informality and unemployment:
Informal worker share, % 84.5 57.4
Share of unregistered startups, % 16.8 9.9
Unemployment rate, % 3.1 6.9Note: Figures for developing Asia include 20 Asian Development Bank developing member economies.Source: Ulyssea 2022.
52 Asian Development Outlook 2022
Determinants of informality
The costs of operating formally can be broadly divided into those of entering the formal sector and those of staying there. The former stem from regulations on entry and the latter from tax burdens and the continuing costs of complying with laws and regulations (Djankov et al. 2002; Ulyssea 2020). Governments can incentivize firms to formalize by reducing either type of cost or both. Alternatively, they can increase the cost of informality with more inspections and stronger enforcement of existing laws and regulations.
Several studies have examined policies that aim to reduce the costs of formality. These often focus on business registration, which is regarded as a major constraint on firm creation and formalization (De Soto 1989; Djankov et al. 2002). Evidence on the impact of such reform on firm formalization is mixed (Bruhn and McKenzie 2014). However, much of it comes from Latin America, where regulations differ from developing Asia. Other studies, some examining the economywide impact, have shown that reducing formal sector entry costs can have substantial benefits (Ulyssea 2010a; D’Erasmo and Boedo 2012; Charlot, Malherbet, and Terra 2015; Ulyssea 2018). Other evidence suggests that formalization is triggered by stronger enforcement of existing laws and regulations, which increases informal costs (de Andrade et al. 2014).
Policy simulations framework
New analysis examines the effects of reduced business registration costs and of stiffer enforcement of existing laws and policies. It examines the impact on unemployment, informality, productivity, and tax revenue in developing Asia using counterfactual policy simulations (Ulyssea 2022). Estimates for the region are obtained by averaging results across 20 economies in developing Asia weighted by population.4 Simulations use a simple two-sector model, formal and informal, developed in Ulyssea (2010b). It captures many of the dimensions discussed above and includes the registration cost of
entering the formal sector, the tax cost of remaining there, unemployment and other effects of transition into and out of the formal and informal sectors, differences in productivity between the two sectors, variation in enforcement intensity, and the main aggregate outcome variables mentioned above.
There are limitations to the analysis. As the model does not account for variation in firm productivity or size, it does not capture composition effects from policy changes or allow for worker reallocation from less productive to more productive firms. These effects are potentially important, especially for policies that stiffen enforcement (Dix-Carneiro et al. 2021). In practice, if firms are highly heterogeneous and the more productive formal ones have scope to expand, stricter enforcement can increase aggregate economic output and tax revenue (Ulyssea 2018). Thus, some potentially important policy effects are muted in the current analysis, so results should be interpreted as indicative.
Main findings from policy simulations
Simulation results for developing Asia suggest that reducing entry cost can significantly reduce informality prevalence and increase tax revenue while reducing unemployment. These positive effects reflect lower entry cost spurring greater firm entry and production in the formal sector, thereby lifting output. The calibrated value for the baseline economy is determined using data from the Doing Business survey (Ulyssea 2022). The average entry cost in developing Asia in this baseline is high, more than four times higher than in Brazil, which itself has high entry cost by global standards.
Results show that reducing entry cost in developing Asia by a quarter would significantly increase revenue. It would have little effect on unemployment—which is already very low in the baseline—but would reduce the informal sector share by 5 percentage points as detailed in Table 2.4.2 (Ulyssea 2022). This reduction in informality is associated with gains in average productivity and
4 Armenia, Bangladesh, Cambodia, Fiji, Georgia, India, Indonesia, the Kyrgyz Republic, the Lao People’s Democratic Republic, Mongolia, Myanmar, Nepal, Pakistan, Samoa, Sri Lanka, Thailand, Timor-Leste, Tonga, Vanuatu, and Viet Nam.
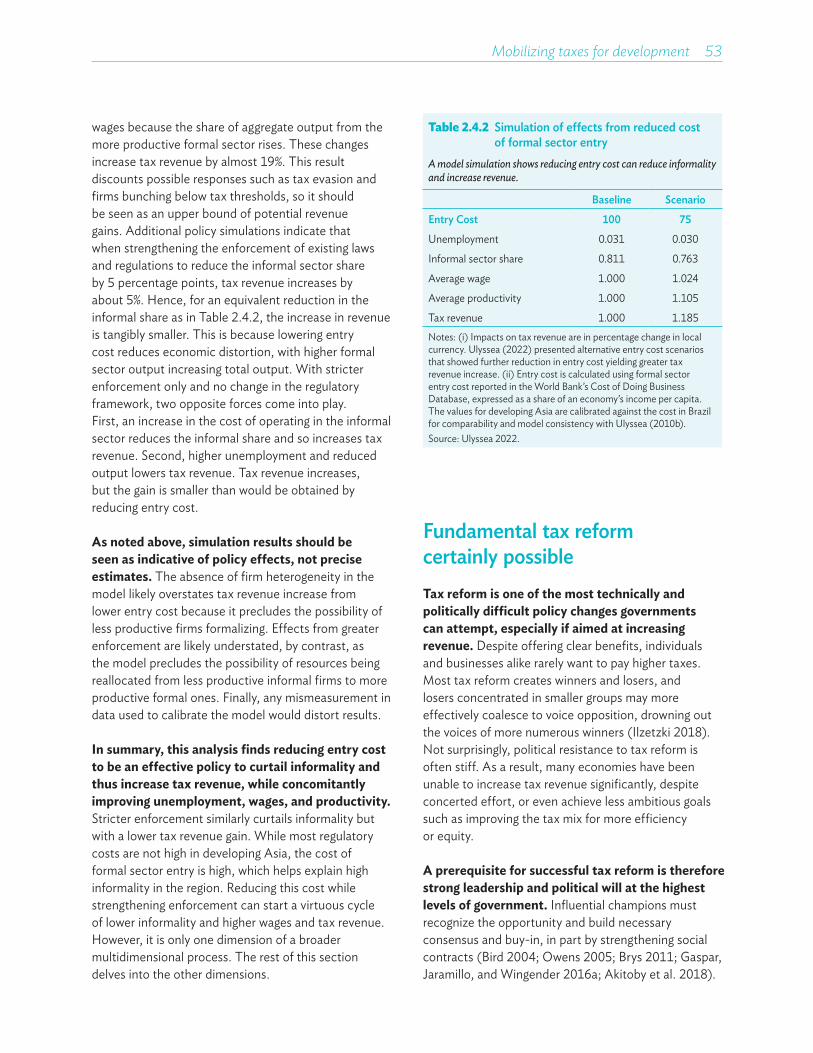
Mobilizing taxes for development 53
wages because the share of aggregate output from the more productive formal sector rises. These changes increase tax revenue by almost 19%. This result discounts possible responses such as tax evasion and firms bunching below tax thresholds, so it should be seen as an upper bound of potential revenue gains. Additional policy simulations indicate that when strengthening the enforcement of existing laws and regulations to reduce the informal sector share by 5 percentage points, tax revenue increases by about 5%. Hence, for an equivalent reduction in the informal share as in Table 2.4.2, the increase in revenue is tangibly smaller. This is because lowering entry cost reduces economic distortion, with higher formal sector output increasing total output. With stricter enforcement only and no change in the regulatory framework, two opposite forces come into play. First, an increase in the cost of operating in the informal sector reduces the informal share and so increases tax revenue. Second, higher unemployment and reduced output lowers tax revenue. Tax revenue increases, but the gain is smaller than would be obtained by reducing entry cost.
As noted above, simulation results should be seen as indicative of policy effects, not precise estimates. The absence of firm heterogeneity in the model likely overstates tax revenue increase from lower entry cost because it precludes the possibility of less productive firms formalizing. Effects from greater enforcement are likely understated, by contrast, as the model precludes the possibility of resources being reallocated from less productive informal firms to more productive formal ones. Finally, any mismeasurement in data used to calibrate the model would distort results.
In summary, this analysis finds reducing entry cost to be an effective policy to curtail informality and thus increase tax revenue, while concomitantly improving unemployment, wages, and productivity. Stricter enforcement similarly curtails informality but with a lower tax revenue gain. While most regulatory costs are not high in developing Asia, the cost of formal sector entry is high, which helps explain high informality in the region. Reducing this cost while strengthening enforcement can start a virtuous cycle of lower informality and higher wages and tax revenue. However, it is only one dimension of a broader multidimensional process. The rest of this section delves into the other dimensions.
Fundamental tax reform certainly possibleTax reform is one of the most technically and politically difficult policy changes governments can attempt, especially if aimed at increasing revenue. Despite offering clear benefits, individuals and businesses alike rarely want to pay higher taxes. Most tax reform creates winners and losers, and losers concentrated in smaller groups may more effectively coalesce to voice opposition, drowning out the voices of more numerous winners (Ilzetzki 2018). Not surprisingly, political resistance to tax reform is often stiff. As a result, many economies have been unable to increase tax revenue significantly, despite concerted effort, or even achieve less ambitious goals such as improving the tax mix for more efficiency or equity.
A prerequisite for successful tax reform is therefore strong leadership and political will at the highest levels of government. Influential champions must recognize the opportunity and build necessary consensus and buy-in, in part by strengthening social contracts (Bird 2004; Owens 2005; Brys 2011; Gaspar, Jaramillo, and Wingender 2016a; Akitoby et al. 2018).
Table 2.4.2 Simulation of effects from reduced cost of formal sector entry
A model simulation shows reducing entry cost can reduce informality and increase revenue.
Baseline Scenario
Entry Cost 100 75
Unemployment 0.031 0.030
Informal sector share 0.811 0.763
Average wage 1.000 1.024
Average productivity 1.000 1.105
Tax revenue 1.000 1.185Notes: (i) Impacts on tax revenue are in percentage change in local currency. Ulyssea (2022) presented alternative entry cost scenarios that showed further reduction in entry cost yielding greater tax revenue increase. (ii) Entry cost is calculated using formal sector entry cost reported in the World Bank’s Cost of Doing Business Database, expressed as a share of an economy’s income per capita. The values for developing Asia are calibrated against the cost in Brazil for comparability and model consistency with Ulyssea (2010b).Source: Ulyssea 2022.
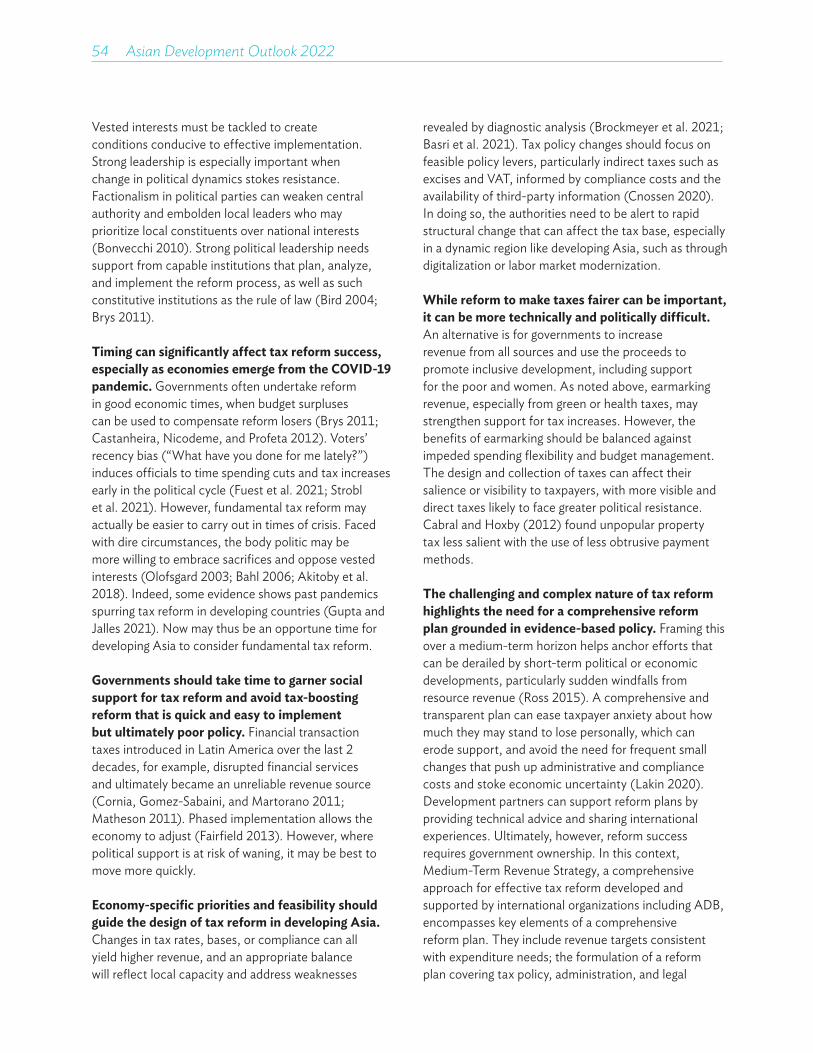
54 Asian Development Outlook 2022
Vested interests must be tackled to create conditions conducive to effective implementation. Strong leadership is especially important when change in political dynamics stokes resistance. Factionalism in political parties can weaken central authority and embolden local leaders who may prioritize local constituents over national interests (Bonvecchi 2010). Strong political leadership needs support from capable institutions that plan, analyze, and implement the reform process, as well as such constitutive institutions as the rule of law (Bird 2004; Brys 2011).
Timing can significantly affect tax reform success, especially as economies emerge from the COVID-19 pandemic. Governments often undertake reform in good economic times, when budget surpluses can be used to compensate reform losers (Brys 2011; Castanheira, Nicodeme, and Profeta 2012). Voters’ recency bias (“What have you done for me lately?”) induces officials to time spending cuts and tax increases early in the political cycle (Fuest et al. 2021; Strobl et al. 2021). However, fundamental tax reform may actually be easier to carry out in times of crisis. Faced with dire circumstances, the body politic may be more willing to embrace sacrifices and oppose vested interests (Olofsgard 2003; Bahl 2006; Akitoby et al. 2018). Indeed, some evidence shows past pandemics spurring tax reform in developing countries (Gupta and Jalles 2021). Now may thus be an opportune time for developing Asia to consider fundamental tax reform.
Governments should take time to garner social support for tax reform and avoid tax-boosting reform that is quick and easy to implement but ultimately poor policy. Financial transaction taxes introduced in Latin America over the last 2 decades, for example, disrupted financial services and ultimately became an unreliable revenue source (Cornia, Gomez-Sabaini, and Martorano 2011; Matheson 2011). Phased implementation allows the economy to adjust (Fairfield 2013). However, where political support is at risk of waning, it may be best to move more quickly.
Economy-specific priorities and feasibility should guide the design of tax reform in developing Asia. Changes in tax rates, bases, or compliance can all yield higher revenue, and an appropriate balance will reflect local capacity and address weaknesses
revealed by diagnostic analysis (Brockmeyer et al. 2021; Basri et al. 2021). Tax policy changes should focus on feasible policy levers, particularly indirect taxes such as excises and VAT, informed by compliance costs and the availability of third-party information (Cnossen 2020). In doing so, the authorities need to be alert to rapid structural change that can affect the tax base, especially in a dynamic region like developing Asia, such as through digitalization or labor market modernization.
While reform to make taxes fairer can be important, it can be more technically and politically difficult. An alternative is for governments to increase revenue from all sources and use the proceeds to promote inclusive development, including support for the poor and women. As noted above, earmarking revenue, especially from green or health taxes, may strengthen support for tax increases. However, the benefits of earmarking should be balanced against impeded spending flexibility and budget management. The design and collection of taxes can affect their salience or visibility to taxpayers, with more visible and direct taxes likely to face greater political resistance. Cabral and Hoxby (2012) found unpopular property tax less salient with the use of less obtrusive payment methods.
The challenging and complex nature of tax reform highlights the need for a comprehensive reform plan grounded in evidence-based policy. Framing this over a medium-term horizon helps anchor efforts that can be derailed by short-term political or economic developments, particularly sudden windfalls from resource revenue (Ross 2015). A comprehensive and transparent plan can ease taxpayer anxiety about how much they may stand to lose personally, which can erode support, and avoid the need for frequent small changes that push up administrative and compliance costs and stoke economic uncertainty (Lakin 2020). Development partners can support reform plans by providing technical advice and sharing international experiences. Ultimately, however, reform success requires government ownership. In this context, Medium-Term Revenue Strategy, a comprehensive approach for effective tax reform developed and supported by international organizations including ADB, encompasses key elements of a comprehensive reform plan. They include revenue targets consistent with expenditure needs; the formulation of a reform plan covering tax policy, administration, and legal

Mobilizing taxes for development 55
frameworks; clear government commitment to reform; and resources and support secured for implementation (Mullins 2020).
Despite considerable challenges, the past few decades have witnessed successful tax reform in numerous economies. These reforms substantially and durably increased tax revenue, including in developing Asia (Martinez-Vasquez 2022). A comparison of some of the most successful reform episodes, where ratios of tax to GDP rose by more than a half, highlights the diverse experiences of countries at different stages of development (Box 2.4.1). While no one-size-fits-all tax reform strategy exists, reform commonly follows major political or economic upheavals and entails strengthened VATs (Akitoby, Honda, and Primus 2020). Experience also highlights the importance of reforming tax administration to boost compliance.
Modernizing and strengthening tax administrations essentialA strong tax administration is central to a sound tax system. It affects tax yield, incidence, and efficiency (Casanegra de Jantscher 1990; Bird 2014). Tax administration and tax policy reforms are therefore highly complementary and reinforce each other. For instance, recent evidence from developing countries suggests that increased tax rates yield more revenue in a strong enforcement environment (Bergeron, Tourek, and Weigel 2021). Good tax administration deters tax evasion, facilitates voluntary compliance, and instills trust. Third-party information is crucial for tax collection, but this needs to be complemented by effective compliance and strong audit capacity (Carrillo, Pomeranz, and Singhal 2017).
Tax administrations seek to raise revenue efficiently, with the lowest administrative and taxpayer compliance costs. Where costs are high relative to revenue raised, tax administration reform is particularly beneficial (Keen and Slemrod 2016). In Indonesia, for example, increasing tax administration staff oversight of selected firms, which required only a small increase in overhead, more than doubled revenue
from them—an achievement that otherwise would have required a substantial corporate tax rate hike (Basri et al. 2021). This example highlights the benefits of investing in tax administration capacity.
Across developing Asia, tax compliance burdens have eased with tax system simplification and improved tax administration capacity, but scope for improvement remains. Over the past decade, the average number of hours required for companies to comply with taxes in developing Asia declined from 236 to 196, a significant improvement and below Latin American and Sub-Saharan African averages but still higher than the OECD average of 158 (Figure 2.4.1). Developing Asia continues to lag OECD countries as well on measures of efficiency after tax return filing.
Effective tax administration requires adequate resources and use of information technology. Many tax administrations in developing Asia suffer low staffing, however, especially compared with OECD countries (Figure 2.4.2). Expanding tax administration resources may therefore significantly improve compliance and tax collection. In many developing economies, reform has prioritized strategically deploying limited resources. Special units to manage large taxpayers, for example, deploy highly skilled auditors to focus on big firms. They have been established across developing Asia, most recently in Hong Kong, China; the PRC; Solomon Islands; and Uzbekistan. However, the region has few dedicated taxpayer units for wealthy individuals (ADB 2022). Evidence is mixed on the revenue impacts of special taxpayer units (Ebeke, Mansour, and Rota-Graziosi 2016; Baum et al. 2017). In Indonesia, an experimental unit for wealthy individuals suffered serious administrative challenges and failed to meet revenue expectations, but a special unit for medium-sized taxpayers has shown far more promise (Widhartanto and Braithwaite 2016; Basri et al. 2021). How effective such units are appears to hinge on careful design and implementation. Finally, the use of information technology has expanded, digitalizing records, automating processes, and facilitating sophisticated data analytics, all of which improve taxpayer services and make better use of limited capacity. While developing Asia has embraced many digital innovations, scope exists to further expand their use (Box 2.4.2).
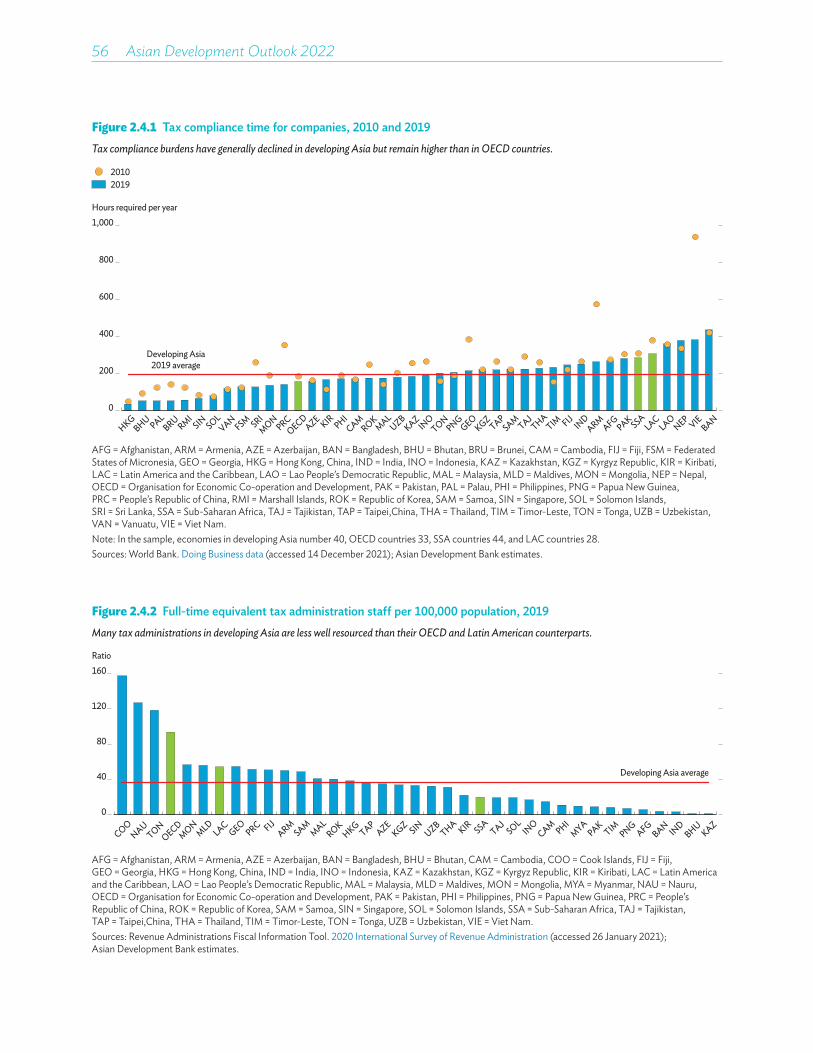
56 Asian Development Outlook 2022
Figure 2.4.1 Tax compliance time for companies, 2010 and 2019Tax compliance burdens have generally declined in developing Asia but remain higher than in OECD countries.
0
200
400
600
800
1,000Hours required per year
20192010
Developing Asia2019 average
HKGBHU PAL
BRU RMISIN SOL
VANFSM SRI
MONPRC
OECDAZE KIR PHI
CAMROK
MALUZB
KAZIN
OTON
PNGGEO
KGZTAP
SAM TAJTHA
TIM FIJ IND
ARMAFG
PAK SSALAC
LAONEP VIE
BAN
AFG = Afghanistan, ARM = Armenia, AZE = Azerbaijan, BAN = Bangladesh, BHU = Bhutan, BRU = Brunei, CAM = Cambodia, FIJ = Fiji, FSM = Federated States of Micronesia, GEO = Georgia, HKG = Hong Kong, China, IND = India, INO = Indonesia, KAZ = Kazakhstan, KGZ = Kyrgyz Republic, KIR = Kiribati, LAC = Latin America and the Caribbean, LAO = Lao People’s Democratic Republic, MAL = Malaysia, MLD = Maldives, MON = Mongolia, NEP = Nepal, OECD = Organisation for Economic Co-operation and Development, PAK = Pakistan, PAL = Palau, PHI = Philippines, PNG = Papua New Guinea, PRC = People’s Republic of China, RMI = Marshall Islands, ROK = Republic of Korea, SAM = Samoa, SIN = Singapore, SOL = Solomon Islands, SRI = Sri Lanka, SSA = Sub-Saharan Africa, TAJ = Tajikistan, TAP = Taipei,China, THA = Thailand, TIM = Timor-Leste, TON = Tonga, UZB = Uzbekistan, VAN = Vanuatu, VIE = Viet Nam.Note: In the sample, economies in developing Asia number 40, OECD countries 33, SSA countries 44, and LAC countries 28.Sources: World Bank. Doing Business data (accessed 14 December 2021); Asian Development Bank estimates.
Figure 2.4.2 Full-time equivalent tax administration staff per 100,000 population, 2019Many tax administrations in developing Asia are less well resourced than their OECD and Latin American counterparts.
0
40
80
120
160Ratio
Developing Asia average
COONAU
TONOECD
MONMLD
LACGEO
PRC FIJARM
SAMMAL
ROKHKG
TAPAZE
KGZ SIN UZBTHA KIR SSA
TAJSOL
INO
CAM PHIMYA
PAKTIM PNG
AFGBAN IN
DBHU
KAZ
AFG = Afghanistan, ARM = Armenia, AZE = Azerbaijan, BAN = Bangladesh, BHU = Bhutan, CAM = Cambodia, COO = Cook Islands, FIJ = Fiji, GEO = Georgia, HKG = Hong Kong, China, IND = India, INO = Indonesia, KAZ = Kazakhstan, KGZ = Kyrgyz Republic, KIR = Kiribati, LAC = Latin America and the Caribbean, LAO = Lao People’s Democratic Republic, MAL = Malaysia, MLD = Maldives, MON = Mongolia, MYA = Myanmar, NAU = Nauru, OECD = Organisation for Economic Co-operation and Development, PAK = Pakistan, PHI = Philippines, PNG = Papua New Guinea, PRC = People’s Republic of China, ROK = Republic of Korea, SAM = Samoa, SIN = Singapore, SOL = Solomon Islands, SSA = Sub-Saharan Africa, TAJ = Tajikistan, TAP = Taipei,China, THA = Thailand, TIM = Timor-Leste, TON = Tonga, UZB = Uzbekistan, VIE = Viet Nam.Sources: Revenue Administrations Fiscal Information Tool. 2020 International Survey of Revenue Administration (accessed 26 January 2021); Asian Development Bank estimates.
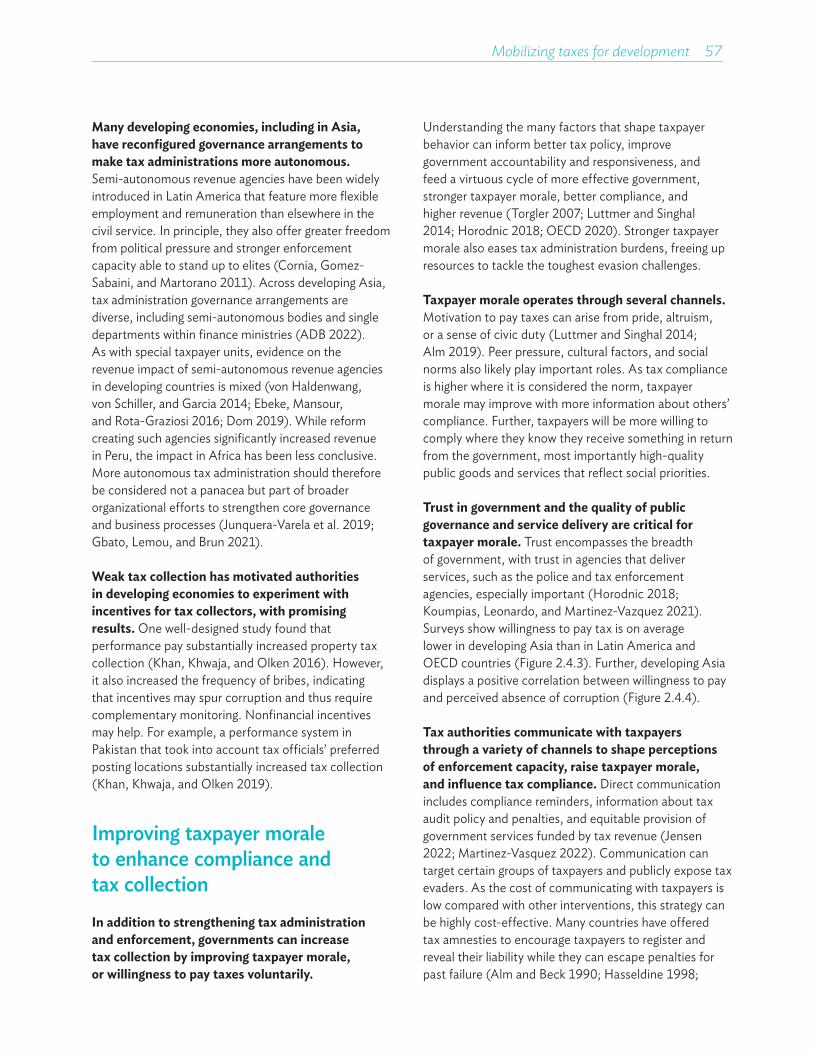
Mobilizing taxes for development 57
Many developing economies, including in Asia, have reconfigured governance arrangements to make tax administrations more autonomous. Semi-autonomous revenue agencies have been widely introduced in Latin America that feature more flexible employment and remuneration than elsewhere in the civil service. In principle, they also offer greater freedom from political pressure and stronger enforcement capacity able to stand up to elites (Cornia, Gomez-Sabaini, and Martorano 2011). Across developing Asia, tax administration governance arrangements are diverse, including semi-autonomous bodies and single departments within finance ministries (ADB 2022). As with special taxpayer units, evidence on the revenue impact of semi-autonomous revenue agencies in developing countries is mixed (von Haldenwang, von Schiller, and Garcia 2014; Ebeke, Mansour, and Rota-Graziosi 2016; Dom 2019). While reform creating such agencies significantly increased revenue in Peru, the impact in Africa has been less conclusive. More autonomous tax administration should therefore be considered not a panacea but part of broader organizational efforts to strengthen core governance and business processes (Junquera-Varela et al. 2019; Gbato, Lemou, and Brun 2021).
Weak tax collection has motivated authorities in developing economies to experiment with incentives for tax collectors, with promising results. One well-designed study found that performance pay substantially increased property tax collection (Khan, Khwaja, and Olken 2016). However, it also increased the frequency of bribes, indicating that incentives may spur corruption and thus require complementary monitoring. Nonfinancial incentives may help. For example, a performance system in Pakistan that took into account tax officials’ preferred posting locations substantially increased tax collection (Khan, Khwaja, and Olken 2019).
Improving taxpayer morale to enhance compliance and tax collection In addition to strengthening tax administration and enforcement, governments can increase tax collection by improving taxpayer morale, or willingness to pay taxes voluntarily.
Understanding the many factors that shape taxpayer behavior can inform better tax policy, improve government accountability and responsiveness, and feed a virtuous cycle of more effective government, stronger taxpayer morale, better compliance, and higher revenue (Torgler 2007; Luttmer and Singhal 2014; Horodnic 2018; OECD 2020). Stronger taxpayer morale also eases tax administration burdens, freeing up resources to tackle the toughest evasion challenges.
Taxpayer morale operates through several channels. Motivation to pay taxes can arise from pride, altruism, or a sense of civic duty (Luttmer and Singhal 2014; Alm 2019). Peer pressure, cultural factors, and social norms also likely play important roles. As tax compliance is higher where it is considered the norm, taxpayer morale may improve with more information about others’ compliance. Further, taxpayers will be more willing to comply where they know they receive something in return from the government, most importantly high-quality public goods and services that reflect social priorities.
Trust in government and the quality of public governance and service delivery are critical for taxpayer morale. Trust encompasses the breadth of government, with trust in agencies that deliver services, such as the police and tax enforcement agencies, especially important (Horodnic 2018; Koumpias, Leonardo, and Martinez-Vazquez 2021). Surveys show willingness to pay tax is on average lower in developing Asia than in Latin America and OECD countries (Figure 2.4.3). Further, developing Asia displays a positive correlation between willingness to pay and perceived absence of corruption (Figure 2.4.4).
Tax authorities communicate with taxpayers through a variety of channels to shape perceptions of enforcement capacity, raise taxpayer morale, and influence tax compliance. Direct communication includes compliance reminders, information about tax audit policy and penalties, and equitable provision of government services funded by tax revenue (Jensen 2022; Martinez-Vasquez 2022). Communication can target certain groups of taxpayers and publicly expose tax evaders. As the cost of communicating with taxpayers is low compared with other interventions, this strategy can be highly cost-effective. Many countries have offered tax amnesties to encourage taxpayers to register and reveal their liability while they can escape penalties for past failure (Alm and Beck 1990; Hasseldine 1998;
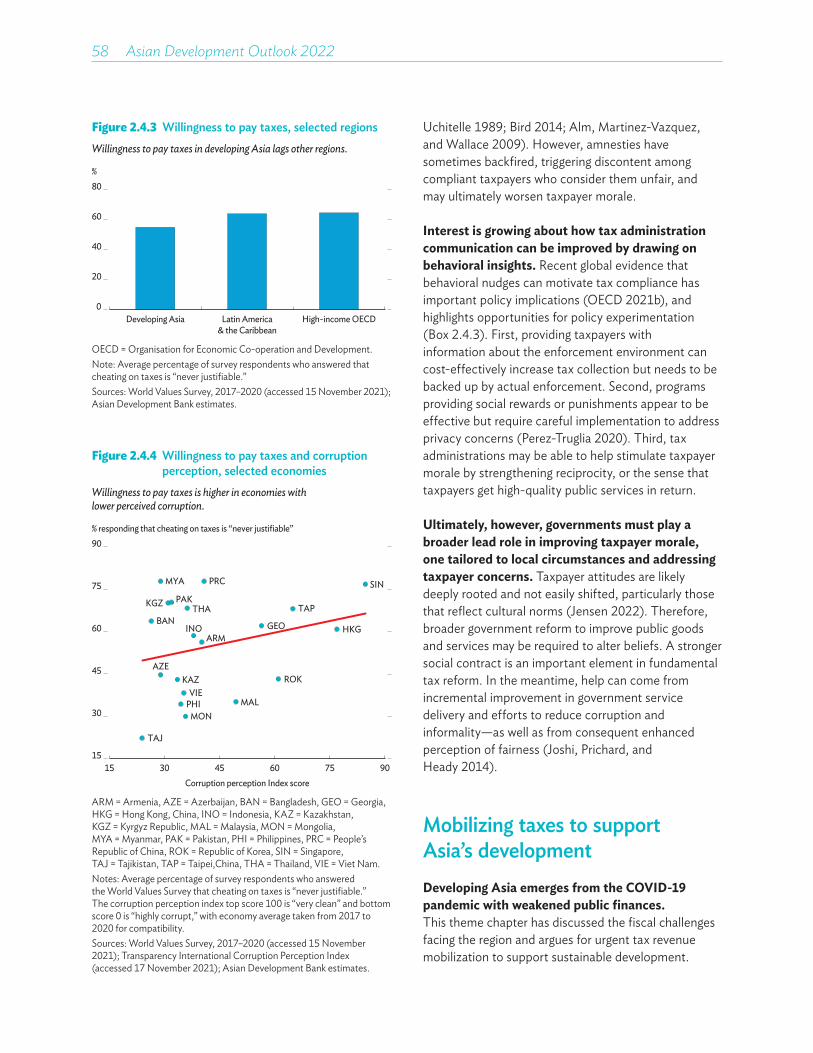
58 Asian Development Outlook 2022
Figure 2.4.3 Willingness to pay taxes, selected regionsWillingness to pay taxes in developing Asia lags other regions.
%
0
20
40
60
80
Developing Asia Latin America& the Caribbean
High-income OECD
OECD = Organisation for Economic Co-operation and Development.Note: Average percentage of survey respondents who answered that cheating on taxes is “never justifiable.” Sources: World Values Survey, 2017–2020 (accessed 15 November 2021); Asian Development Bank estimates.
Figure 2.4.4 Willingness to pay taxes and corruption perception, selected economies
Willingness to pay taxes is higher in economies with lower perceived corruption.
% responding that cheating on taxes is “never justifiable”90
ARM
AZE
BAN GEO HKGINO
KAZ
KGZ
ROK
MALMON
MYA
PAK
PHI
PRC SIN
TAJ
TAPTHA
VIE
15 30 45 60 75 90Corruption perception Index score
15
30
45
60
75
ARM = Armenia, AZE = Azerbaijan, BAN = Bangladesh, GEO = Georgia, HKG = Hong Kong, China, INO = Indonesia, KAZ = Kazakhstan, KGZ = Kyrgyz Republic, MAL = Malaysia, MON = Mongolia, MYA = Myanmar, PAK = Pakistan, PHI = Philippines, PRC = People’s Republic of China, ROK = Republic of Korea, SIN = Singapore, TAJ = Tajikistan, TAP = Taipei,China, THA = Thailand, VIE = Viet Nam.Notes: Average percentage of survey respondents who answered the World Values Survey that cheating on taxes is “never justifiable.” The corruption perception index top score 100 is “very clean” and bottom score 0 is “highly corrupt,” with economy average taken from 2017 to 2020 for compatibility.Sources: World Values Survey, 2017–2020 (accessed 15 November 2021); Transparency International Corruption Perception Index (accessed 17 November 2021); Asian Development Bank estimates.
Uchitelle 1989; Bird 2014; Alm, Martinez-Vazquez, and Wallace 2009). However, amnesties have sometimes backfired, triggering discontent among compliant taxpayers who consider them unfair, and may ultimately worsen taxpayer morale.
Interest is growing about how tax administration communication can be improved by drawing on behavioral insights. Recent global evidence that behavioral nudges can motivate tax compliance has important policy implications (OECD 2021b), and highlights opportunities for policy experimentation (Box 2.4.3). First, providing taxpayers with information about the enforcement environment can cost-effectively increase tax collection but needs to be backed up by actual enforcement. Second, programs providing social rewards or punishments appear to be effective but require careful implementation to address privacy concerns (Perez-Truglia 2020). Third, tax administrations may be able to help stimulate taxpayer morale by strengthening reciprocity, or the sense that taxpayers get high-quality public services in return.
Ultimately, however, governments must play a broader lead role in improving taxpayer morale, one tailored to local circumstances and addressing taxpayer concerns. Taxpayer attitudes are likely deeply rooted and not easily shifted, particularly those that reflect cultural norms (Jensen 2022). Therefore, broader government reform to improve public goods and services may be required to alter beliefs. A stronger social contract is an important element in fundamental tax reform. In the meantime, help can come from incremental improvement in government service delivery and efforts to reduce corruption and informality—as well as from consequent enhanced perception of fairness (Joshi, Prichard, and Heady 2014).
Mobilizing taxes to support Asia’s developmentDeveloping Asia emerges from the COVID-19 pandemic with weakened public finances. This theme chapter has discussed the fiscal challenges facing the region and argues for urgent tax revenue mobilization to support sustainable development.

Mobilizing taxes for development 59
While private finance has a crucial role to play, achieving the SDGs for a greener and more inclusive future requires vast public spending. More efficient public spending can free up additional fiscal resources, but the mobilization of additional revenue is essential to augment fiscal space across the region. Encouragingly, tax revenue in the region started to increase before the pandemic. The right policies can restore this trend.
Tax reform balancing efficiency, equity, and simplicity can mobilize taxes for development. Opportunities seized to mobilize tax revenue need to be tailored to economy-specific circumstances, but more efficient VAT and optimized tax incentives hold promise across the region. Many economies have scope to increase revenue from personal income and property taxes and improve progressivity.
Multilateral initiatives can reduce pressure on corporate income tax and ensure appropriate taxation of the digital economy. Significant opportunities exist to expand the use of tax and other fiscal instruments that address environmental and health priorities while raising revenue: carbon and other environmental taxes, and corrective taxes on alcohol, tobacco, and other unhealthy consumption. Finally, reform is needed to reduce Asia’s large informal sector and thus increase revenue, especially by reducing the cost of business registration. Moreover, while often politically difficult, fundamental tax reform to increase revenue is achievable and best done in tandem with efforts to strengthen tax administration and improve taxpayer morale.
Box 2.4.1 Successful tax reform and revenue mobilization in developing countries
Over the past few decades, several developing countries have successfully undertaken tax reform to substantially increase low tax revenue. It is informative to examine the main features of successful reform in a diverse set of developing countries that generated some of the largest tax revenue increases anywhere over the past few decades (box figure). In these countries reforms led to tax to GDP ratios soaring by more than a half.
Colombia’s tax reform during the 1990s and early 2000s illustrates the importance of a strong social contract, with reform motivated by economic, social, and political demands stemming from a new constitution. Taxes were devolved to subnational governments, social services widened, and security institutions strengthened. The corporate tax rate was cut, a lower rate was introduced for income from repatriated capital, and stock market dividends were made tax exempt. The value-added tax (VAT) base was broadened, the rate increased to 14%, and a tax surcharge was introduced to fund national security measures. Tax administration reform included computerized risk analysis to inform audit cases, stiffened penalties, and improved collection of tax arrears.
Following economic crises in Asia and the Russian Federation and consequent heightened uncertainty, the VAT base was further broadened. Compliance improved through electronic filing, supported by stronger taxpayer morale built on improved governance and service quality and curtailed corruption.
The People’s Republic of China had, prior to 1994, a tax system heavily reliant on taxing state enterprises, with taxes administered and collected by provinces and a portion remitted to the central government. The ratio of tax to GDP declined as provincial governments protected local enterprises and did not consistently enforce payment. The 1994 Tax Sharing System Reform highlighted how intergovernmental fiscal reform that clearly delineates central and subnational government tax responsibilities can support comprehensive tax reform. The central government created its own revenue administration, the State Administration of Taxation, charged with collecting and enforcing all central and shared taxes. Reform simplified and standardized taxes, lowered income tax rates, and established a VAT with a general rate of 17%, later lowered to 13%.
continued on next page
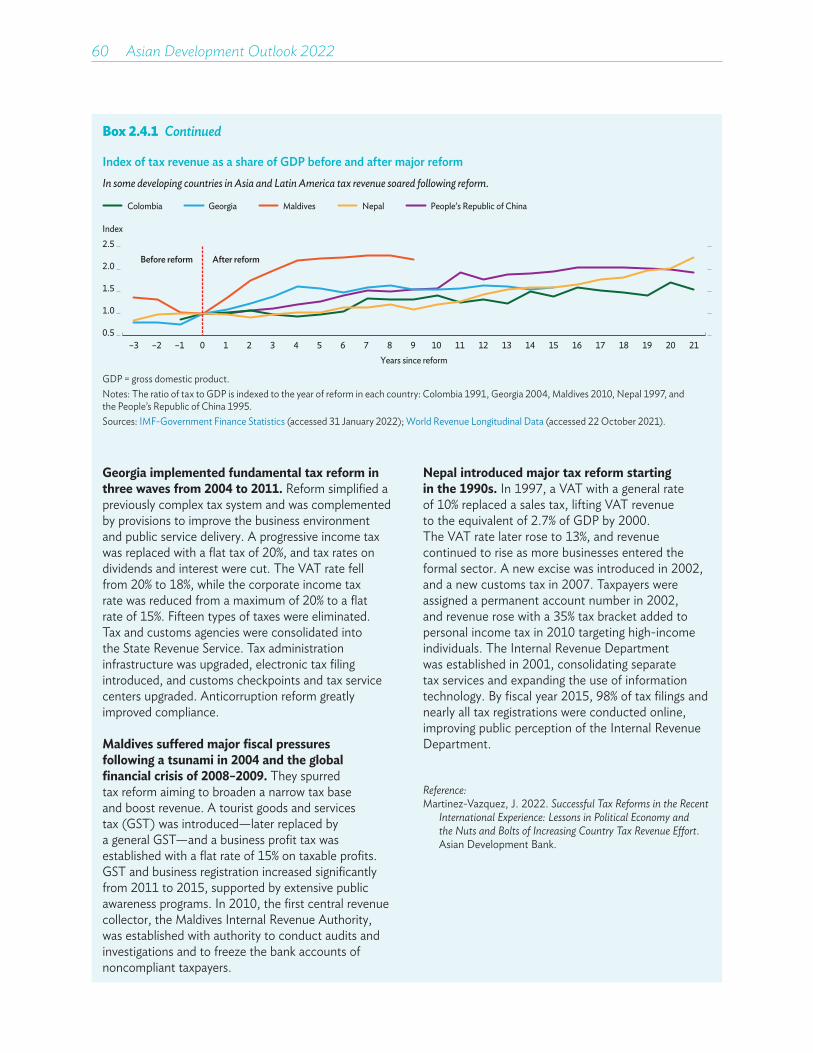
60 Asian Development Outlook 2022
Box 2.4.1 Continued
Georgia implemented fundamental tax reform in three waves from 2004 to 2011. Reform simplified a previously complex tax system and was complemented by provisions to improve the business environment and public service delivery. A progressive income tax was replaced with a flat tax of 20%, and tax rates on dividends and interest were cut. The VAT rate fell from 20% to 18%, while the corporate income tax rate was reduced from a maximum of 20% to a flat rate of 15%. Fifteen types of taxes were eliminated. Tax and customs agencies were consolidated into the State Revenue Service. Tax administration infrastructure was upgraded, electronic tax filing introduced, and customs checkpoints and tax service centers upgraded. Anticorruption reform greatly improved compliance.
Maldives suffered major fiscal pressures following a tsunami in 2004 and the global financial crisis of 2008–2009. They spurred tax reform aiming to broaden a narrow tax base and boost revenue. A tourist goods and services tax (GST) was introduced—later replaced by a general GST—and a business profit tax was established with a flat rate of 15% on taxable profits. GST and business registration increased significantly from 2011 to 2015, supported by extensive public awareness programs. In 2010, the first central revenue collector, the Maldives Internal Revenue Authority, was established with authority to conduct audits and investigations and to freeze the bank accounts of noncompliant taxpayers.
Nepal introduced major tax reform starting in the 1990s. In 1997, a VAT with a general rate of 10% replaced a sales tax, lifting VAT revenue to the equivalent of 2.7% of GDP by 2000. The VAT rate later rose to 13%, and revenue continued to rise as more businesses entered the formal sector. A new excise was introduced in 2002, and a new customs tax in 2007. Taxpayers were assigned a permanent account number in 2002, and revenue rose with a 35% tax bracket added to personal income tax in 2010 targeting high-income individuals. The Internal Revenue Department was established in 2001, consolidating separate tax services and expanding the use of information technology. By fiscal year 2015, 98% of tax filings and nearly all tax registrations were conducted online, improving public perception of the Internal Revenue Department.
Reference: Martinez-Vazquez, J. 2022. Successful Tax Reforms in the Recent
International Experience: Lessons in Political Economy and the Nuts and Bolts of Increasing Country Tax Revenue Effort. Asian Development Bank.
Index of tax revenue as a share of GDP before and after major reformIn some developing countries in Asia and Latin America tax revenue soared following reform.
–3 –2 –1 0 1 2 3 4 5 6 7 8 9 10 11 12 13 14 15 16 17 18 19 20 21
Index
Years since reform
Colombia Georgia Maldives Nepal People’s Republic of China
0.5
1.0
1.5
2.0
2.5After reformBefore reform
GDP = gross domestic product.Notes: The ratio of tax to GDP is indexed to the year of reform in each country: Colombia 1991, Georgia 2004, Maldives 2010, Nepal 1997, and the People’s Republic of China 1995.Sources: IMF-Government Finance Statistics (accessed 31 January 2022); World Revenue Longitudinal Data (accessed 22 October 2021).
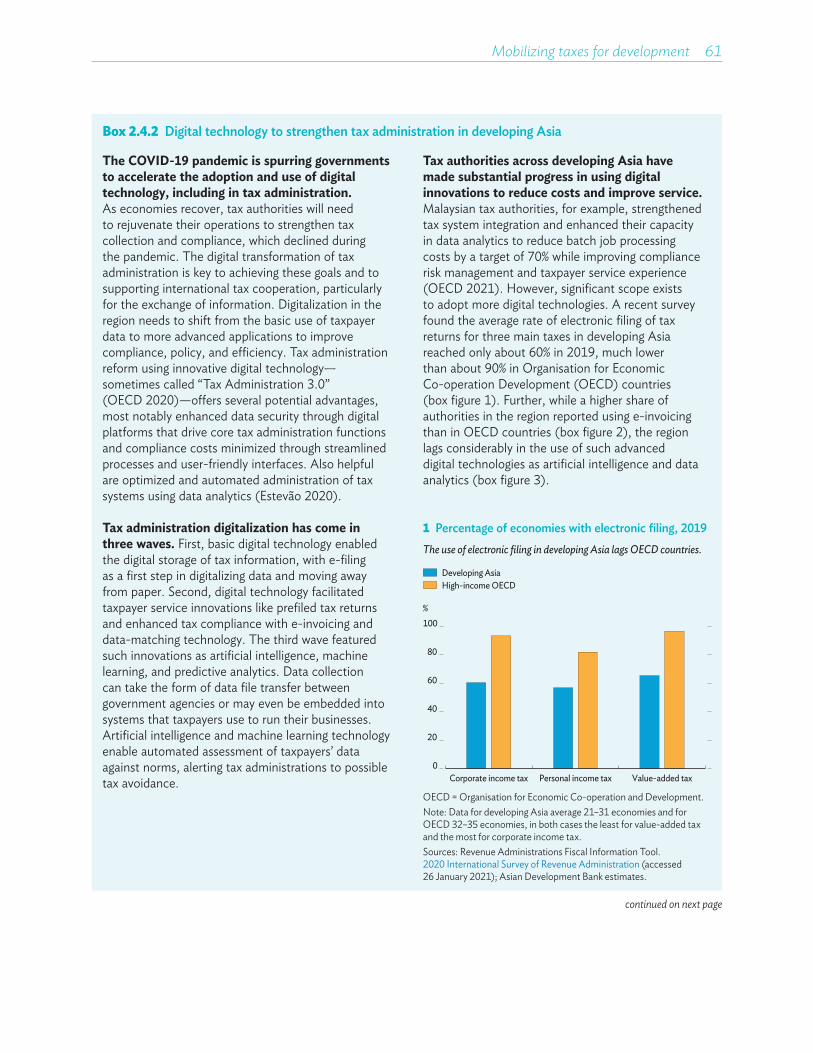
Mobilizing taxes for development 61
Box 2.4.2 Digital technology to strengthen tax administration in developing Asia
The COVID-19 pandemic is spurring governments to accelerate the adoption and use of digital technology, including in tax administration. As economies recover, tax authorities will need to rejuvenate their operations to strengthen tax collection and compliance, which declined during the pandemic. The digital transformation of tax administration is key to achieving these goals and to supporting international tax cooperation, particularly for the exchange of information. Digitalization in the region needs to shift from the basic use of taxpayer data to more advanced applications to improve compliance, policy, and efficiency. Tax administration reform using innovative digital technology—sometimes called “Tax Administration 3.0” (OECD 2020)—offers several potential advantages, most notably enhanced data security through digital platforms that drive core tax administration functions and compliance costs minimized through streamlined processes and user-friendly interfaces. Also helpful are optimized and automated administration of tax systems using data analytics (Estevão 2020).
Tax administration digitalization has come in three waves. First, basic digital technology enabled the digital storage of tax information, with e-filing as a first step in digitalizing data and moving away from paper. Second, digital technology facilitated taxpayer service innovations like prefiled tax returns and enhanced tax compliance with e-invoicing and data-matching technology. The third wave featured such innovations as artificial intelligence, machine learning, and predictive analytics. Data collection can take the form of data file transfer between government agencies or may even be embedded into systems that taxpayers use to run their businesses. Artificial intelligence and machine learning technology enable automated assessment of taxpayers’ data against norms, alerting tax administrations to possible tax avoidance.
continued on next page
Tax authorities across developing Asia have made substantial progress in using digital innovations to reduce costs and improve service. Malaysian tax authorities, for example, strengthened tax system integration and enhanced their capacity in data analytics to reduce batch job processing costs by a target of 70% while improving compliance risk management and taxpayer service experience (OECD 2021). However, significant scope exists to adopt more digital technologies. A recent survey found the average rate of electronic filing of tax returns for three main taxes in developing Asia reached only about 60% in 2019, much lower than about 90% in Organisation for Economic Co-operation Development (OECD) countries (box figure 1). Further, while a higher share of authorities in the region reported using e-invoicing than in OECD countries (box figure 2), the region lags considerably in the use of such advanced digital technologies as artificial intelligence and data analytics (box figure 3).
1 Percentage of economies with electronic filing, 2019The use of electronic filing in developing Asia lags OECD countries.
%
High-income OECDDeveloping Asia
0
20
40
60
80
100
Corporate income tax Personal income tax Value-added tax
OECD = Organisation for Economic Co-operation and Development.Note: Data for developing Asia average 21–31 economies and for OECD 32–35 economies, in both cases the least for value-added tax and the most for corporate income tax.Sources: Revenue Administrations Fiscal Information Tool. 2020 International Survey of Revenue Administration (accessed 26 January 2021); Asian Development Bank estimates.
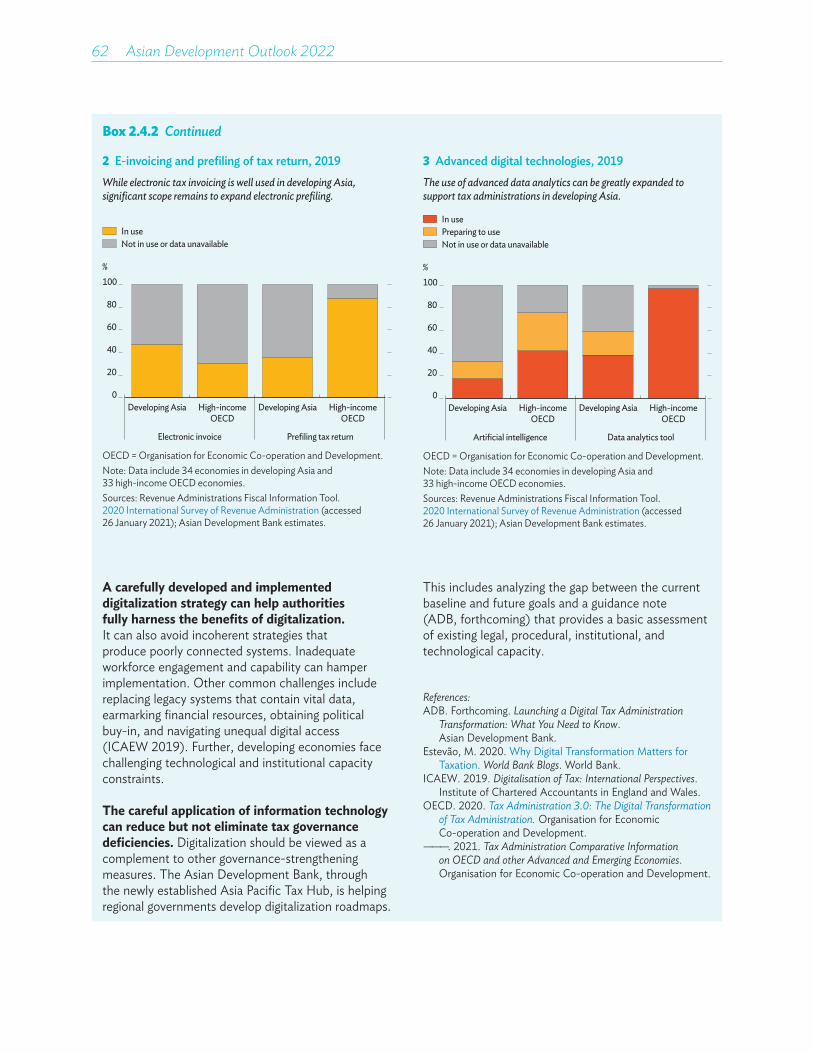
62 Asian Development Outlook 2022
Box 2.4.2 Continued
A carefully developed and implemented digitalization strategy can help authorities fully harness the benefits of digitalization. It can also avoid incoherent strategies that produce poorly connected systems. Inadequate workforce engagement and capability can hamper implementation. Other common challenges include replacing legacy systems that contain vital data, earmarking financial resources, obtaining political buy-in, and navigating unequal digital access (ICAEW 2019). Further, developing economies face challenging technological and institutional capacity constraints.
The careful application of information technology can reduce but not eliminate tax governance deficiencies. Digitalization should be viewed as a complement to other governance-strengthening measures. The Asian Development Bank, through the newly established Asia Pacific Tax Hub, is helping regional governments develop digitalization roadmaps.
2 E-invoicing and prefiling of tax return, 2019While electronic tax invoicing is well used in developing Asia, significant scope remains to expand electronic prefiling.
%
Not in use or data unavailableIn use
0
20
40
60
80
100
Developing Asia Developing Asia
Electronic invoice Prefiling tax return
High-incomeOECD
High-incomeOECD
OECD = Organisation for Economic Co-operation and Development.Note: Data include 34 economies in developing Asia and 33 high-income OECD economies. Sources: Revenue Administrations Fiscal Information Tool. 2020 International Survey of Revenue Administration (accessed 26 January 2021); Asian Development Bank estimates.
3 Advanced digital technologies, 2019The use of advanced data analytics can be greatly expanded to support tax administrations in developing Asia.
%
0
20
40
60
80
100
Developing Asia Developing AsiaHigh-incomeOECD
High-incomeOECD
Artificial intelligence Data analytics tool
Not in use or data unavailablePreparing to useIn use
OECD = Organisation for Economic Co-operation and Development.Note: Data include 34 economies in developing Asia and 33 high-income OECD economies. Sources: Revenue Administrations Fiscal Information Tool. 2020 International Survey of Revenue Administration (accessed 26 January 2021); Asian Development Bank estimates.
This includes analyzing the gap between the current baseline and future goals and a guidance note (ADB, forthcoming) that provides a basic assessment of existing legal, procedural, institutional, and technological capacity.
References:ADB. Forthcoming. Launching a Digital Tax Administration
Transformation: What You Need to Know. Asian Development Bank.
Estevão, M. 2020. Why Digital Transformation Matters for Taxation. World Bank Blogs. World Bank.
ICAEW. 2019. Digitalisation of Tax: International Perspectives. Institute of Chartered Accountants in England and Wales.
OECD. 2020. Tax Administration 3.0: The Digital Transformation of Tax Administration. Organisation for Economic Co-operation and Development.
———. 2021. Tax Administration Comparative Information on OECD and other Advanced and Emerging Economies. Organisation for Economic Co-operation and Development.

Mobilizing taxes for development 63
Box 2.4.3 Evidence on policy interventions to improve taxpayer morale and compliance
Recent empirical studies from around the world have used randomized control trials and other methods to test how effectively policy interventions, including letters from tax authorities, improve taxpayer morale and compliance. They found that compliance can generally be boosted through deterrence messages about tax enforcement audits and penalties (Kleven et al. 2011; Slemrod 2019; De Neve et al. 2021). Such interventions may even have spillover effects, with neighbors of households that receive letters being themselves more likely to comply (Drago, Mengel, and Traxler 2020). Messaging also appears to raise compliance by firms (Bergolo et al., forthcoming; Boning et al. 2020). However, deterrence messages sometimes have only small or even adverse effects. In Rwanda, deterrence messages backfired, while reminders that highlight the civic virtue of paying taxes helped (Mascagni and Nell 2022). Similar effects were found in the US (Slemrod, Blumenthal, and Christian 1999). Negative effects appear to concentrate among higher earners, possibly because deterrence messages counter their intrinsic motivation to pay.
Several studies have analyzed whether it works to prime taxpayers about the social norm to comply. Results are mixed. One study found that messages about how most taxpayers correctly report their income and assets induced previous evaders to report more of their income held abroad (Bott et al. 2020). Similarly, an intervention about how most citizens pay their taxes on time made timely tax payment more likely (Hallsworth et al. 2017). Most studies, however, found little good from such measures and sometimes harm (Luttmer and Singhal 2014). Programs that seek to stimulate social considerations by making taxpayer information public have proved more successful, suggesting that a threat to reputation is a powerful driver of tax compliance. In Pakistan, researchers studied an intervention where the largest 100 taxpayers were socially recognized, and another where taxpayers’ names and tax payment amounts were made publicly available (Slemrod, Rehman, and Waseem 2022). Both programs significantly improved compliance, particularly among heretofore delinquent taxpayers most likely to be singled out after tax records were made public.
Studies have examined interventions that aim to improve compliance by strengthening reciprocity, again with mixed results. In Rwanda, priming taxpayers about the link between taxes paid and public goods substantially increased tax payments more than did deterrence messages (Mascagni and Nell 2022). However, another study reported that providing information on the shares of tax receipts devoted to different public goods lowered tax payment (De Neve et al. 2021). Other studies found no effect from such reciprocity letters (Luttmer and Singhal 2014).
However, more promising results emerged from studies in developing economies that examined how actual public service delivery—not just information provision—affects reciprocity. For example, tax compliance improved in Pakistan when local governments committed to spend more property tax revenue in the neighborhood from which it was collected (Khwaja et al. 2020). Compliance increased when officials allocated a portion of tax revenue to fund priorities identified by taxpayers. In general, though, tax revenue increments from such programs were low relative to their often-large cost. These interventions may thus be less cost-effective than letter interventions or social shaming and recognition programs.
References:Bergolo, M. et al. Forthcoming. Tax Audits as Scarecrows.
American Economic Journal.Boning, W. et al. 2020. Heard It through the Grapevine:
The Direct and Network Effects of a Tax Enforcement Field Experiment on Firms. Journal of Public Economics 190(1).
Bott, K. et al. 2020. You’ve Got Mail: A Randomized Field Experiment on Tax Evasion. Management Science 66(7).
De Neve, J. et al. 2021. How to Improve Tax Compliance? Evidence from Population-Wide Experiments in Belgium. Journal of Political Economy 129(5).
Drago, F., F. Mengel, and C. Traxler 2020. Compliance Behavior in Networks: Evidence from a Field Experiment. American Economic Journal: Applied Economics 12(2).
Hallsworth, M. et al. 2017. The Behavioralist as Tax Collector: Using Natural Field Experiments to Enhance Tax Compliance. Journal of Public Economics 148(1).
Khwaja, A. et al. 2020. Rebuilding the Social Compact: Urban Service Delivery and Property Taxes in Pakistan. Impact Evaluation Report 117.
continued on next page
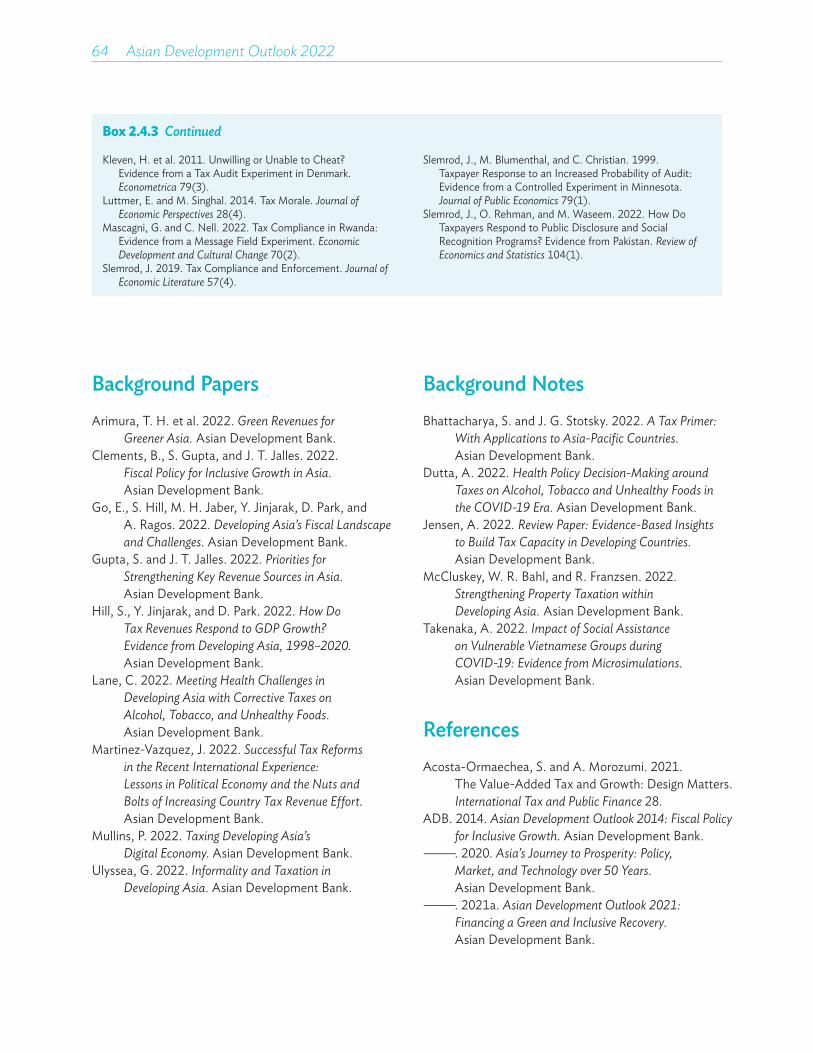
64 Asian Development Outlook 2022
Box 2.4.3 Continued
Kleven, H. et al. 2011. Unwilling or Unable to Cheat? Evidence from a Tax Audit Experiment in Denmark. Econometrica 79(3).
Luttmer, E. and M. Singhal. 2014. Tax Morale. Journal of Economic Perspectives 28(4).
Mascagni, G. and C. Nell. 2022. Tax Compliance in Rwanda: Evidence from a Message Field Experiment. Economic Development and Cultural Change 70(2).
Slemrod, J. 2019. Tax Compliance and Enforcement. Journal of Economic Literature 57(4).
Slemrod, J., M. Blumenthal, and C. Christian. 1999. Taxpayer Response to an Increased Probability of Audit: Evidence from a Controlled Experiment in Minnesota. Journal of Public Economics 79(1).
Slemrod, J., O. Rehman, and M. Waseem. 2022. How Do Taxpayers Respond to Public Disclosure and Social Recognition Programs? Evidence from Pakistan. Review of Economics and Statistics 104(1).
Background PapersArimura, T. H. et al. 2022. Green Revenues for
Greener Asia. Asian Development Bank.Clements, B., S. Gupta, and J. T. Jalles. 2022.
Fiscal Policy for Inclusive Growth in Asia. Asian Development Bank.
Go, E., S. Hill, M. H. Jaber, Y. Jinjarak, D. Park, and A. Ragos. 2022. Developing Asia’s Fiscal Landscape and Challenges. Asian Development Bank.
Gupta, S. and J. T. Jalles. 2022. Priorities for Strengthening Key Revenue Sources in Asia. Asian Development Bank.
Hill, S., Y. Jinjarak, and D. Park. 2022. How Do Tax Revenues Respond to GDP Growth? Evidence from Developing Asia, 1998–2020. Asian Development Bank.
Lane, C. 2022. Meeting Health Challenges in Developing Asia with Corrective Taxes on Alcohol, Tobacco, and Unhealthy Foods. Asian Development Bank.
Martinez-Vazquez, J. 2022. Successful Tax Reforms in the Recent International Experience: Lessons in Political Economy and the Nuts and Bolts of Increasing Country Tax Revenue Effort. Asian Development Bank.
Mullins, P. 2022. Taxing Developing Asia’s Digital Economy. Asian Development Bank.
Ulyssea, G. 2022. Informality and Taxation in Developing Asia. Asian Development Bank.
Background NotesBhattacharya, S. and J. G. Stotsky. 2022. A Tax Primer:
With Applications to Asia-Pacific Countries. Asian Development Bank.
Dutta, A. 2022. Health Policy Decision-Making around Taxes on Alcohol, Tobacco and Unhealthy Foods in the COVID-19 Era. Asian Development Bank.
Jensen, A. 2022. Review Paper: Evidence-Based Insights to Build Tax Capacity in Developing Countries. Asian Development Bank.
McCluskey, W. R. Bahl, and R. Franzsen. 2022. Strengthening Property Taxation within Developing Asia. Asian Development Bank.
Takenaka, A. 2022. Impact of Social Assistance on Vulnerable Vietnamese Groups during COVID-19: Evidence from Microsimulations. Asian Development Bank.
ReferencesAcosta-Ormaechea, S. and A. Morozumi. 2021.
The Value-Added Tax and Growth: Design Matters. International Tax and Public Finance 28.
ADB. 2014. Asian Development Outlook 2014: Fiscal Policy for Inclusive Growth. Asian Development Bank.
———. 2020. Asia’s Journey to Prosperity: Policy, Market, and Technology over 50 Years. Asian Development Bank.
———. 2021a. Asian Development Outlook 2021: Financing a Green and Inclusive Recovery. Asian Development Bank.
Mobilizing taxes for development 65
———. 2021b. Asian Development Outlook 2021 Update: Transforming Agriculture in Asia. Asian Development Bank.
———. 2021c. Asian Development Bank Key Indicators 2021. Asian Development Bank.
———. 2021d. A Comprehensive Assessment of Tax Capacity in Southeast Asia. Asian Development Bank.
———. 2022. A Comparative Analysis of Tax Administration in Asia and the Pacific (5th edition). Asian Development Bank.
Addison, T., M. Niño-Zarazua, and J. Pirttila. 2018. Fiscal Policy, State Building and Economic Development. Journal of International Development 30.
Agnolucci, P. 2009. The Effect of the German and British Environmental Taxation Reforms: A Simple Assessment. Energy Policy 37(8).
Akcigit, U., S. Baslandze, and S. Stantcheva. 2016. Taxation and the International Mobility of Inventors. American Economic Review 106(10).
Akitoby, B. et al. 2018. Tax Revenue Mobilization Episodes in Emerging Markets and Low-Income Countries: Lessons from a New Dataset. IMF Working Paper 18/234. International Monetary Fund.
Akitoby, B., J. Honda, and K. Primus 2020. Tax Revenues in Fragile and Conflict-Affected States—Why Are They Low and How Can We Raise Them? IMF Working Paper No. 20/143. International Monetary Fund.
Akitoby, B. et al. 2006. Public Spending, Voracity, and Wagner’s Law in Developing Countries. European Journal of Political Economy 22.
Alavuotunki, K., M. Haapanen, and J. Pirttila. 2019. The Effects of the Value-Added Tax on Revenue and Inequality. The Journal of Development Studies 55(4). DOI: 10.1080/00220388.2017.1400015.
Ali, D. A., K. Deininger, and M. Wild. 2018. Using Satellite Imagery to Revolutionize Creations of Tax Maps and Local Revenue Collection. Policy Research Working Paper 8437. World Bank.
Alm, J. and W. Beck. 1990. Tax Amnesties and Tax Revenues. Public Finance Quarterly 18(4).
Alm, J., J. Martinez-Vazquez, and S. Wallace. 2009. Do Tax Amnesties Work? The Revenue Effects of Tax Amnesties during the Transition in the Russian Federation. Economic Analysis and Policy 39(2).
Alm, J. 2019. What Motivates Tax Compliance? Journal of Economic Surveys 33(2).
Andersen, M., B. Kett, and E. von Uexkull. 2018. Corporate Tax Incentives and FDI in Developing Countries. In World Bank Group. Global Investment Competitiveness Report 2017/2018.
Appiah-Kubi, S. N. K. et al. 2021. Impact of Tax Incentives on Foreign Direct Investment: Evidence from Africa. Sustainability 13(8661).
Arimura, T. H., M. Duan, and H. Oh. 2021. EEPS Special Issue on Carbon Pricing in East Asia. Environmental Economics and Policy Studies.
Auriol, E. and M. Warlters. 2005. Taxation Base in Developing Countries. Journal of Public Economics 89(4).
Bachas, P., L. Gadenne, and A. Jensen. 2021. Informality, Consumption Taxes and Redistribution. Faculty Research Working Paper RWP21-026. Harvard Kennedy School.
Bahl, R. 2006. How to Approach Tax Reform: Have the Rules of the Game Changed? In Alm, J., J. Martinez-Vazquez, and M. Rider, eds. The Challenge of Tax Reform in the Global Economy. Springer.
Bahl, R. and R. M. Bird. 2018. Fiscal Decentralization and Local Finance in Developing Countries. Edward Elgar Publishing.
Basri, M. C. et al. 2021. Tax Administration versus Tax Rates: Evidence from Corporate Taxation in Indonesia. American Economic Review 111(12).
Baum, A. et al. 2017. Corruption, Taxes and Compliance. Working Paper 17/255. International Monetary Fund.
Benedek, D. et al. 2021. A Post-Pandemic Assessment of the Sustainable Development Goals. IMF Staff Discussion Note SDN/2021/003. International Monetary Fund.
Bergeron, A., G. Tourek, and J. Weigel. 2021. The State Capacity Ceiling on Tax Rates: Evidence from Randomized Tax Abatements in the DRC. CEPR Working Paper No. 16116.
Besley, T. and M. Ghatak. 2006. Public Goods and Economic Development. In Banerjee, A. V., R. Benabou, and D. Mookherjee, eds. Understanding Poverty. Oxford University Press.
Besley, T. and T. Persson. 2014. Public Goods and Economic Development. Why Do Developing Countries Tax so Little? Journal of Economic Perspectives 28(4).
66 Asian Development Outlook 2022
Beuermann, C. and T. Santarius. 2006. Ecological Tax Reform in Germany: Handling Two Hot Potatoes at the Same Time. Energy Policy 34(8).
Bird, R. M. 2004. Managing Tax Reform. Bulletin for International Fiscal Documentation 58.
———. 2008. Tax Challenges Facing Developing Countries. Inaugural Lecture of the Annual Public Lecture Series of the National Institute of Public Finance and Policy.
———. 2014. Administrative Dimensions of Tax Reform. Annals of Economics and Finance 15(2).
Blanchard, O., J. Felman, and A. Subramanian. 2021. Does the New Fiscal Consensus in Advanced Economies Travel to Emerging Markets? PIIE Policy Brief 21-7. Peterson Institute for International Economics.
Blundell, R. 2016. Labor Supply and Taxation. Oxford University Press.
Bonvecchi, A. 2010. The Political Economy of Fiscal Reform in Latin America: The Case of Argentina. IDB Working Paper Series No. IDB-WP-175. Inter-American Development Bank.
Brockmeyer, A. et al. 2021. NBER Working Paper 28637. National Bureau of Economic Research.
Brondolo, J. 2009. Collecting Taxes during an Economic Crisis: Challenges and Policy Options. IMF Staff Position Note SPN/09/17. International Monetary Fund.
Bruhn, M. and D. McKenzie. 2014. Entry Regulation and the Formalization of Microenterprises in Developing Countries. World Bank Research Observer 29(2).
Brys, B. 2011. Making Fundamental Tax Reform Happen. OECD Taxation Working Papers No. 3.
Burman, L. and M. Phaup. 2011. Tax Expenditures: The Big Government Behind the Curtain. VoxEU.org.
Cabezon, E., P. Tumbarello, and Y. Wu. 2015. Strengthening Fiscal Frameworks and Improving the Spending Mix in Small States. IMF Working Paper No. 124. International Monetary Fund.
Cabral, M. and C. Hoxby. 2012. The Hated Property Tax: Salience, Tax Rates and Tax Revolts. NBER Working Paper 18515. National Bureau of Economic Research.
Carrillo, P., D. Pomeranz, and M. Singhal. 2017. Dodging the Taxman: Firm Misreporting and Limits to Tax Enforcement. American Economic Journal: Applied Economics 9(2).
Carter, P. and A. Cobham. 2016. Are Taxes Good for Your Health? WIDER Working Paper 2016/171. World Institute for Development Economics Research.
Casanegra de Jantscher, M. 1990. Administering a VAT. In Gillis, M., C. Shoup, and G. Sicat, eds. Value Added Taxation in Developing Countries. World Bank.
Castanheira, M., G. Nicodeme, and P. Profeta. 2012. On the Political Economics of Tax Reforms: Survey and Empirical Assessment. International Tax and Public Finance 19.
Causa, O. and M. Hermansen. 2017. Income Redistribution through Taxes and Transfers across OCED Countries. OECD Economics Department Working Papers No. 1453. Organisation for Economic Co-operation and Development.
CBO. 2012. Tax Expenditures Have a Major Impact on the Federal Budget. Web Blog Post, Congressional Budget Office.
Cerutti, E. and T. Helbling. 2021. Unconventional Monetary Policies in Emerging Asia during the COVID-19 Crisis: Why Now? Will They Work? In Rhee, C. and K. Svirydzenka, eds. Policy Advice to Asia in the COVID-19 Era. International Monetary Fund.
Chandra, T. 2021. Pricing Carbon: Trade-offs and Opportunities for India. In Mitra, A., ed. Reconciling India’s Climate and Industrial Targets: A Policy Roadmap. Observer Research Foundation.
Charlot, O., F. Malherbet, and C. Terra. 2015. Informality in Developing Economies: Regulation and Fiscal Policies. Journal of Economic Dynamics and Control 51.
Chetty, R. et al. 2014. Active vs. Passive Decisions and Crowd-Out in Retirement Savings Accounts: Evidence from Denmark. The Quarterly Journal of Economics 129.
Cnossen, S. 2020. Excise Taxation for Domestic Resource Mobilization. CESinfo Working Paper No. 8442.
Cobham, A. and P. Jansky. 2018. Global Distribution of Revenue Loss from Corporate Tax Avoidance: Re-estimation and Country Results. Journal of International Development 30.
Cornia, G., J. Gomez-Sabaini, and B. Martorano. 2011. A New Fiscal Pact, Tax Policy Changes and Income Inequality. UNU-WIDER Working Paper No. 2011/70.

Mobilizing taxes for development 67
Cottarelli, C., P. Gerson, and A. Senhadji. 2014. Policy Lessons from the Crisis and the Way Forward. In Cottarelli, C., P. Gerson, and A. Senhadji, eds. Post-Crisis Fiscal Policy. MIT Press.
Crivelli, E., R. De Mooij, and M. Keen. 2016. Base Erosion, Profit Shifting and Developing Countries. FinanzArchiv 72.
CRS. 2019. Spending and Tax Expenditures: Distinctions and Major Programs. Congressional Research Service.
Dabla-Norris, E. et al. 2021. Digitalization and Taxation in Asia. IMF Discussion Paper DP/2021/017. International Monetary Fund.
de Andrade, G. H., M. Bruhn, and D. McKenzie. 2014. A Helping Hand or the Long Arm of the Law? Experimental Evidence on What Governments Can Do to Formalize Firms. Policy Research Working Paper No. 6435. World Bank.
Delong, J. B. and L. Summers. 2012. Fiscal Policy in a Depressed Economy. Brookings Papers on Economic Activity 1.
D’Erasmo, P. and H. Boedo. 2012. Financial Structure, Informality and Development. Journal of Monetary Economics 59(3).
De Soto, H. 1989. The Other Path. Harper & Row. Dix-Carneiro, R. et al. 2021. Trade and Informality
in the Presence of Labor Market Frictions and Regulations. Working Paper Series No. w28391. National Bureau of Economic Research.
Djankov, S. et al. 2002. The Regulation of Entry. The Quarterly Journal of Economics 117(1).
Dom, R. 2019. Semi-Autonomous Revenue Authorities in Sub-Saharan Africa: Silver Bullet or White Elephant. Journal of Development Studies 55(7).
Dorband, I. I. et al. 2019. Poverty and Distributional Effects of Carbon Pricing in Low- and Middle-Income Countries—A Global Comparative Analysis. World Development 115.
Ebeke, C., M. Mansour, and G. Rota-Graziosi. 2016. The Power to Tax in Sub-Saharan Africa: LTUs, VATs, and SARAs. Development Policies Working Paper 154. Fondation pour les études et recherches sur le développement international.
Fairfield, T. 2013. Going Where the Money Is: Strategies for Taxing Economic Elites in Unequal Democracies. World Development 57.
Fan, H. et al. 2021. The Dynamic Effects of Computerized Invoices on Chinese Manufacturing Firms. NBER Working Paper No. 24414. National Bureau of Economic Research.
Favara, G., C. Minoiu, and A. Perez-Orive. 2021. U.S. Zombie Firms: How Many and How Consequential? FEDS Notes. Board of Governors of the Federal Reserve System.
Fernald, J. and H. Li. 2021. The Impact of COVID on Potential Output. Federal Reserve Bank of San Francisco Working Paper Series 2021-09.
Ferrarini, B., M. Giugale, and J. Pradelli, eds. 2022. The Sustainability of Asia’s Debt: Problems, Policies, and Practices. Asian Development Bank and Edward Elgar Publishing.
Franzsen, R. and W. J. McCluskey. 2013. Value-Based Approaches to Property Taxation. In McCluskey, W. J., G. C. Cornia, and L. C. Walters, eds. A Primer on Property Tax: Administration and Policy. Wiley-Blackwell.
Fuest, C. et al. 2021. Read My Lips? Taxes and Elections. EconPol Working Paper 5(71). Ifo Institute, University of Munich.
Furceri, D. et al. 2021. The Rise in Inequality after Pandemics: Can Fiscal Support Play a Mitigating Role? Industrial and Corporate Change 30.
Gaspar, V., L. Jaramillo, and P. Wingender. 2016a. Political Institutions, State Building, and Tax Capacity: Crossing the Tipping Point. IMF Working Papers WP/16/233. International Monetary Fund.
———. 2016b. Tax Capacity and Growth: Is There a Tipping Point? IMF Working Paper WP/16/234. International Monetary Fund.
Gaspar, V. et al. 2019. Fiscal Policy and Development: Human, Social, and Physical Investment for the SDGs. IMF Staff Discussion Note SDN/19/03. International Monetary Fund.
Gbato, A., F. Lemou, and J. F. Brun. 2021. Effectiveness of SARA Reform in Sub-Saharan Africa. HAL Working Papers ffhal-03119001. HAL Open Science.
Gindling, T. H. and D. Newhouse. 2014. Self-Employment in the Developing World. World Development 56.
Goulder, J. H. 1995. Environmental Taxation and the Double Dividend: A Reader’s Guide. International Tax and Public Finance 2(2).
Gunter, S. et al. 2021. Non-Linear Effects of Tax Changes on Output: The Role of the Initial Level of Taxation. Journal of International Economics 131.
Gupta, S. and J. Jalles. 2021. Can COVID-19 Induce Governments to Implement Tax Reforms in
68 Asian Development Outlook 2022
Developing Countries? Working Papers REM 2021/0168. Lisbon School of Economics and Management.
Guvenen, F., B. Kuruscu, and S. Ozkan. 2014. Taxation of Human Capital and Wage Inequality: A Cross-Country Analysis. Review of Economic Studies 81.
Guvenen, F. et al. 2019. Use It or Lose It: Efficiency Gains from Wealth Taxation No. w26284. National Bureau of Economic Research.
Haites, E. 2018. Carbon Taxes and Greenhouse Gas Emissions Trading Systems: What Have We Learned? Climate Policy 18(8).
Haldenwang, C. V., A. Redonda, and F. Aliu. 2021. Shedding Light on Worldwide Tax Expenditures: GTED Flagship Report 2021. German Development Institute.
Hall, S. et al. 2021. Government Revenue and Child and Maternal Mortality. Open Economic Review 32.
Hasseldine, J. 1998. Tax Amnesties: An International Review. Bulletin for International Fiscal Documentation 52.
Heathcote, J., K. Storesletten, and G. Violante. 2014. Optimal Tax Progressivity: An Analytical Framework. NBER Working Paper No. 19899. National Bureau of Economic Research.
Hepburn, C. et al. 2020. Will COVID-19 Fiscal Recovery Packages Accelerate or Retard Progress on Climate Change? Oxford Review of Economic Policy 36.
Horodnic, I. 2018. Tax Morale and Institutional Theory: A Systematic Review. International Journal of Sociology and Social Policy 38(9/10).
Hoynes, H. and A. Patel. 2018. Effective Policy for Reducing Poverty and Inequality? The Earned Income Tax Credit and Distribution of Income. Journal of Human Resources 53(4).
ICAP. 2021. Korea Emissions Trading Scheme. International Carbon Action Partnership (accessed 9 August 2021).
IEA. 2021. Net Zero by 2050: A Roadmap for the Global Energy Sector. International Energy Agency.
IETA. 2020. Carbon Market Business Brief: Korea. International Emissions Trading Association.
IISD. 2017. India’s Energy Transition: Mapping Subsidies to Fossil Fuels and Clean Energy in India. International Institute for Sustainable Development.
———. 2020. Mapping India’s Energy Subsidies 2020: Fossil Fuels, Renewables, and Electric Vehicles: 2020 Annex Update. International Institute for Sustainable Development.
Ilzetzki, E. 2018. Tax Reform and the Political Economy of the Tax Base. Journal of Public Economics 164.
IMF. 2014. Spillovers in International Corporate Taxation. IMF Policy Paper Volume 2014: Issue 071. International Monetary Fund.
———. 2015. Fiscal Policy and Long-Term Growth. IMF Policy Paper 2015(023). International Monetary Fund.
———. 2019. Macroeconomic Developments and Prospects in Low-Income Developing Countries—2019. IMF Policy Paper. International Monetary Fund.
———. 2021. Fiscal Monitor: A Fair Shot. International Monetary Fund.
James, S. 2013. Tax and Non-tax Incentives and Investments: Evidence and Policy Implications. World Bank.
———. 2016. Tax Incentives around the World. In Lehman, A., P. Toledano, L. Johnson, and L. Sachs, eds. Rethinking Investment Incentives: Trends and Policy Options. Columbia University Press.
JAMA. 2020. Automobile Industry in Japan 2020. Japan Automobile Manufacturers Association.
Jensen, A. 2022. Employment Structure and the Rise of Modern Tax System. CID Faculty Working Paper 371. Center for International Development at Harvard University.
Joshi, A., W. Prichard, and C. Heady. 2014. Taxing the Informal Economy: The Current State of Knowledge and Agendas for Future Research. Journal of Development Studies 50(10).
Junquera-Varela, R. F. et al. 2019. Thinking Strategically about Revenue Administration Reform: The Creation of Integrated, Autonomous Revenue Bodies. World Bank Governance Discussion Paper No. 4. World Bank.
Kalkuhl, M. et al. 2018. Can Land Taxes Foster Sustainable Development? An Assessment of Fiscal, Distributional and Implementation Issues. Land Use Policy 78.
Kanbur, R. and M. Keen. 2015. Reducing Informality. Finance and Development 52(1).
Keane, M. P. and N. Wasi. 2016. Labour Supply: The Roles of Human Capital and the Extensive Margin. Economic Journal 126.
Mobilizing taxes for development 69
Keen, M. and J. Slemrod. 2016. Optimal Tax Administration. NBER Working Paper 22408. National Bureau of Economic Research.
———. 2021. Rebellion, Rascals and Revenue: Tax Follies and Wisdom through the Ages. Princeton University Press.
Kelly, R., R. White, and A. Anand, eds. 2020. Property Tax Diagnostic Manual. World Bank.
Khan, A., A. Khwaja, and B. Olken. 2016. Tax Farming Redux: Experimental Evidence on Performance Pay for Tax Collector. Quarterly Journal of Economics 131(1).
———. 2019. Making Moves Matter: Experimental Evidence on Incentivizing Bureaucrats through Performance-Based Postings. American Economic Review 109(1).
Kinda, T. 2014. The Question for Non-Resource-Based FDI: Do Taxes Matter? IMF Working Paper WP/14/15. International Monetary Fund.
Klemm, A. and S. Van Parys. 2012. Empirical Evidence on the Effects of Tax Incentives. International Tax and Public Finance 19.
Kleven, H. et al. 2011. Unwilling or Unable to Cheat? Evidence from a Tax Audit Experiment in Denmark. Econometrica 79(3).
Kleven, H., C. Kreiner, and E. Saez. 2016. Why Can Modern Governments Tax So Much? An Agency Model of Firms as Fiscal Intermediaries. Economica 83(1).
Kleven, H. et al. 2020. Taxation and Migration: Evidence and Policy Implications. Journal of Economic Perspectives 34.
Kose, A. et al. 2021. The Aftermath of Debt Surges. Policy Research Working Paper No. WPS 9771. World Bank.
Koumpias, A., G. Leonardo, and J. Martinez-Vazquez. 2021. Trust in Government Institutions and Tax Morale. FinanzArchiv/Public Finance Analysis 77(2).
Kronfol, H. and V. Steenbergen. 2020. Evaluating the Costs and Benefits of Corporate Tax Incentives: Methodological Approaches and Policy Considerations. World Bank.
Lakin, J. 2020. The Politics of Tax Reform in Low- and Middle-Income Countries: A Literature Review. International Budget Partnership Research Paper.
Li, D. et al. 2021. Assessment of the Performance of Pilot Carbon Emissions Trading Systems in China. Environmental Economics and Policy Studies 23.
Liu, L. et al. 2021. VAT Notches, Voluntary Registration, and Bunching: Theory and UK Evidence. Review of Economics and Statistics 103(1).
Londoño-Vélez, J. and J. Ávila-Mahecha. 2021. Enforcing Wealth Taxes in the Developing World: Quasi-Experimental Evidence from Colombia. American Economic Review: Insights 3.
Luttmer, E. and M. Singhal. 2014. Tax Morale. Journal of Economic Perspectives 28(4).
Martin, M. and K. van Dender. 2019. The Use of Revenues from Carbon Pricing. OECD Taxation Working Papers No. 43.
Matheson, T. 2011. Taxing Financial Transactions: Issues and Evidence. IMF Working Paper No. 11/54. International Monetary Fund.
Mawejje, J. and R. K. Sebudde. 2019. Tax Revenue Potential and Effort: Worldwide Estimates Using a New Dataset. Economic Analysis and Policy 63.
McCluskey, W. J. and R. Franzsen. 2013. Non-Market Value and Hybrid Approaches to Property Taxation. In McCluskey, W. J., G. C. Cornia, and L. C. Walters, eds. A Primer on Property Tax: Administration and Policy. Wiley-Blackwell.
Mehling, M. A. et al. 2019. Designing Border Carbon Adjustments for Enhanced Climate Action. American Journal of International Law 113(3).
MOF. 2022. Receipt Budget, 2022–2023 Appendix 7: Statement of Revenue Impact of Tax Incentives under the Central Tax System: Financial Years 2019–2020 and 2020–2021. Ministry of Finance, Government of India.
Mullins, P. 2020. Medium-Term Revenue Strategies: Are They Realistic for Developing Countries? CGD Policy Paper 180. Center for Global Development.
Muthitacharoen, A., W. Wanichthaworn, and T. Burong. 2021. VAT Threshold and Small Business Behavior: Evidence from Thai Tax Returns. International Tax and Public Finance 28.
Nutman, N., K. Isa, and S. H. Yussof. 2021. GST Complexities in Malaysia: Views from Tax Experts. International Journal of Law and Management 64(2).
OECD. 2015. Examples of Successful DRM Reforms and the Role of International Co-operation. OECD Discussion Paper. Organisation for Economic Co-operation and Development.
———. 2018. The Role and Design of Net Wealth Taxes in the OECD. Tax Policy Studies No. 26.

70 Asian Development Outlook 2022
Organisation for Economic Co-operation and Development.
———. 2020. Global Outlook on Financing for Sustainable Development 2021: New Way for People and Planet. Organisation for Economic Co-operation and Development.
———. 2021a. Two-Pillar Solution to Address the Tax Challenges Arising from the Digitalisation of the Economy. Organisation for Economic Co-operation and Development.
———. 2021b. Behavioural Insights for Better Tax Administration: A Brief Guide. Organisation for Economic Co-operation and Development.
Olofsgård, A. 2003. The Political Economy of Reform: Institutional Change as a Tool for Political Credibility. Background paper for the World Development Report 2005. World Bank.
Owens, J. 2005. Fundamental Tax Reform: The Experience of OECD Countries. Tax Foundation 47.
Parry, I. 2021. Five Things to Know about Carbon Pricing. Finance & Development 0058(003). International Monetary Fund.
Parry, I., S. Black, and N. Vernon. 2021. Still Not Getting Energy Prices Right: A Global and Country Update of Fossil Fuel Subsidies. IMF Working Paper 2021/236. International Monetary Fund.
Perez-Truglia, R. 2020. The Effects of Income Transparency on Well-Being: Evidence from a Natural Experiment. American Economic Review 110(4).
Piketty, T. and G. Zucman. 2014. Capital Is Back: Wealth–Income Ratios in Rich Countries, 1700–2010. Quarterly Journal of Economics 129(3).
Pomeranz, D. 2015. No Taxation without Information: Deterrence and Self-Enforcement in the Value-Added Tax. American Economic Review 105(8).
Pomeranz, D. and J. Vila-Belda. 2019. Taking State-Capacity Research to the Field: Insights from Collaborations with Tax Authorities. Annual Review of Economics 11.
Rao, V. U. A. 2008. Is Area-Based Assessment on Alternative, an Intermediate Step, or an Impediment to Value-Based Taxation. In Bahl, R., J. Martinez-Vazquez, and J. Youngman, eds. Making the Property Tax Work: Experiences in Developing and Transitional Countries. Lincoln Institute of Land Policy.
Redonda, A. and T. Neubig. 2018. Assessing Tax Expenditure Reporting in G20 and OECD Economies. Discussion Note 2018/3. Council on Economic Policies.
Ross, M. 2015. What Have We Learned about the Resource Curse? Annual Review of Political Science 18.
Saez, E. and G. Zucman. 2019. Progressive Wealth Taxation. Brookings Papers on Economic Activity. Brookings Institution.
Scheuer, F. and J. Slemrod. 2021. Taxing Our Wealth. Journal of Economic Perspectives 35.
Slack, E. and R. Bird. 2014. The Political Economy of Property Tax Reform. OECD Working Papers on Fiscal Federalism No. 18. Organisation for Economic Co-operation and Development.
Stretton, S. 2020. A Simple Methodology for Calculating the Impact of a Carbon Tax. MTI Global Practice Discussion Paper No. 23. World Bank Group.
Strobl, D. et al. 2021. Electoral Cycles in Government Policy Making: Strategic Timing of Austerity Reform Measures in Western Europe. British Journal of Political Science 51.
Summan, A. et al. 2020. The Potential Global Gains in Health and Revenue from Increased Taxation of Tobacco, Alcohol and Sugar-Sweetened Beverages: A Modelling Analysis. BMJ Global Health 5:e002143.
Tan, A. 2021. Budget 2021: Govt Will Review Carbon Tax Rate, which Will Remain at $5 per Tonne until 2023. Straits Times. 16 February.
The Hindu. 2015. Budget Punished Rich, Rescued Middle Class. 11 March.
Torgler, B. 2007. Tax Compliance and Tax Morale. Edward Elgar Publishing.
Uchitelle, E. 1989. The Effectiveness of Tax Amnesty Programs in Selected Countries. Federal Reserve Bank of New York Quarterly Review 14(3).
Ulyssea, G. 2010a. The Formal–Informal Labor Market Segmentation Hypothesis Revisited. Brazilian Review of Econometrics 30(2).
———. 2010b. Regulation of Entry, Labor Market Institutions and the Informal Sector. Journal of Development Economics 91.
———. 2018. Firms, Informality, and Development: Theory and Evidence from Brazil. American Economic Review 108(8).
Mobilizing taxes for development 71
UN. 2015. Addis Ababa Action Agenda of the Third International Conference on Financing for Development. United Nations.
UNEP. 2019. Air Pollution in Asia and the Pacific: Science-Based Solutions. United Nations Environment Programme.
UNESCAP. 2019. Economic and Social Survey of Asia and the Pacific: Ambitions beyond Growth. United Nations Economic and Social Commission for Asia and the Pacific.
Vellutini, C. and J. C. Benitez. 2021. Measuring the Redistributive Capacity of Tax Policies. IMF Working Paper WP/21/252. International Monetary Fund.
von Haldenwang, C., A. von Schiller, and M. Garcia. 2014. Tax Collection in Developing Countries—New Evidence on Semi-Autonomous Revenue Agencies (SARAs). The Journal of Development Studies 50(4).
Wang, K., J. Wang, K. Hubacek, Z. Mi, and Y. M. Wei. 2020. A Cost–Benefit Analysis of the Environmental Taxation Policy in China: A Frontier Analysis-Based Environmentally Extended Input–Output Optimization Method. Journal of Industrial Ecology 24(3).
Wheaton, B. 2022. The Macroeconomic Effects of Flat Taxation: Evidence from a Panel of Transition Economies.
Widhartanto, S. and V. Braithwaite. 2016. Hunting Animals in a Zoo? Regulating Indonesia’s High Wealth Individual Taxpayers. RegNet Research Paper No. 101. Regulatory Institutions Network Australian National University.
World Bank. 2018. Global Development Report.———. 2021a. Global Economic Prospects. ———. 2021b. State and Trends of Carbon Pricing 2021.Xu, S. 2021. Singapore Says S$5 Carbon Tax ‘A Start’
as It Eyes Higher Levy. Bloomberg Green. 16 July.Yamazaki, A. 2017. Jobs and Climate Policy: Evidence
from British Columbia’s Revenue-Neutral Carbon Tax. Journal of Environmental Economics and Management 83.
Asian Development Outlook 2022Mobilizing Taxes for Development
Developing Asia faces greater uncertainty from the Russian invasion of Ukraine even as the region continues to contend with COVID-19 outbreaks. The war has sent shockwaves across fi nancial and commodity markets. The highly transmissible Omicron variant has fueled a sharp rise in cases in the region, though its less severe health impact, coupled with increased immunity, has allowed economies to remain relatively open. As such, growth in the region is forecast to remain strong, supported by recovering domestic demand. The Russian invasion of Ukraine, aggressive monetary policy tightening in the US, and renewed COVID-19 outbreaks pose near-term risks to the outlook, alongside medium-term risks such as rising inequality due to school closures.
Fiscal resources are needed to aid recovery and support sustainable development. But defi cits and debt expanded substantially during the pandemic. Mobilizing taxes and optimizing tax incentives needs to be combined with improved spending e� ciency to help developing Asia achieve its development objectives.
About the Asian Development Bank
ADB is committed to achieving a prosperous, inclusive, resilient, and sustainable Asia and the Pacifi c, while sustaining its e� orts to eradicate extreme poverty. Established in 1966, it is owned by 68 members—49 from the region. Its main instruments for helping its developing member countries are policy dialogue, loans, equity investments, guarantees, grants, and technical assistance.
ISBN 978-92-9262-828-4
ASIAN DEVELOPMENT BANK6 ADB Avenue, Mandaluyong City1550 Metro Manila, Philippineswww.adb.org