Doing Business in Kakuma:
44
Doing Business in Kakuma: Refugees, Entrepreneurship, and the Food Market Alexander Betts, Antonia Delius, Cory Rodgers, Olivier Sterck, Maria Stierna
-
Upload
khangminh22 -
Category
Documents
-
view
0 -
download
0
Transcript of Doing Business in Kakuma:

Doing Business in Kakuma: Refugees, Entrepreneurship, and the Food Market
Alexander Betts, Antonia Delius, Cory Rodgers, Olivier Sterck, Maria Stierna

Cre
dit
: N
. Om
ata

ContentsExecutive Summary 4
1. Introduction 6
2. Methodology 9
3. Who is Doing Business? 11
4. Business Practices 13
Suppliers 13
Relationship with Customers 15
Business Strategy and Operations 17
Employees 20
Capital 21
Law and Regulation 24
5. Market Structure and Competition 25
Products 25
Price Competition 25
Sales, Expenditure, and Profit 29
Market Geography and Competition 31
6. External Interventions 32
Business Training 32
Supply Chain Development 34
7. Conclusions and Recommendations 37
Acknowledgements 44
Published by the Refugee Studies Centre, ODID, University of Oxford, September 2019.
Designed by Katy Dawkins. Printed by Oxuniprint.
Citation: Betts, A., Delius, A., Rogers, C., Sterck, O., Stierna, M., (2019), Doing Business
in Kakuma: Refugees, Entrepreneurship, and the Food Market (Oxford: RSC).
Cover photo: Market in Kakuma refugee camp. Credit: World Food Programme
Grocery shop

4 Doing Business in Kakuma: Refugees, Entrepreneurship, and the Food Market
• The Kakuma refugee camps have become popularly
associated with entrepreneurship. From the International
Finance Corporation’s Kakuma as a Marketplace study1
to the bustling retail markets and restaurants in Kakuma
One, the proposed Huduma-Biashara Business Centre, and
the new market based Kalobeyei settlement, the Kakuma
camps have become an exemplar of the shift towards private
sector-led development in refugee contexts.2
• In 2016, the Kalobeyei settlement was opened 3.5
kilometres away from the Kakuma camps, with the
intention of promoting the self-reliance of refugees and
the host population, and delivering integrated services
to both. Its development is guided by the Kalobeyei
Integrated Social and Economic Development Programme
(KISEDP), which offers a range of innovative, market-based
approaches to refugee protection that diverge from the
conventional aid model implemented in Kakuma. There
so far have been few studies that examine the emergence
of refugee-led markets at the business level, whether in the
Kakuma camps, in the Kalobeyei settlement, or elsewhere.
In order to address this gap, our research aimed to study
one particular sector: the food market. This sector is of
particular interest because it is such a significant part of
economic life in refugee camps, and because it is heavily
shaped by the modalities of food assistance provided by the
international community. Kakuma is currently undergoing
a gradual transition from in-kind food assistance to cash-
based assistance, and as an interim step, it has introduced a
food provision model called Bamba Chakula.
• The Bamba Chakula (‘get your food’ in Swahili) programme
is a cash-based intervention designed by World Food
Programme (WFP) as an alternative to in-kind food
assistance. It represents a transitional arrangement between
in-kind and full-cash assistance. It began in 2015. By
providing refugees with mobile currency supplied through
Safaricom, it allows recipients to choose the food items that
suit their preferences, with some restrictions relating to
commodities like alcohol and tobacco, while supporting the
growth of local markets. The currency is only redeemable
from contracted traders, who have been able to apply
for a Bamba Chakula (BC) contract during a series of
competitive application processes. In Kalobeyei, refugees
receive nearly all food assistance through BC, while in
Kakuma, about 70% of food assistance is in-kind and the
rest is through BC. In this report, we focus particularly on
the role that BC has played in shaping the food market.
• Our study is based mainly on a business survey of
three groups of food retailers: successful BC applicants,
unsuccessful BC applicants, and food retailers who have not
applied to be BC traders. The survey targeted all traders in
WFP’s registry of applicants to BC and a random sample
Executive summaryof non-applicant food retailers, sampled from a Norwegian
Refugee Council (NRC) census. In total, we interviewed 730
entrepreneurs (of whom 629 currently have a business). We
complemented the survey with qualitative data collection
based on semi-structured interviews and focus groups.
Our aim was to examine what role BC status, among other
factors, has played in influencing business performance and
market structure.
• We find that Somalis and Ethiopians are the most likely
nationality groups to be engaged in the food retail business,
whereas South Sudanese refugees tend to be the least
represented. Refugee men are more likely to own shops
than refugee women; however, the opposite pattern is found
for Kenyans. The group of shop owners who never applied
for a BC contract are inherently different from those who
applied (whether or not they were successful) in a range
of ways, such as the relative composition of nationalities,
gender, education level, and previous experience and
training. Those who did not apply were sometimes
hindered by information, language, or literacy constraints.
• We find that having a BC contract gives a huge advantage.
This is unsurprising given that it gives selected traders
exclusive access to the purchasing power provided to
refugees through all cash-based assistance. Having a BC
contract is correlated with differences in operational
competence and better business outcomes. BC shops
generally have better outcomes in terms of profits, sales,
stock levels, the variety of goods they offer, and the
estimated current value of the business and its assets. It
is, however, important to highlight that these differences
cannot solely be attributed to the BC contract itself, as the
groups are inherently different in some aspects such as
nationality, gender, family background, education, training
and prior (shop) experience. BC traders also invested more
start-up capital in their businesses to begin with.
• Kalobeyei-based BC traders do better than BC traders in
Kakuma, in terms of profits and sales. This is unsurprising
given that there are fewer BC retailers operating in
Kalobeyei even though the volume of aid distributed in the
form of BC is the same (about 500,000 USD per month per
site) in both Kakuma and Kalobeyei.3 Within Kakuma, 19%
of household survey respondents admit selling part of their
in-kind food aid in order to acquire cash, and this is likely
to be under-reported. However, the selling price is relatively
low and the additional purchasing power does not appear
to create a major opportunity for retailers in Kakuma.
• There is a high concentration of market power. A relatively
small number of mainly Kenyan wholesalers supply the
many small retailers. 69% of traders source exclusively from
the five largest wholesalers. Refugee traders often organise
1 IFC and UNHCR (2018). Kakuma as a Marketplace: A consumer and market study of a refugee camp and town in northwest Kenya (Washington DC: IFC).
2 Bram Jansen describes the emergence of attributes of a city within Kakuma as ‘humanitarian urbanism’. Jansen, B. (2018), Kakuma Refugee Camp: Humanitarian Urbanism in Kenya’a Accidental City (Aldershot: Zed Books).
3 These figures were correct at the time of our data collection but by 2019 were about 700,000 USD in Kakuma and 500,000 USD in Kakuma.

Doing Business in Kakuma: Refugees, Entrepreneurship, and the Food Market 5
in ‘buying groups’ in order to balance wholesalers’ market
dominance. In addition, WFP provides price guidelines
to wholesalers and retailers, and retailers regularly meet
to agree on common prices. These dynamics are among
the factors explaining why prices do not vary much across
traders.
• Nationality plays a role in exchange. A preference for doing
business with one’s own nationality seems apparent in
hiring employees and when customers choose which shop
to buy from, but nationality has little importance when
retailers decide from which wholesaler to source goods.
Refugee-host interaction is limited between retailers and
customers. Refugees source from Kenyans, but Kenyans
rarely source from refugees.
• Credit-based purchases are common and credit flows
exist between both wholesalers and retailers, and between
retailers and consumers. Having access to credit through
wholesalers (due to the predictability of demand) is part
of what lets BC traders operate and compete differently
than others. Many BC shopkeepers retain the refugees’ BC
SIM card as collateral, and in return distribute products on
credit if BC transfers are delayed or if customers run short
of food and money at the end of month. Trust and loyalty
play a key role in shaping market-based interactions.
• Alongside the introduction of BC, WFP has introduced
the Kenya Retail Engagement Initiative (KREI), which
is a holistic approach to support and develop the local
economic systems involved in the broader transition
from in-kind aid to cash-based assistance. In addition to
activities for supply chain development, KREI includes
business training. WFP is one of several actors who offer
business training to food retailers in Kakuma and Kalobeyei.
• Our data shows that access to business training in general
is correlated with improved business performance. It
is associated with a 20% higher level of sales and profit,
although this association is not necessarily reflecting a
causal relationship: it may be driven by businesses with
better performances being more likely to opt into business
training. Nevertheless, insofar as the relationship is causal,
the mechanism through which it operates appears to be by
creating better business practices. The practices that matter
include: giving special offers and bulk discounts (correlated
with higher sales), asking customers whether there are
products they would like (correlated with higher profits),
asking suppliers for preferential terms (correlated with
higher sales and higher stock variety), and book-keeping
(correlated with higher stock variety).
• Although refugees have been more likely to purchase
items from other refugees, initiatives by WFP to provide
additional opportunities to Turkana traders have helped
to increase the number of refugee frequenting Turkana-
owned shops. In particular, WFP paying Turkana shops to
distribute corn soya blend (CSB) has helped increase the
number of refugees going to Turkana shops.
• Our findings suggest that introducing full cash-based
assistance would help to ‘level the playing field’ by removing
some of the advantages afforded to BC traders. This might
lead to possible tensions, particularly among some Turkana
traders who would stand to lose the most. However, this
would partly be mitigated by the advantages that BC shops
have already enjoyed, which have led to greater investment
and stock accumulation. A range of steps are needed to
carefully manage the transition to cash assistance, both in
Kakuma and elsewhere.
• Overall, understanding the BC experience in Kakuma offers
insights of wider relevance into how markets emerge and
develop in refugee camps and settlements, the process of
transition from in-kind to cash-based assistance, and what
determines entrepreneurial success in a refugee camp. It
also poses challenging questions about the appropriate role
for humanitarian organisations in regulating markets. We
offer a series of practical recommendations relating to the
transition to cash assistance, the future role of BC as an
interim measure, and the role of the Retail Engagement
Initiative. C
red
it: W
orl
d F
oo
d P
rog
ram
me
Shop with Bamba Chakula branding in Kakuma

6 Doing Business in Kakuma: Refugees, Entrepreneurship, and the Food Market
From 2015, existing traders were invited to apply to be
selected as BC-contract holders, entitling them to sell food
items in return for BC mobile money, and then redeem
BC mobile money as cash. The aims of the scheme include
enhancing consumer choice while retaining some control
over the items that can be purchased, gradually transitioning
to cash-based assistance, and supporting the gradual
emergence of businesses that can ultimately compete in the
local economy.
Alongside the BC scheme, WFP has also implemented the
Kenya Retail Engagement Initiative (KREI). Its purpose
has been to enhance retailer capacity through, for example,
business training and supply chain development. KREI is
aligned with WFP’s global Cash-Based Transfer Strategy and
its Markets Supply Chain Strategy, to contribute towards the
creation of sustainable markets that aim to eradicate hunger
among vulnerable populations. The specific objectives of the
retail engagement initiative are: first, to reduce and remove
supply chain inefficiencies in order improve customer value
in relation to access, price, quality,
and service; second, to contribute
to self-reliance for refugees and
the host communities by creating
new economic opportunities and
stimulating the development of
the local economy. For example,
WFP provides training to
retailers on business skills and
linkages that will enable them to
run their businesses smoothly.
Key activities implemented through the retail engagement
initiative include: linking retailers directly with large and
efficient suppliers and distributors; organising retailers
into buying clubs to enhance bargaining power; facilitating
retailers’ access to credit facilities from suppliers and financial
institutions; constructing shops for resource-poor retailers;
supporting affirmative action by engaging host community
traders to distribute corn soya blend in Kalobeyei; and
training retailers in business skills, financial management,
trade licensing in Turkana County, food safety and quality
control.
1. Introduction
Since 2015, an innovative approach called Bamba Chakula (BC) - ‘get
your food’ in Swahili - has been operating in Kakuma as a transitional
arrangement between in-kind food assistance and cash-based assistance.
By contracting a limited number of refugee and host community-run shops
as distributors, and giving a proportion of assistance to refugees in the
form of BC mobile money, the goal has been to increase choice for refugees
and to nurture the food retail market.
The BC system was originally introduced to all registered
refugees in Kakuma and Dadaab in response to low dietary
diversity among refugees and the problem of selling in-kind
food assistance at a loss. BC was was initially provided as
a substitution of part of the cereal in-kind food ration. In
Kalobeyei, refugees receive 95% of food assistance through
BC. In Kakuma, only 30% of food
assistance is distributed through BC
while about 70% of food assistance is
still in-kind.
WFP chose to use the electronic
voucher system (restricted cash) as
opposed to direct cash because of
Kenyan Government’s ‘know your
customer’ policy. This policy requires
that customers provide their identity before they can open
bank accounts or engage financial transactions. A policy shift
on mobile money accounts shortly after the cash program
began barred refugee ID cards from being used to open and
operate mobile money or bank accounts. While refugee
ID cards were in 2015 treated similarly to alien cards and
hence could be used to access mobile money accounts, the
Government of Kenya expressed legitimate concerns about
security, which was then volatile particularly in Dadaab, and
pointed at the potential of the cash infusion making this
worse.
In Kakuma and Kalobeyei, WFP and UNHCR are gradually
transitioning from in-kind assistance towards cash-based
assistance, with the dual objective of developing markets
and fostering refugees’ autonomy. In June 2019, WFP
completed the registration and equipping of 1,064 households
(6,010 refugees) with Equity Bank cards to initiate its first
unrestricted cash transfers in Kalobeyei. WFP will closely
monitor the use of cash by households and the functioning
of systems for unrestricted cash transfers. The roll out for
remaining households in Kalobeyei is expected to take
place in September 2019, when 7,000 households (34,000
beneficiaries) are expected to receive unrestricted cash.
WFP then plans to begin the transition to unrestricted cash
assistance in Kakuma in 2020.
“In the new Kalobeyei
settlement, virtually
all food aid is delivered
via mobile phone as
Bamba Chakula.”
“We interviewed 730
people, consisting of the
majority of applicants to
BC from 2015 up until
September 2018 and a
random, representative
sample of non-applicants.”

Doing Business in Kakuma: Refugees, Entrepreneurship, and the Food Market 7
Contracting of the first group of BC traders began in
March-July 2015, and the first transfer of BC to beneficiaries
took place in Kakuma in August 2015. Both refugees and
the local host community were eligible to apply to be BC
traders. Since then and until the time of our survey, there
were four subsequent rounds of contracting, gradually
scaling up the number of BC shops to 226 by September
2018.4 Each round was broadly organised as follows: (1)
WFP organised an information campaign to encourage
applications; (2) Applicants had to submit their application
on time and provide information about themselves and
about their businesses; (3) A multi-stakeholder committee
determined who would get a BC contract, taking into account
criteria such as already having a shop and having relevant
documentation like permits and food safety licenses. The
committee also took into account location, gender, and
nationality in the allocation of contracts for equity reasons
and to avoid possible sources conflict.
Our aim in this report is two-fold. First, we seek to understand
the environment for business and entrepreneurship in
Kakuma through an in-depth examination of the food market.
Second, we aim to examine what role the BC programme
has played, alongside other factors, in influencing business
performance and market structure. What is the impact
of having access to a BC contract? To what extent is BC
an effective means to build the food market? What are its
implications for transitioning from in-kind to cash assistance?
The report is based upon a quantitative business survey,
which examined three strata of food retailers: successful BC
applicants, unsuccessful BC applicants (some of these do not
have a shop), and food retailers who have never applied to be
BC traders. In total, we interviewed 730 people, consisting of
the majority of applicants to BC from 2015 up until September
2018, and a random, representative sample of non-applicants
sampled from an NRC business census. We complemented
the survey with qualitative data collection based on semi-
structured interviews and focus groups.
Within the report, we examine this nascent industry at
the individual, business, and market levels of analysis.
We present who is entering the food market and why,
variations in business practices and performance, and
how the market works at a structural level to shape factors
such as competition and pricing. We argue that BC has
fundamentally influenced the trajectory of the food market.
On the one hand, it has effectively initiated a transition from
an in-kind aid system to a market-based system. On the other
hand, aspects of its implementation have introduced market
distortions, exacerbating a concentration of market power
in the hands of the wholesalers, necessitating a credit-based
economy, and arbitrarily conferring huge advantage on a
small cohort of traders. Nevertheless, we suggest that it is
an important and innovative programme that offers insights
in the management of transition from an aid economy to a
market economy.
In the diagram below, we outline a simplified conceptual
framework, which summarises some of our main findings.
It shows the food market supply chain in the Kakuma camps
and Kalobeyei settlement. It illustrates the key actors and
their interactions, estimates market size and market share for
each, and situates BC within the supply chain. The numbers
given within the diagram are broad approximations based on
our business survey data, triangulated against other available
sources.
The left of the diagram illustrates the main wholesalers.
The wholesaler market share is estimated based on retailers’
reported supply sources. We know from our data that about
75% of the relationships between retailers and wholesalers
include one of the five main wholesalers. Based on the sales
volumes of the retailers in these three categories, we broadly
estimate that around 70-75% of supply by volume probably
comes from the largest five dealers.5 The middle column
illustrates the retail shops, divided between BC-contracted
food shops and non-BC food shops. The numbers of shops are
based on data from WFP and NRC. Sales and profit are the
mean values from our survey. We calculate BC and non-BC
shops’ relative market share based on estimated aggregate sales.
The right of the diagram illustrates refugee consumer
spending within the retail shops. We know from WFP that
500,000 USD per month is allocated in BC transfers in each
of Kakuma and Kalobeyei. It should be noted, however, that
our own survey data suggests that the BC shops in Kakuma
received 720,028 USD in BC transfers and those in Kalobeyei
received 249,743 USD during the month of our survey. This
deviation from the 500,000 USD figure is likely to be because
of reporting errors or delays in monthly BC spending by
customers. We estimate that around 300,000 USD is spent per
month in cash in the BC shops in Kakuma and up to 120,000
USD in those in Kalobeyei based on shop owners reporting
a 63:37 ratio of BC sales to cash sales in Kakuma and a 81:19
ratio in Kalobeyei. For non-BC shop sales, we estimate cash
spending based on multiplying the estimated number of
shops with their reported mean sales. For Kakuma this gives
2,016,700 USD. However, we think this is probably an over-
estimate given that our household survey data from Kakuma
suggests an aggregate monthly earned income in Kakuma
of around 1.3 million6 USD and the IFC estimates around
61.5% of household income goes on food.7 This implies that,
even with additional income from food ration sales and
remittances, cash sales in non-BC shops may be no more
than 1 million USD per month.
Aggregating these estimates of total retail sales and
expenditure gives an approximate market size of around
4 It was 248 by the time of publication in August 2019.
5 We use three measurements of sales volumes: estimated aggregated monthly sales based on reported sales volumes of 29 specific food items, reported monthly sales (raw data), and winsorized reported monthly sales (outliers adjusted by replacing the upper and lower 5% of the distribution with the percentile value).
6 Betts, A et al (2018), ‘Refugee Economies in Kenya’ (Oxford: RSC).
7 IFC (2018), ‘Kakuma as a Marketplace’ (Washington DC: IFC).

8 Doing Business in Kakuma: Refugees, Entrepreneurship, and the Food Market
5 Big Dealers(Mesfin, Ogle, Al-Amin, Al-
Mubarak, Kaeris)
~70% vol
Other Suppliers ~30% vol
Kakuma camp
Kalobeyei settlement
BC Shops~190 shops ~$6015 sales
~$770 profit
Retail Shops
Kakuma camp
(~ 140,000 people)
Kalobeyei settlement
(~ 40,000 people)
BC Transfers($500k)
Customer Spend
BC transfers
Cash (Income and Food Ration
Sales)
Cash (Income)
Wholesalers
Non-BC Shops~700 shops ~$2881 sales
~$190 profit
BC Shops~45 shops ~$6852 sales
~$950 profit
Non-BC Shops~150 shops ~$3493 sales
~$260 profit
36% ofmarket
37% ofmarket
64% ofmarket
63% ofmarket
~$500k
~$500k
~$1-2m
~$500k
Total Food Market Size in Kakuma and Kalobeyei is ~$3 million/month (excluding consumed in-kind food rations, which have an estimated market value of ~$1.7m/month)
BC Transfers($500k)
BC transfers
~£300k
~£40-120k
3 million USD for the Kakuma camps and Kalobeyei
settlement. Based on food ration composition (sorghum,
rice, pulses, and oil), and size and market value at the time of
the survey, we estimate that the market value of WFP food
rations across Kakuma camps is around 1.7 million USD per
month. These estimates suggest that the overall food market
may be worth between 36 million USD and 56.6 million USD
per year, depending on how it is measured.
Conceptual Framework: supply chain diagram illustrating the interaction between wholesalers, retailers, and consumers
in the food market of the Kakuma camps and Kalobeyei settlement.

Doing Business in Kakuma: Refugees, Entrepreneurship, and the Food Market 9
2. Methodology
This study is based mainly on a quantitative and a qualitative business
survey of food retailers in the Kakuma camps, Kalobeyei settlement, and
nearby towns. We also reviewed secondary data provided by WFP. As part
of the quantitative survey, we interviewed a representative sample of
730 entrepreneurs, who were either BC contract holders, unsuccessful
BC applicants, or did not apply for a BC contract. Our qualitative
research focused on both traders and households, as well as wholesalers,
government officials, and employees of international organisations (IOs)
and NGOs. Our aim was to explore the impact that the BC contract, among
other factors, has on a range of business strategies and outcomes.
We undertook the business survey with food retailers in
October 2018. For the survey, we examined three strata of
food retailers: successful BC contract applicants, unsuccessful
BC contract applicants, and food retailers who never applied.
We identified successful and unsuccessful BC applicants
using WFP’s registry, which contained 688 unique applicants.
About 68% applied providing the address of their shop
or household in the Kakuma Camps, 16% in Kalobeyei
Settlement, 9% in Kalobeyei Town and 6% in Kakuma
Town. Most of the successful applicants were easy to locate
because they are in regular contact with WFP and normally
have their BC contracts connected to the phone number
through which they applied to the scheme. For unsuccessful
BC applicants, however, contact details were often out-of-
date. UNHCR therefore assisted us with updated residential
data and phone numbers relating to this group. In total,
we interviewed 543 applicants, out of which 218 had a BC
contract. 30 respondents (5.5%) from the WFP applicant list
claimed that they never applied for BC, and are classified as
non-applicants throughout this report. These cases are likely
explained by changeovers in shop ownership.
To identify food retailers who never applied to get a BC
contract, we used data from a census of retailers conducted
by NRC between August and September 2018. This census
identifies 2,746 shops (all business types), out of which
1,358 were potentially relevant to our study because they
Cre
dit
: A. B
ett
s
Bamba Chakula trader in Kakuma

10 Doing Business in Kakuma: Refugees, Entrepreneurship, and the Food Market
were either food retailer or of unknown business type.
Because details on the characteristics of shops were missing
for a substantial proportion of the shops in the census, we
undertook a mapping exercise of 600 businesses randomly
selected from among these relevant shops. This enabled us
to identify and exclude non-food shops and duplicates from
our sampling frame. Following this process, a representative
sample of 206 food retail shop owners who apparently never
applied to get a BC contract was selected for interview (40 in
Kalobeyei, and 166 in Kakuma). From this list, 187 of these
shop owners were located and consented to be interviewed.
Interestingly, 57 respondents drawn from the NRC sample
actually told us that they had applied for a BC contract but
could not be found in the WFP applicant registry, quite
probably because they had applied after the deadline. We
reclassified them as unsuccessful BC applicants for the
purpose of our study. Similarly, 3 respondents drawn from
the NRC sample said they actually have a BC contract but
could not be found within the WFP registry of applicants. We
therefore reclassified them BC retailers.
Our final sample is described in Table 1, which is based on
self-reported information about BC status. Throughout the
report, we will compare three categories of respondents:
(1) Food retailers who report using a BC contract. This group
is labelled ‘BC’ in the figures below.
(2) Unsuccessful BC applicants, who applied but did not
obtain a BC contract. This group is labelled ‘applied’ in the
figures below. Part of this group did not actually have a
food retail shop at the time of the survey. We will therefore
distinguish the categories ‘applied, no shop’ and ‘applied,
shop’ when relevant.
(3) Food retailers who never applied to obtain a BC contract.
This group is labelled ‘never applied’ in the figures below.
Among the interviewees, 629 are shop owners and 101
do not own a shop (mainly unsuccessful BC applicants).
58 (9.2%) of the sample owned two or more shops at the
time of the survey. Most of these are Kakuma residents. 61
Kakuma resident shop owners are operating either in both
sites or solely in Kalobeyei, whilst no Kalobeyei residents are
operating in Kakuma. The main nationalities in the sample
are Somali (27%), Kenya (16%), Ethiopia (14%), Burundi
(13%), Sudan (12%), South Sudan (8%), DRC (6%). The
sample is 64% male and 36% female.
BC Applied Never applied
Total
Kakuma 170 260 131 561
Kalobeyei 40 103 26 169
Total 210 363 157 730
Table 1: Self-reported BC status among survey sample
In order to implement the survey, we hired a total of 22
enumerators, covering seven nationalities and several
languages used by different ethnicities within these countries.
Enumerators attended four days of pre-survey training,
which covered first general topics on data collection, followed
by familiarising the enumerators with our specific survey and
extensive time to practice interviewing each other and using
the tablets. The general topics covered included, for example:
the aims of the RSC research; understanding research and
data collection; understanding surveys; interview techniques;
the ethics of data collection; using digital surveys; and
adapting to challenges.
The questionnaire covered: respondent and business
characteristics; household information such as demographics,
employment, consumption, food security, remittances, and
assets; business information, including sales, expenses,
investments, profit, capital, loans, permits, employees,
training, suppliers, customers, competition, management and
marketing practices, and questions related to BC; questions
relating to product, pricing, and stock information; questions
relating to subjective well-being, including mental health,
locus of control, and mathematical ability.
The questionnaire was translated into the following seven
languages: Anyuak, Standard Arabic, Juba Arabic, Kirundi,
Oromo, Somali, and Swahili. Translators worked in groups
of two to three, typically with one person translating and
the other typing, then checking it together. Throughout the
data collection, we held regular team meetings to review
errors and misunderstandings, and to provide individual
feedback and supplementary instructions to team members.
During these feedback sessions, enumerators were sometimes
instructed to return to the shops or make phone calls to
respondents in order to make corrections.
Our qualitative research was conducted during December
2018 and early January 2019, and focused on both traders
and households, as well as key informant interviews with
wholesalers, government officials, and agency employees.
Semi-structured interviews were carried out with 67
members of households and 55 BC and non-BC traders
across both Kalobeyei and Kakuma, covering a spectrum
of nationalities and ethnicities. Semi-structured interviews
were carried out in English, Swahili, Turkana, Amharic,
Arabic, Somali, Kirundi, Nuer, Dinka, Lotuko, and Acholi
languages, according to the preferences of the interviewees.
Interviews were translated and transcribed into English, and
coded according to key themes identified in the quantitative
surveys. Key informant interviews were conducted in the
offices or shops of the respective agencies and businesses.
As part of this research, we also analysed secondary data
and policy documents provided by WFP, including, but
not limited to, the Kalobeyei Integrated and Economic
Development Programme (KISEDP), the Kalobeyei master
plan map, WFP’s records on BC cash redemption by traders,
WFP’s data on the content of monthly food baskets and on
prices, data from the BC contracting process, and data related
to WFP’s Kenya Retail Engagement Initiative (KREI).

Doing Business in Kakuma: Refugees, Entrepreneurship, and the Food Market 11
3. Who is Doing Business?
The likelihood of being an entrepreneur, or of having a BC contract, is
shaped greatly by refugees’ identity. Nationality, gender, and educational
background all make certain groups more likely to own their own business,
or among entrepreneurs, to have access to a BC contract.
0 20 40 60 80 100%
BC
Applied, shop
Applied, no shop
Never applied
Somalia
KenyaEthiopia
Burundi Sudan
South SudanDRC
RwandaEritrea
Uganda
04
81
21
6Y
ea
rs o
f e
du
ca
tion
Never applied Applied, no shop Applied, shop BC
Identity shapes participation in business and access to BC
contracts. Refugee men are more likely to own shops than
refugee women: 69% of refugee shop owners are male, and
this pattern is similar for those with BC status and across
locations within Kakuma. The exception is for BC traders in
Kalobeyei, for which the ratio is closer to 50:50. However,
the opposite pattern can be found among Kenyan traders.
Among Kenyans, 63% of shop owners are female: in Kakuma
Town it is 50:50, and in Kalobeyei Town 75% of the shop
owners are women.
In terms of nationality, Somali and Ethiopian refugees are
disproportionately likely to be involved in business compared
to their population size (Fig. 1 and Table 2). To a lesser
extent, other ‘business nationalities’ such as Burundians,
Congolese, and Sudanese refugees are also overrepresented.
By contrast, South Sudanese refugees are underrepresented.
We find a distinctive identity profile for shop owners who
never applied for BC status. Their composition is different
in terms of nationality (Fig. 1), gender, education level (Fig.
2), and previous experience or training in bookkeeping
(Fig. 3). Qualitative interviews suggest this group may have
been hindered in applying by a lack of information about
Kalobeyei Kakuma
HHs
(UNHCH
data)
Food
retailers
(refugees
only)
HHs
(UNHCR
data)
Food
retailers
(refugees
only)
South Sudan 71% 6% 52% 9%
Ethiopia 13% 41% 4% 12%
Burundi 9% 20% 4% 14%
DRC 4% 15% 6% 5%
Uganda 2% 0% 1% 0%
Sudan 1% 6% 6% 9%
Somalia 0% 5% 26% 41%
Total
population37,471 82 145,406 442
Table 2: Refugees’ nationalities in the business survey
sample compared to overall population
19.7 39.6 54.9
02
04
06
08
01
00
%
Never applied Applied BC
Fig.1: Respondent nationality by BC status
Fig. 2: Years of education8
Fig. 3: Experience/training in bookkeeping from before
opening the shop (only answered by shop owners)
8 In this box plot and all similar charts throughout the report, the boxes show the interquartile range (the 25th to 75th percentile) of the distribution of the variable in ques-tion, with the median highlighted by the line within the box. The length of the whiskers are at 1.5x the interquartile range (the Tukey definition). Potential outliers beyond the end of these whiskers will be presented by dots.

12 Doing Business in Kakuma: Refugees, Entrepreneurship, and the Food Market
.8 .9 1.3 1.2
No
ne
Little
Go
od
Ve
ryg
oo
d
En
glis
h le
ve
l
Neverapplied
Applied,no shop
Applied,shop
BC
1.5 1.2 1.7 1.6
No
ne
Little
Go
od
Ve
ryg
oo
d
Sw
ah
ili le
ve
l
Neverapplied
Applied,no shop
Applied,shop
BC
2.9 2.1 2.6 2.7
01
23
Neverapplied
Applied,no shop
Applied,shop
BC
Number of Questions Answered (out of 3)
.38 .29 .43 .37
0.2
.4.6
.81
Neverapplied
Applied,no shop
Applied,shop
BC
Share of Questions Answered Correctly
(Fig. 4). They also answered fewer questions in our math
test during the survey, and still got the lowest proportion of
correct answers, from those that they answered (Fig. 5). In
terms of experience, ‘unsuccessful non-shops’ have fewer
years of work experience than the other groups. In terms
of nationality, South Sudanese, who are already majorly
underrepresented in business compared to their population,
are also overrepresented among the ‘unsuccessful non-shops’.
These findings offer important insights into the identity and
background factors that lead to barriers to aspiring refugee
entrepreneurs.
Very few entrepreneurs have multiple shops. 91% of
respondents own only one shop. 8% owns two shops, and 1%
own three or four shops. More than half of the multiple shops
owners are BC traders, and most of these are BC traders
who have expanded from Kakuma into Kalobeyei in the
2016 BC application round when WFP invited only existing
Kakuma BC traders to apply to expand to Kalobeyei. WFP
did this in order to rapidly establish a market in Kalobeyei in
anticipation of high numbers of new arrivals.
BC, due to for example language barriers or illiteracy. Those
who ‘never applied’ have fewer years of education and worse
English skills than shop owners who applied (regardless of
application success). BC traders had more experience and/
or training in business skills prior to opening their current
shop than ‘unsuccessful’ or ‘never applied’ food retailers.
In summary, shop owners who did not apply to get a BC
contract had lower levels of human capital than applicants,
prior to implementation of the BC programme.
Among the unsuccessful applicants, 25% do not currently
have a shop, and this sub-group is more similar to the ‘never
applied’ group than the other 75% of unsuccessful applicants
who have a shop (who are more similar to BC traders).
In terms of education, ‘unsuccessful non-shops’ are more
similar to the ‘never applied’ group, whilst ‘unsuccessful
shop owners’ are more similar in profile to BC traders. For
example, ‘unsuccessful non-shops’ have a higher probability
of no education and fewer years of education on average.
‘Unsuccessful non-shops’ have poorer language skills in both
English and Swahili than the ‘unsuccessful shop-owners’
Fig. 5: Math skills (survey math test)
Fig. 4: Language skills

Doing Business in Kakuma: Refugees, Entrepreneurship, and the Food Market 13
4. Business Practices
Suppliers
In terms of market structure, BC food retailers are reliant
upon an oligopoly of just a few local suppliers. These
wholesalers consist of four Kenyan Somali host wholesalers,
Al-Amin, Al-Mubarak, Kakuma Wholesalers (Ogle), and
Kaeris, and one Ethiopian refugee wholesaler, Mesfin.9 All
except Al-Amin have entered into an agreement with WFP as
‘preferred wholesalers’, described below.
76% of food retailers inside the camps and settlement are
supplied by at least one of the big five wholesalers, and 69%
of traders report that they source exclusively from them. The
percentages are highest among BC traders: 90% use at least
one of them, and 83% source exclusively from the main five
wholesalers. The reported sales volumes among the shops
that source goods from the main wholesalers are on average
61% larger than the sales volume of the shops that do not
source from them. The dependency on the main wholesalers
is lower among food retailers in Kakuma Town, who are
more connected to suppliers in Kitale, and among those in
Kalobeyei Town, who are more likely to procure products
from networks in Kakuma Town outside the established
wholesaler networks. The five big wholesalers collectively
comprise about 75% of the wholesaler-retailer relationships
identified in our data. The majority of the remaining 10% of
wholesaler-retailer relationships are based in Kitale, followed
by a few in Lodwar, then Nairobi, elsewhere in Kenya and
abroad. Wholesale suppliers within Kalobeyei Settlement and
Kalobeyei Town are virtually non-existent. This oligopolistic
structure is reinforced by retailers normally only using one
or two suppliers due to the importance of loyalty and credit
agreements (Fig. 6).
Less than 6% of food retailers in the market sell their own
cultivation or wild sources. This is unaffected by BC status,
although there is some variation based upon nationality,
with higher rates for Burundians, Congolese, and Kenyans.
Location is also a factor, with more self-cultivated foods in
Kalobeyei (possibly due to kitchen gardens) and in Kakuma
Town (possibly due to Kenyans being permitted to own land).
Business practices in Kakuma are shaped by a complex set of relationships
between wholesalers, retailers, and customers. The food market is
dominated by a small oligopoly of wholesalers, often selling stock to
retailers based on credit, and retailers in turn often sell to consumers based
on credit. Trust and loyalty play a significant role in shaping market-based
interactions. Business practices, such as those relating to pricing and stock
vary considerably.
1.3 1.5 1.6 1.3 1.4 1.9 1.2 2
01
23
Num
ber
of supplie
rs
Neverapplied
Applied BC
Kakuma
Neverapplied
Applied BC
Kalobeyei
Applied BC
Other towns
Nationality plays a role in influencing supply chain
relationships (Fig. 7). Mesfin, the only refugee wholesaler
within the oligopoly of suppliers, is popular not just among
fellow Ethiopians but across all refugee
nationalities, with the striking exception
of Somali refugees. About 25% of
Ethiopians buy from Mesfin, which is
close to the average for all other non-
Somali refugee retailers. However, just
2% of Somali traders buy from Mesfin.
77% of them trade with Kenyan Somali
wholesalers (compared to 67% among
other refugee groups), and 10% use Somali refugee networks
(compared to 3% among the other refugee traders).
This supply chain structure relies upon significant refugee-
host interaction. 70% of refugee traders source all or part of
their supplies from the four Kenyan Somali wholesalers who
dominate the market. However, only about 5% of refugee
traders (across nationalities and locations) source goods from
the Turkana people. Notably, BC traders source less from
Turkana suppliers and more from the established Kenyan
Somali wholesalers. But while refugees often source from
hosts, hosts rarely source from refugees: only about 4% of
Turkana traders and 8% of Kenyan traders from other ethnic
background source all or parts of their supplies from refugees.
Fig. 6: Number of suppliers used by the food retailers
“Bamba Chakula
licensed food retailers
are reliant upon an
oligopoly of just a
few local suppliers.”
9 Halais, F. (2017) “They call him the millionaire”: the refugee who turned his camp into a business empire’, The Guardian, 10 May. Available at: www.theguardian.com/global-development-professionals-network/2017/may/10/millionaire-refugee-mesfin-getahun-kakuma-refugee-camp (Accessed: 12 July 2019).

14 Doing Business in Kakuma: Refugees, Entrepreneurship, and the Food Market
Credit plays an important role between retailers and
wholesalers. More than 60% of food retailers state that
their wholesaler(s) offer(s) either bulk discounts, goods on
credit, or both. There are substantial differences between
BC and non-BC shops with respect to obtaining credit.
76% of BC traders report that their suppliers offer them the
opportunity to purchase goods on credit, as opposed to 58%
of unsuccessful applicants and 47% of non-applicants. This
0 20 40 60 80 100%
BC
Applied
Never applied
Ethiopian refugees Somali refugees
Somali Kenyans Turkana Kenyans
Other Kenyans Other (Other refugees or abroad)
0 20 40 60 80 100%
Kalobeyei Town
Kakuma Town
Kalobeyei
Kakuma
Ethiopian refugees Somali refugees
Somali Kenyans Turkana Kenyans
Other Kenyans Other (Other refugees or abroad)
0 20 40 60 80 100%
Kenya
Other refugees
Sudan
South Sudan
Somalia
Ethiopia
DRC
Burundi
Ethiopian refugees Somali refugees
Somali Kenyans Turkana Kenyans
Other Kenyans Other (Other refugees or abroad)
6.5 13.1 29.3 8.3 18.9 67.7 4.8 53.8
02
04
06
08
01
00
%
Neverapplied
Applied BC
Kakuma
Neverapplied
Applied BC
Kalobeyei
Applied BC
Other towns
24.4 35.2 57.1 16.7 37.8 77.4 14.3 23.1
02
04
06
08
01
00
%
Neverapplied
Applied BC
Kakuma
Neverapplied
Applied BC
Kalobeyei
Applied BC
Other towns
100000
200000
300000
400000
500000
600000
Am
ou
nt
of
cre
dit n
orm
ally
ob
tain
ed
(K
ES
, p
er
sh
op
)
Never applied Applied BC
excludes outside values
0 20 40 60 80 100%
BC
Applied
Never applied
Next purchase 2 weeks or less
1 month or more Next BC transfer
Fig. 8: Shop owner who normally purchase on credit
from their supplier(s)
Fig. 9: Amount of credit per shop normally obtained
(KES)11
Fig. 10: Repayment time
Fig. 11: Shop owners who are part of a buying group
Fig. 7: Nationality of main wholesale supplier (x-axis),
by a) BC status, b) shop location, c) retail shop owner
nationality (y-axis).
difference is partially attributable to the ‘preferred wholesaler’
agreements, which encourage suppliers to provide credit to
BC retailers. The agreements specify that wholesalers should
determine the amount and duration of credit arrangements
according to the “size and health of the retailer’s business”.
WFP estimates that between January and June 2018, a
monthly total of about 46 million KES (460,000 USD)10 was
given out as credit by wholesalers to BC traders.
10 1 USD is equivalent to around 100 KES.
11 For shop owners who at the time of the interview had outstanding credit to suppliers, the amount they owed follows same pattern, but with slightly lower numbers.

Doing Business in Kakuma: Refugees, Entrepreneurship, and the Food Market 15
In addition, BC traders are significantly more likely to
opt in these credit arrangements when offered: 74% of BC
applicants who can access credit report they normally buy
on credit, compared to 54% of unsuccessful applicants and
48% of non-applicants. As a result, BC traders are much
more likely to regularly purchase goods on credit than
non-BC traders (Fig. 8). Furthermore,
among those that normally get goods on
credit, BC traders access larger amounts
(Fig. 9) and have longer repayment
schedules (Fig. 10), all of which give them
a competitive advantage. The guarantee of
a customer base seems to be one reason
why wholesalers are more willing to extend
credit to BC retailers. One Burundian non-
BC trader in Kalobeyei explained the difficulty that shops like
his face in acquiring credit: “If you don’t have enough money,
they [wholesalers] are not willing to give you the goods on
credit. They know that you don’t have a BC contract.”
Ethnicity may also play a role. One Turkana BC trader in
Kalobeyei explained: “Wholesalers prefer to give credit to a
Bamba Chakula traders of their own ethnicity, not a Turkana
Bamba Chakula trader. And that has been a big blow to our
business... The rise in Bamba Chakula shops among the
refugees has led wholesalers to deny credit to us.”
In order to counter-balance asymmetries in market power,
some food retailers self-organise into buying groups to
aggregate demand. BC shops are much more likely to do so
(Fig. 11).
Such groups often include shop owners from same network.
One Somali BC trader explained “We have buying clubs.
Instead of going to Kitale and getting a whole truck alone,
we join as traders, compile our money and buy together,
then go and share transportation costs. This reduces the
transportation cost per person.” WFP encourages shop
owners to organise in this way, but does not formally
establish, run, or otherwise assist such groups.
Relationship with Customers
Trust and loyalty shape retailers’ interactions with their
customers. Shop owners believe customers choose them
on the basis of nationality. Our survey data indicates that
customers frequently use shops owned by people of the
same nationality. When asked to list up to three main
nationalities for customers, 79.5% include the shop owner’s
own nationality.
The most likely customer groups to be listed by retailers as
among their main customer groups are: South Sudanese
(69.5%), Congolese (42.6%), Somali (35.3%), Turkana
(30.2%), Sudan (28.3%), Burundian (27.5%), Ethiopian
(18.8%). This pattern varies little across BC status, but shows
some variation across shop owner nationalities and shop
location (Fig. 12).
Meanwhile, there is little refugee-host interaction relating
to retail-customer relations, in either direction. The only
exception is the case of Kenyans who run shops inside the
camp, which make up 6% of Kakuma’s shops. Sudanese
refugees seem more inclined to buy goods from Kenyans
0 20 40 60 80 100%
Kalobeyei Town
Kakuma Town
Kalobeyei
Kakuma
South Sudan Somali
DRC Burundi
Ethiopia Sudan
Other refugees Turkana
Somali Kenyan Other Kenyan
0 20 40 60 80 100%
KenyaOther refugees
SudanSouth Sudan
SomaliaEthiopia
DRCBurundi
South Sudan Somali
DRC Burundi
Ethiopia Sudan
Other refugees Turkana
Somali Kenyan Other Kenyan
10
20
30
40
50
60
70
Num
ber
of cre
dit c
usto
mers
Never applied Applied BC
excludes outside values
Fig. 12: Main customer groups by BC status, shop
location and shop owner nationality
Shop location:
Shop owner nationality:
Fig. 13: Number of credit customers within past 30 days,
among the shop owners who extended credit
“Less than 6% of
food retailers in
the market sell their
own cultivation or
wild sources.”
Cre
dit
: Wo
rld
Fo
od
Pro
gra
mm
e
Female beneficiary uses her mobile phone to buy food items through Bamba Chakula in Kakuma

16 Doing Business in Kakuma: Refugees, Entrepreneurship, and the Food Market
than other refugees. Refugees do not own shops outside the
Kakuma camps and the Kalobeyei settlement; so interaction
is limited to Kenyans entering the Kakuma camps or the
Kalobeyei settlement to buy goods. Refugee traders in
Kalobeyei interact more with Turkana customers than
refugee traders in Kakuma do: in the Kakuma camps, the
likelihood of listing the Turkana among top customer groups
is only 20.5%, compared to 35.9% in the Kalobeyei settlement
(and 89.7% for Kenyans in Kakuma and Kalobeyei towns). As
one trader explained:
I was previously in Kakuma Four… That’s where my
business was. But I decided to come to Kalobeyei… The
advantage of Kalobeyei is that we have the host community
near to us here. They come and buy our goods, and we
buy from them. That is what motivates us to come here.
(Sudanese non-BC trader, Kalobeyei)
Kenyan shops in the towns rarely list refugees among their
main customers. 10% of shop owners in Kakuma and
Kalobeyei towns list Sudanese refugees among their main
customer groups. The likelihood of listing any of the other
main refugee nationalities among their main customer
groups is only 1-7%. On the other hand, Kenyan shops inside
the camp naturally have a high percentage of refugees among
02
,00
04
,00
06
,00
08
,00
01
0,0
00
Cre
dit p
er
custo
mer
in K
ES
Never applied Applied BC
excludes outside values
0 20 40 60 80 100%
BC
Applied
Never applied
Two weeks or less One month or more
When Bamba Chakula is given
02
04
06
08
01
00
% u
sin
g s
pecia
l offers
Neverapplied
Applied BC
02
04
06
08
01
00
% o
ffering b
ulk
dic
ounts
Neverapplied
Applied BC
02
04
06
08
01
00
% a
ctively
cro
ss−
selli
ng
Neverapplied
Applied BC
their main customer groups. For these Kenyan shops, the
main customers are Sudanese refugees, followed by Turkana,
followed by Ethiopian refugees.
Customer loyalty is high across all locations and among all
shops. Shop owners report that about 60% of their customers
are regular customers, and there is little variation across
BC status or location. Credit plays an important role in this
regard. Rather than shopping around, many people have a
specific trader from whom they always make their monthly
BC purchases. By building trust, they make the seller more
comfortable with selling items on credit. For new customers,
trust is initially established through common social contacts,
as well as knowledge of people’s place of residence, as
explained by a refugee trader in Kalobeyei:
For first time customers, we should find out either where you
live or if you know some customer who has done business
with us before. Then I can help you with something, and
sometime later you can bring the payment. If you do not
bring it, I can ask your neighbour, “where is that guy who
came and picked something from my shop?” He will tell me
where you are exactly, and I will ask what is happening that
has prevented you from paying. If you have a good reason
and a strong excuse, then there is no problem; I can allow
“Customer loyalty
is high across all
locations and
among all shops.
Shop owners report
that about 60% of
their customers are
regular customers.”
Fig. 14: Average credit extended per credit customer Fig. 15: Repayment of credit (customer-retailer)
Fig. 16: Share of shop owners giving special offers, bulk discounts and actively
cross-selling products to customers
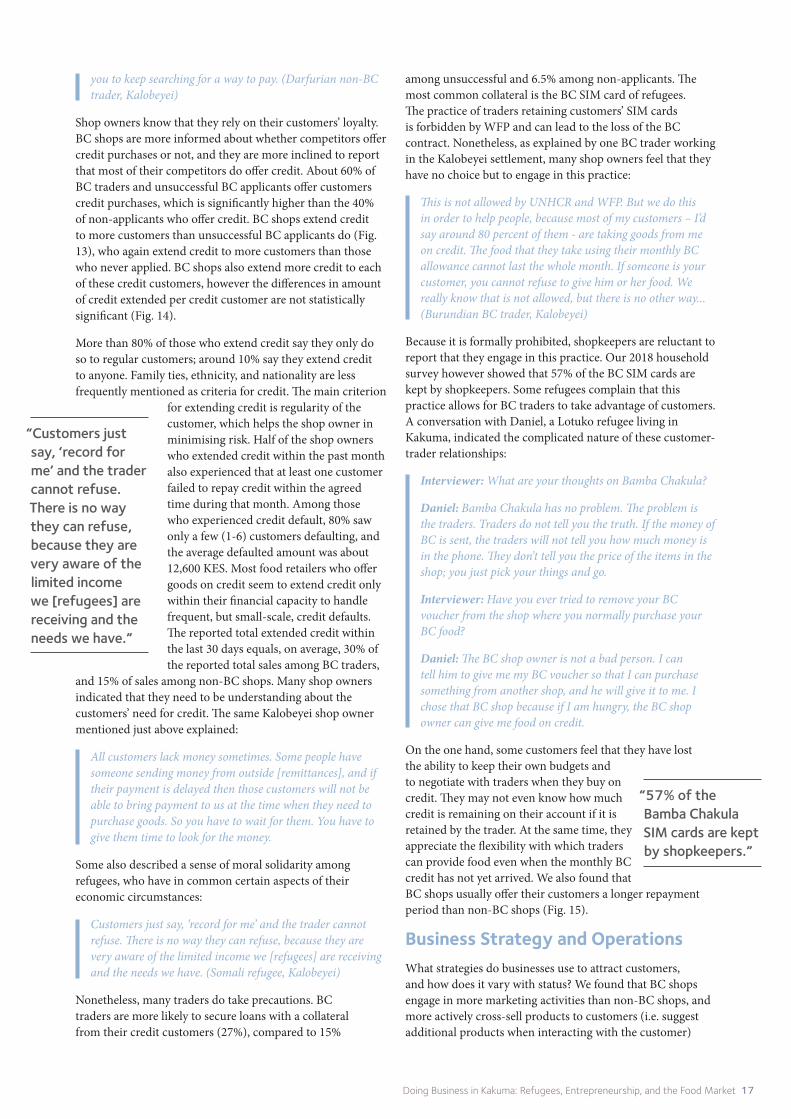
Doing Business in Kakuma: Refugees, Entrepreneurship, and the Food Market 17
you to keep searching for a way to pay. (Darfurian non-BC
trader, Kalobeyei)
Shop owners know that they rely on their customers’ loyalty.
BC shops are more informed about whether competitors offer
credit purchases or not, and they are more inclined to report
that most of their competitors do offer credit. About 60% of
BC traders and unsuccessful BC applicants offer customers
credit purchases, which is significantly higher than the 40%
of non-applicants who offer credit. BC shops extend credit
to more customers than unsuccessful BC applicants do (Fig.
13), who again extend credit to more customers than those
who never applied. BC shops also extend more credit to each
of these credit customers, however the differences in amount
of credit extended per credit customer are not statistically
significant (Fig. 14).
More than 80% of those who extend credit say they only do
so to regular customers; around 10% say they extend credit
to anyone. Family ties, ethnicity, and nationality are less
frequently mentioned as criteria for credit. The main criterion
for extending credit is regularity of the
customer, which helps the shop owner in
minimising risk. Half of the shop owners
who extended credit within the past month
also experienced that at least one customer
failed to repay credit within the agreed
time during that month. Among those
who experienced credit default, 80% saw
only a few (1-6) customers defaulting, and
the average defaulted amount was about
12,600 KES. Most food retailers who offer
goods on credit seem to extend credit only
within their financial capacity to handle
frequent, but small-scale, credit defaults.
The reported total extended credit within
the last 30 days equals, on average, 30% of
the reported total sales among BC traders,
and 15% of sales among non-BC shops. Many shop owners
indicated that they need to be understanding about the
customers’ need for credit. The same Kalobeyei shop owner
mentioned just above explained:
All customers lack money sometimes. Some people have
someone sending money from outside [remittances], and if
their payment is delayed then those customers will not be
able to bring payment to us at the time when they need to
purchase goods. So you have to wait for them. You have to
give them time to look for the money.
Some also described a sense of moral solidarity among
refugees, who have in common certain aspects of their
economic circumstances:
Customers just say, ‘record for me’ and the trader cannot
refuse. There is no way they can refuse, because they are
very aware of the limited income we [refugees] are receiving
and the needs we have. (Somali refugee, Kalobeyei)
Nonetheless, many traders do take precautions. BC
traders are more likely to secure loans with a collateral
from their credit customers (27%), compared to 15%
among unsuccessful and 6.5% among non-applicants. The
most common collateral is the BC SIM card of refugees.
The practice of traders retaining customers’ SIM cards
is forbidden by WFP and can lead to the loss of the BC
contract. Nonetheless, as explained by one BC trader working
in the Kalobeyei settlement, many shop owners feel that they
have no choice but to engage in this practice:
This is not allowed by UNHCR and WFP. But we do this
in order to help people, because most of my customers – I’d
say around 80 percent of them - are taking goods from me
on credit. The food that they take using their monthly BC
allowance cannot last the whole month. If someone is your
customer, you cannot refuse to give him or her food. We
really know that is not allowed, but there is no other way...
(Burundian BC trader, Kalobeyei)
Because it is formally prohibited, shopkeepers are reluctant to
report that they engage in this practice. Our 2018 household
survey however showed that 57% of the BC SIM cards are
kept by shopkeepers. Some refugees complain that this
practice allows for BC traders to take advantage of customers.
A conversation with Daniel, a Lotuko refugee living in
Kakuma, indicated the complicated nature of these customer-
trader relationships:
Interviewer: What are your thoughts on Bamba Chakula?
Daniel: Bamba Chakula has no problem. The problem is
the traders. Traders do not tell you the truth. If the money of
BC is sent, the traders will not tell you how much money is
in the phone. They don’t tell you the price of the items in the
shop; you just pick your things and go.
Interviewer: Have you ever tried to remove your BC
voucher from the shop where you normally purchase your
BC food?
Daniel: The BC shop owner is not a bad person. I can
tell him to give me my BC voucher so that I can purchase
something from another shop, and he will give it to me. I
chose that BC shop because if I am hungry, the BC shop
owner can give me food on credit.
On the one hand, some customers feel that they have lost
the ability to keep their own budgets and
to negotiate with traders when they buy on
credit. They may not even know how much
credit is remaining on their account if it is
retained by the trader. At the same time, they
appreciate the flexibility with which traders
can provide food even when the monthly BC
credit has not yet arrived. We also found that
BC shops usually offer their customers a longer repayment
period than non-BC shops (Fig. 15).
Business Strategy and Operations
What strategies do businesses use to attract customers,
and how does it vary with status? We found that BC shops
engage in more marketing activities than non-BC shops, and
more actively cross-sell products to customers (i.e. suggest
additional products when interacting with the customer)
“Customers just
say, ‘record for
me’ and the trader
cannot refuse.
There is no way
they can refuse,
because they are
very aware of the
limited income
we [refugees] are
receiving and the
needs we have.”
“57% of the
Bamba Chakula
SIM cards are kept
by shopkeepers.”

18 Doing Business in Kakuma: Refugees, Entrepreneurship, and the Food Market
02
04
06
08
01
00
%
Neverapplied
Applied BC
Special offers/ discounts
02
04
06
08
01
00
%
Neverapplied
Applied BC
Variety of goods0
20
40
60
80
10
0
%
Neverapplied
Applied BC
Possibilities for credit (all traders)
02
04
06
08
01
00
%Neverapplied
Applied BC
Possibilities for credit (traders who offered credit in the last month)
02
04
06
08
01
00
%
Neverapplied
Applied BC
Reliable quality
02
04
06
08
01
00
%
Neverapplied
Applied BC
Lower price
02
04
06
08
01
00
%
Neverapplied
Applied BC
Loyalty
02
04
06
08
01
00
%
Neverapplied
Applied BC
Proximity
02
04
06
08
01
00
%
Neverapplied
Applied BC
They are friends
02
04
06
08
01
00
%
Neverapplied
Applied BC
Other reasons (ethnicity, home delivery, or not specified)
Fig. 17: Shop owners’ explanations of why customers choose them

Doing Business in Kakuma: Refugees, Entrepreneurship, and the Food Market 19
than non-BCs do. Non-applicants for BC status are much less
likely to offer special offers or bulk discounts than both BCs
and unsuccessful BC applicants (Fig 16).
Shop owners believe customers choose their shop because
of, first, loyalty, and, second, because of lower prices and
discounts (Fig. 17). However, there is some variation between
the different types of shops. For BC traders, greater variety
of stock is reported as the second most important factor in
attracting customers to their shop, while non-applicants to
BC list offering credit as the second most important factor
(both after loyalty). However, for BC traders and unsuccessful
BC applicants, credit is not regarded so highly as a factor in
attracting customers: it ranks after loyalty, offers/discounts,
low prices, high variety of goods, and reliable quality of
goods. Proximity is rarely listed as a reason for customers to
choose them; it is likely that proximity is an advantage only in
areas with a small number of shops.
What practices do food retailers adopt to determine, for
example, their product mix and prices, to manage their
operations, and to keep financial records? Food retailers
generally select prices and product mix by observing the
behaviour of competitors, by speaking to customers, or
by speaking to suppliers. BC shops and unsuccessful BC
applicants adopt such strategies with similar regularity, while
non-applicants are less likely to adopt deliberate strategies
for determining product range and pricing (Fig. 18). More
than 80% of both BC and unsuccessful applicants use at
least two of the five listed practices (check competitor prices;
check competitor products; ask current customers about new
products in demand; ask former customers for feedback; ask
suppliers for industry best sellers); among non-applicants
only 62% do so. 30% of non-applicants report not using
any of the five practices, whereas less than 10% of BC shops
and unsuccessful BC applicants use them. BC shops and
unsuccessful BC applicants have on average adopted around
3.5 of these practices in the past 30 days.
In terms of keeping records, BC shops are significantly
more likely to record their sales (76%) than unsuccessful BC
applicants (60.4%), who are significantly much more likely
to record their sales than non-applicants (35.4%) (Fig. 19).
Shop owners in Kalobeyei settlement are more likely to keep
records than shop owners in Kakuma camp and the two
towns.
Importantly, the level of detail of records is often poor: the
most common practice is to keep records only of the total
daily sales (Fig. 20). Some BC shop owners reported keeping
two kinds of records: one for inventory, to determine what
had been sold and what needed to be restocked, and another
for information on regular customers, which makes it easy to
look up their BC information and past purchases:
02
04
06
08
01
00
% c
hecked c
om
petito
r prices
Neverapplied
Applied BC
02
04
06
08
01
00
% c
hecked c
om
petito
r pro
ducts
Neverapplied
Applied BC
02
04
06
08
01
00
% a
sked c
usto
mers
about new
pro
ducts
Neverapplied
Applied BC
02
04
06
08
01
00
% a
sked form
er
custo
mers
for
feedback
Neverapplied
Applied BC
02
04
06
08
01
00
% a
sked s
upplie
r fo
r in
dustr
y b
est selle
rs
Neverapplied
Applied BC
Fig. 18: Share of shop owners who within the last 30 days informed their prices and product mix using various
activities/channels

20 Doing Business in Kakuma: Refugees, Entrepreneurship, and the Food Market
I record the name of each customer, their telephone number
and their location, and I assign them a number that they
can use when they return to my shop. Names are difficult to
record and organise, but numbers make it easy to look up
the customer… It may arise that a customer denies taking an
item. When this occurs, I can just open the book and show
them what they bought. (Burundian BC trader, Kalobeyei)
The use of tablets or other technical devices for recording
sales is almost non-existent (2.9%) (Fig. 21). Most traders
with access to a tablet are BC traders who are part of a small
pilot for electronic Point of Sale (POS) systems run by WFP.
.3 .6 .7 .4 .9 1 .4 .6
0.2
.4.6
.81
Sh
are
of
sh
op
ow
ne
rs w
ho
re
co
rd s
ale
s
Neverapplied
Applied BC
Kakuma
Neverapplied
Applied BC
Kalobeyei
Applied BC
Other towns
32.7 32.7 33.5
02
04
06
08
01
00
%
Neverapplied
Applied BC
Every item in a transaction/sale
57.7 51.8 45.8
02
04
06
08
01
00
%
Neverapplied
Applied BC
Total daily sales value
“Most shop owners
have employees:
79% employ at
least one person.
However, more
than half of these
‘employees’ are
unpaid.”
Fig. 19: Share of shop owners who record sales
Fig. 20: Level of records (among those who record)
Employees
Most shop owners have employees: 79% employ at least one
person (Fig 24). However, more than half of these ‘employees’
are unpaid; only 44% of owners pay their employees. BC shop
owners employ more people (Fig. 22), have a greater number of
external employees, and also pay a higher share of employees
(Fig. 23); however, the average monthly wage paid to employees
is the same across all shop types (approximately 3,400 KES/
month) (Fig 25). BC shops also have more trained staff.
Regardless of BC status, location and nationality, shop owners
d B
1.9 6.5 18.1
02
04
06
08
01
00
%
Neverapplied
Applied BC
Every transaction value (total only)
d B
7.7 8.9 2.6
02
04
06
08
01
00
%
Neverapplied
Applied BC
Other (e.g. weekly, above certain value, only credit sales)

Doing Business in Kakuma: Refugees, Entrepreneurship, and the Food Market 21
.7 4.7 9.3
01
02
03
04
05
0%
Never applied Applied BC
.71 .82 .86 .88 .78 .94 .6 .54
0.2
.4.6
.81
Sh
are
of
sh
op
ow
ne
rs w
ho
em
plo
y o
the
rs
Neverapplied
Applied BC
Kakuma
Neverapplied
Applied BC
Kalobeyei
Applied BC
Other towns
1.7 2.4 2.8
01
23
Nu
mb
er
of
em
plo
ye
es a
mo
ng
th
ose
wh
o e
mp
loy
Never applied Applied BC
who employ people from outside their household or family
tend to employ people of their own nationality (this applies
more so for Sudanese, Congolese, Burundian and Ethiopian
shop owners than for South Sudanese, Somali and Kenyan
employers). Many Kenyan traders described employing
refugee workers as a way to overcome language barriers, and
some even learn a bit of their employees’ languages:
As hosts, we have a good relationship with refugees. We have
employed them in our shops, and they assist us to negotiate
with other refugees. They teach us how to talk with them.
Like for me, as of now, I know a little bit of their language.
Not all, but a little… (Kenyan BC trader, Kalobeyei)
In terms of management, 90% of shops are run by the owner
(or co-owner) and the remaining 10% by either a member of
the owner’s household or a hired employee (and there is no
variation with BC status).
Capital
In terms of start-up capital, the amount of initial capital
invested in the business varies greatly. BC traders and
unsuccessful BC applicants invested on average about three
times as much as food retailers who never applied for a BC
contract. The ‘typical’ start-up investment of traders who
never applied to the scheme is 5,000-40,000 KES, compared
with 20,000-100,000 KES among unsuccessful BC applicants
and 20,000-150,000 KES among BC traders (Fig. 26). Lack of
access to capital is one reason that some traders never applied
for a BC contract:
I don’t feel like I can begin using Bamba Chakula now,
because my capital is still low. Even if I had a contract, if I
don’t have capital, I will be unable to keep a sufficient stock
of goods to serve my customers. So I am waiting until I see
that my capital has increased; then I might apply for it.
(Congolese non-BC trader, Kalobeyei)
In terms of infrastructure ownership, 76% of retailers report
owning the building where their business is located; the
remaining 24% own the business but rent the place. 90%
of shop owners in Kalobeyei report owning their shops
compared with 76% in Kakuma, and 51% in Kakuma and
Kalobeyei Towns. There is no difference in ownership
distribution across BC status. Despite high level of reported
ownership, only 24% paid for either the location, the building
.2 .4 .6
0.2
.4.6
.81
Share
who p
ay e
mplo
yee
s
Never applied Applied BC
Fig. 21: Share who has tablet/other technical device
for recording
Fig. 24: Share of shop owners who employ others
Fig. 22: Number of employees among the shop owners
who employ
Fig. 23: Share of employing shop owners who pay their
employees

22 Doing Business in Kakuma: Refugees, Entrepreneurship, and the Food Market
or both, when starting their shop. Among those who paid
for the location or building, the average cost of the business
infrastructure was about 65,000 KES.
Among those who reported owning the infrastructure
(regardless of initially having paid for it or getting it for
free), the estimated replacement cost of the building varies
substantially. The ‘typical’ replacement cost is 25,000-75,000
KES for traders who never applied to the BC scheme, but
35,000-140,000 KES among unsuccessful BC applicants and
50,000-150,000 KES among BC traders (Fig. 27).
Very few shop owners have financial loans (Fig. 28). Among
those who do, most claim to need more than they can access.
BC traders and applicants without loans are more likely to
say that they do not need a loan, compared to non-applicants
who are more likely to need loans but are less likely to know
where, from whom, or how to obtain them.
A majority of shop owners are credit constrained. Many shop
owners without a loan reported that they do not know where
or how to obtain a loan (27.7%) or could not obtain a loan
(27.8%). Only 55 of shop owners from our entire sample have
a loan with a bank, an NGO/IO, a microfinance institution,
or a private lender, and 83% of these also report being
credit constrained, needing more credit than the amount
they have actually obtained. The initial value of the loans
was on average 120,000 KES. Only 40% of loan holders pay
any interest, and for those that do pay interest, the average
interest paid per month is 14,000 KES, or 12% of the initial
loan value. 42% of the shop owners with loans got the loan
from friends, 25% from a bank and 23% from an NGO/IO.
Microfinance organisations and savings groups are rarely
used.
In terms of access to bank accounts, BC shop owners are
significantly more likely to have a bank account. 42% of shop
owners overall have a bank account: 61% of BC shops, 41%
of unsuccessful BC applicants, and 17% of non-applicants
(Fig. 29). M-Pesa12 accounts are more common than bank
accounts. 76% of shop owners have an M-Pesa account: 88%
of BC shops, 76% of unsuccessful BC applicants, and 60%
of non-applicants (Fig. 30). Access to banking and M-Pesa
also varies with location: Kakuma Town has almost universal
coverage of both; the refugee camps/settlements have 78%
M-Pesa and 39% bank accounts (with 35% bank accounts
in Kakuma and 60% in Kalobeyei), and Kalobeyei Town has
25% M-Pesa an 31% bank accounts).
In terms of the estimated current total value of shop owner
assets: BC traders are on average significantly wealthier
(600,000 KES) than unsuccessful BC applicants (460,000
KES), who are on average significantly wealthier than non-
applicants (190,000 KES). However, there are huge variations:
non-applicants’ current assets have the least variation,
typically worth between 55,000-250,000 KES, and not a single
one of the interviewed non-applicants had a negative net
wealth (which is not surprising, given their lack of access to
loans and wholesaler credit). The range of BC traders and
unsuccessful applicants’ current net worth is much wider and
typically ranges 145,000-575,000 KES among unsuccessful
02
,00
04
,00
06
,00
08
,00
01
0,0
00
Avera
ge m
onth
ly w
age a
mong p
aid
em
plo
yees (
KE
S)
Never applied Applied BC
50
,00
01
00
00
01
50
00
02
00
00
02
50
00
03
00
00
0S
tart
capital (K
ES
)
Never applied Applied BC
excludes outside values
50
,00
01
00
00
01
50
00
02
00
00
02
50
00
03
00
00
0R
epla
cem
ent cost (K
ES
, per
shop)
Never applied Applied BC
excludes outside values
4.1 5.8 10.8
02
04
06
08
01
00
%
Never applied Applied BC
12 M-Pesa is a form of mobile money widely used in Kenya.
Fig. 25: Average monthly wage among paid shop
employees (KES)
Fig. 26: Capital invested to start the business
Fig. 27: Current replacement cost of the business buildings
Fig. 28: Share of shop owners who have a loan

Doing Business in Kakuma: Refugees, Entrepreneurship, and the Food Market 23
14.6 35.7 51.7 29.2 62.2 83.9 47.6 84.6
020
40
60
80
100
%
Neverapplied
Applied BC
Kakuma
Neverapplied
Applied BC
Kalobeyei
Applied BC
Other towns
59.3 82.9 90.5 62.5 73 77.4 42.9 88.5
020
40
60
80
100
%
Neverapplied
Applied BC
Kakuma
Neverapplied
Applied BC
Kalobeyei
Applied BC
Other towns
−5
00
05
00
1,0
00
1,5
00
1,0
00 K
ES
Never applied Applied BC
Calculated current value of shop owners’ total assets
“Very few shop
owners have
financial loans.
Among those who
do, most claim to
need more than
they can access.”
13 Estimated current total worth of shop owners business-related assets, calculated as the sum of the replacement cost of shop buildings, current value of stock, cash, M-Pesa reserves and business assets (tills, scales, stalls, desks, calculators, posho mills, bicycles, boda bodas) as well as animals, minus outstanding loan and credit to suppliers. Outliers of the distributions of all components of the index are adjusted by Winsorizing (i.e. replacing extreme values with a certain percentile value at each end of the distribution; in our case the upper and lower 5%), and subsequently aggregated.
Fig. 29: Shop owners who have a bank account
Fig. 30: Shop owners who have M-Pesa
Fig. 31: Estimated current net worth of shop owner assets13

24 Doing Business in Kakuma: Refugees, Entrepreneurship, and the Food Market
applicants and 280,000-805,000 KES among BC traders
(Fig. 31). Only few traders in these groups have a negative
net worth (less than 1% among unsuccessful applicants and
about 2% of the BC traders), but a couple of these are heavily
indebted.
Law and Regulation
BC traders are obliged to hold a business permit in
conformity with the Turkana County Government’s (TCG)
regulatory requirements. The County Government has
criteria according to size and type of business, for example, to
set the cost of a business permit and the registration process
was automated in 2019. While there is no systematic system
of enforcement, failure to obtain a permit can become a
liability if shop owners need to bring a case to the authorities:
Sometimes, you have disagreements with your customers.
They may check to see if you have a permit. If you do, they
will deal with you according to the law. But if you don’t
[have the permit], they will see that you’re not a legitimate
business person, and that maybe you want to play around.
(Sudanese non-BC trader, Kalobeyei)
Almost all BC shops have a valid business permit (98.5%),
compared to 83.5% among unsuccessful BC applicants,
and only about half of the non-applicants (51.7%) (Fig. 32).
BC traders pay on average about 4,500 KES per year for a
contract, which is significantly higher
than non-BC shops (about 3,400 KES
per year). This may be because BC
shops have higher sales volumes, and
permit charges are determined based
on a subjective assessment of the scale
of the business. The same shop owner
explained: “You just go and report your
shop, and then they will come and
see what you are selling... The amount
charged varies according to the shop. If
the shop is big, maybe they will charge
3,000 KES or 3,500 KES.” Our survey showed that the range
of charges is also broader among BC traders than among
non-BC shops (Fig. 33). With the establishment of the new
Huduma-Biashara ‘one-stop-shop’ business centres, these
challenges are expected to reduce over time.
14 Regarding the excluded outliers: The annual permit fee for certain businesses (e.g. hardware shops) can be up to 25,000 KES. A few such shops were included in our sample, as they also sell food.
“Almost all BC shops
have a valid business
permit (98.5%),
compared to 83.5%
among rejected BC
applicants, and only
about half of the non-
applicants (51.7%).”
51.7 83.5 98.5
02
04
06
08
01
00
%
Never applied Applied BC
2,0
00
4,0
00
6,0
00
8,0
00
An
nu
al p
erm
it f
ee
pa
id (
KE
S p
er
sh
op
)
Never applied Applied BC
excludes outside values
Fig. 32: Share of shop owners who holds a valid business
permit
Fig. 33: Annual business permit fee per shops (KES),
among those who paid the fee14

Doing Business in Kakuma: Refugees, Entrepreneurship, and the Food Market 25
15 Items asked: Rice, sorghum, maize, wheat flour, maize flour, beans, lentils, sugar, nuts, coffee, tea leaves, eggs, fresh milk, powder milk, salt, cooking oil, macaroni, spaghetti, canned tuna fish, tomato sauce, bottled water, soft drinks, biscuits, fresh fruit, fresh vegetable, fresh fish/meat, soap, body lotion, charcoal.
The food retail sector is not characterised by perfect competition. Market
concentration among wholesalers, restrictions on the number of BC
contracts, and price collusion are among the factors that inhibit free market
competition. There is little price variation across shops, partly due to price
f ixing. Any price differences tend to relate to the size of the purchase, with
discounts for bulk-buying. Prof it levels are determined less by retail pricing
and more by overall volume of sales because selling in bulk offers increased
access to bulk discounts from suppliers.
Products
BC shops offer a higher variety of products than unsuccessful
BC applicants, who again sell a greater range of products
than shop owners who did not apply for BC status (Fig. 34).
About half of all shops sell animal products (i.e. meat, eggs,
or dairy), and less than 40% sell fruit or vegetables, with no
significant difference across BC status. The most common
commodities are the four main staples (wheat flour, maize,
sorghum, rice), followed by sugar, beans and lentils, and
cooking oil (Fig. 35).
Price Competition
In general, there is little variation in prices (Figs. 36-38) and
when there is, differences are not systematic. No particular
markets have generally higher or lower median prices than
other markets. For example, Kakuma Two has one of the
highest median prices for rice and coffee, but some of the
lowest for maize, sugar, and lentils. It seems that traders are
reluctant to, or incapable of, competing on prices.
Competitive pricing requires the conditions of a free
market. However, a number of circumstances in Kakuma
and Kalobeyei limit free market competition. These
include: (1) an oligopoly of wholesalers, (2) restrictions
on the number of BC retailers, (WFP limited numbers in
order to achieve an optimum level based on retail market
analysis) (3) dependency on credit (which makes loyalty to
a particular trader more important than buying from the
cheapest trader), (4) geography (the market is isolated and
competition appears to work differently in dense market
areas compared to sparse market areas), and (5) coordinated
pricing (BC retailers meet monthly with WFP to agree on
prices based on the cost of goods).
This last limitation on competition is related to coordinating
efforts undertaken by BC traders, who meet together in
a traders’ association, as per WFP guidelines. In these
associations, they can approach wholesalers collectively to
7.9 11.6 14.5 7.6 11.1 16.4 7.4 10.3
02
46
81
01
21
41
61
82
0N
um
be
r o
f th
e g
oo
ds a
ske
d f
or
so
ld a
t th
is s
ho
p
Neverapplied
Applied BC
Kakuma
Neverapplied
Applied BC
Kalobeyei
Applied BC
Other town
0 20 40 60 80 100percent
BC
Applied
Never applied
Staples Fruit/Veg Meat Sugar
Beans/Lentils Pasta Oil Milk
Eggs Salt Drinks Other
Fig. 34: Number of types of goods sold (from a list of 29
items15)
Fig. 35: Composition of sales, calculated using median
prices and volumes
5. Market Structure and Competition

26 Doing Business in Kakuma: Refugees, Entrepreneurship, and the Food Market
negotiate prices, and sometimes they arrange to make bulk
purchases in a group, thereby reducing the unit price and
transport costs.
Traders also receive assistance from WFP in negotiating
prices with wholesalers. WFP monitors the market each
month through price surveys as well as meetings with
wholesalers, traders, and market coordinators. Using this
information, maximum wholesale prices for various items
are recommended to suppliers, and maximum retail prices
based on seven percent mark-up are issued to BC traders.
WFP research has indicated that the price guidelines seem to
be working, pushing the previous 13 percent mark-up among
retailers down to about eight percent.
Whether or not traders used the WFP price guidelines, some
traders complained that they were at times inaccurate. The
primary reasons for this inaccuracy were fluctuations over
time, variations in the prices charged by different wholesalers,
and differences in the prices of items sold at different scales.
The price fluctuations result from short-term changes in the
market, which complicate the attempt by WFP to estimate
prices across an entire month. As one Eritrean BC trader in
Kakuma explained: “WFP gives us a long-term price, but
you may find price changes within two days especially on
goods like maize, wheat flour, sugar etc. The price fluctuates
very fast in the market.” In recognition of this problem, WFP
has committed to review their guideline prices for some
commodities – such as sugar – twice a month.
Another cause of discrepancies between recommended
and actual prices is the variations in the prices charged by
wholesale suppliers. As one Kenyan BC trader in Kalobeyei
explained: “The WFP guidelines are the prices that we use
here, but the problem is the difference that arises because we
don’t buy goods from the same wholesaler”.
Our data confirms that variations in wholesale price seem
to dictate retail prices to deviate from the price guidelines
for certain goods. For example, among the main staples,
the wholesale prices of rice vary greatly, and traders adjust
the retail price to ensure a profit. However, wholesale- and
retail prices of maize and sorghum are more stable, and
interestingly, the price of wheat flour seems almost fixed at
both wholesale and retail level (Fig. 39).
01
,00
02
,00
03
,00
04
,00
0W
ho
lesa
le p
rice
fo
r sta
nd
ard
ba
g o
f sta
ple
s
Maize (45 kg) Sorghum (45 kg)
Rice (25 kg) Wheat flour (24 kg)
05
01
00
15
0R
eta
il p
rice
wh
en
so
ld b
y t
he
kilo
Maize by the kg Sorghum by the kg
Rice by the kg Wheat flour by the kg
Fig. 36: Median retail prices (KES) for the standard
unit of common goods, by markets
Fig. 37: Median retail prices (KES) for main staples
when sold by the kilo, by markets
Fig. 38: Median retail prices (KES) for main staples
when sold by the bag, by markets
Fig. 39: Variation in (a) wholesale and (b) retail prices for main staples
Wheat f lour
(24kg)
Wheat f lour (1kg)
Lotion
Soap
Biscuits
Coffee
Nuts
Sugar
Lentils
Beans
Maize flour
Maize(1kg)
Sorghum(1kg)
Rice(1kg)
Maize
(45kg)
Sorghum
(45kg)
Rice
(25kg)

Doing Business in Kakuma: Refugees, Entrepreneurship, and the Food Market 27
Finally, retail prices vary according to the scale at which
items are sold. There is for example bulk pricing of some key
staples, as shown in Fig. 38 (by markets) and Fig. 43 (by BC
status). Maize and sorghum are often sold in 45 kg bags, rice
in 25 kg bags, and wheat flour in 24 kg bags, rather than by
the kilogram.
However, when retailers sell these staples in large sacks
instead of by the kilo, they sell them for very little mark-up
(Fig. 40). Selling staples in sacks appeals to an important
segment within the camp: large households. While big shops
that can stock large quantities of such bags might make up
for the lower profit per kilo sold of each staple through much
larger sales volumes (and hence likely bulk discounts from
wholesaler; thus minimising this reduction in profit per kilo),
smaller shops need to sell most of their staples by the kilo
in order to make a profit. According to our enumerators,
some traders also consider it ‘safer’ to sell by the bag, because
they sometimes struggle to determine mark-up and prices
at a scale that is different from the units used for wholesale
pricing. This could explain why we observe a few traders
incurring a loss when selling staples by the kilogram.
Hence, large families can save money by purchasing their
staples in bulk, but this greatly limits the ability of retailers to
make a profit. As one BC trader in Kalobeyei explained:
The Size 1 customers, those are the ones for whom we can
charge the retail price. We put the goods into small paper
bags. But if a customer takes a whole sack of maize, we
must sell at the wholesale price. So we buy at the wholesale
price, and then we are forced to sell at the wholesale price!
(Kenyan BC trader, Kalobeyei)
Smaller families make purchases in smaller quantities, which
allows traders to make more profit per kilo of the good. But
bulk pricing among retailers is not reflected in the WFP price
guidelines. However, some traders do find these guidelines
helpful in negotiating with wholesalers in Kakuma:
The WFP price guidelines are helpful not only when selling,
but also when buying from the suppliers. You may find one
item that you are accustomed to buy for this price, and yet
the supplier tells you a different price. When you have that
form [the price guidelines], you can show him the price
fixed by WFP, and you can discuss. If he refuses, you go
to another shop. For example, if you got to Al Mubarak
and find the prices are too high, you can move to Mesfin
to confirm the price... We don’t make a loss, because they
[WFP] determine the prices after asking around. Generally,
the prices they determine are good. (Burundian BC trader,
Kalobeyei)
Furthermore, some traders appreciate that WFP
interventions like the price guidelines result in relatively
standardised prices across different BC shops. This provides
some security for traders because they do not lose customers
to highly competitive pricing:
WFP calls us for meetings and gives us a price guide.
They make a market survey, like for example on Monday,
they will come and ask for our sales prices. They request
the menu for food items that we are selling, and they will
approve it... I am in support of this because all of the traders
become equilibrated, whereby when you go to any of the
shops you find the price for a good is the same. It is good
because customers from my village will not seek out another
shop if goods are sold at the same prices. (South Sudanese
BC trader, Kalobeyei)
Non-licensed traders also meet together to determine
their prices, which are often independent from WFP price
guidelines:
We meet to discuss about how we can set prices. For
example, I may say that one kg of sweet potatoes should be
sold at 60 KES. But another trader explains that a sack of
sweet potatoes contains 80 kg, and we
buy it in bulk, so that if we sell 60 KES
per kilo we shall get a lot of profit and
our customers will complain. So he
might encourage us to reduce our prices
to 50 KES per kilo. It is understandable,
and none will refuse. We also discuss
about items to sell, about different places to purchase goods,
and how we shall be helping each other in case of problems.
(Burundian BC trader, Kalobeyei)
Sometimes these meetings attempt to reconcile differences in
retail prices that derive from changing wholesale prices:
We meet because sometimes we purchase our supplies in one
place, so we interact about the prices. When the prices of our
suppliers change – for example if the price increases and you
buy for a high price – you may find another person who still
has the very same item that he bought for a cheap price. If
this happens often, it can cause confusion to the customers.
(Congolese non-BC trader, Kalobeyei)
Many non-BC traders were unaware that WFP provided
prices guidelines. However, some noted that BC traders had
higher prices:
The prices are very different. In the BC shops the prices are
much higher than in our shops. Some people are surprised
to hear our prices. For example, we sell this washing soap for
“WFP calls us for
meetings and gives
us a price guide.”
Cre
dit
: Wo
rld
Fo
od
Pro
gra
mm
e
Price list of items available through Bamba Chakula in a shop in Kakuma

28 Doing Business in Kakuma: Refugees, Entrepreneurship, and the Food Market
80 KES, but in BCs shop you buy it for 100 KES. The reason
they give is that they must wait a long time for WFP cash to
be transferred. (Burundian non-BC trader, Kalobeyei)
The perceived difference may be due to a time-bound
competitive advantage that non-BC traders enjoy during BC
distribution. At this time, BC traders find themselves with
virtual BC credit while non-BC shops have cash in hand. The
latter can replenish their stocks from suppliers with cash in
hand, whereas BC traders become locked into in a cycle of
debts with wholesalers, who can then demand higher prices
due to the risk of giving goods on credit:
Yeah, there is misunderstanding between the shops of
Bamba Chakula and the shops that receive cash. The Bamba
Chakula shops give out goods before their customers have
signed, and this makes it hard for the traders to go and
bring goods from the suppliers. They must take on debt
with the wholesalers. But for us, we pay in cash. We bring
our goods from suppliers for just a small price. When those
goods are finished, we go and bring again, because we have
cash. (Darfurian non-BC trader, Kalobeyei)
However, in terms of overall price levels, this difference was
not reflected in our data. We found no systematic differences
in median retail prices between BC shops and non-BC
shops (including both unsuccessful BC applicants and non-
applicants) (Figs. 41-43).
Additionally, an important role established through WFP
programmes is that of market coordinators, who are selected
by BC retailers across the markets of the Kakuma camps and
the Kalobeyei settlement. We spoke with a Somali-Ethiopian
man who serves as a market coordinator in Kalobeyei, and he
explained his role:
I am within the market, so I see the challenges here. I discuss
key issues with the people in my market area, and then
I take this information into discussions with the market
coordinators from other parts of Kalobeyei and Kakuma.
Then at the end of the month we take all those challenges
to WFP. We explain those challenges and whatever else
has changed throughout that month, and we also share a
price list from our research. Then we discuss what we are
supposed to do for the coming month. That is our agreement
with WFP. It is for the betterment of the Bamba Chakula
programme. (Somali Ethiopian refugee, Kalobeyei)
Aside from his work among the BC traders in his part of
Kalobeyei, he also travels in order to connect with new
wholesalers, going to Kakuma as many as three times
per week and to Nairobi every few months. However, he
explained that this is difficult due to movement restrictions.
Aside from conditions created by the BC programme,
there were also some accusations among both refugees and
hosts that Somali traders have an unfair market advantage
because they share an ethnicity and a religion with the most
prominent wholesalers in Kakuma:
−.5
0.5
11
.52
Ma
rk−
up
Maize by the kg Maize (45 kg bag)
Sorghum by the kg Sorghum (45 kg bag)
Rice by the kg Rice (25 kg bag)
Wheat flour by the kg Wheat flour (24 kg bag)
Fig. 40: Retail mark-up of staples sold by the kilo and by
the bag (0.5=50%)
Fig. 41: Median retail prices (KES) for common goods,
by BC status
Fig. 42: Median retail prices (KES) for main staples when
sold by the kilo, by BC status
Fig. 43: Median retail prices (KES) for main staples when
sold by the bag, by BC status
Lotion
Soap
Biscuits
Coffee
Nuts
Sugar
Lentils
Beans
Maize flour
Maize (1kg)
Sorghum(1kg)
Rice(1kg)
Wheat flour (1kg)
Maize (45kg)
Sorghum(45kg)
Rice(25kg)
Wheat flour (24kg)

Doing Business in Kakuma: Refugees, Entrepreneurship, and the Food Market 29
If a Somali goes to the wholesaler – many of them, you see,
they are Somalis – they will give him a different price than
me. For example, take wheat flour. A whole box is normally
bought at 1,650 KES, but a Somali can buy if for 1,550
KES. Given this, do you think we can sell at the same price?
(Burundian BC trader, Kakuma)
Resentment about the alleged ‘Somali advantage’ was
especially high among host traders, who accused refugee
traders of colluding with Kenyan wholesalers:
Some people have sold their Bamba Chakula lines to Somali
refugees and the Somali refugees in turn take these cards
to other Somalis of Kenyan origin. The Kenyan Somalis
supply them with goods and they share profits that they
make. They sell goods at prices that are lower than those
agreed upon with WFP. They have killed our business. It is a
plan to discourage the host from doing business so that they
[refugees] take over Bamba Chakula. (Turkana BC trader,
Kalobeyei)
The anger apparent in such accusations is a potential
source of conflict in Kalobeyei, and a threat of which many
refugee traders are aware. Tensions already escalated once
in late 2017, when a Somali trader received death threats in
Kalobeyei and was forced to cease his business activities.16
Sales, Expenditure, and Profit
In terms of sales, BC shops have higher sales volumes in total
(Fig. 46), as well as for most goods separately, especially from
the main staples (Figs. 44 and 45). However, BC shops do
not have higher cash sales; the majority of BC traders get the
vast majority of their sales through BC. For BC shops 19.4%
of sales in Kalobeyei are cash sales; 36.8% of sales in Kakuma
are cash sales.
BC traders are able to keep substantially more stock
compared to other shops (Fig. 47). However, BC shops’
stock seems to vary temporally with the monthly cycle of BC
distribution, whilst non-BC shops’ stock is more consistent
over time. In Kakuma, the BC transfer to beneficiaries takes
place between the 18th - 25th of each month; in October,
it was distributed on Oct 25th. Stock value peaked a couple
days before the designated period, and decreased with each
day after that. In Kalobeyei, BC transfer normally takes
place between the 8th-12th; in October, it was delayed and
distributed on Oct 15th. We started our survey on the 9th,
and observed the same pattern of declining current stock
value for each day throughout the first week.
In line with this, the busiest period for BC shopkeepers is
immediately after BC vouchers are transferred. At this point,
some BC traders complain of a flood of customers. This rush
of customers causes ‘jams’ at the stores, and stock can be
depleted rapidly. However, in order to purchase more stock
from suppliers, shop owners must balance the debts owed to
05
00
1,0
00
1,5
00
2,0
00
2,5
00
Ca
lcu
late
d A
gg
reg
ate
Sa
les (
1,0
00
KE
S)
Ka
ku
ma
Ne
ve
r a
pp
lied
Ka
ku
ma
Ap
plie
d
Ka
ku
ma
BC
Ka
lob
eye
iN
eve
r a
pp
lied
Ka
lob
eye
iA
pp
lied
Ka
lob
eye
iB
C
To
wn
Ap
plie
d
To
wn
BC
excludes outside values
0100000
200000
300000
400000
500000
Ca
lcu
late
d A
gg
reg
ate
Sto
ck
Ka
ku
ma
Ne
ve
r a
pp
lied
Ka
ku
ma
Ap
plie
d
Ka
ku
ma
BC
Ka
lob
eye
iN
eve
r a
pp
lied
Ka
lob
eye
iA
pp
lied
Ka
lob
eye
iB
C
To
wn
Ap
plie
d
To
wn
BC
Fig. 44: Median of monthly sales volume, common goods
(KES)
Fig. 46: Calculated monthly aggregate sales volume (KES)17
Fig. 47: Calculated aggregate current stock volume (KES)18
Fig. 45: Median of monthly sales volume, main staples
(KES)
16 Boru, Q. (2018), ‘Refugee business entrepreneur facing life threats’, Kakuma News Reflector. Available at https://kanere.org/2018/02/11/refugee-business-entrepreneur-facing-life-threats (accessed 22 July 2019).
17 Estimated total sales based on the value of volumes sold of all goods asked for (footnote 4). For each good, the retail price per unit is median corrected and the volume sold adjusted by Winsorizing, before aggregation.
18 Estimated total stock based on the wholesale value (i.e. replacement cost) of volumes stocked of all goods asked for (footnote 4). For each good, the wholesales price per unit is median corrected and the volume stocked adjusted by Winsorizing, before aggregation.
Wheat flour
Lotion
Soap
Biscuits
Coffee
Nuts
Sugar
Lentils
Beans
Maize flour
Maize
Sorghum
Rice

30 Doing Business in Kakuma: Refugees, Entrepreneurship, and the Food Market
them from customers who have taken goods on credit prior
to the distribution date. In many cases, they have retained
the BC lines of these customers, and spend a great deal of
time balancing their customers’ credit, so that the lines can
be returned to their owners and the traders can purchase new
stock. One BC trader in Kalobeyei explained the challenge:
When money is transferred, I become busy withdrawing
cash from my clients’ lines to balance their credit. It can take
me like 5 days. Meanwhile, I must also go around looking
for other goods that my customers want, but which have
been depleted. (Burundian BC trader, Kalobeyei)
Balancing credit takes time and wholesalers will sometimes
refuse to give traders new merchandise until they do so. The
result is a depletion of stock in the BC shops.
Frequent delays in the distribution of BC can exacerbate the
problem of stock depletion, as another Burundian BC shop
owner in Kalobeyei explained:
Ehhhhhh, this one affects me a lot. If the BC distribution is
delayed, the first thing that must happen is that we give out
many goods to our beneficiaries on credit. You may find the
stock is depleted and the wholesalers refuse to give us new
merchandise as long as money is delaying. (Burundian BC
trader)
There is some evidence that when people have spent their BC,
they may choose non-BC shops for cash purchases due to the
reliability of their stock outside of the BC trading period.
In terms of expenditure, BC owners have much higher
expenses than unsuccessful applicants and those who never
applied (Figs. 48 and 49). These are mainly driven by the
higher inventory cost, but they also spend more on wages,
their own salary, and loan repayments. In addition, their
households are likely to consume more from the shop’s stock.
The BC traders in Kalobeyei have substantially higher costs
than BC traders in Kakuma and the towns (Fig. 49).
BC shops within both the Kakuma Camps and Kalobeyei
Settlement have significantly higher profits than non-BC
shops. The profit gap between BC shops and non-BCs is
much larger in Kalobeyei than in Kakuma: In Kakuma,
the average self-reported profit in the last month is about
19,000 KES among non-applicants and 40,000 KES among
unsuccessful applicants, from which BC traders report almost
the double: 77,000 KES. In Kalobeyei, BC shops report more
than 3.5 times the profit of unsuccessful applicants: 95,000
KES compared to 26,000 KES, and the non-applicants report
about 12,000 KES of profit on average. Notably, there is a
minority of BC traders who do very well, which affects these
means. Still, the pattern remains when comparing median
values, in which case reported profits are 2.5 - 5 times larger
among BC than non-BC, irrespective of the shop location
(Fig. 50).
0200
400
600
800
1,0
00
Calc
ula
ted A
ggre
gate
Expenses (
1,0
00 K
ES
)
Kakum
aN
ever
applie
d
Kakum
aA
pplie
d
Kakum
aB
C
Kalo
beye
iN
ever
applie
d
Kalo
beye
iA
pplie
d
Kalo
beye
iB
C
Tow
nA
pplie
d
Tow
nB
C
excludes outside values
05
0,0
00
10
00
00
15
00
00
20
00
00
25
00
00
Self−
report
ed P
rofits
(K
ES
)
Kakum
aN
ever
applie
d
Kakum
aA
pplie
d
Kakum
aB
C
Kalo
beye
iN
ever
applie
d
Kalo
beye
iA
pplie
d
Kalo
beye
iB
C
Tow
nA
pplie
d
Tow
nB
C
Fig. 48: Reported monthly expenses (KES), by BC status
Fig. 49: Calculated aggregated monthly expenses (KES)19
Fig. 50: Self-reported profits last month (KES)20
19 Based on following reported expenses: 1) inventory, 2) electricity, water, gas and fuel, 3) rent, 4) maintenance and repair, 5) rent of machinery and equipment (e.g. generator, fridge), 6) transport costs for business-related reasons (e.g. to buy stock, or travel from home to the shop), 7) telephone cost, 8) household consumption of goods from the business, 9) owner salary, 10) wages to employees, and 11) loan repayment costs. All categories adjusted by Winsorizing before aggregation.
20 Adjusted by Winsorizing above the 95% and below the 5% percentile.

Doing Business in Kakuma: Refugees, Entrepreneurship, and the Food Market 31
Market Geography and Competition
Sales and profits appear to be slightly higher in dense
markets, but the variety of goods sold is slightly lower.21
Surprisingly, prices in dense markets are not significantly
different. This may be a result of either traders colluding on
prices or traders selling with such a low profit margin (due to
wholesalers’ oligopolistic power) that they cannot afford to
reduce prices any further.
It is unclear how easily shops can choose their shop location
within the towns, settlement, or camp. Previous research
in Kakuma camp has suggested that business owners can
choose their location through an informal ‘real estate’ market,
although the lack of formal registration leaves many open to
exploitation.22 In Kalobeyei, however, changing location was
seen as being a hassle, and some expressed frustration about
determining the process. One Somali BC trader in Kalobeyei
complained “There are many procedures regarding the land:
and buildings. This is difficult, from our view. The ones who
allocate space are... I don’t know. DRC, RAS or what.” The
Physical Plan for the Kalobeyei Settlement entails a stricter
system of spatial regulation than in Kakuma, and some
traders expressed uncertainty about where they can build
their shops. This includes non-BC traders:
When I first came to this place, for me, it was difficult. I was
given this place, but later, there was a misunderstanding.
Someone came and asked me, “Who give you this place”?
We went to the person with whom it was registered. I was
worried. I thought I was going to lose money over that issue.
(Darfurian non-BC trader, Kalobeyei)
The Kalobeyei spatial plan was developed using a
participatory approach and the final plan is pending approval
by the County Assembly. However, those who have set up
shelters and shops in spaces that deviate from the Physical
Plan for the Kalobeyei Settlement – some of whom may have
been unaware of the zoning restrictions in the settlement –
are concerned that they may be forced to shift from the places
where they have built their shops. One non-BC Burundian
trader in Village Two expressed his concern:
I have heard that this centre might be changed. They said
that they will kick us out from this place and give us other
places far from here, and this place is where our customers
are accustomed to find us. If this one happens, we will lose
so many things. So if possible, let us remain here - it will
help us to continue developing ourselves. (Burundian non-
BC trader, Kalobeyei)
Nonetheless, others in Kalobeyei expressed a desire to
move. The commercial area in Village One is one of the
largest markets in the settlement. However, some BC traders
explained it might be better to be located in the smaller
market centres closer to where people are living:
According to me, our location here in the market is a
disadvantage because the neighbouring houses are far from
the shop. People must come from far away. Now many
of the traders have started building their shops in their
communities, because the customers buy from the nearest
shop. (Somali BC trader, Kalobeyei)
As noted above, however, customer loyalty is an important
feature of economic relations across Kalobeyei and Kakuma.
Some traders suggested that businesses should remain where
they are established:
I don’t think I will move from this place, because the place
where you start your business is the place you should be.
You have become one of them [local community], and [if
you move], maybe you will lose your customers... It can
take time – maybe two to three years – to build trust and
relationships. (Darfurian non-BC trader, Kalobeyei)
21 We compared three measures of market density: 1) a binary indicator for whether each shop is located in a dense market according to the official camp map of Kakuma (on block level) and satellite images of Kalobeyei; 2) the number of shops in each block based on NRC census; 3) the number of shops in each zone based on NRC census.
22 Rodgers, C (2017). ‘Kenya’s Black Market in ‘Refugee Real Estate’, The New Humanitarian. Aavailable at https://www.thenewhumanitarian.org/feature/2017/05/02/kenya-s-black-market-refugee-real-estate (accessed on 22 July 2019).

32 Doing Business in Kakuma: Refugees, Entrepreneurship, and the Food Market
6. External Interventions
WFP has also created the Kenya Retail Engagement Initiative
(KREI), funded by the EU and USAID, which it sees as
complementary to the aims and scope of BC.23 It focuses on
improving ‘value for money’ for refugees and other retail
consumers by supporting retailers and improving the supply
chain of food commodities to refugee markets. It tries to
meet these objectives through three sets of activities. First, it
tries to improve business infrastructure among BC traders.
Second, it provides training to BC traders in a range of
practices such as the use of hand-held technology for stock
management, improved management practices, and food
safety. Third, it aims to improve supply chain by diversifying
sources. Although we have not undertaken an impact
evaluation focusing specifically on the activities within the
Retail Engagement Initiative, our business survey offers
relevant insights by focusing on the role of business training
and supply chain development, thereby offering insights in
how to improve the Retail Engagement Initiative.
Business Training
Business training sessions are provided by a range of UN
organisations and NGO implementing partners in both
Kakuma and Kalobeyei. Here we explore their impact. Are
businesses owners who participated in training sessions
working differently? Are the different practices they learn
improving their sales or profit margins? How are training
sessions perceived?
First, who participated in the business training? 80% of
the BC traders attended training, 50% of unsuccessful
BC applicants attended, and less than 20% of non-BC
applicants attended (Fig. 51). In terms of the determinants of
participation, previous experience or training in bookkeeping
was associated with a higher likelihood of attending training.
Having attended other vocational training, or having parents
who owned a shop also correlate positively with attendance.
The programmes of humanitarian organisations shape the ways in which
markets and businesses operate in camps and settlements. In many ways,
humanitarian organisations have become de facto economic regulators in
Kakuma, in ways that can create both opportunities and constraints. We
f ind evidence to suggest that access to business training and supply chain
development, if appropriately designed, have the potential to positively
influence business outcomes.
.1 .5 .9 .3 .5 .9 .4 .6
0.2
.4.6
.81
Sh
are
of
sh
op
ow
ne
rs w
ho
ha
d t
rain
ing
Neverapplied
Applied BC
Kakuma
Neverapplied
Applied BC
Kalobeyei
Applied BC
Other towns
Fig. 51: Shop owner participation in business-related trainings.
23 See, for example, WFP Insight (2018), ‘Giving Local Traders the Power to Compete for Refugee Business in Kenya’, https://insight.wfp.org/giving-local-traders-the-power-to-compete-for-refugee-business-in-kenya-a2d8feddc299. Note that the activities within KREI do not only benefit or target BC traders, but rather the broader market.

Doing Business in Kakuma: Refugees, Entrepreneurship, and the Food Market 33
Second, whose training sessions do refugees attend? More
than 80% of the BC shop owners who attend training are
trained through WFP, while more than 60% of the relatively
few non-BC applicants who attend training are trained
through other NGOs/IOs. Among unsuccessful BC applicants
who attended training, half are trained by WFP and the other
half by other NGOs/IOs. A small minority have received
training through Equity Bank or other institutions. Among
all business owners and traders who received business
training, regardless of their BC status, 70% are trained by
WFP (Fig. 52).
Third, what are the effects of business training? It is difficult
to measure impact because of a self-selection bias in training
participants. However, when controlling for a wide range of
fixed and individual and shop-specific
factors (e.g. education, work experience,
vocational training, previous shop
experience, previous experience or
training in bookkeeping, if parents or
family owned a shop, BC status, age and
location of business), there is a positive
and significant correlation between
business trainings and implementing a
range of particular business practices
that in turn correlate with better business
outcomes (i.e. self-reported and calculated total sales, self-
reported profit, self-reported cash sales, variety of goods).
Some of the business practices promoted by training seem to
have a positive impact on outcomes. Shop owners who give
special offers and bulk discounts have higher sales; special
offers are also associated with higher profit; asking existing
customers whether there are any products they would like
you to sell is associated with higher profits; asking suppliers
for advice on bestsellers when deciding the product mix
correlates with higher sales and a higher variety; bookkeeping
is associated with a higher variety.
Traders who have participated in trainings are 13 percentage
points more likely to keep records, as well as 11 and eight
percentage points more likely to have offered, respectively,
‘special offers’ or ‘bulk discounts’ within the past three
months. Business training is not associated with changes
in whether traders monitor the competitors’ products and
prices, but trained shop owners more actively use customers
and suppliers for information. As shown, these activities
correlate positively with business outcomes. Overall, having
participated in business training is – holding other variables
constant – associated with about 20% higher total sales and
profit, however this is only significant at the 10% level.
Overall, controlling for a wide range of fixed and
contemporaneous individual- and shop specific factors, there
is a positive and significant correlation between business
trainings and doing/implementing a range of business
practices that again correlate with higher business outcomes.
However, because training participants were not randomly
selected, we cannot exclude that these correlations are driven
by selection bias (i.e. that the already successful or promising
traders were already more likely to adopt such practices even
in the absence training as well as more likely to participate to
the training).
Refugees in Kakuma and Kalobeyei participate in a plethora
of trainings. During qualitative research, we asked which
trainings stood out as the most memorable or important.
Shop owners in Kalobeyei highlighted the following:
WFP taught us business skills, like how to store things and
to manage our stock… I was in business for so long, yet I
benefited from their trainings. I learned how to keep stock,
for my shop and even for my family (Ethiopian-Somali
refugee, Kalobeyei).
There were trainings provided by Danish Refugee Council
and WFP… They trained us about how to separate business
and the family. For example, if you have a shop and you let
02
04
06
08
01
00
% tra
ined a
t bank
Neverapplied
Applied BC
02
04
06
08
01
00
% tra
ined thro
ugh W
FP
Neverapplied
Applied BC
Who provided the training
d B
02
04
06
08
01
00
% tra
ined thro
ugh N
GO
/IO
Neverapplied
Applied BC
d B
02
04
06
08
01
00
% tra
ined e
lsew
here
Neverapplied
Applied BC
Fig. 52: Providers of trainings attended by shop owners.
“Having participated
in business training
is – holding other
variables constant
– associated with
about 20% higher
total sales and profit.”

34 Doing Business in Kakuma: Refugees, Entrepreneurship, and the Food Market
your child take things randomly from the shop, you will face
a loss (Burundian refugee, Kalobeyei).
AAHI has provided training about agriculture and business.
They taught us how to start a business, how to make it grow,
and how to keep books so that you know whether your
business is growing or not (Burundian refugee, Kalobeyei).
I have been trained with Swiss-Contact organisation in
entrepreneurship and communication skills. They taught us
how to manage our relationships with customers (Sudanese
refugee, Kalobeyei).
At the time of research for this report, WFP was also
piloting a Point of Sale (POS) system with 29 BC traders,
with the aim of improving their business management
practices. The system was originally proposed to improve
accountability, insofar as traders would be required to scan
all items purchased during BC transactions. This would
prevent traders from breaking from the Standard Operating
Procedures (SOP) and selling non-food items, or giving
away cash in exchange for BC credit. This objective becomes
redundant if WFP switches to unrestricted cash transfers
rather than the current e-voucher system. However, POS
systems still play a role in WFP’s retail development strategy,
insofar as it will allow traders to transact goods more quickly
and accurately, as well as allowing them to maintain rigorous
booking.
Supply Chain Development
One of the key aims of the broader humanitarian transition
from in-kind aid to cash-based transfers is to support
local economic systems. In contexts where conventional
aid models have long prevailed, traders must develop
relationships with suppliers to replace the supply chains
previously managed through humanitarian agencies’
procurement units. The business opportunities offered by the
BC programme have encouraged traders – with support from
WFP – to develop relationships with suppliers in Lodwar,
Kitale, and other places on the route to Nairobi. WFP has
formalised this objective under the Kenya Retail Engagement
Initiative (KREI).
An important part of WFP’s retail engagement strategy is to
develop more robust economic relationships between traders
in Kakuma and Kalobeyei and their upstream suppliers,
most of whom are located elsewhere in Kenya. The aims of
supply chain development were to 1) improve the quantity
and diversity of goods available in Kakuma’s market, 2)
lower the price of goods in Kakuma, and 3) provide support
to emerging traders to establish favourable relations with
suppliers. The third aim was a response to the particular
challenges facing refugee traders, who lack capital, access to
credit, and the freedom to move freely to meet wholesalers
outside Kakuma.
The key strategy adopted by WFP was to establish formal
relations with ‘preferred wholesalers’, who would agree to
join traders in meetings facilitated by WFP. These meetings
give traders a chance to negotiate competitive prices with
information support from WFP, and the wholesalers enjoy
access to emerging traders in a nascent market.
In early 2016, WFP issued its first request for proposals to
prospective suppliers, including those already established
in Kakuma, as well as others in Lodwar, Kitale, Nairobi,
and other cities to the south. Some large-scale wholesalers
from outside Kakuma made exploratory visits to the area,
but the logistics of transportation and establishing local
contacts were a challenge. Those with a physical presence and
existing business relations in Kakuma therefore had an early
advantage, and Al Mubarak was signed as the first preferred
wholesaler. Three others were later added: Kaeris, Kakuma
Wholesalers, and the refugee-owned Mesfin Wholesalers.
As of October 2018, shop owners (retailers) sourced their
goods as follows. About 90% of suppliers to food retailers are
located within Kakuma Camp and Kakuma Town (Fig. 53).
The majority of the remaining 10% of suppliers are based
in Kitale, followed by some few in Lodwar, Nairobi and
elsewhere in Kenya and abroad (suppliers within Kalobeyei
Settlement and Town are included in this ‘Other’ category but
are a negligible factor at present). However, links to suppliers
in places other than Kitale may become stronger in the near
future. Efforts to increase access to fresh produce, meat and
fish have encouraged relationships with local producers
within Turkana, from river-side farming schemes in Katilu
and Nakwamoru to fishing cooperatives in Kataboi. Perhaps
the most dramatic expansion of supply chain opportunities
is yet to come, as the Kakuma-based CBO Lokado is
cooperating with government stakeholders to develop the
infrastructure for greater cross-border trade through Moroto
and Kotido, which would supplement the current supply
route from Nairobi with alternatives in Uganda.
Shop owners in Kalobeyei Settlement have few relationships
to suppliers from outside Kakuma Camp and Kakuma Town
(only about 2% of suppliers). The shops with the highest
proportion of their suppliers outside Kakuma are based in
Kakuma Town (about 35%), followed by Kalobeyei Town;
these would be Kenyan nationals rather than refugees.
Indeed, close to 30% of suppliers to Kenyan shop owners
are located outside Kakuma, as opposed to less than 10%
of suppliers to refugee traders. There are variations across
refugee nationalities, and for example Sudanese refugees do
not source goods from outside Kakuma at all.
Interestingly, unsuccessful BC applicants are slightly more
likely to source from suppliers outside Kakuma – especially
from Kitale – than BC traders. This suggests that WFP’s
facilitation of agreements with preferred wholesalers might
keep BC traders’ supply chains more ‘Kakuma-centric’ than
those of non-BC traders. More data on volumes of goods
would be required to assess the relative contribution of BC
versus non-BC traders to the KREI objectives of expanding
supply chains within and beyond Turkana County.
As seen in Fig. 55, 76% of BC traders list at least one of the
four ‘Preferred Wholesalers’ among their suppliers, compared
to 45-50% of non-BC traders. Much of the difference seems

Doing Business in Kakuma: Refugees, Entrepreneurship, and the Food Market 35
0 20 40 60 80 100%
Kalobeyei Town
Kakuma Town
Kalobeyei
Kakuma
Kakuma Camps Kakuma Town
Kitale Kalobeyei, Lodwar, elsewhere Kenya/abroad
0 20 40 60 80 100%
Kenya
Other refugees
Sudan
South Sudan
Somalia
Ethiopia
DRC
Burundi
Kakuma Camps Kakuma Town
Kitale Kalobeyei, Lodwar, elsewhere Kenya/abroad
0 20 40 60 80 100%
BC
Applied
Never applied
Kakuma Camps Kakuma Town
Kitale Kalobeyei, Lodwar, elsewhere Kenya/abroad
11.4 17.9 7.9
020
40
60
80
100
%
Never applied Applied BC
44.3 50.4 76.4
02
04
06
08
01
00
%
Never applied Applied BC
0 20 40 60 80 100%
Kalobeyei Town
Kakuma Town
Kalobeyei
Kakuma
Mesfin Kaeris
Kakuma WS / Ogle Al−Mubarak
Al−Amin Nature / Own production
Other (NGOs/IOs, network in Kakuma, Kitale, Nairobi, abroad)
Fig. 53: Location of supplier(s)
Fig. 54: Share of shop owners who source from outside
Kakuma
Fig. 56: Main wholesale supplier(s) by BC Status,
Location, and Nationality
Fig. 55: Likelihood of listing one or more of the preferred
wholesalers among suppliers (retailers typically use only
1-2)
0 20 40 60 80 100%
BC
Applied
Never applied
Mesfin Kaeris
Kakuma WS / Ogle Al−Mubarak
Al−Amin Nature / Own production
Other (NGOs/IOs, network in Kakuma, Kitale, Nairobi, abroad)
0 20 40 60 80 100%
KenyaOther refugees
SudanSouth Sudan
SomaliaEthiopia
DRCBurundi
Mesfin Kaeris
Kakuma WS / Ogle Al−Mubarak
Al−Amin Nature / Own production
Other (NGOs/IOs, network in Kakuma, Kitale, Nairobi, abroad)
By location:
By shop owner nationality:
By BC status:
By shop BC status:
By shop location:
By shop owner nationality:

36 Doing Business in Kakuma: Refugees, Entrepreneurship, and the Food Market
to be explained by the early arrangements between BC
traders one particular wholesaler, Al Mubarak (see relative
size in Fig. 56), with a large group of mainly BC shops. Non-
BC traders more frequently source goods through NGOs/IOs
and networks outside of established wholesalers.
One of the key commitments in the wholesaler agreements
is to adhere to price guidelines issued by WFP. WFP staff
have emphasised that their goal is to issue negotiable ‘price
guidelines’ and not ‘price controls’, as there is no formal
mechanism to enforce the guidelines. Furthermore, suppliers
and traders should not sell above the prices in the guidelines,
but they may sell below that price. Therefore, while suppliers
maintain low prices, they are encouraged to adopt a strategy
of increasing profits by raising the volumes of their sales.
Over time, non-preferred wholesalers – such as Al Amin –
have also become involved, and some wholesalers are now
buying directly from manufacturers, which lowers the prices
at which they can sell on to retailers in the camps/settlement.
The range of wholesalers has been expanded by the outreach
efforts of BC traders and their market coordinators. Some
allege that Kakuma-based preferred wholesalers have sold
above the price guidelines, and this has been one motivation
for seeking new suppliers outside Kakuma:
Sometimes what the wholesalers write for WFP and what
they are selling to us are different. That is one reason we buy
food from Kitale, because here [in Kakuma] wholesalers
cheat WFP. They report that their price for white flour is,
say, 1,500 KES, but when we go there we are offered flour
for 1,600 KES. They are not giving true information to the
World Food Programme. (Somali BC trader, Kalobeyei)
As traders reach out to more distant wholesalers, they are
contributing to the expansion of the number of business
actors involved in Kakuma’s supply chain. However, access
to new supplier relations is not equal, and some Turkana
traders complained about the advantage held by Somali
refugee traders. This alleged advantage is somewhat counter
intuitive given that refugees face movement restrictions
while Kenyan citizens can travel to Kitale without any legal
barriers. However, Somali networks can circumvent this
barrier. Somali people have operated businesses in Turkana
since the colonial period, when they were the only ethnic
group allowed to operate businesses under the British
administration in that district. Because Somali refugees can
now insert themselves into these historically established
networks, they can circumvent restrictions on movement.
As one Somali BC trader in Kalobeyei explained, he can
establish trade relations remotely.
We don’t go out of Kakuma. We communicate through the
phone, we talk to the client, send the money to their account,
and they give us what we want. That is how we do it.
(Somali BC from Kakuma, working in Kalobeyei)
Refugees do obtain movement passes for business purposes.
However, movement passes are notoriously difficult to
acquire, often requiring multiple trips to the RAS office with
waiting times of up to a week. By using their networks rather
than traveling in person, Somali traders can circumvent this
barrier. As a result, they are able to access suppliers outside
the county even more easily than many Turkana traders.
One Somali BC trader in Kalobeyei explained that he can
offer highly competitive prices to beneficiaries because he
purchases directly from Kitale: “We used to compare our
retail prices with those of the Kakuma Town wholesalers.
We found that if the Kakuma Town wholesalers were selling
for 20 KES, we could sell for 20 KES in Kalobeyei.” He
acknowledged that this had been an issue they had brought
up at the BC trader meetings, as some hosts saw it as an
unfair advantage.
This results in a dynamic that is a bit different from what
we would expect due to the movement restrictions imposed
upon refugees. It seems that, despite the restrictions on their
physical movement, those with the greatest access to Kitale
are Somalis (both refugees and Kenyans). Similarly, other
non-Somali and non-Turkana Kenyan citizens may have
connections in central and western Kenya, and they can move
freely. However, while Turkana traders can legally move to
and from Kitale, they may not have the same access to trade
networks to facilitate travel, trade, and transport of supplies.
Finally, other nationalities among the refugee population
– including those from the Great Lakes Region – face both
physical movement restrictions and a lack of business
connections. The result is a hierarchy of access in Kakuma
that is organised roughly into three tiers: a) connected
minority (e.g. Somali Kenyans, Somali refugees, and non-
Turkana Kenyans), b) a poorly connected host community
(Turkana), and c) a restricted refugee majority.

Doing Business in Kakuma: Refugees, Entrepreneurship, and the Food Market 37
Understanding Kakuma and Kalobeyei’s experience of using BC to develop
the food market provides an opportunity to learn. It offers insights of
wider relevance into how markets emerge and develop in refugee camps
and settlements, the process of transition from in-kind to cash-based
assistance, and what determines entrepreneurial success in a refugee
camp. It also poses challenging questions about the appropriate role for
humanitarian organisations in regulating markets.
Understanding Kakuma and Kalobeyei’s experience of using
BC to develop the food market provides an opportunity to
learn. It offers insights of wider relevance into how markets
emerge and develop in refugee camps and settlements, the
process of transition from in-kind to cash-based assistance,
and what determines entrepreneurial success in a refugee
camp. It also poses challenging questions about the
appropriate role for humanitarian organisations in regulating
markets.
Our study of food retail businesses in Kakuma is one of
relatively few to examine in detail how a nascent industry
can emerge in a refugee camp setting. It highlights some of
the factors and causal mechanisms that explain variation in
both business practices and outcomes. It also offers unique
insights into the impact of World Food Programme’s BC
system, an innovative form of cash-based assistance, in
which a limited number of refugee and host community food
retailers were contracted to be providers of food assistance
within the Kakuma camps, the Kalobeyei Settlement, and
the two nearby towns. The lessons from the BC experience
in Kakuma matter both for the Kenyan context and because
of the potential to replicate aspects of the BC model as
a transitional arrangement in other refugee camps and
settlements.
Our findings reveal that Somali and Ethiopian refugees
are disproportionately likely to be involved in business,
while South Sudanese refugees are underrepresented. The
profile of those entrepreneurs applying to be BC traders
differs from those that never applied, including in terms
of nationality, gender, education, training, and experience.
Food retailers can be divided into three types of traders: BC
traders, unsuccessful BC applicants, and non-applicants.
Being a BC trader confers significant advantages in terms of
offering protected access to a significant part of the camp and
settlement food market. It is also associated with different
behaviours and significantly better outcomes. BC shops,
followed by unsuccessful applicants, followed by non-
applicants are likely to have higher sales and profit levels, and
are also more likely to engage in practices such as book-
keeping, marketing, or stock management.
Differences in profitability do not arise from systematic
differences in pricing, rather, they stem from selling larger
volumes of goods. BC shops sell relatively more of the main
staples in bags, targeting large-sized
household customer markets, thereby
securing high sales volumes and increased
access to bulk discounts from their
suppliers. Non-BC shops sell relatively
more of the staples by the kilo, with greater
mark-up; however, they cannot afford to
hold large stock quantities in the same way
as BC shops do and so lose out on large
household customers and higher volumes.
BC contracts in Kalobeyei are more
profitable than BC contracts in Kakuma. Indeed, while the
total amount of BC money transferred in both sites is similar
(about 500,000 USD monthly), the number of BC shops
operating in Kalobeyei is much lower.
BC traders are doing better. But can we say that they are
self-reliant? In line with UNHCR’s definition of self-reliance24
and with the self-reliance framework of Betts, Omata, and
Sterck25, self-reliance is the ability to meet essential needs
“Differences in
profitability do not
arise from systematic
differences in pricing,
rather, they stem
from selling larger
volumes of goods.”
24 UNHCR (2005), Handbook for Self-Reliance, (Geneva: UNHCR).
25 Betts A., Omata, N., Sterck, O. (2019), The Kalobeyei Settlement: A Self-Reliance Model for Refugees? Journal of Refugee Studies. (Forthcoming).
7. Conclusions and Recommendations
Cre
dit
: N. O
mat
a
Turkana customers at a Bamba Chakula shop in Kakuma

38 Doing Business in Kakuma: Refugees, Entrepreneurship, and the Food Market
with dignity and autonomously from on humanitarian or
external assistance. The food market heavily depends on
money and aid flows from NGOs and IOs in the form of
BC transfers, in-kind food transfers, incentive payments,
and other form of aid. The food market in Kakuma camps
and Kalobeyei settlement would probably entirely collapse
if NGOs and IOs were to discontinue assistance. Therefore,
while BC traders are mostly able to meet their essential
needs, they cannot be characterised as self-reliant because
their survival depends for a large part on external assistance.
Put simply, while some traders meet the socio-economic
needs criteria for self-reliance, few meet the autonomy
criteria, whether on an individual or community level.
Structurally, the food industry is dominated by an oligopoly
of just a few local wholesalers. Just five wholesalers, four
Kenyan Somali (Al-amin, Al-Mubarak, Kakuma Wholesalers
[Ogle], and Kaeris) and one Ethiopian
refugee wholesaler (Mesfin) supply the
majority of all products to food retailers
inside the camps and settlement. Although
BC shops collaborate to bargain with these
wholesalers, the five wholesalers’ market
dominance means they a have significant
influence on pricing.
Credit plays a key role in enabling the
food market to function, with retailers
purchasing from wholesalers based on credit, and consumers
purchasing from retailers based on credit. The primary basis
for customer selection of particular retailers appears to be
loyalty because many customers rely upon credit in order to
be able to purchase staple and common food items during
and outside the monthly BC business cycle (refugees are
given BC credits within a small monthly window).
Based on our findings, we have a series of policy
recommendations, relevant to both the Kenyan context
and any attempts to replicate the BC experience as a
transitional arrangement between in-kind and cash-based
assistance elsewhere. The recommendations are based on the
assumption that the goal is to enhance aggregate welfare in
the camps and settlement by improving market efficiency and
business performance.
1) Manage the transition to cash
BC represents an interim stage on a spectrum between in-
kind assistance and direct cash assistance. It is effectively an
‘artificial currency’ that balances increased choice for refugees
with the goal of ensuring that beneficiaries spend money on
food items. There are concrete plans to introduce unrestricted
cash assistance in Kakuma and Kalobeyei. In June 2019, WFP
completed the registration of just over 1,000 households
in Kalobeyei with Equity Bank cards as part of the first set
of unrestricted cash transfers. Roll out for the remaining
households in Kalobeyei is expected to take place in
September 2019. Thereafter, WFP plans to start the transition
to unrestricted cash assistance in Kakuma in 2020.
The move to unrestricted cash seems desirable if the
transition is managed carefully. The possible benefits, and
associated risks, are worth discussing, and four sets of
transition arrangements are likely to be needed.
a) Mitigating tensions due to BC traders’ loss of entitlement
The increased competition that will result from opening the
market might lower prices for consumers and spread profits
more equally across businesses. This may also generate
tensions in the short-run, especially among BC traders
who have enjoyed a huge advantage under BC compared
with unsuccessful BC applicants and non-applicants.
These tensions need to be prevented through effective
communication. Many BC traders will actually continue to
enjoy the legacy of those advantages, in terms of, for example,
stock, market share, and infrastructure, even once BC ceases
to exist.
b) Ensuring adequate food supply to meet increased demand
Increased cash-assistance in Kakuma is likely to create a
local economic boom that may benefit everyone. However,
if wholesalers and retailers are not ready to satisfy the
increased demand as soon as the switch to full cash transfer
is made, prices may rise sharply in the short run, which
may exacerbate food insecurity. In order to prevent such
problems, WFP would need to ensure that stocks are higher
than usual prior to transition to cash assistance by, for
example, working directly with wholesalers or by temporarily
acting as a wholesaler of last resort.
c) Managing the entry of wholesalers into the retail market
In Kalobeyei, several retailers expressed concern that the
introduction of cash assistance may encourage large-scale
wholesalers from Kakuma to enter the Kalobeyei market,
undermining their market share. This perception requires
some nuance. It is indeed very likely that wholesalers will
open branches in Kalobeyei, as some of them have already
done in the Kakuma camps. The resulting increase in
competition, however, may have both positive and negative
effects, and it is unclear how these will balance out, and much
will depend on the strategies adopted by the wholesalers and
how their entry into Kalobeyei is regulated.
If wholesalers open new wholesale branches, this is likely
to benefit all. For wholesalers closer to the retailers,
transportation costs will be reduced, enabling retailers to
lower their prices to the consumers. WFP should encourage
new and existing wholesalers to establish themselves in
Kalobeyei as a part of their efforts to improve the supply
chain to all parts of the camp.
If wholesalers open retail branches, however, the outcome
is harder to predict. In the short-term, the increased
competition is likely to reduce prices for the consumers,
but also to force the existing retailers, particularly the
most vulnerable and former BC traders, out of business.
Depending on the magnitude of this price effect, the long-
term outcome may actually be fewer entrepreneurs, reduced
competition, and higher consumer prices. The ultimate
effect of wholesalers entering the retail market is therefore
“BC represents an
interim stage on a
spectrum between
in-kind assistance
and direct cash
assistance.”

Doing Business in Kakuma: Refugees, Entrepreneurship, and the Food Market 39
ambiguous, and depends on how one assesses and weighs
these effects.
Even if one wanted to prevent, limit or manage wholesaler
entry into the retail market, it is not entirely clear how
this could be done. However, there are several regulatory
options. First, a rule based on location (‘people can only do
business in the camp or town in which they live’) would not
only prevent geographical expansion by retail branches, but
also wholesale branches. Second, introducing a rule that
wholesalers can only sell goods to business
permit holders could be effective, but only
provided that the infrastructure to enforce
the rule is in place. Third, potentially
the most effective way of preventing
wholesalers from gaining dominance in the
retail market could be to cap the number of
shops traders that are allowed to operate,
or to substantially increase the business permit fee for every
additional shop above 2 or 3. This way, wholesalers would
have to consider how they want to use their limited number
of shops, and whether opening additional branches is actually
beneficial to them or not. The chances are, given such
restrictions, that most wholesalers would prefer to provide
large volumes of goods to a large number of retailers through
wholesale branches, rather than compete with the retailers.
d) Supporting responsible household spending
Lastly, while unrestricted cash allows beneficiaries to choose
what they want to consume, some refugees expressed concern
that it may also lead to ‘undesirable’ purchases, particularly
by men, which in turn may increase food insecurity. WFP
could set up a programme to help families that are not able to
manage their budget adequately, for example by temporarily
offering them food rations instead of cash while the
underlying problems leading to ‘unwise’ budget management
are solved. Here it will be important to take into account
gender-related intra-household dynamics which often affect
household consumption choices.
2) Extend BC as an interim measure where food assistance is currently provided in-kind
Access to BC is associated with significantly better outcomes
for traders. In conjunction with the Retail Engagement
Initiative, it is clear that BC traders enjoy higher sales and
higher profit levels than non-BC traders, and are likely to
adopt business practices associated with better outcomes.
Part of this reflects a selection-bias of BC traders being
selected partly on the basis of already running successful
businesses. Nevertheless, there is evidence that BC is an
effective food modality, a means to build markets, and a way
of expanding consumer choice. Overall, it is an effective
transition arrangement between in-kind assistance and
unrestricted cash-assistance.
Access to BC is also associated with significantly better
outcomes for consumers. Recent arrivals living in Kalobeyei,
who receive 95% of their food assistance in BC money are
characterised by better food security and lower level of
dependency compared to recent arrivals living in Kakuma,
who instead receive 70% of food assistance in-kind (Betts et
al. 2018).
WFP should therefore consider expanding access to BC
more widely within Kakuma as an interim step prior to the
introduction of full cash assistance. It might also consider the
roll-out of BC to other contexts in which in-kind assistance
is still used in refugee contexts, such as the Dollo Ado camps
in Ethiopia. The Kenyan experience also illustrates how BC
can be a useful alternative to unrestricted cash transfers
in the contexts in which government regulation or lack of
access to financial inclusion inhibits the immediate roll out of
unrestricted cash assistance.
Nevertheless, improvements in the BC model can still be
made. First, the monthly BC cycle could be adapted. At the
moment, BC distribution is programmed for all refugees in
a given camp or settlement on the same day each month.
This fixed and unique date (which is
sometimes delayed) requires BC shops
to hold large amounts of stock for just
a few days of each month, and leads to
a ‘run’ on goods by customers eager to
access products before they run out. These
periods of rush contribute to the need for
credit to be used both by retailers and by
consumers in order to purchase in adequate
quantities, in turn inflating prices and
further concentrating power in the hand
of wholesalers. A better option could be
to stagger BC transfer on different days of
the month for different groups of refugees,
ensuring stock availability and avoiding the
need for rushed purchases. Reducing the
need to hold large stock quantities would
also contribute to greater competition, possibly also enabling
alternative sources of supply chain to emerge beyond the
dominant wholesalers. Possible implications on stock
maintenance, quality, and variety, as well on supply chains
should be carefully tested before implementing such change,
and monitored after implementation.
Second, improvements should be made to liberalise the use of
credit between retailers and customers. Our research shows
that the existing system simply could not function without
credit, not least because technical delays in BC distribution
often mean refugees need to buy good on credit when they
run out of food. In order to access credit, customers are
usually required by retailers to leave their Safaricom SIM
cards with the shop owner as collateral. At the moment,
though, it is against WFP rules to keep hold of SIM cards,
and doing so can in theory results in punitive consequences.
The objective of this rule is to prevent the exploitation of
refugees by traders who retain their SIM cards. The rules
could be adapted to recognise the practical reality that
retailers have to be able to retain SIM cards in order to ensure
efficient distribution of products. Alternatively, a credit
option could be offered as a formal option in the BC system.
Credit could then be monitored by WFP and complaints
from both clients and retailers could be formally addressed.
“The existing
system simply
could not function
without credit.”
“The dominant
tool for analysis
has been the
household survey
(demand-side).
Just as important
for understanding
refugee economies
is the use of
representative
business surveys
(supply-side).”

40 Doing Business in Kakuma: Refugees, Entrepreneurship, and the Food Market
3) Adapt the scope of the Retail Engagement Initiative
We have not undertaken an impact evaluation of WFP’s
Retail Engagement Initiative. However, our findings suggest
that it provides an important complement to the use of BC.
By enhancing the capacity of BC traders, it could offer a
means to improve self-reliance opportunities for traders and
ensure better service delivery to consumers.
Although not specific to the Retail Engagement Initiative,
having participated in business training, all else being equal,
is associated with around a 20% higher total sales and profit.
Of course, this correlation could be due to selection bias and
should therefore not be interpreted as causal. Nevertheless,
our evidence suggests that the scope for improving important
business practices is large (e.g. bookkeeping, calculating
profit margins, monitoring prices, managing stocks). A
wide variety of business training is offered by NGOs and
IOs within Kakuma and Kalobeyei. However, a more
evidence-based approach is needed to identify which forms
of training are associated with specific changes in behaviour
and outcomes. Particular consideration should also be given
to how to make business training accessible to non-BC
traders and national and ethnic communities that are under-
represented within business and self-employment, such as the
South Sudanese. More research is also needed to understand
the impact of particular education curricula and the role of
related forms of support such as mentorships and access to
seed capital.
Meanwhile, efforts to expand supply chain beyond the five
main wholesalers need to be further expanded. As dryland
agriculture emerges through the promotion of kitchen
gardens in Kalobeyei and, to a lesser extent, Kakuma, there
is an opportunity to encourage refugees to participate in
the food market as wholesale suppliers as well as simply
retailers. In that respect, WFP’s work to provide training in
marketing and pricing to local farmers and to connect them
to the markets should be welcomed. Further encouraging the
creation of agricultural cooperatives might increase farmers’
capacity to negotiate fair contracts and to more reliably
supply food retail shops. In order to support the development
and diversification of the supply chain, policy-makers might
also consider extending preferred-wholesaler arrangements
to small-scale suppliers as an interim measure in order to
encourage market development.
The overall goal of retail engagement should be to iteratively
improve market efficiency to the benefit of both retailers
and consumers. Our research reveals five main factors that
limit market competition within the food retail sector: the
oligopoly of wholesalers; the limited number of BC retailers;
dependency on credit; price collusion; and geographical
isolation. Insofar as these serve as barriers to competition,
there is a need to think systematically about how to remove
them to improve the efficiency of the food market. This will
require a comprehensive strategy as part of the transition
to cash assistance. Diversifying the supply chain, removing
temporal bottlenecks on demand and supply, preventing
collusion on prices while making prices more transparent,
encouraging the entry of new wholesalers, improving
transport infrastructure, facilitating access to movement
passes for business reasons, and connecting Kakuma to local
and national markets can all contribute to removing some of
these barriers.
It is also important to recognise that legal and physical
barriers continue to impede the development of the retail
sector in the Kakuma camps and the Kalobeyei settlement.
The reconceptualisation of Kakuma as a marketplace also
has to be accompanied by increased entitlements and
opportunities for refugees. This requires investment in
infrastructure, including electricity, roads, and connectivity.
It also requires a revision of the legal framework to allow
refugees to work, move, and contribute to Kenyan society.
Ultimately, a thriving business environment will also require
opportunities for refugees to participate more directly within
the governance and economic regulations of the camps and
settlement.
4) Mainstream business surveys within data collection
Improving the quality of data and evidence have become
increasing priorities in refugee and humanitarian policy.
However, until recently the dominant tool for analysis
has been the household survey (demand-side). Just as
important for understanding refugee economies is the use
of representative business surveys (supply-side), within and
across particular economic sectors. In this report, we have
adopted a mixed methods approach, based upon a survey
of food retail businesses. We think the insights and policy
recommendations highlight the value of such an approach,
and its potential to complement other methodologies for
understanding the economic lives and impact of refugees. On
an academic level, it also highlights the value of an approach
that integrates Business Studies, Economics, and Refugee
Studies. Relatedly, a number of market-based studies have
now been commissioned relating to Kakuma and Kalobeyei,
and greater coordination is needed relating to ongoing
census and survey work to reduce duplication and ensure
complementary insights.
Furthermore, rather than relying exclusively on post-hoc
evaluation, future market-based interventions relating to
BC and the Retail Engagement Initiative should be designed
to be evidence-generating. This could be achieved by for
example, the use of randomisation in participant selection,
the creation of control groups, and baseline surveys of
participants and control groups. Including intervention-
based research methods (randomised control trials and other
impact evaluation methods) within programme design and
implementation is likely to lead to more efficient and rigorous
learning than relying upon retrospective assessment.

Doing Business in Kakuma: Refugees, Entrepreneurship, and the Food Market 41
Cre
dit
: Wo
rld
Fo
od
Pro
gra
mm
eC
red
it: W
orl
d F
oo
d P
rog
ram
me
Female beneficiary uses her mobile phone to buy food items through Bamba Chakula in Kakuma
Close up of mobile phone while using Bamba Chakula initiative

42 Doing Business in Kakuma: Refugees, Entrepreneurship, and the Food Market
Cre
dit
: Wo
rld
Fo
od
Pro
gra
mm
e
Turkana lady buying in a shop in Kakuma Refugee Camp
Cre
dit
: N. O
mat
a
Street vegetable shop

Doing Business in Kakuma: Refugees, Entrepreneurship, and the Food Market 43
In Loving Memory of
Peninah Nanjala Wamalwa
During the research for this report,
we had the pleasure of working
with Peninah Nanjala Wamalwa, a
hardworking young woman, business-
owner, wife, and mother of three. It is
with great sadness that we received
the news about her passing in February
2019, after battling meningitis since
late October. The fact that even
young and otherwise healthy people
in Kakuma and Kalobeyei die from
preventable diseases highlights the still
limited access to basic health facilities,
vaccines, and treatment. Peninah’s destiny is unfortunately not unique in
the context of the settlement. We wish to honour her by dedicating this
report to her memory.
Peninah did an excellent job as a researcher for this project on host
community and refugee businesses. She was a valued member of the
team, who we entrusted with additional responsibilities outside of
surveying. She was always eager to learn and to contribute. Her positive
and kind attitude, and her outstanding effort to deliver high quality work,
made it an absolute pleasure to work with her.
Over the weeks of working together, we were blessed to also get
to know Peninah on a personal level. She became a dear friend, and
especially close to those of us who worked most closely with the
Kalobeyei team.
Our thoughts and condolences go out her family and friends. We will
forever treasure our memories of Peninah.
Cre
dit
: Jac
ob
Ch
eru
iyo
t

Refugee Studies Centre
Oxford Department of International Development
University of Oxford, 3 Mansfield Road
Oxford, OX1 3TB, United Kingdom
Tel: +44 (0)1865 281720
Email: [email protected]
Web: www.rsc.ox.ac.uk
AcknowledgementsThis report is the result of contributions and generosity of many
people. In addition to the co-authors, Sterre Kuipers and Patrick
Mutinda worked as lead research assistants and coordinators
during our fieldwork in Kakuma and Kalobeyei.
As with most of the Refugee Economies Programme’s research,
a feature of our work has been collaboration with researchers
from the refugee and host communities. During survey
implementation, we were privileged to work with an excellent
team of enumerators. We are especially grateful to Peninah
Nanjala, Michael Oyo, Galma Gutu, Armele Ngakani, Feysal
Abdi, Abdikani Wadi Ali, Moses Lujang, Abubakar Rugamba,
Omar Anatole, Jescah Lokaala, Anthony Muema, Kafi Bashir,
Farhan Aden, Saida Aden, Christine Achola, Adam Kuku, Saduna
Ibrahim Kodi, Jean Kubwayo, and Christine Nigene. We also
express our gratitude to our qualitative research team in Kakuma
and Kalobeyei for their hard work: Anicet Ntagahoraho, Ekaran
Lolem Jilly, Filsan Ahmed, Ghak Atem Ghak, James Allam Ejidio,
M. A. Lokuruka, Mohamed Talil, Nyanchiew Paul Dor, Sirak
Eshetu, and Stephen Ekai.
From the international organisations and NGOs working in
Kakuma, we enjoyed significant support and a willingness to
assist us by responding to questions and offering logistical
support. From WFP we are especially grateful to Zippy Mbati,
Shannon Oliver, Annalisa Conte, Olive Wahome, Daniel Dyssel,
Lara Fossi, Sam Okara, Shaun Hughes, Baker Mukeere, Winston
Kivuitu, Samal Lokuno, Allan Kute, Silvano Ndwiga, Eddie
Kisach, Philomena Wanyama, Bedan Mbugi, Soraya Franco,
Boniface Wanganju, Julius Kisingu, and Walter Nyasinga. From
UNHCR, we thank Tayyar Sukru Cansizoglu, Eva Lescrauwaet,
Mohamed Shoman, Seda Kuzucu, and Mukesh Karn. From LWF,
we appreciate the support of Charles Iria, Roseline Nthenge, and
Collins Onyango. From NRC, we wish to thank George Onyore,
and from NCCK, we are grateful to Raphael Ogutu Nyabala,
Bramwel Kibaba, and Wilson Kironyo.
Isabelle Machado Aires, as Refugee Economies’ Programme
Officer, facilitated the logistics of the research and helped to
compile, copy-edit, and proofread this report. We also thank
Katy Dawkins for designing the report. We are grateful to WFP
for generously funding the research on which this report is based.
As ever, the report is based on the independent research of the
RSC and does not necessarily reflect the views or policies of our
donors and partners.