Identifying biological themes within lists of genes with EASE
18
Genome Biology 2003, 4:P4 Deposited research article Identifying biological themes within lists of genes with EASE Douglas A Hosack 1 , Glynn Dennis Jr 1 , Brad T Sherman 1 , H Clifford Lane 2 and Richard A Lempicki 1,3 Addresses: 1 Laboratory of Immunopathogenesis and Bioinformatics, PO Box B, SAIC-Frederick, Inc., Frederick, MD 21702, USA. 2 Clinical and Molecular Retrovirology Section, Bldg 10, Room 11S-231, National Institute of Allergy and Infectious Diseases, National Institutes of Health, Bethesda, MD 20892, USA. Correspondence: Richard A Lempicki. E-mail: [email protected] comment reviews reports deposited research interactions information refereed research .deposited research AS A SERVICE TO THE RESEARCH COMMUNITY, GENOME BIOLOGY PROVIDES A 'PREPRINT' DEPOSITORY TO WHICH ANY ORIGINAL RESEARCH CAN BE SUBMITTED AND WHICH ALL INDIVIDUALS CAN ACCESS FREE OF CHARGE. ANY ARTICLE CAN BE SUBMITTED BY AUTHORS, WHO HAVE SOLE RESPONSIBILITY FOR THE ARTICLE'S CONTENT. THE ONLY SCREENING IS TO ENSURE RELEVANCE OF THE PREPRINT TO GENOME BIOLOGY'S SCOPE AND TO AVOID ABUSIVE, LIBELLOUS OR INDECENT ARTICLES. ARTICLES IN THIS SECTION OF THE JOURNAL HAVE NOT BEEN PEER-REVIEWED. EACH PREPRINT HAS A PERMANENT URL, BY WHICH IT CAN BE CITED. RESEARCH SUBMITTED TO THE PREPRINT DEPOSITORY MAY BE SIMULTANEOUSLY OR SUBSEQUENTLY SUBMITTED TO GENOME BIOLOGY OR ANY OTHER PUBLICATION FOR PEER REVIEW; THE ONLY REQUIREMENT IS AN EXPLICIT CITATION OF, AND LINK TO, THE PREPRINT IN ANY VERSION OF THE ARTICLE THAT IS EVENTUALLY PUBLISHED. IF POSSIBLE, GENOME BIOLOGY WILL PROVIDE A RECIPROCAL LINK FROM THE PREPRINT TO THE PUBLISHED ARTICLE. Posted: 25 April 2003 Genome Biology 2003, 4:P4 The electronic version of this article is the complete one and can be found online at http://genomebiology.com/2003/4/6/P4 © 2003 BioMed Central Ltd Received: 17 April 2003 This is the first version of this article to be made available publicly. A peer-reviewed and modified version is now available in full at http://genomebiology.com/2003/4/10/R70 This information has not been peer-reviewed. Responsibility for the findings rests solely with the author(s).
-
Upload
khangminh22 -
Category
Documents
-
view
4 -
download
0
Transcript of Identifying biological themes within lists of genes with EASE

Genome Biology 2003, 4:P4
Deposited research articleIdentifying biological themes within lists of genes with EASEDouglas A Hosack1, Glynn Dennis Jr1, Brad T Sherman1, H Clifford Lane2
and Richard A Lempicki1,3
Addresses: 1Laboratory of Immunopathogenesis and Bioinformatics, PO Box B, SAIC-Frederick, Inc., Frederick, MD 21702, USA. 2Clinicaland Molecular Retrovirology Section, Bldg 10, Room 11S-231, National Institute of Allergy and Infectious Diseases, National Institutes ofHealth, Bethesda, MD 20892, USA.
Correspondence: Richard A Lempicki. E-mail: [email protected]
com
ment
reviews
reports
deposited research
interactions
inform
ation
refereed research
.deposited research
AS A SERVICE TO THE RESEARCH COMMUNITY, GENOME BIOLOGY PROVIDES A 'PREPRINT' DEPOSITORY
TO WHICH ANY ORIGINAL RESEARCH CAN BE SUBMITTED AND WHICH ALL INDIVIDUALS CAN ACCESS
FREE OF CHARGE. ANY ARTICLE CAN BE SUBMITTED BY AUTHORS, WHO HAVE SOLE RESPONSIBILITY FOR
THE ARTICLE'S CONTENT. THE ONLY SCREENING IS TO ENSURE RELEVANCE OF THE PREPRINT TO
GENOME BIOLOGY'S SCOPE AND TO AVOID ABUSIVE, LIBELLOUS OR INDECENT ARTICLES. ARTICLES IN THIS SECTION OF
THE JOURNAL HAVE NOT BEEN PEER-REVIEWED. EACH PREPRINT HAS A PERMANENT URL, BY WHICH IT CAN BE CITED.
RESEARCH SUBMITTED TO THE PREPRINT DEPOSITORY MAY BE SIMULTANEOUSLY OR SUBSEQUENTLY SUBMITTED TO
GENOME BIOLOGY OR ANY OTHER PUBLICATION FOR PEER REVIEW; THE ONLY REQUIREMENT IS AN EXPLICIT CITATION
OF, AND LINK TO, THE PREPRINT IN ANY VERSION OF THE ARTICLE THAT IS EVENTUALLY PUBLISHED. IF POSSIBLE, GENOME
BIOLOGY WILL PROVIDE A RECIPROCAL LINK FROM THE PREPRINT TO THE PUBLISHED ARTICLE.
Posted: 25 April 2003
Genome Biology 2003, 4:P4
The electronic version of this article is the complete one and can befound online at http://genomebiology.com/2003/4/6/P4
© 2003 BioMed Central Ltd
Received: 17 April 2003
This is the first version of this article to be made available publicly. Apeer-reviewed and modified version is now available in full athttp://genomebiology.com/2003/4/10/R70
This information has not been peer-reviewed. Responsibility for the findings rests solely with the author(s).
2 Genome Biology Deposited research (preprint)
Genome Biology 2003, 4:P4
Identifying Biological Themes within Lists of Genes with EASE
Douglas A. Hosack1, Glynn Dennis Jr.1, Brad T. Sherman1, H. Clifford Lane2 and
Richard A. Lempicki1,3
Douglas A. Hosack Glynn Dennis Jr. [email protected] [email protected] Brad T. Sherman H. Clifford Lane [email protected] [email protected] Richard A. Lempicki [email protected]
1Laboratory of Immunopathogenesis and Bioinformatics, PO Box B, SAIC-Frederick,
Inc., Frederick, MD 21702, Phone: 301-846-1910, Fax: 301-846-6762.
2Clinical and Molecular Retrovirology Section, Bldg 10, Room 11S-231, National
Institute of Allergy and Infectious Diseases, National Institutes of Health, Bethesda, MD
20892. Phone: 301-496-7196, Fax: 301-480-5560.
3Corresponding author

http://genomebiology.com/2003/4/6/P4 Genome Biology 2003, Volume 4, Issue 6, Article P4 Hosack et al. P4.3
Genome Biology 2003, 4:P4
ABSTRACT
EASE is a customizable software application for rapid biological interpretation of gene
lists that result from the analysis of microarray, proteomics, SAGE, and other high-
throughput genomic data. The biological themes returned by EASE recapitulate
manually determined themes in previously published gene lists and are robust to
varying methods of normalization, intensity calculation and statistical selection of genes.
EASE is a powerful tool for rapidly converting the results of functional genomics studies
from “genes to themes.”

4 Genome Biology Deposited research (preprint)
Genome Biology 2003, 4:P4
Biological relevance within lists of genes
High-density microarray and proteomic technologies have enabled the discovery
of global patterns of biological responses with respect to experimental or natural
perturbations [1]. Much work has addressed the issues of data normalization and
statistical selection of genes significantly modulated or clustered based upon expression
profiles [2]. The net result of these efforts is one or more lists of genes. Unfortunately,
little work has addressed the issue of rapidly identifying biological themes in such lists
[3]. Most investigators currently annotate genes one at-a-time using internet-based
databases or manual literature searches. Following this tedious process, many
researchers struggle to identify the most salient biological themes in order to make
sense of their results and have no systematic way to prioritize these themes for further
analysis. A parallel issue in interpreting such data regards how to leverage the ever-
expanding flood of functional genomic data and tools. We developed the Expression
Analysis Systematic Explorer (EASE) to automate the process of biological theme
determination for lists of genes and to serve as a customizable gateway to online
analysis tools. This is the first report to show that the highest-ranking themes derived
by a computational method can recapitulate manually derived themes in previously
published results, and that these themes are stable to varying methods of gene
selection.
EASE performs three basic functions with any list of genes: 1) over-
representation analysis of functional gene categories, 2) customizable linking to online
tools, and 3) creation of descriptive annotation tables. Each of these functions uses a
system of tab-delimited text files that are easy to customize and update. EASE is an

http://genomebiology.com/2003/4/6/P4 Genome Biology 2003, Volume 4, Issue 6, Article P4 Hosack et al. P4.5
Genome Biology 2003, 4:P4
easy-to-use, customizable tool that allows investigators to systematically mine the mass
of functional information associated with data generated by microarray, proteomics or
SAGE studies.
EASE uses customizable text files for theme discovery, annotation, and linking to
online tools
To analyze a gene list, EASE first maps the gene identifiers to a standardized
gene accession (SGA) system via a simple text file in the \Data\Convert\ directory.
The default SGA system used by EASE is LocusLink numbers. Upon conversion to the
SGA system, EASE maps the genes to biological categories within various classification
systems. Each system is specified in a text file in the \Data\Class\ directory that maps
many-to-many relationships between genes and gene categories within the
classification system. Similarly, EASE maps genes to annotation fields specified in files
of the \Data\ directory. Users can therefore utilize any system of identifying genes with
any custom annotation fields or categorical systems by creating the associated text files
in the appropriate directory, as outlined in the help files of EASE. EASE comes
equipped with an automated update routine that downloads and parses public
annotation data sources and installs a LocusLink-based system of files, thereby
allowing researchers to use EASE with the most up-to-date annotation information.
EASE constructs hyperlinks to definitions for various categorical systems and the
gene categories therein with configuration files in the \Data\Class\URL data\ directory.
EASE is also capable of loading the genes in the current gene list into various online
tools by using simple URL configuration text files in the \Links\ directory. Both types of

6 Genome Biology Deposited research (preprint)
Genome Biology 2003, 4:P4
configuration files are text files that are simple to create or modify to facilitate the
addition of new links to online tools and definitions for new categorical systems added
by the user.
For over-representation analysis, EASE can utilize any number of systems of
categorizing genes simultaneously. EASE calculates over-representation with respect
to the total number of genes assayed and annotated within each system to allow for
side-by-side comparisons of categories from categorization systems with varying levels
of annotation. The conversion of gene identifiers to an SGA system such as LocusLink
numbers is essential to the over-representation analysis to ensure that a single gene
represented by more than one identifier (typical of Genbank) receives only one “vote”
for each of its categories.
EASE uses the three systems of the Gene Ontology as default categorization
systems, however any set of custom or public systems can be simultaneously analyzed,
including: SwissProt and PIR keywords, transcription factor regulation, protein domains,
pathway membership, chromosomal location, and MeSH headings or keywords
extracted from gene-associated literature.
The user has a choice of two statistical measures of over-representation: the
one-tailed Fisher exact probability or a variant thereof-- referred to as the “EASE score”-
- calculated by penalizing (removing) one gene within the given category from the list
and calculating the resulting Fisher exact probability for that category. The EASE score
represents the lower bound of all possible jackknife probabilities and has advantages in
terms of penalizing the significance of categories supported by few genes. The EASE
score thus favors more robust categories than the Fisher exact probability.
http://genomebiology.com/2003/4/6/P4 Genome Biology 2003, Volume 4, Issue 6, Article P4 Hosack et al. P4.7
Genome Biology 2003, 4:P4
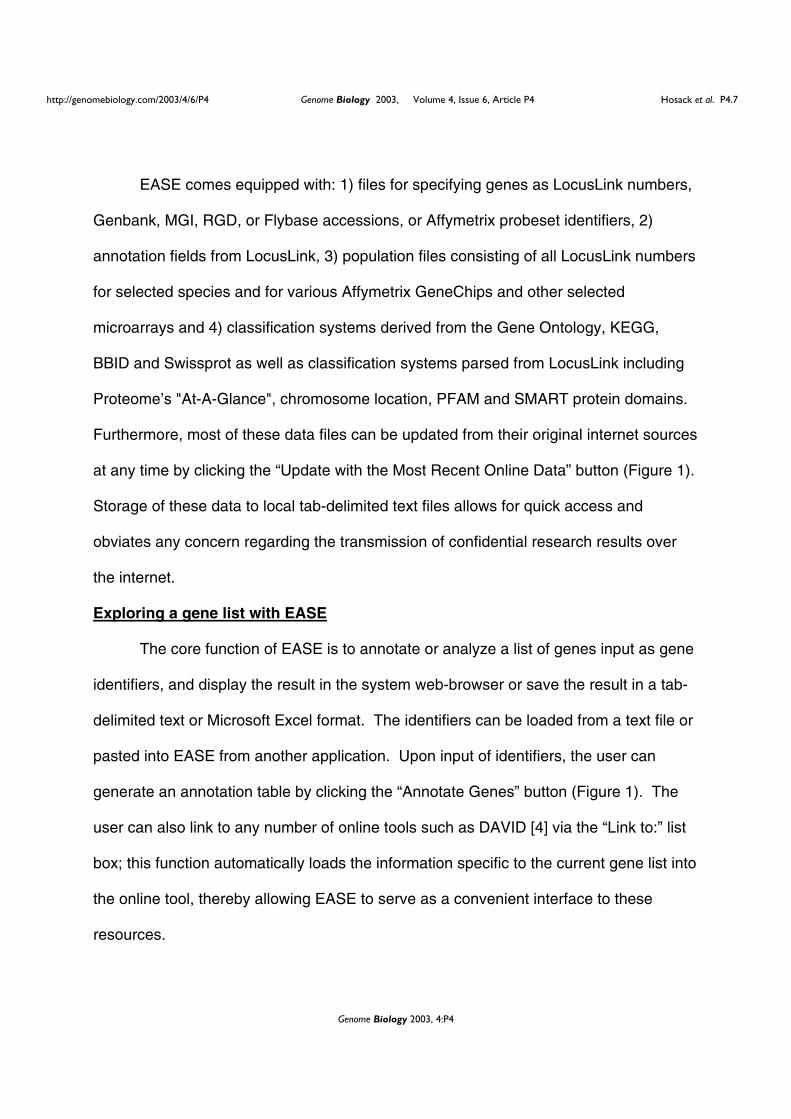
EASE comes equipped with: 1) files for specifying genes as LocusLink numbers,
Genbank, MGI, RGD, or Flybase accessions, or Affymetrix probeset identifiers, 2)
annotation fields from LocusLink, 3) population files consisting of all LocusLink numbers
for selected species and for various Affymetrix GeneChips and other selected
microarrays and 4) classification systems derived from the Gene Ontology, KEGG,
BBID and Swissprot as well as classification systems parsed from LocusLink including
Proteome’s "At-A-Glance", chromosome location, PFAM and SMART protein domains.
Furthermore, most of these data files can be updated from their original internet sources
at any time by clicking the “Update with the Most Recent Online Data” button (Figure 1).
Storage of these data to local tab-delimited text files allows for quick access and
obviates any concern regarding the transmission of confidential research results over
the internet.
Exploring a gene list with EASE
The core function of EASE is to annotate or analyze a list of genes input as gene
identifiers, and display the result in the system web-browser or save the result in a tab-
delimited text or Microsoft Excel format. The identifiers can be loaded from a text file or
pasted into EASE from another application. Upon input of identifiers, the user can
generate an annotation table by clicking the “Annotate Genes” button (Figure 1). The
user can also link to any number of online tools such as DAVID [4] via the “Link to:” list
box; this function automatically loads the information specific to the current gene list into
the online tool, thereby allowing EASE to serve as a convenient interface to these
resources.
8 Genome Biology Deposited research (preprint)
Genome Biology 2003, 4:P4
The identification of biological themes in the gene list is initiated by clicking the
“Find over-represented gene categories” button. This function returns an output of all
gene categories ranked by over-representation, with associated probabilities, counts
used in the probability calculation, associated genes from the original list and links to
various online tools for these genes. The most significantly over-represented categories
that result from this analysis are deemed “biological themes” of the gene list. The user
can optionally limit these analyses to any particular set of gene categories to answer
questions such as "what is special about the mitochondrial genes on my list compared
to all mitochondrial genes on the microarray?" The user can further use the "Refine"
functionality of EASE to remove specific genes from the original list and enable an over-
representation analysis of the remaining genes exclusively. These two functions can be
applied repeatedly until the gene list is thoroughly characterized. EASE also allows for
comparisons of gene lists at a thematic level, wherein the results are expressed in
terms of gene categories over-represented in one list compared to all lists combined.
Calculating statistics on thousands of gene categories can lead to a few
seemingly significant probabilities due simply to random chance. To address this
multiple comparison issue, EASE is capable of implementing a wide variety of
probability corrections including Bonferroni-type methods and bootstrap methods
performed by iteratively running over-representation analyses on random gene lists to
more accurately determine the true probability of observing a given categorical
enrichment. Nevertheless, the power of EASE is most appropriately viewed as an
exploratory tool to direct the attention of the researcher to enriched biological themes by
prioritizing functional categories based on the significance of over-representation.

http://genomebiology.com/2003/4/6/P4 Genome Biology 2003, Volume 4, Issue 6, Article P4 Hosack et al. P4.9
Genome Biology 2003, 4:P4
EASE themes recapitulate manually-determined themes
The published gene lists of Kayo et al. [5] were re-analyzed with EASE to test the
ability of EASE to generate themes comparable to manually determined themes. In the
Kayo study, the authors generated four gene lists corresponding to genes up- and
down- regulated in primate muscle in response to aging or caloric restriction. These
gene lists were analyzed with the categorical over-representation function of EASE
using EASE scores that were corrected for multiplicity using 10,000 bootstrap iterations.
All significant (p<0.05) categories resulting from each list were compared to the themes
manually determined and published by Kayo et al. (Figure 2).
The initial EASE analysis successfully discovered the same themes as Kayo et
al. in three of four gene lists in less than 15 minutes, with the 10,000-iteration bootstrap
corrections requiring an additional 2 hours per list. In contrast, the manual analysis by
Kayo et al. required approximately 200 hours of gene annotation and literature reading,
(R. Weindruch, personal communication.) EASE also uncovered new and potentially
interesting themes including the up-regulation of calmodulin-binding and morphogenesis
genes with caloric restriction and the up-regulation of hemoglobin components within
aging muscle. The disparate results for the list of genes up-regulated with aging is due
to the lack of relative enrichment for "inflammation / immunity" genes in the list of genes
up-regulated with aging (7.5%) relative to all "inflammation / immunity" genes on the
HuGeneFL microarray (8.9%). Therefore, any random list of the same size would be
expected to result in about the same number of "immunity / inflammatory response"
genes as the Kayo list. Similarly, no significant enrichment was detected for the "stress
response / oxidative stress" theme (8.3% vs. 7.8% on list and microarray, respectively).
10 Genome Biology Deposited research (preprint)
Genome Biology 2003, 4:P4
Nevertheless, the discovery of all manual themes by EASE for the majority of gene lists
demonstrates the power of EASE to dramatically reduce the time required to interpret
microarray results while adding a statistical measure of confidence to the interpretation.
EASE themes are robust
Eight methods using different combinations of chip-to-chip normalization
protocols, gene intensity calculations and statistical significance tests were used to
select genes up-regulated in peripheral blood mononuclear cells following HIV-1 viral
rebound in the plasma of six HIV infected patients discontinuing anti-viral drug therapy
for one month (G. Dennis et al., submitted.) Gene expression was assayed with the
Affymetrix HuGeneFL microarray. One of four different normalization protocols were
applied: 1) MAS 4 (Microarray Suite 4, Affymetrix Inc.), 2) dChip [6], 3) rank-remapping
(D. Hosack, unpublished) and 4) non-parametric local fitting [7]. Gene expression
intensity was determined using either the MAS 4 average difference method or the
dChip MBEI, and significantly up-regulated genes were identified using either a paired
student T statistic (t>2.2) or Significance Analysis of Microarrays (SAM; d>2.2) [8]. The
eight resulting lists were analyzed with the categorical over-representation function of
EASE using EASE scores that were corrected for multiplicity using 10,000 bootstrap
iterations (Figure 3).
Figure 3a demonstrates the instability of the size and overlap of the gene lists
that result from varying gene selection methods. The percentage of genes overlapping
in any two lists was highly variable, and ranged from 7% to 60%. In spite of this striking
variation, the top five biological themes returned by EASE for each of the eight gene
lists were virtually the same; all derived from a group of six categories that implicate a
http://genomebiology.com/2003/4/6/P4 Genome Biology 2003, Volume 4, Issue 6, Article P4 Hosack et al. P4.11
Genome Biology 2003, 4:P4
vigorous interferon-induced immune response in patients with rebounding HIV viral
loads (Figure 3b). The conversion of genes to themes with EASE allowed the
"biological result" of the experiment to be determined despite substantial differences in
gene list content resulting from the use of various normalization, gene intensity and
statistical selection methods.
"Genes To Themes" with EASE: Possible uses of the EASE Method
EASE rapidly converts a list of genes into an ordered table of robust biological
themes that summarize the biological result of the experiment. This method has
immediate utility for finding themes that most differentiate lists of genes, e.g. up-
regulated versus down-regulated in a single experiment, but could potentially be applied
to compare the results of different experiments, even involving different species and/or
microarray platforms. The EASE method has proven useful for a SAGE analysis of
cancer (W.D. Stein, manuscript in preparation) and for microarray analyses of cancer
(A. Domkowski, manuscript in preparation; K. Akagi, personal communication),
cataracts (M. Kantorow, manuscript in preparation) and immune function in HIV disease
[9,10]. The EASE method also enables a rapid assay for overlap between gene
clusters identified in any number of experiments when the user creates gene
classification schema based upon these clusters. EASE can potentially be used to
facilitate the development of data normalization and gene selection criteria by observing
the highest enrichment attained for EASE themes within a particular experiment in
which the biological phenomenon is well characterized and confirmed. EASE allows
investigators to fully leverage the potential of high-throughput functional genomics
technologies to infer biological themes. A full-featured version of EASE is freely

12 Genome Biology Deposited research (preprint)
Genome Biology 2003, 4:P4
available to non-profit researchers for use on Windows operating systems
(http://david.niaid.nih.gov/david/ease.htm) and a limited online version of the EASE
over-representation function is available on the DAVID website [4].

http://genomebiology.com/2003/4/6/P4 Genome Biology 2003, Volume 4, Issue 6, Article P4 Hosack et al. P4.13
Genome Biology 2003, 4:P4
REFERENCES
1. Heller MJ: DNA microarray technology: devices, systems, and applications. Annu Rev Biomed Eng 2002, 4:129-153. 2. Quackenbush J: Microarray data normalization and transformation. Nat Genet 2002, 32 Suppl:496-501. 3. Slonim DK: From patterns to pathways: gene expression data analysis comes of age. Nat Genet 2002, 32 Suppl:502-508. 4. Database for Annotation, Visualization and Integrated Discovery [http://david.niaid.nih.gov/] 5. Kayo T, Allison DB, Weindruch R, Prolla TA: Influences of aging and caloric restriction on the transcriptional profile of skeletal muscle from rhesus monkeys. Proc Natl Acad Sci USA 2001, 98:5093-5098. 6. Li C, Wong WH: Model-based analysis of oligonucleotide arrays: Expression index computation and outlier detection. Proc Natl Acad Sci USA 2001, 98:31-36. 7. Sidorov IA, Hosack DA, Gee D, Yang J, Cam MC, Lempicki RA, Dimitrov DS: Oligonucleotide microarray data distribution and normalization. Information Sciences 2002, 146:65-71. 8. Tusher VG, Tibshirani R, Chu G: Significance analysis of microarrays applied to the ionizing radiation response. Proc Natl Acad Sci USA 2001, 98:5116-5121. 9. Cicala C, Arthos J, Selig SM, Dennis G Jr, Hosack DA, Van Ryk D, Spangler ML, Steenbeke TD, Khazanie P, Gupta N, et al.: HIV envelope induces a cascade of cell signals in non-proliferating target cells that favor virus replication. Proc Natl Acad Sci USA 2002, 99:9380-9385. 10. Chun TW, Justement JS, Lempicki RA, Yang J, Dennis G Jr, Hallahan CW, Sanford C, Pandya P, Liu S, McLaughlin M, et al.: Gene expression and viral prodution in latently infected, resting CD4+ T cells in viremic versus aviremic HIV-infected individuals. Proc Natl Acad Sci USA 2003, 100:1908-1913.

14 Genome Biology Deposited research (preprint)
Genome Biology 2003, 4:P4
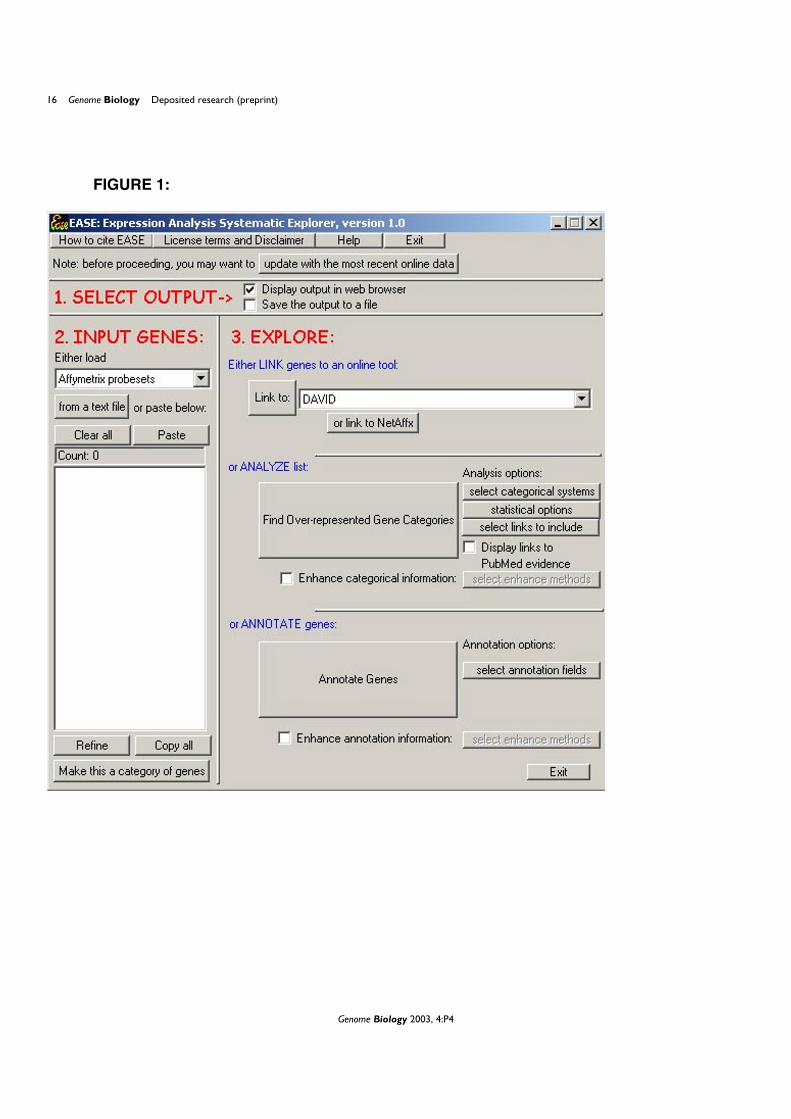
FIGURE LEGENDS FIGURE 1:
The EASE user interface is designed for quick annotation and analysis of gene
lists.
Gene identifiers are pasted into the "INPUT GENES" section, and the processes of
linking to online tools, over-representation analysis or annotation are launched with
buttons in the "EXPLORE" section. Annotation data can be automatically retrieved from
the internet and stored into local data files by clicking the [update with the most recent
online data] button.
FIGURE 2:
EASE identifies themes similar to manually determined themes in a fraction of the
time. The four gene lists analyzed by Kayo et al. along with the total time needed for
initial analysis are shown for the manual and EASE analyses. For each list, the major
biological themes as determined by the authors are shown, as well as all significant
(p<0.05) gene categories as determined by EASE score corrected for multiplicity with
the bootstrap function using 10,000 random trials. The time shown for EASE represents
initial analysis before running the bootstrap analysis. Themes in common between the
authors' themes and the EASE results are highlighted in red.
FIGURE 3:
EASE themes are consistent despite the poor overlap of gene lists derived from
the same experiment by various analytical methods.
http://genomebiology.com/2003/4/6/P4 Genome Biology 2003, Volume 4, Issue 6, Article P4 Hosack et al. P4.15
Genome Biology 2003, 4:P4
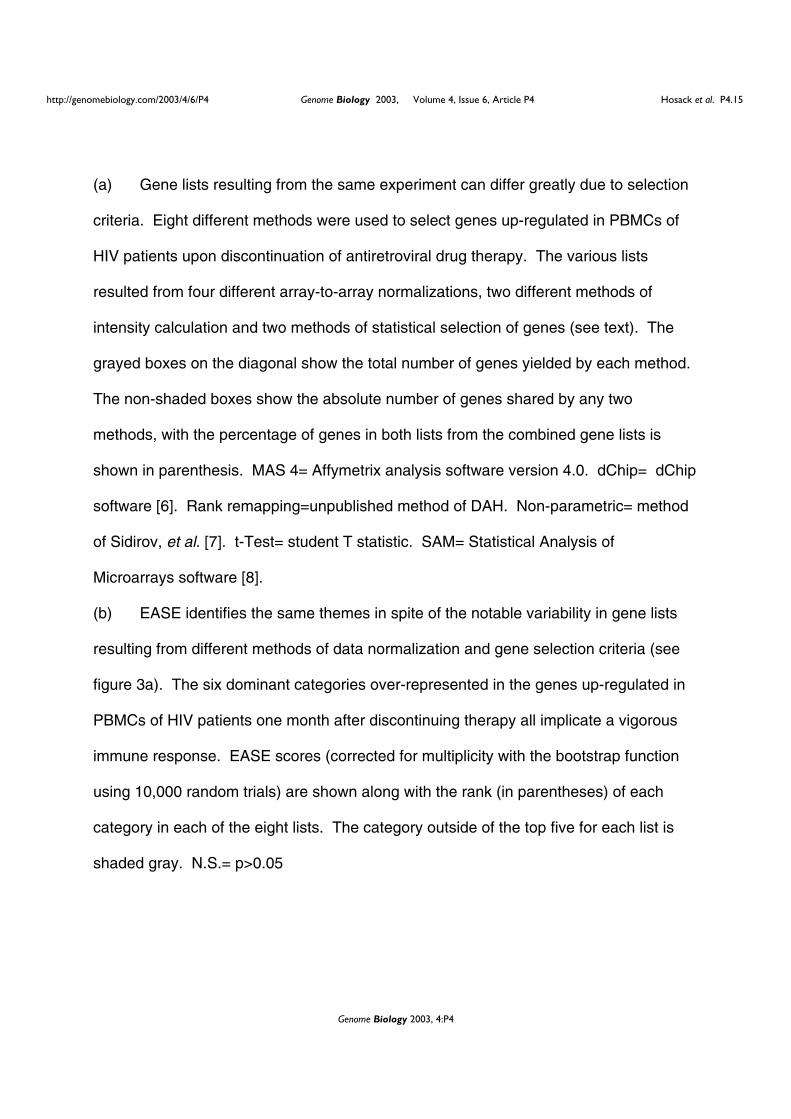
(a) Gene lists resulting from the same experiment can differ greatly due to selection
criteria. Eight different methods were used to select genes up-regulated in PBMCs of
HIV patients upon discontinuation of antiretroviral drug therapy. The various lists
resulted from four different array-to-array normalizations, two different methods of
intensity calculation and two methods of statistical selection of genes (see text). The
grayed boxes on the diagonal show the total number of genes yielded by each method.
The non-shaded boxes show the absolute number of genes shared by any two
methods, with the percentage of genes in both lists from the combined gene lists is
shown in parenthesis. MAS 4= Affymetrix analysis software version 4.0. dChip= dChip
software [6]. Rank remapping=unpublished method of DAH. Non-parametric= method
of Sidirov, et al. [7]. t-Test= student T statistic. SAM= Statistical Analysis of
Microarrays software [8].
(b) EASE identifies the same themes in spite of the notable variability in gene lists
resulting from different methods of data normalization and gene selection criteria (see
figure 3a). The six dominant categories over-represented in the genes up-regulated in
PBMCs of HIV patients one month after discontinuing therapy all implicate a vigorous
immune response. EASE scores (corrected for multiplicity with the bootstrap function
using 10,000 random trials) are shown along with the rank (in parentheses) of each
category in each of the eight lists. The category outside of the top five for each list is
shaded gray. N.S.= p>0.05
16 Genome Biology Deposited research (preprint)
Genome Biology 2003, 4:P4
FIGURE 1:

http://genomebiology.com/2003/4/6/P4 Genome Biology 2003, Volume 4, Issue 6, Article P4 Hosack et al. P4.17
Genome Biology 2003, 4:P4
FIGURE 2:
Total time for
analysis
Themes of genes downregulated with caloric restriction
Themes of genes upregulated with caloric restriction
Themes of genes downregulated with
aging
Themes of genes upregulated with
aging
Manual Analysis by
Kayo et al.(1)
~200 hoursEnergy metabolism,
Mitochondrial bioenergeticsStructural proteins,
Cytoskeletal proteins
Energy metabolism, Mitochondrial electron transport,
Oxidative phosphorylation
Inflamation/ Immune function, Oxidative stress
EASE~15
minutes
Mitochondrion, Electron transport,
Mitochondrial membrane, Inner membrane,
Primary active transporter, Mitochond. electron trans. chain,
Oxidoreductase, Hydrogen ion transporter,
Mitochondrial inner membrane, Monoval. inorg. cation transporter,
Energy pathways, Carrier,
Ion transporter, Cytoplasm
Extracellular matrix, Calmodulin binding,
Morphogenesis, Structural molecule,
Development, Microfibril,
Cytoskeleton
Inner membrane, Hydrogen ion transporter,
Intracellular, Monoval. inorg. cation transporter,
Metabolism, Mitochondrial membrane,
Mitochondrial inner membrane, Primary active transporter,
Energy pathways, Mitochondrion, Ion transporter,
Carrier, Cation transporter
Gas transport, Oxygen transport

18 Genome Biology Deposited research (preprint)
Genome Biology 2003, 4:P4
FIGURE 3:
3a:A B C D E F G H
MAS 4 MAS 4 dChip dChipRank
remappingRank
remappingNon-
parametricNon-
parametric
MAS 4 MAS 4 dChip dChip dChip dChip dChip dChip
Gene selection
t-Test SAM t-Test SAM t-Test SAM t-Test SAM
A MAS 4 MAS 4 t-Test 72 72 (60%) 20 (7%) 17 (12%) 18 (8%) 19 (12%) 24 (8%) 22 (10%)
B MAS 4 MAS 4 SAM 120 27 (9%) 22 (12%) 25 (9%) 25 (13%) 34 (10%) 31 (12%)
C dChip dChip t-Test 220 81 (36%) 130 (48%) 70 (27%) 105 (29%) 71 (22%)
D dChip dChip SAM 86 56 (27%) 55 (40%) 49 (18%) 47 (27%)
ERank
remappingdChip t-Test 180 95 (50 %) 109 (35%) 76 (32%)
FRank
remappingdChip SAM 105 68 (24%) 67 (59%)
GNon-
parametricdChip t-Test 242 154 (59%)
HNon-
parametricdChip SAM 173
3b:A B C D E F G H
MAS 4 MAS 4 dChip dChipRank
remappingRank
remappingNon-
parametricNon-
parametric
MAS 4 MAS 4 dChip dChip dChip dChip dChip dChip
t-Test SAM t-Test SAM t-Test SAM t-Test SAM
< 0.0001 (1) 0.0002 (1) 0.0004 (1) < 0.0001 (1) 0.0005 (2) < 0.0001 (4) < 0.0001 (1) < 0.0001 (1)
0.0006 (2) 0.0027 (2) 0.0383 (4) < 0.0001 (2) < 0.0001 (1) < 0.0001 (1) < 0.0001 (2) < 0.0001 (3)
0.0036 (5) 0.0061 (3) N.S. (5) < 0.0001 (4) 0.0005 (3) < 0.0001 (2) < 0.0001 (4) < 0.0001 (4)
0.0031 (4) 0.0081 (4) N.S. (7) < 0.0001 (5) 0.0006 (4) < 0.0001 (3) < 0.0001 (3) < 0.0001 (2)
0.0333 (6) N.S. (7) 0.0329 (3) < 0.0001 (3) 0.0128 (6) < 0.0001 (5) 0.0003 (5) < 0.0001 (5)
0.0008 (3) 0.0101 (5) 0.0308 (2) < 0.0001 (6) 0.0078 (5) 0.0002 (6) 0.0558 (8) 0.0071 (8)
Biological process
Molecular function
Category
interferon induction
response to biotic stimulus
immune response
defense response
response to external stimulus
antiviral response protein
SwissProt keyword
Biological process
Biological process
Biological process
Normalization:
Intensity calculation:
Gene selection:
System
Method
Normalization
Intensity calculation
Method: