Lists & More Lists: Making Sense Of Corporate Reputations
12
Journal of Business & Economics Research – July, 2010 Volume 8, Number 7 47 Lists & More Lists: Making Sense Of Corporate Reputations Kathleen Campbell, Saint Joseph’s University, USA W. Richard Sherman, Saint Joseph’s University, USA ABSTRACT What would you like to know about a company? What value has the company created in the past, is creating currently, and will create in the future? The creation of financial value is not only important; it is necessary - but is it enough? This study explores the relationships between and among lists of top performers - Boston College’s Corporate Social Responsibility Index, Fortune’s World's Most Admired Companies, Harris Interactive’s Reputation Quotient for the Most Visible Companies, and Newsweek’s Green Rankings of America's 500 largest corporations. Its objective is to see whether in spite of differing methodologies and criteria for rankings, there is a commonality of inclusion in lists. In effect, this paper attempts use statistical analysis in order to determine if there is an agreement as to which companies are top corporate citizens in the United States. Keywords: Corporate Social Responsibility, Corporate Reputation INTRODUCTION oday we are in the midst of a rapid global transformation with increased demand on corporations to perform not only financially but to be good corporate citizens. One of the most important aspects of this transformation is the critical importance of Corporate Social Responsibility (CSR) programs. Climate change; community health, education and development; and business sustainability are some of the most pressing issues of our time. Businesses are increasingly involved in these areas as are their clients and their people. This raises the importance of accurately and transparently accounting for and reporting these activities. Lord Michael Hastings, Global Head of Citizenship & Diversity, KPMG International (KPMG, 2008, p. 2). Financial success has long been accepted as the primary objective of corporate existence. However, many social critics have questioned whether financial success is enough. There are increasing demands that companies be good corporate citizens as well. Organizations struggle to tell their stories, to communicate the good (and sometimes the bad) that they do in the marketplace, in the community, to and for the environment, and in society. Quite clearly, the challenge of telling the company’s story is not being met by current corporate repo rting practices. In particular, criticism has been directed at the failure of annual reports or other regulatory files to tell anything about a company's environmental and social performance. Triple bottom-line (TBL) reporting, a term coined by John Elkington in his 1997 book Cannibals with Forks: the Triple Bottom Line of 21st Century Business , aims to remedy this shortcoming by explicitly considering not only the economic performance of a firm but also the company’s environmental and social performance as well. An increasingly popular practice is the issuance of a corporate responsibility or sustainability report. The international accounting firm KMPG reviewed the disclosures of more than 2,200 companies, including the Global Fortune 250 and 100 largest companies in 22 countries. The KPMG International Survey on Corporate Responsibility Reporting (2008) found that 74 percent of the top 100 U.S. companies (as measured by revenue) published corporate responsibility information in 2008, either as part of their annual financial report or as a separate document. This was an increase from the 37 percent of top U.S. companies that KPMG surveyed in 2005. An even higher percentage of top international firms are reporting on their environmental and social performance with 80 percent of the Global Fortune 250 companies now releasing this information. T
-
Upload
khangminh22 -
Category
Documents
-
view
1 -
download
0
Transcript of Lists & More Lists: Making Sense Of Corporate Reputations

Journal of Business & Economics Research – July, 2010 Volume 8, Number 7
47
Lists & More Lists: Making Sense
Of Corporate Reputations Kathleen Campbell, Saint Joseph’s University, USA
W. Richard Sherman, Saint Joseph’s University, USA
ABSTRACT
What would you like to know about a company? What value has the company created in the past,
is creating currently, and will create in the future? The creation of financial value is not only
important; it is necessary - but is it enough? This study explores the relationships between and
among lists of top performers - Boston College’s Corporate Social Responsibility Index, Fortune’s
World's Most Admired Companies, Harris Interactive’s Reputation Quotient for the Most Visible
Companies, and Newsweek’s Green Rankings of America's 500 largest corporations. Its objective
is to see whether in spite of differing methodologies and criteria for rankings, there is a
commonality of inclusion in lists. In effect, this paper attempts use statistical analysis in order to
determine if there is an agreement as to which companies are top corporate citizens in the United
States.
Keywords: Corporate Social Responsibility, Corporate Reputation
INTRODUCTION
oday we are in the midst of a rapid global transformation with increased demand on corporations to
perform not only financially but to be good corporate citizens. One of the most important aspects of this
transformation is the critical importance of Corporate Social Responsibility (CSR) programs. Climate
change; community health, education and development; and business sustainability are some of the most pressing
issues of our time. Businesses are increasingly involved in these areas as are their clients and their people. This
raises the importance of accurately and transparently accounting for and reporting these activities. Lord Michael
Hastings, Global Head of Citizenship & Diversity, KPMG International (KPMG, 2008, p. 2).
Financial success has long been accepted as the primary objective of corporate existence. However, many
social critics have questioned whether financial success is enough. There are increasing demands that companies be
good corporate citizens as well. Organizations struggle to tell their stories, to communicate the good (and sometimes
the bad) that they do in the marketplace, in the community, to and for the environment, and in society. Quite clearly,
the challenge of telling the company’s story is not being met by current corporate reporting practices. In particular,
criticism has been directed at the failure of annual reports or other regulatory files to tell anything about a company's
environmental and social performance. Triple bottom-line (TBL) reporting, a term coined by John Elkington in his
1997 book Cannibals with Forks: the Triple Bottom Line of 21st Century Business, aims to remedy this shortcoming
by explicitly considering not only the economic performance of a firm but also the company’s environmental and
social performance as well. An increasingly popular practice is the issuance of a corporate responsibility or
sustainability report. The international accounting firm KMPG reviewed the disclosures of more than 2,200
companies, including the Global Fortune 250 and 100 largest companies in 22 countries. The KPMG International
Survey on Corporate Responsibility Reporting (2008) found that 74 percent of the top 100 U.S. companies (as
measured by revenue) published corporate responsibility information in 2008, either as part of their annual financial
report or as a separate document. This was an increase from the 37 percent of top U.S. companies that KPMG
surveyed in 2005. An even higher percentage of top international firms are reporting on their environmental and
social performance with 80 percent of the Global Fortune 250 companies now releasing this information.
T
Journal of Business & Economics Research – July, 2010 Volume 8, Number 7
48
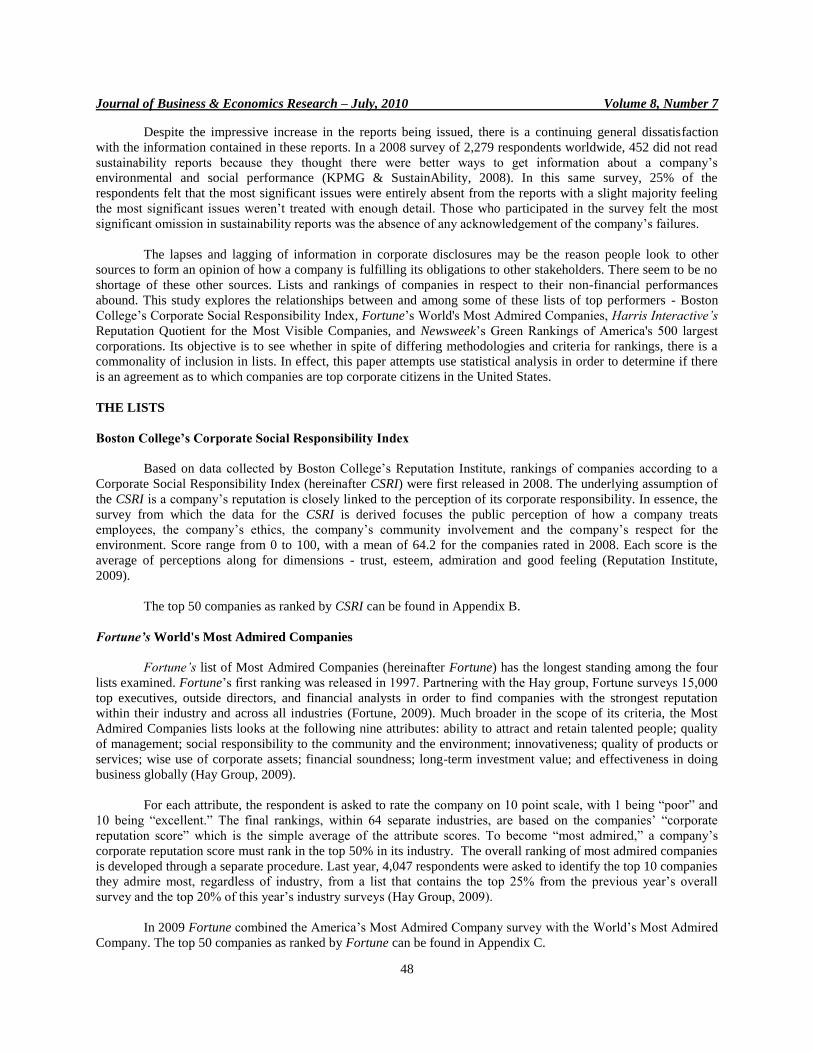
Despite the impressive increase in the reports being issued, there is a continuing general dissatisfaction
with the information contained in these reports. In a 2008 survey of 2,279 respondents worldwide, 452 did not read
sustainability reports because they thought there were better ways to get information about a company’s
environmental and social performance (KPMG & SustainAbility, 2008). In this same survey, 25% of the
respondents felt that the most significant issues were entirely absent from the reports with a slight majority feeling
the most significant issues weren’t treated with enough detail. Those who participated in the survey felt the most
significant omission in sustainability reports was the absence of any acknowledgement of the company’s failures.
The lapses and lagging of information in corporate disclosures may be the reason people look to other
sources to form an opinion of how a company is fulfilling its obligations to other stakeholders. There seem to be no
shortage of these other sources. Lists and rankings of companies in respect to their non-financial performances
abound. This study explores the relationships between and among some of these lists of top performers - Boston
College’s Corporate Social Responsibility Index, Fortune’s World's Most Admired Companies, Harris Interactive’s
Reputation Quotient for the Most Visible Companies, and Newsweek’s Green Rankings of America's 500 largest
corporations. Its objective is to see whether in spite of differing methodologies and criteria for rankings, there is a
commonality of inclusion in lists. In effect, this paper attempts use statistical analysis in order to determine if there
is an agreement as to which companies are top corporate citizens in the United States.
THE LISTS
Boston College’s Corporate Social Responsibility Index
Based on data collected by Boston College’s Reputation Institute, rankings of companies according to a
Corporate Social Responsibility Index (hereinafter CSRI) were first released in 2008. The underlying assumption of
the CSRI is a company’s reputation is closely linked to the perception of its corporate responsibility. In essence, the
survey from which the data for the CSRI is derived focuses the public perception of how a company treats
employees, the company’s ethics, the company’s community involvement and the company’s respect for the
environment. Score range from 0 to 100, with a mean of 64.2 for the companies rated in 2008. Each score is the
average of perceptions along for dimensions - trust, esteem, admiration and good feeling (Reputation Institute,
2009).
The top 50 companies as ranked by CSRI can be found in Appendix B.
Fortune’s World's Most Admired Companies
Fortune’s list of Most Admired Companies (hereinafter Fortune) has the longest standing among the four
lists examined. Fortune’s first ranking was released in 1997. Partnering with the Hay group, Fortune surveys 15,000
top executives, outside directors, and financial analysts in order to find companies with the strongest reputation
within their industry and across all industries (Fortune, 2009). Much broader in the scope of its criteria, the Most
Admired Companies lists looks at the following nine attributes: ability to attract and retain talented people; quality
of management; social responsibility to the community and the environment; innovativeness; quality of products or
services; wise use of corporate assets; financial soundness; long-term investment value; and effectiveness in doing
business globally (Hay Group, 2009).
For each attribute, the respondent is asked to rate the company on 10 point scale, with 1 being “poor” and
10 being “excellent.” The final rankings, within 64 separate industries, are based on the companies’ “corporate
reputation score” which is the simple average of the attribute scores. To become “most admired,” a company’s
corporate reputation score must rank in the top 50% in its industry. The overall ranking of most admired companies
is developed through a separate procedure. Last year, 4,047 respondents were asked to identify the top 10 companies
they admire most, regardless of industry, from a list that contains the top 25% from the previous year’s overall
survey and the top 20% of this year’s industry surveys (Hay Group, 2009).
In 2009 Fortune combined the America’s Most Admired Company survey with the World’s Most Admired
Company. The top 50 companies as ranked by Fortune can be found in Appendix C.

Journal of Business & Economics Research – July, 2010 Volume 8, Number 7
49
Harris Interactive’s Reputation Quotient
Harris Interactive has been calculating its Reputation Quotient (hereinafter RQ) for 10 years. Surveying
more than 25,000 US consumers, Harris first asked its respondents to identify the 60 “most visible” companies.
Once the most visible companies are identified, the respondents rank the companies with respect to their reputation
in six categories: Emotional Appeal, Products & Services, Social Responsibility, Vision & Leadership, Workplace
Environment, and Financial Performance. For its latest rankings, the identification of most visible companies was
conducted from September to October 2008. The second phase (i.e., rating of reputations) was conducted from
December 31, 2008 to February 2, 2009 (Harris, 2009).
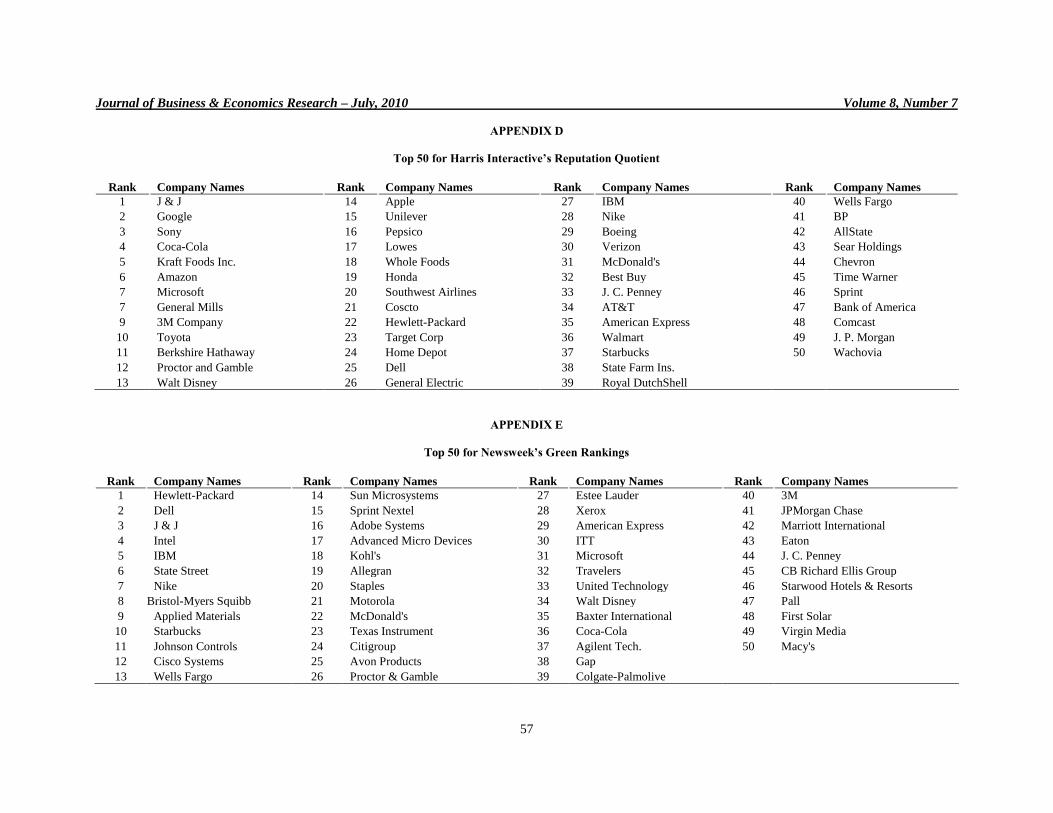
The top 50 companies as ranked by Harris can be found in Appendix D.
Newsweek’s Green Rankings
In September 2009, Newsweek released its first ranking of companies based on the environmental
performance. In order to arrive at its rankings of the largest 500 US companies (as measured by revenue, market
capitalization, and number of employees), Newsweek partnered with KLD Research & Analytics, Trucost, and
CorporateRegister.com, to calculate a “Green Score” for each company based on the total costs of their
environmental impact, their corporate environmental policies and performance, and their reputation based on an
opinion survey of more than 13,000 users of the CorporateRegister.com website and of executives of the 500 largest
US companies (Schwartz, 2009).
While KLD Research, Trucost and CorporateRegister.com all used separate methodologies, their results
were standardized by conversion into Z-scores. The resulting “Green Score” is the weighted sum of the three
component Z-scores. Environmental impact and corporate environment policy scores each received a weighting of
45 percent. The remaining 10% was allocated to the company’s reputation. An additional factor in the rankings is a
company’s greenhouse gas (GHG) emissions (Newsweek, 2009).
The top 50 companies as ranked by Newsweek can be found in Appendix E.
METHODOLOGY
In order to ensure that the comparisons of the four separate rankings are as similar as possible, the focus
was only on the top 50 companies from each list. As noted previously, the top 50 on each list can be found in
Appendices B through E. Within these lists a comparison of pairs allows for six separate analyses and gives one the
ability to look closely for any distinct relationship. While there were many companies that were on the more than
one list, it is critical to note that none of the lists were a direct comparison of the same 50 companies. Because of
this, the non-parametric measure of correlation used, Spearman's rank correlation coefficient (i.e., Spearman's Rho),
as well as the non-parametric used to measure the degrees of correspondence between the two rankings and the
significance of this correspondence, Kendall’s Tau correlation coefficient, are useful but not entirely statistically
valid, reliable, or ethical.
The calculation of Spearman’s Rho allows for a quick overview about whether or not a direct relationship
between the rankings is evident. Since very little, if any, information is given about how the rankings were created,
one must wonder how much validity to attach to the order of the ranking as well as the overall ranking itself of each
list. Because there is no separation of classification of industries (e.g. automotive, technology, retail), it is hard to
assess whether the industry itself plays a factor in the overall ranking. Without knowing what factors are being
used, one might wonder if there are any similarities at all. Spearman’s Rho helps shed some light on the feasibility
that the rankings were done using very similar or very different methodologies.
The calculation of Kendall’s Tau allows one to state whether or not in reality there is a significant
relationship between these rankings in such a way that one could claim that there is evidence that the same factors
were taken into consideration. The combination of the Spearman’s Rho and Kendall’s Tau allows for reasonable
conclusions to be drawn. The output and graphs that follow in Appendix A, Tables 1 through 6, help to show the

Journal of Business & Economics Research – July, 2010 Volume 8, Number 7
50
relationships, or lack thereof, from the six comparisons that are being made. Appendix F lists the seven companies
that made it into all four top fifty lists, along with where they were ranked in each.
ANALYSIS
As a first step, Boston College’s Corporate Social Responsibility Index (CSRI) is compared to the other
three rankings. When comparing CSRI to the Fortune’s World’s Most Admired Companies (Fortune), it can be seen
that two lists have 27 companies in common. Despite this commonality of companies, the Spearman’s Rho of .332 is
indicative of a minimal chance that similar factors were used to create the ranking. At a 5% level of significance, the
p-value of.0839 offers further support to the conclusion that there is no evidence that there are similar factors.
However, the fact that the p-value is relatively low and these two lists do share more than 50% of the same
companies leads one to believe that they do indeed have some similar factors. Therefore, before making an absolute
statement, further analysis should be done. Looking at Appendix A, Table 1, the scattered points give further
evidence of a lack of a relationship between CSRI and Fortune’s ranking.
Next, when comparing CSRI to Newsweek’s Green Ranking (hereinafter Newsweek), it can be seen that the
two lists share only 14 of the same companies. With this small sample, the Spearman’s Rho of -.284 is very small
and indicates that it is very unlikely original criteria used for the ranking are in any way similar. At a 5% level of
significance, the p-value of.3046 supports the same conclusion that there is no evidence that the CSRI and Newsweek
had any similar factors in creating their rankings of sustainability. Finally, looking at the first scatterplot in
Appendix A, Table 2, the scattered points lend further support for the conclusion that there is a lack of a
relationship.
The comparison of CSRI to Harris Interactive’s Reputation Quotient (RQ) provides overwhelming
evidence that the two lists had some similar foundations in their effort to rank. Not only do the two ranking share 19
companies, the Spearman’s Rho of .759 indicates a decent relationship. Likewise, using a 5% level of significance,
the p-value of .000103 gives further evidence that some similar factors were used to create the these two rankings.
This is further supported by the graph in Appendix A, Table 3. This scatterplot shows that there is a string
relationship between these two rankings.
As a second step the relationships between Fortune and to the two remaining rankings, Newsweek and RQ,
is examined. Looking at Fortune in comparison to Newsweek, there are only 16 companies in common. Both the
sample size and any common factors being used by the two types of ranking are questionable. Furthermore, with a
Spearman’s Rho of .086, there is clear evidence that there were no similar factors taken into consideration when
creating each ranking. Similarly, at a 5% level of significance, the p-value of .7434 is evidence that there are no
apparent shared factors when creating these rankings. Finally, looking at Appendix A, Table 4, the scatterplot in the
graph shows sporadic points indicating that no relationship exits.
When comparing Fortune to RQ, there seems to be conflicting results. In part, this may be due to the large
number of shared companies in their lists. In this case, there were 31 common companies listed in the two rankings.
The relatively low Spearman’s Rho (.385) implies that there are no commonalities in the rankings by the two
groups. However, the p-value was .0298, which at a significance level of 5% indicates that there is indeed a
relationship between the factors involved in creating the ranking. Looking at Appendix A, Table 5, one can see how
a linear relationship might be observed while some very influential observations seem to be working against the
slope. Therefore, the graph is consistent with the small value for the Spearman’s Rho but leaving open the question
of whether a significant relationship might still exist. It would be imperative to do further analysis before drawing
an absolute conclusion regarding these two ranking systems.
As a final analysis, when comparing Newsweek with RQ, there are again very strong negative results,
despite the fact that the two rankings had 28 companies in common. In fact, the Spearman’s Rho is -.010. This
extremely low value (i.e., almost 0) indicates there are no similar factors at all between these two rankings.
Likewise, when comparing to a 5% level of significance, the p-value is found to be .9574 which is again absolute
evidence that there are no common factors. It should be noted that this result is surprising because of the fifty
possible companies, the two lists share more than 50% of them and this would seem to imply that some similar

Journal of Business & Economics Research – July, 2010 Volume 8, Number 7
51
features about the companies were used. However, as seen by the lack of any linear pattern in Appendix A, Table 6,
the rankings of these 28 companies are extremely different.
CONCLUSION
Because accounting and other forms of corporate disclosures have seemingly failed to provide an adequate
basis for evaluating the non-financial performance of a company, it is not at all surprising that other forms of
ranking the best performing corporate citizens have attempted to fill the void. This study has looked at four of these
ranking schemes in order to determine whether there is a common denominator between and among the lists.
Overall, the data provided the conclusion that Boston College’s Corporate Social Responsibility Index
(CSRI) and Harris Interactive’s Reputation Quotient (RQ) have a very strong likelihood that the parameters chosen
to make their rankings have evident similarities. Although the rankings shared 38% of the same companies, there is
statistical significance when looking at how similarly they were ordered for these rankings. Meanwhile Newsweek’s
Green Rankings show no evidence that any of the factors that it uses could relate to any of the other rankings. This
is indicative that the parameters chosen to create the ordering for the ranking held no relationship with any other
company making one continue to question how the order was created and if the order has any real value.
The other oddity in the findings relates to Fortune’s World’s Most Admired Companies. This set of
rankings sticks out as being very different that the others despite having so many shared companies. Fortune shares
54% of their companies commonly with CSRI and 62% of their companies are shared with RQ. Yet, the Spearman’s
Rho for each individual comparison shows that the rankings of these are very different. Therefore, with further
analysis, one might be able to identify a confounding variable that connects the three. On the other hand, the
significance, and almost significant, p-values could simply have occurred because of the larger shared sample sizes.
Without knowledge of how the rankings were created, both of these possibilities are equally valid.
LIMITATIONS
The first major limitation to the data is that there are not many known facts about the parameters used to
initially create the lists. The discussion from each organization creating the lists is vague and confusing. The
specific formulas or statistical tests used are not disclosed. Although the need to differentiate the companies being
ranked by size and/or industry was given is referenced multiple times, none of the four list refer or discuss this
differentiation. Also, it is not evident what the initial populations were from which the lists were drawn. Had this
been disclosed, one could better determine if it would even be possible to have all of the same companies on two
separate lists. Overall, if more information could be found from within the organizations that release the surveys,
the comparisons might be more valid.
Second, after much research on current methodologies when looking at order statistics, it quickly becomes
evident that there is not really an accepted metric or known formula to evaluate qualitative data that matches
directly. Because this data has quite a few shared observations, typically over 40%, it would seem that there should
be a way to analyze the different ordering. However, no robust method has yet been found. Therefore, in creating
this output using the Spearman’s Rho and Kendall’s Tau, one might find feasible significance but lack both power
and absolute assurance that the significance holds.
FUTURE RESEARCH
Upon realizing the limitations of current methodologies for comparing lists of qualitative data, it becomes
apparent that this is an area of research that needs further investigation. Therefore, the focus of future research will
be aimed at narrowing down a powerful and robust method of evaluating listings for comparison when not all of the
elements match.

Journal of Business & Economics Research – July, 2010 Volume 8, Number 7
52
AUTHOR INFORMATION
Kathleen Campbell is a Visiting Instructor of Decision Sciences at the Saint Joseph’s University’s Haub School of
Business in Philadelphia, Pennsylvania, USA. Katie majored in Business as an undergraduate at Drexel, earned a
Master's degree in Applied Statistics from Villanova, and is currently working on achieving a PhD in Statistics from
Temple University. Katie has been the recipient of awards for teaching excellence. She is planning on completing
her PhD with research in Order Statistics by the Spring of 2012.
W. Richard Sherman is a Professor of Accounting at the Saint Joseph’s University’s Haub School of Business in
Philadelphia, Pennsylvania, USA. After majoring in Sociology as an undergraduate, Rick earned his law degree, an
MBA with a concentration in Accounting, and a graduate degree in tax law. Recipient of numerous awards for
teaching excellence, including the prestigious Lindback Foundation Award for Distinguished Teaching, Professor
Sherman has published over 50 articles in academic and professional journals. His research spans issues in
accounting education, tax, uses of accounting information, and sustainability/Triple Bottom Line reporting.
REFERENCES
1. Elkington, J. (1997). Cannibals with forks: the triple bottom line of the 21st century business. Capstone,
Oxford.
2. Fortune (2009). World’s most admired companies. Accessed 23 March 2010 at
http://money.cnn.com/magazines/fortune/mostadmired/2009/index.html
3. Hay Group (2009). Fortune’s world’s most admired companies: How we identify and rank the most
admired. Accessed on 23 March 2010 at
http://www.haygroup.com/ww/Best_Companies/Index.aspx?ID=1582.
4. KPMG (2008). International survey of corporate responsibility reporting 2008. Accessed on 23 March 2010
at http://www.kpmg.com/Global/en/IssuesAndInsights/ArticlesPublications/Documents/International-
corporate-responsibility-survey-2008.pdf
5. KPMG & SustainAbility (2008). Count me in: the reader's take on sustainability reporting. Accessed on 23
March 2010 at http://www.globalreporting.org/NR/rdonlyres/3F57ACC8-60D0-48F0-AF28-
527F85A2A4B4/0/CountMeIn.pdf.
6. Newsweek (2009). Green rankings methodology. Accessed on 23 March 2010 at
http://www.newsweek.com/id/215522.
7. Reputation Institute (2009). Google, Campbell Soup, J&J top in CSR. Accessed 23 March 2010 at
http://www.marketingcharts.com/topics/branding/google-campbell-soup-jj-tops-in-csr-6760/.
8. Schwartz, A. (2009). How accurate are Newsweek's green company rankings? Accessed 23 March 2010 at
http://www.fastcompany.com/blog/ariel-schwartz/sustainability/how-accurate-are-newsweeks-green-
company-rankings.

Journal of Business & Economics Research – July, 2010 Volume 8, Number 7
53
APPENDIX A
Table 1: Comparison of CSRI and Fortune
Spearman’s Rho = .332; p-value = .0839. No relationship but interesting results.
Table 2: Comparison of CSRI and Newsweek
Spearman’s Rho = -.284; p-value = .3046. No real relationship found.

Journal of Business & Economics Research – July, 2010 Volume 8, Number 7
54
Table 3: Comparison of CSRI and RQ Spearman’s Rho = .759; p-value = .000103. Evident relationship found.
Table 4: Comparison of Fortune and Newsweek
Spearman’s Rho = -.086; p-value = .7434. No relationship.

Journal of Business & Economics Research – July, 2010 Volume 8, Number 7
55
Table 5: Comparison of Fortune and RQ Spearman’s Rho = .385; p-value = .0298. This too supplies some interesting results.
Table 6: Comparison of Newsweek and RQ
Spearman’s Rho = -.010: p-value = .9574. No relationship.

Journal of Business & Economics Research – July, 2010 Volume 8, Number 7
56
APPENDIX B
Top 50 for Boston College’s Corporate Social Responsibility Index
Rank Company Names Rank Company Names Rank Company Names Rank Company Names
1 Google 14 Anheuser-Busch 27 Green Mountain Coffee Roaster 40 Eastman Kodak
2 Campbell Soup 15 Sara Lee 28 Marriott International 41 Cisco Systems
3 J & J 16 Apple 29 Advanced Micro Devices 42 Costco Wholesale
4 Walt Disney 17 General Electric 30 IBM 43 Sun Microsystems
5 Kraft Foods Inc. 18 Publix Markets 31 The Coca-Cola Company 44 Loews Cos.
6 General Mills 19 Honda of America 32 Whirlpool Corporation 45 Walgreens
7 Levi Strauss & Co. 20 Deere & Company 33 Aflac 46 Fidelity Inv.
8 UPS 21 Adobe Systems 34 Office Depot 47 Express Scripts
9 Berkshire Hathaway 22 Xerox 35 TIAA-CREF 48 Deloitte & Touche
10 Microsoft 23 New Balance 36 PepsiCo 49 Dell
11 Intel 24 Toyota Motor Corp. 37 Nokia 50 Boeing
12 3M 25 Texas Instruments 38 Timberland Company
13 FedEx 26 Colgate-Palmolove 39 Eastman Kodak
APPENDIX C
Top 50 for Fortune’s Most Admired Companies
Rank Company Names Rank Company Names Rank Company Names Rank Company Names
1 Apple 14 Wells Fargo 27 UPS 40 Boeing
2 Berkshire Hathaway 15 Goldman Sachs 28 BMW 41 Deere
3 Toyota Motor 16 McDonald's 29 American Express 42 Nokia
4 Google 17 IBM 30 Hewlett-Packard 43 Northwestern Mutual
5 Johnson & Johnson 18 3M 31 Cisco Systems 44 Best Buy
6 Proctor & Gamble 19 Target 32 Honda Motor 45 General Mills
7 FedEx 20 J. P. Morgan Chase 33 Singapore Airlines 46 Toyota Industries
7 Southwest Airlines 21 PepsiCo 34 Starbucks 47 Lowe's
9 General Electric 22 Costco Wholesale 35 Caterpillar 48 AT&T
10 Microsoft 23 Nike 36 Intel 49 Accenture
11 Wal-Mart Stores 24 Nordstrom 37 Marriott Int’l 50 Samsung Electronics
12 Coca-Cola 25 Exxon Mobil 38 Nestle
13 Walt Disney 26 Bank of America 39 Sony
Journal of Business & Economics Research – July, 2010 Volume 8, Number 7
57
APPENDIX D
Top 50 for Harris Interactive’s Reputation Quotient
Rank Company Names Rank Company Names Rank Company Names Rank Company Names
1 J & J 14 Apple 27 IBM 40 Wells Fargo
2 Google 15 Unilever 28 Nike 41 BP
3 Sony 16 Pepsico 29 Boeing 42 AllState
4 Coca-Cola 17 Lowes 30 Verizon 43 Sear Holdings
5 Kraft Foods Inc. 18 Whole Foods 31 McDonald's 44 Chevron
6 Amazon 19 Honda 32 Best Buy 45 Time Warner
7 Microsoft 20 Southwest Airlines 33 J. C. Penney 46 Sprint
7 General Mills 21 Coscto 34 AT&T 47 Bank of America
9 3M Company 22 Hewlett-Packard 35 American Express 48 Comcast
10 Toyota 23 Target Corp 36 Walmart 49 J. P. Morgan
11 Berkshire Hathaway 24 Home Depot 37 Starbucks 50 Wachovia
12 Proctor and Gamble 25 Dell 38 State Farm Ins.
13 Walt Disney 26 General Electric 39 Royal DutchShell
APPENDIX E
Top 50 for Newsweek’s Green Rankings
Rank Company Names Rank Company Names Rank Company Names Rank Company Names
1 Hewlett-Packard 14 Sun Microsystems 27 Estee Lauder 40 3M
2 Dell 15 Sprint Nextel 28 Xerox 41 JPMorgan Chase
3 J & J 16 Adobe Systems 29 American Express 42 Marriott International
4 Intel 17 Advanced Micro Devices 30 ITT 43 Eaton
5 IBM 18 Kohl's 31 Microsoft 44 J. C. Penney
6 State Street 19 Allegran 32 Travelers 45 CB Richard Ellis Group
7 Nike 20 Staples 33 United Technology 46 Starwood Hotels & Resorts
8 Bristol-Myers Squibb 21 Motorola 34 Walt Disney 47 Pall
9 Applied Materials 22 McDonald's 35 Baxter International 48 First Solar
10 Starbucks 23 Texas Instrument 36 Coca-Cola 49 Virgin Media
11 Johnson Controls 24 Citigroup 37 Agilent Tech. 50 Macy's
12 Cisco Systems 25 Avon Products 38 Gap
13 Wells Fargo 26 Proctor & Gamble 39 Colgate-Palmolive

Journal of Business & Economics Research – July, 2010 Volume 8, Number 7
58
APPENDIX F
The Seven Companies Shared by all Four Lists and the Rankings for Each
Company CSRI Rankings Reputations Newsweek Fortune
Walt Disney 4 13 34 13
Microsoft 10 7 31 10
Johnson and Johnson 3 1 3 5
IBM 30 27 5 17
Hewlett Packard 38 22 1 30
Coca Cola Company 31 4 36 12
3 M 12 9 40 18