
Sigma Guide to Doing More
65
Foreword by Michael L. George Mark O. George The Lean Six Sigma Guide to Doing More with Less Executive Summary Cut Costs, Reduce Waste and Lower Your Overhead
-
Upload
independent -
Category
Documents
-
view
0 -
download
0
Transcript of Sigma Guide to Doing More

Foreword by Michael L. George
Mark O. George
The Lean Six Sigma Guide to Doing Morewith LessExecutive Summary
Cut Costs, Reduce Waste and Lower Your Overhead
The Lean Six Sigma Guide to Doing More with Less—Executive SummaryIn this difficult economic climate, it’s vital to cut waste that can eat at a company’s bottom line, and boost efficiency at every organizational level. The traditional business solution in a crisis is to slash away noncritical talent and resources, often doing more harm than good. There is a far better systematic approach to doing more with less. This Lean Six Sigma book will help you analyze your operational needs, identify high-impact opportunities, design and rapidly implement solutions, and create a system that will build efficiency and strong performance in every area of your business.
Praise for The Lean Six Sigma Guide to Doing More with Less
“ As a large multinational financial services corporation, Unum has been driving for simplicity, continual improvement and lasting productivity gains throughout our entire company. We have consistently adopted and deployed the strategy of Lean Six Sigma across the enterprise, as Mark George has described it in this book. This holistic approach to Lean Six Sigma is providing remarkable returns for Unum.”
-Bob Best—Chief Operating Officer, Unum
“ Lean Six Sigma builds capabilities in our people at all levels. It gives them tools and a framework in which to solve problems and address complicated issues. In the end, individuals feel they can make a difference and are empowered to take on new challenges; teamwork and problem solving become part of our culture and the company benefits financially and organizationally.”
-Al Stroucken—CEO, Owens-Illinois
Full book is published by John Wiley and Sons, 2010

1
A preview of the new book
The Lean Six Sigma Guide to Doing More with Less For novices and veterans alike, how to get the highest returns from Lean Six Sigma programs
Mark O. George
This excerpt from the full book, The Lean Six Sigma Guide to Doing More with Less, is printed with
permission from John Wiley and Sons.
1
ExecutiveSummary

2
A note to readers These days, virtually every business executive I talk with is concerned about reducing operating costs without compromising quality and customer service. Newly frugal consumers and budget-conscious business customers are certainly paying more attention to price – but they still have high standards for certain product features or levels of service. As someone who has spent the past decade architecting and supporting dozens of Lean Six Sigma engagements for companies in a broad range of industries, I’ve seen first-hand how these methodologies can reduce waste and costs while simultaneously improving speed, quality, and flexibility – all of which can enable competitive advantage. The insights derived from these collaborations with clients are what inspired me and my Accenture colleagues to write “The Lean Six Sigma Guide to Doing More With Less.” The book aims to help anyone, no matter what level of experience with Lean Six Sigma, take advantage of these powerful approaches. Don’t just take my word for it. Here’s what a few of our clients say:
• Al Stroucken, the CEO of Owens-Illinois, notes that Lean Six Sigma gives his staff “tools and a framework in which to solve problems and address complicated issues. In the end, individuals feel they can make a difference and are empowered to take on new challenges. Teamwork and problem solving become part of our culture and the company benefits financially and organizationally.”
2
LeanSixSigmaGuidetoDoingMorewithLess

3
• Frito Lay deployed Lean Six Sigma starting in early 2007. Tony Mattei, who oversees the program, says the company is realizing a seven-fold return on annual investment in the program, using many of the concepts and tools covered in the book.
• At Société Générale, the venerable bank based in France, Satheesh Mahadevan, director of processes, says Lean Six Sigma has “set up a process improvement culture” and is helping the firm move into a “global business transformation program.”
• Ted Doheny, president and COO of Joy Mining Machinery, says “transformational changes are occurring by doing more with less by investing and working smarter.” Doheny points out that the benefits extend not only to shareholders but also to customers (through higher value products) and employees (through an improved work environment).
I want to thank these and other clients for their enthusiasm, their observations, and their willingness to experiment and push Lean Six Sigma to new levels. Our new book, which is summarized in this paper, would not have been possible without their support. Sincerely,
Mark George Dallas, Texas
3
ExecutiveSummary

4
Table of contents for full book, The Lean Six Sigma Guide to Doing More with Less Foreword Preface Acknowledgements Chapter 1: Why Use Lean Six Sigma to Reduce Cost? page 1
Transactional Example: Lean Six Sigma Transforming Our Government
The Alloy of High Performance: Why Choose Lean Six Sigma to Reduce Cost?
Lean Six Sigma versus Traditional Cost-Cutting Tactics
Emerging Stronger than Ever Spotlight #1: How to Use This Book Overview of Part I: Process Cost Reduction--a
Focus on the Tools of Waste Elimination Overview of Part II: Enterprise Cost Reduction --
a Focus on Value, Speed, Agility, and Competitive Advantage
Overview of Part III: Accelerating Deployment Returns -- Getting More, Faster, from a Lean Six Sigma Deployment
PART I—Process Cost Reduction — A Focus on Waste Elimination Introduction to Part I Chapter 2: Find Cost Reduction Opportunities in Waste page 25
The Seven Common Faces of Waste: TIMWOOD Using the Full LSS Toolkit to Drive Cost Reduction
Spotlight #2: Special Tips for Nonmanufacturing Processes
Key Success Factors in Reducing Costs in Services and Retail
Spotlight #3: Design a Successful Lean Six Sigma Project or Pilot
Which Methodology Is Right for Your Project? Identifying the Players and Their Roles
4
LeanSixSigmaGuidetoDoingMorewithLess

5
Chapter 3: Use the Voice of the Customer to Identify page 53 Cost-Cutting Opportunities Customer Types and Their Needs
Collecting Data on Customer Needs Getting Specific about Customer Needs Avoiding Misinterpretations Conclusion Chapter 4: Make Processes Transparent to Expose page 67 Waste
How to Define the Boundaries through SIPOC Diagrams
Using Value Stream Maps to Achieve Transparency
Conclusion Chapter 5: Measure Process Efficiency: Finding the page 85 Levers of Waste Reduction
Process Cycle Efficiency (PCE): The Key Metric of Process Time and Process Cost
Little's Law: Understanding the Levers for Improving Process Speed
The WIP Cap Method: How Limiting WIP Can Increase Process Speed and Reduce Costs
Using PCE and Little's Law to Drive Cost Reduction Chapter 6: Improve Your Analysis Skills: How page 99 Understanding Variation, Root Causes, and Factor Relationships Can Help You Cut Costs While Improving Quality Analysis Skill #1: Learning to "Read" Variation Analysis Skill #2: Digging Out Root Causes
Analysis Skill #3: Establishing Relationships Between Factors
Conclusion Chapter 7: Make Rapid Improvements Through page 119 Kaizens Quick Overview: The Kaizen Approach
5
ExecutiveSummary

6
When Should You Use Kaizens in Cost Reduction Projects
Seven Keys to Kaizen Success Conclusion PART II—Raising the Stakes— Reducing Costs at an Enterprise Level Chapter 8: Think Transformation, Not Just page 135 Improvement
Attain a Proper Understanding of the Extent of the Opportunity Consciously Choose a Path to Capture the Opportunity Plan for a Transformation Journey Leadership Challenges in Leading a Transformation Conclusion Spotlight #4: Transformation at Owens-Illinois
Chapter 9: Unlock the Secrets to Speed and Flexibility page 161 Alignment and Analytics A Model of Speed and Agility The Death Trap of Economic Order Quantity (EOQ) Alternatives to EOQ The Equations in Action Conclusion Chapter 10: Reduce the Cost of Complexity page 179 The Hidden Cost of Added Offerings on Processes
Assessing Complexity in Your Business: A Holistic View
Highlights of the Complexity Analysis Process Complexity Reduction as the Gateway to
Transformation Conclusion Chapter 11: Look Outside Your Four Walls to Lower page 199 Costs Inside What Is an Extended Enterprise? Working on the Supplier End of the Extended Enterprise
6
LeanSixSigmaGuidetoDoingMorewithLess

7
What to Do When You're the Supplier: Extending Your Enterprise Downstream
Conclusion PART III—Speeding up Deployment Returns: Strategies for Getting More, Faster from a Lean Six Sigma Deployment Chapter 12: Create a Pipeline of Cost Improvement page 217 Projects the Secret to Protecting the Heart of Your Business
Developing Rigor in Project Identification and Selection
From First-Time to All the Time: Shifting from a One-Time Even to an Ongoing System of Pipeline Management
Conclusion: Maintaining a Dynamic Pipeline Spotlight #5: Link Projects to Value Drivers
Option 1: Value Driver Trees Option 2: Financial Analysis Decision Tree Option 3: Economic Profit Option 4: EP Sensitivity Analyses Value Driver Example Chapter 13: Smooth the Path Through Change page 249 Change the Path through Change Leading versus Managing the Change Upgrading Your Communication Plan Process Ownership and Cost Accountability Conclusion: Restoring Faith, Hope, and Belief Chapter 14: Establishing a Center of Excellence page 263 What Is a CoE and What Does It Do? Focus #1: Performance Management
Focus #2: Replication: Copy and Paste Your Cost Savings
How Can a CoE Fit into an Organization Weaving the CoE into Strategic Planning Conclusion
7
ExecutiveSummary

8
Chapter 15: Gaining New Perspectives on page 283 Deployment Cost and Speed Opportunities
Looking for Focus and Flexibility in Deployment Focusing Deployments on Business Issues Flexibility in Building Skills Conclusion Chapter 16: Reenergizing a Legacy Program page 301 Why Deployments Lose Steam Building a Steam Engine: Performance Management
Process Ownership: The Partner of Performance Management
How to Reenergize a Deployment Conclusion page 320
8
LeanSixSigmaGuidetoDoingMorewithLess

9
Are You Confident in Your Cost-Cutting Scheme? The recent global economic collapse spared no industry, government, or geography. As companies rebalanced capacity to match lower demand, many have undertaken severe measures by consolidating, closing operations, and making across-the-board layoffs.
Corporate responses to the economic crisis reflect a troubling underlying issue: Much of the cost-cutting has come in the form of poorly planned, ad hoc measures. Without careful analysis and understanding of the drivers of cost, the outcomes can be hit and miss. Some may do more harm than good by eroding customer loyalty, market share and brand perception through lower service levels, inattention to customer priorities and poor execution.
If you’re skeptical of such warnings, consider that these mistakes might not show up as disasters, because even ad hoc cost-cutting likely yields some small savings. Yet organizations often miss 10 to 50 times the potential savings by succumbing to traditional cost-cutting tactics or copying the latest improvement fad. Moreover, these tactics typically fail to build in flexibility and speed, which are critical capabilities in today’s dynamic markets.
Organizations are under intense pressure to become much more efficient, accomplishing more with the same or fewer resources. The erosion of operating margins, the declines in revenues, the need to generate new streams of growth – all converge on the imperative for operational excellence. Accenture believes that operational excellence is a valuable competitive differentiator for an organization, because it is both a source of competitive strength as well as a source of cost and cash benefits. Properly architected and managed, operational excellence can achieve significant and measurable performance improvements by
9
ExecutiveSummary

10
focusing on the levers that improve flexibility and speed to market, quality and reliability, and customer value. In addition, Accenture’s ongoing business research has found that the pursuit of high performance is not only a worthy enterprise, but practical and necessary. Our research on past economic downturns has found that high-performing businesses put a premium on operational excellence and pull ahead of their competition at the end of a recession. High-performing companies excel in part because they execute day-to-day business processes better than their competitors. Creating and defending operational advantage is both more important and more difficult to achieve than ever. It requires mastering repetitive processes that deliver value to customers, the organization itself and shareholders.
Lean Six Sigma, a discipline proven over several decades, offers the most effective way to build these capabilities. Lean Six Sigma combines two of the most powerful improvement engines available: Lean provides mechanisms for quickly and dramatically reducing lead times and waste in any process, anywhere in an organization. Six Sigma provides the tools and organizational guidelines that establish a data-based foundation for sustained improvement in customer-critical targets. Together, Lean Six Sigma drives value through a classic equation: operating income growth (by addressing efficiency) + revenue growth (by addressing what matters to customers, in a repeatable manner) = shareholder value.
This paper summarizes our upcoming book, “The Lean Six Sigma Guide to Doing More with Less.” The book
10
LeanSixSigmaGuidetoDoingMorewithLess

11
describes a holistic approach to applying Lean Six Sigma at multiple levels and in multiple ways across an organization. A holistic approach addresses each aspect of effective operational cost reduction:
• Alignment of the effort to company strategy and its level of urgency
• Identification of the greatest levers of operational improvement and the key drivers of economic profit
• Speed to results
• Practical and pragmatic implementation, using techniques that can address a wide array of opportunities and environments
• Balance with internal and external forces, to ensure they don’t adversely affect net overall business performance
• Sustainability of the cost reductions realized
We recognize that Lean Six Sigma is not a new phenomenon. But despite thousands of deployments launched in the past decade, many companies make missteps in deployment design and launch. As a result, they fail to achieve rapid, substantive, and sustainable returns. “The Lean Six Sigma Guide to Doing More with Less” presents tools, insights, and case studies from a variety of manufacturing and service industries as well as the public sector, and guidelines with which to extract the highest returns from a Lean Six Sigma investment. The book is useful for a single project or an enterprise-wide transformation program.
Among the key insights covered in the book are these:
11
ExecutiveSummary

12
Waste is inherent in all processes. Many organizations continue to waste time, effort, and budgets over-engineering their processes, without realizing the cost consequences. They focus on tasks that do not add value for the customer or the business.
Selection of projects matters more than the choice of tools. Roughly 80% of the problems with failed improvement initiatives stem from poor selection of projects and ineffective management of the organization’s project portfolio.
Start with the customer in mind. Customer dissatisfaction and high-cost processes go hand in hand. Without a true understanding of customers’ priorities, a new product or entry into a new market is bound to fail. Lean Six Sigma takes a “voice of the customer” mindset in order to minimize any cost that does not add value from the customer’s perspective.
Deployments can be effective at the business unit level without senior management engagement, as long as there is full engagement from process owners and managers. However, for transformation, senior leaders must be engaged throughout.
The book has been organized to address readers with varying levels of familiarity with Lean Six Sigma. Part One introduces the methodology to novices or those who need to immediately improve local or departmental operating cost structures.
Other readers may already be familiar with Lean Six Sigma but need to extract greater impact from the methodology across the entire business. These readers may be senior executives or Lean Six Sigma experts who want to take their initiative to the next level. Parts Two and Three
12
LeanSixSigmaGuidetoDoingMorewithLess

13
discuss Lean Six Sigma’s deployment strategies for cost reduction at the enterprise level. This paper, then, summarizes highlights from each section of the book.
13
ExecutiveSummary

14
14
LeanSixSigmaGuidetoDoingMorewithLess

15
Part One: Reducing Process Cost by Eliminating Waste Part One of the book speaks to managers or P&L owners looking for cost reduction alternatives to improve financial performance within a functional area, department or single facility. It provides an overview of the tools of cost reduction.
How enterprise speed drives financial performance The tight correlation between speed and cost—both at a process level and at an enterprise level—is a powerful concept. Moving up the speed curve has provided competitive advantage to companies in a broad range of manufacturing and service industries. Consider the one-year turnaround of a hydraulic hose company that supplies a wide array of hoses and fittings to the automotive industry. The company was barely profitable, generated a negative economic profit, had a customer order lead time double the industry average and released low-quality parts to customers. Through a focused Lean Six Sigma program, within a year the firm’s operating margin had more than doubled, economic profit rose from -2% to 21%, and customer order lead time dropped from 14 days to 3 days. Such remarkable results came from focusing not just on cost reduction but also on enterprise speed—reducing
15
ExecutiveSummary
16
waste across functional units. For example, one customer, a truck-maker, required a proliferation of items in low quantities. When the hose company completed some complexity analytics, it discovered that process improvement was not the highest opportunity area. Instead, it focused on long manufacturing lead times. Management decided to drop the truck-maker as a client, eliminate the related complexity, and concentrate on the remaining clients with higher volumes and fewer part numbers. This allowed the company to reduce the number of defective brake and steering components shipped to other customers, through an all-out assault on quality and defect prevention. With product quality under control, the company then could focus on speed and flexibility. A series of operations assessments identified the cause of long process lead times and developed a mitigation plan that included the synchronized deployment of Lean tools. This holistic approach—combining complexity reduction, quality improvement and the elimination of process waste—delivered remarkable improvements. The chart below shows the drop in cost of goods sold as lead times dropped. Initially, process improvement projects resulted in reduced cost of poor quality and direct labor cost, yielding a relatively small incremental impact to overall business performance. But when the company continued to strive for greater speed and reached a 3-day cycle time, operating performance enabled a structural advantage.
16
LeanSixSigmaGuidetoDoingMorewithLess

17
Higher speed, lower costs
Every activity in a process that adds cycle time and does not add value, adds cost. By eliminating the cause of long cycle time, we also eliminate the associated cost. Cycle time, thus, can be viewed as a global metric of corporate efficiency and a guide to quickly reducing cost. Lean Six Sigma helps cut fat, not muscle—that is, reduce costs without destroying the ability to address customer priorities.
The seven faces of waste – and how to wipe them out It all starts with waste. While companies often seek incremental improvements in their value-adding steps, far greater savings can be found by looking first at the waste in their processes – waste being anything customers don’t value. Most business processes contain substantial waste, which generates costs at many levels.
Our work with clients has identified the seven most common types of waste. Some tend to be immediately visible, while others can be more difficult to detect, requiring value stream mapping and analysis to unearth:
17
ExecutiveSummary
89%
88%
87%
86%
85%
84%
83%
82%
81%
80%
79%
Lead time (days)
Cost
of G
oods
Sol
d
15 14 13 12 11 10 9 8 7 6 5 4 3 2
Expected
Observed

18
Transportation – the movement of process inputs, work-in-process, or outputs. Transportation waste typically stems from the layout of facilities, but it can also result from poor flow between process steps. An internal request that has to find its way from department to department and from individual to individual may get lost for days in the maze of cubicles and buildings, all which require outlays of cash and working capital. Lean Six Sigma eliminates transportation wastes through the redesign of processes into cellular layouts and streamlined flows that reduce batch sizes.
Inventory – mismatches throughout the supply chain, often resulting from imbalanced demand and supply. The mismatch stems from poor understanding of customer needs, irrational forecasting, attempts to manage production control from enterprise resource planning software, and other root causes. “Partial products” show up even in transactional processes, such as slow collections of outstanding sales. Only a thorough understanding of the sources of variability in the supply chain will lead to the right mix of reduced inventory levels.
Motion – inefficient movement of people. Follow a worker day to day and you will likely trace a different path each time, filled with wild goose chases, strange body positions, and poor posture. Carpal tunnel syndrome alone caused a generation of typists and assemblers to undergo expensive surgery, pain, lost time and reduced productivity. Lean Six Sigma counters with cellular flow that includes standard walking paths, optimized operating procedures and ergonomic body positioning. Waiting – with costs accumulating at every interruption in process flow. A mortgage application typically spends 99% of its time waiting to be processed at various desks. Lean
18
LeanSixSigmaGuidetoDoingMorewithLess

19
Six Sigma can identify the constraining steps through value stream mapping and by comparing process capabilities to customer demand rates. Overproduction – creating and ordering more than is necessary. In transactional processes, overproduction may go undetected and significantly raise indirect spend, through such items as expediting fees, special orders that fail to leverage economies of scale, and early payments. Managers at one company were often paying legal fees to consult external lawyers at $350 per request; a Lean Six Sigma analysis showed that in-house attorneys possessed standard solutions for most requests that were essentially free. Over-processing – delivering more of something than the customer wants or will pay for. To avoid over-processing, develop an understanding of customer needs along the entire value stream, from concept to production to delivery. If possible, focus on the original design and R&D functions, in order to build in quality and ease of manufacturability and spend fewer resources on the development effort. Defects – errors in the products intended for customers. Because you pay to make defects, not just fix them, focus on high-cost areas of scrap, rework and repair instead of trying to raise quality in value-add process steps. The telephone sales function at one company ran a Lean Six Sigma project to increase sales and lower costs. Managers believed that sales performance hinged on years of experience of the sales person and amount of time on the phone with a customer. A statistical test revealed otherwise: The main factors driving higher sales were following standard scripts, asking for a close from the customer and use of flexible pricing.
19
ExecutiveSummary

The best strategy to address the seven forms of waste: Focus on a process rather than on machines, headcounts, or balance sheet accounts. Employees get so acclimated to the massive efforts it takes to accomplish their tasks that they can't actually see the waste. In most cases, only a Lean Six Sigma project allows people to see the process from end to end, and then to take accountability for the entire value stream.
Let the voice of the customer be your guide Many processes, goods, or services are more expensive than they need to be. They either provide a feature the customer doesn’t value, or provide something of value in a way that’s too costly or time-consuming. Either way, when deciding how to change a process or product, you need to know exactly what customers value and how much. Otherwise, initiatives to eliminate waste or otherwise reduce costs can undermine valuable parts of the customer’s experience and damage the brand.
To understand customer priorities, start with both passive sources of information such as industry expert reports and internal complaint data, and active sources such as focus groups, interviews and surveys. Two examples:
An electronics company observed how customers removed the product from its packaging, used product instructions, and started using the product. These observations led to the conclusion that the company was over-engineering the packaging and some elements of the product. Simplifying these elements reduced costs by $1.3 million.
A pharmaceuticals manufacturer ran a focus group with medical professionals to inform its marketing strategy. One group identified “trust” as a key attribute they wanted in
20
LeanSixSigmaGuidetoDoingMorewithLess

21
ExecutiveSummary
On-time D
elivery
Invent
ory Tu
rns
Correct
Invoic
ePrice
Special
Order L
ead Tim
e
Relation
ship M
anagem
ent
New Prod
uct Deve
lopment
Brand Im
age
Product
Offering
Breadth
Proximity
To Cons
umer
Warrant
y Retu
rns
% Comple
te Orde
r
Impo
rtanc
e ra
tings
(1
0 =
very
; 1 =
not
at a
ll)
Critical-to-Quality (CTQ) Characteristic
4.0
5.0
6.0
7.0
8.0
9.0
10.0
CTQ Importance Company Compet 1 Compet 2 Compet 3
sales representatives. More probing through interviews and surveys identi�ed speci�c trust-related behaviors that could be instilled through training: “respect doctors’ time,” “understand their patient mix” and “don’t try to sell them a product they can’t use in their practice.” Another focus group evaluated the e�ectiveness of a promotional program. The combined group e�orts led the company to modify training and pare back annual spending on one brand from $27 million to less than $1 million.
After collecting customer data, interpreting the data typically involves developing statements about speci�c, measurable customer requirements. Several methods can help to de�ne customer needs with precision. One method called Key Buying Factor Analysis, illustrated in the �gure below, compares customer perceptions of your and your competitors’ delivery on various elements of the o�ering.
Key Buying Factor Analysis
The �gure shows customers’ rating of the importance of various purchase factors. It’s clear that the company in

22
question fares better on everything that matters little to customers and poorly on the things that customers do value. The analysis thus signals where the firm should spend to upgrade performance.
Can you believe what your data is telling you? A tool called Measure System Analysis serves to scrub the data. One bank was concerned about an increase in the amount of documentation being reported as defective by a major customer. Although separate audits of the bank and customer documentation processes found no problem, a Measurement System Analysis discovered that the operational definitions of a “defect” varied slightly, because the bank’s audit process had been revised without consulting the customer.
Listening to the voice of the customer, and applying that knowledge to the relevant processes, will ensure that cost reduction measures don’t inadvertently make products or services less attractive to customers.
What’s really happening in a process? Find out with a value stream map Two questions spur most Lean Six Sigma initiatives: Why does this process take so long? Why does it cost so much? Documenting in detail what actually happens in a process often uncovers new information and identifies the true nature of waste. Putting all of the work steps – emails, online forms, conversations and so on – into a visual map helps everyone involved see the process from start to finish. The map often bears little semblance to official manuals or management’s conception of the process, as it reveals duplicated effort and useless delays built in as standard procedures.
22
LeanSixSigmaGuidetoDoingMorewithLess

23
Process transparency starts by building a SIPOC (supplier-input-process-output-customer) diagram to capture the basic components of a process, as shown below.
SIPOC diagram
The diagram includes four to five high-level steps that identify the full scope of work, without getting caught up in detail. Identify the outputs of the process, key customers (users, purchasers, regulators) of that output, what’s important to those customers, and key inputs (raw materials, instructions, a previous step) and suppliers.
Once the boundaries and basic elements of the process are clear, the next step is to develop a picture of the process details that captures information useful to help identify and select improvement actions. Think of these value stream maps as flow charts with data. They depict both the sequence of actions in a process and data on material flow, information flow, inventories, processing times, setup times and delays.
23
ExecutiveSummary
SUPPLIER
CUSTOMER
INPUT
OUTPUT
PROCESS
Requirements, specifications, information, feedback
Boundary(End of process)
Boundary(Trigger that
starts the process)

24
The figure below depicts the form of a basic value stream map, and there are other map forms that can be tailored to the situation.
Schematic of a traditional value stream map
Boxes that depict each step will contain important process data such as elapsed time and amount. Completed map in hand, determine the value of each step, based on three categories:
• Customer value-add – an activity essential to deliver a service to the customer, a feature that the customer is willing to pay for or a function that enables on-time delivery or enhances price competition.
24
LeanSixSigmaGuidetoDoingMorewithLess
Supplier
Wor
k
Customer
Step 2
Step 1
Step 3 Step 4 Step 5 Step 6
PlanningProduction
Control
Warehouse
InputsEx: 6-mo. forecast,weekly orders
Movement of materials Information flow
Demandinformation
25
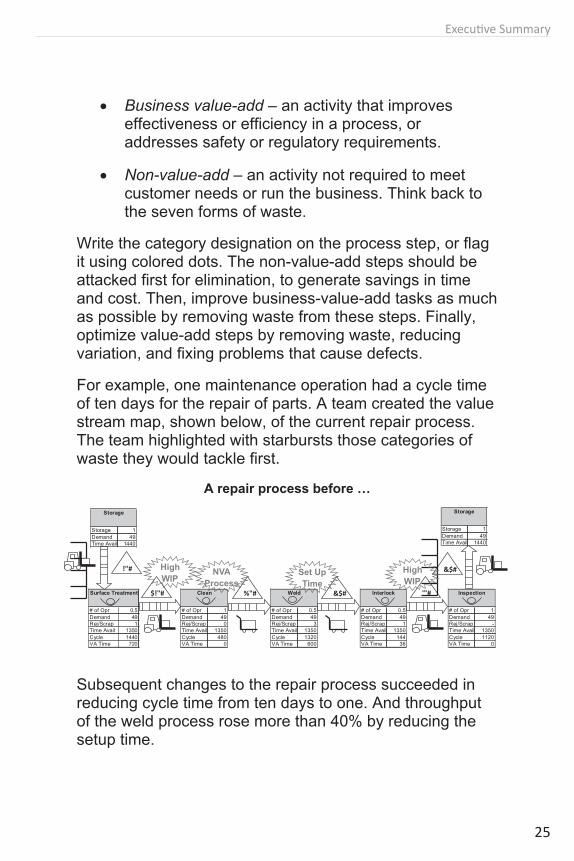
• Business value-add – an activity that improves effectiveness or efficiency in a process, or addresses safety or regulatory requirements.
• Non-value-add – an activity not required to meet customer needs or run the business. Think back to the seven forms of waste.
Write the category designation on the process step, or flag it using colored dots. The non-value-add steps should be attacked first for elimination, to generate savings in time and cost. Then, improve business-value-add tasks as much as possible by removing waste from these steps. Finally, optimize value-add steps by removing waste, reducing variation, and fixing problems that cause defects.
For example, one maintenance operation had a cycle time of ten days for the repair of parts. A team created the value stream map, shown below, of the current repair process. The team highlighted with starbursts those categories of waste they would tackle first.
A repair process before …
Subsequent changes to the repair process succeeded in reducing cycle time from ten days to one. And throughput of the weld process rose more than 40% by reducing the setup time.
25
ExecutiveSummary
!"#
$!"# %"#
Storage 1Demand 49Time Avail 1440
Storage
&$# '"#
Storage 1Demand 49Time Avail 1440
Storage
&$#
# of Opr 0.5Demand 49Rej/Scrap 1Time Avail 1350Cycle 1440VA Time 720
Surface Treatment
# of Opr 1Demand 49Rej/Scrap 0Time Avail 1350Cycle 480VA Time 0
Clean
# of Opr 0.5Demand 49Rej/Scrap 3Time Avail 1350Cycle 1320VA Time 600
Weld
# of Opr 0.5Demand 49Rej/Scrap 1Time Avail 1350Cycle 144VA Time 36
Interlock
# of Opr 1Demand 49Rej/Scrap -Time Avail 1350Cycle 1120VA Time 0
Inspection
Set Up
Time
NVA
Process
High
WIPHigh
WIP

26
… and after improving the flow
The value stream map depicts reality, warts and all. It allows everyone on the team to understand what activities are happening, in what order, and with what levels of performance. You can’t fix what you don’t know is broken.
Finding the levers of process waste reduction Slow processes are expensive processes. Moreover, as we discuss in later sections of the book, process speed and agility can directly enable true competitive advantage. Here, we address the concept of how to minimize the amount of work in process. This helps to reduce cost by improving efficiency, and helps to enable process flexibility. Fewer items in process at any given moment means quicker response time to changes in market conditions, demand profile, customer needs, or regulations.
The application of two process efficiency metrics, called Process Cycle Efficiency and Process Lead Time, can generate major time and cost saving opportunities. And one important relationship, called Little’s Law, connects the two.
26
LeanSixSigmaGuidetoDoingMorewithLess
# of Opr 0.5Demand 49Rej/Scrap 0Time Avail 1350Cycle 275VA Time 240
Weld
40
18
Storage 1Demand 49Time Avail 1440
Storage
6 6
6
# of Opr 0.5Demand 49Rej/Scrap 1Time Avail 1350Cycle 33VA Time 24
Surface Treatment
# of Opr 1Demand 49Rej/Scrap -Time Avail 1350Cycle 84VA Time 0
Inspection
640
Pallet
6 6 66
6
Next Process
# of Opr 0.5Demand 49Rej/Scrap 1Time Avail 1350Cycle 72VA Time 18
Interlock
1 pallet Kanban prior to surface treatment
• Cleaning step eliminated• Kanban of 3 trolleys of 6 pcs. to reduce WIP• New trolley design reduces damage in transit• Trolley replaces forklifts for improved safety
Set-up reduced 45% on welding machine
Interim storageeliminated; mat’lgoes directly tonext step

27
Process Cycle Efficiency compares the value-add time in a process to overall process time, both of which should be calculated as part of building the value stream map. Here’s the simple equation:
Process Cycle Efficiency (PCE) = 100 * Value-Add Time (VA)/ Process Lead Time (PLT)
The IT help desk of a large firm provides a classic example. When an employee calls the desk about a password reset issue, the first-line responders are located offshore, and because of the time difference and backlog of requests, they do not call back until the following day. The average total cycle time to close a case is 17.5 hours (1050 minutes), versus the 6.5 minutes of value-added activity it takes a help desk staff member to actually reset the password – a PCE of 0.6%.
That level of performance may sound low, but it’s typical for most traditional processes that have not been the focus of Lean Six Sigma improvement. The biggest opportunity for improving PCE will be to reduce overall PLT. Why? Look at the alternative: The help desk could develop a standard that allows staff to reset passwords in half the time, or 3.25 minutes. In that scenario, PCE becomes 0.3%:
PCE = 100 * 3.25 / 1050 = 0.3% Improving value-add time but leaving the waste in a process just means you have even less value-add time compared to non-value-add time. But what if you remove non-value-add delays in the process, so the overall cycle time drops by half? Now, PCE doubles:
PCE = 100 * 6.5/525 = 1.2% The lesson: Cutting wasted time is the most effective way to improve process efficiency. One path to doing that uses Little’s Law, which estimates PLT.
27
ExecutiveSummary

28
Little’s Law Concept and Equation
Process Lead Time = Work-in-Process/Exit Rate
Work-in-Process (WIP) = the number of “things” in the process – reports, orders, components, batches, designs
Exit Rate (ER) = the number of things that leave the process within a given time period
Consider the example of an e-commerce website that was feeling overwhelmed by producing so many new advertisements each week. From start to finish, the ad process took about 120 days, including only 15 days of value-add work. ( At any given moment, there were about 180 unique ads in development (WIP), with about 45 new ads required each month, or 1.5 ads per day (ER): PLT = 180 ads/ 1.5 ads per day = 120 days
Cutting WIP turns out to be the fastest and least expensive way to improve PLT, through a systematic approach to rapid improvement. We call it the WIP Cap method because it puts a cap on the amount of WIP. No new work enters the process until something else has been completed. WIP Cap proceeds in six steps:
28
LeanSixSigmaGuidetoDoingMorewithLess
Process
Work-in-process (WIP)
Process Lead Time
Exit rate# completedin a given time period

29
1. Determine the current PLT, directly or via Little’s Law, where you need to know the ER and amount of WIP. The e-commerce company has a PLT of 120 days.
2. Determine the current PCE. Once it completed a value stream map, the e-commerce company knew value-add time was 15 days. Therefore, PCE = 100* 15/120 = 12.5%
3. Identify a target PCE, at a reasonable level between the current PCE and a world-class level. In the ad process, a reasonable target would be 40%.
4. Calculate the PLT needed to achieve the target PCE, by reversing the PCE equation. Thus: PLT = 100*Value Add / PCE. For the e-commerce firm, the new target PCE is 40%, so PLT = 100*24/40 = 60 days.
5. Calculate the WIP Cap. This is the maximum amount of WIP that will let you achieve the target PCE. Find the amount of WIP that will balance the exit rate, by flipping the Little’s Law equation to solve for WIP rather than lead time: WIP = PLT*ER. In the e-commerce example:
PLT = 60 = WIP/ER … and ER = 1.5 … so WIP = PLT*ER = 60*1.5, or 90 ads
6. Gate the work to match the WIP Cap. That is, decide which items to release into the process in which order and in what amounts. From a practical standpoint, it’s easier to step down to the target in several iterations. In the ad creation process, the company stepped down from a 120-day to a 90-day deadline of submission for new adds. After a few months, they dropped to 75 days, then again to 60 days. The gradual drop gave people confidence they could achieve each successive goal. PLT dropped by 50%— improvements achieved solely by eliminating wait times between value-add steps in the process—not by adding staff, limiting clients or any other kind of costly change.
29
ExecutiveSummary

30
30
LeanSixSigmaGuidetoDoingMorewithLess

31
Part Two: Reducing Costs at the Enterprise Level Part Two of the book explores the characteristics of companies that have built true competitive advantage from Lean Six Sigma. These firms focus on enterprise speed, the hidden costs of complexity, the enterprise costs of capital, and extending Lean Six Sigma to suppliers, distributors and retailers.
Beyond incremental improvement, a recipe for enterprise transformation So far, we’ve been discussing tools and approaches that yield incremental improvements. For most large, established companies, however, there comes a time when they need a step-change improvement in operating performance. One might be trying to reposition itself as a premium producer, another to seize market share through ultra-low-cost-driven innovation. In short, they’re transforming their business model.
At the threshold of transformation, most companies don’t truly understand the gap between their performance and that of the leaders in such metrics as lead time and throughput. As a result, they under-commit in their goals. Setting stretch goals across the board (80% improvement in quality, 50% improvement in delivery) raises the bar for creativity in achieving the targets.
Once they’ve made that commitment, managers typically will have to excel on several fronts in order to pull off a successful and sustainable transformation:
31
ExecutiveSummary

32
Value creation and destruction. Rationalizing a product portfolio to eliminate offerings that are destroying value can help reduce the cost of operational complexity. But rationalization alone is not sufficient, as companies need to introduce innovative products to spur growth. Attaining the proper balance between is essential.
Process excellence. View the organization from a process perspective rather than a functional perspective. Understand how people, equipment, and technology interact, which processes deserve first priority for Lean Six Sigma initiatives, and in what sequence.
Asset management and return on invested capital (ROIC). A return-on-assets approach forces management to address key questions. Do we need to continue to invest in a particular asset that has low return, or should we change a process or maybe close a facility? Invest in infrastructure IT? Invest in people?
Evaluating ROIC, meanwhile, gives the organization a common currency for prioritizing which actions to take. The figure below shows the wide range of asset performance within a company. Management could cut poorly performing assets or plants from the network, or determine to lift performance of those assets through a transformation process.
32
LeanSixSigmaGuidetoDoingMorewithLess

33
Linking Value to Opportunities
Leadership with an entrepreneurial bent. Local leaders in particular will have to shift away from a very conservative, cost-center approach to an entrepreneurial, P&L type mindset that promotes growth and change. The
33
ExecutiveSummary
+90%High marginsand low capital base
4321 8765Invested capital
Evaluatelinks toshareholder value(levers withdirect impacthighlightedin reversetext below)
Shareholdervalue
Capital employed
Acquisitions (M&A)
Expansion
Improvement
Marketing & Sales
Hedging
Fixed costs
Variable costs
Prudently use capital on both tangible plantefficiencies and profitable reserve expansion
Alleviate and exploit market risk through intelligentmanagement of fluctuations
Relentlessly drive costs out of operations through determinedimprovement programs
Invested capital
Marketrealization
Operatingcosts
Econ
omic
Pro
fit
Large capitalconsumersw/ nominal returns Not making
their cost of capital
+70%
+50%
+30%
+10%
-10%
-30%

34
organization will have to adapt in a few ways. For instance, more decisions will have to be delegated down, so they can be made quickly. Processes that cut across different functions should be overseen by people with sufficient authority over the entire process.
The stakes and risks get higher in an enterprise transformation. Success thus depends on having strong leaders all pulling towards a common vision and focusing on the vital few issues. Otherwise, individuals won’t be able to make the tough calls and leadership discussions can easily degrade into turf battles. For example, the procurement department will likely resist changing how they’ve functioned for many years — selecting suppliers based on lowest cost — unless the head of that department commits to corporate goals to reduce overall costs, which will require partnering with at least some key suppliers. Senior leaders must find the motivational reasons that will energize different parts of the organization to advance the cause.
Unlocking the secrets of speed and flexibility We’ve seen that transformational improvement depends on connecting and strategically organizing disparate projects across multiple processes – indeed, along entire value streams. Lacking this approach, most organizations will realize only slow and incremental benefits, without attaining competitive advantage. Management must align behaviors, protocols and rewards across the business. This alignment is especially critical for enterprise speed and flexibility.
To promote speed and flexibility, one must expand the scope and focus of the transformation effort beyond production or service delivery processes. It requires a
34
LeanSixSigmaGuidetoDoingMorewithLess

35
holistic, closed loop strategy whereby work planning and scheduling operations make decisions based on the true capability of production or service delivery channels, as well as the total customer demand by each product or service offering in the portfolio.
This would seem simple enough except for two complicating factors. First, there are several elements that determine dynamic production or service capability. And second, most production lines or service delivery channels are not dedicated to a single product or service, so the product mix and demand by product becomes quite important.
Over the years, we’ve determined that the three most significant analytical concepts related to enterprise speed and flexibility are Little’s Law, Workstation Turnover Time (WTT) and Cycle Time Interval (CTI). Together, these equations unify planning, scheduling, dynamic production or service capability and customer demand by offering type.
Little’s Law, discussed earlier, links process performance directly to work scheduling and planning. It highlights the importance of discerning total demand (number of “things” in process) at any given time. And it shows the impact of completion rate instability on process lead time.
The heart of enterprise flexibility lies in the concept of minimum safe batch sizing. Reducing batch sizes can minimize the time a production line locks on to a given product. The lower the quantity of the product in process, the lower the process wastes, and the more rapidly the company can respond to changes in demand and product mix.
35
ExecutiveSummary

36
Many organizations implement an approach called Economic Order Quantity to determine the production schedule, despite the fact that EOQ only considers one part or item at a time. If not part of an overall strategy that includes Sales and Operations Planning (S&OP), EOQ can degrade enterprise flexibility by increasing batch sizes beyond current levels of demand.
Fortunately, there is a more effective approach that augments EOQ and S&OP with Lean analytics. Determining minimum safe batch sizes relies on the two equations of WTT and CTI. We don’t have space here to delve into the math of these equations, but the figures below depict what they represent.
Workstation Turnover Time
WTT is how long it takes for the workstation to complete one full production cycle of all products scheduled for that station. Here there are two full cycles for three products (A, B and C).
Cycle Time Interval
36
LeanSixSigmaGuidetoDoingMorewithLess
Batch A
Setup A Process A Setup B Process B
Batch B
Setup C Process C
Batch C
WTTZ
Batch A
Setup A Process A Setup B Process B
Batch B
Setup C Process C
Batch C
Setup A Process A
Batch A
Setup B Process B
Batch B
Setup C Process C
Batch C
CTI BCTI C
CTI A

37
CTI tracks an individual product or service rather than the workstation. It is the time from the start of one production run of the product to the next run of that same product. Here we see cycle time intervals for the three products.
This pair of equations combines to provide the direct link between actual process capability and the product demand for each part or item in the portfolio. Taken together, they form a closed loop system that accelerates enterprise speed and flexibility as well as improves returns on invested capital. WTT captures the relative capability of the production process and its flexibility while CTI determines the order frequency of each part or item in the portfolio based on the rate of demand and its yield. Furthermore, these equations help managers see how to improve speed and flexibility by reducing set-up times, increasing production rates (especially through maintenance excellence) or improving product yield (through elimination of defects).
Reining in the insidious costs of complexity Innovation and a willingness to always say “yes” to the customer has a downside: Although a differentiated portfolio of products and services are effective in winning new customers and driving new growth, portfolio complexity can mire productivity and actually destroy shareholder value. Growth without attention to its effect on the assets needed to produce additional products can quietly ruin company economics.
A telecommunications provider, for instance, may feel it has to offer a wide array of packages to entice customers. But the breadth of the assortment can cause major complexity headaches. Operations must allow connectivity
37
ExecutiveSummary

38
between vastly different systems; Finance must track the pricing and discounts for more service combinations; Legal must support different regulatory commitments; Customer Service must create more scripts. Complexity grows when users cross state lines, and becomes a nightmare to unravel when the firm decides to phase out a particular service.
Inappropriate cost allocation techniques often mask such complexity costs. Managers assume that offerings consume the utilization of assets (plants, equipment, people, systems) equally, when in fact different products may have very different levels of asset utilization. Take a simple case of two toasters, one for bagels and another for standard slices of bread. In manufacturing, the bagel toaster needs a more expensive shell, and the molds are harder to maintain. It doesn’t fit easily onto a retailer’s shelf. It sells at lower volumes, which raises variation in demand and requires less-than-pallet-load shipping techniques. With cost piling on cost, soon the company faces a large cost spread between the base product and the low-volume “differentiated” product.
Addressing any single element of complexity can lead to suboptimal results; step change requires an integrated, holistic approach. Moreover, looking at traditional management reports or talking only to senior executives won’t help much, either. Instead, an effective process to simplify complexity includes the following tasks:
• Site visits and interviews with people at all levels, to see how they view their part of the business and its relationship to other parts
• An economic profit analysis, which looks at the relative value that products and services are contributing to or removing from the business
38
LeanSixSigmaGuidetoDoingMorewithLess

39
• Benchmarking ROIC and return on assets against other companies in the same industry or with a similar business model or product type
• Reallocating costs to individual product families and then to individual product, to attain a better understanding of the true costs
• Calculating PCE on the value streams or processes that are part of the analysis
• Performing both a Prime Value Chain (PVC) analysis and Complexity Value Stream (CVS) analysis. PVC identifies which value streams are responsible for the most enterprise value destruction. A CVS map shows the interactions across functions and value streams, and how variation in processes impacts the organization’s costs.
• Using the information garnered from the steps above to identify opportunities, grouped by impact or functional sets
• Evaluating risk, feasibility, and benefits for each opportunity. Tackle the quick wins first (low risk, high impact), then proceed to other projects with higher risks or lower impacts.
To truly know whether the variety offered to customers is paying for itself, look closely at how that variety impacts the processes used to design, produce, deliver, sell, and service. Culling the variety that customers don’t value enough is one of the most effective steps to reducing costs across the enterprise.
39
ExecutiveSummary

40
Reaching upstream and downstream to your extended enterprise In many Lean Six Sigma deployments, there’s a point when senior managers realize that further cost reduction will come from looking upstream to suppliers and downstream to distributors, dealers and retailers. Even companies with world-class process excellence can be undercut by mediocre performance in their “extended enterprise.”
Extending Lean Six Sigma beyond the walls of the organization assumes a collaborative rather than adversarial relationship with suppliers and dealers. It requires a shared view of customer demand trends and a common goal of reducing overall costs. But the benefits will be well worth the effort, including shorter lead times, less rework and returns, increased responsiveness to shifting customer priorities and less working capital employed.
40
LeanSixSigmaGuidetoDoingMorewithLess

41
Benefits of an extended view of the enterprise
On the supplier end, look first at those companies with whom you want a strategic sourcing or deep sourcing relationship. Then rank the candidates based on how much business you do with them and indications of their interest.
41
ExecutiveSummary
EnterpriseSupplier BaseDistributor/Dealer Base
Disruptors/Issues Benefits
Disruptors/Issues Benefits
• Supplier failures• Quality issues• Transportation disruptions• Shipping/delivery errors• Weather and labor issues• Long lead times• Insufficient capacity
• Market shifts• Economic downturns• Transportation disruptions• Staff changes• Dealer failures• Poor customer service• Product misrepresentation• Low growth
• Flexibility to address changing demand• Responsive to product changes• Robust processes less affected by staffing changes• Optimum dealer network design to
deal with individual dealer disruptions or failures
• Increased sales effectiveness• Critical link to understanding “heart of the customer” and feeding into supply chain
• Lower probability of failure
• Flexibility from multiple suppliers• Individual supplier increased agility and flexibility• Higher quality and flexibility• Analytically determine safety buffers w/o excess
inventory and its associated costs
• Maximum capacity• Fast lead times

42
Other likely candidates are suppliers with a high defect rate in their materials or components.
The nature of the projects will depend, of course, on the specific situation. One heavy equipment manufacturer identified projects both within its suppliers and joint projects that crossed organizational boundaries. Projects included reducing scrap, shortening lead time by eliminating non-value-add activities, and reducing supplier inventory. Such initiatives can be accomplished as joint improvement projects, loans of Black Belts, exchanging work teams or paying to train supplier staff in Lean Six Sigma techniques.
Looking downstream, the work will depend largely on how many partnerships a company can reasonably handle and how much influence it has with distributors and retailers. A large company with a lot of influence over distributors could offer training courses within those distributors. A smaller firm with influence or a willing partner might invite the customer to send a few staff to its own training courses. And any firm could share training materials and course curricula.
Helping downstream partners improve their own processes and raise end-customer satisfaction yields a number of benefits to the supplier. To start, the effort demonstrates a deep commitment to joint success, which will create more passion around your products inside the distributor or dealer. In addition, the projects often generate better insights into end-customer needs and competitor behavior. One supplier of high-end home products, in the course of a Lean Six Sigma project with a major retailer, learned that the retailer was about to drop a key product because end-customers were balking at the high price. This insight allowed the manufacturer to make some product changes, increase sales, and increase profit based on lower
42
LeanSixSigmaGuidetoDoingMorewithLess

43
manufacturing and raw material costs of the modified product.
Good partnerships with suppliers and downstream players don’t happen by chance. Companies that devote the same attention to priorities, methods, education and metrics that they’ve had to establish internally will get the maximum payoff from their Lean Six Sigma investments.
43
ExecutiveSummary

44
44
LeanSixSigmaGuidetoDoingMorewithLess

45
Part Three: Getting More, Faster Part Three of the book addresses a common complaint about legacy Lean Six Sigma programs: The projects take too long, the returns are too small for the effort required, and projects are under-resourced. This part of the book explains how to inject rigor and discipline to enterprise project portfolio management. Flexible, scalable, rapid deployment models can drive high returns for a relatively low commitment of resources.
A smarter way to select the pipeline of projects When it comes to selecting a portfolio of Lean Six Sigma projects, which of the following two cases resembles your own organization’s approach?
One division of an office products company selects projects “by committee,” said a senior executive there. People pick low-risk pet projects without considering potential return. “We measure our deployment based on the number of events and projects, not on dollar values,” according to the executive. Projects run at the plant site level, with no cross-plant alignment or replication.
Over at a major pharmaceuticals firm, it’s a different story. The firm’s initial goal was to identify projects it could assign to the first wave of Black Belts being trained. But on our advice, they conducted short, focused assessments at eight sites, looking at factors such as strategic objectives, process performance and alignment, and ROIC sensitivity across the different functions. These assessments each took only one to three weeks, so the company quickly
45
ExecutiveSummary

46
identified and validated more than 100 project opportunities—enough to stock a long pipeline valued at more than $100 million.
Selecting projects that will generate significant value depends on understand your organizational needs, not just seizing on problems near to hand that can be addressed with Lean Six Sigma. In our experience, a rigorous process should proceed in four steps:
1. Rapidly assess and validate. The goal is to identify what levers will make the biggest impact on business priorities. Establish a baseline around issues such as strategic objectives, financials (buckets of inventory, what levers can affect ROIC), product mix and primary workflow. The assessment work should be done by a team of people who collectively have extensive Lean Six Sigma experience and specific industry knowledge of your industry – ideally, a mix of internal staff and external advisors to provide a fresh perspective on the opportunities. Each potential opportunity must then be validated so that senior leaders make their decisions based on reliable estimates of the worth of different initiatives.
2. Screen initial list. One of the fastest and easiest ways to screen ideas is by performing a benefit/effort analysis, with benefit usually defined as hard savings realized and effort defined as project time. Plotting the results on a matrix shows the low-effort/high-impact opportunities, which merit the initial projects; the medium- to high-effort/high-impact opportunities, which will require more resources; and the low-effort/low-impact opportunities, worth examining if any could be quick hits that solve a nagging problem.
3. Define and set the scope of projects. To make a better comparison of the best candidates, write a charter for each.
46
LeanSixSigmaGuidetoDoingMorewithLess

47
The charter contains detailed information about scope, goals, resources required and timeline, all essential for numerically scoring benefit and effort criteria in the next step.
4. Prioritize list and select projects. Develop a set of benefit and effort criteria around business impact, team selection and so on, then score the charters along the criteria selected.
Project Selection Process
From the start of the process, it’s important to engage the Finance function to establish guidelines for quantifying the value of projects. Some companies identify a senior Finance manager to sponsor development of financial
47
ExecutiveSummary
Step 1Rapid assessment
and validation
Step 2Screen
initial list
Step 3Scope and
define projects
Step 4Prioritize list andselect projects
Establish perfor-mance baseline,develophypotheses aboutlikeliest rich targets for improvement, andvalidate with data
• Score each project on benefit/effort and create matrix• Select highest priority opps. for further analysis
• Assign selected opportunities to sponsors • Draft project charters
• Assign selected opportunities to sponsors • Draft project charters
√
√√
√
Charter
Charter
Charter 1 11
93
1071710896
5
9
3 9
Project
Criteria& wt
Scor
e2
3

48
guidelines. The team needs to define how to calculate benefits for each project; create a review process to track and report benefits; and create an auditing process to ensure calibration and completion.
Companies will always have more opportunities than resources and time. Don’t try to tackle too much at once, because the longer a project takes, the less likely it is to finish and yield benefits. Instead, once you have a target for the optimal number of active projects at any time, apply the Lean principle of pull systems whereby the completion of one project triggers release of the next project into the pipeline.
The four secrets of successful change management Whether you are implementing change across the enterprise or within a specific business unit, it’s important to take the temperature of the organization first. There are four aspects of change management that, when done well, keep the initiative on the path to success.
1. Assess the organization’s readiness for change. It’s critical to understand how ready people are for change, how able they are to perform work in a new way, and how willing they are to do so. Make no assumptions, because surprises lurk around every corner. Do people truly understand what it means to work in a process environment? Has accountability to measure performance been designed, built in, and communicated appropriately? Are people equipped with the right skills and training for their new roles?
48
LeanSixSigmaGuidetoDoingMorewithLess

49
2. Know the difference between leading and managing change. Leaders should focus on awareness; they’re the source of energy and vision. Managers, by contrast, should focus on buy-in and commitment. Both leaders and managers should seek out and use people who have a lot of influence—formal or informal, no matter what their official job title—to lead high profile, short, quick-win projects. Some may be project sponsors of key improvement areas; others may be team members. Look for people who will be the first to espouse the use of new methods to achieve cost reductions, and who can influence others.
3. Upgrade the communication plan. The basics of building an effective communication plan are well known. But we’d emphasize two underappreciated aspects of communications. The first is to explicitly incorporate feedback when determining what methods to use. Providing the opportunity for feedback lets the speaker know how well the message was heard, and helps improve the plan going forward. Early in the initiative, concentrate on forums where feedback is more feasible, such as one-on-one conversations and small group sessions.
The second aspect is investing the initiative with the proper emotional tone, not just reciting the logic of why things need to happen. The emotional side of the argument has to address both “What’s in it for me?” and “What’s at risk for me?” When leaders publicly respect and address these concerns, they help to convince people that a Lean Six Sigma program is the right thing to do for the future.
4. Enforce process ownership and cost accountability. Change initiatives can cause great confusion, especially in the transitional periods. Sometimes key responsibilities aren’t assigned at all. Other times, several people think they are responsible for the same work. Process ownership means that at every stage, there needs to be someone in
49
ExecutiveSummary
50
charge of each key process—the person who makes the call if something isn’t working right. In addition, clear accountability of cost management during each phase of change is essential for a consistent focus.
The case for establishing a Center of Excellence Some companies plan Lean Six Sigma programs without mustering the energy and commitment that are required to achieve results quickly. Other firms need to rejuvenate Lean Six Sigma initiatives that have enjoyed some minor success and then stalled. In either case, setting up a dedicated Center of Excellence (CoE) can provide the organizational coordination and support that makes the difference between success and failure.
Depending on the scope and scale of the initiative, a Center of Excellence typically consists of five to ten full-time people including the director, a business analyst, and process improvement experts. They provide support to the business unit champions, project sponsors, and the project leaders. The CoE has several objectives:
• Focus the organization on the most important projects, and generate faster returns on invested resources
• Establish a critical mass of capabilities
• Provide training, coaching, and guidance to the business units
• Actively monitor and manage ongoing performance
50
LeanSixSigmaGuidetoDoingMorewithLess

51
• Take an enterprise-wide approach by devising standard process metrics, sharing improvement ideas and lessons learned, and identifying avenues of cross-unit collaboration
Two of these areas merit more discussion, as they both dramatically increase the benefits that companies can reap. First, performance management, meaning a mechanism that closes the loop between estimates of project savings and actual results achieved. The CoE should take the lead here by reporting aggregated project results and program performance, which allow seniors leadership to understand where the program has been successful and where problems are impeding performance.
The second area is replication – capitalizing on successes, applying lessons learned to other areas in the organization, and building institutional knowledge in the process. Replication speeds up the improvement cycle and allows the enterprise to capture the benefits sooner. The CoE can also identify technologies or concepts that can be transferred from one situation to another.
As an organizational entity, the CoE reports to a Steering Committee, CEO, or appointed senior leader responsible for the process improvement initiative. The CoE director works with each of the business unit leaders and business unit champions on identifying and prioritizing projects and setting cost targets. Each project is assigned to a project sponsor, then chartered and staffed by the business unit. The CoE provides process improvement expertise and capability development to the project leaders and team members as needed.
There are three general options for structuring a CoE, as shown in the figure below. In the consolidated model, resources from the business units or an external partner
51
ExecutiveSummary

52
reside within the central CoE, which assumes P&L responsibility. The CoE leadership makes decisions on resource funding and personnel, process improvement priorities, and approaches and standards. A consolidated model works best when the various business units are similar in nature.
In the distributed model, the larger organization has responsibility for maintaining only top-level decisions, such as which methodology to employ, while other decisions get made by the business units. This model lends itself to organizations composed of very different business units, such as holding companies or loosely coordinated enterprises. One drawback here is the inherent difficulty in applying lessons learned and best practices from one business unit to another. For this reason, the distributed model should be used where there is little opportunity to capitalize on intellectual cross-fertilization.
The representative model can be confusing. Most of the process improvement resources will reside in the business units, with a matrix reporting relationship to the business unit and the CoE. These people will usually remain located within the business units, but there is still a “core” CoE group charged with coordinating training, monitoring and reporting performance objectives via dashboards to the steering committee, maintaining a knowledge exchange, and providing Lean Six Sigma experts to mentor and coach project leaders. The representative model can work for organizations that have business units with similar operations but distinct cultures, and thus want to maintain autonomy.
Whatever the organizational structure, the CoE can help to ensure that a company fully leverages its Lean Six Sigma investment, especially as it transitions from early launch
52
LeanSixSigmaGuidetoDoingMorewithLess

53
stages to maintenance, where there is a greater need for coordination and sharing among business units.
53
ExecutiveSummary

54
Three models for the Center of Excellence
Highest-leverage actions to improve payback Given current economic pressures, executives are rightly looking for ways to improve the payback from their Lean Six Sigma investments. They want more flexibility to cover
54
LeanSixSigmaGuidetoDoingMorewithLess
Representative• Resources reside primarily within the business units, with
a small core of central expertise• Governance body consists of representatives across the
business units• Central body responsible for decisions related to degree of
standardization and work jointly to capitalize on lessons learned
• Strategic decisions guided by central authority, which LSS decisions made within business units
Distributed• Resources reside within the individual business units• Central body responsible only for overseeing the most
top-level of decisions• Each business unit responsible for its own process
strategy and improvement approach• There is little or no information flow between business
units• Each has awarenessof LSS Center of Excellence: rationale
for adopting its methodology; how CoE supports organizational goals and objectives; scope and deploy-ment timeline; how BUs can leverage the CoE
• Maximizes individual business unit autonomy
Consolidated• LSS resources are centrally located and fall under a central
Center of Excellence P&L• More command and control to the central organization• Central authority makes decisions related to standards,
functionality, funding, and change management• Information flows from the central body to business units• Centralization of resources allows for timely investment,
resource decisions
Cont
inuu
m

55
a range of situations: lack of sufficient internal capabilities, desire for proof of concept before launching a broad engagement, urgent operational issues that need to be resolved quickly, and so on.
New high-leverage actions have emerged that address both sides of payback – the upfront cost and the return. One action is a focused deployment, which provides an alternative to the classroom training method of the traditional Lean Six Sigma deployment model.
A major distributor of office products took this more flexible approach, starting initially with a group of just four Black Belts and a small consulting team. The team deployed concurrently on four fronts and within the first six weeks had analyzed the firm’s financial landscape and selected the highest-value opportunities; mapped the business process architecture; developed a deployment strategy and custom training program, and chartered the projects.
Because of the fast pace, the Black-Belts-in-training operated in an apprenticeship role by “learning and doing” at the same time, receiving one and a half days of training every other week. The consultants, meanwhile, led the training and coached their apprentices on how to use the right tools and analysis.
Other alternatives to the three- to four-month timeline of the traditional deployment model include these:
• I do-we do-you do skill development. Consider using this model for a limited number of high-potential, focused projects. It begins with traditional classroom training, either via a brief overview (one week) or more robust training (two to five weeks). An expert practitioner leads the team, while the person-in-training is primarily an observer. Next, the roles are reversed, with the expert
55
ExecutiveSummary

56
shadowing the apprentice, who takes the lead role. Finally, the new team leader flies solo.
• A master consultant or sensei. The sensei provides overall guidance for the deployment and deep expertise in a limited area. This works best for a limited number of easily identified cost drivers, and where the company does not need rapid results but rather a reasonable rate of return over a moderate time horizon. Toyota has used this approach to develop capability within specific departments and its supplier base.
• Internal staff augmented with outside resources. Experienced advisors can be brought in temporarily to jumpstart an initiative or to fill in areas of the business where resources are constrained. Experienced practitioners can bring fresh insights, hit the ground running, and quickly build strong teams.
• Applied learning. This approach aims for immediate project results. Tools and methodologies are introduced to participants in a “just in time” manner and focused immediately on the business issue at hand. Experienced practitioners stay with the project team through the life of the project, which facilitates skill development transfer and quick delivery of project results. The model often requires several weeks of pre-work, two weeks of in-class training, skill application via Kaizens or Value Stream Assessment (VSA) sessions, and extensive out-of-class coaching. The organization’s staff becomes qualified to lead subsequent events on their own.
56
LeanSixSigmaGuidetoDoingMorewithLess

57
General map of an applied learning model
• Blended e-learning. This approach combines self-guided study plus interactive, live classroom activities. People work at their own pace on e-modules that convey basic concepts, then attend classroom sessions where they get to apply what they learned under the guidance of an instructor. The training is scheduled for a specific time, on a specific day. Blending the types of learning has proven more effective at improving skill transfer, at a reasonable cost, than either type used independently
Success with these newer approaches will depend on the same factors as more traditional models: having highly engaged executives, linking project selection to a deep
57
ExecutiveSummary
Pre-eventwork
1 week
Prework
Kaizen
Prework
Kaizen
Prework
Kaizen
1 week 1 week2–4
weeks2-6
weeks
Lean Six SigmaTraining
Client-ledfollow-on projects
• Final data collection and mapping
• Stakeholder alignment
• Team stand-up
• Logistics
• 1st Kaizen; training, execution led by expert faciliator
• Basic tools training
• Identify next business issue
• Participant co-leads next Kaizen with expert facilitator (on issue previously identified)
• Project #2 objectives completed
• Advanced tool taining
• Identify next issue
• Continue with Kaizen cycles on targeted areas
VSA
Training
Kaizen
VSA
Training
Kaizen
Prework on key process
areas1 & 2
…
…

58
understanding of business priorities, and making sure that staff have the support they need to finish projects quickly.
Re-energizing a tired legacy program It’s not uncommon for companies to get impressive returns early on from their Lean Six Sigma efforts, but then see the rate of return taper off or vanish. To re-energize the effort, you need to know where it has gone astray. Typical root causes range from an overly narrow effort, to insufficient key metrics, to indiscriminate use of staff, to poor project selection or pipeline management.
Of all these problems, one of the worst is selecting projects that don’t contribute enough (or are perceived that way) to the goals that senior leaders care about: economic profit, costs, margin, shareholder value. The best way to deal with this problem is to establish a formal performance management system and impose strict accountability for the various processes.
A performance management system defines metrics at every level of management, as well as specific responsibilities for tracking and reporting performance on a regular schedule. For example, the figure below shows a typical monthly review by executives, and similar processes should be spelled out for each level.
58
LeanSixSigmaGuidetoDoingMorewithLess

59
Metrics mean nothing without accountability. A global retailer we worked with had recurring problems with its product re-pricing system. It regularly saw a large gap between labor hours allocated to stores to complete the re-pricing work and the actual hours consumed. Individual store execution of label changes was inconsistent, and technological glitches messed up the timing and quantity of new labels. These problems were symptomatic of a lack of process ownership, as there was no clear owner of the re-pricing process.
59
ExecutiveSummary
Performance Management Process for Executives
Monthly deliverablesfor Executives• Target vs. actual• Variance analysis• Countermeasure proposals
Ask staff about Perf. Mgmg. action plans
Review monthlyperf. metrics
with SVP and GM
Createcountermeasures
to close gap
Discuss:Target vs. actual,action plan, and
continuous impv’t
Did Perf.Mgmt. meet or
exceedtarget?
YES
NO

60
To establishing a system of process ownership, take a macro-level view to assess where natural process boundaries should exist, identify the person who will be in charge of each segment, and spell out the specific responsibilities for those roles.
Another way to raise the horsepower of the Lean Six Sigma engine is through an analysis of what is going well and what needs attention. The people closest to a problem may be unable to see it because they’ve grown accustomed to the status quo. So a neutral third party will be useful to assess what’s going on behind the scenes. This person should examine project selection, financial guidelines, links to strategy, roles and rewards, and other criteria. The specific actions taken as a result will naturally depend on the problems and opportunities unearthed.
A major Lean transformation effort at a service company had stalled two years in, with senior leaders expressing disappointment at the lack of impact on business results or culture. While the company had quantified significant financial impact, the lack of rigor around reporting results meant that no one believed the cited benefits. An evaluation revealed several problems. The firm had indiscriminately applied Lean tools and Kaizen methods, resulting in some improvement “events” that took almost a year to complete. Executive engagement varied across the organization. And project selection occurred as a series of one-off events.
To re-energize the effort, management realized they would have to develop two core competencies: integrate Six Sigma into the improvement methods, and develop a better system for project selection and monitoring. Within a year, the company completed a formal deployment planning process and trained 30 deployment champions in project selection. Those skills were put to immediate use to
60
LeanSixSigmaGuidetoDoingMorewithLess

61
provide a mix of project types, and by the end of the second year, the company realized over $50 million in additional benefits.
Taking the time to re-energize a Lean Six Sigma deployment can pay off not only raising the return on the investment already made, but also in generating significant additional savings.
* * *
Ultimately, it’s all about creating enterprise value and competitive advantage. As defined by Accenture’s research, high-performing companies consistently outpace peers in revenue growth, profitability, and total return to shareholders. They sustain their superiority across time, business cycles, industry disruptions, and changes in leadership.
To achieve those goals requires advantages in organizational structure as well as execution. And Lean Six Sigma is a critical set of tools and methodologies that can help you get there. “The Lean Six Sigma Guide to Doing More With Less” can help business leaders advance on the path to high performance, no matter what level they start from.
61
ExecutiveSummary

62
Get your copy of the full book, The Lean Six Sigma Guide to Doing More with Less
The Lean Six Sigma Guide to Doing More with Less, published by John Wiley and Sons, will be available February, 2010.
Books are available at leading retail stores, such as Barnes & Noble and Borders, and online through amazon.com, barnesandnoble.com, books-a-million.com, borders.com, and 800ceoread.com.
To learn more about Lean Six Sigma, author Mark George or Accenture’s Process & Innovation Performance work, please visit www.accenture.com/leansixsigmabook.
62
LeanSixSigmaGuidetoDoingMorewithLess

63
About the author Mark O. George is managing director in Accenture’s Process & Innovation Performance service line. Process & Innovation Performance solutions help clients become high-performance businesses by taking an end-to-end, process-based approach to address key business challenges, as well as working with clients to rapidly enhance the internal capabilities needed to continuously improve operational and innovation outcomes. For almost twenty years, Mark has helped clients with operational excellence initiatives that have helped transform businesses and accelerate financial improvements. Mark has developed enterprise transformation deployments that have helped companies achieve hundreds of millions in economic profit, while at the same time helped establish cultural transformation for long term sustainability. His experience includes leading Lean Six Sigma initiatives at more than two dozen Fortune 1000 companies, in multiple industries such as automobile manufacturing, financial services, food and beverage, telecommunications, electronics, and medical products. He has also provided support to the U.S. Military.
63
ExecutiveSummary

64
About Accenture Accenture is a global management consulting, technology services and outsourcing company. Combining unparalleled experience, comprehensive capabilities across all industries and business functions, and extensive research on the world’s most successful companies. Accenture collaborates with clients to help them become high-performance businesses and governments. With approximately 177,000 people serving clients in more than 120 countries, the company generated net revenues of US$21.58 billion for the fiscal year ended Aug. 31, 2009. Its home page is www.accenture.com.
64
LeanSixSigmaGuidetoDoingMorewithLess