Malawi-Economic-Monitor-Doing-More-with-Less-Improving ...
53
Public Disclosure Authorized Public Disclosure Authorized Public Disclosure Authorized Public Disclosure Authorized
-
Upload
khangminh22 -
Category
Documents
-
view
1 -
download
0
Transcript of Malawi-Economic-Monitor-Doing-More-with-Less-Improving ...
Pub
lic D
iscl
osur
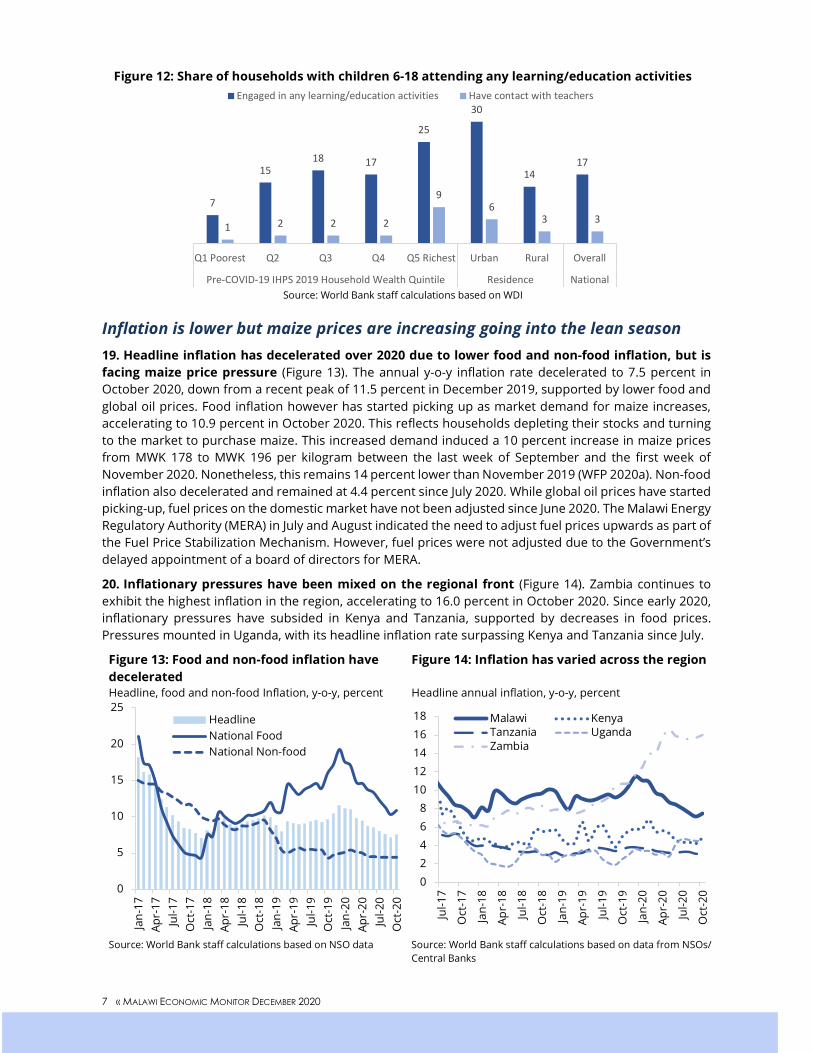
e A
utho
rized
Pub
lic D
iscl
osur
e A
utho
rized
Pub
lic D
iscl
osur
e A
utho
rized
Pub
lic D
iscl
osur
e A
utho
rized
i « MALAWI ECONOMIC MONITOR DECEMBER 2020
MALAWI ECONOMIC MONITOR
December 2020
Doing more with less:
Improving service delivery in energy and water
World Bank Office Malawi
Mulanje House
Capital City, PO Box 30557
Lilongwe 3, Malawi
+265 (0) 1 770 611
www.worldbank.org/mw
Acknowledgements
The Malawi Economic Monitor (MEM) provides an analysis of economic and structural development issues in Malawi. This twelfth edition was published in December 2020 and is part of an ongoing series, with future editions to follow twice each year. The publication intends to foster better-informed policy analysis and debate regarding the key challenges that Malawi faces in its endeavor to achieve high rates of inclusive and sustainable economic growth.
This edition of the Malawi Economic Monitor was prepared by Patrick Hettinger (Senior Country Economist, TTL), Neema Mwingu (Senior Financial Sector Specialist), Yalenga Nyirenda (Consultant), Rami Galal (Young Professional), and Efrem Chilima (Senior Private Sector Specialist). Contributions were also made by Time Fatch (Senior Agriculture Economist), Miguel Angel Saldarriaga (Young Professional), German Caruso (Senior Economist), William Mwanza (Consultant), Francisco Obreque (Senior Agriculture Specialist), Ciliaka Gitau (Economist), Chipo Msowoya (Social Protection Specialist), Odete Muximpua (Water Supply and Sanitation Specialist), Dhruva Sahai (Senior Financial Specialist), Toni Kiguru (Health Specialist), and Munge Kabubei (Consultant).
Vivek Suri (Practice Manager, Macroeconomics, Trade and Investment), Hugh Riddell (Country Manager, Malawi), and Mara Warwick (Country Director, Malawi) provided overall guidance. The team wishes to thank William Battaile (Lead Economist) and peer reviewers Marek Hanusch (Senior Economist), Andrei Busuioc (Senior Financial Management Specialist), and Arnaud Dornel (Lead Financial Sector Specialist) for their constructive inputs.
This report benefited from fruitful discussions, comments and information provided by representatives of the Ministry of Finance; the Ministry of Economic Planning and Development and Public Sector Reforms; the Reserve Bank of Malawi; the National Statistical Office; the Malawi Revenue Authority; and a number of other Government ministries, departments and agencies. The team would also like to thank representatives of the private sector in Lilongwe and Blantyre for their helpful contributions.
Henry Chimbali (External Affairs Officer), Miriam Kalembo (Team Assistant), and Tinyade Kumsinda (Team Assistant) provided assistance with external communications, design and additional production support. Sharon Chetty (Consultant) provided editorial support.
The findings, interpretations, and conclusions expressed in this publication do not necessarily reflect the views of the World Bank’s Executive Directors or the countries they represent. The report is based on information current as of December 10, 2020.
The World Bank team welcomes feedback on the structure and content of the Malawi Economic Monitor. Please send comments to Patrick Hettinger ([email protected]) or Yalenga Nyirenda ([email protected]).
Cover Design and Photo Credit: Deguzman Kaminjolo, Hi Resolution Graphix, Blantyre.
ii « MALAWI ECONOMIC MONITOR DECEMBER 2020
Table of Contents
OVERVIEW ........................................................................................................................................................................... iv COVID-19 has slowed growth in Malawi .................................................................................................................................. iv Doing more with less: improving service delivery in energy and water ............................................................................... vii
1. ECONOMIC DEVELOPMENTS ........................................................................................................................................ 1 1.1 Global and Regional Context ................................................................................................................................. 1
The global economy is experiencing a sharp recession and the pace of recovery is uncertain ......................................... 1 COVID-19 has induced Sub-Saharan Africa’s first recession in 25 years .............................................................................. 2
1.2 Recent Developments ............................................................................................................................................. 2 COVID-19 has substantially slowed economic growth in Malawi .......................................................................................... 2 The COVID-19 pandemic has worsened poverty and human capital development ............................................................ 5 Inflation is lower but maize prices are increasing going into the lean season ..................................................................... 7 The pandemic contributed to a wider fiscal deficit in FY2019/20 .......................................................................................... 8 The FY2020/21 budget deficit is expected to widen further .................................................................................................... 9 Domestic debt burden continues to rise ................................................................................................................................. 10 Flexibility of the kwacha has increased ................................................................................................................................... 13 The Monetary Policy Rate was reduced in November ........................................................................................................... 14 The banking sector has remained resilient, despite the pandemic ..................................................................................... 14
1.3 Macroeconomic Outlook and Risks ................................................................................................................... 16 Malawi needs to manage considerable fiscal challenges and reduce high poverty levels ................................................ 16 Measures to support a resilient and inclusive recovery ........................................................................................................ 17
2. Special Topic: Doing more with less: improving service delivery in energy and water ......................................... 20 2.1 Status of Electricity and Water Service Delivery in Malawi ......................................................................... 20
Inadequate energy and water services have reduced growth and aggravated poverty and health outcomes .............. 20 2.2 Constraints to better delivery of energy and water services...................................................................... 24
Limited fiscal space has led to insufficient investment in infrastructure ............................................................................ 24 Inefficient SOEs responsible for delivery of energy and water services have limited borrowing capacity, hampering infrastructure investment and service delivery ...................................................................................................................... 26 SOE governance is weak, which exacerbates operational challenges and deters private investment ............................ 28 The Government could leverage the potential of the private sector to mobilize finance and implement projects more efficiently .................................................................................................................................................................................... 29
2.3 Policies to maximize investment and finance in energy and water infrastructure and improve service delivery ................................................................................................................................................................... 30
1) Upgrade the PIM framework and integrate it with the PPP program .......................................................................... 30 2) Ensure SOEs are more efficient and creditworthy, thereby able to increase infrastructure investment and minimize their fiscal drain ........................................................................................................................................................ 33 SOEs should increase focus on operational improvements ................................................................................................. 33 Exercise oversight of SOEs without interfering and incentivize them to increase operational efficiency ........................ 35 Enhance SOE board independence, professionalism, and accountability .......................................................................... 35 Ensure regular tariff adjustments, linked to performance improvements and matching inflation ................................. 37 Encourage responsible borrowing by SOEs ............................................................................................................................ 37
References ........................................................................................................................................................................ 40
iii « MALAWI ECONOMIC MONITOR DECEMBER 2020
List of Figures Figure 1: Many countries are expected to plunge into a recession in 2020 ................................................................ 1 Figure 2: GDP growth of Malawi’s main trade partners is expected to decline in 2020 ............................................ 1 Figure 3: Oil prices have only partly recovered from lows in April 2020 ..................................................................... 2 Figure 4: Exports have largely recovered in Malawi’s key trading partners ................................................................ 2 Figure 5: A strong agriculture harvest is supporting real GDP growth......................................................................... 3 Figure 6: Capacity utilization dropped from previous years ......................................................................................... 3 Figure 7: Malawi’s imports have picked up since restrictions in April and May ......................................................... 4 Figure 8: Remittances reduced substantially due to the pandemic, but may be recovering..................................... 4 Figure 9: Malawi’s population distribution by poverty rate .......................................................................................... 6 Figure 10: Sub-Saharan Africa’s population distribution by poverty rate ................................................................... 6 Figure 11: Job losses for different African countries ....................................................................................................... 6 Figure 12: Share of households with children 6-18 attending any learning/education activities ............................ 7 Figure 13: Food and non-food inflation have decelerated ............................................................................................ 7 Figure 14: Inflation has varied across the region ........................................................................................................... 7 Figure 15: The deficit expanded in the third and fourth quarters of FY2019/20 ........................................................ 8 Figure 16: Customs taxes worsened over FY2019/20 and into FY2020/21 .................................................................. 8 Figure 17: Public debt continues to rise ......................................................................................................................... 12 Figure 18: …increasing the fiscal burden from servicing costs ................................................................................... 12 Figure 19: High primary deficits and interest rates continue to drive public debt ................................................... 12 Figure 20: Current account deficit and net FDI are the major drivers of external debt ........................................... 12 Figure 21: Domestic debt continues to shift toward longer-maturing instruments … ............................................. 13 Figure 22: … and increased borrowing from commercial banks ................................................................................ 13 Figure 23: The kwacha has depreciated against the US dollar… ................................................................................ 13 Figure 24: … helping reduce the level of real appreciation ......................................................................................... 13 Figure 25: The policy rate was reduced in November 2020 ........................................................................................ 14 Figure 26: Yields on Government borrowing have increased substantially since January 2020 ........................... 14 Figure 27: Financial soundness indicators continue to be healthy ............................................................................ 15 Figure 28: Private sector credit growth has declined since May 2020 ....................................................................... 15 Figure 29: Malawi electricity generation installed capacity ......................................................................................... 21 Figure 30: Annual power generation .............................................................................................................................. 21 Figure 31: Access to basic water ..................................................................................................................................... 23 Figure 32: Public investment ........................................................................................................................................... 24 Figure 33: Public capital stock ........................................................................................................................................ 24 Figure 34: Distance-to-market score for each SOE ....................................................................................................... 27 Figure 35: PPP Investment (1998-2007) ......................................................................................................................... 30 Figure 36: Proposed framework for developing project pipeline (PIM-PPP integrated framework) ...................... 31 Figure 37: Illustrative annual savings (MWK billion) based on various internal reforms ........................................ 34 List of Tables Table 1: Fiscal accounts ..................................................................................................................................................... 9 Table 2: Reforms to increase investment and strengthen service delivery ................................................................ 38 Table 3: Macroeconomic Indicators ............................................................................................................................... 39 List of Boxes Box 1: Malawi rebases Gross Domestic Product (GDP) upwards by 38.4 percent ..................................................... 5 Box 2: Strengthening agricultural policies in Malawi ................................................................................................... 11 Box 3: Regulatory forbearance provides relief to firms but increases risks to financial stability ........................... 15 Box 4: Basic Principles of Public-Private Partnerships ................................................................................................. 25 Box 5: Considerations for Establishing a Project Preparation Facility (PPF) ............................................................. 33
iv « MALAWI ECONOMIC MONITOR DECEMBER 2020
OVERVIEW
COVID-19 has slowed growth in Malawi The pandemic has induced a sharp recession in many countries across the globe. The COVID-19 pandemic has caused an unprecedented shock to the global economy and led to an expected overall contraction of 4.4 percent in 2020. Advanced economies are projected to shrink by 5.8 percent and emerging and developing economies by 3.3 percent. With large uncertainty about wide and affordable access to vaccines, the outlook for 2021 is for a modest recovery of 5.2 percent.
Malawi’s economy has been heavily affected, with growth projected at 1.0 percent in 2020, down from earlier projections of 4.8 percent. With population growth around 3.0 percent, this represents a 2.0 percent contraction in per capita GDP. Political stability has returned following the June 2020 Presidential elections, which should support investment. However, global and domestic factors emanating from the pandemic are affecting Malawi’s economy, including: 1) disruption in global value chains and trade and logistics; 2) decrease in tourism; and 3) decrease in remittances. This has combined with social distancing policies and behavior to also reduce domestic demand. Lower international oil prices, on the other hand, have helped reduce the import bill and alleviated fuel and transportation price pressures.
Services and industry sectors have been particularly hard hit, leading to a heavier impact in urban areas. The travel and accommodation, tourism, and transport sectors have been substantially affected. Wholesale and retail trade, as well as manufacturing and construction activity declined due to disruptions in sourcing materials and subdued demand. However, favorable weather conditions supported a strong agricultural harvest, particularly for maize, which is supporting growth and food security. Yet, production of key export crops, particularly tobacco, have declined.
Poverty reduction in Malawi has stagnated in the last 15 years and is expected to worsen with the pandemic. An estimated 12 percent of the economically active population have experienced job losses due to the crisis. Although this labor market impact is moderate compared to some other countries in the region, this comes after more than 15 years of Malawi’s poverty rate stagnating at high levels. Poverty has declined more slowly in Malawi than the rest of Sub-Saharan Africa. Malawi’s poverty rate based on the US$1.90 threshold has declined by 3 percentage points from 2004 to 2016, from 73.4 to 70.3 percent. This compares to an 11 percentage point drop for Sub-Saharan Africa, from 53.2 to 42.3 percent.
The current account deficit is projected to expand to 19.6 percent of GDP in 2020, up from 17.8 percent in 2019. Exports and imports have been affected by transport disruptions and lockdowns in major trading partners, as well as lower international oil prices. Despite the decline in imports, the drop in key exports, particularly tobacco, is expected to be even greater. Moreover, the downturn in the global economy has also reduced the inflow of remittances by 30 percent for the year through October compared to last year.
Headline inflation decelerated over the year, but is facing seasonal pressure on maize prices. The annual inflation rate decelerated to 7.5 percent in October 2020 from a recent peak of 11.5 percent in December 2019, supported by a broader decline in food prices and low global oil prices. However, food inflation started accelerating again in recent months, increasing to 10.9 percent in October, as maize prices have started their seasonal increase as households deplete their stocks and turn to the market. Non-food inflation has decelerated over the year and remained at 4.4 percent since July 2020.
Malawi’s fiscal situation deteriorated further in FY2019/20. Optimistic revenue assumptions combined with lower growth and a drop in customs revenues led to revenue shortfalls relative to the mid-year revised budget. This was combined with higher expenditure due to elections, arrears repayments, interest expenses, and pandemic response. These factors contributed to the fiscal deficit widening to 9.4 percent of GDP, far above the mid-year revised target of 5.2 percent of GDP.
The FY2020/21 budget is expansionary, further widening the fiscal deficit to a projected 12.4 percent of GDP. Expenditure is expected to increase substantially, largely due to the Affordable Inputs Program (AIP) for the agricultural sector which is expanding input subsidies to all farming households. In
v « MALAWI ECONOMIC MONITOR DECEMBER 2020
addition, interest payments are budgeted to increase by 44 percent in the current fiscal year, highlighting the heavy reliance on high-cost domestic debt. The wage and pension bill continue to increase moderately. Moreover, tax reduction measures, including more than doubling the Pay As You Earn (PAYE) zero income threshold, could undermine revenue targets, which have already underperformed in the first quarter. Fiscal consolidation will be needed in the medium term in order to reduce domestic debt to sustainable levels.
Following several years of high fiscal deficits financed by domestic borrowing, the new administration has inherited a considerable debt burden. Malawi is at high risk of overall debt distress and moderate risk of external debt distress, with limited space to absorb shocks. Public debt remains on an upward trajectory and is expected to continue to increase due to high primary deficits, which are largely funded by domestic debt at high interest rates. The stock of public debt increased from 59.4 percent in 2019 to a projected 64.6 percent in 2020, largely driven by domestic debt.
Malawi’s economic growth is projected to rebound in 2021 to 3.3 percent, however higher growth will be needed to reduce poverty levels over the medium term. The nature of the recovery will depend on the evolution of the COVID-19 pandemic. A gradual containment of the global pandemic and continuing low case numbers in Malawi would support a rebound in the services and industry sectors. However, the timeline for a rollout of a vaccine in Malawi is unclear. International tourism is unlikely to return to previous levels in the short term. The AIP program is expected to boost agricultural output and raise household incomes in the short-term, although this will rely on a good rainfall season, and is at the cost of promoting diversification.
The COVID-19 crisis poses considerable challenges to the new Government. It must seek to support the most vulnerable and encourage an economic recovery, but has inherited a substantial domestic debt burden, which has severely reduced its fiscal space. Policy actions in both the short and medium term, will be needed in the areas outlined below.
In the short term, the Government has limited fiscal space to act. Yet it needs to continue with efforts in four areas. First, it needs to continue with current efforts to contain the epidemic. This includes: expanding testing; containing outbreaks among high-risk populations; ensuring access to essential care for COVID-19 such as oxygen; and investing in mechanisms to support home-based isolation and care. Maintaining essential health services while doing this will help avoid a worsening of broader health outcomes. The Government should also accelerate planning efforts for future deployment of a COVID-19 vaccine, while maintaining other pandemic control measures such as universal face mask mandates and hygiene measures, as well as limiting large gatherings. Second, carefully targeted response efforts are needed to support the most vulnerable by expanding COVID-19 emergency cash transfers in affected urban areas, objectively identifying beneficiaries using an abridged version of the social registry. Food insecurity emergency cash transfers in both rural and urban areas will help to offset the impact of compounded shocks while supporting functioning food markets. Third, efforts are needed to further ensure regular monitoring of the trade and market situation in order to address potential blockages in food markets and trade. This will be especially key to avoid food shortages in some markets as the country heads into the lean season. Finally, it will need to assess extending the ongoing moratoria on debt service for bank lending, considering balancing access to credit, particularly for Micro, Small, and Medium Enterprises (MSMEs), with financial market stability.
In the medium term, the new Government has an opportunity to implement measures to boost economic recovery and build resilience. Measures in the following areas will help Malawi to return to 5 to 5.5 percent growth, and support incomes and job creation:
First, the Government can strengthen the foundations for macro stability and growth:
x Malawi needs to strengthen fiscal sustainability and reduce domestic debt to create a strong foundation for growth. While some fiscal accommodation in the short term may support the recovery, high and increasing fiscal deficits pose a considerable risk to fiscal sustainability. Malawi should seek a sustainable fiscal policy in the medium term so that it can reduce debt service costs. This will increase fiscal space for public investment and help lower interest rates to support private
vi « MALAWI ECONOMIC MONITOR DECEMBER 2020
investment. Fiscal consolidation will be needed, with realistic assumptions for revenue and grants. Hard choices will need to be made about expenditure priorities, including ensuring that subsidies for agricultural production are sustainable, while containing an increasing wage and pension bill. Close scrutiny of domestically-financed development expenditure is needed to ensure it is justified by high borrowing costs, and the Government has recently stepped up reform efforts in this area. Efforts to increase revenue mobilization should be carefully balanced with promoting the business environment. Greater attention is needed on contingent liabilities related to state-owned enterprises (SOEs), public-private partnerships (PPPs), and guarantees (as discussed in Part 2).
x Strengthening public financial management (PFM) and governance can improve the use of limited public resources. The Government’s efforts to implement transparent and credible financial management practices will be needed to make the best use of limited fiscal funds. This has been heightened by the COVID-19 pandemic, for which the rapid deployment of response funds has exacerbated PFM vulnerabilities. Ensuring transparent and competitive procurement can strengthen value for money of limited fiscal resources, while strong commitment controls can help avoid recurring arrears. Mitigating PFM risks will be critical to ensure that limited funds support their intended purpose and avoid creating further fiscal pressures.
x Strengthening financial oversight and transparency of SOEs is needed to reduce fiscal risks and improve service delivery. Government needs to enhance compliance with financial reporting by SOEs and analyze aggregate and parastatal-level fiscal risks. These efforts can help improve service delivery, avoid the realization of contingent liabilities and accumulation of arrears. The Government could also conduct independent forensic audits on parastatals with performance and integrity issues. It should further seek to consolidate the fragmentation of SOE oversight responsibilities.
Second, it can support diversification, in agriculture and non-agriculture sectors, to increase incomes and resilience:
x Adopting predictable and transparent policies would support diversification and commercialization in the agriculture sector. Malawi has been fortunate that the COVID-19 crisis has struck in a year with good agricultural production; however, it remains highly vulnerable to weather shocks due to its reliance on rainfed subsistence agriculture. The crisis provides an opportunity to set a foundation for increased agricultural production and resilience in the medium term. This calls for predictable and transparent trade policies for agricultural products by minimizing the ad hoc imposition of export bans, which could stimulate investment and commercialization, thereby increasing production and exports in the medium term, while supporting food security. It should further ensure that the Agricultural Development and Marketing Corporation’s (ADMARC’s) market interventions are transparent, timely, and predictable, in order to reduce market distortions. Moreover, the Government can rebalance spending in the agriculture sector to ensure it is fiscally sustainable and promotes diversification, more sustainable farming practices and climate-smart agriculture technologies including irrigation, as well as nutrition-sensitive crops. Transparent and cost-efficient implementation modalities, for instance by fixing an agricultural coupon subsidy value and strongly engaging the private sector, would also increase the efficiency of input subsidy programs. It can also promote the new seed and fertilizer policies.
x The Government needs to address issues that hinder diversification of the economy outside of agriculture. Implementing timebound turnaround plans for energy and water utilities will be critical, as well as continuing progress on critical investment projects in energy generation, transmission, and distribution. In addition, it should further simplify business regulations and taxes. Tax policies and administration should be reviewed and revised to increase transparency, to reduce ad hoc changes, and to support value addition and key growth-enabling sectors. Development of the Information and Communication Technology (ICT) sector could be supported by reviewing the tax regime, levies, and tariffs; fostering competition in the broadband infrastructure development market; and reviewing the Malawi Communication Regulatory Authority’s (MACRA’s) regulations to reduce market distortions. Further areas could include establishing an autonomous agency to promote policies supporting
vii « MALAWI ECONOMIC MONITOR DECEMBER 2020
MSMEs, operationalizing an online business registration system, and making progress on the bankruptcy/insolvency regime.
Third, the Government can strengthen systems to support the vulnerable and increase resilience:
x Developing a shock-sensitive safety net system can help mitigate the impact of the current pandemic and future shocks. Cash transfers would be a more efficient means of targeting support to the most vulnerable households than input subsidies. In addition to the ongoing COVID-19 emergency cash response to urban areas and a cash-based food insecurity response, the Government can establish a pre-existing disaster risk financial instrument to facilitate the scale-up of social cash transfers to poor and vulnerable households in the case of shocks. This will reduce the need for ad hoc budgetary re-allocation when shocks occur.
Doing more with less: improving service delivery in energy and water Malawi suffers from inadequate access to and reliability of energy, water and other infrastructure services, which are costly for growth, health outcomes, and poverty reduction. Malawi has one of the lowest electrification rates in the world (11 percent), which is a significant concern for both citizens and firms. About 67 percent of Malawians have access to basic water supply, although this masks the poor quality of services. High population growth, decreasing water resources, lagging infrastructure development, aging water systems and inefficiency of water boards/SOEs create large gaps between supply and demand, leading to unreliable services.
Malawi underinvests in energy and water supply due to a range of issues, including a lack of fiscal space and inefficiency of SOEs. The lack of fiscal space has been attributable to sluggish economic growth over the past decade; a legacy of poor selection, procurement and implementation of infrastructure projects leading to an unaffordable public investment program; and the lack of diversification of financing sources, including limited ability to leverage finance from private investors. The infrastructure investment gap in the energy and water and sanitation sectors alone is approximately US$332 million per year (about 4 percent of GDP),1 whereas the total public investment in all sectors has averaged 4.2 percent of GDP over the past two decades (between 1998 and 2017).2
SOEs responsible for delivering energy and water infrastructure are performing poorly and lack the resources to make adequate investments. Their poor cashflow generation leaves very little room for commercial borrowing, for much-needed investment, or even to properly operate and maintain existing infrastructure. The underlying cause of these challenges include weak sector policies including tariff policies and regulatory frameworks, poor project selection by line ministries, inefficient project implementation by SOEs (attributable to weak management and human resource capacity), and significant outstanding receivables with the central government, resulting in cashflow constraints and the need to take expensive working capital loans from domestic commercial banks. In addition, a weak governance framework leads to limited independence of boards of directors, lack of professionalism both in boards and management, political interference in decision-making, and lack of transparency in the use of SOE funds.
While the country is currently in the middle of fighting the pandemic, it is critical to strike the balance between delivering both short- and long-term gains. Investing in infrastructure is a way to build the foundation for long-term recovery and the crisis could be leveraged to motivate and accelerate the needed reforms. Even in the short term, the need for better access to water services to prevent the spread of the virus has significantly increased.
The new Government has already committed to undertake needed reforms. It initiated high-level corruption investigations and prosecutions; dissolved boards of directors of all parastatals and SOEs with a view to appoint new boards with more credible members; and has required all SOEs to develop turn-
1 This is based on 10-year investment plans of SOEs under review. 2 World Bank staff calculation based on the IMF’s Investment and Capital Stock Dataset, 1960-2017.
viii « MALAWI ECONOMIC MONITOR DECEMBER 2020
around strategies to improve efficiency and operate on sound business principles. Moreover, it established a Cabinet Committee on PPPs and private sector growth, signaling a desire to increase private sector participation in economic activities. However, designing and implementing a coherent reform program to deliver desired outcomes will be critical.
The Government can take several steps to improve infrastructure investments and service delivery in energy and water. Recommendations on how the new administration can deliver quality services despite limited fiscal space—“doing more with less”—for the energy and water sectors are organized along two pillars:
1) Upgrade the Public Investment Management (PIM) framework and integrate it with the PPP program: The Government needs to address current weaknesses in the PIM framework and institutions to (a) ensure better and more efficient project prioritization and selection, thereby allocating scarce resources to projects that are economically and socially justifiable, (b) improve project design and implementation to minimize delays and cost overruns, (c) improve efficiency of procurement and improve compliance with procurement rules and processes, and (d) for projects deemed suitable for PPP implementation, to leverage private sector efficiency in project implementation through PPPs. To this end, integrating the PPP program into the PIM process would be key, instead of appraising, selecting, budgeting for and monitoring PPPs separately from traditionally implemented projects. This would help the Government to better manage its finances and avoid undue fiscal risks emanating from PPPs by reporting the known and potential future fiscal costs of PPPs in the traditional budget system. Applying a PPP filter early in the project selection process could also help the Government to generate a pipeline of PPP projects that could be further developed for investment by the private sector. Supporting the process of preparing and monitoring PPP projects—developing feasibility studies, supporting transaction structuring, negotiation, contracting, and monitoring transactions during the process of preparing projects—would require dedicated financial resources, which could be availed by establishing a project preparation facility. Notably, the Government has recently initiated a process of reforming the project prioritization process, setting aside MWK 500 million for project preparation in the FY2021 budget. However, more resources may be needed given the magnitude of costs involved in project preparation.3
2) Ensure SOEs are more efficient and creditworthy, thereby able to increase investments in existing and new infrastructure and minimize their fiscal drain. This can be achieved by improving the financial performance of SOEs through stronger human resource and management capacity to enhance operational efficiency, performance-based financing (where direct financial support from the central government is involved),4 and better governance. Improved efficiency of SOEs could contribute to reduced government outlays in terms of (a) direct support to cover operational expenditure, (b) bailouts of poorly performing SOEs, (c) payments related to defaults on government-guaranteed debt, and (d) improve borrowing capacity5 and ability to directly access market-based finance. This will also contribute to improved capacity to undertake regular infrastructure maintenance and contribute to capital expenditure for new infrastructure.
3 Project preparation—from initial identification of project ideas to planning, the development of technical studies, transaction structuring and raising finance from investors—is costly and could amount to 5–10 percent of the total project cost. 4 Direct financial support from the Government to SOEs (e.g. to fund public policy objectives) should be linked to specific performance improvement targets. 5 Borrowing capacity is determined by the ability of the company to generate discretionary/surplus cash flow, which is a function of revenue generation capacity, operational efficiency, efficient capital planning, and the cost of existing debt. Financiers may offer loans ranging from two to six times the level of earnings before interest, tax, depreciation and amortization (a company that exceeds these ratios is over-indebted) but would further subtract the cost of existing debt to determine the actual free cash flow and hence the capacity to absorb additional debt.
1 « MALAWI ECONOMIC MONITOR DECEMBER 2020
1. ECONOMIC DEVELOPMENTS
1.1 Global and Regional Context
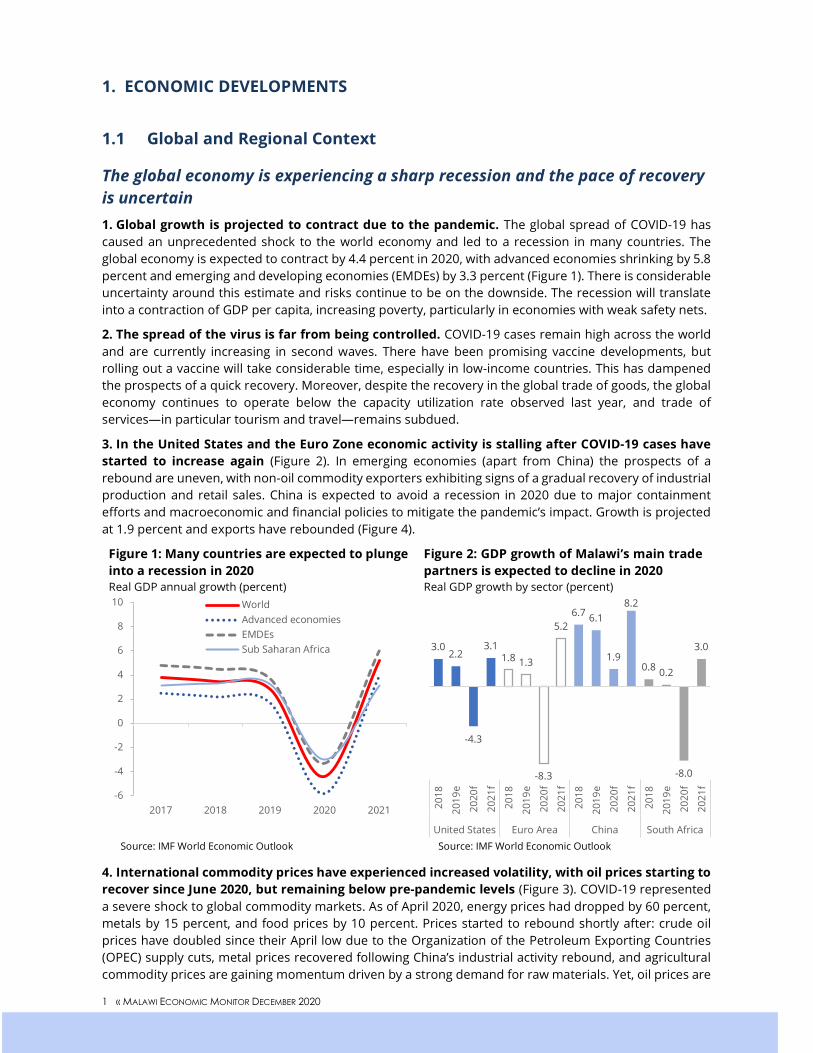
The global economy is experiencing a sharp recession and the pace of recovery is uncertain 1. Global growth is projected to contract due to the pandemic. The global spread of COVID-19 has caused an unprecedented shock to the world economy and led to a recession in many countries. The global economy is expected to contract by 4.4 percent in 2020, with advanced economies shrinking by 5.8 percent and emerging and developing economies (EMDEs) by 3.3 percent (Figure 1). There is considerable uncertainty around this estimate and risks continue to be on the downside. The recession will translate into a contraction of GDP per capita, increasing poverty, particularly in economies with weak safety nets.
2. The spread of the virus is far from being controlled. COVID-19 cases remain high across the world and are currently increasing in second waves. There have been promising vaccine developments, but rolling out a vaccine will take considerable time, especially in low-income countries. This has dampened the prospects of a quick recovery. Moreover, despite the recovery in the global trade of goods, the global economy continues to operate below the capacity utilization rate observed last year, and trade of services—in particular tourism and travel—remains subdued.
3. In the United States and the Euro Zone economic activity is stalling after COVID-19 cases have started to increase again (Figure 2). In emerging economies (apart from China) the prospects of a rebound are uneven, with non-oil commodity exporters exhibiting signs of a gradual recovery of industrial production and retail sales. China is expected to avoid a recession in 2020 due to major containment efforts and macroeconomic and financial policies to mitigate the pandemic’s impact. Growth is projected at 1.9 percent and exports have rebounded (Figure 4).
Figure 1: Many countries are expected to plunge into a recession in 2020 Real GDP annual growth (percent)
Figure 2: GDP growth of Malawi’s main trade partners is expected to decline in 2020 Real GDP growth by sector (percent)
Source: IMF World Economic Outlook Source: IMF World Economic Outlook
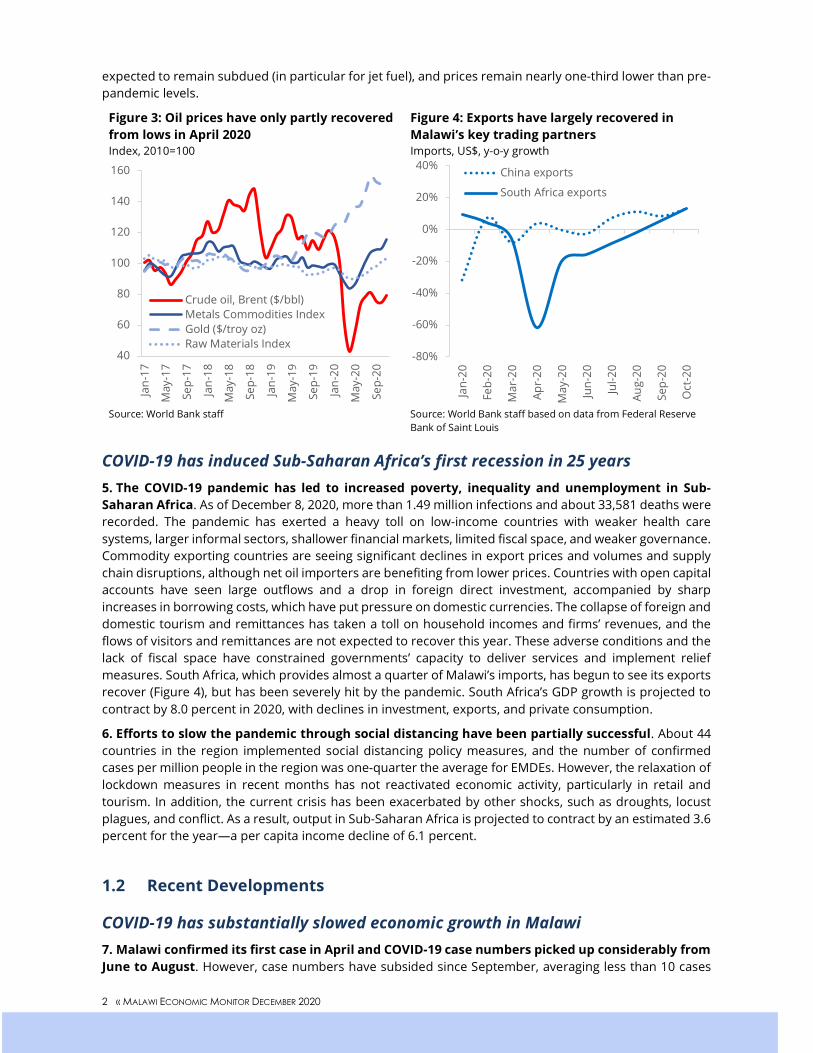
4. International commodity prices have experienced increased volatility, with oil prices starting to recover since June 2020, but remaining below pre-pandemic levels (Figure 3). COVID-19 represented a severe shock to global commodity markets. As of April 2020, energy prices had dropped by 60 percent, metals by 15 percent, and food prices by 10 percent. Prices started to rebound shortly after: crude oil prices have doubled since their April low due to the Organization of the Petroleum Exporting Countries (OPEC) supply cuts, metal prices recovered following China’s industrial activity rebound, and agricultural commodity prices are gaining momentum driven by a strong demand for raw materials. Yet, oil prices are
-6
-4
-2
0
2
4
6
8
10
2017 2018 2019 2020 2021
WorldAdvanced economiesEMDEsSub Saharan Africa 3.0
2.2
-4.3
3.11.8 1.3
-8.3
5.26.7 6.1
1.9
8.2
0.8 0.2
-8.0
3.0
2018
2019
e
2020
f
2021
f
2018
2019
e
2020
f
2021
f
2018
2019
e
2020
f
2021
f
2018
2019
e
2020
f
2021
f
United States Euro Area China South Africa
2 « MALAWI ECONOMIC MONITOR DECEMBER 2020
expected to remain subdued (in particular for jet fuel), and prices remain nearly one-third lower than pre-pandemic levels.
Figure 3: Oil prices have only partly recovered from lows in April 2020 Index, 2010=100
Figure 4: Exports have largely recovered in Malawi’s key trading partners Imports, US$, y-o-y growth
Source: World Bank staff Source: World Bank staff based on data from Federal Reserve Bank of Saint Louis
COVID-19 has induced Sub-Saharan Africa’s first recession in 25 years 5. The COVID-19 pandemic has led to increased poverty, inequality and unemployment in Sub-Saharan Africa. As of December 8, 2020, more than 1.49 million infections and about 33,581 deaths were recorded. The pandemic has exerted a heavy toll on low-income countries with weaker health care systems, larger informal sectors, shallower financial markets, limited fiscal space, and weaker governance. Commodity exporting countries are seeing significant declines in export prices and volumes and supply chain disruptions, although net oil importers are benefiting from lower prices. Countries with open capital accounts have seen large outflows and a drop in foreign direct investment, accompanied by sharp increases in borrowing costs, which have put pressure on domestic currencies. The collapse of foreign and domestic tourism and remittances has taken a toll on household incomes and firms’ revenues, and the flows of visitors and remittances are not expected to recover this year. These adverse conditions and the lack of fiscal space have constrained governments’ capacity to deliver services and implement relief measures. South Africa, which provides almost a quarter of Malawi’s imports, has begun to see its exports recover (Figure 4), but has been severely hit by the pandemic. South Africa’s GDP growth is projected to contract by 8.0 percent in 2020, with declines in investment, exports, and private consumption.
6. Efforts to slow the pandemic through social distancing have been partially successful. About 44 countries in the region implemented social distancing policy measures, and the number of confirmed cases per million people in the region was one-quarter the average for EMDEs. However, the relaxation of lockdown measures in recent months has not reactivated economic activity, particularly in retail and tourism. In addition, the current crisis has been exacerbated by other shocks, such as droughts, locust plagues, and conflict. As a result, output in Sub-Saharan Africa is projected to contract by an estimated 3.6 percent for the year—a per capita income decline of 6.1 percent.
1.2 Recent Developments
COVID-19 has substantially slowed economic growth in Malawi 7. Malawi confirmed its first case in April and COVID-19 case numbers picked up considerably from June to August. However, case numbers have subsided since September, averaging less than 10 cases
40
60
80
100
120
140
160
Jan-
17
May
-17
Sep-
17
Jan-
18
May
-18
Sep-
18
Jan-
19
May
-19
Sep-
19
Jan-
20
May
-20
Sep-
20
Crude oil, Brent ($/bbl)Metals Commodities IndexGold ($/troy oz)Raw Materials Index
-80%
-60%
-40%
-20%
0%
20%
40%
Jan-
20
Feb-
20
Mar
-20
Apr-
20
May
-20
Jun-
20
Jul-2
0
Aug-
20
Sep-
20
Oct
-20
China exports
South Africa exports
3 « MALAWI ECONOMIC MONITOR DECEMBER 2020
per day. As of December 11th, Malawi has cumulatively had 6,055 confirmed cases, 186 deaths, and has carried out 78,389 tests, representing under 0.4 percent of the population, one of the lowest testing rates in the world.
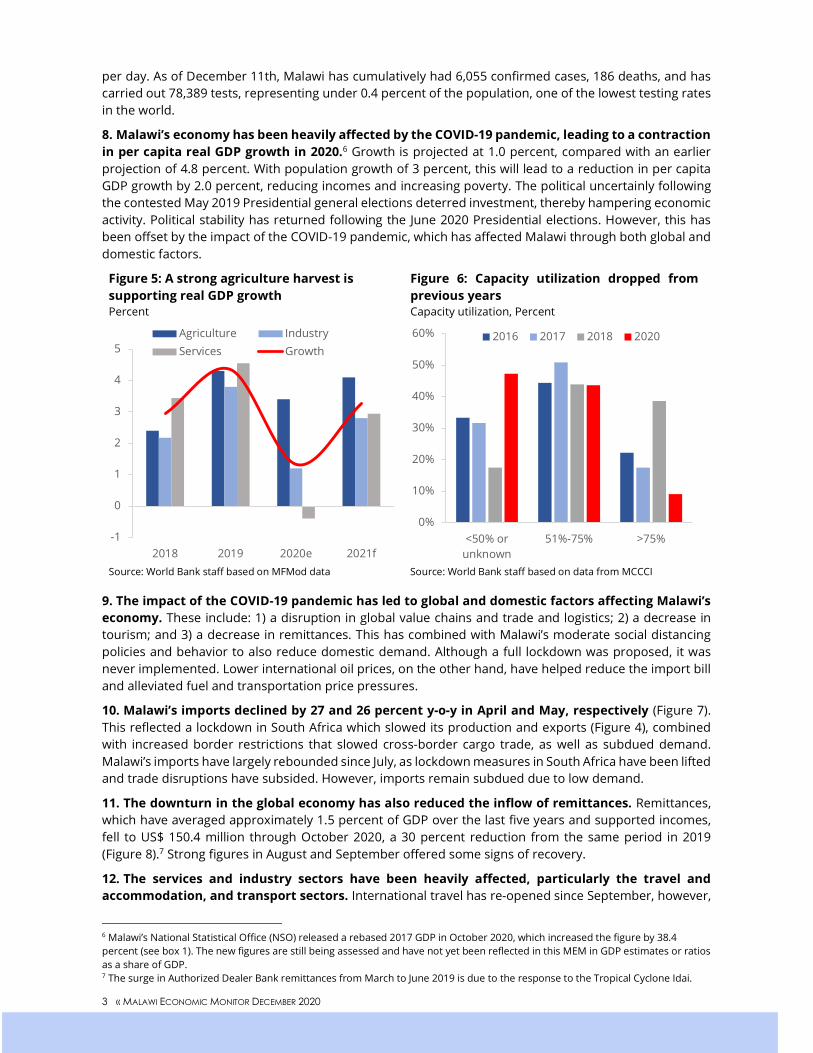
8. Malawi’s economy has been heavily affected by the COVID-19 pandemic, leading to a contraction in per capita real GDP growth in 2020.6 Growth is projected at 1.0 percent, compared with an earlier projection of 4.8 percent. With population growth of 3 percent, this will lead to a reduction in per capita GDP growth by 2.0 percent, reducing incomes and increasing poverty. The political uncertainly following the contested May 2019 Presidential general elections deterred investment, thereby hampering economic activity. Political stability has returned following the June 2020 Presidential elections. However, this has been offset by the impact of the COVID-19 pandemic, which has affected Malawi through both global and domestic factors.
Figure 5: A strong agriculture harvest is supporting real GDP growth Percent
Figure 6: Capacity utilization dropped from previous years Capacity utilization, Percent
Source: World Bank staff based on MFMod data Source: World Bank staff based on data from MCCCI 9. The impact of the COVID-19 pandemic has led to global and domestic factors affecting Malawi’s economy. These include: 1) a disruption in global value chains and trade and logistics; 2) a decrease in tourism; and 3) a decrease in remittances. This has combined with Malawi’s moderate social distancing policies and behavior to also reduce domestic demand. Although a full lockdown was proposed, it was never implemented. Lower international oil prices, on the other hand, have helped reduce the import bill and alleviated fuel and transportation price pressures.
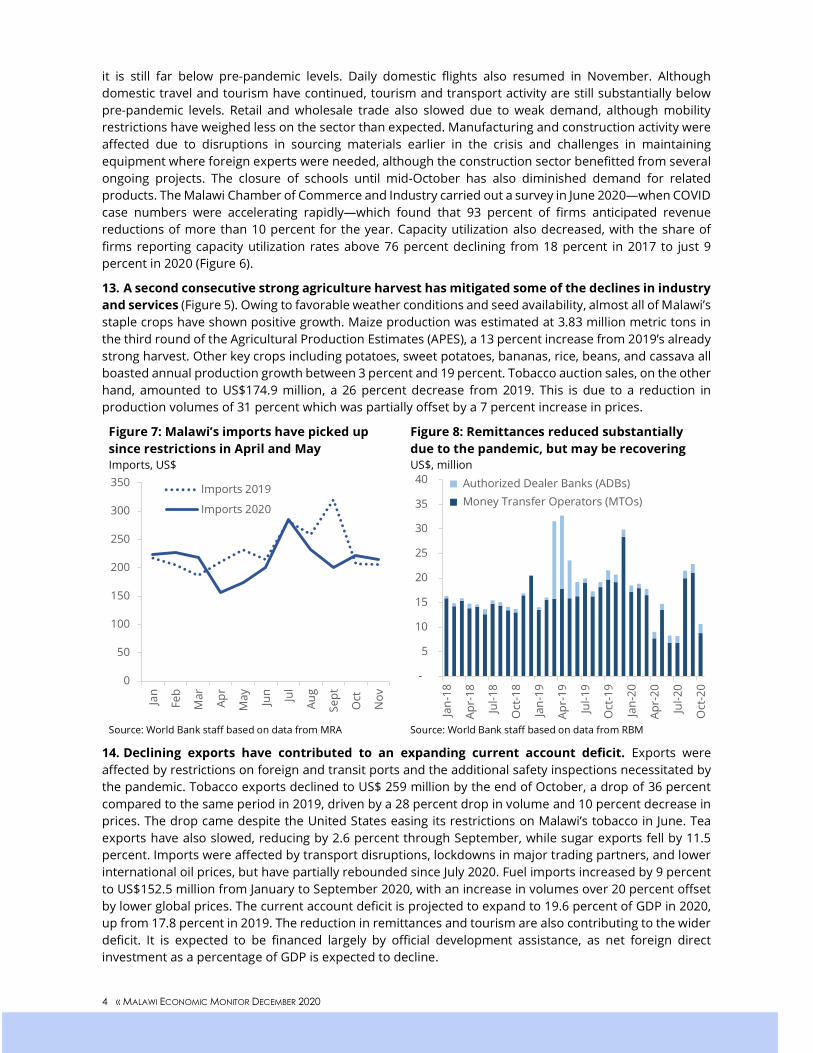
10. Malawi’s imports declined by 27 and 26 percent y-o-y in April and May, respectively (Figure 7). This reflected a lockdown in South Africa which slowed its production and exports (Figure 4), combined with increased border restrictions that slowed cross-border cargo trade, as well as subdued demand. Malawi’s imports have largely rebounded since July, as lockdown measures in South Africa have been lifted and trade disruptions have subsided. However, imports remain subdued due to low demand.
11. The downturn in the global economy has also reduced the inflow of remittances. Remittances, which have averaged approximately 1.5 percent of GDP over the last five years and supported incomes, fell to US$ 150.4 million through October 2020, a 30 percent reduction from the same period in 2019 (Figure 8).7 Strong figures in August and September offered some signs of recovery.
12. The services and industry sectors have been heavily affected, particularly the travel and accommodation, and transport sectors. International travel has re-opened since September, however,
6 Malawi’s National Statistical Office (NSO) released a rebased 2017 GDP in October 2020, which increased the figure by 38.4 percent (see box 1). The new figures are still being assessed and have not yet been reflected in this MEM in GDP estimates or ratios as a share of GDP. 7 The surge in Authorized Dealer Bank remittances from March to June 2019 is due to the response to the Tropical Cyclone Idai.
-1
0
1
2
3
4
5
2018 2019 2020e 2021f
Agriculture IndustryServices Growth
0%
10%
20%
30%
40%
50%
60%
<50% orunknown
51%-75% >75%
2016 2017 2018 2020
4 « MALAWI ECONOMIC MONITOR DECEMBER 2020
it is still far below pre-pandemic levels. Daily domestic flights also resumed in November. Although domestic travel and tourism have continued, tourism and transport activity are still substantially below pre-pandemic levels. Retail and wholesale trade also slowed due to weak demand, although mobility restrictions have weighed less on the sector than expected. Manufacturing and construction activity were affected due to disruptions in sourcing materials earlier in the crisis and challenges in maintaining equipment where foreign experts were needed, although the construction sector benefitted from several ongoing projects. The closure of schools until mid-October has also diminished demand for related products. The Malawi Chamber of Commerce and Industry carried out a survey in June 2020—when COVID case numbers were accelerating rapidly—which found that 93 percent of firms anticipated revenue reductions of more than 10 percent for the year. Capacity utilization also decreased, with the share of firms reporting capacity utilization rates above 76 percent declining from 18 percent in 2017 to just 9 percent in 2020 (Figure 6).
13. A second consecutive strong agriculture harvest has mitigated some of the declines in industry and services (Figure 5). Owing to favorable weather conditions and seed availability, almost all of Malawi’s staple crops have shown positive growth. Maize production was estimated at 3.83 million metric tons in the third round of the Agricultural Production Estimates (APES), a 13 percent increase from 2019’s already strong harvest. Other key crops including potatoes, sweet potatoes, bananas, rice, beans, and cassava all boasted annual production growth between 3 percent and 19 percent. Tobacco auction sales, on the other hand, amounted to US$174.9 million, a 26 percent decrease from 2019. This is due to a reduction in production volumes of 31 percent which was partially offset by a 7 percent increase in prices.
Figure 7: Malawi’s imports have picked up since restrictions in April and May Imports, US$
Figure 8: Remittances reduced substantially due to the pandemic, but may be recovering US$, million
Source: World Bank staff based on data from MRA Source: World Bank staff based on data from RBM
14. Declining exports have contributed to an expanding current account deficit. Exports were affected by restrictions on foreign and transit ports and the additional safety inspections necessitated by the pandemic. Tobacco exports declined to US$ 259 million by the end of October, a drop of 36 percent compared to the same period in 2019, driven by a 28 percent drop in volume and 10 percent decrease in prices. The drop came despite the United States easing its restrictions on Malawi’s tobacco in June. Tea exports have also slowed, reducing by 2.6 percent through September, while sugar exports fell by 11.5 percent. Imports were affected by transport disruptions, lockdowns in major trading partners, and lower international oil prices, but have partially rebounded since July 2020. Fuel imports increased by 9 percent to US$152.5 million from January to September 2020, with an increase in volumes over 20 percent offset by lower global prices. The current account deficit is projected to expand to 19.6 percent of GDP in 2020, up from 17.8 percent in 2019. The reduction in remittances and tourism are also contributing to the wider deficit. It is expected to be financed largely by official development assistance, as net foreign direct investment as a percentage of GDP is expected to decline.
0
50
100
150
200
250
300
350
Jan
Feb
Mar
Apr
May Jun Jul
Aug
Sept
Oct
Nov
Imports 2019
Imports 2020
-
5
10
15
20
25
30
35
40
Jan-
18
Apr-
18
Jul-1
8
Oct
-18
Jan-
19
Apr-
19
Jul-1
9
Oct
-19
Jan-
20
Apr-
20
Jul-2
0
Oct
-20
Authorized Dealer Banks (ADBs) Money Transfer Operators (MTOs)
5 « MALAWI ECONOMIC MONITOR DECEMBER 2020
The COVID-19 pandemic has worsened poverty and human capital development 15. Even before the COVID-19 pandemic, poverty reduction in Malawi had stagnated in contrast with the rest of Sub-Saharan Africa. National poverty has modestly reduced from 52.4 percent in 2004 to 51.5 in 2016.8 Benchmarking this poverty reduction performance in international terms, Malawi’s poverty rate based on the US$1.90 threshold has reduced by 3 percentage points during this period (Figure 9) while it has reduced by almost 11 percentage points in Sub-Saharan Africa (Figure 10). It follows a similar path when considering other international poverty lines. Around 90 percent of Malawians have remained below the international poverty line of US$3.20 between 2004 and 2016. In contrast, the rest of Sub-Saharan Africa has reduced poverty by almost 8 percentage points over this period. These trends highlight that even those who are not poor are still vulnerable and risk falling into poverty when suffering a shock, given that there are few Malawians who are at an economically secure consumption level.
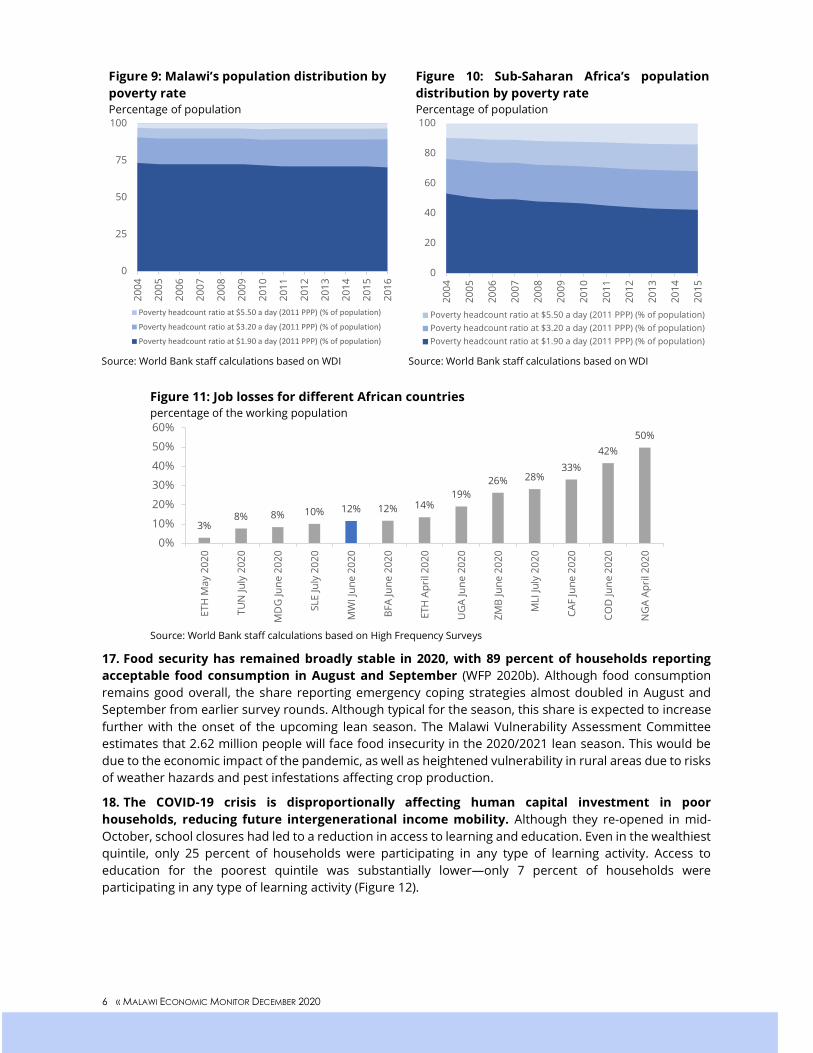
16. The COVID-19 crisis is increasing poverty, particularly in urban areas, where the services and industry sectors have been hit hard. The World Bank carried out a phone survey from May to August 2020, which suggests that the COVID-19 crisis has translated into job losses for 12 percent for the employed population.9 The pattern of job losses was similar across sectors and gender and age groups. Urban areas have a higher share of workers in services (75 percent) and industry (10 percent) which have been more heavily affected by the pandemic. As such, income losses were more significant in urban areas, with 77 percent of the households suffering income losses, in comparison to the 72 percent of households that experienced income losses in rural areas10 (where only 14 percent of employment is in the services and industry sectors). Although the impact is significant, the labor market has been more resilient than in other countries (Figure 11). This could reflect Malawi’s relatively high reliance on the agriculture sector, which has been less affected by the crisis.
8 National poverty line for Malawi is calculated using a basic needs basket which in 2016 was equivalent to US$ 1.36 (2011 PP) per person per day in comparison to the US$ 1.9 (2011 PPP) international poverty rate. International poverty lines are used for cross-country comparisons, but the national poverty line is usually preferred for country specific analysis as it better incorporates the specific consumption patterns of the country of analysis. 9 This analysis uses harmonized indicators which may not match country specific indicators 10 Results represent only those households that have phones, who are typically the less poor. Therefore, these results may not be representative of the full population, especially in rural areas.
Box 1: Malawi rebases Gross Domestic Product (GDP) upwards by 38.4 percent
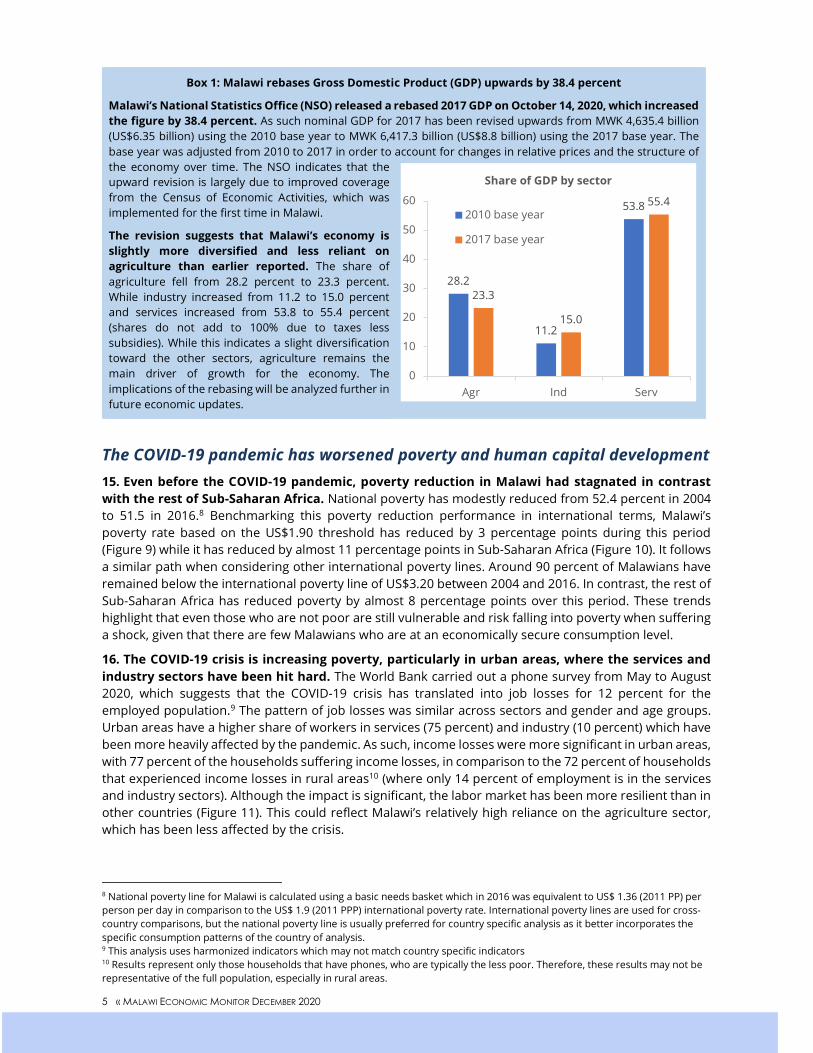
Malawi’s National Statistics Office (NSO) released a rebased 2017 GDP on October 14, 2020, which increased the figure by 38.4 percent. As such nominal GDP for 2017 has been revised upwards from MWK 4,635.4 billion (US$6.35 billion) using the 2010 base year to MWK 6,417.3 billion (US$8.8 billion) using the 2017 base year. The base year was adjusted from 2010 to 2017 in order to account for changes in relative prices and the structure of the economy over time. The NSO indicates that the upward revision is largely due to improved coverage from the Census of Economic Activities, which was implemented for the first time in Malawi.
The revision suggests that Malawi’s economy is slightly more diversified and less reliant on agriculture than earlier reported. The share of agriculture fell from 28.2 percent to 23.3 percent. While industry increased from 11.2 to 15.0 percent and services increased from 53.8 to 55.4 percent (shares do not add to 100% due to taxes less subsidies). While this indicates a slight diversification toward the other sectors, agriculture remains the main driver of growth for the economy. The implications of the rebasing will be analyzed further in future economic updates.
28.2
11.2
53.8
23.3
15.0
55.4
0
10
20
30
40
50
60
Agr Ind Serv
Share of GDP by sector
2010 base year
2017 base year
6 « MALAWI ECONOMIC MONITOR DECEMBER 2020
Figure 11: Job losses for different African countries percentage of the working population
Source: World Bank staff calculations based on High Frequency Surveys
17. Food security has remained broadly stable in 2020, with 89 percent of households reporting acceptable food consumption in August and September (WFP 2020b). Although food consumption remains good overall, the share reporting emergency coping strategies almost doubled in August and September from earlier survey rounds. Although typical for the season, this share is expected to increase further with the onset of the upcoming lean season. The Malawi Vulnerability Assessment Committee estimates that 2.62 million people will face food insecurity in the 2020/2021 lean season. This would be due to the economic impact of the pandemic, as well as heightened vulnerability in rural areas due to risks of weather hazards and pest infestations affecting crop production.
18. The COVID-19 crisis is disproportionally affecting human capital investment in poor households, reducing future intergenerational income mobility. Although they re-opened in mid-October, school closures had led to a reduction in access to learning and education. Even in the wealthiest quintile, only 25 percent of households were participating in any type of learning activity. Access to education for the poorest quintile was substantially lower—only 7 percent of households were participating in any type of learning activity (Figure 12).
3%8% 8% 10% 12% 12% 14%
19%26% 28%
33%42%
50%
0%
10%
20%
30%
40%
50%
60%
ETH
May
202
0
TUN
July
202
0
MD
G Ju
ne 2
020
SLE
July
202
0
MW
I Jun
e 20
20
BFA
June
202
0
ETH
Apr
il 20
20
UG
A Ju
ne 2
020
ZMB
June
202
0
MLI
July
202
0
CAF
June
202
0
COD
June
202
0
NG
A Ap
ril 2
020
Figure 9: Malawi’s population distribution by poverty rate Percentage of population
Figure 10: Sub-Saharan Africa’s population distribution by poverty rate Percentage of population
Source: World Bank staff calculations based on WDI Source: World Bank staff calculations based on WDI
0
25
50
75
10020
04
2005
2006
2007
2008
2009
2010
2011
2012
2013
2014
2015
2016
Poverty headcount ratio at $5.50 a day (2011 PPP) (% of population)
Poverty headcount ratio at $3.20 a day (2011 PPP) (% of population)
Poverty headcount ratio at $1.90 a day (2011 PPP) (% of population)
0
20
40
60
80
100
2004
2005
2006
2007
2008
2009
2010
2011
2012
2013
2014
2015
Poverty headcount ratio at $5.50 a day (2011 PPP) (% of population)Poverty headcount ratio at $3.20 a day (2011 PPP) (% of population)Poverty headcount ratio at $1.90 a day (2011 PPP) (% of population)
7 « MALAWI ECONOMIC MONITOR DECEMBER 2020
Figure 12: Share of households with children 6-18 attending any learning/education activities
Source: World Bank staff calculations based on WDI
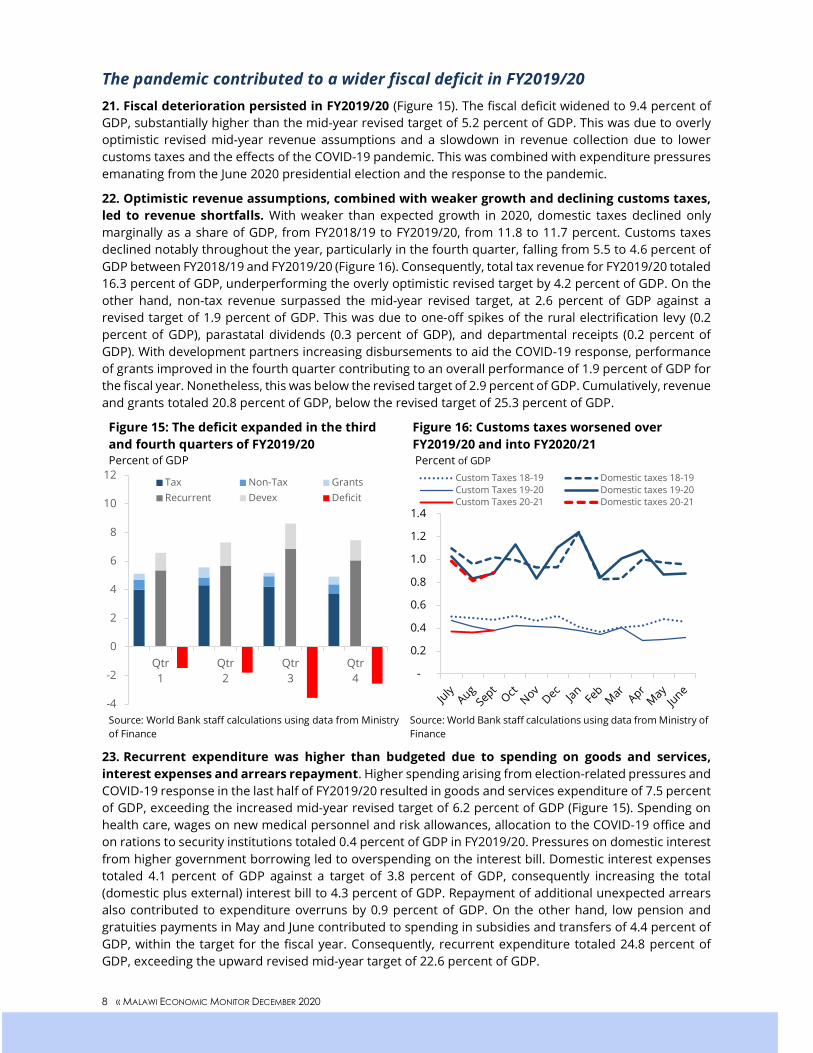
Inflation is lower but maize prices are increasing going into the lean season 19. Headline inflation has decelerated over 2020 due to lower food and non-food inflation, but is facing maize price pressure (Figure 13). The annual y-o-y inflation rate decelerated to 7.5 percent in October 2020, down from a recent peak of 11.5 percent in December 2019, supported by lower food and global oil prices. Food inflation however has started picking up as market demand for maize increases, accelerating to 10.9 percent in October 2020. This reflects households depleting their stocks and turning to the market to purchase maize. This increased demand induced a 10 percent increase in maize prices from MWK 178 to MWK 196 per kilogram between the last week of September and the first week of November 2020. Nonetheless, this remains 14 percent lower than November 2019 (WFP 2020a). Non-food inflation also decelerated and remained at 4.4 percent since July 2020. While global oil prices have started picking-up, fuel prices on the domestic market have not been adjusted since June 2020. The Malawi Energy Regulatory Authority (MERA) in July and August indicated the need to adjust fuel prices upwards as part of the Fuel Price Stabilization Mechanism. However, fuel prices were not adjusted due to the Government’s delayed appointment of a board of directors for MERA.
20. Inflationary pressures have been mixed on the regional front (Figure 14). Zambia continues to exhibit the highest inflation in the region, accelerating to 16.0 percent in October 2020. Since early 2020, inflationary pressures have subsided in Kenya and Tanzania, supported by decreases in food prices. Pressures mounted in Uganda, with its headline inflation rate surpassing Kenya and Tanzania since July.
Figure 13: Food and non-food inflation have decelerated Headline, food and non-food Inflation, y-o-y, percent
Figure 14: Inflation has varied across the region Headline annual inflation, y-o-y, percent
Source: World Bank staff calculations based on NSO data Source: World Bank staff calculations based on data from NSOs/
Central Banks
7
1518 17
25
30
1417
1 2 2 2
96
3 3
Q1 Poorest Q2 Q3 Q4 Q5 Richest Urban Rural Overall
Pre-COVID-19 IHPS 2019 Household Wealth Quintile Residence National
Engaged in any learning/education activities Have contact with teachers
0
5
10
15
20
25
Jan-
17Ap
r-17
Jul-1
7O
ct-1
7Ja
n-18
Apr-
18Ju
l-18
Oct
-18
Jan-
19Ap
r-19
Jul-1
9O
ct-1
9Ja
n-20
Apr-
20Ju
l-20
Oct
-20
HeadlineNational FoodNational Non-food
02468
1012141618
Jul-1
7
Oct
-17
Jan-
18
Apr-
18
Jul-1
8
Oct
-18
Jan-
19
Apr-
19
Jul-1
9
Oct
-19
Jan-
20
Apr-
20
Jul-2
0
Oct
-20
Malawi KenyaTanzania UgandaZambia
8 « MALAWI ECONOMIC MONITOR DECEMBER 2020
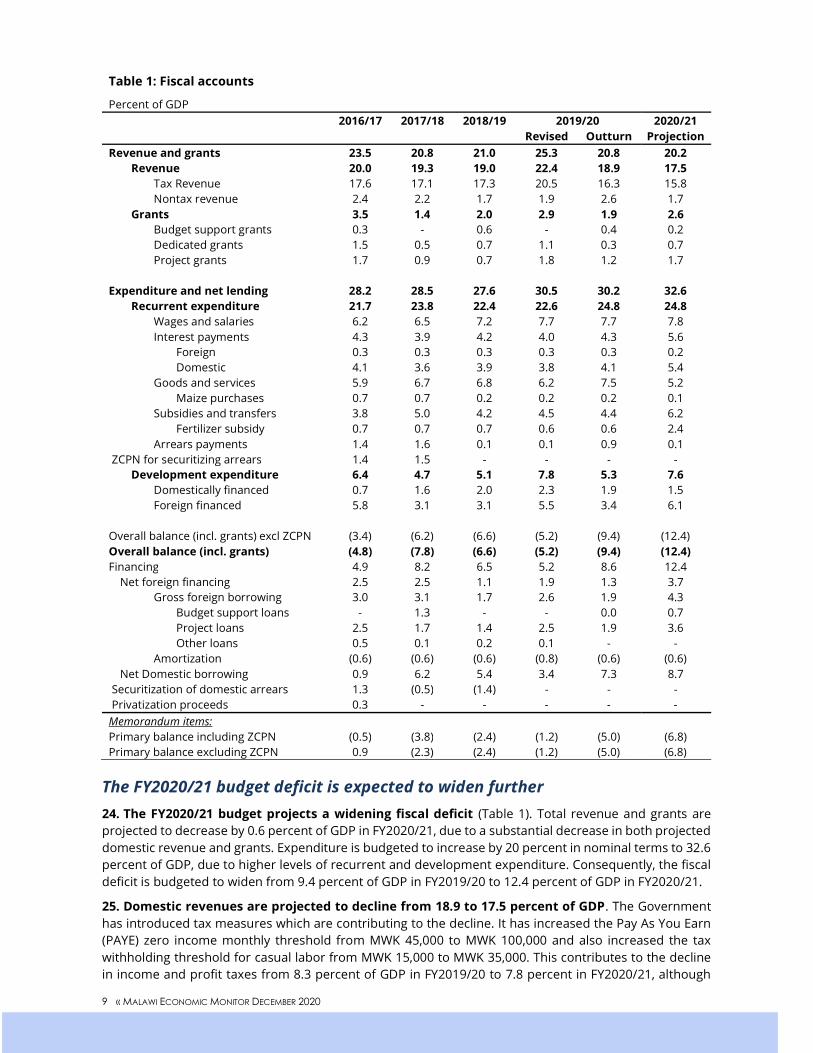
The pandemic contributed to a wider fiscal deficit in FY2019/20 21. Fiscal deterioration persisted in FY2019/20 (Figure 15). The fiscal deficit widened to 9.4 percent of GDP, substantially higher than the mid-year revised target of 5.2 percent of GDP. This was due to overly optimistic revised mid-year revenue assumptions and a slowdown in revenue collection due to lower customs taxes and the effects of the COVID-19 pandemic. This was combined with expenditure pressures emanating from the June 2020 presidential election and the response to the pandemic.
22. Optimistic revenue assumptions, combined with weaker growth and declining customs taxes, led to revenue shortfalls. With weaker than expected growth in 2020, domestic taxes declined only marginally as a share of GDP, from FY2018/19 to FY2019/20, from 11.8 to 11.7 percent. Customs taxes declined notably throughout the year, particularly in the fourth quarter, falling from 5.5 to 4.6 percent of GDP between FY2018/19 and FY2019/20 (Figure 16). Consequently, total tax revenue for FY2019/20 totaled 16.3 percent of GDP, underperforming the overly optimistic revised target by 4.2 percent of GDP. On the other hand, non-tax revenue surpassed the mid-year revised target, at 2.6 percent of GDP against a revised target of 1.9 percent of GDP. This was due to one-off spikes of the rural electrification levy (0.2 percent of GDP), parastatal dividends (0.3 percent of GDP), and departmental receipts (0.2 percent of GDP). With development partners increasing disbursements to aid the COVID-19 response, performance of grants improved in the fourth quarter contributing to an overall performance of 1.9 percent of GDP for the fiscal year. Nonetheless, this was below the revised target of 2.9 percent of GDP. Cumulatively, revenue and grants totaled 20.8 percent of GDP, below the revised target of 25.3 percent of GDP.
Figure 15: The deficit expanded in the third and fourth quarters of FY2019/20 Percent of GDP
Figure 16: Customs taxes worsened over FY2019/20 and into FY2020/21 Percent of GDP
Source: World Bank staff calculations using data from Ministry of Finance
Source: World Bank staff calculations using data from Ministry of Finance
23. Recurrent expenditure was higher than budgeted due to spending on goods and services, interest expenses and arrears repayment. Higher spending arising from election-related pressures and COVID-19 response in the last half of FY2019/20 resulted in goods and services expenditure of 7.5 percent of GDP, exceeding the increased mid-year revised target of 6.2 percent of GDP (Figure 15). Spending on health care, wages on new medical personnel and risk allowances, allocation to the COVID-19 office and on rations to security institutions totaled 0.4 percent of GDP in FY2019/20. Pressures on domestic interest from higher government borrowing led to overspending on the interest bill. Domestic interest expenses totaled 4.1 percent of GDP against a target of 3.8 percent of GDP, consequently increasing the total (domestic plus external) interest bill to 4.3 percent of GDP. Repayment of additional unexpected arrears also contributed to expenditure overruns by 0.9 percent of GDP. On the other hand, low pension and gratuities payments in May and June contributed to spending in subsidies and transfers of 4.4 percent of GDP, within the target for the fiscal year. Consequently, recurrent expenditure totaled 24.8 percent of GDP, exceeding the upward revised mid-year target of 22.6 percent of GDP.
-4
-2
0
2
4
6
8
10
12
Qtr1
Qtr2
Qtr3
Qtr4
Tax Non-Tax GrantsRecurrent Devex Deficit
-
0.2
0.4
0.6
0.8
1.0
1.2
1.4
Custom Taxes 18-19 Domestic taxes 18-19Custom Taxes 19-20 Domestic taxes 19-20Custom Taxes 20-21 Domestic taxes 20-21
9 « MALAWI ECONOMIC MONITOR DECEMBER 2020
Table 1: Fiscal accounts
Percent of GDP 2016/17 2017/18 2018/19 2019/20 2020/21
Revised Outturn Projection Revenue and grants 23.5 20.8 21.0 25.3 20.8 20.2
Revenue 20.0 19.3 19.0 22.4 18.9 17.5 Tax Revenue 17.6 17.1 17.3 20.5 16.3 15.8 Nontax revenue 2.4 2.2 1.7 1.9 2.6 1.7
Grants 3.5 1.4 2.0 2.9 1.9 2.6 Budget support grants 0.3 - 0.6 - 0.4 0.2 Dedicated grants 1.5 0.5 0.7 1.1 0.3 0.7 Project grants 1.7 0.9 0.7 1.8 1.2 1.7
Expenditure and net lending 28.2 28.5 27.6 30.5 30.2 32.6
Recurrent expenditure 21.7 23.8 22.4 22.6 24.8 24.8 Wages and salaries 6.2 6.5 7.2 7.7 7.7 7.8 Interest payments 4.3 3.9 4.2 4.0 4.3 5.6
Foreign 0.3 0.3 0.3 0.3 0.3 0.2 Domestic 4.1 3.6 3.9 3.8 4.1 5.4
Goods and services 5.9 6.7 6.8 6.2 7.5 5.2 Maize purchases 0.7 0.7 0.2 0.2 0.2 0.1
Subsidies and transfers 3.8 5.0 4.2 4.5 4.4 6.2 Fertilizer subsidy 0.7 0.7 0.7 0.6 0.6 2.4
Arrears payments 1.4 1.6 0.1 0.1 0.9 0.1 ZCPN for securitizing arrears 1.4 1.5 - - - -
Development expenditure 6.4 4.7 5.1 7.8 5.3 7.6 Domestically financed 0.7 1.6 2.0 2.3 1.9 1.5 Foreign financed 5.8 3.1 3.1 5.5 3.4 6.1
Overall balance (incl. grants) excl ZCPN (3.4) (6.2) (6.6) (5.2) (9.4) (12.4) Overall balance (incl. grants) (4.8) (7.8) (6.6) (5.2) (9.4) (12.4) Financing 4.9 8.2 6.5 5.2 8.6 12.4
Net foreign financing 2.5 2.5 1.1 1.9 1.3 3.7 Gross foreign borrowing 3.0 3.1 1.7 2.6 1.9 4.3
Budget support loans - 1.3 - - 0.0 0.7 Project loans 2.5 1.7 1.4 2.5 1.9 3.6 Other loans 0.5 0.1 0.2 0.1 - -
Amortization (0.6) (0.6) (0.6) (0.8) (0.6) (0.6) Net Domestic borrowing 0.9 6.2 5.4 3.4 7.3 8.7
Securitization of domestic arrears 1.3 (0.5) (1.4) - - - Privatization proceeds 0.3 - - - - - Memorandum items: Primary balance including ZCPN (0.5) (3.8) (2.4) (1.2) (5.0) (6.8) Primary balance excluding ZCPN 0.9 (2.3) (2.4) (1.2) (5.0) (6.8)
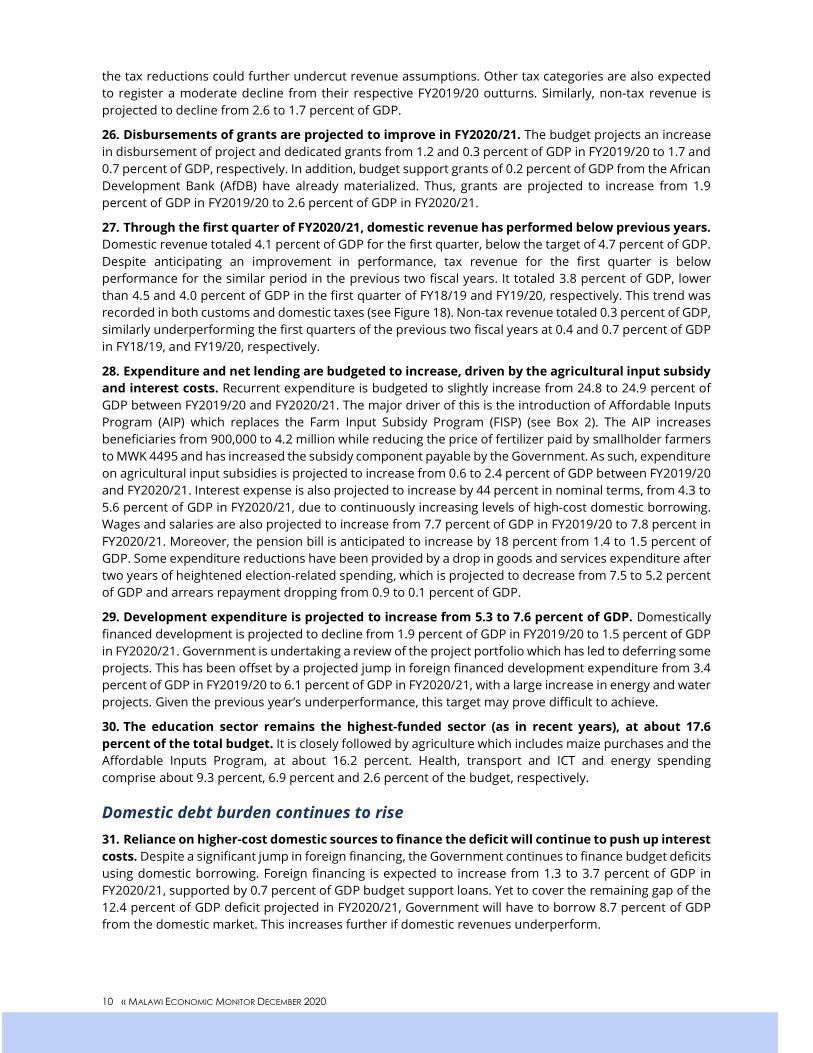
The FY2020/21 budget deficit is expected to widen further 24. The FY2020/21 budget projects a widening fiscal deficit (Table 1). Total revenue and grants are projected to decrease by 0.6 percent of GDP in FY2020/21, due to a substantial decrease in both projected domestic revenue and grants. Expenditure is budgeted to increase by 20 percent in nominal terms to 32.6 percent of GDP, due to higher levels of recurrent and development expenditure. Consequently, the fiscal deficit is budgeted to widen from 9.4 percent of GDP in FY2019/20 to 12.4 percent of GDP in FY2020/21.
25. Domestic revenues are projected to decline from 18.9 to 17.5 percent of GDP. The Government has introduced tax measures which are contributing to the decline. It has increased the Pay As You Earn (PAYE) zero income monthly threshold from MWK 45,000 to MWK 100,000 and also increased the tax withholding threshold for casual labor from MWK 15,000 to MWK 35,000. This contributes to the decline in income and profit taxes from 8.3 percent of GDP in FY2019/20 to 7.8 percent in FY2020/21, although
10 « MALAWI ECONOMIC MONITOR DECEMBER 2020
the tax reductions could further undercut revenue assumptions. Other tax categories are also expected to register a moderate decline from their respective FY2019/20 outturns. Similarly, non-tax revenue is projected to decline from 2.6 to 1.7 percent of GDP.
26. Disbursements of grants are projected to improve in FY2020/21. The budget projects an increase in disbursement of project and dedicated grants from 1.2 and 0.3 percent of GDP in FY2019/20 to 1.7 and 0.7 percent of GDP, respectively. In addition, budget support grants of 0.2 percent of GDP from the African Development Bank (AfDB) have already materialized. Thus, grants are projected to increase from 1.9 percent of GDP in FY2019/20 to 2.6 percent of GDP in FY2020/21.
27. Through the first quarter of FY2020/21, domestic revenue has performed below previous years. Domestic revenue totaled 4.1 percent of GDP for the first quarter, below the target of 4.7 percent of GDP. Despite anticipating an improvement in performance, tax revenue for the first quarter is below performance for the similar period in the previous two fiscal years. It totaled 3.8 percent of GDP, lower than 4.5 and 4.0 percent of GDP in the first quarter of FY18/19 and FY19/20, respectively. This trend was recorded in both customs and domestic taxes (see Figure 18). Non-tax revenue totaled 0.3 percent of GDP, similarly underperforming the first quarters of the previous two fiscal years at 0.4 and 0.7 percent of GDP in FY18/19, and FY19/20, respectively.
28. Expenditure and net lending are budgeted to increase, driven by the agricultural input subsidy and interest costs. Recurrent expenditure is budgeted to slightly increase from 24.8 to 24.9 percent of GDP between FY2019/20 and FY2020/21. The major driver of this is the introduction of Affordable Inputs Program (AIP) which replaces the Farm Input Subsidy Program (FISP) (see Box 2). The AIP increases beneficiaries from 900,000 to 4.2 million while reducing the price of fertilizer paid by smallholder farmers to MWK 4495 and has increased the subsidy component payable by the Government. As such, expenditure on agricultural input subsidies is projected to increase from 0.6 to 2.4 percent of GDP between FY2019/20 and FY2020/21. Interest expense is also projected to increase by 44 percent in nominal terms, from 4.3 to 5.6 percent of GDP in FY2020/21, due to continuously increasing levels of high-cost domestic borrowing. Wages and salaries are also projected to increase from 7.7 percent of GDP in FY2019/20 to 7.8 percent in FY2020/21. Moreover, the pension bill is anticipated to increase by 18 percent from 1.4 to 1.5 percent of GDP. Some expenditure reductions have been provided by a drop in goods and services expenditure after two years of heightened election-related spending, which is projected to decrease from 7.5 to 5.2 percent of GDP and arrears repayment dropping from 0.9 to 0.1 percent of GDP.
29. Development expenditure is projected to increase from 5.3 to 7.6 percent of GDP. Domestically financed development is projected to decline from 1.9 percent of GDP in FY2019/20 to 1.5 percent of GDP in FY2020/21. Government is undertaking a review of the project portfolio which has led to deferring some projects. This has been offset by a projected jump in foreign financed development expenditure from 3.4 percent of GDP in FY2019/20 to 6.1 percent of GDP in FY2020/21, with a large increase in energy and water projects. Given the previous year’s underperformance, this target may prove difficult to achieve.
30. The education sector remains the highest-funded sector (as in recent years), at about 17.6 percent of the total budget. It is closely followed by agriculture which includes maize purchases and the Affordable Inputs Program, at about 16.2 percent. Health, transport and ICT and energy spending comprise about 9.3 percent, 6.9 percent and 2.6 percent of the budget, respectively.
Domestic debt burden continues to rise 31. Reliance on higher-cost domestic sources to finance the deficit will continue to push up interest costs. Despite a significant jump in foreign financing, the Government continues to finance budget deficits using domestic borrowing. Foreign financing is expected to increase from 1.3 to 3.7 percent of GDP in FY2020/21, supported by 0.7 percent of GDP budget support loans. Yet to cover the remaining gap of the 12.4 percent of GDP deficit projected in FY2020/21, Government will have to borrow 8.7 percent of GDP from the domestic market. This increases further if domestic revenues underperform.
11 « MALAWI ECONOMIC MONITOR DECEMBER 2020
32. Malawi is at high risk of overall debt distress due to high levels of domestic debt contracted at high interest rates, and moderate risk of external debt distress, with limited space to absorb shocks. The Government has been running high fiscal deficits which are largely financed with high cost domestic securities. The September 2020 debt sustainability analysis (DSA) indicates how debt servicing costs have increased to 35 percent of revenue and grants in FY2019/20 (Figure 18). Due to an anticipated slower export recovery, the debt-to-exports ratio is projected to deteriorate, thereby narrowing the capacity to absorb shocks.
Box 2: Strengthening agricultural policies in Malawi
The new Government has replaced the Farm Input Subsidy Program (FISP) by the Affordable Inputs Program (AIP). AIP aims to attain food security at both household and national level and reduce poverty. This will be achieved through increasing access to improved farm inputs – fertilizers and certified seeds by smallholder farmers. AIP’s key features include: (i) 4.2 million smallholder farmers being targeted; (ii) each farmer will pay a fixed price of MWK 4,495 per 50kg fertilizer bag and MWK 2,000 for 5kg cereal seed coupon (either 5kg maize hybrid seed or 7 kg sorghum seed or 7 kg rice seed); (iii) about 80 percent of the inputs will be retailed directly by the private sector and about 20 percent by parastatals (ADMARC and the Smallholder Farmers Fertilizer Revolving Fund of Malawi); (iv) the Government will pay suppliers a fixed price of MWK 15,500 per 50kg bag and MWK 6,000 for the cereal seed; and (v) the Government will deliver the subsidies by means of an electronic system; farmers will be able to redeem the inputs with their National ID.
The AIP has a budget of MWK 160 billion, four times the allocation for the FISP in the 2019/20 national budget. The program dominates the overall agricultural budget, taking up about 45 percent of the sector budget. This crowds out potentially valuable investments in the sector, which could promote diversification and more sustainable farming practices. It also comprises about 7 percent of the total approved FY2020/21 national budget, reducing fiscal space for investments in other sectors, while contributing to a widening fiscal deficit and higher interest payments. Moreover, it will also call for a substantial increase in fertilizer imports, thereby further straining the external balance.
Given limited fiscal space, careful review and adjustment of the AIP going forward will help improve fiscal sustainability, reduce vulnerability to weather shocks, and increase agricultural production. AIP has two important positive aspects: the use of an electronic system and the engagement of the private sector in marketing activities (80 percent this year). However, the huge fiscal costs make it impossible for the Government to maintain the scheme in the future. In addition, the AIP almost exclusively incentivizes maize production, exacerbating Malawi’s high dependence on this crop and vulnerability to extreme weather events and diseases, and threatening nutritional outcomes. Monocropping also contributes to depleting natural resources.
The Government should consider lessons from the initial rollout to sharpen targeting of support. Reforms could include reducing the share of subsidy, fixing the subsidy level to reduce the fiscal risk, and reducing the fiscal burden. In addition, it is critical to rethink the objective of the program and the targeting: when it comes to boosting productivity, the bottom ultra-poor are unable to take advantage of subsidies and would be better off being linked to social safety nets (e.g. social cash transfers). The program could help to promote more sustainable farming practices, such as growing legumes, implementing climate-smart agriculture practices, and introducing biofortified varieties to enhance nutrition.
A combination of more targeting input support and removal of market restrictions can boost incomes for small farmers. A World Bank study estimated that Malawi’s maize prices at the farm gate were, on average, 13 percent below market value between 2005 and 2017 (Katjiuongua et al 2019). This price penalty was the second largest in Eastern Africa after Ethiopia. One of the key reasons is the restriction of exports, which keep prices artificially low. It means that farmers have little incentive to produce a surplus to sell in markets. Low farm incomes as a result of low prices suppress investment in the sector that could improve farm production and productivity. In addition, the uncertainty around the export regime has prevented larger farmers from investing.
Government is planning to review existing export restrictions through implementation of the Control of Goods Act (COGA). One of the first actions of the new Government was to gazette COGA regulations in July 2020. This has put in place a regulatory framework that should create a more predictable environment for investment and in the long term incentivize larger farmers to grow maize. As stipulated in the law, by January 2021 the Government is expected to conduct a first review of the current export restrictions based on determined parameters: the food balance sheet and export parity prices. This is an opportunity to shift the course of the agricultural policies that have historically hampered investments in the sector toward a more favorable direction.
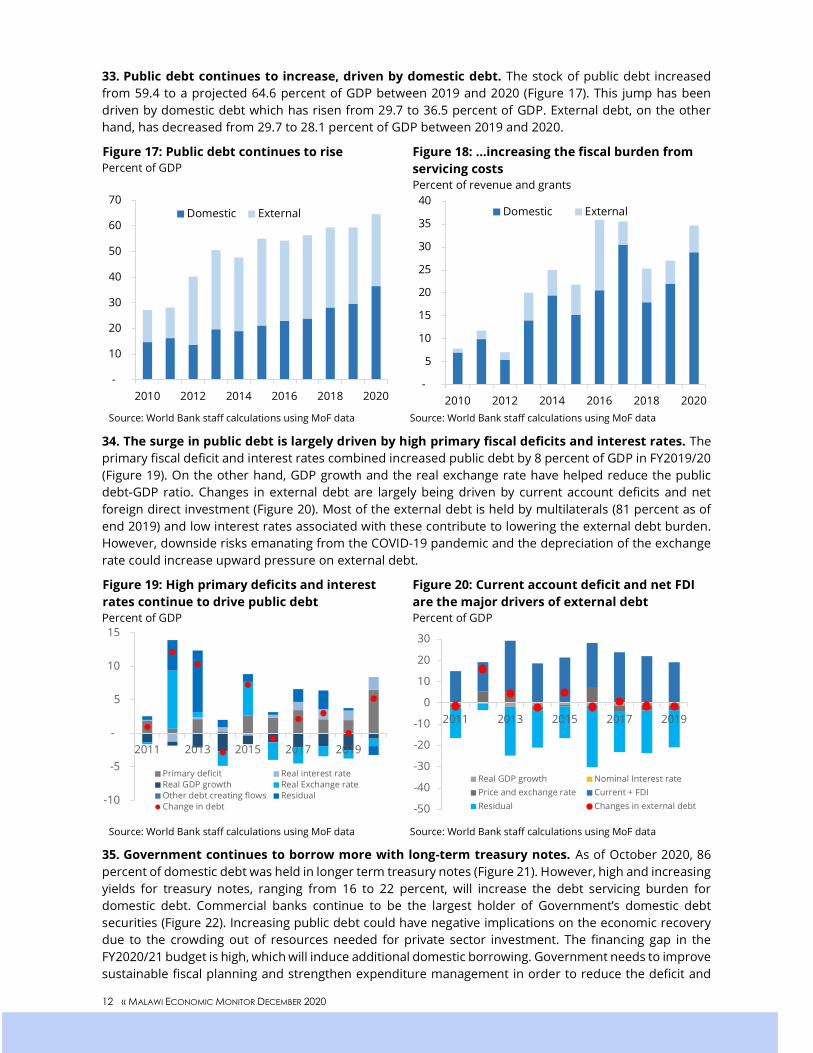
12 « MALAWI ECONOMIC MONITOR DECEMBER 2020
33. Public debt continues to increase, driven by domestic debt. The stock of public debt increased from 59.4 to a projected 64.6 percent of GDP between 2019 and 2020 (Figure 17). This jump has been driven by domestic debt which has risen from 29.7 to 36.5 percent of GDP. External debt, on the other hand, has decreased from 29.7 to 28.1 percent of GDP between 2019 and 2020.
Figure 17: Public debt continues to rise Percent of GDP
Figure 18: …increasing the fiscal burden from servicing costs Percent of revenue and grants
Source: World Bank staff calculations using MoF data Source: World Bank staff calculations using MoF data
34. The surge in public debt is largely driven by high primary fiscal deficits and interest rates. The primary fiscal deficit and interest rates combined increased public debt by 8 percent of GDP in FY2019/20 (Figure 19). On the other hand, GDP growth and the real exchange rate have helped reduce the public debt-GDP ratio. Changes in external debt are largely being driven by current account deficits and net foreign direct investment (Figure 20). Most of the external debt is held by multilaterals (81 percent as of end 2019) and low interest rates associated with these contribute to lowering the external debt burden. However, downside risks emanating from the COVID-19 pandemic and the depreciation of the exchange rate could increase upward pressure on external debt.
Figure 19: High primary deficits and interest rates continue to drive public debt Percent of GDP
Figure 20: Current account deficit and net FDI are the major drivers of external debt Percent of GDP
Source: World Bank staff calculations using MoF data Source: World Bank staff calculations using MoF data
35. Government continues to borrow more with long-term treasury notes. As of October 2020, 86 percent of domestic debt was held in longer term treasury notes (Figure 21). However, high and increasing yields for treasury notes, ranging from 16 to 22 percent, will increase the debt servicing burden for domestic debt. Commercial banks continue to be the largest holder of Government’s domestic debt securities (Figure 22). Increasing public debt could have negative implications on the economic recovery due to the crowding out of resources needed for private sector investment. The financing gap in the FY2020/21 budget is high, which will induce additional domestic borrowing. Government needs to improve sustainable fiscal planning and strengthen expenditure management in order to reduce the deficit and
-
10
20
30
40
50
60
70
2010 2012 2014 2016 2018 2020
Domestic External
-
5
10
15
20
25
30
35
40
2010 2012 2014 2016 2018 2020
Domestic External
-10
-5
-
5
10
15
2011 2013 2015 2017 2019
Primary deficit Real interest rateReal GDP growth Real Exchange rateOther debt creating flows ResidualChange in debt -50
-40
-30
-20
-10
0
10
20
30
2011 2013 2015 2017 2019
Real GDP growth Nominal Interest ratePrice and exchange rate Current + FDIResidual Changes in external debt
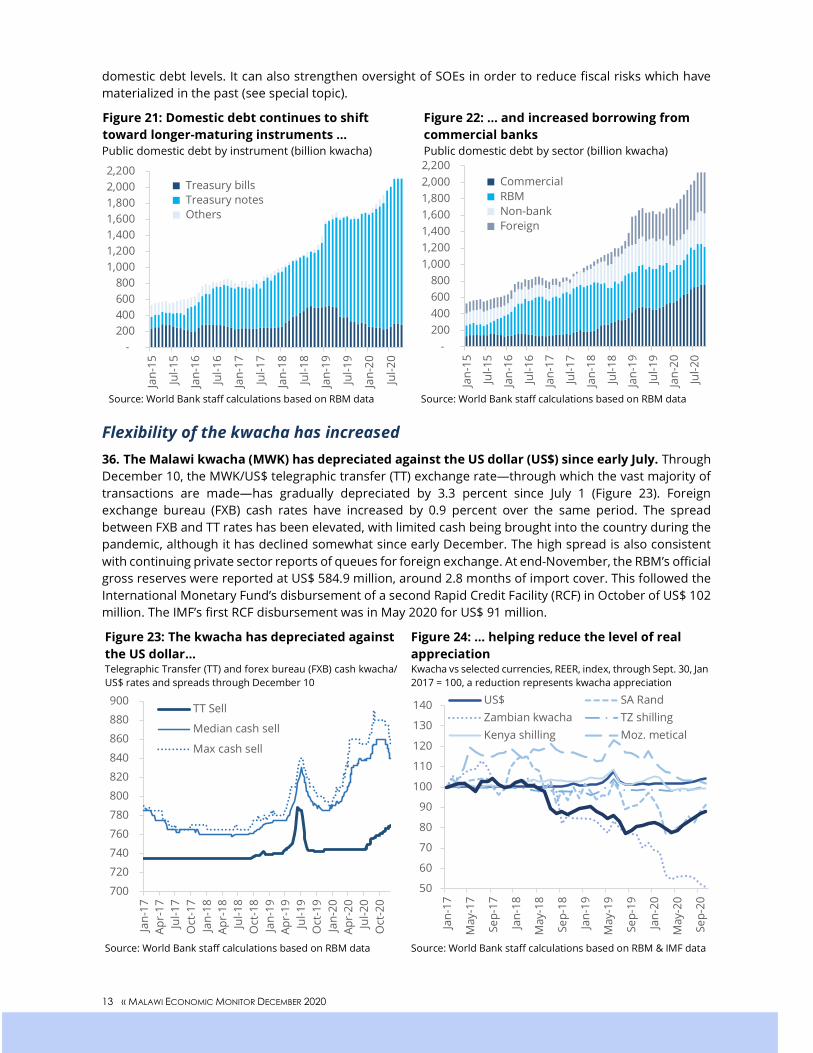
13 « MALAWI ECONOMIC MONITOR DECEMBER 2020
domestic debt levels. It can also strengthen oversight of SOEs in order to reduce fiscal risks which have materialized in the past (see special topic).
Figure 21: Domestic debt continues to shift toward longer-maturing instruments … Public domestic debt by instrument (billion kwacha)
Figure 22: … and increased borrowing from commercial banks Public domestic debt by sector (billion kwacha)
Source: World Bank staff calculations based on RBM data Source: World Bank staff calculations based on RBM data
Flexibility of the kwacha has increased 36. The Malawi kwacha (MWK) has depreciated against the US dollar (US$) since early July. Through December 10, the MWK/US$ telegraphic transfer (TT) exchange rate—through which the vast majority of transactions are made—has gradually depreciated by 3.3 percent since July 1 (Figure 23). Foreign exchange bureau (FXB) cash rates have increased by 0.9 percent over the same period. The spread between FXB and TT rates has been elevated, with limited cash being brought into the country during the pandemic, although it has declined somewhat since early December. The high spread is also consistent with continuing private sector reports of queues for foreign exchange. At end-November, the RBM’s official gross reserves were reported at US$ 584.9 million, around 2.8 months of import cover. This followed the International Monetary Fund’s disbursement of a second Rapid Credit Facility (RCF) in October of US$ 102 million. The IMF’s first RCF disbursement was in May 2020 for US$ 91 million.
Figure 23: The kwacha has depreciated against the US dollar… Telegraphic Transfer (TT) and forex bureau (FXB) cash kwacha/ US$ rates and spreads through December 10
Figure 24: … helping reduce the level of real appreciation Kwacha vs selected currencies, REER, index, through Sept. 30, Jan 2017 = 100, a reduction represents kwacha appreciation
Source: World Bank staff calculations based on RBM data Source: World Bank staff calculations based on RBM & IMF data
- 200 400 600 800
1,000 1,200 1,400 1,600 1,800 2,000 2,200
Jan-
15
Jul-1
5
Jan-
16
Jul-1
6
Jan-
17
Jul-1
7
Jan-
18
Jul-1
8
Jan-
19
Jul-1
9
Jan-
20
Jul-2
0
Treasury bills Treasury notes Others
- 200 400 600 800
1,000 1,200 1,400 1,600 1,800 2,000 2,200
Jan-
15
Jul-1
5
Jan-
16
Jul-1
6
Jan-
17
Jul-1
7
Jan-
18
Jul-1
8
Jan-
19
Jul-1
9
Jan-
20
Jul-2
0
Commercial RBM Non-bank Foreign
700
720
740
760
780
800
820
840
860
880
900
Jan-
17Ap
r-17
Jul-1
7O
ct-1
7Ja
n-18
Apr-
18Ju
l-18
Oct
-18
Jan-
19Ap
r-19
Jul-1
9O
ct-1
9Ja
n-20
Apr-
20Ju
l-20
Oct
-20
TT Sell
Median cash sell
Max cash sell
50
60
70
80
90
100
110
120
130
140
Jan-
17
May
-17
Sep-
17
Jan-
18
May
-18
Sep-
18
Jan-
19
May
-19
Sep-
19
Jan-
20
May
-20
Sep-
20US$ SA RandZambian kwacha TZ shillingKenya shilling Moz. metical
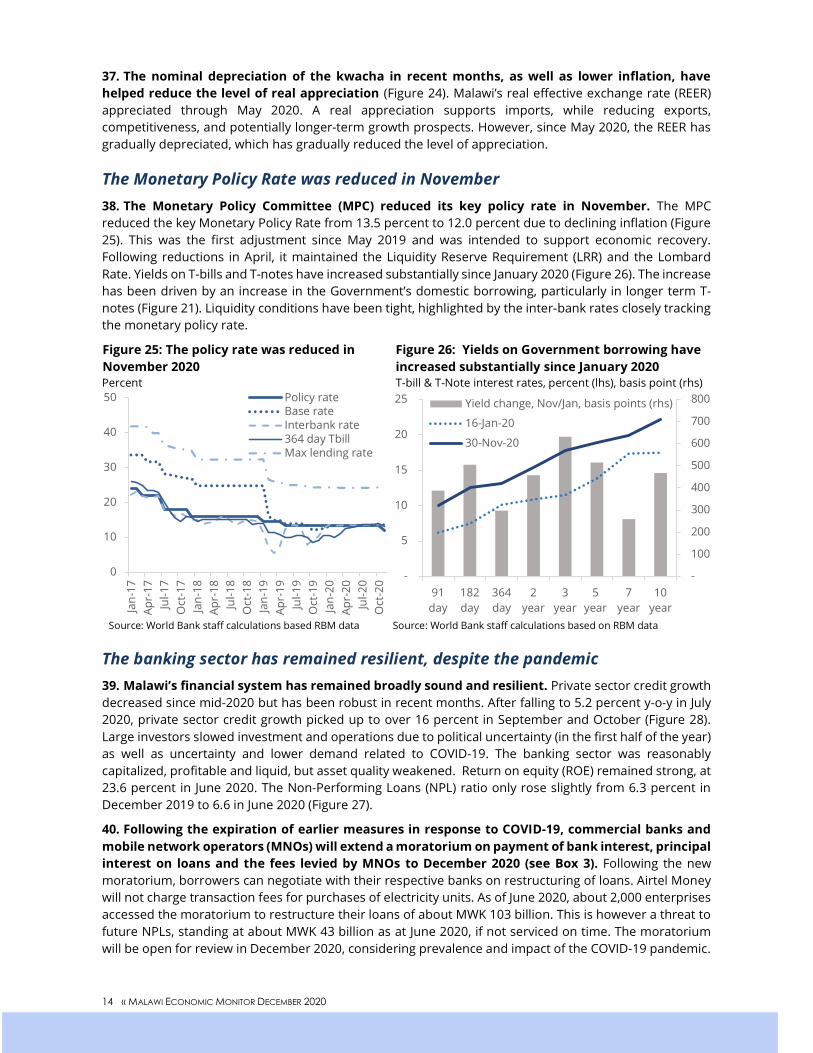
14 « MALAWI ECONOMIC MONITOR DECEMBER 2020
37. The nominal depreciation of the kwacha in recent months, as well as lower inflation, have helped reduce the level of real appreciation (Figure 24). Malawi’s real effective exchange rate (REER) appreciated through May 2020. A real appreciation supports imports, while reducing exports, competitiveness, and potentially longer-term growth prospects. However, since May 2020, the REER has gradually depreciated, which has gradually reduced the level of appreciation.
The Monetary Policy Rate was reduced in November 38. The Monetary Policy Committee (MPC) reduced its key policy rate in November. The MPC reduced the key Monetary Policy Rate from 13.5 percent to 12.0 percent due to declining inflation (Figure 25). This was the first adjustment since May 2019 and was intended to support economic recovery. Following reductions in April, it maintained the Liquidity Reserve Requirement (LRR) and the Lombard Rate. Yields on T-bills and T-notes have increased substantially since January 2020 (Figure 26). The increase has been driven by an increase in the Government’s domestic borrowing, particularly in longer term T-notes (Figure 21). Liquidity conditions have been tight, highlighted by the inter-bank rates closely tracking the monetary policy rate.
Figure 25: The policy rate was reduced in November 2020 Percent
Figure 26: Yields on Government borrowing have increased substantially since January 2020 T-bill & T-Note interest rates, percent (lhs), basis point (rhs)
Source: World Bank staff calculations based RBM data Source: World Bank staff calculations based on RBM data
The banking sector has remained resilient, despite the pandemic 39. Malawi’s financial system has remained broadly sound and resilient. Private sector credit growth decreased since mid-2020 but has been robust in recent months. After falling to 5.2 percent y-o-y in July 2020, private sector credit growth picked up to over 16 percent in September and October (Figure 28). Large investors slowed investment and operations due to political uncertainty (in the first half of the year) as well as uncertainty and lower demand related to COVID-19. The banking sector was reasonably capitalized, profitable and liquid, but asset quality weakened. Return on equity (ROE) remained strong, at 23.6 percent in June 2020. The Non-Performing Loans (NPL) ratio only rose slightly from 6.3 percent in December 2019 to 6.6 in June 2020 (Figure 27).
40. Following the expiration of earlier measures in response to COVID-19, commercial banks and mobile network operators (MNOs) will extend a moratorium on payment of bank interest, principal interest on loans and the fees levied by MNOs to December 2020 (see Box 3). Following the new moratorium, borrowers can negotiate with their respective banks on restructuring of loans. Airtel Money will not charge transaction fees for purchases of electricity units. As of June 2020, about 2,000 enterprises accessed the moratorium to restructure their loans of about MWK 103 billion. This is however a threat to future NPLs, standing at about MWK 43 billion as at June 2020, if not serviced on time. The moratorium will be open for review in December 2020, considering prevalence and impact of the COVID-19 pandemic.
0
10
20
30
40
50
Jan-
17Ap
r-17
Jul-1
7O
ct-1
7Ja
n-18
Apr-
18Ju
l-18
Oct
-18
Jan-
19Ap
r-19
Jul-1
9O
ct-1
9Ja
n-20
Apr-
20Ju
l-20
Oct
-20
Policy rateBase rateInterbank rate364 day TbillMax lending rate
-
100
200
300
400
500
600
700
800
-
5
10
15
20
25
91day
182day
364day
2year
3year
5year
7year
10year
Yield change, Nov/Jan, basis points (rhs)
16-Jan-20
30-Nov-20
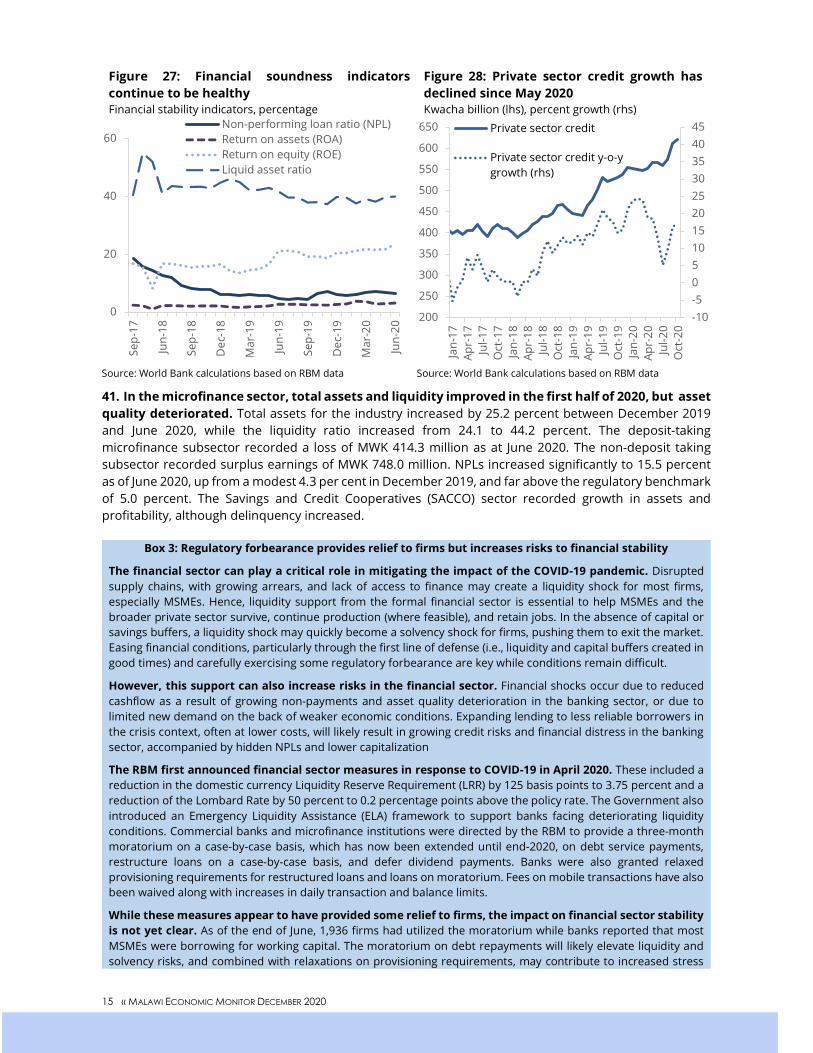
15 « MALAWI ECONOMIC MONITOR DECEMBER 2020
Figure 27: Financial soundness indicators continue to be healthy Financial stability indicators, percentage
Figure 28: Private sector credit growth has declined since May 2020 Kwacha billion (lhs), percent growth (rhs)
Source: World Bank calculations based on RBM data Source: World Bank calculations based on RBM data 41. In the microfinance sector, total assets and liquidity improved in the first half of 2020, but asset quality deteriorated. Total assets for the industry increased by 25.2 percent between December 2019 and June 2020, while the liquidity ratio increased from 24.1 to 44.2 percent. The deposit-taking microfinance subsector recorded a loss of MWK 414.3 million as at June 2020. The non-deposit taking subsector recorded surplus earnings of MWK 748.0 million. NPLs increased significantly to 15.5 percent as of June 2020, up from a modest 4.3 per cent in December 2019, and far above the regulatory benchmark of 5.0 percent. The Savings and Credit Cooperatives (SACCO) sector recorded growth in assets and profitability, although delinquency increased.
0
20
40
60Se
p-17
Jun-
18
Sep-
18
Dec
-18
Mar
-19
Jun-
19
Sep-
19
Dec
-19
Mar
-20
Jun-
20
Non-performing loan ratio (NPL)Return on assets (ROA)Return on equity (ROE)Liquid asset ratio
-10-5051015202530354045
200
250
300
350
400
450
500
550
600
650
Jan-
17Ap
r-17
Jul-1
7O
ct-1
7Ja
n-18
Apr-
18Ju
l-18
Oct
-18
Jan-
19Ap
r-19
Jul-1
9O
ct-1
9Ja
n-20
Apr-
20Ju
l-20
Oct
-20
Private sector credit
Private sector credit y-o-ygrowth (rhs)
Box 3: Regulatory forbearance provides relief to firms but increases risks to financial stability
The financial sector can play a critical role in mitigating the impact of the COVID-19 pandemic. Disrupted supply chains, with growing arrears, and lack of access to finance may create a liquidity shock for most firms, especially MSMEs. Hence, liquidity support from the formal financial sector is essential to help MSMEs and the broader private sector survive, continue production (where feasible), and retain jobs. In the absence of capital or savings buffers, a liquidity shock may quickly become a solvency shock for firms, pushing them to exit the market. Easing financial conditions, particularly through the first line of defense (i.e., liquidity and capital buffers created in good times) and carefully exercising some regulatory forbearance are key while conditions remain difficult.
However, this support can also increase risks in the financial sector. Financial shocks occur due to reduced cashflow as a result of growing non-payments and asset quality deterioration in the banking sector, or due to limited new demand on the back of weaker economic conditions. Expanding lending to less reliable borrowers in the crisis context, often at lower costs, will likely result in growing credit risks and financial distress in the banking sector, accompanied by hidden NPLs and lower capitalization
The RBM first announced financial sector measures in response to COVID-19 in April 2020. These included a reduction in the domestic currency Liquidity Reserve Requirement (LRR) by 125 basis points to 3.75 percent and a reduction of the Lombard Rate by 50 percent to 0.2 percentage points above the policy rate. The Government also introduced an Emergency Liquidity Assistance (ELA) framework to support banks facing deteriorating liquidity conditions. Commercial banks and microfinance institutions were directed by the RBM to provide a three-month moratorium on a case-by-case basis, which has now been extended until end-2020, on debt service payments, restructure loans on a case-by-case basis, and defer dividend payments. Banks were also granted relaxed provisioning requirements for restructured loans and loans on moratorium. Fees on mobile transactions have also been waived along with increases in daily transaction and balance limits.
While these measures appear to have provided some relief to firms, the impact on financial sector stability is not yet clear. As of the end of June, 1,936 firms had utilized the moratorium while banks reported that most MSMEs were borrowing for working capital. The moratorium on debt repayments will likely elevate liquidity and solvency risks, and combined with relaxations on provisioning requirements, may contribute to increased stress
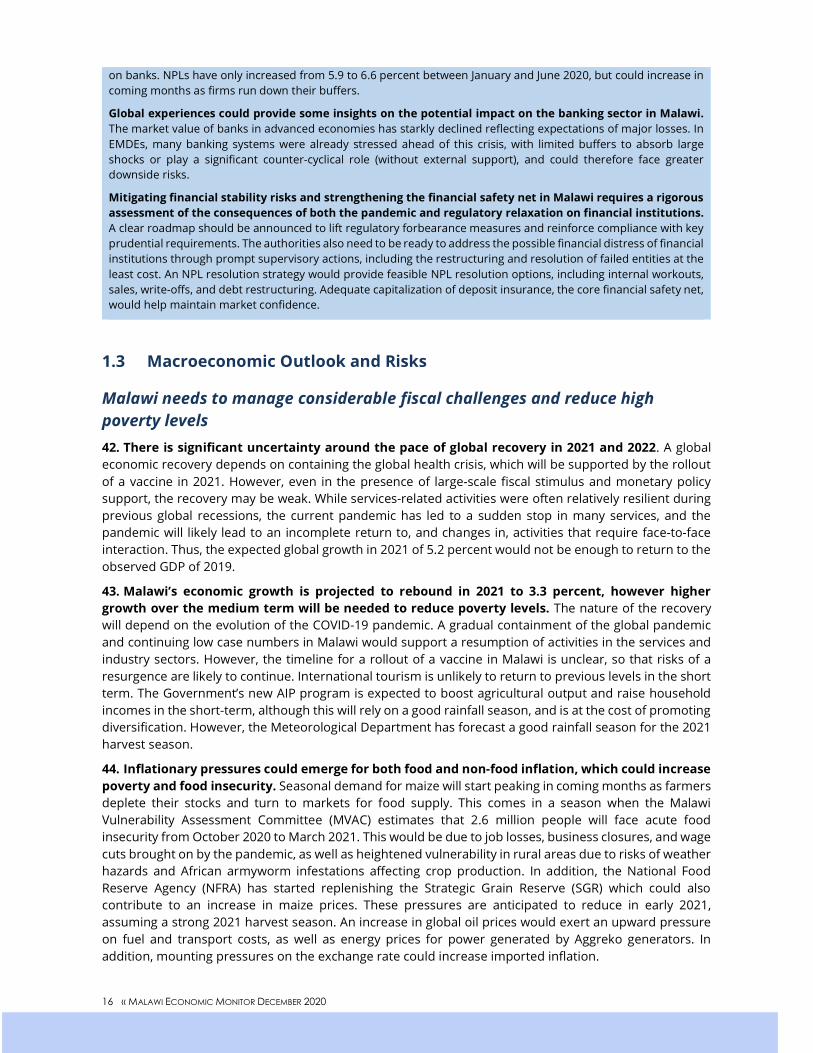
16 « MALAWI ECONOMIC MONITOR DECEMBER 2020
1.3 Macroeconomic Outlook and Risks
Malawi needs to manage considerable fiscal challenges and reduce high poverty levels 42. There is significant uncertainty around the pace of global recovery in 2021 and 2022. A global economic recovery depends on containing the global health crisis, which will be supported by the rollout of a vaccine in 2021. However, even in the presence of large-scale fiscal stimulus and monetary policy support, the recovery may be weak. While services-related activities were often relatively resilient during previous global recessions, the current pandemic has led to a sudden stop in many services, and the pandemic will likely lead to an incomplete return to, and changes in, activities that require face-to-face interaction. Thus, the expected global growth in 2021 of 5.2 percent would not be enough to return to the observed GDP of 2019.
43. Malawi’s economic growth is projected to rebound in 2021 to 3.3 percent, however higher growth over the medium term will be needed to reduce poverty levels. The nature of the recovery will depend on the evolution of the COVID-19 pandemic. A gradual containment of the global pandemic and continuing low case numbers in Malawi would support a resumption of activities in the services and industry sectors. However, the timeline for a rollout of a vaccine in Malawi is unclear, so that risks of a resurgence are likely to continue. International tourism is unlikely to return to previous levels in the short term. The Government’s new AIP program is expected to boost agricultural output and raise household incomes in the short-term, although this will rely on a good rainfall season, and is at the cost of promoting diversification. However, the Meteorological Department has forecast a good rainfall season for the 2021 harvest season.
44. Inflationary pressures could emerge for both food and non-food inflation, which could increase poverty and food insecurity. Seasonal demand for maize will start peaking in coming months as farmers deplete their stocks and turn to markets for food supply. This comes in a season when the Malawi Vulnerability Assessment Committee (MVAC) estimates that 2.6 million people will face acute food insecurity from October 2020 to March 2021. This would be due to job losses, business closures, and wage cuts brought on by the pandemic, as well as heightened vulnerability in rural areas due to risks of weather hazards and African armyworm infestations affecting crop production. In addition, the National Food Reserve Agency (NFRA) has started replenishing the Strategic Grain Reserve (SGR) which could also contribute to an increase in maize prices. These pressures are anticipated to reduce in early 2021, assuming a strong 2021 harvest season. An increase in global oil prices would exert an upward pressure on fuel and transport costs, as well as energy prices for power generated by Aggreko generators. In addition, mounting pressures on the exchange rate could increase imported inflation.
on banks. NPLs have only increased from 5.9 to 6.6 percent between January and June 2020, but could increase in coming months as firms run down their buffers.
Global experiences could provide some insights on the potential impact on the banking sector in Malawi. The market value of banks in advanced economies has starkly declined reflecting expectations of major losses. In EMDEs, many banking systems were already stressed ahead of this crisis, with limited buffers to absorb large shocks or play a significant counter-cyclical role (without external support), and could therefore face greater downside risks.
Mitigating financial stability risks and strengthening the financial safety net in Malawi requires a rigorous assessment of the consequences of both the pandemic and regulatory relaxation on financial institutions. A clear roadmap should be announced to lift regulatory forbearance measures and reinforce compliance with key prudential requirements. The authorities also need to be ready to address the possible financial distress of financial institutions through prompt supervisory actions, including the restructuring and resolution of failed entities at the least cost. An NPL resolution strategy would provide feasible NPL resolution options, including internal workouts, sales, write-offs, and debt restructuring. Adequate capitalization of deposit insurance, the core financial safety net, would help maintain market confidence.
17 « MALAWI ECONOMIC MONITOR DECEMBER 2020
45. Expansionary policies will continue to weaken the fiscal position. The rate of post-pandemic economic recovery will influence domestic resource mobilization. Domestic revenue and grants outturns for the first quarter of FY2020/21 have been weaker than budgeted, and could further underperform in subsequent quarters, particularly once the PAYE tax reform measures come into effect. Given the substantial resources needed for post-pandemic recovery and other discretionary fiscal options including the AIP, as well as interest payments to service high-and-increasing domestic debt, expenditure will continue increasing. Fiscal outcomes are also at risk from the possible materialization of contingent liabilities, including from SOEs (see special topic). As a result, strong policy measures will be needed to contain the fiscal deficit in the medium term.
46. Debt levels are expected to continue increasing. The new administration has inherited a high debt stock, and continuing high fiscal deficits will continue increasing domestic debt. The substantial increase in interest payments, if continued, poses a considerable risk to fiscal sustainability. Continued borrowing from commercial banks and the non-bank sector is also likely to increasingly crowd out private investment, which is needed for the post-pandemic recovery investment and the Government’s development agenda. Prudent expenditure and project prioritization will be needed to avoid increasing domestic debt to unsustainable levels.
47. The current account deficit is projected to remain near 19 percent of GDP over the medium term. The AIP will dissuade crop diversification into higher value-added produce, reduce fiscal space for investing beyond rainfed agriculture, and increased fertilizer imports will put pressure on the exchange rate. Some relief may come as trade restrictions stemming from COVID-19 are relaxed. However, steadily declining global demand for tobacco and high transport costs in Malawi will continue to hamper export growth. Imports could also increase if international oil prices return to 2019 levels. Malawi should also enjoy increased remittance inflows as the global economy recovers. The current account deficit will continue to be financed by official development assistance, and to a lesser extent, foreign direct investment.
48. However, various risks could undermine growth, including a resurgence of COVID-19 in Malawi. A resurgence of cases and consequent stronger social distancing policies and behavior would again depress economic activity, reduce government revenues, and raise the need for further health expenditure. This would further expand the fiscal deficit, raising the already high debt burden. Such risks are compounded by sizable recurrent expenditures and expensive domestic borrowing costs, which leave little fiscal space for development priorities. Aside from risks relating to the pandemic, Malawi’s continued reliance on rainfed agricultural production leaves the country highly vulnerable to climatic shocks, which could affect growth, impair food security, and exacerbate poverty. Given the substantial resources committed to the AIP, which further promotes maize production at the cost of diversification and other investments, this risk is heightened.
Measures to support a resilient and inclusive recovery 49. The COVID-19 crisis poses considerable challenges to the new Government. It must seek to support the most vulnerable and encourage an economic recovery, but has inherited a substantial domestic debt burden which severely limits its fiscal space. It can follow policy actions in both the short and medium term, as outlined below.
50. In the short term, the Government has limited fiscal space to act. Yet it should seek to continue with efforts in four areas. First, it needs to continue with current efforts to contain the epidemic. This includes: expanding testing; containing outbreaks among high risk populations (such as healthcare workers and those at risk of severe disease); ensuring access to essential care for COVID-19 such as oxygen; and investing in mechanisms to support home-based isolation and care. Maintaining essential health services while doing this will help avoid a worsening of broader health outcomes. The Government should also accelerate planning efforts for future deployment of a COVID-19 vaccine, while maintaining other pandemic control measures such as universal face mask mandates and hygiene measures, as well as limiting large gatherings. Second, carefully targeted response efforts are needed to support the most vulnerable by expanding COVID-19 emergency cash transfers in affected urban areas, objectively
18 « MALAWI ECONOMIC MONITOR DECEMBER 2020
identifying beneficiaries using an abridged version of the social registry. Considering Malawi’s susceptibility to compounded shocks this year (both food insecurity and the COVID-19 impact), the Government should also consider food insecurity emergency cash transfer responses in both rural and urban areas, building on functioning food markets. Third, efforts are needed to ensure regular monitoring of the trade and market situation in order to address potential blockages in food markets and trade. This will be especially key to avoid food shortages in some markets as the country heads into the lean season. Finally, it will need to assess extending the ongoing moratoria on debt service for bank lending, while considering balancing access to credit, particularly for MSMEs, with financial market stability.
51. In the medium term, the new Government has an opportunity to implement measures to boost economic recovery and resilience. To do so will allow Malawi to return to 5 to 5.5 percent growth, in order to support incomes and job creation. To do so will call for measures in three areas:
1) The Government can strengthen the foundations for macro stability and growth:
x Malawi needs to strengthen fiscal sustainability and reduce domestic debt to create a strong foundation for growth. While some fiscal accommodation in the short term may support the recovery, high and increasing fiscal deficits pose a considerable risk to fiscal sustainability. Malawi needs to seek a sustainable fiscal policy in the medium term so that it can reduce debt service costs. This will increase fiscal space for public investment and help lower interest rates to support private investment. Fiscal consolidation will be needed, prioritizing expenditure within a sustainable medium term fiscal framework, with realistic revenue and grant assumptions. Hard choices will need to be made about expenditure priorities, including ensuring that subsidies for agricultural production are sustainable, while containing an increasing wage and pension bill. Increasing scrutiny of development expenditure is needed, particularly for domestically financed projects, ensuring that projects are scrutinized through a rigorous assessment in order to ensure they are justified by high borrowing costs (see public investment management discussion in special topic); and the Government has recently increased reform efforts in this area. Efforts to increase revenue mobilization should be carefully balanced with promoting the business environment. More attention is needed on contingent liabilities related to SOEs, PPPs, and guarantees in order to reduce fiscal risks (as discussed in Part 2).
x Strengthening PFM and governance can improve the use of limited public resources. Government efforts to implement transparent and credible financial management practices will be needed to make the best use of limited fiscal funds. This has been heightened by the COVID-19 pandemic, for which the rapid deployment of response funds has exacerbated PFM vulnerabilities. Ensuring transparent and competitive procurement can strengthen value for money of limited fiscal resources, while strong commitment controls can help avoid recurring arrears. Mitigating PFM risks will be critical to ensure that limited funds support their intended purpose and avoid creating further fiscal pressures.
x Strengthening financial oversight and transparency of SOEs is needed to reduce fiscal risks and improve service delivery. The Government needs to enhance compliance with financial reporting by SOEs to improve information flow and allow for effective risk management. It should also analyze aggregate and parastatal-level fiscal risks through a consolidated financial and economic analysis of SOEs. These efforts can help improve service delivery, avoid the realization of contingent liabilities and accumulation of arrears. The Government could also conduct independent forensic audits on parastatals that have had issues with their performance and integrity. It should also seek to consolidate the fragmentation of oversight to ensure that the ownership function is effectively exercised by the Ministry of Finance as the shareholder.
2) It can support economic diversification in agriculture and non-agriculture sectors to increase incomes and resilience:
x Adopting predictable and transparent policies would support diversification and commercialization in the agriculture sector. Malawi has been fortunate that the COVID-19 crisis has struck in a year with good agricultural production; however, it remains highly vulnerable to weather shocks due to its reliance on rainfed subsistence agriculture. The crisis provides an
19 « MALAWI ECONOMIC MONITOR DECEMBER 2020
opportunity to set a foundation for increased agricultural production and resilience in the medium term. This will call for creating predictable and transparent trade policies for agricultural products by minimizing the ad hoc imposition of export bans and reviewing the necessity of products requiring export licenses. This would stimulate investment and commercialization in order to increase production and exports in the medium term while supporting food security. It should further ensure that ADMARC’s market interventions are transparent, timely, and predictable, in order to avoid causing distortions. Moreover, the Government can rebalance spending in the agriculture sector beyond input subsidies for maize, instead promoting diversification, more sustainable farming practices and climate-smart agriculture technologies including irrigation, as well as nutrition-sensitive crops such as legumes and biofortified maize varieties. It should ensure that subsidy programs are fiscally sustainable. Subsidy programs would also benefit from using transparent and cost-efficient implementation modalities, for instance by fixing an agricultural coupon subsidy value and strongly engaging the private sector. It can also promote the new seed and fertilizer policies.
x The Government needs to address structural issues that hinder diversification outside of agriculture. Implementing financial and governance measures will be critical as part of timebound turnaround plans for key utilities for energy as well as water (as discussed in the special topic). Continued progress on critical investment projects in energy generation, transmission, and distribution will be needed. In addition, the Government can further simplify business regulations and taxes. Tax policies and administration should be reviewed and revised to increase transparency, to reduce ad hoc changes, and to support value addition, key growth-enabling sectors, such as ICT, and MSMEs. The development of the ICT sector could be supported by reviewing the tax regime, levies, and tariffs; and fostering competition in the broadband infrastructure development market, including a review of MACRA’s regulations to reduce market distortions. Further areas could include establishing an autonomous agency to promote regulations and policy supporting MSMEs, operationalizing an online business registration system, and making progress on the bankruptcy/ insolvency regime.
3) The Government can strengthen systems to support the vulnerable and increase resilience:
x Developing a shock-sensitive safety net system can help mitigate the impact of the current pandemic and future shocks. Cash transfers would be a more efficient means of targeting support to the most vulnerable households than input subsidies. In addition to the ongoing COVID-19 emergency cash response to urban areas and a cash-based food insecurity response, the Government could further adapt the responsiveness of its safety net system by establishing a pre-existing disaster risk financing mechanism and increase transparency in the selection of beneficiary households. It can achieve this through developing an abridged version of the Unified Beneficiary Registry (UBR) for rapid and transparent beneficiary identification and targeting during disasters. In addition, it can establish a pre-existing disaster risk financial instrument to facilitate the scale-up of social cash transfers to poor and vulnerable households in the case of shocks. This will complement fiscal management reforms by reducing the need for ad hoc budgetary re-allocation when shocks occur, thereby increasing Malawi’s fiscal resilience.
20 « MALAWI ECONOMIC MONITOR DECEMBER 2020
2. Special Topic: Doing more with less: improving service delivery in energy and water
The new Government is cognizant of the high expectations from its constituencies to strengthen service delivery. While the fight against the COVID-19 pandemic is currently a key concern, laying the foundation for recovery and improving provision of services in the medium term will be critical. This calls for reforms that can help increase investment in infrastructure in the medium term. Even in the short term, the need for better access to water services to prevent the further spread of COVID-19 has significantly increased.
Improving infrastructure services delivery, especially in the energy sector where the electrification rate is only 11 percent, will be challenging in light of the precarious fiscal situation, and the poor performance of SOEs, which are the main channel of delivering infrastructure services in Malawi. In the energy and water supply and sanitation sectors, the annual investment gap is approximately US$332 million (about 4 percent of GDP), whereas total public investment across all sectors has averaged 4.2 percent of GDP over the past two decades. A range of issues have contributed to the inability to maintain existing infrastructure and invest in new infrastructure. This includes: sluggish economic growth; a legacy of poor selection, procurement and implementation of infrastructure projects, leading to an unaffordable public investment program; and the lack of diversification of financing sources (including limited ability to leverage finance from private investors).
Both energy and water SOEs face severe cashflow challenges due to low tariffs, low operating efficiency, and high operating costs. SOEs suffer from an inefficient management of operations and a weak governance framework that results in limited independence of boards of directors, lack of professionalism both in boards and management, political interference in decision-making, and corruption. The inability of SOEs to generate positive cashflow leaves almost no room for investments to improve service delivery or to access to commercial markets to raise additional financing.
These problems are not without solutions. It is critical to design and implement a coherent reform program to deliver desired outcomes. This MEM special topic draws on the recently completed analytical report “Mobilizing Long-term Finance for Infrastructure”11 and proposes a package of reforms to increase investments and finance in energy and water infrastructure and thereby improve service delivery. This includes: (a) better sector policies, (b) better project selection through an improved Public Investment Management (PIM) framework that optimizes the relationship between the public and the private sector, (c) more efficient and creditworthy SOEs, and (d) leveraging PPPs to improve efficiency of delivering projects for which PPPs have been deemed appropriate.
The Government is aware of these challenges and has already made some key decisions, signaling its intent to undertake needed reforms. It initiated high-level corruption investigations and prosecutions; dissolved boards of directors of all parastatals/SOEs with a view to appoint new boards with more credible members; and has required all SOEs to develop turn-around strategies to improve efficiency and operate on sound business principles. Additionally, it established a Cabinet Committee on PPPs and private sector growth, signaling a policy to increase private sector participation in economic activities.
2.1 Status of Electricity and Water Service Delivery in Malawi
Inadequate energy and water services have reduced growth and aggravated poverty and health outcomes 1. Limited access and reliability of energy and water services have constrained economic growth prospects, aggravated poverty levels, and negatively affected the health of Malawians. Access to reliable energy is currently the most pressing infrastructure need in Malawi. Malawi has one of the lowest electricity access rates—at 11 percent of population12—compared to 42 percent in low income countries
11 Detailed information about topics covered in this MEM can found in the full report. It should be noted that the SOE topic is very wide and some aspects may require additional analysis in the future. 12 There are severe disparities between urban (38 percent) and rural areas (4 percent). The inequity among the rich and poor is stark—the poorest 20 percent reports 1 percent electrification rate and the richest 20 percent reports 31 percent. Households
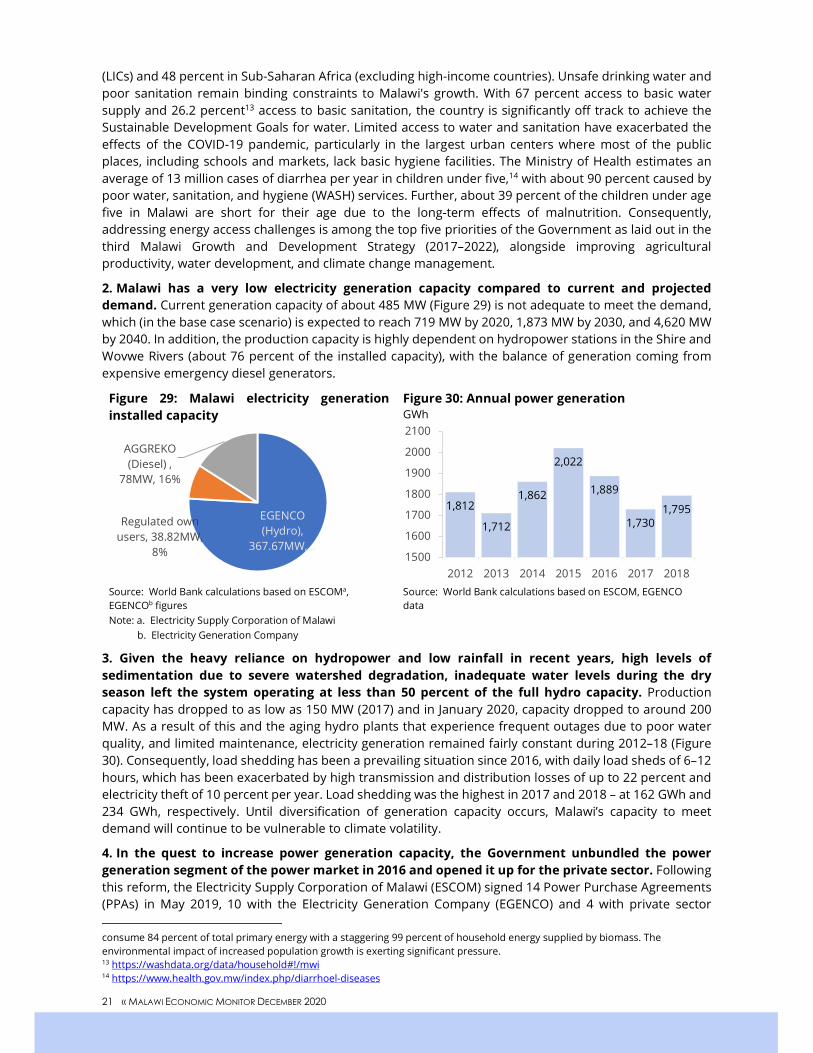
21 « MALAWI ECONOMIC MONITOR DECEMBER 2020
(LICs) and 48 percent in Sub-Saharan Africa (excluding high-income countries). Unsafe drinking water and poor sanitation remain binding constraints to Malawi's growth. With 67 percent access to basic water supply and 26.2 percent13 access to basic sanitation, the country is significantly off track to achieve the Sustainable Development Goals for water. Limited access to water and sanitation have exacerbated the effects of the COVID-19 pandemic, particularly in the largest urban centers where most of the public places, including schools and markets, lack basic hygiene facilities. The Ministry of Health estimates an average of 13 million cases of diarrhea per year in children under five,14 with about 90 percent caused by poor water, sanitation, and hygiene (WASH) services. Further, about 39 percent of the children under age five in Malawi are short for their age due to the long-term effects of malnutrition. Consequently, addressing energy access challenges is among the top five priorities of the Government as laid out in the third Malawi Growth and Development Strategy (2017–2022), alongside improving agricultural productivity, water development, and climate change management.
2. Malawi has a very low electricity generation capacity compared to current and projected demand. Current generation capacity of about 485 MW (Figure 29) is not adequate to meet the demand, which (in the base case scenario) is expected to reach 719 MW by 2020, 1,873 MW by 2030, and 4,620 MW by 2040. In addition, the production capacity is highly dependent on hydropower stations in the Shire and Wovwe Rivers (about 76 percent of the installed capacity), with the balance of generation coming from expensive emergency diesel generators.
3. Given the heavy reliance on hydropower and low rainfall in recent years, high levels of sedimentation due to severe watershed degradation, inadequate water levels during the dry season left the system operating at less than 50 percent of the full hydro capacity. Production capacity has dropped to as low as 150 MW (2017) and in January 2020, capacity dropped to around 200 MW. As a result of this and the aging hydro plants that experience frequent outages due to poor water quality, and limited maintenance, electricity generation remained fairly constant during 2012–18 (Figure 30). Consequently, load shedding has been a prevailing situation since 2016, with daily load sheds of 6–12 hours, which has been exacerbated by high transmission and distribution losses of up to 22 percent and electricity theft of 10 percent per year. Load shedding was the highest in 2017 and 2018 – at 162 GWh and 234 GWh, respectively. Until diversification of generation capacity occurs, Malawi’s capacity to meet demand will continue to be vulnerable to climate volatility.
4. In the quest to increase power generation capacity, the Government unbundled the power generation segment of the power market in 2016 and opened it up for the private sector. Following this reform, the Electricity Supply Corporation of Malawi (ESCOM) signed 14 Power Purchase Agreements (PPAs) in May 2019, 10 with the Electricity Generation Company (EGENCO) and 4 with private sector
consume 84 percent of total primary energy with a staggering 99 percent of household energy supplied by biomass. The environmental impact of increased population growth is exerting significant pressure. 13 https://washdata.org/data/household#!/mwi 14 https://www.health.gov.mw/index.php/diarrhoel-diseases
Figure 29: Malawi electricity generation installed capacity
Figure 30: Annual power generation GWh
Source: World Bank calculations based on ESCOMa, EGENCOb figures
Source: World Bank calculations based on ESCOM, EGENCO data
Note: a. Electricity Supply Corporation of Malawi b. Electricity Generation Company
EGENCO (Hydro),
367.67MW, …
Regulated own users, 38.82MW,
8%
AGGREKO (Diesel) ,
78MW, 16%
1,812
1,712
1,862
2,022
1,889
1,7301,795
1500
1600
1700
1800
1900
2000
2100
2012 2013 2014 2015 2016 2017 2018
22 « MALAWI ECONOMIC MONITOR DECEMBER 2020
Independent Power Producers (IPPs). A new solar IPP (US$67 million)—the Salima Solar Project—reached financial close in 2019 and is backed by a guarantee from the Multilateral Investment Guarantee Agency (MIGA). It will be the first IPP in the country and once operational (at the end of 2020) will bring onstream 60MW of new generation capacity. The flagship Mpatamanga Hydropower Project – set to double installed capacity – is supported through collaboration among World Bank, IFC and MIGA. The successful closure of this US$1.1 billion deal will send a powerful signal to the market and can catalyze wider investment and PPP opportunities.
5. However, ensuring the financial sustainability of the power sector, especially of ESCOM and predictability of tariffs would be critical. ESCOM is the only entity in the sector that generates revenues directly from consumers, hence it is key to the funding of projects seeking private capital. However, as explained in subsequent sections, ESCOM is facing severe financial problems, putting the sector’s sustainability at risk. Following the unbundling, the Malawi Energy Regulatory Authority (MERA) published a ‘New Tariff Methodology’ that requires the separation of the different activities to ensure that cost recovery principles are applied in each component of the sector.
6. The current tariff applied to ESCOM is not cost reflective. However, since ESCOM’s operations are not efficient, the regulator is unwilling to allow tariff increases without performance improvement. In April 2018, ESCOM applied for a 60 percent increase in base tariff, covering all business units. After due consideration and consultation with the public, MERA approved budgets which would result in an average end-user tariff of MWK 97.5 per kWh (US¢13.26 per kWh) for 2018–2022, effective from October 1, 2018. The approved rate is 19 percent lower than what was requested by ESCOM. A downward adjustment of the budget submitted by ESCOM was made to what MERA deemed to be realistic and to encourage greater efficiency. ESCOM’s revenue projection was decreased by 20 percent, head office costs were decreased by 35 percent, bad debts initially were allowed at 3 percent, but the final base rate requires a reduction to 0.5 percent.15 ESCOM was also required to isolate revenue asset revaluation gains and allocate it to a specific fund to be used only for infrastructure enhancements, additions, and improvements. MERA has also resolved that results against key performance indicators will be part of the licensing agreements with electricity sector entities and nonperformance will be subject to penalties.
7. The water sector plays a critical role in Malawi’s economy, but water resources remain scarce. Water-reliant sectors contribute an estimated 35 percent to the country’s GDP. Surface water makes up 98 percent of the available water resources, and currently, the hydropower schemes are the main source of power generation for the whole of Malawi. However, the water resources are under threat from severe watershed degradation and climate change. The total renewable water resource available in Malawi is estimated at 927 m3 per capita per year, which is very close to water scarcity.16 Due to population growth, watershed degradation, and climate change, per capita water availability has declined by 44 percent in the last 20 years. Further, lack of water storage infrastructure limits Malawi's ability to sustainably explore its natural resources for economic growth, regulating unpredictable hydrological variability, and mitigating the effects of floods and droughts. The country's dam storage capacity is significantly underdeveloped (at 2.24m3/inhabitant) and the lowest in the Southern Africa region.
8. Malawi has made significant progress in the past two decades in increasing access to water supply services. Access to basic water increased from 62.4 percent in 2010 to 68.8 percent in 2017 (the access rate was 53 percent in 2000). However, sanitation access has been lagging. Access to basic sanitation services has slightly improved from 20.8 percent in 2000 to 26.2 percent in 2017 (Figure 31). Over a 15-year period (2000-2015) the rate of open defecation declined from 15.7 percent to 6.8 percent. These improvements are partly due to efforts by the Government to introduce the Community Led Total Sanitation Program in 2008.
9. Despite this progress, the infrastructure and services gap is huge, particularly for sanitation. Unsafe drinking water and poor sanitation in both rural and urban areas remain a binding constraint to Malawi’s growth and poverty reduction, especially because official access figures mask the poor levels of
15 As best practice, provision for bad debts should not be passed on to end users. 16 Under the Falkenmark definitions of water scarcity, a country with a total renewable water resource of less than 1000 m3/capita/year is considered water scarce
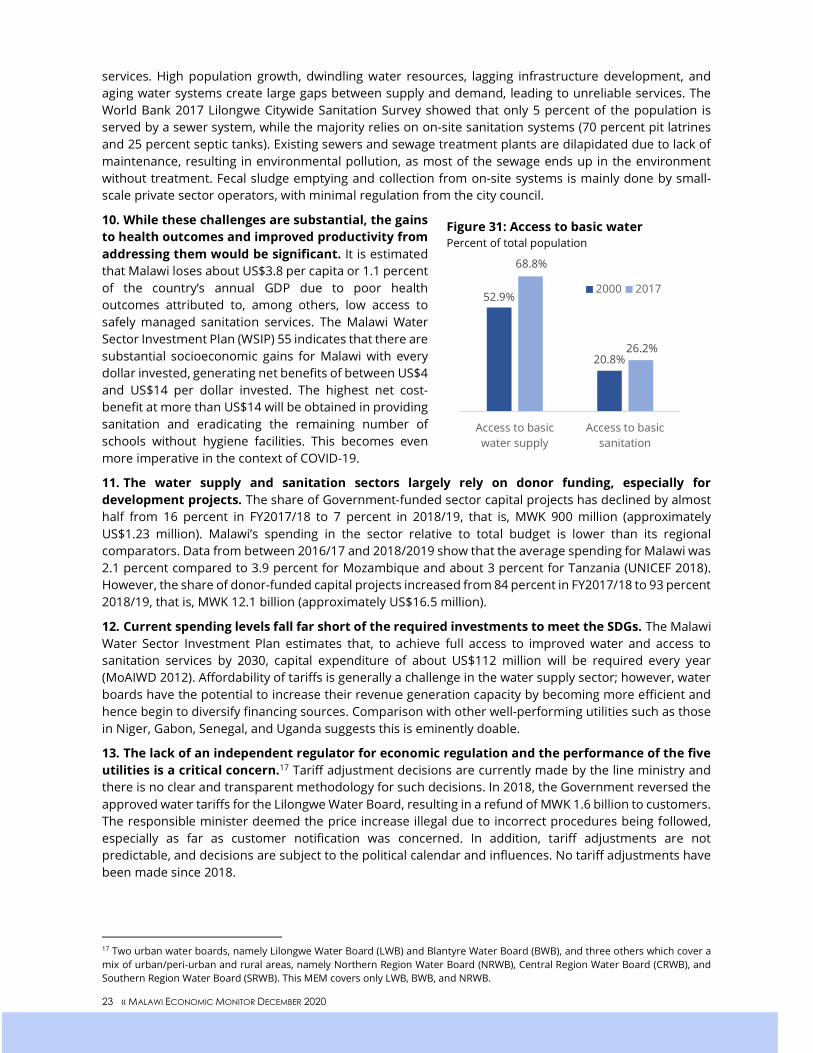
23 « MALAWI ECONOMIC MONITOR DECEMBER 2020
services. High population growth, dwindling water resources, lagging infrastructure development, and aging water systems create large gaps between supply and demand, leading to unreliable services. The World Bank 2017 Lilongwe Citywide Sanitation Survey showed that only 5 percent of the population is served by a sewer system, while the majority relies on on-site sanitation systems (70 percent pit latrines and 25 percent septic tanks). Existing sewers and sewage treatment plants are dilapidated due to lack of maintenance, resulting in environmental pollution, as most of the sewage ends up in the environment without treatment. Fecal sludge emptying and collection from on-site systems is mainly done by small-scale private sector operators, with minimal regulation from the city council.
10. While these challenges are substantial, the gains to health outcomes and improved productivity from addressing them would be significant. It is estimated that Malawi loses about US$3.8 per capita or 1.1 percent of the country’s annual GDP due to poor health outcomes attributed to, among others, low access to safely managed sanitation services. The Malawi Water Sector Investment Plan (WSIP) 55 indicates that there are substantial socioeconomic gains for Malawi with every dollar invested, generating net benefits of between US$4 and US$14 per dollar invested. The highest net cost-benefit at more than US$14 will be obtained in providing sanitation and eradicating the remaining number of schools without hygiene facilities. This becomes even more imperative in the context of COVID-19.
11. The water supply and sanitation sectors largely rely on donor funding, especially for development projects. The share of Government-funded sector capital projects has declined by almost half from 16 percent in FY2017/18 to 7 percent in 2018/19, that is, MWK 900 million (approximately US$1.23 million). Malawi’s spending in the sector relative to total budget is lower than its regional comparators. Data from between 2016/17 and 2018/2019 show that the average spending for Malawi was 2.1 percent compared to 3.9 percent for Mozambique and about 3 percent for Tanzania (UNICEF 2018). However, the share of donor-funded capital projects increased from 84 percent in FY2017/18 to 93 percent 2018/19, that is, MWK 12.1 billion (approximately US$16.5 million).
12. Current spending levels fall far short of the required investments to meet the SDGs. The Malawi Water Sector Investment Plan estimates that, to achieve full access to improved water and access to sanitation services by 2030, capital expenditure of about US$112 million will be required every year (MoAIWD 2012). Affordability of tariffs is generally a challenge in the water supply sector; however, water boards have the potential to increase their revenue generation capacity by becoming more efficient and hence begin to diversify financing sources. Comparison with other well-performing utilities such as those in Niger, Gabon, Senegal, and Uganda suggests this is eminently doable.
13. The lack of an independent regulator for economic regulation and the performance of the five utilities is a critical concern.17 Tariff adjustment decisions are currently made by the line ministry and there is no clear and transparent methodology for such decisions. In 2018, the Government reversed the approved water tariffs for the Lilongwe Water Board, resulting in a refund of MWK 1.6 billion to customers. The responsible minister deemed the price increase illegal due to incorrect procedures being followed, especially as far as customer notification was concerned. In addition, tariff adjustments are not predictable, and decisions are subject to the political calendar and influences. No tariff adjustments have been made since 2018.
17 Two urban water boards, namely Lilongwe Water Board (LWB) and Blantyre Water Board (BWB), and three others which cover a mix of urban/peri-urban and rural areas, namely Northern Region Water Board (NRWB), Central Region Water Board (CRWB), and Southern Region Water Board (SRWB). This MEM covers only LWB, BWB, and NRWB.
Figure 31: Access to basic water Percent of total population
52.9%
20.8%
68.8%
26.2%
Access to basicwater supply
Access to basicsanitation
2000 2017
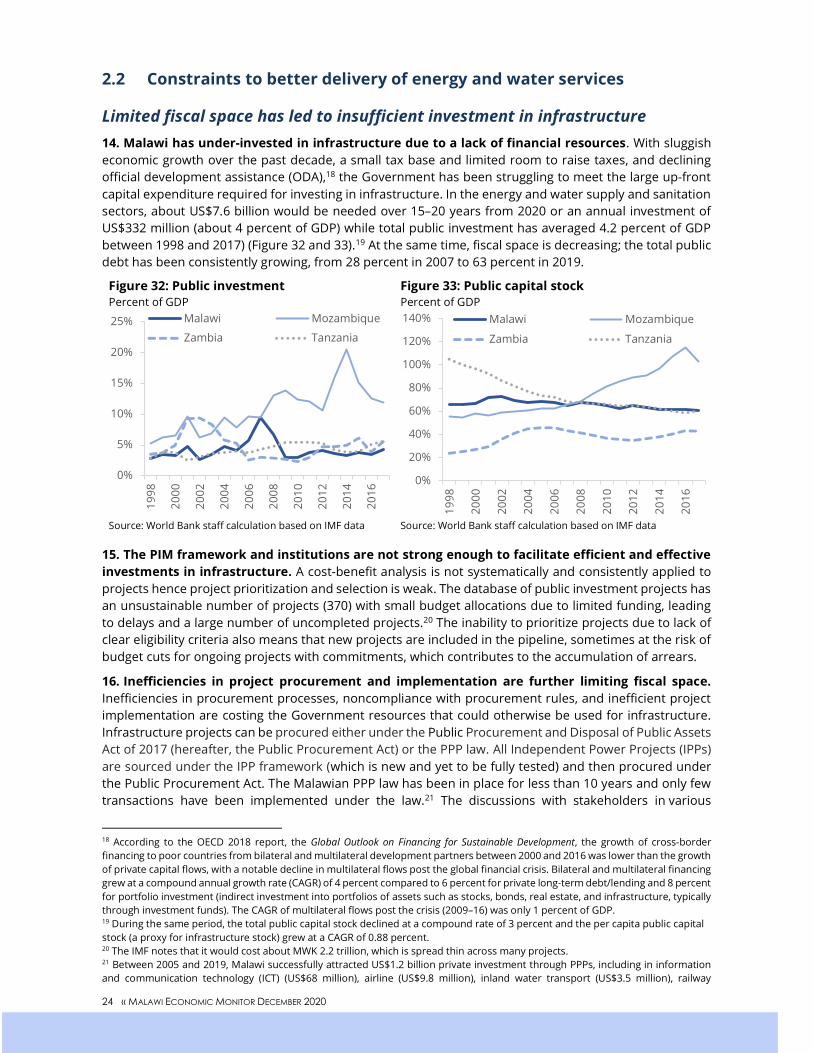
24 « MALAWI ECONOMIC MONITOR DECEMBER 2020
2.2 Constraints to better delivery of energy and water services
Limited fiscal space has led to insufficient investment in infrastructure 14. Malawi has under-invested in infrastructure due to a lack of financial resources. With sluggish economic growth over the past decade, a small tax base and limited room to raise taxes, and declining official development assistance (ODA),18 the Government has been struggling to meet the large up-front capital expenditure required for investing in infrastructure. In the energy and water supply and sanitation sectors, about US$7.6 billion would be needed over 15–20 years from 2020 or an annual investment of US$332 million (about 4 percent of GDP) while total public investment has averaged 4.2 percent of GDP between 1998 and 2017) (Figure 32 and 33).19 At the same time, fiscal space is decreasing; the total public debt has been consistently growing, from 28 percent in 2007 to 63 percent in 2019.
15. The PIM framework and institutions are not strong enough to facilitate efficient and effective investments in infrastructure. A cost-benefit analysis is not systematically and consistently applied to projects hence project prioritization and selection is weak. The database of public investment projects has an unsustainable number of projects (370) with small budget allocations due to limited funding, leading to delays and a large number of uncompleted projects.20 The inability to prioritize projects due to lack of clear eligibility criteria also means that new projects are included in the pipeline, sometimes at the risk of budget cuts for ongoing projects with commitments, which contributes to the accumulation of arrears.
16. Inefficiencies in project procurement and implementation are further limiting fiscal space. Inefficiencies in procurement processes, noncompliance with procurement rules, and inefficient project implementation are costing the Government resources that could otherwise be used for infrastructure. Infrastructure projects can be procured either under the Public Procurement and Disposal of Public Assets Act of 2017 (hereafter, the Public Procurement Act) or the PPP law. All Independent Power Projects (IPPs) are sourced under the IPP framework (which is new and yet to be fully tested) and then procured under the Public Procurement Act. The Malawian PPP law has been in place for less than 10 years and only few transactions have been implemented under the law.21 The discussions with stakeholders in various
18 According to the OECD 2018 report, the Global Outlook on Financing for Sustainable Development, the growth of cross-border financing to poor countries from bilateral and multilateral development partners between 2000 and 2016 was lower than the growth of private capital flows, with a notable decline in multilateral flows post the global financial crisis. Bilateral and multilateral financing grew at a compound annual growth rate (CAGR) of 4 percent compared to 6 percent for private long-term debt/lending and 8 percent for portfolio investment (indirect investment into portfolios of assets such as stocks, bonds, real estate, and infrastructure, typically through investment funds). The CAGR of multilateral flows post the crisis (2009–16) was only 1 percent of GDP. 19 During the same period, the total public capital stock declined at a compound rate of 3 percent and the per capita public capital stock (a proxy for infrastructure stock) grew at a CAGR of 0.88 percent. 20 The IMF notes that it would cost about MWK 2.2 trillion, which is spread thin across many projects. 21 Between 2005 and 2019, Malawi successfully attracted US$1.2 billion private investment through PPPs, including in information and communication technology (ICT) (US$68 million), airline (US$9.8 million), inland water transport (US$3.5 million), railway
Figure 32: Public investment Percent of GDP
Figure 33: Public capital stock Percent of GDP
Source: World Bank staff calculation based on IMF data Source: World Bank staff calculation based on IMF data
0%
5%
10%
15%
20%
25%
1998
2000
2002
2004
2006
2008
2010
2012
2014
2016
Malawi Mozambique
Zambia Tanzania
0%
20%
40%
60%
80%
100%
120%
140%
1998
2000
2002
2004
2006
2008
2010
2012
2014
2016
Malawi Mozambique
Zambia Tanzania

25 « MALAWI ECONOMIC MONITOR DECEMBER 2020
ministries, departments, agencies (MDAs) revealed limited incentives in procuring PPP projects using the PPP framework; hence, consideration of unsolicited proposals is common.22 However, contracting under the PPP law takes a long time due to lack of clarity in the regulatory framework on the timelines for completing the various processes. This partly contributes to the lack of incentives within MDAs to pursue PPPs. The PPP law discourages unsolicited proposals and the Government would like to amend it to allow
transport (the Nacala Railway Corridor project (US$1.1 billion), and tourism, management of the Liwonde National Parks (US$20 million). 22 While governments around the world deal with unsolicited proposals, they require a robust framework of managing such proposals to minimize procurement risks. Malawi already has such a framework and effective implementation and proper coordination would be key.
Box 4: Basic Principles of Public-Private Partnerships
PPPs, broadly defined, are a long-term contract between a government entity and private party, whereby the latter delivers public services, using a capital asset. The private partner is remunerated based on performance and bears significant risk and management responsibility. One may further distinguish between: a) concession contracts (user-pay PPPs), in which the private party provides the service directly to the public and takes end user demand risk; and b) PPPs narrowly defined, in which the private party provides bulk services to the government (government-pay PPP), notably in the form of a build-own-operate contract. In many cases, PPPs deliver services or basic commodities (e.g., power, water) to a state-owned enterprise (the off taker SOE), which distributes them to the end users. In a traditional public procurement, the government outsources the construction of a project. PPPs can be considered a form of public procurement in which a government entity outsources not only the construction but also the long-term maintenance and operation of a project.
Whether provided by a state-owned enterprise or by a PPP, infrastructure is intended to generate positive externalities exceeding the value of the tariff that end users are willing or can afford to pay. For certain types of infrastructure, the retail tariff charged to end users may not be enough to recover the full maintenance and capital cost of the project, whether undertaken directly by a SOE or outsourced to a PPP. To become commercially viable, these projects require a government subsidy to be paid either upfront during construction or in the form of periodic payments during operation. Under international public sector accounting standards (IPSAS), the assets and liabilities associated with PPP projects involving a substantial long-term payment obligation of the government are typically consolidated into the host country’s public sector accounts.
Compared with traditional public procurement, procuring infrastructure through PPPs has both advantages and disadvantages. A private company might construct and operate infrastructure more efficiently than a SOE. The partial transfer of risks to the private party (e.g. unexpected development costs, uncertainty of future tax revenues and user fee receipts) provides an incentive to design and deliver the infrastructure on time and within budget and to consider future maintenance costs. PPP projects whose revenues depend on user tariffs rather than government payments may be commercially financed without the need for the government to incur sovereign debt.
However, PPPs are not a ‘free lunch’. The preparation and procurement process for PPPs may be slower and more expensive than traditional public procurement. The complexity of structuring PPPs also means higher project development costs, and the opportunity cost of dedicating highly qualified professionals to PPPs versus other important areas. The cost of commercial finance for PPPs is generally higher than the cost of sovereign concessional finance and furthermore, to absorb the risks they incur, PPP investors and lenders require higher returns.
In light of this, the costs and benefits of implementing a project through PPPs should be evaluated realistically and costs should be subjected to affordability checks. Since PPPs must be funded either by consumers or from taxes, any shortfall resulting from the inability of consumers to meet the full cost of the infrastructure must be reflected in the government budget. Making the right decision about undertaking PPPs can be achieved by creating a standardized, systematic and comprehensive public investment management framework for identifying, appraising, selecting and prioritizing suitable investment projects and applying the ‘filter’ for PPP suitability (to determine whether the private sector can better deliver the project). A well-managed PPP preparation and bidding process can help ensure a more efficient use of resources. Fiscal impacts and risks and contingent liabilities should be fully appraised upfront, and risks should be appropriately allocated between the public and the private parties. Contingent liabilities should be treated as budgetary or debt items and be proactively managed and monitored.
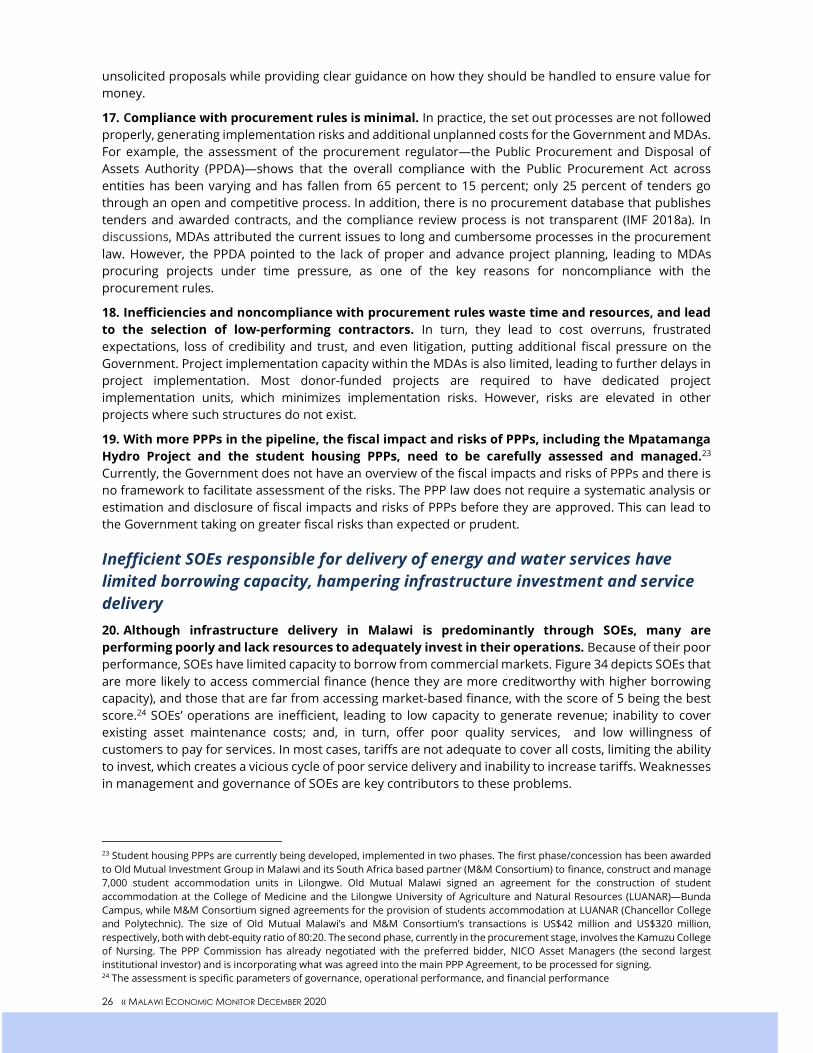
26 « MALAWI ECONOMIC MONITOR DECEMBER 2020
unsolicited proposals while providing clear guidance on how they should be handled to ensure value for money.
17. Compliance with procurement rules is minimal. In practice, the set out processes are not followed properly, generating implementation risks and additional unplanned costs for the Government and MDAs. For example, the assessment of the procurement regulator—the Public Procurement and Disposal of Assets Authority (PPDA)—shows that the overall compliance with the Public Procurement Act across entities has been varying and has fallen from 65 percent to 15 percent; only 25 percent of tenders go through an open and competitive process. In addition, there is no procurement database that publishes tenders and awarded contracts, and the compliance review process is not transparent (IMF 2018a). In discussions, MDAs attributed the current issues to long and cumbersome processes in the procurement law. However, the PPDA pointed to the lack of proper and advance project planning, leading to MDAs procuring projects under time pressure, as one of the key reasons for noncompliance with the procurement rules.
18. Inefficiencies and noncompliance with procurement rules waste time and resources, and lead to the selection of low-performing contractors. In turn, they lead to cost overruns, frustrated expectations, loss of credibility and trust, and even litigation, putting additional fiscal pressure on the Government. Project implementation capacity within the MDAs is also limited, leading to further delays in project implementation. Most donor-funded projects are required to have dedicated project implementation units, which minimizes implementation risks. However, risks are elevated in other projects where such structures do not exist.
19. With more PPPs in the pipeline, the fiscal impact and risks of PPPs, including the Mpatamanga Hydro Project and the student housing PPPs, need to be carefully assessed and managed.23 Currently, the Government does not have an overview of the fiscal impacts and risks of PPPs and there is no framework to facilitate assessment of the risks. The PPP law does not require a systematic analysis or estimation and disclosure of fiscal impacts and risks of PPPs before they are approved. This can lead to the Government taking on greater fiscal risks than expected or prudent.
Inefficient SOEs responsible for delivery of energy and water services have limited borrowing capacity, hampering infrastructure investment and service delivery 20. Although infrastructure delivery in Malawi is predominantly through SOEs, many are performing poorly and lack resources to adequately invest in their operations. Because of their poor performance, SOEs have limited capacity to borrow from commercial markets. Figure 34 depicts SOEs that are more likely to access commercial finance (hence they are more creditworthy with higher borrowing capacity), and those that are far from accessing market-based finance, with the score of 5 being the best score.24 SOEs’ operations are inefficient, leading to low capacity to generate revenue; inability to cover existing asset maintenance costs; and, in turn, offer poor quality services, and low willingness of customers to pay for services. In most cases, tariffs are not adequate to cover all costs, limiting the ability to invest, which creates a vicious cycle of poor service delivery and inability to increase tariffs. Weaknesses in management and governance of SOEs are key contributors to these problems.
23 Student housing PPPs are currently being developed, implemented in two phases. The first phase/concession has been awarded to Old Mutual Investment Group in Malawi and its South Africa based partner (M&M Consortium) to finance, construct and manage 7,000 student accommodation units in Lilongwe. Old Mutual Malawi signed an agreement for the construction of student accommodation at the College of Medicine and the Lilongwe University of Agriculture and Natural Resources (LUANAR)—Bunda Campus, while M&M Consortium signed agreements for the provision of students accommodation at LUANAR (Chancellor College and Polytechnic). The size of Old Mutual Malawi’s and M&M Consortium’s transactions is US$42 million and US$320 million, respectively, both with debt-equity ratio of 80:20. The second phase, currently in the procurement stage, involves the Kamuzu College of Nursing. The PPP Commission has already negotiated with the preferred bidder, NICO Asset Managers (the second largest institutional investor) and is incorporating what was agreed into the main PPP Agreement, to be processed for signing. 24 The assessment is specific parameters of governance, operational performance, and financial performance
27 « MALAWI ECONOMIC MONITOR DECEMBER 2020
21. In the energy sector, the poor performance of ESCOM puts the sustainability of the sector at risk and limits the ability of the sector to attract private capital. ESCOM faces severe financial problems due to inefficiencies (due to limited management and human resource capacity), low revenue generation capacity, and liquidity challenges. ESCOM’s financial performance had deteriorated to the extent that it had to be bailed out by the Government in April 2018. Despite having annual investment needs of about US$274 million (MWK 201 billion), ESCOM has no borrowing capacity. ESCOM was formally rated by the Global Credit Rating (GCR) of South Africa, based on the 2015/16 financial results and was deemed creditworthy and obtained a domestic investment-grade rating of BBB, but since then, performance has significantly deteriorated.
22. EGENCO, a new company created in 2017 following the unbundling of energy generation, has been profitable and is in a better position to access private capital. However, at the time of the assessment, the company had high levels of outstanding receivables of about MWK 30 billion related to ESCOM, affecting its liquidity. EGENCO’s better performance is partly attributable to capacity charges that are protected by the PPA in case of a force majeure event such as an adverse hydrological event25 affecting the production capacity, which has been common in Malawi given its dependency on hydropower. Although the PPA requires the costs associated with hydrological events to be shared equally with ESCOM, the risk-sharing formula was not effectively applied in the post-unbundling transition, where ESCOM claimed it was being billed the full amount. This led to a payment dispute and non-payment by ESCOM and high receivables for EGENCO. Recent negotiations led by the Government and the regulator led to the resolution of the dispute and ESCOM repaying EGENCO a portion of the debt.
23. EGENCO has a large investment program of about US$287 million (MWK 210 billion), but needs to prioritize projects given limited resources. While the entity could access some commercial finance based on current performance, the borrowing capacity (MWK 103 billion over a 10-year period, with an immediate borrowing capacity of about MWK 10 billion) is still limited in light of planned investments. In the long run, the performance of EGENCO (and IPPs entering the market) will largely depend on the performance of ESCOM and its ability to collect user revenue and pay generation entities for power purchased.
24. Most water utilities also suffer from operational challenges and limited financial resources. Out of the three utilities under review, Lilongwe Water Board (LWB) is the only utility that has consistently improved profitability in the past four to five years, largely due to increases in tariff rather than improvement in performance. Between financial years 2014 and 2018, LWB’s tariff grew at a compounded annual growth rate (CAGR) of 38.8 percent from MWK 151 million3 to MWK 778 million3. At the same time, water losses (non-revenue water (NRW) increased from 34.5 percent to 39.6 percent, commercial losses
25 As described in the PPA between ESCOM and EGENCO, an adverse hydrological event means a drought or any other event, condition or circumstance resulting in a reduction in the flow of water from the Shire River.
Figure 34: Distance-to-market score for each SOE Asset Size (MWK, billions)
Source: World Bank staff. Note: RFA=Roads Fund Administration; MHC=Malawi Housing Corporation
ESCOM
EGENCO
LWB
BWB
NRWB
MHC
RFA
020406080
100120140160180
- 0.5 1.0 1.5 2.0 2.5 3.0 3.5 4.0 4.5 5.0Distance from Market Market ReadyFar from Market
28 « MALAWI ECONOMIC MONITOR DECEMBER 2020
increased from 12.1 percent to 13.7 percent, and average hours of service decreased from 18 hours to 7.3 hours. This confirms the need for a strong independent regulator in the sector to ensure tariff increases are linked to performance, using a transparent methodology. Both LWB and Northern Region Water Board (NRWB) can cover operational costs from internally generated revenues and tariffs and service long-term concessionary loans. However, tariffs are not adequate to contribute to capital expenditure needs. Blantyre Water Board (BWB) is technically insolvent with negative equity and displays all the symptoms of a cash-strapped utility struggling to make ends meet. It should be noted that BWB’s biggest challenge is the high cost of pumping water from the current water source (Walker Ferry) on the Shire Valley,26 translating into high energy cost of about 41 percent of BWB’s gross revenue in 2017/18. With staff costs and debt servicing costs amounting to 45.5 percent and 13.8 percent of gross revenue, respectively, BWB is in a loss-making position.
25. LWB could access commercial finance given its current financial performance, but is substantially committed to concessional loans. While most of these have not started to disburse, they still limit its borrowing capacity. LWB is investing the current loan proceeds in additional revenue generating and cost savings projects and could be ready to access the commercial markets in the medium term. The ability of LWB to cover operational costs and maintain positive cashflow is vulnerable if performance does not significantly improve and further tariff adjustments are not made.27 NRWB is not ready to access commercial finance. The entity has been making small profits but is largely sustained by ad hoc grants from the Government and is also substantially committed to concessional loans. Without grants, NRWB’s revenues would not be adequate to service substantial amount of commercial debt.
26. All SOEs have liquidity challenges, largely attributable to the high receivables from the Government and its agencies. Liquidity will play an important role for SOEs to access market finance. SOEs have substantial outstanding amounts of receivables, in most cases, dominated by the Government and MDAs, and amounting to up to 18 percent of the asset value. These levels of unpaid bills deny the SOEs the working capital they need, forcing them to conclude expensive short-term overdraft facilities, with interest charges of up to 25 percent per year.
SOE governance is weak, which exacerbates operational challenges and deters private investment
27. The current governance frameworks in Malawi do not enable SOEs to be efficient and accountable. There is no clear SOE ownership policy that defines the overall objectives and rationale for state ownership in SOEs and the role of the state in the governance of SOEs. In addition, there is no clear separation between some of the state functions that have an influence on the operating conditions of SOEs. For example, with regard to economic regulation in the water sector, there is no independent regulator, which sometimes results in conflicts of interest. The oversight function of SOEs is also fragmented. The role is split between the Office of the President (OPC), the Office of the Vice President, the Ministry of Economic Planning and Development (MoEPD), the Ministry of Finance (MoF) and line ministries. While the Public Finance Management Act (PFMA) provides the MoF with a financial oversight role, the mandate of its department, the Public Enterprises Reform and Monitoring Unit (PERMU), which is tasked with providing financial oversight, is not backed by provisions in the PFMA or other treasury regulations. The OPC has control over administrative and human resource matters, the MoEPD (a newly ministry) has control of public sector reforms (which cover SOEs), while line ministries provide oversight over technical matters. While at face value it seems as if the roles are distinct, there are overlaps in implementation, which makes the oversight function ineffective given the lack of effective coordination across the different institutions.
28. The state is involved in the day-to-day management of SOEs, and political interference in SOEs’ decision-making processes is common. Most decisions that should be made by boards and
26 The water source is 40 km from Blantyre and the head is high at 800 meters. 27 Data from the International Benchmarking Network for Water and Sanitation Utilities suggests that average water tariff in Lilongwe is high compared to countries of similar development and GNI per capita.
29 « MALAWI ECONOMIC MONITOR DECEMBER 2020
managements are subject to Government approval.28 This is partly because boards of directors and executive managements have underperformed in the past, in some cases leading to bailouts of SOEs. When composing SOE boards, the current practice is to have as wide a representation as possible to ensure the interest of the general public is represented.29 Most boards are large and previous boards (prior to dissolution of all boards that took place in July 2020) lacked diversity of skills (especially private sector skills), with a composition that is excessively skewed toward public sector representation and includes farmers and village chiefs, many of whom lack the necessary expertise to govern utilities.30
29. Governance, financial management, and capacity issues are major concerns for financial institutions and private investors when making decisions to finance SOEs or their projects. These concerns include gaps in corporate governance and the independence of boards of directors, limited capacity at the level of both board of directors and executive managements, political interference in decision-making, corruption, and poor operational and financial performance. Further, SOEs lack transparency and accountability, with very little to no performance information made publicly available.31 Success in diversifying infrastructure financing through attracting foreign and domestic private investments depends on the commitment and capability of SOEs to improve their creditworthiness and change the manner in which they approach private investors, and the commitment of the Government to reform the governance environment of SOEs.
The Government could leverage the potential of the private sector to mobilize finance and implement projects more efficiently 30. Experience from other countries shows that private investment and financing of infrastructure range from 0 to 1 percent of GDP, with a global average of about 0.5 percent. In poor countries, the amount of private capital that can be mobilized relative to the size of the economy is limited due to the affordability of fully commercial tariffs. In the past two decades (1998–2017), investments in PPP projects globally averaged 0.51 percent of GDP (IMF 2019). In addition, estimates by Thomson Reuters shows that project finance loans totaled US$ 282.7 billion (0.33 percent of GDP), of which nearly half (48.7 percent) were loans to power projects (Chambers 2019). This estimate excludes financing through project bonds and equity financing. The ratio of investment and financing relative to GDP tends to be higher in low-income countries (LICs – at 0.41 percent of GDP) and lower-middle-income countries (LMICs – 0.89 percent)) than in developed economies (0.14 percent), since they need to invest more in infrastructure than rich countries32 The ratio for Malawi is much lower than the average for LICs, that is, 0.07 percent of GDP in the two decades (Figure 35). Based on these trends, aiming for private investment and financing of about 0.5 percent of GDP annually could be a sustainable vision for Malawi.
28 The lack of independence, with boards and executive managements taking directions from the state on how to run their business, removes the incentive to improve performance, instead expecting bailouts. In discussions, it was revealed that SOEs usually expect bailouts from the Government when they fail to repay their debt, which also creates moral hazard on the part of the private sector. Expectations that SOEs will always be bailed out can encourage irresponsible/excessive lending practices. 29 While the spirit of this practice could be warranted, it does not have to be this way. The interest of the public can best be served by ensuring SOEs are efficient and financially sustainable, which at the basic level is a function of the quality of SOE boards and their executive managements and the quality of the governance framework that enables SOE boards to effectively perform their duties. 30 When forming SOE boards, the current practice in Malawi is to have as wide a representation as possible as a way to ensure the interest of the general public is well represented, resulting in the current composition. 31 For some SOEs, audited financial statements are available on their websites, but usually outdated, often two to three years behind. 32 Based on IMF data over the last two decades. The data include resource-based infrastructure projects which are funded through export/forex revenue of natural resources (for example, the Nacala Project in Mozambique and Malawi which is funded from coal export revenues). If only projects that are funded from domestic revenues (that is, user charges, government pay, or a combination of both) are considered, the ratio could be lower for some countries.
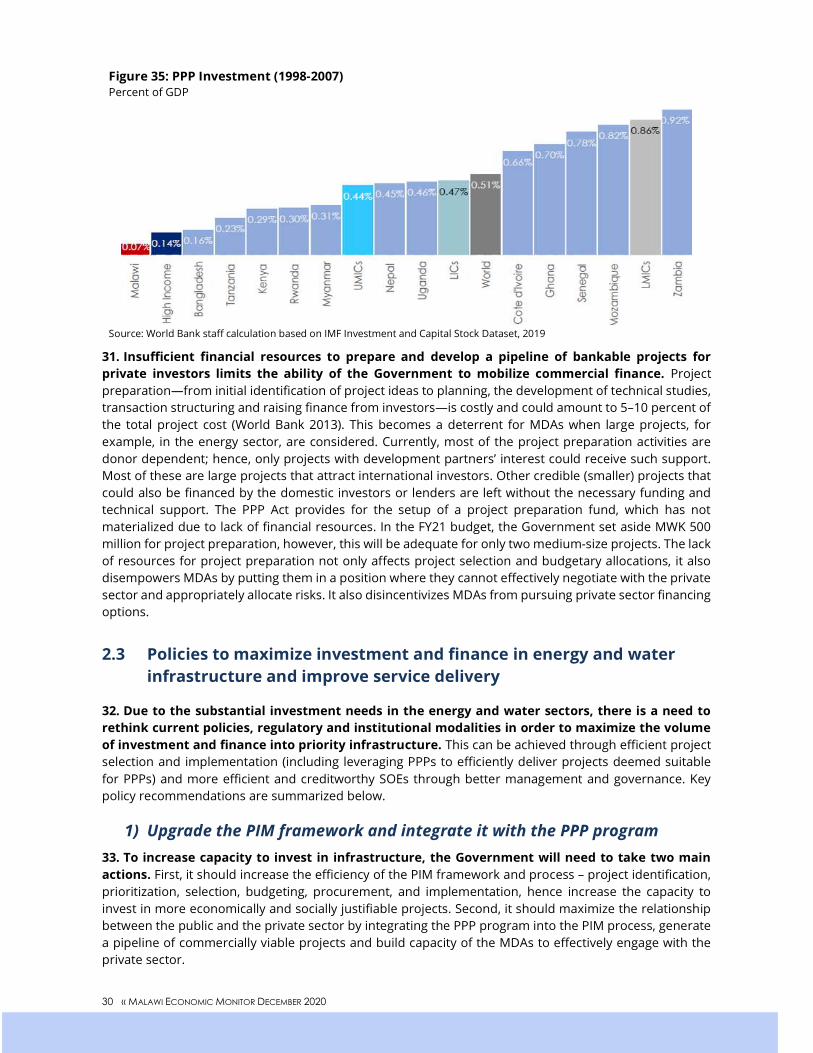
30 « MALAWI ECONOMIC MONITOR DECEMBER 2020
Figure 35: PPP Investment (1998-2007) Percent of GDP
Source: World Bank staff calculation based on IMF Investment and Capital Stock Dataset, 2019
31. Insufficient financial resources to prepare and develop a pipeline of bankable projects for private investors limits the ability of the Government to mobilize commercial finance. Project preparation—from initial identification of project ideas to planning, the development of technical studies, transaction structuring and raising finance from investors—is costly and could amount to 5–10 percent of the total project cost (World Bank 2013). This becomes a deterrent for MDAs when large projects, for example, in the energy sector, are considered. Currently, most of the project preparation activities are donor dependent; hence, only projects with development partners’ interest could receive such support. Most of these are large projects that attract international investors. Other credible (smaller) projects that could also be financed by the domestic investors or lenders are left without the necessary funding and technical support. The PPP Act provides for the setup of a project preparation fund, which has not materialized due to lack of financial resources. In the FY21 budget, the Government set aside MWK 500 million for project preparation, however, this will be adequate for only two medium-size projects. The lack of resources for project preparation not only affects project selection and budgetary allocations, it also disempowers MDAs by putting them in a position where they cannot effectively negotiate with the private sector and appropriately allocate risks. It also disincentivizes MDAs from pursuing private sector financing options.
2.3 Policies to maximize investment and finance in energy and water infrastructure and improve service delivery
32. Due to the substantial investment needs in the energy and water sectors, there is a need to rethink current policies, regulatory and institutional modalities in order to maximize the volume of investment and finance into priority infrastructure. This can be achieved through efficient project selection and implementation (including leveraging PPPs to efficiently deliver projects deemed suitable for PPPs) and more efficient and creditworthy SOEs through better management and governance. Key policy recommendations are summarized below.
1) Upgrade the PIM framework and integrate it with the PPP program 33. To increase capacity to invest in infrastructure, the Government will need to take two main actions. First, it should increase the efficiency of the PIM framework and process – project identification, prioritization, selection, budgeting, procurement, and implementation, hence increase the capacity to invest in more economically and socially justifiable projects. Second, it should maximize the relationship between the public and the private sector by integrating the PPP program into the PIM process, generate a pipeline of commercially viable projects and build capacity of the MDAs to effectively engage with the private sector.
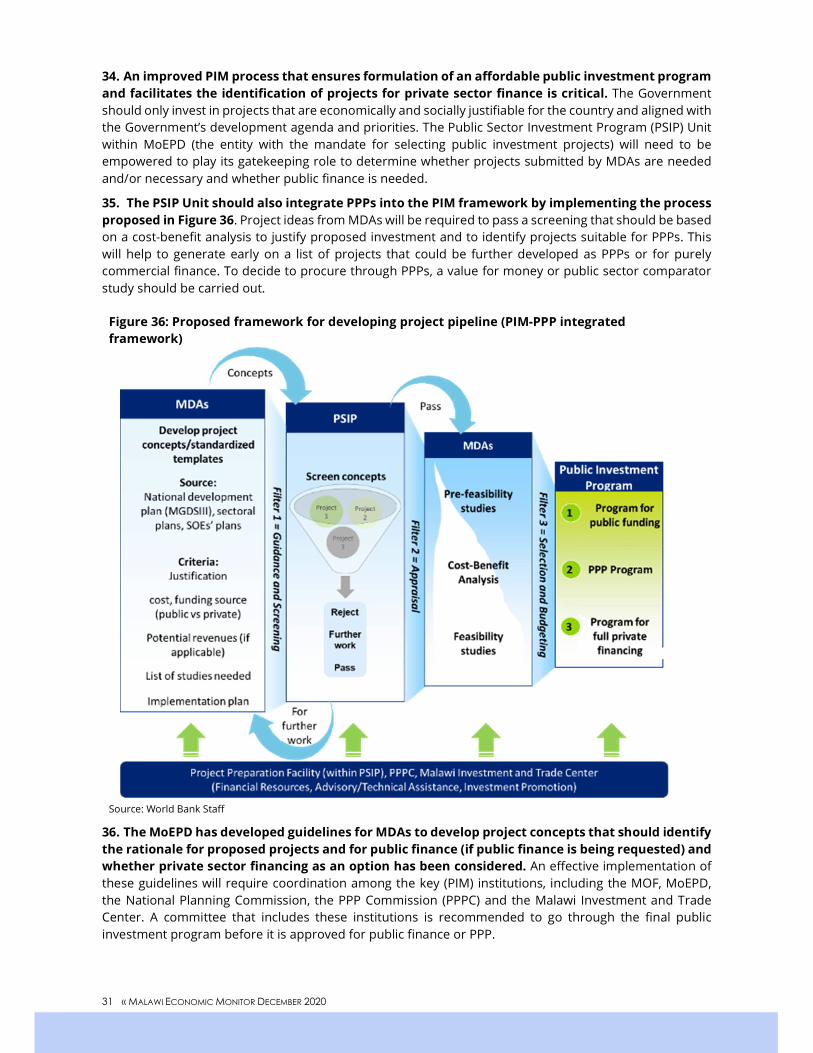
31 « MALAWI ECONOMIC MONITOR DECEMBER 2020
34. An improved PIM process that ensures formulation of an affordable public investment program and facilitates the identification of projects for private sector finance is critical. The Government should only invest in projects that are economically and socially justifiable for the country and aligned with the Government’s development agenda and priorities. The Public Sector Investment Program (PSIP) Unit within MoEPD (the entity with the mandate for selecting public investment projects) will need to be empowered to play its gatekeeping role to determine whether projects submitted by MDAs are needed and/or necessary and whether public finance is needed.
35. The PSIP Unit should also integrate PPPs into the PIM framework by implementing the process proposed in Figure 36. Project ideas from MDAs will be required to pass a screening that should be based on a cost-benefit analysis to justify proposed investment and to identify projects suitable for PPPs. This will help to generate early on a list of projects that could be further developed as PPPs or for purely commercial finance. To decide to procure through PPPs, a value for money or public sector comparator study should be carried out.
36. The MoEPD has developed guidelines for MDAs to develop project concepts that should identify the rationale for proposed projects and for public finance (if public finance is being requested) and whether private sector financing as an option has been considered. An effective implementation of these guidelines will require coordination among the key (PIM) institutions, including the MOF, MoEPD, the National Planning Commission, the PPP Commission (PPPC) and the Malawi Investment and Trade Center. A committee that includes these institutions is recommended to go through the final public investment program before it is approved for public finance or PPP.
Figure 36: Proposed framework for developing project pipeline (PIM-PPP integrated framework)
Source: World Bank Staff
32 « MALAWI ECONOMIC MONITOR DECEMBER 2020
37. The PIM framework should also be adjusted to encourage upfront estimation of the potential fiscal impact of potential long-term deficits that may be created by infrastructure projects.33 This should be supported by a legal change (in the PPP Act) to require upfront analysis and estimation of fiscal impacts and risks of PPPs. This should include (a) undertaking in-depth economic and financial analyses of proposed projects, including cost-benefit analyses and gauging the level of outright government and/or contingent support that would be needed to improve the viability and bankability of these projects; (b) risk identification, quantification, and mitigation for PPP projects; and (c) continuous management and monitoring of outright and contingent liabilities and risks.
38. The effective implementation of the new framework will require capacity building. PPPs are a relatively new form of governance in Malawi, and hence, it would be necessary to establish the capacity within MDAs to adopt PPPs and the private investment agenda in general. Capacity building will need to be undertaken at three levels. First, to create awareness about private sector engagement, PPP regimes, and their benefits. Second, to help MDAs acquire basic skills that can help them undertake the initial appraisal of projects before they are submitted to the PSIP Unit and later be further developed to reach bankability stage. Third, is to avail financial resources to facilitate project development. Other countries have set up project preparation facilities to support PPP programs (see Box 5), which could provide lessons in designing a suitable modality that will work in Malawi. Building capacity to prepare projects well would help the private sector determine whether projects presented to them will yield expected returns and help the MDAs to effectively negotiate with the private sector, including on matters related to risks and an appropriate allocation of such risks.
39. Early engagement with investors would be critical to attracting investors in a country like Malawi, given the information asymmetry surrounding the country risk profile and the risk-return profile of infrastructure assets. The Government can undertake a targeted outreach to potential investors—domestic, regional, and international with experience operating in the African market—by organizing visits and holding workshops to bring together the Government stakeholders, investors, and other market participants. This will facilitate cross-fertilization of ideas and help build an appreciation of both the needs and the opportunities within Malawi.
40. While the Government is encouraged to partner with the private sector, this approach is not without risks. These risks can stem from the imperfection of contracts in predicting all eventualities, or from when the Government ends up taking on additional risks from the exchange rate, demand fluctuations, or the event of bankruptcy of project companies. Moral hazard may also occur if private investors perceive the Government as unable to allow a PPP project to fail, forcing renegotiations of PPP contracts to obtain more favorable tariffs or to assume additional costs. All of the above problems may be compounded if policymakers are unduly optimistic in project selection and preparation, and if contract enforcement is weak.
41. The Government should address project procurement and implementation challenges. This would require a combination of the following measures: (a) PPDA increasing efforts to enforce procurement rules and MDAs ensuring they undertake advance planning of procurement activities; (b) increasing transparency of the procurement process, including publishing information on procurement activities, publishing the PPDA reports on MDAs’ compliance with procurement rules, ensuring the independence of procurement complaint reviews, and publishing their results; (c) training MDAs on procurement frameworks and regulations, including for the procurement of PPPs and IPPs; and (d) continuously monitoring project implementation and leveraging lessons to further improve procurement processes.
42. Implementing these reforms will require a champion or a champion institution to ensure alignment across the Government. In the case of PPPs, several foundational reforms – PPP and procurement laws and frameworks are in place and regulatory reforms have opened up the electricity generation market. The dedicated PPPC serves as the knowledge center on PPP project preparation, negotiation, and execution. The key is to ensure behavior change, alignment with the private sector
33 This should be done whether the projects are undertaken by SOEs or through PPPs and whether financed by the public or private sector.
33 « MALAWI ECONOMIC MONITOR DECEMBER 2020
participation agenda across MDAs and proper coordination, and a clear understanding of the benefits. The move by the Government to set up a cabinet committee on PPPs and private sector growth is a welcome move, which can help achieve these objectives.
2) Ensure SOEs are more efficient and creditworthy, thereby able to increase infrastructure investment and minimize their fiscal drain
SOEs should increase focus on operational improvements
43. All SOEs need to implement continuous improvement plans that identify inefficiencies and cost-saving opportunities that may not initially require substantial capital investments. These will help SOEs ‘build credibility’ with various stakeholders, including customers (by improving service delivery), the Government (by improving performance and reporting), and financial institutions (by strengthening financial performance and ability to service debt). While tariff increases will be needed and should be adjusted regularly, they are politically difficult to effect, given poverty levels and vulnerabilities of the population in Malawi and the poor quality of services currently delivered by SOEs. Tariff increases will need to be gradually phased in and tied to performance improvement.34 In addition, regulators are factoring efficiency improvements in tariff calculations. SOEs will have to identify and implement measures that could help increase internally generated revenue without sharp tariff increases and before regulatory reforms in the enabling environment are implemented.
44. Global experience shows that substantial improvement could be made with each incremental internal reform made by the management. This would include continuous improvement plans and actions such as the reduction of non-technical and or commercial losses in the supply and distribution of energy and water by reducing theft, fixing or replacing faulty meters, advancing prepaid metering programs, replacing some of the aging equipment with more efficient and technologically advanced instruments, investing in network rehabilitation and good management information systems for revenue protection, and by improving billing and collection (update consumer records and collection methods and ensure receivables are collected on time). Programs to improve customer service and transparency, including establishment of call centers would be critical.
45. Each SOE faces unique problems, but ESCOM, EGENCO, LWB, BWB, and NRWB could potentially achieve a substantial impact if they implement various internal reforms (Figure 37). The five SOEs
34 Where the Government implements a public policy objective through SOEs, associated financial support can be linked to improving specific performance targets.
Box 5: Considerations for Establishing a Project Preparation Facility (PPF)
Several governments around the world have set up PPFs to facilitate project development. Results are mixed and are dependent on the operating environment, including the strength of institutions and the focus of such support. For countries with weaknesses in their project selection frameworks and institutions, ensuring that the PPF provides comprehensive technical assistance to MDAs in the preparation from an early stage and structuring of transactions, to providing implementation support and monitoring would be key. To this end, PPFs can serve as centers of information on project performance and lessons learned, which can be disseminated to the Government and policy makers and investors and market participants to instill confidence on the risk-return profile of Malawian assets and MDAs for adjusting strategies based on lessons.
Ensuring the institutional setup works for the country and coordination with central planning and financing institutions is key. In Jamaica, a PPF was placed within the state-owned Development Bank of Jamaica (DBJ) which had technical skills gained during the privatization era). It became clear early on that the missing link was the early stage of project selection, with the mandate residing within the Ministry of Finance. Consequently, the DBJ had to ensure it coordinates and works closely with the Ministry of Finance to generate bankable projects. In Kenya, a World Bank-funded PPP program was housed within the PPP Unit. However, the unit is a department within the MoF, which works well as far as coordination is concerned. In other countries, PPFs have been set up as an independent donor-funded facility to support the government, working closely with the Ministry of Finance and other PIM institutions.
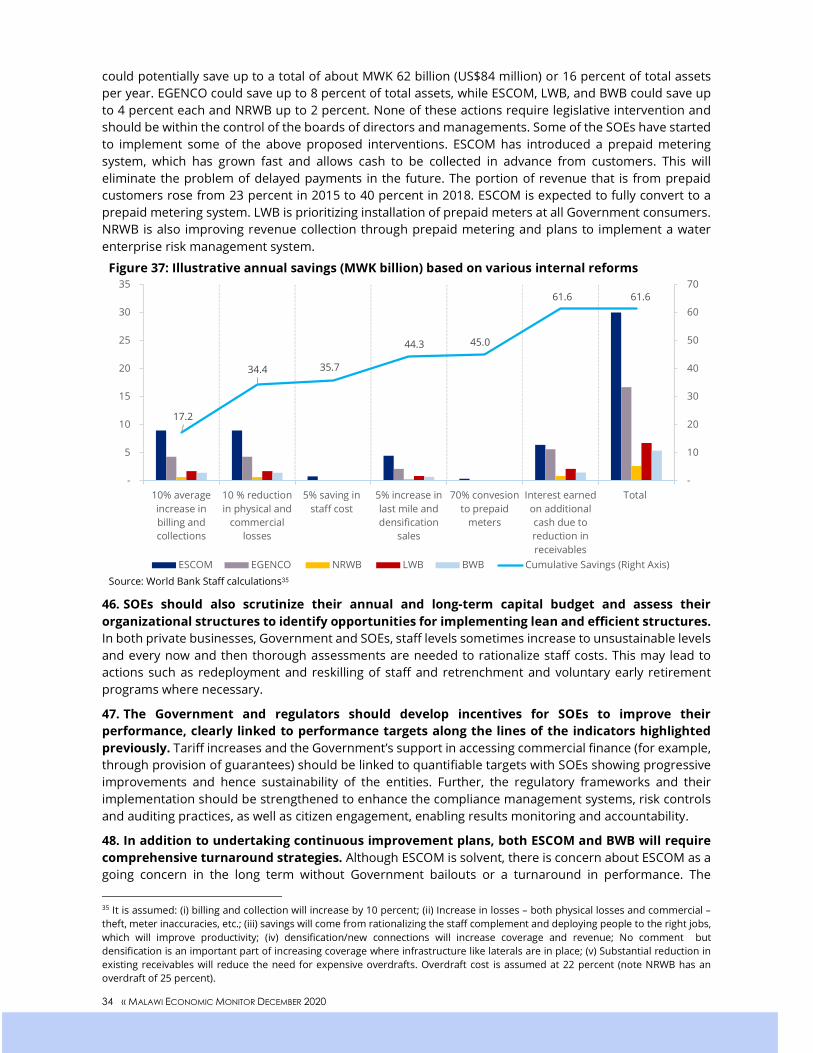
34 « MALAWI ECONOMIC MONITOR DECEMBER 2020
could potentially save up to a total of about MWK 62 billion (US$84 million) or 16 percent of total assets per year. EGENCO could save up to 8 percent of total assets, while ESCOM, LWB, and BWB could save up to 4 percent each and NRWB up to 2 percent. None of these actions require legislative intervention and should be within the control of the boards of directors and managements. Some of the SOEs have started to implement some of the above proposed interventions. ESCOM has introduced a prepaid metering system, which has grown fast and allows cash to be collected in advance from customers. This will eliminate the problem of delayed payments in the future. The portion of revenue that is from prepaid customers rose from 23 percent in 2015 to 40 percent in 2018. ESCOM is expected to fully convert to a prepaid metering system. LWB is prioritizing installation of prepaid meters at all Government consumers. NRWB is also improving revenue collection through prepaid metering and plans to implement a water enterprise risk management system.
46. SOEs should also scrutinize their annual and long-term capital budget and assess their organizational structures to identify opportunities for implementing lean and efficient structures. In both private businesses, Government and SOEs, staff levels sometimes increase to unsustainable levels and every now and then thorough assessments are needed to rationalize staff costs. This may lead to actions such as redeployment and reskilling of staff and retrenchment and voluntary early retirement programs where necessary.
47. The Government and regulators should develop incentives for SOEs to improve their performance, clearly linked to performance targets along the lines of the indicators highlighted previously. Tariff increases and the Government’s support in accessing commercial finance (for example, through provision of guarantees) should be linked to quantifiable targets with SOEs showing progressive improvements and hence sustainability of the entities. Further, the regulatory frameworks and their implementation should be strengthened to enhance the compliance management systems, risk controls and auditing practices, as well as citizen engagement, enabling results monitoring and accountability.
48. In addition to undertaking continuous improvement plans, both ESCOM and BWB will require comprehensive turnaround strategies. Although ESCOM is solvent, there is concern about ESCOM as a going concern in the long term without Government bailouts or a turnaround in performance. The
35 It is assumed: (i) billing and collection will increase by 10 percent; (ii) Increase in losses – both physical losses and commercial – theft, meter inaccuracies, etc.; (iii) savings will come from rationalizing the staff complement and deploying people to the right jobs, which will improve productivity; (iv) densification/new connections will increase coverage and revenue; No comment but densification is an important part of increasing coverage where infrastructure like laterals are in place; (v) Substantial reduction in existing receivables will reduce the need for expensive overdrafts. Overdraft cost is assumed at 22 percent (note NRWB has an overdraft of 25 percent).
Figure 37: Illustrative annual savings (MWK billion) based on various internal reforms
Source: World Bank Staff calculations35
17.2
34.4 35.7
44.3 45.0
61.6 61.6
-
10
20
30
40
50
60
70
-
5
10
15
20
25
30
35
10% averageincrease inbilling andcollections
10 % reductionin physical and
commerciallosses
5% saving instaff cost
5% increase inlast mile anddensification
sales
70% convesionto prepaid
meters
Interest earnedon additionalcash due toreduction inreceivables
Total
ESCOM EGENCO NRWB LWB BWB Cumulative Savings (Right Axis)
35 « MALAWI ECONOMIC MONITOR DECEMBER 2020
Government has recently set up a task force to develop a turnaround strategy for ESCOM that will ensure it is financially sustainable in the next 1-2 years. BWB will require a new source of water or a solution to reduce pumping costs. A cost-benefit analysis of different options should be carried out.
49. Effective implementation of these reforms will require improving the management capacity of SOEs. This can be achieved through a combination of bringing in new executive managements that are commercially oriented and in training and reskilling of both management and staff.
Exercise oversight of SOEs without interfering and incentivize them to increase operational efficiency 50. There is a need to reform the weak governance framework and organizational structures and arrangements that will guide the relationship between the Government and SOEs, minimize the potential for political interference, and improve credibility among private investors. Implementing a coordinated framework of incentives that integrates reform actions by the Government and a policy direction that will allow market forces to incentivize reforms within SOEs will be imperative. For example, the Government will need to commit to not interfering with the business of SOEs and allow the entities to focus on commercial mandates by putting in place arrangements that insulate SOEs from political interference, including appointing professional boards and providing them with autonomy to turn around the institutions. However, this needs to be combined with the Government’s commitment to allow market forces to exert outside pressure that will promote efficiency and accountability of SOEs by increasing the role of the private sector and citizen engagement.
51. Developing an SOE ownership policy that articulates the rationale for state ownership of commercial SOEs and clearly communicates its expectations should be a key reform by the Government. The policy should stipulate intended public policy for owning SOEs in different sectors and whether state ownership is the appropriate instrument to achieve the intended objectives. For existing ownership in SOEs, the Government should focus on improving their performance and assess whether they are meeting the intended public policy objectives. Where there is no clear cost-benefit and tested rationale for state ownership, the Government should determine an exit strategy. Where there is a rationale for continued state ownership, the Government should ensure that the ownership policy articulates outcomes that the Government expects from the SOEs and the oversight framework and process in accordance with best practice. The Government can further implement the following reforms, in line with its ownership policy. The implementation of the policy will require an effective implementation mechanism, which should include a legal and regulatory framework that articulates the institution where the ownership and oversight functions should reside and be coordinated, rather than the current framework where these functions are fragmented between the OPC, the MoEPD, MoF, and line ministries.
Enhance SOE board independence, professionalism, and accountability
52. The Government should change the way it currently interacts with SOEs (their boards and managements) and commit to distancing itself from day-to-day management of their operations. This will allow SOEs to focus on their commercial mandates. The starting point should be ensuring the SOE boards are independent and their members have the requisite skills. To address this, the Government should nominate a sufficient number of independent directors who are independent from executive managements, the government, and business relationships. It is noteworthy that the move toward having independent boards of directors will have to be gradual for it to be sustainable as it will involve a shift in approach and thinking on the part of the Government. They should have relevant commercial competencies and experience and should preferably be recruited from the private sector. This will help commercial SOEs become more business focused. The role of the board chair is also crucial as a key interface between the Government, the board, and the executive management and must therefore understand the business and be able to provide leadership to both the board and the management.
53. Government representation on boards is normal to keep an eye on performance and act as an early warning for the Government should unforeseen and unplanned challenges arise. The representatives (in case they are appointed from the public sector) can bring to the board an
36 « MALAWI ECONOMIC MONITOR DECEMBER 2020
understanding of the political environment in which the SOEs have to operate. However, such representation should not dominate the board. The Government representatives in the boards should also be nominated based on their qualifications. Some countries have stipulated in a legal framework the minimum formal qualification and skills that a person must have to be nominated for a position in the board. This would be a good example for Malawi to follow to minimize ambiguity. Overall, the Government should ensure that the practices as well as the responsibilities and liabilities of SOE boards are not different from those articulated in the national company law.
54. The function of the boards should comprise providing direction over the management of SOEs, including strategic planning, the appointment or dismissal of executives, and setting appropriate incentives for management. In the case of hiring the executive management, the boards of directors should have powers to recruit and hold them accountable. Members of the executive management should not be appointed by the Government (as is the practice currently) but should be competitively recruited by the board of directors. This can be done in consultation with the Government, either by allowing the state to have a veto power or by the candidate being vetted by the Government. However, the ultimate responsibility should lie with the board. Ensuring that the Government does not directly appoint CEOs will help with the recruitment of competent CEOs and minimize the risk of circumventing the role of SOE boards.
55. In light of the above, the board nomination process is key in Malawi. The ownership policy should define a rules-based process that is (preferably) close to practices used in the private sector. The Roads Fund Administration (RFA) provides some lessons that are worth considering for other boards. The board nomination process (clearly articulated in the Roads Funds Act) removes the conflict of interest by requiring professional bodies (a sort of committee), including the Bankers Association, and the Chamber of Commerce, nominate two to three members each, out of which the Government should select one. The law also prohibits an ex officio member from taking the chairmanship of the board.
56. A notable lesson from the RFA is the benefit of ensuring diversity of skills, qualifications and backgrounds within boards of directors, including members with private sector skills and robust understanding of how to efficiently run businesses. Board diversity improves the quality and objectivity of the decision-making process by bringing new voices to board discussions and decisions. It fosters innovation, creativity, and a better understanding of stakeholders’ needs, including of financiers. In the case of the RFA, it is the board of directors that identified and moved the RFA management to consider leveraging the capital markets and to use its stable revenue stream from the fuel levy as security. Decisions to explore opportunities for toll roads, commitment to balance revenues and expenditure (RFA is expected to operate on a balanced budget), and commitment to ensuring value for money in construction projects (in some cases having to cancel non-performing projects after conducting audits), provide the evidence of a well-governed and managed institution. The RFA holds a reputation in the market as a well-managed institution with a good governance structure and limited political interference, which enabled it to access capital markets without a credit guarantee from the Government.
57. The tenure of board members should be secured for a prescribed period to shelter boards from political processes or undue interference. The boards of directors should not be under a constant threat of removal from the board in the case of disagreements with the state. This would be similar to the interference in the day-to-day operations of the SOEs. It is important that the ownership policy provides guidance on this matter to minimize the risk of the tenure of boards being abruptly shortened without justifiable reasons (which should be stipulated in the ownership policy).
58. To encourage SOE boards to perform well, several tools can be used, such as a board charter, shareholder compact, a board remuneration scheme, and a board evaluation tool. An evaluation tool and process will help the Government to systematically (rather than in an ad hoc manner) identify board members who are not performing according to their professional responsibilities. For the board evaluation to be effective, there must be clarity about objectives and measurable performance indicators to form the basis for the evaluation. The focus should not be on managing day-to-day decisions of the boards and managements but to ensure SOEs develop strategic plans and annual business plans, which should contain the expectations of the shareholder, performance targets, and how they will be achieved,
37 « MALAWI ECONOMIC MONITOR DECEMBER 2020
including budgets and sources of funding. The Government should require approvals in different aspects, only in case of deviations from agreed plans. The Government should hold boards accountable for meeting agreed targets, and in turn the boards should hold managements accountable for implementing the business plan and achieving the set targets. Managements should have within the approved budget the right to recruit staff, terminate the employment of non-performers, establish compensation and incentive frameworks, and incur short-term debt. In addition, the board should not take over the responsibilities of executive managements and get involved in the day-to-day management and operations of SOEs.
59. To help SOEs better manage their cash flows and minimize expensive short-term borrowing to cover liquidity shortfalls, the Government should ensure that all Government-related outstanding debt and new bills for services rendered are settled within 30 days. Making these proposed changes would significantly improve the performance of SOEs and send a strong, positive message to private financiers, which would go a long way toward enabling SOEs to access market-based finance. It is noteworthy that the implementation framework of the policy is as important as the policy itself. The majority of the proposed recommendations will need to be stipulated in a legal framework for them to be effectively implemented. In this regard, it is recommended that a single new SOE law is enacted in line with the SOE ownership policy to be developed.
Ensure regular tariff adjustments, linked to performance improvements and matching inflation
60. The Government and regulators should ensure regular reviews and adjustment of tariffs, at least to match inflation. Lack of regularity or long delays in tariff increases can erode a utility’s financial health rapidly. However, automatic tariff adjustments can encourage inefficiencies; therefore, tariff increases should be tied to clear performance improvement targets. The National Water and Sewerage Corporation (NWSC) in Uganda offers some lessons. It was able to negotiate with its parent ministry an indexation of the tariff, which meant tariffs would increase automatically in line with inflation without having to apply for tariff increases or adjustments.
61. Tariff increases should be dependable and preferably formula driven and not subject to discretion. They should also reflect customers’ willingness to pay. In this regard, the presence of a strong and independent regulator can ensure fairness of tariffs and enforce technical standards. The energy sector already has a regulator (though continuous capacity building would be needed), but this is lacking in other sectors such as water and transport. The ongoing review of the National Water Policy proposes the establishment of an independent water sector regulator, by expanding the roles of the existing National Water Resources Authority.
Encourage responsible borrowing by SOEs
62. Responsible borrowing could help SOEs raise the needed finance and enforce financial discipline. Borrowing has an implicit Government guarantee and may put government finances at risk.36 Consequently, incentivizing responsible borrowing is paramount. Providing guarantees to enable financially distressed SOEs to acquire commercial debt increases the Government’s contingent liabilities and removes incentives for SOEs to improve their performance or expect bailouts in case of defaults. The Government will need to shift the incentives in the future to curb excessive borrowing and minimize moral hazard by: (a) implementing the recommended reforms to enable SOEs to improve their borrowing capacity; (b) enhancing the approach to SOE indebtedness control; and (c) adopting a different approach to issuance of guarantees.
63. Control of SOE indebtedness should shift from approvals of individual loans and bank overdrafts to a more strategic approach that considers the total liabilities of SOEs (including arrears). This will eliminate the micro-managing of SOE businesses and also ensure other sources of liabilities, other than loans from financial institutions, are monitored. In this regard, the Government will
36 Some countries explicitly remove implicit guarantees. For example, the government may introduce a requirement that SOEs can only borrow from the private sector if the contract specifically includes the provision that the government will not guarantee this debt, which would provide an incentive to the private investor and or lender to make prudent lending decisions.
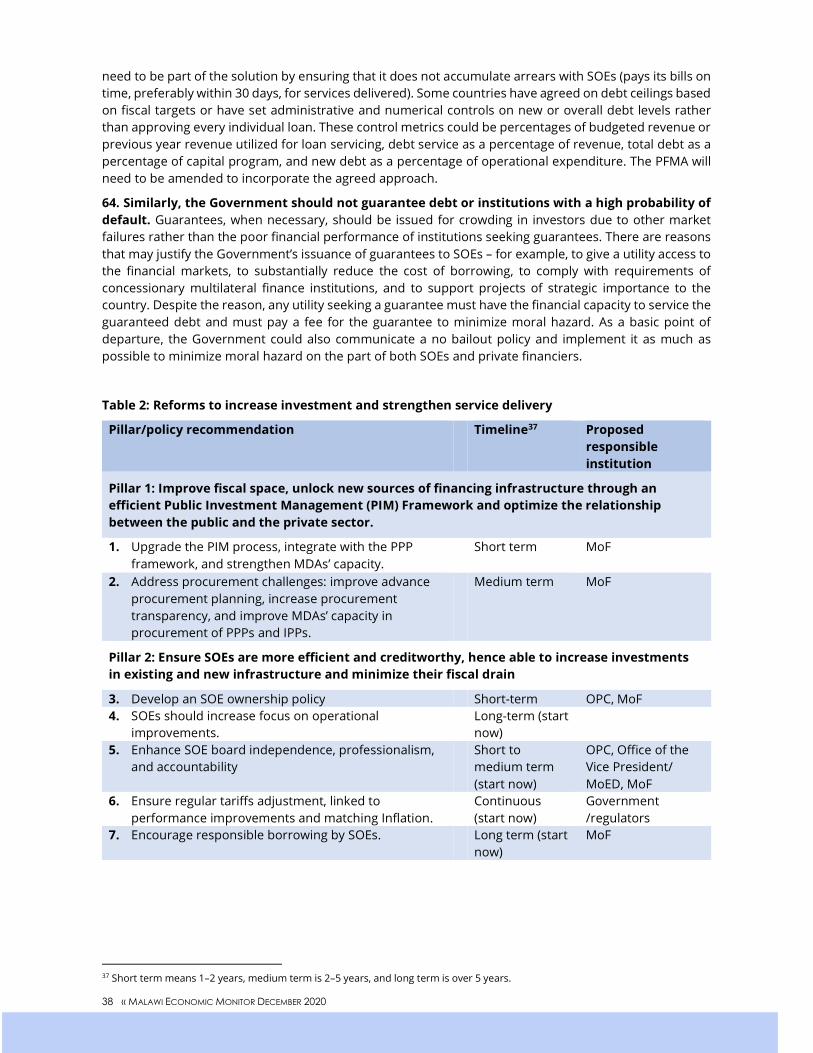
38 « MALAWI ECONOMIC MONITOR DECEMBER 2020
need to be part of the solution by ensuring that it does not accumulate arrears with SOEs (pays its bills on time, preferably within 30 days, for services delivered). Some countries have agreed on debt ceilings based on fiscal targets or have set administrative and numerical controls on new or overall debt levels rather than approving every individual loan. These control metrics could be percentages of budgeted revenue or previous year revenue utilized for loan servicing, debt service as a percentage of revenue, total debt as a percentage of capital program, and new debt as a percentage of operational expenditure. The PFMA will need to be amended to incorporate the agreed approach.
64. Similarly, the Government should not guarantee debt or institutions with a high probability of default. Guarantees, when necessary, should be issued for crowding in investors due to other market failures rather than the poor financial performance of institutions seeking guarantees. There are reasons that may justify the Government’s issuance of guarantees to SOEs – for example, to give a utility access to the financial markets, to substantially reduce the cost of borrowing, to comply with requirements of concessionary multilateral finance institutions, and to support projects of strategic importance to the country. Despite the reason, any utility seeking a guarantee must have the financial capacity to service the guaranteed debt and must pay a fee for the guarantee to minimize moral hazard. As a basic point of departure, the Government could also communicate a no bailout policy and implement it as much as possible to minimize moral hazard on the part of both SOEs and private financiers.
Table 2: Reforms to increase investment and strengthen service delivery
Pillar/policy recommendation Timeline37 Proposed responsible institution
Pillar 1: Improve fiscal space, unlock new sources of financing infrastructure through an efficient Public Investment Management (PIM) Framework and optimize the relationship between the public and the private sector.
1. Upgrade the PIM process, integrate with the PPP framework, and strengthen MDAs’ capacity.
Short term MoF
2. Address procurement challenges: improve advance procurement planning, increase procurement transparency, and improve MDAs’ capacity in procurement of PPPs and IPPs.
Medium term MoF
Pillar 2: Ensure SOEs are more efficient and creditworthy, hence able to increase investments in existing and new infrastructure and minimize their fiscal drain
3. Develop an SOE ownership policy Short-term OPC, MoF 4. SOEs should increase focus on operational
improvements. Long-term (start
now)
5. Enhance SOE board independence, professionalism, and accountability
Short to medium term (start now)
OPC, Office of the Vice President/ MoED, MoF
6. Ensure regular tariffs adjustment, linked to performance improvements and matching Inflation.
Continuous (start now)
Government /regulators
7. Encourage responsible borrowing by SOEs. Long term (start now)
MoF
37 Short term means 1–2 years, medium term is 2–5 years, and long term is over 5 years.
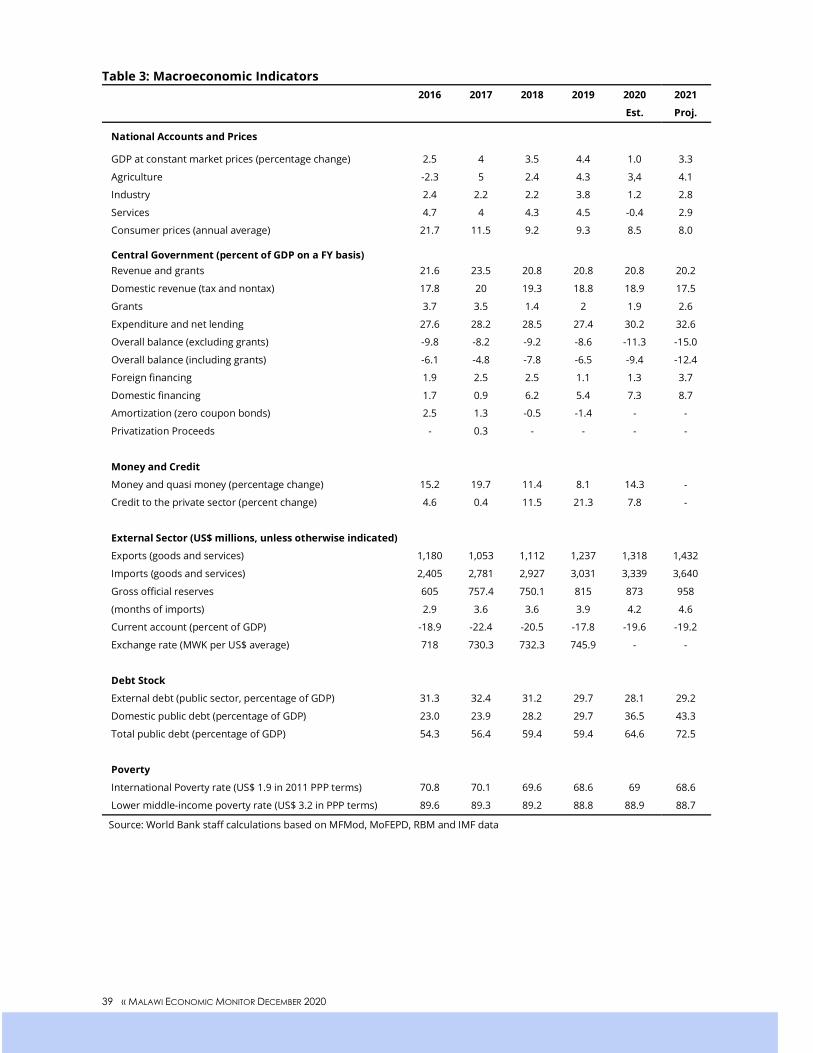
39 « MALAWI ECONOMIC MONITOR DECEMBER 2020
Table 3: Macroeconomic Indicators 2016 2017 2018 2019 2020 2021
Est. Proj.
National Accounts and Prices
GDP at constant market prices (percentage change) 2.5 4 3.5 4.4 1.0 3.3
Agriculture -2.3 5 2.4 4.3 3,4 4.1
Industry 2.4 2.2 2.2 3.8 1.2 2.8
Services 4.7 4 4.3 4.5 -0.4 2.9
Consumer prices (annual average) 21.7 11.5 9.2 9.3 8.5 8.0 Central Government (percent of GDP on a FY basis) Revenue and grants 21.6 23.5 20.8 20.8 20.8 20.2
Domestic revenue (tax and nontax) 17.8 20 19.3 18.8 18.9 17.5
Grants 3.7 3.5 1.4 2 1.9 2.6
Expenditure and net lending 27.6 28.2 28.5 27.4 30.2 32.6
Overall balance (excluding grants) -9.8 -8.2 -9.2 -8.6 -11.3 -15.0
Overall balance (including grants) -6.1 -4.8 -7.8 -6.5 -9.4 -12.4
Foreign financing 1.9 2.5 2.5 1.1 1.3 3.7
Domestic financing 1.7 0.9 6.2 5.4 7.3 8.7
Amortization (zero coupon bonds) 2.5 1.3 -0.5 -1.4 - -
Privatization Proceeds - 0.3 - - - -
Money and Credit
Money and quasi money (percentage change) 15.2 19.7 11.4 8.1 14.3 -
Credit to the private sector (percent change) 4.6 0.4 11.5 21.3 7.8 -
External Sector (US$ millions, unless otherwise indicated) Exports (goods and services) 1,180 1,053 1,112 1,237 1,318 1,432
Imports (goods and services) 2,405 2,781 2,927 3,031 3,339 3,640
Gross official reserves 605 757.4 750.1 815 873 958
(months of imports) 2.9 3.6 3.6 3.9 4.2 4.6
Current account (percent of GDP) -18.9 -22.4 -20.5 -17.8 -19.6 -19.2
Exchange rate (MWK per US$ average) 718 730.3 732.3 745.9 - -
Debt Stock
External debt (public sector, percentage of GDP) 31.3 32.4 31.2 29.7 28.1 29.2
Domestic public debt (percentage of GDP) 23.0 23.9 28.2 29.7 36.5 43.3
Total public debt (percentage of GDP) 54.3 56.4 59.4 59.4 64.6 72.5
Poverty International Poverty rate (US$ 1.9 in 2011 PPP terms) 70.8 70.1 69.6 68.6 69 68.6
Lower middle-income poverty rate (US$ 3.2 in PPP terms) 89.6 89.3 89.2 88.8 88.9 88.7
Source: World Bank staff calculations based on MFMod, MoFEPD, RBM and IMF data
40 « MALAWI ECONOMIC MONITOR DECEMBER 2020
References
Blantyre Water Board. 2018. Strategic Plan 2015–2020.
Chambers. 2019. Project Finance Practice Guide. Second edition.
City Climate Finance Leadership Alliance. 2018. Summary of Good Practice of Successful Project Preparation Facilities.
Electricity Supply Corporation of Malawi. 2018a. Investment Strategy July 2018 to June 2023.
Electricity Supply Corporation of Malawi. 2018b. Integrated Strategy Plan 2017–2018.
Electricity Supply Corporation of Malawi. 2018c. Malawi Electricity Sector Investment Plan 2018–2023.
Electricity Generation Company. 2018. Strategic Plan 2018 to 2033.
Electricity Generation Company. 2019. Integrated Annual Report.
Finmark Trust and Habitat for Humanity. 2009. Overview of the Housing Finance Sector in Malawi.
Gamula, Gregory E. T., Liu Hui, and Wuyuan Peng. 2013. An Overview of The Energy Sector in Malawi.
Global Credit Rating. 2016. ESCOM Credit Rating Report.
Government of Malawi. 1995. Waterworks Act, 1995.
Government of Malawi. 2003. Public Finance Management Act, 2003.
Government of Malawi. 2012. Malawi Water Sector Investment Plan, Volume 1. Water Partnership Program, World Bank Group, Washington, DC: World Bank. Available at: http://documents.worldbank.org/curated/en/800371468048863175/pdf/801430v10WP0P00Box0379800B00PUBLIC0.pdf
Government of Malawi. 2013. Water Resources Act, 2013.
Government of Malawi. 2014. Malawi Code: Sector Guidelines for Parastatal Organizations and State-owned Enterprises.
Government of Malawi. 2017a. Malawi Growth and Development Strategy (MGDS) III.
Government of Malawi. 2017b. Public Procurement and Disposal of Public Assets Act, 2017.
Government of Malawi. 2017c. The Public Service Reforms Commission: Implementation Completion Report.
Government of Malawi. 2017e. The Malawi Housing Corporation Amendment Act (No. 2).
Government of Malawi. 2018a. Malawi National Public Sector Reforms Policy, 2018–2022.
Government of Malawi. 2018b. National Energy Policy.
Government of Malawi. 2018c. Report of the Auditor General on the Selected Accounts of Statutory Boards.
Government of Malawi. National Statistical Office. October 2020. Press Release on Rebasing of GDP from 2010 to 2017.
Government of Malawi, Ministry of Health and Population. The prevalence of diarrhoea in Malawi in children 6-12 months. Lilongwe: Government of Malawi. Available at: https://www.health.gov.mw/index.php/diarrhoel-diseases
Hikuepi Katjiuongua, Holger Kray and Time Fatch. 2019. Carrots and Sticks for Farmers in Malawi: Measuring Distortions to Agricultural Incentives and Implications for Policy Options. World Bank, Agriculture Global Practice, Washington, DC.
IMF. 2018a. Malawi: Technical Assistance Report - Public Investment Management Assessment.
IMF. 2018b. Malawi Selected Issues.
IMF. 2018c. Malawi: Technical Assistance Report - Public Investment Management Assessment. Washington, DC
41 « MALAWI ECONOMIC MONITOR DECEMBER 2020
IMF. 2018d. Malawi: First Review under the Three-Year Extended Credit Facility Arrangement and Requests for Modification and Waivers of Nonobservance of Performance Criteria - Press Release; Staff Report; and Statement by the Executive Director for Malawi.
IMF. 2019. Investment and Capital Stock Dataset, 1960-2017.
IMF. October 2020. World Economic Outlook.
Kojima, M., X. Zhou, J. Jeesun Han, J. de Wit, R. Bacon, and C. Trimble. 2016. Who Uses Electricity in Sub Saharan Africa? Findings from Household Surveys. Policy Research Working Paper 7789.
Lilongwe Water Board. 2015. Infrastructure Investment Plan Implementation, 2016–2026.
Malawi Confederation of Chambers of Commerce and Industry. 2020. Industry Survey.
Malawi Electricity Regulatory Agency. 2015. Regulating Energy for Sustainable Development: The New Tariff Methodology.
Malawi Electricity Regulatory Agency. 2018a. Board Revised Revenue Requirements Version 3.2.
Malawi Electricity Regulatory Agency. 2018b. Board Resolution on ESCOM Base Tariff Application for 2018–2022.
Malawi Housing Corporation. 2018. Strategy Plan 2018 to 2023.
Malawi Vulnerability Assessment Committee. 2020. Food Security Forecast Bulletin. Lilongwe, Malawi.
Mercer. 2018. Investment in African Infrastructure: Challenges and Opportunities.
Ministry of Agriculture, Irrigation and Water Development (MoAIWD). 2012. Malawi Water Sector Investment Plan Volume I.
Ministry of Agriculture. 2020. Agricultural Production Estimates Survey.
Ministry of Energy. 2016. Malawi Integrated Resource Plan.
Ministry of Energy. 2018. Malawi National Electrification Strategy Report Gap Analysis Report.
National Hydropower Association. 2018. Information brochures.
National Statistics Office. 2015. Statistical Yearbook.
Netgroup. 2010. ESCOM Financial Sustainability Plan.
Northern Region Water Board. 2018. Revised Strategic Plan, 2015-2020.
Organization for Economic Co-operation and Development (OECD). 2018. Global Outlook on Financing for Sustainable Development. Paris, France
OECD, "Main Economic Indicators - complete database", Main Economic Indicators (database), http://dx.doi.org/10.1787/data-00052-en. retrieved from FRED, Federal Reserve Bank of St. Louis. (Accessed on December 10, 2020).
Overseas Development Institute. 2016a. Project Preparation for Sustainable Infrastructure.
Overseas Development Institute. 2016b. Finding the Pipeline: Project Preparation for Sustainable Infrastructure.
Overseas Development Institute. 2018. Private Infrastructure Financing in Developing Countries: Five Challenges, Five Solutions.
Parliament of the Republic of South Africa. 2015. Report on State-Owned Enterprises for the Standing Committee on Finance.
Preqin. 2016. Preqin Special Report: The Infrastructure Market in Africa.
Reserve Bank of Malawi (RBM). 2020. Financial and Economic Review. Volume 54, Number 3.
42 « MALAWI ECONOMIC MONITOR DECEMBER 2020
Sadoff, C. W., J. W. Hall, D. Grey, J. C. J. H. Aerts, M. Ait-Kadi, C. Brown, A. Cox, S. Dadson, D. Garrick, J. Kelman, P. McCornick, C. Ringler, M. Rosegrant, D. Whittington, and D. Wiberg. 2015. Securing Water, Sustaining Growth: Report of the GWP UNICEF.
Scottish Government Climate Justice Fund. 2018. The Water Future Program.
Shelter Afrique. 2018. Annual Report.
The Boston Consulting Group. 2017. Infrastructure Financing in Sub-Saharan Africa: Best Practices from Ten Years in the Field.
The Infrastructure Consortium for Africa. 2012. Assessment of Project Preparation Facilities in Africa. Volume A: Diagnostic & Recommendations.
The Infrastructure Consortium for Africa. 2014. Effective Project Preparation for Africa’s Infrastructure Development.
United Nations Children’s Fund. 2019. Malawi 2018/19 WASH Budget Brief.
United States Agency for International Development. 2018. Investment Opportunities in African Infrastructure: Challenges and Opportunities.
UNICEF. 2018. WASH Budget Brief. 2018/19. Investing in Water and Sanitation for all Malawians toward Attainment of SDG 6. New York https://www.unicef.org/esa/sites/unicef.org.esa/files/2019-04/UNICEF-Malawi-2018-WASH-Budget-Brief.pdf.
Van den Berg, Caroline, and Alexander Danilenko. 2011. The IBNET water supply and sanitation performance blue book: the international benchmarking network for water and sanitation utilities databook. Washington, D.C.: World Bank.
World Food Program (WFP). 2020a. Mobile Vulnerability Analysis and Mapping (mVAM) on the Effects of COVID-19 in Malawi – Round 4. Malawi Household Food Security Bulletin.
World Food Program (WFP). 2020b. Minimum Expenditure Basket in Malawi. Round 15: 2-6.
World Bank. 1995. Improving State Enterprises Performance: The Role of Internal and External Incentives.
World Bank. 2010. Malawi’s Infrastructure: A Continental Perspective.
World Bank. 2012. Economic Impacts of Poor Sanitation in Africa.
World Bank. 2013. Financing for Development Post 2015, Washington, DC: World Bank. http://documents.worldbank.org/curated/en/206701468158366611/pdf/828000WP0Finan0Box0379879B00PUBLIC0.pdf
World Bank. 2014a. Corporate Governance of State-Owned Enterprises: A Toolkit.
World Bank. 2014b. Doing More with Less: Smarter Subsidies for Water Supply and Sanitation.
World Bank. 2014c. Public Investment Management for Public-Private Partnerships: A “PIM-for-PPP” Diagnostic Framework.
World Bank. 2014d. Resource Financed Infrastructure: Discussion on a New Form of Infrastructure Finance.
World Bank. 2015. World Bank Group Support to Public-Private Partnerships: Lessons from Experience in Client Countries (FY02–12).
World Bank. 2017a. Benchmarking PPP Procurement 2017 in Malawi.
World Bank. 2017b. Introducing Commercial Finance into the Water Sector in Developing Countries.
World Bank. 2017c. Lilongwe Water and Sanitation Project: Project Appraisal Document.
World Bank. 2017d. “Recovery and Financial Viability of the Power Sector in Developing Countries.” Policy Research Paper.
43 « MALAWI ECONOMIC MONITOR DECEMBER 2020
World Bank. 2018a. “World Bank Group Support for the Reform of State-Owned Enterprises.” Approach Paper.
World Bank. 2018b. Infrastructure Sector Assessment Program, Indonesia.
World Bank. 2018c. Malawi Systematic Country Diagnostic: Breaking the Cycle of Low Growth and Slow Poverty Reduction.
World Bank. 2018d. Private Participation in Infrastructure (PPI) 2018 Annual Report.
World Bank. 2018e. Rwanda Investor Perceptions Survey 2018.
World Bank. 2018f. Vietnam: Maximizing Finance for Development in the Energy Sector.
World Bank. 2019a. Doing Business 2020.
World Bank. 2019b. Malawi Economic Monitor: Charting a New Economic Course.
World Bank. 2019c. Malawi Electricity Access Project: Project Appraisal Document.
World Bank. 2019d. Malawi Economic Monitor: Strengthening Human Capital Through Nutrition.
World Bank. 2019e. Malawi Poverty Outlook.
World Bank. 2019f. Private Participation in Infrastructure (PPI) 2019 Annual Report.
World Bank. 2019g. Mobilizing Long-Term Finance for Infrastructure in Malawi. Washington, DC: World Bank.
World Bank. 2020. Global Economic Prospects, June 2020. Washington, DC: World Bank. DOI: 10.1596/978-1-4648-1553-9. License: Creative Commons Attribution CC BY 3.0 IGO.
WSP (Water and Sanitation Program). 2012. “Economic Impacts of Poor Sanitation in Africa.” Water and Sanitation Program. The World Bank.
Zuka, S. P. (2018). Effects of Rent-Controlled Public Housing on the Supply of Private Rented Housing and Household Mobility in Malawi: A Case Study of Malawi Housing Corporation. American Journal of Theoretical and Applied Business, 4(1), 1-7.