Antolín et al. (2015). What is a litre of sediment? Testing volume measurement techniques for wet...
9
What is a litre of sediment? Testing volume measurement techniques for wet sediment and their implications in archaeobotanical analyses at the Late Neolithic lake-dwelling site of Parkhaus Op era (Zürich, Switzerland) Ferran Antolín a, * , Bigna L. Steiner a , Werner Vach b , Stefanie Jacomet a a Integrative Prehistory and Archaeological Science (IPAS), Dept. of Environmental Sciences, University of Basel, Switzerland b Clinical Epidemiology, Center for Medical Biometry and Medical Informatics, Medical Center - University of Freiburg, Germany article info Article history: Received 6 March 2015 Received in revised form 23 April 2015 Accepted 24 April 2015 Available online 11 May 2015 Keywords: Archaeobotany Plant macroremains Methodology Test GIS Waterlogged preservation abstract Volume measurements in archaeobotany are not performed uniformly. The goal of this paper therefore is to test the different known methods and to define the obtained differences, in order to make the density values (remains per litre of sediment) for plant macroremains in the samples comparable between sites. Three methods of volume measurement were tested for a large number of samples of different sizes coming from two late Neolithic layers of the lakeshore site of Parkhaus Op era (Zürich, Switzerland). The sampled layers were preserved in waterlogged conditions and there were samples rich in sand, loam, lake marl but mostly consisting of organic remains, including uncharred subfossil plant macroremains. In general, the classical volume (that is the upper limit of the sediment in water) measured before and after freezing as pre-treatment gave similar results. But a systematic difference was found between the classical volume measured after freezing and the displacement volume. This difference could be described by a proportionality factor of 1.5. This proportionality factor could be used to make data ob- tained with different methods of volume measurement comparable, although more evaluations are needed from other sites in order to test the generality of the factor proposed. © 2015 Elsevier Ltd. All rights reserved. 1. Introduction The measurement of the amount of sediment sampled and processed for the retrieval of archaeological remains (including archaeobotanical or archaeozoological remains, among others) is considered essential, especially for taphonomic evaluations (e.g. Jacomet et al., 1989; van der Veen and Jones, 2006), mainly con- cerning the rate of deposition, but also for spatial palaeoeconomic interpretations (e.g. Alonso et al., 2008; Maier and Harwath, 2011), in order to identify activity areas. The reason for this is that samples from excavations always have different volumes. For making the values of macroremains out of the samples comparable we have to calculate densities of macroremains per a given volume (usually 1 L). Therefore, the method for measuring the volume of the sedi- ments is crucial for the density value. Other standardization methods could be the use of proportions, which do not have such a strong dependence on the volume of the sample (see Jones, 1991). Both methods are in fact compatible and necessary for a better understanding of archaeobotanical assemblages. Several measurement techniques are cited in the reference literature (Pearsall, 1989; Jacomet, Kreuz et al.,1999; Wright, 2005), mainly oriented to the recording of either sediment volume or weight. The difficulties of using one or another method were already pointed out in previous work (Jacomet, 1980). In general, the measurement of the volume is preferred: Pearsall recom- mended the use of calibrated buckets to measure the volume of the sediment (Pearsall, 2000: 35); Wright (2005) listed several in- consistencies derived from the recording of the weight, like the fact that results might vary due to differences in moisture content. The presence or absence of stones might be a problem as well. Jacomet and Kreuz (1999) also put a larger emphasis on the different pos- sibilities of measuring volume, rather than weight. These are the main three methods of volume measurement mentioned by the authors (1999: 114e115): * Corresponding author. E-mail address: [email protected] (F. Antolín). Contents lists available at ScienceDirect Journal of Archaeological Science journal homepage: http://www.elsevier.com/locate/jas http://dx.doi.org/10.1016/j.jas.2015.04.019 0305-4403/© 2015 Elsevier Ltd. All rights reserved. Journal of Archaeological Science 61 (2015) 36e44
Transcript of Antolín et al. (2015). What is a litre of sediment? Testing volume measurement techniques for wet...
lable at ScienceDirect
Journal of Archaeological Science 61 (2015) 36e44
Contents lists avai
Journal of Archaeological Science
journal homepage: http: / /www.elsevier .com/locate/ jas
What is a litre of sediment? Testing volume measurement techniquesfor wet sediment and their implications in archaeobotanical analysesat the Late Neolithic lake-dwelling site of Parkhaus Op�era (Zürich,Switzerland)
Ferran Antolín a, *, Bigna L. Steiner a, Werner Vach b, Stefanie Jacomet a
a Integrative Prehistory and Archaeological Science (IPAS), Dept. of Environmental Sciences, University of Basel, Switzerlandb Clinical Epidemiology, Center for Medical Biometry and Medical Informatics, Medical Center - University of Freiburg, Germany
a r t i c l e i n f o
Article history:Received 6 March 2015Received in revised form23 April 2015Accepted 24 April 2015Available online 11 May 2015
Keywords:ArchaeobotanyPlant macroremainsMethodologyTestGISWaterlogged preservation
* Corresponding author.E-mail address: [email protected] (F. Antol
http://dx.doi.org/10.1016/j.jas.2015.04.0190305-4403/© 2015 Elsevier Ltd. All rights reserved.
a b s t r a c t
Volume measurements in archaeobotany are not performed uniformly. The goal of this paper therefore isto test the different known methods and to define the obtained differences, in order to make the densityvalues (remains per litre of sediment) for plant macroremains in the samples comparable between sites.Three methods of volume measurement were tested for a large number of samples of different sizescoming from two late Neolithic layers of the lakeshore site of Parkhaus Op�era (Zürich, Switzerland). Thesampled layers were preserved in waterlogged conditions and there were samples rich in sand, loam,lake marl but mostly consisting of organic remains, including uncharred subfossil plant macroremains. Ingeneral, the classical volume (that is the upper limit of the sediment in water) measured before and afterfreezing as pre-treatment gave similar results. But a systematic difference was found between theclassical volume measured after freezing and the displacement volume. This difference could bedescribed by a proportionality factor of 1.5. This proportionality factor could be used to make data ob-tained with different methods of volume measurement comparable, although more evaluations areneeded from other sites in order to test the generality of the factor proposed.
© 2015 Elsevier Ltd. All rights reserved.
1. Introduction
The measurement of the amount of sediment sampled andprocessed for the retrieval of archaeological remains (includingarchaeobotanical or archaeozoological remains, among others) isconsidered essential, especially for taphonomic evaluations (e.g.Jacomet et al., 1989; van der Veen and Jones, 2006), mainly con-cerning the rate of deposition, but also for spatial palaeoeconomicinterpretations (e.g. Alonso et al., 2008; Maier and Harwath, 2011),in order to identify activity areas. The reason for this is that samplesfrom excavations always have different volumes. For making thevalues of macroremains out of the samples comparable we have tocalculate densities of macroremains per a given volume (usually1 L). Therefore, the method for measuring the volume of the sedi-ments is crucial for the density value. Other standardization
ín).
methods could be the use of proportions, which do not have such astrong dependence on the volume of the sample (see Jones, 1991).Both methods are in fact compatible and necessary for a betterunderstanding of archaeobotanical assemblages.
Several measurement techniques are cited in the referenceliterature (Pearsall, 1989; Jacomet, Kreuz et al., 1999;Wright, 2005),mainly oriented to the recording of either sediment volume orweight. The difficulties of using one or another method werealready pointed out in previous work (Jacomet, 1980). In general,the measurement of the volume is preferred: Pearsall recom-mended the use of calibrated buckets to measure the volume of thesediment (Pearsall, 2000: 35); Wright (2005) listed several in-consistencies derived from the recording of the weight, like the factthat results might vary due to differences in moisture content. Thepresence or absence of stones might be a problem as well. Jacometand Kreuz (1999) also put a larger emphasis on the different pos-sibilities of measuring volume, rather than weight. These are themain three methods of volume measurement mentioned by theauthors (1999: 114e115):
F. Antolín et al. / Journal of Archaeological Science 61 (2015) 36e44 37
- Noting the upper limit of the sediment in a bucket with dry orslightly wet (soaked when waterlogged) sediment (so calledclassical volume), optimal for loose sediments;
- by calculating the dimensions (length, width and height) of thesample (when very compact square-shaped samples are to beanalysed);
- by calculating the displacement volume, which is reported togive the most accurate results (following the Archimedes'Principle).
There is a logical inconvenience in the measurement of theclassical volume. One cannot control the empty spaces that areencountered in between the components of the sample: the largerthe components, the more possibilities of increasing the error inthemeasurement (Wright, 2005). But the displacement volume canbe problematic too, since it should be measured when the sampleshave a similar degree of density and humidity for it to be compa-rable. Sediment density might be affected by factors like sedimentpressure, which differ between sites. On the other hand, the mea-surement of the displacement volume has a better repeatability(several individuals would read the same volume). This is not clearfor the classical volume, especially with waterlogged and organic-rich sediments, when the sediment volume is measured in waterand the operators need to use their hand (pressing down all floatingmaterial) to measure the upper limit of the sediment.
Sediment samples from wetland deposits have been measured,in their vast majority, by using calibrated buckets or jars. Volumesare usually expressed in litres or millilitres. Weight and classicalvolume (after letting the sediment settle down in water duringhours) were recorded in the analyses of sites from the Lake Zürich(Jacomet, 1985; Jacomet et al., 1989). Nevertheless, when coresampling has been applied, like in the case of Hornstaad H€ornle,some authors have preferred to calculate the dimensions of thesample using an arithmetic formula (p$r2$L) and the results areconsequently expressed in cubic centimetres (Maier, 2001: 21).Given that 1 cm3 is equivalent to 1 ml, the data should be easilycomparable with other sites. In more recent work, like the Tor-wiesen II project, the displacement volume (also in cm3) wasmeasured instead (Herbig, 2009; Maier and Herbig, 2011). In fact,weight and displacement volume were recorded for all samples(Maier and Herbig, 2011: 83) but unfortunately never compared.
But are all these methods comparable? Do they show a linearrelationship? Are there methods which suffer from a poor repeat-ability? These questions have not been systematically addressed inwetland sites, and for this reason a critical evaluation is needed. Theonly references to previous similar tests known to us are thoseperformed by Wright and Lopinot (Wright, 2005 and referencestherein) in dry sites located in North America, where the authorscompared the measurement of blocks of sediment (length, widthand depth) to the later measurement of the volume using a cali-brated bucket. The first method could produce similar results to thedisplacement volume, while the second should be considered asthe classical volume. Wright concluded that very loose sandy sed-iments yielded a volume around 40% higher when using the clas-sical volume, mainly due to the difficulties of measuring thesediment blocks in the field, while more compact sediments pro-duced similar volumes with both techniques or a slightly largerclassical volume in clayey sediments (25% in average). For this pa-per, the classical volume and the displacement volume of water-logged sediments from the lake-dwelling site of Parkhaus Op�era(Zürich, Switzerland) will be compared. At the same time, it is alsoour aim to calculate a proportionality factor allowing the trans-lation of results between different methods. Finally, the influencethat different techniques might have on the final concentrationvalues of the archaeobotanical data will be evaluated.
2. Methods used at Parkhaus Op�era (Zürich, Switzerland)
Excavations conducted in the car park of the Opera House ofZürich during 2010 uncovered several settlement phases of a largeNeolithic lake-dwelling site. This paper is focused on the data ob-tained from the samples taken in layers 13 and 14, dendrodated tothe years around 3160 BC and 3090 BC respectively (middle HorgenCulture; Bleicher and Harb, 2015). The cultural layer consists oforganic debris, as well as loam heaps (presumably from hearths)and other mineral components (including sand or lake marl, pre-sumably due to water influence). The archaeological layers underanalysis suffered heavy sediment pressure by 4 m of moderninfilling (maybe up to 10 tons/m2, Bleicher, pers.com.). Three vol-ume measurements were recorded at the site: the classical volumebefore (1) and after (2) freezing the samples as pre-treatment forfacilitating the sieving (Vandorpe and Jacomet, 2007), and thedisplacement volume (3). Two types of samples were measured,the so-called A- and B-Samples. B-Samples are random subsamplesof c. 500 ml (classical volume) taken (using the grid method) fromthe total content of A-Samples. A-Samples are usually of4000e8000 ml (classical volume). A-Samples were sieved withsieves of 8 and 2 mm mesh size, for obtaining a representativereflection of large seeded items, while B-Samples were sieved with2 and 0.35 mm meshes, with the goal of recovering here a repre-sentative amount of small seeded taxa). All fractions from the A-samples obtained after sieving were measured using the classicaland the displacement volume. The majority of B-samples were notyet sieved when performing this evaluation and data on the vol-umes of the fractions are therefore not included in this paper. Themeasurements of the displacement volume and the classical vol-ume before freezing were always carried out by the same person.The classical volume after freezing was measured by four differentoperators and only for A-samples.
For the evaluation of the concentration of remains per litre ofsediment, which was calculated with ArboDat (©Kreuz and Sch€afer2013), only A-samples from layer 13 were taken into consideration,since a much larger number of samples were available (N ¼ 202).The spatial representation of the data was carried out with ArcGIS(ESRI, 2010).
The composition of the samples was semi-quantified beforesieving and values from 0 to 3were given to indicate the abundanceof several components in the samples. Thepresence of clay, sand andlake marl will be used to assess the effect of different sedimentcomponents on the outcomeof the different volumemeasurements.
Scatterplots and BlandeAltman-plots were used to investigatethe relation between different measurement procedures. Linearityof the relationship was assessed by adding a quadratic term to aregression model. Proportionality factors between two measure-ment procedures were determined by looking at the differencebetween the mean logarithmic values and exponentiating thisnumber. Multiple Linear regression analysis was used to assess theinfluence of covariates on the difference between measurementmethods (using the logarithmic values, except for the differencebetween the two classical volumes). The covariates consideredsimultaneouslywere the ordinally scaled presence of clay, lakemarl,sand (as continuous covariates), the layer and the sievers. Stata(StataCorp, 2013) was used for the statistical evaluation of the data.The BlandeAltman-Plot was particularly designed to assess thedegree of agreement between two methods of volume measure-mentwhich are not unequivocally correct (Bland andAltman,1986).
3. Results
As already stated, three measurements were taken for A-sam-ples (displacement and classical before and after freezing) and 2 for
F. Antolín et al. / Journal of Archaeological Science 61 (2015) 36e4438
B-samples (displacement and classical before freezing). We decidedto analyse A- and B-samples separately because the amount ofsediment is very different (A-samples are usually about 6e10 timeslarger than B-samples) and this could influence the results. Thedisplacement and classical volume of the sieving fractions obtainedafter sieving A-samples were also measured and compared.
3.1. A-samples: sediment measures before sieving
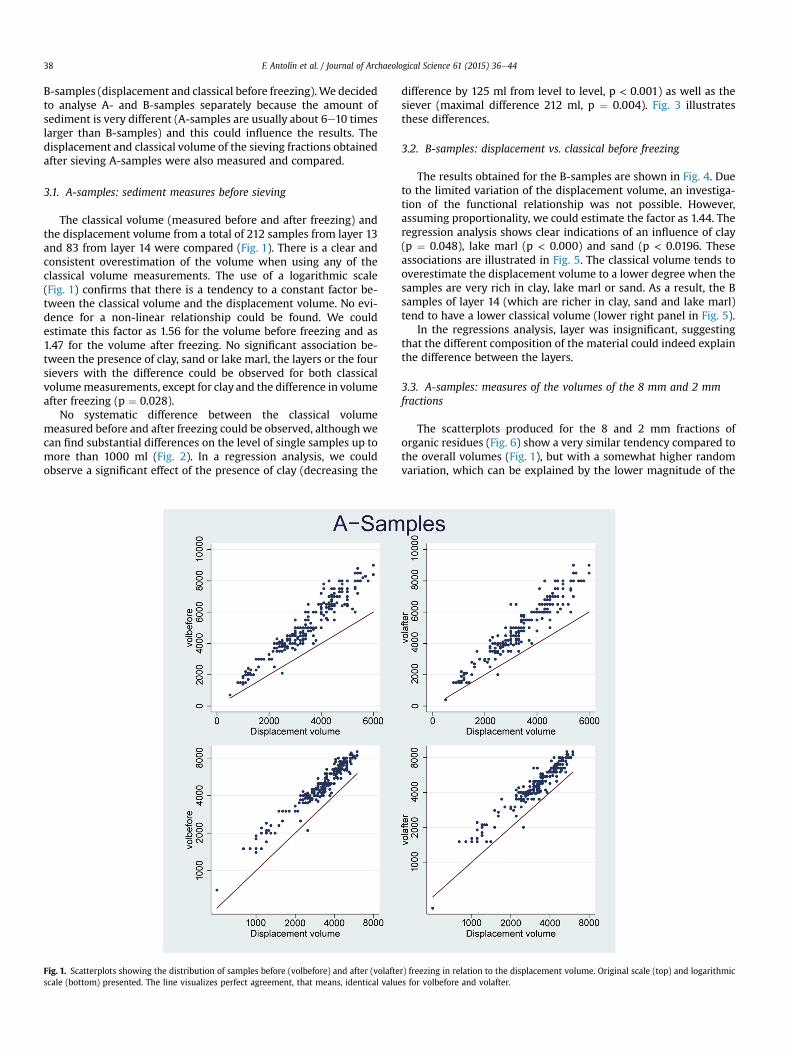
The classical volume (measured before and after freezing) andthe displacement volume from a total of 212 samples from layer 13and 83 from layer 14 were compared (Fig. 1). There is a clear andconsistent overestimation of the volume when using any of theclassical volume measurements. The use of a logarithmic scale(Fig. 1) confirms that there is a tendency to a constant factor be-tween the classical volume and the displacement volume. No evi-dence for a non-linear relationship could be found. We couldestimate this factor as 1.56 for the volume before freezing and as1.47 for the volume after freezing. No significant association be-tween the presence of clay, sand or lake marl, the layers or the foursievers with the difference could be observed for both classicalvolumemeasurements, except for clay and the difference in volumeafter freezing (p ¼ 0.028).
No systematic difference between the classical volumemeasured before and after freezing could be observed, although wecan find substantial differences on the level of single samples up tomore than 1000 ml (Fig. 2). In a regression analysis, we couldobserve a significant effect of the presence of clay (decreasing the
Fig. 1. Scatterplots showing the distribution of samples before (volbefore) and after (volaftescale (bottom) presented. The line visualizes perfect agreement, that means, identical valu
difference by 125 ml from level to level, p < 0.001) as well as thesiever (maximal difference 212 ml, p ¼ 0.004). Fig. 3 illustratesthese differences.
3.2. B-samples: displacement vs. classical before freezing
The results obtained for the B-samples are shown in Fig. 4. Dueto the limited variation of the displacement volume, an investiga-tion of the functional relationship was not possible. However,assuming proportionality, we could estimate the factor as 1.44. Theregression analysis shows clear indications of an influence of clay(p ¼ 0.048), lake marl (p < 0.000) and sand (p < 0.0196. Theseassociations are illustrated in Fig. 5. The classical volume tends tooverestimate the displacement volume to a lower degree when thesamples are very rich in clay, lake marl or sand. As a result, the Bsamples of layer 14 (which are richer in clay, sand and lake marl)tend to have a lower classical volume (lower right panel in Fig. 5).
In the regressions analysis, layer was insignificant, suggestingthat the different composition of the material could indeed explainthe difference between the layers.
3.3. A-samples: measures of the volumes of the 8 mm and 2 mmfractions
The scatterplots produced for the 8 and 2 mm fractions oforganic residues (Fig. 6) show a very similar tendency compared tothe overall volumes (Fig. 1), but with a somewhat higher randomvariation, which can be explained by the lower magnitude of the
r) freezing in relation to the displacement volume. Original scale (top) and logarithmices for volbefore and volafter.
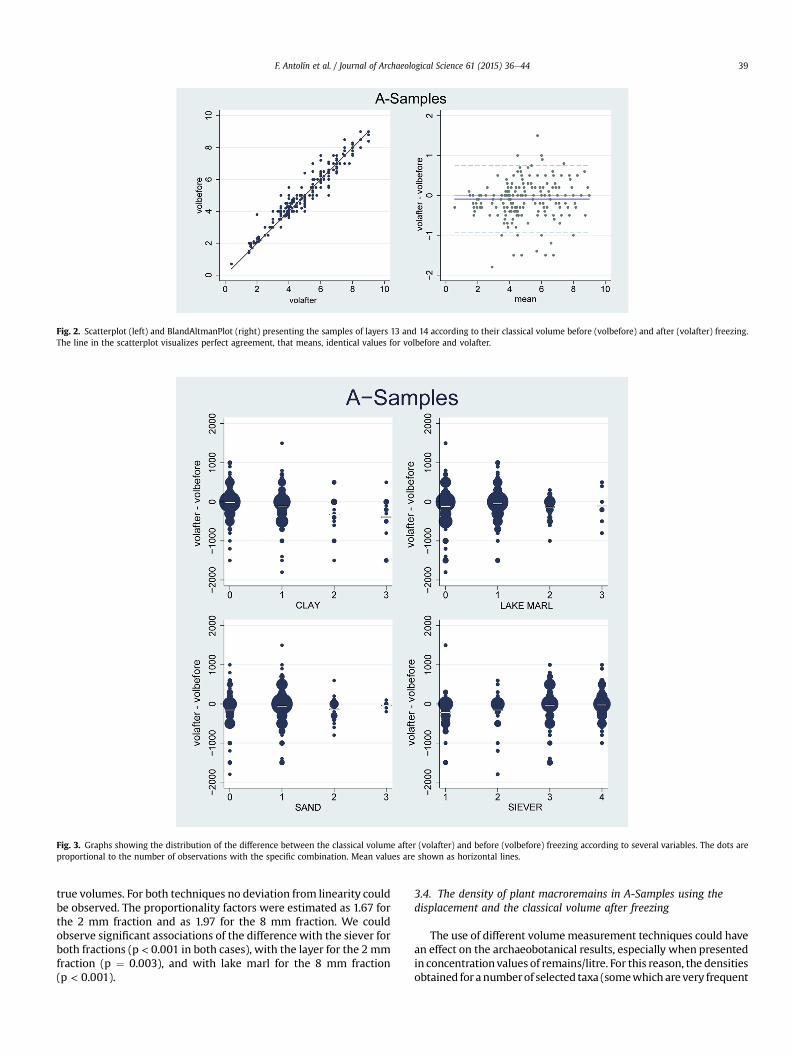
Fig. 2. Scatterplot (left) and BlandAltmanPlot (right) presenting the samples of layers 13 and 14 according to their classical volume before (volbefore) and after (volafter) freezing.The line in the scatterplot visualizes perfect agreement, that means, identical values for volbefore and volafter.
Fig. 3. Graphs showing the distribution of the difference between the classical volume after (volafter) and before (volbefore) freezing according to several variables. The dots areproportional to the number of observations with the specific combination. Mean values are shown as horizontal lines.
F. Antolín et al. / Journal of Archaeological Science 61 (2015) 36e44 39
true volumes. For both techniques no deviation from linearity couldbe observed. The proportionality factors were estimated as 1.67 forthe 2 mm fraction and as 1.97 for the 8 mm fraction. We couldobserve significant associations of the difference with the siever forboth fractions (p < 0.001 in both cases), with the layer for the 2 mmfraction (p ¼ 0.003), and with lake marl for the 8 mm fraction(p < 0.001).
3.4. The density of plant macroremains in A-Samples using thedisplacement and the classical volume after freezing
The use of different volumemeasurement techniques could havean effect on the archaeobotanical results, especially when presentedin concentration values of remains/litre. For this reason, the densitiesobtained for anumberof selected taxa (somewhich are very frequent
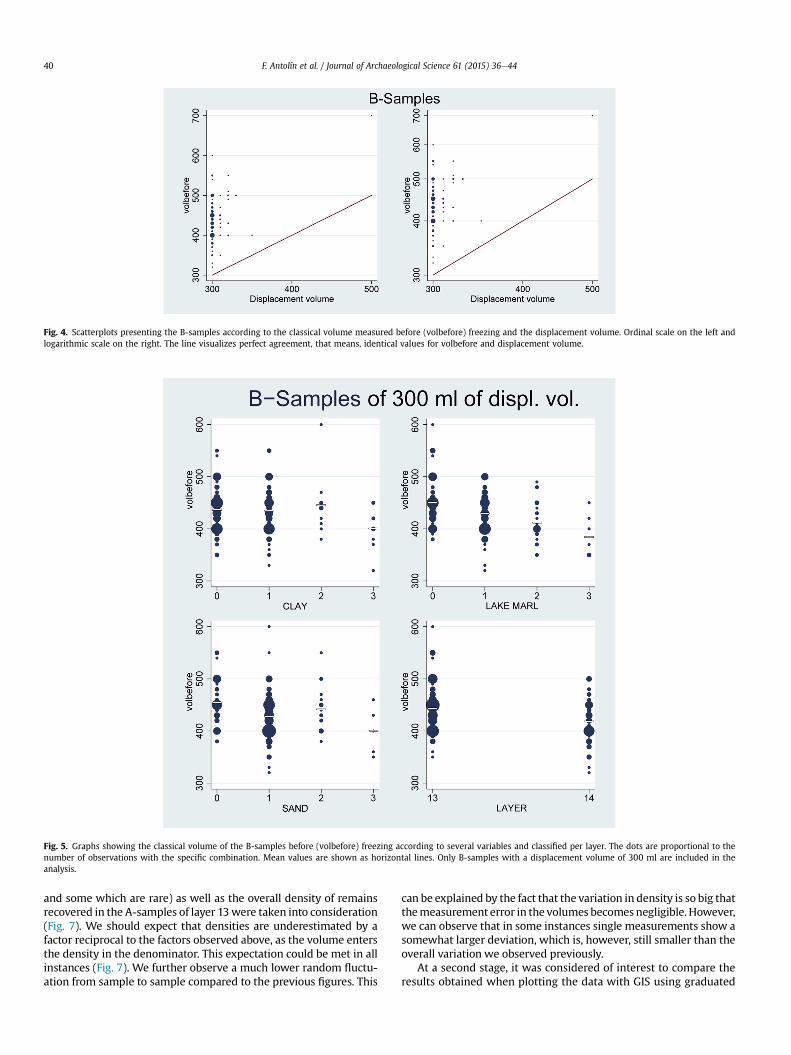
Fig. 4. Scatterplots presenting the B-samples according to the classical volume measured before (volbefore) freezing and the displacement volume. Ordinal scale on the left andlogarithmic scale on the right. The line visualizes perfect agreement, that means, identical values for volbefore and displacement volume.
Fig. 5. Graphs showing the classical volume of the B-samples before (volbefore) freezing according to several variables and classified per layer. The dots are proportional to thenumber of observations with the specific combination. Mean values are shown as horizontal lines. Only B-samples with a displacement volume of 300 ml are included in theanalysis.
F. Antolín et al. / Journal of Archaeological Science 61 (2015) 36e4440
and some which are rare) as well as the overall density of remainsrecovered in the A-samples of layer 13were taken into consideration(Fig. 7). We should expect that densities are underestimated by afactor reciprocal to the factors observed above, as the volume entersthe density in the denominator. This expectation could be met in allinstances (Fig. 7). We further observe a much lower random fluctu-ation from sample to sample compared to the previous figures. This
can be explained by the fact that the variation in density is so big thatthemeasurement error in the volumes becomesnegligible. However,we can observe that in some instances single measurements show asomewhat larger deviation, which is, however, still smaller than theoverall variation we observed previously.
At a second stage, it was considered of interest to compare theresults obtained when plotting the data with GIS using graduated
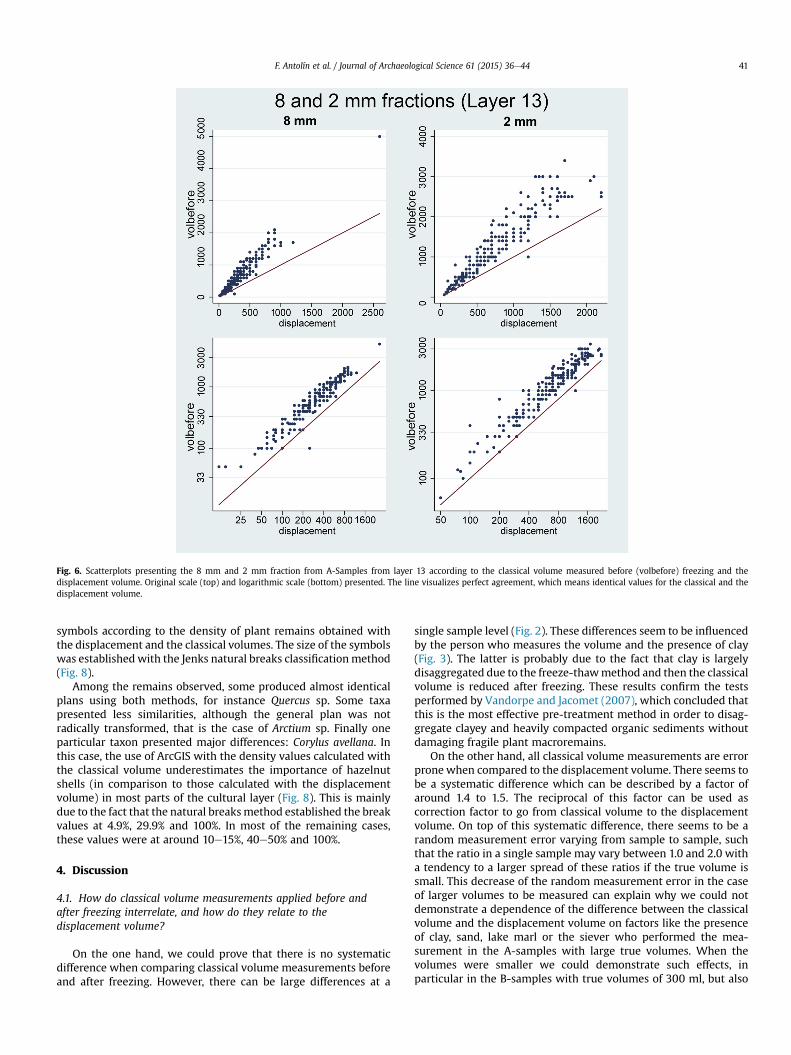
Fig. 6. Scatterplots presenting the 8 mm and 2 mm fraction from A-Samples from layer 13 according to the classical volume measured before (volbefore) freezing and thedisplacement volume. Original scale (top) and logarithmic scale (bottom) presented. The line visualizes perfect agreement, which means identical values for the classical and thedisplacement volume.
F. Antolín et al. / Journal of Archaeological Science 61 (2015) 36e44 41
symbols according to the density of plant remains obtained withthe displacement and the classical volumes. The size of the symbolswas establishedwith the Jenks natural breaks classificationmethod(Fig. 8).
Among the remains observed, some produced almost identicalplans using both methods, for instance Quercus sp. Some taxapresented less similarities, although the general plan was notradically transformed, that is the case of Arctium sp. Finally oneparticular taxon presented major differences: Corylus avellana. Inthis case, the use of ArcGIS with the density values calculated withthe classical volume underestimates the importance of hazelnutshells (in comparison to those calculated with the displacementvolume) in most parts of the cultural layer (Fig. 8). This is mainlydue to the fact that the natural breaksmethod established the breakvalues at 4.9%, 29.9% and 100%. In most of the remaining cases,these values were at around 10e15%, 40e50% and 100%.
4. Discussion
4.1. How do classical volume measurements applied before andafter freezing interrelate, and how do they relate to thedisplacement volume?
On the one hand, we could prove that there is no systematicdifference when comparing classical volume measurements beforeand after freezing. However, there can be large differences at a
single sample level (Fig. 2). These differences seem to be influencedby the person who measures the volume and the presence of clay(Fig. 3). The latter is probably due to the fact that clay is largelydisaggregated due to the freeze-thawmethod and then the classicalvolume is reduced after freezing. These results confirm the testsperformed by Vandorpe and Jacomet (2007), which concluded thatthis is the most effective pre-treatment method in order to disag-gregate clayey and heavily compacted organic sediments withoutdamaging fragile plant macroremains.
On the other hand, all classical volume measurements are errorprone when compared to the displacement volume. There seems tobe a systematic difference which can be described by a factor ofaround 1.4 to 1.5. The reciprocal of this factor can be used ascorrection factor to go from classical volume to the displacementvolume. On top of this systematic difference, there seems to be arandom measurement error varying from sample to sample, suchthat the ratio in a single sample may vary between 1.0 and 2.0 witha tendency to a larger spread of these ratios if the true volume issmall. This decrease of the random measurement error in the caseof larger volumes to be measured can explain why we could notdemonstrate a dependence of the difference between the classicalvolume and the displacement volume on factors like the presenceof clay, sand, lake marl or the siever who performed the mea-surement in the A-samples with large true volumes. When thevolumes were smaller we could demonstrate such effects, inparticular in the B-samples with true volumes of 300 ml, but also
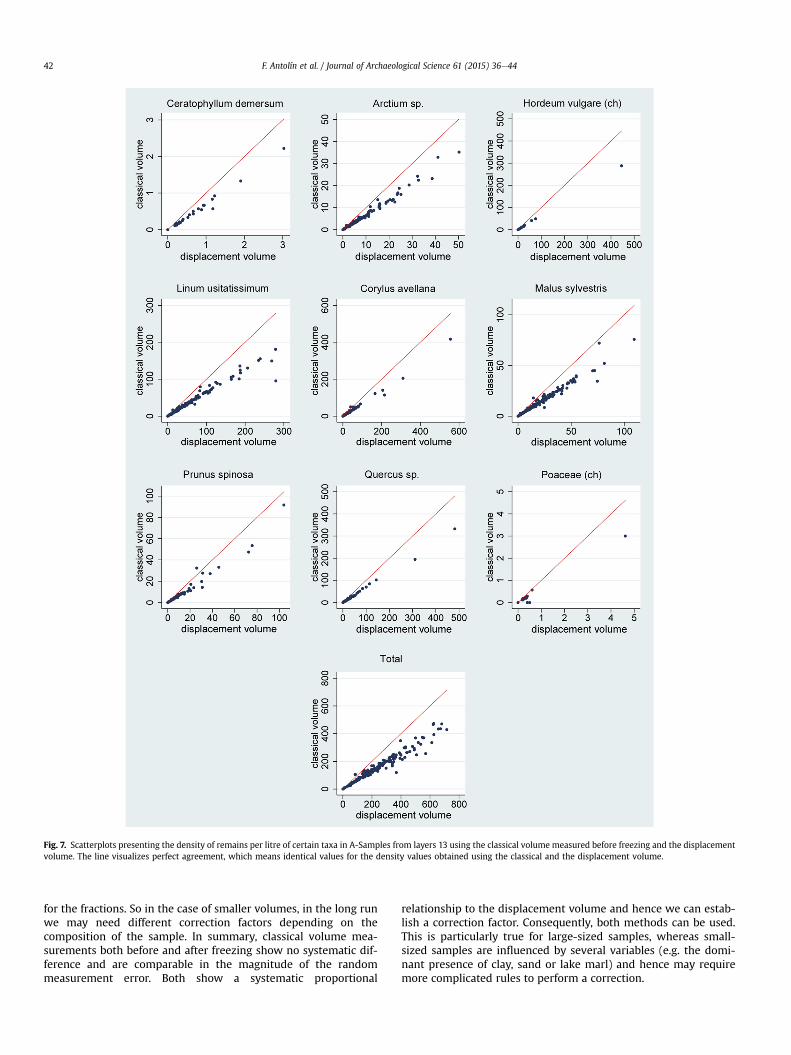
Fig. 7. Scatterplots presenting the density of remains per litre of certain taxa in A-Samples from layers 13 using the classical volume measured before freezing and the displacementvolume. The line visualizes perfect agreement, which means identical values for the density values obtained using the classical and the displacement volume.
F. Antolín et al. / Journal of Archaeological Science 61 (2015) 36e4442
for the fractions. So in the case of smaller volumes, in the long runwe may need different correction factors depending on thecomposition of the sample. In summary, classical volume mea-surements both before and after freezing show no systematic dif-ference and are comparable in the magnitude of the randommeasurement error. Both show a systematic proportional
relationship to the displacement volume and hence we can estab-lish a correction factor. Consequently, both methods can be used.This is particularly true for large-sized samples, whereas small-sized samples are influenced by several variables (e.g. the domi-nant presence of clay, sand or lake marl) and hence may requiremore complicated rules to perform a correction.
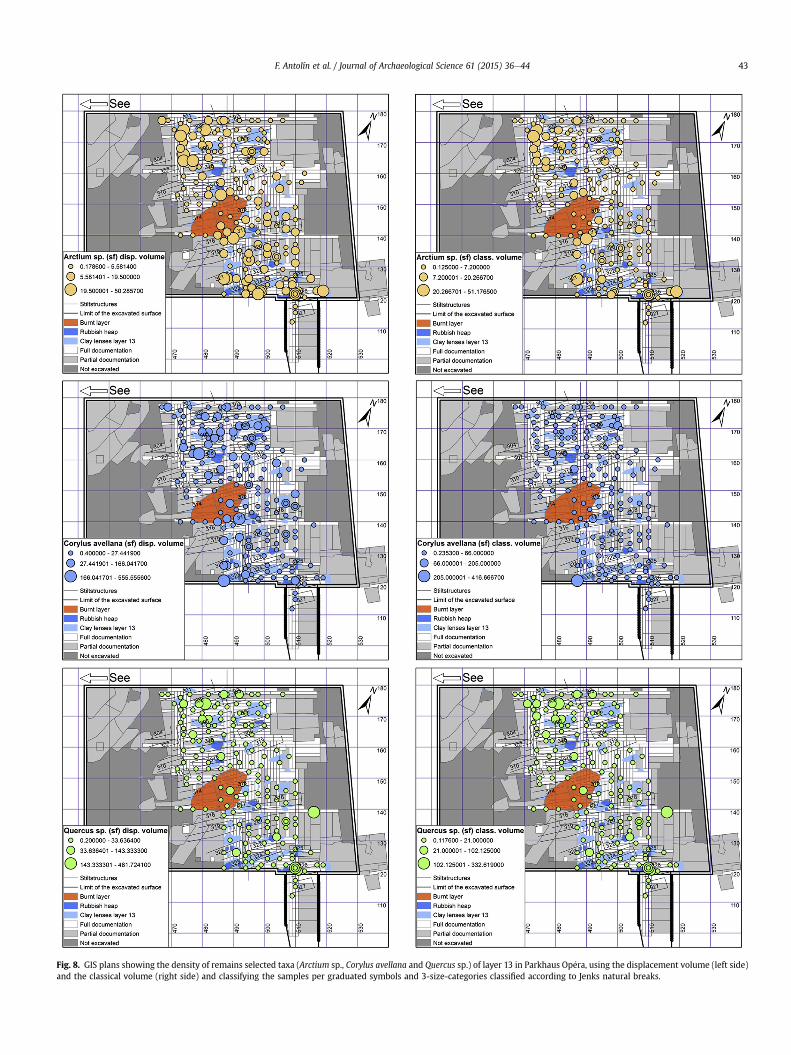
Fig. 8. GIS plans showing the density of remains selected taxa (Arctium sp., Corylus avellana and Quercus sp.) of layer 13 in Parkhaus Op�era, using the displacement volume (left side)and the classical volume (right side) and classifying the samples per graduated symbols and 3-size-categories classified according to Jenks natural breaks.
F. Antolín et al. / Journal of Archaeological Science 61 (2015) 36e44 43
F. Antolín et al. / Journal of Archaeological Science 61 (2015) 36e4444
4.2. What influence does the use of the classical volume have on thefinal calculations of density of remains per sample?
Whenusing volumemeasurements to compute densities of plantmacroremains, the systematic difference in volume measurementstranslate into a systematic difference in the densities, just with areciprocal factor. However, the random measurement error of thevolume does not imply a substantial measurement error of thedensities (at least in our data), as the variation in density is muchmore pronounced than the measurement error in the volumes.
In one example (C. avellana), in spite of only small differences inthe density measurements, a GIS analysis resulted in two qualita-tively very different visualizations of the data (Fig. 8). However, thisseems to be more related to an instability in the algorithm to deter-mine thebreaks than to a changeof the typeof volumemeasurement.
4.3. Then … what method should be used for the recording of thevolume of sediment samples and the different fractions?
It seems that the choice of the measurement procedure of thevolumes has often (but not always) only a very limited impact onthe results obtained within one site. However, great care is neces-sary when comparing numbers across sites, if different volumemeasurement methods have been used. The correction factorspresented in this paper may help to make such numbers compa-rable, but we need similar investigations for other sites to judge thegenerality of these factors and to investigate more systematicallythe dependence of correction factors on external factors like thecomposition of the sample.
In any case, the displacement volume has to be regarded themost objective method to measure the volume of the samples ofwaterlogged sediments (where samples have a similarly high de-gree of wetness). It is a simple measurement that we can expect tohave a very good repeatability. The only difficulty is to make surethat the samples or fractions have approximately the same degreeof wetness when measured.
5. Conclusions
Three methods of volume measurement were compared in thisexperiment. Our starting hypothesis was to regard the displace-ment volume as the best system of volume measurement, and tocontrast it with classical volume measurements e both before andafter freezing. The systematic difference between classical anddisplacement volume measurements could be described by a pro-portionality factor of 1.5. A random measurement error could alsobe demonstrated, but its influence on the final density estimatewasso small that it can be regarded as negligible in this context.However, significant qualitative differences were observed in oneexample when plotting in GIS the concentration of seed and fruitremains recovered in layer 13 (Late Neolithic) of the lake site ofParkhaus Opera (Zürich, Switzerland). Although there can be sub-stantial differences in classical volume measurements before andafter freezing, in general, similar results and patterns were ob-tained using any of these two methods. It is recommended to useour proportionality factor in case of a need for comparison of databetween sites where different measuring techniques were used.Nevertheless, more evaluations are needed from other sites in or-der to test the generality of the factor proposed.
Acknowledgements
The authors thank Niels Bleicher (Office for Urbanism, City ofZürich) for providing the samples and for valuable comments on anearlier draft of this paper. We acknowledge the efforts of the foursievers who participated in the measuring of the volumes of thesamples. We thank also Marlu Kühn and Christoph Brombacher(IPAS, University of Basel) for their co-operation in the analysis ofthe samples, and also Tim Wehrle (Office for Urbanism, City ofZürich) for producing the GIS plans.
This study was funded by the Swiss National Science Founda-tion, project number CR30I2_149679/1 (main project leader Phil-ippe Rentzel) and the canton and town of Zürich.
References
Alonso, N., Junyent, E., Lafuente, A., L�opez, J.B., 2008. Plant remains, storage and cropprocessing inside the Iron Age fort of Els Vilars d’Arbeca (Catalonia, Spain). Veg.Hist. Archaeobot. 17, 149e158.
Bland, J., Altman, D.G., 1986. Statistical methods for assessing agreement betweentwo methods of clinical measurement. Lancet 327, 307e310.
Bleicher, N., Harb, C., 2015. Zürich-Parkhaus Op�era. Eine neolithische Feuchtbo-densiedlung. Band 1. Befunde, Schichten und Dendroarch€aologie, Kant-onsarch€aologie Zürich. Photorotar (Monographien der Kantonsarch€aologieZürich, 48), Zürich und Egg.
ESRI, 2010. ArcGIS 10.0. Environmental System Research Institute, Inc., Redlands,California.
Herbig, C., 2009. Arch€aobotanische Untersuchungen in neolithischen Feuchtbo-densiedlungen am westlichen Bodensee und in Oberschwaben. Verlag Dr.Rudolf Habelt, Bonn.
Jacomet, S., 1980. Botanische Makroreste aus den neolithischen Seeufersiedlungendes Areals Pressehaus Ringier in Zürich (Schweiz). Stratigraphische und vege-tationskundliche Auswertung. Vierteljahresschr. Naturforschenden Ges. Zürich125, 73e163.
Jacomet, S., 1985. Botanische Makroreste aus den Sedimenten des neolithischenSiedlungsplatzes AKAD-Seehofstrasse am untersten Zürichsee. Die Reste derUferpflanzen und ihre Aussagem€oglichkeiten zu Vegetationsgeschichte,Schichtentstehung und Seespiegelschwankungen. Juris, Zürich.
Jacomet, S., Kreuz, A., 1999. Arch€aobotanik. Aufgaben, Methoden und Ergeb-nisse vegetations- und agrargeschichtlicher Forschungen. Eugen Ulmer,Stuttgart.
Jacomet, S., Brombacher, C., Dick, M., 1989. Arch€aobotanik am Zürichsee. Ackerbau,Sammelwirtschaft und Umwelt von neolithischen und bronzezeitlichen Seeu-fersiedlungen im Raum Zürich. Ergebnisse von Untersuchungen pflanzlicherMakroreste der Jahre 1979e1988. Orell Füssli Verlag, Zürich.
Jones, G.E.M., 1991. Numerical analysis in archaeobotany. In: van Zeist, W.,Wasylikowa, K., Behre, K.-E. (Eds.), Progress in Old World Palaeoethnobotany. A.A. Balkema, Rotterdam, pp. 63e80.
Maier, U., 2001. Arch€aobotanische Untersuchungen in der neolithischen Ufersied-lung Hornstaad-H€ornle IA am Bodensee. In: Maier, U., Vogt, R. (Eds.), Sied-lungsarch€aologie im Alpenvorland VI. Botanische und pedologischeUntersuchungen zur Ufersiedlung Hornstaad-H€ornle IA. Konrad Theiss Verlag,Stuttgart, pp. 9e384.
Maier, U., Harwath, A., 2011. Detecting intra-site patterns with systematic sam-pling strategies. Archaeobotanical grid sampling of the lakeshore settlementBad Buchau-Torwiesen II, southwest Germany. Veg. Hist. Archaeobot. 20,349e365.
Maier, U., Herbig, C., 2011. Arch€aobotanische Fl€achenuntersuchungen in der end-neolithischen Feuchtbodensiedlung Torwiesen II. Die endneolithische Moor-siedlung Bad Buchau-Torwiesen II am Federsee. In: NaturwissenschaftlicheUntersuchungen, Band 1. Janus-Verlag, Freibung im Breisgau.
Pearsall, D.M., 1989. Paleoethnobotany. A Handbook of Procedures. Academic Press,San Diego.
StataCorp, 2013. Stata Statistical Software: Statistics: Release 13. Stata Corporation.Vandorpe, P., Jacomet, S., 2007. Comparing different pre-treatment methods for
strongly compacted organic sediments prior to wet-sieving: a case study onRoman waterlogged deposits. Environ. Archaeol. 12, 207e214.
van der Veen, M., Jones, G., 2006. A re-analysis of agricultural production andconsumption: implications for understanding the British Iron Age. Veg. Hist.Archaeobot. 15, 217e228.
Wright, P.J., 2005. Flotation samples and some paleoethnobotanical implications.J. Archaeol. Sci. 32, 19e26.