Evaluation of anthelmintic, antiamoebic and antibacterial ...
Upload
khangminh22Category
view
1download
0
Antibacterial effect of lemon juice-extract on bacteria isolated from
Traditional African sausages (Mutura) sold in Nairobi County and
pathogenicity of one isolate
HENRY KAROKI WAMBUI
J56/73504/2014
Thesis submitted in partial fulfilment of requirements for Master’s Degree
of University of Nairobi (Clinical Pathology and Laboratory Diagnosis)
Department of Veterinary Pathology, Microbiology and Parasitology,
Faculty of Veterinary Medicine
MARCH 2019

ii
DECLARATION
This thesis is my original work and has never been presented for a degree in any other
University.
HENRY KAROKI WAMBUI (BSc.)
Sign……………………………………. Date………………………………….
DR. DAVIS N. KARANJA (BVM, MSc, PhD)
Department of Veterinary Pathology, Microbiology and Parasitology
Sign……………………………………. Date………………………………….
PROF. LILLY C. BEBORA (BVM, MSc, PhD)
Department of Veterinary Pathology, Microbiology and Parasitology
Sign……………………………………. Date………………………………….
DR. LUCY W. NJAGI (BVM, MSc, PhD)
Department of Veterinary Pathology, Microbiology and Parasitology
Sign……………………………………. Date………………………………….

iii
DEDICATION
I dedicate this work to my parent, my wife-Leah and my daughters-Maryanne and Esther

iv
ACKNOWLEDGEMENT
My appreciation goes to my supervisors Dr. Davis N. Karanja, Prof. Lilly C. Bebora, and Dr.
Lucy W. Njagi who stood by me throughout this work. Their constant advice, constructive
criticism and encouragement which kept me going are much appreciated. I am also
particularly thankful to all my lecturers who took me through my MSc. Course. I am grateful
to the department’s technical staff who made a positive contribution to the success of this
work: - Ann Munene, George Dimbu, Charity Gathenya, Ephantus Nyaga and Lydia
Nyambura Maina for their technical assistance in bacterial isolation; Mr. Mukiri for
processing my histopathology samples and Patrick Wahome of the laboratory animal unit all
of the Department of Veterinary Pathology, Microbiology and Parasitology, University of
Nairobi for supporting me in animal experiments. Finally, my gratitude goes to my parent and
my wife for their moral and financial support.

v
TABLE OF CONTENTS
DECLARATION ........................................................................................................................ ii
DEDICATION ........................................................................................................................... iii
ACKNOWLEDGEMENT ......................................................................................................... iv
TABLE OF CONTENTS ............................................................................................................ v
LIST OF TABLES ...................................................................................................................... x
LIST OF APPENDICES ............................................................................................................ xi
LIST OF ACRONYMS AND ABBREVIATIONS ................................................................. xiii
ABSTRACT ............................................................................................................................. xv
CHAPTER 1: INTRODUCTION ............................................................................................... 1
1.4 Objectives ......................................................................................................................... 5
1.4.1 Broad Objective .......................................................................................................... 5
1.4.2 Specific Objectives ..................................................................................................... 5
CHAPTER 2: LITERATURE REVIEW .................................................................................... 6
2.1 Overview of bacteria associated with fresh and stored sausages ......................................... 6
2.2 Commonly isolated bacteria in animal products ............................................................... 7
2.2.1 Escherichia coli .......................................................................................................... 7
2.2.2 Staphylococcus ........................................................................................................... 7
2.2.3 Proteus ........................................................................................................................ 8
2.2.5 Bacillus ....................................................................................................................... 9
2.2.6 Other pathogens associated with meat and meat products ......................................... 9
2.3 Source of contamination ................................................................................................... 9
2.4 Bacterial loads observed on beef sausages ..................................................................... 10
2.5.1 Agar disk-diffusion method ...................................................................................... 11

vi
2.5.2 Agar well-diffusion method...................................................................................... 11
2.5.3 Agar plug-diffusion method ..................................................................................... 12
2.5.4 Agar contact method ................................................................................................. 12
2.5.5 Dilution methods ...................................................................................................... 12
2.5.6 Time-kill test (time-kill curve) ................................................................................. 12
2.6 Bacterial inhibitory effect of natural products including lemon ..................................... 13
2.7 Testing for pathogenicity of bacterial isolates ................................................................ 13
CHAPTER 3: MATERIALS AND METHODS ....................................................................... 15
3.1 Study design .................................................................................................................... 15
3.2 Study area ........................................................................................................................ 15
3.3 Sample size calculation ................................................................................................... 17
3.4 Sample collection and handling ...................................................................................... 18
3.4.1 Homogenate preparation .......................................................................................... 19
3.5 Bacterial isolation .......................................................................................................... 19
3.6 Quantification of bacterial load of the African sausages ................................................ 19
3.7 Susceptibility of the three most prevalent isolates to lemon juice-extract...................... 20
3.7.1 Preparation of lemon juice extract ........................................................................... 20
3.7.2 Lemon susceptibility testing ................................................................................... 20
3.8 Determination of pathogenicity of one of the bacterial isolates using mouse model ..... 22
3.8.1 Experimental animals ............................................................................................... 22
3.8.2 Ethical clearance ...................................................................................................... 22
3.8.3 Biosafety and Occupational Safety .......................................................................... 22
3.8.4 Inoculation of mice for pathogenicity testing .......................................................... 23
3.8.5 Clinical pathology .................................................................................................. 24

vii
3.8.6 Necropsy findings .................................................................................................... 25
3.9 Quality control check ...................................................................................................... 26
3.10 Statistical analysis ......................................................................................................... 26
CHAPTER 4: RESULTS .......................................................................................................... 28
4.1 Isolation of bacteria from African sausages in Nairobi County ...................................... 28
4.2 Quantification of bacterial load of the African sausages ................................................ 30
4.2.1 Bacterial load of both roasted and non-roasted African sausages ............................ 30
4.2.2 Bacterial load from roasted African sausages .......................................................... 31
4.2.3 Total aerobic bacterial count from non-roasted African sausages. ........................... 33
4.3 Susceptibility of the three most prevalent isolates to lemon juice extract ...................... 35
4.3.1 Inhibitory effect of lemon juice-extract at various concentrations ........................... 35
4.3.2 Mean diameters of the inhibition zones ................................................................... 38
4.3.3 Statistical comparison of the mean diameters .......................................................... 38
4.3.4 Minimum Inhibitory Concentration using broth inhibitory testing .......................... 39
4.3.5 Potency of Lemon Juice extract ............................................................................... 39
4.4 Pathogenicity of one isolate - E. coli, using a mouse model .......................................... 40
4.4.1 Clinical signs ............................................................................................................ 40
4.4.2 Clinical pathology .................................................................................................... 41
4.4.3 Necropsy findings .................................................................................................... 43
4.5 Quality control check ...................................................................................................... 43
CHAPTER 5: DISCUSSION, CONCLUSIONS AND RECOMMENDATIONS ................... 44
5.3 Recommendations ........................................................................................................... 51
CHAPER 6: REFERENCES .................................................................................................... 53
CHAPTER 7: APPENDICES ................................................................................................... 64
viii
LIST OF FIGURES
Figure 1: Map of Kenya, showing position of Nairobi County (in red). (Source:
nairobimetro.go.ke) ............................................................................................... 16
Figure 2: Map of Nairobi County, indicating the three study sites of Pangani, Westlands and
Kangemi. Source: nairobimetro.go.ke .................................................................... 17
Figure 3: The African sausage – roasting and serving. ............................................................. 18
Figure 4: Investigator being assisted by a veterinary pathologist collecting blood sample from
a mouse .................................................................................................................... 25
Figure 5 : Veterinary pathologist collecting tissue samples from a mouse.............................. 26
Figure 6 : Prevalence of the five genera of bacteria isolated from African sausages sampled
from Pangani, Kangemi and Westlands, Nairobi County ...................................... 29
Figure 7 : Percent bacterial loads of the sampled African sausages (roasted and non-roasted)
sold in the three study sites ..................................................................................... 31
Figure 8 : Percent bacterial loads of the sampled roasted African sausages sold in the three
study sites ............................................................................................................... 32
Figure 9: Percent bacterial loads of the sampled non-roasted African sausages sold in the
three study sites ........................................................................................................ 34
Figure 10: Inhibitory profile of the three most prevalent isolates to varied concentrations of
lemon extract using agar gel diffusion method ........................................................ 37
Figure 11: Inhibitory pattern of Bacillus sp. to the various dilutions of the lemon juice-extract
................................................................................................................................ 38
Figure 12: Lemon antibacterial sensitivity pattern for E.coli – Minimal inhibitory
concentration. ...................................................................................................... 39

ix
Figure 13: Bacterial loads before and after lemon juice-extract treatment of roasted and
unroasted African sausages homogenates, after specified time periods. .............. 40
Figure 14: Total erythrocyte count variations in control and experimental mice inoculated
intraperitoneally with the various concentrations (4.36x10⁸-4.36x10⁴) of test E.
coli. ........................................................................................................................ 41
Figure 15: Total Leucocyte Count (TLC) variations in control and experimental mice
inoculated intraperitoneally with the various concentrations (4.36x10⁸-4.36x10⁴)
of test E. coli. ....................................................................................................... 42

x
LIST OF TABLES
Table 1: Evaluation of the mean distribution of bacterial isolates from African Sausages across
the three geographical areas using paired sample t-test (P values evaluated at 95%
confidence limits). ....................................................................................................... 29
Table 2: Evaluation of the mean total aerobic bacterial count from roasted African sausages
across the three geographical areas using paired sample t-test (P values evaluated at
95%confidence limits). .............................................................................................. 33
Table 3: Evaluation of the mean total aerobic bacterial count from non-roasted African
sausages across the three geographical areas using paired sample t-test (P values
evaluated at 95%confidence limits). .......................................................................... 35
Table 4: Minimum Inhibitory Concentration profile of the three most prevalent isolates to
varied concentrations of lemon extract using broth inhibitory method ..................... 37

xi
LIST OF APPENDICES
Appendix I: Ethical clearance of proposal by Biosafety, Animal use and Ethics commitee .... 64
Appendix II – Prevalence of the five genera of bacteria isolated from African sausages
sampled from Pangani, Kangemi and Westlands, Nairobi County ................................ 65
Appendix III - Quantification of bacterial load of the African sausages sampled from Pangani,
Kangemi and Westlands, Nairobi County ...................................................................... 66
Appendix IV – Evaluation of mean bacterial load across the three geographical areas among
the roasted and non-roasted African Sausages using paired student t-test (p values
evaluated at 95%confidence limits) ............................................................................... 67
Appendix V – Determination of Mean diameters of the inhibitory zones to lemon juice
extract, measured in mm of three isolates from the three main areas of study. ............. 68
Appendix VI - Comparison of mean inhibitory zones to lemon juice extract of the three
isolates studied using unpaired student t-test (p values evaluated at 95%confidence
limits) ............................................................................................................................. 69
Appendix VII – Average haematological and biochemical parameters of the test mice and
control group after inoculation of various concertation of test organism (E.coli) ......... 70
Appendix VIII – Haematological and biochemical parameters of individual test mice and
control group after inoculation with test organism (E.coli) .......................................... 70
Appendix IX: Means for haematological and biochemical parameter for test mice inoculated
with the test organism - E. coli....................................................................................... 71
Appendix X: Descriptive statistics for haematological and biochemical parameters for control
and test mice inoculated with various concentrations of test organism – E.coli ............ 72

xii
Appendix XI: Comparing mean values of the hematological and biochemical parameters after
inoculating test and control mice with various concentration of test organism using
unpaired student t-test (p values evaluated at 95% confidence limits). ......................... 73
Appendix XII: Analysis of the differences among group means (ANOVA) for hematological
and biochemical parameters in test and control mice inoculated with the test E. coli.. 74

xiii
LIST OF ACRONYMS AND ABBREVIATIONS
AM - Ante meridiem
ANOVA - Analysis of Variance
BKC - Benzalkonium chloride
BUN - Blood Urea Nitrogen
CFU - Colony Forming Units
CM - Centimetres
CPE - Cytopathic Effect
EDTA - Ethylene Diamine Tetra acetic acid
FDA - Food and Drug Administration
GIT - Gastro intestinal Tract
GIT - Gastro-Intestinal Tract
Hb - Haemoglobin
HC - Hemorrhagic colitis
HEPA - high-efficiency particulate air
HRS - Hours
HUS - Hemolytic Uremic Syndrome
KEMRI - Kenya Medical Research Institute
KPHC - Kenya population and Housing Census
KSH - Kenya Shillings
LAB - Lactic Acid Bacteria
LB - Luria Bertani
MCH - Mean Corpuscular Haemoglobin
MCHC - Mean Corpuscular Haemoglobin Concentration
xiv
MCV - Mean Corpuscular Volume
MIC - Minimum Inhibitory Concentration
ML - Millilitres
Mm - Millimetres
PBS - Phosphate Buffer Saline
PCV - Packed cell volume
PM - Post meridiem
RDW - Red Cell Distribution Width
Sp. - Species
SPSS - Statistical Package for the Social Sciences
TBC - Total Bacteria Concentration
TLC - Total Leucocyte Count
UK - United Kingdom
uL - Microliter
VTEC - Vero Cytotoxigenic Escherichia coli
v/v - Volume per Volume
WHO - World Health Organization

xv
ABSTRACT
Demand for African sausages has resulted in this delicacy’s vendors being on the increase.
However, risk of humans to food-borne bacterial disease from these sausages arising from
intestinal bacteria or external contamination as a result of unhygienic food preparation is
largely unknown. In addition, lemons which are common food additives are known to posses
antibacterial activity, but data on their efficacy on pathogens isolated from African sausages
remains scanty. The objectives of this study were: to isolate bacteria from African sausages
sold in Nairobi County, to quantify the bacterial load, to determine susceptibility of the three
most prevalent bacterial isolates to lemon juice extract and to determine pathogenicity of one
of the bacteria using a mouse model. A descriptive study design was employed where one
hundred (100) non-roasted and roasted African sausages were conveniently collected from
three meat eatery points of Westlands, Kangemi slum and Pangani estates. Total viable
bacterial counts were calculated through preparation of ten-fold dilutions of aseptically
homogenised African sausages. The lemon juice extract was tested for antibacterial activity
using minimum inhibitory concentration and agar diffusion methods. Thirty Balb /C mice
were inoculated intraperitoneally with 4.36x10⁴ – 4.36x10⁸ of Escherichia coli (E.coli)
isolated from the sausages and pathogenicity monitored through expression of clinical disease
and clinico-anatomical pathology. Five genera of bacteria namely; Staphylococcus sp.,
Bacillus sp., Streptococcus sp., Proteus sp. and E. coli were isolated from 78 African sausage
samples.Their prevalences were 50.4%, 19.5%, 9.8%, 2.4% and 1.6 %, respectively. There
was no significant difference in distribution of isolates between different sites p≥0.05. The
bioload range was between 1.0-9.9x101 -1.0-9.9x10⁷cfu/g with 37/100 (37%) samples having
bioload of between 1.0- 9.9 x10⁴ to 1.0- 9.9 x10⁷ cfu/g.

xvi
The lemon juice extract had antibacterial activity on all three bacterial isolates tested.
Undiluted lemon juice extract had the highest activity at 20mm for Staphylococcus, 18mm for
Bacillus and 20mm for Streptococcus. All mice inoculated with test organism survived to end
of experiment with no expression of clinical disease. Clinical pathology revealed no
significant variation (p>0.05) between infected and non-infected animals. The peritoneum was
white, smooth and shiny. All other organs retained normal colour, size and shape. Organs
examined were normal except for accumulation of blood in the venous side of circulation and
prominence of lymphoid follicles in the spleen, Peyer's patches and peri-bronchial lymphoid
areas. This study has demonstrated presence of bacteria which are potentially zoonotic to
humans in the roasted and non-roasted African sausages. E.coli load of between 106-108 is
potentially infectious to sausage consumers although similar dosage proved non-pathogenic to
mice, experimentally. Diluted lemon extract juice has antibacterial activity at 25%. There was
no significance difference (p≥0.05) in distribution of isolates and bacterial load across
geographical sites studies among the roasted and non-roasted African sausages.
Comprehensive study is needed to sample more eatery meat points in Nairobi and other areas
in order to isolate, establish the bacterial load and the pathogenicity of isolated organisms to
humans. There is also need to establish the sources of bacteria due to high bacterial load
determined in the current study. Further studies are needed to establish the mode of action of
lemon juice extract whether bacteriostatic or bactericidal and how heat stable it is to
determine if it can be incorporated as one of the ingredients in preparation of African
sausages.

1
CHAPTER 1: INTRODUCTION
Traditional African sausages, popularly known as Kenyan sausages locally known as
‘Mutura’ in Kikuyu dialect is a local delicacy for low, middle income earners and beer
drinkers. It is a protein rich meat snack comprising goat or cow cleaned intestines stuffed with
cooked small pieces of meat and formed into long coils; sometimes blood is added. The
preparation involves cutting the intestines into a length of about 150-1200cm. One end of the
intestinal segment is tied using a sisal rope. Small pieces of meat, and sometimes mixed with
same or other animal’s blood is stashed into the intestines from untied end. When full, the
other end is also tied. Processed African sausages are then placed in boiling water or soup for
30 to 40 minutes and then roasted over coals on outdoor grills using low to medium heat and
turning frequently to dehydrate the meat and give it the sensational smoky taste. The internal
temperature should be at least 160 degrees Fahrenheit (Wiens, 2011).
African sausages roasts are common cuisine among low to middle income earners not
to forget beer drinkers, as they can be cut into different sizes, each pegged on a different
price - from as little as Ksh. 5/- for a 5-10 cm size depending on the locality (Ojode, 2001).
African sausage provides a ready-to-eat meat which Kenyans of all walks of life have at one
time or another had a pleasure of enjoying it; whether on one’s way from school, work (at a
road side butchery) or during festivities that include meat roasting; however, this is dependent
on one’s background and preference. Musa and Akande (2002) noted that the increase in
demand for these finger-licking “sausages” has resulted in this delicacy’s vendors being on the
increase, especially in slum areas. The responsibility for good sanitary measures and proper
food handling is left at the hands of these vendors, majority of whom are semi-literate.

2
According to Yousuf et al. (2008), meat is considered a high-risk perishable
commodity in respect to micro-organism content, natural toxins and other possible
contaminants. Food borne illnesses are a major world-wide health risk with subsequent
economic impact which prompted World Health Organization (WHO) to develop a global
strategy for food safety (Adak et al., 2005). Food borne infections result from ingestion of
microorganisms and toxins present in food. According to Torok et al. (1997), food-borne
disease from African sausages arises from intestinal bacteria or external contamination, which
is a result of unhygienic food preparation - if the vendor fails to adhere to hygiene practices
during processing, preparation, handling and/or storage.
Some of the unhygienic practices noted to contribute to food borne illness arise from
failure of the vendors to maintain cleanliness. This involves dirty or improper dressing,
chopping boards/surfaces and knives that are not regularly cleaned, handling sausages and
money without proper hand-washing practices, poor storage of unsold sausages such as failure
to refrigerate or storage in dirty polythene bags (Torok et al. 1997). Many diseases are caused
by eating food that has been contaminated with an infectious agent, usually from faeces. If
these diseases lead to diarrhoea or vomiting they are easily spread further if sanitation
provision such as toilets is poor or lacking. This could be due to the handlers’ ignorance
and/or carelessness. Meat and blood contain enough nutrients needed for the growth of
microorganisms. Among the bacterial isolates from animal products documented in recent
studies are; Staphylococcus aureus, Streptococcus sp., Escherichia coli, Clostridium
perfrigens, Shigella sp., Salmonella sp. and Campylobacter jejuni (Kazuaki et al., 1999).

3
Globally, World Health Organisation (2007) estimates approximately 1.5 billion
episodes of diarrhoea and over 3 million deaths recorded annually results from consumption
of microbial agents in food. This has posed a very serious health threat to humans, especially
to meat lovers. Unfortunately, various chemical agents and additives that can be used to
preserve African sausages, through prevention of microbial growth, are considered to be
potentially harmful to human health (Sharma, 2015). Thus, this study investigated the possible
use of lemon juice-extract, a biological preservative/antibacterial compound.
The main reason for using lemon juice-extract is because lemons are relatively
inexpensive due to their easy availability, universal acceptability, palatability and their being
well tolerated by most people; lemon juice-extract is therefore, regarded as being safe. The
antibacterial efficacy of lemon juice-extract was tested against the isolated bacteria from fresh
African sausages. This study was necessary since there has been a public health concern over
production and sale of these African sausages especially if cooking and roasting is not
sufficient and hence the need for natural antimicrobials (Mastromatteo et al., 2011).
1.1 Justification
Unhygienic practices in food preparation and consumption of undercooked meat and
meat products has often been associated with many human infections (Sang et al., 1996).
Although reported food borne outbreaks by pathogenic bacteria in Africa have been few to
date, available information indicates that these pathogens have wide geographic distribution.
Meat-borne microbial hazards vary in different geographical and socio-economic settings
(Codex Alimentarius Commission, 2005).

4
Despite numerous researches on pathogens isolated from meat products, knowledge on
bacterial isolates, the antibacterial effect of lemon juice-extract on the bacterial contaminants
from African sausages sold at food outlets in Nairobi County and their pathogenicity is
limited. There are many sources of food contamination. Contamination of food by food-borne
microbes found in healthy intestines of animals can occur during preparation. Meat carcases
can be contaminated during slaughter or during cleaning with contaminated water. Kenya’s
food industry is regulated by public health and safety regulations such as public health act,
food, drugs and chemical substances acts (Kenya Law, 2015) which enforce policies on food
hygiene and sanitation. Concerns have been raised about food safety due to numerous
occurrences of food-borne disease outbreaks. African sausage business, which is part of food
production practice, remains largely unregulated while the said policies are poorly enforced.
The increased informal trade of African sausages, mostly operating in unhygienic makeshift
and road side meat points of Nairobi poses a potential serious health risk to unsuspecting
consumers through outbreaks of food borne illnesses.
The general environmental and personal hygiene of African sausage sellers in this area
is poor. The vendors are just beside the road and major streets which exposes the African
sausages to dust and other environmental contaminants. Their dressing (white coat) is dirty
with no provisions for themselves or clients to hand wash before consuming the African
sausage. The sellers rely on commercial water vendors for their source of water which
exposes the would-be buyers to more infection since the source of water is not well
established. The presence of these organisms in ready to eat African sausages is a pointer that
these African sausages were either processed under poor hygienic and sanitary conditions or
could have been from the animal intestines.
5
Results of this study will help the relevant regulatory body in laying down food safety
measures for the African sausages; lemon-extract with antimicrobial activity being exploited
as both a nutritional agent and a potent preservative.
1.3 Hypothesis
African sausages sold in Nairobi County contain zoonotic, pathogenic bacteria, which are
sensitive to lemon juice-extract.
1.4 Objectives
1.4.1 Broad Objective
To determine the effect of lemon juice-extract on bacteria isolated from African sausages sold
in Nairobi County and pathogenicity of one of the isolates.
1.4.2 Specific Objectives
i) To isolate bacteria from African sausages sold in Nairobi County.
ii) To quantify the bacterial load of the African sausages
iii) To determine susceptibility of the three most prevalent bacterial isolates to lemon juice
extract.
iv) To determine pathogenicity of one of the bacterial isolates using a mouse model

6
CHAPTER 2: LITERATURE REVIEW
2.1 Overview of bacteria associated with fresh and stored sausages
Bacterial growth and lipid oxidation in meat products are the main causes of food
becoming unacceptable for consumption. There are different factors that affect the quality of
meat and meat products, which include temperature, water activity, pH and microbial
composition (Romans et al., 2001). All these factors, therefore, have an influence on the
spoilage potential of food. Spoilage of food involves a complex process and excessive
amounts of food are lost due to microbial spoilage. This results in high economic losses and
may even pose health hazards (Yang & Li, 2006). High water content and nutrients have
rendered fresh pork sausages highly perishable since they serve as substrates for
microorganisms (Cocolin, 2004). Spoilage micro-organisms in meat leads to the development
of bad odor and off-flavours, oxidative rancidity, discoloration, gas production and, often,
slime formation. Escherichia coli and Staphylococcus aureus are commonly isolated from
meat since they occur as normal flora in animals and humans; therefore, their presence in such
sausages indicates mishandling or improper cooking.
Some enzymes and toxins produced by these organisms are heat stable and render
foods dangerous even after cooking or roasting (Torok et al., 1997). Lactobacilli in meat
products are considered a major micro-organism found on various types of packaged or stored
cooked beef sausages. Great diversity of lactic acid bacteria can be found in different types of
spoiled cooked beef sausages (Von et al., 1991). Among the bacteria isolated in animal
products documented in recent studies are; Staphylococcus aureus, Streptococcus sp.,
Escherichia coli, Campylobacter jejuni, Clostridium perfrigens, Shigella sp., Salmonella sp.
(Oluwafemi and Simisaye, 2006).

7
Risk of infection or disease arising from consuming micro-organisms found in raw
meat is significantly higher than cooked meat. Meat can be incorrectly or insufficiently
cooked, allowing disease-carrying pathogens to be ingested (Newell et al., 2010).
Contamination may arise during meat processing or from slicing of ready meat product or
from cross-contamination during refrigeration. Meat can be contaminated during the
production process at any time, from the slicing of prepared meats to cross-contamination of
food in a refrigerator. All of these situations lead to a greater risk of disease.
2.2 Commonly isolated bacteria in animal products
2.2.1 Escherichia coli
According to Cheesbrough (2006), E.coli is a Gram negative, motile, aerobic and
facultative anaerobic rods. These fecal coliforms are considered indicators of fecal
contamination from warm blooded animals (Yousef et al., 2008). Some strains of this
organism are pathogenic and can cause serious food poisoning in humans. Escherichia coli is
particularly abundant in gastro intestinal tract (GIT) especially bowels or intestines of
mammals and birds. Some strains are normal flora while others, such as E. coli 0157:H7, are
pathogenic. Shiga toxins produced by these strains are heat stable and render foods poisonous
even after cooking and roasting because they cause hemorrhagic colitis (Enabulele and Uraih
2009). Bebora et al. (2005) isolated enterotoxigenic E. coli from food handlers working in
selected tourist-class hotels in Nairobi.
2.2.2 Staphylococcus
According to Kloos and Schleifer (1986), Staphylococci Sp. are found to be normal
flora on mucous membrane of warm-blood animals, in foodstuffs such as meat and meat
products and from environments source such as soil, dust, air or natural water.

8
The large numbers of these organisms tend to be found in the nasal passages, axillae
and perineal areas (Kloos and Bennerman, 1994). Staphylococci are able to multiply readily in
many foods including meat and dairy products. Contamination of food products by
Staphylococcus species may occur during the phase of manufacturing and handling of final
products (Rosec et al., 1997; Letertre et al., 2003). Presence of competing micro-organisms
constrains staphylococcal growth. Staphylococci sp. grows well in a less competitive
environment with other organisms such as in food products with high concentration of salt or
sugar that impede the growth of other organisms. According to Prescott et al. (2005), the
presence of Staphylococcus aureus could be attributed to raw ingredients such as raw tomato
sauce and raw sliced onion among others, dirty utensils and environment in which the food is
prepared. Enterotoxigenic strains of Staphylococcus aureus are known to cause serious
foodborne illness.
2.2.3 Proteus
Proteus spp. in the meat product samples usually detected due to unhygienic food
processing. Al-Mutairi (2011) reported presence of Proteus sp. from raw meat and its
products in studies in Egypt. A study by Gwida et al. (2014) reported a 78% and 58% Proteus
isolates from raw chicken meat and raw beef meat samples, respectively. Unhygienic practices
in meat and meat products processing and handling is associated with presence of Escherichia
coli, Klebsiella sp., proteus sp. and Enterobacter sp. leading food-borne infection
(Rajashekara et al., 2009). The source of water, status of the environment, failure to hand
wash and dirty utensils are major hazards associated with roasted meat.

9
2.2.5 Bacillus
Bacillus species are gram positive bacterial rods. Certain Bacillus sp. are common
food contaminants. They contaminate raw food and food materials, particularly foods in
contact with soil. Spores of some certain species are heat stable and can subsequently re-
germinate and grow under favourable conditions, particularly those in warm kitchens.
Consumption of meat or meat products with certain species of Bacillus organisms causes
gastrointestinal illness, especially due to pre-formed toxin or by toxins produced by these
bacteria in the gut (Cheesbrough, 2006). According to Götz (2002), various food stuff that
may contain Bacillus subtilis includes; meat, vegetable pastry products, poultry products and
occasionally bakery products, including bread, crumpets, sandwiches and ethnic meat or
seafood dishes.
2.2.6 Other pathogens associated with meat and meat products
Salmonella, Shigella, Campylobacter, faecal streptococci and Listeria monocytogenes
are also major bacteria associated with foodborne illness (Le-Loir et al., 2003). However, no
data is available, with respect to presence of these microorganisms in African Sausages.
2.3 Source of contamination
According to Borch and Arinder (2002), presence of microorganisms in meat and
intestines of carcasses used for preparation of African sausages is due to contamination
occurring immediately before, during and after slaughter. The microbial contamination of
carcasses occurs mainly at abattoir and retailer establishments during skinning and processing
(Gill, 1998; Abdalla et al. 2009). The main sources of meat contamination include: animal /
carcasses source, on farm factors, transport factors, abattoir and butcher facilities, parasites
and wild animals, meat vans, abattoir and retail meat outlet workers.

10
Meat contamination in abattoirs and retail meat outlets result from the use of
contaminated water, unhygienic practices like poor handling, use of contaminated tables to
display meat intended for sale and the use of contaminated knives and other equipments in
cutting operations (Fasanmi et al., 2010). Similar finding by Adzitey et al. (2011) reported
that cutting knives, intestinal contents, chopping boards, hides, meat handlers, containers,
vehicle for transporting carcasses and the meat selling environment are possible sources of
contaminations. Notably handling the food without washing hands after handling currency has
been demonstrated to carry E.coli 0157:H7 and Salmonella enteritidis (Kuria et al., 2009).
2.4 Bacterial loads observed on beef sausages
Oluwafemi and Simisaye (2006) researched on contamination on and in beef sausages
and reported mean total viable counts of between 1.3-1.47 x 10⁶ colony forming units per
gram (cfu/g) for Staphylococcus aureus, between 2.13-2.33 x 10⁶ cfu/g for lactic acid bacteria
(LAB) count and between 1.7-2.17x10⁶ cfu/g for Enterobacteriaceae. According to Ukut et al.
(2010), the mean microbial load on fresh meat from Watt and Marian markets were between
2.62-4.84 x 10⁴ and 2.24 – 5.01 x 10⁴ cfu/g, respectively, while total coliform counts were
between 1.05-3.72 x 10³ and 1.23-3.42 x 10³ cfu/g, respectively. With respect to the general
principles of meat hygiene according to Codex Alimentarius Standards (2005). The
government, local authorizes and the general public are tasked with ensuring that meat and
meat products are safe and suitable for human consumption. Hygiene practices in meat
processing and preparation for live animal production up to the point of retail sale need to be
observed (Codex Alimentarius Standards, 2005).
2.5 Antimicrobial activity testing
Antimicrobial susceptibility testing is commonly applied for epidemiological studies,
drug discovery and/or prediction of therapeutic outcome.

11
The in vitro test has been used successfully to study effects of antibiotics (Cheesbrough,
2006). This study focussed on effect of lemon juice-extract on three bacterial types isolated
from African sausages, which has not been done in Kenya.
2.5.1 Agar disk-diffusion method
Microbiologists routinely uses agar disk-diffusion testing method developed in 1940
for routine antimicrobial testing work. Clinical and Laboratory Standards Institute (CLSI) has
published approved standards for bacteria testing (CLSI, 2012). Agar plates are inoculated
with a standardized inoculum of the test microorganism. Then, filter paper discs (about 6 mm
in diameter), containing the testing components at specific concentrations, are placed on the
agar surface (Cheesbrough, 2006). The culture plates containing testing organisms and
antimicrobial components are incubated under suitable conditions for the particular
microorganism. Generally, antimicrobial component diffuses through the agar plate and
inhibits the growth of the test organism and then the diameters of inhibition growth zones are
measured (Cheesbrough 2006).
2.5.2 Agar well-diffusion method
Agar well-diffusion method aids in evaluating antimicrobial activity of plant extracts
(Valgas et al., 2007). The culture plate surface is inoculated with the test organisms, a well
with a diameter of 6 to 8 mm is punched aseptically with a sterile agar puncture and a volume
(20–100µL) of the antimicrobial plant extract solution at specific concentration is introduced
into the well. Then, agar plates are then incubated under suitable conditions. The antimicrobial
plant extract diffuses through the agar medium and inhibits the growth of the microbial strain
tested. The growth of the test organism and then the diameters of inhibition growth zones are
measured (Valgas et al., 2007).

12
2.5.3 Agar plug-diffusion method
According to Elleuch et al. (2010), this technique involves streaking agar with
organism of interest, after an overnight growth, certain molecules produced by the organism
defuse into the agar. An agar plug is removed with help of an agar puncture. The cut Agar
plug is put on another culture plate inoculated with test micro-organism. The molecules
diffuse from the plug to the second culture plate. The diameter of inhibition zone around the
agar plug indicates antimicrobial activity.
2.5.4 Agar contact method
According to Marston (2014), antimicrobial component is transferred from a thin layer
chromatogram to culture plate inoculated with test micro-organism. Diffusion takes place after
few hours. The culture place is then incubated and the diameter of inhibition zone around the
area of contact with the chromatogram indicates antimicrobial activity.
2.5.5 Dilution methods
According to Pfaller et al., (2004) and Valgas et al. (2007), this technique presents one
of the most common techniques for MIC determination either in agar or broth medium. The
method for performing broth technique involves dilution preparation of antimicrobial
component in a liquid media in tubes. All tubes are adjusted according to 0.5 McFarland scale.
Endpoint will be determined by the highest dilution that inhibits microbial growth after
incubation.
2.5.6 Time-kill test (time-kill curve)
This is an effective method for antimicrobial activity determination. It shows the
interaction between a microbial agent and antimicrobial component. According to Pfaller et
al. (2004), microbial suspension and broth culture media in 3 tubes are needed in performing
test. The antibacterial effect is tested in relation to time of kill.

13
2.6 Bacterial inhibitory effect of natural products including lemon
Lemon (Citrus limon) is plant with antimicrobial effect belonging to family Rutaceae.
It is grown mainly for food, that is, its fruit is used in beverages and cooking. Its alkaloids,
citric acids and other compounds have anticancer and antibacterial potential. It is also used as
a preservative due to its anti-oxidant properties (Conte et al., 2009). According to Kawaii et
al. (2000), all parts of the plant such as leaves, stem, fruit, roots and flower are useful; they
have demonstrated activity against various microbial agents. Study done by Maruti et al.
(2011) showed that the peel of lemon is a good antimicrobial agent against specific bacteria
such as Pseudomonas and Micrococcus. The respective study involved incubation of different
concentrations of crude solvent extracts of the lemon peel (1:20, 1:40, 1:60, 1:80 and 1:100),
prepared as discs, with different microbial cultures for 24 hrs at 37ºC. The diameter of zones
of inhibition are measured, recorded and interpreted.
2.7 Testing for pathogenicity of bacterial isolates
Animal models and In-Vitro epithelial culture tissue culture have been exploited
extensively in the study of human enteric pathogens and their effect on their host. Virulence
study have made use of several in in vivo models such as mice, rabbits, rats and even humans
among other models. According to Vallance et al. (2004), inoculation of pathogens through
various routes in animal models requires care consideration and expertise to lower the effect
arising from the procedure. The nature of effect anticipated from inoculation of suspected
pathogenic agent determines the route of inoculation effect (Vallance et al., 2004). Parenteral
route offers the best method of administration since GIT and hepatic degradation of the
microbial agent is bypassed. The oral administration offers easy, convenient and safe route
though bioavailability is much slower compared with other methods due to degradation and
metabolic effect of hepatic and GIT effects (FDA, 2010).

14
According to Ngo and Maibach (2010), intramuscular and intra-dermal administration
offers another route of though absorption of injected component is affected by variety of
factors among them; integrity of skin surface, size of skin thickness among others.
Intraperitoneal route is among common methods of administration of substances in small
animals (Turner et al., 2011). According to Turner et al. (2011), absorption of microbial
components through intravenous route is faster than intraperitoneal route. Intranasal method
of administration is also exploited for delivery of sprays (Illum, 2002). Nasal mucosal and the
lungs are highly vascularized thereby maximizing absorption of administered substances
(Illum, 2002). Necropsy, haematological and biochemical processes are essential in
monitoring and evaluating pathogenicity (Porter et al., 2012). In a similar study, Firoz et al.
(2010), after intravenous inoculation, isolated Salmonella enterica serovar Typhi (BKC 3233)
from the liver, spleen, blood and bone marrow samples collected at the end of the experiment
on day 9 post-infection.

15
CHAPTER 3: MATERIALS AND METHODS
3.1 Study design
A descriptive study design was employed whereby a convenience sampling of retail
meat outlets from Westlands, Pangani and Kangemi was carried out. Non-roasted and roasted
African sausage samples were collected and homogenates of inner contents prepared using
sterile peptone water were used to determine total bacterial concentration (TBC) and
identification of the isolates. Three most prevalent bacterial isolates were then tested for
susceptibility to lemon juice-extract, while one of them was further tested for pathogenicity
using mouse experimental model.
3.2 Study area
The study was carried out in Nairobi County, Kenya (Figures 1 and 2). It is the
smallest, yet most populous county; the capital and largest city of Kenya, which has
experienced one of the most rapid growths in urban centres with a population of 3,375,000 as
at year 2009 census (Kenya population and Housing Census, 2009). It has a total area of 696
km2 with 17 parliamentary constituencies. Nairobi is a cosmopolitan and a multicultural city.
Economically, it can be subdivided into three main categories; (1) the high end or leafy
suburbs or upper-class estates, the likes of Muthaiga, Karen, Westlands among others, (2) the
Middle-class estates of Pangani, Buruburu among others and (3) low class estates of Mukuru,
Mathare, Kangemi slums among others (Nairobi Mitaa, 2011). Three ready-to-eat vending
sites and meat eatery points of Westlands market, Kangemi market and Pangani estate (Figure
2) were conveniently selected on the basis of easy access, the limited budget that the
researcher was operating on, perceived sanitation and relative hygiene levels. The number of
vendors in these areas is not known; but they tend to converge around the shopping areas.

16
Figure 1: Map of Kenya, showing position of Nairobi County (in red). (Source:
nairobimetro.go.ke)
17
Figure 2: Map of Nairobi County, indicating the three study sites of Pangani, Westlands and
Kangemi. (Source: nairobimetro.go.ke)
3.3 Sample size calculation
Prevalence of common meat contaminants in previous studies was used to determine
the sample size required to detect the presence of the bacteria. An expected prevalence rate of
7% was used to estimate the sample size in this study since similar studies (Miyoko, et al.,
2004; Magwira et al., 2005; Weese et al., 2009; Kabwanga et al., 2013) reported a prevalence
rate of between 3 - 14%. Using the above information, the sample size was calculated using
the formula given by Fisher et al., (1998), as follows:
Pangani Kangemi
Study sites

18
Where:
n = sample size
Z = Standard normal value for 95% (1.96)
p = Estimated prevalence set at 7%
q= 1 – p
d= precision level of the study set at 5% (±0.05).
The calculated sample size (n) was 100 samples.
3.4 Sample collection and handling
A total of hundred (100) African sausage (63 roasted and 37 non-roasted) samples
were conveniently acquired from three locations (33 samples from Westland market, 33
samples from Pangani and 34 samples from Kangemi shopping center). The samples were
obtained aseptically from the vendors, picked separately as they are sold using sterile
glass bottles, labelled and stored in a cool box before processing in the laboratory within 24
hours of collection. Samples were transported to the Department of Veterinary Pathology,
Microbiology and Parasitology, University of Nairobi, Kabete where they were homogenized
in readiness for bacteriological analysis which was carried-out within 2 hours of collection.
Figure 3 shows the how the African sausage is roasted and served.
Figure 3: The African sausage – roasting and serving.

19
3.4.1 Homogenate preparation
At the laboratory, one-gram portions of the African sausages (roasted and non-roasted)
were obtained aseptically and cut into small pieces on a sterile chopping board using a sterile
knife, and blended (homogenized) in 4ml of 0.1% peptone water to obtain 1:5 initial dilution.
(Health Protection Agency, 2005).
3.5 Bacterial isolation
Since the researcher suspected presence of coliforms and other fastidious organisms,
the homogenates of the African sausages were streaked on general purpose enriched medium
(blood agar) and selective and differential medium for members of family Enterobacteriaceae
(MacConkey agar) (Oxoid Ltd. Termo Scientific, UK) and incubated aerobically at 37∘C for
24 hours. The isolated bacteria were identified based on colony morphology, Gram staining
reaction, and biochemical characteristics using established standardized methods according to
Bergey’s Manual of determinative bacteriology (Holt et al., 1994).
3.6 Quantification of bacterial load of the African sausages
For the determination of bacterial load (total bacterial count), method given by Miles
and Misra (1938) was used. Serial dilutions of 10−1 to 10−10 were prepared from the African
sausage homogenate stock solution that was prepared earlier. Nutrient agar plate was divided
into four quadrants, and each quadrant served as one plate. Using a 25ul calibrated dropper
(equivalent to 1/40th of an ml), one drop from each dilution tube was placed per quadrant;
each dilution was done in quadruplicate. The drop was then allowed to dry and the plate
incubated aerobically at 37∘C for 24 hours (Jersek, 2017), after which the number of colonies
that grew per drop was counted using Quebec Dark Field colony counter taking the average
count for the quadruplicate drops of each dilution.

20
The concentration of the original bacterial suspension was then calculated and
expressed as colony forming units per millilitre (cfu/ml), using the formula, a x 40 x10y,
where a is the average number of colonies in the 4 drops of one dilution tube/diluted
suspension, 40 is the number of drops that make one millilitre (the drop being equivalent to
1.40th of a ml), and10y is the dilution factor of the respective dilution tube/diluted suspension.
This is then multiplied by 5, the initial dilution at homogenization stage
3.7 Susceptibility of the three most prevalent isolates to lemon juice-extract
3.7.1 Preparation of lemon juice extract
Ten (10) large, fresh lemons (Citrus Limon) were purchased from a local supermarket.
Within 2 hours of purchase, lemon juice-extract was prepared in readiness for carrying out of
respective bacterial susceptibility testing. The lemons were cleaned with sterile water and
surface-sterilized by immersing them into 70% (v/v) ethanol for one minute. Fifty (50) grams
of lemon was sliced and homogenized aseptically using mortar and pestle. The homogenized
mixture was filtered through sterile cheesecloth. The lemon juice-extract was considered as
the 100% concentration. The juice-extract was used while fresh; however, in case of some
delay, it was maintained at 40C. The concentrated juice-extract was then diluted with sterile
distilled water to give other concentrations (75%, 50% and 25%) for the assay.
3.7.2 Lemon susceptibility testing
Minimum inhibitory concentration (MIC) using broth inhibitory testing and Agar well
diffusion methods were used to test for bacterial lemon susceptibility. They were carried-out
on each of the three most prevalent bacterial isolates separately and in triplicate, using varying
concentrations of the lemon juice-extract prepared in section 3.7.1 above.

21
3.7.2.1 Preparation of bacterial inocula.
Escherichia coli was chosen for pathogenicity studies since some strains of this
organism are pathogenic and can cause serious food poisoning in humans. Inocula for
antibacterial activity screening were prepared from 24 hour culture of each of the test isolate,
suspended in physiological saline to match a turbidity of 0.5 McFarland Barium sulfate
standards (Valgas et al., 2007). The harvest was then stored in sterile bijou bottles and used as
the stock suspension of organisms.
3.7.2.2 Screening for antibacterial activity
Broth inhibitory testing was done using the method of Valgas et al. (2007), One
millilitre of each of the prepared concentrations of the juice-extract i.e. 25%, 50%, 75% and
100% was separately mixed with 1 ml of nutrient broth in a test tube. A loopful of the test
organism was then introduced to each of the tubes; a tube containing nutrient broth only,
seeded with the test organism, served as control. All the tubes were then incubated at 370C for
24 hrs and then examined for growth by observing turbidity (Ajaiyeoba et al., 2003). If the
organisms were susceptible to the lemon juice-extract, there would be no bacterial growth in
the particular broth/test tube (CLSI, 2012)
Agar diffusion method was carried-out using the method of Valgas et al. (2007).
Streaking of bacteria from the stock culture prepared in 3.7.2.1 above was done on Mueller
Hinton agar (Oxoid Ltd. Thermo Scientific, UK) so as to produce confluent growth; care was
taken to have prepared agar of the same thickness. Wells (6 mm diameter and depth of 4 mm)
were then dug on the streaked agar using sterile agar puncture. Respective concentrations of
the lemon juice extract were poured into the wells; the plates were then incubated at 370C for
24 hours. The diameter of clear region around an antimicrobial agent on the agar surface
(inhibitory zone) was measured in millimeters. All tests were done in triplicate.

22
3.8 Determination of pathogenicity of one of the bacterial isolates using mouse model
Escherichia coli: some strains of this organism are pathogenic and can cause serious food
poisoning in humans (Cheesbrough, 2006).
3.8.1 Experimental animals
Thirty (30) Balb /C mice aged three weeks, equal numbers of males and females were
used for pathogenicity testing. The mice were obtained from Kenya Medical Research
Institute (KEMRI), Nairobi, Kenya. They were transported in small numbers in shoe-box
cages measuring 18x25cm and housed in groups of 5 in polypropylene plastic base cages,
with lids made of straight stainless-steel wire measuring 450 cm2 floor area x 32cm2 height.
They were kept at small animal isolation unit in the Department of Veterinary Pathology,
Microbiology and Parasitology, Kabete Campus, University of Nairobi, where they were
allowed to acclimatize for 3 days before start of the experiment (Obernier and Baldwin,
2006). They were provided with mice pellets and clean water ad libitum while wood
shavings, provided as beddings, were changed after every two days until the end of the
experiment.
3.8.2 Ethical clearance
Prior to the commencement of the study, ethical clearance was obtained from Animal Use and
Ethics committee, Faculty of Veterinary Medicine, University of Nairobi (appendix I).
3.8.3 Biosafety and Occupational Safety
As per the Animal Biosafety Manual (2012), mice were handled in a single sided
animal containment work station that protected the operator, the animal and the assistant
against allergens during animal handling. All manipulations performed on mice using
suspected pathogenic strains were conducted in a class II Biosafety Cabinet equipped with
High Efficiency Particulate Air (HEPA) filters. Appropriate mice restrainers were used.

23
Aseptic techniques were observed to avoid cross contamination. The suspected infectious
pathogen that was inoculated into the mice was handled in safety cabinet using protective
clothing, latex gloves, nose masks and laboratory coats and sharps that were used in the
experiment were disposed into well labeled sharps container. Reference biological and non-
biological materials used in the experiments were stored in a refrigerator while others, to be
discarded, were transported in tightly sealed polythene bags for disposal at Kabete Campus
incinerator, University of Nairobi,
3.8.4 Inoculation of mice for pathogenicity testing
3.8.4.1 Preparation of inocula
E. coli was chosen for pathogenicity studies since some strains of this organism are
pathogenic and can cause serious food poisoning in humans. Sterile swabs, moistened in
sterile peptone water, were used to pick and streak the organism on prepared MacConkey agar
plates; multiple streaks were made in order to obtain confluent growth. Harvesting of the
bacteria was done by flooding the entire plate with 4 ml sterile physiological saline and
agitating it so as to dislodge the bacteria. The harvest was then placed in sterile tubes, from
where bacterial viable count was carried-out following the method of Miles and Misra (1938),
as given in section 3.6 above.
3.8.4.2 Mice inoculation with test bacterium and monitoring for clinical disease
The mice were divided into six groups of five each; caged separately. Different groups
were identified using different coloured dyes. Dilutions 10-1- 10-5 were selected for
pathogenicity testing after viable count. Each mouse was inoculated 0.4 ml intra-peritoneally
with respective bacterial suspension (10-1-10-5). The control group was inoculated with sterile
normal saline.

24
During the experimental period, the inoculated mice were observed twice daily;
morning at 8 am and evening at 5 pm, for manifestation of clinical signs, namely activity,
alertness, presence of discharge in the eyes/nose, appearance of the coat and state of their
droppings (Burkholder, 2013).
3.8.5 Clinical pathology
Two sets of blood samples were collected at once from each mouse on the 7th day of
the experiment: one with anticoagulant, Ethylenediaminetetraacetic acid (EDTA) and one
without anticoagulant, in vacutainer tubes. All blood samples were used for haematology and
clinical chemistry analysis, which included blood cell counts, packed cell volume,
haemoglobin concentration and red cell indices, using IDEXX ProCyte DX automated
haematology analyser (IDEXX Laboratories Inc.). In addition, thin blood smears were
prepared, stained with 1:5 Giemsa and examined under light microscope for cellular
morphology and differential leukocyte counts. Serum samples obtained by centrifugation of
coagulated blood sample were analysed for serum proteins and blood urea nitrogen (BUN)
using IDEXX Catalyst DX automated chemistry analyser (IDEXX Laboratories Inc). All
blood samples were analysed at Pathologist Lancet veterinary laboratories, Kenya. Figure 4
shows Veterinary pathologist collecting blood sample for analysis.

25
Figure 4: Investigator being assisted by a veterinary pathologist collecting blood sample from
a mouse
3.8.6 Necropsy findings
Necropsy on all euthanized mice was carried out according to standard procedures
(Fieldman and Seely, 1988). The mice were euthanized all at once on the 7th day of the
experiment. Any gross lesion observed was recorded while major organs namely liver, spleen,
intestines, lungs, heart, brain were collected, fixed in 10% formal saline, processed, stained
with Hematoxylin and eosin and examined under a light microscope for microscopic lesions.
These were observed and recorded for each experimental group. Figure 5 shows Veterinary
pathologist collecting tissue samples for histological examinations on euthanized mice.

26
Figure 5 : Veterinary pathologist collecting tissue samples from a mouse
3.9 Quality control check
Two randomly-selected control mice were sacrificed before and after the experiment;
their livers and spleens were cultured to ascertain that the un-inoculated-mouse population
was free from the study organism and other bacterial pathogens.
3.10 Statistical analysis
The findings of the study were entered, cleaned and stored into Microsoft Excel
program (Ms Excel). Data on bacteria isolated, bacterial load quantified from African
sausages sold in Nairobi County were analysed and presented in tables and figures.
Susceptibility data of the three most prevalent isolates to lemon juice-extract were subjected
to the analysis of variance (ANOVA) tests (Snedecor and Cochran, 1976). The pathogenicity
data of one of the isolates using a mouse model was imported into Statistical package for
social scientists (SPSS version 14).

27
The determination of the different zones of inhibition from varied concentrations of
lemon extracts, the values for total viable bacterial counts and haematological and
biochemical parameters were subjected to the analysis of variance (ANOVA) tests (Snedecor
and Cochran, 1976). Statistical significant differences between haematological and
biochemical qualities of various samples from different locations were evaluated at p < 0.05
and confidence limits at 95%.

28
CHAPTER 4: RESULTS
4.1 Isolation of bacteria from African sausages in Nairobi County
A total of one hundred (100) African sausage samples were collected and analysed - 33
samples from Westlands market, 33 samples from Pangani and 34 samples from Kangemi. In
Figure 5, five genera of bacteria (123 isolates) were isolated from 80/100 (80%) roasted and
non-roasted African sausages. They were: Staphylococcus, Bacillus, Streptococcus, Proteus
and Escherichia. Staphylococci were the most predominant bacteria in all the sausage samples
collected with a prevalence of 50.4% (62/123), Bacillus at 19.5% (24/123), Streptococcus
9.8% (12/123), Proteus 2.4% (3/123) while E.coli was isolated at 1.6% (2/123).
With respect to roasted African sausages, Staphylococcus accounted for 53.6% (15/28)
of the isolates in Kangemi, 52.2% (12/23) in Pangani and 38.1% (8/21) in Westlands. Bacillus
organisms were isolated at 7.1% (2/28) in Kangemi, 26.1% (6/23) in Pangani and 4.8% (1/21)
in Westlands; Streptococcus 10.7% (3/28) in Kangemi, 13% (3/23) in Pangani and 4.8%
(1/21) in Westlands; Proteus 3.6% (1/28) in Kangemi, 0% both in Pangani and in Westlands;
E.coli, 4.3% (1/23) in Pangani, 0% both in Kangemi and in Westlands .
With respect to non- roasted African sausages, Staphylococcus accounted for 50%
(6/12) of the isolates in Kangemi, 64.7% (11/17) in Westlands and 45.5% (10/22) in Pangani.
Bacillus organisms were isolated at 41.7% (5/12) in Kangemi, 31.8% (7/22) in Pangani and
17.6% (3/17) in Westlands; Streptococcus 17.6% (3/17) in Westlands, 9.1% (2/22) in Pangani
and 0% in Kangemi; Proteus; 9.1% (2/22) in Pangani, 0% both in Kangemi, and in Westlands
areas; E.coli; 4.5% (1/22) in Pangani 0% both in Kangemi and in Westlands areas. The
results are as given in Figure 6. Table 1 gives the mean distribution of bacterial isolates.

29
There was no significant difference (p>0.05) in distribution of isolates across the geographical
areas under study. (appendix II).
Figure 6 : Prevalence of the five genera of bacteria isolated from African sausages sampled
from Pangani, Kangemi and Westlands, Nairobi County
Table 1: Evaluation of the mean distribution of bacterial isolates from African Sausages
across the three geographical areas using paired sample t-test (P values evaluated
at 95% confidence limits).
Paired Differences
t
df
Sig. (2-tailed)
Mean
Std. Deviation
Std. Error Mean
95% Confidence Interval of the Difference
Lower Upper
Pair 1 Kangemi - Pangani -1.333 4.590 1.874 -6.150 3.483 -.712 5 .509
Pair 2 Kangemi - Westlands .333 2.160 .882 -1.934 2.600 .378 5 .721
Pair 3 Pangani - Westlands 1.667 6.282 2.565 -4.926 8.259 .650 5 .544
Bacillus sp.
Staphylococcus sp.
Streptococcus sp.
E. coli
Proteus Sp.
No Growth
0.333 0.882
0.509
0.721
0.544

30
4.2 Quantification of bacterial load of the African sausages
4.2.1 Bacterial load of both roasted and non-roasted African sausages
Overall, 26/100 (26%) African sausage samples had a bacterial load of between 1.0-
9.9 x101 cfu/g , 17/100 (17%) samples had a bacterial load of between 1.0- 9.9 x10² cfu/g,
20/100 (20%) samples had a bacterial load of between 1.0- 9.9 x10³ cfu/g, 17/100 (17%)
samples had a bacterial load of between 1.0- 9.9 x10⁴ cfu/g, 13/100 (13%) samples had a
bacterial load of between 1.0- 9.9 x10⁵ cfu/g, 6/100 (6%) samples had a bacterial load of
between 1.0- 9.9 x10⁶ cfu/g and 1/100 (1%) sample had a bacterial load of between 1.0- 9.9
x107 cfu/g. With respect to individual study sites, 12/34 (35.3%) of samples from Kangemi,
3/33 (9%) from Pangani and 11/33 (33.3%) from Westlands area had a bacterial load of
between 1.0- 9.9 x101 cfu/g. Two of the thirty four (5.9%) samples from Kangemi, 3/33
(9.1%) from Pangani and 12/33 (36.36%) from Westlands area had a bacterial load of between
1.0- 9.9 x10² cfu/g. Six of the thirty four (17.6%) samples from Kangemi, 9/33 (27.27%) from
Pangani and 5/33 (15%) from Westlands area had a bacterial load of between 1.0- 9.9 x10³
cfu/g.
Six of the thirty four (17.6%) samples from Kangemi, 9/33 (27.3%) from Pangani and
2/33 (6%) from Westlands area had a bacterial load of between 1.0- 9.9 x10⁴ cfu/g. 4/34
(11.76%) of samples from Kangemi, 6/33 (18%) from Pangani and 3/33 (9%) from Westlands
area had a bacterial load of between 1.0- 9.9 x10⁵ cfu/g. Three of the thirty four (8.8%) of
samples from Kangemi, 3/33 (9%) from Pangani and 0% from Westlands area had a bacterial
load of between 1.0- 9.9 x10⁶ cfu/g. One of the thirty four (2.9%) of samples from Kangemi,
0% from Pangani and Westlands area had a bacterial load of between 1.0- 9.9 x10⁷ cfu/g
(Appendix III and IV). The results are as given in Figure 7.

31
Figure 7 : Percent bacterial loads of the sampled African sausages (roasted and non-
roasted) sold in the three study sites
4.2.2 Bacterial load from roasted African sausages
Twenty two of sixty two (35.5%) roasted African sausage samples had a bacterial load
of between 1.0- 9.9 x101 cfu/g , 11/62 (17.7%) samples had a bacterial load of between 1.0-
9.9 x10² cfu/g, 12/62 (19%) samples had a bacterial load of between 1.0- 9.9 x10³ cfu/g, 9/62
(14.5%) samples had a bacterial load of between 1.0- 9.9 x10⁴ cfu/g, 5/62 (8%) samples had a
bacterial load of between 1.0- 9.9 x10⁵ cfu/g, 2/62 (3%) samples had a bacterial load of
between 1.0- 9.9 x10⁶ cfu/g and 1/62 (1.6%) sample had a bacterial load of between 1.0- 9.9
x107 cfu/g. With respect to individual study sites, 10/24 (41.7%) of samples from Kangemi,
3/19 (15.8%) from Pangani and 9/20 (45%) from Westlands area had a bacterial load of
between 1.0- 9.9 x101 cfu/g.
One of twenty four (4.17%) of samples from Kangemi, 3/19 (15.8%) from Pangani
and 7/20 (35%) from Westlands area had a bacterial load of between 1.0- 9.9 x10² cfu/g. 4/24
(16.7%) of samples from Kangemi, 7/19 (36.8%) from Pangani and 1/20 (5%) from Westlands
area had a bacterial load of between 1.0- 9.9 x10³ cfu/g.
cfu/g 101 102 103 104 105 106 107

32
Three of the twenty four (12.5%) samples from Kangemi, 4/19 (21%) from Pangani
and 2/20 (10%) from Westlands area had a bacterial load of between 1.0- 9.9 x10⁴ cfu/g. 3/24
(12.5%) of samples from Kangemi, 2/19 (10.5%) from Pangani and 0% from Westlands area
had a bacterial load of between 1.0- 9.9 x10⁵ cfu/g. Two of the twenty four (8.3%) of samples
from Kangemi, 0% from Pangani and Westlands area had a bacterial load of between 1.0- 9.9
x106 cfu/g. 1/24 (4.17%) of samples from Kangemi, 0% from Pangani and Westlands area had
a bacterial load of between 1.0- 9.9 x10⁷ cfu/g. The results are as given in Figure 8. Table 2
gives the mean total aerobic bacterial count from roasted African sausages across the three
geographical areas. There was no significant difference (p≥0.05) in mean total aerobic
bacterial count across the areas under study.
Figure 8 : Percent bacterial loads of the sampled roasted African sausages sold in the three
study sites
101 102 103 104 105 106 107 cfu/g

33
Table 2: Evaluation of the mean total aerobic bacterial count from roasted African sausages
across the three geographical areas using paired sample t-test (P values evaluated at
95%confidence limits).
Paired Differences
t df
Sig. (2-
tailed) Mean
Std. Deviation
Std. Error Mean
95% Confidence Interval of the Difference
Lower Upper
Pair 1
Kangemi - Pangani 147885.000 694148.169 159248.512
-186683.708
482453.708 .929 18 .365
Pair 2
Kangemi - Westlands 175895.500 658535.387 147252.989
-132308.548
484099.548 1.195 19 .247
Pair 3
Pangani - Westlands 26479.211 60777.503 13943.315 -2814.608 55773.029 1.899 18 .074
4.2.3 Total aerobic bacterial count from non-roasted African sausages.
Three of the thirty eight (7.9%) non-roasted African sausage samples had a bacterial
load of between 1.0- 9.9 x101 cfu/g , 6/38 (15.79%) samples had a bacterial load of between
1.0- 9.9 x10² cfu/g, 8/38 (21%) samples had a bacterial load of between 1.0- 9.9 x10³ cfu/g,
8/38 (21%) samples had a bacterial load of between 1.0- 9.9 x10⁴ cfu/g, 8/38 (21%) samples
had a bacterial load of between 1.0- 9.9 x10⁵ cfu/g, 4/38 (10.5%) samples had a bacterial load
of between 1.0- 9.9 x10⁶ cfu/g and 1/38 (2.6%) sample had a bacterial load of between 1.0-
9.9 x10⁷ cfu/g.
With respect to individual study sites, 2/11 (18.8%) of samples from Kangemi, 0%
from Pangani and 1/13 (7.7%) from Westlands area had a bacterial load of between 1.0- 9.9
x101 cfu/g. 1/11 (9%) of samples from Kangemi, 0% from Pangani and 5/13 (38.5%) from
Westlands area had a bacterial load of between 1.0- 9.9 x10² cfu/g. 2/11 (18%) of samples
from Kangemi, 2/14 (14.3%) from Pangani and 4/13 (30.8%) from Westlands area had a
bacterial load of between 1.0- 9.9 x10³ cfu/g.

34
Three of the eleven (27.3%) of samples from Kangemi, 5/14 (35.7%) from Pangani and
0% from Westlands area had a bacterial load of between 1.0- 9.9 x10⁴ cfu/g. 1/11 (9%) of
samples from Kangemi, 4/14 (28.6%) from Pangani and 3/13 (23%) from Westlands area had
a bacterial load of between 1.0- 9.9 x10⁵ cfu/g. One of the eleven (9%) of samples from
Kangemi, 3/14 (21.4%) from Pangani and 0% from Westlands area had a bacterial load of
between 1.0- 9.9 x10⁶ cfu/g. 1/11 (9%) of samples from Kangemi, 0% from Pangani and
Westlands area had a bacterial load of between 1.0- 9.9 x10⁷ cfu/g. The results are as given in
Figure 9. Table 3 gives the mean total aerobic bacterial count from non-roasted African
sausages across the three geographical areas. There was no significant difference (p≥0.05) in
mean total aerobic bacterial count across the areas under study.
Figure 9: Percent bacterial loads of the sampled non-roasted African sausages sold in the
three study sites
101 102 103 104 105 106 107

35
Table 3: Evaluation of the mean total aerobic bacterial count from non-roasted African sausages
across the three geographical areas using paired sample t-test (P values evaluated at
95%confidence limits).
4.3 Susceptibility of the three most prevalent isolates to lemon juice extract
4.3.1 Inhibitory effect of lemon juice-extract at various concentrations
The concentrated extract (100%) showed most effect on all the three bacteria studied
and in all the three study areas for both Broth inhibitory method and agar diffusion method. In
Kangemi, Pangani and Westlands, the MIC was 50% for the Staphylococcus and
Streptococcus isolates under inhibitory testing. The MIC for bacillus in Kangemi was 75%
using broth inhibitory method. Minimum effect being shown by the lowest concentration of
25% using agar diffusion method which, for the three study bacteria gave an inhibition zone
of 10 mm. There were also varied responses even for the same bacterial type and same
concentration, with respect to the three study areas. The 100% extract had highest effect on
Staphylococcus isolate from Pangani (inhibition zone of 20 mm), followed by the one from
Westlands (inhibition zone of 18 mm), lastly the one from Kangemi (inhibition zone of
15mm). For Bacillus, the 100% extract had highest effect on isolate from Kangemi (inhibition
zone of 18mm), followed by the one from Pangani (inhibition zone of 18 mm), lastly the one
from Westlands (inhibition zone of 17 mm).
Paired Differences
t df
Sig. (2-
tailed) Mean
Std. Deviation
Std. Error Mean
95% Confidence Interval of the Difference
Lower Upper
Pair 1
Kangemi - Pangani -32490.00 1839501.21 554630.48 -1268283.73 1203303.73 -.059 10 .954
Pair 2
Kangemi - Westlands 504456.36 1407287.95 424313.28 -440972.54 1449885.27 1.189 10 .262
Pair 3
Pangani - Westlands 457091.54 851423.04 236142.26 -57418.26 971601.33 1.936 12 .077

36
For Streptococcus, the 100% extract had highest effect on isolate from Westlands
(inhibition zone of 20 mm), followed by the one from Pangani (inhibition zone of 18 mm),
lastly the one from Kangemi (inhibition zone of 17 mm). The 75% extract had highest effect
on Staphylococcus isolate from Westlands (inhibition zone of17mm), followed by the one
from Pangani (inhibition zone of 17 mm), lastly the one from Kangemi (inhibition zone of 13
mm). For Bacillus, the 75% extract had highest effect on isolate from Pangani (inhibition zone
of 16 mm), followed by the one from Kangemi (inhibition zone of15 mm), lastly the one from
Westlands (inhibition zone of 14 mm).
For Streptococcus, the 75% extract had highest effect on isolate from Westlands
(inhibition zone of 17 mm), while it had same effect on isolates from Pangani and Westlands
(inhibition zone of15 mm). The 50% extract had highest effect on Staphylococcus isolate from
Westlands (inhibition zone of 16 mm), followed by the one from Pangani (inhibition zone of
15 mm), lastly the one from Kangemi (inhibition zone of 12 mm). For Bacillus, the 50%
extract had highest effect on isolate from Pangani (inhibition zone of 16 mm), followed by the
one from Westlands and Kangemi (inhibition zone of 13 mm). For Streptococcus, the 50%
extract had highest effect on isolate from Westlands (inhibition zone of 15 mm), followed by
the one from Pangani (inhibition zone of 13 mm), lastly the one from Kangemi (inhibition
zone of 12 mm). Interestingly, the 25% extract had the same effect on all the three study
bacteria and the three study areas (inhibition zone of 10 mm). Overall, the bacterium that
showed the most susceptibility to lemon extract was Staphylococcus. Inhibitory profiles for
the three most prevalent isolates to varied concentrations of lemon juice-extract are as given
in Table 4, Figures 10 and 11

37
Table 4: Minimum Inhibitory Concentration profile of the three most prevalent isolates to
varied concentrations of lemon extract using broth inhibitory method
Study site Minimum Inhibitory concentration
Staphylococcus Bacillus Streptococcus
Kangemi 50% 75% 50%
Pangani 50% 50% 50%
Westlands 50% 50% 50%
Figure 10: Inhibitory profile of the three most prevalent isolates to varied concentrations of
lemon extract using agar gel diffusion method
Staphylococcus sp.
Bacillus sp.
Streptococcus sp.

38
Figure 11 shows inhibitory pattern of one of the tested isolates to the various dilutions
of the lemon extract; 50% dilution being the highest dilution/lowest concentration that had
inhibitory effect on the test organism, while the susceptibility results show different zones of
inhibition with 25%, 50%, 75% and 100% concentrations of lemon extract.
Figure 11: Inhibitory pattern of Bacillus sp. to the various dilutions of the lemon juice-extract
4.3.2 Mean diameters of the inhibition zones
The three tested isolates gave a mean inhibitory zone diameter of 14 mm, with a
minimum inhibitory zone of 10mm and a maximum of 20 mm for Streptococcus, minimum
inhibitory zone of 11 mm and a maximum of 20 mm for Staphylococcus and minimum
inhibitory zone of 10mm and a maximum of 18 mm for Bacillus (appendix V).
4.3.3 Statistical comparison of the mean diameters
When the mean values for inhibitory zones were compared statistically using unpaired
student t-test, at 95% confidence level, the p values were above 0.05 (>0.05), indicating that
the mean values were not significantly different (appendix IV).
Zone of Inhibition

39
4.3.4 Minimum Inhibitory Concentration using broth inhibitory testing
In Kangemi area, six isolates were tested namely; four Staphylococcus Spp. and two
Bacillus sp. In Pangani area, eight isolates were tested namely; one Staphylococcus Spp., five
Bacillus Spp. and two E.coli. In Westlands area, five isolates were tested namely; three
Staphylococcus Spp. and two Bacillus Spp. Figure 12 shows the minimum inhibitory
concentration for E.coli isolated from an African sausage. From left, the dilutions are 100%,
75%, 50% and 25%; the one in extreme right is the control with no lemon juice-extract added
Figure 12: Lemon antibacterial sensitivity pattern for E.coli – Minimal inhibitory
concentration.
4.3.5 Potency of Lemon Juice extract
Figure 13 shows relative amounts of harvested bacteria after the homogenates were
treated with lemon juice-extract (100% concentrated). There was almost immediate action on
the bacteria, as indicated by growth reduction, compared to the one without lemon treatment.
Maximum inhibition was shown after 30 minutes’ treatment, after which the lemon effect
faded as shown by the growth one hour after the treatment.
MIC

40
Figure 13: Bacterial loads before and after lemon juice-extract treatment of roasted and
unroasted African sausages homogenates, after specified time periods.
4.4 Pathogenicity of one isolate - E. coli, using a mouse model
4.4.1 Clinical signs
When the mice were inoculated with various concentrations (4.36x10⁸, 4.36x10⁷,
4.36x10⁶, 4.36x10⁵ and 4.36x10⁴) of E. coli, No mortality was observed in all the mice under
experiment as all survived and did not show any clinical sign at the end of the 7 day
experimental period.

41
4.4.2 Clinical pathology
Two sets of blood samples were collected at once from each mouse on the 7th day of
the experiment in vacutainer tubes: one with anticoagulant [Ethylenediaminetetra acetic acid
(EDTA)] for haematological investigations and one without anticoagulant for clinical
chemistry tests. The blood samples were submitted to Pathologist Lancet Kenya for analysis.
The figure 11 shows the investigator assisted by a Veterinary pathologist to collect blood
samples for haematological and clinical examination examinations. Figure 14 show the
comparison of total erythrocyte count in test and control group of mice subjected to varied
concentrations of E.coli.
Figure 14: Total erythrocyte count variations in control and experimental mice inoculated
intraperitoneally with the various concentrations (4.36x10⁸-4.36x10⁴) of test E. coli.
4.36x10⁸ 4.36x10⁷ 4.36x10⁶ 4.36x10⁵ 4.36x10⁴

42
Figure 15 shows the comparison of total leucocyte count in test and control group. The values
fell within the reference value control and experimental mice.
Figure 15: Total Leucocyte Count (TLC) variations in control and experimental mice
inoculated intraperitoneally with the various concentrations (4.36x10⁸-4.36x10⁴) of test E.
coli.
The haematological and biochemical mean values from the mice inoculated with the
test E. coli were statistical compared using unpaired student t-test at 95% confidence level and
the analysis of variance for the test groups. The results/mean values for the control and
experimental mice showed no significance variations (p>0.05), while some for serum proteins
and BUN values (Chemistry parameters) we slightly different from the control group (p>0.05)
(appendices VI, VII, VIII and IX, X and XI).
4.36x10⁸ 4.36x10⁷ 4.36x10⁶ 4.36x10⁵ 4.36x10⁴

43
4.4.3 Necropsy findings
The peritoneum was white, smooth and shiny. All other organs retained normal colour,
size and shape. Organs examined were normal except for accumulation of blood in the venous
side of circulation and prominence of lymphoid follicles in the spleen, Peyer's patches and
peri-bronchial lymphoid areas.
4.5 Quality control check
The peritoneum was white, smooth and shiny euthanized control mice. All other
organs retained normal colour, size and shape while the organs examined were normal.

44
CHAPTER 5: DISCUSSION, CONCLUSIONS AND RECOMMENDATIONS
5.1 Discussion
Five genera of bacteria were isolated, namely: Staphylococcus spp., Bacillus spp.,
Streptococcus spp., Proteus spp. and Escherichia coli. Staphylococcus organisms were the
most predominant bacteria in all the sausage samples collected with a prevalence of 60.2%;
various species of Bacilli were the second most prevalent at 23.5%, followed by Streptococci
spp. at 11.65%, Proteus spp. at 2.9% and E.coli was isolated at 1.9%. The data obtained on
isolation of bacteria in the present study where Staphylococcus spp. and Bacillus spp. were the
predominant isolates, agrees with a study by Oluwafemi and Simisaye (2006) and Okonko et
al., (2009) who isolated similar organisms from beef sausages and seafood in Nigeria,
respectively. However, differences are noted whereby in the present study Streptococci spp.,
Proteus spp. and E. coli were isolated while in the latter, Enterobacter spp., Pseudomonas
spp. and Klebsiella species were isolated from beef sausages and seafood respectively.
The current study showed Staphylococcus species prevalence of 60.2%. This was
higher than the Staphylococcus species recovery at 58.6% from hotels, from restaurants and
cafes; report by Berynestad and Granums (2002). According to the reports, the predominant
organisms included Staphylococcus Spp, E. coli, Bacillus Sp., Enterobacter Spp.,
Pseudomonas Spp. and Klebsiella Spp. Carrying-out a similar study on minced meat, sausage
rolls and pies, Waites and Arbuthnott (1999) reported a 60.9% prevalence of Staphylococcus
aureus and 50% for E. coli. A study by Yusuf et al. (2012), percentage of occurrence of
bacterial isolated from the “balangu” meat product showed highest for Bacillus cereus with
19.6% which was attributed to aerial spores carried in the air and lower prevalence of
Staphylococcus aureus at 12.5% occurrence.

45
A study by Aycicek et al. (2005) reported that processed foods were found to be more
prone to Staphylococcus species contamination. Presence of Staphylococcus contamination in
some of the samples examined in this study might have resulted from handler's skin or the
environment. Among the roasted African sausages, Staphylococcus was highest in Kangemi.
However, the results of the current study contrast the findings by Orogu and Oshilim (2017)
who reported a 30% Bacillus occurrence from suya meat. Similar prevalence was obtained by a
study by Matos et al. (2006) working with dry smoked sausages. Presence of Bacillus
contamination in some of the samples examined in this study might have resulted from
contamination from vendor’s skin or the environment. This may have been attributed to
contamination from aerial spores carried in the air, throat, hands and nail of food handling
persons (Hatakka et al., 2000).
Similar finding on the prevalence of Streptococcus spp. was reported by Onuora et al.
(2015) working on grilled beef. The prevalence of E. coli reported in the present study was
slightly lower than that reported by Syne et al. (2013) and Onuora et al. (2015). E. coli
presence in African sausages have the potential to cause diarrhoea. The incidence of E. coli
obtained in this study is a cause for public health concern as this bacterium has been
implicated in cases of gastroenteritis (1982). The presence of Proteus isolates was remarkably
higher in a study by Gwinda et al. (2014) from beef meat, compared to what was found in the
current study. The presence of Proteus organisms in the meat samples can obviously be
attributed to unhygienic food processing. Staphylococcus spp., Bacillus spp., Streptococcus
spp. and E. coli are known to produce potent enterotoxins and the ingestion of food containing
these toxins can cause a sudden onset of illness within three to four hours, with nausea,
vomiting and diarrhea as the major symptoms (2006). There was no significant difference
(p>0.05) in distribution of these organisms across the three geographical sites studied.

46
Cases of the food handlers being sources of contamination have been reported: Bebora
et al (2005) isolated toxin-producing E. coli from food handlers in some tourist-class hotels in
Nairobi; this implies that the handlers were carriers of the organism. Kuria et al (2009)
isolated Salmonella, E. coli and other bacteria from commonly handled coins (currency) in
Kenya; an important point to note since African sausages sellers normally simultaneously
handle money and the African sausages.
In the present study, it was observed that there was no significant difference in the
bacterial load across the three geographical sites studied (p>0.05). Bacterial load of between
1.0 - 9.9 x 10² and 1.0 x 9.9 104 cfu/g was reported in most (54%) of African sausage samples.
Similar findings by Clarence et al. (2009) reported a bacterial load level of between 3 × 10³ -
2.8 × 10⁴ cfu/g in beef sausages. In present study there was no significant difference (p>0.05)
in mean total aerobic bacterial count across the areas under study and between roasted and
non-roasted African sausages samples.The level of the viable bacterial load in present study
could be attributed to unhygienic processing technique, unhygienic environment and practices
such as dirty cutting boards and knifes or utensils. Cheesbrough (2006) noted that insects
contribute to contamination by mechanical transfer of microorganisms to food products since
they are left uncovered and exposed to dust.
The Citrus Limon fruit juice-extract showed antibacterial activity against the
Staphylococcus, Bacillus and Streptococcus in current study. The susceptibility increasing
with increased concentration of the lemon juice-extract. There was no significant difference
(p>0.05) in the sensitivity patterns across the three genera tested. In the current study, the
MIC was 50% for the Staphylococcus and Streptococcus isolates under inhibitory testing. The
MIC for bacillus in Kangemi was 75% using broth inhibitory method.

47
Report by Adham (2015) revealed that Citrus limon juice and combination extract
showed activity against all gram positive and negative bacterial strain 100%, followed
by Citrus reticulate combination extract effect on 80% gram positive, while juice alone and
in combination with peel effect on 50% gram negative bacterial strain. Combination of peel
and juice extract of Citrus paradisi showed effect on 60% gram positive and 50% gram
negative bacterial strain. Citrus sinensis only effect on 20% gram positive bacteria. The
results supported by previously recorded data in which Citrus fruit have high antimicrobial
activity against gram positive than gram negative bacterial strain (Al-Ani et al., 2010). The
difference in sensitivity of the Gram-positive bacteria compared to that of Gram-negative
bacteria to antibiotics and antimicrobial natural products may due to differences in their cell
wall composition (Samarakoon et al., 2012).
The highest zone of inhibition of 20 mm was demonstrated by Staphylococcus and
Streptococcus organisms at a 100% lemon juice-extract concentration ; inhibition zones of
17mm were exhibited by Staphylococcus and Streptococcus organisms at 75% lemon juice-
extract concentration , 16mm zone of inhibition was exhibited by Staphylococcus organisms
at lemon juice-extract concentration of 50% and 13mm zone of inhibition was exhibited by
Streptococcus organisms at 25% lemon juice-extract concentration. The study confirms that
the bacterial susceptibility to varied concentration of lemon juice-extract is directly
proportional to the size of the inhibition zone (Garg et al., 2010).
A study by Hindi and Chabuck (2013) reported a susceptibility of between 20-26mm
diameter for Staphylococcus except S. epidermidis and a susceptibility of between 20-28 mm
diameters for Streptococcus. Similar findings were recorded by Al-Ani et al. (2010); they
found out that C. limon produced a bactericidal activity on Staphylococcus aureus, with a

48
zone of inhibition of 10 mm to 15 mm by 5% and 10% concentrations. The lowest zone of
inhibition (10 mm) in this study was observed among Bacillus organisms at 25% lemon juice-
extract concentration; other inhibition zones demonstrated by these organisms were: 13 mm at
50% lemon juice-extract concentration, 14 mm at 75% lemon juice-extract concentration and
17 mm at 100% lemon juice-extract concentration.
A sensitivity test study by Marzoog et al. (2015) using conventional drugs,
amoxicillin was the most effective antibiotic on E.coli and Proteus mirabilis with a 20mm and
22 mm diameter inhibition zone respectively followed by tetracycline at 15mm and 8mm
respectively. For, Staphylococcus, erythromycin was the most effective antibiotic at 31mm
diameter inhibition zone followed by tetracycline at 26mm, gentamycin at 25mm and
amoxicillin at 15mm. Differences in susceptibility between Staphylococcus, Bacillus and
Streptococcus organisms can be explained by differences in the nature and extent of cell
membrane damage or disruption of different cellular targets (Winniczuk and Parish, 1997). To
demonstrate potency of lemon juice extract on a whole piece of African sausage, this study
compared the amount of bacterial growth on a culture medium. The African sausage treated
with lemon juice extract and streaked immediately and after 30 minutes showed significantly
reduced amount of growth compared to the untreated “sausage” and one which was lemon
juice-extract treated but streaked after 1 hour.
This therefore has shown that lemon juice-extract can be used to reduce bacterial load
on African sausages, best results being within half an hour of application. Sprinkling of the
juice-extract on the African sausages is, therefore encouraged, more so since it also adds
flavor to the meat product and improves on appetite (personal experience). Organic acids in
lemon have been identified as a possible antibacterial component (Kawaii et al., 2000).

49
Giuseppe et al. (2007) noted presence of limonoids in C. limon, a component that is
antibacterial. Other antimicrobial components identified are terpenoid, alkaloid and phenolic
compounds which interact with enzymes and proteins of the microbial cell membrane
disrupting their structures and changing their permeability (Friedman et al., 2004; Tiwari et
al., 2009; Burt, 2004; Gill and Holley, 2006). The results in the present study suggests that
lemon fruit juice-extract could be a valuable natural antimicrobial compound as natural
preservatives for the food industry to preserve food because it exerts its activity even at very
low concentrations/high dilutions. Using it will avoid application of health hazards of
chemical preservatives/industrial additives.
Escherichia coli isolate was chosen for a pathogenicity study using mouse model.
Some strains of this organism are pathogenic and can cause serious food poisoning in humans
(Cheesbrough, 2006). The aim was to determine if it was pathogenic to the experimental mice.
After intraperitoneal injection of isolated E.coli strain, no mortality was observed in all the
experimental mice studied at the end of experimental period. None of the mice presented with
any clinical signs. The results for the leukocyte count and erythrocyte count fell within the
reference value for mice (Rosenthal, 2002) and the results for the control and experimental
mice showed no significant variations (p>0.05).
In differential leucocyte count, the study found no significant decrease or increase in
mean percentage values of neutrophils, basophils, lymphocytes, eosinophil and monocytes in
the controls and in test mice inoculated with various dilutions of test organism. The test isolate
did not have any statistically significant effect on haematological and biochemical means (p ≥
0.05). The serum protein and BUN parameters were within the reference range (Rosenthal,
2002).

50
These slight variations of serum proteins and BUN in the present study may be
possibly attributed to normal body regulatory physiology or accelerated protein catabolism
because of the stress of the infection and fever and/or may be secondary to the increase in
globulin concentration since colloid osmotic pressure has to be maintained within normal
limits by a regulatory mechanism as seen in increase in serum protein levels (Benjamin,
1978). In the present study, the results for BUN and serum protein were within the reference
ranges for the mice in test and control experimental mice groups.
The congestion observed could be associated with euthanasia method used i.e. diethyl
ether. Proliferation of lymphoid tissues attributed to non-specific immune response to an agent
in the animals' environment as the findings were obtained in all animals including non-
infected controls. Invasive E. coli causes peritonitis and urinary tract infection characterized
by suppurative lesion comprising dead cells surrounded by a haemorrhagic zone. Systemic
reactions include neutrophilia, but when it becomes overwhelming, a neutropenia with toxic
granulation expected. The local inflammation may turn into bacteraemia, septicaemia with
subsequent localization in internal organs especially those with end-artery circulatory system
such as kidney, heart and brain.
Non-invasive E. coli and even commensals are capable of establishing an infection
once mechanical barrier of the skin or mucus membrane is bleached as occurs with
perforations, surgical wound or bedsores (Kumar et al., 2009). Lack of systemic reactions in
mice following intraperitoneal inoculation with E. coli isolated from sausages may be
attributed possibly due to the ability of peritoneal phagocytes to inhibit and/or kill E.coli (Al-
Mariri, 2008). The control mice euthanized before and after experiments showed no apparent
sign of infection. Their peritoneum was white, smooth and shiny.

51
All other organs retained normal colour, size and shape while the organs examined were
normal. This showed that the mice were free from organism(s) of interest.
5.2 Conclusions
The present study reveals the fact that roasted and non-roasted African sausages sold at
retail outlets in Nairobi County are contaminated with bacteria pathogens. The
presence of bacteria which are potentially zoonotic to humans in the roasted and non-
roasted African sausages is of public health significance.
The susceptibility pattern of the bacterial isolates from African sausages with lemon
juice extract shows the high incidence of sensitive bacterial contaminants in meat.
Diluted lemon extract juice has antibacterial activity at 25% which is the minimum
inhibitory concentration in present study.
E.coli bacterial load of between 4.36x10⁴ – 4.36x10⁸ obtained from African sausages
proved non-pathogenic to mice.
The E.coli used in pathogenicity studies was not pathogenic to experimental mice.
5.3 Recommendations
Comprehensive study is needed to sample more eatery meat points in Nairobi and
other areas in order to isolate, characterize and establish the bacterial load and the
pathogenicity of isolated organisms to humans.
There is also need to establish the sources of bacteria due to high bacterial load
determined in the current study.
Relevant regulatory body in conjunction with African sausage vendors should lay
down food safety measures for the African sausages

52
Further studies are needed to establish the mode of action of lemon juice extract
whether bacteriostatic or bactericidal and how heat stable it is to determine if it can be
incorporated as one of the ingredient in preparation of African sausages.

53
CHAPER 6: REFERENCES
Abdalla, M.A., Siham, E., Suliman, Y.Y.H. and Alian, A. (2009). Microbial Contamination
of Sheep Carcasses at El Kadero Slaughterhouse–Khartoum State. Sudan Journal of
Veterinary Science and Animal husbandry, 48:1-2.
Adak, G.K., Meakins, S.M., Yip, H., Lopman, B.A. and O'Brien, S.J. (2005). Disease risks
from foods, England and Wales, 1996-2000. Emerging Infectious Diseases. Accessed
from: http://www.cdc.gov/ncidod/EID/vol11no03/04-0191.htm
Adham, A. N. (2015). Comparative Antimicrobial Activity of Peel and Juice Extract of Citrus
Fruits Growing in Kurdistan/Iraq. American Journal of Microbiological Research,
3(5):155-159
Adzitey, F., Teye, G. A., Kutah, W. N. and Adday, S. (2011). Microbial quality of beef sold
on selected markets in the Tamale Metropolis in the Northern Region of Ghana.
Journal of Applied Sciences and Environmental Management, 14 (4):53 - 55
Ajaiyeoba, E.O, Onocha, P. A., Nwozo, S.O. and Sama, W. (2003). Antibacterial and
cytotoxicity evaluation of Buchholzis coricea step bark. Fitoterapia, 70:184-186
Al-Ani, M.N., Al-Haliem, S.M. and Tawfik, N.O. (2010). Evaluation of the antimicrobial
activity of citrus juices: An in-vitro study: Al-Rafidain Dental Journal, 10:376-382
Al-Mariri, A. (2008). Survival and replication of Escherichia coli 0157:H7 inside the mice
peritoneal macrophages. Brazilian Journal of Microbiology, 39(1): 5-9
Al-Mutairi, M.F. (2011). The incidence of Enterobacteriaceae causing food poisoning in
some meat products. Advanced Journal of Food Science and Technology, 3:116-121.
Animal Biosafety Manual (2012). Manual of Diagnostic Tests and Vaccines for Terrestrial
Animals. Retrieved from http://www.oie.int/standard-setting/terrestrial-manual/access-
online/

54
Bebora L.C., Oundo J.O. and Munene M.N. (2005). Isolation of enterotoxigenic E. coli
from food-handlers in selected tourist-class hotels in Nairobi. Kenya Veterinarian,
29:14-17
Benjamin, M.M. (1978): Outline of Veterinary Clinical Pathology. Third edition. Iowa State
University Press, Iowa, pp. 220
Borch, E. and Arinder, P. (2002). Bacteriological safety issues in beef and ready- to –eat
meat products, as well as control measures. International Journal of Meat Sciences,
62(3):381-390.
Burkholder, T., Foltz, C., Karlsson, E., Linton, C. G. and Smith, J. M. (2013). Health
Evaluation of experimental laboratory mice. Current Protocols in Mouse Biology,
2:145-165
Burt, S. (2004). Essential oils: their antibacterial properties and potential application in foods:
a review. International Journal of Food Microbiology, 94:223–253.
Cheesbrough, M. (2006). District laboratory practice in tropical countries (2nd Ed.). New
York: Cambridge University Press. pp 150-180
Clarence, S. Y., Nwinyi, C. O. and Chinedu, N. S. (2009). Assessment of bacteriological
quality of ready to eat food (Meat pie) in Benin City metropolis, Nigeria. African
Journal of Microbiology Research, 3(6): 390-395.
Clinical and Laboratory Standards Institute (2012). Performance Standards for
Antimicrobial Disk Susceptibility Tests, Approved Standard (7thed.). Wayne,
Pennsylvania.
Cocolin, L. (2004). Study of the ecology of fresh sausages and characterization of populations
of lactic acid bacteria by molecular methods. Applied and Environmental
Microbiology, 70:1883-1894
55
Codex Alimentarius Commission (2005). Code for hygienic practice for meat. CAC/RCP
58. Retrieved from: www.fao.org/input/download/standards/10196/CXP_058e.pdf
Conte, A., Scrocco, C., Sinigaglia, M. and DelNobile, M.A. (2009). Lemon extract as
natural preservative in fruit salad. Journal of Food Safety, 29 (4): 601-616
Elleuch, L. Shaaban, M. and Smaoui, S. (2010). Bioactive secondary metabolites from a
new terrestrial Streptomyces sp. Applied Biochemistry and Biotechnology, 162: 579–
593
Enabulele, S.A. and Uraih, N. (2009). Enterohaemorrhagic Escherichia coli 0157:H7
Prevalence in meat and vegetables sold in Benin City, Nigeria. African Journal of
Microbiology Research, 3(5): 276-279
Fasanmi, G. O., Olukole, S. G. and Kehinde, O. O. (2010). Microbial studies of table
scrapings from meat stalls in Ibadan Metropolis, Nigeria: Implications on meat
hygiene. African Journal of Biotechnology, 9(21): 3158-3162.
Firoz, M, M., Pek, E.A., Chenoweth, M.J. and Ashkar, A.A. (2011). Humanized mice are
susceptible to Salmonella typhi infection. Cell and Molecular Immunology, 8:83–87.
Fisher, A.A, Laing, J.E., Stoeckel, J.E and Townsend, J.W. (1991). Handbook for Family
Planning Operations Research Design 2nd ed. P43. Population Council. New York.
Available on: www.popcouncil.org
Friedman, M., Henika, P.R., Levin, C.E. and Mandrell, R.E. (2004). Antibacterial
activities of plant essential oils and their components against Escherichia coli
O157:H7 and Salmonella enterica in apple juice. Journal of Agricultural and Food
Chemistry, 52:6042–6048.

56
Garg, V.K.R., Jain, M., Sharma, P.K.R. and Garg, G. (2010). Anti-inflammatory activity
of Spinacia Oleracea. International Journal of Pharmaceutical and
Phytopharmacological Research, 1(1):1-4
Gill, A.O. and Holley, R.A. (2006). Disruption of Escherichia coli, Listeria monocytogenes
and Lactobacillus sakei cellular membranes by plant oil aromatics. International
Journal of Food Microbiology, 108:1–9.
Gill, C. O. (1998). Microbiological contamination of meat during slaughter and butchery of
cattle, Sheep and Pig .In Davis, A. and Board, R. (Eds.). The microbiology of meat and
poultry. London. Blackie Academic and professional, pp118-157
Giuseppe, G., Davide, B., Claudia, G., Ugo, L. and Corrado, C. (2007). Flavonoid
Composition of Citrus Juices. Molecules, 12: 1641-1673.
Götz F. (2002). Staphylococcus and biofilms. Molecular Microbiology. 43:1367-1378.
Gwida, M., Hotzel H., Geue, L. and Tomaso, H. (2014). Occurrence of Enterobacteriaceae
in Raw Meat and in Human Samples from Egyptian Retail Sellers. International
Scholarly Research Notices, 2014:1-6.
Hindi, N. K.K., Chabuck, Z. A. G. (2013). Antimicrobial Activity of Different Aqueous
Lemon Extracts. Journal of Applied Pharmaceutical Science, 3(6):074-078,
Holt, J.G., Kreig, N.R., Sneath, P.H.A., Staley, J.T and Williams (1994). Bergey’s Manual
of Determinative Bacteriology (9th Ed.). The William and Wilkins Co. Baltimore,
USA. http://www.cdc.gov/nczved/divisions/dfbmd/diseases/campylobacter/
Illum L. (2002). Nasal drug delivery: new developments and strategies. Drug Discovery
Today, 7:1184–1189.

57
Kabwanga, R. M., Kakubua, M.M., Mukeng, C. K., Khang' F., Akir N. B., Daube G. and
De Mol P. (2013). Bacteriological assessment of smoked game meat in Lubumbashi,
D.R.C. Biotechnologie, Agronomie, Société et Environnement, 17(3):441-449
Kawaii, S., Yasuhiko, T., Eriko, K., Kazunori, Y., Masamichi, K., Meisaku, K. and
Hiroshi, F. (2000). Quantitative study of flavonoids in leaves of Citrus plants. Journal
of Food Chemistry, 48:3865-3871
Kazuaki, O. and Yamamoto, K. (1999). Contamination of meat with Campylobacter jejuni
in Saitama, Japan. International Journal of Food Microbiology, 47(3):211–219
Kenya Law (2015). Food, drugs and chemical substances act. Retrieved from
http://www.kenyalaw.org/lex/sublegview.xql?subleg=CAP.%20254
Kenya population and Housing Census (2009). National data archive. Accessed on 7th
August 2015 at: http://statistics.knbs.or.ke/nada/index.php/catalog/55/study-
description
Kloos, W. E. and Schleifer, K. H. (1986). Genus IV. Staphylococcus. In: Bergey’s Manual
of Systematic Bacteriology, The Williams and Wilkins Co., Baltimore, MD. Eds.
Sneath PHA, (1st ed.), 2:1013-1035.
Kloos, W.E. and Bannerman, T.L. (1995). Staphylococcus and Micrococcus. In: Murray, P.
R., Bron, E. J., Pfaller, M.A., Tenover,F.C., Yolken, R.H.(eds). Manual of Clinical
Microbiology, America Society of Microbiology, 228-298.
Kumar, V., Abbas, A., Fausto, N., Aste, J. (2009). Robbins and Cotran Pathologic Basis of
Disease (8th edition.). Philadelphia: Elsevier,
Kuria J.K.N, Wahome R.G, Jobalamin M. and Kariuki S.M. (2009): Profile of bacteria
and fungi on money coins. East African Medical Journal, 86:151-156

58
Le Loir, Y., Baron, F. and Gautier, M. (2003). Staphylococcus aureus and food poisoning.
Genetics and Molecular Research, 2:63-67.
Letertre, C., Perelle, S., Dilasser, F and Fach, P. (2003). Identification of a new putative
enterotoxin SEU encoded bu the ege cluster of Staphylococcus aureus. Journal of
Applied Microbiology, 95:38-43.
Liu, F., Yang, R. & Li, Y. (2006). Correlations between growth parameters of spoilage
microorganisms and shelf-life of pork stored under air and modified atmosphere at -2,
4 and 10°C. Food Microbiology, 23:578-581.
Magwira, C.A., Gashe, B.A. and Collison, E.K. (2005). Prevalence and antibiotic resistance
profiles of Escherichia coli O157:H7 in beef products from retail outlets in Gaborone,
Botswana. Journal of Food Protection, 68(2):403-6.
Marston, A. (2014).Thin-layer chromatography with biological detection in photochemistry.
Journal of Chromatography, 1218(19): 2676–2683
Maruti J. D., Chidamber B. J., Jai S. G. and Kailash, D. S. (2011). Study on Antimicrobial
Activity of Lemon (Citrus lemon L.) Peel Extract. British Journal of Pharmacology
and Toxicology, 2(3):119-122.
Marzoog, T.R., Younus, A.H. and Naseer, S.M. (2015). The effects of antibiotics with Citrus
limon extract on local bacterial isolates. Journal of the college of basic education, 21
(89): 61-71
Mastromatteo, M., Incoronato, A. L., Conte, A. and Nobile, M. A. (2011). Shelf life of
reduced pork back-fat content sausages as affected by antimicrobial compounds and
modified atmosphere packaging. International Journal of Food Microbiology, 150:1-7
Miles, A.A. and Misra, S.S. (1938). The estimation of the bactericidal power of blood. The
Journal of Hygiene. 38(6):732-49

59
Miyoko, J., Dilma S.G., Christiane, A.R., Ana M. R. D., Harumi, S., Giselle I. S. L., Sueli
A. F. and Renata B. L. (2004). Occurrence of Salmonella spp and Escherichia coli
O157:H7 in raw meat marketed in São Paulo city, Brazil, and evaluation of its cold
tolerance in ground beef. Revista do Instituto Adolfo Lutz, 63(2):238-42
Musa, O.L., Okande, T.M. (2002). Effect of Health Education Intervention or Food Safety
Practice among Food Vendors in Ilorin. Journal of Medicine, 5:120 - 124.
Nairobi City County (2017). Maps. Retrieved from: www.nairobi.go.ke/home/maps/
Nairobi Mitaa (2011). A review of hoods in Nairobi. Retrieved from: http://mitaayanairobi.
blogspot.co.ke/2011?m=1
Newell, D.G., Koopmans, M., Verhoef, L., Duizer, E., Aidara-Kane, A., Sprong, H.,
Opsteegh, M., Langelaar, M., Threfall, J., Scheutz, F., Giessen, J. and Kruse, H.
(2010). Food-borne diseases; the challenges of 20 years ago still persist while new
ones continue to emerge. International Journal of Food Microbiology, 139(1):3–15.
Ngo, M.A. and Maibach, H.I. (2010). Dermatotoxicology: historical perspective and
advances. Toxicology and Applied Pharmacology, 243:225–238
Obernier, J.A. and Baldwin, R.L. (2006). Establishing an appropriate period of
acclimatization following transportation of laboratory animals. Journal of Institute of
Laboratory Animal Resources, 47(4):364-9.
Ojode, G. (2001). African Sausage - 'Mutura'. Accessed on 7th August 2015 from
http://kenya.thebeehive.org/en/content/9/3182
Okonko, I.O., Donbraye, E. and Babatunde, S.O.I. (2009). Microbiological quality of
Seafood processors and water used in two different sea processing plants in Nigeria
Electronic Journal Of Environmental, Agricultural And Food Chemistry, 8(8): 621-
629.
60
Oluwafemi F. and Simisaye, M.T. (2006). Extent of Microbial Contamination of Sausages
sold in two Nigerian cities. African Journal of Biomedical Research, 9:133 – 136
Orogu J.O. and Oshilim A.O. (2017). Comparative study of bacteriological analysis in
hawked suya meat and suya meat on a Barbeque stand. Journal of Microbiology
Research, 3(1): 005-008.
Parker, B.A.C. (1993). Food and microbiological risks. Fred Griffith Review lecture In:
Journal of Microbiology, 140:687-695
Pfaller, M.A., Sheehan, D.J. and Rex J.H. (2004). Determination of fungicidal activities
against yeasts and molds: lessons learned from bactericidal testing and the need for
standardization. Clinical Microbiology Reviews, 17:268–280
Porter, S. B., Johnson, J. R., Zhanel, G., Kuskowski, M.A. and Denamur, E. (2012).
Virulence of Escherichia coli Clinical Isolates in a Murine Sepsis Model in Relation to
Sequence Type ST131 Status, Fluoroquinolone Resistance, and Virulence Genotype,
Infection and Immununity, 83(11):1554-1562
Prescott, M., Harley, P. and Klan, D.A. (2005). Microbiology (6th edition.). McGraw Hill:
New York publishers. 910p
Rajashekara, G., Drozd, M., Gangaiah, D., Jeon, B. and Liu, Z. (2009). Functional
Characterization of the twin-arginine translational system in Campylobacter jejuni.
Food-borne Pathogens and Diseases, 6:935-945.
Romans, J.R., William, J.C., Carloson, C.W., Greaser, M.L. and Jones, K.W. (2001). The
Meat we eat (4th edition). Interstate Publishers, Inc., Danville.
Rosec, J.P., Guiraud, J.P., Dalet, C. and Richared, N. (1997). Enterotoxin production by
staphylococci isolated from foods in France. International Journal of food
Microbiology, 37:213-221.

61
Rosenthal, K. (2002). Rodent reference ranges. Accessed on 19th August 2017 from
http://cal.vet.upenn.edu/projects/ssclinic/refdesk/rodentrr.htm
Samarakoon, K., Senevirathne, M., Lee, W., Kim, Y., Kim, J., Cheo, M. and Jeon, Y.
(2012). “Antibacterial effect of citrus press-cakes dried by high speed and far-
infrared radiation drying methods,” Nutrition Research and Practice, 6(3):187-194.
Sang, W.K., Saidi, S.M., Yamamoto, H., Fzaki, T., Iida, T., Yoh, M. and Honda, T. (1996).
Haemorrhagic colitis due to Escherichia coli O157:H7 in Kenya. Journal of Tropical
Paediatrics, 42:118-119.
Sharma, S. (2015). Food Preservatives and their harmful effects. International Journal of
Scientific and Research Publications, 5(4):1-2
Snedecor, G.W. and Cochran, W.G. (1976). Statistical methods (6th ed.). Ames: Iowa State
University Press, Iowa, pp: 201.
The Health Protection Agency Regulations (2005). Public Health 2005-No. 408. Retrieved
https://www.legislation.gov.uk/uksi/2005/408/regulation/1/made
Tiwari, B.K., Valdramidi, V.P., O’Donnell, C.P., Muthukumarappan, K., Bourke, P. and
Cullen, P.J. (2009). Application of natural antimicrobials for food preservation.
Journal of Agricultural and Food Chemistry, 57:5987–6000.
Torok, T.K., Tanze, R.V., Wise, R.P., Livengood, J.R., Sokolow, R. and Manvans, S.
(1997). A large community outbreak of Salmonellosis caused by International
Contamination of restaurant salads/bars. Journal of America Medical Association,
278(8):389-395.
Turner, V.P., Brabb, T., Pekow. C. and Vasbinder, M.A. (2011). Administration of substances
to laboratory animals: Routes of administration and factors to consider. Journal of the
Americal Association for Laboratory Animal Science, 50(5): 600-613

62
Ukut O.E., Okonko, I.O., Ikpoh, I.S., Nkang, A.O., Udeze, A.O., Babalola, T.A., Mejeha,
O.K. and Fajobi, E.A. (2010). Assessment of bacteriological quality of fresh meats
sold in calabar metropolis, Nigeria. Electronic Journal of Environmental Agriculture
and Food Chemistry, 9 (1):89-100.
Valgas, C., De Souza, S.M. and Smânia E.F.A. (2007). Screening methods to determine
antibacterial activity of natural products. Brazilian Journal of Microbiology, 38:369–
380
Vallance, B.A., Deng, W., Puente, J.L., Gruenheidm S. and Li, Y. (2004). Dissecting
virulence: systematic and functional analyses of a pathogenicity island. Proceedings of
the National Academy of Sciences of the United States of America, 101:3597–3602.
Von H. A., Cloete, T. E. and Holzapfel, W. H. (1991). Quantification and characterization
of microbial populations associated with spoiled, vacuum-packed Vienna sausages.
Food Microbiology. 8:95-104.
Waites, N.M. and Arbuthnott, J.P. (1999). A lancet reviews on foodborne illness. Food
Contamination Residues and Toxicology, 3:146.
Weese, J. S., Avery, B. P., Rousseau, J. and Reid-Smith, R. J. (2009). Detection and
Enumeration of Clostridium difficile Spores in Retail Beef and Pork. Applied and
Environmental Microbiology, 75(15): 5009-5011.
Wiens, M. (2011). Kenyan Food Overview: 20 of Kenya’s Best Dishes. Accessed on 6th
August 2015 from http://migrationology.com/2011/06/kenyan-food-overview-20-of-
kenyas-best-dishes/
Winniczuk, P.P. and Parish, M.E. (1997). Minimum inhibitory concentrations of
antimicrobials against microorganisms related to Citrus juice. Food Microbiology.
14(4):373-381.

63
World Health Organization (2007). Foodborne Hazards in basic food safety for health
workers. Retrieved from: http://www.who.int/foodsafety/publications/capacity/
Yousuf, A.H.M., Ahmed, M.K., Yeasmin, S., Ahsan, N., Rahman, M.M. and Islam, M.M.
(2008). Prevalence of microbial load in shrimp, Penaeus monodon and prawn,
Macrobrachium rosenbergii from Bangladesh. World Journal of Agricultural Science,
4:852-855.
Yusuf, M. A., Hamid, T. H.A.T. A. and Hussain, I. (2012). Isolation and Identification of
Bacteria Associated with Balangu (Roasted Meat Product) Sold in Bauchi. Nigeria.
Journal of Pharmacy, 2(6):38-48

64
CHAPTER 7: APPENDICES
Appendix I: Ethical clearance of proposal by Biosafety, Animal use and Ethics commitee
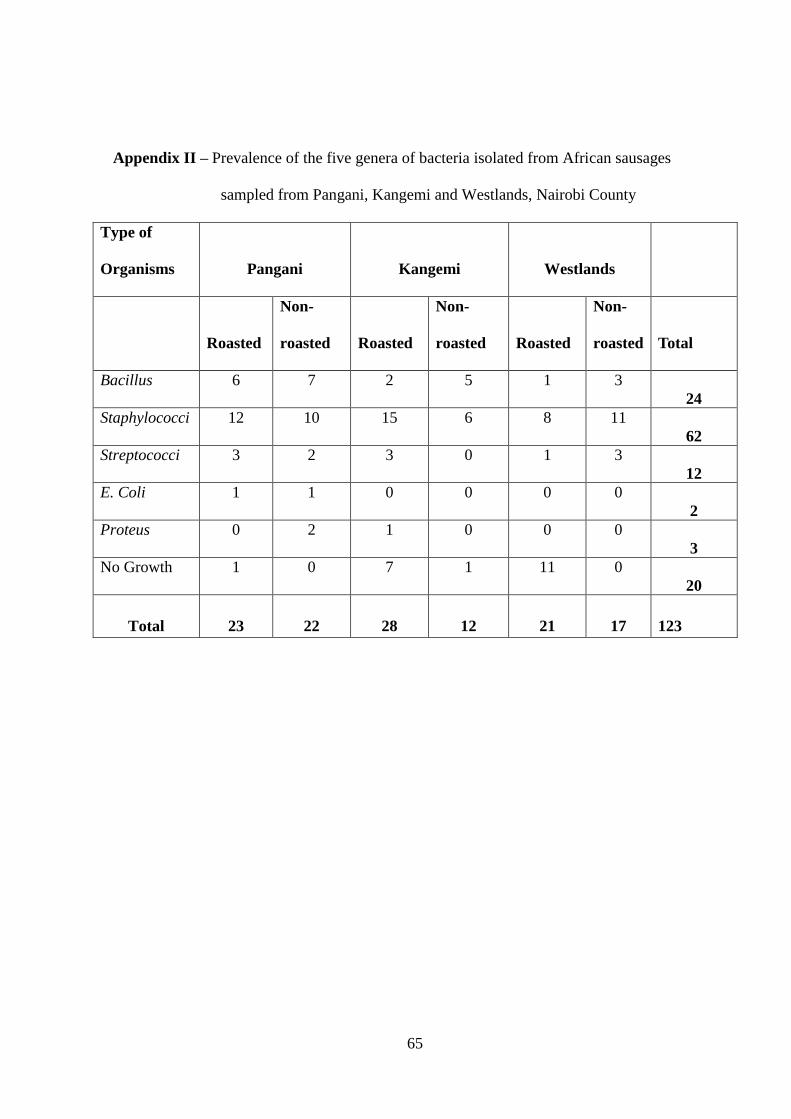
65
Appendix II – Prevalence of the five genera of bacteria isolated from African sausages
sampled from Pangani, Kangemi and Westlands, Nairobi County
Type of
Organisms Pangani Kangemi Westlands
Roasted
Non-
roasted Roasted
Non-
roasted Roasted
Non-
roasted
Total
Bacillus 6 7 2 5 1 3
24
Staphylococci 12 10 15 6 8 11
62
Streptococci 3 2 3 0 1 3
12
E. Coli 1 1 0 0 0 0
2
Proteus 0 2 1 0 0 0
3
No Growth 1 0 7 1 11 0
20
Total 23 22 28 12 21 17
123

66
Appendix III - Quantification of bacterial load of the African sausages sampled from
Pangani, Kangemi and Westlands, Nairobi County
Bacterial
Load Pangani Kangemi Westlands
Roasted
Non-
roasted Roasted
Non-
roasted Roasted
Non-
roasted
1.0 - 9.9 x 101 3 0 10 2 9 1
1.0 - 9.9 x 10² 3 0 1 1 7 5
1.0 - 9.9 x 10³ 7 2 4 2 1 4
1.0 - 9.9 x 10⁴ 4 5 3 3 2 0
1.0 - 9.9 x 10⁵ 2 4 3 1 0 3
1.0 - 9.9 x 10⁶ 0 3 2 1 0 0
1.0 - 9.9 x 10⁷ 0 0 1 1 0 0

67
Appendix IV – Evaluation of mean bacterial load across the three geographical areas among
the roasted and non-roasted African Sausages using paired student t-test (p values evaluated at
95%confidence limits)
Paired Samples Test
-.71 3.30 1.25 -3.77 2.34 -.572 6 .588
.71 3.09 1.17 -2.15 3.58 .611 6 .564
.00 4.00 1.51 -3.70 3.70 .000 6 1.000
.43 1.90 .72 -1.33 2.19 .596 6 .573
-.29 2.43 .92 -2.53 1.96 -.311 6 .766
.14 3.29 1.24 -2.90 3.18 .115 6 .912
.71 2.98 1.13 -2.05 3.47 .633 6 .550
1.86 2.85 1.08 -.78 4.50 1.722 6 .136
.86 3.76 1.42 -2.62 4.34 .603 6 .569
PR - KRPair 1
KR - WRPair 2
PR - WRPair 3
PNONR - KNONRPair 4
KNONR - WNONRPair 5
PNONR - WNONRPair 6
PR - PNONRPair 7
KR - KNONRPair 8
WR - WNONRPair 9
Mean Std. Deviation
Std. Error
Mean Lower Upper
95% Confidence
Interval of the
Difference
Paired Differences
t df Sig. (2-tailed)
Abbreviations/Acronyms
PR- Pangani roasted,
PNOR- Pangani non-roasted,
KR- Kangemi roasted,
KNOR – Kangemi non-roasted,
WR – Westlands roasted,
WNOR – Westlands non-roasted
-0.71
0.71
0.00
0.43
-0.29
0.14
0.71
0.86
0.72
0.92
-0.78
0.115
0.596
0.611
-0.572
-0.311
0.588
0.564
0.573
0.766
0.912
0.550
0.136
0.569

68
Appendix V – Determination of Mean diameters of the inhibitory zones to lemon juice
extract, measured in mm of three isolates from the three main areas of study.
Isolates N Minimum Maximum Mean Std. Deviation
Staphylococcus 12 11 20 14.75 2.958
Bacillus 12 10 18 14.00 2.954
Streptococcus 12 10 20 14.67 2.995

69
Appendix VI - Comparison of mean inhibitory zones to lemon juice extract of the three
isolates studied using unpaired student t-test (p values evaluated at 95%confidence limits)
Isolates
Levene’s Test for Equality
of Variances
t-test for Equality of Means
F
Sig.
t
df
Sig.
(2-tailed)
Mean
Difference
Staph sp. Equal variances
assumed
Equal variances
not assumed
1.630 0.248 -1.722
-1.722
6
4.448
0.136
0.153
-3.250
-3.250
Bacillus sp. Equal variances
assumed
Equal variances
not assumed
0.000 1.000 -0.209
-0.209
6
5.999
0.842
0.842
-0.500
-0.500
Streptococcus sp. Equal variances
assumed
Equal variances
not assumed
0.643 0.453 0.115
0.155
6
5.519
0.912
0.913
-0.250
-0.250

70
Appendix VII – Average haematological and biochemical parameters of the test mice and
control group after inoculation of various concertation of test organism
(E.coli)
Parameters
Control
mice
Treatments – Varied concentrations of test organism
4.36x10⁸ 4.36x10⁷ 4.36x10⁶ 4.36x10⁵ 4.36x10⁴
RBC 6.95 8.34 8.1 8.345 9.35 7.505
WBC x1000 12.3 9.315 6.085 7.86 8.04 7.505
HB g/dl 12.7 15.3 14.75 15.6 17.75 14.9
HCT % 31.3 36.85 35.8 35.85 42.5 32.5
MCV (fl) 44.45 43.95 44.15 43 45.5 43.3
MCH (pg) 18.55 18.35 18.2 18.7 19 19.95
MCHC g/dl 42.15 42 41.3 43.5 41.75 45.95
RDW % 30.5 32.85 32.5 32.2 32.25 33.85
Platetes x1000 229 205 425.5 205 550.5 387
Neutrophil % 38.8 22.75 52.35 47.35 39.5 29.45
Lymphocytes % 55.85 72.55 40.4 45.45 53 63.7
Monocytes % 0.95 0.95 1.35 1.25 0.95 1.9
Eosinophils % 4.1 3.4 4.9 5.85 5.9 4.7
Basophils% 0.3 0.35 1 0.2 0.65 0.25
Serum Protein 10.95 6.65 10.7 5.8 14.6 12.35
BUN 15.26 13.45 7.1 11.2 24.75 6.1
Abbreviations/Acronyms
RBC- Red blood cells WBC – White blood cells
MCV – Mean cell Volume
HB – Hemoglobin
HCT – Hematocrit
MCHC – Mean Cell Haemoglobin
Concentration
RDW – Red cell distribution Width
BUN – Blood Urea Nitrogen

70
Appendix VIII – Haematological and biochemical parameters of individual test mice and
control group after inoculation with test organism (E.coli)
Parameters
Treatmnt RBC WBC MCV MCH
Neu
%
Lym
%
Mon
%
Eos
%
serum
Prot BUN
Control 1 5.68 14.4 41.2 19.9 47.1 49.2 0.4 3.1 11.7 15.96
Control 2 8.22 10.2 47.7 17.2 30.5 62.5 1.5 5.1 10.2 14.56
101a 8.92 8.53 47.3 18.3 18.6 75.3 0.9 4.7 7.3 12.89
101b 7.76 10.1 40.6 18.4 26.9 69.8 1 2.1 6 14
102a 8.38 7.19 45.5 18.1 56.7 34.4 1.5 7 10.1 6.1
102b 7.82 4.98 42.8 18.3 48 46.4 1.2 2.8 11.3 8.1
103a 9.26 12.13 42.8 18.6 46 49.4 0.8 3.6 6.3 10.6
103b 7.43 3.59 43.2 18.8 48.7 41.5 1.7 8.1 5.3 11.8
104a 9.52 10.44 44.9 18 28.3 66.3 1.4 3.6 14.6 23.2
104b 9.18 5.64 46.1 20 50.7 39.7 0.5 8.2 14.6 26.3
105a 7.12 6.83 43.8 21.1 33.2 61.3 1 4.4 11.8 6
105b 7.89 8.18 42.8 18.8 25.7 66.1 2.8 5 12.9 6.2
Abbreviations/Acronyms
RBC- Red blood cells WBC – White blood cells
MCV – Mean cell Volume
HB – Hemoglobin
HCT – Hematocrit
MCHC – Mean Cell Haemoglobin
Concentration
BUN – Blood Urea Nitrogen

71
Appendix IX: Means for haematological and biochemical parameter for test mice inoculated
with the test organism - E. coli
Parameters Minimum x106 Maximum x106
Mean
Std. Deviation
RBC 5.68 9.52 8.0983 1.07861
WBC 3.6 14.4 8.518 3.1113
HB 11.3 18.4 15.167 1.8763
HCT 23.4 42.7 35.800 5.8659
MCV 40.6 47.7 44.058 2.2645
MCH 17.2 21.1 18.792 1.0587
MCHC 36.0 48.3 42.775 3.6646
Platetes x1000 73 738 333.67 186.711
Neutrophil % 18.6 56.7 38.367 12.4130
Lymphocytes % 34.4 75.3 55.158 13.3394
Monocytes % 0.4 2.8 1.225 0.6384
Eosinophils % 2.1 8.2 4.808 2.0147
Basophils% 0.1 1.6 .458 0.4166
Serum Protein 5.3 14.6 10.175 3.2656
BUN 6.00 26.30 12.9758 6.51704
Abbreviations/Acronyms
RBC- Red blood cells WBC – White blood cells
MCV – Mean cell Volume
HB – Hemoglobin
HCT – Hematocrit
MCHC – Mean Cell Haemoglobin
Concentration
BUN – Blood Urea Nitrogen
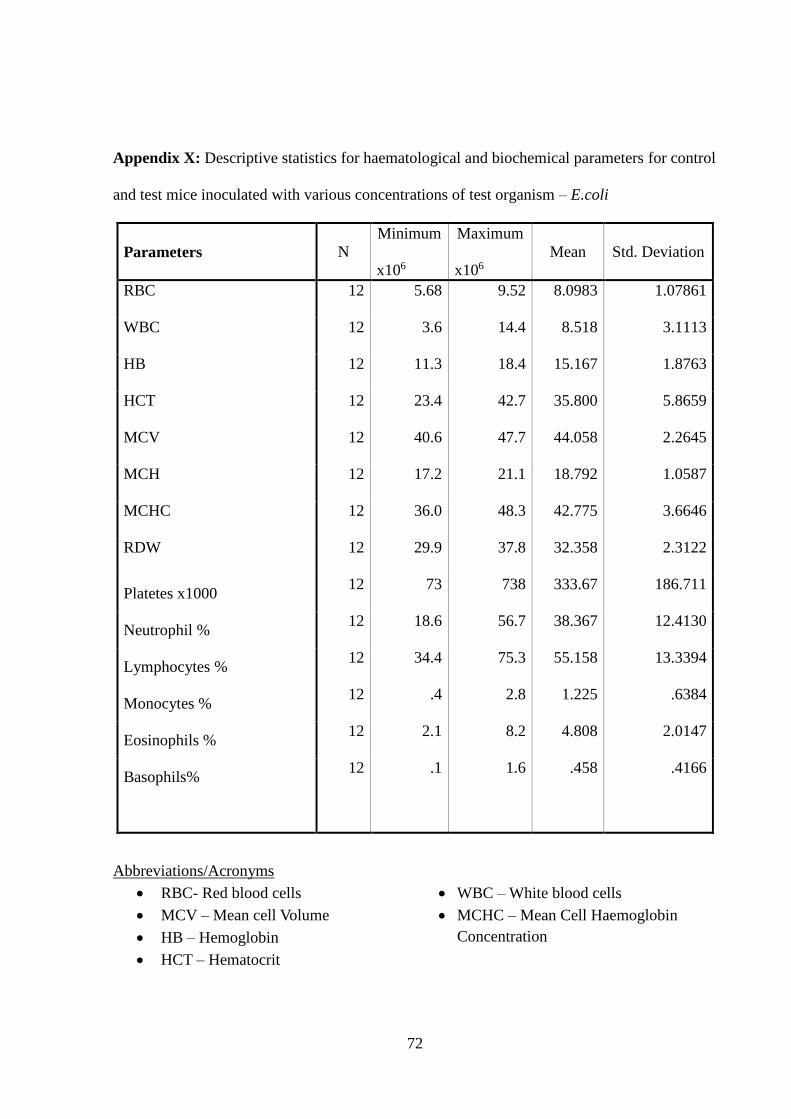
72
Appendix X: Descriptive statistics for haematological and biochemical parameters for control
and test mice inoculated with various concentrations of test organism – E.coli
Parameters N
Minimum
x106
Maximum
x106 Mean Std. Deviation
RBC 12 5.68 9.52 8.0983 1.07861
WBC 12 3.6 14.4 8.518 3.1113
HB 12 11.3 18.4 15.167 1.8763
HCT 12 23.4 42.7 35.800 5.8659
MCV 12 40.6 47.7 44.058 2.2645
MCH 12 17.2 21.1 18.792 1.0587
MCHC 12 36.0 48.3 42.775 3.6646
RDW 12 29.9 37.8 32.358 2.3122
Platetes x1000 12 73 738 333.67 186.711
Neutrophil % 12 18.6 56.7 38.367 12.4130
Lymphocytes % 12 34.4 75.3 55.158 13.3394
Monocytes % 12 .4 2.8 1.225 .6384
Eosinophils % 12 2.1 8.2 4.808 2.0147
Basophils% 12 .1 1.6 .458 .4166
Abbreviations/Acronyms
RBC- Red blood cells WBC – White blood cells
MCV – Mean cell Volume
HB – Hemoglobin
HCT – Hematocrit
MCHC – Mean Cell Haemoglobin
Concentration

73
Appendix XI: Comparing mean values of the hematological and biochemical parameters
after inoculating test and control mice with various concentration of test
organism using unpaired student t-test (p values evaluated at 95%
confidence limits).
Parameter Treatments – Varied concentrations of test organism
4.36x10⁸
cfu/g
4.36x10⁷
cfu/g
4.36x10⁶
cfu/g
4.36x10⁵
cfu/g
4.36x10⁴
cfu/g
RBC 0.424 0.470 0.467 0.202 0.716
WBC x1000 0.315 0.120 0.449 0.313 0.162
HB g/dl 0.270 0.298 0.306 0.082 0.258
HCT % 0.620 0.639 0.655 0.292 0.895
MCV (fl) 0.924 0.940 0.700 0.781 0.760
MCH (pg) 0.896 0.820 0.922 0.814 0.513
MCHC g/dl 0.985 0.905 0.847 0.956 0.619
Platelets x1000 0.814 0.391 0.885 0.246 0.132
Neutrophils % 0.226 0.285 0.416 0.965 0.413
Lymphocytes % 0.146 0.227 0.311 0.866 0.382
Monocytes % 1.00 0.556 0.714 1.000 0.436
Eosinophils % 0.711 0.764 0.551 0.547 0.463
Basophils% 0.811 0.369 0.423 0.323 0.624
Serum Protein *0.049* 0.819 *0.029* *0.040* 0.808
BUN 0.179 *0.022* *0.048* *0.031* 0.271
* mean values that were significantly different from the control group (p≤ 0.05)
Abbreviations/Acronyms
RBC- Red blood cells WBC – White blood cells
MCV – Mean cell Volume
HB – Hemoglobin
HCT – Hematocrit
MCHC – Mean Cell Haemoglobin
Concentration
BUN – Blood Urea Nitrogen

74
Appendix XII: Analysis of the differences among group means (ANOVA) for hematological
and biochemical parameters in test and control mice inoculated with the test
E. coli.
Parameters F Sig.
RBC Between Groups 1.324 0.367
WBC Between Groups 0.881 0.545
HB Between Groups 2.575 0.140
HCT Between Groups 0.826 0.574
MCV Between Groups 0.195 0.953
MCH Between Groups 0.575 0.720
MCHC Between Groups 0.301 0.895
RDW Between Groups 0.306 0.893
Platelets x1000 Between Groups 1.374 0.351
Neutrophils % Between Groups 2.928 0.112
Lymphocytes % Between Groups 2.906 0.113
Monocytes % Between Groups 0.544 0.740
Eosinophils % Between Groups 0.327 0.880
Basophils% Between Groups 1.199 0.409
Serum Protein Between Groups 35.892 0.000**
BUN Between Groups 60.131 0.000**
* - values which show a statistically significant effect (≤ 0.05)
Abbreviations/Acronyms
RBC- Red blood cells WBC – White blood cells
MCV – Mean cell Volume
HB – Hemoglobin
HCT – Hematocrit
MCHC – Mean Cell Haemoglobin
Concentration
BUN – Blood Urea Nitrogen
Copyright © 2022 FDOKUMEN