Anti-Mullerian Hormone as a Marker of Oocyte Quantity ...
155
Anti-Mullerian Hormone as a Marker of Oocyte Quantity, Developmental Potential, and Fetal Sex by Anja Stojsin Carter A Thesis Presented to The University of Guelph In partial fulfillment of requirements for the degree of Doctor of Philosophy in Biomedical Sciences Guelph, Ontario, Canada © Anja Stojsin Carter, December 2016
-
Upload
khangminh22 -
Category
Documents
-
view
3 -
download
0
Transcript of Anti-Mullerian Hormone as a Marker of Oocyte Quantity ...

Anti-Mullerian Hormone as a Marker of
Oocyte Quantity, Developmental Potential, and Fetal Sex
by
Anja Stojsin Carter
A Thesis Presented to
The University of Guelph
In partial fulfillment of requirements
for the degree of
Doctor of Philosophy
in
Biomedical Sciences
Guelph, Ontario, Canada
© Anja Stojsin Carter, December 2016

ABSTRACT
ANTI-MULLERIAN HORMONE AS A MARKER OF OOCYTE QUANTITY,
DEVELOPMENTAL POTENTIAL AND FETAL SEX
Anja Stojsin Carter Advisor:
University of Guelph, 2016 Professor W. A. King
Delayed childbearing age, increased environmental pollutants accompanying modern life
style, and an increase in inbreeding due to high demand for milk and meat yield have resulted in
the decline in human and bovine reproduction respectively. Anti-Mullerian hormone (AMH) is
expressed starting from 7-8 weeks of gestation in males and 20 weeks of gestation in females, in
up to 100x higher concentration in males. AMH has been described as a non-invasive and
accurate marker of ovarian quantitative fertility parameters in both humans and cattle. However,
it is still unknown how AMH levels correlate to different fertility parameters in different cattle
breeds; can AMH levels in the mother be used as a fetal sex marker during pregnancy in cows?
In humans, can AMH collected in the single follicular fluid (mono FF), as well as granulosa cell
(GC) AMH receptor 2 (AMHR2) be used as an embryo developmental potential marker? Here
we present evidence of the higher levels of systemic and follicular AMH in Zebu compared to
European cattle, corresponding to higher levels of AFC and oocytes. Cows pregnant with a male
fetus, as compared to a female fetus, were observed to have a significantly different change in
plasma AMH between day 35 and 135 during gestation. The placenta and cotyledon were found
to express AMHR2 between day 38 and 80, however not significantly different between

pregnancies with an opposite sex fetus. In the human study, systemic and average mono FF
AMH, and average mono GC AMHR2 expression were significantly negatively correlated with
the patient’s blastocyst rate. When patients were divided into normal and high groups based on
the their systemic AMH levels, the following was observed: normal systemic AMH level patients
had a lower average FF AMH level and a higher blastocyst rate compared to the higher systemic
AMH level patients. Also, in normal systemic AMH patients, blastocysts corresponded to
follicles with a lower level of AMH, while in high systemic AMH patients blastocysts
corresponded to follicles with a higher level of AMH.

iv
DECLARATION OF WORK PERFORMED
I declare that, with the exception of the items indicated below, all the work reported in
the body of this thesis was performed by me.
Cattle ovaries and reproductive tracts were collected by Pradeep Blaraju, Steven Huang,
Heather Smale, Stephan Botha, and Brooklin Rushton during the course of these studies. Media
used in Canada for oocyte in vitro maturation, in vitro fertilization, and in vitro culture were
prepared by Liz St. John. Real time qPCR experiments in Chapter I were performed by Kiana
Mahboubi. Cell culture and DNA extraction were performed by Dr. Olutobi Oluwole. Antral
follicle count, ovary diameter measurements, serum collections, slaughterhouse ovary collection,
bovine anti-Mullerian hormone ELISA measurements, and fetal serum collection in Brazil were
performed with the help of Dr. Moyses Miranda, Dr. Otavio Ohashi, Dr. Nathalia Nogueira, Dr.
Tiago de Bem, Rodrigo de Morais, Cinthia Lopes, Mayra Costa, Alessandra Ximenes, Tobias
Sovernigo, and Marcus Filho. ONE Fertility patient consents were obtained by Melody
Rasmussen and Maja Smrzlic. Human anti-Mullerian hormone ELISA measurements were
performed by Alexandra Marinic-Cowden. Human follicular fluid collections were performed by
Michael Neal. Human in vitro fertilization, culture, embryo assessment and transfer were
performed by Katie Willoughby, Lisa Deys, and Lindsay Moffatt. Daniel Gillis performed most
of the statistical analysis.

v
ACKNOWLEDGEMENTS
First and foremost I would like to thank my supervisor Dr. Allan King. Allan provided
me with the opportunity to work in his lab twice, doing a research project during the last year of
my undergraduate degree, and then for my PhD, for which I was able to do a project highly
relevant to my interests and goals. I was also given the opportunity to collaborate with a human
fertility clinic and stay in close contact with the field in which my findings could have an impact.
I also have to thank Allan for the opportunity to go on a research exchange to Brazil, to work
with his collaborators in Belem, Para. Last but not least, Allan has been incredibly understanding
of my personal life; I got married and had a baby after the second year of my degree. Allan
organized the baby shower and allowed me to pursue motherhood in parallel with work on my
thesis. The people Allan gathered around himself are all brilliant and I had the honor of being
part of his team.
I would like to thank Dr. Pavneesh Madan for his support throughout my project and his valuable
input on the project progression and experiment planning. Dr. Madan also helped me
troubleshoot through my immunofluorescence and confocal microscopy work, and was
encouraging throughout my manuscript writing.
I would like to thank Dr. Neil MacLusky for guidance and support during my committee
meetings and for his help with some of my statistics questions. Neil is a very sweet,
approachable and genuine person, finding time to talk to students and allowing them to feel like
one of his colleagues.
I would like to thank Mike Neal, ONE Fertility Burlington scientific director, for giving me the
opportunity to collaborate, for his enthusiasm, for help with writing the ethics protocols,

vi
abstracts and manuscript, and for enabling me to collect valuable sample material, attend
conferences, and extend my research opportunities by including a human study.
I would like to thank Dr. Julang Li, my external committee member, for kind words, support and
guidance.
I would like to give a special Thank You to Dr. Laura Favetta. Dr. Favetta was my advisor, my
friend, my sister, my parent. I met Laura during my undergraduate degree project and she has
provided me with infinite help since then. It was an honor knowing Dr. Favetta, with her devoted
and passionate approach to students and teaching. Dr. Favetta’s knowledge on qPCR and
endocrinology kept me going in the right direction!
I would like to thank Dr. Daniel Gillis for his immense help and patience in performing majority
of the statistical analysis in this thesis.
I would like to thank Liz St. John for her help with ovary and placenta collections, support in any
lab related issues, and who, with her kindness, never intimidated the students around her.
I would like to thank Dr. Monica Antenos for sharing her knowledge, and providing incredible
support in the lab, where she created a friendly, relaxed, but very stimulating atmosphere.
I would like to thank Ed Reyes and Allison MacKay for their technical support and patience,
dealing with ordering supplies and questions at, often, inconvenient times.
I would like to thank Helen Coates for her patience and help with confocal microcopy. I would
like to thank Dr. Tamas Ravay for his valuable input in qPCR and immunofluorescence and
molecular troubleshooting. Dr. Ravay was also more than just a colleague; he was a friend and a
support throughout this project.

vii
I would like to thank Kiana Mahboube, a Masters student, who worked on part of my project and
helped incredibly with qPCR work, and who has also been a close friend and support.
I would like to thank to Dr. Stalker, Kata Ozs, and Dr. Petrik for their help with troubleshooting
experiments and cell material.
I would also like to thank our collaborators and extended family in Brazil, Dr. Miranda, Dr.
Ohashi, Dr. Costa, Dr. de Bem, and many others. Without your input this project would have
been so much more boring. I loved my experience in Brazil, and thank you for providing me
with so many opportunities to examine and learn so much about your beautiful cattle: Bos taurus
indicus.
I would also like to extend my gratitude to the team at ONE Fertility, Burlington. Thank you to
the embryologists: Katie, Lindsay, and Lisa for their patience to have me in the lab during their
busy schedules, to have patients answer my questions, and to trust me to help them with some of
their media preparations and case setups. I also would like to thank the andrology team: Tiffany
and Leanne for allowing me to use some of their space to prepare research samples. I would like
to thank the staff: Melody, Maja and Alexandra for their help with patient consent forms and
running the human ELISA. Last but not least, I would like to thank Dr. Karnis, Dr. Amin, Dr.
Huges and Dr. Faghih for their trust and the opportunity to collaborate.
This research would have not been possible without the financial support from the OVC Doctoral
Scholarship, The Natural Sciences and Engineering Research Council of Canada (NSERC),
Canada Research Chair (CRC), and North/South Animal Biology and Reproductive
Biotechnology Consortium- Canada/Brazil Doctoral Student Research Exchange.

viii
I would now like to thank my friends and family all around the world. I would like to thank my
friends in Canada: Carolyn, Sarah, Jacky, Tobi, Kayla, Allison, Carmon, Leslie, Stewart,
Graham, Faz, Anh, Nayoung, Jyoti, Nina, Anuja, Moez, Ari and many others in the Biomedical
Sciences Department, including staff Kim Best and Frances Graziotto, for their friendship and
support. I would like to thank especially my friend Gilan Abdelaal, who was there for me
through the good, bad and the ugly. I would like to thank my former high school teacher Dragan
Gajic, for his love and passion for science that molded my undergrad and grad scientific path. I
would like to thank my family in Canada, my in-laws Ludy and Ron, who provided me with
support and kind words, lots of tasty food, and babysitting hours. I also owe a big Thank You to
Ludy who was kind enough to go through my thesis and correct all the grammar and spelling. I
would like to thank my friends and colleagues outside of Canada: Sara, Tanja, Jelena, Vera,
Christina, Magda, Nathalia, Priscila, Cinthia, and many others for being there for me. Also, I
would like to thank my past employer, Dr. Zorica Crnogorac-Ilic, for her passion in helping
patients, the opportunity to work in her team, as well as her support in my idea to peruse a
doctorate degree. I would like to thank my extended family, my aunts and uncles, my cousins,
and my dad Radomir and his family for their support.
Now I would like to thank my close family, my grandpa, Bogomir, my mom, Vera and her
partner Slobodan, my son Aleksandar and my husband Timothy for always being my rock and
my inspiration. Hvala Vam!

ix
TABLE OF CONTENTS
DECLARATIONOFWORKPERFORMED......................................................................................................IVACKNOWLEDGEMENTS......................................................................................................................................VLISTOFTABLES..................................................................................................................................................XILISTOFFIGURES................................................................................................................................................XIILISTOFABBREVIATIONS................................................................................................................................XVINTRODUCTION....................................................................................................................................................1LITERATUREREVIEW.........................................................................................................................................5HUMANASSISTEDREPRODUCTIONTECHNOLOGIESTODAY.............................................................................................5INVIVOREPRODUCTION.........................................................................................................................................................10ESTROUSCYCLE.......................................................................................................................................................................11ANTI-MULLERIANHORMONE..............................................................................................................................................13ANTI-MULLERIANHORMONERECEPTOR2......................................................................................................................15AMHinmales.......................................................................................................................................................................16AMHinfemales....................................................................................................................................................................17
AMHASACLINICALMARKEROFOVARIANRESERVE.......................................................................................................19AMHASANOOCYTEANDEMBRYODEVELOPMENTALPOTENTIALMARKER...............................................................21FromHumanSerum..........................................................................................................................................................21FromHumanFollicularFluid.......................................................................................................................................23
AMHASAPCOS,DORANDCANCERMARKER.................................................................................................................24COWASAMODELFORHUMANREPRODUCTION................................................................................................................25DAIRYANDBEEFCOWFERTILITY........................................................................................................................................26ANTI-MULLERIANHORMONEINCATTLE...........................................................................................................................27BOSTAURUSTAURUSVS.BOSTAURUSINDICUS..................................................................................................................28AMHASAFETALSEXMARKER............................................................................................................................................30HUMANVS.BOVINEPLACENTA............................................................................................................................................33
RATIONALE,HYPOTHESIS,ANDOBJECTIVES..........................................................................................36RATIONALE..............................................................................................................................................................................36HYPOTHESIS............................................................................................................................................................................37OBJECTIVES..............................................................................................................................................................................37
CHAPTERI...........................................................................................................................................................38SYSTEMICANDLOCALANTI-MULLERIANHORMONEREFELCTSDIFFERENCESINTHEREPORDUCTIONPOTENTIALOFZEBUANDEUROPEANCATTLE.....................................................38INTRODUCTION.................................................................................................................................................................39MATERIALANDMETHODS...........................................................................................................................................41AnimalsandExperimentalDesign..............................................................................................................................41IVF.............................................................................................................................................................................................42ELISA........................................................................................................................................................................................43RNAextractionandreversetranscription..............................................................................................................44RealTimequantitativePCR...........................................................................................................................................45Statistics.................................................................................................................................................................................46
RESULTS................................................................................................................................................................................48Studygroup1.......................................................................................................................................................................48Studygroup2.......................................................................................................................................................................48
x
DISSCUSION..........................................................................................................................................................................53CHAPTERII..........................................................................................................................................................56PREGNANCYANTI-MULLERIANHORMONEASAFETALSEX-DETERMININGFACTOR...............56INTRODUCTION.................................................................................................................................................................57METHODS..............................................................................................................................................................................59AnimalsandExperimentalDesign..............................................................................................................................59DNAextractionandsexconfirmationusingTSPY...............................................................................................62RNAextractionandreversetranscription..............................................................................................................63RealtimequantitativePCR............................................................................................................................................63ELISA........................................................................................................................................................................................63Statistics.................................................................................................................................................................................64
RESULTS................................................................................................................................................................................65Studygroup1.......................................................................................................................................................................65Studygroup2.......................................................................................................................................................................66Studygroup3.......................................................................................................................................................................66
DISCUSSION..........................................................................................................................................................................69CHAPTERIII........................................................................................................................................................76HUMANMONOFOLLICULARANTI-MULLERIANHORMONEINRELATIONTOOOCYTEDEVELOPMENT..................................................................................................................................................76INTRODUCTION.................................................................................................................................................................77METHODS..............................................................................................................................................................................81PatientsandExperimentalDesign.............................................................................................................................81MonofollicularSampleCollectionandIVF..............................................................................................................82ELISA........................................................................................................................................................................................83Cellculture............................................................................................................................................................................83RNAextractionandreversetranscription..............................................................................................................84RealTimequantitativePCR...........................................................................................................................................84
RESULTS................................................................................................................................................................................86AMHperpatient:................................................................................................................................................................86AMHperindividualfollicles:..........................................................................................................................................86
DISCUSSION..........................................................................................................................................................................91GENERALDISCUSSION.....................................................................................................................................96SUMMARY,CONCLUSIONS,ANDFUTUREDIRECTIONS.......................................................................107LITERATURECITED........................................................................................................................................110APPENDIX..........................................................................................................................................................129APPENDIXI:DATAFROMCHAPTERII,STUDYGROUP1..............................................................................................129APPENDIXII:THECONSENTFORM...................................................................................................................................130APPENDIXIII:MONOFOLLICULARSAMPLECOLLECTIONINSTRUCTIONS..................................................................133APPENDIXIV:PROTOCOLFORTHEMONOFOLLICULAROOCYTECOLLECTION.........................................................135APPENDIXV:MODIFIEDCYCLESHEET...........................................................................................................................136

xi
LIST OF TABLES
Table 1 Real Time PCR primers………………………………………………………………...46
Table 2 Summary of antral follicle count (AFC), ovary diameter (OD), plasma anti-Mullerian hormone (Pl AMH) from Study group 1, and follicular fluid AMH (FF AMH), oocyte, cleavage and blastocyst rate mean values (± SE) from Study group 2 for European type (E), Zebu (Z) and crossbred (C) cattle and the p-values from their average value comparisons. Significant difference (p<0.05) is indicated by the symbol (*)………………………………………………50
Table 3 Real Time PCR primers………………………………………………………………...61
Table 4 Real Time PCR primers………………………………………………………………...85

xii
LIST OF FIGURES
Figure 1 Correlations between anti-Mullerian hormone (AMH) and reproductive parameters in European type (E, light gray square), Zebu (Z, black triangle) and crossbred (C, dark grey diamond) cattle. The plots show simple linear regression trend lines for each of the breeds but that they do not reflect the model that was used in the statistical analysis. A) represented Study group 1 and B) represented Study group 2. Ai) Plasma AMH (Pl AMH) vs. antral follicle count (AFC) for E (n=7), Z (n=30) and C (n=6) animals. Z correlation, ρ=0.54, p=0.002; Z to E comparison, p=0.004; C to E comparison, p=0.049. Aii) Pl AMH concentration vs. ovarian diameter (OD) in E (n=6), Z (n=26) and C (n=6) animals. Z correlation, ρ=0.36, p=0.067; Z to E comparison, p=0.009; C to E comparison, p=0.094. Bi) Pl AMH vs. average number of oocytes per pair in Z (n=12; ρ=0.818, p=0.002); Bii) Follicular fluid AMH (FF AMH) concentration vs. number of oocytes in Z (n=24), and E (n=59) cattle. E correlation, ρ=0.37, p=0.005; Z to E comparison, p<0.0001. Biii) FF AMH concentration (ng/ml) vs. AFC in E (n=56; ρ=0.35, p=0.009)………………………………………………………………………………………….51 Figure 2 A) Relative granulosa cell anti-Mullerian hormone (GC AMH) mRNA expression in low vs. high oocyte producing ovaries for European type (grey, n=56) and Zebu (black, n=10) cattle. B) Relative GC AMH and anti-Mullerian hormone receptor 2 (AMHR2) mRNA expression in low (light gray) vs. high (dark gray) oocyte producing ovaries for European type cattle (n=56) was found to be significantly different (p=0.035). Glyceraldehyde 3-phosphate dehydrogenase housekeeping gene used to determine relative expression level, error bars denote the standard error of the mean (SEM) and significant difference (p<0.05) is indicated by the symbol (*)………………………………………………………………………………………..52 Figure 3 Visual representation of the three study groups for the Chapter 2. Horizontal line represents the time line of gestation divided into the three trimesters and each trimester into three months starting with artificial insemination (AI) of the cow and ending at birth. Literature based fetal expression of AMH is represented by either blue for male at 60 days or red for female at 150 days, with large and small arrows corresponding to the level of expression. In dark red: Study group I, collections at day 0, 35, 135 and 275 and study group II collections from 85 to 155 days of gestation and study group III collections from 38 to 80 days of gestation. In yellow: (Empey et al., 2012; Fanchin et al., 2007) detected significant difference in maternal blood AMH levels between male and female fetuses in humans in between 11th and 15th week of pregnancy, approximately corresponding to 77 and 105 days of gestation……………………………………………………………………………...…………. 61 Figure 4 Graphs representing plasma AMH (Pl AMH) values (pg/ml) measured using Ansh ELISA kit in cows Bos taurus indicus during gestation at 2 time periods, between day 35 and 135 (purple), and between day 135 and 275 (orange) carrying male (M; n=5) vs. female calves (F; n=3). A) Y-axis represents change in Pl AMH between M and F at two time periods, first time period found to be significantly different between M and F (p= 0.036), indicated by the symbol (*). B) Y-axis represents relative change in Pl AMH in terms of its previous value, example: Δ Pl AMH (day x - day y) / Pl AMH (day y). Error bars denote the standard error of the mean (SEM)………………………………………………………………………………….67

xiii
Figure 5 Graphs representing plasma AMH (Pl AMH) values (pg/ml) measured using Ansh ELISA kit in Bos taurus indicus cows (with male, n=10, in blue and with female, n=11, in red) and fetus (male, n=10, in green and female, n=11, in purple) at single time points throughout pregnancy, between day 85 and 155, fetus size from 15cm to 45 cm A) Graph represents average level of Pl AMH of pregnant cow and fetus for period from 85 to 155 days, sex denoted as male (M) and female (F). Difference between the cows was not significant (p=0.560), however differences that were significant were between the female fetuses and cows with those female fetuses (*, p<0.05), between the male fetuses and the cows with those male fetuses (**, p<0.05), and the male and female fetus (***, p<0.05). Error bars denote the standard error of the mean (SEM). B) Graph represents relationship between pregnant cow with male (green triangle) or female fetus (purple cross), or male (blue rhombus) or female fetus (red square) Pl AMH and fetus size in cm…………………………………………………………………………………...68 Figure 6 Graphs representing relative AMHR2 RNA expression from male (blue; n=6) and female (red; n=7) cotyledon (Cot.) and male (M. in blue; n=2) and female (F. in red; n=3) placenta (Plac.) during 1st trimester in Bos taurus taurus. A) Male vs. female relative AMHR2 RNA expression from cotyledon only, gestation days 38 to 76 for male, and 56 to 80 for female. B) Male vs. female cotyledon and placenta relative AMHR2 RNA expression. Gestation days from placenta samples 42 to 46 for males, and 70 to 80 for females. AMHR2 RNA was compared to two housekeeping genes Glyceraldehyde 3-phosphate dehydrogenase and Peptidylprolyl isomerase A to determine relative expression level. Error bars denote the standard error of the mean (SEM)…………………………………………………………………………68 Figure 7 Model describing the fetal testicular AMH secretion 1000x higher than the fetal ovarian AMH secretion and 100x higher than the cow’s ovarian secretion observed between day 85 and 155 of gestation. Model proposes that male fetal AMH crosses placenta and enters maternal circulation leading to the rise in the cow’s Pl AMH compared to the cows that carry female fetuses observed between day 35 and 135 of gestation……………………………….…………75 Figure 8 Anti-Mullerian hormone (AMH) per patient based approach. Correlations between AMH level, its relative receptor transcript amount and embryo development potential in six patients. Ai) Serum AMH (SE AMH) (pmol/l) vs. Average follicular fluid (FF) AMH (pmol/l) (p=0.017). Aii) SE AMH concentration (pmol/l) vs. Average relative GC AMHR2 RNA expression. Aiii) SE AMH (pmol/l) vs. Antral follicle count (AFC); Bi) SE AMH concentration (pmol/l) vs. Blastocyst rate (blast rate) (p=0.015). Bii) Average relative GC AMHR2 RNA expression vs. blast rate p=0.036. Biii) Average FF AMH concentration (pmol/l) vs. blast rate p=0.036…………………………………………………………………………………………..88 Figure 9 Comparisons between individual follicles serum (SE) AMH (pmol/l), average follicular fluid (FF) AMH (pmol/l), relative GC AMHR2 RNA expression, oocyte number and blastocyst (blast) rate between patients (n=3; blue) with “normal” 1.93-2.62 ng/ml and patients (n=3; red) with “high” between 4.21-6.79 ng/ml (x 7.14 to be converted to pmol/l). Significant difference was observed between “normal” and “high” groups for SE AMH, FF AMH and blast rate (p=0.048, p=0.038, and p=0.038, respectively). Glyceraldehyde 3-phosphate dehydrogenase and Peptidylprolyl isomerase A were used as housekeeping genes to determine relative expression

xiv
level. Error bars denote the standard error of the mean (SEM) and significant difference (P<0.05) is indicated by the symbol (*)……………………………………………………………………89
Figure 10 Comparisons between average of individual follicles that gave rise to blastocyst (red/blue) and non blastocyst (green) for each patient being from either “high” (i) or “normal” (ii) SE AMH groups, 4.21-6.79 ng/ml or 1.93-2.62 ng/ml respectively. Ai) Average Mono follicular fluid (FF) AMH (pmol/l) in “high” patient group from blast vs. non blast follicles respectively, patient 1 (n=1, n=2), patient 2 (n=2, n=3), patient 3 (n=5, n=2); Aii) Average Mono FF AMH (pmol/l) in “normal” patient group from blast vs. non blast follicles respectively, patient 4 (n=3, n=4), patient 5 (n=3, n=2), patient 6 (n=2, n=2). Bi) Average FF AMH/SE in “high” patient group from blast vs. non blast follicles respectively, patient 1 (n=1, n=2), patient 2 (n=2, n=3), patient 3 (n=5, n=2); Bii) Average FF AMH/SE in “normal” patient group from blast vs. non blast follicles respectively, patient 4 (n=3, n=4), patient 5 (n=3, n=2), patient 6 (n=2, n=2). Ci) Average relative GC AMHR2 RNA expression in “high” patient group from blast vs. non blast follicles respectively, patient 2 (n=1, n=1), patient 3 (n=3, n=1); Cii) Average relative GC AMHR2 RNA expression in “normal” patient group from blast vs. non blast follicles respectively, patient 4 (n=3, n=1), patient 5 (n=4, n=2). Glyceraldehyde 3-phosphate dehydrogenase and Peptidylprolyl isomerase A were used as housekeeping genes to determine relative expression level, and error bars denote the standard error of the mean (SEM)…………90
Figure 11 Ovaries from high and normal SE AMH patient groups with oocytes that developed to blastocysts corresponding to high FF AMH in red or low FF AMH in blue respectively, compared to oocytes that did not develop to blastocysts corresponding to FF AMH in green for both patient groups……………………………………………………………………………….95
Figure 12 “Size matters concept” representation of the ovary in which the ovarian size is positively correlated to: the ovarian reserve, the ovarian function (based on the oocyte developmental potential), and the systemic AMH level. However it is negatively correlated to the ovulatory follicular AMH level………………………………………………………………...106

xv
LIST OF ABBREVIATIONS
AMH Anti-Mullerian Hormone
AFC Antral follicle count
IVP In vitro production
GC Granulosa cell
FF Follicular fluid
ART Assisted reproduction technologies
MOET Multiple ovulation and embryo transfer
AMHR2 Anti-Mullerian hormone receptor 2
SEF Social egg freezing
IVF In vitro fertilization
WHO World Health Organization
EDC Endocrine disrupting chemicals
HPG Hypothalamic-pituitary-gonadal axis
FSH Follicle stimulating hormone
LH Luteinizing hormone
FSHRc Follicle stimulating hormone receptor

xvi
IGF Insulin growth factor
cAMP Cyclic adenosine monophosphate
MII Metaphase II
MIS Mullerian inhibiting substance
TF Transcription factor
SF1 Sterioidogenic factor 1
WT1 Wilms’ tumor associated protein 1
TGF-beta Transforming growth factor beta
BMP Bone morphogenic proteins
GDF Growth and differentiation factor
GDNF Glial cell-derived neurotrophic factor
SBE Smad binding element
AMHR1 Anti-Mullerian receptor 1
Alk3 Activin-like kinase 3
Bmpr1a Bone morphogenic protein receptor 1a
SRY Sex determining region of Y chromosome
MMP Metalloproteinase

xvii
PCOS Polycystic ovarian syndrome
OHSS Ovarian hyperstimulation syndrome
OPU Ovum pick-up
DOR Diminished ovarian reserve
KGN Ovarian granulosa-like tumor cell line
AI Artificial insemination
BCS Body condition score
Taurus/ European Bos taurus taurus
Indicus/ Zebu Bos taurus indicus
CL Corpus luteum
Pl Plasma
OD Ovarian diameter
COC Cumulus oocyte complex
IVM In vitro maturation
SOF Synthetic oviductal fluid
BSA Bovine serum albumin
ELISA Enzyme linked immunosorbent assay

xviii
dNTP Deoxyribonucleotide triphosphates
qPCR Real time quantitative PCR
GAPDH Glyceraldehyde-3-Phosphate Dehydrogenase
H2A Histone 2A
YWHAZ Tyrosine 3-monooxygenase/tryptophan 5-monooxygenase
activation protein
HPRT1 Zeta hypoxanthine guanine phosphoribosyl transferase 1
SDHA Succinate dehydrogenase complex, subunit A
Glht General liner hypothesis test
PGD Preimplantation genetic diagnosis
AFP Alphafetoprotein
TSPY Testes-specific protein Y
PPIA Peptidylprolyl isomerase I
hCG Human chorionic gonadotropin
TLM Time-lapse microscopy
Mono FF Monofollicular
SE Serum
2PN 2 pronucleus

xix
REB Research Ethics Board
TESA Testicular sperm retrieval
ONE Ontario Network of Experts
FBA Fetal bovine serum
eGFP Enhanced Green Fluorescent Protein
1
INTRODUCTION
Understanding ovarian physiology has both biological and economic importance. The
ovary’s main role is to produce reproductive hormones and to house follicles, structures
enclosing oocytes. Follicle number is established during embryogenesis and rapidly decreases
towards birth and puberty. The time between puberty and menopause represents the reproductive
life during which <1% of follicles will leave their dormant state and become recruited towards
ovulation (Malek et al., 1998; Oktem and Oktay, 2008). The mechanism controlling this switch
between dormancy and activation is under strict paracrine and endocrine control. Strict paracrine
control ensures that individuals do not exhaust their ovarian reserve prematurely, allowing for
maximized propagation of genetic material and survival of the species.
Anti-Mullerian hormone (AMH) is one of the paracrine factors involved in the regulation
of follicle recruitment. In the female, AMH is secreted by the ovary and inhibits premature
primordial follicle activation. It has been shown that ablation of this hormone causes premature
menopause in mice (Durlinger et al., 1999; Pereira et al., 2013). In males, AMH is expressed
earlier during embryogenesis in almost a hundred times higher concentration than in females,
ensuring inhibition of Mullerian ducts that represent the embryological origin of the oviducts,
uterus and upper part of the vagina (Sandvig and Llorente, 2012; Teixeira et al., 2001). In
females, expression of AMH starts a few months later and in much lower concentration, reaching
its peak in puberty. The levels in the female have been shown to reflect reproductive aging,
ovarian reserve, number of growing follicles or antral follicle count (AFC), ability to respond to
superovulation drugs, and number of oocytes retrieved during in vitro production (IVP)
(Anderson et al., 2012; J. J. Ireland et al., 2011; La Marca et al., 2009; Malek et al., 1998).

2
AMH function has been explored at cellular, follicular, ovarian, individual, population,
subspecies, and species level. At the cellular level, AMH has been shown to be expressed by
both Sertoli and granulosa cells (GCs) signaling in both an autocrine and paracrine fashion to
cells of near proximity. Since AMH is expressed at highly different concentrations and times
between sexes, it has been speculated that it might be utilized as a sex-determining marker
during early pregnancy (Empey et al., 2012; Malek et al., 1998). At the follicular level, AMH is
expressed by preantral growing follicles, keeping the remaining primordial follicles in a
dormancy stage, and possibly reflecting the enclosed oocyte’s developmental potential
(Brownbill et al., 1995; Takahashi et al., 2008). At the ovarian level, AMH from pooled
follicular fluid (FF) has been shown to correlate to overall pregnancy rates in humans (Duc-
Goiran et al., 2006; Wunder et al., 2008). Measured in serum and/or plasma, individual AMH
levels have been shown to be consistent between estrous cycles, independent of the
hypothalamic-pituitary-gonadal axis, and correlated to pooled FF levels (Morgan et al., 2011;
Rico et al., 2009; Wang et al., 2009; Wittmann and McLennan, 2011). When examined at the
population level, AMH displays highly variable levels among individuals with different ovarian
potential (Barker, 1944; J. L. H. Ireland et al., 2008). When examined between cattle subspecies
Bos taurus taurus and Bos taurus indicus, a specific AMH range has been shown to be
characteristic of each subspecies (Batista et al., 2014; Firoozi et al., 2009; Hocher et al., 2009;
Walsh et al., 2015). At the species level, there are species specific average serum AMH levels
(Kumar et al., 2013; Stephen et al., 2002).
Human assisted reproduction technologies (ART) and cattle industry in vitro production
(IVP) have a common problem: decreasing fertility. Two of the main factors causing infertility in
women are the increasing age of first time mothers and exposure to environmental stressors

3
related to a modern life style (Bushnik and Garner, 2008; Y. Nishi et al., 2000). As a
consequence ARTs are acquiring increasing importance in the reproductive field, resulting in 5
million babies born worldwide from 1978 until 2012 (Brodin et al., 2013; Holte et al., 2011;
Kawamura et al., 2013; Sunkara et al., 2011; van Loendersloot et al., 2014). One of the main
deficiencies of ART is the lack of markers of oocyte and embryo competence, which would
allow for more accurate and consistent selection methods and increase in success rate. The lack
of viability markers leads to problems such as multiple gestations and risk of preterm delivery,
low gestational weight and long term post natal effects on the child’s development, and ethical
issues with cryopreservation and creation of “excess” embryos (Grady et al., 2012; Keeton et al.,
1996).
Cattle industry IVP, responding to a declining fertility of 3-4% per decade, and has
produced over 500,000 embryos per year (Lucy, 2001; Mapletoft, 2005; Ramsay et al., 2005;
Royal et al., 2000; Spencer, 2013). Dairy cattle particularly have been bred towards increased
milk yield, that has been physiologically prioritized over fertility traits (Leroy et al., 2008;
Woodruff and Shea, 2010). Cattle IVP application has been improved due to the ability to
cryopreserve genetically valuable embryos and transport them around the world. IVP also
brought improvement in reproduction efficiency by retrieving up to hundred oocytes per single
retrieval procedure from cattle using Multiple Ovulation, and Embryo Transfer to multiple
recipients (MOET) (Gilchrist et al., 2008; Li and Albertini, 2013; Mapletoft, 2005). A better
understanding of ovarian physiology, known to be highly similar between human and cow, could
lead to individualized hormonal stimulation protocols and selection of the most viable oocytes
and embryos, resulting in increased safety and efficiency of ART and IVP.

4
The aim of this thesis is to evaluate the correlation between granulosa cell AMH gene
expression and plasma and follicular fluid AMH protein level on oocyte quantity, developmental
potential, and fetal sex. AFC, ovarian diameter, oocyte number, blastocyst rate, FF and plasma
AMH levels, and GC AMH and AMH receptor 2 (AMHR2) expression were assessed in two
cattle subspecies, Bos taurus taurus and Bos taurus indicus, with known fertility differences.
Secondly, pregnant maternal and fetal plasma AMH were compared in cattle carrying male vs.
female fetuses. Finally, serum and monofollicular AMH levels and expression were compared to
oocyte developmental potential in humans.

5
LITERATURE REVIEW
Human Assisted Reproduction Technologies Today
With over 5 million babies born worldwide and the imminent 40th anniversary of the
birth of Louise Brown in 1978, the field of Assisted Reproduction Technologies (ART) went
from being an experimental practice to a common clinical procedure to achieve the birth of a
healthy singleton baby. One of the main reasons for the upsurge of ART in the last 4 decades is
the increased age of first time mothers, as well as the negative influence of environmental stress
on fertility. The number of 30 and over 35 year old first time moms grew from 15% to 26% and
from 3% to 11% from 1987 to 2005 respectively (Bushnik and Garner, 2008; Norris et al., 2009;
Tsafriri et al., 1996; Webb et al., 2002). In addition, the mean of reproductive age moved from
24.6 to 29.1 between 1970 and 1999 (Berkholtz et al., 2006; Hsueh et al., 2015; Velde and
Pearson, 2002). The emancipation of women in the 1960s, leading to an increase in female
education and participation in the labor force, an increase in the rate of divorce and remarriage,
and the availability of more reliable forms of contraception contributed to a change in
reproductive behavior. It resulted in delayed childbearing and a decreased number of children per
couple in most Western-style societies (Agdi et al., 2010; Ortega-Hrepich et al., 2014; Velde and
Pearson, 2002). These sociological factors, together with a physiological decrease in female
fertility with age, are reflected in the difference in infertility rates of 6% versus more than 30%
between the 15-24 age group compared to the over 30 age group, making ART an indispensable
and viable way to have biological children. The rise of “social egg freezing” (SEF) in the last
couple of years allowed for reproductive autonomy for women and a way to arrest the biological
clock (Argyle et al., 2016; La Marca et al., 2009). To illustrate the complex social issues
surrounding the timing of conception, when companies such as Apple or Facebook took the

6
revolutionary step of offering SEF to their employees, women felt pressured to delay childbirth
(Baylis, 2015; Dunlop et al., 2016; Kawamura et al., 2013; Varghese et al., 2008; Xiao et al.,
2015).
SEF has been shown to represent 91% of non-oncological reasons for fertility
preservation, compared to repetitive surgery (1%), endometriosis (6%) and other infertility
causes (2%) (Donnez et al., 2011; Hsueh et al., 2015; Stoop et al., 2014). Using computer
simulation, it was suggested that, with help of in vitro fertilization (IVF), a woman has a 90%
chance of having a one-child family at age of 35 and a three-child family at the age of 28. If no
IVF was involved, the female age would drop to 32 and 23 respectively (Habbema et al., 2015;
Hu et al., 2014). Since 2009, the World Heath Organization (WHO) has recognized infertility as
a disease of the reproductive system, defined by the failure to achieve a clinical pregnancy after
12 months or more of regular unprotected sexual intercourse (J. Johnson et al., 2005; 2004;
World Health Organization, 2011). Infertility is ranked as the 5th highest serious global disability
of women under the age of 60, therefore deserving proper attention and treatment (Zegers-
Hochschild et al., 2009).
Besides maternal age being a contributor to infertility, environmental influences,
especially rising levels of man-made endocrine disrupting chemicals (EDC), are affecting both
humans and animals through eating, drinking, breathing, cosmetic application, and soil contact
from waste, pesticide and fertilizer application (Krisher, 2013). EDC’s are stable and lipophilic
compounds that accumulate over decades, causing both chronic and acute harm to female
fertility (Ferris et al., 2015; Krisher, 2013). The direct effects on female reproduction are seen on
oocyte maturation and blastocyst development, with Bisphenol A exposure during oocyte
maturation in vitro resulting in spindle abnormalities, chromosome misalignment, decreased

7
embryo development, skewed sex ratio, and increased apoptosis in blastocysts (Ferris et al.,
2015). BPA is one of the highest volume synthetic chemicals produced worldwide, exceeding 5.4
million tons in 2015, and present in urine, blood, FF, and tissue of 92.6% of Americans and 90%
of Canadians (Bushnik et al., 2010).
One of the major limiting factors of ART is financial. In the USA, for example, the cost
is up to $15,771 per treatment, and $55, 450 per live birth. (Scheetz et al., 2012). In some
countries, such as Canada, Belgium, the UK, Argentina, Uruguay, Israel, and Serbia, 1-3 cycles
of ART are fully funded, while in others such as Australia, Brazil, and Germany treatment is
partially funded. This assists patients to conceive without being limited by their economic status.
It has been estimated that this investment in ART by governments is highly justified in the long
term due to an eight fold return of approximately $127,000US, in net tax revenue during a
person’s lifetime (Connolly et al., 2008). There are two major ART cost factors: ovarian
stimulation drugs and in vitro media culture systems. Both of these can be reduced with more
precise patient selection, simpler patient diagnostic methods, correct ovarian stimulation,
simplified procedures and equipment in the lab, and minimized complications caused by ART
(Maheshwari and Teoh, 2014).
The main drawback of ART is that the long-term effects are unknown, since the oldest
child is not yet forty. One of the possible consequences of ART is that unfavorable reproductive
traits are being carried from one generation to the next, with increasing chances that the children
conceived by ART will also need assistance in reproducing. Regarding the effect of ART on
developmental competencies of children, a well-conducted Canadian study examined children
ages 0-5. This study provided evidence of increased risk of prenatal and birth-related risk factors
associated with being conceived by mothers aged 35 and older. It was difficult to differentiate

8
between the negative effects due to the use of ARTs versus those due to preterm birth and low
gestational weight. However, the children seemed to also have better outcomes in many of the
tested cognitive, physical, and behavioral criteria compared to children from younger moms
(Bushnik and Garner, 2008). It was found that time spent with the child, relationship factors, and
financial resources have significant impact on developmental milestones such as the age when
the child first ate solid food, sat up, said the first word, or made the first step (Bushnik and
Garner, 2008). There are other potential long term epigenetic risks following ART procedures,
such as Beckwith-Wiedemann syndrome, Angelman syndrome, and the more recently
recognized maternal hypomethylation syndrome, and neurological risks such as cerebral palsy,
that need to be evaluated further (Vulliemoz and Kurinczuk, 2012). Also, possible increased
cancer risk due to ovarian stimulation drugs is still under investigation and long term data is
necessary to remove all the confounding factors (Brinton et al., 2012).
Currently the in vitro parameters for women under 40 using ARTs are ~70% fertilization,
~30% blastocyst rate and ~20% pregnancy rate compared to ~90% fertilization and ~50%
pregnancy success rate with natural conception and timed intercourse (Grodon, 2003; Leroy et
al., 2012). One of the reasons for the lower ART pregnancy rate is the inability to select an
embryo with the highest developmental potential. To compensate for the lowered pregnancy rate,
transfer of more then one embryo is commonly performed, often resulting in multiple gestations.
Multiple gestations are associated with high rates of pregnancy-related and neonatal
complications such as preterm delivery, decreased weight for gestational age, 7.4%, 21.6%, and
50% of twin, triplet, and quadruplet pregnancies respectively, and birth of at least one child with
developmental disabilities. In addition, cost increases with multiple gestations, being 10 times
higher for a triplet vs. singleton pregnancy (Maheshwari and Teoh, 2014). In the US, from 1980

9
to 1997 the number of live birth twin deliveries rose 52%, and high order multiple gestations
increased 404% from 1,337 to 6,737 births (Hankins and Saade, 2005). It is estimated that twin
pregnancies represented 1 in 44 births but accounted for 1 in 8 perinatal deaths. In Australia, the
reduction in multiple births by half allowed for a 55% increase in availability of IVF services, by
redirection of funding and resources. (Chambers et al., 2011).
The main concerns of IVF remain: how to improve our ability to detect oocytes and
embryos with developmental potential that would lead to pregnancy and a healthy child, and how
to mimic the in vivo environment to provide the optimal conditions for the oocyte and embryo to
sustain its development in vitro (Chronopoulou and Harper, 2014)? These oocyte and embryo
selection methods need to fulfill criteria such as being simple and rapid, inexpensive, to allow for
high throughput and consistency, and, most importantly, to be non-invasive. Maybe a new hope
in the future lies in microfluid platforms in which automated robots perform the entire IVF
protocol without any human input; however these are still only a matter of science fiction
( Swain et al., 2013). Current methods of selection include the fields of transcriptomics,
proteomics, metabolomics, but the most commonly used method is still morphology combined
with kinetics-based assessment. There is a wide body of data showing that all currently existing
methods lack precision and consistency to detect oocytes and embryos with the highest
developmental potential (Balaban and Urman, 2006; Boni et al., 2002; Ebner, 2003; Maheshwari
and Teoh, 2014; Rienzi et al., 2010; Robert et al., 2001; Sinclair, 2008; Stojkovic et al., 2001).

10
In vivo reproduction
The oocyte is one of the most unique cells in the mammalian body. It meiotically divides,
resulting in cells with haploid genetic material, is able to give rise to all other cells of the body
by being totipotent, reprograms somatic nuclei, and reprograms sperm chromatin to a functional
pronucleus. It is also a cell that contains the distinctive combination of parental genes through
the process of crossing over. Oocyte importance can be evidenced by the complex endocrine
physiology that regulates its creation, storage, selection, maturation, ovulation and fertilization.
The creation of oocytes takes place during embryogenesis in which 1000-2000 primordial germ
cells migrate to the genital ridges where they can start mitotically dividing, generating around
~7x10⁶ oogonia, and populating an area that will develop into ovaries (Velde and Pearson, 2002).
Other mesodermal somatic cells come to “help” by providing a supporting and structural role in
organ development. These cells are destined to become granulosa and theca cells, and have
important roles in hormone secretion and regulation, ensuring proper oocyte storage and
nurturing for up to 50 years in humans. The complexity and codependence of the interaction
between these two cell types, germ and somatic, is just starting to be revealed by research (Eppig
et al., 2002; Li and Albertini, 2013; Oktem and Oktay, 2008; Rodgers and Irving-Rodgers, 2010;
Webb et al., 2002).
At around 20 weeks of gestation in humans, somatic cells start to envelope oogonia and
form structures called primordial follicles (Oktem and Urman, 2010). Surrounded by somatic
cells, oogonia are ready to start their journey from the diplotene stage to the haploid oocyte. The
process at first only progresses to prophase I of the first meiotic division, and gets arrested at this
stage, mainly in the primary stage follicles that stay dormant until puberty. By the time of
puberty, the follicle number is lessened by almost 80% of its starting quantity (Erickson, 1966).
11
Only a limited number of the remaining follicles are reawakened or recruited, in a strictly timed
manner under the control of both direct paracrine and indirect endocrine factors, after having
been arrested from 13-14 years, at puberty, or for as long as 45-50 years, at menopause (Oktem
and Oktay, 2008).
Estrous cycle
Recurring time periods where the female hormone estrogen is produced by ovaries, in set
patterns during reproductive life, is called the estrous cycle. Sexual maturity starts in puberty
with the establishment of the hypothalamic-pituitary-gonadal axis (HPG). The hypothalamus
secretes gonadotropin-releasing hormone that triggers the pituitary gland to produce follicle
stimulating hormone (FSH) and luteinizing hormone (LH), that in turn leads to gonadal secretion
of steroid hormones. Establishment of HPG results in reawakening, growth, maturation and
ovulation of selected follicles, setting the stage for fertilization, implantation and pregnancy. If
fertilization, implantation and pregnancy do not occur, HPG leads to another cycle of endocrine
hormone secretion, triggering a new set of dormant follicles. Follicle number in an individual’s
lifetime is considered an ovarian reserve. This paradigm can be challenged when new oocytes
are generated from germ cells throughout an individual’s reproductive life (J. Johnson et al.,
2005; 2004). However, the vast majority of the available follicular pool comes from those
generated during embryo development. The reawakening of follicles happens in cycles or
“waves” where a group of 5-10 follicles is triggered to enter the growth phase. Usually there are
three of these waves per one estrogen cycle, and the last wave results in one ovulatory follicle
(Driancourt, 2001). The entire process of selection, growth and maturation of the follicle with

12
ovulation takes about 90 days and this process is governed by fluctuations of reproductive
hormones depending on the follicle growth stage (Webb et al., 2004). Follicle growth is
paracrine influenced stages for approximately 80 days, due to lack of presence of endocrine FSH
receptor (FSHRc) and consist of: primordial, primary, and secondary. Following paracrine, are
the endocrine influenced stages, of mainly FSH, that occur for only the next 7-9 days and consist
of antral and ovulatory (Driancourt, 2001; Oktem and Oktay, 2008; Sirard, 2001). The stage of
the follicle is defined based on the morphological appearance of the follicle and the cells
enclosed in the follicle. The oocyte goes through complex cytoplasmic changes during
maturation stages including organelle redistribution, cytoskeleton dynamics, molecular
maturation, and zona pellucida acquisition (Ferreira et al., 2009). The primordial follicle,
~0.03mm in size, is defined as one with only one arrested oocyte, with one layer of flattened GC
layer (Velde and Pearson, 2002). The primary follicle, 0.03-0.1mm in size, is one where the GCs
start changing shape from flattened to more cuboidal. The ovary is mostly populated by primary
follicles until puberty. The secondary follicle, 0.1-2mm in size, occurs when the number of GC
layers change from one to two or more. The antral follicle, 3-8mm in size, is when there is a
development of a cavity in the follicle as a result of apoptosis, and the follicular fluid (FF) fills
the cavity. At this stage, under the influence of FSH, an aromatase enzyme starts being expressed
by GCs, converting androgens produced by theca cells to estrogen. The GCs also produce
activins, inhibins, follistatins, and insulin growth factors (IGF) (Webb et al., 2007). All of these
paracrine factors have a role in proper follicle and oocyte growth. The ovulatory follicle, 8-
10mm in size, is a follicle where the membrane is thinning and GCs are starting to express LH
receptors. Pulsatile action of LH is what causes the rupture and ovulation. The follicle that first
obtains the highest number of LH receptors is the one selected for ovulation (Hamel et al., 2008).

13
The oocyte resumes meiosis approximately 24 hours prior to ovulation, initiated by a decline in
the surge of cyclic adenosine monophosphate (cAMP) through the gap junction from GCs to
oocyte. During these 24 hours, the oocyte reaches metaphase II (MII) of the second meiotic
division (Norris et al., 2009). As long as the dominant follicle is present, there is no further
recruitment. This process of dominance selection occurs randomly between the ovaries
(Driancourt, 2001). The majority of follicles are at the dormant stage with only less than 1%
becoming selected to be ovulatory in a lifetime.
Anti-Mullerian Hormone
Alfred Jost in 1947 defined a second male determining factor besides testosterone, called
Mullerian Inhibiting Substance (MIS). As its name suggests, its function in the male embryo is
to inhibit the Mullerian duct development. Later, the name more commonly used became Anti-
Mullerian Hormone (AMH). The human AMH gene is located on 19p13.2-13.3. This is a
relatively short gene of 2.75kb, divided into 6 exons, giving rise to 1.7kb mRNA. Bovine and
mouse promoters are a canonical TATA box, with a single transcription start site located 10bp
upstream of the ATG. The human promotor is a degenerate TTAA motif at 26 bp, with the
functional initiator element recognized by the transcription factor (TF) II-I. The proximal
promoter displays a number of evolutionary conserved binding elements: steroidogenic factor 1
(SF1), two GATA, one SOX9, and Wilms’ tumor associated protein 1 (WT1), all indicating a
common AMH expression in mammals (Lasala et al., 2004). Main regulators of AMH
expression are Sf1, Gata4, Wt1, Dax1 and Fog2 (Salmon et al., 2004a). Without the binding of
SF1 and the pair of GATA4, no up regulation of AMH is initiated (Watanabe et al., 2000). AMH

14
mRNA is translated to a 140kDa disulfide linked glycoprotein homodimer, belonging to a
transforming growth factor (TGF)-beta family of proteins. In humans it is synthesized as 560
amino acids with a half life of 3-5 days in serum (La Marca et al., 2009; Lasala et al., 2004).
TGF-beta family is composed of 33 related polypeptides that, beside AMH, also include bone
morphogenic proteins (BMP), growth and differentiation factor (GDF), activin/inhibin subfamily,
glial cell-derived neurotrophic factor (GDNF), and nodal (Knight, 2006). All of these are
involved in injury repair, cellular proliferation, differentiation, adhesion, and immunity
(Morikawa et al., 2016). Disturbance in TGF-beta signaling leads to a variety of diseases such as
connective tissue disorders, fibrosis, and cancer (Morikawa et al., 2016). Even with TGF-beta
family being large, there are many fewer receptors and downstream intercellular effectors than
signaling molecules. They all signal through trans-membrane serine/threonine kinases,
consisting of seven type I receptors and five type II receptors, forming heteromeric type I/type II
receptor complexes. Ligand binding to a tetrameric receptor complex stabilizes and activates
their signaling capacities, further phosphorylating Smad proteins. Smads got their name from
studies in Drosoplila and C. elegans proteins, in which Sma and Mad were identified
respectively and found to be very similar to human, frog and mouse signaling molecules. The
Smad complex translocates to the nucleus where it binds to the promoter Smad Binding Element
(SBE) causing up regulation of metalloproteinases in males and down regulation of follicle
recruitment and growth factors in females (La Marca et al., 2009).
140kDa AMH undergoes posttranslational proteolytic cleavage, starting from covalently
bound prepropeptide and cleaving to become propeptide non-covalently linked between the N
and C terminal domain. Each homodimer becomes 110kDa (pro region) and 30kDa (mature
region) in size. The pro region is where main species-specific sequence differences are located,

15
and the mature region is where most biological activity resides. Unlike other TGF-beta members,
these two regions remain non-covalently associated and bind to the receptor. The pro region is
believed to be involved in proper folding and delivery of the mature region to the receptor
(Morikawa et al., 2016). The biological activity of the mature vs. combined promature version is
enhanced by almost double, indicating that mature version contains hydrophobic properties and
differential folding, decreasing its potency. The non-covalent promature complex is highly
sensitive to heat and pH stress, making it difficult to construct a bioassay that is stable and
consistent. Because the immature covalent version is non biologically active and present in a
very low amount, ~4%, of the total AMH, the proteases serve as a regulatory mechanism
reassuring the promature version is present at the site of action. After the promature complex
binds to the receptor, the two regions dissociate, with the mature region bound to the receptor,
and the pro region remaining loose in the proximity of the receptor (di Clemente et al., 2010;
Wilson et al., 1993). AMH is known to be a protein with highly conserved function throughout
mammalian kingdom with homology between 74% and 68% to bovine, rat and mouse and 27%
and 33% to chicken and alligator (Teixeira et al., 2001)
Anti-Mullerian Hormone Receptor 2
AMHR2 is a transmembrane receptor with serine/threonine kinase activity. It is highly
specific, sharing 30% overall homology with other TGF-beta family type II receptors (Teixeira et
al., 2001). It is expressed at day 15 in mouse embryo in both male and female in the
mesenchymal cells of the gonads surrounding the Mullerian ducts. AMH binds AMHR2, which
causes further phospohorilation of AMH receptor 1 (AMHR1), also known as activin-like kinase

16
3 (Alk3), or bone morphogenic protein receptor 1a (Bmpr1a). This heteromeric complex acts
downstream, phosphorylating Smad proteins within the cytoplasm. AMHR2 is thought to have
two splice variants, both with an inhibitory role on AMH (Imhoff et al., 2013). Monniaux et al.
has shown that the AMHR2 expression pattern resembles AMH transcript levels during follicular
maturation stages in the caprine species (Monniaux et al., 2011).
AMH in males
AMH was primarily discovered as a male determining factor crucial in male sex
differentiation. Knock out of this hormone in males leads to a normal male phenotype but with
Mullerian duct persistence, formation of a uterus and fallopian tubes, azoospermia due to
malformation of the ductus deferens and agenesis of epydidymus, with testes adhered to the
uterine tubes or in the abdominal and inguinal region, and normal testicular histology with
presence of spermatogonia (M. Y. Nishi et al., 2012). The internal genitalia possess the intrinsic
tendency to feminize in the absence of the Y chromosome (Kuijper et al., 2013). AMH is one of
the first genes to be expressed from the bipotential gonad, leading to differentiation of testes
under the influence of the sex determining region of Y chromosome (SRY) (La Marca et al.,
2010; Teixeira et al., 2001). In males both Sertoli and mesenchymal cells express AMH that up
regulates metalloproteinases (MMPs) in the surrounding epithelial duct cells. This leads to the
breakdown of the extracellular matrix and ultimately the disappearance of Mullerian ducts
(Visser, 2003). AMH is also known as a male determining factor in different conditions of
hermaphroditism and tumor growth. Aksglaede et al. studied the AMH serum levels and found

17
that they reach a peak of about 1082pmol/l (~150ng/ml) at 12 months after birth and then decline,
being ~20% lower at the age of 7 and a further 3-4% during adulthood (Ebner, 2006).
AMH in females
Until the 1990s, AMH function and importance was more studied in males due to the fact
that expression of AMH in the male embryo precedes that of the female embryo by ~3 months in
utero, and is expressed in concentrations a few hundred times higher compared to the female
embryo. In the female embryo AMH is secreted by GC cells and is dependent on the follicle
stage, starting with expression in primary follicles and lasting to the antral stage, being highest in
the preantral follicles (Themmen, 2005; Visser et al., 2006; Visser and Themmen, 2005). Knock
out of AMH in the female mouse embryo causes premature exhaustion of ovarian follicle reserve
and early menopause (Durlinger et al., 1999). In mono-ovular species such as the sheep, cow,
monkey and human, AMH plays a key role in modulating follicle growth and development
(Campbell et al., 2012), inhibiting follicular growth, maturation, and dominant follicle selection
during the gonadotropin responsive phase (Xu et al., 2016). In poly-ovular species, the function
of AMH is to inhibit recruitment of primordial and primary follicles (Xu et al., 2016). In
summary AMH could be defined as an intra- and inter- follicular “guardian” of follicle
recruitment and development (Salmon et al., 2004b). Additional studies using bovine, mice and
rat embryonic ovarian cortical pieces, in culture or placed in sham, or in ovariectomised chick
embryos in ovo showed evidence that AMH inhibits follicular growth (Fortune et al., 2011;
Nilsson et al., 2007; 2011). In vitro, when recombinant AMH was added to the cortical ovarian
pieces, the number of primordial follicles increased while the number of primary follicles
18
decreased with increasing AMH concentration (Fortune et al., 2011). As mentioned earlier,
dormancy is the fate of the majority of follicles throughout female life. It is believed that this
inhibition is achieved through suppression of steroidogenesis and differentiation of somatic cells
in the gonads (di Clemente et al., 2003). AMH has been shown to down regulate expression of
aromatase, LH receptor, and steroidogenic enzymes (Visser, 2003). The rate of dizygotic
twinning increases with age and chances of twinning increase with every consecutive pregnancy
(from 1.3% in the first to 2.7% in the fourth pregnancy) (Hankins and Saade, 2005), suggesting
that the decrease with age in the stringency of AMH’s ability to inhibit follicle recruitment might
result in a higher rate of dizygotic twinning. In the presence of AMH, the effect of FSH as one of
the necessary HPG factors for follicle growth is decreased. In addition, in vivo more follicles
start to grow under the influence of exogenous FSH in AMH-deficient mice compared with the
wild types (Durlinger et al., 2001). In a sheep study by Campbell et al., FSH addition caused an
increase in the proportion of small antral follicles with no changes in the pattern or intensity of
AMH expression (Campbell et al., 2004). The AMH mRNA level was significantly lower after
10 days of culture without FSH. However, this decrease was not reflected in the number of
growing follicles, which may suggest that AMH expression in vitro could be high enough to
keep control over follicle recruitment (Sadeu et al., 2008). Even with prior evidence suggesting
that FSH promotes while AMH inhibits follicular growth, in a AMH KO study FSH was shown
to be unnecessary for initial recruitment of follicles, indicating predominantly paracrine control
(Oktem and Urman, 2010). IGF-I has been proposed to have a regulating paracrine role on both
AMH and FSH via a “break free” mechanism from the inhibitory influence of AMH on the
growing follicles (Campbell et al., 2012). AMH was also reported to exhibit a dose responsive
inhibitory effect on LH-stimulated androgen production by theca cells (Campbell et al., 2012).

19
This is particularly important in pathologies such as polycystic ovarian syndrome (PCOS) where
this balance is disturbed.
AMH as a clinical marker of ovarian reserve
Being suppressive of follicle recruitment and reflecting ovarian reproductive aging, AMH
gained clinical importance as a marker of 1) ovarian follicle reserve and 2) the number of
gonadotropin sensitive follicles, also known as the antral follicle count (AFC) (J. J. Ireland et al.,
2011; Kevenaar et al., 2006). These two ovarian parameters, ovarian reserve and AFC, are
interchangeably used in a clinical ART setting as a highly individually repeatable, as well as a
non-invasive way to assess the current status and prognosis of patient outcome (Burns, 2005;
Chang et al., 1998; Sonigo et al., 2016). Ovarian reserve, estimated by AMH, in general reflects
the total quantity of oocytes available in the ovary, while AFC is a measure of the number of
growing follicles (Erickson, 1966; J. J. Ireland et al., 2011; J. L. H. Ireland et al., 2008).
Measured in serum at any stage of the estrous cycle, AMH is found not to have significant
fluctuations, irrespective of the other reproductive endocrine and paracrine hormonal
concentrations (La Marca et al., 2009). AMH is also found to be consistent in individuals and
animals from one cycle to the next, making it an excellent marker of inter- and intra- cycle
ovarian status (La Marca et al., 2006; La Marca and Volpe, 2006). This is very important when,
in comparison, the individual inter-cycle AFC variation has been demonstrated to change by a
factor of 5-7. To demonstrate the potential for AMH as a good prognostic tool for fertility, it
could be used a cattle herd setting to identify the approximately 30% of cattle that end up
producing 70% of total embryos (J. J. Ireland et al., 2007). One of the definite benefits of using

20
AMH over AFC is that it can be done offsite and it is not affected by the technical skills of
personnel. The most concrete result linking AMH, AFC and ovary size shows that ovarian size is
reflective of female fertility, a concept long known in the context of male fertility (Coulter and
Foote, 1979; J. J. Ireland et al., 2011; Keeton et al., 1996). AMH can more accurately predict
occurrence of menopause within 4 years, with 0.87 stringency, than can AFC (Visser et al.,
2006). The latest study by Sonigo et al. provides the threshold values of AMH and AFC, being
3.7ng/ml and 20 respectively, for approval for oocyte crypreservation after in vitro maturation
procedure in IVF patients (Sonigo et al., 2016).
In the ART setting, the number of growing follicles is an important estimate, since those
follicles are sensitive to ovarian superovulation drugs, allowing for growth of more than one
follicle and more than one mature oocyte. An incorrect estimate of the patient’s response can
lead to ovarian hyperstimulation syndrome (OHSS), one of the major risks in ART. OHSS
occurs when a patient is overdosed on gonadotropins, leading to ovarian hyper response and
possibly resulting in: enlargement of the ovaries, abdominal pain, nausea, diarrhea, dehydration,
rise in blood pressure, and even in rare cases: thrombosis, distention, oliguria, pleural effusion,
and respiratory distress. This condition is considered life threating and it often requires
hospitalization. Therefore, correct ovarian stimulation needs to be a balance between achieving
an adequate oocyte yield without causing adverse effects. Current stimulation procedures are
based on the monitoring of follicular growth using ultrasound and biochemical hormonal
analysis. However these are still considered “without the predictive value of individual ovarian
potential …. over simplistic and dangerous” (Maheshwari and Teoh, 2014).
Proper reserve assessment using AMH or AFC has the potential to improve type, dosage,
and duration of ovarian stimulation to maximize the clinical goals of IVF treatment. It also

21
improves cost-effectiveness, considering that ovarian stimulation is the major cost of the IVF
treatment (Maheshwari and Teoh, 2014). Recently, the literature has been defining and
interpreting the cutoff and extreme levels of clinical AMH values: “more invasive or time-
consuming methods of fertility preservation being appropriate for women with a low AMH”
(Anderson et al., 2012), or: “AMH measurement may be useful in the prediction of poor
response and cycle cancellation and also of hyper-response and ovarian hyperstimulation
syndrome” (La Marca et al., 2010). OHSS and multiple pregnancies are the two most common
adverse effects of IVF and AMH has a potential to reduce both in its role of clinical marker at
systemic and local levels.
AMH as an oocyte and embryo developmental potential marker
From Human Serum
AMH correlation to oocyte quantity is well established, and there is now evidence to
suggest AMH levels could be a marker of oocyte quality. This has been investigated in both
humans and bovines, and only a few human clinical studies have established a correlation.
Confounding variables in these studies could be the aging process which links decreasing quality
of oocytes with lower AMH levels, or embryo numbers which could be an extrapolation of
retrieved oocyte number (Fanchin, 2003). A study conducted on 141 patients, divided into three
groups based on 25th and 75th percentile of day 3 serum AMH, showed that 50% of normal
morphological oocytes were derived from the “normal” serum AMH patient group (1.66 and
4.52ng/ml), compared to 30% of normal morphological oocytes derived from the lower or higher
serum AMH groups (Ebner, 2006). Silberstein et al., on the other hand, showed evidence that

22
serum AMH ≥2.7ng/ml measured on the hCG administration day could be correlated with
embryo morphology and cleavage rate (Silberstein, 2005). EldarGeva et al. showed a correlation
between serum AMH of 2.52ng/ml and ongoing pregnancy rates (Eldar-Geva, 2005). Further
studies suggested that 0.69ng/ml could be a cut off between the ovum pick-up (OPU) procedure
cancellation (Penarrubia et al., 2005), while 1.13ng/ml might be an indicator of poor ovarian
reserve, with a specificity of 85% and a sensitivity of 80% (Tremellen et al., 2005). Another
study by Nelson et al. showed the positive correlation between AMH values and live birth rate,
as well as a correlation between AFC and AMH, when AFC values are between 15 and 25
(Nelson et al., 2007). Lakamge et al. defined 14pmol/l or 1.96ng/ml as the cut off for the
cumulative pregnancy rates per cycle (Lakamge, 2007). Majumder et al. showed that serum
AMH and AFC predict oocyte and embryo potential, but both are better in predicting negative
live birth outcome, with AMH being 84% specific (Majumder et al., 2010). LaMarca et al.
showed that serum AMH (prior to gonadotropin stimulation) and age are predictors of live birth,
with a sensitivity of 79.2% and a specificity of 44.2% (La Marca et al., 2011). AMH
concentrations of below 0.4 and between 0.4 and 2.8ng/ml have a 44% and 86% live birth
chance respectively. Even with the moderate ability to predict live birth, AMH was found
superior to age, day 3 FSH, oestradiol, or inhibin B levels and similar to AFC (Hazout et al.,
2004). Brodin et al. provided evidence and set a foundation, supported by Sunkara et al.,
showing that AMH is positively correlated to both oocyte quantity and quality independent of
age and number of oocytes retrieved (Brodin et al., 2013; Sunkara et al., 2011).

23
From Human Follicular Fluid
More recently, a few research groups have become interested in follicular AMH levels
and have shown similar results as seen in serum. Fanchin et al. showed that ovarian preovulatory
FF AMH is correlated to serum AMH, and both are predictive of the implantation potential of
embryos (Fanchin et al., 2007). In this study AMH concentration was adjusted to the total protein
content of the FF, due to variability in the follicular size. FF AMH was stratified as low (up to
1ng/ml), average (1.1-2ng/ml) and high (above 2ng/ml). The prevoulatory FF AMH was
approximately 2.5 times as concentrated compared to serum levels of AMH. This study used
only one retrieved oocyte and one embryo per transfer. Another study successfully compared and
correlated the pooled FF AMH to the maturation status of the oocyte (Cupisti et al., 2007).
Takahashi et al. explored the largest preovulatory FF and found a positive association to oocyte
fertilization, showing that AMH was 3.42 times higher in the fertilized vs. non fertilized groups
(Takahashi et al., 2008). Wunder et al. showed evidence that pooled FF and serum AMH on the
day of oocyte retrieval correlated to the pregnancy outcome (Wunder et al., 2008). There is a
body of evidence showing the effect of other follicular components secreted by GCs that have an
effect on oocyte competence (Mendoza et al., 2002), as well as research by Salmon et al.
showing the effect of the oocyte on AMH expression in GC (Salmon et al., 2004b). These results
clearly point to the fact that ovarian reserve, of which AMH is an obvious marker, is associated
to the oocyte quality, independently of age and oocyte quantity.

24
AMH as a PCOS, DOR and cancer marker
By being representative of ovarian status, AMH has become a marker of ovarian
pathologies such as PCOS, diminished ovarian reserve (DOR), and granulosa cell tumors. PCOS
is caused by insensitivity of the follicular pool to signals that direct selection for dominance and
inhibition of further recruitment and growth. The proportion of growing follicles is increased and
the proportion of atretic follicles is decreased due to the lack of an ovulatory follicle that would
otherwise act as inhibitory signal towards new recruitment. In addition, the number of androgen
receptors in the follicle is increased resulting in constant initiation of growth. Imbalance in AMH,
androgen receptors, FSHRc, estrogen, and progesterone causes the follicular cycle to be “frozen”,
resulting in disruption of follicular maturation and ovulation, decreased oocyte quality, and
infertility (Rice et al., 2006). AMH levels were found to be 3 times higher in PCOS patients than
in controls and were significantly associated with AFC. Diagnostic predictability of AMH was
found to be 0.851, with a threshold of 60pmol/l (8.4ng/ml), and with a specificity of 92% and a
sensitivity of 67% (Pigny, 2005). AMH, AMHRc, FSHR, androgen receptors were all increased
in PCOS patients (Catteau-Jonard et al., 2008). Stimulation response could not be predicted with
AMH in PCOS patients (Kim et al., 2013). Promising treatment lies in the use of suppressors or
inhibitors of AMH to remove the block of the ovulatory signal, and allowing for a selection of a
single ovulatory follicle. This principle extends to patients with DOR or poor responders to
gonadotropin treatment, where AMH activity is insufficient, and where the addition of
recombinant AMH could potentially have a therapeutic value (Campbell et al., 2012).
Levels of AMH in GC tumors were found to precede clinical detection by 16 months (La
Marca and Volpe, 2006). In experiments by Stephen et al., addition of 10g of recombinant AMH
per day for 3 weeks caused inhibition of human cancer cell lines in vivo, under renal capsules

25
(Stephen et al., 2002). The AMH caused decreased neovascularization, necrosis, inflammation,
and tumor size. The TGF-beta family has been shown to have an anti-proliferative response in
different cell types. Inhibition of TGF-beta has been linked to enhanced tumorogenicity in vivo,
and different types of mutations of TGF-beta have also been found in cancers (Morikawa et al.,
2016). Often a same protein can display suppressor properties in the initial stages of tumor
growth, but switches to a pro-onco gene in the later stages (Tang et al., 2003). Anttonen et al.
explored tumor growth using the ovarian granulosa-like cell line (KGN) developed by Nishi et al.
and showed that AMH expression varies depending on the tumor size, while AMHR2 was
unaffected. In addition, increasing levels of exogenous AMH in vivo and in vitro tumor cell
number decreased by mean of apoptosis (Anttonen et al., 2011; Y. Nishi et al., 2000).
Cow as a model for human reproduction
The bovine model in studying human reproduction became popular with the realization
that cattle have a very similar gestation length, endocrine hormone status and regulation, are
monoovulatory, have a similar estrous cycle length, with 2-3 follicular waves, have individually
repeatable AFC, and have similar pathologies such as PCOS and tumors. Because they are large
animals, it is easier to assess the ovary in terms of ultrasound measurements and sampling,
compared to rodents. Ovaries are readily available from slaughtered animals. AFC has been
shown to impact fertility in cattle to the same extent as in human. Variation of AFC has been
shown to differ 7 fold among animals, ranging from 8-56 follicles, but it is highly reproducible
per animal (with an accuracy of 0.85-0.95), regardless of the breed, age, season, or management
conditions. An AFC below 15 was correlated to an 80% smaller ovarian reserve, dramatically

26
different to cattle with an AFC above 25 (J. L. H. Ireland et al., 2008). In 12 month old heifers,
80% of their original oocyte reserve has been normally lost and the average conception rate after
artificial insemination (AI) was found to decline from 56% at 15-16 months of age to 42% at 26-
27 months of age (Kuhn et al., 2006).
Dairy and beef cow fertility
The dairy and beef industries are of tremendous economic importance, and ART is
immensely valuable tool to sustain production. Serious problems have been observed with
decreasing fertility of up to 3-4% per decade (Spencer, 2013). To achieve a pregnancy rate of
40%, usually requires two AIs. The UK dairy industry defined its main problems in dairy and
beef production as subfertility, mastitis, and lameness, with subfertility being the one with the
highest economic impact and the most difficult to solve. The dairy industry is under constant
selective pressure for high milk production (Royal et al., 2000). Several studies have been
conducted on the effect of energy utilization towards increased milk production against body
condition score (BCS) and the effect of prolactin on reproduction efficiency. It has been shown
that fertility traits such as luteal activity postpartum are heritable, while calving interval and BCS
heritability are under investigation (Leroy et al., 2008). Increasing milk yield has been shown to
negatively impact the ART, as the oocyte number and embryo quality decreases. Up to 50% of
modern dairy cows present abnormal estrous cycles postpartum, leading to prolonged calving to
first insemination intervals (Opsomer et al., 2000), low conception rates, and high early
embryonic mortality (Leroy et al., 2012). Luteal activity postpartum has been also shown to
negatively correlate with milk yield, with estimates that lactation uses 75% of the cow’s

27
metabolic capacity. One of the ways to overcome this decreasing fertility issue is to utilize the
IVP or MOET method that includes in vivo fertilization (Mapletoft, 2005). It was found that IVP
produces higher number of oocytes and embryos, 9.4 vs. 6.7, but that the pregnancy rates are
lower, 33.5% vs. 41.5% respectively. After considering the efficiency of IVP over MOET, it was
found that in a 15 day interval, IVP produced more pregnancies even with lower pregnancy rates
(Pontes et al., 2009).
Anti-Mullerian Hormone in cattle
The size of ovaries, ovarian reserve, and AFC have been shown to be highly similar in
both humans and cattle, therefore AMH has also been a candidate parameter to identify cattle
reproduction outcome and fertility (Erickson, 1966). AMH was defined as “an endocrine marker
of gonadotropin responsive follicles” (Rico et al., 2009). Ireland et al. has shown, using the three
largest follicles in low vs. high AFC groups of animals, that intrafollicular estradiol and mRNA
for aromatase in GCs were greater and mRNA for AMH was lower respectively (J. J. Ireland et
al., 2009). Serum AMH was found to be highly individually reproducible and variable between
animals, corresponding to high variation of the number of oocytes in new born calves (10,000-
350,000) and 12 month old heifers (1,920- 40,960) (J. L. H. Ireland et al., 2008; Lo et al., 1998).
AMH half-life in the bovine is 2 days, with levels being static during the estrous cycle. It is
believed that AMH has the ability to inhibit FSH dependent aromatase expression, resulting in an
inverse AMH and estradiol17beta relationship, while AMH production is enhanced by BMP
(Novembri et al., 2015). AMH is regulated at the follicular, ovarian, and endocrine levels. At the
follicular level it is regulated by the stage of follicle, at the ovarian level it is regulated by the

28
pool of small antral follicles, and at the endocrine level it is regulated by the effects of other
endocrine hormones (Rico et al., 2011).
Bos taurus taurus vs. Bos taurus indicus
All domestic cattle belong to the family Bovidae, subfamily Bovinae. The subspecies
studied here belong to two subspecies Bos taurus taurus (taurus) and Bos taurus indicus
(indicus). In Tibetan “Zen” or “Zeba” is the word for hump, which is one of the main physical
features of indicus cattle. The common ancestor originated in Western Asia around 4500 BC.
Zebu cattle comprise more than half of the world’s cattle due to their multipurpose and hardy
features. In the 1800’s, indicus was introduced to the American continent as Brangus, a cross
between the Brahma and Angus breeds. Breeding is known to increase phenotypic superiority, or
hybrid vigor, carrying better-adapted traits from both parents. However, the heritability of these
traits is not linear and is easily influenced by environmental factors (Abeygunawardena and
Dematawewa, 2004). These different subspecies have adapted to diverse environmental
conditions, which impacted overall reproduction physiology (Beatty et al., 2006; Driancourt,
2001). For example, Brahma (Bos taurus indicus) and Senepol (tropical Bos taurus taurus) have
greater numbers of follicles in all size categories than Angus (temperate Bos taurus taurus)
(Alvarez et al., 2000). Bo et al. has described indicus as superior to taurus in terms of calving
rates if both are kept in tropical or subtropical environments (Bó et al., 2003). Indicus has
adapted to hot temperatures, humidity, parasites, and low quality forages. However, indicus
reproduction is characterized by: 6-12 months delayed puberty until 60% of body weight is
reached (compared to 30-55% in taurus); 2-4 follicular waves; lower LH secretion; estrous

29
length on average 20.9 days; smaller duration of estrous (10 hours, compared to 16.3 hours in
taurus); decreased estrous intensity; smaller interval from estrous to ovulation; longer gestation
length; extended post partum period of 17 months (compared to 12 months in taurus); higher
number of AFC (41.5 vs. 21 in taurus); lower number of dominant follicles; smaller max
diameter of dominant follicle (10-12mm vs. 16-20mm in taurus), smaller CL (24mm vs. 28mm
in taurus); and lower twining rate (Sartori and Barros, 2011). Indicus cattle take 3 years to reach
puberty and produce only a few liters of milk over a short lactation period, after which there is an
extended postpartum anestrous. Variability to superovulation treatments and difficulty detecting
estrous causes decreased efficiency in indicus ART. The dose for super ovulation drugs of
indicus vs. taurus is usually reduced by 30% for gonadotropins, by 50% for progesterone, and by
40% for estradiol. The calving interval in the dry vs. wet season differs, from 19.9 months to
14.5 months. There is evidence that for every hour of daylight there is 0.5mm increase of the
dominant follicle diameter, relating seasonal changes to fertility parameters. Baruselli et al.
reported that follicular deviation of the ovulatory follicle is smaller in indicus breeds, and that
estrous occurs more often during the night (Baruselli et al., 2006). Pontes et al. found that there
is no difference in the number of primordial, primary, or secondary follicles in the ovaries of
fetuses or heifers in both subspecies, therefore the initial number is not the reason for the
difference in oocyte and embryo yield (Pontes et al., 2011). It is believed that the mechanism
controlling the follicle development differs in each of the subspecies (Silva-Santos et al., 2011).
Therefore five main problems with ART in indicus were defined: 1) necessity to detect estrous;
2) necessity to start gonadotropin at the correct time; 3) necessity to perform AI at the correct
time; 4) high variability of embryo production per donor; 5) high proportion of unresponsive
donors. Pontes et al. examined a large number of animals belonging to three breeds, Gir,

30
Holstein, and Girolanda (Gir and Holstein in varying percentages of crossbreeding: ¼ Holstein
and ¾ Gir and ½ Holstein Gir mix) (Pontes et al., 2010). It was found that pregnancy rates were
40%, 36%, 37%, and 37% respectively. However, there was a large variation in viable oocytes
per retrieval 12.1, 8.0, 16.8 and 24.3, as well as in pregnancy per retrieval 1.2, 0.7, 1.3, 1.7
respectively.
Batista et al. examined AFC in Nelore and Holstein cattle at 3 different time points, 120
days, 60 days and 0 days before plasma AMH determination and found that at all time points
AFC correlated with AMH (Batista et al., 2014). Nelore heifers had overall higher AFC and
AMH compared to Holstein (Baldrighi et al., 2014; Batista et al., 2014). These authors defined
serum AMH as a reliable phenotypic marker to predict relative number of follicles at any point
of the cycle irrespective of genetic group. Guerreiro et al. also came to a similar conclusion,
defining AMH as an accurate endocrine marker for the in vitro embryo yield but not for
blastocyst yield (Guerreiro et al., 2014).
AMH as a fetal sex marker
AMH has been proposed as a potential sex-determining factor in early pregnancy, but
current studies present contradictory findings. AMH is expressed at different sex specific time
points during pregnancy (7 weeks for males and 20 weeks for females), but is an order of
magnitude more concentrated in male fetal circulation. In male cord blood AMH levels are
around 64 to 92ng/ml in the second trimester, while still undetectable in female fetus cord blood.
Lee and colleagues, in 1996, defined AMH as a “testis specific marker during infancy and early
childhood” (Lee et al., 1996). A human clinical study by Empey et al. included over 100 women

31
carrying either male and female fetuses, and revealed a significant sex specific difference in
maternal serum in the time period between 11 and 15 weeks of pregnancy, with the average male
concentration being 2.0 ± 0.03ng/ml and the average female concentration being 0.94 ± 0.2ng/ml
(Empey et al., 2012). However, a study by LaMarca et al. showed an increase of maternal serum
AMH levels during second semester, but this increase was not found significant (La Marca,
2005). A study by Nelson et al. also examined serum AMH levels across trimesters, and found
AMH levels were significantly decreasing across trimesters (Nelson et al., 2010). Interestingly,
pre-pregnancy and post-pregnancy serum AMH levels were found not to differ. Studies about the
ability of AMH to cross the placenta have not yet been published. Studies on other proteins, such
as alphafetoprotein (AFP), 70kDa in size, crossing from the fetal to the maternal circulation by
passive transport through placental “leaks” have provided evidence of the ability of large
proteins to cross the placenta (Malek et al., 1998). A recent study examined AMH and AMHR2
expression in the placenta and fetal membranes and found no difference in expression levels
using qPCR in either the placenta or fetal membranes between male and female fetuses.
However the study did show significantly higher AMH antibody staining intensity of male fetal
membranes vs. female fetal membranes (Novembri et al., 2015).
The effect of fetal AMH is illustrated in opposite fetal sex twins in the hermaphrodite
condition in cattle called Free-Martin. First described in 1917, it was not until 1991 that AMH
was proposed as a possible cause of Free-Martinism (Komisarek and Dorynek, 2002). This
condition occurs in twin pregnancies with opposite sex fetuses that share circulation with
vascular anastomoses, and results in a disturbed development of the female reproductive tract
due to high male fetal AMH expression. It is the most common type of disorders of sex
development in cattle and occurs in up to 90% of the female fetuses of surviving opposite sex

32
twin sets (Padula, 2005). These animals are described as having morphologically both female
and male external genitalia, both Wolffian and Mullerian ducts, an enlarged clitoris, a shorter
vagina length, an increased ano-vaginal distance, the presence of ovotestes, and the absence of a
cervix (Hwang et al., 2001; Roberts and Greenwood, 1928). Newborn Free-Martin calf AMH
levels were found to be similar to that of a new born male calf, >700ng/ml, compared to the
normal female, <120ng/ml. However a decrease to female levels is observed in the Free-Martin
calf after 2 weeks after birth, while in a normal male the decrease would occur over the first 5
months of life (Padula, 2005). Testosterone levels in the Free-Martin calf are similar to male
levels, but other steroid hormones and gonadotropin levels are much lower, and they also have a
heavier birth weight and higher marbling score. A similar condition was described in the sheep,
deer, pig and horse by the same authors. It is interesting to observe that sheep and deer also
belong to ruminant groups and share the same placenta type as cows, while the pig and horse
placenta is of diffuse type. Another study looked at the effect of hormonal therapy on a Free-
Martin heifer, twin to a bull, and found that the heifer started lactating 9 days after the treatment
and continued for one month, but the milk had low butterfat content. This animal was not able to
conceive, but resumed a normal oestrual cycle after treatments with 20mg of diethylstilbestrol
dipropionate (synthetic estrogen) over 22 days 8 injections (Barker, 1944). Both of these studies
were unable to genotype the Free-Martin animals due to unavailable resources and knowledge at
the time, therefore the sex was not determined with certainty. A more current case study in a
human with a rare type of monochorionic dizygotic twinning with opposite sex twins described a
healthy boy (XY) and girl (XX) born with no sign of hermaphroditism (Souter et al., 2003). In
this study the placental barrier was not present and there was still no effect of male AMH on the
female twin. Other human studies of similar pregnancies did see differences in length of

33
gestation, female behavior, and IQ (Derom et al., 2005; Luke et al., 2005). Other types of
hermaphroditism have been discovered, however the etiologies of the condition are diverse. The
most common condition is a true hemaphroditism due to chimerism or mix of male and female
cells in the gonads during embryo development (Souter et al., 2006).
The newest data has shown that AMH expression is not only limited to the ovary and
placenta but it is also expressed in the liver and brain (Novembri et al., 2015). Brain studies have
shown differential expression between male and female mice and possible differential brain
development and function leading to sex specific behavior (Wang et al., 2009; Wittmann and
McLennan, 2013).
Human vs. bovine placenta
In order to explore levels of fetal AMH in maternal circulation during pregnancy, the
placenta has to be considered, as it is the main barrier between maternal and fetal circulation.
The placenta’s main function is to nurture the fetus and allow for selective transport of nutrients
without compromising the mother’s survival. Simultaneously, fetal secretions, cells, proteins and
DNA are transported and diffused through the placenta to the maternal circulation (Lo et al.,
1998). The placenta produces AMH but with no difference in levels between the male and
female fetus (Novembri et al., 2015).
Bovine placenta differs from the human placenta in morphology. It is epitheliochorial
with cotyledonary morphology, while in the human it is hemochorial with discoid morphology
(Rawn and Cross, 2008). The epitheliochorial placenta is evolutionarily conserved among large
species with increased gestation length, singleton pregnancies, and immature young, while the

34
hemochorial placenta is mostly found in smaller mammals, often with multiple offspring, among
which the human is the largest example (Enders and Carter, 2004). Cotyledons, 100-140 in
number, are the main sites of oxygen, nutrient, and CO2 exchange. In the discoid placenta,
exchange is focused at the disk-specific area where the placenta attaches to the endometrium. In
the epitheliochorial placenta, maternal and fetal vascular systems remain completely separated
by intact epithelial cells with basal laminae and connective tissue on each side, causing minimal
trauma to the uterus. In the hemochorial placenta, fetal chorionic epithelium is bathed in
maternal blood, because chorionic villi erode through the maternal endothelium (Barreto et al.,
2011). This feature of the primate placenta, of being more invasive than in the ruminant placenta,
possibly allows for a more facilitated nutrient transport and more rapid growth within a shorter
gestation length. However, there is also an increased risk of microchimerism, immunological
response, and excessive bleeding at parturition (Barreto et al., 2011; Enders and Carter, 2004;
Nelson et al., 2010).
The placenta is important not just as a barrier, but as an active “nutrient sensing” dynamic
organ, allowing for constant adaptation to the continuously changing environment (Diaz et al.,
2014). For example, oxygen diffusion ability varies across species with different placenta
thicknesses (6um in the cow compared to 1um in the pig and 3um in the horse) (Carter and
Enders, 2013; Kuijper et al., 2013). Another adaptation is the development of endocytosis,
pinocytosis, and trinucleate cells to overcome the lack of direct maternal blood access. Interferon
tau, placental lactogens, pregnancy associated glycoproteins, and growth hormones are a few of
the many endocrine hormones produced by the ruminant placenta. AMH is a 140kDa
glycoprotein dimer, quite a large protein, which needs to be transported across multiple cell
membranes. Means of transport could potentially be either by a slow diffusion process of similar

35
size proteins (Malek et al., 1998) and/or by means of cytoplasmic vesicles such as exosomes
(Pereira et al., 2013; Rong et al., 2015; Sandvig and Llorente, 2012; Vargas et al., 2014).
Differing placenta structure and morphology could be the potential reason why the condition of
Free-Martinism does not occur in human dizygotic monochorionic twin pregnancies. High AMH
levels could possibly move through the discoid placenta in human in a more localized fashion
and not affect the second fetus of opposite sex to the extent that it happens in bovine
cotyledonary placenta (Chen et al., 2013; Derom et al., 2005). In addition, it was interestingly
observed that in humans, female fetuses have a slower rate of growth more in concert with the
growth of the placenta, while male fetuses have a higher tendency to outgrow the capacity of the
placenta to maintain their viability, described as “boys live dangerously in the womb” (Brett et
al., 2014; Eriksson et al., 2009).

36
RATIONALE, HYPOTHESIS, AND OBJECTIVES
Rationale
There is an evident fall in human and bovine fertility in the last few decades. Assisted
reproduction technologies (ART) and in-vitro production (IVP) have been employed to over
come these raising issues. In order to provide safe and efficient ART and IVP there are many
areas that are still in need of significant improvement. One main area in need of a better
understanding is the endocrine and paracrine ovarian function behind creation, storage, selection
and maturation of oocytes. These processes are all crucial in establishment of maximized oocyte
yield and development potential. Anti-Mullerian hormone (AMH) has been established as a
clinical marker of oocyte quantity and ovarian reserve however few studies presented evidence
that these properties seem to be subspecies specific when measured systemically reflecting cattle
fertility characteristics. There has also been some conflicting evidence on early pregnancy
maternal circulation AMH in human as a possible be determinant of the fetal sex due to its
differential expression between male and female fetus and its placenta. AMH has also been
speculated to reflect oocyte quality measured from a single largest ovulatory follicle or pooled
follicular fluid in human. We are interested to expand the evidence on AMH in different cattle
subspecies by including local, granulosa cell and follicular fluid, AMH measurements and AMH
results from their crossbreed. We are interested to see if the difference in AMH expression
detected in early pregnant maternal and male/female fetal circulation; and placenta expression in
order to use AMH as an early fetal sex-determining marker in cattle. Last but not least, we are
interested to utilize human single follicular aspirates, monofollicular samples, and look at the
correlation to oocyte developmental potential.

37
Hypothesis
The hypothesis of this study is as follows: AMH and AMHR2 gene expression and
plasma and follicular fluid AMH protein level correlate with the oocyte quantity, developmental
potential and fetal sex.
Objectives
To test this hypothesis, the following objectives were addressed:
Objective 1: Determine if AMH and granulosa cell AMHR2 mRNA content reflect Nelore (Bos
taurus indicus) breed fertility in terms of oocyte and antral follicle number that differs compared
to Angus and Holstein breeds (Bos taurus taurus).
Objective 2: Determine if plasma AMH, and placental and cotyledonary AMHR2 mRNA
content, differ in pregnant cows carrying male vs. female fetuses.
Objective 3: Determine if monofollicular AMH protein and granulosa cell AMHR2 mRNA
content correlates to oocyte developmental potential in human.

38
CHAPTER I
SYSTEMIC AND LOCAL ANTI-MULLERIAN HORMONE REFELCTS
DIFFERENCES IN THE REPORDUCTION POTENTIAL OF ZEBU AND EUROPEAN
CATTLE
* A portion of the material in this chapter has been published in Animal Reproduction Science (Stojsin-Carter et al., 2016)

39
INTRODUCTION
The genetic background of cattle significantly impacts their reproductive performance. It
is believed that increased inbreeding to achieve maximal milk yield has negatively impacted
reproductive efficiency in temperate, Bos taurus taurus (European type cattle) animals (Bachelot
and Binart, 2007; Leroy et al., 2015). By comparison, the tropical and subtropical subspecies of
cattle, Bos taurus indicus (Zebu), generally found in India and South America, are known for
lower milk yields, but greater reproductive efficiency (Bó et al., 2003). In a direct in vitro
production (IVP) comparison with European type cattle vs. Zebu cattle reported blastocyst rate
was 25.6% and 32.1% respectively, which ultimately gave rise to two thirds more pregnancies
(Viana et al., 2010). However, Zebu were found to have lower breeding capacity due to delayed
puberty, decreased estrous duration and intensity, longer gestation length and postpartum period,
and lower twinning rate compared to European type cattle (Abeygunawardena and Dematawewa,
2004; Bó et al., 2003; Silva-Santos et al., 2011). Taken together, the greater embryo and
pregnancy rate but lower breeding capacity make Zebu cattle an ideal candidate for in vitro
embryo production (IVP). To date, there is an incomplete understanding of the underlying
endocrine, molecular and physiological factors necessary to achieve optimal IVP protocols in
Zebu and European type cattle.
Anti-Mullerian hormone (AMH) is a 140kDa glycoprotein dimer member of the TGF-
beta protein subfamily secreted by Sertoli cells in testes, and by granulosa cells (GC) in the
ovary reviewed by (di Clemente et al., 2003). In females AMH is believed to inhibit premature
follicular growth and maturation, making it the ovarian reserve “guardian” (Visser et al., 2006).
Its minimal intra and inter estrous variability makes it a useful predictor of ovarian reserve
(Fanchin, 2003; Ireland et al., 2007). The exact mechanism by which AMH acts in the ovary is

40
not certain, but it is believed to be through decreasing GC sensitivity to luteinizing hormone
(LH) and follicle stimulating hormone (FSH) (Visser and Themmen, 2005). Due to its link with
ovarian reserve, AMH is used extensively as a quantitative marker of fertility in humans, and is
also being increasingly examined as a potential biomarker of reproductive efficiency in other
species, including cattle (Ireland et al., 2011; Monniaux et al., 2011; Rico et al., 2011). Various
human studies have reported correlation of AMH concentration to a number of qualitative
reproductive parameters, such as fertilization, implantation and pregnancy rates, however, this
has not been previously shown in cattle (Fanchin et al., 2007; Majumder et al., 2010; Takahashi
et al., 2008). In addition to several reports of AMH in European type cattle (Ireland et al., 2009;
Ireland et al., 2008) there are three published investigations involving Zebu cattle (Baldrighi et
al., 2014; Batista et al., 2014; Guerreiro et al., 2014). These studies focused on comparing
plasma AMH (Pl AMH) concentration between Zebu and European type cattle and correlating to
the number of antral follicles (AFC) as a quantitative reproductive parameter. The findings of
these studies provide evidence for plasma (Pl) AMH to AFC correlation with Zebu animals
displaying greater AMH values for the same AFC compared to European type animals.
The aim of the current study was to investigate and compare the relationship between
both systemic and local AMH and reproductive parameters: AFC, ovary diameter (OD), oocyte
number, cleavage and blastocyst rate in both Zebu and European type cattle, as well as a small
cohort of crossbred animals. It was hypothesized that irrespective of its source, AMH correlated
to reproductive parameters with Zebu having greater AMH value compared to European type
cattle.

41
MATERIAL AND METHODS
Animals and Experimental Design
Study group 1
Bos taurus indicus or Zebu (Nelore breed, n=30), Bos taurus taurus or European type
cattle (Red Angus breed, n=10), and crossbred Bos taurus taurus × Bos taurus indicus (Brangus
breed, n=10) cows of average reproductive age (mean ages 8.6, 7.8 and 7.1 years respectively)
raised on pasture in Paraná state, Brazil were subjected to ovarian examination of AFC and OD
with the 2-D trans-rectal Mindray adapted with a linear transductor ultrasound, and peripheral
blood collection via puncture of the tail vein. Blood was collected in EDTA tubes (BD
Vacutaner®, BD Franklin Lakes NJ, USA) to allow for more consistent AMH ELISA
measurement. The Bovine AMH ELISA kit AL-114 (Ansh Labs, Texas, USA) was used
according to the manufacturer’s protocol with the exception of an overnight separation of plasma
at room temperature following the MOFA® Minitube Canada protocol for AMH testing.
Samples were frozen at -20°C following collection until ELISA measurement was performed.
Study group 2
Post-mortem collection of ovaries from unsynchronized, non pregnant pasture raised
Zebu (Nelore breed, n=12) and European type cattle (Holstein breed, n=56) raised under
standard dairy farming conditions, was performed in government-approved slaughterhouses in
Belem, Pará state, Brazil and Guelph, Ontario, Canada, respectively. For the Zebu cattle, each
animal had a matching blood sample as well as a pair of ovaries. Blood was collected during
exsanguination at the time of slaughter and was left overnight in EDTA tubes for separation of
plasma from blood cells at room temperature. For European type cattle, AFC was determined by
visual counting of the antral follicles per ovary. For both cattle subspecies, antral follicles, 5-
42
8mm in diameter, for each ovary were aspirated and pooled. After collection, pooled supernatant
FF was carefully removed without disturbing the cell pellet that has settled and frozen at -20°C
until AMH ELISA measurement. The pooled pellet was re-suspended with HEPES-buffered
Ham's F-10 plus 2% steer serum (Cansera; Rexdale, ON, Canada). The cumulus-oocyte
complexes (COC) were collected, counted and put into in vitro culture, while the rest of the cells
were frozen for qPCR analysis.
For investigations into mRNA expression, the total number of oocytes per ovary or ovary
pair was counted. Samples were grouped into “low” or “high” oocyte producing ovary if they
contained less than 9 or more than 19 oocytes per ovary, respectively. These cut offs were
determined by using 25th and 75th percentiles of the ovary that contained the highest number of
oocytes in order to choose the samples with the potentially most obvious difference in AMH
expression.
IVF
Bovine ovaries from the local abattoir were transported to the laboratory in a 0.9% saline
solution at 33 to 37°C. IVP was preformed as described by Ashkar et al. for samples obtained in
Canada and by Costa et al. for samples obtained in Brazil with the exception that cumulus-oocyte
complexes (COCs) were kept separate per each ovary (Ashkar et al., 2010; Costa et al., 2013). In
brief, cumulus oocyte complexes (COCs) were aspirated from ovarian follicles for collection into
HEPES buffered Ham’s F-10 plus 2% steer serum (Cansera, Rexdale, ON, Canada). COCs were
collected and in groups of 10 were matured in 80uL drops for in vitro maturation under mineral
oil (Paisley Products, Toronto), for 22-24 hours at 38.5°C in 5% CO2. The in vtiro maturation
(IVM) drops consist of TCM199 medium + 2% FBS supplemented with 1µg/mL of E2,

43
0.5µg/mL of FSH and 1µg/mL of LH (NIH, Washington, DC, USA). Frozen-thawed Bos Taurus
semen (EastGen, Guelph On) was used for in vitro fertilization. Semen was placed in 1.5mL of
HEPES Sperm TALP for 45 minutes at 38.5°C in 5% CO2 in order for swim up to occur. The
swim up product (upper layer) was then centrifuged at 2000rpm for 7 minutes. Mature oocytes
were washed twice in HEPES Sperm TALP, and twice in IVF TALP with 20µg/mL heparin, and
transferred into 80µL IVF TALP droplets under mineral oil. Sperm was added to the oocytes and
oocytes were incubated overnight with motile sperm at 38.5°C in 5% CO2. The next day
presumptive zygotes were stripped using pipette-vortexing in a HEPES Sperm TALP wash.
Zygotes were then washed in HEPES Sperm TALP twice and then transferred to synthetic
oviductal fluid (SOF) media supplemented with sodium pyruvate, non-essential and essential
amino acids, gentamicin, 15% bovine serum albumin (BSA), and Cansera. They were then
transferred to 30µL drops of SOF media under mineral oil and incubated at 38.5°C in 5% CO2. A
maximum of 10 oocytes were matured, fertilized and cultured per medium drop. Number of
oocytes was assessed at the time of collection, cleavage rate was assessed on Day 2, and
blastocyst rate on Day 8.
ELISA
AMH was measured using the Bovine AMH enzyme linked immunosorbent assay
(ELISA) kit AL-114 (Ansh Labs, Texas, USA) according to the manufacturer’s protocol. Before
measurement, FF was first diluted between 1:500 and 1:10,000 times using the supplied diluent
and placed in EDTA tubes at 4°C overnight. AMH was measured using 50µL of Pl or diluted FF
sample. The provided analytical range of the assay was 0.156 - 10ng/mL, and the analytical

44
sensitivity 0.011ng/mL. The intra-assay coefficients of variation were 2.92%, 2.54% and 3.65%
for quality control plasma samples containing 0.611, 1.259 and 2.56ng/mL AMH, respectively.
RNA extraction and reverse transcription
RNA was extracted from the GC pellets using a TRIzol reagent (Invitrogen, Cincinnati,
OH, USA) according to the manufacturer’s instructions and previous publications (Favetta et al.,
2004; Scheetz et al., 2012). In brief, each pellet was homogenized in 0.5mL of TRIzol Reagent.
Phase separation was achieved by adding chloroform, and RNA was precipitated from the
aqueous phase with isopropanol. Samples were incubated at -20°C overnight and centrifuged at
10,000g at 4°C. The RNA pellet was washed with 75% ethanol and dissolved in 20µL of sterile
RNase-free water. Contaminants were removed with DNase I treatment (Ambion, Huston, TX,
USA) and total RNA concentration was measured with a spectrophotometer. RNA samples were
stored at -80°C until further use. Reverse transcription PCR was performed using the high-
capacity complementary DNA (cDNA) reverse transcription kit (Applied Biosystems, Auckland,
New Zealand) following manufacturer’s protocol. Briefly, 500ng of oligo(dT) was first added to
each RNA sample and incubated at 70°C for 2 minutes. A mixture of 4µL of RT buffer, 1µL of
0.1M dithiothreitol, 1µL of 10mM deoxyribonucleotide triphosphates (dNTPs) mix, 0.5µL of
RNasin (40U/µL; Promega, Madison, WI, USA), and 1µL of Superscript II (200U/µL;
Invitrogen) was then added and the reaction was incubated further at 42°C for 1 hour, followed
by a final incubation at 70°C for 30 minutes. cDNA samples were stored at -20°C until further
use.

45
Real Time quantitative PCR
Real-time quantitative PCR (RT-qPCR) was carried out to determine AMH and AMHR2
transcript levels using the BIO-RAD CFX96TM Real-Time PCR System and SsoFastTM
EvaGreen Supermix (Bio-Rad Laboratories, Hercules, CA, USA) according to a standard
protocol that had been temperature optimized for the AMH, Glyceraldehyde-3-Phosphate
Dehydrogenase (GAPDH) and AMHR2 primers (Table 1). Prior to quantification, optimization
procedures were performed by running qPCRs with and without the purified template to identify
the melting temperatures of the primer dimers and specific product. Each reaction contained 5µL
of SsoFastTM EvaGreen Supermix reaction mix, 1µL of a mix of the forward and reverse
primers at a concentration of 5µmol, 2µL of the cDNA of interest and was adjusted to a total
volume of 10µL using H2O. The standard curve was established using ovarian tissue cDNA
template in five serial dilutions ranging from 1µg/µL to 0.03125µg/µL of cDNA. The
amplification program was as follows: 95°C for 10 minutes, followed by 50 amplification cycles
of 95°C for 10 seconds, 65°C for 10 seconds, 72°C for 10 seconds and acquisition of
fluorescence for 10 seconds. After the end of the last cycle, a melting curve was generated by
taking measurements every 0.5°C from 72°C to 95°C. GAPDH transcript was selected as the
housekeeping gene, as it showed the most consistent levels of mRNA expression among the
samples tested using geNorm software (Vandesompele et al., 2002). Other housekeeping genes
tested were histone (H2A), tyrosine 3-monooxygenase/tryptophan 5-monooxygenase activation
protein, zeta (YWHAZ), hypoxanthine guanine phosphoribosyl transferase 1 (HPRT1) and
succinate dehydrogenase complex, subunit A (SDHA). Relative quantification of the transcripts
of interest (Table 1) was calculated between two subspecies and between the low and high
oocyte producing ovaries.

46
Table 1 Real Time PCR primers
Gene GenBank
accession
number
Sequence Reference Size (bp)
AMH NM_173890.1 F-5’-CAGGGAAGAAGTCTTCAGCA-3’
R-5’-AAGGTGGTCAAGTCACTCAG-3’
(Ireland et
al., 2009;
Scheetz et
al., 2012)
270
GAPDH NM_001034034.2 F-5’-TTCCT GGTACGACAATGAATTTG-3’
R-5’-GGAGATGGGG CAGGACTC-3’
(Hamilton
et al.,
2011)
153
AMHR2 NM_001205328.1 F-5’-GTGCTTCTCCCAGGTCATAC-3’
R-5’-AATGTGGTCATGCTGTAGGC-3’
(Monniau
x et al.,
2011)
163
Statistics
For statistical investigation Student’s t-test was used to compare parameters between the
subspecies, while Spearman correlation, and multivariable linear models were used to compare
parameters within the subspecies with p<0.05 considered statistically significant. For example,
referring to Figure 1 Part Ai which outlines the relationship between Plasma AMH and the AFC,
the following linear model was considered: Pl AMH = Intercept + AFC + Breed. Here the Breed
is a categorical variable. This allows us to model the Pl AMH for each breed, and compare the
differences between them. To compare differences between breeds, we use a Tukey test that is an
option within the general linear hypothesis test (glht) from the multcomp package in R (Team,
2009). The test allows us to estimate the differences in intercepts between the breeds, assuming

47
that the slope (related to the AFC) is constant for all breeds. This was done due to the available
sample size. A similar modeling exercise was performed comparing Pl AMH to OD (Aii), and
FF AMH to oocyte # (Bii). Pl AMH numbers were calculated using GraphPad Prism (GraphPad
Software, San Diego, CA, USA).

48
RESULTS
Study group 1
Zebu and crossbred animals had significantly greater mean Pl AMH concentration than
their European counterparts (p=0.010, p=0.018 respectively; Table 2). The Pl AMH mean
concentration for Zebu, European type cattle and crossbred cattle were 0.77±0.09, 0.33±0.24 and
0.63±0.07ng/ml respectively (Table 2). The correlation between Pl AMH and AFC was
significantly different when comparing either Zebu or crossbred to European type cattle
(p=0.004 and p=0.049 respectively; Figure 1Ai); the same result was observed for Pl AMH and
OD between Zebu and European type cattle (p=0.009; Figure 1Aii). The correlation between Pl
AMH and AFC in Zebu was significantly positive (p=0.002; Figure 1Ai). The European type
cattle had significantly lower AFC compared to Zebu and crossbreed (p=0.006, p=0.027
respectively; Table 2) and larger OD (p=0.008; Table 2) compared to Zebu animals.
Study group 2
In a subset of Zebu animals, matched plasma samples and ovary samples were available
and it was possible to observe a significant and positive correlation between Pl AMH and
number of oocytes per ovary pair (p=0.002; Figure 1Bi), with the Pl AMH mean value and the
mean oocyte number of 1.15±0.27ng/ml and 11.58±1.83, respectively.
Mean FF AMH concentration was found to be significantly greater in Zebu compared to
European type cattle (p<0.0001; Table 2). The FF AMH mean for Zebu and European type cattle
was 4934.3±568.5ng/ml and 2977.9±214.1ng/ml respectively (Table 2). The correlation between
FF AMH and oocyte number per ovary was significantly different between Zebu and European
type cattle (p<0.0001; Figure 1Bii), and only European type showed significantly positive

49
correlation (p=0.005; Figure 1Bii). A positive correlation was not observed between FF AMH
and cleavage rate, however the mean cleavage rate of 70.92±4.55 for European and 76.77±5.99
for Zebu cattle (Table 2). A positive correlation was not observed between FF AMH and
blastocyst rate, however the mean blastocyst rate of 18.94±2.96 for European and 25.05±6.34 for
Zebu cattle (Table 2). In a subset of European type animals where ovaries were collected post
mortem, it was also possible to compare FF AMH concentration to AFC, and a significant
positive correlation was observed (p=0.009; Figure 1Biii).
The expression of AMH GC mRNA was not found to be significantly different between
either low or high oocyte producing ovary groups, or between European type and Zebu cattle
(Figure 2A). The expression of AMHR2 mRNA was found to be significantly different between
low and high group for European type cattle (p=0.035; Figure 2B) and positively correlated to
oocyte number in this subspecies (p=0.01).

50
Table 2 Summary of antral follicle count (AFC), ovary diameter (OD), plasma anti-Mullerian hormone (Pl AMH) from Study group 1, and follicular fluid AMH (FF AMH), oocyte, cleavage and blastocyst rate mean values (± SE) from Study group 2 for European type (E), Zebu (Z) and crossbred (C) cattle and the p-values from their average value comparisons. Significant difference (p<0.05) is indicated by the symbol (*).
Study group 1 Study group 2
AFC OD (mm) Pl AMH (ng/mL)
FF AMH (ng/mL)
Oocyte #/ovary
Cleavage rate/ovary
Blastocyst rate/ovary
European (E)
17.14 ± 1.82 (n=7)
66.20 ± 3.50 (n=7)
0.33 ± 0.24 (n=8)
2977.9 ± 214.1 (n=56)
17.5 ± 1.60 (n=56)
70.92 ± 4.55 (n=32)
18.94 ± 2.96 (n=32)
Zebu (Z)
27.37 ± 1.83 (n=30)
57.66 ± 1.17 (n=30)
0.77 ± 0.09 (n=30)
4934.3 ± 568.5 (n=24)
11.58 ± 1.83 (n=24)
76.77 ± 5.99 (n=24)
25.05 ± 6.34 (n=24)
Crossbred (C)
25.83 ± 10.55 (n=6)
59.03 ± 3.45 (n=6)
0.63 ± 0.07 (n=10)
P-values
E vs. Z *0.006 *0.008 *0.010 *<0.0001 0.064
E vs. C *0.027 0.138 *0.018
Z vs. C 0.782 0.581 0.532

51
Figure 1 Correlations between anti-Mullerian hormone (AMH) and reproductive parameters in European type (E, light gray square), Zebu (Z, black triangle) and crossbred (C, dark grey diamond) cattle. The plots show simple linear regression trend lines for each of the breeds but that they do not reflect the model that was used in the statistical analysis. A) represented Study group 1 and B) represented Study group 2. Ai) Plasma AMH (Pl AMH) vs. antral follicle count (AFC) for E (n=7), Z (n=30) and C (n=6) animals. Z correlation, ρ=0.54, p=0.002; Z to E comparison, p=0.004; C to E comparison, p=0.049. Aii) Pl AMH concentration vs. ovarian diameter (OD) in E (n=6), Z (n=26) and C (n=6) animals. Z correlation, ρ=0.36, p=0.067; Z to E comparison, p=0.009; C to E comparison, p=0.094. Bi) Pl AMH vs. average number of oocytes per pair in Z (n=12; ρ=0.818, p=0.002); Bii) Follicular fluid AMH (FF AMH) concentration vs. number of oocytes in Z (n=24), and E (n=59) cattle. E correlation, ρ=0.37, p=0.005; Z to E comparison, p<0.0001. Biii) FF AMH concentration (ng/ml) vs. AFC in E (n=56; ρ=0.35, p=0.009).
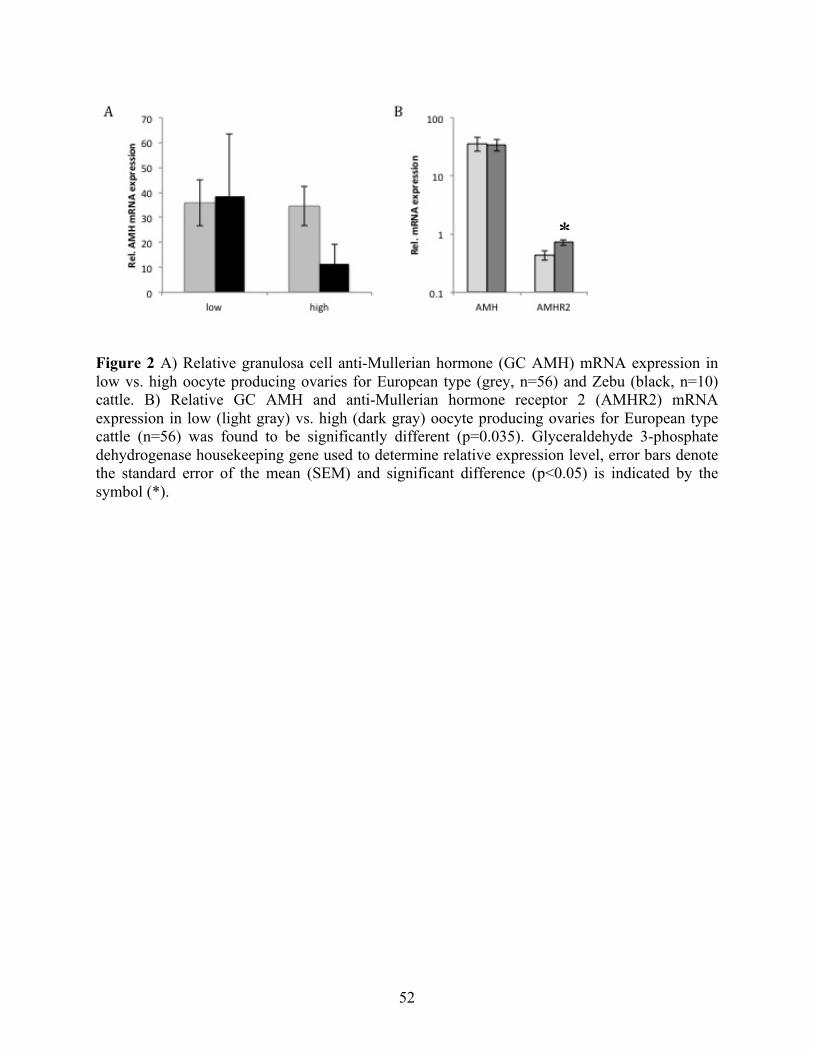
52
Figure 2 A) Relative granulosa cell anti-Mullerian hormone (GC AMH) mRNA expression in low vs. high oocyte producing ovaries for European type (grey, n=56) and Zebu (black, n=10) cattle. B) Relative GC AMH and anti-Mullerian hormone receptor 2 (AMHR2) mRNA expression in low (light gray) vs. high (dark gray) oocyte producing ovaries for European type cattle (n=56) was found to be significantly different (p=0.035). Glyceraldehyde 3-phosphate dehydrogenase housekeeping gene used to determine relative expression level, error bars denote the standard error of the mean (SEM) and significant difference (p<0.05) is indicated by the symbol (*).
*

53
DISSCUSION
The aim of the current study was to investigate and compare the relationship between
both systemic and local AMH and reproductive parameters: antral follicle count, ovary diameter,
oocyte number, cleavage and blastocyst rate in both Zebu and European type cattle, as well as a
small cohort of crossbred animals. Preliminary research published by Batista et al. and Baldrighi
et al. examined and revealed for the first time that plasma AMH and AFC relationship is greater
in Zebu compared to European type cattle (Baldrighi et al., 2014; Batista et al., 2014). The
current report expands their preliminary research by providing evidence that AMH, from both
sources Pl and FF, is significantly different between Zebu and European type cattle for all
examined parameters with Zebu displaying greater AMH values. Plasma and FF AMH was
found correlated with two of the reproductive parameters examined, AFC and oocyte number.
Additionally for the first time in European type cattle GC AMHR2 RNA expression was
examined and found positively correlated to oocyte number. The sequencing of the AMHR2
cDNA product was performed and confirmed 100% homology to the bovine AMHR2 (GenBank
accession number NM_001205328.1). Plasma AMH concentration was also measured in
crossbred cattle and found to more closely mirror their maternal Zebu concentration.
The European type cattle FF AMH concentration displayed a significant positive
correlation to the quantitative reproductive markers: AFC and number of oocytes. A positive
trend yet non-significant was also observed when comparing Pl AMH to AFC. Our results for
AMH in European type cattle are in general agreement with the current literature, however none
of the published work to our knowledge directly compared AMH from both Pl and FF between
two subspecies of cattle. In the current study, FF AMH in bovine subspecies was not found to
have a significant correlation with cleavage nor blastocyst rate, which is in agreement with

54
previous bovine studies correlating reproductive parameters to oocyte quality (Guerreiro et al.,
2014; Ireland et al., 2007). Nevertheless in human studies, AMH from both FF and serum has
been found to correlate to qualitative oocyte markers such as fertilization and implantation rates
(Fanchin et al., 2007; Majumder et al., 2010; Takahashi et al., 2008). The study by Kawamura et
al. speculated that AFC as a quantitative marker has a direct effect on the ovarian structure and
morphology and therefore should have an effect on the quality of oocytes within the ovary.
Further study looking at the oocyte quality parameters would be required to determine if the
absence of the relationship between the quantitative and qualitative markers is the result of
inherent species differences or factors related to in vitro culture conditions.
Granulosa expression measurements were performed in the low and high oocyte yielding
ovaries where the difference in the protein and transcript amounts would be expected to be the
greatest. GC AMH RNA expression measurements from low and high oocyte yielding ovaries
did not appear to differ in the current study. Previously it has been demonstrated that even a
1mm size change in follicle is associated with an exponential expression difference in AMH
level due to its crucial role in follicle growth and maturation (Rico et al., 2011). This would lead
to variability of the AMH GC expression data within both high and low yielding groups, and
possibly result in the absence of the expected difference. It could be speculated that other
determinants beside follicle size also need to be measured and considered during comparison.
Significant positive correlation was observed between GC AMHR2 RNA levels and number of
oocytes, as well as significant difference in levels between the low and high oocyte producing
ovaries. The measured levels of AMHR2 transcript reported here are in accordance with
previously published results in goat GCs (Monniaux et al., 2011).

55
Zebu cattle are known for their greater in vitro embryo and pregnancy rate but lower
breeding capacity. Beyond their different IVP rates and estrous cycle characteristics, the
underlying physiological and endocrine basis for their different reproductive potential is not clear.
In this study, Zebu Pl AMH concentration was significantly positively correlated with
reproductive parameters: AFC and average number of oocytes per pair of ovaries, as well as FF
AMH and number of oocytes, which indicates that AMH irrespective of being systemic or local
can be used as a quantitative reproductive marker. Overall this is in general agreement with the
current AMH model and patterns reported in previous human, European type cattle and Zebu
experiments by Baldraghi et al. and Batista et al. (Baldrighi et al., 2014; Batista et al., 2014;
Stojsin- Carter et al., 2016). Importantly, although Zebu and European type cattle appear to
follow the same patterns of positive correlation, the AMH values and correlated parameters were
significantly different in every case, with Zebu expressing significantly greater AMH
concentrations compared to European type cattle at matched parameter values. This result
demonstrates the importance of species and subspecies when interpreting AMH data.
The crossbred cattle included in this study appeared to be intermediate between the two
subspecies, but more comparable to their Zebu counterparts. The crossbred cows were created
using semen from European bulls to inseminate the Zebu cows despite being considered a 3/8
Zebu, 5/8 European type cattle cross on a genetic level. This also underscores the importance of
considering the genetic background of animals when conducting and interpreting bovine AMH
studies.

56
CHAPTER II
PREGNANCY ANTI-MULLERIAN HORMONE AS A FETAL SEX-DETERMINING
FACTOR

57
INTRODUCTION
In the bovine industry, the ability to influence and determine fetal sex enhances
management of herd breeding, allows for faster genetic progress, has implications in sex-linked
diseases, and improves conservation of superior and endangered animals. Preconception sex
selection by means of sperm sex sorting, or pre-implantation genetic diagnosis (PGD) coupled
with IVF, has been employed since late 1980’s (Andrabi and Maxwell, 2007; Bodo et al., 2001;
Choudhary et al., 2016). Even before 2005, over 30,000 cattle offspring had been produced using
sexed spermatozoa, obtained mostly by flow cytometric sperm sorting (Armstrong et al., 2015; L.
A. Johnson et al., 2005). PGD has been shown to be highly accurate and efficient in sex selection
even in field conditions, however, a major problem for PGD remains its dependence on the use
of IVF (Lopes et al., 2001; Majumder et al., 2010; Nelson et al., 2007; Penarrubia et al., 2005;
Silberstein, 2005; Takahashi et al., 2008; Tremellen et al., 2005; Wunder et al., 2008).
At present, ultrasound starting from 8th week of pregnancy is the most widespread
prenatal sex determination method in bovine industry, as it’s readily available and non-invasive
(Stroud, 2005). However most accurate results are achieved after 10th week of gestation (Ali and
Fahmy, 2008; Stroud, 2005). The downside of this diagnostic method is the lack of consistency
due to variability in both technician skills and in the position of the fetus.
Although usually investigated as a marker for fertility and ovarian reserve, and as an
infancy marker for testicular function, AMH has recently gained attention as a potential early
pregnancy sex-determining marker due to its few hundred-fold concentration difference in
expression by male vs. female fetuses. The increased rate of AMH expression by males starts
from as early as the 7th week of gestation, which could theoretically place it as one of the earliest
58
measurable molecular markers for determining bovine fetal sex (Vigier et al., 1984). Despite this
potential, only a few studies to date have investigated human maternal levels of AMH during
gestation, without reference to fetal sex (La Marca, 2005; Nelson et al., 2010) or with reference
to fetal sex (Empey et al., 2012). All of these studies showed a decline of maternal AMH levels
during pregnancy, presumably due to inactivated follicle growth (Kuijper et al., 2013). The
single study that considered the impact of fetal sex on maternal AMH did reveal a significant
higher Pl AMH levels in mothers carrying a female vs. male fetus (Empey et al., 2012). An
additional recent article by Novembri et al. investigated the placenta of fetuses of both sexes as a
potential source of AMH at birth (Novembri et al., 2015). The authors reported that AMH
expression was not different between the sexes, however the staining intensity of the AMH
antibody appeared higher in the placenta of male pregnancies. These initial studies show the
potential impact of pregnancy on maternal AMH biology, the possibility of AMH representing
an actual marker of fetal sex and the need to consider the potential role of the placenta in the
current and future studies.
The aim of this chapter is to investigate the association between the levels of plasma
AMH in cows carrying female and cows carrying male fetuses at four different time points,
gestation day 0, 35, 135 and 275, for each animal. Also, plasma AMH was measured in single
time points in cows carrying female and cows carrying male fetuses in the period between 85 and
155 days of gestation. Lastly, expression of AMHR2 was measured in the placenta and cotyledon
of male and female fetus pregnancies between 38 and 80 days of gestation to determine if there
is a placental derived sex linked difference. It was hypothesized that levels of plasma AMH
between cows carrying a male vs. cows carrying a female fetus would differ, being higher in the
cows carrying a male fetus, with neither the placenta or cotyledon having an additive effect.

59
METHODS
Animals and Experimental Design
Study group 1
B. taurus indicus or Zebu (n=13) cows of average reproductive age raised on the pasture
in São Paulo state, Brazil were subjected to artificial insemination (AI) and peripheral blood
collection via puncture of the tail vein at day 0 (AI), 35, 135 and 275 of gestation (Figure 3). Out
of 13 animals, 4 animals aborted, 1 animal sample got damaged, and in 8 animals (n=8)
pregnancy resulted in a birth of a healthy singleton calf with all samples successfully retrieved.
Fetal sex determination was assessed using 2-D trans-rectal Mindray adapted with a liner
transductor ultrasound during the 2nd trimester and then was confirmed at birth. Out of 8 animals,
3 carried a female and 5 carried a male fetus. All blood sampling was done by the same person
and blood was collected in EDTA tubes (BD Vacutaner®, BD Franklin Lakes NJ, USA). Plasma
was centrifuged at 1.400rpm and the top layer was aspirated to a new 1.5ml tube and frozen at -
80°C. Samples were shipped on dry ice to the Pará state, Brazil for the ELISA measurements.
The Bovine AMH ELISA kit AL-114 (Ansh Labs, Texas, USA) was used according to the
manufacturer’s protocol.
Study group 2
Post-mortem blood collection of singleton pregnant pasture raised B. taurus indicus or
Zebu cows (n=21) carrying 10 male and 11 female fetuses, was performed in a Para State
Surveillance Agency approved slaughterhouse located in Castanhal, Brazil (Figure 3). The cows’
ages were variable, however they were estimated to be between 6 and 10 years old. Cow’s blood
was collected during exsanguination at the time of slaughter in EDTA tubes. Matching fetal

60
blood was collected in EDTA tubes via heart puncture with a 23-gauge butterfly infusion set
attached to a 5mL syringe and 10ml syringe. Fetal crown to rump length was from 15 to 43 cm,
estimated to represent a 2nd trimester, more specifically 85-155 days old (~3-5 month) fetus.
Fetal sex was determined visually based on the presence or absence of a scrotum and annogenital
distance. Plasma samples were centrifuged at 3000rpm and the top layer was aspirated to a
new 1.5ml tube and frozen at -20°C until the AMH ELISA measurements.
Study group 3
Post-mortem reproductive tracts of singleton pregnant B. taurus taurus of average
reproductive age were collected from the government-approved slaughterhouses in Guelph,
Ontario Canada (Figure 3). Reproductive tracts were transported on ice and sampling was
performed at the University of Guelph. Samples from 13 fetuses, 13 cotyledon and 13 non-
cotyledon from each placenta were obtained and snap frozen in liquid nitrogen. Fetus age was
determined based on the crown to rump length representing 1st trimester, specifically 3-4.5
months of pregnancy, 38 to 73 days for 7 male (2.2-12.5cm) and 56-80 days for 6 female (5.3-
14.5cm). Anogenital distance was used for sex determination. In order to confirm the sex of the
fetus, DNA extraction and quantitative PCR using GAPDH and testes-specific protein Y
encoded (TSPY) primers from Table 3 was performed from the epithelial fetus tissue samples.
Placenta samples were used to measure quantity of AMHR2 RNA expression via quantitative
PCR described in Chapter 1, using GAPDH and Peptidylprolyl Isomerase A (PPIA) as
housekeeping genes, Table 3.

61
Figure 3 Visual representation of the three study groups for the Chapter 2. Horizontal line represents the time line of gestation divided into the three trimesters and each trimester into three months starting with artificial insemination (AI) of the cow and ending at birth. Literature based fetal expression of AMH is represented by either blue for male at 60 days or red for female at 150 days, with large and small arrows corresponding to the level of expression. In dark red: Study group I, collections at day 0, 35, 135 and 275 and study group II collections from 85 to 155 days of gestation and study group III collections from 38 to 80 days of gestation. In yellow: (Empey et al., 2012; Fanchin et al., 2007) detected significant difference in maternal blood AMH levels between male and female fetuses in humans in between 11th and 15th week of pregnancy, approximately corresponding to 77 and 105 days of gestation.
Table 3 Real Time PCR primers
Gene GenBank
accession
number
Sequence Reference Size
(bp)
GAPDH NM_001034034.2 F-5’-TTCCTGGTACGACAATGAATTTG-3’
R-5’-GGAGATGGGGCAGGACTC-3’
(Hamilton et al.,
2011)
153
TSPY NM_001244608.1 F-5’- CCCAGAATCGAACAGGATTG-3’
R-5’- TTGTCTCTCACGGACGAACC-3’
(Hamilton et al.,
2009)
215
AMHR2 NM_001205328.1 F-5’-GTGCTTCTCCCAGGTCATAC-3’
R-5’-AATGTGGTCATGCTGTAGGC-3’
(Monniaux et
al., 2011)
163
PPIA NM_178320.2 F-5’- TCTTGTCCATGGCAAATGCTG -3’
R-5’- TTTCACCTTGCCAAAGTACCAC -3’
(Ferris et al.,
2016)
111
62
DNA extraction and sex confirmation using TSPY
Each epithelial tissue sample was taken out of the liquid nitrogen and homogenized using
a pestle. Homogenized tissue samples were immediately transferred to a tube containing 4ml of
digestion buffer and vortexed to dissolve any clumps. Homogenized tissues were incubated in a
water bath at 50°C for 5 hours. Samples were vortexed every hour for 10 seconds. After
incubation, DNA was extracted using a phenol/savage solution (2ml sample: 1ml phenol: 1ml
savage) and precipitated using ammonium acetate (4M) and isopropanol. The strands of DNA
were scooped out of the solution with a sterile glass hook, washed with 70% alcohol, air dried
for 30 sec to 1 min. The DNA obtained from each sample was resuspended in 100ul of nuclease
free water and kept in the refrigerator overnight. After extraction was completed, DNA obtained
from each tissue was quantified using a NanoDrop spectrophotometer. The TSPY primers (Table
3) amplified a 215bp product from genomic DNA. A 10ul reaction contained 5mM primers, 6ng
of genomic DNA and 1X SsoFast EvaGreen Supermix (Bio-Rad) was carried out in a CFX96
Touch™ Real Time–PCR Detection System (Bio-Rad) with denaturation at 98°C for 2 minutes,
followed by 50 cycles of 98°C for 5 seconds, 60°C for 5 seconds and 95°C for 10 seconds.
Melting curve was obtained starting at 72°C with measurements taken every 0.2°C until 95°C.
All biological replicates were run in triplicates. Since TSPY was used for male or female
confirmation and not quantitative measurements, standard curve was not necessary. Male were
identified as TSPY positive while female were TSPY negative samples.

63
RNA extraction and reverse transcription
RNA extraction was performed as described in Chapter 1 except the reverse transcription
that was performed using qScriptTM cDNA SuperMix (Quanta Biosciences, Canada) according to
the manufacturer’s instructions.
Real time quantitative PCR
Real time quantitative PCR was performed as described in Chapter 1 using primers from
Table 3. The amplification program was as follows: 95°C for 10 minutes, followed by 50
amplification cycles of 95°C for 10 seconds, 60°C for 10 second (and not 65°C as in Chapter 1),
72°C for 10 seconds and acquisition of fluorescence for 10 seconds. Standard curves for GAPDH
and PPIA primers were generated using pooled male and female fetal placenta cotyledon and
non-cotyledon cDNA samples in six serial dilutions ranging from 12.5 to 0.781ng/ul, while
standard curve for the AMHR2 primers were generated using bovine adult testes cDNA sample
in six serial dilutions ranging from 50 to 3.125ng/ul. Calibrator sample used to avoid inter plate
variation was bovine adult testes.
ELISA
Procedure for AMH measurement using the ELISA kit are described in Chapter 1 and
apply to Study group 1 and 2 from this chapter. Novel for the AMH ELISA kit in this Chapter is
use of provided controls, Low and High, specific for each plate and AMH units were pg/ml and
not ng/ml. Specific to Study group 1 and this Chapter is that all the samples from each animal
were all sampled on the same ELISA plate and were done in triplicates. A few of the samples

64
were run more than once across all the plates and shown to be within allowed levels of variation.
Male fetal samples were diluted 100 times.
Statistics
Wilcoxon rank sum test was used to check statistical significance in the patterns of male
vs. female AMH levels throughout pregnancy. Wilcoxon test and Spearman correlation test was
performed to test difference and correlation between serum AMH levels of male fetus to cow and
female fetus to cow during 2nd trimester of pregnancy, as well as AMHR RNA expression
between female and male cotyledon and placenta samples during 1st trimester.

65
RESULTS
Study group 1
Based on the raw data was presented in Appendix I, the difference between day 35 and
135 in Pl AMH was found significant between cows Bos taurus indicus carrying a male, n=5,
and a female fetus, n=3 (p=0.036; Figure 4A). The average change in the level of Pl AMH
between these two time points for cows carrying a male fetus was 255.4±178.5pg/ml, while for
cows carrying a female fetus was -181.3±146.1pg/ml. The difference between day 275 and 135
in Pl AMH were found not significant between cows carrying a male or a female fetus (p=0.786;
Figure 4A). The average change in the level of Pl AMH between these two time points for cows
carrying a male fetus was 87.6±161.2pg/ml, while for cows carrying a female fetus was
59.5±54.3pg/ml.
The relative difference between day 35 and 135 in terms of the level at day 35 in Pl AMH
was found not significant between cows carrying a male or female fetus (p=0.571; Figure 4B).
The average relative change in the level of Pl AMH between these two time points for cows
carrying a male fetus was 0.432±0.260, while for cows carrying a female fetus was 0.160±0.067.
The relative difference between day 275 and 135 in terms of the level at day 135 in Pl AMH was
found not significant between cows carrying a male or female fetus (p=0.549; Figure 4B). The
average relative change in the level of Pl AMH between these two time points for cows carrying
a male fetus was 0.294±0.062, while for cows carrying a female fetus was 0.220±0.190.

66
Study group 2
Pregnant cow Pl AMH for the period of 85 to 155 days of gestation in cows carrying a
male or female fetus was not found significantly different (p=0.557; Figure 5A). The average Pl
AMH for the same period for a cow carrying a male fetus was 947.3±146.6pg/ml, and for a cow
carrying a female fetus was 809.4±180.5pg/ml. The average fetus Pl AMH for males (n=10) was
175,309.9±16,903.7pg/ml and for females (n=11) was 154.1±22.3pg/ml. There was a significant
difference between the levels of male and female fetuses Pl AMH (p<0.05); male fetus and cow
pregnant with the male fetus (p<0.05); and female fetus and cow pregnant with the female fetus
(p<0.05) Figure 5A. The correlation between Bos taurus indicus pregnant cow Pl AMH and fetus
size was not found significant for male fetus carrying cows (n=10; ρ=-0.16; p=0.650; Figure 5B)
nor for female fetus carrying cows (n=11; ρ=-0.21; p=0.523; Figure 5B).
Study group 3
The correlation between days in utero and relative AMHR2 RNA expression from the
cotyledon of Bos taurus taurus was not found significant in cows carrying a male (n= 6, ρ=-0.09,
p=0.870; Figure 6A) or a female fetus (n=7, ρ=0.66, p=0.102; Figure 6A). Cotyledon and
placenta samples were evaluated based on the fetal sex male vs. female and AMHR2 RNA
expression and found not to be significantly different for the cotyledon (p=0.553; Figure 6B) and
for the placenta (n=3 vs. n=4 respectively, p=0.660; Figure 6B). When comparing within each
sex, cotyledon vs. placenta, results were found also not to be significant for the male samples
(p=0.381; Figure 6B), and for the female samples (p=0.927; Figure 6B). The average male
cotyledon relative AMHR2 RNA expression was 0.015±0.004, and female was 0.017±0.001.

67
The average male placenta relative AMHR2 RNA expression was 0.050±0.030, and female was
0.081±0.060.
Figure 4 Graphs representing plasma AMH (Pl AMH) values (pg/ml) measured using Ansh ELISA kit in cows Bos taurus indicus during gestation at 2 time periods, between day 35 and 135 (purple), and between day 135 and 275 (orange) carrying male (M; n=5) vs. female calves (F; n=3). A) Y-axis represents change in Pl AMH between M and F at two time periods, first time period found to be significantly different between M and F (p= 0.036), indicated by the symbol (*). B) Y-axis represents relative change in Pl AMH in terms of its previous value, example: Δ Pl AMH (day x - day y) / Pl AMH (day y). Error bars denote the standard error of the mean (SEM).

68
Figure 5 Graphs representing plasma AMH (Pl AMH) values (pg/ml) measured using Ansh ELISA kit in Bos taurus indicus cows (with male, n=10, in blue and with female, n=11, in red) and fetus (male, n=10, in green and female, n=11, in purple) at single time points throughout pregnancy, between day 85 and 155, fetus size from 15cm to 45 cm A) Graph represents average level of Pl AMH of pregnant cow and fetus for period from 85 to 155 days, sex denoted as male (M) and female (F). Difference between the cows was not significant (p=0.560), however differences that were significant were between the female fetuses and cows with those female fetuses (*, p<0.05), between the male fetuses and the cows with those male fetuses (**, p<0.05), and the male and female fetus (***, p<0.05). Error bars denote the standard error of the mean (SEM). B) Graph represents relationship between pregnant cow with male (green triangle) or female fetus (purple cross), or male (blue rhombus) or female fetus (red square) Pl AMH and fetus size in cm.
Figure 6 Graphs representing relative AMHR2 RNA expression from male (blue; n=6) and female (red; n=7) cotyledon (Cot.) and male (M. in blue; n=2) and female (F. in red; n=3) placenta (Plac.) during 1st trimester in Bos taurus taurus. A) Male vs. female relative AMHR2 RNA expression from cotyledon only, gestation days 38 to 76 for male, and 56 to 80 for female. B) Male vs. female cotyledon and placenta relative AMHR2 RNA expression. Gestation days from placenta samples 42 to 46 for males, and 70 to 80 for females. AMHR2 RNA was compared to two housekeeping genes Glyceraldehyde 3-phosphate dehydrogenase and Peptidylprolyl isomerase A to determine relative expression level. Error bars denote the standard error of the mean (SEM).

69
DISCUSSION
The aim of the current objective was to investigate the levels of Pl AMH in cows carrying
female vs. cows carrying male fetuses at four different time points for each animal: gestation day
0, 35, 135 and 275. Additionally, Pl AMH levels were measured at time of slaughter in a
separate cohort of cows and their respective female or male fetuses in the period between 85 and
155 days of gestation. Lastly, expression of AMHR2 was measured in the placenta and cotyledon
of male and female pregnancies between 38 and 80 days of gestation to investigate possible sex
differences in its expression. It was hypothesized that levels of Pl AMH between cows carrying a
male fetus vs. cows carrying a female fetus would differ, being higher in the cows carrying a
male fetus, and that the placenta and cotyledon would express AMHR2 at a comparable level in
pregnancies of both sexes.
Here, for the first time in a bovine study, we present evidence that cows carrying a male
fetus have significantly higher difference in Pl AMH levels than cows carrying a female fetus.
This observation is in general agreement with the previous humans studies (Empey et al., 2012;
La Marca, 2005). Beginning with Ebner et al. who characterized the range of non-pregnant
systemic AMH level in humans associated with the optimal fertility (Ebner, 2006), Empey et al.
observed women carrying a female fetus show a drop in systemic AMH levels and that those
carrying a male fetus showed levels that were closer to those of the non-pregnant state. In the
current study, we present evidence that in cows carrying a female fetus Pl AMH dropped by
approximately 20% compared to the non-pregnant Pl AMH value, while in cows carrying a male
fetus it increased by about 30%. The overall difference of approximately 50% is comparable to
the findings in humans, which showed a doubling of Pl AMH levels of mothers carrying a fetus
of the opposite sex (Empey et al., 2012). The range, defined by Empey et al., where the influence

70
of fetal sex can be observed on the maternal systemic AMH levels was between 11th and 15th
week of gestation, which falls within the range identified by our current results. Although it did
not consider fetal sex, the previous human study by LaMarca at al. presented evidence of
increased levels of systemic AMH in the 2nd trimester, which can be seen to parallel our current
findings in cattle (La Marca, 2005). The close overall agreement between the current bovine
study and previous human results demonstrates the strong reproductive similarity between these
two species.
Importantly, the observation of significant fetal sex influence on maternal difference in Pl
AMH levels in the current study provides additional evidence that it represents a potential
marker for fetal sex during early pregnancy. As discussed in the Introduction, accurate detection
of the fetus sex in the first trimester of pregnancy could facilitate planning for herd management
and breeding programs. Interestingly, AMH receptors were shown not only expressed in the
ovary, but also brain, lung and adrenal tissue (Imhoff et al., 2013). This opens the possibility that
fetal sex could potentially influence broader aspects of maternal physiology or even mental state
via AMH signaling pathways. Looking at previous reports, when they are carrying fetuses of the
opposite sex, mothers with chronic health conditions have been shown to respond differently to
medical treatment, implying that fetal sex does in some way have an impact on the mother
(Firoozi et al., 2009; Hocher et al., 2009; Walsh et al., 2015). Recognizing the small sample size
of the current study, the future experiments with larger animal numbers and additional sampling
times should be completed to confirm these results and further assess the utility, accuracy and
feasibility of maternal AMH levels as a fetal sex marker.
While the current study found a significant difference in Pl AMH levels between cows
carrying a female or male fetus when multiple measurements were made and considered for each

71
individual cow, a separate cohort consisting of animals that were sampled at only a single time
point did not show a significant difference for the same variable. This can be explained by the
large individual variation in baseline AMH levels shown in Chapter I and the fact that the single
time point sampling, used for the second cohort, did not allow this variation to be normalized for
or considered during analysis (Anderson et al., 2012; J. J. Ireland et al., 2011). Larger animal
numbers are believed to reveal a significant difference even with the single time point
measurements. However, in the current study, technical limitations did not allow for either the
collection of multiple measurements or the inclusion of additional animals in the second cohort.
In addition to maternal Pl AMH, the current study also directly sampled fetuses to
determine fetal Pl AMH levels. To our knowledge, this represents the first report of fetal Pl
AMH levels in cattle. The fetal samples were taken at between day 85 and 155 of gestation and
the observed AMH levels were found to be significantly different compared to those of the
carrying cow. Further, male fetal Pl AMH was found to be approximately 1000x higher than
female fetal levels, and approximately 100x higher than in the Pl AMH levels of the carrying
cows. Although novel as fetal measurements, the relationships and levels observed in each fetal
sex agree with interpolations of published calf Pl AMH levels (Kitahara et al., 2012b; 2012a;
Rota et al., 2002). The current results also fit within previous literature describing a rise in male
bovine and human fetal AMH expression at around 7 and 8 weeks of pregnancy respectively, and
the suspected onset of female human fetal ovarian AMH expression at approximately 140 days
of gestation (Matzuk and Lamb, 2002; Teixeira et al., 2001; Vigier et al., 1984).
Considering the above results and previous reports in combination, specifically the
observations that cows carrying a female pregnancy show decreased Pl AMH compared to a non-
pregnant state, and that male fetal Pl AMH levels were significantly higher than both female fetal
72
and maternal levels, suggests that fetal sex is a significant determinant of maternal AMH levels.
On this basis, we propose a working model of maternal and fetal AMH biology during pregnancy
(Figure 7). In this model, maternal ovarian AMH production decreases during pregnancy and this
decrease is either compensated for, or not compensated for, by AMH produced by a male or
female fetus respectively. The following three assumptions were made within this model and are
considered further below: 1) maternal AMH production decreases during pregnancy; 2) the
placenta, as the other major feature additional to the fetus during pregnancy, is neither a
significant contributor to AMH levels nor complete barrier to fetal-maternal AMH transmission;
3) fetal AMH production falls within the necessary ranges to explain the observed maternal Pl
AMH values.
Both the current experiments and previous studies in humans also show decrease in
maternal Pl AMH during pregnancy, which suggests AMH production by the maternal ovaries is
affected by the pregnant state (La Marca, 2005; Nelson et al., 2010). Considering the physiology
of pregnancy and our understanding of ovarian AMH biogenesis, this is not surprising. During
pregnancy, high progesterone and human chorionic gonadotropin (hCG) values act to inhibit
gonadotropins expressed by the pituitary, which in turn inhibits stimulation of the ovary and
follicular development and cycling. This difference in the ovary between the pregnant compared
to the non-pregnant state in the human and bovine species can be directly observed, with the
pregnant-state ovary showing smaller follicular number and size, and premature follicular atresia
(Guilbault et al., 1986; 2012a; Pierson and Ginther, 1986; Westergaard, 1985). As AMH
production in the ovary is directly tied to follicular development and ovarian cycling, the
quieting of the ovary during pregnancy can be strongly linked to a decline in maternal AMH
production (Kuijper et al., 2013).

73
The role of the placenta in AMH biology has not been extensively explored. A previous
human study by Novembri et al. examined placenta and fetal membranes at birth and detected
expression of both AMH and AMHR2 that did not differ between opposite sex fetuses
(Novembri et al., 2015). The current study is in agreement with their findings in terms of
AMHR2 expression, however, using the same technique we were unable to detect AMH
expression in bovine cotyledon and placenta samples between gestation day 38 and 80 (data not
shown). From these two studies, it can be proposed that placental differences between the species
of each study, as well as time of sampling could be all possible reasons why AMH expression in
the bovine placenta and cotyledon was not detected. Therefore, until additional studies are
conducted, the possibility remains that placental AMH production may be contributing to
maternal AMH levels; however, the results of this current study support the alternative
hypothesis that the placenta expresses AMHR2, but not AMH itself. Although the observations
of the current study are unlikely to represent subspecies differences, it is important to note that Pl
AMH levels in the current study were all measured in Bos taurus indicus, while the placenta and
cotyledon samples were obtained from Bos taurus taurus.
In order to speculate about the increases in maternal Pl AMH due to fetal AMH
production, one has to explore the ability of fetal AMH to cross the placenta and enter the
maternal circulation. Larger charged molecules, such as peptide hormones like AMH, can move
across the bovine placenta by means of active transport by either specialized receptor molecules
within microvesicles (receptor mediated endocytosis) (Pereira et al., 2013; Sandvig and Llorente,
2012), or by pinocytosis of syncytiotrophoblast cells (Palmeira et al., 2012), or by passive
transport at a very slow rate (Malek et al., 1998). Although the ability of AMH to cross the
placenta by these methods has not been directly investigated, previous reports on molecules with

74
similar characteristics, such as IgG and alpha fetal protein (AFP) in human, and enhanced Green
Fluorescent Protein (eGFP) in cattle support the possibility (Brownbill et al., 1995; Duc-Goiran
et al., 2006; Malek et al., 1998; Pereira et al., 2013; Sandvig and Llorente, 2012).
Lastly, assuming fetal AMH can cross through the placenta, the remaining question is
whether this difference would be detectable in the mother, due to its dilution in the larger blood
volume of the mother compared to the fetus. It was determined previously that the first trimester
fetal blood volume in cattle is around 10 000 times lower (~4ml) than the mother (~40 000ml)
(Reynolds, 1953). We have presented evidence that in cattle, the male fetal plasma AMH is up to
500x more concentrated than in the maternal plasma. Considering these values, the overall rise of
maternal AMH levels following dilution of male fetal AMH levels in the maternal blood volume
could be expected to fall between 0.05 to 0.5ng/ml. In our study, we found the rise to be
approximately 0.2ng/ml, which is in line with this rough prediction. Further, maternal Pl AMH in
non-pregnant cows is on average only 0.33ng/ml, meaning this increase represents a significant
proportion of their baseline values (Stojsin- Carter et al., 2016).
In summary, the current study provides evidence of fetal-sex linked differences in
maternal AMH levels and proposes a model where they are driven by a decreases in maternal
AMH production coupled with sex-dependent fetal AMH production. The importance of these
findings lies in their demonstration of the need to consider the potential impact of pregnancy and
fetal sex in future studies of AMH, the potential to use maternal Pl AMH levels as a marker of
fetal sex during early pregnancy and their contribution to our broader knowledge of AMH
biology and ovarian function during pregnancy.

75
Figure 7 Model describing the fetal testicular AMH secretion 1000x higher than the fetal ovarian AMH secretion and 100x higher than the cow’s ovarian secretion observed between day 85 and 155 of gestation. Model proposes that male fetal AMH crosses placenta and enters maternal circulation leading to the rise in the cow’s Pl AMH compared to the cows that carry female fetuses observed between day 35 and 135 of gestation.

76
CHAPTER III
HUMAN MONOFOLLICULAR ANTI-MULLERIAN HORMONE IN RELATION TO
OOCYTE DEVELOPMENT

77
INTRODUCTION
Genomics, transcriptomics, proteomics and metabolomics based methods have all been
employed in an attempt to determine what factors have the most influence on oocyte
developmental potential. However, most of their currently proposed implementations failed to
show sufficient non-invasiveness, consistency, reliability and cost effectiveness in order to be
widely accepted and used. The gold standard in most of human and bovine IVF is still the
morphokinetics approach. This is the morphological examination of the gamete and embryo,
coupled with the monitoring of the speed of embryo development. If performed visually by
individuals, it is found to be subjective and inconsistent (Bols et al., 2012). Standardizing the
evaluation of embryos using morphokinetics has been employed using time-lapse microscopy
(TLM), which captures images of the developing embryo within the incubator and uses an
algorithm to determine its viability. However, recently the Cochrane Database of Systematic
Reviews examined 3 randomized control trials, including 994 women and their IVF success rate
based on use of time-lapse microscopy, and found that there is no difference in the rates of
clinical pregnancy, live birth, miscarriage, and still birth, with or without the use of TLM
(Armstrong et al., 2015; Kaser and Racowsky, 2014). In summary, despite advances into new
areas and the further development of existing methods, there is still a clear need for novel
markers to help determine oocyte developmental potential and guide decision making during
assisted reproduction.
In the scope of ovarian and follicular physiology, AMH has been proposed to have
multiple important functions. In a clinical setting, the most commonly considered role of AMH is
its function as the “guardian” of the ovarian reserve. In brief, AMH is expressed from the
granulosa cells (GC) of pre- antral follicles and is recognized as being crucial for controlling

78
follicle recruitment towards growth and ovulation, as well as preventing premature ovarian
depletion. As a result, AMH levels are now commonly measured to give potential insight into
current and future ovarian status or fertility. Although less commonly considered in comparison,
the expression of AMH by developing follicles and the critical role it plays in follicular
recruitment and development suggests AMH levels may be reflective, and therefore also a
prospective biomarker, of follicle health and oocyte developmental potential. To date, this
concept of AMH as an oocyte quality biomarker has been mostly explored in human fertility
clinics by examining AMH levels in serum or in single or pooled ovulatory follicular fluid, and
comparing it to overall or specific oocyte and embryo development, pregnancy, and live birth
rates (Cupisti et al., 2007; Ebner, 2006; Eldar-Geva, 2005; Hazout et al., 2004; La Marca et al.,
2011; Lakamge, 2007; Majumder et al., 2010; Nelson et al., 2007; Penarrubia et al., 2005;
Silberstein, 2005; Takahashi et al., 2008; Tremellen et al., 2005; Wunder et al., 2008). Evidence
of a broader link or dual relationship between AMH at the levels of both individual fertility,
represented by oocyte quantity, and individual oocyte quality can also be seen in studies by
Sunkara et al. and Brodin et al.; after controlling for both age and oocyte yield in 892 patients
undergoing 1230 ART cycles, they observed that aspects of oocyte quantity and quality are
codependent, due to their positive correlation to serum (SE) AMH as a common parameter
(Brodin et al., 2013; Sunkara et al., 2011). As the authors explained, “If age and oocyte yield
would be the same, a patient with a high AMH level would have a greater likelihood of having a
euploid oocyte retrieved than would a woman with a low AMH level”.
Despite its promise, so far the use of AMH as a marker of oocyte developmental potential
has had mixed success. Looking at the designs of the past studies, they can generally be
considered to be incomplete because they usually do not sufficiently consider the large variation

79
in AMH levels between separate follicles or the need to directly link primary and outcome
measurements between each follicle and its oocyte. Although the specific compromises they
make, like pooled follicular fluid, simplify and therefore facilitate study completion, their
associated loss in study detail is likely hiding important links between AMH levels and oocyte
potential and contributing to the inconclusive or negative study results. For example, extreme
AMH values in the fluid of only a few follicles may be averaged out in a pooled follicular fluid
sample, and therefore would not be linked to an associated outcome in the matched oocyte
during analysis. In short, without individually measuring each follicle and individually tracking
each oocyte to allow pairing during analysis, it quickly becomes difficult or impossible to link
specific characteristics, such as AMH level, between a given follicle and its oocyte.
Only one study to our knowledge has focused on examining each follicle individually,
using monofollicular sampling (mono FF) and linking the observed status of the follicle to the
outcomes of its oocyte (Hamel et al., 2008). This study considered ovulatory stage follicles in
humans and tested the oocytes by a microarray assay. Although this study did not consider AMH
directly, its results did suggest ties between AMH and individual oocyte quality. One of the
factors differentially expressed between follicles that produced an oocyte that lead to pregnancy
vs. one that did not was aromatase, which has been linked to AMH (Hamel et al., 2008). Also in
this study, follicles selected for dominance were shown to be those that enter the luteinization
process first, by having more LH receptors (Hamel et al., 2008). Durlinger et al., Themmen et al.,
and Scheetz et al. presented evidence of opposing concentrations between LH receptors and
AMH, so it could be speculated that a decrease in AMH might be associated with follicular
dominance (Durlinger et al., 2001; Scheetz et al., 2012; Themmen, 2005).

80
Given this background, the aim of the current study was to evaluate SE and mono FF
AMH levels, as well as mono FF AMH receptor 2 (AMHR2) RNA expression at the ovulatory
follicular stage, and to compare the ability of each corresponding oocyte to reach metaphase II
(MII) stage, the zygote to reach 2 pronucleus (2PN) stage, and embryo to reach blastocyst stage,
in patients of similar age and non-AMH related causes of infertility. It was hypothesized that
both SE, pooled average mono FF AMH, and pooled average mono FF AMHR2 RNA
expression would positively correlate to the AFC, oocyte number, and overall blastocyst rates. At
the mono FF level, it was also hypothesized both AMH level and AMHR2 receptor expression
would positively correlate with the oocyte’s and embryo’s ability to reach MII, 2PN, and
blastocyst stage respectively.

81
METHODS
Patients and Experimental Design
Patients (n=6) from age of 27 to 36 admitted to ONE Fertility, Burlington for infertility
treatment by means of IVF. Causes of infertility were same sex couples, male factor, and
increased BMI. All patients from which the samples were collected signed a Participation in
Research consent form outlining the purpose of the study, procedures necessary to obtain
samples, potential risks and discomforts, potential benefits to participants and/or society,
payment for participation, confidentiality, participation and withdrawal, and rights of research
participants. The consent form (Appendix II) was approved by the University of Guelph
Research Ethics Board (REB) under number 13SE007. The title of the project was: “Molecular
Markers of Oocyte Health and Quality”. 16 patients signed the consent form, but patients number
ended up being 6 due to the following research based exclusion criteria: 1) negative for all of the
regular patient screening procedures; 2) screened for serum AMH; 3) not having any of the
following: PCOS, ovarian insufficiency/low reserve, testicular sperm retrieval (TESA) (partner),
a history of ovarian cancer. Logistics exclusion based criteria included: 1) at least 2
embryologists working; 2) use of the single lumen needle for aspiration; 3) not scheduled on the
weekend; 4) not be scheduled with more than 2 other IVF cases; 5) flushing, if necessary,
performed in a separate tube; 6) all the staff involved informed about modifications of the
procedure.

82
Monofollicular Sample Collection and IVF
There was significant organization necessary to perform sample collection in order to
minimize time of the IVF procedure. One day before the collection, IVF lab staff had to prepare
media following “Monofollicular sample collection instructions” (Appendix III) in order to
perform the collection of the oocytes in a single follicle fashion, being able to trace each oocyte
to the follicle data, and without dilution of the follicular fluid with the flush media. “Protocol for
the monofolliclular oocyte collection” (Appendix IV) was used to help the staff go through the
preparation in a stepwise process. “Modified Cycle Sheet” (Appendix V) was used to record
coded details on the number of follicles, volume, number of oocytes, and details about each
sample and patient. IVF procedure, unless specified by the consent form, was performed in the
same fashion as established by the Ontario Network of Experts (ONE) Fertility protocols for the
IVF procedure. Simplified modifications allowing for collection of the research material
included: the gynecologist would have to aspirate each follicle separately instead of continuously
going from one to the other. That would allow the embryologist to obtain a single follicle
aspirate, search for the oocyte, and place the oocyte in the specifically prepared in vitro culture
system. Therefore, the next modification was that the culture system allowed only a single
oocyte, instead of multiple oocytes, to be placed per drop of culture media, in order to be able to
trace which oocyte belonged to each follicle. The next modification was that one of the
researchers would be present to obtain the monofollicular (mono FF) aspirate and place it in the -
20°C until all of the follicles were collected. After collection, aspirates would be spun in the
centrifuge, on 1.400rpm, volume would be recorded, and top layer, at least 100ul, of follicular
fluid would be removed and placed in the separate tube and frozen at -20°C for the AMH ELISA
measurements. Pallets were resuspended in 10% PBS and frozen in liquid N2 until transportation
83
to the University of Guelph. Blastocyst rate per patient was determined based on the total
number of blastocysts at day 5 divided by the total number of oocytes collected.
ELISA
AMH was measured in ONE Fertility, Burlington, using Automated Roche AMH assay
on the cobas e electrochemiluminescence immunoassay platform for AMH, using Beckman
Coulter Gen II assay antibodies (Roche Diagnostics International Ltd, Rotkreuz, Switzerland)
according to the manufacture’s instructions. 50ul of serum samples from each follicle were
measured undiluted, in replicates of two. Each plate was checked against provided controls. The
provided analytical range of the assay was 0.01-23ng/ml, with an analytical sensitivity of
0.01ng/ml. Repeatability and intermediate precision calculated on 14 serum samples ranged from
1.0 to 2.2% and 1.5 to 2.8% respectively.
Cell culture
Human Granulosa-Like Tumor Cell Line (KGN) were obtained from Queen’s University
and used as a positive control. It has been shown that AMH and AMHR2 are both expressed in
KGN cells (Anttonen et al., 2011). The cells were cultured in Dulbecco’s Modified Eagle
Medium (DMEM)/F12, 10% fetal bovine serum (FBS) with a doubling time ~46 hours (Y. Nishi
et al., 2000). They were frozen in FBS containing 10% DMSO at passage 4 and 5 and shipped to
the University of Guelph where they were thawed and cultured until passage 8, followed by
RNA extraction as described in Chapter 1.

84
RNA extraction and reverse transcription
The same protocol was followed as described in Chapter 1 for KGN RNA extraction,
while mono FF cell pellets RNA extraction was done using AllPrepTM DNA/RNA Micro Kit
(QIAGEN, Inc., Burlington, ON) following the manufacture’s protocol. Reverse transcription for
both was performed using qScriptTM cDNA SuperMix (Quanta Biosciences, Canada) according
to the manufacturer’s instructions.
Real Time quantitative PCR
The same protocol was followed as described in Chapter 1, except for the use of primers
from Table 4. All RNA samples were normalized against GAPDH and PPIA. The amplification
program was as follows: 95°C for 10 minutes, followed by 50 amplification cycles of 95°C for
10 seconds, 60°C for 10 seconds (and not 65°C as in Chapter 1), 72°C for 10 seconds, and
acquisition of fluorescence for 10 seconds. Standard curves for all primers were generated using
pooled pellet cDNA samples from a unrelated patient with a signed consent form in six serial
dilutions ranging from 12.5 to 0.781ng/ul, The calibrator sample used to avoid inter plate
variation was KGN cDNA.

85
Table 4 Real Time PCR primers
Gene GenBank
accession
number
Sequence Reference Size
(bp)
hAMH NM_000479.3 F-5’- CGCCTGGTGGTCCTACAC-3’
R-5’-AAGGTGGTCAAGTCACTCAG-3’
(Anttonen et al.,
2011; Catteau-
Jonard et al.,
2008)
60
hGAPDH NM_001256799.2 F-5’- GAAGGTGAAGGTCGGAGTC -3’
R-5’- GAAGATGGTGATGGGATTTC-3’
(Le et al., 2008;
Yoshimura et al.,
2003)
226
PPIA NM_178320.2 F-5’- TCTTGTCCATGGCAAATGCTG -3’
R-5’- TTTCACCTTGCCAAAGTACCAC -
3’
(Ferris et al.,
2016)
111
hAMHR2 NM_001164690.1 F-5’-TGTGTTTCTCCCAGGTAATCCG-3’
R-5’-AATGTGGTCGTGCTGTAGGC-3’
(Anttonen et al.,
2011; Catteau-
Jonard et al.,
2008)
164

86
RESULTS
AMH per patient:
Average FF AMH per patient was positively correlated to SE AMH levels (n=6; ρ=0.94,
p=0.017; Figure 8Ai). There was also a positive trend between SE AMH and relative AMHR2
RNA expression (ρ=0.60, p=0.242; Figure 8Aii), oocyte number (ρ=0.35, p=0.492) and AFC
(ρ=0.09, p=0.870; Figure 8Aiii). Average SE AMH, FF AMH, and relative AMHR2 RNA
expression were all negatively correlated with the rate of blastocyst development (ρ=-0.90,
p=0.015; Figure 8Bi; ρ=-0.84, p=0.036 Figure 8Bii and, ρ=-0.84, p=0.036; Figure 8Biii
respectively) for individual patients. In all six patients transfer of embryos resulted in clinical
pregnancy.
AMH per individual follicles:
Individually collected and grouped for all patients FF AMH was not found different
between M2 oocytes and non M2 oocytes (n=41 vs. n=28, p=0.350), 2PN zygotes and non 2PN
zygotes (n=30 vs. n=11, p=0.940) and blastocyst and non blastocyst group (n=17 vs. n=13,
p=0.563). The average FF AMH for M2 was 34.08±6.66pmol/l vs. non M2 was
35.77±9.99pmol/l. The average FF AMH for 2PN was 36.13±8.29pmol/l vs. non 2PN was
28.50±10.67pmol/l. The average FF for blastocyst was 30.49±11.10pmol/l vs. non blastocyst
was 27.87±7.64pmol/l. When the data was divided based on SE AMH level into two groups,
“normal” group being 1.93 to 2.62ng/ml and “high” group being 4.21 to 6.79ng/ml, each with
n=3, SE AMH level and FF AMH level were found significantly lower in the first group vs. the
second group (p=0.048, p=0.038, respectively). The blastocyst rate was found significantly
higher in the first group vs. the second group (p=0.038) Figure 9. Average relative GC AMHR2

87
RNA expression and oocyte number were not found significantly different between the groups
(p=0.700, p=0.369) respectively. The average value of the SE AMH was 16.83±1.52pmol/l for
the “normal” group 38.4±5.39pmol/l and for “high” group. The average value for the FF AMH
was 10.89±2.62 pmol/l for the “normal” group, and 64.80±11.68pmol/l for the “high” group. The
average relative GC AMHR2 RNA expression for the “normal” group was 0.18±0.04 and for the
“high” group was 0.20±0.03. The oocyte number for the “normal” group was 8.67±0.88 and for
the “high” group was 11.34±1.86. The average blastocyst rate was 0.39±0.05 for the “normal”
group, and 0.25±0.07 for the “high” group. If data between blastocyst and non blastocyst
producing FF AMH (pmol/l) (n=6), FF AMH/SE AMH (n=6) and relative AMHR2 RNA
expression (n=4) was examined per patient in “high” (i) and “normal” (ii) SE AMH groups, in
“high” patients follicles with higher values produced blastocyst while in “normal” patients
follicles with lower values produced blastocyst, Figure 10.

88
Figure 8 Anti-Mullerian hormone (AMH) per patient based approach. Correlations between AMH level, its relative receptor transcript amount and embryo development potential in six patients. Ai) Serum AMH (SE AMH) (pmol/l) vs. Average follicular fluid (FF) AMH (pmol/l) (p=0.017). Aii) SE AMH concentration (pmol/l) vs. Average relative GC AMHR2 RNA expression. Aiii) SE AMH (pmol/l) vs. Antral follicle count (AFC); Bi) SE AMH concentration (pmol/l) vs. Blastocyst rate (blast rate) (p=0.015). Bii) Average relative GC AMHR2 RNA expression vs. blast rate p=0.036. Biii) Average FF AMH concentration (pmol/l) vs. blast rate p=0.036.

89
Figure 9 Comparisons between individual follicles serum (SE) AMH (pmol/l), average follicular fluid (FF) AMH (pmol/l), relative GC AMHR2 RNA expression, oocyte number and blastocyst (blast) rate between patients (n=3; blue) with “normal” 1.93-2.62 ng/ml and patients (n=3; red) with “high” between 4.21-6.79 ng/ml (x 7.14 to be converted to pmol/l). Significant difference was observed between “normal” and “high” groups for SE AMH, FF AMH and blast rate (p=0.048, p=0.038, and p=0.038, respectively). Glyceraldehyde 3-phosphate dehydrogenase and Peptidylprolyl isomerase A were used as housekeeping genes to determine relative expression level. Error bars denote the standard error of the mean (SEM) and significant difference (P<0.05) is indicated by the symbol (*).

90
Figure 10 Comparisons between average of individual follicles that gave rise to blastocyst (red/blue) and non blastocyst (green) for each patient being from either “high” (i) or “normal” (ii) SE AMH groups, 4.21-6.79 ng/ml or 1.93-2.62 ng/ml respectively. Ai) Average Mono follicular fluid (FF) AMH (pmol/l) in “high” patient group from blast vs. non blast follicles respectively, patient 1 (n=1, n=2), patient 2 (n=2, n=3), patient 3 (n=5, n=2); Aii) Average Mono FF AMH (pmol/l) in “normal” patient group from blast vs. non blast follicles respectively, patient 4 (n=3, n=4), patient 5 (n=3, n=2), patient 6 (n=2, n=2). Bi) Average FF AMH/SE in “high” patient group from blast vs. non blast follicles respectively, patient 1 (n=1, n=2), patient 2 (n=2, n=3), patient 3 (n=5, n=2); Bii) Average FF AMH/SE in “normal” patient group from blast vs. non blast follicles respectively, patient 4 (n=3, n=4), patient 5 (n=3, n=2), patient 6 (n=2, n=2). Ci) Average relative GC AMHR2 RNA expression in “high” patient group from blast vs. non blast follicles respectively, patient 2 (n=1, n=1), patient 3 (n=3, n=1); Cii) Average relative GC AMHR2 RNA expression in “normal” patient group from blast vs. non blast follicles respectively, patient 4 (n=3, n=1), patient 5 (n=4, n=2). Glyceraldehyde 3-phosphate dehydrogenase and Peptidylprolyl isomerase A were used as housekeeping genes to determine relative expression level, and error bars denote the standard error of the mean (SEM).

91
DISCUSSION
The aim of the current study was to investigate and compare potential relationships
between both systemic, and mono FF AMH protein level, as well as mono FF GC AMHR2 RNA
expression and the following human reproductive parameters: antral follicle count, oocyte
number, oocyte maturity, zygote and blastocyst rate. The broader goal was to assess the utility of
AMH as a marker of oocyte developmental potential in assisted reproduction. To date, only one
preliminary study published by Hamel et al., used a similar mono FF sampling and analysis
method. Although it did not consider AMH levels, it used a microarray approach, and was
successful in identifying a number of differentially expressed factors in relation to pregnancy
outcome, some of which are known to be part of AMH regulatory function (Hamel et al., 2008).
The current study provides evidence in support of a significant positive correlation
between SE AMH and average mono FF AMH, and a positive trend between SE AMH and
average mono FF GC AMHR2 RNA expression when examined on a per patient basis. This
finding is in agreement with previous studies showing a correlation between average FF and SE
AMH (Fanchin et al., 2007), including our own previous bovine study, which showed average
FF AMH and GC AMHR2 RNA expression to have a significantly positively correlation to SE
AMH (Stojsin- Carter et al., 2016). A positive correlation was not observed between AMH and
AFC or AMH and oocyte number, however this may also be due to the low patient numbers
available for the current study.
Examined on a per patient bases, we found a significant negative correlation between SE
AMH, average FF AMH, average relative GC AMHR2 RNA expression and blastocyst rate. This
finding is contrary to the three previous reports reporting a positive correlation between AMH
and embryo developmental potential (Fanchin et al., 2007; Majumder et al., 2010; Takahashi et

92
al., 2008). However, looking closer, all of these previous studies only measured and considered
the AMH level of single largest ovulatory follicle and did not examine all subsequent follicles
per patient. In contrast, the negative correlation observed in the current study includes these
additional values in the analysis and therefore reaches a separate conclusion. In general, the
interpretation of studies relying on single largest follicle values are problematic due to the strong
impact between absolute follicle size and AMH levels, and the fact that the characteristic of
largest follicle is not standardized across all patients, but rather may vary significantly from one
patient to the next. Additionally, there is evidence the largest or dominant follicle is unique
compared to the other follicles with respect to multiple factors related to development, such as
AMH (Scheetz et al., 2012). Considering this trend, where a developing follicle becomes
depleted in factors involved in dormancy, a negative relationship between localized or follicle
specific AMH and blastocyst rate becomes justified.
In order to further explore the observed negative relationship between AMH and embryo
developmental outcome, patients were divided into two groups based on their SE AMH levels.
These levels were drawn from previous literature that defined the normal human SE AMH range
as being 1.66-4.52ng/ml which is the 25th to 75th percentile of the population (Ebner, 2006).
Additionally, we considered reports describing levels of 2.52 and 2.7 to be correlated with a
positive developmental outcome, and that 1.96ng/ml represents a lower limit associated with
negative developmental outcomes (Eldar-Geva, 2005; La Marca et al., 2011; Lakamge, 2007;
Silberstein, 2005). In this context, the SE AMH level of or two patient groups were 1.93-
2.62ng/ml for the first group, which we considered to fall into the normal AMH range, and 4.21-
6.79ng/ml for the second group, which we considered to represent a higher than normal AMH
range. In addition to the statistically significant difference in both SE and average FF AMH

93
levels, the blastocyst rate was also significantly different with higher levels in the “normal”
group compared to the “high” group. These finding provides evidence, to our knowledge for the
first time, of a potential association between negative blastocyst outcomes in patients with higher
AMH levels, excluding those linked to an identified and specific ovarian pathology such PCOS
(Pigny, 2005). While the specific definition of the “high” SE AMH range used in this analysis
has not been explicitly defined previously in the literature, it falls above 75% of the normal range
(>4.52ng/ml) and bellow the values associated with ovarian dysfunction or defined pathologies
(<8.40ng/ml) (Pigny, 2005). Based on our observations, the possibility of a threshold beyond
which increasing levels of systemic and follicular AMH are no longer associated with a good
IVF prognosis should be considered, even in the absence of an identified ovarian pathology. A
potential mechanism associates increased levels of AMH to decreased oocyte quality and poor
reproductive outcomes due to the lack of follicular selection and maturation. This is a novel
concept and requires further verification.
Looking further using the greater detail provided by the use of a mono FF approach,
reveals an additional relationship. Oocytes showing increased developmental potential in “high”
SE AMH patients were associated with higher AMH and GC AMHR2 RNA expression, while
the opposite relationship was observed in the “normal” SE AMH group with oocytes showing
increased developmental potential were associated with lower AMH and GC AMHR2 RNA
expression (Figure 11). If it is assumed local AMH levels need to drop to a critical point to
allow for the follicle to be recruited and matured properly allowing for increased stereogenic
synthesis and gonadotropin receptor expression as seen in normal SE AMH patient on the local
level (Visser, 2003), it is unclear how can this opposing trend be explained in the high SE AMH
patients. It might be speculated that alterations in the local AMH level in the high SE AMH

94
group remaining high at the ovulatory level could be a reason why the overall blastocyst rate in
the high SE AMH patients is lower compared to the normal SE AMH patients. However,
understanding how few of these follicles still progress and mature producing a blastocyst is
unclear, the current result clearly demonstrates the utility and importance of using paired mono
FF and serum measurements when investigating follicular level AMH biology.
In summary, the findings of the current study provide strong evidence that AMH biology
is not as simple as one measurement or interpretation. Specifically, this study identified two
groups of individuals on the basis of different SE AMH levels that had apparently contrasting
physiology and observed further differences and alternative trends within these groups when
considering AMH measurements of individual follicles and oocytes. These observations suggest
potential relationships between AMH values and reproductive outcomes and parameters should
be investigated at the organism, ovary and individual follicle level. As a general recommendation,
systemic AMH should be considered to provide an overall indication of ovarian function and
context for the interpretation of local AMH values, while the local AMH levels should be
considered reflective of their specific follicular environment and the associated oocyte.
Additionally, although it may be possible to find associations between the AMH level of the
largest follicle and outcomes within a given study or a defined clinical setting extrapolation of
these findings is not recommended. Instead, there should be more investigations exploring the
follicular AMH effects and outcomes such as the current experiment method, but including
larger number of patients, where individual follicles and their oocytes are measured and can be
compared directly to rule out potential confounding variables, such as absolute follicle size.
Further research and implementation of these concepts has the potential to increase the utility

95
AMH in a clinical setting by allowing it to not only serve as an established marker of general
fertility, but also a novel potential marker for in vitro embryo selection.
Figure 11 Ovaries from high and normal SE AMH patient groups with oocytes that developed to blastocysts corresponding to high FF AMH in red or low FF AMH in blue respectively, compared to oocytes that did not develop to blastocysts corresponding to FF AMH in green for both patient groups.

96
GENERAL DISCUSSION
The main objective of this thesis was to examine the correlation between systemic and
ovarian AMH levels and various parameters of fertility in the bovine and human species, as well
as a possible association between the cow’s systemic AMH levels and fetal sex during pregnancy.
AMH was proposed to be a marker of ovarian function in both non-pregnant bovine and human,
as well as in a pregnant bovine model.
Rising levels of infertility have a large impact on the bovine industry and human
reproduction. However, our understanding of ovarian function and biology, which should be
thorough in order to overcome this issue, is still vastly lacking. AMH has been used as a marker
of quantitative ovarian parameters such as AFC and oocyte number in humans and European
cattle. In the Zebu cattle breeds, which occupies a majority of the tropical and subtropical areas
of the planet, and therefore also has great economic importance, AMH has not been extensively
studied. The ability to identify fetal sex in early pregnancy based on the differentially expressed
fetal sex factors and/or their effects on the mother and her ovary is unknown. Only three human
studies have looked at AMH during pregnancy, and only one of those has studied higher levels
of AMH in mothers carrying a male vs. female fetus. The link between AMH and quantitative
fertility parameters has been established in both species, but only a few human IVF studies and
no bovine ones have made the link between AMH and qualitative fertility parameters, such as
successful fertilization and pregnancy rate. In this thesis, it was hypothesized that 1) Zebu cattle
would have higher systemic and ovarian AMH levels compared to European cattle, and in both
breeds AMH levels would be correlated to fertility parameters; that 2) cows carrying a male fetus
would have higher Pl AMH compared to cows carrying a female fetus; and that, 3) in women

97
undergoing IVF, systemic and ovarian AMH would positively correlate with the oocyte
developmental potential outcome.
Species or breed adaptation to various environmental conditions arises though the
combination of genetic differences and evolutionary or breeding pressures. Here we provide
evidence that two cattle breeds with differing reproductive abilities also have underlying
physiological difference in terms of levels of AMH in serum, and follicular fluid. These
observations possibly represent specific adaptations to their environments, as Zebu and European
cattle have been bred for generations to adapt to a more tropical/subtropical vs. a more temperate
climate respectively. Zebu has adapted to using its energy primarily to overcome heat, humidity,
disease, and scarce nutrient availability. In comparison, European cattle have been grown in
optimal surroundings, without heat and nutrient stressors, but with added stress caused by
artificially induced human inbreeding methods for increasing milk and meat yield (Leroy et al.,
2008). These differing environments and pressures may also have resulted in the characteristics
of their reproduction to also differ. In Zebu, reproduction is more “inaccessible”, characterized
by delayed puberty, shorter and more “quiet” estrous, longer gestation, and lengthier postpartum
anestrous, but higher ovarian reserve and AMH. European cattle exhibit more “accessible”
reproduction, characterized by shorter puberty, easier estrous detection and monitoring, shorter
gestation and postpartum anestrous, but lower ovarian reserve and AMH (Butler, 2003;
Koufariotis et al., 2014; O'Brien et al., 2014). Findings from our experiments have came to the
similar conclusion where Zebu has been found to have superior fertility parameters, such as AFC
and oocyte number, that correlated to their systemic and follicular AMH compared to the
European cattle (Stojsin- Carter et al., 2016). Interestingly, Silva-Santos et al. has shown similar
fetal ovarian reserves between the two breeds in terms of primordial follicles, with higher rates

98
of follicular depletion in European cows, which leads to lower reserve in the adult females
compared to Zebu (Silva-Santos et al., 2011). It could be speculated that the slower rate of
follicular depletion and higher AMH levels in Zebu are a consequence of seasonal pressure on
ovarian function. In a broader context, the associated fertility, milk production and genetic
characteristics of European versus Zebu cattle can also be interpreted as a potential cautionary
example of a failure to consider the links and potential trade-offs between traits during long-term
and high pressure animal selection and breeding. Specifically, an overly strong selective focus on
milk production has been implicated as a major source of the growing infertility problems
observed in European cattle. Recognizing the Zebu breed is currently less inbred and does not
yet appear to suffer from infertility traits, Zebu breeders and husbandry programs may wish to
try to avoid a similar limitation and take a more holistic or multi-trait approach during animal
selection. If this action is taken now before the species is further bred out and genetic variability
lost it may preserve the genetics necessary to achieve a more optimal balance between fertility
and production outcomes.
Besides exploring ovarian state of non-pregnant cows and how it relates to their systemic
and follicular AMH levels, this thesis also explored plasma AMH of pregnant cows and how it
relates to their fetal sex and their fetal plasma AMH levels (Chapter 2). Building on what has
already been discussed, additional details related to male fetal AMH expression, maternal ovary
status and potential AMH production, AMH crossing the placental barrier and the potential
effects of increased AMH levels in developing fetuses on the maternal organism were also
considered. The male fetal Pl AMH, not previously published to our knowledge, was in our study
found to be 1000x higher than female fetal Pl AMH levels, and 100x higher than the Pl AMH
levels of pregnant cows. Previous bovine studies showed afterbirth AMH levels up to a hundred

99
times higher in the of male vs. female calves (Kitahara et al., 2012b; 2012a; Rota et al., 2002).
Matzuk et al. and Teixeira et al. also described a higher AMH expression in the human male
fetus at around 8 weeks of pregnancy relating it to its role in development of the male
reproductive system (Matzuk and Lamb, 2002; Teixeira et al., 2001).
Evidence of a maternal ovarian AMH contribution as a response to the pregnancy seems
unlikely based on the following literature findings. The ovary is known to enter a partly
quiescent state during pregnancy in terms of folliculogenesis, due to the lack of gonadotropin
signals from the pituitary gland, which is inhibited by: progesterone, estradiol, and relaxin,
secreted from the corpus luteum; and by hCG, relaxin, prolactin, and progesterone, secreted from
the placenta. Some follicular growth and recruitment still occurs, but follicles do not reach an
ovulatory size and number, and have an increased amount of atresia (Guilbault et al., 1986;
Pierson and Ginther, 1986; Westergaard, 1985). Govan et al. described stunted follicular
development during pregnancy, where follicles would reach a preantral stage, with a size of up to
6mm, and not progress further (Govan, 1968). They proposed that the action of progesterone,
indirectly through inhibition of gonadotropin, is responsible for the inability of follicles to
continue further development. Driancourt et al. presented evidence of follicular cycling during
the first 7 months of pregnancy, but none of the follicles reached an ovulatory state (Driancourt,
2001). Ovarian production of progesterone is crucial in the first two months of gestation. It has
been shown that oophorectomy after 9th week of gestation does not have an effect on pregnancy,
while any disturbance prior to 9th week leads to pregnancy loss (Villaseca, 2004). Also, the urine
of pregnant women was shown to able induce luteinization in the ovaries of hypophysectomized
rats (Leonard and Smith, 1934). Overall, the ovary might be important due to progesterone

100
synthesis, however dormant in terms of folliculogenesis, and therefore an unlikely contributor of
maternal systemic AMH during pregnancy.
Considering the possible contribution of fetal AMH to maternal Pl AMH levels, one has
to explore the potential ability of fetal AMH to cross the placenta and enter the maternal
circulation. There are four anatomical barriers between maternal and fetal circulation:
syncytiotrophoblast, trophoblastic and capillary basement membranes, and fetal capillary
endothelium. It is known that CO2 and steroid compounds move by passive diffusion in the
direction of the equilibration of the concentration gradient. Larger charged molecules, such as
peptide hormones, move across the placenta by means of: active transport by either specialized
receptor molecules within microvesicles (receptor mediated endocytosis) (Pereira et al., 2013;
Sandvig and Llorente, 2012), or by pinocytosis of syncitiothrophoblast cells (Palmeira et al.,
2012); and passive transport at a very slow rate (Malek et al., 1998). Examples of maternal to
fetal active transfer via receptor molecules on the membrane are IgGs, 160kDa in size, which
ensure that her passive immunity is transferred to the fetus towards the end of pregnancy.
Another protein, transferrin, 80kDa in size, is transferred by means of pinocytosis, which ensures
proper supply of oxygen to the fetus. Examples of fetal to maternal active transfer via
microvesicles in a cloned cattle model are transgenic enhanced Green Fluorescent Protein
(eGFP), 32kDa in size, and fetal DNA (Pereira et al., 2013), with an upper limit for a
microvesicle transfer defined as 150kDa (Sandvig and Llorente, 2012). Alpha fetal protein (AFP),
70kDa in size, is an example of a protein transferred by means of diffusion from the fetus to the
mother. AFP is found at a 100x smaller concentration in the mother compared to the fetus, the
levels correlating to placental size and week of pregnancy, starting from the end of the first
trimester (Malek et al., 1998). It is speculated that this passive diffusion occurs not directly

101
through the membranes but through placental “leaks” or defects, as occurs with the fetal cells
found in the maternal circulation (Malek et al., 1998). It is was found that AFP passes through
“the villous core ross the fibrinoid deposits at sites of discontinuity of the syncytiotrophoblast or
from decidua basalis by entering the vessels that traverse the basal plate” without passing
through the cytoplasm (Brownbill et al., 1995). The author argued that, in normal pregnancies,
even with the much higher concentration of AFP in fetal blood, it is difficult to detect evidence
of AFP transfer to the mother due to dilution of AFP in the much higher volume of maternal
blood. This is probably similar to what we observed with AMH. AFP and its receptor have been
shown to be expressed by the placenta (Duc-Goiran et al., 2006), similar to AMH. Therefore,
based on the examples of IgG, eGFP and AFP it could be speculated that AMH could pass
through the placenta from the fetus to the mother, utilizing both passive and active transport.
Further studies are necessary to confirm these speculations.
The potential effects of increased AMH levels during pregnancy, such as those possibly
produced and transferred from the male fetus, may possibly manifest in differences in
developmental between male vs. female brains and associated behaviors, the Free-Martin effect
being one such example, the response of pregnant mothers to chronic illness, and in oncogenesis.
The effect of the absence of AMH on brain and motor development can be seen in the KO mice
studies. AMHR2 is shown to be expressed differently in the brains of male and female mice,
leading to higher levels of motor neuron development and increased novelty preference in the
male mice (Morgan et al., 2011; Wang et al., 2009; Wittmann and McLennan, 2011). Increased
levels of AMH in bovine twin pregnancies with fetuses of opposite sex led to increased levels of
aggression and masculinization of the reproductive tract in the female twin, called a Free-Martin,
due to high levels of male AMH from the male twin (Barker, 1944). It has been shown that

102
mothers carrying a male fetus differ by have a higher risk of needing acute care and medication
if diagnosed with chronic asthma, have decreased blood pressure, and have increased insulin
resistance (Firoozi et al., 2009; Hocher et al., 2009; Walsh et al., 2015). The effect of excess
AMH has been explored in experiments by Stephen et al., where the addition of 10g of
recombinant AMH per day for 3 weeks caused an inhibition of human cancer cell lines in vivo,
and decreased neovascularization, necrosis, inflammation and tumor size (Stephen et al., 2002).
Nishi et al. showed that AMH expression varied depending on the tumor size, while AMHR2 is
unaffected. They also showed that, with increasing levels of exogenous AMH, there was a tumor
cell number decrease, by means of apoptosis, in vivo and in vitro (Y. Nishi et al., 2000). It can
also be speculated that women who carry a male fetus might have delayed subsequent ovulation,
could exhibit more masculine behaviors, and could have a decreased risk of oncogenesis due to
the additive AMH effect.
In this thesis the monofollicular collection (mono FF) method was used to closely
examine and investigate links between AMH and reproductive outcomes in an IVF patient
population. Importantly, this detailed approach allowed for the novel identification of a number
of potential unexpected trends in subsets of individuals or follicles that appear to display
opposing relationships between AMH levels and outcomes. These results show that only
understanding both systemic and follicular levels of AMH, is possible to correctly predict the
capacity of the entire ovary, as well as the potential of the individual follicle. The ovarian
capacity as a whole, and the follicle as a localized environment both have an effect on the
developing oocyte. Fertility, in general, is a property of codependent quantitative and qualitative
parameters, with the ultimate goal of having both a large and healthy oocyte reserve (Brodin et
al., 2013; Holte et al., 2011; Kawamura et al., 2013; Sunkara et al., 2011). This thesis begins to

103
look beyond AMH as either a qualitative or quantitative marker alone and on towards a scenario
where it can be seen to represents both these parameters together. In a general sense, Chapter 1
represents and demonstrates clear evidence AMH is a marker of quantity, and Chapter 3
represents and demonstrates clear evidence AMH is a marker of quality. Perhaps the most
obvious way to begin to tie these two characteristics together is through the “size matters”
concept, where the organ’s size and the quantity of cells positively correlates to its function,
Figure 12. For example, smaller ovarian reserve could directly imply lowered oocyte quality
within the reserve, and vice versa, irrespective of the age. This relationship can also be seen and
has been assessed in other organs such as testes, where size was found to be proportional to the
amount of Sertoli cells, which further correlated to male fertility (Keeton et al., 1996; Velde and
Pearson, 2002). Unlike testes, mammaries and their size were not correlated to the ability of the
secretory cells to produce milk (Ramsay et al., 2005).
On the tissue level, this relationship of quantity and quality codependence is
demonstrated by the complex interplay between cellular interactions. How structure or size can
affect the function or the quality can be seen in the ovarian morphology and factors that disrupt
this equilibrium within the tissue. The ovary has a firm cortex on the outer layer, where the
follicles enclosing the oocytes reside, and a softer medulla in the inner layer. As they mature,
follicles move from the outer firm layers of the ovary towards the inner softer layers. This “out to
in” direction of follicular growth is a fairly novel concept, and provides the link to the
codependence between the physical characteristics of the ovarian reserve and its functional
property, which is to produce a healthy oocyte (Woodruff and Shea, 2010). The physical
interactions between the supporting cells in the follicle (granulosa) with the oocytes, which are
facilitated through the gap and adherent junctions between the cells, ensure follicular arrest and

104
dormancy in the outer layer, or detachment, growth, and proper maturation in the inner layers of
the ovary (Gilchrist et al., 2008; Li and Albertini, 2013). Detachment of these two cell types is
dependent on the decreased amount of cAMP, Ca2+, and AMH, allowing for the increased
expression of gonadotropin receptors, and stereogenesis (Norris et al., 2009; Tsafriri et al., 1996;
Webb et al., 2002). Also, during the follicular recruitment process, physical changes are
evidenced by perturbation in the extracellular matrix and cytoskeleton of the oocyte and
granulosa cells (Berkholtz et al., 2006; Hsueh et al., 2015). Another proof of the codependence
between structure and function are ovarian pathologies and their treatment methods, with AMH
being an indicator of both, as presented in all chapters. One treatment method is ovarian drilling,
where an ovarian injury is deliberately induced, leading to increased ovarian function due to the
disturbance in the ovarian structure (Ortega-Hrepich et al., 2014). A small inaccessible reserve of
follicles unresponsive to gonadotropins is thus reawakened by the structural disturbance. Women
who specifically benefit from this method are those with diminished ovarian reserve (DOR), or
polycystic ovarian syndrome (PCOS) patients both known to have lowered and increased
systemic AMH respectively (La Marca et al., 2009). Second method where ovarian structural
integrity is disturbed is ovarian fragmentation, coupled with oocyte maturation in vitro, or with
crypreservation of the ovarian pieces and in vivo oocyte maturation (Dunlop et al., 2016;
Kawamura et al., 2013; Varghese et al., 2008; Xiao et al., 2015). Patients benefiting are those
with premature ovarian failure (POF), due to cancer diagnosis, who need their gametes preserved
prior to cytotoxic therapy. In both of these methods, the birth of healthy children was achieved
by the disturbance of ovarian structure, leading to a decrease in the paracrine signals that inhibit
follicular recruitment (Donnez et al., 2011; Hsueh et al., 2015). It could be speculated that
ovarian injury may be associated with the lowering of local AMH, and that both may increase

105
the ovarian ability to reacquire its “stemness” or capacity to regenerate ovarian reserve,
supported by Hu et al. (Hu et al., 2014). This concept challenges the dogma that a fixed germ cell
population is determined in utero for the female lifetime (J. Johnson et al., 2005; 2004). A
balance between renewal capacity and dormancy of follicles throughout the reproductive years is
crucial for proper species reproduction and propagation of its genetic material.
The broader importance of these findings lies in strengthening of evidence that AMH
represents consistent, reliable, and inexpensive ovarian function marker during non-pregnant and
pregnant state. In this way, it can provide key insights into fertility potential and be used to
improve ovarian stimulation protocols, breeding program efficiency, determination of fetal sex,
and ovarian pathologies. In specific relation to human ART, development of AMH as a marker
will continue to facilitate individualized ovarian reserve estimates and optimized stimulation
protocols and treatments that increase the safety of patients.

106
Figure 12 “Size matters concept” representation of the ovary in which the ovarian size is positively correlated to: the ovarian reserve, the ovarian function (based on the oocyte developmental potential), and the systemic AMH level. However it is negatively correlated to the ovulatory follicular AMH level.

107
SUMMARY, CONCLUSIONS, AND FUTURE DIRECTIONS
AMH measured from serum/plasma, from pooled or averaged follicular fluid, or as its
receptor RNA transcript from granulosa cells were correlated to the number of antral follicles,
number of oocytes and blastocyst rate. Zebu cattle were found to have a higher level of plasma
and follicular AMH. Crossbred animals were found to more closely mirror Zebu cattle in their
fertility parameters. Differences in AMH, if measured in the serum of pregnant cows between
day 35 and 135 of gestation, were found to reflect the sex of the fetus, with cows carrying a male
fetus having higher AMH level difference compared to cows carrying a female fetus. AMHR2
RNA expression measured in the placenta and cotyledon in pregnancies with male and female
fetuses was not found to be different. AMH levels measured from human serum, averaged
follicular fluid, and AMHR2 transcript levels from averaged pooled granulosa cells showed a
negative correlation to blastocyst rate. If patients were divided into two groups based on their
serum AMH, the group with normal levels was found to have a significantly higher blastocyst
rate compared to the group with a higher serum AMH. When measured in single follicles in high
and normal serum AMH patients, blastocysts developed from follicles with higher AMH levels
in high serum AMH patients, and from follicles with lower AMH levels in normal serum AMH
patients, compared to the AMH levels in follicles of arrested embryos. Therefore, high systemic
and low ovulatory follicular AMH might indicate high ovarian reserve, AFC, and oocyte
numbers, and a good prognosis in infertility treatment; however, if it leaves the realm of
biologically optimal values it might become a marker of a poor prognosis, or lose its value as a
marker.
From the current studies, we can say that AMH is a valid indicator of ovarian structure
and function, being a marker of oocyte number and AFC in cattle, and being a marker of

108
blastocyst rate in humans. We can also say that through measured from serum/plasma, follicular
fluid or granulosa cell transcript levels, it can also represent ovarian activity. These correlations
and relationships can be highly dependent on: species, human or bovine; stage of follicles, antral
or ovulatory; the way follicles are collected, by pooling the follicular fluid or by measuring each
follicle separately and then averaging the value for all; ovarian status; current serum or plasma
and these factors should be considered in investigations and data interpretation. During
pregnancy AMH levels appear to be impacted by the fetal sex in the bovine species and therefore
have a potential use in early sex detection.
Future studies should continue to build on the present results to further increase our
understanding of AMH biology and the potential power and utility of AMH as a marker of
ovarian function. Improved characterization of AMH use within assisted reproduction assays
could be accomplished by including larger number of patients in studies and further exploring
the relationship between AMH and oocyte developmental potential, and other factors involved in
AMH signaling and their transcripts. Also the specific inclusion of patients with different
diagnoses of infertility should be included in future studies to explore changes in AMH biology
or prognostic value in these conditions. In cattle studies, AMH levels should be further explored
at additional time points throughout pregnancy, on a larger sample number, and whenever
possible include corresponding fetus plasma AMH values. Also, specific experiments exploring
the potential transport of AMH across the placenta are important in explaining the relationship
between fetal and maternal AMH levels during pregnancy. Similarly, the possible effects of
increased AMH on mothers carrying a male fetus should be directly investigated. In bovine
experiments, it would be beneficial when possible to control for genetic variability of an oocyte
donor and embryo recipient, in order to more accurately follow up on the pregnancy outcomes of

109
all the oocytes from each animal. Last but not least, our understanding of the specific
mechanisms behind AMH’s ability to arrest follicular selection and maturation remains
incomplete and achieving a greater understanding of these pathways would certainly be useful in
understanding infertility and its treatment.

110
LITERATURE CITED
Abeygunawardena, H., Dematawewa, C.M.B., 2004. Pre-pubertal and postpartum anestrus in tropical Zebu cattle. Animal Reproduction Science 82-83, 373–387.
Agdi, M., Zarei, A., Al-Sannan, B., Tulandi, T., Tan, S.L., 2010. Effects of ovarian puncture for in vitro maturation on subsequent in vitro fertilization cycle in women with polycystic ovaries. Fertility and Sterility 94, 381–383.
Aksglaede, L., Sørensen, K., Boas, M., Mouritsen, A., Hagen, C.P., Jensen, R.B., Petersen, J.H., Linneberg, A., Andersson, A.M., Main, K.M., Skakkebæk, N.E., Juul, A., 2010. Changes in Anti-Müllerian Hormone (AMH) throughout the Life Span: A Population-Based Study of 1027 Healthy Males from Birth (Cord Blood) to the Age of 69 Years. The Journal of Clinical Endocrinology & Metabolism 95, 5357–5364.
Ali, A., Fahmy, S., 2008. Ultrasonographic fetometry and determination of fetal sex in buffaloes (Bubalus bubalis). Animal Reproduction Science 106, 90–99.
Alvarez, P., Spicer, L.J., Chase, C.C., Payton, M.E., Hamilton, T.D., Stewart, R.E., Hammond, A.C., Olson, T.A., Wettemann, R.P., 2000. Ovarian and endocrine characteristics during an estrous cycle in Angus, Brahman, and Senepol cows in a subtropical environment. Journal of Animal Science 1291–1302.
Anderson, R.A., Nelson, S.M., Wallace, W.H.B., 2012. Measuring anti-Müllerian hormone for the assessment of ovarian reserve: When and for whom is it indicated? Maturitas 71, 28–33.
Andrabi, S.M.H., Maxwell, W.M.C., 2007. A review on reproductive biotechnologies for conservation of endangered mammalian species. Animal Reproduction Science 99, 223–243.
Anttonen, M., auml, A.F.A.R., Tauriala, H., Kauppinen, M., MacLaughlin, D.T., Unkila-Kallio, L., tzow, R.B.U., Heikinheimo, M., 2011. Anti-Mullerian hormone inhibits growth of AMHtype II receptor-positive human ovarian granulosacell tumor cells by activating apoptosis. Laboratory Investigation 91, 1605–1614.
Argyle, C.E., Harper, J.C., Davies, M.C., 2016. Oocyte cryopreservation: where are we now? Human Reproduction Update dmw007.
Armstrong, S., Arroll, N., Cree, L.M., Jordan, V., Farquhar, C., 2015. Time-lapse systems for embryo incubation and assessment in assisted reproduction. John Wiley & Sons, Ltd, Chichester, UK.
Ashkar, F.A., Semple, E., Schmidt, C.H., St John, E., Bartlewski, P.M., King, W.A., 2010. Thyroid hormone supplementation improves bovine embryo development in vitro. Human Reproduction 25, 334–344.
Balaban, B., Urman, B., 2006. Effect of oocyte morphology on embryo development and

111
implantation. RBM Online 12, 608–615.
Baldrighi, J.M., Sá Filho, M.F., Batista, E., Lopes, R., Visintin, J.A., Baruselli, P.S., Assumpção, M., 2014. Anti-Mullerian Hormone Concentration and Antral Ovarian Follicle Population in Murrah Heifers Compared to Holstein and Gyr Kept Under the Same Management. Reproduction in Domestic Animals 49, 1015–1020.
Barker, C.A.V., 1944. Lactation in a Free Martin Heifer Following Hormone Therapy. Canadian Journal of Comparative Medicine 8, 216–208.
Barreto, R.S.N., Bressan, F.F., Oliveira, L.J., Pereira, F.T.V., Perecin, F., Ambrósio, C.E., Meirelles, F.V., Miglino, M.A., 2011. Gene expression in placentation of farm animals: An overview of gene function during development. Theriogenology 76, 589–597.
Baruselli, P.S., de Sá Filho, M.F., Martins, C.M., Nasser, L.F., Nogueira, M.F.G., Barros, C.M., Bó, G.A., 2006. Superovulation and embryo transfer in Bos indicus cattle. Theriogenology 65, 77–88.
Batista, E., Macedo, G.G., Sala, R.V., Ortolan, M., Sá Filho, M.F., Del Valle, T.A., Jesus, E.F., Lopes, R., Rennó, F.P., Baruselli, P.S., 2014. Plasma Antimullerian Hormone as a Predictor of Ovarian Antral Follicular Population in Bos indicus(Nelore) and Bos taurus(Holstein) Heifers. Reproduction in Domestic Animals 49, 448–452.
Baylis, F., 2015. Left Out in the Cold: Arguments AgainstNon-Medical Oocyte Cryopreservation. Journal of Obstetrics and Gynaecology Canada 37, 64–67.
Beatty, D.T., Barnes, A., Taylor, E., Pethick, D., McCarthy, M., Maloney, S.K., 2006. Physiological responses of Bos taurus and Bos indicus cattle to prolonged, continuous heat and humidity. Journal of Animal Science 84, 972–985.
Berkholtz, C.B., Shea, L.D., Woodruff, T.K., 2006. Extracelllar matrix functions in follicle maturation. Seminars in Reproductive Medicine 24, 262–269.
Bodo, S., Baranyai, B., Gocza, E., Dohy, J., Markkula, M., 2001. Preimplantation Genetic Diagnosis in Cattle: A Review. Acta Veterianaria Hungarica 49, 99–109.
Bols, P.E.J., Jorssen, E.P.A., Goovaerts, I.G.F., Langbeen, A., Leroy, J.L.M.R., 2012. High throughput non-invasive oocyte quality assessment: the search continues. Animal Reproduction Science 9, 420–425.
Boni, R., Cuomo, A., Tosti, E., 2002. Developmental Potential in Bovine Oocytes Is Related to Cumulus-Oocyte Complex
Grade, Calcium Current Activity, and Calcium Stores. Biology of Reproduction 66, 836–842.
Bó, G.A., Baruselli, P.S., Martı́nez, M.F., 2003. Pattern and manipulation of follicular

112
development in Bos indicus cattle. Animal Reproduction Science 78, 307–326.
Brett, K., Ferraro, Z., Yockell-Lelievre, J., Gruslin, A., Adamo, K., 2014. Maternal–Fetal Nutrient Transport in Pregnancy Pathologies: The Role of the Placenta. International Journal of Molecular Sciences 15, 16153–16185.
Brinton, L., Sahasrabuddhe, V., Scoccia, B., 2012. Fertility Drugs and the Risk of Breast and Gynecologic Cancers. Seminars in Reproductive Medicine 30, 131–145.
Brodin, T., Hadziosmanovic, N., Berglund, L., Olovsson, M., Holte, J., 2013. Antimüllerian Hormone Levels Are Strongly Associated With Live-Birth Rates After Assisted Reproduction. The Journal of Clinical Endocrinology & Metabolism 98, 1107–1114.
Brownbill, P., Edwards, D., Jones, C., Mahendran, D., Owen, D., Sibley, C., Johnson, R., Sanson, P., Nelson, M., 1995. Mechanisms of alphafetoprotein transfer in the perfused human placental cotyledon from uncomplicated pregnancy. Journal of Clinical Investigations 96, 2220–2226.
Burns, D.S., 2005. Numbers of Antral Follicles During Follicular Waves in Cattle: Evidence for High Variation Among Animals, Very High Repeatability in Individuals, and an Inverse Association with Serum Follicle-Stimulating Hormone Concentrations. Biology of Reproduction 73, 54–62.
Bushnik, T., Garner, R., 2008. The Children of Older First-time Mothers in Canada: Their Health and Development. Children and Youth research Paper Series- Ottawa, Statistics Canada 1–58.
Bushnik, T., Haines, D., Levallois, P., Levesque, J., Oostdam, J.V., Viau, C., 2010. Lead and bisphenol A concentrations in the Canadian population. Statistics Canada Catalogue Health Reports 1–13.
Butler, W.R., 2003. Energy balance relationships with follicular development, ovulation and fertility in postpartum dairy cows. Livestock Production Science 83, 211–218.
Campbell, B.K., Clinton, M., Webb, R., 2012. The Role of Anti-Müllerian Hormone (AMH) During Follicle Development in a Monovulatory Species (Sheep). Endocrinology 153, 4533–4543.
Campbell, B.K., Telfer, E.E., Webb, R., Baird, D.T., 2004. Evidence of a Role for Follicle-Stimulating Hormone in Controlling the Rate of Preantral Follicle Development in Sheep. Endocrinology 145, 1870–1879.
Carter, A.M., Enders, A.C., 2013. The Evolution of Epitheliochorial Placentation. Annu. Rev. Anim. Biosci. 1, 443–467.
Catteau-Jonard, S., Jamin, S.P., Leclerc, A., Gonzales, J., Dewailly, D., di Clemente, N., 2008.

113
Anti-Mullerian Hormone, Its Receptor, FSH Receptor, and Androgen Receptor Genes Are Overexpressed by Granulosa Cells from Stimulated Follicles in Women with Polycystic Ovary Syndrome. Journal of Clinical Endocrinology & Metabolism 93, 4456–4461.
Chambers, G.M., Illingworth, P.J., Sullivan, E.A., 2011. Assisted reproductive technology: public funding and the voluntary shift to single embryo transfer in Australia. Med J Aust 195, 594–598.
Chang, M.-Y., Chiang, C.-H., Hsieh, T.-T., Soong, Y.-K., Hsu, K.-H., 1998. Use of the antral follicle count to predict the outcome of assisted reproductive technologies. Fertility and Sterility 69, 505–510.
Chen, K., Chmait, R.H., Vanderbilt, D., Wu, S., Randolph, L., 2013. Chimerism in monochorionic dizygotic twins: Case study and review. Am. J. Med. Genet. 161, 1817–1824.
Choudhary, K.K., Kavya, K.M., Jerome, A., Sharma, R.K., 2016. Advances in reproductive biotechnologies. Vet World 9, 388–395.
Chronopoulou, E., Harper, J.C., 2014. IVF culture media: past, present and future. Human Reproduction Update 21, 39–55.
Connolly, M.P., Pollard, M.S., Hoorens, S., Kaplan, B.R., Oskowitz, S.P., Silber, S.J., 2008. Long-term economic bene ts Attributed to IVF-conceived Children: A Lifetime tax Calculation. American Journal of Menaged Care 14, 598–604.
Costa, N.N., Cordeiro, M.S., Silva, T.V.G., Sastre, D., Santana, P.P.B., Sá, A.L.A., Sampaio, R.V., Santos, S.S.D., Adona, P.R., Miranda, M.S., Ohashi, O.M., 2013. Theriogenology. Theriogenology 80, 295–301.
Coulter, G.H., Foote, R.H., 1979. Bovine testicular measurements as indicators of reporoductive performance and their relationship to productive traits in cattle, a review. Theriogenology 297-311, 297–311.
Cupisti, S., Dittrich, R., Mueller, A., Strick, R., Stiegler, E., Binder, H., Beckmann, W., Strissel, P., 2007. Correlations between anti-Mullerian hormone, inhibin B, and activin A in follicular fluid in IVF/ICSI patents for assesing the maturation and developmental potential of oocyte. European Journal of Medical Research 12, 604–608.
Derom, R., Derom, C., Loos, R.J.F., Thiery, E., Vlietinck, R., Fryns, J.-P., 2005. Gender mix: does it modify birthweight – outcome association? Paediatric and Perinatal Epidemiology 19, 37–40.
di Clemente, N., Jamin, S.P., Lugovskoy, A., Carmillo, P., Ehrenfels, C., Picard, J.-Y., Whitty, A., Josso, N., Pepinsky, R.B., Cate, R.L., 2010. Processing of Anti-Müllerian Hormone Regulates Receptor Activation by a Mechanism Distinct from TGF-β. Molecular Endocrinology 24, 2193–2206.

114
di Clemente, N., Josso, N., Gouédard, L., Belville, C., 2003. Components of the anti-Müllerian hormone signaling pathway in gonads. Molecular and Cellular Endocrinology 211, 9–14.
Diaz, P., Powell, T.L., Jansson, T., 2014. The Role of Placental Nutrient Sensing in Maternal-Fetal Resource Allocation. Biology of Reproduction 91, 82–82.
Donnez, J., Silber, S., Andersen, C.Y., Demeestere, I., Piver, P., Meirow, D., Pellicer, A., Dolmans, M.-M., 2011. Children born after autotransplantation of cryopreserved ovarian tissue. A review of 13 live births. Annals of Medicine 43, 437–450.
Driancourt, M.A., 2001. Regulation of ovarian follicular dynamics in farm animals. Implications for manimulation of reproduction. Theriogenology 55, 1211–1239.
Duc-Goiran, P., Mignot, T.M., Robert, B., Machaboine, F., Mondon, F., Hagnere, A.M., Vacher-Laveny, M.C., Danan, J.L., Vaiman, D., Benassayag, C., Ferre, F., 2006. Expression and Localization of Alpha-fetoprotein mRNA and Protein in Human Early Villous Trophoblasts. Placenta 27, 812–821.
Dunlop, C.E., Brady, B.M., McLaughlin, M., Telfer, E.E., White, J., Cowie, F., Zahra, S., Wallace, W.H.B., Anderson, R.A., 2016. Re-implantation of cryopreserved ovarian cortex resulting in restoration of ovarian function, natural conceptionand successful pregnancy after haematopoietic stemcell transplantation for Wilms tumour. Journal of Assisted Reproduction and Genetics 1–6.
Durlinger, A.L., Gruijters, M.J.G., Kramer, P., Karels, B., Kumar, R.T., Matzuk, M.M., Rose, U.M., de Jong, F.H., Uilenbroek, J.T.J., Grootegoed, A.J., Themmen, A.P.N., 2001. Anti-Mullerian Hormone Attenuates the Effects of FSH on Follicle Development in the Mouse Ovary. Endocrinology 142, 4891–4899.
Durlinger, A.L., Kramer, P., Karels, B., de Jong, F.H., Uilenbroek, J.T.J., Grootegoed, J.A., Themmen, A.P.N., 1999. Control of Primordial Follicle Recruitment by Anti-Mullerian Hormone in the Mouse Ovary*. Endocrinology 140, 5789–5796.
Ebner, T., 2003. Selection based on morphological assessment of oocytes and embryos at different stages of preimplantation development: a review. Human Reproduction Update 9, 251–262.
Ebner, T., 2006. Basal level of anti-Mullerian hormone is associated with oocyte quality in stimulated cycles. Human Reproduction 21, 2022–2026.
Eldar-Geva, T., 2005. Dynamic assays of inhibin B, anti-Mullerian hormone and estradiol following FSH stimulation and ovarian ultrasonography as predictors of IVF outcome. Human Reproduction 20, 3178–3183.
Empey, R., Santillan, D., Santiillan, M., Tyler, E., Hunter, S., Smith, E., Stegman, B., 2012. The influence of fetal sex on patterns of change in anti-Mullerian hormone during pregnancy.

115
Proceedings in Obstertrics and Gynecology 2, 1–2.
Enders, A.C., Carter, A.M., 2004. What Can Comparative Studies of Placental Structure Tell Us?—A Review. Placenta 25, S3–S9.
Eppig, J.J., Wigglesworth, K., Pendola, F.L., 2002. The mammalian oocyte orchestrates the rate of ovarian follicular development. PNAS 99, 2890–2894.
Erickson, B.H., 1966. Development and senescence of the postnatal bovine ovary. J Anim Sci 25, 800–805.
Eriksson, J.G., Kajantie, E., Osmond, C., Thornburg, K., Barker, D.J.P., 2009. Boys live dangerously in the womb. Am. J. Hum. Biol. 22, 330–335.
Fanchin, R., 2003. Serum anti-Mullerian hormone is more strongly related to ovarian follicular status than serum inhibin B, estradiol, FSH and LH on day 3. Human Reproduction 18, 323–327.
Fanchin, R., Mendez Lozano, D.H., Frydman, N., Gougeon, A., di Clemente, N., Frydman, R., Taieb, J., 2007. Anti-Mullerian Hormone Concentrations in the Follicular Fluid of the Preovulatory Follicle Are Predictive of the Implantation Potential of the Ensuing Embryo Obtained by in Vitro Fertilization. Journal of Clinical Endocrinology & Metabolism 92, 1796–1802.
Ferreira, E.M., Vireque, A.A., Adona, P.R., Meirelles, F.V., Ferriani, R.A., Navarro, P.A.A.S., 2009. Cytoplasmic maturation of bovine oocytes: Structural and biochemical modifications and acquisition of developmental competence. Theriogenology 71, 836–848.
Ferris, J., Favetta, L.A., King, W.A., 2015. Bisphenol A Exposure during Oocyte Maturation in vitro Results in Spindle Abnormalities and Chromosome Misalignment in Bos taurus. Cytogenet Genome Res 145, 50–58.
Firoozi, F., Ducharme, F.M., LemiEre, C., Beauchesne, M.-F., Perreault, S., Forget, A., Blais, L., 2009. Effect of fetal gender on maternal asthma exacerbations in pregnant asthmatic women. Respiratory Medicine 103, 144–151.
Fortune, J.E., Yang, M.Y., Muruvi, W., 2011. In vitro and in vivo regulation of follicular formation and activation in cattle. Reprod. Fertil. Dev. 23, 15.
Gilchrist, R.B., Lane, M., Thompson, J.G., 2008. Oocyte-secreted factors: regulators of cumulus cell function and oocyte quality. Human Reproduction Update 14, 159–177.
Govan, A., 1968. The human ovary in early pregnancy. Journal of Endocrinology 40, 421–428.
Grady, R., Alavi, N., Vale, R., Khandwala, M., McDonald, S.D., 2012. Elective single embryo transfer and perinatal outcomes: a systematicreview and meta-analysis. Fertility and Sterility

116
97, 324–331.
Grodon, I.R., 2003. Laboratory Production of Cattle Embryos, 2nd Edition, 2nd ed. CABI Publishing.
Guerreiro, B.M., Batista, E.O.S., Vieira, L.M., Filho, M.F.S., Rodrigues, C.A., Netto, A.C., Silveira, C.R.A., Bayeux, B.M., Dias, E.A.R., Monteiro, F.M., Accorsi, M., Lopes, R.N.V.R., Baruselli, P.S., 2014. Plasma anti-mullerian hormone: an endocrine marker for in vitro embryo production from Bos taurus and Bos indicus. Domestic Animal Endocrinology 49, 96–104.
Guilbault, L.A., Dufour, J.J., Thatcher, W.W., Drost, M., Haibel, G.K., 1986. Ovarian follicular development during early pregnancy in cattle. Journal of Reproduction and Fertility 78, 127–135.
Habbema, J.D.F., Eijkemans, M.J.C., Leridon, H., Velde, te, E.R., 2015. Realizing a desired family size: when should couples start? Human Reproduction 30, 2215–2221.
Hamel, M., Dufort, I., Robert, C., Gravel, C., Leveille, M.C., Leader, A., Sirard, M.A., 2008. Identification of differentially expressed markers in human follicular cells associated with competent oocytes. Human Reproduction 23, 1118–1127.
Hankins, G.V.D., Saade, G.R., 2005. Factors influencing twins and zygosity. Paediatric and Perinatal Epidemiology 19, 8–9.
Hazout, A., Bouchard, P., Seifer, D.B., Aussage, P., Junca, A.M., Cohen-Bacrie, P., 2004. Serum antimüllerian hormone/müllerian-inhibiting substance appears to be a more discriminatory marker of assisted reproductive technology outcome than follicle-stimulating hormone, inhibin B, or estradiol. Fertility and Sterility 82, 1323–1329.
Hocher, B., Chen, Y.-P., Schlemm, L., Burdack, A., Li, J., Halle, H., Pfab, T., Kalk, P., Lang, F., Godes, M., 2009. Fetal sex determines the impact of maternal PROGINS progesterone receptor polymorphism on maternal physiology during pregnancy. Pharmacogenetics and Genomics 19, 710–718.
Holte, J., Brodin, T., Berglund, L., Hadziosmanovic, N., Olovsson, M., Bergh, T., 2011. Antral follicle counts are strongly associated with live-birth rates after assisted reproduction, with superior treatment outcome in women with polycystic ovaries. Fertility and Sterility 96, 594–599.
Hsueh, A.J.W., Kawamura, K., Cheng, Y., Fauser, B.C.J.M., 2015. Intraovarian Control of Early Folliculogenesis. Endocrine Reviews 36, 1–24.
Hu, R., Wang, F.-M., Yu, L., Luo, Y., Wu, X., Li, J., Zhang, X.-M., Oehninger, S., D, S.B.M.D.P., 2014. Antim€ullerian hormone regulatesstem cell factor expression in humangranulosa cells. Fertility and Sterility 102, 1742–1750.e1.

117
Hwang, W.-S., Cho, J.-K., Kim, K.-Y., Shin, S.-J., Kim, S.-K., Park, J.-I., Kim, D.-Y., Lee, J.-K., Lim, J.M., Lee, B.-C., 2001. Births of Freemartins Derived from Embryos Reconstructed with Ear Fibroblasts. Theriogenology 63, 577–578.
Imhoff, F.M., Yang, D., Mathew, S.F., Clarkson, A.N., Kawagishi, Y., Tate, W.P., Koishi, K., McLennan, I.S., 2013. The type 2 anti-Müllerian hormone receptor has splice variants that are dominant-negative inhibitors. FEBS Letters 587, 1749–1753.
Ireland, J.J., Smith, G.W., Scheetz, D., Jimenez-Krassel, F., Folger, J.K., Ireland, J.L.H., Mossa, F., Lonergan, P., Evans, A.C.O., 2011. Does size matter in females? An overview of the impact of the high variation in the ovarian reserve on ovarian function and fertility, utility of anti-Müllerian hormone as a diagnostic marker for fertility and causes of variation in the ovarian reserve in cattle. Reprod. Fertil. Dev. 23, 1.
Ireland, J.J., Ward, F., Jimenez-Krassel, F., Ireland, J.L.H., Smith, G.W., Lonergan, P., Evans, A.C.O., 2007. Follicle numbers are highly repeatable within individual animals but are inversely correlated with FSH concentrations and the proportion of good-quality embryos after ovarian stimulation in cattle. Human Reproduction 22, 1687–1695.
Ireland, J.J., Zielak-Steciwko, A.E., Jimenez-Krassel, F., Folger, J., Bettegowda, A., Scheetz, D., Walsh, S., Mossa, F., Knight, P.G., Smith, G.W., Lonergan, P., Evans, A.C.O., 2009. Variation in the Ovarian Reserve Is Linked to Alterations in Intrafollicular Estradiol Production and Ovarian Biomarkers of Follicular Differentiation and Oocyte Quality in Cattle. Biology of Reproduction 80, 954–964.
Ireland, J.L.H., Scheetz, D., Jimenez-Krassel, F., Themmen, A.P.N., Ward, F., Lonergan, P., Smith, G.W., Perez, G.I., Evans, A.C.O., Ireland, J.J., 2008. Antral Follicle Count Reliably Predicts Number of Morphologically Healthy Oocytes and Follicles in Ovaries of Young Adult Cattle. Biology of Reproduction 79, 1219–1225.
Johnson, J., Bagley, J., Skaznik-Wikiel, M., Lee, H.-J., Adams, G.B., Niikura, Y., Tschudy, K.S., Tilly, J.C., Cortes, M.L., Forkert, R., Spitzer, T., Iacomini, J., Scadden, D.T., Tilly, J.L., 2005. Oocyte Generation in Adult Mammalian Ovaries by Putative Germ Cells in Bone Marrow and Peripheral Blood. Cell 122, 303–315.
Johnson, J., Canning, J., Kaneko, T., Pru, J.K., Tilly, J.L., 2004. Germline stem cells and follicular renewal in the postnatal mammalian ovary. Nature 428, 145–150.
Johnson, L.A., Rath, D., Vazquez, J.M., Maxwell, W.M.C., Dobrinsky, J.R., 2005. Preselection of sex of offspring in swine for production: current status of the process and its application. Theriogenology 63, 615–624.
Kaser, D.J., Racowsky, C., 2014. Clinical outcomes following selection of human preimplantation embryos with time-lapse monitoring: a systematic review. Human Reproduction Update 20, 617–631.

118
Kawamura, K., Cheng, Y., Suzuki, N., Deguchi, M., Sato, Y., Takae, S., Ho, C.H., Kawamura, N., Tamura, M., Hashimoto, S., Sugishita, Y., Morimoto, Y., Hosoi, Y., Yoshioka, N., Ishizuka, B., Hsueh, A.J., 2013. Hippo signaling disruption and Akt stimulation of ovarian follicles for infertility treatment. PNAS 110, 17474–17479.
Keeton, L.L., Green, R.D., Golden, B.L., Anderson, K.J., 1996. Estimation of Variance Components and Prediction of Breeding Values for Scrotal Circumference and Weaning Weight in Limousin Cattle. Journal of Animal Science 74, 31–36.
Kevenaar, M.E., Meerasahib, M.F., Kramer, P., van de Lang-Born, B.M.N., de Jong, F.H., Groome, N.P., Themmen, A.P.N., Visser, J.A., 2006. Serum Anti-Müllerian Hormone Levels Reflect the Size of the Primordial Follicle Pool in Mice. Endocrinology 147, 3228–3234.
Kim, J.Y., Yi, G., Kim, Y.R., Chung, J.Y., Ahn, J.H., Uhm, Y.K., Jee, B.C., Suh, C.S., Kim, S.H., 2013. Association between serum anti-Müllerian hormone level and ovarian response to mild stimulation in normoovulatory women and anovulatory women with polycystic ovary syndrome. Clin Exp Reprod Med 40, 95.
Kitahara, G., El-Sheikh Ali, H., Sato, T., Kobayashi, I., Hemmi, K., Shirao, Y., Kamimura, S., 2012a. Anti-Müllerian Hormone (AMH) Profiles as a Novel Biomarker to Evaluate the Existence of a Functional Cryptorchid Testis in Japanese Black Calves. Journal of Reproduction and Development 58, 310–315.
Kitahara, G., Nambo, Y., El-Sheikh Ali, H., Kajisa, M., Tani, M., 2012b. Anti-Müllerian Hormone Profiles as a Novel Biomarker to Diagnose Granulosa-theca Cell Tumors in Cattle. Journal of Reproduction and Development 58, 98–104.
Knight, P.G., 2006. TGF- superfamily members and ovarian follicle development. Reproduction 132, 191–206.
Komisarek, J., Dorynek, Z., 2002. Genetic aspects of twinning in cattle. Journal of Applied Genetics 43, 55–68.
Koufariotis, L., Chen, Y.-P.P., Bolormaa, S., Hayes, B.J., 2014. Regulatory and coding genome regions are enriched for trait associated variants in dairy and beef cattle. BMC Genomics 15, 1–16.
Krisher, R.L., 2013. In Vivo and In Vitro Environmental Effects on Mammalian Oocyte Quality. Annu. Rev. Anim. Biosci. 1, 393–417.
Kuhn, M.T., Hutchison, J.L., Wiggans, G.R., 2006. Characterization of Holstein Heifer Fertility in the United States. Journal of Dairy Science 89, 4907–4920.
Kuijper, E.A.M., Ket, J.C.F., Caanen, M.R., Lambalk, C.B., 2013. Reproductive hormone concentrations in pregnancy and neonates: a systematic review. Reproductive BioMedicine

119
Online 27, 33–63.
Kumar, A., Kalra, B., Patel, A.S., Shah, S., 2013. New Sensitive Anti-Müllerian Hormone (AMH) ELISAs for Non-Human Primate, Rodent, Equine, Bovine, Canine and Other Species 1–1.
La Marca, A., 2005. Anti-Mullerian hormone concentrations in maternal serum during pregnancy. Human Reproduction 20, 1569–1572.
La Marca, A., Broekmans, F.J., Volpe, A., Fauser, B.C., Macklon, N.S., on behalf of the ESHRE Special Interest Group for Reproductive Endocrinology - AMH Round Table, 2009. Anti-Mullerian hormone (AMH): what do we still need to know? Human Reproduction 24, 2264–2275.
La Marca, A., Nelson, S.M., Sighinolfi, G., Manno, M., Baraldi, E., Roli, L., Xella, S., Marsella, T., Tagliasacchi, D., D’Amico, R., Volpe, A., 2011. Anti-Müllerian hormone-based prediction model for a live birth in assisted reproduction. Reproductive BioMedicine Online 22, 341–349.
La Marca, A., Sighinolfi, G., Radi, D., Argento, C., Baraldi, E., Artenisio, A.C., Stabile, G., Volpe, A., 2010. Anti-Mullerian hormone (AMH) as a predictive marker in assisted reproductive technology (ART). Human Reproduction Update 16, 113–130.
La Marca, A., Stabile, G., Artenisio, A.C., Volpe, A., 2006. Serum anti-Mullerian hormone throughout the human menstrual cycle. Human Reproduction 21, 3103–3107.
La Marca, A., Volpe, A., 2006. Anti-Mullerian hormone (AMH) in female reproduction: is measurement of circulating AMH a useful tool? Clin Endocrinol 64, 603–610.
Lakamge, D.N., 2007. Anti-Müllerian hormone as a predictor of IVF outcome. RBM Online 14, 1–9.
Lasala, C., Carre-Eusebe, D., Picard, J.-Y., Rey, R., 2004. Subcellular and molecular mechanisms regulating anti-Müllerian hormone gene expression in mammalian and nonmammalian species. DNA and Cell Biology 23, 572–585.
Lee, M.M., Donahoe, P.K., Hasegawa, T., Silverman, B., Crist, G.B., Best, S., Hasegawa, Y., Noto, R.A., Schoenfeld, D., MacLaughlin, D.T., 1996. Mullerian inhibiting substance in humans: normal levels from infancy to adulthood. Journal of Clinical Endocrinology & Metabolism 81, 571–576.
Leonard, S.L., Smith, P.E., 1934. Responses of the reproductive system of hypophysectomized rats to injections of pregnancy-urine extracts. The anatomical record 58, 175–203.
Leroy, J., Vanholder, T., Van Knegsel, A., Garcia-Ispierto, I., Bols, P., 2008. Nutrient Prioritization in Dairy Cows Early Postpartum: Mismatch Between Metabolism and

120
Fertility? Reproduction in Domestic Animals 43, 96–103.
Leroy, J.L.M.R., Rizos, D., Sturmey, R., Bossaert, P., Gutierrez-Adan, A., Van Hoeck, V., Valckx, S., Bols, P.E.J., 2012. Intrafollicular conditions as a major link between maternal metabolism and oocyte quality: a focus on dairy cow fertility. Reprod. Fertil. Dev. 24, 1.
Li, R., Albertini, D.F., 2013. The road to maturation: somatic cell interaction and self-organization of the mammalian oocyte. Nature Reviews Molecular Cell Biology 14, 141–152.
Lo, Y.M.D., Tein, M.S.C., Lau, T.K., Haines, C.J., Leung, T.N., Poon, P.M.K., Wainscoat, J.S., Johanson, P.J., Chang, A.M.Z., Hjelm, N.M., 1998. Quantitative Analysis of Fetal DNA in Maternal Plasma and Serum: Implications for Noninvasive Prenatal Diagnosis. American Journal of Human Genetics 62, 768–775.
Lopes, R.F.F., Forell, F., Oliveira, A.T.D., ROdrigues, J.L., 2001. Splitting and Biopsy for Bovine Embryo Sexing Under FIeld Conditions. Theriogenology 56, 1383–1392.
Lucy, M.C., 2001. ADSA Foundation Scholar Award. Journal of Dairy Science 84, 1277–1293.
Luke, B., Hediger, M., Min, S.-J., Brown, M.B., Misiunas, R.B., Gonzalez-Quintero, V.H., Nugent, C., Witter, F.R., Newman, R.B., Hankins, G.D.V., Grainger, D.A., Macones, G.A., 2005. Gender mix in twins and fetal growth, length of gestation and adult cancer risk. Paediatric and Perinatal Epidemiology 19, 41–47.
Maheshwari, A., Teoh, P.J., 2014. Low-cost in vitro fertilization: current insights. IJWH 817.
Majumder, K., Gelbaya, T.A., Laing, I., Nardo, L.G., 2010. The use of anti-Müllerian hormone and antral follicle count to predict the potential of oocytes and embryos. European Journal of Obstetrics & Gynecology and Reproductive Biology 150, 166–170.
Malek, A., Sager, R., Schneider, H., 1998. Transport of Proteins Across the Human Placenta. American Journal of Reproductive Immunology 40, 343–351.
Mapletoft, R.J., F, H.J., 2005. Assisted reproductive technologies in cattle: a review. Rev. sci. tech. Off. int. Epiz. 24, 393–403.
Matzuk, M.M., Lamb, D.J., 2002. Genetic dissection of mammalian fertility pathways. Nat Cell Biol s41–49.
Mendoza, C., Ruiz-Requena, E., Ortega, E., Cremades, N., Martinez, F., Bernabeu, R., Greco, E., Tesarik, J., 2002. Follicular fluid markers of oocyte developmental potential. Human Reproduction 17, 1017–1022.
Monniaux, D., Baril, G., Laine, A.L., Jarrier, P., Poulin, N., Cognie, J., Fabre, S., 2011. Anti-Mullerian hormone as a predictive endocrine marker for embryo production in the goat.
121
Reproduction 142, 845–854.
Morgan, K., Meredith, J., Kuo, J.Y.A., Bilkey, D.K., McLennan, I.S., 2011. Behavioural Brain Research. Behavioural Brain Research 221, 304–306.
Morikawa, M., Derynck, R., Miyazono, K., 2016. TGF-β and the TGF-β Family: Context-Dependent Roles in Cell and Tissue Physiology. Cold Spring Harb Perspect Biol 8, a021873.
Nelson, S.M., Stewart, F., Fleming, R., Freeman, D.J., 2010. Longitudinal assessment of antimulerian hormone during pregnancy- relationship with maternal adiposity, insulin, and adiponectin. Fertility and Sterility 93, 1356–1358.
Nelson, S.M., Yates, R.W., Fleming, R., 2007. Serum anti-Mullerian hormone and FSH: prediction of live birth and extremes of response in stimulated cycles implications for individualization of therapy. Human Reproduction 22, 2414–2421.
Nilsson, E., Rogers, N., Skinner, M.K., 2007. Actions of anti-Mullerian hormone on the ovarian transcriptome to inhibit primordial to primary follicle transition. Reproduction 134, 209–221.
Nilsson, E.E., Schindler, R., Savenkova, M.I., Skinner, M.K., 2011. Inhibitory Actions of Anti-Müllerian Hormone (AMH) on Ovarian Primordial Follicle Assembly. PLoS ONE 6, e20087.
Nishi, M.Y., Domenice, S., Maciel-Guerra, A.T., Neto, A.Z., da Silva, M.A.C.P., Costa, E.M.F., Guerra-Junior, G., de Mendonca, B.B., 2012. Analysis of anti-Müllerian hormone (AMH) and its receptor (AMHR2) genes in patients with persistent Müllerian duct syndrome. Arq Bras Endocrinol Metab 56, 473–478.
Nishi, Y., Yanese, T., Mu, Y.-M., Oba, K., Ichino, I., Saito, M., Nomura, M., Mukasa, C., Okabe, T., Goto, K., Takayanagi, R., Kashimura, Y., Haji, M., Nawata, H., 2000. Establishment and Characterization of a Steroidogenic Human Granulosa-Like Tumor Cell Line, KGN, That Expresses Functional Follicle-StimulatingHormone Receptor. Endocrinology 142, 437–445.
Norris, R.P., Ratzan, W.J., Freudzon, M., Mehlmann, L.M., Krall, J., Movsesian, M.A., Wang, H., Ke, H., Nikolaev, V.O., Jaffe, L.A., 2009. Cyclic GMP from the surrounding somatic cells regulates cyclic AMP and meiosis in the mouse oocyte. Development 136, 1869–1878.
Novembri, R., Funghi, L., Voltolini, C., Belmonte, G., Vannuccini, S., Torricelli, M., Petraglia, F., 2015. Placenta expresses anti-Müllerian hormone and its receptor: Sex-related difference in fetal membranes. Placenta 36, 731–737.
O'Brien, A.M.P., Utsunomiya, Y., Meszaros, G., Bickhart, D.M., Liu, G.E., Van Tassell, C.P., Sonstegard, T.S., Da Silva, M.V., Garcia, J.F., Solkner, J., 2014. Assessing signatures of selection through variation in linkage disequilibrium between taurine and indicine cattle. Genetics Selection Evolution 46, 1–14.
Oktem, O., Oktay, K., 2008. The Ovary. Annals of the New York Academy of Sciences 1127, 1–

122
9.
Oktem, O., Urman, B., 2010. Understanding follicle growth in vivo. Human Reproduction 25, 2944–2954.
Opsomer, G., Grohn, Y.T., Hertl, J., Coryn, M., Deluyker, H., Kruif, A. de, 2000. Risk Factors for Post Partum Ovarian Dysfunction in High Producing Dairy Cows in Belgium: A Field Study. Theriogenology 53, 841–857.
Ortega-Hrepich, C., Polyzos, N.P., Anckaert, E., Guzman, L., Tournaye, H., Smitz, J., De Vos, M., 2014. The effect of ovarian puncture on the endocrine profile of PCOS patients who undergo IVM. Reproductive Biology and Endocrinology 12, 1–6.
Padula, A.M., 2005. The freemartin syndrome: an update. Animal Reproduction Science 87, 93–109.
Palmeira, P., Quinello, C., Silveira-Lessa, A.L., Zago, C.A., Carneiro-Sampaio, M., 2012. IgG Placental Transfer in Healthy and Pathological Pregnancies. Clinical and Developmental Immunology 2012, 1–13.
Penarrubia, J., Fabregues, F., Manau, D., Creus, M., Casals, G., Casamitjana, R., Carmona, F., Vanrell, J.A., Balasch, J., 2005. Basal and stimulation day 5 anti-Mullerian hormone serum concentrations as predictors of ovarian response and pregnancy in assisted reproductive technology cycles stimulated with gonadotropin-releasing hormone agonist-gonadotropin treatment. Human Reproduction 20, 915–922.
Pereira, F.T.V., Oliveira, L.J., Barreto, R.D.S.N., Mess, A., Perecin, F., Bressan, F.F., Mesquita, L.G., Miglino, M.A., Pimentel, J.R., Neto, P.F., Meirelles, F.V., 2013. Fetal-Maternal Interactions in the Synepitheliochorial Placenta Using the eGFP Cloned Cattle Model. PLoS ONE 8, e64399.
Pierson, R.A., Ginther, O.J., 1986. Ovarian follicular populations during early pregnancy in heifers. Theriogenology 26, 1–11.
Pigny, P., 2005. Serum Anti-Mullerian Hormone as a Surrogate for Antral Follicle Count for Definition of the Polycystic Ovary Syndrome. Journal of Clinical Endocrinology & Metabolism 91, 941–945.
Pontes, J.H.F., Nonato-Junior, I., Sanches, B.V., Ereno-Junior, J.C., Uvo, S., Barreiros, T.R.R., Oliveira, J.A., Hasler, J.F., Seneda, M.M., 2009. Comparison of embryo yield and pregnancy rate between in vivo and in vitro methods in the same Nelore (Bos indicus) donor cows. Theriogenology 71, 690–697.
Pontes, J.H.F., Silva, K.C.F., Basso, A.C., Rigo, A.G., Ferreira, C.R., Santos, G.M.G., Sanches, B.V., Porcionato, J.P.F., Vieira, P.H.S., Faifer, F.S., Sterza, F.A.M., Schenk, J.L., Seneda, M.M., 2010. Large-scale. Theriogenology 74, 1349–1355.

123
Pontes, J.H.F., Sterza, F.A.M., Basso, A.C., Ferreira, C.R., Sanches, B.V., Rubin, K.C.P., Seneda, M.M., 2011. Ovum pick up. THE 75, 1640–1646.
Ramsay, D.T., Kent, J.C., Hartmann, R.A., Hartmann, P.E., 2005. Anatomy of the lactating human breast redefined withultrasound imaging. Journal of Anatomy 206, 525–534.
Rawn, S.M., Cross, J.C., 2008. The Evolution, Regulation, and Function of Placenta-Specific Genes. Annu. Rev. Cell Dev. Biol. 24, 159–181.
Reynolds, M., 1953. Plasma and blood volume in the cow using the T-1824 hematocrit method. American Journal of Physiology 173, 421–427.
Rice, S., Ojha, K., Whitehead, S., Mason, H., 2006. Stage-Specific Expression of Androgen Receptor, Follicle-Stimulating Hormone Receptor, and Anti-Mullerian Hormone Type II Receptor in Single, Isolated, Human Preantral Follicles: Relevance to Polycystic Ovaries. Journal of Clinical Endocrinology & Metabolism 92, 1034–1040.
Rico, C., Fabre, S., Medigue, C., Clemente, N.D., Clement, F., Bontoux, M., Touze, J.L., Dupont, M., Briant, E., Remy, B., Beckers, J.F., Monniaux, D., 2009. Anti-Mullerian Hormone Is an Endocrine Marker of Ovarian Gonadotropin-Responsive Follicles and Can Help to Predict Superovulatory Responses in the Cow. Biology of Reproduction 80, 50–59.
Rico, C., Medigue, C., Fabre, S., Jarrier, P., Bontoux, M., Clement, F., Monniaux, D., 2011. Regulation of Anti-Mullerian Hormone Production in the Cow: A Multiscale Study at Endocrine, Ovarian, Follicular, and Granulosa Cell Levels. Biology of Reproduction 84, 560–571.
Rienzi, L., Vajta, G., Ubaldi, F., 2010. Predictive value of oocyte morphology in human IVF: a systematic review of the literature. Human Reproduction Update 17, 34–45.
Robert, C., Gagne, D., Bousquet, D., Barnes, F., Sirard, M.A., 2001. Differential Display and Suppressive Subtractive Hybridization Used to Identify Granulosa Cell Messenger RNA Associated with Bovine Oocyte Developmental Competence. Biology of Reproduction 64, 1812–1820.
Roberts, J.A.F., Greenwood, A.W., 1928. An Extreme Free-Martin and a Free-Martin like codition in the Sheep. Journal of Anatomy 63, 87–94.
Rodgers, R.J., Irving-Rodgers, H.F., 2010. Formation of the Ovarian Follicular Antrum and Follicular Fluid. Biology of Reproduction 82, 1021–1029.
Rong, L., Li, R., Li, S., Luo, R., 2015. Immunosuppression of breast cancer cells mediated by transforming growth factor-β in exosomes from cancer cells. Oncol Lett.
Rota, A., Ballarin, C., Vigier, B., Cozzi, B., Rey, R., 2002. Age dependent changes in plasma anti-Mu€llerian hormone concentrations in the bovine male, female, and freemartin from
124
birth to puberty: relationship betweentestosterone production and influence on sex differentiation. General and Comparative Endocrinology 129, 39–44.
Royal, M., Mann, G.E., Flint, A.P.F., 2000. Strategies for Reversing the Trend Towards Subfertility in Dairy Cattle. The Veterinary Journal 160, 53–60.
Sadeu, J.C., Adriaenssens, T., Smitz, J., 2008. Expression of growth differentiation factor 9, bone morphogenetic protein 15, and anti-Mullerian hormone in cultured mouse primary follicles. Reproduction 136, 195–203.
Salmon, N.A., Handyside, A.H., Joyce, I.M., 2004a. Expression ofSox8, Sf1, Gata4, Wt1, Dax1, andFog2 in the mouse ovarian follicle: Implications for the regulation ofAmh expression. Mol. Reprod. Dev. 70, 271–277.
Salmon, N.A., Handyside, A.H., Joyce, I.M., 2004b. Oocyte regulation of anti-Müllerian hormone expression in granulosa cells during ovarian follicle development in mice. Developmental Biology 266, 201–208.
Sandvig, K., Llorente, A., 2012. Proteomic Analysis of Microvesicles Released by the Human Prostate Cancer Cell Line PC-3. Molecular & Cellular Proteomics 11, M111.012914–M111.012914.
Sartori, R., Barros, C.M., 2011. Animal Reproduction Science. Animal Reproduction Science 124, 244–250.
Scheetz, D., Folger, J.K., Smith, G.W., Ireland, J.J., 2012. Granulosa cells are refractory to FSH action in individuals with a low antral follicle count. Reprod. Fertil. Dev. 24, 327.
Silberstein, T., 2005. Mullerian inhibiting substance levels at the time of HCG administration in IVF cycles predict both ovarian reserve and embryo morphology. Human Reproduction 21, 159–163.
Silva-Santos, K.C., Santos, G.M.G., Siloto, L.S., Hertel, M.F., Andrade, E.R., Rubin, M.I.B., Sturion, L., Melo-Sterza, F.A., Seneda, M.M., 2011. Estimate of the population of preantral follicles in the ovaries of. THE 76, 1051–1057.
Sinclair, K.D., 2008. Amino acid and fatty acid composition of follicular fluid as predictors of in-vitro embryo development. RBM Online 16, 859–868.
Sirard, M.A., 2001. Resumption of meiosis: mechanism involved in meiotic progression and its relation with developmental competence. Theriogenology 55, 1241–1254.
Sonigo, C., Simon, C., Boubaya, M., Benoit, A., Sifer, C., Sermondade, N., Grynberg, M., 2016. What threshold values of antral follicle count and serum AMH levels should be considered for oocyte cryopreservation after in vitromaturation? Human Reproduction dew102.

125
Souter, V.L., Kapur, R.P., Nyholt, D.R., Skogerboe, K., Myerson, D., Ton, C.C., Opheim, K.E., Easterling, T.R., Shields, L.E., Monthomery, G.W., Glass, I.A., 2003. A Report of Dizygous Monochorionic Twins. The New England Journal of Medicine 349, 1–5.
Souter, V.L., Parisi, M.A., Nyholt, D.R., Kapur, R.P., Henders, A.K., Opheim, K.E., Gunther, D.F., Mitchell, M.E., Glass, I.A., Montgomery, G.W., 2006. A case of true hermaphroditism reveals an unusual mechanism of twinning. Hum Genet 121, 179–185.
Spencer, T.E., 2013. Early pregnancy: Concepts, challenges, and potential solutions. Animal Frontiers 3, 48–55.
Stephen, A.E., Pearsall, L.A., Christian, B.P., Danahoe, P.K., Vacanti, J.P., MacLaughlin, D.T., 2002. Highly Purified Mullerian Inhibiting Substance Inhibits Human Ovarian Cancer. Clinical Cancer Research 8, 2640–2646.
Stojkovic, M., Machado, S.A., Stojkovic, P., Zakhartchenko, V., Hutzler, P., Goncalves, P.B., Wolf, E., 2001. Mitochondrial Distribution and Adenosine Triphosphate Content of Bovine Oocytes Before and After In Vitro Maturation: Correlation with Morphological Criteria and Developmental Capacity After In Vitro Fertilization and Culture. Biology of Reproduction 64, 904–909.
Stojsin- Carter, A., Mahboubi, K., Costa, N.N., Gillis, D.J., Carter, T.F., Neal, M.S., Miranda, M.S., Ohashi, O.M., Favetta, L.A., King, W.A., 2016. Animal Reproduction Science. Animal Reproduction Science 1–8.
Stoop, D., Cobo, A., MD, S.S., 2014. Fertility preservation 3Fertility preservation for age-related fertility decline. The Lancet 384, 1311–1319.
Stroud, B., 2005. Bovine Fetal Sexing Using Ultrasound. Proceedings, Applied Reproductive Strategies in Beef Cattle 1–10.
Sunkara, S.K., Rittenberg, V., Raine-Fenning, N., Bhattacharya, S., Zamora, J., Coomarasamy, A., 2011. Association between the number of eggs and live birth in IVF treatment: an analysis of 400 135 treatment cycles. Human Reproduction 26, 1768–1774.
Swain, J.E., Lai, D., Takayama, S., Smith, G.D., 2013. Thinking big by thinking small: application of microfluidic technology to improve ART. Lab Chip 13, 1213.
Takahashi, C., Fujito, A., Kazuka, M., Sugiyama, R., Ito, H., Isaka, K., 2008. Anti-Müllerian hormone substance from follicular fluid is positively associated with success in oocyte fertilization during in vitro fertilization. Fertility and Sterility 89, 586–591.
Tang, B., Vu, M., Booker, T., Santner, S.J., Miller, F.R., Anver, M.R., Wakefield, L.M., 2003. TGF-β switches from tumor suppressor to prometastatic factor in a model of breast cancer progression. J. Clin. Invest. 112, 1116–1124.

126
Teixeira, J., Maheswaran, S., Donehoe, P.K., 2001. Mullerian Inhibiting Substance: An Instructive Developmental Hormone with Diagnostic and Possible Therapeutic Applications. Endocrine Reviews 22, 657–674.
Themmen, A.P.N., 2005. Anti-Mullerian Hormone: Its Role in Follicular Growth Initiation and Survival and as an Ovarian Reserve Marker. Journal of the National Cancer Institute Monographs 2005, 18–21.
Tremellen, K.P., Kolo, M., Gilmore, A., Lekamge, D.N., 2005. Anti-müllerian hormone as a marker of ovarian reserve*. Australian and New Zealand Journal of Obstetrics and Gynaecology 45, 20–24.
Tsafriri, A., Chun, S.-Y., Zhang, R., Hsueh, A., Conti, M., 1996. Oocyte Maturation Involves Compartmentalization and Opposing Changes of cAMP Levels in Follicular Somatic and Germ Cells: Studies Using Selective Phosphodiesterase Inhibitors 178, 393–402.
van Loendersloot, L., Repping, S., Bossuyt, P.M.M., van der Veen, F., van Wely, M., 2014. Prediction models in in vitro fertilization; where are we? A mini review. Journal of Advanced Research 5, 295–301.
Vargas, A., Zhou, S., Ethier-Chiasson, M., Flipo, D., Lafond, J., Gilbert, C., Barbeau, B., 2014. Syncytin proteins incorporated in placenta exosomes are important for cell uptake and show variation in abundance in serum exosomes from patients with preeclampsia. The FASEB Journal 28, 3703–3719.
Varghese, A.C., Plessis, du, S.S., Falcone, T., Agarwal, A., 2008. Cryopreservation/transplantation of ovarian tissue and in vitro maturation of follicles and oocytes: Challenges for fertility preservation. Reproductive Biology and Endocrinology 6, 47.
Velde, E.R.T., Pearson, P.L., 2002. The variability of female reproductive ageing. Human Reproduction Update 8, 141–154.
Vigier, B., Tran, D., Legeai, L., Bezard, J., Josso, N., 1984. Origin of anti-Mullerian hormone in bovine freemartin fetuses. Journal of Reproduction and Fertility 70, 473–479.
Villaseca, P., 2004. Bilateral oophorectomy in a pregnant woman: hormonal profile from late gestation to post-partum: Case report. Human Reproduction 20, 397–401.
Visser, J.A., 2003. AMH signaling: from receptor to target gene. Molecular and Cellular Endocrinology 211, 65–73.
Visser, J.A., de Jong, F.H., Laven, J.S.E., Themmen, A.P.N., 2006. Anti-Mullerian hormone: a new marker for ovarian function. Reproduction 131, 1–9.
Visser, J.A., Themmen, A.P.N., 2005. Anti-Müllerian hormone and folliculogenesis. Molecular
127
and Cellular Endocrinology 234, 81–86.
Vulliemoz, N.R., Kurinczuk, J., 2012. In vitro fertilisation: perinatal risks and early childhood outcomes. Human Fertility 15, 62–68.
Walsh, J.M., Segurado, R., Mahony, R.M., Foley, M.E., McAuliffe, F.M., 2015. The Effects of Fetal Gender on Maternal and Fetal Insulin Resistance. PLoS ONE 10, e0137215.
Wang, J., Dicken, C., Lustbader, J.W., Tortoriello, D.V., 2009. Evidence for a Mullerian-inhibitng substance autocrine/paracrine system in adult human endometrium. Fertility and Sterility 91, 1195–1203.
Watanabe, K., Clarke, T.R., Lane, A.H., Wang, X., Donahoe, P.K., 2000. Endogenous expression of Mullerian inhibiting substance in early postnatal rat Sertoli cells requires multiple steroidogenic factor-1and GATA-4-binding sites. PNAS 97, 1624–1629.
Webb, R., Bains, H., Cruttwell, C., Carroll, J., 2002. Gap-junctional communication in mouse cumulus-oocyte complexes: implications for the mechanism of meiotic maturation. Reproduction 123, 41–52.
Webb, R., Garnsworthy, P.C., Gong, J.-G., Armstrong, D.G., 2004. Control of follicular growth: Local interactions and nutritional influences. Journal of Animal Science 82, E63-E74.
Webb, R., Garnsworthy, P.C., Campbell, B.K., Hunter, M.G., 2007. Intra-ovarian regulation of follicular development and oocyte competence in farm animals. Theriogenology 68, S22–S29.
Westergaard, L., 1985. Follicular stresia in relation to oocyte morphology in non-pregnant and pregnant women. Journal of Reproduction and Fertility 74, 113–118.
Wilson, C.A., di Clemente, N., Ehrenfels, C., Pepinsky, R.B., Josso, N., Vigier, B., Cate, R.L., 1993. Mullerian Inhibiting SubstanceRequires Its N-Terminal Domain for Maintenance of Biological Activity, a Novel Finding within theTransforming Growth Factor-beta Superfamily. Molecular Endocrinology 7, 247–257.
Wittmann, W., McLennan, I.S., 2011. The Male Bias in the Number of Purkinje Cells and the Size of the Murine Cerebellum may Require Müllerian Inhibiting Substance/Anti-Müllerian Hormone. Journal of Neuroendocrinology 23, 831–838.
Wittmann, W., McLennan, I.S., 2013. Anti-Mullerian hormone may regulate the number of calbindin-positive neurons in the sexually dimorphic nucleus of the preoptic area of male mice. Biology of Sex Differences 4, 1–1.
Woodruff, T.K., Shea, L.D., 2010. A new hypothesis regarding ovarian follicle development: ovarian rigidity as a regulator of selection and health. Journal of Assisted Reproduction and Genetics 28, 3–6.

128
World Health Organization, 2011. WORLD REPORT ON DISABILITY 1–24.
Wunder, D.M., Guibourdenche, J., Birkhäuser, M.H., Bersinger, N.A., 2008. Anti-Müllerian hormone and inhibin B as predictors of pregnancy after treatment by in vitro fertilization/intracytoplasmic sperm injection. Fertility and Sterility 90, 2203–2210.
Xiao, S., Zhang, J., Romero, M.M., Smith, K.N., Shea, L.D., Woodruff, T.K., 2015. follicle growth supports human oocyte meiotic maturation. Nature Publishing Group 1–5.
Xu, J., Bishop, C.V., Lawson, M.S., Park, B.S., Xu, F., 2016. Anti-Müllerian hormone promotes pre-antral follicle growth, but inhibits antral follicle maturation and dominant follicle selection in primates. Human Reproduction dew100.
Zegers-Hochschild, F., Adamson, G.D., de Mouzon, J., Ishihara, O., Mansour, R., Nygren, K., Sullivan, E., van der Poel, S., on behalf of ICMART and WHO, 2009. The International Committee for Monitoring Assisted Reproductive Technology (ICMART) and the World Health Organization (WHO) Revised Glossary on ART Terminology, 2009. Human Reproduction 24, 2683–2687.

129
APPENDIX
Appendix I: Data from Chapter II, study group 1
Plasma AMH (Pl AMH) values (pg/ml), y-axis, measured using Ansh ELISA kit in cows Bos taurus indicus during gestation at 4 time points, x-axis, day of artificial insemination (day 0), day 35, day 135, day 275 and approximately one month after calving (last point). Red lines represent samples taken from animals carrying female calf (n=3) while blue lines represent animals carrying male calf (n=5), verified by ultrasound and confirmed at birth. A) Raw data of Pl AMH in pregnant cows. B) Change in Pl AMH (Δ) between time points. C) Relative change in Pl AMH in terms of its previous value, example: Δ Pl AMH (day x - day y) / Pl AMH (day y).
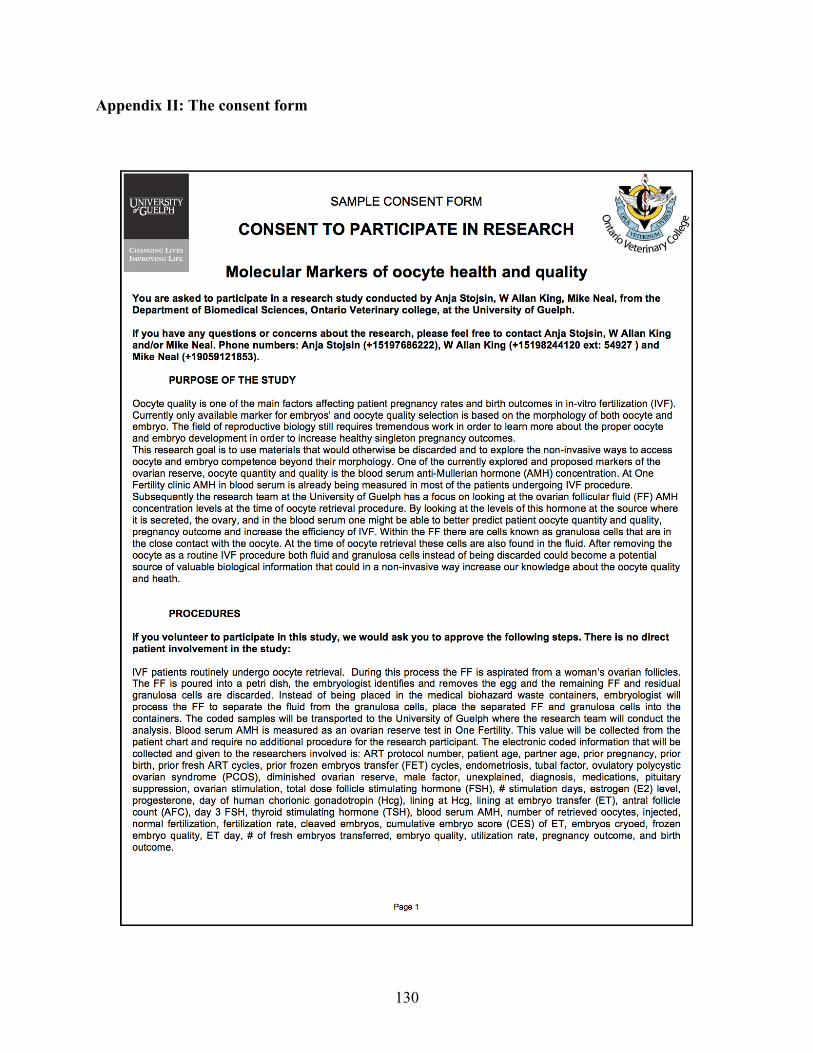
130
Appendix II: The consent form

131

132

133
Appendix III: Monofollicular sample collection instructions
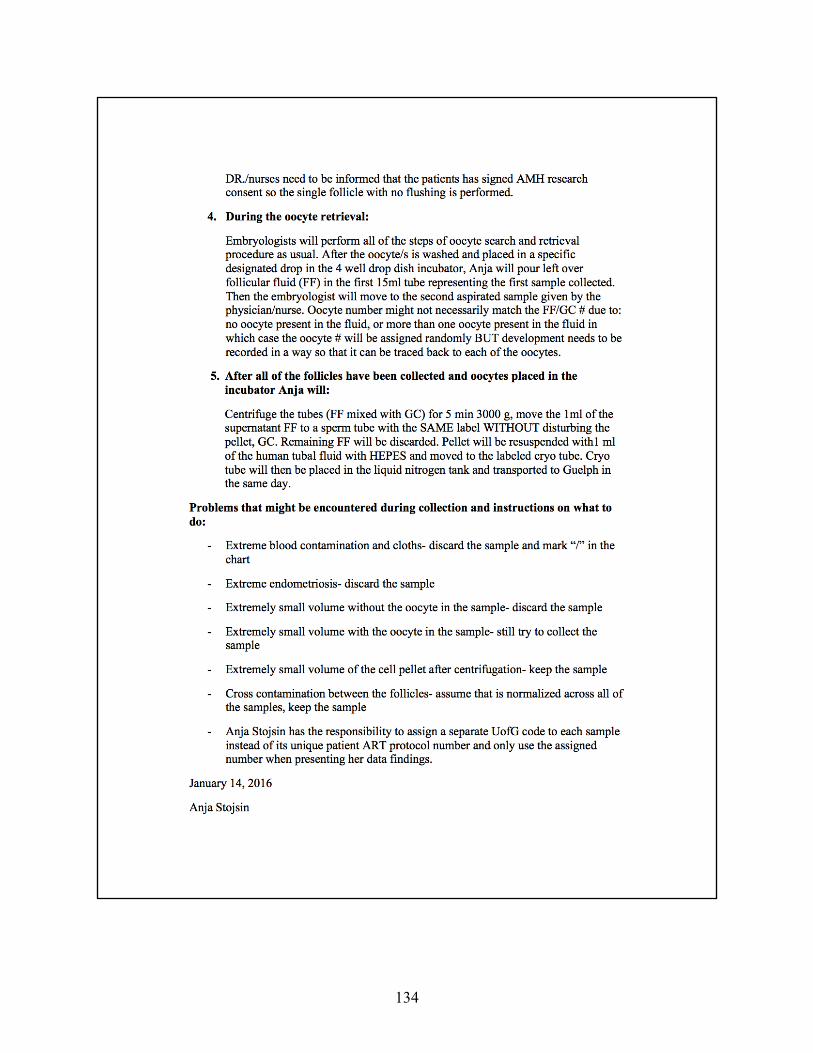
134

135
Appendix IV: Protocol for the monofollicular oocyte collection

136
Appendix V: Modified Cycle Sheet


![109 – [2] Wave Overtopping Quantity](https://static.fdokumen.com/doc/165x107/6333c268e3da70449d01c8d7/109-2-wave-overtopping-quantity.jpg)