
Rapid design of aircraft fuel quantity indication systems via ...
17
Rapid design of aircraft fuel quantity indication systems via multi-objective evolutionary algorithms David Judt a,1 , Craig Lawson a , and Albert S.J. van Heerden a a Centre for Aeronautics, Cranfield University, College Road, Cranfield, MK43 0AL, UK. Abstract. The design of electrical, mechanical and fluid systems on aircraft is becoming increasingly integrated with the aircraft structure definition process. An example is the aircraft fuel quantity indication (FQI) system, of which the design is strongly dependent on the tank geometry definition. Flexible FQI design methods are therefore desirable to swiftly assess system-level impact due to aircraft level changes. For this purpose, a genetic algorithm with a two-stage fitness assignment and FQI specific crossover procedure is proposed (FQI-GA). It can handle multiple measurement accuracy constraints, is coupled to a parametric definition of the wing tank geometry and is tested with two performance objectives. A range of crossover procedures of comparable node placement problems were tested for FQI-GA. Results show that the combinatorial nature of the probe architecture and accuracy constraints require a probe set selection mechanism before any crossover process. A case study, using approximated Airbus A320 requirements and tank geometry, is conducted and shows good agreement with the probe position results obtained with the FQI-GA. For the objectives of accessibility and probe mass, the Pareto front is linear, with little variation in mass. The case study confirms that the FQI-GA method can incorporate complex requirements and that designers can employ it to swiftly investigate FQI probe layouts and trade-offs. Keywords: Evolutionary Algorithm; Multi-objective optimization; Aircraft Fuel System; Sensor System Design; Quantity Indication; Knowledge-based engineering 1. Introduction The design and development process of complex airframe systems, such as the fuel system, requires close interaction between safety and performance analyses [1]. Within this process, performance analysis is a key activity, and the support of it has seen much development in terms of computational modelling and simulation capabilities. The development of these capabilities is driven by the need to consider as many design options as possible during early stage systems architecture definition and sizing. This is to ensure that no potentially high performing solutions are omitted [2-4]. One system that requires extensive design support is the fuel system. Its multiple subsystems fulfil the top-level functions of — storage, delivery, and quantity indication. The design of these is closely coupled to the aircraft geometry, with the wing geometry being the most influential, as it contains most of the system equipment and the integral fuel tanks [5]. Previous work has addressed this, through parametric formulations of wing and integral wing fuel tank geometries. These were then coupled with a multi-disciplinary design optimization framework for preliminary aircraft design, or used within 1 Corresponding Author, E-Mail: [email protected] knowledge based engineering (KBE) frameworks aimed at fuel system conceptual design [6]. KBE is a design philosophy in which geometry and performance modelling efforts are modular, parametric and make use of embedded design rules. This enables fast execution of design studies, from the aircraft to the airframe system level, with a higher level of detail than is traditionally the case [7]. The subsystem most dependent on the wing geometry is the fuel quantity indication (FQI) system. Typically, aircraft rely on capacitance-based fuel level gauging probes as part of a dual redundant and dual channel FQI architecture. In the traditional design process, only a small number of FQI probe placement architectures are investigated, with little consideration of the tank and FQI design relationships. Therefore, even though it is a mature subsystem, approaching its design with a KBE framework [8,9] would provide new insights into FQI, fuel system and aircraft level trade-offs. The academic literature on probe placement algorithms is sparse, as they are often part of the intellectual property portfolio of the airframe system supplier delivering the subsystem design and hence unpublished.
-
Upload
khangminh22 -
Category
Documents
-
view
0 -
download
0
Transcript of Rapid design of aircraft fuel quantity indication systems via ...

Rapid design of aircraft fuel quantity indication systems via multi-objective evolutionary algorithms
David Judta,1, Craig Lawsona, and Albert S.J. van Heerdena a
Centre for Aeronautics, Cranfield University, College Road, Cranfield, MK43 0AL, UK.
Abstract. The design of electrical, mechanical and fluid systems on aircraft is becoming increasingly integrated with the
aircraft structure definition process. An example is the aircraft fuel quantity indication (FQI) system, of which the design is
strongly dependent on the tank geometry definition. Flexible FQI design methods are therefore desirable to swiftly assess
system-level impact due to aircraft level changes. For this purpose, a genetic algorithm with a two-stage fitness assignment
and FQI specific crossover procedure is proposed (FQI-GA). It can handle multiple measurement accuracy constraints, is
coupled to a parametric definition of the wing tank geometry and is tested with two performance objectives. A range of
crossover procedures of comparable node placement problems were tested for FQI-GA. Results show that the combinatorial
nature of the probe architecture and accuracy constraints require a probe set selection mechanism before any crossover process.
A case study, using approximated Airbus A320 requirements and tank geometry, is conducted and shows good agreement with
the probe position results obtained with the FQI-GA. For the objectives of accessibility and probe mass, the Pareto front is
linear, with little variation in mass. The case study confirms that the FQI-GA method can incorporate complex requirements
and that designers can employ it to swiftly investigate FQI probe layouts and trade-offs.
Keywords: Evolutionary Algorithm; Multi-objective optimization; Aircraft Fuel System; Sensor System Design; Quantity
Indication; Knowledge-based engineering
1. Introduction
The design and development process of complex
airframe systems, such as the fuel system, requires
close interaction between safety and performance
analyses [1]. Within this process, performance
analysis is a key activity, and the support of it has
seen much development in terms of computational
modelling and simulation capabilities. The
development of these capabilities is driven by the
need to consider as many design options as possible
during early stage systems architecture definition
and sizing. This is to ensure that no potentially high
performing solutions are omitted [2-4].
One system that requires extensive design support
is the fuel system. Its multiple subsystems fulfil the
top-level functions of — storage, delivery, and
quantity indication. The design of these is closely
coupled to the aircraft geometry, with the wing
geometry being the most influential, as it contains
most of the system equipment and the integral fuel
tanks [5]. Previous work has addressed this, through
parametric formulations of wing and integral wing
fuel tank geometries. These were then coupled with
a multi-disciplinary design optimization framework
for preliminary aircraft design, or used within
1 Corresponding Author, E-Mail: [email protected]
knowledge based engineering (KBE) frameworks
aimed at fuel system conceptual design [6]. KBE is
a design philosophy in which geometry and
performance modelling efforts are modular,
parametric and make use of embedded design rules.
This enables fast execution of design studies, from
the aircraft to the airframe system level, with a
higher level of detail than is traditionally the case [7].
The subsystem most dependent on the wing
geometry is the fuel quantity indication (FQI)
system. Typically, aircraft rely on capacitance-based
fuel level gauging probes as part of a dual redundant
and dual channel FQI architecture. In the traditional
design process, only a small number of FQI probe
placement architectures are investigated, with little
consideration of the tank and FQI design
relationships. Therefore, even though it is a mature
subsystem, approaching its design with a KBE
framework [8,9] would provide new insights into
FQI, fuel system and aircraft level trade-offs.
The academic literature on probe placement
algorithms is sparse, as they are often part of the
intellectual property portfolio of the airframe system
supplier delivering the subsystem design and hence
unpublished.
li2106
Text Box
Integrated Computer-Aided Engineering, Volume 28, Issue 2, 2021, pp. 141-158 DOI:10.3233/ICA-200646
li2106
Text Box
Published by IOS Press. This is the Author Accepted Manuscript issued with: Creative Commons Attribution Non-Commercial License (CC:BY:NC 4.0). The final published version (version of record) is available online at DOI:10.3233/ICA-200646. Please refer to any applicable publisher terms of use.
This paper presents the investigations of one
implementation approach to establish probe
architectures that satisfy the accuracy and
redundancy requirements. The method is aligned
with KBE principles and uses a heuristic
optimization routine for the FQI probe placement
problem. A parametric automated link is maintained
between the wing geometry and the FQI system
design process. This provides substantial flexibility,
as new or modified wing geometries can be analysed
in a single workflow, without geometry data import
and export issues.
The subsequent sections of this paper are
organized as follows. Section 2 presents the FQI
design problem and links it to the wider class of node
placement problems and algorithms. Section 3
describes the FQI-GA algorithm and tests a range of
crossover procedures. An application case study
involving a re-design of the Airbus A320 FQI
system is described in Section 4. The final section
provides the conclusions from this research.
2. FQI design problem description
The FQI design process is heavily influenced by the
types of sensors used within the system. The basic
principles of the most widely used sensor
technology, the capacitance probe, has changed little
since its early presentation in the 1940s [10]. In an
abstract sense, a single probe represents a means to
establish the fuel level at a specific point in the tank.
Level measurements from several sensors establish
a fuel surface geometry which, is translated into a
volume by using known tank geometry information.
Eventually the fuel mass is established, with the help
of a fuel density measurement.
The traditional design processes are well described
and a set of requirements for the probe placement
can be summarized from [11,12] as:
− Define a minimum number of probes consistent
with the method of gauging and the
requirements to minimize weight and cost, and
maximize reliability.
− Accuracy requirements (per attitude, fill state
and flight state) for a complex tank are to be
satisfied with a number of placed probes.
− Maximize the gaugeable fuel.
− Maintain probe – structure clearances, to
minimize fringing and water bridging effects,
and to safeguard against thermal movements.
− Establish probe locations that are compatible
with structure mounting interfaces.
− Ensure that probe positioning does not
contribute to fouling of fuel system
components.
− Avoid potential water collection areas.
− Ensure repeatability in production.
Computing the tank fuel volume from probe
measurements has been approached by different
means. In early designs, the analogue summation of
the capacitance readings from each probe is scaled
with the tank’s height- volume relationship. Probes
can then also be profiled, i.e. have a non-constant
diameter along the probe length, to accommodate
the non-linear nature of the height-volume curve
[10,13]. The curve also changes with aircraft attitude,
acceleration or tank structure deflections, requiring
a compromised profiled probe selection [14]. This
makes the probe profiling approach inherently
inaccurate for tanks with complex geometries.
In modern approaches, the computation is
performed digitally. From a set of probe
measurements, a software program establishes fuel
volume via a nonlinear fitted model of the height-
volume relationship, or a stored tank geometry
model [13]. Models and data specific to attitudes and
flight conditions, can be stored and selected as
required. The flight attitude is a key input to the
computation process. It is either established through
a data connection with the air data/inertial reference
systems (ADIRS) or calculated from a plane formed
by the submerged length measurements of three
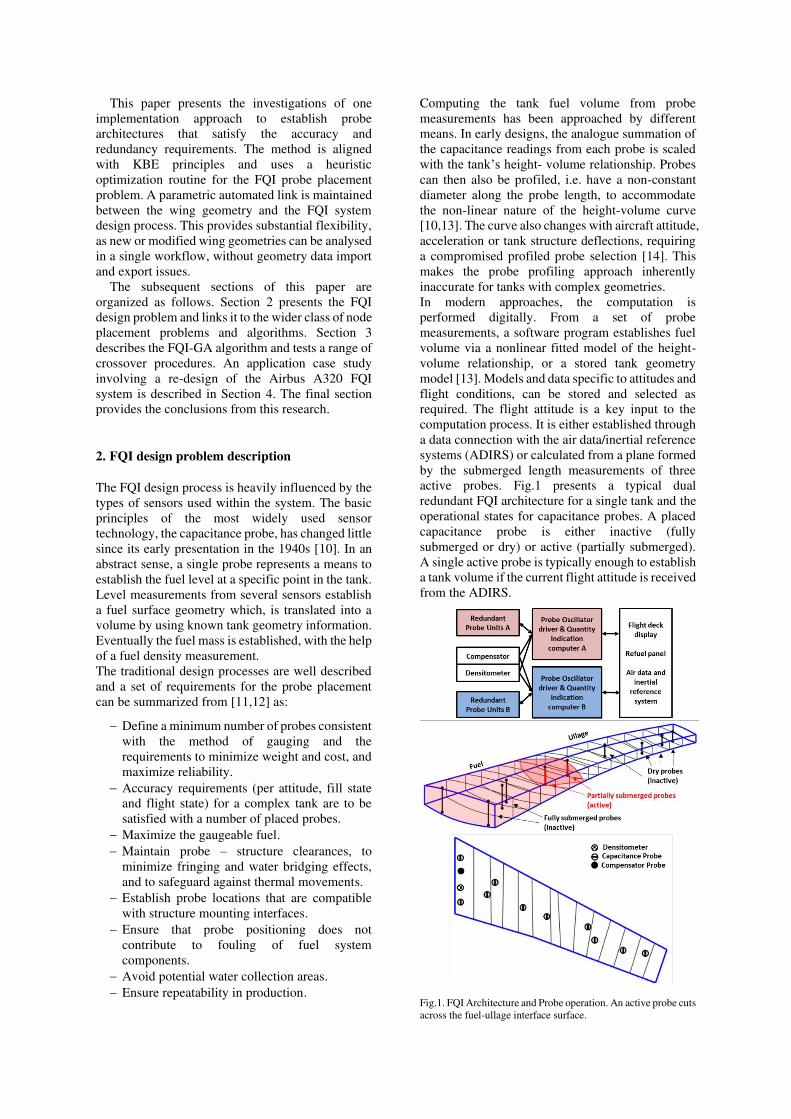
active probes. Fig.1 presents a typical dual
redundant FQI architecture for a single tank and the
operational states for capacitance probes. A placed
capacitance probe is either inactive (fully
submerged or dry) or active (partially submerged).
A single active probe is typically enough to establish
a tank volume if the current flight attitude is received
from the ADIRS.
Fig.1. FQI Architecture and Probe operation. An active probe cuts
across the fuel-ullage interface surface.
The FQI probe placement design problem is part
of a wider class of engineering problems referred to
as node placement problems (NPP). Applications,
such as wind farm layout design [15], wireless
sensor placement [16] and structural health
monitoring sensor networks [17], are typical
examples of NPPs. Such problems require an
unknown number of nodes to be placed to cover a
defined area [18], achieve a degree of coverage
redundancy [19], or maximize power extraction over
a given area and wind-profile [20]. In Table 1, an
overview of comparable NPP design problems and
their design and optimization variables are provided.
In NPPs, the main property information per node
is its x and y position in an area, bound by an upper
and lower limit. For the FQI problem, additional
properties, such as probe mass and an access metric
are continuous variables, mapped directly to nodes.
These are comparable to properties, such as
transmitted power for a sensor node, or wind turbine
hub height in NPPs [15]. However, other aspects of
the FQI probe placement problem (FQI NPP) make
it unique and arguably more challenging than past
studied NPPs. These aspects include:
− There is a strong non-linear and discontinuous
relationship between probe position and tank
study surface coverage. This can lead to sudden
changes in fitness for even small changes in
probe position. Other NPPs have more gradual
changes in fitness, such as the wake impact
diminishing with spacing distance of turbines,
or obstructions causing coverage variations
when sensor positions change.
− Three related solutions to the NPP are required,
in the form of the two independent probe sets
and the single combined probe architecture.
This adds a combinatorial dimension to the
problem, not previously studied in NPPs.
Mixed design spaces of continuous and
combinatorial nature, with discontinues objective
functions, are typical in problems addressed by
heuristic search methods, such as evolutionary
algorithms (EA).
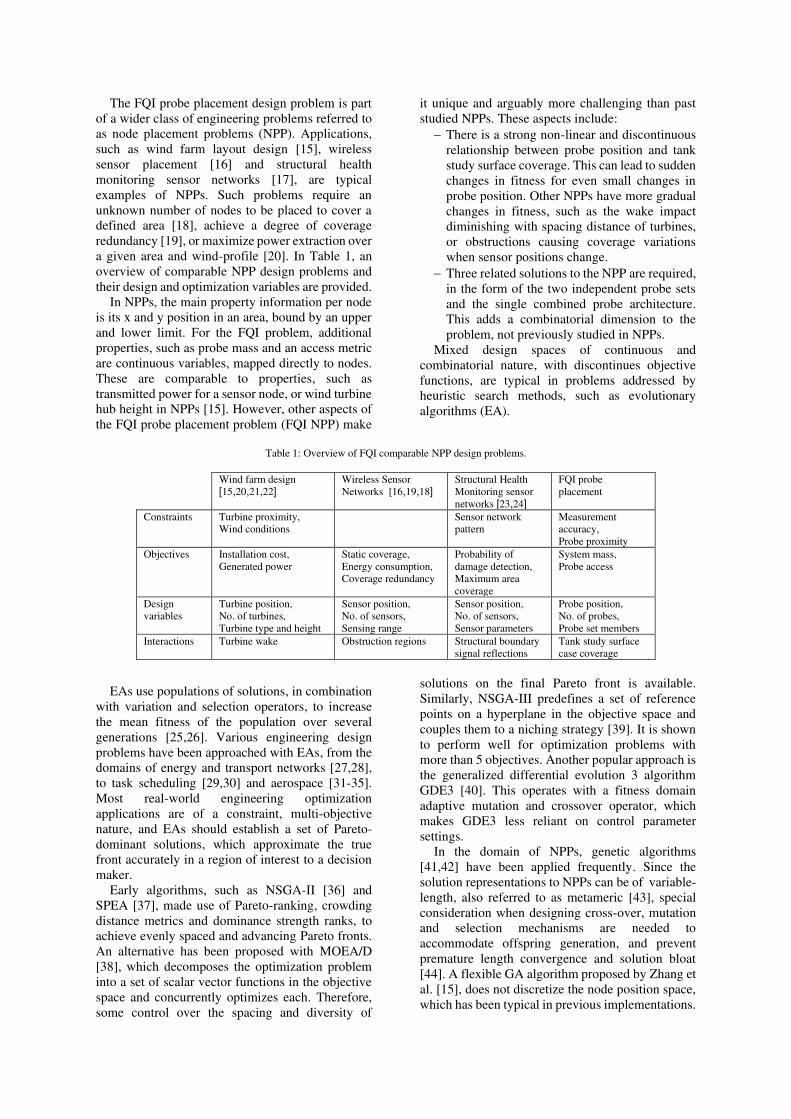
Table 1: Overview of FQI comparable NPP design problems.
Wind farm design
[15,20,21,22] Wireless Sensor
Networks [16,19,18] Structural Health
Monitoring sensor
networks [23,24]
FQI probe
placement
Constraints Turbine proximity,
Wind conditions
Sensor network
pattern
Measurement
accuracy,
Probe proximity
Objectives Installation cost,
Generated power
Static coverage,
Energy consumption,
Coverage redundancy
Probability of
damage detection,
Maximum area
coverage
System mass,
Probe access
Design
variables
Turbine position,
No. of turbines,
Turbine type and height
Sensor position,
No. of sensors,
Sensing range
Sensor position,
No. of sensors,
Sensor parameters
Probe position,
No. of probes,
Probe set members
Interactions Turbine wake Obstruction regions Structural boundary
signal reflections
Tank study surface
case coverage
EAs use populations of solutions, in combination
with variation and selection operators, to increase
the mean fitness of the population over several
generations [25,26]. Various engineering design
problems have been approached with EAs, from the
domains of energy and transport networks [27,28],
to task scheduling [29,30] and aerospace [31-35].
Most real-world engineering optimization
applications are of a constraint, multi-objective
nature, and EAs should establish a set of Pareto-
dominant solutions, which approximate the true
front accurately in a region of interest to a decision
maker.
Early algorithms, such as NSGA-II [36] and
SPEA [37], made use of Pareto-ranking, crowding
distance metrics and dominance strength ranks, to
achieve evenly spaced and advancing Pareto fronts.
An alternative has been proposed with MOEA/D
[38], which decomposes the optimization problem
into a set of scalar vector functions in the objective
space and concurrently optimizes each. Therefore,
some control over the spacing and diversity of
solutions on the final Pareto front is available.
Similarly, NSGA-III predefines a set of reference
points on a hyperplane in the objective space and
couples them to a niching strategy [39]. It is shown
to perform well for optimization problems with
more than 5 objectives. Another popular approach is
the generalized differential evolution 3 algorithm
GDE3 [40]. This operates with a fitness domain
adaptive mutation and crossover operator, which
makes GDE3 less reliant on control parameter
settings.
In the domain of NPPs, genetic algorithms
[41,42] have been applied frequently. Since the
solution representations to NPPs can be of variable-
length, also referred to as metameric [43], special
consideration when designing cross-over, mutation
and selection mechanisms are needed to
accommodate offspring generation, and prevent
premature length convergence and solution bloat
[44]. A flexible GA algorithm proposed by Zhang et
al. [15], does not discretize the node position space,
which has been typical in previous implementations.
Instead, a subarea-swap crossover procedure
ensures variable number of nodes are inherited by
individuals.
Based on the success of heuristic optimization
methods, for NPPs and due to the unique
requirements of the FQI NPP, a new crossover
procedure and constraint handling approach for a
genetic algorithm is required.
3. Genetic algorithm implementation for the
FQI NPP
3.1. FQI NPP formulation
Establishing fuel-ullage interface surfaces for
complex 3D tank geometry data is computationally
intensive and undesirable to be in the loop for an
optimization process. This can be avoided by
converting the continuous geometry space of the
tank into a finite, discrete set. This enables
computing grid cell data prior to executing the
optimization routine, therefore decoupling it from
the tank study execution.
With this approach, the tank grid data set
constitutes the main set of information on tank study
fuel surfaces, probe height, distances from access
panels, and accuracy of the grid cell over the fuel
surface cases. From this, an optimizer has to re-
compute constraint and objective values of cell
combinations only.
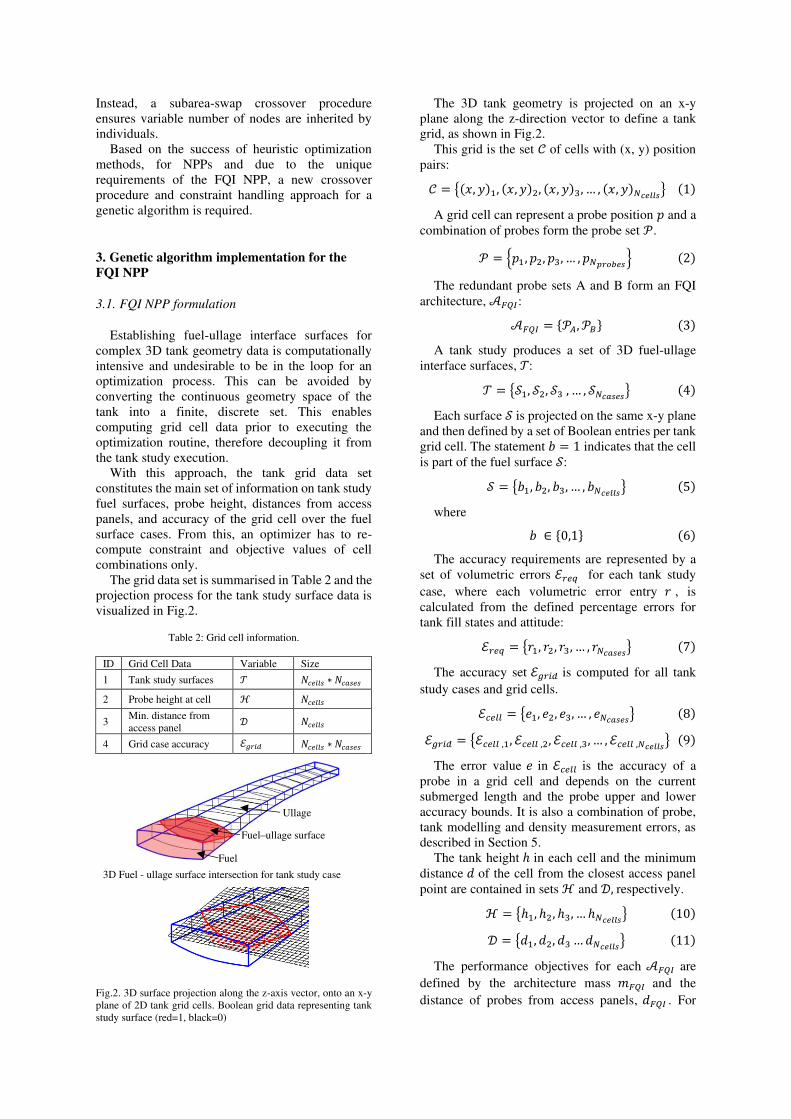
The grid data set is summarised in Table 2 and the
projection process for the tank study surface data is
visualized in Fig.2.
Table 2: Grid cell information.
ID Grid Cell Data Variable Size
1 Tank study surfaces 𝒯 𝑁𝑐𝑒𝑙𝑙𝑠 ∗ 𝑁𝑐𝑎𝑠𝑒𝑠
2 Probe height at cell ℋ 𝑁𝑐𝑒𝑙𝑙𝑠
3 Min. distance from
access panel 𝒟 𝑁𝑐𝑒𝑙𝑙𝑠
4 Grid case accuracy ℰ𝑔𝑟𝑖𝑑 𝑁𝑐𝑒𝑙𝑙𝑠 ∗ 𝑁𝑐𝑎𝑠𝑒𝑠
3D Fuel - ullage surface intersection for tank study case
Fig.2. 3D surface projection along the z-axis vector, onto an x-y
plane of 2D tank grid cells. Boolean grid data representing tank
study surface (red=1, black=0)
The 3D tank geometry is projected on an x-y
plane along the z-direction vector to define a tank
grid, as shown in Fig.2.
This grid is the set 𝒞 of cells with (x, y) position
pairs: 𝒞 = {(𝑥, 𝑦)1, (𝑥, 𝑦)2, (𝑥, 𝑦)3, … , (𝑥, 𝑦)𝑁𝑐𝑒𝑙𝑙𝑠} (1)
A grid cell can represent a probe position 𝑝 and a
combination of probes form the probe set 𝒫. 𝒫 = {𝑝1 , 𝑝2, 𝑝3, … , 𝑝𝑁𝑝𝑟𝑜𝑏𝑒𝑠} (2)
The redundant probe sets A and B form an FQI
architecture, 𝒜𝐹𝑄𝐼: 𝒜𝐹𝑄𝐼 = {𝒫𝐴, 𝒫𝐵} (3)
A tank study produces a set of 3D fuel-ullage
interface surfaces, 𝒯: 𝒯 = {𝒮1, 𝒮2, 𝒮3 , … , 𝒮𝑁𝑐𝑎𝑠𝑒𝑠} (4)
Each surface 𝒮 is projected on the same x-y plane
and then defined by a set of Boolean entries per tank
grid cell. The statement 𝑏 = 1 indicates that the cell
is part of the fuel surface 𝒮: 𝒮 = {𝑏1, 𝑏2, 𝑏3, … , 𝑏𝑁𝑐𝑒𝑙𝑙𝑠} (5)
where 𝑏 ∈ {0,1} (6)
The accuracy requirements are represented by a
set of volumetric errors ℰ𝑟𝑒𝑞 for each tank study
case, where each volumetric error entry 𝑟 , is
calculated from the defined percentage errors for
tank fill states and attitude: ℰ𝑟𝑒𝑞 = {𝑟1, 𝑟2, 𝑟3, … , 𝑟𝑁𝑐𝑎𝑠𝑒𝑠} (7)
The accuracy set ℰ𝑔𝑟𝑖𝑑 is computed for all tank
study cases and grid cells. ℰ𝑐𝑒𝑙𝑙 = {𝑒1, 𝑒2, 𝑒3, … , 𝑒𝑁𝑐𝑎𝑠𝑒𝑠} (8) ℰ𝑔𝑟𝑖𝑑 = {ℰ𝑐𝑒𝑙𝑙 ,1, ℰ𝑐𝑒𝑙𝑙 ,2, ℰ𝑐𝑒𝑙𝑙 ,3, … , ℰ𝑐𝑒𝑙𝑙 ,𝑁𝑐𝑒𝑙𝑙𝑠} (9)
The error value 𝑒 in ℰ𝑐𝑒𝑙𝑙 is the accuracy of a
probe in a grid cell and depends on the current
submerged length and the probe upper and lower
accuracy bounds. It is also a combination of probe,
tank modelling and density measurement errors, as
described in Section 5.
The tank height ℎ in each cell and the minimum
distance 𝑑 of the cell from the closest access panel
point are contained in sets ℋ and 𝒟, respectively. ℋ = {ℎ1, ℎ2, ℎ3, … ℎ𝑁𝑐𝑒𝑙𝑙𝑠} (10) 𝒟 = {𝑑1, 𝑑2, 𝑑3 … 𝑑𝑁𝑐𝑒𝑙𝑙𝑠} (11)
The performance objectives for each 𝒜𝐹𝑄𝐼 are
defined by the architecture mass 𝑚𝐹𝑄𝐼 and the
distance of probes from access panels, 𝑑𝐹𝑄𝐼 . For
Fuel
Fuel–ullage surface
Ullage
mass, the total architecture probe length is used as a
proxy. This is effective, as the probe length-to-mass
relationship is well established and often quoted by
equipment suppliers [45]. However, representing
accessibility with a simple access panel distance
metric is only appropriate for preliminary design,
but is insufficient during detailed design where
component packaging, visibility and other
ergonomic factors need to be evaluated.
𝑚𝐹𝑄𝐼 → ∑ ℎ𝑝𝑟𝑜𝑏𝑒,𝑗𝑁𝑝𝑟𝑜𝑏𝑒𝑠
𝑗=1 (12)
𝑑𝐹𝑄𝐼 = ∑ 𝑑𝑝𝑟𝑜𝑏𝑒,𝑗𝑁𝑝𝑟𝑜𝑏𝑒𝑠
𝑗=1 (13)
where ℎ𝑝𝑟𝑜𝑏𝑒,𝑗 ∈ ℋ (14) 𝑑𝑝𝑟𝑜𝑏𝑒,𝑗 ∈ 𝒟 (15)
The FQI probe placement optimization problem
(FQI-NPP) is to minimize a range of objective
functions for a probe architecture, 𝒜𝐹𝑄𝐼 = {𝒫𝐴 , 𝒫𝐵}.
Here, two objectives for mass and access panel
distance are chosen, namely min 𝑚𝐹𝑄𝐼 = 𝑓1(𝒜𝐹𝑄𝐼) (16) min 𝑑𝐹𝑄𝐼 = 𝑓2(𝒜𝐹𝑄𝐼) (17)
Subject to the constraint that the gauging error of 𝒜𝐹𝑄𝐼 , 𝒫𝐴 and 𝒫𝐵 , as established by ℰ𝑔𝑟𝑖𝑑, is within
the required error bounds for all ℰ𝑟𝑒𝑞 , as follows: 𝑔𝑐1 (ℰ𝑐𝑒𝑙𝑙(𝒜𝐹𝑄𝐼), ℰ𝑟𝑒𝑞(𝒜𝐹𝑄𝐼)) ≤ 0 (18) 𝑔𝑐2 (ℰ𝑐𝑒𝑙𝑙(𝒫𝐴), ℰ𝑟𝑒𝑞(𝒫𝐴)) ≤ 0 (19) 𝑔𝑐2 (ℰ𝑐𝑒𝑙𝑙(𝒫𝐵), ℰ𝑟𝑒𝑞(𝒫𝐵)) ≤ 0 (20)
A further constraint is that the minimum distance
between probes in 𝒜𝐹𝑄𝐼 must be above a cut-off
value 𝑑𝑐𝑢𝑡𝑜𝑓𝑓 , to prevent probes being too close to
each other: 𝑔𝑐3(𝒜𝐹𝑄𝐼) > 𝑑𝑐𝑢𝑡𝑜𝑓𝑓 (21) 𝑝𝑖 ∈ 𝐶 (22)
3.2. Overview of the FQI-GA
The FQI-GA algorithm is an elitist GA with a two
staged fitness assignment approach, random parent
selection and a FQI-NPP specific formulation of
crossover and mutation. A block diagram overview
of its processes is presented in Fig. 4.
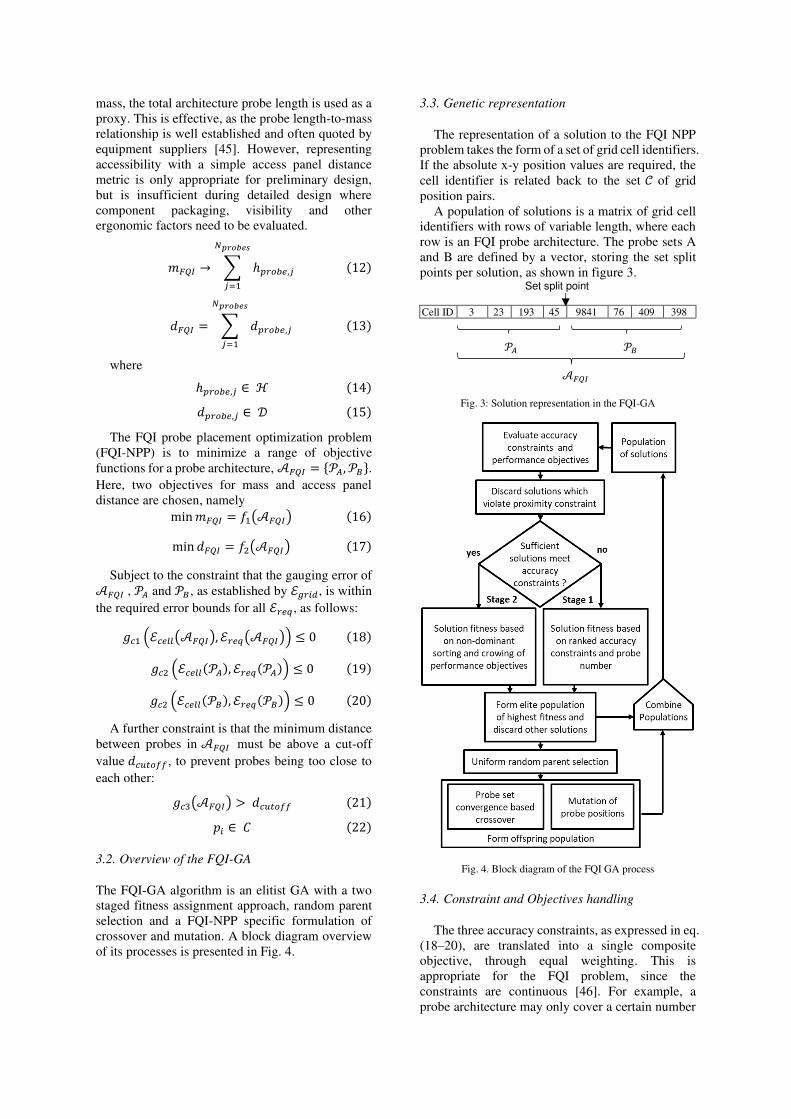
3.3. Genetic representation
The representation of a solution to the FQI NPP
problem takes the form of a set of grid cell identifiers.
If the absolute x-y position values are required, the
cell identifier is related back to the set 𝒞 of grid
position pairs.
A population of solutions is a matrix of grid cell
identifiers with rows of variable length, where each
row is an FQI probe architecture. The probe sets A
and B are defined by a vector, storing the set split
points per solution, as shown in figure 3. Set split point
Cell ID 3 23 193 45 9841 76 409 398
𝒫𝐴 𝒫𝐵 𝒜𝐹𝑄𝐼 Fig. 3: Solution representation in the FQI-GA
Fig. 4. Block diagram of the FQI GA process
3.4. Constraint and Objectives handling
The three accuracy constraints, as expressed in eq.
(18–20), are translated into a single composite
objective, through equal weighting. This is
appropriate for the FQI problem, since the
constraints are continuous [46]. For example, a
probe architecture may only cover a certain number

of fuel surface cases, leading to unmeasurable fuel
states, which degrade the measurement accuracy.
Therefore, as more surface cases are covered, the
accuracy improves. The probe proximity constraint
is considered through a death penalty method [46],
i.e. solution sets with probes violating the constraint
are discarded.
Meeting the accuracy constraints, while
minimizing the probe mass and access, is a trade-off.
It could be approached through a Pareto-based
sorting method of the objectives with included
penalty factor scaled constraint objectives. However,
determining the penalty scaling factors is
application-specific, and a different approach is
therefore chosen.
Seok et al. [18], proposed a bi-population method,
in which one set of constraint-satisfying and a
second of partially-satisfying solutions are evolved
in parallel. Rather than operating in parallel, the
approach taken for the FQI problem operates in
series to ensure only fully constraint-converged
solutions can explore the performance objectives.
In the first stage, solutions with partially fulfilled
constraints dominate the population. Their fitness is
assigned through an equally weighted ranking of
their three accuracy constraints and their number of
probes in the solutions set. Including the probe
number in the fitness assignment is a requirement,
as its omission leads to premature convergence on
solutions with high number of probes.
In the second stage, the elite population of
accuracy-converged solutions is explored against
the defined performance objectives. Solution fitness
is now assigned with a standard non-dominant
sorting mechanism, including crowding distance
considerations [36]. Even though an NSGA-II type
approach is outperformed by methods such
MOEA/D and NSGA-III, it is simple in
implementation and does not need a pre-definition
of the reference domain for the Pareto-front.
3.5. Selection and survival process
As only the elite population produces offspring,
its definition process, as described in section 3.4,
already strongly drives selection. The parent
selection method from this elite population is a
uniform random selection. From the offspring and
the elite population, a new population is formed, and
all other solutions are therefore discarded.
3.6. Crossover and mutation
For the FQI problem, the transferable
characteristics are the (x, y) position of the probes,
the number of probes and their arrangement in sets.
The FQI-GA offspring generation process is
described by the block diagram in Fig. 5. First, the
offspring solution length is determined by a uniform
random selection of a value from the set 𝒲 of
solution lengths, where 𝑁𝑝𝒜𝑃1 and 𝑁𝑝𝒜𝑃2 are the
solution lengths of parent 1 and 2 respectively. 𝒲 = [𝑁𝑝𝒜𝑃1 − 1, 𝑁𝑝𝒜𝑃1 , … , 𝑁𝑝𝒜𝑃2 , 𝑁𝑝𝒜𝑃2 + 1] (23)
Therefore, the number of probes of the parent
architectures, determines the number of probes of
the offspring, but can also increase or decrease by
one. This extension ensures that both larger and
smaller probe solution sets can be generated from
the initial randomly seeded population.
The convergence of the accuracy constraint
values of eq. (19) and eq. (20), for the four parent
sets 𝒫𝐴1, 𝒫𝐵1, 𝒫𝐴2, 𝒫𝐵2, are used to select candidates
for crossover. If none have converged, all sets have
uniform probability of being inherited. This solution
set based selective crossover approach ensures that
converged sets are more likely to be regenerated
with the same probe configuration. This part of the
process is marked as (A) in Fig. 5.
Fig. 5. Block diagram of the recombination method, using a
constraint converged sorted set process (CC-SS)
A range of options have been investigated for the
crossover process, marked as (B) in Fig. 5. In NPPs,
the crossover has been addressed with a subarea-
swap operator in the past [15]. This operator
randomly chooses two nodes and establishes the
area swept by the radius of halve their Euclidian
distance. Any nodes which fall in this area are
swapped between the two parents to form an
offspring node set. Other recombination
mechanisms, such as single point crossover [25] and
a performance-weighted ranked crossover were also
implemented and investigated, with results
presented in section 3.7.
Mutation, as described by part (C) in Fig. 5, either
induces small positional variations for a probe
position, or sets a new random position. The
probability values, 𝑝2𝑚 and 𝑝3𝑚, control mutation
with the options of a mutated position operation in
the surrounding area of the parent probe, and a fully
random new probe position, respectively. The third
possibility is a maintained probe position, controlled
by 𝑝1𝑚. The probability of inheriting a fully random
probe and a probe with a maintained or slightly
modified position are EA parameters which trade-
off search diversity with convergence rate.
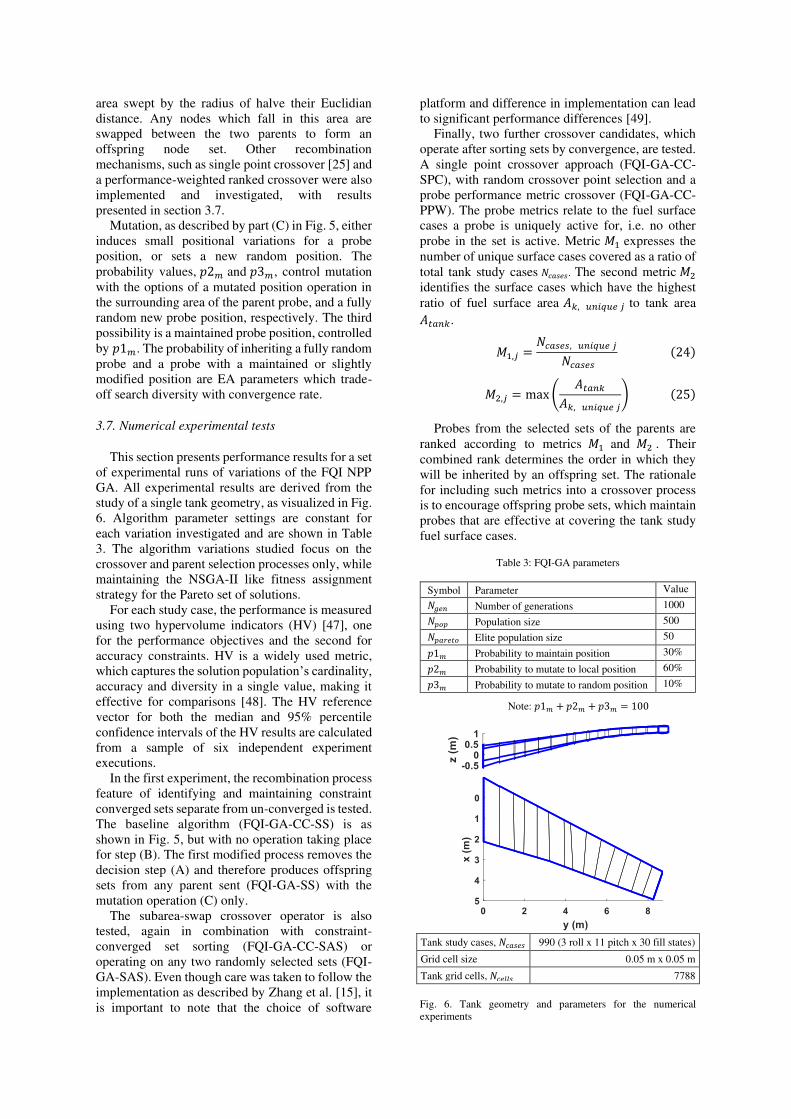
3.7. Numerical experimental tests
This section presents performance results for a set
of experimental runs of variations of the FQI NPP
GA. All experimental results are derived from the
study of a single tank geometry, as visualized in Fig.
6. Algorithm parameter settings are constant for
each variation investigated and are shown in Table
3. The algorithm variations studied focus on the
crossover and parent selection processes only, while
maintaining the NSGA-II like fitness assignment
strategy for the Pareto set of solutions.
For each study case, the performance is measured
using two hypervolume indicators (HV) [47], one
for the performance objectives and the second for
accuracy constraints. HV is a widely used metric,
which captures the solution population’s cardinality, accuracy and diversity in a single value, making it
effective for comparisons [48]. The HV reference
vector for both the median and 95% percentile
confidence intervals of the HV results are calculated
from a sample of six independent experiment
executions.
In the first experiment, the recombination process
feature of identifying and maintaining constraint
converged sets separate from un-converged is tested.
The baseline algorithm (FQI-GA-CC-SS) is as
shown in Fig. 5, but with no operation taking place
for step (B). The first modified process removes the
decision step (A) and therefore produces offspring
sets from any parent sent (FQI-GA-SS) with the
mutation operation (C) only.
The subarea-swap crossover operator is also
tested, again in combination with constraint-
converged set sorting (FQI-GA-CC-SAS) or
operating on any two randomly selected sets (FQI-
GA-SAS). Even though care was taken to follow the
implementation as described by Zhang et al. [15], it
is important to note that the choice of software
platform and difference in implementation can lead
to significant performance differences [49].
Finally, two further crossover candidates, which
operate after sorting sets by convergence, are tested.
A single point crossover approach (FQI-GA-CC-
SPC), with random crossover point selection and a
probe performance metric crossover (FQI-GA-CC-
PPW). The probe metrics relate to the fuel surface
cases a probe is uniquely active for, i.e. no other
probe in the set is active. Metric 𝑀1 expresses the
number of unique surface cases covered as a ratio of
total tank study cases 𝑁𝑐𝑎𝑠𝑒𝑠. The second metric 𝑀2
identifies the surface cases which have the highest
ratio of fuel surface area 𝐴𝑘, 𝑢𝑛𝑖𝑞𝑢𝑒 𝑗 to tank area 𝐴𝑡𝑎𝑛𝑘. 𝑀1,𝑗 = 𝑁𝑐𝑎𝑠𝑒𝑠, 𝑢𝑛𝑖𝑞𝑢𝑒 𝑗 𝑁𝑐𝑎𝑠𝑒𝑠 (24)
𝑀2,𝑗 = max ( 𝐴𝑡𝑎𝑛𝑘𝐴𝑘, 𝑢𝑛𝑖𝑞𝑢𝑒 𝑗) (25)
Probes from the selected sets of the parents are
ranked according to metrics 𝑀1 and 𝑀2 . Their
combined rank determines the order in which they
will be inherited by an offspring set. The rationale
for including such metrics into a crossover process
is to encourage offspring probe sets, which maintain
probes that are effective at covering the tank study
fuel surface cases.
Table 3: FQI-GA parameters
Symbol Parameter Value 𝑁𝑔𝑒𝑛 Number of generations 1000 𝑁𝑝𝑜𝑝 Population size 500 𝑁𝑝𝑎𝑟𝑒𝑡𝑜 Elite population size 50 𝑝1𝑚 Probability to maintain position 30% 𝑝2𝑚 Probability to mutate to local position 60% 𝑝3𝑚 Probability to mutate to random position 10%
Note: 𝑝1𝑚 + 𝑝2𝑚 + 𝑝3𝑚 = 100
Tank study cases, 𝑁𝑐𝑎𝑠𝑒𝑠 990 (3 roll x 11 pitch x 30 fill states) Grid cell size 0.05 m x 0.05 m Tank grid cells, 𝑁𝑐𝑒𝑙𝑙𝑠 7788
Fig. 6. Tank geometry and parameters for the numerical
experiments

(a) (b) (c)
(d) (e) (f)
Fig. 7. Hypervolume indicator mean and 95% confidence interval (CI) results against generation count from the recombination variation
experiments. (a-c) show the HV for the accuracy constraints. (d- f) show the HV for the performance objectives.
Table 4. HV results after 𝑁𝑔𝑒𝑛=1000 for accuracy constraint and performance objectives
Hypervolume indicator of accuracy constraint fitness Hypervolume indicator of performance objectives
Worst Mean Best 95% CI Worst Mean Best 95% CI
Random Search 17674 19586 22563 ± 2094 31.21 73 130 ± 38
FQI-GA-CC-SS 36450 36450 36450 ± 0 1537 1596 1718 ± 83
FQI-GA-SS 18782 31357 36450 ± 8429 171 847 1479 ± 557
FQI-GA-SAS 11183 24756 36450 ± 13485 185 555 1229 ± 476
FQI-GA-CC-SAS 36450 36450 36450 ± 0 258 828 1268 ± 357
FQI-GA-CC-SPC 36450 36450 36450 ± 0 607 860 1028 ± 173
FQI-GA-CC-PPW 36450 36450 36450 ± 0 1281 1490 1611 ± 134
Results in Fig. 7a, Fig. 7b and Fig. 7c show that
making a distinction between non-converged and
converged accuracy constraints sets is key to enable
convergence, independent of the crossover process.
This is due to the combinatorial nature of the
solution, where specific sets of probes together fulfil
a constraint.
The results of the different crossover processes
show that both the subarea swap crossover and a
single point crossover are performing poorly for the
FQI NPP. The mixing of probes from two converged
sets does not effectively lead to offspring sets which
are both converged and explore the Pareto front well.
An exception is the FQI-GA-CC-PPW crossover
method, where probe metrics influence the selected
probe to be inherited. However, as shown by the Fig.
7f, and Table 4, even if such a crossover process is
chosen, the baseline algorithm FQI-GA-CC-SS
outperforms with only the use of mutation
operations.
Even for the best performing crossover
implementation, FQI-GA-CC-SS, the Pareto-front
quality, as indicated by the HV mean and 95% CI
could be improved. One option would be to use the
HV for solution fitness assignment. Calculating the
contribution each Pareto-optimal solution makes to
the HV and combining it with a grid based objective
space niching strategy, has been shown to be
effective [50,51]. This does not require significant
changes to the FQI-GA two-staged architecture, as
would be the case with MOE/D or NSGA-III.
Finally, algorithm performance results presented
here need to be investigated for grid cell size
sensitivity. The chosen value of 0.05 m is based on
typical physical probe size diameters and therefore
represents the lower limit on grid cell size.
4. Application study
4.1. Analysis of the Airbus A320 FQI System
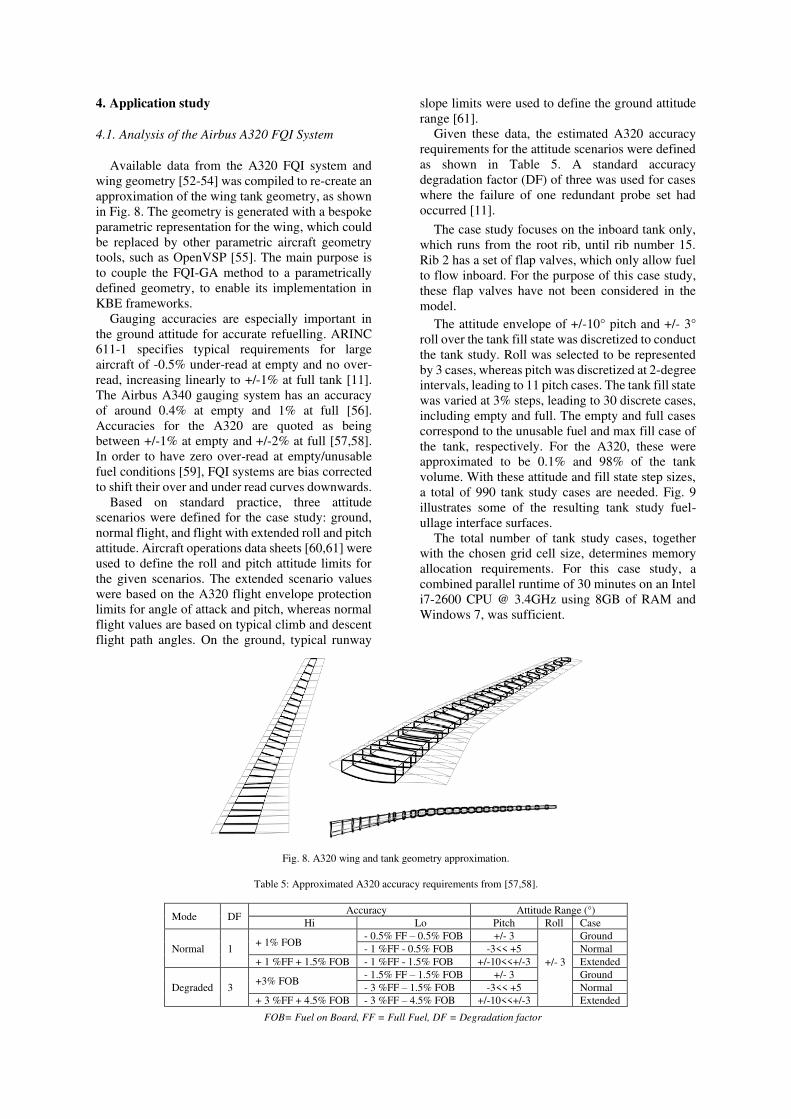
Available data from the A320 FQI system and
wing geometry [52-54] was compiled to re-create an
approximation of the wing tank geometry, as shown
in Fig. 8. The geometry is generated with a bespoke
parametric representation for the wing, which could
be replaced by other parametric aircraft geometry
tools, such as OpenVSP [55]. The main purpose is
to couple the FQI-GA method to a parametrically
defined geometry, to enable its implementation in
KBE frameworks.
Gauging accuracies are especially important in
the ground attitude for accurate refuelling. ARINC
611-1 specifies typical requirements for large
aircraft of -0.5% under-read at empty and no over-
read, increasing linearly to +/-1% at full tank [11].
The Airbus A340 gauging system has an accuracy
of around 0.4% at empty and 1% at full [56].
Accuracies for the A320 are quoted as being
between +/-1% at empty and +/-2% at full [57,58].
In order to have zero over-read at empty/unusable
fuel conditions [59], FQI systems are bias corrected
to shift their over and under read curves downwards.
Based on standard practice, three attitude
scenarios were defined for the case study: ground,
normal flight, and flight with extended roll and pitch
attitude. Aircraft operations data sheets [60,61] were
used to define the roll and pitch attitude limits for
the given scenarios. The extended scenario values
were based on the A320 flight envelope protection
limits for angle of attack and pitch, whereas normal
flight values are based on typical climb and descent
flight path angles. On the ground, typical runway
slope limits were used to define the ground attitude
range [61].
Given these data, the estimated A320 accuracy
requirements for the attitude scenarios were defined
as shown in Table 5. A standard accuracy
degradation factor (DF) of three was used for cases
where the failure of one redundant probe set had
occurred [11].
The case study focuses on the inboard tank only,
which runs from the root rib, until rib number 15.
Rib 2 has a set of flap valves, which only allow fuel
to flow inboard. For the purpose of this case study,
these flap valves have not been considered in the
model.
The attitude envelope of +/-10° pitch and +/- 3°
roll over the tank fill state was discretized to conduct
the tank study. Roll was selected to be represented
by 3 cases, whereas pitch was discretized at 2-degree
intervals, leading to 11 pitch cases. The tank fill state
was varied at 3% steps, leading to 30 discrete cases,
including empty and full. The empty and full cases
correspond to the unusable fuel and max fill case of
the tank, respectively. For the A320, these were
approximated to be 0.1% and 98% of the tank
volume. With these attitude and fill state step sizes,
a total of 990 tank study cases are needed. Fig. 9
illustrates some of the resulting tank study fuel-
ullage interface surfaces.
The total number of tank study cases, together
with the chosen grid cell size, determines memory
allocation requirements. For this case study, a
combined parallel runtime of 30 minutes on an Intel
i7-2600 CPU @ 3.4GHz using 8GB of RAM and
Windows 7, was sufficient.
Fig. 8. A320 wing and tank geometry approximation.
Table 5: Approximated A320 accuracy requirements from [57,58].
Mode DF Accuracy Attitude Range (°)
Hi Lo Pitch Roll Case
Normal 1 + 1% FOB
- 0.5% FF – 0.5% FOB +/- 3
+/- 3
Ground
- 1 %FF - 0.5% FOB -3<< +5 Normal
+ 1 %FF + 1.5% FOB - 1 %FF - 1.5% FOB +/-10<<+/-3 Extended
Degraded 3 +3% FOB
- 1.5% FF – 1.5% FOB +/- 3 Ground
- 3 %FF – 1.5% FOB -3<< +5 Normal
+ 3 %FF + 4.5% FOB - 3 %FF – 4.5% FOB +/-10<<+/-3 Extended
FOB= Fuel on Board, FF = Full Fuel, DF = Degradation factor

The A320 wing FQI probe system consists of
two sets of probes, each having their own in-tank
wiring harness and a probe oscillator driver. Both
sets provide data to the fuel quantity indication
computers, which calculate the current fuel mass per
tank from the probe readings, ADIRS inputs, and
stored tank height-volume tables. Probes are
generally non-vertical, which allows them to cover
more fuel surface but increases their length and
therefore weight. An approximated representation of
the dual redundant FQI architecture [58,62], is
shown in Fig. 10. Each set has six probes and can
cover all measurement requirements for the
extended flight envelope under degraded accuracy
values. As the FQI-GA operates on a 2D projection
grid, the angled probes from the A320 are
approximated with a vertical probe. In the optimal
re-design approach, an FQI architecture redundancy
is integrated by requiring two probe sets to
independently fulfil the accuracy requirements. This
makes the approach specific to a dual redundant FQI
design philosophy, which is common in modern
aircraft, as seen in the A320 example, but not
explicitly required by civil certification standards.
Table 6: Error sources included in error modelling.
Error
source Value Type Symbol
Density
error
0.4% of density
indication Random 𝑒𝑑𝑒
Tank
modelling
0.2% of max tank
volume Bias 𝑒 𝑉,𝑡
Probe
error
±0.5% (dry) linearly
increasing to
±1.6% (full) of probe
indication
Random 𝑒𝐿𝐵, 𝑒𝑈𝐵
No
coverage
Non-measurable
volume between two
probes
Bias 𝑒𝑉,𝑐
The gauging accuracy of a probe set, or
architecture is calculated by considering three error
sources: density measurement, tank modelling, and
probe indication errors. For each tank analysis case,
the levels of submersion of probes in the architecture
varies, leading to changes in total gauging accuracy.
A fourth error term is required in the case of a non-
measurable volume, due to no probes being active
for a tank. This is visible in Fig. 11, in which some
cases are not covered by the probes and a resulting
high spike in gauging error results. A summary of
the error sources and their estimated values based on
the available literature [63,45], is presented in Table
6.
The total gauging mass error 𝑒𝑇 is the arithmetic
combination of errors, as shown in eq. (26-28). The
volume error for a probe is based on its length 𝑙𝑝, wetted length 𝑙𝑝, 𝑠, measurement error 𝑒 𝑝,𝑧 and the
gradient of volume change per height 𝑑𝑉𝑑𝑧 of the
corresponding tank section. The volume error is
combined with a density error 𝜀𝑑𝑒𝑛 and expressed as
a ratio of maximum fuel mass, shifted by the bias
term ∆𝐹𝑄𝐼,𝑏. 𝑒 𝑝,𝑧 = (±𝑒𝐿𝐵 + 𝑙𝑝 ∗ (∆𝑒𝑈𝐵−𝐿𝐵)) ∗ 𝑙𝑝, 𝑠 (26) 𝑒 𝑉,𝑝 = 𝑒 𝑝,𝑧 ∗ 𝑑𝑉𝑑𝑧 (27)
𝑒𝑇 = (±𝑒𝑉,𝑡 ± e𝑉,𝑝 ± 𝑒𝑉,𝑐) ∗ (𝜌 ± 𝜀𝑑𝑒𝑛)𝑉𝑇 ∗ 𝜌 − ∆𝐹𝑄𝐼,𝑏 (28)
Some tank study cases have multiple active
probes. Each has its own volume error magnitude,
depending on its wetted length and local
volume/height gradient. The probe with the lowest
error value is chosen as active for this case. Finally,
all gauging errors are shifted with a system-bias,
equal to the over-read value at the zero useable fuel
level. This is a certification requirement for large
civil aircraft under §25.1337 [59].
There is a relation between accuracy estimations
and the tank geometry and fuel surface calculations.
For example, tank geometries with low dihedral
angles, may require more roll angle steps, as the fuel
surface changes more drastically compared with a
high dihedral wing. In addition, the chosen
discretization step size for the fuel state has a direct
impact on the probe accuracy calculation in the case
of a non-covered fuel surface. This is because the
error term 𝑒𝑉,𝑐 depends on the next case at which a
probe is active, which may be closer or further,
depending on the fill state step size. Finally, as the
tank volume and surface calculations are coupled,
the simplified geometry of the tank structure and the
omission of internal fuel system components can
render volume estimates inaccurate, which impacts
the probe accuracy estimations.
Notwithstanding these potential modelling
uncertainties, Fig. 11 shows the A320 tank study
accuracy results for the two independent sets of
probes and the nominal case where all probes are
active. For the three attitude envelope cases, the
highest over and under-read results are plotted as a
boundary around the rest of the non-critical cases.
This boundary can then be compared to the
requirements, represented by the dashed lines.
The results show that, for the assumed error
source magnitudes, the specified degraded accuracy
limits were achieved. For the nominal limits of
ground and normal flight attitudes, the under-read
error between the 25 and 40% tank fill states was
marginally exceeded as, indicated in Fig. 11.

a) Fill state cases at 0° pitch and 0° roll angle b) Pitch and roll angle cases at zero fill state
Fig. 9. Tank study results. The red lines represent contours of example fuel-ullage interface surfaces.
Fig. 10. Approximated A320 probe positions and directions.
Set A active Set B active Both Sets
Tank fill state (%)
Fig. 11. A320 tank study accuracy results for redundant probe sets and full architecture.

4.2. Optimal FQI probe placement redesign and
comparison with the A320 baseline
Given the case study geometry data and accuracy
requirements, an overall satisfactory agreement
between requirements and achieved accuracy was
shown for the reconstructed A320 FQI architecture.
Subsequently, this design is the baseline reference
for comparisons with re-designs produced by the
FQI-GA under equivalent requirements and
constraints. Three studies were conducted, as shown
in Table 7, with the same algorithm parameter
settings from Table 3.
Table 7: A320 FQI probe placement redesign studies
Study Performance Objective(s)
A Minimize mass
B Maximize access
C Minimize mass & maximize access
The resulting probe architectures from studies A
and B are shown in Fig. 15. The optimization
achieves a total probe count reduction of four for
both. The probe count is driven by the accuracy
constraints rather than the performance objectives
and therefore is equal in both studies, whereas the
probe positions varies. The reduced probe count
leads to reduced overlap coverage of tank study fuel-
ullage interface surface cases. This is illustrated in
Fig. 12 and Fig. 13 for study A, with coverage for
redundant set A shown only. Coverage is displayed
for three single roll angle cases and a range of pitch
angles and fill states. In the 0 to 50% fill state range,
the coverage is provided by the A320 probes A1, A2
and A3, located in the tank rib bays (RB) 1, 2 and 3.
Their combined coverage can be achieved by probes
AA1 and AA2, which are located in RB1 and RB3.
Fig. 12. Tank study coverage for the A320 and the study A
resulting probes of set A.
Fig. 13. Tank study coverage for the study A resulting probes of
set A.
All individual probe coverages are combined to
form the probe set coverage, as shown in Fig. 14.
Overlap is reduced throughout the tank study cases,
with the peak values reducing from 6 to 4. There was
some increase in areas of non-coverage, such as the
90-100% fill state at pitch angles above -8°.
However, this non-coverage does not lead to a
violation of the accuracy requirements, as solutions
from the FQI-GA are fully constraint-converged.
A simplification, which impacts the probe count
for the re-design study, is the omission of the flap
valves located in rib 2. Flap valves only allow fuel
to flow unidirectional through a rib. Therefore, in
the case of the A320, with a negative roll angle two
fuel surfaces would form for the inboard tank; one
located in RB1 and the second in the rest of the tank.
This requires additional probes in RB2 in order to
measure this surface at low fuel states, which are
present in the A320 arrangement.
In the re-design studies, it is assumed that
accuracy, rather than tank study case coverage
requirements are to be met. However, it is possible
that the A320 FQI probe placement requirements
were based on coverage and accuracy, resulting in a
design with more probes.
A probe position comparison is presented in Fig.
15 for studies A and B. In study A, probes were
forced towards the front spar, where their length
reduced due to the tank shape. Probe length can vary
by as much as 0.5 m between the front and rear spars,
at RB2. In contrast, for study B, probes are located
towards the access panels, to minimize the access
objective. Because the access panels are located
around the thickest part of the rib bays, the resulting
architectures have longer probes.

A3
20
Se
t A
Stu
dy A
Se
t A
Fig. 14. Tank study coverage comparison for one probe set of the A320 and the FQI-GA study A.
Study A
Study B
Fig. 15. FQI-GA and A320 probe position comparison and objective function grid values.
Fig. 15 also compares the A320 probe positions
and highlights differences with the closest probes of
the re-design. The A320 arrangement favours
positions closer to access panels, rather than
optimizing towards shorter probes.
A comparison of probe architecture measurement
accuracy for studies A, B and the baseline, is shown
in Fig. 16. It confirms that the FQI-GA solution has
achieved constraint convergence, as the maximum
error bounds for the three flight cases are within the
respective requirement area. A difference between
the resulting re-designed and the A320 architectures,
is a spike in measurement error around the empty
and full cases for the extended flight attitude case.

The fuel-ullage interface surfaces for these cases,
have no active probes, whereas the A320 achieves
full coverage for the full tank study case set. RB1
always requires two probes, one for each redundant
set, which is also the case for the A320 arrangement.
The re-designed solutions, however, have probes
towards the centre of the rib bay, whereas the A320
locates them close to the root rib. Their position
indicates that they may be designed to cover cases
below the assumed 0.1% unusable fuel limit of the
available tank volume in the nominal case.
Therefore, it is possible that the A320 design
requirements were more stringent for the nominal
tank study cases, as assumed for the re-design study.
Tank fill state (%)
A320 Study A Study B
Fig. 16. Comparison between A320 Study A and B probe architecture accuracies.
Fig. 17. Pareto fronts of four FQI-GA executions for study C.
Probe mass is modelled as a function of probe length with 0.45
kg/m and a base mass per probe of 0.8 kg.
Fig. 18. Probe positions of all Pareto optimal FQI architectures
for study C.
Study B
Study A

Study C has two performance objectives and its
resulting Pareto fronts are shown in Fig. 17. The four
independent FQI-GA executions produced similar
fronts with minor differences in accuracy and
diversity. Overall an almost linear front, with a ratio
of approximately -16 to 1 for access distance to
probe length is estimated. This means that probe
architectures will decrease 16 times faster for access
distance than for the increase in probe mass. The
shape of the Pareto front is mainly driven by the tank
geometry height distribution, as shown in Fig. 15,
whereas the gradient depends on the probe mass
model.
Fig. 18 shows the probe positions of all Pareto-
optimal FQI architectures, shaded according to their
objective values. At the extreme ends, the resulting
probe positions mirror the position trends from study
A and B, as expected. Architectures which fall in
between the two objective cases have probes which
change position in various ways. Probe positions
remain relatively static for RB1 and RB6 whereas
other probes shift in the chord direction.
Even-though the exact probe locations of the
A320 FQI design could not be regenerated by the
FQI-GA process, results show good similarity in
position trends. Factors impacting the FQI-GA
outcomes have been discussed and range from
accuracy requirement assumptions to tank geometry
modelling. In order to select a probe architecture
from the Pareto front, other requirements need to be
considered. Effects such as installation interface
availability on rib, spar or skin structures, proximity
to water collection areas and other fuel system
components need to be considered.
Rather than producing such a fully validated FQI
design, the main outcome from the case study is the
demonstration that the FQI-GA process can
incorporate industrially representative requirements
for multiple accuracy constraints, complex tank
geometries and handle multiple design objectives.
5. Conclusions
This paper presents a new, knowledge-based
engineering compatible solution process to the
optimal placement of FQI gauging probes under
redundancy and measurement accuracy constraints.
It enables fast preliminary design studies, where
objectives, constraints, requirements, and geometry
can be explored.
The FQI NPP is formally defined, based on
discretized tank geometry and fuel surfaces,
projected onto a 2D plane. This converts the
problem into a combinatorial set selection
optimization problem, which is different to the
traditional NPP. A genetic algorithm with a
sequential, two-staged fitness assignment strategy is
proposed and tested for a range of crossover
procedures. It is shown that the treatment of probe
sets according to their accuracy constraint
convergence is key for any crossover procedure. A
range of crossover methods for NPPs were tested,
including subarea-swap, and are shown to only
provide little performance benefits, compared with a
baseline of local and global mutation operations
only. The NSGA-II based fitness assignment
operation provides a relatively evenly spaced final
Pareto front for the two-objective problem. However
as more objectives are considered, newer methods,
such as MOE/D and NSGA-III need to be
investigated.
The algorithm was tested with a real-world
engineering case study of the re-design of an FQI
probe architecture for estimated accuracy
requirements and inboard wing tank geometry of the
Airbus A320. The resulting Pareto front is linear,
with an approximate slope of -16 to 1 between
probe-to-access panel distance and total probe mass.
It was also found that Pareto-optimal architectures
have 8 probes, which is a reduction of 4 over the
baseline. Resulting probe positions are comparable
to the A320 baseline for an optimization of access
only. Further work is required to model flap valves
in the tank study and include varying discretization
levels of both the geometry and the tank study cases,
to establish their impact on the optimal probe
positions.
References
1. SAE International. Aerospace Recommended Practice
4754A, “Guidelines for Development of Civil Aircraft and Systems”, SAE; (2010)
2. Dean, S., R., H., Doherty, J., J., Wallace, T., R., “MDO-
Based Concept Modelling and the impact of fuel systems on
wing design”, 47th AIAA Aerospace Sciences Meeting,
(2009)
3. Gavel., H., Oelvander. J., Krus, P., “Aircraft fuel system
synthesis aided by interactive morphology, optimization and
probabilistic design”, 46th AIAA Aerospace Sciences Meeting and Exhibit, (2008)
4. Mihalyi, L., “Multi objective optimization and probabilistic
design on aircraft fuel system”, Master Thesis, Lulea Tekniska University, (2007)
5. Tookey, R M; Spicer, M G; Diston, D., “Integrated Design
and Analysis of an Aircraft Fuel System”, NATO/RTO Air Vehicle Technology Panel Symposium, Paris, France.
Published in RTO-MP-089, (2003)
6. Dorbath, F., Nagel, B., Gollnick, V., “A Knowledge based
approach for automated modelling of extended wing
structures in preliminary aircraft design”, 28th ICAS, (2012)
7. La Rocca, G., “Knowledge based Engineering techniques to
support aircraft design and optimization”, PhD Thesis, TU Delft, (2011)
8. López, A., S., Munulury, .R., C., ”Parametric modelling of aircraft fuel systems integration in rapid”, 6th EASN
International Conference on Innovation in European
Aeronautics Research, (2016)
9. Munulury, R., C., “Knowledge-based Aircraft Systems
Integration”, MODPROD Workshop, (2017) 10. Pearson, D.B., “A Capacitance-Type Fuel-Measurement
System for Aircraft”, Transactions of the American Institute
of Electrical Engineers, Vol 66, Issue 1, (1947)

11. SAE International. Aerospace Information Report
AIR5691™, “Guidance for the Design and Installation of
Fuel Quantity Indicating Systems”, SAE; (2013) 12. Langton, R. Clark, C., Hewitt, M., Richards, L., “Aircraft
Fuel Systems”, Wiley 1st Edition, (2009)
13. Newport, R., Nelson, D., Manfred, M., “Digital fuel quantity indicating system for aircraft”, AIAA - Digital avionics
Systems Conference, (1984)
14. Fisher, H., “Re-profiled Fuel Quantity capacitance Probes
for improved A300 FQI Accuracy”, FAST Airbus technical digest magazine, (1984)
15. Zhang, Y.-H., Gong, Y.-J., Gu, T.-L., Li, Y. and Zhang, J.,
“Flexible genetic algorithm: A simple and generic approach
to node placement problems”, Applied Soft Computing, 52,
pp. 457-470. (2017) (doi:10.1016/j.asoc.2016.10.022)
16. S. Abdollahzadeh, N.J. Navimipour, “Deployment strategies
in the wireless sensor network: a comprehensive review”, Comput. Commun.91–92, 1–16 (2016)
17. Mallardo, V., Aliabadi, M. “Optimal Sensor Placement for Structural, Damage and Impact Identification: A Review”.
Structural Durability & Health Monitoring, 9(4), 287–323.
(2013)
18. J. Seok, J. Lee, W. Kim and J. Lee, "A Bipopulation-Based
Evolutionary Algorithm for Solving Full Area Coverage
Problems", IEEE Sensors Journal, vol. 13, no. 12, pp. 4796-
4807, (2013)
19. Rangel, E., & Costa, D., & Loula, A., “On redundant
coverage maximization in wireless visual sensor networks:
Evolutionary algorithms for multi-objective optimization”, Applied Soft Computing. Vol. 82. 105578 (2019)
20. Khanali, M., Ahmadzadegan, S., Omid, M. et
al.,“Optimizing layout of wind farm turbines using genetic algorithms in Tehran province, Iran.”, Int J Energy Environ
Eng 9, 399–411 (2018) https://doi.org/10.1007/s40095-
018-0280-x
21. Charhouni, N., Sallaou, M. & Mansouri, K.,”Realistic wind
farm design layout optimization with different wind turbines
types”, Int J Energy Environ Eng 10, 307–318 (2019).
https://doi.org/10.1007/s40095-019-0303-2
22. Y. Chen, H. Li, K. Jin, Q. Song, “Wind farm layout
optimization using genetic algorithm with different hub
height wind turbines”. Energy Convers. Manag. 70, 56–65
(2013)
23. Thiene, M., Sharif Khodaei, Z., Aliabadi, M. H., “Optimal
sensor placement for maximum area coverage (MAC) for
damage localization in composite structures” Smart Materials and Structures, Vol. 25 No.9 (2016)
24. Ismail, Z., Mustapha, S., Fakih, M. A., & Tarhini, H.,”Sensor placement optimization on complex and large metallic and
composite structures.”, Structural Health Monitoring, 19(1),
262–280. (2020).
https://doi.org/10.1177/1475921719841307
25. Eiben, A. E., & Smith, J. E., ”Introduction to evolutionary
computing”, 2nd Edition, Springer-Verlag (2015)
26. Coello, C., Lamont, G., Van Veldhuizen, D., “Evolutionary
Algorithms for Solving Multi-Objective Problems”, Springer Verlag, 2nd Edition, (2007)
27. Wang, Q., Liu, H., Yuan, J., & Chen, L. “Optimizing the energy-spectrum efficiency of cellular systems by
evolutionary multi-objective algorithm.” Integrated
Computer-Aided Engineering, 26(2), 207-220. (2019)
28. Wei, Y, Jin, JG, Yang, J, Lu, L. Strategic network expansion
of urban rapid transit systems: A bi‐objective programming model. Computer-Aided Civil and Infrastructure
Engineering.; Vol. 34: pp431– 443. (2019)
https://doi.org/10.1111/mice.12426
29. Mencía, C., Sierra, M.R., Mencía, R., and Varela, R.,
“Evolutionary one-machine scheduling in the context of
electric vehicles charging”, Integrated Computer-Aided
Engineering, 26:1, pp. 49-63. (2019)
30. Palacios, J.J., González-Rodríguez, I., Vela, C.R., Puente, J.,
“Satisfying flexible due dates in fuzzy job shop by means of hybrid evolutionary algorithms”, Integrated Computer-
Aided Engineering, 26:1, pp. 65-84. (2019)
31. Frank, C., P., Marlier, R., A., Pinon-Fisher, O., J., Mavris, D.,
N., “Evolutionary multi-objective multi architecture design
space exploration methodology”, Optimization Engineering,
Vol 19, pp 359–381, (2018)
32. Judt, D., M., Lawson, C., P., “Application of an automated aircraft architecture generation and analysis tool to
unmanned aerial vehicle subsystem design”, Proceedings of
the Institution of Mechanical Engineers, Part G: Journal of
Aerospace Engineering, 229(9), 1690–1708, (2015)
33. Judt, D. M. and Lawson, C., “Development of an automated
aircraft subsystem architecture generation and analysis
tool”, Engineering Computations, Vol. 33, No. 5, pp. 1327–1352, (2016)
34. Ho-Huu, V.; Hartjes, S.; Visser, H.G.; Curran, R. “An
Efficient Application of the MOEA/D Algorithm for
Designing Noise Abatement Departure Trajectories”. Aerospace, Vol 4, 54. (2017)
35. Zhang, M., Filippone, A., Bojdo, N., “Multi-objective
optimization of aircraft departure trajectories”, Aerospace
science and technology, Vol. 79, 37-47, (2018)
36. K. Deb, A. Pratap, S. Agarwal, and T. Meyarivan, “A fast and
elitist multi-objective genetic algorithm: NSGA-II”, IEEE
Transactions on Evolutionary Computation, vol. 6, no. 2, pp.
182–197, (2002)
37. Zitzler, E., Thiele, L., “An Evolutionary Algorithm for
Multiobjective Optimization: The Strength Pareto
Approach”. Technical Report 43, Computer Engineering and
Communication Networks Lab (TIK), Swiss Federal
Institute of Technology (ETH), Zurich, Switzerland, (1998)
38. Zhang, Q., and Li, H., "MOEA/D: A Multiobjective
Evolutionary Algorithm Based on Decomposition," in IEEE
Transactions on Evolutionary Computation, vol. 11, no. 6, pp.
712-731, Dec. (2007), doi: 10.1109/TEVC.2007.892759.
39. Deb, K. and Jain H., "An Evolutionary Many-Objective
Optimization Algorithm Using Reference-Point-Based
Nondominated Sorting Approach, Part I: Solving Problems
With Box Constraints," in IEEE Transactions on
Evolutionary Computation, vol. 18, no. 4, pp. 577-601, Aug.
(2014), doi: 10.1109/TEVC.2013.2281535.
40. S. Kukkonen and J. Lampinen, "GDE3: the third evolution
step of generalized differential evolution," 2005 IEEE
Congress on Evolutionary Computation, Edinburgh,
Scotland, 2005, pp. 443-450 Vol.1, doi:
10.1109/CEC.2005.1554717.
41. B. Saavedra-Moreno, S. Salcedo-Sanz, A. Paniagua-Tineo,
L. Prieto, A. Portilla-Figueras, ”Seeding evolutionary algorithms with heuristics for optimal wind turbines
positioning in wind farms”, Renew. Energy, Vol. 36,
pp2838–2844. (2011)
42. J.S. González, A.G.G. Rodriguez, J.C. Mora, J.R. Santos,
M.B. Payan, “Optimization of wind farm turbines layout using an evolutive algorithm”, Renew. Energy Vol. 35,
pp1671–1681, (2010)
43. Ryerkerk, M., Averill, R., Deb, K. et al. “A survey of evolutionary algorithms using metameric representations”,
Genet Program Evolvable Mach 20, 441–478 (2019).
https://doi.org/10.1007/s10710-019-09356-2
44. Wagner M., Neumann F., “Parsimony Pressure versus Multi-objective Optimization for Variable Length
Representations”, In: Coello C.A.C., Cutello V., Deb K.,
Forrest S., Nicosia G., Pavone M. (eds) Parallel Problem
Solving from Nature - PPSN XII. PPSN (2012). Lecture
Notes in Computer Science, vol 7491. Springer, Berlin,
Heidelberg
45. Autoflug, “Fuel Gauge transmitter datasheet”, www.autoflug.de, accessed 2020
46. Kramer, O.“A Review of Constraint-Handling Techniques
for Evolution Strategies”, Applied Comp. Int. Soft
Computing. (2010) 10.1155/2010/185063.
47. E. Zitzler and L. Thiele "Multiobjective evolutionary
algorithms: a comparative case study and the strength pareto
approach" evolutionary computation IEEE transactions on
vol. 3 no. 4 pp. 257-271 (1999)
48. N. Riquelme, C. Von Lücken and B. Baran, "Performance
metrics in multi-objective optimization," 2015 Latin

American Computing Conference (CLEI), Arequipa, 2015,
pp. 1-11, doi: 10.1109/CLEI.2015.7360024.
49. Rostami, S., Neri, F. & Gyaurski, K., “On Algorithmic Descriptions and Software Implementations for Multi-
objective Optimisation: A Comparative Study.” SN
COMPUT. SCI. 1, 247 (2020).
50. Rostami, S. and Neri, F. “Covariance Matrix Adaptation Pareto Archived Evolution Strategy with Hyper volume-
sorted Adaptive Grid Algorithm”. Integrated Computer-
Aided Engineering, 23 (4), pp. 313-329, (2016)
51. Rostami, S. and Ferrante Neri. “A fast hypervolume driven
selection mechanism for many-objective optimisation
problems.” Swarm Evol. Comput. Vol.34, pp50-67. (2017)
52. Obert, E., “Aerodynamic design of transport aircraft”, IOS
Press, (2009)
53. Orlita, M., & Vos, R. “Cruise Performance Optimization of the Airbus A320 through Flap Morphing”. In 17th AIAA
Aviation Technology, Integration, and Operations
Conference, (2017),DOI: 10.2514/6.2017-3264
54. Gresty, D., Mueller, J., Rudolph, P., Schallert, C., “Airplane wing with slat and Krueger flap -EP1338506A1”, European
Patent Office, (2002)
55. Hahn, A., “Vehicle Sketch Pad: Parametric Geometry for
Conceptual Aircraft Design”, 48th AIAA Aerospace Sciences Meeting, Orlando, FL, Jan 4 - 7, AIAA-2010-657,
(2010)
56. Walker, R., “The new A340-500/600 Fuel System”, FAST
Airbus technical digest magazine, (2000)
57. Vallée, G., Pernet, R., Urdiroz, A.,”Fuel monitoring on A320 Family aircraft “. The Airbus Safety Magazine, issue 22,
(2015)
58. Airbus. “Operational Liaison Meeting FBW Aircraft: Fuel
Accuracy”. Airbus; (2017) 59. European Aviation Safety Agency, “Certification
Specifications and acceptable means of compliance for large
aeroplanes - CS-25 amendment 22”, §25.1337, (2018)
60. Airbus, A318/A319/A320/A321, “Flight crew operating manual”, Airbus; (2017)
61. Airbus, “Getting to grips with aircraft performance”, Airbus
flight operations support & line assistance magazine, (2002)
62. Hilmi, M., H., R., “Investigating pressure-based aircraft fuel
gauging systems”, MSc Thesis, Cranfield University, (2018) 63. SAE International. Aerospace Information Report
AIR1184™, “Capacitive Fuel Gauging System Accuracies”,
SAE; (2016)


![109 – [2] Wave Overtopping Quantity](https://static.fdokumen.com/doc/165x107/6333c268e3da70449d01c8d7/109-2-wave-overtopping-quantity.jpg)