Anomalous melting and solid polymorphism of a modified inverse-power potential
19
For Peer Review Only !"# ! $ % &" $ ’ () *+, # ’ ’ ) *+, # ’ -’ ./) &0&. 12# " "3’ # "" 0 23 2 !"# ! +2’ ! ! +# .4 5 " +2 6434 "+7 4 "48 URL: http://mc.manuscriptcentral.com/tandf/tmph Molecular Physics peer-00732670, version 1 - 16 Sep 2012 Author manuscript, published in "Molecular Physics (2011) 1" DOI : 10.1080/00268976.2011.609146
-
Upload
independent -
Category
Documents
-
view
2 -
download
0
Transcript of Anomalous melting and solid polymorphism of a modified inverse-power potential
For Peer Review O
nly
�������������� �������������������������������������������������
�������� ����������� �� �
������ ������ ��������������
������ �������� ���� ��������� ��������������� ���� ������
�������!" ���#�!������$������
�%����������
&�"������� ������$������� ����� �'�( ��� ����)�*� +��� �,�# ���� ��'����� �������� � ��'����� )�*� +��� �,�# ���� ��'����� ����� -�'�.���/)�&0 ���&.�
1��2��#�� ���"������"��� �3'���� #�����"���� �"�
0�������������2 �3�� ����2������!" ���#�!������������������������+ �2'�!����������!�����+����#������.4��5���"����+ �2�������� ����6�434�"�+ ��7���� ��4�
"����� �4��8�
URL: http://mc.manuscriptcentral.com/tandf/tmph
Molecular Physicspe
er-007
3267
0, version
1 - 16 Sep
201
2Author manuscript, published in "Molecular Physics (2011) 1"
DOI : 10.1080/00268976.2011.609146

For Peer Review O
nly
Anomalous melting and solid polymorphism
of a modified inverse-power potential
Gianpietro Malescio1 [*], Santi Prestipino1 [†], and Franz Saija2 [‡]
1 Universita degli Studi di Messina, Dipartimento di Fisica,
Viale F. Stagno d’Alcontres 31, 98166 Messina, Italy
2 CNR-IPCF, Viale F. Stagno d’Alcontres 37, 98158 Messina, Italy
(Dated: July 1, 2011)
Abstract
We numerically investigate a system of particles interacting through a repulsive pair potential of
inverse-power form, modified in such a way that the strength of the repulsion is softened in a range
of distances. The solid phases of the system for various levels of softness are identified by computing
the zero-temperature phase diagram; then, for each solid phase, the melting line is determined by
Monte Carlo simulation. Upon increasing the softness of the potential core, a region appears where
melting occurs upon compression at constant temperature (“anomalous” melting) and a number of
low-coordinated crystals become stable at moderate pressures. Next, the structural properties of
the system for varying core softness are surveyed in the hypernetted-chain approximation, whose
accuracy has been positively tested against numerical simulation. For sufficiently high degrees of
softness, the radial distribution function shows the typical interplay between two distinct length
scales. In a narrow range of moderate softness, reentrant melting occurs instead with just one
length scale, which shows that the existence of two well-definite length scales is not the only
mechanism for anomalous melting.
Keywords: anomalous melting, solid polymorphism, hypernetted-chain approximation
1
Page 1 of 18
URL: http://mc.manuscriptcentral.com/tandf/tmph
Molecular Physics
123456789101112131415161718192021222324252627282930313233343536373839404142434445464748495051525354555657585960
peer-007
3267
0, version
1 - 16 Sep
201
2
For Peer Review O
nly
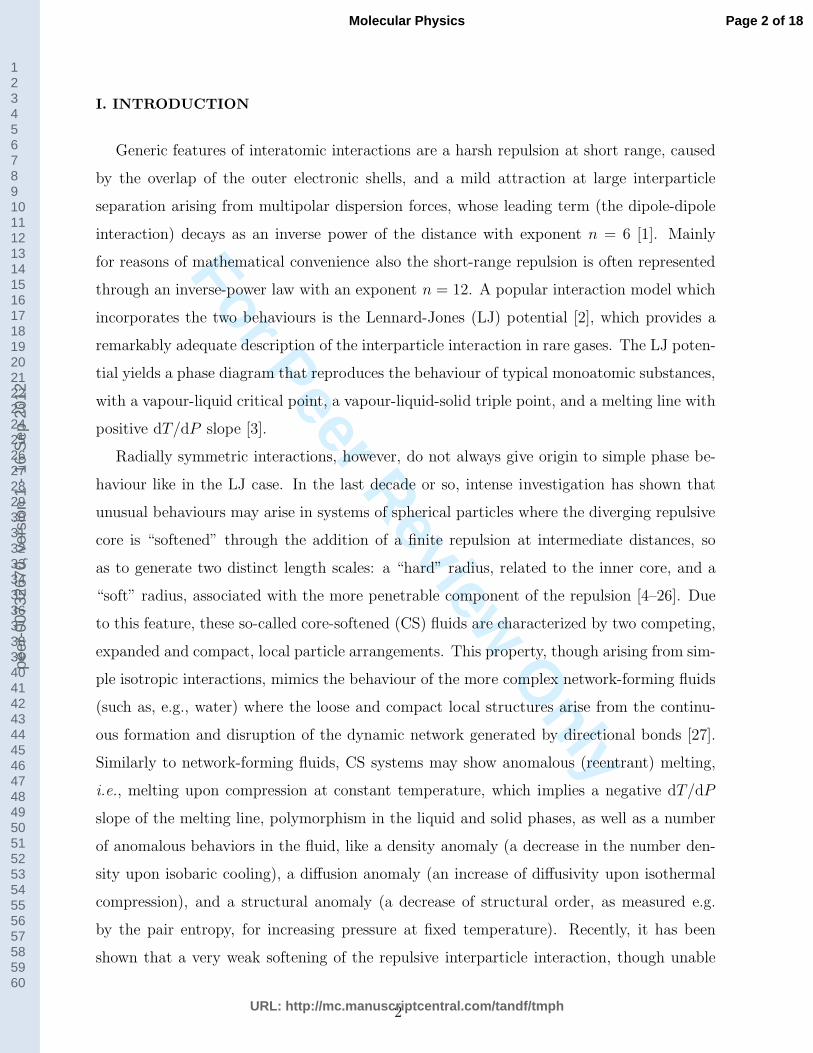
I. INTRODUCTION
Generic features of interatomic interactions are a harsh repulsion at short range, caused
by the overlap of the outer electronic shells, and a mild attraction at large interparticle
separation arising from multipolar dispersion forces, whose leading term (the dipole-dipole
interaction) decays as an inverse power of the distance with exponent n = 6 [1]. Mainly
for reasons of mathematical convenience also the short-range repulsion is often represented
through an inverse-power law with an exponent n = 12. A popular interaction model which
incorporates the two behaviours is the Lennard-Jones (LJ) potential [2], which provides a
remarkably adequate description of the interparticle interaction in rare gases. The LJ poten-
tial yields a phase diagram that reproduces the behaviour of typical monoatomic substances,
with a vapour-liquid critical point, a vapour-liquid-solid triple point, and a melting line with
positive dT/dP slope [3].
Radially symmetric interactions, however, do not always give origin to simple phase be-
haviour like in the LJ case. In the last decade or so, intense investigation has shown that
unusual behaviours may arise in systems of spherical particles where the diverging repulsive
core is “softened” through the addition of a finite repulsion at intermediate distances, so
as to generate two distinct length scales: a “hard” radius, related to the inner core, and a
“soft” radius, associated with the more penetrable component of the repulsion [4–26]. Due
to this feature, these so-called core-softened (CS) fluids are characterized by two competing,
expanded and compact, local particle arrangements. This property, though arising from sim-
ple isotropic interactions, mimics the behaviour of the more complex network-forming fluids
(such as, e.g., water) where the loose and compact local structures arise from the continu-
ous formation and disruption of the dynamic network generated by directional bonds [27].
Similarly to network-forming fluids, CS systems may show anomalous (reentrant) melting,
i.e., melting upon compression at constant temperature, which implies a negative dT/dP
slope of the melting line, polymorphism in the liquid and solid phases, as well as a number
of anomalous behaviors in the fluid, like a density anomaly (a decrease in the number den-
sity upon isobaric cooling), a diffusion anomaly (an increase of diffusivity upon isothermal
compression), and a structural anomaly (a decrease of structural order, as measured e.g.
by the pair entropy, for increasing pressure at fixed temperature). Recently, it has been
shown that a very weak softening of the repulsive interparticle interaction, though unable
2
Page 2 of 18
URL: http://mc.manuscriptcentral.com/tandf/tmph
Molecular Physics
123456789101112131415161718192021222324252627282930313233343536373839404142434445464748495051525354555657585960
peer-007
3267
0, version
1 - 16 Sep
201
2

For Peer Review O
nly
to yield two distinct length scales, can nevertheless give origin to anomalous behaviors [28].
This evidence challenges the idea that the existence of two length scales is essential for the
occurrence of anomalous behaviours and suggests that the class of isotropic interactions that
may generate such behaviours is wider than commonly assumed.
In this paper, we investigate the effects of gradually softening an inverse-power repulsive
interaction. By making use of numerical simulation and of the hypernetted-chain integral
equation, we study how the behaviour of the system varies as the repulsion softening becomes
more and more strong. This makes it possible to follow the onset of water-like anomalies
until their full development and, in particular, it enables to see the crossover from the one-
scale behaviour typical of standard LJ-like fluids to the two-scale behaviour characterizing
the CS systems.
II. MODEL
Since we plan to focus on anomalous melting and solid polymorphism as the main features
of anomalous phase behaviour [29], our analysis will be limited to systems with purely
repulsive interactions. We consider a family of modified inverse-power (MIP) potentials
where the exponent n depends on the interparticle distance r in such a way as to make the
repulsion milder in a range of distances:
uMIP(r) = ǫ(σ/r)n(r) , (1)
where ǫ and σ are energy and length units and
n(r) = n0{1 − a exp[−b(1 − r/σ)2]} . (2)
Here, a is a number between 0 and 1, and b is positive. The parameter a controls the repulsion
softening: the greater is a the more substantial the softening effect is, i.e., the higher the
local reduction of n(r). The exponent n(r) attains its minimum nmin = n0(1 − a) at r = σ.
The parameter b governs the width of the interval where n(r) is significantly smaller than
n0: the larger is b the smaller this interval is. In the following, we choose n0 = 12 and b = 5.
For a = 0 the potential in Eq. 1 has a purely inverse-power form, i.e., u(r) = ǫ(σ/r)n0 and
there is only one solid phase with FCC symmetry. As a increases, uMIP(r) becomes less and
less steep in a range of distances centred around r = σ until, for a = 1, uMIP(r) shows an
3
Page 3 of 18
URL: http://mc.manuscriptcentral.com/tandf/tmph
Molecular Physics
123456789101112131415161718192021222324252627282930313233343536373839404142434445464748495051525354555657585960
peer-007
3267
0, version
1 - 16 Sep
201
2
For Peer Review O
nly
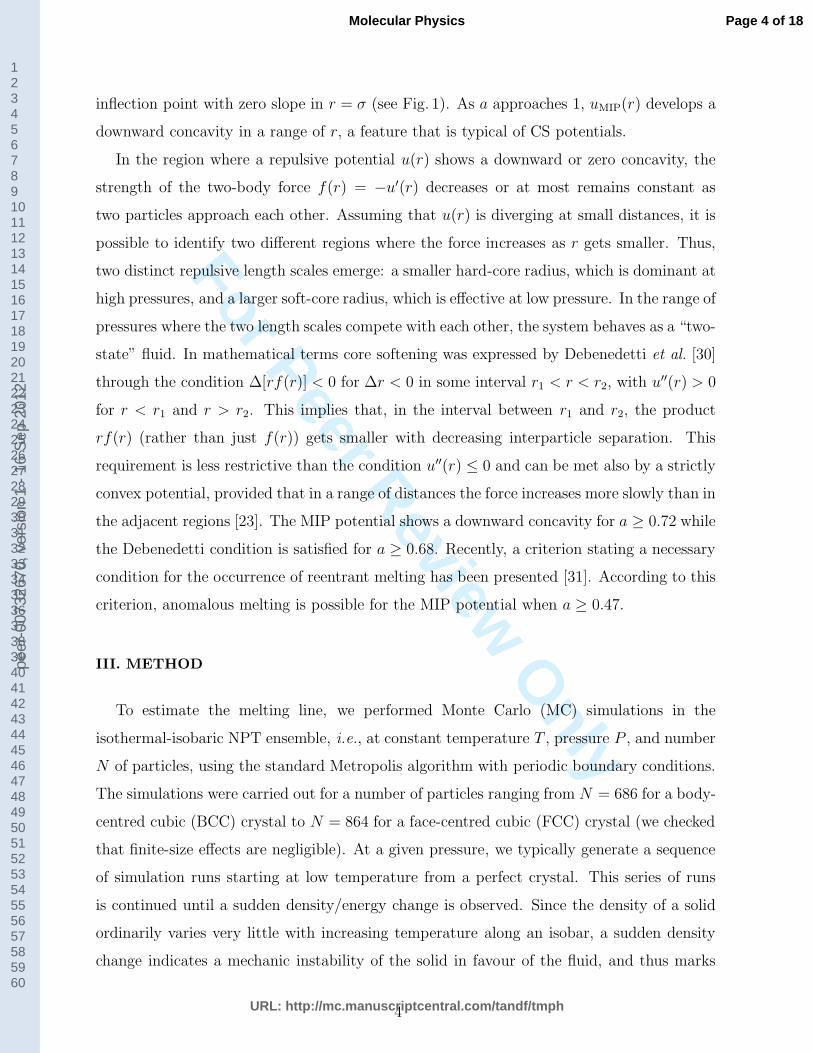
inflection point with zero slope in r = σ (see Fig. 1). As a approaches 1, uMIP(r) develops a
downward concavity in a range of r, a feature that is typical of CS potentials.
In the region where a repulsive potential u(r) shows a downward or zero concavity, the
strength of the two-body force f(r) = −u′(r) decreases or at most remains constant as
two particles approach each other. Assuming that u(r) is diverging at small distances, it is
possible to identify two different regions where the force increases as r gets smaller. Thus,
two distinct repulsive length scales emerge: a smaller hard-core radius, which is dominant at
high pressures, and a larger soft-core radius, which is effective at low pressure. In the range of
pressures where the two length scales compete with each other, the system behaves as a “two-
state” fluid. In mathematical terms core softening was expressed by Debenedetti et al. [30]
through the condition ∆[rf(r)] < 0 for ∆r < 0 in some interval r1 < r < r2, with u′′(r) > 0
for r < r1 and r > r2. This implies that, in the interval between r1 and r2, the product
rf(r) (rather than just f(r)) gets smaller with decreasing interparticle separation. This
requirement is less restrictive than the condition u′′(r) ≤ 0 and can be met also by a strictly
convex potential, provided that in a range of distances the force increases more slowly than in
the adjacent regions [23]. The MIP potential shows a downward concavity for a ≥ 0.72 while
the Debenedetti condition is satisfied for a ≥ 0.68. Recently, a criterion stating a necessary
condition for the occurrence of reentrant melting has been presented [31]. According to this
criterion, anomalous melting is possible for the MIP potential when a ≥ 0.47.
III. METHOD
To estimate the melting line, we performed Monte Carlo (MC) simulations in the
isothermal-isobaric NPT ensemble, i.e., at constant temperature T , pressure P , and number
N of particles, using the standard Metropolis algorithm with periodic boundary conditions.
The simulations were carried out for a number of particles ranging from N = 686 for a body-
centred cubic (BCC) crystal to N = 864 for a face-centred cubic (FCC) crystal (we checked
that finite-size effects are negligible). At a given pressure, we typically generate a sequence
of simulation runs starting at low temperature from a perfect crystal. This series of runs
is continued until a sudden density/energy change is observed. Since the density of a solid
ordinarily varies very little with increasing temperature along an isobar, a sudden density
change indicates a mechanic instability of the solid in favour of the fluid, and thus marks
4
Page 4 of 18
URL: http://mc.manuscriptcentral.com/tandf/tmph
Molecular Physics
123456789101112131415161718192021222324252627282930313233343536373839404142434445464748495051525354555657585960
peer-007
3267
0, version
1 - 16 Sep
201
2
For Peer Review O
nly
approximately the location of melting, as also confirmed by the concurrent rounding off of
the peaks of the radial distribution function (RDF). In fact, by this so-called “heat-until-it-
melts” (HUIM) method one just determines the upper stability threshold of the solid when
heated isobarically. The reliability of the HUIM approach as a means to locate fluid-solid
coexistence has been recently tested against “exact” free-energy calculations for a couple of
softened-core fluids and found to be good (see Ref. [21, 23, 28] for details). In any event,
our use of the HUIM method is especially directed to obtain the topology of the melting line
and to locate the threshold in a between the regimes of standard and anomalous melting.
In this respect, the HUIM method represents a satisfactory approach.
In order to study how the structural properties of the MIP fluid change as the interaction
is gradually softened, it is convenient to have a fast method to calculate the RDF. Such
a method may be provided by integral-equation theories. In particular, we consider the
hypernetted-chain (HNC) approximation, consisting in solving the Ornstein-Zernike relation
by using the HNC closure [1]:
g(r) = exp[−βu(r) + h(r) − c(r)] , (3)
where g(r) is the RDF, h(r) = g(r) − 1, c(r) is the direct correlation function, and β =
1/(kBT ). We will show in the following that the HNC theory is surprisingly good for the
MIP fluid.
A distinctive feature of systems with softened interparticle repulsion is a rich solid poly-
morphism, i.e., the existence of many different stable crystal phases at low temperature. In
systems with unbounded interparticle repulsion, this multiplicity of phases occurs because
of the frustration of highly-coordinated packings at intermediate pressures, which opens
the way to observing “unusual” particle arrangements of moderately high density and low
coordination number. Eventually, upon further compression, the harsh inner core of the
potential comes into play and the FCC order takes over. When investigating the melting
behaviour, solid polymorphism represents a complication since the number of crystals that
are potentially relevant for the system at hand is enormous. A common simplification con-
sists in restricting the calculation of chemical potential to just those phases that are found
stable or nearly stable at zero temperature, where obtaining the chemical potential as a
function of pressure is a rather straightforward task. Hence, we performed an analysis of the
zero-temperature phase diagram of the system as a function of the softness parameter by
5
Page 5 of 18
URL: http://mc.manuscriptcentral.com/tandf/tmph
Molecular Physics
123456789101112131415161718192021222324252627282930313233343536373839404142434445464748495051525354555657585960
peer-007
3267
0, version
1 - 16 Sep
201
2
For Peer Review O
nly
examining a large number of crystal structures. The outcome of this calculation is used as
a guide for computing, through the HUIM method, the melting temperature of the system
as a function of the pressure P .
IV. RESULTS
At T = 0 and fixed pressure, a crystal phase is thermodynamically stable if its enthalpy
is smaller than that of any other phase. However, the problem of minimizing the enthalpy
among all crystals is a formidable task, since the number of possible structures is virtually
infinite. Hence, we restrict the search for stable structures to a limited – albeit large – number
of candidates, including, aside from Bravais crystals, also a number of Bravais lattices with
a basis (non-Bravais crystals). Enthalpy minimization is achieved by adjusting the crystal
density and, for some of the analysed crystal lattices, also a structure parameter.
In Table I, the zero-temperature phases of the MIP fluid are reported for a number of a
values. Overall, we see that the softer is the potential the richer the solid polymorphism is.
Upon increasing a up to 0.8, a non-Bravais crystal (β-Sn, with fourfold coordination) be-
comes eventually stabilized at moderate pressures. In fact, the preference for low-coordinated
crystals at intermediate pressures seems to be a general feature among CS potentials, while
the close-packed FCC structure is stable only for the low and the very high pressures [32].
Obviously, we cannot exclude the existence of other phases that are more stable than those
found in our calculation; yet, the conclusion that the coordination number shows a dip for
intermediate pressures remains valid even if some of the phases that we say stable are actu-
ally metastable (note that the high-coordinated crystals are all among the reviewed phases).
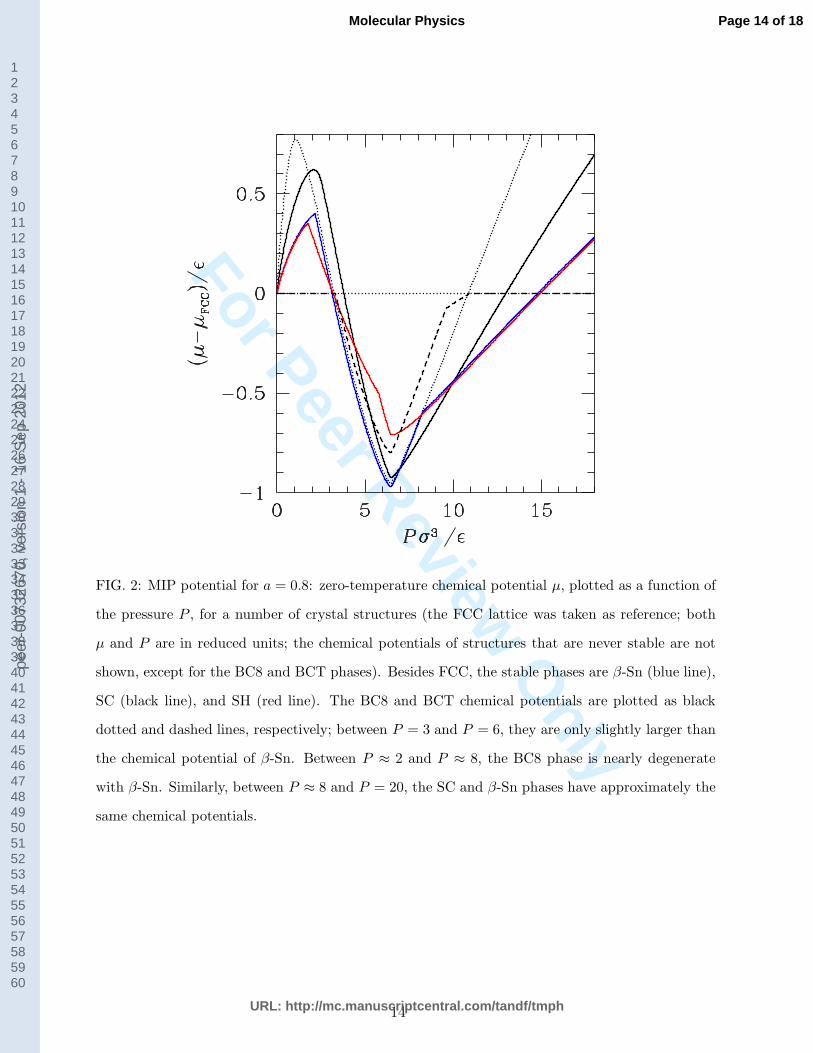
In Fig. 2, the chemical potential of the relevant phases for a = 0.8 is plotted as a function
of the pressure P , assuming the FCC solid as reference. We see that, in its own range of
stability, the β-Sn solid is almost degenerate with a BC8 phase, signalling that the latter
phase may become stable at T > 0 just for entropic reasons. In a similar way, the β-Sn
crystal is nearly as stable as the simple cubic (SC) crystal at still higher pressures, leaving
the possibility of a phase transition from SC to β-Sn at some non-zero temperature. On
account of this, we included also the BC8 crystal in the list of phases to be analysed later,
for a = 0.8, by the HUIM method.
Computer-simulation results show (see Fig. 3) that, as a increases, the melting line gradu-
6
Page 6 of 18
URL: http://mc.manuscriptcentral.com/tandf/tmph
Molecular Physics
123456789101112131415161718192021222324252627282930313233343536373839404142434445464748495051525354555657585960
peer-007
3267
0, version
1 - 16 Sep
201
2
For Peer Review O
nly
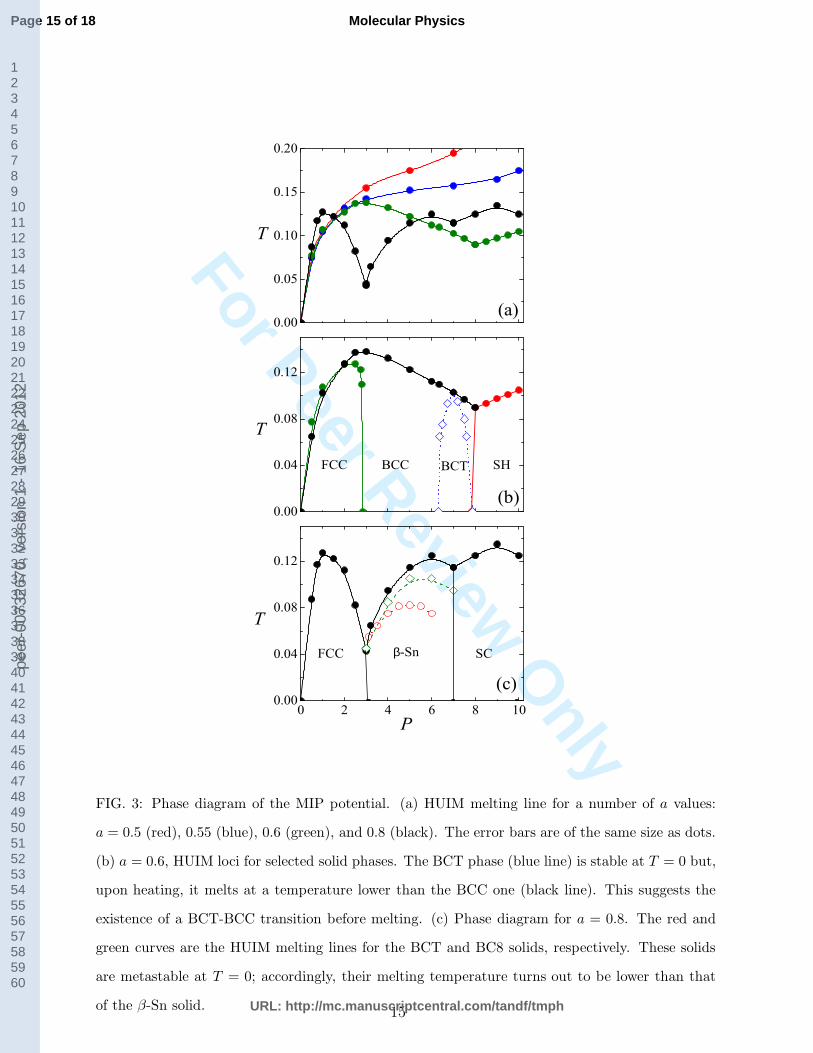
ally turns from a monotonously increasing behaviour (a = 0.5) to a non-monotonic one where
a local maximum is followed by a region of reentrant melting (a = 0.6). Correspondigly, the
phase portrait becomes rich, with solid phases other than FCC and BCC. For a considerably
softened repulsion (a = 0.8), the melting line has a complex shape with multiple maxima
and reentrant regions while the system displays water-like anomalies in the fluid phase [31].
For this a value, the stable phases for T > 0 are, besides a low-pressure FCC crystal, also a
non-Bravais crystal (β-Sn) followed, at higher pressures, by a simple-cubic solid. We checked
that, between P = 3 and P = 7, the BC8 and body-centred tetragonal (BCT) solids would
melt at a temperature lower than the melting temperature for β-Sn, which is consistent with
their status of metastable phases.
For two selected values of a (i.e., a = 0.6 and a = 0.8), we calculated the RDF along
the T = 0.2 ǫ/kB path and compared the results with those got from the HNC approxi-
mation. As shown in Fig. 4 and 5 the HNC approximation is reasonably accurate. The
main discrepancies are observed for intermediate pressures, where the height of the RDF
peak corresponding to the soft radius is slightly underestimated, while the height of the
peak relative to the hard radius is slightly overestimated at low pressures. However, all
differences turn out to be smaller than 10%. Aside from these minor deviations, the HNC
theory is nonetheless able to reproduce accurately the qualitative changes occurring in the
local structure of the system when varying the level of repulsion softening. Moreover, in
spite of the thermodynamic inconsistency of the HNC theory, the pressure computed using
the virial route is quite close to the simulation value (see Table II).
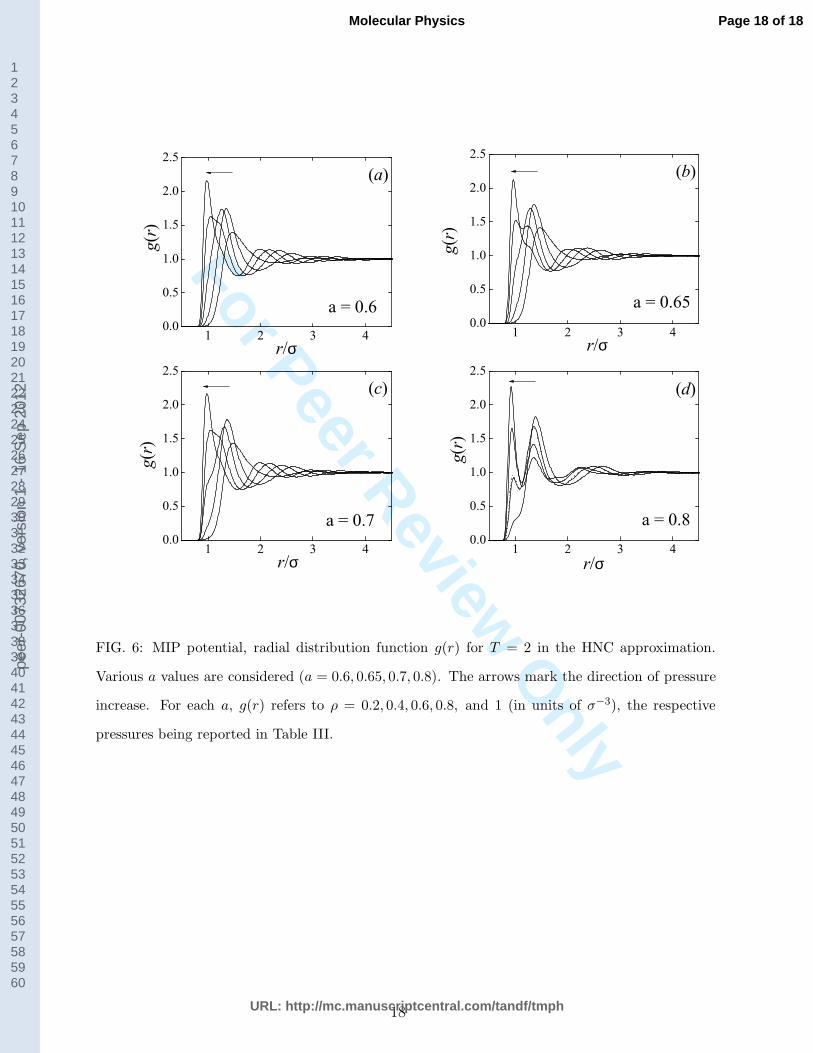
Given the accuracy of the HNC approximation in the present case, we used this theory to
obtain an overall picture of the softening-induced structural modifications in the MIP fluid
(see Fig. 6). For a = 0.6 (Fig. 6a) the pressure behaviour of the RDF is intermediate between
that typical of CS fluids and the one characteristic of standard inverse-power repulsive
interactions. As P increases at constant temperature, the nearest-neighbour peak of g(r)
gradually moves towards small r. Meanwhile its height first grows, due to the increasing
proximity with the solid lying at lower temperature, and then goes down in the pressure
range where reentrant melting occurs. As P increases further, the peak grows again while its
position changes less and less sensibly due to the small-r steep repulsion. This behaviour is
consistent with the existence of just one effective length scale that shrinks with pressure (a
feature typical of inverse-power potentials); at the same time, the rise and fall with pressure
7
Page 7 of 18
URL: http://mc.manuscriptcentral.com/tandf/tmph
Molecular Physics
123456789101112131415161718192021222324252627282930313233343536373839404142434445464748495051525354555657585960
peer-007
3267
0, version
1 - 16 Sep
201
2
For Peer Review O
nly
of the height of the main g(r) peak is reminiscent of the order-disorder interplay related to
the occurring of reentrant melting (a feature characterizing CS fluids).
As a gets larger, the soft length scale becomes better and better defined. The first
peak of g(r) starts bifurcating (Fig. 6b and 6c) until, for a = 0.8 (Fig. 6d), it splits into
two well-distinct peaks corresponding to the hard and the soft radius, respectively. Like
for CS interactions, the heights of these peaks change in opposite directions on increasing
pressure, the first peak becoming higher and higher while the second peak gradually gets
lower. This behaviour signals the coexistence in the system of two populations of particles
having distinct effective diameters. As the pressure goes up, the hard-core radius (associated
with the first RDF peak) becomes more and more populated at the expenses of the soft-core
radius (associated with the second peak), whereas the positions of the two peaks, i.e., the
two length scales, remain essentially unaltered.
V. CONCLUDING REMARKS
In recent years, increasing attention has been payed to soft-matter systems as real exam-
ples of anomalous thermodynamic and structural behaviours. Much effort has been devoted
to the investigation of simple isotropic model systems which, through the softening of the re-
pulsive component of the particle interaction, are able to display such anomalous behaviours.
The study of these systems may help to unveil the statistical mechanisms that are respon-
sible for these anomalies. This research is relevant also for the physics of elemental solids
under extreme conditions, where anomalous melting and solid polymorphism are observed
as a result of pressure-induced rearrangements in the electronic structure [21].
In this paper we studied the phase behaviour of a family of potentials with tunable core
softness, finding elements of complexity that are simply unknown to “normal” systems like
the Lennard-Jones and inverse-power fluids. In particular, we found a clear evidence that
low-coordinated (even non-Bravais) lattices do provide the structure of stable solid phases
at intermediate pressures. In the next years, as the techniques to functionalize the surface
of colloidal particles gradually improve, it will become possible to realize soft materials
characterized by effective interparticle potentials similar to the one investigated here and
thus able to yield spontaneous assembly of particles into non-Bravais structures.
Another significant point of our investigation concerns the analysis of the changes in the
8
Page 8 of 18
URL: http://mc.manuscriptcentral.com/tandf/tmph
Molecular Physics
123456789101112131415161718192021222324252627282930313233343536373839404142434445464748495051525354555657585960
peer-007
3267
0, version
1 - 16 Sep
201
2
For Peer Review O
nly
local structure of the system as the repulsion is gradually softened, going from the inverse-
power form to that typical of CS potentials. For weak repulsion softening, a reentrant-fluid
region appears in the melting line while the radial distribution function g(r) still exhibits a
single pressure-modulated length scale. Only when the level of softening becomes significant,
g(r) acquires the two-scale aspect typical of CS systems. This outcome confirms that the
“two-scale” mechanism is not strictly necessary for explaining the occurrence of anomalous
behaviors in systems with isotropic interactions [28].
[*] Corresponding author. E-mail: [email protected]
[†] E-mail: [email protected]
[‡] E-mail: [email protected]
[1] J. P. Hansen and I. R. McDonald, Theory of simple liquids (Academic Press, London, 1976)
[2] J. E. Lennard-Jones, Proc. Camb. Phil. Soc. 27, 469 (1931)
[3] D. A. Young, Phase Diagrams of the Elements (University of California, Berkeley, 1991).
[4] P. C. Hemmer and G. Stell. Phys. Rev. Lett. 24, 1284 (1970).
[5] M. R. Sadr-Lahijany, A. Scala, S. V. Buldyrev, H. E. Stanley, Phys. Rev. Lett. 81, (1998).
[6] E. A. Jagla, Phys. Rev. E 58, 1478 (1998).
[7] M. Watzlawek, C. N. Likos, H. Lowen, Phys. Rev. Lett. 82, 5289 (1999).
[8] G. Franzese, G. Malescio, A. Skibinsky, S. V. Buldyrev, H. E. Stanley, Nature 409, 692 (2001).
[9] G. Franzese, G. Malescio, A. Skibinsky, S. V. Buldyrev, H. E. Stanley, Phys. Rev. E 66,
051206 (2002).
[10] G. Malescio, G. Franzese, G. Pellicane, A. Skibinsky, S. V. Buldyrev, H. E. Stanley, J. Phys.:
Condens. Matter 14, 2193 (2002).
[11] G. Malescio and G. Pellicane, Nature Mat. 2, 97 (2003).
[12] A. Skibinsky, S. V. Buldyrev, G. Franzese, G. Malescio, H. E. Stanley, Phys. Rev. E 69,
061206 (2004).
[13] G. Malescio and G. Pellicane, Phys. Rev. E 70, 021202 (2004).
[14] G. Malescio, G. Franzese, A. Skibinsky, S. V. Buldyrev, H. E. Stanley, Phys. Rev. E 71,
061504 (2005).
[15] Z. Yan, S. V. Buldyrev, N. Giovambattista, H. E. Stanley, Phys. Rev. Lett. 95, 130604 (2005).
9
Page 9 of 18
URL: http://mc.manuscriptcentral.com/tandf/tmph
Molecular Physics
123456789101112131415161718192021222324252627282930313233343536373839404142434445464748495051525354555657585960
peer-007
3267
0, version
1 - 16 Sep
201
2
For Peer Review O
nly
[16] H. M. Gibson and N. B. Wilding,. Phys. Rev. E 73, 061507 (2006).
[17] G. Malescio, J. Phys.: Condensed Matter 19, 073101 (2007).
[18] Y. D. Fomin, N. V. Gribova, V. N. Ryzhov, S. M. Stishov, D. Frenkel, J. Chem. Phys. 129,
064512 (2008).
[19] Y. D. Fomin, E. N. Tsiok, V. N. Ryzhov, J. Chem. Phys. 134, 044523 (2011).
[20] G. J. Pauschenwein and G. Kahl, Soft Matter 4, 1396 (2008).
[21] G. Malescio, F. Saija, S. Prestipino, J. Chem. Phys. 129, 241101 (2008).
[22] A. B. de Oliveira, P. A. Netz, M. Barbosa, Europhys. Lett. 85, 36001 (2009).
[23] F. Saija, S. Prestipino, G. Malescio, Phys. Rev. E 80, 031502 (2009).
[24] P. Vilaseca and G. Franzese, J. Chem. Phys. 133, 084507 (2010).
[25] E. Lascaris, G. Malescio, S. V. Buldyrev, H. E. Stanley, Phys. Rev. E 81, 031201 (2010).
[26] O. Mishima and H. E. Stanley, Nature 396, 329 (1998).
[27] P. G. Debenedetti Metastable Liquids (Princeton University Press, Princeton, 1996).
[28] S. Prestipino, F. Saija, and G. Malescio, J. Chem. Phys. 133, 144504 (2010).
[29] P. F. McMillan, J. Mater. Chem. 14, 1506 (2004).
[30] P. G. Debenedetti, V. S. Raghavan, S. S. Borick, J. Phys. Chem. 95, 4540 (1991).
[31] G.Malescio and F.Saija, J. Phys. Chem. B (2011), submitted.
[32] S. Prestipino, F. Saija, and G. Malescio, Soft Matter 5, 2795 (2009).
10
Page 10 of 18
URL: http://mc.manuscriptcentral.com/tandf/tmph
Molecular Physics
123456789101112131415161718192021222324252627282930313233343536373839404142434445464748495051525354555657585960
peer-007
3267
0, version
1 - 16 Sep
201
2

For Peer Review O
nlyε
σ
FIG. 1: The potential uMIP(r) for several values of a: a = 0.2 (black solid line), 0.4 (blue dashed
line), 0.6 (red dotted line), 0.8 (green dash-dotted line), and 1 (orange long-dashed line).
11
Page 11 of 18
URL: http://mc.manuscriptcentral.com/tandf/tmph
Molecular Physics
123456789101112131415161718192021222324252627282930313233343536373839404142434445464748495051525354555657585960
peer-007
3267
0, version
1 - 16 Sep
201
2

For Peer Review O
nly
TABLE I: MIP potential, zero-temperature phase diagram up to P = 20 ǫσ−3 for a number of
a values. For each phase (column 2), we report the pressure interval of stability (column 1,
units of ǫσ−3), the corresponding density interval (column 3, units of σ−3), and the values of the
structure parameter (if any is present; column 4). The scrutinized lattices were the following: FCC,
BCC, HCP, SC, diam, BC8, cI16-Li, β-Sn, SH, ST, BCT, graphite (see Ref. [32] for the notation
employed).
a = 0.5
0–2.91 FCC 0–0.729 —
2.92–11.91 BCC 0.739–1.210 —
11.92–20 FCC 1.229–1.464 —
a = 0.55
0–2.83 FCC 0–0.705 —
2.84–11.14 BCC 0.717–1.200 —
11.15–11.72 BCT 1.204–1.233 0.92–0.87
11.73–20 FCC 1.254–1.510 —
a = 0.6
0–2.85 FCC 0–0.688 —
2.86–6.32 BCC 0.701–0.948 —
6.33–7.88 BCT 0.958–1.040 1.95–1.93
7.89–13.00 SH 1.096–1.287 0.94–0.97
13.01–20 FCC 1.352–1.563 —
a = 0.8
0–3.12 FCC 0–0.631 —
3.13–6.98 β-Sn 0.850–1.019 0.77–0.80
6.99–9.89 SC 1.118–1.218 —
9.90–14.91 SH 1.315–1.454 1.06–1.05
14.92–20 FCC 1.674–1.801 —
12
Page 12 of 18
URL: http://mc.manuscriptcentral.com/tandf/tmph
Molecular Physics
123456789101112131415161718192021222324252627282930313233343536373839404142434445464748495051525354555657585960
peer-007
3267
0, version
1 - 16 Sep
201
2
For Peer Review O
nly
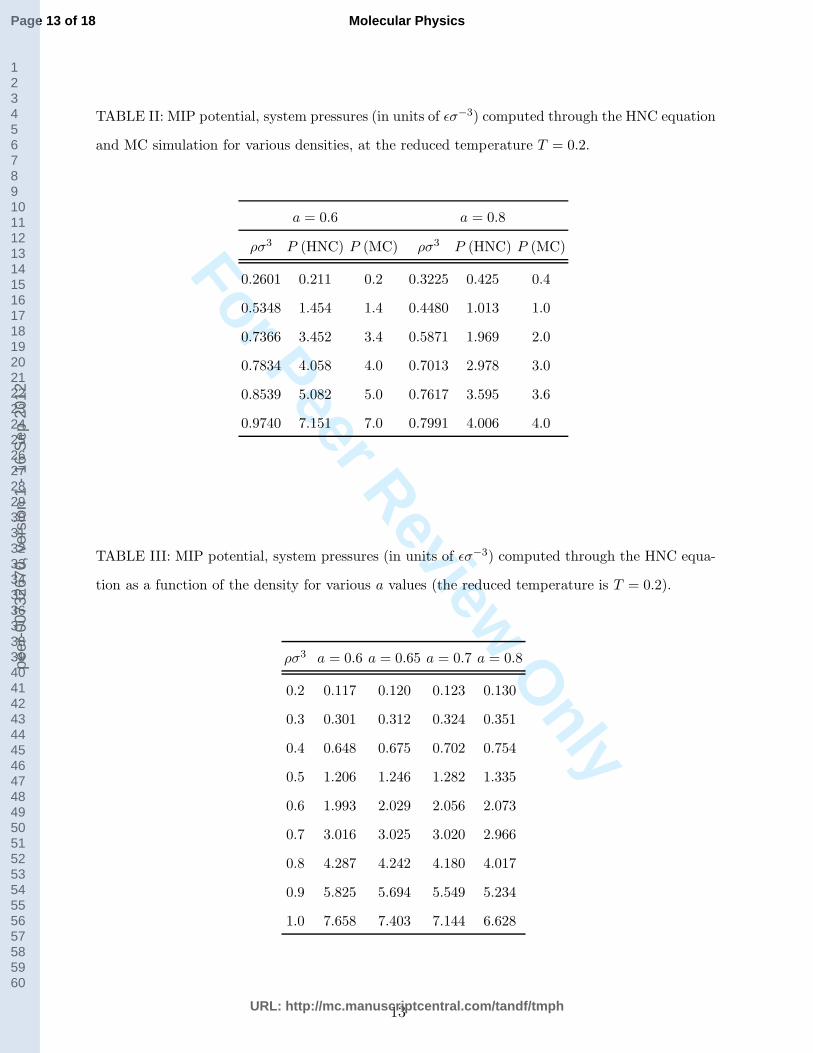
TABLE II: MIP potential, system pressures (in units of ǫσ−3) computed through the HNC equation
and MC simulation for various densities, at the reduced temperature T = 0.2.
a = 0.6 a = 0.8
ρσ3 P (HNC) P (MC) ρσ3 P (HNC) P (MC)
0.2601 0.211 0.2 0.3225 0.425 0.4
0.5348 1.454 1.4 0.4480 1.013 1.0
0.7366 3.452 3.4 0.5871 1.969 2.0
0.7834 4.058 4.0 0.7013 2.978 3.0
0.8539 5.082 5.0 0.7617 3.595 3.6
0.9740 7.151 7.0 0.7991 4.006 4.0
TABLE III: MIP potential, system pressures (in units of ǫσ−3) computed through the HNC equa-
tion as a function of the density for various a values (the reduced temperature is T = 0.2).
ρσ3 a = 0.6 a = 0.65 a = 0.7 a = 0.8
0.2 0.117 0.120 0.123 0.130
0.3 0.301 0.312 0.324 0.351
0.4 0.648 0.675 0.702 0.754
0.5 1.206 1.246 1.282 1.335
0.6 1.993 2.029 2.056 2.073
0.7 3.016 3.025 3.020 2.966
0.8 4.287 4.242 4.180 4.017
0.9 5.825 5.694 5.549 5.234
1.0 7.658 7.403 7.144 6.628
13
Page 13 of 18
URL: http://mc.manuscriptcentral.com/tandf/tmph
Molecular Physics
123456789101112131415161718192021222324252627282930313233343536373839404142434445464748495051525354555657585960
peer-007
3267
0, version
1 - 16 Sep
201
2
For Peer Review O
nly
FIG. 2: MIP potential for a = 0.8: zero-temperature chemical potential µ, plotted as a function of
the pressure P , for a number of crystal structures (the FCC lattice was taken as reference; both
µ and P are in reduced units; the chemical potentials of structures that are never stable are not
shown, except for the BC8 and BCT phases). Besides FCC, the stable phases are β-Sn (blue line),
SC (black line), and SH (red line). The BC8 and BCT chemical potentials are plotted as black
dotted and dashed lines, respectively; between P = 3 and P = 6, they are only slightly larger than
the chemical potential of β-Sn. Between P ≈ 2 and P ≈ 8, the BC8 phase is nearly degenerate
with β-Sn. Similarly, between P ≈ 8 and P = 20, the SC and β-Sn phases have approximately the
same chemical potentials.
14
Page 14 of 18
URL: http://mc.manuscriptcentral.com/tandf/tmph
Molecular Physics
123456789101112131415161718192021222324252627282930313233343536373839404142434445464748495051525354555657585960
peer-007
3267
0, version
1 - 16 Sep
201
2
For Peer Review O
nly
β
FIG. 3: Phase diagram of the MIP potential. (a) HUIM melting line for a number of a values:
a = 0.5 (red), 0.55 (blue), 0.6 (green), and 0.8 (black). The error bars are of the same size as dots.
(b) a = 0.6, HUIM loci for selected solid phases. The BCT phase (blue line) is stable at T = 0 but,
upon heating, it melts at a temperature lower than the BCC one (black line). This suggests the
existence of a BCT-BCC transition before melting. (c) Phase diagram for a = 0.8. The red and
green curves are the HUIM melting lines for the BCT and BC8 solids, respectively. These solids
are metastable at T = 0; accordingly, their melting temperature turns out to be lower than that
of the β-Sn solid. 15
Page 15 of 18
URL: http://mc.manuscriptcentral.com/tandf/tmph
Molecular Physics
123456789101112131415161718192021222324252627282930313233343536373839404142434445464748495051525354555657585960
peer-007
3267
0, version
1 - 16 Sep
201
2

For Peer Review O
nly
σσσ
σσσ
FIG. 4: MIP potential, radial distribution function g(r) as computed from the HNC theory (solid
lines) and from MC simulation (dots) for a = 0.6 and six pressures (the reduced temperature is
T = 0.2).
16
Page 16 of 18
URL: http://mc.manuscriptcentral.com/tandf/tmph
Molecular Physics
123456789101112131415161718192021222324252627282930313233343536373839404142434445464748495051525354555657585960
peer-007
3267
0, version
1 - 16 Sep
201
2

For Peer Review O
nly
σσσ
σσσ
FIG. 5: MIP potential, radial distribution function g(r) as computed from the HNC theory (solid
lines) and from MC simulation (dots) for a = 0.8 and six pressures (the reduced temperature is
T = 0.2).
17
Page 17 of 18
URL: http://mc.manuscriptcentral.com/tandf/tmph
Molecular Physics
123456789101112131415161718192021222324252627282930313233343536373839404142434445464748495051525354555657585960
peer-007
3267
0, version
1 - 16 Sep
201
2
For Peer Review O
nly
σσ
σσ
FIG. 6: MIP potential, radial distribution function g(r) for T = 2 in the HNC approximation.
Various a values are considered (a = 0.6, 0.65, 0.7, 0.8). The arrows mark the direction of pressure
increase. For each a, g(r) refers to ρ = 0.2, 0.4, 0.6, 0.8, and 1 (in units of σ−3), the respective
pressures being reported in Table III.
18
Page 18 of 18
URL: http://mc.manuscriptcentral.com/tandf/tmph
Molecular Physics
123456789101112131415161718192021222324252627282930313233343536373839404142434445464748495051525354555657585960
peer-007
3267
0, version
1 - 16 Sep
201
2