Provincial government and administration in Jacobean Munster
Upload
khangminh22Category
view
0download
0
Annual Report2016 / 2017
Northern Cape Department of Agriculture, Land Reform & Rural Development
Annual Report 2016/2017
PR118/2017ISBN: 978-0-621-45378-2
Dep
artment of A
griculture, Land R
eform &
Rural D
evelopm
entN
orthern Cap
e Province Vote 12
Annual R
epo
rt 2016/2017
Designed & printed by SwiftPrint, Tel: 053 839 2900, Kimberley

Annual Report for 2016/17 Financial Year
| 1Department of Agriculture, Land Reform & Rural Development Northern Cape Province Vote 12

Annual Report for 2016/17 Financial Year
2 |Department of Agriculture, Land Reform & Rural Development Northern Cape Province Vote 12
TABLE OF CONTENTS
PART A: GENERAL INFORMATION ............................................................................................................ 4
1. DEPARTMENT GENERAL INFORMATION ............................................................................................ 5
2. LIST OF ABBREVIATIONS/ACRONYMS ............................................................................................... 6
3. FOREWORD BY THE MEC .................................................................................................................... 8
4. REPORT OF THE ACCOUNTING OFFICER .......................................................................................... 9
5. STATEMENT OF RESPONSIBILITY AND CONFIRMATION OF ACCURACY FOR THE ANNUAL REPORT ............................................................................................................................... 15
6. STRATEGIC OVERVIEW ...................................................................................................................... 16
6.1. Vision ............................................................................................................................................. 16
6.2. Mission .......................................................................................................................................... 16
6.3. Values ............................................................................................................................................ 16
7. LEGISLATIVE AND OTHER MANDATES ............................................................................................. 17
8. ORGANISATIONAL STRUCTURE ....................................................................................................... 18
9. ENTITIES REPORTING TO THE MEC ................................................................................................. 18
PART B: PERFORMANCE INFORMATION ................................................................................................ 19
1. AUDITOR GENERAL’S REPORT: PREDETERMINED OBJECTIVES ................................................... 20
2. OVERVIEW OF DEPARTMENTAL PERFORMANCE............................................................................ 20
2.1 Service Delivery Environment ....................................................................................................... 20
2.2 Service Delivery Improvement Plan .............................................................................................. 21
2.3 Organisational environment .......................................................................................................... 23
2.4 Key policy developments and legislative changes ....................................................................... 24
3. STRATEGIC OUTCOME ORIENTED GOALS ...................................................................................... 24
4. PERFORMANCE INFORMATION BY PROGRAMME .......................................................................... 39
4.1 Programme 1: Administration ....................................................................................................... 39
4.2 Programme 2: Sustainable Resource Management ..................................................................... 46
4.3 Programme 3:Farmer Support and Development ........................................................................ 60
4.4 Programme 4: Veterinary Services ............................................................................................... 73
4.5 Programme 5: Research and Technology Development Services ............................................... 90
4.6 Programme 6: Agricultural Economics Services ........................................................................ 103
4.7 Programme 7: Rural Development Coordination .........................................................................112

Annual Report for 2016/17 Financial Year
| 3Department of Agriculture, Land Reform & Rural Development Northern Cape Province Vote 12
5. TRANSFER PAYMENTS .................................................................................................................... 122
6. CONDITIONAL GRANTS ................................................................................................................... 122
6.1. Conditional grants and earmarked funds received .................................................................... 122
7. DONOR FUNDS ................................................................................................................................ 127
7.1. Donor Funds Received ............................................................................................................... 127
8. CAPITAL INVESTMENT ..................................................................................................................... 127
8.1. Capital investment, maintenance and asset management plan ....................................................... 127
PART C: GOVERNANCE ........................................................................................................................... 127
1. INTRODUCTION ................................................................................................................................ 129
2. RISK MANAGEMENT ........................................................................................................................ 129
3. FRAUD AND CORRUPTION .............................................................................................................. 129
4. MINIMISING CONFLICT OF INTEREST ............................................................................................ 130
5. CODE OF CONDUCT ........................................................................................................................ 130
6. HEALTH SAFETY AND ENVIRONMENTAL ISSUES ......................................................................... 131
7. PORTFOLIO COMMITTEES .............................................................................................................. 132
8. SCOPA RESOLUTIONS ..................................................................................................................... 132
9. PRIOR MODIFICATIONS TO AUDIT REPORTS ................................................................................ 132
10. INTERNAL CONTROL UNIT .............................................................................................................. 133
11. INTERNAL AUDIT AND AUDIT COMMITTEES.................................................................................. 133
12. REPORT OF THE AUDIT COMMITTEE ............................................................................................. 136
PART D: HUMAN RESOURCE MANAGEMENT ...................................................................................... 138
1. INTRODUCTION ................................................................................................................................ 139
2. HUMAN RESOURCES OVERSIGHT STATISTICS ............................................................................. 140
PART E: FINANCIAL INFORMATION ....................................................................................................... 167
1. REPORT OF THE AUDITOR GENERAL ............................................................................................ 169
2. ANNUAL FINANCIAL STATEMENTS ..................................................................................................174

Annual Report for 2016/17 Financial Year
4 |Department of Agriculture, Land Reform & Rural Development Northern Cape Province Vote 12

Annual Report for 2016/17 Financial Year
| 5Department of Agriculture, Land Reform & Rural Development Northern Cape Province Vote 12
1. DEPARTMENT GENERAL INFORMATION
PHYSICAL ADDRESS: 162 George Street
Kimberley
8301
POSTAL ADDRESS: Private bag X5018
Kimberley
8301
TELEPHONE NUMBER/S: +27 538389100
FAX NUMBER: +27 538389138
EMAIL ADDRESS: [email protected]
WEBSITE ADDRESS: www.agrinc.gov.za

Annual Report for 2016/17 Financial Year
6 |Department of Agriculture, Land Reform & Rural Development Northern Cape Province Vote 12
2. LIST OF ABBREVIATIONS/ACRONYMS
ABET Adult Basic Education & Training
AC Audit Committee
AFASA African Farmers Association of South Africa
AFS Annual Financial Statements
AGSA Auditor General of South Africa
AgriNK Agri – Noord Kaap
AO Accounting Officer
APR Agricultural Potential Reports
ARC Agricultural Research Council
BBBEE Broad Based Black Economic Empowerment
BMF Broad Management Forum
CAADP Comprehensive African Agricultural Development
CASP Comprehensive Agricultural Support Programme
CFO Chief Financial Officer
COGSTA Department of Cooperative Governance, Human Settlements & Traditional Affairs
CPA Communal Property Association
CRDP Comprehensive Rural Development Programme
CWP Community Work programme
DAFF Department of Agriculture, Forestry and Fisheries
DALRRD Department of Agriculture, Land Reform and Rural Development
DSA Descriptive Sensory Analysis
ECDC Early Childhood Development Centres
EDEC Extended Departmental Executive Committee
EPWP Expanded Public Works Programme
EIA Environmental Impact Assessment
EU European Union
FAO Food & Agriculture Organization
FMD Foot and Mouth Disease
GADI Grootfontein Agricultural Development Institute
GI Geographic Indication
HOD Head of Department
IDP Integrated Development Programme
IFSNP Integrated Food Security & Nutrition Programme
IEC Independent Electoral Commission
IFSS Integrated Food Security Strategy of South Africa
JTG John Taolo Gaetsewe
KDF Trust Karoo Development Foundation Trust
LSU Large Stock Unit
MEC Member of Executive Council

Annual Report for 2016/17 Financial Year
| 7Department of Agriculture, Land Reform & Rural Development Northern Cape Province Vote 12
MOU Memorandum of Understanding
MIG Municipal Infrastructure Grant
MISS Management Information Security Systems
MPAT Management Performance Assessment Tool
MPL Member of the Provincial Legislature
MTSF Medium Term Strategic Framework
MTEF Medium Term Expenditure Framework
NAFU National African Farmers Union
NAMC National Agriculture Marketing Council
NCOP National Council of Provinces
NDMC National Disaster Management Centre
NDP National Development Plan
NGO Non-Governmental Organization
NICD National Institute of Communicable Diseases
OIE Office International des Epizooties
OCFO Office of the Chief Financial Officer
PA Pyrrolizidine alkaloid
PAIA Promotion of Access to Information
PAJA Promotion of Administrative Justice
PSC Public Service Commission
PDMC Provincial Disaster Management Centre
PFMA Public Finance Management Act
PPME Planning Performance Monitoring & Evaluation
PPP Public Private Partnerships
QLFS Quarterly Labour Force Survey
RADP Recapitalization and Development Programme
RMC Risk Management Committee
SASSA South African Social Security Agency
SASAE South African Society for Agricultural Extension
SCOPA Standing Committee on Public Accounts
SIP Strategic Integrated Projects
SKA Square Kilometre Array
SMME Small Medium and Micro Enterprises
SCM Supply Chain Management
SAQA South African Qualifications Authority
SDVI Standardized Difference Vegetation Index
SITA State Information Technology Agency
SDIP Service Delivery Improvement Plan
SPLUMA Spatial Planning and Land Use Management Act
SSA State Security Agency
TR Treasury Regulations
VCI Vegetation Condition Index
Annual Report for 2016/17 Financial Year
8 |Department of Agriculture, Land Reform & Rural Development Northern Cape Province Vote 12
3. FOREWORD BY THE MEC
The annual report 2016/17 presents the work undertaken by the department in pursuit of a transformed, vibrant agricultural sector for food security and sustainable rural development. It is this vision that has guided the activities, interventions, and programmes of the department. The delivery environment was complicated by the subdued economic outlook, natural disasters such as drought, and internal constraints pertaining to the recruitment of personnel in the scarce skills category. However, prudency has enabled the department to implement and pursue its planned programmes successfully.
The department continued to prioritise and implement the Fetsa Tlala Food Production Programme as part of the food security initiatives. This programme aims to put 1 million hectares of unproductive land into production, create jobs and address challenges of food security in the Province. During the year under review, a total of 812.5 ha were planted with various crops in the province. The main crops planted were maize, wheat, oats and dry beans.
The department, in its endeavour to contribute to economic growth and creation of jobs, used the conditional grants of CASP and Ilima/Letsema to fund projects for smallholder farmers and black commercial farmers. Projects implemented through these conditional grants resulted in the creation of 708 jobs. A total of 3965 smallholder farmers were supported with the aim of increasing production and transforming the sector.
Assistance to smallholder farmers was particularly important given the impact of the drought that was experienced in parts of the province. Through funds allocated by Department of Agriculture, Forestry and Fisheries (DAFF), farmers in the affected areas were provided with feed and technical support. It remains a priority of the department to monitor the situation and to intervene timeously to avoid any catastrophe resulting from natural disasters. Accordingly, the department has established a fodder bank to support farmers affected by disasters such as drought and veld fires.
Research and technology transfer is one of the key instruments that will be used to support growth of the sector in the province. Against this backdrop, the department has implemented 13 long term projects that will potentially lead to adoption of more sustainable production technologies thereby grow and transform the sector. This is central to achieving improved livelihoods, sustainable rural development, and food security for all.
My sincerest gratitude goes to all members of staff who with the support of our partners worked tirelessly and diligently to ensure that the priorities of government are pursued through the achievement that are reported in this annual report. Together we will continue to do more in improving the quality and access of services to the public.
_________________
Mr GNJ Shushu, MPL
MEC of the Department of Agriculture, Land Reform and Rural Development
Date: 29 August 2017
Mr G.N.J Shushu
Member of the Executive Council

Annual Report for 2016/17 Financial Year
| 9Department of Agriculture, Land Reform & Rural Development Northern Cape Province Vote 12
4. REPORT OF THE ACCOUNTING OFFICER
Overview of the operations of the department:
The 2016/2017 financial year has been an exciting and eventful year in the achievement of annual performance strategic indicators, as presented in the Annual Performance Plan (APP) 2016/2017. Despite various challenges the department continued to aggressively pursue planned targets in the interest of ensuring service delivery was not compromised or negatively impacted.
The 2011 Flood Assistance scheme has finally been concluded by 31 March 2017. Although the department envisaged in its APP to conclude on the scheme during 2015/2016, it was challenged in the EIA process for the Onseepkans bulk water supply infrastructure. The challenge to the EIA process was attributed to a decision to replace the canal with a pipeline that was not only cost effective, but considered the risk of damages to the pipeline owing to it falling beneath floodline. The proposed alternative required a re-submission of the EIA process that was issued during October 2016.
The province continues to experience recurrent droughts and continues with its mitigation strategies. In the 2016/17, following the driest year since 1904, the province was allocated an amount of R25m from a request of R163m but the implementation was centralized by national. This forced the province to prioritize the winter rainfall and transitional areas for urgent intervention and an amount of R20m was for fodder and the remaining R5m was for transportation of donated fodder.
Overview of the financial results of the department:
Departmental receipts
Departmental receipts
2016/2017 2015/2016
Estimate Actual Amount
Collected
(Over)/Under
Collection
Estimate Actual Amount
Collected
(Over)/Under
Collection
R’000 R’000 R’000 R’000 R’000 R’000
Tax Receipts
Casino taxes
Horse racing taxes
Liquor licences
Motor vehicle licences
Sale of goods and services other than capital assets
2 557 2 838 (281) 1 974 2 820 (846)
Transfers received
Fines, penalties and forfeits
Interest, dividends and rent on land
4 5 (1) 9 9 -
Sale of capital assets 648 648 -
Financial transactions in assets and liabilities
102 221 (119) 72 139 (67)
Total 3 311 3 712 (401) 2 055 2 968 (913)
Mr W.V.D Mothibi
Head of Department

Annual Report for 2016/17 Financial Year
10 |Department of Agriculture, Land Reform & Rural Development Northern Cape Province Vote 12
The department collected R3.712 million of own revenue for the 2016/17 financial year and this represents an increase of 25 percent when compared to the previous financial year. This increase mainly is noted in the category of sale of capital assets and is related to the insurance payment received for the official vehicle of the Executive Member that was written-off after an accident.
As has been the trend over the past few years, the department has over collected on its revenue estimates. This is to some extent is deliberate in that it is difficult to reasonably forecast the incidental sale of biological assets which are used for breeding and research purposes on our research stations and the Livestock Improvement Programme (LIP).
The tariffs related to veterinary services are reviewed annually and when necessary increased with the approval of the Provincial Treasury. There were no bad debts written off during the period under review.
The list below represents those free services rendered by the department that if a fee/tariff were charged, could have yielded a significant amount of revenue.• Veterinary services• Primary animal health care (e.g. spay campaigns)• Awareness campaigns (radio talks, farmer’s days & workshops)• Vaccination campaigns• Agricultural business development• Business plan development• Feasibility studies• Training and capacity building of farmer’s• Extension and advisory services
Programme Expenditure
Programme 2016/2017 2015/2016
Final Appropri-
ation
Actual Expendi-
ture
(Over)/Under Ex-penditure
Final Appropri-
ation
Actual Expendi-
ture
(Over)/Under Ex-penditure
R’000 R’000 R’000 R’000 R’000 R’000
Pr 1: Administration 118 608 118 606 2 106 491 106 424 67
Pr 2: Sustainable Resource Management 95 698 95 444 254 97 500 97 496 4
Pr 3: Farmer Support & Development 226 885 212 071 14 814 245 596 243 345 2 251
Pr 4: Veterinary Services 44 659 44 659 - 43 017 42 682 355
Pr 5: Research & Technology Development 46 656 46 656 - 43 308 43 065 243
Pr 6: Agricultural Economics 9 061 9 043 18 9 119 8 138 981
Pr 7: Rural Development 13 638 13 630 8 12 916 12 900 16
Total 555 205 540 109 15 096 557 947 554 947 3 892
The final adjusted budget allocation of the department, including conditional grants, for the 2016/17 financial year was R555.205 million of which R540.109 million or 97 percent was spent. The unspent portion mainly related to the conditional grants however these funds were committed and rollover of funds was requested from the Provincial Treasury.
The total budget available from four conditional grants amounted to R196.466 million of which R181.634 million or 92 percent was spent. R14.810 million of the unspent funds have been requested to be rolled over to the 2017/18 financial year.

Annual Report for 2016/17 Financial Year
| 11Department of Agriculture, Land Reform & Rural Development Northern Cape Province Vote 12
The graph below shows the overall budget and expenditure trend of the Department for the past three financial years
715 690
619 947
552 383
776 638
557 947 555 205
769 439
554 050 540 109
0
100 000
200 000
300 000
400 000
500 000
600 000
700 000
800 000
900 000
2014/15 2015/16 2016/17
Original Budget Final Budget Final Expenditure
Virements/Roll Overs
The department has effected virements between the main divisions and fund shifts within main division in terms of section 43 of the PFMA and Treasury Regulation 6.3 to defray excess expenditure in some programmes with savings from other programmes. The details of the virements are summarised in the table. The virements were approved by the Accounting Officer and the both the Executive Authority and the Provincial Treasury were informed.
Virement from Virement to
Programme / Economic classification
R thousand
Programme / Economic classification
R thousand
Programme 1: (297) Programme 1: 1,174
Current payments - Current payments 1,174
Compensation of employees Compensation of employees 123
Goods and services Goods and services 1,051
Transfers and Subsidies Transfers and Subsidies
Payment for capital assets (297) Payment for capital assets
Programme 2: (334) Programme 2: -
Current payments (334) Current payments -
Compensation of employees (334) Compensation of employees
Goods and services Goods and services
Transfers and Subsidies Transfers and Subsidies
Payment for capital assets (164) Payment for capital assets

Annual Report for 2016/17 Financial Year
12 |Department of Agriculture, Land Reform & Rural Development Northern Cape Province Vote 12
Virement from Virement to
Programme / Economic classification
R thousand
Programme / Economic classification
R thousand
Programme 3: (164) Programme 3: 1,099
Current payments - Current payments 1,099
Compensation of employees Compensation of employees 547
Goods and services Goods and services 552
Transfers and Subsidies Transfers and Subsidies
Payment for capital assets (164) Payment for capital assets
Programme 4: (481) Programme 4: -
Current payments (245) Current payments -
Compensation of employees (160) Compensation of employees
Goods and services (85) Goods and services
Transfers and Subsidies Transfers and Subsidies
Payment for capital assets (236) Payment for capital assets
Programme 5: (1,438) Programme 5: 804
Current payments (1,438) Current payments -
Compensation of employees (547) Compensation of employees
Goods and services (891) Goods and services
Transfers and Subsidies Transfers and Subsidies
Payment for capital assets Payment for capital assets 804
Programme 6: (787) Programme 6: -
Current payments (680) Current payments -
Compensation of employees (680) Compensation of employees
Goods and services Goods and services
Transfers and Subsidies Transfers and Subsidies
Payment for capital assets (107) Payment for capital assets
Programme 7: - Programme 7: 424
Current payments - Current payments 424
Compensation of employees Compensation of employees
Goods and services Goods and services 424
Transfers and Subsidies Transfers and Subsidies
Payment for capital assets Payment for capital assets
The department received roll-overs on two of the conditional grants during the adjustment estimates process of the 2016/17 financial year. The details thereof are summarised in the table below. There were unspent funds of the 2016/17 financial year of conditional grants that have been requested for roll over to the 2017/18 financial year.
Grant Name R thousand
Original Budget
Roll-over Adjusted Budget
Programme 3: Farmer Support and Development
Comprehensive Agriculture Support Programme Grant (Projects & ERP)
128 364 1 560 129 924
Illima/Letsema Projects Grant 55 050 172 55 222

Annual Report for 2016/17 Financial Year
| 13Department of Agriculture, Land Reform & Rural Development Northern Cape Province Vote 12
Unauthorised, fruitless and wasteful expenditure
There has been no unauthorised expenditure incurred during the current financial year.
The department went through a thorough exercise to ensure that all fruitless and wasteful expenditure is identified and treated appropriately. During the 2016/2017 financial year a total amount of R0.153 million was identified as fruitless and wasteful expenditure. Included in this was 76% (R0.116 million) related to costs incurred as a result of vehicle accidents, the remainder of the 24% (R0.37 million) was attributed to fines, cancellation fees and interest on accounts. Investigations to determine whether there was gross negligence or circumstances beyond reasonable care that resulted in the fruitless and wasteful expenditure is underway and expected to be finalised during the 2017/18 financial year.
Also included in the thorough investigation exercise, was the investigation of the 2015/16 financial year’s fruitless and wasteful expenditure of R0.62 million. An amount R0.014 million or 23% could be attributed to accidental incidences and an amount of R0.047 million or 77% was incurred due to traffic fines, interest and penalties on accounts or no show. The traffic fines are in progress of being recovered for the transgressors.
Thorough investigations for the remainder, indicated that there were no reason to believe that any official acted due to gross negligence or any other deliberate action to cause the fruitless and wasteful expenditure to the department, however instruction letters were sent to these officials involved to ensure that this will not be repeated in future.
Future plans of the department
None
Discontinued activities / activities to be discontinued
None
New or proposed activities
None
Supply Chain Management
The Department did not conclude any unsolicited bid for the year under review.
Immense progress was made during this financial year by the department under the watchful eye of the Internal Control unit, with regard to the identification and reporting of Irregular expenditure within the department.
Investigations for the huge backlog of cases since 2014/15 was prioritised. The outcome indicated that for most of these cases, though proper supply chain management procedures were not always followed, there were indeed justifiable circumstances that resulted in deviations being the only option, so as not to compromise the service delivery.
The investigations indicated however, that there was a huge gap in the awareness of new developments in the legislation pieces that lead to the non-adherence. The Internal Control unit and SCM unit embarked on training workshops to update officials involved. The training focused on procurement officials and other users within our department that were linked to the procurement process. The objective of the training was simple and that was to ensure that future occurrence on irregular expenditure is avoided before it enters the procurement process. This being said, the department realises that it would not be an overnight solution for various reasons, but training, updates and consequence management will be applied consistently in the endeavour to eliminate irregular expenditure completely. The note to the financial statements on irregular displays a significant reduction in irregular expenditure, indicating that significant strides have been made to reduce irregular expenditure instances.
Annual Report for 2016/17 Financial Year
14 |Department of Agriculture, Land Reform & Rural Development Northern Cape Province Vote 12
Gifts and donation received in kind from non-related parties
No gifts and donations have been received in-kind from a non-related party.
Exemptions and deviations received from National Treasury
For the year under review, the Department did not receive any exemptions and/or deviations from National Treasury
Events after the reporting dates
There are no reportable events subsequent to the reporting date
Other
There are no other material fact or circumstances, which may have an effect on the understanding of the financial state of affairs, not addressed elsewhere in this report.
Acknowledgement/s or Appreciation
I would like to thank all the officials of the department who worked diligently and tirelessly with the support of our partners and the relevant stakeholders in the sector to ensure that our priorities are pursued unrelentingly and our goals and objectives achieved.
Conclusion
The achievements and success of the department is driven by a mindset that is shared by management and staff, to serve the agriculture sector to the best of our ability. Ensuring that the department operates in an environment that encourages economical and efficient use of resources in delivery of services that our valued by all our stakeholders. We are not perfect but we will continue to strive towards perfection, learning from the failures of our past.
Approval and sign off
The Annual Financial Statements set out on pages 175 to 266 have been approved by the Accounting Officer
_________________
Mr WVD Mothibi
Accounting Officer
Department of Agriculture, Land Reform and Rural Development
Date: 29 August 2017
Annual Report for 2016/17 Financial Year
| 15Department of Agriculture, Land Reform & Rural Development Northern Cape Province Vote 12
5. STATEMENT OF RESPONSIBILITY AND CONFIRMATION OF ACCURACY FOR THE ANNUAL REPORT
To the best of my knowledge and belief, I confirm the following:
All information and amounts disclosed throughout the annual report are consistent.
The annual report is complete, accurate and is free from any omissions.
The annual report has been prepared in accordance with the guidelines on the annual report as issued by National Treasury.
The Annual Financial Statements (Part E) have been prepared in accordance with the modified cash standard and the relevant frameworks and guidelines issued by the National Treasury.
The Accounting Officer is responsible for the preparation of the annual financial statements and for the judgements made in this information.
The Accounting Officer is responsible for establishing, and implementing a system of internal control that has been designed to provide reasonable assurance as to the integrity and reliability of the performance information, the human resources information and the annual financial statements.
The external auditors are engaged to express an independent opinion on the annual financial statements.
In my opinion, the annual report fairly reflects the operations, the performance information, the human resources information and the financial affairs of the department for the financial year ended 31 March 2017.
Yours faithfully
___________________
Accounting Officer
Mr WVD Mothibi
Department of Agriculture, Land Reform and Rural Development
Date: 29 August 2017

Annual Report for 2016/17 Financial Year
16 |Department of Agriculture, Land Reform & Rural Development Northern Cape Province Vote 12
6. STRATEGIC OVERVIEW
6.1 Vision
A transformed, vibrant agricultural sector for food security and sustainable rural development.
6.2 Mission
The Department as a lead agent in the sector, will champion land and agrarian transformation, promote and facilitate increased production and provide expertise for improved livelihoods, sustainable rural development and food security for all.
6.3 Values
The Department will aspire to the following values:
• Responsiveness • Sacrifice • Professionalism• Accountability• Respect • Innovation

Annual Report for 2016/17 Financial Year
| 17Department of Agriculture, Land Reform & Rural Development Northern Cape Province Vote 12
7. LEGISLATIVE AND OTHER MANDATES
The Department of Agriculture, Land Reform and Rural Development is an integral part of the South African Public Service established in terms of section 197 of the Constitution and read with section 7 (1) and 7 (2) of the Public Services Act of 1994. In particular the following sections are relevant to the Department. Chapter 2, Sections 23, 25 and 27 Schedule 4 and 5 of the Constitution.
The Department functions under several legislative mandates, which include among others the following:• Agricultural Development Fund Act, 1993 (Act No 175 of 1993)• Agricultural Product Standards Act, 1990 (Act No 119 of 1990)• Animal Diseases Act, 1984 (Act 35 of 1984)• Agricultural Research Act, 1990 (Act No 86 of 1990)• Animal Identification Act, 2002 (Act No 6 of 2002• Animal Improvement Act, 1998 (Act 62 of 1998)• Broad Based Black Economic Empowerment Act, 2003 (Act No 53 of 2003)• Codex Alimentarius of the World Health Organization (WHO) and Food and Agricultural Organization
(FAO) (International Code on Food Safety)• Communal Land Rights Act, 2004• Conservation of Agricultural Resources Act, 1983 (Act 43 of 1983)• Constitution of the Republic of South Africa, 1996 (Act 108 of 1996)• Disaster Management Act, 2002 (Act No 57 of 2002)• Fencing Act, 1963 (Act No 31 of 1963)• Fertilizers, Farm feeds, Agricultural Remedies and Stock Remedies Act, 1947 (Act 36 of 1947)• Genetically Modified Organisms Act, 1997 (Act 15 of 1997)• Land Reform Act, 1997 (Act 3 of 1997)• Marketing of Agricultural Produce Act, 1996 (Act 47 of 1996)• Meat Safety Act, 2000 (Act 40 of 2000)• Northern Cape Land Administration Act, 2003• Perishable Product Export Control Act, 1983 (Act 9 of 1983)• Plant Improvement Act, 1976 (Act 53 of 1976)• Public Finance Management Act, 1999 (PFMA), Act 1 of 1999 as amended by Act 29 of 1999• Preferential Procurement Policy Framework Act, 2000 (Act No 5 of 2000)• Preferential Procurement Regulations of August 2001• Provincial Supply Chain Management Policy (April 2006)• South African Abattoir Corporation Act, 2005 Repeal (Act no 17 of 2005)• Subdivision of Agricultural Land Act, 1970 (Act 70 of 1970) (pending repeal)• Spatial Planning and Land Use Management Act 16 of 2013• The International Animal Health Code of the World Organization for Animal Health (OIE – Office
International des Epizooties)• The international Code for Laboratory Diagnostic Procedure for Animal Diseases of the World
Organization for Animal Health• The Sanitary and Phyto-sanitary Agreement of the World Trade Organization (WTO)• Treasury Regulations for Departments, constitutional institutions and public entities issued in
March 2005 in terms of the PFMA• Veterinary and Para-Veterinary Professions Act, 1982 (Act 19 of 1982)• Water Act, 1998

Annual Report for 2016/17 Financial Year
18 |Department of Agriculture, Land Reform & Rural Development Northern Cape Province Vote 12
8. Organisational Structure
9. Entities Reporting to the MEC

Annual Report for 2016/17 Financial Year
| 19Department of Agriculture, Land Reform & Rural Development Northern Cape Province Vote 12

Annual Report for 2016/17 Financial Year
20 |Department of Agriculture, Land Reform & Rural Development Northern Cape Province Vote 12
1. AUDITOR GENERAL’S REPORT: PREDETERMINED OBJECTIVES
Refer to page 169 of the Report of the Auditor General, published as Part E: Financial Information.
2. OVERVIEW OF DEPARTMENTAL PERFORMANCE
2.1 Service Delivery Environment
The performance environment during the year under review was characterised by a constraint economic growth; decrease in the levels of employment; and severe drought that affected parts of the country and led to a sharp increase in the food prices. These factors adversely affected the poverty levels and food security in the province. Accordingly, the department had to respond to the service delivery challenges while contributing to the broad developmental goals of government.
In terms of the global economic outlook, The International Monetary Fund projects that the world economy will grow by 3.4 per cent in 2017 and 3.6 per cent in 2018. At the national level, the GDP growth is expected to increase from 0.5 per cent last year to 1.3 per cent in 2017, and will continue to improve moderately over the medium term. This represents a very modest growth which places a strain on the government revenue and its ability to expand public services. In terms of the province, the economy grew by 2.8 percent, this is higher than growth of 2.1 percent in 2013. This rate was higher than the national growth rate of 1.5 percent in 2014. The agricultural sector in the Northern Cape grew by 3.0 percent in 2014 which was slightly lower that the 3.3 percent in 2013. This demonstrates the support from the agricultural sector towards positive provincial growth.
One of the priorities of government is the creation of decent jobs. According to the Labour Force Survey of Statistics South Africa (StatsSA), provincial employment decreased by roughly 10 000 between the third and fourth quarters of 2016 from 308 000 to 298 000. As a result, unemployment increased from 29.5 percent to 32.0 percent over that period. Employment in the agricultural sector of the Northern Cape decreased with 3 000 jobs from 56 000 to 53 000 from the third to the fourth quarter, but still significantly higher than the 43 000 of the fourth quarter of 2015.
The Northern Cape, like most provinces in South Africa, experienced 2015/16 as the driest year since 1904 with resultant percentage rise in food prices reaching 12.0% in December 2016 (December 2016 compared to December 2015). As a result of this dry period, the Department of Water and Sanitation announced water cuts for the Vaal and Orange River systems of 15% and 20% forcing farmers to revise their planting terms. Some farmers moved from planting two crops per year to only one and that affected farm incomes in the short term. The challenges of water quantities available to farmers were not the only concern as the quality of the water especially along the Vaal River System was worrying farmers. Bad quality water is as worrying as low water availability especially in the agricultural sector producing food. The possible water restrictions will have a severe negative impact. The Livestock producers were affected negatively by the drought situation and lower stock levels and rebuilding of stock numbers affects availability of marketable animals.
Drought Relief Programme
The province experienced a major drought in the 2013/14 financial year where 8 000 farmers from the JTG, Frances Baard and part of Namakwa were assisted. During 2015/16 financial year the drought extended to new parts of the Namakwa district. Loeriesfontein and Hantam areas were hard hit. However, four of the five districts; Frances Baard, John Taolo Gaetsewe, Pixley Ka Seme and biggest part of ZF Mgcawu received good, average to above average, rains during the past summer season, October 2016 – February 2017.

Annual Report for 2016/17 Financial Year
| 21Department of Agriculture, Land Reform & Rural Development Northern Cape Province Vote 12
The areas identified during October/ November 2016 to support farmers were Namakwa district, especially the winter rainfall area, as well as an area in Khai Ma (Kenhardt) in the ZF Mgcawu district. These identified areas received very little or no rain since October 2016 and drought conditions in the Hantam area, Calvinia, Fraserburg, Sutherland, Williston, Brandvlei and Loeriesfontein actually worsened drastically. The Department of Agriculture, Forestry and Fisheries (DAFF) allocated R25 million of the total allocation of R212 million from National Treasury to the Northern Cape for the procurement of drought feed. DAFF centrally procured 73 000 bags of drought pellets at a cost of R 20,44 million from Stanch Trading of Hartswater for distribution to farmers in the identified drought stricken areas. The distribution is at present in process.
The remainder of the R25 million (R4.5 million) will be utilised for the transport of donated animal feed from various locations to further support the farmers in need. The department is also in process to make approximately 60 tons of feed from the fodderbank at Eiland Research Station at Upington available to Agri – North Cape for distribution to farmers in dire need.Furthermore, during the year under review, there was African swine fever outbreak in our neighbouring provinces. Consequently, the province had to be on standby and put measures in place for a possible outbreak and to conduct surveillance. This implied redirection of resources and personnel as farms had to be visited. Thus further, the province has not been affected and the situation is continuously being monitored.
Another challenge is the illegal slaughtering of donkeys which has become a booming business given the high demand of gelatin from donkey skins by pharmaceutical companies in China. Two high profile incidents of illegal donkey slaughtering including an organized syndicate were halted in the province by the law enforcement units. Officials from Kuruman State Vet office, together with the NSPCA and SAPS discovered a site on a farm in Olifantshoek where more than 100 donkeys had been illegally slaughtered.
2.2 Service Delivery Improvement Plan
The department has completed a service delivery improvement plan. The tables below highlight the service delivery plan and the achievements to date.
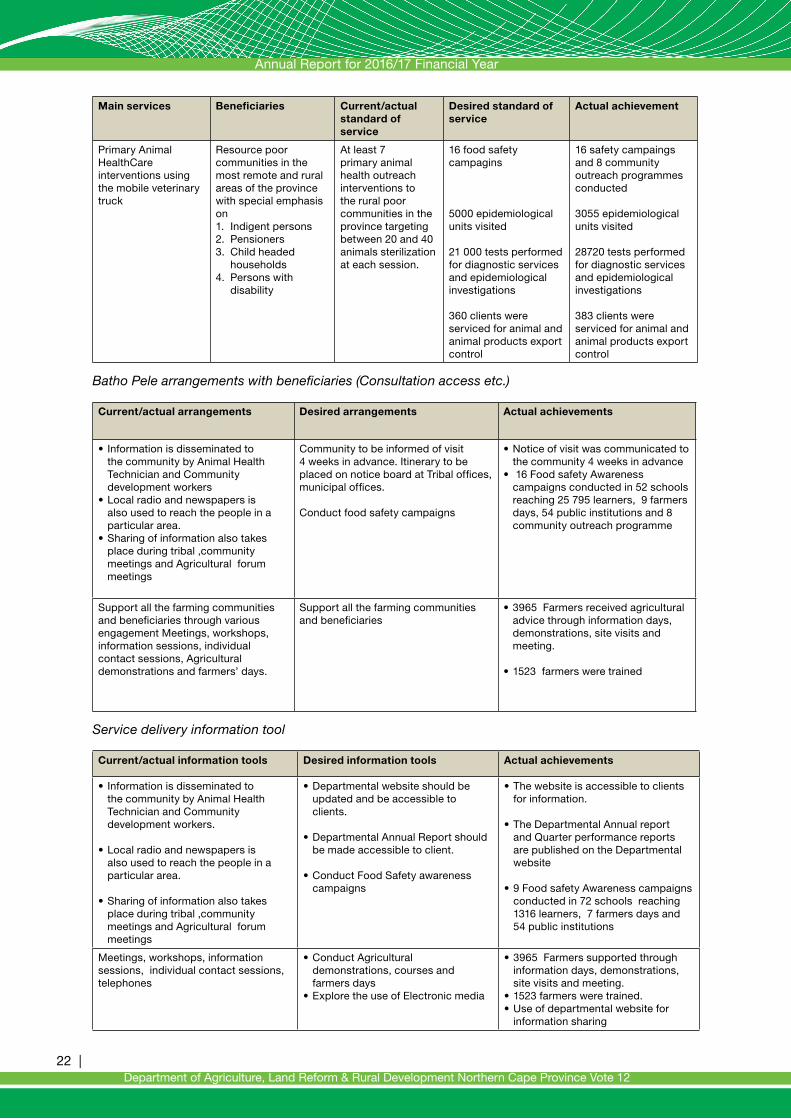
Main services and standards
Main services Beneficiaries Current/actual standard of service
Desired standard of service
Actual achievement
Extension and advisory Services
Farmers
Land reform beneficiaries
Communities
4258 famers and beneficiaries
2500 smallholder farmers supported with agricultural advice
1200 training in agricultural skills programmes
6 Commodity groups supported
26 projects supported with CASP(Comprehensive Agricultural Support Programme)
14 Projects supported with Ililma/Letsema
1000 work opportunities created
3965 Farmers received agricultural advice through information days, demonstrations, site visits and meeting.
1523 farmers were trained
6 Commodity groups supported
25 projects supported with CASP
14 Projects supported with Ililma/Letsema
708 work opportunities created
Annual Report for 2016/17 Financial Year
22 |Department of Agriculture, Land Reform & Rural Development Northern Cape Province Vote 12
Main services Beneficiaries Current/actual standard of service
Desired standard of service
Actual achievement
Primary Animal HealthCare interventions using the mobile veterinary truck
Resource poor communities in the most remote and rural areas of the province with special emphasis on1. Indigent persons2. Pensioners3. Child headed
households4. Persons with
disability
At least 7 primary animal health outreach interventions to the rural poor communities in the province targeting between 20 and 40 animals sterilization at each session.
16 food safety campagins
5000 epidemiological units visited
21 000 tests performed for diagnostic services and epidemiological investigations
360 clients were serviced for animal and animal products export control
16 safety campaings and 8 community outreach programmes conducted
3055 epidemiological units visited
28720 tests performed for diagnostic services and epidemiological investigations
383 clients were serviced for animal and animal products export control
Batho Pele arrangements with beneficiaries (Consultation access etc.)
Current/actual arrangements Desired arrangements Actual achievements
• Information is disseminated to the community by Animal Health Technician and Community development workers
•Local radio and newspapers is also used to reach the people in a particular area.
•Sharing of information also takes place during tribal ,community meetings and Agricultural forum meetings
Community to be informed of visit 4 weeks in advance. Itinerary to be placed on notice board at Tribal offices, municipal offices.
Conduct food safety campaigns
•Notice of visit was communicated to the community 4 weeks in advance
• 16 Food safety Awareness campaigns conducted in 52 schools reaching 25 795 learners, 9 farmers days, 54 public institutions and 8 community outreach programme
Support all the farming communities and beneficiaries through various engagement Meetings, workshops, information sessions, individual contact sessions, Agricultural demonstrations and farmers’ days.
Support all the farming communities and beneficiaries
•3965 Farmers received agricultural advice through information days, demonstrations, site visits and meeting.
•1523 farmers were trained
Service delivery information tool
Current/actual information tools Desired information tools Actual achievements
• Information is disseminated to the community by Animal Health Technician and Community development workers.
•Local radio and newspapers is also used to reach the people in a particular area.
•Sharing of information also takes place during tribal ,community meetings and Agricultural forum meetings
•Departmental website should be updated and be accessible to clients.
•Departmental Annual Report should be made accessible to client.
•Conduct Food Safety awareness campaigns
•The website is accessible to clients for information.
•The Departmental Annual report and Quarter performance reports are published on the Departmental website
•9 Food safety Awareness campaigns conducted in 72 schools reaching 1316 learners, 7 farmers days and 54 public institutions
Meetings, workshops, information sessions, individual contact sessions, telephones
•Conduct Agricultural demonstrations, courses and farmers days
•Explore the use of Electronic media
•3965 Farmers supported through information days, demonstrations, site visits and meeting.
•1523 farmers were trained.•Use of departmental website for
information sharing

Annual Report for 2016/17 Financial Year
| 23Department of Agriculture, Land Reform & Rural Development Northern Cape Province Vote 12
Complaints mechanism
Current/actual complaints mechanism
Desired complaints mechanism Actual achievements
•All complaints are directed to the Deputy Director: Animal Health who may refer the complaint to the Director.
•Code of conduct exits for public servants and professionals e.g. PSC code and SAVC code.
Departmental grievance procedure should be explained to clients
No formal complaints received by the Deputy Director: animal Health due to high level of service delivery satisfaction from most of our farmers.
Response given to the grievances by the Senior manager, HOD office, and the MEC to the farmers
•Shorten the turn -around time of responses and act on the grievances.
•Put in the corrective measures on grievances lodged.
Due to high level of transparency and the improved reporting system introduced by the department grievances and feedback to farmers are immediately attended to during farmers days and Agricultural demonstration days.
Reports to Director, HOD or Ministry •Reports to Director, HOD or Ministry Most of the complaints are attended and resolved during the information days and Agricultural demonstrations.
2.3 Organisational environment
The constrained economic outlook was one of the key factors that affected the organisational environment during the year under review. The South African economy experienced a sluggish growth resulting in technical budget adjustment due to mandatory budget cuts. This meant that the department had to look at innovative ways to achieve predetermined objectives. In addition, it had to explore ways to increase efficiency; implement cost saving measures; work with sector partners to pool resources; and target high impact projects.
In the ensuing years focus will be on revising Terms of Reference of the Departmental Technical Committee and Departmental Project Coordinating Committees in order to institutionalise long-term planning and provide the platform for the private sector to engage government on pooling resources and efficient implementation of high impact projects. This is to ensure that the constrained economic situation does not affect the delivery of services to the clientele of the department.
The department resources continued to be drained by replacement of material lost through theft, especially at our research stations. A Comprehensive Security plan to secure government assets has been prioritised. Theft at the research stations has resulted in some projects, especially where edible products are researched, being temporarily stopped until access control and patrols are instituted.
The audit of the 2015/16 by the Auditor-General of South Africa (AGSA) highlighted some of the administrative and compliance issues that the department must focus on. In addition, the Management Performance Assessment Tool (MPAT 1.5) enabled the department to assess the functionality of key management performance areas. These include the strategic planning; governance and accountability; human resources; and financial management.
During the year under review the department implemented an audit action plan and MPAT improvement plan in order to address the identified areas of weaknesses. Accordingly the results of MPAT 1.6 show that there has been significant improvement in the key management functionality areas. Provincially the department imporived from position nine (MPAT 1.5) to position three (MPAT 1.6).
Effective human resource management systems have been identified as some of the key priorities in improving the organisational environment. These include establishing management structures and developing policies and systems. In this respect the following committees were established: Human Resource Planning and Capability Committee; Training Committee; Leave Committee; Diversity Committee; and Women Network and Men’s Committee. In addition the Succession Plan and the Resettlement Policy were approved. These developments are expected to aid improved human resource management.

Annual Report for 2016/17 Financial Year
24 |Department of Agriculture, Land Reform & Rural Development Northern Cape Province Vote 12
The effort to mitigate skills deficit that has also affected the delivery of services includes continuous training of staff in technical and scares skill as well as provision of bursaries to students. In this respect, it can be reported that 11 employees completed their studies in various fields of study while 6 external students graduated. It is expected that the skills base that is being built over time will be used whenever there is a need and financial resources in the department. The main objective is to ensure that the department is able to provide quality services to all its clients at all times and make a meaningful contribution to the broad development agenda of the state.
2.4 Key policy developments and legislative changes
There were no key policy and legislative changes.
3. STRATEGIC OUTCOME ORIENTED GOALS
3.1 The Department has the following goals that are linked to the MTSF 2015-2019 outcomes.
Strategic outcome oriented goal 1
EFFECTIVE AND EFFICIENT GOVERNANCE
Goal statement To ensure effective and efficient governance
Strategic outcome oriented goal 2
SUSTAINABLE USE AND MANAGEMENT OF NATURAL RESOURCES
Goal statement To ensure sustainable use and management of natural resources
Strategic outcome oriented goal 3
SUSTAINABLE AGRICULTURAL PRODUCTION
Goal statementOptimal and sustainable agricultural production to ensure food security
Strategic outcome oriented goal 4
BIO-SAFETY AND BIO-SECURITY FOR THE WELLNESS OF THE PUBLIC
Goal statement To ensure bio-safety and bio-security for the wellness of the public
Strategic outcome oriented goal 5
EXPERT AND NEEDS BASED RESEARCH AND TECHNOLOGY
Goal statementTo render expert and needs based research and technology transfer services to clients
Strategic outcome oriented goal 6
INCLUSIVE AGRICULTURAL ECONOMIC GROWTH
Goal statement Inclusive Agricultural Economic Growth
Strategic outcome oriented goal 7
COMPREHENSIVE RURAL DEVELOPMENT
Goal statementTo ensure the effective implementation of the Comprehensive Rural Development Programme.

Annual Report for 2016/17 Financial Year
| 25Department of Agriculture, Land Reform & Rural Development Northern Cape Province Vote 12
Outcomes Reports
Outcome 7: Comprehensive Rural Development
The National Development Plan (NDP) 2030 vision is rural areas (in chapter 6 Inclusive rural economy) which are spatially, socially and economically well integrated across municipal, district and provincial and regional boundaries – where residents have economic growth, food security and jobs as a result of agrarian transformation and infrastructure development programmes and have improved access to basic services, health care and quality education”. By 2030 agriculture is expected to create close to 1 million new jobs, contributing significantly to reducing overall unemployment. Chapter 6 of the NDP provides for the differentiated strategy that focuses on agricultural development based on successful land reform, employment creation and strong environmental safeguards. To achieve this, irrigated agriculture and dry-land production should be expanded, with emphasis on smallholder producers where possible. Quality basic services, particularly education, health care and public transport. In areas with greater economic potential, industries such as agro-processing, tourism, fisheries (in coastal areas) and small enterprise development should be developed with market support.
This was then developed into the Medium Term Strategic Framework (MTSF) that identified 10 strategic priorities that were further developed into 14 Outcomes. The Outcome that encapsulates the renewed emphasis on rural development is Outcome 7, which calls on government to promote Comprehensive Rural Development and Food Security.”
The co-ordinating department for Outcome 7 is the Department of Agriculture Land Reform and Rural Development (DALRRD). Key government partners in this endeavour include Provincial Department of Rural Development and Land Reform, Department of Co-operative Governance and Traditional Affairs and human settlement, the Department of Social Development, the Department of Health, the Department of Environmental and Nature Conservation, the National Departments such as the Department of Water and sanitation, the Department of Energy, the Department of trade and Tourism, the Department of Small businesses and all Municipalities. See below figure;
The figure below represents the NC outcome 7 delivery partners
Provincial depart-ments
SALGA & District Municipality
• Agriculture, Land Reform Rural development
• Provincial Treasury • Economic Development and
Tourism• Social Services• Environment & Conservation • Cooperative Government,
Human Settlement & Traditional Affairs
• Roads & Public Works • Education• Health• Transport, Safety and Liaison
• National Development Agency• Independent Development
Trust (IDT)• Industrial Development
Corporation (IDC)• Development Bank of
Southern Africa (DBSA)
• Rural Development and Land Reform
• Water Affairs• Public Works• Mineral Resources• Energy
State Agencies
& DFIs
National Depart-ments

Annual Report for 2016/17 Financial Year
26 |Department of Agriculture, Land Reform & Rural Development Northern Cape Province Vote 12
The Department of Agriculture Land Reform and Rural Development as a provincial coordinator is tasked with the coordination of all the delivery partners so the objective of Comprehensive Rural Development is achieved.
Provincial Problem Statement
The Apartheid’s spatial design (patterns) inevitably resulted in fragmented and segregated development planning, without viable economic, social and cultural linkages between the economically active and relatively prosperous commercial urban areas of the country and the rural hinterland
These patterns led to the marginalisation of the poor, with many in rural areas and households trapped in a vicious cycle of poverty. Skewed land ownership patterns such that land was in the hands of the few resulting in the majority not having means of production. Land Reform has not yet translated into the establishment of sufficient numbers of sustainable new black farmers.
Outcome 7 Delivery Agreement – an Overview
The Ministers Performance Agreement provides six key sub-outcomes that contribute to the achievement of Outcome 7: “Comprehensive Rural Development and food security”. This agreement was then cascaded to the Northern Cape Premier who delegated to the Member of the executive Agriculture, Land Reform and Rural Development to coordinate Comprehensive Rural Development and Food Security in the Province. The sub outcomes talking to the outcome are:
1. Improved land administration and spatial planning for integrated development in rural areas2. Sustainable land reform (agrarian transformation)3. Improved food security 4. Smallholder farmer development and support (technical, financial, infrastructure) for agrarian
transformation5. Increased access to quality basic infrastructure and services, particularly in education, healthcare
and public transport in rural areas6. Growth of sustainable rural enterprises and industries characterised by strong rural-urban linkages,
increased investment in agro-processing, trade development and access to markets and financial services – resulting in rural job creation.
Review by Sub-Outcome
Overall achievement
Figure 1: Represent the overall achievement of outcome 7 for the 16/17 financial year
35
Outcome 7 Delivery Agreement – an Overview The Ministers Performance Agreement provides six key sub-outcomes that contribute to the achievement of Outcome 7: “Comprehensive Rural Development and food security”. This agreement was then cascaded to the Northern Cape Premier who delegated to the Member of the executive Agriculture land Reform and Rural Development to coordinate Comprehensive Rural Development and Food Security in the Province. The sub outcomes talking to the outcome are;
1. Improved land administration and spatial planning for integrated development in rural areas
2. Sustainable land reform (agrarian transformation) 3. Improved food security 4. Smallholder farmer development and support (technical, financial,
infrastructure) for agrarian transformation 5. Increased access to quality basic infrastructure and services, particularly in
education, healthcare and public transport in rural areas 6. Growth of sustainable rural enterprises and industries characterised by strong
rural-urban linkages, increased investment in agro-processing, trade development and access to markets and financial services – resulting in rural job creation.
Review by Sub-Outcome Overall achievement
Figure 1: Represent the overall achievement of outcome 7 for the 16/17 financial year
0%
10%
20%
30%
40%
50%
60%
70%
52% 61%
58% 59%
15% 19%
7% 8%
33.3%
19%
36% 32%
Outcome 7 - Performance on POA Quarter 1 -3 Validated and Quarter 4 Preliminary 2016/17
Financial year.
Achieved 100%+
Partial achievement 50% -99%
Not achieved <50%

Annual Report for 2016/17 Financial Year
| 27Department of Agriculture, Land Reform & Rural Development Northern Cape Province Vote 12
Sub-outcome 1: Improved land administration and spatial planning for integrated development in rural areas
This sub-outcome aims to contribute to the following:
The Developing and implementing of the spatial development framework as the basis to guide land use planning and development and to address spatial inequalities, prioritising the 27 resource-poor district municipalities
To strengthening coordination across the three spheres of government and external stakeholders to implement the Comprehensive Rural Development programme(CRDP) in line with the spatial development plans.
To this end the following targets were set by the Province for 2016/17:• A total of 26 Municipalities supported to develop SDFs; • A total of 19 Municipalities to implement Spatial planning and Land Use Management Act(
SPLUMA); and• Coordination of stakeholders to contribute to the implementation of the Comprehensive Rural
Development and Food security( technical and financial resources).
The key driver for this sub outcome is the (1) alignment to SPLUMA and (2) coordination. This sub outcome is a shared responsibility of all the three spheres of government.
Progress
Developing and implementing of the spatial development framework• A total of 13 municipalities were supported to implement spatial planning and land use
management Act (SPLUMA) in the Namakwa, Frances Baard, ZF Mgcawu and Pixley Ka Seme district Municipalities (SDF);
• A total of 9 municipalities were supported to implement spatial planning and land use management Act (SPLUMA)-land use schemes(LUS) in ZF Mgcawu.
• 100% of Municipalities were supported to implement the spatial planning and land use management Act (All 32 Northern Cape Municipalities);
• A total of 8 municipalities were supported with the implementation of SPLUMA (Spatial Planning and Land use Management Act) 8 Municipal Planning Tribunals (MPTs) for all 32 Northern Cape Municipalities; and
• A total of 4 Rural Development Plan guidelines were developed in the ZF Mgcawu, Namakwa, Pixley Ka Seme and Frances Baard.
Challenges
Challenges include:• Lack of alignment in all spheres of Government• Lack of comprehensive reporting• Poor attendance of PTIF meeting
Strategies have been put in plans to overcome challenges as per the Minmec and Mintech resolutions. To date, a service delivery workshop was held in the province for the purposes of the midterm reporting and the coordination mechanisms of the outcome. This was done so as to promote stakeholder engagement, so there is planning and reporting jointly. Herewith

Annual Report for 2016/17 Financial Year
28 |Department of Agriculture, Land Reform & Rural Development Northern Cape Province Vote 12
Figure below illustrates the NC Service delivery workshop:
Output 2: Sustainable Land Reform contributing to Agrarian transformation
This sub outcome aims to acquire land for labour tenants, farm dwellers, smallholder farmers, AVMP and restored in terms of restitution Act). The key driver for this sub outcome is therefore acquisition of land. The targets that were set were as follows:• A total of 15,252 hectares to be acquired.• A total of 9073 hectares to be allocated to smallholder farmers• A total of 2984 hectares to be allocated to farm dwellers and labour tenants• A total of 14 Land Claims to be finalised and 15 land claims to be settled.• A total of 11 farmers should acquired to support Agri-Park• A total of 23 farms should be under recapitalisation
Progress
Hectares acquired.
A total of 36657.3518 ha of land was acquired in the Pixley Ka Seme, Frances Baard ( Kleindoornpan), John Taolo Gaetsewe, ZF Mgcawu ( Jackhauls Vley Farm no 107, Farm no 87 Bock Boerdery, WEJ Booerdery, Mosadifontein, Farm 83A and Farm 85).
A total of 3013.4181 hectares allocated to farm dwellers and labour tenants. A total of 11 Number of farms acquired to support Agri-Parks.
Land Claims Settled/ finalised
A total of 17 land claims were settled in John Taolo Gaetsewe, Frances Baard, Pixley Ka Seme and ZF Mgcawu. A total of 25 land claims were Finalised in ZF Mgcawu (Mooilaagte famly claims, Madibeng Comm claims), Pixley Ka Seme, John Taolo Gaetsewe (Keimoes Dry Erven, Zoutputs I42).
Output 3: Improved food security
This sub outcome aims to reduce the percentage of the total population that experiences hunger. The key driver for this output is therefore food security. It mainly supports the 1st phase of the

Annual Report for 2016/17 Financial Year
| 29Department of Agriculture, Land Reform & Rural Development Northern Cape Province Vote 12
comprehensive rural development programme. It is made up of various delivery partners such as the DALRRD, DSD, DOE, DOH. The targets were set as follows:
• 1000 household should benefit from agricultural food security initiatives• 750 hectares to be cultivated for food production in communal areas and land reform projects.• 250 household gardens to be established• 5 institutional gardens to be established• 36000 vulnerable Households should accessing nutritious and affordable foods• 37000 beneficiaries who should benefitted from DSD social relief programmes• 217 school food gardens to be supported• 151 713 learners should benefit from the National School Nutrition Programme
Progress
A total of 1321 household benefitted from agricultural food security initiatives. A total of 837.5 hectares cultivated for food production in communal areas and land reform projects. A total of 574 household gardens were established. A total 17 institutional gardens were established.
A total of 290631 vulnerable Households have accessed nutritious and affordable foods. A total of 29486 beneficiaries benefitted from DSD social relief programmes.
A total of 3 new school food gardens were established in this financial year. Food gardens that are well looked after are supplementing the National School Nutrition Programme meal with the produce. Schools are also using food gardens as a living laboratory for learners. A total of 151 713 learners in 284 schools benefitted from the National School Nutrition Programme
Challenges
The coordination of food security requires a high level coordination that should be at the DALRRD and at the OTP.
Water is a scarce resource especially when communities must establish community or backyard gardens
The increasing number of vulnerable people within communities
Output 4: Smallholder producers development and support (technical, financial, infrastructure) for Agrarian Transformation
This sub-outcome is aimed at recapitalisation of farms, providing support to smallholder producer in order to ensure production efficiencies. It also provides support to farms in order to ensure production. The key driver for this sub-outcome is the support to smallholder producers. The targets were as follows:• 100% of water use authorisation applications finalised • Recapitalise farms• 500 smallholder producers should receiving supported• smallholder producers support with agricultural advice• 5000 epidemiological units to be visited for veterinary intervention• 63% percentage level of abattoir compliance to meat safety legislation • 21000 tests to be performed, the quality of which meets the ISO 17025_ and OIE requirement.• 360 clients to be serviced for animal and products export control• 50 Agricultural infrastructure to be established• 4600 hectares protected/ rehabilitated to be improve agricultural production
Progress
A total of 225 160/a (59ha) Percentage of water use authorisation applications were finalised.
A total of 574 smallholder producers supported. A total of 16 farms are under the recapitalization programme. A total of 4543 smallholder producers supported with agricultural advice. A total of 90 units of Agricultural infrastructure established. A total of 9300 hectares protected/ rehabitalised to improve agricultural production. A total of 3295 epidemiological units visited for veterinary interventions.
Annual Report for 2016/17 Financial Year
30 |Department of Agriculture, Land Reform & Rural Development Northern Cape Province Vote 12
A total of 234.7percentage level of abattoir compliance to meat safety legislation. A total of 19721 of tests performed to the quality of which meets the ISO 17025 standard _and OIE requirements. A total of 295 Number of clients serviced for animal and animal products export control.
Challenges
Ownership of land as farmers cannot be supported without having access to land. Secondly grants can only contribute so much to farmers, they therefore need loans. These loans require security which they don’t possess as smallholder farmers.
Output 5: Increased access to quality infrastructure and functional services, particularly in education, healthcare and public transport in rural areas
This sub-outcome aims at:
Eradicating infrastructure backlogs in rural schools, Eradicate infrastructure backlogs in health facilities to meet national core standards. Provide ICT infrastructure to rural communities, Provide access to piped water in rural areas ( in the house, yard and 200m from the house, Provide access to sanitation services in rural areas, Provide access energy in rural areas, Improved transport infrastructure and public transport in rural areas. The sub-outcome is made up of various stakeholders such as DALRRD, DOE, DOH, COGHSTA, DWS, DOEnergy and Municipalities• 780 households should access to clean water – only WSIG• 24500 learners should subsidised with transport• 7 additional clinics, community health centres to be constructed and office facilities constructed• 3 additional hospitals and mortuaries to be constructed or revitalized
Progress
A total of 793 households accessed clean water - only WSIG. A total of 834 households were provided access to clean water. A total of 48693 learners subsidized with transport. A total of 5 additional clinics, community health centers constructed and office facilities constructed. A total of 4 additional hospitals and mortuaries were constructed or revitalized.
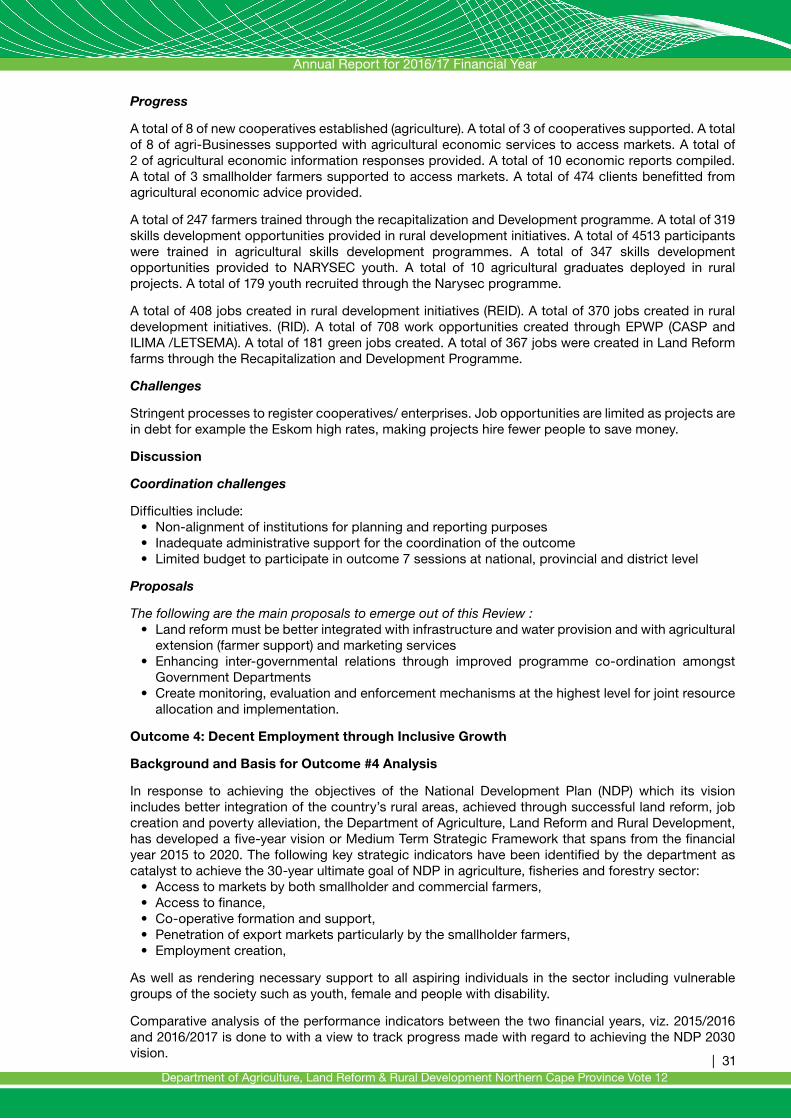
Output 6: Growth of sustainable rural enterprises and industries- resulting in rural job creation
This sub-outcome aims at;• Promoting sustainable rural enterprises and industries in areas with economic development
potential, • Promote skills development in rural areas with economic development potential.• Create job opportunities
To this end the following targets were set by the province:
11 new cooperatives to be established (agriculture);• Cooperatives to be supported;• 10 agri-Businesses should be supported with agricultural economic services to access markets; • 8 agricultural economic information responses to be provided;• 12 economic reports to be compiled;• 12 smallholder farmers should supported to access markets; • 700 clients should benefitted from agricultural economic advice provided;• A total of 135 farmers to be trained through the recapitalization and Development programme;• 240 skills development opportunities to be provided in rural development initiatives;• 1200 participants trained in agricultural skills development programmes;• 320 skills development opportunities should be provided to NARYSEC youth; • 15 agricultural graduates should deployed in rural projects;• 300 youth should be recruited through the Narysec programme;• 245 jobs to be created in rural development initiatives (REID); • 250 jobs to be created in rural development initiatives. (RID);• 1000 work opportunities to be created through EPWP (CASP and Ilima /Letsema);• 100 green jobs to be create; and • 270 jobs should be created in Land Reform farms through the Recapitalization and Development
Programme;
Annual Report for 2016/17 Financial Year
| 31Department of Agriculture, Land Reform & Rural Development Northern Cape Province Vote 12
Progress
A total of 8 of new cooperatives established (agriculture). A total of 3 of cooperatives supported. A total of 8 of agri-Businesses supported with agricultural economic services to access markets. A total of 2 of agricultural economic information responses provided. A total of 10 economic reports compiled. A total of 3 smallholder farmers supported to access markets. A total of 474 clients benefitted from agricultural economic advice provided.
A total of 247 farmers trained through the recapitalization and Development programme. A total of 319 skills development opportunities provided in rural development initiatives. A total of 4513 participants were trained in agricultural skills development programmes. A total of 347 skills development opportunities provided to NARYSEC youth. A total of 10 agricultural graduates deployed in rural projects. A total of 179 youth recruited through the Narysec programme.
A total of 408 jobs created in rural development initiatives (REID). A total of 370 jobs created in rural development initiatives. (RID). A total of 708 work opportunities created through EPWP (CASP and ILIMA /LETSEMA). A total of 181 green jobs created. A total of 367 jobs were created in Land Reform farms through the Recapitalization and Development Programme.
Challenges
Stringent processes to register cooperatives/ enterprises. Job opportunities are limited as projects are in debt for example the Eskom high rates, making projects hire fewer people to save money.
Discussion
Coordination challenges
Difficulties include:• Non-alignment of institutions for planning and reporting purposes • Inadequate administrative support for the coordination of the outcome• Limited budget to participate in outcome 7 sessions at national, provincial and district level
Proposals
The following are the main proposals to emerge out of this Review :• Land reform must be better integrated with infrastructure and water provision and with agricultural
extension (farmer support) and marketing services• Enhancing inter-governmental relations through improved programme co-ordination amongst
Government Departments • Create monitoring, evaluation and enforcement mechanisms at the highest level for joint resource
allocation and implementation.
Outcome 4: Decent Employment through Inclusive Growth
Background and Basis for Outcome #4 Analysis
In response to achieving the objectives of the National Development Plan (NDP) which its vision includes better integration of the country’s rural areas, achieved through successful land reform, job creation and poverty alleviation, the Department of Agriculture, Land Reform and Rural Development, has developed a five-year vision or Medium Term Strategic Framework that spans from the financial year 2015 to 2020. The following key strategic indicators have been identified by the department as catalyst to achieve the 30-year ultimate goal of NDP in agriculture, fisheries and forestry sector: • Access to markets by both smallholder and commercial farmers, • Access to finance, • Co-operative formation and support, • Penetration of export markets particularly by the smallholder farmers,• Employment creation,
As well as rendering necessary support to all aspiring individuals in the sector including vulnerable groups of the society such as youth, female and people with disability.
Comparative analysis of the performance indicators between the two financial years, viz. 2015/2016 and 2016/2017 is done to with a view to track progress made with regard to achieving the NDP 2030 vision.

Annual Report for 2016/17 Financial Year
32 |Department of Agriculture, Land Reform & Rural Development Northern Cape Province Vote 12
Access to Markets: Market Linkages Created
Figure1: Number of Agri-Businesses Supported to Access Markets
44
Access to Markets: Market Linkages Created Figure1: Number of Agri-Businesses Supported to Access Markets
The figure above indicates that there has been a huge decrease in the number of agricultural economic services given to agribusinesses with a view to help them access markets. The percentage decrease from 2015/2016 to 2016/2017 financial year has been recorded at 28%. In terms of the Medium Term Strategic Framework or vision 2015-2020 of the Department of Agriculture, Land Reform and Rural Development, only 32.4% of the targets have been achieved so far as opposed to 47.1% expected from the two years under review. This outlook is attributed to the fact that most projects are unable to meet market requirements due to quantity and quality of the produce as well as lack of their own transports to take produce to the market place. These factors as a result are caused them not to access sustainable markets. Access to Finance: Micro-Agricultural Finance Institution of South Africa (MAFISA)
During the financial years 2015/2016 and 2016/2017, the total amount of money disbursed to 65 MAFISA applicants was only R3, 725,000. The amount of money disbursed relative to the number of applications looks so small and this is attributed to the fact that fewer applications were received resulting in fewer screening committee meetings being held (see Figure 2 below) due to drought conditions experienced in the province, poor repayment rate by the farmers and some famers totally not meeting their financial obligations to the scheme resulted in National
6 5 -1
83
10 6
-4
60
16 11
-5
69
-10
0
10
20
30
40
50
60
70
80
90
Planned Target(s) Actual Achievement Deviation %Achievement
Access to Markets
The figure above indicates that there has been a huge decrease in the number of agricultural economic services given to agribusinesses with a view to help them access markets. The percentage decrease from 2015/2016 to 2016/2017 financial year has been recorded at 28%. In terms of the Medium Term Strategic Framework or vision 2015-2020 of the Department of Agriculture, Land Reform and Rural Development, only 32.4% of the targets have been achieved so far as opposed to 47.1% expected from the two years under review. This outlook is attributed to the fact that most projects are unable to meet market requirements due to quantity and quality of the produce as well as lack of their own transports to take produce to the market place. These factors as a result are caused them not to access sustainable markets.
Access to Finance: Micro-Agricultural Finance Institution of South Africa (MAFISA)
During the financial years 2015/2016 and 2016/2017, the total amount of money disbursed to 65 MAFISA applicants was only R3, 725,000. The amount of money disbursed relative to the number of applications looks so small and this is attributed to the fact that fewer applications were received resulting in fewer screening committee meetings being held (see Figure 2 below) due to drought conditions experienced in the province, poor repayment rate by the farmers and some famers totally not meeting their financial obligations to the scheme resulted in National Emergent Red Meat Producers Organisation (NERPO) as an intermediary suspending the scheme.
Figure 2: Number of Screening Committee Meetings Held to Process Applications
45
Emergent Red Meat Producers Organisation (NERPO) as an intermediary suspending the scheme. Figure 2: Number of Screening Committee Meetings Held to Process Applications
Establishment of New Co-operatives During the two financial years under review, the department has achieved 100% of the planned targets (see Figure 3 below). This translates to 46.3% progress made towards achieving departmental 5-year vision as expected. Figure 3: Number of New Co-operatives Established
10 5
-5
50
10 4
-6
40
20
9
-11
45
-20
-10
0
10
20
30
40
50
60
Planned Target(s) Actual Achievement Deviation %Achievement
Access to Finance
8 8 0
100
11 11 0
100
19 19
0
100
0
20
40
60
80
100
120
Planned Target(s) Actual Achievement Deviation %Achievement
Co-operatives Established

Annual Report for 2016/17 Financial Year
| 33Department of Agriculture, Land Reform & Rural Development Northern Cape Province Vote 12
Establishment of New Co-operatives
During the two financial years under review, the department has achieved 100% of the planned targets (see Figure 3 below). This translates to 46.3% progress made towards achieving departmental 5-year vision as expected.
Figure 3: Number of New Co-operatives Established
45
Emergent Red Meat Producers Organisation (NERPO) as an intermediary suspending the scheme. Figure 2: Number of Screening Committee Meetings Held to Process Applications
Establishment of New Co-operatives During the two financial years under review, the department has achieved 100% of the planned targets (see Figure 3 below). This translates to 46.3% progress made towards achieving departmental 5-year vision as expected. Figure 3: Number of New Co-operatives Established
10 5
-5
50
10 4
-6
40
20
9
-11
45
-20
-10
0
10
20
30
40
50
60
Planned Target(s) Actual Achievement Deviation %Achievement
Access to Finance
8 8 0
100
11 11 0
100
19 19
0
100
0
20
40
60
80
100
120
Planned Target(s) Actual Achievement Deviation %Achievement
Co-operatives Established
Export Markets
Figure 4: Number of Export Opportunities Created
46
Export Markets Figure 4: Number of Export Opportunities Created
During the two financial years under review, the department has achieved far beyond planned targets (i.e. 500% and 250%) financial years 2015/2016 and 2016/2017 respectively. (see Figure 4 above). However, it should be noted that these are not necessarily actual linkages to export markets but exposure given to smallholder farmers to various potential international investors. Support to the Vulnerable Groups Support to the Youth and Female Farmers The government is committed to promote the inclusion of both youth and women owned agricultural enterprises with a view to address the issue of gender based inequality, poverty, unemployment amongst women and youth, improve food security as well as stimulating local economies. During the two financial years under review, the department made considerable strides to support many youth farmers as possible. It has achieved far beyond planned targets (i.e. 102% and 184%) financial years 2015/2016 and 2016/2017 respectively. (see Figure 5 below). This translates to 65% progress made towards achieving departmental 5-year vision against expected target of 53.4%.
1 5 4
500
2 5 3
250
3 10 7
333
0
100
200
300
400
500
600
Planned Target(s) Actual Achievement Deviation %Achievement
Export Markets
During the two financial years under review, the department has achieved far beyond planned targets (i.e. 500% and 250%) financial years 2015/2016 and 2016/2017 respectively. (see Figure 4 above). However, it should be noted that these are not necessarily actual linkages to export markets but exposure given to smallholder farmers to various potential international investors.

Annual Report for 2016/17 Financial Year
34 |Department of Agriculture, Land Reform & Rural Development Northern Cape Province Vote 12
Support to the Vulnerable Groups
Support to the Youth and Female Farmers
The government is committed to promote the inclusion of both youth and women owned agricultural enterprises with a view to address the issue of gender based inequality, poverty, unemployment amongst women and youth, improve food security as well as stimulating local economies. During the two financial years under review, the department made considerable strides to support many youth farmers as possible. It has achieved far beyond planned targets (i.e. 102% and 184%) financial years 2015/2016 and 2016/2017 respectively. (see Figure 5 below). This translates to 65% progress made towards achieving departmental 5-year vision against expected target of 53.4%.
Figure 5: Number of Youth Farmers Supported
47
Figure 5: Number of Youth Farmers Supported
Figure 6: Number of Female Farmers Supported
As for the support rendered to the female farmers, the was a huge improvement from the financial year 2015/2016 to 2016/2017 (see Figure 6 above). This translates to 59% progress made towards achieving departmental MTSF targets against expectation of 38%.
160 163
3
102
50
92
42
184 210
255
45
121
0
50
100
150
200
250
300
Planned Target(s) ActualAchievement
Deviation %Achievement
Youth Farmers Supported
100
142
42
142 110
183
73
166
210
325
115
155
0
50
100
150
200
250
300
350
Planned Target(s) Actual Achievement Deviation %Achievement
Female Farmers Supported
Figure 6: Number of Female Farmers Supported
47
Figure 5: Number of Youth Farmers Supported
Figure 6: Number of Female Farmers Supported
As for the support rendered to the female farmers, the was a huge improvement from the financial year 2015/2016 to 2016/2017 (see Figure 6 above). This translates to 59% progress made towards achieving departmental MTSF targets against expectation of 38%.
160 163
3
102
50
92
42
184 210
255
45
121
0
50
100
150
200
250
300
Planned Target(s) ActualAchievement
Deviation %Achievement
Youth Farmers Supported
100
142
42
142 110
183
73
166
210
325
115
155
0
50
100
150
200
250
300
350
Planned Target(s) Actual Achievement Deviation %Achievement
Female Farmers Supported
As for the support rendered to the female farmers, the was a huge improvement from the financial year 2015/2016 to 2016/2017 (see Figure 6 above). This translates to 59% progress made towards achieving departmental MTSF targets against expectation of 38%.
Employment Creation
The Northern Cape Department of Agriculture, Land Reform and Rural Development finds its expression within the NDP vision 2030 and trajectory that aim to support all employment intensive programmes and initiatives especially those that target the youth and women. Investment in new sources of growth

Annual Report for 2016/17 Financial Year
| 35Department of Agriculture, Land Reform & Rural Development Northern Cape Province Vote 12
as clearly defined in the NDP statement of intention will be encouraged and incentivised. The NDP provides a long-term vision through 2030 for accelerating GDP growth so that unemployment and inequality can be reduced and for creating a more inclusive society (National Planning Commission, 2011).
Jobs from Expanded Public Work Programme (EPWP)
The figure below indicates that year-on-year, there was a percentage drop of 27% on jobs created through CASP and Ilima-Letsema. This is attributed to poor quality of evidence submitted from districts, during implementation of projects in the financial year 2016/2017. So far, only 34% progress has been made towards achieving the MTSF target as opposed to 40% expected from the two years under review.
Figure 7: Number of Jobs Created through EPWP
48
Employment Creation The Northern Cape Department of Agriculture, Land Reform and Rural Development finds its expression within the NDP vision 2030 and trajectory that aim to support all employment intensive programmes and initiatives especially those that target the youth and women. Investment in new sources of growth as clearly defined in the NDP statement of intention will be encouraged and incentivised. The NDP provides a long-term vision through 2030 for accelerating GDP growth so that unemployment and inequality can be reduced and for creating a more inclusive society (National Planning Commission, 2011). Jobs from Expanded Public Work Programme (EPWP) The figure below indicates that year-on-year, there was a percentage drop of 27% on jobs created through CASP and Ilima-Letsema. This is attributed to poor quality of evidence submitted from districts, during implementation of projects in the financial year 2016/2017. So far, only 34% progress has been made towards achieving the MTSF target as opposed to 40% expected from the two years under review. Figure 7: Number of Jobs Created through EPWP
Green Jobs As for the green jobs, despite the performance regression experienced in the financial year 2016/2017 yielding the percentage drop year-on-year of 42.4% (see Figure 8 below). There was a progress witnessed in terms of meeting the MTSF target as recorded at 51.1% against 40% expected from two financial year.
1000 1032
32 103
1000 708
292 74
2000 1790
324 90
-500
0
500
1000
1500
2000
2500
Planned Target(s) Actual Achievement Deviation %Achievement
Employment Created Through EPWP (CASP & Ilima-Letsema
Green Jobs
As for the green jobs, despite the performance regression experienced in the financial year 2016/2017 yielding the percentage drop year-on-year of 42.4% (see Figure 8 below). There was a progress witnessed in terms of meeting the MTSF target as recorded at 51.1% against 40% expected from two financial year.
Figure: 8: Number of Jobs Created through Green Jobs
49
Figure: 8: Number of Jobs Created through Green Jobs
Outcome 6: An efficient, competitive and responsive economic infrastructure network
Background and Basis for Outcome #6 Analysis
According to the Planning Commission on the National Development Plan (Vision 2030) South Africa needs to invest in a strong network of economic infrastructure designed to support the country’s medium and long-term economic and social objectives. This economic infrastructure is a precondition for providing basic services such as electricity, water, sanitation, telecommunications and public transport, and it needs to be robust and extensive enough to meet industrial, commercial and household needs.
In response to achieving the objective of outcome#6 which seeks to address the issue of lack of growth stimulating infrastructure, the Department of Agriculture, Land Reform and Rural Development made considerable strides in the following farmers’ fundamental and developmental areas: Projects implemented through Comprehensive Agricultural Support Programme (CASP) ,Ilima-Letsema as well as agricultural infrastructure established.
100
243
143
243 200
140
-60
70
300
383
83 128
-100-50
050
100150200250300350400450
Planned Target(s) Actual Achievement Deviation %Achievement
Green Jobs
2015/2016 2016/2017 Total

Annual Report for 2016/17 Financial Year
36 |Department of Agriculture, Land Reform & Rural Development Northern Cape Province Vote 12
Outcome 6: An efficient, competitive and responsive economic infrastructure network
Background and Basis for Outcome #6 Analysis
According to the Planning Commission on the National Development Plan (Vision 2030) South Africa needs to invest in a strong network of economic infrastructure designed to support the country’s medium and long-term economic and social objectives. This economic infrastructure is a precondition for providing basic services such as electricity, water, sanitation, telecommunications and public transport, and it needs to be robust and extensive enough to meet industrial, commercial and household needs.
In response to achieving the objective of outcome#6 which seeks to address the issue of lack of growth stimulating infrastructure, the Department of Agriculture, Land Reform and Rural Development made considerable strides in the following farmers’ fundamental and developmental areas: Projects implemented through Comprehensive Agricultural Support Programme (CASP) ,Ilima-Letsema as well as agricultural infrastructure established.
Comparative analysis of the performance indicators between the two financial years, viz. 2015/2016 and 2016/2017 is done to with a view to track progress made with regard to achieving the NDP 2030 vision.
Support to Smallholder Farmers
During the two financial years under review, the department has achieved 100% of the planned targets (see Figure 1 and 2 below). This translates to 51% progress made towards achieving departmental 5-year vision as expected on CASP and 41.3% on Ilima-Letsema.
Implementation of Comprehensive Agricultural Support Programme (CASP) Projects
Figure 1: Number of CASP Projects Implemented
50
Comparative analysis of the performance indicators between the two financial years, viz. 2015/2016 and 2016/2017 is done to with a view to track progress made with regard to achieving the NDP 2030 vision. Support to Smallholder Farmers During the two financial years under review, the department has achieved 100% of the planned targets (see Figure 1 and 2 below). This translates to 51% progress made towards achieving departmental 5-year vision as expected on CASP and 41.3% on Ilima-Letsema. Implementation of Comprehensive Agricultural Support Programme (CASP) Projects Figure 1: Number of CASP Projects Implemented
Implementation of Ilima-Letsema Projects Figure 2: Number of Ilima-Letsema Projects Implemented
25 25
0
100
25 25
0
100
50 50
0
100
0
20
40
60
80
100
120
Planned Target(s) Actual Achievement Deviation %Achievement
Support to Smallholder Farmers
CASP CASP CASP
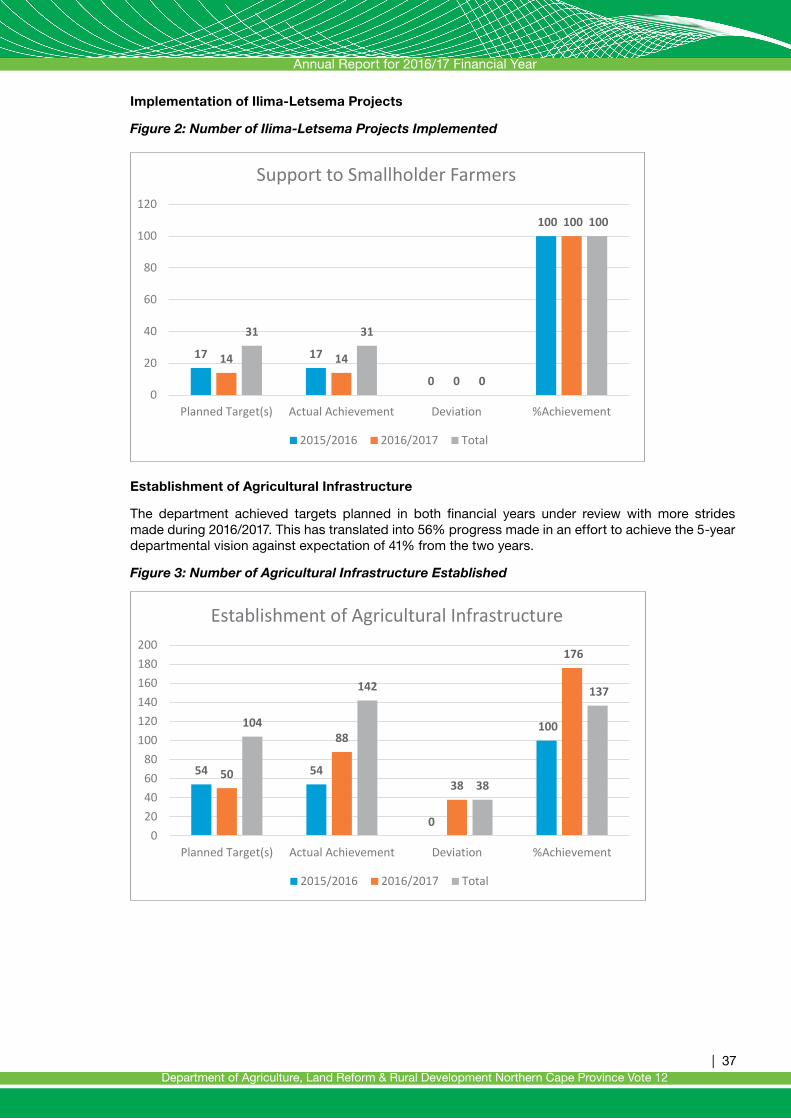
Annual Report for 2016/17 Financial Year
| 37Department of Agriculture, Land Reform & Rural Development Northern Cape Province Vote 12
Implementation of Ilima-Letsema Projects
Figure 2: Number of Ilima-Letsema Projects Implemented
51
Establishment of Agricultural Infrastructure The department achieved targets planned in both financial years under review with more strides made during 2016/2017. This has translated into 56% progress made in an effort to achieve the 5-year departmental vision against expectation of 41% from the two years. Figure 3: Number of Agricultural Infrastructure Established
17 17
0
100
14 14
0
100
31 31
0
100
0
20
40
60
80
100
120
Planned Target(s) Actual Achievement Deviation %Achievement
Support to Smallholder Farmers
2015/2016 2016/2017 Total
54 54
0
100
50
88
38
176
104
142
38
137
020406080
100120140160180200
Planned Target(s) Actual Achievement Deviation %Achievement
Establishment of Agricultural Infrastructure
2015/2016 2016/2017 Total
Establishment of Agricultural Infrastructure
The department achieved targets planned in both financial years under review with more strides made during 2016/2017. This has translated into 56% progress made in an effort to achieve the 5-year departmental vision against expectation of 41% from the two years.
Figure 3: Number of Agricultural Infrastructure Established
51
Establishment of Agricultural Infrastructure The department achieved targets planned in both financial years under review with more strides made during 2016/2017. This has translated into 56% progress made in an effort to achieve the 5-year departmental vision against expectation of 41% from the two years. Figure 3: Number of Agricultural Infrastructure Established
17 17
0
100
14 14
0
100
31 31
0
100
0
20
40
60
80
100
120
Planned Target(s) Actual Achievement Deviation %Achievement
Support to Smallholder Farmers
2015/2016 2016/2017 Total
54 54
0
100
50
88
38
176
104
142
38
137
020406080
100120140160180200
Planned Target(s) Actual Achievement Deviation %Achievement
Establishment of Agricultural Infrastructure
2015/2016 2016/2017 Total

Annual Report for 2016/17 Financial Year
38 |Department of Agriculture, Land Reform & Rural Development Northern Cape Province Vote 12

Annual Report for 2016/17 Financial Year
| 39Department of Agriculture, Land Reform & Rural Development Northern Cape Province Vote 12
4. Performance Information by Programme
4. 1 Programme 1: Administration
Purpose: The purpose of this programme is to manage and formulate policy directives and priorities and, to ensure there is appropriate support service to all other programmes with regard to finance, personnel, information, communication and procurement.
Sub- Programmes:• Office of the MEC• Senior Management• Corporate Services• Financial Management• Communication Services
Strategic Objectives: • To determine policy and set priorities for the department• To provide strategic leadership and support throughout the organization• To ensure effective human resource management of 624 employees• To provide sound financial and risk management support services to the department• To provide communication services and Information Technology support
Strategic objectives, performance indicators planned targets and actual outputs
Strategic Objectives:
Programme: 1 Administration
Strategic objective Actual Achievement2015/2016
Planned Target 2016/2017
Actual Achievement 2016/2017
Deviation from planned target to Actual Achievement for 2016/12017
Comment on deviations
To determine policy and priorities for the department
- 4 3.7 1 -0.3 The requirements for level 4 in 3 out of 10 standards were not met.
To provide strategic leadership and support throughout the organization
6 4 3.8 2 -0.2 The requirements for level 4 in 1 out of 4 standards were not met.
To ensure effective human resource management of 624 employees
- 3 2.4 3 -0.6 The requirements for level 3 in 7 out of 11 standards were not met.
To provide sound financial and risk management support services to the department
- 3 3.3 4 3 The requirements for level 3 in 2 out of 9 standards were not met.
To provide communication services and Information Technology support
- 4 4 0
1 The output has been calculated by averaging all the sores under the Governance and Accountability KPA2 The output has been calculated by averaging all the sores under the Strategic Management KPA3 The output has been calculated by averaging all the sores under the Human Resource Management KPA4 The output has been calculated by averaging all the sores under the Financial Management KPA

Annual Report for 2016/17 Financial Year
40 |Department of Agriculture, Land Reform & Rural Development Northern Cape Province Vote 12
Performance Indicators
Sub-programme: 1.2. Senior Management
Performance Indicators Actual Achieve-ment 2013/2014
Actual Achieve-ment 2014/2015
Actual Achieve-ment2015/2016
Planned Target 2016/2017
Actual Achieve-ment 2016/2017
Devia-tion from planned tar-get to Actual Achieve-ment for 2016/12017
Comment on devia-tions
1.2.1 Number of performance reports Produced
5 5 5 5 5 0
1.2.2 Number of performance plans developed
1 2 2 2 2 0
1.2.3 Number of evaluations conducted
- 1 0 1 1 0
1.2.4 Number of monitoring reports produced
- - - 3 3 0
Sub-programme : 1.3 Corporate Services
Performance Indicators Actual Achieve-ment 2013/2014
Actual Achieve-ment 2014/2015
Actual Achieve-ment2015/2016
Planned Target 2016/2017
Actual Achieve-ment 2016/2017
Devia-tion from planned target to Ac-tual Achieve-ment for 2016/12017
Comment on deviations
1.3.1 Percentage of employees Performance Agreement and assessment captured on Persal
- - - 80% 99% 19% Target was over achieved as all employees are expected to submit EPMDS documents
1.3.2 Submission of the approved employee health wellness operational plan
- - - 1 1 0
1.3.3 Number of Agricultural Higher Education And Training graduates
- - - 5 6 1 The target was over achieved due to one student that had to graduate in the previous year only completed his studies in 2016
1.3.4 Number of officials to be vetted
- 58 62 80 80 0
1.3.5 Number of PAIA reports produced
- - 3 4 3 -1 In quarter 1 we could not conduct intended training program due to unavailability of targeted officials.
1.3.6 Number of PAJA reports produced
- - 3 4 3 -1 In quarter we could not conduct intended training program due to unavailability of targeted officials.
1.3.7 Number of implementation plans on Management of diversity
- - - 4 4 0

Annual Report for 2016/17 Financial Year
| 41Department of Agriculture, Land Reform & Rural Development Northern Cape Province Vote 12
Sub-programme : 1.3 Corporate Services
Performance Indicators Actual Achieve-ment 2013/2014
Actual Achieve-ment 2014/2015
Actual Achieve-ment2015/2016
Planned Target 2016/2017
Actual Achieve-ment 2016/2017
Devia-tion from planned target to Ac-tual Achieve-ment for 2016/12017
Comment on deviations
1.3.8 Repot on the analysis of the exit interviews
- - - 1 1 0
Strategy to overcome areas of under performance
Regular joint meetings by all sub directorates to review performance of each unit in Corporate Services. Constant reviews of implementation plans and strategies. Enforcement and application of consequence management on any matters of ill-discipline (late coming, absenteeism, poor work performance etc.)
Sub-programme : 1.4 Financial Management
Performance Indicators Actual Achieve-ment 2013/2014
Actual Achieve-ment 2014/2015
Actual Achieve-ment2015/2016
Planned Target 2016/2017
Actual Achieve-ment 2016/2017
Devia-tion from planned tar-get to Actual Achieve-ment for 2016/12017
Comment on devia-tions
1.4.1 Number of In-Year Monitoring reports
- - - 12 12 0
1.4.2 Number of MTEF budget submissions
- - - 1 1 0
1.4.3 Number of expenditure and revenue projection reports
- - - 1 1 0
1.4.4 Number of monthly compliance certificates on or before due date
10 12 - 12 12 0
1.4.5 Number of annual and interim financial statements
5 5 - 3 3 0
1.4.6 Number of risk management reviews conducted
- - - 4 4 0
1.4.7 Number of statistical reports regarding procurement submitted to the provincial treasury on or before due date
8 12 - 12 12 0
1.4.8 Number of DAMP reports submitted to the provincial treasury on or before due date
- - - 12 12 0
1.4.9 Number of reports on verified and reconciled asset registers
4 1 - 4 4 0
Strategy to overcome areas of under performance
Sub-programme : 1.5 Communication Services
Performance Indicators Actual Achieve-ment 2013/2014
Actual Achieve-ment 2014/2015
Actual Achieve-ment2015/2016
Planned Target 2016/2017
Actual Achieve-ment 2016/2017
Devia-tion from planned tar-get to Actual Achieve-ment for 2016/12017
Comment on deviations
1.5.1 Communication plan developed
1 1 1 1 1 0

Annual Report for 2016/17 Financial Year
42 |Department of Agriculture, Land Reform & Rural Development Northern Cape Province Vote 12
Sub-programme : 1.5 Communication Services
Performance Indicators Actual Achieve-ment 2013/2014
Actual Achieve-ment 2014/2015
Actual Achieve-ment2015/2016
Planned Target 2016/2017
Actual Achieve-ment 2016/2017
Devia-tion from planned tar-get to Actual Achieve-ment for 2016/12017
Comment on deviations
1.5.2 Number of publications produced
50 46 25 52 50 -2 The publication of the weekly brief are always produced on a Friday, due to some of the shorter weeks in the year (e.g. Easter week), information of the shorter week was combined in the information of the week that followed
1.5.3 Number of media campaigns
16 17 29 15 30 15 Due to proactive action efficient planning by the unit.Due to ad-hoc activities not in the original plan.
1.5.4 Number of ICT support provided
200 566 661 1400 1124 -276 Minimal use of helpdesk portal by the end users.
Strategy to overcome areas of under performance
The unit is going to have one on one meeting with all directorates to discuss matters in relation to information sharing. Monthly informative notices will be send out to all end users on how to utilize the Helpdesk Portal.
Changes to planned targets
None
Linking performance with budgets
Sub programme expenditure
Pr 1: Administration: 2016/2017 2015/2016
Final Appropriation
Actual Expenditure
(Over)/Under
Expenditure
Final Appropriation
Actual Expenditure
(Over)/Under
Expenditure
R’000 R’000 R’000 R’000 R’000 R’000
Office of the MEC 12 680 12 680 - 11 018 10 999 19
Senior Management 22 454 22 452 2 20 356 20 356 -
Corporate Services 45 658 45 658 - 41 600 41 600 -
Financial Management 27 908 27 908 - 24 185 24 184 1
Communication Services
9 908 9 908 - 9 332 9 333 -1
Total 118 608 118 606 2 106 491 106 472 19
SERVICE DELIVERY HIGHLIGHTS
4.1.1 Human Resource Management
The department currently employs a total of 606 employees, of which 570 are permanent employees and 36 are on a contractual basis. Staff vacancy rate was 8.1.

Annual Report for 2016/17 Financial Year
| 43Department of Agriculture, Land Reform & Rural Development Northern Cape Province Vote 12
We confirm that all filled vacancies can be accounted for due to our monthly payroll certifications confirmed by the different program managers, therefor the PERSAL system reflects all warm bodies in the department. In the previous financial year, 2015/16, Human Resources coordinated the provincial biometrics headcount. The department then embarked on a departmental headcount in an attempt to ensure accountability for value of capital resources.
To ensure that employees perform optimally and that they remain motivated they are continuously encouraged to further their studies. For the year under review a total of 21 employees were awarded bursaries in different study fields. The bursary scheme also assists the unemployed youth to further their studies in various fields. A total number of 44 were funded and 6 graduates from the previous group. The later initiative is to continue expanding our pool of technical fields to narrow the gap of skill scarcity in the department.
The EPMDS Compliance has improved and the department complied with signing and capturing of PA’s for all the 9 SMS members on PERSAL in accordance with MPAT requirements.
We have seen an increase of officials’ participation in the Health and Wellness programme in terms of celebration of wellness awareness days for the financial year in review. We held four (4) wellness days in collaboration with GEMS and the Department of Health wherein officials tested for blood pressure, diabetes, cholesterol, IBM measurements and HIV/AIDS.
The use of sick leave in the department has decreased as opposed to the previous financial year. This may be attributed to the intensive assessments and rejection of temporary incapacity cases by the Health Risk Manager, Pro-Active Health Solutions.
Management of leave remains a challenge, however, control measures were put in place to attempt to achieve our goal. HRM established a leave advisory panel in districts in order to strengthen controls in leave management.
4.1.2 Legal Services and Logistics
PAJA mainstreaming was embarked on to review PAJA compliance on veterinary business processes. Workshops conducted with project leaders on the legal implications of service level agreements.
Workshops on the implementation, application and implications of Promotion of Administrative Justice act (PAJA) and Promotion of Access to Information Act (PAIA) reaching more than one hundred (100) officials across the province from different levels.
The department managed to purchase its Head Office building it previously rented from Delta Properties which realised a saving of about R350 000. 00 per month. The transport policy was also reviewed.
4.1.3 Security Management
We have coordinated vetting of officials and submitted eighty (80) security clearance forms to SSA this year. It remains the responsibility of the Security Management unit to conduct the pre - screening of applicants as part of assistance to the recruitment process. A name list of eleven (11) applicants was submitted to SSA.
4.1.4 Records Management
The procurement and installation of steel bulk filing shelves for the registry office at Head Office was done. This process was done to incorporate the records of the HOD and Human Resources Director into the system at registry.
Following the approved DESTRUCTION REGISTER by the Provincial Archivist we were required to complete for signature by the accounting officer a disposal procedure and regulation. The guideline or register will indicate which records were destroyed and which records will be disposed of in that year. The departmental disposal certificate which is being issued after the destruction of records was issued.

Annual Report for 2016/17 Financial Year
44 |Department of Agriculture, Land Reform & Rural Development Northern Cape Province Vote 12
4.1.5 Gender
The unit managed to host four (4) gender forum meetings, three (3) gender capacity building sessions in Frances Baard, Upington and Namakwa District. Outreach programmes were held in Namakwa, John Taolo Gaetsewe, Pixley Ka Seme, Frances Baard and ZF Mgcawu for the community (farmers) and officials. A Departmental Plan and Report for 2016/17 was compiled, approved and forwarded to DPSA.
Job Access
A Job Access departmental plan and report were compiled, approved and submitted to DPSA. An awareness session was hosted in Frances Baard District for Human Rights of lesbians, gays, bisexual, and transgender (LGBT
4.1.6 Communication and ICT
Offices visited during the period under review
Kuruman Vet, Springbok, De Aar, De Aar vet, Colesberg, Victoria West, Prieska, Carnarvon, Calvinia, Calvinia Vet and Hope Town. Most of the computers were checked for virus updates and configured to be inventoried on Spice Works.
Progress with the Website revitalisation
The website http://agrihelpdesk.ncpg.gov.za was created and is active for fault reporting on spice works and is working very well. We have sent out numerous mails informing personnel to log faults on the website and or either send an email to [email protected] for IT assistance.
We are in consultation with Microsoft Partners through Microsoft SA on further deployment of Microsoft Cloud Infrastructure including the Active Directory and a workshop will be held.
This workshop will prepare our IT staff to support and manage Microsoft cloud infrastructure after the deployment.
Tabular representation of the performance and call resolution of all Presidential Hotline queries/cases (October 2016 to March 2017)
Department No. of Open Calls
No. of Resolved Calls
Avg. Time to Resolve (Gov. Bus. Hrs)
Total Calls
% Resolved 31 March 2017
% Resolved Oct 2016 - Feb 2017
NC Dept. of Agriculture, Land Reform and Rural Development
1 39 2386 40 97,5% 100%
We had two Imbizo for farmers during the period under review addressed by deputy minister of Agriculture, Forestry and Fisheries, General Bheki Cele in the Phokwane municipal district.
Taking up slots on agricultural topics at most community radio stations and Interviews conducted by radio and TV on Agricultural matters.
Francis Baard Farmers Day Communication Support to Farmers of the District during their interactions.
State of the Province Address by Premier Lucas, Kimberley
Branding and Exhibitions
Premier’s Youth Launch, Upington Branding and Exhibitions
Minister Jeff Radebe’s Visit to Kimberley Branding and Exhibitions
Niewoudtsville Community Meeting Communication and Technical Support
MEC Shushu Community Outreach Programme (Sanitary Towels and School Uniform) Leratong Park.
Communication and Technical Support

Annual Report for 2016/17 Financial Year
| 45Department of Agriculture, Land Reform & Rural Development Northern Cape Province Vote 12

Annual Report for 2016/17 Financial Year
46 |Department of Agriculture, Land Reform & Rural Development Northern Cape Province Vote 12
4.2 Programme 2: Sustainable Resource Management
Purpose: The purpose of the programme is to provide agricultural engineering support service to farmers in order to ensure sustainable development and management of agricultural resources.
Sub- Programmes:• Engineering Services;• LandCare;• Land Use Management; and• Disaster Risk Management.
Strategic Objectives:• To provide engineering support (planning, development, monitoring and evaluation) with regards to
irrigation technology, on-farm mechanization, value adding, farm structures, resource conservation management, operation and maintenance of farm equipment, machinery, tools, and implements solutions;
• To plan and coordinate the implementation of 25 LandCare projects;• To Promote sustainable use of natural resources through the implementation of regulated land use
Act (Act 43 of 1983, Act 70 of 1970, and related legislation); and• To provide agricultural disaster risk management support services to clients/farmers by
implementing programmes on disaster plans for droughts, veld fires and floods.
Strategic objectives, performance indicators planned targets and actual outputs
Strategic Objectives:
Programme: 2 Sustainable Resource Management
Strategic objective Actual Achievement2015/2016
Planned Target 2016/2017
Actual Achievement 2016/2017
Deviation from planned target to Actual Achievement for 2016/12017
Comment on deviations
To provide engineering support (planning, development, monitoring and evaluation) with regards to irrigation technology, on-farm mechanization, value adding, farm structures, resource conservation management, operation and maintenance of farm equipment, machinery, tools, and implements solutions.
54 50 88 38 All 50 planned, funded projects were completed. At final planning and design stage it became clear that for some projects the infrastructure can best be established by more than one tender. Each tender need a final completion certificate. This resulted in more completion certificates issued than the target.
To plan and coordinate the implementation of 25 LandCare projects
- 6 6 0
To Promote sustainable use of natural resources through the implementation of regulated land use Act (Act 43 of 1983, Act 70 of 1970, and related legislation)
- 25 22 -3 Demand driven, Less application received.
To provide agricultural disaster risk management support services to clients/farmers by implementing programmes on disaster plans for droughts, veld fires and floods
- 1 1 0

Annual Report for 2016/17 Financial Year
| 47Department of Agriculture, Land Reform & Rural Development Northern Cape Province Vote 12
Performance indicators
Sub-programme: 2.1 Engineering Services
Performance Indicators Actual Achieve-ment 2013/2014
Actual Achieve-ment 2014/2015
Actual Achieve-ment2015/2016
Planned Target 2016/2017
Actual Achieve-ment 2016/2017
Deviation from planned target to Actual Achievement for 2016/12017
Comment on deviations
2.1.1 Number of Agricultural infrastructure established
- - 54 50 88 38 All 50 planned, funded projects were completed. At final planning and design stage it became clear that for some projects the infrastructure can best be established by more than one tender. Each tender need a final completion certificate. This resulted in more completion certificates issued than the target.
Strategy to overcome areas of under performance
None
Sub-programme: 2.2 LandCare
Performance Indicators Actual Achieve-ment 2013/2014
Actual Achieve-ment 2014/2015
Actual Achieve-ment2015/2016
Planned Target 2016/2017
Actual Achieve-ment 2016/2017
Deviation from planned target to Ac-tual Achieve-ment for 2016/12017
Comment on deviations
2.2.1 Number of hectares protected/rehabilitated to improve agricultural production
- 2000 7363 4600 4700 100 Surplus material was utilised to rehabilitate an additional 100ha of rangeland prone to soil erosion at the Pixley Ka Seme Soil Care project situated in Richmond (Ubuntu local municipality)
2.2.2 Number of green jobs created
221 188 243 100 153 53 Bush control projects in the John Taolo Gaetsewe and Z.F Mgcawu districts; commenced late in the financial year which necessitated the project team to increase the number of workers in order to complete the project on scheduled time and set out targets.
2.2.3 Number of awareness campaigns conducted on LandCare
1 2 2 2 2 0
2.2.4 Number of capacity building exercises conducted within approved LandCare projects
2 2 2 2 2 0

Annual Report for 2016/17 Financial Year
48 |Department of Agriculture, Land Reform & Rural Development Northern Cape Province Vote 12
Sub-programme: 2.2 LandCare
Performance Indicators Actual Achieve-ment 2013/2014
Actual Achieve-ment 2014/2015
Actual Achieve-ment2015/2016
Planned Target 2016/2017
Actual Achieve-ment 2016/2017
Deviation from planned target to Ac-tual Achieve-ment for 2016/12017
Comment on deviations
2.2.5 Number of beneficiaries adopting/practising sustainable production technologies & practices
6 100 100 100 100 0
Strategy to overcome areas of under performance
None
Sub-programme: 2.3 Land Use Management
Performance Indicators Actual Achieve-ment 2013/2014
Actual Achieve-ment 2014/2015
Actual Achieve-ment2015/2016
Planned Target 2016/2017
Actual Achieve-ment 2016/2017
Deviation from planned target to Actual Achievement for 2016/12017
Comment on deviations
2.3.1 Number of hectares of agricultural land protected through guiding subdivision/rezoning/change of agricultural land use
- - 1591 200 16609 16409 Indicator demand driven. Very high output is result of applications received for rezoning for mining rights for large areas
Strategy to overcome areas of under performance
None
Sub-programme: 2.4 Disaster Risk Management
Performance Indicators Actual Achieve-ment 2013/2014
Actual Achieve-ment 2014/2015
Actual Achieve-ment2015/2016
Planned Target 2016/2017
Actual Achieve-ment 2016/2017
Deviation from planned target to Actual Achievement for 2016/12017
Comment on deviations
2.4.1 Number of disaster risks reduction programme managed
12 12 12 12 12 0
2.4.2 Number of disaster relief schemes managed
3 1 1 1 1 0
Strategy to overcome areas of under performance
None
Changes to planned targets
None

Annual Report for 2016/17 Financial Year
| 49Department of Agriculture, Land Reform & Rural Development Northern Cape Province Vote 12
Linking performance with budgets
Sub programme expenditure
Pr 2: Sustainable Resource Management:
2016/2017 2015/2016
Final Appropriation
Actual Expenditure
(Over)/Under
Expenditure
Final Appropriation
Actual Expenditure
(Over)/Under
Expenditure
R’000 R’000 R’000 R’000 R’000 R’000
Engineering Services 7 126 7 126 - 4 944 4 941 3
Land Care 9 320 9 306 14 7 440 7 439 1
Land Use Management 15 055 14 815 240 16 789 16 789 -
Disaster Risk Management
64 197 64 197 - 68 327 68 327 -
Total 95 698 95 444 254 97 500 97 496 4
SERVICE DELIVERY HIGHLIGHTS
This programme provides essential engineering and land use management support to the 5 mega-investment projects of the department and their outputs will cut across various other departmental programmes.
4.2.1. Engineering Support for Development of Infrastructure and Mechanisation Systems to Increase Production, Food and Product Processing and Marketing
4.2.1.1 Namakwa Irrigation Development
The Namakwa Irrigation Development is an NDP compliant initiative to Expand Irrigated Agriculture by 2030 and is one of the five long-term provincial mega-investment projects of the Department worth R1.7 billion along the lower Orange River. The entire project when fully developed, has potential to generate R521 million per annum in value of production and create 3 447 direct jobs.
The project scope is to develop 3 200 Ha high potential arable land in the Namakwa district along eleven distinct
riverine areas and with Onseepkans as the anchor. In the year under review, the plan for Onseepkans was to develop 40 Ha of vineyards, install the Bulk Water distribution system for the water distribution to the 268 Ha plots (118 Ha of which belong to emerging farmers), finalise the EIA process for the construction of the solar powered pump station and reservoir, initiate the EIA process for the further development of the 260 Ha of table grapes on virgin lands.
In terms of progress, the department established an implementation committee made up of the department, implementing agent and consulting engineers for the entire Namakwa Irrigation Development initiative to monitor on the ground progress.
Trellising and Irrigation systems were installed for the planned 40 Ha and only 23 Ha were planted with raisin vineyards. The window for planting in Onseepkans is very narrow and heavily dependent on the weather. The risk became high to plant the remaining portions due to high temperatures.

Annual Report for 2016/17 Financial Year
50 |Department of Agriculture, Land Reform & Rural Development Northern Cape Province Vote 12
Progress regarding the installation of the mother pipes as well as the temporary pump station was also completed in the year under review. These pipes essentially replaces the earth canal of Onseepkans and modernizes the irrigation infrastructure of Onseepkans.
The Implementation committee had regular meetings to monitor the work of the implementing agents and the consulting engineers with various onsite inspection meetings throughout the year.
In terms of the EIAs, the Record of decision (ROD) for the solar-driven pump station and reservoir was issued in the 3rd of quarter of the financial year and the plans for the construction were finalised.
The EIA for the 260 HA virgin land for table grapes is also at an advanced stage of completion but it is likely to be concluded in the 2017/18 financial year. Soil surveys and mapping of the area is complete.
In other areas of the Namakwa Irrigation Development, micro-irrigation systems were installed at Pella for the development of 15 Ha of vineyards, trellising system was installed at Coboop for the development of 10 Ha of vineyards.

Annual Report for 2016/17 Financial Year
| 51Department of Agriculture, Land Reform & Rural Development Northern Cape Province Vote 12
4.2.1.2 Rooibos Development
The programme continues to give engineering support to the Nieuwoudtville Rooibos Factory and although the factory is running independently as a private business, the department is giving guidance regarding the development of further value added products as part of the 9 point plan and Revitalization of Agriculture and Agro-processing Value-Chain (RAAVC).
In the year under review, the factory embarked on the construction of a concentrate / extract and aroma factory as well as product development of beauty products. The intention being to further develop SMMEs in the downstream.
The concentrate and aroma factory was completed and commissioned in November 2016 and due to immediate availability of tea dust, the factory could immediately produce some concentrate and aroma.
Concentrate / extract is a high value product and news of our production sparked interest in international buyers.
The factory together with government, is looking at further SMME development in the compost / coal and executive tea boxing areas. Discussions are at an advanced stage and a complete plan will be presented in the next financial year with possible sources of funding.
The factory has expanded its reach firmly into the Western Cape and in the year under review, secured tea from the Wuppertal emerging farmers and a community of 1500 members with over 200 years of tea producing heritage.
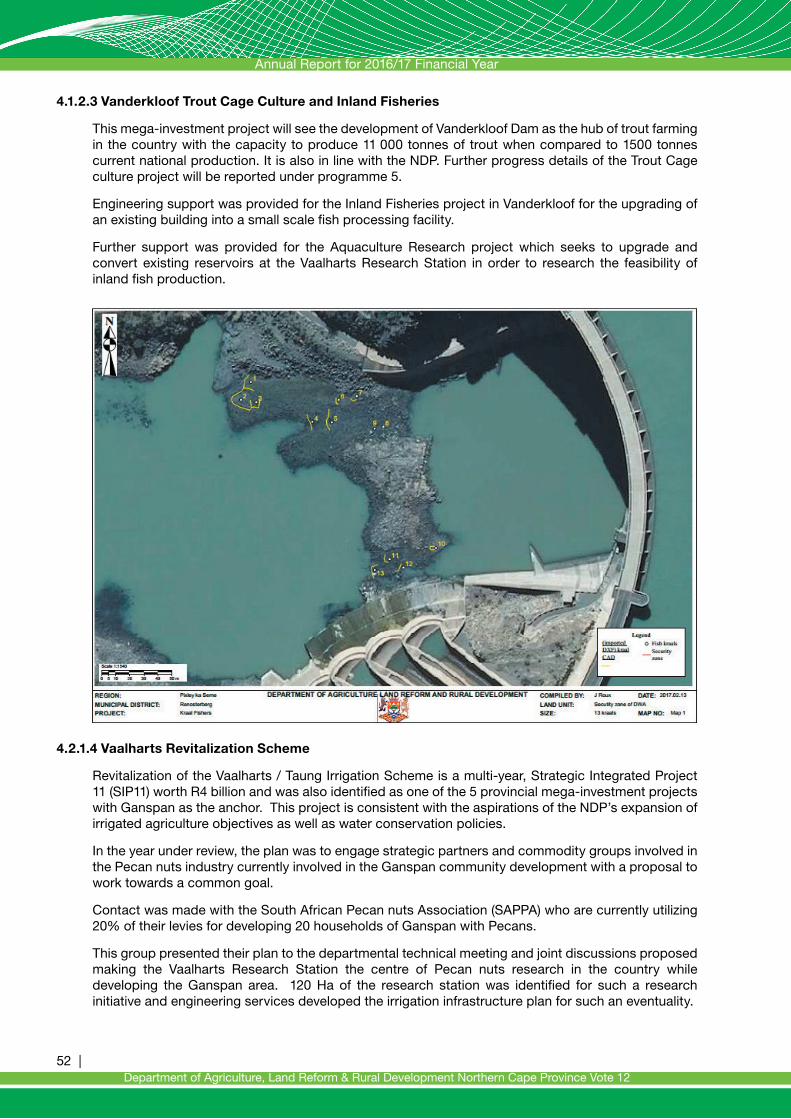
Annual Report for 2016/17 Financial Year
52 |Department of Agriculture, Land Reform & Rural Development Northern Cape Province Vote 12
4.1.2.3 Vanderkloof Trout Cage Culture and Inland Fisheries
This mega-investment project will see the development of Vanderkloof Dam as the hub of trout farming in the country with the capacity to produce 11 000 tonnes of trout when compared to 1500 tonnes current national production. It is also in line with the NDP. Further progress details of the Trout Cage culture project will be reported under programme 5.
Engineering support was provided for the Inland Fisheries project in Vanderkloof for the upgrading of an existing building into a small scale fish processing facility.
Further support was provided for the Aquaculture Research project which seeks to upgrade and convert existing reservoirs at the Vaalharts Research Station in order to research the feasibility of inland fish production.
4.2.1.4 Vaalharts Revitalization Scheme
Revitalization of the Vaalharts / Taung Irrigation Scheme is a multi-year, Strategic Integrated Project 11 (SIP11) worth R4 billion and was also identified as one of the 5 provincial mega-investment projects with Ganspan as the anchor. This project is consistent with the aspirations of the NDP’s expansion of irrigated agriculture objectives as well as water conservation policies.
In the year under review, the plan was to engage strategic partners and commodity groups involved in the Pecan nuts industry currently involved in the Ganspan community development with a proposal to work towards a common goal.
Contact was made with the South African Pecan nuts Association (SAPPA) who are currently utilizing 20% of their levies for developing 20 households of Ganspan with Pecans.
This group presented their plan to the departmental technical meeting and joint discussions proposed making the Vaalharts Research Station the centre of Pecan nuts research in the country while developing the Ganspan area. 120 Ha of the research station was identified for such a research initiative and engineering services developed the irrigation infrastructure plan for such an eventuality.

Annual Report for 2016/17 Financial Year
| 53Department of Agriculture, Land Reform & Rural Development Northern Cape Province Vote 12
In terms of Ganspan, 210 plots have 0.85 Ha water entitlement but the current infrastructure is inadequate to support such an initiative. The plan was therefore to present a total infrastructure revamp plan costed at R88m and involve various role-players for a 3 year funding plan. In the year under review, such a plan was presented and included in future CASP funding.
The pink coloration of some plots indicates where trees are already planted.
In terms of the general progress with regards to the Vaalharts Revitalization scheme, 2944m of communal main drainage pipelines were installed to service 720 hectares of sub-surface drainage water for irrigation areas adjacent to Jan Kempdorp and plots of block I6. A total of 28 plots were surveyed and sub- surface systems designed to drain 900 ha and this includes the 200 ha water logged land to be drained at Ganspan.
Concrete lined reservoirs were constructed at Kalkputs and VH20 to irrigate 57 and 20 Ha respectively. Furthermore, subsurface drainage system to service 25.6 hectares of irrigation land was completed at Plot 7h14.
4.2.1.5 Vineyards Development Scheme
The Vineyards Development Scheme is primarily coordinated by Programme 3 of the department but substantial engineering support was provided by Programme 2. The role of engineering services is to survey and design irrigation systems associated with the scheme and design and construction of storage and processing facilities.

Annual Report for 2016/17 Financial Year
54 |Department of Agriculture, Land Reform & Rural Development Northern Cape Province Vote 12
To that end, engineering services assisted as follows:• Blocuso - Design one raisin drying facility, security fence and install a 9ha micro-irrigation system
to establish vineyards.• Eiland Women project – Construction of security fence completed. • Lemoendraai - A storage facility was constructed.• Nomalanga – Complete soil preparation to establish 10 ha vineyards.• Silver Moon – Construction of raisin drying facilities and security fence completed and recommend
mechanisation package.• Vaaldrift – Install netting, trellis and micro-irrigation systems to develop 40 ha irrigation.
4.2.2 LANDCARE
The LandCare programme is a community based and government supported approach to the sustainable management of the utilisation of agricultural natural resources and was conceptualised by the South African Government in 1997.
The LandCare programme is currently one of Government’s key programmes that addresses presidential outcomes 4, 7 and 10 and for the 2016/17 financial year, was funded to the tune of R9, 302 m.
4.2.2.1 Rangeland protected/rehabilitated to improve agricultural production
A total of 4700ha was rehabilitated by implementing a total of six (6) projects across the province. The following projects were implemented during the 2016/2017.
Project name Local municipality
John Taolo Gaetsewe VeldCare Joe Morolong
Pixley Ka Seme SoilCare Ubuntu
Z.F Mgcawu VeldCare Dawid Kruiper
Niekerkshoop Prosopis control Siyathemba
Northern Cape LandCare awareness All districts
LandCare administration All districts
4.2.2.2 Creation of Green Jobs
The term “green jobs” is used to classify job opportunities created under the environmental sector. The provincial LandCare programme created a total of 153 jobs during the implementation of projects.
The job specs included amongst others the implementation of a veld management program, fencing, application of herbicides and implementation of a bio-engineering program aimed at curbing soil erosion.

Annual Report for 2016/17 Financial Year
| 55Department of Agriculture, Land Reform & Rural Development Northern Cape Province Vote 12
4.2.2.3 Promotion of LandCare Awareness
The LandCare programme hosted two (2) LandCare awareness days to heighten the knowledge of farming and none farming communities about conservation of natural resources.
A land-users (Farmers) focused LandCare awareness campaign on rangeland management practices was also conducted. These LandCare awareness days were held in the John Taolo Gaetsewe and Frances Baard districts and was attended by councilors, traditional authority, Farmer’s unions, LandCare committees.
4.2.2.4 7th Biennial National LandCare Conference, 2016
The Biennial National LandCare conference is a National Awareness event encapsulated in the awareness strategy to halt land degradation.
The importance of this countrywide awareness on land degradation is anchored within the vision that people are the custodians of the land and are therefore key for any sustainable interventions and livelihoods.
The LandCare National conference was co-hosted by the Department of Agriculture, Forestry and Fisheries (DAFF) in partnership Provincial Department of Agriculture, Land Reform and Rural Development and it is held once every two (2) years.
National LandCare Conference 2016
Junior LandCare

Annual Report for 2016/17 Financial Year
56 |Department of Agriculture, Land Reform & Rural Development Northern Cape Province Vote 12
The 7th Biennial National LandCare Conference was held in Kimberley from the 3rd-6th October 2016 and was attended by 1031 delegates; consisting of: • Farmers from nine provinces (including Junior LandCare participants).• District and local municipalities.• MECs, mayors, traditional authority and councilors (politicians).• Department of Agriculture, Forestry and Fisheries management and officials.• Provincial departments of agriculture and other relevant departments.• African LandCare Networks members (ALN).• Natural Resource Management consultants and NGOs.• South African and international public.• Agricultural Research Council (ARC). • Media fraternity.• Food security ambassadors.
4.2.3. SUSTAINABLE LAND USE MANAGEMENT
Engineering inputs were delivered to ensure sustainable utilisation of agricultural resources as provided for in the Conservation of Agricultural Resources Act; Act 43 of 1983.
4.2.3.1 Subdivision/rezoning/change of agricultural land use
Distribution of adequate stock water on rural and land reform farms is one of the limiting factors to ensure effective utilisation of rangeland by emerging stock farmers.
Stock water systems were designed, service providers appointed and construction of stock water systems completed: Support towards development of stock water:
District Number of projects/ Farms Serviced
Boreholes Drilled
Pumps Installed
Windmills Installed/ Upgraded
Stock Water Systems Installed/ Upgraded
Area Serviced with Stock Water (Ha)
John Taolo Gaetsewe
42 17 16 7 17 71 089
ZF Mgcawu 6 11 29 700
Pixley Ka Seme 11 7 12 1 12 9526
Namakwa 4 4 24 7 24 159 877
Frances Baard 4 3 3 2 1 401
Total 61 34 66 18 55 271 593
4.2.3.2 Sub-Surface Drainage and Lining of Irrigation Dams
To solve the problem of water logging and salinization of irrigation land a programme was implemented to support farmers to install sub-surface drainage systems and to line old leaking irrigation dams.
ZF Mgcawu –
Three farm plans with all relevant documents were compiled for one sub-surface drainage system (5 works) with a total length of 729 m on 5 land partials to be installed at a total value of R 531 740.
Vaalharts Revitalisation –
Install 2944m of communal main drainage pipelines to service 720 hectares of sub-surface drainage water for irrigation areas adjacent to Jan Kempdorp and plots of block I6.
Plot 7H14 – Installation of a subsurface drainage system to service 25.6 hectares of irrigation land was completed.

Annual Report for 2016/17 Financial Year
| 57Department of Agriculture, Land Reform & Rural Development Northern Cape Province Vote 12
A total of 28 plots were surveyed and sub- surface systems designed to drain 900 ha. This includes the 200 ha water logged land to be drained at Ganspan.
Ten communal main drainage pipelines were designed to service 1350 ha of sub-surface systems on irrigation plots.
4.2.4 DISASTER MANAGEMENT
4.2.4.1 Disaster Risk Reduction
The department implemented programmes aimed to minimize the agricultural vulnerabilities and disaster risks. It includes prevention, mitigation, adaptation, prediction and early warning systems. The following activities were implemented in support during the year:
Early warning system –
Twelfth (12) early warning reports have been generated for the whole province and disseminated to farmers through extension services and communication as an integral component of an effective Early Warning System.
Awareness campaigns -
The objective of the campaigns is to promote a culture of risk avoidance among stakeholders by capacitating them through integrated education, training and public awareness programmes informed by scientific research.
The disaster unit conducts annual disaster training for extension officials in order to capacitate them regarding hazard specific risks for Agriculture.
African Centre for Disaster Studies was contracted to conduct and facilitate an accredited course in Basic Disaster Management for extension officials. Training was conducted from the 6th – 8th December 2016 in Upington for 16 extension officials.
4.2.4.2 Agricultural Disaster Management Veld Fire Plan
The department has embarked on a process of conducting and completing disaster management hazard specific plans (Floods, Drought and Veld Fires).
The purpose of the whole project is to be pro-active towards disaster risks affecting the agricultural sector and to ensure a well-coordinated planning and response to disasters. Stakeholder workshops were held and final workshop took place on the 1st of December 2016 and final inputs and amendments were captured and booklets, cd’s, USB developed.
4.2.4.3 Disaster Relief Schemes Implemented
Drought Aid Schemes
Severe drought conditions that developed during 2015 continued and the province was classified as a provincial state of drought disaster on 12 of April 2016 by National Disaster Management Centre.
The conditions deteriorated during 2016 and NDMC through DAFF has allocated R25 million to the Northern Cape Department of Agriculture for drought relief.
Four of the five districts; Frances Baard, John Taolo Gaetsewe, Pixley Ka Seme and biggest part of ZF Mgcawu received good rains during the summer season of October 2016 – February 2017.
In January 2017 it was assessed that the Namakwa district and a small area in the west of ZF Mgcawu district (Kenhardt) did received very little to no rain since October 2016.DAFF procured 73 000 bags of drought pellets at a cost of R20.44 million for distribution to farmers in the identified drought stricken areas of Namakwa district.

Annual Report for 2016/17 Financial Year
58 |Department of Agriculture, Land Reform & Rural Development Northern Cape Province Vote 12
The distribution is at present in process.
The remainder of the R25 million (R4.5 million) will be utilised for the transport of donated animal feed from various locations to further support the farmers in need.
Flood Assistance Scheme
In November 2015 an amount of R64 million was suspended to be made available in the 2016/2017 financial year to complete the following work that could not be completed by 31 March 2016:
• Onseepkans bulk water supply infrastructure – An EIA – ROD was issued by Department of Nature Conservation and Environment in October 2016.
• A distribution pipeline of 9.77 km replacing the old earth canal was installed. Construction of river pump station and dam will be done during 2017/ 2018 after issuing of a Water Use Licence by Department of Water and Sanitation.
• Blocuso Islands - Repair of 38 small bridges and roads for farmers to access their irrigation lands on the islands were completed.
• Eksteenskuil farms – A total length of 3930m of river streams that silted up during the flood, supplying irrigation water to the farmers, were cleaned with excavating machines.
• Sub-surface drainage systems were installed to service 36.8 ha water logged irrigation lands. In total 10 626m of drainage pipes were installed.
• Repair of flood walls along the banks of the Orange River in ZF Mgcawu district continued with the completion of 27 flood diversion works on 31 land partials. A total length of 17 515 meters of walls were constructed at a cost of R 39.103 million.

Annual Report for 2016/17 Financial Year
| 59Department of Agriculture, Land Reform & Rural Development Northern Cape Province Vote 12

Annual Report for 2016/17 Financial Year
60 |Department of Agriculture, Land Reform & Rural Development Northern Cape Province Vote 12
4.3 Programme 3: Farmer Support and Development
Purpose: The purpose of the programme is to provide support to farmers and rural communities through agricultural development programmes.
Sub- Programmes:• Farmer settlement and development;• Extension and advisory services; and• Food security.
Strategic Objectives:• To provide agricultural support to 8400 smallholder and commercial producers for sustainable
agricultural development;• To provide extension and advisory services to 25 000 farmers; and• To provide support to 10 000 food insecure households by 2020.
Strategic objectives, performance indicators planned targets and actual outputs
Strategic Objectives:
Programme: 3 Farmer Support and Development
Strategic objective Actual Achieve-ment2015/2016
Planned Target 2016/2017
Actual Achieve-ment 2016/2017
Deviation from planned target to Ac-tual Achieve-ment for 2016/12017
Comment on deviations
To provide support to 8400 smallholder and commercial producers for sustainable agricultural development
2622 1650 773 -877 Less producers were supported due to commercial farmers are depending primarily on private institutions. E.g Griekwaland West Kooperasie (GWK),Orange River Wine Cellars(ORC) and commodity groups
To provide extension and advisory services to 25 000 farmers
4390 5000 5494 494 More producers supported due to completion of most projects at district level.
To provide support to 10 000 food insecure households by 2020
1895 2000 1899 -101 Some of the beneficiaries migrated from their original address and it became difficult to locate them.
Performance indicators:
Sub-programme: 3.1 Farmer Settlement and Development
Strategic objective Actual Achieve-ment 2013/2014
Actual Achieve-ment 2014/2015
Actual Achieve-ment2015/2016
Planned Target 2016/2017
Actual Achieve-ment 2016/2017
Deviation from planned target to Ac-tual Achieve-ment for 2016/12017
Comment on deviations
3.1.1 Number of smallholder producers receiving support
209 222 2622 500 773 273 More producers supported due to completion of most project s at district level
3.1.2 Number of municipalities supported to manage commonages
23 12 27 27 27 0
3.1.3 Number of landholding institutions provided with support
12 16 20 16 16 0

Annual Report for 2016/17 Financial Year
| 61Department of Agriculture, Land Reform & Rural Development Northern Cape Province Vote 12
Strategy to overcome areas of under performance
The aim is now to revive the commonage with support of organised agriculture, municipality and the department. Proper monitoring has been put into place to ensure the proper running of the committee
Sub-programme: 3.2 Extension and Advisory Services
Performance Indicators Actual Achieve-ment 2013/2014
Actual Achieve-ment 2014/2015
Actual Achieve-ment2015/2016
Planned Target 2016/2017
Actual Achieve-ment 2016/2017
Deviation from planned target to Ac-tual Achieve-ment for 2016/12017
Comment on deviations
3.2.1 Number of smallholder producers supported with agricultural advice
5963 3897 2685 2500 3965 1465 Additional advice was provided by other farming stakeholders and commodity partners. E.g. SAPA & GWK
3.2.2 Number of participants trained in Agricultural skills development programmes
- - 1372 1200 1523 323 The target was over achieved due to participation from stakeholders. E.g. ARC, GWK, SAPA, GADI & officials from Department of Land Reform & Rural Development.
3.2.3 Number of commodity groups supported
- - 6 6 6 0
3.2.4 Number of Projects Supported with CASP
19 22 25 25 25 0
3.2.5 Number of Projects Supported with Ilima/Letsema
13 19 17 14 14 0
3.2.6 Number of youth farmers supported
26 151 163 50 98 48 Youth farmers received production inputs( Fetsa Tlala ) , infrastructure and training
3.2.7 Number of female farmers supported
59 122 142 110 183 73 More female farmers received production inputs & requested advice on agricultural production and training
3.2.8 Number of work opportunities created through EPWP (CASP & Ilima/ Letsema)
1046 1046 1032 1000 708 -292 Less work opportunities were created due to Richtersveld crop production project not being implemented.
Strategy to overcome areas of under performance
More jobs will be allocated to construction projects.

Annual Report for 2016/17 Financial Year
62 |Department of Agriculture, Land Reform & Rural Development Northern Cape Province Vote 12
Sub-programme: 3.3 Food Security
Performance Indicators Actual Achieve-ment 2013/2014
Actual Achieve-ment 2014/2015
Actual Achieve-ment2015/2016
Planned Target 2016/2017
Actual Achieve-ment 2016/2017
Deviation from planned target to Ac-tual Achieve-ment for 2016/12017
Comment on deviations
3.3.1 Number of households benefiting from agricultural food security initiatives
558 693 1157 1000 1322 320 More households were supported due to collaboration and assistance from Department of Agriculture, Forestry and Fisheries (DAFF) with provision of starter packs.
3.3.2 Number of hectares cultivated for food production in communal areas and land reform projects
- - 1308.44 750 812.5 62.5 Contribution and support from stakeholder’s such ARC Potchefstroom with planting of beans led to more hectares achieved.
3.3.4 Number of household gardens established
500 353 698 250 574 324 More households requested garden starter packs to address the increase in food prices by establishing their own food gardens.
3.3.5 Number of institutional gardens established
20 12 20 5 17 12 More request received from different institutions for establishment of gardens to support beneficiaries with balanced diet e.g. soup kitchens
Strategy to overcome areas of under performance
None
Changes to planned targets
None
Linking performance with budgets
Sub programme expenditure
Pr 3: Farmer Support & Development
2016/2017 2015/2016
Final Appropriation
Actual Expenditure
(Over)/Under
Expenditure
Final Appropriation
Actual Expenditure
(Over)/Under
Expenditure
R’000 R’000 R’000 R’000 R’000 R’000
Farmer-Settlement and Development
4 411 4 411 - 4 108 4 108 -
Extension and Advisory Services
217 754 202 940 14 814 236 073 233 822 2 251
Food Security 4 720 4 720 - 5 415 5 415 -
Total 226 885 212 071 14 814 245 596 243 345 2 251

Annual Report for 2016/17 Financial Year
| 63Department of Agriculture, Land Reform & Rural Development Northern Cape Province Vote 12
SERVICE DELIVERY HIGHLIGHTS
4.3.1 Smallholder Producers Receiving Support
Support was in the form of production inputs especially for Fetsa Tlala Food Production Programme where farmers from districts received seeds, fertilizer and diesel. The following projects received inputs; Kamiesberg Grain Project, all 16 projects under Fetsa Tlala in the Frances Baard District and 4 projects in Pixley Ka Seme.
The support included:• Supply and delivery of chicken feed in different poultry projects at John Taolo Gaetsewe;• Construction of fencing on livestock farms at Kareeberg Farms in Pixley Ka Seme District;• Supply and delivery of production inputs on various projects;• Supply and delivery of trellis material on vineyard projects at ZF Mgcawu & Namakwa Districts;• Supply and delivery of fencing material for construction and completion of 7km of border fence at
Masselfontein & Katlani in Douglas and another 20km at Bontheuwel in Grikwastaad at Pixley Ka Seme District;
• Construction of 10km border fence and supply and delivery of 9 mobile handling facilities at Umsobomvu Commonage in Colesberg; and
• Construction of stock handling at Mier Livestock Project for proper livestock management. The two piggery projects in Phillipstown received 275 bags of feed.
Installation of stock water system was done at the following projects:• Installation of water pipes at Waterfall, Groenville, Middleplaas and Borrelskop Commonage Farms
in Frances Baard District where water pipes were installed for improved livestock production in the district;
• Drilling of 12 boreholes and testing 8 at Siyathemba Livestock Infrastructure Project in Niekerkshoop and Koegas; as well as at Driehoek Farm and Colesburg Commonage in Pixley Ka Seme District;
• The support continued at Geselskapbank Project in Namakwa and Eksteenfontein at ZF Magcawu District;
• Installation of windmill, reservoir and 600m pipeline to supply 75 households with drinking water at Babatus in John Taolo Gaetswe District; and
• Installation of 3 solar and submersible pumps to support Reries CPA with livestock water in Gasegonyana Municipality. Solar pumps at Vredebron farm to support 10 farmers with livestock water in Gamagara Municipality.
4.3.2 Smallholder Producers Supported With Agricultural Advice
A total of 3965 farmers received agricultural advice on various aspects of production to improve their yield and income through farmer’s days, information days and demonstrations, site visits and meetings. All this extension techniques aims at increasing the level of knowledge as well as skills of farmers to increase production. The advice included the following application to request a farm of Land through Department of Rural Development and Land Reform, Grazing Management on livestock farms, How to apply for MAFISA, Record keeping in farming business, Safety and health issues in handling of raisins, Milk Goat Production, Mentorship Programme, Drought Relief, Calibration of planter and boom sprayer, Departmental Funding Programmes, Vegetable Production
4.3.3 Commodity Groups Supported
A total of 6 commodity groups were supported (Poultry; Warrenton Super chicken, Red meat; Nguni Farmers, Wine and raisins; Blocuso, Grain ; Fetsa Tlala Projects in , Pixley and Frances Baard, Deciduous fruit; ZF Mgcawu were supported during the quarter in the various districts through technical support, supply of production inputs and infrastructure development on livestock farms
Support was in the form of fence, supply and delivery of production inputs; seed, fertilizer, diesel, on grain projects. SA GAP training was provided to Blocuso Trust Grain projects received production inputs in the form of seed, fertilizer, diesel, pesticides through Fetsa Tlala Food Production Programme. The aim of this support was to improve the production and farm profit on different commodities

Annual Report for 2016/17 Financial Year
64 |Department of Agriculture, Land Reform & Rural Development Northern Cape Province Vote 12
4.3.4 Farmers Trained
Training was provided to 1 615 farmers in all 5 districts. Officials from the Department including, Extension officials, Economists, Animal Health Technicians and other officials from Department of Land Reform & Rural Development, GADI, SAPA, GWK & ARC conducted various training sessions on the following topics:
Lucerne Production; Financial Record keeping; Irrigation Scheduling; Hydroponics Management; Small stock Management; Cattle Production; Integrated Pest Management; Safe handling of chemicals & Crop rotation; Pig Farming; Establishment of Food Garden; Control of blackthorn; Construction of fence; Herd Health Management and principles of Livestock pricing and marketing; Maize Production under Irrigation; PPECB Principles and Good Agricultural Practices (GAP) Farmworker training; Application of pesticides; Animal Husbandry; Animal Health management for large stock; Vegetable Production; Broiler Production; Herd Health management and principles of livestock; Veldt Management; and Re-seeding methods.
4.3.5 Youth Farmers Supported
Department focused the support to Youth in the Province through infrastructure development, supply of production inputs and training. In total, 98 young farmers were supported during 2016/17 financial year and amongst them, 54 of them received production inputs through Fetsa Tlala Programme for planting of wheat and maize at Pniel and Windsorton Small farmers (Kalkput). Pniel Youth Cooperative managed to produce wheat at 1st grade and was marketed at GWK in Barkley West
Youth farmers supported with inputs at Kalkput Farm Frances Baard
4.3.6 Female Farmers Supported
Through departmental funding programmes, 187 female farmers received support through technical advice, training establishment of household food gardens, mechanization, Livestock Improvement Programme, Vaccination Programmes, and infrastructure development through CASP & Illima/ Letsema Funding. Some of the Women benefited from provision of production inputs for planting of wheat and maize through Fetsa Tlala Food Production Programme.
Female Entrepreneur Awards (FEA) is an instrument and platform through which women’s contribution to fight against poverty is being recognized. It also seeks to appreciate women who are leaving an indelible mark in the sector.The 2016/17 Provincial FEA was held at Keimoes in the ZF Mgcawu District on the 11th of August 2016 with 45 participated in various categories. Unfortunately the export farmer, Ms Dina Strauss passed on before

Annual Report for 2016/17 Financial Year
| 65Department of Agriculture, Land Reform & Rural Development Northern Cape Province Vote 12
Provincial Winners
45 participants vied for glory in the following categories, and the winners were:
CATEGORY NAME OF WINNER PRIZES
Best Female Worker in the sectors Ms Denise Smith R 50 000
Best Subsistence Producer in the SectorsRunner up
Ms Annah GaetseweMs Maria Lombaard
R 75 000R 25 000
Top Entrepreneur in the Sectors: SmallholderRunner up
Ms Maria Kantwan Bomme ke Nako
R125 000R 32 000
Top Entrepreneur Processing in the SectorsRunner up
Warrenton Super ChickenCoboop Agric Co-op
R125 000R 32 000
Top Entrepreneur in the Sectors: CommercialRunner up
Ms Martha SawaalMs Margret Francis
R125 000R 32 000
MEC Special Award/s (Youth) (Disabled)
Ms Candice BostanderMs Lena Kotze
R 50 000R 50 000
Overall Winner Ms Maria Kantwan R250 000
Total R971 000
All 6 the winners represented the province at the National Female Entrepreneur Awards in Polokwane Limpopo Province, were Ms Candice Bostander was the Best Youth in the Ministerial Award and Warrenton Super Chicken, Best Entrepreneur in Processing Category. Prize money for the Ministerial Award amounted to R100 000, and for Best Entrepreneur Processing was R250 000. The winners also received a subscription of Extension Suite on Line and tablet each.
Martha Saawal- provincial winner commercial Category
4.3.7 Job Creation through CASP & Illima/ Letsema
708 temporary jobs were created in all 5 districts through implementation of CASP & Illima projects in the Province.
Activity Number of jobs District
Vineyard Development 361 ZF Mgqawu & Namakwa
Irrigation Infrastructure 73 ZF Mgqawu & Frances Baard
Fencing Construction 49 Pixley Ka Seme & John Taole Gaetsewe
Stock Water reticulation 10 Frances Baard
Vaalharts Revilization 76 Frances Baard
Crop Production 82 Frances Baard, John Taole Gaetswe & Pixley Ka Seme
Stock Handling Facilities 4 ZF Mgqawu

Annual Report for 2016/17 Financial Year
66 |Department of Agriculture, Land Reform & Rural Development Northern Cape Province Vote 12
Construction of stock handling facilities at Kalkput
Some of the 59 casual workers during harvesting of grapes at Blocuso Trust
4.3.8 Fetsa Tlala Food Production Programme
This initiative aims at putting 1million hectares of unproductive land into production job creation and to address challenges of food security in the Province. A total of 812.5 ha were planted with various crops in the province. The main crops planted were Maize, wheat, oats and dry beans. The achievement are indicated in the table below
District Product/ Crop Ha Yield per ton Price per ton Total tonnage
Frances Baard
Maize 379 11ton/ha 2 500 1 422
Wheat 237 10ton/ha 3 400 2 200
Dry beans 5 2ton/ha 12 000 10
Pixley Ka SemeMaize 126 10ton/ha 2 600 1 386
Wheat 20 11ton/ha 3 500 700
Namakwa Oats 25 1ton/ha 25
ZF MgcawuRaisin Grapes 17 3.5ton/ha 25 000 1 419.5
Wine Grapes 3.5 40ton/ha 1 400 56 000
Total 812.5
Planting of 24ha of maize & newly installed centre pivot at Kalkput Farm
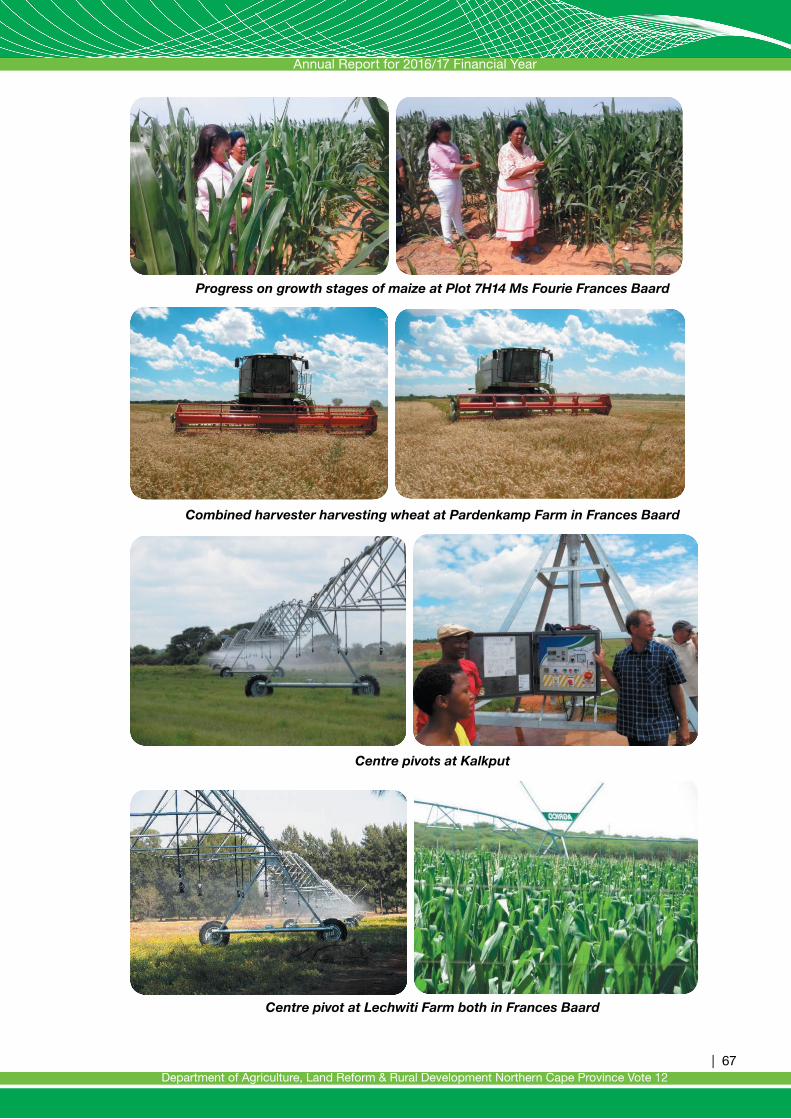
Annual Report for 2016/17 Financial Year
| 67Department of Agriculture, Land Reform & Rural Development Northern Cape Province Vote 12
Progress on growth stages of maize at Plot 7H14 Ms Fourie Frances Baard
Combined harvester harvesting wheat at Pardenkamp Farm in Frances Baard
Centre pivots at Kalkput
Centre pivot at Lechwiti Farm both in Frances Baard

Annual Report for 2016/17 Financial Year
68 |Department of Agriculture, Land Reform & Rural Development Northern Cape Province Vote 12
4.3.9 Vineyard Development Programme
The following activities were completed at the different projects.
Irrigation systems:
A micro Irrigation system for 9.03 ha is completed at Blocuso Trust and in Nomalanga a bulk irrigation system for 70ha is completed. At Lemoendraai the supply, delivery and construction of the pipelines to replace the canal system is completed.
Harvesting in Process at Blocuso Trust
Harvested grapes and drying of raisins at Blocuso Trust
Drying Facility.
All the fencing material to fence off the drying facilities at Eksteenskuil as well as the upgrading and construction of the drying facilities at Silver Moon is completed.
Soil preparations
The soil preparation for 10 ha at Eksteenskuil as one of the vineyard project at ZF Mgcawu is completed for expansion of the vineyard development and this will increase and improve farm profit of farmers.
Storing facilities & Trellis material
The store at Lemoendraai is completed for safety and security of the implements, tractors and production inputs and trellis for planting of 10ha at Nomalangha was delivered to prepare the planting process.Completed Drying facility at Silvermoon
Vineyard Project

Annual Report for 2016/17 Financial Year
| 69Department of Agriculture, Land Reform & Rural Development Northern Cape Province Vote 12
4.3.10 Namakwa Irrigation Development
Pella Vineyard Project
Construction of Trellis and irrigation system for vineyard development is at completion and soil preparation of 15ha for expansion of the 2nd phase is also completed. Planting of the 15ha land is completed.
Coboop Vineyard Project
Trellis system 10ha constructed, 10ha of vineyard cuttings are planted and trellis material for planting of second phase is delivered. Construction of bulk water system for proper irrigation is in completed.
43.11 Mechanization Programme
Different mechanization items were procured and delivered to the following projects through CASP & Illima Funding; Plot 7H14 Female farmer in Frances Baard District and Delivery of tractor at Eiland Wine Project. (Tractor & implements). Supply and delivery of 2 x 65kw tractors and disc plough at Kamiesberg Grain Development and one 6 ton trailer at Kharkams in Namakwa District. Supply and delivery of new tractor and implements at Eiland Women Wine Project
4.3.12 Livestock Production & Development Programme
The programme is aimed at genetic improvement of livestock farmer flock by introduction of genetic material or breeds for quality and optimal livestock production and sustainable utilisation of resources to enhance farming profit. During the year under review, 86 farmers were supplied with subsidized animals to improve genetic. In total, 83 farmers were supported with breeding stock. The support was as follows
Number of Breeding Livestock Supplied to Farmers
District Type of Animals Total
Frances Baard Bonsmara BullsBonsmara Heifers
726
Pixley Ka Seme Bonsmara BullsMerino EwesMeri no Rams
450015
John Taolo Gaetsewe Bonsmara BullsHeifers
1320
ZF Mgcawu Bonsmara Heifers 15
Total Animals 604
The Richmond Opkomende Boere Cooperative project in Ubuntu municipality received 500 stud merino ewes and 15 merino rams in order to improve the quality and quantity of wool production in the district
Livestock Infrastructure
Siting, testing and drilling of boreholes in Collesburg, Madibeng, Bendel, Babatas, Dikgweng CPA, Churchil, Gamopedi CPA and Loopeng.
Three livestock handling facilities were constructed at Esparenza, Padstow, and Occidental Ranch in John Taolo Gaetsewe

Annual Report for 2016/17 Financial Year
70 |Department of Agriculture, Land Reform & Rural Development Northern Cape Province Vote 12
Stock water system at Umsobomvu Commonage
4.3.14 Extension Recovery Plan (ERP)
Pillar 2: Promote Professionalism and Improve Image
17 officials attended the 50th Commemorative Conference of the South African Society for Agricultural Extension (SASAE) held in Gauteng. The theme of the conference was “Quo Vadis (Where are you going?) and 12 Extension practitioners received SACNASP membership certificates
Of the 67 Extension officials in the Province, 4 of them and 2 managers attended Extension Conferences in North West & Free State and the other 4 officials attended Intermediate Poultry Production Training through KZN Poultry Institute to acquire more knowledge on Poultry Production and transfer skills to different poultry Projects beneficiaries in the Province.
Pillar 4: Re-skilling & Re-orientation
Advanced computer training was attended by 11 Extension officials and the duration of the training course was ten days and was held in Kimberly at SMME Centre. The course was offered at an NQF level 3 by Harvex Computer Solutions.
Three officials mainly from John Taole Gaetsewe and ZF Mgcawu completed their studies in the following:• 2 officials- Project Management,• 4 officials- Advanced Diploma in Agricultural Extension,• officials -Management Development Programme
The objective of these qualifications is to improve officials on Extension work
4.3.15 Food Security
World Food Day Commemoration
The Food and Agriculture Organization (FAO) of the United Nations has been celebrating the World Food Day (WFD) on 16th October for the past 35 years, therefore the Department celebrates this initiative where one district is identified where the event takes place. A successful world food day event was hosted by Frances Baard District in Pampierstad; Phokwane Municipality. In total, 2000 local people and farmers from neighbouring villages attended in line with the theme “Climate is changing. Food and agriculture are too”.
Department distributed 30 garden starter packs. These included different vegetable seedlings, garden equipment, various vegetable seeds, beetroot, spinach, carrots and cabbage. As part of the build-up campaign, 70 household gardens from neighbouring villages were established. MEC Mr Shushu together with Local Mayor and Councillors visited three projects:

Annual Report for 2016/17 Financial Year
| 71Department of Agriculture, Land Reform & Rural Development Northern Cape Province Vote 12
• 7H14 Plot for Ms Fourier where the Department assisted with funding for procurement of inputs through Fetsa Tlala Programme, Procurement of implements, construction of overnight dam and installation of sub surface drainage system and centre pivots through Ilima/ Letsema funds
• Moso Irrigation Project in Jan Kempdorp was visited where Department assisted four farmers through conditional grant and procurement of Fetsa Tlala Production inputs. Unfortunately the farm burned down during December 2015 where all implements and storage facility were totally destroyed.
• Oreratile Ostrich Project in Pampierstad was visited. The project has 4 beneficiaries and received funding through CASP for procurement of equipment, ostrich houses, truck, construction of fence, procurement of production inputs and wages
Household & Institutional Gardens Established
Through the integrated food security initiatives, 1 322 households were supported with poultry and garden starter packs to address challenges of food insecurity and in addition 574, household gardens were established to improve the nutritional status of beneficiaries. 17 institutional gardens were established at different municipalities as part of the integrated food security initiative approach and to support affected communities.
Establishment of institutional garden at Plaatfontein Local Church
New shade structure at Bomme Ke Nako Community Food Garden Project at JTG

Annual Report for 2016/17 Financial Year
72 |Department of Agriculture, Land Reform & Rural Development Northern Cape Province Vote 12
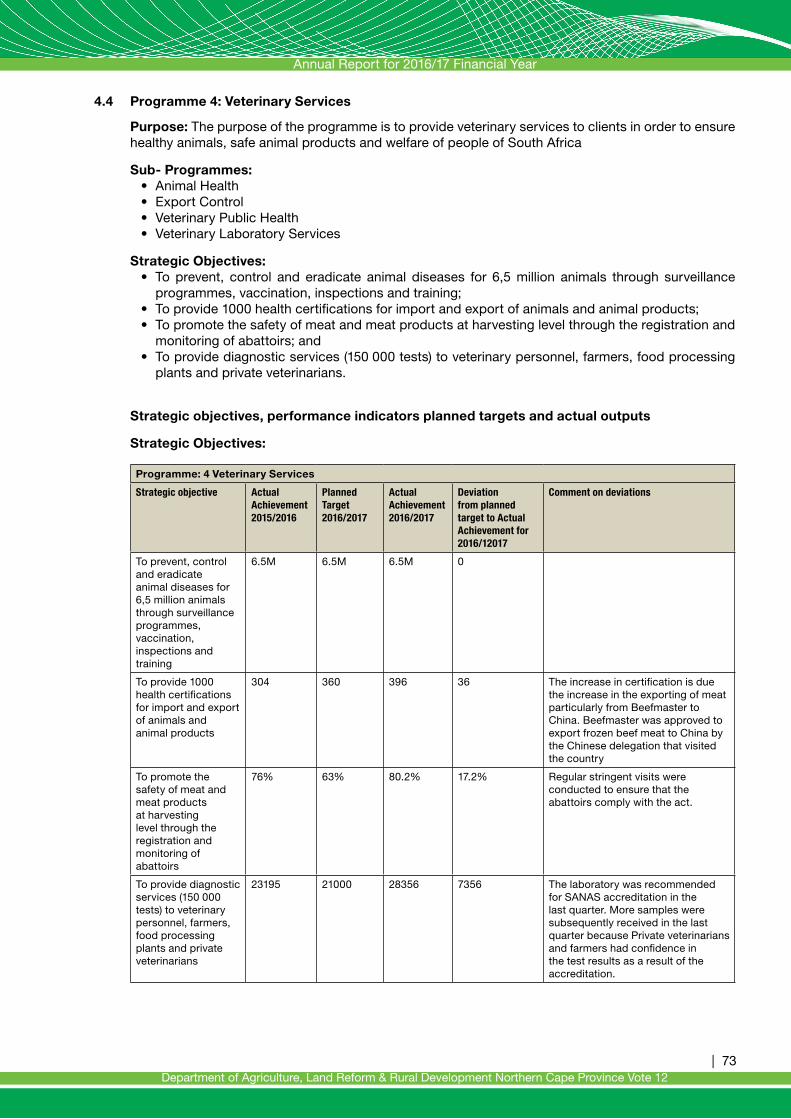
Annual Report for 2016/17 Financial Year
| 73Department of Agriculture, Land Reform & Rural Development Northern Cape Province Vote 12
4.4 Programme 4: Veterinary Services
Purpose: The purpose of the programme is to provide veterinary services to clients in order to ensure healthy animals, safe animal products and welfare of people of South Africa
Sub- Programmes:• Animal Health• Export Control• Veterinary Public Health • Veterinary Laboratory Services
Strategic Objectives:• To prevent, control and eradicate animal diseases for 6,5 million animals through surveillance
programmes, vaccination, inspections and training;• To provide 1000 health certifications for import and export of animals and animal products;• To promote the safety of meat and meat products at harvesting level through the registration and
monitoring of abattoirs; and• To provide diagnostic services (150 000 tests) to veterinary personnel, farmers, food processing
plants and private veterinarians.
Strategic objectives, performance indicators planned targets and actual outputs
Strategic Objectives:
Programme: 4 Veterinary Services
Strategic objective Actual Achievement2015/2016
Planned Target 2016/2017
Actual Achievement 2016/2017
Deviation from planned target to Actual Achievement for 2016/12017
Comment on deviations
To prevent, control and eradicate animal diseases for 6,5 million animals through surveillance programmes, vaccination, inspections and training
6.5M 6.5M 6.5M 0
To provide 1000 health certifications for import and export of animals and animal products
304 360 396 36 The increase in certification is due the increase in the exporting of meat particularly from Beefmaster to China. Beefmaster was approved to export frozen beef meat to China by the Chinese delegation that visited the country
To promote the safety of meat and meat products at harvesting level through the registration and monitoring of abattoirs
76% 63% 80.2% 17.2% Regular stringent visits were conducted to ensure that the abattoirs comply with the act.
To provide diagnostic services (150 000 tests) to veterinary personnel, farmers, food processing plants and private veterinarians
23195 21000 28356 7356 The laboratory was recommended for SANAS accreditation in the last quarter. More samples were subsequently received in the last quarter because Private veterinarians and farmers had confidence in the test results as a result of the accreditation.

Annual Report for 2016/17 Financial Year
74 |Department of Agriculture, Land Reform & Rural Development Northern Cape Province Vote 12
Performance indicators
Sub-programme: 4.1 Animal Health
Performance Information Actual Achieve-ment 2013/ 2014
Actual Achieve-ment 2014/ 2015
Actual Achieve-ment2015/ 2016
Planned Target 2016/ 2017
Actual Achieve-ment 2016/ 2017
Deviation from planned target to Actual Achievement for 2016/12017
Comment on deviations
4.1.1 Number of epidemiological units visited for veterinary interventions
- - 2083 5000 3055 -1945 Attention and focus was on controlling the spread of ASF outbreak in Pniel during the last quarter. Officials spent more time visiting the area as part of disease control than other farms. The BLNS protocol allows for imports of animals from neighbouring countries almost weekly and veterinary officials have to be present during offloading to break the seal and do physical count. Visitation to these abattoir count only once.
Strategy to overcome areas of under performance
The performance indicator for 4.1.1 has been reviewed for 2018/19 going forward by DAFF. From 2018/19, the performance indicator will refer to number of visits to epidemiological units and not epidemiological units visited.
Sub-programme: 4.2 Export Control
Performance Indicator Actual Achieve-ment 2013/2014
Actual Achieve-ment 2014/2015
Actual Achieve-ment2015/2016
Planned Target 2016/2017
Actual Achieve-ment 2016/2017
Deviation from planned target to Actual Achievement for 2016/12017
Comment on deviations
4.2.1 Number of clients serviced for animal and animal products export control
145 125 304 360 383 23 The increase in certification is due the increase in the exporting of meat particularly from Beefmaster to China. Beefmaster was approved to export frozen beef meat to China by the Chinese delegation that visited the country
Strategy to overcome areas of under performance
None
Sub-programme: 4.3 Veterinary Public Health
Performance Indicator Actual Achieve-ment 2013/2014
Actual Achieve-ment 2014/2015
Actual Achieve-ment2015/2016
Planned Target 2016/2017
Actual Achieve-ment 2016/2017
Deviation from planned target to Actual Achievement for 2016/12017
Comment on deviations
4.3.1 % level of abattoir compliance to meat safety legislation
- - 76% 63% 80.2% 17.2% Regular stringent visits to abattoirs by VPH officials ensured that non-conformances were rectified in time
4.3.2 Number of Food Safety Campaigns conducted
14 12 12 16 16 0

Annual Report for 2016/17 Financial Year
| 75Department of Agriculture, Land Reform & Rural Development Northern Cape Province Vote 12
Strategy to overcome areas of under performance
None
Sub-programme: 4.4 Veterinary Lab Services
Strategic objective Actual Achieve-ment 2013/2014
Actual Achieve-ment 2014/2015
Actual Achieve-ment2015/2016
Planned Target 2016/2017
Actual Achieve-ment 2016/2017
Deviation from planned target to Actual Achievement for 2016/12017
Comment on deviations
4.4.1 Number of tests performed the quality of which meets the ISO 17025 standard and OIE requirements
28346 25108 23195 21000 28720 7720 Number of samples wincreased in the last quarter after the laboratory was recommended for SANAS accreditation. Private veterinarians and farmers showed confidence in the lab by sending their samples to the lab.
4.4.2 Number of audits reports
1 1 - 6 10 4 More pre-audits were conducted in preparation for the SANAS accreditation in order to ensure that non-conformances were rectified before the SANAS audit.
Strategy to overcome areas of under performance
None
Changes to planned targets
None
Linking performance with budgets
Sub programme expenditure
Pr 4: Veterinary Services
2016/2017 2015/2016
Final Appropriation
Actual Expenditure
(Over)/Under
Expenditure
Final Appropriation
Actual Expenditure
(Over)/Under
Expenditure
R’000 R’000 R’000 R’000 R’000 R’000
Animal Health 31 604 31 604 - 29 999 29 665 334
Export Control 96 96 - 1 564 1 562 2
Veterinary Public Health 5 653 5 653 - 5 227 5 228 -1
Veterinary Laboratory Services
7 306 7 306 - 6 227 6 227 -
Total 44 659 44 659 - 43 017 42 682 335

Annual Report for 2016/17 Financial Year
76 |Department of Agriculture, Land Reform & Rural Development Northern Cape Province Vote 12
SERVICE DELIVERY HIGHLIGHTS
4.4.1 Animal Health
Over the past few years, the country has experienced an increase in demand for veterinary services among small scale farmers. Government responded by introducing the Compulsory Community Service (CCS) and Primary Animal Health Care (PAHC) programmes.
The programmes offer newly qualified veterinarians the opportunity to provide accessible and affordable primary animal health care services to rural communities in the province. Prieska which is mainly a sheep farming area and De Aar abattoir will each receive a CCS veterinarian starting from January 2017.
Kuruman and Kimberley also received 2 CCS vets. This brings the total number of CCS vets in the province to 6. The CCS vets have already participated in a number of spay campaigns, farmers days and assisted at the Tankwa goat project with the sampling of genetic material from feral goats.
This financial year, we received 4 LWB 4x4 bakkies from the Department of Agriculture Forestry and Fisheries to be used by the CCS veterinarians in the province during call-outs.

Annual Report for 2016/17 Financial Year
| 77Department of Agriculture, Land Reform & Rural Development Northern Cape Province Vote 12
Surveillance for Peste des Petite Ruminant (PPR) also known as ‘goat plague’ in the high risk areas of the province is on-going. The surveillance information is needed to confirm South Africa’s freedom from PPR.
So far, the samples collected from susceptible species in the province came back negative. Awareness campaigns on the disease are on-going.
As indicated in the previous annual report, the roll out of the national Veterinary Public Health food safety project for 2016/17 to the rest of the districts began on the 1st April 2017. To date, 75 meat handling outlets have been profiled ranging from butcheries to supermarkets. This was a joint effort with Environmental Health unit from the local municipalities.

Annual Report for 2016/17 Financial Year
78 |Department of Agriculture, Land Reform & Rural Development Northern Cape Province Vote 12
Revamp of UBALO system to improve our reporting and data capturing was completed successfully. The new look system is user-friendly and makes reporting very easy. Training was arranged for officials and this initiative is already starting to yield the desired outcomes.
4.4.1.1 Animal Disease Control
One case of mortalities in Clarias gariepinus (African Catfish) was undertaken after a report from a concerned citizen.
These mortalities were occurring in the Homestead sewerage treatment plant settler tanks. Due to the advanced stages of autolysis in the carcasses, no post mortem was carried out. The area is fenced out and the public health concerns from these fish is minimal.
The outflow of treated effluent to the Kamfers dam is negligible exacerbating the drying off of the dam. The water levels have drastically fallen and the flamingos have departed from the dam. The dam now resembles a dry pen. Monitoring of Kamfers dam is continuing.
The border fence inspection in the Upington area took place from 31 October 2016 till 3 November 2016. The inspection of the border fence during the indicated timeframe was done after numerous complaints were received from farmers along the border.
The concerns were referred to the Department of Agriculture Forestry and Fisheries (DAFF) since border fence maintenance is the function performed by officials from DAFF. The farming community were requested to alert the DAFF official of any problems on the fence. The involvement of the farming community along the border to keep the fence in good condition is appreciated.
4.4.1.2 Controlled and Notifiable Diseases
Due to the good rains we had this year, state veterinarians and animal health technicians were inundated with reports of horses dying due to African Horse Sickness.
Control measures applied brought the disease under control. We also had to deal with high numbers of vector-borne diseases such as Lumpy Skin, Ephemeral fever as well as parasitic conditions. Farmers were advised to vaccinate their animals and to treat with insecticides.
Figure 1: Map generated from UBALO report

Annual Report for 2016/17 Financial Year
| 79Department of Agriculture, Land Reform & Rural Development Northern Cape Province Vote 12
4.4.1.2.1 African Swine Fever (ASF)
Two separate cases of African Swine Fever (ASF) were reported last year in Schweizer Reneke in the North West province and on a farm near Koffiefontein in the Free State. The veterinary services undertook a survey of the pig population and production systems as a response to the African Swine Fever (ASF) outbreak in North West and Free State Provinces. The province shares common borders with these 2 provinces. No evidence of exposure to ASF was picked up during the survey.
Few month later, the department received a report that pigs were dying in numbers in Pniel. This is a small community with free ranging pigs. African Swine Fever (ASF) was suspected and samples were collected and sent to Onderstepoort Veterinary Institute (OVI) for confirmation.
The disease was confirmed positive by polymerase chain reaction (PCR) by the OVI OIE (World Organization for Animal Health) reference laboratory. This is the first case of ASF to be reported in the province, prompting Veterinary Service to impose movement restriction of live pigs and pig products in Pniel.
Molecular typing of the virus is similar to the Koffiefontein strain and confirms the suspicion that there was definitely introduction of the virus from outside. Stamping out of pigs was successfully executed. Fourteen (14) pigs were euthanized and approximately eighty pigs died overall.
We are continuing with awareness campaign and at the same time intensifying surveillance on all nearby premises to determine the extent of the spread. We are working with the Agricultural Research Council on a project to establish if the warthogs played a role in the transmission of the disease (sylvatic cycle).
4.4.1.2.2 Bovine Tuberculosis
One buffalo was euthanized for post mortem following suspicious reactions to the comparative intradermal tuberculin test. The culture results came back positive for Mycobacterium tuberculosis and Mycobacterium bovis. The variable number of tandem repeats (VNTR) of the M. bovis revealed a general strain.
The National Institute for Communicable Diseases helped in the 24 loci VNTR of the M. Tuberculosis and it is a strain not known.
Currently five farms are under quarantine and three farms that had suspicious reactions were cleared as non-specific reactions probably due to non-tuberculous mycobacteria (NTM) and the quarantine was lifted.
The industry is expected to grow and to demand more services. More farms are being registered to keep buffaloes.
4.4.1.2.3 Rabies
During the rabies month celebration, our officials did not only focus on the vaccination of animals against rabies but also saw the need to educate the nursing staff from various clinics in the province about the rabies treatment protocol and the importance of the disease. This important zoonotic disease is 100% preventable and September month is celebrated internationally as rabies month.
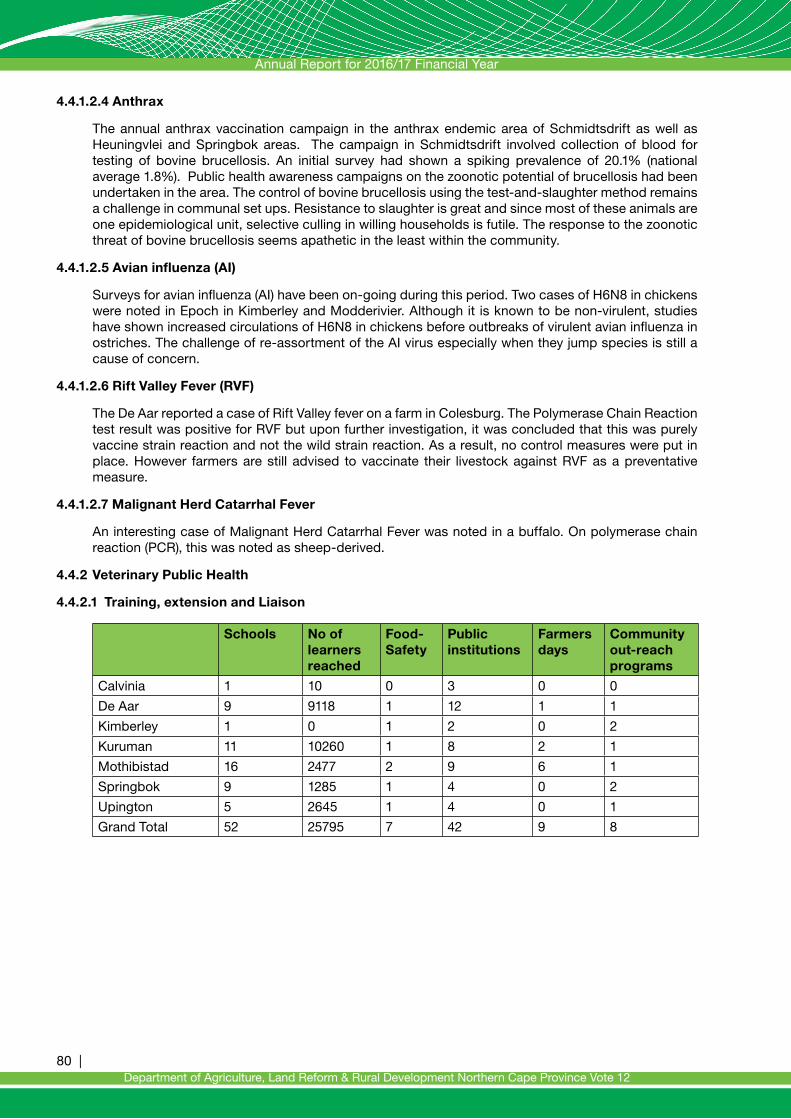
Annual Report for 2016/17 Financial Year
80 |Department of Agriculture, Land Reform & Rural Development Northern Cape Province Vote 12
4.4.1.2.4 Anthrax
The annual anthrax vaccination campaign in the anthrax endemic area of Schmidtsdrift as well as Heuningvlei and Springbok areas. The campaign in Schmidtsdrift involved collection of blood for testing of bovine brucellosis. An initial survey had shown a spiking prevalence of 20.1% (national average 1.8%). Public health awareness campaigns on the zoonotic potential of brucellosis had been undertaken in the area. The control of bovine brucellosis using the test-and-slaughter method remains a challenge in communal set ups. Resistance to slaughter is great and since most of these animals are one epidemiological unit, selective culling in willing households is futile. The response to the zoonotic threat of bovine brucellosis seems apathetic in the least within the community.
4.4.1.2.5 Avian influenza (AI)
Surveys for avian influenza (AI) have been on-going during this period. Two cases of H6N8 in chickens were noted in Epoch in Kimberley and Modderivier. Although it is known to be non-virulent, studies have shown increased circulations of H6N8 in chickens before outbreaks of virulent avian influenza in ostriches. The challenge of re-assortment of the AI virus especially when they jump species is still a cause of concern.
4.4.1.2.6 Rift Valley Fever (RVF)
The De Aar reported a case of Rift Valley fever on a farm in Colesburg. The Polymerase Chain Reaction test result was positive for RVF but upon further investigation, it was concluded that this was purely vaccine strain reaction and not the wild strain reaction. As a result, no control measures were put in place. However farmers are still advised to vaccinate their livestock against RVF as a preventative measure.
4.4.1.2.7 Malignant Herd Catarrhal Fever
An interesting case of Malignant Herd Catarrhal Fever was noted in a buffalo. On polymerase chain reaction (PCR), this was noted as sheep-derived.
4.4.2 Veterinary Public Health
4.4.2.1 Training, extension and Liaison
Schools No of learners reached
Food-Safety
Public institutions
Farmers days
Community out-reach programs
Calvinia 1 10 0 3 0 0
De Aar 9 9118 1 12 1 1
Kimberley 1 0 1 2 0 2
Kuruman 11 10260 1 8 2 1
Mothibistad 16 2477 2 9 6 1
Springbok 9 1285 1 4 0 2
Upington 5 2645 1 4 0 1
Grand Total 52 25795 7 42 9 8

Annual Report for 2016/17 Financial Year
| 81Department of Agriculture, Land Reform & Rural Development Northern Cape Province Vote 12
4.4.2.2 Distribution of Abattoirs
123
7.1.2 Veterinary Public Health
7.1.2.1 Training, extension and Liaison Schools No of
learners reached
Food-Safety Public institutions
Farmers days
Community out-reach programs
Calvinia 1 10 0 3 0 0
De Aar 9 9118 1 12 1 1
Kimberley 1 0 1 2 0 2
Kuruman 11 10260 1 8 2 1
Mothibistad 16 2477 2 9 6 1
Springbok 9 1285 1 4 0 2
Upington 5 2645 1 4 0 1
Grand Total 52 25795 7 42 9 8
7.1.2.2 Distribution of Abattoirs
A total of 198 routine abattoir inspections were carried out at the 60 (49 red meat and 11 poultry) abattoirs throughout the year. Two brand new slaughter facilities were registered in ZF Mgcawu (Desert Beef abattoir) and Frances Baard (Muttlam abattoir) respectively. The unit deems this in a very positive light given the socioeconomic challenges of the province.
Kimberley De Aar Kuruman Calvinia Upington Mothibstad Springbok
Red Meat 10 12 6 8 6 1 6Poultry 5 1 3 0 2 0 0
02468
101214
Distribution of Abattoirs 2016 - 2017
A total of 198 routine abattoir inspections were carried out at the 60 (49 red meat and 11 poultry) abattoirs throughout the year.
Two brand new slaughter facilities were registered in ZF Mgcawu (Desert Beef abattoir) and Frances Baard (Muttlam abattoir) respectively. The unit deems this in a very positive light given the socioeconomic challenges of the province.
4.4.2.2.1 Slaughter Statistics
124
De Aar Kimberley Calvinia Kuruman Upington Springbok Mothibistad Total2014/15 40 87 0 59 246 42 0 4742015/16 92 0 0 85 165 6 91 4392016/17 152 123 16 68 333 11 12 715
0
100
200
300
400
500
600
700
800
BSE samples 2014 - 2016
7.1.2.2.1 Slaughter Statistics
Due to the severe drought the number of sheep slaughtered increased a lot towards the end of 2016. It will be interesting to see what this does in the new-year. The graph clearly shows that the slaughter figures for other species including poultry are not picking up. The reasons for such a decline are mainly due to the economics of this commodity in relation to global markets. 7.1.2.2.2 Bovine Spongy Encephalopathy (BSE) Sampling
715 brain samples were collected from cattle at various abattoirs in the province by Veterinary Public Health officials.
7.1.2.2.3 Illegal Slaughtering
010000002000000300000040000005000000600000070000008000000
2010/11 2011/12 2012/13 2013/14 2014/15 2015/16 2016/17
Cattle Goats Pigs Poultry Sheep Venison Ostriches
Due to the severe drought the number of sheep slaughtered increased a lot towards the end of 2016. It will be interesting to see what this does in the new-year.
The graph clearly shows that the slaughter figures for other species including poultry are not picking up. The reasons for such a decline are mainly due to the economics of this commodity in relation to global markets.

Annual Report for 2016/17 Financial Year
82 |Department of Agriculture, Land Reform & Rural Development Northern Cape Province Vote 12
4.4.2.2.2 Bovine Spongy Encephalopathy (BSE) Sampling
124
De Aar Kimberley Calvinia Kuruman Upington Springbok Mothibistad Total2014/15 40 87 0 59 246 42 0 4742015/16 92 0 0 85 165 6 91 4392016/17 152 123 16 68 333 11 12 715
0
100
200
300
400
500
600
700
800
BSE samples 2014 - 2016
7.1.2.2.1 Slaughter Statistics
Due to the severe drought the number of sheep slaughtered increased a lot towards the end of 2016. It will be interesting to see what this does in the new-year. The graph clearly shows that the slaughter figures for other species including poultry are not picking up. The reasons for such a decline are mainly due to the economics of this commodity in relation to global markets. 7.1.2.2.2 Bovine Spongy Encephalopathy (BSE) Sampling
715 brain samples were collected from cattle at various abattoirs in the province by Veterinary Public Health officials.
7.1.2.2.3 Illegal Slaughtering
010000002000000300000040000005000000600000070000008000000
2010/11 2011/12 2012/13 2013/14 2014/15 2015/16 2016/17
Cattle Goats Pigs Poultry Sheep Venison Ostriches
715 brain samples were collected from cattle at various abattoirs in the province by Veterinary Public Health officials.
4.4.2.2.3 Illegal Slaughtering
Illegal slaughtering of donkeys has become a booming business given the high demand of the gelatin from donkey skins by pharmaceutical companies in China. Two high profile incidents of illegal donkey slaughtering including an organized syndicate were halted in the province by the law enforcement units.
Officials from Kuruman State Vet office, together with the NSPCA and SAPS discovered a site on a farm in Olifantshoek where more than 100 donkeys had been illegally slaughtered. Two individuals were arrested and have been charged in terms of the Animals Protection Act and the Meat Safety Act”
Veterinary Public Health unit in the Namakwa region hosted a successful illegal slaughtering seminar with all roles players with the aim of stream lining roles and responsibilities envisaged by the Meat Safety Act and different applicable national legislations. However the challenge remains to be the penalties imposed by the legislation.
4.4.2.3 Hygiene Assessment Score
A total of 84 Hygiene Assessment System Audits were done throughout the financial year ending 31 March 2017. The compliance level with regard to Meat safety Act 40 of 2000 is sitting at 79% with 15% attributed to issues relating to carcass marking and poor meat inspection incisions.
Figure 2: Workshop on illegal slaughtering in Namakwa

Annual Report for 2016/17 Financial Year
| 83Department of Agriculture, Land Reform & Rural Development Northern Cape Province Vote 12
4.4.2.3.1 Residue and Microbiological sampling
The unit remains committed to the commitment made by the Department of Agriculture Forestry and Fisheries to our international trade partners through the implementation of the National Residue Monitoring Programme.
A total of 87 residue samples were collected from the 7 participating abattoirs within the province.
4.4.2.3.2 Instructions
A total of 4 instructions were issued to 4 abattoir for failing to abide by the law related to the handling and disposal of condemned material as envisaged in the Red Meat Regulation.
4.4.2.3.3 Independent Meat Inspection
The long standing issue of Independent Meat Inspection (IMI) in South Africa is at the advanced stage.
The Meat Inspection Scheme was signed on the 30 Nov 2016 by the Minister paving the way for the implementation of the independent meat inspection. The Meat Inspection Scheme ensures that the meat inspection service provider has no interest in the abattoir other than the rendering of a meat inspection service.
4.4.2.4 Export Control
Despite a difficult year, the export unit managed to ensure that our clients were serviced when required and assistance provided whenever clients explored new markets.
The onus is now on the farmers to ensure that their production systems are of such a level that they can supply the abattoir for the huge demand that is expected to follow.
During this period, two taxidermies and two dip and pack facilities were inspected and approved for the annual re-registration. African San Taxidermy remains the major player in processing and export of game trophies.
4.4.2.4.1 Certification
126
The Meat Inspection Scheme was signed on the 30 Nov 2016 by the Minister paving the way for the implementation of the independent meat inspection. The Meat Inspection Scheme ensures that the meat inspection service provider has no interest in the abattoir other than the rendering of a meat inspection service. 7.1.2.4 Export Control Despite a difficult year, the export unit managed to ensure that our clients were serviced when required and assistance provided whenever clients explored new markets. The onus is now on the farmers to ensure that their production systems are of such a level that they can supply the abattoir for the huge demand that is expected to follow. During this period, two taxidermies and two dip and pack facilities were inspected and approved for the annual re-registration. African San Taxidermy remains the major player in processing and export of game trophies. 7.1.2.4.1 Certification
There number of health attestations can be seen picking up in 2016/17 compared to 2015/16. Beef exports are mainly being done through Beefmaster abattoir with export certifications on a daily basis to different destinations including Egypt, Dubai, Hong Kong, Kuwait, Qatar and Mauritius.
7.1.2.4.2 Live Animal Exports
2009/10
2010/11
2011/12
2012/13
2013/14
2014/15
2015/16
2016/17
Total Health Attestation 1243 1306 1160 1280 1288 1180 804 1091
0200400600800
100012001400
Certification 2009 - 2017
There number of health attestations can be seen picking up in 2016/17 compared to 2015/16. Beef exports are mainly being done through Beefmaster abattoir with export certifications on a daily basis to different destinations including Egypt, Dubai, Hong Kong, Kuwait, Qatar and Mauritius.

Annual Report for 2016/17 Financial Year
84 |Department of Agriculture, Land Reform & Rural Development Northern Cape Province Vote 12
4.4.2.4.2 Live Animal Exports
127
The implementation of the BLNS SOP (Botswana, Lesotho, Namibia and Swaziland Standard Operating Procedures) has resulted in huge number of live animals imports. The protocol allows for imports of animals from these neighbouring countries almost weekly and veterinary officials have to be present during offloading to break the seal and do physical count. Per consignment, the cattle are usually about 75 and the sheep about 700. This in itself is a full time job resulting in other regulatory activities being compromised. Cattle and goat exports are mainly focused on stud breeds mainly to Botswana although we had a recent export of Boer goats to Uganda. Horses are mainly destined for Namibia and Botswana. There has been an increase in exports of wildlife (sable and roan antelope) to Namibia.
7.1.2.4.3 Trophies
The Namibian market has become lucrative for overseas trophy hunters. Hunters prefers to hunt in Namibia than in South Africa. 7.1.2.4.4 Feed and Lucerne exports
020000400006000080000
100000120000140000
Bovine Ovine Caprine
2009/10 2010/11 2011/12 2012/13 2013/14 2014/15 2015/16 2016/17Trophies Units 2208 3799 5038 4737 4884 5489 5987 3412
01000200030004000500060007000 Trophies Units 2009 - 2016
The implementation of the BLNS SOP (Botswana, Lesotho, Namibia and Swaziland Standard Operating Procedures) has resulted in huge number of live animals imports. The protocol allows for imports of animals from these neighbouring countries almost weekly and veterinary officials have to be present during offloading to break the seal and do physical count. Per consignment, the cattle are usually about 75 and the sheep about 700.
This in itself is a full time job resulting in other regulatory activities being compromised. Cattle and goat exports are mainly focused on stud breeds mainly to Botswana although we had a recent export of Boer goats to Uganda. Horses are mainly destined for Namibia and Botswana. There has been an increase in exports of wildlife (sable and roan antelope) to Namibia.
4.4.2.4.3 Trophies
127
The implementation of the BLNS SOP (Botswana, Lesotho, Namibia and Swaziland Standard Operating Procedures) has resulted in huge number of live animals imports. The protocol allows for imports of animals from these neighbouring countries almost weekly and veterinary officials have to be present during offloading to break the seal and do physical count. Per consignment, the cattle are usually about 75 and the sheep about 700. This in itself is a full time job resulting in other regulatory activities being compromised. Cattle and goat exports are mainly focused on stud breeds mainly to Botswana although we had a recent export of Boer goats to Uganda. Horses are mainly destined for Namibia and Botswana. There has been an increase in exports of wildlife (sable and roan antelope) to Namibia.
7.1.2.4.3 Trophies
The Namibian market has become lucrative for overseas trophy hunters. Hunters prefers to hunt in Namibia than in South Africa. 7.1.2.4.4 Feed and Lucerne exports
020000400006000080000
100000120000140000
Bovine Ovine Caprine
2009/10 2010/11 2011/12 2012/13 2013/14 2014/15 2015/16 2016/17Trophies Units 2208 3799 5038 4737 4884 5489 5987 3412
01000200030004000500060007000 Trophies Units 2009 - 2016
The Namibian market has become lucrative for overseas trophy hunters. Hunters prefers to hunt in Namibia than in South Africa.

Annual Report for 2016/17 Financial Year
| 85Department of Agriculture, Land Reform & Rural Development Northern Cape Province Vote 12
4.4.2.4.4 Feed and Lucerne exports
128
Feed and Lucerne exports are expected to increase in the following year. Already cattle feed in excess of 2 000 tons has been exported from Luberne Voere based in Hartswater to Mauritius in the last quarter of 2016. The Lucerne is mainly destined for Zambia and Mauritius with the recent inclusion of the Reunion Islands. 7.1.2.4.5 Export of milk and milk products
The import permit is granted to Suide Koelkamers of Namibia for the imports of milk and milk products produced in Clover S.A. and send to the mentioned company in Keetmanshoop in Namibia.
7.1.2.4.6 Beef and Lamb exports
0
5000000
10000000
15000000
20000000
25000000
30000000
2009/10 2010/11 2011/12 2012/13 2013/14 2014/15 2015/16 2016/17
Feed and Lucerne exports 2009 - 2016 (Kg)
Feed Kilograms Lucerne Kilograms
0100002000030000400005000060000700008000090000
Export of milk and milk products
Milk Butter Yogurt Juice
Feed and Lucerne exports are expected to increase in the following year. Already cattle feed in excess of 2 000 tons has been exported from Luberne Voere based in Hartswater to Mauritius in the last quarter of 2016. The Lucerne is mainly destined for Zambia and Mauritius with the recent inclusion of the Reunion Islands.
4.4.2.4.5 Export of milk and milk products
128
Feed and Lucerne exports are expected to increase in the following year. Already cattle feed in excess of 2 000 tons has been exported from Luberne Voere based in Hartswater to Mauritius in the last quarter of 2016. The Lucerne is mainly destined for Zambia and Mauritius with the recent inclusion of the Reunion Islands. 7.1.2.4.5 Export of milk and milk products
The import permit is granted to Suide Koelkamers of Namibia for the imports of milk and milk products produced in Clover S.A. and send to the mentioned company in Keetmanshoop in Namibia.
7.1.2.4.6 Beef and Lamb exports
0
5000000
10000000
15000000
20000000
25000000
30000000
2009/10 2010/11 2011/12 2012/13 2013/14 2014/15 2015/16 2016/17
Feed and Lucerne exports 2009 - 2016 (Kg)
Feed Kilograms Lucerne Kilograms
0100002000030000400005000060000700008000090000
Export of milk and milk products
Milk Butter Yogurt Juice
The import permit is granted to Suide Koelkamers of Namibia for the imports of milk and milk products produced in Clover S.A. and send to the mentioned company in Keetmanshoop in Namibia.

Annual Report for 2016/17 Financial Year
86 |Department of Agriculture, Land Reform & Rural Development Northern Cape Province Vote 12
4.4.2.4.6 Beef and Lamb exports
129
Figure 3: Dr Kegakilwe presenting to the China delegation
The increase in the exporting of meat particularly from Beefmaster is very encouraging. Beefmaster abattoir is amongst the three abattoirs in the country that got selected after a visit from officials from China to export frozen beef to the People’s Republic of China. This is a massive achievement for the red meat industry as well as for the Province. The European Union (EU) delegation visited the country in the February 2017 to evaluate the veterinary control measures that are in place in EU approved facilities. Moreson’s abattoir in De Aar registration was suspended by Department of Agriculture Forestry and Fisheries before the European Union’s visit due to non-conformances. The Moreson abattoir was also audited by the EU and even though the abattoir itself managed to impress the delegation, the absence of a permanent official veterinarian at the plant is currently a major stumbling block in the abattoir’s way to be registered for EU exports of venison and ostrich meat. Resuming exports to the EU will play an important role in curbing job losses at this abattoir which currently employs 35 permanent workers.
2009/10
2010/11
2011/12
2012/13
2013/14
2014/15
2015/16
2016/17
Ovine Meat 50 5400 0 0 0 2771 32796 16000Bovine Meat 190674 194328 59763 109967 313420 436992 1600450 2317000
0
500000
1000000
1500000
2000000
2500000
Beef and Lamb Exports 2009 - 2016 (Kg)
The increase in the exporting of meat particularly from Beefmaster is very encouraging. Beefmaster abattoir is amongst the three abattoirs in the country that got selected after a visit from officials from China to export frozen beef to the People’s Republic of China. This is a massive achievement for the red meat industry as well as for the Province.
The European Union (EU) delegation visited the country in the February 2017 to evaluate the veterinary control measures that are in place in EU approved facilities. Moreson’s abattoir in De Aar registration was suspended by Department of Agriculture Forestry and Fisheries before the European Union’s visit due to non-conformances.
The Moreson abattoir was also audited by the EU and even though the abattoir itself managed to impress the delegation, the absence of a permanent official veterinarian at the plant is currently a major stumbling block in the abattoir’s way to be registered for EU exports of venison and ostrich meat. Resuming exports to the EU will play an important role in curbing job losses at this abattoir which currently employs 35 permanent workers.
4.4.3 Veterinary Laboratory Services and Epidemiology
The Northern Cape Provincial Veterinary Laboratory has scored a number of successes in its quest to compete with the best laboratories in the world. A state of the art carcass incinerator has been commissioned at the laboratory with the training of the end users. The facility has been advertised to stakeholders through the departmental website and has been fully operational since January 2017 after the issuance of a provisional air emission license. The license was only issued after a rigorous Environmental Impact Assessment which expires in June 2017. Plans are at advanced stage to comply with the requirements for a full license.
Figure 3: Dr Kegakilwe presenting to the China delegation
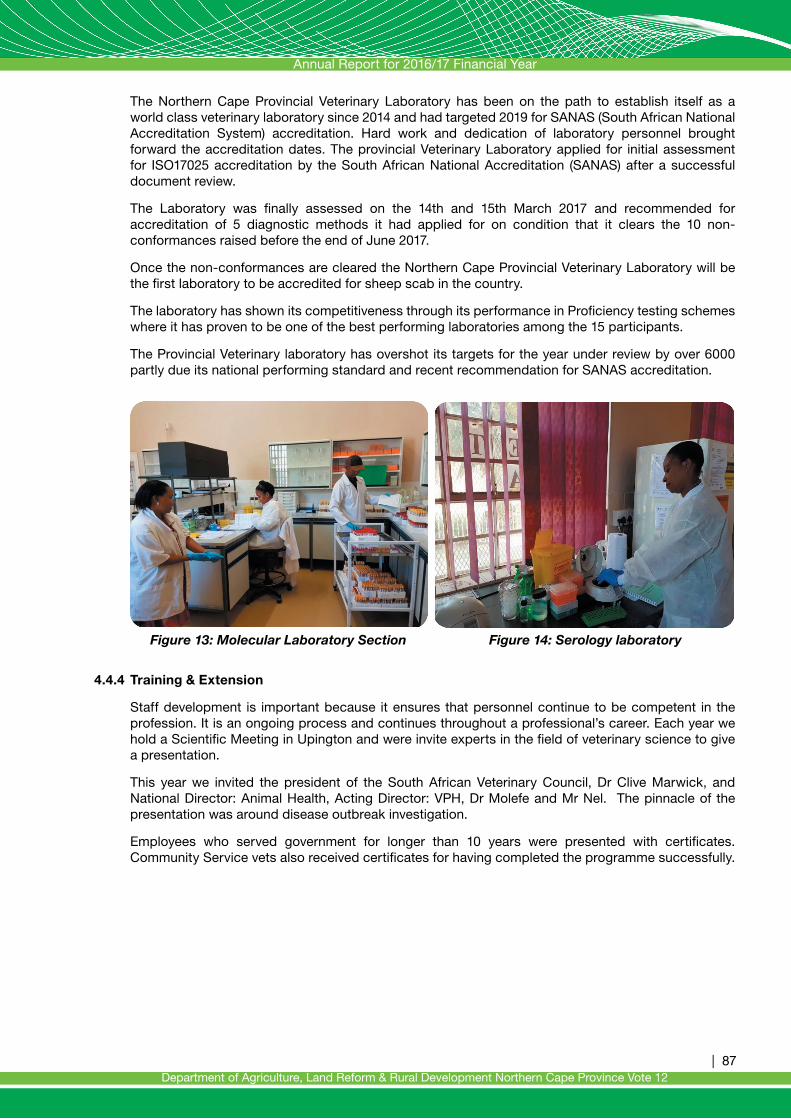
Annual Report for 2016/17 Financial Year
| 87Department of Agriculture, Land Reform & Rural Development Northern Cape Province Vote 12
The Northern Cape Provincial Veterinary Laboratory has been on the path to establish itself as a world class veterinary laboratory since 2014 and had targeted 2019 for SANAS (South African National Accreditation System) accreditation. Hard work and dedication of laboratory personnel brought forward the accreditation dates. The provincial Veterinary Laboratory applied for initial assessment for ISO17025 accreditation by the South African National Accreditation (SANAS) after a successful document review.
The Laboratory was finally assessed on the 14th and 15th March 2017 and recommended for accreditation of 5 diagnostic methods it had applied for on condition that it clears the 10 non-conformances raised before the end of June 2017.
Once the non-conformances are cleared the Northern Cape Provincial Veterinary Laboratory will be the first laboratory to be accredited for sheep scab in the country.
The laboratory has shown its competitiveness through its performance in Proficiency testing schemes where it has proven to be one of the best performing laboratories among the 15 participants.
The Provincial Veterinary laboratory has overshot its targets for the year under review by over 6000 partly due its national performing standard and recent recommendation for SANAS accreditation.
4.4.4 Training & Extension
Staff development is important because it ensures that personnel continue to be competent in the profession. It is an ongoing process and continues throughout a professional’s career. Each year we hold a Scientific Meeting in Upington and were invite experts in the field of veterinary science to give a presentation.
This year we invited the president of the South African Veterinary Council, Dr Clive Marwick, and National Director: Animal Health, Acting Director: VPH, Dr Molefe and Mr Nel. The pinnacle of the presentation was around disease outbreak investigation.
Employees who served government for longer than 10 years were presented with certificates. Community Service vets also received certificates for having completed the programme successfully.
Figure 13: Molecular Laboratory Section Figure 14: Serology laboratory

Annual Report for 2016/17 Financial Year
88 |Department of Agriculture, Land Reform & Rural Development Northern Cape Province Vote 12
Dr Lea Shuda and Franciska Einkamerer attended a Climate change workshop at the JTG District Municipality. Several role players took part in this brainstorming session.
Dr Petty from DAFF gave training on PAPA (Performing Animal Performance Amendment Bill. Once the act is enacted, it removes the responsibility from the magistrate to issue permits for performing animal performance and places it on the state veterinarians.
Drs Maja, Molefe and Marwick listening to the presentations
Dr Gayakaya presenting on Foot & Mouth Disease testing

Annual Report for 2016/17 Financial Year
| 89Department of Agriculture, Land Reform & Rural Development Northern Cape Province Vote 12

Annual Report for 2016/17 Financial Year
90 |Department of Agriculture, Land Reform & Rural Development Northern Cape Province Vote 12
4.5 Programme 5: Research and Technology Development Services
Purpose: The purpose of the programme is to render expert and needs based research, development and technology transfer services impacting on development objectives.
Sub-Programmes:• Research• Technology Transfer Services• Infrastructure Support Services
Strategic Objectives:• To improve the agricultural production through conducting, facilitating and coordinating 13 medium
to long term research and technology development projects;• To disseminate information on research and technology developed to clients, peers and scientific
community;• To provide and maintain 7 infrastructure facilities for the line function to perform their research and
other functions.
Strategic objectives, performance indicators planned targets and actual outputs
Strategic Objectives:
Programme: 5 Research and Technology Development Services
Strategic objective Actual Achievement2015/2016
Planned Target 2016/2017
Actual Achievement 2016/2017
Deviation from planned target to Actual Achievement for 2016/12017
Comment on deviations
To improve the agricultural production through conducting, facilitating and co-ordinating 13 medium to long term research and technology development projects
13 13 13 0
To disseminate information on research and technology developed to clients, peers and scientific community
- 5 8 3 Publications in scientific as well as popular media is not within the control of the department, although requests are made for when documents should be published the final decision is that of the editors of the specific media.
To provide and maintain 7 infrastructure facilities for the line function to perform their research and other functions
6 6 6 0

Annual Report for 2016/17 Financial Year
| 91Department of Agriculture, Land Reform & Rural Development Northern Cape Province Vote 12
Performance indicators:
Sub-programme: 5.1 Research
Performance Indicators Actual Achieve-ment 2013/2014
Actual Achieve-ment 2014/2015
Actual Achieve-ment2015/2016
Planned Target 2016/2017
Actual Achieve-ment 2016/2017
Deviation from planned target to Actual Achievement for 2016/12017
Comment on deviations
5.1.1 Number of research and technology development projects implemented to improve agricultural production
13 13 13 13 13 0
5.1.2 Number of scientific investigations conducted
- - 8 8 8 0
Strategy to overcome areas of under performance
None
Sub-programme: 5.2 Technology Transfer Services
Performance Indicators Actual Achieve-ment 2013/2014
Actual Achieve-ment 2014/2015
Actual Achieve-ment2015/2016
Planned Target 2016/2017
Actual Achieve-ment 2016/2017
Deviation from planned target to Actual Achievement for 2016/12017
Comment on deviations
5.2.1 Number of research presentations made nationally or internationally
6 5 9 6 7 1 More than one presentation was made at the annual grassland society conference this year.
5.2.2 Number of scientific papers published nationally or internationally
2 2 2 2 4 2 Two papers were published in the first quarter. Part of the master’s research of the candidate scientist was published and the department as her new employer was acknowledged. The other publication was as a co-author.
5.2.3 Number of presentations made at technology transfer events
7 10 12 8 11 3 More requests were received from districts to present research information than had been planned for. The programme also held a successful farmer’s day on milk goat production.
5.2.4 Number of articles in popular media
3 4 3 3 3 0
5.2.5 Number of spatial datasets and maps created
12 12 16 16 16 0

Annual Report for 2016/17 Financial Year
92 |Department of Agriculture, Land Reform & Rural Development Northern Cape Province Vote 12
Sub-programme: 5.2 Technology Transfer Services
Performance Indicators Actual Achieve-ment 2013/2014
Actual Achieve-ment 2014/2015
Actual Achieve-ment2015/2016
Planned Target 2016/2017
Actual Achieve-ment 2016/2017
Deviation from planned target to Actual Achievement for 2016/12017
Comment on deviations
5.2.6 Number of development projects/programmes supported
11 12 11 10 10 0
5.2.7 Number of reports on support provided to KKC
- - - 4 4 0
Strategy to overcome areas of under performance
None
Sub-programme: 5.3 Infrastructure Support Services
Performance indicator Actual Achieve-ment 2013/2014
Actual Achieve-ment 2014/2015
Actual Achieve-ment2015/2016
Planned Target 2016/2017
Actual Achievement 2016/2017
Deviation from planned target to Actual Achievement for 2016/12017
Comment on deviations
5.3.1 Number of research infrastructure managed
- - 6 6 6 0
Strategy to overcome areas of under performance
None
Changes to planned targets
None
Linking performance with budgets
Sub programme expenditure
Pr 5: Research & Technology Development Services
2016/2017 2015/2016
Final Appropriation
Actual Expenditure
(Over)/Under
Expenditure
Final Appropriation
Actual Expenditure
(Over)/Under
Expenditure
R’000 R’000 R’000 R’000 R’000 R’000
Research 26 256 26 256 - 23 842 23 842 -
Technology Transfer Services
18 18 - - - -
Infrastructure Support Services
20 382 20 382 - 19 466 19 223 243
Total 46 656 46 656 - 43 308 43 065 243

Annual Report for 2016/17 Financial Year
| 93Department of Agriculture, Land Reform & Rural Development Northern Cape Province Vote 12
SERVICE DELIVERY HIGHLIGHTS
4.5.1 Research
4.5.1.1 Key Deliverables:
The development of veldt condition and degradation indices using Unmanned Aerial Vehicle (UAV) technologies.
One of the primary objectives of rangeland monitoring is to determine whether grazing management strategies meet the goals for sustainable resource utilization and to prevent rangeland degradation from taking place. Monitoring, however is an ongoing process needed to determine whether progress is being made towards the achievement of objectives on given variables such as prolonged droughts, veld fires, grazing pressures, land-use and climate change. Ground surveys can be time consuming, labour intensive, logistically challenging in remote areas and, therefore, very expensive. Depending on the scale, the objectivity and representativeness of ground based assessments can at times be questioned since surveys cannot be conducted at the frequency required for proper analysis and monitoring of trends due to high cost implications and inaccessibility. Therefore, a significant weakness in ecological research and rangeland monitoring in southern Africa’s rangelands remains its inability to easily track changes in vegetation structure and composition resulting from management strategies, land-use and climate change. This can further be attributed to the lack of access to high resolution geospatial data sets. Ground resolutions and sensor capabilities of satellites have improved immensely within recent years. While remote sensing technologies are evolving at a rapid rate, most researchers currently rely on satellite based remote sensing for mapping and monitoring. Even though certain low resolution satellite images are freely available (e.g. Landsat and MODIS), other sub-meter resolution images (such as IKONOS, Worldview and Quickbird) can be extremely costly and may not always offer timely high resolution images to fulfil the objectives required. Remote sensing images from satellites are also often obscured by cloud cover, preventing any real-time monitoring.
The drought event of 2015/16 across large parts of South Africa has emphasized the importance of sustainable livestock production in a variable climate characterised by extreme events. A lack of
rainfall and excessive heat characterised much of the early-to-mid summer (2015/16) period over the Northern Cape. Rain towards the latter part of the summer rainfall season however did result in an improvement in the grazing conditions in some areas. We consider the varied responses over the Savannah biome over the northern to central parts of the Northern Cape, focussing on vegetation response to rainfall events after the extremely dry period and how it relates to indications of land degradation. A time series spanning the period 2000 – 2016 of coarse-resolution vegetation monitoring data from the MODIS instrument is used towards identifying potentially degraded areas within the background of climate variability, based on anomalous vegetation trends within areas of relatively homogeneous land cover. The “Spearman’s Rank Correlation” map shows areas where significant trends have been noted over the past 16 years - in vegetation activity. These indicators of gradual change, together with tree cover products, will be used to inform anomalies depicted in the operational drought products - such as the PASG (percentage average seasonal greenness).

Annual Report for 2016/17 Financial Year
94 |Department of Agriculture, Land Reform & Rural Development Northern Cape Province Vote 12
With the introduction of affordable remotely piloted aircrafts (RPA’s), also known as unmanned aerial vehicles (UAV’s), one can now safely acquire timely hyper-resolution aerial images at low altitudes. Currently the National Aeronautics and Space Administration as well as the National Oceanic and Atmospheric Administration have Unmanned Aircraft Systems Programs. RPA’s provide low operational complexity and costs, compared to manned aerial photography. Remote sensing sensors placed in RPA’s furthermore provides the capacity to combine high spatial resolution and quick turnaround times in order to meet critical requirements of spatial, spectral and temporal resolution at budget cost.
RPA’s have the potential to bridge the gap between ground-based surveys and remote sensing data acquired from satellites or manned aircrafts. Ground surveys provide only the information required to develop high resolution maps and allow monitoring of vegetation changes in small areas. Remote sensing data acquired from satellites are sufficient to produce maps and monitor vegetation activity over areas of a much larger extent; however, limitations arise in terms of lower spatial resolution and operational flexibility. It becomes expensive to monitor features at a finer-scale from satellite derived remote sensing images on a routinely basis. However, with fully autonomous GPS-guided RPA’s, mapping and monitoring changes on a routinely basis at an intermediate spatial scale is possible. The RPA is capable of producing high quality ortho-rectified and geo-referenced images (Figure 1) which can be used for mapping purposes as well as a tool to verify course scale satellite data in order to conduct ground truthing on vegetation indexes calculated from near-infrared images, such as; the Normalized Difference Vegetation Index (NDVI) and Enhanced Vegetation Index (EVI) (Figure 2).
a) b)
Figure 1: High quality geo-referenced image captured by a RPA (a) with a clear distinction possible between individual grass tufts compared to (b) a lower quality satellite image with only larger woody plants barely visible as darker patches.
Satellite derived remote sensing has already been used in various previous studies to depict land-cover change, the impact of fires and grazing systems on plant biomass, biodiversity science and for assessing drought events and the relationship that exists between biophysical climate variables and vegetation indices. Unmanned Aerial Vehicles’, therefore offer a range of new opportunities in high resolution applications in rangeland research.
a) b)
Figure 2: a) Remotely sensed image of a drainage line running down the middle of the image, b) Enhanced Vegetation Index calculated from Near-infrared image captured by a RPA indicating, in white, photosynthetic activity of the vegetation layer in and along the drainage lines.

Annual Report for 2016/17 Financial Year
| 95Department of Agriculture, Land Reform & Rural Development Northern Cape Province Vote 12
Figure 3: Mosaic image indicating individual woody shrubs and trees (i.e. white dots) that can be exploited to identify and monitor shrub encroached areas as seen on the bottom left of the image.
These technologies are being used in a long term trial established on the Carnarvon Research Station where vegetation change under the four different treatments, have been monitored for over 28 years using descending point line surveys. The most recent results using conventional vegetation survey techniques could find no significant differences between stocking density treatments with regard to plant height, cover and, ecological- and grazing index scores. In order to confirm the accuracy of these outcomes, remotely sensed, high-resolution spectral images of this long term trial will be analysed. By determining the spectral signatures of the plants, the density cover of each species can accurately be calculated across the entire trial area. The impact of climate on vegetation conditions can be monitored on a routinely basis.
Preliminary results from the data obtained by the RPA highlight, not only, the lack of previously perceived uniformity in vegetation, but also the implications of site selection for surveys. While the overall outcomes suggest that the three camp system provides an adequate rest period for vegetation under these stocking rates, high resolution remote sensed data do provide new and interesting perspectives regarding species distribution and the influence of soil properties. This has been reported at two conferences and a scientific paper has been forwarded for publication in the African Rangeland Journal.
RPA’s together with the appropriate multispectral sensors are emerging as essential monitoring and quantitative research tools that have the ability to enhance objective measurement of rangeland dynamics.
The development of a comprehensive project footprint linked to the Northern Cape Agricultural information system (NCAIS).
The development of the Northern Cape Agricultural Information System (NCAIS) is a tool to track and monitor the extent of the department’s intervention on development projects. The Department of Agriculture, Land Reform and Rural Development in the Northern Cape Province decided to have a location based, electronic filing system that will employ both Microsoft programs and ArcGIS to store and retrieve information. NCAIS has been developed to look at the footprint of the Department in the Province. The main focus was to establish how much has already been spent, and how the funds were spent. Further, also linking the amount to a land parcel and sum it up to Local- or District Municipality level. In order to determine where the department has been more visible and where there has been a lack of support. This filing system will help to indicate the distribution of beneficiaries by gender, age group and location. The current aim is to collect historical data and convert it from the old hardcopy documents to a digital format. This system will enhance the reporting of the department at different management levels.

Annual Report for 2016/17 Financial Year
96 |Department of Agriculture, Land Reform & Rural Development Northern Cape Province Vote 12
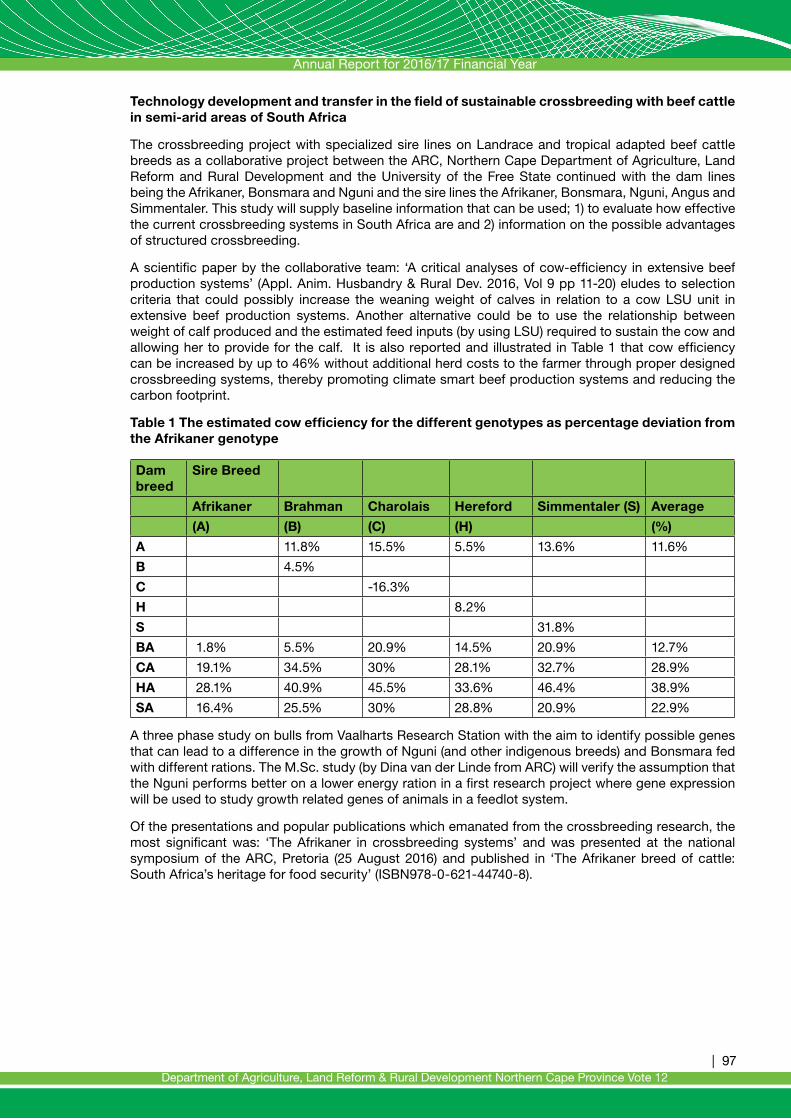
Annual Report for 2016/17 Financial Year
| 97Department of Agriculture, Land Reform & Rural Development Northern Cape Province Vote 12
Technology development and transfer in the field of sustainable crossbreeding with beef cattle in semi-arid areas of South Africa
The crossbreeding project with specialized sire lines on Landrace and tropical adapted beef cattle breeds as a collaborative project between the ARC, Northern Cape Department of Agriculture, Land Reform and Rural Development and the University of the Free State continued with the dam lines being the Afrikaner, Bonsmara and Nguni and the sire lines the Afrikaner, Bonsmara, Nguni, Angus and Simmentaler. This study will supply baseline information that can be used; 1) to evaluate how effective the current crossbreeding systems in South Africa are and 2) information on the possible advantages of structured crossbreeding.
A scientific paper by the collaborative team: ‘A critical analyses of cow-efficiency in extensive beef production systems’ (Appl. Anim. Husbandry & Rural Dev. 2016, Vol 9 pp 11-20) eludes to selection criteria that could possibly increase the weaning weight of calves in relation to a cow LSU unit in extensive beef production systems. Another alternative could be to use the relationship between weight of calf produced and the estimated feed inputs (by using LSU) required to sustain the cow and allowing her to provide for the calf. It is also reported and illustrated in Table 1 that cow efficiency can be increased by up to 46% without additional herd costs to the farmer through proper designed crossbreeding systems, thereby promoting climate smart beef production systems and reducing the carbon footprint.
Table 1 The estimated cow efficiency for the different genotypes as percentage deviation from the Afrikaner genotype
Dam breed
Sire Breed
Afrikaner Brahman Charolais Hereford Simmentaler (S) Average
(A) (B) (C) (H) (%)
A 11.8% 15.5% 5.5% 13.6% 11.6%
B 4.5%
C -16.3%
H 8.2%
S 31.8%
BA 1.8% 5.5% 20.9% 14.5% 20.9% 12.7%
CA 19.1% 34.5% 30% 28.1% 32.7% 28.9%
HA 28.1% 40.9% 45.5% 33.6% 46.4% 38.9%
SA 16.4% 25.5% 30% 28.8% 20.9% 22.9%
A three phase study on bulls from Vaalharts Research Station with the aim to identify possible genes that can lead to a difference in the growth of Nguni (and other indigenous breeds) and Bonsmara fed with different rations. The M.Sc. study (by Dina van der Linde from ARC) will verify the assumption that the Nguni performs better on a lower energy ration in a first research project where gene expression will be used to study growth related genes of animals in a feedlot system.
Of the presentations and popular publications which emanated from the crossbreeding research, the most significant was: ‘The Afrikaner in crossbreeding systems’ and was presented at the national symposium of the ARC, Pretoria (25 August 2016) and published in ‘The Afrikaner breed of cattle: South Africa’s heritage for food security’ (ISBN978-0-621-44740-8).
Annual Report for 2016/17 Financial Year
98 |Department of Agriculture, Land Reform & Rural Development Northern Cape Province Vote 12
4.5.1.2 Aquaculture and inland fisheries
Aquaculture is the fastest growing animal production sector in the world and the NC has the resources that can be exploited for both fresh and salt water aquaculture and fisheries development. This includes the nutrient rich waters of the west coast where the Department is supporting small scale fishermen and a number of commercial aquaculture enterprises are contributing to the development of the area. The NC also has access to two of the biggest rivers in South Africa linked to a number of dams. These resources are currently utilised by subsistence and recreational fishermen, but have the potential to support much larger fishery and aquaculture development.
The development of management plans for small scale and kraal fisheries at Vanderkloof Dam have gone through a rigorous consultation process and both documents are close to finalisation. Implementation will start in the new financial year. The trout cage culture in Vanderkloof has been registered under Operation Phakisa and a pilot study will start in the 2017/18 financial year. Furthermore, the Department facilitated the establishment of a NC Mariculture Working Group which meets quarterly. The Department is also represented on the Provincial Coastal Committee and actively participates in activities in this regard. Important legislation that will assist the development of these industries is in various stages of finalisation and this will include an Aquaculture Bill and an Inland Fishery Policy.
The Strategic Environmental Assessment for Aquaculture Development in South Africa (SEA) has started and the purpose of the SEA is to promote and support the growth of the aquaculture industry in South Africa through:
(i) identifying suitable areas where environmentally sustainable aquaculture development can be prioritised and incentivised; and
(ii) providing a streamlined and integrated management and regulatory framework to reduce compliance complexities and improve decision-making processes
This process is currently in its 2nd phase or screening phase which includes a national scale review and mapping of aquaculture facilities, environmental attributes, specific siting criteria, alien fish invasion, biodiversity risks, key issues/impacts and licensing/permits.
The Department has agreed to develop an aquaculture plan for Vaalharts Irrigation Scheme that will address the:• establishment of an aquaculture research facility at Vaalharts Research Station;• completion of a comprehensive desktop study to determine the potential of aquaculture on
Vaalharts Irrigation Scheme;• monitoring of water parameters at selected sights on the irrigation scheme (expand to other
localities in the Province);• determination of irrigation dam capacities, water fluctuations and flushing rates;• evaluation of suitable species in terms of growth rates, mortalities and other factors; and• examination of critical success factors for example access to fingerlings, feed and markets
4.5.1.3 Monitoring of fruit-fly infestation in Lower Orange area
The purpose of the fruit fly project is to investigate the occurrence and population dynamics of fruit flies on fruit crops such as grapes (table, dry, wine, citrus etc.) in the Lower Orange River area, as well as to determine possible hot spots and overwintering/alternative hosts for the fruit flies. The study area consists of eight locations from Upington to Blouputs and at each location eight variables are being monitored. Variables include table grape vineyards, wine/dry grape vineyards, raisin floor, cellars/packhorse, riverine vegetation, outcrops away from the river, home vegetable/fruit tree gardens and orchards. The collected fly specimens were counted taxonomically identified. The numbers for the Mediterranean fruit fly (Ceratitis capitata) increased as the season progress towards March 2015. It is evident from the results that there is movement of especially vinegar flies from the table grape orchard to pack houses and from pack houses to wine grape orchards as the season progressed and fruit ripened accordingly. Fruit fly populations were monitored over two years in order to track the population density and migration. In the first phase, BioLure® and methyl eugenol (ME) were used as lures in yellow bucket traps. BioLure® was used to monitor fruit fly diversity and ME was used to lure Bactrocera invadens males. After this phase Ceratitis capitata was identified as a major threat, no B. invadens individuals were collected. During phase two sex specific lures (Capilure and Questlure) targeting C. capitata were used in census traps, while we continued using methyl eugenol in bucket traps in case of B. invadens emergence.
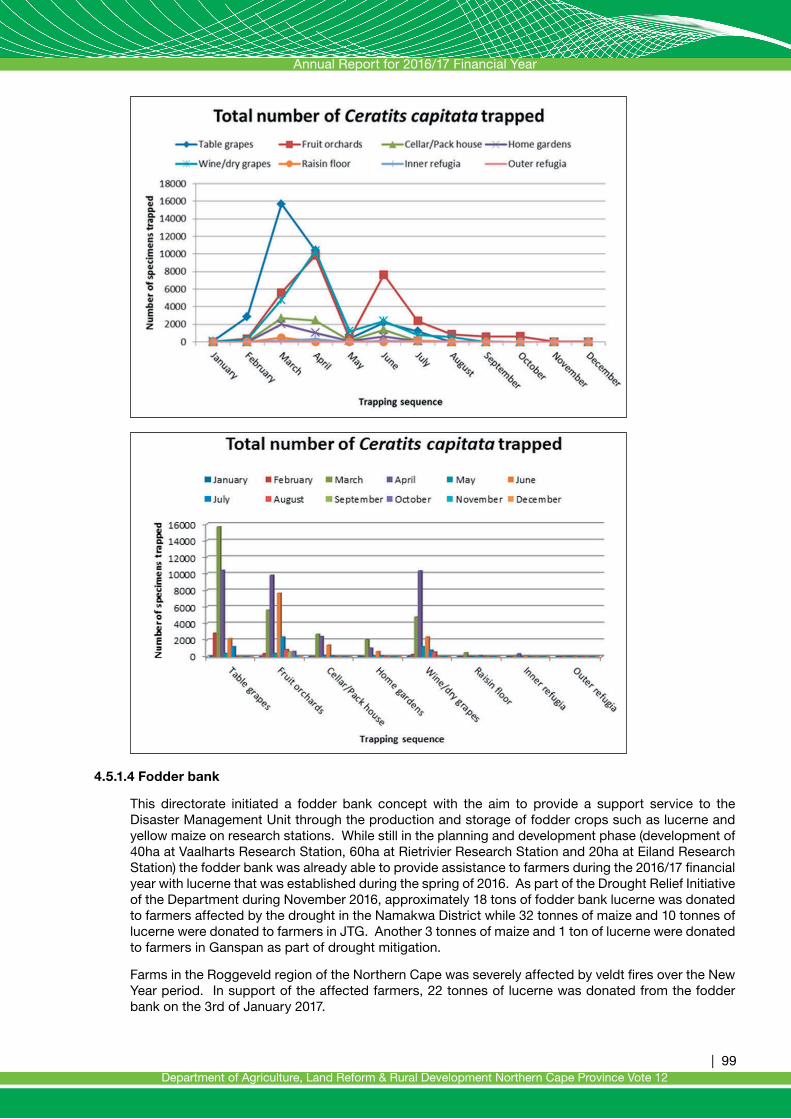
Annual Report for 2016/17 Financial Year
| 99Department of Agriculture, Land Reform & Rural Development Northern Cape Province Vote 12
142
8.1.1.2 Fodder bank This directorate implemented a fodder bank concept with the aim to provide a
support service to the Disaster Management Unit through the production and
storage of fodder crops such as lucerne and yellow maize on research stations.
While still in the planning and development phase (development of 40ha at
Vaalharts Research Station, 60ha at Rietrivier Research Station and 20ha at
Eiland Research Station) the fodder bank was already able to provide assistance
to farmers during the 2016/17 financial year with lucerne that was established
during the spring of 2016.
4.5.1.4 Fodder bank
This directorate initiated a fodder bank concept with the aim to provide a support service to the Disaster Management Unit through the production and storage of fodder crops such as lucerne and yellow maize on research stations. While still in the planning and development phase (development of 40ha at Vaalharts Research Station, 60ha at Rietrivier Research Station and 20ha at Eiland Research Station) the fodder bank was already able to provide assistance to farmers during the 2016/17 financial year with lucerne that was established during the spring of 2016. As part of the Drought Relief Initiative of the Department during November 2016, approximately 18 tons of fodder bank lucerne was donated to farmers affected by the drought in the Namakwa District while 32 tonnes of maize and 10 tonnes of lucerne were donated to farmers in JTG. Another 3 tonnes of maize and 1 ton of lucerne were donated to farmers in Ganspan as part of drought mitigation.
Farms in the Roggeveld region of the Northern Cape was severely affected by veldt fires over the New Year period. In support of the affected farmers, 22 tonnes of lucerne was donated from the fodder bank on the 3rd of January 2017.

Annual Report for 2016/17 Financial Year
100 |Department of Agriculture, Land Reform & Rural Development Northern Cape Province Vote 12
By the end of March 2017, another 64 tonnes of lucerne were donated to farmers in the drought stricken vicinity of Calvinia.
The fodder bank is expected to be in full production by September 2017.
4.5.2 Technology Transfer Services
A very successful milk goat farmer’s day was held on May 2016 where farmer who attended got to share information and ideas with experts in the milk goat industry. Presentations included topics such as the basic management principles and its effect on milk production, value adding through measuring (animal quality etc), management of animals during times of drought and then more technical aspects such as animal handling, handling of vaccines etc as well as the maintenance of equipment and an introduction to new technologies.
Farmers attending the milk goat farmer’s day.
Right: A representative from Delaval, discussing the maintenance and management of the milking equipment.
Fifteen youth from the Maths and Science Leadership Academy attended a career information workshop and job shadowing in June.
In June, the programme hosted the grade 11 students from the Maths and Science Leadership Academy for a career awareness workshop and job shadowing. Fifteen students attended where they were exposed to different careers offered in Agriculture, such as engineering, environmental risk management, animal production and animal health technician. They then had the opportunity to be exposed to the actual activities on a research farm as well as the veterinary laboratory.

Annual Report for 2016/17 Financial Year
| 101Department of Agriculture, Land Reform & Rural Development Northern Cape Province Vote 12
The above is part of the report received from the youth on their experience at the Department.
4.5.3 Infrastructure Support Services
The Department currently has six research stations actively supporting research and the research animals. Except for Carnarvon and Rietrivier Research Stations, theft of both research material and equipment at the other four research stations places a heavy burden on what the Department can deliver in terms of research results.
Annual Report for 2016/17 Financial Year
102 |Department of Agriculture, Land Reform & Rural Development Northern Cape Province Vote 12

Annual Report for 2016/17 Financial Year
| 103Department of Agriculture, Land Reform & Rural Development Northern Cape Province Vote 12
4.6 Programme 6: Agricultural Economics Services
Purpose: The purpose of the programme is to provide timely and relevant agricultural economic services to the sector in support of sustainable agricultural and agri-business development to increase economic growth.
Sub- Programmes:• Agri-business Support and Development• Macroeconomics Support
Strategic Objectives:• To provide Agri-Businesses support through entrepreneurial development, marketing services,
value adding, production and resource economics.• To provide macroeconomic and statistical information on the performance of the agricultural
sector in order to inform planning and decision making
Strategic objectives, performance indicators planned targets and actual outputs
Strategic objectives:
Programme: 6 Agricultural Economics Services
Strategic objective Actual Achievement2015/2016
Planned Target 2016/2017
Actual Achievement 2016/2017
Deviation from planned target to Actual Achievement for 2016/12017
Comment on deviations
To provide Agri-Businesses support services through entrepreneurial development, marketing services, value adding, production and resource economics.
52 32 32 0
To provide macroeconomic and statistical information on the performance of the agricultural sector in order to inform planning and decision making
1 14 14 0
Performance indicators:
Sub-programme: 6.1 Agri-business Support and Development
Performance Indicator Actual Achieve-ment 2013/2014
Actual Achieve-ment 2014/2015
Actual Achieve-ment2015/2016
Planned Target 2016/2017
Actual Achieve-ment 2016/2017
Deviation from planned target to Actual Achievement for 2016/12017
Comment on deviations
6.1.1 Number of agri-Businesses supported with agricultural economic services to access markets
7 5 5 10 6 -4 Projects unable to meet market requirements due to quantity and quality of the produce as well as lack of their own transports to take produce to the market place. These factors as a result are causing them not to access sustainable markets
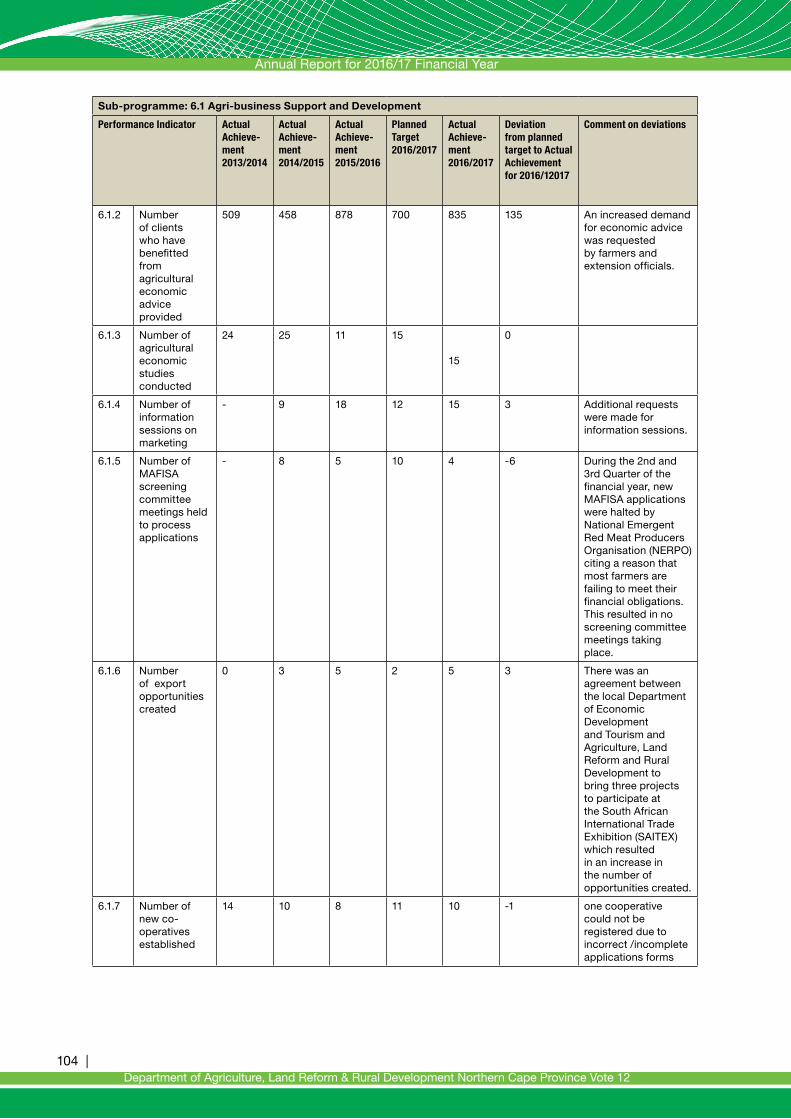
Annual Report for 2016/17 Financial Year
104 |Department of Agriculture, Land Reform & Rural Development Northern Cape Province Vote 12
Sub-programme: 6.1 Agri-business Support and Development
Performance Indicator Actual Achieve-ment 2013/2014
Actual Achieve-ment 2014/2015
Actual Achieve-ment2015/2016
Planned Target 2016/2017
Actual Achieve-ment 2016/2017
Deviation from planned target to Actual Achievement for 2016/12017
Comment on deviations
6.1.2 Number of clients who have benefitted from agricultural economic advice provided
509 458 878 700 835 135 An increased demand for economic advice was requested by farmers and extension officials.
6.1.3 Number of agricultural economic studies conducted
24 25 11 15 15
0
6.1.4 Number of information sessions on marketing
- 9 18 12 15 3 Additional requests were made for information sessions.
6.1.5 Number of MAFISA screening committee meetings held to process applications
- 8 5 10 4 -6 During the 2nd and 3rd Quarter of the financial year, new MAFISA applications were halted by National Emergent Red Meat Producers Organisation (NERPO) citing a reason that most farmers are failing to meet their financial obligations. This resulted in no screening committee meetings taking place.
6.1.6 Number of export opportunities created
0 3 5 2 5 3 There was an agreement between the local Department of Economic Development and Tourism and Agriculture, Land Reform and Rural Development to bring three projects to participate at the South African International Trade Exhibition (SAITEX) which resulted in an increase in the number of opportunities created.
6.1.7 Number of new co-operatives established
14 10 8 11 10 -1 one cooperative could not be registered due to incorrect /incomplete applications forms

Annual Report for 2016/17 Financial Year
| 105Department of Agriculture, Land Reform & Rural Development Northern Cape Province Vote 12
Sub-programme: 6.1 Agri-business Support and Development
Performance Indicator Actual Achieve-ment 2013/2014
Actual Achieve-ment 2014/2015
Actual Achieve-ment2015/2016
Planned Target 2016/2017
Actual Achieve-ment 2016/2017
Deviation from planned target to Actual Achievement for 2016/12017
Comment on deviations
6.1.8 Number of workshops conducted to promote affiliation to commodity organisations by smallholder farmers
- 5 12 10 13 3 Additional requests were made to conduct workshops on commodity affiliations
6.1.9 Number of smallholder farmers supported to access markets
- 23 0 12 14 2 More small holder farmers were assisted to sell their Lucerne in the 3rd quarter resulting in over performance of planned targets
6.1.10 Number of co-operatives supported
- - - 15 16 1 The over performance was due to the increase in the need for business plan training in the Province.
Strategy to overcome areas of under performance
One of the endeavours is to ensure that we assist agri-business entities with the necessary support to access market. To this end, we will continue to work closely with Farmer Support and Development Programme of the Department to develop production strategy that will address the challenge of quantity and quality of farmers produce such that they appeal to potential buyers. Another strategy is to ensure that we continue to assist farmers to get compliance certificates in order for their produce to be market ready and compliant
In order to ensure that stakeholders benefit from agricultural economic studies, outreach programmes will be intensified with a view to stimulate interest to aspirant farmers in the province across all vulnerable groups of the society such as the youth, females as well as people living with disabilities
During the financial year under review, the plans made for assisting farmers to access MAFISA could not be realised. During the 2nd and 3rd Quarter of the financial year, all new MAFISA applications were halted by National Emergent Red Meat Producers Organisation (NERPO) citing a reason that most farmers are failing to meet their financial obligations. This resulted in no screening committee meetings taking place. The Department will make proposals to Department of Agriculture, Forestry and Fisheries (DAFF) as part of a general solution to affected provinces with failure by their respective farmers to meet their financial obligations to NERPO. The envisaged solution strategy will look at amongst other ways, the best repayment method that will suit both farmers and NERPO,
In assisting sector beneficiaries with cooperative registrations, the department will strive to ensure that it stays abreast of any new developments of registration processes and requirements in order to ensure maximum beneficiation of beneficiaries.

Annual Report for 2016/17 Financial Year
106 |Department of Agriculture, Land Reform & Rural Development Northern Cape Province Vote 12
Sub-programme: 6.2 Macroeconomic Support
Performance Indicator Actual Achieve-ment 2013/2014
Actual Achieve-ment 2014/2015
Actual Achieve-ment2015/2016
Planned Target 2016/2017
Actual Achieve-ment 2016/2017
Deviation from planned target to Actual Achievement for 2016/12017
Comment on deviations
6.2.1 Number of agricultural economic information responses provided
5 5 10 8 8 0
6.2.2 Number of economic reports compiled
14 12 12 12 12 0
6.2.3 Number of new enterprise budgets (combuds) developed
6 5 5 4 4 0
6.2.4 Enterprise budgets (combuds) annual prices updated and report generated
1 1 1 1 1 0
6.2.5 Functional statistical economic database available
1 1 1 1 1 0
Strategy to overcome areas of under performance
None
Changes to planned targets
None
Linking performance with budgets
Sub programme expenditure
Pr 6:Agricultural Economics
2016/2017 2015/2016
Final Appropriation
Actual Expenditure
(Over)/Under
Expenditure
Final Appropriation
Actual Expenditure
(Over)/Under
Expenditure
R’000 R’000 R’000 R’000 R’000 R’000
Agric-Business and Development
2 987 2 987 - 3 544 2 861 683
Macroeconomics Support
6 074 6 056 18 5 575 5 277 298
Total 9 061 9 043 18 9 119 8 138 981
SERVICE DELIVERY HIGHLIGHTS
4.6.1 Marketing
Rekgarathile BEE Project, ZF Mgcawu District
The project, initially funded by Kolomela Mines in Postmasburg was established and registered in 2009, in the ZF Mgcawu district. It started with six beneficiaries and they have since added an additional six members. The farmers are producing and packaging pure honey. They sell to the Skeyfontein and Postbmasburg local community at R60.00 per 500g bottle. If they sell to businesses, they sell at R35.00 per 500g bottle.The members have had basic training in Bee-keeping and how to run a small business. The department has linked the project to various markets in Postmasburg (Save Rite, Vintage Skiek); Danielskuil (KaapAgri Express, Danielskuil Spar); and Kuruman (Geel Kombuis, Kalahari Supermarket, Kuruman Superspar, Kalahari Bilton and Kuru Kuru Guest house).

Annual Report for 2016/17 Financial Year
| 107Department of Agriculture, Land Reform & Rural Development Northern Cape Province Vote 12
Skeyfontein Vegetable Garden
This project was established in 2002 and in 2009 legally registered as an agricultural cooperative and is based in the ZF Mgcawu district. It is comprised of seven female beneficiaries who are producing vegetables in four tunnels including spinach, cabbage, lettuce, tomatoes and green peppers. For the period under review, the project was linked to various markets Postmasburg including African Supermarket, Save Rite, Shoprite and Jimbos.
Emthanjeni Hydroponics
Emthanjeni was linked to Veggie on Line, a marketer of vegetables. An agreement (a Letter Of Intent) was signed between the project and the marketer with specification on quantities and frequencies of delivery
Reetsang Agricultural Cooperative
Retsang Agricultural Cooperative in Barkly West was linked with Pick n Pay in Galeshewe, Kimberley to sell vegetables including cabbage, beetroot and carrots. These transactions took place in the second quarter of the financial year under review.A Letter of Intent to purchase future produce was also signed. In the 3rd quarter, the department was again able to assist the cooperative to sell its produce to Spesbona and the Santos Kitchen. Vegetables were sold to Santos Kitchen while Lucerne was sold to Spesbona. For the 2016/17 financial year, the department was able to link the cooperative to three different markets.
Coboop Cooperative
The cooperative has been struggling to secure formal markets to sell its mangoes and has been selling to informal markets. The department was able to link Cooboop with OK Supermarket in springbok. A Letter of Intent was signed specifying issues such as the quality, distribution and packaging of the mangoes
Rooival Cooperative
The Rooival cooperative was linket to a market in Cape Town through the assistance of Maysen Boerdery CC. The project is currently planting chillies and brinjal in Viooldrift. This market linkage resulted after department approached the Maysen Boerdery CC the as well as the women beneficiaries of Plot 156 with the aim of forming a joint venture that will benefit both parties. Maysen Boerdery consists of two well-known commercial farmers in Vioolsdrift. These farmers specialize in vegetable production for export as well as national markets.
Pella Small-holder farmers
The Pella Small-holder farmers were linked to Pioneer Foods and OK for their table grapes. Even though the produce will only be harvested and available for market in two years’ time, the department will continue to ensure that communication between these parties continue and that each honour the commitments they made to each other.
Small-holder Farmers from Namakwaland
Small-holder farmers from Nama-Khoi, Richtersveld, Khai-Ma and Kamiesberg were assisted by the department to sell their produce to Nam-lam Abattoir, which is a formal market. These farmers have been struggling to access the formal markets of Nam-lam and Nam Meat abattoirs. The department will ensure that the agreements reached by these parties are sustainable and that these small-holder farmers continue to supply to these abattoirs.
Information Sharing Session
A total of fourteen information sharing sessions were held during this financial year. The information that was disseminated in these sessions focused around agricultural marketing, commodity associations, access to finance, cooperatives formation, business plans development and financial management. The information sharing sessions took place in the following areas:

Annual Report for 2016/17 Financial Year
108 |Department of Agriculture, Land Reform & Rural Development Northern Cape Province Vote 12
MARKETING INFORMATION SHARING SESSIONS IN 2016/2017
No. PLACE DISTRICT DATE
1 Danielskuil ZF Mcgawu 02 June 2016
2 Kuruman John Taolo Gaetsewe 12 May 2016
3 Olifantshoek ZF Mcgawu 13 May 2016
4 Victoria West Pixley Ka Seme 31 May 2016
5 Delportshoop John Taolo Gaetsewe 28 July 2016
6 Noupoort Pixley Ka Seme 29 September 2016
7 Hartswater Frances Baard 06 October 2016
8 Petrusville Pixley Ka Seme 16 October 2016
9 Brandvlei Namakwa 25 October 2016
10 Calvinia Namakwa 27 October 2016
11 Loxton Pixley Ka seme 15 February 2017
12 Upington ZF Mcgawu 28 February 2017
13 Keimoes ZF Mcgawu 01 March 2017
14 Pniel Frances Baard March 2017
4.6.2 MAFISA
Four MAFISA screening committee meetings were held during this financial year, wherein 34 application forms were screened and recommended to NERPO head office for approval. The total amount of money applied for by these farmers was R2, 035,000.00.
4.6.3 Cooperative establishment and support
Cooperatives established
REGISTERED COOPERATIVES 2016/17
No. NAME LOCATION
1 Skobi Project Primary Cooperative Kimberley, Frances Baard
2 Itireleng Ma Africa Agricultural Cooperative Windsorton, Frances Baard
3 Hopetown Piggery Primary Cooperative Hopetown, Pixely Ka Seme
4 Tshepano Primary Cooperative Batlharos, John Taolo Gaetsewe
5 Bokgoni Cooperative Kimberley, Frances Baard
6 Katemo Agricultural Primary Cooperative Kimberley, Frances Baard
7 Eyabantu Livestock Agricultural Cooperative Petrusville, Pixley Ka Seme
8 Oteng Agricultural Cooperative Kuruman, John Taolo Gaetsewe
9 Mo- Afrika Organic Farming Pampierstad, Frances Baard
10 Marang a Lesedi agricultural primary cooperative Kuruman, John Taolo Gaetsewe
Cooperative Support
Seventeen cooperatives were supported through either Farm Together Training or business plan training conducted by Departmental Economists. The training sessions conducted by the Farm Together took place over two weeks whereby cooperatives were trained on financial management, cooperative governance, team work, conflict management and business plan development. The business plan training conducted by the Department official was over a two day period.

Annual Report for 2016/17 Financial Year
| 109Department of Agriculture, Land Reform & Rural Development Northern Cape Province Vote 12
The following cooperatives were supported with training during this financial year:
No COOPERATIVE NAME DISTRICT TYPE OF TRAINING
1 Cholofelo Ntle Agricultural Cooperative Frances Baard Farm Together Training
2 Tshepanang Agricultural Cooperative Frances Baard Farm Together Training
3P-Niel Youth Development Agricultural Cooperative
Frances Baard Farm Together Training
4Chicken project & Trading Agric Cooperative
Frances Baard Farm Together Training
5 Lemoendraai Agricultural Cooperative ZF Mcgawu Business Plan Training
6 Victory Farmers Cooperative ZF Mcgawu Business Plan Training
7 Morning Star Cooperative ZF Mcgawu Business Plan Training
8 Gamagula Agricultural Cooperative ZF Mcgawu Business Plan Training
9 Vertrou Ons Cooperative Pixley Ka Seme Business Plan Training
10Itireleng Ma Afrika Agricultural Cooperative
Frances Baard Business Plan Training
11 Mo-Afrika Organic Farm Frances Baard Business Plan Training
12 Lithelihle Piggery Pixley Ka Seme Business Plan Training
13 Umsombovu Fresh Produce Cooperative Pixley Ka Seme Business Plan Training
14 Itireleng Dipudi Agricultural Cooperative John Taole Gaetsewe Business Plan Training
15 Tirisano Livestock Breeders Cooperative John Taole Gaetsewe Business Plan Training
16 Thou-Boswa agricultural cooperative John Taole Gaetsewe Business Plan Training
4.6.4 Export
South African International Trade Exhibition (SAITEX)
The 23rd South African International Trade Exhibition took place in June 2016 at the Gallagher Convention Centre in Midrand. The Department together with the Department of Economic Development and Tourism came together to set-up a Northern Cape Pavilion whereby opportunities were given to eight projects from the Province. The aim for the Pavilion was to market as well as secure potential national and international market linkages. The Department brought four agricultural projects to exhibit namely; Niewoudtville Rooibos, Emthanjeni Hydroponics, Henkries and Warrenton Superchicken. The trade exhibition was extremely beneficial as there were numerous interests in all four projects both from national and international markets.
Exhibition at the Intra-African Investment Symposium
On the 3rd of November 2016, the Department attended an Intra-African Investment Symposium at Mittah Seperepere Convention Centre. The Department exhibited the Niewoudtville Rooibos tea in order to create a possible market linkage to the Tanzanian market. The Tanzania Minister of Trade and Industry showed interest in the Rooibos tea. Even though no Memorandum of Understanding has been signed between the two parties, communication lines will be continued to ensure that this type of networking eventually yields some results for the farmers of the Rooibos tea
Export Certification Training
Three SA-GAP export trainings were conducted together with the Perishable Products Export Control Board (PPECB). The training sessions were conducted as a requirement of the export certification process. The following projects were trained:

Annual Report for 2016/17 Financial Year
110 |Department of Agriculture, Land Reform & Rural Development Northern Cape Province Vote 12
NAME OF PROJECT LOCATION DATE TRAINED
Eksteenskuil Keimoes, ZF Mgcawu District 12TH, 13TH May 2016
Henkries Springbok, Namakwa District 08th February 2017
Blocuso Trust Upington, ZF Mgcawu District 02nd March 2017
Introduction to Export and Incoterms Training with the Department of Trade and Industry
The Department of Trade & Industry together with the Department of Economic Development & Tourism arranged a three day ‘Introduction to Export’ in Kimberley during August 2016. The Department arranged that two projects be brought to this training. Two farmers from Warrenton Super chicken and Henkries attended. The training aimed to introduce the basic concepts and information on exporting as well as understanding the relevant INCOTERMS (International Commercial Terms) to smallholder farmers. The training was both theoretical as well as practical where all attendees were requested to complete the necessary questions in order to successfully pass the training.
Exhibiting at the 7th Biennial LandCare Conference
The 7th Biennial LandCare Conference took place during October 2016. The department exhibited six projects at the afore-mentioned event in order to create brand awareness as well as to network with potential buyers/markets. The six projects that exhibited were; Niewoudtville Rooibos, Warrenton Superchicken, Manyeding, Emthanjeni Hydroponics, Henkries, Chikaina and Tshwaraganang.
4.6.5 Financial Record Keeping Training
Training on financial record keeping is provided to Districts through the Farmer Training and Capacity Building programme. Training was provided to 149 farmers during 10 training events held in the Districts of Frances Baard (3events), JTG (2 events), ZF Mgcawu (2 events) and Namakwa (3 events). From the farmers attending, 40 (27%) were youth and 77 (52%) were females.
4.6.6 Economic Studies
Fifteen economic studies were conducted and reports produced during this financial year:
NAME OF STUDY
1 Patryskraal Portion 1 – Agricultural Potential Report (APR)
2 Patryskraal Portion 2 – APR
3 Food Cost Review in Rural Areas
4 Agricultural Commodities Price Analysis (Quarter 2)
5 Commonages in Carnavon – APR
6 Commonages in Van Wyksvlei – APR
7 Commonage in Vosburg – APR
8 Metsi Botshelo Business Plan
9 Agricultural Commodities Price Analysis (Quarter 3)
10 Vooruit Boerdery Ltd: Lucerne Establishment Business Plan
11 Oteng Cooperative: Poultry Business Plan
12 Food price Monitoring in rural areas of the Northern Cape Province
13 Agricultural Commodities Price Analysis (Quarter 4)

Annual Report for 2016/17 Financial Year
| 111Department of Agriculture, Land Reform & Rural Development Northern Cape Province Vote 12
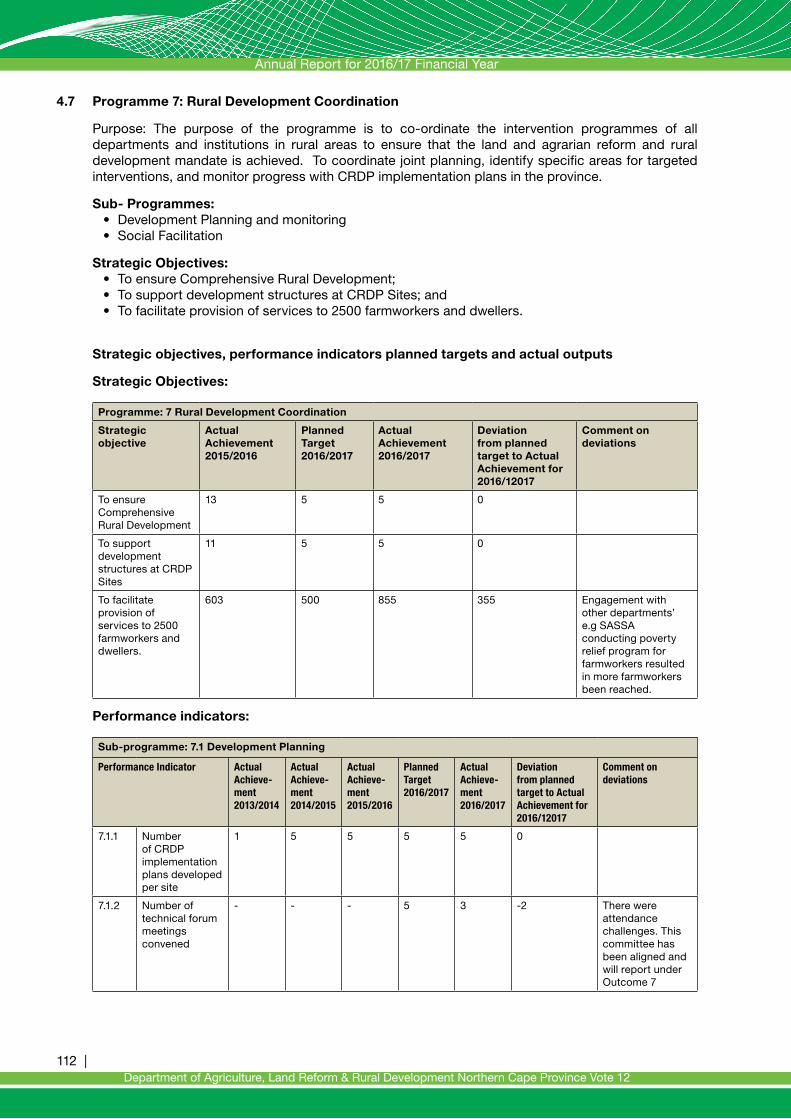
Annual Report for 2016/17 Financial Year
112 |Department of Agriculture, Land Reform & Rural Development Northern Cape Province Vote 12
4.7 Programme 7: Rural Development Coordination
Purpose: The purpose of the programme is to co-ordinate the intervention programmes of all departments and institutions in rural areas to ensure that the land and agrarian reform and rural development mandate is achieved. To coordinate joint planning, identify specific areas for targeted interventions, and monitor progress with CRDP implementation plans in the province.
Sub- Programmes:• Development Planning and monitoring• Social Facilitation
Strategic Objectives:• To ensure Comprehensive Rural Development;• To support development structures at CRDP Sites; and • To facilitate provision of services to 2500 farmworkers and dwellers.
Strategic objectives, performance indicators planned targets and actual outputs
Strategic Objectives:
Programme: 7 Rural Development Coordination
Strategic objective
Actual Achievement 2015/2016
Planned Target 2016/2017
Actual Achievement 2016/2017
Deviation from planned target to Actual Achievement for 2016/12017
Comment on deviations
To ensure Comprehensive Rural Development
13 5 5 0
To support development structures at CRDP Sites
11 5 5 0
To facilitate provision of services to 2500 farmworkers and dwellers.
603 500 855 355 Engagement with other departments’ e.g SASSA conducting poverty relief program for farmworkers resulted in more farmworkers been reached.
Performance indicators:
Sub-programme: 7.1 Development Planning
Performance Indicator Actual Achieve-ment2013/2014
Actual Achieve-ment2014/2015
Actual Achieve-ment2015/2016
Planned Target 2016/2017
Actual Achieve-ment 2016/2017
Deviation from planned target to Actual Achievement for 2016/12017
Comment on deviations
7.1.1 Number of CRDP implementation plans developed per site
1 5 5 5 5 0
7.1.2 Number of technical forum meetings convened
- - - 5 3 -2 There were attendance challenges. This committee has been aligned and will report under Outcome 7

Annual Report for 2016/17 Financial Year
| 113Department of Agriculture, Land Reform & Rural Development Northern Cape Province Vote 12
Sub-programme: 7.1 Development Planning
Performance Indicator Actual Achieve-ment2013/2014
Actual Achieve-ment2014/2015
Actual Achieve-ment2015/2016
Planned Target 2016/2017
Actual Achieve-ment 2016/2017
Deviation from planned target to Actual Achievement for 2016/12017
Comment on deviations
7.1.3 Number of CRDP progress reports compiled
12 4 4 4 4 0
7.1.4 Number of reports on outcome 7
4 4 4 4 4 0
Strategy to overcome areas of under performance
The reason for these targets not been achieved is that they are dependent on various stakeholders contributing to their achievement. The Department experienced challenges with non-attendance of stakeholders, misaligned participants to meetings. These structures have been aligned and will report under the Outcome 7 Technical Implementation Forum.
Sub-programme: 7.2 Social Facilitation
Performance Indicator Actual Achieve-ment2013/2014
Actual Achieve-ment2014/2015
Actual Achieve-ment2015/2016
Planned Target 2016/2017
Actual Achieve-ment 2016/2017
Deviation from planned target to Actual Achievement for 2016/12017
Comment on deviations
7.2.1 Number of structures establish to achieve social cohesion and development
12 0 3 5 4 -1 The Kamiesberg Local Municipality could not confirm date for the establishment of the Council of Stakeholders
7.2.2 Number of structures supported to achieve social cohesion and development
- 15 11 5 5 0
7.3.1 Number of farmworker advocacy sessions held
14 16 22 20 21 1 SASSA poverty relief program for farmworkers resulted in convening more sessions than planned.
7.3.2 Number of Provincial delivery forum meetings held
- 4 3 4 3 -1 The meeting was convened but couldn’t continue due to fewer stakeholders attending
7.3.3 Number of farm workers and dwellers assisted to access government services
403 554 581 500 860 360 SASSA poverty relief program for farmworkers resulted in more farmworkers been reached.

Annual Report for 2016/17 Financial Year
114 |Department of Agriculture, Land Reform & Rural Development Northern Cape Province Vote 12
Strategy to overcome areas of under performance
The reason for these targets not been achieved is that they are dependent on various stakeholders contributing to their achievement. The Department experienced challenges with non-attendance of stakeholders, misaligned participants to meetings.
Changes to planned targets
None
Linking performance with budgets
Sub programme expenditure
Pr 7: Rural Devlopment
2016/2017 2015/2016
Final Appropriation
Actual Expenditure
(Over)/Under
Expenditure
Final Appropriation
Actual Expenditure
(Over)/Under
Expenditure
R’000 R’000 R’000 R’000 R’000 R’000
Rural Development Coordination
13 638 13 630 8 12 916 12 900 16
Total 13 638 13 630 8 12 916 12 900 16
SERVICE DELIVERY HIGHLIGHTS
4.7.1 Comprehensive Rural Development Program (CRDP)
The Department continued to implement facets of the CRDP during the year under review. The CRDP framework seeks to improve the livelihood of people in rural areas by amongst others: dealing effectively with state land administration; improvement or development of economic infrastructure; providing basic needs for farm dwellers and workers, social mobilisation to enable rural communities to take initiative in their development and delivery partners to achieve an integrated and inclusive rural economy.
4.7.2 Agricultural Potential Reports (APR)
The Department conduct APR`s for farms that must be purchased for land reform purposes. This report determines whether the farm is suitable for agricultural purposes or not. It highlights the conditions of the existing infrastructure in order to negotiate for a better price. During the period under review the following APR’s were completed and send to Department of Rural Development and Land Reform for consideration.

Annual Report for 2016/17 Financial Year
| 115Department of Agriculture, Land Reform & Rural Development Northern Cape Province Vote 12
DISTRICTS APR’S received Extent (ha) Land Use
Frances Baard •Newlands farm •59.8097 Mixed farming (livestock and crop production)
•Melkvlei •1532.584 Mixed farming (livestock and crop production)
•Portion 1 of Farm no. 113 •2567.0080 Mixed farming (livestock and crop production)
•Karolusdrift •1060.9926 Mixed farming (livestock and crop production)
•Rus en Vrede •834.3736 Mixed farming (livestock and crop production)
•Remaining extent of portion 3 (Onverwag) of the farm Elandsdrift no. 159
•513. 9213 Mixed farming
•Portion 11 and remaining extent of portion 21 of Roodepan no. 70
•59.8097 Crop production
•Remainders of farm Zoelenslaagte 158 and farm Holpan Hotel 364
•1846.0485 Mixed farming
•Portion 2 of farm 134 (Weltevreden)
•712.2777 Livestock production
•Farm Kalkfontein •783.6982 Livestock production
•VH32 •606.6542 Livestock production
Namakwa •Matjeskloof •3991 Livestock production
•Remhoogte •5193.4271 Livestock production
•Kromkolk •4677.4310 Livestock production
•Jobskolk •8822.3971 Livestock production
•Brakfontein No 266 •7510.085 Livestock production
•Portion 1 of farm Kromkolk 338 •4677.4310 Livestock production
•Farm 508 of Onverwag •1879.9984 Livestock production
•Mosquito kraal •4338.3145 Livestock production
•Bloubos •11032.9816 Livestock production
Z.F Mgcawu •Kalk Bult •6031.6813 Livestock production
•Remainder of Farm Avilion No. 325 & portion 1 of the farm Kalkpoort landgoed No. 627
•16 857 Livestock production
•Remaining of portion 1 Welgelegen Farm Rooiputs
•6637 Livestock production

Annual Report for 2016/17 Financial Year
116 |Department of Agriculture, Land Reform & Rural Development Northern Cape Province Vote 12
The Department participated in the District Land Reform Committees in all districts. The following farms were purchase during financial year 2016/17:
Prov-ince
District Farm name
Property description
Hectares Commodity Allocated to
Target group
NC Pixley ka Seme
Goodhope Portion 2 (Good Hope) of the Farm Naauwe Kloof Nr 122
2587.2562 Red meat Mr Gerhardus Timotheus Saaiman
Smallholder
NC Pixley ka Seme
Duurwater Portions 23 & 26 (Duurwater) Farm Readsdrift No. 74
1832.4963 Red meat Mr Cornellius Townsend
Smallholder
NC Frances Baard
Plot 84 Plot 84, Portion of plot 1 Vaalharts Settlement B
43,8072 Crop Production
Mr Wilson Giel
Smallholder (youth)
NC ZF Mgcawu
Droehout Portion 4 of the Farm Hedley Plain Number 266
6589. 9237 Livestock Production
Mr Franklin Heinrich Benade
Youth
NC Frances Baard
Witbank Portion 2 (Witbank) of Farm no 118
856.5320 Livestock Production
Ms Gairu Beukes
Smallholder
Prov-ince
District Farm name
Property description
Hectares Commodity Allocated to
Target group
NC John Taolo Gaet-sewe
Compton Ptn 0 of the farm No 169 (Compton)
1 960.2634 Livestock Production
Mr Tetelo Waiting Kgopodith-ate
Youth
NC Pixley ka Seme
Kleindoor-npan
Portion 4 of the Farm Kleindoorn-pan no 123.
3013.4181 Livestock Production
Mr Piet Kerneels Jan Wilson
Farm dweller
NC Frances Baard
VH32 Plot 1043 of plot 393 Vaalharts Settlement B
606.6542 Crop & Livestock Production
Mr Thapelo Tlhokwe
Agricultural Graduate

Annual Report for 2016/17 Financial Year
| 117Department of Agriculture, Land Reform & Rural Development Northern Cape Province Vote 12
Prov-ince
District Farm name
Property description
Hectares Commodity Allocated to
Target group
NC ZF Mg-cawu
Brulkolk Remain-der of farm Brulkolk No. 154 and Portion 1 (De Dam) of farm Longziek-Vlei No. 151
11474.6057 Livestock Production
Mr Jo-hannes Van Wyk
Smallhold-er
NC Namak-wa
Breek Been Kolk
Breek Been Kolk (Por-tion 4 of farm Zwart Kolk no 253; Portion 2 of farm Breek Been no 293; portion 3 of the farm Breek Been no 293
5315.2156 Livestock Production
Mr Karel Jacobus Jonkers
Smallhold-er
NC Namak-wa
Avoca Portion 1 (Avoca) of the Farm Uit-vlugt No.90
2376.8763 Livestock Production
Mr. Jan van Wyk
Smallhold-er
Total 36657.0487
4.7.3 Providing Basic Needs for Farm Dwellers and Workers
The Department facilitated the donation of Gazebos, Chairs and tables from the Mme Re Ka Thusa Trust Fund to enable dwellers from Loopeng, Maphiniki and Seoding to establish their own small businesses. 20 female farmworkers in the John Taolo Gaetsewe District were assisted by the Trust to acquire drivers’ licences. This programme was aimed at empowering rural women so that they can become employable. Mme Re ka Thusa advised farm workers on available funding for projects and also on procedures to follow to access the funding.
The National Youth Development Agency (NYDA) provided the Department with sanitary towels. They were distributed to farmworkers, farm dwellers and their children.
The Department assisted the community of Deurwaard after there was an outcry of shortage or lack to access of portable consumable water. The matter was escalated to the municipality for their urgent intervention. After this intervention by the Department, water was provided to the community.
The Department in October 2016 held a successful Conference on Farmworkers Equity Schemes in the Province. This was necessitated by cases reported to the Department regarding the abuse of these schemes that resulted in beneficiaries loosing almost all their shares, dismissed from farms they had shares and evicted from the farms. The Conference was addressed by representatives from National Prosecuting Authority, Lawyers for Human Rights, AFASA, NAFU, Department of Agriculture Land Reform and Rural Development, Department of Rural Development and Land Reform, and representatives from different Farm Equity Schemes. A Task Team composed of all stakeholders was established to seek recourse and justice for farm workers who participated in these BBBEE schemes. A program of action was developed and the task team meets quarterly to monitor and assess the implementation of resolutions taken at the conference.

Annual Report for 2016/17 Financial Year
118 |Department of Agriculture, Land Reform & Rural Development Northern Cape Province Vote 12
BACKGROUND TO FARMWORKERS EQUITY SCHEMES
CONTRIBUTIONS and %
SCHEMES COMMERCIAL FARMER FARMWORKERS NUMBER OF BENEFICIARIES
Vaallus 75% Property
25% R6m
95
Jonker Water 51% Property valued at R 1.2m
49% R 480 000. 00
32
Rekopane 75% Property value at R 56m
25% R 14m
65
Sonvrucht 55% R 7.7m
45% R6.3m
42
Opwag Farm 25% 75% R 542 500
58
Sheep power 34% R4.59m
66% R8.9m
10
4.7.4 Advocacy Sessions
The Department for the financial year under review focused on the farmworkers children learner transportation. The Department of Transport, Safety and Liaison was engaged to attend to the problems referred. Stakeholders were mobilised and inducted on the importance of the provision of this service as it contributed immensely to the education and development of the most vulnerable and the poor children in farming communities.
Farm workers and farm dwellers were work shopped on the 2010 Farm Workers Summit Resolutions which focused on Social Determinants, Health, Education and Training . Sessions were held in the following areas:• Magobing Communal Area• Madibeng Communal Area• Vergenoeg Communal Area• Babathas Restituted Farm• Kono Restituted Farm• Kuruman ( farm dwellers from different areas)
At these sessions, Mme Re Ka Thusa educated communities on how to start their own businesses and the funding available for these projects. Local Government Councilors also utilized these sessions to listen and attend to issues of service delivery as raised by communities mentioned above. The Department of Justice and the Department of Social Development educated communities about domestic violence, morality, family relationships and marriage and this became part of commemorating 16 Days of Activism against Gender Based Violence Awareness.
4.7.5 Government Services
Due to lack of formal skills training for farm workers in the province, the Department organized programmes aimed at ensuring that the knowledge they have acquired should be recognised assist in creating job opportunities with the skills acquired. These workers were trained on Tractor Maintenance and Welding Skills. They received certificates after the training. The Training Sessions were held in the following Districts: • Frances Baard - Phokwane • ZF Mgcawu – Kai Garib• Pixley Ka Seme – Siyancuma• John Taolo Gaetsewe.
The Local Councillors informed workers about Basic Municipal Services and procedures they needed to follow in order to raise governance issues.
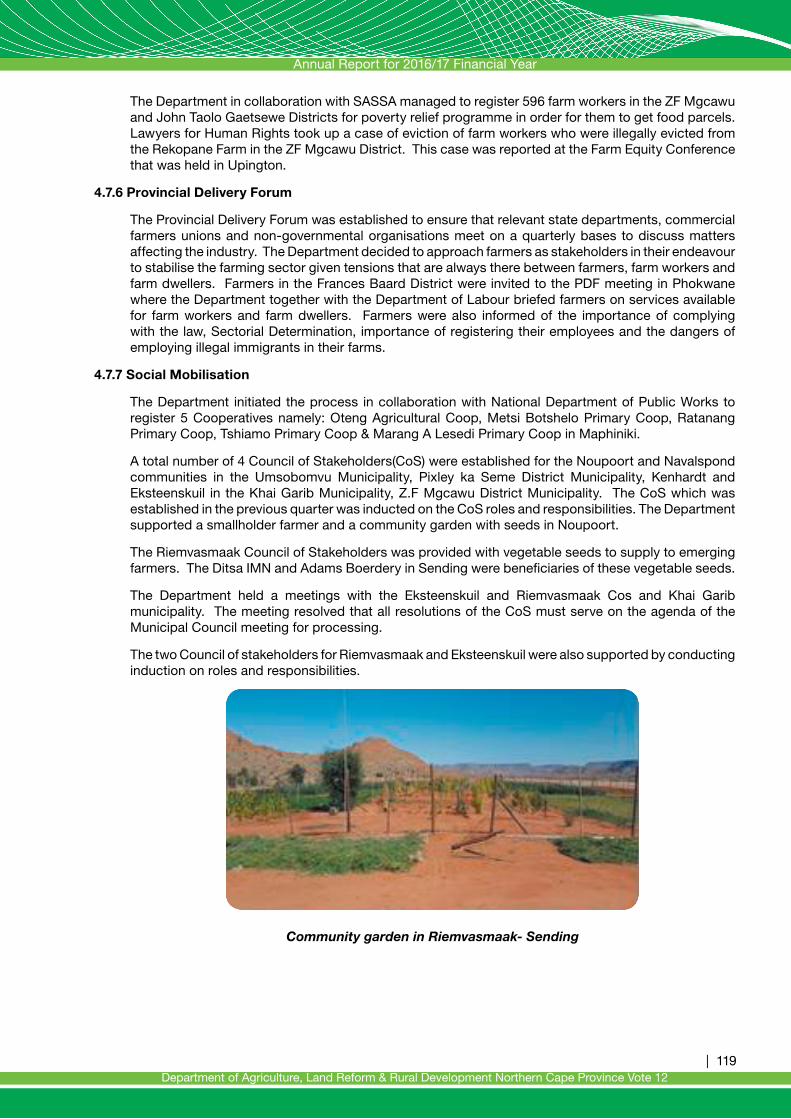
Annual Report for 2016/17 Financial Year
| 119Department of Agriculture, Land Reform & Rural Development Northern Cape Province Vote 12
The Department in collaboration with SASSA managed to register 596 farm workers in the ZF Mgcawu and John Taolo Gaetsewe Districts for poverty relief programme in order for them to get food parcels. Lawyers for Human Rights took up a case of eviction of farm workers who were illegally evicted from the Rekopane Farm in the ZF Mgcawu District. This case was reported at the Farm Equity Conference that was held in Upington.
4.7.6 Provincial Delivery Forum
The Provincial Delivery Forum was established to ensure that relevant state departments, commercial farmers unions and non-governmental organisations meet on a quarterly bases to discuss matters affecting the industry. The Department decided to approach farmers as stakeholders in their endeavour to stabilise the farming sector given tensions that are always there between farmers, farm workers and farm dwellers. Farmers in the Frances Baard District were invited to the PDF meeting in Phokwane where the Department together with the Department of Labour briefed farmers on services available for farm workers and farm dwellers. Farmers were also informed of the importance of complying with the law, Sectorial Determination, importance of registering their employees and the dangers of employing illegal immigrants in their farms.
4.7.7 Social Mobilisation
The Department initiated the process in collaboration with National Department of Public Works to register 5 Cooperatives namely: Oteng Agricultural Coop, Metsi Botshelo Primary Coop, Ratanang Primary Coop, Tshiamo Primary Coop & Marang A Lesedi Primary Coop in Maphiniki.
A total number of 4 Council of Stakeholders(CoS) were established for the Noupoort and Navalspond communities in the Umsobomvu Municipality, Pixley ka Seme District Municipality, Kenhardt and Eksteenskuil in the Khai Garib Municipality, Z.F Mgcawu District Municipality. The CoS which was established in the previous quarter was inducted on the CoS roles and responsibilities. The Department supported a smallholder farmer and a community garden with seeds in Noupoort.
The Riemvasmaak Council of Stakeholders was provided with vegetable seeds to supply to emerging farmers. The Ditsa IMN and Adams Boerdery in Sending were beneficiaries of these vegetable seeds.
The Department held a meetings with the Eksteenskuil and Riemvasmaak Cos and Khai Garib municipality. The meeting resolved that all resolutions of the CoS must serve on the agenda of the Municipal Council meeting for processing.
The two Council of stakeholders for Riemvasmaak and Eksteenskuil were also supported by conducting induction on roles and responsibilities.
Community garden in Riemvasmaak- Sending

Annual Report for 2016/17 Financial Year
120 |Department of Agriculture, Land Reform & Rural Development Northern Cape Province Vote 12
Council of Stakeholders: Riemvasmaak Council of Stakeholders: Eksteenskuil
4.7.8 Outcome 7
Outcome 7 still remains an important mechanism of coordinating developmental contributions of all 3 spheres of government in the rural space.
It an important objective of the NDP in its quest to the reduction of poverty, unemployment levels and equality for the MTSF period. The MTSF has 6 priorities areas namely;• Improved land administration and spatial planning for integrated development with a bias towards
rural areas;• Sustainable land reform (agrarian transformation);• Improved food security;• Smallholder farmer development and support (technical, financial, infrastructure) for agrarian
transformation; Increased access to quality basic infrastructure and services, particularly in education, healthcare and public transport in rural areas;
• Growth of sustainable rural enterprises and industries characterised by strong rural-urban linkages, increased investment in agro-processing, trade development and access to markets and financial services– resulting in job creation.
The Department as coordinator of Outcome 7 is tasked with the coordination of the planning, implementation and monitoring process of the outcome. The following delivery partner contribute to the outcome: Department of Social Development, Department of Sports Arts and Culture, Department of Health, Department of Education, Department of Transport, Safety and Liaison, Department of Environmental and Nature Conservation, Department of Cooperative Government Human Settlement and Traditional Affairs, Department of Economic Development and Tourism, Department of Roads and Public Works. National Departments such as the Department of Water and Sanitation, Department of Energy, Department of Land Reform and Rural Development, Department of Small Business and all the District Municipalities in the Province.
Following the MinTech and MinMec resolutions, the Department hosted a Service Delivery Workshop on 28-29 March 2017 to report on the midterm status of the outcome 7(Comprehensive Rural Development and food security). This workshop also focused on the coordination mechanism of the outcome.
Picture: Outcome 7 Service Delivery Workshop

Annual Report for 2016/17 Financial Year
| 121Department of Agriculture, Land Reform & Rural Development Northern Cape Province Vote 12
Outcome 7 project visit – Iphemeleng Irrigation farm
4.7.9 State Land Administration
The Alheit Haartebees Kleinboere are currently leasing 12 Ha from the national Department of Public Works. An application for implements and land for storage submitted to Public Works and the Department. Their application for funding has been approved for procurement of implements for the financial year 2017/18. The unit Macro-economics and statistics also assisted by conducting workshops on financial record keeping.
Vastrap portion 97 and Klaarkry portion 96 situated in ZF Mgcawu District. The farm is ± 3300 Ha in extend, divided into 6 camps and two emerging farmers appointed as caretakers. The emerging farmers have divided the camps equally according to the availability of water. The Department assisted Drie Plotte women’s project in Frances Baard by installing a centre pivot. The women have planted lucerne.
During the state land visit at Vioolsdrift the farmers were advised to consolidate two plots namely: plot 62 that is under the caretakeship of one of the farmers and plot 156 which is leased to two farmers in order be able to increase production and generate profit.
Eiland Women’s Project
The farmers have been allocated additional 10 Ha of irrigation land for cash crop production in order to sustain the project.
Massakloutjie
The farm was allocated to three emerging farmers under a mentorship programme in 2005 until 2011. After the mentorship programme farmers were given two years lease contracts which were renewable. The project experienced a lot of challenges like overstocking and illegal occupants. The farm was issued with directives (legal notice of instruction to either reduce stock or rest some camps) because of poor land use management. Two beneficiaries were evicted as result of non-payment of rental, water and for sub-letting some camps without permission from the state. The Department in collaboration with National Department of Public Works applied for a court order to evict an illegal occupant who refused to vacate the farm. The matter is currently with the Office of the State Attorney.
A meeting was convened with National Department of Public Works to address the issue of outstanding lease agreements as well as high rental charged on state land leased out by Public Works. The high rental is creating challenges for merging farmers. The meeting resolved that the province should come up with a standard formula for the calculation of rental on state land and also to engage with other stakeholders like Municipalities and the Department of Rural Development and Land Reform to determine rental that shouldn’t disadvantage emerging farmers.
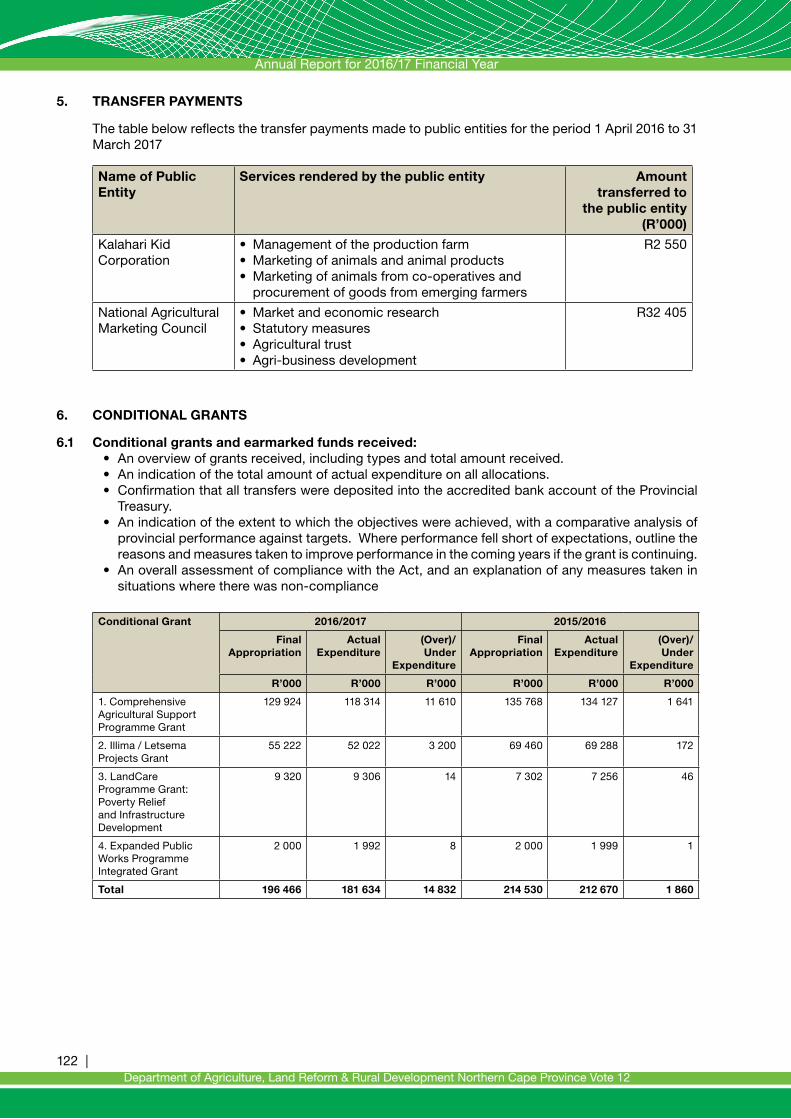
Annual Report for 2016/17 Financial Year
122 |Department of Agriculture, Land Reform & Rural Development Northern Cape Province Vote 12
5. TRANSFER PAYMENTS
The table below reflects the transfer payments made to public entities for the period 1 April 2016 to 31 March 2017
Name of Public Entity
Services rendered by the public entity Amount transferred to
the public entity (R’000)
Kalahari Kid Corporation
• Management of the production farm• Marketing of animals and animal products• Marketing of animals from co-operatives and
procurement of goods from emerging farmers
R2 550
National Agricultural Marketing Council
• Market and economic research• Statutory measures• Agricultural trust• Agri-business development
R32 405
6. CONDITIONAL GRANTS
6.1 Conditional grants and earmarked funds received:• An overview of grants received, including types and total amount received.• An indication of the total amount of actual expenditure on all allocations.• Confirmation that all transfers were deposited into the accredited bank account of the Provincial
Treasury.• An indication of the extent to which the objectives were achieved, with a comparative analysis of
provincial performance against targets. Where performance fell short of expectations, outline the reasons and measures taken to improve performance in the coming years if the grant is continuing.
• An overall assessment of compliance with the Act, and an explanation of any measures taken in situations where there was non-compliance
Conditional Grant 2016/2017 2015/2016
Final Appropriation
Actual Expenditure
(Over)/Under
Expenditure
Final Appropriation
Actual Expenditure
(Over)/Under
Expenditure
R’000 R’000 R’000 R’000 R’000 R’000
1. Comprehensive Agricultural Support Programme Grant
129 924 118 314 11 610 135 768 134 127 1 641
2. Illima / Letsema Projects Grant
55 222 52 022 3 200 69 460 69 288 172
3. LandCare Programme Grant: Poverty Relief and Infrastructure Development
9 320 9 306 14 7 302 7 256 46
4. Expanded Public Works Programme Integrated Grant
2 000 1 992 8 2 000 1 999 1
Total 196 466 181 634 14 832 214 530 212 670 1 860

Annual Report for 2016/17 Financial Year
| 123Department of Agriculture, Land Reform & Rural Development Northern Cape Province Vote 12
The total budget allocation for the 2016/17 financial year amounted to R196.466 million of which R181.634 million or 92 percent was spent. The full amount that was appropriated to the department was received and none of the funds were withheld by any of the transferring departments. All the funds of the conditional grants that were appropriated to the department were transferred into the accredited bank account of the Provincial Treasury and then subsequently transferred into the bank account of the department.
The unspent portions of the CASP and Ilima/Letsema were requested for rollover to the 2017/18 financial since these funds were committed to identifiable projects. The specific performance of each grant is discussed in detail under the relevant programme that administers and implements the grants
The table/s below details the conditional grants and ear marked funds received during for the period 1 April 2016 to 31 March 2017.
Comprehensive Agricultural Support Programme Grant
Department who transferred the grant
National Department of Agriculture, Forestry and Fisheries
Purpose of the grant
To provide effective agricultural support services, promote and facilitate agricultural development by targeting beneficiaries of land restitution and redistribution, and other black producers who have acquired land through private means and are engaged in value-adding enterprises domestically, or involved in exportsTo address damage to infrastructure caused by floods.
Expected outputs of the grant
• Farmers supported per category (subsistence, smallholder and black commercial farmers)
• Youth, women and farmers with disabilities supported through CASP• On - and off - farm infrastructure provided and repaired• Land under agricultural production (crop and livestock)• Yields per unit area• Beneficiaries of CASP trained on farming methods or opportunities along the value chain• Beneficiaries of CASP accessing markets• Jobs created• Extension personnel recruited and maintained in the system• Extension officers upgrading qualifications at various institutions• Agriculture Information Management System (AIMS) implemented in all 9 provinces

Annual Report for 2016/17 Financial Year
124 |Department of Agriculture, Land Reform & Rural Development Northern Cape Province Vote 12
Actual outputs achieved
Farmers supported per category (subsistence, smallholder and black commercial farmers)• Subsistence:534• Smallholder:2203• Commercial:209
Youth, women and farmers with disabilities supported through CASP• Youth: 996• Women:1657• Farmers with disabilities: 3
On - and off - farm infrastructure provided and repaired• Inner Fencing 89 km • Border Fencing 153km
Stock handling facility e.g. Crush Pens structures 29Stock water systems/structures 29Number: Boreholes (drilled & tested)60 (28 drilled)Land under agricultural production (crop and livestock)Crop 308 45Yields per unit area Oats 1 ton/haBeneficiaries of CASP trained on farming methods or opportunities along the value chainCourses in small stock production, veldt management, crop production & financial management, etc.1200• Farmers days 650
Demonstration tours to experimental farms 75Mentorship 93
Beneficiaries of CASP accessing markets• 1884 female• 418 male
Jobs created • Male• Female• Youth
Extension personnel recruited and maintained in the system• Salary payment of 46 Extension Officials • No new officials appointed
Extension officers upgrading qualifications at various institutions• officials obtained advanced diplomas in agricultural extension• 1 official obtained a B Tech in project management.
Agriculture Information Management System (AIMS) implemented in all 9 provinces
Amount per amended DORA
R129.924 million
Amount received (R’000) R129.924 million
Reasons if amount as per DORA was not received
Not applicable
Amount spent by the department (R’000)
R118.314 million
Reasons for the funds unspent by the entity
Reasons for deviations on performance
none
Measures taken to improve performance
Implementation of projects within the financial year
Monitoring mechanism by the receiving department
Monthly reporting and quarterly reporting

Annual Report for 2016/17 Financial Year
| 125Department of Agriculture, Land Reform & Rural Development Northern Cape Province Vote 12
Ilima/Letsema Projects Grant
Department who transferred the grant
National Department of Agriculture, Forestry and Fisheries
Purpose of the grantTo assist vulnerable South African farming communities to achieve an increase in agricultural production and invest in infrastructure that unlocks agricultural production.
Expected outputs of the grant
Land under agricultural production (crop and livestock)Yields per hectares of land plantedJobs createdBeneficiaries/farmers supported by the grant per categoryHectares of rehabilitated and expanded irrigation schemes
Actual outputs achieved
Land under agricultural production (crop and livestock)• 989.63 ha crop• Grazing 73 500 ha
Yields per hectares of land planted• Maize 11 ton/ha • Wheat 10 ton/ha• Dry beans2ton/ha• Raisins 3.5 ton/ha• Wine grapes 30ton/ha
Jobs created• Male :• Female:• Youth:
Beneficiaries/farmers supported by the grant per category• Subsistence 534• Smallholder 2203• Black commercial 209
Hectares of rehabilitated• 3384 m of subsurface drainage was installed to drain 25 ha• 2675m of main communal line was installed • 2 Irrigation dams was built to cover 50 ha
Infrastructure through the grant• 1 Hydroponics structure• 10 ha trellising infrastructure
Centre pivots• Drieplotte 56 ha• Rooibuilt 23 ha• Kalkput 9 ha• Lechwiti 17.5
Infrastructure through the grant
Amount per amended DORA (R’000)
R55.222 million
Amount received (R’000) R55.222 million
Reasons if amount as per DORA was not received
N/A
Amount spent by the department (R’000)
R52.022 million
Reasons for the funds unspent by the entity
Reasons for deviations on performance
None
Measures taken to improve performance
Monitoring mechanism by the receiving department
Monthly reports and quarterly reports

Annual Report for 2016/17 Financial Year
126 |Department of Agriculture, Land Reform & Rural Development Northern Cape Province Vote 12
Land Care Programme Grant: Poverty Relief and Infrastructure Development
Department who transferred the grant
National Department of Agriculture, Forestry and Fisheries
Purpose of the grant
To promote sustainable use and management of natural resources by engaging in community based initiatives that support the pillars of sustainability (social, economic and environmental) leading to greater productivity, food security, job creation and better well-being for all.
Expected outputs of the grant
• Hectares of rangeland protected and rehabilitated• Hectares of land protected and rehabilitated• Number of Junior Care participants involved in the programme• Number of hectares of land where water resources are protected and rehabilitated• Number of capacity building initiatives conducted for Junior Care• Number of capacity building initiatives conducted for Land Carers• Number of awareness campaigns conducted and attended by Land Carers• Number of Land Care committees/Land Care groups established• Hectares of land where weeds and invader plants are under control• Number of kilometres of fence erected• Number of green jobs created expressed as Full Time Equivalents (FTEs)
Actual outputs achieved
• 4700 Hectares of rangeland protected and rehabilitated• 160 Number of Junior Care participants involved in the programme• 0 hectares of land where water resources are protected and rehabilitated• 3 capacity building initiatives conducted for Junior Care• 2 Number of capacity building initiatives conducted for Land Carers• 2 awareness campaigns conducted and attended by Land Carers• 4 Land Care committees/Land Care groups established• 252 green jobs created expressed as Full Time Equivalents (FTEs)
Amount per amended DORA (R’000)
R9.320 million
Amount received (R’000) R9.306 million
Reasons if amount as per DORA was not received
N/A
Amount spent by the department (R’000)
R9.302.000.00
Reasons for the funds unspent by the entity
N/A
Reasons for deviations on performance
N/A
Measures taken to improve performance
N/A
Monitoring mechanism by the receiving department
Monthly and quarterly project visits.Monthly and quarterly reporting. (Finance and actual work reporting)
Expanded Public Works Programme Integrated Grant for Provinces
Department who transferred the grant
Na National Public Works
Purpose of the grant
To incentivise provincial departments to expand work creation efforts through the use of labour intensive delivery methods in the following identified focus areas, in compliance with the Expanded Public Works Programme guidelines: road maintenance and the maintenance of buildings, low traffic volume roads and rural roads, other economic and social infrastructure, tourism and cultural industries, sustainable land based livelihoods and waste management.
Expected outputs of the grant
• Number of people employed and receiving income through the EPWP• Increased average duration of the work opportunities created
Actual outputs achieved 1498 Ha
Amount per amended DORA
R2.000 million
Amount received (R’000)R2.000 million
Reasons if amount as per DORA was not received
N/A

Annual Report for 2016/17 Financial Year
| 127Department of Agriculture, Land Reform & Rural Development Northern Cape Province Vote 12
Amount spent by the department (R’000)
R1.992 million
Reasons for the funds unspent by the entity
The intended output of 1200 Ha for the project was already achieved and the funds remaining was not sufficient to extend the project.
Reasons for deviations on performance
N/A ( The intended output was achieved)
Measures taken to improve performance
N/A
Monitoring mechanism by the receiving department
• Conduct internal monitoring visits• Monthly reporting on the EPWP Reporting System as well final reporting• Submission of quarterly evaluation reports
7. DONOR FUNDS
7.1 Donor Funds Received
None
8. CAPITAL INVESTMENT
8.1 Capital investment, maintenance and asset management plan
The department did not undertake any major maintenance for the year under review. There was however some minor maintenance that was done at some of the research stations. As was previously reported, there exists a significant backlog of infrastructure maintenance on the department’s research stations and the situation has not changed. This is proving a challenge to address since no dedicated funding has been made available. Management has committed itself to find the necessary resources within future budget allocations.
In total, there were 67 infrastructure type activities/projects that were undertaken in the 2016/17. An amount of R60.245 million was spent on new and replacement assets through 51 infrastructure type activities mainly associated with the flood scheme.The other significant infrastructure spend of R57.261 million in 2016/17 related to upgrades and additions on 8 different projects/activities.
The CASP and Ilima/Letsema grant account for 44 percent of the total money spent on infrastructure while the balance was mainly from the funds of the flood scheme for flood diversion walls.
Infrastructure projects
2016/2017 2015/2016
Final Appropriation
Actual Expenditure
(Over)/Under Expenditure
Final Appropriation
Actual Expenditure
(Over)/Under
Expenditure
R’000 R’000 R’000 R’000 R’000 R’000
New and replacement assets
63,160 60,245 2,915 71,942 49,918 22,024
Existing infrastructure assets
61,790 60,015 1,775 45,345 63,197 -17,852
- Upgrades and additions
59,066 57,261 1,805 35,703 56,839 -21,136
- Rehabilitation, renovations and refurbishments
917 947 -30 5,909 2,707 3,202
- Maintenance and repairs
1,807 1,807 - 3,733 3,651 82
Infrastructure transfer
- - - -
- Current - -
- Capital - -
Total 124,950 120,260 4,690 117,287 113,115 4,172

Annual Report for 2016/17 Financial Year
128 |Department of Agriculture, Land Reform & Rural Development Northern Cape Province Vote 12

Annual Report for 2016/17 Financial Year
| 129Department of Agriculture, Land Reform & Rural Development Northern Cape Province Vote 12
1. INTRODUCTION
The Department scored an average score of 3.7 in the final Management Performance and Assessment tool (MPAT) 1.6, in the key performance area of Governance and Accountability. The areas where the department was found to be fully compliant with legal/ regulatory requirements and is doing this smartly (scoring the maximum of 4) are:• Functionality of management structures – the Department Executive (DEC), chaired by the
Accounting Office and its members are all the senior managers, while the Service Delivery Forum (SDF), is also chaired by the Accounting Officer and members include senior management and middle management. Internal Audit and Provincial Treasury are attendees of both mentioned management structures.
• Assessment of Accountability mechanisms, through the Audit Committee• Prevention of fraud and corruption• Assessment of Internal Audit Arrangements• Corporate Governance of ICT• Promotion of Access to information• Compliance with PAJA requirements
Performance areas where the department was found to be fully compliant with legal/ regulatory requirements (scoring of 3), • Service Delivery Improvement Mechanisms • Professional Ethics• Assessment of Risk Management
An improvement plan has been implemented to work toward obtaining a 4 with the next MPAT cycle.
2. RISK MANAGEMENT
The Department’s risk management policy and strategy were reviewed by the Risk Management Committee (RMC) on 01 April 2016. Risks assessments are conducted continuously through risk assessment workshops throughout the year. The workshops are held with each programme individually, while strategic risks are discussed at the DEC. The workshops discuss mitigating actions of existing risks, analysis of whether the actions are appropriately mitigating the risk, identification of new and emerging risks and designing specific actions to mitigate the new and emerging risks.
The Risk Management Committee (RMC) reviews the risk register to monitor the effective implementation of the risk management strategy in the department. The RMC met quarterly during the 2016/2017 financial year.
The Audit Committee has discussed the risk management process and the risk register at its quarterly meetings, where specific recommendations have been made to the Accounting Officer to improve and enhance risk management within the department.
An assessment on the impact of the risk management process specific to improvements in the department’s performance will be performed during the 2017/2018 financial year.
3. FRAUD AND CORRUPTION
The department’s fraud prevention plan was reviewed and approved on 01 April 2016 and the progress made in implementing the fraud prevention plan was discussed at the RMC on 29 November 2016 and 30 March 2017.
The anti-fraud and Whistle blower policy provides guidance on the mechanisms and processes to follow when reporting fraud and corruption. The policy has communicated to all officials.

Annual Report for 2016/17 Financial Year
130 |Department of Agriculture, Land Reform & Rural Development Northern Cape Province Vote 12
4. MINIMISING CONFLICT OF INTEREST
Conflict of interest in Supply Chain Management (SCM) is minimized by, annual signing of a code of conduct by all officials involved in the SCM process, including members of departmental bid committees. This will be extended to all other role players in SCM especially at District level in 2017/18 going forward. Officials are not only required to sign code of conduct but are reminded and trained on what constitutes as conflict of interest and processes to follow should a conflict of interest be identified.
Departmental bid committee members (Evaluation and Adjudication Committees) sign a declaration of interest for each bid evaluated and adjudicated.
SCM officials in Contract Management unit checks with the Persal system for each bid awarded whether the shareholders/owners of companies doing business with the State are not state employees.
During the 2016/17 financial year there were 2 identified cases where the SCM unit discovered that some of the bidders awarded a bid by the Department that were state employees. The cases were investigated and appropriate procedures followed in dealing with those cases. All the bidders who failed to produce proof of permission or consent by their respective MEC’s to do remunerative work outside of their formal employment were not appointed to do work for the Department.
Company ownership and/or shareholders with regard to suppliers doing business with the State in the Department are also verified by using the Central Supplier Database reports.
During April 2017, SCM submitted a report to the Head of Department based on an enquiry from the Public Service Commission on a few employees of the Department with business interests. It was confirmed that none of those employees were found to have done business with the Department for the 2016/17 financial year.
5. CODE OF CONDUCT
During the year under review the department undertook information sessions throughout the province to capacitate new entrants and current employees on the Code of Conduct for the Public Service. This explanatory manual, together with the Disciplinary Code and Procedure are intended to serve as internal communication tools to reduce both misconducts and grievance cases in the department. The Code outlines and emphasize the importance of acceptable conduct from all employees, helps managers and supervisors who are entrusted with the responsibility of enforcing the code to apply same prompt and fairly. It further conveys consequences management for poor decisions. We had a total of 500 employees who attended these sessions which constitutes more than 80% of workforce and all these employees signed attendance registers indicating that they have received and understood the said code.
These information sessions were also aimed at promoting mutual respect between employees themselves, between employees and the employer, to avert and correct unacceptable conduct
For the year under review there has been an increase in Management understanding that discipline is their function due to the participation in the information sessions and supervisors are more empowered to exercise their expected and legal duties as outlined in the relevant prescripts that governs the workplace.
We continued to capacitate employees on new developments on labour matters, legislation amendments, policy change, and implementation of new policies and/or resolutions, all these endeavors were aimed a harmonizing and contributing towards labour peace at the workplace. The information sessions on different kinds of topics were also aimed at strengthening and deepening a common understanding between the employer and employees (STAKEHOLDERS), to provide an insight on acceptable conduct and standards within the workplace.

Annual Report for 2016/17 Financial Year
| 131Department of Agriculture, Land Reform & Rural Development Northern Cape Province Vote 12
We continued vigorously to capacitate officials on the importance of the attendance register, to encourage official’s attendances, to be punctual and to respect their work, to build a culture and develop a great sense of the value of time.Furthermore this was aimed at making employees aware of the attendance expectations by the employer and the unintended consequences effects of excessive absenteeism to other colleagues, productivity and service delivery in the public service.
We will continue with this whole exercise of capacity building because as the department we strongly believe that this is the right step towards the right direction that will ultimately contribute to maximum discipline at the workplace, improved service delivery and increase employees’ morale towards attaining the strategic objectives of the department.
Code of Conduct Procedures:
The Labour Relations receives the formal written complaint from the Managers or Supervisors detailing with the offenses committed by their immediate subordinates for action and mediation
The following are exhausted by the Manager/Supervisor prior to referring the cases to Labour Relations:• The manager must bring the alleged misconduct to the attention of the employee.• Determine the reasons for the misconduct.• Give and employee an opportunity to respond.• Depending on the seriousness of the misconduct the manager must apply corrective counselling
or utilize a system of warnings.
6. HEALTH SAFETY AND ENVIRONMENTAL ISSUES
The Health, Safety and Environment (HSE) Unit’s purpose is to ensure compliance and implementation of the Occupational Health and Safety (OHS) Act 85 of 1993. Numerous activities and processes have led to the Department improving its compliance with the OHS Act. Currently there are Safety Representatives who have been nominated in all Departmental units, and they serve in averting emergencies and acting appropriately where workplace injuries occur. Safety Representatives are nominated and remain in office for a period of 3 years. They receive First Aid training which is also valid for 3 years.
In addition, all units have had safety audits conducted by the Safety Officer and the unit-based Safety Representatives. The audit report includes recommendations for compliance, where these have been identified and praises the unit managers where compliance was adhered to. Matters that have been challenging are related to staff changes, where trainings have been conducted, e.g. the firefighting training done for the farms has to be repeated due to staff changes.
Quarterly OHS committee meetings address all the health, safety and environmental issues highlighted by managers of the units. The matters addressed at the meeting are related to identification of occupational hazards, risks, OHS compliance issues and workplace injuries. Strategies and processes are identified and plans put in place to address any risk and non-compliance issues. Seventy per cent of Emergency evacuation plans have been developed and signed off by the Fire Department. The outstanding plans are still being developed. Annual emergency evacuation drills are done with the Fire Departments’ support at the Department, to ensure the employees evacuate safely from a building should a fire, hostage situation or a bomb scare occur.
In units where safety clothing is required this has been identified and managers requested to follow the procurement process for the purchase of these. Unfortunately, the process often takes long and workers end up doing their jobs without the safety clothing. This poses a risk for the Department should the worker have an injury on duty and it can be related to lack of safety clothing. Audits have revealed issues related to lack of maintenance, e.g. peeling paint, lack of storage space for equipment and paper, broken pipes and toilets which should be included in the unit maintenance plan.

Annual Report for 2016/17 Financial Year
132 |Department of Agriculture, Land Reform & Rural Development Northern Cape Province Vote 12
7. PORTFOLIO COMMITTEES
DATE OF MEETING MATTERS DISCUSSED
5 May 2016 2016/2017 Annual Performance Plan
19 May 2016 Budget Speech (Vote 12) 2017
25 August 2016 4th QPR 2015/2016 Presentation
8 September 2016 1st QPR 2016/2017 Presentation
16 November 2016 Annual Report 2015/2016 Portfolio Committee and SCOPA
22 November 2016 2nd QPR 2016/2017 Presentation
22 March 2017 3rd QPR 2016/2017 Presentation
8. SCOPA RESOLUTIONS
SUBJECT RESPONSE BY THE DEPARTMENT
1. The department should improve its audit outcome in the next financial year by ensuring the performance information report is reliable, relevant.
The Department concurs and agrees that information as provided to the Auditor-General on performance information should be reliable and relevant. Additional controls have been put in place to ensure information as submitted for audit is reliable and relevant.
2. It is appropriate that the Accounting Officer take full responsibility by ensuring that all employees sign their performance agreements as required.
The Accounting Officer accepts responsibility to ensure that systems are put in place to monitor and track that all employees sign their performance agreements.
3. The department must actively manage and reduce liabilities by complying with legislation.
The department is on the modified cash accounting system and it has been managing its annual budget within the legal framework of virement, shifting and rollovers to ensure the maximisation of the annual available budget. Over the past 3-4 years the department has faced enormous pressure on budget cuts and therefor will ensure a progressive systematic reduction in liabilities that does not negatively impact on service delivery but simultaneously does not result in unauthorised expenditure.
4. Irregular expenditure must be avoided at all costs by monitoring and reviewing internal control measures on a monthly basis.
Control measures have been implemented, the monitoring and control thereof is done by the internal control unit. There has been a significant reduction in irregular expenditure for the 2016/2017 financial year, mainly attributed to finalisation of the departmental procurement policy and training. The department commits to ensuring that during the 2017/2018 financial year no transactions will be entered into that could result in irregular expenditure.
9. PRIOR MODIFICATIONS TO AUDIT REPORTS
The department obtained an unqualified audit opinion in the previous financial year. This displaying the progress made with the 2014/2015 modified report.
The following matters were reported on as matters of compliance:• Material misstatements identified by the auditors and corrected by the department• Findings on procurement and contract management• Effective steps not taken to prevent irregular expenditure• Effecitve steps not taken to prevent fruitless and wasteful expenditure• Ineffective consequence management

Annual Report for 2016/17 Financial Year
| 133Department of Agriculture, Land Reform & Rural Development Northern Cape Province Vote 12
Matters of non-compliance
Financial year in which it first arose
Progress made in clearing / resolving the matter
Material misstatements identified by the auditors and corrected by the department
Improved review process on the Annual Financial Statements before 31 May 2017
Findings on procurement and contract management
Findings specifically relate to irregular expenditure.
Reduction in irregular expenditure through training and improved systems of internal control specific to SCM policies and procedures.
Effective steps not taken to prevent irregular expenditure
Reduction in irregular expenditure through training and improved systems of internal control specific to SCM policies and procedures.
Effecitve steps not taken to prevent fruitless and wasteful expenditure
Reduction in fruitless and wasteful expenditure will occur once effective consequence management processes are implemented. Officials that have caused fruitless and wasteful expenditure have received instruction letters and where evidence exists that the fruitless expenditure was incurred owing to negligence, such cases will be recovered from the officials.
Lack consequence management
Consequence management has been implemented, evidenced through the condonement processes of irregular expenditure. Recurring instances subsequent to instruction letters will follow a disciplinary process.
10. INTERNAL CONTROL UNIT
As discussed in the Accounting Officer’s report on irregular expenditure, the internal control unit played a significant role in 100% batch testing specific to the identification of irregular expenditure, fruitless and wasteful expenditure. The internal control unit comprising of a unit of 3 individuals, post identification of cases since 2014/2015 now had to focus on investigations of irregular, fruitless and wasteful expenditure, the subsequent condonement thereof and ensuring controls that are put in place, are adequate to prevent recurrence. The internal control unit plays a pivotal role in ensuring that consequence management is implemented on cases where repeat offenders have been identified.
The internal control unit also reviews all deviation requests and advises the CFO and HOD accordingly. The unit also provides training to officials where deviations on SCM processes are submitted. The unit also performs as a strong coordinating role with respect to both internal and external audit. The unit monitors findings, updates the audit action plan and facilitates audit matters between the auditors and the department.
11. INTERNAL AUDIT AND AUDIT COMMITTEES
Internal Audit
The department’s internal audit function is performed by the Shared Provincial Internal Audit Unit which fulfils an independent assurance function. The internal audit unit follows a risk-based audit approach in providing management and the audit committee with assurance on the adequacy and effectiveness of governance, risk management and internal control processes. The internal audit unit is guided by an Internal Audit Charter approved by the Audit Committee and performs its functions as provided in the Public Finance Management Act (PFMA) and the internal audit charter.
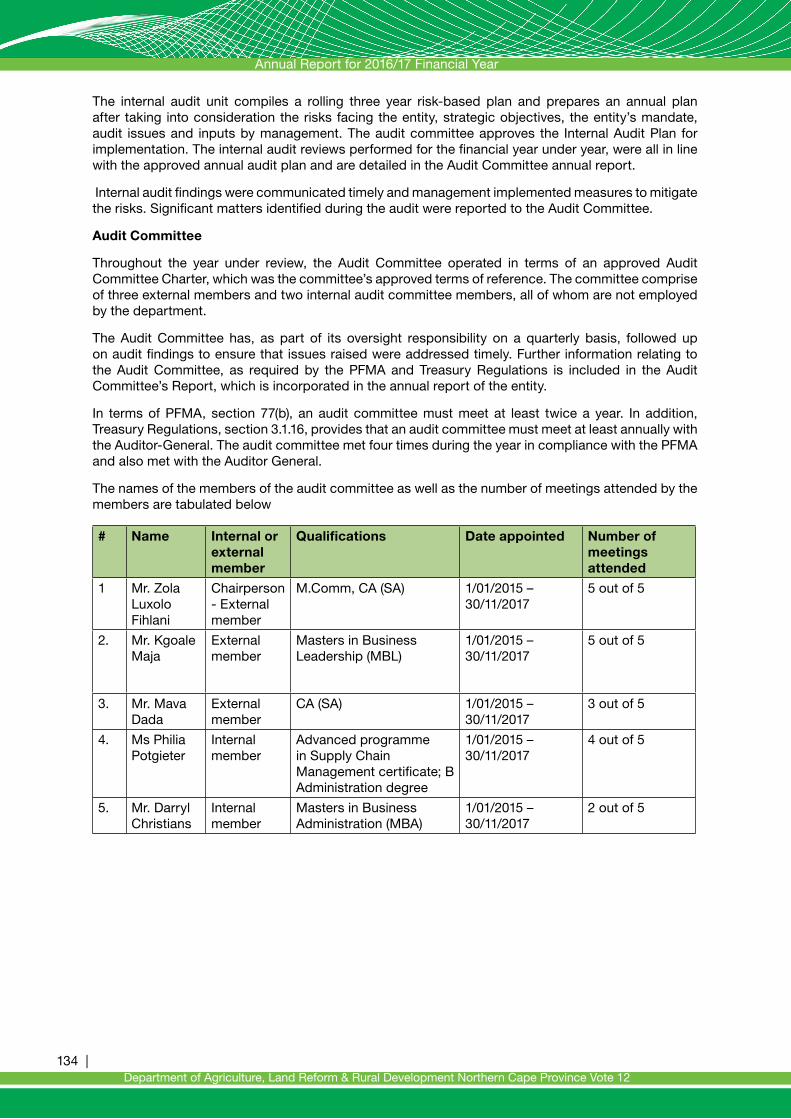
Annual Report for 2016/17 Financial Year
134 |Department of Agriculture, Land Reform & Rural Development Northern Cape Province Vote 12
The internal audit unit compiles a rolling three year risk-based plan and prepares an annual plan after taking into consideration the risks facing the entity, strategic objectives, the entity’s mandate, audit issues and inputs by management. The audit committee approves the Internal Audit Plan for implementation. The internal audit reviews performed for the financial year under year, were all in line with the approved annual audit plan and are detailed in the Audit Committee annual report.
Internal audit findings were communicated timely and management implemented measures to mitigate the risks. Significant matters identified during the audit were reported to the Audit Committee.
Audit Committee
Throughout the year under review, the Audit Committee operated in terms of an approved Audit Committee Charter, which was the committee’s approved terms of reference. The committee comprise of three external members and two internal audit committee members, all of whom are not employed by the department.
The Audit Committee has, as part of its oversight responsibility on a quarterly basis, followed up on audit findings to ensure that issues raised were addressed timely. Further information relating to the Audit Committee, as required by the PFMA and Treasury Regulations is included in the Audit Committee’s Report, which is incorporated in the annual report of the entity.
In terms of PFMA, section 77(b), an audit committee must meet at least twice a year. In addition, Treasury Regulations, section 3.1.16, provides that an audit committee must meet at least annually with the Auditor-General. The audit committee met four times during the year in compliance with the PFMA and also met with the Auditor General.
The names of the members of the audit committee as well as the number of meetings attended by the members are tabulated below
# Name Internal or external member
Qualifications Date appointed Number of meetings attended
1 Mr. Zola Luxolo Fihlani
Chairperson - External member
M.Comm, CA (SA) 1/01/2015 – 30/11/2017
5 out of 5
2. Mr. Kgoale Maja
External member
Masters in Business Leadership (MBL)
1/01/2015 – 30/11/2017
5 out of 5
3. Mr. Mava Dada
External member
CA (SA) 1/01/2015 – 30/11/2017
3 out of 5
4. Ms Philia Potgieter
Internal member
Advanced programme in Supply Chain Management certificate; B Administration degree
1/01/2015 – 30/11/2017
4 out of 5
5. Mr. Darryl Christians
Internal member
Masters in Business Administration (MBA)
1/01/2015 – 30/11/2017
2 out of 5

Annual Report for 2016/17 Financial Year
| 135Department of Agriculture, Land Reform & Rural Development Northern Cape Province Vote 12

Annual Report for 2016/17 Financial Year
136 |Department of Agriculture, Land Reform & Rural Development Northern Cape Province Vote 12
12. REPORT OF THE AUDIT COMMITTEE FOR 2016/17
We are pleased to present our report for the financial year ended 31 March 2017. The Audit Committee has been functional throughout the financial year. The Audit Committee acknowledges the attendance and participation of the Accounting Officer and Senior Management in the Audit Committee meetings.
Audit Committee Responsibility
The Audit Committee reports that it has complied with its responsibilities arising from section 38 (1) (a) (ii) of the Public Finance Management Act and Treasury Regulation 3.1.13. The Audit Committee also reports that it has adopted appropriate formal terms of reference as its Audit Committee Charter, has regulated its affairs in compliance with this charter and has discharged all its responsibilities as contained therein and has discharged all its responsibilities.
The Effectiveness of Internal Control and Internal Audit
The Department has and maintains the Internal Control unit responsible for management of internal controls within the Department.
The Audit Committee is satisfied as to effectiveness of internal audit function during the year and that the internal audit activity has to a large extent addressed the risks pertinent to the Department. Our review of the findings of the Internal Audit work, which was based on the risk assessments conducted in the Department revealed certain weaknesses, which were then raised with the Department.
The following internal audit work was completed during the year under review, based on the internal audit plan 2016/2017:
198
Regulation 3.1.13. The Audit Committee also reports that it has adopted appropriate formal terms of reference as its Audit Committee Charter, has regulated its affairs in compliance with this charter and has discharged all its responsibilities as contained therein and has discharged all its responsibilities. The Effectiveness of Internal Control and Internal Audit The Department has and maintains the Internal Control unit responsible for management of internal controls within the Department.
The Audit Committee is satisfied as to effectiveness of internal audit function during the year and that the internal audit activity has to a large extent addressed the risks pertinent to the Department. Our review of the findings of the Internal Audit work, which was based on the risk assessments conducted in the Department revealed certain weaknesses, which were then raised with the Department.
The following internal audit work was completed during the year under review, based on the internal audit plan 2016/2017:
Leave management remains a challenge with the highest number of issues not implemented. Management has however developed a pragmatic action plan to address the issues within a reasonable time period. The Audit Committee monitored the implementation of the plan during the quarterly audit committee meetings and is satisfied with the implementation of its recommendations.
The Internal Audit activity also maintains combined assurance framework and plan which were developed in collaboration with the departmental risk
00.5
11.5
22.5
33.5
Significant
Housekeeping
Critical
Housekeeping CriticalSignificant
Leave management remains a challenge with the highest number of issues not implemented. Management has however developed a pragmatic action plan to address the issues within a reasonable time period. The Audit Committee monitored the implementation of the plan during the quarterly audit committee meetings and is satisfied with the implementation of its recommendations.
The Internal Audit activity also maintains combined assurance framework and plan which were developed in collaboration with the departmental risk management unit and Auditor General. The plan has been useful in ensuring that assurance is placed at all high risks by various assurance providers.
In-Year Management and Monthly/Quarterly Report
The Audit Committee satisfied itself of the expertise, resources and experience of the departments finance function.
Annual Report for 2016/17 Financial Year
| 137Department of Agriculture, Land Reform & Rural Development Northern Cape Province Vote 12
The Department has been reporting monthly and quarterly to Provincial Treasury as is required by the PFMA. We had engagements with the Department’s management to provide clarity on completeness and quality of the monthly and quarterly reports during our quarterly meetings and officials of the Department were able to clarify areas of concern raised by the Audit Committee.
Evaluation of Financial Statements
• The Audit Committee reviewed the financial statements for the year ended 31 March 2017 at a meeting which took place 24 May 2017. In addition the Audit Committee reviewed the draft Annual Report of the Department.
• The Audit Committee reviewed the accounting policies which were applied in the compilation of the annual financial statements and confirm if the policies are consistent with those of prior year, have been consistently applied and are in accordance with the National Treasury guidelines.
• The Audit Committee reviewed the Department’s compliance with legal and regulatory provisions during the quarterly audit committee meetings and management was directed to implement remedial measures where instances of non-compliance are noted.
• The Audit Committee also reviewed quarterly financial and 6 monthly Interim Financial Statements as presented to it by IA and management. It interrogated monthly IYM on expenditure as well as status of payment of accruals and commitments. Status of clearing irregular expenditure by the department was monitored throughout the year.
Meeting with Member of the Executive Council
The Audit Committee met with the MEC for Agriculture, land reform and rural development on 24 May 2016 to discuss matters of outmost importance to the committee and department. The Committee appreciate commitment and support from the office of the MEC to ensure that the Committee as well the department fulfil its obligations.
Auditor-General South Africa
We have reviewed the Department’s implementation plan for audit issues raised in the prior year and we are satisfied that the matters have been adequately resolved.
The audit committee met with representatives from the Office of the Auditor-General South Africa during the year and discussed issues of mutual concern and ensured that there are no other unresolved issues.
The Audit Committee reviewed the audit and management reports for the audit of 2016/17 annual financial statements in a meeting held 26 July 2017. The Committee concurs and accepts the conclusions of the Auditor-General on the annual financial statements and is of the opinion that the audited annual financial statements be accepted and read together with the report of the Auditor-General.
____________________________
Z. Fihlani
Chairperson of the Audit Committee
Northern Cape Department of Agriculture, Land Reform and Rural Development
Date: 26 July 2017

Annual Report for 2016/17 Financial Year
138 |Department of Agriculture, Land Reform & Rural Development Northern Cape Province Vote 12
Annual Report for 2016/17 Financial Year
| 139Department of Agriculture, Land Reform & Rural Development Northern Cape Province Vote 12
1. INTRODUCTION
The department currently employs a total of 606 employees, of which 570 are permanent employees and 36 are on a contractual basis. Staff vacancy rate was 8.1. We confirm that all filled vacancies can be accounted for due to our monthly payroll certifications confirmed by the different program managers, therefor the PERSAL system reflects all warm bodies in the department. In the previous financial year, 2015/16, Human Resources coordinated the provincial biometrics headcount. The department then embarked on a departmental headcount in an attempt to ensure accountability for value of capital resources.
To ensure that employees perform optimally and that they remain motivated they are continuously encouraged to further their studies. For the year under review a total of 21 employees were awarded bursaries in different study fields. The bursary scheme also assist the unemployed youth to further their studies in various fields. A total number of 44 were funded and 6 graduates from the previous group. The later initiative is to continue expanding our pool of technical fields narrow the gap of skill scarcity in the department.
The EPMDS Compliance has improved and the department complied with signing and capturing of PA’s for all the 9 SMS members on PERSAL in accordance with MPAT requirements. We have seen an increase of officials’ participation in the Health and Wellness programme in terms of celebration of wellness awareness days for the financial year in review. We held four (4) wellness days in collaboration with GEMS and the Department of Health wherein officials tested for blood pressures, diabetes, cholesterol, IBM measurements and HIV/AIDS.
The use of sick leave in the department has decreased as oppose to the previous financial year. This may be attributed to the intensive assessments and rejection of temporary incapacity cases by the Health Risk Manager, Pro-Active Health Solutions. Management of leave remains a challenge, however, control measures were put in place to attempt to achieve our goal. Human Resource Management embarked on decentralizing leave to the Districts targeting Upington, De Aar, Jan Kempdorp, Springbok and Kuruman. We with the engagement of Provincial Treasury (Biometrics) and our Departmental PERSAL Controller, are halfway through with the implementation to allocate PERSAL to identified users.
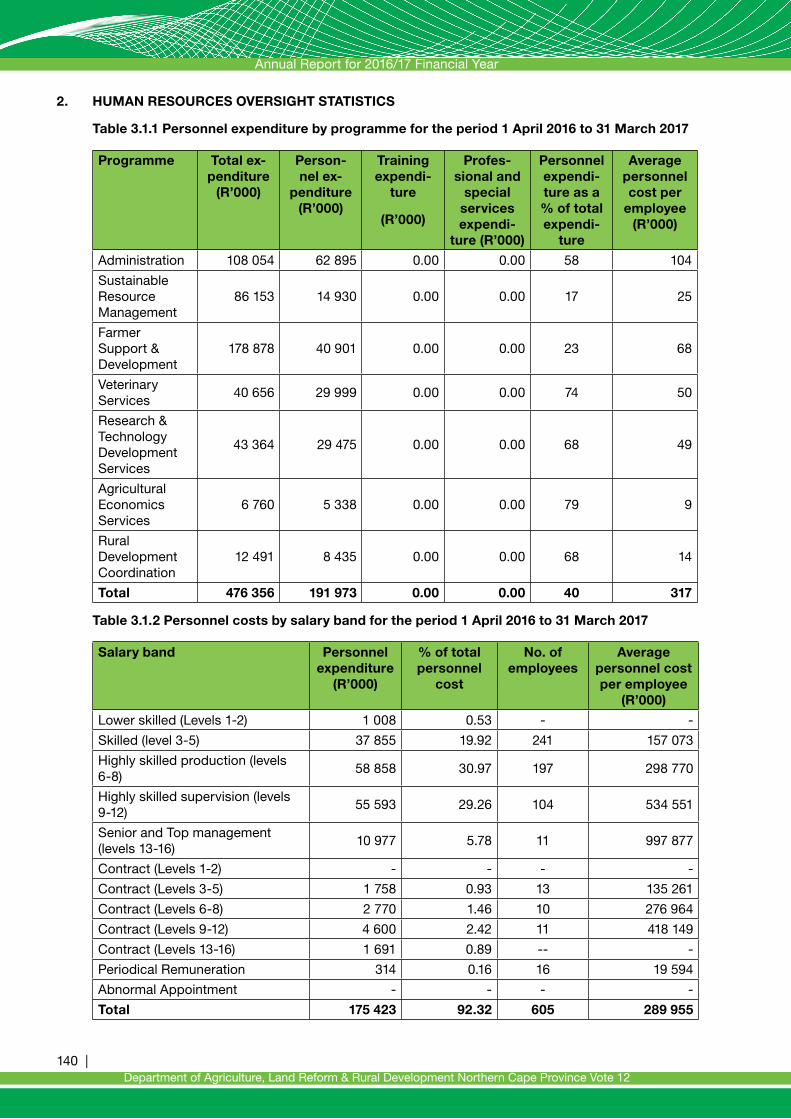
Annual Report for 2016/17 Financial Year
140 |Department of Agriculture, Land Reform & Rural Development Northern Cape Province Vote 12
2. HUMAN RESOURCES OVERSIGHT STATISTICS
Table 3.1.1 Personnel expenditure by programme for the period 1 April 2016 to 31 March 2017
Programme Total ex-penditure
(R’000)
Person-nel ex-
penditure (R’000)
Training expendi-
ture
(R’000)
Profes-sional and
special services expendi-
ture (R’000)
Personnel expendi-ture as a % of total expendi-
ture
Average personnel cost per
employee (R’000)
Administration 108 054 62 895 0.00 0.00 58 104
Sustainable Resource Management
86 153 14 930 0.00 0.00 17 25
Farmer Support & Development
178 878 40 901 0.00 0.00 23 68
Veterinary Services
40 656 29 999 0.00 0.00 74 50
Research & Technology Development Services
43 364 29 475 0.00 0.00 68 49
Agricultural Economics Services
6 760 5 338 0.00 0.00 79 9
Rural Development Coordination
12 491 8 435 0.00 0.00 68 14
Total 476 356 191 973 0.00 0.00 40 317
Table 3.1.2 Personnel costs by salary band for the period 1 April 2016 to 31 March 2017
Salary band Personnel expenditure
(R’000)
% of total personnel
cost
No. of employees
Average personnel cost per employee
(R’000)
Lower skilled (Levels 1-2) 1 008 0.53 - -
Skilled (level 3-5) 37 855 19.92 241 157 073
Highly skilled production (levels 6-8)
58 858 30.97 197 298 770
Highly skilled supervision (levels 9-12)
55 593 29.26 104 534 551
Senior and Top management (levels 13-16)
10 977 5.78 11 997 877
Contract (Levels 1-2) - - - -
Contract (Levels 3-5) 1 758 0.93 13 135 261
Contract (Levels 6-8) 2 770 1.46 10 276 964
Contract (Levels 9-12) 4 600 2.42 11 418 149
Contract (Levels 13-16) 1 691 0.89 -- -
Periodical Remuneration 314 0.16 16 19 594
Abnormal Appointment - - - -
Total 175 423 92.32 605 289 955

Annual Report for 2016/17 Financial Year
| 141Department of Agriculture, Land Reform & Rural Development Northern Cape Province Vote 12
Table 3.1.3 Salaries, Overtime, Home Owners Allowance and Medical Aid by programme for the period 1 April 2016 to 31 March 2017
Programme Salaries Overtime Home Owners Allowance
Medical Aid
Amount (R’000
Salaries as a % of per-sonnel costs
Amount (R’000)
Over-time
as a % of per-sonnel costs
Amount (R’000)
HOA as a % of per-son-nel
costs
Amount (R’000)
Medical aid as a % of per-
sonnel costs
Administration 42 900 71.9 - - 1 582 2.7 2 853 4.8
Sustainable Resource Management
10 82061.8 - - 259 1.5 562 3.2
Farmer Support & Development
26 879 65.7 - - 1 182 2.9 2 041 5
Veterinary Services
20 263 67.5 - - 738 2.5 1 207 4
Research & Technology Development Services
18 630 64.9 660 2.3 1 205 4.2 2 188 7.6
Agricultural Economics Services
3 748 73.8 - - 104 2.1 192 3.8
Rural Development Coordination
5 773 70.9 - - 268 3.3 399 4.9
Total 129 013 67.9 660 .3 5 338 2.8 9 443 5
Table 3.1.4 Salaries, Overtime, Home Owners Allowance and Medical Aid by salary band for the period 1 April 2016 to 31 March 2017
Salary band Salaries Overtime Home Owners Allowance
Medical Aid
Amount (R’000
Salaries as a % of per-sonnel costs
Amount (R’000)
Over-time as a % of per-
sonnel costs
Amount (R’000)
HOA as a % of per-
sonnel costs
Amount (R’000)
Medical aid as a % of per-
sonnel costs
Skilled (Levels 3-5)
24 454 64.2 432 1.1 2 658 7 4 256 11.2
Highly skilled production (Levels 6-8)
41 604 66.7 189 .3 1 894 3 3 420 5.5
Highly skilled supervision (Levels 9-12)
42 456 66.6 - - 613 1 1 471 2.3
Senior management (Levels 13-16)
9 093 71.5 - - 87 .7 155 1.2

Annual Report for 2016/17 Financial Year
142 |Department of Agriculture, Land Reform & Rural Development Northern Cape Province Vote 12
Salary band Salaries Overtime Home Owners Allowance
Medical Aid
Amount (R’000
Salaries as a % of per-sonnel costs
Amount (R’000)
Over-time as a % of per-
sonnel costs
Amount (R’000)
HOA as a % of per-
sonnel costs
Amount (R’000)
Medical aid as a % of per-
sonnel costs
Contract (Levels 3-5)
1 755 97.4 3 .2 - - - -
Contract (Levels 6-8)
2 742 98 27 1 - - - -
Contract (Levels 9-12)
4 599 87.5 - - - - - -
Contract (Levels 13-16)
1 691 88 - - - - - -
Lower skilled (Levels 1-2)
619 61.4 9 .9 86 8.5 140 13.9
Total 129 013 67.9 660 .3 5 338 2.8 9 443 5
Employment and Vacancies
Table 3.2.1 Employment and vacancies by programme as on 31 March 2017
Programme Number of posts on approved
establishment
Number of posts filled
Vacancy Rate
Number of employees
additional to the establishment
Administration 194 175 9.79 0
Sustainable Resource Management
45 38 15.56 0
Farmer Support & Development
137 127 7.3 0
Veterinary Services 94 86 8.51 0
Research & Technology Development Services
129 117 9.3 0
Agricultural Economics Services
13 13 0 0
Rural Development Coordination
32 31 3.13 0
Total 644 587 8.85 0
Table 3.2.2 Employment and vacancies by salary band as on 31 March 2017
Salary band Number of posts on approved
establishment
Number of posts filled
Vacancy Rate
Number of employees
additional to the establishment
Skilled(3-5) 265 241 9.06 0.00
Highly skilled production (6-8) 209 197 5.74 0.00
Highly skilled supervision (9-12) 120 102 15.00 0.00
Senior management (13-16) 14.00 11.00 21.43 0.00

Annual Report for 2016/17 Financial Year
| 143Department of Agriculture, Land Reform & Rural Development Northern Cape Province Vote 12
Salary band Number of posts on approved
establishment
Number of posts filled
Vacancy Rate
Number of employees
additional to the establishment
Contract (Levels 3-5), Permanent 13.00 13.00 0.00 0.00
Contract (Levels 6-8), Permanent 10.00 10.00 0.00 0.00
Contract (Levels 9-12), Permanent 11.00 11.00 0.00 0.00
Contract (Levels 13-16), Permanent 2.00 2.00 0.00 0.00
Total 644 589 8.85 0.00
Table 3.2.3 Employment and vacancies by critical occupations as on 31 March 2017
Critical occupation Number of posts on approved
establishment
Number of posts filled
Vacancy Rate
Number of employees additional
to the establishment
Administrative related, Permanent 73 61 16.44 0
Agricultural animal oceanography forestry & other science, Permanent
46 46 0 0
Agriculture related, Permanent 107 102 4.67 0
Auxiliary and related workers, Permanent
5 5 0 0
Biochemistry pharmacology. zoology & life science .technical, Permanent
6 4 33.33 0
Civil engineering technicians, Permanent
17 15 11.76 0
Cleaners in offices workshops hospitals etc., Permanent
42 37 11.9 0
Client inform clerks(switchboard receptionist inform clerks), Permanent
2 2 0 0
Communication and information related, Permanent
6 6 0 0
Economists, Permanent 9 9 0 0
Engineering Sciences Related Permanent
1 1 0 0
Engineers and related professionals, Permanent
5 4 20 0
Farm hands and labourers, Permanent
100 92 8 0
Farming forestry advisors and farm managers, Permanent
4 3 25 0
Finance and economics related, Permanent
1 1 0 0
Financial and related professionals, Permanent
7 7 0 0
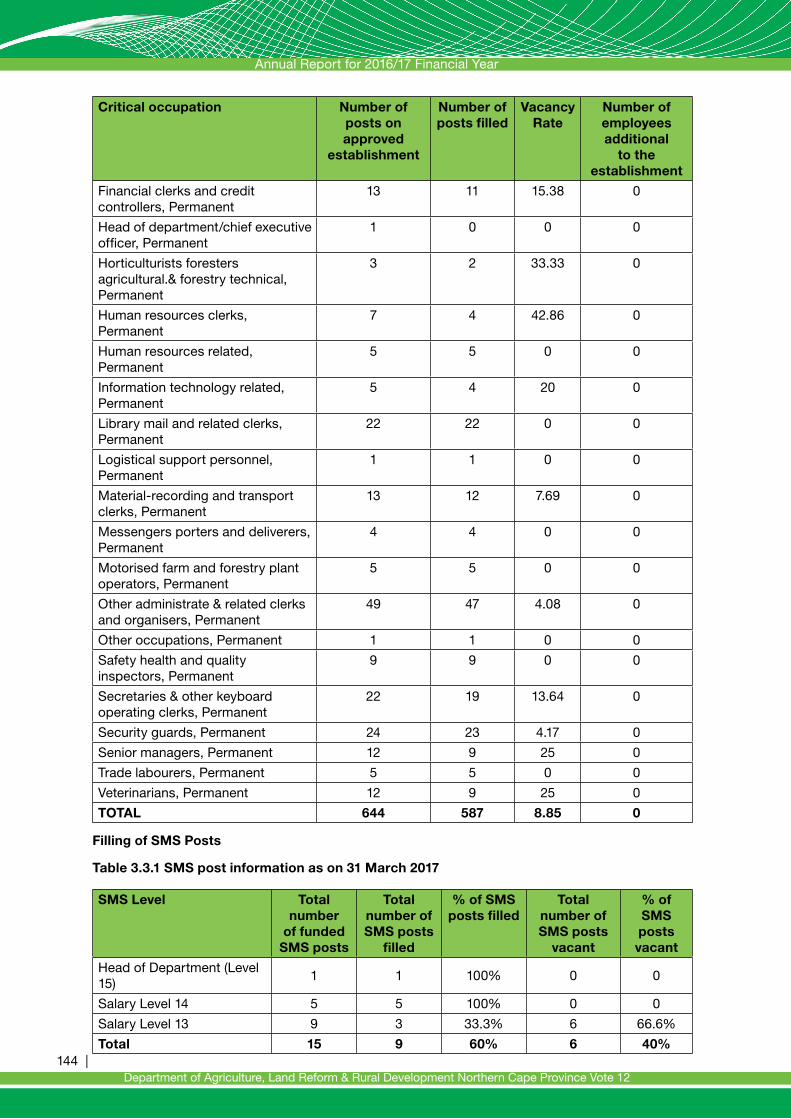
Annual Report for 2016/17 Financial Year
144 |Department of Agriculture, Land Reform & Rural Development Northern Cape Province Vote 12
Critical occupation Number of posts on approved
establishment
Number of posts filled
Vacancy Rate
Number of employees additional
to the establishment
Financial clerks and credit controllers, Permanent
13 11 15.38 0
Head of department/chief executive officer, Permanent
1 0 0 0
Horticulturists foresters agricultural.& forestry technical, Permanent
3 2 33.33 0
Human resources clerks, Permanent
7 4 42.86 0
Human resources related, Permanent
5 5 0 0
Information technology related, Permanent
5 4 20 0
Library mail and related clerks, Permanent
22 22 0 0
Logistical support personnel, Permanent
1 1 0 0
Material-recording and transport clerks, Permanent
13 12 7.69 0
Messengers porters and deliverers, Permanent
4 4 0 0
Motorised farm and forestry plant operators, Permanent
5 5 0 0
Other administrate & related clerks and organisers, Permanent
49 47 4.08 0
Other occupations, Permanent 1 1 0 0
Safety health and quality inspectors, Permanent
9 9 0 0
Secretaries & other keyboard operating clerks, Permanent
22 19 13.64 0
Security guards, Permanent 24 23 4.17 0
Senior managers, Permanent 12 9 25 0
Trade labourers, Permanent 5 5 0 0
Veterinarians, Permanent 12 9 25 0
TOTAL 644 587 8.85 0
Filling of SMS Posts
Table 3.3.1 SMS post information as on 31 March 2017
SMS Level Total number
of funded SMS posts
Total number of SMS posts
filled
% of SMS posts filled
Total number of SMS posts
vacant
% of SMS posts vacant
Head of Department (Level 15)
1 1 100% 0 0
Salary Level 14 5 5 100% 0 0
Salary Level 13 9 3 33.3% 6 66.6%
Total 15 9 60% 6 40%
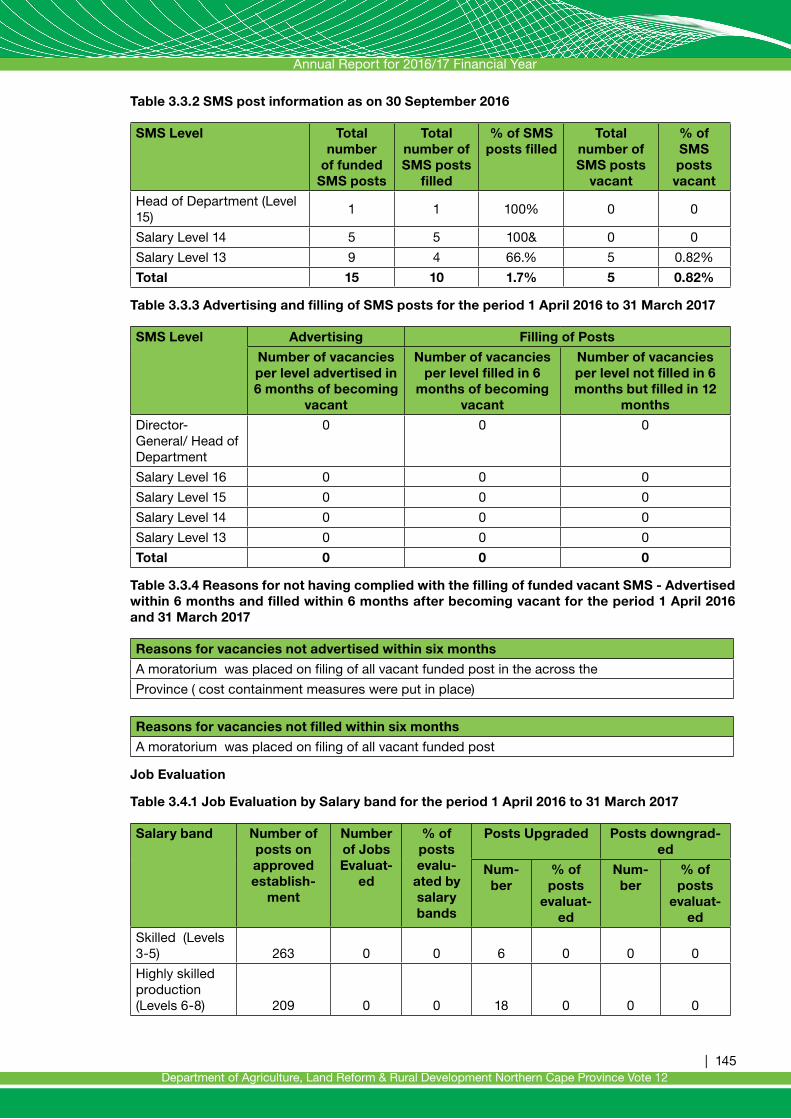
Annual Report for 2016/17 Financial Year
| 145Department of Agriculture, Land Reform & Rural Development Northern Cape Province Vote 12
Table 3.3.2 SMS post information as on 30 September 2016
SMS Level Total number
of funded SMS posts
Total number of SMS posts
filled
% of SMS posts filled
Total number of SMS posts
vacant
% of SMS posts vacant
Head of Department (Level 15)
1 1 100% 0 0
Salary Level 14 5 5 100& 0 0
Salary Level 13 9 4 66.% 5 0.82%
Total 15 10 1.7% 5 0.82%
Table 3.3.3 Advertising and filling of SMS posts for the period 1 April 2016 to 31 March 2017
SMS Level Advertising Filling of Posts
Number of vacancies per level advertised in 6 months of becoming
vacant
Number of vacancies per level filled in 6
months of becoming vacant
Number of vacancies per level not filled in 6 months but filled in 12
months
Director-General/ Head of Department
0 0 0
Salary Level 16 0 0 0
Salary Level 15 0 0 0
Salary Level 14 0 0 0
Salary Level 13 0 0 0
Total 0 0 0
Table 3.3.4 Reasons for not having complied with the filling of funded vacant SMS - Advertised within 6 months and filled within 6 months after becoming vacant for the period 1 April 2016 and 31 March 2017
Reasons for vacancies not advertised within six months
A moratorium was placed on filing of all vacant funded post in the across the
Province ( cost containment measures were put in place)
Reasons for vacancies not filled within six months
A moratorium was placed on filing of all vacant funded post
Job Evaluation
Table 3.4.1 Job Evaluation by Salary band for the period 1 April 2016 to 31 March 2017
Salary band Number of posts on approved establish-
ment
Number of Jobs Evaluat-
ed
% of posts evalu-
ated by salary bands
Posts Upgraded Posts downgrad-ed
Num-ber
% of posts
evaluat-ed
Num-ber
% of posts
evaluat-ed
Skilled (Levels 3-5) 263 0 0 6 0 0 0
Highly skilled production (Levels 6-8) 209 0 0 18 0 0 0
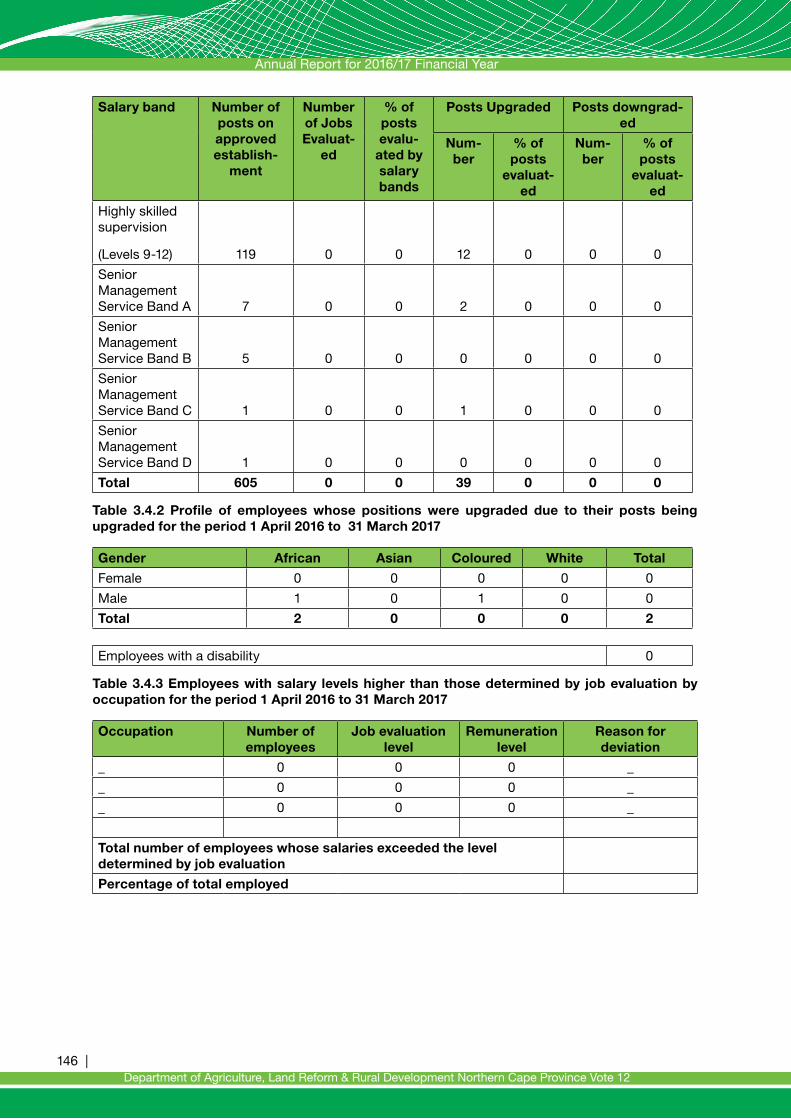
Annual Report for 2016/17 Financial Year
146 |Department of Agriculture, Land Reform & Rural Development Northern Cape Province Vote 12
Salary band Number of posts on approved establish-
ment
Number of Jobs Evaluat-
ed
% of posts evalu-
ated by salary bands
Posts Upgraded Posts downgrad-ed
Num-ber
% of posts
evaluat-ed
Num-ber
% of posts
evaluat-ed
Highly skilled supervision
(Levels 9-12) 119 0 0 12 0 0 0
Senior Management Service Band A 7 0 0 2 0 0 0
Senior Management Service Band B 5 0 0 0 0 0 0
Senior Management Service Band C 1 0 0 1 0 0 0
Senior Management Service Band D 1 0 0 0 0 0 0
Total 605 0 0 39 0 0 0
Table 3.4.2 Profile of employees whose positions were upgraded due to their posts being upgraded for the period 1 April 2016 to 31 March 2017
Gender African Asian Coloured White Total
Female 0 0 0 0 0
Male 1 0 1 0 0
Total 2 0 0 0 2
Employees with a disability 0
Table 3.4.3 Employees with salary levels higher than those determined by job evaluation by occupation for the period 1 April 2016 to 31 March 2017
Occupation Number of employees
Job evaluation level
Remuneration level
Reason for deviation
_ 0 0 0 _
_ 0 0 0 _
_ 0 0 0 _
Total number of employees whose salaries exceeded the level determined by job evaluation
Percentage of total employed

Annual Report for 2016/17 Financial Year
| 147Department of Agriculture, Land Reform & Rural Development Northern Cape Province Vote 12
Table 3.4.4 Profile of employees who have salary levels higher than those determined by job evaluation for the period 1 April 2016 to 31 March 2017
Gender African Asian Coloured White Total
Female 0 0 0 0 0
Male 0 0 0 0 0
Total 0 0 0 0 0
Employees with a disability 0 0 0 0 0
Total number of Employees whose salaries exceeded the grades determine by job evaluation
0
Employment Changes
Table 3.5.1 Annual turnover rates by salary band for the period 1 April 2015 to 31 March 2016
Salary band Number of employees at beginning of period-1 April
2016
Appointments and transfers
into the department
Terminations and transfers
out of the department
Turnover rate
Lower skilled (Levels 1-2) 78 0 0 0.00
Skilled (Levels3-5) 189 0 10 5.29
Highly skilled production (Levels 6-8)
193 0 5 2.59
Highly skilled supervision (Levels 9-12)
100 0 5 5.00
Senior Management Service Bands A
5 0 0 0.00
Senior Management Service Bands B
5 0 0 0.00
Senior Management Service Bands C
1 0 0 0.00
Senior Management Service Bands D
1 0 0 0.00
Contract (Levels 1-2) 4 0 0 0.00
Contract (Levels 3-5) 9 1 0 77.78
Contract (Levels 6-8) 10 2 3 30.00
Contract (Levels 9-12) 9 2 4 44.44
Contract Band A Permanent 2 0 1 50.00
Total 606 5 35 5.78

Annual Report for 2016/17 Financial Year
148 |Department of Agriculture, Land Reform & Rural Development Northern Cape Province Vote 12
Table 3.5.2 Annual turnover rates by critical occupation for the period 1 April 2016 to 31 March 2017
Critical occupation Number of employees at beginning of period-April
2016
Appoint-ments and transfers
into the de-partment
Termina-tions and transfers out of the
department
Turnover rate
Administrative related, Permanent 63 2 1 1.59
Agricultural animal oceanography forestry & other science, Permanent 46 1 1 2.17
Agriculture related, Permanent 105 0 4 3.81
Auxiliary and related workers, Permanent 4 0 0 0.00
Biochemistry pharmacology. zoology & life science and technical, Permanent 4 0 0 0.00
Civil engineering technicians, Permanent 16 0 1 6.25
Cleaners in offices workshops hospitals etc., Permanent 40 0 3 7.50
Client inform clerks(switchboard receptionist inform clerks), Permanent 2 0 0 0.00
Communication and information related, Permanent 6 0 0 0.00
Economists, Permanent 9 0 0 0.00
Engineers and related professionals, Permanent 4 0 0 0.00
Farm hands and labourers, Permanent 98 0 5 5.10
Farming forestry advisors and farm managers, Permanent 4 0 0 0.00
Finance and economics related, Permanent 1 0 0 0.00
Financial and related professionals, Permanent 5 1 0 0.00
Financial clerks and credit controllers, Permanent 11 0 0 0.00
Head of Department/Chief Executives 1 0 0 0.00
Horticulturists foresters agricultural.& forestry technology, Permanent 2 0 0 0.00
Human resources clerks, Permanent 4 0 0 0.00
Human resources related, Permanent 5 0 0 0.00
Information technology related, Permanent 5 0 1 20.00
Library mail and related clerks, Permanent 23 0 0 0.00
Light vehicle drivers, Permanent 1 0 1 100.00
Logistical support personnel, Permanent 1 0 0 0.00

Annual Report for 2016/17 Financial Year
| 149Department of Agriculture, Land Reform & Rural Development Northern Cape Province Vote 12
Critical occupation Number of employees at beginning of period-April
2016
Appoint-ments and transfers
into the de-partment
Termina-tions and transfers out of the
department
Turnover rate
Material-recording and transport clerks, Permanent 13 0 0 0.00
Messengers porters and deliverers, Permanent 4 0 0 0.00
Motorised farm and forestry plant operators, Permanent 6 0 1 16.67
Other administrate & related clerks and organisers, Permanent 44 0 0 0.00
Other administrative policy and related officers, Permanent 1 0 0 0.00
Other occupations, Permanent 1 0 0
Safety health and quality inspectors, Permanent 9 0 0 0.00
Secretaries & other keyboard operating clerks, Permanent 21 0 1 4.76
Security guards, Permanent 23 0 0 0.00
Senior managers, Permanent 10 0 0 0.00
Trade labourers, Permanent 6 0 0 0.00
Veterinarians, Permanent 9 1 1 11.11
TOTAL 606 5 20 3.30
Table 3.5.3 Reasons why staff left the department for the period 1 April 2016 to 31 March 2017
Termination Type Number
% of Total Resignations
Death 2 5.71
Resignation 9 22.86
Expiry of contract 15 42.86
Dismissal-operational changes 0 0
Dismissal – misconduct 4 11.43
Dismissal-inefficiency 0 0
Discharged due to ill-health 0 0
Retirement 6 17.14
Transfer to other Public Service Departments 4 0
Other 0 0
Total 25 100
Total number of employees who left as a % of total employment
5.96%

Annual Report for 2016/17 Financial Year
150 |Department of Agriculture, Land Reform & Rural Development Northern Cape Province Vote 12
Table 3.5.4 Promotions by critical occupation for the period 1 April 2016 and 31 March 2017
Occupation Employees at 01 April
2016
Promo-tions to another salary level
Salary level promotions
as a % of employees by
occupation
Progres-sions to another
notch with-in a salary
level
Notch progres-sion as a % of employees by
occupation
Administrative related 63 1 1.59 30 47.62
Agricultural animal oceanography forestry & other science
46 0 0.00 26 56.52
Agriculture related 105 0 0.00 46 43.81
Auxiliary and related workers
4 0 0.00 4 100.00
Biochemistry pharmacology. zoology & life science and technical
4 0 0.00 2 50.00
Civil engineering technicians
16 0 0.00 6 37.50
Cleaners in offices workshops hospitals etc.
40 0 0.00 25 62.50
Client inform clerks(switchboard receptionist inform clerks)
2 0 0.00 0 0.00
Communication and information related
6 0 0.00 3 50.00
Economists 9 0 0.00 7 77.78
Engineers and related professionals
4 0 0.00 1 25.00
Farm hands and labourers
98 0 0.00 67 68.37
Farming forestry advisors and farm managers
4 0 0.00 1 25.00
Finance and economics related
1 0 0.00 1 100.00
Financial and related professionals
5 1 20.00 4 80.00
Financial clerks and credit controllers
11 0 0.00 9 81.82
General legal administration & rel. professionals
1 0 0.00 0 0.00
Horticulturists foresters agriculture.& forestry technology
2 0 0.00 0 0.00
Human resources clerks
4 0 0.00 2 50.00

Annual Report for 2016/17 Financial Year
| 151Department of Agriculture, Land Reform & Rural Development Northern Cape Province Vote 12
Occupation Employees at 01 April
2016
Promo-tions to another salary level
Salary level promotions
as a % of employees by
occupation
Progres-sions to another
notch with-in a salary
level
Notch progres-sion as a % of employees by
occupation
Human resources related
5 0 0.00 4 80.00
Information technology related
5 0 0.00 2 40.00
Library mail and related clerks
23 0 0.00 10 43.48
Light vehicle drivers 1 0 0.00 0 0.00
Logistical support personnel
1 0 0.00 0 0.00
Material-recording and transport clerks
13 0 0.00 9 69.23
Messengers porters and deliverers
4 0 0.00 3 75.00
Motorised farm and forestry plant operators
6 0 0.00 4 66.67
Other administrate & related clerks and organisers
44 1 2.27 40 90.91
Other administrative policy and related officers
Other occupations 1 0 0.00 0 0.00
Safety health and quality inspectors
9 0 0.00 3 33.33
Secretaries & other keyboard operating clerks
21 0 0.00 12 57.14
Security guards 23 0 0.00 15 65.22
Senior managers 10 0 0.00 1 10.00
Trade labourers 6 0 0.00 5 83.33
Veterinarians 9 0 0.00 4 44.44
TOTAL 606 3 0.50 346 57.10
Table 3.5.5 Promotions by salary band for the period 1 April 2016 to 31 March 2017
Salary Band Employees at 01 April
2016
Promo-tions to another salary level
Salary bands promotions
as a % of employees by
salary level
Progres-sions to an-other notch
within a salary level
Notch progres-sion as a % of employees by salary bands
Lower skilled (Levels 1-2)
78 0 0.00 0 0.00
Skilled (Levels 3-5), Permanent
189 1 0.53 169 89.42

Annual Report for 2016/17 Financial Year
152 |Department of Agriculture, Land Reform & Rural Development Northern Cape Province Vote 12
Salary Band Employees at 01 April
2016
Promo-tions to another salary level
Salary bands promotions
as a % of employees by
salary level
Progres-sions to an-other notch
within a salary level
Notch progres-sion as a % of employees by salary bands
Highly skilled production (Levels 6-8), Permanent
193 1 0.52 115 59.59
Highly skilled supervision (Levels 9-12), Permanent
100 1 1.00 61 61.00
Senior management (Levels 13-16), Permanent
12 0 0.00 1 8.33
Contract (Levels 1-2), Permanent
4 0 0.00 0 0.00
Contract (Levels 3-5), Permanent
9 0 0.00 0 0.00
Contract (Levels 6-8), Permanent
10 0 0.00 0 0.00
Contract (Levels 9-12), Permanent
9 0 0.00 0 0.00
Contract (Levels 13-16), Permanent
2 0 0.00 0 0.00
TOTAL 606 3 0.50 346 57.10
Employment Equity
Table 3.6.1 Total number of employees (including employees with disabilities) in each of the following occupational categories as on 31 March 2017
Occupational category
Male Female Total
African Coloured Indian White African Coloured Indian White
Legislators, senior officials and managers 12 0 0 0 5 3 0 0 10
Professionals 183 19 0 18 114 12 0 14 196
Technicians and associate professionals 71 11 2 14 63 12 1 6 100
Clerks 57 7 0 0 127 12 1 14 116
Service and sales workers 19 1 0 0 26 0 0 0 23
Skilled agriculture and fishery workers
Craft and related trades workers
Plant and machine operators and assemblers 6 4 0 0 0 0 0 0 5
Labourers and related 147 47 0 0 69 15 0 0 139
Total 495 89 2 32 404 54 2 34 589
Employees with disabilities
1 1

Annual Report for 2016/17 Financial Year
| 153Department of Agriculture, Land Reform & Rural Development Northern Cape Province Vote 12
Table 3.6.2 Total number of employees (including employees with disabilities) in each of the following
Occupational bands as on 31 March 2017
Occupational band Male Female Total
African Coloured Indian White African Coloured Indian White
Top Management, Permanent 2 0 0 0 0 0 0 0 2
Senior Management, Permanent 6 0 0 0 1 2 0 0 9
Professionally qualified and experienced specialists and mid-management, Permanent 35 5 1 24 24 6 1 8 104
Skilled technical and academically qualified workers, junior management, supervisors, foremen, Permanent 74 21 1 3 65 14 1 18 197
Semi-skilled and discretionary decision making, Permanent 75 60 0 0 75 25 0 6 241
Contract (Senior Management), Permanent 0 0 0 1 0 1 0 0 2
Contract (Professionally qualified), Permanent 4 0 0 3 2 1 0 1 11
Contract (Skilled technical), Permanent 4 1 0 0 1 3 0 1 10
Contract (Semi-skilled), Permanent 3 2 0 0 6 2 0 0 13
TOTAL 202 89 2 293 174 54 2 34 589
Table 3.6.3 Recruitment for the period 1 April 2016 to 31 March 2017
Occupational band Male Female Total
African Coloured Indian White African Coloured Indian White
Top Management
Senior Management
Professionally qualified and experienced specialists and mid-management (Contract) 1 0 0 0 0 0 0 1 2
Skilled technical and academically qualified workers, junior management, supervisors, foreman and superintendents (Contract) 2 0 0 0 0 0 0 0 2

Annual Report for 2016/17 Financial Year
154 |Department of Agriculture, Land Reform & Rural Development Northern Cape Province Vote 12
Occupational band Male Female Total
African Coloured Indian White African Coloured Indian White
Semi-skilled and discretionary decision making (Contract) 0 0 0 0 1 0 0 0 1
Unskilled and defined decision making
Total 3 0 0 0 1 0 0 1 5
Employees with disabilities
Table 3.6.4 Promotions for the period 1 April 2016 to 31 March 2017
Occupational band Male Female Total
African Coloured Indian White African Coloured Indian White
Senior Management 1 0 0 0 0 0 0 0 1
Professionally qualified and experienced specialists and mid-management 23 2 0 12 16 4 1 4 62
Skilled technical and academically qualified workers, junior management, supervisors, foreman and superintendents 42 12 0 1 39 5 1 16 116
Semi-skilled and discretionary decision making 55 44 0 0 49 16 0 5 169
Unskilled and defined decision making 0
Total 121 58 0 13 104 25 2 25 348
Employees with disabilities
Table 3.6.5 Terminations for the period 1 April 2016 to 31 March 2017
Occupational band Male Female Total
African Coloured Indian White African Coloured Indian White
Senior Management
Professionally qualified and experienced specialists and mid-management
2 0 0 1 0 0 0 1 4
Skilled technical and academically qualified workers, junior management, supervisors, foreman and superintendents
1 1 0 1 2 0 0 0 4
Semi-skilled and discretionary decision making
5 4 0 0 1 1 0 0 10

Annual Report for 2016/17 Financial Year
| 155Department of Agriculture, Land Reform & Rural Development Northern Cape Province Vote 12
Occupational band Male Female Total
African Coloured Indian White African Coloured Indian White
Contract (Professionally qualified)
0 0 0 1 0 0 0 0 1
Contract (Skilled Technical)
0 0 0 0 0 1 0 0 1
Total 7 5 0 3 4 2 0 1 20
Employees with Disabilities
Table 3.6.6 Disciplinary action for the period 1 April 2016 to 31 March 2017
Disciplinary action
Male Female Total
African Coloured Indian White African Coloured Indian White
Dismissal 2 1 3
Three months suspension without salary
1 1
Final written warning & three months suspension without salary
1 1
Final written warning & Two months suspension without salary
1 1
Total 6
Table 3.6.7 Skills development for the period 1 April 2016 to 31 March 2017
Occupational category
Male Female Total
African Coloured Indian White African Coloured Indian White
Legislators, senior officials and managers
0 0 0 0 0 0 0 0 0
Professionals 0 0 0 0 0 0 0 0 0
Technicians and associate professionals
0 0 0 0 0 0 0 0 0
Clerks 12 7 0 0 5 3 0 3 27
Service and sales workers
Skilled agriculture and fishery workers
32 6 0 3 19 14 1 2 77
Craft and related trades workers
0 0 0 0 0 0 0 0 0
Plant and machine operators and assemblers
0 0 0 0 0 0 0 0 0

Annual Report for 2016/17 Financial Year
156 |Department of Agriculture, Land Reform & Rural Development Northern Cape Province Vote 12
Occupational category
Male Female Total
African Coloured Indian White African Coloured Indian White
Elementary occupations
Total 44 13 0 3 24 17 1 5 104
Employees with disabilities
Signing of Performance Agreements by SMS Members
Table 3.7.1 Signing of Performance Agreements by SMS members as on 31 March 2017
SMS Level Total number of funded SMS
posts
Total number of SMS members
Total number of signed
performance agreements
Signed performance
agreements as % of total number of
SMS members
Head of Department (Level 15)
1 1 1 100
Salary Level 14 5 5 5 100
Salary Level 13 9 5 5 55
Total 15 11 11 85
Table 3.7.2 Reasons for not having concluded Performance agreements for all SMS members as on 31 March 2017
Reasons
None
Performance Rewards
Table 3.8.1 Performance Rewards by race, gender and disability for the period 1 April 2016 to 31 March 2017
Race and Gender Beneficiary Profile Cost
Number of beneficiaries
Number of employees
% of total within group
Cost (R’000) Average cost per employee
African
Male 67 202 40 1,007.31 112,750.78
Female 79 173 39 745.19 11,122.23
Asian
Male 1 2 50 55.66 55,656.30
Female 2 2 100 30.14 15,069.83
Coloured
Male 24 89 38 284.52 8,368.19
Female 34 54 44 301.74 12,572.47
White
Male 21 32 66 1,347.49 11,820.05
Female 18 34 53 1,077.07 11,581.38
Blacks
Male 114 293 39 518.85 24,708.14
Female 93 229 41 264.54 14,696.83
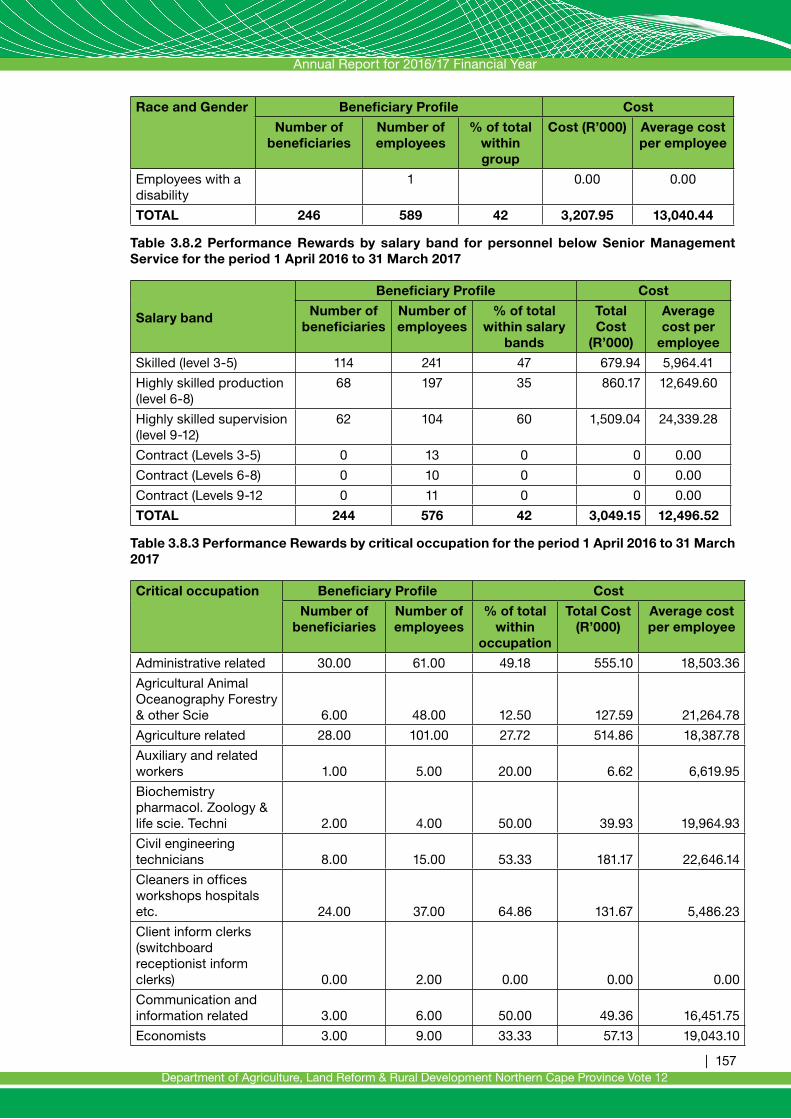
Annual Report for 2016/17 Financial Year
| 157Department of Agriculture, Land Reform & Rural Development Northern Cape Province Vote 12
Race and Gender Beneficiary Profile Cost
Number of beneficiaries
Number of employees
% of total within group
Cost (R’000) Average cost per employee
Employees with a disability
1 0.00 0.00
TOTAL 246 589 42 3,207.95 13,040.44
Table 3.8.2 Performance Rewards by salary band for personnel below Senior Management Service for the period 1 April 2016 to 31 March 2017
Salary band
Beneficiary Profile Cost
Number of beneficiaries
Number of employees
% of total within salary
bands
Total Cost
(R’000)
Average cost per
employee
Skilled (level 3-5) 114 241 47 679.94 5,964.41
Highly skilled production (level 6-8)
68 197 35 860.17 12,649.60
Highly skilled supervision (level 9-12)
62 104 60 1,509.04 24,339.28
Contract (Levels 3-5) 0 13 0 0 0.00
Contract (Levels 6-8) 0 10 0 0 0.00
Contract (Levels 9-12 0 11 0 0 0.00
TOTAL 244 576 42 3,049.15 12,496.52
Table 3.8.3 Performance Rewards by critical occupation for the period 1 April 2016 to 31 March 2017
Critical occupation Beneficiary Profile Cost
Number of beneficiaries
Number of employees
% of total within
occupation
Total Cost (R’000)
Average cost per employee
Administrative related 30.00 61.00 49.18 555.10 18,503.36
Agricultural Animal Oceanography Forestry & other Scie 6.00 48.00 12.50 127.59 21,264.78
Agriculture related 28.00 101.00 27.72 514.86 18,387.78
Auxiliary and related workers 1.00 5.00 20.00 6.62 6,619.95
Biochemistry pharmacol. Zoology & life scie. Techni 2.00 4.00 50.00 39.93 19,964.93
Civil engineering technicians 8.00 15.00 53.33 181.17 22,646.14
Cleaners in offices workshops hospitals etc. 24.00 37.00 64.86 131.67 5,486.23
Client inform clerks (switchboard receptionist inform clerks) 0.00 2.00 0.00 0.00 0.00
Communication and information related 3.00 6.00 50.00 49.36 16,451.75
Economists 3.00 9.00 33.33 57.13 19,043.10

Annual Report for 2016/17 Financial Year
158 |Department of Agriculture, Land Reform & Rural Development Northern Cape Province Vote 12
Critical occupation Beneficiary Profile Cost
Number of beneficiaries
Number of employees
% of total within
occupation
Total Cost (R’000)
Average cost per employee
Engineers an related professionals 0.00 1.00 0.00 0.00 0.00
Farm hands and labourers 1.00 4.00 25.00 23.46 23,455.68
Farming forestry advisors and farm managers 42.00 93.00 45.16 230.73 5,493.54
Finance and economics related 2.00 3.00 66.67 45.17 22,584.59
Financial and related professionals 1.00 1.00 100.00 24.18 24,179.64
Financial clerks and credit controllers 2.00 7.00 28.57 26.60 13,298.78
Head of department/chief executive officer 10.00 11.00 90.91 174.84 17,483.62
Horticulturists’ foresters’ agricultural & forestry technical 1.00 2.00 50.00 25.51 25,506.39
Human resource clerks 1.00 4.00 25.00 15.02 15,023.19
Human resources related 5.00 5.00 100.00 66.36 13,272.21
Information technology related 3.00 5.00 60.00 42.77 14,257.30
Library mail an related clerks 10.00 23.00 43.48 77.29 7,729.34
Light vehicle drivers 0.00 0.00 0.00 0.00 0.00
Logistical support personnel 0.00 1.00 0.00 0.00 0.00
Material-recording and transport clerks 4.00 12.00 33.33 37.35 9,336.30
Messengers porters and deliverers 1.00 4.00 25.00 5.50 5,503.65
Motorised farm and forestry plant operators 0.00 5.00 0.00 0.00 0.00
Other administration & related clerks and organisers 23.00 46.00 50.00 229.05 9,958.87
Other occupations 0.00 1.00 0.00 0.00 0.00
Safety health and quality inspectors 5.00 9.00 55.56 112.72 22,543.10
Secretaries & other keyboard operating clerks 11.00 18.00 61.11 99.02 9,002.03
Security guards 10.00 23.00 43.48 48.28 4,828.37
Senior Managers 1.00 9.00 11.11 122.30 122,298.12
Trade labourers 4.00 5.00 80.00 24.77 6,193.27
Veterinarians 4.00 9.00 44.44 113.61 28,402.26
TOTAL 246.00 589.00 41.77 3,207.95 13,040.44
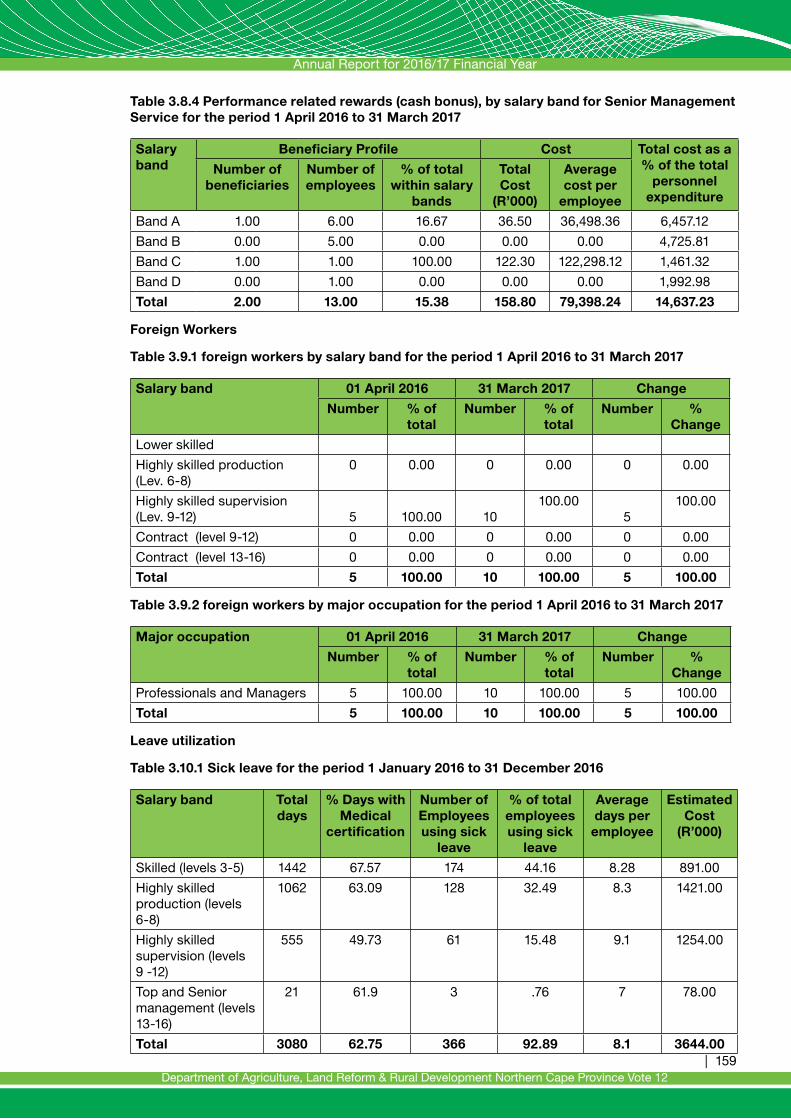
Annual Report for 2016/17 Financial Year
| 159Department of Agriculture, Land Reform & Rural Development Northern Cape Province Vote 12
Table 3.8.4 Performance related rewards (cash bonus), by salary band for Senior Management Service for the period 1 April 2016 to 31 March 2017
Salary band
Beneficiary Profile Cost Total cost as a % of the total
personnel expenditure
Number of beneficiaries
Number of employees
% of total within salary
bands
Total Cost
(R’000)
Average cost per
employee
Band A 1.00 6.00 16.67 36.50 36,498.36 6,457.12
Band B 0.00 5.00 0.00 0.00 0.00 4,725.81
Band C 1.00 1.00 100.00 122.30 122,298.12 1,461.32
Band D 0.00 1.00 0.00 0.00 0.00 1,992.98
Total 2.00 13.00 15.38 158.80 79,398.24 14,637.23
Foreign Workers
Table 3.9.1 foreign workers by salary band for the period 1 April 2016 to 31 March 2017
Salary band 01 April 2016 31 March 2017 Change
Number % of total
Number % of total
Number % Change
Lower skilled
Highly skilled production (Lev. 6-8)
0 0.00 0 0.00 0 0.00
Highly skilled supervision (Lev. 9-12) 5 100.00 10
100.005
100.00
Contract (level 9-12) 0 0.00 0 0.00 0 0.00
Contract (level 13-16) 0 0.00 0 0.00 0 0.00
Total 5 100.00 10 100.00 5 100.00
Table 3.9.2 foreign workers by major occupation for the period 1 April 2016 to 31 March 2017
Major occupation 01 April 2016 31 March 2017 Change
Number % of total
Number % of total
Number % Change
Professionals and Managers 5 100.00 10 100.00 5 100.00
Total 5 100.00 10 100.00 5 100.00
Leave utilization
Table 3.10.1 Sick leave for the period 1 January 2016 to 31 December 2016
Salary band Total days
% Days with Medical
certification
Number of Employees using sick
leave
% of total employees using sick
leave
Average days per employee
Estimated Cost
(R’000)
Skilled (levels 3-5) 1442 67.57 174 44.16 8.28 891.00
Highly skilled production (levels 6-8)
1062 63.09 128 32.49 8.3 1421.00
Highly skilled supervision (levels 9 -12)
555 49.73 61 15.48 9.1 1254.00
Top and Senior management (levels 13-16)
21 61.9 3 .76 7 78.00
Total 3080 62.75 366 92.89 8.1 3644.00

Annual Report for 2016/17 Financial Year
160 |Department of Agriculture, Land Reform & Rural Development Northern Cape Province Vote 12
Table 3.10.2 Disability leave (temporary and permanent) for the period 1 January 2016 to 31 December 2016
Salary band Total days % Days with Medical
certification
Number of Employees
using disability
leave
% of total employees using disability leave
Skilled (Levels 3-5) 0 0 0 0
Highly skilled production (Levels 6-8)
10 100 1 25
Highly skilled supervision (Levels 9-12)
83 100 3 75
Total 93 100 4 100
Table 3.10.3 Annual Leave for the period 1 January 2016 to 31 December 2016
Salary band Total days taken Number of Employees using
annual leave
Average per employee
Skilled Levels 3-5) 5225 253 20.65
Highly skilled production (Levels 6-8)
4164 201 20.72
Highly skilled supervision(Levels 9-12)
2349 106 22.16
Senior management (Levels 13-16) 209 11 19
Total 11947 571 15.93
Table 3.10.4 Capped leave for the period 1 January 2016 to 31 December 2016
Salary band Total days of capped leave
taken
Number of Employees using
capped leave
Average number of days taken per
employee
Skilled Levels 3-5) 21 7 3
Highly skilled production (Levels 6-8)
10 5 2
Highly skilled supervision(Levels 9-12)
Total 31 12 2.58
Table 3.10.5 Leave payouts for the period 1 April 2016 to 31 March 2017
Reason Total amount (R’000)
Number of employees
Average per employee
(R’000)
Capped leave payouts on termination of service for 2016/2017
598 13 46 001
Current leave payout on termination of service for 2016/2017
51 5 10 274
Total 649 18 36 077

Annual Report for 2016/17 Financial Year
| 161Department of Agriculture, Land Reform & Rural Development Northern Cape Province Vote 12
HIV/AIDS & Health Promotion Programmes
Table 3.11.1 Steps taken to reduce the risk of occupational exposure
Units/categories of employees identified to be at high risk of contracting HIV & related diseases (if any)
Key steps taken to reduce the risk
None
Table 3.11.2 Details of Health Promotion and HIV/AIDS Programmes (tick the applicable boxes and provide the required information)
Question Yes No Details, if yes
1. Has the department designated a member of the SMS to implement the provisions contained in Part VI E of Chapter 1 of the Public Service Regulations, 2001? If so, provide her/his name and position.
X Mrs MM Motaung: Director Human Resource Management
2. Does the department have a dedicated unit or has it designated specific staff members to promote the health and well-being of your employees? If so, indicate the number of employees who are involved in this task and the annual budget that is available for this purpose.
X The unit has 1 employee who deals with the promotion of health and wellbeing of employees.
3. Has the department introduced an Employee Assistance or Health Promotion Programme for your employees? If so, indicate the key elements/services of this Programme.
X Wellness days and information sessions
4. Has the department established (a) committee(s) as contemplated in Part VI E.5 (e) of Chapter 1 of the Public Service Regulations, 2001? If so, please provide the names of the members of the committee and the stakeholder(s) that they represent.
X The committee was established. (The list of the committee members is attached)
5. Has the department reviewed its employment policies and practices to ensure that these do not unfairly discriminate against employees on the basis of their HIV status? If so, list the employment policies/practices so reviewed.
X HIV/AIDS, TB and STI management policy
6. Has the department introduced measures to protect HIV-positive employees or those perceived to be HIV-positive from discrimination? If so, list the key elements of these measures.
X The policy states that employees who discriminate against others shall face disciplinary actions
7. Does the department encourage its employees to undergo Voluntary Counselling and Testing? If so, list the results that you have you achieved.
X The results are still minimum as most of the employees that take part in wellness screenings do not undergo the HCT testing
8. Has the department developed measures/indicators to monitor & evaluate the impact of its health promotion programme? If so, list these measures/indicators.
X GEMS reports

Annual Report for 2016/17 Financial Year
162 |Department of Agriculture, Land Reform & Rural Development Northern Cape Province Vote 12
Labour Relations
Table 3.12.1 Collective agreements for the period 1 April 2016 to 31 March 2017
Subject matter Date
0
Total number of Collective agreements 0
Table 3.12.2 Misconduct and disciplinary hearings finalised for the period 1 April 2016 to 31 March 2017
Outcomes of disciplinary hearings Number % of total
Correctional counselling 0
Verbal warning 0
Written warning 0
Final written warning 0
Suspended without pay 3, two were coupled with final written warning
0.49
Fine 0
Demotion 0
Dismissal 3
Not guilty 0
Case withdrawn 0
Total 3 0.49
Table 3.12.3 Types of misconduct addressed at disciplinary hearings for the period 1 April 2016 to 31 March 2017
Type of misconduct Number % of total
Absenteeism & unauthorised leave 0 0
Gross insubordination 0 0
Multiple misconduct 9 1.48
TOTAL 9 1.48
Table 3.12.4 Grievances logged for the period 1 April 2016 to 31 March 2017
Grievances Number % of Total
Number of grievances resolved 1 0.16
Number of grievances not resolved 0 0
Total number of grievances lodged 1 0.16
Table 3.12.5 Disputes logged with Councils for the period 1 April 2016 to 31 March 2017
Disputes Number % of Total
Number of disputes upheld 0 0
Number of disputes dismissed 2 0.33
Total number of disputes lodged 2 0.33

Annual Report for 2016/17 Financial Year
| 163Department of Agriculture, Land Reform & Rural Development Northern Cape Province Vote 12
Table 3.12.6 Strike actions for the period 1 April 2016 to 31 March 2017
Total number of persons working days lost 0
Total costs working days lost 0
Amount recovered as a result of no work no pay (R’000) 0
Table 3.12.7 Precautionary suspensions for the period 1 April 2016 and 31 March 2017
Number of people suspended 4
Number of people who’s suspension exceeded 30 days
4
Average number of days suspended 90 Days
Cost of suspension(R’000) R232.745.75
Skills development
Table 3.13.1 Training needs identified for the period 1 April 2016 to 31 March 2017
Occupational category
Gender Number of employees
as at 01 April 2016
Training needs identified at start of the reporting period
Learnerships Skills Pro-grammes & other short
courses
Other forms of training
Total
Legislators, senior officials and managers
Female 0
Male 0
Professionals Female 0
Male 0
Technicians and associate professionals
Female 0 45 11 56
Male 0 41 14 55
Clerks Female 3 10 1 11
Male 5 8 8
Service and sales workers
Female 0
Male 0
Skilled agriculture and fishery workers
Female 11 11
Male 15 15
Craft and related trades workers
Female 0
Male 0
Plant and machine operators and assemblers
Female 0
Male 0
Elementary occupations
Female
Male
Sub Total Female
Male
Total 26 104 26 156

Annual Report for 2016/17 Financial Year
164 |Department of Agriculture, Land Reform & Rural Development Northern Cape Province Vote 12
Table 3.13.2 Training provided for the period 1 April 2016 to 31 March 2017
Occupational category
Gender Number of employees
as at 01 April 2016
Training provided within the reporting period
Learner-ships
Skills Programmes & other short
courses
Other forms of training
Total
Legislators, senior officials and managers
Female
Male
Professionals Female
Male
Technicians and associate professionals
Female 4 36 9 49
Male 3 41 6 50
Clerks Female 5 19 3 27
Male 3 8 3 14
Service and sales workers
Female
Male
Skilled agriculture and fishery workers
Female
Male
Craft and related trades workers
Female
Male
Plant and machine operators and assemblers
Female
Male
Elementary occupations Female
Male
Sub Total Female
Male
Total 15 104 21 140
Injury on duty
Table 3.14.1 Injury on duty for the period 1 April 2016 to 31 March 2017
Nature of injury on duty Number % of total
Required basic medical attention only 7 0.01%
Temporary Total Disablement 7 0.01%
Permanent Disablement 0 0%
Fatal 0 0%
Total 7 0.01%

Annual Report for 2016/17 Financial Year
| 165Department of Agriculture, Land Reform & Rural Development Northern Cape Province Vote 12
Utilization of Consultants
Table 3.15.1 Report on consultant appointments using appropriated funds for the period 1 April 2016 and 31 March 2017
Project title Total number of
consultants that worked on project
Duration (work days)
Contract value in
R’000
Value-adding through aroma and taste profile of rooibos waste material
1 88 320
Assessment - SANAS 1 20 69
Internal Control Environment 1 240 3,216
Provision of programme management, community facilitation and resource mobilisation services
1 720 12,825
Payment of provision of rapid market assessment; marketing & business plan and mentorship services at manyeding
1 240 4,587
Consequence management, compliance and internal control
1 60 483
Provide support to SCM governance 1 240 202
Obtaining of environmental authorisation at sonderwaterkraal and tweerivier, niewoudtville area, northern cape province
1 240 253
Assessment conducted 1 220 4,687
Arc-institute for soil, climate and water research projects 1 1200 802,674
Committee meetings and small-scale fisherman’s workshops
1 1200 3,950
Value-adding through aroma and taste profile of rooibos waste material
1 720 1,647
Total number of projects Total individual consultants
Duration (work days)
Total contract value in R’000
12 12 5188 33,051
Table 3.15.2 Analysis of consultant appointments using appropriated funds, in terms of Historically Disadvantaged Individuals (HDIs) for the period 1 April 2016 and 31 March 2017
Project title Percentage ownership by BBBEE
groups
Percentage management
by BBBEE groups
Number of consultants from BBBEE groups that work on the
project
BBBEE Contributor
Value-adding through aroma and taste profile of rooibos waste material
0.00% 0.00% 0.00% Level 5
Assessment – SANAS Not applicable
Not applicable Not applicable
Not applicable
Internal Control Environment 100.00% 100.00% 100.00% Level 1
Provision of programme management, community facilitation and resource mobilisation services
100.00% 100.00% 100.00% Level 1
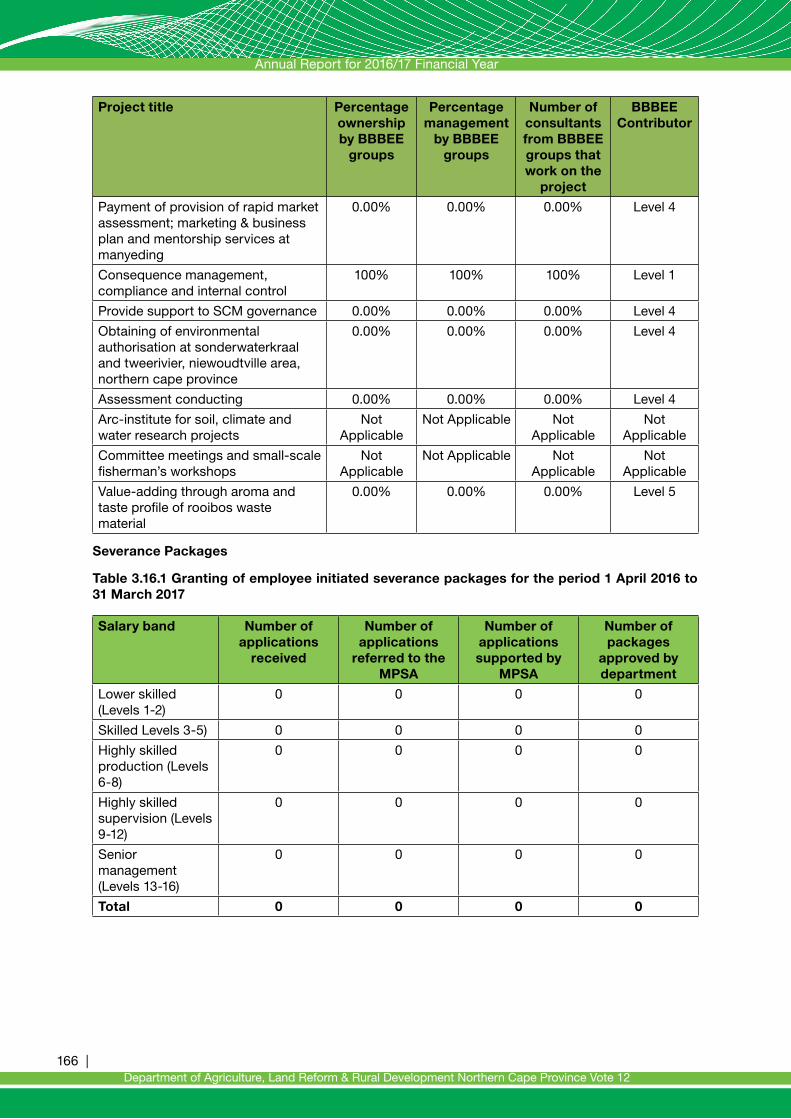
Annual Report for 2016/17 Financial Year
166 |Department of Agriculture, Land Reform & Rural Development Northern Cape Province Vote 12
Project title Percentage ownership by BBBEE
groups
Percentage management
by BBBEE groups
Number of consultants from BBBEE groups that work on the
project
BBBEE Contributor
Payment of provision of rapid market assessment; marketing & business plan and mentorship services at manyeding
0.00% 0.00% 0.00% Level 4
Consequence management, compliance and internal control
100% 100% 100% Level 1
Provide support to SCM governance 0.00% 0.00% 0.00% Level 4
Obtaining of environmental authorisation at sonderwaterkraal and tweerivier, niewoudtville area, northern cape province
0.00% 0.00% 0.00% Level 4
Assessment conducting 0.00% 0.00% 0.00% Level 4
Arc-institute for soil, climate and water research projects
Not Applicable
Not Applicable Not Applicable
Not Applicable
Committee meetings and small-scale fisherman’s workshops
Not Applicable
Not Applicable Not Applicable
Not Applicable
Value-adding through aroma and taste profile of rooibos waste material
0.00% 0.00% 0.00% Level 5
Severance Packages
Table 3.16.1 Granting of employee initiated severance packages for the period 1 April 2016 to 31 March 2017
Salary band Number of applications
received
Number of applications
referred to the MPSA
Number of applications supported by
MPSA
Number of packages
approved by department
Lower skilled (Levels 1-2)
0 0 0 0
Skilled Levels 3-5) 0 0 0 0
Highly skilled production (Levels 6-8)
0 0 0 0
Highly skilled supervision (Levels 9-12)
0 0 0 0
Senior management (Levels 13-16)
0 0 0 0
Total 0 0 0 0
Annual Report for 2016/17 Financial Year
| 167Department of Agriculture, Land Reform & Rural Development Northern Cape Province Vote 12
Annual Report for 2016/17 Financial Year
168 |Department of Agriculture, Land Reform & Rural Development Northern Cape Province Vote 12
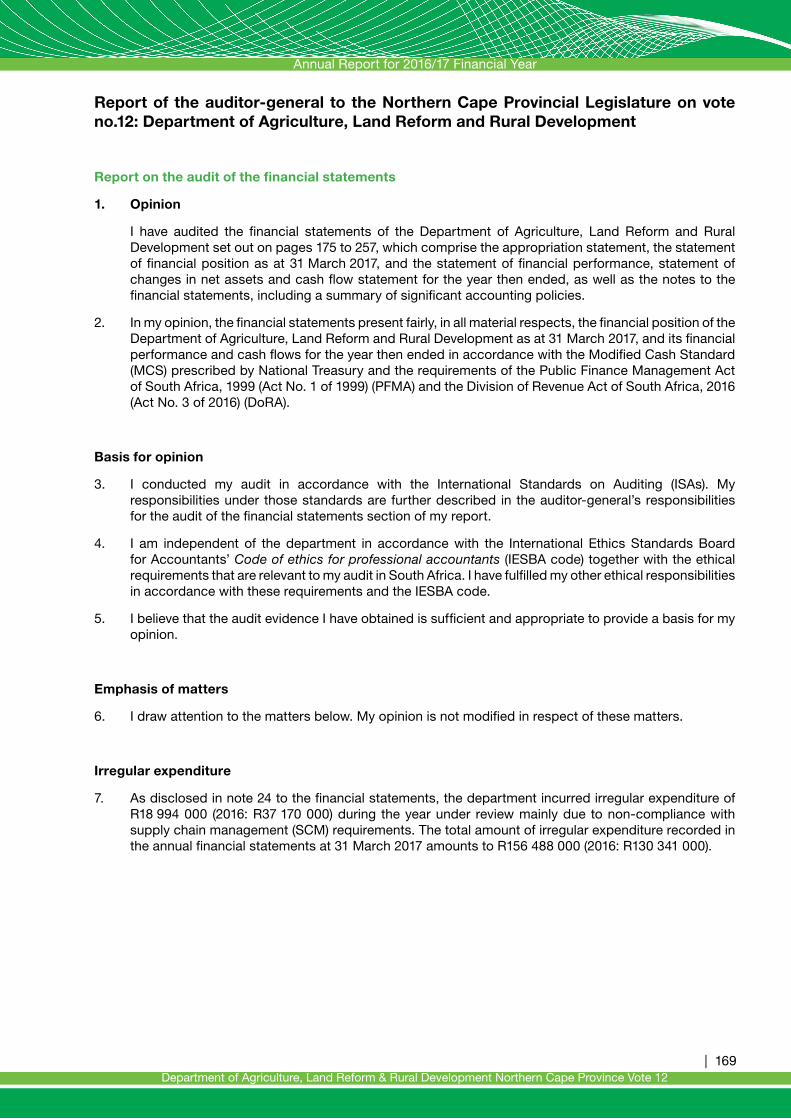
Annual Report for 2016/17 Financial Year
| 169Department of Agriculture, Land Reform & Rural Development Northern Cape Province Vote 12
Report of the auditor-general to the Northern Cape Provincial Legislature on vote no.12: Department of Agriculture, Land Reform and Rural Development
Report on the audit of the financial statements
1. Opinion
I have audited the financial statements of the Department of Agriculture, Land Reform and Rural Development set out on pages 175 to 257, which comprise the appropriation statement, the statement of financial position as at 31 March 2017, and the statement of financial performance, statement of changes in net assets and cash flow statement for the year then ended, as well as the notes to the financial statements, including a summary of significant accounting policies.
2. In my opinion, the financial statements present fairly, in all material respects, the financial position of the Department of Agriculture, Land Reform and Rural Development as at 31 March 2017, and its financial performance and cash flows for the year then ended in accordance with the Modified Cash Standard (MCS) prescribed by National Treasury and the requirements of the Public Finance Management Act of South Africa, 1999 (Act No. 1 of 1999) (PFMA) and the Division of Revenue Act of South Africa, 2016 (Act No. 3 of 2016) (DoRA).
Basis for opinion
3. I conducted my audit in accordance with the International Standards on Auditing (ISAs). My responsibilities under those standards are further described in the auditor-general’s responsibilities for the audit of the financial statements section of my report.
4. I am independent of the department in accordance with the International Ethics Standards Board for Accountants’ Code of ethics for professional accountants (IESBA code) together with the ethical requirements that are relevant to my audit in South Africa. I have fulfilled my other ethical responsibilities in accordance with these requirements and the IESBA code.
5. I believe that the audit evidence I have obtained is sufficient and appropriate to provide a basis for my opinion.
Emphasis of matters
6. I draw attention to the matters below. My opinion is not modified in respect of these matters.
Irregular expenditure
7. As disclosed in note 24 to the financial statements, the department incurred irregular expenditure of R18 994 000 (2016: R37 170 000) during the year under review mainly due to non-compliance with supply chain management (SCM) requirements. The total amount of irregular expenditure recorded in the annual financial statements at 31 March 2017 amounts to R156 488 000 (2016: R130 341 000).
Annual Report for 2016/17 Financial Year
170 |Department of Agriculture, Land Reform & Rural Development Northern Cape Province Vote 12
Movable Tangible Capital Assets
8. As disclosed in note 29 to the financial statements, the department disclosed movable tangible capital assets to the value of R23 767 000. This disclosure was done in compliance with the MCS for assets under investigation.
Other matter
9. I draw attention to the matter below. My opinion is not modified in respect of this matter.
Unaudited supplementary schedules
10. The supplementary information set out on pages 258 to 266 does not form part of the financial statements and is presented as additional information. I have not audited these schedules and, accordingly, I do not express an opinion thereon.
Responsibilities of the accounting officer for the financial statements
11. The accounting officer is responsible for the preparation and fair presentation of the financial statements in accordance with the MCS prescribed by National Treasury and the requirements of the PFMA and DoRA and for such internal control as the accounting officer determines is necessary to enable the preparation of financial statements that are free from material misstatement, whether due to fraud or error.
12. In preparing the financial statements, the accounting officer is responsible for assessing the Department of Agriculture, Land Reform and Rural Development’s ability to continue as a going concern, disclosing, as applicable, matters relating to going concern and using the going concern basis of accounting unless there is an intention either to liquidate the department or to cease operations, or there is no realistic alternative but to do so.
Auditor-general’s responsibilities for the audit of the financial statements
13. My objectives are to obtain reasonable assurance about whether the financial statements as a whole are free from material misstatement, whether due to fraud or error, and to issue an auditor’s report that includes my opinion. Reasonable assurance is a high level of assurance, but is not a guarantee that an audit conducted in accordance with ISAs will always detect a material misstatement when it exists. Misstatements can arise from fraud or error and are considered material if, individually or in the aggregate, they could reasonably be expected to influence the economic decisions of users taken on the basis of these financial statements.
14. A further description of my responsibilities for the audit of the financial statements is included in the annexure to the auditor’s report.

Annual Report for 2016/17 Financial Year
| 171Department of Agriculture, Land Reform & Rural Development Northern Cape Province Vote 12
Report on the audit of the annual performance report
Introduction and scope
15. In accordance with the Public Audit Act of South Africa, 2004 (Act No. 25 of 2004) (PAA) and the general notice issued in terms thereof I have a responsibility to report material findings on the reported performance information against predetermined objectives for selected programmes presented in the annual performance report. I performed procedures to identify findings but not to gather evidence to express assurance.
16. My procedures address the reported performance information, which must be based on the approved performance planning documents of the department. I have not evaluated the completeness and appropriateness of the performance indicators included in the planning documents. My procedures also did not extend to any disclosures or assertions relating to planned performance strategies and information in respect of future periods that may be included as part of the reported performance information. Accordingly, my findings do not extend to these matters.
17. I evaluated the usefulness and reliability of the reported performance information in accordance with the criteria developed from the performance management and reporting framework, as defined in the general notice, for the following selected programmes presented in the annual performance report of the department for the year ended 31 March 2017:
Programmes Pages in the annual performance report
Programme 2 – Sustainable Resource Management 46-58
Programme 3 – Farmer Support and Development 60-71
Programme 4 – Veterinary Services 73-88
18. I did not identify any material findings on the usefulness and reliability of the reported performance information for the following programmes:
Programme 2 – Sustainable Resource ManagementProgramme 3 – Farmer Support and DevelopmentProgramme 4 – Veterinary Services
Other matter
19. I draw attention to the matter below.
Achievement of planned targets
20. Refer to the annual performance report on pages 19-127 for information on the achievement of planned targets for the year.

Annual Report for 2016/17 Financial Year
172 |Department of Agriculture, Land Reform & Rural Development Northern Cape Province Vote 12
Report on audit of compliance with legislation
Introduction and scope
21. In accordance with the PAA and the general notice issued in terms thereof I have a responsibility to report material findings on the compliance of the department with specific matters in key legislation. I performed procedures to identify findings but not to gather evidence to express assurance.
22. The material findings in respect of the compliance criteria for the applicable subject matters are as follows:
Annual financial statements, performance reports and annual reports
23. The financial statements submitted for auditing were not prepared in accordance with the prescribed financial reporting framework as required by section 40(1)(a) of the Public Finance Management Act. Material misstatements of goods and services, transfer payments, expenditure for capital assets and movable capital items identified by the auditors in the submitted financial statement were corrected and/or the supporting records were provided subsequently, resulting in the financial statements receiving an unqualified audit opinion.
Expenditure management
24. Effective steps were not taken to prevent irregular expenditure amounting to R18 994 000 as disclosed in note 24 to the annual financial statements, as required by section 38(1)(c)(ii) of the PFMA and treasury regulation 9.1.1.
25. Effective steps were not taken to prevent fruitless and wasteful expenditure, amounting to R153 000 as disclosed in note 25 of the AFS, as required by section 38(1)(c)(ii) of the Public Finance Management Act and Treasury Regulation 9.1.1.
Procurement and contract management
26. Sufficient appropriate audit evidence could not be obtained that goods and services with a transaction value below R500 000 were procured by means of obtaining the required price quotations, as required by Treasury Regulation 16A6.1.
Other information
27. The Department of Agriculture, Land Reform and Rural Development Accounting Officer is responsible for the other information. The other information comprises the information included in the annual report. The other information does not include the financial statements, the auditor’s report thereon and those selected programmes presented in the annual performance report that have been specifically reported on in the auditor’s report.
28. My opinion on the financial statements and findings on the reported performance information and compliance with legislation do not cover the other information and I do not express an audit opinion or any form of assurance conclusion thereon.

Annual Report for 2016/17 Financial Year
| 173Department of Agriculture, Land Reform & Rural Development Northern Cape Province Vote 12
29. In connection with my audit, my responsibility is to read the other information and, in doing so, consider whether the other information is materially inconsistent with the financial statements and the selected programmes presented in the annual performance report, or my knowledge obtained in the audit, or otherwise appears to be materially misstated. If, based on the work I have performed on the other information obtained prior to the date of this auditor’s report, I conclude that there is a material misstatement of this other information, I am required to report that fact.
30. I have not yet received the final annual report. When I do receive this information, if I conclude that there is a material misstatement therein, I am required to communicate the matter to those charged with governance and request that the other information be corrected. If the other information is not corrected I may have to re-issue my auditor’s report amended as appropriate.
Internal control deficiencies
31. I considered internal control relevant to my audit of the statements, reported performance information and compliance with applicable legislation; however, my objective was not to express any form of assurance thereon. The matters reported below are limited to the significant internal control deficiencies that resulted in the basis for qualified opinion, the findings on compliance with legislation included in this report.
• Leadership did not take appropriate action with regard to a lack of controls in the finance and supply chain management directorates to facilitate the continuous monitoring of internal controls which resulted in misstatements in the Transfer payments, Expenditure for capital assets, Goods and services.
• Leadership did not exercise its oversight responsibility over regular monitoring of compliance with laws and regulations.
• The department did not implement proper record keeping in a timely manner to ensure that complete, relevant and accurate information is accessible and available to support financial reporting.
• Management did not ensure that on-going monitoring and supervision were undertaken to enable an assessment of the effectiveness of internal control over compliance with laws and regulations.
• The department developed a plan to address the audit findings relating to the prior year. The appropriate level of management did not timeously monitor adherence to the plan resulting in the re-occurrence of some of the non-compliance issues and material misstatements corrected in the annual financial statements.

Annual Report for 2016/17 Financial Year
174 |Department of Agriculture, Land Reform & Rural Development Northern Cape Province Vote 12

Annual Report for 2016/17 Financial Year
| 175Department of Agriculture, Land Reform & Rural Development Northern Cape Province Vote 12
Table of Contents
Appropriation Statement 176
Notes to the Appropriation Statement 214
Statement of Financial Performance 216
Statement of Financial Position 217
Statement of Changes in Net Assets 218
Cash Flow Statement 219
Notes to the Annual Financial Statements (including Accounting policies) 220
Annexures 258

Annual Report for 2016/17 Financial Year
176 |Department of Agriculture, Land Reform & Rural Development Northern Cape Province Vote 12
Ap
pro
pri
atio
n p
er p
rog
ram
me
20
16/1
720
15/1
6
Vo
ted
fu
nd
s an
d D
irec
t ch
arg
es
R’0
00
Ad
just
ed
Ap
pro
pri
a-ti
on
Sh
ifti
ng
o
f Fu
nd
s V
ire
-m
ent
Fin
al A
p-
pro
pri
atio
n A
ctu
al E
x-p
end
itu
re
Var
i-an
ce
Exp
end
-it
ure
as
% o
f fi
nal
ap
pro
pri
-at
ion
Fin
al A
p-
pro
pri
atio
n A
ctu
al E
x-p
end
itu
re
R’0
00R
’000
R’0
00R
’000
R’0
00%
R’0
00R
’000
Pro
gra
mm
e
1A
dm
inis
trat
ion
117,
731
- 87
7 11
8,60
8 11
8,60
6 2
100.
0%10
6,49
1 10
6,42
4
2S
usta
inab
le R
esou
rce
Man
agem
ent
96,0
32
- (3
34)
95,6
98
95,4
44
254
99.7
%97
,500
97
,496
3Fa
rmer
Sup
po
rt A
nd D
evel
opm
ent
225,
950
- 93
5 22
6,88
5 21
2,07
1 14
,814
93
.5%
245,
596
243,
345
4Ve
terin
ary
Ser
vice
s45
,140
-
(481
)44
,659
44
,659
-
100.
0%43
,017
42
,682
5R
esea
rch
and
Tec
hnol
og
y D
evel
opm
ent
Ser
vice
s47
,290
-
(634
)46
,656
46
,656
-
100.
0%43
,308
43
,065
6A
gric
ultu
ral E
cono
mic
s S
ervi
ces
9,84
8 -
(787
)9,
061
9,04
3 18
99
.8%
9,11
9 8,
138
7R
ural
Dev
elop
men
t13
,214
-
424
13,6
38
13,6
30
8 99
.9%
12,9
16
12,9
00
Tota
l55
5,20
5 -
- 55
5,20
5 54
0,10
9 15
,096
97
.3%
557,
947
554,
050
Rec
on
cilia
tio
n w
ith
Sta
tem
ent
of
Fin
anci
al P
erfo
rman
ce
Ad
d:
D
epar
tmen
tal r
ecei
pts
40
1
913
Ac
tual
am
ou
nts
per
Sta
tem
ent
of
Fin
anci
al P
erfo
rman
ce (
Tota
l Rev
enu
e) R
even
ue)
555,
606
55
8,86
0
Ad
d: A
id a
ssis
tanc
e -
-
P
rior
year
una
utho
rised
exp
end
iture
ap
pro
ved
with
out
fund
ing
Ac
tual
am
ou
nts
per
Sta
tem
ent
of
Fin
anci
al P
erfo
rman
ce (E
xpen
dit
ure
)
540,
109
554,
050
AP
PR
OP
RIA
TIO
N S
TAT
EM
EN
T
for
the
year
en
ded
31
Mar
ch 2
017

Annual Report for 2016/17 Financial Year
| 177Department of Agriculture, Land Reform & Rural Development Northern Cape Province Vote 12
Ap
pro
pri
atio
n p
er e
con
om
ic c
lass
ifica
tio
n
2016
/17
2015
/16
Ad
just
ed
Ap
pro
pri
-at
ion
Sh
ifti
ng
o
f Fu
nd
s V
ire
-m
ent
Fin
al
Ap
pro
pri
-at
ion
Ac
tual
E
xpen
di-
ture
V
ari-
ance
Exp
end
-it
ure
as
% o
f fi
nal
ap
pro
pri
a-ti
on
Fin
al
Ap
pro
pri
-at
ion
Ac
tual
E
xpen
di-
ture
R’0
00R
’000
R’0
00R
’000
R’0
00%
R’0
00R
’000
R’0
00
C
urr
ent
pay
men
ts36
9,49
3 (4
24)
- 36
9,06
9 36
5,05
5 4,
014
98.9
%37
6,92
0 38
0,00
4
C
om
pen
satio
n of
em
plo
yees
213,
505
(2,7
65)
(1,0
51)
209,
689
209,
301
388
99.8
%19
3,32
1 19
2,57
5
S
alar
ies
and
wag
es18
4,15
3 (2
,356
)(1
,338
)18
0,45
9 18
0,12
5 33
499
.8%
165,
704
165,
342
S
oci
al c
ont
ribut
ions
29,3
52
(409
)28
7 29
,230
29
,176
54
99
.8%
27,6
17
27,2
33
G
oo
ds
and
ser
vice
s15
5,98
8
2,
341
1,05
1 15
9,38
0 15
5,73
6 3,
644
97.7
%18
3,59
9 18
7,40
7
A
dm
inis
trat
ive
fees
1,15
9 (1
,502
)22
2,
683
2,67
7 6
99.4
%85
3 1,
947
A
dve
rtis
ing
1,95
6 (1
,261
)-
695
695
- 10
0.0%
1,67
0 1,
656
M
ino
r as
sets
1,16
4 (7
92)
- 37
2 37
2 -
100.
0%2,
646
1,2
58
A
udit
cost
s: E
xter
nal
4,44
1 46
3 (2
25)
4,67
9 4,
679
- 10
0.0%
4,59
8 4,
598
B
ursa
ries:
Em
plo
yees
965
(320
)-
645
645
- 10
0.0%
900
900
C
ater
ing:
Dep
artm
enta
l act
iviti
es2,
811
(706
)-
2,10
5 2,
087
18
99.1
%2,
474
2,48
9
C
om
mun
icat
ion
(G&
S)
4,74
4 (1
,543
) -
3,20
1 2,
999
202
93.7
%5,
238
3,30
7
C
om
put
er s
ervi
ces
1,93
8 26
9 -
2,20
7 2,
206
1 10
0.0%
2,20
3 2,
203
C
ons
ulta
nts:
Bus
ines
s an
d a
dvi
sory
ser
vice
s2,
230
7,79
8 20
3 10
,231
10
,231
-
100.
0%6,
524
6,39
8
In
fras
truc
ture
and
pla
nnin
g se
rvic
es5,
484
(4,7
35)
- 74
9 74
9 -
100.
0%15
,696
15
,709
La
bo
rato
ry s
ervi
ces
442
534
- 97
6 97
6 -
100.
0%1,
696
1,69
6
Le
gal
ser
vice
s31
3 56
-
369
369
- 10
0.0%
365
365
C
ont
ract
ors
18,8
44
(4,9
46)
1,45
4 15
,352
13
,225
2,
127
86.1
%16
,579
16
,367
A
gen
cy a
nd s
upp
ort
/ o
utso
urce
d s
ervi
ces
5,11
4 (1
,873
)-
3,24
1 3,
241
- 10
0.0%
2,96
7 1,
351
Fl
eet
serv
ices
(inc
lud
ing
gov
ernm
ent
mot
or
tran
spo
rt)
14,4
48
(5,6
48)
(309
)8,
491
8,49
1 -
100,
0%11
,009
5,
118
In
vent
ory
: Clo
thin
g m
ater
ial a
nd a
cces
sorie
s10
9 (1
09)
- -
- -
0.0%
618
616
In
vent
ory
: Far
min
g su
pp
lies
12,3
28
6,38
2 -
18,7
10
18,4
51
259
98.6
%36
,064
35
,779
In
vent
ory
: Fo
od
and
foo
d s
upp
lies
96
(96)
- -
- -
0.0%
86
86
AP
PR
OP
RIA
TIO
N S
TAT
EM
EN
T
for
the
year
en
ded
31
Mar
ch 2
017

Annual Report for 2016/17 Financial Year
178 |Department of Agriculture, Land Reform & Rural Development Northern Cape Province Vote 12
Ap
pro
pri
atio
n p
er e
con
om
ic c
lass
ifica
tio
n
2016
/17
2015
/16
Ad
just
ed
Ap
pro
pri
-at
ion
Sh
ifti
ng
o
f Fu
nd
s V
ire
-m
ent
Fin
al
Ap
pro
pri
-at
ion
Ac
tual
E
xpen
di-
ture
V
ari-
ance
Exp
end
-it
ure
as
% o
f fi
nal
ap
pro
pri
a-ti
on
Fin
al
Ap
pro
pri
-at
ion
Ac
tual
E
xpen
di-
ture
R’0
00R
’000
R’0
00R
’000
R’0
00%
R’0
00R
’000
R’0
00
In
vent
ory
: Fue
l, oi
l and
gas
2,74
6 34
8 (2
4)3,
070
2,96
9 10
1 96
.7%
3,74
2 3,
731
In
vent
ory
: Mat
eria
ls a
nd s
upp
lies
3,26
2 (2
07)
(1,1
91)
1,86
4 1,
864
- 10
0.0%
9,06
7 9,
055
In
vent
ory
: Med
ical
sup
plie
s71
(2
9)-
42
42
- 10
0.0%
31
31
In
vent
ory
: Med
icin
e27
9 26
6 -
545
544
1 99
.8%
395
395
In
vent
ory
: Oth
er s
upp
lies
50
10,5
25
- 10
,575
10
,574
1 10
0.0%
43
16,0
70
C
ons
umab
le s
upp
lies
9,42
4 (5
,404
)10
4,
030
3,83
3 19
7 95
.1%
2,05
8 2,
062
C
ons
umab
le: S
tatio
nery
, prin
ting
and
offi
ce
sup
plie
s1,
963
(654
)4
1,31
3 1,
313
- 10
0.0%
1,82
0 1,
821
O
per
atin
g le
ases
13,5
37
(2,6
25)
- 10
,912
10
,545
36
7 96
.6%
12,3
35
11,0
45
P
rop
erty
pay
men
ts7,
384
4,00
7 -
11,3
91
11,0
74
317
97.2
%8,
681
8,68
1
Tr
ansp
ort
pro
vid
ed: D
epar
tmen
tal a
ctiv
ity49
2 (4
92)
- -
- -
--
-
Tr
avel
and
sub
sist
ence
30,3
06
2,26
4 1,
067
33,6
37
33,6
15
22
99.9
%28
,590
28
,476
Tr
aini
ng a
nd d
evel
opm
ent
2,23
1 (8
69)
1 1,
363
1,36
3 -
100.
0%1,
585
1,58
5
O
per
atin
g p
aym
ents
2,01
9 (1
89)
- 1,
830
1,81
5 15
99
.2%
1,62
3 1,
622
Ve
nues
and
faci
litie
s3,
507
149
- 3,
656
3,64
6 10
99
.7%
752
752
R
enta
l and
hiri
ng13
1 27
6 39
44
6 44
6 -
100.
0%69
1 23
8
In
tere
st a
nd r
ent
on
land
- -
- -
18
(18)
--
22
In
tere
st (I
ncl.
inte
rest
on
unita
ry p
aym
ents
(PP
P))
- -
- -
18
(18)
--
21
R
ent
on
land
- -
- -
- -
--
1
Tr
ansf
ers
and
su
bsi
die
s44
,072
(3
8,10
7)-
5,96
5 5,
965
- 10
0.0%
47,0
19
19,9
68
P
rovi
nces
and
mun
icip
aliti
es12
10
7 -
119
119
- 10
0.0%
74
54
P
rovi
nces
- -
- -
- -
-20
19
P
rovi
ncia
l ag
enci
es a
nd f
und
s-
- -
- -
- -
20
19
AP
PR
OP
RIA
TIO
N S
TAT
EM
EN
T
for
the
year
en
ded
31
Mar
ch 2
017

Annual Report for 2016/17 Financial Year
| 179Department of Agriculture, Land Reform & Rural Development Northern Cape Province Vote 12
Ap
pro
pri
atio
n p
er e
con
om
ic c
lass
ifica
tio
n
2016
/17
2015
/16
Ad
just
ed
Ap
pro
pri
-at
ion
Sh
ifti
ng
o
f Fu
nd
s V
ire
-m
ent
Fin
al
Ap
pro
pri
-at
ion
Ac
tual
E
xpen
di-
ture
V
ari-
ance
Exp
end
-it
ure
as
% o
f fi
nal
ap
pro
pri
a-ti
on
Fin
al
Ap
pro
pri
-at
ion
Ac
tual
E
xpen
di-
ture
R’0
00R
’000
R’0
00R
’000
R’0
00%
R’0
00R
’000
R’0
00
M
unic
ipal
ities
12
107
- 11
9 11
9 -
100.
0%54
35
M
unic
ipal
ban
k ac
coun
ts12
10
7 -
119
119
- 10
0.0%
54
35
D
epar
tmen
tal a
gen
cies
and
acc
ount
s40
,900
(3
8,35
0)-
2,55
0 2,
550
- 10
0.0%
30,1
16
3,05
3
D
epar
tmen
tal a
gen
cies
(no
n-b
usin
ess
entit
ies)
40,9
00
(38,
350)
- 2,
550
2,55
0 -
100.
0%30
,116
3,
053
P
ublic
co
rpo
ratio
ns a
nd p
rivat
e en
terp
rises
- -
- -
- -
-10
,400
10
,415
P
ublic
co
rpo
ratio
ns-
- -
- -
- -
10,4
00
10,4
15
O
ther
tra
nsfe
rs t
o p
ublic
co
rpo
ratio
ns-
- -
- -
- -
10,4
00
10,4
15
N
on-
pro
fit in
stitu
tions
- -
- -
- -
-15
7 15
7
H
ouse
hold
s3,
160
135
- 3,
295
3,29
5 -
100.
0%6,
272
6,28
9
S
oci
al b
enefi
ts11
5 48
3 -
598
598
- 10
0.0%
1,07
0 1,
069
O
ther
tra
nsfe
rs t
o ho
useh
old
s3,
045
(348
)-
2,69
7 2,
697
- 10
0.0%
5,20
2 5,
220
P
aym
ents
fo
r ca
pit
al a
sset
s14
1,64
0 38
,532
-
180,
172
169,
090
11,0
82
93.8
%13
4,00
8 15
4,07
7
B
uild
ing
s an
d o
ther
fixe
d s
truc
ture
s12
6,56
5 37
,448
22
4 16
4,23
715
3,87
2 10
,365
93,7
%10
9,43
5 14
1,31
7
O
ther
fixe
d s
truc
ture
s12
6,56
5 37
,448
22
4 16
4,23
7 15
3,87
210
,365
93.7
%10
9,43
5 14
1,31
7
M
achi
nery
and
eq
uip
men
t12
,470
30
4 (3
75)
12,3
99
11,6
82
717
94.2
%21
,768
10
,193
Tr
ansp
ort
eq
uip
men
t1,
348
4,56
2 -
5,91
0 5,
910
- 10
0.0%
1,17
6 5,
764
O
ther
mac
hine
ry a
nd e
qui
pm
ent
11,1
22
(4,2
58)
(375
)6,
489
5,77
2 71
789
.0%
20,5
92
4,39
9
B
iolo
gica
l ass
ets
- 82
6 16
4 99
0 99
0 -
100.
0%93
0 69
2
S
oftw
are
and
oth
er in
tang
ible
ass
ets
2,60
5 (4
6)(1
3)2,
546
2,54
6 -
100.
0%1,
875
1,87
5
P
aym
ent
for
fin
anci
al a
sset
s-
- -
- -
- -
- 1
To
tal
555,
205
- -
555,
205
540,
109
15,0
96
97.3
%55
7,94
7 55
4,05
0
The
com
par
ativ
e fig
ure
for
finan
ce le
ases
of
vehi
cles
and
mac
hine
ry a
nd e
qui
pm
ent
has
bee
n re
stat
ed d
ue t
o a
clas
sific
atio
n er
ror
from
cur
rent
to
cap
ital i
n th
e p
rior
year
.
AP
PR
OP
RIA
TIO
N S
TAT
EM
EN
T
for
the
year
en
ded
31
Mar
ch 2
017

Annual Report for 2016/17 Financial Year
180 |Department of Agriculture, Land Reform & Rural Development Northern Cape Province Vote 12
Pro
gra
mm
e 1:
Ad
min
istr
atio
n
2016
/17
2015
/16
Ad
just
ed
Ap
pro
pri
a-ti
on
Sh
ift-
ing
of
Fun
ds
Vir
e-
men
t
Fin
al
Ap
pro
-p
riat
ion
Ac
tual
E
xpen
d-
itu
re
Var
i-an
ce
Exp
end
itu
re
as %
of
fin
al
app
rop
ria-
tio
n F
inal
Ap
-p
rop
riat
ion
Ac
tual
Ex-
pen
dit
ure
R’0
00R
’000
R’0
00R
’000
R’0
00R
’000
%R
’000
R’0
00
Su
b p
rog
ram
me
1O
ffice
of t
he M
EC
12,1
47
314
219
12,6
80
12,6
80
- 10
0.0%
11,0
18
10,9
51
2S
enio
r M
anag
emen
t22
,228
21
20
5 22
,454
22
,452
2
100.
0%20
,356
20
,356
3C
orp
ora
te S
ervi
ces
47,2
68
(1,4
61)
(149
)45
,658
45
,658
-
100.
0%41
,600
41
,600
4Fi
nanc
ial M
anag
emen
t26
,155
1,
142
611
27,9
08
27,9
08
- 10
0.0%
24,1
85
24,1
84
5C
om
mun
icat
ion
Ser
vice
s9,
933
(16)
(9)
9,90
8 9,
908
- 10
0.0%
9,33
2 9,
333
To
tal
117,
731
- 87
7 11
8,60
8 11
8,60
6 2
100.
0%10
6,49
1 10
6,42
4
Eco
no
mic
cla
ssifi
cati
on
C
urr
ent
pay
men
ts11
2,6
61
(1,1
22)
1,17
4 11
2,7
13
112
,713
-
100.
0%10
2,0
69
100,
788
C
om
pen
satio
n of
em
plo
yees
68,5
43
(31)
123
68,6
35
68,6
35
- 10
0.0%
61,6
11
61,6
09
S
alar
ies
and
wag
es59
,255
(4
7)12
3 59
,331
59
,331
- 10
0.0%
53,0
48
53,0
47
S
oci
al c
ont
ribut
ions
9,28
8 16
-
9,30
4 9,
304
- 10
0.0%
8,56
3 8,
562
G
oo
ds
and
ser
vice
s44
,118
(1,0
91)
1,05
1 44
,078
44
,066
12
97
.0%
40,4
58
39,1
79
A
dm
inis
trat
ive
fees
134
(79)
- 55
55
-
100.
0%76
76
A
dve
rtis
ing
234
(56)
- 17
8 17
8 -
100.
0%18
4 18
4
M
ino
r as
sets
59
62
- 12
1 12
1 -
100.
0%87
76
A
udit
cost
s: E
xter
nal
3,69
6 41
9 -
4,11
5 4,
115
- 10
0.0%
3,89
5 3,
895
B
ursa
ries:
Em
plo
yees
320
50
- 37
0 37
0 -
100.
0%21
7 21
7
C
ater
ing:
Dep
artm
enta
l act
iviti
es58
9 (7
5)-
514
514
- 10
0.0%
523
523
C
om
mun
icat
ion
(G&
S)
1,84
8 (2
91)
- 1,
557
1,55
7 -
100.
0%2,
013
1,64
9
C
om
put
er s
ervi
ces
1,67
4 (2
05)
- 1,
469
1,46
9 -
100.
0%1,
749
1,74
9
C
ons
ulta
nts:
Bus
ines
s an
d a
dvi
sory
ser
vice
s30
2 54
22
4 58
0 58
0 -
100.
0%87
6 87
6
AP
PR
OP
RIA
TIO
N S
TAT
EM
EN
T
for
the
year
en
ded
31
Mar
ch 2
017

Annual Report for 2016/17 Financial Year
| 181Department of Agriculture, Land Reform & Rural Development Northern Cape Province Vote 12
2016
/17
2015
/16
Ad
just
ed
Ap
pro
pri
a-ti
on
Sh
ift-
ing
of
Fun
ds
Vir
e-
men
t
Fin
al
Ap
pro
-p
riat
ion
Ac
tual
E
xpen
d-
itu
re
Var
i-an
ce
Exp
end
itu
re
as %
of
fin
al
app
rop
ria-
tio
n F
inal
Ap
-p
rop
riat
ion
Ac
tual
Ex-
pen
dit
ure
R’0
00R
’000
R’0
00R
’000
R’0
00R
’000
%R
’000
R’0
00
Le
gal
ser
vice
s29
4 56
-
350
350
- 10
0.0%
365
365
C
ont
ract
ors
273
(69)
- 20
4 20
4 -
100.
0%39
5 39
5
A
gen
cy a
nd s
upp
ort
/ o
utso
urce
d s
ervi
ces
3,30
2 (8
6)-
3,21
6 3,
216
- 10
0.0%
766
766
Fl
eet
serv
ices
(inc
lud
ing
gov
ernm
ent
mot
or
tran
spo
rt)
1,36
3 (6
50)
1 71
4 71
4 -
61.4
%1,
061
623
In
vent
ory
: Clo
thin
g m
ater
ial a
nd a
cces
sorie
s-
- -
- -
- 0.
0%18
0 18
0
In
vent
ory
: Far
min
g su
pp
lies
- -
- -
- -
- 30
30
In
vent
ory
: Fo
od
and
foo
d s
upp
lies
58
(58)
- -
- -
- 64
64
In
vent
ory
: Fue
l, oi
l and
gas
4 (4
)-
- -
- -
- -
In
vent
ory
: Mat
eria
ls a
nd s
upp
lies
85
(64)
2 23
23
-
100.
0%15
15
Inve
nto
ry: O
ther
sup
plie
s -
11-
1111
-10
0.0%
-19
C
ons
umab
le s
upp
lies
574
108
- 68
2 68
2 -
100.
0%82
2 82
2
C
ons
umab
le: S
tatio
nery
, prin
ting
and
offi
ce s
upp
lies
633
(222
)4
415
415
- 10
0.0%
756
756
O
per
atin
g le
ases
12,8
65
(2,3
67)
- 10
,498
10
,498
-
100.
0%11
,465
11
,045
P
rop
erty
pay
men
ts5,
543
1,64
2 -
7,18
5 7,
185
- 10
0.0%
6,03
8 6,
038
Tr
avel
and
sub
sist
ence
8,20
9 95
2 78
0 9,
941
9,92
9 12
99
.9%
7,89
0 7,
825
Tr
aini
ng a
nd d
evel
opm
ent
679
(534
)1
146
146
- 10
0.0%
270
270
O
per
atin
g p
aym
ents
868
104
- 97
2 97
2 -
100.
0%34
4 34
4
Ve
nues
and
faci
litie
s50
9 (5
0)-
459
459
- 10
0.0%
248
248
R
enta
l and
hiri
ng3
261
39
303
303
- 10
0.0%
129
129
In
tere
st a
nd r
ent
on
land
- -
- -
12
(12)
--
-
In
tere
st (I
ncl.
inte
rest
on
unita
ry p
aym
ents
(PP
P))
- -
- -
12
(12)
--
-
AP
PR
OP
RIA
TIO
N S
TAT
EM
EN
T
for
the
year
en
ded
31
Mar
ch 2
017

Annual Report for 2016/17 Financial Year
182 |Department of Agriculture, Land Reform & Rural Development Northern Cape Province Vote 12
2016
/17
2015
/16
Ad
just
ed
Ap
pro
pri
a-ti
on
Sh
ift-
ing
of
Fun
ds
Vir
e-
men
t
Fin
al
Ap
pro
-p
riat
ion
Ac
tual
E
xpen
d-
itu
re
Var
i-an
ce
Exp
end
itu
re
as %
of
fin
al
app
rop
ria-
tio
n F
inal
Ap
-p
rop
riat
ion
Ac
tual
Ex-
pen
dit
ure
R’0
00R
’000
R’0
00R
’000
R’0
00R
’000
%R
’000
R’0
00
Tr
ansf
ers
and
su
bsi
die
s3,
026
(234
)-
2,79
2 2,
792
- 10
0.0%
4,17
6 4,
175
P
rovi
nces
and
mun
icip
aliti
es-
- -
- -
- -
54
35
M
unic
ipal
ities
- -
- -
- -
- 54
35
M
unic
ipal
ban
k ac
coun
ts-
- -
- -
- -
54
35
H
ouse
hold
s3,
026
(234
)-
2,79
2 2,
792
- 10
0.0%
4,12
2 4,
140
S
oci
al b
enefi
ts8
215
- 22
3 22
3 -
100.
0%83
83
O
ther
tra
nsfe
rs t
o ho
useh
old
s3,
018
(449
)-
2,56
9 2,
569
- 10
0.0%
4,03
9 4,
057
P
aym
ents
fo
r ca
pit
al a
sset
s2,
044
1,35
6 (2
97)
3,10
3 3,
101
2 99
.9%
246
1,46
1
M
achi
nery
and
eq
uip
men
t2,
044
1,35
6 (2
97)
3,10
3 3,
101
2 99
.9%
246
1,46
1
Tr
ansp
ort
eq
uip
men
t1,
240
44
8-
1,68
8 1,
688
- 10
0.0%
- 43
8
O
ther
mac
hine
ry a
nd e
qui
pm
ent
804
908
(297
)1,
415
1,41
32
99.9
%24
6 1,
023
To
tal
117,
731
- 87
7 11
8,60
8 11
8,60
6 2
100.
0%10
6,49
1 10
6,42
4
AP
PR
OP
RIA
TIO
N S
TAT
EM
EN
T
for
the
year
en
ded
31
Mar
ch 2
017

Annual Report for 2016/17 Financial Year
| 183Department of Agriculture, Land Reform & Rural Development Northern Cape Province Vote 12
AP
PR
OP
RIA
TIO
N S
TAT
EM
EN
T
for
the
year
en
ded
31
Mar
ch 2
017
Su
bp
rog
ram
me:
1.1
: Offi
ce o
f th
e M
EC
2016
/17
2015
/16
Ad
just
ed
Ap
pro
pri
a-ti
on
Sh
ifti
ng
o
f Fu
nd
s V
ire
-m
ent
Fin
al
Ap
pro
pri
-at
ion
Ac
tual
E
xpen
di-
ture
V
ari-
ance
Exp
end
itu
re
as %
of
fin
al
app
rop
riat
ion
Fin
al
Ap
pro
-p
riat
ion
Ac
tual
E
xpen
di-
ture
Eco
no
mic
cla
ssifi
cati
on
R’0
00R
’000
R’0
00R
’000
R’0
00R
’000
%R
’000
R’0
00
Cu
rren
t p
aym
ents
10,5
54
(94)
21
9 10
,679
10
,679
-
100.
0%10
,735
10
,483
Co
mp
ensa
tion
of e
mp
loye
es6,
626
- 12
3 6,
749
6,74
9 -
100.
0%6,
239
6,23
9
Go
od
s an
d s
ervi
ces
3,92
8 (9
4)
96
3,93
0 3,
930
- 10
0.0%
4,49
6 4,
244
Tran
sfer
s an
d s
ub
sid
ies
262
136
- 39
8 39
8 -
100.
0%26
0 25
9
Pro
vinc
es a
nd m
unic
ipal
ities
- -
- -
- -
0.0%
32
13
Hou
seho
lds
262
136
- 39
8 39
8 -
100.
0%26
0 25
9
Pay
men
ts f
or
cap
ital
ass
ets
1,33
1 27
2 -
1,60
3 1,
603
- 10
0.0%
23
209
Mac
hine
ry a
nd e
qui
pm
ent
1,33
1 27
2 -
1,60
3 1,
603
- 10
0.0%
23
209
Pay
men
t fo
r fin
anci
al a
sset
s-
- -
- -
- 0.
0%-
To
tal
12,1
47
314
219
12,6
80
12,6
80
- 10
0.0%
11,0
18
10,9
51

Annual Report for 2016/17 Financial Year
184 |Department of Agriculture, Land Reform & Rural Development Northern Cape Province Vote 12
Su
bp
rog
ram
me:
1.2
: Sen
ior
Man
agem
ent
20
16/1
720
15/1
6
Ad
just
ed
Ap
pro
pri
a-ti
on
Sh
ifti
ng
o
f Fu
nd
s V
irem
ent
Fin
al A
p-
pro
pri
atio
n A
ctu
al E
x-p
end
itu
re
Var
ian
ce
Exp
end
itu
re
as %
of
fin
al
app
rop
riat
ion
Fin
al A
p-
pro
pri
atio
n A
ctu
al E
x-p
end
itu
re
Eco
no
mic
cla
ssifi
cati
on
R’0
00R
’000
R’0
00R
’000
R’0
00R
’000
%R
’000
R’0
00C
urr
ent
pay
men
ts21
,986
(3
50)
263
21,8
99
21,8
99
- 10
0.0%
20,3
05
19,9
81
Co
mp
ensa
tion
of e
mp
loye
es15
,453
(1
12)
- 15
,341
15
,341
-
100.
0%14
,311
14
,311
G
oo
ds
and
ser
vice
s6,
533
(238
) 26
3 6,
558
6,54
6 12
99
.8%
5,99
4 5,
670
Inte
rest
and
ren
t o
n la
nd-
- -
- 12
(1
2)0.
0%-
- Tr
ansf
ers
and
su
bsi
die
s14
-
- 14
14
-
100.
0%10
10
H
ouse
hold
s14
-
- 14
14
-
100.
0%10
10
P
aym
ents
fo
r ca
pit
al a
sset
s22
8 37
1 (5
8)54
1 53
9 2
99.6
%41
36
5B
uild
ing
s an
d o
ther
fixe
d s
truc
ture
s-
- -
- -
- 0.
0%-
- M
achi
nery
and
eq
uip
men
t22
8 37
1 (5
8)54
1 53
9 2
99.6
%41
36
5 T
ota
l 22
,228
21
20
5 22
,454
22
,452
2
100.
0%20
,356
20
,356
Su
bp
rog
ram
me:
1.3
: Co
rpo
rate
Ser
vice
s
2016
/17
2015
/16
A
dju
sted
A
pp
rop
ria-
tio
n S
hif
tin
g
of
Fun
ds
Vir
emen
t F
inal
Ap
pro
-p
riat
ion
Ac
tual
Ex-
pen
dit
ure
V
aria
nce
Exp
end
itu
re
as %
of
fin
al
app
rop
ria-
tio
n F
inal
Ap
pro
-p
riat
ion
Ac
tual
Ex-
pen
dit
ure
E
con
om
ic c
lass
ifica
tio
n R
’000
R’0
00R
’000
R’0
00R
’000
R’0
00%
R’0
00R
’000
Cu
rren
t p
aym
ents
44,2
99
(1,3
15)
- 42
,984
42
,984
-
100.
0%38
,709
38
,247
C
om
pen
satio
n of
em
plo
yees
22,0
81
(84)
- 21
,997
21
,997
-
100.
0%18
,505
18
,504
G
oo
ds
and
ser
vice
s22
,218
(1
,231
)-
20,9
87
20,9
87
-10
0.0%
20,2
04
19,7
43
Tran
sfer
s an
d s
ub
sid
ies
2,7
50
(585
)-
2,1
65
2,1
65
- 10
0.0%
2,8
86
2,8
86
Pro
vinc
es a
nd m
unic
ipal
ities
- -
- -
- -
0.0%
22
22
Hou
seho
lds
2,75
0 (5
85)
- 2,
165
2,16
5 -
100.
0%2,
864
2,86
4 P
aym
ents
fo
r ca
pit
al a
sset
s21
9 43
9 (1
49)
509
509
-10
0.0%
5 46
7 M
achi
nery
and
eq
uip
men
t21
9 43
9 (1
49)
509
509
-10
0.0%
5
46
7 T
ota
l 47
,268
(1
,461
)(1
49)
45,6
58
45,6
58
- 10
0.0%
41,6
00
41,6
00
AP
PR
OP
RIA
TIO
N S
TAT
EM
EN
T
for
the
year
en
ded
31
Mar
ch 2
017

Annual Report for 2016/17 Financial Year
| 185Department of Agriculture, Land Reform & Rural Development Northern Cape Province Vote 12
AP
PR
OP
RIA
TIO
N S
TAT
EM
EN
T
for
the
year
en
ded
31
Mar
ch 2
017
Su
bp
rog
ram
me:
1.4
: Fin
anci
al M
anag
emen
t
20
16/1
720
15/1
6
A
dju
sted
A
pp
rop
ria-
tio
n S
hif
tin
g
of
Fun
ds
Vir
emen
t F
inal
Ap
-p
rop
riat
ion
Ac
tual
Ex-
pen
dit
ure
V
aria
nce
Exp
end
itu
re
as %
of
fin
al
app
rop
ria-
tio
n F
inal
Ap
-p
rop
riat
ion
Ac
tual
Ex-
pen
dit
ure
Eco
no
mic
cla
ssifi
cati
on
R’0
00R
’000
R’0
00R
’000
R’0
00R
’000
%R
’000
R’0
00
Cu
rren
t p
aym
ents
25,9
84
942
668
27,7
94
27,7
94
- 10
0.0%
23,0
55
22,8
76
Co
mp
ensa
tion
of e
mp
loye
es18
,536
23
4 -
18,7
70
18,7
70
- 10
0.0%
16,8
60
16,8
59
Go
od
s an
d s
ervi
ces
7,44
8 70
8 66
8 8,
824
8,82
4 -
100.
0%6,
195
6,01
7
Tran
sfer
s an
d s
ub
sid
ies
- -
- -
- -
0.0%
1,00
3 1,
003
Hou
seho
lds
- -
- -
- -
0.0%
1,00
3 1,
003
Pay
men
ts f
or
cap
ital
ass
ets
171
200
(57)
314
314
(100
) 27
5.4%
127
305
Mac
hine
ry a
nd e
qui
pm
ent
171
200
(57)
314
314
(100
) 27
5.4%
127
305
To
tal
26,1
55
1,14
2 61
1 27
,908
27
,908
-
100.
0%24
,185
24
,184
Su
bp
rog
ram
me:
1.5
: Co
mm
un
icat
ion
Ser
vice
s
20
16/1
720
15/1
6
A
dju
sted
A
pp
rop
ria-
tio
n S
hif
tin
g
of
Fun
ds
Vir
emen
t F
inal
Ap
-p
rop
riat
ion
Ac
tual
Ex-
pen
dit
ure
V
aria
nce
Exp
end
itu
re
as %
of
fin
al
app
rop
ria-
tio
n F
inal
Ap
-p
rop
riat
ion
Ac
tual
Ex-
pen
dit
ure
Eco
no
mic
cla
ssifi
cati
on
R’0
00R
’000
R’0
00R
’000
R’0
00R
’000
%R
’000
R’0
00
Cu
rren
t p
aym
ents
9,83
8 (3
05)
24
9,55
7 9,
557
- 10
0.0%
9,26
5 9,
201
Co
mp
ensa
tion
of e
mp
loye
es5,
847
(69)
- 5,
778
5,77
8 -
100.
0%5,
696
5,69
6
Go
od
s an
d s
ervi
ces
3,99
1 (2
36)
24
3,77
9 3,
779
- 10
0.0%
3,56
9 3,
505
Tran
sfer
s an
d s
ub
sid
ies
- 21
5 -
215
215
- 10
0.0%
17
17
Hou
seho
lds
- 21
5 -
215
215
- 10
0.0%
17
17
Pay
men
ts f
or
cap
ital
ass
ets
95
(74)
(33)
136
136
- 10
0.0%
50
115
Mac
hine
ry a
nd e
qui
pm
ent
95
(74)
(33)
136
136
-10
0.0%
50
115
To
tal
9,93
3 (1
6)(9
)9,
908
9,90
8 -
100.
0%9,
332
9,33
3

Annual Report for 2016/17 Financial Year
186 |Department of Agriculture, Land Reform & Rural Development Northern Cape Province Vote 12
Pro
gra
mm
e 2:
Su
stai
nab
le R
eso
urc
e M
anag
emen
t
2016
/17
2015
/16
Ad
just
ed
Ap
pro
pri
-at
ion
Sh
ift-
ing
of
Fun
ds
Vir
e-
men
t
Fin
al
Ap
pro
-p
riat
ion
Ac
tual
E
xpen
di-
ture
V
aria
nce
Exp
end
-it
ure
as
% o
f fi
nal
ap
pro
pri
a-ti
on
Fin
al
Ap
pro
pri
-at
ion
Ac
tual
Ex-
pen
dit
ure
R’0
00R
’000
R’0
00R
’000
R’0
00R
’000
%R
’000
R’0
00
Su
b p
rog
ram
me
1E
ngin
eerin
g S
ervi
ces
7,35
6 (2
30)
- 7,
126
7,12
6 -
100.
0%4,
944
4,94
1
2La
nd C
are
9,32
0 -
- 9,
320
9,30
6 14
99
.8%
7,44
0 7,
439
3La
nd U
se M
anag
emen
t15
,356
33
(3
34)
15,0
55
14,8
15
240
98.4
%16
,789
16
,789
4D
isas
ter
Ris
k M
anag
emen
t64
,000
19
7 -
64,1
97
64,1
97
- 10
0.0%
68,3
27
68,3
27
Tota
l96
,032
-
(334
)95
,698
95
,444
25
4 99
.7%
97,5
00
97,4
96
Eco
no
mic
cla
ssifi
cati
on
C
urr
ent
pay
men
ts41
,222
(8
,731
)(3
34)
32,1
57
31,9
03
254
99.2
%40
,818
40
,515
C
om
pen
satio
n of
em
plo
yees
17,1
33
(315
)(3
34)
16,4
84
16,2
44
240
98.5
%15
,315
15
,315
S
alar
ies
and
wag
es14
,699
14
4 (3
34)
14,5
09
14,3
22
187
98.7
%13
,446
13
,446
S
oci
al c
ont
ribut
ions
2,43
4 (4
59)
- 1,
975
1,92
2 53
97
.3%
1,86
9 1,
869
G
oo
ds
and
ser
vice
s24
,089
(8
,416
)-
15,6
73
15,6
59
14
99.9
%25
,503
25
,200
A
dm
inis
trat
ive
fees
146
(89)
- 57
57
-
100.
0%46
46
A
dve
rtis
ing
187
127
- 31
4 31
4 -
100.
0%13
7 13
7
M
ino
r as
sets
122
(9)
- 11
3 11
3 -
100.
0%21
7 50
C
ater
ing:
Dep
artm
enta
l act
iviti
es52
2 (4
51)
- 71
71
-
100.
0%24
4 24
4
C
om
mun
icat
ion
(G&
S)
209
(158
) -
51
51
-10
0.0%
212
24
C
om
put
er s
ervi
ces
- 24
-
24
24
- 10
0.0%
42
42
C
ons
ulta
nts:
Bus
ines
s an
d a
dvi
sory
ser
vice
s10
0 -
- 10
0 10
0 -
100.
0%82
82
In
fras
truc
ture
and
pla
nnin
g se
rvic
es4,
748
(4,7
48)
- -
- -
0.0%
11,6
60
11,6
60
C
ont
ract
ors
7,14
0 (4
,373
)-
2,76
7 2,
767
- 10
0.0%
5,13
4 5,
088
A
gen
cy a
nd s
upp
ort
/ o
utso
urce
d s
ervi
ces
- 8
- 8
8 -
100.
0%-
-
AP
PR
OP
RIA
TIO
N S
TAT
EM
EN
T
for
the
year
en
ded
31
Mar
ch 2
017
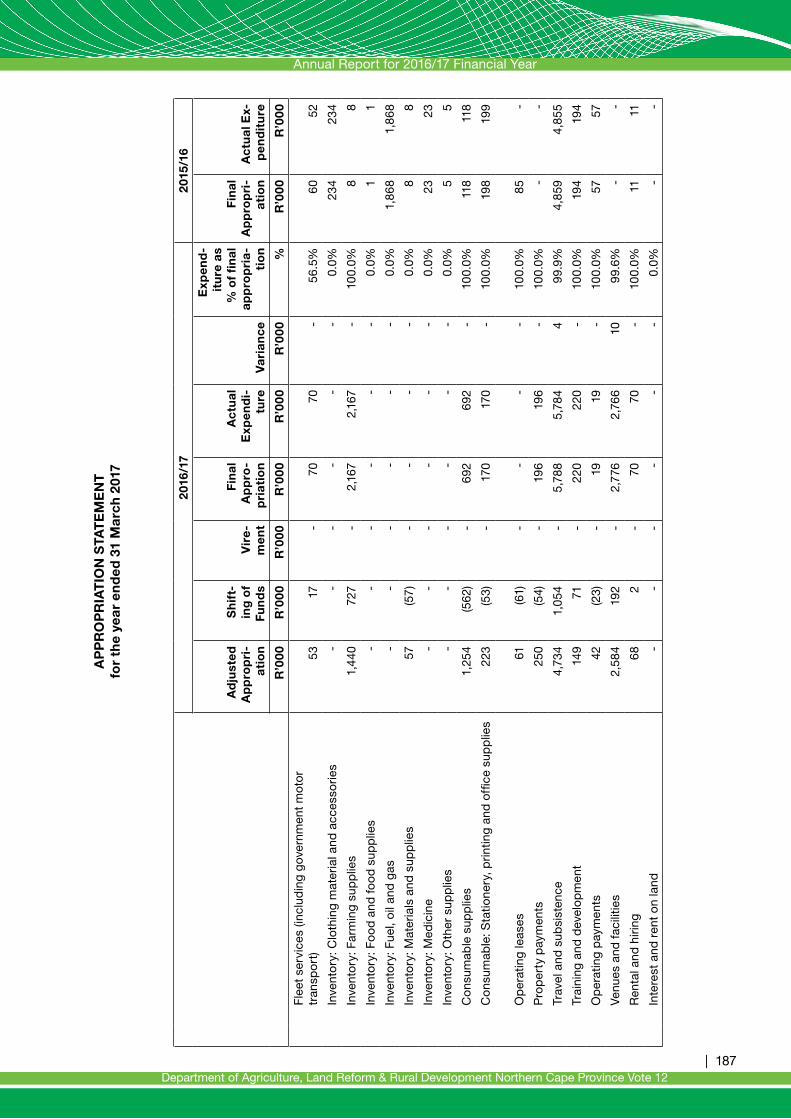
Annual Report for 2016/17 Financial Year
| 187Department of Agriculture, Land Reform & Rural Development Northern Cape Province Vote 12
AP
PR
OP
RIA
TIO
N S
TAT
EM
EN
T
for
the
year
en
ded
31
Mar
ch 2
017
2016
/17
2015
/16
Ad
just
ed
Ap
pro
pri
-at
ion
Sh
ift-
ing
of
Fun
ds
Vir
e-
men
t
Fin
al
Ap
pro
-p
riat
ion
Ac
tual
E
xpen
di-
ture
V
aria
nce
Exp
end
-it
ure
as
% o
f fi
nal
ap
pro
pri
a-ti
on
Fin
al
Ap
pro
pri
-at
ion
Ac
tual
Ex-
pen
dit
ure
R’0
00R
’000
R’0
00R
’000
R’0
00R
’000
%R
’000
R’0
00
Fl
eet
serv
ices
(inc
lud
ing
gov
ernm
ent
mot
or
tran
spo
rt)
53
17
-
70
70
-56
.5%
60
52
In
vent
ory
: Clo
thin
g m
ater
ial a
nd a
cces
sorie
s-
- -
- -
- 0.
0%23
4 23
4
In
vent
ory
: Far
min
g su
pp
lies
1,44
0 72
7 -
2,16
7 2,
167
- 10
0.0%
8 8
In
vent
ory
: Fo
od
and
foo
d s
upp
lies
- -
- -
- -
0.0%
1 1
In
vent
ory
: Fue
l, oi
l and
gas
- -
- -
- -
0.0%
1,86
8 1,
868
In
vent
ory
: Mat
eria
ls a
nd s
upp
lies
57
(57)
- -
- -
0.0%
8 8
In
vent
ory
: Med
icin
e-
- -
- -
- 0.
0%23
23
In
vent
ory
: Oth
er s
upp
lies
- -
- -
- -
0.0%
5 5
C
ons
umab
le s
upp
lies
1,25
4 (5
62)
- 69
2 69
2 -
100.
0%11
8 11
8
C
ons
umab
le: S
tatio
nery
, prin
ting
and
offi
ce s
upp
lies
223
(53)
- 17
0 17
0 -
100.
0%19
8 19
9
O
per
atin
g le
ases
61
(61)
-
--
- 10
0.0%
85
-
P
rop
erty
pay
men
ts25
0 (5
4)-
196
196
- 10
0.0%
- -
Tr
avel
and
sub
sist
ence
4,73
4 1,
054
- 5,
788
5,78
4 4
99.9
%4,
859
4,85
5
Tr
aini
ng a
nd d
evel
opm
ent
149
71
- 22
0 22
0 -
100.
0%19
4 19
4
O
per
atin
g p
aym
ents
42
(23)
- 19
19
-
100.
0%57
57
Ve
nues
and
faci
litie
s2,
584
192
- 2,
776
2,76
6 10
99
.6%
- -
R
enta
l and
hiri
ng68
2
- 70
70
-
100.
0%11
11
In
tere
st a
nd r
ent
on
land
- -
- -
- -
0.0%
- -
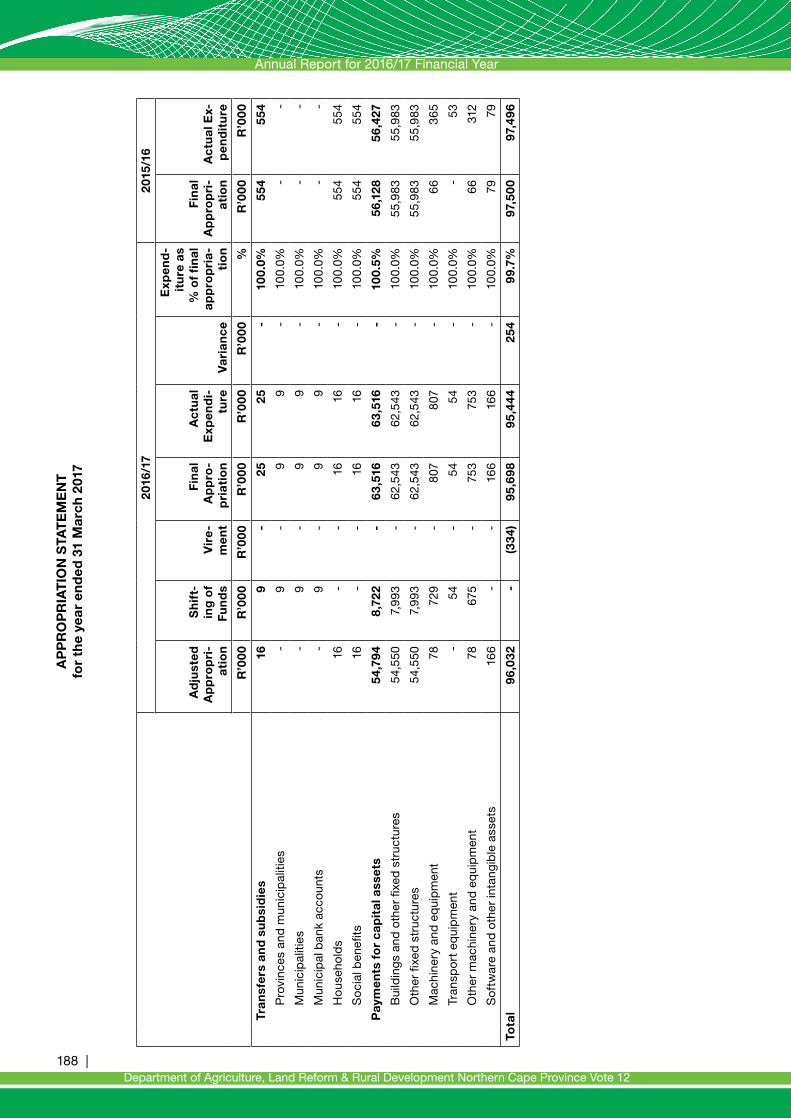
Annual Report for 2016/17 Financial Year
188 |Department of Agriculture, Land Reform & Rural Development Northern Cape Province Vote 12
2016
/17
2015
/16
Ad
just
ed
Ap
pro
pri
-at
ion
Sh
ift-
ing
of
Fun
ds
Vir
e-
men
t
Fin
al
Ap
pro
-p
riat
ion
Ac
tual
E
xpen
di-
ture
V
aria
nce
Exp
end
-it
ure
as
% o
f fi
nal
ap
pro
pri
a-ti
on
Fin
al
Ap
pro
pri
-at
ion
Ac
tual
Ex-
pen
dit
ure
R’0
00R
’000
R’0
00R
’000
R’0
00R
’000
%R
’000
R’0
00
Tr
ansf
ers
and
su
bsi
die
s16
9
- 25
25
-
100.
0%55
4 55
4
P
rovi
nces
and
mun
icip
aliti
es-
9 -
9 9
- 10
0.0%
- -
M
unic
ipal
ities
- 9
- 9
9 -
100.
0%-
-
M
unic
ipal
ban
k ac
coun
ts-
9 -
9 9
- 10
0.0%
- -
H
ouse
hold
s16
-
- 16
16
-
100.
0%55
4 55
4
S
oci
al b
enefi
ts16
-
- 16
16
-
100.
0%55
4 55
4
P
aym
ents
fo
r ca
pit
al a
sset
s54
,794
8,
722
- 63
,516
63
,516
-
100.
5%56
,128
56
,427
B
uild
ing
s an
d o
ther
fixe
d s
truc
ture
s54
,550
7,
993
- 62
,543
62
,543
-
100.
0%55
,983
55
,983
O
ther
fixe
d s
truc
ture
s54
,550
7,
993
- 62
,543
62
,543
-
100.
0%55
,983
55
,983
M
achi
nery
and
eq
uip
men
t78
72
9 -
807
807
- 10
0.0%
66
365
Tran
spo
rt e
qui
pm
ent
-54
-54
54-
100.
0%-
53
O
ther
mac
hine
ry a
nd e
qui
pm
ent
78
675
- 75
3 75
3 -
100.
0%66
31
2
S
oftw
are
and
oth
er in
tang
ible
ass
ets
166
- -
166
166
- 10
0.0%
79
79
Tota
l96
,032
-
(334
)95
,698
95
,444
25
4 99
.7%
97,5
00
97,4
96
AP
PR
OP
RIA
TIO
N S
TAT
EM
EN
T
for
the
year
en
ded
31
Mar
ch 2
017

Annual Report for 2016/17 Financial Year
| 189Department of Agriculture, Land Reform & Rural Development Northern Cape Province Vote 12
AP
PR
OP
RIA
TIO
N S
TAT
EM
EN
T
for
the
year
en
ded
31
Mar
ch 2
017
Su
bp
rog
ram
me:
2.1
: En
gin
eeri
ng
Ser
vice
s
20
16/1
720
15/1
6
Ad
just
ed
Ap
pro
pri
-at
ion
Sh
ifti
ng
o
f Fu
nd
s V
irem
ent
Fin
al
Ap
pro
pri
-at
ion
Ac
tual
E
xpen
di-
ture
V
aria
nce
Exp
end
-it
ure
as
% o
f fi
nal
ap
pro
pri
a-ti
on
Fin
al
Ap
pro
pri
-at
ion
Ac
tual
E
xpen
di-
ture
Eco
no
mic
cla
ssifi
cati
on
R’0
00R
’000
R’0
00R
’000
R’0
00R
’000
%R
’000
R’0
00
Cu
rren
t p
aym
ents
7,19
0 (2
61)
- 6,
929
6,92
9 -
100.
0%4,
834
4,79
8
Co
mp
ensa
tion
of e
mp
loye
es5,
465
(405
)-
5,06
0 5,
060
- 10
0.0%
3,67
0 3,
670
Go
od
s an
d s
ervi
ces
1,72
5 14
4 -
1,86
9 1,
869
- 10
0.0%
1,16
4 1,
128
Pay
men
ts f
or
cap
ital
ass
ets
166
31
- 19
7 19
7 -
100.
0%11
0 14
3
Mac
hine
ry a
nd e
qui
pm
ent
- 31
-
31
31-
100.
0%31
64
Sof
twar
e an
d o
ther
inta
ngib
le a
sset
s16
6 -
- 16
6 16
6 -
100.
0%79
79
To
tal
7,35
6 (2
30)
- 7,
126
7,12
6 -
100.
0%4,
944
4,94
1
Su
bp
rog
ram
me:
2.2
: Lan
d C
are
20
16/1
720
15/1
6
Ad
just
ed
Ap
pro
pri
-at
ion
Sh
ifti
ng
o
f Fu
nd
s V
irem
ent
Fin
al
Ap
pro
pri
-at
ion
Ac
tual
E
xpen
di-
ture
V
aria
nce
Exp
end
-it
ure
as
% o
f fi
nal
ap
pro
pri
a-ti
on
Fin
al
Ap
pro
pri
-at
ion
Ac
tual
E
xpen
di-
ture
Eco
no
mic
cla
ssifi
cati
on
R’0
00R
’000
R’0
00R
’000
R’0
00R
’000
%R
’000
R’0
00
Cu
rren
t p
aym
ents
8,77
0 (2
29)
- 8,
541
8,52
7 14
99
.8%
7,31
6 7,
289
Co
mp
ensa
tion
of e
mp
loye
es-
- -
- -
- 0.
0%34
34
Go
od
s an
d s
ervi
ces
8,77
0 (2
29)
- 8,
541
8,52
7 14
99
.8%
7,28
2 7,
255
Pay
men
ts f
or
cap
ital
ass
ets
550
229
- 77
9 77
9 -
100.
0%12
4 15
0
Bui
ldin
gs
and
oth
er fi
xed
str
uctu
res
550
229
- 77
9 77
9 -
100.
0%96
96
Mac
hine
ry a
nd e
qui
pm
ent
- -
- -
- -
0.0%
28
82
To
tal
9,32
0 -
- 9,
320
9,30
6 14
99
.8%
7,44
0 7,
439
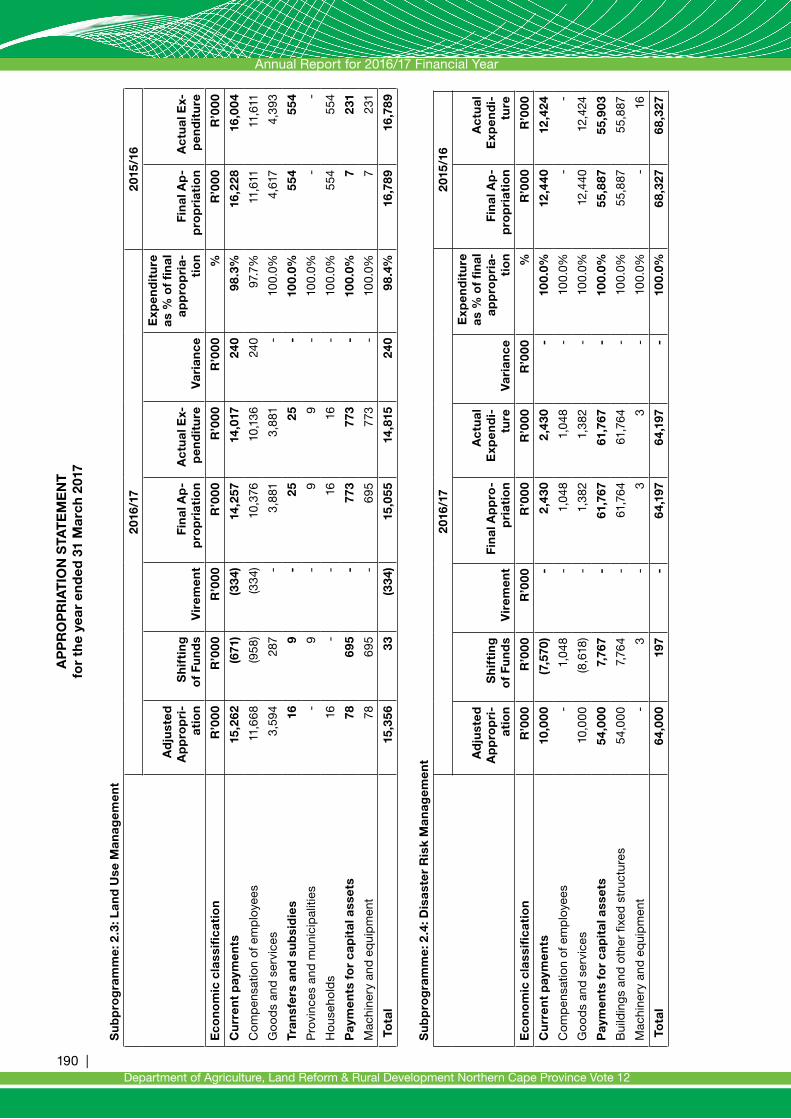
Annual Report for 2016/17 Financial Year
190 |Department of Agriculture, Land Reform & Rural Development Northern Cape Province Vote 12
Su
bp
rog
ram
me:
2.3
: Lan
d U
se M
anag
emen
t
20
16/1
720
15/1
6
Ad
just
ed
Ap
pro
pri
-at
ion
Sh
ifti
ng
o
f Fu
nd
s V
irem
ent
Fin
al A
p-
pro
pri
atio
n A
ctu
al E
x-p
end
itu
re
Var
ian
ce
Exp
end
itu
re
as %
of
fin
al
app
rop
ria-
tio
n F
inal
Ap
-p
rop
riat
ion
Ac
tual
Ex-
pen
dit
ure
Eco
no
mic
cla
ssifi
cati
on
R’0
00R
’000
R’0
00R
’000
R’0
00R
’000
%R
’000
R’0
00
Cu
rren
t p
aym
ents
15,2
62
(671
)(3
34)
14,2
57
14,0
17
240
98.3
%16
,228
16
,004
Co
mp
ensa
tion
of e
mp
loye
es11
,668
(9
58)
(334
)10
,376
10
,136
24
0 97
.7%
11,6
11
11,6
11
Go
od
s an
d s
ervi
ces
3,59
4 28
7 -
3,88
1 3,
881
- 10
0.0%
4,61
7 4,
393
Tran
sfer
s an
d s
ub
sid
ies
16
9 -
25
25
- 10
0.0%
554
554
Pro
vinc
es a
nd m
unic
ipal
ities
- 9
- 9
9 -
100.
0%-
-
Hou
seho
lds
16
- -
16
16
- 10
0.0%
554
554
Pay
men
ts f
or
cap
ital
ass
ets
78
695
- 77
3 77
3 -
100.
0%7
231
Mac
hine
ry a
nd e
qui
pm
ent
78
695
- 69
5 77
3 -
100.
0%7
231
To
tal
15,3
56
33
(334
)15
,055
14
,815
24
0 98
.4%
16,7
89
16,7
89
Su
bp
rog
ram
me:
2.4
: Dis
aste
r R
isk
Man
agem
ent
20
16/1
720
15/1
6
Ad
just
ed
Ap
pro
pri
-at
ion
Sh
ifti
ng
o
f Fu
nd
s V
irem
ent
Fin
al A
pp
ro-
pri
atio
n
Ac
tual
E
xpen
di-
ture
V
aria
nce
Exp
end
itu
re
as %
of
fin
al
app
rop
ria-
tio
n F
inal
Ap
-p
rop
riat
ion
Ac
tual
E
xpen
di-
ture
Eco
no
mic
cla
ssifi
cati
on
R’0
00R
’000
R’0
00R
’000
R’0
00R
’000
%R
’000
R’0
00
Cu
rren
t p
aym
ents
10,0
00
(7,5
70)
- 2
,430
2
,430
-
100.
0%12
,440
12
,424
Co
mp
ensa
tion
of e
mp
loye
es-
1,04
8 -
1,04
8 1,
048
- 10
0.0%
- -
Go
od
s an
d s
ervi
ces
10,0
00
(8,6
18)
- 1,
382
1,38
2 -
100.
0%12
,440
12
,424
Pay
men
ts f
or
cap
ital
ass
ets
54,0
00
7,76
7 -
61,7
67
61,7
67
- 10
0.0%
55,8
87
55,9
03
Bui
ldin
gs
and
oth
er fi
xed
str
uctu
res
54,0
00
7,76
4 -
61,7
64
61,7
64
- 10
0.0%
55,8
87
55,8
87
Mac
hine
ry a
nd e
qui
pm
ent
-3
-3
3-
100.
0%-
16
To
tal
64,0
00
197
- 64
,197
64
,197
-
100.
0%68
,327
68
,327
AP
PR
OP
RIA
TIO
N S
TAT
EM
EN
T
for
the
year
en
ded
31
Mar
ch 2
017
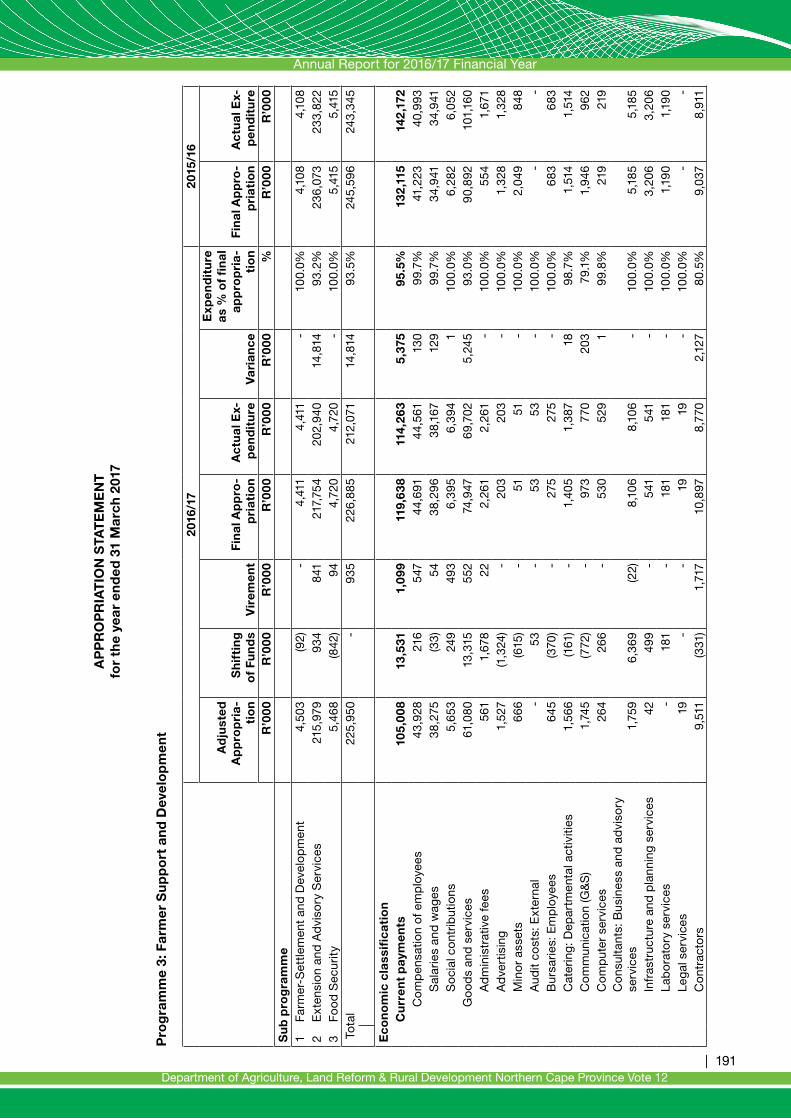
Annual Report for 2016/17 Financial Year
| 191Department of Agriculture, Land Reform & Rural Development Northern Cape Province Vote 12
AP
PR
OP
RIA
TIO
N S
TAT
EM
EN
T
for
the
year
en
ded
31
Mar
ch 2
017
Pro
gra
mm
e 3:
Far
mer
Su
pp
ort
an
d D
evel
op
men
t
2016
/17
2015
/16
Ad
just
ed
Ap
pro
pri
a-ti
on
Sh
ifti
ng
o
f Fu
nd
s V
irem
ent
Fin
al A
pp
ro-
pri
atio
n A
ctu
al E
x-p
end
itu
re
Var
ian
ce
Exp
end
itu
re
as %
of
fin
al
app
rop
ria-
tio
n F
inal
Ap
pro
-p
riat
ion
Ac
tual
Ex-
pen
dit
ure
R
’000
R’0
00R
’000
R’0
00R
’000
R’0
00%
R’0
00R
’000
Su
b p
rog
ram
me
1
Farm
er-S
ettle
men
t an
d D
evel
opm
ent
4,50
3 (9
2)-
4,41
1 4,
411
- 10
0.0%
4,10
8 4,
108
2E
xten
sio
n an
d A
dvi
sory
Ser
vice
s21
5,97
9 93
4 84
1 21
7,75
4 20
2,94
0 14
,814
93
.2%
236,
073
233,
822
3Fo
od
Sec
urity
5,46
8 (8
42)
94
4,72
0 4,
720
- 10
0.0%
5,41
5 5,
415
Tot
al
225,
950
- 93
5 22
6,88
5 21
2,07
1 14
,814
93
.5%
245,
596
243,
345
E
con
om
ic c
lass
ifica
tio
n
C
urr
ent
pay
men
ts10
5,00
8 13
,531
1,
099
119,
638
114,
263
5,37
5 95
.5%
132
,115
14
2,1
72
C
om
pen
satio
n of
em
plo
yees
43,9
28
216
547
44,6
91
44,5
61
130
99.7
%41
,223
40
,993
Sal
arie
s an
d w
ages
38,2
75
(33)
54
38,2
96
38,1
67
129
99.7
%34
,941
34
,941
So
cial
co
ntrib
utio
ns5,
653
249
493
6,39
5 6,
394
1 10
0.0%
6,28
2 6,
052
G
oo
ds
and
ser
vice
s61
,080
13
,315
55
2 74
,947
69
,702
5,24
5 93
.0%
90,8
92
101,
160
A
dm
inis
trat
ive
fees
561
1,67
8 22
2,
261
2,26
1 -
100.
0%55
4 1,
671
A
dve
rtis
ing
1,52
7 (1
,324
)-
203
203
- 10
0.0%
1,32
8 1,
328
M
ino
r as
sets
666
(615
)-
51
51
- 10
0.0%
2,04
9 84
8
Aud
it co
sts:
Ext
erna
l-
53
- 53
53
-
100.
0%-
-
Bur
sarie
s: E
mp
loye
es64
5 (3
70)
- 27
5 27
5 -
100.
0%68
3 68
3
Cat
erin
g: D
epar
tmen
tal a
ctiv
ities
1,56
6 (1
61)
- 1,
405
1,38
7 18
98
.7%
1,51
4 1,
514
C
om
mun
icat
ion
(G&
S)
1,74
5 (7
72)
- 97
3 77
0 20
3 79
.1%
1,94
6 96
2
Co
mp
uter
ser
vice
s26
4 26
6 -
530
529
1 99
.8%
219
219
C
ons
ulta
nts:
Bus
ines
s an
d a
dvi
sory
se
rvic
es1,
759
6,36
9 (2
2)8,
106
8,10
6 -
100.
0%5,
185
5,18
5
Infr
astr
uctu
re a
nd p
lann
ing
serv
ices
42
499
- 54
1 54
1 -
100.
0%3,
206
3,20
6
Lab
ora
tory
ser
vice
s-
181
- 18
1 18
1 -
100.
0%1,
190
1,19
0
Leg
al s
ervi
ces
19
- -
19
19
- 10
0.0%
- -
C
ont
ract
ors
9,51
1 (3
31)
1,71
7 10
,897
8,
770
2,12
7 80
.5%
9,03
7 8,
911

Annual Report for 2016/17 Financial Year
192 |Department of Agriculture, Land Reform & Rural Development Northern Cape Province Vote 12
2016
/17
2015
/16
Ad
just
ed
Ap
pro
pri
a-ti
on
Sh
ifti
ng
o
f Fu
nd
s V
irem
ent
Fin
al A
pp
ro-
pri
atio
n A
ctu
al E
x-p
end
itu
re
Var
ian
ce
Exp
end
itu
re
as %
of
fin
al
app
rop
ria-
tio
n F
inal
Ap
pro
-p
riat
ion
Ac
tual
Ex-
pen
dit
ure
R
’000
R’0
00R
’000
R’0
00R
’000
R’0
00%
R’0
00R
’000
A
gen
cy a
nd s
upp
ort
/ o
utso
urce
d
serv
ices
1,17
0 (1
,153
)-
17
17
- 10
0.0%
2,16
0 54
4
Fl
eet
serv
ices
(inc
lud
ing
gov
ernm
ent
mot
or
tran
spo
rt)
5,89
8 (1
,783
)-
4,11
5 4,
115
- 10
0.0%
4,16
7 2,
118
In
vent
ory
: Clo
thin
g m
ater
ial a
nd
acce
sso
ries
11
(11)
- -
- -
0.0%
20
20
In
vent
ory
: Far
min
g su
pp
lies
9,97
9 6,
121
- 16
,100
15
,841
25
9 98
.4%
33,8
41
33,5
44
In
vent
ory
: Fo
od
and
foo
d s
upp
lies
38
(38)
- -
- -
0.0%
20
20
In
vent
ory
: Fue
l, oi
l and
gas
1,08
4 45
7 (1
3)1,
528
1,42
7 10
1 93
.4%
1,58
4 1,
584
In
vent
ory
: Mat
eria
ls a
nd s
upp
lies
2,97
7 (1
17)
(1,1
62)
1,69
8 1,
698
- 10
0.0%
8,85
8 8,
858
In
vent
ory
: Med
ical
sup
plie
s-
12
- 12
12
-
100.
0%1
1
Inve
nto
ry: M
edic
ine
- 1
- 1
1 -
100.
0%-
-
Inve
nto
ry: O
ther
sup
plie
s-
10,4
81
- 10
,481
10
,480
-
100.
0%-
-
Co
nsum
able
sup
plie
s6,
860
(4,9
05)
10
1,96
5 1,
768
197
90.0
%51
4 51
4
C
ons
umab
le: S
tatio
nery
, prin
ting
and
of
fice
sup
plie
s64
9 (3
00)
- 34
9 34
9 -
100.
0%39
1 39
1
Op
erat
ing
leas
es36
0 54
-
414
47
367
11.4
%38
5 -
P
rop
erty
pay
men
ts1,
170
1,02
7 -
2,19
7 1,
880
317
85.6
%2,
055
2,05
5
Tr
ansp
ort
pro
vid
ed: D
epar
tmen
tal
activ
ity22
5 (2
25)
- -
- -
0.0%
- -
Tr
avel
and
sub
sist
ence
10,8
00
(1,6
16)
- 9,
184
9,18
4 -
100.
0%7,
921
7,92
1
Trai
ning
and
dev
elop
men
t59
1 32
5 -
916
916
- 10
0.0%
945
945
O
per
atin
g p
aym
ents
745
(386
)-
359
346
13
96.4
%61
2 61
2
Venu
es a
nd fa
cilit
ies
159
(115
)-
44
44
- 10
0.0%
410
410
R
enta
l and
hiri
ng59
13
-
72
72
- 10
0.0%
97
97
In
tere
st a
nd r
ent
on
land
- -
- -
- -
0.0%
- 19
In
tere
st (I
ncl.
inte
rest
on
unita
ry
pay
men
ts (P
PP
))-
- -
- -
- 0.
0%-
18
R
ent
on
land
- -
- -
- -
0.0%
- 1
AP
PR
OP
RIA
TIO
N S
TAT
EM
EN
T
for
the
year
en
ded
31
Mar
ch 2
017

Annual Report for 2016/17 Financial Year
| 193Department of Agriculture, Land Reform & Rural Development Northern Cape Province Vote 12
AP
PR
OP
RIA
TIO
N S
TAT
EM
EN
T
for
the
year
en
ded
31
Mar
ch 2
017
2016
/17
2015
/16
Ad
just
ed
Ap
pro
pri
a-ti
on
Sh
ifti
ng
o
f Fu
nd
s V
irem
ent
Fin
al A
pp
ro-
pri
atio
n A
ctu
al E
x-p
end
itu
re
Var
ian
ce
Exp
end
itu
re
as %
of
fin
al
app
rop
ria-
tio
n F
inal
Ap
pro
-p
riat
ion
Ac
tual
Ex-
pen
dit
ure
R
’000
R’0
00R
’000
R’0
00R
’000
R’0
00%
R’0
00R
’000
Tr
ansf
ers
and
su
bsi
die
s38
,406
(3
8,22
9)-
177
177
- 10
0.0%
38,7
93
11,7
45
P
rovi
nces
and
mun
icip
aliti
es2
62
- 64
64
-
100.
0%-
-
Mun
icip
aliti
es2
62
- 64
64
-
100.
0%-
-
Mun
icip
al b
ank
acco
unts
2 62
-
64
64
- 10
0.0%
- -
D
epar
tmen
tal a
gen
cies
and
acc
ount
s38
,350
(3
8,35
0)-
- -
- 10
0.0%
27,0
63
1
D
epar
tmen
tal a
gen
cies
(no
n-b
usin
ess
entit
ies)
38,3
50
(38,
350)
- -
- -
100.
0%27
,063
1
P
ublic
co
rpo
ratio
ns a
nd p
rivat
e en
terp
rises
- -
- -
- -
0.0%
10,4
00
10,4
15
P
ublic
co
rpo
ratio
ns-
- -
- -
- 0.
0%10
,400
10
,415
Oth
er t
rans
fers
to
pub
lic c
orp
ora
tions
- -
- -
- -
0.0%
10,4
00
10,4
15
N
on-
pro
fit in
stitu
tions
- -
- -
- -
0.0%
157
157
H
ouse
hold
s54
58
-
112
112
- 10
0.0%
1,17
3 1,
173
S
oci
al b
enefi
ts27
7
- 34
34
-
100.
0%10
10
Oth
er t
rans
fers
to
hous
ehol
ds
27
51
- 78
78
-
100.
0%1,
163
1,16
3
Pay
men
ts f
or
cap
ital
ass
ets
82,5
36
24,6
99
(164
)10
7,07
1
95
,991
11,0
80
91.2
%74
,688
89
,428
B
uild
ing
s an
d o
ther
fixe
d s
truc
ture
s70
,480
29
,874
- 10
0,35
5 89
,990
10
,365
89
.7%
51,9
71
83,8
24
Oth
er fi
xed
str
uctu
res
70,4
80
29,8
74-
100,
355
89,9
9010
,365
89
,7%
51,9
71
83,8
24
M
achi
nery
and
eq
uip
men
t9,
630
(5,1
30)
(164
)4,
336
3,62
1 (7
15)
83.5
%20
,683
24
,100
Tr
ansp
ort
eq
uip
men
t10
8 1,
891
- 1,
999
1,99
9 -
83.5
%1,
176
3,22
5
Oth
er m
achi
nery
and
eq
uip
men
t9,
522
(7,0
21)
(164
)2,
337
1,62
2 (7
15)
69.4
%19
,507
20
,875
Her
itag
e as
sets
- -
- -
- -
0.0%
- -
S
pec
ialis
ed m
ilita
ry a
sset
s-
- -
- -
- 0.
0%-
-
Bio
logi
cal a
sset
s-
- -
- -
- 0.
0%23
8 23
8
Land
and
sub
-soi
l ass
ets
- -
- -
- -
0.0%
- -
S
oftw
are
and
oth
er in
tang
ible
ass
ets
2,42
6 (4
6)-
2,38
0 2,
380
- 10
0.0%
1,79
6 1,
796
P
aym
ent
for
finan
cial
ass
ets
- -
- -
- -
0.0%
- -
To
tal
225,
950
- 93
5 22
6,88
5 21
2,0
71
14,8
14
93.5
%24
5,59
6 24
3,34
5

Annual Report for 2016/17 Financial Year
194 |Department of Agriculture, Land Reform & Rural Development Northern Cape Province Vote 12
AP
PR
OP
RIA
TIO
N S
TAT
EM
EN
T
for
the
year
en
ded
31
Mar
ch 2
017
Su
bp
rog
ram
me:
3.1
: Far
mer
-Set
tlem
ent a
nd
Dev
elo
pm
ent
20
16/1
720
15/1
6
Ad
just
ed
Ap
pro
pri
-at
ion
Sh
ifti
ng
o
f Fu
nd
s V
irem
ent
Fin
al
Ap
pro
pri
-at
ion
Ac
tual
E
xpen
di-
ture
V
aria
nce
Exp
end
-it
ure
as
% o
f fi
nal
ap
pro
pri
a-ti
on
Fin
al
Ap
pro
pri
-at
ion
Ac
tual
E
xpen
di-
ture
Eco
no
mic
cla
ssifi
cati
on
R’0
00R
’000
R’0
00R
’000
R’0
00R
’000
%R
’000
R’0
00
Cur
rent
pay
men
ts4,
403
(150
)-
4,23
5 4,
253
- 10
0.0%
4,10
8 4,
017
Co
mp
ensa
tion
of e
mp
loye
es2,
766
44
- 2,
810
2,81
0 -
100.
0%2,
604
2,60
4
Go
od
s an
d s
ervi
ces
1,63
7 (1
94)
- 1,
443
1,44
3 -
100.
0%1,
504
1,41
3
Pay
men
ts fo
r ca
pita
l ass
ets
100
58-
158
158
- 10
0.0%
- 91
Mac
hine
ry a
nd e
qui
pm
ent
100
58-
158
158
- 10
0.0%
- 91
To
tal
4,50
3 (9
2)-
4,41
1 4,
411
- 10
0.0%
4,10
8 4,
108

Annual Report for 2016/17 Financial Year
| 195Department of Agriculture, Land Reform & Rural Development Northern Cape Province Vote 12
Su
bp
rog
ram
me:
3.2
: Ext
ensi
on
and
Ad
viso
ry S
ervi
ces
20
16/1
720
15/1
6
Ad
just
ed
Ap
pro
pri
-at
ion
Sh
ifti
ng
o
f Fu
nd
s V
irem
ent
Fin
al
Ap
pro
pri
-at
ion
Ac
tual
E
xpen
di-
ture
V
aria
nce
Exp
end
-it
ure
as
% o
f fi
nal
ap
pro
pri
a-ti
on
Fin
al
Ap
pro
pri
-at
ion
Ac
tual
E
xpen
di-
ture
Eco
no
mic
cla
ssifi
cati
on
R’0
00R
’000
R’0
00R
’000
R’0
00R
’000
%R
’000
R’0
00
Cur
rent
pay
men
ts95
,607
14
,576
1,
005
111,
188
107,
454
3,73
4 96
.6%
123,
908
118,
331
Co
mp
ensa
tion
of e
mp
loye
es39
,915
19
1 54
7 40
,653
40
,523
13
0 99
.7%
37,4
81
37,2
50
Go
od
s an
d s
ervi
ces
55,6
92
14,3
85
458
70,5
35
66,9
31
3,60
4 94
.9%
86,4
27
81.0
62
Inte
rest
and
ren
t o
n la
nd-
- -
- -
- 0.
0%-
19
Tran
sfer
s an
d s
ubsi
die
s38
,406
(3
8,28
2)-
124
124
- 10
0.0%
38,7
93
11,7
45
Pro
vinc
es a
nd m
unic
ipal
ities
2 62
-
64
64
- 10
0.0%
- -
Dep
artm
enta
l ag
enci
es a
nd a
ccou
nts
38,3
50
(38,
350)
- -
- -
100.
0%27
,063
27
,048
Pub
lic c
orp
ora
tions
and
priv
ate
ente
rpris
es-
- -
- -
- 0.
0%10
,400
10
,415
No
n-p
rofit
inst
itutio
ns-
- -
- -
- 0.
0%15
7 15
7
Hou
seho
lds
54
6 -
60
60
- 10
0.0%
1,17
3 1,
173
Pay
men
ts fo
r ca
pita
l ass
ets
81,9
66
24,6
40
(164
)10
6,44
2 95
,362
11
,080
89
.6%
73,3
72
88,2
82
Bui
ldin
gs
and
oth
er fi
xed
str
uctu
res
70,4
80
(29,
427)
- 99
,907
89
,542
10
,365
89
.6%
51,0
83
82,7
99
Mac
hine
ry a
nd e
qui
pm
ent
9,06
0 (4
,741
) (1
64)
4,15
5 3,
440
715
8
2.8%
20,2
55
23,5
81
Bio
logi
cal a
sset
s-
- -
- -
- 0.
0%23
8 23
8
Sof
twar
e an
d o
ther
inta
ngib
le a
sset
s2,
426
(46)
- 2,
380
2,38
0 -
100.
0%1,
796
1,79
6
To
tal
215,
979
934
841
217,
754
202
,940
14
,814
93
.2%
236,
073
233,
822
AP
PR
OP
RIA
TIO
N S
TAT
EM
EN
T
for
the
year
en
ded
31
Mar
ch 2
017

Annual Report for 2016/17 Financial Year
196 |Department of Agriculture, Land Reform & Rural Development Northern Cape Province Vote 12
Su
bp
rog
ram
me:
3.3
: Fo
od
Sec
uri
ty
20
16/1
720
15/1
6
Ad
just
ed
Ap
pro
pri
-at
ion
Sh
ifti
ng
o
f Fu
nd
s V
irem
ent
Fin
al
Ap
pro
pri
-at
ion
Ac
tual
E
xpen
di-
ture
V
aria
nce
Exp
end
-it
ure
as
% o
f fi
nal
ap
pro
pri
a-ti
on
Fin
al
Ap
pro
pri
-at
ion
Ac
tual
E
xpen
di-
ture
Eco
no
mic
cla
ssifi
cati
on
R’0
00R
’000
R’0
00R
’000
R’0
00R
’000
%R
’000
R’0
00
Cu
rren
t p
aym
ents
4,99
8 (8
95)
94
4,19
7 4,
197
- 10
0.0%
4,09
9 4,
360
Co
mp
ensa
tion
of e
mp
loye
es1,
247
(19)
- 1,
228
1,22
8 -
100.
0%1,
138
1,13
9
Go
od
s an
d s
ervi
ces
3,75
1 (8
76)
94
2,96
9 2,
969
- 10
0.0%
2,96
1 3,
221
Tran
sfer
s an
d s
ub
sid
ies
- 52
-
52
52
- 10
0.0%
- -
Hou
seho
lds
- 52
-
52
52
- 10
0.0%
- -
Pay
men
ts f
or
cap
ital
ass
ets
470
1 -
471
471
- 10
0.0%
1,31
6 1,
055
Bui
ldin
gs
and
oth
er fi
xed
str
uctu
res
- 44
8 -
448
448
- 10
0.0%
888
1,02
5
Mac
hine
ry a
nd e
qui
pm
ent
470
(447
)-
23
23
- 10
0.0%
428
30
To
tal
5,46
8 (8
42)
94
4,72
0 4,
720
- 10
0.0%
5,41
5 5,
415
AP
PR
OP
RIA
TIO
N S
TAT
EM
EN
T
for
the
year
en
ded
31
Mar
ch 2
017

Annual Report for 2016/17 Financial Year
| 197Department of Agriculture, Land Reform & Rural Development Northern Cape Province Vote 12
Pro
gra
mm
e 4:
Vet
erin
ary
Ser
vice
s
2016
/17
2015
/16
Ad
just
ed
Ap
pro
pri
a-ti
on
Sh
ift-
ing
of
Fun
ds
Vir
e-
men
t
Fin
al
Ap
pro
pri
-at
ion
Ac
tual
E
xpen
di-
ture
V
aria
nce
Exp
end
itu
re
as %
of
fin
al
app
rop
ria-
tio
n
Fin
al
Ap
pro
-p
riat
ion
Ac
tual
E
xpen
di-
ture
R’0
00R
’000
R’0
00R
’000
R’0
00R
’000
%R
’000
R’0
00
Su
b p
rog
ram
me
1A
nim
al H
ealth
31,9
21
164
(481
)31
,604
31
,604
-
100.
0%29
,999
29
,665
2E
xpo
rt C
ont
rol
629
(533
)-
96
96
- 10
0.0%
1,56
4 1,
562
3Ve
terin
ary
Pub
lic H
ealth
5,47
7 17
6 -
5,65
3 5,
653
- 10
0.0%
5,22
7 5,
228
4Ve
terin
ary
Lab
ora
tory
Ser
vice
s7,
113
193
- 7,
306
7,30
6 -
100.
0%6,
227
6,22
7
To
tal
45,1
40
- (4
81)
44,6
59
44,6
59
- 10
0.0%
43,0
17
42,6
82
Eco
no
mic
cla
ssifi
cati
on
C
urr
ent
pay
men
ts43
,784
(1
,639
)(2
45)
41,9
00
41,9
00
- 10
0.0%
41,4
83
39,0
16
C
om
pen
satio
n of
em
plo
yees
34,0
03
(996
)(1
60)
32,8
47
32,8
47
- 10
0.0%
30,3
44
30,3
43
S
alar
ies
and
wag
es29
,666
(9
43)
(160
)28
,563
28
,563
-
100.
0%26
,437
26
,436
S
oci
al c
ont
ribut
ions
4,33
7 (5
3)-
4,28
4 4,
284
- 10
0.0%
3,90
7 3,
907
G
oo
ds
and
ser
vice
s9,
781
(643
) (8
5)9,
053
9,04
8 5
99.9
%11
,139
8,
673
A
dm
inis
trat
ive
fees
87
1 -
88
88
- 10
0.0%
64
64
M
ino
r as
sets
54
(6)
- 48
48
-
100.
0%15
1 14
7
C
ater
ing:
Dep
artm
enta
l act
iviti
es20
(8
)-
12
12
- 10
0.0%
64
64
C
om
mun
icat
ion
(G&
S)
535
(6
5)
- 47
0 47
0 -
71%
640
428
C
om
put
er s
ervi
ces
- 2
- 2
2 -
100.
0%19
3 19
3
C
ons
ulta
nts:
Bus
ines
s an
d a
dvi
sory
ser
vice
s69
-
- 69
69
-
100.
0%-
-
La
bo
rato
ry s
ervi
ces
418
134
- 55
2 55
2 -
100.
0%32
2 32
2
C
ont
ract
ors
87
148
- 23
5 23
5 -
100.
0%14
3 (3
)
A
gen
cy a
nd s
upp
ort
/ o
utso
urce
d s
ervi
ces
2 (2
)-
- -
- 0.
0%16
16
AP
PR
OP
RIA
TIO
N S
TAT
EM
EN
T
for
the
year
en
ded
31
Mar
ch 2
017

Annual Report for 2016/17 Financial Year
198 |Department of Agriculture, Land Reform & Rural Development Northern Cape Province Vote 12
2016
/17
2015
/16
Ad
just
ed
Ap
pro
pri
a-ti
on
Sh
ift-
ing
of
Fun
ds
Vir
e-
men
t
Fin
al
Ap
pro
pri
-at
ion
Ac
tual
E
xpen
di-
ture
V
aria
nce
Exp
end
itu
re
as %
of
fin
al
app
rop
ria-
tio
n
Fin
al
Ap
pro
-p
riat
ion
Ac
tual
E
xpen
di-
ture
R’0
00R
’000
R’0
00R
’000
R’0
00R
’000
%R
’000
R’0
00
Fl
eet
serv
ices
(inc
lud
ing
gov
ernm
ent
mot
or
tran
spo
rt)
4,00
4 (1
,925
)-
2,07
9 2,
079
- 10
0.0%
3,06
3 1,
253
In
vent
ory
: Clo
thin
g m
ater
ial a
nd a
cces
sorie
s-
- -
- -
- 0.
0%-
1
In
vent
ory
: Far
min
g su
pp
lies
1 -
- 1
1 -
100.
0%51
1 51
1
In
vent
ory
: Fue
l, oi
l and
gas
22
(2)
- 20
20
-
100.
0%-
-
In
vent
ory
: Mat
eria
ls a
nd s
upp
lies
9 37
-
46
46
- 10
0.0%
11
11
In
vent
ory
: Med
ical
sup
plie
s38
(8
)-
30
30
- 10
0.0%
30
30
In
vent
ory
: Med
icin
e25
2 21
4 -
466
466
- 10
0.0%
318
318
In
vent
ory
: Oth
er s
upp
lies
50
33
- 83
83
-
100.
0%38
38
C
ons
umab
le s
upp
lies
190
161
- 35
1 35
1 -
100.
3%34
5 34
9
C
ons
umab
le: S
tatio
nery
, prin
ting
and
offi
ce
sup
plie
s14
9 (1
2)-
137
137
- 10
0.0%
276
276
O
per
atin
g le
ases
170
(170
) -
- -
- 10
0.0%
299
-
P
rop
erty
pay
men
ts-
161
- 16
1 16
1 -
100.
0%18
18
Tr
avel
and
sub
sist
ence
3,16
3 56
9 (8
5)3,
647
3,64
2 5
99.9
%3,
917
3,91
7
Tr
aini
ng a
nd d
evel
opm
ent
335
(266
)-
69
69
- 10
0.0%
153
153
O
per
atin
g p
aym
ents
96
300
- 39
6 39
6 -
100.
0%51
4 51
4
Ve
nues
and
faci
litie
s30
61
-
91
91
- 10
0.0%
53
53
In
tere
st a
nd r
ent
on
land
- -
- -
5 (5
)0.
0%-
-
In
tere
st (I
ncl.
inte
rest
on
unita
ry p
aym
ents
(P
PP
))-
- -
- 5
(5)
0.0%
- -
AP
PR
OP
RIA
TIO
N S
TAT
EM
EN
T
for
the
year
en
ded
31
Mar
ch 2
017

Annual Report for 2016/17 Financial Year
| 199Department of Agriculture, Land Reform & Rural Development Northern Cape Province Vote 12
2016
/17
2015
/16
Ad
just
ed
Ap
pro
pri
a-ti
on
Sh
ift-
ing
of
Fun
ds
Vir
e-
men
t
Fin
al
Ap
pro
pri
-at
ion
Ac
tual
E
xpen
di-
ture
V
aria
nce
Exp
end
itu
re
as %
of
fin
al
app
rop
ria-
tio
n
Fin
al
Ap
pro
-p
riat
ion
Ac
tual
E
xpen
di-
ture
R’0
00R
’000
R’0
00R
’000
R’0
00R
’000
%R
’000
R’0
00
Tr
ansf
ers
and
su
bsi
die
s24
63
-
87
87
- 10
0.0%
323
322
P
rovi
nces
and
mun
icip
aliti
es-
33
- 33
33
-
100.
0%20
19
P
rovi
nces
- -
- -
- -
0.0%
20
19
P
rovi
ncia
l ag
enci
es a
nd f
und
s-
- -
- -
- 0.
0%20
19
M
unic
ipal
ities
- 33
-
33
33
- 10
0.0%
- -
M
unic
ipal
ban
k ac
coun
ts-
33
- 33
33
-
100.
0%-
-
H
ouse
hold
s24
30
-
54
54
- 10
0.0%
303
303
S
oci
al b
enefi
ts24
30
-
54
54
- 10
0.0%
303
303
P
aym
ents
fo
r ca
pit
al a
sset
s1,
332
1,57
6 (2
36)
2,6
72
2,6
72
- 10
0.0%
1,21
1 3,
433
B
uild
ing
s an
d o
ther
fixe
d s
truc
ture
s99
0 22
-
1,01
2 1,
012
- 10
0.0%
1,05
7 1,
086
O
ther
fixe
d s
truc
ture
s99
0 22
-
1,01
2 1,
012
- 10
0.0%
1,05
7 1,
086
M
achi
nery
and
eq
uip
men
t34
2 1,
554
(236
)1,
660
1,66
0-
100.
0%15
4 2,
257
Tr
ansp
ort
eq
uip
men
t-
1,12
7 -
1,12
7 1,
127
- 10
0.0%
- 1,
622
O
ther
mac
hine
ry a
nd e
qui
pm
ent
342
427
(236
)53
3 53
3-
750.
7%15
4 63
5
P
aym
ent
for
fin
anci
al a
sset
s-
- -
- -
- 0.
0%-
1
To
tal
45,1
40
- (4
81)
44,6
59
44,6
59
- 10
0.0%
43,0
17
42,6
82
AP
PR
OP
RIA
TIO
N S
TAT
EM
EN
T
for
the
year
en
ded
31
Mar
ch 2
017
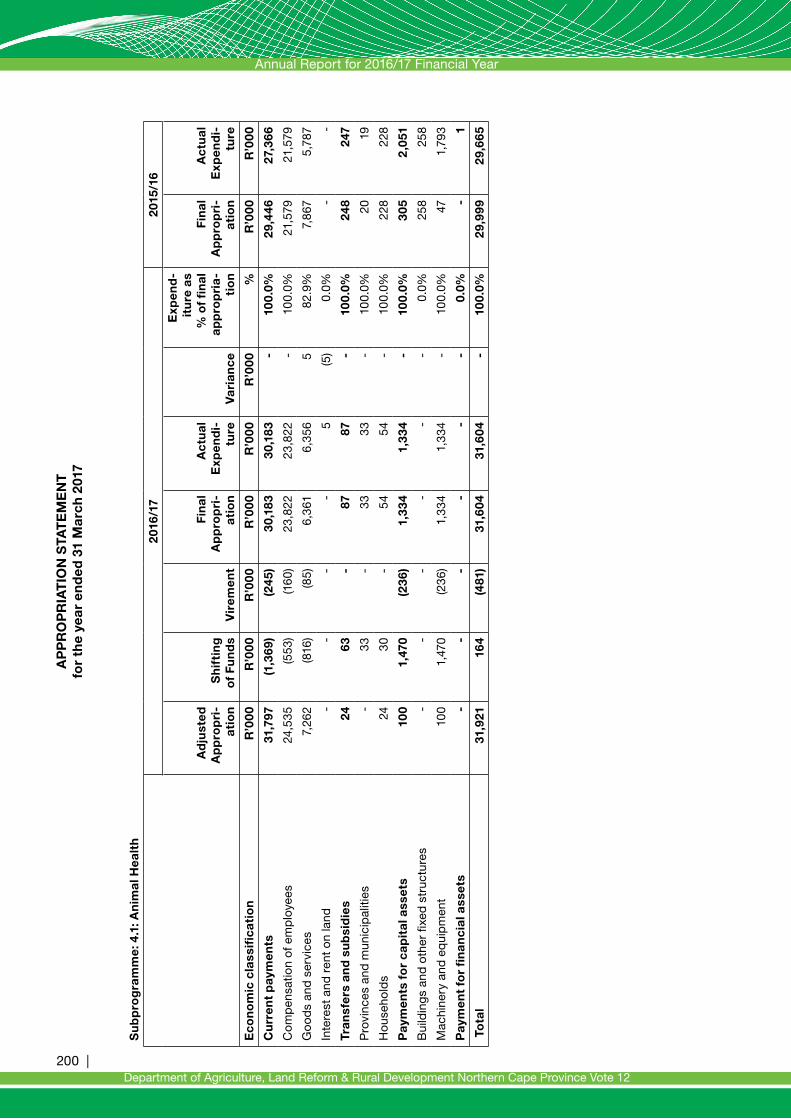
Annual Report for 2016/17 Financial Year
200 |Department of Agriculture, Land Reform & Rural Development Northern Cape Province Vote 12
Su
bp
rog
ram
me:
4.1
: An
imal
Hea
lth
20
16/1
720
15/1
6
Ad
just
ed
Ap
pro
pri
-at
ion
Sh
ifti
ng
o
f Fu
nd
s V
irem
ent
Fin
al
Ap
pro
pri
-at
ion
Ac
tual
E
xpen
di-
ture
V
aria
nce
Exp
end
-it
ure
as
% o
f fi
nal
ap
pro
pri
a-ti
on
Fin
al
Ap
pro
pri
-at
ion
Ac
tual
E
xpen
di-
ture
Eco
no
mic
cla
ssifi
cati
on
R’0
00R
’000
R’0
00R
’000
R’0
00R
’000
%R
’000
R’0
00
Cu
rren
t p
aym
ents
31,7
97
(1,3
69)
(245
)30
,183
30
,183
-
100.
0%29
,446
27
,366
Co
mp
ensa
tion
of e
mp
loye
es24
,535
(5
53)
(160
)23
,822
23
,822
-
100.
0%21
,579
21
,579
Go
od
s an
d s
ervi
ces
7,26
2 (8
16)
(85)
6,36
1 6,
356
5 82
.9%
7,86
7 5,
787
Inte
rest
and
ren
t o
n la
nd-
- -
- 5
(5)
0.0%
- -
Tran
sfer
s an
d s
ub
sid
ies
24
63
- 87
87
-
100.
0%24
8 24
7
Pro
vinc
es a
nd m
unic
ipal
ities
- 33
-
33
33
- 10
0.0%
20
19
Hou
seho
lds
24
30
- 54
54
-
100.
0%22
8 22
8
Pay
men
ts f
or
cap
ital
ass
ets
100
1,47
0 (2
36)
1,33
4 1,
334
- 10
0.0%
305
2,0
51
Bui
ldin
gs
and
oth
er fi
xed
str
uctu
res
- -
- -
- -
0.0%
258
258
Mac
hine
ry a
nd e
qui
pm
ent
100
1,47
0 (2
36)
1,33
4 1,
334
- 10
0.0%
47
1,79
3
Pay
men
t fo
r fi
nan
cial
ass
ets
- -
- -
- -
0.0%
- 1
To
tal
31,9
21
164
(481
)31
,604
31
,604
-
100.
0%29
,999
29
,665
AP
PR
OP
RIA
TIO
N S
TAT
EM
EN
T
for
the
year
en
ded
31
Mar
ch 2
017
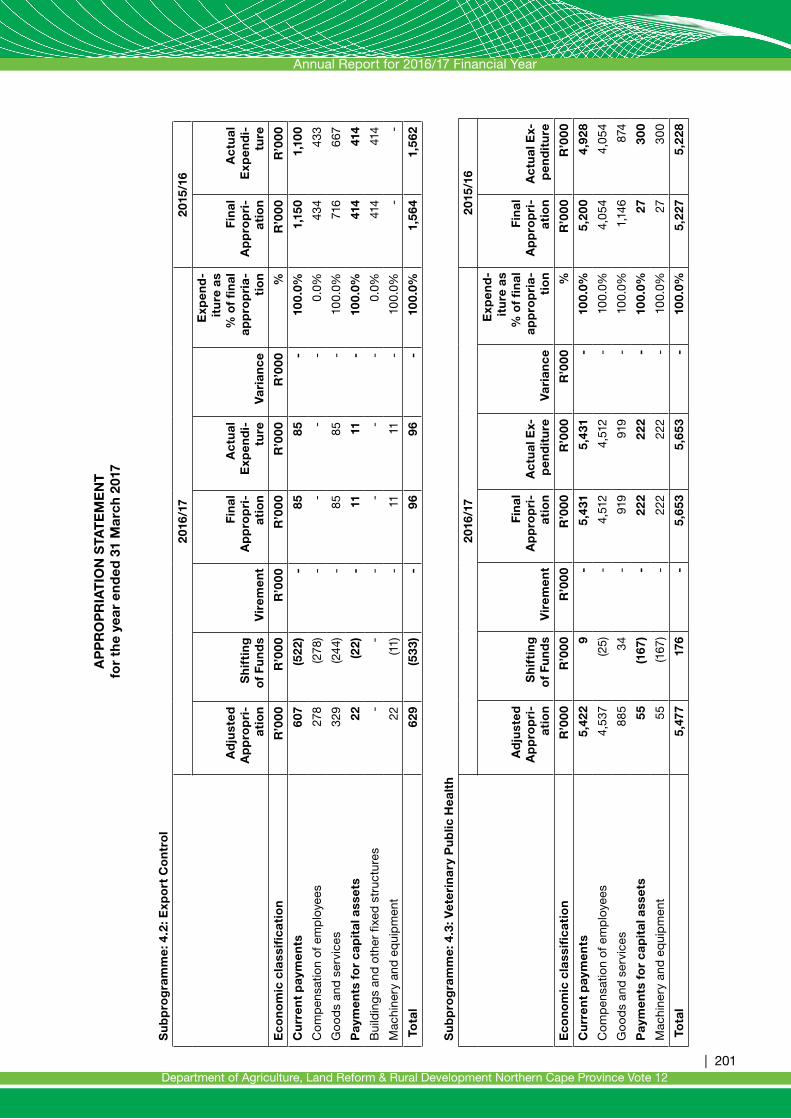
Annual Report for 2016/17 Financial Year
| 201Department of Agriculture, Land Reform & Rural Development Northern Cape Province Vote 12
Su
bp
rog
ram
me:
4.2
: Exp
ort
Co
ntr
ol
20
16/1
720
15/1
6
Ad
just
ed
Ap
pro
pri
-at
ion
Sh
ifti
ng
o
f Fu
nd
s V
irem
ent
Fin
al
Ap
pro
pri
-at
ion
Ac
tual
E
xpen
di-
ture
V
aria
nce
Exp
end
-it
ure
as
% o
f fi
nal
ap
pro
pri
a-ti
on
Fin
al
Ap
pro
pri
-at
ion
Ac
tual
E
xpen
di-
ture
Eco
no
mic
cla
ssifi
cati
on
R’0
00R
’000
R’0
00R
’000
R’0
00R
’000
%R
’000
R’0
00
Cu
rren
t p
aym
ents
607
(522
)-
85
85-
100.
0%1,
150
1,10
0
Co
mp
ensa
tion
of e
mp
loye
es27
8 (2
78)
- -
- -
0.0%
434
433
Go
od
s an
d s
ervi
ces
329
(244
)-
85
85
- 10
0.0%
716
667
Pay
men
ts f
or
cap
ital
ass
ets
22
(22)
- 11
11
-
100.
0%41
4 41
4
Bui
ldin
gs
and
oth
er fi
xed
str
uctu
res
- -
- -
- -
0.0%
414
414
Mac
hine
ry a
nd e
qui
pm
ent
22
(11)
- 11
11
-
100.
0%-
-
To
tal
629
(533
)-
96
96
- 10
0.0%
1,56
4 1,
562
Su
bp
rog
ram
me:
4.3
: Vet
erin
ary
Pu
blic
Hea
lth
20
16/1
720
15/1
6
Ad
just
ed
Ap
pro
pri
-at
ion
Sh
ifti
ng
o
f Fu
nd
s V
irem
ent
Fin
al
Ap
pro
pri
-at
ion
Ac
tual
Ex-
pen
dit
ure
V
aria
nce
Exp
end
-it
ure
as
% o
f fi
nal
ap
pro
pri
a-ti
on
Fin
al
Ap
pro
pri
-at
ion
Ac
tual
Ex-
pen
dit
ure
Eco
no
mic
cla
ssifi
cati
on
R’0
00R
’000
R’0
00R
’000
R’0
00R
’000
%R
’000
R’0
00
Cu
rren
t p
aym
ents
5,42
2 9
- 5,
431
5,43
1 -
100.
0%5,
200
4,92
8
Co
mp
ensa
tion
of e
mp
loye
es4,
537
(25)
- 4,
512
4,51
2 -
100.
0%4,
054
4,05
4
Go
od
s an
d s
ervi
ces
885
3
4 -
919
919
- 10
0.0%
1,14
6 87
4
Pay
men
ts f
or
cap
ital
ass
ets
55
(167
)-
222
222
- 10
0.0%
27
300
Mac
hine
ry a
nd e
qui
pm
ent
55
(167
)-
222
222
- 10
0.0%
27
300
To
tal
5,47
7 17
6 -
5,65
3 5,
653
- 10
0.0%
5,22
7 5,
228
AP
PR
OP
RIA
TIO
N S
TAT
EM
EN
T
for
the
year
en
ded
31
Mar
ch 2
017

Annual Report for 2016/17 Financial Year
202 |Department of Agriculture, Land Reform & Rural Development Northern Cape Province Vote 12
Su
bp
rog
ram
me:
4.4
: Vet
erin
ary
Lab
ora
tory
Ser
vice
s
20
16/1
720
15/1
6
A
dju
sted
A
pp
rop
riat
ion
Sh
ifti
ng
o
f Fu
nd
s V
irem
ent
Fin
al
Ap
pro
pri
atio
n A
ctu
al
Exp
end
itu
re
Var
ian
ce
Exp
end
itu
re
as %
of
fin
al
app
rop
riat
ion
Fin
al
Ap
pro
pri
atio
n A
ctu
al
Exp
end
itu
re
Eco
no
mic
cla
ssifi
cati
on
R’0
00R
’000
R’0
00R
’000
R’0
00R
’000
%R
’000
R’0
00
Cu
rren
t p
aym
ents
5,95
8 24
3 -
6,20
1 6,
201
- 10
0.0%
5,68
7 5,
622
Co
mp
ensa
tion
of e
mp
loye
es4,
653
(140
)-
4,51
3 4,
513
- 10
0.0%
4,27
7 4,
277
Go
od
s an
d s
ervi
ces
1,30
5 38
3 -
1,68
8 1,
688
- 10
0.0%
1,41
0 1,
345
Tran
sfer
s an
d s
ub
sid
ies
- -
- -
- -
0.0%
75
75
Hou
seho
lds
- -
- -
- -
0.0%
75
75
Pay
men
ts f
or
cap
ital
ass
ets
1,15
5 (5
0)-
1,10
5 1,
105
- 10
0.0%
465
530
Bui
ldin
gs
and
oth
er fi
xed
st
ruct
ures
990
22
- 1,
012
1,01
2 -
100.
0%38
5 41
4
Mac
hine
ry a
nd e
qui
pm
ent
165
(72)
- 93
93
-
100.
0%80
11
6
To
tal
7,11
3 19
3 -
7,30
6 7,
306
- 10
0.0%
6,22
7 6,
227
AP
PR
OP
RIA
TIO
N S
TAT
EM
EN
T
for
the
year
en
ded
31
Mar
ch 2
017
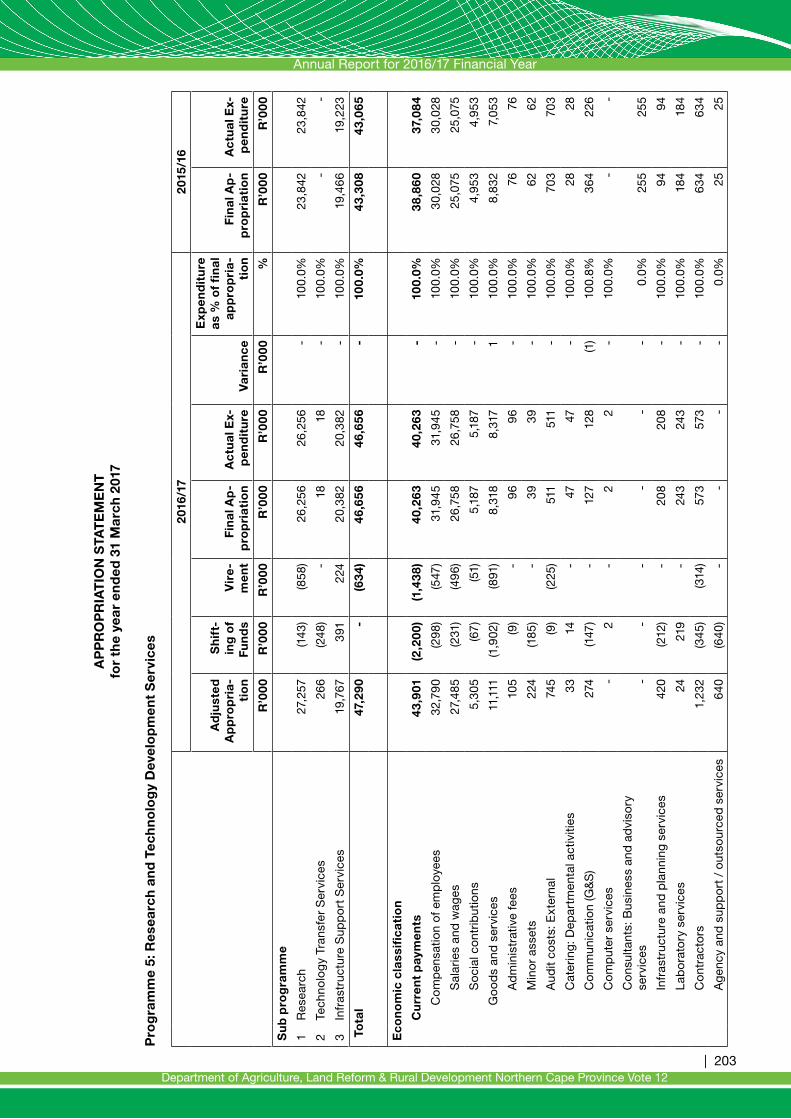
Annual Report for 2016/17 Financial Year
| 203Department of Agriculture, Land Reform & Rural Development Northern Cape Province Vote 12
Pro
gra
mm
e 5:
Res
earc
h an
d T
ech
no
log
y D
evel
op
men
t S
ervi
ces
2016
/17
2015
/16
Ad
just
ed
Ap
pro
pri
a-ti
on
Sh
ift-
ing
of
Fun
ds
Vir
e-
men
t F
inal
Ap
-p
rop
riat
ion
Ac
tual
Ex-
pen
dit
ure
V
aria
nce
Exp
end
itu
re
as %
of
fin
al
app
rop
ria-
tio
n F
inal
Ap
-p
rop
riat
ion
Ac
tual
Ex-
pen
dit
ure
R’0
00R
’000
R’0
00R
’000
R’0
00R
’000
%R
’000
R’0
00
Su
b p
rog
ram
me
1R
esea
rch
27,2
57
(143
)(8
58)
26,2
56
26,2
56
- 10
0.0%
23,8
42
23,8
42
2Te
chno
log
y Tr
ansf
er S
ervi
ces
266
(248
)-
18
18
- 10
0.0%
- -
3In
fras
truc
ture
Sup
po
rt S
ervi
ces
19,7
67
391
224
20,3
82
20,3
82
- 10
0.0%
19,4
66
19,2
23
To
tal
47,2
90
- (6
34)
46,6
56
46,6
56
- 10
0.0%
43,3
08
43,0
65
Eco
no
mic
cla
ssifi
cati
on
C
urr
ent
pay
men
ts43
,901
(2
,200
)(1
,438
)40
,263
40
,263
-
100.
0%38
,860
37
,084
C
om
pen
satio
n of
em
plo
yees
32,7
90
(298
)(5
47)
31,9
45
31,9
45
- 10
0.0%
30,0
28
30,0
28
S
alar
ies
and
wag
es27
,485
(2
31)
(496
)26
,758
26
,758
-
100.
0%25
,075
25
,075
S
oci
al c
ont
ribut
ions
5,30
5 (6
7)(5
1)5,
187
5,18
7 -
100.
0%4,
953
4,95
3
G
oo
ds
and
ser
vice
s11
,111
(1
,902
)(8
91)
8,31
8 8,
317
1 10
0.0%
8,83
2 7,
053
A
dm
inis
trat
ive
fees
105
(9)
- 96
96
-
100.
0%76
76
M
ino
r as
sets
224
(185
)-
39
39
- 10
0.0%
62
62
A
udit
cost
s: E
xter
nal
745
(9)
(225
)51
1 51
1 -
100.
0%70
3 70
3
C
ater
ing:
Dep
artm
enta
l act
iviti
es33
14
-
47
47
- 10
0.0%
28
28
C
om
mun
icat
ion
(G&
S)
274
(147
)-
127
128
(1)
100.
8%36
4 22
6
C
om
put
er s
ervi
ces
- 2
- 2
2 -
100.
0%-
-
C
ons
ulta
nts:
Bus
ines
s an
d a
dvi
sory
se
rvic
es-
- -
- -
- 0.
0%25
5 25
5
In
fras
truc
ture
and
pla
nnin
g se
rvic
es42
0 (2
12)
- 20
8 20
8 -
100.
0%94
94
La
bo
rato
ry s
ervi
ces
24
219
- 24
3 24
3 -
100.
0%18
4 18
4
C
ont
ract
ors
1,23
2 (3
45)
(314
)57
3 57
3 -
100.
0%63
4 63
4
A
gen
cy a
nd s
upp
ort
/ o
utso
urce
d s
ervi
ces
640
(640
)-
- -
- 0.
0%25
25
AP
PR
OP
RIA
TIO
N S
TAT
EM
EN
T
for
the
year
en
ded
31
Mar
ch 2
017

Annual Report for 2016/17 Financial Year
204 |Department of Agriculture, Land Reform & Rural Development Northern Cape Province Vote 12
2016
/17
2015
/16
Ad
just
ed
Ap
pro
pri
a-ti
on
Sh
ift-
ing
of
Fun
ds
Vir
e-
men
t F
inal
Ap
-p
rop
riat
ion
Ac
tual
Ex-
pen
dit
ure
V
aria
nce
Exp
end
itu
re
as %
of
fin
al
app
rop
ria-
tio
n F
inal
Ap
-p
rop
riat
ion
Ac
tual
Ex-
pen
dit
ure
R’0
00R
’000
R’0
00R
’000
R’0
00R
’000
%R
’000
R’0
00
Fl
eet
serv
ices
(inc
lud
ing
gov
ernm
ent
mot
or
tran
spo
rt)
2,76
5 (1
,150
)(3
10)
1,30
5 1,
305
- 10
0.0%
2,52
6 97
7
In
vent
ory
: Clo
thin
g m
ater
ial a
nd
acce
sso
ries
28
(28)
- -
- -
0.0%
88
88
In
vent
ory
: Far
min
g su
pp
lies
903
(478
)-
425
425
- 10
0.0%
450
450
In
vent
ory
: Fo
od
and
foo
d s
upp
lies
- -
- -
- -
0.0%
1 1
In
vent
ory
: Fue
l, oi
l and
gas
346
(96)
(11)
239
239
- 10
0.0%
170
170
In
vent
ory
: Mat
eria
ls a
nd s
upp
lies
119
4 (3
1)92
92
-
100.
0%13
3 13
3
In
vent
ory
: Med
ical
sup
plie
s33
(3
3)-
- -
- 0.
0%-
-
In
vent
ory
: Med
icin
e27
51
-
78
77
1 98
.7%
54
54
C
ons
umab
le s
upp
lies
354
(158
)-
196
196
- 10
0.0%
153
153
C
ons
umab
le: S
tatio
nery
, prin
ting
and
of
fice
sup
plie
s17
6 (1
)-
175
175
- 10
0.0%
117
117
O
per
atin
g le
ases
55
(55)
-
- -
- -
92
-
P
rop
erty
pay
men
ts40
3 1,
249
- 1,
652
1,65
2 -
100.
0%57
0 57
0
Tr
avel
and
sub
sist
ence
1,67
0 53
3 -
2,20
3 2,
202
1 10
0.0%
1,93
6 1,
936
Tr
aini
ng a
nd d
evel
opm
ent
316
(316
)-
- -
- 0.
0%-
-
O
per
atin
g p
aym
ents
208
(134
)-
74
74
- 10
0.0%
76
76
Ve
nues
and
faci
litie
s11
21
-
32
32
- 10
0.0%
41
41
R
enta
l and
hiri
ng-
1 -
1 1
- 10
0.0%
- -
In
tere
st a
nd r
ent
on
land
- -
- -
1 (1
)0.
0%-
3
In
tere
st (I
ncl.
inte
rest
on
unita
ry p
aym
ents
(P
PP
))-
- -
- 1
(1)
0.0%
- 3
Tr
ansf
ers
and
su
bsi
die
s2
,600
23
4 -
2,8
34
2,8
34
- 10
0.0%
3,15
0 3,
150
P
rovi
nces
and
mun
icip
aliti
es10
3
- 13
13
-
100.
0%-
-
M
unic
ipal
ities
10
3 -
13
13
- 10
0.0%
- -
AP
PR
OP
RIA
TIO
N S
TAT
EM
EN
T
for
the
year
en
ded
31
Mar
ch 2
017

Annual Report for 2016/17 Financial Year
| 205Department of Agriculture, Land Reform & Rural Development Northern Cape Province Vote 12
2016
/17
2015
/16
Ad
just
ed
Ap
pro
pri
a-ti
on
Sh
ift-
ing
of
Fun
ds
Vir
e-
men
t F
inal
Ap
-p
rop
riat
ion
Ac
tual
Ex-
pen
dit
ure
V
aria
nce
Exp
end
itu
re
as %
of
fin
al
app
rop
ria-
tio
n F
inal
Ap
-p
rop
riat
ion
Ac
tual
Ex-
pen
dit
ure
R’0
00R
’000
R’0
00R
’000
R’0
00R
’000
%R
’000
R’0
00
M
unic
ipal
ban
k ac
coun
ts10
3
- 13
13
-
100.
0%-
-
D
epar
tmen
tal a
gen
cies
and
acc
ount
s2,
550
- -
2,55
0 2,
550
- 10
0.0%
3,05
3 3,
053
D
epar
tmen
tal a
gen
cies
(no
n-b
usin
ess
entit
ies)
2,55
0 -
- 2,
550
2,55
0 -
100.
0%3,
053
3,05
3
H
ighe
r ed
ucat
ion
inst
itutio
ns-
- -
- -
- 0.
0%-
-
Fo
reig
n g
over
nmen
ts a
nd in
tern
atio
nal
org
anis
atio
ns-
- -
- -
- 0.
0%-
-
P
ublic
co
rpo
ratio
ns a
nd p
rivat
e en
terp
rises
- -
- -
- -
0.0%
- -
N
on-
pro
fit in
stitu
tions
- -
- -
- -
0.0%
- -
H
ouse
hold
s40
23
1 -
271
271
- 10
0.0%
97
97
S
oci
al b
enefi
ts40
23
1 -
271
271
- 10
0.0%
97
97
P
aym
ents
fo
r ca
pit
al a
sset
s78
9 1,
966
804
3,55
9 3,
559
- 10
0.0%
1,29
8 2
,831
B
uild
ing
s an
d o
ther
fixe
d s
truc
ture
s54
5 (4
42)
224
327
327
-10
0.0%
424
424
O
ther
fixe
d s
truc
ture
s54
5 (4
42)
224
327
327
-10
0.0%
424
424
M
achi
nery
and
eq
uip
men
t24
4 1.
582
416
2,24
2 2,
242
- 10
0.0%
182
1,71
5
Tr
ansp
ort
eq
uip
men
t -
868
- 86
8 86
8 -
100.
0%18
2 41
2
Oth
er m
achi
nery
and
eq
uip
men
t24
4 71
4 41
6 1,
374
1,37
4 -
100.
0%18
2 41
2
H
erita
ge
asse
ts-
- -
- -
- 0.
0%-
-
S
pec
ialis
ed m
ilita
ry a
sset
s-
- -
- -
- 0.
0%-
-
B
iolo
gica
l ass
ets
- 82
6 16
4 99
0 99
0 -
100.
0%69
2 69
2
La
nd a
nd s
ub-s
oil a
sset
s-
- -
- -
- 0.
0%-
-
S
oftw
are
and
oth
er in
tang
ible
ass
ets
- -
- -
- -
0.0%
- -
P
aym
ent
for
fin
anci
al a
sset
s-
- -
- -
- 0.
0%-
-
To
tal
47,2
90
- (6
34)
46,6
56
46,6
56
- 10
0.0%
43,3
08
43,0
65
AP
PR
OP
RIA
TIO
N S
TAT
EM
EN
T
for
the
year
en
ded
31
Mar
ch 2
017

Annual Report for 2016/17 Financial Year
206 |Department of Agriculture, Land Reform & Rural Development Northern Cape Province Vote 12
Su
bp
rog
ram
me:
5.1
: Res
earc
h
20
16/1
720
15/1
6
Ad
just
ed
Ap
pro
pri
-at
ion
Sh
ifti
ng
o
f Fu
nd
s V
ire
-m
ent
Fin
al
Ap
pro
pri
-at
ion
Ac
tual
Ex-
pen
dit
ure
V
ari-
ance
Exp
end
itu
re
as %
of
fin
al
app
rop
ria-
tio
n F
inal
Ap
-p
rop
riat
ion
Ac
tual
Ex-
pen
dit
ure
Eco
no
mic
cla
ssifi
cati
on
R’0
00R
’000
R’0
00R
’000
R’0
00R
’000
%R
’000
R’0
00
Cu
rren
t p
aym
ents
24,0
42
(1,7
50)
(1,4
38)
20,8
54
20,8
54
- 10
0.0%
19,8
86
18,8
85
Co
mp
ensa
tion
of e
mp
loye
es16
,171
-
(547
)15
,624
15
,624
-
100.
0%14
,041
14
,041
Go
od
s an
d s
ervi
ces
7,87
1 (1
,750
)(8
91)
5,23
0 5,
230
- 10
0.0%
5,84
5 4,
844
Tran
sfer
s an
d s
ub
sid
ies
2,5
50
- -
2,5
50
2,5
50
- 10
0.0%
3,08
9 3,
089
Dep
artm
enta
l ag
enci
es a
nd a
ccou
nts
2,55
0 -
- 2,
550
2,55
0 -
100.
0%3,
053
3,05
3
Hou
seho
lds
- -
- -
- -
0.0%
36
36
Pay
men
ts f
or
cap
ital
ass
ets
665
1,60
7 58
0 2
,852
2
,852
-
100.
0%86
7 1,
868
Bui
ldin
gs
and
oth
er fi
xed
str
uctu
res
450
(450
)-
- -
- 0.
0%29
29
Mac
hine
ry a
nd e
qui
pm
ent
215
1,23
1 41
6 1,
862
1,86
2 -
100.
0%14
6 1,
147
Bio
logi
cal a
sset
s-
826
164
990
990
- 10
0.0%
692
692
To
tal
27,2
57
(143
)(8
58)
26,2
56
26,2
56
- 10
0.0%
23,8
42
23,8
42
AP
PR
OP
RIA
TIO
N S
TAT
EM
EN
T
for
the
year
en
ded
31
Mar
ch 2
017

Annual Report for 2016/17 Financial Year
| 207Department of Agriculture, Land Reform & Rural Development Northern Cape Province Vote 12
Su
bp
rog
ram
me:
5.2
: Tec
hn
olo
gy
Tran
sfer
Ser
vice
s
20
16/1
720
15/1
6
Ad
just
ed
Ap
pro
pri
a-ti
on
Sh
ifti
ng
o
f Fu
nd
s V
ire
-m
ent
Fin
al
Ap
pro
pri
-at
ion
Ac
tual
Ex-
pen
dit
ure
V
aria
nce
Exp
end
itu
re
as %
of
fin
al
app
rop
ria-
tio
n F
inal
Ap
-p
rop
riat
ion
Ac
tual
Ex-
pen
dit
ure
Eco
no
mic
cla
ssifi
cati
on
R’0
00R
’000
R’0
00R
’000
R’0
00R
’000
%R
’000
R’0
00
Cu
rren
t p
aym
ents
266
(248
)-
18
18
- 10
0.0%
- -
Go
od
s an
d s
ervi
ces
266
(248
)-
18
18
- 10
0.0%
- -
To
tal
266
(248
)-
18
18
- 10
0.0%
- -
Su
bp
rog
ram
me:
5.3
: In
fras
tru
ctu
re S
up
po
rt S
ervi
ces
20
16/1
720
15/1
6
Ad
just
ed
Ap
pro
pri
a-ti
on
Sh
ifti
ng
o
f Fu
nd
s V
ire
-m
ent
Fin
al
Ap
pro
pri
-at
ion
Ac
tual
Ex-
pen
dit
ure
V
aria
nce
Exp
end
itu
re
as %
of
fin
al
app
rop
ria-
tio
n F
inal
Ap
-p
rop
riat
ion
Ac
tual
Ex-
pen
dit
ure
Eco
no
mic
cla
ssifi
cati
on
R’0
00R
’000
R’0
00R
’000
R’0
00R
’000
%R
’000
R’0
00
Cu
rren
t p
aym
ents
19,5
93
(202
) -
19,3
91
19,3
91
- 10
0.0%
18,9
74
18,1
99
Co
mp
ensa
tion
of e
mp
loye
es16
,619
(2
98)
- 16
,321
16
,321
-
100.
0%15
,987
15
,987
Go
od
s an
d s
ervi
ces
2,97
4 96
-
3,07
0 3,
069
1 10
0.0%
2,98
7 2,
209
Inte
rest
and
ren
t o
n la
nd-
- -
- 1
(1)
0.0%
- 3
Tran
sfer
s an
d s
ub
sid
ies
50
234
- 28
4 28
4 -
100.
0%61
61
Pro
vinc
es a
nd m
unic
ipal
ities
10
3 -
13
13
- 10
0.0%
- -
Hou
seho
lds
40
231
- 27
1 27
1 -
100.
0%61
61
Pay
men
ts f
or
cap
ital
ass
ets
124
359
224
707
707
- 10
0.0%
431
963
Bui
ldin
gs
and
oth
er fi
xed
str
uctu
res
95
8 22
4 32
7 32
7 -
100.
0%39
5 39
5
Mac
hine
ry a
nd e
qui
pm
ent
29
(351
)-
380
380
- 10
0.0%
36
568
To
tal
19,7
67
391
224
20,3
82
20,3
82
- 10
0.0%
19,4
66
19,2
23
AP
PR
OP
RIA
TIO
N S
TAT
EM
EN
T
for
the
year
en
ded
31
Mar
ch 2
017

Annual Report for 2016/17 Financial Year
208 |Department of Agriculture, Land Reform & Rural Development Northern Cape Province Vote 12
Pro
gra
mm
e 6:
Ag
ricu
ltu
ral E
con
om
ics
Ser
vice
s
2016
/17
2015
/16
Ad
just
ed
Ap
pro
pri
a-ti
on
Sh
ifti
ng
o
f Fu
nd
s V
ire
-m
ent
Fin
al
Ap
pro
pri
-at
ion
Ac
tual
Ex-
pen
dit
ure
V
ari-
ance
Exp
end
itu
re
as %
of
fin
al
app
rop
ria-
tio
n F
inal
Ap
-p
rop
riat
ion
Ac
tual
Ex-
pen
dit
ure
R’0
00R
’000
R’0
00R
’000
R’0
00R
’000
%R
’000
R’0
00
Su
b p
rog
ram
me
1A
gric
-Bus
ines
s S
upp
ort
and
Dev
elop
men
t2,
707
442
(162
)2,
987
2,98
7 -
100.
0%3,
544
2,86
1
2M
acro
eco
nom
ics
Sup
po
rt7,
141
(442
)(6
25)
6,07
4 6,
056
18
99.7
%5,
575
5,27
7
To
tal
9,84
8 -
(787
)9,
061
9,04
3 18
99
.8%
9,11
9 8,
138
Eco
no
mic
cla
ssifi
cati
on
C
urr
ent
pay
men
ts9,
703
(89)
(680
)8,
934
8,91
6 18
99
.8%
8,68
8 7,
666
C
om
pen
satio
n of
em
plo
yees
7,63
6 (1
,082
)(6
80)
5,87
4 5,
856
18
99.7
%6,
429
6,00
4
S
alar
ies
and
wag
es6,
532
(926
)(5
25)
5,08
1 5,
063
18
99.6
%5,
545
5,27
3
S
oci
al c
ont
ribut
ions
1,10
4 (1
56)
(155
)79
3 79
3 -
100.
0%88
4 73
1
G
oo
ds
and
ser
vice
s2,
067
993
- 3,
060
3,06
0 -
100.
0%2,
259
1,66
2
A
dm
inis
trat
ive
fees
116
- -
116
116
- 10
0.0%
30
7
A
dve
rtis
ing
5 (5
)-
- -
- 0.
0%14
-
M
ino
r as
sets
14
(14)
- -
- -
0.0%
17
17
C
ater
ing:
Dep
artm
enta
l act
iviti
es26
(1
4)-
12
12
- 10
0.0%
8 8
C
om
mun
icat
ion
(G&
S)
64
(45)
- 19
19
-
100.
0%63
46
C
om
put
er s
ervi
ces
- 18
0 -
180
180
- 10
0.0%
- -
C
ons
ulta
nts:
Bus
ines
s an
d a
dvi
sory
se
rvic
es-
1,36
7 -
1,36
7 1,
367
- 10
0.0%
126
-
In
fras
truc
ture
and
pla
nnin
g se
rvic
es27
4 (2
74)
- -
- -
0.0%
208
208
C
ont
ract
ors
1 1
- 2
2 -
100.
0%95
17
8
Fl
eet
serv
ices
(inc
lud
ing
gov
ernm
ent
mot
or
tran
spo
rt)
67
(67)
- -
- -
0.0%
22
22
In
vent
ory
: Far
min
g su
pp
lies
- -
- -
- -
0.0%
221
238
AP
PR
OP
RIA
TIO
N S
TAT
EM
EN
T
for
the
year
en
ded
31
Mar
ch 2
017

Annual Report for 2016/17 Financial Year
| 209Department of Agriculture, Land Reform & Rural Development Northern Cape Province Vote 12
2016
/17
2015
/16
Ad
just
ed
Ap
pro
pri
a-ti
on
Sh
ifti
ng
o
f Fu
nd
s V
ire
-m
ent
Fin
al
Ap
pro
pri
-at
ion
Ac
tual
Ex-
pen
dit
ure
V
ari-
ance
Exp
end
itu
re
as %
of
fin
al
app
rop
ria-
tio
n F
inal
Ap
-p
rop
riat
ion
Ac
tual
Ex-
pen
dit
ure
R’0
00R
’000
R’0
00R
’000
R’0
00R
’000
%R
’000
R’0
00
In
vent
ory
: Fue
l, oi
l and
gas
- -
- -
- -
0.0%
120
109
C
ons
umab
le s
upp
lies
75
(75)
- -
- -
0.0%
- -
C
ons
umab
le: S
tatio
nery
, prin
ting
and
offi
ce
sup
plie
s80
(1
4)-
66
66
- 10
0.0%
27
27
O
per
atin
g le
ases
9 (9
) -
- -
- -
9 -
Tr
ansp
ort
pro
vid
ed: D
epar
tmen
tal a
ctiv
ity26
7 (2
67)
- -
- -
0.0%
- -
Tr
avel
and
sub
sist
ence
750
349
- 1,
099
1,09
9 -
100.
0%84
5 84
5
Tr
aini
ng a
nd d
evel
opm
ent
65
(65)
- -
- -
0.0%
- -
O
per
atin
g p
aym
ents
50
(50)
- -
- -
0.0%
1 -
Ve
nues
and
faci
litie
s20
4 (5
)-
199
199
- 10
0.0%
- -
R
enta
l and
hiri
ng-
- -
- -
- 0.
0%45
3 -
Tr
ansf
ers
and
su
bsi
die
s-
50
- 50
50
-
100.
0%23
22
H
ouse
hold
s-
50
- 50
50
-
100.
0%23
22
S
oci
al b
enefi
ts-
- -
- -
- 0.
0%23
22
O
ther
tra
nsfe
rs t
o ho
useh
old
s-
50
- 50
50
-
100.
0%-
-
P
aym
ents
fo
r ca
pit
al a
sset
s14
5 39
(1
07)
77
77
- 10
0.0%
408
450
M
achi
nery
and
eq
uip
men
t13
2 39
(9
4)77
77
- 10
0.0/
%40
8 45
0
Tran
spo
rt e
qui
pm
ent
--
--
--
--
15
O
ther
mac
hine
ry a
nd e
qui
pm
ent
132
39
(94)
77
77-
202.
6%40
8 43
5
S
oftw
are
and
oth
er in
tang
ible
ass
ets
13
- (1
3)-
- -
0.0%
- -
To
tal
9,84
8 -
(787
)9,
061
9,04
3 18
99
.8%
9,11
9 8,
138
AP
PR
OP
RIA
TIO
N S
TAT
EM
EN
T
for
the
year
en
ded
31
Mar
ch 2
017

Annual Report for 2016/17 Financial Year
210 |Department of Agriculture, Land Reform & Rural Development Northern Cape Province Vote 12
Su
bp
rog
ram
me:
6.1
: Ag
ric-
Bu
sin
ess
Su
pp
ort
an
d D
evel
op
men
t
20
16/1
720
15/1
6
Ad
just
ed
Ap
pro
pri
a-ti
on
Sh
ifti
ng
o
f Fu
nd
s V
ire
-m
ent
Fin
al A
p-
pro
pri
atio
n A
ctu
al E
x-p
end
itu
re
Var
ian
ce
Exp
end
-it
ure
as
% o
f fi
nal
ap
pro
pri
a-ti
on
Fin
al
Ap
pro
pri
a-ti
on
Ac
tual
Ex-
pen
dit
ure
Eco
no
mic
cla
ssifi
cati
on
R’0
00R
’000
R’0
00R
’000
R’0
00R
’000
%R
’000
R’0
00
Cu
rren
t p
aym
ents
2,6
41
392
(96)
2,9
37
2,9
37
- 10
0.0%
3,12
7 2
,445
Co
mp
ensa
tion
of e
mp
loye
es1,
359
(465
)(9
6)79
8 79
8 -
100.
0%1,
755
1,37
2
Go
od
s an
d s
ervi
ces
1,28
2 85
7 -
2,13
9 2,
139
- 10
0.0%
1,37
2 1,
073
Tran
sfer
s an
d s
ub
sid
ies
- 50
-
50
50
- 10
0.0%
23
22
Hou
seho
lds
- 50
-
50
50
- 10
0.0%
23
22
Pay
men
ts f
or
cap
ital
ass
ets
66
- (6
6)-
- -
0.0%
394
394
Mac
hine
ry a
nd e
qui
pm
ent
66
- (6
6)-
- -
0.0%
394
394
To
tal
2,7
07
442
(162
)2
,987
2
,987
-
100.
0%3,
544
2,8
61
Su
bp
rog
ram
me:
6.2
: Mac
roec
on
om
ics
Su
pp
ort
20
16/1
720
15/1
6
Ad
just
ed
Ap
pro
pri
-at
ion
Sh
ifti
ng
o
f Fu
nd
s V
irem
ent
Fin
al
Ap
pro
pri
-at
ion
Ac
tual
E
xpen
di-
ture
V
aria
nce
Exp
end
-it
ure
as
% o
f fi
nal
ap
pro
pri
a-ti
on
Fin
al
Ap
pro
pri
-at
ion
Ac
tual
E
xpen
di-
ture
Eco
no
mic
cla
ssifi
cati
on
R’0
00R
’000
R’0
00R
’000
R’0
00R
’000
%R
’000
R’0
00
Cu
rren
t p
aym
ents
7,06
2 (4
81)
(584
)5,
997
5,97
9 18
99
.7%
5,56
1 5,
221
Co
mp
ensa
tion
of e
mp
loye
es6,
277
(617
)(5
84)
5,07
6 5,
058
18
99.6
%4,
674
4,63
2
Go
od
s an
d s
ervi
ces
785
136
- 92
1 92
1 -
100.
0%88
7 58
9
Pay
men
ts f
or
cap
ital
ass
ets
79
39
(41)
77
77
- 10
0.0%
14
56
Mac
hine
ry a
nd e
qui
pm
ent
66
39
(28)
77
77
- 10
0.0%
14
56
Tran
spo
rt e
qui
pm
ent
--
--
--
--
15
Oth
er m
achi
nery
and
eq
uip
men
t66
39(2
8)38
77-
100.
0%14
41
Sof
twar
e an
d o
ther
inta
ngib
le a
sset
s13
-
(13)
- -
- 0.
0%-
-
To
tal
7,14
1 (4
42)
(625
)6,
074
6,05
6 18
99
.7%
5,57
5 5,
277
AP
PR
OP
RIA
TIO
N S
TAT
EM
EN
T
for
the
year
en
ded
31
Mar
ch 2
017
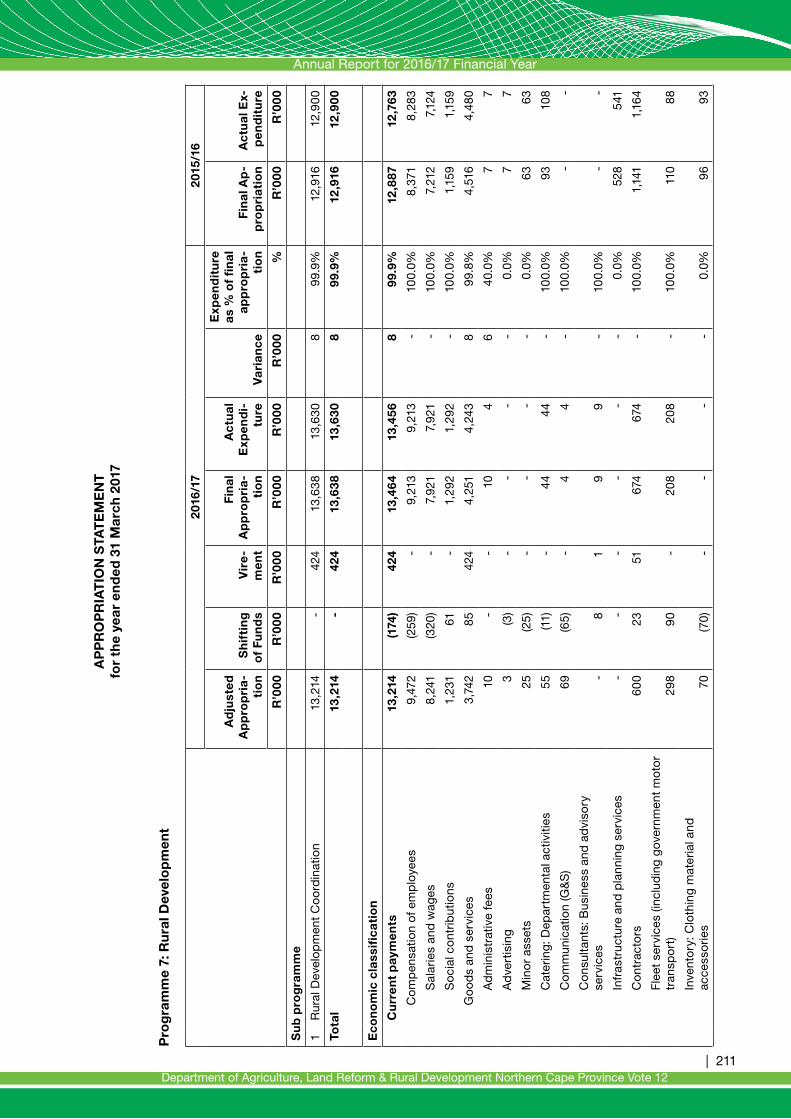
Annual Report for 2016/17 Financial Year
| 211Department of Agriculture, Land Reform & Rural Development Northern Cape Province Vote 12
Su
bp
rog
ram
me:
6.1
: Ag
ric-
Bu
sin
ess
Su
pp
ort
an
d D
evel
op
men
t
20
16/1
720
15/1
6
Ad
just
ed
Ap
pro
pri
a-ti
on
Sh
ifti
ng
o
f Fu
nd
s V
ire
-m
ent
Fin
al A
p-
pro
pri
atio
n A
ctu
al E
x-p
end
itu
re
Var
ian
ce
Exp
end
-it
ure
as
% o
f fi
nal
ap
pro
pri
a-ti
on
Fin
al
Ap
pro
pri
a-ti
on
Ac
tual
Ex-
pen
dit
ure
Eco
no
mic
cla
ssifi
cati
on
R’0
00R
’000
R’0
00R
’000
R’0
00R
’000
%R
’000
R’0
00
Cu
rren
t p
aym
ents
2,6
41
392
(96)
2,9
37
2,9
37
- 10
0.0%
3,12
7 2
,445
Co
mp
ensa
tion
of e
mp
loye
es1,
359
(465
)(9
6)79
8 79
8 -
100.
0%1,
755
1,37
2
Go
od
s an
d s
ervi
ces
1,28
2 85
7 -
2,13
9 2,
139
- 10
0.0%
1,37
2 1,
073
Tran
sfer
s an
d s
ub
sid
ies
- 50
-
50
50
- 10
0.0%
23
22
Hou
seho
lds
- 50
-
50
50
- 10
0.0%
23
22
Pay
men
ts f
or
cap
ital
ass
ets
66
- (6
6)-
- -
0.0%
394
394
Mac
hine
ry a
nd e
qui
pm
ent
66
- (6
6)-
- -
0.0%
394
394
To
tal
2,7
07
442
(162
)2
,987
2
,987
-
100.
0%3,
544
2,8
61
Su
bp
rog
ram
me:
6.2
: Mac
roec
on
om
ics
Su
pp
ort
20
16/1
720
15/1
6
Ad
just
ed
Ap
pro
pri
-at
ion
Sh
ifti
ng
o
f Fu
nd
s V
irem
ent
Fin
al
Ap
pro
pri
-at
ion
Ac
tual
E
xpen
di-
ture
V
aria
nce
Exp
end
-it
ure
as
% o
f fi
nal
ap
pro
pri
a-ti
on
Fin
al
Ap
pro
pri
-at
ion
Ac
tual
E
xpen
di-
ture
Eco
no
mic
cla
ssifi
cati
on
R’0
00R
’000
R’0
00R
’000
R’0
00R
’000
%R
’000
R’0
00
Cu
rren
t p
aym
ents
7,06
2 (4
81)
(584
)5,
997
5,97
9 18
99
.7%
5,56
1 5,
221
Co
mp
ensa
tion
of e
mp
loye
es6,
277
(617
)(5
84)
5,07
6 5,
058
18
99.6
%4,
674
4,63
2
Go
od
s an
d s
ervi
ces
785
136
- 92
1 92
1 -
100.
0%88
7 58
9
Pay
men
ts f
or
cap
ital
ass
ets
79
39
(41)
77
77
- 10
0.0%
14
56
Mac
hine
ry a
nd e
qui
pm
ent
66
39
(28)
77
77
- 10
0.0%
14
56
Tran
spo
rt e
qui
pm
ent
--
--
--
--
15
Oth
er m
achi
nery
and
eq
uip
men
t66
39(2
8)38
77-
100.
0%14
41
Sof
twar
e an
d o
ther
inta
ngib
le a
sset
s13
-
(13)
- -
- 0.
0%-
-
To
tal
7,14
1 (4
42)
(625
)6,
074
6,05
6 18
99
.7%
5,57
5 5,
277
Pro
gra
mm
e 7:
Ru
ral D
evel
op
men
t
2016
/17
2015
/16
Ad
just
ed
Ap
pro
pri
a-ti
on
Sh
ifti
ng
o
f Fu
nd
s V
ire
-m
ent
Fin
al
Ap
pro
pri
a-ti
on
Ac
tual
E
xpen
di-
ture
V
aria
nce
Exp
end
itu
re
as %
of
fin
al
app
rop
ria-
tio
n F
inal
Ap
-p
rop
riat
ion
Ac
tual
Ex-
pen
dit
ure
R’0
00R
’000
R’0
00R
’000
R’0
00R
’000
%R
’000
R’0
00
Su
b p
rog
ram
me
1R
ural
Dev
elop
men
t C
oo
rdin
atio
n13
,214
-
424
13,6
38
13,6
30
8 99
.9%
12,9
16
12,9
00
Tota
l 13
,214
-
424
13,6
38
13,6
30
8 99
.9%
12,9
16
12,9
00
Eco
no
mic
cla
ssifi
cati
on
C
urr
ent
pay
men
ts13
,214
(1
74)
424
13,4
64
13,4
56
8 99
.9%
12,8
87
12,7
63
C
om
pen
satio
n of
em
plo
yees
9,47
2 (2
59)
- 9,
213
9,21
3 -
100.
0%8,
371
8,28
3
S
alar
ies
and
wag
es8,
241
(320
)-
7,92
1 7,
921
- 10
0.0%
7,21
2 7,
124
S
oci
al c
ont
ribut
ions
1,23
1 61
-
1,29
2 1,
292
- 10
0.0%
1,15
9 1,
159
G
oo
ds
and
ser
vice
s3,
742
85
424
4,25
1 4,
243
8 99
.8%
4,51
6 4,
480
A
dm
inis
trat
ive
fees
10
- -
10
4 6
40.0
%7
7
A
dve
rtis
ing
3 (3
)-
- -
- 0.
0%7
7
M
ino
r as
sets
25
(25)
- -
- -
0.0%
63
63
C
ater
ing:
Dep
artm
enta
l act
iviti
es55
(1
1)-
44
44
- 10
0.0%
93
108
C
om
mun
icat
ion
(G&
S)
69
(65)
- 4
4 -
100.
0%-
-
C
ons
ulta
nts:
Bus
ines
s an
d a
dvi
sory
se
rvic
es-
8 1
9 9
- 10
0.0%
- -
In
fras
truc
ture
and
pla
nnin
g se
rvic
es-
- -
- -
- 0.
0%52
8 54
1
C
ont
ract
ors
600
23
51
674
674
- 10
0.0%
1,14
1 1,
164
Fl
eet
serv
ices
(inc
lud
ing
gov
ernm
ent
mot
or
tran
spo
rt)
298
90
- 20
8 20
8 -
100.
0%11
0 88
In
vent
ory
: Clo
thin
g m
ater
ial a
nd
acce
sso
ries
70
(70)
- -
- -
0.0%
96
93
AP
PR
OP
RIA
TIO
N S
TAT
EM
EN
T
for
the
year
en
ded
31
Mar
ch 2
017

Annual Report for 2016/17 Financial Year
212 |Department of Agriculture, Land Reform & Rural Development Northern Cape Province Vote 12
2016
/17
2015
/16
Ad
just
ed
Ap
pro
pri
a-ti
on
Sh
ifti
ng
o
f Fu
nd
s V
ire
-m
ent
Fin
al
Ap
pro
pri
a-ti
on
Ac
tual
E
xpen
di-
ture
V
aria
nce
Exp
end
itu
re
as %
of
fin
al
app
rop
ria-
tio
n F
inal
Ap
-p
rop
riat
ion
Ac
tual
Ex-
pen
dit
ure
R’0
00R
’000
R’0
00R
’000
R’0
00R
’000
%R
’000
R’0
00
In
vent
ory
: Far
min
g su
pp
lies
5 12
-
17
17
- 10
0.0%
1,00
3 99
8
In
vent
ory
: Fue
l, oi
l and
gas
1,29
0 (7
)-
1,28
3 1,
283
- 10
0.0%
- -
In
vent
ory
: Mat
eria
ls a
nd s
upp
lies
15
(10)
- 5
5 -
100.
0%42
30
C
ons
umab
le s
upp
lies
117
27
- 14
4 14
4 -
100.
0%10
6 10
6
C
ons
umab
le: S
tatio
nery
, prin
ting
and
offi
ce
sup
plie
s53
(5
2)-
1 1
- 10
0.0%
55
55
O
per
atin
g le
ases
17
(17)
- -
- -
0.0%
- -
P
rop
erty
pay
men
ts18
(1
8)-
- -
- 0.
0%-
-
Tr
avel
and
sub
sist
ence
980
423
372
1,77
5 1,
775
- 10
0.0%
1,22
2 1,
177
Tr
aini
ng a
nd d
evel
opm
ent
96
(84)
- 12
12
-
100.
0%23
23
O
per
atin
g p
aym
ents
10
- -
10
8 2
80.0
%19
19
Ve
nues
and
faci
litie
s10
45
-
55
55
- 10
0.0%
- -
R
enta
l and
hiri
ng1
(1)
- -
- -
0.0%
1 1
P
aym
ents
fo
r ca
pit
al a
sset
s-
174
- 17
4 17
4 -
100.
0%29
13
7
M
achi
nery
and
eq
uip
men
t-
174
- 17
4 17
4 -
100.
0%29
13
7
Tran
spo
rt e
qui
pm
ent
-17
4-
174
174
-10
0.0%
-10
8
O
ther
mac
hine
ry a
nd e
qui
pm
ent
- -
- -
- -
0.0%
29
29
Tota
l 13
,214
-
424
13,6
38
13,6
30
8 99
.9%
12,9
16
12,9
00
AP
PR
OP
RIA
TIO
N S
TAT
EM
EN
T
for
the
year
en
ded
31
Mar
ch 2
017

Annual Report for 2016/17 Financial Year
| 213Department of Agriculture, Land Reform & Rural Development Northern Cape Province Vote 12
Su
bp
rog
ram
me:
7.1
: Ru
ral D
evel
op
men
t C
oo
rdin
atio
n
20
16/1
720
15/1
6
A
dju
sted
A
pp
rop
riat
ion
Sh
ifti
ng
o
f Fu
nd
s V
irem
ent
Fin
al
Ap
pro
pri
atio
n A
ctu
al
Exp
end
itu
re
Var
ian
ce
Exp
end
itu
re
as %
of
fin
al
app
rop
riat
ion
Fin
al
Ap
pro
pri
atio
n A
ctu
al
Exp
end
itu
re
Eco
no
mic
cla
ssifi
cati
on
R’0
00R
’000
R’0
00R
’000
R’0
00R
’000
%R
’000
R’0
00
Cu
rren
t p
aym
ents
13,2
14
(174
)42
4 13
,464
13
,456
8
99.9
%12
,887
12
,763
Co
mp
ensa
tion
of e
mp
loye
es9,
472
(259
)-
9,21
3 9,
213
- 10
0.0%
8,37
1 8,
283
Go
od
s an
d s
ervi
ces
3,74
2
85
42
4 4,
251
4,24
3 8
95.9
%4,
516
4,48
0
Pay
men
ts f
or
cap
ital
ass
ets
- 17
4 -
174
174
- 10
0.0%
29
137
Mac
hine
ry a
nd e
qui
pm
ent
- 17
4 -
174
174
- 10
0.0%
29
137
To
tal
13,2
14
- 42
4 13
,638
13
,630
8
99.9
%12
,916
12
,900
AP
PR
OP
RIA
TIO
N S
TAT
EM
EN
T
for
the
year
en
ded
31
Mar
ch 2
017

Annual Report for 2016/17 Financial Year
214 |Department of Agriculture, Land Reform & Rural Development Northern Cape Province Vote 12
1. Detail of transfers and subsidies as per Appropriation Act (after Virement):
Detail of these transactions can be viewed in the note on Transfers and subsidies, disclosure notes and Annexure 1 (A-H) to the Annual Financial Statements.
2. Detail of specifically and exclusively appropriated amounts voted (after Virement):
Detail of these transactions can be viewed in note 1 (Annual Appropriation) to the Annual Financial Statements.
3. Detail on payments for financial assets
Detail of these transactions per programme can be viewed in the note on Payments for financial assets to the Annual Financial Statements.
4. Explanations of material variances from Amounts Voted (after Virement):
4.1 Per programme Final Appropriation
Actual Expenditure
Variance R’000
Variance as a % of Final
Appropriation
R’000 R’000 R’000 R’000
3 Farmer Support And Development 226,885 212,071 14,814 6.53%
A significant portion of the unspent funds relate to conditional grants that were committed but not spent. Roll-over of funds were requested.
NOTES TO THE APPROPRIATION STATEMENT for the year ended 31 March 2017

Annual Report for 2016/17 Financial Year
| 215Department of Agriculture, Land Reform & Rural Development Northern Cape Province Vote 12
4.2 Per economic classification Final Appropriation
Actual Expenditure
Variance Variance as a % of Final
Appropriation
R’000 R’000 R’000 R’000
Current payments
Compensation of employees 209,689 209,301 388 0.2%
Goods and services 156,110 143,668 12,442 8.0%
Interest and rent on land - 18 (18) 100.00%
Transfers and subsidies
Provinces and municipalities 119 119 - -
Departmental agencies and accounts 34,955 34,955 - -
Households 3,295 3,295 - -
Payments for capital assets
Buildings and other fixed structures 127,176 118,453 8,723 6.86%
Machinery and equipment 20,325 26,764 (6,439) -31.7%
Biological assets 990 990 - -
Software and other Intangible assets 2,546 2,546 - -
The department has reclassified some operating lease expenditure as finance lease expenditure that resulted in the variances noted between Goods and services and Machinery and equipment.
4.3 Per conditional grant Final Appropriation
Actual Expenditure
Variance Variance as a % of Final
Appropriation
R’000 R’000 R’000 R’000
DAFF-CASP 129,924 118,314 11,610 8.9%
DAFF-Land Care 9,320 9,306 14 0.2%
DAFF-Ilima/Letsema 55,222 52,022 3,200 5.8%
Public Works-EPWP Incentive Grant 2,000 1,992 8 0.4%
A significant portion of the unspent funds relate to conditional grants that were committed but not spent. Roll-over of these funds were requested.
NOTES TO THE APPROPRIATION STATEMENT for the year ended 31 March 2017
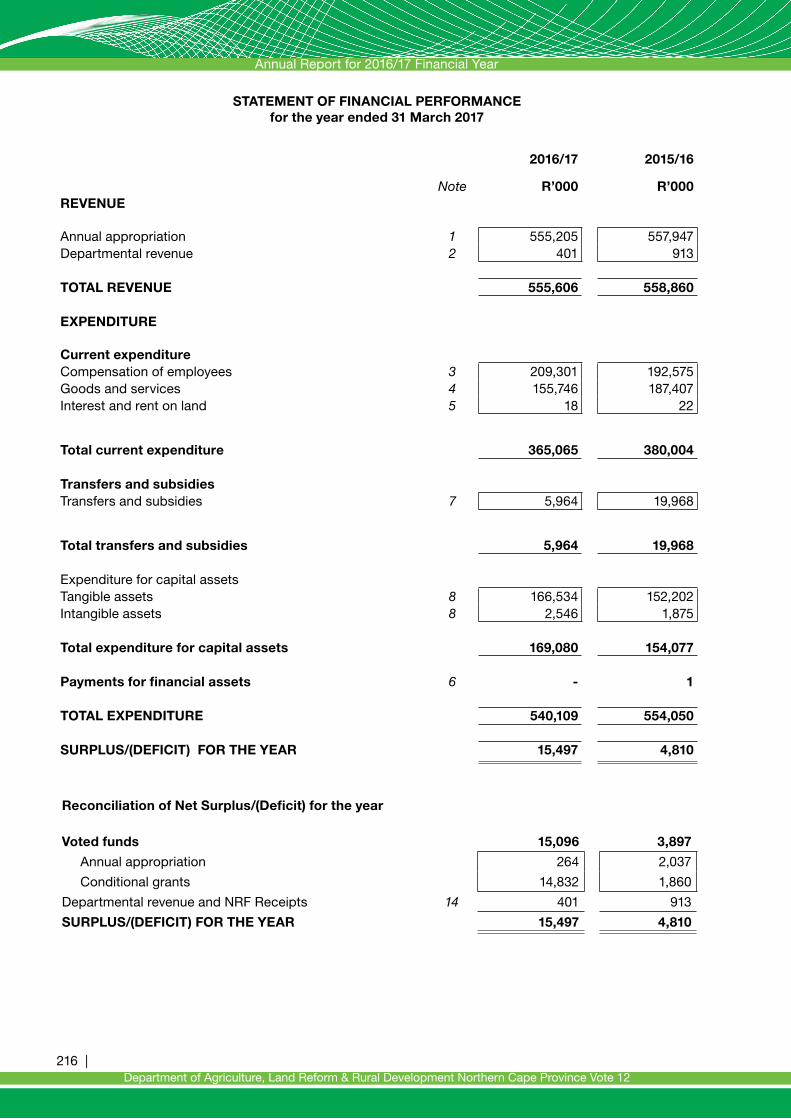
Annual Report for 2016/17 Financial Year
216 |Department of Agriculture, Land Reform & Rural Development Northern Cape Province Vote 12
Note
2016/17
R’000
2015/16
R’000REVENUE
Annual appropriation 1 555,205 557,947 Departmental revenue 2 401 913
TOTAL REVENUE 555,606 558,860
EXPENDITURE
Current expenditureCompensation of employees 3 209,301 192,575Goods and services 4 155,746 187,407Interest and rent on land 5 18 22
Total current expenditure
365,065 380,004
Transfers and subsidiesTransfers and subsidies 7 5,964 19,968
Total transfers and subsidies 5,964 19,968
Expenditure for capital assetsTangible assets 8 166,534 152,202Intangible assets 8 2,546 1,875
Total expenditure for capital assets 169,080 154,077
Payments for financial assets 6 - 1
TOTAL EXPENDITURE 540,109 554,050
SURPLUS/(DEFICIT) FOR THE YEAR 15,497 4,810
Reconciliation of Net Surplus/(Deficit) for the year
Voted funds 15,096 3,897
Annual appropriation 264 2,037
Conditional grants 14,832 1,860
Departmental revenue and NRF Receipts 14 401 913
SURPLUS/(DEFICIT) FOR THE YEAR 15,497 4,810
STATEMENT OF FINANCIAL PERFORMANCE for the year ended 31 March 2017

Annual Report for 2016/17 Financial Year
| 217Department of Agriculture, Land Reform & Rural Development Northern Cape Province Vote 12
Note 2016/17 2015/16
R’000 R’000
ASSETS
Current assets 14,106 3,014
Unauthorised expenditure 9 97 97
Cash and cash equivalents 10 11,233 1,064
Prepayments and advances 11 2,740 561
Receivables 12 36 1,292
Non-current assets 4,196 4,165
Receivables 12 4,196 4,165
TOTAL ASSETS 18,302 7,179
LIABILITIES
Current liabilities 15,559 4,448
Voted funds to be surrendered to the Revenue Fund 13 15,096 3,897
Departmental revenue and NRF Receipts to be surrendered to the Revenue Fund
14463 326
Payables 15 - 225
Non-current liabilities - -
TOTAL LIABILITIES 15,559 4,448
NET ASSETS 2,743 2,731
Represented by:
Capitalisation reserve 23 23
Recoverable revenue 2,720 2,708
TOTAL 2,743 2,731
STATEMENT OF FINANCIAL POSITION as at 31 March 2017
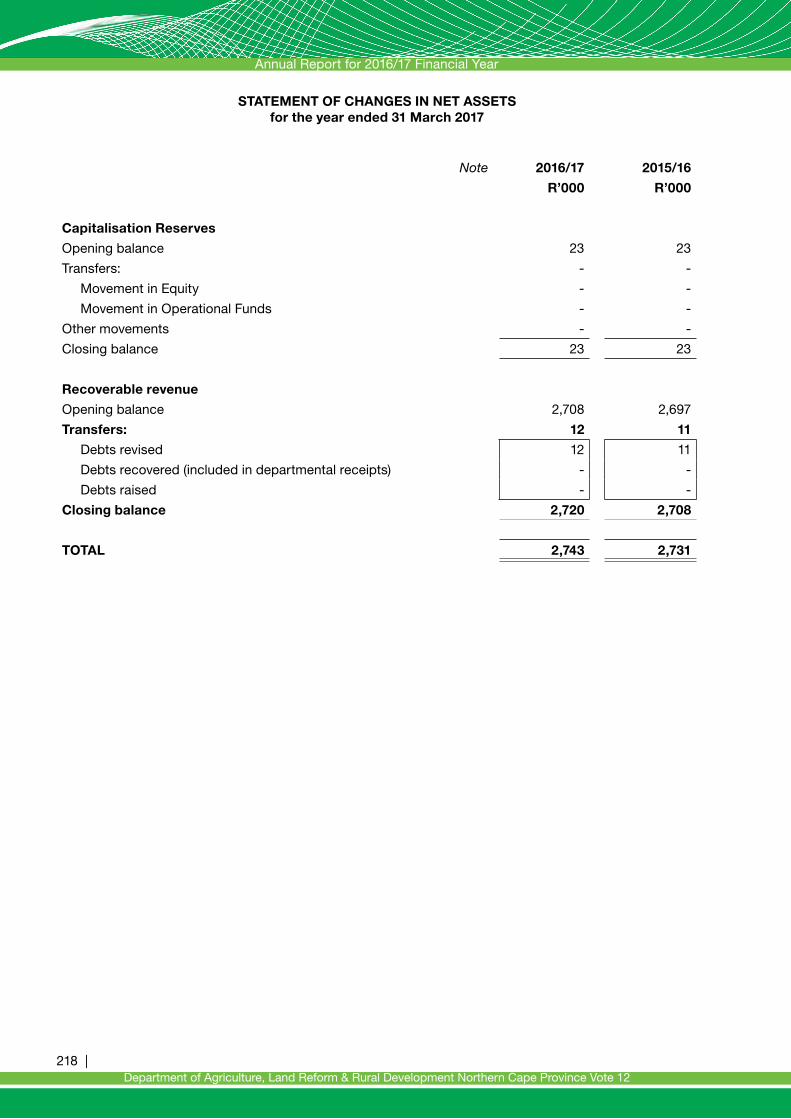
Annual Report for 2016/17 Financial Year
218 |Department of Agriculture, Land Reform & Rural Development Northern Cape Province Vote 12
Note 2016/17 2015/16
R’000 R’000
Capitalisation Reserves
Opening balance 23 23
Transfers: - -
Movement in Equity - -
Movement in Operational Funds - -
Other movements - -
Closing balance 23 23
Recoverable revenue
Opening balance 2,708 2,697
Transfers: 12 11
Debts revised 12 11
Debts recovered (included in departmental receipts) - -
Debts raised - -
Closing balance 2,720 2,708
TOTAL 2,743 2,731
STATEMENT OF CHANGES IN NET ASSETS for the year ended 31 March 2017

Annual Report for 2016/17 Financial Year
| 219Department of Agriculture, Land Reform & Rural Development Northern Cape Province Vote 12
2016/17 2015/16
Note R’000 R’000
CASH FLOWS FROM OPERATING ACTIVITIES
Receipts 558,269 560,915
Annual appropriated funds received 1.1 555,205 577,947
Departmental revenue received 2 3,064 2,968
Net (increase)/decrease in working capital (1,179) (946)
Surrendered to Revenue Fund (7,472) (10,678)
Current payments (365,047) (379,982)
Interest paid 4 (18) (22)
Payments for financial assets - (1)
Transfers and subsidies paid (5,964) (19,968)
Net cash flow available from operating activities 16 178,589 149,318
CASH FLOWS FROM INVESTING ACTIVITIES
Payments for capital assets 8 (169,080) (154,077)
Proceeds from sale of capital assets 2.3 648 -
Net cash flows from investing activities (168,432) (154,077)
CASH FLOWS FROM FINANCING ACTIVITIES
Distribution/dividend received - -
Increase/(decrease) in net assets 12 11
Increase/(decrease) in non-current payables - -
Net cash flows from financing activities 12 11
Net increase/(decrease) in cash and cash equivalents 10,169 (4,748)
Cash and cash equivalents at beginning of period 1,064 5,812
Cash and cash equivalents at end of period 17 11,233 1,064
CASH FLOW STATEMENT for the year ended 31 March 2017

Annual Report for 2016/17 Financial Year
220 |Department of Agriculture, Land Reform & Rural Development Northern Cape Province Vote 12
Summary of significant accounting policies
The financial statements have been prepared in accordance with the following policies, which have been applied consistently in all material aspects, unless otherwise indicated. Management has concluded that the financial statements present fairly the department’s primary and secondary information.
The historical cost convention has been used, except where otherwise indicated. Management has used assessments and estimates in preparing the annual financial statements. These are based on the best information available at the time of preparation.
Where appropriate and meaningful, additional information has been disclosed to enhance the usefulness of the financial statements and to comply with the statutory requirements of the Public Finance Management Act (PFMA), Act 1 of 1999 (as amended by Act 29 of 1999), and the Treasury Regulations issued in terms of the PFMA and the annual Division of Revenue Act.
1 Basis of preparation
The financial statements have been prepared in accordance with the Modified Cash Standard.
2 Going concern
The financial statements have been prepared on a going concern basis.
3 Presentation currency
Amounts have been presented in the currency of the South African Rand (R) which is also the functional currency of the department.
4 Rounding
Unless otherwise stated financial figures have been rounded to the nearest one thousand Rand (R’000).
5 Foreign currency translation
Cash flows arising from foreign currency transactions are translated into South African Rands using the spot exchange rates prevailing at the date of payment / receipt.
6 Comparative information
6.1 Prior period comparative information
Prior period comparative information has been presented in the current year’s financial statements. Where necessary figures included in the prior period financial statements have been reclassified to ensure that the format in which the information is presented is consistent with the format of the current year’s financial statements.
ACCOUNTING POLICIES for the year ended 31 March 2017

Annual Report for 2016/17 Financial Year
| 221Department of Agriculture, Land Reform & Rural Development Northern Cape Province Vote 12
6.2 Current year comparison with budget
A comparison between the approved, final budget and actual amounts for each programme and economic classification is included in the appropriation statement.
7 Revenue
7.1 Appropriated funds
Appropriated funds comprises of departmental allocations as well as direct charges against the revenue fund (i.e. statutory appropriation).
Appropriated funds are recognised in the statement of financial performance on the date the appropriation becomes effective. Adjustments made in terms of the adjustments budget process are recognised in the statement of financial performance on the date the adjustments become effective.
The net amount of any appropriated funds due to / from the relevant revenue fund at the reporting date is recognised as a payable / receivable in the statement of financial position.
7.2 Departmental revenue
Departmental revenue is recognised in the statement of financial performance when received and is subsequently paid into the relevant revenue fund, unless stated otherwise.
Any amount owing to the relevant revenue fund at the reporting date is recognised as a payable in the statement of financial position.
7.3 Accrued departmental revenue
Accruals in respect of departmental revenue (excluding tax revenue) are recorded in the notes to the financial statements when:
• it is probable that the economic benefits or service potential associated with the transaction will flow to the department; and
• the amount of revenue can be measured reliably.
The accrued revenue is measured at the fair value of the consideration receivable.
Accrued tax revenue (and related interest and / penalties) is measured at amounts receivable from collecting agents.
Write-offs are made according to the department’s debt write-off policy
8 Expenditure
8.1 Compensation of employees
8.1.1 Salaries and wages
Salaries and wages are recognised in the statement of financial performance on the date of payment.
Wages paid to departmental projects are recognised in the statement of financial performance on the date of payment to the project.
ACCOUNTING POLICIES for the year ended 31 March 2017
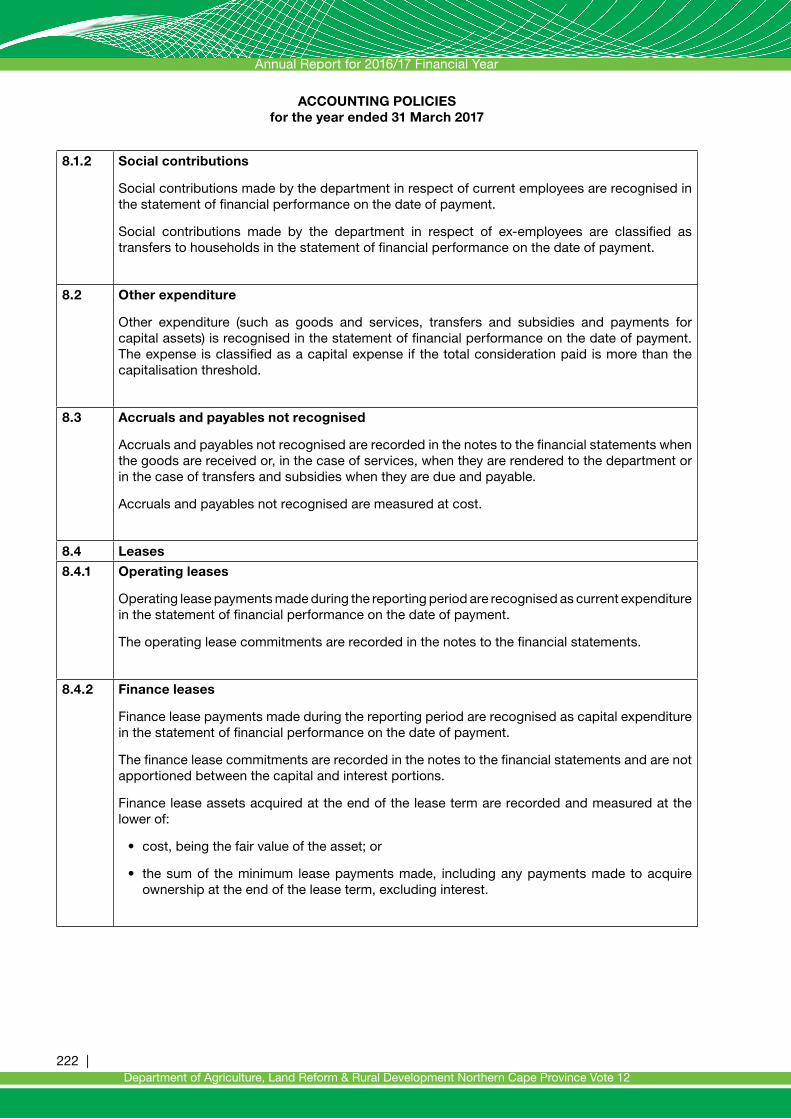
Annual Report for 2016/17 Financial Year
222 |Department of Agriculture, Land Reform & Rural Development Northern Cape Province Vote 12
8.1.2 Social contributions
Social contributions made by the department in respect of current employees are recognised in the statement of financial performance on the date of payment.
Social contributions made by the department in respect of ex-employees are classified as transfers to households in the statement of financial performance on the date of payment.
8.2 Other expenditure
Other expenditure (such as goods and services, transfers and subsidies and payments for capital assets) is recognised in the statement of financial performance on the date of payment. The expense is classified as a capital expense if the total consideration paid is more than the capitalisation threshold.
8.3 Accruals and payables not recognised
Accruals and payables not recognised are recorded in the notes to the financial statements when the goods are received or, in the case of services, when they are rendered to the department or in the case of transfers and subsidies when they are due and payable.
Accruals and payables not recognised are measured at cost.
8.4 Leases
8.4.1 Operating leases
Operating lease payments made during the reporting period are recognised as current expenditure in the statement of financial performance on the date of payment.
The operating lease commitments are recorded in the notes to the financial statements.
8.4.2 Finance leases
Finance lease payments made during the reporting period are recognised as capital expenditure in the statement of financial performance on the date of payment.
The finance lease commitments are recorded in the notes to the financial statements and are not apportioned between the capital and interest portions.
Finance lease assets acquired at the end of the lease term are recorded and measured at the lower of:
• cost, being the fair value of the asset; or
• the sum of the minimum lease payments made, including any payments made to acquire ownership at the end of the lease term, excluding interest.
ACCOUNTING POLICIES for the year ended 31 March 2017

Annual Report for 2016/17 Financial Year
| 223Department of Agriculture, Land Reform & Rural Development Northern Cape Province Vote 12
9 Aid Assistance
9.1 Aid assistance received
Aid assistance received in cash is recognised in the statement of financial performance when received. In-kind aid assistance is recorded in the notes to the financial statements on the date of receipt and is measured at fair value.
Aid assistance not spent for the intended purpose and any unutilised funds from aid assistance that are required to be refunded to the donor are recognised as a payable in the statement of financial position.
9.2 Aid assistance paid
Aid assistance paid is recognised in the statement of financial performance on the date of payment. Aid assistance payments made prior to the receipt of funds are recognised as a receivable in the statement of financial position.
10 Cash and cash equivalents
Cash and cash equivalents are stated at cost in the statement of financial position.
Bank overdrafts are shown separately on the face of the statement of financial position as a current liability.
For the purposes of the cash flow statement, cash and cash equivalents comprise cash on hand, deposits held, other short-term highly liquid investments and bank overdrafts.
11 Prepayments and advances
Prepayments and advances are recognised in the statement of financial position when the department receives or disburses the cash.
Prepayments and advances are initially and subsequently measured at cost.
12 Loans and receivables
Loans and receivables are recognised in the statement of financial position at cost plus accrued interest, where interest is charged, less amounts already settled or written-off. Write-offs are made according to the department’s write-off policy.
13 Investments
Investments are recognised in the statement of financial position at cost.
ACCOUNTING POLICIES for the year ended 31 March 2017

Annual Report for 2016/17 Financial Year
224 |Department of Agriculture, Land Reform & Rural Development Northern Cape Province Vote 12
14 Financial assets
14.1 Financial assets (not covered elsewhere)
A financial asset is recognised initially at its cost plus transaction costs that are directly attributable to the acquisition or issue of the financial.
At the reporting date, a department shall measure its financial assets at cost, less amounts already settled or written-off, except for recognised loans and receivables, which are measured at cost plus accrued interest, where interest is charged, less amounts already settled or written-off.
14.2 Impairment of financial assets
Where there is an indication of impairment of a financial asset, an estimation of the reduction in the recorded carrying value, to reflect the best estimate of the amount of the future economic benefits expected to be received from that asset, is recorded in the notes to the financial statements.
15 Payables
Loans and payables are recognised in the statement of financial position at cost, where applicable.
16 Capital Assets
16.1 Immovable capital assets
Immovable capital assets are initially recorded in the notes to the financial statements at cost. Immovable capital assets acquired through a non-exchange transaction are measured at fair value as at the date of acquisition.
Where the cost of immovable capital assets cannot be determined reliably, the immovable capital assets are measured at fair value for recording in the asset register.
Immovable capital assets are subsequently carried at cost and are not subject to depreciation or impairment.
Subsequent expenditure that is of a capital nature is added to the cost of the asset at the end of the capital project unless the immovable asset is recorded by another department in which case the completed project costs are transferred to that department.
ACCOUNTING POLICIES for the year ended 31 March 2017
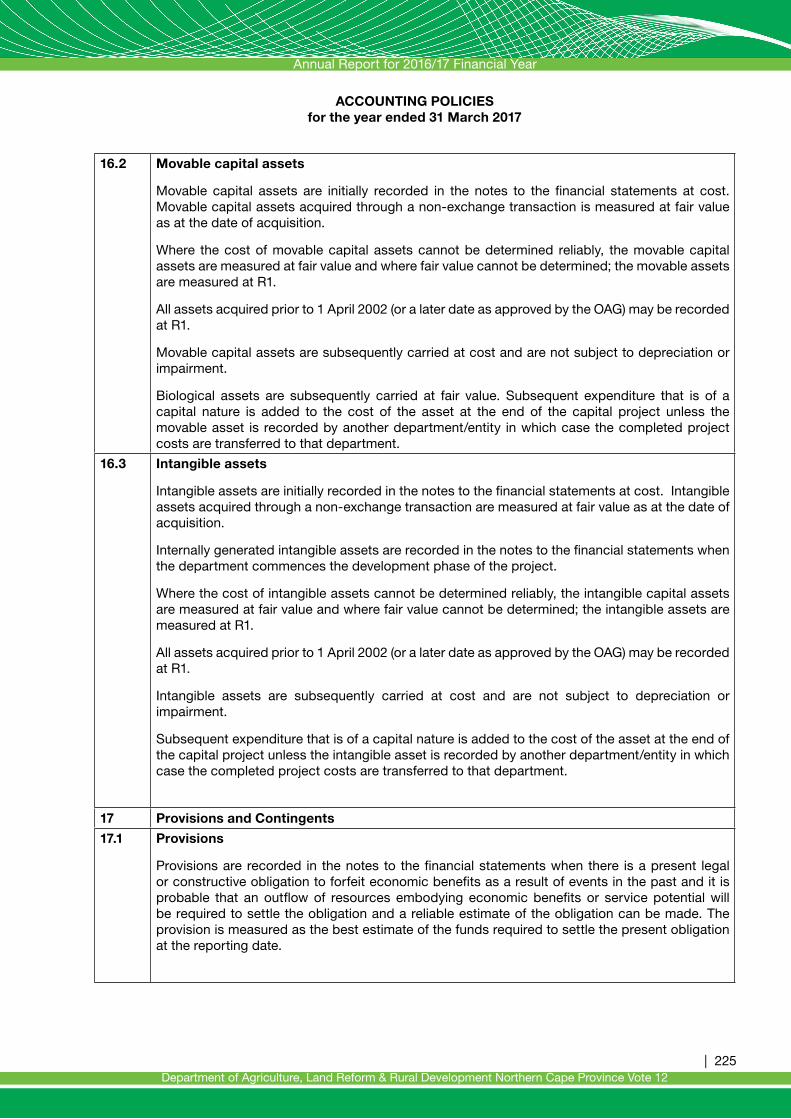
Annual Report for 2016/17 Financial Year
| 225Department of Agriculture, Land Reform & Rural Development Northern Cape Province Vote 12
16.2 Movable capital assets
Movable capital assets are initially recorded in the notes to the financial statements at cost. Movable capital assets acquired through a non-exchange transaction is measured at fair value as at the date of acquisition.
Where the cost of movable capital assets cannot be determined reliably, the movable capital assets are measured at fair value and where fair value cannot be determined; the movable assets are measured at R1.
All assets acquired prior to 1 April 2002 (or a later date as approved by the OAG) may be recorded at R1.
Movable capital assets are subsequently carried at cost and are not subject to depreciation or impairment.
Biological assets are subsequently carried at fair value. Subsequent expenditure that is of a capital nature is added to the cost of the asset at the end of the capital project unless the movable asset is recorded by another department/entity in which case the completed project costs are transferred to that department.
16.3 Intangible assets
Intangible assets are initially recorded in the notes to the financial statements at cost. Intangible assets acquired through a non-exchange transaction are measured at fair value as at the date of acquisition.
Internally generated intangible assets are recorded in the notes to the financial statements when the department commences the development phase of the project.
Where the cost of intangible assets cannot be determined reliably, the intangible capital assets are measured at fair value and where fair value cannot be determined; the intangible assets are measured at R1.
All assets acquired prior to 1 April 2002 (or a later date as approved by the OAG) may be recorded at R1.
Intangible assets are subsequently carried at cost and are not subject to depreciation or impairment.
Subsequent expenditure that is of a capital nature is added to the cost of the asset at the end of the capital project unless the intangible asset is recorded by another department/entity in which case the completed project costs are transferred to that department.
17 Provisions and Contingents
17.1 Provisions
Provisions are recorded in the notes to the financial statements when there is a present legal or constructive obligation to forfeit economic benefits as a result of events in the past and it is probable that an outflow of resources embodying economic benefits or service potential will be required to settle the obligation and a reliable estimate of the obligation can be made. The provision is measured as the best estimate of the funds required to settle the present obligation at the reporting date.
ACCOUNTING POLICIES for the year ended 31 March 2017

Annual Report for 2016/17 Financial Year
226 |Department of Agriculture, Land Reform & Rural Development Northern Cape Province Vote 12
17.2 Contingent liabilities
Contingent liabilities are recorded in the notes to the financial statements when there is a possible obligation that arises from past events, and whose existence will be confirmed only by the occurrence or non-occurrence of one or more uncertain future events not within the control of the department or when there is a present obligation that is not recognised because it is not probable that an outflow of resources will be required to settle the obligation or the amount of the obligation cannot be measured reliably.
17.3 Contingent assets
Contingent assets are recorded in the notes to the financial statements when a possible asset arises from past events, and whose existence will be confirmed by the occurrence or non-occurrence of one or more uncertain future events not within the control of the department.
17.4 Commitments
Commitments (other than for transfers and subsidies) are recorded at cost in the notes to the financial statements when there is a contractual arrangement or an approval by management in a manner that raises a valid expectation that the department will discharge its responsibilities thereby incurring future expenditure that will result in the outflow of cash.
18 Unauthorised expenditure
Unauthorised expenditure is recognised in the statement of financial position until such time as the expenditure is either:
• approved by Parliament or the Provincial Legislature with funding and the related funds are received; or
• approved by Parliament or the Provincial Legislature without funding and is written off against the appropriation in the statement of financial performance; or
• transferred to receivables for recovery.
Unauthorised expenditure is measured at the amount of the confirmed unauthorised expenditure.
19 Fruitless and wasteful expenditure
Fruitless and wasteful expenditure is recorded in the notes to the financial statements when confirmed. The amount recorded is equal to the total value of the fruitless and or wasteful expenditure incurred.
Fruitless and wasteful expenditure is removed from the notes to the financial statements when it is resolved or transferred to receivables for recovery.
Fruitless and wasteful expenditure receivables are measured at the amount that is expected to be recoverable and are de-recognised when settled or subsequently written-off as irrecoverable.
ACCOUNTING POLICIES for the year ended 31 March 2017

Annual Report for 2016/17 Financial Year
| 227Department of Agriculture, Land Reform & Rural Development Northern Cape Province Vote 12
20 Irregular expenditure
Irregular expenditure is recorded in the notes to the financial statements when confirmed. The amount recorded is equal to the value of the irregular expenditure incurred unless it is impracticable to determine, in which case reasons therefor are provided in the note.
Irregular expenditure is removed from the note when it is either condoned by the relevant authority, transferred to receivables for recovery or not condoned and is not recoverable.
Irregular expenditure receivables are measured at the amount that is expected to be recoverable and are de-recognised when settled or subsequently written-off as irrecoverable.
21 Changes in accounting policies, accounting estimates and errors
Changes in accounting policies that are effected by management have been applied retrospectively in accordance with MCS requirements, except to the extent that it is impracticable to determine the period-specific effects or the cumulative effect of the change in policy. In such instances the department shall restate the opening balances of assets, liabilities and net assets for the earliest period for which retrospective restatement is practicable.
Changes in accounting estimates are applied prospectively in accordance with MCS requirements.
Correction of errors is applied retrospectively in the period in which the error has occurred in accordance with MCS requirements, except to the extent that it is impracticable to determine the period-specific effects or the cumulative effect of the error. In such cases the department shall restate the opening balances of assets, liabilities and net assets for the earliest period for which retrospective restatement is practicable.
22 Events after the reporting date
Events after the reporting date that are classified as adjusting events have been accounted for in the financial statements. The events after the reporting date that are classified as non-adjusting events after the reporting date have been disclosed in the notes to the financial statements.
23 Principal-Agent arrangements
The department not have any principal-agent arrangements.
24 Departures from the MCS requirements
Management concluded that the financial statements present fairly the department’s primary and secondary information. The department complied with the Modified Cash Standard in the preparation of the Annual Financial Statements.
25 Capitalisation reserve
The capitalisation reserve comprises of financial assets and/or liabilities originating in a prior reporting period but which are recognised in the statement of financial position for the first time in the current reporting period. Amounts are recognised in the capitalisation reserves when identified in the current period and are transferred to the National/Provincial Revenue Fund when the underlying asset is disposed and the related funds are received.
ACCOUNTING POLICIES for the year ended 31 March 2017

Annual Report for 2016/17 Financial Year
228 |Department of Agriculture, Land Reform & Rural Development Northern Cape Province Vote 12
26 Recoverable revenue
Amounts are recognised as recoverable revenue when a payment made in a previous financial year becomes recoverable from a debtor in the current financial year. Amounts are either transferred to the National/Provincial Revenue Fund when recovered or are transferred to the statement of financial performance when written-off.
27 Related party transactions
A related party transaction is a transfer of resources, services or obligations between the reporting entity and a related party. Related party transactions within the Minister/MEC’s portfolio are recorded in the notes to the financial statements when the transaction is not at arm’s length.
Key management personnel are those persons having the authority and responsibility for planning, directing and controlling the activities of the department. The number of individuals and their full compensation is recorded in the notes to the financial statements.
28 Inventories (Effective from date determined in a Treasury Instruction)
At the date of acquisition, inventories are recorded at cost price in the statement of financial performance.
Where inventories are acquired as part of a non-exchange transaction, the cost of inventory is its fair value at the date of acquisition.
Inventories are subsequently measured at the lower of cost and net realisable value or the lower of cost and current replacement value.
Subsequent measurement of the cost of inventory is determined on the weighted average basis.
29 Public-Private Partnerships
Public Private Partnerships are accounted for based on the nature and or the substance of the partnership. The transaction is accounted for in accordance with the relevant accounting policies.
A summary of the significant terms of the PPP agreement, the parties to the agreement, and the date of commencement thereof together with the description and nature of the concession fees received, the unitary fees paid, rights and obligations of the department are recorded in the notes to the financial statements.
30 Employee benefits
The value of each major class of employee benefit obligation (accruals, payables not recognised and provisions) is disclosed in the Employee benefits note.
ACCOUNTING POLICIES for the year ended 31 March 2017

Annual Report for 2016/17 Financial Year
| 229Department of Agriculture, Land Reform & Rural Development Northern Cape Province Vote 12
1. Annual Appropriation
1.1 Annual Appropriation
Included are funds appropriated in terms of the Appropriation Act (and the Adjustments Appropriation Act) for National Departments (Voted funds) and Provincial Departments:
2016/17 2015/16
Final Appropria-
tion
Actual Funds
Received
Funds not requested/
not re-ceived
Final Ap-propriation
Appro-priation
received
R’000 R’000 R’000 R’000 R’000
Administration 118,608 118,608 - 106,491 106,491
Sustainable Resource development
95,698 95,698 - 97,500 97,500
Farmer Support & Development
226,885 226,885 - 245,596 245,596
Veterinary Services 44,659 44,659 - 43,017 43,017
Research& Development 46,656 46,656 - 43,308 43,308
Agricultural Economics Services
9,061 9,061 - 9,119 9,119
Rural Development 13,638 13,638 - 12,916 12,916
Total 555,205 555,205 - 557,947 557,947
1.2 Conditional grants
2016/17 2015/16
Note R’000 R’000
Total grants received 34 196,466 214,530
2. Departmental revenue
2017/16 2015/16
Note R’000 R’000
Tax revenue
Sales of goods and services other than capital assets 2.1 2,838 2,820
Interest, dividends and rent on land 2.2 5 9
Sales of capital assets 2.3 648 -
Transactions in financial assets and liabilities 2.4 221 139
Total revenue collected 3,712 2,968
Less: Own revenue included in appropriation 14 3,311 2,055
Departmental revenue collected 401 913
NOTES TO THE ANNUAL FINANCIAL STATEMENTS for the year ended 31 March 2017

Annual Report for 2016/17 Financial Year
230 |Department of Agriculture, Land Reform & Rural Development Northern Cape Province Vote 12
2.1 Sales of goods and services other than capital assets
2016/17 2015/16
Note R’000 R’000
Sales of goods and services produced by the department 2 2,838 2,820
Sales by market establishment 613 580
Administrative fees 171 75
Other sales 2,054 2,165
Total 2,838 2,820
Other sales include sales of animals, dates, commission on insurance and garnishees.
2.2 Interest, dividends and rent on land
2016/17 2015/16
Note R’000 R’000
Rent on land 2 5 9
Total 5 9
2.3 Sale of capital assets
2016/17 2015/16
Note R’000 R’000
Tangible assets 2 648
Machinery and equipment 30.2 648 -
Biological assets 30 - -
Intangible assets - -
Total 648 -
2.4 Transactions in financial assets and liabilities
2016/17 2015/16
Note R’000 R’000
Receivables 2 77 120
Stale cheques written back 2 144 19
Total 221 139
NOTES TO THE ANNUAL FINANCIAL STATEMENTS for the year ended 31 March 2017
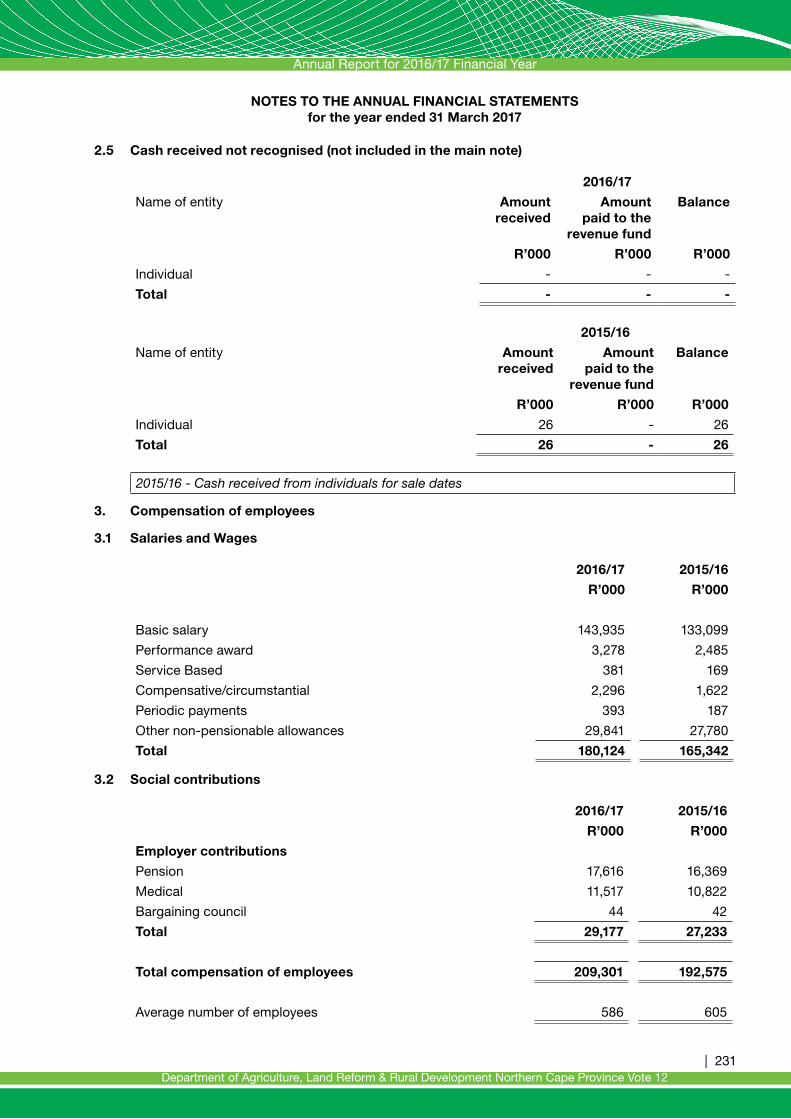
Annual Report for 2016/17 Financial Year
| 231Department of Agriculture, Land Reform & Rural Development Northern Cape Province Vote 12
2.5 Cash received not recognised (not included in the main note)
2016/17
Name of entity Amount received
Amount paid to the
revenue fund
Balance
R’000 R’000 R’000
Individual - - -
Total - - -
2015/16
Name of entity Amount received
Amount paid to the
revenue fund
Balance
R’000 R’000 R’000
Individual 26 - 26
Total 26 - 26
2015/16 - Cash received from individuals for sale dates
3. Compensation of employees
3.1 Salaries and Wages
2016/17 2015/16
R’000 R’000
Basic salary 143,935 133,099
Performance award 3,278 2,485
Service Based 381 169
Compensative/circumstantial 2,296 1,622
Periodic payments 393 187
Other non-pensionable allowances 29,841 27,780
Total 180,124 165,342
3.2 Social contributions
2016/17 2015/16
R’000 R’000
Employer contributions
Pension 17,616 16,369
Medical 11,517 10,822
Bargaining council 44 42
Total 29,177 27,233
Total compensation of employees 209,301 192,575
Average number of employees 586 605
NOTES TO THE ANNUAL FINANCIAL STATEMENTS for the year ended 31 March 2017

Annual Report for 2016/17 Financial Year
232 |Department of Agriculture, Land Reform & Rural Development Northern Cape Province Vote 12
4. Goods and services
2016/17 2015/16Note R’000 R’000
Administrative fees 2,677 1,947Advertising 695 1,656Minor assets 4.1 372 1,858Bursaries (employees) 645 900Catering 2,087 2,488Communication 3,000 3,308Computer services 4.2 2,207 2,203Consultants: Business and advisory services 10,231 6,398Infrastructure and planning services 750 15,709Laboratory services 975 1,696Legal services 369 365Contractors 13,225 16,370Agency and support / outsourced services 3,240 1,350Audit cost – external 4.3 4,679 4,598Fleet services 8,491 5,118Inventory 4.4 34,452 65,760Consumables 4.5 5,144 3,885Operating leases 10,498 11,046Property payments 4.6 11,074 8,681Rental and hiring 446 238Travel and subsistence 4.7 33,617 28,476Venues and facilities 3,646 752Training and development 1,363 1,584Other operating expenditure 4.8 1,863 1,621Total 155,746 187,407
4.1 Minor assets
2016/17 2015/16Note R’000 R’000
Tangible assets 4 372 1,253 Biological assets - 691 Machinery and equipment 372 562Intangible assets - 5 Software - 5Total 372 1,258
4.2 Computer services
2016/17 2015/16Note R’000 R’000
SITA computer services 1,458 1,739External computer service providers 794 464Total 4 2,207 2,203
NOTES TO THE ANNUAL FINANCIAL STATEMENTS for the year ended 31 March 2017

Annual Report for 2016/17 Financial Year
| 233Department of Agriculture, Land Reform & Rural Development Northern Cape Province Vote 12
4.3 Audit cost – External
2016/17 2015/16Note R’000 R’000
Regularity audits 4 4,679 4,598Total 4,679 4,598
4.4 Inventory
Note 2016/17 2015/164 R’000 R’000
Clothing material and accessories - 615Farming supplies 18,451 35,777Food and food supplies - 86Fuel, oil and gas 2,970 3,731Materials and supplies 1,905 9,053Medical supplies 41 31Medicine 502 395Other supplies 4.4.1 10,583 16,072Total 34,452 65,760
4.4.1 Other supplies
2016/17 2015/16Note R’000 R’000
Assets for distribution 10,499 16,029 Other assets for distribution 10,499 16,029Other 4.4 84 43Total 10,583 16,072
Other include cleaning, security and gardening service at Research station.Other assets for distribution refers to expenditure on departmental projects
4.5 Consumables
2016/17 2016/15Note R’000 R’000
Consumable supplies 4 3,832 2,062 Uniform and clothing 469 189 Household supplies 1,075 1,588 Other consumables 2,288 285Stationery, printing and office supplies 4 1,312 1,823Total 5,144 3,885
4.6 Property payments
2016/17 2015/16Note R’000 R’000
Municipal services 4 10,012 7,662Other 4 1,062 1,019Total 11,074 8,681
NOTES TO THE ANNUAL FINANCIAL STATEMENTS for the year ended 31 March 2017

Annual Report for 2016/17 Financial Year
234 |Department of Agriculture, Land Reform & Rural Development Northern Cape Province Vote 12
4.7 Travel and subsistence
2016/17 2015/16
Note R’000 R’000
Local 4 33,205 26,909
Foreign 4 412 1,567
Total 33,617 28,476
4.8 Other operating expenditure
Note 2016/17 2015/16
4 R’000 R’000
Professional bodies, membership and subscription fees 140 21
Resettlement costs 3 76
Other 1,720 1,524
Total 1,863 1,621
5. Interest and rent on land
2016/17 2015/16
R’000 R’000
Interest paid 18 22
Total 18 22
6. Payments for financial assets
2016/17 2015/16
Note R’000 R’000
Material losses through criminal conduct - 1
Theft - -
Other material losses 6.1 - 1
Total - 1
6.1 Other material losses
2016/17 2015/16
Note R’000 R’000
Nature of other material losses
Incident Disciplinary Steps taken/ Criminal proceedings
Unpaid cheque 6 - 1
Total - 1
NOTES TO THE ANNUAL FINANCIAL STATEMENTS for the year ended 31 March 2017

Annual Report for 2016/17 Financial Year
| 235Department of Agriculture, Land Reform & Rural Development Northern Cape Province Vote 12
7. Transfers and subsidies
2016/17 2015/16
R’000 R’000
Note
Provinces and municipalities 119 54
Departmental agencies and accounts Annex 1A 2,550 3,054
Public corporations and private enterprises Annex 1B - 10,415
Non-profit institutions Annex 1C - 157
Households Annex 1D 3,295 6,288
Total 5,964 19,968
Unspent funds transferred to the above beneficiaries
Departmental agencies and accounts 4,688 13,353
Total 4,688 13,353
Unspent funds:2015/16R13 350 000 relate to NAMCR3 000 relate to KKC2016/17R4 688 000 relate to NAMCExpenditure for capital assets
2016/17 2015/16
Note R’000 R’000
Tangible assets 166,534 152,202
Buildings and other fixed structures 32.1 153,872 141,381
Machinery and equipment 30.1 11,672 10,192
Biological assets 30.1 990 692
Intangible assets 2,546 1,875
Software 31.1 2,546 1,875
Total 169,080 154,077
NOTES TO THE ANNUAL FINANCIAL STATEMENTS for the year ended 31 March 2017
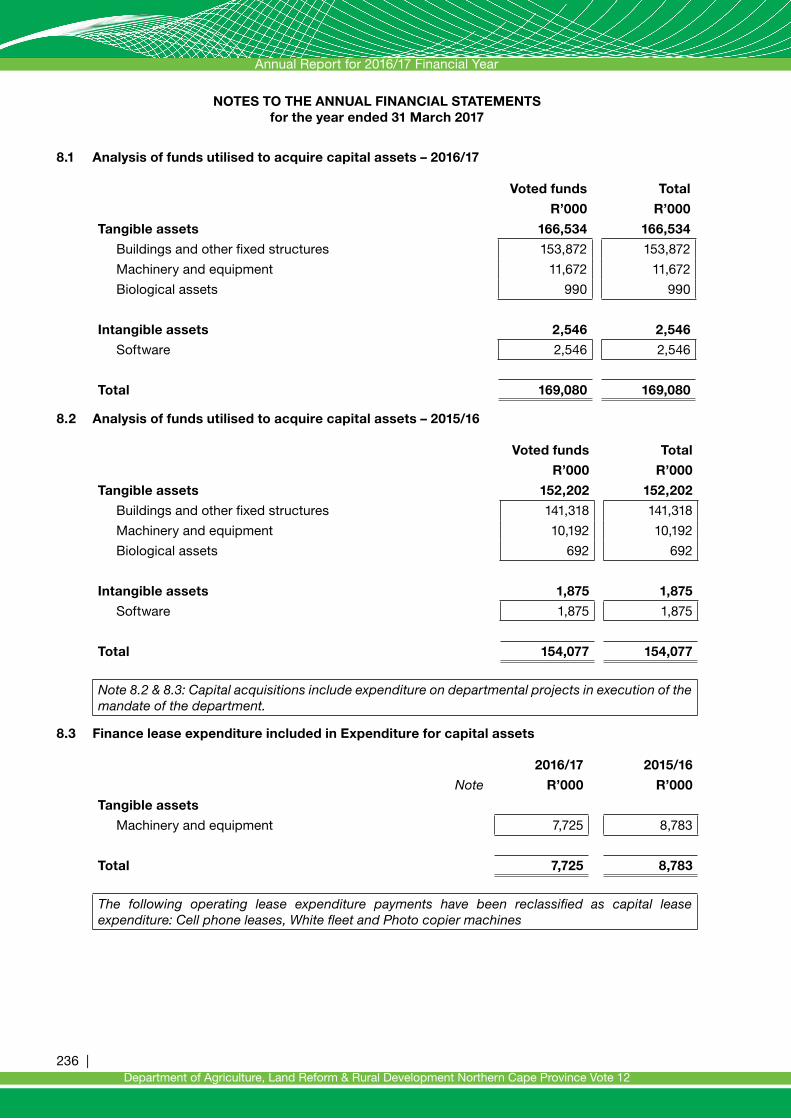
Annual Report for 2016/17 Financial Year
236 |Department of Agriculture, Land Reform & Rural Development Northern Cape Province Vote 12
8.1 Analysis of funds utilised to acquire capital assets – 2016/17
Voted funds Total
R’000 R’000
Tangible assets 166,534 166,534
Buildings and other fixed structures 153,872 153,872
Machinery and equipment 11,672 11,672
Biological assets 990 990
Intangible assets 2,546 2,546
Software 2,546 2,546
Total 169,080 169,080
8.2 Analysis of funds utilised to acquire capital assets – 2015/16
Voted funds Total
R’000 R’000
Tangible assets 152,202 152,202
Buildings and other fixed structures 141,318 141,318
Machinery and equipment 10,192 10,192
Biological assets 692 692
Intangible assets 1,875 1,875
Software 1,875 1,875
Total 154,077 154,077
Note 8.2 & 8.3: Capital acquisitions include expenditure on departmental projects in execution of the mandate of the department.
8.3 Finance lease expenditure included in Expenditure for capital assets
2016/17 2015/16
Note R’000 R’000
Tangible assets
Machinery and equipment 7,725 8,783
Total 7,725 8,783
The following operating lease expenditure payments have been reclassified as capital lease expenditure: Cell phone leases, White fleet and Photo copier machines
NOTES TO THE ANNUAL FINANCIAL STATEMENTS for the year ended 31 March 2017

Annual Report for 2016/17 Financial Year
| 237Department of Agriculture, Land Reform & Rural Development Northern Cape Province Vote 12
9. Unauthorised expenditure
9.1 Reconciliation of unauthorised expenditure
2016/17 2015/16
Note R’000 R’000
Opening balance 9.2 97 97
Prior period error - -
As restated 97 97
Unauthorised expenditure – discovered in current year (as restated) - -
Less: Amounts transferred to receivables for recovery - -
Closing balance 97 97
Analysis of awaiting authorisation per economic classification
Capital
Current 97 97
Transfers and subsidies 97 97
Total
9.2 Analysis of unauthorised expenditure awaiting authorisation per economic classification
2016/17 2015/16
Note R’000 R’000
Current 9.1 97 97
Total 97 97
9.3 Analysis of unauthorised expenditure awaiting authorisation per type
2016/17 2015/16
R’000 R’000
Unauthorised expenditure relating to overspending of the vote or a main division within a vote 97 97
Total 97 97
10. Cash and cash equivalents
2016/17 2015/16
R’000 R’000
Consolidated Paymaster General Account 11,173 1,050
Cash on hand 60 14
Total 11,233 1,064
NOTES TO THE ANNUAL FINANCIAL STATEMENTS for the year ended 31 March 2017

Annual Report for 2016/17 Financial Year
238 |Department of Agriculture, Land Reform & Rural Development Northern Cape Province Vote 12
11. Prepayments and advances
2016/17 2015/16
Note R’000 R’000
Travel and subsistence 36 (1)
Prepayments (Not expensed) 11.1 2,704 562
Total 2,740 561
11.1 Prepayments (Not expensed)
2016/17 2015/16
Note R’000 R’000
Other 11 2,704 562
Total 2,704 562
Advance payments were made in the execution of the department’s mandate. Advances made primarily for wages and transport costs.
12. Receivables
2016/17 2015/16
Current Non-current
Total Current Non-current
Total
Note R’000 R’000 R’000 R’000 R’000 R’000
Claims recoverable 12.1 24 - 24 1,161 - 1,161
Recoverable expenditure 12.2 - - - 123 299 422
Other debtors 12.3 12 4,196 4,208 8 3,866 3,874
Total 36 4,196 4,232 1,292 4,165 5,457
12.1 Claims recoverable
2016/17 2015/16
Note R’000 R’000
National departments 12 & Annex 4 24 654
Provincial departments - 487
Private enterprises - 20
Total 24 1,161
12.2 Recoverable expenditure (disallowance accounts)
2016/17 2015/16
Note R’000 R’000
Disallowance Miscellaneous 12 - 422
Total - 422
NOTES TO THE ANNUAL FINANCIAL STATEMENTS for the year ended 31 March 2017
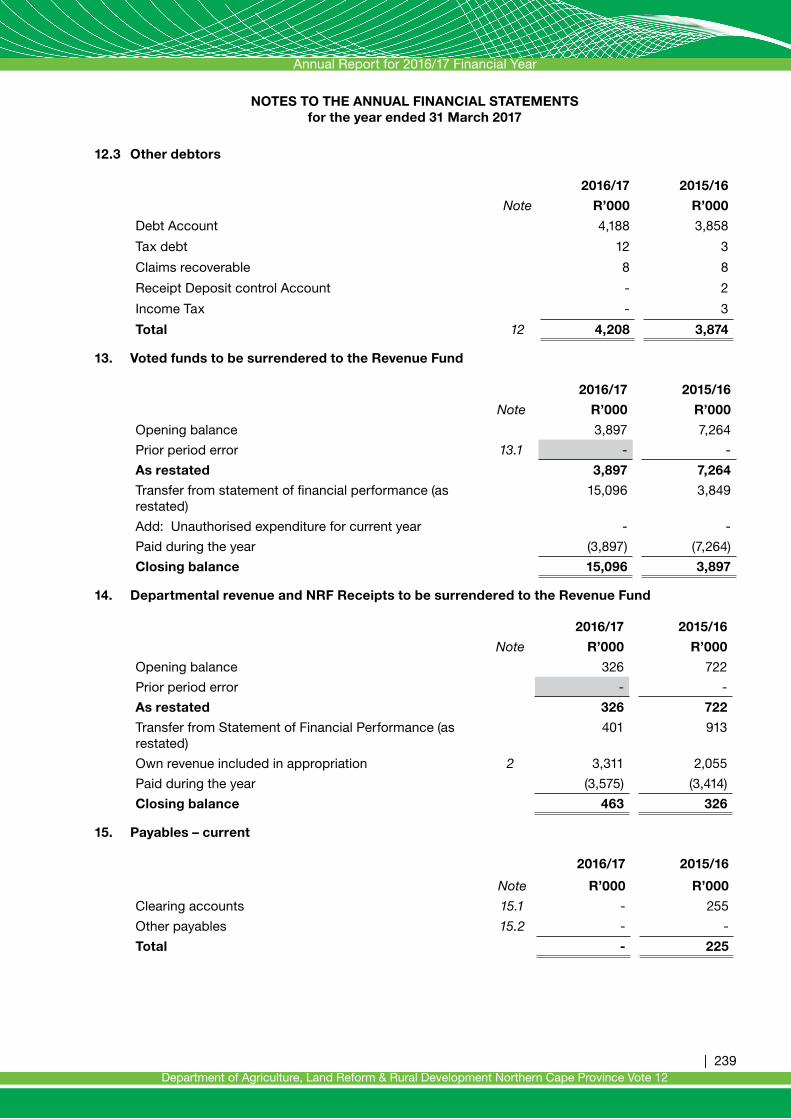
Annual Report for 2016/17 Financial Year
| 239Department of Agriculture, Land Reform & Rural Development Northern Cape Province Vote 12
12.3 Other debtors
2016/17 2015/16
Note R’000 R’000
Debt Account 4,188 3,858
Tax debt 12 3
Claims recoverable 8 8
Receipt Deposit control Account - 2
Income Tax - 3
Total 12 4,208 3,874
13. Voted funds to be surrendered to the Revenue Fund
2016/17 2015/16
Note R’000 R’000
Opening balance 3,897 7,264
Prior period error 13.1 - -
As restated 3,897 7,264
Transfer from statement of financial performance (as restated)
15,096 3,849
Add: Unauthorised expenditure for current year - -
Paid during the year (3,897) (7,264)
Closing balance 15,096 3,897
14. Departmental revenue and NRF Receipts to be surrendered to the Revenue Fund
2016/17 2015/16
Note R’000 R’000
Opening balance 326 722
Prior period error - -
As restated 326 722
Transfer from Statement of Financial Performance (as restated)
401 913
Own revenue included in appropriation 2 3,311 2,055
Paid during the year (3,575) (3,414)
Closing balance 463 326
15. Payables – current
2016/17 2015/16
Note R’000 R’000
Clearing accounts 15.1 - 255
Other payables 15.2 - -
Total - 225
NOTES TO THE ANNUAL FINANCIAL STATEMENTS for the year ended 31 March 2017

Annual Report for 2016/17 Financial Year
240 |Department of Agriculture, Land Reform & Rural Development Northern Cape Province Vote 12
15.1 Clearing accounts
2016/17 2015/16
Note R’000 R’000
Description
CETA 15 - 225
Total - 225
16. Net cash flow available from operating activities
2016/17 2015/16
R’000 R’000
Net surplus/(deficit) as per Statement of Financial Performance 15,497 4,810
Add back non cash/cash movements not deemed operating activities 163,092 144,508
(Increase)/decrease in receivables – current 1,225 (610)
(Increase)/decrease in prepayments and advances (2,179) (561)
Increase/(decrease) in payables – current (225) 225
Proceeds from sale of capital assets (648) -
Expenditure on capital assets 169,080 154,077
Surrenders to Revenue Fund (7,472) (10,678)
Own revenue included in appropriation 3,311 2,055
Net cash flow generated by operating activities 178,589 149,318
17. Reconciliation of cash and cash equivalents for cash flow purposes
2016/17 2015/16
R’000 R’000
Consolidated Paymaster General account 11,173 1,050
Cash on hand 60 14
Total 11,233 1,064
18. Contingent liabilities and contingent assets
18.1 Contingent liabilities
2016/17 2015/16
Note R’000 R’000
Liable to Nature
Claims against the department Annex 3A 3,197 2,907
Intergovernmental payables (unconfirmed balances) Annex 5 5 -
Total 3,202 2,907
NOTES TO THE ANNUAL FINANCIAL STATEMENTS for the year ended 31 March 2017

Annual Report for 2016/17 Financial Year
| 241Department of Agriculture, Land Reform & Rural Development Northern Cape Province Vote 12
18.2 Contingent assets
2016/17 2015/16
R’000 R’000
Nature of contingent asset
Department vs Martin: Application for Eviction 500 500
Total 500 500
19. Commitments
2016/17 2015/16
R’000 R’000
Current expenditure 18,825 30,896
Approved and contracted 18,825 30,896
Capital expenditure 11,667 9,874
Approved and contracted 11,667 9,874
Total Commitments 30,492 40,770
The department has a three year contract with a service provider relating to the provision of programme management, community facilitation and resources mobilization services amounting to R12,824,814. The contract is currently in the first year of implementation.
20. Accruals and payables not recognised
20.1 Accruals
2016/17 2015/16
R’000 R’000
Listed by economic classification
30 Days 30+ Days Total Total
Goods and services 3,817 1,998 5,815 11,007
Capital assets 1,817 3,026 4,843 8,381
Total 5,634 5,024 10,658 19,388
2016/17 2015/16
R’000 R’000
Listed by programme level
Administration
Sustainable Resource Management
Farmer Support & Development
Veterinary services
Technological Research & development
Agricultural economics
Rural Development & Farmer Settlement
4,906
250
4,237
1,158
37
20
50
8,311
5,887
4,776
169
138
107
-
Total 10,658 19,388
NOTES TO THE ANNUAL FINANCIAL STATEMENTS for the year ended 31 March 2017

Annual Report for 2016/17 Financial Year
242 |Department of Agriculture, Land Reform & Rural Development Northern Cape Province Vote 12
20.2 Payables not recognised
2016/17 2015/16
R’000 R’000
Listed by economic classification
30 Days 30+ Days Total Total
Goods and services - 5,664 5,664 1,734
Capital assets - 6,569 6,569 1,798
Total - 12,233 12,233 3,532
2016/17 2015/16
R’000 R’000
Listed by programme level
Administration
Sustainable Resource Management
Farmer Support & Development
Veterinary services
Technological Research & development
Agricultural Economics
Rural Development & Farmer Settlement
3,191
280
8,053
78
586
12
33
455
1,438
1,022
331
263
-
23
Total 12,233 3,532
2016/17 2015/16
Included in the above totals are the following: Note R’000 R’000
Confirmed balances with other departments Annex 5 1,390 3,093
Confirmed balances with other government entities Annex 5 197 432
Total 1,587 3,525
21. Employee benefits
2016/17 2015/16
R’000 R’000
Leave entitlement 9,459 7,439
Service bonus (Thirteenth cheque) 5,789 5,439
Performance awards 3,219 3,025
Capped leave commitments 4,640 5,044
Other 9 195
Total 23,116 21,142
1.Other is long service awarded to officials working more than 15 years in Government.
2.Included in the leave entitlement amount is the amount for negative leave credits to the total amount R 169,486.48
NOTES TO THE ANNUAL FINANCIAL STATEMENTS for the year ended 31 March 2017

Annual Report for 2016/17 Financial Year
| 243Department of Agriculture, Land Reform & Rural Development Northern Cape Province Vote 12
22. Lease commitments
22.1 Operating leases expenditure
2016/17
Buildings and other
fixed structures
Machinery and
equipment Total
Not later than 1 year 937 342 1,279
Later than 1 year and not later than 5 years 195 - 195
Later than five years - - -
Total lease commitments 1,132 342 1,474
2015/16
Buildings and other
fixed structures
Machinery and
equipment Total
Not later than 1 year 4,108 341 4,449
Later than 1 year and not later than 5 years 1,132 - 1,132
Later than five years - - -
Total lease commitments 5,240 341 5,581
Contract with Steiner for toiletry services expired in December 2016.
22.2 Finance leases expenditure
2016/17
Machinery and
equipment Total
Not later than 1 year 3,384 3,384
Later than 1 year and not later than 5 years 4,990 4,990
Later than five years - -
Total lease commitments 8,374 8,374
2015/16
Machinery and
equipment Total
Not later than 1 year 3,557 3,557
Later than 1 year and not later than 5 years 2,290 2,290
Later than five years - -
Total lease commitments 5,847 5,847
The finance lease commitment include motor vehicles that the department leased from Fleet Trading entity.(White fleet)
NOTES TO THE ANNUAL FINANCIAL STATEMENTS for the year ended 31 March 2017

Annual Report for 2016/17 Financial Year
244 |Department of Agriculture, Land Reform & Rural Development Northern Cape Province Vote 12
22.3 Operating lease revenue
2016/17
Buildings and other
fixed structures
Machinery and
equipment Total
Not later than 1 year - - -
Later than 1 year and not later than 5 years - - -
Later than five years - - -
Total operating lease revenue receivable - - -
2015/16
Buildings and other
fixed structures
Machinery and
equipment Total
Not later than 1 year 75 - 75
Later than 1 year and not later than 5 years - - -
Later than five years - - -
Total operating lease revenue receivable 75 - 75
Madeira contract expired in December 2016 currently the contract has been entered on a month to month with the department
23. Accrued departmental revenue
2016/17 2015/16
Note R’000 R’000
Sales of capital assets 23.1 650 650
Other - -
Total 650 650
23.1 Analysis of accrued departmental revenue
2016/17 2015/16
Note R’000 R’000
Opening balance 23 650 650
Less: amounts received - -
Add: amounts recognised - -
Less: amounts written-off/reversed as irrecoverable - -
Closing balance 650 650
The R0.650 million disclosed as received, was a non-cash transaction, refer to Annexure 1E
The department entered into a non-cash Swap agreement for Veterinary Mobile clinic procurement in 2013/14 financial year. During the year under review the transaction has been concluded upon receipt of the Mobile clinic.
NOTES TO THE ANNUAL FINANCIAL STATEMENTS for the year ended 31 March 2017

Annual Report for 2016/17 Financial Year
| 245Department of Agriculture, Land Reform & Rural Development Northern Cape Province Vote 12
24. Irregular expenditure
24.1 Reconciliation of irregular expenditure
2016/17 2015/16
R’000 R’000
Opening balance 130,341 22,030
Prior period error -
As restated 130,341 22,030
Add: Irregular expenditure – relating to prior year 7,153 71,141
Add: Irregular expenditure – relating to current year 18,994 37,170
Less: Prior year amounts condoned - -
Less: Current year amounts condoned - -
Less: Amounts not condoned and recoverable - -
Less: Amounts not condoned and not recoverable - -
Closing balance 156 488 130,341
Analysis of awaiting condonation per age classification
Current year 18,994 37,170
Prior years 137 494 93,171
Total 156 488 130,341
24.2 Details of irregular expenditure – added current year (relating to current and prior years)
Incident Disciplinary steps taken/criminal proceedings
2016/17
R’000
None compliance with Practice Note 8 of 2007/08
Investigations are still in process as these follow instruction letters and training provided as corrective and preventative measure in the current year.
1,353
Non- Compliance with section 44 of PFMA 145
None Compliance with Practice Note 6 of 2007/2008 paragraph 2.3I 7,009
None Compliance with Practice Note 4A of 2016/17 par 3.4. 23
None compliance with TR 16A 9.1 and Practice Note 8 of 2007/08 905
None Compliance with TR16A6.5 222
None Compliance with TR16A6.3[b] 1,379
None Compliance with TR16A6.3[c] 7,958
Total 18,994
NOTES TO THE ANNUAL FINANCIAL STATEMENTS for the year ended 31 March 2017

Annual Report for 2016/17 Financial Year
246 |Department of Agriculture, Land Reform & Rural Development Northern Cape Province Vote 12
25. Fruitless and wasteful expenditure
25.1 Reconciliation of fruitless and wasteful expenditure
2016/17 2015/16
R’000 R’000
Opening balance 2,680 2,618
Prior period error
As restated 2,680 2,618
Fruitless and wasteful expenditure – relating to prior year - -
Fruitless and wasteful expenditure – relating to current year 153 62
Less: Amounts resolved - -
Less: Amounts transferred to receivables for recovery - -
Closing balance 2,833 2,680
25.2 Analysis of awaiting resolution per economic classification
2016/17 2015/16
R’000 R’000
Current 818 665
Capital 1993 1,993
Transfers and subsidies 22 22
Total 2,816 2,680
25.3 Analysis of Current year’s fruitless and wasteful expenditure
Incident Disciplinary steps taken/criminal proceedings
2016/17
R’000
Interest on overdue account Investigations are in process 6
Cancellation cost Investigations are in process 12
Traffic fines Investigations are in process 1
Accident costs – damage to vehicles Investigations are in process 116
Accommodation: No show Investigations are in process 18
Total 153
26. Related party transactions
Payments made 2016/17 2015/16
Note R’000 R’000
Transfers Annex 1B - 10,415
Total - 10,415
Related party relationships:
Kalahari Kid Corporation (Public Entity falling under the control of the MEC)
Nieuwoudtville Rooibos (PTY) Ltd
NOTES TO THE ANNUAL FINANCIAL STATEMENTS for the year ended 31 March 2017

Annual Report for 2016/17 Financial Year
| 247Department of Agriculture, Land Reform & Rural Development Northern Cape Province Vote 12
27. Key management personnel
No. of Individuals 2016/17 2015/16
R’000 R’000
Political office bearers (provide detail below) 1 1,902 1,902
Officials:
Level 15 to 16 1 1,659 1,458
Level 14 (incl. CFO if at a lower level) 5 5,489 5,365
Family members of key management personnel - -
Total 9,050 8,725
28. Provisions
2016/17 2015/16
Note R’000 R’000
Microsoft 28.1 - 164
Total - 164
28.1 Reconciliation of movement in provisions – 2016/17
Microsoft Licence
Total provisions
R’000 R’000
Opening balance - 164
Increase in provision - -
Settlement of provision - -
Unused amount reversed - -
Reimbursement expected from third party - -
Closing balance - 164
Reconciliation of movement in provisions – 2015/16
Microsoft Licence
Total provisions
R’000 R’000
Opening balance 164 164
Increase in provision - -
Settlement of provision - -
Unused amount reversed - -
Reimbursement expected from third party - -
Change in provision due to change in estimation of inputs - -
Closing balance 164 164
NOTES TO THE ANNUAL FINANCIAL STATEMENTS for the year ended 31 March 2017

Annual Report for 2016/17 Financial Year
248 |Department of Agriculture, Land Reform & Rural Development Northern Cape Province Vote 12
29. Movable Tangible Capital Assets
MOVEMENT IN MOVABLE TANGIBLE CAPITAL ASSETS PER ASSET REGISTER FOR THE YEAR ENDED 31 MARCH 2017
Opening balance
Value adjustments
Additions Disposals Closing Balance
R’000 R’000 R’000 R’000 R’000
MACHINERY AND EQUIPMENT 94,118 11,695 4,439 17,048 93,204
Transport assets 44,548 1,237 1,457 2,633 44,609
Computer equipment 16,582 2,321 751 408 19,246
Furniture and office equipment 13,754 3,051 979 175 17,609
Other machinery and equipment 19,234 5,086 1,252 13,832 11,740
BIOLOGICAL ASSETS 2,450 - 990 129 3,311
Biological assets 2,450 - 990 129 3,311
TOTAL MOVABLE TANGIBLE CAPITAL ASSETS 96,568 11,695 5,429 17,177 96,515
Movable Tangible Capital Assets under investigation
Number Value
R’000
Included in the above total of the movable tangible capital assets per the asset register are assets that are under investigation:
Machinery and equipment
Biological assets
1,866
48
22,555
1,212
Movable assets under investigation amounting to R21 million of the previous year was investigated and decreased to R14 Million. Assets amounting to R 7 million was verified. The investigation is still underway. During the current year an additional amount of R9,2 Million is considered under investigation.
NOTES TO THE ANNUAL FINANCIAL STATEMENTS for the year ended 31 March 2017

Annual Report for 2016/17 Financial Year
| 249Department of Agriculture, Land Reform & Rural Development Northern Cape Province Vote 12
29.1 Additions
ADDITIONS TO MOVABLE TANGIBLE CAPITAL ASSETS PER ASSET REGISTER FOR THE YEAR ENDED 31 MARCH 2017
Cash Non-cash (Capital Work in
Progress current
costs and finance
lease payments)
Received current, not paid
(Paid current
year, received
prior year)
Total
R’000 R’000 R’000 R’000 R’000
MACHINERY AND EQUIPMENT 11,703 - (7,725) 461 4,439Transport assets 5,896 - (4,439) - 1,457Computer equipment 737 - - 14 751Furniture and office equipment 643 - - 336 979Other machinery and equipment 4,427 - (3,286) 111 1,252
BIOLOGICAL ASSETS 990 - - - 990Biological assets 990 - - - 990
TOTAL ADDITIONS TO MOVABLE TANGIBLE CAPITAL ASSETS 12,693 - (7,725) 461 5,429
29.2 Disposals
DISPOSALS OF MOVABLE TANGIBLE CAPITAL ASSETS PER ASSET REGISTER FOR THE YEAR ENDED 31 MARCH 2017
Sold for cash
Non-cash disposal
Total disposals
Cash Received
ActualR’000 R’000 R’000 R’000
MACHINERY AND EQUIPMENT 1,012 16,036 17,048 648Transport assets 1,012 1,621 2,633 648Computer equipment - 408 408 -Furniture and office equipment - 175 175 -Other machinery and equipment - 13,832 13,832 -
BIOLOGICAL ASSETS 115 14 129Biological assets 115 14 129 -
TOTAL DISPOSAL OF MOVABLE TANGIBLE CAPITAL ASSETS 1,127 16,050 17,177 648
NOTES TO THE ANNUAL FINANCIAL STATEMENTS for the year ended 31 March 2017

Annual Report for 2016/17 Financial Year
250 |Department of Agriculture, Land Reform & Rural Development Northern Cape Province Vote 12
29.3 Movement for 2015/16
MOVEMENT IN TANGIBLE CAPITAL ASSETS PER ASSET REGISTER FOR THE YEAR ENDED 31 MARCH 2016
Opening balance
Prior period
error
Additions Disposals Closing Balance
R’000 R’000 R’000 R’000 R’000
MACHINERY AND EQUIPMENT 103,396 (1,245) 12,603 20,636 94,118
Transport assets 37,223 (47) 7,975 603 44,548
Computer equipment 17,203 (899) 427 149 16,582
Furniture and office equipment 13,798 (145) 129 28 13,754
Other machinery and equipment 35,172 (154) 4,072 19,856 19,432
BIOLOGICAL ASSETS 3,216 27 930 1,723 2,450
Biological assets 3,216 27 930 1,723 2,450
TOTAL MOVABLE TANGIBLE CAPITAL ASSETS 106,612 (1,218) 13,533 22,359 96,586
29.3.1 Prior period error
2015/16
Note R’000
Nature of prior period error
Relating to 2015/16 [affecting the opening balance] (1,218)
Machinery and equipment (1,245)
Biological Assets 27
Total prior period errors (1,218)
Duplicates; Items tagged more than once; Items not supposed to be recognised as assets; assets not in asset register but should have been included.
NOTES TO THE ANNUAL FINANCIAL STATEMENTS for the year ended 31 March 2017
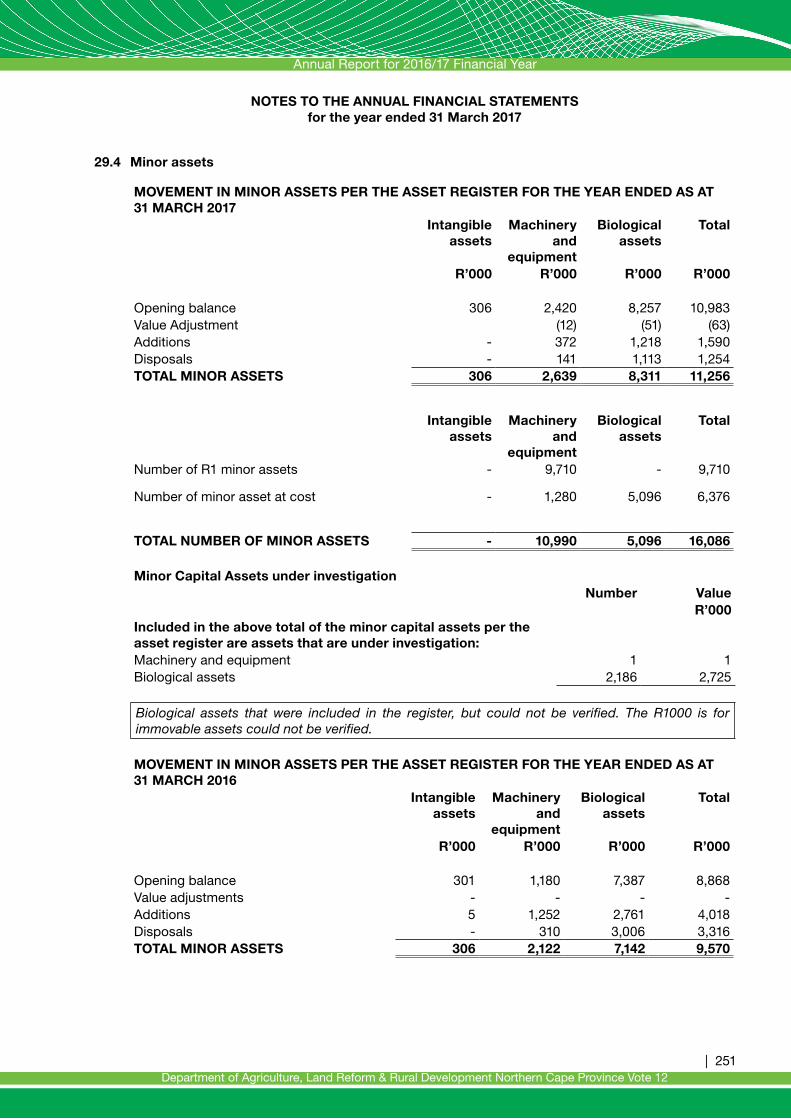
Annual Report for 2016/17 Financial Year
| 251Department of Agriculture, Land Reform & Rural Development Northern Cape Province Vote 12
29.4 Minor assets
MOVEMENT IN MINOR ASSETS PER THE ASSET REGISTER FOR THE YEAR ENDED AS AT 31 MARCH 2017
Intangible assets
Machinery and
equipment
Biological assets
Total
R’000 R’000 R’000 R’000
Opening balance 306 2,420 8,257 10,983Value Adjustment (12) (51) (63)Additions - 372 1,218 1,590Disposals - 141 1,113 1,254TOTAL MINOR ASSETS 306 2,639 8,311 11,256
Intangible assets
Machinery and
equipment
Biological assets
Total
Number of R1 minor assets
Number of minor asset at cost
-
-
9,710
1,280
-
5,096
9,710
6,376
TOTAL NUMBER OF MINOR ASSETS - 10,990 5,096 16,086
Minor Capital Assets under investigationNumber Value
R’000Included in the above total of the minor capital assets per the asset register are assets that are under investigation:Machinery and equipment 1 1Biological assets 2,186 2,725
Biological assets that were included in the register, but could not be verified. The R1000 is for immovable assets could not be verified.
MOVEMENT IN MINOR ASSETS PER THE ASSET REGISTER FOR THE YEAR ENDED AS AT 31 MARCH 2016
Intangible assets
Machinery and
equipment
Biological assets
Total
R’000 R’000 R’000 R’000
Opening balance 301 1,180 7,387 8,868Value adjustments - - - -Additions 5 1,252 2,761 4,018Disposals - 310 3,006 3,316TOTAL MINOR ASSETS 306 2,122 7,142 9,570
NOTES TO THE ANNUAL FINANCIAL STATEMENTS for the year ended 31 March 2017

Annual Report for 2016/17 Financial Year
252 |Department of Agriculture, Land Reform & Rural Development Northern Cape Province Vote 12
Intangible assets
Machinery and
equipment
Biological assets
Total
Number of R1 minor assets - 7,536 - 7,536Number of minor assets at cost 306 8,817 7,748 16,871TOTAL NUMBER OF MINOR ASSETS 306 16,353 7,748 24,407
29.4.1 Prior period error
2016/17Note R’000
Nature of prior period errorRelating to 2015/16 [affecting the opening balance] 2,297Software and Intangible Assets (56)Biological Assets 3,853Machinery and equipment (1,500)Total prior period errors 2,297
This relates to theft of various minor assets (assets with values below R5,000) which were not deducted from the asset register.
29.5 Movable assets written off
MOVABLE ASSETS WRITTEN OFF FOR THE YEAR ENDED 31 MARCH 2017
Intangible assets
Machinery and
equipment Biological
assets Total R’000 R’000 R’000 R’000
Assets written off - - - -TOTAL MOVABLE ASSETS WRITTEN OFF - - - -
29.6 S42 Movable Capital Assets
MINOR ASSETS SUBJECTED TO TRANSFER IN TERMS OF S42 OF THE PFMA – 31 MARCH 2016
Machinery and equipment Total
No of Assets 243 243 Value of the asset (R’000) 795 795
30. Intangible Capital Assets
MOVEMENT IN INTANGIBLE CAPITAL ASSETS PER ASSET REGISTER FOR THE YEAR ENDED 31 MARCH 2017
Opening balance
Value adjustments
Additions Disposals Closing Balance
R’000 R’000 R’000 R’000 R’000
SOFTWARE 3,069 - 2,546 - 5,615
TOTAL INTANGIBLE CAPITAL ASSETS 3,069 - 2,546 - 5,615
NOTES TO THE ANNUAL FINANCIAL STATEMENTS for the year ended 31 March 2017

Annual Report for 2016/17 Financial Year
| 253Department of Agriculture, Land Reform & Rural Development Northern Cape Province Vote 12
30.1 Additions
ADDITIONS TO INTANGIBLE CAPITAL ASSETS PER ASSET REGISTER FOR THE YEAR ENDED 31 MARCH 2017
Cash Non-Cash (Develop-ment work
in progress – current
costs)
Received current
year, not paid
(Paid current
year, received
prior year)
Total
R’000 R’000 R’000 R’000 R’000
SOFTWARE 2,546 - - - 2,546
TOTAL ADDITIONS TO INTANGIBLE CAPITAL ASSETS 2,546 - - - 2,546
30.2 Disposals
DISPOSALS OF INTANGIBLE CAPITAL ASSETS PER ASSET REGISTER FOR THE YEAR ENDED 31 MARCH 2017
Sold for cash
Non-cash disposal
Total disposals
Cash Received
Actual
R’000 R’000 R’000 R’000
SOFTWARE - - - -
TOTAL DISPOSALS OF INTANGIBLE CAPITAL ASSETS - - - -
30.3 Movement for 2015/16
MOVEMENT IN INTANGIBLE CAPITAL ASSETS PER ASSET REGISTER FOR THE YEAR ENDED 31 MARCH 2016
Opening balance
Prior period
error
Additions Disposals Closing Balance
R’000 R’000 R’000 R’000 R’000
SOFTWARE 6,368 - 1,875 5,174 3,069
TOTAL INTANGIBLE CAPITAL ASSETS 6,368 - 1,875 5,174 3,069
NOTES TO THE ANNUAL FINANCIAL STATEMENTS for the year ended 31 March 2017
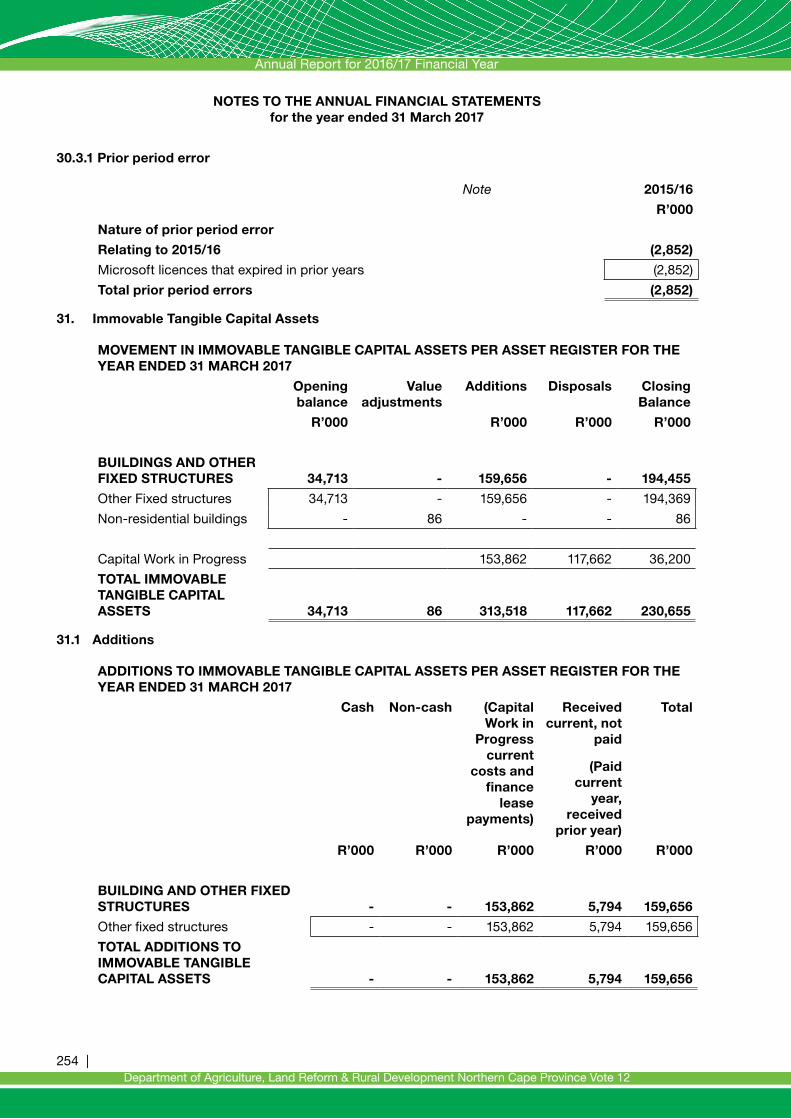
Annual Report for 2016/17 Financial Year
254 |Department of Agriculture, Land Reform & Rural Development Northern Cape Province Vote 12
30.3.1 Prior period error
Note 2015/16
R’000
Nature of prior period error
Relating to 2015/16 (2,852)
Microsoft licences that expired in prior years (2,852)
Total prior period errors (2,852)
31. Immovable Tangible Capital Assets
MOVEMENT IN IMMOVABLE TANGIBLE CAPITAL ASSETS PER ASSET REGISTER FOR THE YEAR ENDED 31 MARCH 2017
Opening balance
Value adjustments
Additions Disposals Closing Balance
R’000 R’000 R’000 R’000
BUILDINGS AND OTHER FIXED STRUCTURES 34,713 - 159,656 - 194,455
Other Fixed structures 34,713 - 159,656 - 194,369
Non-residential buildings - 86 - - 86
Capital Work in Progress 153,862 117,662 36,200
TOTAL IMMOVABLE TANGIBLE CAPITAL ASSETS 34,713 86 313,518 117,662 230,655
31.1 Additions
ADDITIONS TO IMMOVABLE TANGIBLE CAPITAL ASSETS PER ASSET REGISTER FOR THE YEAR ENDED 31 MARCH 2017
Cash Non-cash (Capital Work in
Progress current
costs and finance
lease payments)
Received current, not
paid
(Paid current
year, received
prior year)
Total
R’000 R’000 R’000 R’000 R’000
BUILDING AND OTHER FIXED STRUCTURES - - 153,862 5,794 159,656
Other fixed structures - - 153,862 5,794 159,656
TOTAL ADDITIONS TO IMMOVABLE TANGIBLE CAPITAL ASSETS - - 153,862 5,794 159,656
NOTES TO THE ANNUAL FINANCIAL STATEMENTS for the year ended 31 March 2017

Annual Report for 2016/17 Financial Year
| 255Department of Agriculture, Land Reform & Rural Development Northern Cape Province Vote 12
31.2 DISPOSALS OF IMMOVABLE TANGIBLE CAPITAL ASSETS PER ASSET REGISTER FOR THE YEAR ENDED 31 MARCH 2017
Sold for cash
Non-cash disposal
Total disposals
Cash received
Actual
R’000 R’000 R’000 R’000
BUILDINGS AND OTHER FIXED STRUCTURES - - - -
Other fixed structures - - - -
TOTAL DISPOSAL OF IMMOVABLE TANGIBLE CAPITAL ASSETS
-
-
-
-
31.3 Movement for 2015/16
MOVEMENT IN IMMOVABLE TANGIBLE CAPITAL ASSETS PER ASSET REGISTER FOR THE YEAR ENDED 31 MARCH 2016
Opening balance
Prior period
error
Additions Disposals Closing Balance
R’000 R’000 R’000 R’000 R’000
BUILDINGS AND OTHER FIXED STRUCTURES 2,860 - 141,318 109,465
34,713
Other fixed structures 2,860 - 141,318 109,465 34,713
TOTAL IMMOVABLE TANGIBLE CAPITAL ASSETS 2,860 - 141,318 109,465 34,713
32. Prior period errors
32.1 Correction of prior period errors
Note 2015/16
R’000
Expenditure:
Goods and Services 4 (8,783)
Payments for capital assets 4 8,783
Net effect -
The department has reclassified some operating lease expenditure as finance lease expenditure that resulted in the variances noted between Goods and services and Machinery and equipment.
NOTES TO THE ANNUAL FINANCIAL STATEMENTS for the year ended 31 March 2017

Annual Report for 2016/17 Financial Year
256 |Department of Agriculture, Land Reform & Rural Development Northern Cape Province Vote 12
Note 2015/16
R’000
Assets:
Machinery and equipment 29.3.1 (1,320)
Software and intangible assets - minor 29.4.1 (56)
Biological assets – minor 29.4.1 3,853
Machinery and equipment 29.4.1 (1,500)
Intangible assets 30.3.1 (2,852)
Net effect (2,875)
Duplicates; Items tagged more than once; Items not supposed to be recognised as assets; assets not in asset register but should have been included.
This relates to thefts of various minor assets (assets with values below R5,000) which were not deducted from the asset register.
Microsoft licences that expired in prior years.
33. Inventory
2016/17 2015/16
Note R’000 R’000
Opening balance Annexure 6 1,249 34,486
Add/(Less): Adjustments to prior year balances - (34,486)
Add: Additions/Purchases - Cash Annexure 6 23,954 62,109
Add: Additions - Non-cash - -
(Less): Disposals - -
(Less): Issues Annexure 6 (18,877) (60,860)
Add/(Less): Adjustments - -
Closing balance 6,326 1,249
NOTES TO THE ANNUAL FINANCIAL STATEMENTS for the year ended 31 March 2017

Annual Report for 2016/17 Financial Year
| 257Department of Agriculture, Land Reform & Rural Development Northern Cape Province Vote 12
34.
STA
TE
ME
NT
OF
CO
ND
ITIO
NA
L G
RA
NT
S R
EC
EIV
ED
NA
ME
OF
DE
PA
RT
ME
NT
GR
AN
T A
LLO
CA
TIO
NS
PE
NT
2015
/16
Div
isio
n o
f R
even
ue
Act
/ P
rovi
nci
al
Gra
nts
Ro
ll O
vers
DO
RA
A
dju
st-
men
ts
Oth
er
Ad
just
-m
ents
Tota
l A
vaila
ble
Am
ou
nt
rece
ived
b
y d
epar
t-m
ent
Am
ou
nt
spen
t b
y d
epar
t-m
ent
Un
der
/
(Ove
r-sp
end
ing
)
% o
f av
aila
ble
fu
nd
s sp
ent
by
dep
art-
men
t
Div
isio
n o
f R
even
ue
Act
Am
ou
nt
spen
t b
y d
epar
t-m
ent
R’0
00R
’000
R’0
00R
’000
R’0
00R
’000
R’0
00R
’000
%R
’000
R’0
00
DA
AF-
CA
SP
128,
364
1,56
0-
-12
9,92
412
9,92
411
8,31
411
,610
91%
135,
768
134,
127
DA
FF-
LA
ND
C
AR
E9,
320
--
-9,
320
9,32
09,
306
1499
.8%
7,30
27,
256
DA
FF-
ILIM
A/
LETS
EM
A55
,050
172
--
55,2
2255
,222
52,0
223,
200
94%
69,4
6069
,288
PU
BLI
C W
OR
KS
-E
PW
P
INC
EN
TIV
ES
PR
OV
INC
IAL
DIS
AS
TER
2,00
0-
--
2,00
02,
000
1,99
28
99.6
%2,
000
1,99
9
194,
734
1,73
2-
-19
6,46
619
6,46
618
1,63
414
,832
214,
530
212,
670
Dep
artm
ents
are
rem
ind
ed o
f th
e re
qui
rem
ent
to c
ertif
y th
at a
ll tr
ansf
ers
in t
erm
s of
thi
s A
ct w
ere
dep
osite
d in
to t
he p
rimar
y b
ank
acco
unt
of t
he p
rovi
nce
or,
whe
re a
pp
rop
riate
, int
o th
e C
PD
acc
ount
of t
he p
rovi
nce.
NO
TE
S T
O T
HE
AN
NU
AL
FIN
AN
CIA
L S
TAT
EM
EN
TS
fo
r th
e ye
ar e
nd
ed 3
1 M
arch
201
7
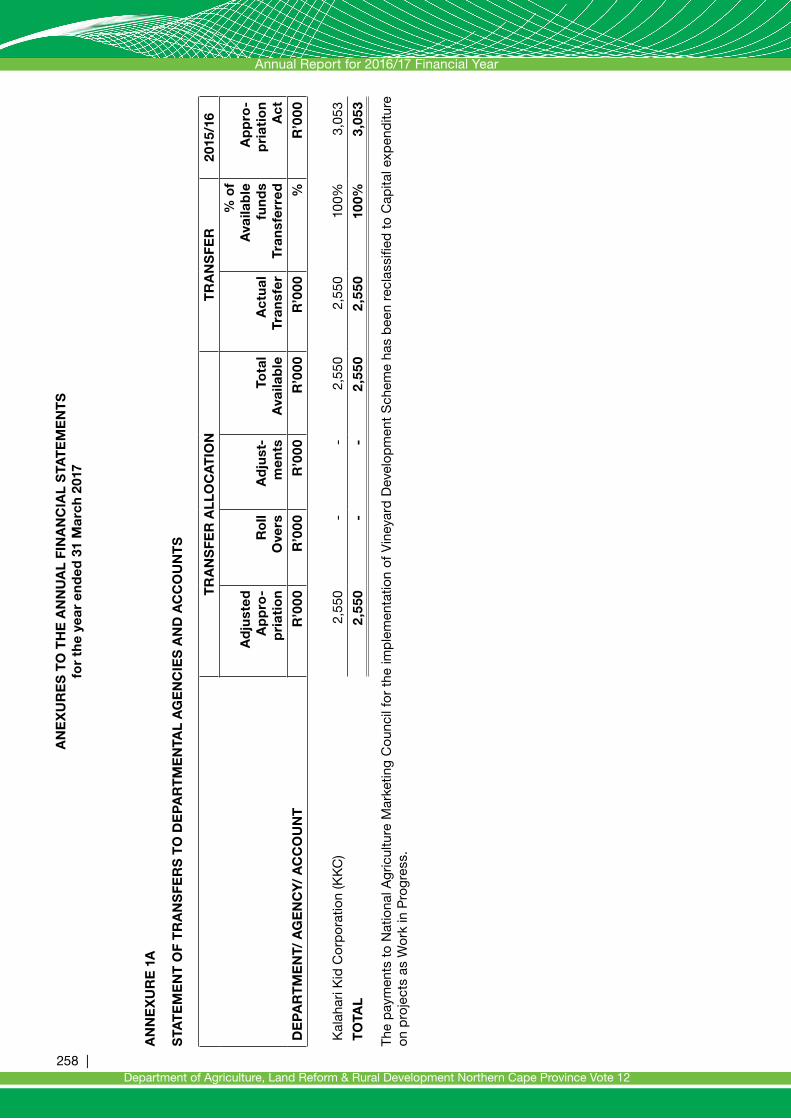
Annual Report for 2016/17 Financial Year
258 |Department of Agriculture, Land Reform & Rural Development Northern Cape Province Vote 12
AN
NE
XU
RE
1A
STA
TE
ME
NT
OF
TR
AN
SFE
RS
TO
DE
PA
RT
ME
NTA
L A
GE
NC
IES
AN
D A
CC
OU
NT
S
DE
PA
RT
ME
NT/
AG
EN
CY
/ A
CC
OU
NT
TR
AN
SFE
R A
LLO
CA
TIO
NT
RA
NS
FER
2015
/16
Ad
just
ed
Ap
pro
-p
riat
ion
Ro
ll O
vers
Ad
just
-m
ents
Tota
l A
vaila
ble
Act
ual
Tr
ansf
er
% o
f A
vaila
ble
fu
nd
s Tr
ansf
erre
d
Ap
pro
-p
riat
ion
Act
R’0
00R
’000
R’0
00R
’000
R’0
00%
R’0
00
Kal
ahar
i Kid
Cor
por
atio
n (K
KC
)2,
550
--
2,55
02,
550
100%
3,05
3
TO
TAL
2,55
0-
-2,
550
2,55
010
0%3,
053
The
pay
men
ts t
o N
atio
nal A
gric
ultu
re M
arke
ting
Cou
ncil
for
the
imp
lem
enta
tion
of V
iney
ard
Dev
elop
men
t S
chem
e ha
s b
een
recl
assi
fied
to
Cap
ital e
xpen
ditu
re
on p
roje
cts
as W
ork
in P
rogr
ess.
AN
EX
UR
ES
TO
TH
E A
NN
UA
L FI
NA
NC
IAL
STA
TE
ME
NT
S
for
the
year
en
ded
31
Mar
ch 2
017
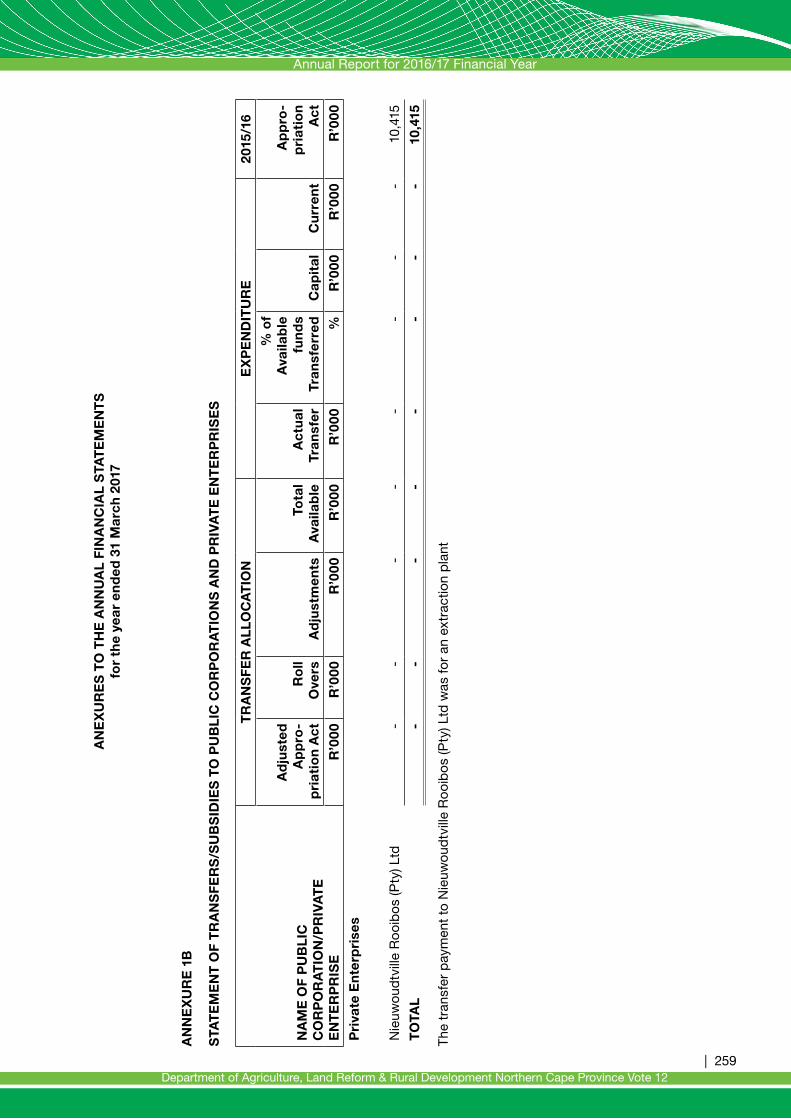
Annual Report for 2016/17 Financial Year
| 259Department of Agriculture, Land Reform & Rural Development Northern Cape Province Vote 12
AN
NE
XU
RE
1B
STA
TE
ME
NT
OF
TR
AN
SFE
RS
/SU
BS
IDIE
S T
O P
UB
LIC
CO
RP
OR
AT
ION
S A
ND
PR
IVA
TE
EN
TE
RP
RIS
ES
NA
ME
OF
PU
BLI
C
CO
RP
OR
AT
ION
/PR
IVA
TE
E
NT
ER
PR
ISE
TR
AN
SFE
R A
LLO
CA
TIO
NE
XP
EN
DIT
UR
E20
15/1
6
Ad
just
ed
Ap
pro
-p
riat
ion
Act
Ro
ll O
vers
Ad
just
men
tsTo
tal
Ava
ilab
leA
ctu
al
Tran
sfer
% o
f A
vaila
ble
fu
nd
s Tr
ansf
erre
d
Cap
ital
Cu
rren
t
Ap
pro
-p
riat
ion
Act
R’0
00R
’000
R’0
00R
’000
R’0
00%
R’0
00R
’000
R’0
00
Pri
vate
En
terp
rise
s
Nie
uwou
dtv
ille
Roo
ibos
(Pty
) Ltd
--
--
--
--
10,4
15
TO
TAL
--
--
--
--
10,4
15
The
tra
nsfe
r p
aym
ent
to N
ieuw
oud
tvill
e R
ooib
os (P
ty) L
td w
as fo
r an
ext
ract
ion
pla
nt
AN
EX
UR
ES
TO
TH
E A
NN
UA
L FI
NA
NC
IAL
STA
TE
ME
NT
S
for
the
year
en
ded
31
Mar
ch 2
017

Annual Report for 2016/17 Financial Year
260 |Department of Agriculture, Land Reform & Rural Development Northern Cape Province Vote 12
AN
NE
XU
RE
1C
STA
TE
ME
NT
OF
TR
AN
SFE
RS
TO
NO
N-P
RO
FIT
INS
TIT
UT
ION
S
NO
N-P
RO
FIT
INS
TIT
UT
ION
S
TR
AN
SFE
R A
LLO
CA
TIO
NE
XP
EN
DIT
UR
E20
15/1
6
Ad
just
ed
Ap
pro
-p
riat
ion
Act
Ro
ll o
vers
Ad
just
-m
ents
Tota
l A
vaila
ble
Act
ual
Tr
ansf
er
% o
f A
vaila
ble
fu
nd
s tr
ansf
erre
d
Ap
pro
-p
riat
ion
Act
R’0
00R
’000
R’0
00R
’000
R’0
00%
R’0
00
Tran
sfer
s
Kar
oo D
evel
opm
ent
Foun
dat
ion
--
--
--
157
TO
TAL
--
--
--
157
Tran
sfer
to K
aroo
Dev
elop
men
t Fo
und
atio
n w
as fo
r th
e K
aroo
Mea
t of
Orig
in in
itiat
ive.
AN
EX
UR
ES
TO
TH
E A
NN
UA
L FI
NA
NC
IAL
STA
TE
ME
NT
S
for
the
year
en
ded
31
Mar
ch 2
017

Annual Report for 2016/17 Financial Year
| 261Department of Agriculture, Land Reform & Rural Development Northern Cape Province Vote 12
AN
NE
XU
RE
1D
STA
TE
ME
NT
OF
TR
AN
SFE
RS
TO
HO
US
EH
OLD
S
HO
US
EH
OLD
S
TR
AN
SFE
R A
LLO
CA
TIO
NE
XP
EN
DIT
UR
E20
15/1
6
Ad
just
ed
Ap
pro
pri
atio
n A
ctR
oll
Ove
rsA
dju
st-
men
tsTo
tal
Ava
ilab
leA
ctu
al
Tran
sfer
% o
f A
vaila
ble
fu
nd
s Tr
ansf
erre
d
Ap
pro
-p
riat
ion
Act
R’0
00R
’000
R’0
00R
’000
R’0
00%
R’0
00
Tran
sfer
s
Leav
e gr
atui
ty
Bur
sarie
s to
non
-em
plo
yees
Ass
ista
nce
to c
omm
uniti
es
Cla
ims
agai
nst
the
Sta
te
115
2,75
0
262 -
- - - -
- - - -
115
2,75
0
262 -
598
2,16
6
531 -
520% 79%
203%
1,06
9
2,85
1
1,36
8
1,00
0
TO
TAL
3,12
7-
-3,
127
3,29
56,
437
AN
EX
UR
ES
TO
TH
E A
NN
UA
L FI
NA
NC
IAL
STA
TE
ME
NT
S
for
the
year
en
ded
31
Mar
ch 2
017

Annual Report for 2016/17 Financial Year
262 |Department of Agriculture, Land Reform & Rural Development Northern Cape Province Vote 12
AN
NE
XU
RE
2A
STA
TE
ME
NT
OF
INV
ES
TM
EN
TS
IN A
ND
AM
OU
NT
S O
WIN
G B
Y/T
O N
AT
ION
AL
/PR
OV
INC
IAL
PU
BLI
C E
NT
ITIE
S
Nam
e o
f P
ub
lic E
nti
ty
Sta
te
En
tity
’s
PFM
A
Sch
edu
le
typ
e (s
tate
ye
ar e
nd
if
no
t 31
M
arch
)
%
Hel
d
16/1
7
N
um
ber
of
shar
es
hel
dC
ost
of
inve
stm
ent
Net
Ass
et v
alu
e o
f in
vest
men
tP
rofi
t/(L
oss
) fo
r th
e ye
arL
oss
es
gu
aran
teed
R’0
00R
’000
R’0
00
% H
eld
15
/16
2016
/17
2015
/16
2016
/17
2015
/16
2016
/17
2015
/16
2016
/17
2015
/16
Yes
/No
Nat
ion
al/P
rovi
nci
al
Pu
blic
En
tity
Kal
ahar
i Kid
Cor
p 3
C
100%
10
0%
7,00
07,
000
--
--
--
TO
TAL
100%
10
0%7,
000
7,00
0-
--
--
-
The
Dep
artm
ent
hold
s 70
00 s
hare
s @
R0,
01 p
er s
hare
in K
alah
ari K
id C
orp
orat
ion
AN
EX
UR
ES
TO
TH
E A
NN
UA
L FI
NA
NC
IAL
STA
TE
ME
NT
S
for
the
year
en
ded
31
Mar
ch 2
017

Annual Report for 2016/17 Financial Year
| 263Department of Agriculture, Land Reform & Rural Development Northern Cape Province Vote 12
AN
NE
XU
RE
3A
STA
TE
ME
NT
OF
CO
NT
ING
EN
T L
IAB
ILIT
IES
AS
AT
31
MA
RC
H 2
017
Nat
ure
of
Lia
bili
ty
Op
enin
g
Bal
ance
L
iab
iliti
es
incu
rred
d
uri
ng
th
e ye
ar
Lia
bili
ties
pai
d/
can
celle
d/r
edu
ced
d
uri
ng
th
e ye
ar
Lia
bili
ties
re
cove
rab
le
(Pro
vid
e d
etai
ls
her
eun
der
)
Clo
sin
g
Bal
ance
1 A
pri
l 201
731
Mar
ch
2016
R’0
00R
’000
R’0
00R
’000
R’0
00
Cla
ims
agai
nst
th
e d
epar
tmen
t
Blu
e S
and
s Tr
adin
g 81
9 cc
2,0
00-
- -
2,00
0
Pem
ber
ley
Inve
stm
ent
(Pty
) Lim
ited
270
--
-27
0
Dep
artm
ent
of R
oad
s an
d P
ublic
Wor
ks63
7-
--
637
Four
ie :H
arts
wat
er-
23-
-23
Mtim
kulu
Saf
ari
-26
7-
-26
7
TO
TAL
2,90
729
0-
-3,
197
AN
EX
UR
ES
TO
TH
E A
NN
UA
L FI
NA
NC
IAL
STA
TE
ME
NT
S
for
the
year
en
ded
31
Mar
ch 2
017

Annual Report for 2016/17 Financial Year
264 |Department of Agriculture, Land Reform & Rural Development Northern Cape Province Vote 12
AN
NE
XU
RE
4
CL
AIM
S R
EC
OV
ER
AB
LE
Go
vern
men
t E
nti
ty
Co
nfi
rmed
bal
ance
o
uts
tan
din
gU
nco
nfi
rmed
bal
ance
o
uts
tan
din
gTo
tal
Cas
h in
tra
nsi
t at
yea
r en
d 2
016/
17 *
31/0
3/20
1731
/03/
2016
31/0
3/20
1731
/03/
2016
31/0
3/20
1731
/03/
2016
Rec
eip
t d
ate
up
to
six
(6)
wo
rkin
g
day
s af
ter
year
en
dA
mo
un
t
R’0
00R
’000
R’0
00R
’000
R’0
00R
’000
R’0
00
Dep
artm
ent
Nat
iona
l Dep
t of
Agr
icul
ture
, Fis
herie
s &
Fo
rest
ry-
593
24
-
-
6
17
- -
KZ
N D
ept
of A
gric
ultu
re &
Env
ironm
enta
l A
ffai
rs-
61
- -
- 61
-
-
NC
Dep
artm
ent
of E
duc
atio
n-
487
- -
- 48
7 -
-
Dep
t of
Inte
rnal
Rel
atio
ns &
Co
oper
atio
ns-
48
- -
- 48
-
-
TO
TAL
- 1,
189
24-
- 1,
213
--
AN
EX
UR
ES
TO
TH
E A
NN
UA
L FI
NA
NC
IAL
STA
TE
ME
NT
S
for
the
year
en
ded
31
Mar
ch 2
017
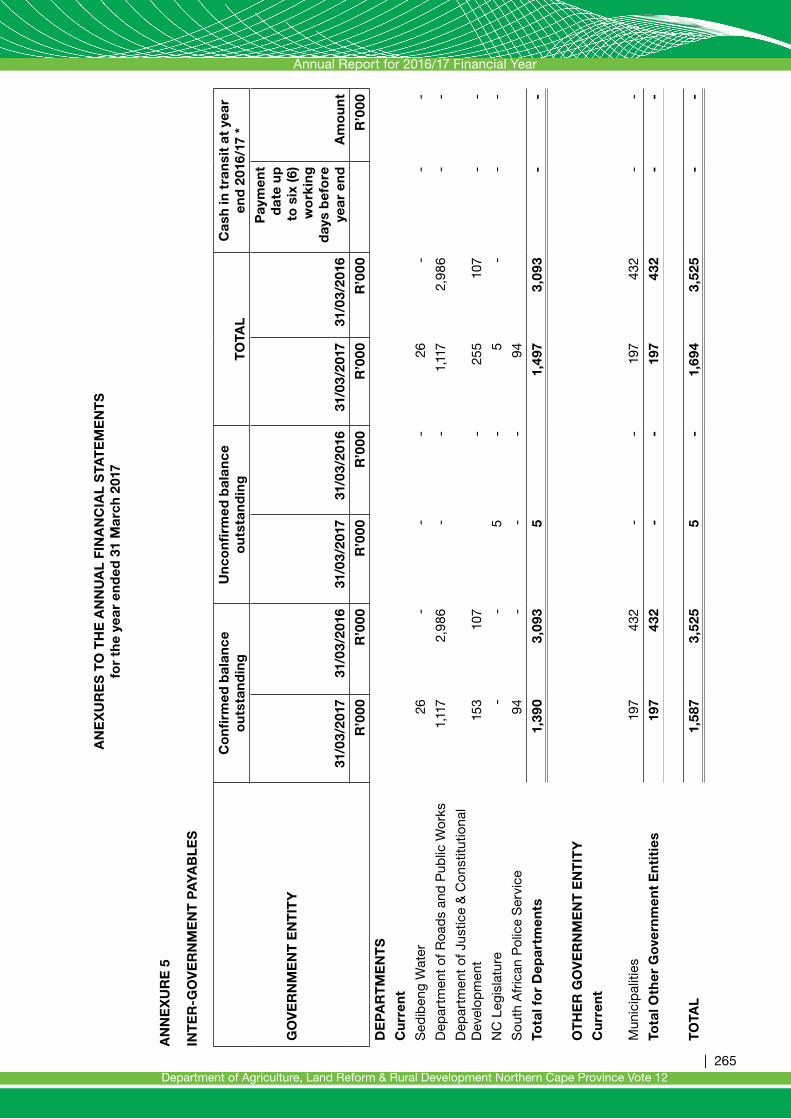
Annual Report for 2016/17 Financial Year
| 265Department of Agriculture, Land Reform & Rural Development Northern Cape Province Vote 12
AN
NE
XU
RE
5
INT
ER
-GO
VE
RN
ME
NT
PA
YA
BLE
S
GO
VE
RN
ME
NT
EN
TIT
Y
Co
nfi
rmed
bal
ance
o
uts
tan
din
gU
nco
nfi
rmed
bal
ance
o
uts
tan
din
gT
OTA
LC
ash
in t
ran
sit
at y
ear
end
201
6/17
*
31/0
3/20
1731
/03/
2016
31/0
3/20
1731
/03/
2016
31/0
3/20
1731
/03/
2016
Pay
men
t d
ate
up
to
six
(6)
wo
rkin
g
day
s b
efo
re
year
en
dA
mo
un
t
R’0
00R
’000
R’0
00R
’000
R’0
00R
’000
R’0
00
DE
PA
RT
ME
NT
S
Cu
rren
t
Sed
iben
g W
ater
26-
--
26-
--
Dep
artm
ent
of R
oad
s an
d P
ublic
Wor
ks1,
117
2,98
6-
-1,
117
2,98
6-
-
Dep
artm
ent
of J
ustic
e &
Con
stitu
tiona
l D
evel
opm
ent
153
107
-25
510
7-
-
NC
Leg
isla
ture
--
5-
5-
--
Sou
th A
fric
an P
olic
e S
ervi
ce94
--
-94
Tota
l fo
r D
epar
tmen
ts
1,3
90
3,0
93
5
1,
497
3
,093
-
-
OT
HE
R G
OV
ER
NM
EN
T E
NT
ITY
Cu
rren
t
Mun
icip
aliti
es
19
7
4
32
-
-
19
7
4
32
--
Tota
l Oth
er G
ove
rnm
ent
En
titi
es
1
97
432
-
-
19
7
4
32
--
TO
TAL
1,58
7
3,5
25
5
-
1,
694
3
,525
-
-
AN
EX
UR
ES
TO
TH
E A
NN
UA
L FI
NA
NC
IAL
STA
TE
ME
NT
S
for
the
year
en
ded
31
Mar
ch 2
017

Annual Report for 2016/17 Financial Year
266 |Department of Agriculture, Land Reform & Rural Development Northern Cape Province Vote 12
ANNEXURE 6
INVENTORIES
Inventory Note Quantity 2016/17 Quantity 2015/16
R’000 R’000
Opening balance - 1,249 34.486
Add/(Less): Adjustments to prior year balance
- - (34,486)
Add: Additions/Purchases - Cash 45,363 23,954 49,731
Add: Additions - Non-cash - - -
(Less): Disposals - - -
(Less): Issues (4,601) (18,877) (48,482)
Add/(Less): Adjustments - - -
Closing balance 40,762 6,326 1,249
Quantities comprise several different units of measurement such as litres, kilograms, boxes, bags etc. and thus could not be assimilated.
ANNEXURE 7
MOVEMENT IN CAPITAL WORK IN PROGRESS
MOVEMENT IN CAPITAL WORK IN PROGRESS FOR THE YEAR ENDED 31 MARCH 2017
Opening balance
Current Year
Capital WIPCompleted
AssetsClosing balance
R’000 R’000 R’000 R’000
BUILDINGS AND OTHER FIXED STRUCTURES
153,862 (117,662) 36,200
Other fixed structures 153,862 (117,662) 36,200
Age analysis on ongoing projects
Number of projects 2016/17
Planned, Construction not started
Planned, Construction
startedTotal
R’000
0 to 1 Year 28 123,098
3 to 5 Years 10 30,764
Total 38 153,862
ANEXURES TO THE ANNUAL FINANCIAL STATEMENTS for the year ended 31 March 2017
Annual Report2016 / 2017
Northern Cape Department of Agriculture, Land Reform & Rural Development
Annual Report 2016/2017
PR118/2017ISBN: 978-0-621-45378-2
Dep
artment of A
griculture, Land R
eform &
Rural D
evelopm
entN
orthern Cap
e Province Vote 12
Annual R
epo
rt 2016/2017
Designed & printed by SwiftPrint, Tel: 053 839 2900, Kimberley
Copyright © 2022 FDOKUMEN