
Free State Province - Provincial Gazette Provinsiale Koerant
Upload
khangminh22Category
view
0download
0
Page 1
EDUCATION STRATEGIC PLANNING V6
PROVINCIAL GOVERNMENT FREE STATE
DEPARTMENT OF EDUCATION
STRATEGIC PLAN
2003/04 - 2005/06
Page 2
EDUCATION STRATEGIC PLANNING V6
To obtain additional copies of this document please contact: Head Education, Private Bag X20565, BLOEMFONTEIN, 9300 Tel: (051) 404 8435 Fax: (051) 404 8315 E-mail: [email protected] OR Tel: (051) 404 8417 Fax: (051) 404 8106 E-mail: [email protected]

Page 3
EDUCATION STRATEGIC PLANNING V6
PART A: VISION, MISSION AND OVERALL STRATEGIES........................................................................................................5 1. Statement of policy and commitment by the MEC .................................................................................5 2. Overview by the accounting officer ..........................................................................................................6 3. Vision..........................................................................................................................................................7 4. Mission, strategic goals and strategic objectives ....................................................................................7 5. Legislative and other mandates ...............................................................................................................8 6. Description of status quo ........................................................................................................................10 7. Description of strategic planning process..............................................................................................11 8. The overall planning framework and terminology.................................................................................11 PART B: THREE-YEAR STRATEGIC PLAN
Measurable objectives, activities, performance measures and performance targets by programme and sub-probramme 13 Medium-term revenues and expenditures ................................................................................................................62 Summary of revenue ..................................................................................................................................................62 Summary of expenditure by programme...................................................................................................................62 Coordination, cooperation and outsourcing plans....................................................................................................62 Interdepartmental linkages .........................................................................................................................................62 Local government linkages.......................................................................................................................................62 Public-private partnerships.........................................................................................................................................62 PART C: BACKGROUND INFORMATION ............................................................................................................................63 PART A: VISION, MISSION AND OVERALL STRATEGIES........................................................................................................5
1. Statement of policy and commitment by the MEC .................................................................................5 2. Overview by the accounting officer ..........................................................................................................6 3. Vision..........................................................................................................................................................7 4. Mission, strategic goals and strategic objectives ....................................................................................7 5. Legislative and other mandates ...............................................................................................................8 6. Description of status quo ........................................................................................................................10 7. Description of strategic planning process..............................................................................................11 8. The overall planning framework and terminology.................................................................................11 PART B: THREE-YEAR STRATEGIC PLAN 9. Measurable objectives, activities, performance measures and performance targets by programme and sub-probramme .........................................................................................................................................13 10. Medium-term revenues and expenditures ............................................................................................62 10.1 Summary of revenue...............................................................................................................................62 10.2 Summary of expenditure by programme...............................................................................................62 11. Coordination, cooperation and outsourcing plans ................................................................................62 11.1 Interdepartmental linkages 11.2 Local government linkages 11.3 Public entities 11.4 Public-private partnerships
PART C: BACKGROUND INFORMATION ............................................................................................................................63 11. SITUATIONAL ANALYSIS OF THE SYSTEM AS A WHOLE.................................................................................................63 11.1 DEMOGRAPHIC PRESSURES AND ACCESS ISSUES...................................................................................................65 11.2 INSTITUTIONAL LANDSCAPE ...................................................................................................................................65 11.3 BUDGETED RESOURCES ........................................................................................................................................69 11.3.1 PHYSICAL INFRASTRUCTURE...............................................................................................................................69 11.3.2 EMPLOYEES.......................................................................................................................................................72 12.1 TRANSFERS TO INSTITUTIONS ................................................................................................................................73 12.2 EFFICIENCY OF RESOURCE UTILISATION .................................................................................................................72 13. PROGRAMME1: ADMINISTRATION ....................................................................................................................78 13.1 PROGRAMME 2.......................................................................................................................................................80 13.2 BUDGETED RESOURCES ........................................................................................................................................80 13.2.1 PHYSICAL INFRASTRUCTURE...............................................................................................................................80 13.2.2 EMPLOYEES.......................................................................................................................................................81 TRANSFERS TO INSTITUTIONS..........................................................................................................................................83 EFFICIENCY OF RESOURCE UTILISATION..........................................................................................................................89 9 EXPENDITURE BREAKDOWN ........................................................................................................................................93 9.1 BREAKDOWN BY GFS ECONOMIC CATEGORIES..........................................................................................................93 2.2 BREAKDOWN BY STANDARD ITEM .......................................................................................................................... 100
EXPENDITURE BREAKDOWN......................................................................................................101 11. Conditional grants ............................................................................................................................. 102 12. Donor funding.................................................................................................................................... 102
Page 4
EDUCATION STRATEGIC PLANNING V6
FIGURES AND TABLES
THREE YEAR STRATEGIC PLAN
FIGURE 1: FIVE MAGISTERIAL DISTRICTS OF FREE STATE
FIGURE 3: MACROSTRUCTURE OF DEPARTMENT FIGURE 3: EMPLOYEES PROFILE
TABLE A.1: PROGRAMMES, MEASURABLE OBJECTIVES, ACTIVITIES AND PERFORMANCE MEASURES
TABLE A.3: PERFORMANCE TARGETS
TABLE: NUMBER OF EMPLOYEES
TABLE: RESOURCING EFFECTED VIA THE SCHOOL FUNDING NORMS
TABLE: ABSOLUTE SPREAD ACROSS ECONOMIC CATEGORIES
TABLE: PROPORTIONAL SPREAD ACROSS ECONOMIC CATEGORIES
TABLE: AGE-SPECIFIC ENROLMENT RATES FOR SCHOOLS
TABLE: CLASSROOMS AVAILABLE FOR PROGRAMME 2
TABLE: LEARNER-EDUCATOR RATIOS IN PROGRAMME 2 SCHOOLS
TABLE: BREAKDOWN OF NON-PERSONNEL RECURRENT IN PROGRAMME 2
TABLE: PROGRAMME 2 ENROLMENT AND FLOW RATE DETAILS
TABLE: EDUCATOR ATTENDANCE INDICATORS FOR PROGRAMME 2

Page 5
EDUCATION STRATEGIC PLANNING V6
Part A: Vision, mission and overall strategies
1. Statement of policy and commitment by the MEC
Strategic planning in government is guided by political priorities. Executive authorities take overall responsibility for developing a vision for the five-year period and beyond, developing policy and obtaining approval for the planned outcomes of the department within the political collective.
The 2003-2006 strategic plan emanates from an ongoing process of planning and accountability. It is a process characterised by the notion of a learning organisation that subscribes to regular review and continuous improvement. It is solidly underpinned by performance management and development, service delivery innovations and a caring government department.
This strategic plan is a vehicle that will complement the excellent government work of pushing back the frontiers of poverty. It paves the way to ensuring that our department responds correctly to the challenge to help provide a better life for all and advance the goals of reconstruction and development as well as to discharge our responsibilities both at political and management level in such a way that it improves systems of governance and accountability to our people.
1. The strategic policy priorities for our strategic plan are both derived from the provincial and national government. They are mainly dictated to by the general and basic principles of consultation, economy, effectiveness, efficiency, integration, co-ordinated planning and development, batho pele principles and a people-driven development.
Tirisano is a further clarion call for government to take a collective approach to matters of education transformation and development. It calls on all stakeholders in the education fraternity to occupy their rightful positions as we march forward.
This strategic plan represents an historic epoch from the very beginning of the department. It is a continuation of all the previous good work that deals with planning and performance improvement. It is the first departmental strategic plan that is aligned with the national education planning framework linking all the nine provincial departments into a uniform and consolidated product that represents South African education as one entity.
It is a reflection of how our democracy is maturing, with the development and implementation of political and management systems and tools that fairly and equally monitor and evaluate performance across the provinces.
It is therefore in the spirit of our commitment to accountability, that I fully endorse the strategic direction indicated in this plan for the 2003/04-2005/06 cycle
_______________________
Mr DA Kganare
27 March 2003.

Page 6
EDUCATION STRATEGIC PLANNING V6
2. Overview by the accounting officer
The challenge for the department in its strategic planning process in the past two years has been to align itself, first in the previous year with the provincial strategy and then, in this cycle, with the national education strategic measurements. In some instances this unfortunately led to the adjustment of targets as the department shifted some of its resources during the alignment processes. Such a shift will not occur again unless major policy changes occur from a national directive or from a political directive. The department wishes to clearly indicate that any change in targets is not meant to hide non-service delivery. It is proud to have gone through this process that supports the achievement of educational strategic objectives within the strategic priorities of the Free State Development Plan.
The Department is in the best position ever to face the challenges of Education in the Free State Province. The constant changes taking place within the strategic planning setting augurs well for an organisation that seeks to benchmark itself against the best in the continent and the world. These changes must deliver the desired changes that will improve service innovation and delivery.
We therefore pledge our dedication and commitment to the achievement of our objectives.
_________________
Dr MC Nwaila
27 March 2003.

Page 7
EDUCATION STRATEGIC PLANNING V6
3. Vision
To be a department that improves the quality of life of all Free State citizens by providing quality life-long education and training.
4. Mission, strategic goals and strategic objectives
MISSION To operate an efficient, effective, outcomes-based education system that works towards the overall
development of Free State citizens in a dedicated, professional manner.
VALUES Uphold the Constitution Communicate effectively Re-dress past imbalances Manage Human resources Interact with mutual respect Foster innovation and creativity Be professional and accountable Provide courteous, timely service Comply with the National Qualifications Framework (NQF).
STRATEGIC GOALS AND OBJECTIVES
STRATEGIC PRIORITIES OF THE FREE STATE PROVINCE
1. To enhance Economic Development and Job Creation
2. Sustainable Infrastructure Development
3. Investing in the Development of People
4. Ensuring a Safe and Secure Environment
5. Good and Co-Operative Governance with sustainable use of Resources and the Environment
STRATEGIC GOALS
TIRISANO
1. To make our provincial systems work by making co-operative government work
2. To break the back of illiteracy among adults and youths by 2005
3. To make schools centres of community life
4. To end conditions of physical degradation in South African schools
5. To develop the professional quality of our teaching force
6. To ensure the success of active learning through outcomes-based education
7. To create a vibrant further education and training system to equip youth and adults to meet the social and economic needs of the 21st century
8. To deal urgently and purposefully with the HIV/AIDS emergency in and through the education and training system
Page 8
EDUCATION STRATEGIC PLANNING V6
5. Legislative and other mandates
The legislative mandate of the Department of Education is found in the Constitution of South Africa, the South African Schools Act, the Norms and Standards and several other legislative, functional and policy mandates that inform what the department does and how it does it.
Constitutional Basis: Section 7(2) of the Constitution enjoins the state to “respect, protect, promote and fulfil the rights in the Bill of Rights”. Guidance as to the meaning of these obligations can be found in international law.
Documents on which Constitutional Mandate is based and implemented
Free State Schools Education Act 2 of 2000: This Act should be read with and subject to the South African Schools Act 84 of 1996. It addresses those issues which are peculiar to the Free State and are covered in the National Act, e. g. the establishment of the Free State Education and Training Council – which is a body comprised of diverse stakeholders which advises the MEC on education issues broadly, as well as the establishment of the Principals’ Council and the Provincial Examination Board.
The Act further gives the MEC the authority to make regulations on any matter relating to education in the Province.
This is in furtherance of the mandate of the Department in terms of the Constitution.
Admission Policy: National Guidelines regulating admission of learners to Public Schools. Previously national regulations stipulated that learners would be admitted to Public Schools in the year in which they turned 7.
In view of the ruling in the case of ‘Harris vs the Minister of Education’ the admission age for both public and independent schools has been changed to the age of 5 turning 6 in the year of admission for Grade 1.
Norms and Standards for funding of Public Schools: Provides the criteria for funding of public schools in order to address the past imbalances in the provision of education and facilities. The more disadvantaged schools receive more funding.
Regulations for discipline of learners in Public Schools: It states which offences are considered to be serious enough to warrant expulsion of learners from Public Schools. It also regulates the procedure to be followed by the School Governing Body, the District Office and the Head Office when dealing with recommendations for expulsions and the time frames thereof.
Regulations for financial records of Public Schools: To ensure that all Public Schools have proper financial systems to handle and control their finances and the finances transferred to them by the Department and also to ensure accountability by the School Governing Body.
Regulations for the examinations: Irregularities and the Examination Board: To regulate the matters relating to the conducting of exams, to define the nature of examination irregularities by the Departmental officials and candidates, and also to establish the Provincial Examination Board and the Irregularities Committees.
Governance of Public Schools: The regulations for the election of the members of the Governing Bodies ensures participation of stakeholders at school level in school matters – for example determination of payment of school fees, admission policy for the school and the issues around finances, discipline and general management of the school. White Paper 5 on Early Childhood Development National Education Policy Act, 1996 (Act No 27 of 1996). National Policy: Education White Paper five (5) on Early Childhood Development (ECD). The paper deals with the implementation of Grade R as a compulsory year of schooling with an emphasis on poverty alleviation and collaborative approach to programmes for learners from birth to pre-Grade R. ECD refers to a comprehensive approach to policies and programmes for children from birth to nine years of age, and processes by which children grow and thrive physically, mentally, emotionally, spiritually, morally and socially, with the active participation of their parents and caregivers.

Page 9
EDUCATION STRATEGIC PLANNING V6
FET Act There is a National FET Act which regulates broadly for FET matters on a National level. Provinces have a concurrent legislative authority with National on matters relating to FET, which are specific to a particular Province. The Free State Department of Education is in the process of drafting a Bill for the establishment of the Further Education and Training Council, which is not catered for in the National Act and which the Province needs to establish in order to ensure stakeholder participation in FET matters and also to advise the MEC. ABET Act and Regulations The National Department has enacted the National ABET Act to regulate for a broad framework with regard to admission to ABET centres, governance and funding of ABET centres. The ABET Act empowers the MEC to make resolutions with regard to specific matters pertaining to Provinces, e.g. Regulations for merger of Public Adult Learning Centres, Regulations relating to Private Adult Learning Centres and Regulations for admission to Public Learning Centres including Regulations for minimum requirements of financial records of Public Adult Learning Centres. The Department has published the abovementioned Notices for comment in the Provincial Gazette and they should be promulgated soon. OTHER LEGISLATIVE REQUIREMENTS Corporate Services dealing with the support of educational activities, are also governed by various Acts, of which the goal is to ensure economic, efficient and effective administration, sound labour relations and discipline. These Acts are: Preferential Procurement Procedures Act The general conditions and procedures are subject to the Preferential Procurement Policy Framework Act, 2000 (Act No 5 of 2000), and the Preferential Procurement Regulations, 2001 and are applicable to all tenders, contracts and orders, unless otherwise decided by the Accounting Officer prior to the invitation of tenders. Public Finance Management Act Public Finance Management Act, No 1 of 1999 (as amended by Act 29 of 1999), deals with funding and spending of the State monies. The Act promotes the objective of good financial management in order to maximise delivery through the efficient and effective use of limited resources. Acts governing Human Resource Management The following acts govern the relations with employees
• Public Service Act (Proclamation No. 103 of 1994) • Public Service Regulations 2001 (Government Notice No. R 1 of 5 January 2001, amended as set
out in the Schedule with effect from 1 January 2003) • Employment of Educators Act, No 76 of 1998, read together with Government Notice No. 1400, as
published in the Government Gazette No.22961: Repeal of regulations and determining of conditions, and Government Notice No.1451 Government Gazette No. 24077: Amendment of Regulations for the distribution of educator posts to schools in a Provincial Department of Education.
• Basic Conditions of Employment Act No 74 of 1997 • Labour Relations Act No 66 of 1995
Skills Development Act Skills Development Act , No 97 of 1998. This Act deals with the skills grants to be paid by the Sector Education and Training Authorities (SETAs). There are six (6) types of grants that an Employer might claim: • a workplace skills grant • a workplace skills implementation grant • a grant towards the costs of learnerships and learner allowances

Page 10
EDUCATION STRATEGIC PLANNING V6
• a grant towards the costs of skills programme • a grant towards the costs of providing apprenticeship training, and • a grant towards a programme, project or research activity that helps the relevant SETA to implement its
sector skills plan. Occupational Health and Safety Act The Occupational Health and Safety Act, No 85 of 1993 provides for the health and safety of persons at work as well as the protection of persons other than persons at work against hazards to health and safety arising out of or in connection with the activities of persons at work.
6. Description of status quo
The Free State Department of Education is tasked with the responsibility of providing an effective, quality public education and training system to the citizens of the province. It has to provide this service to 750,000 learners at 2,500 schools across the province. It is mainly rural and as such more than 60% (sixty percent) are farm schools. This situation plays a critical role in the development of policies, plans and implementation strategies. Its total human resource capacity including both the educator and non-educator is equivalent to approximately 30,000.
The Free State Province is the second poorest province in the country. Unemployment and poverty are rife particular in to the previously disadvantaged communities. It is divided into five (5) magisterial districts ranging from rural to extremely underdeveloped districts. Its economy is not highly industrialised with some emphasis on mining, agriculture, manufacturing, services and other sectors. The state is a major contributor in terms of employment opportunities and economic development. There is no strong private sector as compared to highly industrialised provinces. Education plays a very important role in the socio-economic upliftment of communities.
As part of meeting its mandate to the client, it has developed a system of accountability that is informed by the overall government strategy of regular consultation and feedback with the communities. This enables it to prepare and develop policies that balances community needs and demands with broad government service delivery programmes. A key strategic intervention that meets the needs of the community and balances strategic intervention measures of the department is the Farm school project.
Poverty alleviation programmes and economic development and job creation initiatives are in place and more are in the pipeline to ensure that as a department we play an important role in the development of the Free State community. This is also done through integrating our programmes with the provincial strategic plan namely the Free State Development Plan.
The department as part of its internal delivery environment has initiated performance management and development systems that transcends positions and levels of management. This includes developing individual plans and workplans for components and directorates. Performance management is now in the process of being extended to middle managers and heads of institutions. All these efforts are geared towards meeting the needs and demands of our stakeholders and delivering a quality public education that will bring about desired changes and a better life to the citizens of the province.
The department has evolved through the various stages of growth since the amalgamation of the various education departments. It has now stabilised in all its areas of responsibility.
This can be verified by the disciplined approach within the department, the improvement of the various information and administrative support systems, the improvements of the audit reports as well as the improvement of the Grade 12 results.
The department is proud of its efforts that resulted in a pass rate and an exemption rate that is higher than the country’s average.
Page 11
EDUCATION STRATEGIC PLANNING V6
6.1 Summary of service delivery environment and challenges
From an educational perspective, the challenges still facing the department are the further improvement of the exemption rate, as an indicator of quality education, the improvement of inclusivity in education in the province, the support to those affected by HIV/AIDS and the successful implementation of FET and ECD.
6.2 Summary of organisational environment and challenges
From an administrative point of view the improvement of asset management and funding of maintenance of infrastructure remains a challenge.
The establishment of work ethics in the department is also high on the agenda. One of the vehicles to ensure an improvement in work ethics, is improved performance management.
Through the risk assessment process the processes in the department are being adapted to ensure economy, efficiency and effectiveness in service delivery.
The challenge also remain to support the strategic plan through structured and aligned information systems that are cost effective.
7. Description of strategic planning process
The strategic planning process started in 1999 when the current political head, MEC Kganare took office. The result was the development of a (5) five-year strategic plan for his term of office. The Broad Management aligned this plan in November 2001 to the Free State Development Plan in terms of the Public Finance Management Act multi-year planning (three years) cycle.
The aligned three years strategic plan was finalised in January 2002 after the appointment of the new accounting officer, Dr M.C. Nwaila. This plan was extensively consulted in the 5 districts of the province where a series of community meetings were held. Towards the end of 2002, all nine provincial departments were requested to align their strategic plans using a national framework that focussed on the standardisation of perfomance measures. Inputs from the senior and broad management and the community were integrated into the plan. The Department is therefore confident that the result of this strategic planning process is a well consulted and communicated plan that will improve the quality of life of all Free State citizens in a dedicated and professional manner. The plan is the third strategic plan document of the department since 1994 .
8. The overall planning framework and terminology
It is important that the public education system be relatively consistent in its use of a planning framework, and a planning terminology. This section attempts to outline how the bits and pieces mentioned in the formats for the strategic and operational plans fit together.

Page 12
EDUCATION STRATEGIC PLANNING V6
FIGURE 1: RELATIONSHIPS BETWEEN THE UNITS IN THE PLANNING FRAMEWORK
In the above figure the following notation is used:
The top right corner of each box indicates how many of this item can be expected to exist in one departmental strategic plan.
STRATEGIC LEVEL
PROGRAMME LEVEL
Approx. 8STRATEGIC GOALS
(5 years +)
Approx. 30STRATEGIC OBJECTIVES
(5 years +)
8PROGRAMMES
(permanent)
Approx. 30SUB-PROGRAMMES
(permanent)
30-60MEASURABLE OBJECTIVES
(3 years +)
60-120PERFORMANCE MEASURES
(3 years +)
180-360PERFORMANCE TARGETS
(3 years)
30-60SETS OF ACTIVITIES
(3 years +)

Page 13
EDUCATION STRATEGIC PLANNING V6
The information in brackets below the name of the item indicates for what period of time this item can be expected to apply.
The lines between boxes represent relationships. A thick end to a line indicates a many relationship, so, for instance, one strategic goal relates to many strategic objectives, and the relationship between programmes and strategic objectives is a many-to-many relationship (i.e. one programme may relate to many strategic objectives, and one strategic objective may relate to many programmes).
Part B:
THREE YEAR STRATEGIC PLAN
TABLE A.1: PROGRAMMES, MEASURABLE OBJECTIVES, ACTIVITIES AND PERFORMANCE MEASURES Provincial Vote 6: Education (R 4,028,808,000) Aim of vote: To provide education in the province to people whose education is the responsibility of the department MEASURABLE OBJECTIVE ACTIVITIES PERFORMANCE MEASURE MO 0.A: To ensure that the population of compulsory school-going age in the province attends schools.
• Create a conducive environment that facilitates access to education
PM 0.A: Percentage of the population aged 6 to 14 attending schools.
MO 0.B: To make FET progressively available to youth and adults above compulsory school-going age.
• Create a conduce environment that facilitates access to education and training
PM 0.B: Percentage of the population aged 15 to 17 attending schools and other educational institutions.
MO 0.C: To build a society that is well educated. • Provide quality public education and training PM 0.C.a: Average highest GET or FET level attained by adults in the population. PM 0.C.b: Adult literacy rate.
Programme 1: Administration (R305,782 000) Programme objective: To provide overall management of the education system in accordance with the National Education Policy Act., the Public Finance Management Act, and other policies. MO 1.A: To bring about effective management at all levels of the system.
• Planning and budgeting. • Monitoring by Norms and Standards unit. • Capacitation
PM 1.A.a: Percentage of schools with Section 21 status. PM 1.A.b: Percentage of recurrent non-personnel funding being channelled through the School Funding Norms.
MO 1.B: To realise an optimal distribution of financial, physical and human resources across the system.
• Planning • Budgeting • Monitoring
PM 1.B.a: Average real per learner allocation for recurrent non-personnel items using funding supplied via the School Funding Norms. PM 1.B.b: Percentage of non-Section 21 schools with all LSMs and other required materials delivered on day one of the school year.

Page 14
EDUCATION STRATEGIC PLANNING V6
MO 1.C: To ensure that the flow of learners through the system is optimal.
• Planning • Monitoring
PM 1.C: Years input per Senior Certificate/FETC graduate.
Sub- Programme 1.1: Office of the MEC (R3 071 000) Sub-Programme objective: To provide for the functioning of the office of the MEC for education MEASURABLE OBJECTIVE ACTIVITIES PERFORMANCE MEASURE To establish structures to ensure good governance • Establishment and consultation
• Review and approval of structure • Monitoring and Evaluation
The extent to which functional Advisory Councils and relevant Bodies are established. The extent to which sustainable posts are timely created. The extent to which the budget reflects determined priorities.
To determine and establish policies and priorities for the FSDE.
• Monitoring and Evaluation • Establishment and consultation
The extent of compliance with legislative requirements. The extent to which priorities support the National and Provincial mandates
To determine the Public Service Delivery Improvement Plan. • Monitoring and Evaluation The extent to which Batho Pele principles are prioritised.
To monitor the impact of the Free State Development Plan in the Department.
• Monitoring and Evaluation The extent to which the quality of education provided is improved.
To ensure accountability. • Monitoring and Evaluation
The extent to which interaction with SGB’s and communities is effected. The extent to which public queries and concerns are addressed, by the Department, in a timely manner.
To ensure the FSDE is kept abreast with international developments
• Liaison and consultation The extent to which partnerships are established with international stakeholders.

Page 15
EDUCATION STRATEGIC PLANNING V6
Sub-Programme 1.2: Corporate Services (R150 287 000……….) Sub-Programme objective: To provide management services that are not education specific for the education system MEASURABLE OBJECTIVE ACTIVITIES PERFORMANCE MEASURE
To ensure through tenders and procurement that economic development and job creation projects / initiatives are enhanced.
• Preparation of advertisements in terms of set criteria
• Evaluation of tenders • Monitoring and evaluation of poverty alleviation
plan
The extent to which the number of job creation projects are increased
To improve access to Information, Communication and Technology (ICT)
• ICT Service plan developed • Implementation of ICT Service Plan • IT Posts in districts created and filled
The extent to which all districts/directorates/schools are linked electronically to all relevant systems and/or programs, e.g. LOGIS/Vulindela, etc.
To reduce losses due to poor asset and inventory management
• Updating of internal control procedures • Updating of asset register • Disposal of assets • Stock taking • Monitoring and evaluation of internal control
procedures
The extent to which asset registers are accurate, complete and updated The extent to which losses are reduced.
To improve communication with stakeholders • Implementation of communication strategy • Liaison with communities by districts • Liaison with unions • Liaison with School Governing Bodies
The extent to which communication with stakeholders take place.

Page 16
EDUCATION STRATEGIC PLANNING V6
To improve the internal control environment to prevent corruption
• Current target 38 cases per annum
• Current target 8 cases per annum
• Current target R57,418 per case
• Current target R23,585 per case
• Current target 100%
• Current target 100%
The extent to which the average number of fraud cases in the department are reduced The extent to which the average number of fraud cases in schools are reduced The extent to which the average fraud case value in the department decreases. The extent to which the average fraud case value in schools decreases. The extent to which the fraud prevention plan is rolled out. The extent to which Responsibility Managers provide a representation letter on compliance to the Chief Financial Officer by 31 March per annum (Adherence to Risk Management Policy)
To improve Human Resource Management practices at all levels
• Development of advertisements for local newspapers and radio stations
• Establishment and maintenance of databases
• Planning of Human Resource requirements
• Collection of data through advertisements. • Capturing of data on developed database • Assessment of data. • Development of strategy
• Setting of work standards • Training in customer care and work ethics
The extent to which all vacant funded educator and public servants posts are permanently filled in a timely manner within budget limitations The extent to which the Human Resources Plan are updated The extent to which a strategy has been developed for the prioritisation of appointment of educators who have completed there studies and remain unemployed The extent to which identified Batho Pele principles are adhered to.
To realise an optimal utilisation and distribution of physical, financial physical and human resources across the system
• Monitoring and evaluation • Physical planning and monitoring
The extent to which optimal utilization of class rooms are ensured
Page 17
EDUCATION STRATEGIC PLANNING V6
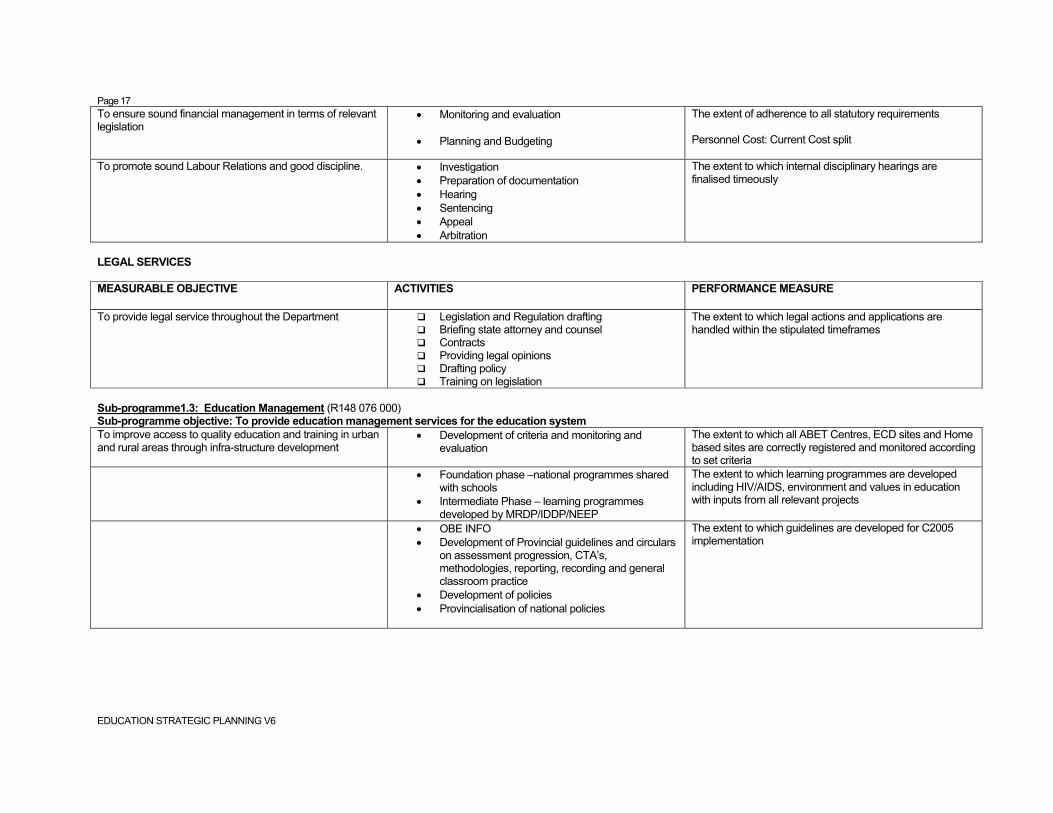
To ensure sound financial management in terms of relevant legislation
• Monitoring and evaluation
• Planning and Budgeting
The extent of adherence to all statutory requirements Personnel Cost: Current Cost split
To promote sound Labour Relations and good discipline.
• Investigation • Preparation of documentation • Hearing • Sentencing • Appeal • Arbitration
The extent to which internal disciplinary hearings are finalised timeously
LEGAL SERVICES MEASURABLE OBJECTIVE ACTIVITIES PERFORMANCE MEASURE
To provide legal service throughout the Department Legislation and Regulation drafting Briefing state attorney and counsel Contracts Providing legal opinions Drafting policy Training on legislation
The extent to which legal actions and applications are handled within the stipulated timeframes
Sub-programme1.3: Education Management (R148 076 000) Sub-programme objective: To provide education management services for the education system To improve access to quality education and training in urban and rural areas through infra-structure development
• Development of criteria and monitoring and evaluation
The extent to which all ABET Centres, ECD sites and Home based sites are correctly registered and monitored according to set criteria
• Foundation phase –national programmes shared with schools
• Intermediate Phase – learning programmes developed by MRDP/IDDP/NEEP
The extent to which learning programmes are developed including HIV/AIDS, environment and values in education with inputs from all relevant projects
• OBE INFO • Development of Provincial guidelines and circulars
on assessment progression, CTA’s, methodologies, reporting, recording and general classroom practice
• Development of policies • Provincialisation of national policies
The extent to which guidelines are developed for C2005 implementation
Page 18
EDUCATION STRATEGIC PLANNING V6
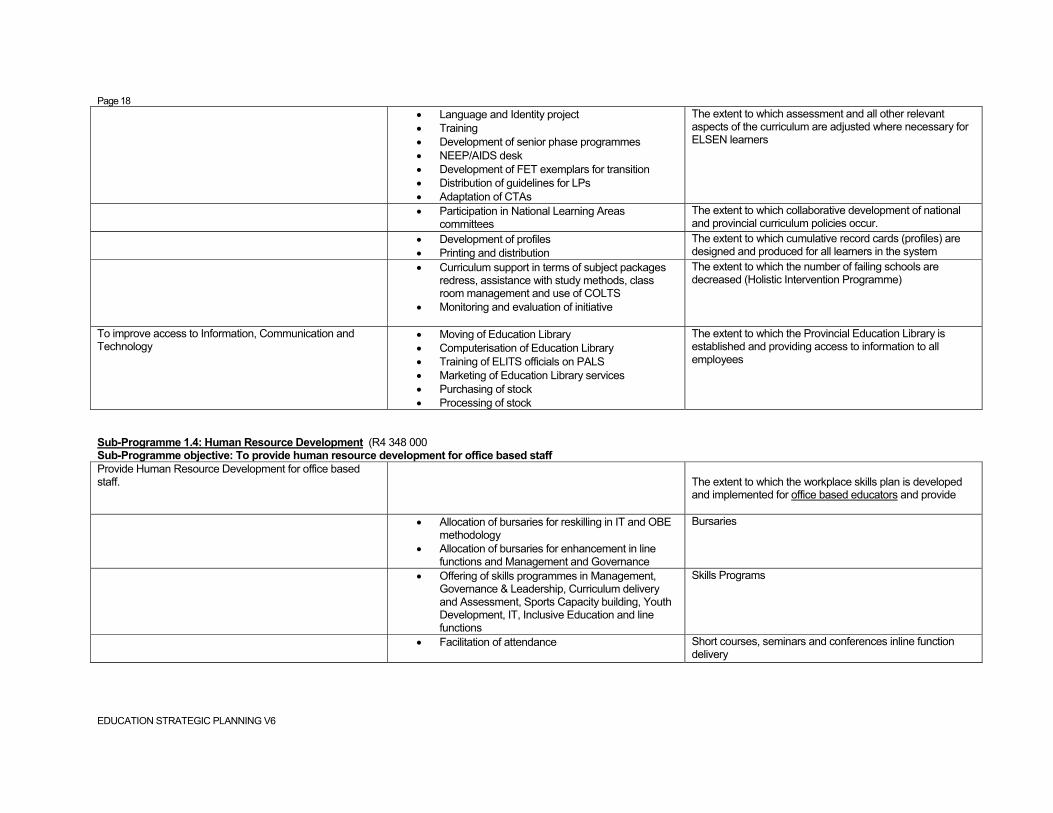
• Language and Identity project • Training • Development of senior phase programmes • NEEP/AIDS desk • Development of FET exemplars for transition • Distribution of guidelines for LPs • Adaptation of CTAs
The extent to which assessment and all other relevant aspects of the curriculum are adjusted where necessary for ELSEN learners
• Participation in National Learning Areas committees
The extent to which collaborative development of national and provincial curriculum policies occur.
• Development of profiles • Printing and distribution
The extent to which cumulative record cards (profiles) are designed and produced for all learners in the system
• Curriculum support in terms of subject packages redress, assistance with study methods, class room management and use of COLTS
• Monitoring and evaluation of initiative
The extent to which the number of failing schools are decreased (Holistic Intervention Programme)
To improve access to Information, Communication and Technology
• Moving of Education Library • Computerisation of Education Library • Training of ELITS officials on PALS • Marketing of Education Library services • Purchasing of stock • Processing of stock
The extent to which the Provincial Education Library is established and providing access to information to all employees
Sub-Programme 1.4: Human Resource Development (R4 348 000 Sub-Programme objective: To provide human resource development for office based staff Provide Human Resource Development for office based staff.
The extent to which the workplace skills plan is developed and implemented for office based educators and provide
• Allocation of bursaries for reskilling in IT and OBE methodology
• Allocation of bursaries for enhancement in line functions and Management and Governance
Bursaries
• Offering of skills programmes in Management, Governance & Leadership, Curriculum delivery and Assessment, Sports Capacity building, Youth Development, IT, Inclusive Education and line functions
Skills Programs
• Facilitation of attendance Short courses, seminars and conferences inline function delivery

Page 19
EDUCATION STRATEGIC PLANNING V6
• Development of programmes • Implementation of programmes
The extent to which an Employee wellness program (HIV/AIDS in the workplace) is implemented.
The extent to which the workplace skills plan is developed and implemented for office based public servants (including SMS) and provide
• Allocation of bursaries in Financial Management, Human Resource Management, Organisation and Human Resource Development, Psychology, Information Management, Project Management, Management and Administration, IT and Labour Relations
Bursaries
• Development and implementation Learnerships: Financial Management
• Offering of skills programmes in Financial Management, Human Resource Management, Assessor, Moderator, Verifier, Job descriptions, Psychology, IT, Project Management, Management and Administration, Labour Relations, Office admin, Line functions and ABET
Skills programs:
• Facilitation of attendance Short Courses, conferences and seminars
• Development • Implementation
The extent to which a Human Resource Plan and employment equity plan are implemented
• Development • Maintenance of database • Support of work plans through training
The extent to which job descriptions and performance work plans are implemented
• Development • Implementation
The extent to which an Employee wellness program (HIV/AIDS in the workplace) is implemented.
Programme 2: Public ordinary school education (R3,271,399 000 Programme objective: To provide public ordinary education from Grades 1 to 12 in accordance with the South African Schools Act. Sub-programme 2.1: Public primary phase (R1 836 801 000) Sub-programme objective: To provide specific public primary ordinary schools with resources required for the Grades 1 to 7 phase. MO 2.1.A: To provide spaces in the public primary phase in accordance with policy.
• Establishment of information systems PM 2.1.A: Number of spaces provided in the public primary phase.
Page 20
EDUCATION STRATEGIC PLANNING V6
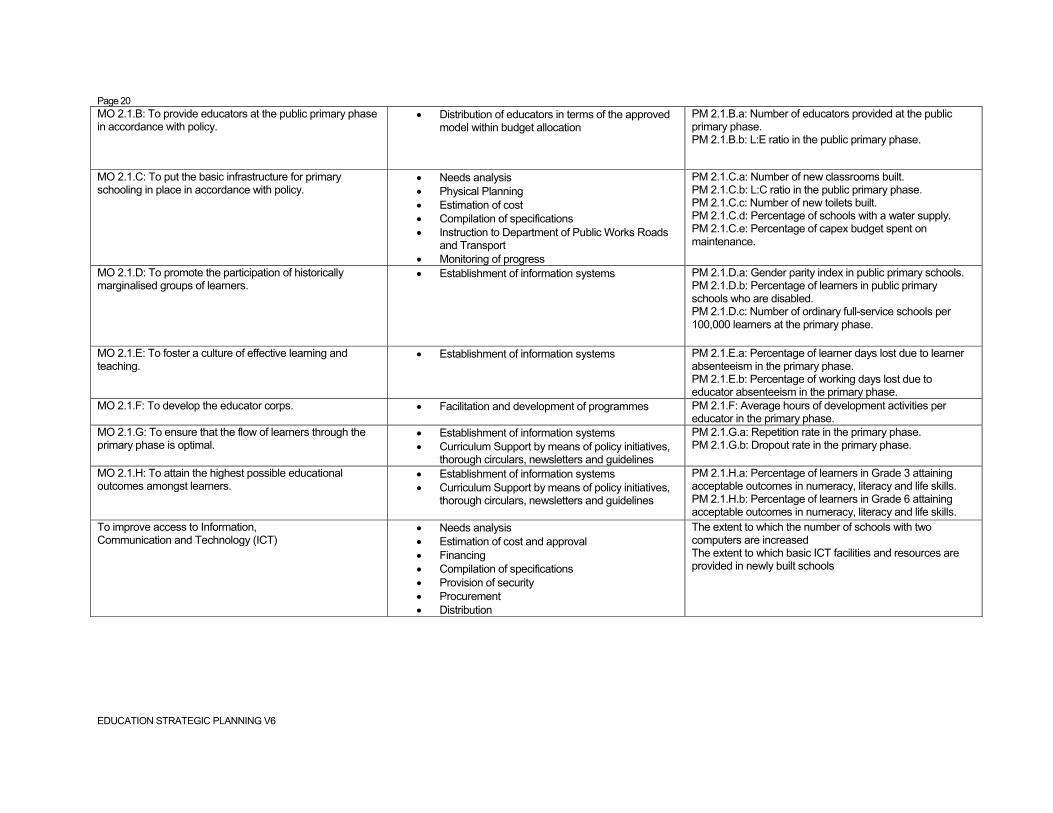
MO 2.1.B: To provide educators at the public primary phase in accordance with policy.
• Distribution of educators in terms of the approved model within budget allocation
PM 2.1.B.a: Number of educators provided at the public primary phase. PM 2.1.B.b: L:E ratio in the public primary phase.
MO 2.1.C: To put the basic infrastructure for primary schooling in place in accordance with policy.
• Needs analysis • Physical Planning • Estimation of cost • Compilation of specifications • Instruction to Department of Public Works Roads
and Transport • Monitoring of progress
PM 2.1.C.a: Number of new classrooms built. PM 2.1.C.b: L:C ratio in the public primary phase. PM 2.1.C.c: Number of new toilets built. PM 2.1.C.d: Percentage of schools with a water supply. PM 2.1.C.e: Percentage of capex budget spent on maintenance.
MO 2.1.D: To promote the participation of historically marginalised groups of learners.
• Establishment of information systems PM 2.1.D.a: Gender parity index in public primary schools. PM 2.1.D.b: Percentage of learners in public primary schools who are disabled. PM 2.1.D.c: Number of ordinary full-service schools per 100,000 learners at the primary phase.
MO 2.1.E: To foster a culture of effective learning and teaching.
• Establishment of information systems PM 2.1.E.a: Percentage of learner days lost due to learner absenteeism in the primary phase. PM 2.1.E.b: Percentage of working days lost due to educator absenteeism in the primary phase.
MO 2.1.F: To develop the educator corps. • Facilitation and development of programmes PM 2.1.F: Average hours of development activities per educator in the primary phase.
MO 2.1.G: To ensure that the flow of learners through the primary phase is optimal.
• Establishment of information systems • Curriculum Support by means of policy initiatives,
thorough circulars, newsletters and guidelines
PM 2.1.G.a: Repetition rate in the primary phase. PM 2.1.G.b: Dropout rate in the primary phase.
MO 2.1.H: To attain the highest possible educational outcomes amongst learners.
• Establishment of information systems • Curriculum Support by means of policy initiatives,
thorough circulars, newsletters and guidelines
PM 2.1.H.a: Percentage of learners in Grade 3 attaining acceptable outcomes in numeracy, literacy and life skills. PM 2.1.H.b: Percentage of learners in Grade 6 attaining acceptable outcomes in numeracy, literacy and life skills.
To improve access to Information, Communication and Technology (ICT)
• Needs analysis • Estimation of cost and approval • Financing • Compilation of specifications • Provision of security • Procurement • Distribution
The extent to which the number of schools with two computers are increased The extent to which basic ICT facilities and resources are provided in newly built schools

Page 21
EDUCATION STRATEGIC PLANNING V6
• Organising of exhibitions to screen, select and evaluate relevant learning resources
• Acquisition of printed and electronic resources • Processing of stock for schools • Marketing the library service • Delivering stock to schools • Training educators on basic library set-up skills
The extent to which public primary ordinary schools are provided with school library core collections
• Production of LTSM and resource catalogues • Distribution of catalogues for ordering
The extent to which LSM and multi-media resources are screened, evaluated and selected
• Training of educators on information and research skills
• Training of educators on reading skills • Training of educators on computer skills
The extent to which library based resources are integrated into classroom practice
To put the basic infrastructure for primary schooling in place in accordance with policy
• Needs analysis • Cost analysis, consultation and approval • Physical planning • Financing • Compilations of specifications • Implementation
The extent to which hostels are provided for primary farm school learners
The extent to which schools / educational institutions / offices are upgraded Upgraded:
• Needs analysis and prioritisation by Physical Planning
• Cost estimation • Financing • Compilation of specifications • Procurement and appointment of service provider • Monitoring of progress • Final site-handover
Media / School libraries Laboratories Halls
• Needs analysis • Estimation of cost and approval • Financing • Compilation of specifications • Procurement and appointment of service provider • Monitoring of progress
Appropriate new equipment provided (excluding halls and administration blocks)
Facilities provided in terms of:

Page 22
EDUCATION STRATEGIC PLANNING V6
• Needs analysis and prioritisation • Collaboration with ESKOM and TELKOM • Financing • Procurement and appointment of service provider • Monitoring of progress
Water Electricity Solar power Sanitation Telephone lines Administration blocks
• Needs analysis • Estimation of cost and approval • Financing • Compilation of specifications • Procurement and appointment of service provider • Monitoring of progress
Number of facilities renovated and maintained
• Needs analysis • Estimation of cost and approval • Financing • Compilation of specifications • Procurement and appointment of service provider • Monitoring of progress
The extent to which schools are accessible for the physically challenged
• Needs analysis and prioritisation • Estimation of cost and approval • Financing • Compilation of specifications • Procurement and appointment of service provider • Monitoring of progress
The extent to which new schools are provided within a 15 km accessibility radius in rural areas and a 5 km accessibility radius in urban areas
Sub-programme 2.2: Public secondary phase (R1 352 070 000)Sub-programme objective: To provide specific public secondary ordinary schools with resources required for the Grades 8 to 12 levels. MO 2.2.A: To provide spaces in the public secondary phase in accordance with policy.
• Establishment of information systems PM 2.2.A: Number of spaces provided in the public secondary phase.
MO 2.2.B: To provide educators at the public secondary phase in accordance with policy.
• Distribution of educators in terms of the approved model within budget allocation
PM 2.2.B.a: Number of educators provided at the public secondary phase. PM 2.2.B.b: L:E ratio in the public secondary phase.
Page 23
EDUCATION STRATEGIC PLANNING V6
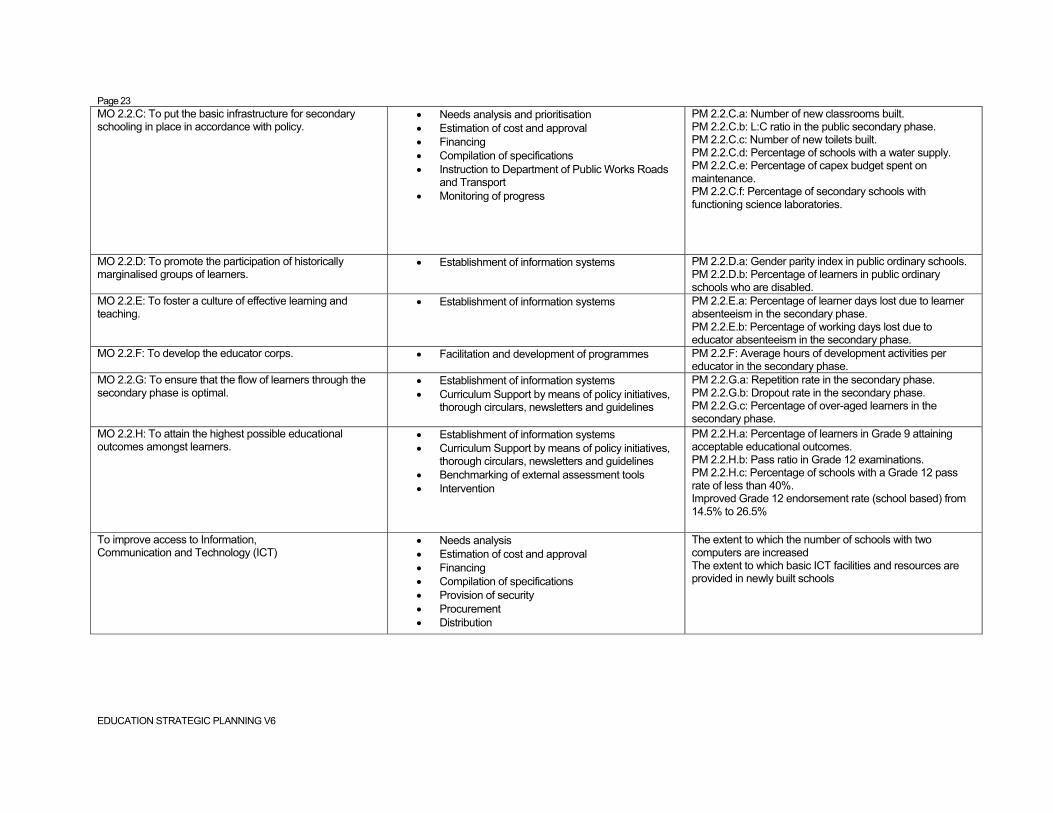
MO 2.2.C: To put the basic infrastructure for secondary schooling in place in accordance with policy.
• Needs analysis and prioritisation • Estimation of cost and approval • Financing • Compilation of specifications • Instruction to Department of Public Works Roads
and Transport • Monitoring of progress
PM 2.2.C.a: Number of new classrooms built. PM 2.2.C.b: L:C ratio in the public secondary phase. PM 2.2.C.c: Number of new toilets built. PM 2.2.C.d: Percentage of schools with a water supply. PM 2.2.C.e: Percentage of capex budget spent on maintenance. PM 2.2.C.f: Percentage of secondary schools with functioning science laboratories.
MO 2.2.D: To promote the participation of historically marginalised groups of learners.
• Establishment of information systems PM 2.2.D.a: Gender parity index in public ordinary schools. PM 2.2.D.b: Percentage of learners in public ordinary schools who are disabled.
MO 2.2.E: To foster a culture of effective learning and teaching.
• Establishment of information systems PM 2.2.E.a: Percentage of learner days lost due to learner absenteeism in the secondary phase. PM 2.2.E.b: Percentage of working days lost due to educator absenteeism in the secondary phase.
MO 2.2.F: To develop the educator corps. • Facilitation and development of programmes PM 2.2.F: Average hours of development activities per educator in the secondary phase.
MO 2.2.G: To ensure that the flow of learners through the secondary phase is optimal.
• Establishment of information systems • Curriculum Support by means of policy initiatives,
thorough circulars, newsletters and guidelines
PM 2.2.G.a: Repetition rate in the secondary phase. PM 2.2.G.b: Dropout rate in the secondary phase. PM 2.2.G.c: Percentage of over-aged learners in the secondary phase.
MO 2.2.H: To attain the highest possible educational outcomes amongst learners.
• Establishment of information systems • Curriculum Support by means of policy initiatives,
thorough circulars, newsletters and guidelines • Benchmarking of external assessment tools • Intervention
PM 2.2.H.a: Percentage of learners in Grade 9 attaining acceptable educational outcomes. PM 2.2.H.b: Pass ratio in Grade 12 examinations. PM 2.2.H.c: Percentage of schools with a Grade 12 pass rate of less than 40%. Improved Grade 12 endorsement rate (school based) from 14.5% to 26.5%
To improve access to Information, Communication and Technology (ICT)
• Needs analysis • Estimation of cost and approval • Financing • Compilation of specifications • Provision of security • Procurement • Distribution
The extent to which the number of schools with two computers are increased The extent to which basic ICT facilities and resources are provided in newly built schools
Page 24
EDUCATION STRATEGIC PLANNING V6
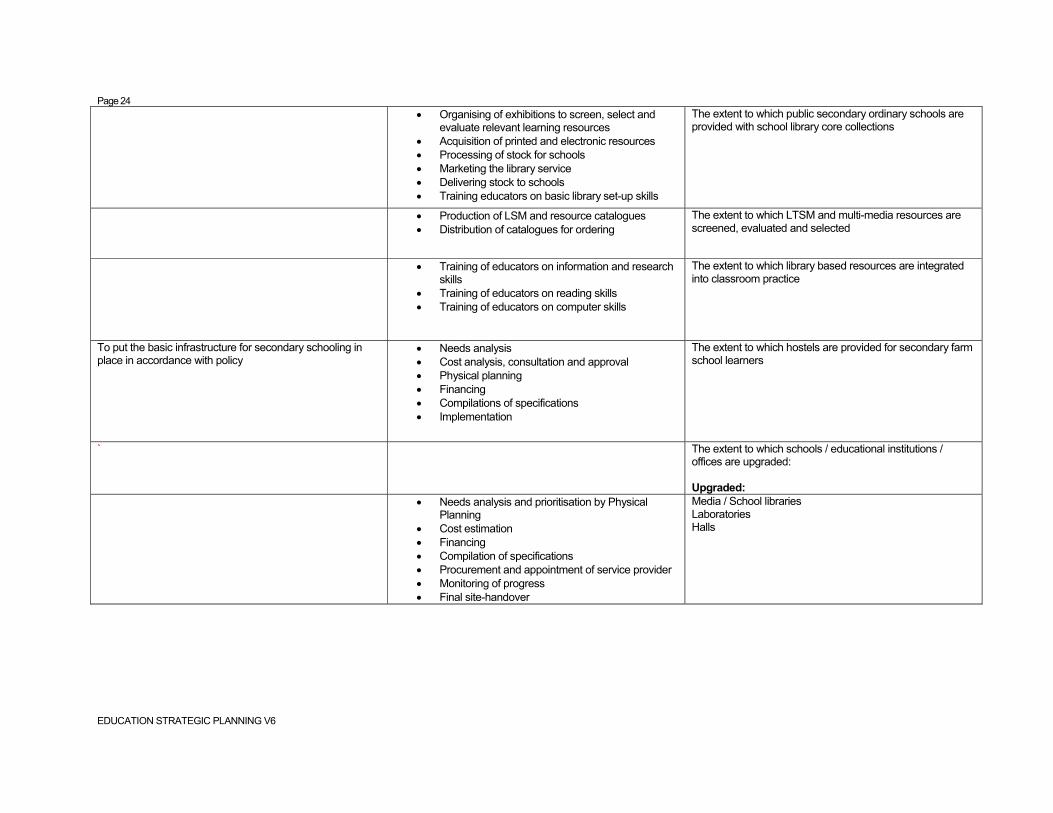
• Organising of exhibitions to screen, select and evaluate relevant learning resources
• Acquisition of printed and electronic resources • Processing of stock for schools • Marketing the library service • Delivering stock to schools • Training educators on basic library set-up skills
The extent to which public secondary ordinary schools are provided with school library core collections
• Production of LSM and resource catalogues • Distribution of catalogues for ordering
The extent to which LTSM and multi-media resources are screened, evaluated and selected
• Training of educators on information and research skills
• Training of educators on reading skills • Training of educators on computer skills
The extent to which library based resources are integrated into classroom practice
To put the basic infrastructure for secondary schooling in place in accordance with policy
• Needs analysis • Cost analysis, consultation and approval • Physical planning • Financing • Compilations of specifications • Implementation
The extent to which hostels are provided for secondary farm school learners
` The extent to which schools / educational institutions / offices are upgraded: Upgraded:
• Needs analysis and prioritisation by Physical Planning
• Cost estimation • Financing • Compilation of specifications • Procurement and appointment of service provider • Monitoring of progress • Final site-handover
Media / School libraries Laboratories Halls

Page 25
EDUCATION STRATEGIC PLANNING V6
• Needs analysis • Estimation of cost and approval • Financing • Compilation of specifications • Procurement and appointment of service provider • Monitoring of progress
Appropriate new equipment provided (excluding halls and administration blocks)
Facilities provided in terms of: • Needs analysis and prioritisation
• Collaboration with ESKOM and TELKOM • Financing • Procurement and appointment of service provider • Monitoring of progress
Water Electricity Solar power Sanitation Telephone lines Administration blocks
• Needs analysis • Estimation of cost and approval • Financing • Compilation of specifications • Procurement and appointment of service provider • Monitoring of progress
The extent to which facilities are renovated and maintained
• Needs analysis • Estimation of cost and approval • Financing • Compilation of specifications • Procurement and appointment of service provider • Monitoring of progress
The extent to which schools are accessible for the physically challenged
• Needs analysis • Estimation of cost and approval • Financing • Compilation of specifications • Procurement and appointment of service provider • Monitoring of progress
The extent to which new schools are provided within a 15 km accessibility radius in rural areas and a 5 km accessibility radius in urban areas
To improve access to and quality of formal education at learning institutions in terms of school effectiveness and educator professionalism in the secondary phase
• Curriculum support in terms of subject package redress, assistance with study methods, class room management, methodologies, and use of COLTS
The extent to which the Grade 12 endorsement rate (school based) is improved
Page 26
EDUCATION STRATEGIC PLANNING V6
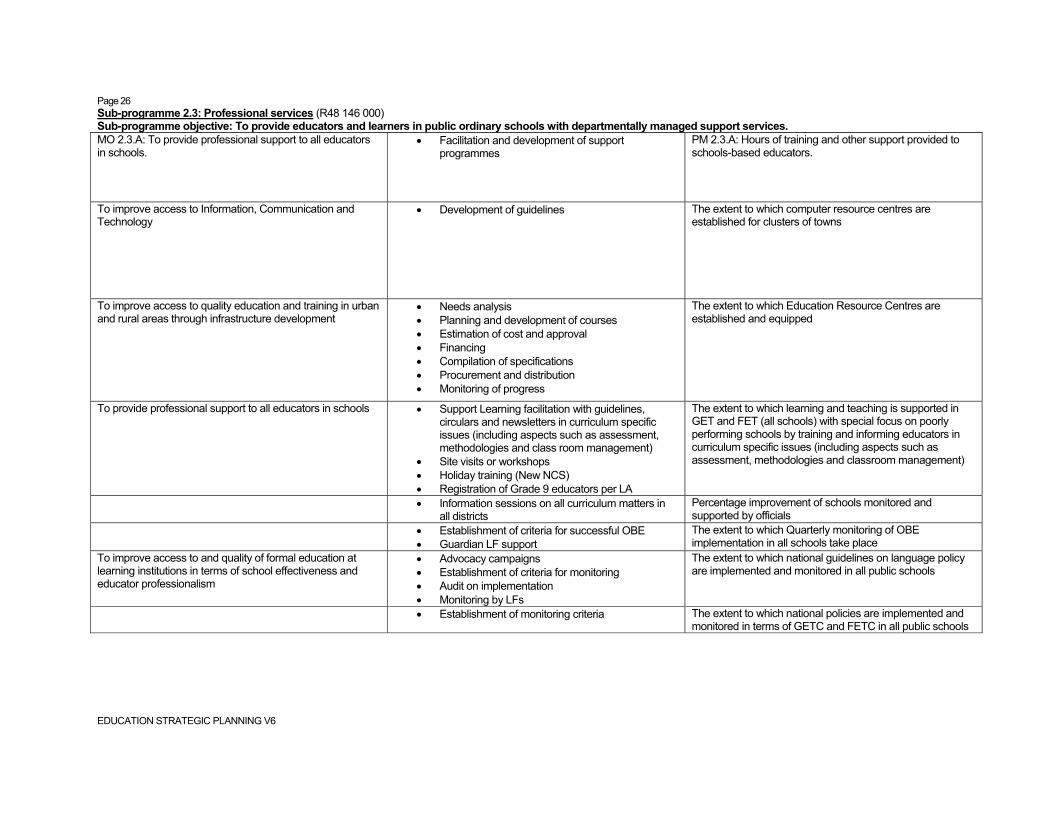
Sub-programme 2.3: Professional services (R48 146 000) Sub-programme objective: To provide educators and learners in public ordinary schools with departmentally managed support services. MO 2.3.A: To provide professional support to all educators in schools.
• Facilitation and development of support programmes
PM 2.3.A: Hours of training and other support provided to schools-based educators.
To improve access to Information, Communication and Technology
• Development of guidelines
The extent to which computer resource centres are established for clusters of towns
To improve access to quality education and training in urban and rural areas through infrastructure development
• Needs analysis • Planning and development of courses • Estimation of cost and approval • Financing • Compilation of specifications • Procurement and distribution • Monitoring of progress
The extent to which Education Resource Centres are established and equipped
To provide professional support to all educators in schools • Support Learning facilitation with guidelines, circulars and newsletters in curriculum specific issues (including aspects such as assessment, methodologies and class room management)
• Site visits or workshops • Holiday training (New NCS) • Registration of Grade 9 educators per LA
The extent to which learning and teaching is supported in GET and FET (all schools) with special focus on poorly performing schools by training and informing educators in curriculum specific issues (including aspects such as assessment, methodologies and classroom management)
• Information sessions on all curriculum matters in all districts
Percentage improvement of schools monitored and supported by officials
• Establishment of criteria for successful OBE • Guardian LF support
The extent to which Quarterly monitoring of OBE implementation in all schools take place
To improve access to and quality of formal education at learning institutions in terms of school effectiveness and educator professionalism
• Advocacy campaigns • Establishment of criteria for monitoring • Audit on implementation • Monitoring by LFs
The extent to which national guidelines on language policy are implemented and monitored in all public schools
• Establishment of monitoring criteria The extent to which national policies are implemented and monitored in terms of GETC and FETC in all public schools

Page 27
EDUCATION STRATEGIC PLANNING V6
• Support Learning facilitation with guidelines, circulars and newsletters in curriculum specific issues (including aspects such as assessment, methodologies and class room management)
The extent to which schools are supported with Guidelines for C2005 implementation
• Support Learning facilitation with guidelines, circulars and newsletters in curriculum specific issues (including aspects such as assessment, methodologies and class room management)
The extent to which assessment and all other relevant aspects of the curriculum are adjusted and training provided where necessary for ELSEN learners
• Establishment of information systems The extent to which the average hours of developmental activity per educator in primary and secondary phases are improved (a vast data-base is essential here for this to be possible)
Sub-Programme 2.4: Human Resource Development (R23 278 000) Sub-programme objective: To provide departmental services for the professional and further development of educators and non-educators in public ordinary schools MEASURABLE OBJECTIVE ACTIVITIES PERFORMANCE MEASURE To provide departmental services for the professional and further development of educators and non educators in public ordinary schools.
The extent to which the educator corps in the public primary phase and special schools are developed through the offering of:
• Allocate bursaries for un- and underqualified educators to become qualified
• Allocate bursaries for reskilling in scarce subjects, OBE Learning Areas, OBE Methodology, ELITS, Art and Music and Remedial
• Allocate bursaries for enhancement in scarce subjects
Bursaries:
• Offer skills programmes in Management and Governance, Curriculum Delivery and Assessment in scarce subjects and OBE learning areas, Assessor, moderator, verifier, Sport Development Programmes, IT and ELITS, Inclusive/specialised
Skills Programs @ 80 hours per educator
• Establish SDTs • Train SDTs and other educators in DAS • Monitor the implementation of DAS
The extent to which a Training needs analysis is completed: DAS
• Develop and Implement Human Resource Plan • Develop and Implement Employment Equity Plan
The extent to which a Human Resource plan and Employment Equity plan is developed and implemented

Page 28
EDUCATION STRATEGIC PLANNING V6
• Develop job descriptions framework • Maintain job description data base • Support the implementation of performance work plans
The extent to which Job descriptions and performance work plans are developed and implemented
• Develop and Implement appropriate wellness programmes
The extent to which employee wellness programmes are developed and implemented
The extent to which the educator corps and public servants in the public secondary phase and special schools are developed through the offering of:
• Allocate bursaries for under qualified educators to become qualified, reskilling in scarce subjects, FET fields, OBE methodology, ELITS, Art and Music and Remedial
• Allocate bursaries for best performing Grade 12 learners whose parents cannot afford to pay for their further study
Bursaries Educators
Public Servants
• Offer skills programmes in Financial Management, Project Management, IT, Line Functions, ABET, Management and Governance, Curriculum Delivery and Assessment in scarce subjects and technical subjects, Sport Development Programmes and Youth development programmes for members of RCL, ELITS and inclusive education
Skills Programs Educators
Public Servants
• Develop and Implement Human Resources Plan • Develop and Implement Employment Equity Plan
The extent to which a Human Resource plan and Employment Equity plan is developed and implemented
• Develop job descriptions framework • Maintain job description data base • Support the implementation of performance work plans
The extent to which a Job Descriptions Framework has been developed
• Develop and implement appropriate wellness programmes
Employee wellness programme
In School Sport and Culture (11 104 000) Programme 3: Independent school subsidies (R 17,138,000) Programme objective: To support independent schools in accordance with the South African Schools Act. MO 3.A: To support independent schooling, especially if catering for poorer communities, as a complement to public schooling.
• Registration of schools • Evaluations of schools • Evaluation of Financial Statements of schools • Determination of subsidy • Payment of subsidy
PM 3.A.a: Average real per learner subsidy. PM 3.A.b: Percentage of independent school learners receiving a state subsidy.

Page 29
EDUCATION STRATEGIC PLANNING V6
Sub-programme 3.1: Primary Schools (R8 235 000) Sub-programme objective: To support independent schools in grades 1-7 To support independent schooling especially if catering for poor communities as a complement to public schooling
• Curriculum Support by means of policy initiatives, thorough circulars, newsletters and guidelines
The extent to which assessment and all other relevant aspects of the curriculum are adjusted and training provided where necessary for ELSEN learners
• Establishment of information systems • Curriculum Support by means of policy initiatives,
thorough circulars, newsletters and guidelines
The extent to which learning and teaching in GET are supported with special focus on poorly performing schools by training and informing educators in curriculum specific issues (including aspects such as assessment, methodologies and classroom management)
• Establishment of information systems • Curriculum Support by means of policy initiatives,
thorough circulars, newsletters and guidelines
The extent to which systems and procedures for the early identification and addressing of barriers to learning in the Foundation Phase are established.
Sub-programme 3.2: Secondary Schools (R8 903 000…) Sub-programme objective: To support independent schools in grades 8-12 MEASURABLE OBJECTIVE ACTIVITIES PERFORMANCE MEASURE • OBE INFO
• Development of Provincial guidelines and circulars on assessment progression, CTAs, methodologies, reporting, recording and general classroom practice
• Development of policies • Provincialisation of national policies
The extent to which Guidelines are available for C2005 implementation
• Curriculum Support by means of policy initiatives, thorough circulars, newsletters and guidelines
The extent to which assessment and all other relevant aspects of the curriculum are adjusted and training provided where necessary for ELSEN learners
• Establishment of monitoring criteria The extent to which Curriculum 2005 policies are implemented in FET (Secondary schools)
Page 30
EDUCATION STRATEGIC PLANNING V6
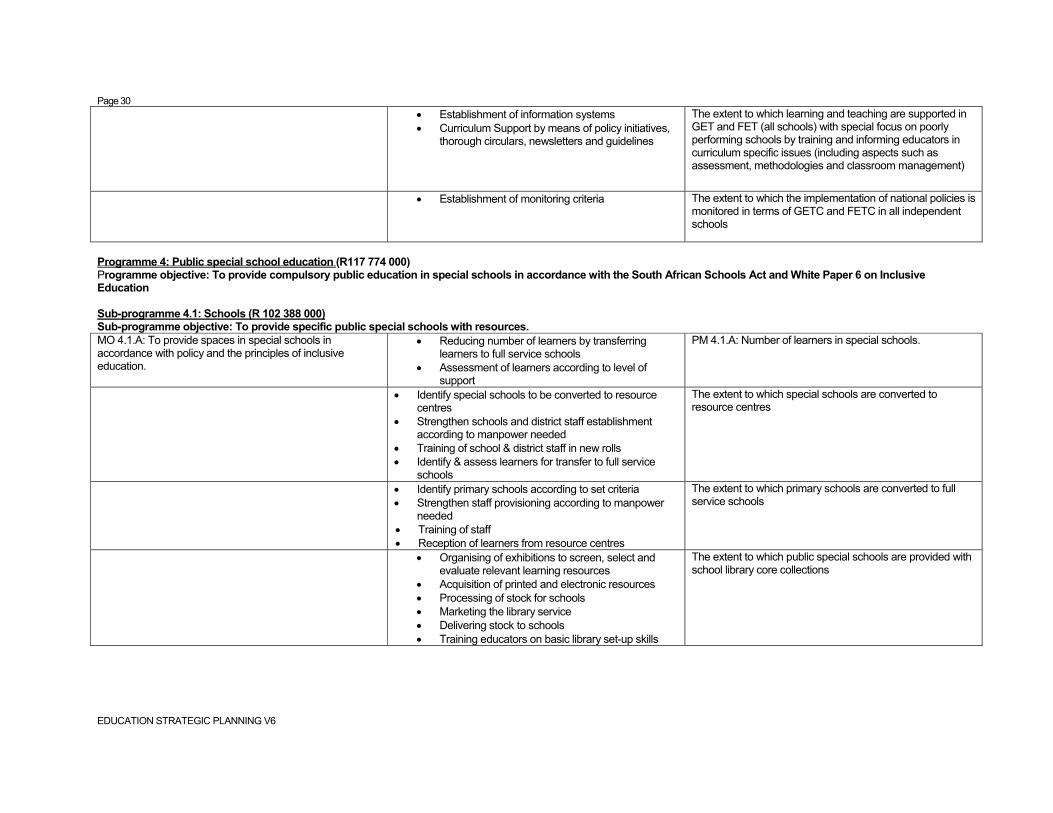
• Establishment of information systems • Curriculum Support by means of policy initiatives,
thorough circulars, newsletters and guidelines
The extent to which learning and teaching are supported in GET and FET (all schools) with special focus on poorly performing schools by training and informing educators in curriculum specific issues (including aspects such as assessment, methodologies and classroom management)
• Establishment of monitoring criteria The extent to which the implementation of national policies is monitored in terms of GETC and FETC in all independent schools
Programme 4: Public special school education (R117 774 000) Programme objective: To provide compulsory public education in special schools in accordance with the South African Schools Act and White Paper 6 on Inclusive Education Sub-programme 4.1: Schools (R 102 388 000) Sub-programme objective: To provide specific public special schools with resources. MO 4.1.A: To provide spaces in special schools in accordance with policy and the principles of inclusive education.
• Reducing number of learners by transferring learners to full service schools
• Assessment of learners according to level of support
PM 4.1.A: Number of learners in special schools.
• Identify special schools to be converted to resource centres
• Strengthen schools and district staff establishment according to manpower needed
• Training of school & district staff in new rolls • Identify & assess learners for transfer to full service
schools
The extent to which special schools are converted to resource centres
• Identify primary schools according to set criteria • Strengthen staff provisioning according to manpower
needed • Training of staff • Reception of learners from resource centres
The extent to which primary schools are converted to full service schools
• Organising of exhibitions to screen, select and evaluate relevant learning resources
• Acquisition of printed and electronic resources • Processing of stock for schools • Marketing the library service • Delivering stock to schools • Training educators on basic library set-up skills
The extent to which public special schools are provided with school library core collections

Page 31
EDUCATION STRATEGIC PLANNING V6
Sub-programme4.2 Professional Services (R14 550 000) Sub-programme objective: To provide educators and learners in public special schools with departmentally managed support services. To provide professional support to all educators in schools • Support of learning and teaching by training and
informing educators in curriculum specific issues The extent to which learning and teaching are supported in GET and FET by training and informing educators in curriculum specific issues (including aspects such as assessment, methodologies and classroom management)
To improve access to and quality of formal education at learning institutions in terms of school effectiveness and educator professionalism
• Advocacy • Establishment of monitoring criteria
The extent to which Implementation of national guidelines on language policy are monitored in all public schools
• Establishment of monitoring criteria The extent to which Implementation of national policies in terms of GETC and FETC are monitored in all public special schools
Sub-Programme 4.3: Human Resource Development (R836 000) Sub-programme objective: To provide departmental services for the professional and other development of educators and non educators in public special schools MEASURABLE OBJECTIVE ACTIVITIES PERFORMANCE MEASURE To provide departmental services for the professional and other development of educators and non-educators in public special schools.
The extend to which the educator corps and public servants in special schools Schools: 22 Educators: 434 are developed through the offering of
• Allocate bursaries for enhancement in special education
Bursaries
• Offer skills programmes in Management and Governance, Curriculum delivery and assessment, Assessors, moderators and verifiers, sport development programmes, youth development programmes and IT and ELITS
• Offer skills programmes in Financial Management,
Project Management, IT, Line functions and ABET
Skills Programs @ 80 hours per educator: Educator Public Servant

Page 32
EDUCATION STRATEGIC PLANNING V6
• Establish SDTs • Train SDTs and other educators in DAS • Monitor the implementation of Das
The extent to which a Training needs analysis is completed: DAS
• Develop and implement Human Resource Plan • Develop and implement Employment Equity Plan
The extent to which a Human Resource Plan and Employment Equity Plan is developed and implemented
• Develop job descriptions framework • Maintain job description data base • Support and implementation of performance work plans
through training
The extent to which Job descriptions and Performance Work Plans are developed and implemented
• Develop and implement appropriate wellness programmes, including HIV/AISDS in the workplace
The extent to which employee wellness programmes are developed and implemented
Programme 5: Further Education and Training (R 109,871,000) Programme objective: To provide Further Education and Training (FET) at public FET colleges in accordance with the Further Education and Training Act. Sub-programme 5.1: Public institutions (R109 035 000) Sub-programme objective: To provide specific public FET colleges with resources. MEASURABLE OBJECTIVE ACTIVITIES PERFORMANCE MEASURE MO 5.1.A: To provide spaces in FET institutions in accordance with policy.
• Establishing four responsive FET Colleges. • Providing relevant and accessible FET
programmes in line with the needs of the communities as well as labour market
• Establishing sub-campuses in towns where there is no FET College Campuses
PM 5.1.A.a: Percentage of adults enrolled in FET institutions. PM 5.1.A.b: Number full-time equivalent enrolments in FET institutions.
MO 5.1.B: To promote the participation by historically marginalised groups in public FET institutions.
• Establish information systems • Recruitment
PM 5.1.B.a: Percentage of students who are girls or women. PM 5.1.B.b: Percentage of educators who are African.
To enhance learners skills and self reliance • Recruitment The extent to which learnerships are provided to learners, including out-of-school youth

Page 33
EDUCATION STRATEGIC PLANNING V6
Sub-Programme 5.4 Human Resource Development (R836 000 Sub-programme objective: To provide departmental services for the professional development of educators and non-educators in public FET colleges To provide departmental services for the professional and development of educators and non-educators in public FET Colleges
The extend to which educator corps and public servants at FET Colleges are developed through the offering of:
• Allocate bursaries for under-qualified educators to become qualified
• Allocate bursaries for re-skilling in FET Colleges curriculum
• Offer skills programmes in Financial Management,
Human Resources Management, OHRD, Psychological services – counselling, Information management and Library Science, Project Management and Administration, IT and Labour Relations
Bursaries for Educator Corps Bursaries for Public Servants Corps
• Offer skills programmes in Management and Governance, Curriculum delivery and Assessment, Assessor, moderator and verified, sport capacity building programs, IT, ELITS, Inclusive education and line functions
• Offer skills programmes in Financial Management,
Human Resource Management, OHRD, Psychological services, Information science, Internet and e-mail, Project management, Management and Administration, IT, Labour Relation, Office Admin, line functions and ABET
Skills programs for Educator Corps Skills programs for Public Servants Corps
• Facilitate the attendance of short courses, seminars and conferences in line function delivery
Short courses and seminars
• Develop and Implement Human Resource Plan • Develop and Implement Employment equity Plan
The extent to which a Human Resource Plan and Employment Equity Plan are developed and implemented
• Develop job descriptions framework • Maintain job description data base • Support the implementation of performance work plans
through training
The extent to which Job descriptions and Performance Work Plans are developed and implemented

Page 34
EDUCATION STRATEGIC PLANNING V6
• Develop and implement appropriate wellness programmes, including HIV/AIDS in the workplace
The extent to which Employee wellness programs are developed and implemented
Programme 6: Adult Basic Education and Training (R64 010 000 Programme objective: To provide Adult Basic Education and Training (ABET) in accordance with the Adult Basic Education Act. Sub-programme 6.1: Public centres (R51 818 000 Sub-programme objective: To provide specific public ABET sites with resources. MO 6.1.A: To provide spaces in public ABET centres in accordance with policy.
• Development of a recruitment and advocacy manual • Training of ABET educator corps and personnel in
recruitment strategies • Intensify Adult Learners’ Week Campaign and
International Literacy Day Celebrations • Liaise with Lesedi FM on civic education
PM 6.1.A.a: Number of full-time equivalent enrolments in public ABET centres. PM 6.1.A.b: Percentage of illiterate adults in the province enrolled in public ABET centre programmes.
• Training of adult educators on Fundamentals, Core and Electives including the development of Learning programmes and Assessment techniques
• Training adult educators in the use of Unit Standards and the development of Learner Portfolios
• Monitoring of adult educators
The extent to which Learners achieving General Education and Training Certificate in ABET are increased
Prof. Services (R10 997 000) • Identification
• Audit of potential learners • Consultation with stakeholders and community • Establish interim committee • Process applications
The extent to which Learning Centres are provided to villages currently without such facilities
• Develop a monitoring tool • Establish information systems • Provision of motivational sessions to learners
The extent to which Learner drop-out rate is reduced
Page 35
EDUCATION STRATEGIC PLANNING V6
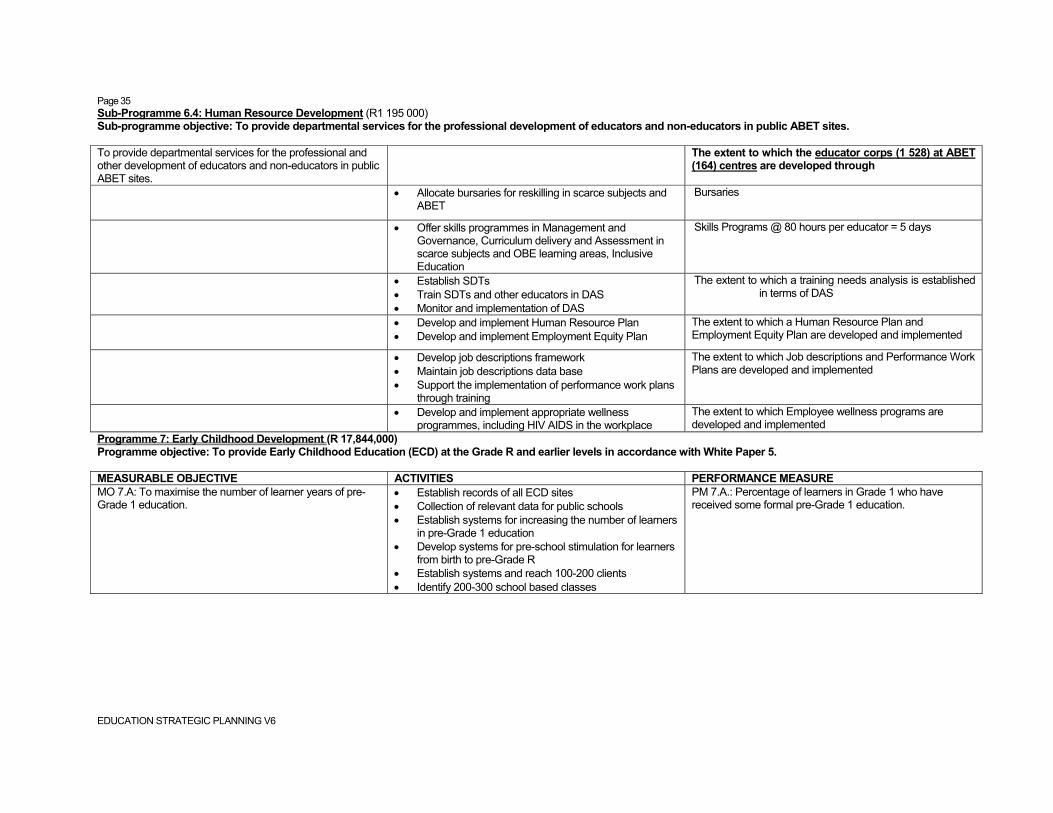
Sub-Programme 6.4: Human Resource Development (R1 195 000) Sub-programme objective: To provide departmental services for the professional development of educators and non-educators in public ABET sites. To provide departmental services for the professional and other development of educators and non-educators in public ABET sites.
The extent to which the educator corps (1 528) at ABET (164) centres are developed through
• Allocate bursaries for reskilling in scarce subjects and ABET
Bursaries
• Offer skills programmes in Management and Governance, Curriculum delivery and Assessment in scarce subjects and OBE learning areas, Inclusive Education
Skills Programs @ 80 hours per educator = 5 days
• Establish SDTs • Train SDTs and other educators in DAS • Monitor and implementation of DAS
The extent to which a training needs analysis is established in terms of DAS
• Develop and implement Human Resource Plan • Develop and implement Employment Equity Plan
The extent to which a Human Resource Plan and Employment Equity Plan are developed and implemented
• Develop job descriptions framework • Maintain job descriptions data base • Support the implementation of performance work plans
through training
The extent to which Job descriptions and Performance Work Plans are developed and implemented
• Develop and implement appropriate wellness programmes, including HIV AIDS in the workplace
The extent to which Employee wellness programs are developed and implemented
Programme 7: Early Childhood Development (R 17,844,000) Programme objective: To provide Early Childhood Education (ECD) at the Grade R and earlier levels in accordance with White Paper 5. MEASURABLE OBJECTIVE ACTIVITIES PERFORMANCE MEASURE MO 7.A: To maximise the number of learner years of pre-Grade 1 education.
• Establish records of all ECD sites • Collection of relevant data for public schools • Establish systems for increasing the number of learners
in pre-Grade 1 education • Develop systems for pre-school stimulation for learners
from birth to pre-Grade R • Establish systems and reach 100-200 clients • Identify 200-300 school based classes
PM 7.A.: Percentage of learners in Grade 1 who have received some formal pre-Grade 1 education.

Page 36
EDUCATION STRATEGIC PLANNING V6
Sub-programme 7.1: Grade R in public schools (R 10 791 000 Sub-programme objective: To provide specific public ordinary schools with resources required for Grade R. MO 7.1.A: To provide Grade R spaces in public ordinary schools in accordance with policy, but specifically White Paper 5.
• Establish information system PM 7.1.A: Percentage of 5 year olds in publicly funded school Grade R.
• Establish information system The extent to which the Number of ECD sites at primary schools are increased
• Needs analysis • Cost Estimation • Budget allocation in terms of affordability
The extent to which basic resources required in ECD sites at Primary Schools (not responsibility of this branch but needs to be included for budgeting purposes) are provided
Sub-programme 7.2: Grade R in community centres (R …) Sub-programme objective: To provide specific public ordinary schools with resources required for Grade R. MO 7.2.A: To provide Grade R spaces in education-funded community based sites in accordance with policy, but specifically White Paper 5.
• Identification of sites PM 7.2.A: Number of learners in education-funded community-based ECD sites.
• Establish information system The extent to which the Number of ECD sites at community based sites are increased
• Establish information system The extent to which the Number of learners in education funded community based ECD sites are increased
• Needs analysis • Cost Estimation • Budget allocation in terms of affordability
The extent to which basic resources required in community based ECD sites (not responsibility of this branch but needs inclusion for budgeting purposes) are provided.
Sub-programme 7.4: Professional Services (R1 200 000) Sub-programme objective: To provide educators and learners at ECD sites with departmental management support services MEASURABLE OBJECTIVE ACTIVITIES PERFORMANCE MEASURE To Provide educators and learners in ECD sites with departmentally managed support services
• Needs analysis • Cost Estimation • Budget allocation in terms of affordability
The extent to which funding mechanisms are designed
• Establish monitoring criteria The extent to which all qualifying ECD sites are monitored for subsidy payment
• Needs analysis • Cost Estimation • Norms and Standards allocated in terms of
affordability
The extent to which norms and standards are developed for basic resources required in community based ECD sites

Page 37
EDUCATION STRATEGIC PLANNING V6
• Evaluation and registration of all school based, independent and community based sites
• Development of Registration process
The extent to which all ECD sites are correctly registered according to set criteria and monitored where relevant
• Development of guidelines
The extent to which guidelines are developed for C2005 implementation
• Collaboration with stakeholders The extent to which collaboration takes place on policy development
Sub-programme 7.5: Human Resource development (R310 000 Sub-programme objective: To provide departmental services for the professional and other development of educators in ECD sites To provide departmental services for the professional and other development of educators and non-educators in ECD sites
The extent to which the educator corps at the following ECD sites 180 X free standing 280 community based sites 300 school based Grade R independent and home based Grade R – n/a are developed through:
• Allocation of bursaries for reskilling in ECD Class room practice
Bursaries
• Offering of skills programmes after needs identification in mostly Management and Leadership, Curriculum Delivery and Assessment and Inclusive Education, Site management, Line functions
Skills programmes @ 80 hours per educator = 5 – 7 days
Learnerships Programme 8: Auxiliary and Associated Services (R124,989,000) Programme objective: To provide the education institutions as a whole with training and support Sub-programme 8.3: Special Projects (R11 970 000 Sub-programme objectives: To provide for special departmentally managed intervention projects in the education system as a whole. MEASURABLE OBJECTIVE ACTIVITIES PERFORMANCE MEASURE To improve access to and quality of formal education at learning institutions in terms of school effectiveness and educator professionalism
• Collaboration with National Department • Support of Partnerships
The extent to which effective participation in donor-funded projects occur (Flemish, Danish, Canadian, USA, Cuban) in terms of delivery for departmental officials, educators and learning institutions

Page 38
EDUCATION STRATEGIC PLANNING V6
• Establishing and equipping centres The extent to which Education Resource Centres are established and operating effectively
• Establishing hubs • Linking with RAU techno lab • Ensure efficiency and sustainability
The extent to which Thintana Hubs are operational
• Establish partnerships The extent to which a Flagship Science Centre is established in partnership with other institutions
• Monitoring of the reading hour in all schools • Advocacy on the importance of reading • Celebration of International Literacy Days
The extent to which the Masifunde Sonke Campaign is sustained
To educate learners on HIV / AIDS and provide care & support to those infected and affected by HIV / AIDS
Peer Education The extent to which Norms and standards workshop for Peer Education is facilitated by NDoE and NDoH
The extent to which Master Trainers are trained in Peer Education
The extent to which Advocacy workshops are conducted for Principals / SGB’s in Peer Education Gr. 10, 11, 12
The extent to which Educators are trained at secondary schools in Peer Education
The extent to which Gr. 10 / 11 learners are trained as Peer Educators.
The extent to which Youth camps, Seminars are held – Peer Educators receive further training, motivation and support / Refresher Course for Educators
Care and support for learners infected and affected The extent to which Public schools are trained in care and support and referral system (grief counseling, home-based care and death & dying)
Training Educators in counseling The extent to which 1 educator from 1000 public schools trained in counseling by iCam
Training of Master Trainers Foundation Phase – The extent to which Master Trainers are trained in Foundation Phase Life Skills & HIV / AIDS education
ECD – The extent to which Master Trainers are trained in ECD Life Skills & HIV / AIDS education
FET – The extent to which Master Trainers are trained in FET Life Skills & HIV / AIDS Education
Counselling –The extent to which Master Trainers are trained in Counselling

Page 39
EDUCATION STRATEGIC PLANNING V6
Project Management Course – The extent to which District Co-ordinators are trained in Project Management
Advocacy Advocacy – Foundation Phase The extent to which Advocacy workshops are conducted for Principals, SGBs & SMTs – ECD / Foundation Phase, Gr. R – 3, - 635 schools
Advocacy – FET – The extent to which advocacy workshops are conducted for Principals, SGBs and SMTs – FET. Gr. 10, 11, 12 – 349 secondary schools
Training: Educators The extent to which Educators are trained in Foundation Phase in Life Skills & HIV / AIDS Education for Curriculum Based implementation
The extent to which Educators are trained at ECD sites in Life Skills & HIV / AIDS Education for curriculum-based implementation
The extent to which Educators are trained in FET schools in Life Skills and HIV / AIDS Education for curriculum-based implementation – 349 schools
Monitoring and quarterly support for Educators The extent to which Meetings are held with trained educators from public schools to address needs of educators as implementers.
Focus on the Family The extent to which Gr. 7 educators are trained in 20 pilot schools in Bethlehem, Qwa-Qwa, Thaba ‘Nchu, Bloemfontein, Koffiefontein, Kroonstad, Odendaalsrus
Interim evaluation - external agency ascertained level of implementation in trained pubic schools
Comprehensive Evaluation of current status of activities / programmes in schools
Free State Life Skills Forum The extent to which the needs of Life Skills NGOs, Master Trainers & Educators are supported.
Sub-programme 8.4: Examinations (R37 233 000) Sub-programme objective: To provide for departmentally managed examination services. To provide for departmentally managed examination services
• Capturing of entries • Determination of timetable • Distribution of examination papers • Marking and re-marking of examination scripts • Moderation of examination papers and scripts
The extent to which Examinations (including Grade 12 end of year, supplementary and common examinations, ABET level 4 and the GETC) are conducted according to relevant national policy and provincial guidelines in terms of entries, timetabling, distribution, marking, remarking, moderation, certification and payment.

Page 40
EDUCATION STRATEGIC PLANNING V6
• Appointment of examiners and moderators for period of three years
• Follow-up on paper progress
The extent to which Provincial examination papers for Grade 12 and Grade 12 supplementary examinations are developed 3 months prior to commencement of examinations
To provide recognition to schools and candidates for their performance
• Arrange well-done function for 50 schools and 100 candidates
The extent to which schools and candidates receive recognition for their performance at a successful well done function
TABLE A.3: PERFORMANCE TARGETS Provincial Vote 6: Education (R4,028,808,000) Aim of vote: To provide education in the province to people whose education is the responsibility of the department
Performance measure 2001/02 actual 2002/03 estimated 2003/04 target 2004/05 target 2005/06 target PM 0.A: Percentage of the population aged 6 to 14 attending schools.
Establishment of information systems
PM 0.B: Percentage of the population aged 15 to 17 attending schools and other educational institutions.
Establishment of information systems
PM 0.C.a: Average highest GET or FET level attained by adults in the population. PM 0.C.b: Adult literacy rate.
Establishment of information systems
Programme 1: Administration (R305,782, 000) Programme objective: To provide overall management of the education system in accordance with the National Education Policy Act., the Public Finance Management Act, and other policies.
Performance measure 2001/02 actual 2002/03 estimated 2003/04 target 2004/05 target 2005/06 target PM 1.A.a: Percentage of schools with Section 21 status. PM 1.A.b: Percentage of recurrent non-personnel funding being channelled through the School Funding Norms.
8% 93%
16% 97%
23,4% 97%
28% 97%
35% 97%
PM 1.B.a: Average real per learner allocation for recurrent non-personnel items using funding supplied via the School Funding Norms. PM 1.B.b: Percentage of non-Section 21 schools with all LTSMs and other required materials delivered on day one of the school year.
R172
100%
R260
100%
R287
100%
R294
100%
R294
100%
PM 1.C: Years input per Senior Certificate/FETC graduate. Establishment of information systems

Page 41
EDUCATION STRATEGIC PLANNING V6
Sub- Programme 1.1: Office of the MEC (R3 071 000) Sub-Programme objective: To provide for the functioning of the office of the MEC for education The extent to which functional Advisory Councils and relevant Bodies are established. The extent to which sustainable posts are timeously created. The extent to which the budget reflects determined priorities.
3 councils
Structure reviewed and finalised 30
November 100%
3 councils
Structure reviewed and finalised 30
November 100%
5 councils
Structure reviewed and finalised 30
November 100%
5 councils
Structure reviewed and finalised 30
November 100%
5 councils
Structure reviewed and finalised 30
November 100%
Performance measure 2001/02 actual 2002/03 estimated 2003/04 target 2004/05 target 2005/06 target The extent of compliance to legislative requirements. The extent to which priorities support the National and Provincial mandates
Strategic Plan and Annual Report
submitted timeously to the legislature
100%
Strategic Plan and Annual Report
submitted timeously to the legislature
100%
Strategic Plan and Annual Report
submitted timeously to the legislature
100%
Strategic Plan and Annual Report
submitted timeously to the legislature
100%
Strategic Plan and Annual Report
submitted timeously to the legislature
100%
The extent to which Batho Pele principles are prioritised. Not applicable Not applicable Courtesy
Access
Service Standards
Redress
Information
Openness
Transparency
Value for money
The extent to which the quality of education provided is improved.
100% achievement of strategic targets
100% achievement of strategic targets
100% achievement of strategic targets
100% achievement of strategic targets
100% achievement of strategic targets
The extent to which interaction with SGB’s and communities is effected. The extent to which public queries and concerns are addressed, by the Department, in a timely manner.
Meet SGBs in each district at least once a
year
100%
Meet SGBs in each district at least once a
year
100%
Meet SGBs in each district at least once a
year
100%
Meet SGBs in each district at least once a
year
100%
Meet SGBs in each district at least once a
year
100%
The extent to which partnerships are established with international stakeholders.
Not applicable Partnerships established in FET
Partnerships established on
Technology and ECD
As determined by new developments, such as new curriculum
As determined by new developments, such as new curriculum

Page 42
EDUCATION STRATEGIC PLANNING V6
Sub-Programme 1.2: Corporate Services (R150 287 000) Sub-programme objective: To provide management services that are not education specific for the education system The extent to which the number of job creation projects are increased
222 233 245 257 257
The extent to which all districts/directorates/schools are linked electronically to all relevant systems and/or programs, e.g. LOGIS/Vulindela, etc.
N/a ICT Plan Developed 80% implemented 100% implemented 100% implemented
Performance measure 2001/02 actual 2002/03 estimated 2003/04 target 2004/05 target 2005/06 target The extent to which asset registers are accurate, complete and updated The extent to which losses are reduced.
R174 million
31 March
R165,3 million
31 March
R148,8 million
31 March
R133,9 million
31 March
R84 million
Extent to which communication with stakeholders take place.
Not measured Strategy developed 80% implemented 100% implemented 100% implemented
The extent to which the average number of fraud cases in the department are reduced The extent to which the average number of fraud cases in schools are reduced The extent to which the average fraud case value in the department decreases. The extent to which the average fraud case value in schools decreases. The extent to which the fraud prevention plan is rolled out. The extent to which Responsibility Managers provide a representation letter on compliance to the Chief Financial Officer by 31 March per annum (Adherence to Risk Management Policy)
Average of 38 cases per annum
Average of 8 cases per annum
Average value of R57 418 per case
Average value of R23 585 per case
10%
0%
Average of 38 cases per annum
Average of 8 cases per annum
Average value of R57 418 per case
Average value of R23 585 per case
100%
100%
Average of 38 cases per annum
Average of 8 cases per annum
Average value of R57 418 per case
Average value of R23 585 per case
100%
100%
Average of 19 cases per annum
Average of 4 cases per annum
Average value of R28 708 per case
Average value of R11 792 per case 100% 100%
Average of 19 cases per annum
Average of 4 cases per annum
Average value of R28 708 per case
Average value of R11 792 per case 100% 100%
The extent to which all vacant funded educator posts and public servants posts are permanently filled in a timely manner within budget limitations
No target was set Filled within three (3) months
Filled within 3 months Filled within 3 months Filled within 3 months

Page 43
EDUCATION STRATEGIC PLANNING V6
The extent to which a strategy has been developed for the prioritisation of appointment of educators who have completed their studies and remain unemployed
Data acquired and evaluated
Strategy developed Strategy implemented
The extent to which identified Batho Pele principles are adhered to
Standards set and adhered to
Standards set and adhered to
Standards set and adhered to
The extent to which optimal utilization of class rooms is ensured
Data acquired and evaluated
Strategy developed Strategy implemented
The extent of adherence to all statutory requirements Personnel Cost: Current Cost split
100%
86:14
100%
85.5:14.5
100%
85.5:14.5
The extent to which internal disciplinary hearings are finalised timeously
Finalised within two months
Finalised within two months
Finalised within two months
LEGAL SERVICES
Performance measure 2001/02 actual 2002/03 estimated 2003/04 target 2004/05 target 2005/06 target The extent to which legal actions and application are handled within stipulated timeframes
100% 100% 100%
Sub-programme1: Education Management (R148 076 000) Sub-programme objective: To provide education management services for the education system The extent to which all ABET Centres, ECD sites and Home based sites are correctly registered and monitored according to set criteria
100% 100% 100% 100% 100%
The extent to which learning programmes are developed including HIV/AIDS, environment and values in education with inputs from all relevant projects
1 exemplar per school 1 exemplar per school 2 exemplars per school
3 exemplars per school
4 exemplars per school
The extent to which guidelines are developed for C2005 implementation
100% 100% 100% 100% 100%
The extent to which assessment and all other relevant aspects of the curriculum are adjusted where necessary for ELSEN learners
100% 100% 100% 100% 100%

Page 44
EDUCATION STRATEGIC PLANNING V6
The extent to which collaborative development of national and provincial curriculum policies occur.
Necessary policies developed
100%
Necessary policies developed 100%
Necessary policies developed 100%
Necessary policies developed 100%
Necessary policies developed 100%
The extent to which cumulative record cards (profiles) are designed and produced for all learners in the system
N/a Design finalized by March 2003
Grade 1 supplied with profiles
Grade 1, 2 and 3 Grade 1 and Intermediate Phase supplied
The extent to which the number of failing schools are decreased (Holistic Intervention Programme)
N/a By 50% By 50% By 100% By 100% (new criteria)
The extent to which the Provincial Education Library is established and provides access to information to all employees
100% 100% 100%
Sub-Programme 1.4: Human Resource Development (R4 348 000) Sub-programme objective: To provide human resource development for office based staff
Performance measure 2001/02 actual 2002/03 estimated 2003/04 target 2004/05 target 2005/06 target The extent to which the workplace skills plan is developed and implemented for office based educators and public servants and provide
Bursaries - - 350 350 350
Skills Programs 238 960 1100 1100 1100
Short courses, seminars and conferences inline function delivery
- 20 30 30 30
The extent to which an Employee wellness program (HIV/AIDS in the workplace) is implemented.
- March 2005 100%
The extent to which the workplace skills plan is developed and implemented for office based public servants (including SMS) and provide
Bursaries 30 114 286 286 286
Learnerships: Financial Management 5 5
Skills programs 138 800 800 800 800
Short courses, conferences and seminars 60 60 60 60

Page 45
EDUCATION STRATEGIC PLANNING V6
The extent to which a Human Resource Plan and employment equity plan are implemented
March 2005 100%
The extent to which job descriptions and performance work plans are implemented
March 2004 100% 100%
The extent to which an Employee wellness program (HIV/AIDS in the workplace) is implemented.
- - March 2006
Programme 2: Public ordinary school education (R3,271,399,000) Programme objective: To provide public ordinary education from Grades 1 to 12 in accordance with the South African Schools Act. Sub-programme 2.1: Public primary phase (R1 836 801 000) Sub-programme objective: To provide specific public primary ordinary schools with resources required for the Grades 1 to 7 phase.
Performance measure 2001/02 actual 2002/03 estimated 2003/04 target 2004/05 target 2005/06 target PM 2.1.A: Number of spaces provided in the public primary phase.
Establishment of information systems
PM 2.1.B.a: Number of educators provided at the public primary phase. PM 2.1.B.b: L:E ratio in the public primary phase.
35
35
35
35
33
PM 2.1.C.a: Number of new classrooms built. PM 2.1.C.b: L:C ratio in the public primary phase. PM 2.1.C.c: Number of new toilets built. PM 2.1.C.d: Percentage of schools with a water supply. PM 2.1.C.e: Percentage of capex budget spent on maintenance.
40
180
23%
3%
28
40
15
23.5%
11.93%
0
40
15
24.5%
14%
36
40
15
25%
11.8%
18
40
15
26%
11.8%
PM 2.1.D.a: Gender parity index in public primary schools. PM 2.1.D.b: Percentage of learners in public primary schools who are disabled. PM 2.1.D.c: Number of ordinary full-service schools per 100,000 learners at the primary phase.
Establishment of information systems
PM 2.1.E.a: Percentage of learner days lost due to learner absenteeism in the primary phase. PM 2.1.E.b: Percentage of working days lost due to educator absenteeism in the primary phase.
Establishment of information systems
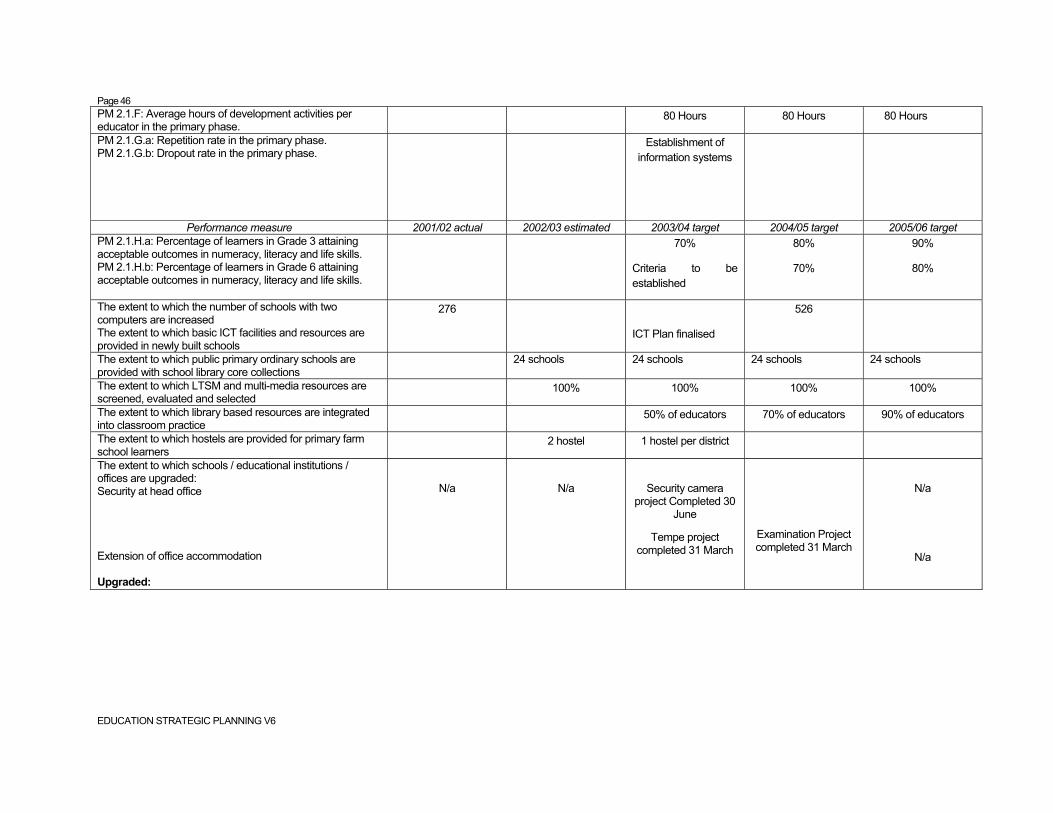
Page 46
EDUCATION STRATEGIC PLANNING V6
PM 2.1.F: Average hours of development activities per educator in the primary phase.
80 Hours 80 Hours 80 Hours
PM 2.1.G.a: Repetition rate in the primary phase. PM 2.1.G.b: Dropout rate in the primary phase.
Establishment of information systems
Performance measure 2001/02 actual 2002/03 estimated 2003/04 target 2004/05 target 2005/06 target PM 2.1.H.a: Percentage of learners in Grade 3 attaining acceptable outcomes in numeracy, literacy and life skills. PM 2.1.H.b: Percentage of learners in Grade 6 attaining acceptable outcomes in numeracy, literacy and life skills.
70%
Criteria to be established
80%
70%
90%
80%
The extent to which the number of schools with two computers are increased The extent to which basic ICT facilities and resources are provided in newly built schools
276
ICT Plan finalised
526
The extent to which public primary ordinary schools are provided with school library core collections
24 schools 24 schools 24 schools 24 schools
The extent to which LTSM and multi-media resources are screened, evaluated and selected
100% 100% 100% 100%
The extent to which library based resources are integrated into classroom practice
50% of educators 70% of educators 90% of educators
The extent to which hostels are provided for primary farm school learners
2 hostel 1 hostel per district
The extent to which schools / educational institutions / offices are upgraded: Security at head office Extension of office accommodation Upgraded:
N/a
N/a
Security camera project Completed 30
June
Tempe project completed 31 March
Examination Project completed 31 March
N/a
N/a

Page 47
EDUCATION STRATEGIC PLANNING V6
Media / School libraries Laboratories Halls
N/a N/a N/a N/a N/a
Appropriate new equipment provided (excluding halls and administration blocks)
N/a N/a N/a N/a N/a
The extent to which Facilities are provided in terms of:
Performance measure 2001/02 actual 2002/03 estimated 2003/04 target 2004/05 target 2005/06 target Water Electricity Solar power Sanitation Telephone lines Administration blocks
10
14
44
-
-
-
10
40
12
15
100
5
10
25
18
15
150
5
10
-
18
15
120
5
20
-
18
15
120
10
The extent to which facilities are renovated and maintained Conversion of pit latrines to waterborne systems Fencing
168
-
-
200
15
-
200
15
9
200
15
9
200
15
9
The extent to which schools are accessible for the physically challenged
- - - - -
The extent to which new schools are provided within a 15 km accessibility radius in rural areas and a 5 km accessibility radius in urban areas
1 Urban
5 Rural
3 Urban
0 Rural
4 Urban
0 Rural
3 Urban
0 Rural
4 Urban

Page 48
EDUCATION STRATEGIC PLANNING V6
Sub-programme 2.2: Public secondary phase (R1 352 070 000) Sub-programme objective: To provide specific public secondary ordinary schools with resources required for the Grades 8 to 12 levels. PM 2.2.A: Number of spaces provided in the public secondary phase.
Establishment of information systems
PM 2.2.B.a: Number of educators provided at the public secondary phase. PM 2.2.B.b: L:E ratio in the public secondary phase.
33
33
33
33
33
Performance measure 2001/02 actual 2002/03 estimated 2003/04 target 2004/05 target 2005/06 target PM 2.2.C.a: Number of new classrooms built. PM 2.2.C.b: L:C ratio in the public secondary phase. PM 2.2.C.c: Number of new toilets built. PM 2.2.C.d: Percentage of schools with a water supply. PM 2.2.C.e: Percentage of capex budget spent on maintenance. PM 2.2.C.f: Percentage of secondary schools with functioning science laboratories.
59
35
80
20%
3%
2
35
15
23.5%
11.93%
0
35
15
24.5%
14%
Establishment of information systems
37
35
15
25%
11.8%
0
35
15
26%
11.8%
PM 2.2.D.a: Gender parity index in public ordinary schools. PM 2.2.D.b: Percentage of learners in public ordinary schools who are disabled.
Establishment of information systems
PM 2.2.E.a: Percentage of learner days lost due to learner absenteeism in the secondary phase. PM 2.2.E.b: Percentage of working days lost due to educator absenteeism in the secondary phase.
Establishment of information systems
PM 2.2.F: Average hours of development activities per educator in the secondary phase.
80 Hours 80 Hours 80 Hours
PM 2.2.G.a: Repetition rate in the secondary phase. PM 2.2.G.b: Dropout rate in the secondary phase. PM 2.2.G.c: Percentage of over-aged learners in the secondary phase.
Establishment of information systems

Page 49
EDUCATION STRATEGIC PLANNING V6
PM 2.2.H.a: Percentage of learners in Grade 9 attaining acceptable educational outcomes. PM 2.2.H.b: Pass ratio in Grade 12 examinations. PM 2.2.H.c: Percentage of schools with a Grade 12 pass rate of less than 40%. Improved Grade 12 endorsement rate (school based) from 14.5% to 26.5%
60%
64%
14%
17.5%
68%
69%
10%
21.5%
80%
74%
6%
26.5%
90%
79%
5%
30%
The extent to which the number of schools with two computers are increased The extent to which basic ICT facilities and resources are provided in newly built schools
276
ITC Plan established
526
The extent to which public secondary ordinary schools are provided with school library core collections
24 Schools 24 Schools 24 Schools 24 Schools
Performance measure 2001/02 actual 2002/03 estimated 2003/04 target 2004/05 target 2005/06 target The extent to which LSM and multi-media resources are screened, evaluated and selected
100% 100% 100% 100%
The extent to which library based resources are integrated into classroom practice
50% of educators 70% of educators 90% of educators
The extent to which hostels are provided for secondary farm school learners
2 hostels 1 hostel per district
The extent to which schools / educational institutions / offices are upgraded Upgraded:
Media / School libraries Laboratories Halls
4
5
5
5
5
5
5
5
5
5
5
5
The extent to which appropriate new equipment is provided (excluding halls and administration blocks)
0 0 0 0 0
Facilities provided in terms of:

Page 50
EDUCATION STRATEGIC PLANNING V6
Water Electricity Solar power Sanitation Telephone lines Administration blocks
10
14
40
10
40
12
15
100
5
10
25
18
15
120
5
10
-
18
15
150
5
10
-
17
15
120
5
The extent to which facilities are renovated and maintained Conversion of pit latrines to waterborne systems Fencing
168 200
15
200
15
9
200
15
9
200
15
9
The extent to which schools are to be accessible for the physically challenged
N/a 1 school per district 1 school per district 1 school per district 2 school per district
Performance measure 2001/02 actual 2002/03 estimated 2003/04 target 2004/05 target 2005/06 target The extent to which new schools are provided within a 15 km accessibility radius in rural areas and a 5 km accessibility radius in urban areas
N/a 2 Rural
0 Urban
0 Rural
1 Urban
0 Rural
2 Urban
0 Rural
6 Urban
The extent to which the Grade 12 endorsement rate (school based) is improved
14.5% 18% 22% 26.5% 26.5%
Sub-programme 2.3: Professional services (R48 146 000) Sub-programme objective: To provide educators and learners in public ordinary schools with departmentally managed support services. PM 2.3.A: Hours of training and other support provided to schools-based educators.
80 Hours 80 Hours 80 Hours
The extent to which Computer resource centres are established for clusters of towns
0 10 15 15
The extent to which Education Resource Centres are established and equipped
3 2 Maintenance
The extent to which learning and teaching is supported in GET and FET (all schools) with special focus on poorly performing schools by training and informing educators in curriculum specific issues (including aspects such as assessment, methodologies and classroom management)
All sites visited or workshops on a quarterly basis
All sites visited or workshops on a quarterly basis
All sites visited or workshops on a quarterly basis
All sites visited or workshops on a quarterly basis

Page 51
EDUCATION STRATEGIC PLANNING V6
Percentage improvement of schools monitored and supported by officials
50% 75% 100% 100%
The extent to which Quarterly monitoring of OBE implementation in all schools take place
100% 100% 100% 100%
The extent to which national guidelines on language policy are implemented and monitored in all public schools
100% 100% 100% 100%
The extent to which national policies are implemented and monitored in terms of GETC and FETC in all public schools
100% 100% 100%
The extent to which schools are supported with Guidelines for C2005 implementation
100% 100% 100% 100%
The extent to which assessment and all other relevant aspects of the curriculum are adjusted and training provided where necessary for ELSEN learners
100% 100% 100%
The extent to which the average hours of developmental activity per educator in primary and secondary phases are improved (a vast data-base is essential here for this to be possible)
Collection of relevant data and establishment of data-base by March 2003. Targets established
Possible 60 hours Possible 70 hours 80 hours
Sub-Programme 2.4: Human Resource Development (R23 278 000) Sub-programme objective: To provide departmental services for the professional and other development of educators and non-educators in public ordinary schools
Performance measure 2001/02 actual 2002/03 estimated 2003/04 target 2004/05 target 2005/06 target The extent to which the educator corps in the public primary phase and special schools are developed through the offering of:
Bursaries 520 1165 3150 3150 3150 Skills Programs @ 80 hours per educator in : 150 schools 150 schools 150 schools 150 schools The extent to which a Training needs analysis is completed: DAS
20 Feeder schools to 71 dysfunctional schools
100 schools
100 schools
100 schools
The extent to which a Human Resource plan and Employment Equity plan is developed and implemented
March 2005 100%
The extent to which Job descriptions and performance work plans are developed and implemented
March 2004 March 2005 March 2006
The extent to which employee wellness programmes are developed and implemented
March 2005
March 2006

Page 52
EDUCATION STRATEGIC PLANNING V6
The extent to which the educator corps and public servants in the public secondary phase and special schools are developed through the offering of:
Bursaries Educators Grade 12 learners Public servants
835
755 150
755 70
755 30
755 30
Skills Programs Educators Public Servants
1353 SGB members
150 schools 71 schools
150 schools 200 schools
150 schools 200 schools
150 schools 200 schools
The extent to which a Human Resource plan and Employment Equity plan is developed and implemented
March 2005 100%
The extent to which a Job Descriptions Framework is developed and implemented
March 2005 March 2006
Employee wellness programme March 2005 March 2006 The extent to which a Training needs analysis is completed: DAS
40 schools 100 schools 100 schools 100 schools
In School Sport and Culture (11 104 000) Programme 3: Independent school subsidies (R 17,138,000) Programme objective: To support independent schools in accordance with the South African Schools Act.
Performance measure 2001/02 actual 2002/03 estimated 2003/04 target 2004/05 target 2005/06 target PM 3.A.a: Average real per learner subsidy. PM 3.A.b: Percentage of independent school learners receiving a state subsidy.
Establishment of information systems
Sub-programme 3.1: Primary Schools (R8 235 000) Sub-programme objective: To support independent schools in Grades 1-7 The extent to which assessment and all other relevant aspects of the curriculum are adjusted ad training provided where necessary for ELSEN learners
100% 100% 100%
The extent to which learning and teaching are supported in GET with special focus on poorly performing schools by training and informing educators in curriculum specific issues (including aspects such as assessment, methodologies and classroom management)
All sites visited or workshops on a quarterly basis
All sites visited or workshops on a quarterly basis
All sites visited or workshops on a quarterly basis
All sites visited or workshops on a quarterly basis

Page 53
EDUCATION STRATEGIC PLANNING V6
The extent to which systems and procedures for the early identification and addressing of barriers to learning in the Foundation Phase are established.
Systems established Barriers addressed 100%
Barriers addressed 100%
Barriers addressed 100%
Barriers addressed 100%
Sub-programme 3.2: Secondary Schools (R8 903 000 Sub-programme objective: To support independent schools in grades 8-12 The extent to which Guidelines are available for C2005 implementation
100% 100% 100% 100%
The extent to which assessment and all other relevant aspects of the curriculum are adjusted and training provided where necessary for ELSEN learners
100% 100% 100%
The extent to which Curriculum 2005 policies are implemented in FET (Secondary schools)
100%
100% 100% 100%
The extent to which learning and teaching are supported in GET and FET (all schools) with special focus on poorly performing schools by training and informing educators in curriculum specific issues (including aspects such as assessment, methodologies and classroom management)
All sites visited or workshops on a quarterly basis
All sites visited or workshops on a quarterly basis
All sites visited or workshops on a quarterly basis
All sites visited or workshops on a quarterly basis
The extent to which Implementation of national policies in terms of GETC and FETC are monitored in all independent schools
100% 100% 100%
Programme 4: Public special school education (R 117,774 000) Programme objective: To provide compulsory public education in special schools in accordance with the South African Schools Act and White Paper 6 on Inclusive Education Sub-programme 4.1: Schools (R102 388 000) Sub-programme objective: To provide specific public special schools with resources.
Performance measure 2001/02 actual 2002/03 estimated 2003/04 target 2004/05 target 2005/06 target PM 4.1.A: Number of learners in special schools. The extent to which special schools are converted to resource centres
0 schools 3 schools 5 schools 11 schools
The extent to which primary schools are converted to full service schools
0 schools 3 schools 5 schools 5 schools
The extent to which public special schools are provided with school library core collections
All schools
All Schools
All schools
The extent to which LTSM and multi-media resources are screened, evaluated and selected
100% 100% 100%

Page 54
EDUCATION STRATEGIC PLANNING V6
The extent to which library based resources are integrated into classroom practice
100% 100% 100%
Sub-programme4.2 Professional Services (R14 550 000) Sub-programme objective: To provide educators and learners in public special schools with departmentally managed support services. The extent to which learning and teaching are supported in GET and FET by training and informing educators in curriculum specific issues (including aspects such as assessment, methodologies and classroom management)
All sites visited or workshops on a quarterly basis
All sites visited or workshops on a quarterly basis
All sites visited or workshops on a quarterly basis
All sites visited or workshops on a quarterly basis
The extent to which Implementation of national guidelines on language policy are monitored in all special schools
100% 100% 100% 100%
The extent to which Implementation of national policies in terms of GETC and FETC are monitored in all public special schools
100% 100% 100%
Sub-Programme 4.3: Human Resource Development (R836 000) Sub-programme objective: To provide departmental services for the professional and other development of educators and non-educators in public special schools
Performance measure 2001/02 actual 2002/03 estimated 2003/04 target 2004/05 target 2005/06 target The extent to which the educator corps and public servants in special schools Schools: 22 Educators: 434 are developed through the offering of
Bursaries 100 50 25 25 Skills Programs @ 80 hours per educator: Educators Public Servants
-
22 schools
22 schools 22 schools
22 schools 22 schools
The extent to which a Training needs analyses is completed: DAS
-
-
22 schools
22 schools
The extent to which a Human Resource Plan and Employment Equity Plan is developed and implemented
March 2005 100%
The extent to which Job descriptions and Performance Work Plans are developed and implemented
March 2005 March 2006
The extent to which employee wellness programmes are developed and implemented
March 2005 March 2006

Page 55
EDUCATION STRATEGIC PLANNING V6
Programme 5: Further Education and Training (R 109,870,000) Programme objective: To provide Further Education and Training (FET) at public FET colleges in accordance with the Further Education and Training Act. Sub-programme 5.1: Public institutions (R109 035 000) Sub-programme objective: To provide specific public FET colleges with resources. PM 5.1.A.a: Percentage of adults enrolled in FET institutions. PM 5.1.A.b: Number full-time equivalent enrolments in FET institutions.
Establishing information systems 8490.5
9198.5
10\613.5
PM 5.1.B.a: Percentage of students who are girls or women. PM 5.1.B.b: Percentage of educators who are African.
10% 10%
20% 30%
30% 40%
The extent to which learnerships are provided to learners, including out-of-school youth
200 learners 300 learners 500 learners 1000 learners
Sub-Programme 5.4 : Human Resource Development (R836 000 Sub-programme objective: To provide departmental services for the professional development of educators and non-educators in public FET colleges
Performance measure 2001/02 actual 2002/03 estimated 2003/04 target 2004/05 target 2005/06 target The extent to which educator corps and public servants at FET Colleges are developed through the offering of:
Bursaries for Educator Corps Bursaries for Public Servants Corps
282 33
280 43
300
56
300
56 Skills programs for Educator Corps Skills programs for Public Servants Corps
150
30
200
40
220
50
220
50 Short courses and seminars 9 public servants 14 public servants 14 public servants
14 public servants
The extent to which a Human Resource Plan and Employment Equity Plan are developed and implemented
- - March 2005 100%
The extent to which Job descriptions and Performance Work Plans are developed and implemented
- - March 2005 March 2006
The extent to which Employee wellness programs are developed and implemented
- - March 2005 March 2006

Page 56
EDUCATION STRATEGIC PLANNING V6
Programme 6: Adult Basic Education and Training (R 64,010,000) Programme objective: To provide Adult Basic Education and Training (ABET) in accordance with the Adult Basic Education Act. Sub-programme 6.1: Public centres (R51 818 000) Sub-programme objective: To provide specific public ABET sites with resources.
Performance measure 2001/02 actual 2002/03 estimated 2003/04 target 2004/05 target 2005/06 target PM 6.1.A.a: Number of full-time equivalent enrolments in public ABET centres. PM 6.1.A.b: Percentage of illiterate adults in the province enrolled in public ABET centre programmes.
5.5% (1996 cencus)
3.3%
Establishing information systems
3%
2.7%
2.5%
The extent to which Learning Centres are provided to villages currently without such facilities The extent to which Learner drop-out rate is reduced. The extent to which Learners achieving General Education and Training Certificate in ABET are increased
0 30% 0.1%
11 learning centres 20% 15%
10 learning centres 15% 30%
10% 45%
5% 60%
Sub-Programme 6.4: Human Resource Development (R1 195 000 Sub-programme objective: To provide departmental services for the professional development of educators and non-educators in public ABET sites.
The extent to which the educator corps (1 528) at ABET (164) centres are developed through
Bursaries 50 100 100 100 Skills Programs @ 80 hours per educator = 5 days 1120 - 664 664 664
The extent to which training needs analysis are established in terms of DAS
March 2005 March 2006
The extent to which a Human Resource Plan and Employment Equity Plan are developed and implemented
March 2005 100%
The extent to which Job descriptions and Performance Work Plans are developed and implemented
March 2005 March 2006
The extent to which Employee wellness programs are developed and implemented
March 2005 March 2006
Professional Services R10 997 000

Page 57
EDUCATION STRATEGIC PLANNING V6
Programme 7: Early Childhood Development (R 17,844,000) Programme objective: To provide Early Childhood Education (ECD) at the Grade R and earlier levels in accordance with White Paper 5.
Performance measure 2001/02 actual 2002/03 estimated 2003/04 target 2004/05 target 2005/06 target PM 7.A.: Percentage of learners in Grade 1 who have received some formal pre-Grade 1 education.
Establishing information systems
Sub-programme 7.1: Grade R in public schools (R10 791 000 Sub-programme objective: To provide specific public ordinary schools with resources required for Grade R. PM 7.1.A: Percentage of 5 year olds in publicly funded schools Grade R.
Establishing information systems
The extent to which the Number of ECD sites at primary schools is increased
200 227 227 427 774
The extent to which basic resources required in ECD sites at Primary Schools (not responsibility of this branch but needs to be included for budgeting purposes) is provided.
Needs analysis and viability study
Sub-programme 7.2: Grade R in community centres (R1 200 000) Sub-programme objective: To provide specific public ordinary schools with resources required for Grade R. PM 7.2.A: Number of learners in education-funded community-based ECD sites.
Establishing information systems
The extent to which the Number of ECD sites at community based sites are increased
180 sites 285 additional sites (conditional grant)
Maximum of 100 additional Practitioners
Maximum of 100 additional practitioners 465 sites in total
Completed (15% of total number of sites for community based sites
The extent to which the Number of learners in education funded community based ECD sites are increased
Establishing information systems
The extent to which basic resources required in community based ECD sites (not responsibility of this branch but needs inclusion for budgeting purposes) are provided
Needs analysis and viability study

Page 58
EDUCATION STRATEGIC PLANNING V6
Sub-programme 7.4: Professional Services (R310 000) Sub-programme objective: To provide educators and learners at ECD sites with departmental management support services
Performance measure 2001/02 actual 2002/03 estimated 2003/04 target 2004/05 target 2005/06 target The extent to which funding mechanisms are designed The extent to which all qualifying ECD sites are monitored for subsidy payment
100% 100% 100% 100%
The extent to which norms and standards for basic resources required in community based ECD sites are determined
Finalise December 2003
Completed
The extent to which ECD sites are registered according to set criteria and monitored where relevant
100% 100% 100%
The extent to which guidelines are correctly registered according to set criteria and monitored where relevant
100% 100% 100%
The extent to which collaboration takes place on policy development
100% 100% 100%
Sub-programme 7.5: Human Resource development (R..) Sub-programme objective: To provide departmental services for the professional and other development of educators in ECD sites The extent to which the educator corps at the following ECD sites 180 X free standing 280 community based sites 300 school based Grade R independent and home based Grade R – n/a are developed through:
Bursaries 75 50 50 50 Skills programmes @ 80 hours per educator = 5 – 7 days 300 300 300
Learnerships 50 50 50

Page 59
EDUCATION STRATEGIC PLANNING V6
Programme 8: Auxiliary and Associated Services (R124,989,000) Programme objective: To provide the education institutions as a whole with training and support Sub-programme 8.3: Special Projects (R11 970 000) Sub-programme objective: To provide for special departmentally managed intervention projects in the education system as a whole.
Performance measure 2001/02 actual 2002/03 estimated 2003/04 target 2004/05 target 2005/06 target The extent to which effective participation occurs with donor-funded projects (Flemish, Danish, Canadian, USA, Cuban) in terms of delivery for departmental officials, educators and learning institutions
100% 100% 100%
The extent to which Education Resource Centres are established and operational
3 centres 3 centres Maintain and support
The extent to which Thintana Hubs are operational 100% 100% 100% The extent to which a Flagship Science Centre is established in partnership with other institutions
100% 100% 100%
The extent to which all other partnership projects contribute to effective learning and teaching
100% 100% 100%
The extent to which the Masifunde Sonke Campaign is sustained
100% 100% 100%
The extent to which Norms and standards workshop for Peer Education are facilitated by NDoE and NDoH
Workshop for 65 delegates Training of 50 master trainers Advocacy workshops for all principals
Workshop for 65 delegates Training of 50 master trainers Advocacy workshops for all principals
Workshop for 65 delegates Training of 50 master trainers Advocacy workshops for all principals
The extent to which Master Trainers are trained in Peer Education
50
The extent to which Advocacy workshops are conducted for Principals / SGB’s in Peer Education Gr. 10, 11, 12
15
The extent to which Educators from secondary schools are trained in Peer Education
349
The extent to which Gr. 10 / 11 learners are trained as Peer Educators.
1500
The extent to which Youth camps, Seminars are held – Peer Educators received further training, motivation and support / Refresher Course for Educators
150 delegated

Page 60
EDUCATION STRATEGIC PLANNING V6
Performance measure 2001/02 actual 2002/03 estimated 2003/04 target 2004/05 target 2005/06 target The extent to which Public schools are trained in care and support and referral system (grief counseling, home-based care and death & dying)
1000
The extent to which 1 educator from 1000 public schools are trained in counseling by iCam
1000
Foundation Phase – The extent to which Master Trainers are trained in Foundation Phase Life Skills & HIV / AIDS education
60
ECD – The extent to which Master Trainers are trained in ECD Life Skills & HIV / AIDS education
60
FET – The extent to which Master Trainers are trained in FET Life Skills & HIV / AIDS Education
30
Counselling – The extent to which Master Trainers are trained in Counselling
49
Project Management Course - The extent to which District Co-ordinators are trained in Project Management
20
Advocacy – Foundation Phase The extent to which Advocacy workshops are conducted for Principals, SGBs & SMTs – ECD / Foundation Phase, Gr. R – 3, - 635 schools
20
Advocacy – FET – The extent to which advocacy workshops are conducted for Principals, SGBs and SMTs – FET. Gr. 10, 11, 12 – 349 secondary schools
20
The extent to which Educators are trained in Foundation Phase in Life Skills & HIV / AIDS Education for Curriculum Based implementation – 635 schools
1000
The extent to which Educators are trained at ECD sites in Life Skills & HIV / AIDS Education for curriculum-based implementation
400

Page 61
EDUCATION STRATEGIC PLANNING V6
Performance measure 2001/02 actual 2002/03 estimated 2003/04 target 2004/05 target 2005/06 target The extent to which Educators are trained in FET schools in Life Skills and HIV / AIDS Education for curriculum-based implementation – 349 schools
400
The extent to which Meetings are held with trained educators from public schools to address needs of educators as implementers.
The extent to which Gr. 7 educators are trained in 20 pilot schools in Bethlehem, Qwa-Qwa, Thaba ‘Nchu, Bloemfontein, Koffiefontein, Kroonstad, Odendaalsrus
20
The extent to which the needs of Life Skills NGOs, Master Trainers & Educators are supported and identified.
150
Sub-programme 8.4: Examinations (R37 233 000) Sub-programme objective: To provide for departmentally managed examination services. The extent to which Examinations (including Grade 12 end of year, supplementary and common examinations, ABET level 4 and the GETC) are conducted according to relevant national policy and provincial guidelines in terms of entries, timetabling, distribution, marking, remarking, moderation, certification and payment.
100%
100%
100%
100%
The extent to which Provincial examination papers for Grade 12 and Grade 12 supplementary examinations are developed 3 months prior to commencement of examinations
100%
100%
100%
100%
The extent to which schools and candidates receive recognition for their performance at a successful well done function
50 schools and 100 candidates
50 schools and 100 candidates
50 schools and 100 candidates
50 schools and 100 candidates
50 schools and 100 candidates

Page 62
EDUCATION STRATEGIC PLANNING V6
Medium-term revenues and expenditures TABLE B: SUMMARY OF REVENUE (IN R 000) 2000/01 2001/02 2002/03 2003/04 200
4/05 2005/06
Actual Actual Estimated Actual
Voted Forward Estimates
R 000 R 000 R 000 R 000 R 000 R 000 Equitable share 3 138 948 3 303 516 3 313 393 3 822 113 4 131 818 4 460 427 Conditional grant National: HIV/AIDS
4 000
9 072
7 590
8 100
8 586
Infrastructure 17 000 30 000 42 585 52 598 55 913 Infrastructure (Floods) 43 000 20 590 7 455 Financial Management 14 393 14 384 14 768 15 654 16 593 Early Childhood Development Provincial
1 323 3 339 5 544
- Financial Mangement 13 419 4 180 Infrastructure 40 000 100 000 104 800 Donations 125 1 236 Provincial revenue 285 923 128 753 141 360 145 080 Total revenue 3 153 466 3 382 258 3 722 117 4 028 808 4 449 530 4 791 399 Inflationary increments used: Increments in conditions of service (ICS) levels used: TABLE C: SUMMARY OF EXPENDITURE BY PROGRAMME PROVINCIAL FUNDING
Programme structure 2000/01 2001/02 2002/03 2003/04 2004/05
2005/06
Actual Actual Estimated Actual
Voted Forward Estimates
R 000 R 000 R 000 R 000 R 000 R 000 1. Administration 184 52248 248 243 351 515 305 782 313 759 339 007 2. Public Ordinary School 2 504 940 2 610 698 2 918 581 3 271 399 3 521 756 3 779 892 3. Independent School Subsidies
13 075 13 575
15 300 17 138 18 852 20 737
4. Public Special School EDUCATION
88 536 93 570 118 383 117 774 127 135 136 995
5. Further Education and Training
114 996 93 753 136 013 109 871 127 547 139 090
6. Adult Basic Education and Training
37 591 44 027 76 892 64 010 77 472 79 266
7. Early Childhood Development
10 554 9 958 14 555 17 845 34 545 57 019
-8. Auxiliary and Associated Servicest
36 022 60 059 135 610 124 989 228 464 239 393
Total : Programmes 2 990 236 3 173 883 3 766 849 4 028 808 4 449 530 4 791 399 COORDINATION AND COOPERATION: INTERDEPARTMENTAL LINKAGES The department has built partnerships with various departments, the private sector and stakeholders. The most important cooperation is with the following departments:
• Health – School Nutrition • Public Works Roads and Transport – Capital works and Rental of accommodation
LOCAL GOVERNMENT LINKAGES As part of its commitment to co-operative governance and inter-governmental relations, the department has estsablished a Local Government Education Forum. The Forum consist of all the municipalities in the Province. The department also participates in the Provincial and Local Government Fora PUBLIC-PRIVATE PARTNERSHIPS: A viability study is currently being conducted on the provisioning of new schools.

Page 63
EDUCATION STRATEGIC PLANNING V6
Part C: Background information
The Free State Department of Education is expected to deliver quality public education driven by the constitutional and policy mandates dictated to by the Free State Development Plan strategic priorities, TIRISANO and its three year strategic plan. The following are its targeted clients:
1. 690355 Learners and 22660 educators in 2336 Public Ordinary schools
2. 4606 Learners in 20 ELSEN (Special and Specialised) schools
3. Learners at 376 ECD(Targeted) School based classes and private centres
4. 11469 Learners at 63 Independent Schools
5. 36840 Adult Learners at 204 Adult Centres
6. 26390 Learners at 342 Private ECD Centres and 376 ECD School based classes
7. 4924 Personnel at 1 Provincial Head Office, 5 District Offices, Schools, ABET and ECD centres
11 Situational analysis of the system as a whole
The ‘external delivery environment’ :
The demand for the services of the Department is affected by both the new educational as well as non-educational policy developments. Since educational policies have a direct bearing on services of the department, they will have more influence on demand for these services than non-educational policies.
The purpose of all new policy developments is to ensure that people have access to services they are entitled to as provided for by the constitution. The people expect the Department to be committed to the progressive realisation of social and economic rights envisaged in the constitution. The new policy developments therefore raise demand for service that the Department has to provide as required for by the constitution. As the Minister of Finance stated in the 2002 Medium Term Budget Policy Statement, the need to address poverty is the over-arching goal of South African economic and social policy.
The new policy developments can only influence the demand for services of the department if the people are aware of the developments and how those developments should benefit them. In other words the people should be aware of their rights, which should be served by the Department through its services. It is therefore important for the Department to adequately inform its stakeholders and clients about new policy developments and how these developments will improve service delivery.
In order that the new policy developments can appropriately affect the demand for the Department’s service delivery, such developments must be understood by officials of the Department. New policy developments can only affect the demand for the services of the Department as they are supposed to if the developments are operationalised by officials and supported by the intended beneficiaries. As the Minister of Finance stated: “Policy only succeeds if it has broad support; if those who operationalise it, and intended beneficiaries alike, participate in its formulation and implementation.”
11.1 External factors that have already or are likely to impact on its ability to deliver services.
The high poverty and unemployment levels in the Free State characterize the external environment in which the Department of Education as well as other departments have to provide their services. 63% of the population are living in poverty (Poverty Eradication Strategy: 1999).As indicated in the Free State Development Plan, 34% of the population is unemployed. The effectiveness of schools situated in communities living under such circumstances is inevitably negatively affected. This is reflected in the inability of an increasing number of parents to pay for school fees. The unemployment rate ranges from 27% in the Northern Free State and Lejweleputswa districts to 37% in the Thabo Mofutsanyana District. It is the latter district where most of the failing schools are found.
The increasing levels of poverty impacts negatively on teaching and learning. It is possible that many of the learners from poor families often come to school without having had a proper meal. In some instances learners are living alone as most of their parents are employed elsewhere.
The majority of schools in the Free State, almost 60% are farm schools situated on privately owned land. Circumstances at these schools such as multigrade teaching, poor physical facilities and long distances travelled by learners between homes and schools, make it difficult for the Department to provide quality

Page 64
EDUCATION STRATEGIC PLANNING V6
education at these schools. Agreements with some farmers (owners of private land) have not been concluded. The other challenge currently impacting on the Department is the decline in learner numbers.
However the Free State province has a good infrastructure and stable and peaceful social conditions (Free State Development Plan). Institutionally there has been a steady advance in effectiveness and efficiency of the provincial administration.
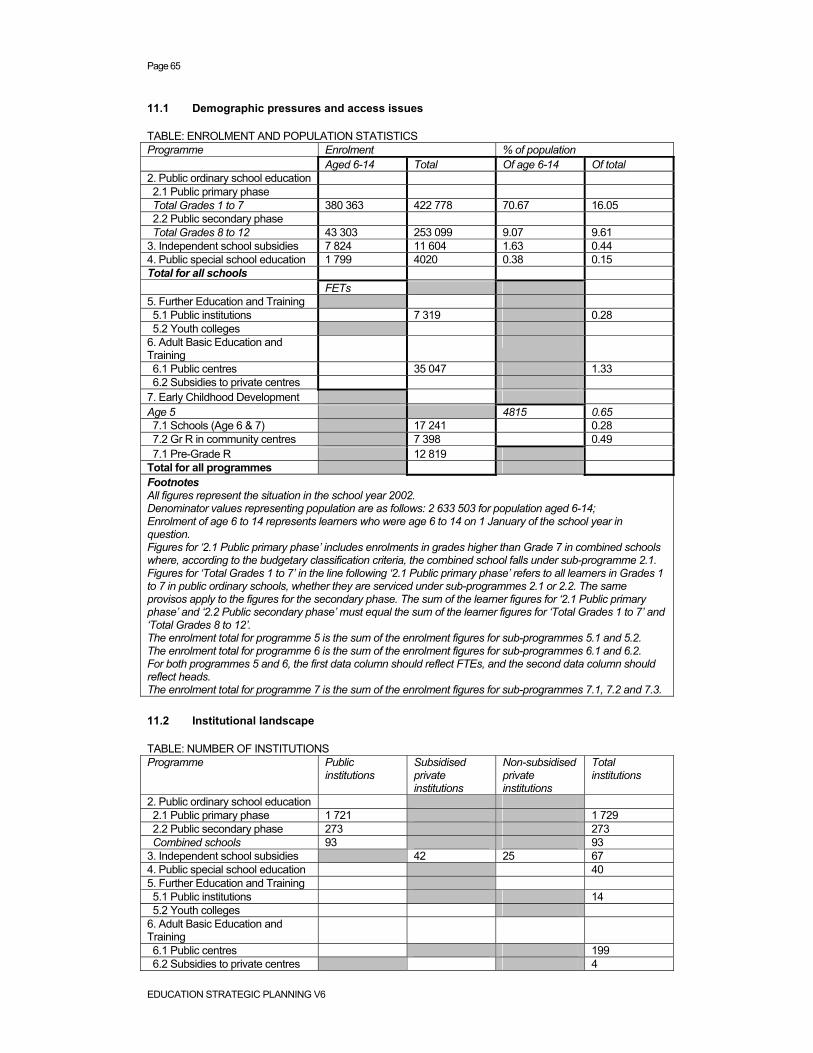
Page 65
EDUCATION STRATEGIC PLANNING V6
11.1 Demographic pressures and access issues
TABLE: ENROLMENT AND POPULATION STATISTICS Programme Enrolment % of population Aged 6-14 Total Of age 6-14 Of total 2. Public ordinary school education 2.1 Public primary phase Total Grades 1 to 7 380 363 422 778 70.67 16.05 2.2 Public secondary phase Total Grades 8 to 12 43 303 253 099 9.07 9.61 3. Independent school subsidies 7 824 11 604 1.63 0.44 4. Public special school education 1 799 4020 0.38 0.15 Total for all schools FETs 5. Further Education and Training 5.1 Public institutions 7 319 0.28 5.2 Youth colleges 6. Adult Basic Education and Training
6.1 Public centres 35 047 1.33 6.2 Subsidies to private centres 7. Early Childhood Development Age 5 4815 0.65 7.1 Schools (Age 6 & 7) 17 241 0.28 7.2 Gr R in community centres 7 398 0.49 7.1 Pre-Grade R 12 819 Total for all programmes Footnotes All figures represent the situation in the school year 2002. Denominator values representing population are as follows: 2 633 503 for population aged 6-14; Enrolment of age 6 to 14 represents learners who were age 6 to 14 on 1 January of the school year in question. Figures for ‘2.1 Public primary phase’ includes enrolments in grades higher than Grade 7 in combined schools where, according to the budgetary classification criteria, the combined school falls under sub-programme 2.1. Figures for ‘Total Grades 1 to 7’ in the line following ‘2.1 Public primary phase’ refers to all learners in Grades 1 to 7 in public ordinary schools, whether they are serviced under sub-programmes 2.1 or 2.2. The same provisos apply to the figures for the secondary phase. The sum of the learner figures for ‘2.1 Public primary phase’ and ‘2.2 Public secondary phase’ must equal the sum of the learner figures for ‘Total Grades 1 to 7’ and ‘Total Grades 8 to 12’. The enrolment total for programme 5 is the sum of the enrolment figures for sub-programmes 5.1 and 5.2. The enrolment total for programme 6 is the sum of the enrolment figures for sub-programmes 6.1 and 6.2. For both programmes 5 and 6, the first data column should reflect FTEs, and the second data column should reflect heads. The enrolment total for programme 7 is the sum of the enrolment figures for sub-programmes 7.1, 7.2 and 7.3. 11.2 Institutional landscape
TABLE: NUMBER OF INSTITUTIONS Programme Public
institutions Subsidised private institutions
Non-subsidised private institutions
Total institutions
2. Public ordinary school education 2.1 Public primary phase 1 721 1 729 2.2 Public secondary phase 273 273 Combined schools 93 93 3. Independent school subsidies 42 25 67 4. Public special school education 40 5. Further Education and Training 5.1 Public institutions 14 5.2 Youth colleges 6. Adult Basic Education and Training
6.1 Public centres 199 6.2 Subsidies to private centres 4

Page 66
EDUCATION STRATEGIC PLANNING V6
7. Early Childhood Development 7.1 Schools 342 342 7.2 Gr R in community centres 326 7.1 Pre-Grade R 348 Total for all programmes Footnotes All figures represent the situation in the school year 2002 The total for programme 1 is the sum of the figures for sub-programmes 2.1 and 2.2. ‘Combined schools’ refers to those public schools in sub-programmes 2.1 and 2.2 which have learners in both the primary and secondary phases. Independent ordinary schools which do not receive a subsidy appear in the row for programme 3, under ‘Non-subsidised private institutions’. If there are independent special schools, they are entered in the row for programme 4, under ‘Non-subsidised private institutions’. The total for programme 5 is the sum of the figures for sub-programmes 5.1 and 5.2. Private FET institutions are entered in the row for programme 5 in the third data column. The total for programme 6 is the sum of the figures for sub-programmes 6.1 and 6.2. Private ABET centres which do not receive a subsidy are entered in the row for programme 6, in the third data column. The total for programme 7 is the sum of the figures for sub-programmes 7.1, 7.2 and 7.3. Private non-subsidised ECD centres are entered in the row for programme 7. Organisational design:
The departmental structure includes the following: Accounting Officer – Superintendent General DDG: Administration Support Services (Corporate Services) DDG:Educational Development and Management Services Chief Financial Officer Chief Director – Corporate Services Chief Director – Education Management and Governance Chief Director – Education Management and Professional Services Chief Director – Director – Auxiliary Services Director – Curriculum Services Director – Examinations and Evaluation Director – Financial Management Director – Human Resources Management Director – Legal Services and Labour Relations Director – Quality Assurance Director - Organisational and Human Resource Development Director – Strategic Management Services Director – Works Director – Organisational and Human Resource Development 5 x District Directors The structure supports 5 Districts (i.e. Lejweleputswa, Thabo Mofutsanyana, Northern Free State, Motheo and Xhariep. The approved establishment consists of 24,318 educators and 5,903 public servants.

Page 67
EDUCATION STRATEGIC PLANNING V6
FIGURE: 1
The Five Magisterial Districts of the Province

Page 68
EDUCATION STRATEGIC PLANNING V6
FIGURE: 2
Approved 6/06/2002
APPROVED ORGANISATIONAL STRUCTURE FOR THE DEPARTMENT OF EDUCATION
C://My documents/Restructuring/Mac 6Jun
QUALITYASSURANCE
1 x Director
EXAMINATION ANDASSESSMENT
1 x Director
CURRICULUMSERVICES
1 x Director
INCLUSIVE EDUCATIONSPORT AND
YOUTH DEVELOPMENT
1 x Director
FET COLLEGES ,AND ABET
1 x Director
EDUCATION DEVELOPMENTAND PROFESSIONAL SERVICES
1 x Chief Director1 x Secretarty
XHARIEP
161 x Director
MOTHEO
171 x Director
LEJWELEPUTSWA
181 x Director
THABOMOFUTSANYANA
191 x Director
NORTHERNFREE STATE
201 x Director
DISTRICT MANAGEMENT ANDGOVERNANCE
1 x Chief Director
EDUCATION MANAGEMENTAND DEVELOPMENT SERVICES
1 x Deputy Director General
FINANCIAL PLANNING ANDRISK MANAGMENT
1 x Director
FRAUD ANDANTI-CORRUPTION
1 x Deputy Director
OFFICE OF THE CHIEF FINANCIAL OFFICER
1 x Chief Financial Officer
IT AND IRRISS
1 x Director
LABOUR RELATIONSAND LEGAL SERVICES
1 x Director
COMMUNICATIONSERVICES
1 x Deputy Director
STRATEGIC PLANNING,SPECIAL PROGRAMMESAND TRANSFORMATION
1 x CES
STRATEGIC MANAGEMENTSERVICES
1 x Chief Director
HR MANAGEMENT
1 x Director
ORG. AND HR DEVELOPMENT
1 x Director
AUXILIARYSERVICES
1 x Director
WORKS AND PHYSICALPLANNING
1 x Director
FINANCIALMANAGEMENT
1 x Director
CORPORATE SERVICES
1 x Chief Director
AMINISTRATIVE SUPPORT SERVICES
1 x Deputy Director General (PL 15)
DEPARTMENT OF EDUCATION
1 x Head of Department
MEC: EDUCATION

Page 69
EDUCATION STRATEGIC PLANNING V6
11.3 Budgeted resources
11.3.1 Physical infrastructure
1. Key characteristics and statistics relating to the Department’s current asset holding
The Department of Public Works Roads and Transport is responsible for the immovable properties in the Free State Province in terms of the Free State Land Administration Act, 1998 (Act. No 1 of 1998) this function is divided in (i) Land Affairs and (ii) accommodation matters which include municipal services. The Property Administration Section of the Directorate Works and Physical Planning (Department of Education) manage ± 4000 education properties on behalf of the Department of Public Works Roads and Transport. The Property Administration Section make use of a manual register which indicated the following information:
Town, site no, physical address, size, description (school, hostel, sportfields, vacant etc.) file,
reference no. owner, title deed no, land surveyor plan no. remark for additional information, additional accommodation / land that are leased / utilised for educational purposes, public schools (mainly farm schools that are situated on private property.
Although this register is functional much information is outstanding in respect of information with
regard to new town establishment that taking place in Qwa Qwa / Thaba Nchu as well as in respect of rural areas in these regions. Although most of the site numbers in connection with other education properties in the Free State Province are recorded there are some that must be still confirmed for correctness. In some other cases that correct title deed land surveyor plan no, description and ownership should still be finalised and obtained. Additional accommodation / land are also not completely recorded yet and are information regarding agreements, which have been signed for public schools on private property , is also not yet complete recorded. The Directorate Works and Physical Planning are presently busy with an investigation to computerise the Immovable Property Register in co-operation with the Department of Public Works (National) and the Provincial Department of Public Works Roads and Transport.
2. Adequacy of the information systems of the Department used for the auditing and management of immovable and major movable assets:
The Property Administration Section of the Directorate Works and Physical Planning (Department of Education) uses a manual register to manage ± 4000 education properties. Although this register is functional, certain information is lacking in respect of several properties.
The IT of the Department of Education is however in an advanced stage of gathering statistics of several aspects of properties for example: Management used this information on a regularly basis with regard to policy matter and decision making processes.
3. Current state of the Department ‘s capital stock:
The Department of Education is inter alia responsible for the provisioning and maintaining of physical facilities for education purposes in the Free State Province. Due to financial shortages, the Department of Education experienced a huge backlog in maintaining these facilities. The requests for services till October 2002 amounts up to ± R57 million. Only R6 000 000-00 at the Regional offices is presently available to give attention to the most urgent cases, for example the repairing of toilets. The state of the physical facilities (Schools) can be seen as follows:
Good 10 % Medium 40 % Bad 50 %
4. Building projects in progress:
Name of Project Date of completion
PETRUSBURG: Ipetleng Combined School July 2003 PHUTA: Thabong: Makwane Prim. School December 2004 TWEELING: Refengthabo Secondary School April 2003 VILJOENSKROON:Kgologano Secondary School June 2003 REITZ: Kgotso-Uxolo Secondary School April 2004

Page 70
EDUCATION STRATEGIC PLANNING V6
KESTELL: Nkarabeng Secondary School April 2003 DEWETSDORP: Katiso Prim. School December 2003 VIRGINIA: Lieketseng Prim. School September 2003 BLOEMFONTEIN: Unity Primary School October 2003 BLOEMFONTEIN: Lourierpark Primary School October 2004
5. New building projects being planned:
Name of Project Date of commencement Completion date SENEKAL: Tumisang Prim. School 2003/2004 ± 18- 24 Months – Subject to
contractor performance
VREDEFORT: S.S Paki Sec. School
2003/2004 Ditto
DENEYSVILLE: J.J Khubeka Primary School
2003/2004 Ditto
FOURIESBURG: Tshepano 3 Primary School
2003/2004 Ditto
Name of Project Date of commencement Completion date BLUEGUMBOSCH: Disasterpark Prim. School
2003/2004 Ditto
BOTHAVILLE: Hlaboloha Prim. School 2004/2005 Ditto WELKOM: Mokgwabong Prim. School 2004/2005 Ditto VIRGINIA : Marematlou Sec. School 2004/2005 Ditto ODENDAALSRUS: J.C Motumi Secondary School
2004/2005 Ditto
WARDEN: Kopanang Hlanganani Intermediate School
2004/2005 Ditto
KOPPIES: Rebatla Thuto Sec. School 2005/2006 Ditto DENEYSVILLE : Nomsa Sec. School 2005/2006 Ditto
BLOEMFONTEIN: Kamohelo Prim. School
2005/2006
Ditto
WESSELSBRON: Iphateleng Sec. School 2004/2005 Ditto SENEKAL: E.E Monese Comb. School 2004/2005 Ditto THABA NCHU: Refentse Prim. School 2005/2006 Ditto HARRISMITH: Kgethatsebo Prim. School 2005/2006 Ditto BLOEMFONTEIN: Kopanong Sec. School 2005/2006 Ditto PARYS: Bopasetjhaba Sec. School 2005/2006 Ditto
6. Facilities whose closure or down grading is being planned
The Department of Education is presently busy reconsidering the Farm School policy due to the declining of learners ± 50 638 in certain areas. From the original figure of ± 2413 farm schools, the Department has already closed down ± 803 farm schools. A new policy has been implemented to bus learners from closed down farm schools to hostels in town for example: Fauresmith : Olien Secondary School and Tseki Secondary School in Phuthadijthaba
7. Plans for major refurbishing projects
Three Business plans for refurbishment of existing schools have been submitted to the National Department for possible funding. The plans are prioritised from worst to less worst. The first worst plan is estimated at R 57 million which it is envisaged to be made available during the 2003/2004 financial year. 400 Other schools are on the Departmental MTEF for refurbishment has been budgeted apart from the day-to-day funds made available for minor repairs.
8. Impact of capital investment plans on current expenditures in the future:
The Department of Education is obliged to formulate a capital investment plan according to the funds allocated. The projects on these capital investment plan are however subject to time consuming planning and tender processes and the performance of consultants (Architects, Quantity Surveyor and engineers) and contractors. These factors have a huge influence on the expenditure if problems are experienced with, for example, a contractor who cannot perform according to schedule on a

Page 71
EDUCATION STRATEGIC PLANNING V6
capital project. Arrangements must be made with the Department of Finance for the roll-over of these funds because the circumstances are out of the control of the Department of Education.
9. Maintenance backlog:
The backlog for new schools is currently 67 and 101 schools need additional facilities and 281 schools need renovations, all this estimates to an amount of R 2,418,345,000 - 00. The intention is to implement programmed / routine maintenance plan which will be costed on the MTEF and 5 years Strategic Plan. The Transaction advisor has been appointed to assist the Public Private Partnerships to conduct a feasibility study for future routine maintenance of existing schools.
10. Division between major, emergency and routine maintenance
Major renovations are addressed as indicated in 7 above. Emergency R6,000,000-00 million is allocated to the Education Regional Works offices for emergency and essential services. No routine maintenance is carried out at this stage due to shortage of funds.
11. Plans around key moveable assets
• The installation of gear-locks for all government-owned vehicles has been implemented. • The placing of identification logos, with toll free number on both sides of the door so that any
suspected misuse can be reported. • The implementation of a pilot project for satellite tracking systems to ensure the safety, efficient
utilisation and risk management around Departmental vehicles. With the availability of funds this project will be extended to the entire fleet. The initial pilot project was provided free by the service provider.
• The implementation of the Transport Management Information systems to manage the - utilisation
- cost impact - operational control measures around the
Departmental fleet. This project is being implemented in phases and will be completed by 2004.
Projects to be carried forward from the previous year:
Name of Project VILJOENSKROON: Mphalalatsane Spec. School BLOEMFONTEIN: Pholoho Spec. School SENEKAL: Tumisang Prim. School PETRUSBURG: Ipetleng Combined School PHUTA: Thabong: Makwane Prim. School TWEELING: Refengthabo Secondary School VILJOENSKROON:Kgologano Secondary School REITZ: Kgotso-Uxolo Secondary School KESTELL: Nkarabeng Secondary School DEWETSDORP: Katiso Prim. School VIRGINIA: Lieketseng Prim. School BLOEMFONTEIN: Unity Primary School BLOEMFONTEIN: Lourierpark Primary School FOURIESBURG: Tshepano Prim. School BOTHAVILLE: Hlaboloha Prim. School DENEYSVILLE: J.J Khubeka Prim. School WELKOM: Mokgwabong Prim.School VIRGINIA: Marematlou Prim School ODENDAALSRUS: J.C Motumi Sec. School WARDEN: Kopanang Hlangane Prim. School BLOEMFONTEIN: Bloemside Prim.School WESSELSBRON: Iphateleng VREDEFORT: S.S Paki Sec. School BLUEGUMBOSCH: Disasterpark Prim. School
Projects to begin construction in the current year:
Name of Project PETRUSBURG: Ipetleng Combined School

Page 72
EDUCATION STRATEGIC PLANNING V6
PHUTA: Thabong: Makwane Prim. School TWEELING: Refengthabo Secondary School VILJOENSKROON:Kgologano Secondary School REITZ: Kgotso-Uxolo Secondary School KESTELL: Nkarabeng Secondary School DEWETSDORP: Katiso Prim. School VIRGINIA: Lieketseng Prim. School BLOEMFONTEIN: Unity Primary School BLOEMFONTEIN: Lourierpark Primary School BLUEGUMBOSCH: Disasterpark Prim. School
Expenditure involved in the medium term:
R 461 232 000-00
Rollover of funds from previous years
R 28 000 000-00
No provision has been made in future budgets to maintain the infrastructure as the MTEF was compiled according to the MTEF baseline allocation to indicative amounts. Additional funds to address the backlog in upgrading and renovation at existing schools calculate to an amount of R 119 405 127-00 for the medium term. This information was send to Min. Kadar Asmal. 11.3.2 Employees
TABLE: RESOURCING EFFECTED VIA THE POST PROVISIONING NORMS Programmes/Purpose of posts PL1 PL2 PL3 PL4 Total
educator posts
Learners/ FTEs
L:E ratio
Posts top-sliced before model is run Posts distributed by model 2. Public ordinary school education 2.1 Public primary phase 10 280 1440 485 334 Posts attached to schools Posts not attached to schools Curriculum redress posts … 2.2 Public secondary phase 6 399 1 289 410 226 Posts attached to schools Posts not attached to schools 21 Curriculum redress posts 200 … 4. Public special school education 305 71 21 6 5. Further Education and Training Footnote: All figures represent the situation in the school year 2002 ‘Posts top-sliced before model is run’ refers to the number of posts that are not generated through the provisioning model of the Post Provisioning Norms. This could include curriculum redress posts that are top-sliced where the model does not explicitly specify the calculation of redress posts. ‘Posts distributed by model’ should be the sum of the subsequent figures for programmes 2, 4 and 5. In the rows for programmes 2, 4 and 5, the number of learners or FTEs used in the calculation of the number of posts should be specified. ‘L:E ratio’ for these three rows should be ‘Learners/ FTEs’ divided by ‘Total educator posts’. ‘Posts attached to schools’ refers to posts that are explicitly allocated to a particular school in terms of the post provisioning model. Figures would only appear for ‘Posts not attached to schools’ once the post provisioning model has been officially revised to include calculations for ‘pool posts’ within the model. Once this has occurred, the various categories of such ‘pool posts’ should be specified, e.g. ‘Curriculum redress posts’.

Page 73
EDUCATION STRATEGIC PLANNING V6
The Department has managed to reskill as well as to assist underqualified educators through bursaries. There is a commitment on the side of employees to ensure competence. The department is investing approximately R26 million per annum on the training and support of staff.
12.1 Transfers to institutions
TABLE: RESOURCING EFFECTED VIA THE SCHOOL FUNDING NORMS
Programmes/Legal status/Poverty quintiles
Schools Total expenditure
Learners Expenditure per learner
2. Public ordinary schooling education Non-Section 21 schools Quintile 1 (poorest) 961 37,417,762 103 488 361.57 Quintile 2 422 29,073,288 94 128 308.87 Quintile 3 272 21,368,616 90 870 235.16 Quintile 4 158 19,346,312 77 277 250.35 Quintile 5 (least poor) 84 8,426,760 52 579 160.27 Section 21 schools Quintile 1 (poorest) 34 10,249,980 31 686 323.49 Quintile 2 58 10,833,634 40 857 265.16 Quintile 3 70 13,199,762 44 511 296.55 Quintile 4 76 11,912,335 58 083 205.09 Quintile 5 (least poor) 141 13,678,658 82 398 166.01 Total for public quintile 1 995 47,667,742 135 174 352.64 Total for public quintile 2 480 39,906,922 134 985 295.64 Total for public quintile 3 342 34,568,378 135 381 255.34 Total for public quintile 4 234 31,258,647 135 360 230.93 Total for public quintile 5 225 22,105,418 134 977 163.77 3. Independent school subsidies Quintile 1 (poorest) 10 8,093,786 3 868 2092.49 Quintile 2 9 4,908,842 3 528 1391.39 Quintile 3 17 1,778,914 1 978 899.34 Quintile 4 9 491,965 943 521.7 Quintile 5 (least poor) 19 0 1 287 0 Grand total 2 340 190,780,614 687 481 277.51 Footnotes: All figures represent the situation in the school year 2002. In the row ‘2. Public ordinary school education’, financial figures should reflect only rands flowing through
the funding model of the School Funding Norms, and should be the sum of the figures in ‘Non-Section 21 schools’ and ‘Section 21 schools’.
The row ‘Total for public quintile 1’ must contain the sum of the previous two references to quintile 1. The same applies to ‘Total for public quintile 2’, etc.
In the row ‘3. Independent school subsidies’ financial figures should refer to rands distributed via the funding model of the School Funding Norms.
Financial figures represent estimated expenditure. ‘Expenditure per learner’ is ‘Total expenditure’ divided by ‘Learners’. The financial figure under ‘Grand total’ represents value of all funds distributed via the funding model of the
School Funding Norms. This would in other words be the sum of the figures for programmes 2 and 3.
12.2 Efficiency of Resource Utilisation
The efficiency of resource utilisation in terms of budget and human resource management is up to the required standard. Asset management is as previously stated, a problem area in terms of the management of efficient and effective utilisation.
12.2.1 Mix of resources
The following tables provide a summary of the tables EXPENDITURE BREAKDOWN BY GFS ECONOMIC CATEGORIES.

Page 74
EDUCATION STRATEGIC PLANNING V6
TABLE: ABSOLUTE SPREAD ACROSS ECONOMIC CATEGORIES
Current Expenditure Capital Exp. Total
R'000 R'000 R'000
Personnel
Non-Personnel Total
1 Administration 187,054 98,829 285,883 19,899 305,7821.1 Member of the Executive Council – – – – 3,0711.2 Corporate Services – – – – 150,2871.3 Education Management – – – – 148,0761.4 Human Resource Development – – – – 150,2872 Public Ordinary School Education
2,934,548 295,545
3,230,093 27,372
3,271,399
2.1 Public Primary Phase – – – –1,836,80
1
2.2 Public Secondary Phase – – – –1,352,07
02.3 Professional Services – – – – 48,1462.4 Human Resource Development – – – – 23,2782.5 In-School Sport
– – – – 11,1043 Independent School Education – 17,138 17,138 – 17,1383.1 Primary Phase – – – – 8,2353.2 Secondary Phase – – – – 8,9034 Public Special School Education 95,319 21,058 116,377 1,397 117,7744.1 Schools – – – – 102,3884.2 Professional Services – – – – 14,5504.3 Human Resource Development 836

Page 75
EDUCATION STRATEGIC PLANNING V6
5 Further Education and Training 92,489 11,491 103,980 5,891 109,8715.1 Public Institutions – – – – 109,0355.2 Professional Services – – – –5.3 Human Resource Development – – – – 8365.4 In College Sport and Culture – – – – –6 Adult Basic Education and Training 52,101 11,712 63,813 197 64,0106.1 Public Centres – – – – 51,8186.2 Private Centres – – – – –6.3 Professional Services – – – – 10,9976.4 Human Resource Development – – – – 1,1957 Early Childhood Development 17,790 – 17,790 55 17,8457.1 Grade R in Public Schools – – – – 10,7917.2 Grade R in Community Centres – – – – 1,2007.3 Pre-Grade R – – – – –7.4 Professional Services – – – – 3107.5 Human Resource Development – – – – –7.6 Conditional Grants – – – – 5,5448 Auxiliary and Associated Services 16,000 57,375 73,375 51,614 124,9898.1 Payments to SETA – – – – 3,3888.2 Conditional Grants – – – – 72,3988.3 Special Projects – – – – 11,9708.4 External Examinations – – – – 37,233
TOTAL EXPENDITURE 3,388,27
1 520,1783,908,44
9 120,359 4,028,80
8

Page 76
EDUCATION STRATEGIC PLANNING V6
TABLE : PROPORTIONAL SPREAD ACROSS ECONOMIC CATEGORIES
% Current Expenditure
% Capital Expenditure % Total
% Personnel
% Non-Personnel % Total
1 Administration 61% 32% 93% 7% 100%1.1 Member of the Executive Council 1.2 Corporate Services 1.3 Education Management 1.4 Human Resource Development 2 Public Ordinary School Education 90% 9% 99% 1% 100%2.1 Public Primary Phase 2.2 Public Secondary Phase 2.3 Professional Services 2.4 Human Resource Development 2.5 In-School Sport 3 Independent School Education 100% 100% 100%3.1 Primary Phase 3.2 Secondary Phase

Page 77
EDUCATION STRATEGIC PLANNING V6
4 Public Special School Education 81% 18% 99% 1% 100%4.1 Schools 4.2 Professional Services 4.3 Human Resource Development 5 Further Education and Training 84% 11% 95% 5% 100%5.1 Public Institutions 5.2 Professional Services 5.3 Human Resource Development 5.4 In College Sport and Culture 6 Adult Basic Education and Training 81% 18% 99% 1% 100%6.1 Public Centres 6.2 Private Centres 6.3 Professional Services 6.4 Human Resource Development 7 Early Childhood Development 99% 99% 1% 100%7.1 Grade R in Public Schools 7.2 Grade R in Community Centres 7.3 Pre-Grade R 7.4 Professional Services 7.5 Human Resource Development 7.6 Conditional Grants 8 Auxiliary and Associated Services 13% 46% 59% 41% 100%8.1 Payments to SETA 8.2 Conditional Grants 8.3 Special Projects 8.4 External Examinations TOTAL EXPENDITURE 84% 13% 97% 3% 100%

Page 78
EDUCATION STRATEGIC PLANNING V6
13 Programme 1: Administration
Sub-Programme Structure 2000/01 2001/02 2002/03 2003/04 2004/05 2005/06
Actual Actual Estimated Actual
Voted Forward Estimates
R 000 R 000 R 000 R 000 R 000 R 000 1 Office of the MEC 1 401 1 487 2 040 3 071 3 111 3 278 2 Corporation services 91 342 144 158 176 671 150 287 150 716 165 055 3 Education management 91 502 99 889 143 568 148 076 155 303 165 766 4 Human Resource 277 2 709 26 430 4 348 4 629 4 908 5 Conditional Grants - Provincial Financial Management
2 806
Total Administration 184 522 248 243 351 515 305 782 313 759 339 007
Internal Environment
1. IT systems for effective service delivery
The Department has followed the lead of the Province in setting up an aligned IT strategy. At present the systems are adequate to render an effective service within the Head Office and district environment, however in the light of developments in ICT there is still a need for continued expansion and upgrading.
In order to improve IT systems the Department is looking at alternative ways and means to enhance communication, expanding wide area network service to include schools, organise appropriate training for the different user groups.
Provide a proper infrastructure for maintenance, hardware and software support, provide training in accordance with ICT needs and required skills. Staff development plan to be developed for employees and schools. Conversion of all schools to e-schools and connectivity programme for all learning institutions. Develop and finalise the Departmental ICT Service Plan.
2. Performance management systems.
The roll-out of performance management from SMS-level upwards has been successful. It will be rolled-out to levels below the senior management service in 2003/04 by implementing the provincial Performance and Development Management System for public servants (non-educators) that was adopted by EXCO and the Performance Management and Development Scheme for Office Based Educators(ELRC Collective Agreement Number 3 of 2002).
The implementation of the performance management system is one of the strategic objectives of the Department. It is managed in terms of key result areas, which aligns individual goals and objectives with the strategic goals and objectives of the Department, and core management criteria, which are the competencies members of the senior management service are required to perform effectively.
Performance agreements are aligned with the strategic and operational plan of the Department. Individual workplans have been developed for office based educators and public servants.
3. Financial Systems
The department has struggled in the past with under expenditure. However, except for conditional grants and Capital Works, the Department has turned the situation around.

Page 79
EDUCATION STRATEGIC PLANNING V6
Systems are being put in place to ensure sound financial management. However, backlogs have been a challenge but should be cleared in the 2002/03 financial year. Cash flow predictions remain a problem due to unpredictability of conditional grants and capital works.
Old outstanding issues on the audit reports have been resolved. However, full adherence to the spirit of the PFMA will only be achieved by the end of the MTEF period.
Unauthorised expenditure is properly recorded and reported on. The current amount reflected as unauthorised expenditure is R24,752 million, emanating between 1996 and 1998.
The Department is experiencing an increase in debts due to salary overpayments and bursary holders who do not honour their contracts. Debt collection was outsourced to reduce the debt collection.
Budgets are compiled in accordance with the Departmental Strategic Plan with clear objectives and perfomance measures which are monitored on a regular basis.
The department is making full use of the Financial Management System, PERSAL, and LOGIS. Monthly expenditure reports are distributed to all Responsibility Managers. A Departmental Finance Committee is in place and holds regular monthly meetings constituted by the Accounting Officer, Chief Financial Officer and Programme Managers. Its purpose is to monitor expenditure against budget and to timeously detect possible deviations from budgets.
Financial capacity building was outsourced and conducted at all levels within the Department to enhance financial management.

Page 80
EDUCATION STRATEGIC PLANNING V6
Programme 2
13.2 Budgeted Resources
Sub-Programme Structure 2000/01 2001/02 2002/03 2003/04 2004/05 2005/06
Actual Actual Estimated Actual
Voted Forward Estimates
R 000 R 000 R 000 R 000 R 000 R 000 1 Public Primary Schools 1 467 657 1 532 939 1 732 169 1 836 801 1 947 263 2 098 694 2 Public Secondary Schools 999 614 1 032 848 1 137 196 1 352 070 1 486 055 1 585 452 3 Professional services 31 752 37 432 39 121 48 146 51 658 56 060 4 Human Resource Dev. 23 278 24 874 26 723 5 In-School sport & culture 5 917 7 479 10 095 11 104 11 906 12 963 6 Conditional Grants Total Public Ordinary School Education
2 504 940 2 610 698 2 918 581 3 271 399 3 521 756 3 799 892
13.2.1 Physical infrastructure
TABLE: CLASSROOMS AVAILABLE FOR PROGRAMME 2
Programme Learners Classrooms L:C ratio Classroom backlog
2.1 Public primary phase 422 778 11 621 36.4 999 2.2 Public secondary phase 253 099 6 535 38.7 672 Total for public ordinary schools 675 877 18 156 37.2 1 671 Footnotes: All figures represent the situation in the school year 2002 ‘Classrooms’ includes all functional classrooms within public ordinary schools, including instructional
rooms like laboratories. ‘Classroom backlog’ figures are derived from Register of Needs

Page 81
EDUCATION STRATEGIC PLANNING V6
13.2.2 Employees
Although the focus is on publicly employed employees, the interaction between publicly and privately employed employees is important, and is therefore included in the following table.
Employees and vacancies by Programme
APPROVED ESTABLISHMENT
NUMBER OF EMPLOYEES
VACANCY RATE
ADDITIONAL (-)
PROGRAMME 1 ADMINISTRATION
SUBPROGRAMME 1: Office of the MEC
6 7 -17% -1
SUBPROGRAMME 2: All Head Office & District Staff ex those who fall under Programme 7 & 8
1859 1282 31% 577
PROGRAMME 2: Public Ordinary School Pre-Primary, and Secondary Schools
26797 26145 2% 652
PROGRAMME 3: Independent Schools
PROGRAMME 4: Special School Education
994 810 19% 184
PROGRAMME 5: Teacher Training
378 289 24% 89
PROGRAMME 6: Technical College Education
626 454 27% 172
PROGRAMME 7: Non-Formal Education
SUB-PROGRAMME 1: Adult Basic Education & Training
81 64 21% 17
PROGRAMME 8: Auxiliary & Associated Serv.
SUB-PROGRAMME 1: Learning Facilitation
259 179 31% 80
SUB-PROGRAMME 2: Information Technology Services
21 9 57% 12
SUB-PROGRAMME 3: Learning Assessment, evaluation &
34 31 9% 3

Page 82
EDUCATION STRATEGIC PLANNING V6
examinations SUB-PROGRAMME 4: School Sport, Recreation and Youth Development
53 45 15% 8
SUB-PROGRAMME 5: Psychological Services
232 141 39% 91
SUB-PROGRAMME 6: Physical Planning
19 15 21% 4
SUB-PROGRAMME 7: School Capacitation
52 15 71% 37
SUB-PROGRAMME 8: Curriculum Development
8 8 0% 0
SUB-PROGRAMME 9: Educational Planning
7 3 57% 4
TOTAL 31426 29497 6% 1929
Actual filled posts per month
1 2 3 MONTH CS EDUCATORS CS EDUCATORS CIVIL
SERVANTS TOTAL
All posts Schools Colleges, etc.
All posts Col 1+3
JANUARY 2002 23614 23044 5249 28863 FEBRUARY 2002 23801 23263 5358 29159 MARCH 2002 23520 22953 5384 28904 APRIL 2002 23721 23216 5500 29221 MAY 2002 24000 23425 5602 29602 JUNE 2002 24042 23468 5613 29655 JULY 2002 23818 23230 5591 29409 AUGUST 2002 24114 23521 5598 29712 SEPTEMBER 2002 24162 23569 5543 29705 OCTOBER 2002 24217 23622 5768 29985 NOVEMBER 2002 24297 23741 5975 30272 DECEMBER 2002 24318 23717 5981 30299

Page 83
EDUCATION STRATEGIC PLANNING V6
TABLE: LEARNER-EDUCATOR RATIOS IN PROGRAMME 2 SCHOOLS
Learners Publicly employed educators
Public L:E Privately employed educators
Total educators
Effective L:E ratio
2.1 Public primary phase 438 818 13 685 32 308 13 993 31.3 Quintile 1 (poorest) 102 868 3 487 29.5 29 3 516 29.3 Quintile 2 85 382 2 632 32.4 7 2 639 32.4 Quintile 3 97 401 2 941 33.1 8 2 949 33 Quintile 4 77 710 2 307 33.7 28 2 335 33.3 Quintile 5 (least poor) 74 957 2 318 32.3 236 2 554 29.3 2.2 Public secondary phase 250 365 8 211 30.5 312 8 523 29.4 Quintile 1 (poorest) 34 038 1 106 30.8 9 1 115 30.5 Quintile 2 52 732 1 695 31.1 30 1 725 30.6 Quintile 3 39 921 1 287 31 16 1 303 30.6 Quintile 4 60 294 1 986 30.4 82 2 068 29.2 Quintile 5 (least poor) 63 380 2 137 29.7 175 2 312 27.4 Footnotes: All figures represent the situation in the school year 2002 ‘2.1 Public primary phase’ values should reflect the sum of the five quintiles. The same applies to ‘2.2
Public secondary phase’. ‘Publicly employed educators’ includes all publicly employed educators working full-time in a school,
regardless of whether they are attached to individual institutions via the post provisioning model, or allocated to a school from a pool like a curriculum redress pool.
‘Public L:E’ is ‘Learners’ divided by ‘Publicly employed educators’. ‘Privately employed educators are all full-time educators working in the public school but not remunerated
by the state. ‘Total educators’ is the sum of ‘Publicly employed educators’ and ‘Privately employed educators’. ‘Effective L:E ratio’ is ‘Learners’ divided by ‘Total educators’.
Transfers to institutions
Due to particular concerns around the way the School Funding Norms are being implemented, it is crucial that the following table be thoroughly analysed.

Page 84
EDUCATION STRATEGIC PLANNING V6
TABLE: BREAKDOWN OF NON-PERSONNEL RECURRENT IN PROGRAMME 2
Budget Expenditure Programme Funding via SFN/
RTL
Total non-pers.
recurrent
% to SFN/ RTL
Funding via SFN/
RTL
Total non-pers.
recurrent
% to SFN/ RTL
2.1 Public primary phase 2.2 Public secondary phase Total for public ordinary schools Footnotes: Figures refer to financial year 2002 ‘Funding via SFN/ RTL’ refers to allocations via the resource targeting list, in accordance with the
calculations specified in the School Funding Norms. ‘Total non-pers. recurrent’ refers to all allocations under the ‘Current expenditure’ class, minus the
amounts under the ‘Compensation of employees’ class. ‘% to SFN/ RTL’ is calculated as ‘Funding via SFN/ RTL’ divided by ‘Total non-pers. recurrent’.

Page 85
EDUCATION STRATEGIC PLANNING V6
EMPLOYEES: HUMAN RESOURCE PLAN
Office based public servants
0
10
20
30
40
50
60
70
80
14-16 13 12-Nov 10-Sep 8-Jul 6-Mar 2-Jan
Salary Level
%
Black Male (47%)
Back Female (39%)
White Male (8%)
White Female (6%)
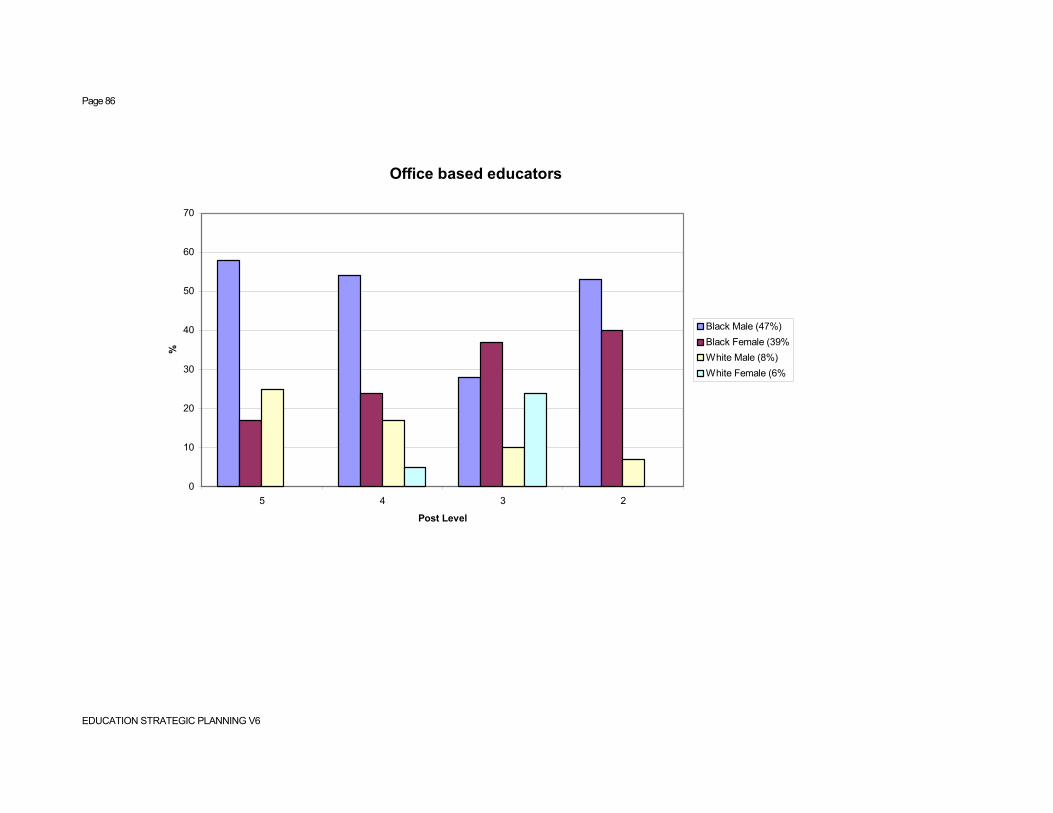
Page 86
EDUCATION STRATEGIC PLANNING V6
Office based educators
0
10
20
30
40
50
60
70
5 4 3 2
Post Level
%
Black Male (47%)Black Female (39%White Male (8%)White Female (6%

Page 87
EDUCATION STRATEGIC PLANNING V6
FET College Lecturers
0
10
20
30
40
50
60
Rector Vice Rector Snr Lecturer Lecturer
Post Level
%
Black Male (47%)Black Female (39%)White Male (8%)White Female (6%)

Page 88
EDUCATION STRATEGIC PLANNING V6
Educators at Schools
0
10
20
30
40
50
60
70
80
4 3 2 1
Post Level
%
Black Male (47%)Black Female (39%)White Male (8%)White Female (6%)

Page 89
EDUCATION STRATEGIC PLANNING V6
Age Structure
Age Educators Public Servants
20-29 6% 11%
30-39 43% 29%
40-49 39% 31%
50-59 11% 23%
60+ years 1% 6%
Age structure with regard to educators is not balanced as only 1% will leave the system over the next 5 years because of age
In real figures it means approximately 230 employees
862 employees left system between April 2001 and March 2002 because of death, resignation, ill health, retirement and “other reasons” Constitutes an attrition rate of 2,5% If applied to existing number of employees, 753 will leave the system in 2003/04 – this will then be the number of new recruits that can come into the system, assuming the attrition rate remains the same
Efficiency of resource utilisation
TABLE: PROGRAMME 2 ENROLMENT AND FLOW RATE DETAILS
Learners Repeaters Repeater rate Dropouts Dropout rate Grade 1 62 284 8 180 8 180:61 084 3 384 0.05 Grade 2 54 404 4 848 4 848:54 216 1 362 0.03 Grade 3 52 761 4 755 4 755:57 899 1 351 0.03 Grade 4 57 983 6 190 6 190: 70 415 2 349 0.04 Grade 5 69 985 8 109 8 190: 68 826 3 182 0.05 Grade 6 63 164 5 629 5 629: 65 638 4 476 0.07 Grade 7 57 599 2 066 2 066:56 064 2 166 0.04 Grade 8 55 786 3 954 3 954: 64 155 3 822 0.07 Grade 9 68 812 12 433 12 433: 60 360 4 070 0.06 Grade 10 57 987 14 130 14 130: 57 679 10 054 0.17 Grade 11 44 170 10 675 10 675: 46 639 10 449 0.24 Grade 12 26 344 829 829: 28 137 Total 671 279 81 798 Footnotes All figures represent the situation in the school year 2002 ‘Repeater rate’ is ‘Repeaters’ divided by the enrolment for that grade in the previous year. ‘Dropouts’ is the number of learners who dropped out of that grade during the previous year. It is
calculated as enrolment in that grade in the previous year, minus enrolment in the next grade in the current year, minus repeaters in the same grade in the current year, plus the repeaters in the next grade in the current year.
Statistics were obtained from the Annual Survey of Schools for the year 2002
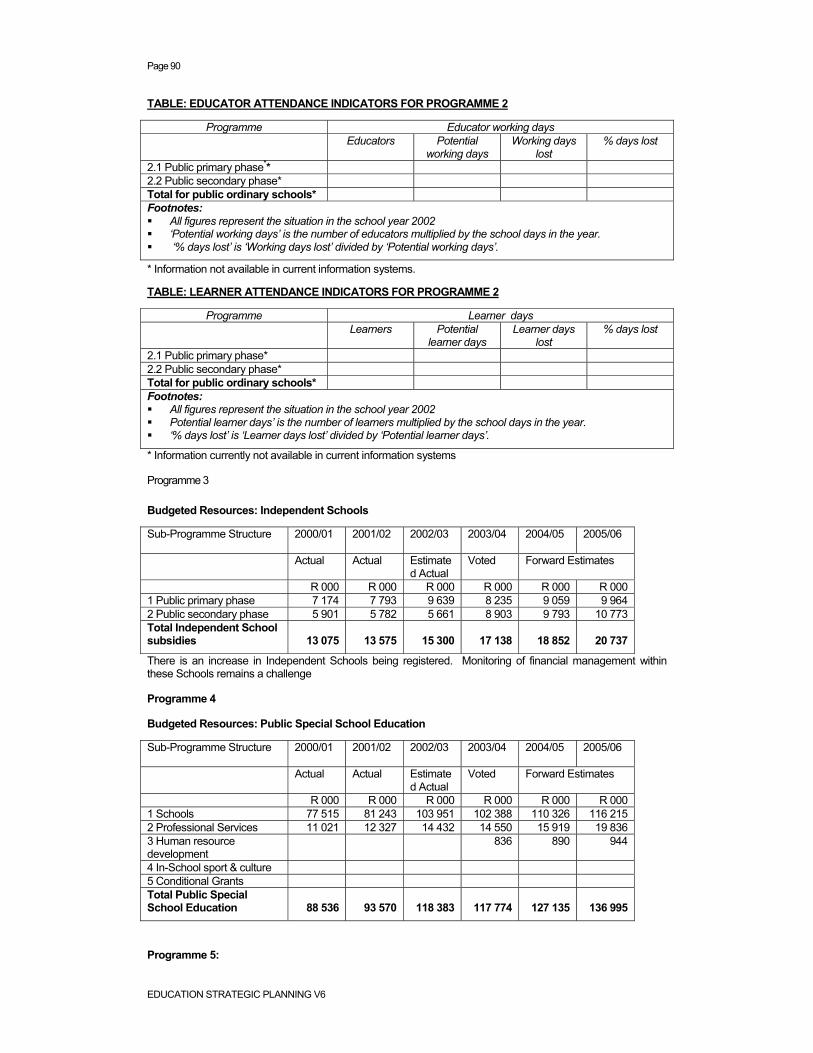
Page 90
EDUCATION STRATEGIC PLANNING V6
TABLE: EDUCATOR ATTENDANCE INDICATORS FOR PROGRAMME 2
Programme Educator working days Educators Potential
working days Working days
lost % days lost
2.1 Public primary phase** 2.2 Public secondary phase* Total for public ordinary schools* Footnotes: All figures represent the situation in the school year 2002 ‘Potential working days’ is the number of educators multiplied by the school days in the year. ‘% days lost’ is ‘Working days lost’ divided by ‘Potential working days’.
* Information not available in current information systems.
TABLE: LEARNER ATTENDANCE INDICATORS FOR PROGRAMME 2
Programme Learner days Learners Potential
learner days Learner days
lost % days lost
2.1 Public primary phase* 2.2 Public secondary phase* Total for public ordinary schools* Footnotes: All figures represent the situation in the school year 2002 Potential learner days’ is the number of learners multiplied by the school days in the year. ‘% days lost’ is ‘Learner days lost’ divided by ‘Potential learner days’.
* Information currently not available in current information systems
Programme 3
Budgeted Resources: Independent Schools
Sub-Programme Structure 2000/01 2001/02 2002/03 2003/04 2004/05 2005/06
Actual Actual Estimated Actual
Voted Forward Estimates
R 000 R 000 R 000 R 000 R 000 R 000 1 Public primary phase 7 174 7 793 9 639 8 235 9 059 9 964 2 Public secondary phase 5 901 5 782 5 661 8 903 9 793 10 773 Total Independent School subsidies
13 075
13 575
15 300
17 138
18 852
20 737
There is an increase in Independent Schools being registered. Monitoring of financial management within these Schools remains a challenge
Programme 4
Budgeted Resources: Public Special School Education
Sub-Programme Structure 2000/01 2001/02 2002/03 2003/04 2004/05 2005/06
Actual Actual Estimated Actual
Voted Forward Estimates
R 000 R 000 R 000 R 000 R 000 R 000 1 Schools 77 515 81 243 103 951 102 388 110 326 116 215 2 Professional Services 11 021 12 327 14 432 14 550 15 919 19 836 3 Human resource development
836 890 944
4 In-School sport & culture 5 Conditional Grants Total Public Special School Education
88 536
93 570
118 383
117 774
127 135
136 995
Programme 5:

Page 91
EDUCATION STRATEGIC PLANNING V6
Budgeted Resources: Further Education and Training (FET)
Sub-Programme Structure 2000/01 2001/02 2002/03 2003/04 2004/05 2005/06
Actual Actual Estimated Actual
Voted Forward Estimates
R 000 R 000 R 000 R 000 R 000 R 000 1 Public institutions 114 107 93 576 136 013 109 035 126 657 138 146 2 Youth College 3 Professional services 4 Human Resource Development
889 177 836 890 944
5 In-College sport & culture 6 Conditional Grants Total FET 114 996 93 753 136 013 109 871 127 547 139 090
The funding of FET according to Norms per FET is estimated to have a material impact on the budget in future.
Programme 6:
Budgeted Resources: Adult Basic Education and Training (ABET)
Sub-Programme Structure 2000/01 2001/02 2002/03 2003/04 2004/05 2005/06
Actual Actual Estimated Actual
Voted Forward Estimates
R 000 R 000 R 000 R 000 R 000 R 000 1 Public centres 29 856 36 696 53 891 51 818 63 580 60 745 2 Subsidies to private centre 3 Professional services 7 735 7 331 23 001 10 997 12 620 17 172 4 Human Resource Development
1 195 1 272 1 349
5 Conditional Grants Total Adult Basic Education & Training
37 591
44 027
76 892
64 010
77 472
79 266
The implementation of ABET is expected to have a material impact on the budget in future.
Programme 7:
Budgeted Resources: Early Childhood Development (ECD)
Sub-Programme Structure 2000/01 2001/02 2002/03 2003/04 2004/05 2005/06
Actual Actual Estimated Actual
Voted Forward Estimates
R 000 R 000 R 000 R 000 R 000 R 000 1 Grade R in pubic schools 8 951 9 013 10 063 10 791 29 588 50 432 2 Grade R in community centres
1 589 777 1 200 4 617 6 156
3 Pre-Grade R 4 Professional Services 14 144 256 310 370 431 5 Human Resource Dev. 6 Conditional Grants -Early Childhood Dev. 24 4 236 5544 Total ECD 10 554 9 958 14 555 17 845 34 545 57 019
The implementation of ECD is expected to have a material impact on the budget in future.
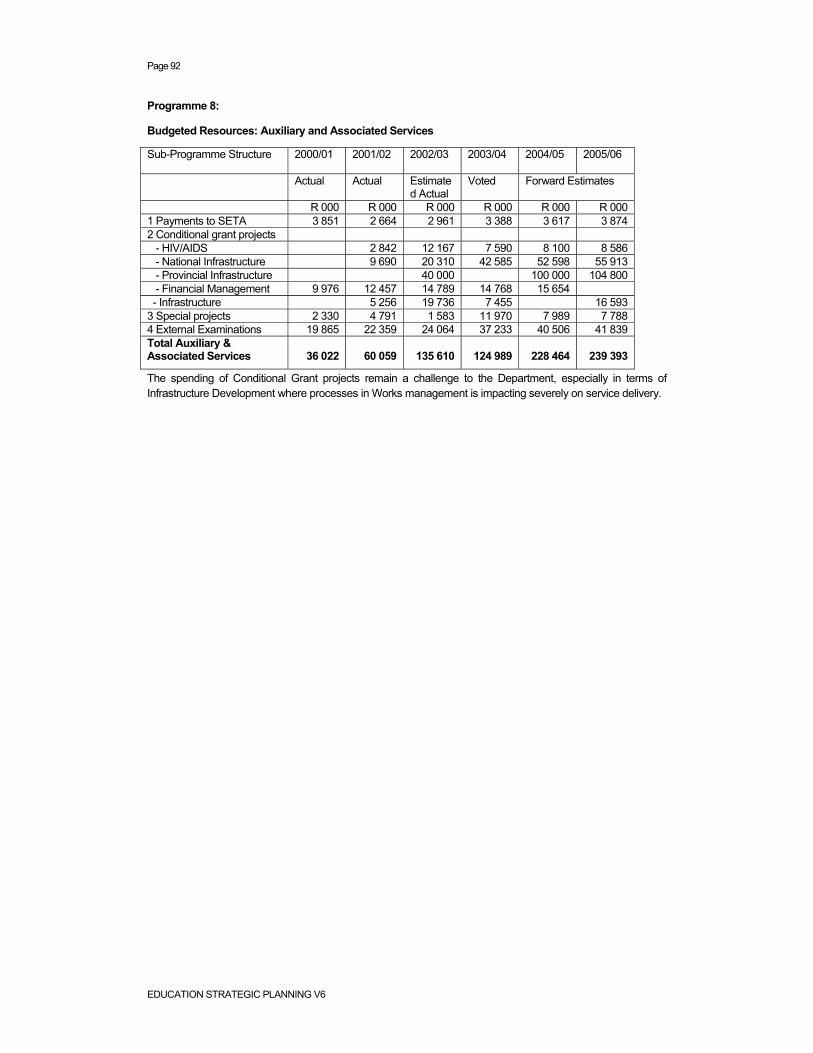
Page 92
EDUCATION STRATEGIC PLANNING V6
Programme 8:
Budgeted Resources: Auxiliary and Associated Services
Sub-Programme Structure 2000/01 2001/02 2002/03 2003/04 2004/05 2005/06
Actual Actual Estimated Actual
Voted Forward Estimates
R 000 R 000 R 000 R 000 R 000 R 000 1 Payments to SETA 3 851 2 664 2 961 3 388 3 617 3 874 2 Conditional grant projects - HIV/AIDS 2 842 12 167 7 590 8 100 8 586 - National Infrastructure 9 690 20 310 42 585 52 598 55 913 - Provincial Infrastructure 40 000 100 000 104 800 - Financial Management 9 976 12 457 14 789 14 768 15 654 - Infrastructure 5 256 19 736 7 455 16 593 3 Special projects 2 330 4 791 1 583 11 970 7 989 7 788 4 External Examinations 19 865 22 359 24 064 37 233 40 506 41 839 Total Auxiliary & Associated Services
36 022
60 059
135 610
124 989
228 464
239 393
The spending of Conditional Grant projects remain a challenge to the Department, especially in terms of Infrastructure Development where processes in Works management is impacting severely on service delivery.

Page 93
EDUCATION STRATEGIC PLANNING V6
9. Expenditure breakdown
This section should present expenditure information based on the latest version of the budget, disaggregated by (a) GFS economic categories and (b) standard items. In the absence of a finalised chart of accounts, both these types of disaggregation must be maintained as an interim measure.
9.1 Breakdown by GFS economic categories
The GFS economic categories, insofar as they apply to the education sector, are as follows (indentation indicates hierarchy):
Process point: Formal definitions for each of the economic classifications need to be included. There have been a number of draft sets of classifications, and users generally understand what the terms mean. So it is largely a matter of formalisation.
Economic category Definition Current expenditure Compensation of employees Educators Salaries & wages Other remuneration Other personnel Salaries & wages Other remuneration Use of goods and services Textbooks Media collections Stationery Transport Telecom Equipment Acquisition Rental Buildings Maintenance Rental Municipal services Hostels Other Transfer payments Section 21 schools Other Capital expenditure Non-financial assets Buildings and structures Machinery & equipment Non-produced goods Other assets Capital transfers Local government Other capital transfers
The expenditure table should use the GFS categories as column headings. This makes the full table much too wide for an A4 page. For this reason, the table has been broken up into four parts. Note that the current expenditure total column appearing on the right hand side of part 3, adds the values up for all the preceding parts. Expenditure of conditional grant funds should be included in values in the main expenditure table, but should also be stated separately in the separate conditional grants table.

Page 94
EDUCATION STRATEGIC PLANNING V6
EXPENDITURE BREAKDOWN BY GFS ECONOMIC CLASSFICATION – PART 1 Current expenditure Compensation of employees Educators Other personnel Total Salaries & wages Other remuneration Salaries and wages Other remuneration 1 Administration 22,363 7,235 118,177 39,280 187,0551.1 Office of the MEC --- --- 1,230 632 1,8621.2 Corporate Services 4,037 1,383 56,215 19,255 80,8901.3 Education Management 18,326 5,852 60,732 19,393 104,3031.4 Human Resource Development --- --- --- --- ---1.5 Conditional Grants --- --- --- --- ---2 Public Ordinary School Education 2,099,599 673,220 115,640 37,099 2,925,5582.1 Public Primary Schools 1,184,027 381,253 66,265 21,337 1,652,8822 Public Secondary Schools 879,516 280,800 49,223 15,715 1,225,2542.3 Professional Services 30,290 9,278 152 47 39,7672.4 Human Resource Development --- --- --- --- ---2.5 In-school Sport and Culture 5,766 1,889 --- --- 7,6552.6 Conditional Grants --- --- --- --- ---3 Independent School Subsidies --- --- --- --- ---3.1 Primary Phase --- --- --- --- ---3.2 Secondary Phase --- --- --- --- ---4 Public Special Schools 60,973 20,158 10,610 3,578 95,3194.1 Schools 51,079 17,226 10,610 3,578 82,4934.2 Professional Services 9,894 2,932 --- --- 12,8264.3 Human Resource Development --- --- --- --- ---4.4 In-School Sport and Training --- --- --- --- ---5 Further Education & Training 61,657 19,271 8,808 2,753 92,4895.1 Public Institutions 61,657 19,271 8,808 2,753 92,4895.2 Youth Colleges --- --- --- --- ---5.3 Professional Services --- --- --- --- ---5.4 Human Resource Development --- --- --- --- ---5.5 In-College Sport and Culture --- --- --- --- ---

Page 95
EDUCATION STRATEGIC PLANNING V6
Current expenditure Compensation of employees Educators Other personnel Total Salaries & wages Other remuneration Salaries and wages Other remuneration 6 Adult Basic Education and Training 6,793 45,264 31 13 52,106.1 Public centres 867 43,436 31 13 44,3476.2 Professional Services 5,926 1,828 --- --- 7,7546.3 Human Resource Development --- --- --- --- ---7 Early Childhood Development 8,020 2,202 422 116 10,7607.1 Grade R in Pubic Schools 8,020 2,202 422 116 10,7607.2 Grade R in Community Centres --- --- --- --- ---7.3 Pre-Grade R --- --- --- --- ---7.4 Professional Services --- --- --- --- ---7.5 Human Resource Development --- --- --- --- ---7.6 Conditional Grants --- --- --- --- ---8 Auxiliary and Associated Services --- 16,000 --- --- 16,0008.1 Payments to SETA --- --- --- --- ---8.2 Conditional Grant Projects --- --- --- --- ---8.3 Special Projects --- --- --- --- ---8.4 External examinations --- 16,000 --- --- 16,000Total expenditure 2,259,405 783,350 253,688 82,839 3,379,282 EXPENDITURE BREAKDOWN BY GFS ECONOMIC CLASSFICATION – PART 2 Current expenditure Use of goods and services Equipment Buildings Total
Text-books
Media collec-tions
Station-ery
Trans-port
TelecomAcquisi-
tion Rental Main-
tenanceRental
Muni-cipal
services
Hostels Other
1 Administration --- 2,810 6,816 27,733 8,360 51 4,748 2,050 11,706 1,802 --- 40,747 106,8231.1 Office of the MEC --- --- 20 320 75 --- 48 --- --- --- --- 540 1,0031.2 Corporate Services --- 18 4,371 13,350 6,782 29 2,211 1,700 11,520 1,300 --- 23,866 65,147
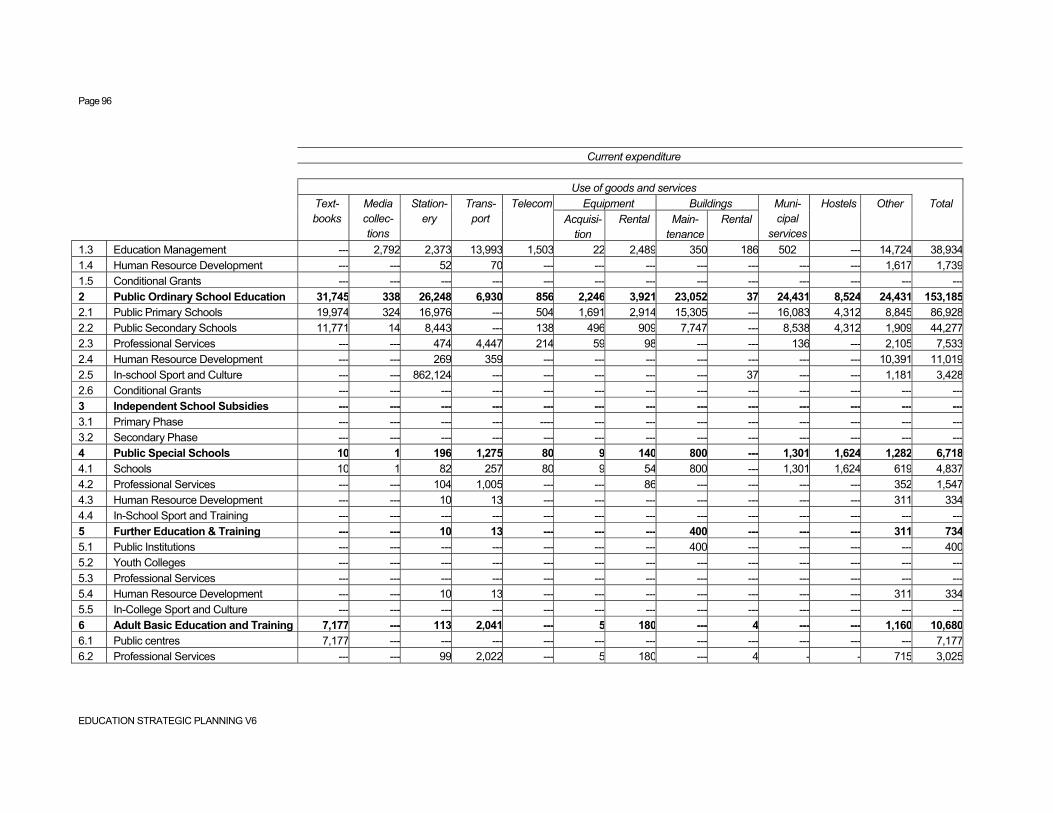
Page 96
EDUCATION STRATEGIC PLANNING V6
Current expenditure Use of goods and services Equipment Buildings Total
Text-books
Media collec-tions
Station-ery
Trans-port
TelecomAcquisi-
tion Rental Main-
tenanceRental
Muni-cipal
services
Hostels Other
1.3 Education Management --- 2,792 2,373 13,993 1,503 22 2,489 350 186 502 --- 14,724 38,9341.4 Human Resource Development --- --- 52 70 --- --- --- --- --- --- --- 1,617 1,7391.5 Conditional Grants --- --- --- --- --- --- --- --- --- --- --- --- ---2 Public Ordinary School Education 31,745 338 26,248 6,930 856 2,246 3,921 23,052 37 24,431 8,524 24,431 153,1852.1 Public Primary Schools 19,974 324 16,976 --- 504 1,691 2,914 15,305 --- 16,083 4,312 8,845 86,9282.2 Public Secondary Schools 11,771 14 8,443 --- 138 496 909 7,747 --- 8,538 4,312 1,909 44,2772.3 Professional Services --- --- 474 4,447 214 59 98 --- --- 136 --- 2,105 7,5332.4 Human Resource Development --- --- 269 359 --- --- --- --- --- --- --- 10,391 11,0192.5 In-school Sport and Culture --- --- 862,124 --- --- --- --- --- 37 --- --- 1,181 3,4282.6 Conditional Grants --- --- --- --- --- --- --- --- --- --- --- --- ---3 Independent School Subsidies --- --- --- --- --- --- --- --- --- --- --- --- ---3.1 Primary Phase --- --- --- --- ---- --- --- --- --- --- --- --- ---3.2 Secondary Phase --- --- --- --- --- --- --- --- --- --- --- --- ---4 Public Special Schools 10 1 196 1,275 80 9 140 800 --- 1,301 1,624 1,282 6,7184.1 Schools 10 1 82 257 80 9 54 800 --- 1,301 1,624 619 4,8374.2 Professional Services --- --- 104 1,005 --- --- 86 --- --- --- --- 352 1,5474.3 Human Resource Development --- --- 10 13 --- --- --- --- --- --- --- 311 3344.4 In-School Sport and Training --- --- --- --- --- --- --- --- --- --- --- --- ---5 Further Education & Training --- --- 10 13 --- --- --- 400 --- --- --- 311 7345.1 Public Institutions --- --- --- --- --- --- --- 400 --- --- --- --- 4005.2 Youth Colleges --- --- --- --- --- --- --- --- --- --- --- --- ---5.3 Professional Services --- --- --- --- --- --- --- --- --- --- --- --- ---5.4 Human Resource Development --- --- 10 13 --- --- --- --- --- --- --- 311 3345.5 In-College Sport and Culture --- --- --- --- --- --- --- --- --- --- --- --- ---6 Adult Basic Education and Training 7,177 --- 113 2,041 --- 5 180 --- 4 --- --- 1,160 10,6806.1 Public centres 7,177 --- --- --- --- --- --- --- --- --- --- --- 7,1776.2 Professional Services --- --- 99 2,022 --- 5 180 --- 4 - - 715 3,025

Page 97
EDUCATION STRATEGIC PLANNING V6
Current expenditure Use of goods and services Equipment Buildings Total
Text-books
Media collec-tions
Station-ery
Trans-port
TelecomAcquisi-
tion Rental Main-
tenanceRental
Muni-cipal
services
Hostels Other
6.3 Human Resource Development --- --- 14 19 --- --- --- --- --- --- --- 445 4787 Early Childhood Development --- --- 1,735 144 --- --- --- --- 1 --- --- 94 1,9747.1 Grade R in Pubic Schools --- --- --- --- --- --- --- --- --- --- --- --- ---7.2 Grade R in Community Centres --- --- --- --- --- --- --- --- --- --- --- --- ---7.3 Pre-Grade R --- --- --- --- --- --- --- --- --- --- --- --- ---7.4 Professional Services --- --- 16 144 --- --- --- --- 1 --- --- 94 2557.5 Human Resource Development --- --- --- --- --- --- --- --- --- --- --- --- ---7.6 Conditional Grants --- --- 1,719 --- --- --- --- --- --- --- --- --- 1,7198 Auxiliary and Associated Services --- 480 11,830 1,259 360 2,927 469 --- 1,714 480 --- 36,876 56,3958.1 Payments to SETA --- --- --- --- --- --- --- --- --- --- 3,388 3,3888.2 Conditional Grant Projects --- --- --- --- --- --- --- --- --- --- --- 22,358 22,3588.3 Special Projects --- 480 246 695 360 2,927 335 --- --- 480 --- 4,321 9,8448.4 External Examinations --- --- 11,584 564 --- --- 134 --- 1,714 --- --- 6,809 20,805 Total expenditure 38,932 3,629 46,948 39,395 9,656 5,238 9,458 26,302 13,462 28,340 10,248 104,901 336,509

Page 98
EDUCATION STRATEGIC PLANNING V6
EXPENDITURE BREAKDOWN BY GFS ECONOMIC CATEGORIES – PART 3 Current expenditure Transfer payments Total Section 21 schools Other Total 1 Administration 1.1 Office of the MEC
…all programmes and sub-programmes to be included…
8.3 Special Projects 8.4 External examinations Total expenditure
EXPENDITURE BREAKDOWN BY GFS ECONOMIC CATEGORIES – PART 4 Capital expenditure Non-financial assets Capital transfers Total
Buildings & structures
Machinery & equipment
Non-produced
goods
Total
Other assets
Local government
Other capital
transfers
Total
Grand total
1 Administration 1.1 Office of the MEC
…all programmes and sub-programmes to be included…
9.3 Special Projects 9.4 External examinations Total expenditure

Page 99
EDUCATION STRATEGIC PLANNING V6
TABLE: ABSOLUTE SPREAD ACROSS ECONOMIC CATEGORIES
Current expenditure (R 000)
Personnel
Programme
Educators Non-educators
Non-personnel
Total
Capital exp.
(R 000)
Total (R 000)
1. Administration 29 598 157 457 112 028 299 083 19 899 318 982 1.1 Office of the MEC - 1 862 1 009 2 871 200 3 071 1.2 Corporate services 5 420 75 470 65 391 146 281 17 206 163 487 1.3 Education management 24 178 80 125 41 280 145 583 2 493 148 076 1.4 Human resource development - - 4 348 4 348 - 4 348 1.5 Conditional grants - - - - - - 2. Public Ordinary School Education 2 772 819 152 739 266 942 3 192 500 23 907 3 216 407 2.1 Public primary schools 1 565 280 87 602 143 082 1 795 964 15 721 1 811 685 2.2 Public secondary schools 1 160 316 64 938 89 491 1 314 745 7 450 1 322 195 2.3 Professional services 39 568 199 7 642 47 409 736 48 145 2.4 Human resource development - - 23 278 23 278 - 23 278 2.5 In-school sport and cultures 7 655 - 3 449 11 104 - 11 104 2.6 Conditional grants - - - - - - 3. Independent School Subsidies - - 17 138 17 138 - 17 138 3.1 Primary phase - - 8 235 8 235 - 8 235 3.2 Secondary phase - - 8 903 8 903 - 8 903 4. Public Special Schools 81 131 14 188 21 058 116 377 1 994 118 371 4.1 Schools 68 305 14 188 18 639 101 132 1 854 102 986 4.2 Professional services 12 826 - 1 583 14 409 140 14 549 4.3 Human resource development - - 836 836 - 836 4.4 In-school sport and culture - - - - - - 4.5 Conditional grants - - - - - - 5. Further Education and Training 80 928 11 561 11 491 103 980 5 891 109 871 5.1 Public institutions 80 928 11 561 10 655 103 144 5 891 109 035 5.2 Youth colleges - - - - - - 5.3 Professional services - - - - - - 5.4 Human resource development - - 836 836 - 836 5.5 In-college sport and culture 5.6 Conditional grants 6. Adult Basic Education and Training 6.1 Public centres
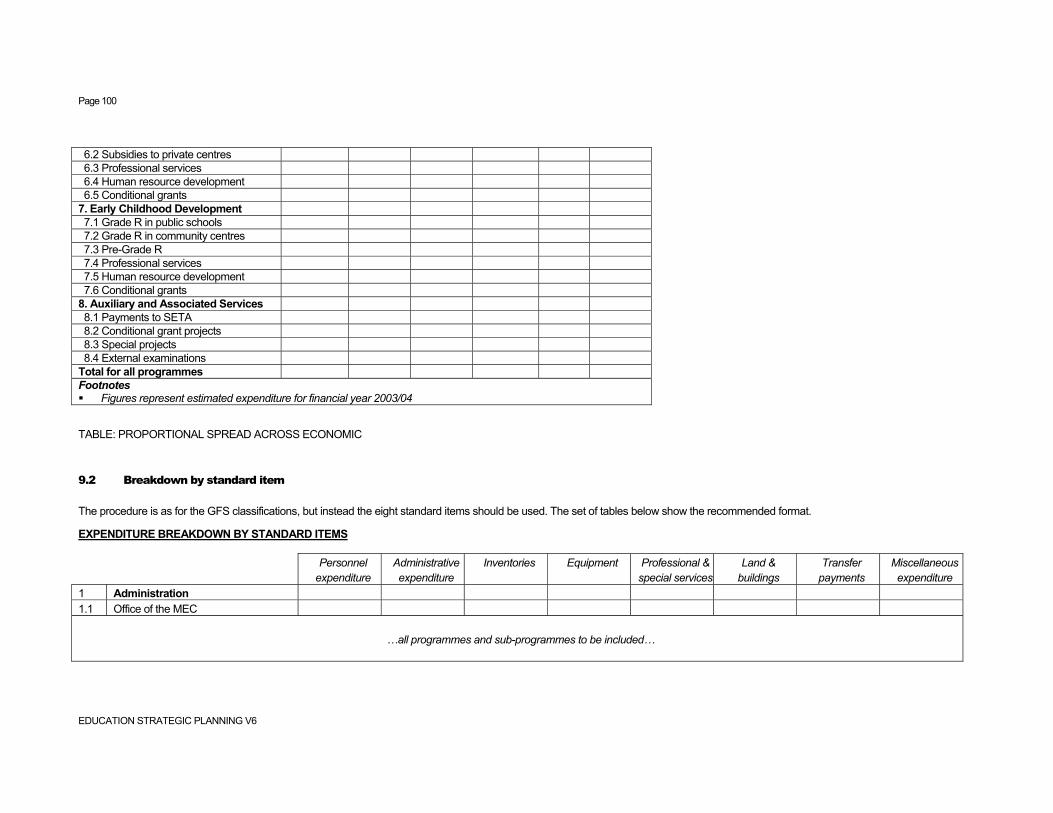
Page 100
EDUCATION STRATEGIC PLANNING V6
6.2 Subsidies to private centres 6.3 Professional services 6.4 Human resource development 6.5 Conditional grants 7. Early Childhood Development 7.1 Grade R in public schools 7.2 Grade R in community centres 7.3 Pre-Grade R 7.4 Professional services 7.5 Human resource development 7.6 Conditional grants 8. Auxiliary and Associated Services 8.1 Payments to SETA 8.2 Conditional grant projects 8.3 Special projects 8.4 External examinations Total for all programmes Footnotes Figures represent estimated expenditure for financial year 2003/04
TABLE: PROPORTIONAL SPREAD ACROSS ECONOMIC
9.2 Breakdown by standard item
The procedure is as for the GFS classifications, but instead the eight standard items should be used. The set of tables below show the recommended format.
EXPENDITURE BREAKDOWN BY STANDARD ITEMS Personnel
expenditure Administrative expenditure
Inventories Equipment Professional & special services
Land & buildings
Transfer payments
Miscellaneous expenditure
1 Administration 1.1 Office of the MEC
…all programmes and sub-programmes to be included…

Page 101
EDUCATION STRATEGIC PLANNING V6
Personnel expenditure
Administrative expenditure
Inventories Equipment Professional & special services
Land & buildings
Transfer payments
Miscellaneous expenditure
9.3 Special Projects 9.4 External examinations Total expenditure
10. Monthly cashflow by programme
It is only necessary to indicate cashflow by programme, and not by GFS classification or standard item. The recommended format is presented below. Note that only monthly expenditure, and not revenue, needs to be specified.
MONTHLY CASHFLOW Apr May Jun Jul Aug Sep Oct Nov Dec Jan Feb Mar 1 Administration 1.1 Office of the MEC
…all programmes and sub-programmes to be included…
9.3 Special Projects 9.4 External examinations Total expenditure

Page 102
EDUCATION STRATEGIC PLANNING V6
11. Conditional grants
This section should provide a summary of how the Department plans to manage the roll-out and monitoring of Conditional Grant expenditure.
12. Donor funding
This section should provide some detailed information, including relevant financial figures, on the use, direct or indirect, of donor funding by projects and programmes of the Department. The recommended format is provided below. Note that any donor funded activity where employees of the Department are involved at a management level must be referred to. The activity could be a project that is clearly owned, and mainly funded by the Department, but where donors are making contributions, or the activity could be a project that is clearly run from outside the Department, but where the Department is participating in the management of the project, e.g. through some participatory management structure.
The one example provided in the table below should help clarify how the table is to be used. Importantly, the financial figures should not include departmental contributions, or contributions from education Conditional Grant funds.
The table should include funding flowing through the provincial revenue fund, which would, in accordance with Treasury regulations, appear within the departmental budget and within MTEF projections.

Page 103
EDUCATION STRATEGIC PLANNING V6
DONOR FUNDING
Project name External donors Monetary contributions by donors (R 000) 2001/02
actual 2002/03
estimated 2003/04
estimated 2004/05
estimated 2005/06
estimated
Project outcomes Departmental reporting
responsibility Thuto Lesedi School Kroonstad
Vodacom South Africa
0 2,500 0 0 0 Renovation and upgrading of Thuto-Lesedi School in Kroonstad. The DoE Free State & Vodacom are to contribute equal amounts of R2,5 million each to complete the project
Mr L. Koen Acting Director Works & Physical Planning
Rebatla Thuto Sec. School Koppies
Shoprite South Africa
0 300 0 0 0 To erect +10 pre-fabricated classrooms for Rebatla Thuto Secondary School in Koppies. The School is currently platooning
Mr L. Koen Acting Director Works & Physical Planning
National Environmental Education Project (NEEP)
Danish Government Denmark
0 46 0 0 0 A Flemish Government project in collaboration with national DoE towards capacity building of the National Environmental Education Project. Donation in-kind towards flight and accommodation to Denmark for two officials
Mr MS Rakometsi CD: EDPS
Copyright © 2022 FDOKUMEN