Annual Report 2016/17 - Provincial Government
282
-
Upload
khangminh22 -
Category
Documents
-
view
2 -
download
0
Transcript of Annual Report 2016/17 - Provincial Government
Page 1
DEPARTMENT OF EDUCATION
PROVINCE OF MPUMALANGA
VOTE NO. 7
ANNUAL REPORT
2016/17 FINANCIAL YEAR

Page 2
Page 3
PART A: GENERAL INFORMATION .......................................................................................................................................................5
1. DEPARTMENT GENERAL INFORMATION ............................................................................................................................... 6
2. LIST OF ABBREVIATIONS/ACRONYMS .................................................................................................................................. 7
3. FOREWORD BY THE MINISTER/MEC ......................................................................................................................... 9
4. REPORT OF THE ACCOUNTING OFFICER ................................................................................................................11
5. STATEMENT OF RESPONSIBILITY AND CONFIRMATION OF ACCURACY FOR THE ANNUAL REPORT ..................... 20
6. STRATEGIC OVERVIEW ........................................................................................................................................... 21
6.1. Vision ....................................................................................................................................................................... 21
6.2. Mission ..................................................................................................................................................................... 21
6.3. Values ...................................................................................................................................................................... 21
7. LEGISLATIVE AND OTHER MANDATES .................................................................................................................... 21
8. ORGANISATIONAL STRUCTURE .............................................................................................................................. 23
9. ENTITIES REPORTING TO THE MINISTER/MEC ....................................................................................................... 23
PART B: PERFORMANCE INFORMATION ..........................................................................................................................................................25
1. AUDITOR GENERAL’S REPORT: PREDETERMINED OBJECTIVES ............................................................................ 26
2. OVERVIEW OF DEPARTMENTAL PERFORMANCE ................................................................................................... 26
2.1 Service Delivery Environment ..................................................................................................................................... 26
2.2 Service Delivery Improvement Plan ............................................................................................................................. 27
2.3 Organisational environment ........................................................................................................................................ 28
2.4 Key policy developments and legislative changes......................................................................................................... 29
3. STRATEGIC OUTCOME ORIENTED GOALS.............................................................................................................. 30
4. PERFORMANCE INFORMATION BY PROGRAMME ................................................................................................... 35
4.1 Programme 1: Administration...................................................................................................................................... 35
4.2 Programme 2: Public Ordinary Schools ....................................................................................................................... 43
4.3 Programme 3: Independent Schools ....................................................................................................................................... 58
4.4 Programme 4: Public Special Schools ..................................................................................................................................... 62
4.5 Programme 5: Early Childhood Development .......................................................................................................................... 65
4.6 Programme 6: Infrastructure Development .............................................................................................................................. 70
Table of Contents
Page 4
4.7 Programme 7: Examination and Education Related Services ................................................................................................. 75
5. TRANSFER PAYMENTS ............................................................................................................................................ 86
5.1. Transfer payments to public entities ............................................................................................................................ 86
5.2. Transfer payments to all organisations other than public entities .................................................................................... 87
6. CONDITIONAL GRANTS ........................................................................................................................................... 88
6.1. Conditional grants and earmarked funds paid .............................................................................................................. 88
6.2. Conditional grants and earmarked funds received ........................................................................................................ 88
7. DONOR FUNDS ....................................................................................................................................................... 93
7.1. Donor Funds Received .............................................................................................................................................. 93
8. CAPITAL INVESTMENT ............................................................................................................................................ 93
8.1. Capital investment, maintenance and asset management plan ...................................................................................... 93
PART C: GOVERNANCE ........................................................................................................................................................................................113
1. INTRODUCTION ......................................................................................................................................................115
2. RISK MANAGEMENT ...............................................................................................................................................115
3. FRAUD AND CORRUPTION .....................................................................................................................................116
4. MINIMISING CONFLICT OF INTEREST ....................................................................................................................116
5. CODE OF CONDUCT ...............................................................................................................................................116
6. HEALTH SAFETY AND ENVIRONMENTAL ISSUES ...................................................................................................117
7. PORTFOLIO COMMITTEES .....................................................................................................................................118
8. SCOPA RESOLUTIONS ...........................................................................................................................................124
9. PRIOR MODIFICATIONS TO AUDIT REPORTS .........................................................................................................124
10. INTERNAL CONTROL UNIT .....................................................................................................................................124
11. INTERNAL AUDIT AND AUDIT COMMITTEES ...........................................................................................................124
12. AUDIT COMMITTEE REPORT ..................................................................................................................................126
PART D: HUMAN RESOURCE MANAGEMENT ................................................................................................................................................129
1. INTRODUCTION ......................................................................................................................................................130
2. OVERVIEW OF HUMAN RESOURCES .....................................................................................................................130
3. HUMAN RESOURCES OVERSIGHT STATISTICS ......................................................................................................137
PART E: FINANCIAL INFORMATION ..................................................................................................................................................................171
1. REPORT OF THE AUDITOR GENERAL ....................................................................................................................172
2. ANNUAL FINANCIAL STATEMENTS .........................................................................................................................179

Page 5
PART A:
GENERALINFORMATION
Page 6
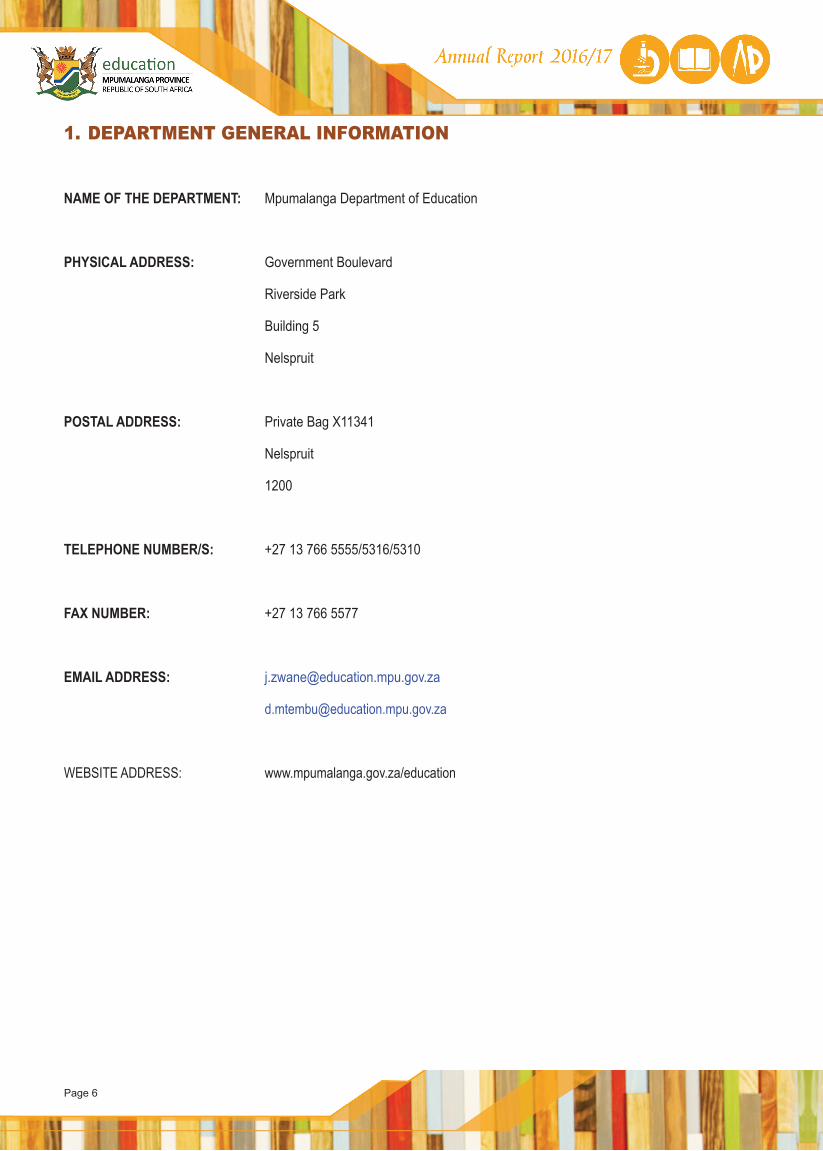
1. DEPARTMENT GENERAL INFORMATION
NAME OF THE DEPARTMENT: Mpumalanga Department of Education
PHYSICAL ADDRESS: Government Boulevard
Riverside Park
Building 5
Nelspruit
POSTAL ADDRESS: Private Bag X11341
Nelspruit
1200
TELEPHONE NUMBER/S: +27 13 766 5555/5316/5310
FAX NUMBER: +27 13 766 5577
EMAIL ADDRESS: [email protected]
WEBSITE ADDRESS: www.mpumalanga.gov.za/education
Page 7
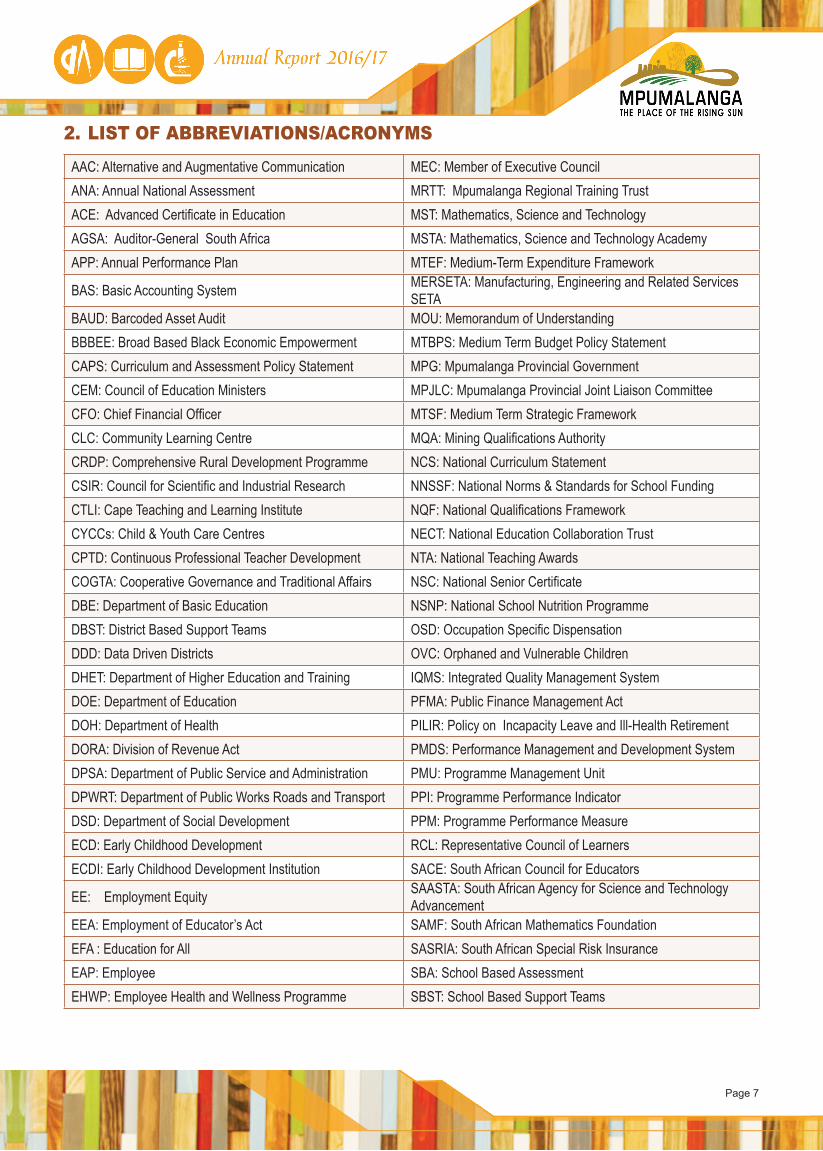
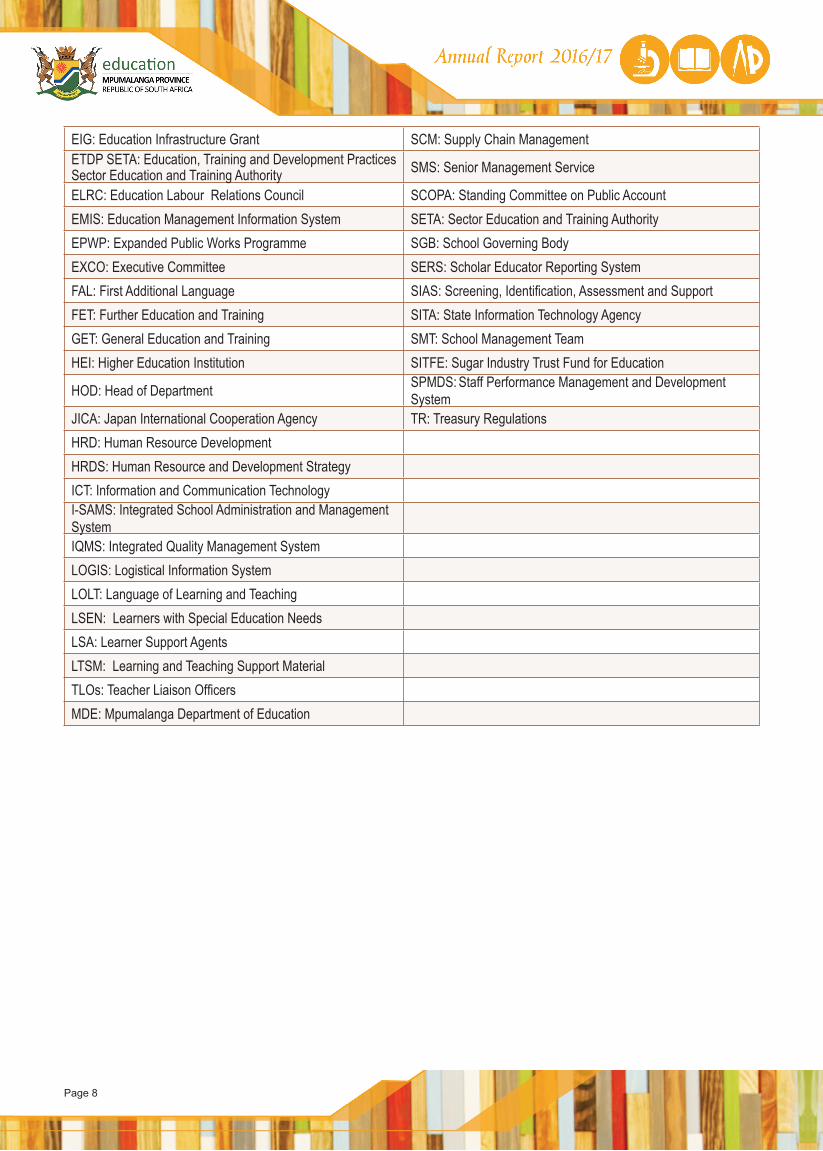
2. LIST OF ABBREVIATIONS/ACRONYMSAAC: Alternative and Augmentative Communication MEC: Member of Executive CouncilANA: Annual National Assessment MRTT: Mpumalanga Regional Training TrustACE: Advanced Certificate in Education MST: Mathematics, Science and TechnologyAGSA: Auditor-General South Africa MSTA: Mathematics, Science and Technology AcademyAPP: Annual Performance Plan MTEF: Medium-Term Expenditure Framework
BAS: Basic Accounting System MERSETA: Manufacturing, Engineering and Related Services SETA
BAUD: Barcoded Asset Audit MOU: Memorandum of UnderstandingBBBEE: Broad Based Black Economic Empowerment MTBPS: Medium Term Budget Policy StatementCAPS: Curriculum and Assessment Policy Statement MPG: Mpumalanga Provincial GovernmentCEM: Council of Education Ministers MPJLC: Mpumalanga Provincial Joint Liaison CommitteeCFO: Chief Financial Officer MTSF: Medium Term Strategic FrameworkCLC: Community Learning Centre MQA: Mining Qualifications AuthorityCRDP: Comprehensive Rural Development Programme NCS: National Curriculum StatementCSIR: Council for Scientific and Industrial Research NNSSF: National Norms & Standards for School Funding CTLI: Cape Teaching and Learning Institute NQF: National Qualifications FrameworkCYCCs: Child & Youth Care Centres NECT: National Education Collaboration TrustCPTD: Continuous Professional Teacher Development NTA: National Teaching AwardsCOGTA: Cooperative Governance and Traditional Affairs NSC: National Senior CertificateDBE: Department of Basic Education NSNP: National School Nutrition ProgrammeDBST: District Based Support Teams OSD: Occupation Specific DispensationDDD: Data Driven Districts OVC: Orphaned and Vulnerable ChildrenDHET: Department of Higher Education and Training IQMS: Integrated Quality Management SystemDOE: Department of Education PFMA: Public Finance Management ActDOH: Department of Health PILIR: Policy on Incapacity Leave and Ill-Health RetirementDORA: Division of Revenue Act PMDS: Performance Management and Development SystemDPSA: Department of Public Service and Administration PMU: Programme Management UnitDPWRT: Department of Public Works Roads and Transport PPI: Programme Performance IndicatorDSD: Department of Social Development PPM: Programme Performance MeasureECD: Early Childhood Development RCL: Representative Council of LearnersECDI: Early Childhood Development Institution SACE: South African Council for Educators
EE: Employment Equity SAASTA: South African Agency for Science and Technology Advancement
EEA: Employment of Educator’s Act SAMF: South African Mathematics FoundationEFA : Education for All SASRIA: South African Special Risk InsuranceEAP: Employee SBA: School Based AssessmentEHWP: Employee Health and Wellness Programme SBST: School Based Support Teams
Page 8
EIG: Education Infrastructure Grant SCM: Supply Chain ManagementETDP SETA: Education, Training and Development Practices Sector Education and Training Authority SMS: Senior Management Service
ELRC: Education Labour Relations Council SCOPA: Standing Committee on Public AccountEMIS: Education Management Information System SETA: Sector Education and Training AuthorityEPWP: Expanded Public Works Programme SGB: School Governing BodyEXCO: Executive Committee SERS: Scholar Educator Reporting SystemFAL: First Additional Language SIAS: Screening, Identification, Assessment and SupportFET: Further Education and Training SITA: State Information Technology AgencyGET: General Education and Training SMT: School Management TeamHEI: Higher Education Institution SITFE: Sugar Industry Trust Fund for Education
HOD: Head of Department SPMDS: Staff Performance Management and Development System
JICA: Japan International Cooperation Agency TR: Treasury RegulationsHRD: Human Resource DevelopmentHRDS: Human Resource and Development StrategyICT: Information and Communication TechnologyI-SAMS: Integrated School Administration and Management SystemIQMS: Integrated Quality Management SystemLOGIS: Logistical Information SystemLOLT: Language of Learning and TeachingLSEN: Learners with Special Education NeedsLSA: Learner Support AgentsLTSM: Learning and Teaching Support MaterialTLOs: Teacher Liaison OfficersMDE: Mpumalanga Department of Education

Page 9
The Annual Report provides a summary of our services, achievements and operational activities for the 2016/17 financial year. It covers our services in the areas of public schools, independent schools, public special schools and early childhood education in relation to Outcome 1: Improved quality basic education. It also includes the operations of Transversal Human Resource Development as well as that of the Mpumalanga Regional Training Trust in relation to Outcome 5: ‘A skilled and capable workforce to support an inclusive growth path. The report bears testimony to our quest to institute an education system that has as its core a development agenda that is people-driven aimed at unearthing abilities and potential of African children and the youth within the province. It provides a clear mirror of the road travelled informed by the vision to emancipate the young and the old and to foster a system of education that responds to the desire to topple the triple challenges of poverty, inequality and unemployment.
Achievements in relation to policy directives and strategic outcome related goals
Today we take pride of the fact that the grade 12 results are stable above the 77% bracket and the potential to improve them going forward.
Through the Human Resource Development programmes we are reaching out to students who would have been denied education due to issues of none affordability and we are encouraged to observe that there are tangible results in that front. The actual number of students that are benefiting are provided in this report.
We remain mindful that it is through Early Childhood Development (ECD) that a solid ground can be created to prepare children for productive adulthood. This fact compels us to do more in order to ensure that programmes aimed at the realisation of the ECD agenda are not in any way compromised. The provincial Early Childhood Development Institute and programmes implemented at that institute so far bears testimony of our commitment.
The province will not rest until such time that a realisation that is embedded in the National Development Plan regarding the increased performance in fields of Mathematics, Physical Science and technology.
Every effort therefore is made to equip the Mathematics, Science and Technology Academy for the province to achieve the set targets.
The operationalization of the fifth boarding school for farm and vulnerable children truly reflects government’s commitment to make the lives of the poor better. Equally we are steadfast in ensuring that the dignity of both learners and teachers is at all times protected by prioritising the provision of basic services focusing at sanitation facilities, water and supply of electricity. This annual report provides details on the extent to which this area is being fulfilled.
Challenges for the financial year under review
Indeed there are recorded hindrances some of which are an inheritance from the old order, others are as a result of austerity measures as well as the community protests that have a tendency to disrupt teaching and learning in some parts of the province. I am also concerned with the snail pace at which ICT is being rolled out in schools including the unwarranted conduct of some of the teachers, high rate of teenage pregnancy and lack of a united front in some schools.
3. FOREWORD BY THE MEC
HON MRS MR MHAULE (MPL)MEC FOR EDUCATION
Page 10
Medium to long term goals of the department
All our efforts are geared to ensure that we:• Provide effective teaching in all schools; • Ensure effective and efficient management at all educational institutions and offices; • Ensure professional and ethical conduct by all educators, support staff and managers; • Progressively put adequate measures in place to ensure the safety and security of educators and learners in schools; • Progressively provide learners with relevant school infrastructure to create a conducive learning environment;• Provide nutritious meals in the poorest schools;• Expand the delivery and quality of Early Childhood Development programmes; and • Improve participation and performance in gateway subjects, such as Mathematics, Sciences and Technology.
Acknowledgements /Appreciation
One of the most important jobs we have as a government and as a society is to prepare our children to be the community and business leaders of tomorrow. Investing in education is an investment in our future. I wish to extend my gratitude to all officials under the management of the Head of Education, Mrs Mahlasedi Mhlabane. I also want to recognise and thank all of our partners in education for their input and support of our school communities – students, parents, teachers, paraprofessionals, principals, deputy-principals, School Governing Bodies, Representative Councils of Learners, Organised Labour, Oversight Institutions, Institutions of Higher Learning, Business Partners, Civil Society, and others.
Conclusion
Everyone is aware that the national fiscus is taking a strain following the international economic meltdown. It is against this background that some of the predetermined objectives could not be achieved during the year under review, as well as why some of our targets for future years will remain modest, because the budgets will only grow modestly for the immediate future. Our key stakeholders should also take note of this.
This report reflects on the past year – its challenges, progress and opportunities. Let us use it as a foundation for looking forward to what we want education to be. We know there is room for improvement. Let us build a new vision, together, for public education in Mpumalanga.
Mrs MR Mhaule (MPL)MEC for Department of Education Date: 31 May 2017
Signature: __________________________
Page 11
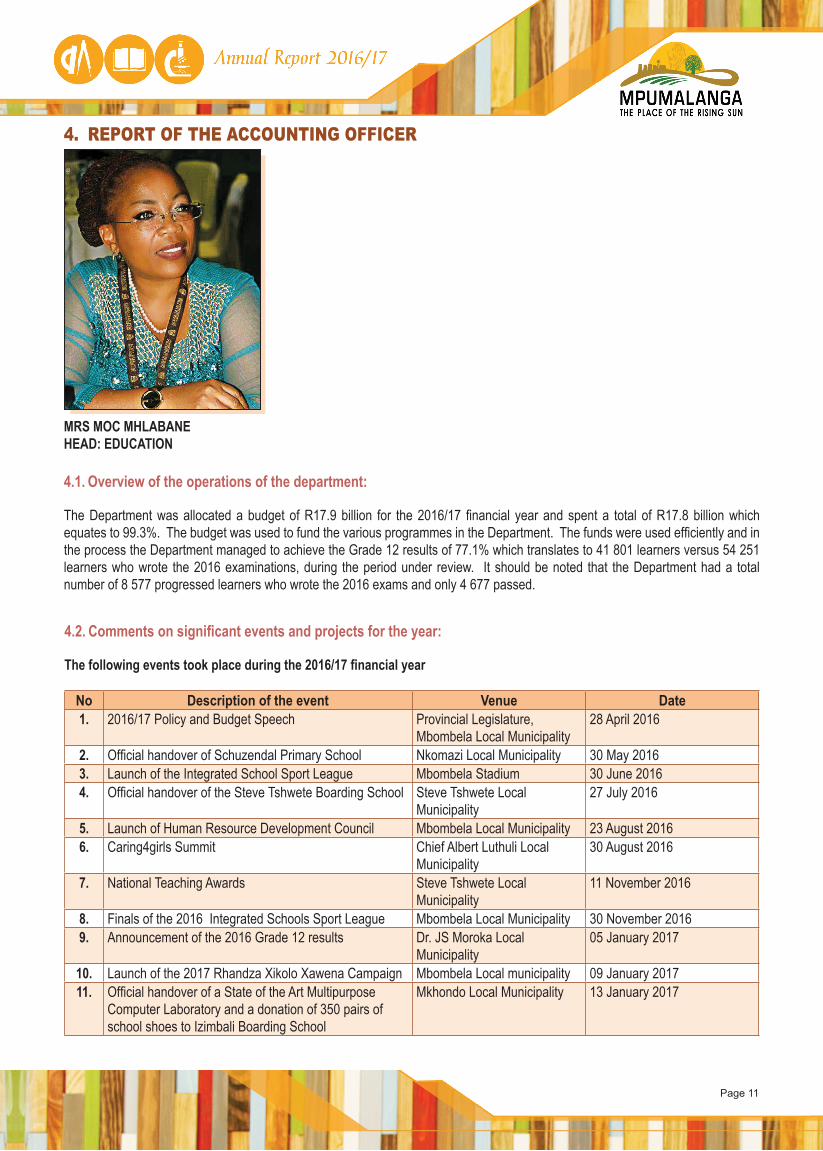
4.1. Overview of the operations of the department:
The Department was allocated a budget of R17.9 billion for the 2016/17 financial year and spent a total of R17.8 billion which equates to 99.3%. The budget was used to fund the various programmes in the Department. The funds were used efficiently and in the process the Department managed to achieve the Grade 12 results of 77.1% which translates to 41 801 learners versus 54 251 learners who wrote the 2016 examinations, during the period under review. It should be noted that the Department had a total number of 8 577 progressed learners who wrote the 2016 exams and only 4 677 passed.
No Description of the event Venue Date1. 2016/17 Policy and Budget Speech Provincial Legislature,
Mbombela Local Municipality28 April 2016
2. Official handover of Schuzendal Primary School Nkomazi Local Municipality 30 May 20163. Launch of the Integrated School Sport League Mbombela Stadium 30 June 20164. Official handover of the Steve Tshwete Boarding School Steve Tshwete Local
Municipality27 July 2016
5. Launch of Human Resource Development Council Mbombela Local Municipality 23 August 20166. Caring4girls Summit Chief Albert Luthuli Local
Municipality30 August 2016
7. National Teaching Awards Steve Tshwete Local Municipality
11 November 2016
8. Finals of the 2016 Integrated Schools Sport League Mbombela Local Municipality 30 November 20169. Announcement of the 2016 Grade 12 results Dr. JS Moroka Local
Municipality05 January 2017
10. Launch of the 2017 Rhandza Xikolo Xawena Campaign Mbombela Local municipality 09 January 201711. Official handover of a State of the Art Multipurpose
Computer Laboratory and a donation of 350 pairs of school shoes to Izimbali Boarding School
Mkhondo Local Municipality 13 January 2017
4. REPORT OF THE ACCOUNTING OFFICER
MRS MOC MHLABANEHEAD: EDUCATION
4.2. Comments on significant events and projects for the year:
The following events took place during the 2016/17 financial year
Page 12
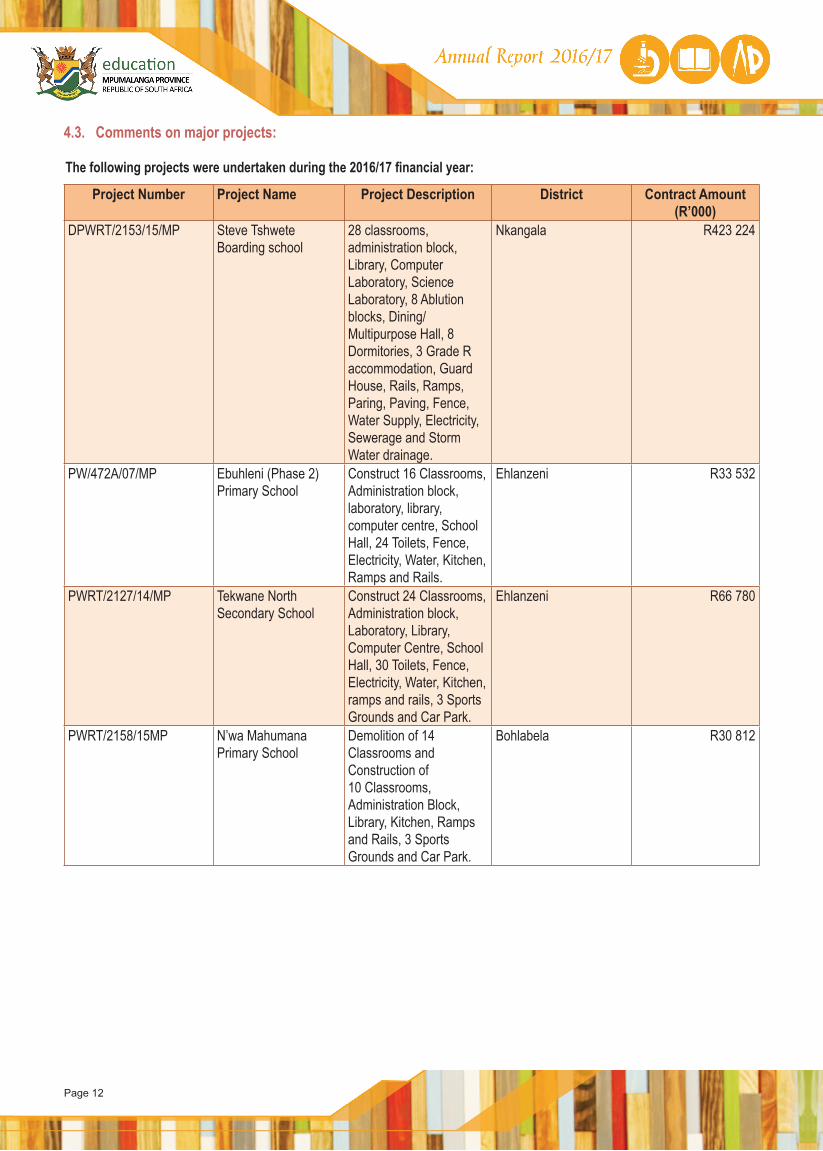
4.3. Comments on major projects:
The following projects were undertaken during the 2016/17 financial year:
Project Number Project Name Project Description District Contract Amount(R’000)
DPWRT/2153/15/MP Steve Tshwete Boarding school
28 classrooms, administration block, Library, Computer Laboratory, Science Laboratory, 8 Ablution blocks, Dining/Multipurpose Hall, 8 Dormitories, 3 Grade R accommodation, Guard House, Rails, Ramps, Paring, Paving, Fence, Water Supply, Electricity, Sewerage and Storm Water drainage.
Nkangala R423 224
PW/472A/07/MP Ebuhleni (Phase 2) Primary School
Construct 16 Classrooms, Administration block, laboratory, library, computer centre, School Hall, 24 Toilets, Fence, Electricity, Water, Kitchen, Ramps and Rails.
Ehlanzeni R33 532
PWRT/2127/14/MP Tekwane North Secondary School
Construct 24 Classrooms, Administration block, Laboratory, Library, Computer Centre, School Hall, 30 Toilets, Fence, Electricity, Water, Kitchen, ramps and rails, 3 Sports Grounds and Car Park.
Ehlanzeni R66 780
PWRT/2158/15MP N’wa Mahumana Primary School
Demolition of 14 Classrooms and Construction of 10 Classrooms, Administration Block, Library, Kitchen, Ramps and Rails, 3 Sports Grounds and Car Park.
Bohlabela R30 812
Page 13
4.4. Overview of the financial results of the Department:
The department has ensured that it articulates all its financial responsibilities in line with the Public Finance Management Act (PFMA) and Treasury Regulations (TR). The details of the financial results are stated in the tables and narratives below:
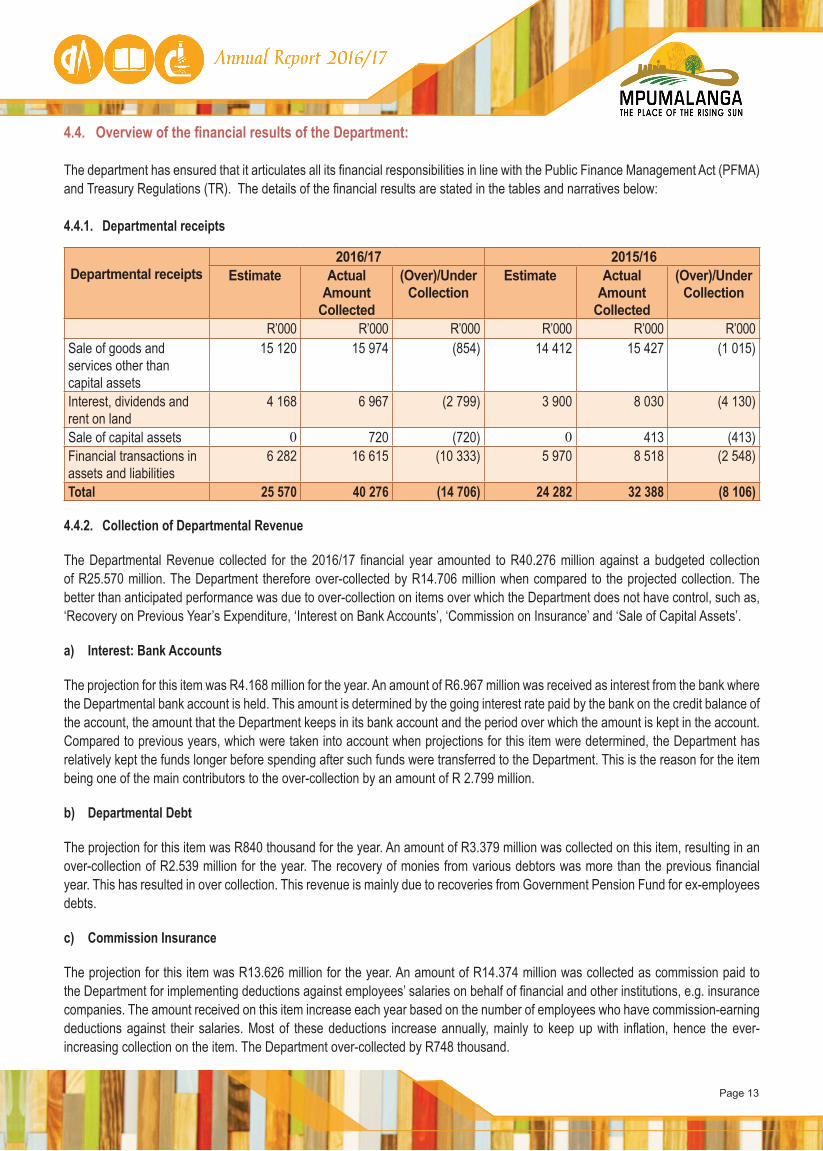
4.4.1. Departmental receipts
Departmental receipts2016/17 2015/16
Estimate ActualAmount
Collected
(Over)/Under Collection
Estimate ActualAmount
Collected
(Over)/Under Collection
R’000 R’000 R’000 R’000 R’000 R’000Sale of goods and services other than capital assets
15 120 15 974 (854) 14 412 15 427 (1 015)
Interest, dividends and rent on land
4 168 6 967 (2 799) 3 900 8 030 (4 130)
Sale of capital assets 0 720 (720) 0 413 (413)Financial transactions in assets and liabilities
6 282 16 615 (10 333) 5 970 8 518 (2 548)
Total 25 570 40 276 (14 706) 24 282 32 388 (8 106)
4.4.2. Collection of Departmental Revenue
The Departmental Revenue collected for the 2016/17 financial year amounted to R40.276 million against a budgeted collection of R25.570 million. The Department therefore over-collected by R14.706 million when compared to the projected collection. The better than anticipated performance was due to over-collection on items over which the Department does not have control, such as, ‘Recovery on Previous Year’s Expenditure, ‘Interest on Bank Accounts’, ‘Commission on Insurance’ and ‘Sale of Capital Assets’.
a) Interest: Bank Accounts
The projection for this item was R4.168 million for the year. An amount of R6.967 million was received as interest from the bank where the Departmental bank account is held. This amount is determined by the going interest rate paid by the bank on the credit balance of the account, the amount that the Department keeps in its bank account and the period over which the amount is kept in the account. Compared to previous years, which were taken into account when projections for this item were determined, the Department has relatively kept the funds longer before spending after such funds were transferred to the Department. This is the reason for the item being one of the main contributors to the over-collection by an amount of R 2.799 million.
b) Departmental Debt
The projection for this item was R840 thousand for the year. An amount of R3.379 million was collected on this item, resulting in an over-collection of R2.539 million for the year. The recovery of monies from various debtors was more than the previous financial year. This has resulted in over collection. This revenue is mainly due to recoveries from Government Pension Fund for ex-employees debts.
c) Commission Insurance
The projection for this item was R13.626 million for the year. An amount of R14.374 million was collected as commission paid to the Department for implementing deductions against employees’ salaries on behalf of financial and other institutions, e.g. insurance companies. The amount received on this item increase each year based on the number of employees who have commission-earning deductions against their salaries. Most of these deductions increase annually, mainly to keep up with inflation, hence the ever-increasing collection on the item. The Department over-collected by R748 thousand.
Page 14
d) Recovery of Previous Year’s Expenditure
The projection for this item was R5.400 million for the year. An amount of R13.199 million was collected on this item, resulting in an over-collection of R7.799 million. The collection on this item is due to the recovery of debts that were created in previous years, i.e. before the current Financial Year.
e) Sale of Capital Assets
The Department received proceeds from the sale of old/damaged Government Vehicles amounting to R720 thousand during the course of the year. An amount of R144 thousand was received in October 2016 and R576 thousand was received in March 2017.The Department did not anticipate any auction during the planning process, hence there was no projection for this item. The Department, however, had to auction old/damaged Government Vehicles towards the end of the financial year.
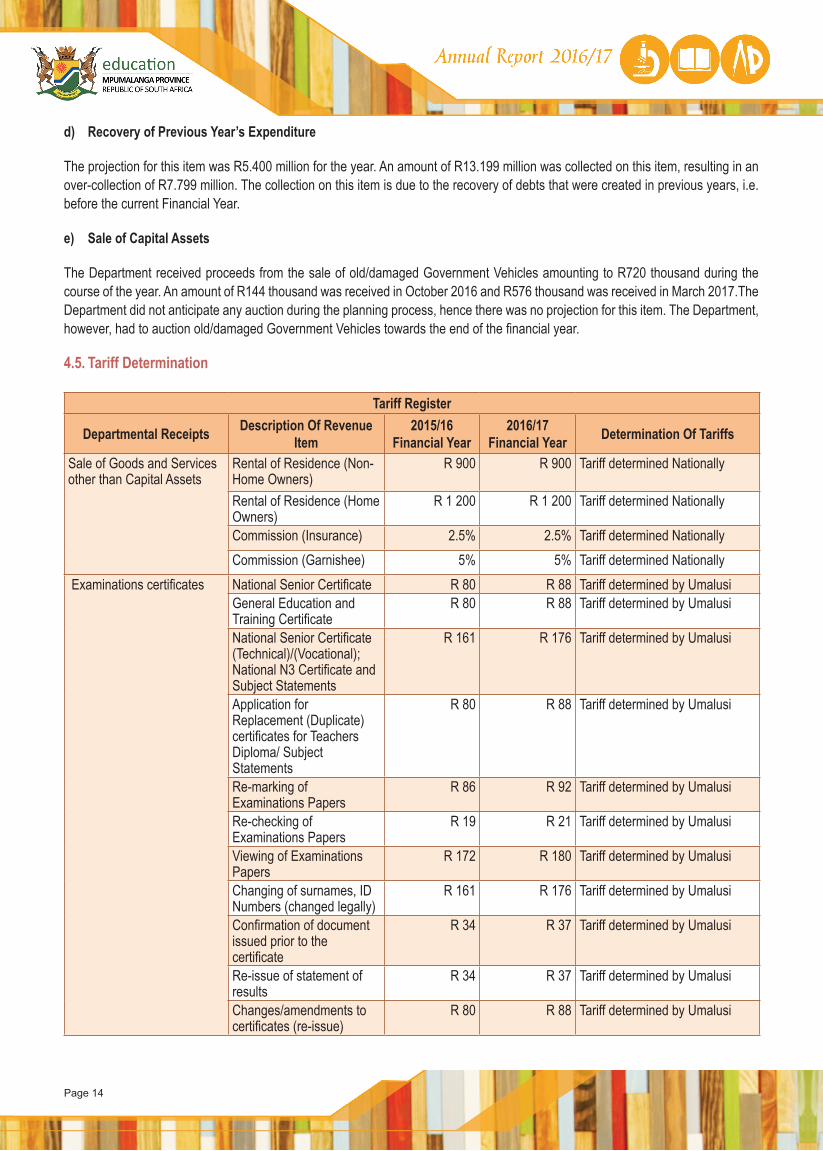
4.5. Tariff Determination
Tariff Register
Departmental Receipts Description Of Revenue Item
2015/16 Financial Year
2016/17 Financial Year Determination Of Tariffs
Sale of Goods and Services other than Capital Assets
Rental of Residence (Non-Home Owners)
R 900 R 900 Tariff determined Nationally
Rental of Residence (Home Owners)
R 1 200 R 1 200 Tariff determined Nationally
Commission (Insurance) 2.5% 2.5% Tariff determined NationallyCommission (Garnishee) 5% 5% Tariff determined Nationally
Examinations certificates National Senior Certificate R 80 R 88 Tariff determined by UmalusiGeneral Education and Training Certificate
R 80 R 88 Tariff determined by Umalusi
National Senior Certificate (Technical)/(Vocational); National N3 Certificate and Subject Statements
R 161 R 176 Tariff determined by Umalusi
Application for Replacement (Duplicate) certificates for Teachers Diploma/ Subject Statements
R 80 R 88 Tariff determined by Umalusi
Re-marking of Examinations Papers
R 86 R 92 Tariff determined by Umalusi
Re-checking of Examinations Papers
R 19 R 21 Tariff determined by Umalusi
Viewing of Examinations Papers
R 172 R 180 Tariff determined by Umalusi
Changing of surnames, ID Numbers (changed legally)
R 161 R 176 Tariff determined by Umalusi
Confirmation of document issued prior to the certificate
R 34 R 37 Tariff determined by Umalusi
Re-issue of statement of results
R 34 R 37 Tariff determined by Umalusi
Changes/amendments to certificates (re-issue)
R 80 R 88 Tariff determined by Umalusi
Page 15
4.5.1 Bad debts written off
The Department did not write off any debts in the year under review as there were no savings realised due to unauthorised expenditure in Programme Two.
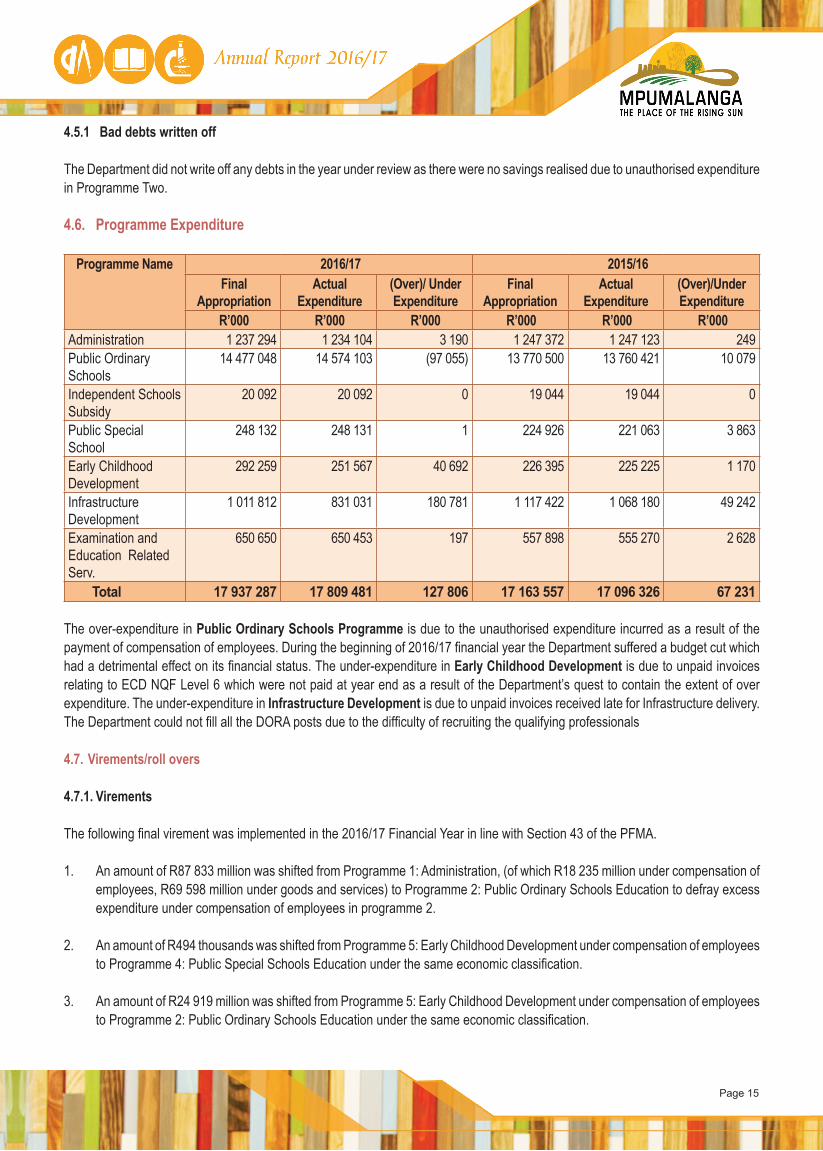
4.6. Programme Expenditure
Programme Name 2016/17 2015/16Final
AppropriationActual
Expenditure(Over)/ Under Expenditure
Final Appropriation
Actual Expenditure
(Over)/Under Expenditure
R’000 R’000 R’000 R’000 R’000 R’000Administration 1 237 294 1 234 104 3 190 1 247 372 1 247 123 249Public Ordinary Schools
14 477 048 14 574 103 (97 055) 13 770 500 13 760 421 10 079
Independent Schools Subsidy
20 092 20 092 0 19 044 19 044 0
Public Special School
248 132 248 131 1 224 926 221 063 3 863
Early Childhood Development
292 259 251 567 40 692 226 395 225 225 1 170
Infrastructure Development
1 011 812 831 031 180 781 1 117 422 1 068 180 49 242
Examination and Education Related Serv.
650 650 650 453 197 557 898 555 270 2 628
Total 17 937 287 17 809 481 127 806 17 163 557 17 096 326 67 231
The over-expenditure in Public Ordinary Schools Programme is due to the unauthorised expenditure incurred as a result of the payment of compensation of employees. During the beginning of 2016/17 financial year the Department suffered a budget cut which had a detrimental effect on its financial status. The under-expenditure in Early Childhood Development is due to unpaid invoices relating to ECD NQF Level 6 which were not paid at year end as a result of the Department’s quest to contain the extent of over expenditure. The under-expenditure in Infrastructure Development is due to unpaid invoices received late for Infrastructure delivery. The Department could not fill all the DORA posts due to the difficulty of recruiting the qualifying professionals
4.7. Virements/roll overs
4.7.1. Virements
The following final virement was implemented in the 2016/17 Financial Year in line with Section 43 of the PFMA.
1. An amount of R87 833 million was shifted from Programme 1: Administration, (of which R18 235 million under compensation of employees, R69 598 million under goods and services) to Programme 2: Public Ordinary Schools Education to defray excess expenditure under compensation of employees in programme 2.
2. An amount of R494 thousands was shifted from Programme 5: Early Childhood Development under compensation of employees to Programme 4: Public Special Schools Education under the same economic classification.
3. An amount of R24 919 million was shifted from Programme 5: Early Childhood Development under compensation of employees to Programme 2: Public Ordinary Schools Education under the same economic classification.
Page 16
4. An amount of R637 thousand was shifted between sub-programmes within Programme 5: Early Childhood Development from compensation of employees to transfers and subsidies.
5. An amount of R10 208 million was shifted from Programme 6: Infrastructure Development under goods and services to Programme 2: Public Ordinary Schools Education (HRD sub-programme) under the same economic classification.
6. An amount of R8 445 million was shifted from Programme 6: Infrastructure Development under goods and services to Programme 2: Public Ordinary Schools Education under compensation of employees.
7. An amount of R8 411 million was shifted from Programme 7: Examination and Education Related Services under compensation of employees to Programme 2: Public Ordinary Schools Education under the same economic classification.
8. An amount of R25 986 million was shifted from Programme 7: Examination and Education Related Services under goods and services to Programme 2: Public Ordinary Schools Education under compensation of employees.
9. An amount of R9 659 million was shifted from Programme 7: Examination and Education Related Services under transfers and subsidies to Programme 2: Public Ordinary Schools Education under transfers and subsidies.
4.7.2. Rollovers
The following roll-overs were requested on unspent Conditional Grant funds:
1. R9 987million for National Schools Nutrition Programmes Grant (NSNP)
2. R263 thousand for Mathematics, Science and Technology Grant
3. R1 178 million for Social Sector EPWP Incentive Grant for Provinces.
4. R109 444 million for Education Infrastructure Grant.
5. R110 thousand for EPWP Integrated Infrastructure Grant for Provinces.
6. R196 thousand for HIV/AIDS Life Skills Grant
The following roll-overs were requested of unspent funds on equitable share.
R 4.489 Million for the purchase of buses, Programme 2
4.8. Unauthorised, Irregular and Fruitless and Wasteful Expenditure
4.8.1. Unauthorised expenditure
The Department incurred unauthorised expenditure amounting to R97 million for the year under review. This was incurred mainly under compensation of employees as a result of budget cuts experienced by the Department at the beginning of 2016/17 financial year.
Page 17
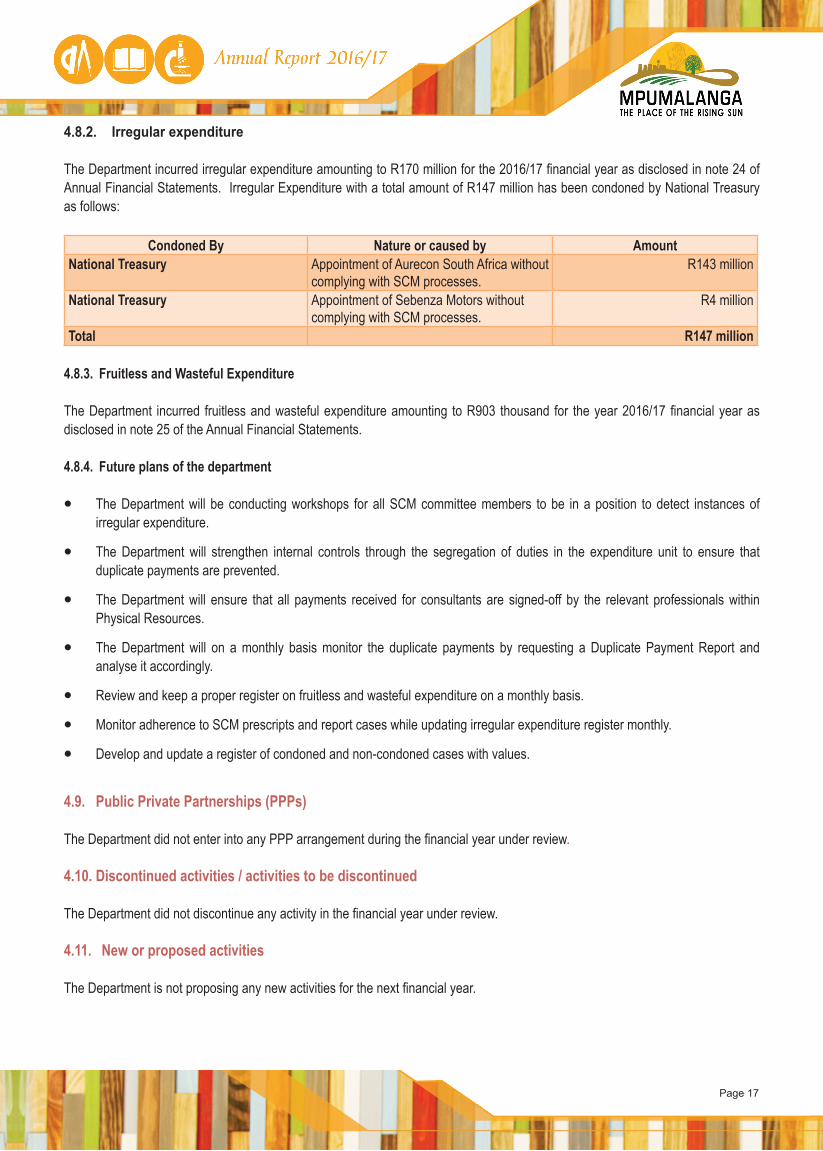
4.8.2. Irregular expenditure
The Department incurred irregular expenditure amounting to R170 million for the 2016/17 financial year as disclosed in note 24 of Annual Financial Statements. Irregular Expenditure with a total amount of R147 million has been condoned by National Treasury as follows:
Condoned By Nature or caused by Amount National Treasury Appointment of Aurecon South Africa without
complying with SCM processes. R143 million
National Treasury Appointment of Sebenza Motors without complying with SCM processes.
R4 million
Total R147 million
4.8.3. Fruitless and Wasteful Expenditure
The Department incurred fruitless and wasteful expenditure amounting to R903 thousand for the year 2016/17 financial year as disclosed in note 25 of the Annual Financial Statements.
4.8.4. Future plans of the department
The Department will be conducting workshops for all SCM committee members to be in a position to detect instances of irregular expenditure.
The Department will strengthen internal controls through the segregation of duties in the expenditure unit to ensure that duplicate payments are prevented.
The Department will ensure that all payments received for consultants are signed-off by the relevant professionals within Physical Resources.
The Department will on a monthly basis monitor the duplicate payments by requesting a Duplicate Payment Report and analyse it accordingly.
Review and keep a proper register on fruitless and wasteful expenditure on a monthly basis.
Monitor adherence to SCM prescripts and report cases while updating irregular expenditure register monthly.
Develop and update a register of condoned and non-condoned cases with values.
4.9. Public Private Partnerships (PPPs)
The Department did not enter into any PPP arrangement during the financial year under review.
4.10. Discontinued activities / activities to be discontinued
The Department did not discontinue any activity in the financial year under review.
4.11. New or proposed activities
The Department is not proposing any new activities for the next financial year.
Page 18
4.12. Supply chain management
The Department did not award any unsolicited bid proposal during the 2016-17 financial year.4.12.1. SCM processes and systems to prevent irregular expenditure
Several processes and controls have since been implemented to manage the increase in irregular expenditure over the years. Transgressions against regulations and controls which cause irregular expenditure are dealt with by applying consequence management.
Supply chain processes are in place to prevent irregular expenditure whereby procurement with a rand value of less than R500 000 per case is awarded by the economizing committee in case of head office and District Acquisition committee in case of Districts. It should however be noted that the systems are not yet full proof as there were requests for approval to procure goods and services which were approved ex post facto. Furthermore some other requests were disapproved and therefore disclosed as irregular expenditure. The Department has noticed a dramatic decrease in applications for ex post facto approval of procurement of goods and services and this could be attributed to the fact that the Bid Adjudication Committee strongly condemns these kinds of actions.
The Bid Adjudication Committee will continue to play a major role in ensuring that ex post facto applications and request for deviation from normal procurement procedures are limited to a bare minimum.
Members serving on bid committees, economizing committee and District Acquisition committee were trained by the Department through on the job training to ensure that decisions taken by the Department are transparent and fair and may not lead the Department to any litigation.
Officials responsible for procurement in the Department are continuously receiving on the job training, training provided by Provincial Treasury and training programs on the Work Skills Plan to ensure continuous compliance with SCM prescripts.
The Department is currently liaising with implementing agent for infrastructure with a view to reduce irregular expenditure incurred as a result of non-submission of procurement documents for audit purposes.
The Department has fully implemented Central Supplier Database (CSD) introduced by National Treasury as from 01 April 2016.
4.12.2. Challenges experienced in SCM and how they were resolved
The Department is still experiencing challenges with regard to officials doing business with other departments and other spheres of government without the approval of the Executing Authority. The Department has also broadcast a message on the salary advices to the effect that government officials are not allowed to do business or perform remunerative work anymore.
The Department has implemented the Public Administration Management Act that prohibit all employees appointed by the state to conduct business with the State and are not allowed to be a director of public or private company conducting business with the state.
The Department still experiences challenges on contracts awarded by implementing agent and later declared irregular by AG due to non-compliance with SCM prescripts.
The introduction and implementation of the CSD will minimise the challenge of officials doing business with government.
The implementing agent includes officials from Education in their Bid Committees when appointments of contractors are done.
Page 19
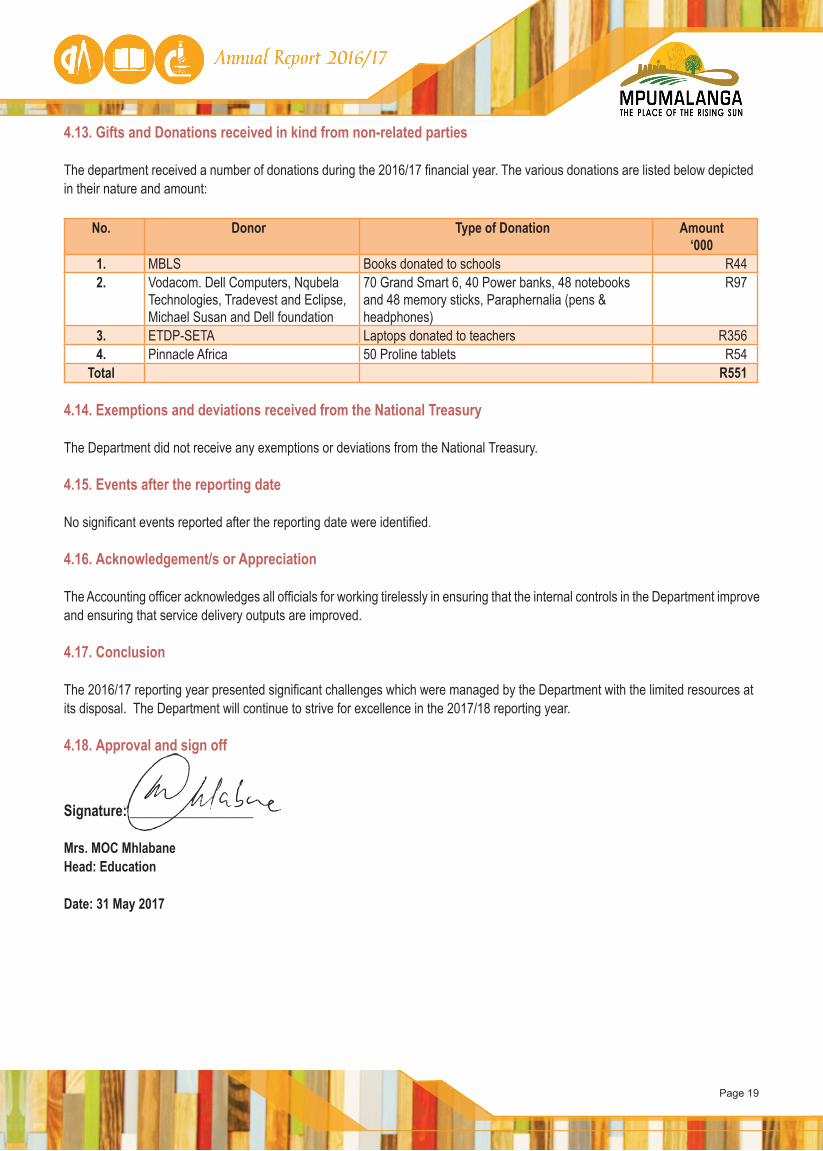
4.13. Gifts and Donations received in kind from non-related parties
The department received a number of donations during the 2016/17 financial year. The various donations are listed below depicted in their nature and amount:
No. Donor Type of Donation Amount‘000
1. MBLS Books donated to schools R442. Vodacom. Dell Computers, Nqubela
Technologies, Tradevest and Eclipse, Michael Susan and Dell foundation
70 Grand Smart 6, 40 Power banks, 48 notebooks and 48 memory sticks, Paraphernalia (pens & headphones)
R97
3. ETDP-SETA Laptops donated to teachers R3564. Pinnacle Africa 50 Proline tablets R54
Total R551
4.14. Exemptions and deviations received from the National Treasury
The Department did not receive any exemptions or deviations from the National Treasury.
4.15. Events after the reporting date
No significant events reported after the reporting date were identified.
4.16. Acknowledgement/s or Appreciation The Accounting officer acknowledges all officials for working tirelessly in ensuring that the internal controls in the Department improve and ensuring that service delivery outputs are improved.
4.17. Conclusion
The 2016/17 reporting year presented significant challenges which were managed by the Department with the limited resources at its disposal. The Department will continue to strive for excellence in the 2017/18 reporting year.
4.18. Approval and sign off
Mrs. MOC Mhlabane Head: Education
Date: 31 May 2017
Signature: __________________________
Page 20
5. STATEMENT OF RESPONSIBILITY AND CONFIRMATION OF ACCURACY FOR THE ANNUAL REPORT
To the best of my knowledge and belief, I confirm the following:
All information and amounts disclosed throughout the annual report are consistent.
The annual report is complete, accurate and is free from any omissions.
The annual report has been prepared in accordance with the guidelines on the annual report as issued by National Treasury.
The Annual Financial Statements (Part E) have been prepared in accordance with the modified cash standard and the relevant frameworks and guidelines issued by the National Treasury.
The Accounting Officer is responsible for the preparation of the annual financial statements and for the judgements made in this information.
The Accounting Officer is responsible for establishing, and implementing a system of internal control that has been designed to provide reasonable assurance as to the integrity and reliability of the performance information, the human resources information and the annual financial statements.
The external auditors are engaged to express an independent opinion on the annual financial statements.
In my opinion, the annual report fairly reflects the operations, the performance information, the human resources information and the financial affairs of the department for the financial year ended 31 March 2017.
Yours faithfully
Mrs. MOC MhlabaneHead: Education
Date: 31/05/2017
Signature: __________________________
Page 21
6. STRATEGIC OVERVIEW
6.1. Vision
Advancing excellence in quality education provision
6.2. Mission
The Mpumalanga Department of Education commits to work with its stakeholders to promote effective teaching and learning through good governance, capable management and proficient leadership
6.3. Values
Key corporate values that the Mpumalanga Department of Education intended to provide in the next 5 year period include:
• Integrity: Employees to ensure uncompromising and predictably consistent commitment to honour moral and ethical values at all times
• Consultation: Managers and staff regularly consult with all internal and external customers to ensure client satisfaction at all levels of the department
• Accountability: Officials at all levels of the department have set service delivery standards that ensure accountability
• Professionalism: Employees at all levels in the department are committed to the delivery of an equitable and efficient service to all stakeholders in education.
• Innovation: Continuously strive to be creative and innovative in the services offered by the department in keeping with the 21st Century.
• Transformation: Ensure equal access to services rendered by the department.
Page 22
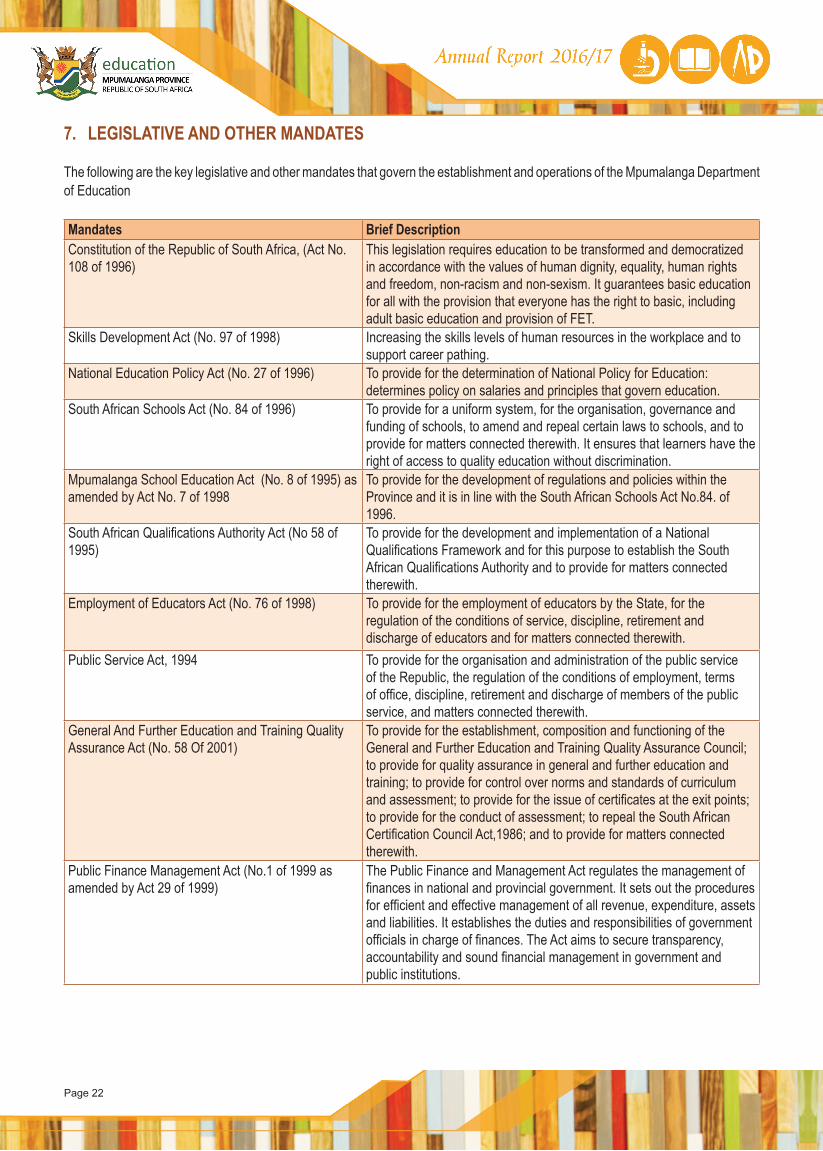
7. LEGISLATIVE AND OTHER MANDATES
The following are the key legislative and other mandates that govern the establishment and operations of the Mpumalanga Department of Education
Mandates Brief DescriptionConstitution of the Republic of South Africa, (Act No. 108 of 1996)
This legislation requires education to be transformed and democratized in accordance with the values of human dignity, equality, human rights and freedom, non-racism and non-sexism. It guarantees basic education for all with the provision that everyone has the right to basic, including adult basic education and provision of FET.
Skills Development Act (No. 97 of 1998) Increasing the skills levels of human resources in the workplace and to support career pathing.
National Education Policy Act (No. 27 of 1996) To provide for the determination of National Policy for Education: determines policy on salaries and principles that govern education.
South African Schools Act (No. 84 of 1996) To provide for a uniform system, for the organisation, governance and funding of schools, to amend and repeal certain laws to schools, and to provide for matters connected therewith. It ensures that learners have the right of access to quality education without discrimination.
Mpumalanga School Education Act (No. 8 of 1995) as amended by Act No. 7 of 1998
To provide for the development of regulations and policies within the Province and it is in line with the South African Schools Act No.84. of 1996.
South African Qualifications Authority Act (No 58 of 1995)
To provide for the development and implementation of a National Qualifications Framework and for this purpose to establish the South African Qualifications Authority and to provide for matters connected therewith.
Employment of Educators Act (No. 76 of 1998) To provide for the employment of educators by the State, for the regulation of the conditions of service, discipline, retirement and discharge of educators and for matters connected therewith.
Public Service Act, 1994 To provide for the organisation and administration of the public service of the Republic, the regulation of the conditions of employment, terms of office, discipline, retirement and discharge of members of the public service, and matters connected therewith.
General And Further Education and Training Quality Assurance Act (No. 58 Of 2001)
To provide for the establishment, composition and functioning of the General and Further Education and Training Quality Assurance Council; to provide for quality assurance in general and further education and training; to provide for control over norms and standards of curriculum and assessment; to provide for the issue of certificates at the exit points; to provide for the conduct of assessment; to repeal the South African Certification Council Act,1986; and to provide for matters connected therewith.
Public Finance Management Act (No.1 of 1999 as amended by Act 29 of 1999)
The Public Finance and Management Act regulates the management of finances in national and provincial government. It sets out the procedures for efficient and effective management of all revenue, expenditure, assets and liabilities. It establishes the duties and responsibilities of government officials in charge of finances. The Act aims to secure transparency, accountability and sound financial management in government and public institutions.
Page 23
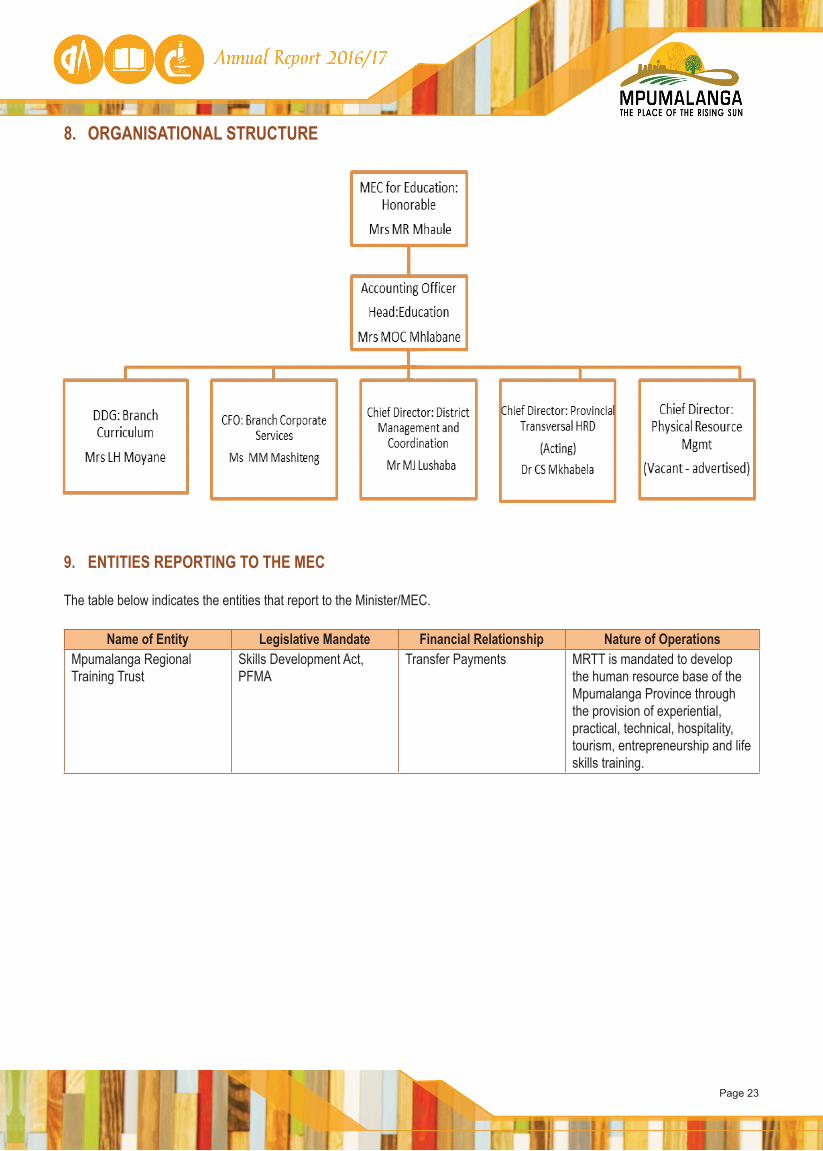
8. ORGANISATIONAL STRUCTURE
9. ENTITIES REPORTING TO THE MEC
The table below indicates the entities that report to the Minister/MEC.
Name of Entity Legislative Mandate Financial Relationship Nature of OperationsMpumalanga Regional Training Trust
Skills Development Act, PFMA
Transfer Payments MRTT is mandated to develop the human resource base of the Mpumalanga Province through the provision of experiential, practical, technical, hospitality, tourism, entrepreneurship and life skills training.

Page 24

Page 25
PART B:
PERFORMANCEINFORMATION
Page 26
1. AUDITOR GENERAL’S REPORT: PREDETERMINED OBJECTIVESThe Auditor General-South Africa (AGSA) currently performs certain audit procedures on the performance information to provide reasonable assurance in the form of an audit conclusion. The audit conclusion on the performance against predetermined objectives is included in the report to management, with material findings being reported on the audit of the Annual Performance Report Section of the auditor’s report.
Refer to page 172 of the Report of the Auditor General, published as Part E: Financial Information.
2. OVERVIEW OF DEPARTMENTAL PERFORMANCE2.1 Service Delivery Environment The year 2016/17 was a bit of a challenge for the Mpumalanga Department of Education in a number of areas. Amid these challenges, there were also successes. The 2016/17 year started with a positive note where the Mpumalanga Department of Education had managed to sustain its National Senior Certificate results only dropping by 0.4% when the nation had experienced a drop of 5%. It has seen an increase in the number of candidates enrolling to sit for the National Senior Certificate at the end of the 2016 academic year. It has also experienced a huge increase in the number of learners progressed into Grade 12. Of the 60 794 candidates that entered for the NSC, 14 027 of these had been progressed into Grade 12. Whilst a number opted for multiple examination opportunities, 8 577 wrote the exam and 4 677 of these passed. It must be noted that these are learners who could have missed Grade 12 and maybe even drop out of the system.
In general, the Department within its bounds enjoys a positive mood and high morale. However, slow service delivery was experienced in Nkangala and Ehlanzeni District due to water and sanitation inadequacies in the district offices. Bohlabela was also affected by water shortages and officials had to knock off early. These matters are receiving attention from the Department through its implementing agent.
The year under review has been a difficult one for the Department due to the global economic meltdown which led to reduced funding for the province and the department specifically. As a result, the Department continued to enforce fiscal prudence and tighten the implementation of its cost curtailment measures. With all its effort of realising savings, by the 4th quarter of the financial year, it was evident that the Department will overspend its budget; as a result, the Department had to delay the start of some programmes, reduce targets and even postpone some of its planned activities. It was however able to deliver the key resources required for the delivery of education, e.g. Learning and Teaching Support Materials, National School Nutrition Programme, school infrastructure and meet the required financial transfers to all schools.
In the year under review the Department continued observing the provincial moratorium on the filling of office-based posts and school based support posts which started in March 2015. Due to this, the capacity in some units of the department continued to dwindle as service terminations continued to take place. The early termination of services particularly for school based educator posts continued but not at the scale of the previous year. The Department is able to replace these educators as they leave the system. However, due to the policy decision on the appointment of resigned and foreign educators, the speed at which these are actualised was very low. The Department had to tighten its systems as some officials that terminate their services want to come back into the service within a month or so of cashing in on the retirement benefits. It was also established that some of our foreign educators present fraudulent qualifications.
There were however community service delivery protests that caused disruptions to teaching and learning in our schools. These took place in a number of communities with Marite Circuit being the most affected as it lost 48 teaching days in the first quarter of the 2017 academic year. With intervention by the provincial leadership and partners, the issue was resolved. A catch up programme has since been developed for implementation from April 2017.
Matters of safety and security in our institutions continues to create a challenge for the Department and negatively affect service delivery. The burglary at the ECDI where electricity cables were stolen and the kitchen vandalised stalled the delivery of the practitioner programme in the facility. Going forward the Department will campaign for communities to take ownership of the institutions within their bounds and ensure that they are protected and maintained for use by future generations. The Rhandza Xikolo xa Wena initiative will contribute towards this ideal.
The Department continues to enjoy a cordial working relationship with labour formations, parent formations and learner formations.
Page 27
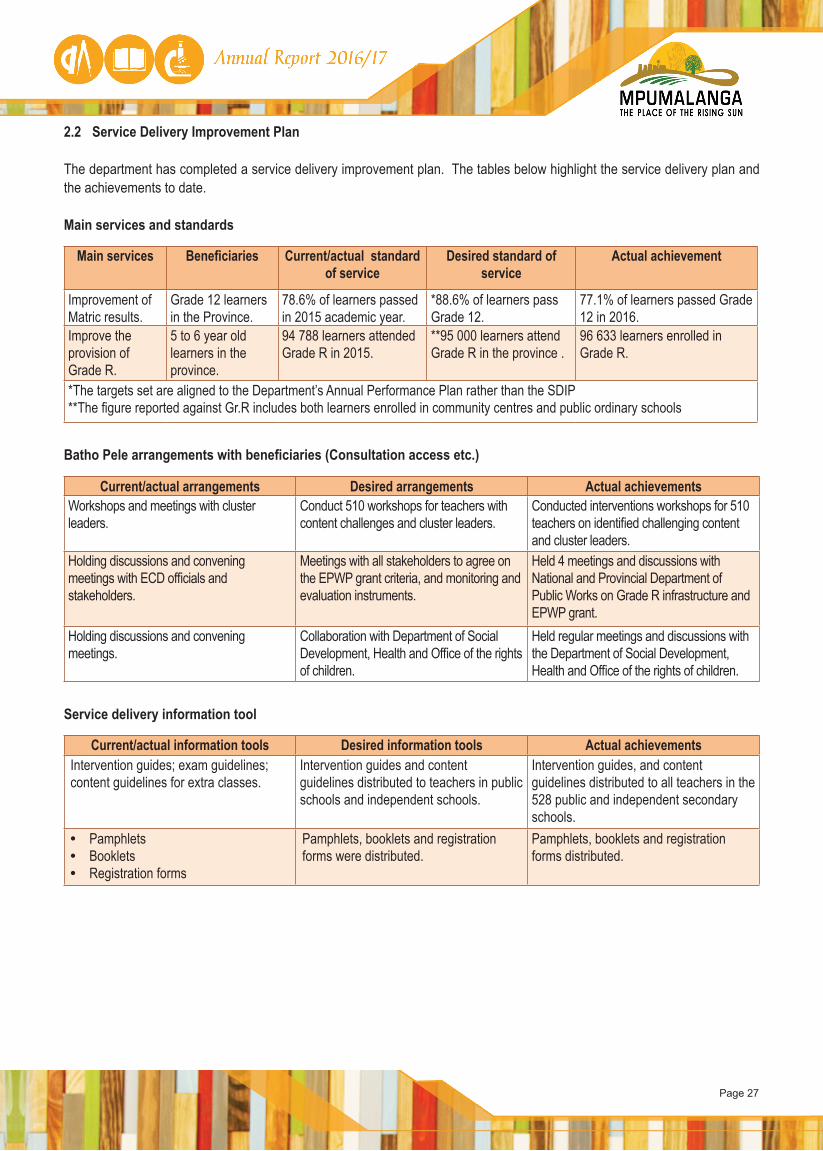
2.2 Service Delivery Improvement Plan
The department has completed a service delivery improvement plan. The tables below highlight the service delivery plan and the achievements to date.
Main services and standards
Main services Beneficiaries Current/actual standard of service
Desired standard of service
Actual achievement
Improvement of Matric results.
Grade 12 learners in the Province.
78.6% of learners passed in 2015 academic year.
*88.6% of learners pass Grade 12.
77.1% of learners passed Grade 12 in 2016.
Improve the provision of Grade R.
5 to 6 year old learners in the province.
94 788 learners attended Grade R in 2015.
**95 000 learners attend Grade R in the province .
96 633 learners enrolled in Grade R.
*The targets set are aligned to the Department’s Annual Performance Plan rather than the SDIP**The figure reported against Gr.R includes both learners enrolled in community centres and public ordinary schools
Batho Pele arrangements with beneficiaries (Consultation access etc.)
Current/actual arrangements Desired arrangements Actual achievementsWorkshops and meetings with cluster leaders.
Conduct 510 workshops for teachers with content challenges and cluster leaders.
Conducted interventions workshops for 510 teachers on identified challenging content and cluster leaders.
Holding discussions and convening meetings with ECD officials and stakeholders.
Meetings with all stakeholders to agree on the EPWP grant criteria, and monitoring and evaluation instruments.
Held 4 meetings and discussions with National and Provincial Department of Public Works on Grade R infrastructure and EPWP grant.
Holding discussions and convening meetings.
Collaboration with Department of Social Development, Health and Office of the rights of children.
Held regular meetings and discussions with the Department of Social Development, Health and Office of the rights of children.
Service delivery information tool
Current/actual information tools Desired information tools Actual achievementsIntervention guides; exam guidelines; content guidelines for extra classes.
Intervention guides and content guidelines distributed to teachers in public schools and independent schools.
Intervention guides, and content guidelines distributed to all teachers in the 528 public and independent secondary schools.
• Pamphlets • Booklets• Registration forms
Pamphlets, booklets and registration forms were distributed.
Pamphlets, booklets and registration forms distributed.
Page 28
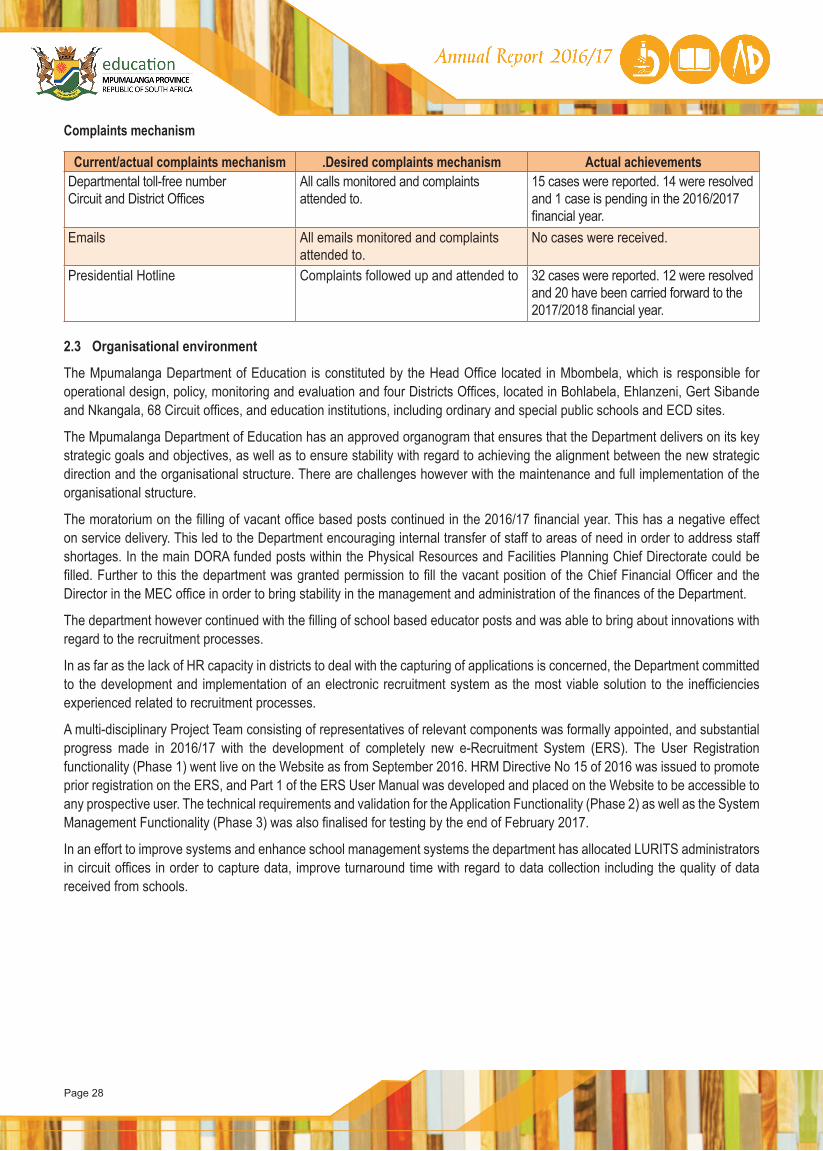
Complaints mechanism
Current/actual complaints mechanism .Desired complaints mechanism Actual achievementsDepartmental toll-free numberCircuit and District Offices
All calls monitored and complaints attended to.
15 cases were reported. 14 were resolved and 1 case is pending in the 2016/2017 financial year.
Emails All emails monitored and complaints attended to.
No cases were received.
Presidential Hotline Complaints followed up and attended to 32 cases were reported. 12 were resolved and 20 have been carried forward to the 2017/2018 financial year.
2.3 Organisational environment
The Mpumalanga Department of Education is constituted by the Head Office located in Mbombela, which is responsible for operational design, policy, monitoring and evaluation and four Districts Offices, located in Bohlabela, Ehlanzeni, Gert Sibande and Nkangala, 68 Circuit offices, and education institutions, including ordinary and special public schools and ECD sites.
The Mpumalanga Department of Education has an approved organogram that ensures that the Department delivers on its key strategic goals and objectives, as well as to ensure stability with regard to achieving the alignment between the new strategic direction and the organisational structure. There are challenges however with the maintenance and full implementation of the organisational structure.
The moratorium on the filling of vacant office based posts continued in the 2016/17 financial year. This has a negative effect on service delivery. This led to the Department encouraging internal transfer of staff to areas of need in order to address staff shortages. In the main DORA funded posts within the Physical Resources and Facilities Planning Chief Directorate could be filled. Further to this the department was granted permission to fill the vacant position of the Chief Financial Officer and the Director in the MEC office in order to bring stability in the management and administration of the finances of the Department.
The department however continued with the filling of school based educator posts and was able to bring about innovations with regard to the recruitment processes.
In as far as the lack of HR capacity in districts to deal with the capturing of applications is concerned, the Department committed to the development and implementation of an electronic recruitment system as the most viable solution to the inefficiencies experienced related to recruitment processes.
A multi-disciplinary Project Team consisting of representatives of relevant components was formally appointed, and substantial progress made in 2016/17 with the development of completely new e-Recruitment System (ERS). The User Registration functionality (Phase 1) went live on the Website as from September 2016. HRM Directive No 15 of 2016 was issued to promote prior registration on the ERS, and Part 1 of the ERS User Manual was developed and placed on the Website to be accessible to any prospective user. The technical requirements and validation for the Application Functionality (Phase 2) as well as the System Management Functionality (Phase 3) was also finalised for testing by the end of February 2017.
In an effort to improve systems and enhance school management systems the department has allocated LURITS administrators in circuit offices in order to capture data, improve turnaround time with regard to data collection including the quality of data received from schools.

Page 29
MDoE activities – scope and scale
LearnersLearners in Public Ordinary Schools Grades 1 – 12 inclusive 991 021Learners in Grade R in Public Ordinary Schools 65 187Learners in Grade R in Community Centres 31 446Learners in Public Special Schools 3 978Learners in Subsidised Independent Schools 5 848StaffEducators 33 015Public service staff 8 981 (which also includes 1 763 Grade R
Practitioners in public ordinary schools)InstitutionsPublic Ordinary Schools 1 735Public Special Schools 18Subsidised Independent Schools 26District offices 4Circuit Offices 68
2.4 Key policy developments and legislative changes
During the period under review the policy on Multiple Examination Opportunities for Grade 12 candidates who were progressed was finalised. This policy allows progressed learners to offer the National Senior Certificate over an extended period of more than one academic year, where they can write at least three subjects in the first year and write the other three in May/June of the following year and also in October/November of the following year.
The Policy on HIV, STIs and TB was also approved in the 2016/17 year. This is the revision of the previous policy on HIV and AIDS in schools. The intention with the revision was to strengthen education’s response with regard to prevention and also to incorporate other conditions/diseases that are related e.g. TB.
The Mpumalanga Department of Education entered into a Memorandum of Agreement with the Department of Social Development to accommodate learners with Mild Intellectual Disabilities at George Hofmeyr boarding facilities. This has enabled the Department to enrol additional girl learners at the school which currently accommodates learners assigned to it by the Children’s Court.
The DBE has informed provinces to take responsibility for the provision of the Life Skills workbooks from 2018 academic year. This has for the past 7 years been managed and funded at DBE level, going forward, the PDE will take responsibility.
The policy on Incremental Introduction of African Languages in schools was approved in the year under review. This is intended to provide an opportunity for schools not currently offering an African Language to provide this for learners at a Second Additional Level. 58 schools in Mpumalanga will be affected.
On 10 March 2017, the Executive Council approved the Mpumalanga Government Nutrition Programme. Through this programme, farmers in the province will provide fresh produce for the National School Nutrition Programme. The programme will be rolled out in schools, hospitals and DSD Centres from 01 June 2017.
Page 30
3. STRATEGIC OUTCOME ORIENTED GOALS Strategic Goal 1: Improve access and provision of ECD
The National Department of Education defines early childhood development (ECD) as “... the processes by which children from birth to nine years of age grow and thrive physically, mentally, emotionally, morally and socially” (DoE, 2001a). Early childhood development is recognised as the foundation for success in future learning. Quality early learning programmes prepare children for adulthood, providing them with the necessary opportunities for social, cognitive, spiritual, physical and emotional development. These programmes assist in laying the foundation for holistic development, whilst cultivating a love for lifelong learning (Biersteker & Dawes, 2008).
• Access to ECD has decreased from 177 788 in 2015/16 to 163 919 in 2016/17 financial year, which is a decrease of 13 869 children.
• The ECDI now boasts a total of 9 lecturers and 2 administration personnel which were transferred to the institution, through the restructuring and rationalisation process.
• Refurbishment of phase 2 of the ECDI is at 94% and this was planned for completion by 31 March 2017. Currently a snag list is being finalised.
• In support of community centres and in an effort to streamline curriculum delivery across the ECD sector 1000 Pre-Grade R practitioners have been enrolled towards an ECD Level 1 qualification through the ECDI.
• 700 Pre-Grade R practitioners have been enrolled for NQF Level 4 training and will complete their training in the new financial year.
• 529 Grade R practitioners are studying towards ECD NQF Level 6 since 2015/16 – currently they are in the 2nd year. 300 first year Grade R practitioners were enrolled in March 2017 for the Grade R Diploma. By 2019 the department shall have trained 829 practitioners which is slightly above the set MTSF target of 708.
• In order to professionalise the ECD sector the department has to date translated 292 qualifying Grade R practitioners into Grade R educators. The department is currently focusing on the level 6 training programme in order to ensure that the number of qualifying practitioners to be translated is increased.
Strategic Goal 2: Improve learner performance
The Annual National Assessment (ANA) was not administered in the 2016/17 financial year as it is being remodelled by the Department of Basic Education. The Province however continued with the administering of its own common assessments.
Performance is as follows:
Grade 3, 6 and 9• In Grade 3 both Mathematics and Home Languages learner performance have surpassed the 65% target and are on an
upward trajectory which needs to be sustained and increased to lay a solid foundation
Page 31
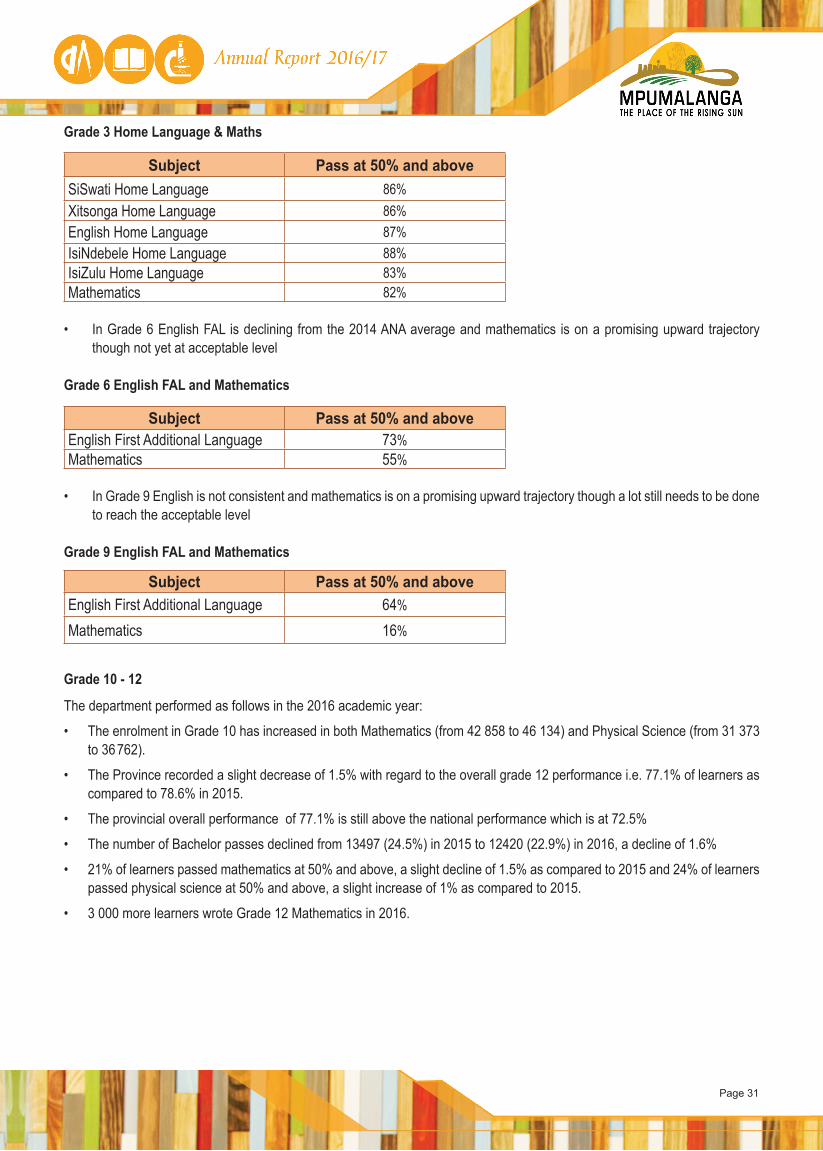
Grade 3 Home Language & Maths
Subject Pass at 50% and aboveSiSwati Home Language 86%Xitsonga Home Language 86%English Home Language 87%IsiNdebele Home Language 88%IsiZulu Home Language 83%Mathematics 82%
• In Grade 6 English FAL is declining from the 2014 ANA average and mathematics is on a promising upward trajectory though not yet at acceptable level
Grade 6 English FAL and Mathematics
Subject Pass at 50% and aboveEnglish First Additional Language 73%Mathematics 55%
• In Grade 9 English is not consistent and mathematics is on a promising upward trajectory though a lot still needs to be done to reach the acceptable level
Grade 9 English FAL and Mathematics
Subject Pass at 50% and aboveEnglish First Additional Language 64%
Mathematics 16%
Grade 10 - 12
The department performed as follows in the 2016 academic year:
• The enrolment in Grade 10 has increased in both Mathematics (from 42 858 to 46 134) and Physical Science (from 31 373 to 36 762).
• The Province recorded a slight decrease of 1.5% with regard to the overall grade 12 performance i.e. 77.1% of learners as compared to 78.6% in 2015.
• The provincial overall performance of 77.1% is still above the national performance which is at 72.5%
• The number of Bachelor passes declined from 13497 (24.5%) in 2015 to 12420 (22.9%) in 2016, a decline of 1.6%
• 21% of learners passed mathematics at 50% and above, a slight decline of 1.5% as compared to 2015 and 24% of learners passed physical science at 50% and above, a slight increase of 1% as compared to 2015.
• 3 000 more learners wrote Grade 12 Mathematics in 2016.
Page 32
Strategic Goal 3: Improve quality of teaching and learning
Teacher Development and MSTA
• The renovation of the MSTA Hub was completed and staff took full occupation of the facility on 1st May 2016. Lessons have been broadcast to 35 MSTA schools that could access internet connectivity.
• Through the MSTA 1 036 teachers were trained on specific topics in order to improve their pedagogic content knowledge.
• Continuous Professional Teacher Development and Integrated Quality Management System was administered in 1 735 schools in line with management plans and implementation of the IQMS cycle starting from self-evaluation, development cycle and summative evaluation.
• In order to increase a new pool of young teachers, the department continued to monitor and support the 413 students doing their second year and recruited 420 students to be registered in 2017.
• In line with the ICT roll-out programme for teachers, 2 975 teachers were trained on ICT programmes.
Strategic goal 4: Skilled and capable workforce
Skills deficits and bottlenecks, especially in priority and scarce skills, contribute to the structural constraints to our growth and development path in the Province. A skilled and capable workforce is critical for decent work; an inclusive economy; labour absorption; rural development; the reduction of inequalities and the need for a more diversified and knowledge intensive economy. In addressing this the province has been focusing on the 5 pillars:
• Strengthening the Education System• Aligning skills and professional requirements with Higher Education and Training• Aligning the allocation of financial Aid with the Province’s Skills requirements• Forming strategic partnerships • Build a capable public service workforce
The province in partnership with SETAs and private sector made enormous strides to ensure that HRD Council is established and launched during the 2016/17 financial year and Chairpersons of Technical Task Teams were appointed by the Chairperson of the Technical Working Group to establish and manage Technical Task Teams for the implementation of the key deliverables of the HRD Strategy. A model and draft guidelines for the functioning of the HRD Council was formulated and Chairpersons of Technical Task Teams were requested to develop Terms of Reference in line with the guidelines.
Capacity of the public service workforce was enhanced by coordinating and facilitating the induction (CIP) of 1 599 newly appointed employees in all departments.
Post school education remains one of the priorities of the provincial administration and a vehicle to skill the youth of the province in line with the economic needs as outlined in the HRDS. During this financial year 1 157 bursaries were awarded to the youth who are currently studying at different universities nationally. Additionally in partnership with Russian Government 100 students were also awarded bursaries to study Medicine, Veterinary Science, Education (Maths & Science) and Engineering in 2016 academic year in various universities in Russia.
The province continued to face challenges of unemployed youth, in addressing this the Department through MRTT and Hydra Arc, has partnered with other training providers to train out of school youth on artisan development programme. During the financial year 1 144 learners have been registered for artisan development programme (apprenticeship) for a three year programme, the training focuses on boiler making, pipe fitting, coded welding, manufacturing and engineering. In fast tracking the establishment of the Provincial Skills Hub, the Mpumalanga Integrated Skills Hub Operational and funding Model was adopted, the hub will be located at eMalahleni and currently the MRTT is still pursuing a site in which the hub will be built. Construction is anticipated to start in the latter part of the 2017/18 financial year.
Developing the skills base of the province is not an event but a continuous process. In this regard stakeholder involvement is critical. The Department will continue to ensure that resources are used strategically, making skills development a central pillar of all development projects and providing pivotal workplace opportunities for trained unemployed youth.

Page 33
Strategic Goal 5: Improve performance of systems
• Financial prudence continued to improve during the year under review and the department managed to process 98% of the invoices from the service providers with 30 days of receipt. Regular monitoring of departmental expenditure conducted by collecting and collating monthly disclosure notes and conducted quarterly reviews on Interim and Annual Financial Statements.
• There has been training prioritisation of officials on various training programmes in order to increase the capacity and ensure that the department renders public value. The following programmes were undertaken during the year under review: Capacitated 35 officials within SCM Unit and 7 members of Supply Chain Management related committees to detect irregular expenditure at the inception stage; Capacitated 63 officials on file plan in order to improve and align records management system in accordance with National Archives, 855 SMT capacitated on Professional Management Development Programme (School Leadership) and 1588 principals were trained on Financial Management.
• In an effort to strengthen and improve the process flow of filling vacant posts (including educators), the e-Recruitment System (ERS) was developed, and the User Registration functionality (Phase 1) went live on the Website as from September 2016. The technical requirements and validation rules for the Application Functionality (Phase 2) as well as the System Management Functionality (Phase 3) were finalised by end of February 2017. Moreover, the department managed to place over 85% of newly qualified teachers in schools within three months of completing their studies.
• The ICT governance framework was reviewed in order to support the reliability of the systems and the availability, accuracy and protection of information. 150 schools were provided with media resources, 210 schools were connected to respond to the current demands, improve teaching and learning at classroom level and infuse blended learning. Additionally the LURITS system was implemented to accurately track learners across the system through quarterly uploads and verification of learner ID numbers in collaboration with the Department of Home Affairs in order to have accurate learner data. 98.04% Ordinary schools uploaded successfully to LURITS.
• There were challenges with data from schools which resulted in the department conducting quarterly data audits from which samples were drawn and verified. 562 Schools were found to have supplied the department with incorrect information. In the main, principals provide incorrect learner data in order to retain or upgrade the schools staff establishment and salary levels. The matter will be addressed by reviewing letters of account per school and consequence management will be applied for schools’ deliberate transgression.
Strategic Goal 6: Create a conducive environment for teaching and learning
During 2016/17 the department implemented 244 projects of which 216 projects were completed, 13 were multi-year projects and 15 projects were not completed as planned thus carried over to the new financial year. Condition assessment of all public schools in the province was undertaken in order to ensure a well-informed intervention that will stimulate conducive teaching and learning.
The implemented projects are broken down as follows:
• 171 basic services projects (water and electricity supply & sanitation) in line with the Departments’ intervention programmes for ensuring adherence to the Norms & Standards.
• In line with the broad school strategy aimed at the rationalization of unviable farm schools in the province and improve on the quality of education provision, a boarding school was built and operationalised in the year under review which brings the number of comprehensive boarding schools to 5. Moreover, in the 2017/18 the department will commence with the construction of an additional boarding school in Bohlabela.
• Corrective maintenance addressing 22 storm damages that occurred to schools in February 2016 (2015/16 financial year), and 2 more schools damaged by storm in Nkangala early October 2016 was conducted during the reporting period, bringing the total number of corrective maintenance projects to 24.
• 28 projects are under implementation and on-going after the reporting period, and are carried forward into the next financial year.
Page 34
The rate of maintenance is not according to plan because there has not been much movement in addressing preventative maintenance. Thus our infrastructure maintenance backlog continues to grow. The reason is the inadequate budget since the available budget is targeted at meeting the norms and standards in terms of basic services. Moving forward, the department is going to allocate 20% of its Education Infrastructure Grant towards maintenance in order to reduce the infrastructure maintenance backlog.
Procured and delivered textbooks for new schools and new grades, textbooks for technical subjects including technical maths and sciences, and FET literature to ensure that all learners have access to textbooks, and in implementing textbook retrieval policy 90% of the books were retrieved at schools and reused in the 2016 academic year. The no fee school policy caters for 899 959 learners which indicates that more learners are enrolled in no fee paying schools than in fee paying schools. In ensuring that needy learners in both primary and secondary schools are provided with nutritious meals, 901 378 learners in 1 619 schools from Quintile 1-3 schools benefited from the programme for 198 days in line with DORA. This assisted learners through promoting punctual school attendance, alleviating short term hunger, improving concentration and contributing to general development. Furthermore, curriculum enrichment programmes were implemented in all 1735 schools; this included in-school sport, music and culture programmes, and life skills programmes.
Capacity of school safety committees was improved through support to 1 509 schools on school safety programmes in partnership with all stakeholders including SAPS, DSD, etc. to ensure that teaching and learning is conducted in a safe environment. Although there were few incidents (bullying, crime, etc.) reported during the year under review, concerted effort will continue to be made to ensure that all schools are safe and secure.
Page 35
4. PERFORMANCE INFORMATION BY PROGRAMME
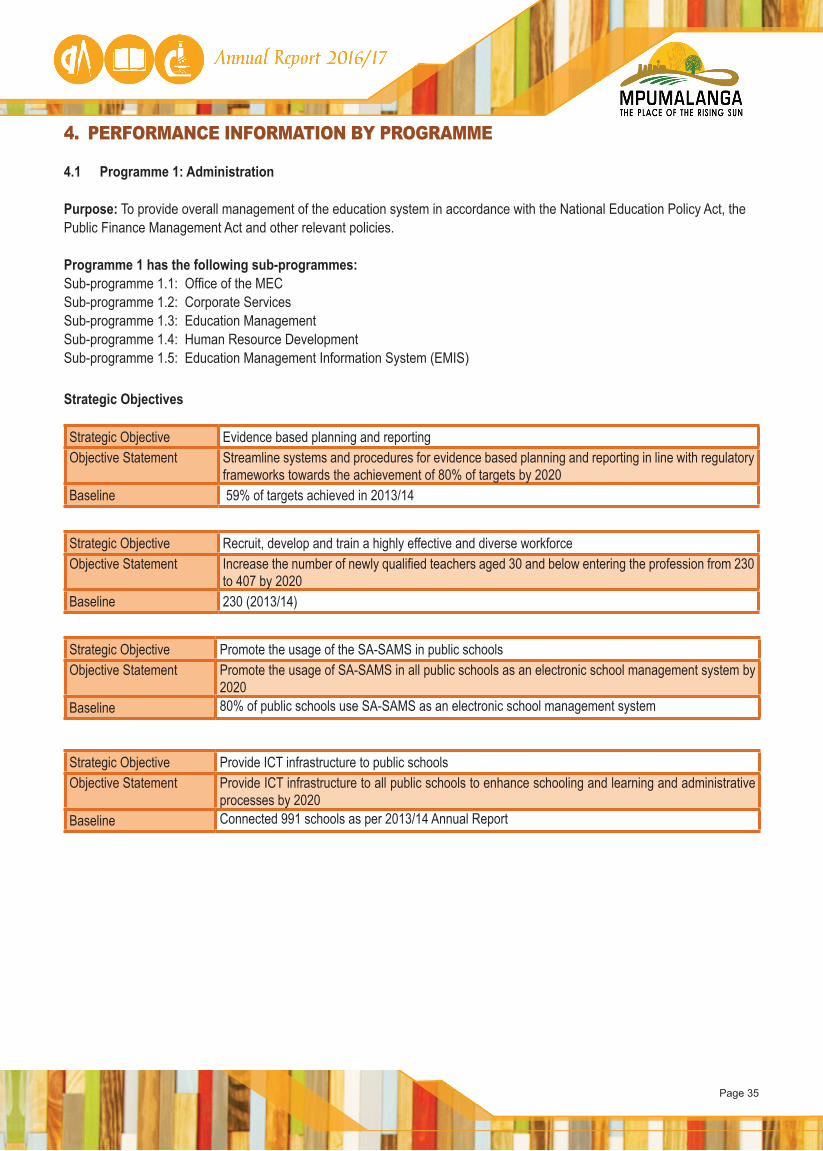
4.1 Programme 1: Administration
Purpose: To provide overall management of the education system in accordance with the National Education Policy Act, the Public Finance Management Act and other relevant policies.
Programme 1 has the following sub-programmes:Sub-programme 1.1: Office of the MECSub-programme 1.2: Corporate ServicesSub-programme 1.3: Education ManagementSub-programme 1.4: Human Resource Development Sub-programme 1.5: Education Management Information System (EMIS)
Strategic Objectives
Strategic Objective Evidence based planning and reportingObjective Statement Streamline systems and procedures for evidence based planning and reporting in line with regulatory
frameworks towards the achievement of 80% of targets by 2020Baseline 59% of targets achieved in 2013/14
Strategic Objective Recruit, develop and train a highly effective and diverse workforceObjective Statement Increase the number of newly qualified teachers aged 30 and below entering the profession from 230
to 407 by 2020Baseline 230 (2013/14)
Strategic Objective Promote the usage of the SA-SAMS in public schoolsObjective Statement Promote the usage of SA-SAMS in all public schools as an electronic school management system by
2020Baseline 80% of public schools use SA-SAMS as an electronic school management system
Strategic Objective Provide ICT infrastructure to public schoolsObjective Statement Provide ICT infrastructure to all public schools to enhance schooling and learning and administrative
processes by 2020Baseline Connected 991 schools as per 2013/14 Annual Report
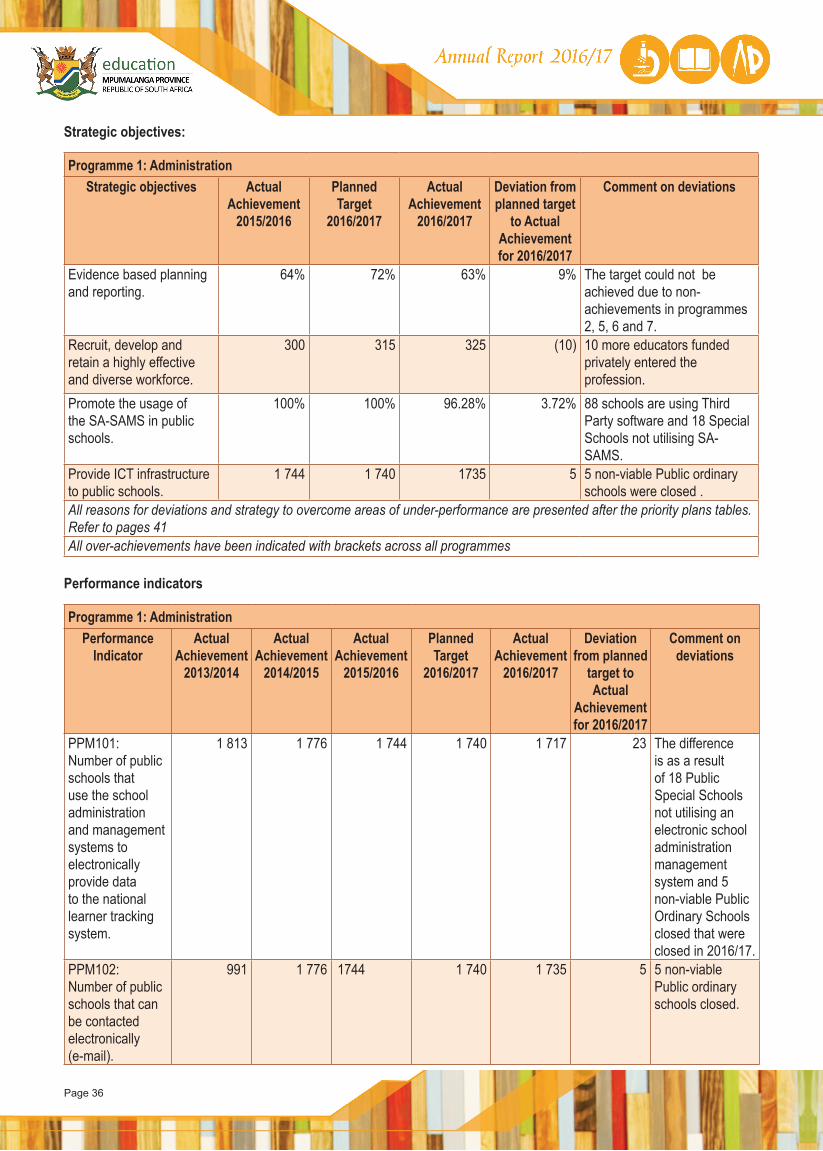
Page 36
Strategic objectives: Programme 1: Administration
Strategic objectives Actual Achievement
2015/2016
Planned Target
2016/2017
Actual Achievement
2016/2017
Deviation from planned target
to Actual Achievement for 2016/2017
Comment on deviations
Evidence based planning and reporting.
64% 72% 63% 9% The target could not be achieved due to non-achievements in programmes 2, 5, 6 and 7.
Recruit, develop and retain a highly effective and diverse workforce.
300 315 325 (10) 10 more educators funded privately entered the profession.
Promote the usage of the SA-SAMS in public schools.
100% 100% 96.28% 3.72% 88 schools are using Third Party software and 18 Special Schools not utilising SA-SAMS.
Provide ICT infrastructure to public schools.
1 744 1 740 1735 5 5 non-viable Public ordinary schools were closed .
All reasons for deviations and strategy to overcome areas of under-performance are presented after the priority plans tables. Refer to pages 41All over-achievements have been indicated with brackets across all programmes
Performance indicators
Programme 1: AdministrationPerformance
IndicatorActual
Achievement 2013/2014
Actual Achievement
2014/2015
Actual Achievement
2015/2016
Planned Target
2016/2017
Actual Achievement
2016/2017
Deviation from planned
target to Actual
Achievement for 2016/2017
Comment on deviations
PPM101: Number of public schools that use the school administration and management systems to electronically provide data to the national learner tracking system.
1 813 1 776 1 744 1 740 1 717 23 The difference is as a result of 18 Public Special Schools not utilising an electronic school administration management system and 5 non-viable Public Ordinary Schools closed that were closed in 2016/17.
PPM102: Number of public schools that can be contacted electronically (e-mail).
991 1 776 1744 1 740 1 735 5 5 non-viable Public ordinary schools closed.
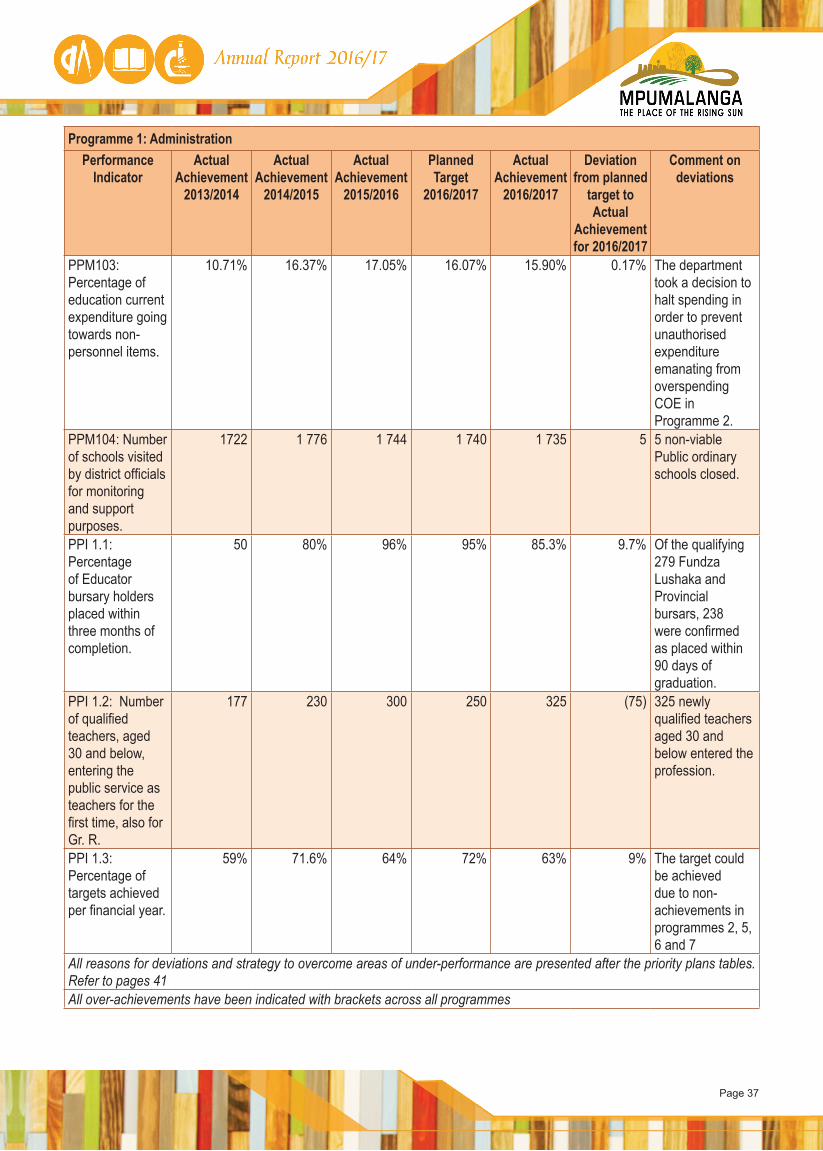
Page 37
Programme 1: AdministrationPerformance
IndicatorActual
Achievement 2013/2014
Actual Achievement
2014/2015
Actual Achievement
2015/2016
Planned Target
2016/2017
Actual Achievement
2016/2017
Deviation from planned
target to Actual
Achievement for 2016/2017
Comment on deviations
PPM103: Percentage of education current expenditure going towards non-personnel items.
10.71% 16.37% 17.05% 16.07% 15.90% 0.17% The department took a decision to halt spending in order to prevent unauthorised expenditure emanating from overspending COE in Programme 2.
PPM104: Number of schools visited by district officials for monitoring and support purposes.
1722 1 776 1 744 1 740 1 735 5 5 non-viable Public ordinary schools closed.
PPI 1.1: Percentage of Educator bursary holders placed within three months of completion.
50 80% 96% 95% 85.3% 9.7% Of the qualifying 279 Fundza Lushaka and Provincial bursars, 238 were confirmed as placed within 90 days of graduation.
PPI 1.2: Number of qualified teachers, aged 30 and below, entering the public service as teachers for the first time, also for Gr. R.
177 230 300 250 325 (75) 325 newly qualified teachers aged 30 and below entered the profession.
PPI 1.3: Percentage of targets achieved per financial year.
59% 71.6% 64% 72% 63% 9% The target could be achieved due to non-achievements in programmes 2, 5, 6 and 7
All reasons for deviations and strategy to overcome areas of under-performance are presented after the priority plans tables. Refer to pages 41All over-achievements have been indicated with brackets across all programmes

Page 38
Priority Plans 2016/2017
Priority Plans Achievements Challenges/highlights Mitigations Capacitate 35 officials within SCM and 7 members of Supply Chain Management related committees to detect irregular expenditure at the inception stage.
22 SCM practitioners have been capacitated as follows; Head Office – 15Ehlanzeni District – 2Gert Sibande District – 1Bohlabela District – 2 Nkangala District – 2
Not all officials and members of SCM committees could be capacitated due to competing programmes.
The remaining officials and members of committees will be prioritised in the 2017/18 financial year.
Maintain and align the records management system in accordance with National Archives.
Capacitated 27 officials from Head Office, 15 from Bohlabela, and 21 from Gert Sibande on file plan in order to improve records management.
None None
Reconciliation of Asset Register with LOGIS and BAS.
Reconciled Asset register with LOGIS and BAS.
None None
Maintenance of office buildings and Labour Saving devices.
22 office buildings and 708 labour saving devices maintained.
None None
Reconciliation of inventory to BAS and LOGIS.
12 monthly inventory reconciliation between BAS and LOGIS were performed.
None None
Improve the efficiency of filling school based promotional educator posts through the utilisation of an E-Recruitment system as well as issuing 3 provincial vacancy lists per annum.
E-Recruitment System (ERS) developed, and the User Registration functionality (Phase 1) went live on the Website as from September 2016. The technical requirements and validation rules for the Application Functionality (Phase 2) as well as the System Management Functionality (Phase 3) were finalised by end of February 2017. Three (3) Vacancy Lists for school based promotional educator posts issued as required.
The rate of prior user registration is monitored and is at 1 984, while only 983 of said users created complete profiles.
HRM Directive No 15 of 2016 was issued to promote prior registration on the ERS. Part 1 of the User Manual developed and placed on the Website to be accessible to any prospective user.
Develop job specific Provincial guidelines and criteria for recruitment and selection of principals, SMTs and teachers, also prescribing the departmental representatives to be assigned for different advertised posts.
Job specific Guidelines and Criteria for recruitment and selection of Foreign Teachers developed and approved for implementation. Final draft on job specific Provincial Guidelines and criteria for recruitment and selection of RSA Teachers developed.
The process of finalisation of the Provincial Guidelines and criteria for recruitment of SMTs and Principals had to be stopped as DBE had already undertaken a process of developing National Guidelines which will inform the Provincial Guidelines.
To await the finalisation of the National Guidelines in order to finalise the Provincial Guidelines.
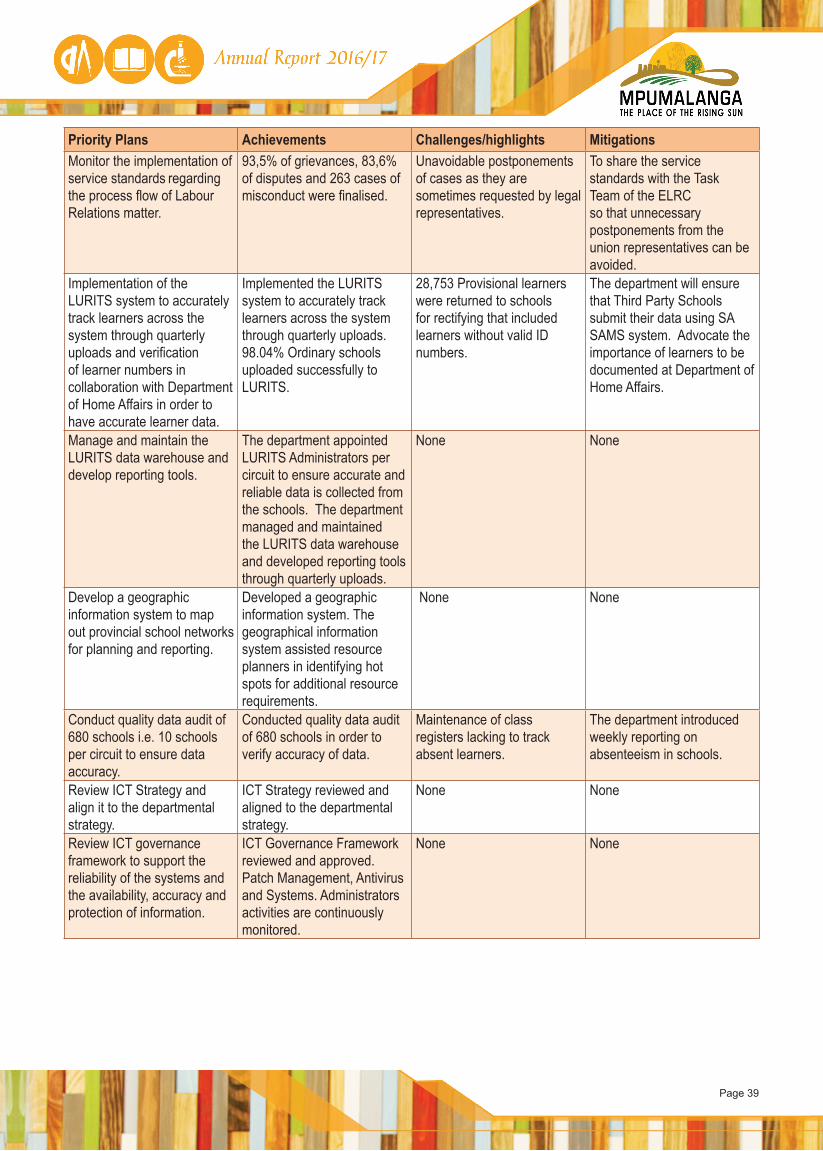
Page 39
Priority Plans Achievements Challenges/highlights Mitigations Monitor the implementation of service standards regarding the process flow of Labour Relations matter.
93,5% of grievances, 83,6% of disputes and 263 cases of misconduct were finalised.
Unavoidable postponements of cases as they are sometimes requested by legal representatives.
To share the service standards with the Task Team of the ELRC so that unnecessary postponements from the union representatives can be avoided.
Implementation of the LURITS system to accurately track learners across the system through quarterly uploads and verification of learner numbers in collaboration with Department of Home Affairs in order to have accurate learner data.
Implemented the LURITS system to accurately track learners across the system through quarterly uploads. 98.04% Ordinary schools uploaded successfully to LURITS.
28,753 Provisional learners were returned to schools for rectifying that included learners without valid ID numbers.
The department will ensure that Third Party Schools submit their data using SA SAMS system. Advocate the importance of learners to be documented at Department of Home Affairs.
Manage and maintain the LURITS data warehouse and develop reporting tools.
The department appointed LURITS Administrators per circuit to ensure accurate and reliable data is collected from the schools. The department managed and maintained the LURITS data warehouse and developed reporting tools through quarterly uploads.
None None
Develop a geographic information system to map out provincial school networks for planning and reporting.
Developed a geographic information system. The geographical information system assisted resource planners in identifying hot spots for additional resource requirements.
None None
Conduct quality data audit of 680 schools i.e. 10 schools per circuit to ensure data accuracy.
Conducted quality data audit of 680 schools in order to verify accuracy of data.
Maintenance of class registers lacking to track absent learners.
The department introduced weekly reporting on absenteeism in schools.
Review ICT Strategy and align it to the departmental strategy.
ICT Strategy reviewed and aligned to the departmental strategy.
None None
Review ICT governance framework to support the reliability of the systems and the availability, accuracy and protection of information.
ICT Governance Framework reviewed and approved. Patch Management, Antivirus and Systems. Administrators activities are continuously monitored.
None None
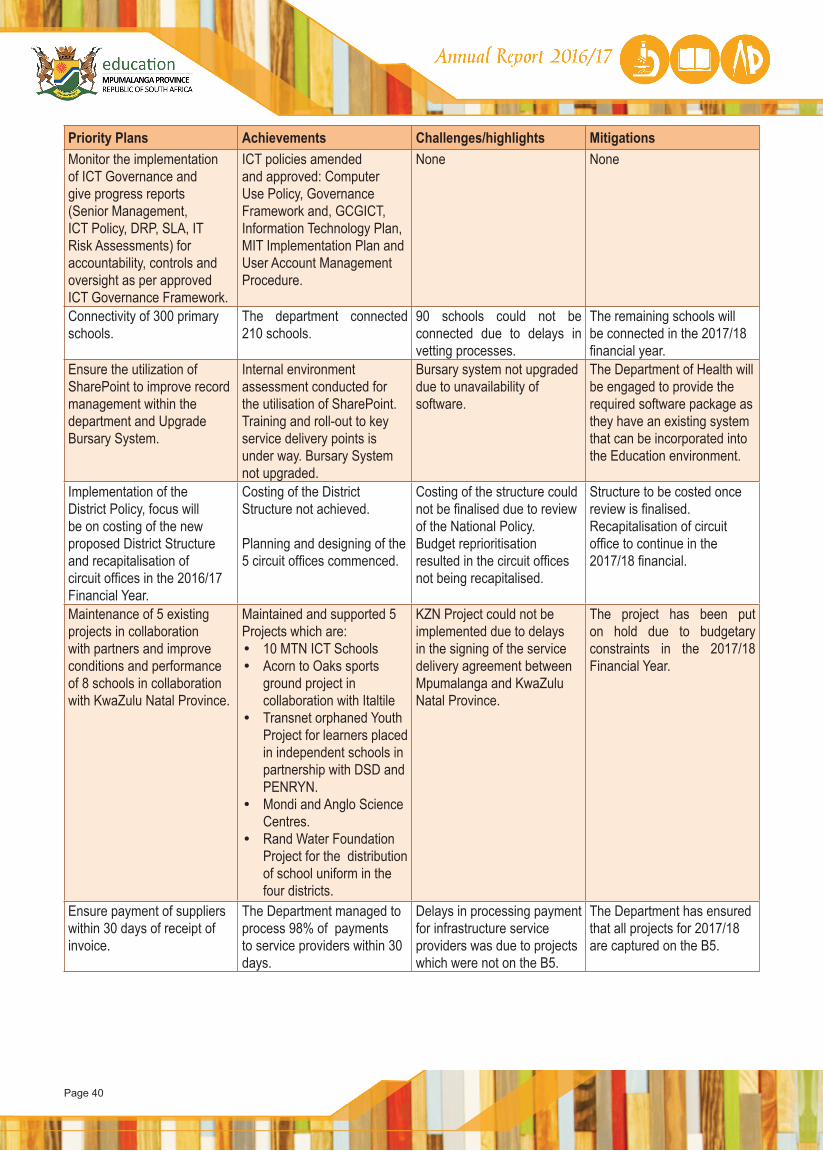
Page 40
Priority Plans Achievements Challenges/highlights Mitigations Monitor the implementation of ICT Governance and give progress reports (Senior Management, ICT Policy, DRP, SLA, IT Risk Assessments) for accountability, controls and oversight as per approved ICT Governance Framework.
ICT policies amended and approved: Computer Use Policy, Governance Framework and, GCGICT, Information Technology Plan, MIT Implementation Plan and User Account Management Procedure.
None None
Connectivity of 300 primary schools.
The department connected 210 schools.
90 schools could not be connected due to delays in vetting processes.
The remaining schools will be connected in the 2017/18 financial year.
Ensure the utilization of SharePoint to improve record management within the department and Upgrade Bursary System.
Internal environment assessment conducted for the utilisation of SharePoint. Training and roll-out to key service delivery points is under way. Bursary System not upgraded.
Bursary system not upgraded due to unavailability of software.
The Department of Health will be engaged to provide the required software package as they have an existing system that can be incorporated into the Education environment.
Implementation of the District Policy, focus will be on costing of the new proposed District Structure and recapitalisation of circuit offices in the 2016/17 Financial Year.
Costing of the District Structure not achieved.
Planning and designing of the 5 circuit offices commenced.
Costing of the structure could not be finalised due to review of the National Policy. Budget reprioritisation resulted in the circuit offices not being recapitalised.
Structure to be costed once review is finalised. Recapitalisation of circuit office to continue in the 2017/18 financial.
Maintenance of 5 existing projects in collaboration with partners and improve conditions and performance of 8 schools in collaboration with KwaZulu Natal Province.
Maintained and supported 5 Projects which are: • 10 MTN ICT Schools• Acorn to Oaks sports
ground project in collaboration with Italtile
• Transnet orphaned Youth Project for learners placed in independent schools in partnership with DSD and PENRYN.
• Mondi and Anglo Science Centres.
• Rand Water Foundation Project for the distribution of school uniform in the four districts.
KZN Project could not be implemented due to delays in the signing of the service delivery agreement between Mpumalanga and KwaZulu Natal Province.
The project has been put on hold due to budgetary constraints in the 2017/18 Financial Year.
Ensure payment of suppliers within 30 days of receipt of invoice.
The Department managed to process 98% of payments to service providers within 30 days.
Delays in processing payment for infrastructure service providers was due to projects which were not on the B5.
The Department has ensured that all projects for 2017/18 are captured on the B5.
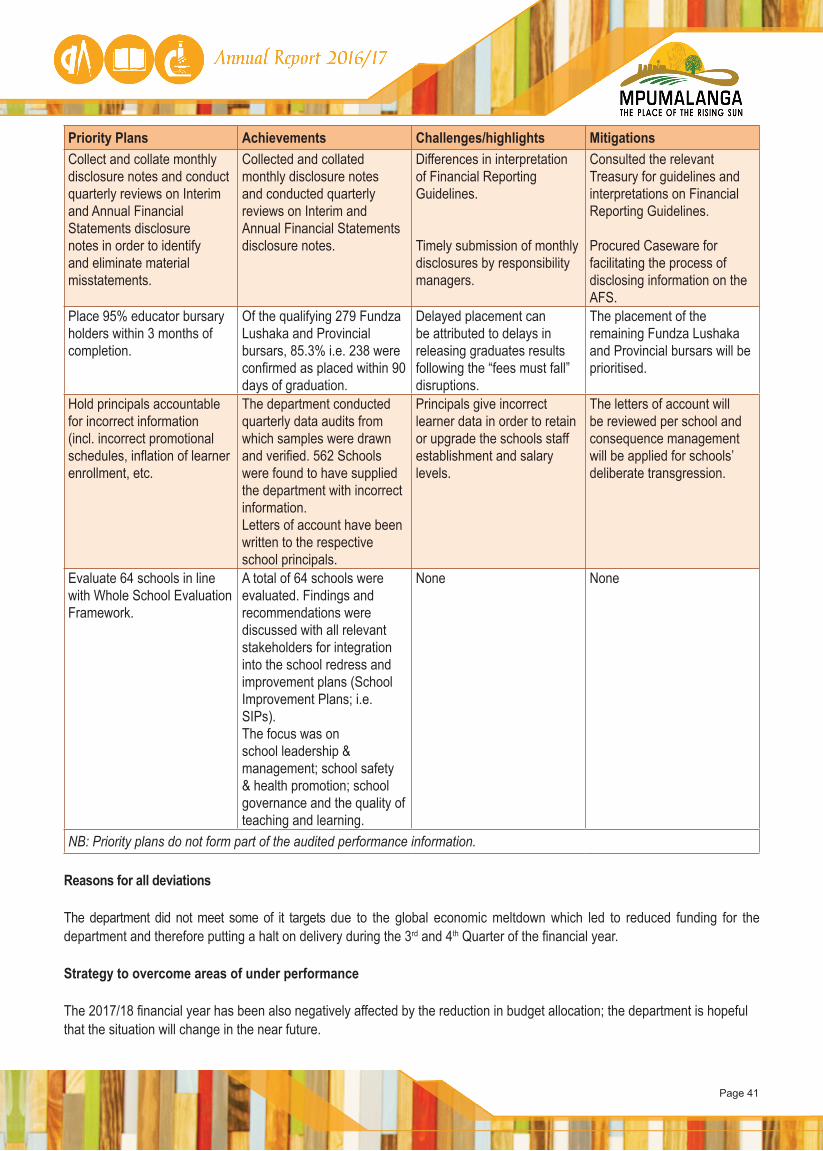
Page 41
Priority Plans Achievements Challenges/highlights Mitigations Collect and collate monthly disclosure notes and conduct quarterly reviews on Interim and Annual Financial Statements disclosure notes in order to identify and eliminate material misstatements.
Collected and collated monthly disclosure notes and conducted quarterly reviews on Interim and Annual Financial Statements disclosure notes.
Differences in interpretation of Financial Reporting Guidelines.
Timely submission of monthly disclosures by responsibility managers.
Consulted the relevant Treasury for guidelines and interpretations on Financial Reporting Guidelines.
Procured Caseware for facilitating the process of disclosing information on the AFS.
Place 95% educator bursary holders within 3 months of completion.
Of the qualifying 279 Fundza Lushaka and Provincial bursars, 85.3% i.e. 238 were confirmed as placed within 90 days of graduation.
Delayed placement can be attributed to delays in releasing graduates results following the “fees must fall” disruptions.
The placement of the remaining Fundza Lushaka and Provincial bursars will be prioritised.
Hold principals accountable for incorrect information (incl. incorrect promotional schedules, inflation of learner enrollment, etc.
The department conducted quarterly data audits from which samples were drawn and verified. 562 Schools were found to have supplied the department with incorrect information.Letters of account have been written to the respective school principals.
Principals give incorrect learner data in order to retain or upgrade the schools staff establishment and salary levels.
The letters of account will be reviewed per school and consequence management will be applied for schools’ deliberate transgression.
Evaluate 64 schools in line with Whole School Evaluation Framework.
A total of 64 schools were evaluated. Findings and recommendations were discussed with all relevant stakeholders for integration into the school redress and improvement plans (School Improvement Plans; i.e. SIPs).The focus was on school leadership & management; school safety & health promotion; school governance and the quality of teaching and learning.
None None
NB: Priority plans do not form part of the audited performance information.
Reasons for all deviations
The department did not meet some of it targets due to the global economic meltdown which led to reduced funding for the department and therefore putting a halt on delivery during the 3rd and 4th Quarter of the financial year.
Strategy to overcome areas of under performance
The 2017/18 financial year has been also negatively affected by the reduction in budget allocation; the department is hopeful that the situation will change in the near future.
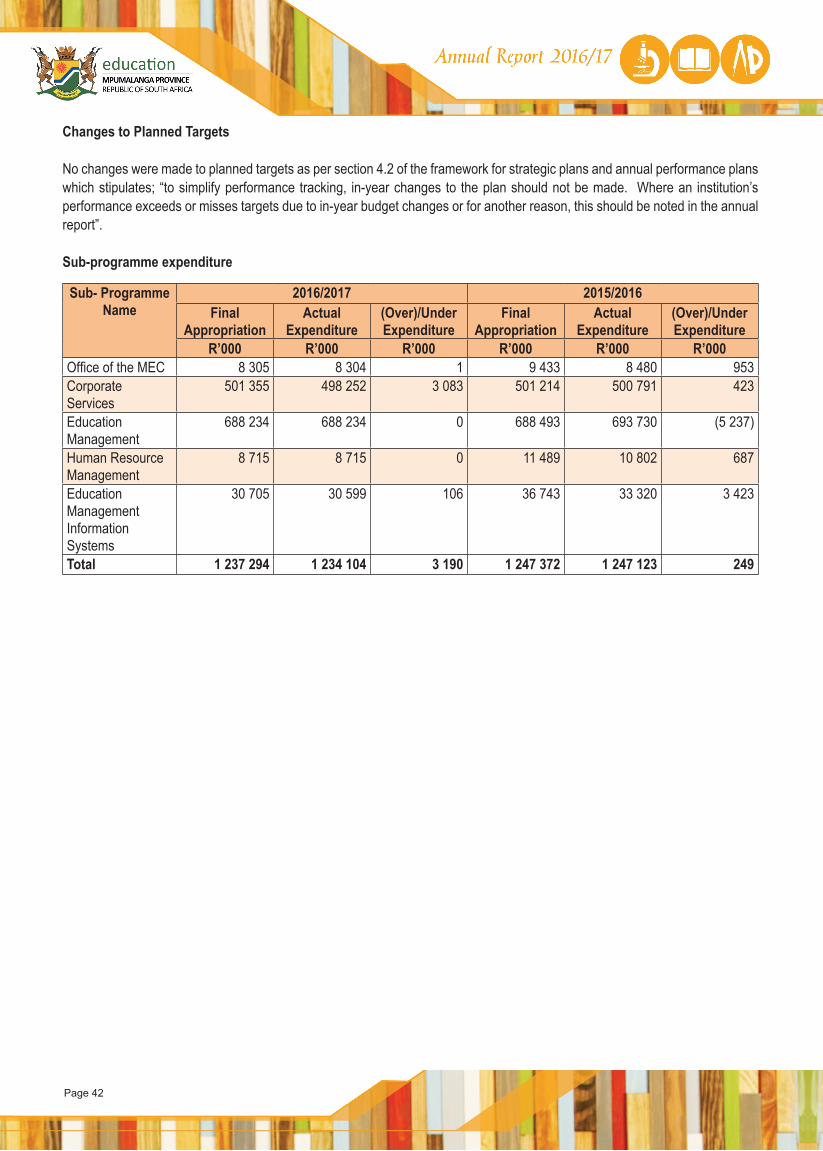
Page 42
Changes to Planned Targets
No changes were made to planned targets as per section 4.2 of the framework for strategic plans and annual performance plans which stipulates; “to simplify performance tracking, in-year changes to the plan should not be made. Where an institution’s performance exceeds or misses targets due to in-year budget changes or for another reason, this should be noted in the annual report”.
Sub-programme expenditure
Sub- Programme Name
2016/2017 2015/2016Final
AppropriationActual
Expenditure(Over)/Under Expenditure
Final Appropriation
Actual Expenditure
(Over)/Under Expenditure
R’000 R’000 R’000 R’000 R’000 R’000Office of the MEC 8 305 8 304 1 9 433 8 480 953Corporate Services
501 355 498 252 3 083 501 214 500 791 423
Education Management
688 234 688 234 0 688 493 693 730 (5 237)
Human Resource Management
8 715 8 715 0 11 489 10 802 687
Education Management Information Systems
30 705 30 599 106 36 743 33 320 3 423
Total 1 237 294 1 234 104 3 190 1 247 372 1 247 123 249
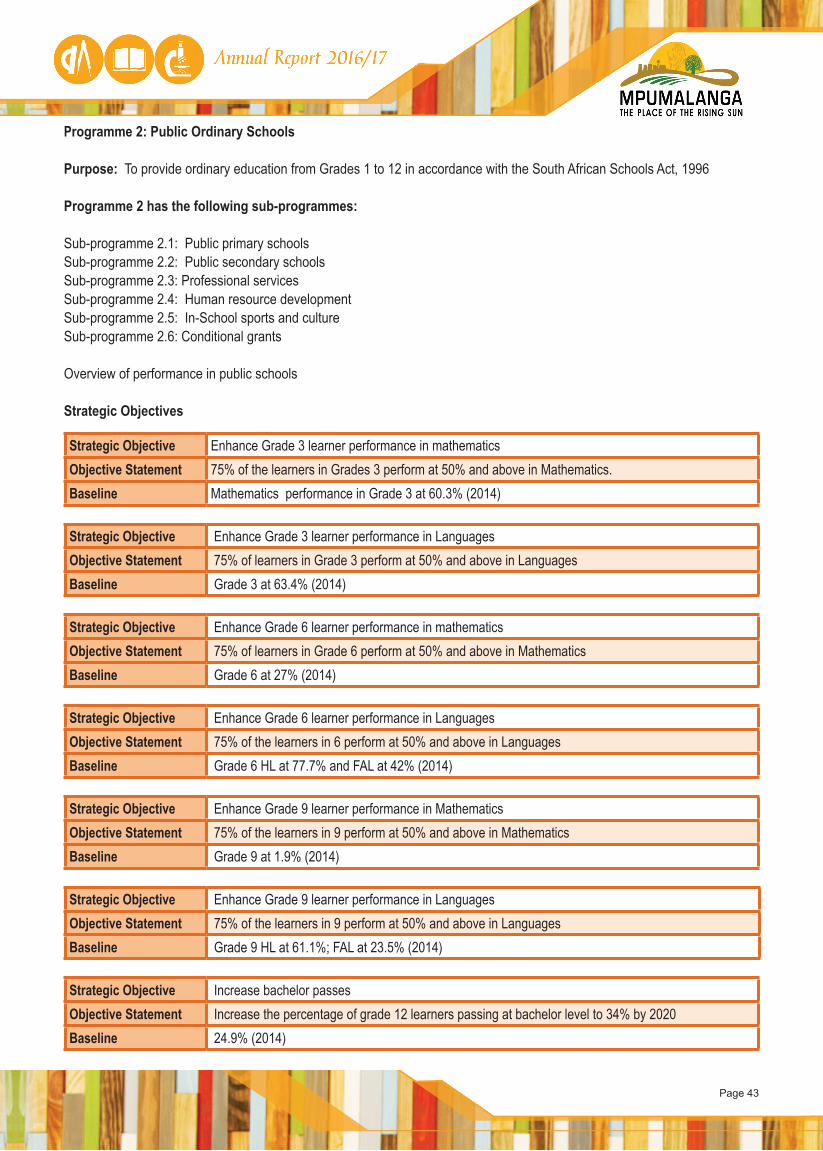
Page 43
Programme 2: Public Ordinary Schools
Purpose: To provide ordinary education from Grades 1 to 12 in accordance with the South African Schools Act, 1996
Programme 2 has the following sub-programmes:
Sub-programme 2.1: Public primary schoolsSub-programme 2.2: Public secondary schoolsSub-programme 2.3: Professional servicesSub-programme 2.4: Human resource developmentSub-programme 2.5: In-School sports and cultureSub-programme 2.6: Conditional grants
Overview of performance in public schools
Strategic Objectives
Strategic Objective Enhance Grade 3 learner performance in mathematics Objective Statement 75% of the learners in Grades 3 perform at 50% and above in Mathematics. Baseline Mathematics performance in Grade 3 at 60.3% (2014)
Strategic Objective Enhance Grade 3 learner performance in LanguagesObjective Statement 75% of learners in Grade 3 perform at 50% and above in LanguagesBaseline Grade 3 at 63.4% (2014)
Strategic Objective Enhance Grade 6 learner performance in mathematicsObjective Statement 75% of learners in Grade 6 perform at 50% and above in Mathematics Baseline Grade 6 at 27% (2014)
Strategic Objective Enhance Grade 6 learner performance in LanguagesObjective Statement 75% of the learners in 6 perform at 50% and above in LanguagesBaseline Grade 6 HL at 77.7% and FAL at 42% (2014)
Strategic Objective Enhance Grade 9 learner performance in Mathematics Objective Statement 75% of the learners in 9 perform at 50% and above in MathematicsBaseline Grade 9 at 1.9% (2014)
Strategic Objective Enhance Grade 9 learner performance in LanguagesObjective Statement 75% of the learners in 9 perform at 50% and above in LanguagesBaseline Grade 9 HL at 61.1%; FAL at 23.5% (2014)
Strategic Objective Increase bachelor passesObjective Statement Increase the percentage of grade 12 learners passing at bachelor level to 34% by 2020 Baseline 24.9% (2014)
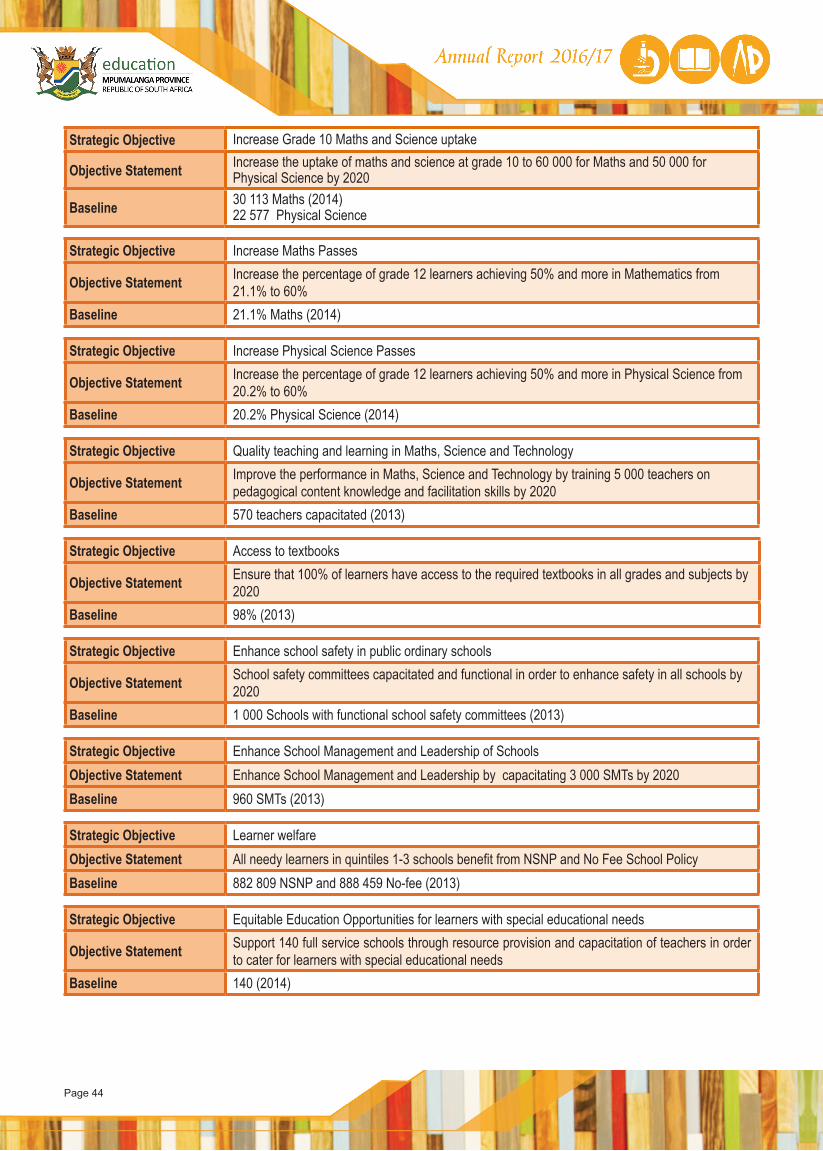
Page 44
Strategic Objective Increase Grade 10 Maths and Science uptake
Objective Statement Increase the uptake of maths and science at grade 10 to 60 000 for Maths and 50 000 for Physical Science by 2020
Baseline 30 113 Maths (2014)22 577 Physical Science
Strategic Objective Increase Maths Passes
Objective Statement Increase the percentage of grade 12 learners achieving 50% and more in Mathematics from 21.1% to 60%
Baseline 21.1% Maths (2014)
Strategic Objective Increase Physical Science Passes
Objective Statement Increase the percentage of grade 12 learners achieving 50% and more in Physical Science from 20.2% to 60%
Baseline 20.2% Physical Science (2014)
Strategic Objective Quality teaching and learning in Maths, Science and Technology
Objective Statement Improve the performance in Maths, Science and Technology by training 5 000 teachers on pedagogical content knowledge and facilitation skills by 2020
Baseline 570 teachers capacitated (2013)
Strategic Objective Access to textbooks
Objective Statement Ensure that 100% of learners have access to the required textbooks in all grades and subjects by 2020
Baseline 98% (2013)
Strategic Objective Enhance school safety in public ordinary schools
Objective Statement School safety committees capacitated and functional in order to enhance safety in all schools by 2020
Baseline 1 000 Schools with functional school safety committees (2013)
Strategic Objective Enhance School Management and Leadership of SchoolsObjective Statement Enhance School Management and Leadership by capacitating 3 000 SMTs by 2020Baseline 960 SMTs (2013)
Strategic Objective Learner welfareObjective Statement All needy learners in quintiles 1-3 schools benefit from NSNP and No Fee School PolicyBaseline 882 809 NSNP and 888 459 No-fee (2013)
Strategic Objective Equitable Education Opportunities for learners with special educational needs
Objective Statement Support 140 full service schools through resource provision and capacitation of teachers in order to cater for learners with special educational needs
Baseline 140 (2014)
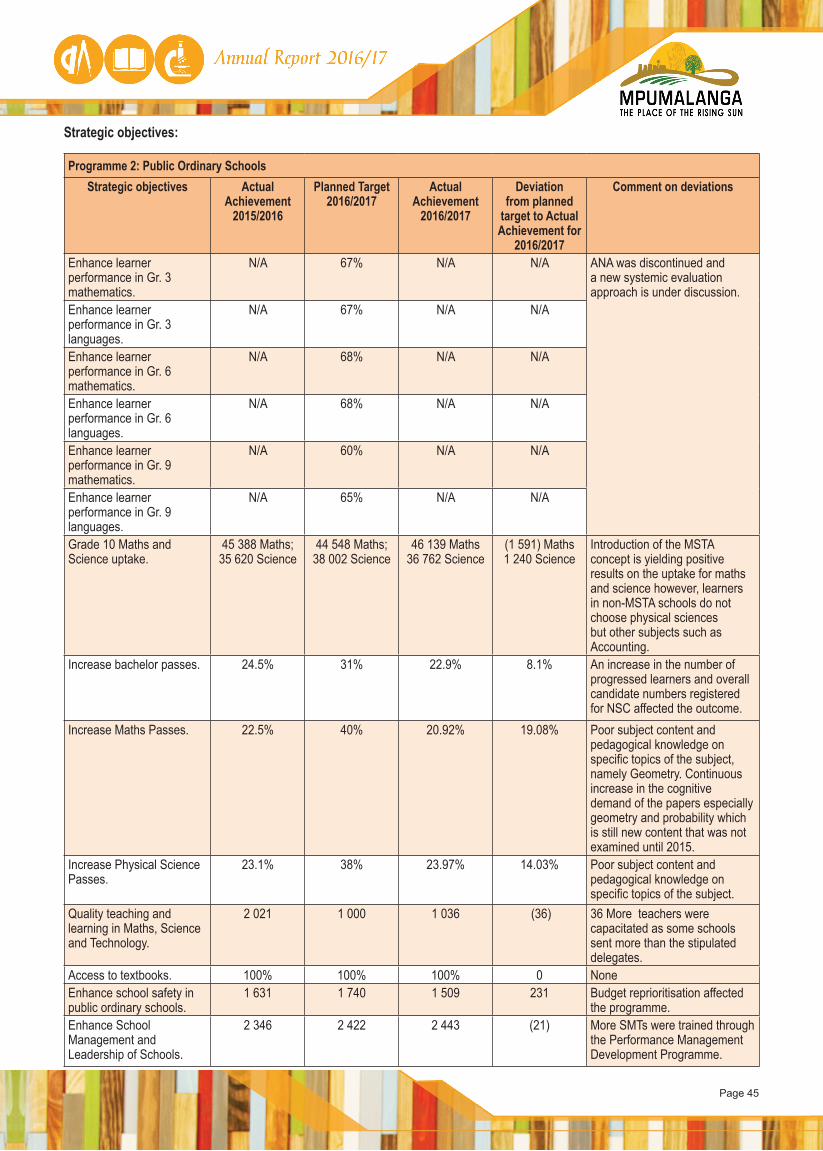
Page 45
Strategic objectives: Programme 2: Public Ordinary Schools
Strategic objectives Actual Achievement
2015/2016
Planned Target2016/2017
Actual Achievement
2016/2017
Deviation from planned
target to Actual Achievement for
2016/2017
Comment on deviations
Enhance learner performance in Gr. 3 mathematics.
N/A 67% N/A N/A ANA was discontinued and a new systemic evaluation approach is under discussion.
Enhance learner performance in Gr. 3 languages.
N/A 67% N/A N/A
Enhance learner performance in Gr. 6 mathematics.
N/A 68% N/A N/A
Enhance learner performance in Gr. 6 languages.
N/A 68% N/A N/A
Enhance learner performance in Gr. 9 mathematics.
N/A 60% N/A N/A
Enhance learner performance in Gr. 9 languages.
N/A 65% N/A N/A
Grade 10 Maths and Science uptake.
45 388 Maths; 35 620 Science
44 548 Maths; 38 002 Science
46 139 Maths36 762 Science
(1 591) Maths1 240 Science
Introduction of the MSTA concept is yielding positive results on the uptake for maths and science however, learners in non-MSTA schools do not choose physical sciences but other subjects such as Accounting.
Increase bachelor passes. 24.5% 31% 22.9% 8.1% An increase in the number of progressed learners and overall candidate numbers registered for NSC affected the outcome.
Increase Maths Passes. 22.5% 40% 20.92% 19.08% Poor subject content and pedagogical knowledge on specific topics of the subject, namely Geometry. Continuous increase in the cognitive demand of the papers especially geometry and probability which is still new content that was not examined until 2015.
Increase Physical Science Passes.
23.1% 38% 23.97% 14.03% Poor subject content and pedagogical knowledge on specific topics of the subject.
Quality teaching and learning in Maths, Science and Technology.
2 021 1 000 1 036 (36) 36 More teachers were capacitated as some schools sent more than the stipulated delegates.
Access to textbooks. 100% 100% 100% 0 NoneEnhance school safety in public ordinary schools.
1 631 1 740 1 509 231 Budget reprioritisation affected the programme.
Enhance School Management and Leadership of Schools.
2 346 2 422 2 443 (21) More SMTs were trained through the Performance Management Development Programme.

Page 46
Programme 2: Public Ordinary SchoolsStrategic objectives Actual
Achievement 2015/2016
Planned Target2016/2017
Actual Achievement
2016/2017
Deviation from planned
target to Actual Achievement for
2016/2017
Comment on deviations
Learner welfare (NSNP) 892 202 901 378 901 378 0 NoneLearner welfare (No Fee schools).
888 993 892 000 899 959 (7 959) More learners were enrolled in no-fee schools than expected.
Equitable education opportunities for learners with special educational needs.
140 140 140 0 None
All reasons for deviations and strategy to overcome areas of under-performance are presented after the priority plans tables. Refer to page 55-56
Performance indicators
Programme 2: Public Ordinary SchoolsPerformance Indicators Actual
Achievement 2013/2014
Actual Achievement
2014/2015
Actual Achievement
2015/2016
Planned Target
2016/2017
Actual Achievement
2016/2017
Deviation from planned
target to Actual
Achievement for 2016/2017
Comment on deviations
PPM201: Number of full service schools servicing learners with learning barriers.
140 140 140 140 140 0 None
PPM202: Number of primary schools with an overall pass rate in ANA of 50% and above .
N/A N/A N/A 658 N/A N/A ANA was discontinued and a new systemic evaluation approach is under discussion.
PPM203: Number of secondary schools with an overall pass rate in ANA of 40% and above (Grade 9).
N/A N/A N/A 345 N/A N/A ANA was discontinued and a new systemic evaluation approach is under discussion.
PPM204: Number of secondary schools with National Senior Certificate pass rate of 60% and above.
444 459 475 510 472 38 Inability of schools to sustain good performance as schools that performed above 60% in the previous year dropped to below 60%.
PPM205: The percentage of children who turned 9 in the previous year and who are currently enrolled in Grade 4 (or higher grade).
N/A N/A 68.89% 90% 72% 18% The variance is due to the low throughput rate in the previous grades, the other contributing factor is learners that are already over aged when they start school.
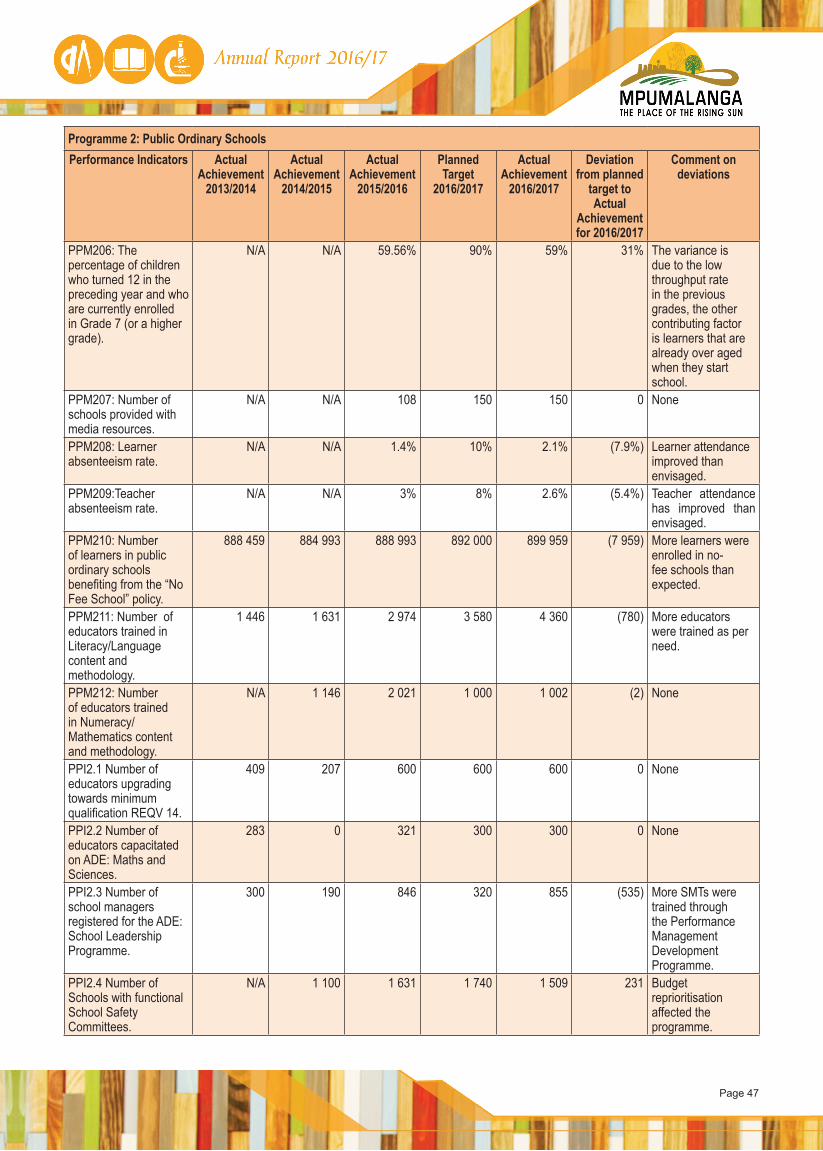
Page 47
Programme 2: Public Ordinary SchoolsPerformance Indicators Actual
Achievement 2013/2014
Actual Achievement
2014/2015
Actual Achievement
2015/2016
Planned Target
2016/2017
Actual Achievement
2016/2017
Deviation from planned
target to Actual
Achievement for 2016/2017
Comment on deviations
PPM206: The percentage of children who turned 12 in the preceding year and who are currently enrolled in Grade 7 (or a higher grade).
N/A N/A 59.56% 90% 59% 31% The variance is due to the low throughput rate in the previous grades, the other contributing factor is learners that are already over aged when they start school.
PPM207: Number of schools provided with media resources.
N/A N/A 108 150 150 0 None
PPM208: Learner absenteeism rate.
N/A N/A 1.4% 10% 2.1% (7.9%) Learner attendance improved than envisaged.
PPM209:Teacher absenteeism rate.
N/A N/A 3% 8% 2.6% (5.4%) Teacher attendance has improved than envisaged.
PPM210: Number of learners in public ordinary schools benefiting from the “No Fee School” policy.
888 459 884 993 888 993 892 000 899 959 (7 959) More learners were enrolled in no-fee schools than expected.
PPM211: Number of educators trained in Literacy/Language content and methodology.
1 446 1 631 2 974 3 580 4 360 (780) More educators were trained as per need.
PPM212: Number of educators trained in Numeracy/Mathematics content and methodology.
N/A 1 146 2 021 1 000 1 002 (2) None
PPI2.1 Number of educators upgrading towards minimum qualification REQV 14.
409 207 600 600 600 0 None
PPI2.2 Number of educators capacitated on ADE: Maths and Sciences.
283 0 321 300 300 0 None
PPI2.3 Number of school managers registered for the ADE: School Leadership Programme.
300 190 846 320 855 (535) More SMTs were trained through the Performance Management Development Programme.
PPI2.4 Number of Schools with functional School Safety Committees.
N/A 1 100 1 631 1 740 1 509 231 Budget reprioritisation affected the programme.
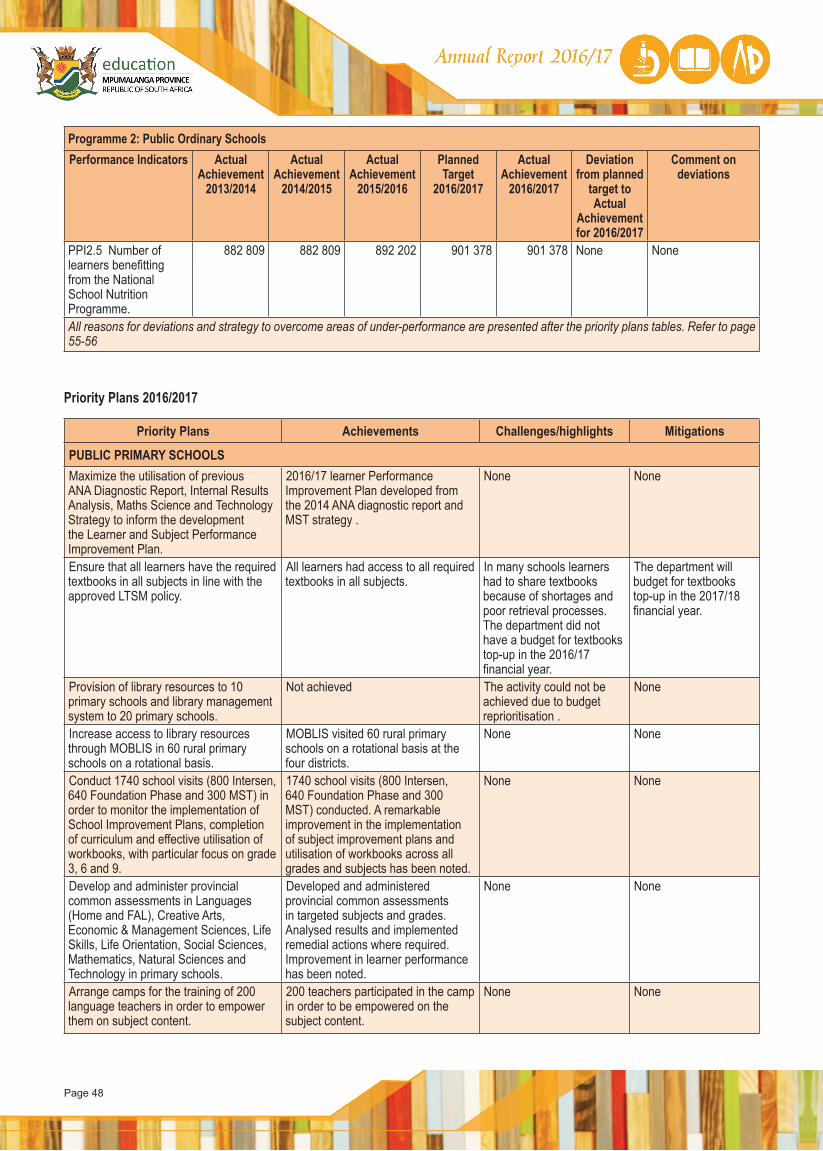
Page 48
Programme 2: Public Ordinary SchoolsPerformance Indicators Actual
Achievement 2013/2014
Actual Achievement
2014/2015
Actual Achievement
2015/2016
Planned Target
2016/2017
Actual Achievement
2016/2017
Deviation from planned
target to Actual
Achievement for 2016/2017
Comment on deviations
PPI2.5 Number of learners benefitting from the National School Nutrition Programme.
882 809 882 809 892 202 901 378 901 378 None None
All reasons for deviations and strategy to overcome areas of under-performance are presented after the priority plans tables. Refer to page 55-56
Priority Plans 2016/2017
Priority Plans Achievements Challenges/highlights Mitigations
PUBLIC PRIMARY SCHOOLSMaximize the utilisation of previous ANA Diagnostic Report, Internal Results Analysis, Maths Science and Technology Strategy to inform the development the Learner and Subject Performance Improvement Plan.
2016/17 learner Performance Improvement Plan developed from the 2014 ANA diagnostic report and MST strategy .
None None
Ensure that all learners have the required textbooks in all subjects in line with the approved LTSM policy.
All learners had access to all required textbooks in all subjects.
In many schools learners had to share textbooks because of shortages and poor retrieval processes. The department did not have a budget for textbooks top-up in the 2016/17 financial year.
The department will budget for textbooks top-up in the 2017/18 financial year.
Provision of library resources to 10 primary schools and library management system to 20 primary schools.
Not achieved The activity could not be achieved due to budget reprioritisation .
None
Increase access to library resources through MOBLIS in 60 rural primary schools on a rotational basis.
MOBLIS visited 60 rural primary schools on a rotational basis at the four districts.
None None
Conduct 1740 school visits (800 Intersen, 640 Foundation Phase and 300 MST) in order to monitor the implementation of School Improvement Plans, completion of curriculum and effective utilisation of workbooks, with particular focus on grade 3, 6 and 9.
1740 school visits (800 Intersen, 640 Foundation Phase and 300 MST) conducted. A remarkable improvement in the implementation of subject improvement plans and utilisation of workbooks across all grades and subjects has been noted.
None None
Develop and administer provincial common assessments in Languages (Home and FAL), Creative Arts, Economic & Management Sciences, Life Skills, Life Orientation, Social Sciences, Mathematics, Natural Sciences and Technology in primary schools.
Developed and administered provincial common assessments in targeted subjects and grades. Analysed results and implemented remedial actions where required. Improvement in learner performance has been noted.
None None
Arrange camps for the training of 200 language teachers in order to empower them on subject content.
200 teachers participated in the camp in order to be empowered on the subject content.
None None
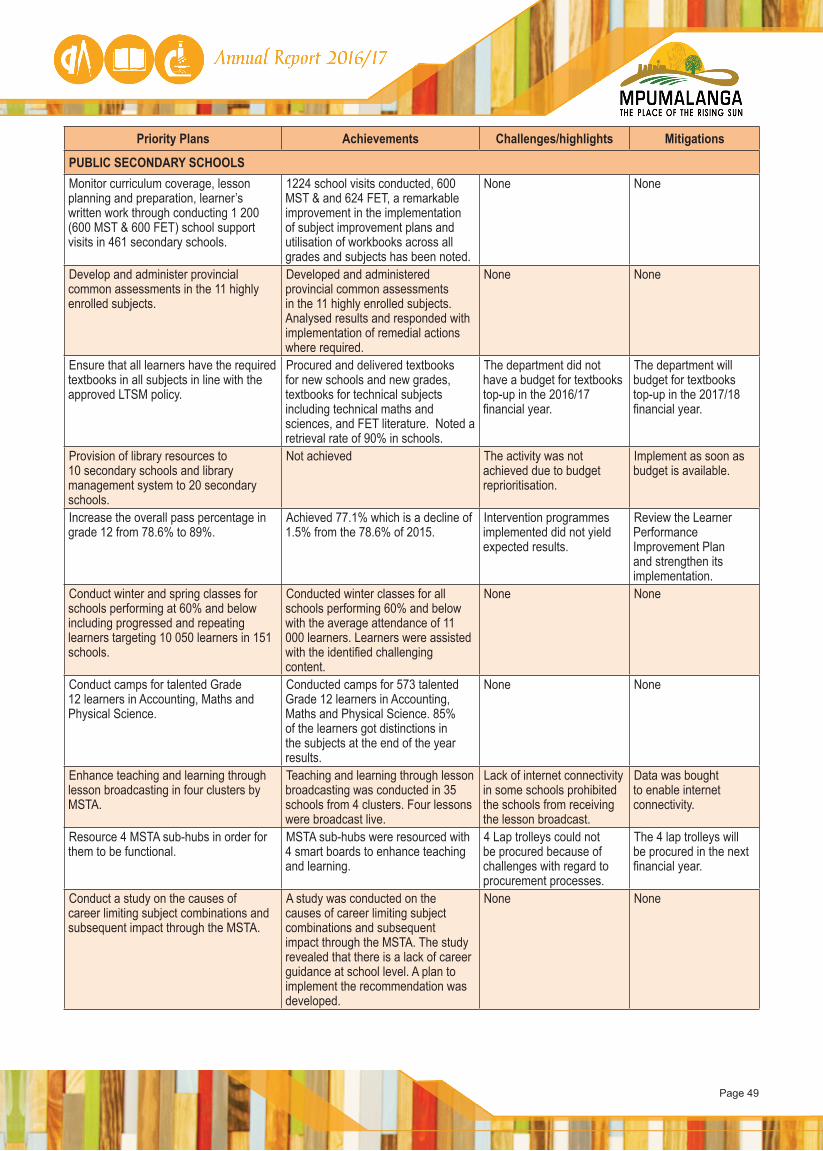
Page 49
Priority Plans Achievements Challenges/highlights Mitigations
PUBLIC SECONDARY SCHOOLSMonitor curriculum coverage, lesson planning and preparation, learner’s written work through conducting 1 200 (600 MST & 600 FET) school support visits in 461 secondary schools.
1224 school visits conducted, 600 MST & and 624 FET, a remarkable improvement in the implementation of subject improvement plans and utilisation of workbooks across all grades and subjects has been noted.
None None
Develop and administer provincial common assessments in the 11 highly enrolled subjects.
Developed and administered provincial common assessments in the 11 highly enrolled subjects. Analysed results and responded with implementation of remedial actions where required.
None None
Ensure that all learners have the required textbooks in all subjects in line with the approved LTSM policy.
Procured and delivered textbooks for new schools and new grades, textbooks for technical subjects including technical maths and sciences, and FET literature. Noted a retrieval rate of 90% in schools.
The department did not have a budget for textbooks top-up in the 2016/17 financial year.
The department will budget for textbooks top-up in the 2017/18 financial year.
Provision of library resources to 10 secondary schools and library management system to 20 secondary schools.
Not achieved The activity was not achieved due to budget reprioritisation.
Implement as soon as budget is available.
Increase the overall pass percentage in grade 12 from 78.6% to 89%.
Achieved 77.1% which is a decline of 1.5% from the 78.6% of 2015.
Intervention programmes implemented did not yield expected results.
Review the Learner Performance Improvement Plan and strengthen its implementation.
Conduct winter and spring classes for schools performing at 60% and below including progressed and repeating learners targeting 10 050 learners in 151 schools.
Conducted winter classes for all schools performing 60% and below with the average attendance of 11 000 learners. Learners were assisted with the identified challenging content.
None None
Conduct camps for talented Grade 12 learners in Accounting, Maths and Physical Science.
Conducted camps for 573 talented Grade 12 learners in Accounting, Maths and Physical Science. 85% of the learners got distinctions in the subjects at the end of the year results.
None None
Enhance teaching and learning through lesson broadcasting in four clusters by MSTA.
Teaching and learning through lesson broadcasting was conducted in 35 schools from 4 clusters. Four lessons were broadcast live.
Lack of internet connectivity in some schools prohibited the schools from receiving the lesson broadcast.
Data was bought to enable internet connectivity.
Resource 4 MSTA sub-hubs in order for them to be functional.
MSTA sub-hubs were resourced with 4 smart boards to enhance teaching and learning.
4 Lap trolleys could not be procured because of challenges with regard to procurement processes.
The 4 lap trolleys will be procured in the next financial year.
Conduct a study on the causes of career limiting subject combinations and subsequent impact through the MSTA.
A study was conducted on the causes of career limiting subject combinations and subsequent impact through the MSTA. The study revealed that there is a lack of career guidance at school level. A plan to implement the recommendation was developed.
None None
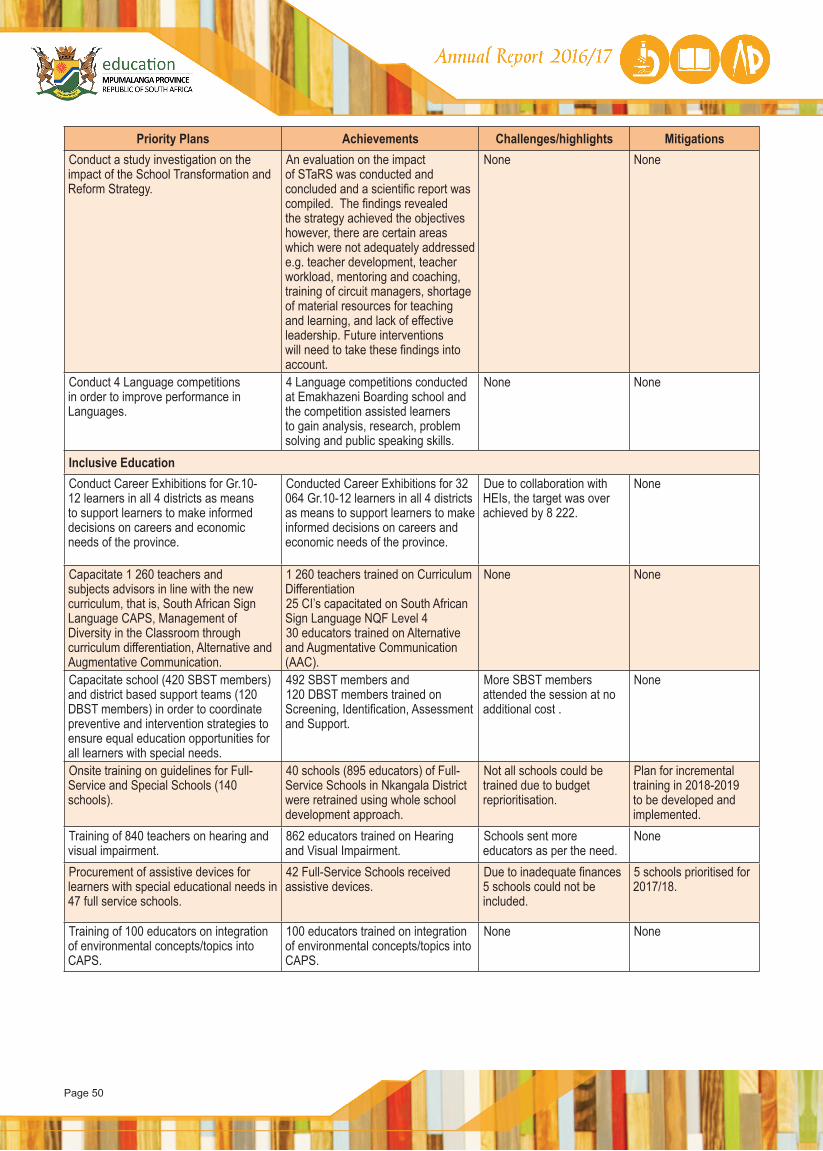
Page 50
Priority Plans Achievements Challenges/highlights Mitigations Conduct a study investigation on the impact of the School Transformation and Reform Strategy.
An evaluation on the impact of STaRS was conducted and concluded and a scientific report was compiled. The findings revealed the strategy achieved the objectives however, there are certain areas which were not adequately addressed e.g. teacher development, teacher workload, mentoring and coaching, training of circuit managers, shortage of material resources for teaching and learning, and lack of effective leadership. Future interventions will need to take these findings into account.
None None
Conduct 4 Language competitions in order to improve performance in Languages.
4 Language competitions conducted at Emakhazeni Boarding school and the competition assisted learners to gain analysis, research, problem solving and public speaking skills.
None None
Inclusive Education Conduct Career Exhibitions for Gr.10-12 learners in all 4 districts as means to support learners to make informed decisions on careers and economic needs of the province.
Conducted Career Exhibitions for 32 064 Gr.10-12 learners in all 4 districts as means to support learners to make informed decisions on careers and economic needs of the province.
Due to collaboration with HEIs, the target was over achieved by 8 222.
None
Capacitate 1 260 teachers and subjects advisors in line with the new curriculum, that is, South African Sign Language CAPS, Management of Diversity in the Classroom through curriculum differentiation, Alternative and Augmentative Communication.
1 260 teachers trained on Curriculum Differentiation25 CI’s capacitated on South African Sign Language NQF Level 430 educators trained on Alternative and Augmentative Communication (AAC).
None None
Capacitate school (420 SBST members) and district based support teams (120 DBST members) in order to coordinate preventive and intervention strategies to ensure equal education opportunities for all learners with special needs.
492 SBST members and 120 DBST members trained on Screening, Identification, Assessment and Support.
More SBST members attended the session at no additional cost .
None
Onsite training on guidelines for Full-Service and Special Schools (140 schools).
40 schools (895 educators) of Full-Service Schools in Nkangala District were retrained using whole school development approach.
Not all schools could be trained due to budget reprioritisation.
Plan for incremental training in 2018-2019 to be developed and implemented.
Training of 840 teachers on hearing and visual impairment.
862 educators trained on Hearing and Visual Impairment.
Schools sent more educators as per the need.
None
Procurement of assistive devices for learners with special educational needs in 47 full service schools.
42 Full-Service Schools received assistive devices.
Due to inadequate finances 5 schools could not be included.
5 schools prioritised for 2017/18.
Training of 100 educators on integration of environmental concepts/topics into CAPS.
100 educators trained on integration of environmental concepts/topics into CAPS.
None None

Page 51
Priority Plans Achievements Challenges/highlights Mitigations
Teacher development, school management and governanceCapacitation of teachers through Higher Education Institutions on formal qualification to meet the REQV 14 requirement.
600 educators have been registered For Advanced Certificate in Teaching for REQV 14 requirement. The educators are in their second and last year of study in the 2017 academic year.
None None
Capacitation of teachers and subject advisors in Advanced Certificate in Teaching for 1400 Foundation Phase teachers, 600 Intermediate Phase, 600 Senior Phase and 600 FET Phase (PIVOTAL).
635 teachers enrolled on Foundation Phase, 699 enrolled on Intermediate Phase, 567 enrolled on Senior Phase and 194 teachers enrolled on FET Phase.
The number of participants was reduced due to budgetary constraints as well as the capacity of the University to host all the participants.
The second cohort of 765 teachers on Foundation phase and 406 teachers on FET Phase will be enrolled in the 2018/2019 financial year when the current cohort completes the programme.
Piloting of teacher self-diagnostic assessment.
Piloting of teacher self-diagnostic was conducted and 251 teachers successfully completed the English test.
Challenges experienced with the administration of the programme hampered the full implementation of the project.
The piloting will be continued in the new financial year.
Training of 38 Subject Advisors and 2000 teachers in the foundation phase on Languages, Mathematics, Life Skills and Curriculum Differentiation.
38 Subject Advisors and 2000 teachers in the foundation phase trained on Languages, Mathematics, Life Skills and Curriculum Differentiation.
None None
Training of 500 grade 8 and 9 Mathematics teachers through the 1+4 model.
500 Grade 8 and 9 teachers trained through the 1+4 intervention model. Analysis of pre and post-test show that teacher content knowledge improved from an average of 58% to 74%.
None None
Training of 200 teachers teaching maths and science for the first time.
458 teachers teaching maths and science for the first time in grade 10 and 11 were trained on content.
Grade 11 teachers were added to prepare for the extension of maths and science in MSTA schools in 2017.
None
Resource two District Teacher Development Centres for their optimal functionality.
2 District centres resourced with 2 laboratory tables, chairs and 45 training tables each.
None None
Advocate World Teachers Day and National Teaching Awards.
Advocacy was successfully conducted.Two Provincial finalists obtained position 1 at National level, in the category: Excellence in Secondary school leadership, and Excellence in Special Needs Category. Five finalists got position 2.
None None
Administration of IQMS and CPTD in 1 740 and sample 729 schools for monitoring and support.
IQMS and CPTD were administered in 1735 schools; 729 (CPTD) and (IQMS) schools were sampled for monitoring and support.
None None
Training of 250 multi-grade teachers on subject content including on the multi-grade toolkit.
250 multi-grade teachers trained on subject content including on the multi-grade toolkit.
None None
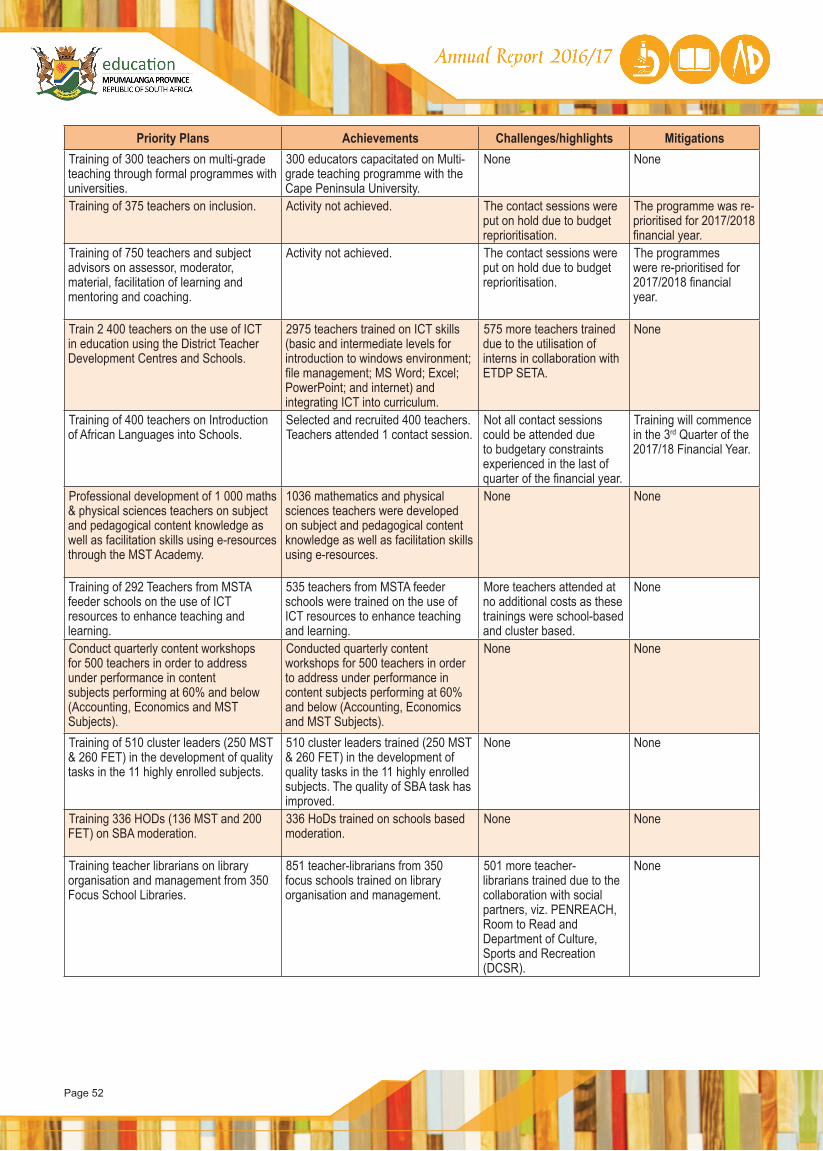
Page 52
Priority Plans Achievements Challenges/highlights Mitigations Training of 300 teachers on multi-grade teaching through formal programmes with universities.
300 educators capacitated on Multi-grade teaching programme with the Cape Peninsula University.
None None
Training of 375 teachers on inclusion. Activity not achieved. The contact sessions were put on hold due to budget reprioritisation.
The programme was re-prioritised for 2017/2018 financial year.
Training of 750 teachers and subject advisors on assessor, moderator, material, facilitation of learning and mentoring and coaching.
Activity not achieved. The contact sessions were put on hold due to budget reprioritisation.
The programmes were re-prioritised for 2017/2018 financial year.
Train 2 400 teachers on the use of ICT in education using the District Teacher Development Centres and Schools.
2975 teachers trained on ICT skills (basic and intermediate levels for introduction to windows environment; file management; MS Word; Excel; PowerPoint; and internet) and integrating ICT into curriculum.
575 more teachers trained due to the utilisation of interns in collaboration with ETDP SETA.
None
Training of 400 teachers on Introduction of African Languages into Schools.
Selected and recruited 400 teachers.Teachers attended 1 contact session.
Not all contact sessions could be attended due to budgetary constraints experienced in the last of quarter of the financial year.
Training will commence in the 3rd Quarter of the 2017/18 Financial Year.
Professional development of 1 000 maths & physical sciences teachers on subject and pedagogical content knowledge as well as facilitation skills using e-resources through the MST Academy.
1036 mathematics and physical sciences teachers were developed on subject and pedagogical content knowledge as well as facilitation skills using e-resources.
None None
Training of 292 Teachers from MSTA feeder schools on the use of ICT resources to enhance teaching and learning.
535 teachers from MSTA feeder schools were trained on the use of ICT resources to enhance teaching and learning.
More teachers attended at no additional costs as these trainings were school-based and cluster based.
None
Conduct quarterly content workshops for 500 teachers in order to address under performance in content subjects performing at 60% and below (Accounting, Economics and MST Subjects).
Conducted quarterly content workshops for 500 teachers in order to address under performance in content subjects performing at 60% and below (Accounting, Economics and MST Subjects).
None None
Training of 510 cluster leaders (250 MST & 260 FET) in the development of quality tasks in the 11 highly enrolled subjects.
510 cluster leaders trained (250 MST & 260 FET) in the development of quality tasks in the 11 highly enrolled subjects. The quality of SBA task has improved.
None None
Training 336 HODs (136 MST and 200 FET) on SBA moderation.
336 HoDs trained on schools based moderation.
None None
Training teacher librarians on library organisation and management from 350 Focus School Libraries.
851 teacher-librarians from 350 focus schools trained on library organisation and management.
501 more teacher-librarians trained due to the collaboration with social partners, viz. PENREACH, Room to Read and Department of Culture, Sports and Recreation (DCSR).
None
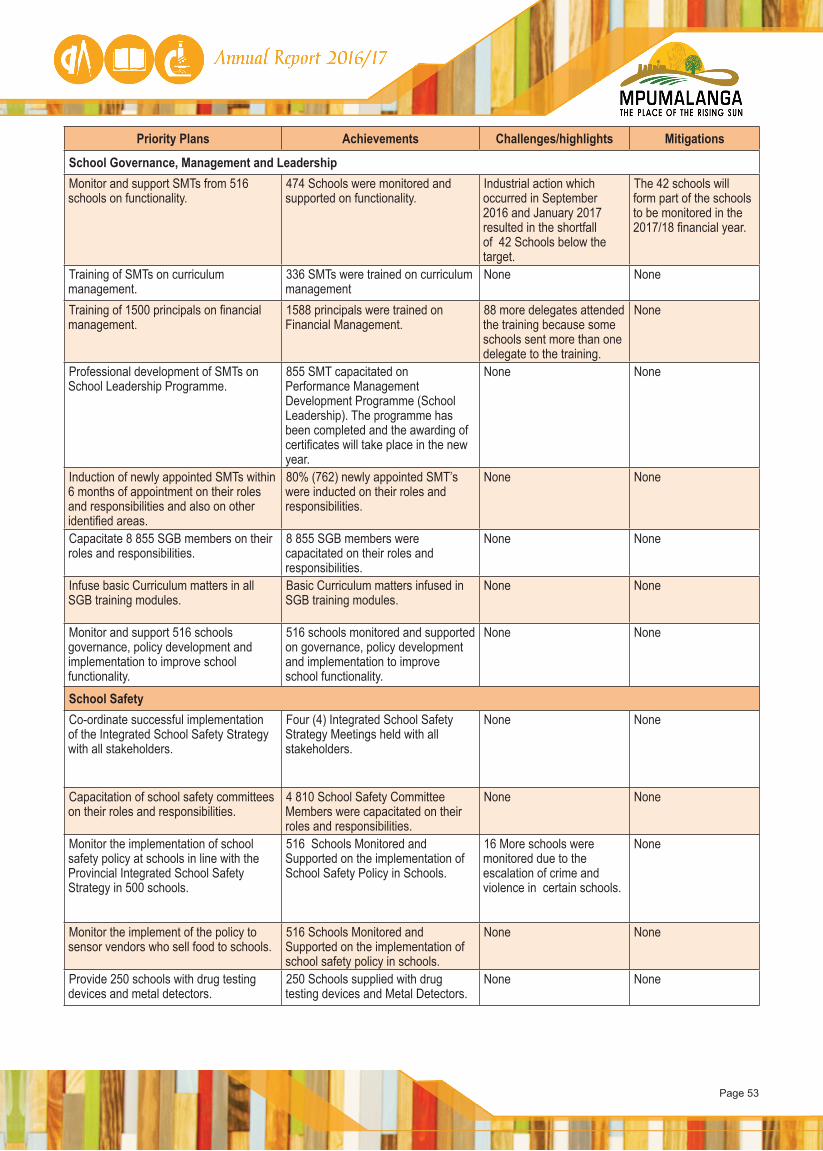
Page 53
Priority Plans Achievements Challenges/highlights Mitigations
School Governance, Management and LeadershipMonitor and support SMTs from 516 schools on functionality.
474 Schools were monitored and supported on functionality.
Industrial action which occurred in September 2016 and January 2017 resulted in the shortfall of 42 Schools below the target.
The 42 schools will form part of the schools to be monitored in the 2017/18 financial year.
Training of SMTs on curriculum management.
336 SMTs were trained on curriculum management
None None
Training of 1500 principals on financial management.
1588 principals were trained on Financial Management.
88 more delegates attended the training because some schools sent more than one delegate to the training.
None
Professional development of SMTs on School Leadership Programme.
855 SMT capacitated on Performance Management Development Programme (School Leadership). The programme has been completed and the awarding of certificates will take place in the new year.
None None
Induction of newly appointed SMTs within 6 months of appointment on their roles and responsibilities and also on other identified areas.
80% (762) newly appointed SMT’s were inducted on their roles and responsibilities.
None None
Capacitate 8 855 SGB members on their roles and responsibilities.
8 855 SGB members were capacitated on their roles and responsibilities.
None None
Infuse basic Curriculum matters in all SGB training modules.
Basic Curriculum matters infused in SGB training modules.
None None
Monitor and support 516 schools governance, policy development and implementation to improve school functionality.
516 schools monitored and supported on governance, policy development and implementation to improve school functionality.
None None
School SafetyCo-ordinate successful implementation of the Integrated School Safety Strategy with all stakeholders.
Four (4) Integrated School Safety Strategy Meetings held with all stakeholders.
None None
Capacitation of school safety committees on their roles and responsibilities.
4 810 School Safety Committee Members were capacitated on their roles and responsibilities.
None None
Monitor the implementation of school safety policy at schools in line with the Provincial Integrated School Safety Strategy in 500 schools.
516 Schools Monitored and Supported on the implementation of School Safety Policy in Schools.
16 More schools were monitored due to the escalation of crime and violence in certain schools.
None
Monitor the implement of the policy to sensor vendors who sell food to schools.
516 Schools Monitored and Supported on the implementation of school safety policy in schools.
None None
Provide 250 schools with drug testing devices and metal detectors.
250 Schools supplied with drug testing devices and Metal Detectors.
None None
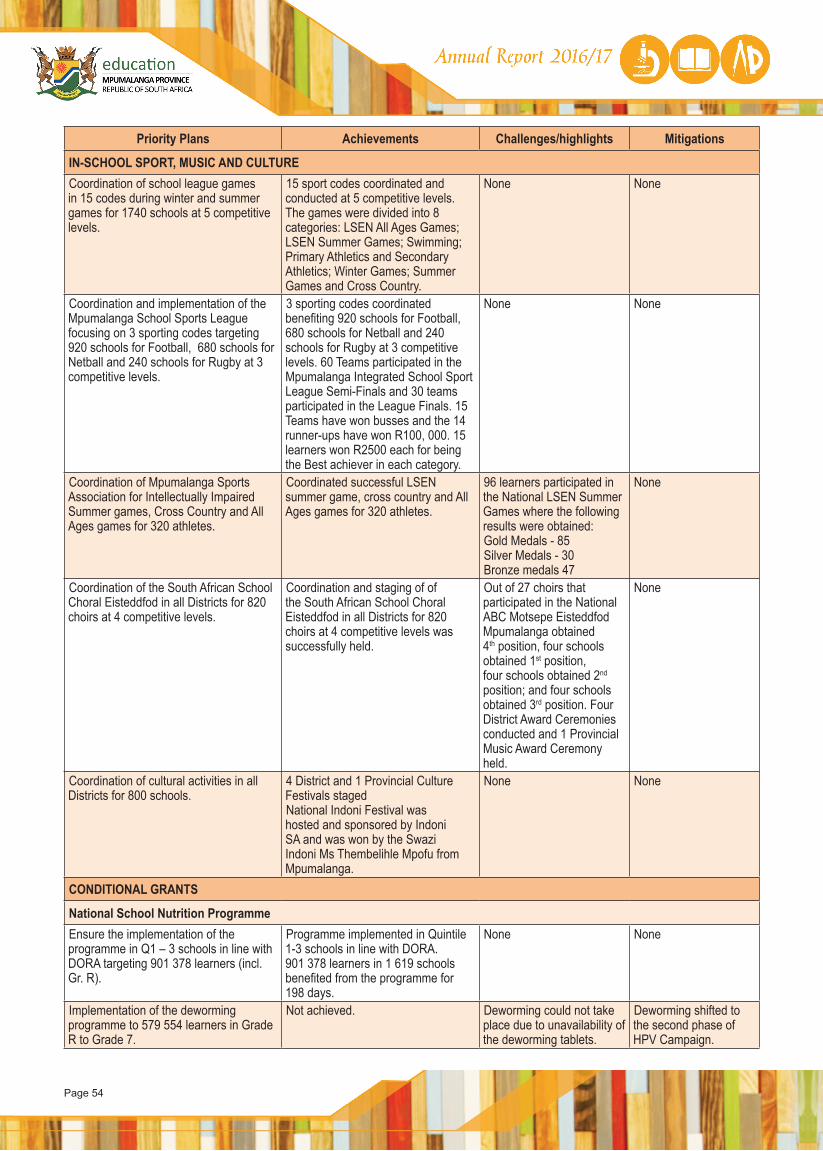
Page 54
Priority Plans Achievements Challenges/highlights Mitigations
IN-SCHOOL SPORT, MUSIC AND CULTURECoordination of school league games in 15 codes during winter and summer games for 1740 schools at 5 competitive levels.
15 sport codes coordinated and conducted at 5 competitive levels. The games were divided into 8 categories: LSEN All Ages Games; LSEN Summer Games; Swimming; Primary Athletics and Secondary Athletics; Winter Games; Summer Games and Cross Country.
None None
Coordination and implementation of the Mpumalanga School Sports League focusing on 3 sporting codes targeting 920 schools for Football, 680 schools for Netball and 240 schools for Rugby at 3 competitive levels.
3 sporting codes coordinated benefiting 920 schools for Football, 680 schools for Netball and 240 schools for Rugby at 3 competitive levels. 60 Teams participated in the Mpumalanga Integrated School Sport League Semi-Finals and 30 teams participated in the League Finals. 15 Teams have won busses and the 14 runner-ups have won R100, 000. 15 learners won R2500 each for being the Best achiever in each category.
None None
Coordination of Mpumalanga Sports Association for Intellectually Impaired Summer games, Cross Country and All Ages games for 320 athletes.
Coordinated successful LSEN summer game, cross country and All Ages games for 320 athletes.
96 learners participated in the National LSEN Summer Games where the following results were obtained:Gold Medals - 85 Silver Medals - 30 Bronze medals 47
None
Coordination of the South African School Choral Eisteddfod in all Districts for 820 choirs at 4 competitive levels.
Coordination and staging of of the South African School Choral Eisteddfod in all Districts for 820 choirs at 4 competitive levels was successfully held.
Out of 27 choirs that participated in the National ABC Motsepe Eisteddfod Mpumalanga obtained 4th position, four schools obtained 1st position, four schools obtained 2nd position; and four schools obtained 3rd position. Four District Award Ceremonies conducted and 1 Provincial Music Award Ceremony held.
None
Coordination of cultural activities in all Districts for 800 schools.
4 District and 1 Provincial Culture Festivals stagedNational Indoni Festival was hosted and sponsored by Indoni SA and was won by the Swazi Indoni Ms Thembelihle Mpofu from Mpumalanga.
None None
CONDITIONAL GRANTS
National School Nutrition ProgrammeEnsure the implementation of the programme in Q1 – 3 schools in line with DORA targeting 901 378 learners (incl. Gr. R).
Programme implemented in Quintile 1-3 schools in line with DORA. 901 378 learners in 1 619 schools benefited from the programme for 198 days.
None None
Implementation of the deworming programme to 579 554 learners in Grade R to Grade 7.
Not achieved. Deworming could not take place due to unavailability of the deworming tablets.
Deworming shifted to the second phase of HPV Campaign.
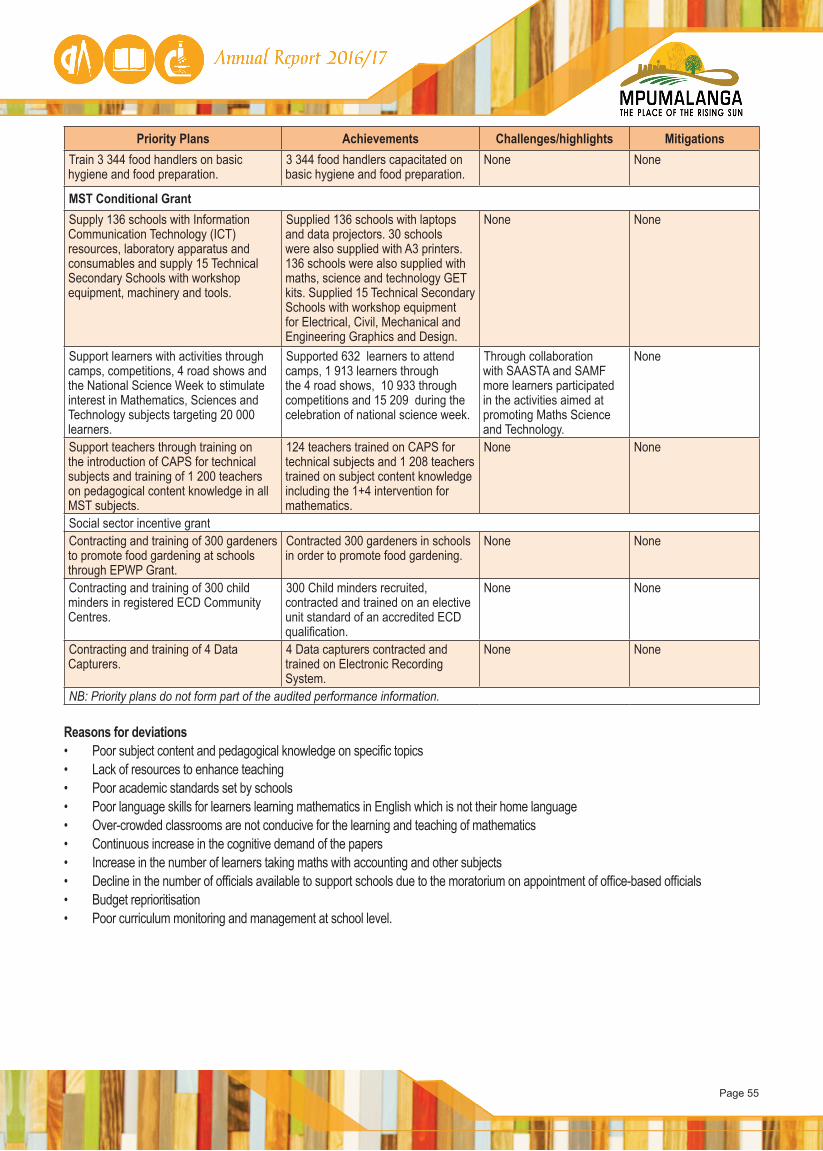
Page 55
Priority Plans Achievements Challenges/highlights Mitigations Train 3 344 food handlers on basic hygiene and food preparation.
3 344 food handlers capacitated on basic hygiene and food preparation.
None None
MST Conditional GrantSupply 136 schools with Information Communication Technology (ICT) resources, laboratory apparatus and consumables and supply 15 Technical Secondary Schools with workshop equipment, machinery and tools.
Supplied 136 schools with laptops and data projectors. 30 schools were also supplied with A3 printers. 136 schools were also supplied with maths, science and technology GET kits. Supplied 15 Technical Secondary Schools with workshop equipment for Electrical, Civil, Mechanical and Engineering Graphics and Design.
None None
Support learners with activities through camps, competitions, 4 road shows and the National Science Week to stimulate interest in Mathematics, Sciences and Technology subjects targeting 20 000 learners.
Supported 632 learners to attend camps, 1 913 learners through the 4 road shows, 10 933 through competitions and 15 209 during the celebration of national science week.
Through collaboration with SAASTA and SAMF more learners participated in the activities aimed at promoting Maths Science and Technology.
None
Support teachers through training on the introduction of CAPS for technical subjects and training of 1 200 teachers on pedagogical content knowledge in all MST subjects.
124 teachers trained on CAPS for technical subjects and 1 208 teachers trained on subject content knowledge including the 1+4 intervention for mathematics.
None None
Social sector incentive grantContracting and training of 300 gardeners to promote food gardening at schools through EPWP Grant.
Contracted 300 gardeners in schools in order to promote food gardening.
None None
Contracting and training of 300 child minders in registered ECD Community Centres.
300 Child minders recruited, contracted and trained on an elective unit standard of an accredited ECD qualification.
None None
Contracting and training of 4 Data Capturers.
4 Data capturers contracted and trained on Electronic Recording System.
None None
NB: Priority plans do not form part of the audited performance information.
Reasons for deviations• Poor subject content and pedagogical knowledge on specific topics • Lack of resources to enhance teaching • Poor academic standards set by schools • Poor language skills for learners learning mathematics in English which is not their home language • Over-crowded classrooms are not conducive for the learning and teaching of mathematics • Continuous increase in the cognitive demand of the papers • Increase in the number of learners taking maths with accounting and other subjects• Decline in the number of officials available to support schools due to the moratorium on appointment of office-based officials• Budget reprioritisation• Poor curriculum monitoring and management at school level.
Page 56
Strategy to overcome areas of under performance
Monitoring and support• Internal staff reallocation to be encouraged so as to fill gaps in most critical areas • Conduct oversight visit to districts on a quarterly basis• Cause schools performing below 70% to submit monthly reports on the implementation of their improvement plans and provide feedback
and support to them• Improve and encourage the utilisation of the Data Driven Districts dashboard• Allocate Members of the Executive Council, Senior Managers and Middle Managers to circuits and schools for support.
Learner support• Strengthen support for progressed learners and agree with parent on methods for learners failing to meet the requirements in the
preparatory exam• Increase the number of learners attending learner camps for mathematics and physical sciences• Conduct lesson broadcast for all schools in a number of subjects• Increase the number of learners participating in Grade 12 winter and spring classes • Cause all schools below 70% to conduct extra classes.
Teacher support• Extend the 1+4 teacher training model for mathematics teachers to cover Grade 4 – 12• Conduct full day workshops on weekends and school holidays• Conduct motivational talks to all Grade 12 MST teachers.
School Based Assessment• Conduct workshops on SBA for subject advisors and SMTs• Conduct sample SBA moderation at District and Provincial level.
Parental involvement• Cause schools to hold quarterly meetings with parents of progressed learners to discuss learners performance and strategies to improve
performance.
Financial Constraints • Maximise the number of kilometres that can be travelled per month to support schools through team travel• Prioritise budgets to support curriculum delivery.
Changes to planned targets
No changes were made to planned targets as per section 4.2 of The Framework for Strategic Plans and Annual Performance Plans which stipulates, “To simplify performance tracking, in-year changes to the plan should not be made. Where an institution’s performance exceeds or misses targets due to in-year budget changes or for another reason, this should be noted in its annual report”.
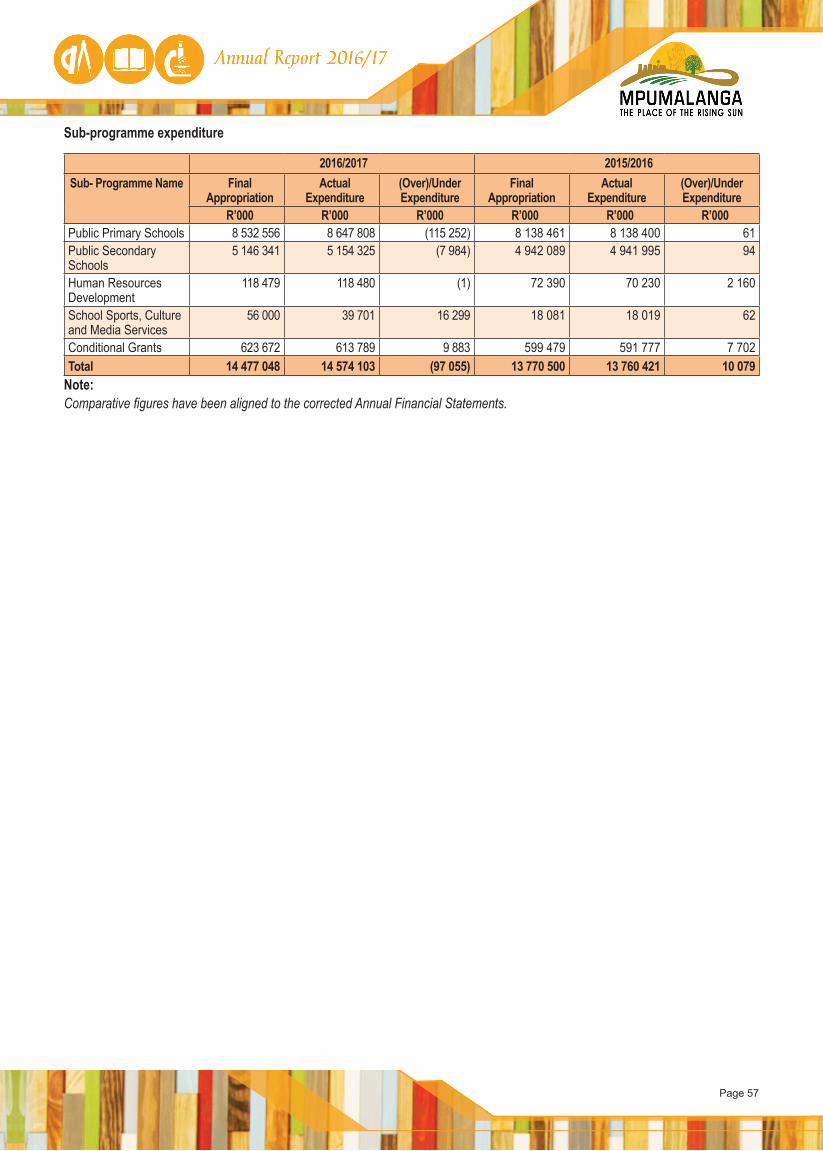
Page 57
Sub-programme expenditure
2016/2017 2015/2016Sub- Programme Name Final
AppropriationActual
Expenditure(Over)/Under Expenditure
Final Appropriation
ActualExpenditure
(Over)/Under Expenditure
R’000 R’000 R’000 R’000 R’000 R’000Public Primary Schools 8 532 556 8 647 808 (115 252) 8 138 461 8 138 400 61Public Secondary Schools
5 146 341 5 154 325 (7 984) 4 942 089 4 941 995 94
Human Resources Development
118 479 118 480 (1) 72 390 70 230 2 160
School Sports, Culture and Media Services
56 000 39 701 16 299 18 081 18 019 62
Conditional Grants 623 672 613 789 9 883 599 479 591 777 7 702Total 14 477 048 14 574 103 (97 055) 13 770 500 13 760 421 10 079
Note:Comparative figures have been aligned to the corrected Annual Financial Statements.
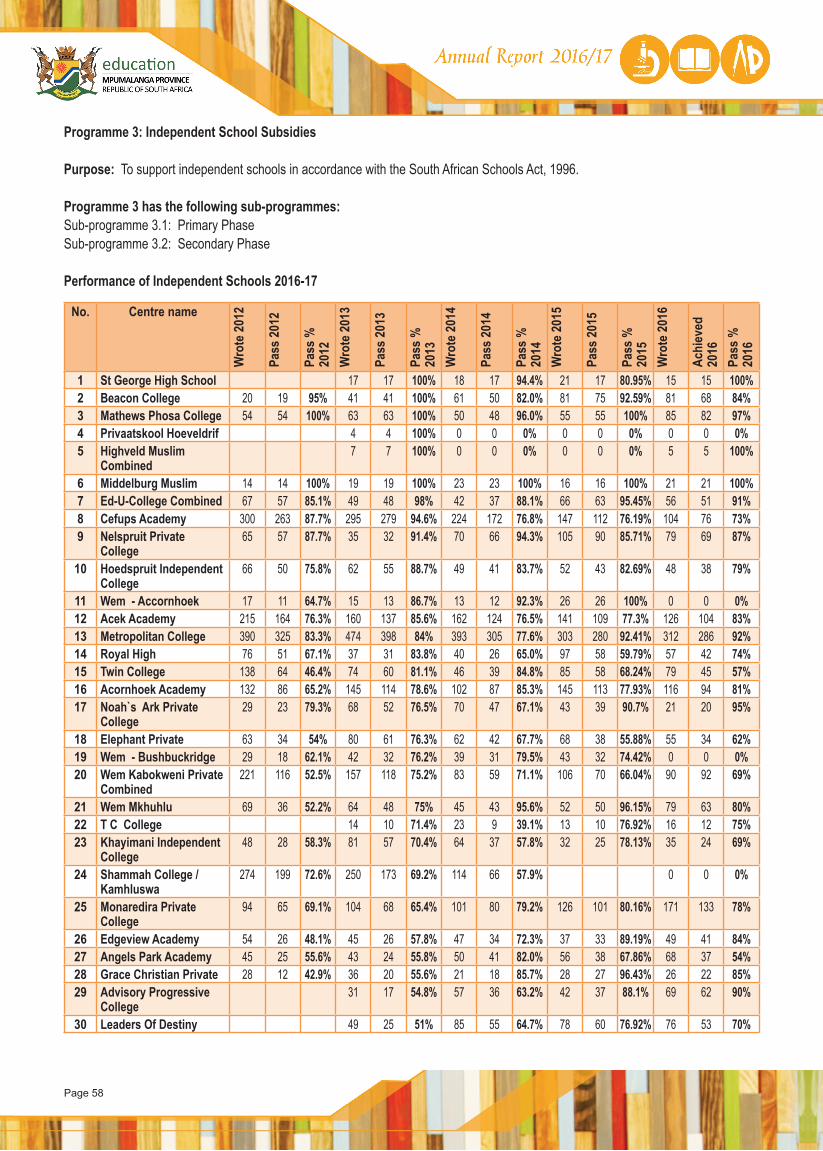
Page 58
Programme 3: Independent School Subsidies
Purpose: To support independent schools in accordance with the South African Schools Act, 1996.
Programme 3 has the following sub-programmes:Sub-programme 3.1: Primary Phase Sub-programme 3.2: Secondary Phase
Performance of Independent Schools 2016-17
No. Centre name
Wro
te 2
012
Pass
201
2
Pass
%
2012
Wro
te 2
013
Pass
201
3
Pass
%
2013
Wro
te 2
014
Pass
201
4
Pass
%
2014
Wro
te 2
015
Pass
201
5
Pass
%
2015
Wro
te 2
016
Achi
eved
20
16Pa
ss %
20
16
1 St George High School 17 17 100% 18 17 94.4% 21 17 80.95% 15 15 100%2 Beacon College 20 19 95% 41 41 100% 61 50 82.0% 81 75 92.59% 81 68 84%3 Mathews Phosa College 54 54 100% 63 63 100% 50 48 96.0% 55 55 100% 85 82 97%4 Privaatskool Hoeveldrif 4 4 100% 0 0 0% 0 0 0% 0 0 0%5 Highveld Muslim
Combined7 7 100% 0 0 0% 0 0 0% 5 5 100%
6 Middelburg Muslim 14 14 100% 19 19 100% 23 23 100% 16 16 100% 21 21 100%7 Ed-U-College Combined 67 57 85.1% 49 48 98% 42 37 88.1% 66 63 95.45% 56 51 91%8 Cefups Academy 300 263 87.7% 295 279 94.6% 224 172 76.8% 147 112 76.19% 104 76 73%9 Nelspruit Private
College65 57 87.7% 35 32 91.4% 70 66 94.3% 105 90 85.71% 79 69 87%
10 Hoedspruit Independent College
66 50 75.8% 62 55 88.7% 49 41 83.7% 52 43 82.69% 48 38 79%
11 Wem - Accornhoek 17 11 64.7% 15 13 86.7% 13 12 92.3% 26 26 100% 0 0 0%12 Acek Academy 215 164 76.3% 160 137 85.6% 162 124 76.5% 141 109 77.3% 126 104 83%13 Metropolitan College 390 325 83.3% 474 398 84% 393 305 77.6% 303 280 92.41% 312 286 92%14 Royal High 76 51 67.1% 37 31 83.8% 40 26 65.0% 97 58 59.79% 57 42 74%15 Twin College 138 64 46.4% 74 60 81.1% 46 39 84.8% 85 58 68.24% 79 45 57%16 Acornhoek Academy 132 86 65.2% 145 114 78.6% 102 87 85.3% 145 113 77.93% 116 94 81%17 Noah`s Ark Private
College29 23 79.3% 68 52 76.5% 70 47 67.1% 43 39 90.7% 21 20 95%
18 Elephant Private 63 34 54% 80 61 76.3% 62 42 67.7% 68 38 55.88% 55 34 62%19 Wem - Bushbuckridge 29 18 62.1% 42 32 76.2% 39 31 79.5% 43 32 74.42% 0 0 0%20 Wem Kabokweni Private
Combined 221 116 52.5% 157 118 75.2% 83 59 71.1% 106 70 66.04% 90 92 69%
21 Wem Mkhuhlu 69 36 52.2% 64 48 75% 45 43 95.6% 52 50 96.15% 79 63 80%22 T C College 14 10 71.4% 23 9 39.1% 13 10 76.92% 16 12 75%23 Khayimani Independent
College48 28 58.3% 81 57 70.4% 64 37 57.8% 32 25 78.13% 35 24 69%
24 Shammah College / Kamhluswa
274 199 72.6% 250 173 69.2% 114 66 57.9% 0 0 0%
25 Monaredira Private College
94 65 69.1% 104 68 65.4% 101 80 79.2% 126 101 80.16% 171 133 78%
26 Edgeview Academy 54 26 48.1% 45 26 57.8% 47 34 72.3% 37 33 89.19% 49 41 84%27 Angels Park Academy 45 25 55.6% 43 24 55.8% 50 41 82.0% 56 38 67.86% 68 37 54%28 Grace Christian Private 28 12 42.9% 36 20 55.6% 21 18 85.7% 28 27 96.43% 26 22 85%29 Advisory Progressive
College31 17 54.8% 57 36 63.2% 42 37 88.1% 69 62 90%
30 Leaders Of Destiny 49 25 51% 85 55 64.7% 78 60 76.92% 76 53 70%
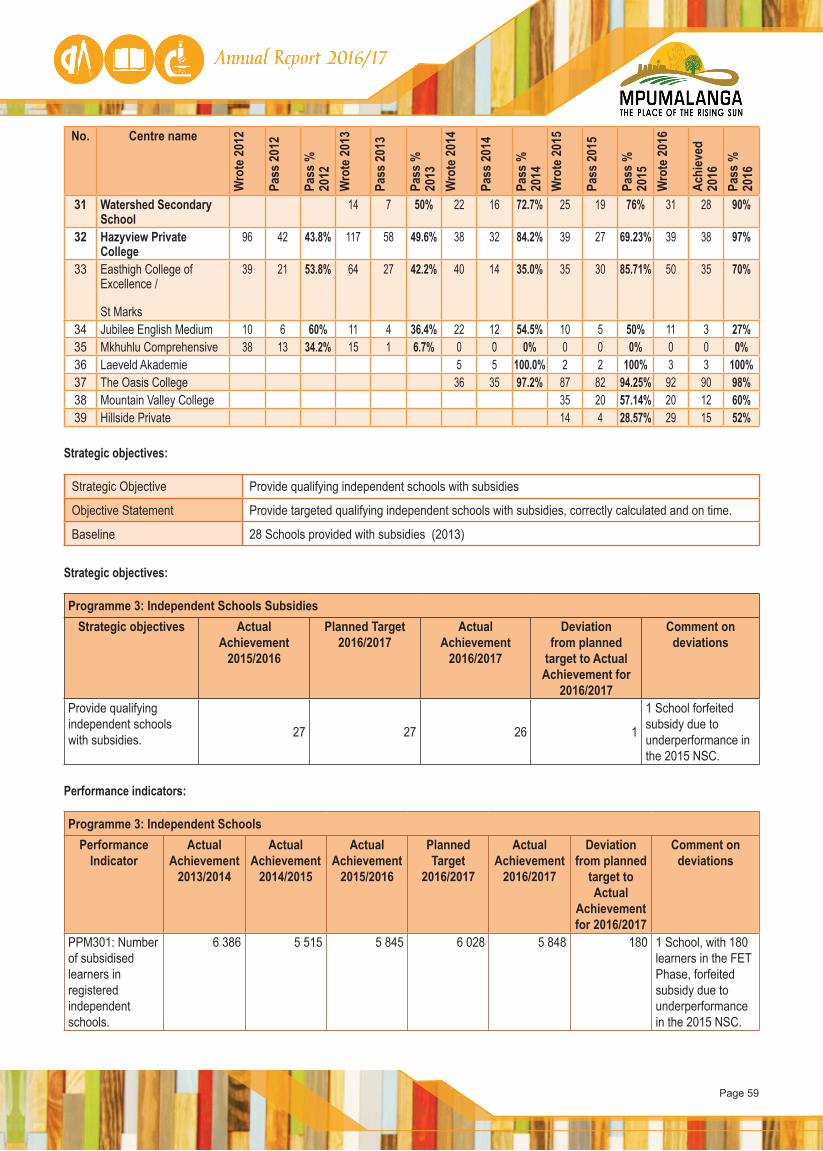
Page 59
No. Centre name
Wro
te 2
012
Pass
201
2
Pass
%
2012
Wro
te 2
013
Pass
201
3
Pass
%
2013
Wro
te 2
014
Pass
201
4
Pass
%
2014
Wro
te 2
015
Pass
201
5
Pass
%
2015
Wro
te 2
016
Achi
eved
20
16Pa
ss %
20
16
31 Watershed Secondary School
14 7 50% 22 16 72.7% 25 19 76% 31 28 90%
32 Hazyview Private College
96 42 43.8% 117 58 49.6% 38 32 84.2% 39 27 69.23% 39 38 97%
33 Easthigh College of Excellence /
St Marks
39 21 53.8% 64 27 42.2% 40 14 35.0% 35 30 85.71% 50 35 70%
34 Jubilee English Medium 10 6 60% 11 4 36.4% 22 12 54.5% 10 5 50% 11 3 27%35 Mkhuhlu Comprehensive 38 13 34.2% 15 1 6.7% 0 0 0% 0 0 0% 0 0 0%36 Laeveld Akademie 5 5 100.0% 2 2 100% 3 3 100%37 The Oasis College 36 35 97.2% 87 82 94.25% 92 90 98%38 Mountain Valley College 35 20 57.14% 20 12 60%39 Hillside Private 14 4 28.57% 29 15 52%
Strategic objectives:
Strategic Objective Provide qualifying independent schools with subsidies
Objective Statement Provide targeted qualifying independent schools with subsidies, correctly calculated and on time.
Baseline 28 Schools provided with subsidies (2013)
Strategic objectives:
Programme 3: Independent Schools SubsidiesStrategic objectives Actual
Achievement 2015/2016
Planned Target2016/2017
Actual Achievement
2016/2017
Deviation from planned
target to Actual Achievement for
2016/2017
Comment on deviations
Provide qualifying independent schools with subsidies. 27 27 26 1
1 School forfeited subsidy due to underperformance in the 2015 NSC.
Performance indicators:
Programme 3: Independent SchoolsPerformance
IndicatorActual
Achievement 2013/2014
Actual Achievement
2014/2015
Actual Achievement
2015/2016
Planned Target
2016/2017
Actual Achievement
2016/2017
Deviation from planned
target to Actual
Achievement for 2016/2017
Comment on deviations
PPM301: Number of subsidised learners in registered independent schools.
6 386 5 515 5 845 6 028 5 848 180 1 School, with 180 learners in the FET Phase, forfeited subsidy due to underperformance in the 2015 NSC.
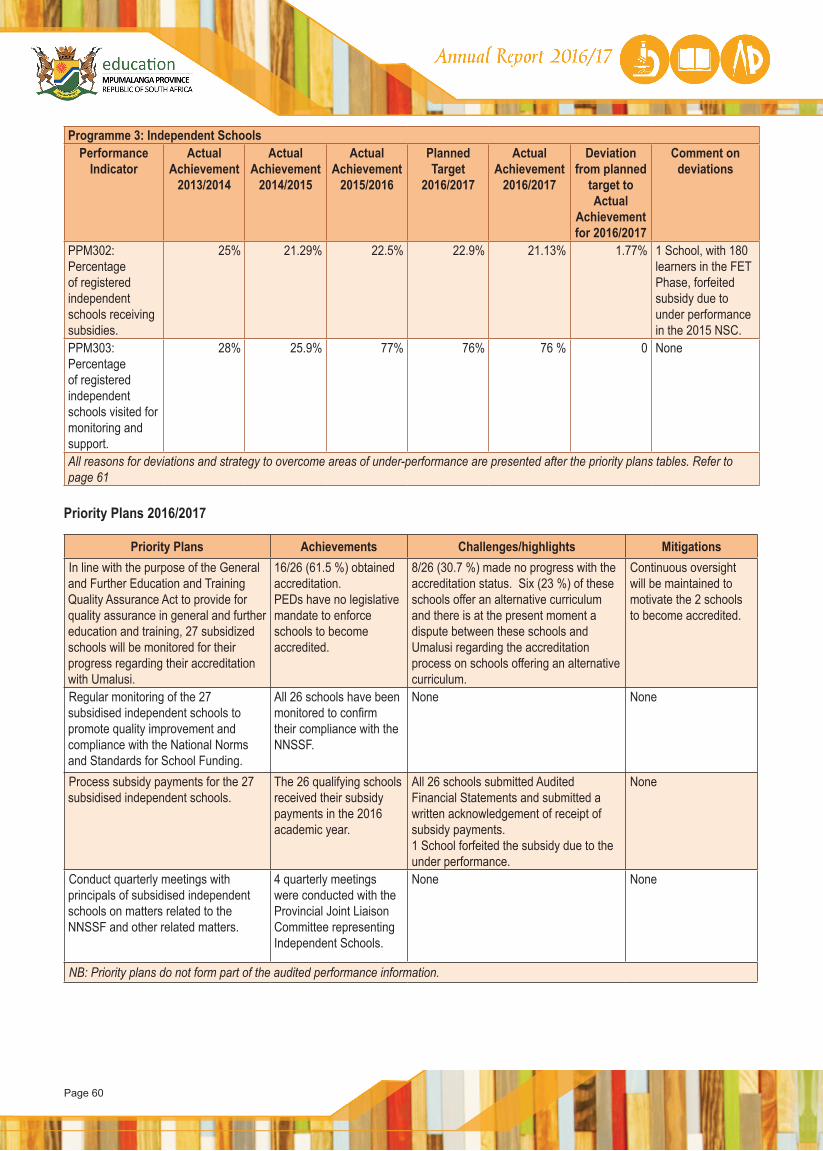
Page 60
Programme 3: Independent SchoolsPerformance
IndicatorActual
Achievement 2013/2014
Actual Achievement
2014/2015
Actual Achievement
2015/2016
Planned Target
2016/2017
Actual Achievement
2016/2017
Deviation from planned
target to Actual
Achievement for 2016/2017
Comment on deviations
PPM302: Percentage of registered independent schools receiving subsidies.
25% 21.29% 22.5% 22.9% 21.13% 1.77% 1 School, with 180 learners in the FET Phase, forfeited subsidy due to under performance in the 2015 NSC.
PPM303: Percentage of registered independent schools visited for monitoring and support.
28% 25.9% 77% 76% 76 % 0 None
All reasons for deviations and strategy to overcome areas of under-performance are presented after the priority plans tables. Refer to page 61
Priority Plans 2016/2017
Priority Plans Achievements Challenges/highlights Mitigations In line with the purpose of the General and Further Education and Training Quality Assurance Act to provide for quality assurance in general and further education and training, 27 subsidized schools will be monitored for their progress regarding their accreditation with Umalusi.
16/26 (61.5 %) obtained accreditation.PEDs have no legislative mandate to enforce schools to become accredited.
8/26 (30.7 %) made no progress with the accreditation status. Six (23 %) of these schools offer an alternative curriculum and there is at the present moment a dispute between these schools and Umalusi regarding the accreditation process on schools offering an alternative curriculum.
Continuous oversight will be maintained to motivate the 2 schools to become accredited.
Regular monitoring of the 27 subsidised independent schools to promote quality improvement and compliance with the National Norms and Standards for School Funding.
All 26 schools have been monitored to confirm their compliance with the NNSSF.
None None
Process subsidy payments for the 27 subsidised independent schools.
The 26 qualifying schools received their subsidy payments in the 2016 academic year.
All 26 schools submitted Audited Financial Statements and submitted a written acknowledgement of receipt of subsidy payments.1 School forfeited the subsidy due to the under performance.
None
Conduct quarterly meetings with principals of subsidised independent schools on matters related to the NNSSF and other related matters.
4 quarterly meetings were conducted with the Provincial Joint Liaison Committee representing Independent Schools.
None None
NB: Priority plans do not form part of the audited performance information.
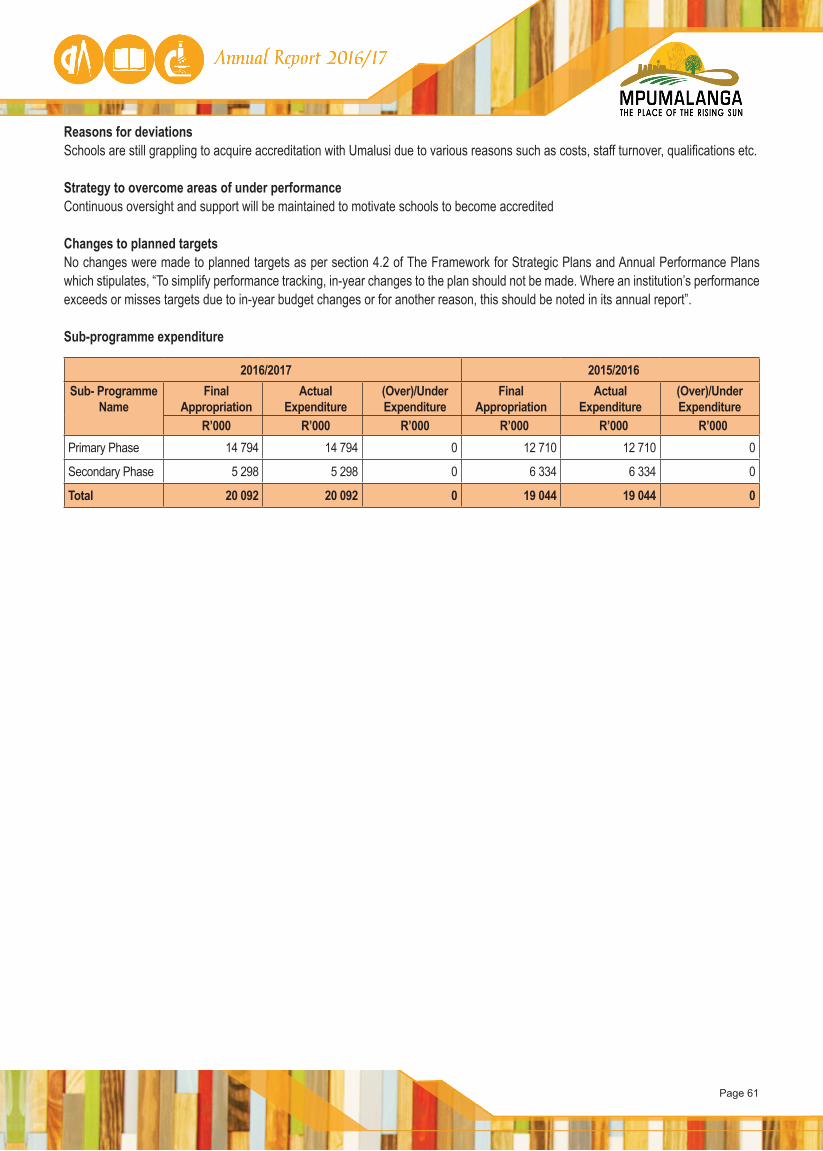
Page 61
Reasons for deviations Schools are still grappling to acquire accreditation with Umalusi due to various reasons such as costs, staff turnover, qualifications etc.
Strategy to overcome areas of under performance Continuous oversight and support will be maintained to motivate schools to become accredited
Changes to planned targets No changes were made to planned targets as per section 4.2 of The Framework for Strategic Plans and Annual Performance Plans which stipulates, “To simplify performance tracking, in-year changes to the plan should not be made. Where an institution’s performance exceeds or misses targets due to in-year budget changes or for another reason, this should be noted in its annual report”.
Sub-programme expenditure
2016/2017 2015/2016Sub- Programme
NameFinal
AppropriationActual
Expenditure(Over)/Under Expenditure
Final Appropriation
ActualExpenditure
(Over)/Under Expenditure
R’000 R’000 R’000 R’000 R’000 R’000Primary Phase 14 794 14 794 0 12 710 12 710 0
Secondary Phase 5 298 5 298 0 6 334 6 334 0
Total 20 092 20 092 0 19 044 19 044 0
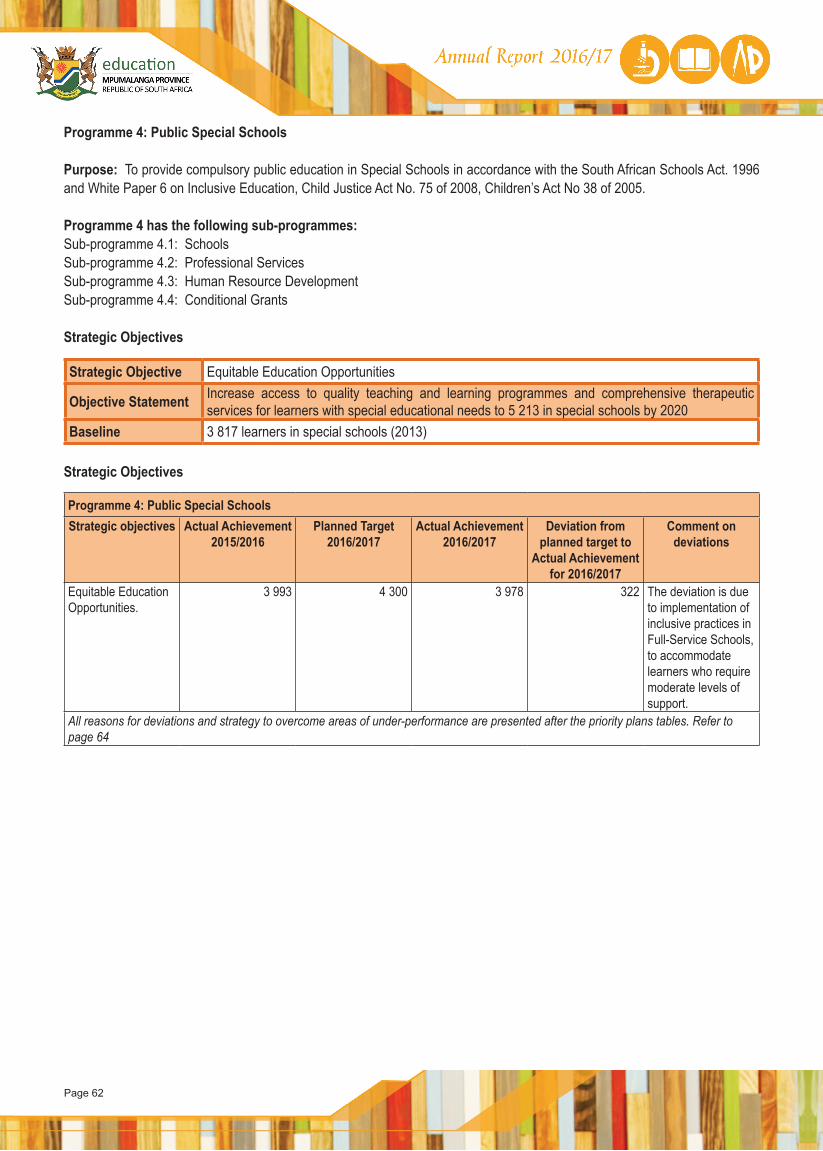
Page 62
Programme 4: Public Special Schools
Purpose: To provide compulsory public education in Special Schools in accordance with the South African Schools Act. 1996 and White Paper 6 on Inclusive Education, Child Justice Act No. 75 of 2008, Children’s Act No 38 of 2005.
Programme 4 has the following sub-programmes:Sub-programme 4.1: Schools Sub-programme 4.2: Professional ServicesSub-programme 4.3: Human Resource DevelopmentSub-programme 4.4: Conditional Grants
Strategic Objectives
Strategic Objective Equitable Education Opportunities
Objective Statement Increase access to quality teaching and learning programmes and comprehensive therapeutic services for learners with special educational needs to 5 213 in special schools by 2020
Baseline 3 817 learners in special schools (2013)
Strategic Objectives
Programme 4: Public Special SchoolsStrategic objectives Actual Achievement
2015/2016Planned Target
2016/2017Actual Achievement
2016/2017Deviation from
planned target to Actual Achievement
for 2016/2017
Comment on deviations
Equitable Education Opportunities.
3 993 4 300 3 978 322 The deviation is due to implementation of inclusive practices in Full-Service Schools, to accommodate learners who require moderate levels of support.
All reasons for deviations and strategy to overcome areas of under-performance are presented after the priority plans tables. Refer to page 64
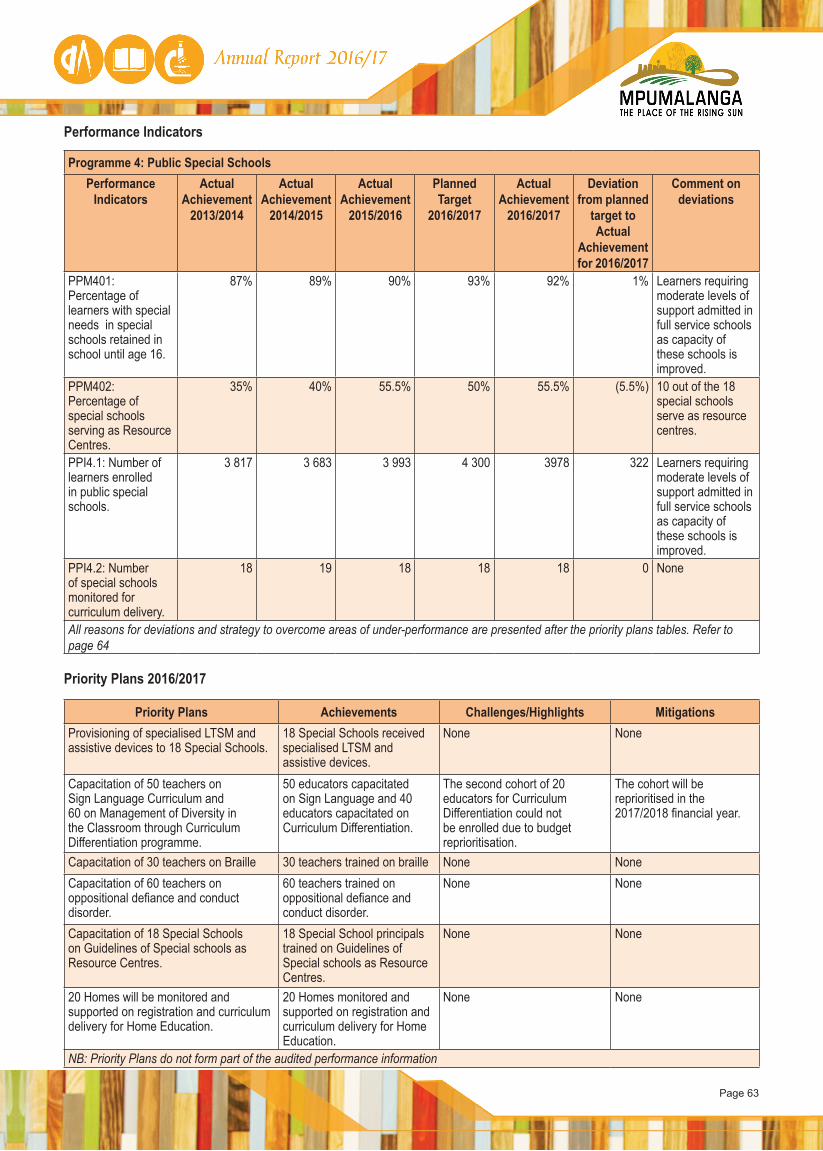
Page 63
Performance Indicators
Programme 4: Public Special SchoolsPerformance
IndicatorsActual
Achievement 2013/2014
Actual Achievement
2014/2015
Actual Achievement
2015/2016
Planned Target
2016/2017
Actual Achievement
2016/2017
Deviation from planned
target to Actual
Achievement for 2016/2017
Comment on deviations
PPM401: Percentage of learners with special needs in special schools retained in school until age 16.
87% 89% 90% 93% 92% 1% Learners requiring moderate levels of support admitted in full service schools as capacity of these schools is improved.
PPM402: Percentage of special schools serving as Resource Centres.
35% 40% 55.5% 50% 55.5% (5.5%) 10 out of the 18 special schools serve as resource centres.
PPI4.1: Number of learners enrolled in public special schools.
3 817 3 683 3 993 4 300 3978 322 Learners requiring moderate levels of support admitted in full service schools as capacity of these schools is improved.
PPI4.2: Number of special schools monitored for curriculum delivery.
18 19 18 18 18 0 None
All reasons for deviations and strategy to overcome areas of under-performance are presented after the priority plans tables. Refer to page 64
Priority Plans 2016/2017
Priority Plans Achievements Challenges/Highlights MitigationsProvisioning of specialised LTSM and assistive devices to 18 Special Schools.
18 Special Schools received specialised LTSM and assistive devices.
None None
Capacitation of 50 teachers on Sign Language Curriculum and 60 on Management of Diversity in the Classroom through Curriculum Differentiation programme.
50 educators capacitated on Sign Language and 40 educators capacitated on Curriculum Differentiation.
The second cohort of 20 educators for Curriculum Differentiation could not be enrolled due to budget reprioritisation.
The cohort will be reprioritised in the 2017/2018 financial year.
Capacitation of 30 teachers on Braille 30 teachers trained on braille None NoneCapacitation of 60 teachers on oppositional defiance and conduct disorder.
60 teachers trained on oppositional defiance and conduct disorder.
None None
Capacitation of 18 Special Schools on Guidelines of Special schools as Resource Centres.
18 Special School principals trained on Guidelines of Special schools as Resource Centres.
None None
20 Homes will be monitored and supported on registration and curriculum delivery for Home Education.
20 Homes monitored and supported on registration and curriculum delivery for Home Education.
None None
NB: Priority Plans do not form part of the audited performance information
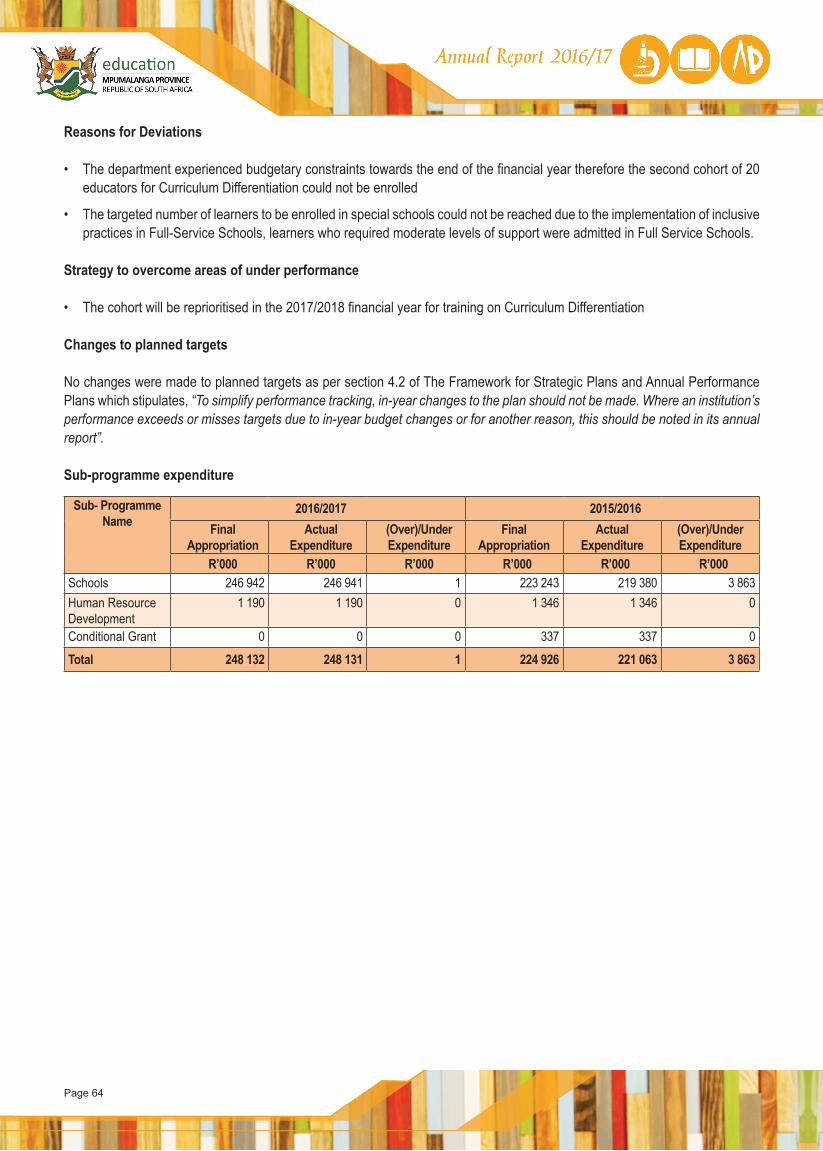
Page 64
Reasons for Deviations
• The department experienced budgetary constraints towards the end of the financial year therefore the second cohort of 20 educators for Curriculum Differentiation could not be enrolled
• The targeted number of learners to be enrolled in special schools could not be reached due to the implementation of inclusive practices in Full-Service Schools, learners who required moderate levels of support were admitted in Full Service Schools.
Strategy to overcome areas of under performance • The cohort will be reprioritised in the 2017/2018 financial year for training on Curriculum Differentiation
Changes to planned targets No changes were made to planned targets as per section 4.2 of The Framework for Strategic Plans and Annual Performance Plans which stipulates, “To simplify performance tracking, in-year changes to the plan should not be made. Where an institution’s performance exceeds or misses targets due to in-year budget changes or for another reason, this should be noted in its annual report”.
Sub-programme expenditure
Sub- Programme Name
2016/2017 2015/2016Final
AppropriationActual
Expenditure(Over)/Under Expenditure
Final Appropriation
ActualExpenditure
(Over)/Under Expenditure
R’000 R’000 R’000 R’000 R’000 R’000Schools 246 942 246 941 1 223 243 219 380 3 863Human Resource Development
1 190 1 190 0 1 346 1 346 0
Conditional Grant 0 0 0 337 337 0
Total 248 132 248 131 1 224 926 221 063 3 863
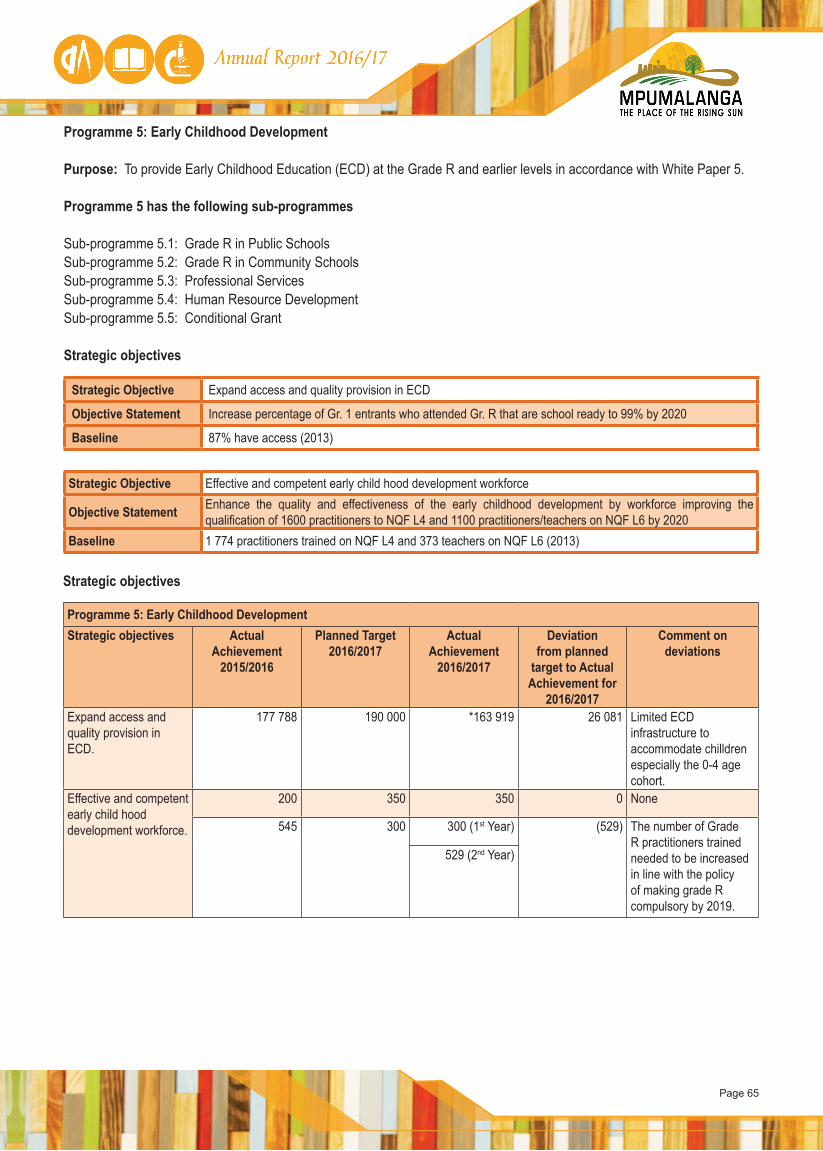
Page 65
Programme 5: Early Childhood Development
Purpose: To provide Early Childhood Education (ECD) at the Grade R and earlier levels in accordance with White Paper 5.
Programme 5 has the following sub-programmes
Sub-programme 5.1: Grade R in Public SchoolsSub-programme 5.2: Grade R in Community SchoolsSub-programme 5.3: Professional ServicesSub-programme 5.4: Human Resource DevelopmentSub-programme 5.5: Conditional Grant
Strategic objectives
Strategic Objective Expand access and quality provision in ECD
Objective Statement Increase percentage of Gr. 1 entrants who attended Gr. R that are school ready to 99% by 2020
Baseline 87% have access (2013)
Strategic Objective Effective and competent early child hood development workforce
Objective Statement Enhance the quality and effectiveness of the early childhood development by workforce improving the qualification of 1600 practitioners to NQF L4 and 1100 practitioners/teachers on NQF L6 by 2020
Baseline 1 774 practitioners trained on NQF L4 and 373 teachers on NQF L6 (2013)
Strategic objectives
Programme 5: Early Childhood Development Strategic objectives Actual
Achievement 2015/2016
Planned Target2016/2017
Actual Achievement
2016/2017
Deviation from planned
target to Actual Achievement for
2016/2017
Comment on deviations
Expand access and quality provision in ECD.
177 788 190 000 *163 919 26 081 Limited ECD infrastructure to accommodate chilldren especially the 0-4 age cohort.
Effective and competent early child hood development workforce.
200 350 350 0 None
545 300 300 (1st Year) (529) The number of Grade R practitioners trained needed to be increased in line with the policy of making grade R compulsory by 2019.
529 (2nd Year)
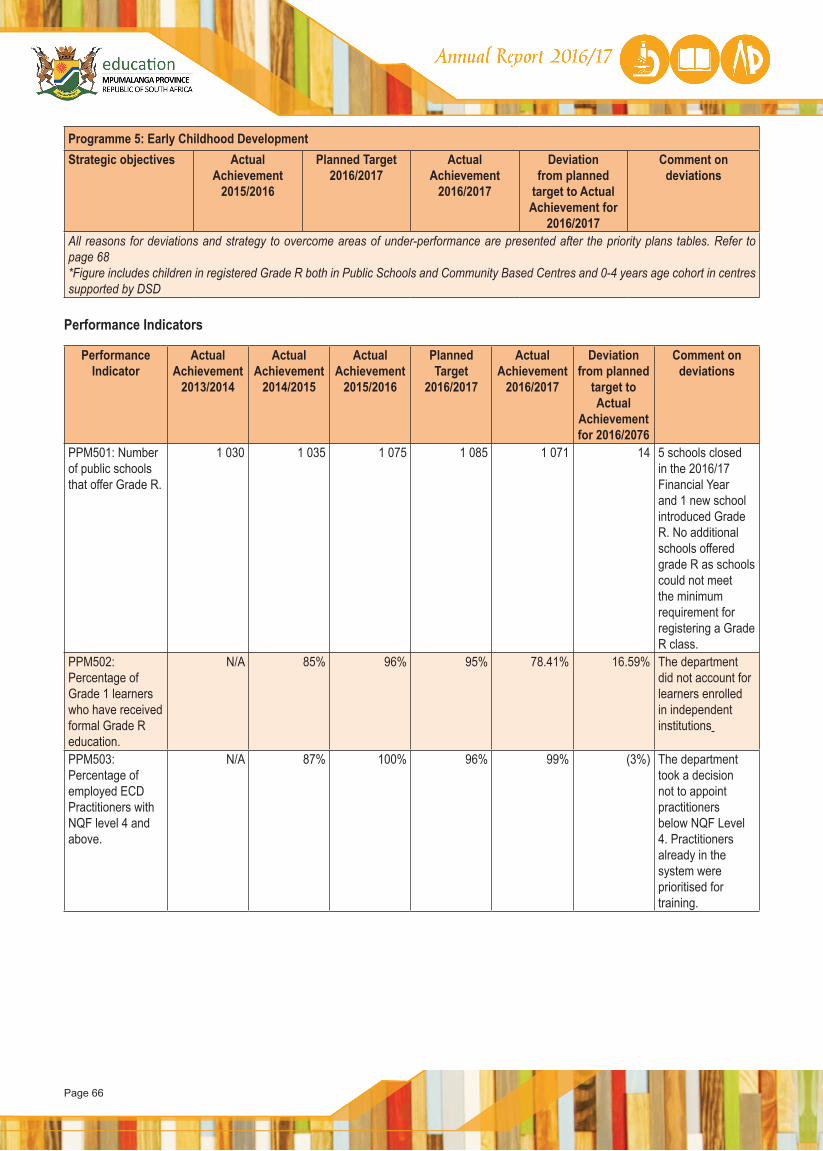
Page 66
Programme 5: Early Childhood Development Strategic objectives Actual
Achievement 2015/2016
Planned Target2016/2017
Actual Achievement
2016/2017
Deviation from planned
target to Actual Achievement for
2016/2017
Comment on deviations
All reasons for deviations and strategy to overcome areas of under-performance are presented after the priority plans tables. Refer to page 68*Figure includes children in registered Grade R both in Public Schools and Community Based Centres and 0-4 years age cohort in centres supported by DSD
Performance Indicators
Performance Indicator
Actual Achievement
2013/2014
Actual Achievement
2014/2015
Actual Achievement
2015/2016
Planned Target
2016/2017
Actual Achievement
2016/2017
Deviation from planned
target to Actual
Achievement for 2016/2076
Comment on deviations
PPM501: Number of public schools that offer Grade R.
1 030 1 035 1 075 1 085 1 071 14 5 schools closed in the 2016/17 Financial Year and 1 new school introduced Grade R. No additional schools offered grade R as schools could not meet the minimum requirement for registering a Grade R class.
PPM502: Percentage of Grade 1 learners who have received formal Grade R education.
N/A 85% 96% 95% 78.41% 16.59% The department did not account for learners enrolled in independent institutions
PPM503: Percentage of employed ECD Practitioners with NQF level 4 and above.
N/A 87% 100% 96% 99% (3%) The department took a decision not to appoint practitioners below NQF Level 4. Practitioners already in the system were prioritised for training.
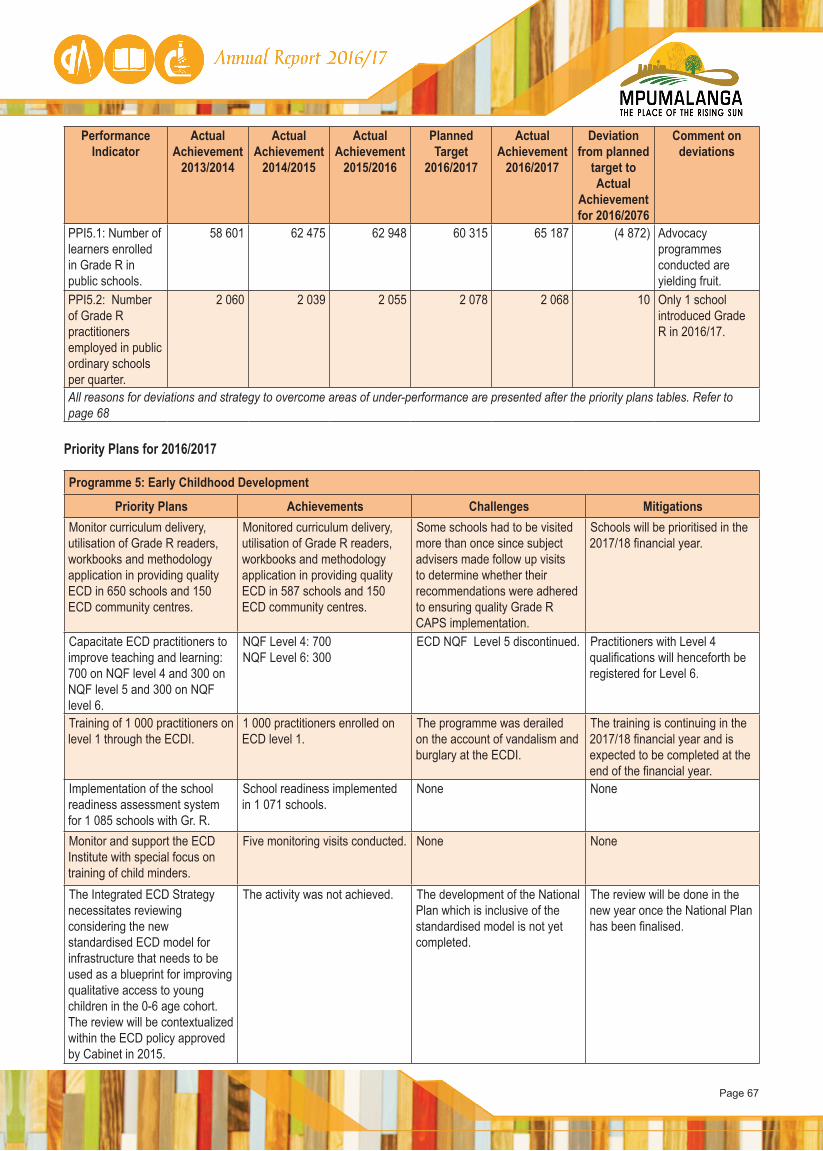
Page 67
Performance Indicator
Actual Achievement
2013/2014
Actual Achievement
2014/2015
Actual Achievement
2015/2016
Planned Target
2016/2017
Actual Achievement
2016/2017
Deviation from planned
target to Actual
Achievement for 2016/2076
Comment on deviations
PPI5.1: Number of learners enrolled in Grade R in public schools.
58 601 62 475 62 948 60 315 65 187 (4 872) Advocacy programmes conducted are yielding fruit.
PPI5.2: Number of Grade R practitioners employed in public ordinary schools per quarter.
2 060 2 039 2 055 2 078 2 068 10 Only 1 school introduced Grade R in 2016/17.
All reasons for deviations and strategy to overcome areas of under-performance are presented after the priority plans tables. Refer to page 68
Priority Plans for 2016/2017
Programme 5: Early Childhood Development
Priority Plans Achievements Challenges MitigationsMonitor curriculum delivery, utilisation of Grade R readers, workbooks and methodology application in providing quality ECD in 650 schools and 150 ECD community centres.
Monitored curriculum delivery, utilisation of Grade R readers, workbooks and methodology application in providing quality ECD in 587 schools and 150 ECD community centres.
Some schools had to be visited more than once since subject advisers made follow up visits to determine whether their recommendations were adhered to ensuring quality Grade R CAPS implementation.
Schools will be prioritised in the 2017/18 financial year.
Capacitate ECD practitioners to improve teaching and learning: 700 on NQF level 4 and 300 on NQF level 5 and 300 on NQF level 6.
NQF Level 4: 700NQF Level 6: 300
ECD NQF Level 5 discontinued. Practitioners with Level 4 qualifications will henceforth be registered for Level 6.
Training of 1 000 practitioners on level 1 through the ECDI.
1 000 practitioners enrolled on ECD level 1.
The programme was derailed on the account of vandalism and burglary at the ECDI.
The training is continuing in the 2017/18 financial year and is expected to be completed at the end of the financial year.
Implementation of the school readiness assessment system for 1 085 schools with Gr. R.
School readiness implemented in 1 071 schools.
None None
Monitor and support the ECD Institute with special focus on training of child minders.
Five monitoring visits conducted. None None
The Integrated ECD Strategy necessitates reviewing considering the new standardised ECD model for infrastructure that needs to be used as a blueprint for improving qualitative access to young children in the 0-6 age cohort. The review will be contextualized within the ECD policy approved by Cabinet in 2015.
The activity was not achieved. The development of the National Plan which is inclusive of the standardised model is not yet completed.
The review will be done in the new year once the National Plan has been finalised.
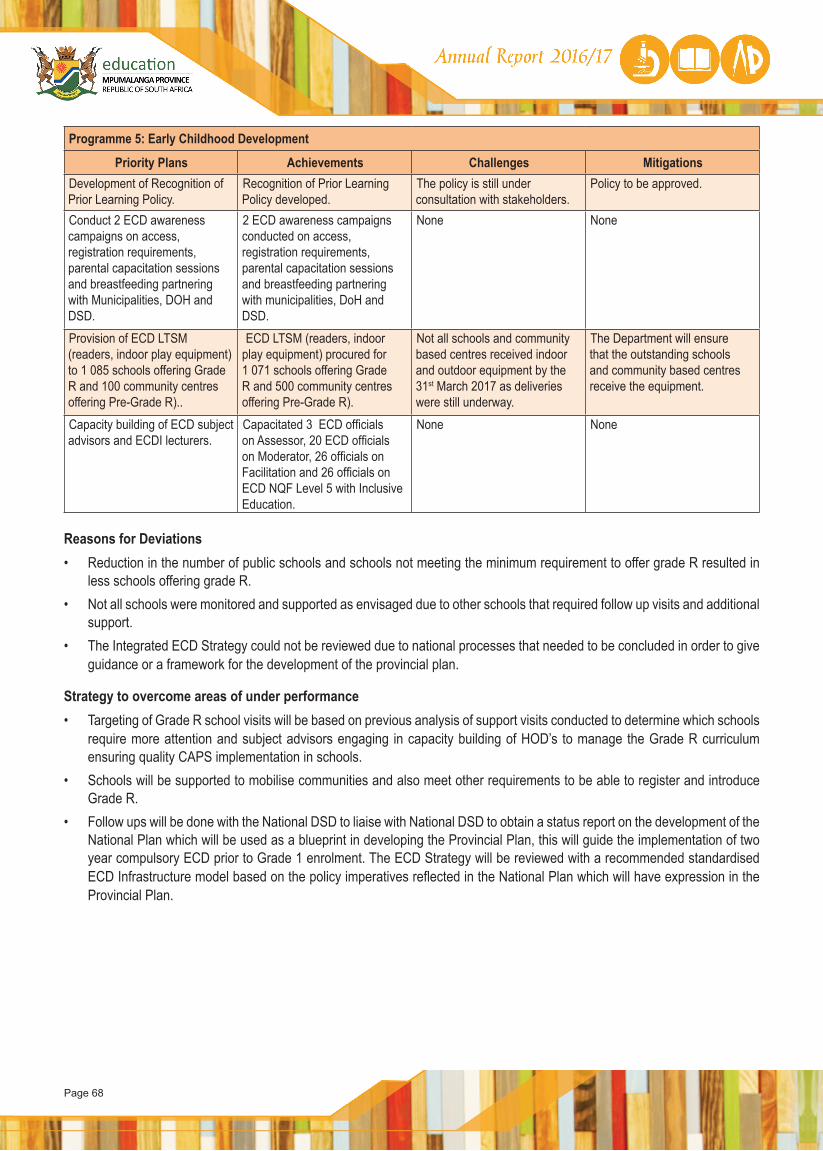
Page 68
Programme 5: Early Childhood Development
Priority Plans Achievements Challenges MitigationsDevelopment of Recognition of Prior Learning Policy.
Recognition of Prior Learning Policy developed.
The policy is still under consultation with stakeholders.
Policy to be approved.
Conduct 2 ECD awareness campaigns on access, registration requirements, parental capacitation sessions and breastfeeding partnering with Municipalities, DOH and DSD.
2 ECD awareness campaigns conducted on access, registration requirements, parental capacitation sessions and breastfeeding partnering with municipalities, DoH and DSD.
None None
Provision of ECD LTSM (readers, indoor play equipment) to 1 085 schools offering Grade R and 100 community centres offering Pre-Grade R)..
ECD LTSM (readers, indoor play equipment) procured for 1 071 schools offering Grade R and 500 community centres offering Pre-Grade R).
Not all schools and community based centres received indoor and outdoor equipment by the 31st March 2017 as deliveries were still underway.
The Department will ensure that the outstanding schools and community based centres receive the equipment.
Capacity building of ECD subject advisors and ECDI lecturers.
Capacitated 3 ECD officials on Assessor, 20 ECD officials on Moderator, 26 officials on Facilitation and 26 officials on ECD NQF Level 5 with Inclusive Education.
None None
Reasons for Deviations• Reduction in the number of public schools and schools not meeting the minimum requirement to offer grade R resulted in
less schools offering grade R.• Not all schools were monitored and supported as envisaged due to other schools that required follow up visits and additional
support.• The Integrated ECD Strategy could not be reviewed due to national processes that needed to be concluded in order to give
guidance or a framework for the development of the provincial plan.
Strategy to overcome areas of under performance • Targeting of Grade R school visits will be based on previous analysis of support visits conducted to determine which schools
require more attention and subject advisors engaging in capacity building of HOD’s to manage the Grade R curriculum ensuring quality CAPS implementation in schools.
• Schools will be supported to mobilise communities and also meet other requirements to be able to register and introduce Grade R.
• Follow ups will be done with the National DSD to liaise with National DSD to obtain a status report on the development of the National Plan which will be used as a blueprint in developing the Provincial Plan, this will guide the implementation of two year compulsory ECD prior to Grade 1 enrolment. The ECD Strategy will be reviewed with a recommended standardised ECD Infrastructure model based on the policy imperatives reflected in the National Plan which will have expression in the Provincial Plan.
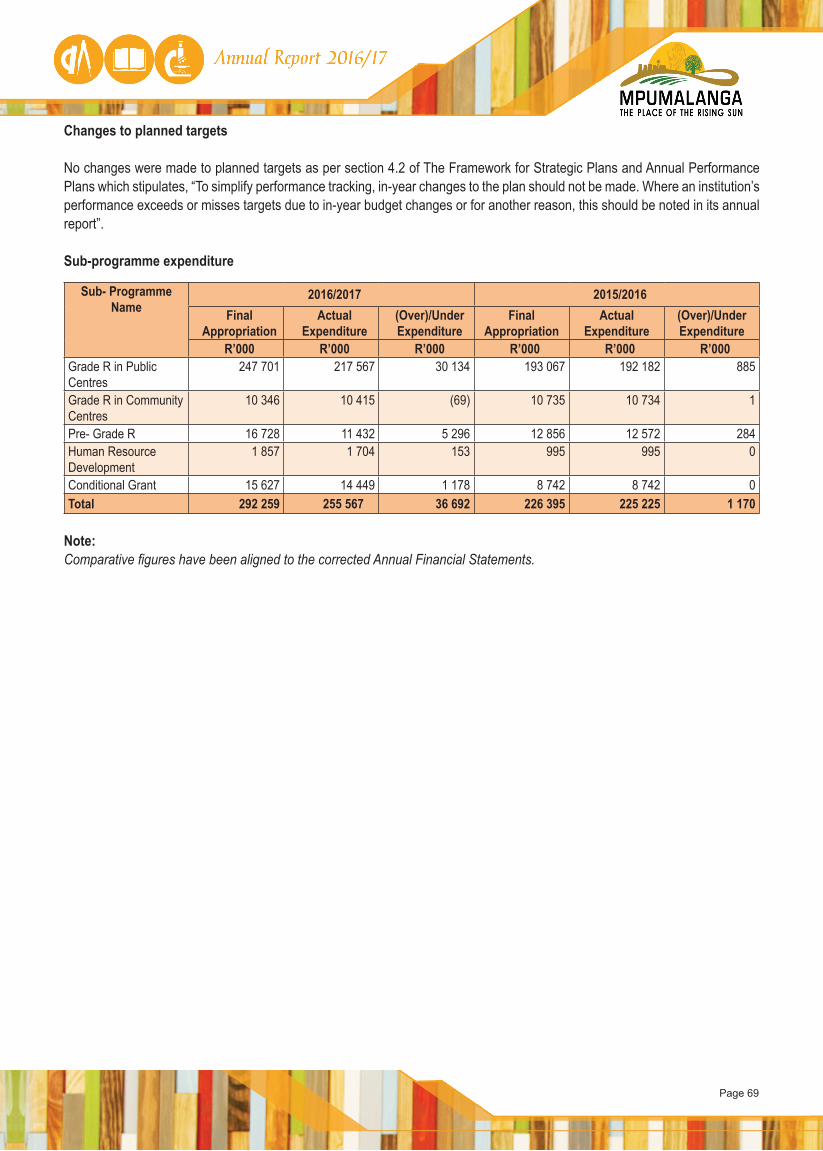
Page 69
Changes to planned targets No changes were made to planned targets as per section 4.2 of The Framework for Strategic Plans and Annual Performance Plans which stipulates, “To simplify performance tracking, in-year changes to the plan should not be made. Where an institution’s performance exceeds or misses targets due to in-year budget changes or for another reason, this should be noted in its annual report”.
Sub-programme expenditure
Sub- Programme Name
2016/2017 2015/2016Final
AppropriationActual
Expenditure(Over)/Under Expenditure
Final Appropriation
ActualExpenditure
(Over)/Under Expenditure
R’000 R’000 R’000 R’000 R’000 R’000Grade R in Public Centres
247 701 217 567 30 134 193 067 192 182 885
Grade R in Community Centres
10 346 10 415 (69) 10 735 10 734 1
Pre- Grade R 16 728 11 432 5 296 12 856 12 572 284Human Resource Development
1 857 1 704 153 995 995 0
Conditional Grant 15 627 14 449 1 178 8 742 8 742 0Total 292 259 255 567 36 692 226 395 225 225 1 170
Note:Comparative figures have been aligned to the corrected Annual Financial Statements.
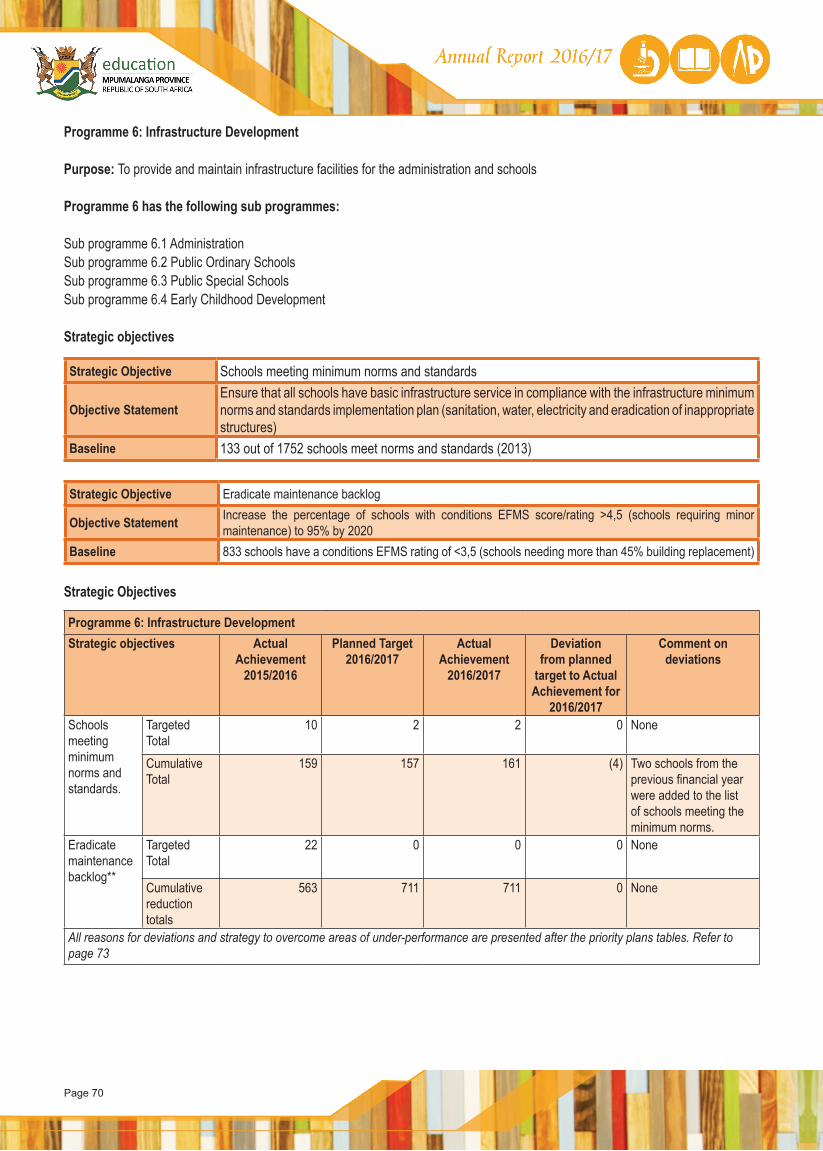
Page 70
Programme 6: Infrastructure Development
Purpose: To provide and maintain infrastructure facilities for the administration and schools
Programme 6 has the following sub programmes:
Sub programme 6.1 AdministrationSub programme 6.2 Public Ordinary SchoolsSub programme 6.3 Public Special SchoolsSub programme 6.4 Early Childhood Development
Strategic objectives
Strategic Objective Schools meeting minimum norms and standards
Objective StatementEnsure that all schools have basic infrastructure service in compliance with the infrastructure minimum norms and standards implementation plan (sanitation, water, electricity and eradication of inappropriate structures)
Baseline 133 out of 1752 schools meet norms and standards (2013)
Strategic Objective Eradicate maintenance backlog
Objective Statement Increase the percentage of schools with conditions EFMS score/rating >4,5 (schools requiring minor maintenance) to 95% by 2020
Baseline 833 schools have a conditions EFMS rating of <3,5 (schools needing more than 45% building replacement)
Strategic Objectives
Programme 6: Infrastructure DevelopmentStrategic objectives Actual
Achievement 2015/2016
Planned Target2016/2017
Actual Achievement
2016/2017
Deviation from planned
target to Actual Achievement for
2016/2017
Comment on deviations
Schools meeting minimum norms and standards.
Targeted Total
10 2 2 0 None
Cumulative Total
159 157 161 (4) Two schools from the previous financial year were added to the list of schools meeting the minimum norms.
Eradicate maintenance backlog**
Targeted Total
22 0 0 0 None
Cumulative reduction totals
563 711 711 0 None
All reasons for deviations and strategy to overcome areas of under-performance are presented after the priority plans tables. Refer to page 73
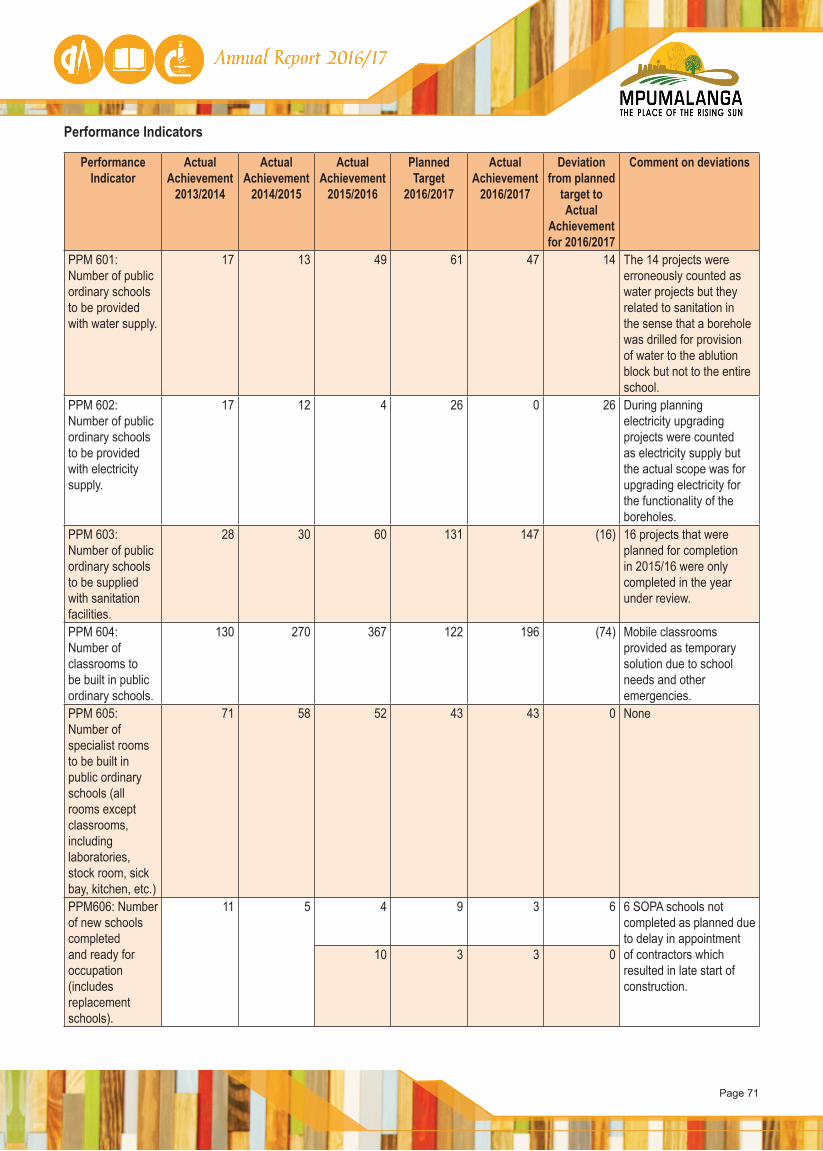
Page 71
Performance Indicators
Performance Indicator
Actual Achievement
2013/2014
Actual Achievement
2014/2015
Actual Achievement
2015/2016
Planned Target
2016/2017
Actual Achievement
2016/2017
Deviation from planned
target to Actual
Achievement for 2016/2017
Comment on deviations
PPM 601: Number of public ordinary schools to be provided with water supply.
17 13 49 61 47 14 The 14 projects were erroneously counted as water projects but they related to sanitation in the sense that a borehole was drilled for provision of water to the ablution block but not to the entire school.
PPM 602: Number of public ordinary schools to be provided with electricity supply.
17 12 4 26 0 26 During planning electricity upgrading projects were counted as electricity supply but the actual scope was for upgrading electricity for the functionality of the boreholes.
PPM 603: Number of public ordinary schools to be supplied with sanitation facilities.
28 30 60 131 147 (16) 16 projects that were planned for completion in 2015/16 were only completed in the year under review.
PPM 604: Number of classrooms to be built in public ordinary schools.
130 270 367 122 196 (74) Mobile classrooms provided as temporary solution due to school needs and other emergencies.
PPM 605: Number of specialist rooms to be built in public ordinary schools (all rooms except classrooms, including laboratories, stock room, sick bay, kitchen, etc.)
71 58 52 43 43 0 None
PPM606: Number of new schools completed and ready for occupation (includes replacement schools).
11 5 4 9 3 6 6 SOPA schools not completed as planned due to delay in appointment of contractors which resulted in late start of construction.
10 3 3 0
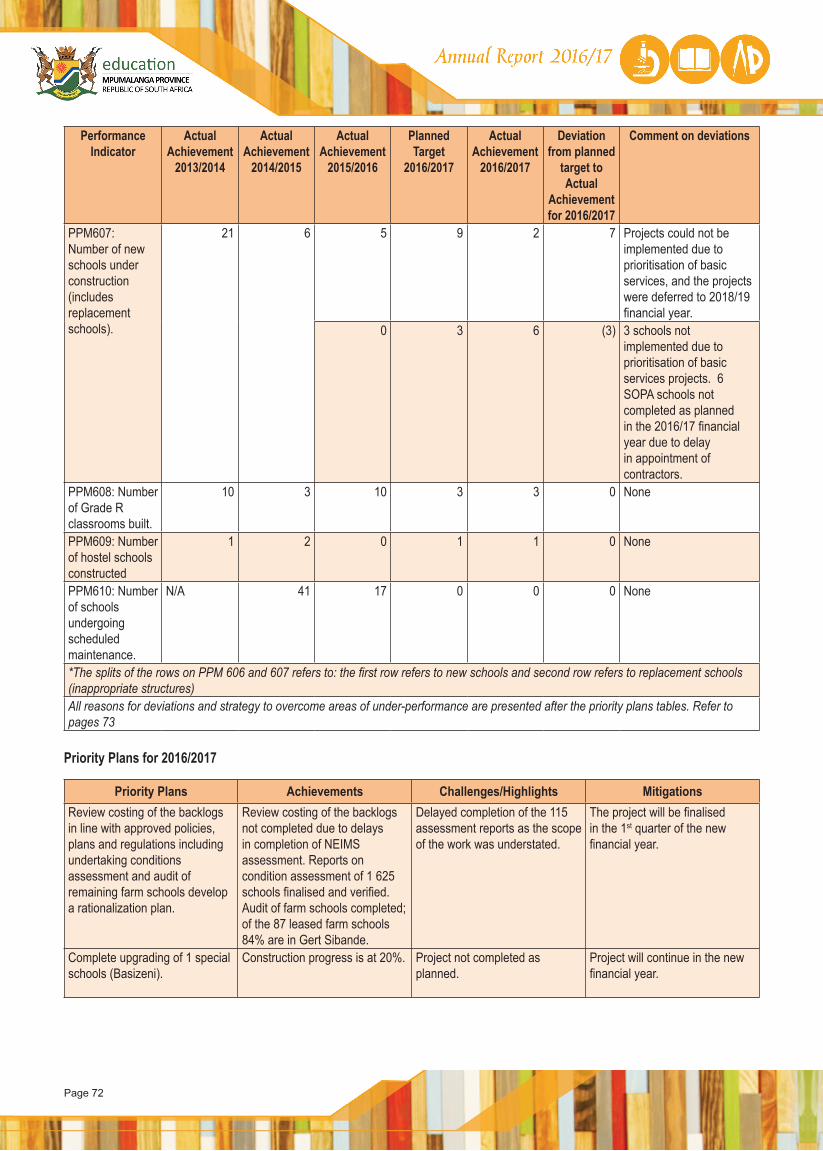
Page 72
Performance Indicator
Actual Achievement
2013/2014
Actual Achievement
2014/2015
Actual Achievement
2015/2016
Planned Target
2016/2017
Actual Achievement
2016/2017
Deviation from planned
target to Actual
Achievement for 2016/2017
Comment on deviations
PPM607: Number of new schools under construction (includes replacement schools).
21 6 5 9 2 7 Projects could not be implemented due to prioritisation of basic services, and the projects were deferred to 2018/19 financial year.
0 3 6 (3) 3 schools not implemented due to prioritisation of basic services projects. 6 SOPA schools not completed as planned in the 2016/17 financial year due to delay in appointment of contractors.
PPM608: Number of Grade R classrooms built.
10 3 10 3 3 0 None
PPM609: Number of hostel schools constructed
1 2 0 1 1 0 None
PPM610: Number of schools undergoing scheduled maintenance.
N/A 41 17 0 0 0 None
*The splits of the rows on PPM 606 and 607 refers to: the first row refers to new schools and second row refers to replacement schools (inappropriate structures)All reasons for deviations and strategy to overcome areas of under-performance are presented after the priority plans tables. Refer to pages 73
Priority Plans for 2016/2017
Priority Plans Achievements Challenges/Highlights MitigationsReview costing of the backlogs in line with approved policies, plans and regulations including undertaking conditions assessment and audit of remaining farm schools develop a rationalization plan.
Review costing of the backlogs not completed due to delays in completion of NEIMS assessment. Reports on condition assessment of 1 625 schools finalised and verified. Audit of farm schools completed; of the 87 leased farm schools 84% are in Gert Sibande.
Delayed completion of the 115 assessment reports as the scope of the work was understated.
The project will be finalised in the 1st quarter of the new financial year.
Complete upgrading of 1 special schools (Basizeni).
Construction progress is at 20%. Project not completed as planned.
Project will continue in the new financial year.
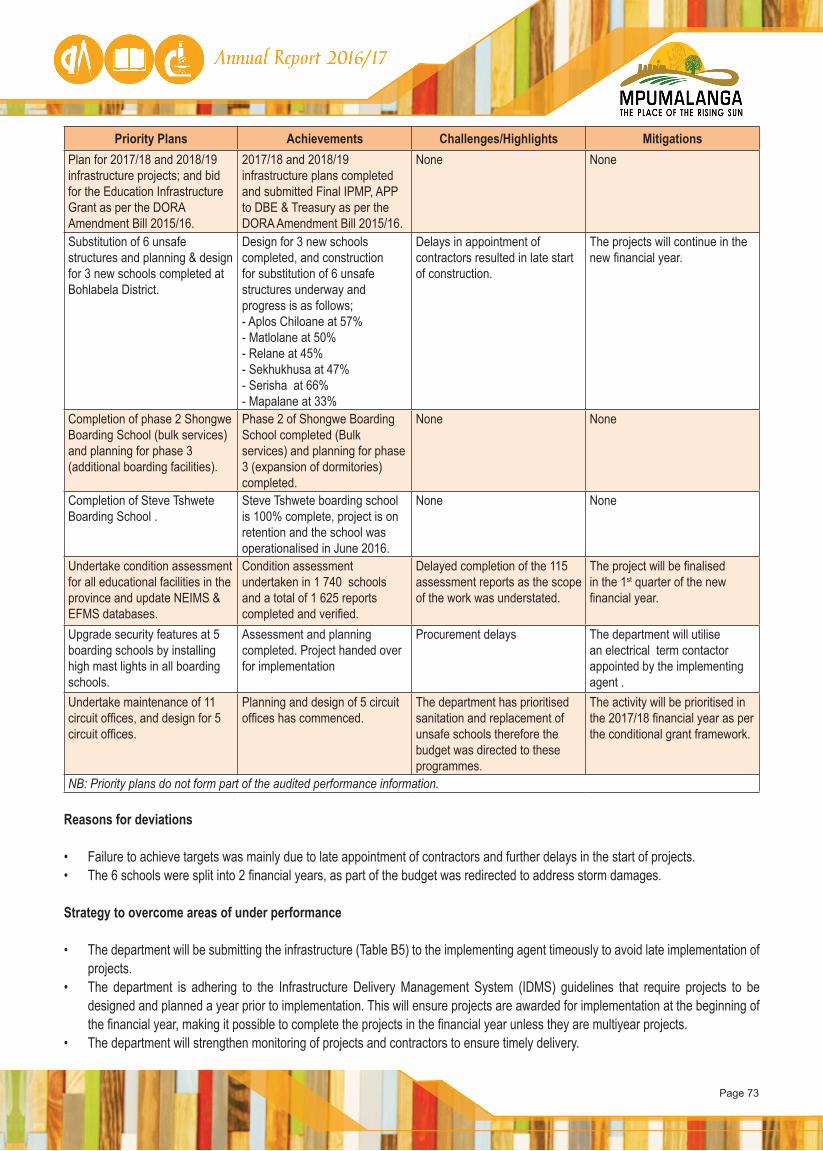
Page 73
Priority Plans Achievements Challenges/Highlights MitigationsPlan for 2017/18 and 2018/19 infrastructure projects; and bid for the Education Infrastructure Grant as per the DORA Amendment Bill 2015/16.
2017/18 and 2018/19 infrastructure plans completed and submitted Final IPMP, APP to DBE & Treasury as per the DORA Amendment Bill 2015/16.
None None
Substitution of 6 unsafe structures and planning & design for 3 new schools completed at Bohlabela District.
Design for 3 new schools completed, and construction for substitution of 6 unsafe structures underway and progress is as follows;- Aplos Chiloane at 57%- Matlolane at 50%- Relane at 45%- Sekhukhusa at 47%- Serisha at 66%- Mapalane at 33%
Delays in appointment of contractors resulted in late start of construction.
The projects will continue in the new financial year.
Completion of phase 2 Shongwe Boarding School (bulk services) and planning for phase 3 (additional boarding facilities).
Phase 2 of Shongwe Boarding School completed (Bulk services) and planning for phase 3 (expansion of dormitories) completed.
None None
Completion of Steve Tshwete Boarding School .
Steve Tshwete boarding school is 100% complete, project is on retention and the school was operationalised in June 2016.
None None
Undertake condition assessment for all educational facilities in the province and update NEIMS & EFMS databases.
Condition assessment undertaken in 1 740 schools and a total of 1 625 reports completed and verified.
Delayed completion of the 115 assessment reports as the scope of the work was understated.
The project will be finalised in the 1st quarter of the new financial year.
Upgrade security features at 5 boarding schools by installing high mast lights in all boarding schools.
Assessment and planning completed. Project handed over for implementation
Procurement delays The department will utilise an electrical term contactor appointed by the implementing agent .
Undertake maintenance of 11 circuit offices, and design for 5 circuit offices.
Planning and design of 5 circuit offices has commenced.
The department has prioritised sanitation and replacement of unsafe schools therefore the budget was directed to these programmes.
The activity will be prioritised in the 2017/18 financial year as per the conditional grant framework.
NB: Priority plans do not form part of the audited performance information.
Reasons for deviations
• Failure to achieve targets was mainly due to late appointment of contractors and further delays in the start of projects.• The 6 schools were split into 2 financial years, as part of the budget was redirected to address storm damages.
Strategy to overcome areas of under performance
• The department will be submitting the infrastructure (Table B5) to the implementing agent timeously to avoid late implementation of projects.
• The department is adhering to the Infrastructure Delivery Management System (IDMS) guidelines that require projects to be designed and planned a year prior to implementation. This will ensure projects are awarded for implementation at the beginning of the financial year, making it possible to complete the projects in the financial year unless they are multiyear projects.
• The department will strengthen monitoring of projects and contractors to ensure timely delivery.
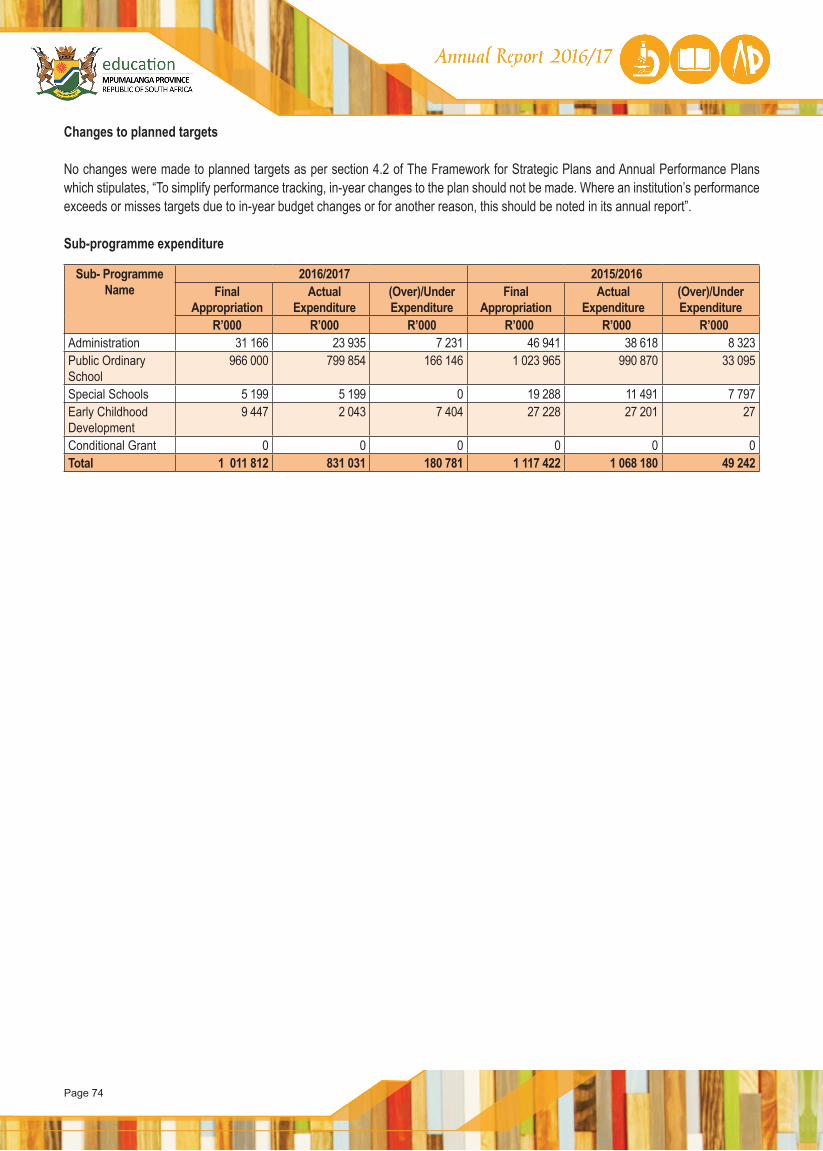
Page 74
Changes to planned targets No changes were made to planned targets as per section 4.2 of The Framework for Strategic Plans and Annual Performance Plans which stipulates, “To simplify performance tracking, in-year changes to the plan should not be made. Where an institution’s performance exceeds or misses targets due to in-year budget changes or for another reason, this should be noted in its annual report”.
Sub-programme expenditure
Sub- Programme Name
2016/2017 2015/2016Final
AppropriationActual
Expenditure(Over)/Under Expenditure
Final Appropriation
ActualExpenditure
(Over)/Under Expenditure
R’000 R’000 R’000 R’000 R’000 R’000Administration 31 166 23 935 7 231 46 941 38 618 8 323Public Ordinary School
966 000 799 854 166 146 1 023 965 990 870 33 095
Special Schools 5 199 5 199 0 19 288 11 491 7 797Early Childhood Development
9 447 2 043 7 404 27 228 27 201 27
Conditional Grant 0 0 0 0 0 0Total 1 011 812 831 031 180 781 1 117 422 1 068 180 49 242
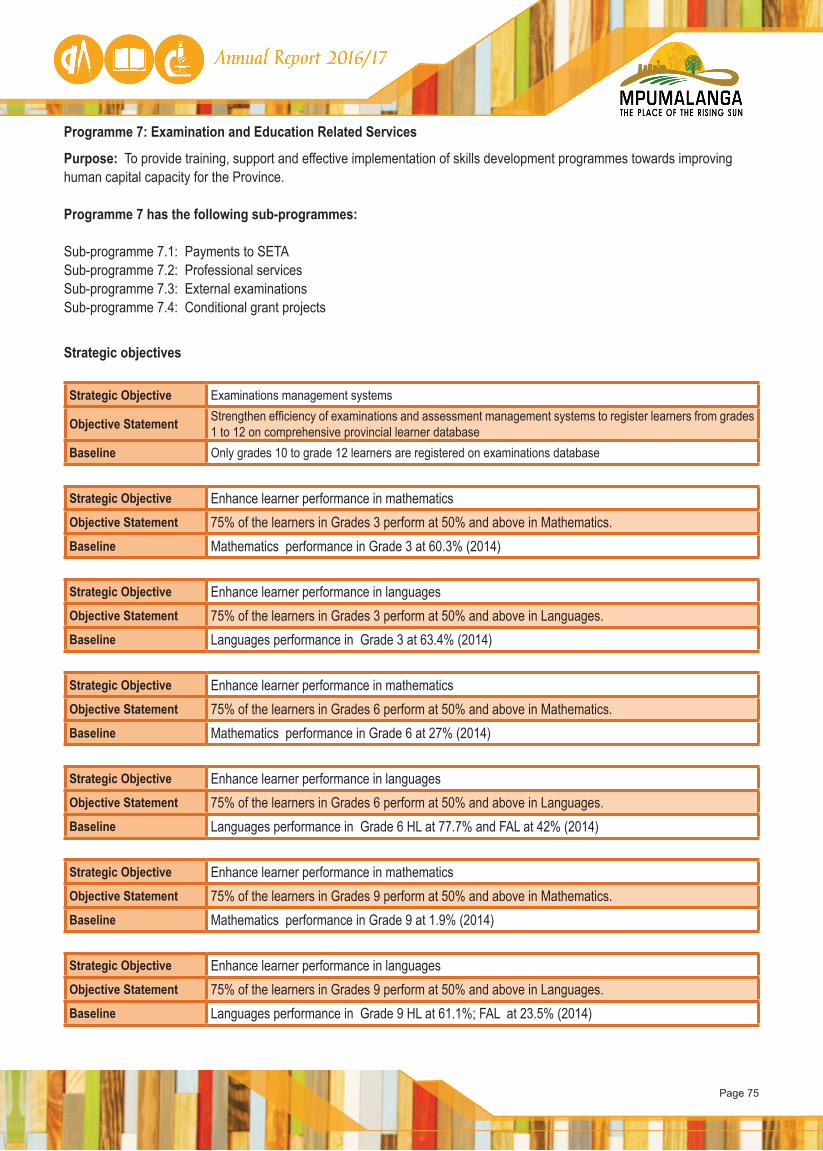
Page 75
Programme 7: Examination and Education Related Services
Purpose: To provide training, support and effective implementation of skills development programmes towards improving human capital capacity for the Province.
Programme 7 has the following sub-programmes:
Sub-programme 7.1: Payments to SETASub-programme 7.2: Professional servicesSub-programme 7.3: External examinationsSub-programme 7.4: Conditional grant projects
Strategic objectives
Strategic Objective Examinations management systems
Objective Statement Strengthen efficiency of examinations and assessment management systems to register learners from grades 1 to 12 on comprehensive provincial learner database
Baseline Only grades 10 to grade 12 learners are registered on examinations database
Strategic Objective Enhance learner performance in mathematics Objective Statement 75% of the learners in Grades 3 perform at 50% and above in Mathematics. Baseline Mathematics performance in Grade 3 at 60.3% (2014)
Strategic Objective Enhance learner performance in languagesObjective Statement 75% of the learners in Grades 3 perform at 50% and above in Languages. Baseline Languages performance in Grade 3 at 63.4% (2014)
Strategic Objective Enhance learner performance in mathematicsObjective Statement 75% of the learners in Grades 6 perform at 50% and above in Mathematics. Baseline Mathematics performance in Grade 6 at 27% (2014)
Strategic Objective Enhance learner performance in languagesObjective Statement 75% of the learners in Grades 6 perform at 50% and above in Languages. Baseline Languages performance in Grade 6 HL at 77.7% and FAL at 42% (2014)
Strategic Objective Enhance learner performance in mathematics Objective Statement 75% of the learners in Grades 9 perform at 50% and above in Mathematics. Baseline Mathematics performance in Grade 9 at 1.9% (2014)
Strategic Objective Enhance learner performance in languagesObjective Statement 75% of the learners in Grades 9 perform at 50% and above in Languages. Baseline Languages performance in Grade 9 HL at 61.1%; FAL at 23.5% (2014)

Page 76
Strategic Objective Increase bachelor passesObjective Statement Increase the percentage of grade 12 learners passing at bachelor level to 34% by 2020 Baseline 24.9% (2014)
Strategic Objective Increase Maths Passes
Objective Statement Increase the percentage of grade 12 learners achieving 50% and more in Mathematics from 21.1% to 60%
Baseline 21.1% Maths (2014)
Strategic Objective Increase Physical Science Passes
Objective Statement Increase the percentage of grade 12 learners achieving 50% and more in Physical Science from 20.2% to 60%
Baseline 20.2% Physical Science (2014)
Strategic Objective Bursaries in scarce and critical skills
Objective Statement Increased access to post school funding in critical and scarce skills as indicated in the HRDS and MEGDP by offering bursaries to 3 400 students by 2020
Baseline 570 Students
Strategic Objective Skilled and capable workforce
Objective Statement Increase the percentage of bursars completing formal education and acquiring work placement to 50% by 2020
Baseline 10% of graduates placed
Strategic Objective Artisan Development
Objective Statement Train 5 000 learners in artisan development programmes focusing on constructions, manufacturing and engineering related trades by 2020
Baseline 32 Candidates qualified as artisans in 2013/14
Strategic Objective Mitigate the impact of HIV and TB
Objective Statement To ensure that the most vulnerable and indigent learners access and complete schooling through the provisioning of care and support programmes to 20680 teachers and 28380 Learners by 2020
Baseline 23 458 Learners reached (Since 2005), and 34 721 teachers capacitated (Since 2001)
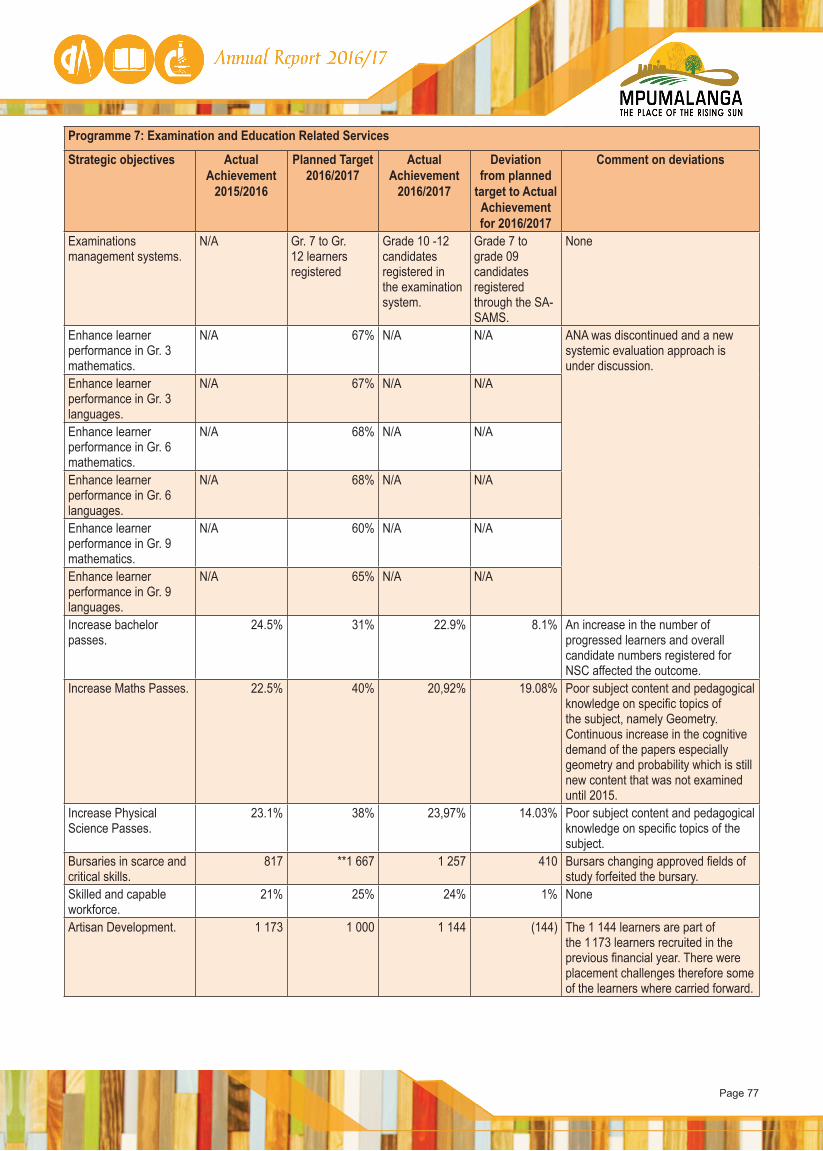
Page 77
Programme 7: Examination and Education Related Services
Strategic objectives Actual Achievement
2015/2016
Planned Target2016/2017
Actual Achievement
2016/2017
Deviation from planned
target to Actual Achievement for 2016/2017
Comment on deviations
Examinations management systems.
N/A Gr. 7 to Gr. 12 learners registered
Grade 10 -12 candidates registered in the examination system.
Grade 7 to grade 09 candidates registered through the SA-SAMS.
None
Enhance learner performance in Gr. 3 mathematics.
N/A 67% N/A N/A ANA was discontinued and a new systemic evaluation approach is under discussion.
Enhance learner performance in Gr. 3 languages.
N/A 67% N/A N/A
Enhance learner performance in Gr. 6 mathematics.
N/A 68% N/A N/A
Enhance learner performance in Gr. 6 languages.
N/A 68% N/A N/A
Enhance learner performance in Gr. 9 mathematics.
N/A 60% N/A N/A
Enhance learner performance in Gr. 9 languages.
N/A 65% N/A N/A
Increase bachelor passes.
24.5% 31% 22.9% 8.1% An increase in the number of progressed learners and overall candidate numbers registered for NSC affected the outcome.
Increase Maths Passes. 22.5% 40% 20,92% 19.08% Poor subject content and pedagogical knowledge on specific topics of the subject, namely Geometry. Continuous increase in the cognitive demand of the papers especially geometry and probability which is still new content that was not examined until 2015.
Increase Physical Science Passes.
23.1% 38% 23,97% 14.03% Poor subject content and pedagogical knowledge on specific topics of the subject.
Bursaries in scarce and critical skills.
817 **1 667 1 257 410 Bursars changing approved fields of study forfeited the bursary.
Skilled and capable workforce.
21% 25% 24% 1% None
Artisan Development. 1 173 1 000 1 144 (144) The 1 144 learners are part of the 1 173 learners recruited in the previous financial year. There were placement challenges therefore some of the learners where carried forward.
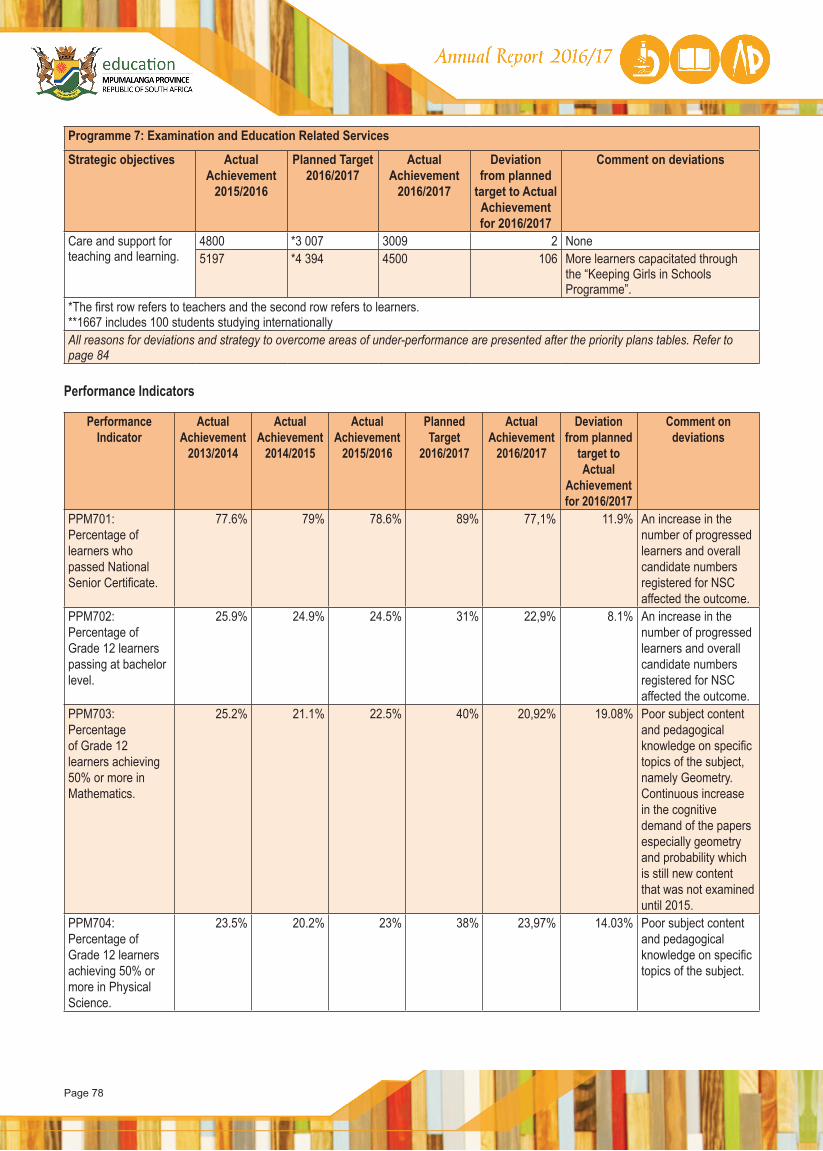
Page 78
Programme 7: Examination and Education Related Services
Strategic objectives Actual Achievement
2015/2016
Planned Target2016/2017
Actual Achievement
2016/2017
Deviation from planned
target to Actual Achievement for 2016/2017
Comment on deviations
Care and support for teaching and learning.
4800 *3 007 3009 2 None 5197 *4 394 4500 106 More learners capacitated through
the “Keeping Girls in Schools Programme”.
*The first row refers to teachers and the second row refers to learners.**1667 includes 100 students studying internationallyAll reasons for deviations and strategy to overcome areas of under-performance are presented after the priority plans tables. Refer to page 84
Performance Indicators
Performance Indicator
Actual Achievement
2013/2014
Actual Achievement
2014/2015
Actual Achievement
2015/2016
Planned Target
2016/2017
Actual Achievement
2016/2017
Deviation from planned
target to Actual
Achievement for 2016/2017
Comment on deviations
PPM701: Percentage of learners who passed National Senior Certificate.
77.6% 79% 78.6% 89% 77,1% 11.9% An increase in the number of progressed learners and overall candidate numbers registered for NSC affected the outcome.
PPM702: Percentage of Grade 12 learners passing at bachelor level.
25.9% 24.9% 24.5% 31% 22,9% 8.1% An increase in the number of progressed learners and overall candidate numbers registered for NSC affected the outcome.
PPM703: Percentage of Grade 12 learners achieving 50% or more in Mathematics.
25.2% 21.1% 22.5% 40% 20,92% 19.08% Poor subject content and pedagogical knowledge on specific topics of the subject, namely Geometry. Continuous increase in the cognitive demand of the papers especially geometry and probability which is still new content that was not examined until 2015.
PPM704: Percentage of Grade 12 learners achieving 50% or more in Physical Science.
23.5% 20.2% 23% 38% 23,97% 14.03% Poor subject content and pedagogical knowledge on specific topics of the subject.
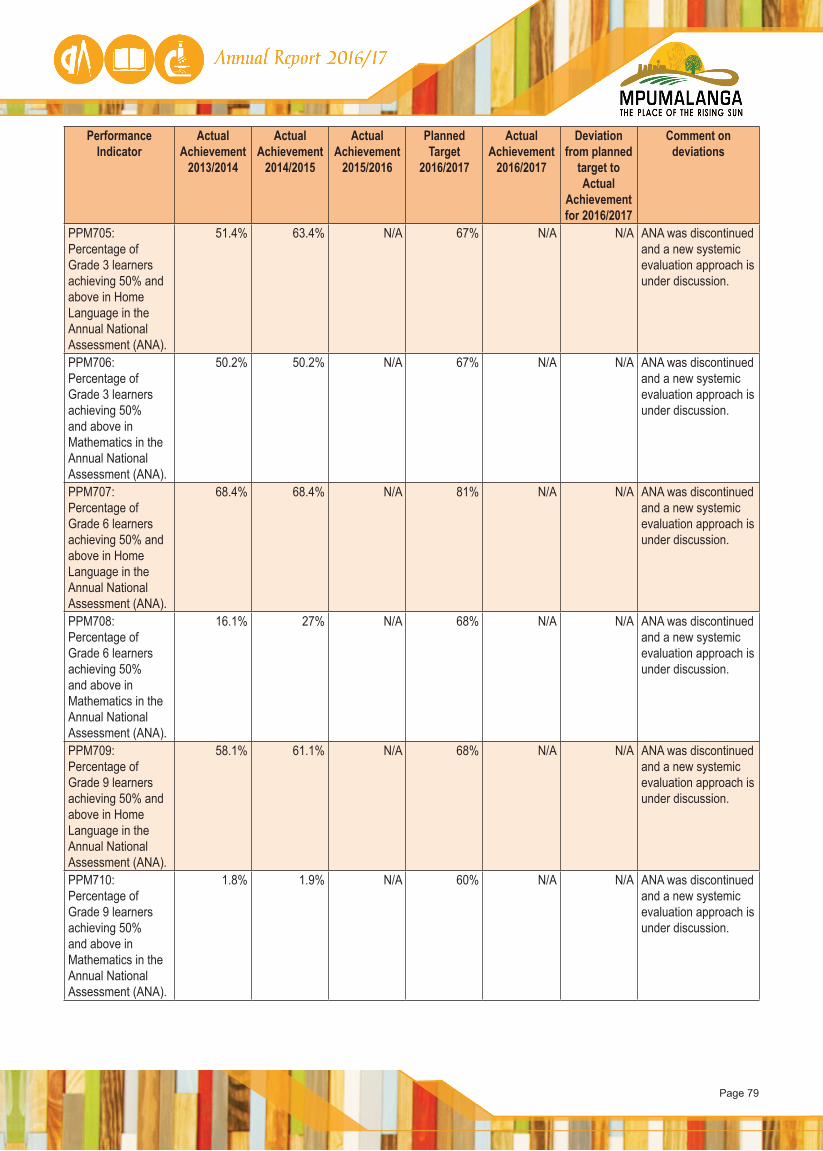
Page 79
Performance Indicator
Actual Achievement
2013/2014
Actual Achievement
2014/2015
Actual Achievement
2015/2016
Planned Target
2016/2017
Actual Achievement
2016/2017
Deviation from planned
target to Actual
Achievement for 2016/2017
Comment on deviations
PPM705: Percentage of Grade 3 learners achieving 50% and above in Home Language in the Annual National Assessment (ANA).
51.4% 63.4% N/A 67% N/A N/A ANA was discontinued and a new systemic evaluation approach is under discussion.
PPM706: Percentage of Grade 3 learners achieving 50% and above in Mathematics in the Annual National Assessment (ANA).
50.2% 50.2% N/A 67% N/A N/A ANA was discontinued and a new systemic evaluation approach is under discussion.
PPM707: Percentage of Grade 6 learners achieving 50% and above in Home Language in the Annual National Assessment (ANA).
68.4% 68.4% N/A 81% N/A N/A ANA was discontinued and a new systemic evaluation approach is under discussion.
PPM708: Percentage of Grade 6 learners achieving 50% and above in Mathematics in the Annual National Assessment (ANA).
16.1% 27% N/A 68% N/A N/A ANA was discontinued and a new systemic evaluation approach is under discussion.
PPM709: Percentage of Grade 9 learners achieving 50% and above in Home Language in the Annual National Assessment (ANA).
58.1% 61.1% N/A 68% N/A N/A ANA was discontinued and a new systemic evaluation approach is under discussion.
PPM710: Percentage of Grade 9 learners achieving 50% and above in Mathematics in the Annual National Assessment (ANA).
1.8% 1.9% N/A 60% N/A N/A ANA was discontinued and a new systemic evaluation approach is under discussion.
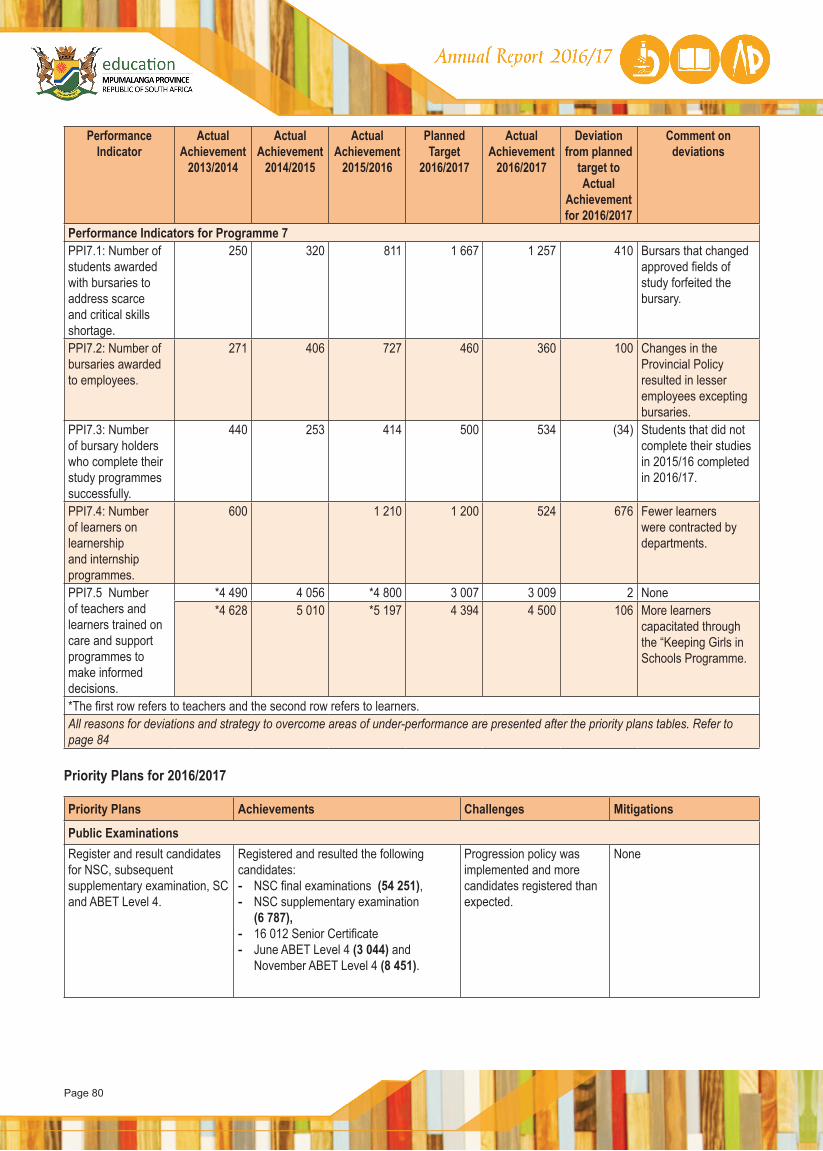
Page 80
Performance Indicator
Actual Achievement
2013/2014
Actual Achievement
2014/2015
Actual Achievement
2015/2016
Planned Target
2016/2017
Actual Achievement
2016/2017
Deviation from planned
target to Actual
Achievement for 2016/2017
Comment on deviations
Performance Indicators for Programme 7PPI7.1: Number of students awarded with bursaries to address scarce and critical skills shortage.
250 320 811 1 667 1 257 410 Bursars that changed approved fields of study forfeited the bursary.
PPI7.2: Number of bursaries awarded to employees.
271 406 727 460 360 100 Changes in the Provincial Policy resulted in lesser employees excepting bursaries.
PPI7.3: Number of bursary holders who complete their study programmes successfully.
440 253 414 500 534 (34) Students that did not complete their studies in 2015/16 completed in 2016/17.
PPI7.4: Number of learners on learnership and internship programmes.
600 1 210 1 200 524 676 Fewer learners were contracted by departments.
PPI7.5 Number of teachers and learners trained on care and support programmes to make informed decisions.
*4 490 4 056 *4 800 3 007 3 009 2 None *4 628 5 010 *5 197 4 394 4 500 106 More learners
capacitated through the “Keeping Girls in Schools Programme.
*The first row refers to teachers and the second row refers to learners.All reasons for deviations and strategy to overcome areas of under-performance are presented after the priority plans tables. Refer to page 84
Priority Plans for 2016/2017
Priority Plans Achievements Challenges Mitigations
Public ExaminationsRegister and result candidates for NSC, subsequent supplementary examination, SC and ABET Level 4.
Registered and resulted the following candidates: - NSC final examinations (54 251), - NSC supplementary examination
(6 787), - 16 012 Senior Certificate - June ABET Level 4 (3 044) and
November ABET Level 4 (8 451).
Progression policy was implemented and more candidates registered than expected.
None
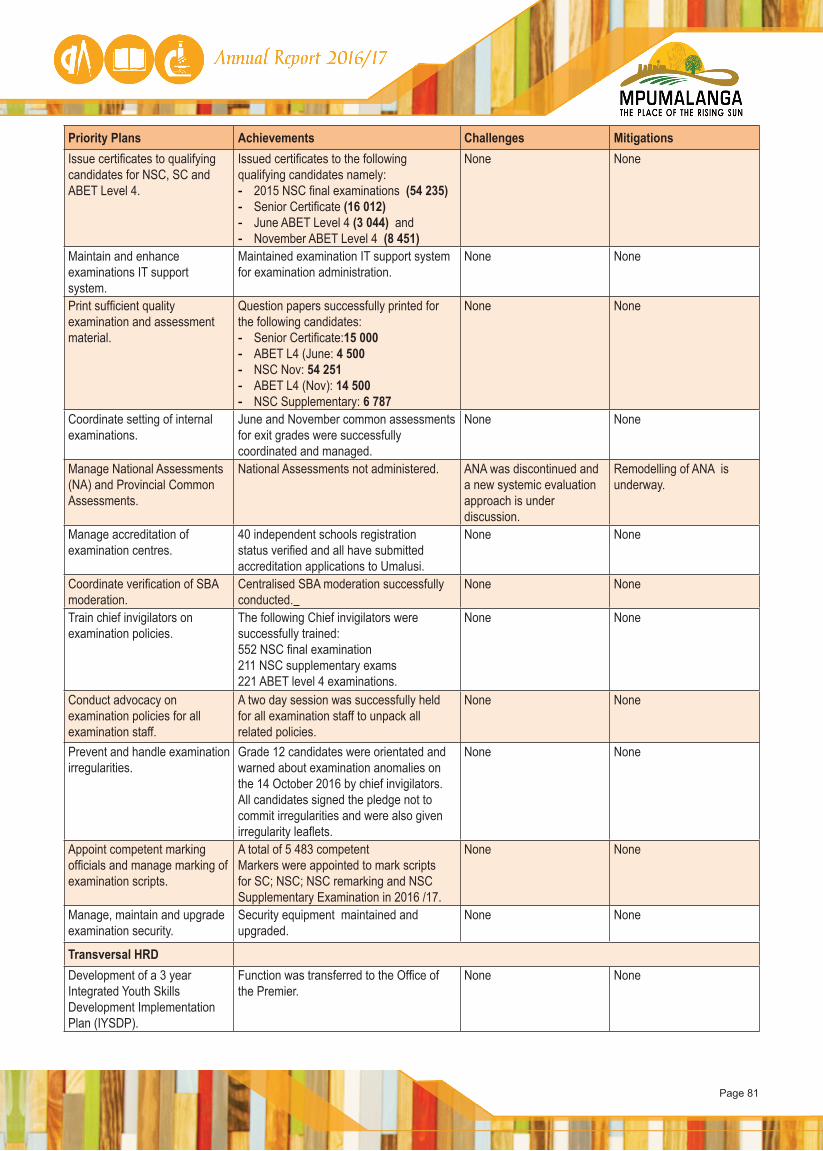
Page 81
Priority Plans Achievements Challenges MitigationsIssue certificates to qualifying candidates for NSC, SC and ABET Level 4.
Issued certificates to the following qualifying candidates namely:- 2015 NSC final examinations (54 235)- Senior Certificate (16 012) - June ABET Level 4 (3 044) and - November ABET Level 4 (8 451)
None None
Maintain and enhance examinations IT support system.
Maintained examination IT support system for examination administration.
None None
Print sufficient quality examination and assessment material.
Question papers successfully printed for the following candidates:- Senior Certificate:15 000 - ABET L4 (June: 4 500- NSC Nov: 54 251- ABET L4 (Nov): 14 500- NSC Supplementary: 6 787
None None
Coordinate setting of internal examinations.
June and November common assessments for exit grades were successfully coordinated and managed.
None None
Manage National Assessments (NA) and Provincial Common Assessments.
National Assessments not administered. ANA was discontinued and a new systemic evaluation approach is under discussion.
Remodelling of ANA is underway.
Manage accreditation of examination centres.
40 independent schools registration status verified and all have submitted accreditation applications to Umalusi.
None None
Coordinate verification of SBA moderation.
Centralised SBA moderation successfully conducted.
None None
Train chief invigilators on examination policies.
The following Chief invigilators were successfully trained:552 NSC final examination211 NSC supplementary exams221 ABET level 4 examinations.
None None
Conduct advocacy on examination policies for all examination staff.
A two day session was successfully held for all examination staff to unpack all related policies.
None None
Prevent and handle examination irregularities.
Grade 12 candidates were orientated and warned about examination anomalies on the 14 October 2016 by chief invigilators. All candidates signed the pledge not to commit irregularities and were also given irregularity leaflets.
None None
Appoint competent marking officials and manage marking of examination scripts.
A total of 5 483 competent Markers were appointed to mark scripts for SC; NSC; NSC remarking and NSC Supplementary Examination in 2016 /17.
None None
Manage, maintain and upgrade examination security.
Security equipment maintained and upgraded.
None None
Transversal HRDDevelopment of a 3 year Integrated Youth Skills Development Implementation Plan (IYSDP).
Function was transferred to the Office of the Premier.
None None
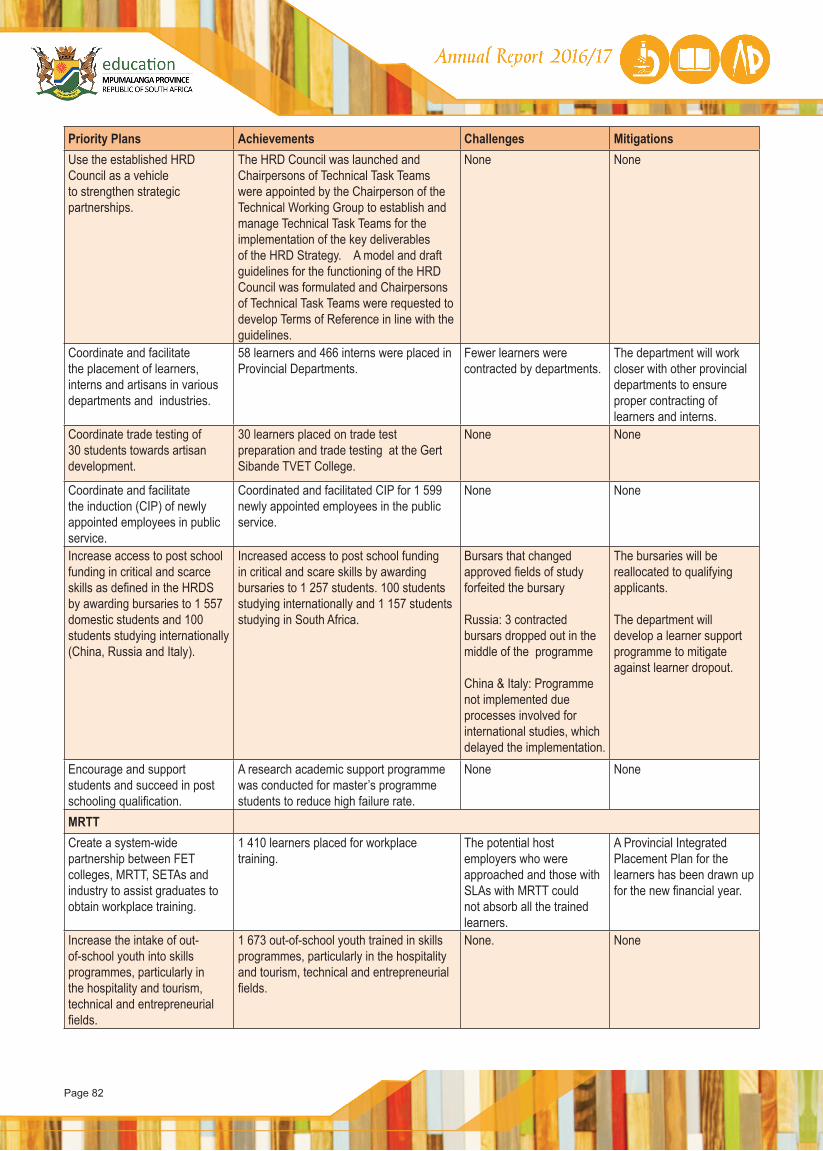
Page 82
Priority Plans Achievements Challenges MitigationsUse the established HRD Council as a vehicle to strengthen strategic partnerships.
The HRD Council was launched and Chairpersons of Technical Task Teams were appointed by the Chairperson of the Technical Working Group to establish and manage Technical Task Teams for the implementation of the key deliverables of the HRD Strategy. A model and draft guidelines for the functioning of the HRD Council was formulated and Chairpersons of Technical Task Teams were requested to develop Terms of Reference in line with the guidelines.
None None
Coordinate and facilitate the placement of learners, interns and artisans in various departments and industries.
58 learners and 466 interns were placed in Provincial Departments.
Fewer learners were contracted by departments.
The department will work closer with other provincial departments to ensure proper contracting of learners and interns.
Coordinate trade testing of 30 students towards artisan development.
30 learners placed on trade test preparation and trade testing at the Gert Sibande TVET College.
None None
Coordinate and facilitate the induction (CIP) of newly appointed employees in public service.
Coordinated and facilitated CIP for 1 599 newly appointed employees in the public service.
None None
Increase access to post school funding in critical and scarce skills as defined in the HRDS by awarding bursaries to 1 557 domestic students and 100 students studying internationally (China, Russia and Italy).
Increased access to post school funding in critical and scare skills by awarding bursaries to 1 257 students. 100 students studying internationally and 1 157 students studying in South Africa.
Bursars that changed approved fields of study forfeited the bursary
Russia: 3 contracted bursars dropped out in the middle of the programme
China & Italy: Programme not implemented due processes involved for international studies, which delayed the implementation.
The bursaries will be reallocated to qualifying applicants.
The department will develop a learner support programme to mitigate against learner dropout.
Encourage and support students and succeed in post schooling qualification.
A research academic support programme was conducted for master’s programme students to reduce high failure rate.
None None
MRTTCreate a system-wide partnership between FET colleges, MRTT, SETAs and industry to assist graduates to obtain workplace training.
1 410 learners placed for workplace training.
The potential host employers who were approached and those with SLAs with MRTT could not absorb all the trained learners.
A Provincial Integrated Placement Plan for the learners has been drawn up for the new financial year.
Increase the intake of out-of-school youth into skills programmes, particularly in the hospitality and tourism, technical and entrepreneurial fields.
1 673 out-of-school youth trained in skills programmes, particularly in the hospitality and tourism, technical and entrepreneurial fields.
None. None
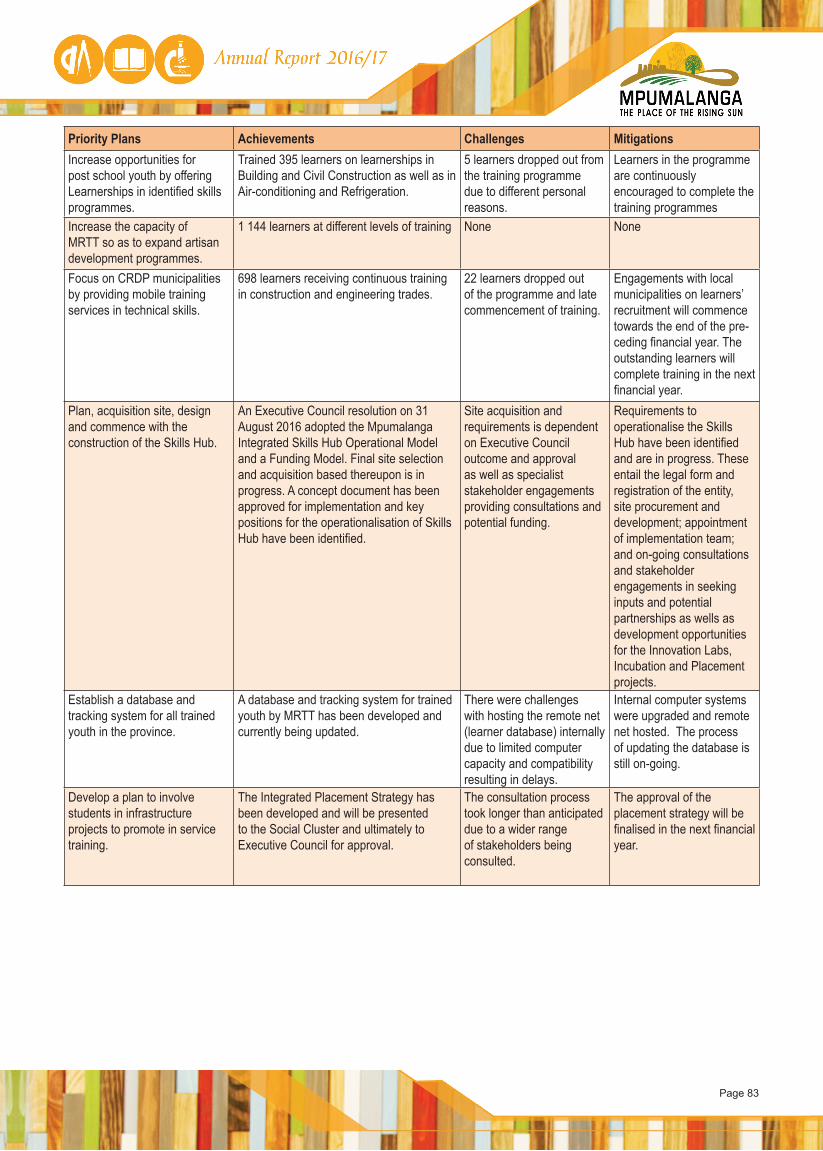
Page 83
Priority Plans Achievements Challenges MitigationsIncrease opportunities for post school youth by offering Learnerships in identified skills programmes.
Trained 395 learners on learnerships in Building and Civil Construction as well as in Air-conditioning and Refrigeration.
5 learners dropped out from the training programme due to different personal reasons.
Learners in the programme are continuously encouraged to complete the training programmes
Increase the capacity of MRTT so as to expand artisan development programmes.
1 144 learners at different levels of training None None
Focus on CRDP municipalities by providing mobile training services in technical skills.
698 learners receiving continuous training in construction and engineering trades.
22 learners dropped out of the programme and late commencement of training.
Engagements with local municipalities on learners’ recruitment will commence towards the end of the pre-ceding financial year. The outstanding learners will complete training in the next financial year.
Plan, acquisition site, design and commence with the construction of the Skills Hub.
An Executive Council resolution on 31 August 2016 adopted the Mpumalanga Integrated Skills Hub Operational Model and a Funding Model. Final site selection and acquisition based thereupon is in progress. A concept document has been approved for implementation and key positions for the operationalisation of Skills Hub have been identified.
Site acquisition and requirements is dependent on Executive Council outcome and approval as well as specialist stakeholder engagements providing consultations and potential funding.
Requirements to operationalise the Skills Hub have been identified and are in progress. These entail the legal form and registration of the entity, site procurement and development; appointment of implementation team; and on-going consultations and stakeholder engagements in seeking inputs and potential partnerships as wells as development opportunities for the Innovation Labs, Incubation and Placement projects.
Establish a database and tracking system for all trained youth in the province.
A database and tracking system for trained youth by MRTT has been developed and currently being updated.
There were challenges with hosting the remote net (learner database) internally due to limited computer capacity and compatibility resulting in delays.
Internal computer systems were upgraded and remote net hosted. The process of updating the database is still on-going.
Develop a plan to involve students in infrastructure projects to promote in service training.
The Integrated Placement Strategy has been developed and will be presented to the Social Cluster and ultimately to Executive Council for approval.
The consultation process took longer than anticipated due to a wider range of stakeholders being consulted.
The approval of the placement strategy will be finalised in the next financial year.
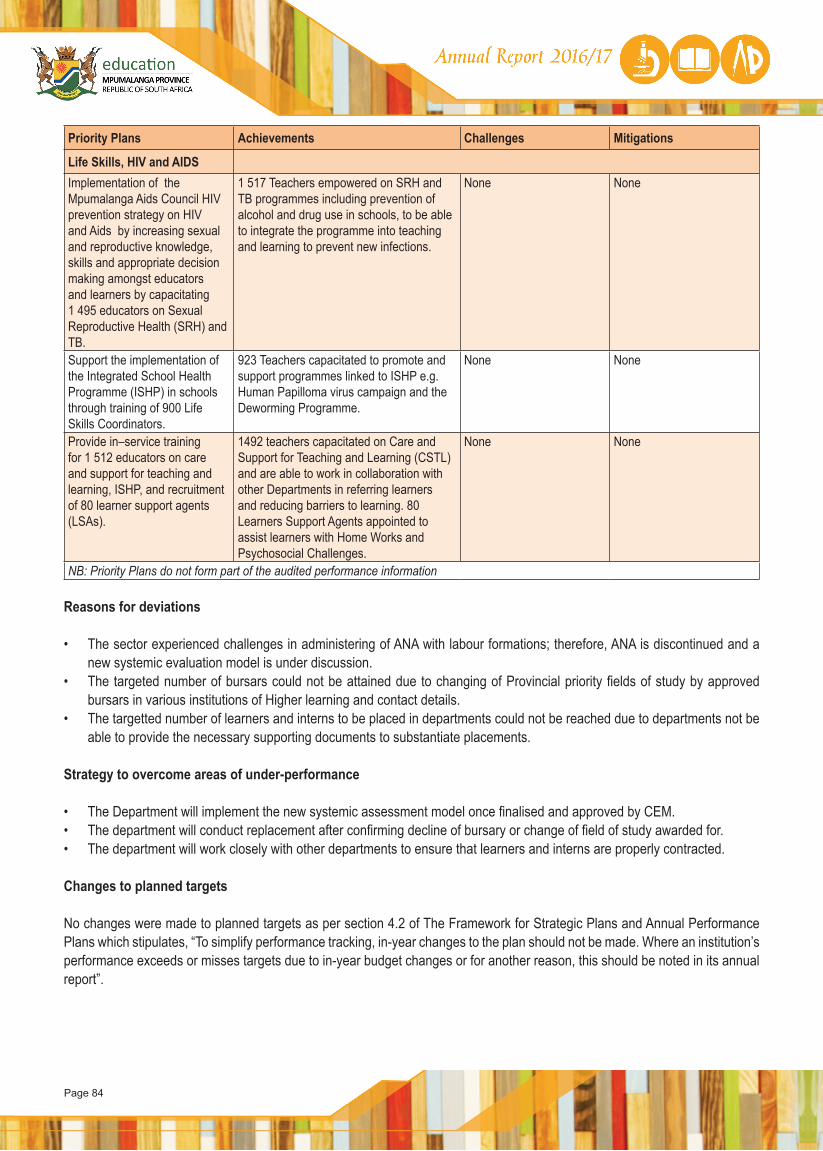
Page 84
Priority Plans Achievements Challenges Mitigations
Life Skills, HIV and AIDSImplementation of the Mpumalanga Aids Council HIV prevention strategy on HIV and Aids by increasing sexual and reproductive knowledge, skills and appropriate decision making amongst educators and learners by capacitating 1 495 educators on Sexual Reproductive Health (SRH) and TB.
1 517 Teachers empowered on SRH and TB programmes including prevention of alcohol and drug use in schools, to be able to integrate the programme into teaching and learning to prevent new infections.
None None
Support the implementation of the Integrated School Health Programme (ISHP) in schools through training of 900 Life Skills Coordinators.
923 Teachers capacitated to promote and support programmes linked to ISHP e.g. Human Papilloma virus campaign and the Deworming Programme.
None None
Provide in–service training for 1 512 educators on care and support for teaching and learning, ISHP, and recruitment of 80 learner support agents (LSAs).
1492 teachers capacitated on Care and Support for Teaching and Learning (CSTL) and are able to work in collaboration with other Departments in referring learners and reducing barriers to learning. 80 Learners Support Agents appointed to assist learners with Home Works and Psychosocial Challenges.
None None
NB: Priority Plans do not form part of the audited performance information
Reasons for deviations • The sector experienced challenges in administering of ANA with labour formations; therefore, ANA is discontinued and a
new systemic evaluation model is under discussion.• The targeted number of bursars could not be attained due to changing of Provincial priority fields of study by approved
bursars in various institutions of Higher learning and contact details.• The targetted number of learners and interns to be placed in departments could not be reached due to departments not be
able to provide the necessary supporting documents to substantiate placements.
Strategy to overcome areas of under-performance
• The Department will implement the new systemic assessment model once finalised and approved by CEM.• The department will conduct replacement after confirming decline of bursary or change of field of study awarded for.• The department will work closely with other departments to ensure that learners and interns are properly contracted.
Changes to planned targets No changes were made to planned targets as per section 4.2 of The Framework for Strategic Plans and Annual Performance Plans which stipulates, “To simplify performance tracking, in-year changes to the plan should not be made. Where an institution’s performance exceeds or misses targets due to in-year budget changes or for another reason, this should be noted in its annual report”.
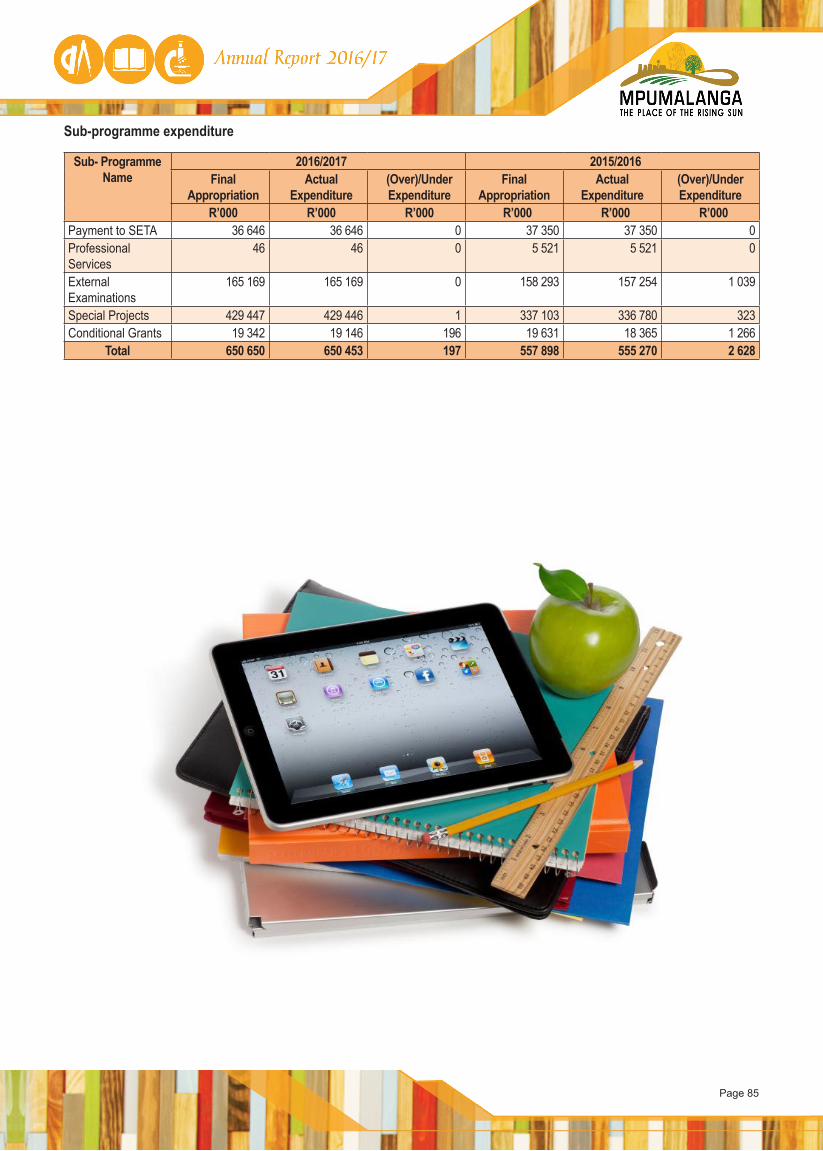
Page 85
Sub-programme expenditure
Sub- Programme Name
2016/2017 2015/2016Final
AppropriationActual
Expenditure(Over)/Under Expenditure
Final Appropriation
ActualExpenditure
(Over)/Under Expenditure
R’000 R’000 R’000 R’000 R’000 R’000Payment to SETA 36 646 36 646 0 37 350 37 350 0Professional Services
46 46 0 5 521 5 521 0
External Examinations
165 169 165 169 0 158 293 157 254 1 039
Special Projects 429 447 429 446 1 337 103 336 780 323Conditional Grants 19 342 19 146 196 19 631 18 365 1 266
Total 650 650 650 453 197 557 898 555 270 2 628
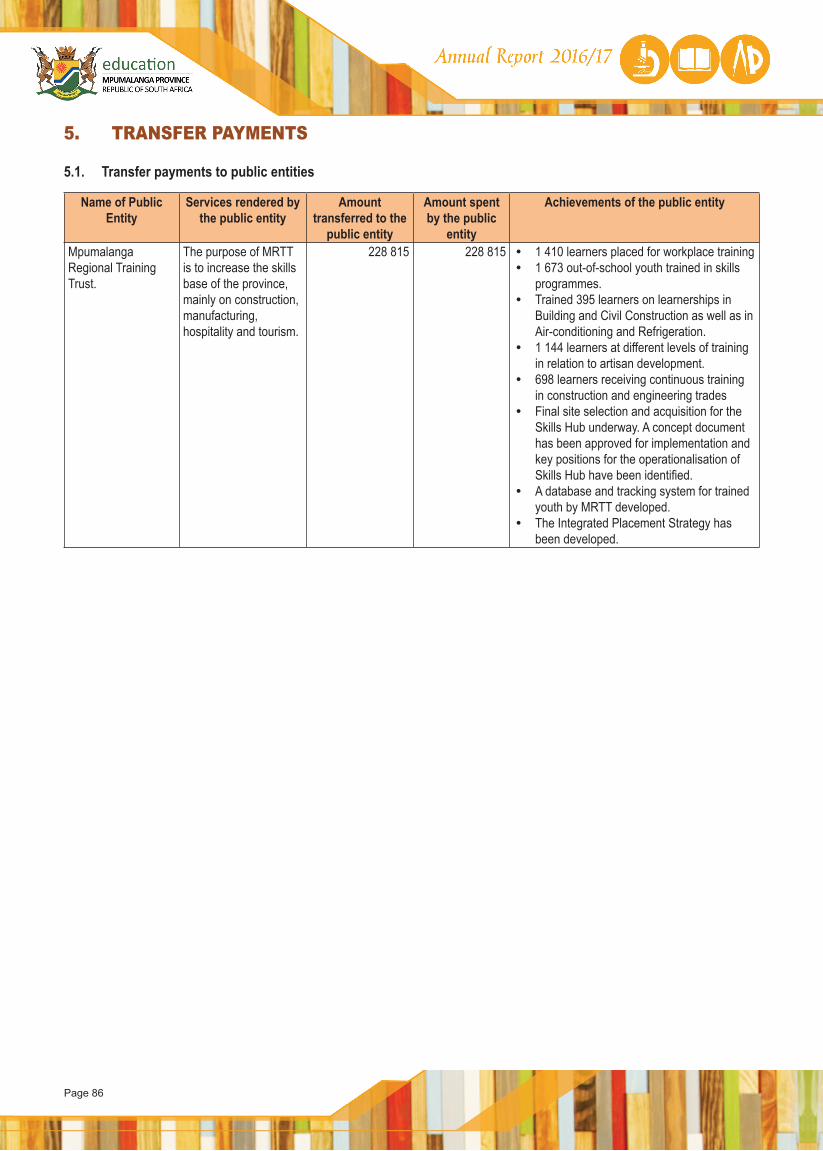
Page 86
5. TRANSFER PAYMENTS
5.1. Transfer payments to public entities
Name of Public Entity
Services rendered by the public entity
Amount transferred to the
public entity
Amount spent by the public
entity
Achievements of the public entity
Mpumalanga Regional Training Trust.
The purpose of MRTT is to increase the skills base of the province, mainly on construction, manufacturing, hospitality and tourism.
228 815 228 815 • 1 410 learners placed for workplace training• 1 673 out-of-school youth trained in skills
programmes.• Trained 395 learners on learnerships in
Building and Civil Construction as well as in Air-conditioning and Refrigeration.
• 1 144 learners at different levels of training in relation to artisan development.
• 698 learners receiving continuous training in construction and engineering trades
• Final site selection and acquisition for the Skills Hub underway. A concept document has been approved for implementation and key positions for the operationalisation of Skills Hub have been identified.
• A database and tracking system for trained youth by MRTT developed.
• The Integrated Placement Strategy has been developed.
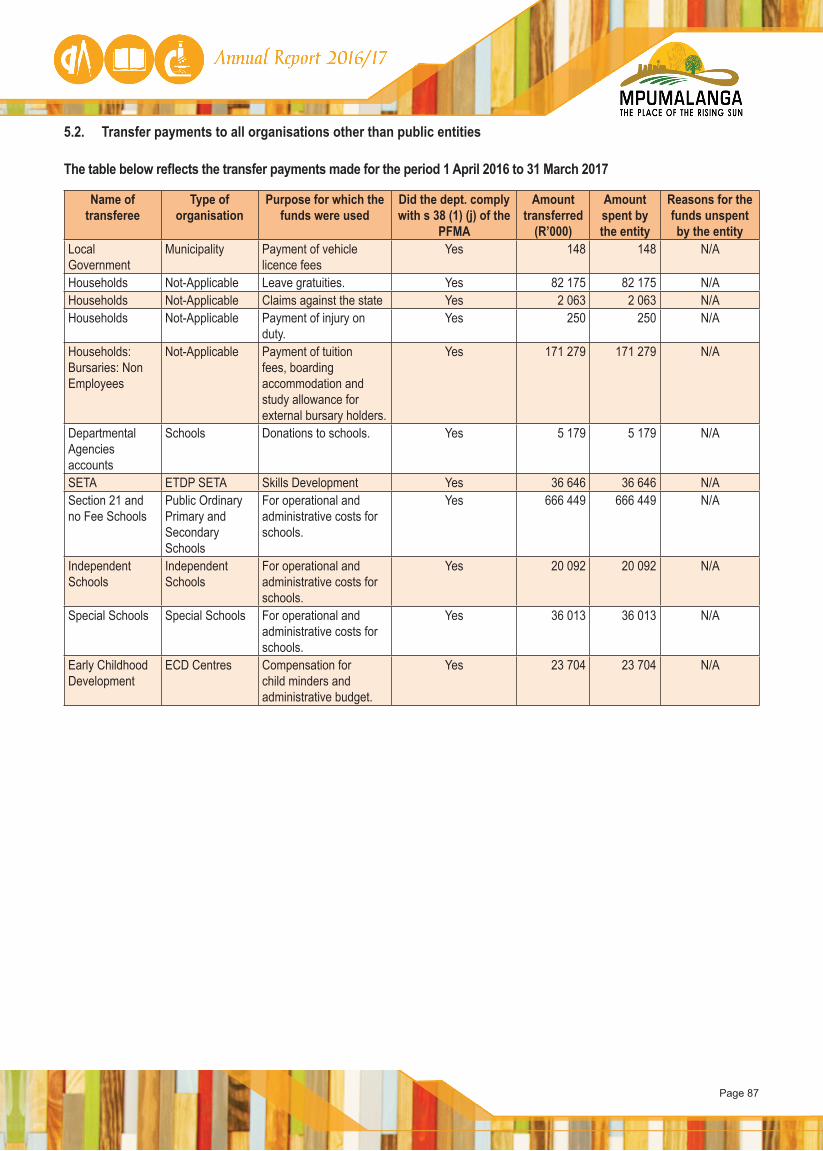
Page 87
5.2. Transfer payments to all organisations other than public entities The table below reflects the transfer payments made for the period 1 April 2016 to 31 March 2017
Name of transferee
Type of organisation
Purpose for which the funds were used
Did the dept. comply with s 38 (1) (j) of the
PFMA
Amount transferred
(R’000)
Amount spent by the entity
Reasons for the funds unspent by the entity
Local Government
Municipality Payment of vehicle licence fees
Yes 148 148 N/A
Households Not-Applicable Leave gratuities. Yes 82 175 82 175 N/AHouseholds Not-Applicable Claims against the state Yes 2 063 2 063 N/AHouseholds Not-Applicable Payment of injury on
duty.Yes 250 250 N/A
Households: Bursaries: Non Employees
Not-Applicable Payment of tuition fees, boarding accommodation and study allowance for external bursary holders.
Yes 171 279 171 279 N/A
Departmental Agencies accounts
Schools Donations to schools. Yes 5 179 5 179 N/A
SETA ETDP SETA Skills Development Yes 36 646 36 646 N/ASection 21 and no Fee Schools
Public Ordinary Primary and Secondary Schools
For operational and administrative costs for schools.
Yes 666 449 666 449 N/A
Independent Schools
Independent Schools
For operational and administrative costs for schools.
Yes 20 092 20 092 N/A
Special Schools Special Schools For operational and administrative costs for schools.
Yes 36 013 36 013 N/A
Early Childhood Development
ECD Centres Compensation for child minders and administrative budget.
Yes 23 704 23 704 N/A
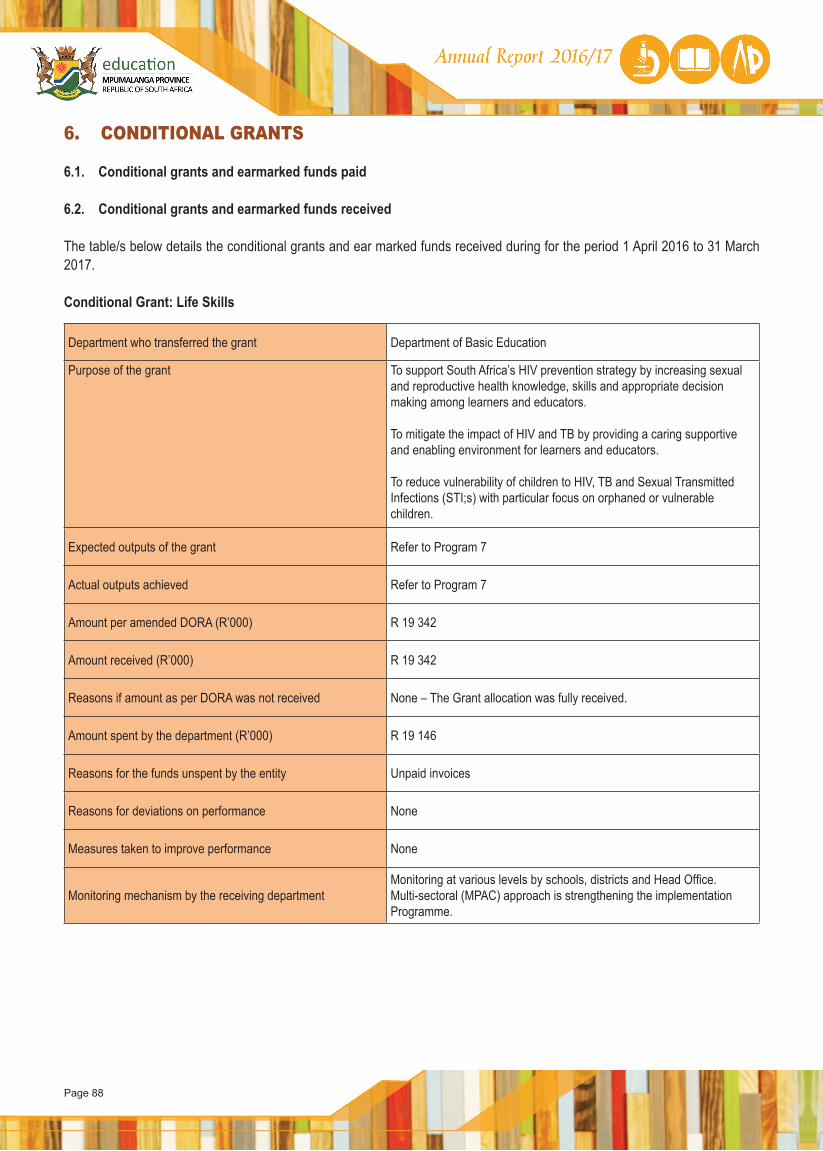
Page 88
6. CONDITIONAL GRANTS
6.1. Conditional grants and earmarked funds paid
6.2. Conditional grants and earmarked funds received
The table/s below details the conditional grants and ear marked funds received during for the period 1 April 2016 to 31 March 2017.
Conditional Grant: Life Skills
Department who transferred the grant Department of Basic Education
Purpose of the grant To support South Africa’s HIV prevention strategy by increasing sexual and reproductive health knowledge, skills and appropriate decision making among learners and educators.
To mitigate the impact of HIV and TB by providing a caring supportive and enabling environment for learners and educators.
To reduce vulnerability of children to HIV, TB and Sexual Transmitted Infections (STI;s) with particular focus on orphaned or vulnerable children.
Expected outputs of the grant Refer to Program 7
Actual outputs achieved Refer to Program 7
Amount per amended DORA (R’000) R 19 342
Amount received (R’000) R 19 342
Reasons if amount as per DORA was not received None – The Grant allocation was fully received.
Amount spent by the department (R’000) R 19 146
Reasons for the funds unspent by the entity Unpaid invoices
Reasons for deviations on performance None
Measures taken to improve performance None
Monitoring mechanism by the receiving departmentMonitoring at various levels by schools, districts and Head Office.Multi-sectoral (MPAC) approach is strengthening the implementation Programme.
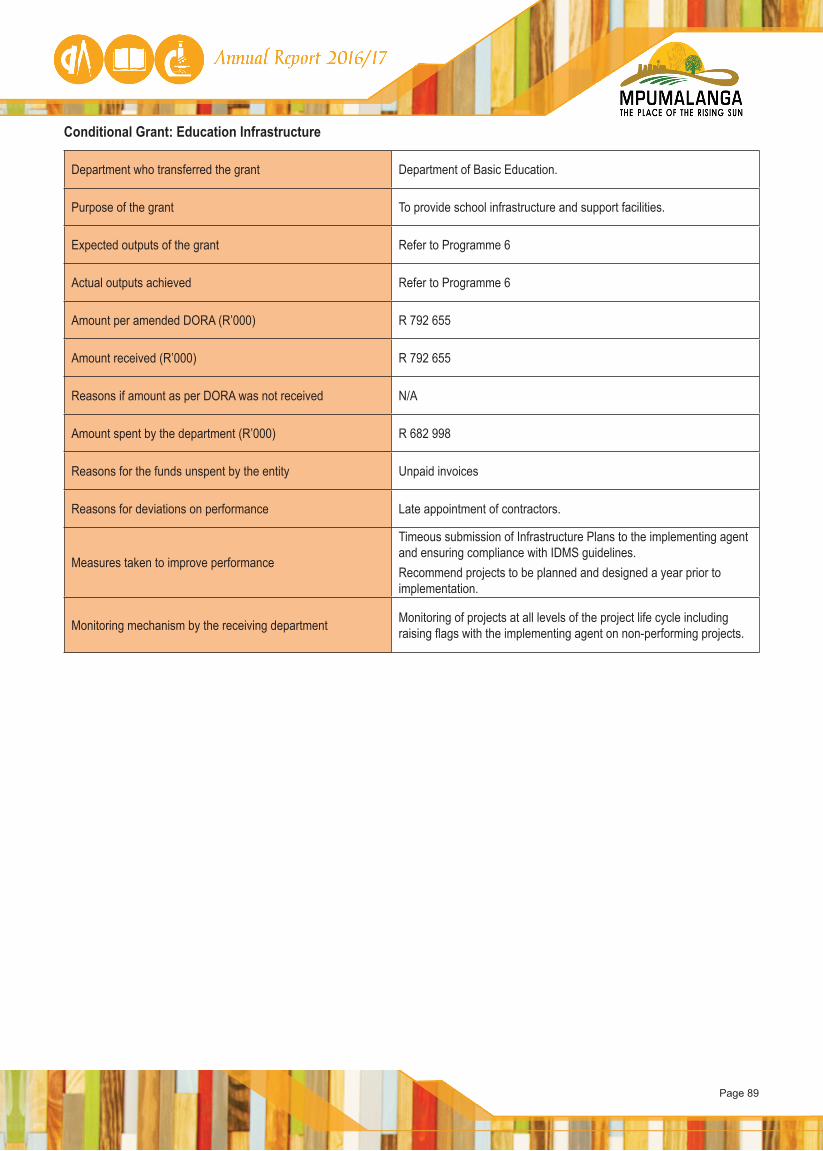
Page 89
Conditional Grant: Education Infrastructure
Department who transferred the grant Department of Basic Education.
Purpose of the grant To provide school infrastructure and support facilities.
Expected outputs of the grant Refer to Programme 6
Actual outputs achieved Refer to Programme 6
Amount per amended DORA (R’000) R 792 655
Amount received (R’000) R 792 655
Reasons if amount as per DORA was not received N/A
Amount spent by the department (R’000) R 682 998
Reasons for the funds unspent by the entity Unpaid invoices
Reasons for deviations on performance Late appointment of contractors.
Measures taken to improve performance
Timeous submission of Infrastructure Plans to the implementing agent and ensuring compliance with IDMS guidelines. Recommend projects to be planned and designed a year prior to implementation.
Monitoring mechanism by the receiving department Monitoring of projects at all levels of the project life cycle including raising flags with the implementing agent on non-performing projects.
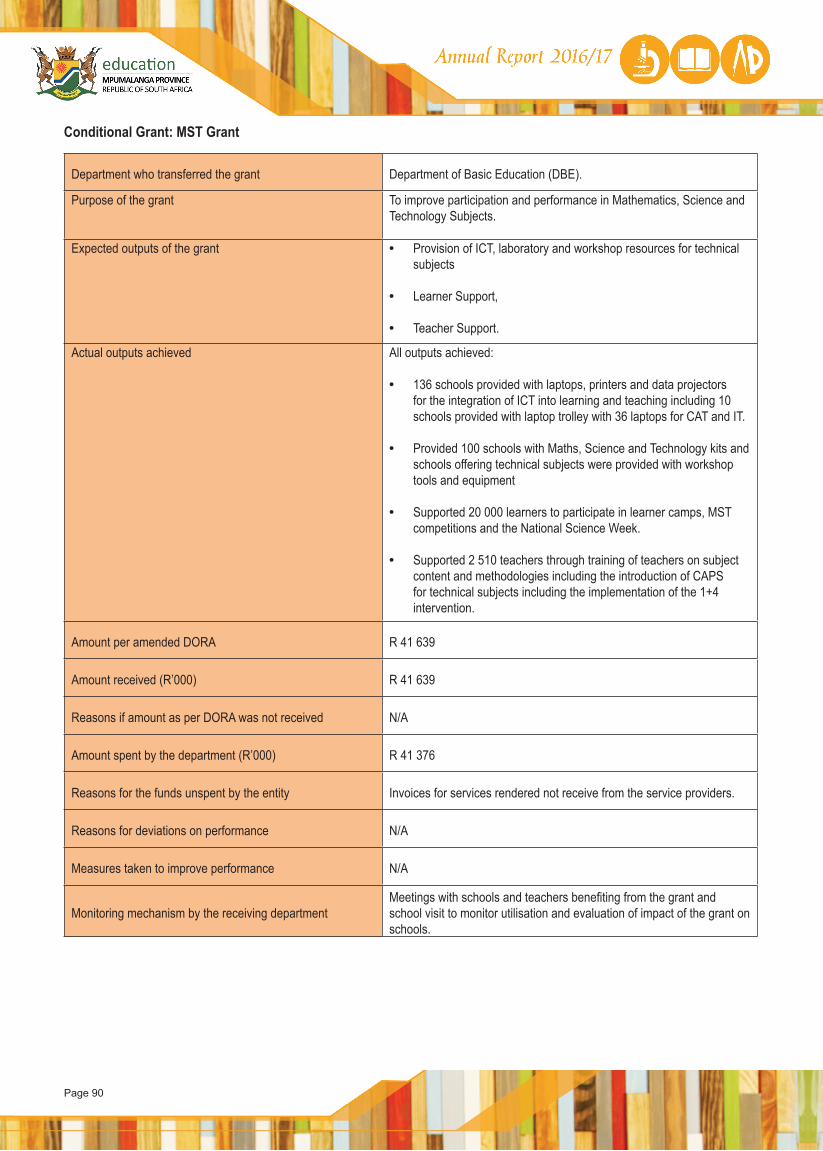
Page 90
Conditional Grant: MST Grant
Department who transferred the grant Department of Basic Education (DBE).
Purpose of the grant To improve participation and performance in Mathematics, Science and Technology Subjects.
Expected outputs of the grant • Provision of ICT, laboratory and workshop resources for technical subjects
• Learner Support,
• Teacher Support.
Actual outputs achieved All outputs achieved:
• 136 schools provided with laptops, printers and data projectors for the integration of ICT into learning and teaching including 10 schools provided with laptop trolley with 36 laptops for CAT and IT.
• Provided 100 schools with Maths, Science and Technology kits and schools offering technical subjects were provided with workshop tools and equipment
• Supported 20 000 learners to participate in learner camps, MST competitions and the National Science Week.
• Supported 2 510 teachers through training of teachers on subject content and methodologies including the introduction of CAPS for technical subjects including the implementation of the 1+4 intervention.
Amount per amended DORA R 41 639
Amount received (R’000) R 41 639
Reasons if amount as per DORA was not received N/A
Amount spent by the department (R’000) R 41 376
Reasons for the funds unspent by the entity Invoices for services rendered not receive from the service providers.
Reasons for deviations on performance N/A
Measures taken to improve performance N/A
Monitoring mechanism by the receiving departmentMeetings with schools and teachers benefiting from the grant and school visit to monitor utilisation and evaluation of impact of the grant on schools.
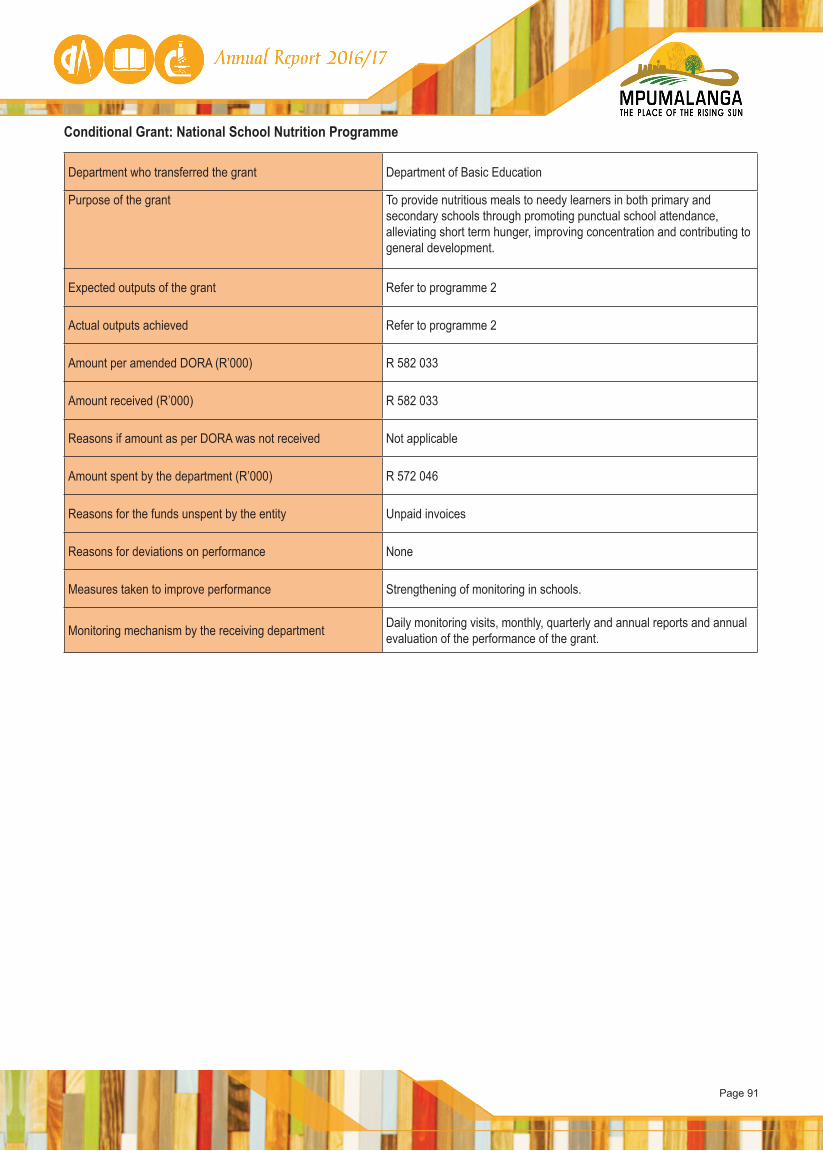
Page 91
Conditional Grant: National School Nutrition Programme
Department who transferred the grant Department of Basic Education
Purpose of the grant To provide nutritious meals to needy learners in both primary and secondary schools through promoting punctual school attendance, alleviating short term hunger, improving concentration and contributing to general development.
Expected outputs of the grant Refer to programme 2
Actual outputs achieved Refer to programme 2
Amount per amended DORA (R’000) R 582 033
Amount received (R’000) R 582 033
Reasons if amount as per DORA was not received Not applicable
Amount spent by the department (R’000) R 572 046
Reasons for the funds unspent by the entity Unpaid invoices
Reasons for deviations on performance None
Measures taken to improve performance Strengthening of monitoring in schools.
Monitoring mechanism by the receiving department Daily monitoring visits, monthly, quarterly and annual reports and annual evaluation of the performance of the grant.
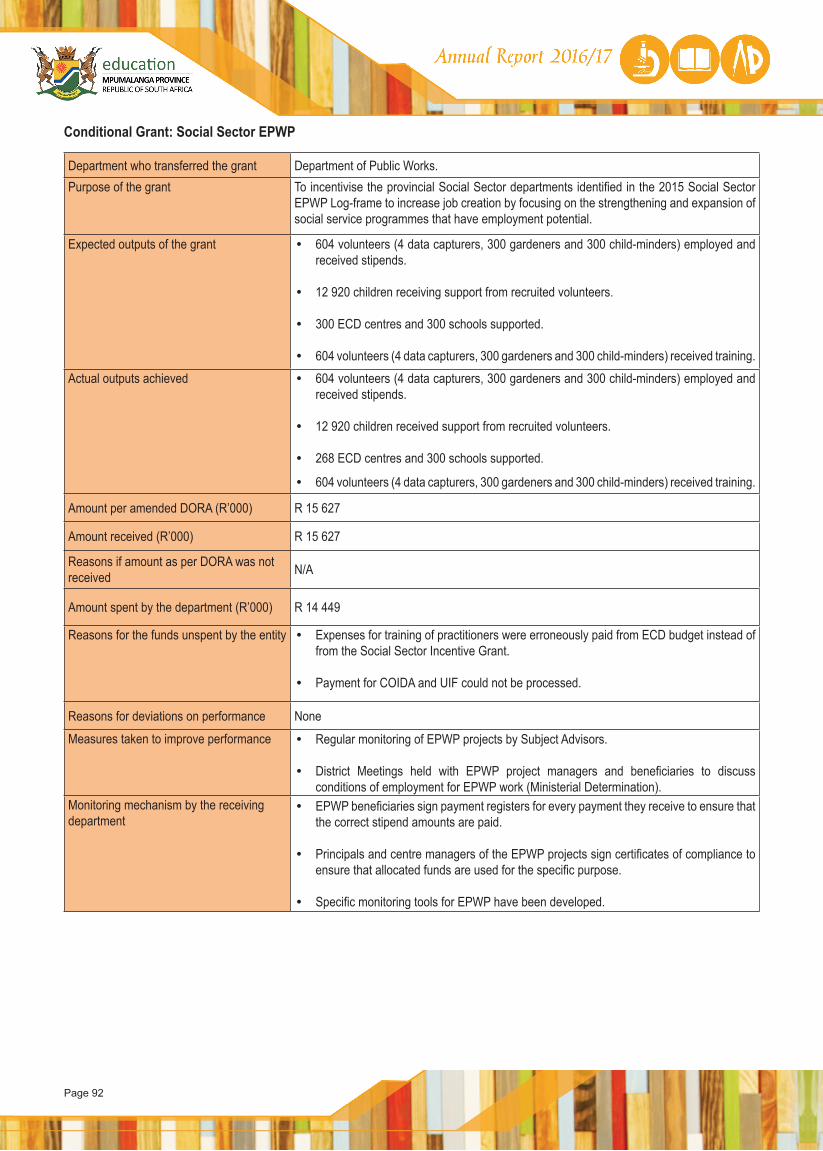
Page 92
Conditional Grant: Social Sector EPWP
Department who transferred the grant Department of Public Works.Purpose of the grant To incentivise the provincial Social Sector departments identified in the 2015 Social Sector
EPWP Log-frame to increase job creation by focusing on the strengthening and expansion of social service programmes that have employment potential.
Expected outputs of the grant • 604 volunteers (4 data capturers, 300 gardeners and 300 child-minders) employed and received stipends.
• 12 920 children receiving support from recruited volunteers.
• 300 ECD centres and 300 schools supported.
• 604 volunteers (4 data capturers, 300 gardeners and 300 child-minders) received training.
Actual outputs achieved • 604 volunteers (4 data capturers, 300 gardeners and 300 child-minders) employed and received stipends.
• 12 920 children received support from recruited volunteers.
• 268 ECD centres and 300 schools supported.
• 604 volunteers (4 data capturers, 300 gardeners and 300 child-minders) received training.
Amount per amended DORA (R’000) R 15 627
Amount received (R’000) R 15 627
Reasons if amount as per DORA was not received N/A
Amount spent by the department (R’000) R 14 449
Reasons for the funds unspent by the entity • Expenses for training of practitioners were erroneously paid from ECD budget instead of from the Social Sector Incentive Grant.
• Payment for COIDA and UIF could not be processed.
Reasons for deviations on performance None
Measures taken to improve performance • Regular monitoring of EPWP projects by Subject Advisors.
• District Meetings held with EPWP project managers and beneficiaries to discuss conditions of employment for EPWP work (Ministerial Determination).
Monitoring mechanism by the receiving department
• EPWP beneficiaries sign payment registers for every payment they receive to ensure that the correct stipend amounts are paid.
• Principals and centre managers of the EPWP projects sign certificates of compliance to ensure that allocated funds are used for the specific purpose.
• Specific monitoring tools for EPWP have been developed.
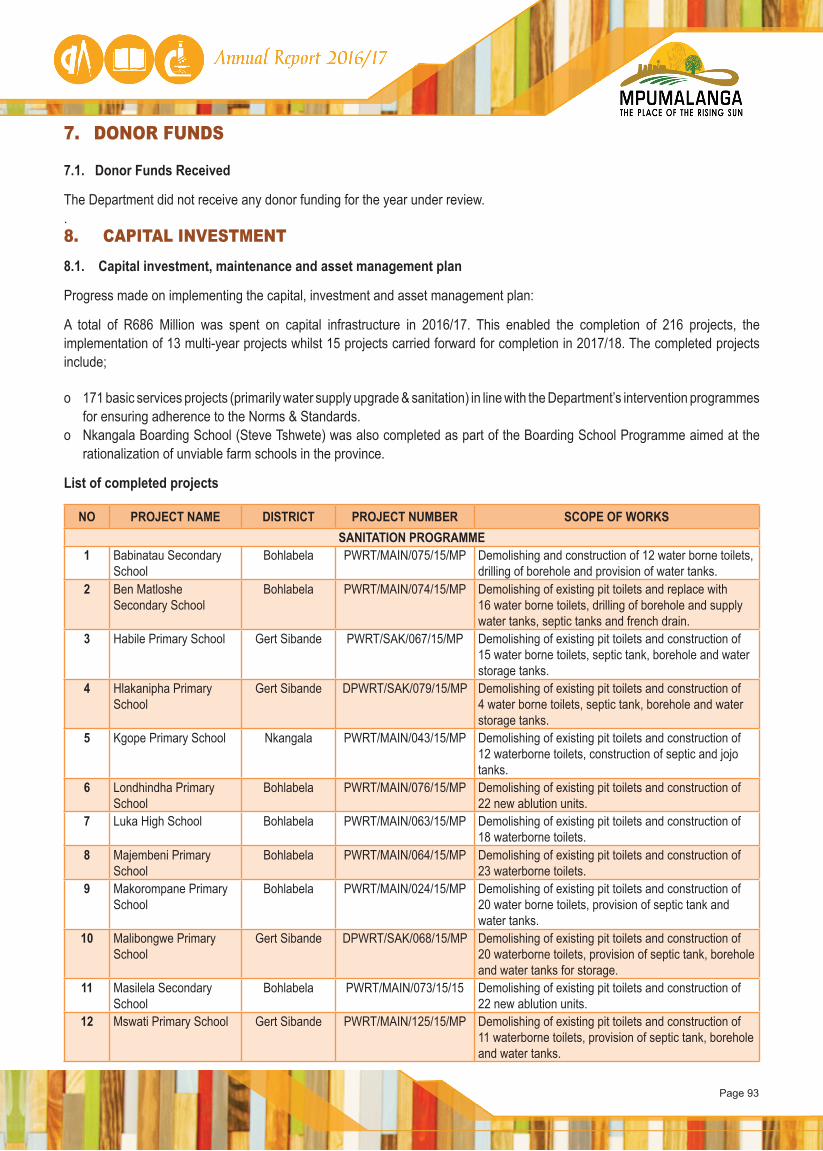
Page 93
7. DONOR FUNDS
7.1. Donor Funds Received
The Department did not receive any donor funding for the year under review..8. CAPITAL INVESTMENT 8.1. Capital investment, maintenance and asset management plan
Progress made on implementing the capital, investment and asset management plan:
A total of R686 Million was spent on capital infrastructure in 2016/17. This enabled the completion of 216 projects, the implementation of 13 multi-year projects whilst 15 projects carried forward for completion in 2017/18. The completed projects include;
o 171 basic services projects (primarily water supply upgrade & sanitation) in line with the Department’s intervention programmes for ensuring adherence to the Norms & Standards.
o Nkangala Boarding School (Steve Tshwete) was also completed as part of the Boarding School Programme aimed at the rationalization of unviable farm schools in the province.
List of completed projects
NO PROJECT NAME DISTRICT PROJECT NUMBER SCOPE OF WORKSSANITATION PROGRAMME
1 Babinatau Secondary School
Bohlabela PWRT/MAIN/075/15/MP Demolishing and construction of 12 water borne toilets, drilling of borehole and provision of water tanks.
2 Ben Matloshe Secondary School
Bohlabela PWRT/MAIN/074/15/MP Demolishing of existing pit toilets and replace with 16 water borne toilets, drilling of borehole and supply water tanks, septic tanks and french drain.
3 Habile Primary School Gert Sibande PWRT/SAK/067/15/MP Demolishing of existing pit toilets and construction of 15 water borne toilets, septic tank, borehole and water storage tanks.
4 Hlakanipha Primary School
Gert Sibande DPWRT/SAK/079/15/MP Demolishing of existing pit toilets and construction of 4 water borne toilets, septic tank, borehole and water storage tanks.
5 Kgope Primary School Nkangala PWRT/MAIN/043/15/MP Demolishing of existing pit toilets and construction of 12 waterborne toilets, construction of septic and jojo tanks.
6 Londhindha Primary School
Bohlabela PWRT/MAIN/076/15/MP Demolishing of existing pit toilets and construction of 22 new ablution units.
7 Luka High School Bohlabela PWRT/MAIN/063/15/MP Demolishing of existing pit toilets and construction of 18 waterborne toilets.
8 Majembeni Primary School
Bohlabela PWRT/MAIN/064/15/MP Demolishing of existing pit toilets and construction of 23 waterborne toilets.
9 Makorompane Primary School
Bohlabela PWRT/MAIN/024/15/MP Demolishing of existing pit toilets and construction of 20 water borne toilets, provision of septic tank and water tanks.
10 Malibongwe Primary School
Gert Sibande DPWRT/SAK/068/15/MP Demolishing of existing pit toilets and construction of 20 waterborne toilets, provision of septic tank, borehole and water tanks for storage.
11 Masilela Secondary School
Bohlabela PWRT/MAIN/073/15/15 Demolishing of existing pit toilets and construction of 22 new ablution units.
12 Mswati Primary School Gert Sibande PWRT/MAIN/125/15/MP Demolishing of existing pit toilets and construction of 11 waterborne toilets, provision of septic tank, borehole and water tanks.
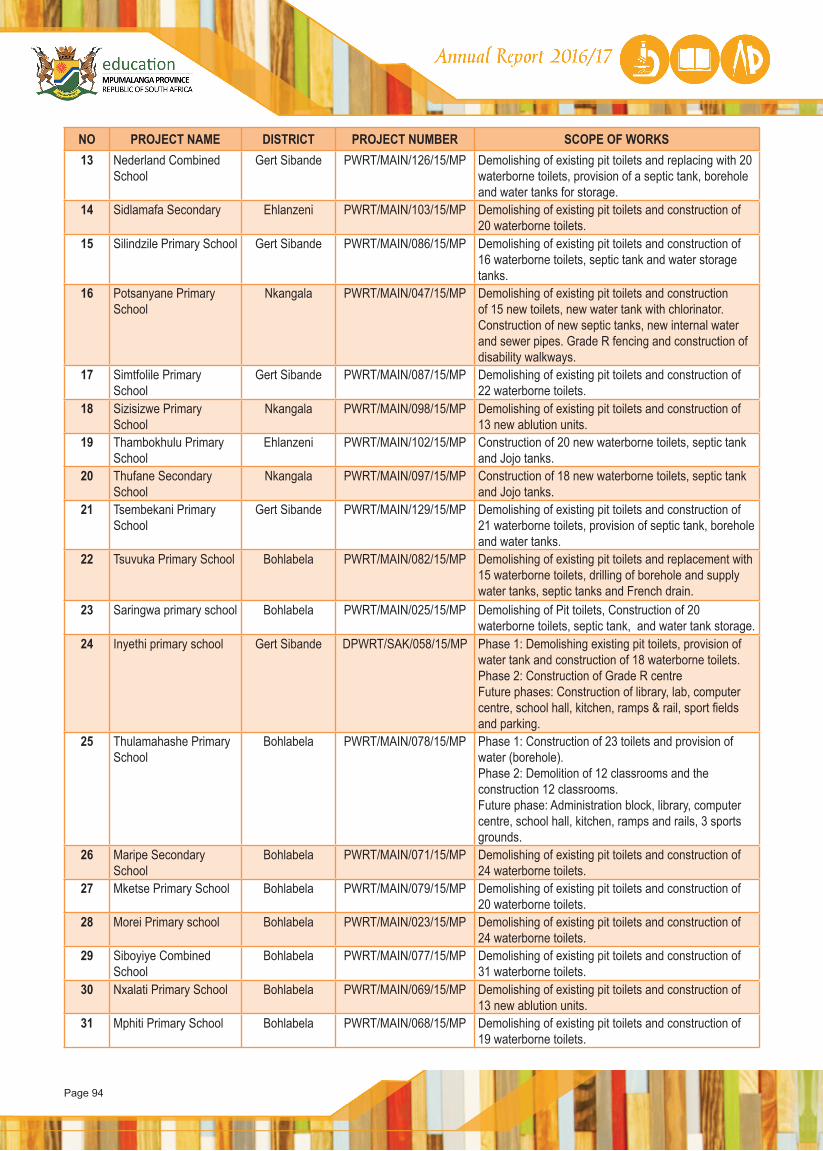
Page 94
NO PROJECT NAME DISTRICT PROJECT NUMBER SCOPE OF WORKS13 Nederland Combined
SchoolGert Sibande PWRT/MAIN/126/15/MP Demolishing of existing pit toilets and replacing with 20
waterborne toilets, provision of a septic tank, borehole and water tanks for storage.
14 Sidlamafa Secondary Ehlanzeni PWRT/MAIN/103/15/MP Demolishing of existing pit toilets and construction of 20 waterborne toilets.
15 Silindzile Primary School Gert Sibande PWRT/MAIN/086/15/MP Demolishing of existing pit toilets and construction of 16 waterborne toilets, septic tank and water storage tanks.
16 Potsanyane Primary School
Nkangala PWRT/MAIN/047/15/MP Demolishing of existing pit toilets and construction of 15 new toilets, new water tank with chlorinator. Construction of new septic tanks, new internal water and sewer pipes. Grade R fencing and construction of disability walkways.
17 Simtfolile Primary School
Gert Sibande PWRT/MAIN/087/15/MP Demolishing of existing pit toilets and construction of 22 waterborne toilets.
18 Sizisizwe Primary School
Nkangala PWRT/MAIN/098/15/MP Demolishing of existing pit toilets and construction of 13 new ablution units.
19 Thambokhulu Primary School
Ehlanzeni PWRT/MAIN/102/15/MP Construction of 20 new waterborne toilets, septic tank and Jojo tanks.
20 Thufane Secondary School
Nkangala PWRT/MAIN/097/15/MP Construction of 18 new waterborne toilets, septic tank and Jojo tanks.
21 Tsembekani Primary School
Gert Sibande PWRT/MAIN/129/15/MP Demolishing of existing pit toilets and construction of 21 waterborne toilets, provision of septic tank, borehole and water tanks.
22 Tsuvuka Primary School Bohlabela PWRT/MAIN/082/15/MP Demolishing of existing pit toilets and replacement with 15 waterborne toilets, drilling of borehole and supply water tanks, septic tanks and French drain.
23 Saringwa primary school Bohlabela PWRT/MAIN/025/15/MP Demolishing of Pit toilets, Construction of 20 waterborne toilets, septic tank, and water tank storage.
24 Inyethi primary school Gert Sibande DPWRT/SAK/058/15/MP Phase 1: Demolishing existing pit toilets, provision of water tank and construction of 18 waterborne toilets. Phase 2: Construction of Grade R centre Future phases: Construction of library, lab, computer centre, school hall, kitchen, ramps & rail, sport fields and parking.
25 Thulamahashe Primary School
Bohlabela PWRT/MAIN/078/15/MP Phase 1: Construction of 23 toilets and provision of water (borehole). Phase 2: Demolition of 12 classrooms and the construction 12 classrooms. Future phase: Administration block, library, computer centre, school hall, kitchen, ramps and rails, 3 sports grounds.
26 Maripe Secondary School
Bohlabela PWRT/MAIN/071/15/MP Demolishing of existing pit toilets and construction of 24 waterborne toilets.
27 Mketse Primary School Bohlabela PWRT/MAIN/079/15/MP Demolishing of existing pit toilets and construction of 20 waterborne toilets.
28 Morei Primary school Bohlabela PWRT/MAIN/023/15/MP Demolishing of existing pit toilets and construction of 24 waterborne toilets.
29 Siboyiye Combined School
Bohlabela PWRT/MAIN/077/15/MP Demolishing of existing pit toilets and construction of 31 waterborne toilets.
30 Nxalati Primary School Bohlabela PWRT/MAIN/069/15/MP Demolishing of existing pit toilets and construction of 13 new ablution units.
31 Mphiti Primary School Bohlabela PWRT/MAIN/068/15/MP Demolishing of existing pit toilets and construction of 19 waterborne toilets.
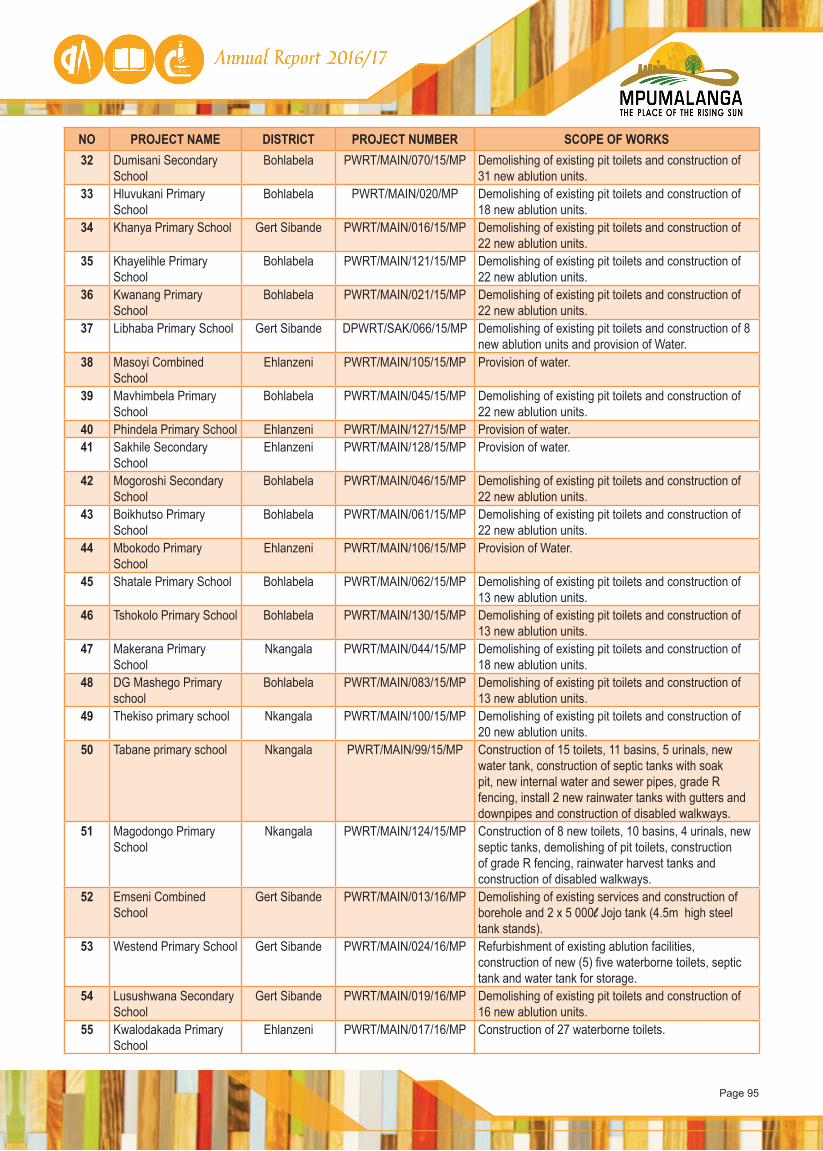
Page 95
NO PROJECT NAME DISTRICT PROJECT NUMBER SCOPE OF WORKS32 Dumisani Secondary
SchoolBohlabela PWRT/MAIN/070/15/MP Demolishing of existing pit toilets and construction of
31 new ablution units.33 Hluvukani Primary
SchoolBohlabela PWRT/MAIN/020/MP Demolishing of existing pit toilets and construction of
18 new ablution units.34 Khanya Primary School Gert Sibande PWRT/MAIN/016/15/MP Demolishing of existing pit toilets and construction of
22 new ablution units.35 Khayelihle Primary
SchoolBohlabela PWRT/MAIN/121/15/MP Demolishing of existing pit toilets and construction of
22 new ablution units.36 Kwanang Primary
SchoolBohlabela PWRT/MAIN/021/15/MP Demolishing of existing pit toilets and construction of
22 new ablution units.37 Libhaba Primary School Gert Sibande DPWRT/SAK/066/15/MP Demolishing of existing pit toilets and construction of 8
new ablution units and provision of Water.38 Masoyi Combined
SchoolEhlanzeni PWRT/MAIN/105/15/MP Provision of water.
39 Mavhimbela Primary School
Bohlabela PWRT/MAIN/045/15/MP Demolishing of existing pit toilets and construction of 22 new ablution units.
40 Phindela Primary School Ehlanzeni PWRT/MAIN/127/15/MP Provision of water.41 Sakhile Secondary
SchoolEhlanzeni PWRT/MAIN/128/15/MP Provision of water.
42 Mogoroshi Secondary School
Bohlabela PWRT/MAIN/046/15/MP Demolishing of existing pit toilets and construction of 22 new ablution units.
43 Boikhutso Primary School
Bohlabela PWRT/MAIN/061/15/MP Demolishing of existing pit toilets and construction of 22 new ablution units.
44 Mbokodo Primary School
Ehlanzeni PWRT/MAIN/106/15/MP Provision of Water.
45 Shatale Primary School Bohlabela PWRT/MAIN/062/15/MP Demolishing of existing pit toilets and construction of 13 new ablution units.
46 Tshokolo Primary School Bohlabela PWRT/MAIN/130/15/MP Demolishing of existing pit toilets and construction of 13 new ablution units.
47 Makerana Primary School
Nkangala PWRT/MAIN/044/15/MP Demolishing of existing pit toilets and construction of 18 new ablution units.
48 DG Mashego Primary school
Bohlabela PWRT/MAIN/083/15/MP Demolishing of existing pit toilets and construction of 13 new ablution units.
49 Thekiso primary school Nkangala PWRT/MAIN/100/15/MP Demolishing of existing pit toilets and construction of 20 new ablution units.
50 Tabane primary school Nkangala PWRT/MAIN/99/15/MP Construction of 15 toilets, 11 basins, 5 urinals, new water tank, construction of septic tanks with soak pit, new internal water and sewer pipes, grade R fencing, install 2 new rainwater tanks with gutters and downpipes and construction of disabled walkways.
51 Magodongo Primary School
Nkangala PWRT/MAIN/124/15/MP Construction of 8 new toilets, 10 basins, 4 urinals, new septic tanks, demolishing of pit toilets, construction of grade R fencing, rainwater harvest tanks and construction of disabled walkways.
52 Emseni Combined School
Gert Sibande PWRT/MAIN/013/16/MP Demolishing of existing services and construction of borehole and 2 x 5 000l Jojo tank (4.5m high steel tank stands).
53 Westend Primary School Gert Sibande PWRT/MAIN/024/16/MP Refurbishment of existing ablution facilities, construction of new (5) five waterborne toilets, septic tank and water tank for storage.
54 Lusushwana Secondary School
Gert Sibande PWRT/MAIN/019/16/MP Demolishing of existing pit toilets and construction of 16 new ablution units.
55 Kwalodakada Primary School
Ehlanzeni PWRT/MAIN/017/16/MP Construction of 27 waterborne toilets.
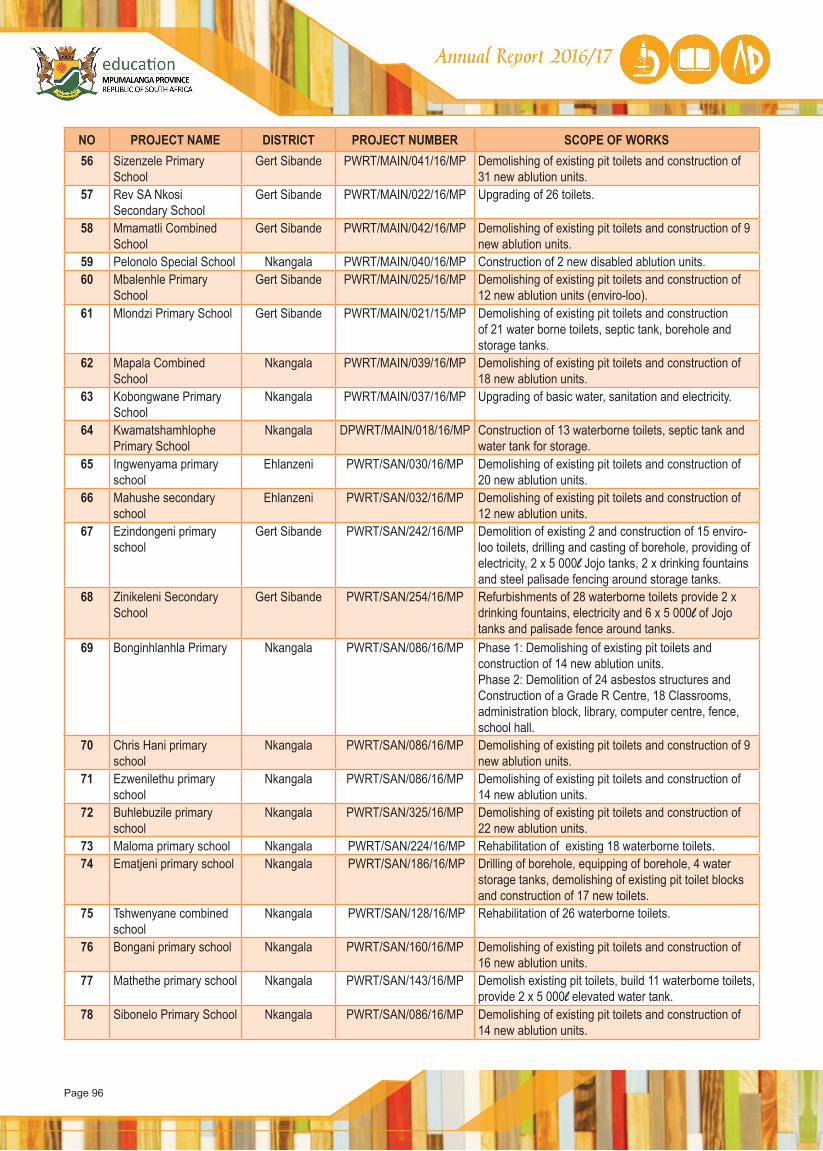
Page 96
NO PROJECT NAME DISTRICT PROJECT NUMBER SCOPE OF WORKS56 Sizenzele Primary
SchoolGert Sibande PWRT/MAIN/041/16/MP Demolishing of existing pit toilets and construction of
31 new ablution units.57 Rev SA Nkosi
Secondary SchoolGert Sibande PWRT/MAIN/022/16/MP Upgrading of 26 toilets.
58 Mmamatli Combined School
Gert Sibande PWRT/MAIN/042/16/MP Demolishing of existing pit toilets and construction of 9 new ablution units.
59 Pelonolo Special School Nkangala PWRT/MAIN/040/16/MP Construction of 2 new disabled ablution units.60 Mbalenhle Primary
SchoolGert Sibande PWRT/MAIN/025/16/MP Demolishing of existing pit toilets and construction of
12 new ablution units (enviro-loo).61 Mlondzi Primary School Gert Sibande PWRT/MAIN/021/15/MP Demolishing of existing pit toilets and construction
of 21 water borne toilets, septic tank, borehole and storage tanks.
62 Mapala Combined School
Nkangala PWRT/MAIN/039/16/MP Demolishing of existing pit toilets and construction of 18 new ablution units.
63 Kobongwane Primary School
Nkangala PWRT/MAIN/037/16/MP Upgrading of basic water, sanitation and electricity.
64 Kwamatshamhlophe Primary School
Nkangala DPWRT/MAIN/018/16/MP Construction of 13 waterborne toilets, septic tank and water tank for storage.
65 Ingwenyama primary school
Ehlanzeni PWRT/SAN/030/16/MP Demolishing of existing pit toilets and construction of 20 new ablution units.
66 Mahushe secondary school
Ehlanzeni PWRT/SAN/032/16/MP Demolishing of existing pit toilets and construction of 12 new ablution units.
67 Ezindongeni primary school
Gert Sibande PWRT/SAN/242/16/MP Demolition of existing 2 and construction of 15 enviro-loo toilets, drilling and casting of borehole, providing of electricity, 2 x 5 000l Jojo tanks, 2 x drinking fountains and steel palisade fencing around storage tanks.
68 Zinikeleni Secondary School
Gert Sibande PWRT/SAN/254/16/MP Refurbishments of 28 waterborne toilets provide 2 x drinking fountains, electricity and 6 x 5 000l of Jojo tanks and palisade fence around tanks.
69 Bonginhlanhla Primary Nkangala PWRT/SAN/086/16/MP Phase 1: Demolishing of existing pit toilets and construction of 14 new ablution units. Phase 2: Demolition of 24 asbestos structures and Construction of a Grade R Centre, 18 Classrooms, administration block, library, computer centre, fence, school hall.
70 Chris Hani primary school
Nkangala PWRT/SAN/086/16/MP Demolishing of existing pit toilets and construction of 9 new ablution units.
71 Ezwenilethu primary school
Nkangala PWRT/SAN/086/16/MP Demolishing of existing pit toilets and construction of 14 new ablution units.
72 Buhlebuzile primary school
Nkangala PWRT/SAN/325/16/MP Demolishing of existing pit toilets and construction of 22 new ablution units.
73 Maloma primary school Nkangala PWRT/SAN/224/16/MP Rehabilitation of existing 18 waterborne toilets. 74 Ematjeni primary school Nkangala PWRT/SAN/186/16/MP Drilling of borehole, equipping of borehole, 4 water
storage tanks, demolishing of existing pit toilet blocks and construction of 17 new toilets.
75 Tshwenyane combined school
Nkangala PWRT/SAN/128/16/MP Rehabilitation of 26 waterborne toilets.
76 Bongani primary school Nkangala PWRT/SAN/160/16/MP Demolishing of existing pit toilets and construction of 16 new ablution units.
77 Mathethe primary school Nkangala PWRT/SAN/143/16/MP Demolish existing pit toilets, build 11 waterborne toilets, provide 2 x 5 000l elevated water tank.
78 Sibonelo Primary School Nkangala PWRT/SAN/086/16/MP Demolishing of existing pit toilets and construction of 14 new ablution units.
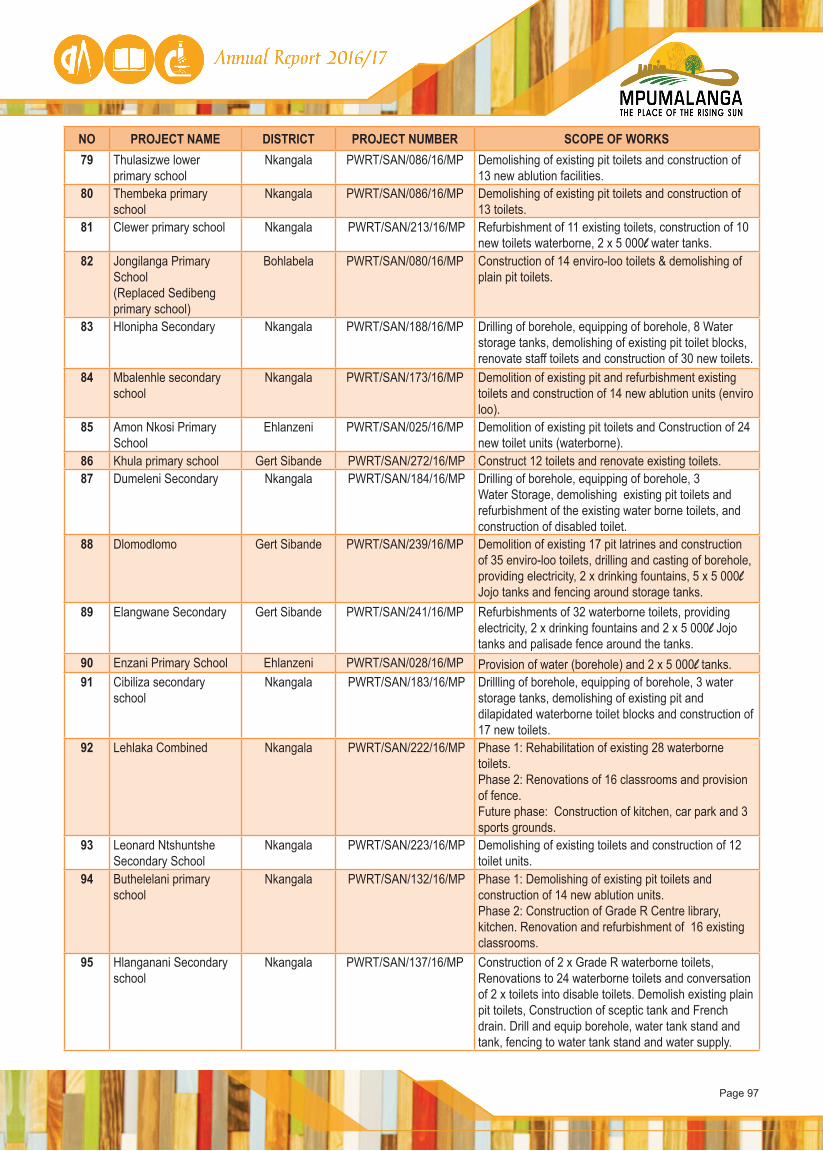
Page 97
NO PROJECT NAME DISTRICT PROJECT NUMBER SCOPE OF WORKS79 Thulasizwe lower
primary schoolNkangala PWRT/SAN/086/16/MP Demolishing of existing pit toilets and construction of
13 new ablution facilities.80 Thembeka primary
schoolNkangala PWRT/SAN/086/16/MP Demolishing of existing pit toilets and construction of
13 toilets. 81 Clewer primary school Nkangala PWRT/SAN/213/16/MP Refurbishment of 11 existing toilets, construction of 10
new toilets waterborne, 2 x 5 000l water tanks.82 Jongilanga Primary
School (Replaced Sedibeng primary school)
Bohlabela PWRT/SAN/080/16/MP Construction of 14 enviro-loo toilets & demolishing of plain pit toilets.
83 Hlonipha Secondary Nkangala PWRT/SAN/188/16/MP Drilling of borehole, equipping of borehole, 8 Water storage tanks, demolishing of existing pit toilet blocks, renovate staff toilets and construction of 30 new toilets.
84 Mbalenhle secondary school
Nkangala PWRT/SAN/173/16/MP Demolition of existing pit and refurbishment existing toilets and construction of 14 new ablution units (enviro loo).
85 Amon Nkosi Primary School
Ehlanzeni PWRT/SAN/025/16/MP Demolition of existing pit toilets and Construction of 24 new toilet units (waterborne).
86 Khula primary school Gert Sibande PWRT/SAN/272/16/MP Construct 12 toilets and renovate existing toilets.87 Dumeleni Secondary Nkangala PWRT/SAN/184/16/MP Drilling of borehole, equipping of borehole, 3
Water Storage, demolishing existing pit toilets and refurbishment of the existing water borne toilets, and construction of disabled toilet.
88 Dlomodlomo Gert Sibande PWRT/SAN/239/16/MP Demolition of existing 17 pit latrines and construction of 35 enviro-loo toilets, drilling and casting of borehole, providing electricity, 2 x drinking fountains, 5 x 5 000l Jojo tanks and fencing around storage tanks.
89 Elangwane Secondary Gert Sibande PWRT/SAN/241/16/MP Refurbishments of 32 waterborne toilets, providing electricity, 2 x drinking fountains and 2 x 5 000l Jojo tanks and palisade fence around the tanks.
90 Enzani Primary School Ehlanzeni PWRT/SAN/028/16/MP Provision of water (borehole) and 2 x 5 000l tanks.91 Cibiliza secondary
schoolNkangala PWRT/SAN/183/16/MP Drillling of borehole, equipping of borehole, 3 water
storage tanks, demolishing of existing pit and dilapidated waterborne toilet blocks and construction of 17 new toilets.
92 Lehlaka Combined Nkangala PWRT/SAN/222/16/MP Phase 1: Rehabilitation of existing 28 waterborne toilets. Phase 2: Renovations of 16 classrooms and provision of fence. Future phase: Construction of kitchen, car park and 3 sports grounds.
93 Leonard Ntshuntshe Secondary School
Nkangala PWRT/SAN/223/16/MP Demolishing of existing toilets and construction of 12 toilet units.
94 Buthelelani primary school
Nkangala PWRT/SAN/132/16/MP Phase 1: Demolishing of existing pit toilets and construction of 14 new ablution units. Phase 2: Construction of Grade R Centre library, kitchen. Renovation and refurbishment of 16 existing classrooms.
95 Hlanganani Secondary school
Nkangala PWRT/SAN/137/16/MP Construction of 2 x Grade R waterborne toilets, Renovations to 24 waterborne toilets and conversation of 2 x toilets into disable toilets. Demolish existing plain pit toilets, Construction of sceptic tank and French drain. Drill and equip borehole, water tank stand and tank, fencing to water tank stand and water supply.

Page 98
NO PROJECT NAME DISTRICT PROJECT NUMBER SCOPE OF WORKS96 Intuthuko secondary
schoolNkangala PWRT/SAN/138/16/MP Demolish existing pit toilets, build 11 waterborne toilets,
provide 2 x 5 000l elevated water tank.97 Mantwani primary
schoolNkangala PWRT/SAN/142/16/MP Demolish existing pit toilets, build 15 waterborne
toilets, provide 2 x 10000l elevated water tank.98 Mosipa Secondary
school (replaced Mhlava-khosa primary school)
Bohlabela PWRT/SAN/352/16/MP Construction of 15 enviro-loo toilet and water supply.
99 Mothaileng Primary School (Replaced Mapfalane Secondary School)
Bohlabela PWRT/SAN/351/16/MP Construction of 20 enviro-loo toilets and water supply.
100 Lihawu secondary school
Ehlanzeni PWRT/SANS/011/16/MP Demolishing of existing toilets and construction of 26 toilet units (enviro-loo).
101 Mbambiso secondary school
Ehlanzeni PWRT/SAN/033/16/MP Demolishing of existing pit toilets and construction of 18 new enviro loo toilets and provision of water (borehole).
102 Xanthia Secondary School (Replaced Hambanathi)
Bohlabela PWRT/SAN/350/16/MP Construction of 15 enviro-loo toilets.
103 Madzuma high school Bohlabela PWRT/SAN/047/16/MP Constructing 16 toilets and provision of water (borehole).
104 Mapetekoane primary school
Bohlabela PWRT/SAN/050/16/MP Construction of 17 enviro-loo toilet block.
105 Lehlogonolo Primary School
Bohlabela PWRT/SAN/068/16/MP Construction of 6 new toilets and demolition of pit toilets.
106 Impilo primary school Nkangala PWRT/SAN/217/16/MP Demolishing of existing pit toilets and construction of 13 new ablution units.
107 Khayalami secondary school
Nkangala PWRT/SAN/219/16/MP Rehabilitation of 30 waterborne toilets.
108 Khonzimfundo Combined School
Nkangala PWRT/SAN/220/16/MP Phase 1: Rehabilitation of 34 waterborne toilets. Phase 2: Refurbishment of existing 24 classrooms Future Phases: Refurbishment of administration block, library, kitchen and school hall.
109 Digwale secondary school
Nkangala PWRT/SAN/133/16/MP Demolish existing pit toilets, construct 13 waterborne toilets, provide 1 x 10 000l and 1 x 5 000l water tank.
110 Ekukhanyeni primary school
Nkangala PWRT/SAN/134/16/MP Demolishing of existing pit toilets and construction of 10 new ablution units.
111 Fundukhuphuke primary school
Nkangala PWRT/SAN/135/16/MP Demolishing of existing pit toilets and construction of 14 new ablution units.
112 Mandlakababa primary school
Nkangala PWRT/SAN/141/16/MP Demolishing of existing pit toilets and construction of 13 new ablution units.
113 Katjibane primary school Nkangala PWRT/SAN/086/16/MP Demolition of old pit toilet and construction of 16 (8 boys & 8 girls) waterborne toilet with septic tank and borehole.
114 Bongumusa secondary school
Nkangala PWRT/SAN/161/16/MP Demolition of existing pit toilets and construction of 13 new ablution units.
115 Hlobisa primary school Nkangala PWRT/SAN/167/16/MP Demolition of existing pit toilets, construction of 8 enviro loo toilets.
116 Mandlethu Secondary Nkangala PWRT/SAN/171/16/MP Demolishing of existing pit toilets and waterborne toilets. Construction of 12 new ablution units (enviro loo)
117 Zakhele primary school Nkangala PWRT/SAN/181/16/MP Demolishing of existing pit toilets and refurbishment of existing ablutions and construction (11) of enviro loo toilets.
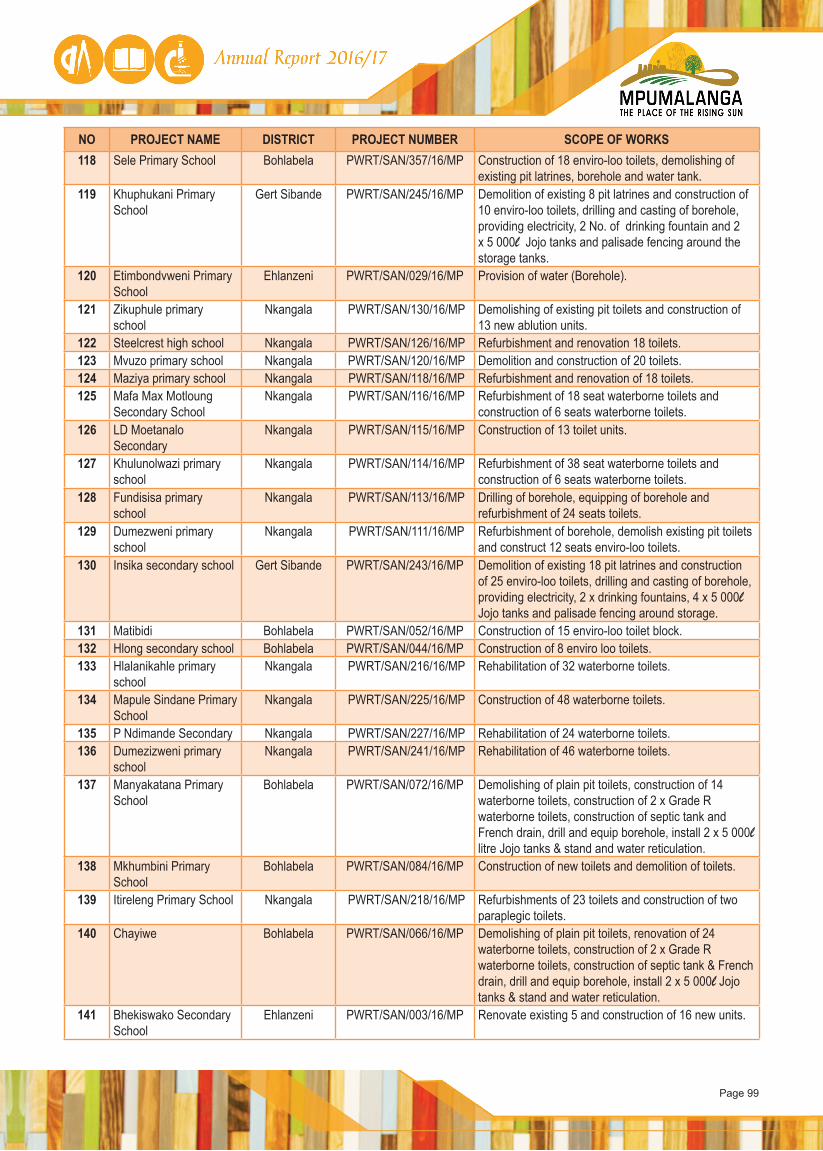
Page 99
NO PROJECT NAME DISTRICT PROJECT NUMBER SCOPE OF WORKS118 Sele Primary School Bohlabela PWRT/SAN/357/16/MP Construction of 18 enviro-loo toilets, demolishing of
existing pit latrines, borehole and water tank.119 Khuphukani Primary
SchoolGert Sibande PWRT/SAN/245/16/MP Demolition of existing 8 pit latrines and construction of
10 enviro-loo toilets, drilling and casting of borehole, providing electricity, 2 No. of drinking fountain and 2 x 5 000l Jojo tanks and palisade fencing around the storage tanks.
120 Etimbondvweni Primary School
Ehlanzeni PWRT/SAN/029/16/MP Provision of water (Borehole).
121 Zikuphule primary school
Nkangala PWRT/SAN/130/16/MP Demolishing of existing pit toilets and construction of 13 new ablution units.
122 Steelcrest high school Nkangala PWRT/SAN/126/16/MP Refurbishment and renovation 18 toilets.123 Mvuzo primary school Nkangala PWRT/SAN/120/16/MP Demolition and construction of 20 toilets.124 Maziya primary school Nkangala PWRT/SAN/118/16/MP Refurbishment and renovation of 18 toilets.125 Mafa Max Motloung
Secondary SchoolNkangala PWRT/SAN/116/16/MP Refurbishment of 18 seat waterborne toilets and
construction of 6 seats waterborne toilets.126 LD Moetanalo
Secondary Nkangala PWRT/SAN/115/16/MP Construction of 13 toilet units.
127 Khulunolwazi primary school
Nkangala PWRT/SAN/114/16/MP Refurbishment of 38 seat waterborne toilets and construction of 6 seats waterborne toilets.
128 Fundisisa primary school
Nkangala PWRT/SAN/113/16/MP Drilling of borehole, equipping of borehole and refurbishment of 24 seats toilets.
129 Dumezweni primary school
Nkangala PWRT/SAN/111/16/MP Refurbishment of borehole, demolish existing pit toilets and construct 12 seats enviro-loo toilets.
130 Insika secondary school Gert Sibande PWRT/SAN/243/16/MP Demolition of existing 18 pit latrines and construction of 25 enviro-loo toilets, drilling and casting of borehole, providing electricity, 2 x drinking fountains, 4 x 5 000l Jojo tanks and palisade fencing around storage.
131 Matibidi Bohlabela PWRT/SAN/052/16/MP Construction of 15 enviro-loo toilet block.132 Hlong secondary school Bohlabela PWRT/SAN/044/16/MP Construction of 8 enviro loo toilets.133 Hlalanikahle primary
schoolNkangala PWRT/SAN/216/16/MP Rehabilitation of 32 waterborne toilets.
134 Mapule Sindane Primary School
Nkangala PWRT/SAN/225/16/MP Construction of 48 waterborne toilets.
135 P Ndimande Secondary Nkangala PWRT/SAN/227/16/MP Rehabilitation of 24 waterborne toilets.136 Dumezizweni primary
schoolNkangala PWRT/SAN/241/16/MP Rehabilitation of 46 waterborne toilets.
137 Manyakatana Primary School
Bohlabela PWRT/SAN/072/16/MP Demolishing of plain pit toilets, construction of 14 waterborne toilets, construction of 2 x Grade R waterborne toilets, construction of septic tank and French drain, drill and equip borehole, install 2 x 5 000l litre Jojo tanks & stand and water reticulation.
138 Mkhumbini Primary School
Bohlabela PWRT/SAN/084/16/MP Construction of new toilets and demolition of toilets.
139 Itireleng Primary School Nkangala PWRT/SAN/218/16/MP Refurbishments of 23 toilets and construction of two paraplegic toilets.
140 Chayiwe Bohlabela PWRT/SAN/066/16/MP Demolishing of plain pit toilets, renovation of 24 waterborne toilets, construction of 2 x Grade R waterborne toilets, construction of septic tank & French drain, drill and equip borehole, install 2 x 5 000l Jojo tanks & stand and water reticulation.
141 Bhekiswako Secondary School
Ehlanzeni PWRT/SAN/003/16/MP Renovate existing 5 and construction of 16 new units.
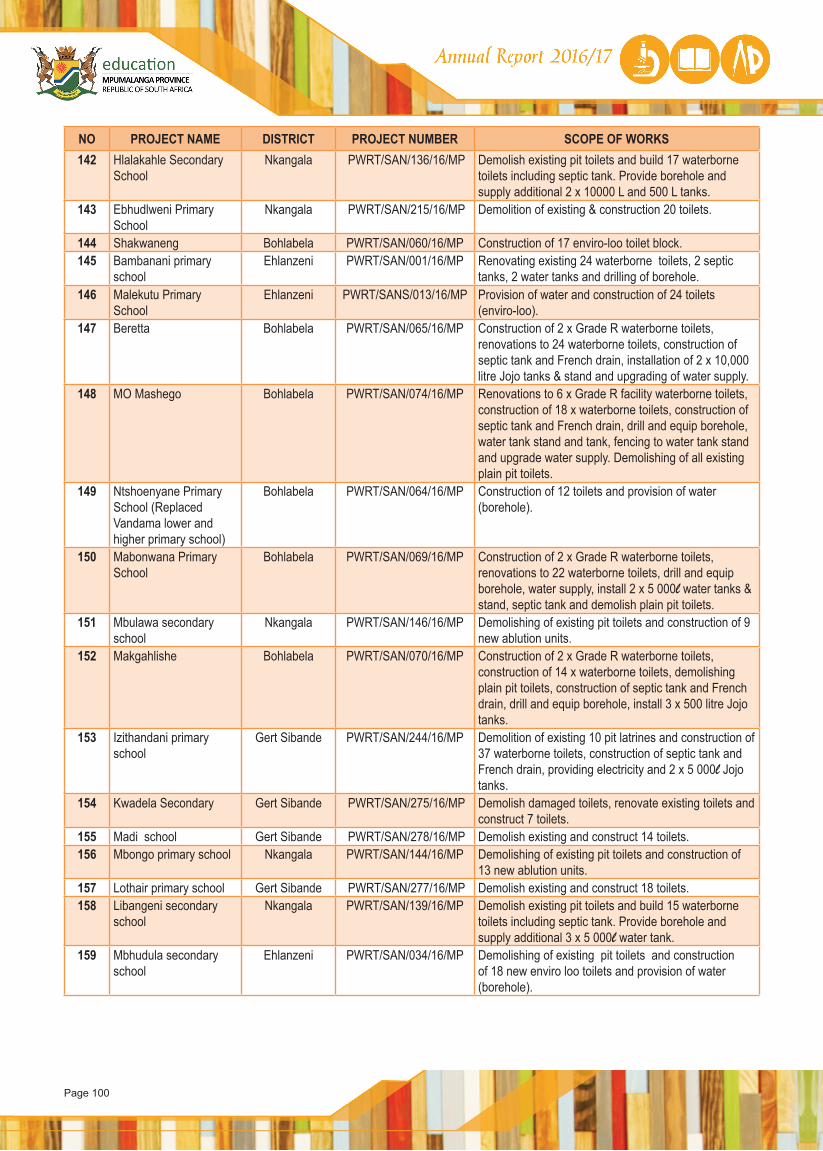
Page 100
NO PROJECT NAME DISTRICT PROJECT NUMBER SCOPE OF WORKS142 Hlalakahle Secondary
SchoolNkangala PWRT/SAN/136/16/MP Demolish existing pit toilets and build 17 waterborne
toilets including septic tank. Provide borehole and supply additional 2 x 10000 L and 500 L tanks.
143 Ebhudlweni Primary School
Nkangala PWRT/SAN/215/16/MP Demolition of existing & construction 20 toilets.
144 Shakwaneng Bohlabela PWRT/SAN/060/16/MP Construction of 17 enviro-loo toilet block.145 Bambanani primary
schoolEhlanzeni PWRT/SAN/001/16/MP Renovating existing 24 waterborne toilets, 2 septic
tanks, 2 water tanks and drilling of borehole.146 Malekutu Primary
SchoolEhlanzeni PWRT/SANS/013/16/MP Provision of water and construction of 24 toilets
(enviro-loo).147 Beretta Bohlabela PWRT/SAN/065/16/MP Construction of 2 x Grade R waterborne toilets,
renovations to 24 waterborne toilets, construction of septic tank and French drain, installation of 2 x 10,000 litre Jojo tanks & stand and upgrading of water supply.
148 MO Mashego Bohlabela PWRT/SAN/074/16/MP Renovations to 6 x Grade R facility waterborne toilets, construction of 18 x waterborne toilets, construction of septic tank and French drain, drill and equip borehole, water tank stand and tank, fencing to water tank stand and upgrade water supply. Demolishing of all existing plain pit toilets.
149 Ntshoenyane Primary School (Replaced Vandama lower and higher primary school)
Bohlabela PWRT/SAN/064/16/MP Construction of 12 toilets and provision of water (borehole).
150 Mabonwana Primary School
Bohlabela PWRT/SAN/069/16/MP Construction of 2 x Grade R waterborne toilets, renovations to 22 waterborne toilets, drill and equip borehole, water supply, install 2 x 5 000l water tanks & stand, septic tank and demolish plain pit toilets.
151 Mbulawa secondary school
Nkangala PWRT/SAN/146/16/MP Demolishing of existing pit toilets and construction of 9 new ablution units.
152 Makgahlishe Bohlabela PWRT/SAN/070/16/MP Construction of 2 x Grade R waterborne toilets, construction of 14 x waterborne toilets, demolishing plain pit toilets, construction of septic tank and French drain, drill and equip borehole, install 3 x 500 litre Jojo tanks.
153 Izithandani primary school
Gert Sibande PWRT/SAN/244/16/MP Demolition of existing 10 pit latrines and construction of 37 waterborne toilets, construction of septic tank and French drain, providing electricity and 2 x 5 000l Jojo tanks.
154 Kwadela Secondary Gert Sibande PWRT/SAN/275/16/MP Demolish damaged toilets, renovate existing toilets and construct 7 toilets.
155 Madi school Gert Sibande PWRT/SAN/278/16/MP Demolish existing and construct 14 toilets.156 Mbongo primary school Nkangala PWRT/SAN/144/16/MP Demolishing of existing pit toilets and construction of
13 new ablution units. 157 Lothair primary school Gert Sibande PWRT/SAN/277/16/MP Demolish existing and construct 18 toilets.158 Libangeni secondary
schoolNkangala PWRT/SAN/139/16/MP Demolish existing pit toilets and build 15 waterborne
toilets including septic tank. Provide borehole and supply additional 3 x 5 000l water tank.
159 Mbhudula secondary school
Ehlanzeni PWRT/SAN/034/16/MP Demolishing of existing pit toilets and construction of 18 new enviro loo toilets and provision of water (borehole).
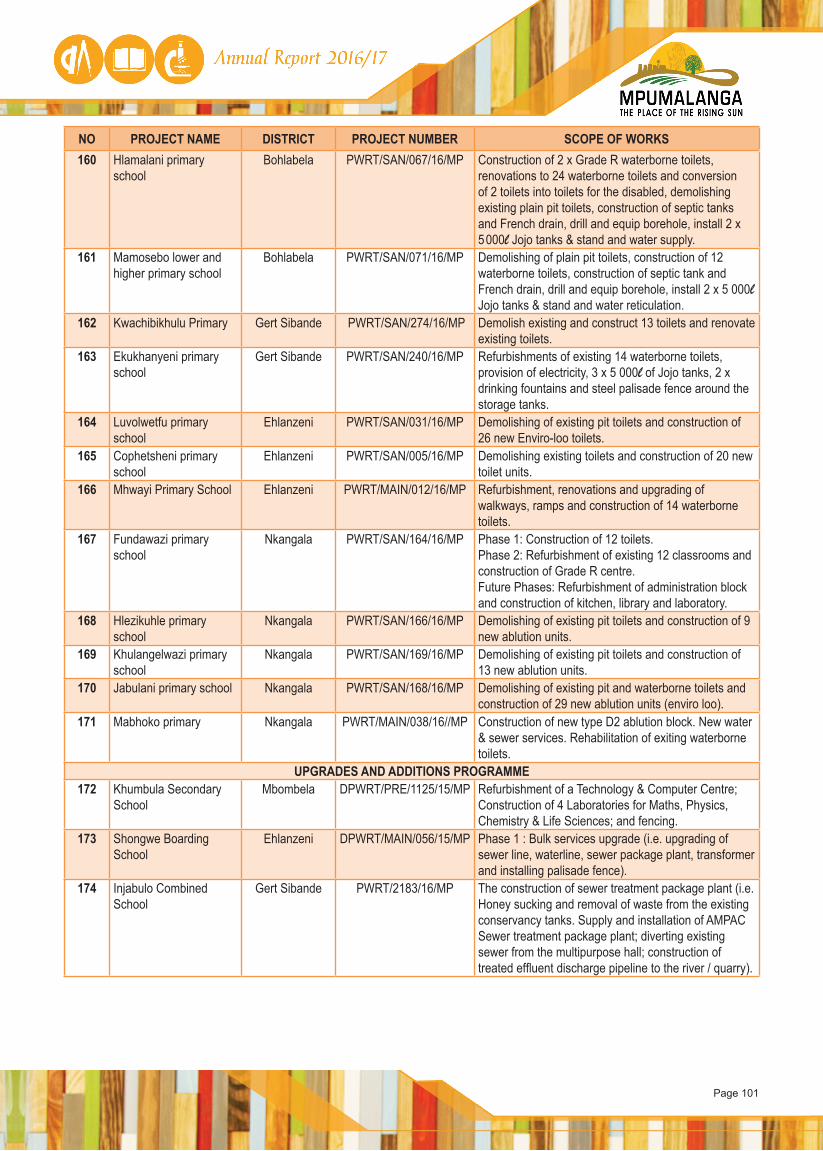
Page 101
NO PROJECT NAME DISTRICT PROJECT NUMBER SCOPE OF WORKS160 Hlamalani primary
schoolBohlabela PWRT/SAN/067/16/MP Construction of 2 x Grade R waterborne toilets,
renovations to 24 waterborne toilets and conversion of 2 toilets into toilets for the disabled, demolishing existing plain pit toilets, construction of septic tanks and French drain, drill and equip borehole, install 2 x 5 000l Jojo tanks & stand and water supply.
161 Mamosebo lower and higher primary school
Bohlabela PWRT/SAN/071/16/MP Demolishing of plain pit toilets, construction of 12 waterborne toilets, construction of septic tank and French drain, drill and equip borehole, install 2 x 5 000l Jojo tanks & stand and water reticulation.
162 Kwachibikhulu Primary Gert Sibande PWRT/SAN/274/16/MP Demolish existing and construct 13 toilets and renovate existing toilets.
163 Ekukhanyeni primary school
Gert Sibande PWRT/SAN/240/16/MP Refurbishments of existing 14 waterborne toilets, provision of electricity, 3 x 5 000l of Jojo tanks, 2 x drinking fountains and steel palisade fence around the storage tanks.
164 Luvolwetfu primary school
Ehlanzeni PWRT/SAN/031/16/MP Demolishing of existing pit toilets and construction of 26 new Enviro-loo toilets.
165 Cophetsheni primary school
Ehlanzeni PWRT/SAN/005/16/MP Demolishing existing toilets and construction of 20 new toilet units.
166 Mhwayi Primary School Ehlanzeni PWRT/MAIN/012/16/MP Refurbishment, renovations and upgrading of walkways, ramps and construction of 14 waterborne toilets.
167 Fundawazi primary school
Nkangala PWRT/SAN/164/16/MP Phase 1: Construction of 12 toilets. Phase 2: Refurbishment of existing 12 classrooms and construction of Grade R centre. Future Phases: Refurbishment of administration block and construction of kitchen, library and laboratory.
168 Hlezikuhle primary school
Nkangala PWRT/SAN/166/16/MP Demolishing of existing pit toilets and construction of 9 new ablution units.
169 Khulangelwazi primary school
Nkangala PWRT/SAN/169/16/MP Demolishing of existing pit toilets and construction of 13 new ablution units.
170 Jabulani primary school Nkangala PWRT/SAN/168/16/MP Demolishing of existing pit and waterborne toilets and construction of 29 new ablution units (enviro loo).
171 Mabhoko primary Nkangala PWRT/MAIN/038/16//MP Construction of new type D2 ablution block. New water & sewer services. Rehabilitation of exiting waterborne toilets.
UPGRADES AND ADDITIONS PROGRAMME172 Khumbula Secondary
SchoolMbombela DPWRT/PRE/1125/15/MP Refurbishment of a Technology & Computer Centre;
Construction of 4 Laboratories for Maths, Physics, Chemistry & Life Sciences; and fencing.
173 Shongwe Boarding School
Ehlanzeni DPWRT/MAIN/056/15/MP Phase 1 : Bulk services upgrade (i.e. upgrading of sewer line, waterline, sewer package plant, transformer and installing palisade fence).
174 Injabulo Combined School
Gert Sibande PWRT/2183/16/MP The construction of sewer treatment package plant (i.e. Honey sucking and removal of waste from the existing conservancy tanks. Supply and installation of AMPAC Sewer treatment package plant; diverting existing sewer from the multipurpose hall; construction of treated effluent discharge pipeline to the river / quarry).
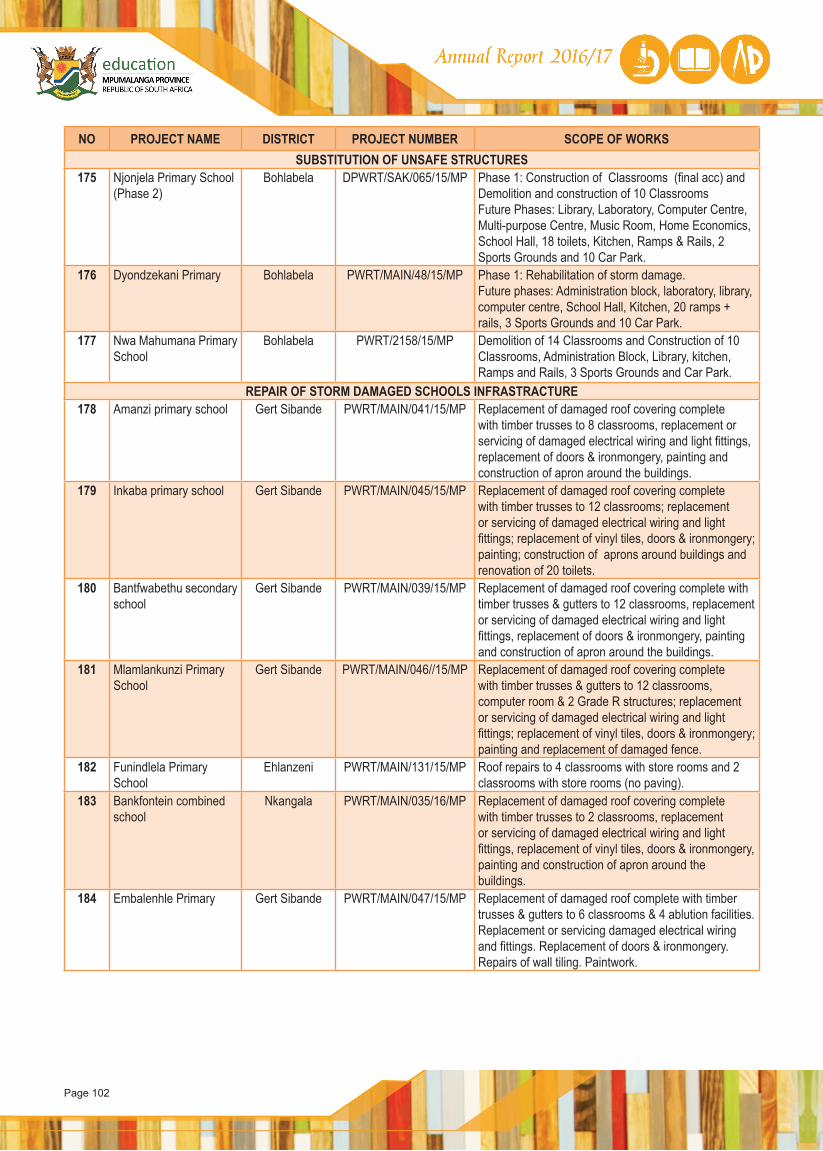
Page 102
NO PROJECT NAME DISTRICT PROJECT NUMBER SCOPE OF WORKSSUBSTITUTION OF UNSAFE STRUCTURES
175 Njonjela Primary School (Phase 2)
Bohlabela DPWRT/SAK/065/15/MP Phase 1: Construction of Classrooms (final acc) and Demolition and construction of 10 Classrooms Future Phases: Library, Laboratory, Computer Centre, Multi-purpose Centre, Music Room, Home Economics, School Hall, 18 toilets, Kitchen, Ramps & Rails, 2 Sports Grounds and 10 Car Park.
176 Dyondzekani Primary Bohlabela PWRT/MAIN/48/15/MP Phase 1: Rehabilitation of storm damage. Future phases: Administration block, laboratory, library, computer centre, School Hall, Kitchen, 20 ramps + rails, 3 Sports Grounds and 10 Car Park.
177 Nwa Mahumana Primary School
Bohlabela PWRT/2158/15/MP Demolition of 14 Classrooms and Construction of 10 Classrooms, Administration Block, Library, kitchen, Ramps and Rails, 3 Sports Grounds and Car Park.
REPAIR OF STORM DAMAGED SCHOOLS INFRASTRACTURE178 Amanzi primary school Gert Sibande PWRT/MAIN/041/15/MP Replacement of damaged roof covering complete
with timber trusses to 8 classrooms, replacement or servicing of damaged electrical wiring and light fittings, replacement of doors & ironmongery, painting and construction of apron around the buildings.
179 Inkaba primary school Gert Sibande PWRT/MAIN/045/15/MP Replacement of damaged roof covering complete with timber trusses to 12 classrooms; replacement or servicing of damaged electrical wiring and light fittings; replacement of vinyl tiles, doors & ironmongery; painting; construction of aprons around buildings and renovation of 20 toilets.
180 Bantfwabethu secondary school
Gert Sibande PWRT/MAIN/039/15/MP Replacement of damaged roof covering complete with timber trusses & gutters to 12 classrooms, replacement or servicing of damaged electrical wiring and light fittings, replacement of doors & ironmongery, painting and construction of apron around the buildings.
181 Mlamlankunzi Primary School
Gert Sibande PWRT/MAIN/046//15/MP Replacement of damaged roof covering complete with timber trusses & gutters to 12 classrooms, computer room & 2 Grade R structures; replacement or servicing of damaged electrical wiring and light fittings; replacement of vinyl tiles, doors & ironmongery; painting and replacement of damaged fence.
182 Funindlela Primary School
Ehlanzeni PWRT/MAIN/131/15/MP Roof repairs to 4 classrooms with store rooms and 2 classrooms with store rooms (no paving).
183 Bankfontein combined school
Nkangala PWRT/MAIN/035/16/MP Replacement of damaged roof covering complete with timber trusses to 2 classrooms, replacement or servicing of damaged electrical wiring and light fittings, replacement of vinyl tiles, doors & ironmongery, painting and construction of apron around the buildings.
184 Embalenhle Primary Gert Sibande PWRT/MAIN/047/15/MP Replacement of damaged roof complete with timber trusses & gutters to 6 classrooms & 4 ablution facilities. Replacement or servicing damaged electrical wiring and fittings. Replacement of doors & ironmongery. Repairs of wall tiling. Paintwork.
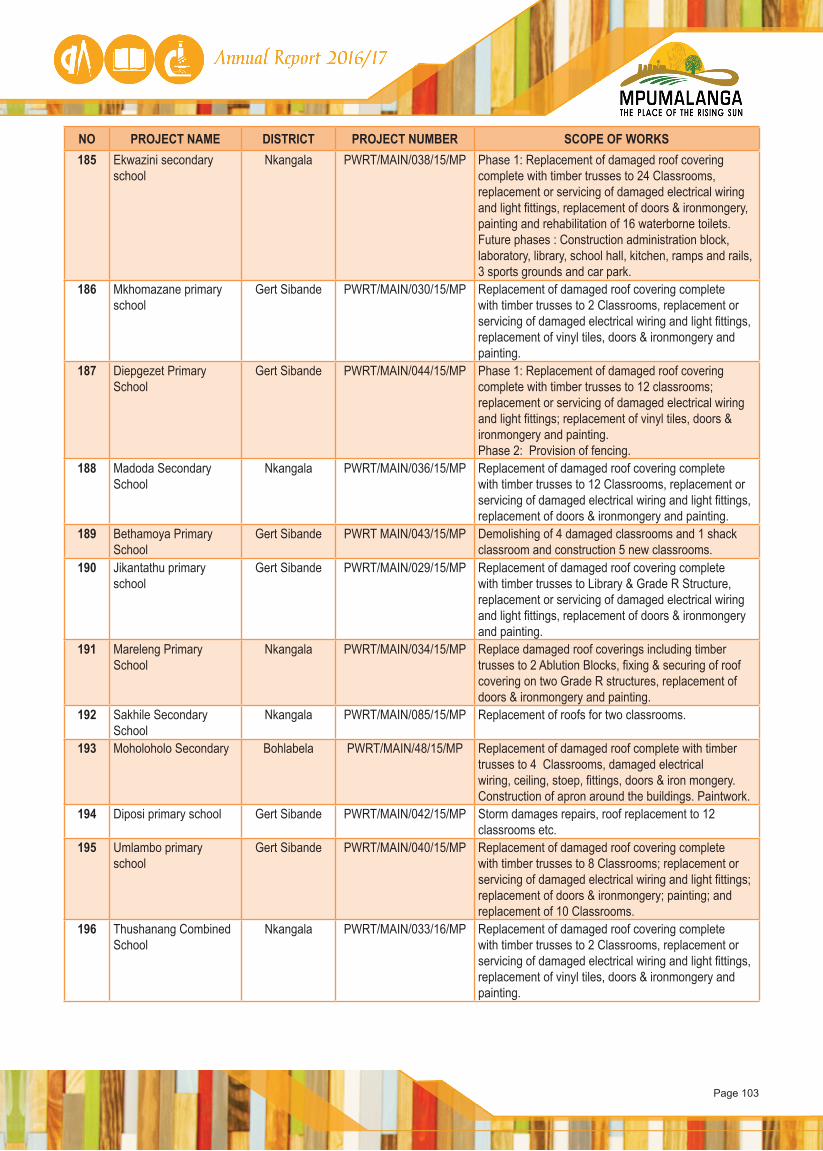
Page 103
NO PROJECT NAME DISTRICT PROJECT NUMBER SCOPE OF WORKS185 Ekwazini secondary
schoolNkangala PWRT/MAIN/038/15/MP Phase 1: Replacement of damaged roof covering
complete with timber trusses to 24 Classrooms, replacement or servicing of damaged electrical wiring and light fittings, replacement of doors & ironmongery, painting and rehabilitation of 16 waterborne toilets. Future phases : Construction administration block, laboratory, library, school hall, kitchen, ramps and rails, 3 sports grounds and car park.
186 Mkhomazane primary school
Gert Sibande PWRT/MAIN/030/15/MP Replacement of damaged roof covering complete with timber trusses to 2 Classrooms, replacement or servicing of damaged electrical wiring and light fittings, replacement of vinyl tiles, doors & ironmongery and painting.
187 Diepgezet Primary School
Gert Sibande PWRT/MAIN/044/15/MP Phase 1: Replacement of damaged roof covering complete with timber trusses to 12 classrooms; replacement or servicing of damaged electrical wiring and light fittings; replacement of vinyl tiles, doors & ironmongery and painting. Phase 2: Provision of fencing.
188 Madoda Secondary School
Nkangala PWRT/MAIN/036/15/MP Replacement of damaged roof covering complete with timber trusses to 12 Classrooms, replacement or servicing of damaged electrical wiring and light fittings, replacement of doors & ironmongery and painting.
189 Bethamoya Primary School
Gert Sibande PWRT MAIN/043/15/MP Demolishing of 4 damaged classrooms and 1 shack classroom and construction 5 new classrooms.
190 Jikantathu primary school
Gert Sibande PWRT/MAIN/029/15/MP Replacement of damaged roof covering complete with timber trusses to Library & Grade R Structure, replacement or servicing of damaged electrical wiring and light fittings, replacement of doors & ironmongery and painting.
191 Mareleng Primary School
Nkangala PWRT/MAIN/034/15/MP Replace damaged roof coverings including timber trusses to 2 Ablution Blocks, fixing & securing of roof covering on two Grade R structures, replacement of doors & ironmongery and painting.
192 Sakhile Secondary School
Nkangala PWRT/MAIN/085/15/MP Replacement of roofs for two classrooms.
193 Moholoholo Secondary Bohlabela PWRT/MAIN/48/15/MP Replacement of damaged roof complete with timber trusses to 4 Classrooms, damaged electrical wiring, ceiling, stoep, fittings, doors & iron mongery. Construction of apron around the buildings. Paintwork.
194 Diposi primary school Gert Sibande PWRT/MAIN/042/15/MP Storm damages repairs, roof replacement to 12 classrooms etc.
195 Umlambo primary school
Gert Sibande PWRT/MAIN/040/15/MP Replacement of damaged roof covering complete with timber trusses to 8 Classrooms; replacement or servicing of damaged electrical wiring and light fittings; replacement of doors & ironmongery; painting; and replacement of 10 Classrooms.
196 Thushanang Combined School
Nkangala PWRT/MAIN/033/16/MP Replacement of damaged roof covering complete with timber trusses to 2 Classrooms, replacement or servicing of damaged electrical wiring and light fittings, replacement of vinyl tiles, doors & ironmongery and painting.

Page 104
NO PROJECT NAME DISTRICT PROJECT NUMBER SCOPE OF WORKS197 Imemeza Secondary Nkangala PWRT/MAIN/002//16/MP Replacement of damaged roof complete with timber
trusses to 12 Classrooms, a computer centre and 2 ablutions. Replacement of ceiling, damaged electrical wiring, vinyl tiles to 6 classrooms fittings, doors & iron mongery. Construction of apron around the computer centre. Paintwork.
198 Gobolibi secondary school
Nkangala PWRT/MAIN/036/15/MP Replacement of damaged roof covering complete with timber trusses to 2 Classrooms, replacement or servicing of damaged electrical wiring and light fittings, replacement of vinyl tiles, doors & ironmongery and painting.
199 Yedwa Primary School Bohlabela PWRT/MAIN/032/16/MP Replacement of damaged roof covering complete with timber trusses to 2 classrooms, replacement & servicing of damaged electrical wiring and light fittings, replacement of vinyl tiles, doors & ironmongery, and painting.
200 Lepesi Primary School Ehlanzeni PWRT/MAIN/049/15/MP Replacement of 5 classrooms.201 Bonginhlanhla
Secondary SchoolEhlanzeni DPWRT/075/16/MP Storm damage repairs -replacement of roof.
202 Mafu Secondary School Bohlabela DPWRT/075/16/MP Storm damage repairs -replacement of roof.203 Torbanite Primary
SchoolGert Sibande DPWRT/085/15/MP Demolishing of existing buildings and construction of 5
new classrooms.204 Jongilanga Primary
SchoolEhlanzeni PWRT/MAIN/031/16/MP Demolishing 5 classrooms and building 4 classrooms.
205 Evimbilanga Primary Ehlanzeni PWRT/MAIN050/15/MP Replacement of damaged roof covering complete with timber trusses to 18 classrooms, replacement or servicing of damaged electrical wiring and light fittings, replacement of doors & ironmongery, construction of apron around the buildings and paintwork.
206 Pansele Secondary School
Bohlabela PWRT/MAIN/008/15/MP Replacement of administrative block.
207 Intuthuko Secondary School
Nkangala PWRT/MAIN/035/15/MP Replacement of damaged roof covering complete with timber trusses to 12 Classrooms, replacement or servicing of damaged electrical wiring and light fittings, replacement of doors & ironmongery and painting.
208 Ngilandi Secondary School
Gert Sibande PWRT MAIN/009/15/MP Repair and upgrading of storm damaged facility.
NEW SCHOOL'S PROGRAMME209 Ebuhleni (Phase 2) Ehlanzeni PW/472A/07/MP Construct 16 Classrooms, Administration block, Library,
Computer Centre, School Hall, 24Toilets, Fence, Electricity, Water, Kitchen, Ramps and Rails.
210 New Vezikgono Senior Phase School
Nkangala PWRT/MAIN/001/16/MP Provision of bulk services, fence and guardhouse and 12 enviro-loo toilets.
211 Trichardsfontein (Phase 1B)
Gert Sibande DPWRT/SAK/1191/MP Construction of Palisade fencing and bulk external service.
212 Tekwane North Secondary School
Ehlanzeni PWRT/2127/14/MP Construct 24 Classrooms, Administration block, laboratory, library, computer centre, School Hall, 30 Toilets, Fence, Electricity, Water, Kitchen, ramps + rails, 3 Sports Grounds and Car Park.
213 Ilanga [Bosfontein] Secondary School (Phase 2)
Ehlanzeni PWRT/2188/15/MP Construction of fence and provision of bulk services.
214 Mkhuhlu T/Ship Secondary School
Bohlabela PWRT/2187/15/MP Construction of fence and provision of bulk services.
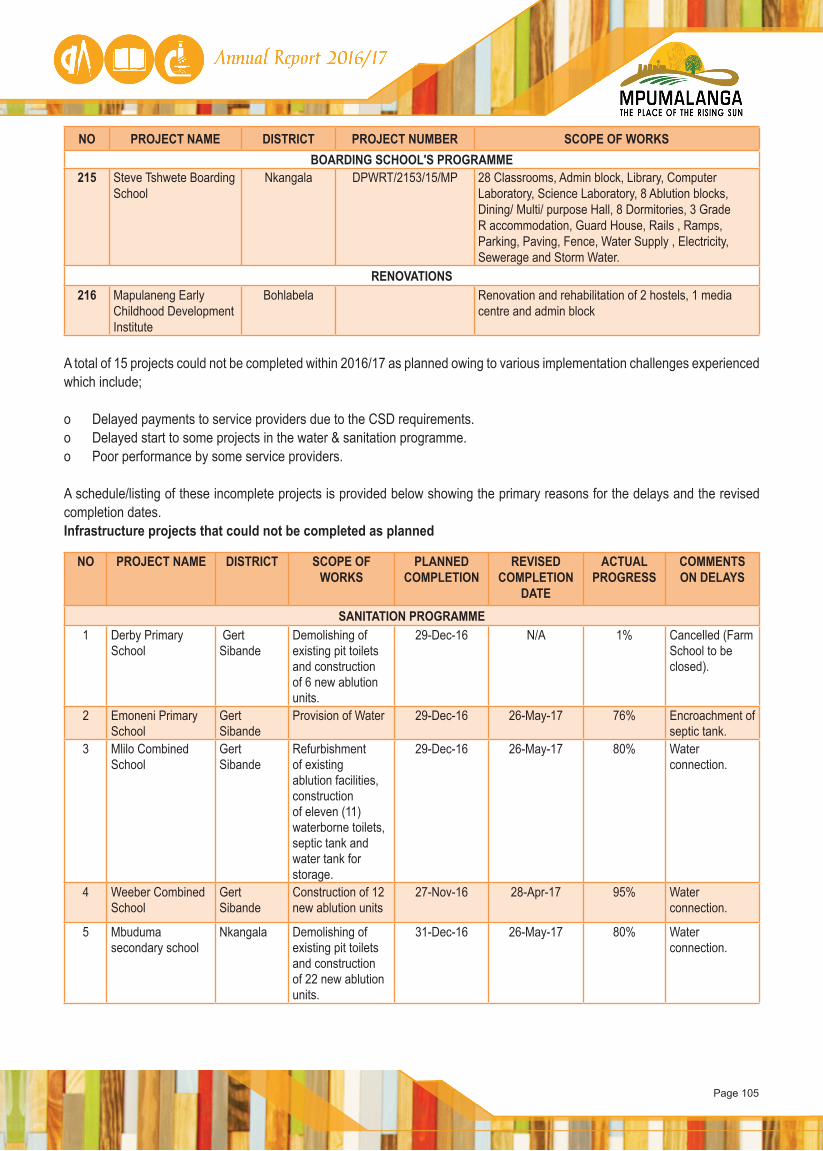
Page 105
NO PROJECT NAME DISTRICT PROJECT NUMBER SCOPE OF WORKSBOARDING SCHOOL'S PROGRAMME
215 Steve Tshwete Boarding School
Nkangala DPWRT/2153/15/MP 28 Classrooms, Admin block, Library, Computer Laboratory, Science Laboratory, 8 Ablution blocks, Dining/ Multi/ purpose Hall, 8 Dormitories, 3 Grade R accommodation, Guard House, Rails , Ramps, Parking, Paving, Fence, Water Supply , Electricity, Sewerage and Storm Water.
RENOVATIONS216 Mapulaneng Early
Childhood Development Institute
Bohlabela Renovation and rehabilitation of 2 hostels, 1 media centre and admin block
A total of 15 projects could not be completed within 2016/17 as planned owing to various implementation challenges experienced which include;
o Delayed payments to service providers due to the CSD requirements.o Delayed start to some projects in the water & sanitation programme.o Poor performance by some service providers.
A schedule/listing of these incomplete projects is provided below showing the primary reasons for the delays and the revised completion dates.Infrastructure projects that could not be completed as planned
NO PROJECT NAME DISTRICT SCOPE OF WORKS
PLANNED COMPLETION
REVISED COMPLETION
DATE
ACTUAL PROGRESS
COMMENTS ON DELAYS
SANITATION PROGRAMME1 Derby Primary
School Gert Sibande
Demolishing of existing pit toilets and construction of 6 new ablution units.
29-Dec-16 N/A 1% Cancelled (Farm School to be closed).
2 Emoneni Primary School
Gert Sibande
Provision of Water 29-Dec-16 26-May-17 76% Encroachment of septic tank.
3 Mlilo Combined School
Gert Sibande
Refurbishment of existing ablution facilities, construction of eleven (11) waterborne toilets, septic tank and water tank for storage.
29-Dec-16 26-May-17 80% Water connection.
4 Weeber Combined School
Gert Sibande
Construction of 12 new ablution units
27-Nov-16 28-Apr-17 95% Water connection.
5 Mbuduma secondary school
Nkangala Demolishing of existing pit toilets and construction of 22 new ablution units.
31-Dec-16 26-May-17 80% Water connection.
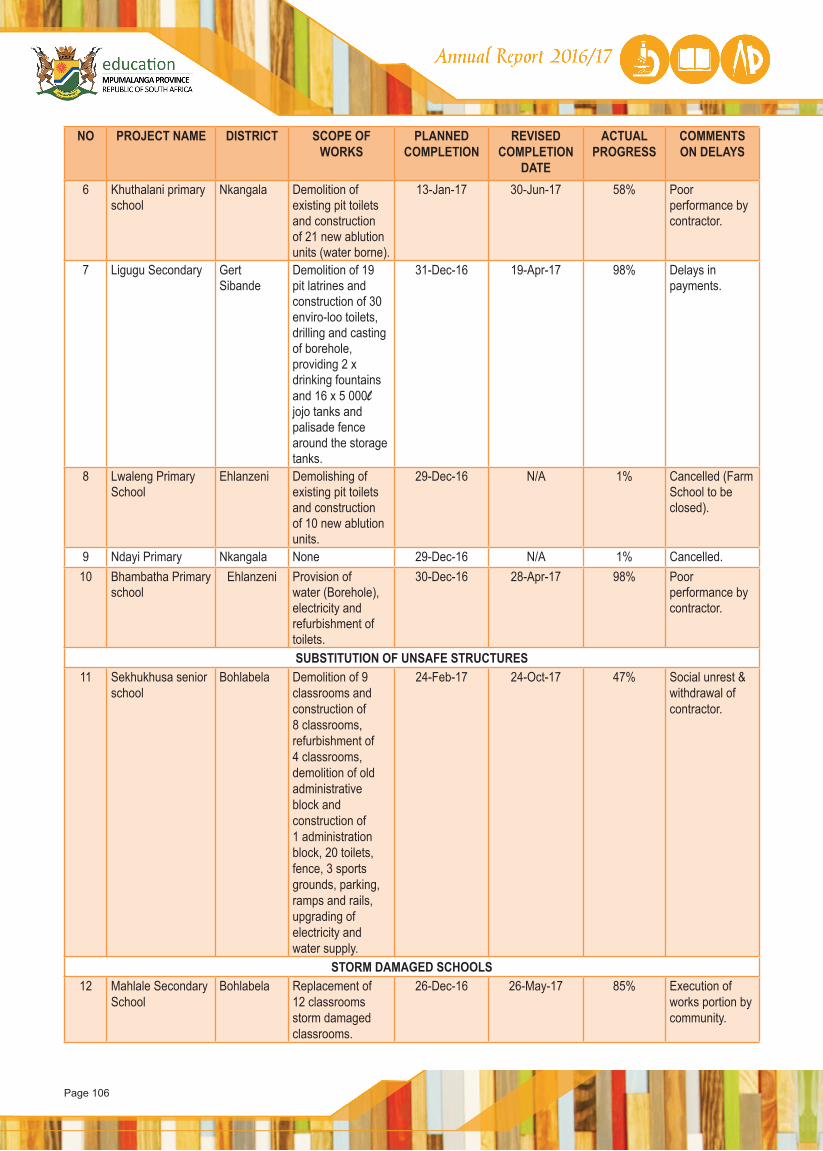
Page 106
NO PROJECT NAME DISTRICT SCOPE OF WORKS
PLANNED COMPLETION
REVISED COMPLETION
DATE
ACTUAL PROGRESS
COMMENTS ON DELAYS
6 Khuthalani primary school
Nkangala Demolition of existing pit toilets and construction of 21 new ablution units (water borne).
13-Jan-17 30-Jun-17 58% Poor performance by contractor.
7 Ligugu Secondary Gert Sibande
Demolition of 19 pit latrines and construction of 30 enviro-loo toilets, drilling and casting of borehole, providing 2 x drinking fountains and 16 x 5 000l jojo tanks and palisade fence around the storage tanks.
31-Dec-16 19-Apr-17 98% Delays in payments.
8 Lwaleng Primary School
Ehlanzeni Demolishing of existing pit toilets and construction of 10 new ablution units.
29-Dec-16 N/A 1% Cancelled (Farm School to be closed).
9 Ndayi Primary Nkangala None 29-Dec-16 N/A 1% Cancelled.10 Bhambatha Primary
schoolEhlanzeni Provision of
water (Borehole), electricity and refurbishment of toilets.
30-Dec-16 28-Apr-17 98% Poor performance by contractor.
SUBSTITUTION OF UNSAFE STRUCTURES 11 Sekhukhusa senior
schoolBohlabela Demolition of 9
classrooms and construction of 8 classrooms, refurbishment of 4 classrooms, demolition of old administrative block and construction of 1 administration block, 20 toilets, fence, 3 sports grounds, parking, ramps and rails, upgrading of electricity and water supply.
24-Feb-17 24-Oct-17 47% Social unrest & withdrawal of contractor.
STORM DAMAGED SCHOOLS12 Mahlale Secondary
SchoolBohlabela Replacement of
12 classrooms storm damaged classrooms.
26-Dec-16 26-May-17 85% Execution of works portion by community.
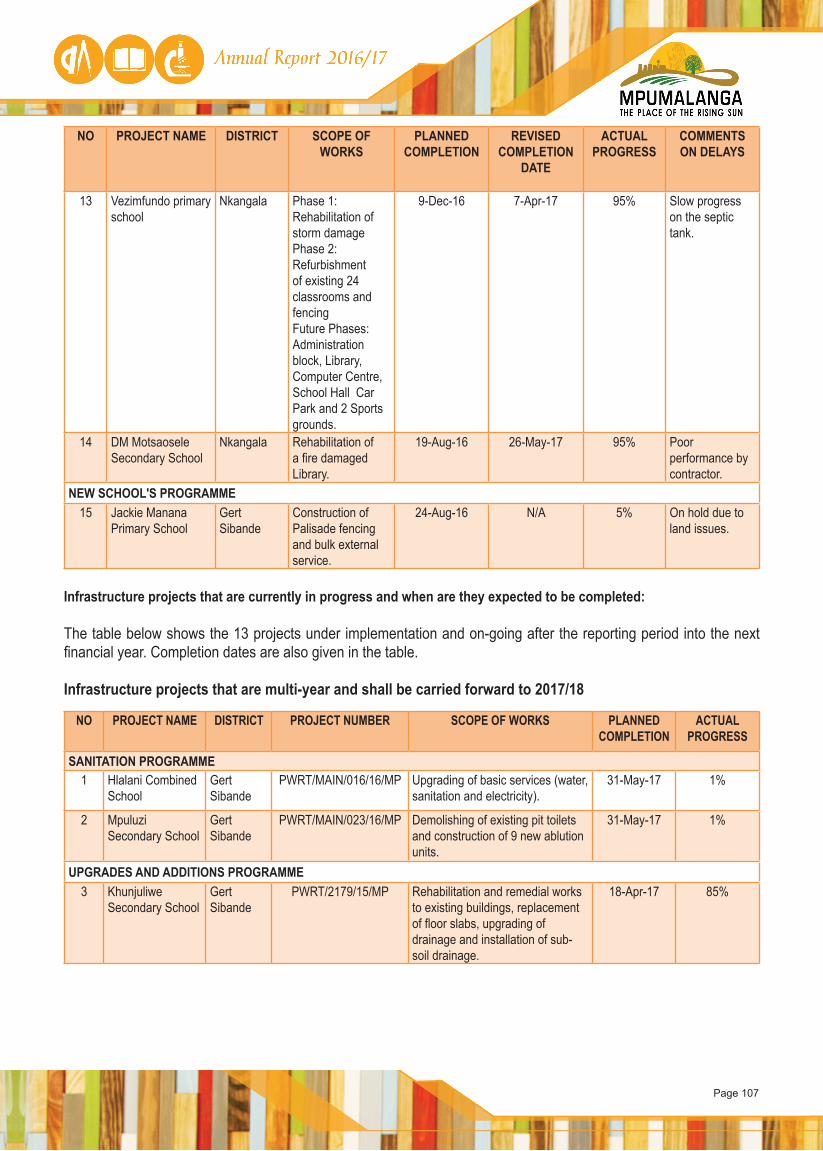
Page 107
NO PROJECT NAME DISTRICT SCOPE OF WORKS
PLANNED COMPLETION
REVISED COMPLETION
DATE
ACTUAL PROGRESS
COMMENTS ON DELAYS
13 Vezimfundo primary school
Nkangala Phase 1: Rehabilitation of storm damage Phase 2: Refurbishment of existing 24 classrooms and fencing Future Phases: Administration block, Library, Computer Centre, School Hall Car Park and 2 Sports grounds.
9-Dec-16 7-Apr-17 95% Slow progress on the septic tank.
14 DM Motsaosele Secondary School
Nkangala Rehabilitation of a fire damaged Library.
19-Aug-16 26-May-17 95% Poor performance by contractor.
NEW SCHOOL'S PROGRAMME 15 Jackie Manana
Primary SchoolGert Sibande
Construction of Palisade fencing and bulk external service.
24-Aug-16 N/A 5% On hold due to land issues.
Infrastructure projects that are currently in progress and when are they expected to be completed:
The table below shows the 13 projects under implementation and on-going after the reporting period into the next financial year. Completion dates are also given in the table.
Infrastructure projects that are multi-year and shall be carried forward to 2017/18
NO PROJECT NAME DISTRICT PROJECT NUMBER SCOPE OF WORKS PLANNED COMPLETION
ACTUAL PROGRESS
SANITATION PROGRAMME1 Hlalani Combined
SchoolGert Sibande
PWRT/MAIN/016/16/MP Upgrading of basic services (water, sanitation and electricity).
31-May-17 1%
2 Mpuluzi Secondary School
Gert Sibande
PWRT/MAIN/023/16/MP Demolishing of existing pit toilets and construction of 9 new ablution units.
31-May-17 1%
UPGRADES AND ADDITIONS PROGRAMME 3 Khunjuliwe
Secondary SchoolGert Sibande
PWRT/2179/15/MP Rehabilitation and remedial works to existing buildings, replacement of floor slabs, upgrading of drainage and installation of sub-soil drainage.
18-Apr-17 85%
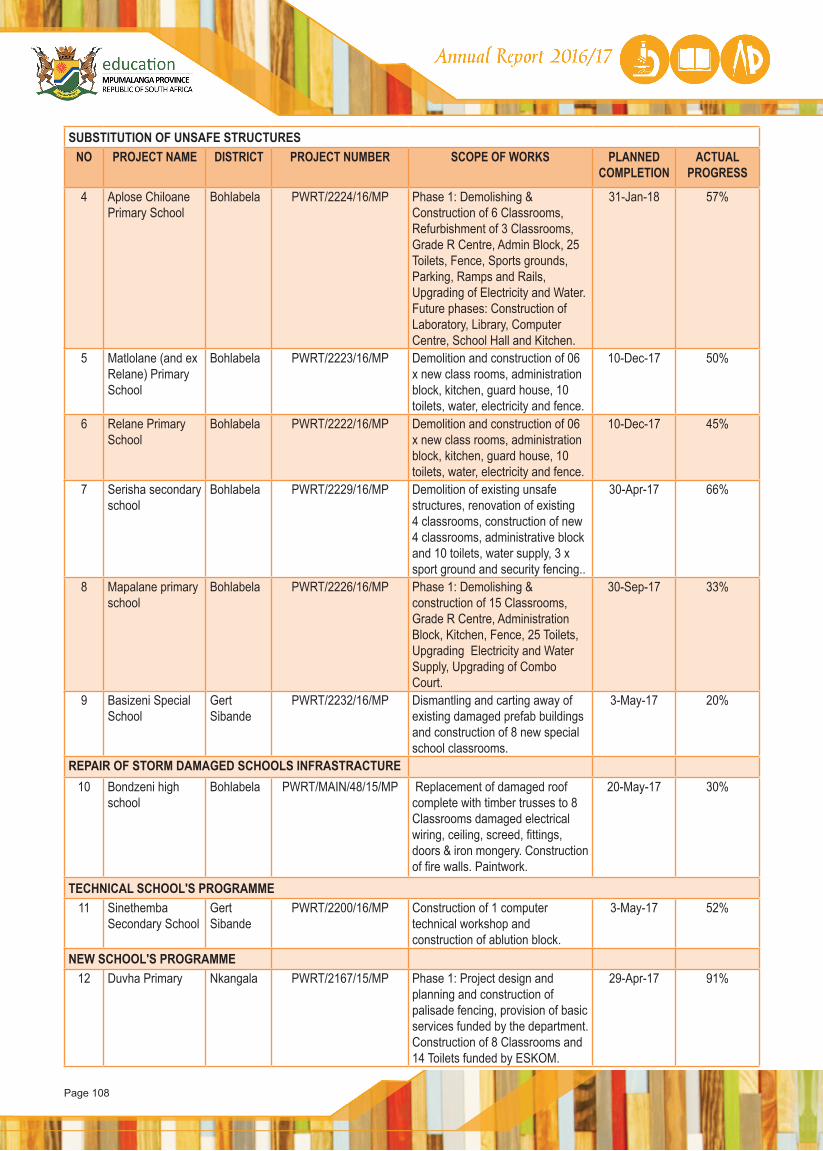
Page 108
SUBSTITUTION OF UNSAFE STRUCTURES NO PROJECT NAME DISTRICT PROJECT NUMBER SCOPE OF WORKS PLANNED
COMPLETIONACTUAL
PROGRESS
4 Aplose Chiloane Primary School
Bohlabela PWRT/2224/16/MP Phase 1: Demolishing & Construction of 6 Classrooms, Refurbishment of 3 Classrooms, Grade R Centre, Admin Block, 25 Toilets, Fence, Sports grounds, Parking, Ramps and Rails, Upgrading of Electricity and Water. Future phases: Construction of Laboratory, Library, Computer Centre, School Hall and Kitchen.
31-Jan-18 57%
5 Matlolane (and ex Relane) Primary School
Bohlabela PWRT/2223/16/MP Demolition and construction of 06 x new class rooms, administration block, kitchen, guard house, 10 toilets, water, electricity and fence.
10-Dec-17 50%
6 Relane Primary School
Bohlabela PWRT/2222/16/MP Demolition and construction of 06 x new class rooms, administration block, kitchen, guard house, 10 toilets, water, electricity and fence.
10-Dec-17 45%
7 Serisha secondary school
Bohlabela PWRT/2229/16/MP Demolition of existing unsafe structures, renovation of existing 4 classrooms, construction of new 4 classrooms, administrative block and 10 toilets, water supply, 3 x sport ground and security fencing..
30-Apr-17 66%
8 Mapalane primary school
Bohlabela PWRT/2226/16/MP Phase 1: Demolishing & construction of 15 Classrooms, Grade R Centre, Administration Block, Kitchen, Fence, 25 Toilets, Upgrading Electricity and Water Supply, Upgrading of Combo Court.
30-Sep-17 33%
9 Basizeni Special School
Gert Sibande
PWRT/2232/16/MP Dismantling and carting away of existing damaged prefab buildings and construction of 8 new special school classrooms.
3-May-17 20%
REPAIR OF STORM DAMAGED SCHOOLS INFRASTRACTURE 10 Bondzeni high
schoolBohlabela PWRT/MAIN/48/15/MP Replacement of damaged roof
complete with timber trusses to 8 Classrooms damaged electrical wiring, ceiling, screed, fittings, doors & iron mongery. Construction of fire walls. Paintwork.
20-May-17 30%
TECHNICAL SCHOOL'S PROGRAMME 11 Sinethemba
Secondary SchoolGert Sibande
PWRT/2200/16/MP Construction of 1 computer technical workshop and construction of ablution block.
3-May-17 52%
NEW SCHOOL'S PROGRAMME 12 Duvha Primary Nkangala PWRT/2167/15/MP Phase 1: Project design and
planning and construction of palisade fencing, provision of basic services funded by the department. Construction of 8 Classrooms and 14 Toilets funded by ESKOM.
29-Apr-17 91%
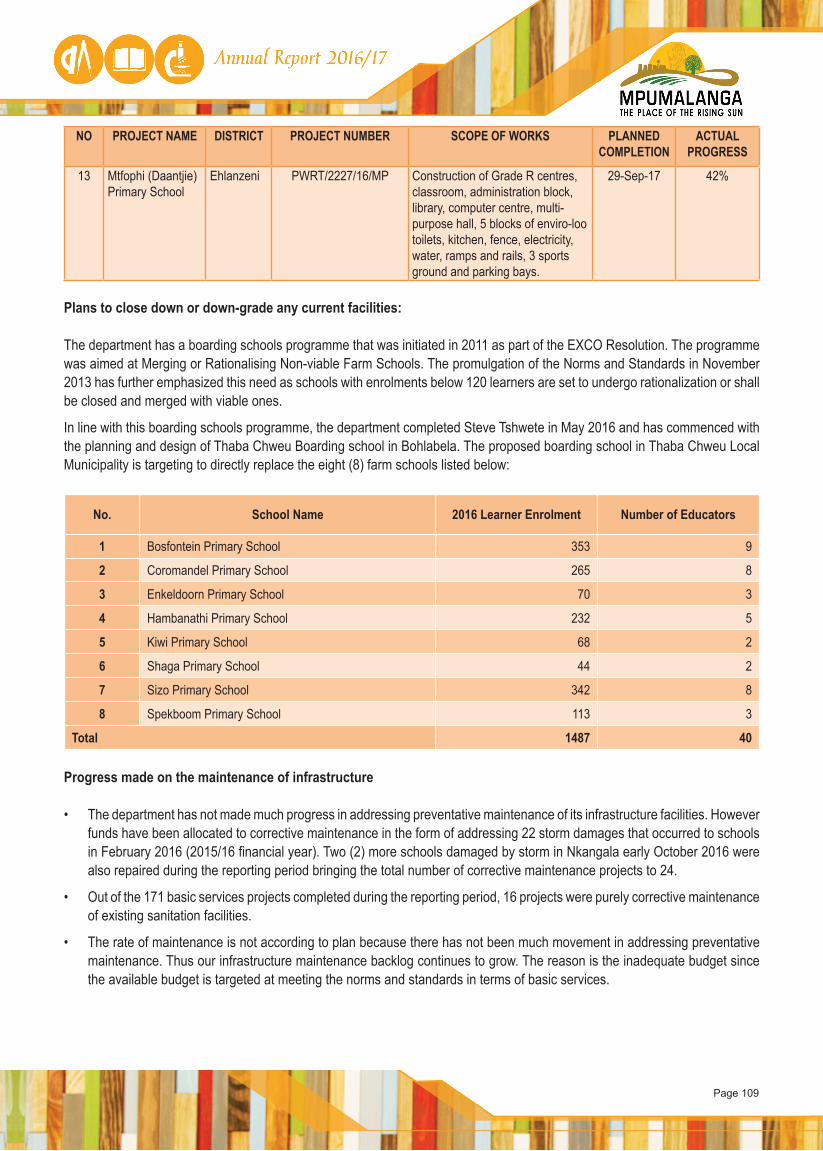
Page 109
NO PROJECT NAME DISTRICT PROJECT NUMBER SCOPE OF WORKS PLANNED COMPLETION
ACTUAL PROGRESS
13 Mtfophi (Daantjie) Primary School
Ehlanzeni PWRT/2227/16/MP Construction of Grade R centres, classroom, administration block, library, computer centre, multi-purpose hall, 5 blocks of enviro-loo toilets, kitchen, fence, electricity, water, ramps and rails, 3 sports ground and parking bays.
29-Sep-17 42%
Plans to close down or down-grade any current facilities:
The department has a boarding schools programme that was initiated in 2011 as part of the EXCO Resolution. The programme was aimed at Merging or Rationalising Non-viable Farm Schools. The promulgation of the Norms and Standards in November 2013 has further emphasized this need as schools with enrolments below 120 learners are set to undergo rationalization or shall be closed and merged with viable ones.
In line with this boarding schools programme, the department completed Steve Tshwete in May 2016 and has commenced with the planning and design of Thaba Chweu Boarding school in Bohlabela. The proposed boarding school in Thaba Chweu Local Municipality is targeting to directly replace the eight (8) farm schools listed below:
No. School Name 2016 Learner Enrolment Number of Educators
1 Bosfontein Primary School 353 9
2 Coromandel Primary School 265 8
3 Enkeldoorn Primary School 70 3
4 Hambanathi Primary School 232 5
5 Kiwi Primary School 68 2
6 Shaga Primary School 44 2
7 Sizo Primary School 342 8
8 Spekboom Primary School 113 3
Total 1487 40
Progress made on the maintenance of infrastructure
• The department has not made much progress in addressing preventative maintenance of its infrastructure facilities. However funds have been allocated to corrective maintenance in the form of addressing 22 storm damages that occurred to schools in February 2016 (2015/16 financial year). Two (2) more schools damaged by storm in Nkangala early October 2016 were also repaired during the reporting period bringing the total number of corrective maintenance projects to 24.
• Out of the 171 basic services projects completed during the reporting period, 16 projects were purely corrective maintenance of existing sanitation facilities.
• The rate of maintenance is not according to plan because there has not been much movement in addressing preventative maintenance. Thus our infrastructure maintenance backlog continues to grow. The reason is the inadequate budget since the available budget is targeted at meeting the norms and standards in terms of basic services.
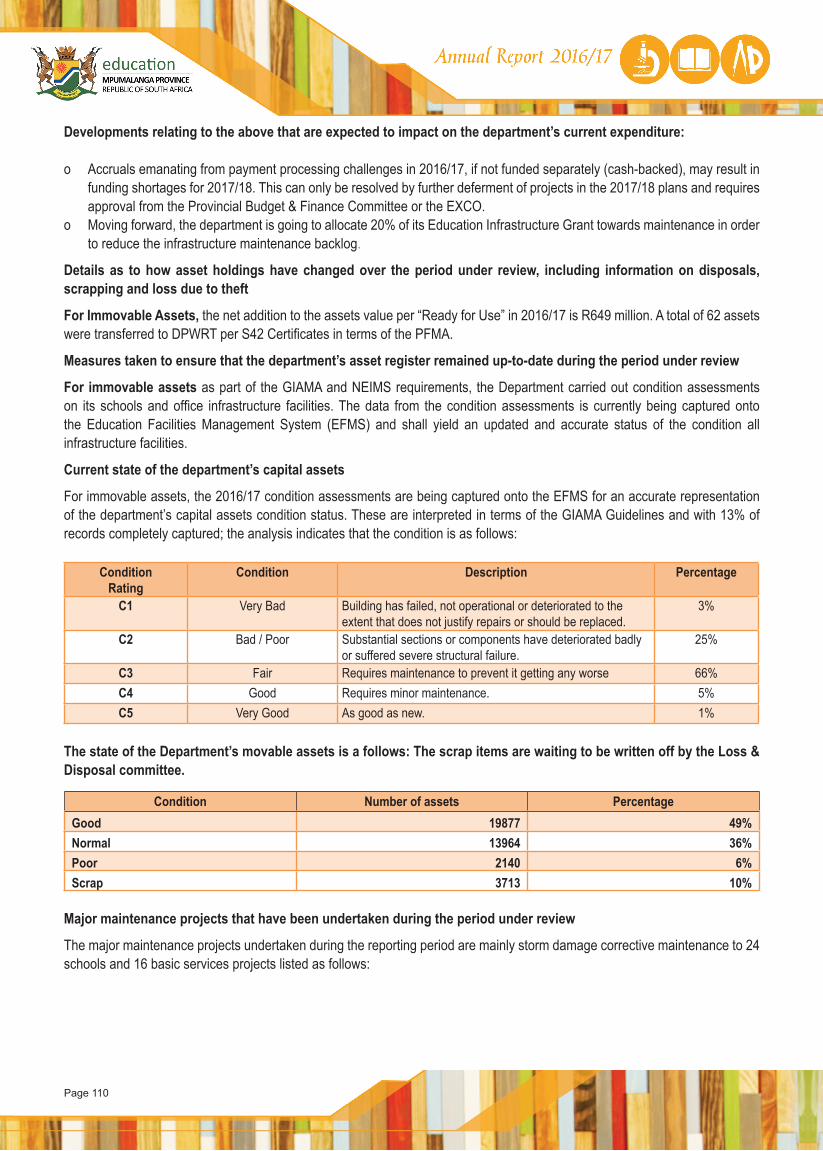
Page 110
Developments relating to the above that are expected to impact on the department’s current expenditure:
o Accruals emanating from payment processing challenges in 2016/17, if not funded separately (cash-backed), may result in funding shortages for 2017/18. This can only be resolved by further deferment of projects in the 2017/18 plans and requires approval from the Provincial Budget & Finance Committee or the EXCO.
o Moving forward, the department is going to allocate 20% of its Education Infrastructure Grant towards maintenance in order to reduce the infrastructure maintenance backlog.
Details as to how asset holdings have changed over the period under review, including information on disposals, scrapping and loss due to theft
For Immovable Assets, the net addition to the assets value per “Ready for Use” in 2016/17 is R649 million. A total of 62 assets were transferred to DPWRT per S42 Certificates in terms of the PFMA.
Measures taken to ensure that the department’s asset register remained up-to-date during the period under review
For immovable assets as part of the GIAMA and NEIMS requirements, the Department carried out condition assessments on its schools and office infrastructure facilities. The data from the condition assessments is currently being captured onto the Education Facilities Management System (EFMS) and shall yield an updated and accurate status of the condition all infrastructure facilities.
Current state of the department’s capital assets
For immovable assets, the 2016/17 condition assessments are being captured onto the EFMS for an accurate representation of the department’s capital assets condition status. These are interpreted in terms of the GIAMA Guidelines and with 13% of records completely captured; the analysis indicates that the condition is as follows:
ConditionRating
Condition Description Percentage
C1 Very Bad Building has failed, not operational or deteriorated to the extent that does not justify repairs or should be replaced.
3%
C2 Bad / Poor Substantial sections or components have deteriorated badly or suffered severe structural failure.
25%
C3 Fair Requires maintenance to prevent it getting any worse 66%C4 Good Requires minor maintenance. 5%C5 Very Good As good as new. 1%
The state of the Department’s movable assets is a follows: The scrap items are waiting to be written off by the Loss & Disposal committee.
Condition Number of assets PercentageGood 19877 49%Normal 13964 36%Poor 2140 6%Scrap 3713 10%
Major maintenance projects that have been undertaken during the period under review
The major maintenance projects undertaken during the reporting period are mainly storm damage corrective maintenance to 24 schools and 16 basic services projects listed as follows:
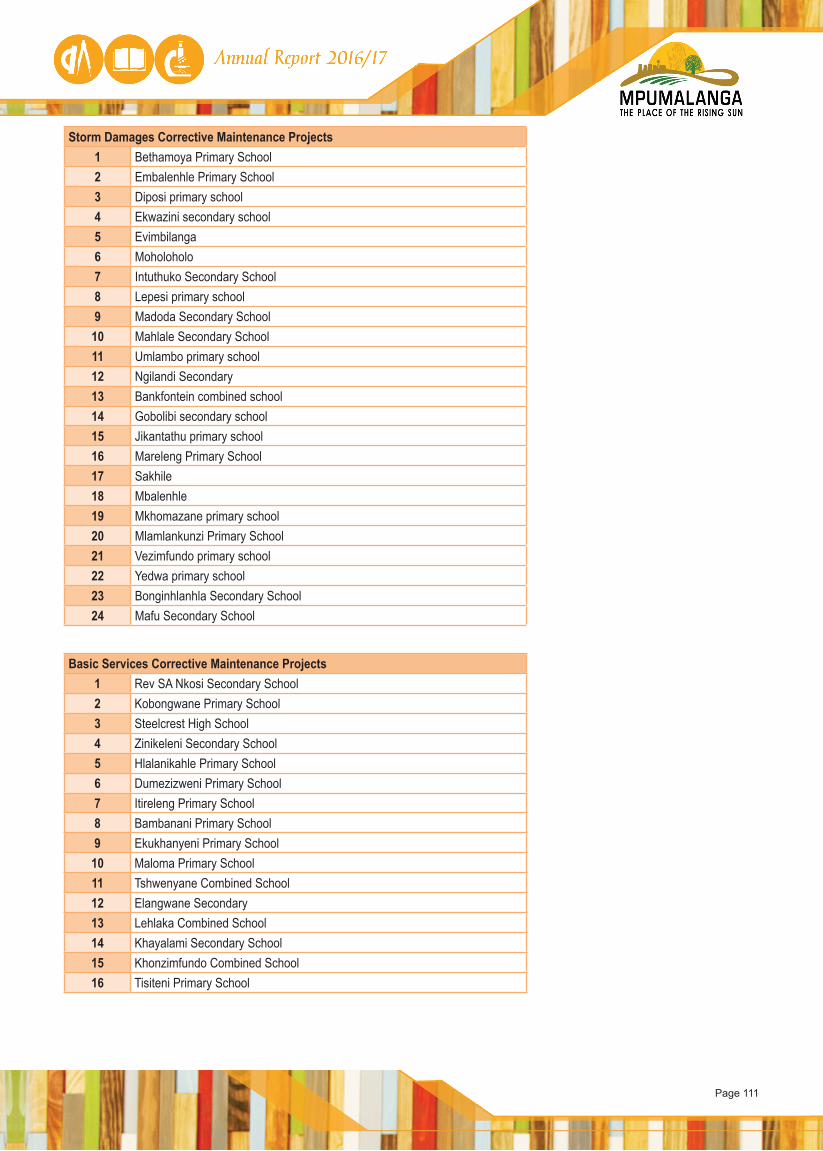
Page 111
Storm Damages Corrective Maintenance Projects1 Bethamoya Primary School2 Embalenhle Primary School3 Diposi primary school4 Ekwazini secondary school5 Evimbilanga6 Moholoholo7 Intuthuko Secondary School8 Lepesi primary school9 Madoda Secondary School
10 Mahlale Secondary School11 Umlambo primary school12 Ngilandi Secondary13 Bankfontein combined school14 Gobolibi secondary school15 Jikantathu primary school16 Mareleng Primary School17 Sakhile18 Mbalenhle19 Mkhomazane primary school20 Mlamlankunzi Primary School21 Vezimfundo primary school22 Yedwa primary school23 Bonginhlanhla Secondary School24 Mafu Secondary School
Basic Services Corrective Maintenance Projects 1 Rev SA Nkosi Secondary School2 Kobongwane Primary School3 Steelcrest High School4 Zinikeleni Secondary School5 Hlalanikahle Primary School6 Dumezizweni Primary School7 Itireleng Primary School8 Bambanani Primary School9 Ekukhanyeni Primary School
10 Maloma Primary School11 Tshwenyane Combined School12 Elangwane Secondary13 Lehlaka Combined School14 Khayalami Secondary School15 Khonzimfundo Combined School16 Tisiteni Primary School
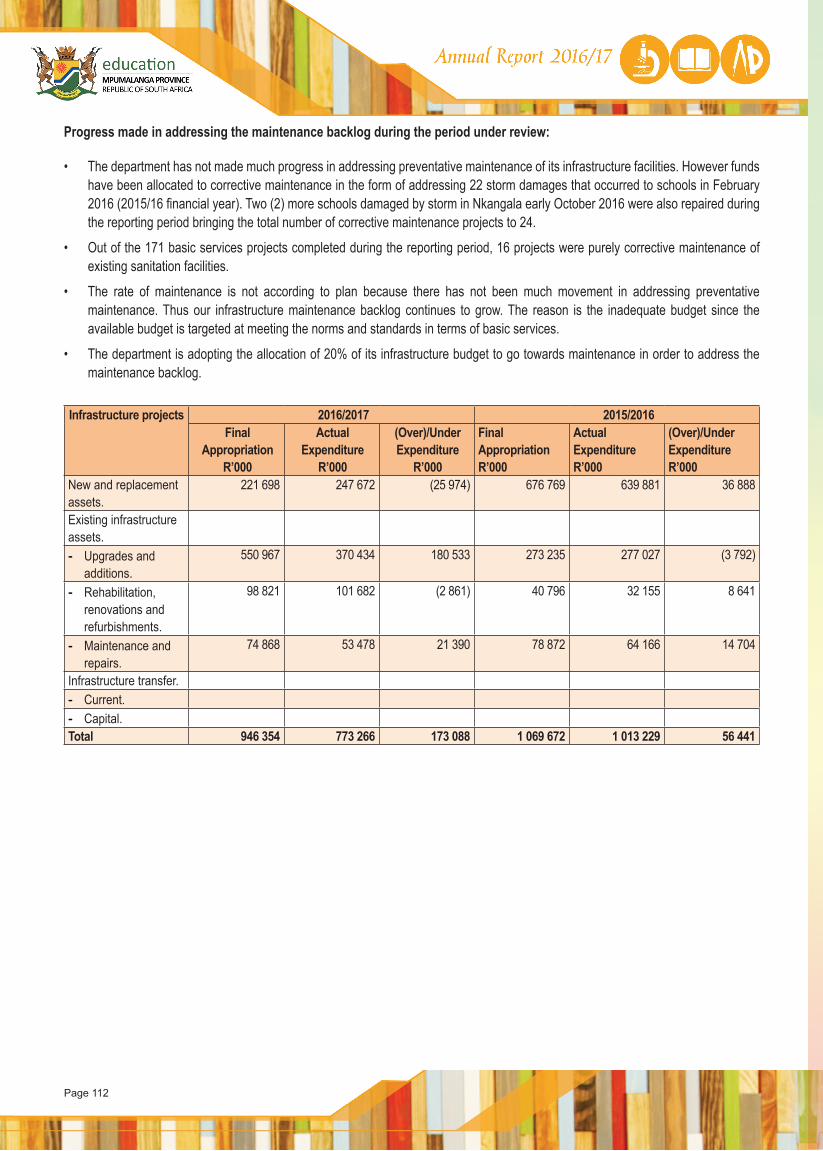
Page 112
Progress made in addressing the maintenance backlog during the period under review:
• The department has not made much progress in addressing preventative maintenance of its infrastructure facilities. However funds have been allocated to corrective maintenance in the form of addressing 22 storm damages that occurred to schools in February 2016 (2015/16 financial year). Two (2) more schools damaged by storm in Nkangala early October 2016 were also repaired during the reporting period bringing the total number of corrective maintenance projects to 24.
• Out of the 171 basic services projects completed during the reporting period, 16 projects were purely corrective maintenance of existing sanitation facilities.
• The rate of maintenance is not according to plan because there has not been much movement in addressing preventative maintenance. Thus our infrastructure maintenance backlog continues to grow. The reason is the inadequate budget since the available budget is targeted at meeting the norms and standards in terms of basic services.
• The department is adopting the allocation of 20% of its infrastructure budget to go towards maintenance in order to address the maintenance backlog.
Infrastructure projects 2016/2017 2015/2016Final
AppropriationR’000
Actual Expenditure
R’000
(Over)/Under Expenditure
R’000
Final AppropriationR’000
Actual ExpenditureR’000
(Over)/Under ExpenditureR’000
New and replacement assets.
221 698 247 672 (25 974) 676 769 639 881 36 888
Existing infrastructure assets. - Upgrades and
additions.550 967 370 434 180 533 273 235 277 027 (3 792)
- Rehabilitation, renovations and refurbishments.
98 821 101 682 (2 861) 40 796 32 155 8 641
- Maintenance and repairs.
74 868 53 478 21 390 78 872 64 166 14 704
Infrastructure transfer. - Current.- Capital.Total 946 354 773 266 173 088 1 069 672 1 013 229 56 441
Page 113
PART C:
GOVERNANCE

Page 114
1. INTRODUCTION
Commitment by the department to maintain the highest standards of governance is fundamental to the management of public finances and resources. Users want assurance that the department has good governance structures in place to effectively, efficiently and economically utilize the state resources, which is funded by the tax payer.
2. RISK MANAGEMENT
The Department’s service delivery programmes and initiatives are underpinned in the principle of good governance that is fundamental to the optimal utilization and management of public finances and resources to enhance education delivery in the Province. The executive and senior management is committed to monitoring and evaluating the implementation of risk management strategies on a regular basis through a Risk Management Committee. The Department believes in the ethical conduct of its employees and service providers and has adopted a zero tolerance approach to fraud and maladministration. The Department has developed a fraud prevention and response plan to mitigate risks of fraud.
The Department’s Executive and Senior Management have been accountable for policy and responsible for the management of strategic risks. The Department adopted the strategy of an enterprise-wide approach to risk management which means that each key risk in every business unit of the Department is included in a structured framework and systematic process of risk management.
The Department’s Executive and Senior Management have a role to:
a) Set the tone and influence the culture of risk management within the Department.
This includes:
• determining whether the Department is risk taking or risk averse as a whole or on any relevant individual issue;• determining what types of risk are acceptable and which are not; and• setting the standards and expectations of staff with respect to conduct.
b) Determine the appropriate risk appetite or level of exposure for the Department.c) Approve major decisions affecting the Department’s risk profile or exposure.d) Monitor the management of significant risks to reduce the likelihood of unwelcomed surprises.e) Satisfy itself that the less significant risks are being actively managed, with the appropriate controls in place and are
working effectively. f) Review the Department’s approach to risk management during the year under review and approve changes or
improvements to key elements of its processes and procedures
Risk assessment reviews were conducted to specifically address strategic, operational, human resource, financial, information, communication and technology risks. Risk management has remained an integral part of the operations of the Department during the year under review. Effective management of risk was essential in the achievement of the Department’s goals and objectives.

Page 115
Key risk management initiatives undertaken during the year included
• Identification of the Department’s key risks and commencement of a structured risk management process of a number of management areas
• Continuation of the monitoring of the risks identified during the implementation of the operational plan for the Department• General advisory services to raise risk awareness throughout the Department.• Facilitated a process of embedding risk management into the day to day activities and management processes within the
Department were followed. This included the following activities.a) Conducting annual strategic risk assessment reviews.b) Conducting operational risk assessment and re-evaluation of key risks for all business units at least annually.c) Regular review and updated the risk registers and management provided actions intended to or minimize or reduce
the identified risk.d) Development of contingency plans for high risks.e) Early identification of emerging risks and its possible reduction process.f) Monitoring and reporting on key risks affecting the Department.g) The identified risks were reported to the Risk Management Committee and the Audit Committee.
Risk Committee Members: Meetings and Attendance
The Department appointed two external risk committee members in accordance to section 38(1) (a) (i) of the Public Finance Management Act No. 1 of 1999, supported by paragraph 24 (3) the Public Sector Risk Management Framework, which makes provision of the effect that the risk management committee should be chaired by an independent external person appointed by the Accounting Officer.
The Chairperson interacted with the Audit Committee in sharing information related to material risks and also formal reports were tabled with recommendations to address any deficiencies identified by the Committee. In terms of approved terms of reference, the committee is required to meet at least four times in a year. During the current financial year the committee met three times. Members and their attendance were as follows:
Member Ordinary meetingsMr K Maja Chairperson (external) 3Mrs MOC Mhlabane Head of Department 2Mrs LH Moyane Deputy Director General: Curriculum 3Ms MM Mashiteng Deputy Director General: Finance 3Mr DM Mtembu Director: Strategic Planning & Coordination 3Ms MTF Tebeila Director: MIT 2Mr MEM Bhembe Head of Risk Management 3Mr TA Varghese Director: Internal Audit (standing invitee) 2
Page 116
3. FRAUD AND CORRUPTION The Department has approved and adopted a fraud prevention strategy. The plan was compiled during the year in line with the requirements of the Public Finance Management Act (PFMA) and the Treasury Regulations (TR). The main objectives of the plan include:
• Developing a culture of ethical behaviour and instilling zero tolerance to fraud and corruption.
• Sending a clear message to all employees and members of the public who interact with the Department that it is committed to fighting fraud and corruption.
• Improving accountability, efficiency and effective administration within the Department and to deal decisively with acts of fraud and corruption.
• Improving the application of system policies, procedures and regulations.
• Encouraging all employees and other stakeholders to strive towards the prevention and detection of fraud and corruption impacting or having the potential to impact on the Department.
The Department conducted several workshops facilitated by Risk Management Unit on the Code of Conduct, Ethics, to emphasise the importance of ethical conduct to be displayed at the workplace in several situations.
Mechanisms to report fraud and corruption:
There are various ways in which Departmental officials and members of the public report suspected fraud and corruption activities, for example, Presidential Hotline, National and Provincial hotline, anonymous emails and letters, the PSC etc. The Department forwards these allegations to both the Internal Audit Unit and the Integrity Management Unit in the Office of the Premier for investigation. The recommendations from these offices are implemented by the Department once received and progress reports are discussed in risk management and audit committee meetings.
4. MINIMISING CONFLICT OF INTEREST
The Department of Public Service and Administration (DPSA) requires all senior managers (Directors and above) to disclose their financial interest annually and all other levels are required to apply for permission to do remunerative work over and above their normal work. Senior managers disclosed their financial interest for the 2016/17 financial year which was due on 30 April 2016.
In addition, the Department requires disclosures of interest by bid committee members prior to all evaluation and adjudication of bids. All members of bid committees declare their interest during the meetings. The members of short listing and interviewing panels for appointment of employees also declared their interests during the financial year. Similarly, all employees are required to seek permission of the Executive Authority for additional remunerative work and no such approval was granted by the Honourable MEC during the financial year under review.
5. CODE OF CONDUCT The Code of Conduct is the set of principles and behavioural rules that employees, supervisors, subordinates within the public service as a group and as individuals are required to observe in their daily operations. In terms of Section 195(1)(a) of the Constitution we are obliged to maintain and promote a high standard of professional ethics in the public administration.
The public service furthermore requires us to maintain values and principles which inter alia include democratic values, promoting efficient administration, developmental oriented administration and accountability.
The Code of Professional Ethics as promulgated under the South African Council of Educators (SACE) Act 31 of 2000 also emphasizes the professional behaviours expected from teachers. Although the primary purpose of the Code of Conduct is a positive one, an employee shall be guilty of misconduct when there is violation of the Code of Conduct. The employer will subject
Page 117
the employee to a disciplinary procedure with adherence to principles of administrative justice, procedural- and substantive fairness.
Contrary to what is expected of employees related to the observance of the Code of Conduct for Public Servants and the Code of Professional Ethics for educators, we have witnessed a breach of the Code where officials and educators have not adhered to the rules and guidelines on required standards of behaviour.
The result of such breach has seen 263 employees subjected to disciplinary processes and 11 placed on precautionary suspension. Employees allegedly doing business with other organs of States were found to have either resigned from the companies, or were otherwise charged with the violation of the provisions of Section 30 of the Public Service Act or Section 18 of the Employment of Educators Act and final written warnings issued. To curb non-adherence and non-compliance to these Codes, training has been conducted to both public servants in the offices and also at school level. This will be intensified and consolidated going forward.
6. HEALTH SAFETY AND ENVIRONMENTAL ISSUES Safety, Health, Environment, Risk, & Quality (SHERQ) is one of the pillars implemented by EHWP. Hazards Identification and Risk Assessment (HIRA) entails the process of evaluating hazards for the purpose of eliminating or controlling them. The process is guided by Occupational Health and Safety Act no 85 of 1993.
The Department has concluded the SHERQ policy on safety, which takes into account the occupational wellbeing of employees in as far as the following are concerned:
• Hygienic issues: The Department has made strides in making sure that this factor is carefully looked after. That is why sanitation issues are of satisfactory standard.
• Wellness through sport: The Department organises Wellness days which test the mental and physical fitness of employees through minor exercise and engaging in different sporting codes. This also extends to participating in inter-Provincial sport events for selected employees.
• Ergonomic issues: The overall working environment of employees provides satisfactory productivity due to the availability of basic working tools.
• Health issues: The Department coordinates health awareness campaigns and health screening sessions in collaboration with sister Departments and social partners.
However, the Department does experience challenges with regard to the following:
• Occasional water shortages are experienced resulting in employees not being comfortable staying at work for the whole eight hours. These situations are normally reported and quickly resolved.
• The Department has fully signaged its Head Office sufficiently but has not done so effectively in its other outside located offices.
• Air-conditions are centrally controlled resulting in uncomfortable temperatures for other employees.
The continuous usage of the same area by employees results in it requiring special cleaning procedures. The Department sometimes organises office cleaning campaigns through the participation of all employees.
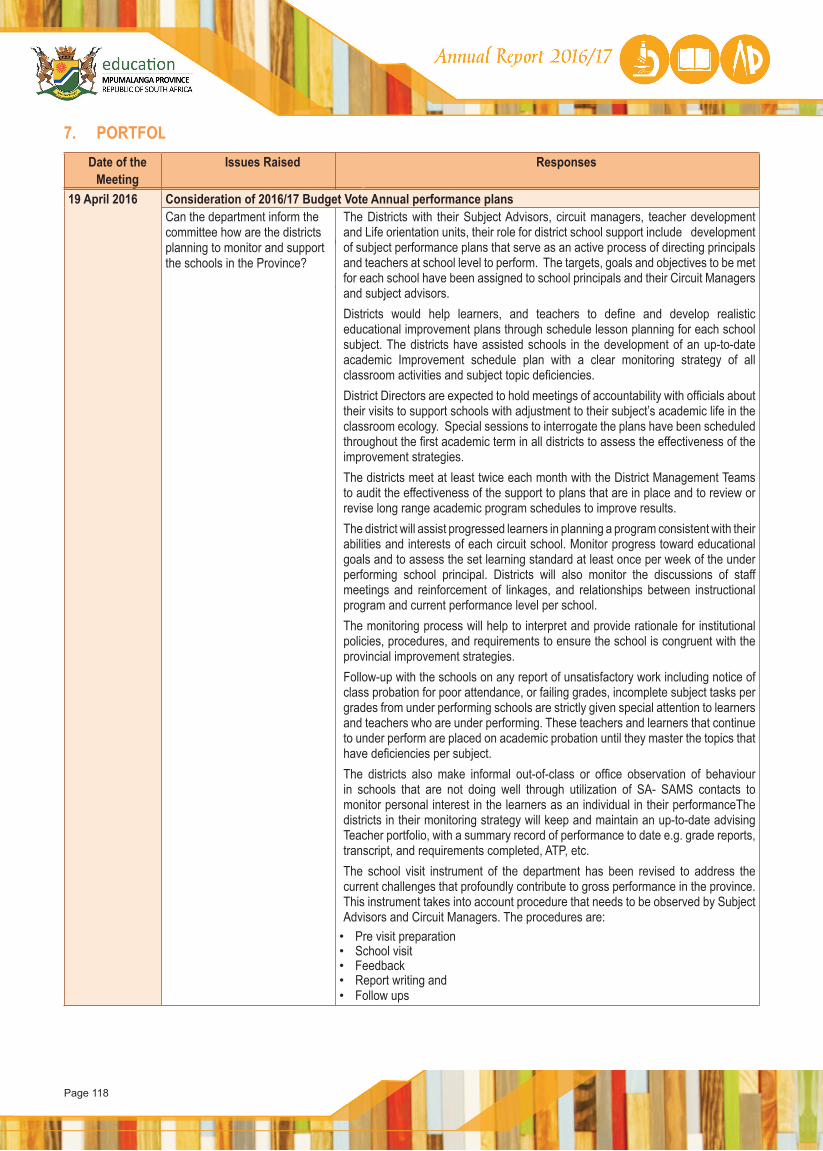
Page 118
7. PORTFOLIODate of the
MeetingIssues Raised Responses
19 April 2016 Consideration of 2016/17 Budget Vote Annual performance plans Can the department inform the committee how are the districts planning to monitor and support the schools in the Province?
The Districts with their Subject Advisors, circuit managers, teacher development and Life orientation units, their role for district school support include development of subject performance plans that serve as an active process of directing principals and teachers at school level to perform. The targets, goals and objectives to be met for each school have been assigned to school principals and their Circuit Managers and subject advisors.Districts would help learners, and teachers to define and develop realistic educational improvement plans through schedule lesson planning for each school subject. The districts have assisted schools in the development of an up-to-date academic Improvement schedule plan with a clear monitoring strategy of all classroom activities and subject topic deficiencies.District Directors are expected to hold meetings of accountability with officials about their visits to support schools with adjustment to their subject’s academic life in the classroom ecology. Special sessions to interrogate the plans have been scheduled throughout the first academic term in all districts to assess the effectiveness of the improvement strategies.The districts meet at least twice each month with the District Management Teams to audit the effectiveness of the support to plans that are in place and to review or revise long range academic program schedules to improve results.The district will assist progressed learners in planning a program consistent with their abilities and interests of each circuit school. Monitor progress toward educational goals and to assess the set learning standard at least once per week of the under performing school principal. Districts will also monitor the discussions of staff meetings and reinforcement of linkages, and relationships between instructional program and current performance level per school. The monitoring process will help to interpret and provide rationale for institutional policies, procedures, and requirements to ensure the school is congruent with the provincial improvement strategies.Follow-up with the schools on any report of unsatisfactory work including notice of class probation for poor attendance, or failing grades, incomplete subject tasks per grades from under performing schools are strictly given special attention to learners and teachers who are under performing. These teachers and learners that continue to under perform are placed on academic probation until they master the topics that have deficiencies per subject. The districts also make informal out-of-class or office observation of behaviour in schools that are not doing well through utilization of SA- SAMS contacts to monitor personal interest in the learners as an individual in their performanceThe districts in their monitoring strategy will keep and maintain an up-to-date advising Teacher portfolio, with a summary record of performance to date e.g. grade reports, transcript, and requirements completed, ATP, etc.The school visit instrument of the department has been revised to address the current challenges that profoundly contribute to gross performance in the province. This instrument takes into account procedure that needs to be observed by Subject Advisors and Circuit Managers. The procedures are:
• Pre visit preparation• School visit• Feedback• Report writing and• Follow ups
Date of the Meeting
Issues Raised Responses
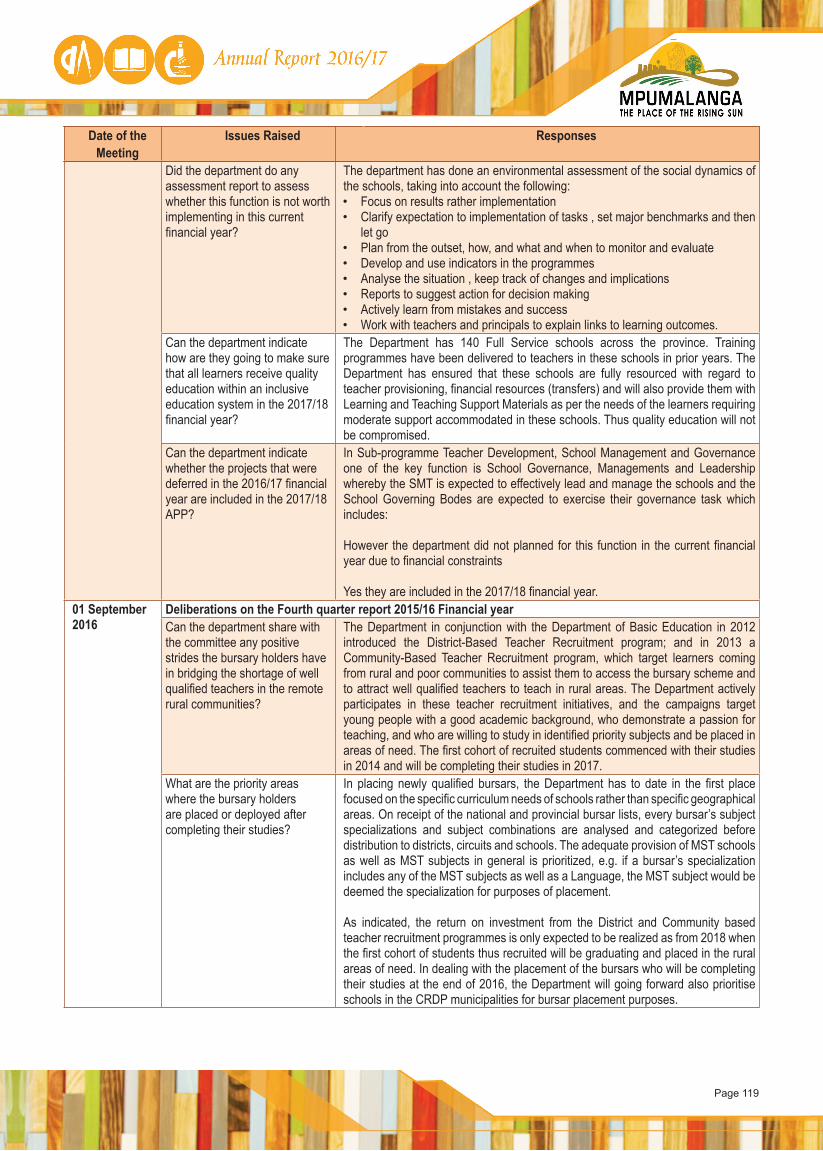
Page 119
Date of the Meeting
Issues Raised Responses
Did the department do any assessment report to assess whether this function is not worth implementing in this current financial year?
The department has done an environmental assessment of the social dynamics of the schools, taking into account the following: • Focus on results rather implementation• Clarify expectation to implementation of tasks , set major benchmarks and then
let go• Plan from the outset, how, and what and when to monitor and evaluate • Develop and use indicators in the programmes • Analyse the situation , keep track of changes and implications • Reports to suggest action for decision making • Actively learn from mistakes and success • Work with teachers and principals to explain links to learning outcomes.
Can the department indicate how are they going to make sure that all learners receive quality education within an inclusive education system in the 2017/18 financial year?
The Department has 140 Full Service schools across the province. Training programmes have been delivered to teachers in these schools in prior years. The Department has ensured that these schools are fully resourced with regard to teacher provisioning, financial resources (transfers) and will also provide them with Learning and Teaching Support Materials as per the needs of the learners requiring moderate support accommodated in these schools. Thus quality education will not be compromised.
Can the department indicate whether the projects that were deferred in the 2016/17 financial year are included in the 2017/18 APP?
In Sub-programme Teacher Development, School Management and Governance one of the key function is School Governance, Managements and Leadership whereby the SMT is expected to effectively lead and manage the schools and the School Governing Bodes are expected to exercise their governance task which includes:
However the department did not planned for this function in the current financial year due to financial constraints
Yes they are included in the 2017/18 financial year.01 September 2016
Deliberations on the Fourth quarter report 2015/16 Financial yearCan the department share with the committee any positive strides the bursary holders have in bridging the shortage of well qualified teachers in the remote rural communities?
The Department in conjunction with the Department of Basic Education in 2012 introduced the District-Based Teacher Recruitment program; and in 2013 a Community-Based Teacher Recruitment program, which target learners coming from rural and poor communities to assist them to access the bursary scheme and to attract well qualified teachers to teach in rural areas. The Department actively participates in these teacher recruitment initiatives, and the campaigns target young people with a good academic background, who demonstrate a passion for teaching, and who are willing to study in identified priority subjects and be placed in areas of need. The first cohort of recruited students commenced with their studies in 2014 and will be completing their studies in 2017.
What are the priority areas where the bursary holders are placed or deployed after completing their studies?
In placing newly qualified bursars, the Department has to date in the first place focused on the specific curriculum needs of schools rather than specific geographical areas. On receipt of the national and provincial bursar lists, every bursar’s subject specializations and subject combinations are analysed and categorized before distribution to districts, circuits and schools. The adequate provision of MST schools as well as MST subjects in general is prioritized, e.g. if a bursar’s specialization includes any of the MST subjects as well as a Language, the MST subject would be deemed the specialization for purposes of placement.
As indicated, the return on investment from the District and Community based teacher recruitment programmes is only expected to be realized as from 2018 when the first cohort of students thus recruited will be graduating and placed in the rural areas of need. In dealing with the placement of the bursars who will be completing their studies at the end of 2016, the Department will going forward also prioritise schools in the CRDP municipalities for bursar placement purposes.
Date of the Meeting
Issues Raised ResponsesDate of the Meeting
Issues Raised Responses

Page 120
25 October 2016 Deliberations on the 2015/16 Annual reportsCan the department indicate to the Committees strategies put in place to ensure there is improvement in this regard?
The Department has developed an Action Plan which is monitored weekly through the Audit Steering Committee. The matter of immovable tangible assets has been escalated to the Provincial Treasury, DPWRT and DBE for advice and technical support. The Provincial Treasury has advised the department to fair value its assets using Municipal Valuation rolls. The HOD will be writing to Municipal Managers requesting their assistance in this regard. All other items in the management letter are also monitored and managers are required to submit monthly returns as supporting documentation to prove that work is on-going to clear the findings. Managers have also been advised to put in place daily internal controls to avoid irregular, unauthorised and fruitless and wasteful expenditure. The department is also preparing Interim Financial Statements in order to gauge if any progress has been made to clear issues and if the internal control environment is improving or not. These will be submitted to internal audit for auditing. This will help the Department to adequately prepare for the final audit. There are substantive matters which the department feels need a discussion with the AG and National Treasury and these have been forwarded to the Office of the Premier and DBE as these are sectoral in nature and cut across all Departments. It is hoped that addressing these will minimise challenges and assist the Department to move towards an unqualified audit opinion.
Date of the Meeting
Issues Raised Responses
Can the accounting officer share with the committee if there are noticeable positive strides in the performance of learners in mathematics since the introduction of the 1+4 approach?
Yes, the 2015 results of the Grade 9 class showed improvement. The Department has this year extended the 1+4 model to include Grade 8.
What must be put in place in the SIP that must address social challenges that contribute to under performance and failure rate?
The context of each school will determine what programmes must be put in the SIP of that school. These are some of the challenges that could be affecting schools that must be included in the SIP - Social challenges such as Teenage Pregnancy, drug abuse, child headed families, OVCs, absenteeism, child neglect and abuse, hunger, barriers to learning etc.
Deliberations on the First Quarter Performance report 2016/17The Accounting Officer must ensure that the approved 2016/17 Annual Performance Plan is adhered to and that the necessary financial control mechanisms are in place so that the allocated budget and conditional grants are spent as planned for.
The Department has introduced the following financial control mechanisms:
• There is a budget advisory committee which is sitting on monthly basis to discuss the expenditure trend of the Department, cash flow management and follow up on critical matters.
• Expenditure reports are presented in Executive and Senior Management meetings to ensure that all members of management are aware of their spending pattern.
• The audit committee as an oversight body assist the Department to monitor the spending trends and provide advice accordingly.
• The Department has a financial reporting unit which advice and monitor on the Internal controls within the Department.
The Department must finalize the ICT connectivity of the Maths, Science and Technology Academy (MSTA) before the end of the 2016 school year. Provide a progress report in this regard by 30 September 2016.
The Department has appointed CSIR to conduct an audit of the existing VPN infrastructure. However, The Department is currently broadcasting Grade 10 Maths lessons via the internet to 17 out of the 68 schools across the province as a test
The department will ensure that the ICT connectivity for the 101 MSTA schools is finalized by the end of 2016 school year.
Date of the Meeting
Issues Raised ResponsesDate of the Meeting
Issues Raised Responses
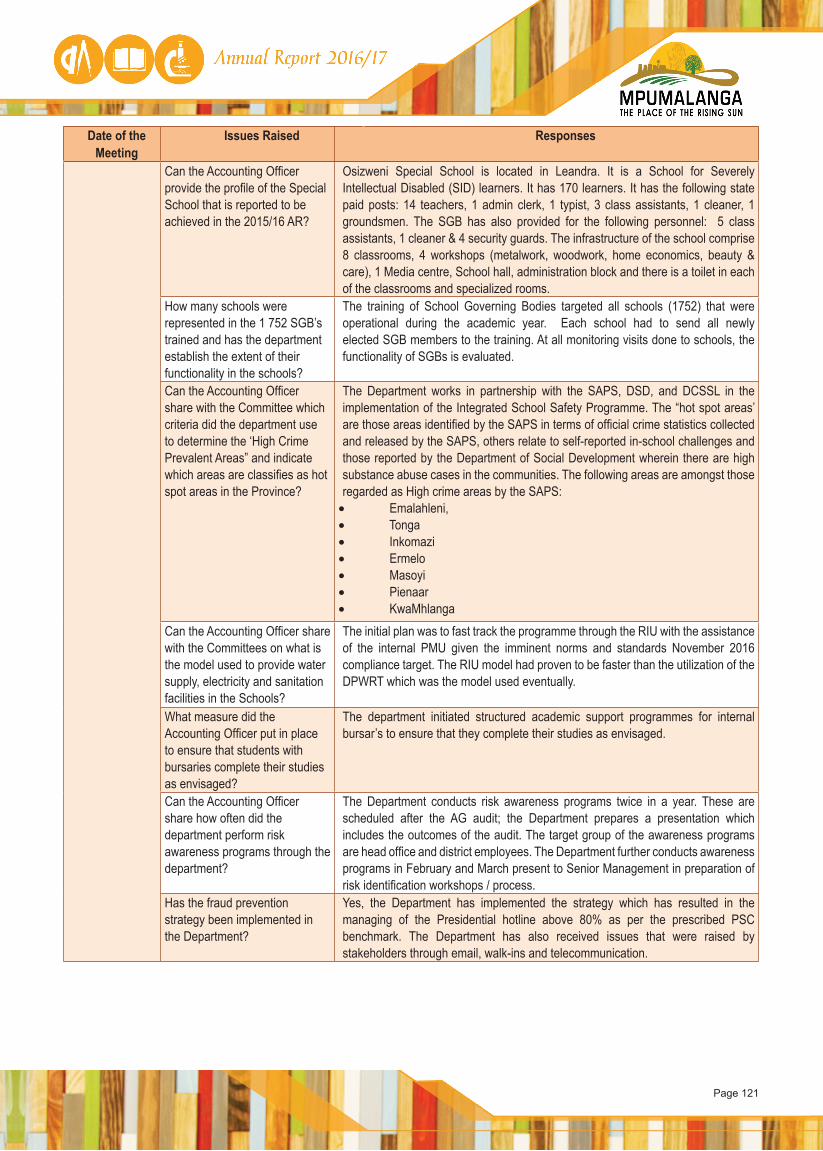
Page 121
Can the Accounting Officer provide the profile of the Special School that is reported to be achieved in the 2015/16 AR?
Osizweni Special School is located in Leandra. It is a School for Severely Intellectual Disabled (SID) learners. It has 170 learners. It has the following state paid posts: 14 teachers, 1 admin clerk, 1 typist, 3 class assistants, 1 cleaner, 1 groundsmen. The SGB has also provided for the following personnel: 5 class assistants, 1 cleaner & 4 security guards. The infrastructure of the school comprise 8 classrooms, 4 workshops (metalwork, woodwork, home economics, beauty & care), 1 Media centre, School hall, administration block and there is a toilet in each of the classrooms and specialized rooms.
How many schools were represented in the 1 752 SGB’s trained and has the department establish the extent of their functionality in the schools?
The training of School Governing Bodies targeted all schools (1752) that were operational during the academic year. Each school had to send all newly elected SGB members to the training. At all monitoring visits done to schools, the functionality of SGBs is evaluated.
Can the Accounting Officer share with the Committee which criteria did the department use to determine the ‘High Crime Prevalent Areas” and indicate which areas are classifies as hot spot areas in the Province?
The Department works in partnership with the SAPS, DSD, and DCSSL in the implementation of the Integrated School Safety Programme. The “hot spot areas’ are those areas identified by the SAPS in terms of official crime statistics collected and released by the SAPS, others relate to self-reported in-school challenges and those reported by the Department of Social Development wherein there are high substance abuse cases in the communities. The following areas are amongst those regarded as High crime areas by the SAPS:• Emalahleni, • Tonga• Inkomazi• Ermelo• Masoyi• Pienaar• KwaMhlanga
Can the Accounting Officer share with the Committees on what is the model used to provide water supply, electricity and sanitation facilities in the Schools?
The initial plan was to fast track the programme through the RIU with the assistance of the internal PMU given the imminent norms and standards November 2016 compliance target. The RIU model had proven to be faster than the utilization of the DPWRT which was the model used eventually.
What measure did the Accounting Officer put in place to ensure that students with bursaries complete their studies as envisaged?
The department initiated structured academic support programmes for internal bursar’s to ensure that they complete their studies as envisaged.
Can the Accounting Officer share how often did the department perform risk awareness programs through the department?
The Department conducts risk awareness programs twice in a year. These are scheduled after the AG audit; the Department prepares a presentation which includes the outcomes of the audit. The target group of the awareness programs are head office and district employees. The Department further conducts awareness programs in February and March present to Senior Management in preparation of risk identification workshops / process.
Has the fraud prevention strategy been implemented in the Department?
Yes, the Department has implemented the strategy which has resulted in the managing of the Presidential hotline above 80% as per the prescribed PSC benchmark. The Department has also received issues that were raised by stakeholders through email, walk-ins and telecommunication.
Date of the Meeting
Issues Raised ResponsesDate of the Meeting
Issues Raised Responses
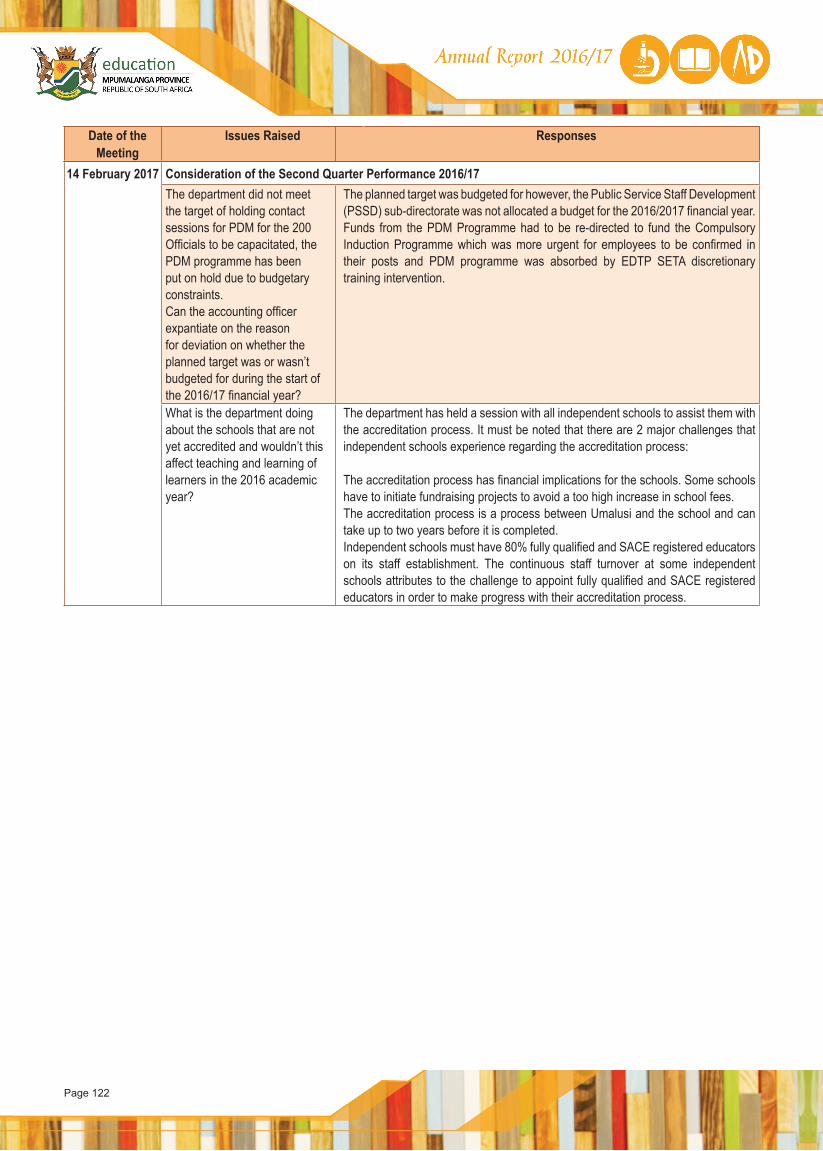
Page 122
14 February 2017 Consideration of the Second Quarter Performance 2016/17 The department did not meet the target of holding contact sessions for PDM for the 200 Officials to be capacitated, the PDM programme has been put on hold due to budgetary constraints.Can the accounting officer expantiate on the reason for deviation on whether the planned target was or wasn’t budgeted for during the start of the 2016/17 financial year?
The planned target was budgeted for however, the Public Service Staff Development (PSSD) sub-directorate was not allocated a budget for the 2016/2017 financial year. Funds from the PDM Programme had to be re-directed to fund the Compulsory Induction Programme which was more urgent for employees to be confirmed in their posts and PDM programme was absorbed by EDTP SETA discretionary training intervention.
What is the department doing about the schools that are not yet accredited and wouldn’t this affect teaching and learning of learners in the 2016 academic year?
The department has held a session with all independent schools to assist them with the accreditation process. It must be noted that there are 2 major challenges that independent schools experience regarding the accreditation process:
The accreditation process has financial implications for the schools. Some schools have to initiate fundraising projects to avoid a too high increase in school fees.The accreditation process is a process between Umalusi and the school and can take up to two years before it is completed. Independent schools must have 80% fully qualified and SACE registered educators on its staff establishment. The continuous staff turnover at some independent schools attributes to the challenge to appoint fully qualified and SACE registered educators in order to make progress with their accreditation process.
Date of the Meeting
Issues Raised ResponsesDate of the Meeting
Issues Raised Responses
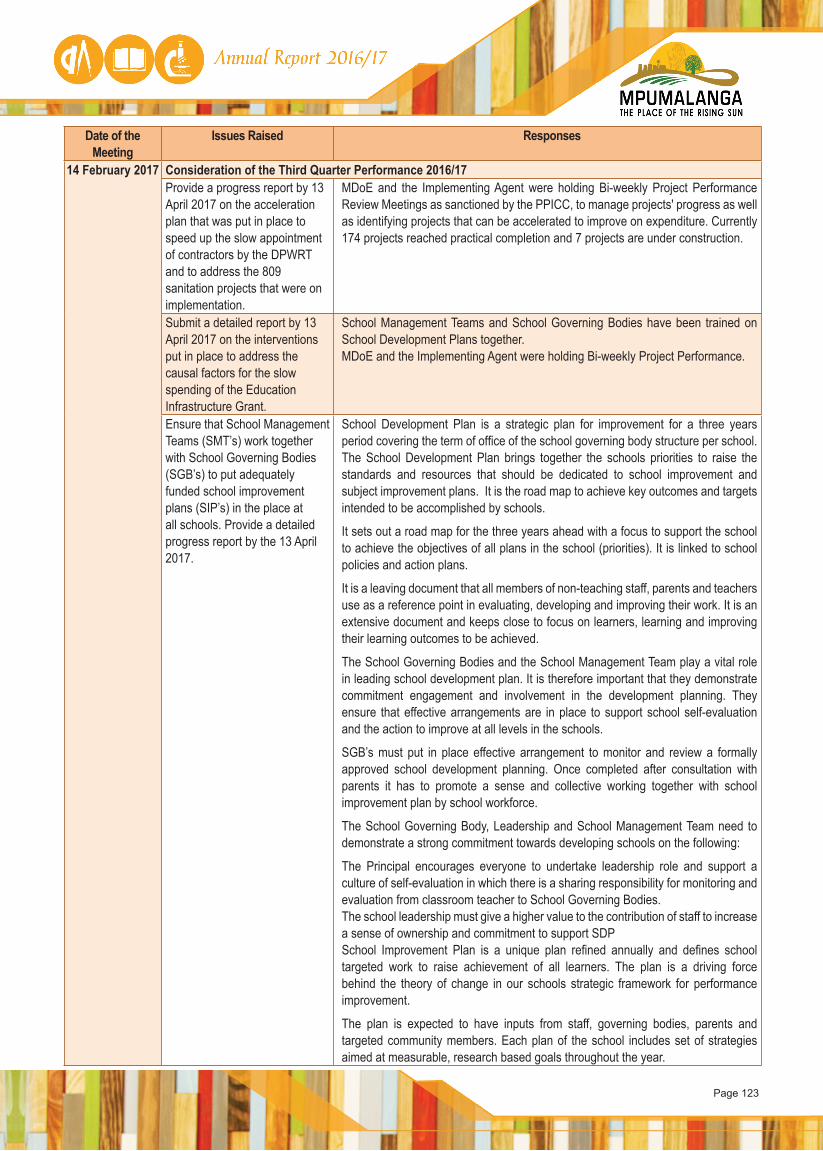
Page 123
Date of the Meeting
Issues Raised Responses
14 February 2017 Consideration of the Third Quarter Performance 2016/17 Provide a progress report by 13 April 2017 on the acceleration plan that was put in place to speed up the slow appointment of contractors by the DPWRT and to address the 809 sanitation projects that were on implementation.
MDoE and the Implementing Agent were holding Bi-weekly Project Performance Review Meetings as sanctioned by the PPICC, to manage projects' progress as well as identifying projects that can be accelerated to improve on expenditure. Currently 174 projects reached practical completion and 7 projects are under construction.
Submit a detailed report by 13 April 2017 on the interventions put in place to address the causal factors for the slow spending of the Education Infrastructure Grant.
School Management Teams and School Governing Bodies have been trained on School Development Plans together. MDoE and the Implementing Agent were holding Bi-weekly Project Performance.
Ensure that School Management Teams (SMT’s) work together with School Governing Bodies (SGB’s) to put adequately funded school improvement plans (SIP’s) in the place at all schools. Provide a detailed progress report by the 13 April 2017.
School Development Plan is a strategic plan for improvement for a three years period covering the term of office of the school governing body structure per school. The School Development Plan brings together the schools priorities to raise the standards and resources that should be dedicated to school improvement and subject improvement plans. It is the road map to achieve key outcomes and targets intended to be accomplished by schools.
It sets out a road map for the three years ahead with a focus to support the school to achieve the objectives of all plans in the school (priorities). It is linked to school policies and action plans.
It is a leaving document that all members of non-teaching staff, parents and teachers use as a reference point in evaluating, developing and improving their work. It is an extensive document and keeps close to focus on learners, learning and improving their learning outcomes to be achieved.
The School Governing Bodies and the School Management Team play a vital role in leading school development plan. It is therefore important that they demonstrate commitment engagement and involvement in the development planning. They ensure that effective arrangements are in place to support school self-evaluation and the action to improve at all levels in the schools.
SGB’s must put in place effective arrangement to monitor and review a formally approved school development planning. Once completed after consultation with parents it has to promote a sense and collective working together with school improvement plan by school workforce.
The School Governing Body, Leadership and School Management Team need to demonstrate a strong commitment towards developing schools on the following:
The Principal encourages everyone to undertake leadership role and support a culture of self-evaluation in which there is a sharing responsibility for monitoring and evaluation from classroom teacher to School Governing Bodies.The school leadership must give a higher value to the contribution of staff to increase a sense of ownership and commitment to support SDPSchool Improvement Plan is a unique plan refined annually and defines school targeted work to raise achievement of all learners. The plan is a driving force behind the theory of change in our schools strategic framework for performance improvement.
The plan is expected to have inputs from staff, governing bodies, parents and targeted community members. Each plan of the school includes set of strategies aimed at measurable, research based goals throughout the year.
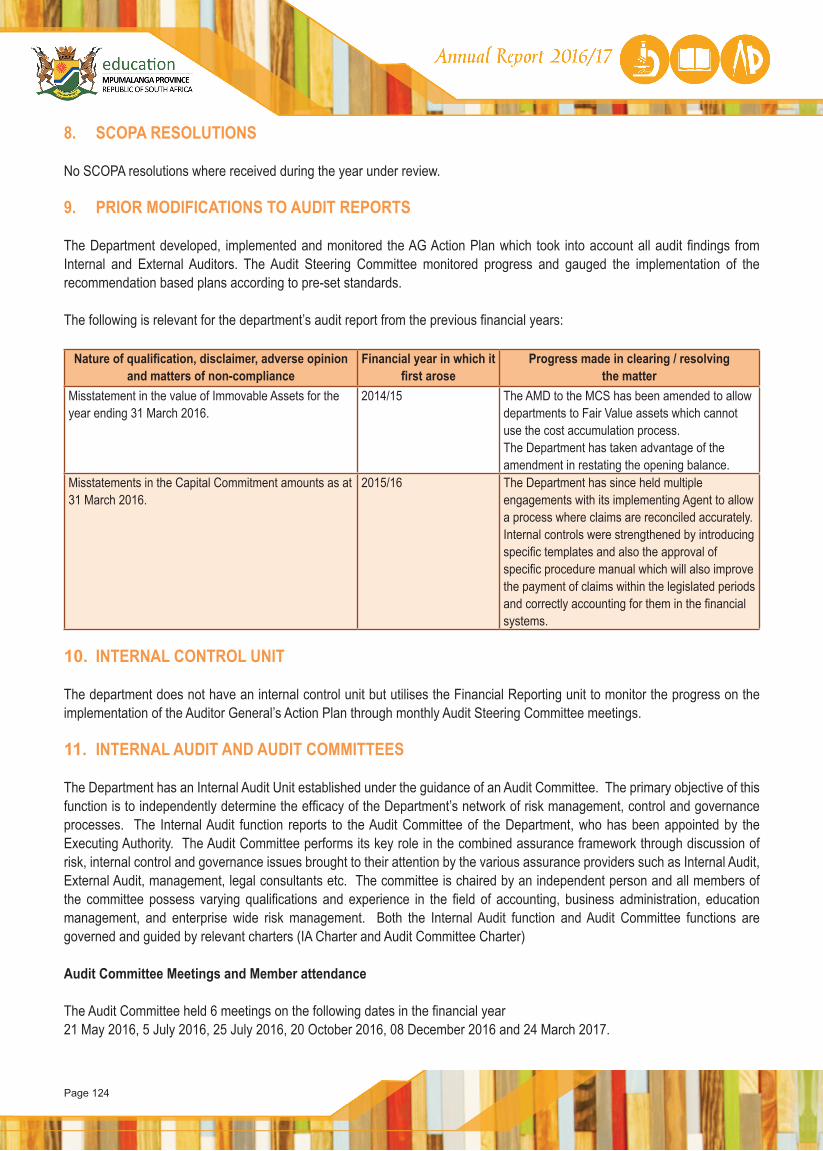
Page 124
8. SCOPA RESOLUTIONS No SCOPA resolutions where received during the year under review.
9. PRIOR MODIFICATIONS TO AUDIT REPORTS
The Department developed, implemented and monitored the AG Action Plan which took into account all audit findings from Internal and External Auditors. The Audit Steering Committee monitored progress and gauged the implementation of the recommendation based plans according to pre-set standards.
The following is relevant for the department’s audit report from the previous financial years:
Nature of qualification, disclaimer, adverse opinion and matters of non-compliance
Financial year in which it first arose
Progress made in clearing / resolving the matter
Misstatement in the value of Immovable Assets for the year ending 31 March 2016.
2014/15 The AMD to the MCS has been amended to allow departments to Fair Value assets which cannot use the cost accumulation process.The Department has taken advantage of the amendment in restating the opening balance.
Misstatements in the Capital Commitment amounts as at 31 March 2016.
2015/16 The Department has since held multiple engagements with its implementing Agent to allow a process where claims are reconciled accurately. Internal controls were strengthened by introducing specific templates and also the approval of specific procedure manual which will also improve the payment of claims within the legislated periods and correctly accounting for them in the financial systems.
10. INTERNAL CONTROL UNIT
The department does not have an internal control unit but utilises the Financial Reporting unit to monitor the progress on the implementation of the Auditor General’s Action Plan through monthly Audit Steering Committee meetings.
11. INTERNAL AUDIT AND AUDIT COMMITTEES
The Department has an Internal Audit Unit established under the guidance of an Audit Committee. The primary objective of this function is to independently determine the efficacy of the Department’s network of risk management, control and governance processes. The Internal Audit function reports to the Audit Committee of the Department, who has been appointed by the Executing Authority. The Audit Committee performs its key role in the combined assurance framework through discussion of risk, internal control and governance issues brought to their attention by the various assurance providers such as Internal Audit, External Audit, management, legal consultants etc. The committee is chaired by an independent person and all members of the committee possess varying qualifications and experience in the field of accounting, business administration, education management, and enterprise wide risk management. Both the Internal Audit function and Audit Committee functions are governed and guided by relevant charters (IA Charter and Audit Committee Charter)
Audit Committee Meetings and Member attendance
The Audit Committee held 6 meetings on the following dates in the financial year21 May 2016, 5 July 2016, 25 July 2016, 20 October 2016, 08 December 2016 and 24 March 2017.
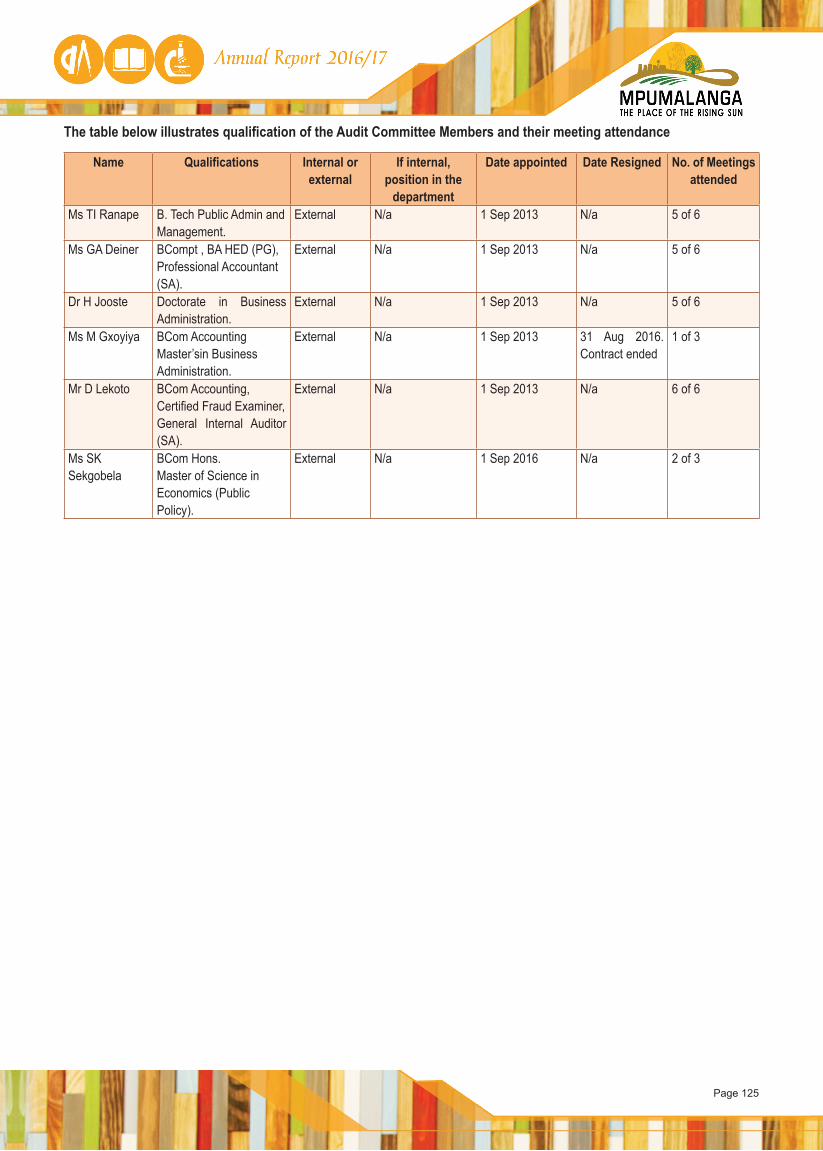
Page 125
The table below illustrates qualification of the Audit Committee Members and their meeting attendance
Name Qualifications Internal or external
If internal, position in the
department
Date appointed Date Resigned No. of Meetings attended
Ms TI Ranape B. Tech Public Admin and Management.
External N/a 1 Sep 2013 N/a 5 of 6
Ms GA Deiner BCompt , BA HED (PG), Professional Accountant (SA).
External N/a 1 Sep 2013 N/a 5 of 6
Dr H Jooste Doctorate in Business Administration.
External N/a 1 Sep 2013 N/a 5 of 6
Ms M Gxoyiya BCom AccountingMaster’sin Business Administration.
External N/a 1 Sep 2013 31 Aug 2016. Contract ended
1 of 3
Mr D Lekoto BCom Accounting,Certified Fraud Examiner,General Internal Auditor (SA).
External N/a 1 Sep 2013 N/a 6 of 6
Ms SK Sekgobela
BCom Hons.Master of Science in Economics (Public Policy).
External N/a 1 Sep 2016 N/a 2 of 3
Page 126
12. AUDIT COMMITTEE REPORT
We are pleased to present our final report for the financial year ended 31 March 2017.
Audit Committee Responsibility
The Audit Committee reports that it has complied with its responsibilities arising from Section 38 (1) (a) (ii) of the Public Finance Management Act and Treasury Regulations 3.1.10 and 3.1.13. The Audit Committee has adopted appropriate formal terms of reference as its Audit Committee Charter, has regulated its affairs in compliance with this charter and has discharged all its responsibilities as contained therein, except that we have not reviewed changes in accounting policies and practices.
The Effectiveness of Internal Control
The Audit Committee has in terms of Treasury Regulation 3.1.10 reviewed the effectiveness of the internal control systems of the Department. The review was based on the internal audit reports that were informed by the risk based audit plan for 2016/2017. There are noted improvements in the effectiveness of the internal control systems affecting the following areas:
• Compliance with applicable laws and regulations with certain exceptions to PPPFA that have caused irregular expenditure, and compliance to the framework of 30 days payment cycle to suppliers.
• Human resource management - Overtime management.• Compliance to the IT governance framework, though there are challenges in the implementation phase.
As part of strengthening Governance, the Portfolio Committee of Education, Arts and Culture continued to consider the Audit Committee reports on the internal control environment of the Department as part of their oversight work on a quarterly basis. The Audit Committee continued to have open and honest discussions with the Member of the Executive Council on matters of audit concerns both from internal audit and external audit. The committee also discussed audit matters with the Auditor General. The Audit Committee appreciates the efforts taken by the Accounting Officer in filling the position of the Chief Financial Officer during the financial year and expects that the stability in leadership will improve internal control and risk management.
In our assessment the internal control systems of the Department were ineffective in particular in the following areas:
• Management of the provision of school infrastructure, including record keeping and reporting.• Financial management in boarding schools.• Slow progress in resolving or responding to both external and internal audit findings.• Misstatements and incorrect disclosures on the Interim Financial Statements.• Inaccurate and incomplete performance reporting during the 6 months reporting period.• Internal Audit reviews also identified fraudulent overpayments to independent registered ECD centres and payments to
non-registered independent ECD centres.
The main root causes for the ineffectiveness are that management has not incorporated risk management into the daily operations which has resulted in weak accountability. The quarterly reports received from the independent chairperson of the risk management committee indicate that low level of maturity of risk management within the Department and remains a grave concern for the Audit Committee. Though the Accounting Officer has demonstrated leadership in taking corrective actions, the efforts have not yet proven to be a deterrent in addressing weaknesses in internal control and risk management. Executive and Senior Management has not made reliable progress in instilling accountability and responsibility in the organizational hierarchy.
Page 127
In-Year Management and Monthly/Quarterly Reporting
The Audit Committee has taken note of the contents and quality of the quarterly reports prepared and issued by the Head of Department during the period under review. The quality of these reports complied with the terms of the PFMA and the Division of Revenue Act. Though the Audit Committee has noted improvement in the completeness, accuracy and validity of reporting on performance information, the committee remains concerned that the system needs improvement in the compilation of the portfolio of evidence to substantiate performance reporting.
Evaluation of Financial Statements
Internal Audit will review the financial statements prior to submission to the Auditor-General.
Auditor-General’s Report
The Audit Committee will review the audit report of the Auditor-General on conclusion of the audit
Appreciation
The Audit Committee extends its appreciation for the support that it has received from the Member of the Executive Council, Accounting Officer, the former Acting Chief Financial Officer, the newly appointed Chief Financial Officer, the Chief Audit Executive, senior management of MDE, the team from Auditor General and internal audit staff in the execution of its duties.
________________________________________
MS TI RANAPEChairperson of the Audit Committee
Date 31/07/2017

Page 128

Page 129
PART D:
HUMAN RESOURCEMANAGEMENT
Page 130
1. INTRODUCTION
The information contained in this part of the annual report has been prescribed by the Minister for the Public Service and Administration for all departments in the public service.
2. OVERVIEW OF HUMAN RESOURCES
The status of human resources in the department
The Department distinguishes between 3 main sectors for purposes of organizing its human resources, i.e. Human Resources in Departmental Offices (including office based officials and office based educators in the Head Office, district offices, and their education development centers and circuit offices), Support Staff, and Educators in schools. The status of human resources in these 3 main sectors is discussed below:
Departmental Offices
The Minister of Finance already in the 2014 Medium Term Budget Policy Statement (MTBPS) indicated that the government – forth flowing from severe economic pressures - would freeze government headcounts and will also review the funded vacancies.
Whilst aware that the quality of education also relies on the provision of sufficient professional and administrative systemic support, the Department also understands national and provincial fiscal challenges. The Department has therefore as from February 2015 to date fully complied with the provincial moratorium implementation framework in terms of which the Department is only allowed to fill funded school based posts.
All vacant posts in offices were abolished, and funded posts that became vacant were also abolished throughout when vacated - as per Executive Council Resolution. It is confirmed that no posts in the Departmental offices were filled after the announcement of the provincial moratorium in March 2015.
Support Staff in schools
Due to lack of dedicated funding and ongoing financial constraints, the Department has been unable to make any progress towards the attainment of the national Policy on the Provisioning of Support Staff to Schools as approved by CEM in 2007. In terms of said Policy the Department was required to in fact phase in the creation and filling of more than 4000 additional support staff posts in Ordinary schools.
The Department in 2016/17 continued implementing an interim strategy in terms of which funding for vacated posts in more advantageously staffed schools was re-allocated to ensure the advertising and filling of at least 1 Admin Clerk post and 1 General Worker post in those schools without any such staff.
The provincial moratorium measures were however extended in January 2017 to also prohibit the filling of support staff posts in schools without prior Executive Council approval.
Educator Staff in schools
In as far as educator provisioning is concerned, the Department has from 2010 maintained the same pool of educator posts for annual distribution in terms of the nationally prescribed post provisioning model, at an overall Educator: Learner ratio for Public schools (Grade 1 to 12) of 1:30.
Schools and district education line managers are mandated to immediately fill vacated promotional educator posts in schools in acting capacity, and also immediately supplement any deficit on the annual approved educator post provisioning through the appointment of teachers on temporary contract. This is in line with the Department’s core mandate to ensure that there are teachers in class rooms.
Human resource priorities for the year under review and the impact of these
The Department’s critical human resource priorities for the year under review are discussed below.
Page 131
HR Priority 1: Professionalization of Grade R
The Department commenced with the first phase to professionalize Grade R in 2015/16, which entailed the translation of all 170 qualifying Grade R Practitioners to Grade R Teachers. Under-qualified practitioners enrolled for studies were retained in the system and the Department is supporting them towards attaining the required qualifications. The professionalization process will continue in phases with newly qualifying Grade R Practitioners translated to teachers on an annual basis.
The stipends of all serving Grade R Practitioners was duly increased from R5500.00 pm to R5900.00 pm as from 1 April 2016 in line with the national Cost of Living Increase approved for government employees. The Department also completed the translation of the next cohort of qualifying Grade R Practitioners to Grade R Teachers in the 2016/17 financial year. There are 292 professionally qualified Grade R Teachers in the system as on 31 March 2017.
HR Priority 2: Strengthening the HR capacity of the Department to render critical Infrastructure services
The DORA funding principle was introduced by the National Treasury during the 2012/13 financial year with the allocation of R10m to finance the filling of 24 technical posts to assist in the delivery of infrastructure in schools. Funding and posts for capacitation of the Infrastructure Unit of the Department were subsequently increased by National Treasury to R32,8 million to finance the filling of additional posts. A further R3.2m was provided to assist the Department to cover recruitment and incidental costs incurred during the filling of the recommended posts.
The organizational structure of the Physical Resources Management Unit was subsequently restructured as a Chief Directorate in line with the generic structure developed by DPSA in consultation with the National Treasury and Basic Education. The structure was approved by the Honorable MEC for Education on 10 December 2015. Posts were subsequently filled through both internal placement - and external recruitment processes.The Department has been unable to achieve 100% filling of the vacant DoRA Infrastructure Conditional Grant posts mainly due to the following:
− The Department is competing with the private sector for these scarce skills, as a result of which is either limited or no qualifying applications are received, while qualifying applicants often either decline the interview invitations or decline the offers of appointment;
− The staff turnover in this work area is substantial, and apart from the 38 posts initially advertised in January 2016, four (4) posts which were filled during 2016/17 have already been vacated again. Posts therefore had to be advertised on a number of occasions following the original advert, i.e. on 17 April 2016, 7 August 2016, 23 October 2016 and as well as 22 January 2017.
The Department mitigated these challenges through expanding the recruitment methodology to also include head hunting, funded through the equitable share. As a result the Department was able to issue offer letters for 5 Chief Infrastructure professional posts, which could not be filled through advertising.
The approved Organogram of the Chief Directorate: Physical Resources and Facilities Management provided for 63 DoRA Infrastructure Conditional Grant Posts. The Conditional Grant Funding in respect of 7 of the posts will be activated once the placed incumbents meet all the qualification - and professional registration requirements. A further 8 vacant Works Inspector posts are currently frozen pending investigation and approval for restructuring to 4 alternative posts deemed better suited to the priority needs of the Department.
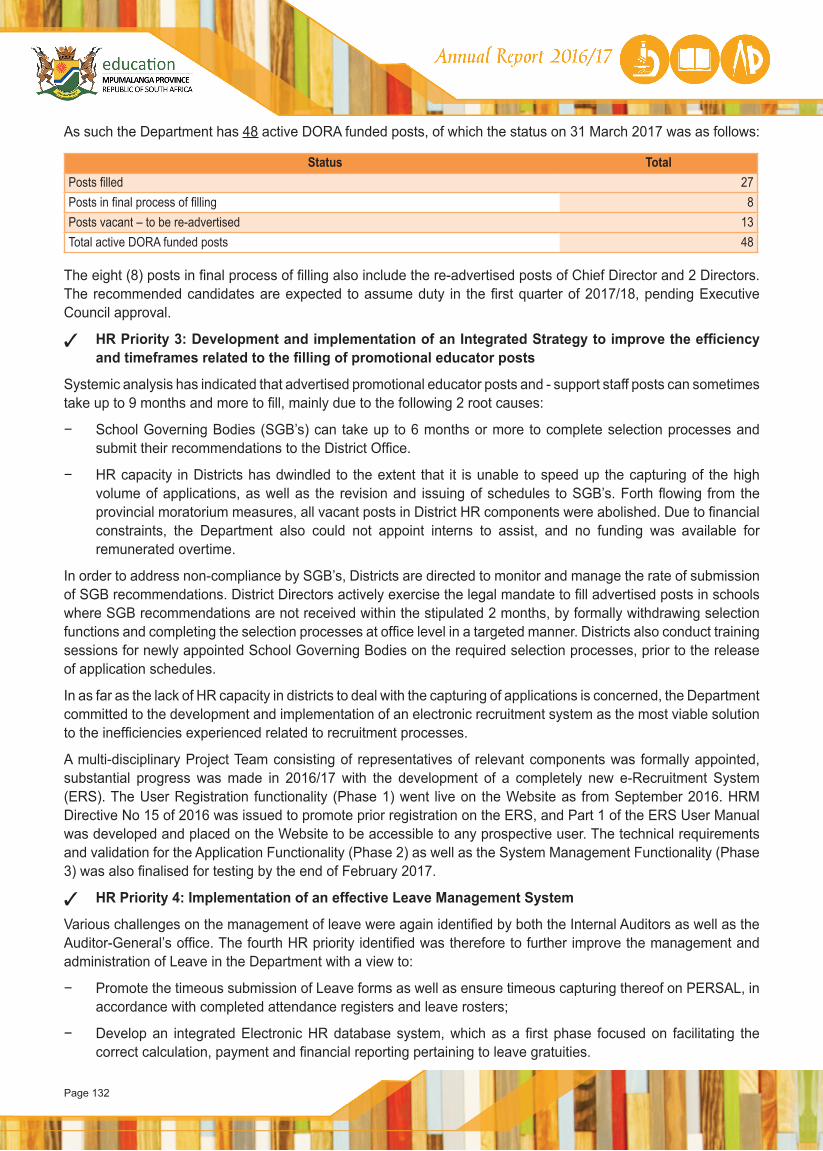
Page 132
As such the Department has 48 active DORA funded posts, of which the status on 31 March 2017 was as follows:
Status TotalPosts filled 27Posts in final process of filling 8Posts vacant – to be re-advertised 13Total active DORA funded posts 48
The eight (8) posts in final process of filling also include the re-advertised posts of Chief Director and 2 Directors. The recommended candidates are expected to assume duty in the first quarter of 2017/18, pending Executive Council approval.
HR Priority 3: Development and implementation of an Integrated Strategy to improve the efficiency and timeframes related to the filling of promotional educator posts
Systemic analysis has indicated that advertised promotional educator posts and - support staff posts can sometimes take up to 9 months and more to fill, mainly due to the following 2 root causes:
− School Governing Bodies (SGB’s) can take up to 6 months or more to complete selection processes and submit their recommendations to the District Office.
− HR capacity in Districts has dwindled to the extent that it is unable to speed up the capturing of the high volume of applications, as well as the revision and issuing of schedules to SGB’s. Forth flowing from the provincial moratorium measures, all vacant posts in District HR components were abolished. Due to financial constraints, the Department also could not appoint interns to assist, and no funding was available for remunerated overtime.
In order to address non-compliance by SGB’s, Districts are directed to monitor and manage the rate of submission of SGB recommendations. District Directors actively exercise the legal mandate to fill advertised posts in schools where SGB recommendations are not received within the stipulated 2 months, by formally withdrawing selection functions and completing the selection processes at office level in a targeted manner. Districts also conduct training sessions for newly appointed School Governing Bodies on the required selection processes, prior to the release of application schedules.
In as far as the lack of HR capacity in districts to deal with the capturing of applications is concerned, the Department committed to the development and implementation of an electronic recruitment system as the most viable solution to the inefficiencies experienced related to recruitment processes.
A multi-disciplinary Project Team consisting of representatives of relevant components was formally appointed, substantial progress was made in 2016/17 with the development of a completely new e-Recruitment System (ERS). The User Registration functionality (Phase 1) went live on the Website as from September 2016. HRM Directive No 15 of 2016 was issued to promote prior registration on the ERS, and Part 1 of the ERS User Manual was developed and placed on the Website to be accessible to any prospective user. The technical requirements and validation for the Application Functionality (Phase 2) as well as the System Management Functionality (Phase 3) was also finalised for testing by the end of February 2017.
HR Priority 4: Implementation of an effective Leave Management System
Various challenges on the management of leave were again identified by both the Internal Auditors as well as the Auditor-General’s office. The fourth HR priority identified was therefore to further improve the management and administration of Leave in the Department with a view to:
− Promote the timeous submission of Leave forms as well as ensure timeous capturing thereof on PERSAL, in accordance with completed attendance registers and leave rosters;
− Develop an integrated Electronic HR database system, which as a first phase focused on facilitating the correct calculation, payment and financial reporting pertaining to leave gratuities.

Page 133
The HRS system is in place which mainly assists with correct calculation of leave gratuities for educators. The second phase of the system i.e. to assist with the leave gratuities calculation for public sector service staff will still be developed.
HR Priority 5: Development and Implementation of an effective Conduct Management Strategy
Conduct Management is meant to address the systemic challenges related to the administration and management of employee conduct, promote acceptable conduct in order to enhance mutual respect between employees and between employees and the employer. This will help to ensure that managers and employees share a common understanding of misconduct and discipline.
For this to be realised, the Department developed and implemented a Turn-around Strategy in Labour Relations that was meant to direct the actions of all role players, and also assisted with matters of conduct management.
The primary focus was on investigation, prosecution of matters, presiding in hearings and conducting workshops on the Code of Conduct, Disciplinary Code and Procedure and the Code of Professional Ethics, matters of Grievance and Dispute Resolutions as well as Collective Bargaining.
Adherence to and implementation of the Turn-around Strategy assisted and will continue to assist in timeous conduct management leading to efficient institution and application of discipline in a prompt, fair, consistent and progressive manner.
Unacceptable conduct will be corrected if not averted and the arbitrary or discriminatory actions by managers towards employees will be prevented resulting in a sound and constructive labour relations in the Department.
The Turn-around Strategy was concluded, adopted and presented at the Senior Management meeting and Audit Committee for purposes of advocacy and implementation as an on-going process.
Workforce planning and key strategies to attract and recruit a skilled and capable workforce
The Department issues provincial vacancy lists advertising vacant promotional educator posts at least 3 times per annum to facilitate the efficient replacement of educator staff. Vacant promotional posts are immediately filled in acting capacity until such time as posts can be advertised and effectively filled.
In order to facilitate the efficient replacement of teachers in institutions, the power to employ temporary teachers is delegated to district level in consultation with school governing bodies. Districts are therefore - subject to specific conditions - mandated to immediately effect the employment of temporary teachers in approved vacant posts and educator posts that are vacated are therefore continuously in the process of filling.
In as far as the permanent filling of Teacher posts are concerned, it is generally acknowledged that temporary appointment of teachers on fixed term contract is essential in the education system to ensure that vacated teacher posts are filled appropriately within a short space of time and that learners are not left without educators. Teachers should however not remain on fixed term contract for extensive periods of time. This mode of appointment does not foster a sense of job security or career pathing, and the system could lose some of the new teachers due to concerns around job security thus contributing to the low numbers of younger teachers in the system.
The provincial MELRC Collective Agreement No 1 of 2014 was ratified by the national ELRC in April 2014 for implementation, which provides for the annual translation of serving qualifying temporary teachers to permanent subject to strict requirements and processes. The Department has completed the project to translate 1205 temporary teachers to permanent in the 2016 academic year.

Page 134
Employee performance management
Performance management and development is a continuous process of ensuring that employees know exactly what is expected of them, are properly trained or equipped to be able to do what is expected of them and produce the results required of them. The process obviously involves regular performance appraisal and is results-driven. It focuses more on what the employee has achieved in terms of quantity and quality (as measured against pre-determined performance standards) rather than on isolated activities.
Achievements for 2016/17
− Performance bonuses and Pay progression paid out to all deserving officials in terms of their assessment - and moderated scores.
− Workshops or information sharing sessions with regard to the implementation of PMDS conducted for Departmental officials.
− Approved moderation schedule issued out to PMDMC members.
− Monitoring in terms of compliance conducted and lists with names of officials not assessed circulated to Heads of Directorates so as to reflect on the compliance status.
− Procedure manual on PMDS has been approved.
Challenges:
− Non -compliance to the PMDS policy by some managers and their subordinates.
Future Actions:− Department to ensure improvement on accountability and implementation of Consequence Management by
managers and supervisors regarding PMDS non-compliance.
Employee wellness programmes
Mpumalanga Department of Education like any other Department recognizes the need to have an instrument which will assist in addressing challenges experienced by employees in a workplace. The Department developed an Employee Health and Wellness Policy which seeks to address all challenges in the workplace in order to enhance productivity and performance to the benefit of both the employee and the employer. The policy covers all aspects of the programmes which are offered within the Employee Health and Wellness Unit.
Achievements:
− The Employee Health and Wellness policy has been reviewed and the inputs regarding its review have assisted to further improve the programme implementation.
− New aspects of the Health and Wellness programme were introduced. − More social partners came on board in partnering with the Department regarding workplace Health and
Wellness programme. − The Department continues to participate in inter-Provincial sport wellness with other Provinces.− Occupational Health and Safety Representatives have been appointed and trained.
Challenges:
− Support of the Wellness programmes is sometimes challenged by low attendance of sessions by employees due to other Departmental engagements.
− Advisory Committee meetings are not taking place as scheduled. − The Department experiences occupational health and safety challenges in some offices in the districts.

Page 135
Future Actions
− The Advisory committee will be re-visited so as to make amends in terms of representation and participation. In this way programme ownership will be increased.
− To improve the coordination of Occupational health and safety issues in the Department.
• Achievements and challenges faced by the department, as well as future human resource plans /goals.
Challenge: Mitigation of the impact of the moratorium on the filling of office based posts, through re-organisation
It is important to note that all government departments and provincial administrations – including Mpumalanga - will remain subject to severe financial constraints, and the provincial moratorium measures pertaining to the filling of office based posts as well as support staff posts in schools, will still apply in the 2017/18 financial year.
In order to mitigate the impact of reduced staffing in offices, the Department had to look at strategies to re-organise and re-prioritise its available human resources in offices. These strategies would imply the assignment of some serving employees to alternative units or the re-allocation of responsibilities and functions, which will be subject to consultation. Re-organisation as a vehicle to mitigate the impact of the moratorium and a means to contain the compensation of employees was introduced in the Provincial Chamber to consult with trade unions for purpose of a buy-in before implementation. No consensus could however be reached to date, mainly due to the employee parties’ concerns about the increased workload that their members will have to contend with and the effect thereof on their conditions of employment.
Following the abolishment of all vacant and vacated SM posts, the Department of Education also conducted extensive internal streamlining of SM functions to ensure continued line function reporting and service delivery. Some of these streamlining initiatives are however not sustainable in the long term and are deemed to be interim measures only. The Department will also continue to manage voluntary internal transfers strategically with a view to at least partially address the critical needs in office components. It is however clear that this will have limited impact considering the following critical areas of need:
− Critical vacant Professional Senior Management posts in Head Office responsible for education management (as opposed to corporate management)
− Critical Professional District and Circuit Management posts− Critical Professional Subject Advisor posts (Failure to ensure the provision of critical Subject Advisory services
is deemed a serious obstacle to the Department successfully implementing improved learner outcomes in Mathematics, Sciences, Languages and other under-resourced mass enrolment subject areas across the system.)
Challenge: Mitigation of the impact of the moratorium on the filling of school based support staff posts
The Provincial Directive dated 31 January 2017 indicated that the provincial moratorium measures will also include vacant support staff posts in schools.
In as far as remedial and professional services are concerned, the Department has strategically clustered small Social Support teams in the Province to provide services to a variety of schools in particular geographical areas. Schools are also utilizing the services of professionals in the Department of Health.
Failure to support schools and learners through adequate provision of support staff might however have severe legal implications, especially where the health, wellbeing and safety of learners and educators are placed at risk.
Page 136
The specific implications are as follows:− Failure to ensure the provision of at least one Admin Clerk per school will seriously compromise the Department’s
capacity to fully implement the South African School Administration and Management System (SA SAMS). The Department will also be unable to effectively deal with the financial administration and - management issues at schools raised by both the Auditor-General and Provincial Treasury.
− Failure to provide a minimum allocation of General Workers will not only compromise the general cleanliness of the school work environment to the extent that it will negatively impact on processes of teaching and learning, but would also pose a real health and sanitation risk.
− Having convinced communities to allow their children to be placed full-time in Boarding Schools after phasing out educationally non-viable farm schools, failure to provide a minimum allocation of hostel staff would seriously compromise rendering the package of essential services required by these learners in terms of learner supervision, hostel management, cleaning, laundry, basic health care, supply and stores, food preparation and kitchen duties etc.
− Failure to provide a minimum allocation of General Childcare/Therapy Assistant posts in special schools for learners with mild/severe intellectual impairment, compromises the Department’s ability to provide around the clock personal, physical and emotional care required for the wellbeing and safety of these learners.
As a remedial strategy, the Department will again circulate the critical vacant support posts to other provincial departments for possible transfer of supernumerary staff.
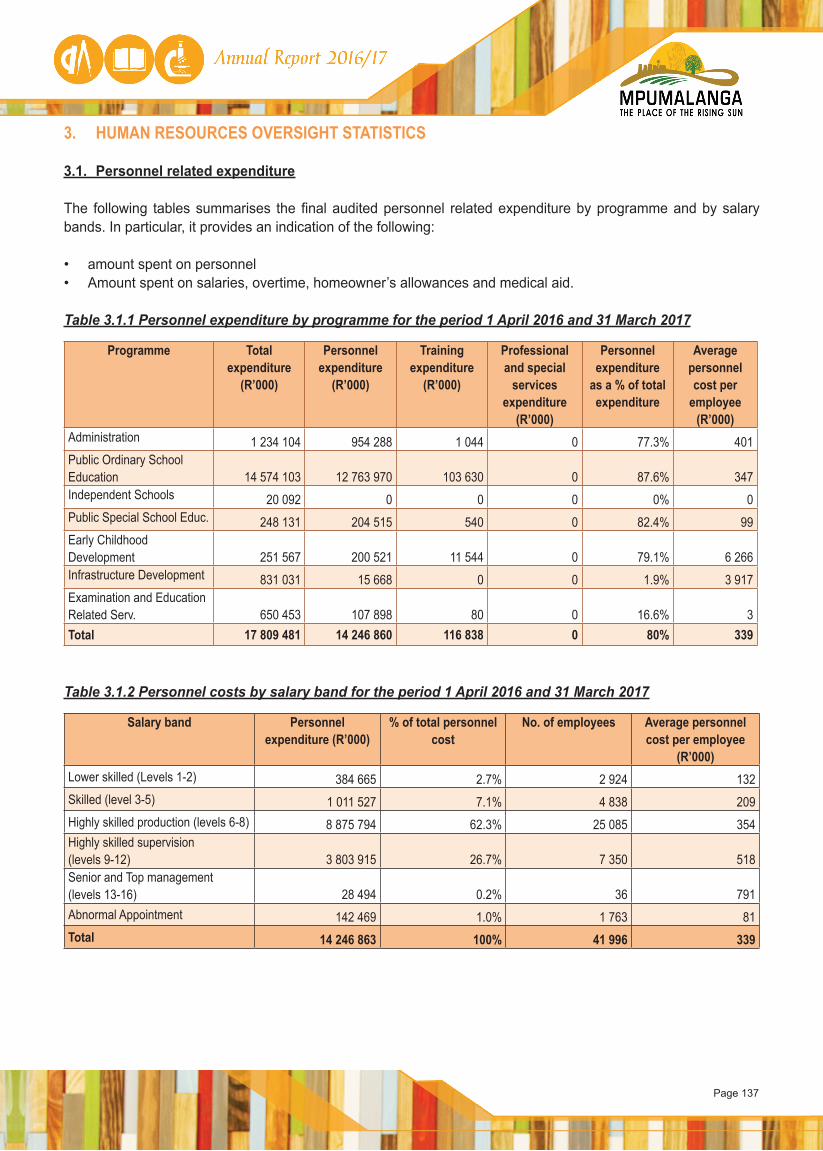
Page 137
3. HUMAN RESOURCES OVERSIGHT STATISTICS
3.1. Personnel related expenditure
The following tables summarises the final audited personnel related expenditure by programme and by salary bands. In particular, it provides an indication of the following:
• amount spent on personnel • Amount spent on salaries, overtime, homeowner’s allowances and medical aid.
Table 3.1.1 Personnel expenditure by programme for the period 1 April 2016 and 31 March 2017
Programme Total expenditure
(R’000)
Personnel expenditure
(R’000)
Training expenditure
(R’000)
Professional and special
services expenditure
(R’000)
Personnel expenditure
as a % of total expenditure
Average personnel cost per
employee (R’000)
Administration 1 234 104 954 288 1 044 0 77.3% 401Public Ordinary School Education 14 574 103 12 763 970 103 630 0 87.6% 347Independent Schools 20 092 0 0 0 0% 0Public Special School Educ. 248 131 204 515 540 0 82.4% 99Early Childhood Development 251 567 200 521 11 544 0 79.1% 6 266Infrastructure Development 831 031 15 668 0 0 1.9% 3 917Examination and Education Related Serv. 650 453 107 898 80 0 16.6% 3Total 17 809 481 14 246 860 116 838 0 80% 339
Table 3.1.2 Personnel costs by salary band for the period 1 April 2016 and 31 March 2017
Salary band Personnel expenditure (R’000)
% of total personnel cost
No. of employees Average personnel cost per employee
(R’000)Lower skilled (Levels 1-2) 384 665 2.7% 2 924 132Skilled (level 3-5) 1 011 527 7.1% 4 838 209Highly skilled production (levels 6-8) 8 875 794 62.3% 25 085 354Highly skilled supervision (levels 9-12) 3 803 915 26.7% 7 350 518Senior and Top management (levels 13-16) 28 494 0.2% 36 791Abnormal Appointment 142 469 1.0% 1 763 81Total 14 246 863 100% 41 996 339
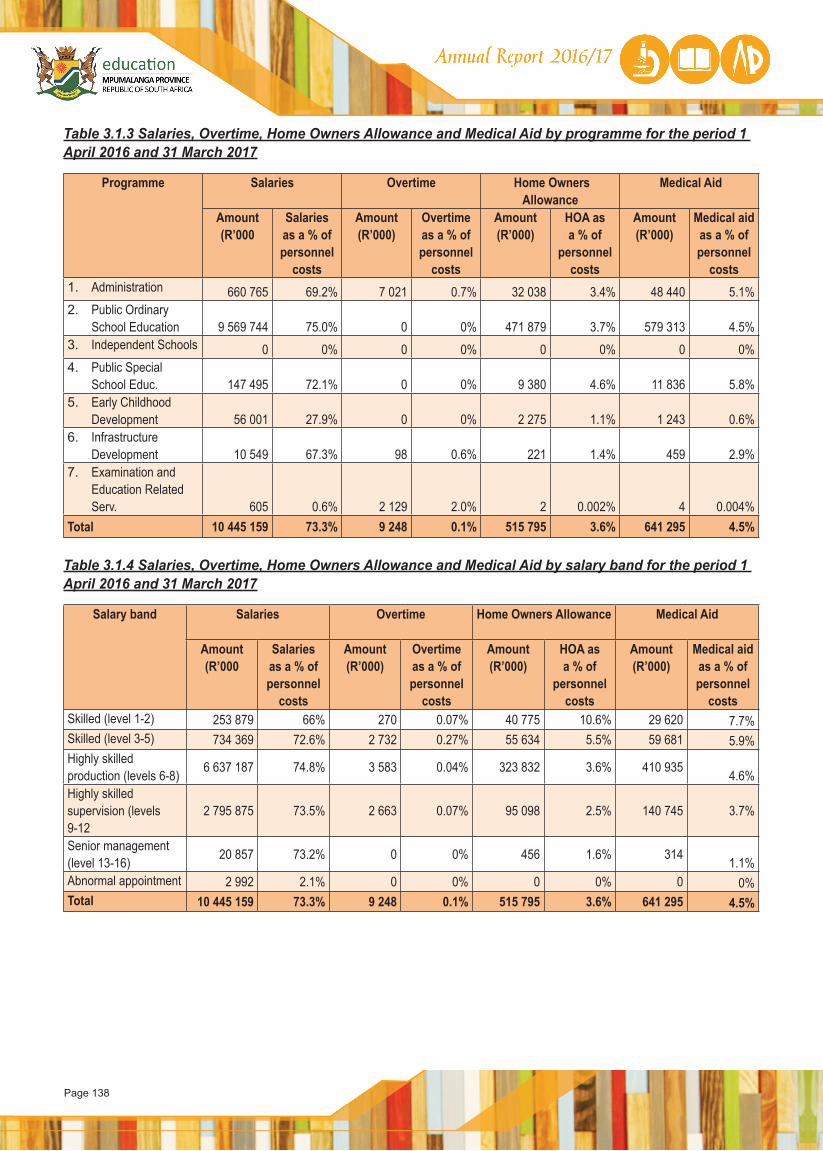
Page 138
Table 3.1.3 Salaries, Overtime, Home Owners Allowance and Medical Aid by programme for the period 1 April 2016 and 31 March 2017
Programme Salaries Overtime Home Owners Allowance
Medical Aid
Amount (R’000
Salaries as a % of personnel
costs
Amount (R’000)
Overtime as a % of personnel
costs
Amount (R’000)
HOA as a % of
personnel costs
Amount (R’000)
Medical aid as a % of personnel
costs 1. Administration 660 765 69.2% 7 021 0.7% 32 038 3.4% 48 440 5.1%2. Public Ordinary
School Education 9 569 744 75.0% 0 0% 471 879 3.7% 579 313 4.5%3. Independent Schools 0 0% 0 0% 0 0% 0 0%4. Public Special
School Educ. 147 495 72.1% 0 0% 9 380 4.6% 11 836 5.8%5. Early Childhood
Development 56 001 27.9% 0 0% 2 275 1.1% 1 243 0.6%6. Infrastructure
Development 10 549 67.3% 98 0.6% 221 1.4% 459 2.9%7. Examination and
Education Related Serv. 605 0.6% 2 129 2.0% 2 0.002% 4 0.004%
Total 10 445 159 73.3% 9 248 0.1% 515 795 3.6% 641 295 4.5%
Table 3.1.4 Salaries, Overtime, Home Owners Allowance and Medical Aid by salary band for the period 1 April 2016 and 31 March 2017
Salary band Salaries Overtime Home Owners Allowance Medical Aid
Amount (R’000
Salaries as a % of personnel
costs
Amount (R’000)
Overtime as a % of personnel
costs
Amount (R’000)
HOA as a % of
personnel costs
Amount (R’000)
Medical aid as a % of personnel
costs Skilled (level 1-2) 253 879 66% 270 0.07% 40 775 10.6% 29 620 7.7%Skilled (level 3-5) 734 369 72.6% 2 732 0.27% 55 634 5.5% 59 681 5.9%Highly skilled production (levels 6-8) 6 637 187 74.8% 3 583 0.04% 323 832 3.6% 410 935 4.6%Highly skilled supervision (levels 9-12
2 795 875 73.5% 2 663 0.07% 95 098 2.5% 140 745 3.7%
Senior management (level 13-16) 20 857 73.2% 0 0% 456 1.6% 314 1.1%Abnormal appointment 2 992 2.1% 0 0% 0 0% 0 0%Total 10 445 159 73.3% 9 248 0.1% 515 795 3.6% 641 295 4.5%

Page 139
3.2. Employment and Vacancies
The tables in this section summarise the position with regard to employment and vacancies.
The following tables summarise the number of posts on the establishment, the number of employees, the vacancy rate, and whether there are any staff that are additional to the establishment. This information is presented in terms of three key variables:
• programme• salary band• critical occupations (see definition in notes below).
Departments have identified critical occupations that need to be monitored. In terms of current regulations, it is possible to create a post on the establishment that can be occupied by more than one employee. Therefore, the vacancy rate reflects the percentage of posts that are not filled.
Notes pertaining to Tables 3.2.1 to 3.2.3
General:
− The number of posts on the approved establishment includes funded approved posts.
− Apart from the 1763 Grade R Practitioners, persons remunerated on abnormal appointments (fixed stipend or on claims basis) are not included in the HR Oversight tables.
− The 2068 filled posts on Program 5 include the 13 remaining educators in Pre-Primary Schools as well as the 2055 Grade R Practitioners/ Grade R Teachers in Public Schools.
− The filling of posts in offices (Programme 1 Administration) is prohibited as from February 2015 due to a provincial moratorium, which was extended to Support Staff posts in schools as from February 2017. Said moratorium does not apply to educator posts in schools.
Employees in addition to the establishment:
The 66 employees additional to the establishment are as follows:
− Programme 1: 1 x cleaner in the Office of the Executive Authority, 54 x Graduate Interns, as well as 3 x full-time contract staff to deal with the obsolete books project.
− Programme 2: 4 x full-time contract staff employed and remunerated from the Nutrition Conditional Grant.− Programme 7: 4 x full-time contract staff employed and remunerated from the Life Skills HIV and AIDS
Conditional Grant.
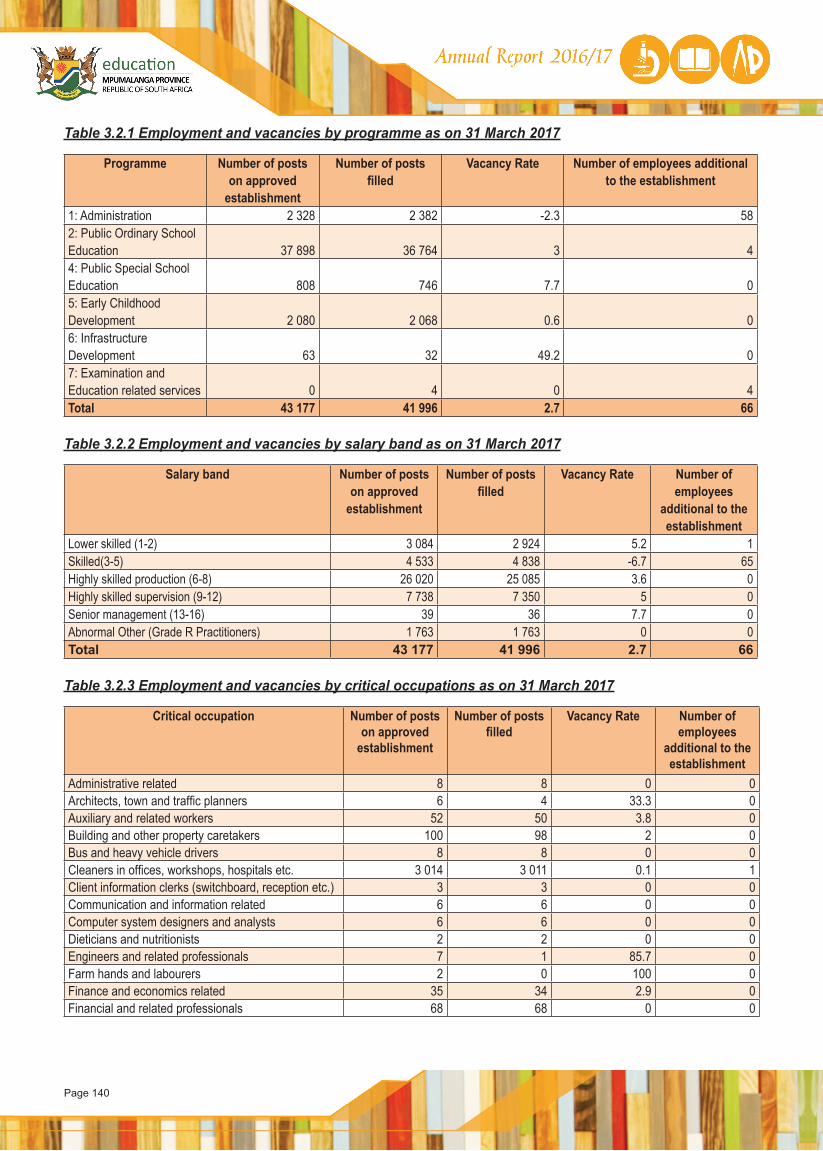
Page 140
Table 3.2.1 Employment and vacancies by programme as on 31 March 2017
Programme Number of posts on approved
establishment
Number of posts filled
Vacancy Rate Number of employees additional to the establishment
1: Administration 2 328 2 382 -2.3 582: Public Ordinary School Education 37 898 36 764 3 44: Public Special School Education 808 746 7.7 05: Early Childhood Development 2 080 2 068 0.6 06: Infrastructure Development 63 32 49.2 07: Examination and Education related services 0 4 0 4Total 43 177 41 996 2.7 66
Table 3.2.2 Employment and vacancies by salary band as on 31 March 2017
Salary band Number of posts on approved
establishment
Number of posts filled
Vacancy Rate Number of employees
additional to the establishment
Lower skilled (1-2) 3 084 2 924 5.2 1Skilled(3-5) 4 533 4 838 -6.7 65Highly skilled production (6-8) 26 020 25 085 3.6 0Highly skilled supervision (9-12) 7 738 7 350 5 0Senior management (13-16) 39 36 7.7 0Abnormal Other (Grade R Practitioners) 1 763 1 763 0 0Total 43 177 41 996 2.7 66
Table 3.2.3 Employment and vacancies by critical occupations as on 31 March 2017
Critical occupation Number of posts on approved
establishment
Number of posts filled
Vacancy Rate Number of employees
additional to the establishment
Administrative related 8 8 0 0Architects, town and traffic planners 6 4 33.3 0Auxiliary and related workers 52 50 3.8 0Building and other property caretakers 100 98 2 0Bus and heavy vehicle drivers 8 8 0 0Cleaners in offices, workshops, hospitals etc. 3 014 3 011 0.1 1Client information clerks (switchboard, reception etc.) 3 3 0 0Communication and information related 6 6 0 0Computer system designers and analysts 6 6 0 0Dieticians and nutritionists 2 2 0 0Engineers and related professionals 7 1 85.7 0Farm hands and labourers 2 0 100 0Finance and economics related 35 34 2.9 0Financial and related professionals 68 68 0 0
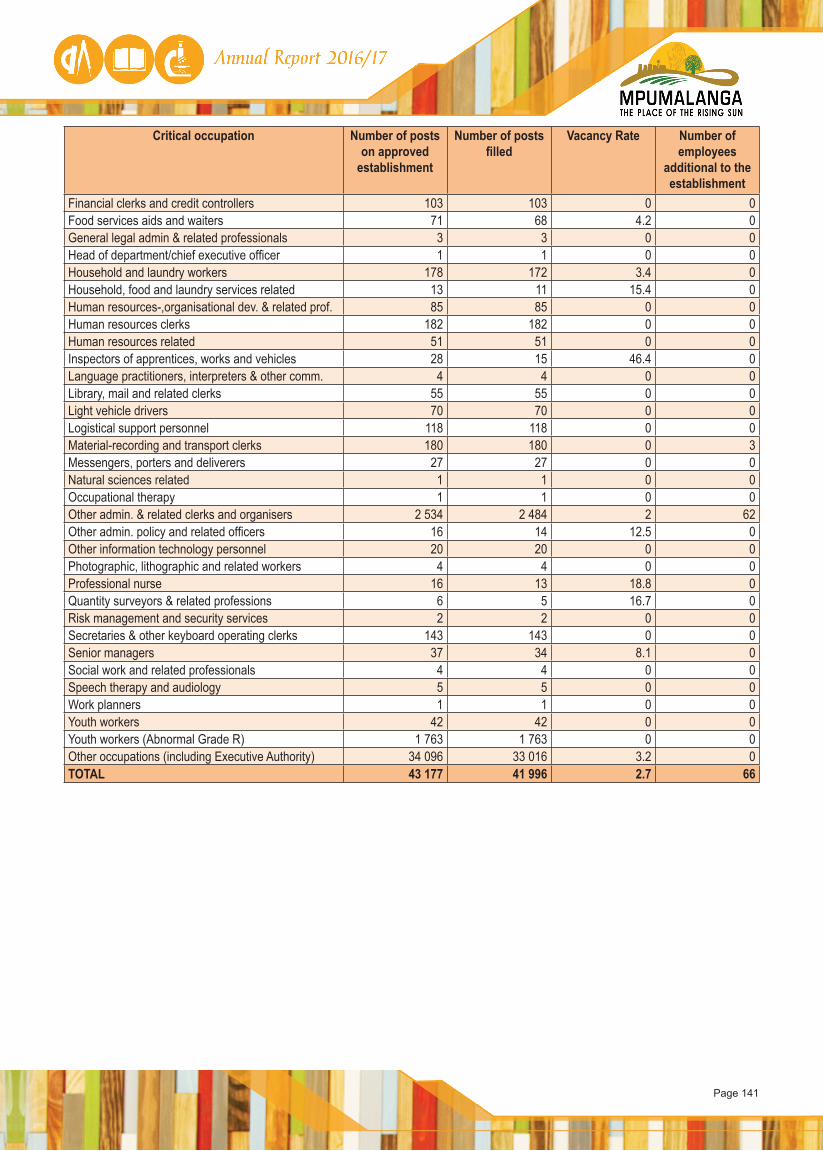
Page 141
Critical occupation Number of posts on approved
establishment
Number of posts filled
Vacancy Rate Number of employees
additional to the establishment
Financial clerks and credit controllers 103 103 0 0Food services aids and waiters 71 68 4.2 0General legal admin & related professionals 3 3 0 0Head of department/chief executive officer 1 1 0 0Household and laundry workers 178 172 3.4 0Household, food and laundry services related 13 11 15.4 0Human resources-,organisational dev. & related prof. 85 85 0 0Human resources clerks 182 182 0 0Human resources related 51 51 0 0Inspectors of apprentices, works and vehicles 28 15 46.4 0Language practitioners, interpreters & other comm. 4 4 0 0Library, mail and related clerks 55 55 0 0Light vehicle drivers 70 70 0 0Logistical support personnel 118 118 0 0Material-recording and transport clerks 180 180 0 3Messengers, porters and deliverers 27 27 0 0Natural sciences related 1 1 0 0Occupational therapy 1 1 0 0Other admin. & related clerks and organisers 2 534 2 484 2 62Other admin. policy and related officers 16 14 12.5 0Other information technology personnel 20 20 0 0Photographic, lithographic and related workers 4 4 0 0Professional nurse 16 13 18.8 0Quantity surveyors & related professions 6 5 16.7 0Risk management and security services 2 2 0 0Secretaries & other keyboard operating clerks 143 143 0 0Senior managers 37 34 8.1 0Social work and related professionals 4 4 0 0Speech therapy and audiology 5 5 0 0Work planners 1 1 0 0Youth workers 42 42 0 0Youth workers (Abnormal Grade R) 1 763 1 763 0 0Other occupations (including Executive Authority) 34 096 33 016 3.2 0TOTAL 43 177 41 996 2.7 66
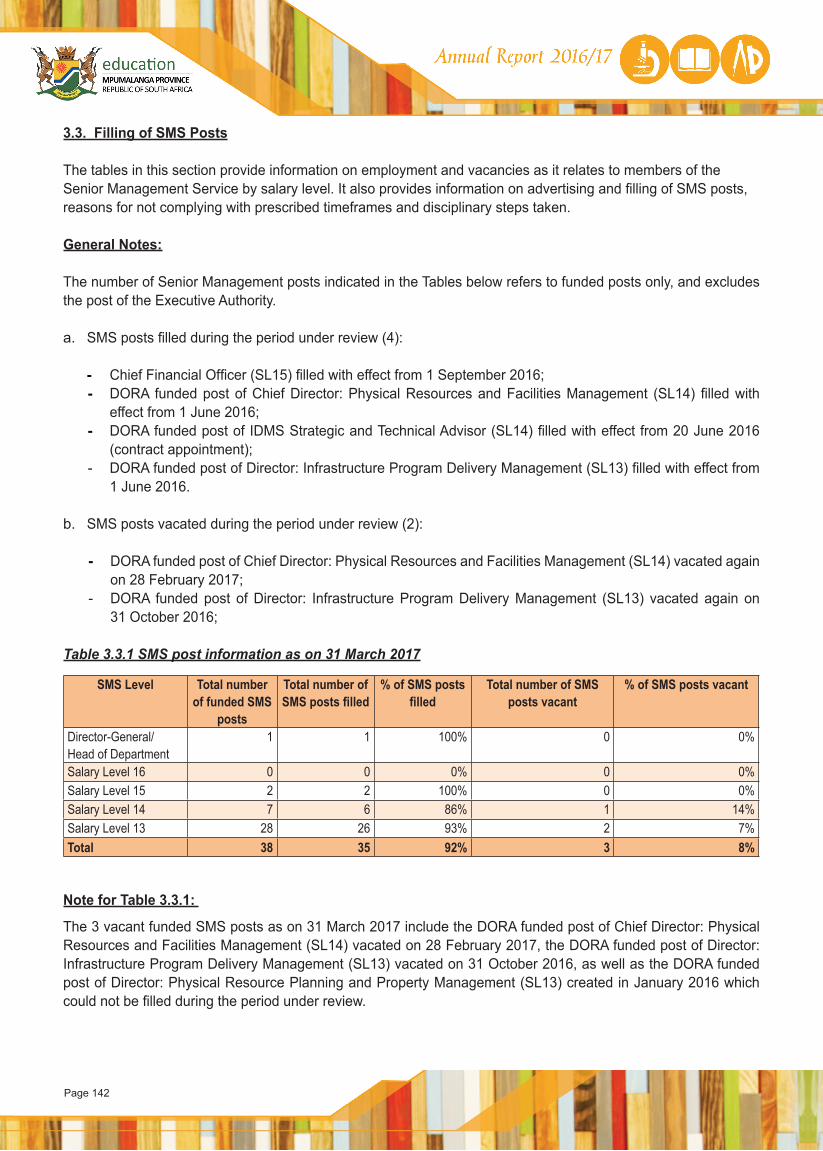
Page 142
3.3. Filling of SMS Posts
The tables in this section provide information on employment and vacancies as it relates to members of the Senior Management Service by salary level. It also provides information on advertising and filling of SMS posts, reasons for not complying with prescribed timeframes and disciplinary steps taken.
General Notes:
The number of Senior Management posts indicated in the Tables below refers to funded posts only, and excludes the post of the Executive Authority.
a. SMS posts filled during the period under review (4):
- Chief Financial Officer (SL15) filled with effect from 1 September 2016;- DORA funded post of Chief Director: Physical Resources and Facilities Management (SL14) filled with
effect from 1 June 2016; - DORA funded post of IDMS Strategic and Technical Advisor (SL14) filled with effect from 20 June 2016
(contract appointment);- DORA funded post of Director: Infrastructure Program Delivery Management (SL13) filled with effect from
1 June 2016.
b. SMS posts vacated during the period under review (2):
- DORA funded post of Chief Director: Physical Resources and Facilities Management (SL14) vacated again on 28 February 2017;
- DORA funded post of Director: Infrastructure Program Delivery Management (SL13) vacated again on 31 October 2016;
Table 3.3.1 SMS post information as on 31 March 2017
SMS Level Total number of funded SMS
posts
Total number of SMS posts filled
% of SMS posts filled
Total number of SMS posts vacant
% of SMS posts vacant
Director-General/ Head of Department
1 1 100% 0 0%
Salary Level 16 0 0 0% 0 0%Salary Level 15 2 2 100% 0 0%Salary Level 14 7 6 86% 1 14%Salary Level 13 28 26 93% 2 7%Total 38 35 92% 3 8%
Note for Table 3.3.1:
The 3 vacant funded SMS posts as on 31 March 2017 include the DORA funded post of Chief Director: Physical Resources and Facilities Management (SL14) vacated on 28 February 2017, the DORA funded post of Director: Infrastructure Program Delivery Management (SL13) vacated on 31 October 2016, as well as the DORA funded post of Director: Physical Resource Planning and Property Management (SL13) created in January 2016 which could not be filled during the period under review.
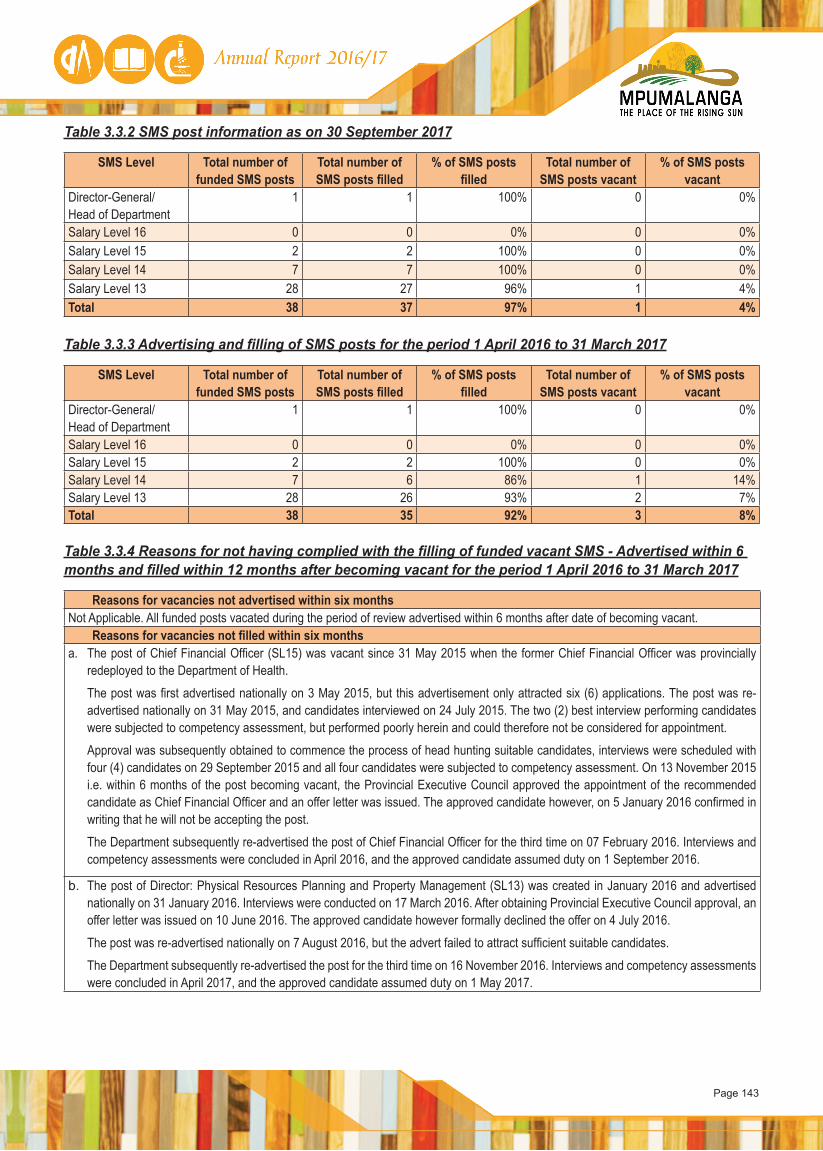
Page 143
Table 3.3.2 SMS post information as on 30 September 2017
SMS Level Total number of funded SMS posts
Total number of SMS posts filled
% of SMS posts filled
Total number of SMS posts vacant
% of SMS posts vacant
Director-General/ Head of Department
1 1 100% 0 0%
Salary Level 16 0 0 0% 0 0%Salary Level 15 2 2 100% 0 0%Salary Level 14 7 7 100% 0 0%Salary Level 13 28 27 96% 1 4%Total 38 37 97% 1 4%
Table 3.3.3 Advertising and filling of SMS posts for the period 1 April 2016 to 31 March 2017
SMS Level Total number of funded SMS posts
Total number of SMS posts filled
% of SMS posts filled
Total number of SMS posts vacant
% of SMS posts vacant
Director-General/ Head of Department
1 1 100% 0 0%
Salary Level 16 0 0 0% 0 0%Salary Level 15 2 2 100% 0 0%Salary Level 14 7 6 86% 1 14%Salary Level 13 28 26 93% 2 7%Total 38 35 92% 3 8%
Table 3.3.4 Reasons for not having complied with the filling of funded vacant SMS - Advertised within 6 months and filled within 12 months after becoming vacant for the period 1 April 2016 to 31 March 2017
Reasons for vacancies not advertised within six monthsNot Applicable. All funded posts vacated during the period of review advertised within 6 months after date of becoming vacant.
Reasons for vacancies not filled within six monthsa. The post of Chief Financial Officer (SL15) was vacant since 31 May 2015 when the former Chief Financial Officer was provincially
redeployed to the Department of Health.
The post was first advertised nationally on 3 May 2015, but this advertisement only attracted six (6) applications. The post was re-advertised nationally on 31 May 2015, and candidates interviewed on 24 July 2015. The two (2) best interview performing candidates were subjected to competency assessment, but performed poorly herein and could therefore not be considered for appointment.
Approval was subsequently obtained to commence the process of head hunting suitable candidates, interviews were scheduled with four (4) candidates on 29 September 2015 and all four candidates were subjected to competency assessment. On 13 November 2015 i.e. within 6 months of the post becoming vacant, the Provincial Executive Council approved the appointment of the recommended candidate as Chief Financial Officer and an offer letter was issued. The approved candidate however, on 5 January 2016 confirmed in writing that he will not be accepting the post.
The Department subsequently re-advertised the post of Chief Financial Officer for the third time on 07 February 2016. Interviews and competency assessments were concluded in April 2016, and the approved candidate assumed duty on 1 September 2016.
b. The post of Director: Physical Resources Planning and Property Management (SL13) was created in January 2016 and advertised nationally on 31 January 2016. Interviews were conducted on 17 March 2016. After obtaining Provincial Executive Council approval, an offer letter was issued on 10 June 2016. The approved candidate however formally declined the offer on 4 July 2016.
The post was re-advertised nationally on 7 August 2016, but the advert failed to attract sufficient suitable candidates.
The Department subsequently re-advertised the post for the third time on 16 November 2016. Interviews and competency assessments were concluded in April 2017, and the approved candidate assumed duty on 1 May 2017.

Page 144
Table 3.3.5 Disciplinary steps taken for not complying with the prescribed time-frames for filling SMS posts within 12 months for the period 1 April 2016 and 31 March 2017
Reasons for vacancies not advertised within six monthsNot applicableReasons for vacancies not filled within six monthsNo disciplinary steps taken in view of good cause / reasons as indicated in Table 3.3.4.
3.4 Job Evaluation
Within a nationally determined framework, executing authorities may evaluate or re-evaluate any job in his or her organisation. In terms of the Regulations all vacancies on salary levels 9 and higher must be evaluated before they are filled. The following table summarises the number of jobs that were evaluated during the year under review. The table also provides statistics on the number of posts that were upgraded or downgraded.
Table 3.4.1 Job Evaluation by Salary band for the period 1 April 2016 and 31 March 2017
Salary band Number of posts on approved
establishment
Number of Jobs
Evaluated
% of posts evaluated by salary bands
Posts Upgraded Posts downgradedNumber % of posts
evaluatedNumber % of posts
evaluated
Lower Skilled (Levels1-2) 3 084 0 0% 0 0% 0 0%Skilled (Levels 3-5) 4 533 0 0% 0 0% 0 0%Highly skilled production (Levels 6-8)
26 020 0 0% 0 0% 0 0%
Highly skilled supervision(Levels 9-12)
7 738 6 0.1% 6 100% 0 0%
Senior Management Service Band A
28 0 0% 0 0% 0 0%
Senior Management Service Band B
7 0 0% 0 0% 0 0%
Senior Management Service Band C
2 0 0% 0 0% 0 0%
Senior Management Service Band D
2 0 0% 0 0% 0 0%
Abnormal Other 1 763 0 0% 0 0% 0 0%Total 43 177 6 0.01% 6 100% 0 0%
The following table provides a summary of the number of employees whose positions were upgraded due to their post being upgraded. The number of employees might differ from the number of posts upgraded since not all employees are automatically absorbed into the new posts and some of the posts upgraded could also be vacant.
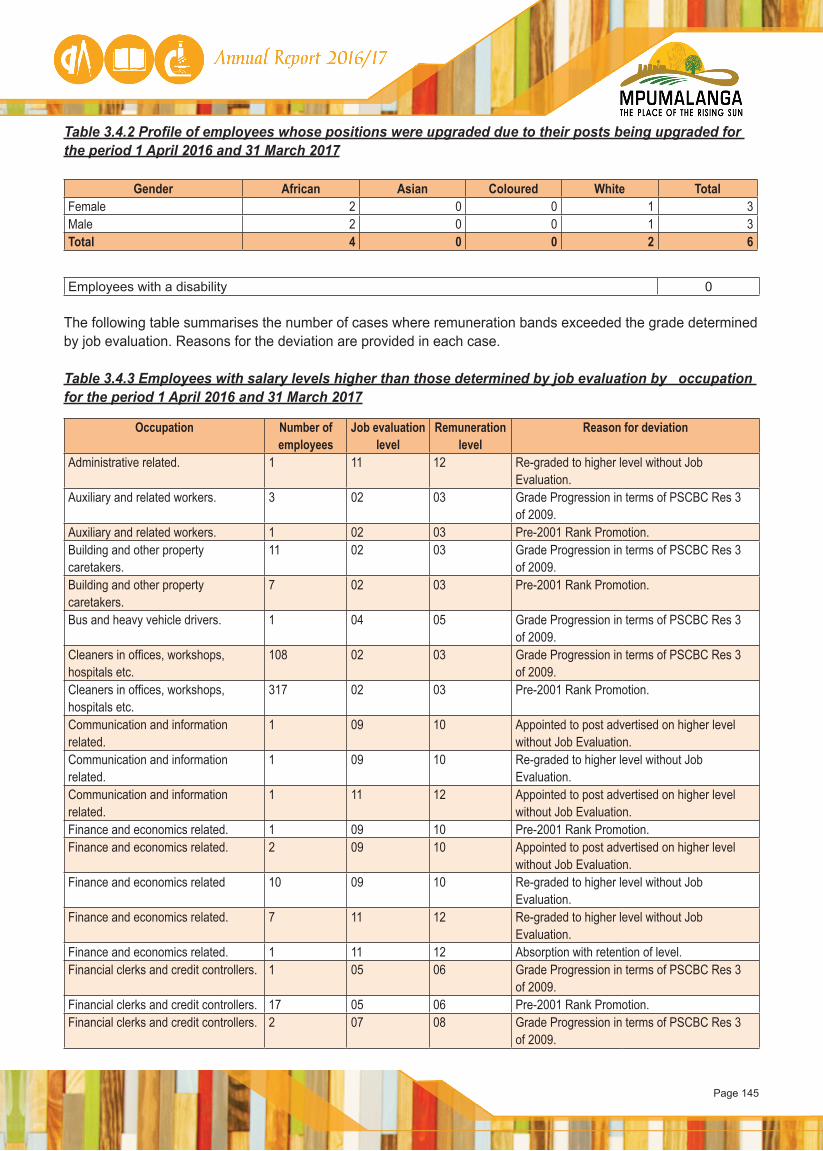
Page 145
Table 3.4.2 Profile of employees whose positions were upgraded due to their posts being upgraded for the period 1 April 2016 and 31 March 2017
Gender African Asian Coloured White TotalFemale 2 0 0 1 3Male 2 0 0 1 3Total 4 0 0 2 6
Employees with a disability 0
The following table summarises the number of cases where remuneration bands exceeded the grade determined by job evaluation. Reasons for the deviation are provided in each case.
Table 3.4.3 Employees with salary levels higher than those determined by job evaluation by occupation for the period 1 April 2016 and 31 March 2017
Occupation Number of employees
Job evaluation level
Remuneration level
Reason for deviation
Administrative related. 1 11 12 Re-graded to higher level without Job Evaluation.
Auxiliary and related workers. 3 02 03 Grade Progression in terms of PSCBC Res 3 of 2009.
Auxiliary and related workers. 1 02 03 Pre-2001 Rank Promotion.Building and other property caretakers.
11 02 03 Grade Progression in terms of PSCBC Res 3 of 2009.
Building and other property caretakers.
7 02 03 Pre-2001 Rank Promotion.
Bus and heavy vehicle drivers. 1 04 05 Grade Progression in terms of PSCBC Res 3 of 2009.
Cleaners in offices, workshops, hospitals etc.
108 02 03 Grade Progression in terms of PSCBC Res 3 of 2009.
Cleaners in offices, workshops, hospitals etc.
317 02 03 Pre-2001 Rank Promotion.
Communication and information related.
1 09 10 Appointed to post advertised on higher level without Job Evaluation.
Communication and information related.
1 09 10 Re-graded to higher level without Job Evaluation.
Communication and information related.
1 11 12 Appointed to post advertised on higher level without Job Evaluation.
Finance and economics related. 1 09 10 Pre-2001 Rank Promotion.Finance and economics related. 2 09 10 Appointed to post advertised on higher level
without Job Evaluation.Finance and economics related 10 09 10 Re-graded to higher level without Job
Evaluation.Finance and economics related. 7 11 12 Re-graded to higher level without Job
Evaluation.Finance and economics related. 1 11 12 Absorption with retention of level.Financial clerks and credit controllers. 1 05 06 Grade Progression in terms of PSCBC Res 3
of 2009.Financial clerks and credit controllers. 17 05 06 Pre-2001 Rank Promotion.Financial clerks and credit controllers. 2 07 08 Grade Progression in terms of PSCBC Res 3
of 2009.
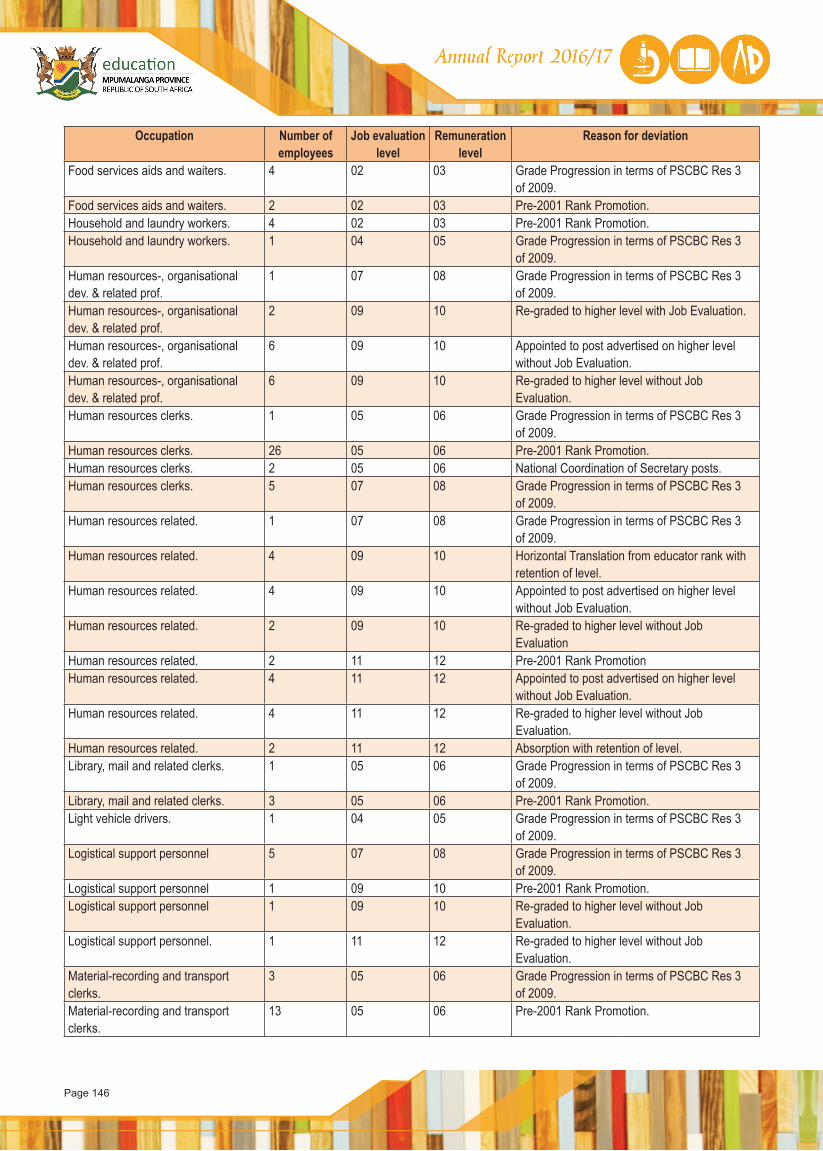
Page 146
Occupation Number of employees
Job evaluation level
Remuneration level
Reason for deviation
Food services aids and waiters. 4 02 03 Grade Progression in terms of PSCBC Res 3 of 2009.
Food services aids and waiters. 2 02 03 Pre-2001 Rank Promotion.Household and laundry workers. 4 02 03 Pre-2001 Rank Promotion.Household and laundry workers. 1 04 05 Grade Progression in terms of PSCBC Res 3
of 2009.Human resources-, organisational dev. & related prof.
1 07 08 Grade Progression in terms of PSCBC Res 3 of 2009.
Human resources-, organisational dev. & related prof.
2 09 10 Re-graded to higher level with Job Evaluation.
Human resources-, organisational dev. & related prof.
6 09 10 Appointed to post advertised on higher level without Job Evaluation.
Human resources-, organisational dev. & related prof.
6 09 10 Re-graded to higher level without Job Evaluation.
Human resources clerks. 1 05 06 Grade Progression in terms of PSCBC Res 3 of 2009.
Human resources clerks. 26 05 06 Pre-2001 Rank Promotion.Human resources clerks. 2 05 06 National Coordination of Secretary posts.Human resources clerks. 5 07 08 Grade Progression in terms of PSCBC Res 3
of 2009.Human resources related. 1 07 08 Grade Progression in terms of PSCBC Res 3
of 2009.Human resources related. 4 09 10 Horizontal Translation from educator rank with
retention of level.Human resources related. 4 09 10 Appointed to post advertised on higher level
without Job Evaluation.Human resources related. 2 09 10 Re-graded to higher level without Job
EvaluationHuman resources related. 2 11 12 Pre-2001 Rank PromotionHuman resources related. 4 11 12 Appointed to post advertised on higher level
without Job Evaluation.Human resources related. 4 11 12 Re-graded to higher level without Job
Evaluation.Human resources related. 2 11 12 Absorption with retention of level.Library, mail and related clerks. 1 05 06 Grade Progression in terms of PSCBC Res 3
of 2009.Library, mail and related clerks. 3 05 06 Pre-2001 Rank Promotion.Light vehicle drivers. 1 04 05 Grade Progression in terms of PSCBC Res 3
of 2009.Logistical support personnel 5 07 08 Grade Progression in terms of PSCBC Res 3
of 2009.Logistical support personnel 1 09 10 Pre-2001 Rank Promotion.Logistical support personnel 1 09 10 Re-graded to higher level without Job
Evaluation.Logistical support personnel. 1 11 12 Re-graded to higher level without Job
Evaluation.Material-recording and transport clerks.
3 05 06 Grade Progression in terms of PSCBC Res 3 of 2009.
Material-recording and transport clerks.
13 05 06 Pre-2001 Rank Promotion.
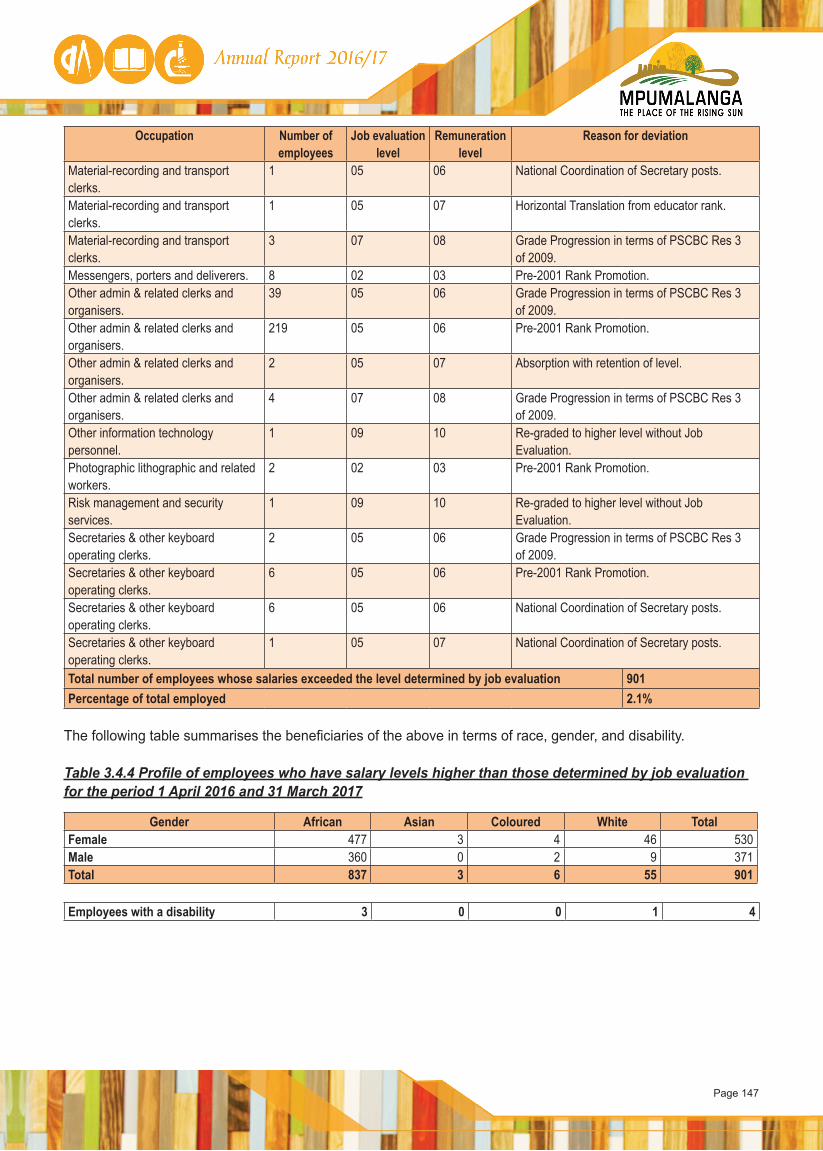
Page 147
Occupation Number of employees
Job evaluation level
Remuneration level
Reason for deviation
Material-recording and transport clerks.
1 05 06 National Coordination of Secretary posts.
Material-recording and transport clerks.
1 05 07 Horizontal Translation from educator rank.
Material-recording and transport clerks.
3 07 08 Grade Progression in terms of PSCBC Res 3 of 2009.
Messengers, porters and deliverers. 8 02 03 Pre-2001 Rank Promotion.Other admin & related clerks and organisers.
39 05 06 Grade Progression in terms of PSCBC Res 3 of 2009.
Other admin & related clerks and organisers.
219 05 06 Pre-2001 Rank Promotion.
Other admin & related clerks and organisers.
2 05 07 Absorption with retention of level.
Other admin & related clerks and organisers.
4 07 08 Grade Progression in terms of PSCBC Res 3 of 2009.
Other information technology personnel.
1 09 10 Re-graded to higher level without Job Evaluation.
Photographic lithographic and related workers.
2 02 03 Pre-2001 Rank Promotion.
Risk management and security services.
1 09 10 Re-graded to higher level without Job Evaluation.
Secretaries & other keyboard operating clerks.
2 05 06 Grade Progression in terms of PSCBC Res 3 of 2009.
Secretaries & other keyboard operating clerks.
6 05 06 Pre-2001 Rank Promotion.
Secretaries & other keyboard operating clerks.
6 05 06 National Coordination of Secretary posts.
Secretaries & other keyboard operating clerks.
1 05 07 National Coordination of Secretary posts.
Total number of employees whose salaries exceeded the level determined by job evaluation 901Percentage of total employed 2.1%
The following table summarises the beneficiaries of the above in terms of race, gender, and disability.
Table 3.4.4 Profile of employees who have salary levels higher than those determined by job evaluation for the period 1 April 2016 and 31 March 2017
Gender African Asian Coloured White TotalFemale 477 3 4 46 530Male 360 0 2 9 371Total 837 3 6 55 901
Employees with a disability 3 0 0 1 4
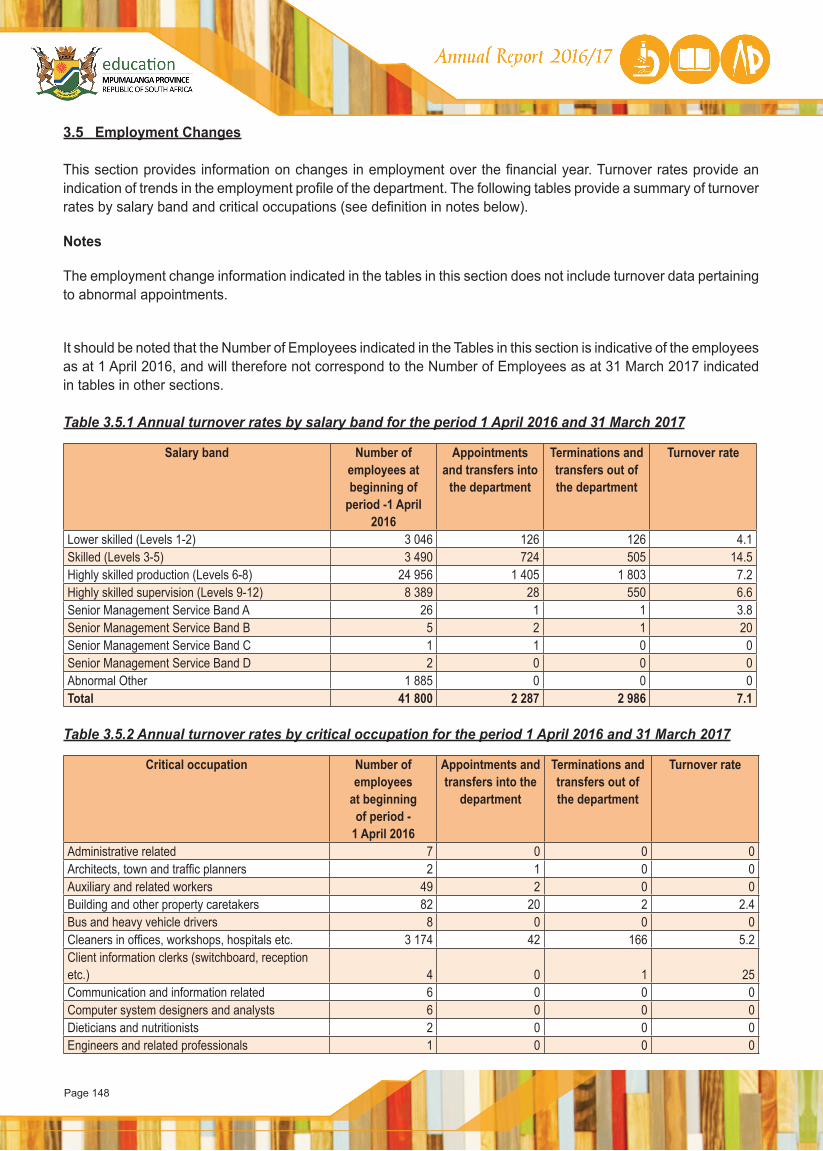
Page 148
3.5 Employment Changes
This section provides information on changes in employment over the financial year. Turnover rates provide an indication of trends in the employment profile of the department. The following tables provide a summary of turnover rates by salary band and critical occupations (see definition in notes below).
Notes
The employment change information indicated in the tables in this section does not include turnover data pertaining to abnormal appointments.
It should be noted that the Number of Employees indicated in the Tables in this section is indicative of the employees as at 1 April 2016, and will therefore not correspond to the Number of Employees as at 31 March 2017 indicated in tables in other sections. Table 3.5.1 Annual turnover rates by salary band for the period 1 April 2016 and 31 March 2017
Salary band Number of employees at beginning of
period -1 April 2016
Appointments and transfers into
the department
Terminations and transfers out of the department
Turnover rate
Lower skilled (Levels 1-2) 3 046 126 126 4.1Skilled (Levels 3-5) 3 490 724 505 14.5Highly skilled production (Levels 6-8) 24 956 1 405 1 803 7.2Highly skilled supervision (Levels 9-12) 8 389 28 550 6.6Senior Management Service Band A 26 1 1 3.8Senior Management Service Band B 5 2 1 20Senior Management Service Band C 1 1 0 0Senior Management Service Band D 2 0 0 0Abnormal Other 1 885 0 0 0Total 41 800 2 287 2 986 7.1
Table 3.5.2 Annual turnover rates by critical occupation for the period 1 April 2016 and 31 March 2017
Critical occupation Number of employees
at beginning of period -
1 April 2016
Appointments and transfers into the
department
Terminations and transfers out of the department
Turnover rate
Administrative related 7 0 0 0Architects, town and traffic planners 2 1 0 0Auxiliary and related workers 49 2 0 0Building and other property caretakers 82 20 2 2.4Bus and heavy vehicle drivers 8 0 0 0Cleaners in offices, workshops, hospitals etc. 3 174 42 166 5.2Client information clerks (switchboard, reception etc.) 4 0 1 25Communication and information related 6 0 0 0Computer system designers and analysts 6 0 0 0Dieticians and nutritionists 2 0 0 0Engineers and related professionals 1 0 0 0
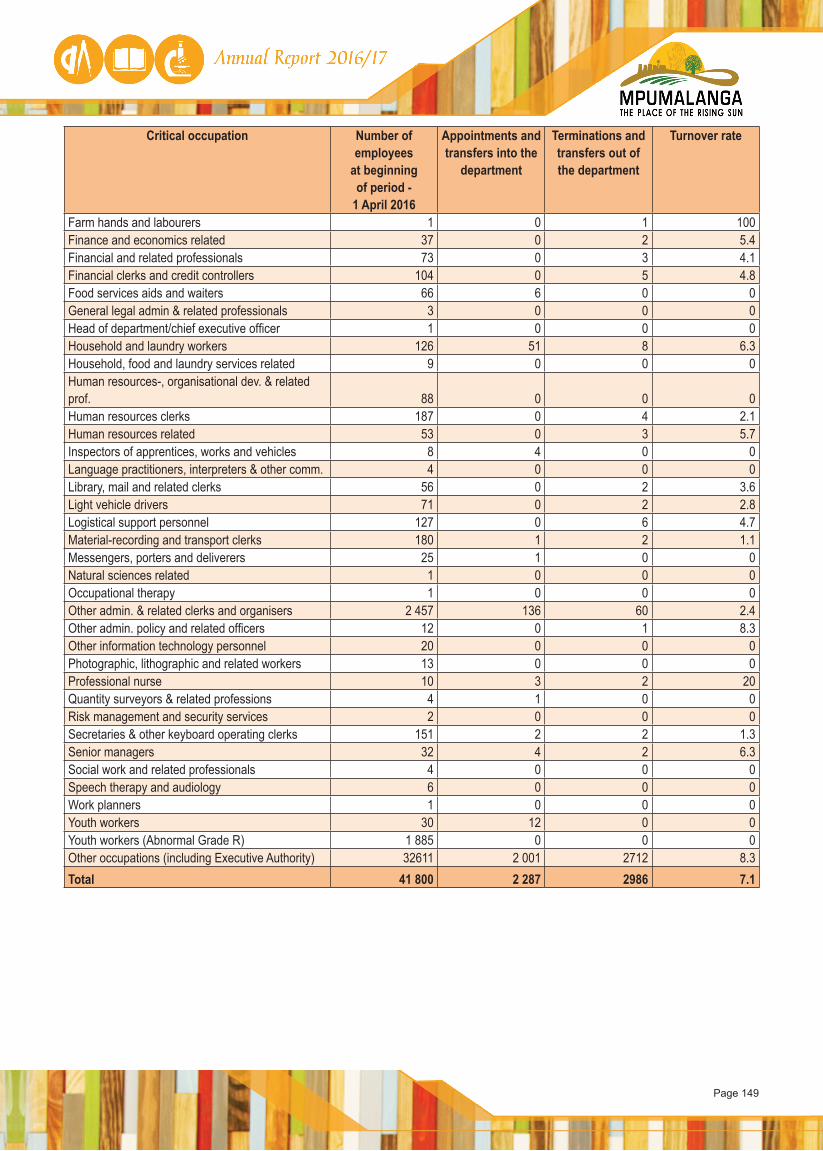
Page 149
Critical occupation Number of employees
at beginning of period -
1 April 2016
Appointments and transfers into the
department
Terminations and transfers out of the department
Turnover rate
Farm hands and labourers 1 0 1 100Finance and economics related 37 0 2 5.4Financial and related professionals 73 0 3 4.1Financial clerks and credit controllers 104 0 5 4.8Food services aids and waiters 66 6 0 0General legal admin & related professionals 3 0 0 0Head of department/chief executive officer 1 0 0 0Household and laundry workers 126 51 8 6.3Household, food and laundry services related 9 0 0 0Human resources-, organisational dev. & related prof. 88 0 0 0Human resources clerks 187 0 4 2.1Human resources related 53 0 3 5.7Inspectors of apprentices, works and vehicles 8 4 0 0Language practitioners, interpreters & other comm. 4 0 0 0Library, mail and related clerks 56 0 2 3.6Light vehicle drivers 71 0 2 2.8Logistical support personnel 127 0 6 4.7Material-recording and transport clerks 180 1 2 1.1Messengers, porters and deliverers 25 1 0 0Natural sciences related 1 0 0 0Occupational therapy 1 0 0 0Other admin. & related clerks and organisers 2 457 136 60 2.4Other admin. policy and related officers 12 0 1 8.3Other information technology personnel 20 0 0 0Photographic, lithographic and related workers 13 0 0 0Professional nurse 10 3 2 20Quantity surveyors & related professions 4 1 0 0Risk management and security services 2 0 0 0Secretaries & other keyboard operating clerks 151 2 2 1.3Senior managers 32 4 2 6.3Social work and related professionals 4 0 0 0Speech therapy and audiology 6 0 0 0Work planners 1 0 0 0Youth workers 30 12 0 0Youth workers (Abnormal Grade R) 1 885 0 0 0Other occupations (including Executive Authority) 32611 2 001 2712 8.3Total 41 800 2 287 2986 7.1
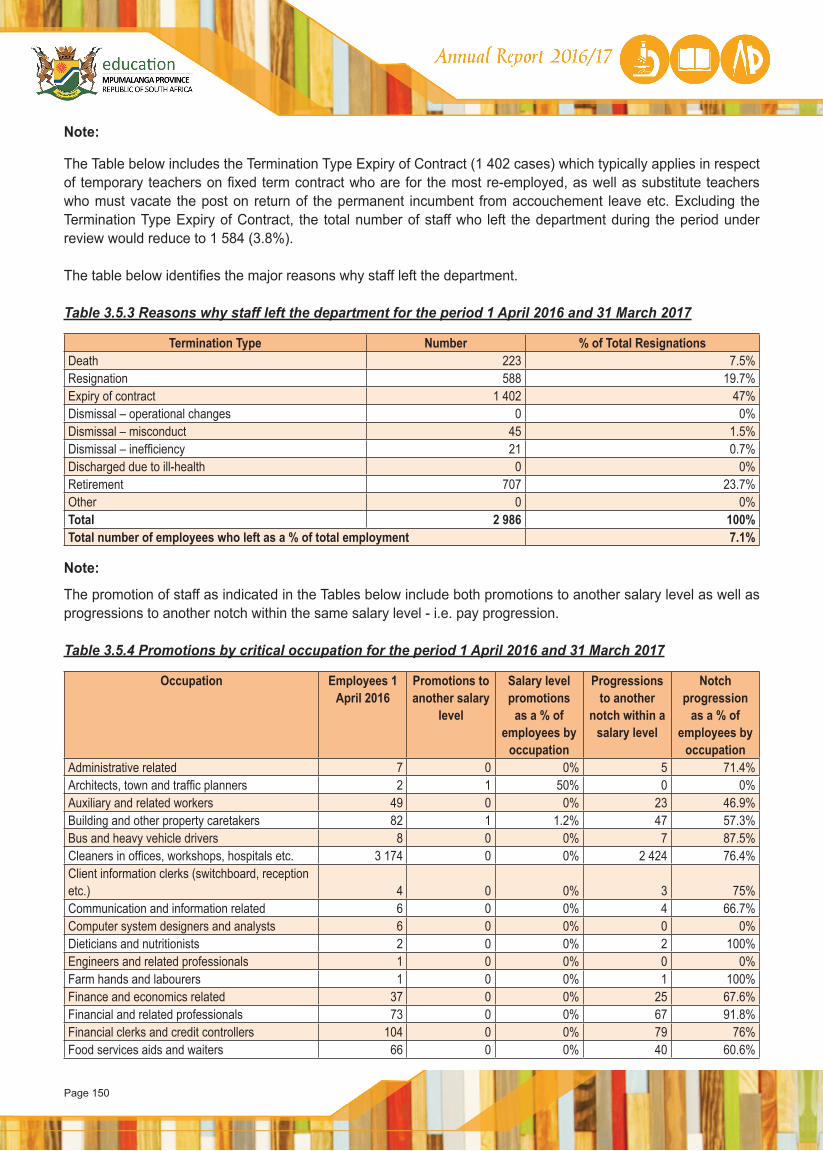
Page 150
Note:
The Table below includes the Termination Type Expiry of Contract (1 402 cases) which typically applies in respect of temporary teachers on fixed term contract who are for the most re-employed, as well as substitute teachers who must vacate the post on return of the permanent incumbent from accouchement leave etc. Excluding the Termination Type Expiry of Contract, the total number of staff who left the department during the period under review would reduce to 1 584 (3.8%). The table below identifies the major reasons why staff left the department.
Table 3.5.3 Reasons why staff left the department for the period 1 April 2016 and 31 March 2017
Termination Type Number % of Total ResignationsDeath 223 7.5%Resignation 588 19.7%Expiry of contract 1 402 47%Dismissal – operational changes 0 0%Dismissal – misconduct 45 1.5%Dismissal – inefficiency 21 0.7%Discharged due to ill-health 0 0%Retirement 707 23.7%Other 0 0%Total 2 986 100%Total number of employees who left as a % of total employment 7.1%
Note:
The promotion of staff as indicated in the Tables below include both promotions to another salary level as well as progressions to another notch within the same salary level - i.e. pay progression.
Table 3.5.4 Promotions by critical occupation for the period 1 April 2016 and 31 March 2017
Occupation Employees 1 April 2016
Promotions to another salary
level
Salary level promotions
as a % of employees by
occupation
Progressions to another
notch within a salary level
Notch progression
as a % of employees by
occupationAdministrative related 7 0 0% 5 71.4%Architects, town and traffic planners 2 1 50% 0 0%Auxiliary and related workers 49 0 0% 23 46.9%Building and other property caretakers 82 1 1.2% 47 57.3%Bus and heavy vehicle drivers 8 0 0% 7 87.5%Cleaners in offices, workshops, hospitals etc. 3 174 0 0% 2 424 76.4%Client information clerks (switchboard, reception etc.) 4 0 0% 3 75%Communication and information related 6 0 0% 4 66.7%Computer system designers and analysts 6 0 0% 0 0%Dieticians and nutritionists 2 0 0% 2 100%Engineers and related professionals 1 0 0% 0 0%Farm hands and labourers 1 0 0% 1 100%Finance and economics related 37 0 0% 25 67.6%Financial and related professionals 73 0 0% 67 91.8%Financial clerks and credit controllers 104 0 0% 79 76%Food services aids and waiters 66 0 0% 40 60.6%
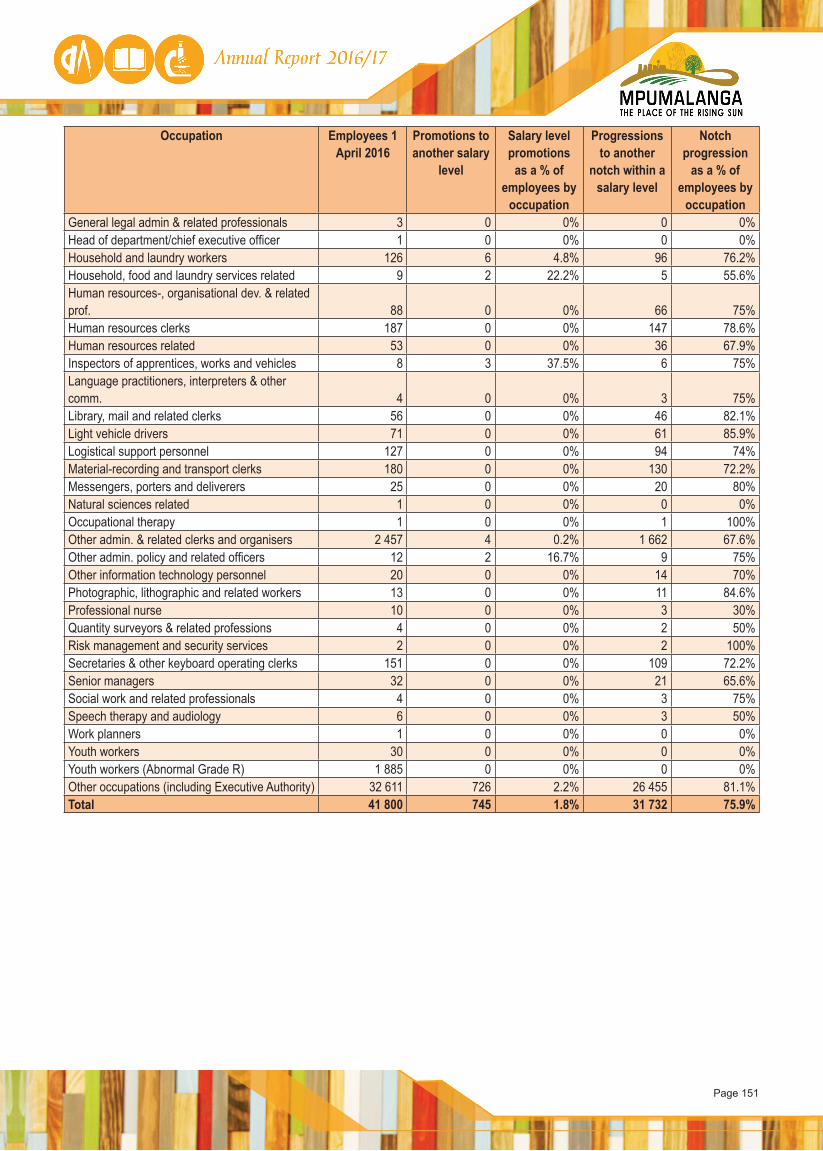
Page 151
Occupation Employees 1 April 2016
Promotions to another salary
level
Salary level promotions
as a % of employees by
occupation
Progressions to another
notch within a salary level
Notch progression
as a % of employees by
occupationGeneral legal admin & related professionals 3 0 0% 0 0%Head of department/chief executive officer 1 0 0% 0 0%Household and laundry workers 126 6 4.8% 96 76.2%Household, food and laundry services related 9 2 22.2% 5 55.6%Human resources-, organisational dev. & related prof. 88 0 0% 66 75%Human resources clerks 187 0 0% 147 78.6%Human resources related 53 0 0% 36 67.9%Inspectors of apprentices, works and vehicles 8 3 37.5% 6 75%Language practitioners, interpreters & other comm. 4 0 0% 3 75%Library, mail and related clerks 56 0 0% 46 82.1%Light vehicle drivers 71 0 0% 61 85.9%Logistical support personnel 127 0 0% 94 74%Material-recording and transport clerks 180 0 0% 130 72.2%Messengers, porters and deliverers 25 0 0% 20 80%Natural sciences related 1 0 0% 0 0%Occupational therapy 1 0 0% 1 100%Other admin. & related clerks and organisers 2 457 4 0.2% 1 662 67.6%Other admin. policy and related officers 12 2 16.7% 9 75%Other information technology personnel 20 0 0% 14 70%Photographic, lithographic and related workers 13 0 0% 11 84.6%Professional nurse 10 0 0% 3 30%Quantity surveyors & related professions 4 0 0% 2 50%Risk management and security services 2 0 0% 2 100%Secretaries & other keyboard operating clerks 151 0 0% 109 72.2%Senior managers 32 0 0% 21 65.6%Social work and related professionals 4 0 0% 3 75%Speech therapy and audiology 6 0 0% 3 50%Work planners 1 0 0% 0 0%Youth workers 30 0 0% 0 0%Youth workers (Abnormal Grade R) 1 885 0 0% 0 0%Other occupations (including Executive Authority) 32 611 726 2.2% 26 455 81.1%Total 41 800 745 1.8% 31 732 75.9%
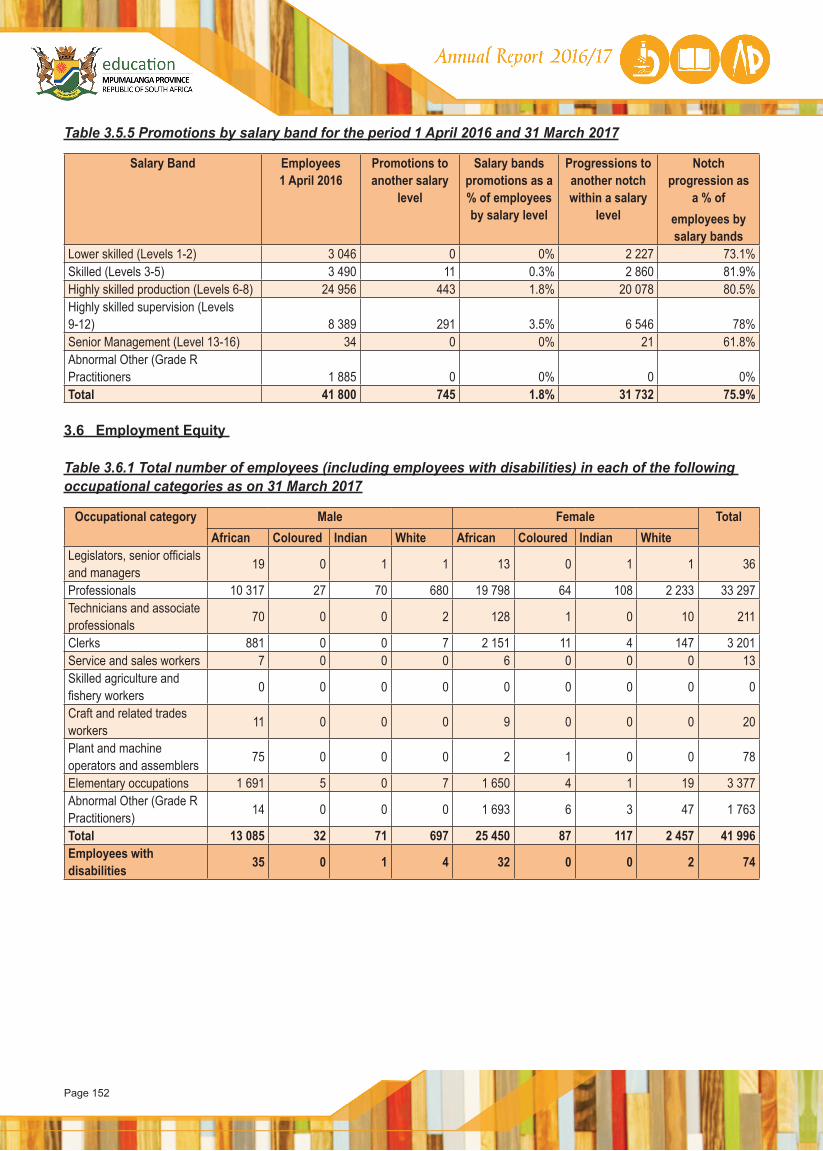
Page 152
Table 3.5.5 Promotions by salary band for the period 1 April 2016 and 31 March 2017
Salary Band Employees 1 April 2016
Promotions to another salary
level
Salary bands promotions as a % of employees by salary level
Progressions to another notch within a salary
level
Notch progression as
a % ofemployees by salary bands
Lower skilled (Levels 1-2) 3 046 0 0% 2 227 73.1%Skilled (Levels 3-5) 3 490 11 0.3% 2 860 81.9%Highly skilled production (Levels 6-8) 24 956 443 1.8% 20 078 80.5%Highly skilled supervision (Levels 9-12) 8 389 291 3.5% 6 546 78%Senior Management (Level 13-16) 34 0 0% 21 61.8%Abnormal Other (Grade R Practitioners 1 885 0 0% 0 0%Total 41 800 745 1.8% 31 732 75.9%
3.6 Employment Equity
Table 3.6.1 Total number of employees (including employees with disabilities) in each of the following occupational categories as on 31 March 2017
Occupational category Male Female TotalAfrican Coloured Indian White African Coloured Indian White
Legislators, senior officials and managers 19 0 1 1 13 0 1 1 36
Professionals 10 317 27 70 680 19 798 64 108 2 233 33 297Technicians and associate professionals 70 0 0 2 128 1 0 10 211
Clerks 881 0 0 7 2 151 11 4 147 3 201Service and sales workers 7 0 0 0 6 0 0 0 13Skilled agriculture and fishery workers 0 0 0 0 0 0 0 0 0
Craft and related trades workers 11 0 0 0 9 0 0 0 20
Plant and machine operators and assemblers 75 0 0 0 2 1 0 0 78
Elementary occupations 1 691 5 0 7 1 650 4 1 19 3 377Abnormal Other (Grade R Practitioners) 14 0 0 0 1 693 6 3 47 1 763
Total 13 085 32 71 697 25 450 87 117 2 457 41 996Employees with disabilities 35 0 1 4 32 0 0 2 74
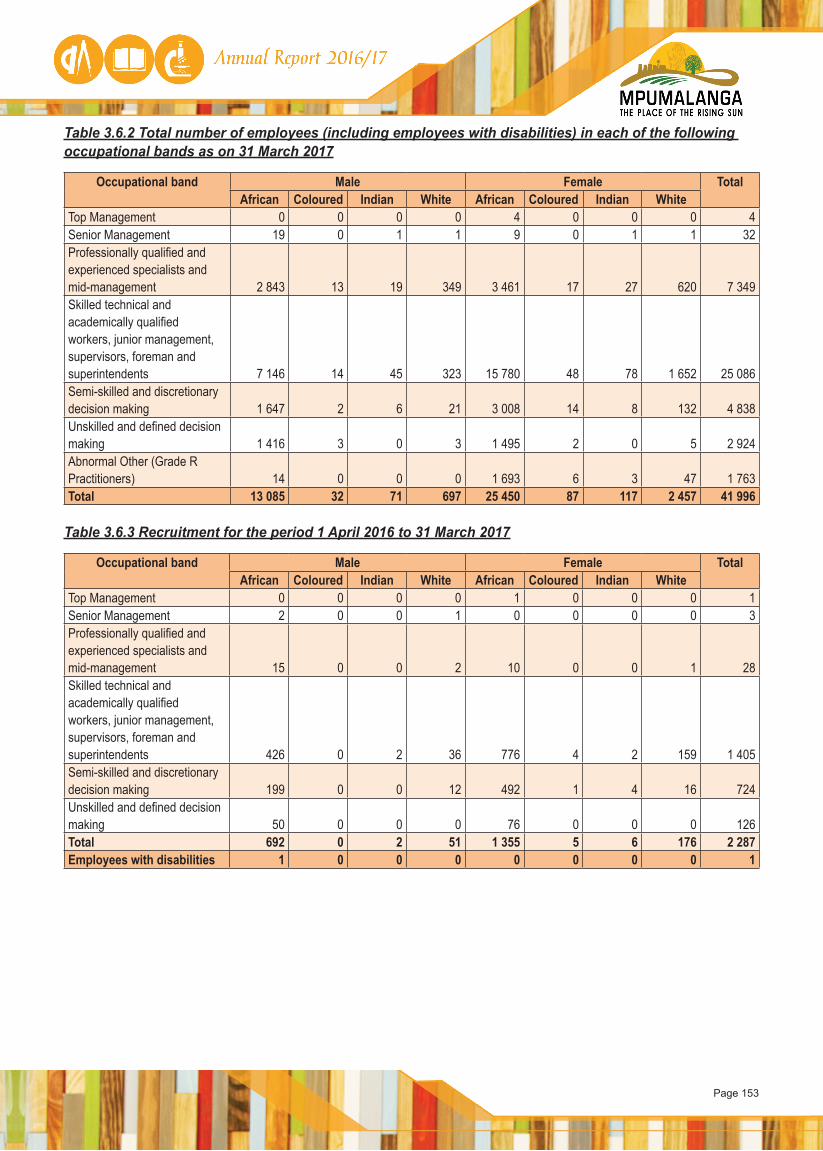
Page 153
Table 3.6.2 Total number of employees (including employees with disabilities) in each of the following occupational bands as on 31 March 2017
Occupational band Male Female TotalAfrican Coloured Indian White African Coloured Indian White
Top Management 0 0 0 0 4 0 0 0 4Senior Management 19 0 1 1 9 0 1 1 32Professionally qualified and experienced specialists and mid-management 2 843 13 19 349 3 461 17 27 620 7 349Skilled technical and academically qualified workers, junior management, supervisors, foreman and superintendents 7 146 14 45 323 15 780 48 78 1 652 25 086Semi-skilled and discretionary decision making 1 647 2 6 21 3 008 14 8 132 4 838Unskilled and defined decision making 1 416 3 0 3 1 495 2 0 5 2 924Abnormal Other (Grade R Practitioners) 14 0 0 0 1 693 6 3 47 1 763Total 13 085 32 71 697 25 450 87 117 2 457 41 996
Table 3.6.3 Recruitment for the period 1 April 2016 to 31 March 2017
Occupational band Male Female TotalAfrican Coloured Indian White African Coloured Indian White
Top Management 0 0 0 0 1 0 0 0 1Senior Management 2 0 0 1 0 0 0 0 3Professionally qualified and experienced specialists and mid-management 15 0 0 2 10 0 0 1 28Skilled technical and academically qualified workers, junior management, supervisors, foreman and superintendents 426 0 2 36 776 4 2 159 1 405Semi-skilled and discretionary decision making 199 0 0 12 492 1 4 16 724Unskilled and defined decision making 50 0 0 0 76 0 0 0 126Total 692 0 2 51 1 355 5 6 176 2 287Employees with disabilities 1 0 0 0 0 0 0 0 1
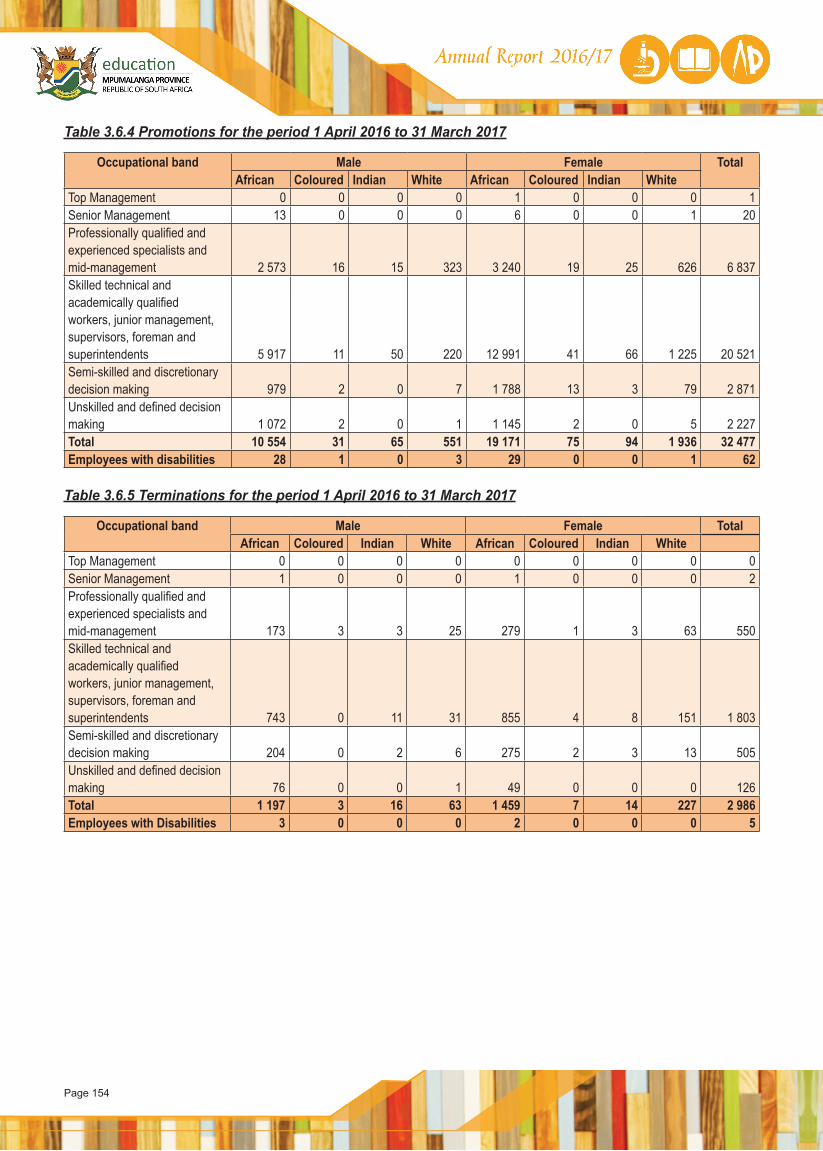
Page 154
Table 3.6.4 Promotions for the period 1 April 2016 to 31 March 2017
Occupational band Male Female TotalAfrican Coloured Indian White African Coloured Indian White
Top Management 0 0 0 0 1 0 0 0 1Senior Management 13 0 0 0 6 0 0 1 20Professionally qualified and experienced specialists and mid-management 2 573 16 15 323 3 240 19 25 626 6 837Skilled technical and academically qualified workers, junior management, supervisors, foreman and superintendents 5 917 11 50 220 12 991 41 66 1 225 20 521Semi-skilled and discretionary decision making 979 2 0 7 1 788 13 3 79 2 871Unskilled and defined decision making 1 072 2 0 1 1 145 2 0 5 2 227Total 10 554 31 65 551 19 171 75 94 1 936 32 477Employees with disabilities 28 1 0 3 29 0 0 1 62
Table 3.6.5 Terminations for the period 1 April 2016 to 31 March 2017
Occupational band Male Female TotalAfrican Coloured Indian White African Coloured Indian White
Top Management 0 0 0 0 0 0 0 0 0Senior Management 1 0 0 0 1 0 0 0 2Professionally qualified and experienced specialists and mid-management 173 3 3 25 279 1 3 63 550Skilled technical and academically qualified workers, junior management, supervisors, foreman and superintendents 743 0 11 31 855 4 8 151 1 803Semi-skilled and discretionary decision making 204 0 2 6 275 2 3 13 505Unskilled and defined decision making 76 0 0 1 49 0 0 0 126Total 1 197 3 16 63 1 459 7 14 227 2 986Employees with Disabilities 3 0 0 0 2 0 0 0 5
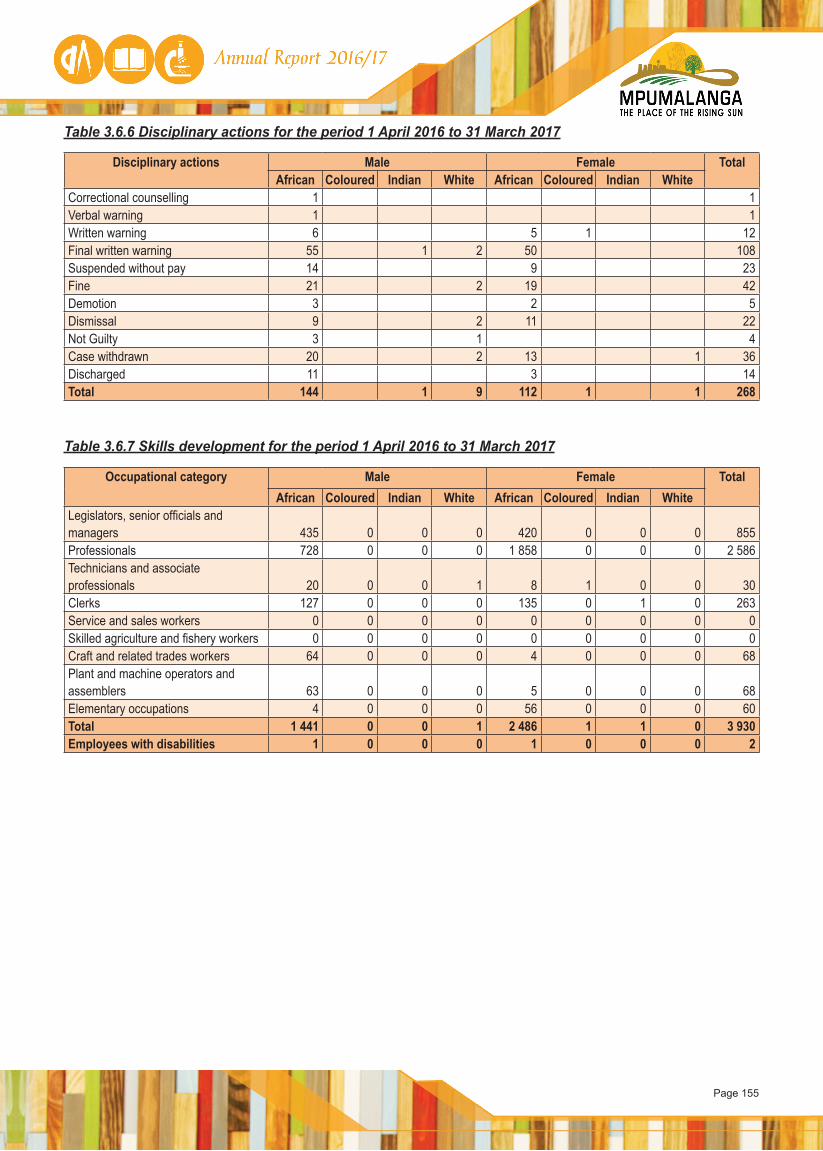
Page 155
Table 3.6.6 Disciplinary actions for the period 1 April 2016 to 31 March 2017
Disciplinary actions Male Female TotalAfrican Coloured Indian White African Coloured Indian White
Correctional counselling 1 1Verbal warning 1 1Written warning 6 5 1 12Final written warning 55 1 2 50 108Suspended without pay 14 9 23Fine 21 2 19 42Demotion 3 2 5Dismissal 9 2 11 22Not Guilty 3 1 4Case withdrawn 20 2 13 1 36Discharged 11 3 14Total 144 1 9 112 1 1 268
Table 3.6.7 Skills development for the period 1 April 2016 to 31 March 2017
Occupational category Male Female TotalAfrican Coloured Indian White African Coloured Indian White
Legislators, senior officials and managers 435 0 0 0 420 0 0 0 855Professionals 728 0 0 0 1 858 0 0 0 2 586Technicians and associate professionals 20 0 0 1 8 1 0 0 30Clerks 127 0 0 0 135 0 1 0 263Service and sales workers 0 0 0 0 0 0 0 0 0Skilled agriculture and fishery workers 0 0 0 0 0 0 0 0 0Craft and related trades workers 64 0 0 0 4 0 0 0 68Plant and machine operators and assemblers 63 0 0 0 5 0 0 0 68Elementary occupations 4 0 0 0 56 0 0 0 60Total 1 441 0 0 1 2 486 1 1 0 3 930Employees with disabilities 1 0 0 0 1 0 0 0 2
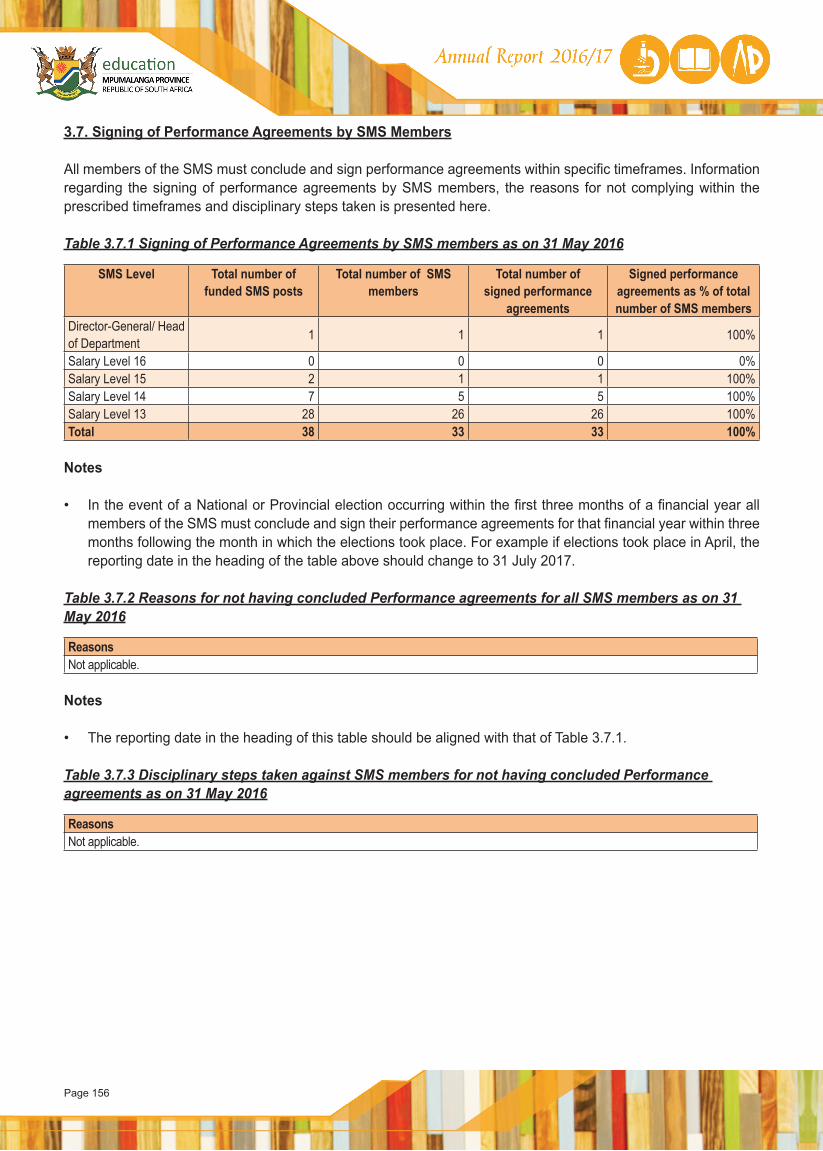
Page 156
3.7. Signing of Performance Agreements by SMS Members
All members of the SMS must conclude and sign performance agreements within specific timeframes. Information regarding the signing of performance agreements by SMS members, the reasons for not complying within the prescribed timeframes and disciplinary steps taken is presented here.
Table 3.7.1 Signing of Performance Agreements by SMS members as on 31 May 2016
SMS Level Total number of funded SMS posts
Total number of SMS members
Total number of signed performance
agreements
Signed performance agreements as % of total number of SMS members
Director-General/ Head of Department 1 1 1 100%
Salary Level 16 0 0 0 0%Salary Level 15 2 1 1 100%Salary Level 14 7 5 5 100%Salary Level 13 28 26 26 100%Total 38 33 33 100%
Notes
• In the event of a National or Provincial election occurring within the first three months of a financial year all members of the SMS must conclude and sign their performance agreements for that financial year within three months following the month in which the elections took place. For example if elections took place in April, the reporting date in the heading of the table above should change to 31 July 2017.
Table 3.7.2 Reasons for not having concluded Performance agreements for all SMS members as on 31 May 2016
Reasons Not applicable.
Notes
• The reporting date in the heading of this table should be aligned with that of Table 3.7.1.
Table 3.7.3 Disciplinary steps taken against SMS members for not having concluded Performance agreements as on 31 May 2016
Reasons Not applicable.
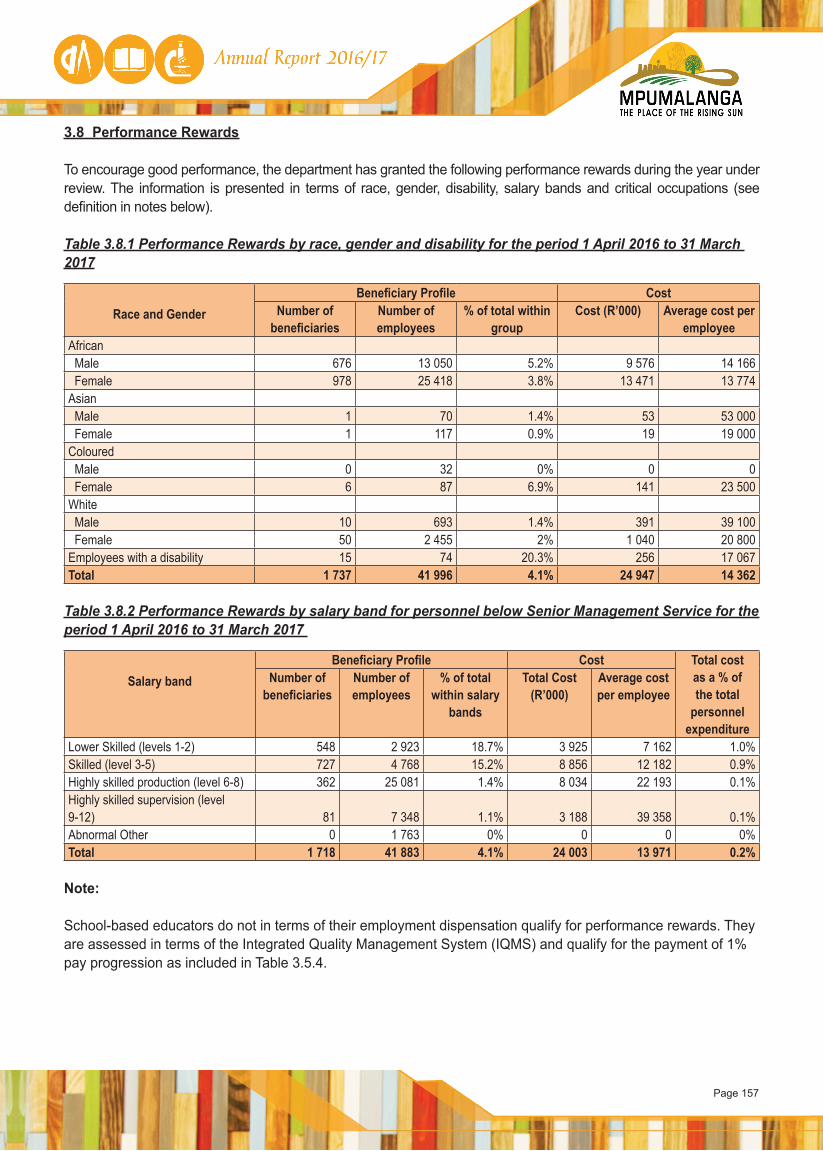
Page 157
3.8 Performance Rewards
To encourage good performance, the department has granted the following performance rewards during the year under review. The information is presented in terms of race, gender, disability, salary bands and critical occupations (see definition in notes below).
Table 3.8.1 Performance Rewards by race, gender and disability for the period 1 April 2016 to 31 March 2017
Race and GenderBeneficiary Profile Cost
Number of beneficiaries
Number of employees
% of total within group
Cost (R’000) Average cost per employee
African Male 676 13 050 5.2% 9 576 14 166 Female 978 25 418 3.8% 13 471 13 774Asian Male 1 70 1.4% 53 53 000 Female 1 117 0.9% 19 19 000Coloured Male 0 32 0% 0 0 Female 6 87 6.9% 141 23 500White Male 10 693 1.4% 391 39 100 Female 50 2 455 2% 1 040 20 800Employees with a disability 15 74 20.3% 256 17 067Total 1 737 41 996 4.1% 24 947 14 362
Table 3.8.2 Performance Rewards by salary band for personnel below Senior Management Service for the period 1 April 2016 to 31 March 2017
Salary bandBeneficiary Profile Cost Total cost
as a % of the total
personnel expenditure
Number of beneficiaries
Number of employees
% of total within salary
bands
Total Cost (R’000)
Average cost per employee
Lower Skilled (levels 1-2) 548 2 923 18.7% 3 925 7 162 1.0%Skilled (level 3-5) 727 4 768 15.2% 8 856 12 182 0.9%Highly skilled production (level 6-8) 362 25 081 1.4% 8 034 22 193 0.1%Highly skilled supervision (level 9-12) 81 7 348 1.1% 3 188 39 358 0.1%Abnormal Other 0 1 763 0% 0 0 0%Total 1 718 41 883 4.1% 24 003 13 971 0.2%
Note:
School-based educators do not in terms of their employment dispensation qualify for performance rewards. They are assessed in terms of the Integrated Quality Management System (IQMS) and qualify for the payment of 1% pay progression as included in Table 3.5.4.
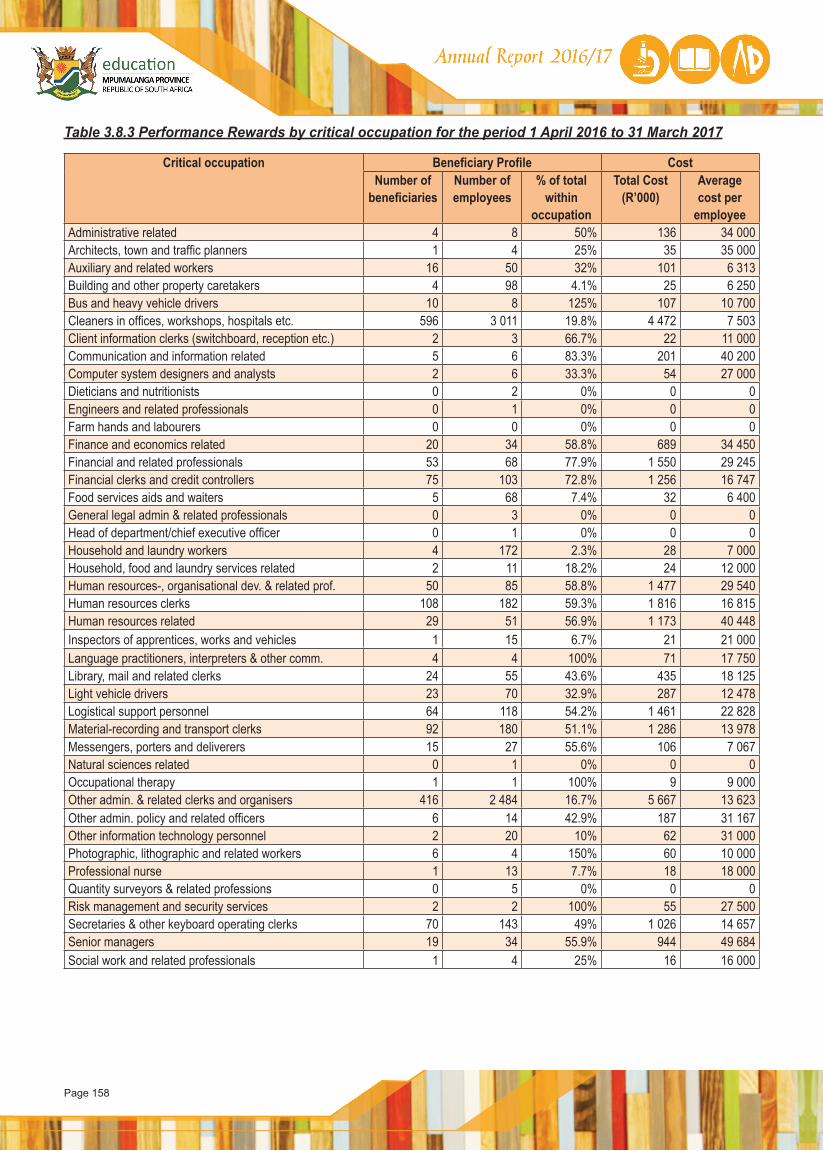
Page 158
Table 3.8.3 Performance Rewards by critical occupation for the period 1 April 2016 to 31 March 2017
Critical occupation Beneficiary Profile CostNumber of
beneficiariesNumber of employees
% of total within
occupation
Total Cost (R’000)
Average cost per
employeeAdministrative related 4 8 50% 136 34 000Architects, town and traffic planners 1 4 25% 35 35 000Auxiliary and related workers 16 50 32% 101 6 313Building and other property caretakers 4 98 4.1% 25 6 250Bus and heavy vehicle drivers 10 8 125% 107 10 700Cleaners in offices, workshops, hospitals etc. 596 3 011 19.8% 4 472 7 503Client information clerks (switchboard, reception etc.) 2 3 66.7% 22 11 000Communication and information related 5 6 83.3% 201 40 200Computer system designers and analysts 2 6 33.3% 54 27 000Dieticians and nutritionists 0 2 0% 0 0Engineers and related professionals 0 1 0% 0 0Farm hands and labourers 0 0 0% 0 0Finance and economics related 20 34 58.8% 689 34 450Financial and related professionals 53 68 77.9% 1 550 29 245Financial clerks and credit controllers 75 103 72.8% 1 256 16 747Food services aids and waiters 5 68 7.4% 32 6 400General legal admin & related professionals 0 3 0% 0 0Head of department/chief executive officer 0 1 0% 0 0Household and laundry workers 4 172 2.3% 28 7 000Household, food and laundry services related 2 11 18.2% 24 12 000Human resources-, organisational dev. & related prof. 50 85 58.8% 1 477 29 540Human resources clerks 108 182 59.3% 1 816 16 815Human resources related 29 51 56.9% 1 173 40 448Inspectors of apprentices, works and vehicles 1 15 6.7% 21 21 000Language practitioners, interpreters & other comm. 4 4 100% 71 17 750Library, mail and related clerks 24 55 43.6% 435 18 125Light vehicle drivers 23 70 32.9% 287 12 478Logistical support personnel 64 118 54.2% 1 461 22 828Material-recording and transport clerks 92 180 51.1% 1 286 13 978Messengers, porters and deliverers 15 27 55.6% 106 7 067Natural sciences related 0 1 0% 0 0Occupational therapy 1 1 100% 9 9 000Other admin. & related clerks and organisers 416 2 484 16.7% 5 667 13 623Other admin. policy and related officers 6 14 42.9% 187 31 167Other information technology personnel 2 20 10% 62 31 000Photographic, lithographic and related workers 6 4 150% 60 10 000Professional nurse 1 13 7.7% 18 18 000Quantity surveyors & related professions 0 5 0% 0 0Risk management and security services 2 2 100% 55 27 500Secretaries & other keyboard operating clerks 70 143 49% 1 026 14 657Senior managers 19 34 55.9% 944 49 684Social work and related professionals 1 4 25% 16 16 000
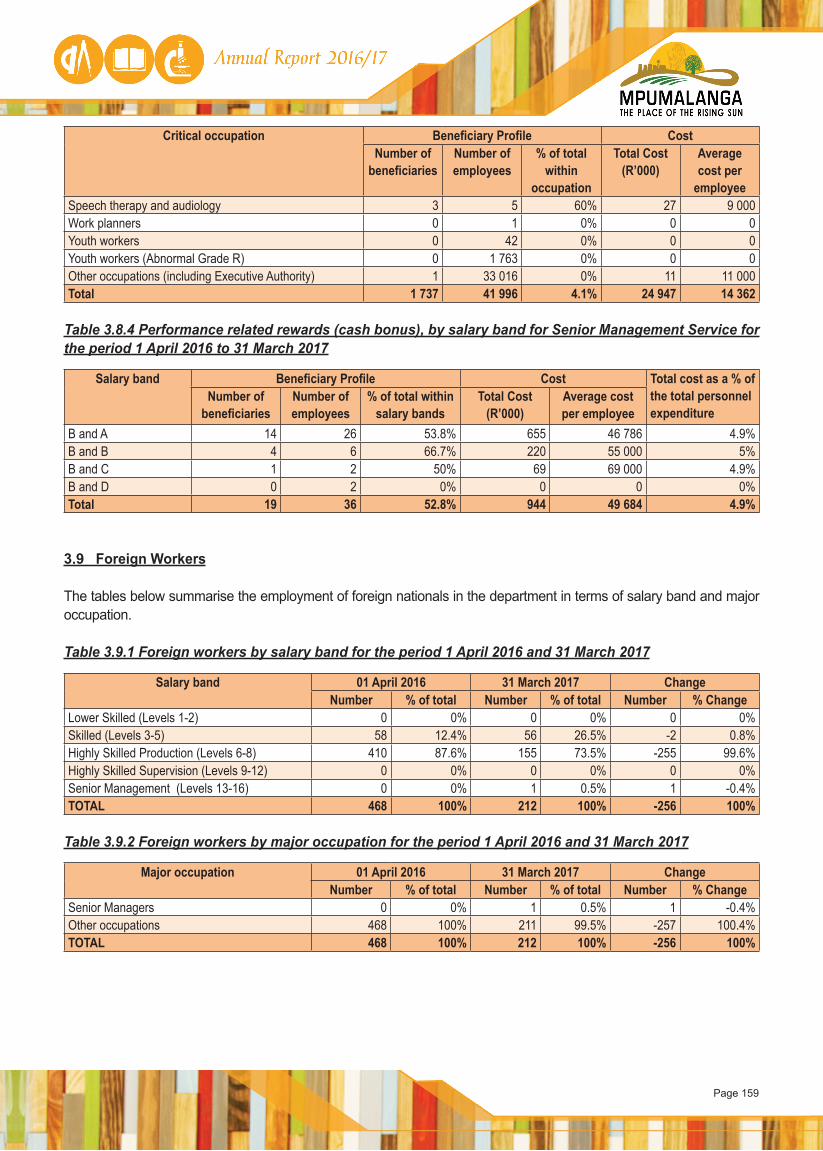
Page 159
Critical occupation Beneficiary Profile CostNumber of
beneficiariesNumber of employees
% of total within
occupation
Total Cost (R’000)
Average cost per
employeeSpeech therapy and audiology 3 5 60% 27 9 000Work planners 0 1 0% 0 0Youth workers 0 42 0% 0 0Youth workers (Abnormal Grade R) 0 1 763 0% 0 0Other occupations (including Executive Authority) 1 33 016 0% 11 11 000Total 1 737 41 996 4.1% 24 947 14 362
Table 3.8.4 Performance related rewards (cash bonus), by salary band for Senior Management Service for the period 1 April 2016 to 31 March 2017
Salary band Beneficiary Profile Cost Total cost as a % of the total personnel expenditure
Number of beneficiaries
Number of employees
% of total within salary bands
Total Cost (R’000)
Average cost per employee
B and A 14 26 53.8% 655 46 786 4.9%B and B 4 6 66.7% 220 55 000 5%B and C 1 2 50% 69 69 000 4.9%B and D 0 2 0% 0 0 0%Total 19 36 52.8% 944 49 684 4.9%
3.9 Foreign Workers
The tables below summarise the employment of foreign nationals in the department in terms of salary band and major occupation.
Table 3.9.1 Foreign workers by salary band for the period 1 April 2016 and 31 March 2017
Salary band 01 April 2016 31 March 2017 ChangeNumber % of total Number % of total Number % Change
Lower Skilled (Levels 1-2) 0 0% 0 0% 0 0%Skilled (Levels 3-5) 58 12.4% 56 26.5% -2 0.8%Highly Skilled Production (Levels 6-8) 410 87.6% 155 73.5% -255 99.6%Highly Skilled Supervision (Levels 9-12) 0 0% 0 0% 0 0%Senior Management (Levels 13-16) 0 0% 1 0.5% 1 -0.4%TOTAL 468 100% 212 100% -256 100%
Table 3.9.2 Foreign workers by major occupation for the period 1 April 2016 and 31 March 2017
Major occupation 01 April 2016 31 March 2017 ChangeNumber % of total Number % of total Number % Change
Senior Managers 0 0% 1 0.5% 1 -0.4%Other occupations 468 100% 211 99.5% -257 100.4%TOTAL 468 100% 212 100% -256 100%

Page 160
3.10 Leave utilisation
The Public Service Commission identified the need for careful monitoring of sick leave within the public service. The following tables provide an indication of the use of sick leave and disability leave. In both cases, the estimated cost of the leave is also provided.
Table 3.10.1 Sick leave for the period 1 January 2016 to 31 December 2016
Salary band Total days % Days with Medical
certification
Number of Employees using sick
leave
% of total employees using sick
leave
Average days per employee
Estimated Cost (R’000)
Lower Skilled (Level 1-2) 9 593 48.1% 1 479 6.5% 6 4 328Skilled (levels 3-5) 16 011 46.1% 2 598 11.4% 6 11 966Highly skilled production (levels 6-8) 84 108 45.6% 14 652 64.6% 6 110 861Highly skilled supervision (levels 9-12) 24 533 48.9% 3 937 17.4% 6 48 754Top and Senior management (levels 13-16) 219 40.6% 22 0.1% 10 806Total 134 464 46.4% 22 688 100% 6 176 715
Table 3.10.2 Disability leave (temporary and permanent) for the period 1 January 2016 to 31 December 2016
Salary band Total days % Days with Medical
certification
Number of Employees
using disability
leave
% of total employees
using disability
leave
Average days per employee
Estimated Cost (R’000)
Lower skilled (Levels 1-2) 775 100% 15 5% 52 350Skilled (Levels 3-5) 747 100% 17 5.7% 44 519Highly skilled production (Levels 6-8) 12 266 100% 206 68.7% 60 16 426Highly skilled supervision (Levels 9-12) 3 101 100% 62 20.7% 50 5 890Senior management (Levels 13-16) 0 0% 0 0% 0 0Total 16 889 100% 300 100% 56 23 185
The table below summarises the utilisation of annual leave. The wage agreement concluded with trade unions in the PSCBC in 2000 requires management of annual leave to prevent high levels of accrued leave being paid at the time of termination of service.
Table 3.10.3 Annual Leave for the period 1 January 2016 to 31 December 2016
Salary band Total days taken Number of Employees using annual leave
Average per employee
Lower skilled (Levels 1-2) 51 494 27 2 780Skilled (Levels 3-5) 58 986 33 3 107Highly skilled production (Levels 6-8) 18 878 39 1 029Highly skilled supervision(Levels 9-12) 19 570 34 1 082Senior management (Levels 13-16) 736 23 37Total 149 664 19 8 035
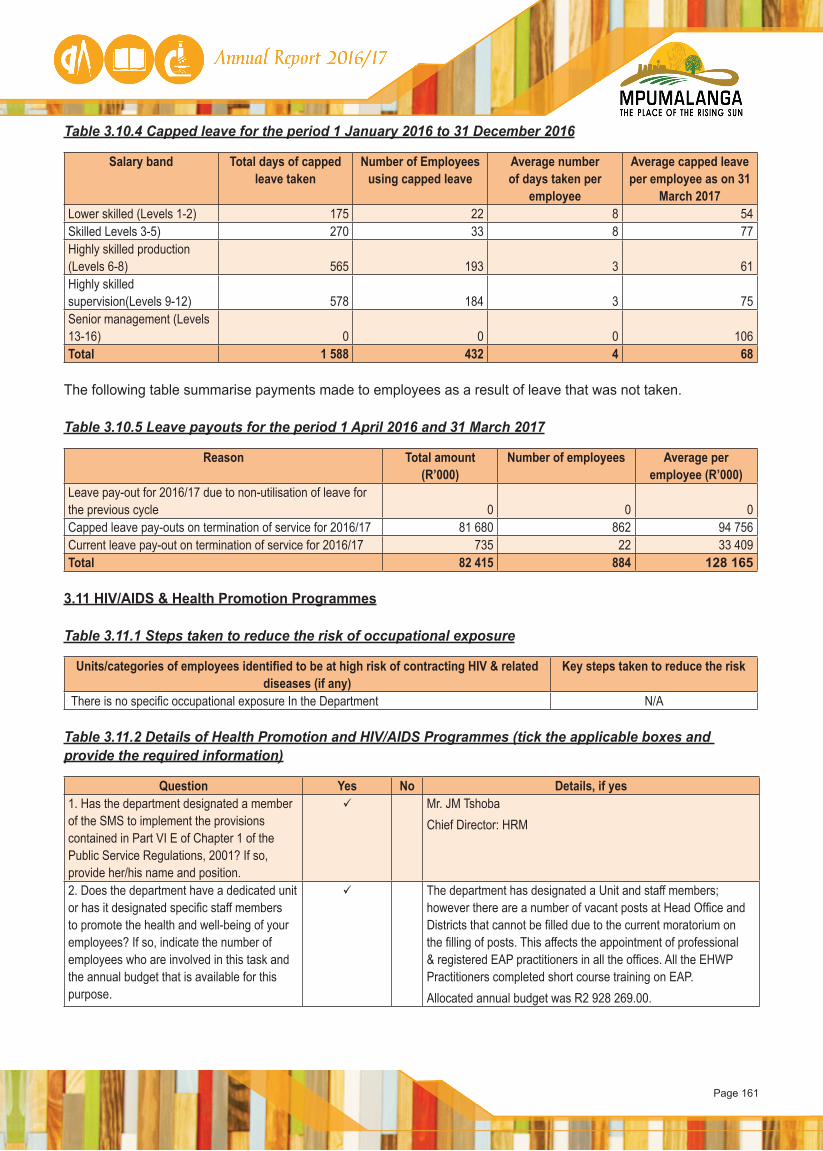
Page 161
Table 3.10.4 Capped leave for the period 1 January 2016 to 31 December 2016
Salary band Total days of capped leave taken
Number of Employees using capped leave
Average number of days taken per
employee
Average capped leave per employee as on 31
March 2017Lower skilled (Levels 1-2) 175 22 8 54Skilled Levels 3-5) 270 33 8 77Highly skilled production (Levels 6-8) 565 193 3 61Highly skilled supervision(Levels 9-12) 578 184 3 75Senior management (Levels 13-16) 0 0 0 106Total 1 588 432 4 68
The following table summarise payments made to employees as a result of leave that was not taken.
Table 3.10.5 Leave payouts for the period 1 April 2016 and 31 March 2017
Reason Total amount (R’000)
Number of employees Average per employee (R’000)
Leave pay-out for 2016/17 due to non-utilisation of leave for the previous cycle 0 0 0Capped leave pay-outs on termination of service for 2016/17 81 680 862 94 756Current leave pay-out on termination of service for 2016/17 735 22 33 409Total 82 415 884 128 165
3.11 HIV/AIDS & Health Promotion Programmes
Table 3.11.1 Steps taken to reduce the risk of occupational exposure
Units/categories of employees identified to be at high risk of contracting HIV & related diseases (if any)
Key steps taken to reduce the risk
There is no specific occupational exposure In the Department N/A
Table 3.11.2 Details of Health Promotion and HIV/AIDS Programmes (tick the applicable boxes and provide the required information)
Question Yes No Details, if yes1. Has the department designated a member of the SMS to implement the provisions contained in Part VI E of Chapter 1 of the Public Service Regulations, 2001? If so, provide her/his name and position.
Mr. JM TshobaChief Director: HRM
2. Does the department have a dedicated unit or has it designated specific staff members to promote the health and well-being of your employees? If so, indicate the number of employees who are involved in this task and the annual budget that is available for this purpose.
The department has designated a Unit and staff members; however there are a number of vacant posts at Head Office and Districts that cannot be filled due to the current moratorium on the filling of posts. This affects the appointment of professional & registered EAP practitioners in all the offices. All the EHWP Practitioners completed short course training on EAP. Allocated annual budget was R2 928 269.00.
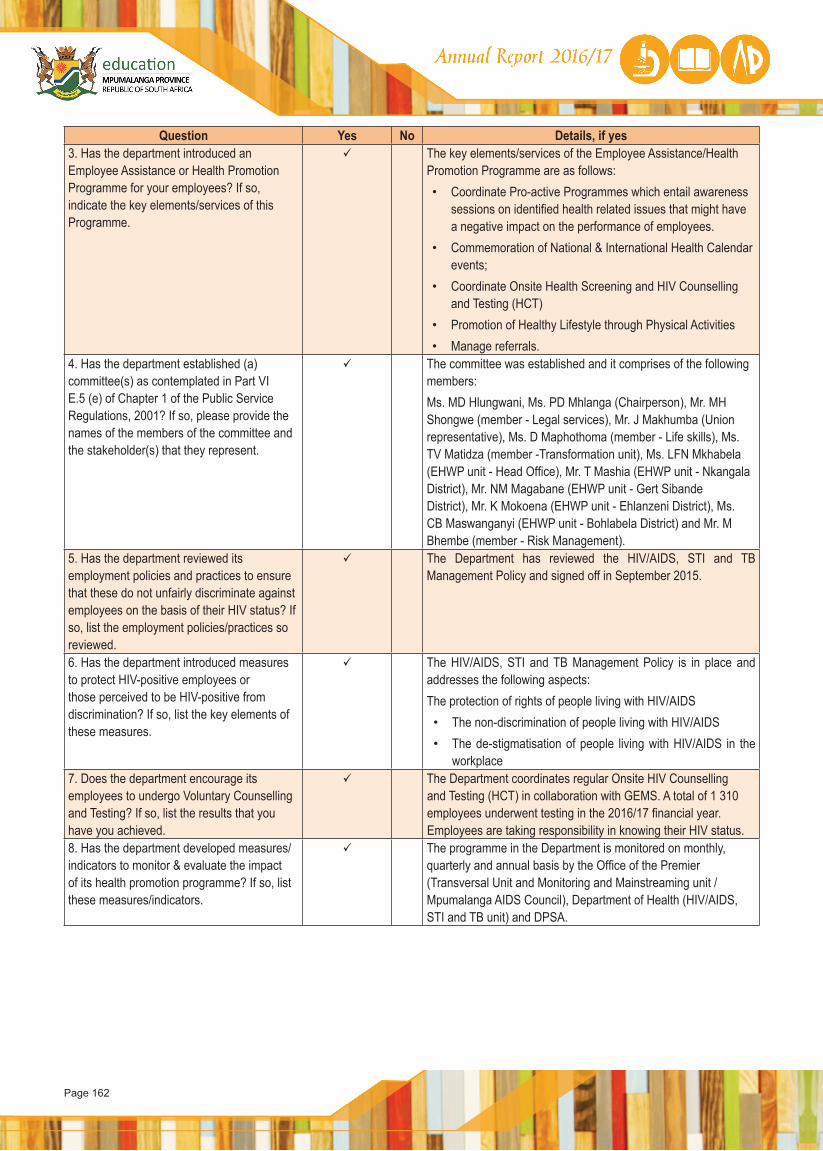
Page 162
Question Yes No Details, if yes3. Has the department introduced an Employee Assistance or Health Promotion Programme for your employees? If so, indicate the key elements/services of this Programme.
The key elements/services of the Employee Assistance/Health Promotion Programme are as follows: • Coordinate Pro-active Programmes which entail awareness
sessions on identified health related issues that might have a negative impact on the performance of employees.
• Commemoration of National & International Health Calendar events;
• Coordinate Onsite Health Screening and HIV Counselling and Testing (HCT)
• Promotion of Healthy Lifestyle through Physical Activities• Manage referrals.
4. Has the department established (a) committee(s) as contemplated in Part VI E.5 (e) of Chapter 1 of the Public Service Regulations, 2001? If so, please provide the names of the members of the committee and the stakeholder(s) that they represent.
The committee was established and it comprises of the following members: Ms. MD Hlungwani, Ms. PD Mhlanga (Chairperson), Mr. MH Shongwe (member - Legal services), Mr. J Makhumba (Union representative), Ms. D Maphothoma (member - Life skills), Ms. TV Matidza (member -Transformation unit), Ms. LFN Mkhabela (EHWP unit - Head Office), Mr. T Mashia (EHWP unit - Nkangala District), Mr. NM Magabane (EHWP unit - Gert Sibande District), Mr. K Mokoena (EHWP unit - Ehlanzeni District), Ms. CB Maswanganyi (EHWP unit - Bohlabela District) and Mr. M Bhembe (member - Risk Management).
5. Has the department reviewed its employment policies and practices to ensure that these do not unfairly discriminate against employees on the basis of their HIV status? If so, list the employment policies/practices so reviewed.
The Department has reviewed the HIV/AIDS, STI and TB Management Policy and signed off in September 2015.
6. Has the department introduced measures to protect HIV-positive employees or those perceived to be HIV-positive from discrimination? If so, list the key elements of these measures.
The HIV/AIDS, STI and TB Management Policy is in place and addresses the following aspects:The protection of rights of people living with HIV/AIDS • The non-discrimination of people living with HIV/AIDS• The de-stigmatisation of people living with HIV/AIDS in the
workplace7. Does the department encourage its employees to undergo Voluntary Counselling and Testing? If so, list the results that you have you achieved.
The Department coordinates regular Onsite HIV Counselling and Testing (HCT) in collaboration with GEMS. A total of 1 310 employees underwent testing in the 2016/17 financial year. Employees are taking responsibility in knowing their HIV status.
8. Has the department developed measures/indicators to monitor & evaluate the impact of its health promotion programme? If so, list these measures/indicators.
The programme in the Department is monitored on monthly, quarterly and annual basis by the Office of the Premier (Transversal Unit and Monitoring and Mainstreaming unit / Mpumalanga AIDS Council), Department of Health (HIV/AIDS, STI and TB unit) and DPSA.
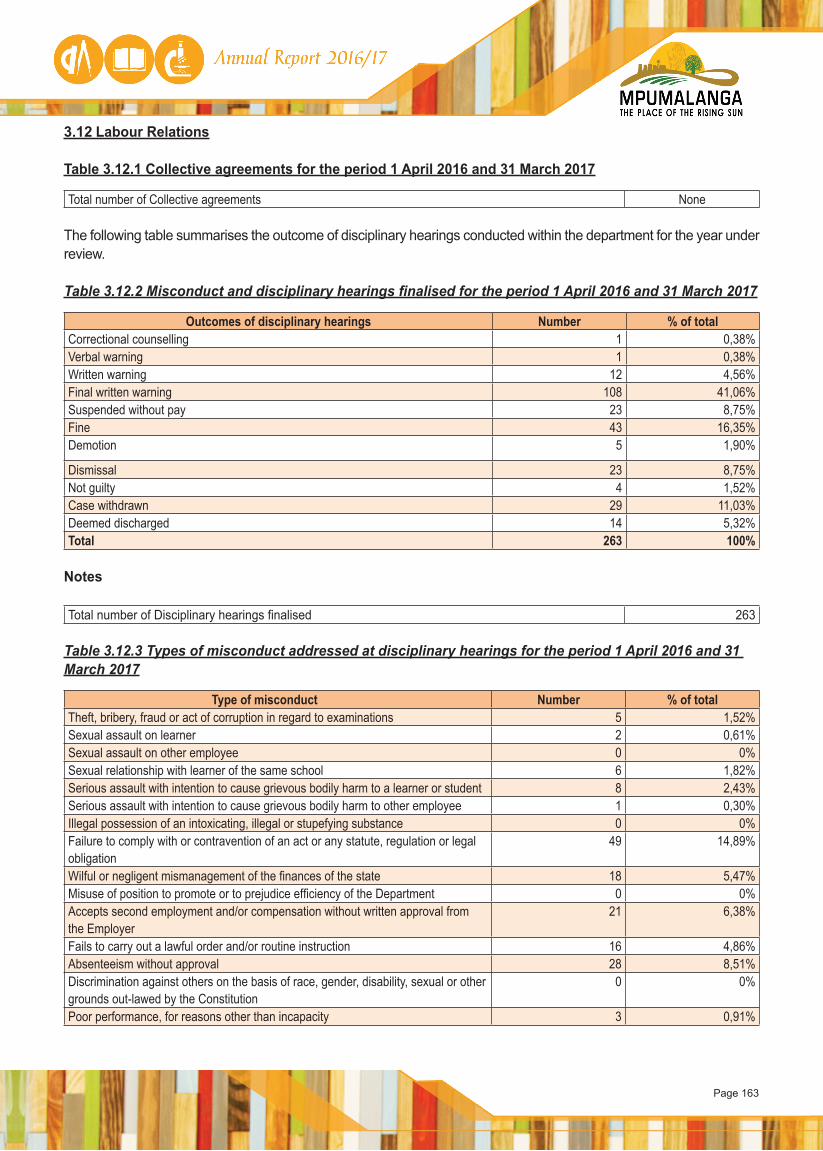
Page 163
3.12 Labour Relations
Table 3.12.1 Collective agreements for the period 1 April 2016 and 31 March 2017
Total number of Collective agreements None
The following table summarises the outcome of disciplinary hearings conducted within the department for the year under review.
Table 3.12.2 Misconduct and disciplinary hearings finalised for the period 1 April 2016 and 31 March 2017
Outcomes of disciplinary hearings Number % of totalCorrectional counselling 1 0,38%Verbal warning 1 0,38%Written warning 12 4,56%Final written warning 108 41,06%Suspended without pay 23 8,75%Fine 43 16,35%Demotion 5 1,90%
Dismissal 23 8,75%Not guilty 4 1,52%Case withdrawn 29 11,03%Deemed discharged 14 5,32%Total 263 100%
Notes
Total number of Disciplinary hearings finalised 263
Table 3.12.3 Types of misconduct addressed at disciplinary hearings for the period 1 April 2016 and 31 March 2017
Type of misconduct Number % of totalTheft, bribery, fraud or act of corruption in regard to examinations 5 1,52%Sexual assault on learner 2 0,61%Sexual assault on other employee 0 0%Sexual relationship with learner of the same school 6 1,82%Serious assault with intention to cause grievous bodily harm to a learner or student 8 2,43%Serious assault with intention to cause grievous bodily harm to other employee 1 0,30%Illegal possession of an intoxicating, illegal or stupefying substance 0 0%Failure to comply with or contravention of an act or any statute, regulation or legal obligation
49 14,89%
Wilful or negligent mismanagement of the finances of the state 18 5,47%Misuse of position to promote or to prejudice efficiency of the Department 0 0%Accepts second employment and/or compensation without written approval from the Employer
21 6,38%
Fails to carry out a lawful order and/or routine instruction 16 4,86%Absenteeism without approval 28 8,51%Discrimination against others on the basis of race, gender, disability, sexual or other grounds out-lawed by the Constitution
0 0%
Poor performance, for reasons other than incapacity 3 0,91%
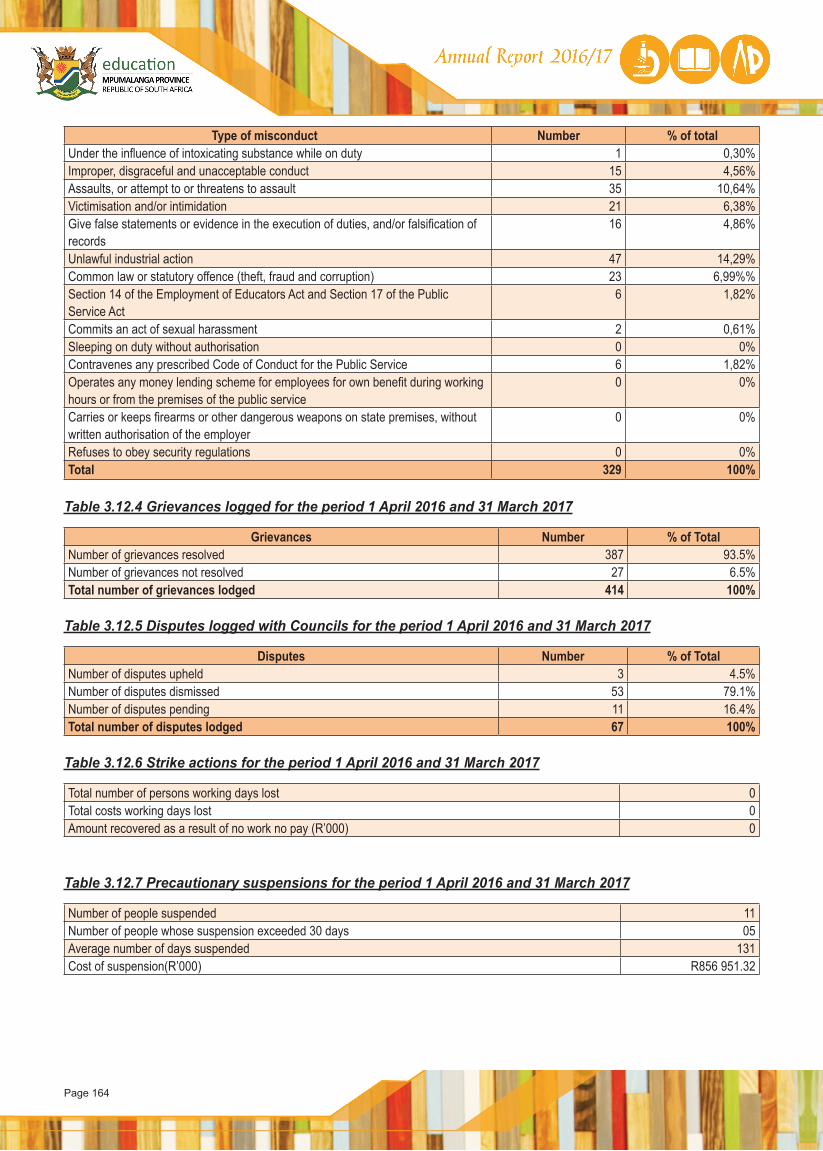
Page 164
Type of misconduct Number % of totalUnder the influence of intoxicating substance while on duty 1 0,30%Improper, disgraceful and unacceptable conduct 15 4,56%Assaults, or attempt to or threatens to assault 35 10,64%Victimisation and/or intimidation 21 6,38%Give false statements or evidence in the execution of duties, and/or falsification of records
16 4,86%
Unlawful industrial action 47 14,29%Common law or statutory offence (theft, fraud and corruption) 23 6,99%%Section 14 of the Employment of Educators Act and Section 17 of the Public Service Act
6 1,82%
Commits an act of sexual harassment 2 0,61%Sleeping on duty without authorisation 0 0%Contravenes any prescribed Code of Conduct for the Public Service 6 1,82%Operates any money lending scheme for employees for own benefit during working hours or from the premises of the public service
0 0%
Carries or keeps firearms or other dangerous weapons on state premises, without written authorisation of the employer
0 0%
Refuses to obey security regulations 0 0%Total 329 100%
Table 3.12.4 Grievances logged for the period 1 April 2016 and 31 March 2017
Grievances Number % of TotalNumber of grievances resolved 387 93.5%Number of grievances not resolved 27 6.5%Total number of grievances lodged 414 100%
Table 3.12.5 Disputes logged with Councils for the period 1 April 2016 and 31 March 2017
Disputes Number % of TotalNumber of disputes upheld 3 4.5%Number of disputes dismissed 53 79.1%Number of disputes pending 11 16.4%Total number of disputes lodged 67 100%
Table 3.12.6 Strike actions for the period 1 April 2016 and 31 March 2017 Total number of persons working days lost 0Total costs working days lost 0Amount recovered as a result of no work no pay (R’000) 0
Table 3.12.7 Precautionary suspensions for the period 1 April 2016 and 31 March 2017
Number of people suspended 11Number of people whose suspension exceeded 30 days 05Average number of days suspended 131Cost of suspension(R’000) R856 951.32
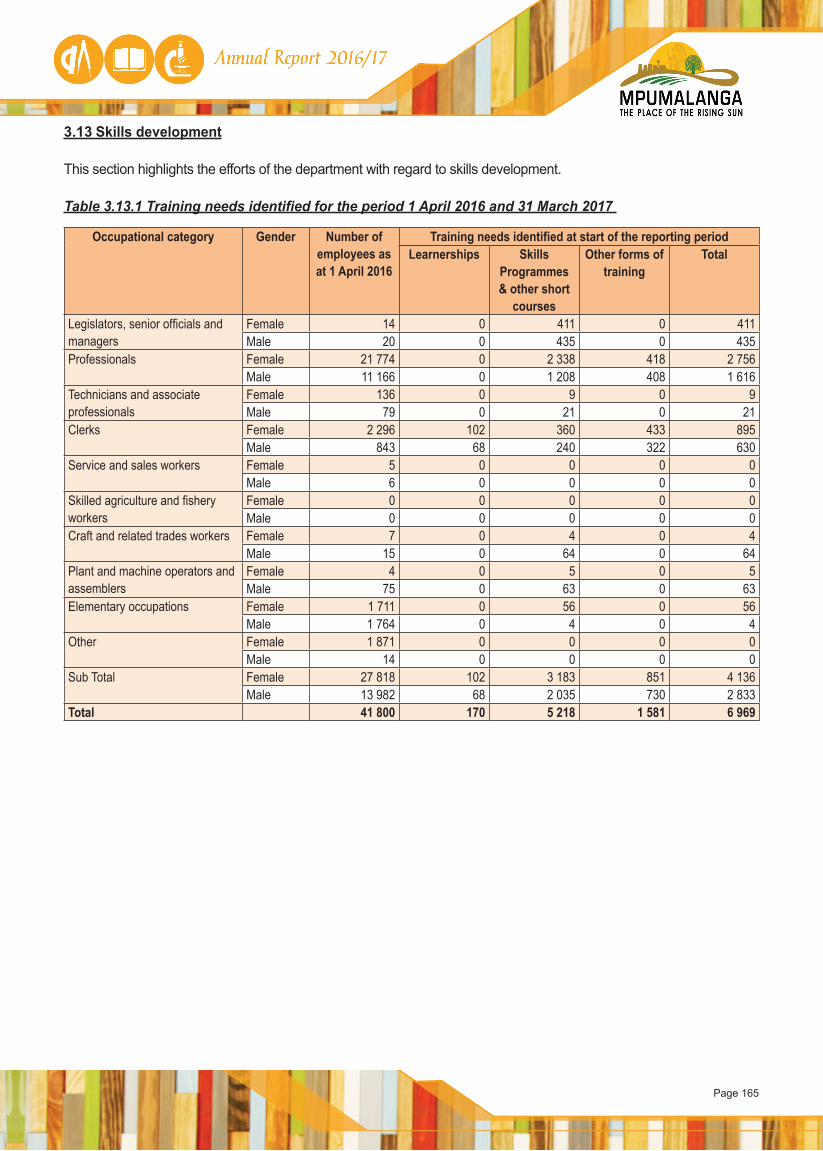
Page 165
3.13 Skills development
This section highlights the efforts of the department with regard to skills development.
Table 3.13.1 Training needs identified for the period 1 April 2016 and 31 March 2017
Occupational category Gender Number of employees as at 1 April 2016
Training needs identified at start of the reporting periodLearnerships Skills
Programmes & other short
courses
Other forms of training
Total
Legislators, senior officials and managers
Female 14 0 411 0 411Male 20 0 435 0 435
Professionals Female 21 774 0 2 338 418 2 756Male 11 166 0 1 208 408 1 616
Technicians and associate professionals
Female 136 0 9 0 9Male 79 0 21 0 21
Clerks Female 2 296 102 360 433 895Male 843 68 240 322 630
Service and sales workers Female 5 0 0 0 0Male 6 0 0 0 0
Skilled agriculture and fishery workers
Female 0 0 0 0 0Male 0 0 0 0 0
Craft and related trades workers Female 7 0 4 0 4Male 15 0 64 0 64
Plant and machine operators and assemblers
Female 4 0 5 0 5Male 75 0 63 0 63
Elementary occupations Female 1 711 0 56 0 56Male 1 764 0 4 0 4
Other Female 1 871 0 0 0 0Male 14 0 0 0 0
Sub Total Female 27 818 102 3 183 851 4 136Male 13 982 68 2 035 730 2 833
Total 41 800 170 5 218 1 581 6 969
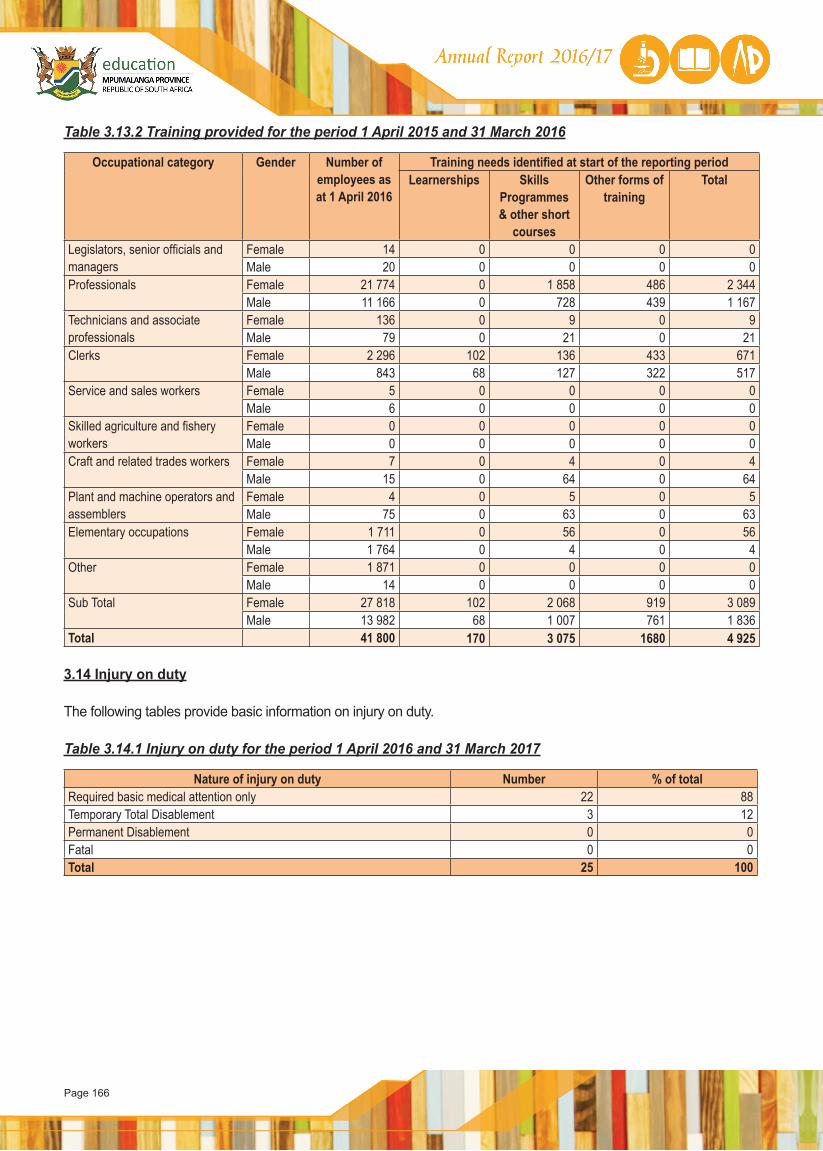
Page 166
Table 3.13.2 Training provided for the period 1 April 2015 and 31 March 2016
Occupational category Gender Number of employees as at 1 April 2016
Training needs identified at start of the reporting periodLearnerships Skills
Programmes & other short
courses
Other forms of training
Total
Legislators, senior officials and managers
Female 14 0 0 0 0Male 20 0 0 0 0
Professionals Female 21 774 0 1 858 486 2 344Male 11 166 0 728 439 1 167
Technicians and associate professionals
Female 136 0 9 0 9Male 79 0 21 0 21
Clerks Female 2 296 102 136 433 671Male 843 68 127 322 517
Service and sales workers Female 5 0 0 0 0Male 6 0 0 0 0
Skilled agriculture and fishery workers
Female 0 0 0 0 0Male 0 0 0 0 0
Craft and related trades workers Female 7 0 4 0 4Male 15 0 64 0 64
Plant and machine operators and assemblers
Female 4 0 5 0 5Male 75 0 63 0 63
Elementary occupations Female 1 711 0 56 0 56Male 1 764 0 4 0 4
Other Female 1 871 0 0 0 0Male 14 0 0 0 0
Sub Total Female 27 818 102 2 068 919 3 089Male 13 982 68 1 007 761 1 836
Total 41 800 170 3 075 1680 4 925
3.14 Injury on duty
The following tables provide basic information on injury on duty.
Table 3.14.1 Injury on duty for the period 1 April 2016 and 31 March 2017
Nature of injury on duty Number % of totalRequired basic medical attention only 22 88Temporary Total Disablement 3 12Permanent Disablement 0 0Fatal 0 0Total 25 100
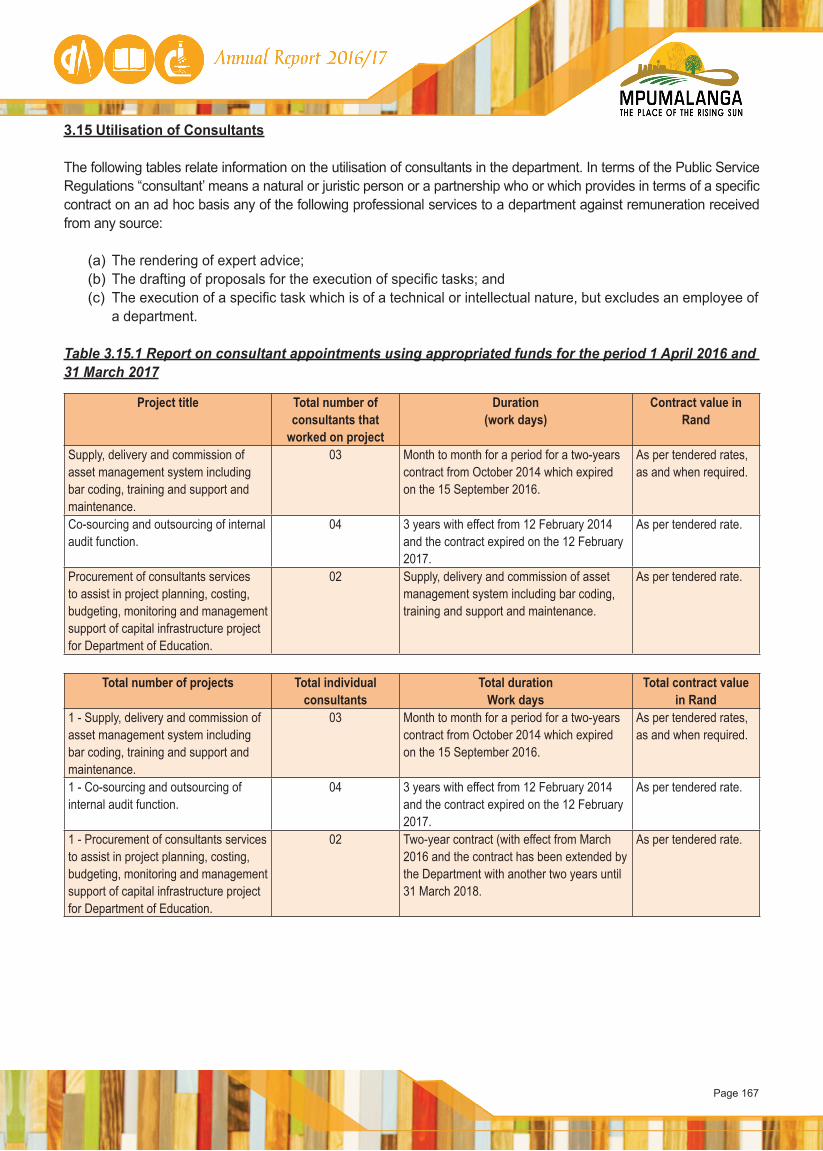
Page 167
3.15 Utilisation of Consultants
The following tables relate information on the utilisation of consultants in the department. In terms of the Public Service Regulations “consultant’ means a natural or juristic person or a partnership who or which provides in terms of a specific contract on an ad hoc basis any of the following professional services to a department against remuneration received from any source:
(a) The rendering of expert advice;(b) The drafting of proposals for the execution of specific tasks; and(c) The execution of a specific task which is of a technical or intellectual nature, but excludes an employee of
a department.
Table 3.15.1 Report on consultant appointments using appropriated funds for the period 1 April 2016 and 31 March 2017
Project title Total number of consultants that
worked on project
Duration(work days)
Contract value inRand
Supply, delivery and commission of asset management system including bar coding, training and support and maintenance.
03 Month to month for a period for a two-years contract from October 2014 which expired on the 15 September 2016.
As per tendered rates, as and when required.
Co-sourcing and outsourcing of internal audit function.
04 3 years with effect from 12 February 2014 and the contract expired on the 12 February 2017.
As per tendered rate.
Procurement of consultants services to assist in project planning, costing, budgeting, monitoring and management support of capital infrastructure project for Department of Education.
02 Supply, delivery and commission of asset management system including bar coding, training and support and maintenance.
As per tendered rate.
Total number of projects Total individual consultants
Total durationWork days
Total contract value in Rand
1 - Supply, delivery and commission of asset management system including bar coding, training and support and maintenance.
03 Month to month for a period for a two-years contract from October 2014 which expired on the 15 September 2016.
As per tendered rates, as and when required.
1 - Co-sourcing and outsourcing of internal audit function.
04 3 years with effect from 12 February 2014 and the contract expired on the 12 February 2017.
As per tendered rate.
1 - Procurement of consultants services to assist in project planning, costing, budgeting, monitoring and management support of capital infrastructure project for Department of Education.
02 Two-year contract (with effect from March 2016 and the contract has been extended by the Department with another two years until 31 March 2018.
As per tendered rate.
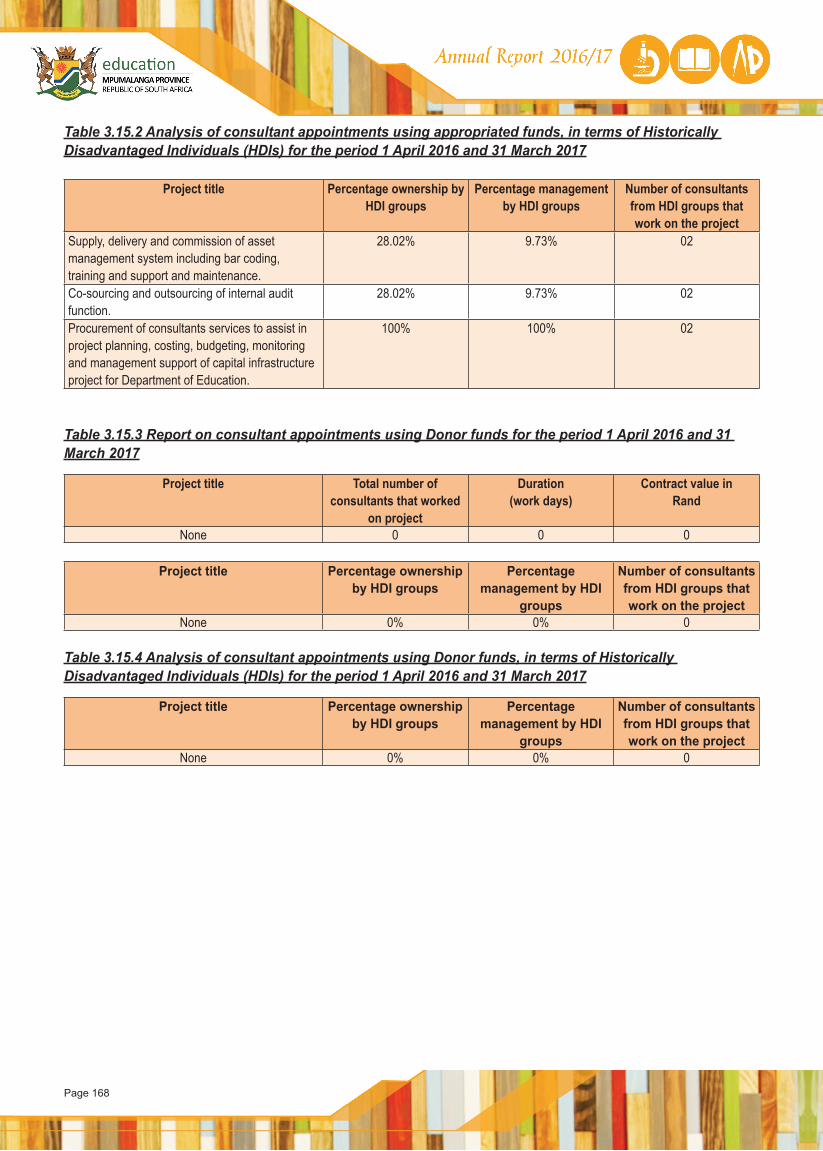
Page 168
Table 3.15.2 Analysis of consultant appointments using appropriated funds, in terms of Historically Disadvantaged Individuals (HDIs) for the period 1 April 2016 and 31 March 2017
Project title Percentage ownership by HDI groups
Percentage management by HDI groups
Number of consultants from HDI groups that work on the project
Supply, delivery and commission of asset management system including bar coding, training and support and maintenance.
28.02% 9.73% 02
Co-sourcing and outsourcing of internal audit function.
28.02% 9.73% 02
Procurement of consultants services to assist in project planning, costing, budgeting, monitoring and management support of capital infrastructure project for Department of Education.
100% 100% 02
Table 3.15.3 Report on consultant appointments using Donor funds for the period 1 April 2016 and 31 March 2017
Project title Total number of consultants that worked
on project
Duration(work days)
Contract value inRand
None 0 0 0
Project title Percentage ownership by HDI groups
Percentage management by HDI
groups
Number of consultants from HDI groups that work on the project
None 0% 0% 0
Table 3.15.4 Analysis of consultant appointments using Donor funds, in terms of Historically Disadvantaged Individuals (HDIs) for the period 1 April 2016 and 31 March 2017
Project title Percentage ownership by HDI groups
Percentage management by HDI
groups
Number of consultants from HDI groups that work on the project
None 0% 0% 0
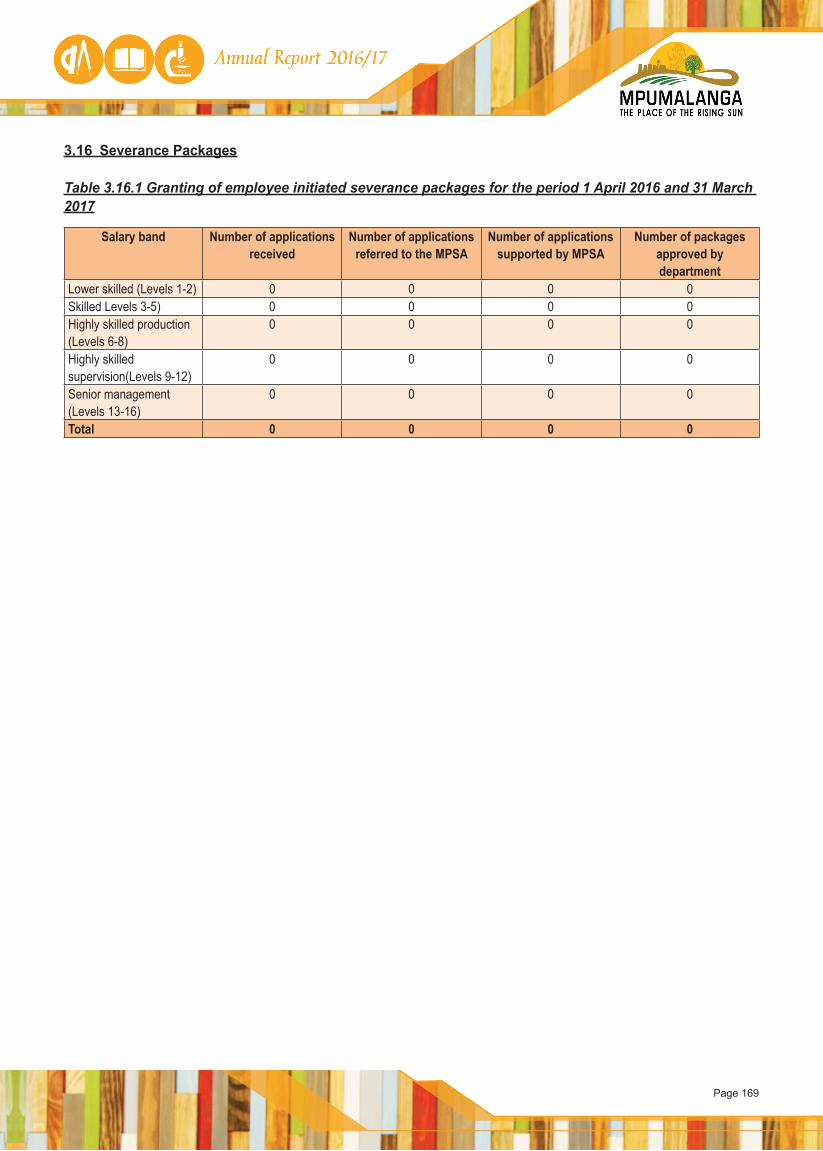
Page 169
3.16 Severance Packages
Table 3.16.1 Granting of employee initiated severance packages for the period 1 April 2016 and 31 March 2017
Salary band Number of applications received
Number of applications referred to the MPSA
Number of applications supported by MPSA
Number of packages approved by department
Lower skilled (Levels 1-2) 0 0 0 0Skilled Levels 3-5) 0 0 0 0Highly skilled production (Levels 6-8)
0 0 0 0
Highly skilled supervision(Levels 9-12)
0 0 0 0
Senior management (Levels 13-16)
0 0 0 0
Total 0 0 0 0
Page 170
Page 171
PART E:
FINANCIALINFORMATION
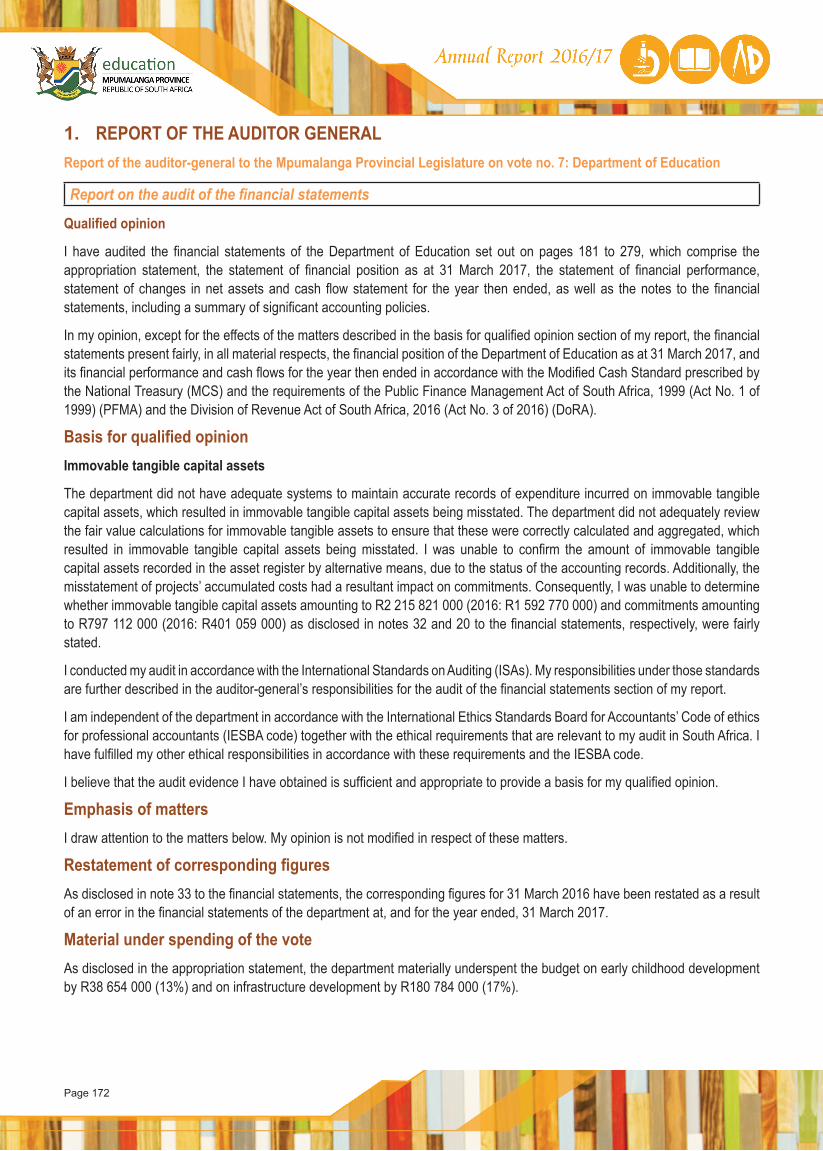
Page 172
1. REPORT OF THE AUDITOR GENERAL Report of the auditor-general to the Mpumalanga Provincial Legislature on vote no. 7: Department of Education
Report on the audit of the financial statements
Qualified opinion
I have audited the financial statements of the Department of Education set out on pages 181 to 279, which comprise the appropriation statement, the statement of financial position as at 31 March 2017, the statement of financial performance, statement of changes in net assets and cash flow statement for the year then ended, as well as the notes to the financial statements, including a summary of significant accounting policies.
In my opinion, except for the effects of the matters described in the basis for qualified opinion section of my report, the financial statements present fairly, in all material respects, the financial position of the Department of Education as at 31 March 2017, and its financial performance and cash flows for the year then ended in accordance with the Modified Cash Standard prescribed by the National Treasury (MCS) and the requirements of the Public Finance Management Act of South Africa, 1999 (Act No. 1 of 1999) (PFMA) and the Division of Revenue Act of South Africa, 2016 (Act No. 3 of 2016) (DoRA).
Basis for qualified opinionImmovable tangible capital assets
The department did not have adequate systems to maintain accurate records of expenditure incurred on immovable tangible capital assets, which resulted in immovable tangible capital assets being misstated. The department did not adequately review the fair value calculations for immovable tangible assets to ensure that these were correctly calculated and aggregated, which resulted in immovable tangible capital assets being misstated. I was unable to confirm the amount of immovable tangible capital assets recorded in the asset register by alternative means, due to the status of the accounting records. Additionally, the misstatement of projects’ accumulated costs had a resultant impact on commitments. Consequently, I was unable to determine whether immovable tangible capital assets amounting to R2 215 821 000 (2016: R1 592 770 000) and commitments amounting to R797 112 000 (2016: R401 059 000) as disclosed in notes 32 and 20 to the financial statements, respectively, were fairly stated.
I conducted my audit in accordance with the International Standards on Auditing (ISAs). My responsibilities under those standards are further described in the auditor-general’s responsibilities for the audit of the financial statements section of my report.
I am independent of the department in accordance with the International Ethics Standards Board for Accountants’ Code of ethics for professional accountants (IESBA code) together with the ethical requirements that are relevant to my audit in South Africa. I have fulfilled my other ethical responsibilities in accordance with these requirements and the IESBA code.
I believe that the audit evidence I have obtained is sufficient and appropriate to provide a basis for my qualified opinion.
Emphasis of mattersI draw attention to the matters below. My opinion is not modified in respect of these matters.
Restatement of corresponding figuresAs disclosed in note 33 to the financial statements, the corresponding figures for 31 March 2016 have been restated as a result of an error in the financial statements of the department at, and for the year ended, 31 March 2017.
Material under spending of the voteAs disclosed in the appropriation statement, the department materially underspent the budget on early childhood development by R38 654 000 (13%) and on infrastructure development by R180 784 000 (17%).
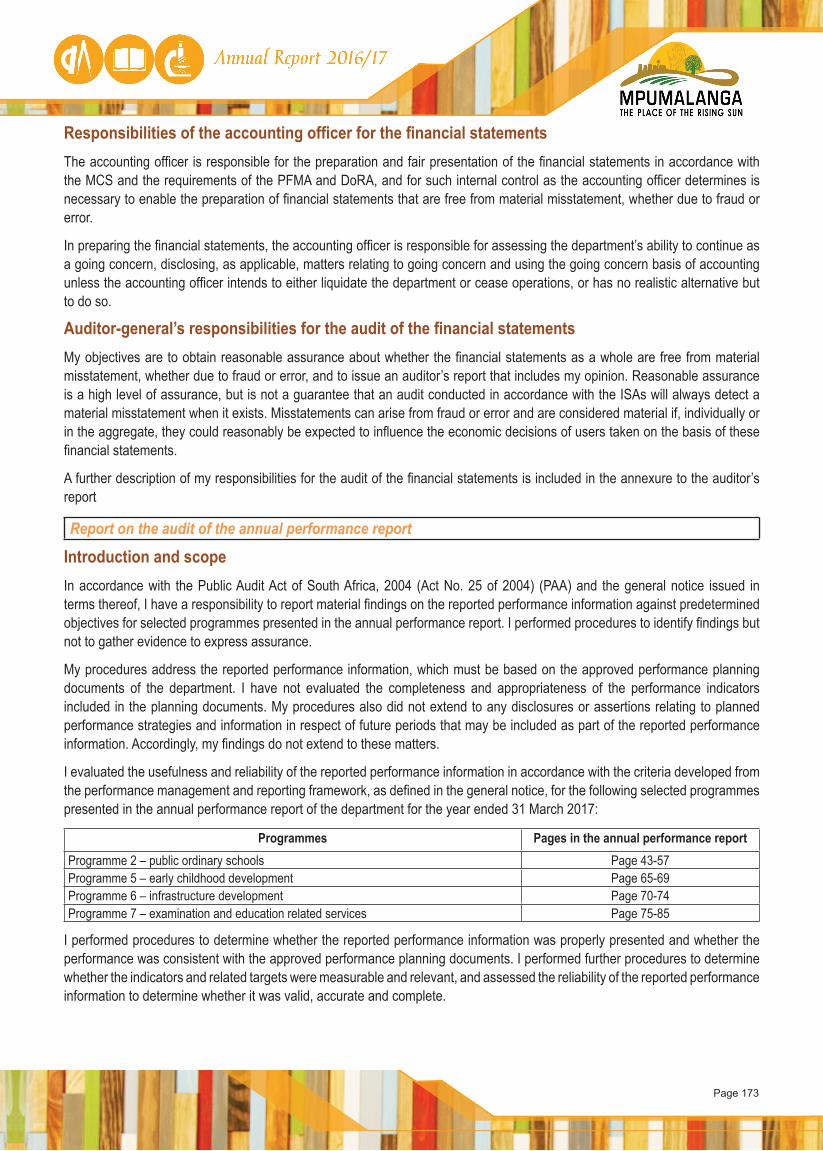
Page 173
Responsibilities of the accounting officer for the financial statementsThe accounting officer is responsible for the preparation and fair presentation of the financial statements in accordance with the MCS and the requirements of the PFMA and DoRA, and for such internal control as the accounting officer determines is necessary to enable the preparation of financial statements that are free from material misstatement, whether due to fraud or error.
In preparing the financial statements, the accounting officer is responsible for assessing the department’s ability to continue as a going concern, disclosing, as applicable, matters relating to going concern and using the going concern basis of accounting unless the accounting officer intends to either liquidate the department or cease operations, or has no realistic alternative but to do so.
Auditor-general’s responsibilities for the audit of the financial statementsMy objectives are to obtain reasonable assurance about whether the financial statements as a whole are free from material misstatement, whether due to fraud or error, and to issue an auditor’s report that includes my opinion. Reasonable assurance is a high level of assurance, but is not a guarantee that an audit conducted in accordance with the ISAs will always detect a material misstatement when it exists. Misstatements can arise from fraud or error and are considered material if, individually or in the aggregate, they could reasonably be expected to influence the economic decisions of users taken on the basis of these financial statements.
A further description of my responsibilities for the audit of the financial statements is included in the annexure to the auditor’s report
Report on the audit of the annual performance report
Introduction and scopeIn accordance with the Public Audit Act of South Africa, 2004 (Act No. 25 of 2004) (PAA) and the general notice issued in terms thereof, I have a responsibility to report material findings on the reported performance information against predetermined objectives for selected programmes presented in the annual performance report. I performed procedures to identify findings but not to gather evidence to express assurance.
My procedures address the reported performance information, which must be based on the approved performance planning documents of the department. I have not evaluated the completeness and appropriateness of the performance indicators included in the planning documents. My procedures also did not extend to any disclosures or assertions relating to planned performance strategies and information in respect of future periods that may be included as part of the reported performance information. Accordingly, my findings do not extend to these matters.
I evaluated the usefulness and reliability of the reported performance information in accordance with the criteria developed from the performance management and reporting framework, as defined in the general notice, for the following selected programmes presented in the annual performance report of the department for the year ended 31 March 2017:
Programmes Pages in the annual performance reportProgramme 2 – public ordinary schools Page 43-57Programme 5 – early childhood development Page 65-69Programme 6 – infrastructure development Page 70-74Programme 7 – examination and education related services Page 75-85
I performed procedures to determine whether the reported performance information was properly presented and whether the performance was consistent with the approved performance planning documents. I performed further procedures to determine whether the indicators and related targets were measurable and relevant, and assessed the reliability of the reported performance information to determine whether it was valid, accurate and complete.
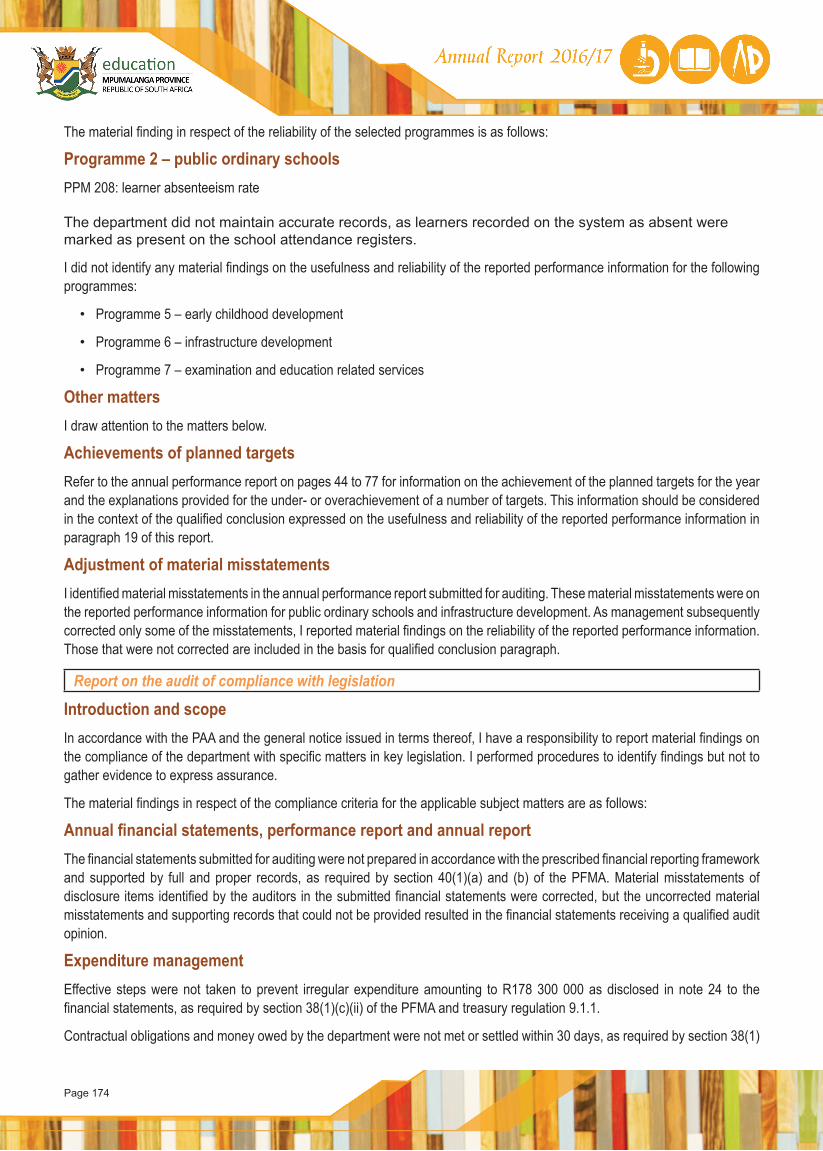
Page 174
The material finding in respect of the reliability of the selected programmes is as follows:
Programme 2 – public ordinary schoolsPPM 208: learner absenteeism rate
The department did not maintain accurate records, as learners recorded on the system as absent were marked as present on the school attendance registers.
I did not identify any material findings on the usefulness and reliability of the reported performance information for the following programmes:
• Programme 5 – early childhood development
• Programme 6 – infrastructure development
• Programme 7 – examination and education related services
Other mattersI draw attention to the matters below.
Achievements of planned targetsRefer to the annual performance report on pages 44 to 77 for information on the achievement of the planned targets for the year and the explanations provided for the under- or overachievement of a number of targets. This information should be considered in the context of the qualified conclusion expressed on the usefulness and reliability of the reported performance information in paragraph 19 of this report.
Adjustment of material misstatementsI identified material misstatements in the annual performance report submitted for auditing. These material misstatements were on the reported performance information for public ordinary schools and infrastructure development. As management subsequently corrected only some of the misstatements, I reported material findings on the reliability of the reported performance information. Those that were not corrected are included in the basis for qualified conclusion paragraph.
Report on the audit of compliance with legislation
Introduction and scope In accordance with the PAA and the general notice issued in terms thereof, I have a responsibility to report material findings on the compliance of the department with specific matters in key legislation. I performed procedures to identify findings but not to gather evidence to express assurance.
The material findings in respect of the compliance criteria for the applicable subject matters are as follows:
Annual financial statements, performance report and annual reportThe financial statements submitted for auditing were not prepared in accordance with the prescribed financial reporting framework and supported by full and proper records, as required by section 40(1)(a) and (b) of the PFMA. Material misstatements of disclosure items identified by the auditors in the submitted financial statements were corrected, but the uncorrected material misstatements and supporting records that could not be provided resulted in the financial statements receiving a qualified audit opinion.
Expenditure managementEffective steps were not taken to prevent irregular expenditure amounting to R178 300 000 as disclosed in note 24 to the financial statements, as required by section 38(1)(c)(ii) of the PFMA and treasury regulation 9.1.1.
Contractual obligations and money owed by the department were not met or settled within 30 days, as required by section 38(1)
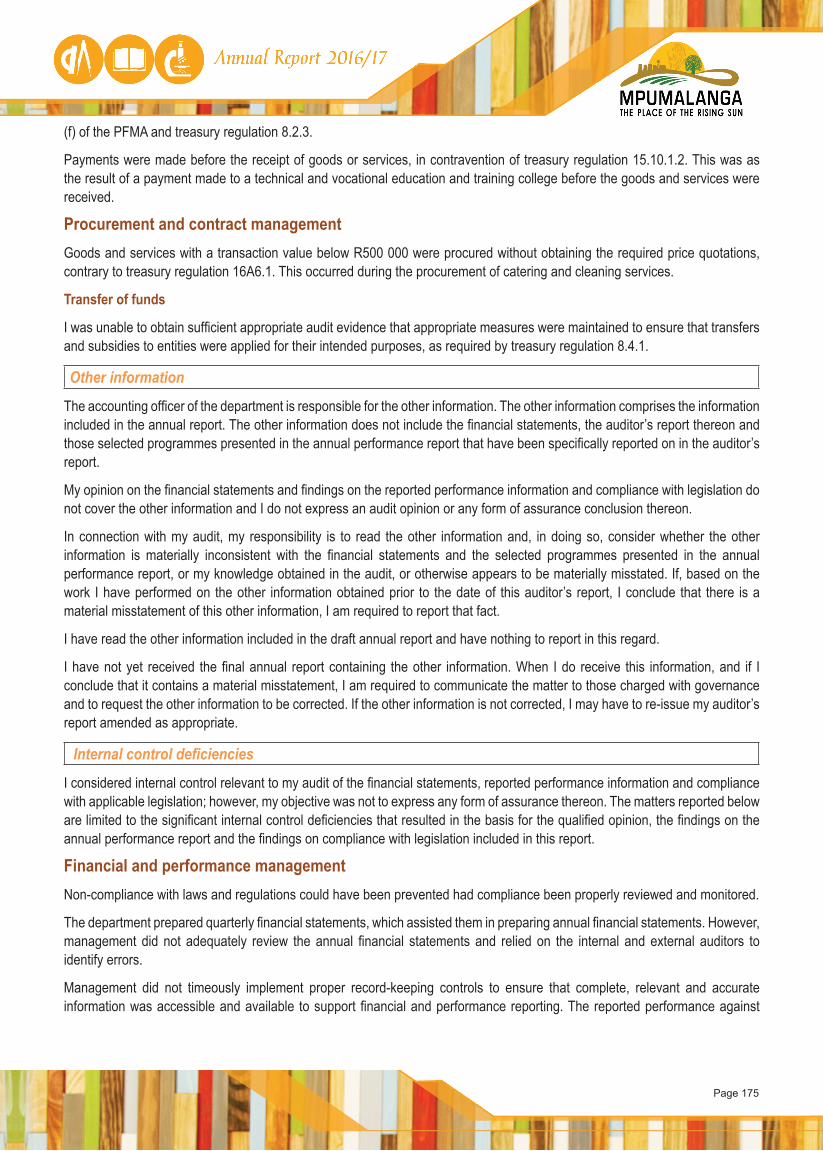
Page 175
(f) of the PFMA and treasury regulation 8.2.3.
Payments were made before the receipt of goods or services, in contravention of treasury regulation 15.10.1.2. This was as the result of a payment made to a technical and vocational education and training college before the goods and services were received.
Procurement and contract managementGoods and services with a transaction value below R500 000 were procured without obtaining the required price quotations, contrary to treasury regulation 16A6.1. This occurred during the procurement of catering and cleaning services.
Transfer of funds
I was unable to obtain sufficient appropriate audit evidence that appropriate measures were maintained to ensure that transfers and subsidies to entities were applied for their intended purposes, as required by treasury regulation 8.4.1.
Other information
The accounting officer of the department is responsible for the other information. The other information comprises the information included in the annual report. The other information does not include the financial statements, the auditor’s report thereon and those selected programmes presented in the annual performance report that have been specifically reported on in the auditor’s report.
My opinion on the financial statements and findings on the reported performance information and compliance with legislation do not cover the other information and I do not express an audit opinion or any form of assurance conclusion thereon.
In connection with my audit, my responsibility is to read the other information and, in doing so, consider whether the other information is materially inconsistent with the financial statements and the selected programmes presented in the annual performance report, or my knowledge obtained in the audit, or otherwise appears to be materially misstated. If, based on the work I have performed on the other information obtained prior to the date of this auditor’s report, I conclude that there is a material misstatement of this other information, I am required to report that fact.
I have read the other information included in the draft annual report and have nothing to report in this regard.
I have not yet received the final annual report containing the other information. When I do receive this information, and if I conclude that it contains a material misstatement, I am required to communicate the matter to those charged with governance and to request the other information to be corrected. If the other information is not corrected, I may have to re-issue my auditor’s report amended as appropriate.
Internal control deficiencies
I considered internal control relevant to my audit of the financial statements, reported performance information and compliance with applicable legislation; however, my objective was not to express any form of assurance thereon. The matters reported below are limited to the significant internal control deficiencies that resulted in the basis for the qualified opinion, the findings on the annual performance report and the findings on compliance with legislation included in this report.
Financial and performance managementNon-compliance with laws and regulations could have been prevented had compliance been properly reviewed and monitored.
The department prepared quarterly financial statements, which assisted them in preparing annual financial statements. However, management did not adequately review the annual financial statements and relied on the internal and external auditors to identify errors.
Management did not timeously implement proper record-keeping controls to ensure that complete, relevant and accurate information was accessible and available to support financial and performance reporting. The reported performance against

Page 176
predetermined objectives was not verified against supporting evidence to ensure that it was valid, accurate and complete.
There were inadequate controls over the daily and monthly processing and reconciliation of immovable asset expenditure, resulting in differences between the amount disclosed in the financial statements and the system.
Other reports
I draw attention to the following engagements conducted by various parties that had, or could have, an impact on the matters reported in the department’s financial statements, reported performance information, compliance with applicable legislation and other related matters. These reports did not form part of my opinion on the financial statements or my findings on the reported performance information or compliance with legislation.
Performance audit on the curriculum support and monitoring provided by education districts to schoolsA performance audit was conducted during the 2015-16 financial year on the department’s curriculum support and monitoring provided through education districts to schools. The report covered the period 2012 to 2016 (with greater emphasis on 2014), and was tabled on 30 November 2016 as part of the 2015-16 education sector report.
Mbombela
31 July 2017

Page 177
Annexure – Auditor-general’s responsibility for the audit 1. As part of an audit in accordance with the ISAs, I exercise professional judgement and maintain professional scepticism
throughout my audit of the financial statements, and the procedures performed on the reported performance information for selected programmes and on the department’s compliance with respect to the selected subject matters.
Financial statementsIn addition to my responsibility for the audit of the financial statements as described in the auditor’s report, I also:
• identify and assess the risks of material misstatement of the financial statements whether due to fraud or error, design and perform audit procedures responsive to those risks, and obtain audit evidence that is sufficient and appropriate to provide a basis for my opinion. The risk of not detecting a material misstatement resulting from fraud is higher than for one resulting from error, as fraud may involve collusion, forgery, intentional omissions, misrepresentations, or the override of internal control.
• obtain an understanding of internal control relevant to the audit in order to design audit procedures that are appropriate in the circumstances, but not for the purpose of expressing an opinion on the effectiveness of the department’s internal control.
• evaluate the appropriateness of accounting policies used and the reasonableness of accounting estimates and related disclosures made by the accounting officer.
• conclude on the appropriateness of the accounting officer’s use of the going concern basis of accounting in the prepa-ration of the financial statements. I also conclude, based on the audit evidence obtained, whether a material uncertain-ty exists related to events or conditions that may cast significant doubt on the ability of the department to continue as a going concern. If I conclude that a material uncertainty exists, I am required to draw attention in my auditor’s report to the related disclosures in the financial statements about the material uncertainty or, if such disclosures are inadequate, to modify the opinion on the financial statements. My conclusions are based on the information available to me at the date of the auditor’s report. However, future events or conditions may cause the department to cease to continue as a going concern.
• evaluate the overall presentation, structure and content of the financial statements, including the disclosures, and whether the financial statements represent the underlying transactions and events in a manner that achieves fair pre-sentation.
Communication with those charged with governanceI communicate with the accounting officer regarding, among other matters, the planned scope and timing of the audit and signifi-cant audit findings, including any significant deficiencies in internal control that I identify during my audit.
I also confirm to the accounting officer that I have complied with relevant ethical requirements regarding independence, and communicate all relationships and other matters that may reasonably be thought to have a bearing on my independence and, where applicable, related safeguards.
Page 178
Page 179
ANNUAL FINANCIAL STATEMENTS FOR THE MPUMALANGA DEPARTMENT OF EDUCATION
For the Year ending 31 March 2017
Page 179
Page 180
Table of Contents
Appropriation Statement 181
Notes to the Appropriation Statement 230
Statement of Financial Performance 232
Statement of Financial Position 233
Statement of Changes in Net Assets 234
Cash Flow Statement 235
Notes to the Annual Financial Statements (including Accounting policies) 236
Annexures 267
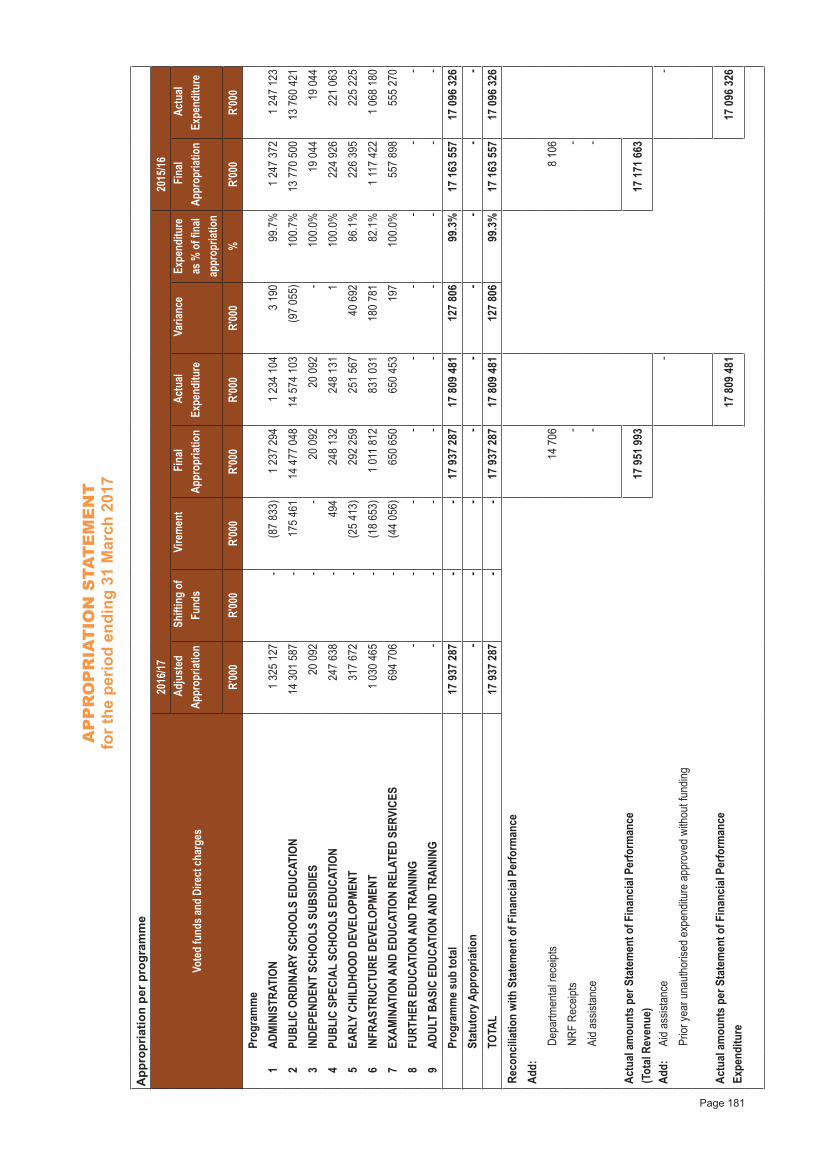
AP
PR
OP
RIA
TIO
N S
TAT
EM
EN
Tfo
r the
per
iod
endi
ng 3
1 M
arch
201
7
Page 181
App
ropr
iatio
n pe
r pro
gram
me
Vo
ted
fund
s and
Dire
ct ch
arge
s
2016
/17
20
15/16
A
djus
ted
Appr
opria
tion
Shi
fting
of
Fund
s V
irem
ent
Fin
al Ap
prop
riatio
n A
ctua
l Ex
pend
iture
V
arian
ce
Expe
nditu
re
as %
of fi
nal
appr
opria
tion
Fin
al Ap
prop
riatio
n A
ctua
l Ex
pend
iture
R'00
0R'
000
R'00
0R'
000
R'00
0R'
000
%R'
000
R'00
0
Prog
ram
me
1AD
MIN
ISTR
ATIO
N
1 32
5 12
7 -
(8
7 83
3)
1 23
7 29
4
1 23
4 10
4 3
190
99
.7%
1
247
372
1
247
123
2PU
BLIC
ORD
INAR
Y SC
HOOL
S ED
UCAT
ION
14
301
587
- 1
75 4
61
14
477
048
14
574
103
(9
7 05
5)10
0.7%
13
770
500
13
760
421
3IN
DEPE
NDEN
T SC
HOOL
S SU
BSID
IES
2
0 09
2 -
-
20
092
2
0 09
2 -
100.
0%
19
044
1
9 04
4
4PU
BLIC
SPE
CIAL
SCH
OOLS
EDU
CATI
ON 2
47 6
38
-
494
2
48 1
32
248
131
1
100.
0% 2
24 9
26
221
063
5EA
RLY
CHIL
DHOO
D DE
VELO
PMEN
T 3
17 6
72
-
(25
413)
292
259
2
51 5
67
4
0 69
2 86
.1%
226
395
2
25 2
25
6IN
FRAS
TRUC
TURE
DEV
ELOP
MEN
T
1 03
0 46
5 -
(1
8 65
3)
1 01
1 81
2 8
31 0
31
180
781
82
.1%
1
117
422
1
068
180
7EX
AMIN
ATIO
N AN
D ED
UCAT
ION
RELA
TED
SERV
ICES
694
706
-
(4
4 05
6) 6
50 6
50
650
453
197
10
0.0%
557
898
5
55 2
70
8FU
RTHE
R ED
UCAT
ION
AND
TRAI
NING
- -
- -
- -
- -
-
9AD
ULT
BASI
C ED
UCAT
ION
AND
TRAI
NING
- -
- -
- -
- -
-
Pr
ogra
mm
e su
b to
tal
17
937
287
- -
17
937
287
17
809
481
127
806
99.3
% 1
7 16
3 55
7 1
7 09
6 32
6
Stat
utor
y App
ropr
iatio
n -
- -
- -
- -
- -
TO
TAL
17
937
287
- -
17
937
287
17
809
481
127
806
99
.3%
17
163
557
17
096
326
Rec
onci
liatio
n wi
th S
tate
men
t of F
inan
cial
Per
form
ance
Add
:
D
epar
tmen
tal r
eceip
ts
1
4 70
6
8 1
06
N
RF R
eceip
ts
-
-
A
id as
sista
nce
-
-
Act
ual a
mou
nts
per S
tate
men
t of F
inan
cial
Per
form
ance
(Tot
al R
even
ue)
1
7 95
1 99
3
17
171
663
Add
: A
id as
sista
nce
-
-
P
rior y
ear u
naut
horis
ed e
xpen
ditur
e ap
prov
ed w
ithou
t fun
ding
A
ctua
l am
ount
s pe
r Sta
tem
ent o
f Fin
anci
al P
erfo
rman
ce
Exp
endi
ture
1
7 80
9 48
1
1
7 09
6 32
6
STA
TE
ME
NT
OF
FIN
AN
CIA
L P
ER
FOR
MA
NC
Efo
r the
per
iod
endi
ng 3
1 M
arch
201
7
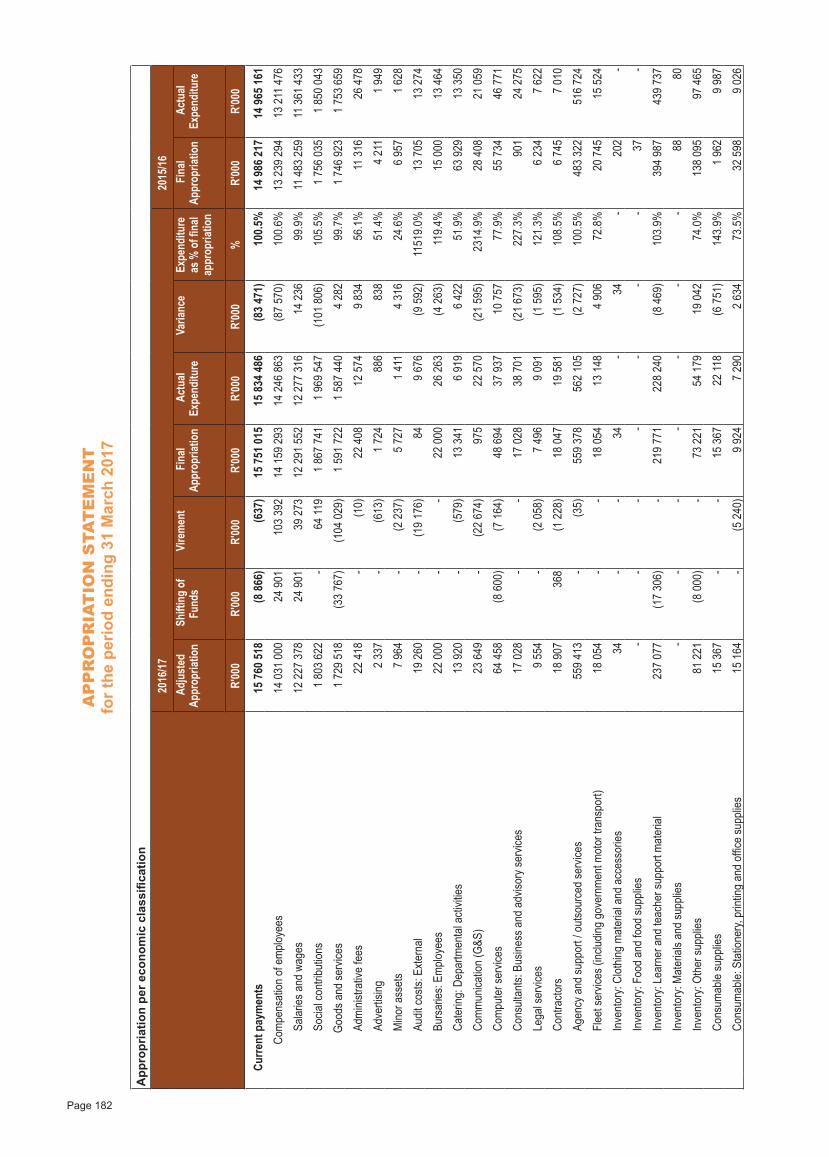
AP
PR
OP
RIA
TIO
N S
TAT
EM
EN
Tfo
r the
per
iod
endi
ng 3
1 M
arch
201
7
Page 182
App
ropr
iatio
n pe
r eco
nom
ic c
lass
ifica
tion
2016
/17
20
15/16
A
djus
ted
Appr
opria
tion
Shi
fting
of
Fund
s V
irem
ent
Fin
al Ap
prop
riatio
n A
ctua
l Ex
pend
iture
V
arian
ce
Expe
nditu
re
as %
of fi
nal
appr
opria
tion
Fin
al Ap
prop
riatio
n A
ctua
l Ex
pend
iture
R'00
0R'
000
R'00
0R'
000
R'00
0R'
000
%R'
000
R'00
0
Cu
rrent
pay
men
ts 1
5 76
0 51
8 (8
866
)
(637
) 1
5 75
1 01
5 1
5 83
4 48
6
(83
471)
100.
5% 1
4 98
6 21
7 1
4 96
5 16
1
Com
pens
ation
of e
mplo
yees
14
031
000
2
4 90
1 1
03 3
92
14
159
293
14
246
863
(8
7 57
0)10
0.6%
13
239
294
13
211
476
Sa
laries
and
wag
es 1
2 22
7 37
8
24
901
3
9 27
3 1
2 29
1 55
2 1
2 27
7 31
6
14
236
99.9
% 1
1 48
3 25
9 1
1 36
1 43
3
So
cial c
ontri
butio
ns
1 80
3 62
2 -
6
4 11
9
1 86
7 74
1
1 96
9 54
7 (1
01 8
06)
105.
5%
1 75
6 03
5
1 85
0 04
3
Goo
ds a
nd se
rvice
s
1 72
9 51
8
(33
767)
(104
029
)
1 59
1 72
2 1
587
440
4 28
299
.7%
1
746
923
1
753
659
Ad
mini
strat
ive fe
es
22
418
- (1
0)
22
408
1
2 57
4 9
834
56
.1%
11
316
26
478
Ad
verti
sing
2 3
37
-
(613
) 1
724
886
838
51
.4%
4 2
11
1 9
49
M
inor a
sset
s 7
964
-
(2 2
37)
5 7
27
1 4
11
4 3
16
24.6
% 6
957
1
628
Au
dit co
sts: E
xtern
al
19
260
-
(19
176)
84
9 6
76
(9 5
92)
1151
9.0%
1
3 70
5
13
274
Bu
rsar
ies: E
mplo
yees
2
2 00
0 -
-
22
000
2
6 26
3 (4
263
)11
9.4%
1
5 00
0
13
464
Ca
terin
g: D
epar
tmen
tal a
ctivit
ies
13
920
-
(579
)
13
341
6 9
19
6 4
22
51.9
%
63
929
1
3 35
0
Co
mm
unica
tion
(G&S
)
23
649
-
(22
674)
9
75
2
2 57
0
(21
595)
2314
.9%
2
8 40
8
21
059
Co
mpu
ter s
ervic
es
64
458
(8 6
00)
(7 1
64)
4
8 69
4
37
937
1
0 75
7 77
.9%
5
5 73
4
46
771
Co
nsult
ants:
Bus
iness
and
adv
isory
serv
ices
1
7 02
8 -
-
17
028
3
8 70
1
(21
673)
227.
3%
901
24
275
Le
gal s
ervic
es 9
554
-
(2 0
58)
7 4
96
9 0
91
(1 5
95)
121.
3% 6
234
7
622
Co
ntra
ctors
1
8 90
7
368
(1
228
)
18
047
1
9 58
1 (1
534
)10
8.5%
6 7
45
7 0
10
Ag
ency
and
supp
ort /
out
sour
ced
serv
ices
559
413
-
(35)
559
378
5
62 1
05
(2 7
27)
100.
5% 4
83 3
22
516
724
Fl
eet s
ervic
es (i
nclud
ing g
over
nmen
t mot
or tr
ansp
ort)
1
8 05
4 -
-
18
054
1
3 14
8 4
906
72
.8%
2
0 74
5
15
524
In
vent
ory:
Clot
hing
mat
erial
and
acc
esso
ries
34
- -
34
- 3
4 -
2
02
-
In
vent
ory:
Food
and
food
supp
lies
- -
- -
- -
- 3
7 -
In
vent
ory:
Lear
ner a
nd te
ache
r sup
port
mat
erial
237
077
(17
306)
- 2
19 7
71
228
240
(8
469
)10
3.9%
394
987
4
39 7
37
In
vent
ory:
Mat
erial
s and
supp
lies
- -
- -
- -
- 8
8 8
0
In
vent
ory:
Othe
r sup
plies
8
1 22
1 (8
000
) -
7
3 22
1
54
179
1
9 04
2 74
.0%
138
095
97
465
Co
nsum
able
supp
lies
1
5 36
7 -
-
15
367
2
2 11
8 (6
751
)14
3.9%
1 9
62
9 9
87
Co
nsum
able:
Sta
tione
ry, p
rintin
g an
d of
fice
supp
lies
1
5 16
4 -
(5 2
40)
9 9
24
7 2
90
2 6
34
73.5
%
32
598
9 0
26
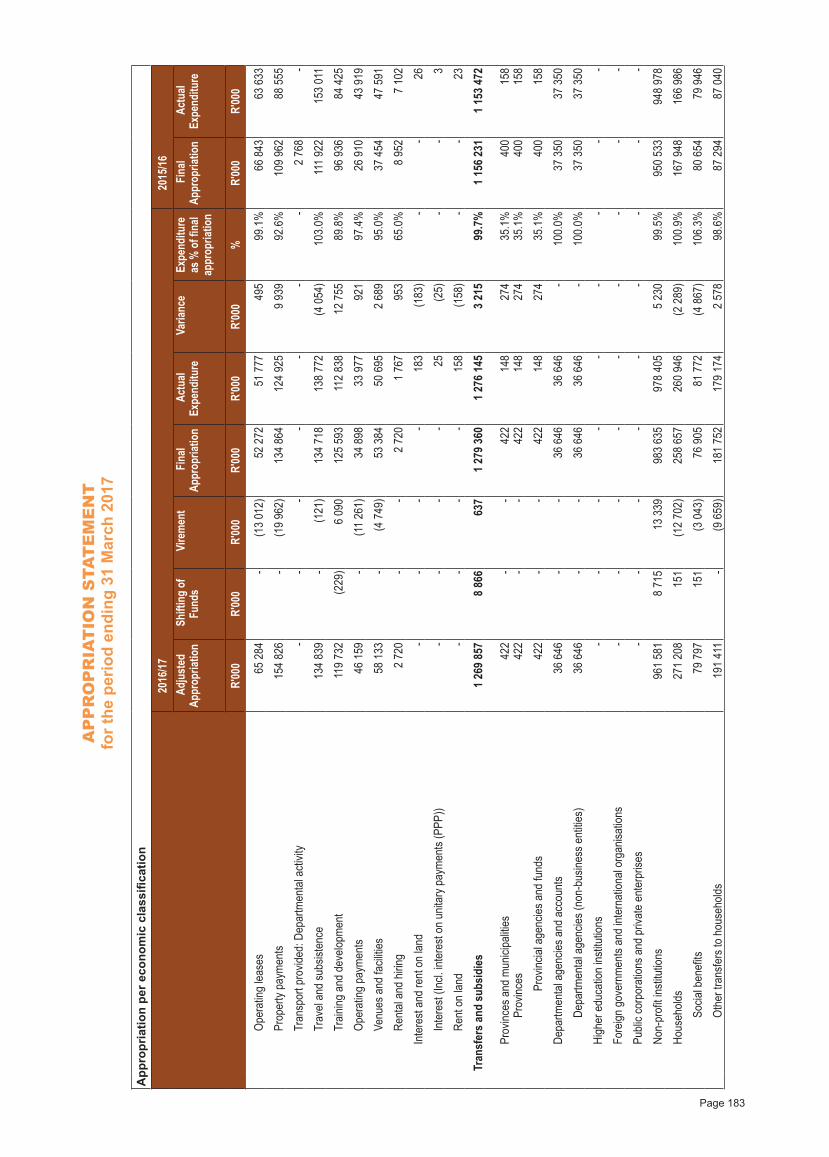
AP
PR
OP
RIA
TIO
N S
TAT
EM
EN
Tfo
r the
per
iod
endi
ng 3
1 M
arch
201
7
Page 183
App
ropr
iatio
n pe
r eco
nom
ic c
lass
ifica
tion
2016
/17
20
15/16
A
djus
ted
Appr
opria
tion
Shi
fting
of
Fund
s V
irem
ent
Fin
al Ap
prop
riatio
n A
ctua
l Ex
pend
iture
V
arian
ce
Expe
nditu
re
as %
of fi
nal
appr
opria
tion
Fin
al Ap
prop
riatio
n A
ctua
l Ex
pend
iture
R'00
0R'
000
R'00
0R'
000
R'00
0R'
000
%R'
000
R'00
0
Op
erat
ing le
ases
6
5 28
4 -
(1
3 01
2)
52
272
5
1 77
7
495
99
.1%
6
6 84
3
63
633
Pr
oper
ty pa
ymen
ts 1
54 8
26
-
(19
962)
134
864
12
4 92
59
939
92.6
% 1
09 9
62
8
8 55
5
Tr
ansp
ort p
rovid
ed: D
epar
tmen
tal a
ctivit
y -
- -
- -
- -
2 7
68
-
Tr
avel
and
subs
isten
ce 1
34 8
39
-
(121
) 1
34 7
18
138
772
(4
054
)10
3.0%
111
922
1
53 0
11
Tr
aining
and
dev
elopm
ent
119
732
(229
) 6
090
1
25 5
93
112
838
1
2 75
5 89
.8%
9
6 93
6
84
425
Op
erat
ing p
aym
ents
4
6 15
9 -
(1
1 26
1)
34
898
3
3 97
7
921
97
.4%
2
6 91
0
43
919
Ve
nues
and
facil
ities
5
8 13
3 -
(4 7
49)
5
3 38
4
50
695
2 6
89
95.0
%
37
454
4
7 59
1
Re
ntal
and
hiring
2 7
20
- -
2 7
20
1 7
67
9
53
65.0
% 8
952
7
102
In
tere
st an
d re
nt o
n lan
d -
- -
-
183
(183
) -
- 2
6
In
tere
st (In
cl. in
tere
st on
unit
ary p
aym
ents
(PPP
)) -
- -
- 2
5 (2
5) -
-
3
Re
nt o
n lan
d -
- -
-
158
(158
) -
- 2
3
Tr
ansf
ers
and
subs
idie
s
1 26
9 85
7 8
866
637
1 27
9 36
0
1 27
6 14
5 3
215
99
.7%
1
156
231
1
153
472
Pr
ovinc
es a
nd m
unici
paliti
esPr
ovinc
es
422
422
- -
- -
422
422
148
148
274
274
35
.1%
35.1
%
400
400
158
158
Pr
ovinc
ial a
genc
ies a
nd fu
nds
4
22
- -
4
22
1
48
2
74
35.1
%
400
158
De
partm
enta
l age
ncies
and
acc
ount
s
36
646
- -
3
6 64
6
36
646
- 10
0.0%
3
7 35
0
37
350
De
partm
enta
l age
ncies
(non
-bus
iness
ent
ities)
3
6 64
6 -
-
36
646
3
6 64
6 -
100.
0%
37
350
3
7 35
0
Hi
gher
edu
catio
n ins
titutio
ns -
- -
- -
- -
- -
Fo
reign
gov
ernm
ents
and
inter
natio
nal o
rgan
isatio
ns -
- -
- -
- -
- -
Pu
blic c
orpo
ratio
ns a
nd p
rivat
e en
terp
rises
- -
- -
- -
- -
-
No
n-pr
ofit in
stitu
tions
961
581
8
715
13
339
983
635
9
78 4
05
5 2
30
99.5
% 9
50 5
33
948
978
Ho
useh
olds
271
208
151
(12
702)
258
657
2
60 9
46
(2 2
89)
100.
9% 1
67 9
48
166
986
So
cial b
enefi
ts
79
797
1
51
(3 0
43)
7
6 90
5
81
772
(4 8
67)
106.
3%
80
654
7
9 94
6
Ot
her t
rans
fers
to h
ouse
holds
191
411
-
(9 6
59)
181
752
1
79 1
74
2 5
78
98.6
%
87
294
8
7 04
0
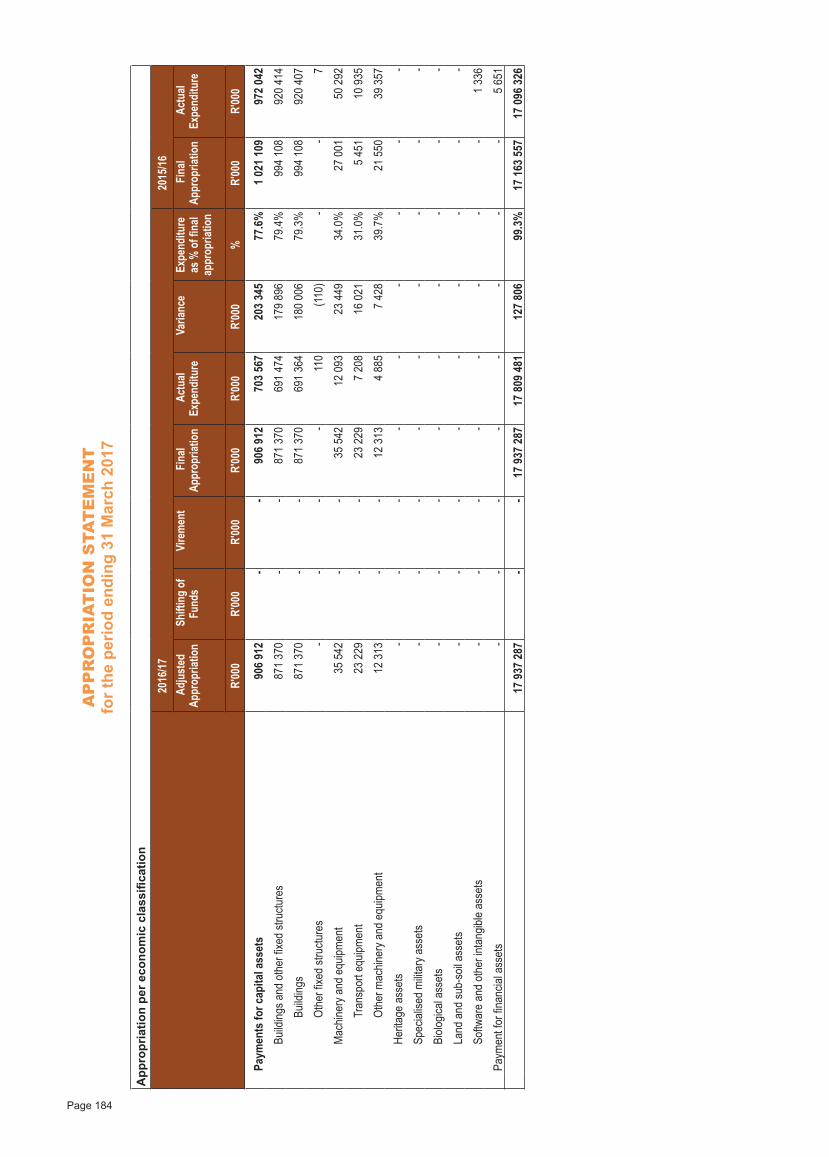
AP
PR
OP
RIA
TIO
N S
TAT
EM
EN
Tfo
r the
per
iod
endi
ng 3
1 M
arch
201
7
Page 184
App
ropr
iatio
n pe
r eco
nom
ic c
lass
ifica
tion
2016
/17
20
15/16
A
djus
ted
Appr
opria
tion
Shi
fting
of
Fund
s V
irem
ent
Fin
al Ap
prop
riatio
n A
ctua
l Ex
pend
iture
V
arian
ce
Expe
nditu
re
as %
of fi
nal
appr
opria
tion
Fin
al Ap
prop
riatio
n A
ctua
l Ex
pend
iture
R'00
0R'
000
R'00
0R'
000
R'00
0R'
000
%R'
000
R'00
0
Pa
ymen
ts fo
r cap
ital a
sset
s 9
06 9
12
- -
906
912
7
03 5
67
203
345
77.6
%
1 02
1 10
9 9
72 0
42
Bu
ilding
s and
oth
er fix
ed st
ructu
res
871
370
-
- 8
71 3
70
691
474
17
9 89
679
.4%
994
108
9
20 4
14
Bu
ilding
s 8
71 3
70
- -
871
370
6
91 3
64
180
006
79.3
% 9
94 1
08
920
407
Ot
her fi
xed
struc
ture
s -
- -
-
110
(1
10)
- -
7
M
achin
ery a
nd e
quipm
ent
3
5 54
2 -
-
35
542
1
2 09
3
23
449
34.0
%
27
001
5
0 29
2
Tr
ansp
ort e
quipm
ent
2
3 22
9 -
-
23
229
7 2
08
1
6 02
1 31
.0%
5 4
51
1
0 93
5
Ot
her m
achin
ery a
nd e
quipm
ent
1
2 31
3 -
-
12
313
4 8
85
7 4
28
39.7
%
21
550
3
9 35
7
He
ritag
e as
sets
- -
- -
- -
- -
-
Sp
ecial
ised
milit
ary a
sset
s -
- -
- -
- -
- -
Bi
ologic
al as
sets
- -
- -
- -
- -
-
La
nd a
nd su
b-so
il ass
ets
- -
- -
- -
- -
-
So
ftwar
e an
d ot
her i
ntan
gible
asse
ts -
- -
- -
- -
- 1
336
Pa
ymen
t for
finan
cial a
sset
s -
- -
- -
- -
- 5
651
1
7 93
7 28
7 -
- 1
7 93
7 28
7 1
7 80
9 48
1 1
27 8
06
99.3
% 1
7 16
3 55
7 1
7 09
6 32
6
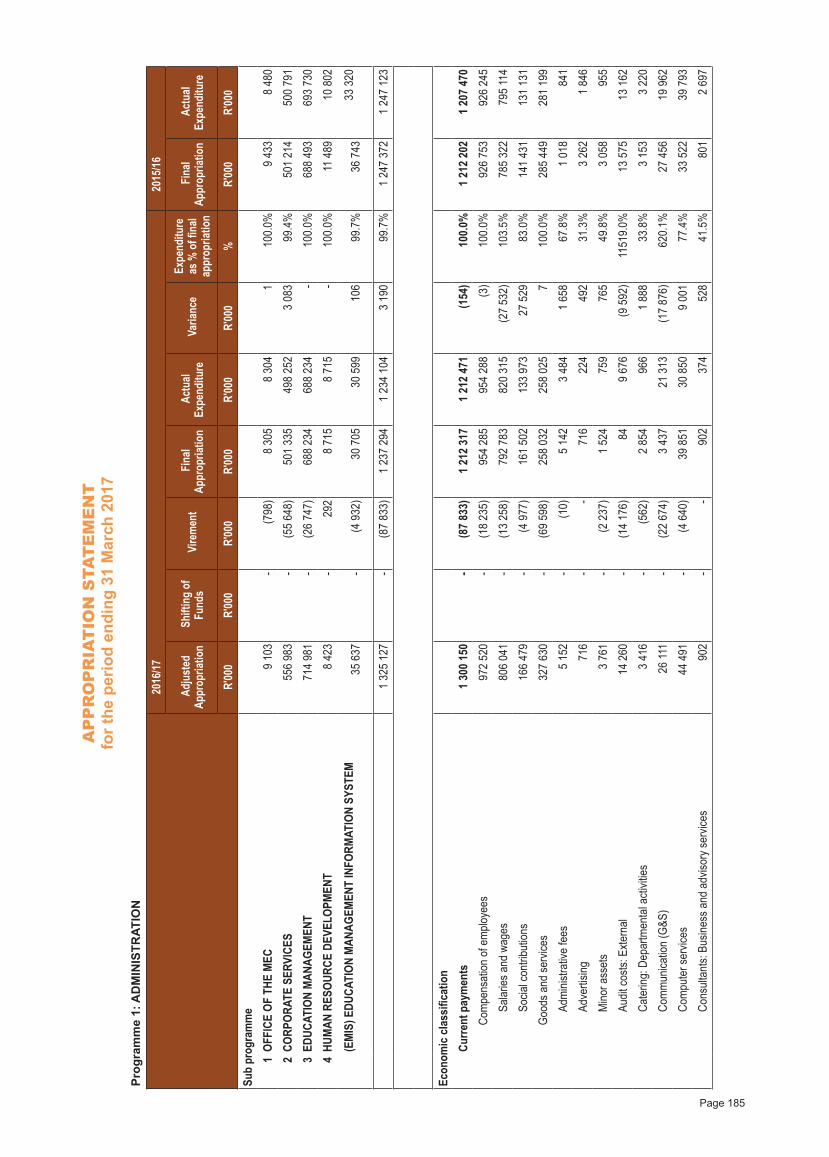
AP
PR
OP
RIA
TIO
N S
TAT
EM
EN
Tfo
r the
per
iod
endi
ng 3
1 M
arch
201
7
Page 185
Prog
ram
me
1: A
DM
INIS
TRAT
ION
2016
/17
20
15/16
Adj
uste
d Ap
prop
riatio
n S
hifti
ng o
f Fu
nds
Vire
men
t F
inal
Appr
opria
tion
Act
ual
Expe
nditu
re
Var
iance
Ex
pend
iture
as
% o
f fina
l ap
prop
riatio
n F
inal
Appr
opria
tion
Act
ual
Expe
nditu
re
R'00
0R'
000
R'00
0R'
000
R'00
0R'
000
%R'
000
R'00
0Su
b pr
ogra
mm
e
1OF
FICE
OF
THE
MEC
9 1
03
-
(798
) 8
305
8
304
1
100.
0% 9
433
8
480
2CO
RPOR
ATE
SERV
ICES
556
983
-
(5
5 64
8) 5
01 3
35
498
252
3
083
99
.4%
501
214
5
00 7
91
3ED
UCAT
ION
MAN
AGEM
ENT
714
981
-
(2
6 74
7) 6
88 2
34
688
234
-
100.
0% 6
88 4
93
693
730
4HU
MAN
RES
OURC
E DE
VELO
PMEN
T 8
423
-
2
92
8 7
15
8 7
15
- 10
0.0%
11
489
10
802
(EM
IS) E
DUCA
TION
MAN
AGEM
ENT
INFO
RMAT
ION
SYST
EM
35
637
- (4
932
)
30
705
3
0 59
9
106
99
.7%
3
6 74
3
33
320
1
325
127
-
(87
833)
1
237
294
1
234
104
3 1
90
99.7
%
1 24
7 37
2
1 24
7 12
3
Econ
omic
cla
ssifi
catio
n
Cu
rrent
pay
men
ts
1 30
0 15
0 -
(8
7 83
3)
1 21
2 31
7
1 21
2 47
1
(154
)10
0.0%
1
212
202
1
207
470
Co
mpe
nsat
ion o
f em
ploye
es 9
72 5
20
-
(18
235)
954
285
9
54 2
88
(3
)10
0.0%
926
753
9
26 2
45
Sa
laries
and
wag
es 8
06 0
41
-
(13
258)
792
783
8
20 3
15
(2
7 53
2)10
3.5%
785
322
7
95 11
4
So
cial c
ontri
butio
ns 1
66 4
79
- (4
977
) 1
61 5
02
133
973
27
529
83.0
% 1
41 4
31
131
131
Go
ods a
nd se
rvice
s 3
27 6
30
-
(69
598)
258
032
2
58 0
25
7
10
0.0%
285
449
2
81 1
99
Ad
mini
strat
ive fe
es 5
152
-
(10)
5 1
42
3 4
84
1 6
58
67.8
% 1
018
841
Ad
verti
sing
7
16
- -
7
16
2
24
4
92
31.3
% 3
262
1
846
M
inor a
sset
s 3
761
-
(2 2
37)
1 5
24
7
59
7
65
49.8
% 3
058
955
Au
dit co
sts: E
xtern
al
14
260
-
(14
176)
84
9 6
76
(9 5
92)
1151
9.0%
1
3 57
5
13
162
Ca
terin
g: D
epar
tmen
tal a
ctivit
ies 3
416
-
(5
62)
2 8
54
9
66
1 8
88
33.8
% 3
153
3
220
Co
mm
unica
tion
(G&S
)
26
111
-
(22
674)
3 4
37
2
1 31
3
(17
876)
620.
1%
27
456
1
9 96
2
Co
mpu
ter s
ervic
es
44
491
- (4
640
)
39
851
3
0 85
0 9
001
77
.4%
3
3 52
2
39
793
Co
nsult
ants:
Bus
iness
and
adv
isory
serv
ices
9
02
- -
9
02
3
74
5
28
41.5
%
801
2
697
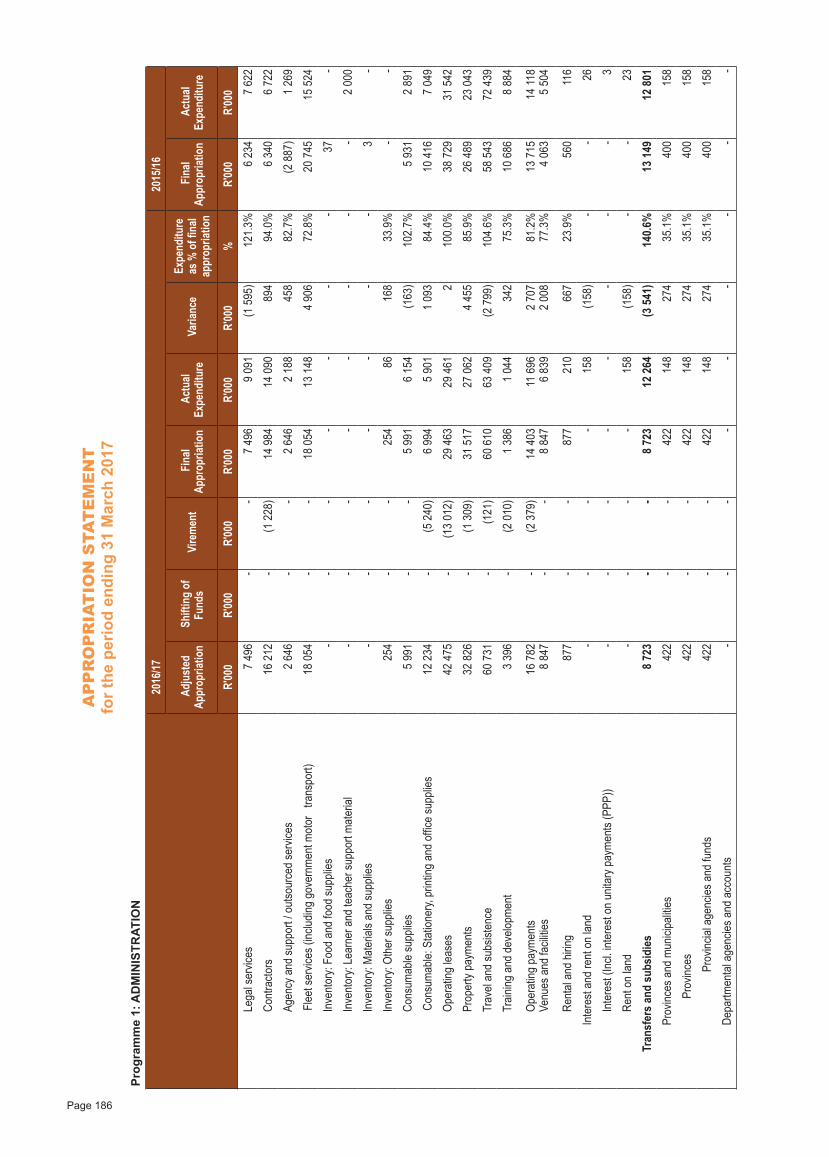
AP
PR
OP
RIA
TIO
N S
TAT
EM
EN
Tfo
r the
per
iod
endi
ng 3
1 M
arch
201
7
Page 186
Prog
ram
me
1: A
DM
INIS
TRAT
ION
2016
/17
20
15/16
Adj
uste
d Ap
prop
riatio
n S
hifti
ng o
f Fu
nds
Vire
men
t F
inal
Appr
opria
tion
Act
ual
Expe
nditu
re
Var
iance
Ex
pend
iture
as
% o
f fina
l ap
prop
riatio
n F
inal
Appr
opria
tion
Act
ual
Expe
nditu
re
R'00
0R'
000
R'00
0R'
000
R'00
0R'
000
%R'
000
R'00
0
Lega
l ser
vices
7 4
96
- -
7 4
96
9 0
91
(1 5
95)
121.
3% 6
234
7
622
Co
ntra
ctors
1
6 21
2 -
(1 2
28)
1
4 98
4
14
090
8
94
94.0
% 6
340
6
722
Ag
ency
and
supp
ort /
out
sour
ced
serv
ices
2 6
46
- -
2 6
46
2 1
88
4
58
82.7
% (2
887
) 1
269
Fl
eet s
ervic
es (i
nclud
ing g
over
nmen
t mot
or
trans
port)
1
8 05
4 -
-
18
054
1
3 14
8 4
906
72
.8%
2
0 74
5
15
524
In
vent
ory:
Food
and
food
supp
lies
- -
- -
- -
- 3
7 -
In
vent
ory:
Lear
ner a
nd te
ache
r sup
port
mat
erial
- -
- -
- -
- -
2 0
00
In
vent
ory:
Mat
erial
s and
supp
lies
- -
- -
- -
-
3
-
In
vent
ory:
Othe
r sup
plies
2
54
- -
2
54
86
1
68
33.9
% -
-
Co
nsum
able
supp
lies
5 9
91
- -
5 9
91
6 1
54
(1
63)
102.
7% 5
931
2
891
Co
nsum
able:
Sta
tione
ry, p
rintin
g an
d of
fice
supp
lies
1
2 23
4 -
(5 2
40)
6 9
94
5 9
01
1 0
93
84.4
%
10
416
7 0
49
Op
erat
ing le
ases
4
2 47
5 -
(1
3 01
2)
29
463
2
9 46
1
2
100.
0%
38
729
3
1 54
2
Pr
oper
ty pa
ymen
ts
32
826
- (1
309
)
31
517
2
7 06
2 4
455
85
.9%
2
6 48
9
23
043
Tr
avel
and
subs
isten
ce
60
731
-
(121
)
60
610
6
3 40
9 (2
799
)10
4.6%
5
8 54
3
72
439
Tr
aining
and
dev
elopm
ent
3 3
96
- (2
010
) 1
386
1
044
342
75
.3%
1
0 68
6 8
884
Op
erat
ing p
aym
ents
Venu
es a
nd fa
cilitie
s
16
782
8 8
47
- - (2
379
) -
14
403
8 8
47
11
696
6
839
2
707
2
008
81
.2%
77.3
%
13
715
4 0
63
1
4 11
8 5
504
Re
ntal
and
hiring
8
77
- -
8
77
2
10
6
67
23.9
%
560
116
In
tere
st an
d re
nt o
n lan
d -
- -
-
158
(158
) -
- 2
6
In
tere
st (In
cl. in
tere
st on
unit
ary p
aym
ents
(PPP
)) -
- -
- -
- -
-
3
Re
nt o
n lan
d -
- -
-
158
(158
) -
- 2
3
Tr
ansf
ers
and
subs
idie
s 8
723
-
- 8
723
12
264
(3 5
41)
140.
6%
13
149
1
2 80
1
Prov
inces
and
mun
icipa
lities
4
22
- -
4
22
1
48
2
74
35.1
%
400
158
Pr
ovinc
es
422
-
-
422
148
274
35
.1%
4
00
1
58
Pr
ovinc
ial a
genc
ies a
nd fu
nds
4
22
- -
4
22
1
48
2
74
35.1
%
400
158
De
partm
enta
l age
ncies
and
acc
ount
s -
- -
- -
- -
- -
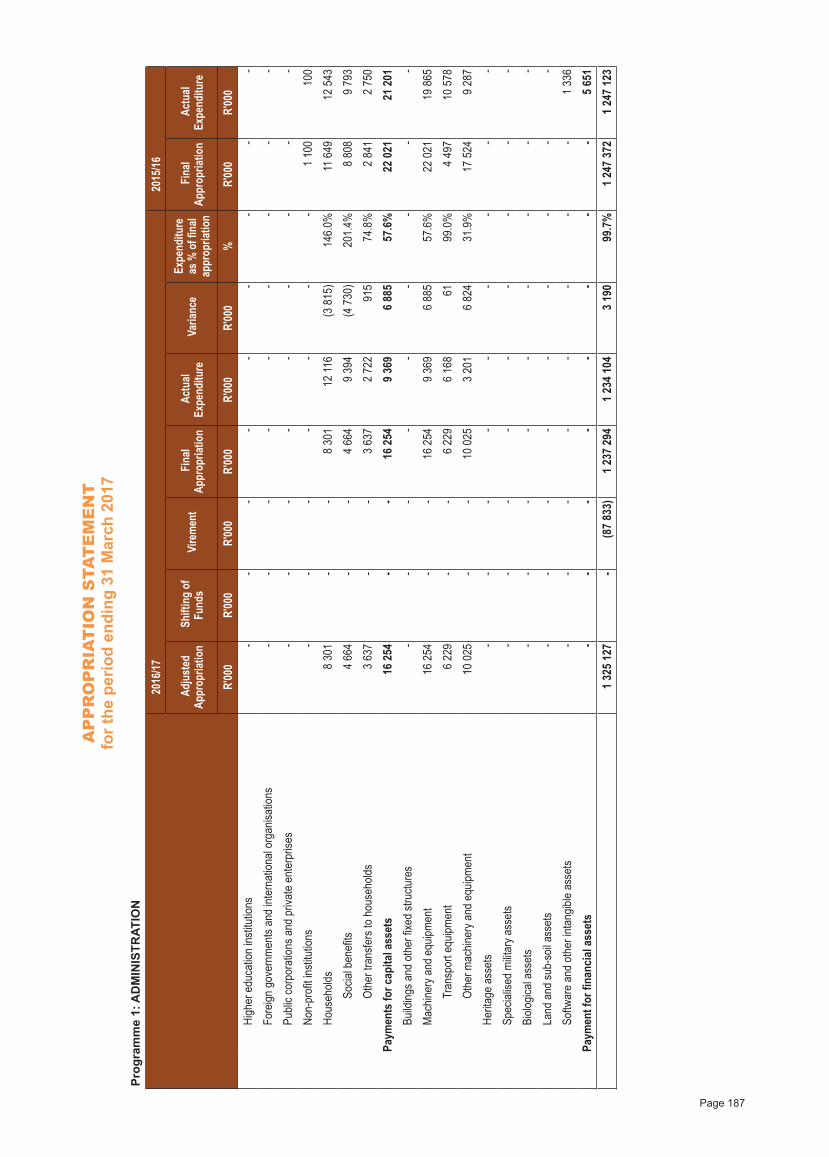
AP
PR
OP
RIA
TIO
N S
TAT
EM
EN
Tfo
r the
per
iod
endi
ng 3
1 M
arch
201
7
Page 187
Prog
ram
me
1: A
DM
INIS
TRAT
ION
2016
/17
20
15/16
Adj
uste
d Ap
prop
riatio
n S
hifti
ng o
f Fu
nds
Vire
men
t F
inal
Appr
opria
tion
Act
ual
Expe
nditu
re
Var
iance
Ex
pend
iture
as
% o
f fina
l ap
prop
riatio
n F
inal
Appr
opria
tion
Act
ual
Expe
nditu
re
R'00
0R'
000
R'00
0R'
000
R'00
0R'
000
%R'
000
R'00
0
High
er e
duca
tion
institu
tions
- -
- -
- -
- -
-
Fo
reign
gov
ernm
ents
and
inter
natio
nal o
rgan
isatio
ns -
- -
- -
- -
- -
Pu
blic c
orpo
ratio
ns a
nd p
rivat
e en
terp
rises
- -
- -
- -
- -
-
No
n-pr
ofit in
stitu
tions
- -
- -
- -
- 1
100
100
Ho
useh
olds
8 3
01
- -
8 3
01
1
2 11
6 (3
815
)14
6.0%
11
649
12
543
So
cial b
enefi
ts 4
664
-
- 4
664
9
394
(4
730
)20
1.4%
8 8
08
9 7
93
Ot
her t
rans
fers
to h
ouse
holds
3 6
37
- -
3 6
37
2 7
22
9
15
74.8
% 2
841
2
750
Pa
ymen
ts fo
r cap
ital a
sset
s
16
254
- -
1
6 25
4 9
369
6
885
57
.6%
2
2 02
1
21
201
Bu
ilding
s and
oth
er fix
ed st
ructu
res
- -
- -
- -
- -
-
M
achin
ery a
nd e
quipm
ent
1
6 25
4 -
-
16
254
9 3
69
6 8
85
57.6
%
22
021
1
9 86
5
Tr
ansp
ort e
quipm
ent
6 2
29
- -
6 2
29
6 1
68
61
99.0
% 4
497
10
578
Ot
her m
achin
ery a
nd e
quipm
ent
1
0 02
5 -
-
10
025
3 2
01
6 8
24
31.9
%
17
524
9 2
87
He
ritag
e as
sets
- -
- -
- -
- -
-
Sp
ecial
ised
milit
ary a
sset
s -
- -
- -
- -
- -
Bi
ologic
al as
sets
- -
- -
- -
- -
-
La
nd a
nd su
b-so
il ass
ets
- -
- -
- -
- -
-
So
ftwar
e an
d ot
her i
ntan
gible
asse
ts -
- -
- -
- -
- 1
336
Pa
ymen
t for
fina
ncia
l ass
ets
- -
- -
- -
- -
5 6
51
1
325
127
-
(87
833)
1
237
294
1
234
104
3 1
90
99.7
%
1 24
7 37
2
1 24
7 12
3
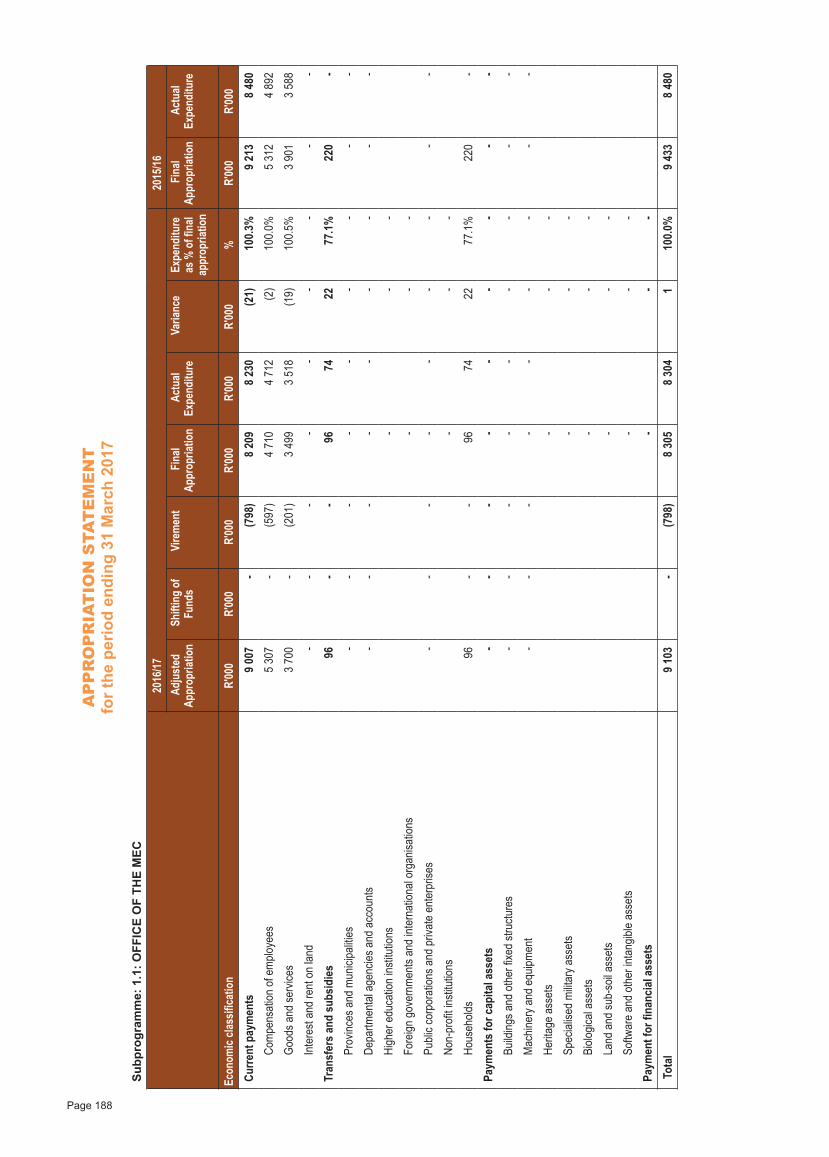
AP
PR
OP
RIA
TIO
N S
TAT
EM
EN
Tfo
r the
per
iod
endi
ng 3
1 M
arch
201
7
Page 188
Subp
rogr
amm
e: 1
.1: O
FFIC
E O
F TH
E M
EC
2016
/17
20
15/16
Adj
uste
d Ap
prop
riatio
n S
hifti
ng o
f Fu
nds
Vire
men
t F
inal
Appr
opria
tion
Act
ual
Expe
nditu
re
Var
iance
Ex
pend
iture
as
% o
f fina
l ap
prop
riatio
n
Fin
al Ap
prop
riatio
n A
ctua
l Ex
pend
iture
Eco
nom
ic cla
ssifi
catio
n R'
000
R'00
0R'
000
R'00
0R'
000
R'00
0%
R'00
0R'
000
Curre
nt p
aym
ents
9 0
07
-
(798
) 8
209
8
230
(2
1)10
0.3%
9 2
13
8 4
80
Com
pens
ation
of e
mplo
yees
5 3
07
-
(597
) 4
710
4
712
(2)
100.
0% 5
312
4
892
Good
s and
serv
ices
3 7
00
-
(201
) 3
499
3
518
(1
9)10
0.5%
3 9
01
3 5
88
Inte
rest
and
rent
on
land
- -
- -
- -
- -
-
Tran
sfer
s an
d su
bsid
ies
96
- -
96
74
22
77.1
%
220
-
Prov
inces
and
mun
icipa
lities
- -
- -
- -
- -
-
Depa
rtmen
tal a
genc
ies a
nd a
ccou
nts
- -
- -
- -
- -
-
High
er e
duca
tion
institu
tions
-
-
-
Fore
ign g
over
nmen
ts an
d int
erna
tiona
l org
anisa
tions
-
-
-
Publi
c cor
pora
tions
and
priv
ate
ente
rpris
es -
- -
- -
- -
- -
Non-
profi
t insti
tutio
ns
-
- -
Hous
ehold
s 9
6 -
- 9
6 7
4 2
2 77
.1%
2
20
-
Paym
ents
for c
apita
l ass
ets
- -
- -
- -
- -
- Bu
ilding
s and
oth
er fix
ed st
ructu
res
- -
- -
- -
- -
-
Mac
hiner
y and
equ
ipmen
t -
- -
- -
- -
- -
Herit
age
asse
ts
-
- -
Spec
ialise
d m
ilitar
y ass
ets
-
-
-
Biolo
gical
asse
ts
-
- -
Land
and
sub-
soil a
sset
s
-
- -
Softw
are
and
othe
r int
angib
le as
sets
-
-
-
Pa
ymen
t for
fina
ncia
l ass
ets
-
-
-
To
tal
9 1
03
-
(798
) 8
305
8
304
1
100.
0% 9
433
8
480

AP
PR
OP
RIA
TIO
N S
TAT
EM
EN
Tfo
r the
per
iod
endi
ng 3
1 M
arch
201
7
Page 189
Subp
rogr
amm
e: 1
.2: C
OR
POR
ATE
SER
VIC
ES
2016
/17
20
15/16
Adj
uste
d Ap
prop
riatio
n S
hifti
ng o
f Fu
nds
Vire
men
t F
inal
Appr
opria
tion
Act
ual
Expe
nditu
re
Var
iance
Ex
pend
iture
as
% o
f fina
l ap
prop
riatio
n
Fin
al Ap
prop
riatio
n A
ctua
l Ex
pend
iture
Eco
nom
ic cla
ssifi
catio
n R'
000
R'00
0R'
000
R'00
0R'
000
R'00
0%
R'00
0R'
000
Cur
rent
pay
men
ts 5
40 3
29
-
(55
648)
484
681
4
84 8
30
(1
49)
100.
0% 4
79 4
43
470
131
Com
pens
atio
n of
em
ploy
ees
355
251
-
(1
2 74
9) 3
42 5
02
342
503
(1)
100.
0% 3
24 3
03
324
215
Goo
ds a
nd s
ervi
ces
185
078
-
(4
2 89
9) 1
42 1
79
142
175
4
100.
0% 1
55 1
40
145
893
Inte
rest
and
rent
on
land
- -
- -
1
52
(1
52)
- -
23
Tran
sfer
s an
d su
bsid
ies
5 7
62
- -
5 7
62
5 8
68
(1
06)
101.
8% 5
746
5
621
Pro
vinc
es a
nd m
unic
ipal
ities
4
22
- -
4
22
1
48
2
74
35.1
%
400
158
Dep
artm
enta
l age
ncie
s an
d ac
coun
ts -
- -
- -
- -
- -
Hig
her e
duca
tion
inst
itutio
ns
-
- -
Fore
ign
gove
rnm
ents
and
inte
rnat
iona
l org
anis
atio
ns
-
- -
Pub
lic c
orpo
ratio
ns a
nd p
rivat
e en
terp
rises
- -
- -
- -
- -
-
Non
-pro
fit in
stitu
tions
-
- -
- 1
000
Hou
seho
lds
5 3
40
- -
5 3
40
5 7
20
(3
80)
107.
1% 4
346
5
463
Paym
ents
for c
apita
l ass
ets
1
0 89
2 -
-
10
892
7 5
54
3 3
38
69.4
%
16
025
1
9 38
8
Bui
ldin
gs a
nd o
ther
fixe
d st
ruct
ures
- -
- -
- -
- -
-
Mac
hine
ry a
nd e
quip
men
t
10
892
- -
1
0 89
2 7
554
3
338
69
.4%
1
6 02
5
18
052
Her
itage
ass
ets
-
-
-
Spe
cial
ised
mili
tary
ass
ets
-
-
-
Bio
logi
cal a
sset
s
-
- -
Land
and
sub
-soi
l ass
ets
-
-
-
Sof
twar
e an
d ot
her i
ntan
gibl
e as
sets
-
-
-
1 3
36
Paym
ent f
or fi
nanc
ial a
sset
s
-
- -
5
651
Tot
al
556
983
-
(5
5 64
8) 5
01 3
35
498
252
3
083
99
.4%
501
214
5
00 7
91
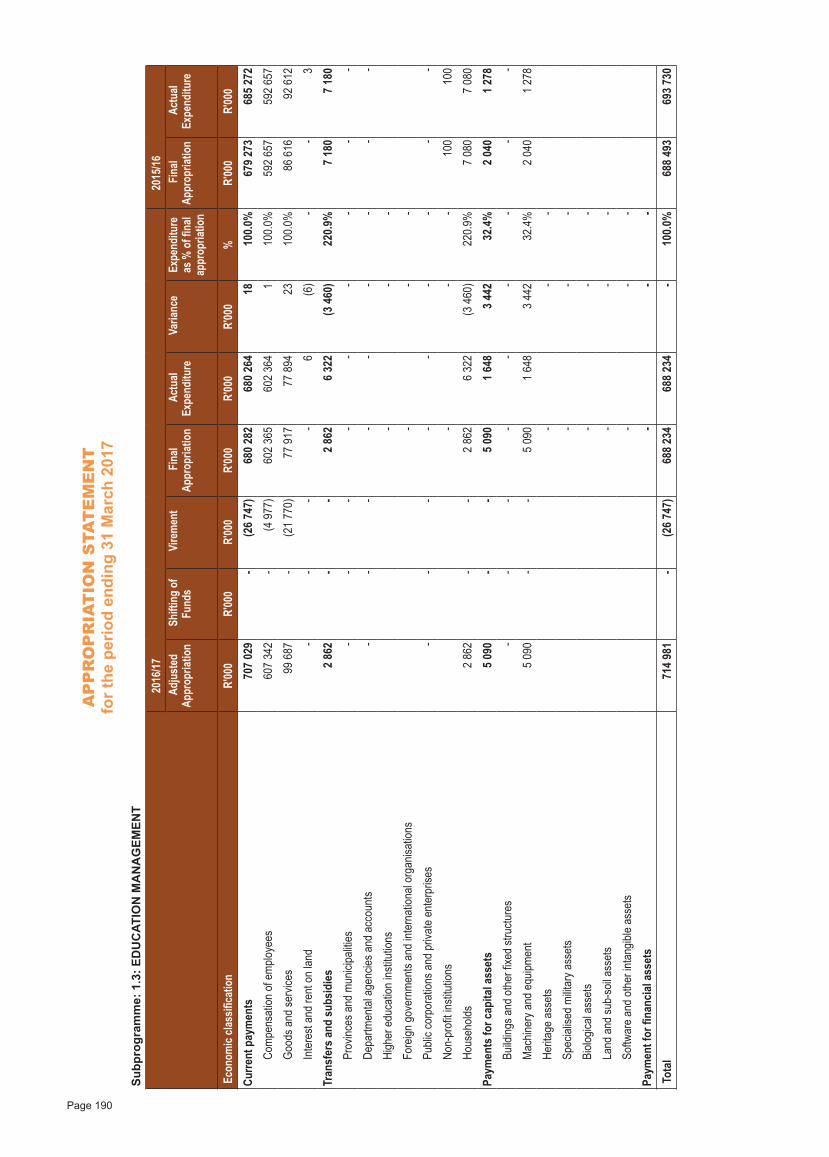
AP
PR
OP
RIA
TIO
N S
TAT
EM
EN
Tfo
r the
per
iod
endi
ng 3
1 M
arch
201
7
Page 190
Subp
rogr
amm
e: 1
.3: E
DU
CAT
ION
MA
NA
GEM
ENT
20
16/17
2015
/16
A
djus
ted
Appr
opria
tion
Shi
fting
of
Fund
s V
irem
ent
Fin
al Ap
prop
riatio
n A
ctua
l Ex
pend
iture
V
arian
ce
Expe
nditu
re
as %
of fi
nal
appr
opria
tion
Fin
al Ap
prop
riatio
n A
ctua
l Ex
pend
iture
Eco
nom
ic cla
ssifi
catio
n R'
000
R'00
0R'
000
R'00
0R'
000
R'00
0%
R'00
0R'
000
Curre
nt p
aym
ents
707
029
-
(2
6 74
7) 6
80 2
82
680
264
1
8 10
0.0%
679
273
6
85 2
72
Com
pens
ation
of e
mplo
yees
607
342
-
(4 9
77)
602
365
6
02 3
64
1
10
0.0%
592
657
5
92 6
57
Good
s and
serv
ices
9
9 68
7 -
(2
1 77
0)
77
917
7
7 89
4 2
3 10
0.0%
8
6 61
6
92
612
Inte
rest
and
rent
on
land
- -
- -
6
(6)
- -
3
Tran
sfer
s an
d su
bsid
ies
2 8
62
- -
2 8
62
6 3
22
(3 4
60)
220.
9% 7
180
7
180
Pr
ovinc
es a
nd m
unici
paliti
es -
- -
- -
- -
- -
Depa
rtmen
tal a
genc
ies a
nd a
ccou
nts
- -
- -
- -
- -
-
High
er e
duca
tion
institu
tions
-
-
-
Fore
ign g
over
nmen
ts an
d int
erna
tiona
l org
anisa
tions
-
-
-
Publi
c cor
pora
tions
and
priv
ate
ente
rpris
es -
- -
- -
- -
- -
Non-
profi
t insti
tutio
ns
-
- -
1
00
1
00
Hous
ehold
s 2
862
-
- 2
862
6
322
(3
460
)22
0.9%
7 0
80
7 0
80
Paym
ents
for c
apita
l ass
ets
5 0
90
- -
5 0
90
1 6
48
3 4
42
32.4
% 2
040
1
278
Bu
ilding
s and
oth
er fix
ed st
ructu
res
- -
- -
- -
- -
-
Mac
hiner
y and
equ
ipmen
t 5
090
-
- 5
090
1
648
3
442
32
.4%
2 0
40
1 2
78
Herit
age
asse
ts
-
- -
Spec
ialise
d m
ilitar
y ass
ets
-
-
-
Biolo
gical
asse
ts
-
- -
Land
and
sub-
soil a
sset
s
-
- -
Softw
are
and
othe
r int
angib
le as
sets
-
-
-
Paym
ent f
or fi
nanc
ial a
sset
s
-
- -
Tota
l 7
14 9
81
-
(26
747)
688
234
6
88 2
34
- 10
0.0%
688
493
6
93 7
30
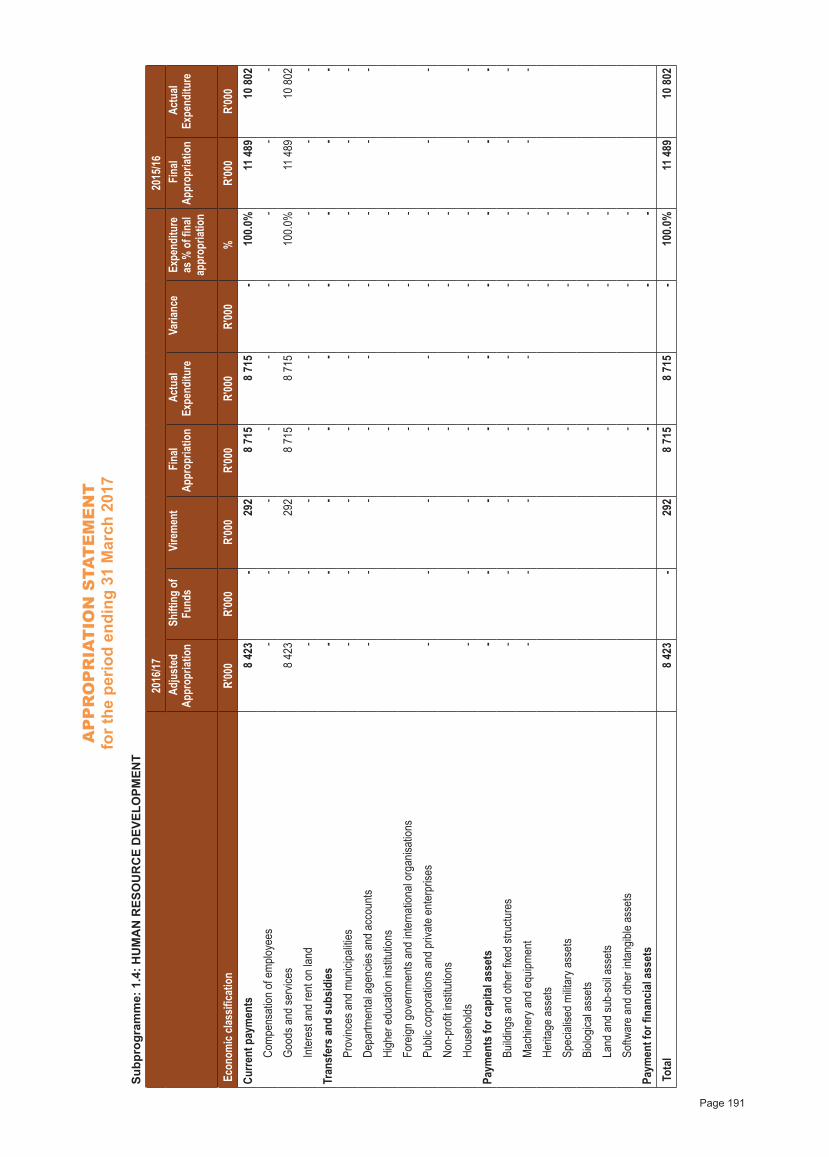
AP
PR
OP
RIA
TIO
N S
TAT
EM
EN
Tfo
r the
per
iod
endi
ng 3
1 M
arch
201
7
Page 191
Subp
rogr
amm
e: 1
.4: H
UM
AN
RES
OU
RC
E D
EVEL
OPM
ENT
20
16/17
2015
/16
A
djus
ted
Appr
opria
tion
Shi
fting
of
Fund
s V
irem
ent
Fin
al Ap
prop
riatio
n A
ctua
l Ex
pend
iture
V
arian
ce
Expe
nditu
re
as %
of fi
nal
appr
opria
tion
Fin
al Ap
prop
riatio
n A
ctua
l Ex
pend
iture
Eco
nom
ic cla
ssifi
catio
n R'
000
R'00
0R'
000
R'00
0R'
000
R'00
0%
R'00
0R'
000
Curre
nt p
aym
ents
8 4
23
-
292
8
715
8
715
-
100.
0%
11 4
89
1
0 80
2 Co
mpe
nsat
ion o
f em
ploye
es -
- -
- -
- -
- -
Good
s and
serv
ices
8 4
23
-
292
8
715
8
715
-
100.
0%
11 4
89
1
0 80
2
Inte
rest
and
rent
on
land
- -
- -
- -
- -
-
Tran
sfer
s an
d su
bsid
ies
- -
- -
- -
- -
- Pr
ovinc
es a
nd m
unici
paliti
es -
- -
- -
- -
- -
Depa
rtmen
tal a
genc
ies a
nd a
ccou
nts
- -
- -
- -
- -
-
High
er e
duca
tion
institu
tions
-
-
-
Fore
ign g
over
nmen
ts an
d int
erna
tiona
l org
anisa
tions
-
-
-
Publi
c cor
pora
tions
and
priv
ate
ente
rpris
es -
- -
- -
- -
- -
Non-
profi
t insti
tutio
ns
-
- -
Hous
ehold
s -
- -
- -
- -
- -
Paym
ents
for c
apita
l ass
ets
- -
- -
- -
- -
- Bu
ilding
s and
oth
er fix
ed st
ructu
res
- -
- -
- -
- -
-
Mac
hiner
y and
equ
ipmen
t -
- -
- -
- -
- -
Herit
age
asse
ts
-
- -
Spec
ialise
d m
ilitar
y ass
ets
-
-
-
Biolo
gical
asse
ts
-
- -
Land
and
sub-
soil a
sset
s
-
- -
Softw
are
and
othe
r int
angib
le as
sets
-
-
-
Paym
ent f
or fi
nanc
ial a
sset
s
-
- -
Tota
l 8
423
-
2
92
8 7
15
8 7
15
- 10
0.0%
11
489
10
802
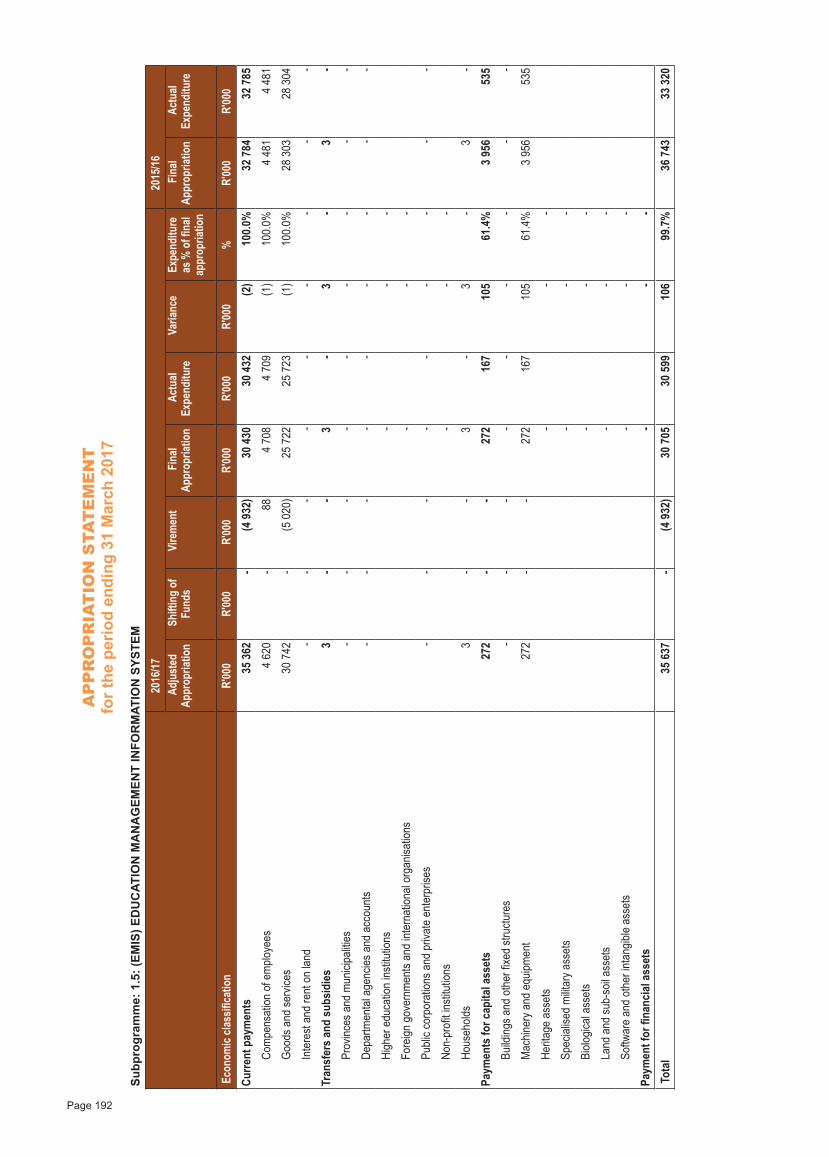
AP
PR
OP
RIA
TIO
N S
TAT
EM
EN
Tfo
r the
per
iod
endi
ng 3
1 M
arch
201
7
Page 192
Subp
rogr
amm
e: 1
.5: (
EMIS
) ED
UC
ATIO
N M
AN
AG
EMEN
T IN
FOR
MAT
ION
SYS
TEM
20
16/17
2015
/16
A
djus
ted
Appr
opria
tion
Shi
fting
of
Fund
s V
irem
ent
Fin
al Ap
prop
riatio
n A
ctua
l Ex
pend
iture
V
arian
ce
Expe
nditu
re
as %
of fi
nal
appr
opria
tion
Fin
al Ap
prop
riatio
n A
ctua
l Ex
pend
iture
Eco
nom
ic cla
ssifi
catio
n R'
000
R'00
0R'
000
R'00
0R'
000
R'00
0%
R'00
0R'
000
Curre
nt p
aym
ents
3
5 36
2 -
(4 9
32)
3
0 43
0
30
432
(2
)10
0.0%
3
2 78
4
32
785
Com
pens
ation
of e
mplo
yees
4 6
20
- 8
8 4
708
4
709
(1)
100.
0% 4
481
4
481
Good
s and
serv
ices
3
0 74
2 -
(5 0
20)
2
5 72
2
25
723
(1
)10
0.0%
2
8 30
3
28
304
Inte
rest
and
rent
on
land
- -
- -
- -
- -
-
Tran
sfer
s an
d su
bsid
ies
3
-
-
3
-
3
-
3
- Pr
ovinc
es a
nd m
unici
paliti
es -
- -
- -
- -
- -
Depa
rtmen
tal a
genc
ies a
nd a
ccou
nts
- -
- -
- -
- -
-
High
er e
duca
tion
institu
tions
-
-
-
Fore
ign g
over
nmen
ts an
d int
erna
tiona
l org
anisa
tions
-
-
-
Publi
c cor
pora
tions
and
priv
ate
ente
rpris
es -
- -
- -
- -
- -
Non-
profi
t insti
tutio
ns
-
- -
Hous
ehold
s
3
- -
3
-
3
-
3
-
Paym
ents
for c
apita
l ass
ets
2
72
- -
2
72
1
67
1
05
61.4
% 3
956
535
Bu
ilding
s and
oth
er fix
ed st
ructu
res
- -
- -
- -
- -
-
Mac
hiner
y and
equ
ipmen
t
272
-
-
272
167
105
61
.4%
3 9
56
5
35
Herit
age
asse
ts
-
- -
Spec
ialise
d m
ilitar
y ass
ets
-
-
-
Biolo
gical
asse
ts
-
- -
Land
and
sub-
soil a
sset
s
-
- -
Softw
are
and
othe
r int
angib
le as
sets
-
-
-
Paym
ent f
or fi
nanc
ial a
sset
s
-
- -
Tota
l
35
637
- (4
932
)
30
705
3
0 59
9
106
99
.7%
3
6 74
3
33
320
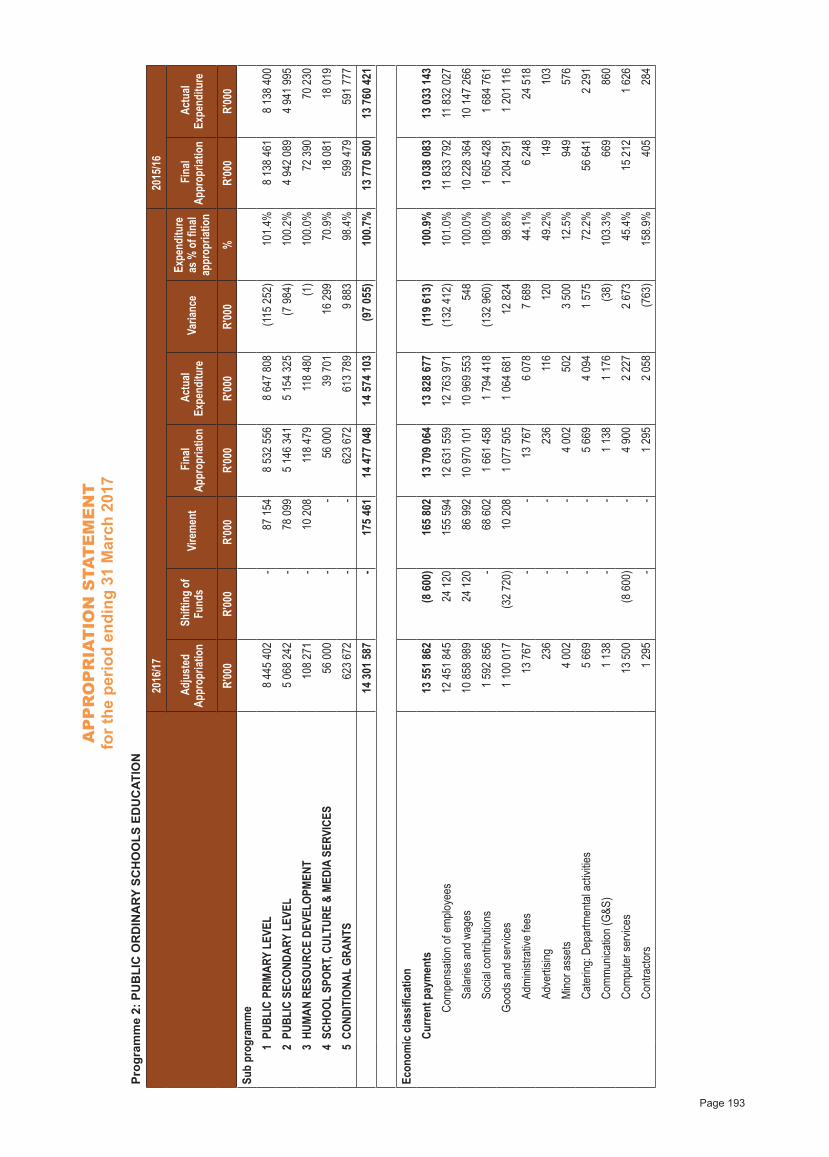
AP
PR
OP
RIA
TIO
N S
TAT
EM
EN
Tfo
r the
per
iod
endi
ng 3
1 M
arch
201
7
Page 193
Prog
ram
me
2: P
UB
LIC
OR
DIN
ARY
SC
HO
OLS
ED
UC
ATIO
N
2016
/17
20
15/16
Adj
uste
d Ap
prop
riatio
n S
hifti
ng o
f Fu
nds
Vire
men
t F
inal
Appr
opria
tion
Act
ual
Expe
nditu
re
Var
iance
Ex
pend
iture
as
% o
f fina
l ap
prop
riatio
n F
inal
Appr
opria
tion
Act
ual
Expe
nditu
re
R'00
0R'
000
R'00
0R'
000
R'00
0R'
000
%R'
000
R'00
0Su
b pr
ogra
mm
e
1PU
BLIC
PRI
MAR
Y LE
VEL
8
445
402
-
87
154
8
532
556
8
647
808
(115
252
)10
1.4%
8
138
461
8
138
400
2PU
BLIC
SEC
ONDA
RY L
EVEL
5
068
242
-
78
099
5
146
341
5
154
325
(7 9
84)
100.
2%
4 94
2 08
9
4 94
1 99
5
3HU
MAN
RES
OURC
E DE
VELO
PMEN
T 1
08 2
71
-
10
208
118
479
1
18 4
80
(1
)10
0.0%
7
2 39
0
70
230
4SC
HOOL
SPO
RT, C
ULTU
RE &
MED
IA S
ERVI
CES
5
6 00
0 -
-
56
000
3
9 70
1
16
299
70.9
%
18
081
1
8 01
9
5CO
NDIT
IONA
L GR
ANTS
623
672
-
- 6
23 6
72
613
789
9
883
98
.4%
599
479
5
91 7
77
14
301
587
- 1
75 4
61
14
477
048
14
574
103
(9
7 05
5)10
0.7%
13
770
500
13
760
421
Econ
omic
cla
ssifi
catio
n
Cu
rrent
pay
men
ts 1
3 55
1 86
2 (8
600
) 1
65 8
02
13
709
064
13
828
677
(119
613
)10
0.9%
13
038
083
13
033
143
Co
mpe
nsat
ion o
f em
ploye
es 1
2 45
1 84
5
24
120
155
594
1
2 63
1 55
9 1
2 76
3 97
1 (1
32 4
12)
101.
0% 1
1 83
3 79
2 1
1 83
2 02
7
Sa
laries
and
wag
es 1
0 85
8 98
9
24
120
8
6 99
2 1
0 97
0 10
1 1
0 96
9 55
3
548
10
0.0%
10
228
364
10
147
266
So
cial c
ontri
butio
ns
1 59
2 85
6 -
6
8 60
2
1 66
1 45
8
1 79
4 41
8 (1
32 9
60)
108.
0%
1 60
5 42
8
1 68
4 76
1
Go
ods a
nd se
rvice
s
1 10
0 01
7
(32
720)
1
0 20
8
1 07
7 50
5
1 06
4 68
1
12
824
98.8
%
1 20
4 29
1
1 20
1 11
6
Ad
mini
strat
ive fe
es
13
767
- -
1
3 76
7 6
078
7
689
44
.1%
6 2
48
2
4 51
8
Ad
verti
sing
2
36
- -
2
36
11
6
120
49
.2%
1
49
1
03
M
inor a
sset
s 4
002
-
- 4
002
502
3
500
12
.5%
9
49
5
76
Ca
terin
g: D
epar
tmen
tal a
ctivit
ies 5
669
-
- 5
669
4
094
1
575
72
.2%
5
6 64
1 2
291
Co
mm
unica
tion
(G&S
) 1
138
-
- 1
138
1
176
(3
8)10
3.3%
6
69
8
60
Co
mpu
ter s
ervic
es
13
500
(8 6
00)
- 4
900
2
227
2
673
45
.4%
1
5 21
2 1
626
Co
ntra
ctors
1 2
95
- -
1 2
95
2 0
58
(7
63)
158.
9%
405
284
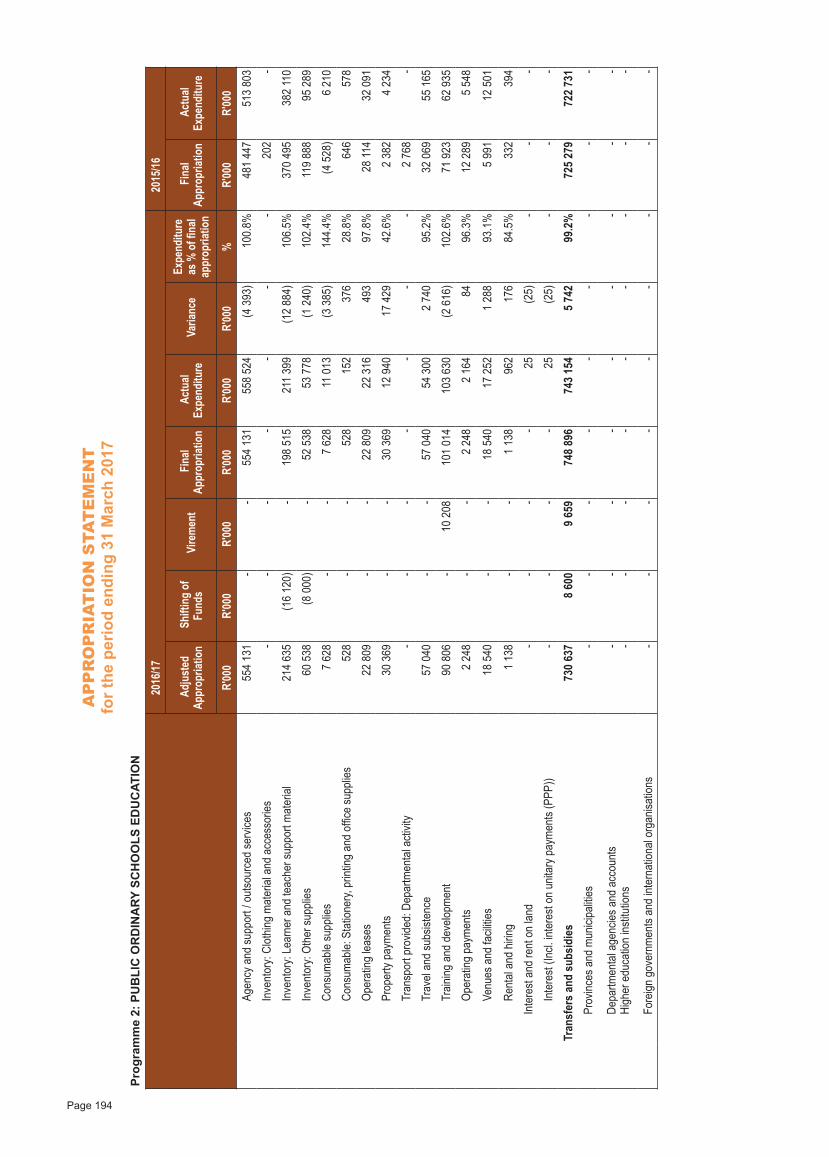
AP
PR
OP
RIA
TIO
N S
TAT
EM
EN
Tfo
r the
per
iod
endi
ng 3
1 M
arch
201
7
Page 194
Prog
ram
me
2: P
UB
LIC
OR
DIN
ARY
SC
HO
OLS
ED
UC
ATIO
N
2016
/17
20
15/16
Adj
uste
d Ap
prop
riatio
n S
hifti
ng o
f Fu
nds
Vire
men
t F
inal
Appr
opria
tion
Act
ual
Expe
nditu
re
Var
iance
Ex
pend
iture
as
% o
f fina
l ap
prop
riatio
n F
inal
Appr
opria
tion
Act
ual
Expe
nditu
re
R'00
0R'
000
R'00
0R'
000
R'00
0R'
000
%R'
000
R'00
0
Agen
cy a
nd su
ppor
t / o
utso
urce
d se
rvice
s 5
54 1
31
- -
554
131
5
58 5
24
(4 3
93)
100.
8% 4
81 4
47
513
803
In
vent
ory:
Clot
hing
mat
erial
and
acc
esso
ries
- -
- -
- -
-
202
-
In
vent
ory:
Lear
ner a
nd te
ache
r sup
port
mat
erial
214
635
(16
120)
- 1
98 5
15
211
399
(12
884)
106.
5% 3
70 4
95
382
110
In
vent
ory:
Othe
r sup
plies
6
0 53
8 (8
000
) -
5
2 53
8
53
778
(1 2
40)
102.
4% 1
19 8
88
9
5 28
9
Co
nsum
able
supp
lies
7 6
28
- -
7 6
28
11
013
(3
385
)14
4.4%
(4 5
28)
6 2
10
Co
nsum
able:
Sta
tione
ry, p
rintin
g an
d of
fice
supp
lies
5
28
- -
5
28
1
52
3
76
28.8
%
646
578
Op
erat
ing le
ases
2
2 80
9 -
-
22
809
2
2 31
6
493
97
.8%
2
8 11
4
32
091
Pr
oper
ty pa
ymen
ts
30
369
- -
3
0 36
9
12
940
1
7 42
9 42
.6%
2 3
82
4 2
34
Tr
ansp
ort p
rovid
ed: D
epar
tmen
tal a
ctivit
y -
- -
- -
- -
2 7
68
-
Tr
avel
and
subs
isten
ce
57
040
- -
5
7 04
0
54
300
2 7
40
95.2
%
32
069
5
5 16
5
Tr
aining
and
dev
elopm
ent
9
0 80
6 -
1
0 20
8 1
01 0
14
103
630
(2
616
)10
2.6%
7
1 92
3
62
935
Op
erat
ing p
aym
ents
2 2
48
- -
2 2
48
2 1
64
84
96.3
%
12
289
5 5
48
Ve
nues
and
facil
ities
1
8 54
0 -
-
18
540
1
7 25
2 1
288
93.1
% 5
991
1
2 50
1
Re
ntal
and
hiring
1 1
38
- -
1 1
38
9
62
1
76
84.5
%
332
394
In
tere
st an
d re
nt o
n lan
d -
- -
- 2
5 (2
5) -
- -
In
tere
st (In
cl. in
tere
st on
unit
ary p
aym
ents
(PPP
)) -
- -
- 2
5 (2
5) -
- -
Tr
ansf
ers
and
subs
idie
s 7
30 6
37
8 6
00
9 6
59
748
896
7
43 1
54
5 7
42
99.2
% 7
25 2
79
722
731
Prov
inces
and
mun
icipa
lities
- -
- -
- -
- -
-
De
partm
enta
l age
ncies
and
acc
ount
sHi
gher
edu
catio
n ins
titutio
ns - -
- - - -
- - - -
- - - -
- - - -
Fo
reign
gov
ernm
ents
and
inter
natio
nal o
rgan
isatio
ns -
- -
- -
- -
- -
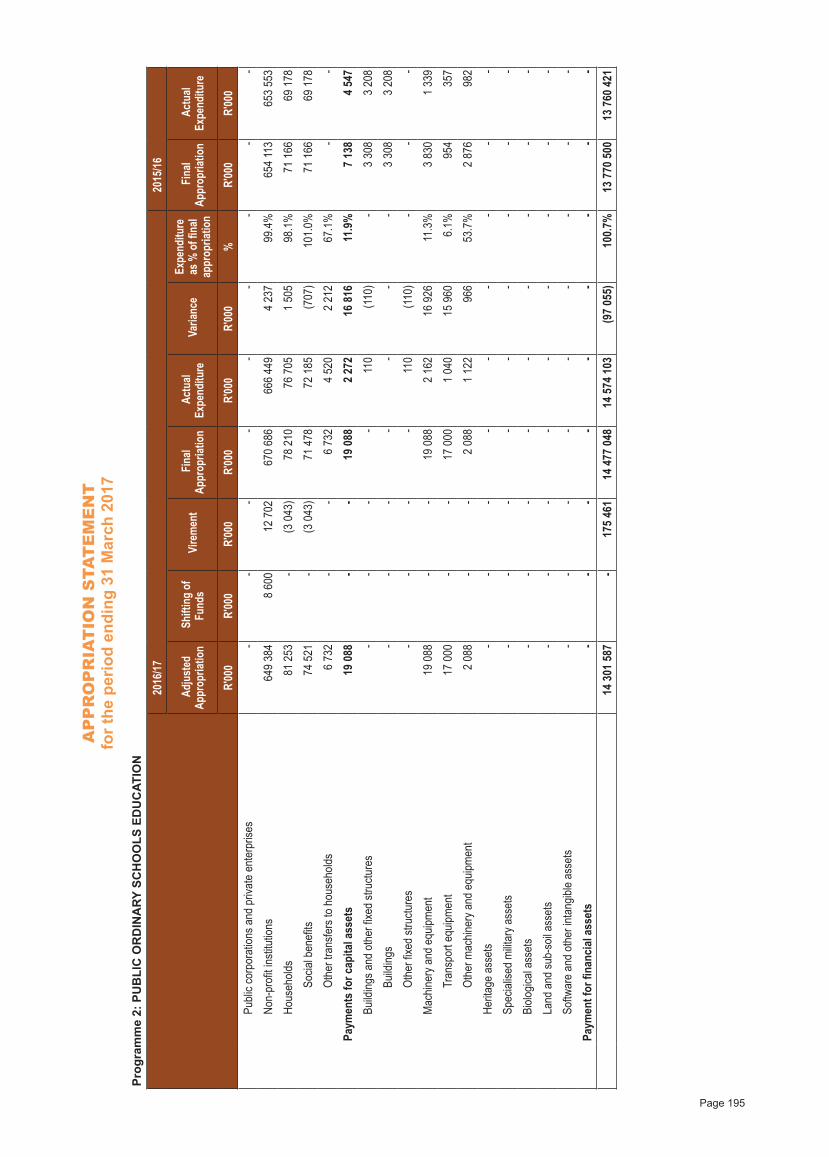
AP
PR
OP
RIA
TIO
N S
TAT
EM
EN
Tfo
r the
per
iod
endi
ng 3
1 M
arch
201
7
Page 195
Prog
ram
me
2: P
UB
LIC
OR
DIN
ARY
SC
HO
OLS
ED
UC
ATIO
N
2016
/17
20
15/16
Adj
uste
d Ap
prop
riatio
n S
hifti
ng o
f Fu
nds
Vire
men
t F
inal
Appr
opria
tion
Act
ual
Expe
nditu
re
Var
iance
Ex
pend
iture
as
% o
f fina
l ap
prop
riatio
n F
inal
Appr
opria
tion
Act
ual
Expe
nditu
re
R'00
0R'
000
R'00
0R'
000
R'00
0R'
000
%R'
000
R'00
0
Publi
c cor
pora
tions
and
priv
ate
ente
rpris
es -
- -
- -
- -
- -
No
n-pr
ofit in
stitu
tions
649
384
8
600
12
702
670
686
6
66 4
49
4 2
37
99.4
% 6
54 11
3 6
53 5
53
Ho
useh
olds
8
1 25
3 -
(3 0
43)
7
8 21
0
76
705
1 5
05
98.1
%
71
166
6
9 17
8
So
cial b
enefi
ts
74
521
- (3
043
)
71
478
7
2 18
5
(707
)10
1.0%
7
1 16
6
69
178
Ot
her t
rans
fers
to h
ouse
holds
6 7
32
- -
6 7
32
4 5
20
2 2
12
67.1
% -
-
Pa
ymen
ts fo
r cap
ital a
sset
s
19
088
- -
1
9 08
8 2
272
16
816
11.9
% 7
138
4
547
Build
ings a
nd o
ther
fixed
stru
cture
s -
- -
-
110
(1
10)
- 3
308
3
208
Bu
ilding
s -
- -
- -
- -
3 3
08
3 2
08
Ot
her fi
xed
struc
ture
s -
- -
-
110
(1
10)
- -
-
M
achin
ery a
nd e
quipm
ent
1
9 08
8 -
-
19
088
2 1
62
1
6 92
6 11
.3%
3 8
30
1 3
39
Tr
ansp
ort e
quipm
ent
1
7 00
0 -
-
17
000
1 0
40
1
5 96
0 6.
1%
954
357
Ot
her m
achin
ery a
nd e
quipm
ent
2 0
88
- -
2 0
88
1 1
22
9
66
53.7
% 2
876
982
He
ritag
e as
sets
- -
- -
- -
- -
-
Sp
ecial
ised
milit
ary a
sset
s -
- -
- -
- -
- -
Bi
ologic
al as
sets
- -
- -
- -
- -
-
La
nd a
nd su
b-so
il ass
ets
- -
- -
- -
- -
-
So
ftwar
e an
d ot
her i
ntan
gible
asse
ts -
- -
- -
- -
- -
Pa
ymen
t for
fina
ncia
l ass
ets
- -
- -
- -
- -
-
1
4 30
1 58
7 -
175
461
1
4 47
7 04
8 1
4 57
4 10
3
(97
055)
100.
7% 1
3 77
0 50
0 1
3 76
0 42
1
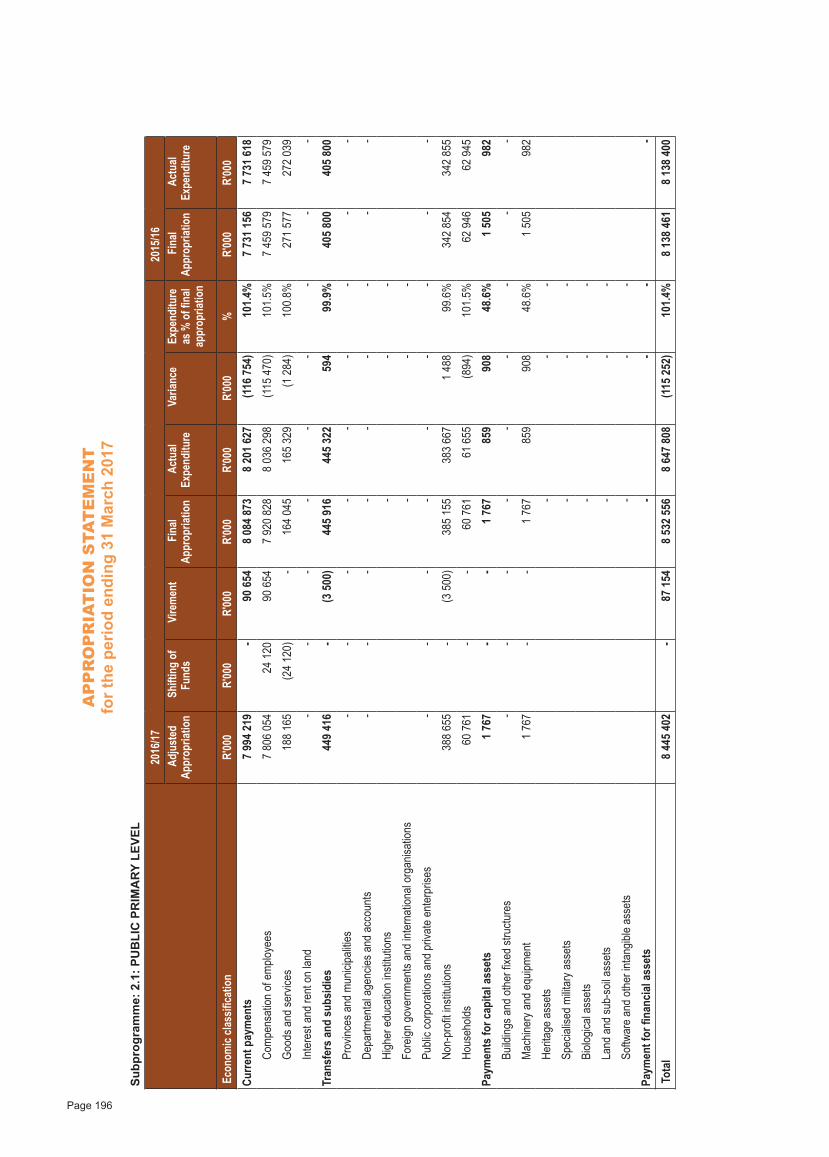
AP
PR
OP
RIA
TIO
N S
TAT
EM
EN
Tfo
r the
per
iod
endi
ng 3
1 M
arch
201
7
Page 196
Subp
rogr
amm
e: 2
.1: P
UB
LIC
PR
IMA
RY L
EVEL
20
16/17
2015
/16
A
djus
ted
Appr
opria
tion
Shi
fting
of
Fund
s V
irem
ent
Fin
al Ap
prop
riatio
n A
ctua
l Ex
pend
iture
V
arian
ce
Expe
nditu
re
as %
of fi
nal
appr
opria
tion
Fin
al Ap
prop
riatio
n A
ctua
l Ex
pend
iture
Eco
nom
ic cla
ssifi
catio
n R'
000
R'00
0R'
000
R'00
0R'
000
R'00
0%
R'00
0R'
000
Curre
nt p
aym
ents
7
994
219
-
90
654
8
084
873
8
201
627
(116
754
)10
1.4%
7
731
156
7
731
618
Com
pens
ation
of e
mplo
yees
7
806
054
2
4 12
0
90
654
7
920
828
8
036
298
(115
470
)10
1.5%
7
459
579
7
459
579
Good
s and
serv
ices
188
165
(24
120)
- 1
64 0
45
165
329
(1
284
)10
0.8%
271
577
2
72 0
39
Inte
rest
and
rent
on
land
- -
- -
- -
- -
-
Tran
sfer
s an
d su
bsid
ies
449
416
-
(3 5
00)
445
916
4
45 3
22
5
94
99.9
% 4
05 8
00
405
800
Pr
ovinc
es a
nd m
unici
paliti
es -
- -
- -
- -
- -
Depa
rtmen
tal a
genc
ies a
nd a
ccou
nts
- -
- -
- -
- -
-
High
er e
duca
tion
institu
tions
-
-
-
Fore
ign g
over
nmen
ts an
d int
erna
tiona
l org
anisa
tions
-
-
-
Publi
c cor
pora
tions
and
priv
ate
ente
rpris
es -
- -
- -
- -
- -
Non-
profi
t insti
tutio
ns 3
88 6
55
- (3
500
) 3
85 1
55
383
667
1
488
99
.6%
342
854
3
42 8
55
Hous
ehold
s
60
761
- -
6
0 76
1
61
655
(8
94)
101.
5%
62
946
6
2 94
5
Paym
ents
for c
apita
l ass
ets
1 7
67
- -
1 7
67
8
59
9
08
48.6
% 1
505
982
Bu
ilding
s and
oth
er fix
ed st
ructu
res
- -
- -
- -
- -
-
Mac
hiner
y and
equ
ipmen
t 1
767
-
- 1
767
859
908
48
.6%
1 5
05
9
82
Herit
age
asse
ts
-
- -
Spec
ialise
d m
ilitar
y ass
ets
-
-
-
Biolo
gical
asse
ts
-
- -
Land
and
sub-
soil a
sset
s
-
- -
Softw
are
and
othe
r int
angib
le as
sets
-
-
-
Paym
ent f
or fi
nanc
ial a
sset
s
-
- -
-
Tota
l
8 44
5 40
2 -
8
7 15
4
8 53
2 55
6
8 64
7 80
8 (1
15 2
52)
101.
4%
8 13
8 46
1
8 13
8 40
0
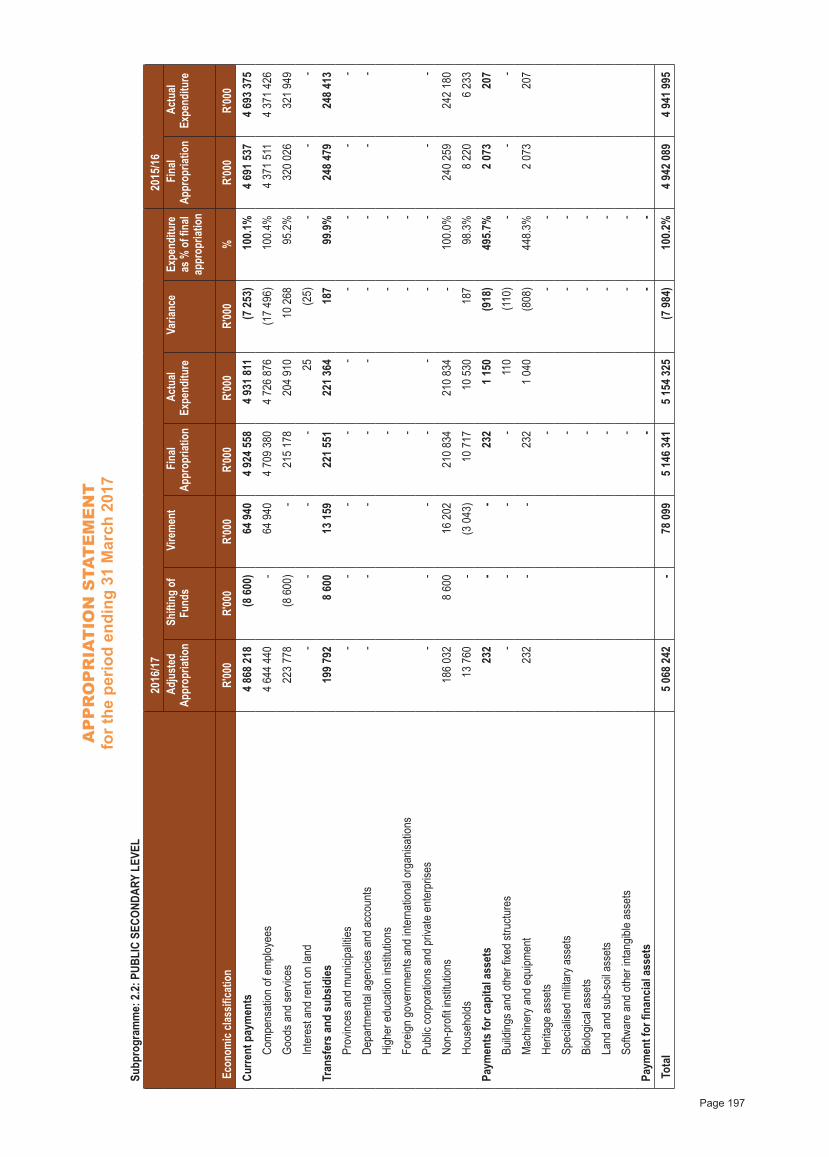
AP
PR
OP
RIA
TIO
N S
TAT
EM
EN
Tfo
r the
per
iod
endi
ng 3
1 M
arch
201
7
Page 197
Subp
rogr
amm
e: 2
.2: P
UBLI
C SE
COND
ARY
LEVE
L
2016
/17
2015
/16
Adj
uste
d Ap
prop
riatio
n S
hifti
ng o
f Fu
nds
Vire
men
t F
inal
Appr
opria
tion
Act
ual
Expe
nditu
re
Var
iance
Ex
pend
iture
as
% o
f fina
l ap
prop
riatio
n
Fin
al Ap
prop
riatio
n A
ctua
l Ex
pend
iture
Eco
nom
ic cla
ssifi
catio
n R'
000
R'00
0R'
000
R'00
0R'
000
R'00
0%
R'00
0R'
000
Curre
nt p
aym
ents
4
868
218
(8 6
00)
6
4 94
0
4 92
4 55
8
4 93
1 81
1 (7
253
)10
0.1%
4
691
537
4
693
375
Com
pens
ation
of e
mplo
yees
4
644
440
-
64
940
4
709
380
4
726
876
(1
7 49
6)10
0.4%
4
371
511
4
371
426
Good
s and
serv
ices
223
778
(8
600
) -
215
178
2
04 9
10
1
0 26
8 95
.2%
320
026
3
21 9
49
Inte
rest
and
rent
on
land
- -
- -
25
(25)
- -
-
Tran
sfer
s an
d su
bsid
ies
199
792
8
600
13
159
221
551
2
21 3
64
1
87
99.9
% 2
48 4
79
248
413
Pr
ovinc
es a
nd m
unici
paliti
es -
- -
- -
- -
- -
Depa
rtmen
tal a
genc
ies a
nd a
ccou
nts
- -
- -
- -
- -
-
High
er e
duca
tion
institu
tions
-
-
-
Fore
ign g
over
nmen
ts an
d int
erna
tiona
l org
anisa
tions
-
-
-
Publi
c cor
pora
tions
and
priv
ate
ente
rpris
es -
- -
- -
- -
- -
Non-
profi
t insti
tutio
ns 1
86 0
32
8 6
00
1
6 20
2 2
10 8
34
210
834
-
100.
0% 2
40 2
59
242
180
Hous
ehold
s
13
760
- (3
043
)
10
717
1
0 53
0
187
98
.3%
8 2
20
6 2
33
Paym
ents
for c
apita
l ass
ets
2
32
- -
2
32
1 1
50
(9
18)
495.
7% 2
073
207
Bu
ilding
s and
oth
er fix
ed st
ructu
res
- -
- -
11
0
(110
) -
- -
Mac
hiner
y and
equ
ipmen
t
232
-
-
232
1
040
(808
)44
8.3%
2 0
73
2
07
Herit
age
asse
ts
-
- -
Spec
ialise
d m
ilitar
y ass
ets
-
-
-
Biolo
gical
asse
ts
-
- -
Land
and
sub-
soil a
sset
s
-
- -
Softw
are
and
othe
r int
angib
le as
sets
-
-
-
Pa
ymen
t for
fina
ncia
l ass
ets
-
-
-
To
tal
5
068
242
-
78
099
5
146
341
5
154
325
(7 9
84)
100.
2%
4 94
2 08
9
4 94
1 99
5
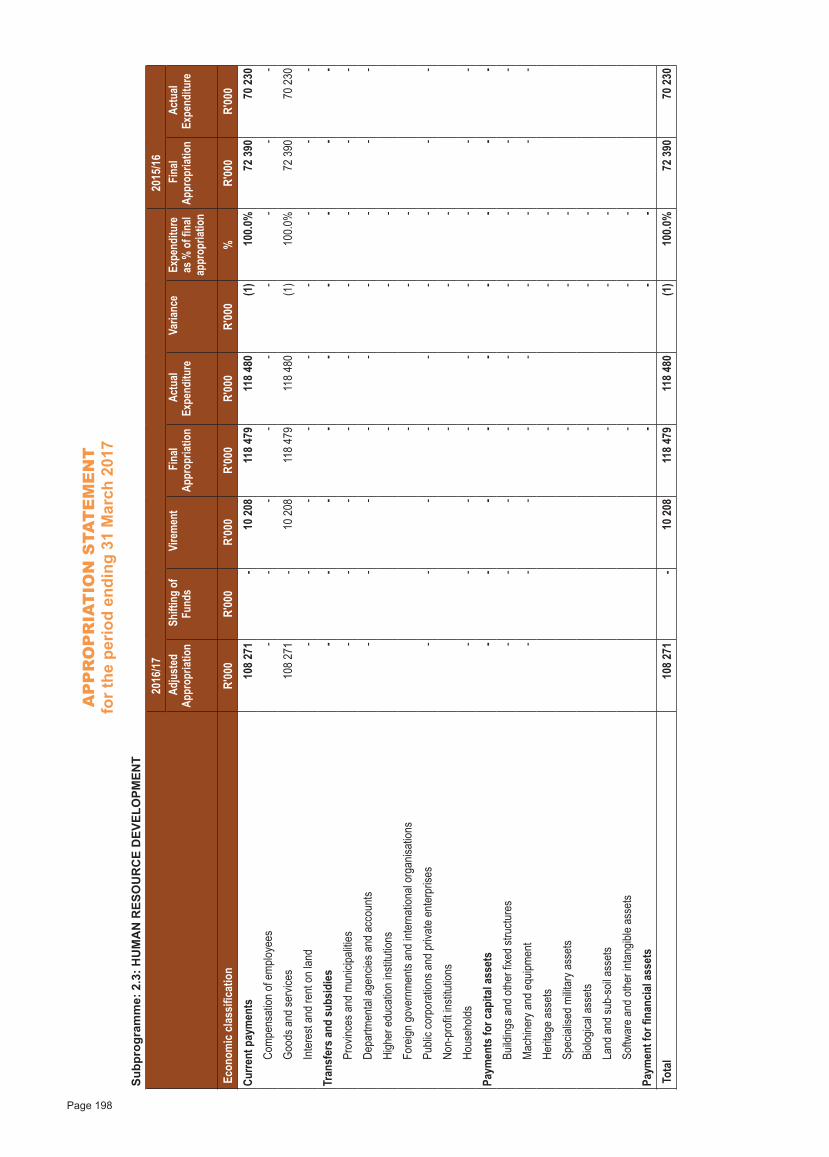
AP
PR
OP
RIA
TIO
N S
TAT
EM
EN
Tfo
r the
per
iod
endi
ng 3
1 M
arch
201
7
Page 198
Subp
rogr
amm
e: 2
.3: H
UM
AN
RES
OU
RC
E D
EVEL
OPM
ENT
20
16/1
7
20
15/1
6
A
djus
ted
Appr
opria
tion
Shi
fting
of
Fund
s V
irem
ent
Fin
al Ap
prop
riatio
n A
ctua
l Ex
pend
iture
V
arian
ce
Expe
nditu
re
as %
of fi
nal
appr
opria
tion
Fin
al Ap
prop
riatio
n A
ctua
l Ex
pend
iture
Eco
nom
ic c
lass
ifica
tion
R'00
0R'
000
R'00
0R'
000
R'00
0R'
000
%R'
000
R'00
0Cu
rrent
pay
men
ts 1
08 2
71
-
10
208
118
479
1
18 4
80
(1
)10
0.0%
7
2 39
0
70
230
Com
pens
ation
of e
mplo
yees
- -
- -
- -
- -
-
Good
s and
serv
ices
108
271
-
1
0 20
8 1
18 4
79
118
480
(1)
100.
0%
72
390
7
0 23
0
Inte
rest
and
rent
on
land
- -
- -
- -
- -
-
Tran
sfer
s an
d su
bsid
ies
- -
- -
- -
- -
- Pr
ovinc
es a
nd m
unici
paliti
es -
- -
- -
- -
- -
Depa
rtmen
tal a
genc
ies a
nd a
ccou
nts
- -
- -
- -
- -
-
High
er e
duca
tion
institu
tions
-
-
-
Fore
ign g
over
nmen
ts an
d int
erna
tiona
l org
anisa
tions
-
-
-
Publi
c cor
pora
tions
and
priv
ate
ente
rpris
es -
- -
- -
- -
- -
Non-
profi
t insti
tutio
ns
-
- -
Hous
ehold
s -
- -
- -
- -
- -
Paym
ents
for c
apita
l ass
ets
- -
- -
- -
- -
- Bu
ilding
s and
oth
er fix
ed st
ructu
res
- -
- -
- -
- -
-
Mac
hiner
y and
equ
ipmen
t -
- -
- -
- -
- -
Herit
age
asse
ts
-
- -
Spec
ialise
d m
ilitar
y ass
ets
-
-
-
Biolo
gical
asse
ts
-
- -
Land
and
sub-
soil a
sset
s
-
- -
Softw
are
and
othe
r int
angib
le as
sets
-
-
-
Paym
ent f
or fi
nanc
ial a
sset
s
-
- -
Tota
l 1
08 2
71
-
10
208
118
479
1
18 4
80
(1
)10
0.0%
7
2 39
0
70
230
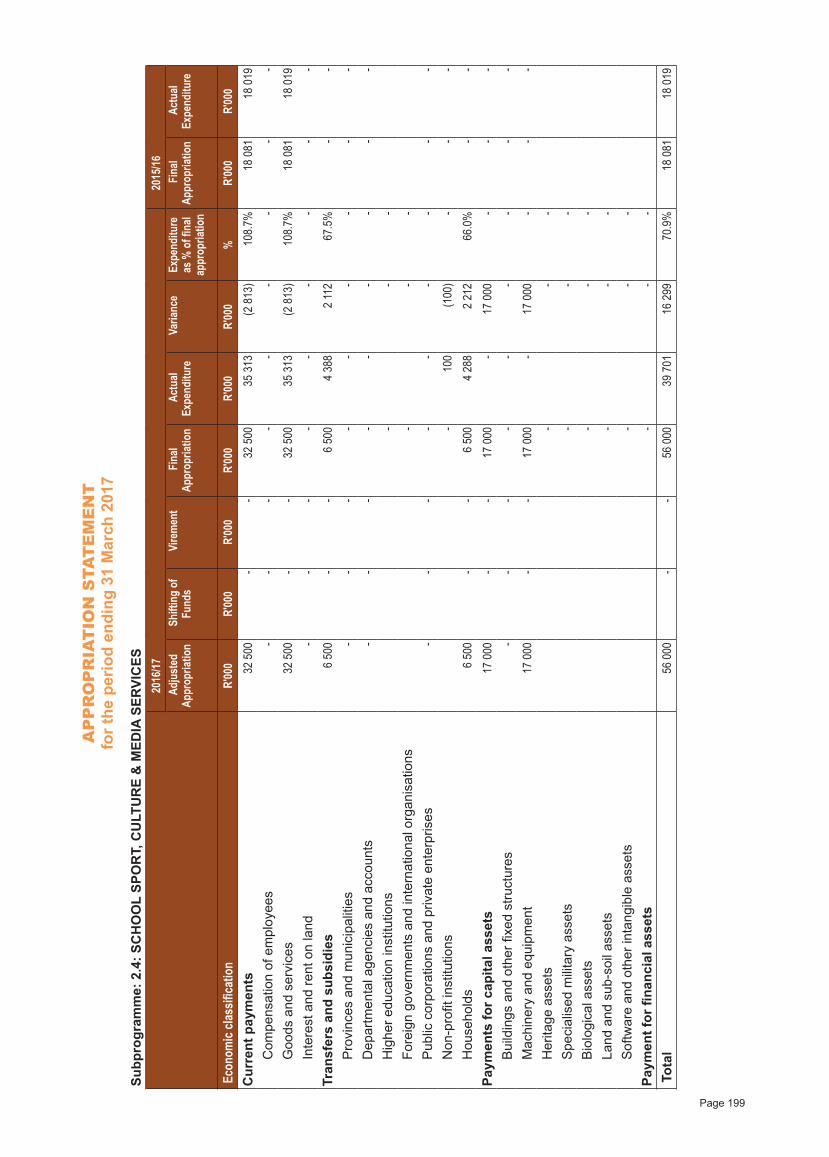
AP
PR
OP
RIA
TIO
N S
TAT
EM
EN
Tfo
r the
per
iod
endi
ng 3
1 M
arch
201
7
Page 199
Subp
rogr
amm
e: 2
.4: S
CH
OO
L SP
OR
T, C
ULT
UR
E &
MED
IA S
ERVI
CES
20
16/17
2015
/16
A
djus
ted
Appr
opria
tion
Shi
fting
of
Fund
s V
irem
ent
Fin
al Ap
prop
riatio
n A
ctua
l Ex
pend
iture
V
arian
ce
Expe
nditu
re
as %
of fi
nal
appr
opria
tion
Fin
al Ap
prop
riatio
n A
ctua
l Ex
pend
iture
Eco
nom
ic cla
ssifi
catio
n R'
000
R'00
0R'
000
R'00
0R'
000
R'00
0%
R'00
0R'
000
Cur
rent
pay
men
ts
32
500
- -
3
2 50
0
35
313
(2 8
13)
108.
7%
18
081
1
8 01
9
Com
pens
atio
n of
em
ploy
ees
- -
- -
- -
- -
-
Goo
ds a
nd s
ervi
ces
3
2 50
0 -
-
32
500
3
5 31
3 (2
813
)10
8.7%
1
8 08
1
18
019
Inte
rest
and
rent
on
land
- -
- -
- -
- -
-
Tran
sfer
s an
d su
bsid
ies
6 5
00
- -
6 5
00
4 3
88
2 11
2 67
.5%
- -
Pro
vinc
es a
nd m
unic
ipal
ities
- -
- -
- -
- -
-
Dep
artm
enta
l age
ncie
s an
d ac
coun
ts -
- -
- -
- -
- -
Hig
her e
duca
tion
inst
itutio
ns
-
- -
Fore
ign
gove
rnm
ents
and
inte
rnat
iona
l org
anis
atio
ns
-
- -
Pub
lic c
orpo
ratio
ns a
nd p
rivat
e en
terp
rises
- -
- -
- -
- -
-
Non
-pro
fit in
stitu
tions
-
1
00
(1
00)
- -
-
Hou
seho
lds
6 5
00
- -
6 5
00
4 2
88
2 2
12
66.0
% -
-
Paym
ents
for c
apita
l ass
ets
1
7 00
0 -
-
17
000
-
17
000
- -
-
Bui
ldin
gs a
nd o
ther
fixe
d st
ruct
ures
- -
- -
- -
- -
-
Mac
hine
ry a
nd e
quip
men
t
17
000
- -
1
7 00
0 -
1
7 00
0 -
- -
Her
itage
ass
ets
-
-
-
Spe
cial
ised
mili
tary
ass
ets
-
-
-
Bio
logi
cal a
sset
s
-
- -
Land
and
sub
-soi
l ass
ets
-
-
-
Sof
twar
e an
d ot
her i
ntan
gibl
e as
sets
-
-
-
Paym
ent f
or fi
nanc
ial a
sset
s
-
- -
Tot
al
5
6 00
0 -
-
56
000
3
9 70
1
16
299
70.9
%
18
081
1
8 01
9
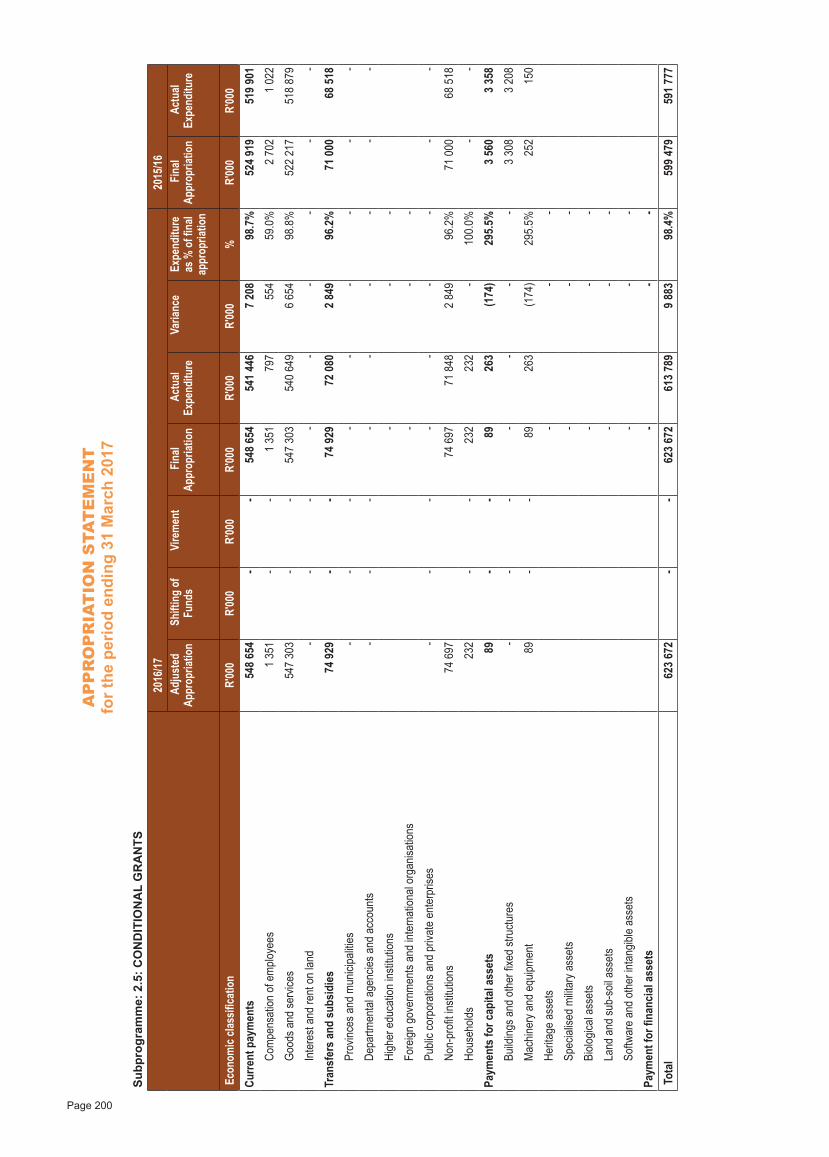
AP
PR
OP
RIA
TIO
N S
TAT
EM
EN
Tfo
r the
per
iod
endi
ng 3
1 M
arch
201
7
Page 200
Subp
rogr
amm
e: 2
.5: C
ON
DIT
ION
AL
GR
AN
TS
2016
/17
20
15/16
Adj
uste
d Ap
prop
riatio
n S
hifti
ng o
f Fu
nds
Vire
men
t F
inal
Appr
opria
tion
Act
ual
Expe
nditu
re
Var
iance
Ex
pend
iture
as
% o
f fina
l ap
prop
riatio
n
Fin
al Ap
prop
riatio
n A
ctua
l Ex
pend
iture
Eco
nom
ic cla
ssifi
catio
n R'
000
R'00
0R'
000
R'00
0R'
000
R'00
0%
R'00
0R'
000
Curre
nt p
aym
ents
548
654
-
- 5
48 6
54
541
446
7
208
98
.7%
524
919
5
19 9
01
Com
pens
ation
of e
mplo
yees
1 3
51
- -
1 3
51
7
97
5
54
59.0
% 2
702
1
022
Good
s and
serv
ices
547
303
-
- 5
47 3
03
540
649
6
654
98
.8%
522
217
5
18 8
79
Inte
rest
and
rent
on
land
- -
- -
- -
- -
-
Tran
sfer
s an
d su
bsid
ies
7
4 92
9 -
-
74
929
7
2 08
0 2
849
96
.2%
7
1 00
0
68
518
Prov
inces
and
mun
icipa
lities
- -
- -
- -
- -
-
Depa
rtmen
tal a
genc
ies a
nd a
ccou
nts
- -
- -
- -
- -
-
High
er e
duca
tion
institu
tions
-
-
-
Fore
ign g
over
nmen
ts an
d int
erna
tiona
l org
anisa
tions
-
-
-
Publi
c cor
pora
tions
and
priv
ate
ente
rpris
es -
- -
- -
- -
- -
Non-
profi
t insti
tutio
ns
74
697
7
4 69
7
71
848
2 8
49
96.2
%
71
000
6
8 51
8
Hous
ehold
s
232
-
-
232
232
-
100.
0% -
-
Paym
ents
for c
apita
l ass
ets
89
- -
89
2
63
(1
74)
295.
5% 3
560
3
358
Bu
ilding
s and
oth
er fix
ed st
ructu
res
- -
- -
- -
- 3
308
3
208
Mac
hiner
y and
equ
ipmen
t 8
9 -
- 8
9
263
(174
)29
5.5%
2
52
1
50
Herit
age
asse
ts
-
- -
Spec
ialise
d m
ilitar
y ass
ets
-
-
-
Biolo
gical
asse
ts
-
- -
Land
and
sub-
soil a
sset
s
-
- -
Softw
are
and
othe
r int
angib
le as
sets
-
-
-
Paym
ent f
or fi
nanc
ial a
sset
s
-
- -
Tota
l 6
23 6
72
- -
623
672
6
13 7
89
9 8
83
98.4
% 5
99 4
79
591
777
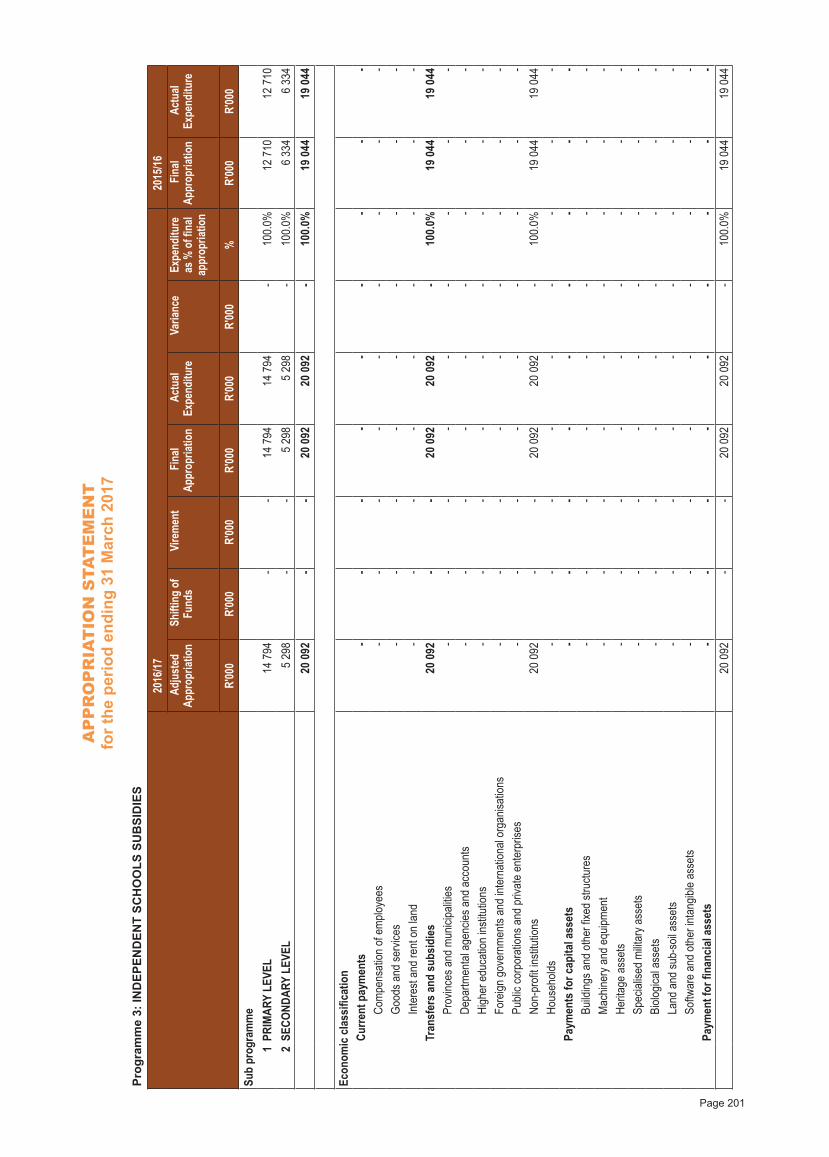
AP
PR
OP
RIA
TIO
N S
TAT
EM
EN
Tfo
r the
per
iod
endi
ng 3
1 M
arch
201
7
Page 201
Prog
ram
me
3: IN
DEP
END
ENT
SCH
OO
LS S
UB
SID
IES
2016
/17
20
15/16
A
djus
ted
Appr
opria
tion
Shi
fting
of
Fund
s V
irem
ent
Fin
al Ap
prop
riatio
n A
ctua
l Ex
pend
iture
V
arian
ce
Expe
nditu
re
as %
of fi
nal
appr
opria
tion
Fin
al Ap
prop
riatio
n A
ctua
l Ex
pend
iture
R'00
0R'
000
R'00
0R'
000
R'00
0R'
000
%R'
000
R'00
0Su
b pr
ogra
mm
e
1PR
IMAR
Y LE
VEL
1
4 79
4 -
-
14
794
1
4 79
4 -
100.
0%
12
710
1
2 71
0 2
SECO
NDAR
Y LE
VEL
5 2
98
- -
5 2
98
5 2
98
- 10
0.0%
6 3
34
6 3
34
2
0 09
2 -
-
20
092
2
0 09
2 -
100.
0%
19
044
1
9 04
4
Econ
omic
cla
ssifi
catio
n
Cu
rrent
pay
men
ts -
- -
- -
- -
- -
Co
mpe
nsat
ion o
f em
ploye
es -
- -
- -
- -
- -
Go
ods a
nd se
rvice
s -
- -
- -
- -
- -
In
tere
st an
d re
nt o
n lan
d -
- -
- -
- -
- -
Tr
ansf
ers
and
subs
idie
s
20
092
- -
2
0 09
2
20
092
- 10
0.0%
1
9 04
4
19
044
Pr
ovinc
es a
nd m
unici
paliti
es -
- -
- -
- -
- -
De
partm
enta
l age
ncies
and
acc
ount
s -
- -
- -
- -
- -
Hi
gher
edu
catio
n ins
titutio
ns -
- -
- -
- -
- -
Fo
reign
gov
ernm
ents
and
inter
natio
nal o
rgan
isatio
ns -
- -
- -
- -
- -
Pu
blic c
orpo
ratio
ns a
nd p
rivat
e en
terp
rises
- -
- -
- -
- -
-
Non-
profi
t insti
tutio
ns
20
092
- -
2
0 09
2
20
092
- 10
0.0%
1
9 04
4
19
044
Ho
useh
olds
- -
- -
- -
- -
-
Paym
ents
for c
apita
l ass
ets
- -
- -
- -
- -
-
Build
ings a
nd o
ther
fixed
stru
cture
s -
- -
- -
- -
- -
M
achin
ery a
nd e
quipm
ent
- -
- -
- -
- -
-
Herit
age
asse
ts -
- -
- -
- -
- -
Sp
ecial
ised
milit
ary a
sset
s -
- -
- -
- -
- -
Bi
ologic
al as
sets
- -
- -
- -
- -
-
Land
and
sub-
soil a
sset
s -
- -
- -
- -
- -
So
ftwar
e an
d ot
her i
ntan
gible
asse
ts -
- -
- -
- -
- -
Pa
ymen
t for
fina
ncia
l ass
ets
- -
- -
- -
- -
-
20
092
- -
2
0 09
2
20
092
- 10
0.0%
1
9 04
4
19
044

AP
PR
OP
RIA
TIO
N S
TAT
EM
EN
Tfo
r the
per
iod
endi
ng 3
1 M
arch
201
7
Page 202
Subp
rogr
amm
e: 3
.1: P
RIM
ARY
LEV
EL
2016
/17
20
15/16
Adj
uste
d Ap
prop
riatio
n S
hifti
ng o
f Fu
nds
Vire
men
t F
inal
Appr
opria
tion
Act
ual
Expe
nditu
re
Var
iance
Ex
pend
iture
as
% o
f fina
l ap
prop
riatio
n
Fin
al Ap
prop
riatio
n A
ctua
l Ex
pend
iture
Eco
nom
ic cla
ssifi
catio
n R'
000
R'00
0R'
000
R'00
0R'
000
R'00
0%
R'00
0R'
000
Curre
nt p
aym
ents
- -
- -
- -
- -
- Co
mpe
nsat
ion o
f em
ploye
es -
- -
- -
- -
- -
Good
s and
serv
ices
- -
- -
- -
- -
-
Inte
rest
and
rent
on
land
- -
- -
- -
- -
-
Tran
sfer
s an
d su
bsid
ies
1
4 79
4 -
-
14
794
1
4 79
4 -
100.
0%
12
710
1
2 71
0 Pr
ovinc
es a
nd m
unici
paliti
es -
- -
- -
- -
- -
Depa
rtmen
tal a
genc
ies a
nd a
ccou
nts
- -
- -
- -
- -
-
High
er e
duca
tion
institu
tions
-
-
-
Fore
ign g
over
nmen
ts an
d int
erna
tiona
l org
anisa
tions
-
-
-
Publi
c cor
pora
tions
and
priv
ate
ente
rpris
es -
- -
- -
- -
- -
Non-
profi
t insti
tutio
ns
14
794
1
4 79
4
14
794
- 10
0.0%
1
2 71
0
12
710
Hous
ehold
s -
- -
- -
- -
- -
Paym
ents
for c
apita
l ass
ets
- -
- -
- -
- -
- Bu
ilding
s and
oth
er fix
ed st
ructu
res
- -
- -
- -
- -
-
Mac
hiner
y and
equ
ipmen
t -
- -
- -
- -
- -
Herit
age
asse
ts
-
- -
Spec
ialise
d m
ilitar
y ass
ets
-
-
-
Biolo
gical
asse
ts
-
- -
Land
and
sub-
soil a
sset
s
-
- -
Softw
are
and
othe
r int
angib
le as
sets
-
-
-
Paym
ent f
or fi
nanc
ial a
sset
s
-
- -
Tota
l
14
794
- -
1
4 79
4
14
794
- 10
0.0%
1
2 71
0
12
710
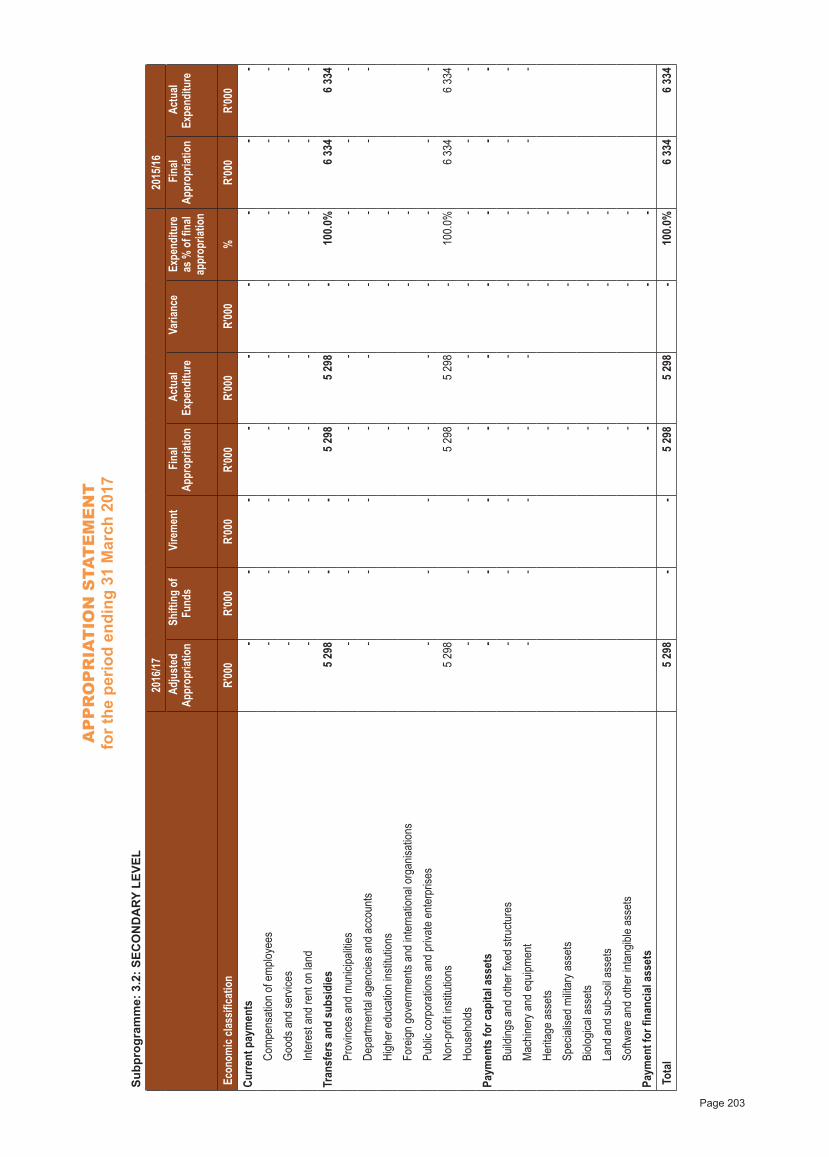
AP
PR
OP
RIA
TIO
N S
TAT
EM
EN
Tfo
r the
per
iod
endi
ng 3
1 M
arch
201
7
Page 203
Subp
rogr
amm
e: 3
.2: S
ECO
ND
ARY
LEV
EL
2016
/17
20
15/16
Adj
uste
d Ap
prop
riatio
n S
hifti
ng o
f Fu
nds
Vire
men
t F
inal
Appr
opria
tion
Act
ual
Expe
nditu
re
Var
iance
Ex
pend
iture
as
% o
f fina
l ap
prop
riatio
n
Fin
al Ap
prop
riatio
n A
ctua
l Ex
pend
iture
Eco
nom
ic cla
ssifi
catio
n R'
000
R'00
0R'
000
R'00
0R'
000
R'00
0%
R'00
0R'
000
Curre
nt p
aym
ents
- -
- -
- -
- -
- Co
mpe
nsat
ion o
f em
ploye
es -
- -
- -
- -
- -
Good
s and
serv
ices
- -
- -
- -
- -
-
Inte
rest
and
rent
on
land
- -
- -
- -
- -
-
Tran
sfer
s an
d su
bsid
ies
5 2
98
- -
5 2
98
5 2
98
- 10
0.0%
6 3
34
6 3
34
Prov
inces
and
mun
icipa
lities
- -
- -
- -
- -
-
Depa
rtmen
tal a
genc
ies a
nd a
ccou
nts
- -
- -
- -
- -
-
High
er e
duca
tion
institu
tions
-
-
-
Fore
ign g
over
nmen
ts an
d int
erna
tiona
l org
anisa
tions
-
-
-
Publi
c cor
pora
tions
and
priv
ate
ente
rpris
es -
- -
- -
- -
- -
Non-
profi
t insti
tutio
ns 5
298
5
298
5
298
-
100.
0% 6
334
6
334
Hous
ehold
s -
- -
- -
- -
- -
Paym
ents
for c
apita
l ass
ets
- -
- -
- -
- -
- Bu
ilding
s and
oth
er fix
ed st
ructu
res
- -
- -
- -
- -
-
Mac
hiner
y and
equ
ipmen
t -
- -
- -
- -
- -
Herit
age
asse
ts
-
- -
Spec
ialise
d m
ilitar
y ass
ets
-
-
-
Biolo
gical
asse
ts
-
- -
Land
and
sub-
soil a
sset
s
-
- -
Softw
are
and
othe
r int
angib
le as
sets
-
-
-
Paym
ent f
or fi
nanc
ial a
sset
s
-
- -
Tota
l 5
298
-
- 5
298
5
298
-
100.
0% 6
334
6
334
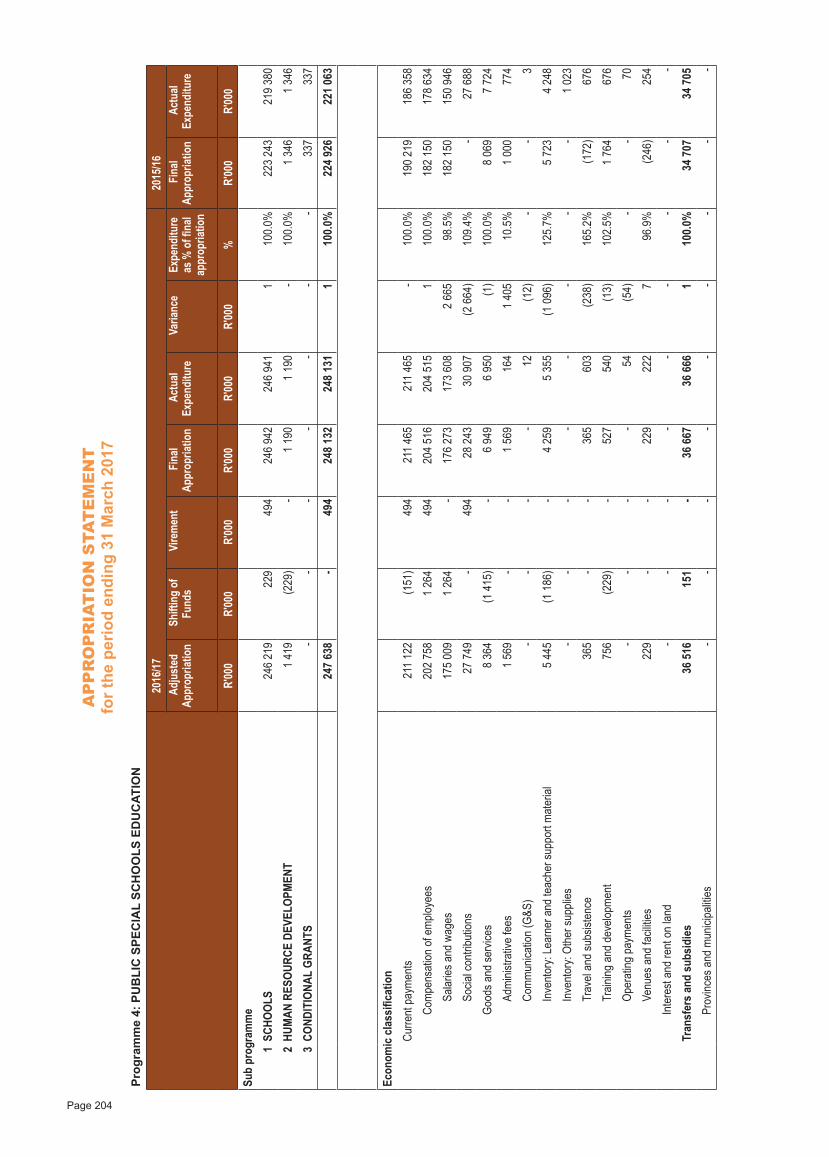
AP
PR
OP
RIA
TIO
N S
TAT
EM
EN
Tfo
r the
per
iod
endi
ng 3
1 M
arch
201
7
Page 204
Prog
ram
me
4: P
UB
LIC
SPE
CIA
L SC
HO
OLS
ED
UC
ATIO
N
2016
/17
20
15/16
A
djus
ted
Appr
opria
tion
Shi
fting
of
Fund
s V
irem
ent
Fin
al Ap
prop
riatio
n A
ctua
l Ex
pend
iture
V
arian
ce
Expe
nditu
re
as %
of fi
nal
appr
opria
tion
Fin
al Ap
prop
riatio
n A
ctua
l Ex
pend
iture
R'00
0R'
000
R'00
0R'
000
R'00
0R'
000
%R'
000
R'00
0Su
b pr
ogra
mm
e
1SC
HOOL
S 2
46 2
19
2
29
4
94
246
942
2
46 9
41
1
10
0.0%
223
243
2
19 3
80
2HU
MAN
RES
OURC
E DE
VELO
PMEN
T 1
419
(229
) -
1 1
90
1 1
90
- 10
0.0%
1 3
46
1 3
46
3CO
NDIT
IONA
L GR
ANTS
- -
- -
- -
-
337
337
247
638
-
4
94
248
132
2
48 1
31
1
10
0.0%
224
926
2
21 0
63
Econ
omic
cla
ssifi
catio
n
Cu
rrent
pay
men
ts 2
11 1
22
(1
51)
4
94
211
465
2
11 4
65
- 10
0.0%
190
219
1
86 3
58
Co
mpe
nsat
ion o
f em
ploye
es 2
02 7
58
1 2
64
4
94
204
516
2
04 5
15
1
10
0.0%
182
150
1
78 6
34
Sa
laries
and
wag
es 1
75 0
09
1 2
64
- 1
76 2
73
173
608
2
665
98
.5%
182
150
1
50 9
46
So
cial c
ontri
butio
ns
27
749
-
494
28
243
3
0 90
7 (2
664
)10
9.4%
-
27
688
Go
ods a
nd se
rvice
s 8
364
(1
415
) -
6 9
49
6 9
50
(1
)10
0.0%
8 0
69
7 7
24
Ad
mini
strat
ive fe
es 1
569
-
- 1
569
164
1
405
10
.5%
1 0
00
7
74
Co
mm
unica
tion
(G&S
) -
- -
- 1
2 (1
2) -
-
3
In
vent
ory:
Lear
ner a
nd te
ache
r sup
port
mat
erial
5 4
45
(1 1
86)
- 4
259
5
355
(1
096
)12
5.7%
5 7
23
4 2
48
In
vent
ory:
Othe
r sup
plies
- -
- -
- -
- -
1 0
23
Tr
avel
and
subs
isten
ce
365
-
-
365
603
(238
)16
5.2%
(1
72)
6
76
Tr
aining
and
dev
elopm
ent
7
56
(2
29)
-
527
540
(1
3)10
2.5%
1 7
64
6
76
Op
erat
ing p
aym
ents
- -
- -
54
(54)
- -
70
Ve
nues
and
facil
ities
2
29
- -
2
29
2
22
7
96
.9%
(2
46)
2
54
In
tere
st an
d re
nt o
n lan
d -
- -
- -
- -
- -
Tr
ansf
ers
and
subs
idie
s
36
516
1
51
-
36
667
3
6 66
6
1
100.
0%
34
707
3
4 70
5
Prov
inces
and
mun
icipa
lities
- -
- -
- -
- -
-
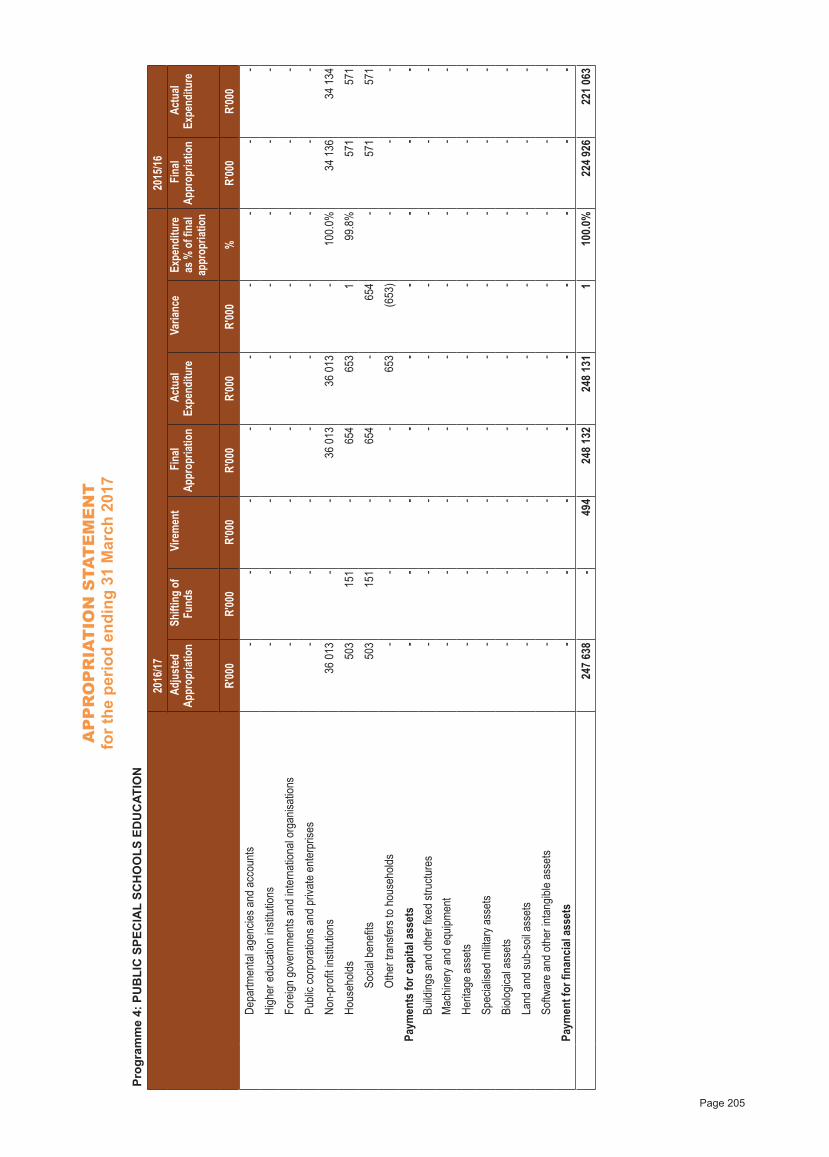
AP
PR
OP
RIA
TIO
N S
TAT
EM
EN
Tfo
r the
per
iod
endi
ng 3
1 M
arch
201
7
Page 205
Prog
ram
me
4: P
UB
LIC
SPE
CIA
L SC
HO
OLS
ED
UC
ATIO
N
2016
/17
20
15/16
A
djus
ted
Appr
opria
tion
Shi
fting
of
Fund
s V
irem
ent
Fin
al Ap
prop
riatio
n A
ctua
l Ex
pend
iture
V
arian
ce
Expe
nditu
re
as %
of fi
nal
appr
opria
tion
Fin
al Ap
prop
riatio
n A
ctua
l Ex
pend
iture
R'00
0R'
000
R'00
0R'
000
R'00
0R'
000
%R'
000
R'00
0
Depa
rtmen
tal a
genc
ies a
nd a
ccou
nts
- -
- -
- -
- -
-
Hi
gher
edu
catio
n ins
titutio
ns -
- -
- -
- -
- -
Fo
reign
gov
ernm
ents
and
inter
natio
nal o
rgan
isatio
ns -
- -
- -
- -
- -
Pu
blic c
orpo
ratio
ns a
nd p
rivat
e en
terp
rises
- -
- -
- -
- -
-
No
n-pr
ofit in
stitu
tions
3
6 01
3 -
-
36
013
3
6 01
3 -
100.
0%
34
136
3
4 13
4
Ho
useh
olds
5
03
1
51
-
654
653
1
99.8
%
571
571
So
cial b
enefi
ts
503
151
-
6
54
-
654
-
5
71
5
71
Ot
her t
rans
fers
to h
ouse
holds
- -
- -
6
53
(6
53)
- -
-
Pa
ymen
ts fo
r cap
ital a
sset
s -
- -
- -
- -
- -
Bu
ilding
s and
oth
er fix
ed st
ructu
res
- -
- -
- -
- -
-
Mac
hiner
y and
equ
ipmen
t -
- -
- -
- -
- -
He
ritag
e as
sets
- -
- -
- -
- -
-
Sp
ecial
ised
milit
ary a
sset
s -
- -
- -
- -
- -
Bi
ologic
al as
sets
- -
- -
- -
- -
-
La
nd a
nd su
b-so
il ass
ets
- -
- -
- -
- -
-
So
ftwar
e an
d ot
her i
ntan
gible
asse
ts -
- -
- -
- -
- -
Pa
ymen
t for
fina
ncia
l ass
ets
- -
- -
- -
- -
-
2
47 6
38
-
494
2
48 1
32
248
131
1
100.
0% 2
24 9
26
221
063
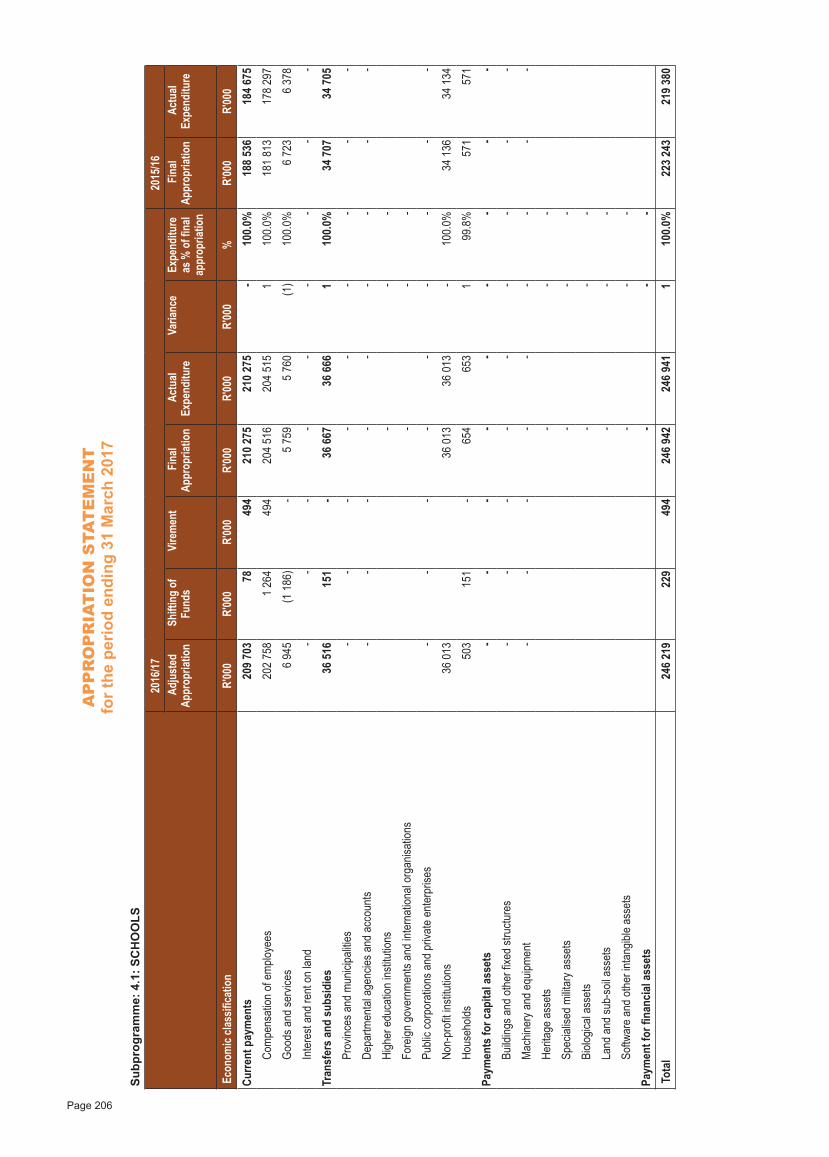
AP
PR
OP
RIA
TIO
N S
TAT
EM
EN
Tfo
r the
per
iod
endi
ng 3
1 M
arch
201
7
Page 206
Subp
rogr
amm
e: 4
.1: S
CH
OO
LS
2016
/17
20
15/16
Adj
uste
d Ap
prop
riatio
n S
hifti
ng o
f Fu
nds
Vire
men
t F
inal
Appr
opria
tion
Act
ual
Expe
nditu
re
Var
iance
Ex
pend
iture
as
% o
f fina
l ap
prop
riatio
n
Fin
al Ap
prop
riatio
n A
ctua
l Ex
pend
iture
Eco
nom
ic cla
ssifi
catio
n R'
000
R'00
0R'
000
R'00
0R'
000
R'00
0%
R'00
0R'
000
Curre
nt p
aym
ents
209
703
7
8
494
2
10 2
75
210
275
-
100.
0% 1
88 5
36
184
675
Co
mpe
nsat
ion o
f em
ploye
es 2
02 7
58
1 2
64
4
94
204
516
2
04 5
15
1
10
0.0%
181
813
1
78 2
97
Good
s and
serv
ices
6 9
45
(1 1
86)
- 5
759
5
760
(1)
100.
0% 6
723
6
378
Inte
rest
and
rent
on
land
- -
- -
- -
- -
-
Tran
sfer
s an
d su
bsid
ies
3
6 51
6
151
-
3
6 66
7
36
666
1
10
0.0%
3
4 70
7
34
705
Prov
inces
and
mun
icipa
lities
- -
- -
- -
- -
-
Depa
rtmen
tal a
genc
ies a
nd a
ccou
nts
- -
- -
- -
- -
-
High
er e
duca
tion
institu
tions
-
-
-
Fore
ign g
over
nmen
ts an
d int
erna
tiona
l org
anisa
tions
-
-
-
Publi
c cor
pora
tions
and
priv
ate
ente
rpris
es -
- -
- -
- -
- -
Non-
profi
t insti
tutio
ns
36
013
3
6 01
3
36
013
- 10
0.0%
3
4 13
6
34
134
Hous
ehold
s
503
151
-
6
54
6
53
1
99
.8%
5
71
5
71
Paym
ents
for c
apita
l ass
ets
- -
- -
- -
- -
- Bu
ilding
s and
oth
er fix
ed st
ructu
res
- -
- -
- -
- -
-
Mac
hiner
y and
equ
ipmen
t -
- -
- -
- -
- -
Herit
age
asse
ts
-
- -
Spec
ialise
d m
ilitar
y ass
ets
-
-
-
Biolo
gical
asse
ts
-
- -
Land
and
sub-
soil a
sset
s
-
- -
Softw
are
and
othe
r int
angib
le as
sets
-
-
-
Paym
ent f
or fi
nanc
ial a
sset
s
-
- -
Tota
l 2
46 2
19
2
29
4
94
246
942
2
46 9
41
1
10
0.0%
223
243
2
19 3
80
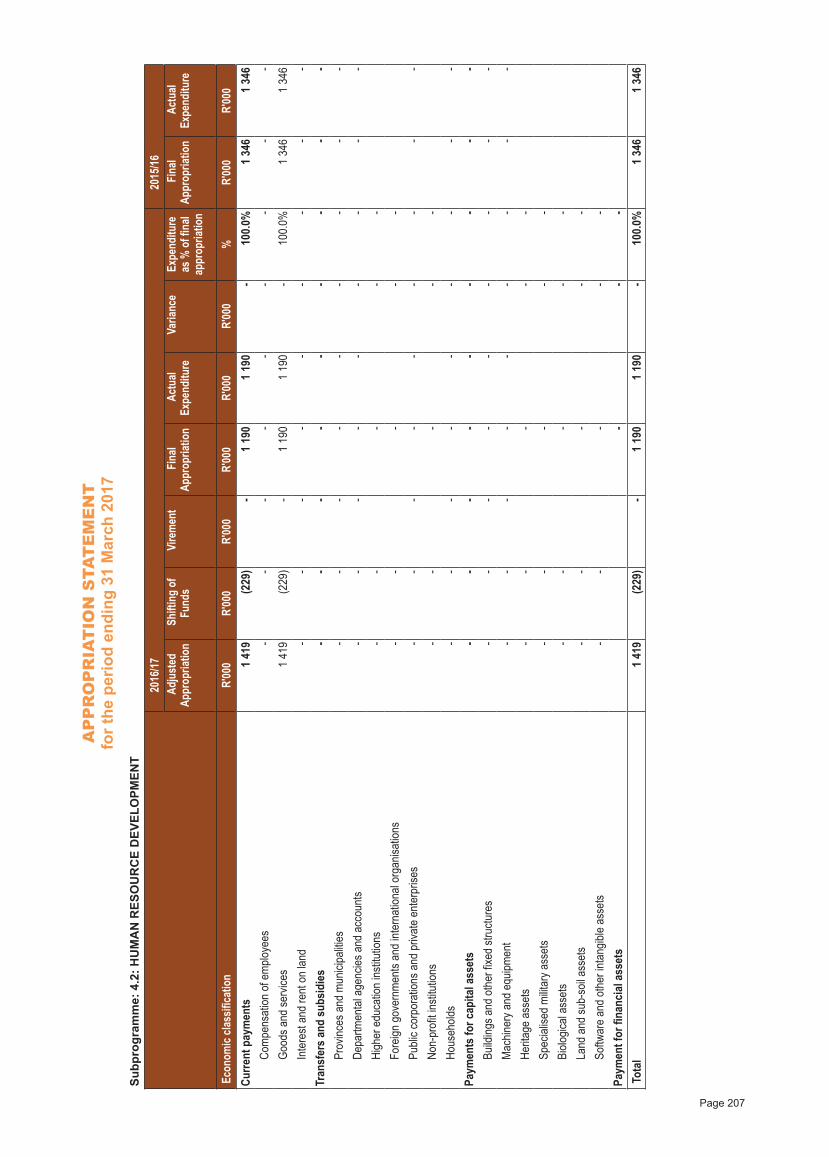
AP
PR
OP
RIA
TIO
N S
TAT
EM
EN
Tfo
r the
per
iod
endi
ng 3
1 M
arch
201
7
Page 207
Subp
rogr
amm
e: 4
.2: H
UM
AN
RES
OU
RC
E D
EVEL
OPM
ENT
20
16/17
2015
/16
A
djus
ted
Appr
opria
tion
Shi
fting
of
Fund
s V
irem
ent
Fin
al Ap
prop
riatio
n A
ctua
l Ex
pend
iture
V
arian
ce
Expe
nditu
re
as %
of fi
nal
appr
opria
tion
Fin
al Ap
prop
riatio
n A
ctua
l Ex
pend
iture
Eco
nom
ic cla
ssifi
catio
n R'
000
R'00
0R'
000
R'00
0R'
000
R'00
0%
R'00
0R'
000
Curre
nt p
aym
ents
1 4
19
(2
29)
- 1
190
1
190
-
100.
0% 1
346
1
346
Co
mpe
nsat
ion o
f em
ploye
es -
- -
- -
- -
- -
Good
s and
serv
ices
1 4
19
(2
29)
- 1
190
1
190
-
100.
0% 1
346
1
346
In
tere
st an
d re
nt o
n lan
d -
- -
- -
- -
- -
Tran
sfer
s an
d su
bsid
ies
- -
- -
- -
- -
- Pr
ovinc
es a
nd m
unici
paliti
es -
- -
- -
- -
- -
Depa
rtmen
tal a
genc
ies a
nd a
ccou
nts
- -
- -
- -
- -
- Hi
gher
edu
catio
n ins
titutio
ns-
-
-
- -
Fore
ign g
over
nmen
ts an
d int
erna
tiona
l org
anisa
tions
- -
-
-
-
Pu
blic c
orpo
ratio
ns a
nd p
rivat
e en
terp
rises
- -
- -
- -
- -
- No
n-pr
ofit in
stitu
tions
--
-
-
-
Ho
useh
olds
- -
- -
- -
- -
- Pa
ymen
ts fo
r cap
ital a
sset
s -
- -
- -
- -
- -
Build
ings a
nd o
ther
fixed
stru
cture
s -
- -
- -
- -
- -
Mac
hiner
y and
equ
ipmen
t -
- -
- -
- -
- -
Herit
age
asse
ts -
-
-
- -
Spec
ialise
d m
ilitar
y ass
ets
--
-
-
-
Bi
ologic
al as
sets
--
-
-
-
La
nd a
nd su
b-so
il ass
ets
--
-
-
-
So
ftwar
e an
d ot
her i
ntan
gible
asse
ts -
-
-
- -
Paym
ent f
or fi
nanc
ial a
sset
s
-
- -
Tota
l 1
419
(229
) -
1 1
90
1 1
90
- 10
0.0%
1 3
46
1 3
46

AP
PR
OP
RIA
TIO
N S
TAT
EM
EN
Tfo
r the
per
iod
endi
ng 3
1 M
arch
201
7
Page 208
Subp
rogr
amm
e: 4
.3: C
ON
DIT
ION
AL
GR
AN
TS
2016
/17
20
15/16
Adj
uste
d Ap
prop
riatio
n S
hifti
ng o
f Fu
nds
Vire
men
t F
inal
Appr
opria
tion
Act
ual
Expe
nditu
re
Var
iance
Ex
pend
iture
as
% o
f fina
l ap
prop
riatio
n
Fin
al Ap
prop
riatio
n A
ctua
l Ex
pend
iture
Eco
nom
ic cla
ssifi
catio
n R'
000
R'00
0R'
000
R'00
0R'
000
R'00
0%
R'00
0R'
000
Cur
rent
pay
men
ts -
- -
- -
- -
3
37
3
37
Com
pens
atio
n of
em
ploy
ees
- -
- -
- -
-
337
337
Goo
ds a
nd s
ervi
ces
- -
- -
- -
- -
-
Inte
rest
and
rent
on
land
- -
- -
- -
- -
-
Tran
sfer
s an
d su
bsid
ies
- -
- -
- -
- -
- P
rovi
nces
and
mun
icip
aliti
es -
- -
- -
- -
- -
Dep
artm
enta
l age
ncie
s an
d ac
coun
ts -
- -
- -
- -
- -
Hig
her e
duca
tion
inst
itutio
ns
-
- -
Fore
ign
gove
rnm
ents
and
inte
rnat
iona
l org
anis
atio
ns
-
- -
Pub
lic c
orpo
ratio
ns a
nd p
rivat
e en
terp
rises
- -
- -
- -
- -
-
Non
-pro
fit in
stitu
tions
-
-
-
Hou
seho
lds
- -
- -
- -
- -
-
Paym
ents
for c
apita
l ass
ets
- -
- -
- -
- -
- B
uild
ings
and
oth
er fi
xed
stru
ctur
es -
- -
- -
- -
- -
Mac
hine
ry a
nd e
quip
men
t -
- -
- -
- -
- -
Her
itage
ass
ets
-
-
-
Spe
cial
ised
mili
tary
ass
ets
-
-
-
Bio
logi
cal a
sset
s
-
- -
Land
and
sub
-soi
l ass
ets
-
-
-
Sof
twar
e an
d ot
her i
ntan
gibl
e as
sets
-
-
-
Paym
ent f
or fi
nanc
ial a
sset
s
-
- -
Tot
al
- -
- -
- -
-
337
337
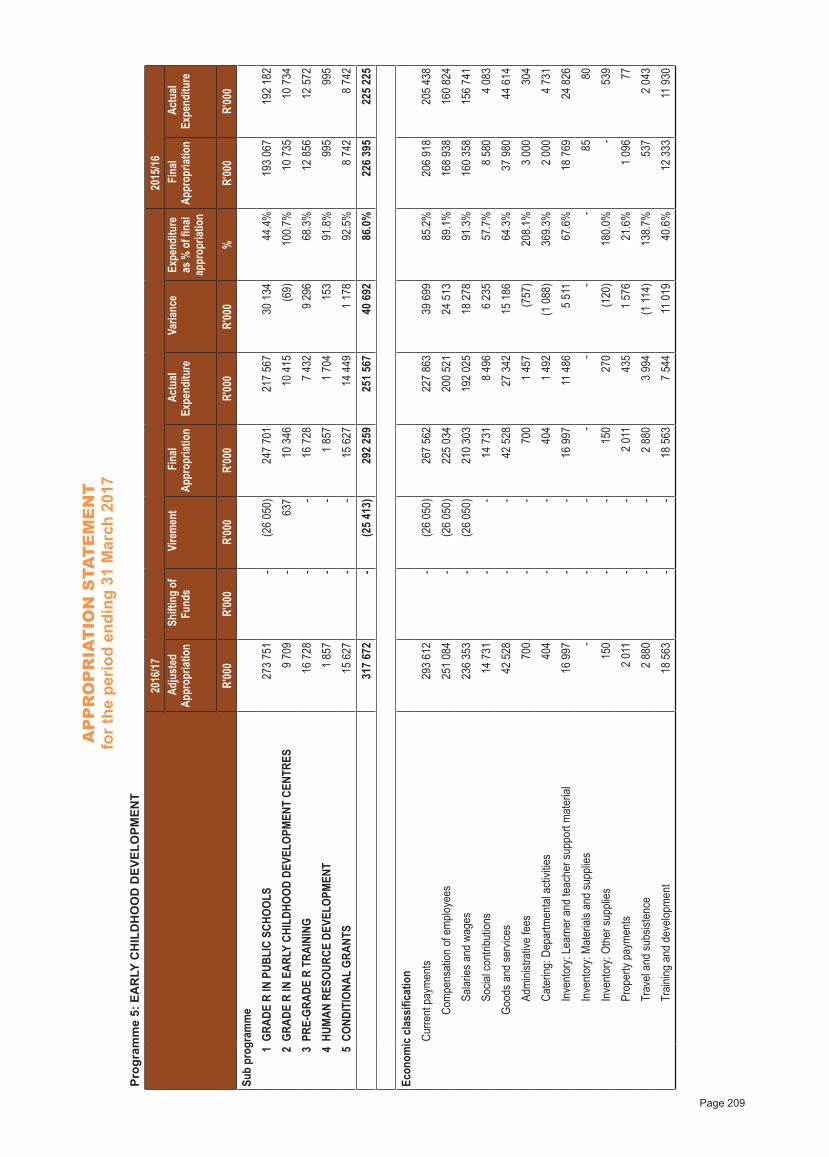
AP
PR
OP
RIA
TIO
N S
TAT
EM
EN
Tfo
r the
per
iod
endi
ng 3
1 M
arch
201
7
Page 209
Prog
ram
me
5: E
AR
LY C
HIL
DH
OO
D D
EVEL
OPM
ENT
2016
/17
20
15/16
A
djus
ted
Appr
opria
tion
Shi
fting
of
Fund
s V
irem
ent
Fin
al Ap
prop
riatio
n A
ctua
l Ex
pend
iture
V
arian
ce
Expe
nditu
re
as %
of fi
nal
appr
opria
tion
Fin
al Ap
prop
riatio
n A
ctua
l Ex
pend
iture
R'00
0R'
000
R'00
0R'
000
R'00
0R'
000
%R'
000
R'00
0Su
b pr
ogra
mm
e
1GR
ADE
R IN
PUB
LIC
SCHO
OLS
273
751
-
(2
6 05
0) 2
47 7
01
217
567
30
134
44.4
% 1
93 0
67
192
182
2GR
ADE
R IN
EAR
LY C
HILD
HOOD
DEV
ELOP
MEN
T CE
NTRE
S 9
709
-
6
37
1
0 34
6
10
415
(69)
100.
7%
10
735
1
0 73
4
3PR
E-GR
ADE
R TR
AINI
NG
16
728
- -
1
6 72
8
7 4
32
9 2
96
68.3
%
12
856
1
2 57
2
4HU
MAN
RES
OURC
E DE
VELO
PMEN
T 1
857
-
- 1
857
1
704
153
91
.8%
9
95
9
95
5CO
NDIT
IONA
L GR
ANTS
1
5 62
7 -
-
15
627
1
4 44
9 1
178
92
.5%
8 7
42
8 7
42
317
672
-
(2
5 41
3) 2
92 2
59
251
567
40
692
86.0
% 2
26 3
95
225
225
Econ
omic
cla
ssifi
catio
n
Cu
rrent
pay
men
ts 2
93 6
12
-
(26
050)
267
562
2
27 8
63
3
9 69
9 85
.2%
206
918
2
05 4
38
Co
mpe
nsat
ion o
f em
ploye
es 2
51 0
84
-
(26
050)
225
034
2
00 5
21
2
4 51
3 89
.1%
168
938
1
60 8
24
Sa
laries
and
wag
es 2
36 3
53
-
(26
050)
210
303
1
92 0
25
1
8 27
8 91
.3%
160
358
1
56 7
41
So
cial c
ontri
butio
ns
14
731
- -
1
4 73
1 8
496
6
235
57
.7%
8 5
80
4 0
83
Go
ods a
nd se
rvice
s
42
528
- -
4
2 52
8
27
342
1
5 18
6 64
.3%
3
7 98
0
44
614
Ad
mini
strat
ive fe
es
700
-
-
700
1
457
(757
)20
8.1%
3 0
00
3
04
Ca
terin
g: D
epar
tmen
tal a
ctivit
ies
404
-
-
404
1
492
(1
088
)36
9.3%
2 0
00
4 7
31
In
vent
ory:
Lear
ner a
nd te
ache
r sup
port
mat
erial
1
6 99
7 -
-
16
997
11
486
5
511
67
.6%
1
8 76
9
24
826
In
vent
ory:
Mat
erial
s and
supp
lies
- -
- -
- -
- 8
5 8
0
In
vent
ory:
Othe
r sup
plies
1
50
- -
1
50
2
70
(1
20)
180.
0% -
5
39
Pr
oper
ty pa
ymen
ts 2
011
-
- 2
011
435
1
576
21
.6%
1 0
96
77
Tr
avel
and
subs
isten
ce 2
880
-
- 2
880
3
994
(1
114)
138.
7%
537
2
043
Tr
aining
and
dev
elopm
ent
1
8 56
3 -
-
18
563
7
544
11
019
40.6
%
12
333
11
930
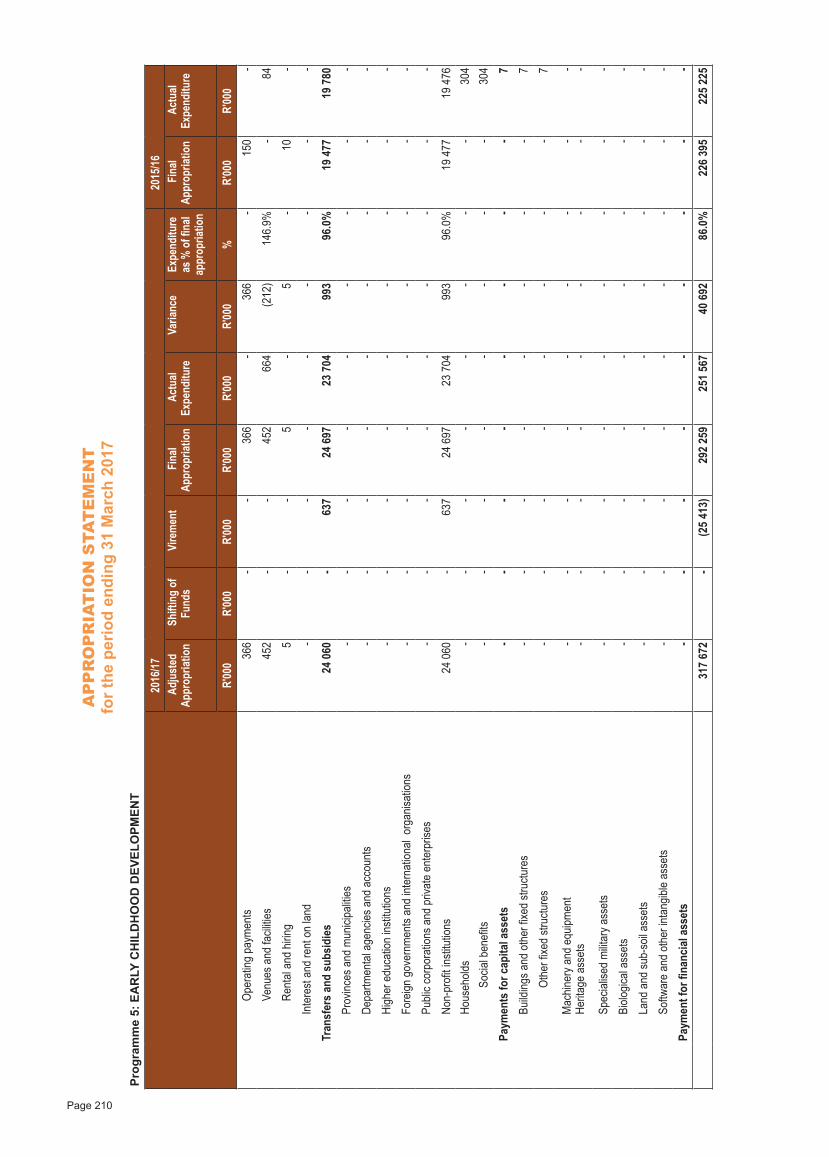
AP
PR
OP
RIA
TIO
N S
TAT
EM
EN
Tfo
r the
per
iod
endi
ng 3
1 M
arch
201
7
Page 210
Prog
ram
me
5: E
AR
LY C
HIL
DH
OO
D D
EVEL
OPM
ENT
2016
/17
20
15/16
A
djus
ted
Appr
opria
tion
Shi
fting
of
Fund
s V
irem
ent
Fin
al Ap
prop
riatio
n A
ctua
l Ex
pend
iture
V
arian
ce
Expe
nditu
re
as %
of fi
nal
appr
opria
tion
Fin
al Ap
prop
riatio
n A
ctua
l Ex
pend
iture
R'00
0R'
000
R'00
0R'
000
R'00
0R'
000
%R'
000
R'00
0
Oper
ating
pay
men
ts
366
-
-
366
-
3
66
-
150
-
Ve
nues
and
facil
ities
4
52
- -
4
52
6
64
(2
12)
146.
9% -
84
Re
ntal
and
hiring
5
-
-
5
-
5
- 1
0 -
In
tere
st an
d re
nt o
n lan
d -
- -
- -
- -
- -
Tr
ansf
ers
and
subs
idie
s
24
060
-
637
24
697
2
3 70
4
993
96
.0%
1
9 47
7
19
780
Pr
ovinc
es a
nd m
unici
paliti
es -
- -
- -
- -
- -
De
partm
enta
l age
ncies
and
acc
ount
s -
- -
- -
- -
- -
Hi
gher
edu
catio
n ins
titutio
ns -
- -
- -
- -
- -
Fo
reign
gov
ernm
ents
and
inter
natio
nal o
rgan
isatio
ns -
- -
- -
- -
- -
Pu
blic c
orpo
ratio
ns a
nd p
rivat
e en
terp
rises
- -
- -
- -
- -
-
No
n-pr
ofit in
stitu
tions
2
4 06
0 -
6
37
2
4 69
7
23
704
9
93
96.0
%
19
477
1
9 47
6
Hous
ehold
s -
- -
- -
- -
-
304
So
cial b
enefi
ts -
- -
- -
- -
-
304
Pa
ymen
ts fo
r cap
ital a
sset
s -
- -
- -
- -
-
7
Bu
ilding
s and
oth
er fix
ed st
ructu
res
- -
- -
- -
- -
7
Ot
her fi
xed
struc
ture
s -
- -
- -
- -
-
7
M
achin
ery a
nd e
quipm
ent
Herit
age
asse
ts - -
- - - -
- - - -
- - - -
- - - -
Sp
ecial
ised
milit
ary a
sset
s -
- -
- -
- -
- -
Bi
ologic
al as
sets
- -
- -
- -
- -
-
La
nd a
nd su
b-so
il ass
ets
- -
- -
- -
- -
-
So
ftwar
e an
d ot
her i
ntan
gible
asse
ts -
- -
- -
- -
- -
Pa
ymen
t for
fina
ncia
l ass
ets
- -
- -
- -
- -
-
3
17 6
72
-
(25
413)
292
259
2
51 5
67
4
0 69
2 86
.0%
226
395
2
25 2
25
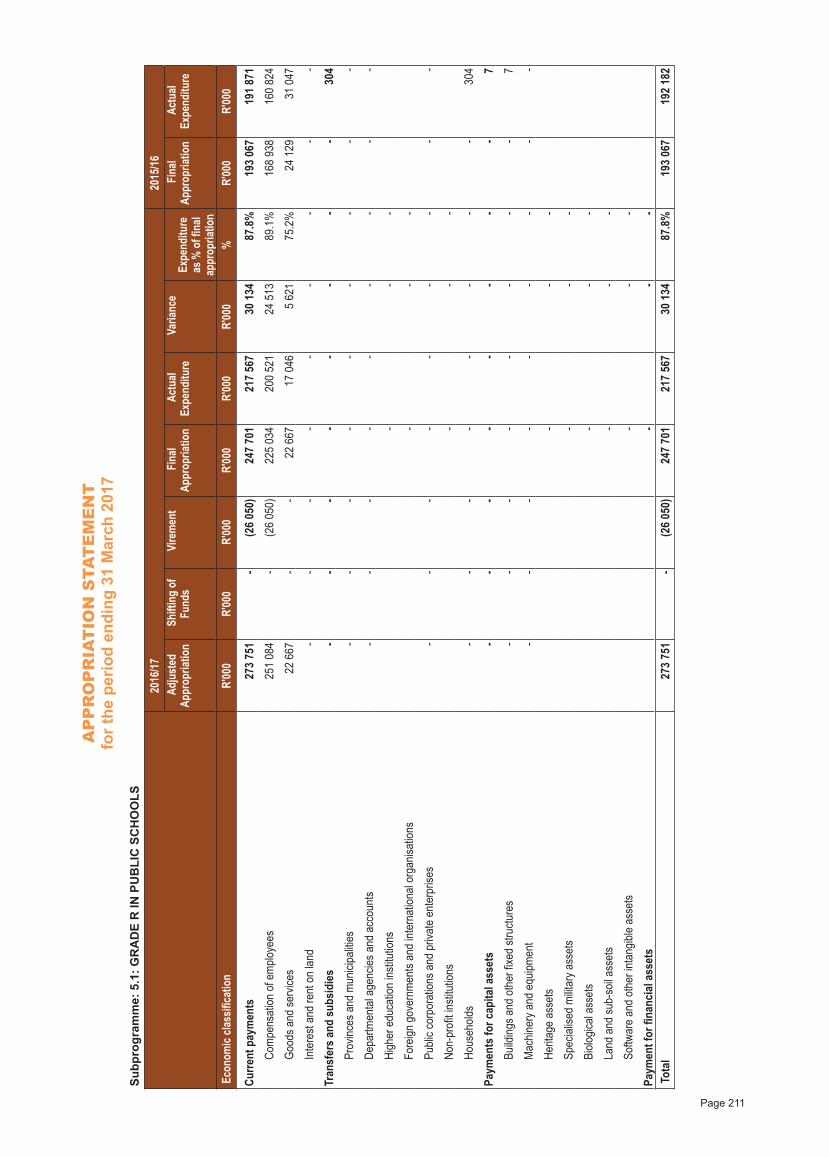
AP
PR
OP
RIA
TIO
N S
TAT
EM
EN
Tfo
r the
per
iod
endi
ng 3
1 M
arch
201
7
Page 211
Subp
rogr
amm
e: 5
.1: G
RA
DE
R IN
PU
BLI
C S
CH
OO
LS
2016
/17
20
15/16
Adj
uste
d Ap
prop
riatio
n S
hifti
ng o
f Fu
nds
Vire
men
t F
inal
Appr
opria
tion
Act
ual
Expe
nditu
re
Var
iance
Ex
pend
iture
as
% o
f fina
l ap
prop
riatio
n
Fin
al Ap
prop
riatio
n A
ctua
l Ex
pend
iture
Eco
nom
ic cla
ssifi
catio
n R'
000
R'00
0R'
000
R'00
0R'
000
R'00
0%
R'00
0R'
000
Curre
nt p
aym
ents
273
751
-
(2
6 05
0) 2
47 7
01
217
567
30
134
87.8
% 1
93 0
67
191
871
Co
mpe
nsat
ion o
f em
ploye
es 2
51 0
84
-
(26
050)
225
034
2
00 5
21
2
4 51
3 89
.1%
168
938
1
60 8
24
Good
s and
serv
ices
2
2 66
7 -
-
22
667
1
7 04
6 5
621
75
.2%
2
4 12
9
31
047
Inte
rest
and
rent
on
land
- -
- -
- -
- -
-
Tran
sfer
s an
d su
bsid
ies
- -
- -
- -
- -
3
04
Prov
inces
and
mun
icipa
lities
- -
- -
- -
- -
-
Depa
rtmen
tal a
genc
ies a
nd a
ccou
nts
- -
- -
- -
- -
-
High
er e
duca
tion
institu
tions
-
-
-
Fore
ign g
over
nmen
ts an
d int
erna
tiona
l org
anisa
tions
-
-
-
Publi
c cor
pora
tions
and
priv
ate
ente
rpris
es -
- -
- -
- -
- -
Non-
profi
t insti
tutio
ns
-
- -
Hous
ehold
s -
- -
- -
- -
-
304
Paym
ents
for c
apita
l ass
ets
- -
- -
- -
- -
7
Bu
ilding
s and
oth
er fix
ed st
ructu
res
- -
- -
- -
- -
7
Mac
hiner
y and
equ
ipmen
t -
- -
- -
- -
- -
Herit
age
asse
ts
-
- -
Spec
ialise
d m
ilitar
y ass
ets
-
-
-
Biolo
gical
asse
ts
-
- -
Land
and
sub-
soil a
sset
s
-
- -
Softw
are
and
othe
r int
angib
le as
sets
-
-
-
Paym
ent f
or fi
nanc
ial a
sset
s
-
- -
Tota
l 2
73 7
51
-
(26
050)
247
701
2
17 5
67
3
0 13
4 87
.8%
193
067
1
92 1
82
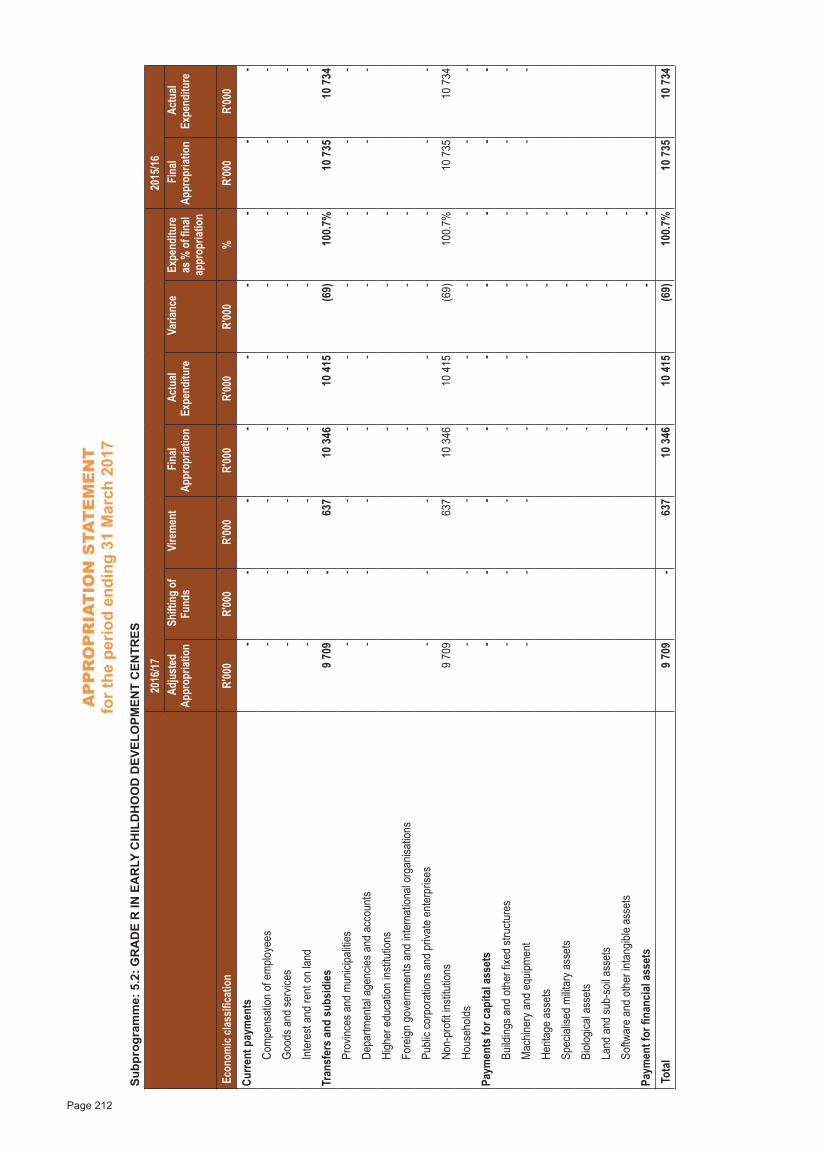
AP
PR
OP
RIA
TIO
N S
TAT
EM
EN
Tfo
r the
per
iod
endi
ng 3
1 M
arch
201
7
Page 212
Subp
rogr
amm
e: 5
.2: G
RA
DE
R IN
EA
RLY
CH
ILD
HO
OD
DEV
ELO
PMEN
T C
ENTR
ES
2016
/17
20
15/16
Adj
uste
d Ap
prop
riatio
n S
hifti
ng o
f Fu
nds
Vire
men
t F
inal
Appr
opria
tion
Act
ual
Expe
nditu
re
Var
iance
Ex
pend
iture
as
% o
f fina
l ap
prop
riatio
n
Fin
al Ap
prop
riatio
n A
ctua
l Ex
pend
iture
Eco
nom
ic cla
ssifi
catio
n R'
000
R'00
0R'
000
R'00
0R'
000
R'00
0%
R'00
0R'
000
Curre
nt p
aym
ents
- -
- -
- -
- -
- Co
mpe
nsat
ion o
f em
ploye
es -
- -
- -
- -
- -
Good
s and
serv
ices
- -
- -
- -
- -
-
Inte
rest
and
rent
on
land
- -
- -
- -
- -
-
Tran
sfer
s an
d su
bsid
ies
9 7
09
-
637
10
346
1
0 41
5 (6
9)10
0.7%
1
0 73
5
10
734
Prov
inces
and
mun
icipa
lities
- -
- -
- -
- -
-
Depa
rtmen
tal a
genc
ies a
nd a
ccou
nts
- -
- -
- -
- -
-
High
er e
duca
tion
institu
tions
-
-
-
Fore
ign g
over
nmen
ts an
d int
erna
tiona
l org
anisa
tions
-
-
-
Publi
c cor
pora
tions
and
priv
ate
ente
rpris
es -
- -
- -
- -
- -
Non-
profi
t insti
tutio
ns 9
709
6
37
1
0 34
6
10
415
(69)
100.
7%
10
735
1
0 73
4
Hous
ehold
s -
- -
- -
- -
- -
Paym
ents
for c
apita
l ass
ets
- -
- -
- -
- -
- Bu
ilding
s and
oth
er fix
ed st
ructu
res
- -
- -
- -
- -
-
Mac
hiner
y and
equ
ipmen
t -
- -
- -
- -
- -
Herit
age
asse
ts
-
- -
Spec
ialise
d m
ilitar
y ass
ets
-
-
-
Biolo
gical
asse
ts
-
- -
Land
and
sub-
soil a
sset
s
-
- -
Softw
are
and
othe
r int
angib
le as
sets
-
-
-
Paym
ent f
or fi
nanc
ial a
sset
s
-
- -
Tota
l 9
709
-
6
37
1
0 34
6
10
415
(69)
100.
7%
10
735
1
0 73
4
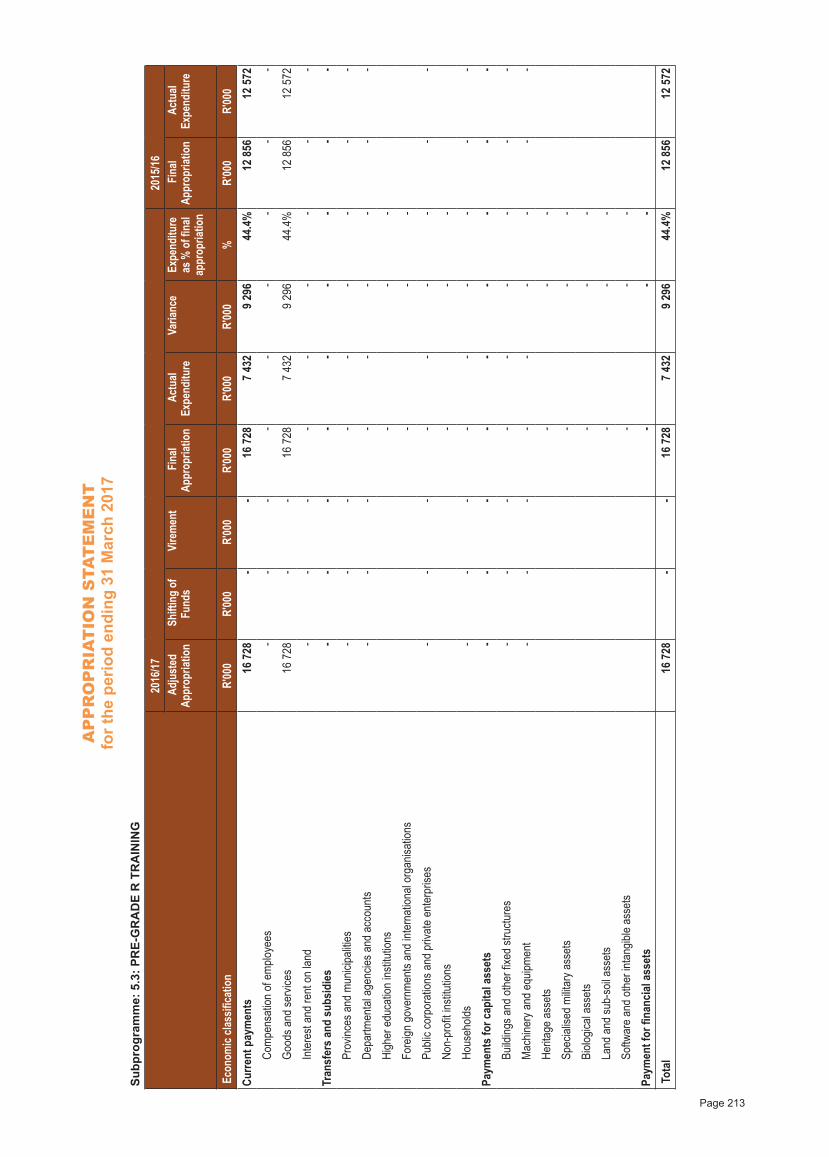
AP
PR
OP
RIA
TIO
N S
TAT
EM
EN
Tfo
r the
per
iod
endi
ng 3
1 M
arch
201
7
Page 213
Subp
rogr
amm
e: 5
.3: P
RE-
GR
AD
E R
TR
AIN
ING
20
16/17
2015
/16
A
djus
ted
Appr
opria
tion
Shi
fting
of
Fund
s V
irem
ent
Fin
al Ap
prop
riatio
n A
ctua
l Ex
pend
iture
V
arian
ce
Expe
nditu
re
as %
of fi
nal
appr
opria
tion
Fin
al Ap
prop
riatio
n A
ctua
l Ex
pend
iture
Eco
nom
ic cla
ssifi
catio
n R'
000
R'00
0R'
000
R'00
0R'
000
R'00
0%
R'00
0R'
000
Curre
nt p
aym
ents
1
6 72
8 -
-
16
728
7
432
9
296
44
.4%
1
2 85
6
12
572
Com
pens
ation
of e
mplo
yees
- -
- -
- -
- -
-
Good
s and
serv
ices
1
6 72
8 -
-
16
728
7
432
9
296
44.4
%
12
856
1
2 57
2
Inte
rest
and
rent
on
land
- -
- -
- -
- -
-
Tran
sfer
s an
d su
bsid
ies
- -
- -
- -
- -
- Pr
ovinc
es a
nd m
unici
paliti
es -
- -
- -
- -
- -
Depa
rtmen
tal a
genc
ies a
nd a
ccou
nts
- -
- -
- -
- -
-
High
er e
duca
tion
institu
tions
-
-
-
Fore
ign g
over
nmen
ts an
d int
erna
tiona
l org
anisa
tions
-
-
-
Publi
c cor
pora
tions
and
priv
ate
ente
rpris
es -
- -
- -
- -
- -
Non-
profi
t insti
tutio
ns
-
- -
Hous
ehold
s -
- -
- -
- -
- -
Paym
ents
for c
apita
l ass
ets
- -
- -
- -
- -
- Bu
ilding
s and
oth
er fix
ed st
ructu
res
- -
- -
- -
- -
-
Mac
hiner
y and
equ
ipmen
t -
- -
- -
- -
- -
Herit
age
asse
ts
-
- -
Spec
ialise
d m
ilitar
y ass
ets
-
-
-
Biolo
gical
asse
ts
-
- -
Land
and
sub-
soil a
sset
s
-
- -
Softw
are
and
othe
r int
angib
le as
sets
-
-
-
Paym
ent f
or fi
nanc
ial a
sset
s
-
- -
Tota
l
16
728
- -
1
6 72
8
7 4
32
9 2
9644
.4%
1
2 85
6
12
572
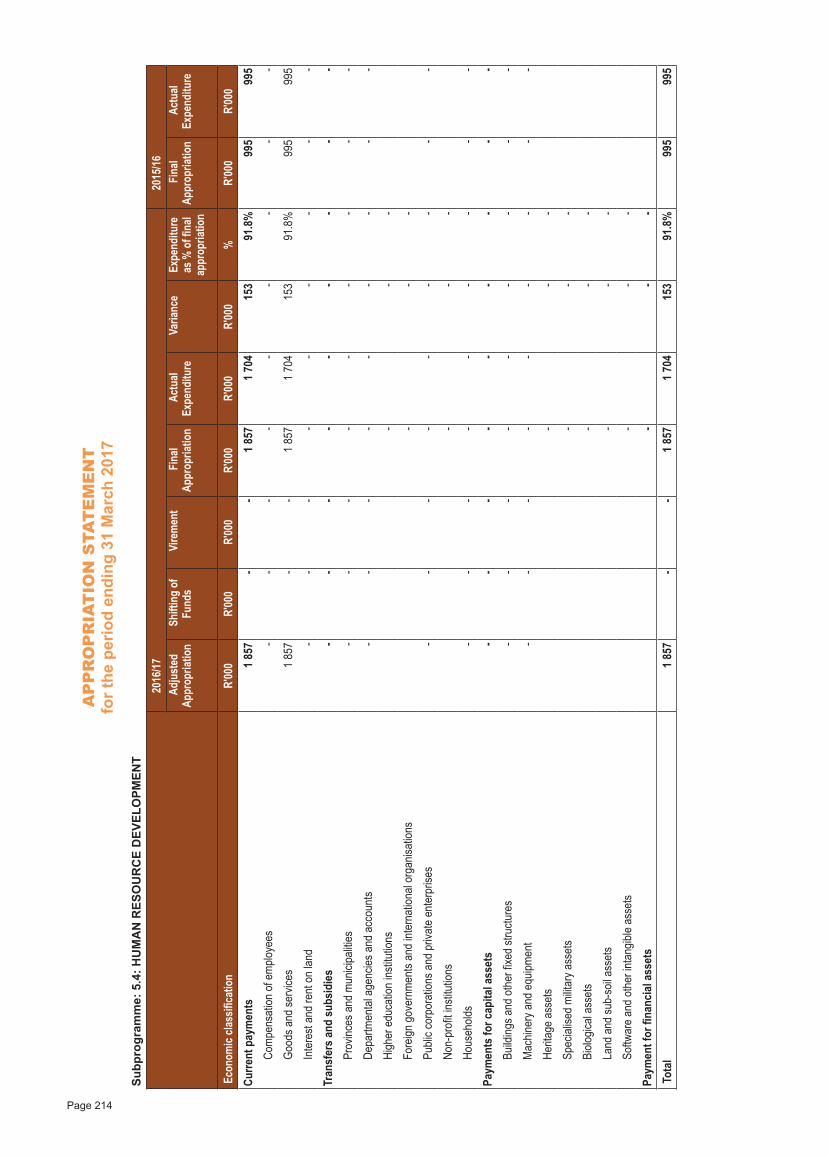
AP
PR
OP
RIA
TIO
N S
TAT
EM
EN
Tfo
r the
per
iod
endi
ng 3
1 M
arch
201
7
Page 214
Subp
rogr
amm
e: 5
.4: H
UM
AN
RES
OU
RC
E D
EVEL
OPM
ENT
20
16/17
2015
/16
A
djus
ted
Appr
opria
tion
Shi
fting
of
Fund
s V
irem
ent
Fin
al Ap
prop
riatio
n A
ctua
l Ex
pend
iture
V
arian
ce
Expe
nditu
re
as %
of fi
nal
appr
opria
tion
Fin
al Ap
prop
riatio
n A
ctua
l Ex
pend
iture
Eco
nom
ic cla
ssifi
catio
n R'
000
R'00
0R'
000
R'00
0R'
000
R'00
0%
R'00
0R'
000
Curre
nt p
aym
ents
1 8
57
- -
1 8
57
1 7
04
1
53
91.8
%
995
995
Co
mpe
nsat
ion o
f em
ploye
es -
- -
- -
- -
- -
Good
s and
serv
ices
1 8
57
- -
1 8
57
1 7
04
1
53
91.8
%
995
995
Inte
rest
and
rent
on
land
- -
- -
- -
- -
-
Tran
sfer
s an
d su
bsid
ies
- -
- -
- -
- -
- Pr
ovinc
es a
nd m
unici
paliti
es -
- -
- -
- -
- -
Depa
rtmen
tal a
genc
ies a
nd a
ccou
nts
- -
- -
- -
- -
-
High
er e
duca
tion
institu
tions
-
-
-
Fore
ign g
over
nmen
ts an
d int
erna
tiona
l org
anisa
tions
-
-
-
Publi
c cor
pora
tions
and
priv
ate
ente
rpris
es -
- -
- -
- -
- -
Non-
profi
t insti
tutio
ns
-
- -
Hous
ehold
s -
- -
- -
- -
- -
Paym
ents
for c
apita
l ass
ets
- -
- -
- -
- -
- Bu
ilding
s and
oth
er fix
ed st
ructu
res
- -
- -
- -
- -
-
Mac
hiner
y and
equ
ipmen
t -
- -
- -
- -
- -
Herit
age
asse
ts
-
- -
Spec
ialise
d m
ilitar
y ass
ets
-
-
-
Biolo
gical
asse
ts
-
- -
Land
and
sub-
soil a
sset
s
-
- -
Softw
are
and
othe
r int
angib
le as
sets
-
-
-
Paym
ent f
or fi
nanc
ial a
sset
s
-
- -
Tota
l 1
857
-
- 1
857
1
704
153
91
.8%
9
95
9
95

AP
PR
OP
RIA
TIO
N S
TAT
EM
EN
Tfo
r the
per
iod
endi
ng 3
1 M
arch
201
7
Page 215
Subp
rogr
amm
e: 5
.5: C
ON
DIT
ION
AL
GR
AN
TS
2016
/17
20
15/16
Adj
uste
d Ap
prop
riatio
n S
hifti
ng o
f Fu
nds
Vire
men
t F
inal
Appr
opria
tion
Act
ual
Expe
nditu
re
Var
iance
Ex
pend
iture
as
% o
f fina
l ap
prop
riatio
n
Fin
al Ap
prop
riatio
n A
ctua
l Ex
pend
iture
Eco
nom
ic cla
ssifi
catio
n R'
000
R'00
0R'
000
R'00
0R'
000
R'00
0%
R'00
0R'
000
Curre
nt p
aym
ents
1 2
76
- -
1 2
76
1 1
60
11
6 90
.9%
- -
Com
pens
ation
of e
mplo
yees
- -
- -
- -
- -
-
Good
s and
serv
ices
1 2
76
- -
1 2
76
1 1
60
11
6 90
.9%
- -
Inte
rest
and
rent
on
land
- -
- -
- -
- -
-
Tran
sfer
s an
d su
bsid
ies
1
4 35
1 -
-
14
351
1
3 28
9 1
062
92
.6%
8 7
42
8 7
42
Prov
inces
and
mun
icipa
lities
- -
- -
- -
- -
-
Depa
rtmen
tal a
genc
ies a
nd a
ccou
nts
- -
- -
- -
- -
-
High
er e
duca
tion
institu
tions
-
-
-
Fore
ign g
over
nmen
ts an
d int
erna
tiona
l org
anisa
tions
-
-
-
Publi
c cor
pora
tions
and
priv
ate
ente
rpris
es -
- -
- -
- -
- -
Non-
profi
t insti
tutio
ns
14
351
1
4 35
1
13
289
1 0
62
92.6
% 8
742
8
742
Hous
ehold
s -
- -
- -
- -
- -
Paym
ents
for c
apita
l ass
ets
- -
- -
- -
- -
- Bu
ilding
s and
oth
er fix
ed st
ructu
res
- -
- -
- -
- -
-
Mac
hiner
y and
equ
ipmen
t -
- -
- -
- -
- -
Herit
age
asse
ts
-
- -
Spec
ialise
d m
ilitar
y ass
ets
-
-
-
Biolo
gical
asse
ts
-
- -
Land
and
sub-
soil a
sset
s
-
- -
Softw
are
and
othe
r int
angib
le as
sets
-
-
-
Paym
ent f
or fi
nanc
ial a
sset
s
-
- -
Tota
l
15
627
- -
1
5 62
7
14
449
1 1
78
92.5
% 8
742
8
742
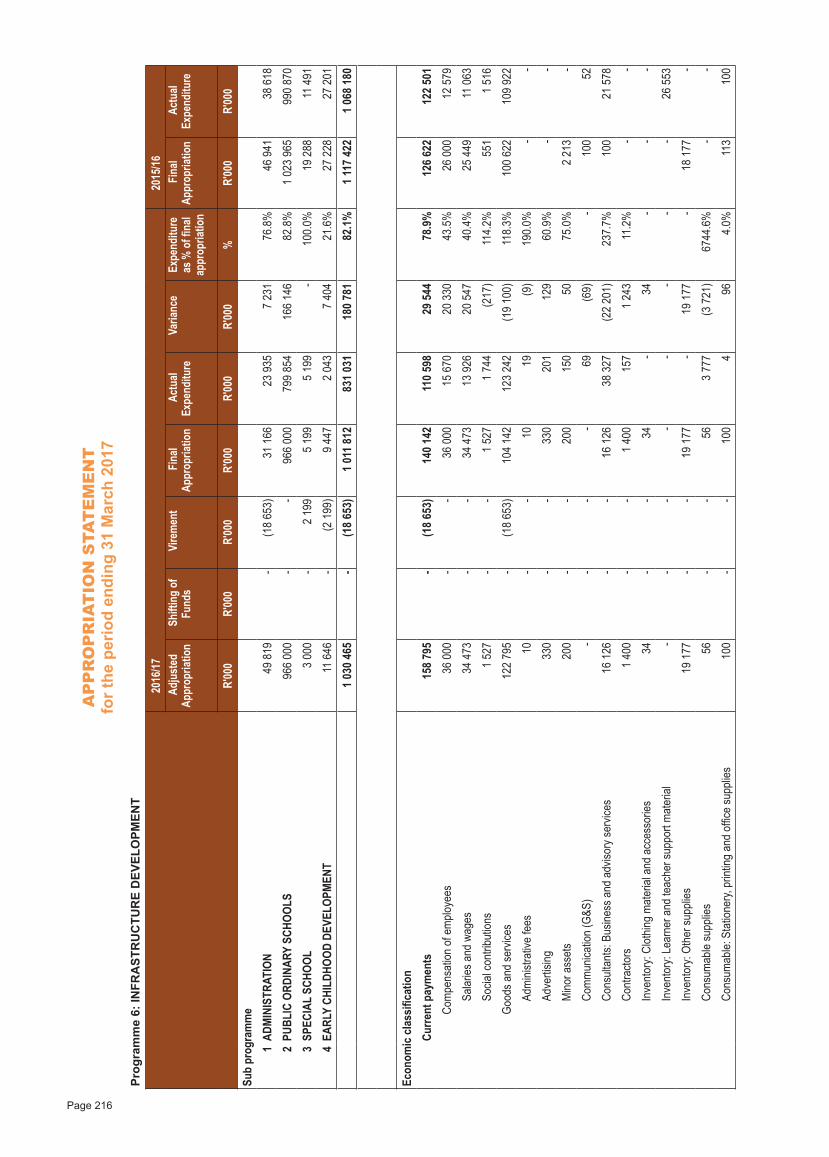
AP
PR
OP
RIA
TIO
N S
TAT
EM
EN
Tfo
r the
per
iod
endi
ng 3
1 M
arch
201
7
Page 216
Prog
ram
me
6: IN
FRA
STR
UC
TUR
E D
EVEL
OPM
ENT
2016
/17
20
15/16
A
djus
ted
Appr
opria
tion
Shi
fting
of
Fund
s V
irem
ent
Fin
al Ap
prop
riatio
n A
ctua
l Ex
pend
iture
V
arian
ce
Expe
nditu
re
as %
of fi
nal
appr
opria
tion
Fin
al Ap
prop
riatio
n A
ctua
l Ex
pend
iture
R'00
0R'
000
R'00
0R'
000
R'00
0R'
000
%R'
000
R'00
0Su
b pr
ogra
mm
e
1AD
MIN
ISTR
ATIO
N
49
819
-
(18
653)
3
1 16
6
23
935
7 2
31
76.8
%
46
941
3
8 61
8
2PU
BLIC
ORD
INAR
Y SC
HOOL
S 9
66 0
00
- -
966
000
7
99 8
54
166
146
82
.8%
1
023
965
990
870
3SP
ECIA
L SC
HOOL
3 0
00
- 2
199
5
199
5
199
-
100.
0%
19
288
11
491
4EA
RLY
CHIL
DHOO
D DE
VELO
PMEN
T
11 6
46
- (2
199
) 9
447
2
043
7
404
21
.6%
2
7 22
8
27
201
1
030
465
-
(18
653)
1
011
812
831
031
1
80 7
81
82.1
%
1 11
7 42
2
1 06
8 18
0
Econ
omic
cla
ssifi
catio
n
Cu
rrent
pay
men
ts 1
58 7
95
-
(18
653)
140
142
1
10 5
98
2
9 54
4 78
.9%
126
622
1
22 5
01
Co
mpe
nsat
ion o
f em
ploye
es
36
000
- -
3
6 00
0
15
670
2
0 33
0 43
.5%
2
6 00
0
12
579
Sa
laries
and
wag
es
34
473
- -
3
4 47
3
13
926
2
0 54
7 40
.4%
2
5 44
9
11 0
63
So
cial c
ontri
butio
ns 1
527
-
- 1
527
1
744
(217
)11
4.2%
5
51
1 5
16
Go
ods a
nd se
rvice
s 1
22 7
95
-
(18
653)
104
142
12
3 24
2(1
9 10
0)11
8.3%
100
622
1
09 9
22
Ad
mini
strat
ive fe
es 1
0 -
- 1
0 1
9
(9)
190.
0% -
-
Ad
verti
sing
3
30
- -
3
30
2
01
1
29
60.9
% -
-
M
inor a
sset
s
200
-
-
200
150
5
0 75
.0%
2 2
13
-
Co
mm
unica
tion
(G&S
) -
- -
- 6
9 (6
9) -
1
00
52
Co
nsult
ants:
Bus
iness
and
adv
isory
serv
ices
1
6 12
6 -
-
16
126
3
8 32
7
(22
201)
237.
7%
100
21
578
Co
ntra
ctors
1 4
00
- -
1 4
00
1
57
1 2
43
11.2
% -
-
In
vent
ory:
Clot
hing
mat
erial
and
acc
esso
ries
34
- -
34
- 3
4 -
- -
In
vent
ory:
Lear
ner a
nd te
ache
r sup
port
mat
erial
- -
- -
- -
- -
2
6 55
3
In
vent
ory:
Othe
r sup
plies
1
9 17
7 -
-
19
177
-
19
177
-
18
177
-
Co
nsum
able
supp
lies
56
- -
56
3 7
77
(3 7
21)
6744
.6%
- -
Co
nsum
able:
Sta
tione
ry, p
rintin
g an
d of
fice
supp
lies
1
00
- -
1
00
4
9
6 4.
0%
113
1
00
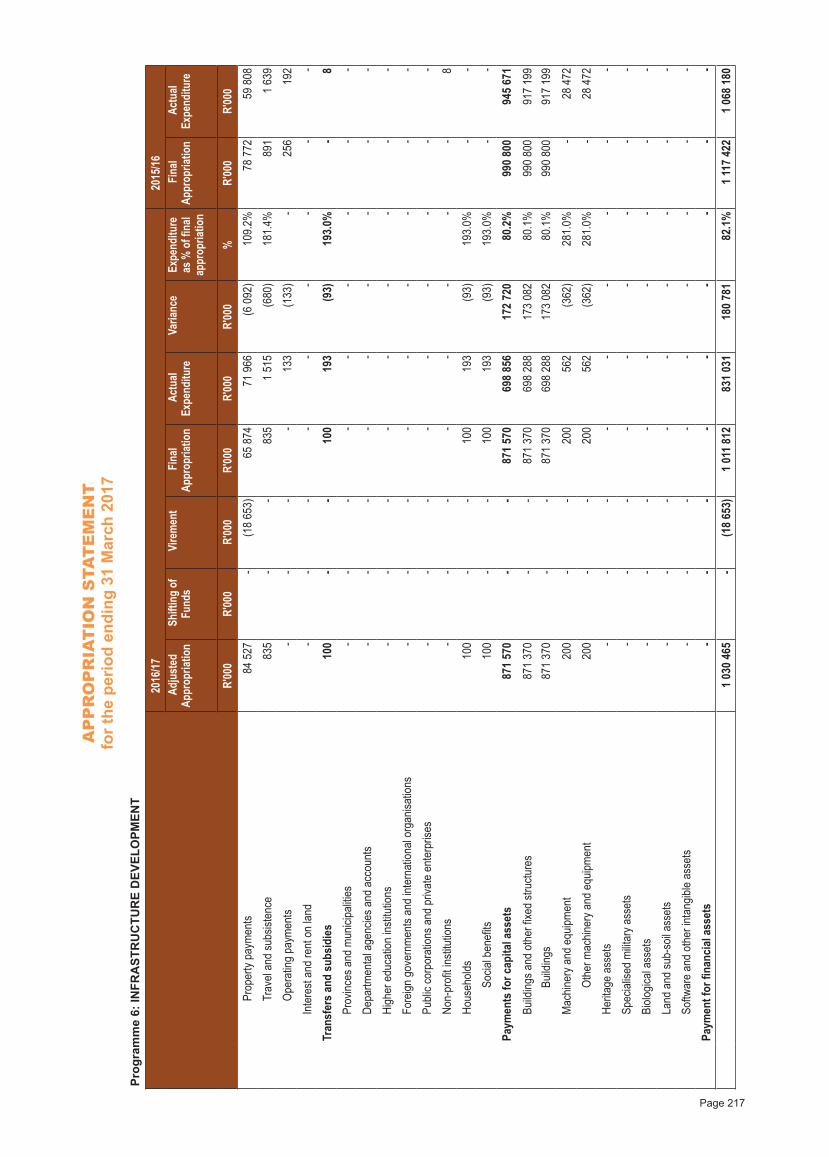
AP
PR
OP
RIA
TIO
N S
TAT
EM
EN
Tfo
r the
per
iod
endi
ng 3
1 M
arch
201
7
Page 217
Prog
ram
me
6: IN
FRA
STR
UC
TUR
E D
EVEL
OPM
ENT
2016
/17
20
15/16
A
djus
ted
Appr
opria
tion
Shi
fting
of
Fund
s V
irem
ent
Fin
al Ap
prop
riatio
n A
ctua
l Ex
pend
iture
V
arian
ce
Expe
nditu
re
as %
of fi
nal
appr
opria
tion
Fin
al Ap
prop
riatio
n A
ctua
l Ex
pend
iture
R'00
0R'
000
R'00
0R'
000
R'00
0R'
000
%R'
000
R'00
0
Prop
erty
paym
ents
8
4 52
7 -
(1
8 65
3)
65
874
71 9
66(6
092
)10
9.2%
7
8 77
2
59
808
Tr
avel
and
subs
isten
ce
835
-
-
835
1
515
(680
)18
1.4%
8
91
1 6
39
Op
erat
ing p
aym
ents
- -
- -
1
33
(1
33)
-
256
192
In
tere
st an
d re
nt o
n lan
d -
- -
- -
- -
- -
Tr
ansf
ers
and
subs
idie
s
100
-
-
100
193
(9
3)19
3.0%
-
8
Pr
ovinc
es a
nd m
unici
paliti
es -
- -
- -
- -
- -
De
partm
enta
l age
ncies
and
acc
ount
s -
- -
- -
- -
- -
Hi
gher
edu
catio
n ins
titutio
ns -
- -
- -
- -
- -
Fo
reign
gov
ernm
ents
and
inter
natio
nal o
rgan
isatio
ns -
- -
- -
- -
- -
Pu
blic c
orpo
ratio
ns a
nd p
rivat
e en
terp
rises
- -
- -
- -
- -
-
No
n-pr
ofit in
stitu
tions
- -
- -
- -
- -
8
Ho
useh
olds
1
00
- -
1
00
1
93
(93)
193.
0% -
-
So
cial b
enefi
ts
100
-
-
100
193
(9
3)19
3.0%
- -
Pa
ymen
ts fo
r cap
ital a
sset
s 8
71 5
70
- -
871
570
6
98 8
56
172
720
80
.2%
990
800
9
45 6
71
Bu
ilding
s and
oth
er fix
ed st
ructu
res
Build
ings
871
370
8
71 3
70
- - - -
871
370
8
71 3
70
698
288
6
98 2
88
173
082
1
73 0
8280
.1%
80.1
% 9
90 8
00
990
800
9
17 1
99
917
199
M
achin
ery a
nd e
quipm
ent
2
00
- -
2
00
5
62
(3
62)
281.
0% -
2
8 47
2
Ot
her m
achin
ery a
nd e
quipm
ent
2
00
- -
2
00
5
62
(3
62)
281.
0% -
2
8 47
2
He
ritag
e as
sets
- -
- -
- -
- -
-
Sp
ecial
ised
milit
ary a
sset
s -
- -
- -
- -
- -
Bi
ologic
al as
sets
- -
- -
- -
- -
-
La
nd a
nd su
b-so
il ass
ets
- -
- -
- -
- -
-
So
ftwar
e an
d ot
her i
ntan
gible
asse
ts -
- -
- -
- -
- -
Pa
ymen
t for
fina
ncia
l ass
ets
- -
- -
- -
- -
-
1 03
0 46
5 -
(1
8 65
3)
1 01
1 81
2 8
31 0
31
180
781
82
.1%
1
117
422
1
068
180
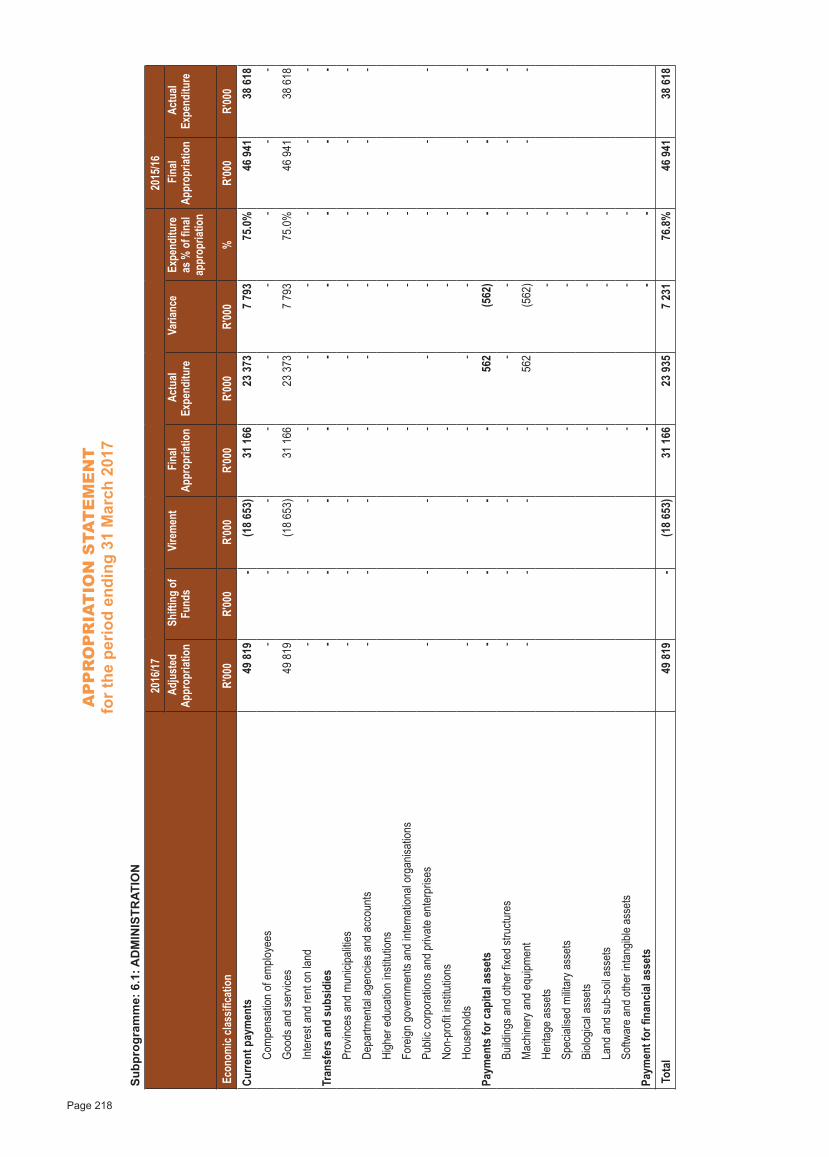
AP
PR
OP
RIA
TIO
N S
TAT
EM
EN
Tfo
r the
per
iod
endi
ng 3
1 M
arch
201
7
Page 218
Subp
rogr
amm
e: 6
.1: A
DM
INIS
TRAT
ION
20
16/17
2015
/16
A
djus
ted
Appr
opria
tion
Shi
fting
of
Fund
s V
irem
ent
Fin
al Ap
prop
riatio
n A
ctua
l Ex
pend
iture
V
arian
ce
Expe
nditu
re
as %
of fi
nal
appr
opria
tion
Fin
al Ap
prop
riatio
n A
ctua
l Ex
pend
iture
Eco
nom
ic cla
ssifi
catio
n R'
000
R'00
0R'
000
R'00
0R'
000
R'00
0%
R'00
0R'
000
Curre
nt p
aym
ents
4
9 81
9 -
(1
8 65
3)
31
166
2
3 37
3 7
793
75
.0%
4
6 94
1
38
618
Com
pens
ation
of e
mplo
yees
- -
- -
- -
- -
-
Good
s and
serv
ices
4
9 81
9 -
(1
8 65
3)
31
166
2
3 37
3 7
793
75
.0%
4
6 94
1
38
618
Inte
rest
and
rent
on
land
- -
- -
- -
- -
-
Tran
sfer
s an
d su
bsid
ies
- -
- -
- -
- -
- Pr
ovinc
es a
nd m
unici
paliti
es -
- -
- -
- -
- -
Depa
rtmen
tal a
genc
ies a
nd a
ccou
nts
- -
- -
- -
- -
-
High
er e
duca
tion
institu
tions
-
-
-
Fore
ign g
over
nmen
ts an
d int
erna
tiona
l org
anisa
tions
-
-
-
Publi
c cor
pora
tions
and
priv
ate
ente
rpris
es -
- -
- -
- -
- -
Non-
profi
t insti
tutio
ns
-
- -
Hous
ehold
s -
- -
- -
- -
- -
Paym
ents
for c
apita
l ass
ets
- -
- -
5
62
(5
62)
- -
- Bu
ilding
s and
oth
er fix
ed st
ructu
res
- -
- -
- -
- -
-
Mac
hiner
y and
equ
ipmen
t -
- -
-
562
(562
) -
- -
Herit
age
asse
ts
-
- -
Spec
ialise
d m
ilitar
y ass
ets
-
-
-
Biolo
gical
asse
ts
-
- -
Land
and
sub-
soil a
sset
s
-
- -
Softw
are
and
othe
r int
angib
le as
sets
-
-
-
Paym
ent f
or fi
nanc
ial a
sset
s
-
- -
Tota
l
49
819
-
(18
653)
3
1 16
6
23
935
7 2
31
76.8
%
46
941
3
8 61
8
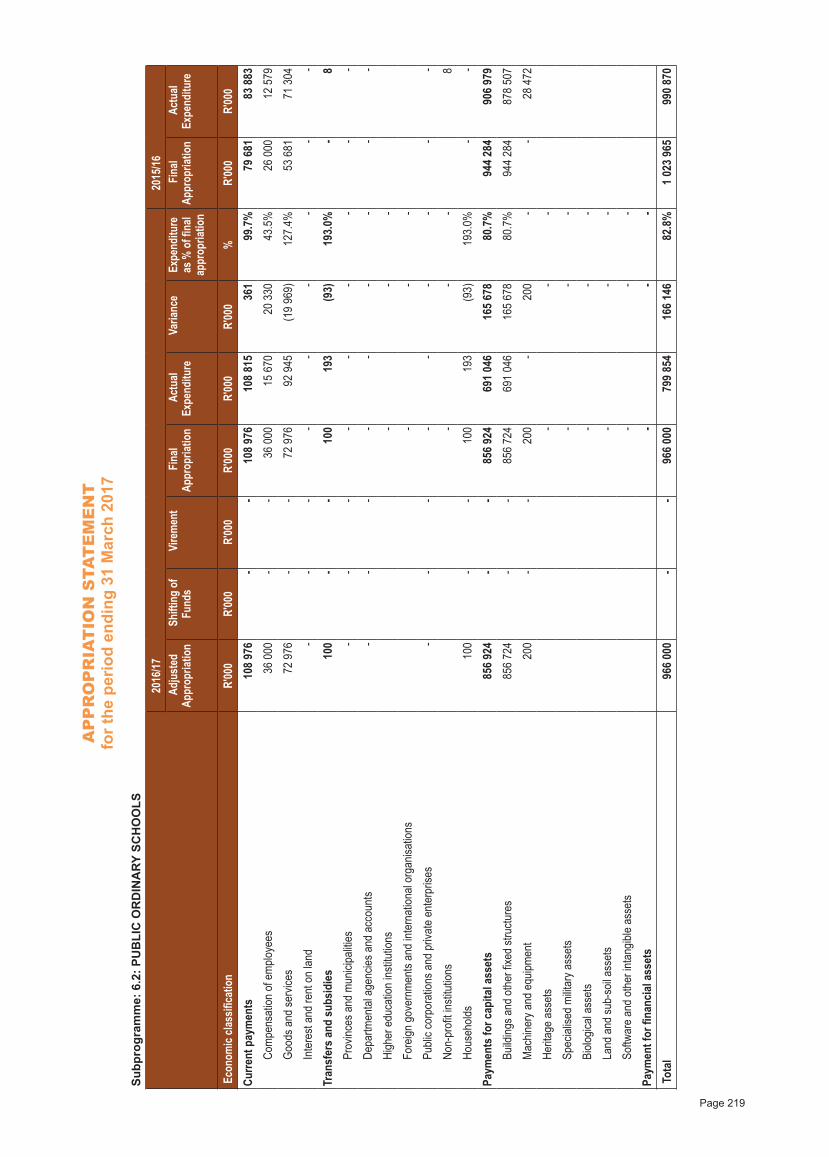
AP
PR
OP
RIA
TIO
N S
TAT
EM
EN
Tfo
r the
per
iod
endi
ng 3
1 M
arch
201
7
Page 219
Subp
rogr
amm
e: 6
.2: P
UB
LIC
OR
DIN
ARY
SC
HO
OLS
20
16/17
2015
/16
A
djus
ted
Appr
opria
tion
Shi
fting
of
Fund
s V
irem
ent
Fin
al Ap
prop
riatio
n A
ctua
l Ex
pend
iture
V
arian
ce
Expe
nditu
re
as %
of fi
nal
appr
opria
tion
Fin
al Ap
prop
riatio
n A
ctua
l Ex
pend
iture
Eco
nom
ic cla
ssifi
catio
n R'
000
R'00
0R'
000
R'00
0R'
000
R'00
0%
R'00
0R'
000
Curre
nt p
aym
ents
108
976
-
- 1
08 9
76
1
08 8
15
361
99
.7%
7
9 68
1
83
883
Com
pens
ation
of e
mplo
yees
3
6 00
0 -
-
36
000
1
5 67
0
20
330
43.5
%
26
000
1
2 57
9
Good
s and
serv
ices
7
2 97
6 -
-
72
976
9
2 94
5 (1
9 96
9)12
7.4%
5
3 68
1
71
304
Inte
rest
and
rent
on
land
- -
- -
- -
- -
-
Tran
sfer
s an
d su
bsid
ies
1
00
- -
1
00
1
93
(93)
193.
0% -
8
Pr
ovinc
es a
nd m
unici
paliti
es -
- -
- -
- -
- -
Depa
rtmen
tal a
genc
ies a
nd a
ccou
nts
- -
- -
- -
- -
-
High
er e
duca
tion
institu
tions
-
-
-
Fore
ign g
over
nmen
ts an
d int
erna
tiona
l org
anisa
tions
-
-
-
Publi
c cor
pora
tions
and
priv
ate
ente
rpris
es -
- -
- -
- -
- -
Non-
profi
t insti
tutio
ns
-
- -
8
Hous
ehold
s
100
-
-
100
193
(9
3)19
3.0%
- -
Paym
ents
for c
apita
l ass
ets
856
924
-
- 8
56 9
24
691
046
1
65 6
78
80.7
% 9
44 2
84
906
979
Bu
ilding
s and
oth
er fix
ed st
ructu
res
856
724
-
- 8
56 7
24
691
046
1
65 6
78
80.7
% 9
44 2
84
878
507
Mac
hiner
y and
equ
ipmen
t
200
-
-
200
-
2
00
- -
2
8 47
2
Herit
age
asse
ts
-
- -
Spec
ialise
d m
ilitar
y ass
ets
-
-
-
Biolo
gical
asse
ts
-
- -
Land
and
sub-
soil a
sset
s
-
- -
Softw
are
and
othe
r int
angib
le as
sets
-
-
-
Paym
ent f
or fi
nanc
ial a
sset
s
-
- -
Tota
l 9
66 0
00
- -
966
000
7
99 8
54
166
146
82
.8%
1
023
965
990
870
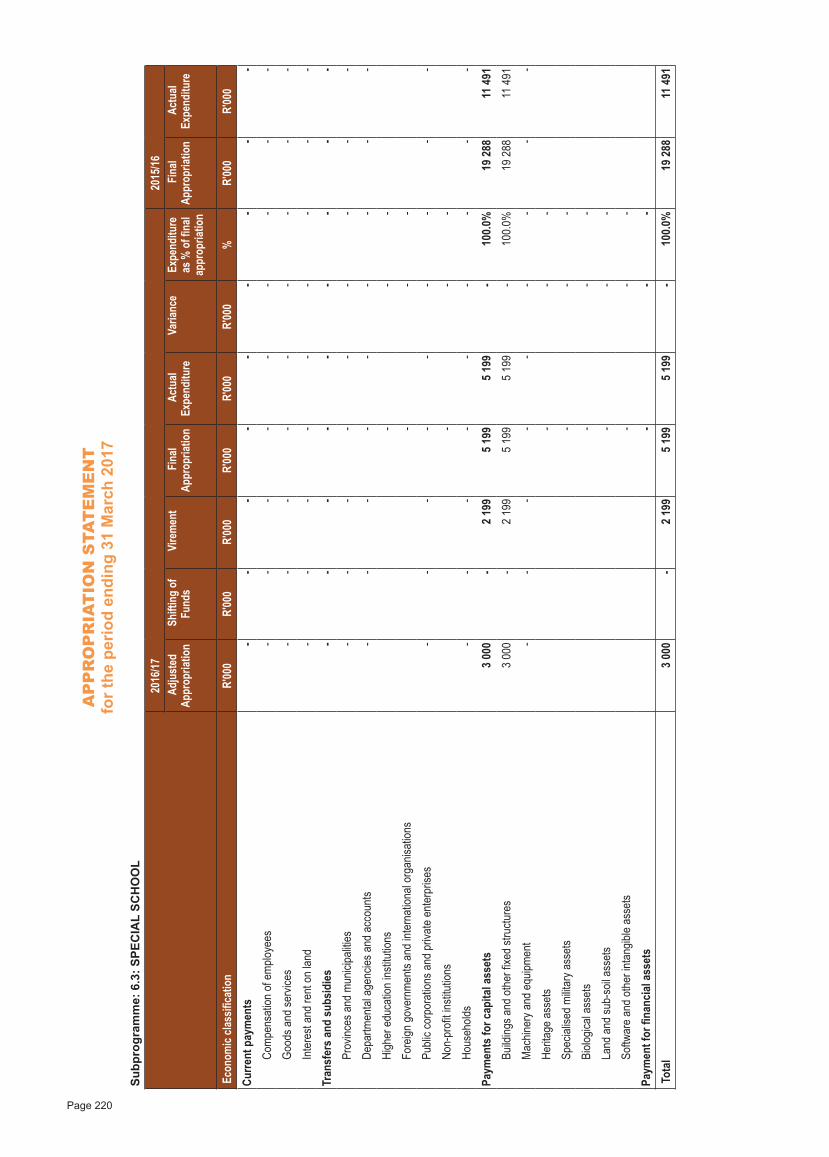
AP
PR
OP
RIA
TIO
N S
TAT
EM
EN
Tfo
r the
per
iod
endi
ng 3
1 M
arch
201
7
Page 220
Subp
rogr
amm
e: 6
.3: S
PEC
IAL
SCH
OO
L
2016
/17
20
15/16
Adj
uste
d Ap
prop
riatio
n S
hifti
ng o
f Fu
nds
Vire
men
t F
inal
Appr
opria
tion
Act
ual
Expe
nditu
re
Var
iance
Ex
pend
iture
as
% o
f fina
l ap
prop
riatio
n
Fin
al Ap
prop
riatio
n A
ctua
l Ex
pend
iture
Eco
nom
ic cla
ssifi
catio
n R'
000
R'00
0R'
000
R'00
0R'
000
R'00
0%
R'00
0R'
000
Curre
nt p
aym
ents
- -
- -
- -
- -
- Co
mpe
nsat
ion o
f em
ploye
es -
- -
- -
- -
- -
Good
s and
serv
ices
- -
- -
- -
- -
-
Inte
rest
and
rent
on
land
- -
- -
- -
- -
-
Tran
sfer
s an
d su
bsid
ies
- -
- -
- -
- -
- Pr
ovinc
es a
nd m
unici
paliti
es -
- -
- -
- -
- -
Depa
rtmen
tal a
genc
ies a
nd a
ccou
nts
- -
- -
- -
- -
-
High
er e
duca
tion
institu
tions
-
-
-
Fore
ign g
over
nmen
ts an
d int
erna
tiona
l org
anisa
tions
-
-
-
Publi
c cor
pora
tions
and
priv
ate
ente
rpris
es -
- -
- -
- -
- -
Non-
profi
t insti
tutio
ns
-
- -
Hous
ehold
s -
- -
- -
- -
- -
Paym
ents
for c
apita
l ass
ets
3 0
00
- 2
199
5
199
5
199
-
100.
0%
19
288
11
491
Bu
ilding
s and
oth
er fix
ed st
ructu
res
3 0
00
- 2
199
5
199
5
199
-
100.
0%
19
288
11
491
Mac
hiner
y and
equ
ipmen
t -
- -
- -
- -
- -
Herit
age
asse
ts
-
- -
Spec
ialise
d m
ilitar
y ass
ets
-
-
-
Biolo
gical
asse
ts
-
- -
Land
and
sub-
soil a
sset
s
-
- -
Softw
are
and
othe
r int
angib
le as
sets
-
-
-
Paym
ent f
or fi
nanc
ial a
sset
s
-
- -
Tota
l 3
000
-
2 1
99
5 1
99
5 1
99
- 10
0.0%
1
9 28
8
11 4
91
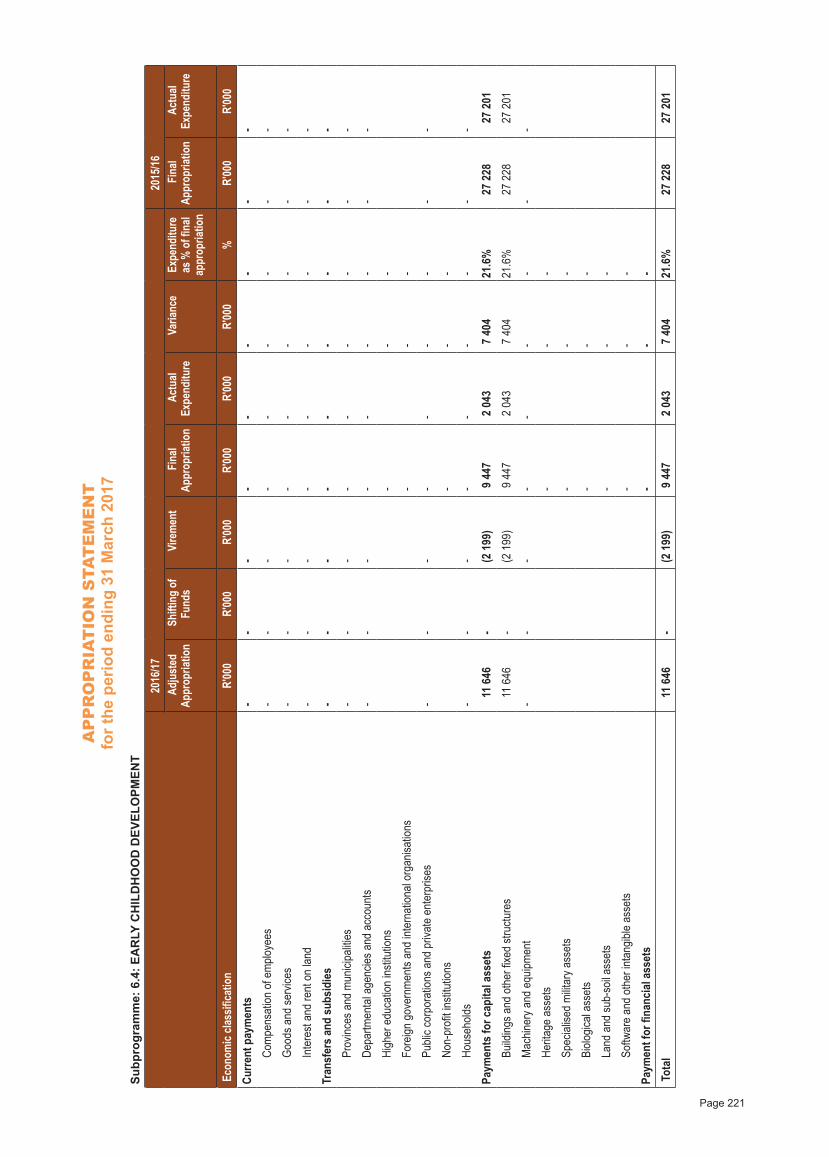
AP
PR
OP
RIA
TIO
N S
TAT
EM
EN
Tfo
r the
per
iod
endi
ng 3
1 M
arch
201
7
Page 221
Subp
rogr
amm
e: 6
.4: E
AR
LY C
HIL
DH
OO
D D
EVEL
OPM
ENT
20
16/17
2015
/16
A
djus
ted
Appr
opria
tion
Shi
fting
of
Fund
s V
irem
ent
Fin
al Ap
prop
riatio
n A
ctua
l Ex
pend
iture
V
arian
ce
Expe
nditu
re
as %
of fi
nal
appr
opria
tion
Fin
al Ap
prop
riatio
n A
ctua
l Ex
pend
iture
Eco
nom
ic cla
ssifi
catio
n R'
000
R'00
0R'
000
R'00
0R'
000
R'00
0%
R'00
0R'
000
Curre
nt p
aym
ents
- -
- -
- -
- -
- Co
mpe
nsat
ion o
f em
ploye
es -
- -
- -
- -
- -
Good
s and
serv
ices
- -
- -
- -
- -
-
Inte
rest
and
rent
on
land
- -
- -
- -
- -
-
Tran
sfer
s an
d su
bsid
ies
- -
- -
- -
- -
- Pr
ovinc
es a
nd m
unici
paliti
es -
- -
- -
- -
- -
Depa
rtmen
tal a
genc
ies a
nd a
ccou
nts
- -
- -
- -
- -
-
High
er e
duca
tion
institu
tions
-
-
-
Fore
ign g
over
nmen
ts an
d int
erna
tiona
l org
anisa
tions
-
-
-
Publi
c cor
pora
tions
and
priv
ate
ente
rpris
es -
- -
- -
- -
- -
Non-
profi
t insti
tutio
ns
-
- -
Hous
ehold
s -
- -
- -
- -
- -
Paym
ents
for c
apita
l ass
ets
11
646
-
(2 1
99)
9 4
47
2 0
43
7 4
04
21.6
%
27
228
2
7 20
1 Bu
ilding
s and
oth
er fix
ed st
ructu
res
11
646
-
(2 1
99)
9 4
47
2 0
43
7 4
04
21.6
%
27
228
2
7 20
1
Mac
hiner
y and
equ
ipmen
t -
- -
- -
- -
- -
Herit
age
asse
ts
-
- -
Spec
ialise
d m
ilitar
y ass
ets
-
-
-
Biolo
gical
asse
ts
-
- -
Land
and
sub-
soil a
sset
s
-
- -
Softw
are
and
othe
r int
angib
le as
sets
-
-
-
Paym
ent f
or fi
nanc
ial a
sset
s
-
- -
Tota
l
11 6
46
- (2
199
) 9
447
2
043
7
404
21
.6%
2
7 22
8
27
201
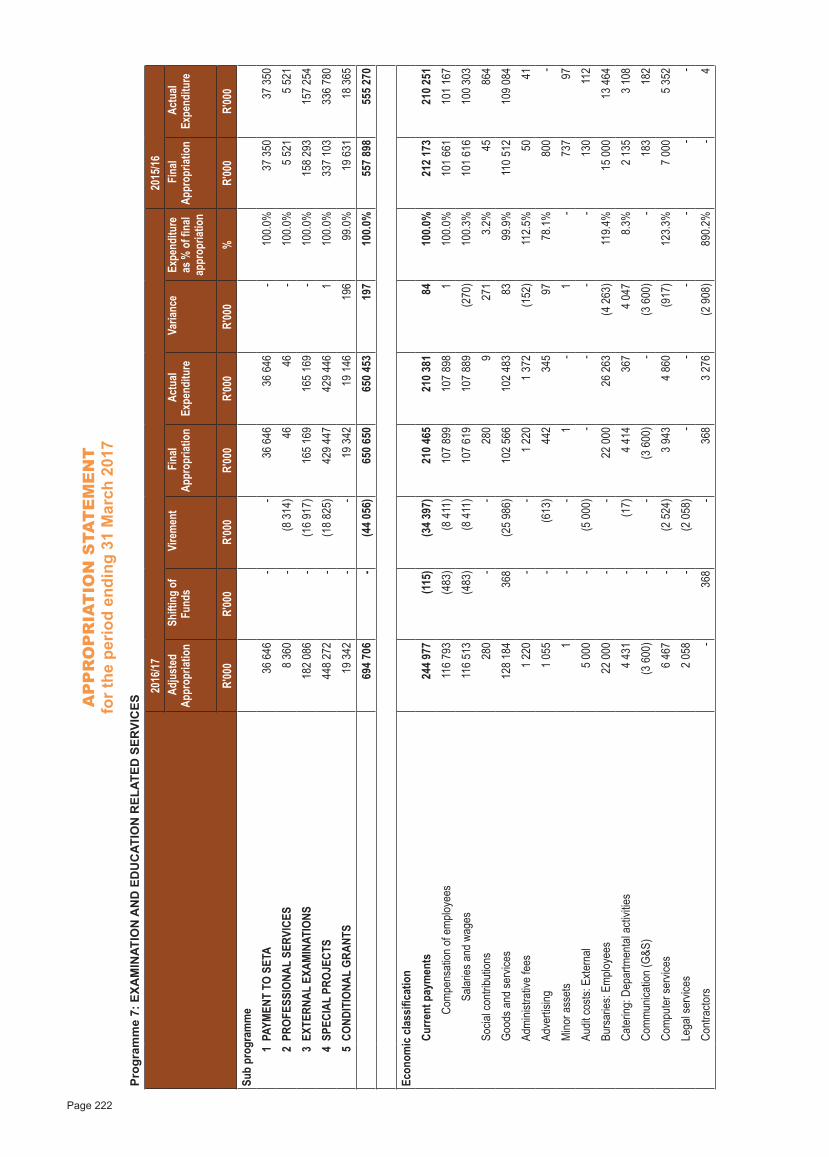
AP
PR
OP
RIA
TIO
N S
TAT
EM
EN
Tfo
r the
per
iod
endi
ng 3
1 M
arch
201
7
Page 222
Prog
ram
me
7: E
XAM
INAT
ION
AN
D E
DU
CAT
ION
REL
ATED
SER
VIC
ES
2016
/17
20
15/16
A
djus
ted
Appr
opria
tion
Shi
fting
of
Fund
s V
irem
ent
Fin
al Ap
prop
riatio
n A
ctua
l Ex
pend
iture
V
arian
ce
Expe
nditu
re
as %
of fi
nal
appr
opria
tion
Fin
al Ap
prop
riatio
n A
ctua
l Ex
pend
iture
R'00
0R'
000
R'00
0R'
000
R'00
0R'
000
%R'
000
R'00
0Su
b pr
ogra
mm
e
1PA
YMEN
T TO
SET
A
36
646
- -
3
6 64
6
36
646
- 10
0.0%
3
7 35
0
37
350
2PR
OFES
SION
AL S
ERVI
CES
8 3
60
- (8
314
) 4
6 4
6 -
100.
0% 5
521
5
521
3EX
TERN
AL E
XAM
INAT
IONS
182
086
-
(1
6 91
7) 1
65 1
69
165
169
-
100.
0% 1
58 2
93
157
254
4SP
ECIA
L PR
OJEC
TS 4
48 2
72
-
(18
825)
429
447
4
29 4
46
1
10
0.0%
337
103
3
36 7
80
5CO
NDIT
IONA
L GR
ANTS
1
9 34
2 -
-
19
342
1
9 14
6
196
99
.0%
1
9 63
1
18
365
694
706
-
(4
4 05
6) 6
50 6
50
650
453
197
10
0.0%
557
898
5
55 2
70
Econ
omic
cla
ssifi
catio
n
Cu
rrent
pay
men
ts 2
44 9
77
(1
15)
(3
4 39
7) 2
10 4
65
210
381
8
4 10
0.0%
212
173
2
10 2
51
Co
mpe
nsat
ion o
f em
ploye
es 1
16 7
93
(4
83)
(8 4
11)
107
899
1
07 8
98
1
10
0.0%
101
661
1
01 1
67
Sa
laries
and
wag
es 1
16 5
13
(4
83)
(8 4
11)
107
619
1
07 8
89
(2
70)
100.
3% 1
01 6
16
100
303
So
cial c
ontri
butio
ns
280
-
-
280
9
2
71
3.2%
45
8
64
Go
ods a
nd se
rvice
s 1
28 1
84
3
68
(2
5 98
6) 1
02 5
66
102
483
8
3 99
.9%
110
512
1
09 0
84
Ad
mini
strat
ive fe
es 1
220
-
- 1
220
1
372
(152
)11
2.5%
50
41
Ad
verti
sing
1 0
55
-
(613
)
442
345
9
7 78
.1%
8
00
-
M
inor a
sset
s
1
- -
1
-
1
-
7
37
97
Au
dit co
sts: E
xtern
al 5
000
-
(5 0
00)
- -
- -
1
30
11
2
Bu
rsar
ies: E
mplo
yees
2
2 00
0 -
-
22
000
2
6 26
3 (4
263
)11
9.4%
1
5 00
0
13
464
Ca
terin
g: D
epar
tmen
tal a
ctivit
ies 4
431
-
(17)
4 4
14
3
67
4 0
47
8.3%
2 1
35
3 1
08
Co
mm
unica
tion
(G&S
) (3
600
) -
- (3
600
) -
(3 6
00)
-
183
182
Co
mpu
ter s
ervic
es 6
467
-
(2 5
24)
3 9
43
4 8
60
(9
17)
123.
3% 7
000
5
352
Le
gal s
ervic
es 2
058
-
(2 0
58)
- -
- -
- -
Co
ntra
ctors
-
368
-
3
68
3 2
76
(2 9
08)
890.
2% -
4
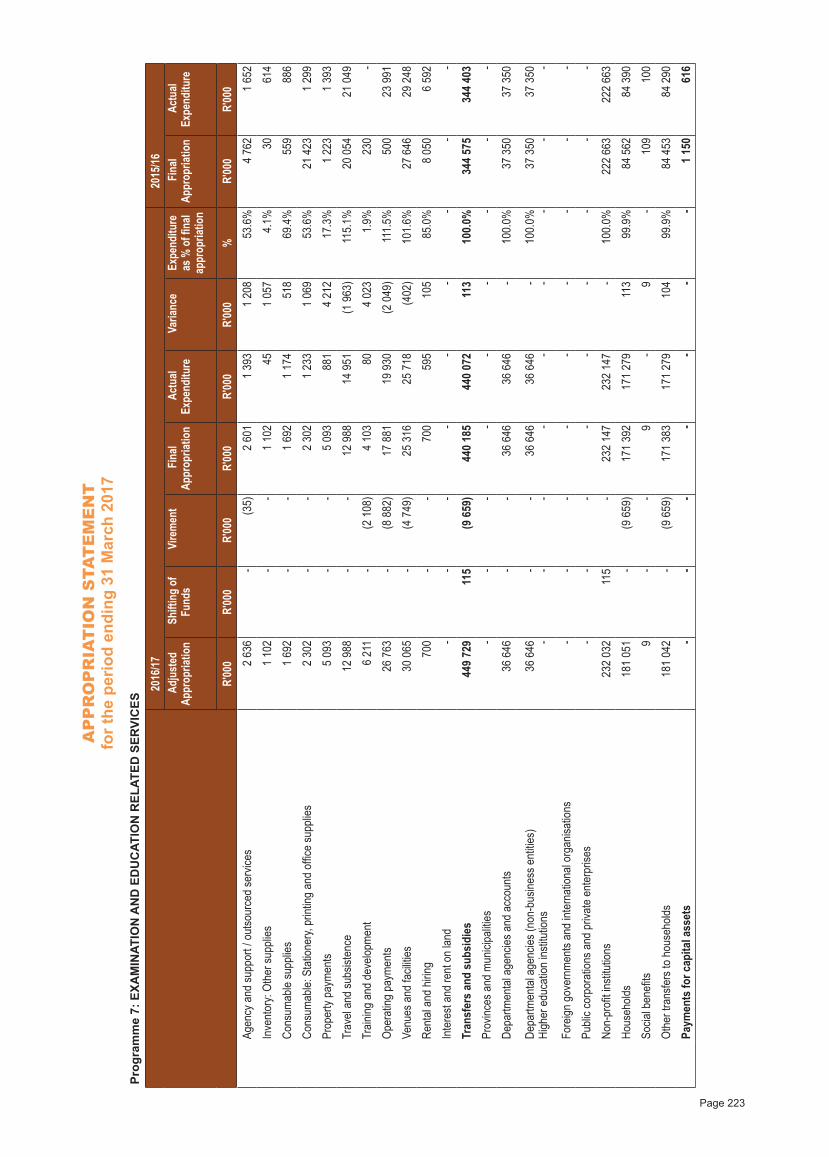
AP
PR
OP
RIA
TIO
N S
TAT
EM
EN
Tfo
r the
per
iod
endi
ng 3
1 M
arch
201
7
Page 223
Prog
ram
me
7: E
XAM
INAT
ION
AN
D E
DU
CAT
ION
REL
ATED
SER
VIC
ES
2016
/17
20
15/16
A
djus
ted
Appr
opria
tion
Shi
fting
of
Fund
s V
irem
ent
Fin
al Ap
prop
riatio
n A
ctua
l Ex
pend
iture
V
arian
ce
Expe
nditu
re
as %
of fi
nal
appr
opria
tion
Fin
al Ap
prop
riatio
n A
ctua
l Ex
pend
iture
R'00
0R'
000
R'00
0R'
000
R'00
0R'
000
%R'
000
R'00
0
Agen
cy a
nd su
ppor
t / o
utso
urce
d se
rvice
s 2
636
-
(35)
2 6
01
1 3
93
1 2
08
53.6
% 4
762
1
652
In
vent
ory:
Othe
r sup
plies
1 1
02
- -
1 1
02
45
1 0
57
4.1%
30
6
14
Co
nsum
able
supp
lies
1 6
92
- -
1 6
92
1 1
74
5
18
69.4
%
559
886
Co
nsum
able:
Sta
tione
ry, p
rintin
g an
d of
fice
supp
lies
2 3
02
- -
2 3
02
1 2
33
1 0
69
53.6
%
21
423
1 2
99
Pr
oper
ty pa
ymen
ts 5
093
-
- 5
093
881
4
212
17
.3%
1 2
23
1 3
93
Tr
avel
and
subs
isten
ce
12
988
- -
1
2 98
8
14
951
(1 9
63)
115.
1%
20
054
2
1 04
9
Tr
aining
and
dev
elopm
ent
6 2
11
- (2
108
) 4
103
8
0 4
023
1.
9%
230
-
Op
erat
ing p
aym
ents
2
6 76
3 -
(8 8
82)
1
7 88
1
19
930
(2 0
49)
111.
5%
500
23
991
Ve
nues
and
facil
ities
3
0 06
5 -
(4 7
49)
2
5 31
6
25
718
(4
02)
101.
6%
27
646
2
9 24
8
Re
ntal
and
hiring
7
00 -
-
700
5
95
105
85.0
% 8
050
6 5
92
In
tere
st an
d re
nt o
n lan
d -
- -
- -
- -
- -
Tr
ansf
ers
and
subs
idie
s 4
49 7
29
11
5 (9
659
) 4
40 1
85
440
072
113
100.
0% 3
44 5
75
344
403
Prov
inces
and
mun
icipa
lities
- -
- -
- -
- -
-
De
partm
enta
l age
ncies
and
acc
ount
s
36
646
- -
3
6 64
6
36
646
- 10
0.0%
3
7 35
0
37
350
De
partm
enta
l age
ncies
(non
-bus
iness
ent
ities)
High
er e
duca
tion
institu
tions
3
6 64
6 - - -
- -
36
646 -
3
6 64
6 - - -
100.
0% -
3
7 35
0 -
37
350 -
Fo
reign
gov
ernm
ents
and
inter
natio
nal o
rgan
isatio
ns -
- -
- -
- -
- -
Pu
blic c
orpo
ratio
ns a
nd p
rivat
e en
terp
rises
- -
- -
- -
- -
-
No
n-pr
ofit in
stitu
tions
232
032
115
- 2
32 1
47
232
147
-
100.
0% 2
22 6
63
222
663
Ho
useh
olds
181
051
-
(9 6
59)
171
392
1
71 2
79
11
3 99
.9%
8
4 56
2
84
390
So
cial b
enefi
ts
9
- -
9
-
9
-
1
09
1
00
Ot
her t
rans
fers
to h
ouse
holds
181
042
-
(9 6
59)
171
383
1
71 2
79
1
04
99.9
%
84
453
8
4 29
0
Pa
ymen
ts fo
r cap
ital a
sset
s -
- -
- -
- -
1 1
50
6
16
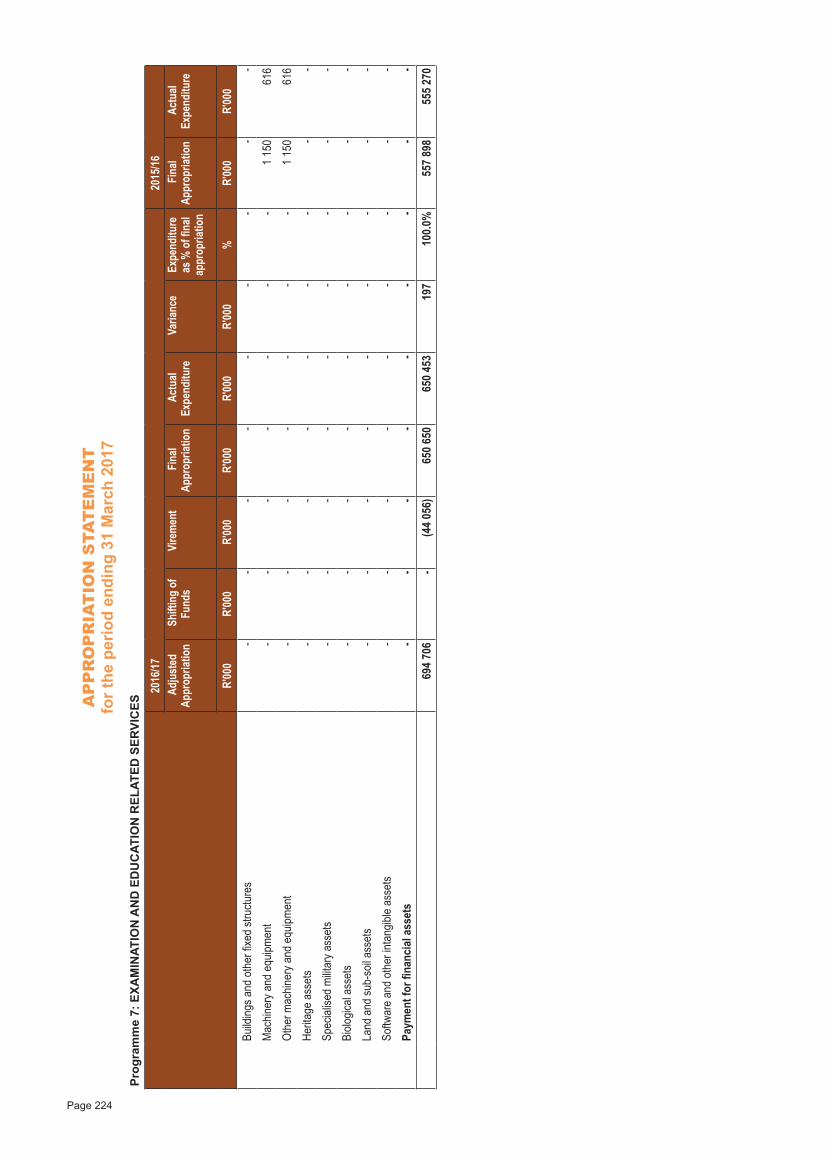
AP
PR
OP
RIA
TIO
N S
TAT
EM
EN
Tfo
r the
per
iod
endi
ng 3
1 M
arch
201
7
Page 224
Prog
ram
me
7: E
XAM
INAT
ION
AN
D E
DU
CAT
ION
REL
ATED
SER
VIC
ES
2016
/17
20
15/16
A
djus
ted
Appr
opria
tion
Shi
fting
of
Fund
s V
irem
ent
Fin
al Ap
prop
riatio
n A
ctua
l Ex
pend
iture
V
arian
ce
Expe
nditu
re
as %
of fi
nal
appr
opria
tion
Fin
al Ap
prop
riatio
n A
ctua
l Ex
pend
iture
R'00
0R'
000
R'00
0R'
000
R'00
0R'
000
%R'
000
R'00
0
Build
ings a
nd o
ther
fixed
stru
cture
s -
- -
- -
- -
- -
M
achin
ery a
nd e
quipm
ent
- -
- -
- -
- 1
150
616
Ot
her m
achin
ery a
nd e
quipm
ent
- -
- -
- -
- 1
150
616
He
ritag
e as
sets
- -
- -
- -
- -
-
Sp
ecial
ised
milit
ary a
sset
s -
- -
- -
- -
- -
Bi
ologic
al as
sets
- -
- -
- -
- -
-
La
nd a
nd su
b-so
il ass
ets
- -
- -
- -
- -
-
So
ftwar
e an
d ot
her i
ntan
gible
asse
ts -
- -
- -
- -
- -
Pa
ymen
t for
fina
ncia
l ass
ets
- -
- -
- -
- -
-
6
94 7
06
-
(44
056)
650
650
6
50 4
53
1
97
100.
0% 5
57 8
98
555
270

AP
PR
OP
RIA
TIO
N S
TAT
EM
EN
Tfo
r the
per
iod
endi
ng 3
1 M
arch
201
7
Page 225
Subp
rogr
amm
e: 7
.1: P
AYM
ENT
TO S
ETA
20
16/17
2015
/16
A
djus
ted
Appr
opria
tion
Shi
fting
of
Fund
s V
irem
ent
Fin
al Ap
prop
riatio
n A
ctua
l Ex
pend
iture
V
arian
ce
Expe
nditu
re
as %
of fi
nal
appr
opria
tion
Fin
al Ap
prop
riatio
n A
ctua
l Ex
pend
iture
Eco
nom
ic cla
ssifi
catio
n R'
000
R'00
0R'
000
R'00
0R'
000
R'00
0%
R'00
0R'
000
Curre
nt p
aym
ents
- -
- -
- -
- -
-
Com
pens
ation
of e
mplo
yees
- -
- -
- -
- -
-
Go
ods a
nd se
rvice
s -
- -
- -
- -
- -
In
tere
st an
d re
nt o
n lan
d -
- -
- -
- -
- -
Tr
ansfe
rs a
nd su
bsidi
es
36
646
- -
3
6 64
6
36
646
- 10
0.0%
3
7 35
0
37
350
Pr
ovinc
es a
nd m
unici
paliti
es -
- -
- -
- -
- -
De
partm
enta
l age
ncies
and
acc
ount
s
36
646
- -
3
6 64
6
36
646
- 10
0.0%
3
7 35
0
37
350
Hi
gher
edu
catio
n ins
titutio
ns
-
- -
Fo
reign
gov
ernm
ents
and
inter
natio
nal o
rgan
isatio
ns
-
- -
Pu
blic c
orpo
ratio
ns a
nd p
rivat
e en
terp
rises
- -
- -
- -
- -
-
No
n-pr
ofit in
stitu
tions
-
-
-
Ho
useh
olds
- -
- -
- -
- -
-
Paym
ents
for c
apita
l ass
ets
- -
- -
- -
- -
-
Build
ings a
nd o
ther
fixed
stru
cture
s -
- -
- -
- -
- -
M
achin
ery a
nd e
quipm
ent
- -
- -
- -
- -
-
He
ritag
e as
sets
-
-
-
Sp
ecial
ised
milit
ary a
sset
s
-
- -
Bi
ologic
al as
sets
-
-
-
La
nd a
nd su
b-so
il ass
ets
-
-
-
So
ftwar
e an
d ot
her i
ntan
gible
asse
ts
-
- -
Paym
ent f
or fi
nanc
ial a
sset
s
-
- -
Tota
l
36
646
- -
3
6 64
6
36
646
- 10
0.0%
3
7 35
0
37
350
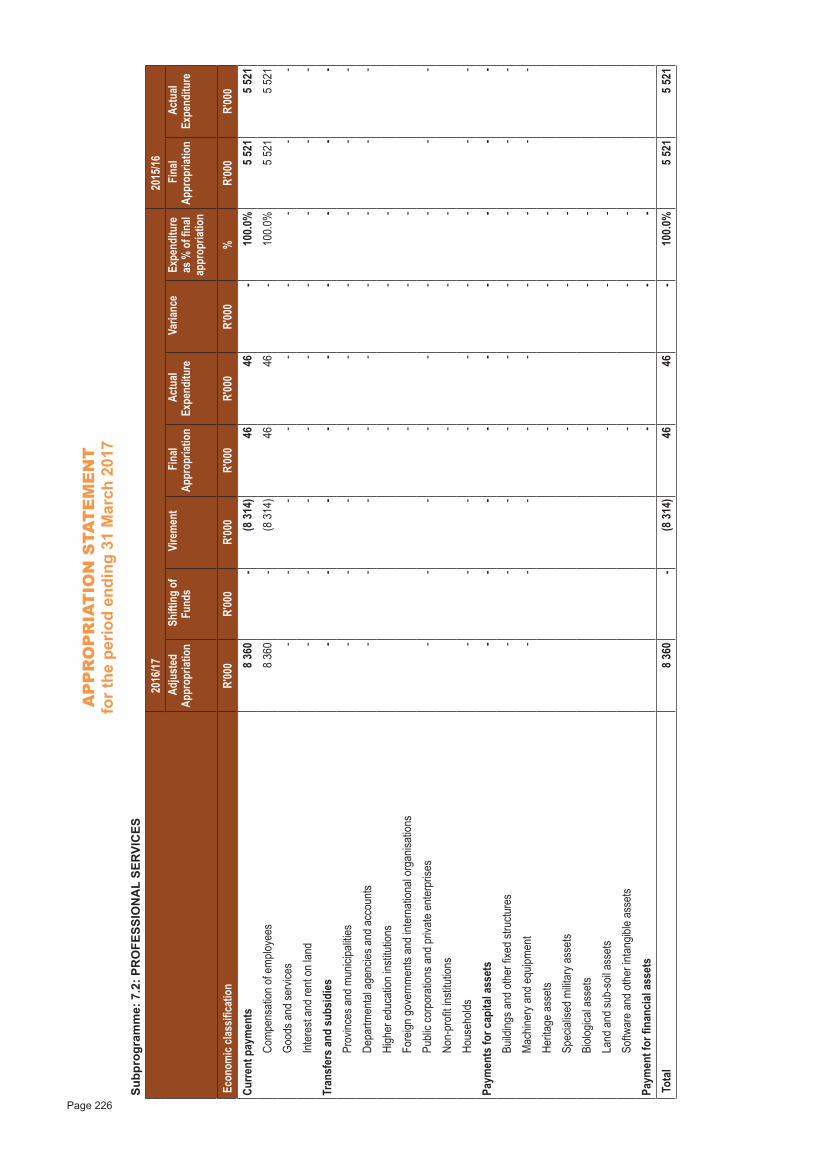
AP
PR
OP
RIA
TIO
N S
TAT
EM
EN
Tfo
r the
per
iod
endi
ng 3
1 M
arch
201
7
Page 226
Subp
rogr
amm
e: 7
.2: P
RO
FESS
ION
AL
SER
VIC
ES
2016
/17
20
15/16
Adj
uste
d Ap
prop
riatio
n S
hifti
ng o
f Fu
nds
Vire
men
t F
inal
Appr
opria
tion
Act
ual
Expe
nditu
re
Var
iance
Ex
pend
iture
as
% o
f fina
l ap
prop
riatio
n
Fin
al Ap
prop
riatio
n A
ctua
l Ex
pend
iture
Eco
nom
ic cla
ssifi
catio
n R'
000
R'00
0R'
000
R'00
0R'
000
R'00
0%
R'00
0R'
000
Curre
nt p
aym
ents
8 3
60
- (8
314
) 4
6 4
6 -
100.
0% 5
521
5
521
Com
pens
ation
of e
mplo
yees
8 3
60
- (8
314
) 4
6 4
6 -
100.
0% 5
521
5
521
Go
ods a
nd se
rvice
s -
- -
- -
- -
- -
In
tere
st an
d re
nt o
n lan
d -
- -
- -
- -
- -
Tran
sfer
s an
d su
bsid
ies
- -
- -
- -
- -
-
Prov
inces
and
mun
icipa
lities
- -
- -
- -
- -
-
De
partm
enta
l age
ncies
and
acc
ount
s -
- -
- -
- -
- -
Hi
gher
edu
catio
n ins
titutio
ns
-
- -
Fo
reign
gov
ernm
ents
and
inter
natio
nal o
rgan
isatio
ns
-
- -
Pu
blic c
orpo
ratio
ns a
nd p
rivat
e en
terp
rises
- -
- -
- -
- -
-
No
n-pr
ofit in
stitu
tions
-
-
-
Ho
useh
olds
- -
- -
- -
- -
-
Paym
ents
for c
apita
l ass
ets
- -
- -
- -
- -
-
Build
ings a
nd o
ther
fixed
stru
cture
s -
- -
- -
- -
- -
M
achin
ery a
nd e
quipm
ent
- -
- -
- -
- -
-
He
ritag
e as
sets
-
-
-
Sp
ecial
ised
milit
ary a
sset
s
-
- -
Bi
ologic
al as
sets
-
-
-
La
nd a
nd su
b-so
il ass
ets
-
-
-
So
ftwar
e an
d ot
her i
ntan
gible
asse
ts
-
- -
Paym
ent f
or fi
nanc
ial a
sset
s
-
- -
Tota
l 8
360
-
(8 3
14)
46
46
- 10
0.0%
5 5
21
5 5
21
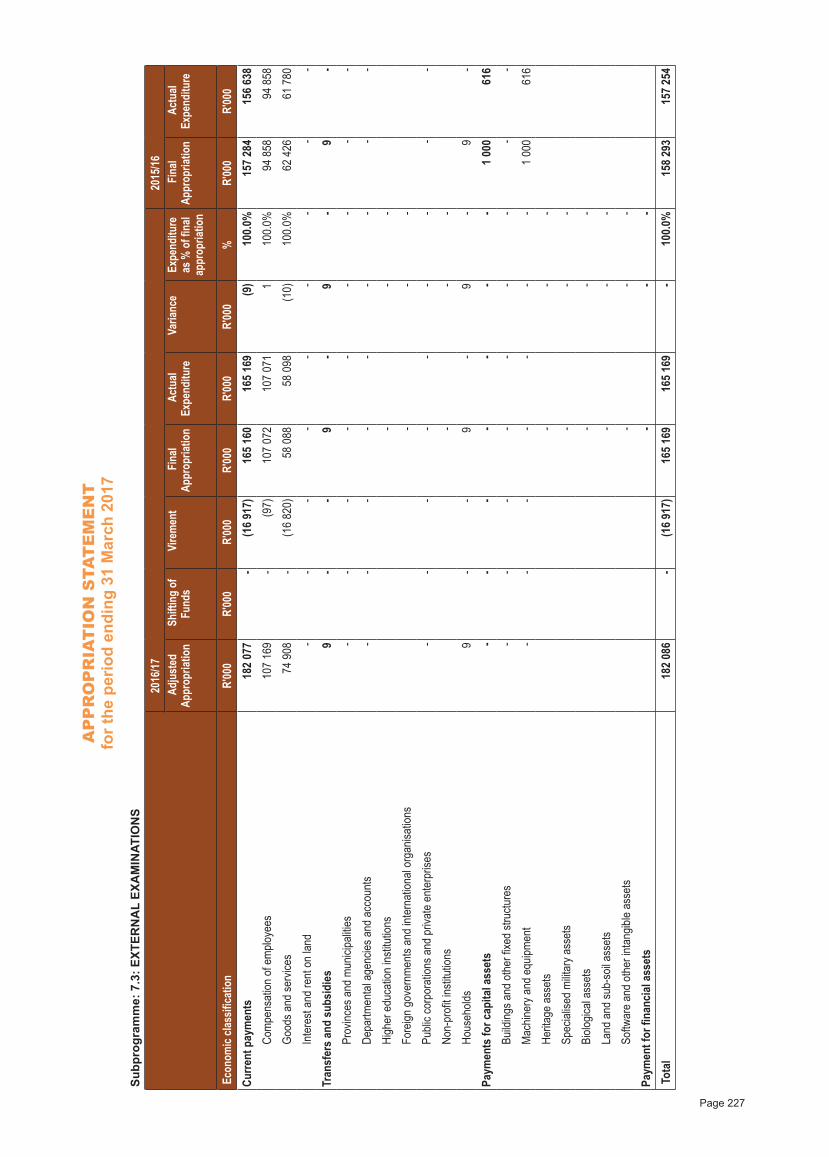
AP
PR
OP
RIA
TIO
N S
TAT
EM
EN
Tfo
r the
per
iod
endi
ng 3
1 M
arch
201
7
Page 227
Subp
rogr
amm
e: 7
.3: E
XTER
NA
L EX
AM
INAT
ION
S
2016
/17
20
15/16
Adj
uste
d Ap
prop
riatio
n S
hifti
ng o
f Fu
nds
Vire
men
t F
inal
Appr
opria
tion
Act
ual
Expe
nditu
re
Var
iance
Ex
pend
iture
as
% o
f fina
l ap
prop
riatio
n
Fin
al Ap
prop
riatio
n A
ctua
l Ex
pend
iture
Eco
nom
ic cla
ssifi
catio
n R'
000
R'00
0R'
000
R'00
0R'
000
R'00
0%
R'00
0R'
000
Curre
nt p
aym
ents
182
077
-
(1
6 91
7) 1
65 1
60
165
169
(9)
100.
0% 1
57 2
84
156
638
Com
pens
ation
of e
mplo
yees
107
169
-
(97)
107
072
1
07 0
71
1
10
0.0%
9
4 85
8
94
858
Go
ods a
nd se
rvice
s
74
908
-
(16
820)
5
8 08
8
58
098
(10)
100.
0%
62
426
6
1 78
0
In
tere
st an
d re
nt o
n lan
d -
- -
- -
- -
- -
Tran
sfer
s an
d su
bsid
ies
9
-
-
9
-
9
-
9
-
Prov
inces
and
mun
icipa
lities
- -
- -
- -
- -
-
De
partm
enta
l age
ncies
and
acc
ount
s -
- -
- -
- -
- -
Hi
gher
edu
catio
n ins
titutio
ns
-
- -
Fo
reign
gov
ernm
ents
and
inter
natio
nal o
rgan
isatio
ns
-
- -
Pu
blic c
orpo
ratio
ns a
nd p
rivat
e en
terp
rises
- -
- -
- -
- -
-
No
n-pr
ofit in
stitu
tions
-
-
-
Ho
useh
olds
9
-
-
9
-
9
-
9
-
Paym
ents
for c
apita
l ass
ets
- -
- -
- -
- 1
000
616
Build
ings a
nd o
ther
fixed
stru
cture
s -
- -
- -
- -
- -
M
achin
ery a
nd e
quipm
ent
- -
- -
- -
- 1
000
616
He
ritag
e as
sets
-
-
-
Sp
ecial
ised
milit
ary a
sset
s
-
- -
Bi
ologic
al as
sets
-
-
-
La
nd a
nd su
b-so
il ass
ets
-
-
-
So
ftwar
e an
d ot
her i
ntan
gible
asse
ts
-
- -
Paym
ent f
or fi
nanc
ial a
sset
s
-
- -
Tota
l 1
82 0
86
-
(16
917)
165
169
1
65 1
69
- 10
0.0%
158
293
1
57 2
54
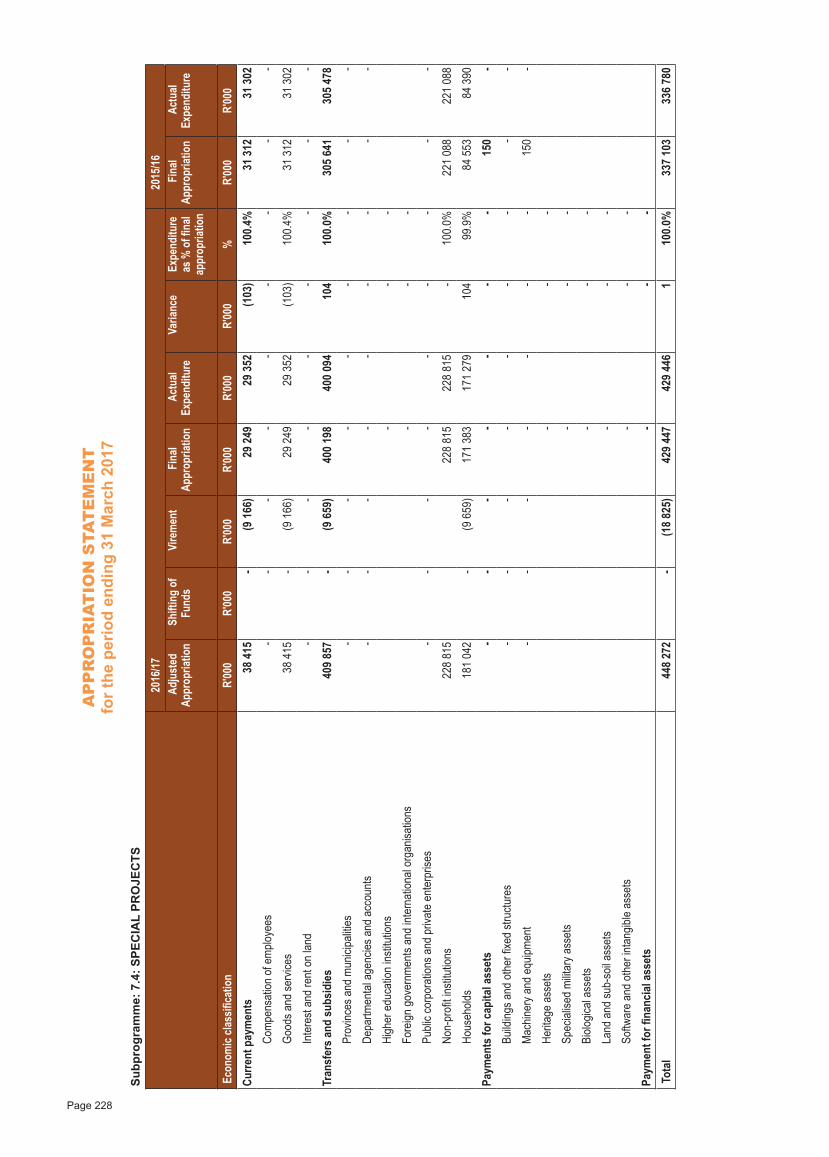
AP
PR
OP
RIA
TIO
N S
TAT
EM
EN
Tfo
r the
per
iod
endi
ng 3
1 M
arch
201
7
Page 228
Subp
rogr
amm
e: 7
.4: S
PEC
IAL
PRO
JEC
TS
2016
/17
20
15/16
Adj
uste
d Ap
prop
riatio
n S
hifti
ng o
f Fu
nds
Vire
men
t F
inal
Appr
opria
tion
Act
ual
Expe
nditu
re
Var
iance
Ex
pend
iture
as
% o
f fina
l ap
prop
riatio
n
Fin
al Ap
prop
riatio
n A
ctua
l Ex
pend
iture
Eco
nom
ic cla
ssifi
catio
n R'
000
R'00
0R'
000
R'00
0R'
000
R'00
0%
R'00
0R'
000
Curre
nt p
aym
ents
3
8 41
5 -
(9 1
66)
2
9 24
9
29
352
(1
03)
100.
4%
31
312
3
1 30
2
Com
pens
ation
of e
mplo
yees
- -
- -
- -
- -
-
Go
ods a
nd se
rvice
s
38
415
- (9
166
)
29
249
2
9 35
2
(103
)10
0.4%
3
1 31
2
31
302
In
tere
st an
d re
nt o
n lan
d -
- -
- -
- -
- -
Tran
sfer
s an
d su
bsid
ies
409
857
-
(9 6
59)
400
198
4
00 0
94
1
04
100.
0% 3
05 6
41
305
478
Prov
inces
and
mun
icipa
lities
- -
- -
- -
- -
-
De
partm
enta
l age
ncies
and
acc
ount
s -
- -
- -
- -
- -
Hi
gher
edu
catio
n ins
titutio
ns
-
- -
Fo
reign
gov
ernm
ents
and
inter
natio
nal o
rgan
isatio
ns
-
- -
Pu
blic c
orpo
ratio
ns a
nd p
rivat
e en
terp
rises
- -
- -
- -
- -
-
No
n-pr
ofit in
stitu
tions
228
815
2
28 8
15
228
815
-
100.
0% 2
21 0
88
221
088
Ho
useh
olds
181
042
-
(9 6
59)
171
383
1
71 2
79
1
04
99.9
%
84
553
8
4 39
0
Paym
ents
for c
apita
l ass
ets
- -
- -
- -
-
150
-
Bu
ilding
s and
oth
er fix
ed st
ructu
res
- -
- -
- -
- -
-
M
achin
ery a
nd e
quipm
ent
- -
- -
- -
-
150
-
He
ritag
e as
sets
-
-
-
Sp
ecial
ised
milit
ary a
sset
s
-
- -
Bi
ologic
al as
sets
-
-
-
La
nd a
nd su
b-so
il ass
ets
-
-
-
So
ftwar
e an
d ot
her i
ntan
gible
asse
ts
-
- -
Paym
ent f
or fi
nanc
ial a
sset
s
-
- -
Tota
l 4
48 2
72
-
(18
825)
429
447
4
29 4
46
1
10
0.0%
337
103
3
36 7
80
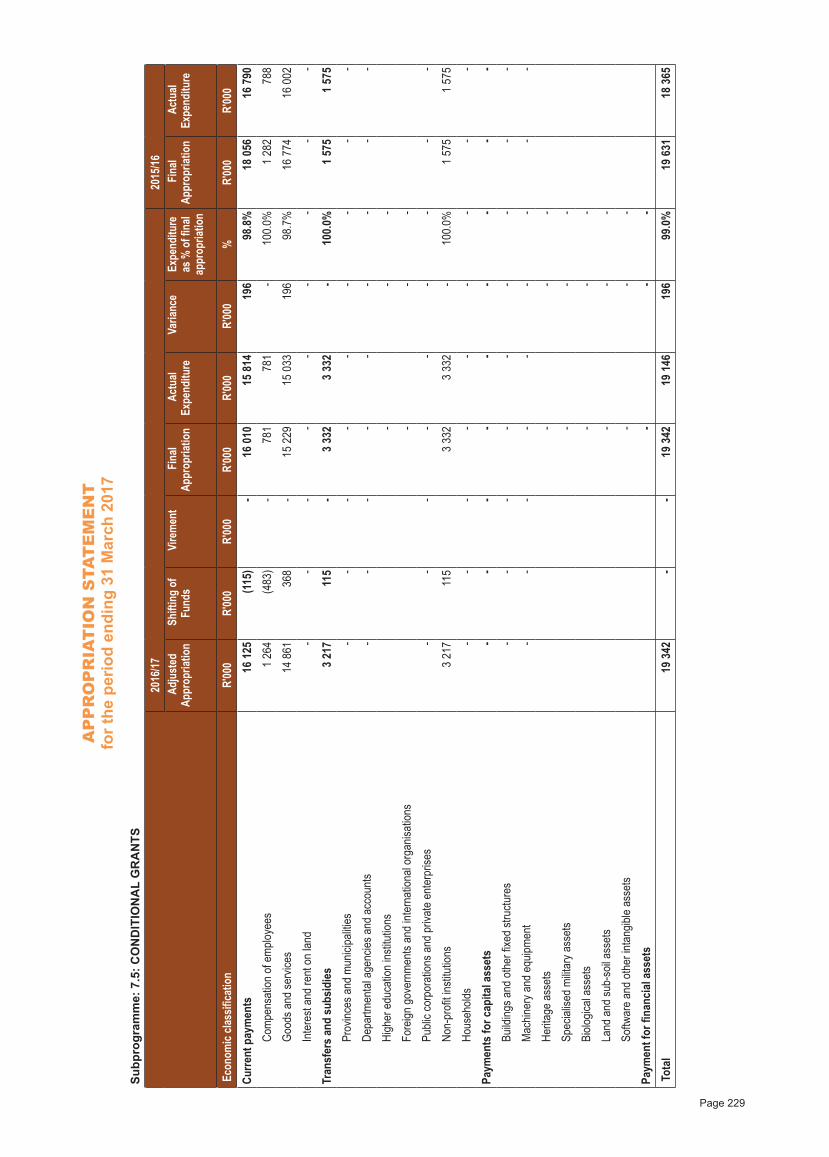
AP
PR
OP
RIA
TIO
N S
TAT
EM
EN
Tfo
r the
per
iod
endi
ng 3
1 M
arch
201
7
Page 229
Subp
rogr
amm
e: 7
.5: C
ON
DIT
ION
AL
GR
AN
TS
2016
/17
20
15/16
Adj
uste
d Ap
prop
riatio
n S
hifti
ng o
f Fu
nds
Vire
men
t F
inal
Appr
opria
tion
Act
ual
Expe
nditu
re
Var
iance
Ex
pend
iture
as
% o
f fina
l ap
prop
riatio
n
Fin
al Ap
prop
riatio
n A
ctua
l Ex
pend
iture
Eco
nom
ic cla
ssifi
catio
n R'
000
R'00
0R'
000
R'00
0R'
000
R'00
0%
R'00
0R'
000
Curre
nt p
aym
ents
1
6 12
5
(115
) -
1
6 01
0
15
814
1
96
98.8
%
18
056
1
6 79
0
Com
pens
ation
of e
mplo
yees
1 2
64
(4
83)
-
781
781
-
100.
0% 1
282
788
Go
ods a
nd se
rvice
s
14
861
3
68
-
15
229
1
5 03
3
196
98
.7%
1
6 77
4
16
002
In
tere
st an
d re
nt o
n lan
d -
- -
- -
- -
- -
Tran
sfer
s an
d su
bsid
ies
3 2
17
11
5 -
3 3
32
3 3
32
- 10
0.0%
1 5
75
1 5
75
Pr
ovinc
es a
nd m
unici
paliti
es -
- -
- -
- -
- -
De
partm
enta
l age
ncies
and
acc
ount
s -
- -
- -
- -
- -
Hi
gher
edu
catio
n ins
titutio
ns
-
- -
Fo
reign
gov
ernm
ents
and
inter
natio
nal o
rgan
isatio
ns
-
- -
Pu
blic c
orpo
ratio
ns a
nd p
rivat
e en
terp
rises
- -
- -
- -
- -
-
No
n-pr
ofit in
stitu
tions
3 2
17
11
5
3 3
32
3 3
32
- 10
0.0%
1 5
75
1 5
75
Ho
useh
olds
- -
- -
- -
- -
-
Paym
ents
for c
apita
l ass
ets
- -
- -
- -
- -
-
Build
ings a
nd o
ther
fixed
stru
cture
s -
- -
- -
- -
- -
M
achin
ery a
nd e
quipm
ent
- -
- -
- -
- -
-
He
ritag
e as
sets
-
-
-
Sp
ecial
ised
milit
ary a
sset
s
-
- -
Bi
ologic
al as
sets
-
-
-
La
nd a
nd su
b-so
il ass
ets
-
-
-
So
ftwar
e an
d ot
her i
ntan
gible
asse
ts
-
- -
Paym
ent f
or fi
nanc
ial a
sset
s
-
- -
Tota
l
19
342
- -
1
9 34
2
19
146
1
96
99.0
%
19
631
1
8 36
5
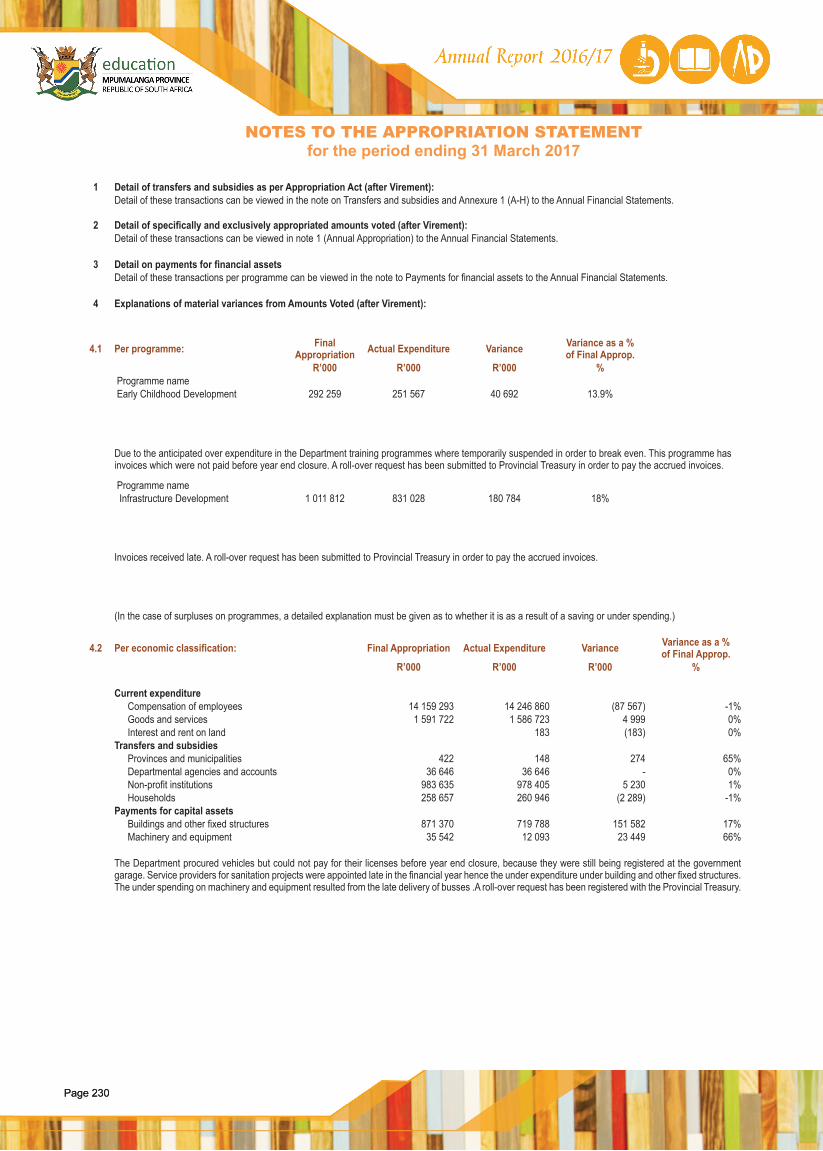
Page 230Page 230
1 Detail of transfers and subsidies as per Appropriation Act (after Virement):Detail of these transactions can be viewed in the note on Transfers and subsidies and Annexure 1 (A-H) to the Annual Financial Statements.
2 Detail of specifically and exclusively appropriated amounts voted (after Virement):Detail of these transactions can be viewed in note 1 (Annual Appropriation) to the Annual Financial Statements.
3 Detail on payments for financial assetsDetail of these transactions per programme can be viewed in the note to Payments for financial assets to the Annual Financial Statements.
4 Explanations of material variances from Amounts Voted (after Virement):
4.1 Per programme: Final Appropriation Actual Expenditure Variance Variance as a %
of Final Approp.R’000 R’000 R’000 %
Programme name Early Childhood Development 292 259 251 567 40 692 13.9%
Due to the anticipated over expenditure in the Department training programmes where temporarily suspended in order to break even. This programme has invoices which were not paid before year end closure. A roll-over request has been submitted to Provincial Treasury in order to pay the accrued invoices.
Programme name Infrastructure Development 1 011 812 831 028 180 784 18%
Invoices received late. A roll-over request has been submitted to Provincial Treasury in order to pay the accrued invoices.
(In the case of surpluses on programmes, a detailed explanation must be given as to whether it is as a result of a saving or under spending.)
4.2 Per economic classification: Final Appropriation Actual Expenditure Variance Variance as a % of Final Approp.
R’000 R’000 R’000 %
Current expenditureCompensation of employees 14 159 293 14 246 860 (87 567) -1%Goods and services 1 591 722 1 586 723 4 999 0%Interest and rent on land 183 (183) 0%
Transfers and subsidiesProvinces and municipalities 422 148 274 65%Departmental agencies and accounts 36 646 36 646 - 0%Non-profit institutions 983 635 978 405 5 230 1%Households 258 657 260 946 (2 289) -1%
Payments for capital assetsBuildings and other fixed structures 871 370 719 788 151 582 17%Machinery and equipment 35 542 12 093 23 449 66%
The Department procured vehicles but could not pay for their licenses before year end closure, because they were still being registered at the government garage. Service providers for sanitation projects were appointed late in the financial year hence the under expenditure under building and other fixed structures. The under spending on machinery and equipment resulted from the late delivery of busses .A roll-over request has been registered with the Provincial Treasury.
NOTES TO THE APPROPRIATION STATEMENTfor the period ending 31 March 2017
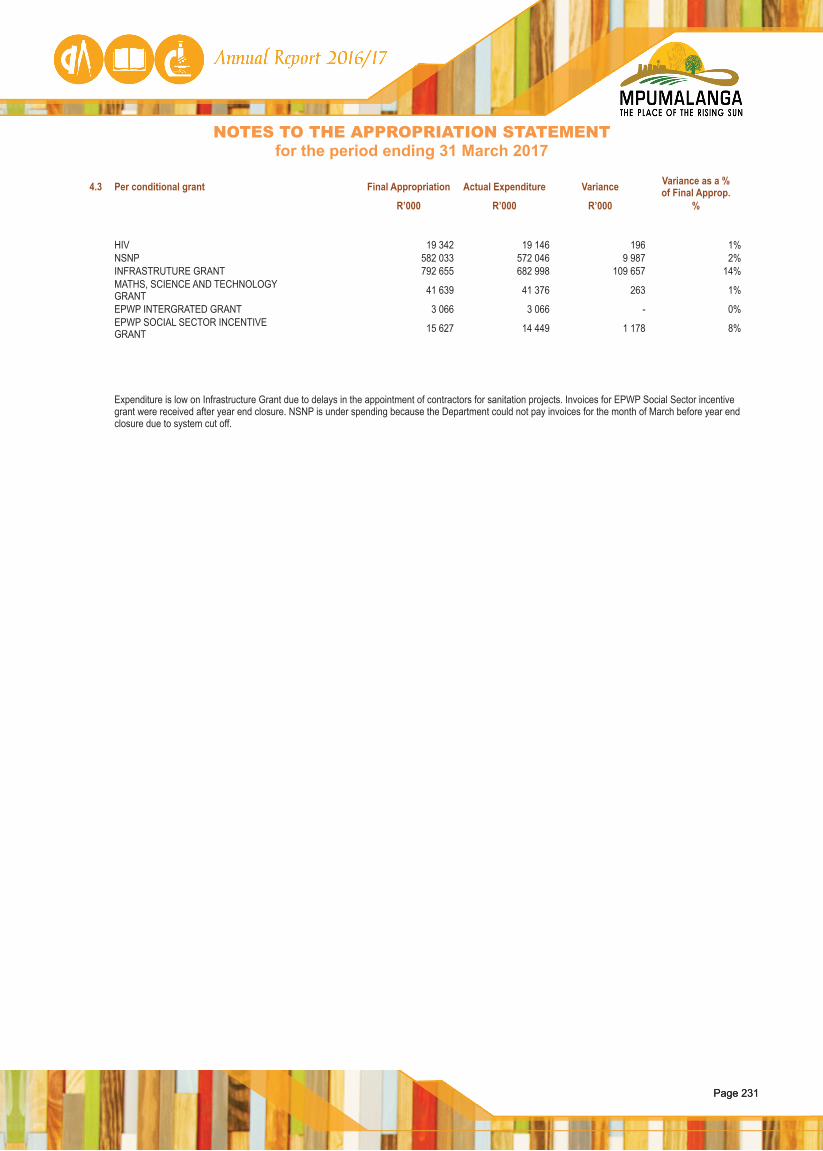
Page 231Page 231
4.3 Per conditional grant Final Appropriation Actual Expenditure Variance Variance as a % of Final Approp.
R’000 R’000 R’000 %
HIV 19 342 19 146 196 1%NSNP 582 033 572 046 9 987 2%INFRASTRUTURE GRANT 792 655 682 998 109 657 14%MATHS, SCIENCE AND TECHNOLOGY GRANT 41 639 41 376 263 1%
EPWP INTERGRATED GRANT 3 066 3 066 - 0%EPWP SOCIAL SECTOR INCENTIVE GRANT 15 627 14 449 1 178 8%
Expenditure is low on Infrastructure Grant due to delays in the appointment of contractors for sanitation projects. Invoices for EPWP Social Sector incentive grant were received after year end closure. NSNP is under spending because the Department could not pay invoices for the month of March before year end closure due to system cut off.
NOTES TO THE APPROPRIATION STATEMENTfor the period ending 31 March 2017
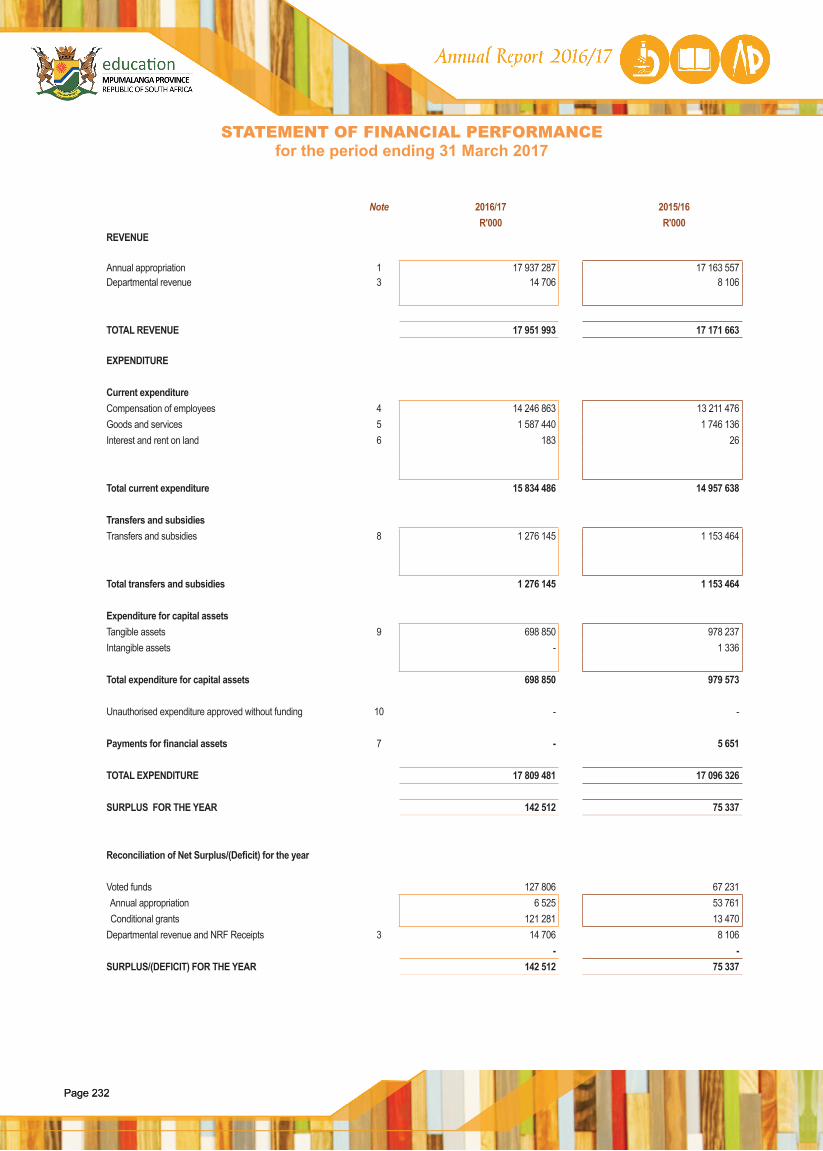
Page 232Page 232
STATEMENT OF FINANCIAL PERFORMANCEfor the period ending 31 March 2017
Note 2016/17 2015/16R'000 R'000
REVENUE
Annual appropriation 1 17 937 287 17 163 557Departmental revenue 3 14 706 8 106
TOTAL REVENUE 17 951 993 17 171 663
EXPENDITURE
Current expenditureCompensation of employees 4 14 246 863 13 211 476Goods and services 5 1 587 440 1 746 136Interest and rent on land 6 183 26
Total current expenditure 15 834 486 14 957 638
Transfers and subsidiesTransfers and subsidies 8 1 276 145 1 153 464
Total transfers and subsidies 1 276 145 1 153 464
Expenditure for capital assetsTangible assets 9 698 850 978 237Intangible assets - 1 336
Total expenditure for capital assets 698 850 979 573
Unauthorised expenditure approved without funding 10 - -
Payments for financial assets 7 - 5 651
TOTAL EXPENDITURE 17 809 481 17 096 326
SURPLUS FOR THE YEAR 142 512 75 337
Reconciliation of Net Surplus/(Deficit) for the year
Voted funds 127 806 67 231 Annual appropriation 6 525 53 761 Conditional grants 121 281 13 470
Departmental revenue and NRF Receipts 3 14 706 8 106- -
SURPLUS/(DEFICIT) FOR THE YEAR 142 512 75 337
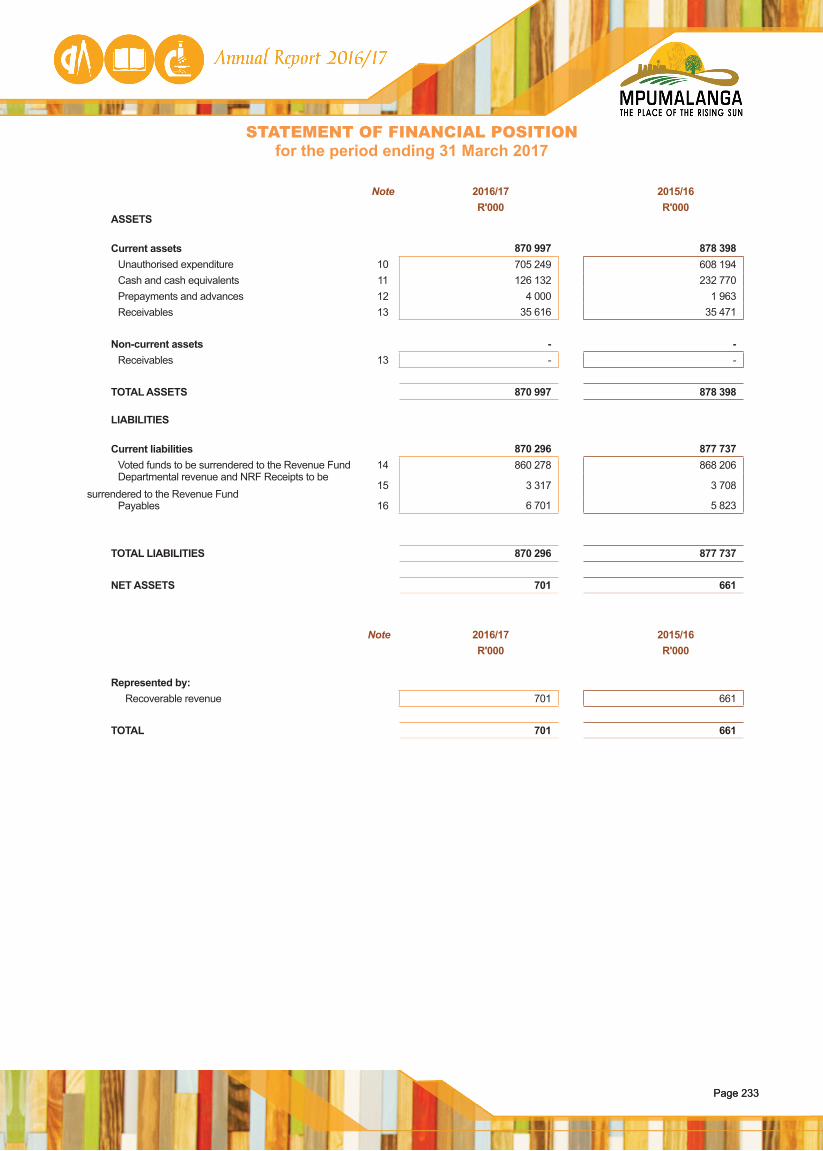
Page 233Page 233
Note 2016/17 2015/16R'000 R'000
ASSETS
Current assets 870 997 878 398 Unauthorised expenditure 10 705 249 608 194 Cash and cash equivalents 11 126 132 232 770 Prepayments and advances 12 4 000 1 963 Receivables 13 35 616 35 471
Non-current assets - - Receivables 13 - -
TOTAL ASSETS 870 997 878 398
LIABILITIES
Current liabilities 870 296 877 737 Voted funds to be surrendered to the Revenue Fund 14 860 278 868 206 Departmental revenue and NRF Receipts to be
surrendered to the Revenue Fund15 3 317 3 708
Payables 16 6 701 5 823
TOTAL LIABILITIES 870 296 877 737
NET ASSETS 701 661
Note 2016/17 2015/16R'000 R'000
Represented by: Recoverable revenue 701 661
TOTAL 701 661
STATEMENT OF FINANCIAL POSITIONfor the period ending 31 March 2017

Page 234Page 234
STATEMENT OF CHANGES IN NET ASSETSfor the period ending 31 March 2017
Note 2016/17 2015/16R'000 R'000
Recoverable revenueOpening balance 661 1 039Transfers: 40 (378)
Irrecoverable amounts written off 7 - 5 651Debts revisedDebts raised
-40
(6 029)-
Closing balance 701 661
TOTAL 701 661
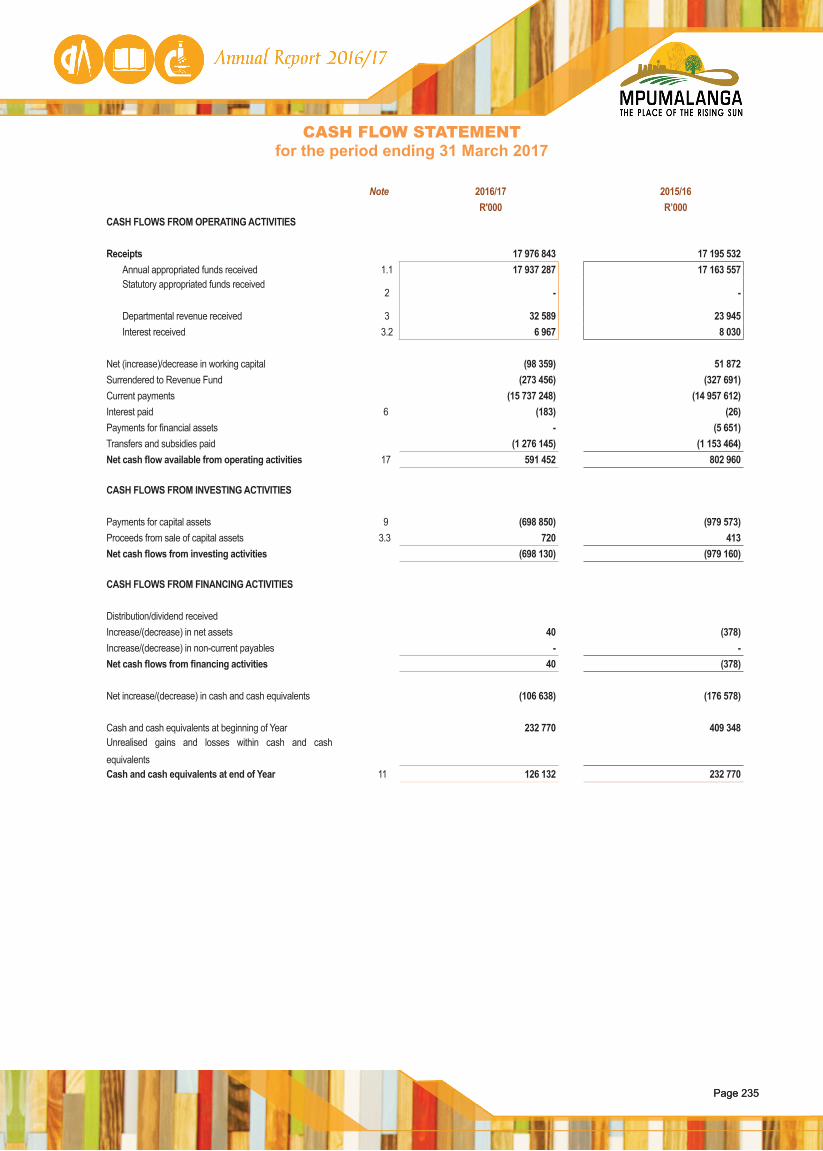
Page 235Page 235
CASH FLOW STATEMENTfor the period ending 31 March 2017
Note 2016/17 2015/16R'000 R’000
CASH FLOWS FROM OPERATING ACTIVITIES
Receipts 17 976 843 17 195 532Annual appropriated funds received 1.1 17 937 287 17 163 557Statutory appropriated funds received
2 - -
Departmental revenue received 3 32 589 23 945Interest received 3.2 6 967 8 030
Net (increase)/decrease in working capital (98 359) 51 872Surrendered to Revenue Fund (273 456) (327 691)Current payments (15 737 248) (14 957 612)Interest paid 6 (183) (26)Payments for financial assets - (5 651)Transfers and subsidies paid (1 276 145) (1 153 464)Net cash flow available from operating activities 17 591 452 802 960
CASH FLOWS FROM INVESTING ACTIVITIES
Payments for capital assets 9 (698 850) (979 573)Proceeds from sale of capital assets 3.3 720 413Net cash flows from investing activities (698 130) (979 160)
CASH FLOWS FROM FINANCING ACTIVITIES
Distribution/dividend receivedIncrease/(decrease) in net assets 40 (378)Increase/(decrease) in non-current payables - -Net cash flows from financing activities 40 (378)
Net increase/(decrease) in cash and cash equivalents (106 638) (176 578)
Cash and cash equivalents at beginning of Year 232 770 409 348Unrealised gains and losses within cash and cash equivalentsCash and cash equivalents at end of Year 11 126 132 232 770
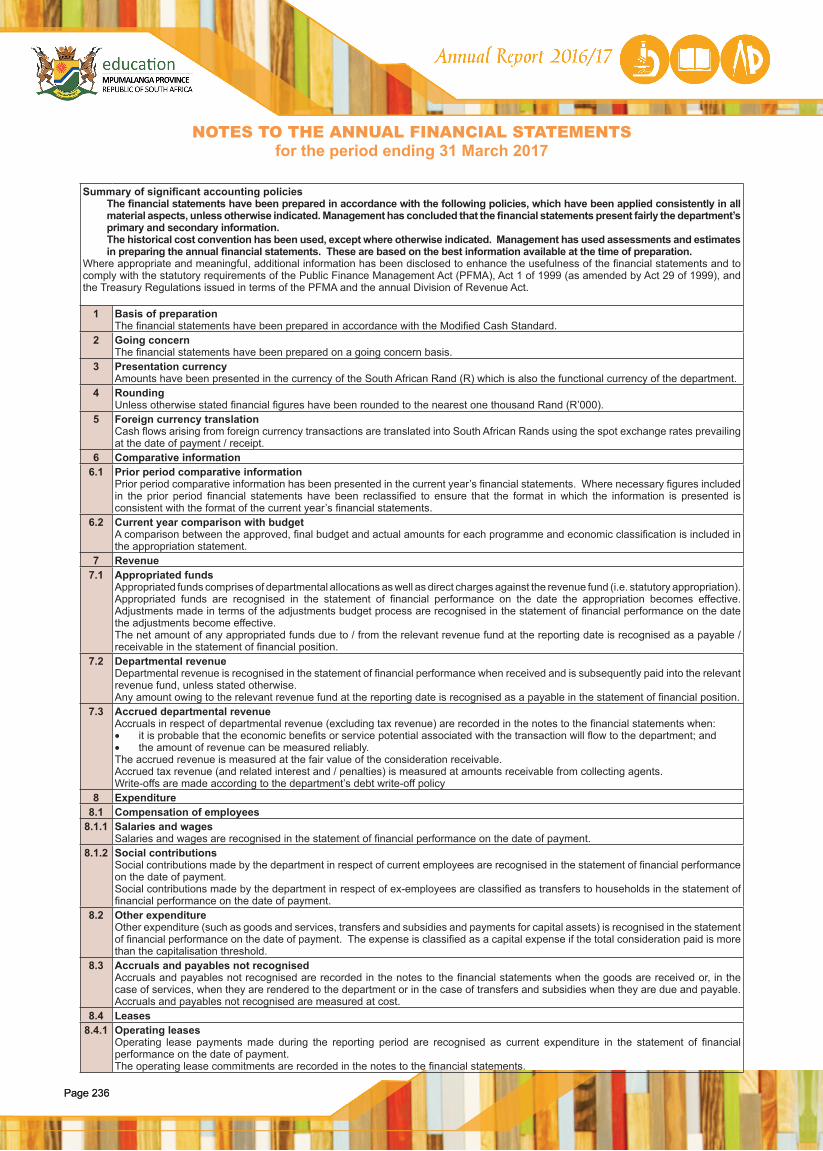
Page 236Page 236
NOTES TO THE ANNUAL FINANCIAL STATEMENTSfor the period ending 31 March 2017
Summary of significant accounting policies The financial statements have been prepared in accordance with the following policies, which have been applied consistently in all material aspects, unless otherwise indicated. Management has concluded that the financial statements present fairly the department’s primary and secondary information. The historical cost convention has been used, except where otherwise indicated. Management has used assessments and estimates in preparing the annual financial statements. These are based on the best information available at the time of preparation.
Where appropriate and meaningful, additional information has been disclosed to enhance the usefulness of the financial statements and to comply with the statutory requirements of the Public Finance Management Act (PFMA), Act 1 of 1999 (as amended by Act 29 of 1999), and the Treasury Regulations issued in terms of the PFMA and the annual Division of Revenue Act.
1 Basis of preparation The financial statements have been prepared in accordance with the Modified Cash Standard.
2 Going concern The financial statements have been prepared on a going concern basis.
3 Presentation currencyAmounts have been presented in the currency of the South African Rand (R) which is also the functional currency of the department.
4 Rounding Unless otherwise stated financial figures have been rounded to the nearest one thousand Rand (R’000).
5 Foreign currency translationCash flows arising from foreign currency transactions are translated into South African Rands using the spot exchange rates prevailing at the date of payment / receipt.
6 Comparative information6.1 Prior period comparative information
Prior period comparative information has been presented in the current year’s financial statements. Where necessary figures included in the prior period financial statements have been reclassified to ensure that the format in which the information is presented is consistent with the format of the current year’s financial statements.
6.2 Current year comparison with budget A comparison between the approved, final budget and actual amounts for each programme and economic classification is included in the appropriation statement.
7 Revenue7.1 Appropriated funds
Appropriated funds comprises of departmental allocations as well as direct charges against the revenue fund (i.e. statutory appropriation).Appropriated funds are recognised in the statement of financial performance on the date the appropriation becomes effective. Adjustments made in terms of the adjustments budget process are recognised in the statement of financial performance on the date the adjustments become effective.The net amount of any appropriated funds due to / from the relevant revenue fund at the reporting date is recognised as a payable / receivable in the statement of financial position.
7.2 Departmental revenue Departmental revenue is recognised in the statement of financial performance when received and is subsequently paid into the relevant revenue fund, unless stated otherwise.Any amount owing to the relevant revenue fund at the reporting date is recognised as a payable in the statement of financial position.
7.3 Accrued departmental revenue Accruals in respect of departmental revenue (excluding tax revenue) are recorded in the notes to the financial statements when:• it is probable that the economic benefits or service potential associated with the transaction will flow to the department; and• the amount of revenue can be measured reliably.The accrued revenue is measured at the fair value of the consideration receivable.Accrued tax revenue (and related interest and / penalties) is measured at amounts receivable from collecting agents.Write-offs are made according to the department’s debt write-off policy
8 Expenditure8.1 Compensation of employees
8.1.1 Salaries and wagesSalaries and wages are recognised in the statement of financial performance on the date of payment.
8.1.2 Social contributionsSocial contributions made by the department in respect of current employees are recognised in the statement of financial performance on the date of payment. Social contributions made by the department in respect of ex-employees are classified as transfers to households in the statement of financial performance on the date of payment.
8.2 Other expenditureOther expenditure (such as goods and services, transfers and subsidies and payments for capital assets) is recognised in the statement of financial performance on the date of payment. The expense is classified as a capital expense if the total consideration paid is more than the capitalisation threshold.
8.3 Accruals and payables not recognised Accruals and payables not recognised are recorded in the notes to the financial statements when the goods are received or, in the case of services, when they are rendered to the department or in the case of transfers and subsidies when they are due and payable.Accruals and payables not recognised are measured at cost.
8.4 Leases8.4.1 Operating leases
Operating lease payments made during the reporting period are recognised as current expenditure in the statement of financial performance on the date of payment.The operating lease commitments are recorded in the notes to the financial statements.
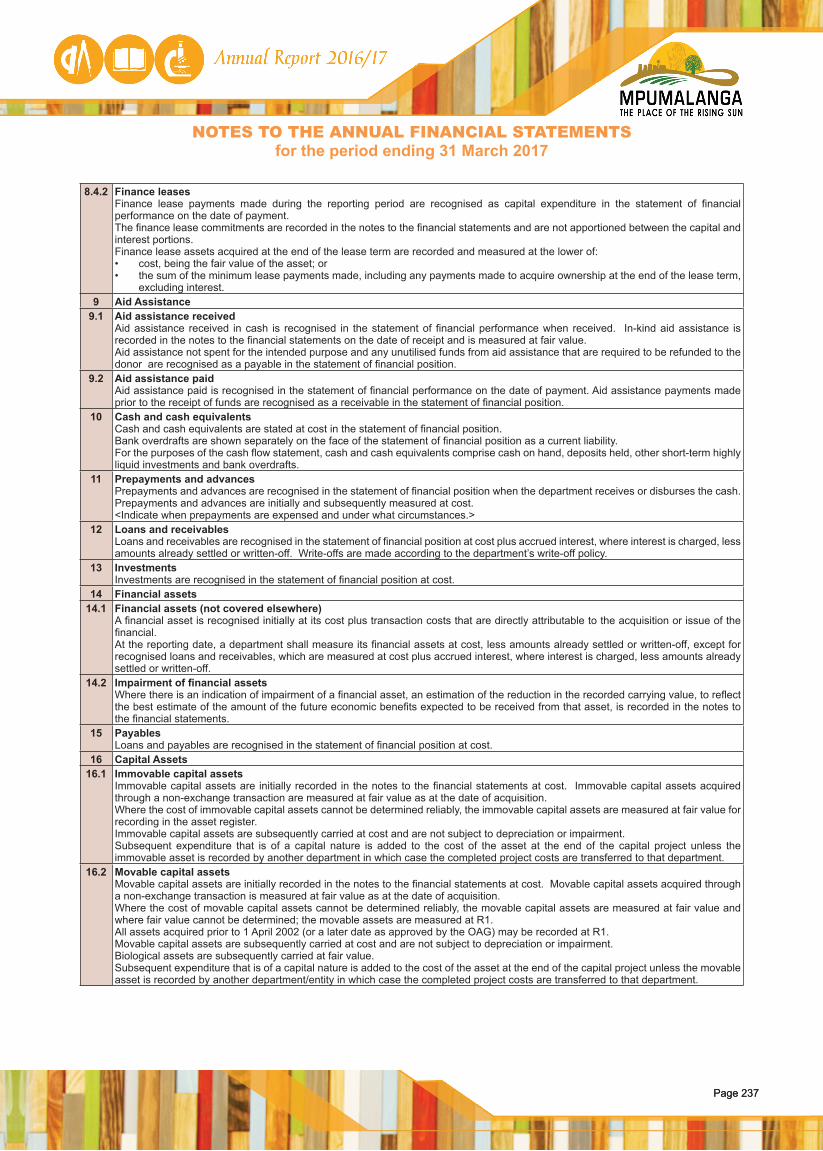
Page 237Page 237
NOTES TO THE ANNUAL FINANCIAL STATEMENTSfor the period ending 31 March 2017
8.4.2 Finance leases Finance lease payments made during the reporting period are recognised as capital expenditure in the statement of financial performance on the date of payment.The finance lease commitments are recorded in the notes to the financial statements and are not apportioned between the capital and interest portions. Finance lease assets acquired at the end of the lease term are recorded and measured at the lower of:• cost, being the fair value of the asset; or• the sum of the minimum lease payments made, including any payments made to acquire ownership at the end of the lease term,
excluding interest.9 Aid Assistance
9.1 Aid assistance receivedAid assistance received in cash is recognised in the statement of financial performance when received. In-kind aid assistance is recorded in the notes to the financial statements on the date of receipt and is measured at fair value.Aid assistance not spent for the intended purpose and any unutilised funds from aid assistance that are required to be refunded to the donor are recognised as a payable in the statement of financial position.
9.2 Aid assistance paidAid assistance paid is recognised in the statement of financial performance on the date of payment. Aid assistance payments made prior to the receipt of funds are recognised as a receivable in the statement of financial position.
10 Cash and cash equivalentsCash and cash equivalents are stated at cost in the statement of financial position. Bank overdrafts are shown separately on the face of the statement of financial position as a current liability.For the purposes of the cash flow statement, cash and cash equivalents comprise cash on hand, deposits held, other short-term highly liquid investments and bank overdrafts.
11 Prepayments and advancesPrepayments and advances are recognised in the statement of financial position when the department receives or disburses the cash. Prepayments and advances are initially and subsequently measured at cost.<Indicate when prepayments are expensed and under what circumstances.>
12 Loans and receivablesLoans and receivables are recognised in the statement of financial position at cost plus accrued interest, where interest is charged, less amounts already settled or written-off. Write-offs are made according to the department’s write-off policy.
13 InvestmentsInvestments are recognised in the statement of financial position at cost.
14 Financial assets14.1 Financial assets (not covered elsewhere)
A financial asset is recognised initially at its cost plus transaction costs that are directly attributable to the acquisition or issue of the financial.At the reporting date, a department shall measure its financial assets at cost, less amounts already settled or written-off, except for recognised loans and receivables, which are measured at cost plus accrued interest, where interest is charged, less amounts already settled or written-off.
14.2 Impairment of financial assetsWhere there is an indication of impairment of a financial asset, an estimation of the reduction in the recorded carrying value, to reflect the best estimate of the amount of the future economic benefits expected to be received from that asset, is recorded in the notes to the financial statements.
15 PayablesLoans and payables are recognised in the statement of financial position at cost.
16 Capital Assets16.1 Immovable capital assets
Immovable capital assets are initially recorded in the notes to the financial statements at cost. Immovable capital assets acquired through a non-exchange transaction are measured at fair value as at the date of acquisition. Where the cost of immovable capital assets cannot be determined reliably, the immovable capital assets are measured at fair value for recording in the asset register. Immovable capital assets are subsequently carried at cost and are not subject to depreciation or impairment.Subsequent expenditure that is of a capital nature is added to the cost of the asset at the end of the capital project unless the immovable asset is recorded by another department in which case the completed project costs are transferred to that department.
16.2 Movable capital assetsMovable capital assets are initially recorded in the notes to the financial statements at cost. Movable capital assets acquired through a non-exchange transaction is measured at fair value as at the date of acquisition. Where the cost of movable capital assets cannot be determined reliably, the movable capital assets are measured at fair value and where fair value cannot be determined; the movable assets are measured at R1. All assets acquired prior to 1 April 2002 (or a later date as approved by the OAG) may be recorded at R1.Movable capital assets are subsequently carried at cost and are not subject to depreciation or impairment.Biological assets are subsequently carried at fair value. Subsequent expenditure that is of a capital nature is added to the cost of the asset at the end of the capital project unless the movable asset is recorded by another department/entity in which case the completed project costs are transferred to that department.
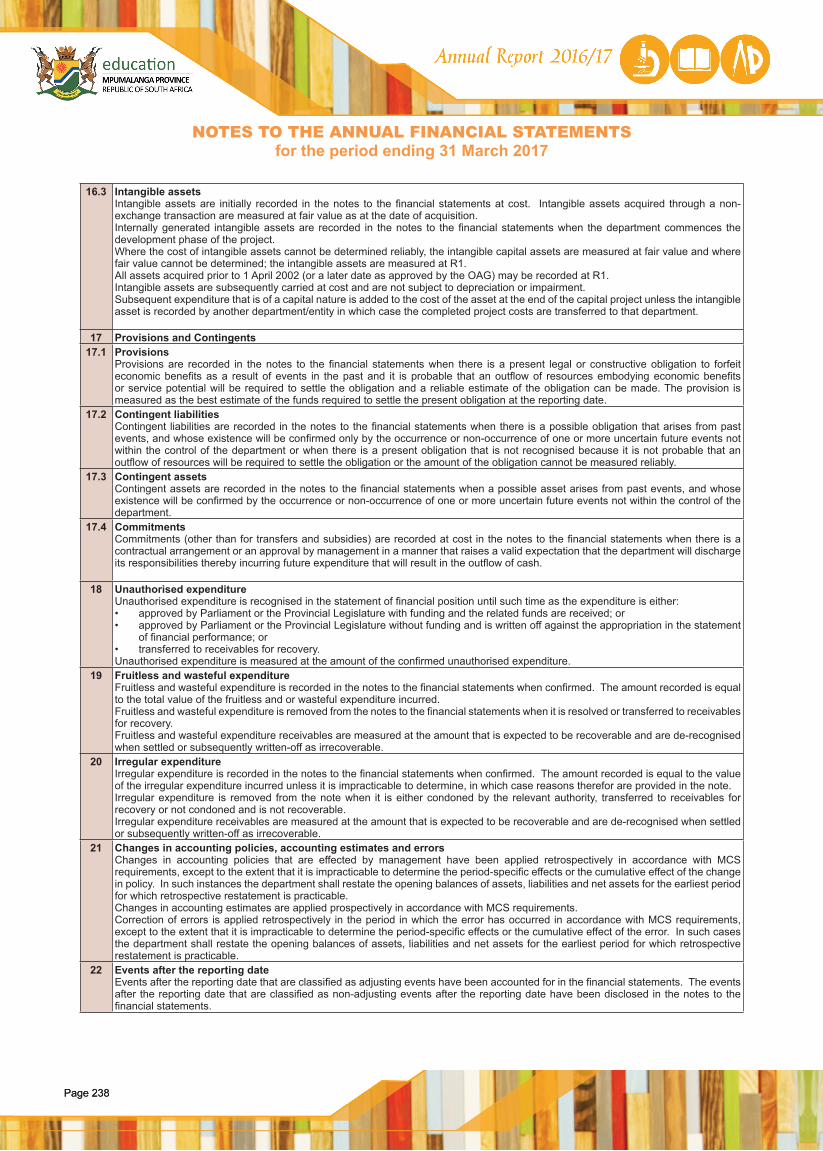
Page 238Page 238
NOTES TO THE ANNUAL FINANCIAL STATEMENTSfor the period ending 31 March 2017
16.3 Intangible assetsIntangible assets are initially recorded in the notes to the financial statements at cost. Intangible assets acquired through a non-exchange transaction are measured at fair value as at the date of acquisition. Internally generated intangible assets are recorded in the notes to the financial statements when the department commences the development phase of the project. Where the cost of intangible assets cannot be determined reliably, the intangible capital assets are measured at fair value and where fair value cannot be determined; the intangible assets are measured at R1. All assets acquired prior to 1 April 2002 (or a later date as approved by the OAG) may be recorded at R1.Intangible assets are subsequently carried at cost and are not subject to depreciation or impairment.Subsequent expenditure that is of a capital nature is added to the cost of the asset at the end of the capital project unless the intangible asset is recorded by another department/entity in which case the completed project costs are transferred to that department.
17 Provisions and Contingents17.1 Provisions
Provisions are recorded in the notes to the financial statements when there is a present legal or constructive obligation to forfeit economic benefits as a result of events in the past and it is probable that an outflow of resources embodying economic benefits or service potential will be required to settle the obligation and a reliable estimate of the obligation can be made. The provision is measured as the best estimate of the funds required to settle the present obligation at the reporting date.
17.2 Contingent liabilitiesContingent liabilities are recorded in the notes to the financial statements when there is a possible obligation that arises from past events, and whose existence will be confirmed only by the occurrence or non-occurrence of one or more uncertain future events not within the control of the department or when there is a present obligation that is not recognised because it is not probable that an outflow of resources will be required to settle the obligation or the amount of the obligation cannot be measured reliably.
17.3 Contingent assetsContingent assets are recorded in the notes to the financial statements when a possible asset arises from past events, and whose existence will be confirmed by the occurrence or non-occurrence of one or more uncertain future events not within the control of the department.
17.4 Commitments Commitments (other than for transfers and subsidies) are recorded at cost in the notes to the financial statements when there is a contractual arrangement or an approval by management in a manner that raises a valid expectation that the department will discharge its responsibilities thereby incurring future expenditure that will result in the outflow of cash.
18 Unauthorised expenditureUnauthorised expenditure is recognised in the statement of financial position until such time as the expenditure is either:• approved by Parliament or the Provincial Legislature with funding and the related funds are received; or• approved by Parliament or the Provincial Legislature without funding and is written off against the appropriation in the statement
of financial performance; or• transferred to receivables for recovery.Unauthorised expenditure is measured at the amount of the confirmed unauthorised expenditure.
19 Fruitless and wasteful expenditureFruitless and wasteful expenditure is recorded in the notes to the financial statements when confirmed. The amount recorded is equal to the total value of the fruitless and or wasteful expenditure incurred. Fruitless and wasteful expenditure is removed from the notes to the financial statements when it is resolved or transferred to receivables for recovery.Fruitless and wasteful expenditure receivables are measured at the amount that is expected to be recoverable and are de-recognised when settled or subsequently written-off as irrecoverable.
20 Irregular expenditureIrregular expenditure is recorded in the notes to the financial statements when confirmed. The amount recorded is equal to the value of the irregular expenditure incurred unless it is impracticable to determine, in which case reasons therefor are provided in the note. Irregular expenditure is removed from the note when it is either condoned by the relevant authority, transferred to receivables for recovery or not condoned and is not recoverable. Irregular expenditure receivables are measured at the amount that is expected to be recoverable and are de-recognised when settled or subsequently written-off as irrecoverable.
21 Changes in accounting policies, accounting estimates and errorsChanges in accounting policies that are effected by management have been applied retrospectively in accordance with MCS requirements, except to the extent that it is impracticable to determine the period-specific effects or the cumulative effect of the change in policy. In such instances the department shall restate the opening balances of assets, liabilities and net assets for the earliest period for which retrospective restatement is practicable.Changes in accounting estimates are applied prospectively in accordance with MCS requirements.Correction of errors is applied retrospectively in the period in which the error has occurred in accordance with MCS requirements, except to the extent that it is impracticable to determine the period-specific effects or the cumulative effect of the error. In such cases the department shall restate the opening balances of assets, liabilities and net assets for the earliest period for which retrospective restatement is practicable.
22 Events after the reporting dateEvents after the reporting date that are classified as adjusting events have been accounted for in the financial statements. The events after the reporting date that are classified as non-adjusting events after the reporting date have been disclosed in the notes to the financial statements.
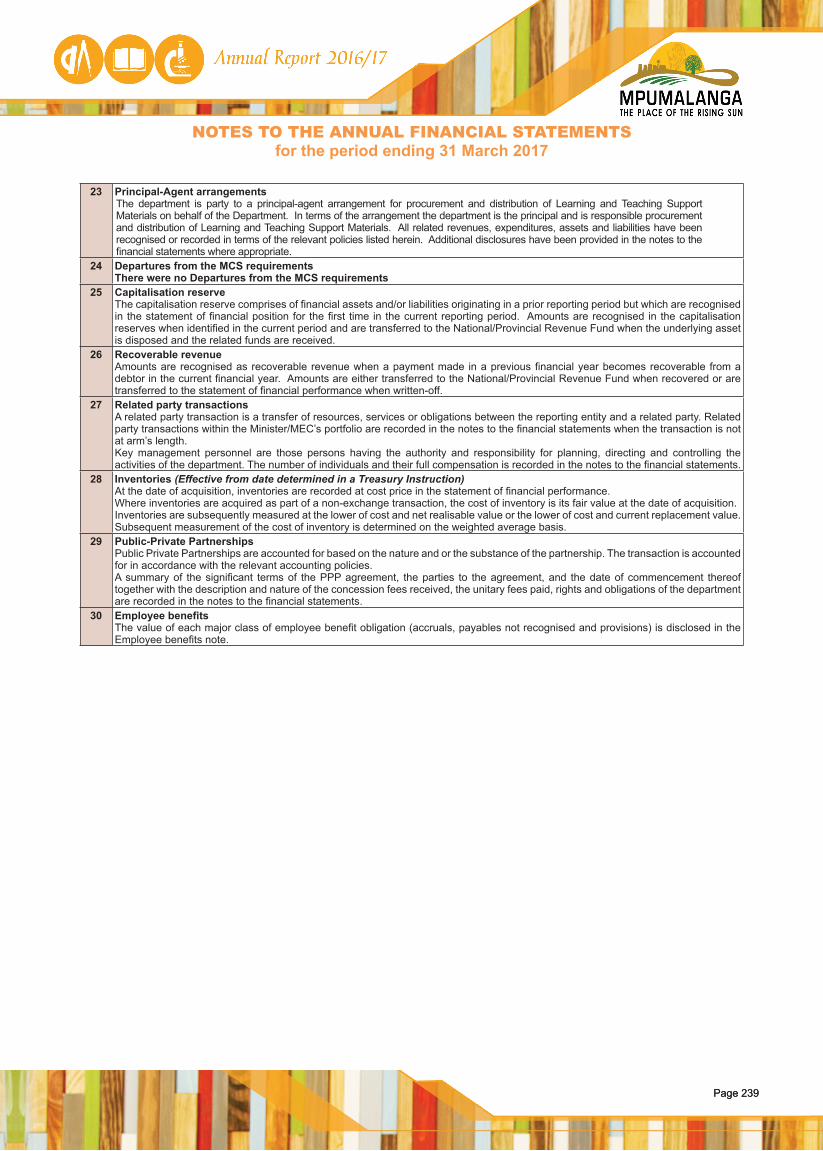
Page 239Page 239
NOTES TO THE ANNUAL FINANCIAL STATEMENTSfor the period ending 31 March 2017
23 Principal-Agent arrangementsThe department is party to a principal-agent arrangement for procurement and distribution of Learning and Teaching Support Materials on behalf of the Department. In terms of the arrangement the department is the principal and is responsible procurement and distribution of Learning and Teaching Support Materials. All related revenues, expenditures, assets and liabilities have been recognised or recorded in terms of the relevant policies listed herein. Additional disclosures have been provided in the notes to the financial statements where appropriate.
24 Departures from the MCS requirementsThere were no Departures from the MCS requirements
25 Capitalisation reserveThe capitalisation reserve comprises of financial assets and/or liabilities originating in a prior reporting period but which are recognised in the statement of financial position for the first time in the current reporting period. Amounts are recognised in the capitalisation reserves when identified in the current period and are transferred to the National/Provincial Revenue Fund when the underlying asset is disposed and the related funds are received.
26 Recoverable revenueAmounts are recognised as recoverable revenue when a payment made in a previous financial year becomes recoverable from a debtor in the current financial year. Amounts are either transferred to the National/Provincial Revenue Fund when recovered or are transferred to the statement of financial performance when written-off.
27 Related party transactionsA related party transaction is a transfer of resources, services or obligations between the reporting entity and a related party. Related party transactions within the Minister/MEC’s portfolio are recorded in the notes to the financial statements when the transaction is not at arm’s length. Key management personnel are those persons having the authority and responsibility for planning, directing and controlling the activities of the department. The number of individuals and their full compensation is recorded in the notes to the financial statements.
28 Inventories (Effective from date determined in a Treasury Instruction)At the date of acquisition, inventories are recorded at cost price in the statement of financial performance.Where inventories are acquired as part of a non-exchange transaction, the cost of inventory is its fair value at the date of acquisition.Inventories are subsequently measured at the lower of cost and net realisable value or the lower of cost and current replacement value.Subsequent measurement of the cost of inventory is determined on the weighted average basis.
29 Public-Private PartnershipsPublic Private Partnerships are accounted for based on the nature and or the substance of the partnership. The transaction is accounted for in accordance with the relevant accounting policies.A summary of the significant terms of the PPP agreement, the parties to the agreement, and the date of commencement thereof together with the description and nature of the concession fees received, the unitary fees paid, rights and obligations of the department are recorded in the notes to the financial statements.
30 Employee benefitsThe value of each major class of employee benefit obligation (accruals, payables not recognised and provisions) is disclosed in the Employee benefits note.
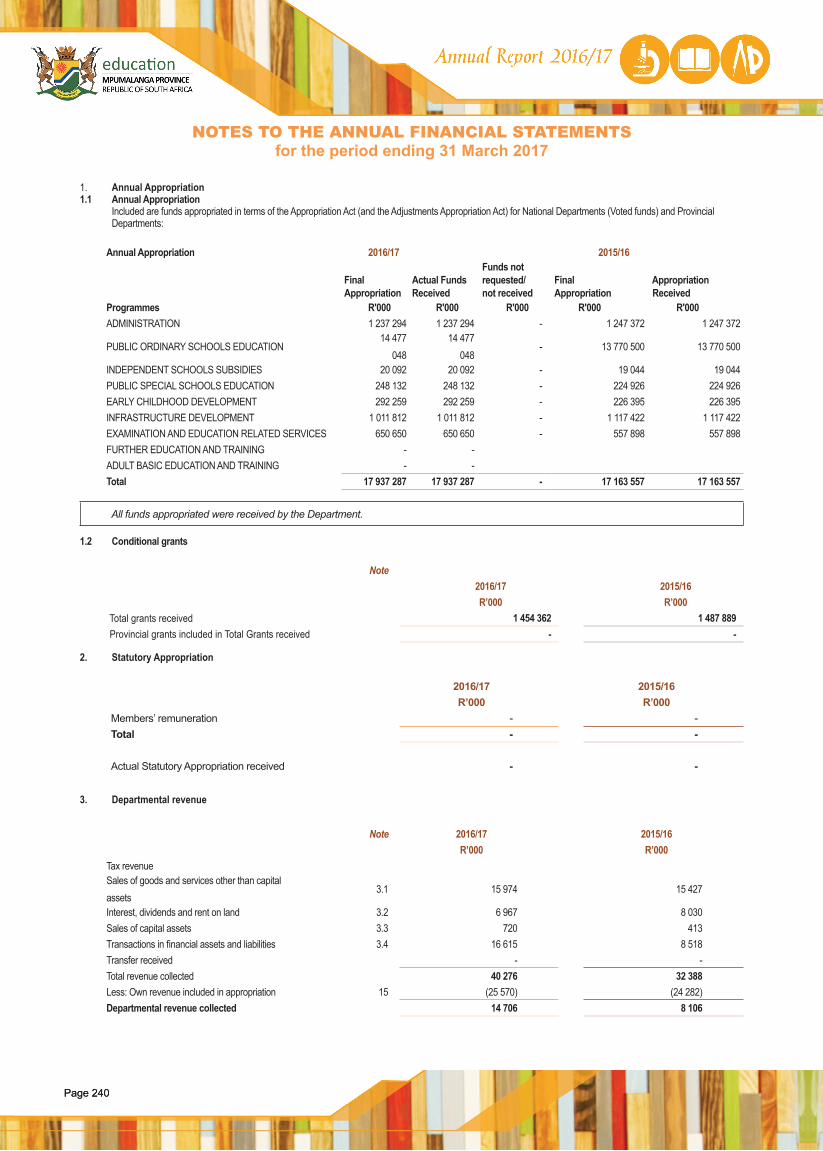
Page 240Page 240
NOTES TO THE ANNUAL FINANCIAL STATEMENTSfor the period ending 31 March 2017
1. Annual Appropriation 1.1 Annual Appropriation Included are funds appropriated in terms of the Appropriation Act (and the Adjustments Appropriation Act) for National Departments (Voted funds) and Provincial Departments:
Annual Appropriation 2016/17 2015/16 Funds not
Final Actual Funds requested/ Final Appropriation Appropriation Received not received Appropriation Received
Programmes R'000 R'000 R'000 R'000 R'000 ADMINISTRATION 1 237 294 1 237 294 - 1 247 372 1 247 372
PUBLIC ORDINARY SCHOOLS EDUCATION14 477
04814 477
048- 13 770 500 13 770 500
INDEPENDENT SCHOOLS SUBSIDIES 20 092 20 092 - 19 044 19 044PUBLIC SPECIAL SCHOOLS EDUCATION 248 132 248 132 - 224 926 224 926 EARLY CHILDHOOD DEVELOPMENT 292 259 292 259 - 226 395 226 395INFRASTRUCTURE DEVELOPMENT 1 011 812 1 011 812 - 1 117 422 1 117 422EXAMINATION AND EDUCATION RELATED SERVICES 650 650 650 650 - 557 898 557 898FURTHER EDUCATION AND TRAINING - -ADULT BASIC EDUCATION AND TRAINING - -Total 17 937 287 17 937 287 - 17 163 557 17 163 557
All funds appropriated were received by the Department.
1.2 Conditional grants
Note2016/17 2015/16R’000 R’000
Total grants received 1 454 362 1 487 889 Provincial grants included in Total Grants received - -
2. Statutory Appropriation
2016/17 2015/16R’000 R’000
Members’ remuneration - -Total - -
Actual Statutory Appropriation received - -
3. Departmental revenue
Note 2016/17 2015/16R’000 R’000
Tax revenueSales of goods and services other than capital assets
3.1 15 974 15 427
Interest, dividends and rent on land 3.2 6 967 8 030Sales of capital assets 3.3 720 413Transactions in financial assets and liabilities 3.4 16 615 8 518Transfer received - -Total revenue collected 40 276 32 388Less: Own revenue included in appropriation 15 (25 570) (24 282)Departmental revenue collected 14 706 8 106
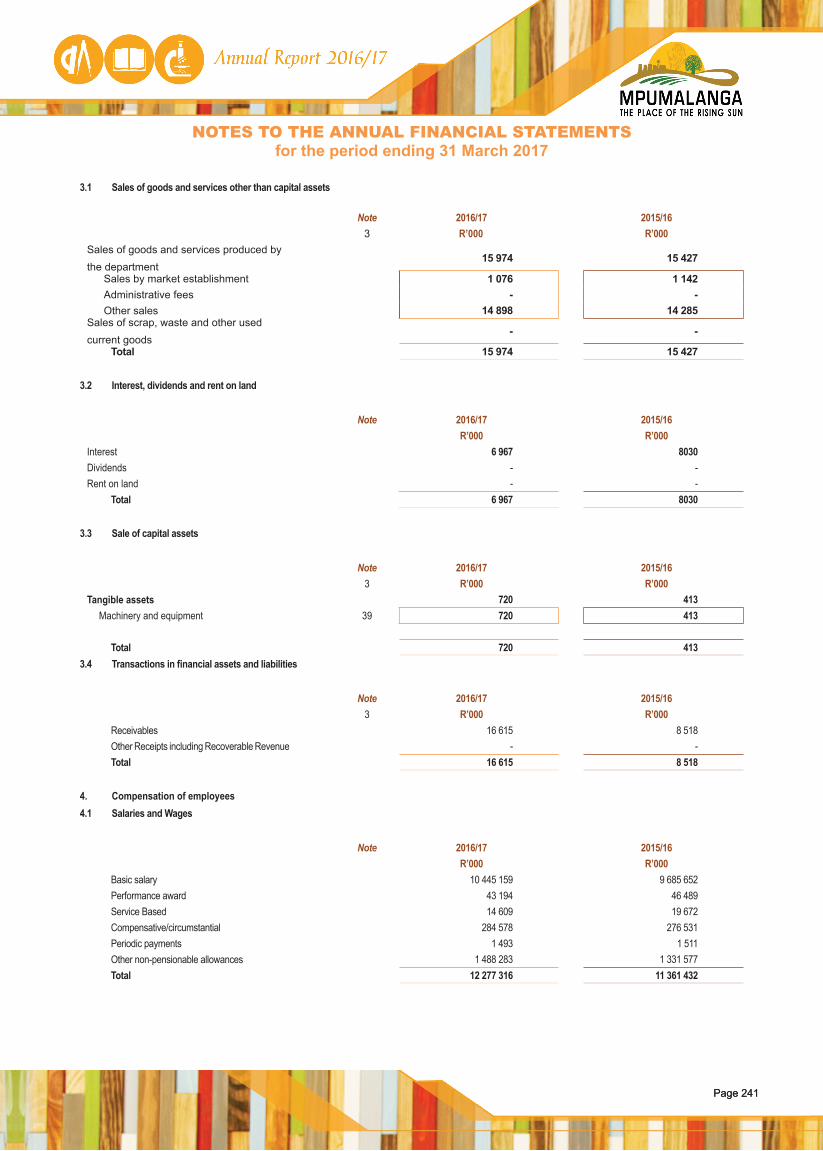
Page 241Page 241
3.1 Sales of goods and services other than capital assets
Note 2016/17 2015/163 R’000 R’000
Sales of goods and services produced by the department
15 974 15 427
Sales by market establishment 1 076 1 142Administrative fees - -Other sales 14 898 14 285
Sales of scrap, waste and other used current goods
- -
Total 15 974 15 427
3.2 Interest, dividends and rent on land
Note 2016/17 2015/16R’000 R’000
Interest 6 967 8030Dividends - -Rent on land - -
Total 6 967 8030
3.3 Sale of capital assets
Note 2016/17 2015/163 R’000 R’000
Tangible assets 720 413Machinery and equipment 39 720 413
Total 720 4133.4 Transactions in financial assets and liabilities
Note 2016/17 2015/163 R’000 R’000
Receivables 16 615 8 518Other Receipts including Recoverable Revenue - -Total 16 615 8 518
4. Compensation of employees4.1 Salaries and Wages
Note 2016/17 2015/16R’000 R’000
Basic salary 10 445 159 9 685 652Performance award 43 194 46 489Service Based 14 609 19 672Compensative/circumstantial 284 578 276 531Periodic payments 1 493 1 511Other non-pensionable allowances 1 488 283 1 331 577Total 12 277 316 11 361 432
NOTES TO THE ANNUAL FINANCIAL STATEMENTSfor the period ending 31 March 2017
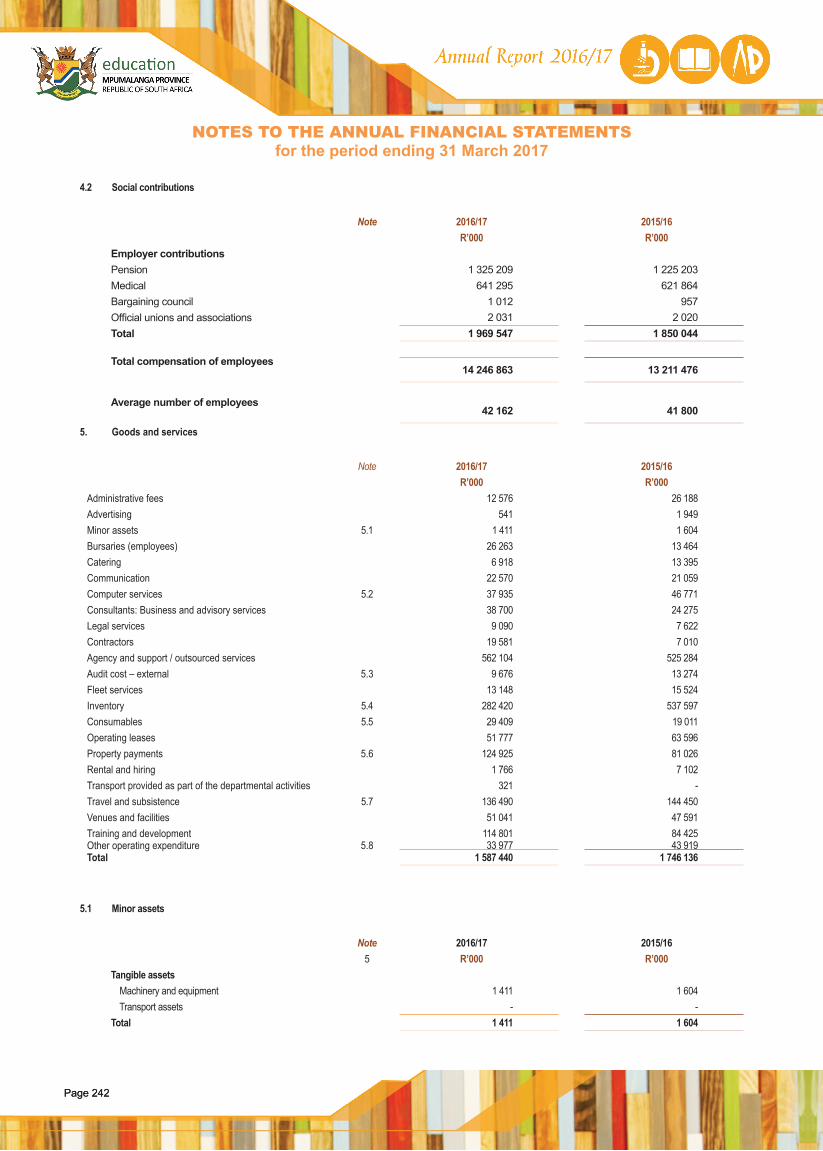
Page 242Page 242
4.2 Social contributions
Note 2016/17 2015/16R’000 R’000
Employer contributionsPension 1 325 209 1 225 203Medical 641 295 621 864Bargaining council 1 012 957Official unions and associations 2 031 2 020Total 1 969 547 1 850 044
Total compensation of employees 14 246 863 13 211 476
Average number of employees 42 162 41 800
5. Goods and services
Note 2016/17 2015/16R’000 R’000
Administrative fees 12 576 26 188Advertising 541 1 949Minor assets 5.1 1 411 1 604Bursaries (employees) 26 263 13 464Catering 6 918 13 395Communication 22 570 21 059Computer services 5.2 37 935 46 771Consultants: Business and advisory services 38 700 24 275Legal services 9 090 7 622Contractors 19 581 7 010Agency and support / outsourced services 562 104 525 284Audit cost – external 5.3 9 676 13 274Fleet services 13 148 15 524Inventory 5.4 282 420 537 597Consumables 5.5 29 409 19 011Operating leases 51 777 63 596Property payments 5.6 124 925 81 026Rental and hiring 1 766 7 102Transport provided as part of the departmental activities 321 -Travel and subsistence 5.7 136 490 144 450Venues and facilities 51 041 47 591Training and development 114 801 84 425Other operating expenditure 5.8 33 977 43 919Total 1 587 440 1 746 136
5.1 Minor assets
Note 2016/17 2015/165 R’000 R’000
Tangible assets Machinery and equipment 1 411 1 604 Transport assets - -
Total 1 411 1 604
NOTES TO THE ANNUAL FINANCIAL STATEMENTSfor the period ending 31 March 2017
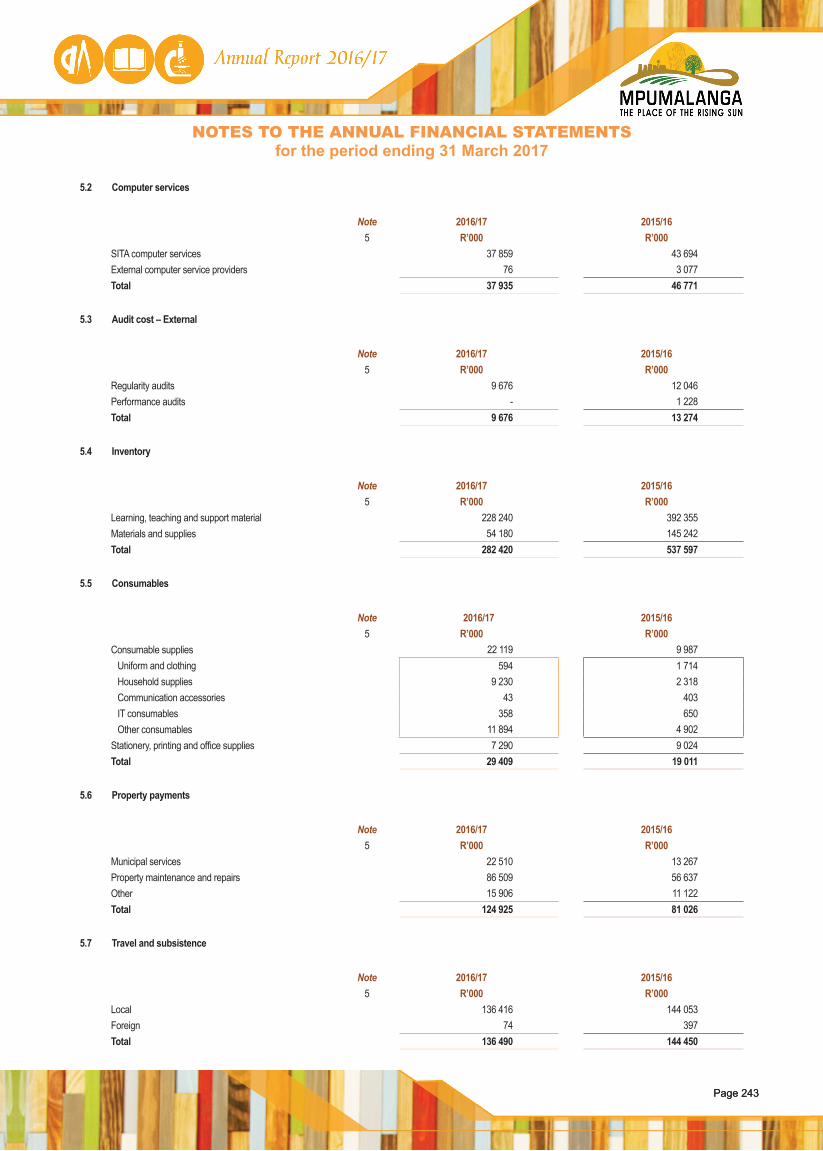
Page 243Page 243
5.2 Computer services
Note 2016/17 2015/165 R’000 R’000
SITA computer services 37 859 43 694External computer service providers 76 3 077Total 37 935 46 771
5.3 Audit cost – External
Note 2016/17 2015/165 R’000 R’000
Regularity audits 9 676 12 046Performance audits - 1 228Total 9 676 13 274
5.4 Inventory
Note 2016/17 2015/165 R’000 R’000
Learning, teaching and support material 228 240 392 355Materials and supplies 54 180 145 242Total 282 420 537 597
5.5 Consumables
Note 2016/17 2015/165 R’000 R’000
Consumable supplies 22 119 9 987Uniform and clothing 594 1 714Household supplies 9 230 2 318Communication accessories 43 403IT consumables 358 650Other consumables 11 894 4 902
Stationery, printing and office supplies 7 290 9 024Total 29 409 19 011
5.6 Property payments
Note 2016/17 2015/165 R’000 R’000
Municipal services 22 510 13 267Property maintenance and repairs 86 509 56 637 Other 15 906 11 122Total 124 925 81 026
5.7 Travel and subsistence
Note 2016/17 2015/165 R’000 R’000
Local 136 416 144 053Foreign 74 397Total 136 490 144 450
NOTES TO THE ANNUAL FINANCIAL STATEMENTSfor the period ending 31 March 2017
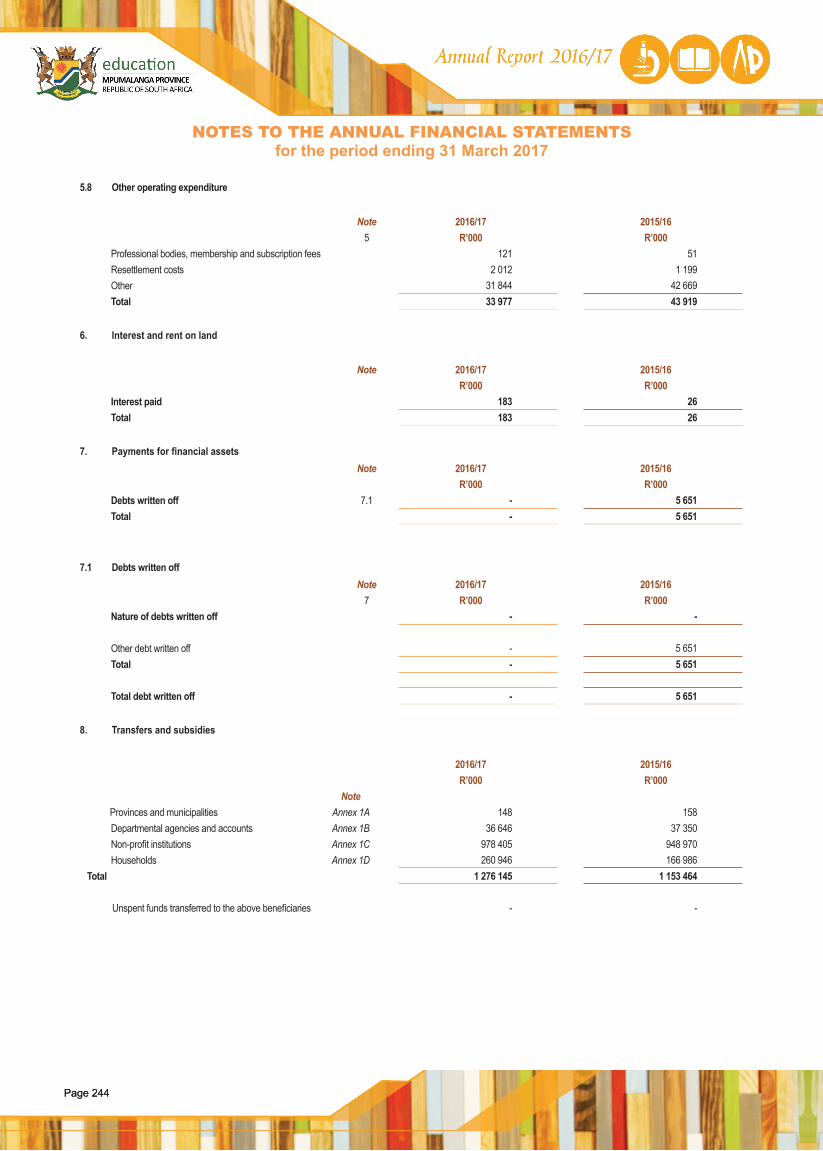
Page 244Page 244
5.8 Other operating expenditure
Note 2016/17 2015/165 R’000 R’000
Professional bodies, membership and subscription fees 121 51Resettlement costs 2 012 1 199Other 31 844 42 669Total 33 977 43 919
6. Interest and rent on land
Note 2016/17 2015/16R’000 R’000
Interest paid 183 26Total 183 26
7. Payments for financial assetsNote 2016/17 2015/16
R’000 R’000Debts written off 7.1 - 5 651Total - 5 651
7.1 Debts written offNote 2016/17 2015/16
7 R’000 R’000Nature of debts written off - -
Other debt written off - 5 651Total - 5 651
Total debt written off - 5 651
8. Transfers and subsidies
2016/17 2015/16R’000 R’000
Note Provinces and municipalities Annex 1A 148 158
Departmental agencies and accounts Annex 1B 36 646 37 350Non-profit institutions Annex 1C 978 405 948 970Households Annex 1D 260 946 166 986
Total 1 276 145 1 153 464
Unspent funds transferred to the above beneficiaries - -
NOTES TO THE ANNUAL FINANCIAL STATEMENTSfor the period ending 31 March 2017

Page 245Page 245
9. Expenditure for capital assets
Note 2016/17 2015/16R’000 R’000
Tangible assets 698 850 978 237 Buildings and other fixed structures 32 686 757 928 119 Machinery and equipment 29 12 093 50 118
Intangible assets - 1 336 Software 31 - 1 336
Total 698 850 979 573
The following amounts have been included as project costs in Expenditure for capital assets
Compensation of employees - - Goods and services - -
Total - -
9.1 Analysis of funds utilised to acquire capital assets – 2016/17
Voted funds TotalR’000 R’000
Tangible assets 698 850 698 850 Buildings and other fixed structures 686 757 686 757 Machinery and equipment 12 093 12 093
Total 698 850 698 850
9.2 Analysis of funds utilised to acquire capital assets – 2015/16Voted funds Total
R’000 R’000Tangible assets 978 237 978 237
Buildings and other fixed structures 928 119 978 119 Machinery and equipment 50 118 50 118
Intangible assets 1 336 1 336 Software 1 336 1 336
Total 979 573 979 573
10. Unauthorised expenditure10.1 Reconciliation of unauthorised expenditure
Note 2016/17 2015/16R’000 R’000
Opening balance 608 194 608 194
As restated 608 194 608 194Unauthorised expenditure – discovered in the current year (as restated) 97 055 -
Less: Amounts approved by Parliament/Legislature without funding - -
Less: Amounts transferred to receivables for recovery - -
Closing balance 705 249 608 194
Analysis of awaiting authorisation per economic classification
Capital 705 246 608 194Total 705 246 608 194
NOTES TO THE ANNUAL FINANCIAL STATEMENTSfor the period ending 31 March 2017

Page 246Page 246
10.2 Analysis of unauthorised expenditure awaiting authorisation per economic classification
2016/17 2015/16R’000 R’000
Capital 705 246 608 194 Current - - Transfers and subsidies - -
Total 705 246 608 194
10.3 Analysis of unauthorised expenditure awaiting authorisation per type
2016/17 2015/16R’000 R’000
Unauthorised expenditure relating to overspending of the vote or a main division within a vote
705 246 608 194
Total 705 246 608 194
10.4 Details of unauthorised expenditure – current year
Incident Disciplinary steps taken/criminal proceedings2016/17R’000
Unauthorised Expenditure – overspending on program 2
None - Unauthorised expenditure discovered after year-end. Pending Investigation.
97 055
Total 97 055
11. Cash and cash equivalents
Note 2016/17 2015/16R’000 R’000
Consolidated Paymaster General Account 126 132 232 792Disbursements
Cash on hand-
-(22)
-Total 126 132 232 770
12. Prepayments and advances
Note 2016/17 2015/16R’000 R’000
Prepayments (Not expensed) 12.1 4 000 1 963Total 4 000 1 963
12.1 Prepayments (Not expensed)2016/17 2015/16R’000 R’000
Goods and services 4 000 1 963Total 4 000 1 963
2016/17 2015/1612.2 Prepayments (Expensed)
R’000 R’000
Goods and services - 1 963Total - 1 963
NOTES TO THE ANNUAL FINANCIAL STATEMENTSfor the period ending 31 March 2017
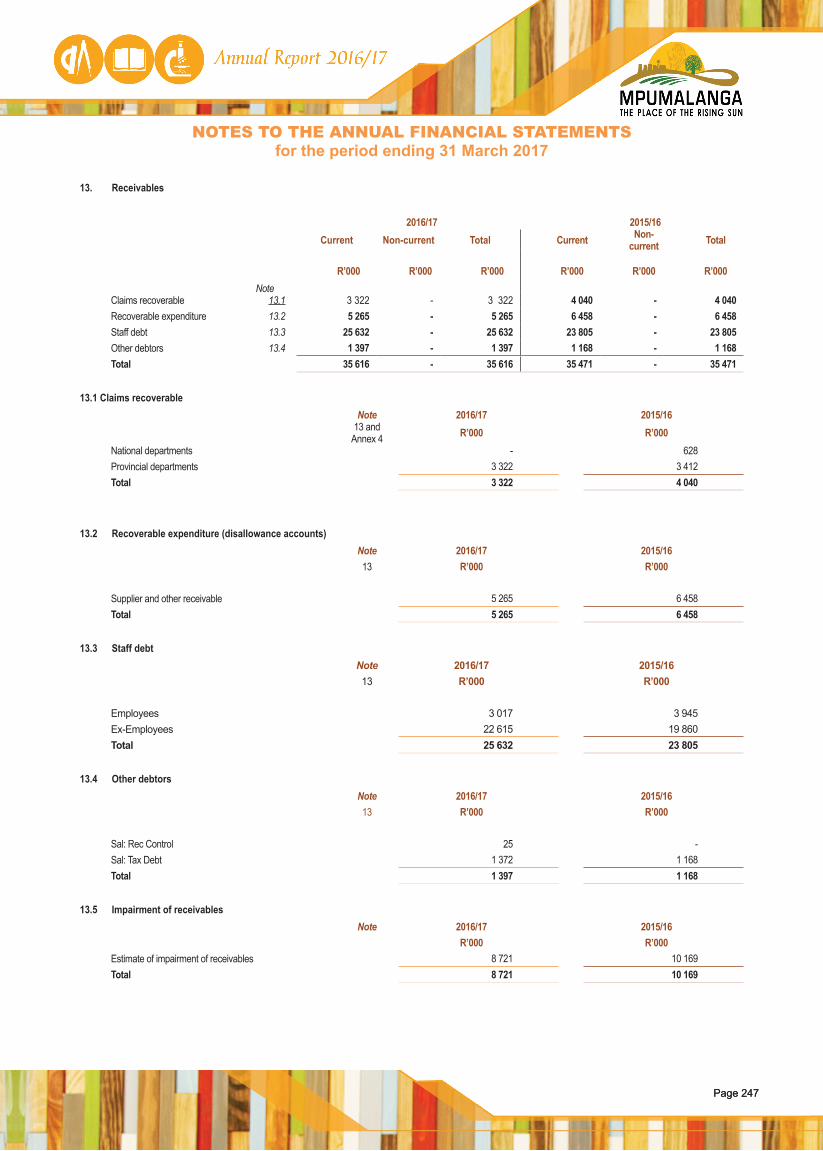
Page 247Page 247
13. Receivables
2016/17 2015/16Current Non-current Total Current Non-
current Total
NoteR’000 R’000 R’000 R’000 R’000 R’000
Claims recoverable 13.1 3 322 - 3 322 4 040 - 4 040Recoverable expenditure 13.2 5 265 - 5 265 6 458 - 6 458Staff debt 13.3 25 632 - 25 632 23 805 - 23 805Other debtors 13.4 1 397 - 1 397 1 168 - 1 168Total 35 616 - 35 616 35 471 - 35 471
13.1 Claims recoverableNote 2016/17 2015/16
13 and Annex 4 R’000 R’000
National departments - 628Provincial departments 3 322 3 412Total 3 322 4 040
13.2 Recoverable expenditure (disallowance accounts)Note 2016/17 2015/1613 R’000 R’000
Supplier and other receivable 5 265 6 458Total 5 265 6 458
13.3 Staff debtNote 2016/17 2015/1613 R’000 R’000
Employees 3 017 3 945Ex-Employees 22 615 19 860Total 25 632 23 805
13.4 Other debtorsNote 2016/17 2015/1613 R’000 R’000
Sal: Rec Control 25 -Sal: Tax Debt 1 372 1 168Total 1 397 1 168
13.5 Impairment of receivablesNote 2016/17 2015/16
R’000 R’000Estimate of impairment of receivables 8 721 10 169Total 8 721 10 169
NOTES TO THE ANNUAL FINANCIAL STATEMENTSfor the period ending 31 March 2017
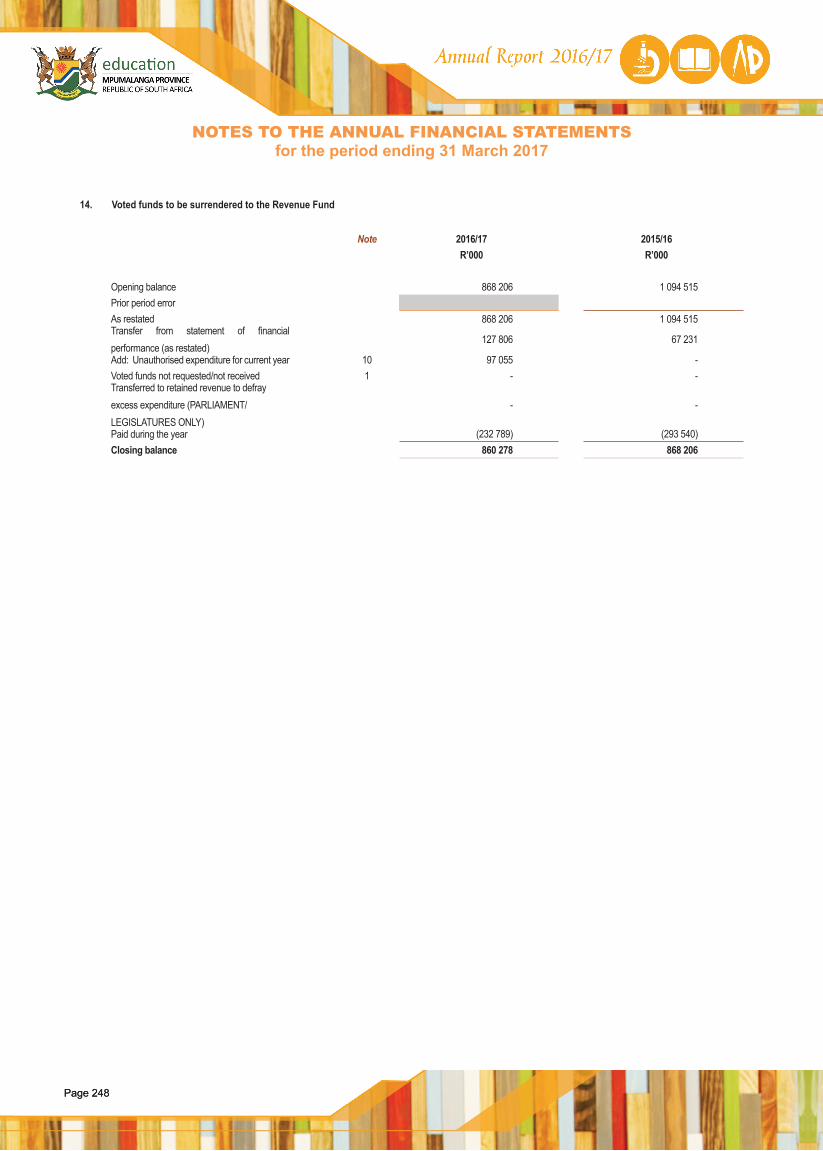
Page 248Page 248
14. Voted funds to be surrendered to the Revenue Fund
Note 2016/17 2015/16R’000 R’000
Opening balance 868 206 1 094 515Prior period error As restated 868 206 1 094 515Transfer from statement of financial performance (as restated)
127 806 67 231
Add: Unauthorised expenditure for current year 10 97 055 -Voted funds not requested/not received 1 - -Transferred to retained revenue to defray excess expenditure (PARLIAMENT/LEGISLATURES ONLY)
- -
Paid during the year (232 789) (293 540)Closing balance 860 278 868 206
NOTES TO THE ANNUAL FINANCIAL STATEMENTSfor the period ending 31 March 2017
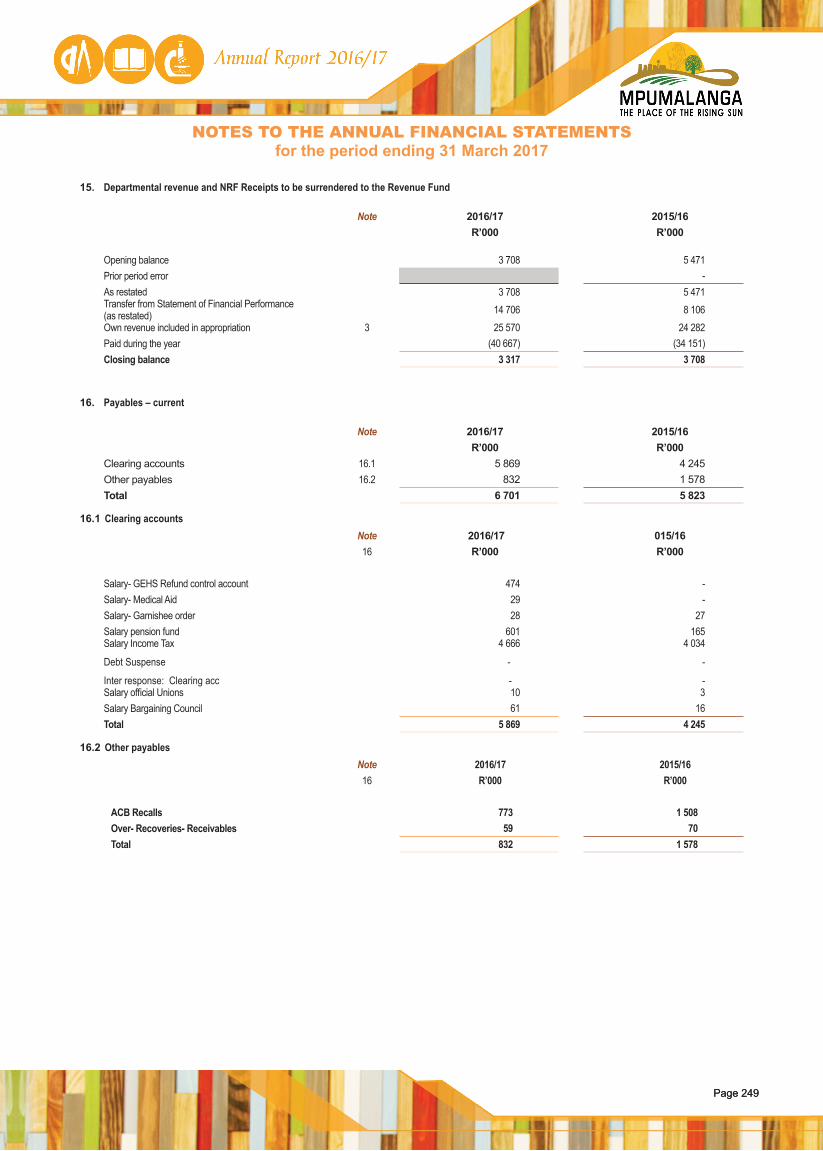
Page 249Page 249
NOTES TO THE ANNUAL FINANCIAL STATEMENTSfor the period ending 31 March 2017
15. Departmental revenue and NRF Receipts to be surrendered to the Revenue Fund
Note 2016/17 2015/16 R’000 R’000
Opening balance 3 708 5 471Prior period error -As restated 3 708 5 471Transfer from Statement of Financial Performance (as restated) 14 706 8 106
Own revenue included in appropriation 3 25 570 24 282Paid during the year (40 667) (34 151)Closing balance 3 317 3 708
16. Payables – current
Note 2016/17 2015/16 R’000 R’000
Clearing accounts 16.1 5 869 4 245Other payables 16.2 832 1 578Total 6 701 5 823
16.1 Clearing accountsNote 2016/17 015/1616 R’000 R’000
Salary- GEHS Refund control account 474 -Salary- Medical Aid 29 -Salary- Garnishee order 28 27Salary pension fund 601 165Salary Income Tax
Debt Suspense
Inter response: Clearing acc
4 666
-
-
4 034
-
-Salary official Unions 10 3Salary Bargaining Council 61 16Total 5 869 4 245
16.2 Other payablesNote 2016/17 2015/1616 R’000 R’000
ACB Recalls 773 1 508Over- Recoveries- Receivables 59 70Total 832 1 578
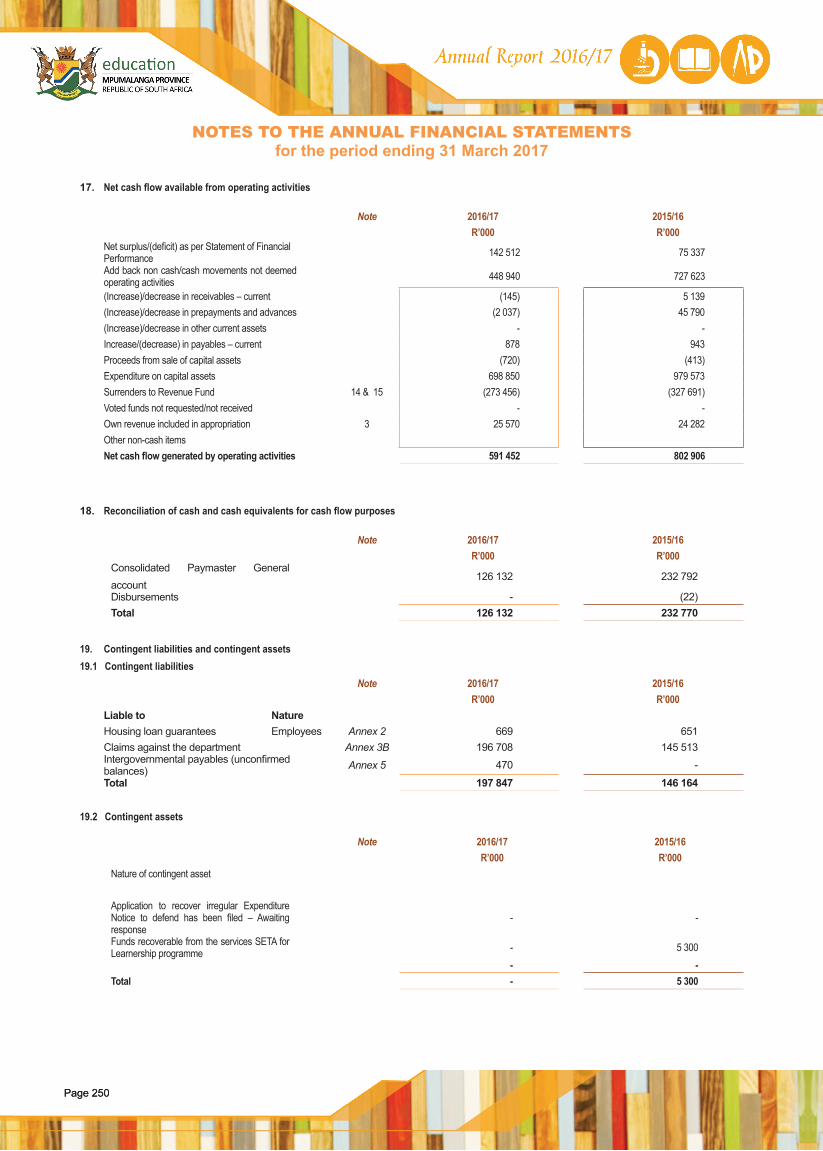
Page 250Page 250
NOTES TO THE ANNUAL FINANCIAL STATEMENTSfor the period ending 31 March 2017
19. Contingent liabilities and contingent assets19.1 Contingent liabilities
Note 2016/17 2015/16 R’000 R’000
Liable to NatureHousing loan guarantees Employees Annex 2 669 651Claims against the department Annex 3B 196 708 145 513Intergovernmental payables (unconfirmed balances) Annex 5 470 -
Total 197 847 146 164
19.2 Contingent assets
Note 2016/17 2015/16 R’000 R’000
Nature of contingent asset
Application to recover irregular Expenditure Notice to defend has been filed – Awaiting response
- -
Funds recoverable from the services SETA for Learnership programme - 5 300
- -Total - 5 300
17. Net cash flow available from operating activities
Note 2016/17 2015/16 R’000 R’000
Net surplus/(deficit) as per Statement of Financial Performance 142 512 75 337
Add back non cash/cash movements not deemed operating activities 448 940 727 623
(Increase)/decrease in receivables – current (145) 5 139(Increase)/decrease in prepayments and advances (2 037) 45 790(Increase)/decrease in other current assets - -Increase/(decrease) in payables – current 878 943Proceeds from sale of capital assets (720) (413)Expenditure on capital assets 698 850 979 573Surrenders to Revenue Fund 14 & 15 (273 456) (327 691)Voted funds not requested/not received - -Own revenue included in appropriation 3 25 570 24 282Other non-cash itemsNet cash flow generated by operating activities 591 452 802 906
18. Reconciliation of cash and cash equivalents for cash flow purposes
Note 2016/17 2015/16 R’000 R’000
Consolidated Paymaster General account
126 132 232 792
Disbursements - (22)Total 126 132 232 770
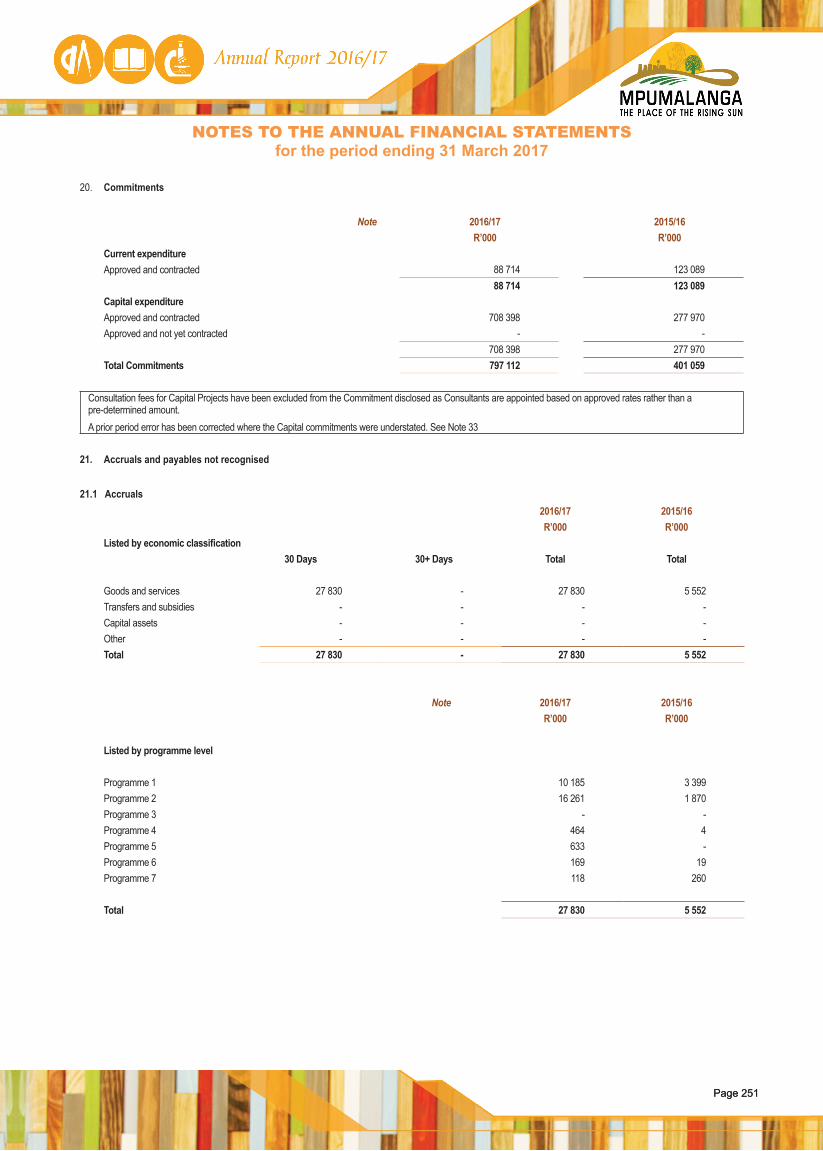
Page 251Page 251
19. Contingent liabilities and contingent assets19.1 Contingent liabilities
Note 2016/17 2015/16 R’000 R’000
Liable to NatureHousing loan guarantees Employees Annex 2 669 651Claims against the department Annex 3B 196 708 145 513Intergovernmental payables (unconfirmed balances) Annex 5 470 -
Total 197 847 146 164
19.2 Contingent assets
Note 2016/17 2015/16 R’000 R’000
Nature of contingent asset
Application to recover irregular Expenditure Notice to defend has been filed – Awaiting response
- -
Funds recoverable from the services SETA for Learnership programme - 5 300
- -Total - 5 300
NOTES TO THE ANNUAL FINANCIAL STATEMENTSfor the period ending 31 March 2017
20. Commitments
Note 2016/17 2015/16 R’000 R’000
Current expenditureApproved and contracted 88 714 123 089
88 714 123 089Capital expenditureApproved and contracted 708 398 277 970Approved and not yet contracted - -
708 398 277 970Total Commitments 797 112 401 059
Consultation fees for Capital Projects have been excluded from the Commitment disclosed as Consultants are appointed based on approved rates rather than a pre-determined amount. A prior period error has been corrected where the Capital commitments were understated. See Note 33
21. Accruals and payables not recognised
21.1 Accruals2016/17 2015/16R’000 R’000
Listed by economic classification30 Days 30+ Days Total Total
Goods and services 27 830 - 27 830 5 552Transfers and subsidies - - - -Capital assets - - - -Other - - - -Total 27 830 - 27 830 5 552
Note 2016/17 2015/16R’000 R’000
Listed by programme level
Programme 1 10 185 3 399Programme 2 16 261 1 870Programme 3 - -Programme 4 464 4Programme 5 633 -Programme 6 169 19Programme 7 118 260
Total 27 830 5 552
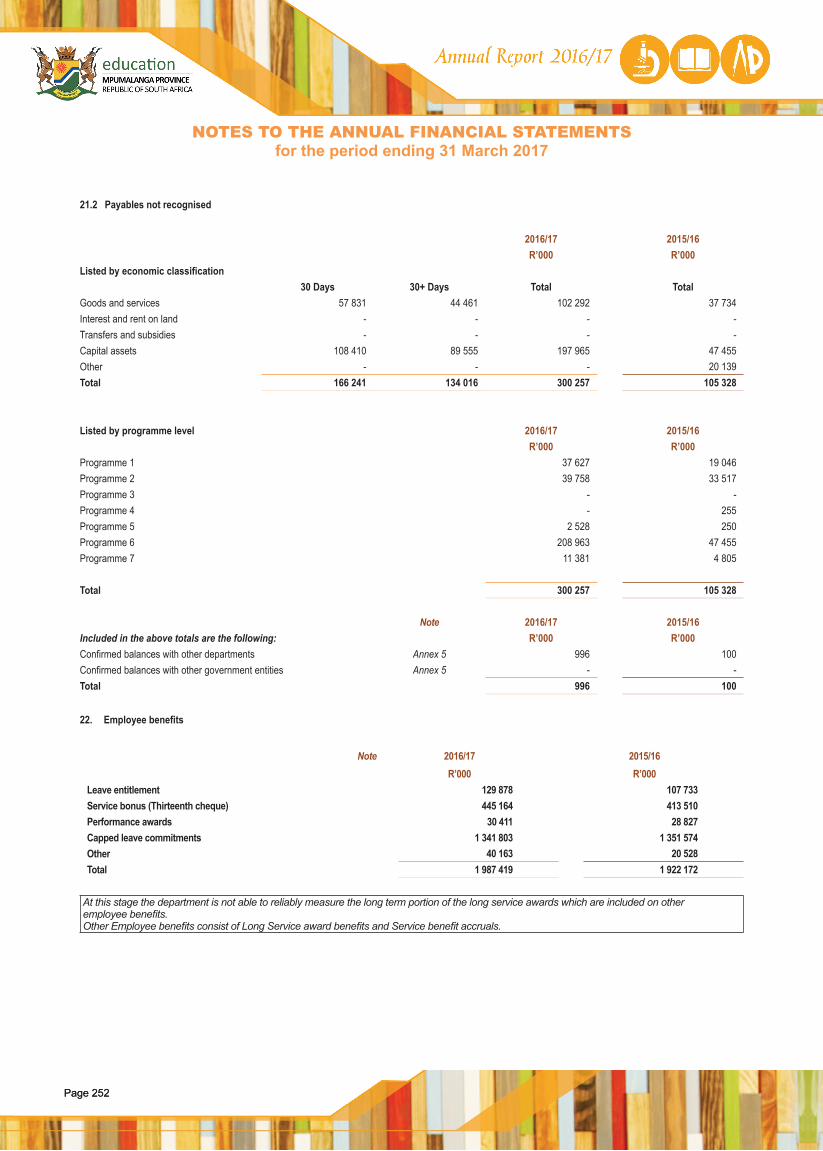
Page 252Page 252
NOTES TO THE ANNUAL FINANCIAL STATEMENTSfor the period ending 31 March 2017
21.2 Payables not recognised
2016/17 2015/16R’000 R’000
Listed by economic classification30 Days 30+ Days Total Total
Goods and services 57 831 44 461 102 292 37 734Interest and rent on land - - - -Transfers and subsidies - - - -Capital assets 108 410 89 555 197 965 47 455Other - - - 20 139Total 166 241 134 016 300 257 105 328
Listed by programme level 2016/17 2015/16R’000 R’000
Programme 1 37 627 19 046Programme 2 39 758 33 517Programme 3 - -Programme 4 - 255Programme 5 2 528 250Programme 6 208 963 47 455Programme 7 11 381 4 805
Total 300 257 105 328
Note 2016/17 2015/16Included in the above totals are the following: R’000 R’000Confirmed balances with other departments Annex 5 996 100Confirmed balances with other government entities Annex 5 - -Total 996 100
22. Employee benefits
Note 2016/17 2015/16R’000 R’000
Leave entitlement 129 878 107 733Service bonus (Thirteenth cheque) 445 164 413 510Performance awards 30 411 28 827Capped leave commitments 1 341 803 1 351 574Other 40 163 20 528Total 1 987 419 1 922 172
At this stage the department is not able to reliably measure the long term portion of the long service awards which are included on other employee benefits. Other Employee benefits consist of Long Service award benefits and Service benefit accruals.
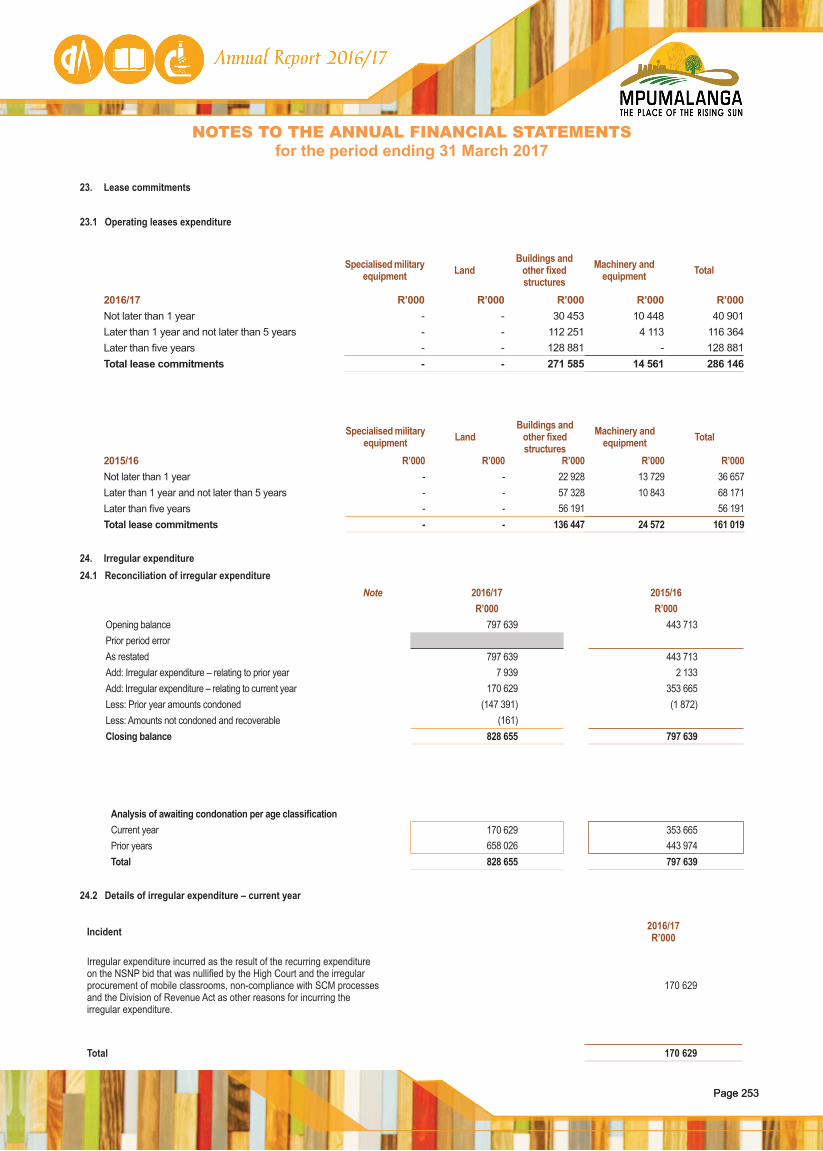
Page 253Page 253
21.2 Payables not recognised
2016/17 2015/16R’000 R’000
Listed by economic classification30 Days 30+ Days Total Total
Goods and services 57 831 44 461 102 292 37 734Interest and rent on land - - - -Transfers and subsidies - - - -Capital assets 108 410 89 555 197 965 47 455Other - - - 20 139Total 166 241 134 016 300 257 105 328
Listed by programme level 2016/17 2015/16R’000 R’000
Programme 1 37 627 19 046Programme 2 39 758 33 517Programme 3 - -Programme 4 - 255Programme 5 2 528 250Programme 6 208 963 47 455Programme 7 11 381 4 805
Total 300 257 105 328
Note 2016/17 2015/16Included in the above totals are the following: R’000 R’000Confirmed balances with other departments Annex 5 996 100Confirmed balances with other government entities Annex 5 - -Total 996 100
22. Employee benefits
Note 2016/17 2015/16R’000 R’000
Leave entitlement 129 878 107 733Service bonus (Thirteenth cheque) 445 164 413 510Performance awards 30 411 28 827Capped leave commitments 1 341 803 1 351 574Other 40 163 20 528Total 1 987 419 1 922 172
At this stage the department is not able to reliably measure the long term portion of the long service awards which are included on other employee benefits. Other Employee benefits consist of Long Service award benefits and Service benefit accruals.
NOTES TO THE ANNUAL FINANCIAL STATEMENTSfor the period ending 31 March 2017
23. Lease commitments
23.1 Operating leases expenditure
Specialised military equipment Land
Buildings and other fixed structures
Machinery and equipment Total
2016/17 R’000 R’000 R’000 R’000 R’000Not later than 1 year - - 30 453 10 448 40 901Later than 1 year and not later than 5 years - - 112 251 4 113 116 364Later than five years - - 128 881 - 128 881Total lease commitments - - 271 585 14 561 286 146
Specialised military equipment Land
Buildings and other fixed structures
Machinery and equipment Total
2015/16 R’000 R’000 R’000 R’000 R’000Not later than 1 year - - 22 928 13 729 36 657Later than 1 year and not later than 5 years - - 57 328 10 843 68 171Later than five years - - 56 191 56 191Total lease commitments - - 136 447 24 572 161 019
24. Irregular expenditure24.1 Reconciliation of irregular expenditure
Note 2016/17 2015/16R’000 R’000
Opening balance 797 639 443 713Prior period errorAs restated 797 639 443 713Add: Irregular expenditure – relating to prior year 7 939 2 133Add: Irregular expenditure – relating to current year 170 629 353 665Less: Prior year amounts condoned (147 391) (1 872)Less: Amounts not condoned and recoverable (161)Closing balance 828 655 797 639
Analysis of awaiting condonation per age classificationCurrent year 170 629 353 665Prior years 658 026 443 974Total 828 655 797 639
24.2 Details of irregular expenditure – current year
Incident 2016/17R’000
Irregular expenditure incurred as the result of the recurring expenditure on the NSNP bid that was nullified by the High Court and the irregular procurement of mobile classrooms, non-compliance with SCM processes and the Division of Revenue Act as other reasons for incurring the irregular expenditure.
170 629
Total 170 629
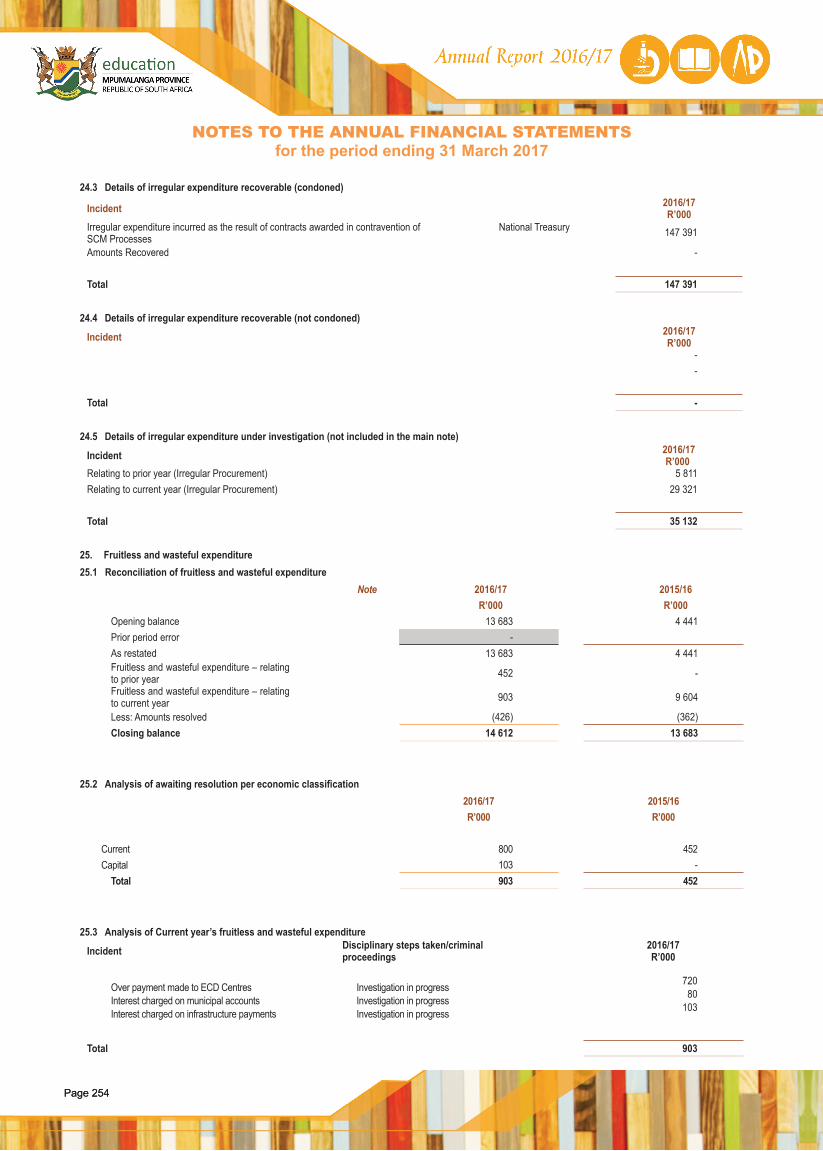
Page 254Page 254
NOTES TO THE ANNUAL FINANCIAL STATEMENTSfor the period ending 31 March 2017
24.3 Details of irregular expenditure recoverable (condoned)
Incident 2016/17R’000
Irregular expenditure incurred as the result of contracts awarded in contravention of SCM Processes
National Treasury 147 391
Amounts Recovered -
Total 147 391
24.4 Details of irregular expenditure recoverable (not condoned)
Incident 2016/17R’000
--
Total -
24.5 Details of irregular expenditure under investigation (not included in the main note)
Incident 2016/17 R’000
Relating to prior year (Irregular Procurement) 5 811Relating to current year (Irregular Procurement) 29 321
Total 35 132
25. Fruitless and wasteful expenditure25.1 Reconciliation of fruitless and wasteful expenditure
Note 2016/17 2015/16R’000 R’000
Opening balance 13 683 4 441Prior period error -As restated 13 683 4 441Fruitless and wasteful expenditure – relating to prior year 452 -
Fruitless and wasteful expenditure – relating to current year 903 9 604
Less: Amounts resolved (426) (362)Closing balance 14 612 13 683
25.2 Analysis of awaiting resolution per economic classification2016/17 2015/16R’000 R’000
Current 800 452Capital 103 -
Total 903 452
25.3 Analysis of Current year’s fruitless and wasteful expenditure
Incident Disciplinary steps taken/criminal proceedings
2016/17R’000
Over payment made to ECD Centres Interest charged on municipal accounts Interest charged on infrastructure payments
Investigation in progress Investigation in progress Investigation in progress
72080
103
Total 903
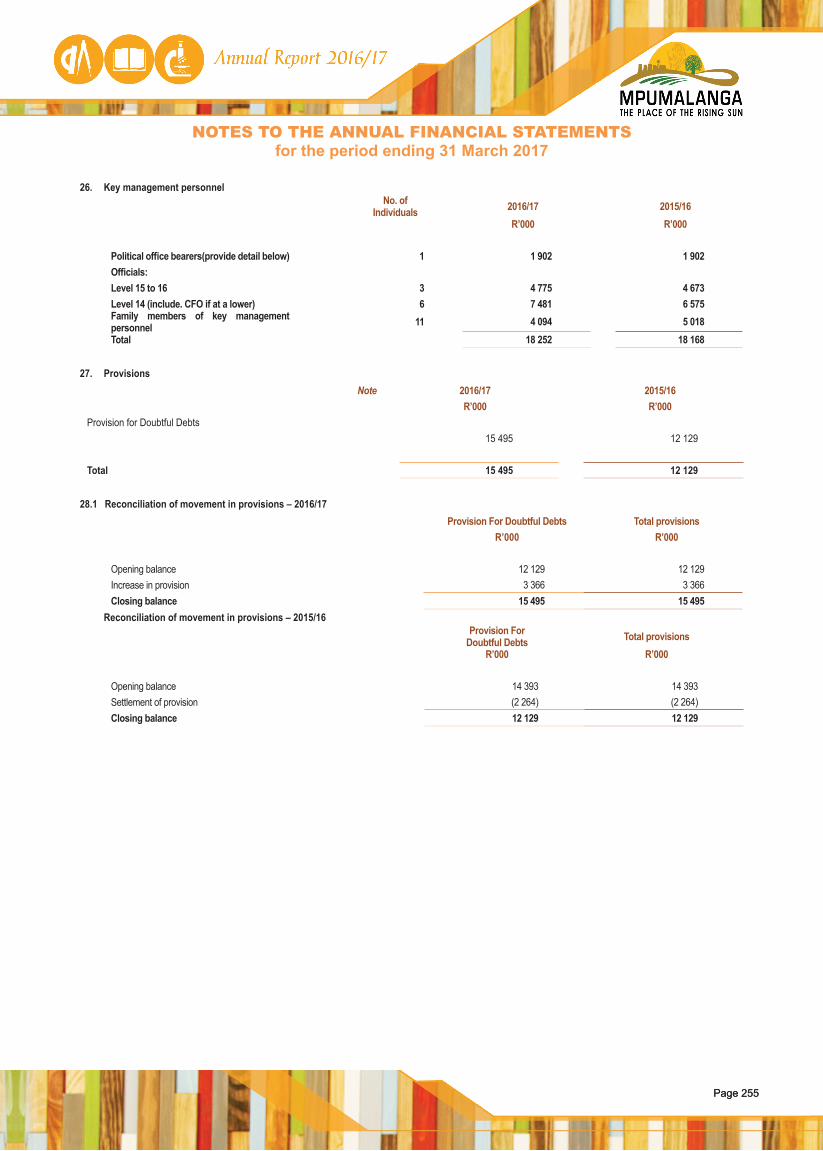
Page 255Page 255
24.3 Details of irregular expenditure recoverable (condoned)
Incident 2016/17R’000
Irregular expenditure incurred as the result of contracts awarded in contravention of SCM Processes
National Treasury 147 391
Amounts Recovered -
Total 147 391
24.4 Details of irregular expenditure recoverable (not condoned)
Incident 2016/17R’000
--
Total -
24.5 Details of irregular expenditure under investigation (not included in the main note)
Incident 2016/17 R’000
Relating to prior year (Irregular Procurement) 5 811Relating to current year (Irregular Procurement) 29 321
Total 35 132
25. Fruitless and wasteful expenditure25.1 Reconciliation of fruitless and wasteful expenditure
Note 2016/17 2015/16R’000 R’000
Opening balance 13 683 4 441Prior period error -As restated 13 683 4 441Fruitless and wasteful expenditure – relating to prior year 452 -
Fruitless and wasteful expenditure – relating to current year 903 9 604
Less: Amounts resolved (426) (362)Closing balance 14 612 13 683
25.2 Analysis of awaiting resolution per economic classification2016/17 2015/16R’000 R’000
Current 800 452Capital 103 -
Total 903 452
25.3 Analysis of Current year’s fruitless and wasteful expenditure
Incident Disciplinary steps taken/criminal proceedings
2016/17R’000
Over payment made to ECD Centres Interest charged on municipal accounts Interest charged on infrastructure payments
Investigation in progress Investigation in progress Investigation in progress
72080
103
Total 903
NOTES TO THE ANNUAL FINANCIAL STATEMENTSfor the period ending 31 March 2017
26. Key management personnelNo. of
Individuals 2016/17 2015/16R’000 R’000
Political office bearers(provide detail below) 1 1 902 1 902Officials:Level 15 to 16 3 4 775 4 673Level 14 (include. CFO if at a lower) 6 7 481 6 575Family members of key management personnel 11 4 094 5 018Total 18 252 18 168
27. ProvisionsNote 2016/17 2015/16
R’000 R’000Provision for Doubtful Debts 15 495 12 129
Total 15 495 12 129
28.1 Reconciliation of movement in provisions – 2016/17Provision For Doubtful Debts Total provisions
R’000 R’000
Opening balance 12 129 12 129Increase in provision 3 366 3 366Closing balance 15 495 15 495
Reconciliation of movement in provisions – 2015/16Provision For
Doubtful Debts Total provisionsR’000 R’000
Opening balance 14 393 14 393Settlement of provision (2 264) (2 264)Closing balance 12 129 12 129

Page 256Page 256
NOTES TO THE ANNUAL FINANCIAL STATEMENTSfor the period ending 31 March 2017
29. Movable Tangible Capital AssetsMOVEMENT IN MOVABLE TANGIBLE CAPITAL ASSETS PER ASSET REGISTER FOR THE YEAR ENDED 31 MARCH 2017
Opening balance Value adjustments Additions Disposals Closing Balance
R’000 R’000 R’000 R’000 R’000
MACHINERY AND EQUIPMENT 137 053 12 093 3 061 146 086Transport assets 48 093 7 209 3 061 52 241Computer equipment 62 886 2 452 65 338Mobile classrooms - - -Furniture and office equipment 20 177 1 167 21 344Other machinery and equipment 5 897 1 265 7 065TOTAL MOVABLE TANGIBLE CAPITAL ASSETS 137 053 12 093 3 061 146 086
Movable Tangible Capital Assets under investigation
Number Value R’000
Included in the above total of the movable tangible capital assets per the asset register are assets that are under investigation:Machinery and equipment 3 325 119 200
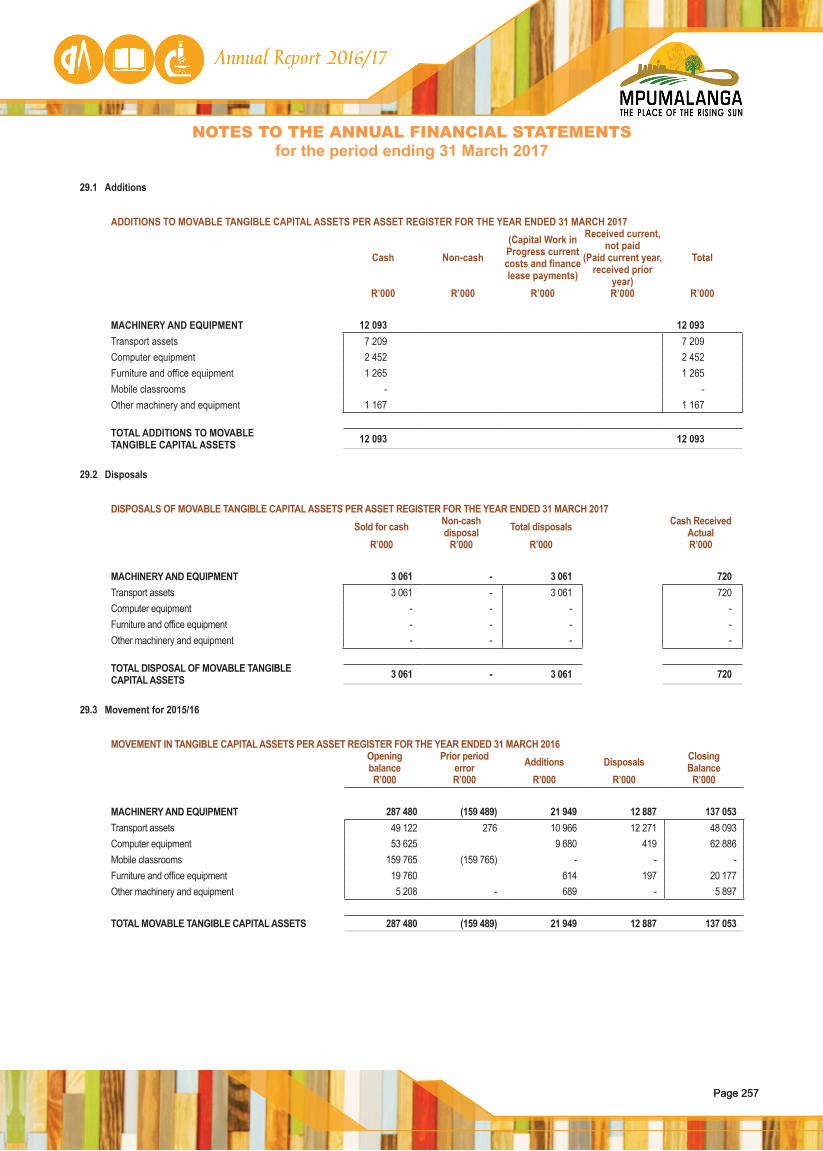
Page 257Page 257
29. Movable Tangible Capital AssetsMOVEMENT IN MOVABLE TANGIBLE CAPITAL ASSETS PER ASSET REGISTER FOR THE YEAR ENDED 31 MARCH 2017
Opening balance Value adjustments Additions Disposals Closing Balance
R’000 R’000 R’000 R’000 R’000
MACHINERY AND EQUIPMENT 137 053 12 093 3 061 146 086Transport assets 48 093 7 209 3 061 52 241Computer equipment 62 886 2 452 65 338Mobile classrooms - - -Furniture and office equipment 20 177 1 167 21 344Other machinery and equipment 5 897 1 265 7 065TOTAL MOVABLE TANGIBLE CAPITAL ASSETS 137 053 12 093 3 061 146 086
Movable Tangible Capital Assets under investigation
Number Value R’000
Included in the above total of the movable tangible capital assets per the asset register are assets that are under investigation:Machinery and equipment 3 325 119 200
NOTES TO THE ANNUAL FINANCIAL STATEMENTSfor the period ending 31 March 2017
29.1 Additions
ADDITIONS TO MOVABLE TANGIBLE CAPITAL ASSETS PER ASSET REGISTER FOR THE YEAR ENDED 31 MARCH 2017
Cash Non-cash(Capital Work in Progress current costs and finance lease payments)
Received current, not paid
(Paid current year, received prior
year)
Total
R’000 R’000 R’000 R’000 R’000
MACHINERY AND EQUIPMENT 12 093 12 093Transport assets 7 209 7 209Computer equipment 2 452 2 452Furniture and office equipment 1 265 1 265Mobile classrooms - -Other machinery and equipment 1 167 1 167
TOTAL ADDITIONS TO MOVABLE TANGIBLE CAPITAL ASSETS 12 093 12 093
29.2 Disposals
DISPOSALS OF MOVABLE TANGIBLE CAPITAL ASSETS PER ASSET REGISTER FOR THE YEAR ENDED 31 MARCH 2017Sold for cash Non-cash
disposal Total disposals Cash Received Actual
R’000 R’000 R’000 R’000
MACHINERY AND EQUIPMENT 3 061 - 3 061 720Transport assets 3 061 - 3 061 720Computer equipment - - - -Furniture and office equipment - - - -Other machinery and equipment - - - -
TOTAL DISPOSAL OF MOVABLE TANGIBLE CAPITAL ASSETS 3 061 - 3 061 720
29.3 Movement for 2015/16
MOVEMENT IN TANGIBLE CAPITAL ASSETS PER ASSET REGISTER FOR THE YEAR ENDED 31 MARCH 2016Opening balance
Prior period error Additions Disposals Closing
BalanceR’000 R’000 R’000 R’000 R’000
MACHINERY AND EQUIPMENT 287 480 (159 489) 21 949 12 887 137 053Transport assets 49 122 276 10 966 12 271 48 093Computer equipment 53 625 9 680 419 62 886Mobile classrooms 159 765 (159 765) - - -Furniture and office equipment 19 760 614 197 20 177Other machinery and equipment 5 208 - 689 - 5 897
TOTAL MOVABLE TANGIBLE CAPITAL ASSETS 287 480 (159 489) 21 949 12 887 137 053
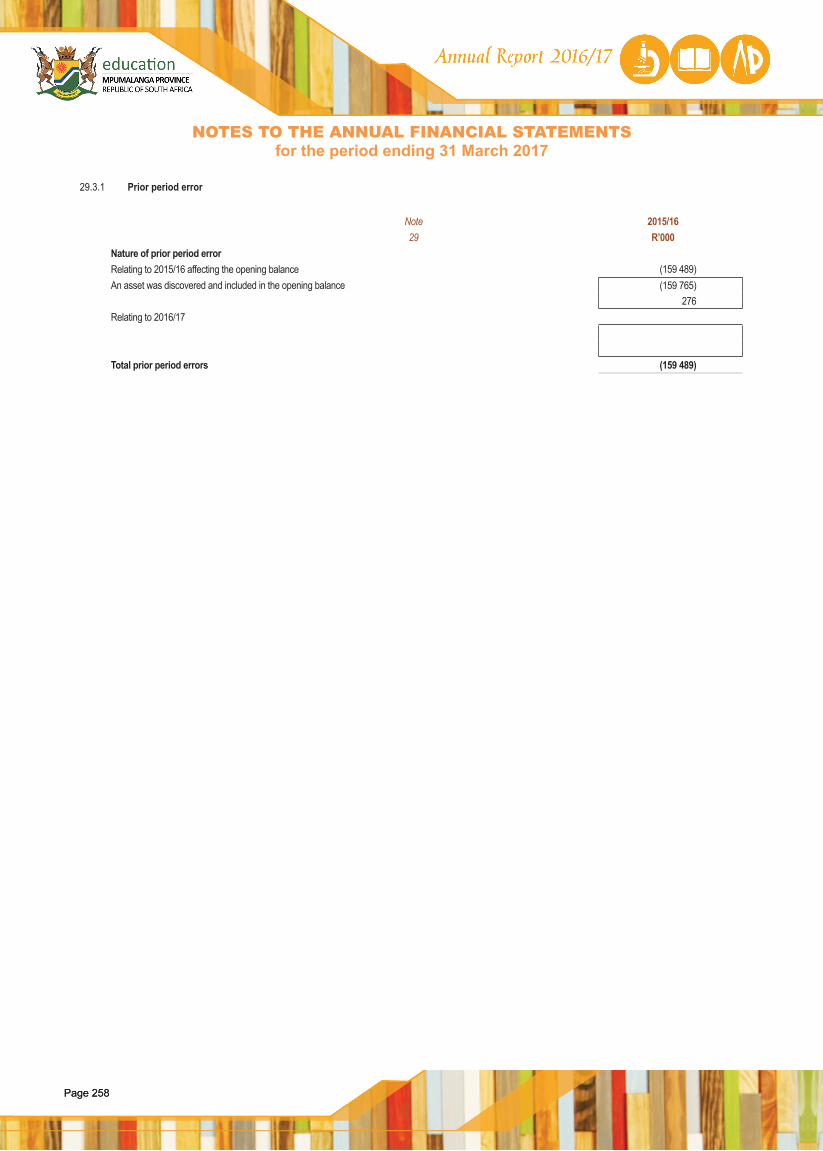
Page 258Page 258
NOTES TO THE ANNUAL FINANCIAL STATEMENTSfor the period ending 31 March 2017
29.3.1 Prior period error
Note 2015/1629 R’000
Nature of prior period errorRelating to 2015/16 affecting the opening balance (159 489)An asset was discovered and included in the opening balance (159 765)
276Relating to 2016/17
Total prior period errors (159 489)
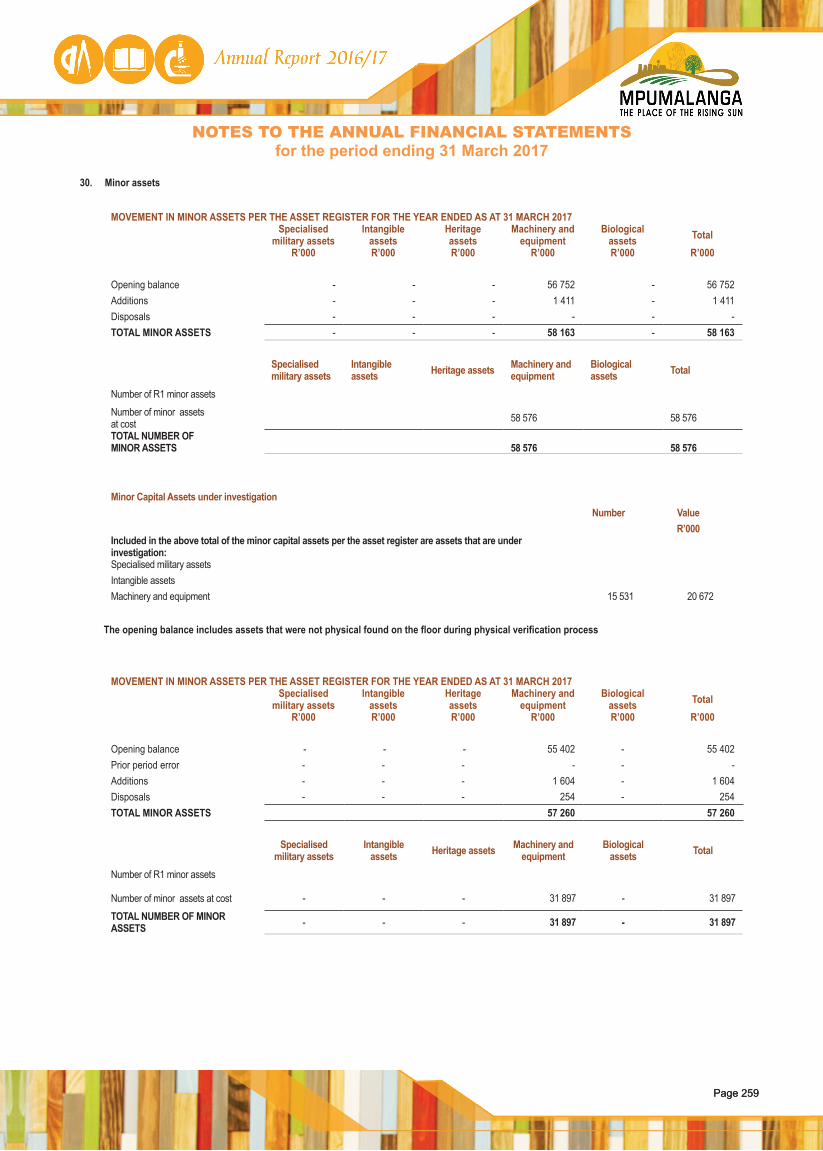
Page 259Page 259
29.3.1 Prior period error
Note 2015/1629 R’000
Nature of prior period errorRelating to 2015/16 affecting the opening balance (159 489)An asset was discovered and included in the opening balance (159 765)
276Relating to 2016/17
Total prior period errors (159 489)
NOTES TO THE ANNUAL FINANCIAL STATEMENTSfor the period ending 31 March 2017
30. Minor assets
MOVEMENT IN MINOR ASSETS PER THE ASSET REGISTER FOR THE YEAR ENDED AS AT 31 MARCH 2017Specialised
military assetsIntangible
assetsHeritage assets
Machinery and equipment
Biological assets Total
R’000 R’000 R’000 R’000 R’000 R’000
Opening balance - - - 56 752 - 56 752Additions - - - 1 411 - 1 411Disposals - - - - - -TOTAL MINOR ASSETS - - - 58 163 - 58 163
Specialised military assets
Intangible assets Heritage assets Machinery and
equipmentBiological assets Total
Number of R1 minor assets
Number of minor assets at cost 58 576 58 576
TOTAL NUMBER OF MINOR ASSETS 58 576 58 576
Minor Capital Assets under investigationNumber Value
R’000Included in the above total of the minor capital assets per the asset register are assets that are under investigation:Specialised military assetsIntangible assetsMachinery and equipment 15 531 20 672
The opening balance includes assets that were not physical found on the floor during physical verification process
MOVEMENT IN MINOR ASSETS PER THE ASSET REGISTER FOR THE YEAR ENDED AS AT 31 MARCH 2017Specialised
military assetsIntangible
assetsHeritage assets
Machinery and equipment
Biological assets Total
R’000 R’000 R’000 R’000 R’000 R’000
Opening balance - - - 55 402 - 55 402Prior period error - - - - - - Additions - - - 1 604 - 1 604Disposals - - - 254 - 254TOTAL MINOR ASSETS 57 260 57 260
Specialised military assets
Intangible assets Heritage assets Machinery and
equipmentBiological
assets Total
Number of R1 minor assets
Number of minor assets at cost - - - 31 897 - 31 897
TOTAL NUMBER OF MINOR ASSETS - - - 31 897 - 31 897

Page 260Page 260
NOTES TO THE ANNUAL FINANCIAL STATEMENTSfor the period ending 31 March 2017
30.1 Movable assets written off
MOVABLE ASSETS WRITTEN OFF FOR THE YEAR ENDED AS AT 31 MARCH 2017Specialised
military assets
Intangible assets
Heritage assets
Machinery and
equipmentBiological
assets Total
R’000 R’000 R’000 R’000 R’000 R’000
Assets written off - - - - - -TOTAL MOVABLE ASSETS WRITTEN OFF - - - - - -
MOVABLE ASSETS WRITTEN OFF FOR THE YEAR ENDED AS AT 31 MARCH 2017Specialised
military assets Intangible assets Heritage assets Machinery and equipment Biological assets Total
R’000 R’000 R’000 R’000 R’000 R’000
Assets written off - - - - - -TOTAL MOVABLE ASSETS WRITTEN OFF - - - - - -
30.2 S42 Movable Capital Assets MAJOR ASSETS SUBJECTED TO TRANSFER IN TERMS OF S42 OF THE PFMA - 31 MARCH 2016
Specialised military assets Intangible assets Heritage assets Machinery and
equipment Biological assets Total
No of Assets - - - - - -Value of the asset (R'000) - - - - - -
MINOR ASSETS SUBJECTED TO TRANSFER IN TERMS OF S42 OF THE PFMA - 31 MARCH 2017Specialised
military assets Intangible assets Heritage assets Machinery and equipment Biological assets Total
No of Assets - - - - - -Value of the asset (R'000) - - - - - -
MAJOR ASSETS SUBJECTED TO TRANSFER IN TERMS OF S42 OF THE PFMA - 31 MARCH 2016Specialised
military assets Intangible assets Heritage assets Machinery and equipment Biological assets Total
No of Assets - - - - - -Value of the asset (R'000) - - - - - -
MINOR ASSETS SUBJECTED TO TRANSFER IN TERMS OF S42 OF THE PFMA - 31 MARCH 2016Specialised
military assets Intangible assets Heritage assets Machinery and equipment Biological assets Total
No of Assets - - - - - -Value of the asset (R'000) - - - - - -
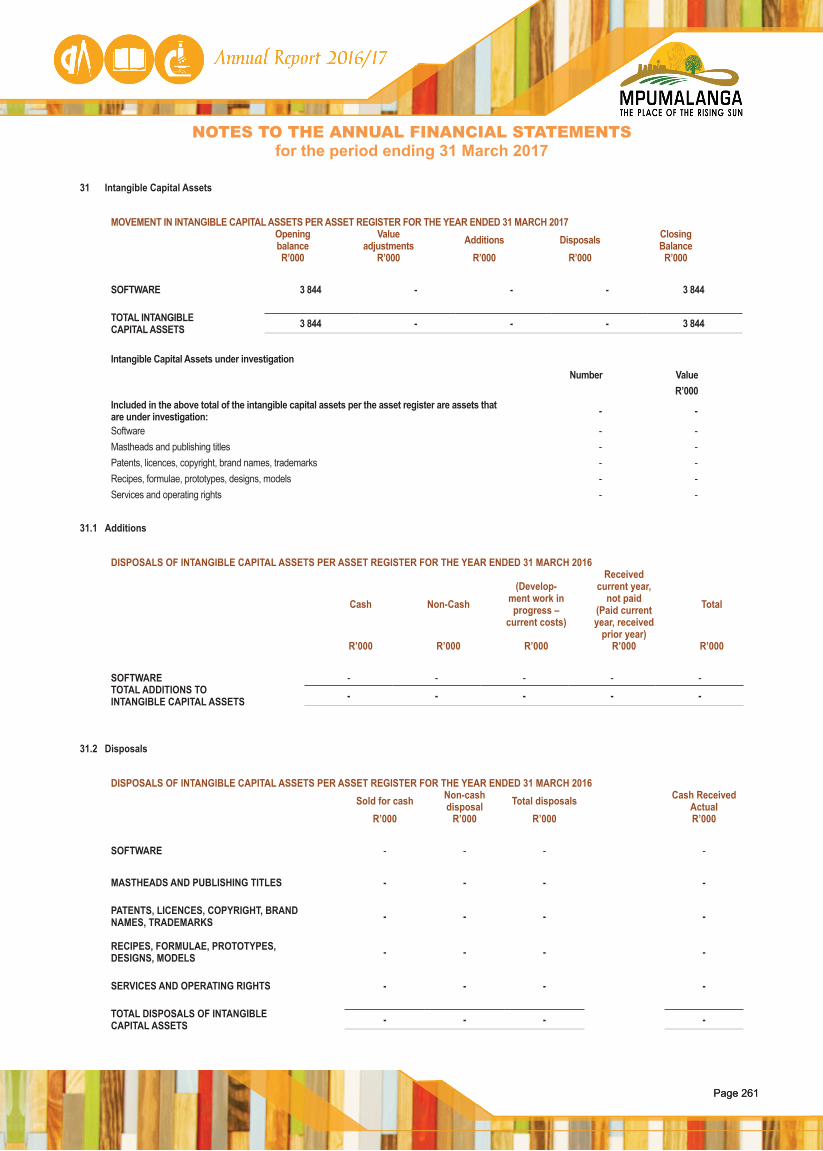
Page 261Page 261
30.1 Movable assets written off
MOVABLE ASSETS WRITTEN OFF FOR THE YEAR ENDED AS AT 31 MARCH 2017Specialised
military assets
Intangible assets
Heritage assets
Machinery and
equipmentBiological
assets Total
R’000 R’000 R’000 R’000 R’000 R’000
Assets written off - - - - - -TOTAL MOVABLE ASSETS WRITTEN OFF - - - - - -
MOVABLE ASSETS WRITTEN OFF FOR THE YEAR ENDED AS AT 31 MARCH 2017Specialised
military assets Intangible assets Heritage assets Machinery and equipment Biological assets Total
R’000 R’000 R’000 R’000 R’000 R’000
Assets written off - - - - - -TOTAL MOVABLE ASSETS WRITTEN OFF - - - - - -
30.2 S42 Movable Capital Assets MAJOR ASSETS SUBJECTED TO TRANSFER IN TERMS OF S42 OF THE PFMA - 31 MARCH 2016
Specialised military assets Intangible assets Heritage assets Machinery and
equipment Biological assets Total
No of Assets - - - - - -Value of the asset (R'000) - - - - - -
MINOR ASSETS SUBJECTED TO TRANSFER IN TERMS OF S42 OF THE PFMA - 31 MARCH 2017Specialised
military assets Intangible assets Heritage assets Machinery and equipment Biological assets Total
No of Assets - - - - - -Value of the asset (R'000) - - - - - -
MAJOR ASSETS SUBJECTED TO TRANSFER IN TERMS OF S42 OF THE PFMA - 31 MARCH 2016Specialised
military assets Intangible assets Heritage assets Machinery and equipment Biological assets Total
No of Assets - - - - - -Value of the asset (R'000) - - - - - -
MINOR ASSETS SUBJECTED TO TRANSFER IN TERMS OF S42 OF THE PFMA - 31 MARCH 2016Specialised
military assets Intangible assets Heritage assets Machinery and equipment Biological assets Total
No of Assets - - - - - -Value of the asset (R'000) - - - - - -
NOTES TO THE ANNUAL FINANCIAL STATEMENTSfor the period ending 31 March 2017
31 Intangible Capital Assets
MOVEMENT IN INTANGIBLE CAPITAL ASSETS PER ASSET REGISTER FOR THE YEAR ENDED 31 MARCH 2017Opening balance
Value adjustments Additions Disposals Closing
BalanceR’000 R’000 R’000 R’000 R’000
SOFTWARE 3 844 - - - 3 844
TOTAL INTANGIBLE CAPITAL ASSETS 3 844 - - - 3 844
Intangible Capital Assets under investigationNumber Value
R’000Included in the above total of the intangible capital assets per the asset register are assets that are under investigation: - -
Software - -Mastheads and publishing titles - -Patents, licences, copyright, brand names, trademarks - -Recipes, formulae, prototypes, designs, models - -Services and operating rights - -
31.1 Additions
DISPOSALS OF INTANGIBLE CAPITAL ASSETS PER ASSET REGISTER FOR THE YEAR ENDED 31 MARCH 2016
Cash Non-Cash(Develop-
ment work in progress –
current costs)
Received current year,
not paid(Paid current year, received
prior year)
Total
R’000 R’000 R’000 R’000 R’000
SOFTWARE - - - - -TOTAL ADDITIONS TO INTANGIBLE CAPITAL ASSETS - - - - -
31.2 Disposals
DISPOSALS OF INTANGIBLE CAPITAL ASSETS PER ASSET REGISTER FOR THE YEAR ENDED 31 MARCH 2016Sold for cash Non-cash
disposal Total disposals Cash Received Actual
R’000 R’000 R’000 R’000
SOFTWARE - - - -
MASTHEADS AND PUBLISHING TITLES - - - -
PATENTS, LICENCES, COPYRIGHT, BRAND NAMES, TRADEMARKS - - - -
RECIPES, FORMULAE, PROTOTYPES, DESIGNS, MODELS - - - -
SERVICES AND OPERATING RIGHTS - - - -
TOTAL DISPOSALS OF INTANGIBLE CAPITAL ASSETS - - - -
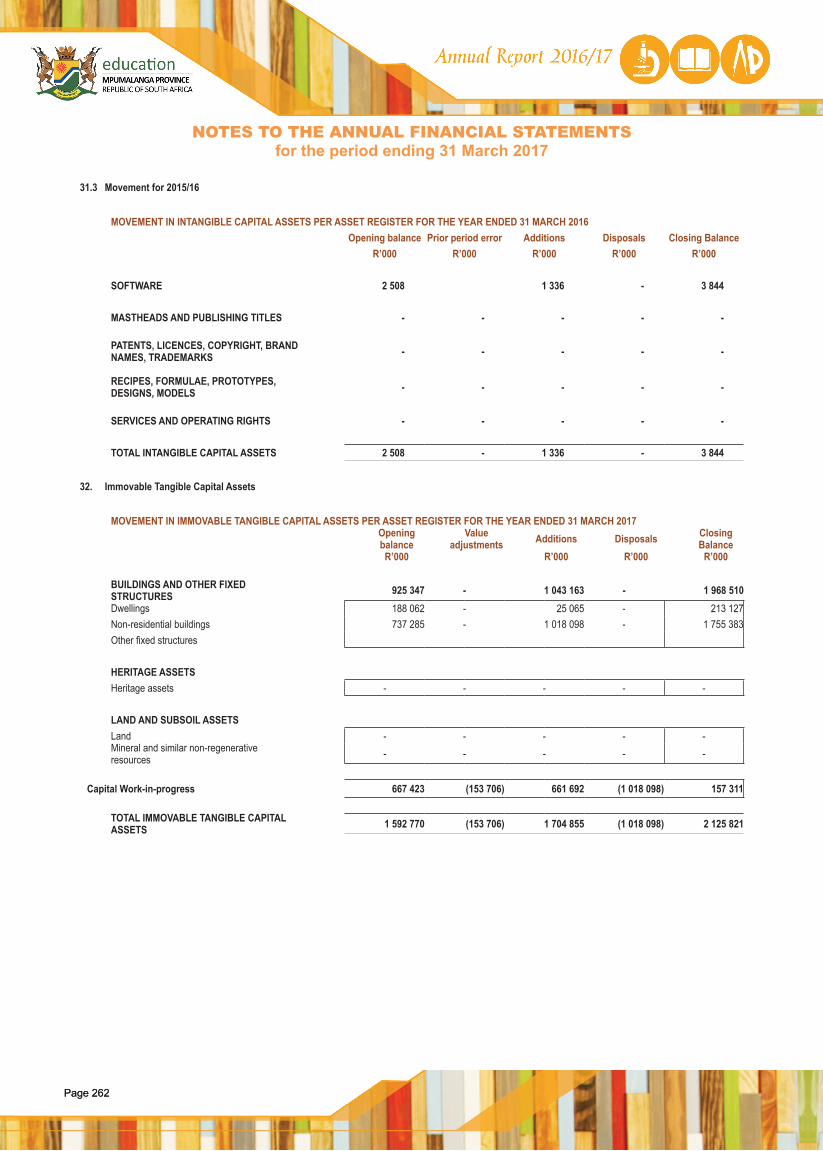
Page 262Page 262
NOTES TO THE ANNUAL FINANCIAL STATEMENTSfor the period ending 31 March 2017
31.3 Movement for 2015/16
MOVEMENT IN INTANGIBLE CAPITAL ASSETS PER ASSET REGISTER FOR THE YEAR ENDED 31 MARCH 2016Opening balance Prior period error Additions Disposals Closing Balance
R’000 R’000 R’000 R’000 R’000
SOFTWARE 2 508 1 336 - 3 844
MASTHEADS AND PUBLISHING TITLES - - - - -
PATENTS, LICENCES, COPYRIGHT, BRAND NAMES, TRADEMARKS - - - - -
RECIPES, FORMULAE, PROTOTYPES, DESIGNS, MODELS - - - - -
SERVICES AND OPERATING RIGHTS - - - - -
TOTAL INTANGIBLE CAPITAL ASSETS 2 508 - 1 336 - 3 844
32. Immovable Tangible Capital Assets
MOVEMENT IN IMMOVABLE TANGIBLE CAPITAL ASSETS PER ASSET REGISTER FOR THE YEAR ENDED 31 MARCH 2017Opening balance
Value adjustments Additions Disposals Closing
BalanceR’000 R’000 R’000 R’000
BUILDINGS AND OTHER FIXED STRUCTURES 925 347 - 1 043 163 - 1 968 510Dwellings 188 062 - 25 065 - 213 127Non-residential buildings 737 285 - 1 018 098 - 1 755 383Other fixed structures
HERITAGE ASSETSHeritage assets - - - - -
LAND AND SUBSOIL ASSETSLand - - - - -Mineral and similar non-regenerative resources - - - - -
Capital Work-in-progress 667 423 (153 706) 661 692 (1 018 098) 157 311
TOTAL IMMOVABLE TANGIBLE CAPITAL ASSETS 1 592 770 (153 706) 1 704 855 (1 018 098) 2 125 821
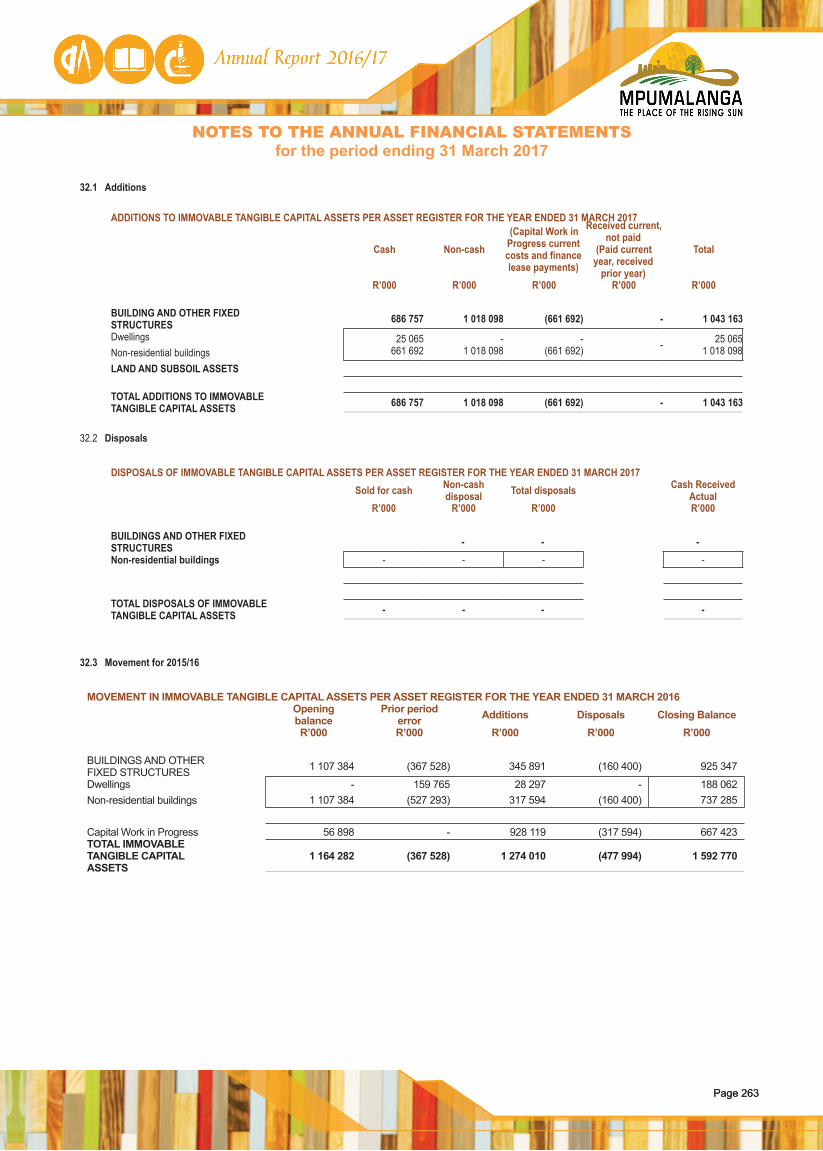
Page 263Page 263
NOTES TO THE ANNUAL FINANCIAL STATEMENTSfor the period ending 31 March 2017
32.1 Additions
ADDITIONS TO IMMOVABLE TANGIBLE CAPITAL ASSETS PER ASSET REGISTER FOR THE YEAR ENDED 31 MARCH 2017
Cash Non-cash(Capital Work in
Progress current costs and finance lease payments)
Received current, not paid
(Paid current year, received
prior year)
Total
R’000 R’000 R’000 R’000 R’000
BUILDING AND OTHER FIXED STRUCTURES 686 757 1 018 098 (661 692) - 1 043 163Dwellings 25 065
661 692-
1 018 098-
(661 692) - 25 0651 018 098Non-residential buildings
LAND AND SUBSOIL ASSETS
TOTAL ADDITIONS TO IMMOVABLE TANGIBLE CAPITAL ASSETS 686 757 1 018 098 (661 692) - 1 043 163
32.2 Disposals
DISPOSALS OF IMMOVABLE TANGIBLE CAPITAL ASSETS PER ASSET REGISTER FOR THE YEAR ENDED 31 MARCH 2017Sold for cash Non-cash
disposal Total disposals Cash Received Actual
R’000 R’000 R’000 R’000
BUILDINGS AND OTHER FIXED STRUCTURES - - - Non-residential buildings - - - -
TOTAL DISPOSALS OF IMMOVABLE TANGIBLE CAPITAL ASSETS - - - -
32.3 Movement for 2015/16
MOVEMENT IN IMMOVABLE TANGIBLE CAPITAL ASSETS PER ASSET REGISTER FOR THE YEAR ENDED 31 MARCH 2016Opening balance
Prior period error Additions Disposals Closing Balance
R’000 R’000 R’000 R’000 R’000
BUILDINGS AND OTHER FIXED STRUCTURES 1 107 384 (367 528) 345 891 (160 400) 925 347
Dwellings - 159 765 28 297 - 188 062Non-residential buildings 1 107 384 (527 293) 317 594 (160 400) 737 285
Capital Work in Progress 56 898 - 928 119 (317 594) 667 423TOTAL IMMOVABLE TANGIBLE CAPITAL ASSETS
1 164 282 (367 528) 1 274 010 (477 994) 1 592 770
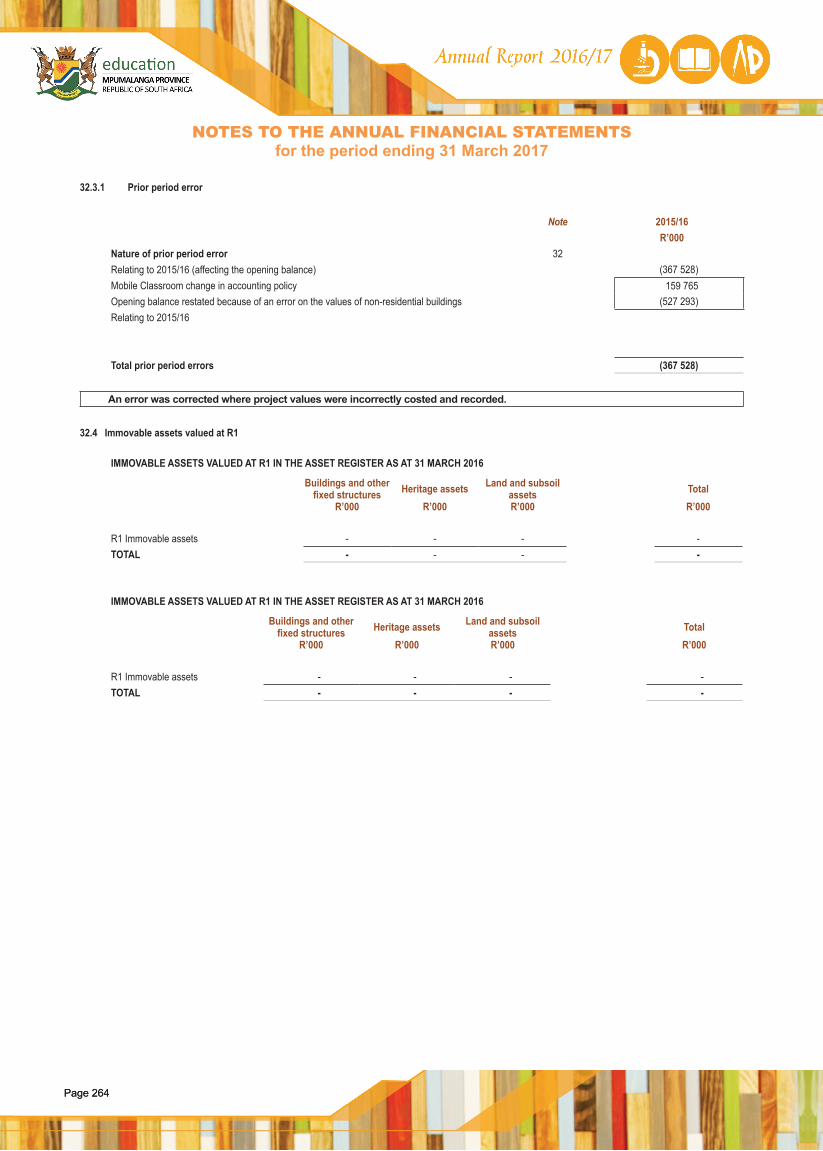
Page 264Page 264
NOTES TO THE ANNUAL FINANCIAL STATEMENTSfor the period ending 31 March 2017
32.3.1 Prior period error
Note 2015/16R’000
Nature of prior period error 32Relating to 2015/16 (affecting the opening balance) (367 528)Mobile Classroom change in accounting policy 159 765Opening balance restated because of an error on the values of non-residential buildings (527 293)Relating to 2015/16
Total prior period errors (367 528)
An error was corrected where project values were incorrectly costed and recorded.
32.4 Immovable assets valued at R1
IMMOVABLE ASSETS VALUED AT R1 IN THE ASSET REGISTER AS AT 31 MARCH 2016
Buildings and other fixed structures Heritage assets Land and subsoil
assets TotalR’000 R’000 R’000 R’000
R1 Immovable assets - - - -TOTAL - - - -
IMMOVABLE ASSETS VALUED AT R1 IN THE ASSET REGISTER AS AT 31 MARCH 2016
Buildings and other fixed structures Heritage assets Land and subsoil
assets TotalR’000 R’000 R’000 R’000
R1 Immovable assets - - - -TOTAL - - - -
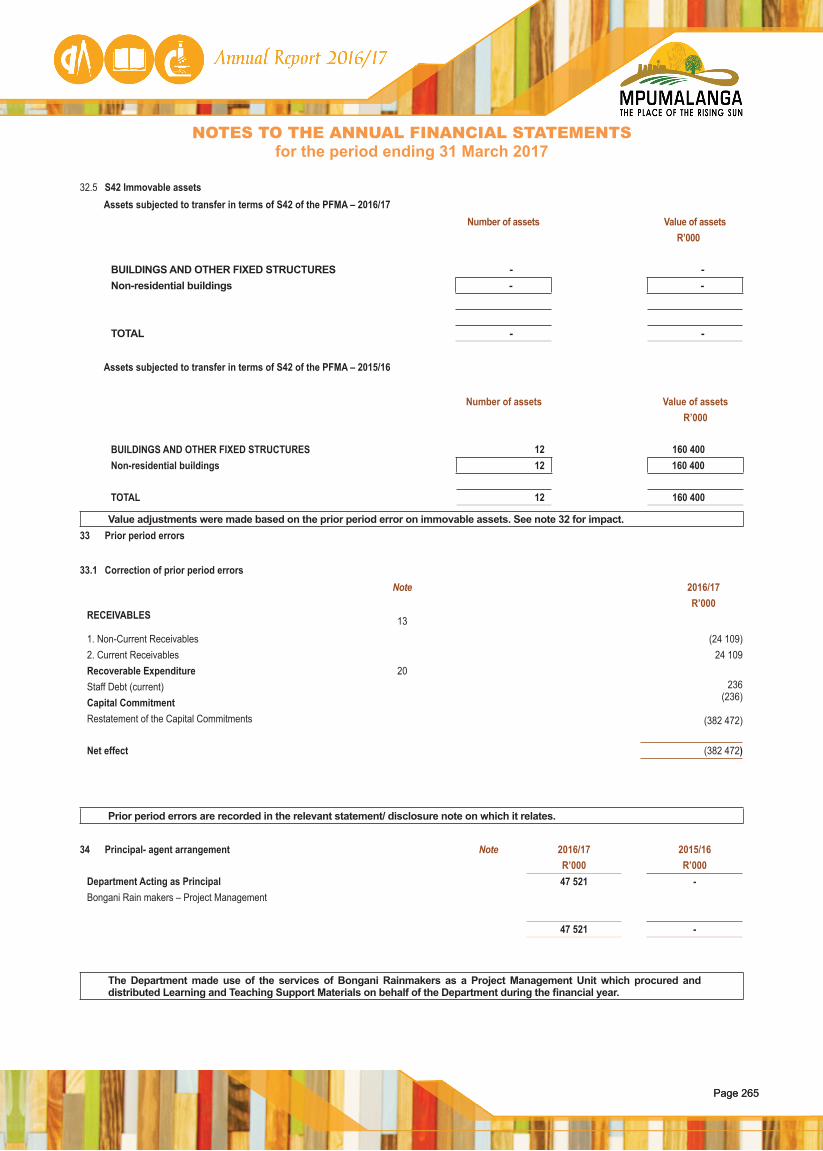
Page 265Page 265
32.3.1 Prior period error
Note 2015/16R’000
Nature of prior period error 32Relating to 2015/16 (affecting the opening balance) (367 528)Mobile Classroom change in accounting policy 159 765Opening balance restated because of an error on the values of non-residential buildings (527 293)Relating to 2015/16
Total prior period errors (367 528)
An error was corrected where project values were incorrectly costed and recorded.
32.4 Immovable assets valued at R1
IMMOVABLE ASSETS VALUED AT R1 IN THE ASSET REGISTER AS AT 31 MARCH 2016
Buildings and other fixed structures Heritage assets Land and subsoil
assets TotalR’000 R’000 R’000 R’000
R1 Immovable assets - - - -TOTAL - - - -
IMMOVABLE ASSETS VALUED AT R1 IN THE ASSET REGISTER AS AT 31 MARCH 2016
Buildings and other fixed structures Heritage assets Land and subsoil
assets TotalR’000 R’000 R’000 R’000
R1 Immovable assets - - - -TOTAL - - - -
NOTES TO THE ANNUAL FINANCIAL STATEMENTSfor the period ending 31 March 2017
32.5 S42 Immovable assetsAssets subjected to transfer in terms of S42 of the PFMA – 2016/17
Number of assets Value of assets R’000
BUILDINGS AND OTHER FIXED STRUCTURES - -Non-residential buildings - -
TOTAL - -
Assets subjected to transfer in terms of S42 of the PFMA – 2015/16
Number of assets Value of assetsR’000
BUILDINGS AND OTHER FIXED STRUCTURES 12 160 400Non-residential buildings 12 160 400
TOTAL 12 160 400
Value adjustments were made based on the prior period error on immovable assets. See note 32 for impact.33 Prior period errors
33.1 Correction of prior period errors Note 2016/17
R’000RECEIVABLES 13
1. Non-Current Receivables (24 109)2. Current Receivables 24 109Recoverable Expenditure 20
236(236)
(382 472)
Staff Debt (current)Capital Commitment Restatement of the Capital Commitments
Net effect (382 472)
Prior period errors are recorded in the relevant statement/ disclosure note on which it relates.
34 Principal- agent arrangement Note 2016/17 2015/16R’000 R’000
Department Acting as Principal 47 521 -Bongani Rain makers – Project Management
47 521 -
The Department made use of the services of Bongani Rainmakers as a Project Management Unit which procured and distributed Learning and Teaching Support Materials on behalf of the Department during the financial year.
Page 266Page 266
NOTES TO THE ANNUAL FINANCIAL STATEMENTSfor the period ending 31 March 2017
35 Related party transactions
The Department has the following Related Parties:1. The Mpumalanga Department of Public Works Roads and TransportDuring the year the Department received service from the Department of Public Works, Road and Transport that are related to the Department. The Department of Education occupies Government Building in the Province provided by the Department of Public Works, Roads and Transport free of charge.
2. Departmental AgenciesThe Department has one Public Entities reporting to it and these entities assist the department in carrying out its legislative mandate. The Department enters into a shareholders compact with the Boards of these agencies. The public entity is described below:- The Mpumalanga Regional Training Trust.
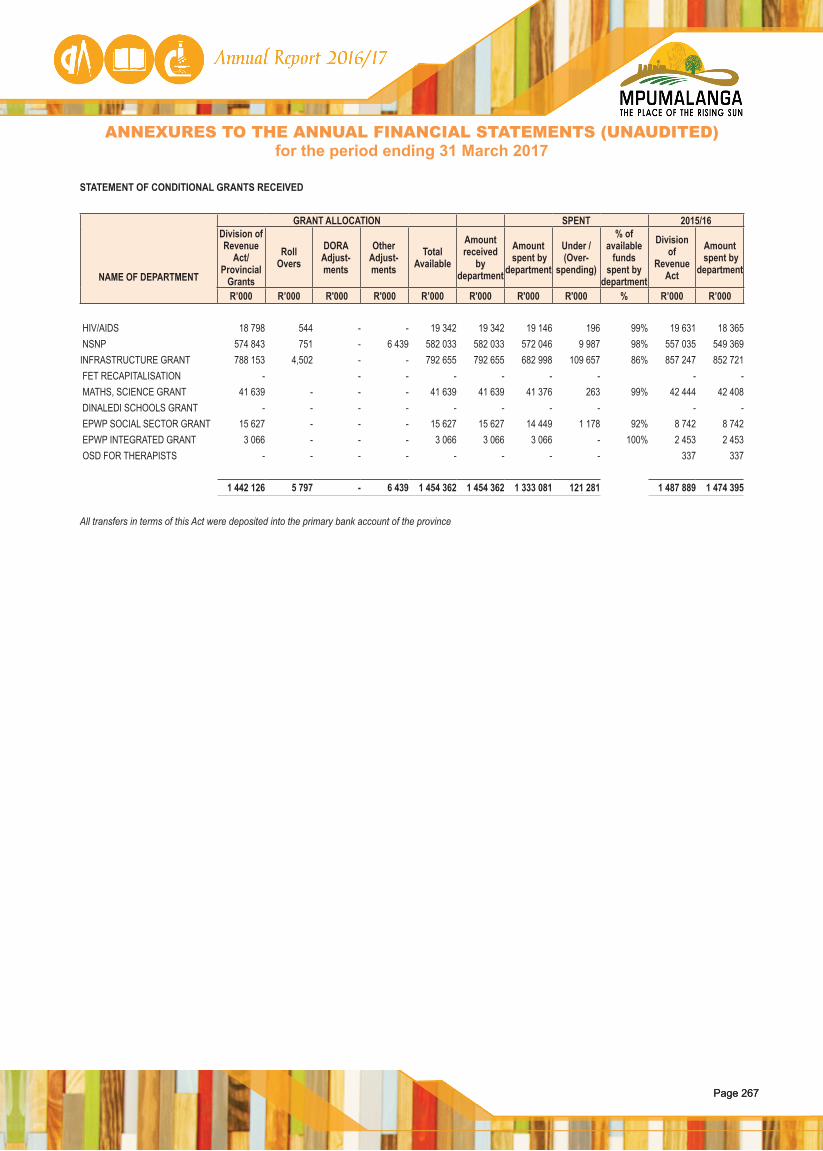
Page 267Page 267
ANNEXURES TO THE ANNUAL FINANCIAL STATEMENTS (UNAUDITED)for the period ending 31 March 2017
STATEMENT OF CONDITIONAL GRANTS RECEIVED
NAME OF DEPARTMENT
GRANT ALLOCATION SPENT 2015/16Division of Revenue
Act/ Provincial
Grants
Roll Overs
DORA Adjust-ments
Other Adjust-ments
Total Available
Amount received
by department
Amount spent by
department
Under / (Over-
spending)
% of available
funds spent by
department
Division of
Revenue Act
Amount spent by
department
R’000 R’000 R'000 R'000 R’000 R'000 R'000 R'000 % R’000 R’000
HIV/AIDS 18 798 544 - - 19 342 19 342 19 146 196 99% 19 631 18 365 NSNP 574 843 751 - 6 439 582 033 582 033 572 046 9 987 98% 557 035 549 369 INFRASTRUCTURE GRANT 788 153 4,502 - - 792 655 792 655 682 998 109 657 86% 857 247 852 721 FET RECAPITALISATION - - - - - - - - - MATHS, SCIENCE GRANT 41 639 - - - 41 639 41 639 41 376 263 99% 42 444 42 408 DINALEDI SCHOOLS GRANT - - - - - - - - - - EPWP SOCIAL SECTOR GRANT 15 627 - - - 15 627 15 627 14 449 1 178 92% 8 742 8 742 EPWP INTEGRATED GRANT 3 066 - - - 3 066 3 066 3 066 - 100% 2 453 2 453 OSD FOR THERAPISTS - - - - - - - - 337 337
1 442 126 5 797 - 6 439 1 454 362 1 454 362 1 333 081 121 281 1 487 889 1 474 395
All transfers in terms of this Act were deposited into the primary bank account of the province
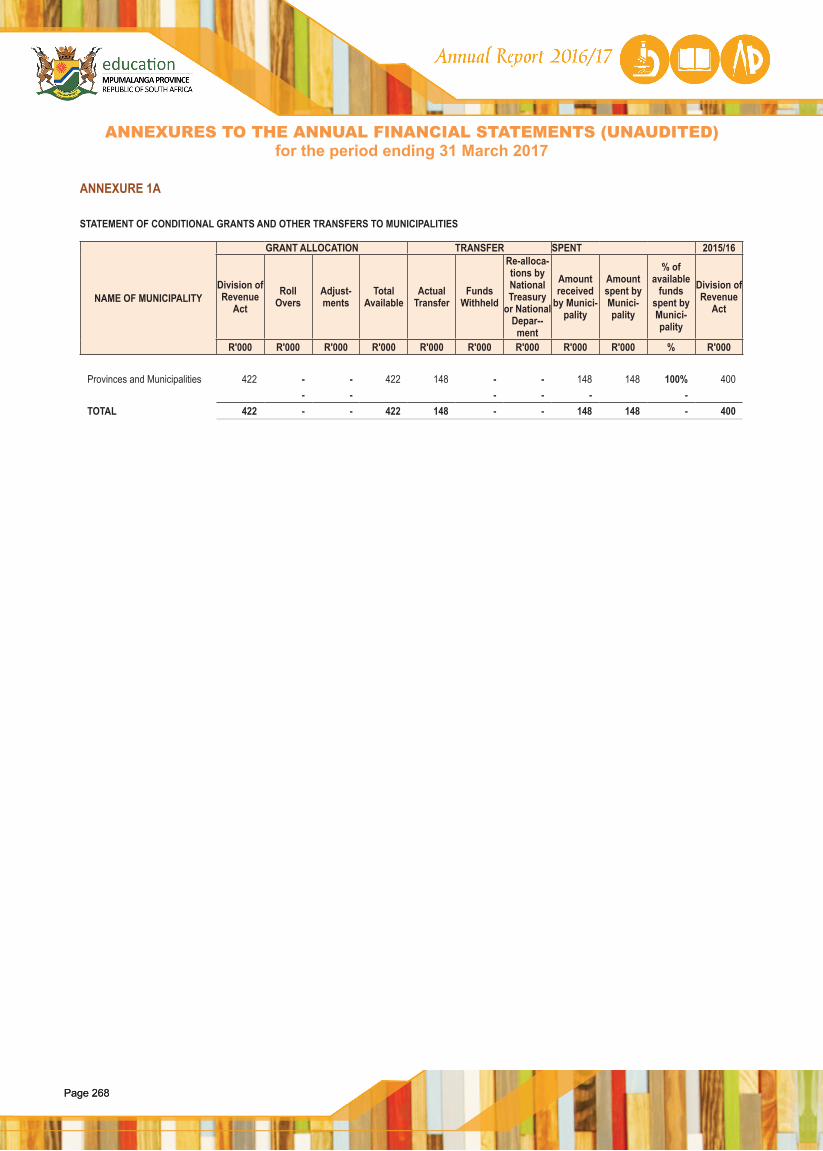
Page 268Page 268
ANNEXURES TO THE ANNUAL FINANCIAL STATEMENTS (UNAUDITED)for the period ending 31 March 2017
ANNEXURE 1A
STATEMENT OF CONDITIONAL GRANTS AND OTHER TRANSFERS TO MUNICIPALITIES
NAME OF MUNICIPALITY
GRANT ALLOCATION TRANSFER SPENT 2015/16
Division of Revenue
ActRoll
OversAdjust-ments
Total Available
Actual Transfer
Funds Withheld
Re-alloca-tions by National Treasury
or National Depar--ment
Amount received
by Munici-pality
Amount spent by Munici-pality
% of available
funds spent by Munici-pality
Division of Revenue
Act
R'000 R'000 R'000 R'000 R'000 R'000 R'000 R'000 R'000 % R'000
Provinces and Municipalities 422 - - 422 148 - - 148 148 100% 400- - - - - -
TOTAL 422 - - 422 148 - - 148 148 - 400
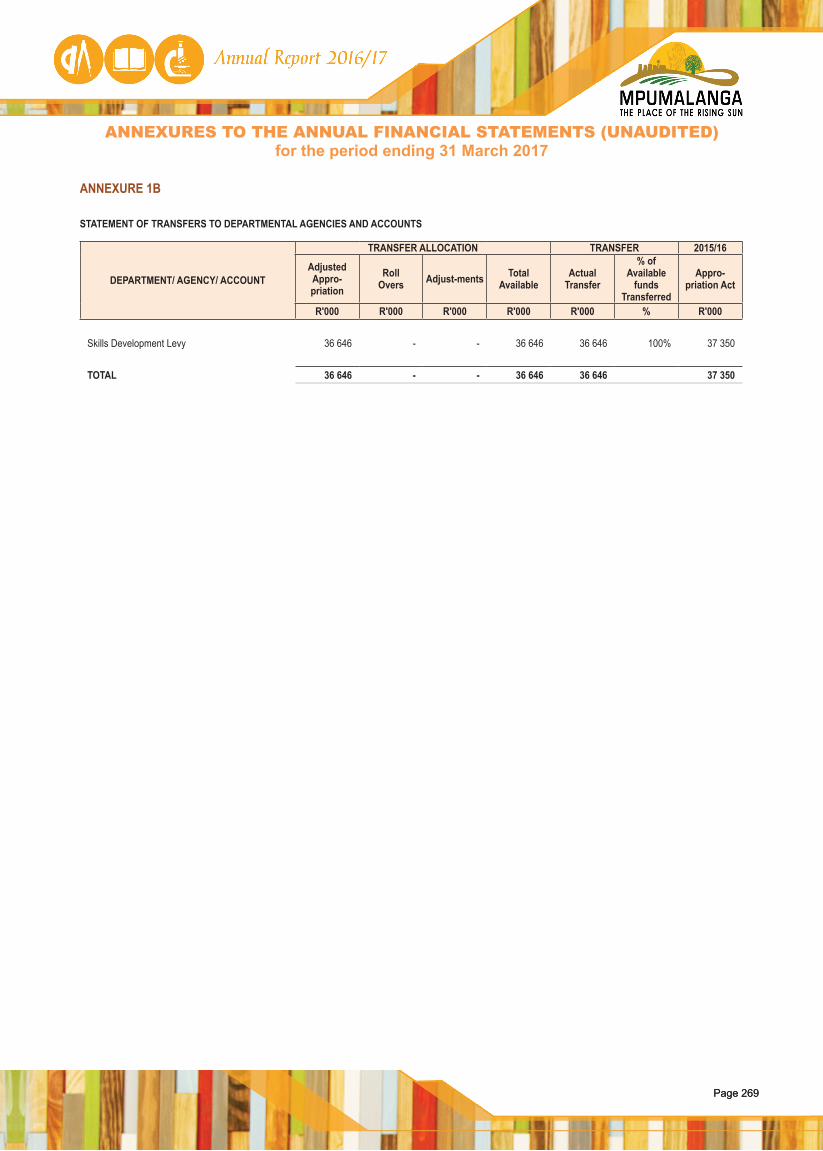
Page 269Page 269
ANNEXURE 1A
STATEMENT OF CONDITIONAL GRANTS AND OTHER TRANSFERS TO MUNICIPALITIES
NAME OF MUNICIPALITY
GRANT ALLOCATION TRANSFER SPENT 2015/16
Division of Revenue
ActRoll
OversAdjust-ments
Total Available
Actual Transfer
Funds Withheld
Re-alloca-tions by National Treasury
or National Depar--ment
Amount received
by Munici-pality
Amount spent by Munici-pality
% of available
funds spent by Munici-pality
Division of Revenue
Act
R'000 R'000 R'000 R'000 R'000 R'000 R'000 R'000 R'000 % R'000
Provinces and Municipalities 422 - - 422 148 - - 148 148 100% 400- - - - - -
TOTAL 422 - - 422 148 - - 148 148 - 400
ANNEXURES TO THE ANNUAL FINANCIAL STATEMENTS (UNAUDITED)for the period ending 31 March 2017
ANNEXURE 1B
STATEMENT OF TRANSFERS TO DEPARTMENTAL AGENCIES AND ACCOUNTS
DEPARTMENT/ AGENCY/ ACCOUNT
TRANSFER ALLOCATION TRANSFER 2015/16
AdjustedAppro-priation
Roll Overs Adjust-ments Total
AvailableActual
Transfer
% of Available
funds Transferred
Appro-priation Act
R'000 R'000 R'000 R'000 R'000 % R'000
Skills Development Levy 36 646 - - 36 646 36 646 100% 37 350
TOTAL 36 646 - - 36 646 36 646 37 350
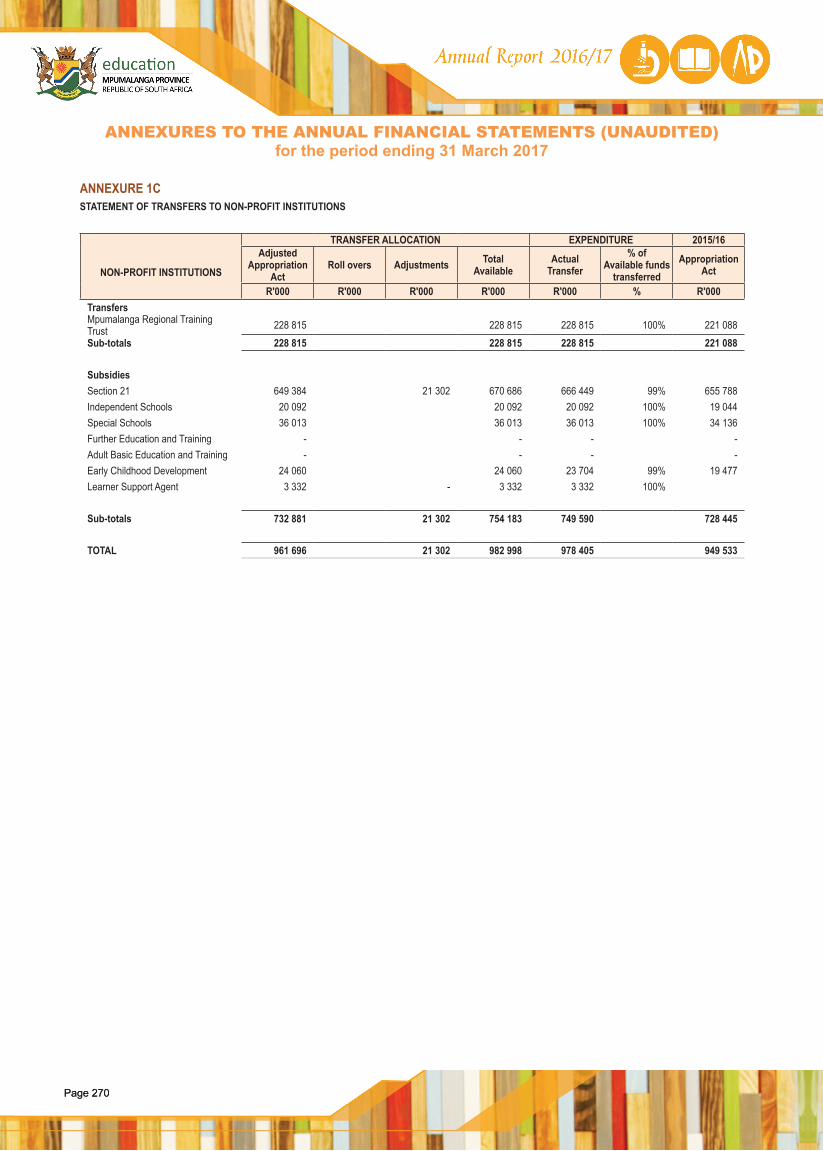
Page 270Page 270
ANNEXURES TO THE ANNUAL FINANCIAL STATEMENTS (UNAUDITED)for the period ending 31 March 2017
ANNEXURE 1CSTATEMENT OF TRANSFERS TO NON-PROFIT INSTITUTIONS
NON-PROFIT INSTITUTIONS
TRANSFER ALLOCATION EXPENDITURE 2015/16Adjusted
Appropriation Act
Roll overs Adjustments Total Available
Actual Transfer
% of Available funds
transferredAppropriation
Act
R'000 R'000 R'000 R'000 R'000 % R'000TransfersMpumalanga Regional Training Trust 228 815 228 815 228 815 100% 221 088
Sub-totals 228 815 228 815 228 815 221 088
SubsidiesSection 21 649 384 21 302 670 686 666 449 99% 655 788Independent Schools 20 092 20 092 20 092 100% 19 044Special Schools 36 013 36 013 36 013 100% 34 136Further Education and Training - - - -Adult Basic Education and Training - - - -Early Childhood Development 24 060 24 060 23 704 99% 19 477Learner Support Agent 3 332 - 3 332 3 332 100%
Sub-totals 732 881 21 302 754 183 749 590 728 445
TOTAL 961 696 21 302 982 998 978 405 949 533
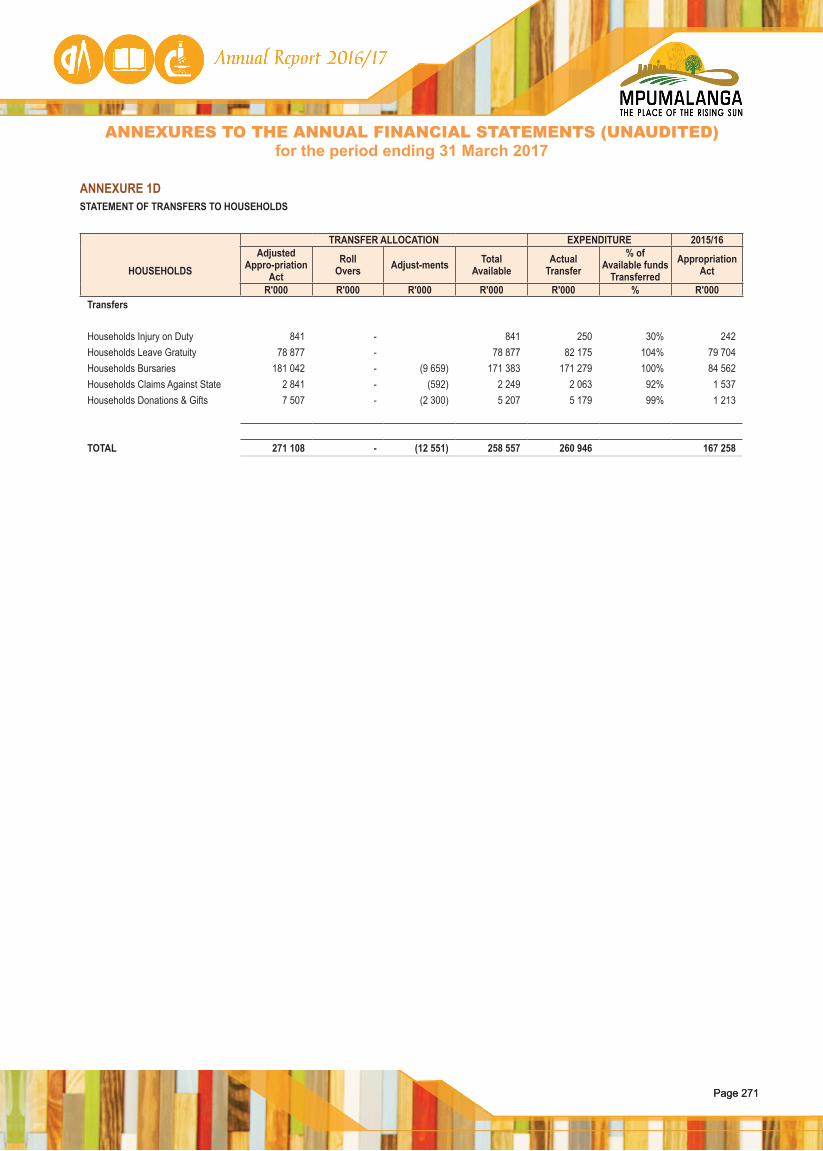
Page 271Page 271
ANNEXURES TO THE ANNUAL FINANCIAL STATEMENTS (UNAUDITED)for the period ending 31 March 2017
ANNEXURE 1DSTATEMENT OF TRANSFERS TO HOUSEHOLDS
HOUSEHOLDS
TRANSFER ALLOCATION EXPENDITURE 2015/16Adjusted
Appro-priation Act
Roll Overs Adjust-ments Total
AvailableActual
Transfer% of
Available funds Transferred
Appropriation Act
R'000 R'000 R'000 R'000 R'000 % R'000Transfers
Households Injury on Duty 841 - 841 250 30% 242Households Leave Gratuity 78 877 - 78 877 82 175 104% 79 704Households Bursaries 181 042 - (9 659) 171 383 171 279 100% 84 562Households Claims Against State 2 841 - (592) 2 249 2 063 92% 1 537Households Donations & Gifts 7 507 - (2 300) 5 207 5 179 99% 1 213
TOTAL 271 108 - (12 551) 258 557 260 946 167 258
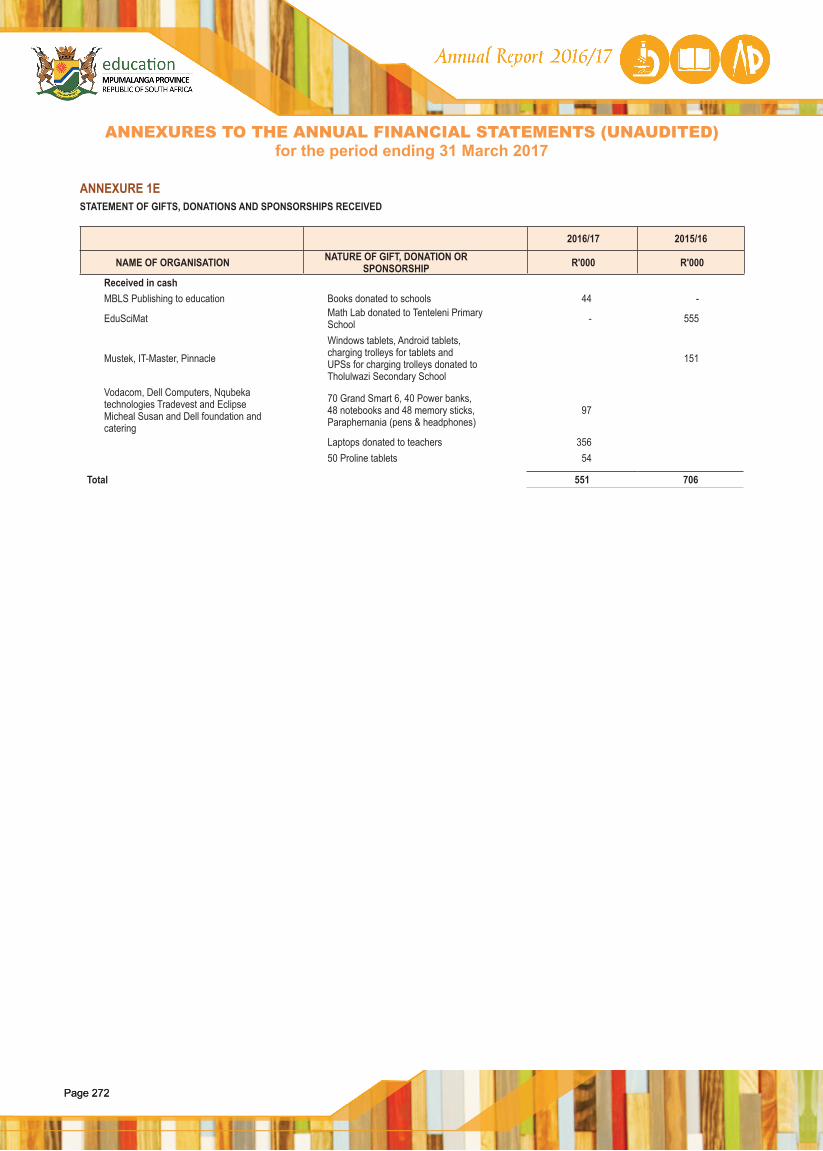
Page 272Page 272
ANNEXURES TO THE ANNUAL FINANCIAL STATEMENTS (UNAUDITED)for the period ending 31 March 2017
ANNEXURE 1ESTATEMENT OF GIFTS, DONATIONS AND SPONSORSHIPS RECEIVED
2016/17 2015/16
NAME OF ORGANISATION NATURE OF GIFT, DONATION OR SPONSORSHIP R'000 R'000
Received in cashMBLS Publishing to education Books donated to schools 44 -
EduSciMat Math Lab donated to Tenteleni Primary School - 555
Mustek, IT-Master, Pinnacle
Windows tablets, Android tablets, charging trolleys for tablets and UPSs for charging trolleys donated to Tholulwazi Secondary School
151
Vodacom, Dell Computers, Nqubeka technologies Tradevest and Eclipse Micheal Susan and Dell foundation and catering
70 Grand Smart 6, 40 Power banks, 48 notebooks and 48 memory sticks, Paraphernania (pens & headphones)
97
Laptops donated to teachers 35650 Proline tablets 54
Total 551 706
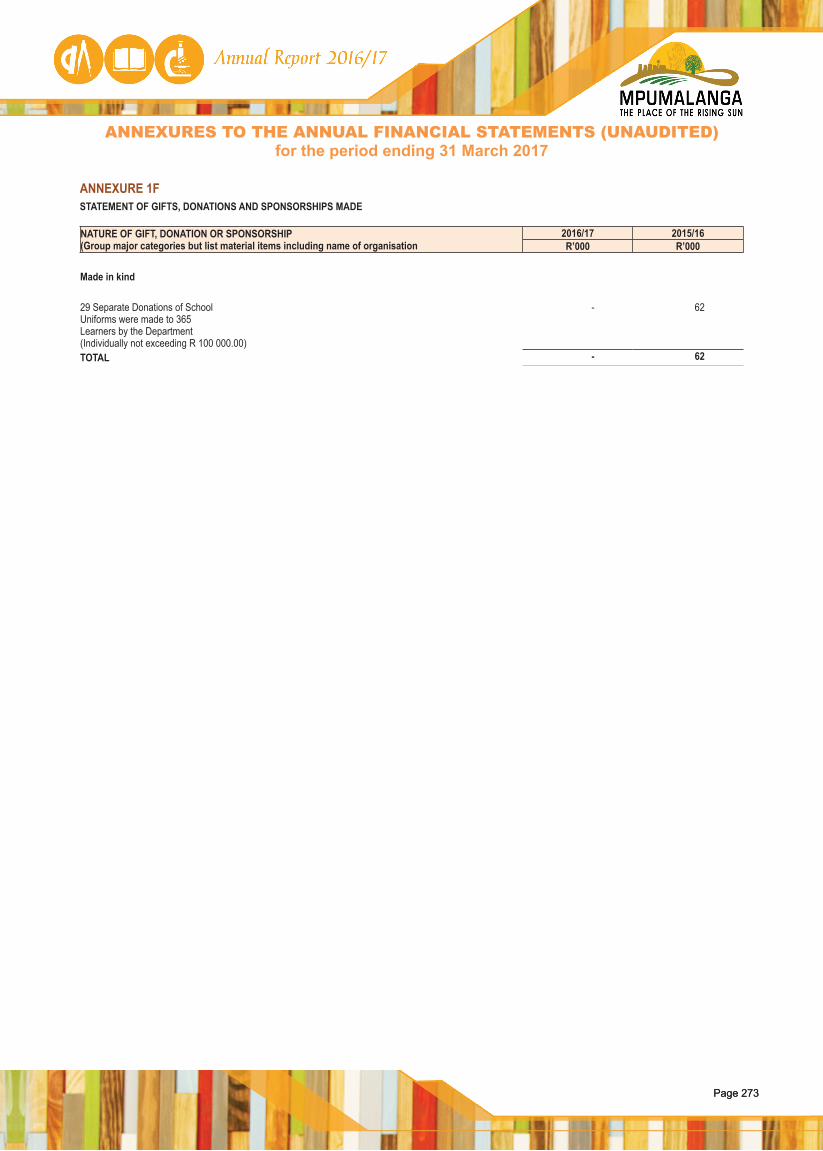
Page 273Page 273
ANNEXURE 1ESTATEMENT OF GIFTS, DONATIONS AND SPONSORSHIPS RECEIVED
2016/17 2015/16
NAME OF ORGANISATION NATURE OF GIFT, DONATION OR SPONSORSHIP R'000 R'000
Received in cashMBLS Publishing to education Books donated to schools 44 -
EduSciMat Math Lab donated to Tenteleni Primary School - 555
Mustek, IT-Master, Pinnacle
Windows tablets, Android tablets, charging trolleys for tablets and UPSs for charging trolleys donated to Tholulwazi Secondary School
151
Vodacom, Dell Computers, Nqubeka technologies Tradevest and Eclipse Micheal Susan and Dell foundation and catering
70 Grand Smart 6, 40 Power banks, 48 notebooks and 48 memory sticks, Paraphernania (pens & headphones)
97
Laptops donated to teachers 35650 Proline tablets 54
Total 551 706
ANNEXURE 1FSTATEMENT OF GIFTS, DONATIONS AND SPONSORSHIPS MADE
NATURE OF GIFT, DONATION OR SPONSORSHIP(Group major categories but list material items including name of organisation
2016/17 2015/16R’000 R’000
Made in kind
29 Separate Donations of School Uniforms were made to 365Learners by the Department(Individually not exceeding R 100 000.00)
- 62
TOTAL - 62
ANNEXURES TO THE ANNUAL FINANCIAL STATEMENTS (UNAUDITED)for the period ending 31 March 2017
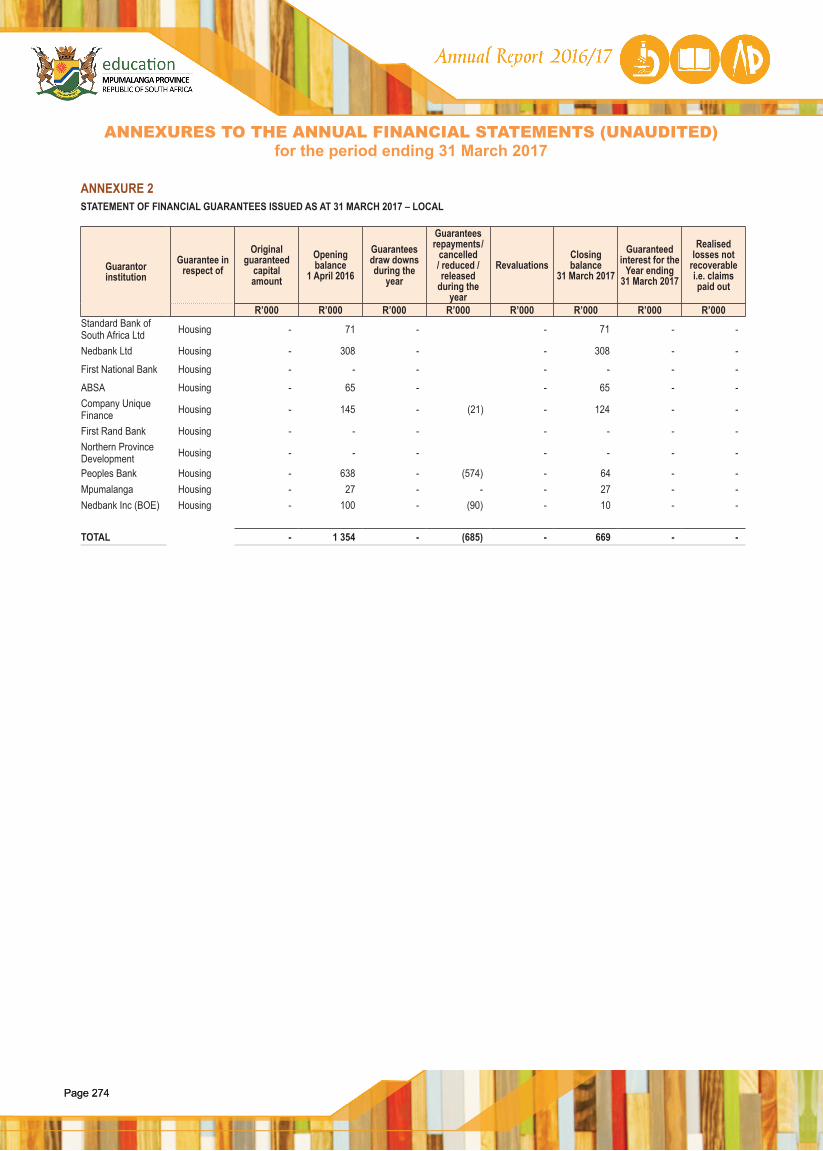
Page 274Page 274
ANNEXURE 2STATEMENT OF FINANCIAL GUARANTEES ISSUED AS AT 31 MARCH 2017 – LOCAL
Guarantor institution
Guarantee in respect of
Original guaranteed
capital amount
Opening balance
1 April 2016
Guarantees draw downsduring the
year
Guarantees repayments /
cancelled / reduced / released
during the year
RevaluationsClosing balance
31 March 2017
Guaranteed interest for the
Year ending 31 March 2017
Realised losses not
recoverable i.e. claims paid out
R’000 R’000 R’000 R’000 R’000 R’000 R’000 R’000Standard Bank of South Africa Ltd Housing - 71 - - 71 - -
Nedbank Ltd Housing - 308 - - 308 - -
First National Bank Housing - - - - - - -
ABSA Housing - 65 - - 65 - -Company Unique Finance Housing - 145 - (21) - 124 - -
First Rand Bank Housing - - - - - - -Northern Province Development Housing - - - - - - -
Peoples Bank Housing - 638 - (574) - 64 - -Mpumalanga Housing - 27 - - - 27 - -Nedbank Inc (BOE) Housing - 100 - (90) - 10 - -
TOTAL - 1 354 - (685) - 669 - -
ANNEXURES TO THE ANNUAL FINANCIAL STATEMENTS (UNAUDITED)for the period ending 31 March 2017
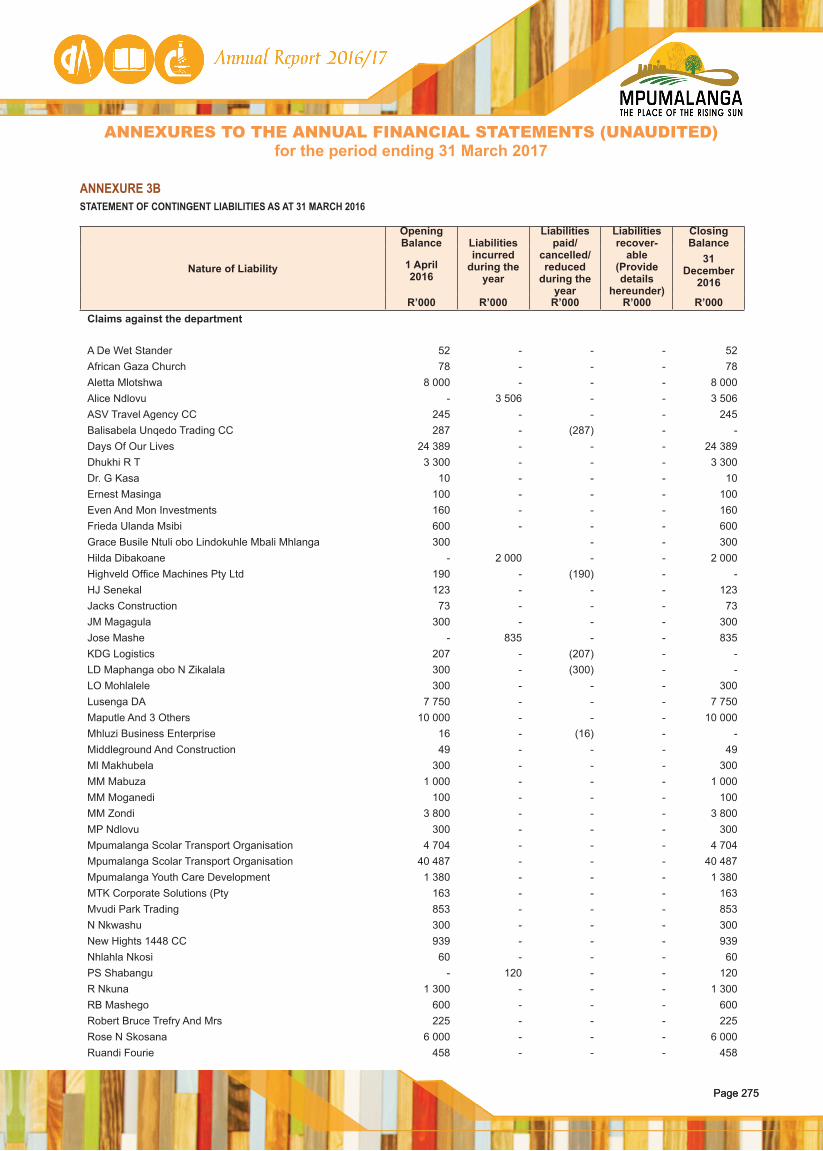
Page 275Page 275
ANNEXURE 3BSTATEMENT OF CONTINGENT LIABILITIES AS AT 31 MARCH 2016
Nature of Liability
Opening Balance Liabilities
incurred during the
year
Liabilities paid/
cancelled/reduced
during the year
Liabilities recover-
able (Provide details
hereunder)
Closing Balance
1 April 2016
31 December
2016
R’000 R’000 R’000 R’000 R’000Claims against the department A De Wet Stander 52 - - - 52African Gaza Church 78 - - - 78Aletta Mlotshwa 8 000 - - - 8 000Alice Ndlovu - 3 506 - - 3 506ASV Travel Agency CC 245 - - - 245Balisabela Unqedo Trading CC 287 - (287) - -Days Of Our Lives 24 389 - - - 24 389Dhukhi R T 3 300 - - - 3 300Dr. G Kasa 10 - - - 10Ernest Masinga 100 - - - 100Even And Mon Investments 160 - - - 160Frieda Ulanda Msibi 600 - - - 600Grace Busile Ntuli obo Lindokuhle Mbali Mhlanga 300 - - 300Hilda Dibakoane - 2 000 - - 2 000Highveld Office Machines Pty Ltd 190 - (190) - -HJ Senekal 123 - - - 123Jacks Construction 73 - - - 73JM Magagula 300 - - - 300Jose Mashe - 835 - - 835KDG Logistics 207 - (207) - -LD Maphanga obo N Zikalala 300 - (300) - -LO Mohlalele 300 - - - 300Lusenga DA 7 750 - - - 7 750Maputle And 3 Others 10 000 - - - 10 000Mhluzi Business Enterprise 16 - (16) - -Middleground And Construction 49 - - - 49Ml Makhubela 300 - - - 300MM Mabuza 1 000 - - - 1 000MM Moganedi 100 - - - 100MM Zondi 3 800 - - - 3 800MP Ndlovu 300 - - - 300Mpumalanga Scolar Transport Organisation 4 704 - - - 4 704Mpumalanga Scolar Transport Organisation 40 487 - - - 40 487Mpumalanga Youth Care Development 1 380 - - - 1 380MTK Corporate Solutions (Pty 163 - - - 163Mvudi Park Trading 853 - - - 853N Nkwashu 300 - - - 300New Hights 1448 CC 939 - - - 939Nhlahla Nkosi 60 - - - 60PS Shabangu - 120 - - 120R Nkuna 1 300 - - - 1 300RB Mashego 600 - - - 600Robert Bruce Trefry And Mrs 225 - - - 225Rose N Skosana 6 000 - - - 6 000Ruandi Fourie 458 - - - 458
ANNEXURES TO THE ANNUAL FINANCIAL STATEMENTS (UNAUDITED)for the period ending 31 March 2017
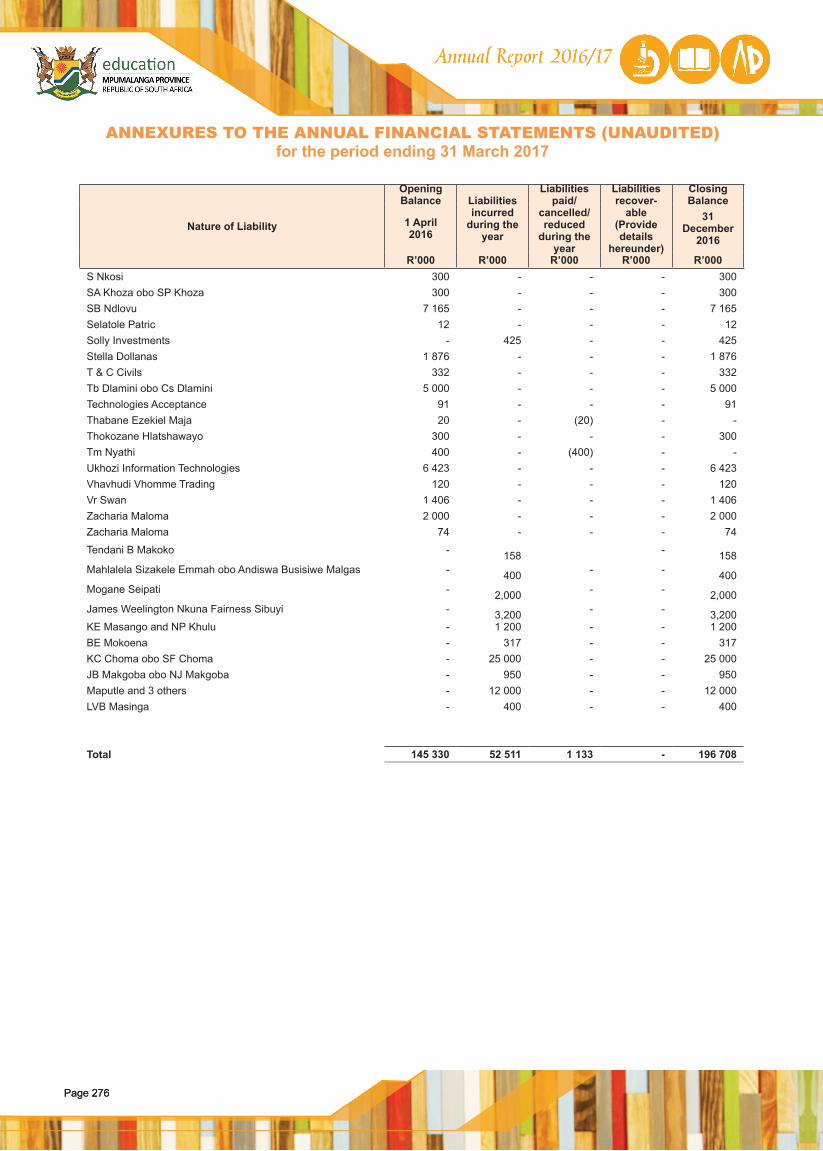
Page 276Page 276
Nature of Liability
Opening Balance Liabilities
incurred during the
year
Liabilities paid/
cancelled/reduced
during the year
Liabilities recover-
able (Provide details
hereunder)
Closing Balance
1 April 2016
31 December
2016
R’000 R’000 R’000 R’000 R’000S Nkosi 300 - - - 300SA Khoza obo SP Khoza 300 - - - 300SB Ndlovu 7 165 - - - 7 165Selatole Patric 12 - - - 12Solly Investments - 425 - - 425Stella Dollanas 1 876 - - - 1 876T & C Civils 332 - - - 332Tb Dlamini obo Cs Dlamini 5 000 - - - 5 000Technologies Acceptance 91 - - - 91Thabane Ezekiel Maja 20 - (20) - -Thokozane Hlatshawayo 300 - - - 300Tm Nyathi 400 - (400) - -Ukhozi Information Technologies 6 423 - - - 6 423Vhavhudi Vhomme Trading 120 - - - 120Vr Swan 1 406 - - - 1 406Zacharia Maloma 2 000 - - - 2 000Zacharia Maloma 74 - - - 74
Tendani B Makoko - 158 -
158 Mahlalela Sizakele Emmah obo Andiswa Busisiwe Malgas -
400 - - 400
Mogane Seipati - 2,000 - -
2,000 James Weelington Nkuna Fairness Sibuyi -
3,200 - - 3,200
KE Masango and NP Khulu - 1 200 - - 1 200BE Mokoena - 317 - - 317KC Choma obo SF Choma - 25 000 - - 25 000JB Makgoba obo NJ Makgoba - 950 - - 950Maputle and 3 others - 12 000 - - 12 000LVB Masinga - 400 - - 400
Total 145 330 52 511 1 133 - 196 708
ANNEXURES TO THE ANNUAL FINANCIAL STATEMENTS (UNAUDITED)for the period ending 31 March 2017
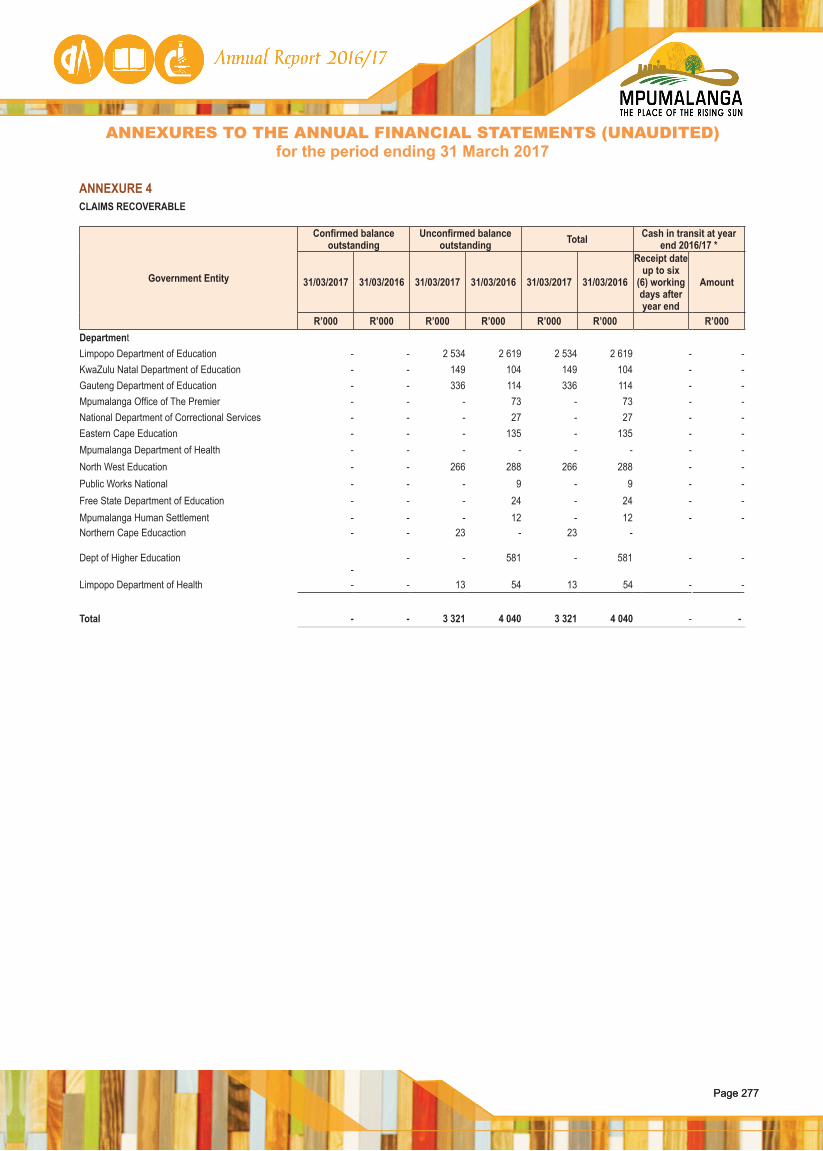
Page 277Page 277
ANNEXURE 4CLAIMS RECOVERABLE
Government Entity
Confirmed balance outstanding
Unconfirmed balance outstanding Total Cash in transit at year
end 2016/17 *
31/03/2017 31/03/2016 31/03/2017 31/03/2016 31/03/2017 31/03/2016
Receipt date up to six
(6) working days after year end
Amount
R’000 R’000 R’000 R’000 R’000 R’000 R’000DepartmentLimpopo Department of Education - - 2 534 2 619 2 534 2 619 - -KwaZulu Natal Department of Education - - 149 104 149 104 - -Gauteng Department of Education - - 336 114 336 114 - -Mpumalanga Office of The Premier - - - 73 - 73 - -National Department of Correctional Services - - - 27 - 27 - -Eastern Cape Education - - - 135 - 135 - -Mpumalanga Department of Health - - - - - - - -North West Education - - 266 288 266 288 - -Public Works National - - - 9 - 9 - -Free State Department of Education - - - 24 - 24 - -Mpumalanga Human Settlement - - - 12 - 12 - -Northern Cape Educaction - - 23 - 23 -
Dept of Higher Education-
- - 581 - 581 - -
Limpopo Department of Health - - 13 54 13 54 - -
Total - - 3 321 4 040 3 321 4 040 - -
ANNEXURES TO THE ANNUAL FINANCIAL STATEMENTS (UNAUDITED)for the period ending 31 March 2017
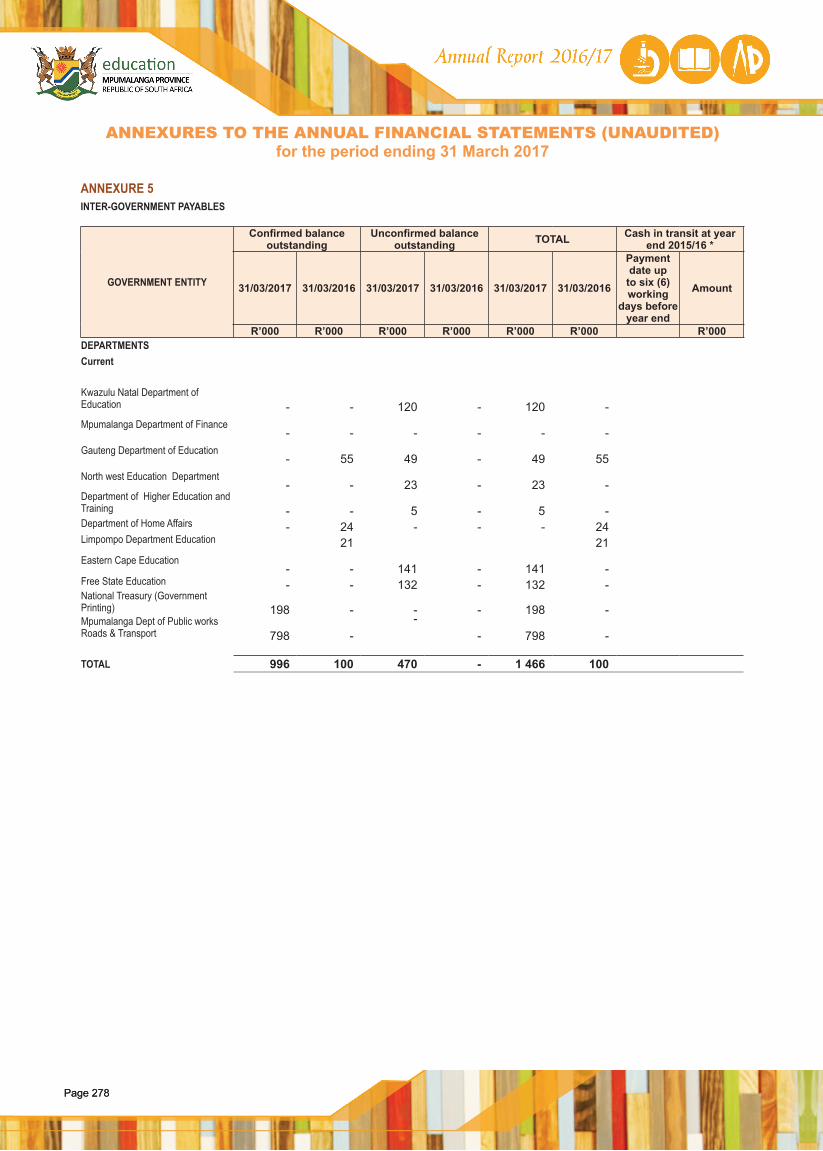
Page 278Page 278
ANNEXURE 5INTER-GOVERNMENT PAYABLES
GOVERNMENT ENTITY
Confirmed balance outstanding
Unconfirmed balance outstanding TOTAL Cash in transit at year
end 2015/16 *
31/03/2017 31/03/2016 31/03/2017 31/03/2016 31/03/2017 31/03/2016
Payment date up
to six (6) working
days before year end
Amount
R’000 R’000 R’000 R’000 R’000 R’000 R’000DEPARTMENTSCurrent
Kwazulu Natal Department of Education - - 120 - 120 -Mpumalanga Department of Finance
- - - - - -Gauteng Department of Education
- 55 49 - 49 55North west Education Department
- - 23 - 23 -Department of Higher Education and Training - - 5 - 5 -Department of Home Affairs - 24 - - - 24Limpompo Department Education 21 21Eastern Cape Education
- - 141 - 141 -Free State Education - - 132 - 132 -National Treasury (Government Printing) 198 - - - 198 -Mpumalanga Dept of Public works Roads & Transport 798 -
-- 798 -
TOTAL 996 100 470 - 1 466 100
ANNEXURES TO THE ANNUAL FINANCIAL STATEMENTS (UNAUDITED)for the period ending 31 March 2017
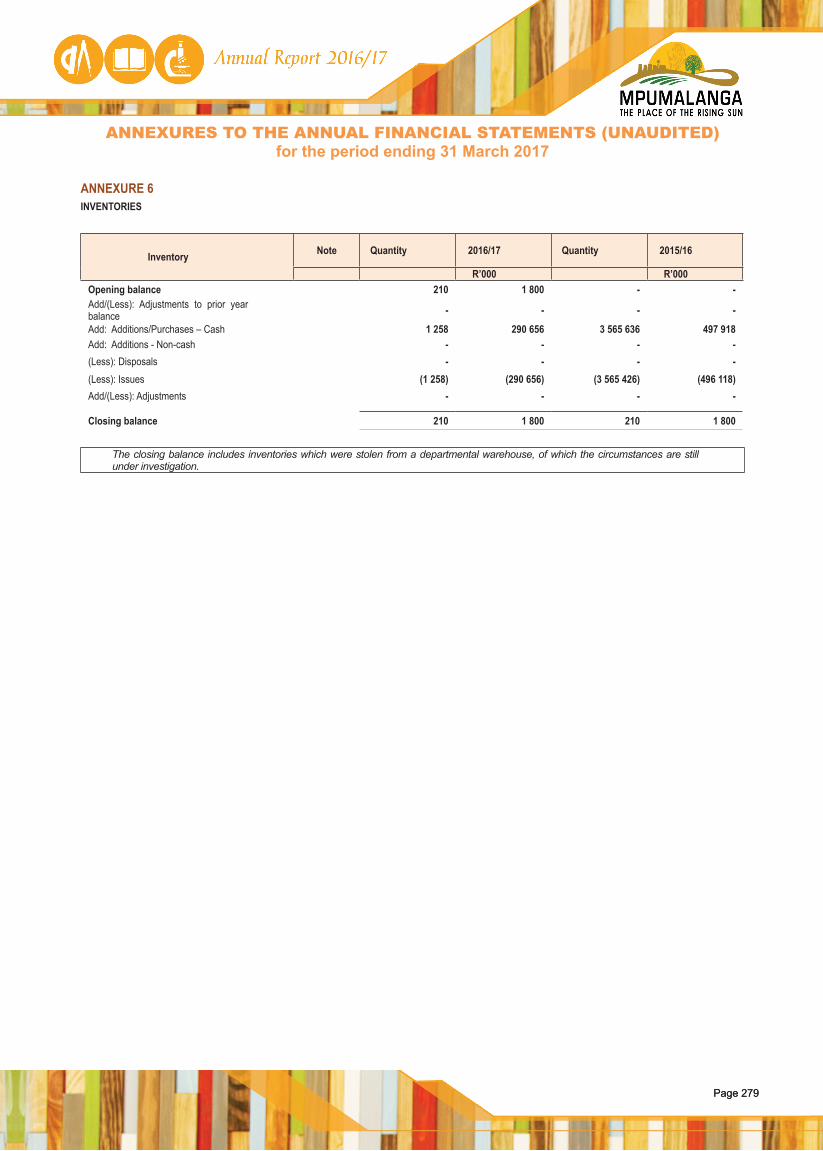
Page 279Page 279
ANNEXURE 6INVENTORIES
Inventory Note Quantity 2016/17 Quantity 2015/16
R’000 R’000Opening balance 210 1 800 - -Add/(Less): Adjustments to prior year balance - - - -
Add: Additions/Purchases – Cash 1 258 290 656 3 565 636 497 918Add: Additions - Non-cash - - - -(Less): Disposals - - - -(Less): Issues (1 258) (290 656) (3 565 426) (496 118)Add/(Less): Adjustments - - - -
Closing balance 210 1 800 210 1 800
The closing balance includes inventories which were stolen from a departmental warehouse, of which the circumstances are still under investigation.
ANNEXURES TO THE ANNUAL FINANCIAL STATEMENTS (UNAUDITED)for the period ending 31 March 2017
Page 280Page 280
Notes_______________________________________________________________________________________________________________
_______________________________________________________________________________________________________________
_______________________________________________________________________________________________________________
_______________________________________________________________________________________________________________
_______________________________________________________________________________________________________________
_______________________________________________________________________________________________________________
_______________________________________________________________________________________________________________
_______________________________________________________________________________________________________________
_______________________________________________________________________________________________________________
_______________________________________________________________________________________________________________
_______________________________________________________________________________________________________________
_______________________________________________________________________________________________________________
_______________________________________________________________________________________________________________
_______________________________________________________________________________________________________________
_______________________________________________________________________________________________________________
_______________________________________________________________________________________________________________
_______________________________________________________________________________________________________________
_______________________________________________________________________________________________________________
_______________________________________________________________________________________________________________
_______________________________________________________________________________________________________________
_______________________________________________________________________________________________________________
_______________________________________________________________________________________________________________
_______________________________________________________________________________________________________________
_______________________________________________________________________________________________________________
_______________________________________________________________________________________________________________
_______________________________________________________________________________________________________________
_______________________________________________________________________________________________________________