Annual Report - Provincial Government of South Africa
199
-
Upload
khangminh22 -
Category
Documents
-
view
0 -
download
0
Transcript of Annual Report - Provincial Government of South Africa
Contents
PART A: GENERAL INFORMATION 5
1. DEPARTMENT GENERAL INFORMATION 5
2. LIST OF ABBREVIATIONS/ ACRONYMS 6
3. FOREWORD BY THE MEC 10
4. REPORT OF THE ACCOUNTING OFFICER 12
5. STATEMENT OF RESPONSIBILITY AND CONFIRMATION OF ACCURACY FOR THE
ANNUAL REPORT 17
6. STRATEGIC OVERVIEW 18
6.1 Vision 18
6.2 Mission 18
6.3 Values 18
7. LEGISLATIVE AND OTHER MANDATES 19
8. ORGANISATIONAL STRUCTURE 20
9. ENTITIES REPORTING TO THE MEC 21
PART B: PERFORMANCE INFORMATION 22 1. AUDITOR GENERAL’S REPORT: PREDETERMINED OBJECTIVES 23
2. OVERVIEW OF DEPARTMENTAL PERFORMANCE 23
2.1 Service Delivery Environment 23
2.2 Service Delivery Improvement Plan 25
Main Services and Standards 25
Batho Pele Arrangements with Beneficiaries (Consultation access etc.) 25
Service Delivery Information Tool 27
Complaints Mechanism 27
2.3 Organisational Environment 27
2.4 Key Policy Developments and Legislative Changes 29
3. Strategic outcome oriented goals 30
Performance Information by Programme 31
3.1 Programme 1: Administration 31
3.2 Programme 2: Economic Development and Tourism 39
3.3 Programme 3: Environmental Affairs 57
Compensation of employees: 67
4. Transfer payments 68
4.1 Transfer payments to Public Entities 68
4.2 Transfer payments to all organisations other than public entities 70
5. Donor Funds 74
5.1 Conditional Grants 74
5.1.1 Donor Funds Received 74
6. Capital Investments 74
6.1 Capital Investment, Maintenance and Asset Management Plan 74
PART C: GOVERNANCE 75 1. Introduction 76
2. Risk Management 76
3. Fraud and Corruption 76
4. Minimising Conflict of Interest 76
5. Code of Conduct 76
6. Health Safety and Environmental Issues 76
7. Portfolio Committees 77
8. SCOPA Resolutions 77
Responses to General Recommendations 78
9. Prior Modification to Audit Reports 79
2
11. Internal Control Unit 80
12. Internal audit and audit committees 80
2. AUDIT COMMITTEE AUTHORITY 81
2 Audit Committee report 81
PART D: HUMAN RESOURCE MANAGEMENT 85
PART E: FINANCIAL INFORMATION 110 Report of the auditor-general to Eastern Cape Provincial Legislature on vote no. 9:
Department of Economic Development, Environmental Affairs and Tourism 111
Report on the audit of the financial statements 111
2. ANNUAL FINANCIAL STATEMENTS 111
Compensation of employees: 152
The underspending on the item compensation of employees mainly related to planned
vacancies not filled and natural attrition during the year. 152
SIGNIFICANT ACCOUNTING POLICIES 158
1 Annual Appropriation 162
2 Departmental revenue 162
3 Aid assistance 163
4 Compensation of employees 163
5 Goods and services 164
6 Payments for financial assets 166
7 Transfers and subsidies 166
8 Expenditure for capital assets 167
9 Unauthorised expenditure 168
10 Cash and cash equivalents 168
11 Prepayments and advances 168
12 Receivables 169
13 Investments 169
14 Loans 169
15 Voted funds to be surrendered to the Revenue Fund 170
16 Departmental revenue and NRF Receipts to be surrendered to the Revenue Fund 170
17 Payables – current 170
18 Payables – non-current 170
19 Net cash flow available from operating activities 171
20 Reconciliation of cash and cash equivalents for cash flow purposes 171
21 Contingent liabilities and contingent assets 171
22 Commitments 171
23 Accruals and payables not recognised 171
24 Employee benefits 172
25 Lease commitments 173
26 Accrued departmental revenue 173
27 Irregular expenditure 173
28 Fruitless and wasteful expenditure 174
29 Related party transactions 175
30 Key management personnel 175
31 Non-adjusting events after reporting date 175
32 Movable Tangible Capital Assets 175
33 Intangible Capital Assets 177
34 Immovable Tangible Capital Assets 178
35 Prior period error 180
36 Inventories 181
37. Statement of Conditional Grants Received 182
38. Statement of Conditional Grants and other Transfers Paid to Municipalities 183
3
Part A: General Information 1. DEPARTMENT GENERAL INFORMATION PHYSICAL ADDRESS:
Hockley Hill, Hockley Close
King Williams Town
South Africa
5605
POSTAL ADDRESS:
Private Bag X0054
Bisho
5605
TELEPHONE NUMBER: (+27) 043 605 7022
FAX NUMBER: (+27) 043 605 7303
EMAIL ADDRESS: [email protected]
WEBSITE ADDRESS: www.dedea.gov.za
5
2. LIST OF ABBREVIATIONS/ ACRONYMS
ADZ Aquaculture Development Zone
AEL Atmospheric Emission Licenses
AFS Annual Financial Statements
AGSA Auditor General of South Africa
AIDC Automotive Industry Development Centre
AIDF Agro Industry Development Forum
AIDS Acquired Immune Deficiency Syndrome
AIM Agro-Industrial Manufacturing Cluster
AIP Audit Intervention Plan
ANC African Nation Congress
AO Accounting Officer
APP Annual Performance Plan
AQMPs Air Quality Management Plans
ASF Annual Stakeholder Forum
BAIC Beijing Automotive Industry Corporation
BAR Basic Assessment Report
BAS Basic Accounting System
BBBEE Broad Based Black Economic Empowerment
BCMM Buffalo City Metropolitan Municipality
BEE Black Economic Empowerment
BIGM Building Inclusive Green Municipalities
BMP Biodiversity Management Plan
C&E Compliance and Enforcement
CA Chartered Accountant
CAE Compliance and Enforcement
CDC Coega Development Corporation
CEOs Chief Executive Officers
CFI Capital Finance International
CFO’s Chief Financial Officers
CGEIT Certificate in the Governance of Enterprise Information Technology
CGICT Corporate Governance of ICT
CGSO Consumer Goods and Services Ombud
CHEMIN Chemical Incubator
CISA Certified Information Systems Auditor
CITES Convention of Internationally Threatened and Endangered Species
CMP Coastal Management Programme
CMT Coastal and Marine Tourism
CO2 Carbon Dioxide
COE Compensation of Employees
COGP Code of Good Practise
COGTA Department of Cooperative Governance and Traditional Affairs
CoP Conference of Parties
CPA A certified Public Accountant
CSIR Council for Scientific and Industrial Research
CTA Certificate in the Theory of Accounting
DCCRS District Climate Change Response Strategy
DEA Department of Environmental Affairs
DEDEAT Department of Economic Development, Environmental Affairs and Tourism
DFI’s Development Finance Institutions
DGITO Departmental Government Information Technology Officer
DIRCO Department for International Relations and Cooperation
DLGTA Department of Local Government and Traditional Affairs
DMR Department of Mineral Resources
DPSA Department of Public Service and Administration
DPME Department of Performance Monitoring and Evaluation
DRDAR Department of Rural Development and Agrarian Reform
DRDLR Department of Rural Development and Land Reform
DSBD Department of Small Business Development
DTI Department of Trade and Industry
EAP Environmental Assessment Practitioners
EAPASA Environmental Practitioners Association of South Africa
ECAIF Eastern Cape Automotive Industry Forum
6
ECBCSAP Eastern Cape Biodiversity Conservation Strategy Action Plan
ECCOB Eastern Cape Chamber of Commerce and Business
ECDC Eastern Cape Development Corporation
ECDEET Eastern Cape Disability Economic Empowerment Trust
ECGB Eastern Cape Gambling Board
ECGMA Eastern Cape Game Management Association
ECITI Eastern Cape Information Technology Incubator
ECIWMP Eastern Cape Integrated Waste Management Plan
ECLA Eastern Cape Liquor Act
ECLB Eastern Cape Liquor Board
ECIP Eastern Cape Infrastructure Plan
ECMS Electronic Case Management System
ECPTA Eastern Cape Parks and Tourism Agency
ECRDA Eastern Cape Rural Development Agency
ECSECC Eastern Cape Socio Economic Consultative Council
EACS Environment and Culture Sector
EDMRS Electronic Document Management and Records System
EHW Employee, Health and Wellness
EIP Economic Infrastructure Programme
EIA Environmental Impact Assessment
EIM Environmental Impact Management
EIR Environmental Impact Report
ELIDZ East London Industrial Development Zone
EPWP Extended Public Works Programme
EQM Environmental Quality Management
ERLN Economies of Regions Learning Network
FSB Financial Services Board
FMCMM Financial Management Capability Maturity Model
GDP Gross Domestic Product
GDP-R Growth Domestic Product - Regional
GEF Global Environmental Facility
GEMS Government Employees Medical Scheme
GEC Global Entrepreneurship Congress
GEN Global Entrepreneurship Network
GEW Global Education Week
GG Government Gazette
GIS Geographic Information System
GMC Greenest Municipality Competition
GTAC Government Technical Advisory Centre
HCT HIV Counselling and Testing
HDIs Historically Disadvantaged Individuals
HIV Human Immune Virus/
HOD Head of Department
HR Human Resources
HRD Human Resource Development
HRPP Human Resource Practise and Planning
IA Internal Audit
ICASA Independent Communications Association of South Africa
ICT Information and Communication Technology
ICDP Integrated Social Infrastructure Delivery Programme
IDAM Institute for Development Assistance
IDC Industrial Development Corporation
IDP Integrated Development Plan
IDZ Industrial Development Zone
IGR Inter-Governmental Relations
IMF Integrated Monetary Fund
ILO International Labour Organisation
IOD Institute of Directors
IPAP Industrial Policy Action Plan 3
IPP Independent Power Producer
ISER Institution of Social and Economic Research
IT Information Technology
IWCDP Integrated Wild Coast Development Programme
IWMP Integrated Waste Management Plan
KPI Key Performance Indicator
LED Local Economic Development
LM Local Municipality
7
LNG Liquefied Natural Gas
LOGIS Local Government Information Systems
LRED Local and Regional Economic Development
MBCC Mandela Bay Composites Cluster
MBL Master of Business Leadership
MBSA Mercedes-Benz South Africa
MDA Manufacturing Development Act
MEC Member of the Executive Council
M&E Monitoring and Evaluation
METT Management Effectiveness Tracking Tool
MinMECs Ministers and Members of Executive Council
MIOSA Motor Industry Ombud of South Africa
MPAT Management Performance Assessment Tool
MPSA Minister of Public Service and Administration
MTEF Medium Term Expenditure Framework
MW Megawatts
NALSU Neil Aggett Labour Studies Unit
NAM Non-Automotive Manufacturing
NAMC National Agricultural Marketing Council
NDT National Department of Tourism
NEAS National Environmental Assessment Services
NEM National Environment Management
NEMA National Environmental Management Act
NHBRC National Home Builders Registration Council
NIRP National Integrated Resources Plan
NMBM Nelson Mandela Bay Municipality
NMMU Nelson Mandela Metropolitan University
OAG Office of the Accountant General
OMF Operations Management Framework
OTP Office of the Premier
PA Performance Agreement
PAIP SCOPA
PC Partially Conforms
PCC Provincial Coastal Committee
PCF Premier Coordinating Committee Forum
PCMT Provincial Coordinating Management Team
PCMTC Provincial Coastal management Technical Committee
PEDS Provincial Economic Development Strategy
PERSAL Personnel and Salary System
PFMA Public Finance Management Act
PIDS Provincial Industrial Development Strategy
PILIR Procedure on Incapacity Leave and Ill-Health Retirement
PMDS Performance Management and Development System
PMER Planning, Monitoring, Evaluation and Reporting
PMI Purchasing Management Indices
PMO Programme/Portfolio/Project Management Office
PoA Programme of Action
PRIME Programme for Industrial and Manufacturing Excellence
PSCBC Public Service Co-ordinating Bargaining Council
PSES Public Sector Economic Forum
PSR Public Service Regulations
PT Provincial Treasury
PTCC Provincial Tourism Coordination Council
PTCE Provincial Tourism Career Expo
PWC Price Water House Coopers
QAIP Quality Assurance Improvement Program
QERF Quarterly Economic Research Forum
QLFS Quarterly Labour Force Survey
QPR Quarterly Performance Reporting
RMC Risk Management Committee
RMDEC Regional Mining Development And Environmental Committee
S&T Subsistence and Travel
SAAELIP South African Atmospheric Emission Licensing and Inventory Portal
SAAQI South African Air Quality Information System
SAB South African Breweries
SALEDP South African Low Emission Development Programme
SALGA South African Local Government Association
8
SAMEA South African Monitoring and Evaluation Association
SANRAL South African National Roads Agency Limited
SAPS South African Police Service
SAWIS South African Waste Information System
SCOPA Standing Committee on Public Accounts
SCM Supply Chain Management
SDIP Service Delivery Improvement Plan
SEA Strategic Environmental Assessment
SECSICOM Stakeholders in the Eastern Cape Safari Industry Committee
SEDA Small Enterprise Development Agency
SEM Species and Ecosystems Management
SERO Socio-Economic Review and Outlook
SEZ Special Economic Zone
SIP3 Strategic Infrastructure/Integrated Programmes
SITA State Information Technology Agency
SLAs Service Level Agreements
SMMEs Small , Medium and Micro Enterprises
SMS Senior Management Service
SPU Special Programmes Unit
TB Tuberculosis
TGCSA Tourism Grading Council of South Africa
TIERM Technical Indicator and Evidence Reference Manual
TNPA Transnet National Ports Authority
TOPS Threatened or Protected Species
UFH University of Fort Hare
UNIDO United Nations Industrial Development Organisation
USAID United States Agency for International Development
VAT Value Added Tax
VW Volkswagen South Africa
WIS Waste Information System
WSP Work Skills Plan
WRT Workplace Readiness Training
9
3. FOREWORD BY THE MEC
I, Lubabalo Oscar Mabuyane, MEC for DEDEAT, in
terms of the requirements of Section 65(1) (a) of the
Public Finance Management Act and Chapter 1, Part III
of the Public Service Regulations, do hereby table the
Annual Report for the 2017/18 financial year.
Foreword for the 2017/18 Annual Report
In March last year we outlined our Policy Statement
for the 2017/18 financial year. Our policy statement
was informed by the State of the Province Address,
the Medium Term Expenditure Framework and the
Annual Performance Plans.
The basis of our Policy Statement for the period under
review was a need for true radical economic
transformation to broaden economic access and
participation by our people in the life of our nation.
This is the posture that was invoked by the Strategy
and Tactics of the ANC adopted in the Morogoro
Conference in 1969 which noted that: “In our country
- more than in any other part of the oppressed
world - it is inconceivable for liberation to have
meaning without a return of the wealth of the land
to the people as a whole. It is therefore a
fundamental feature of our strategy that victory
must embrace more than formal political
democracy. To allow the existing economic forces
to retain their interests intact is to feed the root of
racial supremacy and does not represent even the
shadow of liberation.”
Thus in our Policy Statement we committed to pursue
the same priority areas that we adopted at the
beginning of this term which are Economic
Transformation, Environmental Management and
Governance and Administration with more emphasis
on urgent implementation of programmes and
projects that underpin these policy priorities.
Economic Transformation
Our flagship Special Economic Zones have continued
to rollout multimillion rand infrastructure projects to
enable economic development thereby creating jobs
and opening opportunities for SMMEs. In the period
under review, 19 investments were realised (Coega +
ELIDZ) valued at R 2,565 billion.
We have been unequivocal in insisting on the
beneficiation and promotion of local content
throughout the economic development value chain
targeting mainly the auto-motive sector, energy
sector, agro-processing, tourism and the government
procurement system.
We also entered uncharted waters by venturing into
the ocean economy targeting offshore marine fuel
bunkering. The bunkering support service value chain
represents a significant economic sector in the region
thus we commissioned a bunkering value chain
opportunities analysis and support programme for
SMME and Black Industrialists. As second bunkering
licensee, South African Maine Fuels Limited which has
meaningful black women ownership and management
is already in operation.
While we continue to pursue a macro-economic
posture we are also cultivating ground for micro-
economics to thrive in our province. This can be seen
in the financial and none financial support that we
continue to provide to SMMEs and Cooperatives
within our province through the ECDC.
On the Tourism front, we continue to make headways
towards the transformation of the sector which is still
predominantly white. The increased participation of
black owned tourism enterprises at the Lilizela Awards
and the introduction of black people in the wildlife
gaming industry is a long overdue step in the right
direction.
Our two compliance and enforcement entities the
Eastern Cape Gambling Board and the Eastern Cape
Liquor Board are continuing to contribute significant
revenue to the provincial fiscus through licence fees
and taxes. For instance, the ECGB collected revenue
10
amounting to R180,9 million against R160 million
projected during the 2017/18 financial.
Environmental Management
For us to achieve sustainable economic development
in our province, we must promote and ensure
adherence to the statutory laws that govern
environmental management. The Department of
Environmental Affairs DEA has developed a Policies
and Strategy on Biodiversity Economy which seeks
to support Game Transformation including Trade of
Natural Resources including both Faunal and Floral
Species. The Province of the Eastern Cape has been
fully participating in the Programme on permit
administration for Bioprospecting of Floral Species as
well as Wildlife Permitting including Taxidermy
Management.
We have also finalised five (5) Waste Management
Licence applications and all were issued within
legislated timeframe for waste recycling initiatives
and composting facility in various Regions (OR
Tambo, Chris Hani, and Amathole). These facilities will
promote and improve the rate of waste recycling in
the province, as an alternative method for waste
management other than disposal of waste to land
(landfilling).
Governance and Accountability
Our Group continues to comply with the 30-day
payment of service providers. We pay suppliers within
a 21-day window where all valid documentation is in
place.
We continued to improve efficiencies in our public
entities. The Department attended to the reviews of
legislations for ECDC and ECGB and is busy
facilitating transition of ELIDZ and Coega in line with
the SEZ Act.
We also submitted comments to Provincial Treasury
on the National Treasury framework on
standardisation of remuneration for boards and
executives.
The Group continues to perform admirable in the
audit outcome space with five (5) obtaining clean
audit opinions.
Going forward we will robustly engage the Provincial
Government to increase drastically our meagre budget
which is not conducive for the economic development
trajectory we are pursuing.
I, Lubabalo Oscar Mabuyane, MEC for DEDEAT, in
terms of the requirements of Section 65(1) (a) of the
Public Finance Management Act and Chaper 1, Part III
of the Public Service Regulations, do hereby table the
Annual Report for the 2017/18 Financial Year.
_________________________________
Mr Lubabalo Oscar Mabuyane1
MEC of the Department of Economic Development,
Environmental Affairs and Tourism
31 August 2018
1 During the review period, Hon. S. Somyo was the executive
authority responsible for DEDEAT. Hon. L.O. Mabuyane replaced
Hon. S. Somyo on 25 May 2018.
11
4. REPORT OF THE ACCOUNTING OFFICER Overview of the operations of the department
In pursuit of the development agenda set in the 2015
– 2019 strategic plan of the department, a number of
activities were implemented in line with both the
2017/18 annual performance and operational plans.
Summary activity outputs of the three programmes,
namely Administration, Economic Development and
Tourism, and Environmental Affairs are reported under
each of the programmes on pages 31, 39 and 57
respectively. No significant policy shifts were recorded
during the year. The focus has been on
implementation of policies and strategies that were
developed in prior years.
The two key programmes, Economic Development and
Tourism as well as Environmental Affairs, continued to
pursue their activities with vigour with the aim of
developing a sustainable development path for the
Eastern Cape. All work was aimed at job creation,
SMME development, socio-economic infrastructure
development, investment promotion and sound
environmental management. During the year, the
economic development programme achieved 78,79%
of set targets compared to 82,35% achieved in the
previous year. The environmental affairs programme
achieved 50% of set targets versus 60% achieved
during the 2016/17 financial year. Overall, the
department achieved fully 64,40% of set targets
compared to 62,26% achieved in the preceding year.
Specific outputs and outcomes are outlined under
each of the three programmes. Significant results, events and challenges are listed as
follows:
A new organogram for the department was finally
approved in March 2018 by the Minister of Public
Service and Administration. The new structure will be
implemented starting 2018/19 financial year. The
entities of the department continued to perform well.
In the prior year, four of the six public entities of the
department received clean audit opinion from the
Auditor General. Governance of the entities continue
to improve with the majority of the entities having
fully functional boards. Legislative processes that were
started a couple of years ago are nearing finality. Of
particular note is the Eastern Cape Gambling Act
which came into effect in 2017/18. Specific progress
with regards to the review of the ECDC Act, the
development of the enabling legislation of the SEZ
regime in the province will be reported under the
section on Legislation. The registration of Coega as a
public entity of the Eastern Cape Government is still
being processed after the initial step of notifying the
National Treasury in line with the PFMA was done.
Final registration is dependent on the completion of
an enabling Provincial Legislation. During the year, 9 LRED projects were funded from a
budget slightly above R22 million. In the year before, 9
LRED projects were funded. There are still teething
problems in ensuring that quality projects are funded
within the first half of each year. Previously funded
projects were also monitored throughout the Province.
A total of 98 Cooperatives were provided with non-
financial support during the period under review.
Other cooperatives as shown in the detail under
economic development, were provided with technical
support.
Over the year in review, the DEDEAT sustainable
energy activities have focussed on support to 6
sustainable energy initiatives.
The office of the consumer protector has held 6
consumer education programmes reaching 8607
participants throughout the Province. Ninety-five
percent of consumer complaints were resolved during
the year.
Through the research unit, the department has
produced 6 economic intelligence reports. The Real
Investment Monitor and International Trade Tracker
was also produced to track investment trends. The
department is in the process of exploring tools that
can assist in identifying international trade
opportunities with the aim of supporting
entrepreneurs with export development and
promotion.
12
Environmental Affairs
Three Section 24G applications were finalised during
the reporting year. The Environmental Impact
Management finalized 100% of applications compared
to 97.3% in the 2016/17 year.
During the year no Atmospheric Emission Licenses
(AEL) were issued. Although issues of greenhouse gas
emissions are dealt with, the department has since
dropped the Cos emissions indicator due to
challenges in obtaining consistent quality data to
compute the statistic.
The department continued to host the Provincial
Greenest Municipality Competition and Top Green
Organisation Awards. The top three winners for the
year were Didi Senior Primary School (Alfred Nzo),
Ngwenyeni Junior Secondary School (OT Tambo) and
Luyteville Primary School (Amathole)
Last year, an integrated waste management license
was issued to Clariter Waste Plastics Reprocessing
plant at the East London IDZ. Clariter’s R290-million
factory at the ELIDZ, which will turn plastic waste
gathered locally into industrial solvents such as oils
and waxes, will be completed in the second half of
2018. The factory will create 50 direct jobs for those
“highly skilled” in mechanics and chemical
engineering, as well as a number of indirect jobs
through sub-contractors involved in the plastic waste
supply chain. The factory, will recycle about 80 tons of
plastic waste each month and will be the first to
globally showcase methodology which has been
developed over the past decade by a multinational
team at a pilot plant in Poland.
The first phase of the Biodiversity Electronic Permit
System which was being developed in 2016/17 is now
operational. This has improved the turnaround time of
processing the applications for the various categories
and improve document management and reporting.
EPWP projects were implemented resulting in the
creation of 921 jobs compared to 954 created in the
2016/17 financial year. Funding constraints as well as
poor record keeping led to the reduction in the
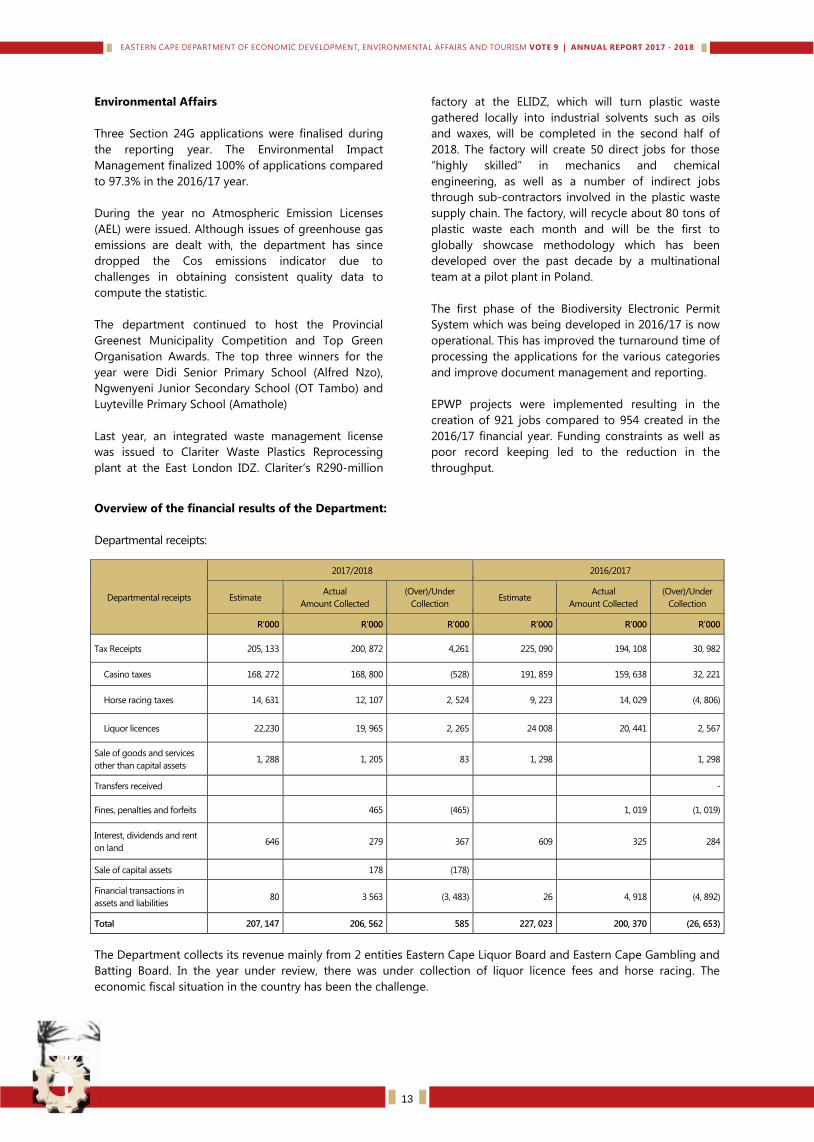
throughput. Overview of the financial results of the Department:
Departmental receipts:
Departmental receipts
2017/2018 2016/2017
Estimate Actual
Amount Collected
(Over)/Under
Collection Estimate
Actual
Amount Collected
(Over)/Under
Collection
R’000 R’000 R’000 R’000 R’000 R’000
Tax Receipts 205, 133 200, 872 4,261 225, 090 194, 108 30, 982
Casino taxes 168, 272 168, 800 (528) 191, 859 159, 638 32, 221
Horse racing taxes 14, 631 12, 107 2, 524 9, 223 14, 029 (4, 806)
Liquor licences 22,230 19, 965 2, 265 24 008 20, 441 2, 567
Sale of goods and services
other than capital assets 1, 288 1, 205 83 1, 298 1, 298
Transfers received -
Fines, penalties and forfeits 465 (465) 1, 019 (1, 019)
Interest, dividends and rent
on land 646 279 367 609 325 284
Sale of capital assets 178 (178)
Financial transactions in
assets and liabilities 80 3 563 (3, 483) 26 4, 918 (4, 892)
Total 207, 147 206, 562 585 227, 023 200, 370 (26, 653)
The Department collects its revenue mainly from 2 entities Eastern Cape Liquor Board and Eastern Cape Gambling and
Batting Board. In the year under review, there was under collection of liquor licence fees and horse racing. The
economic fiscal situation in the country has been the challenge.
13
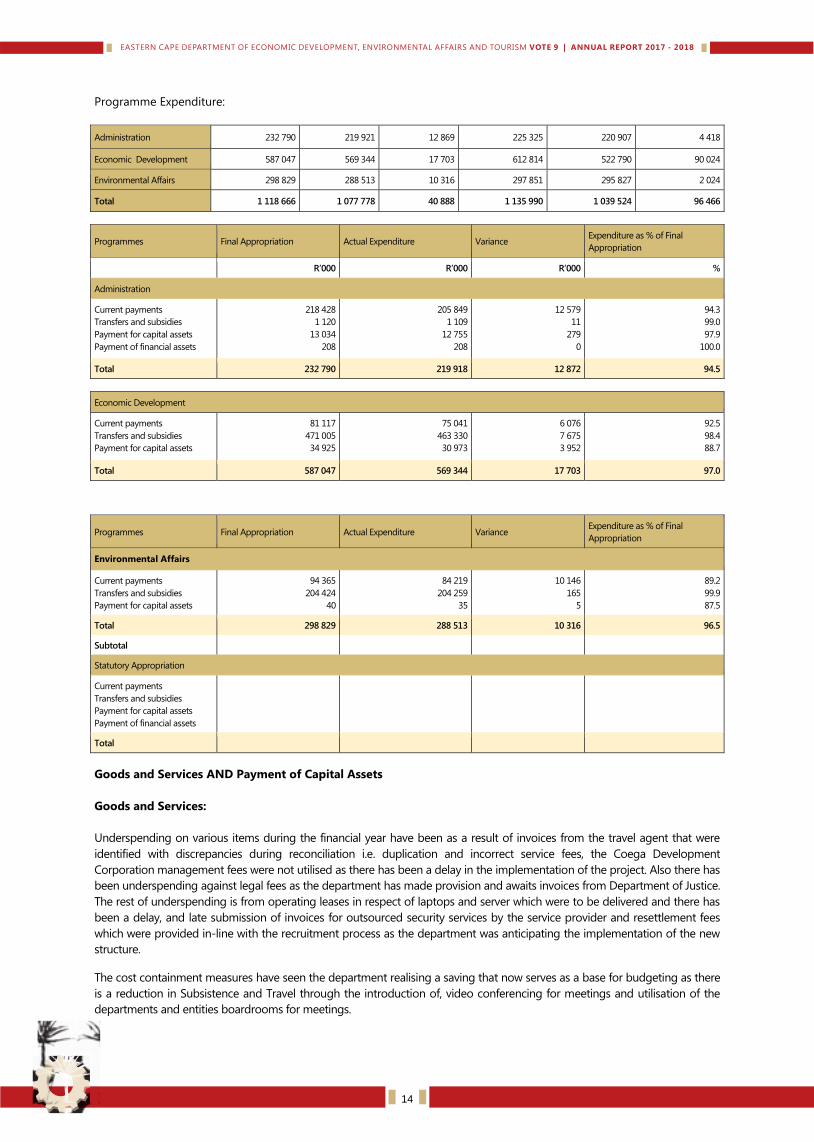
Programme Expenditure:
Administration 232 790 219 921 12 869 225 325 220 907 4 418
Economic Development 587 047 569 344 17 703 612 814 522 790 90 024
Environmental Affairs 298 829 288 513 10 316 297 851 295 827 2 024
Total 1 118 666 1 077 778 40 888 1 135 990 1 039 524 96 466
Programmes Final Appropriation Actual Expenditure Variance Expenditure as % of Final
Appropriation
R’000 R’000 R’000 %
Administration
Current payments
Transfers and subsidies
Payment for capital assets
Payment of financial assets
218 428
1 120
13 034
208
205 849
1 109
12 755
208
12 579
11
279
0
94.3
99.0
97.9
100.0
Total 232 790 219 918 12 872 94.5
Economic Development
Current payments
Transfers and subsidies
Payment for capital assets
81 117
471 005
34 925
75 041
463 330
30 973
6 076
7 675
3 952
92.5
98.4
88.7
Total 587 047 569 344 17 703 97.0
Programmes Final Appropriation Actual Expenditure Variance Expenditure as % of Final
Appropriation
Environmental Affairs
Current payments
Transfers and subsidies
Payment for capital assets
94 365
204 424
40
84 219
204 259
35
10 146
165
5
89.2
99.9
87.5
Total 298 829 288 513 10 316 96.5
Subtotal
Statutory Appropriation
Current payments
Transfers and subsidies
Payment for capital assets
Payment of financial assets
Total
Goods and Services AND Payment of Capital Assets
Goods and Services:
Underspending on various items during the financial year have been as a result of invoices from the travel agent that were
identified with discrepancies during reconciliation i.e. duplication and incorrect service fees, the Coega Development
Corporation management fees were not utilised as there has been a delay in the implementation of the project. Also there has
been underspending against legal fees as the department has made provision and awaits invoices from Department of Justice.
The rest of underspending is from operating leases in respect of laptops and server which were to be delivered and there has
been a delay, and late submission of invoices for outsourced security services by the service provider and resettlement fees
which were provided in-line with the recruitment process as the department was anticipating the implementation of the new
structure. The cost containment measures have seen the department realising a saving that now serves as a base for budgeting as there
is a reduction in Subsistence and Travel through the introduction of, video conferencing for meetings and utilisation of the
departments and entities boardrooms for meetings.
14
Capital Payments
The variance on the expenditure is as a result of social Infrastructure projects implemented, challenges faced by the
communities within the area on housing, there were no approved beneficial list from the NMBM. Also challenges with
retaining walls and storm water drains and water meter implementation. Underspending on the acquisition of new furniture
for new employees as the department made provision in anticipation of the approval of the new structure.
Transfers and subsidies
LRED transfers to beneficiaries were delayed due to a number of proposals that were incomplete not submitted in line with the
departmental policy requirements and through the due diligence process had to be rejected. This caused a delay in payment
and awarding as the number of projects to be awarded was reduced hence the underspending although there was a positive
response to the call for projects to be awarded.
Virements/ rollovers
The Department has applied for roll over for accruals, payables and LRED funds as there were LRED applications which
were awarded but delayed for payment due to SARS and CSD registrations on the system.
Unauthorised Expenditure
There was no unauthorised expenditure.
Future plans of the Department
In line with our determination to continuously improve the implementation of service delivery related statutory
requirements, the Department will support and increase opportunities for small business. This strategy has already
seen the development of a ground-breaking, the Department will ensure that programmes for SMME and economic
growth and environmental related matters are In terms of the Departmental mandate, the strategic focus is to ensure
that the needs of the most vulnerable areas in the province are prioritised while also providing services, opportunities
and support to a cross various sectors.
The Department will also continue to provide interventions which seek to reduce red tape and support the ease of
going business across South Africa.
Public Private Partnerships
There were no Public-Private Partnerships in 2017/18.
Discontinued activities/activities to be discontinued
There are no activities that have been discontinued and there is no intention to discontinue any services.
New or proposed activities
There are no new proposed activities.
Supply chain management
The departmental deliverables are managed through supply chain management process which is more reliant on the
approved procurement plans. During the year under review supply chain processes have improved in order to
eliminate inefficiencies in turnaround times and processes. There are strict controls to curb conflict of interest.
Supply chain management practitioners, role players disclose their financial interest. Senior management and staff
within the unit are vetted and all staff appointed within the Supply Chain Management unit, complete a declaration of
interest documentation and acknowledgement of the content of the code of conduct form, which is kept on file by the
Senior Manager of SCM.
15
Gifts and Donations received in kind from non-related parties
The department didn’t have gifts and donations in 2017/18
Events after the reporting date
No events were reported.
Other
The Department transferred improvements done to schools through the infrastructure programme through Section 42
of the PFMA. This was approved by the Department of Public Works.
I thank you.
_____________________
Mr B. Gxilishe
Accounting Officer
Department of Economic Development, Environmental Affairs and Tourism
Date: 31 May 2018
16
5. STATEMENT OF RESPONSIBILITY AND CONFIRMATION OF ACCURACY FOR THE
ANNUAL REPORT
To the best of my knowledge and belief, I confirm the following:
All information and amounts disclosed in the annual report is consistent.
The annual report is complete, accurate and is free of any omissions.
The annual report has been prepared in accordance with the guidelines on annual reports as issued by National
Treasury.
The Annual Financial Statements (Part F) have been prepared in accordance with the modified cash standard and the
relevant frameworks and guidelines issued by the National Treasury.
The Accounting Officer is responsible for the preparation of the annual financial statements and for the judgements
made in this information.
The Accounting Officer is responsible for establishing and implementing a system of internal control that has been
designed to provide reasonable assurance as to the integrity and reliability of the performance information, the
human resources information and the annual financial statements.
The external auditors are engaged to express an independent opinion on the annual financial statements.
In my opinion, the annual report fairly reflects the operations, the performance information, the human resources
information and the financial affairs of the Department for the financial year ended 31 March 2018.
Yours faithfully
____________________ Mr Bongani Gxilishe
Accounting Officer
Department of Economic Development, Environmental Affairs and Tourism
Date: 31 May 2018
17
6. STRATEGIC OVERVIEW
6.1 Vision
Sustainable development underpinned by economic growth and sound environmental management.
6.2 Mission
To lead economic development and environmental management in the Eastern Cape.
6.3 Values
Leadership: We influence the thinking and development of the Eastern Cape; develop team skills at every
level and lead in research, planning, performance management and financial results.
Integrity: We remain honest and loyal while maintaining high professional standards.
Flexibility: Within the framework of the law, our operations are amenable to adjustments in line with
changes in the operating environment.
Teamwork: We design, implement and review our work through strong relationships, respect and sharing
across boundaries to achieve our objectives.
18
7. LEGISLATIVE AND OTHER MANDATES
The key mandates of DEDEAT are derived from Schedules 4 and 5 of the Constitution and a number of Acts have been
promulgated to further support the Department’s constitutional mandate. These include, among others: the Co-
operatives Act (14 of 2005); the Co-operatives Bank Act (40 of 2007); the Eastern Cape Unfair Business Practices Act (5
of 1998); the Consumer Protection Act (68 of 2008); the National Environmental Management Act (107 of 1998); the
Environment Conservation Act (73 of 1989); the National Environmental Management: Biodiversity Act (10 of 2004);
the Nature and the Environmental Conservation Ordinance (19 of 1974); the National Environmental Management -
Protected Areas Act (57 of 2003); the Sea Shore Act; the Environmental Conservation Decree (Former Transkei); the
Nature Conservation Act (Former Ciskei); the Atmospheric Pollution Prevention Act; and the Problem Animal Control
Ordinance. In addition, specific pieces of enabling legislation have been enacted to support the work of the
department through its six public entities. Examples include the Eastern Cape Development Corporation Act (2 of
1997) and the Eastern Cape Gambling Amendment Act (Act 1 of 2015).
The mandate of the Department has been enhanced by the 12 (now 14) key outcomes identified and agreed to by the
National Cabinet in 2010. The Department had to adjust its strategic plan to demonstrate alignment with outcomes 4,
6, 7, 10 and 12 which are outlined below:
Outcome 4: Decent employment through inclusive economic growth.
Under this outcome, the following policies and strategies are used to drive DEDEAT programmes: Industrial
Policy Action Plan (IPAP); National Development Plan; New Growth Path; National LED Framework; Vision 2030
(successor to the Provincial Growth and Development Plan); Jobs Fund Strategy; Provincial Industrial
Development Strategy (PIDS) now succeeded by the Provincial Economic Development Strategy (PEDS-2016);
Strategic Integrated Projects (SIP3); the 10 Point-Plan; National Youth Policy 2015 -2020; Provincial Youth
Development Strategy (2015); and the Renewable Energy Strategy.
Outcome 6: An efficient, competitive and responsive economic infrastructure Network.
This is done through the Industrial Development Zone (IDZ) programmes at Coega and ELIDZ. The Department
is supporting the development of socio-economic infrastructure in identified areas of the Province. A process
to transition from the IDZs to SEZs is underway since the gazetting of the SEZ Act (2014) and SEZ Regulations
(2016).
Outcome 7: Rural development, land and agrarian reform, food security.
The Department has been collaborating with the Department of Rural Development and Agriculture. Agro-
industry is being supported through an industry forum whose aim is to develop specific agro value chains.
Outcome 10: Environmental assets and natural resources that are well protected and continually enhanced.
This is done through the Department and the ECPTA. The DEDEAT Group maintains a network of Reserves
throughout the Province. The Environmental Affairs Programme is responsible for implementation of
environmental legislation through compliance and enforcement, environmental quality management,
biodiversity management and environmental education services.
Outcome 12: An efficient, effective and development oriented public service and an empowered, fair and
inclusive citizenship.
This is done through various programmes of the Department and public entities such as consumer awareness
training, and environmental awareness training. Citizens are also empowered through province wide
programmes of the Eastern Cape Liquor Board (ECLB) and Eastern Cape Gambling Board (ECGB). Inclusivity is
also done partly through EPWP programmes, SMMEs/Cooperatives support and training as part of outcome 4
above.
19
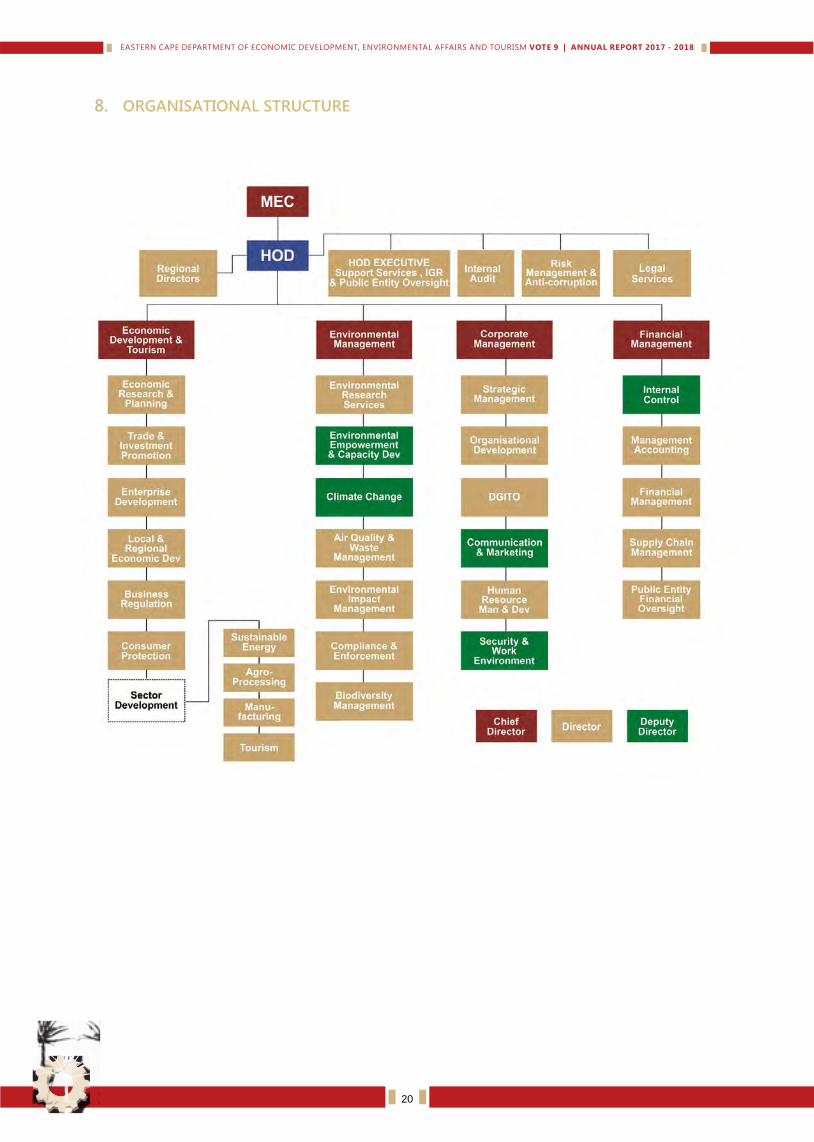
8. ORGANISATIONAL STRUCTURE
20
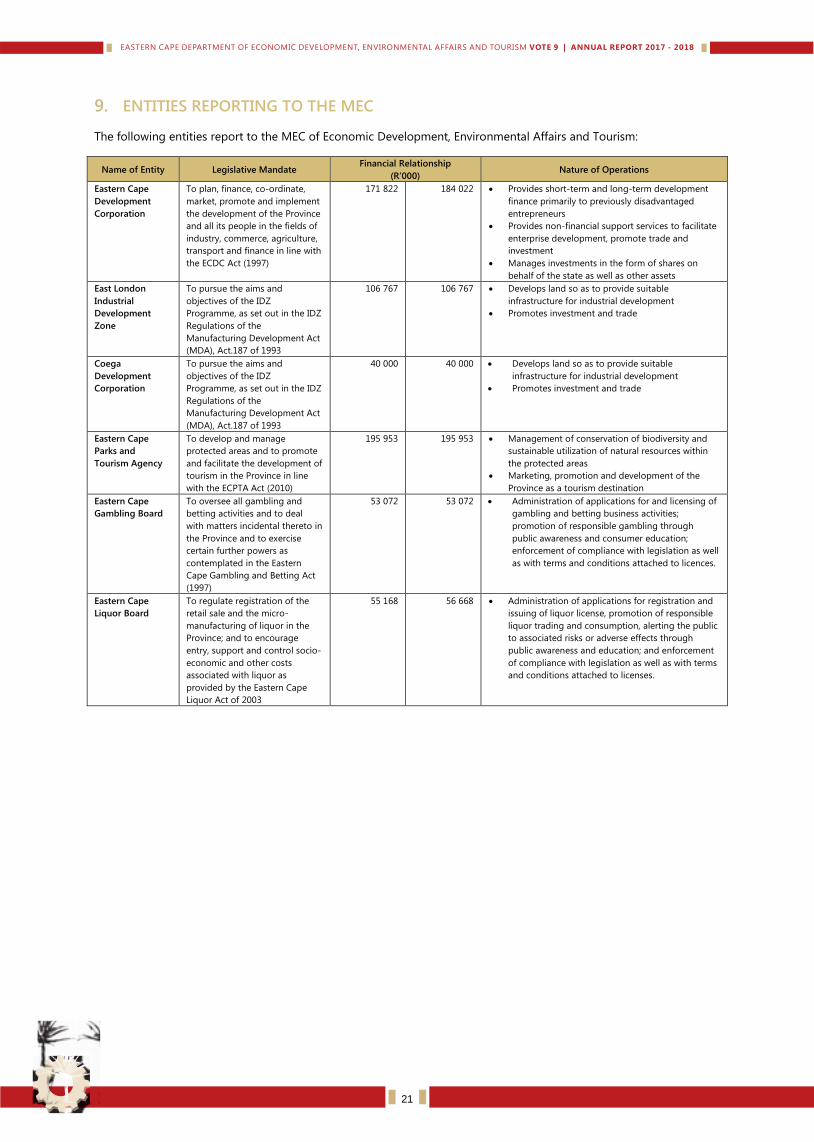
9. ENTITIES REPORTING TO THE MEC The following entities report to the MEC of Economic Development, Environmental Affairs and Tourism:
Name of Entity Legislative Mandate Financial Relationship
(R‘000) Nature of Operations
Eastern Cape
Development
Corporation
To plan, finance, co-ordinate,
market, promote and implement
the development of the Province
and all its people in the fields of
industry, commerce, agriculture,
transport and finance in line with
the ECDC Act (1997)
171 822
184 022
Provides short-term and long-term development
finance primarily to previously disadvantaged
entrepreneurs
Provides non-financial support services to facilitate
enterprise development, promote trade and
investment
Manages investments in the form of shares on
behalf of the state as well as other assets
East London
Industrial
Development
Zone
To pursue the aims and
objectives of the IDZ
Programme, as set out in the IDZ
Regulations of the
Manufacturing Development Act
(MDA), Act.187 of 1993
106 767 106 767
Develops land so as to provide suitable
infrastructure for industrial development
Promotes investment and trade
Coega
Development
Corporation
To pursue the aims and
objectives of the IDZ
Programme, as set out in the IDZ
Regulations of the
Manufacturing Development Act
(MDA), Act.187 of 1993
40 000
40 000
Develops land so as to provide suitable
infrastructure for industrial development
Promotes investment and trade
Eastern Cape
Parks and
Tourism Agency
To develop and manage
protected areas and to promote
and facilitate the development of
tourism in the Province in line
with the ECPTA Act (2010)
195 953
195 953
Management of conservation of biodiversity and
sustainable utilization of natural resources within
the protected areas
Marketing, promotion and development of the
Province as a tourism destination
Eastern Cape
Gambling Board
To oversee all gambling and
betting activities and to deal
with matters incidental thereto in
the Province and to exercise
certain further powers as
contemplated in the Eastern
Cape Gambling and Betting Act
(1997)
53 072
53 072
Administration of applications for and licensing of
gambling and betting business activities;
promotion of responsible gambling through
public awareness and consumer education;
enforcement of compliance with legislation as well
as with terms and conditions attached to licences.
Eastern Cape
Liquor Board
To regulate registration of the
retail sale and the micro-
manufacturing of liquor in the
Province; and to encourage
entry, support and control socio-
economic and other costs
associated with liquor as
provided by the Eastern Cape
Liquor Act of 2003
55 168
56 668
Administration of applications for registration and
issuing of liquor license, promotion of responsible
liquor trading and consumption, alerting the public
to associated risks or adverse effects through
public awareness and education; and enforcement
of compliance with legislation as well as with terms
and conditions attached to licenses.
21
Part B: Performance Information
1. AUDITOR GENERAL’S REPORT: PREDETERMINED OBJECTIVES The AGSA currently performs the necessary audit procedures on the performance information to provide reasonable
assurance in the form of an audit conclusion. The audit conclusion on the performance against predetermined
objectives is included in the report to management, with material findings being reported under the Predetermined
Objectives heading in the Report on other legal and regulatory requirement sections of the auditor’s report.
Refer to page 111 of the Report of the Auditor General, published as Part E: Financial Information.
2. OVERVIEW OF DEPARTMENTAL PERFORMANCE
2.1 Service Delivery Environment
Global Economic Performance
According to the International Monetary Fund (IMF), global economic growth slowed to 3.2 per cent in 2016 from 3.4
per cent in 2015. The slowdown came predominantly from advanced economies, while growth in emerging and
developing economies, as a group, remained unchanged. Despite the slower growth recorded for the full year, global
growth in the second-half of 2016 was noticeably better than in the first half of 2016. Thus far, the global economic
performance continued to improve in 2017.
Performance of advanced economies economic output in advanced economies moderated to 1.7 per cent in 2016
from 2.1 per cent in 2015. The slowdown was due to softer growth in the United States (US) and the United Kingdom
(UK). For the rest, the slowdown was less severe and some countries, including Germany, France and Canada, managed
to register higher growth in 2016 compared to 2015.
In the US, economic growth decelerated to 1.6 per cent in 2016 from 2.6 per cent in 2015. The economy received a
marked boost in confidence towards the end of 2016 in the run up to the presidential election and the inauguration of
the new President in January 2017. President Trump promised an expansionary fiscal policy stance through tax
incentives and increased infrastructure spending which resulted in the so-called “Trump bump2”. The economy
expanded by only 1.2 per cent quarter-on-quarter in the first quarter of 2017 but output rose by 2.6 per cent in the
second quarter. Much of the rebound was due to more robust consumer spending at the expense of savings.
In recent months, world trade has grown strongly owing to the pick-up in investment from developed countries and
the increase in the manufacturing output in Asia. The Purchasing Managers’ Indices (PMI) predict steady
manufacturing activity ahead. This is consistent with strong consumer confidence resulting in healthy final demand. In
the USA, activities are expected to be stimulated in a short term owing to the tax policy changes. The impact of the tax
policy package on the America GDP would be positive through 2020 but is forecast to lower growth for a few years
from 2022 forwards. China would grow more steadily, by 6.2 percent in the medium term. However, excess capacity
issues and financial market vulnerabilities are the main constraints on China’s growth. Investment and private
households’ spending will remain the anchors of growth. China’s exports are expected to contribute more significantly
in the coming years as new free trade zones gain traction. Overall risks to the global growth projection seem to
balance in the near term but remain skewed over the medium term to the downside. Geopolitical tensions and
political uncertainty in some countries also pose downside risks. Weak inflation also indicates that slack remains in
many developed economies and, as a consequence, monetary policy should continue to remain accommodative. If
global sentiment remains strong and inflation muted, then financial conditions could ease in the medium term and the
global economy’s growth, on average, could be around 3.9 percent in 2018 and 2019.
The South African Economy
Growth in economic output slowed to 0.3 per cent in 2016 from 1.3 per cent in 2015. Several factors contributed to the
frail growth that led to tepid business and consumer confidence. This continued into 2017. The South African economy
contracted by 0.6 per cent quarter-on-quarter in the first quarter of 2017 following the 0.3 per cent contraction in the
fourth quarter of 2016. This means that South Africa entered a technical recession in the first quarter of 2017, its first in
23
eight years. Only agriculture and mining GDP increased in the first quarter of 2017, while all other sectors either
declined or stagnated. In sum, GDP growth in the primary sector rose by 14.1 per cent quarter-on-quarter in the first
quarter of 2017. However, the rebound was partly due to base effects following weaker growth for much of 2016.
Growth in the tertiary sector contracted unexpectedly by 2 per cent quarter on-quarter. This was led by a noticeable
fall in output in the trade sector that registered a quarterly decline of 5.9 per cent (subtracting 0.8 percentage points
from GDP growth). In the secondary sector, growth also contracted.
The economy of South Africa has stagnated over the last couple of years with high levels of unemployment and no
improvement in the level of poverty. The beginning of 2017 was marked by recession owing to a number of factors
such as: water shortages, high electricity tariffs, contraction in manufacturing production, decline of private
consumption and private investment as well as slower exports to mention a few. The threat of down grade by rating
agencies also contributed to economic stagnation in South Africa as investor confidence was and is still relatively low.
However, the country’s economic outlook has improved in recent months, after the ruling party’s national conference
and the election of a new president which was widely anticipated by the market and private sector
In his state of the nation address on the 16th of February 2018, the new president vowed to improve the country’s
dysfunctional state-owned enterprises and cut the bloated public sector to contain rising public debt. Also, during the
budget speech in the following week, the Minister of Finance announced that Value Added Tax (VAT) would increase
from 14 to 15 percent from 1st April 2018.
Government is set to continue to invest in economic and social infrastructure although at a moderate pace. The
budget deficit is expected to narrow from 4.3 percent of GDP in 2017/18 to 3.5 percent in 2020/21. The net debt is
projected to stabilise at 53.2 percent of GDP in 2023/24 while the current account balance deficit is expected to be
around 3.2 percent of the GDP. To reduce the current level of unemployment, the country needs high and sustain
economic growth over the next five years. The risk to the inflation outlook will be moderately on the upside, owing to
the high degree of exchange rate uncertainty, but within the target range.
The Eastern Cape Economy
The Eastern Cape economy depends heavily on the country’s economic performance and growth. It is also affected by
the increasing domestic political uncertainty which can stall reforms. Also, lack of huge capital investment especially in
the rural areas would negatively impact the Province’s economic outlook. Although the EC economic growth is
showing an upward trend, it’s still well below its real performance potential. The Province’s economy is expected to
recover at a slow pace despite a favourable global environment with higher commodity prices.
SA exports have increased significantly from R382 billion in 2006 to R 1.1 trillion in 2016, equivalent to an annual
average increase of 11 percent. Exports from the GP made the highest contribution, followed by North West (NW) and
KZN in 2016. The automotive sector remains the Province’s leading exporter. However, there has been steady growth
in sectors such as agro-processing, energy, general manufacturing and pharmaceutical products. EU is still the EC’s
biggest export recipient followed by Asian countries.
The Eastern Cape economy has been affected by the national economic turmoil, owing to its exposure to external
shocks and high dependency on national grants. In terms of population size, the Province lost its third position to the
Western Cape Province to become the fourth largest province. This new ranking is expected to affect the Province’s
grant allocation.
The Black/African community represented more than 85 percent of the population followed by the Coloured
community with 7.7 percent and Whites with 4.2 percent in 2017. Owing to the increase in migration of its inhabitants
to other provinces, the EC Province’s population growth has been below the national average growth with a
consequence of a gradual decline in its percentage share to the total country population over the years.
The Eastern Cape is the fourth largest economy in SA and increased by 0.8 percent in 2016. It is projected to increase
by 1.3 percent in 2017. The unemployment rate is estimated at 35.1 percent in the 4Q2017: the highest rate in the
country. Between the 4Q2016 and 4Q2017, the construction industry lost more than 30 000 jobs, followed by the
manufacturing industry with 27 000 and the wholesale and retail trade industry with a loss of 19 000 jobs.
The EC’s economic activities are still concentrated in the urban areas and dominated by the tertiary sector with 79.2
percent of the total economy. However, an increased level of public investment as well as improved household
consumption spending in the Province has mitigated the impact. The fixed capital stock per capita of the Eastern Cape
24
was the smallest in the country and below the national average in 2016. Total investment is expected to increase by
1.8 percent on average over the medium term however, this is insufficient to have a major impact on the current
unemployment rate.
At district level, the Alfred Nzo, O.R. Tambo and Joe Gqabi District Municipalities showed stronger annual growth than
Buffalo City and Nelson Mandela Bay Metropolitan Municipality. However, the two Metros represented more than 50
percent of the provincial economy. An upward trajectory is forecast for the Province over the medium term. However,
this positive outlook could be threatened by the current political instability within the Province. Rural district
municipalities showed high dependency ratios compared to urban regions, while “extreme poverty” has improved
considerably over the years. The unemployment rate remains high in the rural municipalities even though access to
basic services has improved.
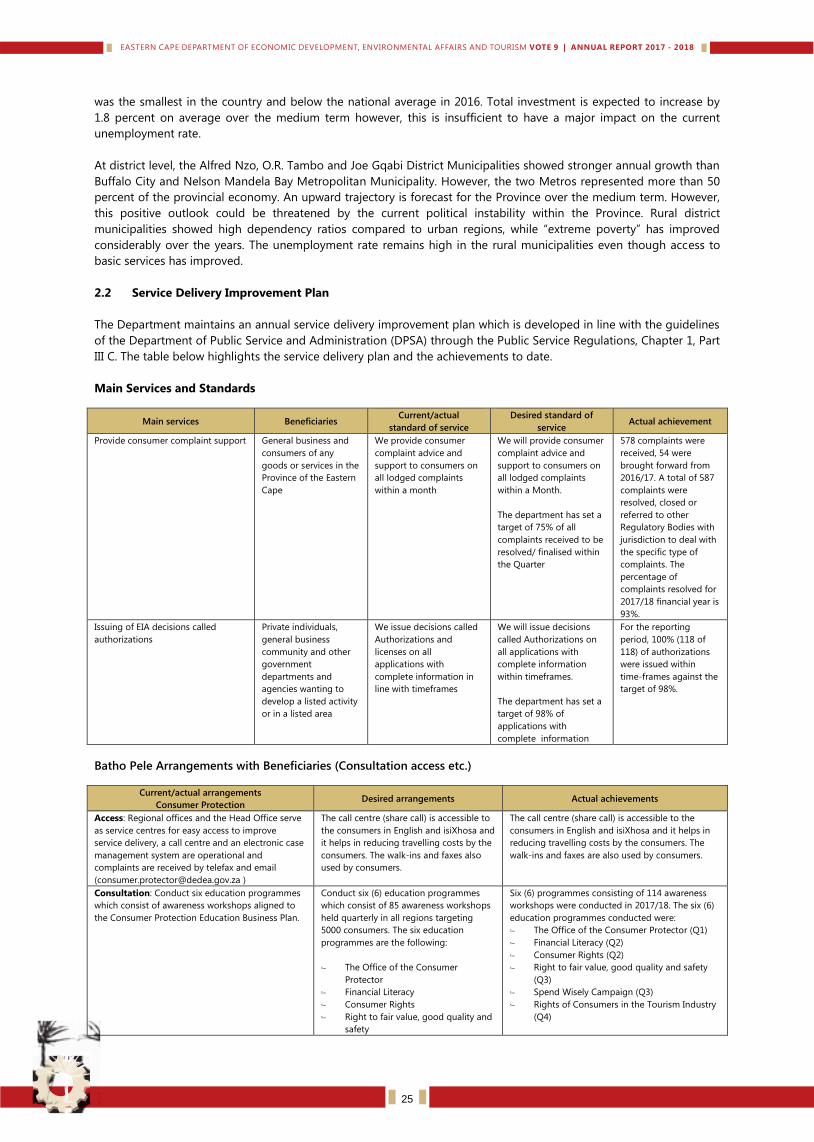
2.2 Service Delivery Improvement Plan
The Department maintains an annual service delivery improvement plan which is developed in line with the guidelines
of the Department of Public Service and Administration (DPSA) through the Public Service Regulations, Chapter 1, Part
III C. The table below highlights the service delivery plan and the achievements to date.
Main Services and Standards
Main services Beneficiaries Current/actual
standard of service
Desired standard of
service Actual achievement
Provide consumer complaint support
General business and
consumers of any
goods or services in the
Province of the Eastern
Cape
We provide consumer
complaint advice and
support to consumers on
all lodged complaints
within a month
We will provide consumer
complaint advice and
support to consumers on
all lodged complaints
within a Month.
The department has set a
target of 75% of all
complaints received to be
resolved/ finalised within
the Quarter
578 complaints were
received, 54 were
brought forward from
2016/17. A total of 587
complaints were
resolved, closed or
referred to other
Regulatory Bodies with
jurisdiction to deal with
the specific type of
complaints. The
percentage of
complaints resolved for
2017/18 financial year is
93%.
Issuing of EIA decisions called
authorizations
Private individuals,
general business
community and other
government
departments and
agencies wanting to
develop a listed activity
or in a listed area
We issue decisions called
Authorizations and
licenses on all
applications with
complete information in
line with timeframes
We will issue decisions
called Authorizations on
all applications with
complete information
within timeframes.
The department has set a
target of 98% of
applications with
complete information
For the reporting
period, 100% (118 of
118) of authorizations
were issued within
time-frames against the
target of 98%.
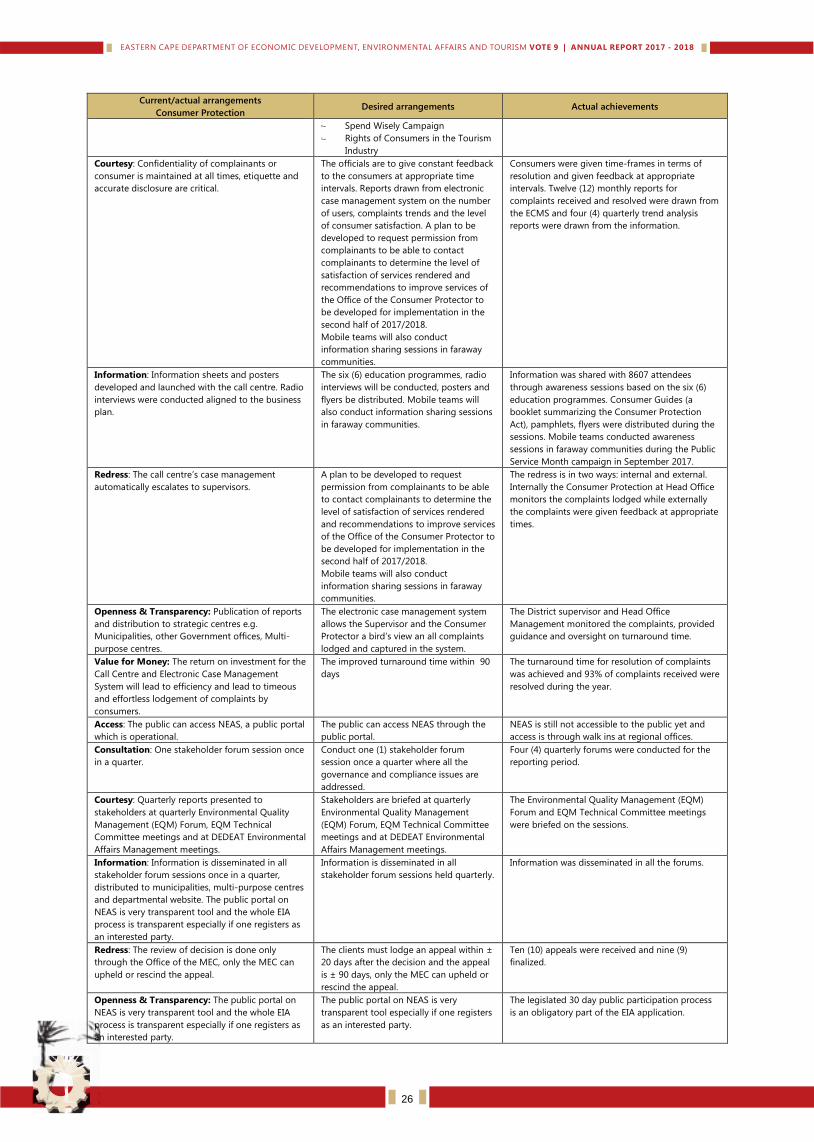
Batho Pele Arrangements with Beneficiaries (Consultation access etc.)
Current/actual arrangements
Consumer Protection Desired arrangements Actual achievements
Access: Regional offices and the Head Office serve
as service centres for easy access to improve
service delivery, a call centre and an electronic case
management system are operational and
complaints are received by telefax and email
The call centre (share call) is accessible to
the consumers in English and isiXhosa and
it helps in reducing travelling costs by the
consumers. The walk-ins and faxes also
used by consumers.
The call centre (share call) is accessible to the
consumers in English and isiXhosa and it helps in
reducing travelling costs by the consumers. The
walk-ins and faxes are also used by consumers.
Consultation: Conduct six education programmes
which consist of awareness workshops aligned to
the Consumer Protection Education Business Plan.
Conduct six (6) education programmes
which consist of 85 awareness workshops
held quarterly in all regions targeting
5000 consumers. The six education
programmes are the following:
– The Office of the Consumer
Protector
– Financial Literacy
– Consumer Rights
– Right to fair value, good quality and
safety
Six (6) programmes consisting of 114 awareness
workshops were conducted in 2017/18. The six (6)
education programmes conducted were:
– The Office of the Consumer Protector (Q1)
– Financial Literacy (Q2)
– Consumer Rights (Q2)
– Right to fair value, good quality and safety
(Q3)
– Spend Wisely Campaign (Q3)
– Rights of Consumers in the Tourism Industry
(Q4)
25
Current/actual arrangements
Consumer Protection Desired arrangements Actual achievements
– Spend Wisely Campaign
– Rights of Consumers in the Tourism
Industry
Courtesy: Confidentiality of complainants or
consumer is maintained at all times, etiquette and
accurate disclosure are critical.
The officials are to give constant feedback
to the consumers at appropriate time
intervals. Reports drawn from electronic
case management system on the number
of users, complaints trends and the level
of consumer satisfaction. A plan to be
developed to request permission from
complainants to be able to contact
complainants to determine the level of
satisfaction of services rendered and
recommendations to improve services of
the Office of the Consumer Protector to
be developed for implementation in the
second half of 2017/2018.
Mobile teams will also conduct
information sharing sessions in faraway
communities.
Consumers were given time-frames in terms of
resolution and given feedback at appropriate
intervals. Twelve (12) monthly reports for
complaints received and resolved were drawn from
the ECMS and four (4) quarterly trend analysis
reports were drawn from the information.
Information: Information sheets and posters
developed and launched with the call centre. Radio
interviews were conducted aligned to the business
plan.
The six (6) education programmes, radio
interviews will be conducted, posters and
flyers be distributed. Mobile teams will
also conduct information sharing sessions
in faraway communities.
Information was shared with 8607 attendees
through awareness sessions based on the six (6)
education programmes. Consumer Guides (a
booklet summarizing the Consumer Protection
Act), pamphlets, flyers were distributed during the
sessions. Mobile teams conducted awareness
sessions in faraway communities during the Public
Service Month campaign in September 2017.
Redress: The call centre’s case management
automatically escalates to supervisors.
A plan to be developed to request
permission from complainants to be able
to contact complainants to determine the
level of satisfaction of services rendered
and recommendations to improve services
of the Office of the Consumer Protector to
be developed for implementation in the
second half of 2017/2018.
Mobile teams will also conduct
information sharing sessions in faraway
communities.
The redress is in two ways: internal and external.
Internally the Consumer Protection at Head Office
monitors the complaints lodged while externally
the complaints were given feedback at appropriate
times.
Openness & Transparency: Publication of reports
and distribution to strategic centres e.g.
Municipalities, other Government offices, Multi-
purpose centres.
The electronic case management system
allows the Supervisor and the Consumer
Protector a bird’s view an all complaints
lodged and captured in the system.
The District supervisor and Head Office
Management monitored the complaints, provided
guidance and oversight on turnaround time.
Value for Money: The return on investment for the
Call Centre and Electronic Case Management
System will lead to efficiency and lead to timeous
and effortless lodgement of complaints by
consumers.
The improved turnaround time within 90
days
The turnaround time for resolution of complaints
was achieved and 93% of complaints received were
resolved during the year.
Access: The public can access NEAS, a public portal
which is operational.
The public can access NEAS through the
public portal.
NEAS is still not accessible to the public yet and
access is through walk ins at regional offices.
Consultation: One stakeholder forum session once
in a quarter.
Conduct one (1) stakeholder forum
session once a quarter where all the
governance and compliance issues are
addressed.
Four (4) quarterly forums were conducted for the
reporting period.
Courtesy: Quarterly reports presented to
stakeholders at quarterly Environmental Quality
Management (EQM) Forum, EQM Technical
Committee meetings and at DEDEAT Environmental
Affairs Management meetings.
Stakeholders are briefed at quarterly
Environmental Quality Management
(EQM) Forum, EQM Technical Committee
meetings and at DEDEAT Environmental
Affairs Management meetings.
The Environmental Quality Management (EQM)
Forum and EQM Technical Committee meetings
were briefed on the sessions.
Information: Information is disseminated in all
stakeholder forum sessions once in a quarter,
distributed to municipalities, multi-purpose centres
and departmental website. The public portal on
NEAS is very transparent tool and the whole EIA
process is transparent especially if one registers as
an interested party.
Information is disseminated in all
stakeholder forum sessions held quarterly.
Information was disseminated in all the forums.
Redress: The review of decision is done only
through the Office of the MEC, only the MEC can
upheld or rescind the appeal.
The clients must lodge an appeal within ±
20 days after the decision and the appeal
is ± 90 days, only the MEC can upheld or
rescind the appeal.
Ten (10) appeals were received and nine (9)
finalized.
Openness & Transparency: The public portal on
NEAS is very transparent tool and the whole EIA
process is transparent especially if one registers as
an interested party.
The public portal on NEAS is very
transparent tool especially if one registers
as an interested party.
The legislated 30 day public participation process
is an obligatory part of the EIA application.
26
Current/actual arrangements
Consumer Protection Desired arrangements Actual achievements
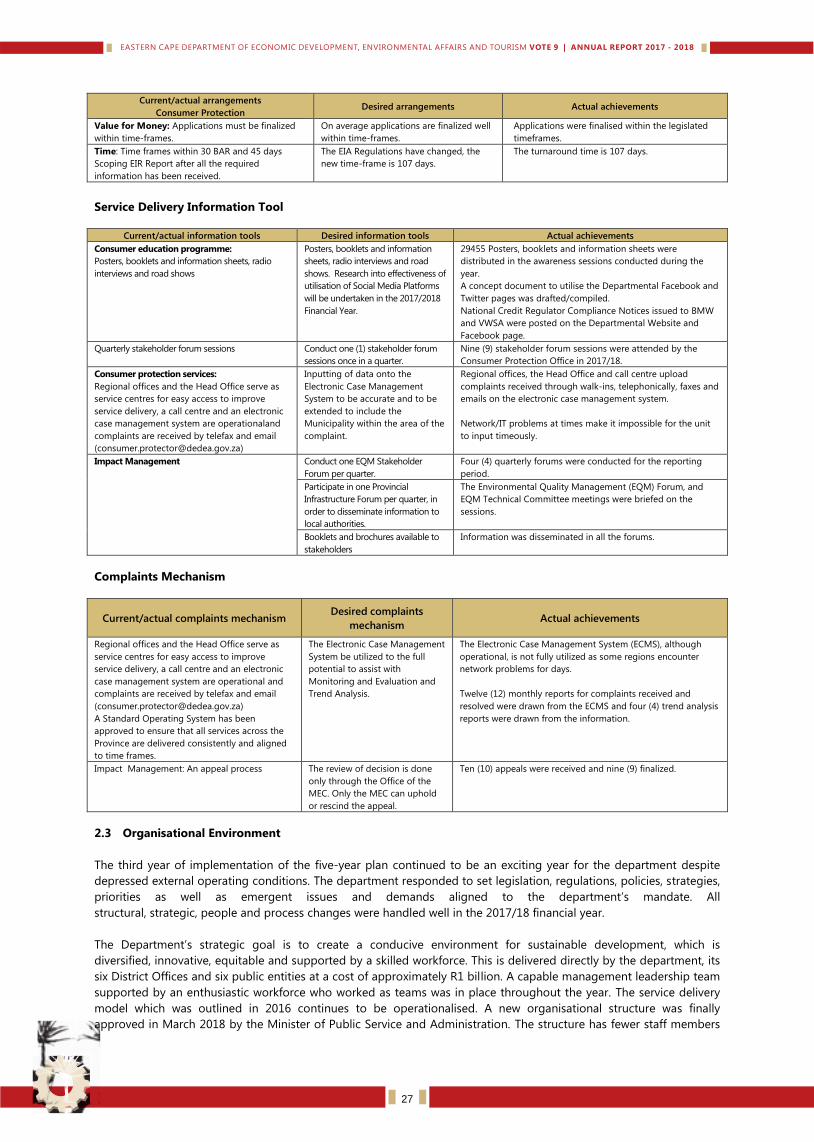
Value for Money: Applications must be finalized
within time-frames.
On average applications are finalized well
within time-frames.
Applications were finalised within the legislated
timeframes.
Time: Time frames within 30 BAR and 45 days
Scoping EIR Report after all the required
information has been received.
The EIA Regulations have changed, the
new time-frame is 107 days.
The turnaround time is 107 days.
Service Delivery Information Tool
Current/actual information tools Desired information tools Actual achievements
Consumer education programme:
Posters, booklets and information sheets, radio
interviews and road shows
Posters, booklets and information
sheets, radio interviews and road
shows. Research into effectiveness of
utilisation of Social Media Platforms
will be undertaken in the 2017/2018
Financial Year.
29455 Posters, booklets and information sheets were
distributed in the awareness sessions conducted during the
year.
A concept document to utilise the Departmental Facebook and
Twitter pages was drafted/compiled.
National Credit Regulator Compliance Notices issued to BMW
and VWSA were posted on the Departmental Website and
Facebook page.
Quarterly stakeholder forum sessions Conduct one (1) stakeholder forum
sessions once in a quarter.
Nine (9) stakeholder forum sessions were attended by the
Consumer Protection Office in 2017/18.
Consumer protection services:
Regional offices and the Head Office serve as
service centres for easy access to improve
service delivery, a call centre and an electronic
case management system are operationaland
complaints are received by telefax and email
Inputting of data onto the
Electronic Case Management
System to be accurate and to be
extended to include the
Municipality within the area of the
complaint.
Regional offices, the Head Office and call centre upload
complaints received through walk-ins, telephonically, faxes and
emails on the electronic case management system.
Network/IT problems at times make it impossible for the unit
to input timeously.
Impact Management Conduct one EQM Stakeholder
Forum per quarter.
Four (4) quarterly forums were conducted for the reporting
period.
Participate in one Provincial
Infrastructure Forum per quarter, in
order to disseminate information to
local authorities.
The Environmental Quality Management (EQM) Forum, and
EQM Technical Committee meetings were briefed on the
sessions.
Booklets and brochures available to
stakeholders
Information was disseminated in all the forums.
Complaints Mechanism
Current/actual complaints mechanism Desired complaints
mechanism Actual achievements
Regional offices and the Head Office serve as
service centres for easy access to improve
service delivery, a call centre and an electronic
case management system are operational and
complaints are received by telefax and email
A Standard Operating System has been
approved to ensure that all services across the
Province are delivered consistently and aligned
to time frames.
The Electronic Case Management
System be utilized to the full
potential to assist with
Monitoring and Evaluation and
Trend Analysis.
The Electronic Case Management System (ECMS), although
operational, is not fully utilized as some regions encounter
network problems for days.
Twelve (12) monthly reports for complaints received and
resolved were drawn from the ECMS and four (4) trend analysis
reports were drawn from the information.
Impact Management: An appeal process The review of decision is done
only through the Office of the
MEC. Only the MEC can uphold
or rescind the appeal.
Ten (10) appeals were received and nine (9) finalized.
2.3 Organisational Environment
The third year of implementation of the five-year plan continued to be an exciting year for the department despite
depressed external operating conditions. The department responded to set legislation, regulations, policies, strategies,
priorities as well as emergent issues and demands aligned to the department’s mandate. All
structural, strategic, people and process changes were handled well in the 2017/18 financial year.
The Department’s strategic goal is to create a conducive environment for sustainable development, which is
diversified, innovative, equitable and supported by a skilled workforce. This is delivered directly by the department, its
six District Offices and six public entities at a cost of approximately R1 billion. A capable management leadership team
supported by an enthusiastic workforce who worked as teams was in place throughout the year. The service delivery
model which was outlined in 2016 continues to be operationalised. A new organisational structure was finally
approved in March 2018 by the Minister of Public Service and Administration. The structure has fewer staff members
27
and flatter hierarchy compared to the 2006 model. However, owing to capacity challenges within the Human
Resources function, an organisational climate survey could not be done. It’s worth noting that the DPSA administered
HR Assessment yielded slightly poor results (4.5) compared to the score achieved in the previous year (4.7). Scores
were particularly poor in the strategic function role of HR. All organisational committees were largely functional and
effective during the year.
The centralised recruitment process designed to limit the growth of CEO budgets has yielded some results but can
work better if there is direct control by departments. The department operated with 13.8% vacancy rate during the
year. This was within the acceptable limit set for the public sector. This is also a good proxy indicator of loyalty to the
organisation. The department staff is well qualified with a number of officials being holders of Specialist, Masters and
PhDs degrees. During the year, 226 staff members were exposed to training (inclusive of short-term and long term
courses). The department had 59 learners and experiential learners on an 18-month period in line with the objectives
of empowering and developing youth for employment creation and poverty reduction. Overall, the organisational
environment remained stable although the human resource function remained constrained.
The department has been largely compliant with processes and policies operational in the public service. The financial
management processes improved as indicated in the latest MPAT results. The department has achieved a score of 2.75
compared to 2.5 which was achieved in the previous year. Management is putting measures in place to address the
shortcomings. Financial resources of the department of approximately R1.1 billion, representing an allocation of 1.4%
of the total Provincial budget, is insignificant to make a massive dent to unemployment, poverty and lack of industrial
infrastructure. On the other hand, financial expenditure has been impressive at 96.5% for the year. However, budgeting
efficiency issues need to be improved since there was significant virement of funds within programmes.
Strategic risks were identified and documented at the end of the financial year. This will assist the department in
managing its strategic objectives. Work continued on governance and oversight of public entities under care of the
department. Management of both the department and public entities continued to receive political and strategic
support from the MEC, Portfolio Committee and Boards of Directors. Engagements with the Chairpersons and Chief
Executives of all entities were undertaken in order to check progress and or remove any hindrance towards the full
implementation of the department’s plans in line with governance and oversight functions. There is still room for
improvement in providing timely and accurate performance information to aid management, the MEC and Boards with
decision making.
Although the department adopted a Project Management Methodology Framework Policy and Procedure to support
the effective delivery of projects, there hasn’t been any traction on the implementation front. The executive
responsible for the portfolio resigned during the year and the position was not filled. The proposed integrated
strategic management solution to support performance and project management monitoring and reporting for the
DEDEAT Group could not be developed during the year due to funding constraints. A budget has been set aside for
partial development and implementation in 2018/19 financial year.
A desired futurist planning conference could not be realised due to non-response from certified futurists. Two DEDEAT
Group planning sessions took place to review and plan for the next MTEF period. The department partnered with a
number of stakeholders to complement implementation of programmes and activities. This is key going forward since
it increases the chances of success given the dwindling resources and challenging operating environment. Evaluations
have not been prioritised in the past. Going forward, at least two evaluations will be conducted in each year. The
Operations Management Framework (OMF) will be institutionalised in the department starting 2018/19 with partial
allocation of funding for the project.
It is pleasing to note that the department had an adequate complement of tools and assets (e.g. vehicles, uniforms,
ICT equipment) to facilitate the implementation of various programmes. It is mainly the head office building that
requires serious attention in order to improve the health and safety of staff. Provision of most ICT services like email,
internet was at 97.5% to all staff members of the Department. This includes the provision of adequate working tools
desktop, laptops, tablets and printing services. Electronic communication of DEDEAT work was enhanced during the
year. Electronic e-permit solution for the Environmental Affairs section which was developed in 2017/18 is now
functional. Citizens can now apply for biodiversity permits electronically. The e-vaya (an electronic document
processing and tracking tool) system continued to function well easing and speeding transactional processes in the
department.
28
2.4 Key Policy Developments and Legislative Changes
A number of policy and legislative issues have been relatively stable in the year under review. While the Demarcation
Board completed its demarcation study and report, the Eastern Cape has not been affected by such changes. The
operations of the Department have also not changed from the preceding year.
The following is the status of pieces of legislation which are still under review:
The Eastern Cape Gambling Amendment Act, 2015 (Act No. 1 of 2015) amended the Eastern Cape Gambling Act,
1997 (Act No. 5 of 1997) and came into operation on 1 August 2016The impact of the Act provides for the
following: reinforced monitoring to enforce compliance by the industry; an expanded revenue-base and increased
economic contribution; a revised regulatory system that caters for new forms of gambling; a quicker decision
making process and responsiveness to demands; and enhanced suitability of mechanisms to promote entry into
the industry. Section 4 and 5 of the Eastern Cape Gambling Amendment Act, 2015 was proclaimed in February
2018 and the Public Entity is now known as the Eastern Cape Gambling Board. Regulations in terms of the Act
have been drafted and were published for comment during February 2018 and will be finalised in June 2018.
The Eastern Cape Liquor Authority Bill, 2016 was published for public comment on the 24th October 2016. The
Honourable MEC extended the period for the public to comment until the 18th May 2017. The comments were
considered and Tabled at the Provincial Legislature during October 2017. Public Hearings on the Bill by the
Eastern Cape Provincial Legislature are scheduled for June 2018.
Liquor regulations will be finalised and gazetted once the Bill has been processed through the Legislative
procedures. This will only occur once the Bill is promulgated by the Eastern Cape Provincial Legislature.
The White Paper on Consumer Protection in the Eastern Cape has been approved and the Eastern Cape Consumer
Protection Bill, 2016 have been tabled at the Eastern Cape Provincial Legislature. Public Hearings on the Bill by the
Eastern Cape Provincial Legislature are scheduled for June 2018.
The Bill when proclaimed and in operation will provide the Office of the Consumer Protector with the necessary
legislative mandate to ensure a more effective and efficient service to consumers within the Eastern Cape and will
be aligned to the Consumer Protection Act and provides for procedures and mechanisms to provide redress to
consumers. Provision is made for the establishment of the Eastern Cape Consumer Tribunal for referral of
complaints that are not resolved in terms of alternative dispute resolution mechanisms.
The Eastern Cape Parks and Tourism Agency Act (No 2 of 2010) is currently under review. The amended Act
will promote alignment with the National tourism legislation whilst it will seek to address gaps that have been
identified which have a direct impact on implementation. The Eastern Cape Tourism Agency Bill, 2018 has been
published for comment in February 2018. The comments are being considered and will be processed during June
2018.
The Department together with the two IDZs will work together to ensure the transition of the existing IDZs into
SEZs. Work will continue and ensure full conversion of existing development zones into fully-fledged SEZs by 2019
in line with the SEZ Act and associated regulations. The Department is currently drafting a White Paper on Eastern
Cape Special Economic Zones Management The aim is to develop a policy to ensure the efficient governance and
management of the business affairs of the SEZs; to ensure management of the SEZs in accordance with the
Companies Act as well as the Public Finance Management Act; and to inform the development of the Special
Economic Zone in alignment with provincial economic goals and objectives.
The Policy will ensure that the management of SEZ’s will ensure compliance with the Constitution and other
legislation, will promote good governance and accountability and provide for mechanisms to ensure that the
Department is able to fulfil its Public Entity Oversight function.
The Eastern Cape Development Corporation Act, 1997 is under review and a White Paper is in the process of being
developed.
The Department is in the process of developing policy in respect of an Environmental Management Bill and it is
envisaged that this process will be finalised by year end. This is a first for the Province as currently we do not have
any provincial legislation for Environmental Management. All decrees that governed the former Transkei areas
and outdated Acts will be repealed once the Act is promulgated. It is however necessary to mention that even
though the province will have an Environmental Management Act, various other acts such as NEMA and CITES will
still be applicable.
The department is already factoring some of the issues in the national youth policy 2020 (2015) which cover
unemployment and joblessness, inadequate skills development, high rates of violence and substance abuse and
disability and exclusion. The policy proposals of economic participation and transformation, education and skills,
youth absorption into employment and income opportunities such as EPWP are already factored in the operations
of the department. The department has learnership and internship programme for youth. The SMME desk is also
supporting youth SMMEs including enterprise education and training, incubation and access to both finance and
markets. The ECLB and ECGB already have programmes to support irresponsible gambling and alcohol abuse.
29
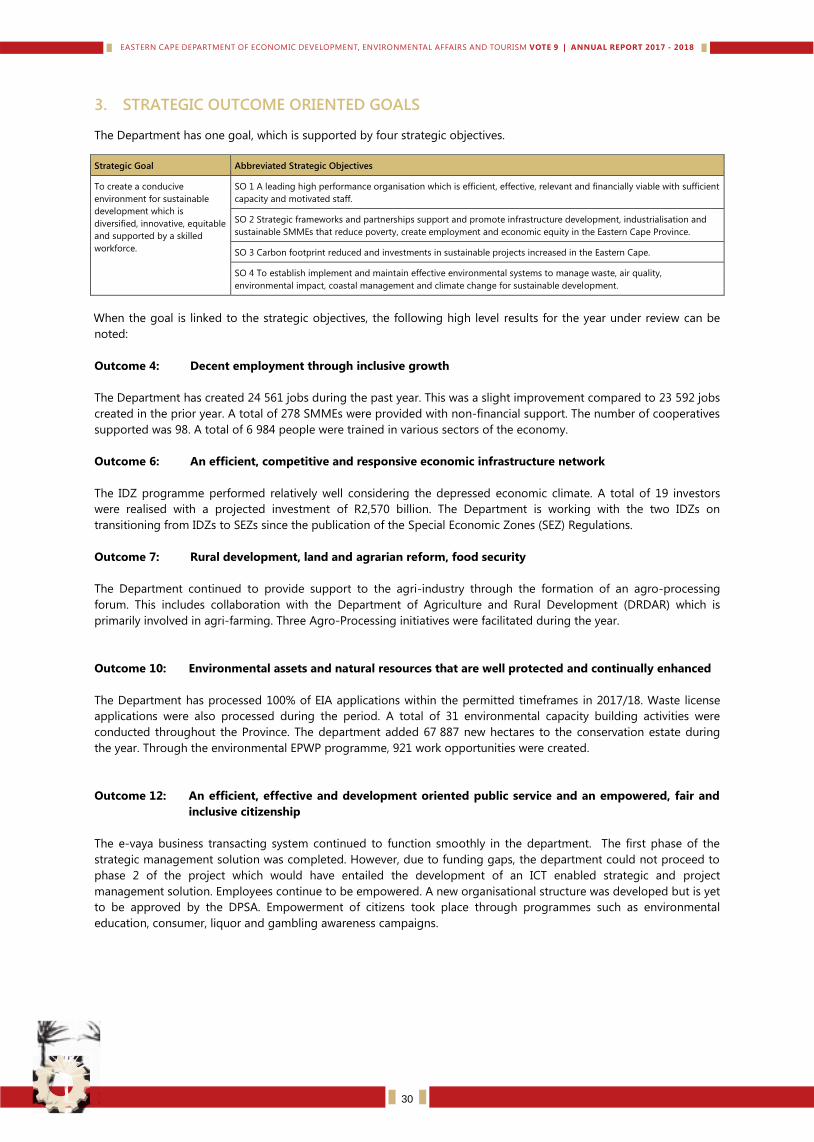
3. STRATEGIC OUTCOME ORIENTED GOALS The Department has one goal, which is supported by four strategic objectives.
Strategic Goal Abbreviated Strategic Objectives
To create a conducive
environment for sustainable
development which is
diversified, innovative, equitable
and supported by a skilled
workforce.
SO 1 A leading high performance organisation which is efficient, effective, relevant and financially viable with sufficient
capacity and motivated staff.
SO 2 Strategic frameworks and partnerships support and promote infrastructure development, industrialisation and
sustainable SMMEs that reduce poverty, create employment and economic equity in the Eastern Cape Province.
SO 3 Carbon footprint reduced and investments in sustainable projects increased in the Eastern Cape.
SO 4 To establish implement and maintain effective environmental systems to manage waste, air quality,
environmental impact, coastal management and climate change for sustainable development.
When the goal is linked to the strategic objectives, the following high level results for the year under review can be
noted:
Outcome 4: Decent employment through inclusive growth
The Department has created 24 561 jobs during the past year. This was a slight improvement compared to 23 592 jobs
created in the prior year. A total of 278 SMMEs were provided with non-financial support. The number of cooperatives
supported was 98. A total of 6 984 people were trained in various sectors of the economy.
Outcome 6: An efficient, competitive and responsive economic infrastructure network
The IDZ programme performed relatively well considering the depressed economic climate. A total of 19 investors
were realised with a projected investment of R2,570 billion. The Department is working with the two IDZs on
transitioning from IDZs to SEZs since the publication of the Special Economic Zones (SEZ) Regulations.
Outcome 7: Rural development, land and agrarian reform, food security
The Department continued to provide support to the agri-industry through the formation of an agro-processing
forum. This includes collaboration with the Department of Agriculture and Rural Development (DRDAR) which is
primarily involved in agri-farming. Three Agro-Processing initiatives were facilitated during the year.
Outcome 10: Environmental assets and natural resources that are well protected and continually enhanced
The Department has processed 100% of EIA applications within the permitted timeframes in 2017/18. Waste license
applications were also processed during the period. A total of 31 environmental capacity building activities were
conducted throughout the Province. The department added 67 887 new hectares to the conservation estate during
the year. Through the environmental EPWP programme, 921 work opportunities were created.
Outcome 12: An efficient, effective and development oriented public service and an empowered, fair and
inclusive citizenship
The e-vaya business transacting system continued to function smoothly in the department. The first phase of the
strategic management solution was completed. However, due to funding gaps, the department could not proceed to
phase 2 of the project which would have entailed the development of an ICT enabled strategic and project
management solution. Employees continue to be empowered. A new organisational structure was developed but is yet
to be approved by the DPSA. Empowerment of citizens took place through programmes such as environmental
education, consumer, liquor and gambling awareness campaigns.
30
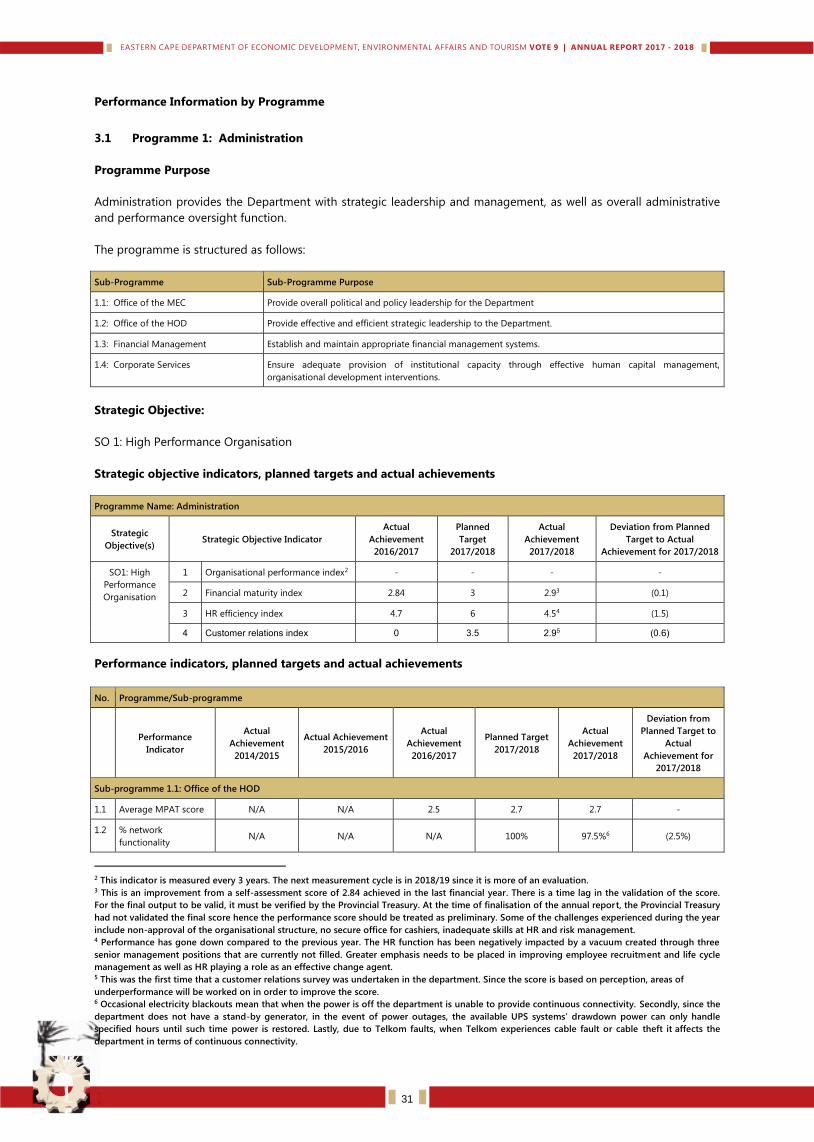
Performance Information by Programme
3.1 Programme 1: Administration
Programme Purpose
Administration provides the Department with strategic leadership and management, as well as overall administrative
and performance oversight function.
The programme is structured as follows:
Sub-Programme Sub-Programme Purpose
1.1: Office of the MEC Provide overall political and policy leadership for the Department
1.2: Office of the HOD Provide effective and efficient strategic leadership to the Department.
1.3: Financial Management Establish and maintain appropriate financial management systems.
1.4: Corporate Services Ensure adequate provision of institutional capacity through effective human capital management,
organisational development interventions.
Strategic Objective:
SO 1: High Performance Organisation
Strategic objective indicators, planned targets and actual achievements
Programme Name: Administration
Strategic
Objective(s) Strategic Objective Indicator
Actual
Achievement
2016/2017
Planned
Target
2017/2018
Actual
Achievement
2017/2018
Deviation from Planned
Target to Actual
Achievement for 2017/2018
SO1: High
Performance
Organisation
1 Organisational performance index2 - - - -
2 Financial maturity index 2.84 3 2.93 (0.1)
3 HR efficiency index 4.7 6 4.54 (1.5)
4 Customer relations index 0 3.5 2.95 (0.6)
Performance indicators, planned targets and actual achievements
No. Programme/Sub-programme
Performance
Indicator
Actual
Achievement
2014/2015
Actual Achievement
2015/2016
Actual
Achievement
2016/2017
Planned Target
2017/2018
Actual
Achievement
2017/2018
Deviation from
Planned Target to
Actual
Achievement for
2017/2018
Sub-programme 1.1: Office of the HOD
1.1 Average MPAT score N/A N/A 2.5 2.7 2.7 -
1.2 % network
functionality N/A N/A N/A 100% 97.5%6 (2.5%)
2 This indicator is measured every 3 years. The next measurement cycle is in 2018/19 since it is more of an evaluation. 3 This is an improvement from a self-assessment score of 2.84 achieved in the last financial year. There is a time lag in the validation of the score.
For the final output to be valid, it must be verified by the Provincial Treasury. At the time of finalisation of the annual report, the Provincial Treasury
had not validated the final score hence the performance score should be treated as preliminary. Some of the challenges experienced during the year
include non-approval of the organisational structure, no secure office for cashiers, inadequate skills at HR and risk management. 4 Performance has gone down compared to the previous year. The HR function has been negatively impacted by a vacuum created through three
senior management positions that are currently not filled. Greater emphasis needs to be placed in improving employee recruitment and life cycle
management as well as HR playing a role as an effective change agent. 5 This was the first time that a customer relations survey was undertaken in the department. Since the score is based on perception, areas of
underperformance will be worked on in order to improve the score. 6 Occasional electricity blackouts mean that when the power is off the department is unable to provide continuous connectivity. Secondly, since the
department does not have a stand-by generator, in the event of power outages, the available UPS systems’ drawdown power can only handle
specified hours until such time power is restored. Lastly, due to Telkom faults, when Telkom experiences cable fault or cable theft it affects the
department in terms of continuous connectivity.
31
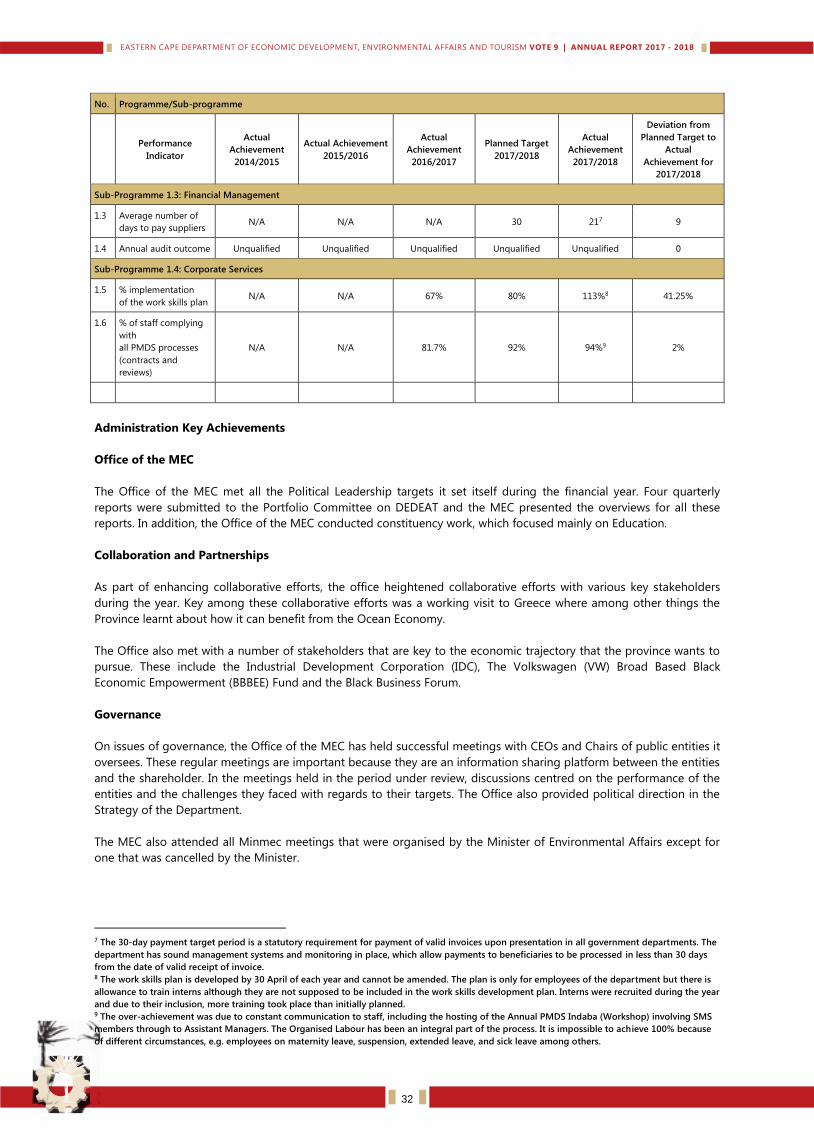
No. Programme/Sub-programme
Performance
Indicator
Actual
Achievement
2014/2015
Actual Achievement
2015/2016
Actual
Achievement
2016/2017
Planned Target
2017/2018
Actual
Achievement
2017/2018
Deviation from
Planned Target to
Actual
Achievement for
2017/2018
Sub-Programme 1.3: Financial Management
1.3 Average number of
days to pay suppliers N/A N/A N/A 30 217 9
1.4 Annual audit outcome Unqualified Unqualified Unqualified Unqualified Unqualified 0
Sub-Programme 1.4: Corporate Services
1.5 % implementation
of the work skills plan N/A N/A 67% 80% 113%8 41.25%
1.6 % of staff complying
with
all PMDS processes
(contracts and
reviews)
N/A N/A 81.7% 92% 94%9 2%
Administration Key Achievements
Office of the MEC
The Office of the MEC met all the Political Leadership targets it set itself during the financial year. Four quarterly
reports were submitted to the Portfolio Committee on DEDEAT and the MEC presented the overviews for all these
reports. In addition, the Office of the MEC conducted constituency work, which focused mainly on Education.
Collaboration and Partnerships
As part of enhancing collaborative efforts, the office heightened collaborative efforts with various key stakeholders
during the year. Key among these collaborative efforts was a working visit to Greece where among other things the
Province learnt about how it can benefit from the Ocean Economy.
The Office also met with a number of stakeholders that are key to the economic trajectory that the province wants to
pursue. These include the Industrial Development Corporation (IDC), The Volkswagen (VW) Broad Based Black
Economic Empowerment (BBBEE) Fund and the Black Business Forum.
Governance
On issues of governance, the Office of the MEC has held successful meetings with CEOs and Chairs of public entities it
oversees. These regular meetings are important because they are an information sharing platform between the entities
and the shareholder. In the meetings held in the period under review, discussions centred on the performance of the
entities and the challenges they faced with regards to their targets. The Office also provided political direction in the
Strategy of the Department.
The MEC also attended all Minmec meetings that were organised by the Minister of Environmental Affairs except for
one that was cancelled by the Minister.
7 The 30-day payment target period is a statutory requirement for payment of valid invoices upon presentation in all government departments. The
department has sound management systems and monitoring in place, which allow payments to beneficiaries to be processed in less than 30 days
from the date of valid receipt of invoice. 8 The work skills plan is developed by 30 April of each year and cannot be amended. The plan is only for employees of the department but there is
allowance to train interns although they are not supposed to be included in the work skills development plan. Interns were recruited during the year
and due to their inclusion, more training took place than initially planned. 9 The over-achievement was due to constant communication to staff, including the hosting of the Annual PMDS Indaba (Workshop) involving SMS
members through to Assistant Managers. The Organised Labour has been an integral part of the process. It is impossible to achieve 100% because
of different circumstances, e.g. employees on maternity leave, suspension, extended leave, and sick leave among others.
32
Cluster Reports – Auto and Non-Auto Sector
The Auto Sector remains the most critical sector of the Eastern Cape economy. As such engagements between the
MEC and leaders of the Auto Sector were held regularly during the 2017/18 financial year. The MEC held a meeting
with VW and MBSA CEOs to discuss a variety of issues that are aimed at ensuring beneficiation of Black Industrialists in
the sector.
Engagements with External Stakeholders
Constant engagements with stakeholders has been a rallying call of this fifth term of government. The MEC
participated in the Taking the Legislature to the People Session and the National Council of Provinces Week activities
where he addressed a number of issues raised by communities that relate to the DEDEAT Group.
The Office also handed over a Science laboratory to Imingcangathelo High School and participated in Mandela Day
activities at Nompumelelo High School in Beacon Bay.
Office of the HOD
The Office of the HOD ensured that Management practices in Strategic Management, Governance and Accountability,
Human Resources and Financial Management were in line with the legislative prescripts. The Office provided a vision
and direction in order to deliver on the Departmental mandate and promoted good corporate governance.
The Office ensured management and implementation of Provincial Transveral and transformation priorities.
Promotion of integrated governance and Public Entity Oversight was prioritised. The Office ensured that sustainable
economic development, job creation, tourism management and sustainable use of the environmental resources is
achieved through the work of the departmental programmes.
The Office of the HOD ensured that Executive Council Resolutions, Audit Intervention Plan and Service Delivery
Improvement Plans were implemented. Public Entity Oversight was prioritised through the implementation of the
Oversight Framework that provided a integrated approach to oversight over public entities. The implementation of the
Management Performance Assessment Tool was also enforced.
The Special Programmes Unit (SPU), which is a sub-programme in the Office of the HOD had the following
achievements during the year:
Firstly, the Edu Drama and Debate in the Nyandeni Local Municipality was hosted. In May 2017, the SPU and the
ECLB worked together to discourage underage drinking on youth of ages 13-18 years, a category which is
reported to be excessively consuming liquor.
The Unit has also hosted a First Eastern Cape Youth Economic Summit in partnership with Sarah Baartman District
Municipality, the ECDC and ABSA in Port Alfred in June 2017 in celebration of youth month and also as a
deliberate effort to empower them to participate into the mainstream economy for inclusive economic growth.
The unit also hosted an out of school environment camp which was held at Double Drift Game Reserve. The camp
sought to curb illegal poaching activities in the area and raise awareness on the long term implication of being on
the wrong side of the law while at the same time tried to achieve many things such as: provide basic
environmental literacy, minimising land degrading and deforestation and instilling love of animals and encourage
nature conservation for the next generation.
In partnership with the Great Kei Local Municipality and Amatole District Municipality, the SPU and Enterprise
Development Unit co-hosted a business awareness workshop focusing on Persons with disabilities in celebration
of disability month in November 2017.
The Unit co-hosted an Enterprise Development Sensitisation workshop in partnership with ECDEET at Empekweni
Resort for 14 persons with disabilities in the last quarter of the financial year. The participants were also exposed
to funding and financing opportunities that are obtaining at various development finance institutions.
Portfolio Management Office (PMO)
The Portfolio Management Office (PMO) has served as a transversal support unit to the Department’s mandated
numerous provincial activities, centred its resources to the economic and social infrastructure initiatives. The PMO’s
intention being to support efficient and effective service delivery mandates of the department, its entities and related
stakeholders.
33
To this end, the PMO participated in both the Provincial Local Economic Development (LED) Summit held in East
London and the National LED Summit held in Pretoria in October & November 2017 respectively, the Coastal and
Marine Tourism working group session in February 2018 – which monitors and reports on work being done by the
coastal municipalities of the province in alignment with the Operation Phakisa work. The PMO was also part of the
engagement with National Department of Water and Sanitation – discussing provincial infrastructure needs of
economic development stakeholders (economic cluster departments and business chamber representatives) to ensure
co-ordinated inputs into their Master Plan that was held in March 2018, as well as the Township Economies
development interaction that took place in the same month by the Enterprise Development Unit.
The PMO is involved in both the Integrated Social Infrastructure Delivery Programme (ISIDP) being rolled out by
Coega Development Corporation (CDC), together with Nelson Mandela Bay Municipality, focused on human
settlements. The Economic Infrastructure Programme (EIP) is currently being implemented by Eastern Cape
Development Corporation (ECDC) and includes the revitilisation of the Industrial Parks in the Province. The PMO also
participated in the revival and institutionalization of the infrastructure integrated planning and coordination platform
for the Province that was facilitated by the office of the Premier in March 2018 which was aimed at addressing
challenges raised by the EC Infrastructure Plan (ECIP), which is the absence of centralized planning of infrastructure to
ensure integrated planning, rational project prioritization to ensure seamless coordination and bring certainty but the
various committees and working groups failing to function optimally. The joint technical provincial infrastructure
coordination team from Office of the Premier (OTP), Provincial Treasury (PT), Cooperative Government and Traditional
Affairs (COGTA) and Eastern Cape Socio-Economic Consultative Council (ECSECC) were then tasked to revive the
platform and chart a way forward for coordination of infrastructure in the Province.
The PMO continued to support the Economic Development & Job Creation cluster working group in a secretariat
function and participated in the Provincial Infrastructure and Immovable Assets working group. Both these working
groups are under the Economic Development Cluster of the Provincial Cabinet structures.
Strategic Management
At the beginning of the financial year, all reporting tools for the 2017/18 financial period were crafted and distributed
to the DEDEAT Group. Workshops were conducted for reporting tools for regions and programmes. Quarterly
performance reports (eQPR and full reports) were generated in each quarter and submitted to the relevant offices and
management. The 2016/17 annual report was produced and published after all portfolios of evidence were verified in
each quarter with respect to all programmes and the six public entities of the department. Performance assessment
results were communicated with programmes and outstanding information was requested from programme managers
in order to adjust and reconcile performance accordingly.
Work was coordinated to prepare and submit documentation for Management Performance Assessment Tool (MPAT)
during the reporting period. The department achieved an average score of 2.7 on MPAT. A draft Monitoring and
Evaluation (M&E) policy and evaluation plan were developed.
Two DEDEAT Group planning workshops were conducted culminating in the development and publication of the
2018/19 Annual Performance Plan, Operational Plan, Policy Speech and Service Delivery Improvement Plan (SDIP). The
Unit coordinated timely finalization and submission of Public Entities APPs and Corporate Plans to the Accounting
Officer. These were subsequently tabled in the Provincial Legislature in March 2018. The Technical Indicator and
Evidence Reference Manual (TIERM) document was reviewed, signed off and posted on the intranet. The document is
a reference manual for understanding of indicators and guidance in the compilation of portfolios of evidence. Support
was given to Public Entities and various sub-programmes during their planning processes. Part of the planning process
involved participation in Integrated Development Plan (IDP) planning processes, Manufacturing Indaba, South African
Monitoring and Evaluation Association (SAMEA) Conference, Information and Communication Technology (ICT)
Summit, Public Sector Economist Forum (PSEF) Conference, Agro-processing workshop, Provincial Tourism
Coordinating Council (PTCC) and sector workshops e.g. the national dialogue on the sharing economy which gave an
impetus to the revision of the National Tourism Policy.
In an effort to improve and calibrate the performance of the Environmental Affairs Unit, together with the
Environmental Affairs Unit, Strategic Management coordinated benchmark visits to the departments of Environmental
Affairs in KwaZulu-Natal and Western Cape Provinces.
Strategic Management and Enterprise Development invited the OTP to train the Enterprise Development Officials on
the Business Process Mapping and Standard Operating Procedure for 4 days. This process should be aligned to the
Operations Management Framework (OMF) process which will be implemented by the department starting in 2018/19.
34
Information and Communication Technology (ICT) Agro Processing Market Intelligence Portal.
The DEDEAT Information Technology (IT) Unit has intensified its focus on solutions that have a direct impact on the
citizens. One of the solutions that has been implemented is the Agro Processing Market Intelligence Portal. This
initiative forms parts of the e-Government strategy with the aim to digitise and transform the services in the Agro
industry. The Agro processing industry has a number of binding constraints.
This poses a number of business challenges which include:
Inadequate supply of primary production. The province has limited capacity in producing raw materials for the
existing processors;
National policies have been unsuccessful at addressing land rights issues;
Land reform and redistribution farms as well as communal areas not fully utilised;
Poor state of economic infrastructure for primary production;
Limited market intelligence in that farmers are producing products and then struggle to find markets;
Slow pace of transformation in the Agro-industry; and
Limited coordination and collaboration among sector players.
In addressing these challenges DEDEAT ICT in collaboration with Agro-processing division embarked on a solution
which resulted in the design and development of portal for Agro processing, this portal, links the primary producers in
the agro industry with the market so that they can be able to supply their produce to the market according to the
demands of the market.
Departmental users from DEDEAT and Department of Agriculture and Rural Development (DRDAR) have been trained
on the system. The system covers the user registration for the primary market (supplier and distributor) and demands
of the Agro processing industry. It allows the market to register their demand in terms of, the produce that is required
in the market, the quantity of the demand, the quality of the product, the timeframe or projections of when the
demand is required.
The solution enables the demand to view what the market has registered as demand, facilitate communication
between the primary producer and the agro-processors and the market, it tracks progress between the parties and
facilitate drafting of the contract between supply and demand.
This will in the future allow the linking of the portal to external incubators where farmers will be trained on quality
of the produce to ensure compliance with Agro processing industry standards, and communicate on all Agro
processing industry events. The system is available online and user-friendly.
Electronic Document Records Management System
In the drive to improve record keeping, training has been conducted on Electronic Document Records Management
System (EDRMS) and Evaya System’s new modules. As a result, all documents and particular Performance
Management and Development Services (PMDS) documents can be scanned and uploaded on the system to reduce
document loss.
Electronic permit management system
The e-permit system went live on the 10th of August 2017. Training of users as well as workshops with potential permit
applicants were held in most regions of the Eastern Cape. The development of the 2nd phase of e-permit system has
also been completed. Testing, implementation and training has been concluded while full implementation of phase 2
will be on the 1st quarter of the new financial year, this will improve the service rendered by the department to its
customers as Threatened or Protected Species (TOPS) permit will be issued online.
Financial Management
The financial management directorate which includes risk management is improving year on year and has met almost
all its targets. The Supply Chain management MPAT score remains a 4 which is consistent with the previous years.
There has been a concerted effort to reduce or minimise current irregular expenditure. There has been interaction with
National and Provincial Treasury to address inherited irregular expenditure emanating from Nelson Mandela Bay
35
Municipality infrastructure projects. These will be hopefully condoned in the 2018/19 financial year. Oversight has
been intensified and reports produced on financial and risk management in the public entities.
The unit has secured services to facilitate the deeds search for vehicle, sea transport and aircrafts’ registration and
ownership search, to verify employees loan accounts and to verify employee’s interests in registered entities on the
Companies and Intellectual Property Commissions (CIPC) database, directorship and partnerships and registered
trusts, income generating assets, consultancies and retainer ships, other remunerative work outside the department,
sponsorships, gifts and any other financial interests on behalf of the department in line with the requirements of the
Department of Public Service and Administration.
The unit has rolled out (Capacity building, including facilitation and communication) of the ethics management
training in line with the National School of Governance and the Department of Public Service and Administration
directive.
Capacitation on risk management has been extended to interns, technical support staff to Risk Champions, with the
National Treasury eLearning and the Institute of Risk Management South Africa.
Corporate Services
Organizational Development
The expanded mandate of the department resulted in the process to review the organizational structure in order to
align with demands, needs and application legislative mandate. A project team was formed and a consultation process
with the relevant stakeholders was held on continuous basis.
Thereafter the team mostly from efficiency services was required to draw up the organizational structure in
consultation with departmental core programs and support. The organizational structure was finalized and submitted
to relevant stakeholders for consultation and confirmation and thereafter a DPSA letter approving the structure was
communicated to the department.
Through the internship and learnership programme, four interns were employed by the South African Broadcasting
Corporation (SABC), SANLAM, Correctional Services and Defence. Two learners were employed by the South African
Police Services (SAPS). In the year under review, 14 officials who were given bursaries graduated.
PMDS
The department’s PMDS compliance, though in the 90% category is still unsatisfactory. The state of compliance
remains unsatisfactory and attention should be given to those who submit their documentation late. The PMDS Unit
conducted a planning session for contracting (performance agreement) for the 2017/2018 financial year which yielded
the desired results. The OTP-Human Resource dashboard and Persal report show the position of the department in
relation to compliance in relation to other Provincial Departments.
During the reporting period, quarterly performance reviews and first half yearly assessments were received and
captured on Persal. The MPAT assessment report clearly shows satisfactory performance on departmental PMDS
processes. Circulars and reminders about the submission of all PMDS documents on a quarterly basis greatly assisted
the department in getting better scores across other departments. In addition, the HOD and level based moderation
committees provided necessary skills in achieving desired goals.
Communications
Communications unit seeks to provide strategic support to the department in pursuit of its vision through provision of
sound internal, external communication and media services.
To achieve this, the unit has updated its intranet and website, published sector content for publicity, profiled the
programmes and campaigns in community media including holding media briefings over the 2017/18 financial year.
The department initiated a process of establishing DEDEAT group forum to align and coordinate group programmes
and resources.
36
Strategy to overcome areas of under performance
Indicator Short title Strategy to overcome under-performance
2 Financial maturity
index
This index is based on a self-assessment and, at the time of the annual report, had not yet been verified by the
Provincial Treasury. The department has identified that a number of the challenges that lead to the
underperformance are related to HR capacity in the areas of human resource management and risk
management. The new organisational structure was approved by the MEC in March 2018 and the department
will, therefore, be able to address these capacity constraints through the implementation of the structure.
3 HR efficiency index The underperformance is underpinned by a lack of senior leadership in the Corporate Services sub-programme
who need to be providing strategic direction and oversight. The department has appointed an acting Chief
Director for Corporate Services, but there are still gaps in the areas of human resource management and
organisational development (which includes human resource development, PMDS and change management).
The department has since appointed a director for human resource management, who will assume duties on 1
July 2018. This incumbent will be responsible to drive the improvement in the HR function.
4 Customer relations
index
Considering that this was the first year of undertaking the assessment, and that it is based on perception, the
department will thoroughly analyse the areas of underperformance and develop action plans to address these.
This will include the development of communication strategies, stakeholder needs analysis and better managed
and designed customer survey processes in order to collect data at service delivery points.
1.2 % network
functionality
In many instances the network functionality is affected by situations outside the control of the department.
Nonetheless, the department will continue to pursue the purchase of a standby generator for times of
electricity outage. The department is in the process of developing a business continuity plan which, in
alignment to the disaster recovery plan, will ensure that the department is able to function during times of
outage, but it must be borne in mind that not all eventualities can be managed.
A new organisational structure will be implemented in 2018/19. Staff training will continue including the recruitment
of qualified and competent staff. Consequence management will also continue to be of priority in the department. All
efforts will be made to ensure that consequence management is efficiently applied at every level of the department.
Changes to planned targets
There were no changes to planned targets.
Linking performance with budgets
The performance indicators of the programme provide firstly an indication of overall organisational performance and,
secondly, measures of performance in the delivery of administrative service functions to the rest of the Department.
Therefore, there may not be a direct link between the performance of the programme and the budget. The link is
more indirect and reflected through compensation of employees, goods and services etc.
Sub-programme Expenditure
2017/18 2016/17
Sub programme Final
Appropriation Actual Expenditure
(Over)/Under
Expenditure
Final
Appropriation
Actual
Expenditure
(Over)/Under
Expenditure
R'000 R'000 R'000 % R'000 R'000
1 Office of the MEC 2 548 2 233 315 2 181 2 130 51
2 Office of the HOD 68 176 64 192 3 984 68 682 68 197 485
3 Financial Management 102 790 98 247 4 543 101 844 99 471 2 373
4 Corporate Services 59 276 55 249 4 027 52 618 51 109 1 509
TOTAL 232 790 219 921 12 869 225 325 220 907 4 418
Compensation of employees:
The underspending on the item compensation of employees mainly related to planned vacancies not filled, early
retirement and natural attrition during the year.
Goods and Services:
Underspending on various items during the financial year have been as a result of invoices from the travel agent that were
identified with discrepancies during reconciliation i.e. duplication and incorrect service fees. Also there has been
37
underspending against legal fees as the department has made provision and awaits invoices from Department of Justice. The
rest of underspending is from operating leases in respect of laptops and server which were to be delivered and there has been
a delay, and late submission of invoices for outsourced security services by the service provider and resettlement fees which
were provided in-line with the recruitment process as the department was anticipating the implementation of the new
structure.
The cost containment measures have seen the department realising a saving that now serves as a base for budgeting as there
is a reduction in Subsistence and Travel through the introduction of, video conferencing for meetings and utilisation of the
departments and entities boardrooms for meetings.
Capital Payments:
The variance on the expenditure is as a result of the acquisition of new furniture for new employees as the department made
provision in anticipation of the approval of the new structure.
38
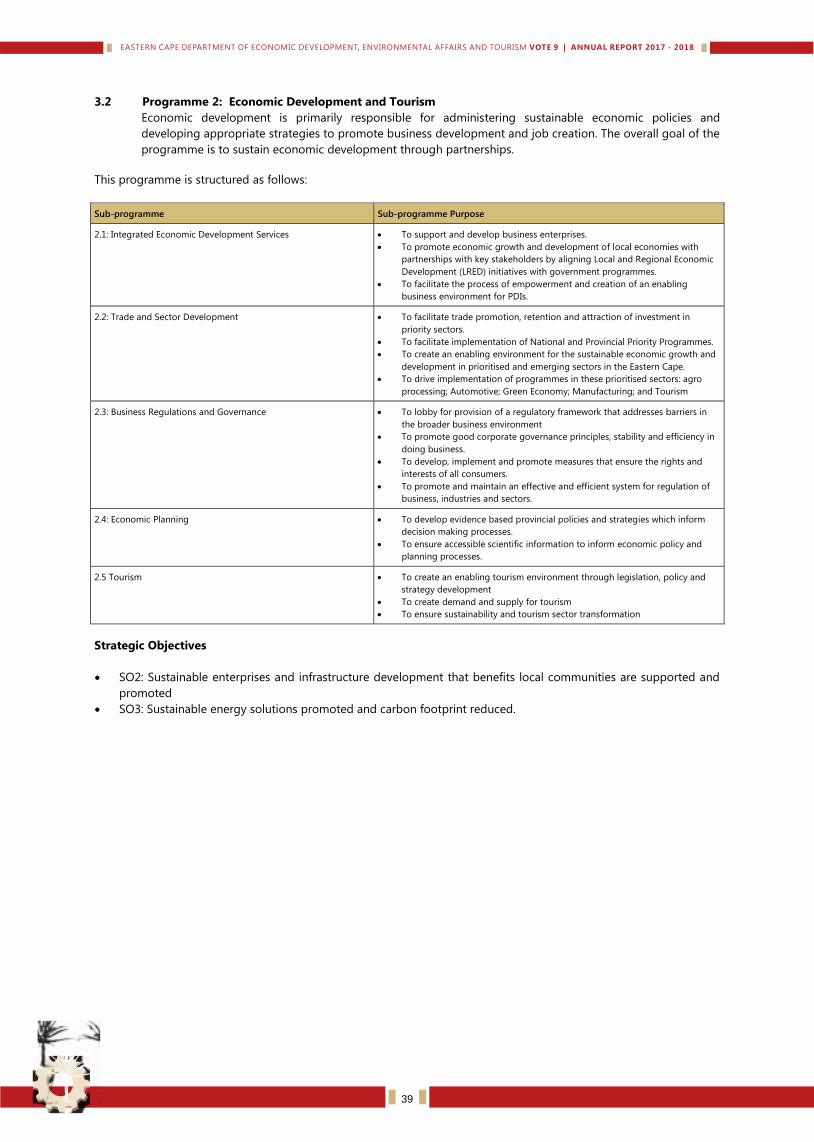
3.2 Programme 2: Economic Development and Tourism
Economic development is primarily responsible for administering sustainable economic policies and
developing appropriate strategies to promote business development and job creation. The overall goal of the
programme is to sustain economic development through partnerships.
This programme is structured as follows:
Sub-programme Sub-programme Purpose
2.1: Integrated Economic Development Services To support and develop business enterprises.
To promote economic growth and development of local economies with
partnerships with key stakeholders by aligning Local and Regional Economic
Development (LRED) initiatives with government programmes.
To facilitate the process of empowerment and creation of an enabling
business environment for PDIs.
2.2: Trade and Sector Development To facilitate trade promotion, retention and attraction of investment in
priority sectors.
To facilitate implementation of National and Provincial Priority Programmes.
To create an enabling environment for the sustainable economic growth and
development in prioritised and emerging sectors in the Eastern Cape.
To drive implementation of programmes in these prioritised sectors: agro
processing; Automotive; Green Economy; Manufacturing; and Tourism
2.3: Business Regulations and Governance To lobby for provision of a regulatory framework that addresses barriers in
the broader business environment
To promote good corporate governance principles, stability and efficiency in
doing business.
To develop, implement and promote measures that ensure the rights and
interests of all consumers.
To promote and maintain an effective and efficient system for regulation of
business, industries and sectors.
2.4: Economic Planning To develop evidence based provincial policies and strategies which inform
decision making processes.
To ensure accessible scientific information to inform economic policy and
planning processes.
2.5 Tourism To create an enabling tourism environment through legislation, policy and
strategy development
To create demand and supply for tourism
To ensure sustainability and tourism sector transformation
Strategic Objectives
SO2: Sustainable enterprises and infrastructure development that benefits local communities are supported and
promoted
SO3: Sustainable energy solutions promoted and carbon footprint reduced.
39
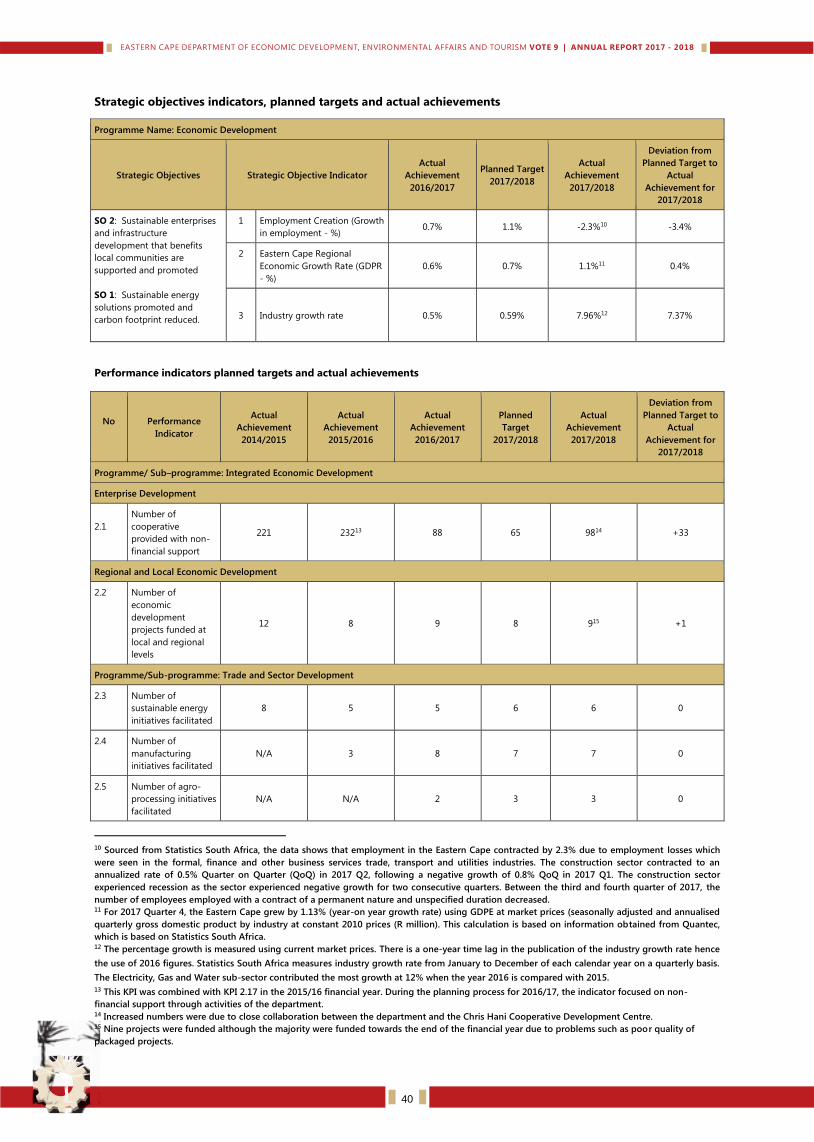
Strategic objectives indicators, planned targets and actual achievements
Performance indicators planned targets and actual achievements
No
Performance
Indicator
Actual
Achievement
2014/2015
Actual
Achievement
2015/2016
Actual
Achievement
2016/2017
Planned
Target
2017/2018
Actual
Achievement
2017/2018
Deviation from
Planned Target to
Actual
Achievement for
2017/2018
Programme/ Sub–programme: Integrated Economic Development
Enterprise Development
2.1
Number of
cooperative
provided with non-
financial support
221 23213 88 65
9814
+33
Regional and Local Economic Development
2.2 Number of
economic
development
projects funded at
local and regional
levels
12 8 9 8 915 +1
Programme/Sub-programme: Trade and Sector Development
2.3 Number of
sustainable energy
initiatives facilitated
8 5 5 6
6
0
2.4 Number of
manufacturing
initiatives facilitated
N/A 3 8 7 7
0
2.5 Number of agro-
processing initiatives
facilitated
N/A N/A 2 3
3
0
10 Sourced from Statistics South Africa, the data shows that employment in the Eastern Cape contracted by 2.3% due to employment losses which
were seen in the formal, finance and other business services trade, transport and utilities industries. The construction sector contracted to an
annualized rate of 0.5% Quarter on Quarter (QoQ) in 2017 Q2, following a negative growth of 0.8% QoQ in 2017 Q1. The construction sector
experienced recession as the sector experienced negative growth for two consecutive quarters. Between the third and fourth quarter of 2017, the
number of employees employed with a contract of a permanent nature and unspecified duration decreased. 11 For 2017 Quarter 4, the Eastern Cape grew by 1.13% (year-on year growth rate) using GDPE at market prices (seasonally adjusted and annualised
quarterly gross domestic product by industry at constant 2010 prices (R million). This calculation is based on information obtained from Quantec,
which is based on Statistics South Africa. 12 The percentage growth is measured using current market prices. There is a one-year time lag in the publication of the industry growth rate hence
the use of 2016 figures. Statistics South Africa measures industry growth rate from January to December of each calendar year on a quarterly basis.
The Electricity, Gas and Water sub-sector contributed the most growth at 12% when the year 2016 is compared with 2015.
13 This KPI was combined with KPI 2.17 in the 2015/16 financial year. During the planning process for 2016/17, the indicator focused on non-
financial support through activities of the department. 14 Increased numbers were due to close collaboration between the department and the Chris Hani Cooperative Development Centre. 15 Nine projects were funded although the majority were funded towards the end of the financial year due to problems such as poor quality of
packaged projects.
Programme Name: Economic Development
Strategic Objectives Strategic Objective Indicator
Actual
Achievement
2016/2017
Planned Target
2017/2018
Actual
Achievement
2017/2018
Deviation from
Planned Target to
Actual
Achievement for
2017/2018
SO 2: Sustainable enterprises
and infrastructure
development that benefits
local communities are
supported and promoted
SO 1: Sustainable energy
solutions promoted and
carbon footprint reduced.
1 Employment Creation (Growth
in employment - %) 0.7% 1.1% -2.3%10 -3.4%
2 Eastern Cape Regional
Economic Growth Rate (GDPR
- %)
0.6% 0.7% 1.1%11 0.4%
3 Industry growth rate 0.5% 0.59% 7.96%12 7.37%
40
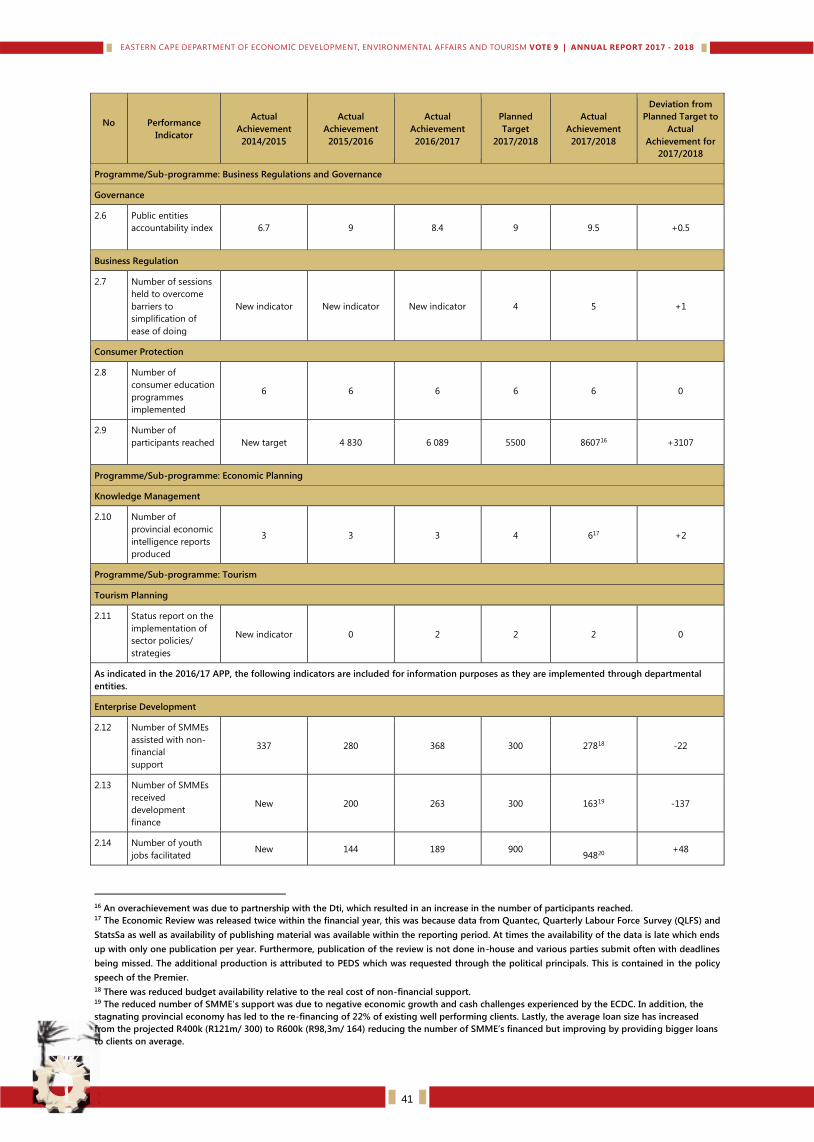
No
Performance
Indicator
Actual
Achievement
2014/2015
Actual
Achievement
2015/2016
Actual
Achievement
2016/2017
Planned
Target
2017/2018
Actual
Achievement
2017/2018
Deviation from
Planned Target to
Actual
Achievement for
2017/2018
Programme/Sub-programme: Business Regulations and Governance
Governance
2.6 Public entities
accountability index 6.7 9 8.4 9
9.5
+0.5
Business Regulation
2.7 Number of sessions
held to overcome
barriers to
simplification of
ease of doing
New indicator New indicator New indicator 4
5
+1
Consumer Protection
2.8 Number of
consumer education
programmes
implemented
6 6 6 6
6
0
2.9 Number of
participants reached New target 4 830 6 089 5500
860716
+3107
Programme/Sub-programme: Economic Planning
Knowledge Management
2.10 Number of
provincial economic
intelligence reports
produced
3 3 3 4 617 +2
Programme/Sub-programme: Tourism
Tourism Planning
2.11 Status report on the
implementation of
sector policies/
strategies
New indicator 0 2 2
2
0
As indicated in the 2016/17 APP, the following indicators are included for information purposes as they are implemented through departmental
entities.
Enterprise Development
2.12 Number of SMMEs
assisted with non-
financial
support
337 280 368 300
27818
-22
2.13 Number of SMMEs
received
development
finance
New 200 263 300
16319
-137
2.14 Number of youth
jobs facilitated New 144 189 900
94820 +48
16 An overachievement was due to partnership with the Dti, which resulted in an increase in the number of participants reached. 17 The Economic Review was released twice within the financial year, this was because data from Quantec, Quarterly Labour Force Survey (QLFS) and
StatsSa as well as availability of publishing material was available within the reporting period. At times the availability of the data is late which ends
up with only one publication per year. Furthermore, publication of the review is not done in-house and various parties submit often with deadlines
being missed. The additional production is attributed to PEDS which was requested through the political principals. This is contained in the policy
speech of the Premier.
18 There was reduced budget availability relative to the real cost of non-financial support. 19 The reduced number of SMME’s support was due to negative economic growth and cash challenges experienced by the ECDC. In addition, the
stagnating provincial economy has led to the re-financing of 22% of existing well performing clients. Lastly, the average loan size has increased
from the projected R400k (R121m/ 300) to R600k (R98,3m/ 164) reducing the number of SMME’s financed but improving by providing bigger loans
to clients on average.
41
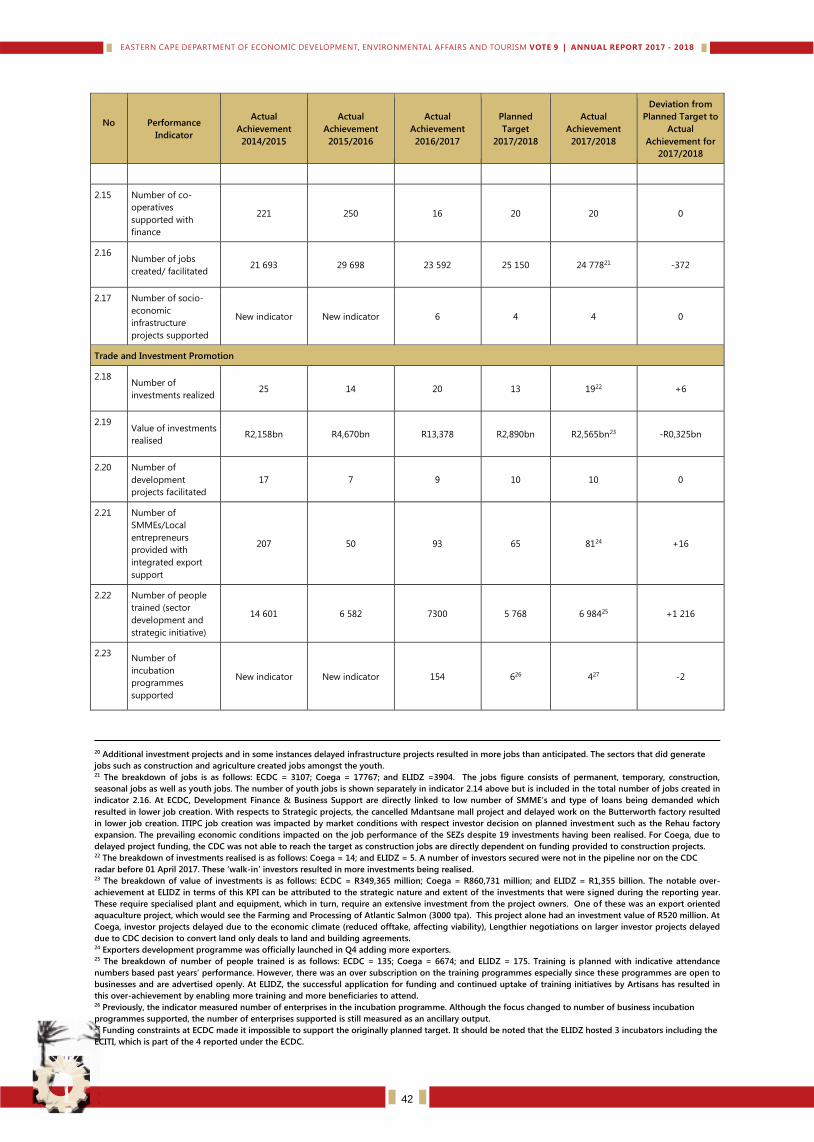
No
Performance
Indicator
Actual
Achievement
2014/2015
Actual
Achievement
2015/2016
Actual
Achievement
2016/2017
Planned
Target
2017/2018
Actual
Achievement
2017/2018
Deviation from
Planned Target to
Actual
Achievement for
2017/2018
2.15 Number of co-
operatives
supported with
finance
221 250 16 20
20
0
2.16 Number of jobs
created/ facilitated 21 693 29 698 23 592 25 150
24 77821
-372
2.17 Number of socio-
economic
infrastructure
projects supported
New indicator New indicator 6 4
4
0
Trade and Investment Promotion
2.18 Number of
investments realized 25 14 20 13
1922
+6
2.19 Value of investments
realised R2,158bn R4,670bn R13,378 R2,890bn
R2,565bn23
-R0,325bn
2.20 Number of
development
projects facilitated
17 7 9 10
10
0
2.21 Number of
SMMEs/Local
entrepreneurs
provided with
integrated export
support
207 50 93 65 8124 +16
2.22 Number of people
trained (sector
development and
strategic initiative)
14 601 6 582 7300 5 768
6 98425
+1 216
2.23 Number of
incubation
programmes
supported
New indicator New indicator 154 626
427
-2
20 Additional investment projects and in some instances delayed infrastructure projects resulted in more jobs than anticipated. The sectors that did generate
jobs such as construction and agriculture created jobs amongst the youth. 21 The breakdown of jobs is as follows: ECDC = 3107; Coega = 17767; and ELIDZ =3904. The jobs figure consists of permanent, temporary, construction,
seasonal jobs as well as youth jobs. The number of youth jobs is shown separately in indicator 2.14 above but is included in the total number of jobs created in
indicator 2.16. At ECDC, Development Finance & Business Support are directly linked to low number of SMME’s and type of loans being demanded which
resulted in lower job creation. With respects to Strategic projects, the cancelled Mdantsane mall project and delayed work on the Butterworth factory resulted
in lower job creation. ITIPC job creation was impacted by market conditions with respect investor decision on planned investment such as the Rehau factory
expansion. The prevailing economic conditions impacted on the job performance of the SEZs despite 19 investments having been realised. For Coega, due to
delayed project funding, the CDC was not able to reach the target as construction jobs are directly dependent on funding provided to construction projects. 22 The breakdown of investments realised is as follows: Coega = 14; and ELIDZ = 5. A number of investors secured were not in the pipeline nor on the CDC
radar before 01 April 2017. These ‘walk-in’ investors resulted in more investments being realised. 23 The breakdown of value of investments is as follows: ECDC = R349,365 million; Coega = R860,731 million; and ELIDZ = R1,355 billion. The notable over-
achievement at ELIDZ in terms of this KPI can be attributed to the strategic nature and extent of the investments that were signed during the reporting year.
These require specialised plant and equipment, which in turn, require an extensive investment from the project owners. One of these was an export oriented
aquaculture project, which would see the Farming and Processing of Atlantic Salmon (3000 tpa). This project alone had an investment value of R520 million. At
Coega, investor projects delayed due to the economic climate (reduced offtake, affecting viability), Lengthier negotiations on larger investor projects delayed
due to CDC decision to convert land only deals to land and building agreements. 24 Exporters development programme was officially launched in Q4 adding more exporters. 25 The breakdown of number of people trained is as follows: ECDC = 135; Coega = 6674; and ELIDZ = 175. Training is planned with indicative attendance
numbers based past years’ performance. However, there was an over subscription on the training programmes especially since these programmes are open to
businesses and are advertised openly. At ELIDZ, the successful application for funding and continued uptake of training initiatives by Artisans has resulted in
this over-achievement by enabling more training and more beneficiaries to attend. 26 Previously, the indicator measured number of enterprises in the incubation programme. Although the focus changed to number of business incubation
programmes supported, the number of enterprises supported is still measured as an ancillary output. 27 Funding constraints at ECDC made it impossible to support the originally planned target. It should be noted that the ELIDZ hosted 3 incubators including the
ECITI, which is part of the 4 reported under the ECDC.
42
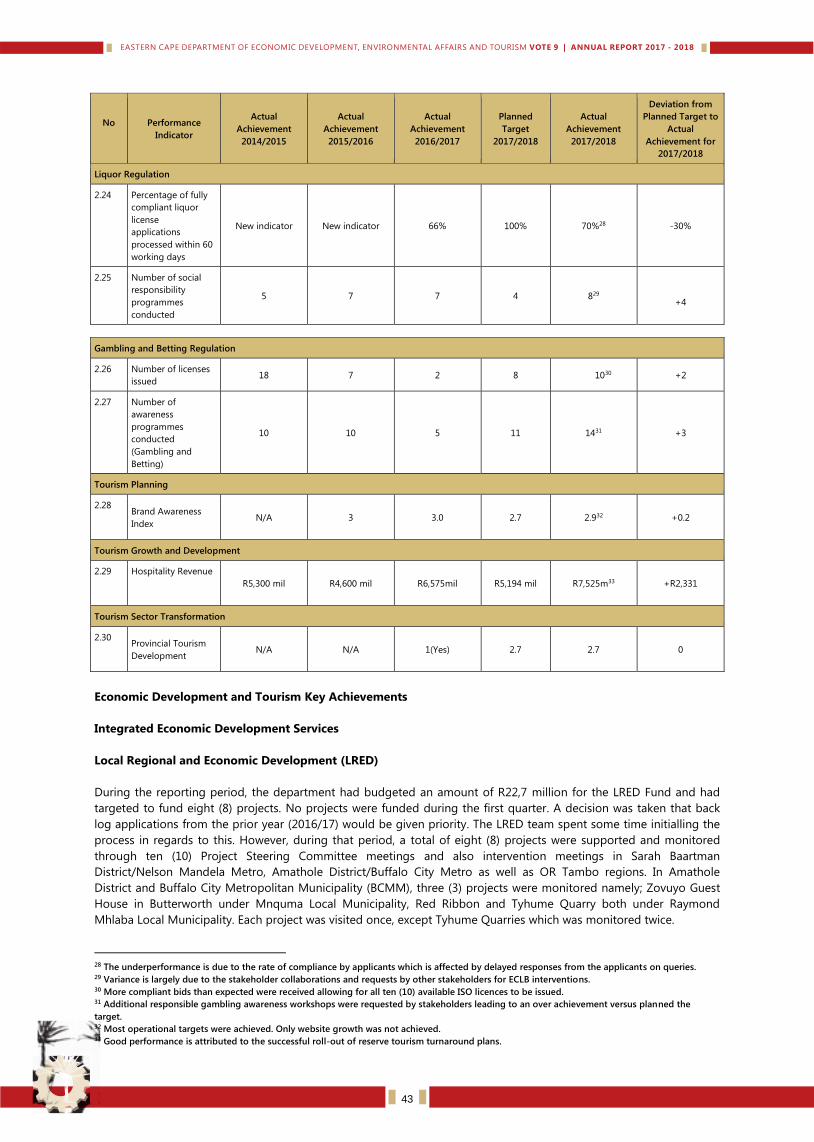
No
Performance
Indicator
Actual
Achievement
2014/2015
Actual
Achievement
2015/2016
Actual
Achievement
2016/2017
Planned
Target
2017/2018
Actual
Achievement
2017/2018
Deviation from
Planned Target to
Actual
Achievement for
2017/2018
Liquor Regulation
2.24 Percentage of fully
compliant liquor
license
applications
processed within 60
working days
New indicator New indicator 66% 100% 70%28 -30%
2.25 Number of social
responsibility
programmes
conducted
5 7 7 4 829
+4
Gambling and Betting Regulation
2.26 Number of licenses
issued 18 7 2 8 1030 +2
2.27 Number of
awareness
programmes
conducted
(Gambling and
Betting)
10 10 5 11 1431 +3
Tourism Planning
2.28 Brand Awareness
Index N/A 3 3.0 2.7
2.932
+0.2
Tourism Growth and Development
2.29 Hospitality Revenue
R5,300 mil R4,600 mil R6,575mil R5,194 mil R7,525m33 +R2,331
Tourism Sector Transformation
2.30 Provincial Tourism
Development N/A N/A 1(Yes) 2.7
2.7
0
Economic Development and Tourism Key Achievements
Integrated Economic Development Services
Local Regional and Economic Development (LRED)
During the reporting period, the department had budgeted an amount of R22,7 million for the LRED Fund and had
targeted to fund eight (8) projects. No projects were funded during the first quarter. A decision was taken that back
log applications from the prior year (2016/17) would be given priority. The LRED team spent some time initialling the
process in regards to this. However, during that period, a total of eight (8) projects were supported and monitored
through ten (10) Project Steering Committee meetings and also intervention meetings in Sarah Baartman
District/Nelson Mandela Metro, Amathole District/Buffalo City Metro as well as OR Tambo regions. In Amathole
District and Buffalo City Metropolitan Municipality (BCMM), three (3) projects were monitored namely; Zovuyo Guest
House in Butterworth under Mnquma Local Municipality, Red Ribbon and Tyhume Quarry both under Raymond
Mhlaba Local Municipality. Each project was visited once, except Tyhume Quarries which was monitored twice.
28 The underperformance is due to the rate of compliance by applicants which is affected by delayed responses from the applicants on queries. 29 Variance is largely due to the stakeholder collaborations and requests by other stakeholders for ECLB interventions. 30 More compliant bids than expected were received allowing for all ten (10) available ISO licences to be issued. 31 Additional responsible gambling awareness workshops were requested by stakeholders leading to an over achievement versus planned the
target. 32 Most operational targets were achieved. Only website growth was not achieved. 33 Good performance is attributed to the successful roll-out of reserve tourism turnaround plans.
43
In Sarah Baartman District, three (3) projects were monitored namely Chicory SA in Alexandria under Ndlambe Local
Municipality, and Heights Tea Estate in Twee Riviere, and Blue Karoo Trust both under Koukamma Local Municipality.
Each project was visited once, except Chicory SA which was visited twice.
In OR Tambo district municipality, two (2) projects were monitored, namely Ideal Vege and Amina Chem.
Two projects previously funded through LRED were launched successfully by MEC Somyo, namely: Ikusasa Green
which is a plastic cooler box manufacturer for the Mass Mart Group. The second project launched was Red Ribbon, a
toilet paper manufacturer based in Mngcangeni Village, Debe Nek. It is 100% owned by youth and currently supplies a
few retail stores including a Spar outlet in Kings Williams Town.
During Quarter 2 seven (7) applications were received in the regional offices: four in Amathole/BCMM; one in Chris
Hani; one in Sarah Baartman and one in OR Tambo. The Assessment process took place, including project site
verifications to all seven projects. During the same quarter, a total of nine (9) previously funded projects were
monitored through ten (10) Project Steering Committee meetings and also intervention meetings in Sarah Baartman
District/Nelson Mandela Metro, Amathole District/Buffalo City Metro as well as OR Tambo regions. In Amathole
District and Buffalo City Metropolitan Municipality (BCMM), four (4) projects were monitored namely; Tyhume Quarries
under Raymond Mhlaba Local Municipality, Brite Wave, Buzwe Bethu both under Buffalo City Metropolitan
Municipality, and Ivili Loboya under Mnquma Local Municipality and each project was visited once.
In Sarah Baartman District, four (4) projects were monitored namely Chicory SA in Alexandria under Ndlambe Local
Municipality, and Heights Tea Estate in Twee Riviere under Koukamma Local Municipality, RV Footwear under Nelson
Mandela Bay Metropolitan Municipality and Blue Karoo Trust under Beyers Naude Local Municipality. Each project was
visited once, except Chicory SA and RV Footwear which were visited twice. In OR Tambo district municipality, one (1)
project was monitored, namely Ideal Vege and it was monitored twice.
During Quarter 3, a project from OR Tambo Region Amakhulu Pole Treatment t/a Umzomhle Project was funded, this
was a legal case dating as far back as 2013 and DEDEAT was ordered by the High Court to pay this LRED applicant.
Twenty-one (21) applications for LRED were received during the quarter, ten from Amathole/BCMM; one in Chris Hani;
six in Sarah Baartman; two in Alfred Nzo and two in OR Tambo. From the 21 projects, seven underwent due diligence
process conducted by an independent service provider (Price Water House Coopers -PWC).
During the last Quarter of the 2017/18 financial year, eight (8) projects were funded, as follows: from Amathole/BCMM
(Manufacturing and Agro-processing sectors); two from Sarah Baartman/NMBM (Agro-processing sector) and one
from OR Tambo (Manufacturing sector).
Two (2) assessment committee meetings took place during the period for new LRED fund submissions. Site
verifications were conducted for Ivili Loboya in Amathole District/Buffalo City Metro Municipality and La Mohair in
Sarah Baartman/Nelson Mandela Metropolitan. Three (3) Evaluation committee meetings took place to evaluate
findings of the due diligence report conducted by PWC, findings of site verification visits conducted by DEDEAT, and
for the Evaluation Committee to make a final recommendation of projects to be approved by the Head of Department.
Also, during this quarter there were projects that were previously funded by DEDEAT through the LRED fund and those
that were funded during the current financial year where monitoring took place through PSC and Inception meetings.
In total, the LRED Unit attended eight (8) project meetings as part of monitoring of previously funded projects.
The department continued to honour a collaboration agreement entered into with Small Enterprise Development
Agency (SEDA) for the purposes of developing the business initiatives of entrepreneurs in the Eastern Cape Province
DEDEAT funded LRED projects in particular with the view to promote, grow them, create sustainable jobs and support
economic development in the Eastern Cape Province. DEDEAT will continue to form partnerships with other partners in
order to establish and develop local and regional economic development of the Eastern Cape Province as well as
provide skills to entrepreneurs.
Enterprise Development
A total of 98 co-operatives were assisted with non- financial support during the period under review. The nature of support
provided included technical assistance, regulatory compliance including amendments of registration certificates, training of
co-operative governance and leadership. The co-operatives were also provided with machinery and working implements
through referrals to respective municipalities and other development agencies based on their needs from the monitoring
activities conducted by the department. Some co-operatives were linked with funding institutions for the growth and
44
expansion of their businesses based on need assessment. The cooperatives were from different sectors including Agriculture,
manufacturing, agro-processing and services.
The department supported a total of 60 co-operatives to participate both as delegates and exhibitors in the 8th International
Co-operatives Day Celebrations that was held in August in Bloemfontein. The goal of the event was to celebrate the role of co-
operatives in South Africa’s search for radical economic transformation. The main activities included holding a co-operatives
colloquium and; hosting a trade fair.
In the last quarter of the year, a consultative workshop with stakeholders was held to review the implementation of the
National Co-operatives Development Strategy 2012-2022 as part of the periodic review process and evaluate the
impact thereof. The Eastern Cape Province hosted the Department of small business development in February 2018 for
the mid- term review and alignment of the provincial strategy to the national one. The department hosted the
provincial informal business summit from 23-24 November 2018 at Mthatha in partnership with the Department of
Small Business Development, International Labour Organisation (ILO), OR Tambo District Municipality and KSD Local
Municipality. The key objectives of the summit are summarized as follows:
Create a knowledge sharing platform on interventions towards transitioning to formal economy.
Facilitate dialogue and validation of the Eastern Cape Provincial Informal Business Strategy with various
stakeholders.
Facilitate the establishment of strategic partnerships with public sector institutions and private sector for the
growth and development of the informal economy sector in the Eastern Cape Province.
Strategically mobilize resources for high impact projects that will unleash the economic potential of the informal
business sector in the Eastern Cape Province.
Develop action plans aligned to the ILO recommendation 2014 in support of transitioning to formal economy
In line with the Provincial SMME strategy 2015-2020 and its implementation Plan the department held a consultative
session with organised business through business chamber and associations in February 2018. The provincial treasury
formed part of the meeting as there were broad and diverse issues raised by the sector that needed a collective
response from government. The issues raised varied from tender opportunities, infrastructure projects, non-payment
of SMMEs within 30 days, set asides, lack of information on progress on matters raised in State of the Province
Address (SOPA) and policy speech of the MEC’s in support of SMME’s.
The key recommendations from the consultative session included the following:
1. The department should work together with the national departments e.g. Department of Small Business
Development (DSBD) for developing support programmes for the business chambers/associations.
2. The department should implement its plans as outlined in the Provincial Strategy 2015-2020 for establishing a
forum for business chambers and associations. The Forums will serve as platform to engage effectively with
organized business and for policy dialogue.
3. The department should institutionalize the forums and assist in drafting terms of reference for the forum that
will be discussed in the next meeting.
4. Provincial treasury committed to assist the business forum for tracking non-payment of their members on
monthly basis to address the concerns.
5. The provincial treasury was advised to visit Gauteng Province to benchmark on open and transparent tender
system that is implemented there so that best practices can be emulated.
6. Draft terms of reference to be circulated within 14 days for consideration by respective business
chambers/associations.
In March 2018, an information session was held on Black Industrialist (BI) Programme focussing on access to markets.
The department in partnership with the dti and ECDC held a session with SMME’s on available opportunities in terms
the BI programme and export markets. The focus was to encourage more black people applying for the BI incentive
especially those that are in the manufacturing sector. The session was informed by the low number of beneficiaries in
the Eastern Cape (EC) Province. The current statistics from the dti indicate that 83 benefitted financially and out of that
number, 58 benefitted non-financially. The Eastern Cape has only 5 beneficiaries and they are involved in agro
processing and renewable energy.
The recommendation of the meeting was that the dti should waiver the requirement for co funding by the department
and rather use existing DFI’s including ECDC to support BI applicants in the EC province. Thus, the Memorandum of
Understanding (MOU) should be reviewed to allow this flexibility and signing be expedited so that provincial steering
committee for DFI’s can resume with tracking and recommending BI applications to the dti.
45
As part of the annual celebration of the Global Entrepreneurship Week (GEW) a series of events and activities were
held in collaboration with various strategic partners in the EC province. These included the co-hosting of the 9th Small
Enterprise and Development Agency (SEDA) Annual Stakeholder Forum in November 2017 in East London. The event
was preceded by the master classes on entrepreneurship, innovation and coaching on business pitching for emerging
entrepreneurs. The outcome of the SEDA ASF was the strategic partnership for support of entrepreneurs involved in
manufacturing, Tourism, Agro-processing and innovation.
As part of the GEW Activities a launch of Walter Sisulu Contractors Association was held in Joe Gqabi region and
information on NHRBC shared with participants. Furthermore, a flea market and exhibition was also held in Senqu
Local Municipality in the Joe Gqabi District. A pop-up market was held in Bizana in collaboration with SEDA and local
municipalities to showcase the products and service offerings of the local entrepreneurs as part of celebrating GEW in
Alfred Nzo district.
Trade and Sector Development
Sustainable Energy
In respect of sustainable energy, DEDEAT facilitated six sustainable energy initiatives – particularly with regards to new
and emerging issues in the province. These include
Support to the UNIDO biogas initiative;
Support for USAID technical assistance in the Province;
Request-based ad-hoc presentations and support meetings to assist local government in the handling of
sustainable energy at a strategic and planning level;
Managing the vulture and wind farm challenge in the former homelands;
Support for the development of a South African Wind Energy Programme (small wind component) in the Eastern
Cape;
Support to one municipality in respect to bilateral power purchase agreements.
In addition to these activities significant work has taken place in other areas of the sustainable energy sector.
In respect of utility Scale Wind and Solar farms, the SMME in energy programme operated at a low key due to the
delays in the signing of the final four of 16 wind farms in the Province. The projects were finally signed on the 4th of
April 2018, which means that the programme of facilitating local participation will re-start in earnest in the new
financial year.
While the large facilities are important, our energy system is going through a transition towards more agile, smarter
and distributed forms of energy generation and use, including small scale embedded generation. This has
significant implications for the municipal energy business model. DEDEAT together with its partners has been
developing capabilities to support municipalities through this future transition, and has already interacted with four
municipalities in this respect.
One of the key mechanisms for bringing energy to people in deep rural areas is through minigrid technology.
DEDEAT together with partners from South Africa and Lower Saxony in Germany has project managed and
championed the development of a first-of-kind minigrid in the Raymond Mhlaba Local Municipality. The project was
conceptualized in 2015, and construction started in the village of Upper Blinkwater in March 2018. This project
represents a model for supplying high quality energy to deep rural villages which are not due to be connected to the
national electricity grid within the next five to ten years. This in turn brings the developmental opportunities for the
rural community forward by a decade. This represents a first of its kind social technical and institutional model for rural
electrification.
While our prospects for renewable energy in the province are promising, it is also necessary to consider a companion
energy source to make up for the variability of renewables. Together with the Coega Development Corporation,
DEDEAT has been working extensively on technical readiness processes for liquid natural gas to power, as well as for
the offtake of gas supplies for industry and the commercial sector. The work has also included a localisation study for
participation of SMMEs and Black industrialists in the value chain. In addition to these studies, a number of
stakeholder information sharing and capacity development workshops in respect to gas localization took place during
the year.
The Eastern Cape Province has become a significant hub for offshore marine fuel bunkering. Approximately 100
vessels visit Algoa Bay for bunkering services every month. The bunkering support service value chain represents a
46
significant economic sector in the region. A bunkering value chain opportunities analysis and support programme for
SMME and Black Industrialists has been initiated by DEDEAT and its partners in 2017/18, and will go into
implementation phase in 2018/19.
Manufacturing
Automotive Sector
The strategic partnership with the Eastern Cape Automotive Industry Forum (automotive component sector) have
resulted in the development of a black supplier – and skills development programme planned to be rolled out in 2018.
The Automotive Industry Development Centre (AIDC) prime project is still delivering great results. The 137 graduates
placed in the auto industry are currently still in employment. Of these, 26 graduates have now been promoted to
middle management and above. This attest to the calibre of training this programme is providing to upskill
unemployed graduates within the Automotive sector. Due to this programme, unemployed youth graduates provincial
careers now are being fast tracked by at least 3-4 years.
The R 11 billion BAIC investment is well on track and infrastructure build for the facility planned to be complete before
June 2018. The facility plans to be in operation by 30 June 2018. It is envisioned that BAIC will follow a phased
approach towards production at this facility and expected direct jobs to peak between 800 – 1500.
General Manufacturing – Transversal
With regards to the de-industrialisation trend, a web-based manufacturing support system has been implemented to
assist with curbing job losses that may result from the closure of manufacturing and agro-processing enterprises
across the Province.
The manufacturing Unit focused on the revitalization of Eastern Cape industrial parks that were allocated R6 million
and R 2.5 million during mid-term review for critical upgrading of electricity infrastructure at Komani Industrial park
and the development of master plans for Vulinledla, Fort Jackson and Butterworth respectively. The DTI has approved
R45.32 million and R 49.9 million towards infrastructure upgrades at the Komani and Dimbaza Industrial Park
respectively, which will be implemented in the new financial year.
Ocean’s Economy – Maritime Manufacturing
In terms of support to the Oceans Economy, we are making constant improvements to ports infrastructure. The 1st
phase refurbishment of the graving dock at East London Port is still in progress. Additional infrastructure upgrades is
planned in 2018 for the Port of Port Elizabeth.
With respect to investments in the maritime manufacturing sector, the Tide Marine facility has been activated in 2017
in the Port of Port Elizabeth and work at the facility is on track and has employed 22 people thus far. Concerning
maritime skills development, Transnet National Ports Authority (TNPA) has commenced with the implementation of a
national training college for the introduction of specialist maritime skill courses to service the broader TNPA
requirements. The Mandela Bay Composites Cluster situated in Port Elizabeth has introduced a new introductory
“composites training course’’ that has been rolled out in the province.
Agro processing:
Agro Industry Development (Coordination and management of the Agro-Industry Development Forum)
In pursuit of the mandate to facilitate and drive the development of the agro processing sector for the provincial
economic growth and job creation, DEDEAT has led a process of establishing a formal multi-stakeholder platform for
the sector so as to address the challenges limiting the development of the sector such as limited availability of raw
materials, duplication of activities by government departments and unsustainable developments implemented by
government, which could have led to meaningful contribution elsewhere within the sector if directed properly.
The development of a Provincial Agro Industry Development Action Implementation Plan continued with the
compilation of the draft plan as an outcome of the first Provincial Agro Industry planning session held in August 2017.
Identified focus programmes are expected to contribute towards the comprehensive development of the sector for
47
the realisation of the economic development potential of the sector. The draft plan will be presented to the key sector
stakeholders after which it will be presented to the Economic Development and Job Creation Working Group through
to Cabinet and EXCO for approval. This will then provide for the alignment of government and industry initiatives for
the sector development. This is expected to be finalized in the next financial year.
Further, in support of the Agro Industry development, the department has developed the development of a Provincial
Agro Industry Market Intelligence Portal in partnership with the State Information Technology Agency (SITA), to be
rolled out in the next financial year.
The portal will serve as a demand and supply meeting place for the industry so as to provide for informed production
planning thus providing an opportunity for the development of new and sustainable enterprises, reduction of imports
of raw agricultural products and increased job creation with resultant increased sector contribution to the provincial
economic development.
Agro Industrial Manufacturing (AIM) Cluster Management
The Department has adopted the cluster development approach as a vehicle for industry development and as such
work on the establishment of the AIM Cluster together with the Non-Automotive Cluster was done during the
previous years. The purpose of the clusters is to create a platform for industry collaboration so as to improve
productivity and efficiencies and provide an interface with government for focused interventions for industry
contribution to the regional and provincial economic development.
The programme for the year continued with the launch in 2017 with BCM and NMBM AIM Cluster Chapters and this
was followed with the registration of 50 companies as members of the cluster. The main sub-sectors are Food
Processors (Dairy, Fruit and vegetable, Confectionary and Beverage processors) and Animal Fibres Cluster (Wool and
Mohair processors). The AIM Cluster Board was established to provide for governance and guidance. This was
followed with the project identification and packaging to for Dti application for Cluster Development Support. The
department is now awaiting feedback on the application which is expected by the end of June 2018. In project
packaging and development, more focus was on providing linkages of processors with the primary producers for
optimization of the priority value chains in the province such as the meat and horticulture (fruit and vegetables)
industries.
Support to agro-processing programmes/projects
Support to various agro processing and agro industry projects and/or programmes were supported in collaboration
with different stakeholders such as the:
Forestry sector development with Dti, ECRDA and IDC and
Facilitation for enterprise development support for the organization of small-scale saw millers (26 in total) was
provided in preparation for commercialization in partnership with potential industry player in the Eastern Part of
the province.
Aquaculture sector development with Coega SEZ.
A feasibility study for freshwater aquaculture in the Coega Aquaculture Development Zone (ADZ) was funded as an
investment promotion tool for the entity. The project will be finalized in the next financial year. This is in line with the
development to the Ocean Economy in the province.
Business regulation and governance
Regulation Services
Investment in the eastern cape province is happening at a desirable rate on the back of the general view that the ease
of doing business is clogged by protracted processes, systems fragmented and in discord with the intention to
moderate risk, interruptions to prompt and correct decision making. The department is committed to discouraging
introduction of a regulatory or administrative system which does not support enhanced value adding productivity.
Instead such a system is a hindrance to the ease of doing business and attracting investment, therefore, has to be
modified.
Acknowledging realities of a sluggish rate of investment in the province, the many factors that cause deferment to the
ease of doing business and related adverse experiences, the department, in co-operation with EC-COGTA embarked
48
on solution-seeking engagements with municipalities and business formations in the year under review. These
engagements were underscored by a commitment to removing barriers to the ease of doing business and
establishment of a bylaw environment favourable to promoting investment. A precursor to this initiative was a set of
draft generic bylaws which the department had developed in support to municipalities in the prior year consistent with
this purpose.
In the dialogues held with municipalities and business across the province, barriers to the ease of doing business were
attributed to a wide range of different but related factors. Featuring most in the host of experienced difficulties to
enter markets, sustain and grow business were assertions of failing in state interventions, corporate conduct that is
loath and some fissures in the public procurement system. A worrying observation was that organised business did
not seem to have a coherent approach to dealing with most of the obstacles that emerged during the one-on-one
engagements some of which were therefore within their own influence.
Notwithstanding other important issues, priority interventions proposed to facilitate ease of doing business were:
1. Augmenting Platforms for Dialogue - the existing platforms are of strategic importance to enhancing integrated
planning and coherence in implementation. However, this is largely dependent on sharing of knowledge which is
essential to respond appropriately to investor expectations and available at development agencies, research or
tertiary institutions and business formations. It is through this means that the content of integrated development
plans best guide government interventions, investment promotion strategies and SMME support programmes.
2. Reinforcing Enabling Regulatory System - there is limited evidence to suggest that the national policy on red-tape
reduction is highly valued. It was also noted that there is no regular assessment of the impact of the
administrative systems using the results of independent rating agencies to guide remedial interventions. It was
further observed that empowering regulatory framework were not optimally utilised to give assurance to
business, attract investors through special concessions or incentives and to reinforce national or provincial
legislation.
Therefore, alignment of by-laws to local economic development objectives, prevention of illicit trading, unfair
market conduct, trade practice and undue profiteering is imperative. The high cost of processing legislation into
law negatively affecting most municipalities consequently, there is a general lack of a comprehensive by-law
system which regulates trade and business, provides incentives for corporate investment and retention business.
3. Enhancing Municipal Revenue Generation Capacity – the limited capability of municipal development agencies to
market comparative advantages, attract and direct investment to potential growth sectors is a major hindrance to
realise sufficient levels of own revenue. In turn, this adversely affects their ability to finance essential services and
development projects.
4. Improving Role of Organised Business - it is not the sole duty of the state to persuade corporates to embrace
transformation through various policy instruments. Organised business formations should as a matter of principle
and practice strongly and relentlessly lobby for a change in corporate policies in the interest of SMMEs. The
SMMEs particularly those who are from sectors that were previously excluded complained that they benefit least
in securing state contracts in construction and strategic service sectors. Suspicions of flouting the Competition Act
were rife, hence the advice that they should have a structured approach in dealing with identified challenges.
5. Ease Access to Business and Public Facilities – access to and exit from public facilities like national roads, airports,
city centre and amenities is hampered by congestions in traffic flow. This was attributable to ill configured road
networks, absence, obscured positioning and poor manifestation of signage including road markings essential to
ease traffic flows within cities and towns to the detriment of quick delivery of goods to business sites.
6. Easing Negative Impact of National Roads - most towns along national roads are the most to experience problems
of traffic jams thus causing time delays resulting from difficulties to pass through over and above those already
mentioned. This is also attributable to poor town planning and lack of effective control by the municipal
authorities which compounds the problem. It is therefore critical to improve cooperation across spheres of
government to address this problem and other similar challenges.
The department committed to cooperate with other critical stakeholders in facilitating implementation of interventions
that are within its capacity in the next financial year onwards.
Governance
The public entities within the province reporting to the Member of the Executive Council (MEC) for DEDEAT are critical
service delivery vehicles which together with DEDEAT work towards the achievement of its mandate. The entities are
experiencing increased pressure to demonstrate, on a regular basis, that they are creating value for the shareholder.
This has led to the emergence of a variety of measures that claim to quantify value creating performance.
49
The department through Deloitte completed the Board effectiveness evaluation for Coega SEZ. The key report findings
on the effectiveness of the Board, together with any associated recommendations were implemented, which include
board appointments and rating on performance. The Coega A class shares were transferred from the DTI to the
department (DEDEA) as the shareholder. This process will assist in addressing the financial sustainability and
compliance with the Special Economic Zone (SEZ) Act.
The Provincial Treasury received comments from the public entities on the National Treasury framework on
standardisation of remuneration for boards and executives. The salaries and remunerations for public entities were not
standardised and uniform. This matter will be addressed once the framework has been approved by Parliament for
implementation.
The department engaged in the following activities to streamline governance during the 2017/18 financial year:
Review of the ECDC Act;
Filling of vacant positions, amongst others, the ECDC and Coega;
Amendment to the ECGB name to ECGB;
Transfer of the Coega shares to DEDEAT;
Facilitation of the Coega listing as Schedule 3D in terms of the PFMA;
Inputs on the proposed rationalisation of the ECGB and the ECGB;
Facilitation of the MEC/Chairpersons of the Board meetings;
Presentations and response to the Portfolio Committee questions;
Submission of the oversight reports to the Audit Committee for comment and also conducting oversight
meetings; and
Facilitation of the submission of the SEZ transition plans by the ELIDZ and the Coega.
IGR / Resource Mobilisation / Economic Infrastructure
The Resource Mobilisation function of the Department is directed at seeking-out opportunities for partnerships that
assist the department to achieve its mandate. This function is primarily undertaken by the Resource Mobilisation
Unit. However, sectors in different Units of the Department are actively engaged in mobilising resources in their own
right. The target for this particular financial year for the Resource Mobilisation Unit was to mobilise resources to the
value of R 15 000 000 (fifteen million Rands).
This target was achieved with the Unit being able to mobilise resources to the value of R 39 653 000 (thirty-nine
million, six hundred and fifty-three thousand). This amount constitutes allocations for the economic Infrastructure
programme where an allocation of R 12 200 000 was made during the adjustment process and an allocation of R
27 453 000 for the 2018-2019 financial year.
This work will contribute towards sector development in a broad number of projects and includes funding of projects
such as: the electrification of the Queenstown Industrial Park; renovations of the Butterworth Factory facility that will
be used to contribute in the process of making filter bags for Eskom; and planning/ feasibility work for Sola
Streetlights for Ports Saint Johns under the Small Towns Revitalisation Programme of the province. Also linked to the
Small Towns Programme, the allocated amount includes planning work for a number of informal trade infrastructure
facilities for a number of towns located in the Eastern Part of the province i.e. Libode, Ngqeleni, Mt Ayliff, and Mt
Frere. The economic infrastructure programme is likely to be a vital instrument in ensuring the Department is able to
make significant inroads into improving the economic prospects of the province.
The Resource Mobilisation function of the Department continues to take advantage of both domestic and
international partnerships, in this regard resources mobilised through the European Union and National Treasury
General budget support partnership to the value of R 8 914 626 were transferred to the Chris Hani Chris Hani DM for
Rural Sustainable Villages Project as well as the ECDC for the Amatole 30 Schools Biogas. Further support and
partnership to ensure success of these projects has been negotiated with the United States of America International
Aid (USAID) who have shown willingness to support the initiative.
The Unit continues to find opportunities for supporting the development of Tourism in the province. In this regard
ongoing work is taking place to find a suitable process for the upkeep of roads leading to provincial parks. In growing
its partnership base, the Unit will explore further partnerships with the domestic private sector. Already, interest has
been shown from some of the country’s top industries such as South African Breweries and Coca Cala.
50
The Department will continue to participate in a number of Inter-Governmental Relations (IGR) structures with a view
to establishing partnerships that will support the department in meeting its mandate. During the year under review
work has included regular interface with provincial and national departments as well as local municipalities and public
entities. This work included maintaining constant interface and reporting to structures such as the National Council of
Provinces, the Provincial Economic Development Portfolio Committee, the National Minister and MEC political and
technical meetings (MINMEC) as well as the MEC and Municipality forums MUNMEC, as well as the Premier’s
Coordinating Committee (PCF).
The Department was also proud to have mobilised support through its entities and contributed in supporting projects
in Mbizana in line with the OR Tambo 100 year Celebrations. Participation in the Provincial International Relations
Steering Committee has also been valuable to the Department and witnessed through some of the projects that have
been initiated through this interface, such as the Blink Water Minigrid Project that is substantially funded by the
Province of lower Saxony –Germany.
Office of the Consumer Protector
During Quarter 1, the Office of the Consumer Protector conducted an awareness campaign under the theme “Services
Offered by the Office of Consumer Protector consumers are made aware of services offered by this office as well as
those of accredited National Ombudsman and Regulators who have no Provincial footprint.
1522 participants were reached in 17 awareness sessions that were conducted during Quarter 1.
The Unit worked in collaboration with sister regulators to ensure that consumers are able to be aware of their rights in
terms of other Consumer Related Legislation and that they are able to utilize the Office of the Consumer Protector as a
conduit for referral of their complaints to National Ombudsman and Regulators.
The following National Regulators participated in workshops during the Quarter:
Consumer Goods and Services Ombud (CGSO);
Motor Industry Ombud of South Africa (MIOSA);
Independent Communications Association of South Africa (ICASA);
Council For Medical Schemes;
Council for Debt Collectors;
National Credit Regulator (NCR); and
Financial Services Board (FSB. The Office of the Consumer Protector conducted two Education Programmes in Quarter 2. The first education
Programme consisted of a number of workshops that occurred in the Province which were aimed at educating
attendees on good financial skills, the importance of budgeting as well as creating awareness of Consumer Rights as
contained in the Consumer Protection Act. In all the sessions the Share Call Centre number was marketed in an
attempt to take the Services of the Consumer Protection Office to the People of the Province. The highlight of this
Programme was that the office has forged good working relations with the Department of Trade and Industry
Consumer and Corporate Division. Through this partnership three successful awareness sessions were conducted in
Port Elizabeth, Queenstown and East London.
The Second Education Programme that was conducted was creating awareness and ensuring that Consumers “Know
Your Rights”. In September 2017, the office fully participated in the Public Service Month that was in the O. R. Tambo
District. This gave an opportunity for the Office of the Consumer Protector to take its services to the People, creating
awareness on their rights and responsibilities and how the Office is able to assist consumers within the Eastern Cape.
Through the Public Service Month (PSM) activities, 891 participants were reached. The total number of Participants
reached during Quarter 2 was 3380.
The 4th Education Programme is known as ‘The Right to Fair Value, Good Quality and Safety’, which was implemented
throughout the province in October. Education Programme 4 Workshops that occurred in the Province were aimed at
educating attendees on their right to demand quality service, the right to receive goods or services that are of good
quality, in good working order and free of any defects. During the Campaign, 10 workshops were held across the
Province in support of Education Programme 4.
While the Consumer Protection office acknowledges the spirit of giving that characterizes the Christmas season, the
department believes that responsible spending without incurring debt is a far healthier option for any household.
South Africans often hit the festive season as if it is the end of time, choosing to ignore the looming financial
responsibilities, such as school fees and other bills that come only too quickly in the New Year. Education Workshops
51
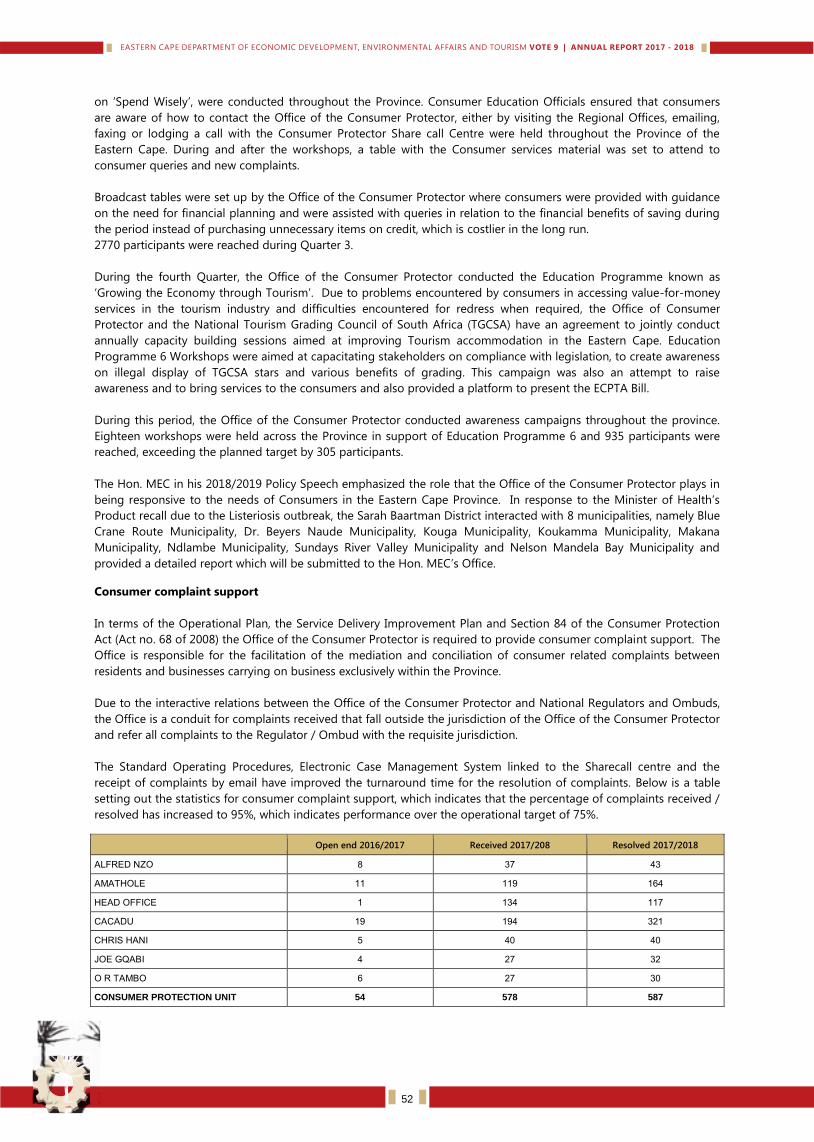
on ‘Spend Wisely’, were conducted throughout the Province. Consumer Education Officials ensured that consumers
are aware of how to contact the Office of the Consumer Protector, either by visiting the Regional Offices, emailing,
faxing or lodging a call with the Consumer Protector Share call Centre were held throughout the Province of the
Eastern Cape. During and after the workshops, a table with the Consumer services material was set to attend to
consumer queries and new complaints.
Broadcast tables were set up by the Office of the Consumer Protector where consumers were provided with guidance
on the need for financial planning and were assisted with queries in relation to the financial benefits of saving during
the period instead of purchasing unnecessary items on credit, which is costlier in the long run.
2770 participants were reached during Quarter 3.
During the fourth Quarter, the Office of the Consumer Protector conducted the Education Programme known as
‘Growing the Economy through Tourism’. Due to problems encountered by consumers in accessing value-for-money
services in the tourism industry and difficulties encountered for redress when required, the Office of Consumer
Protector and the National Tourism Grading Council of South Africa (TGCSA) have an agreement to jointly conduct
annually capacity building sessions aimed at improving Tourism accommodation in the Eastern Cape. Education
Programme 6 Workshops were aimed at capacitating stakeholders on compliance with legislation, to create awareness
on illegal display of TGCSA stars and various benefits of grading. This campaign was also an attempt to raise
awareness and to bring services to the consumers and also provided a platform to present the ECPTA Bill.
During this period, the Office of the Consumer Protector conducted awareness campaigns throughout the province.
Eighteen workshops were held across the Province in support of Education Programme 6 and 935 participants were
reached, exceeding the planned target by 305 participants.
The Hon. MEC in his 2018/2019 Policy Speech emphasized the role that the Office of the Consumer Protector plays in
being responsive to the needs of Consumers in the Eastern Cape Province. In response to the Minister of Health’s
Product recall due to the Listeriosis outbreak, the Sarah Baartman District interacted with 8 municipalities, namely Blue
Crane Route Municipality, Dr. Beyers Naude Municipality, Kouga Municipality, Koukamma Municipality, Makana
Municipality, Ndlambe Municipality, Sundays River Valley Municipality and Nelson Mandela Bay Municipality and
provided a detailed report which will be submitted to the Hon. MEC’s Office. Consumer complaint support
In terms of the Operational Plan, the Service Delivery Improvement Plan and Section 84 of the Consumer Protection
Act (Act no. 68 of 2008) the Office of the Consumer Protector is required to provide consumer complaint support. The
Office is responsible for the facilitation of the mediation and conciliation of consumer related complaints between
residents and businesses carrying on business exclusively within the Province.
Due to the interactive relations between the Office of the Consumer Protector and National Regulators and Ombuds,
the Office is a conduit for complaints received that fall outside the jurisdiction of the Office of the Consumer Protector
and refer all complaints to the Regulator / Ombud with the requisite jurisdiction.
The Standard Operating Procedures, Electronic Case Management System linked to the Sharecall centre and the
receipt of complaints by email have improved the turnaround time for the resolution of complaints. Below is a table
setting out the statistics for consumer complaint support, which indicates that the percentage of complaints received /
resolved has increased to 95%, which indicates performance over the operational target of 75%.
Open end 2016/2017 Received 2017/208 Resolved 2017/2018
ALFRED NZO 8 37 43
AMATHOLE 11 119 164
HEAD OFFICE 1 134 117
CACADU 19 194 321
CHRIS HANI 5 40 40
JOE GQABI 4 27 32
O R TAMBO 6 27 30
CONSUMER PROTECTION UNIT 54 578 587
52
Economic Planning and Research
During the year, the Unit had the following outputs:
Provincial Economic Development Strategy - The final product of the Provincial Economic Development Strategy
was completed in Quarter 2 of 2017. Various sessions were held where the strategy was shared with a number of key
stakeholders to receive inputs and comments. An implementation plan is set to be released in 2018.
Eastern Cape Economic Review – These publications were released in Quarter 1 and Quarter 4 of 2017/18. This
publication provides a bi-annual economic overview of the performance of the Eastern Cape economy. The intention is
for readers to be taken on a guided tour of the latest ‘facts and figures’ of the provincial economy. The publication
provides a concise but broad overview of the provincial socio-economic landscape. Importantly, the EC Economic
Review represents a collaborative research partnership amongst numerous Economic Researchers in the province –
and henceforth provides a holistic provincial perspective.
Real Investment Monitor -The Eastern Cape Real Investment Monitor is released on a quarterly basis. This
publication provides a concise and easy to interpret overview of recent real investment trends in the province. There is
a statistical section which monitors capital formation, business confidence and economic growth; this is supported by
a media monitoring section which provides headlines of noteworthy investment announcements in the media during
the quarter.
International Trade Tracker released in Quarter 1 and Quarter 3 of the 2017/18 year. This publication is particularly
useful in analyzing sub-provincial flows of economic activity. In particular, the imports/exports and origins/destinations
from the Port of East London and the Ports of Port Elizabeth/Ngqura can be unpacked to express the strengths of the
local economy.
Quarterly Economic Research Dialogue - The Quarterly Economic Dialogue is a new concept developed in the
programme to amalgamate what was done in the previous Quarterly Economic Research Forum and the Economic
Symposium. It aims to initiate discourse on policy and developmental issues affecting the province. Dialogues were
hosted in Quarter 2 and Quarter 4 in 2017/18.
Public Sector Economist Forum – The Economic Planning Unit hosted the PSEF in Quarter 3 of the financial year. This
is a conference which has a national reach and brings together public sector researchers sharing papers chosen by a
panel of judges.
Emerging Views Conference – In the third quarter of 2017/18 the Economic Planning Unit hosted a post-graduate
research conference hosted at the Walter Sisulu University Potsdam Campus. This conference gives students a
platform to share research on socio-economic issues affecting the Eastern Cape.
Neil Agget Labour Studies Unit - The Neil Aggett Labour Studies Unit (NALSU) was established in the Institute of
Social and Economic Research (ISER) at Rhodes University in partnership with the Department of Economic
Development, Environmental Affairs and Tourism (DEDEAT) of the Eastern Cape Provincial Government. A third term of
support began from 01 July 2017 and will end on 30th June 2018. Amongst a host of activities NALSU is at the
forefront of the national policy discourse, below are some of the activities delivered by the unit.
Publications
1. Michael Rogan, (2017). “Food poverty, hunger and household production in rural Eastern Cape households.”
Development Southern Africa.
2. Ana Carolina Ogando, Sally Roever & Michael Rogan, (2017) “Gender and Informal Livelihoods: Coping Strategies
and Perceptions of Waste Pickers in sub-Saharan Africa and Latin America”
3. Rogan, M. & Alfers, L. “Employment-based social protection in the global north and south: ‘productivism,
universalism and social citizenship’.”
4. Rogan, M. “Agricultural production, the household ‘development cycle’ and migrant remittances: continuities and
change in the Eastern Cape hinterland.” In Bank, L., Posel, D.
5. Rogan, M. & Reynolds, J. “Trends in the working poverty rate (WPR) in post-apartheid South Africa, 1997-2012”
(Development Southern Africa)
6. Otterbach, S. & Rogan, M. “Spatial differences in stunting and household agricultural production in South Africa:
(re)-examining the links using national panel survey data” (Journal of Rural Studies)
7. Posel, D. & Rogan, M. “Inequality, social comparisons and minimum income aspirations: Evidence from South
53
Publications
Africa” (Journal of Human Development and Capabilities)
8. Rogan, M. & Reynolds, J. (2018). Meeting food security needs in very poor households in the Eastern Cape: the role
of own agricultural production. REDI3x3 Working Paper, February 2018. Cape Town: Research Project on
Employment, Income Distribution and Inclusive Growth (REDI), SALDRU, University of Cape Town
Seminars –
1. Eastern Cape Quarterly Economic Dialogue, 13 March 2018, East London
2. LMIP Capacity Building Programme: Session 7- Institutionalising Tracer Studies to Assess the Impact of
Workplace Based Training, 14-15 February 2018, Pretoria
3. Nimi Hoffmann, Rhodes University The unfolding of African feminism in CODESRIA
4. Prof Sonwabile Mnwana, University of Fort Hare Who Owns the Land, Who Owns the Platinum? Conflict and
Contested Meanings of Land and Mineral Wealth in Rural South Africa. The Unresolved National Question: in
South Africa: Left Thought under Apartheid, edited by Eddie Webster & Karin Pampallis Prof Eddie Webster,
University of the Witwatersrand, supported by a number of the contributing authors, including Prof Lucien van
der Walt and Prof Robert van Niekerk of Rhodes University. Mazibuko Jara served as discussant.
5. The Crisis in the ANC and the Struggle against Corruption Oupa Lehulere, Khanya College
Tourism Development
On tourism, there was aggressive engagement with the coastal municipalities and the National Department of
Tourism, which resulted in the finalisation and endorsement of the Coastal and Marine Tourism key initiatives that
centre on improving the enabling environment for the investment along the coast. The following projects have
received funding for implementation over the next three years through a partnership between the NDT and the
ECPTA:
R9 million for the expansion of a 6-day hiking trail on the Wild Coast, which includes an overnight lodge;
R21 million over a period of 3 years for the upgrading of Mtentu, Mzamba and priority beaches in Port Alfred
mainly focussing on planning and upgrading of public infrastructure;
Technical studies towards Waterfront Development in Port St. Johns, which are recommended from revision of the
feasibility study and no development can occur without first finalising these studies; and
Development of a Tourism Master Plan for the Wild Coast Tourism Corridor starting with Port St. Johns / Coffee
Bay Node – this will be overarching integrating all eco-tourism related work including key initiatives that are
coming from the Operation Phakisa initiatives.
In close collaboration with the KSD Local Municipality, the department approved R500 000 for the revitalization of the
Coffee Bay Beach Campsite and the project. The Tourism Blue Flag Programme which started in the previous financial
year also continued with 7 beaches having been awarded a full blue flag, 9 pilot status – the latter involving two
beaches that are in the Wild Coast.
In close collaboration with the NDT, a total of 52 product owners, which were spread across the entire province,
completed the one-year training programme on tourism enterprise development. The programme will continue for a
period of two years with more focus on marketing and finance.
Working together with the NDT, a total of 44 youth completed the National Chefs Training Programme. Ten of these
graduates were offered immediate appointment at Cecilia Makiwane Hospita. The hospital will also be used as an
alternative site for the National Chefs Training Programme.
The Hospitality Youth Initiative (National Certificate in Accommodations services NQF Level 2 and National Certificate
in Food and Beverage NQF Level 4), which is a 12 month learnership that started in November 2016 has now come to
an end. The programme started with 100 participants of which 17 dropped out due to various reasons. A total of 83
learners completed the training and were awarded certificates in a graduation function that was hosted by the Deputy
Minister in Port Elizabeth. Fort one of the participants have already been employed.
The third Provincial Tourism Careers Expo (PTCE) was hosted in Mthatha, of which a total of 1563 registered Tourism,
Hospitality and Consumer Studies learners attended and benefitted from the event and exposed the participants to
various career, business, training and development opportunities.
54
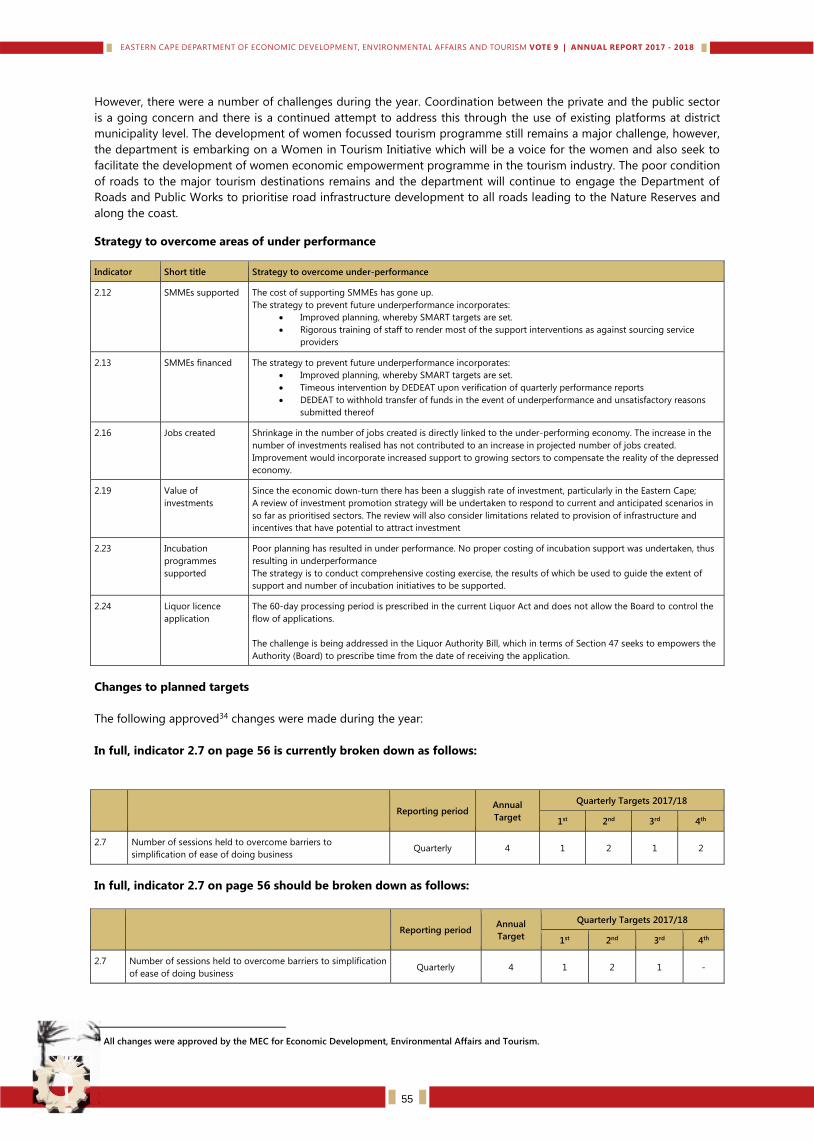
However, there were a number of challenges during the year. Coordination between the private and the public sector
is a going concern and there is a continued attempt to address this through the use of existing platforms at district
municipality level. The development of women focussed tourism programme still remains a major challenge, however,
the department is embarking on a Women in Tourism Initiative which will be a voice for the women and also seek to
facilitate the development of women economic empowerment programme in the tourism industry. The poor condition
of roads to the major tourism destinations remains and the department will continue to engage the Department of
Roads and Public Works to prioritise road infrastructure development to all roads leading to the Nature Reserves and
along the coast. Strategy to overcome areas of under performance Indicator Short title Strategy to overcome under-performance
2.12 SMMEs supported The cost of supporting SMMEs has gone up.
The strategy to prevent future underperformance incorporates:
Improved planning, whereby SMART targets are set.
Rigorous training of staff to render most of the support interventions as against sourcing service
providers
2.13 SMMEs financed The strategy to prevent future underperformance incorporates:
Improved planning, whereby SMART targets are set.
Timeous intervention by DEDEAT upon verification of quarterly performance reports
DEDEAT to withhold transfer of funds in the event of underperformance and unsatisfactory reasons
submitted thereof
2.16 Jobs created Shrinkage in the number of jobs created is directly linked to the under-performing economy. The increase in the
number of investments realised has not contributed to an increase in projected number of jobs created.
Improvement would incorporate increased support to growing sectors to compensate the reality of the depressed
economy.
2.19 Value of
investments
Since the economic down-turn there has been a sluggish rate of investment, particularly in the Eastern Cape;
A review of investment promotion strategy will be undertaken to respond to current and anticipated scenarios in
so far as prioritised sectors. The review will also consider limitations related to provision of infrastructure and
incentives that have potential to attract investment
2.23 Incubation
programmes
supported
Poor planning has resulted in under performance. No proper costing of incubation support was undertaken, thus
resulting in underperformance
The strategy is to conduct comprehensive costing exercise, the results of which be used to guide the extent of
support and number of incubation initiatives to be supported.
2.24 Liquor licence
application
The 60-day processing period is prescribed in the current Liquor Act and does not allow the Board to control the
flow of applications.
The challenge is being addressed in the Liquor Authority Bill, which in terms of Section 47 seeks to empowers the
Authority (Board) to prescribe time from the date of receiving the application.
Changes to planned targets
The following approved34 changes were made during the year:
In full, indicator 2.7 on page 56 is currently broken down as follows:
Reporting period
Annual
Target
Quarterly Targets 2017/18
1st 2nd 3rd 4th
2.7 Number of sessions held to overcome barriers to
simplification of ease of doing business Quarterly 4 1 2 1 2
In full, indicator 2.7 on page 56 should be broken down as follows:
Reporting period
Annual
Target
Quarterly Targets 2017/18
1st 2nd 3rd 4th
2.7 Number of sessions held to overcome barriers to simplification
of ease of doing business Quarterly 4 1 2 1 -
34 All changes were approved by the MEC for Economic Development, Environmental Affairs and Tourism.
55
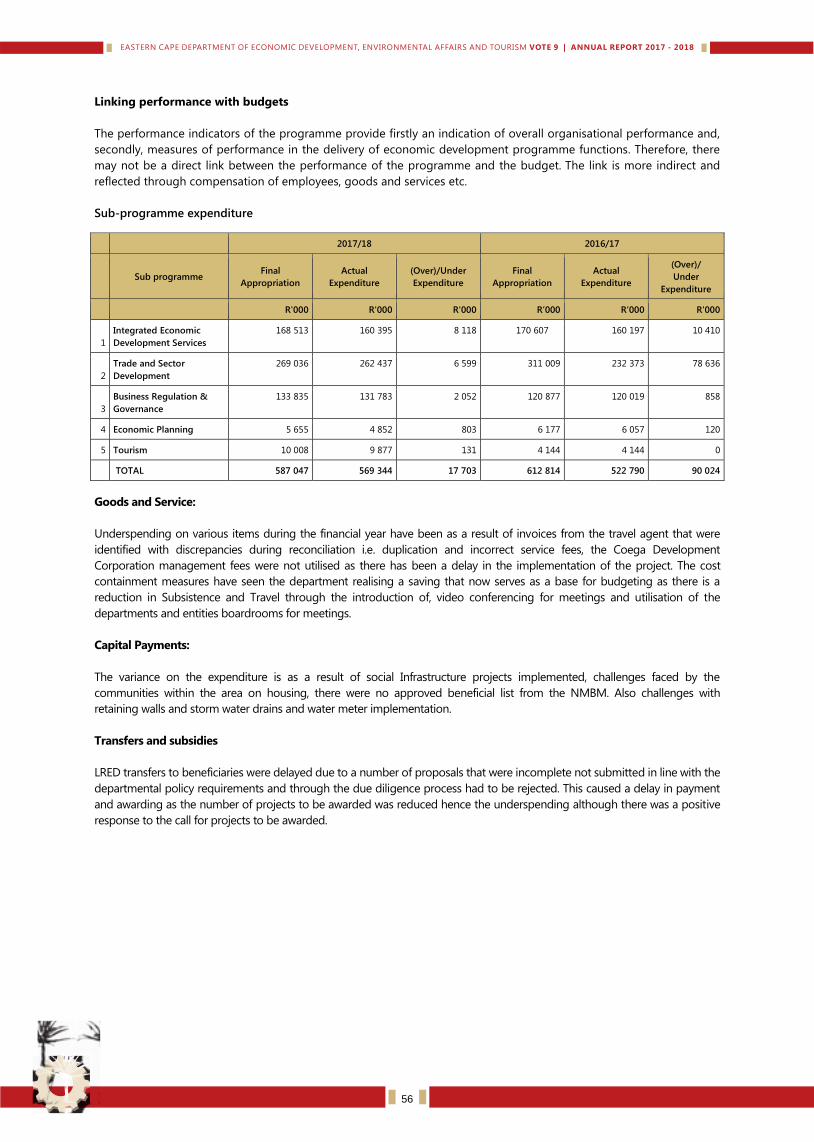
Linking performance with budgets
The performance indicators of the programme provide firstly an indication of overall organisational performance and,
secondly, measures of performance in the delivery of economic development programme functions. Therefore, there
may not be a direct link between the performance of the programme and the budget. The link is more indirect and
reflected through compensation of employees, goods and services etc.
Sub-programme expenditure
2017/18 2016/17
Sub programme Final
Appropriation
Actual
Expenditure
(Over)/Under
Expenditure
Final
Appropriation
Actual
Expenditure
(Over)/
Under
Expenditure
R'000 R'000 R'000 R’000 R'000 R'000
1
Integrated Economic
Development Services
168 513 160 395 8 118 170 607 160 197 10 410
2
Trade and Sector
Development
269 036 262 437 6 599 311 009 232 373 78 636
3
Business Regulation &
Governance
133 835 131 783 2 052 120 877 120 019 858
4 Economic Planning 5 655 4 852 803 6 177 6 057 120
5 Tourism 10 008 9 877 131 4 144 4 144 0
TOTAL 587 047 569 344 17 703 612 814 522 790 90 024
Goods and Service:
Underspending on various items during the financial year have been as a result of invoices from the travel agent that were
identified with discrepancies during reconciliation i.e. duplication and incorrect service fees, the Coega Development
Corporation management fees were not utilised as there has been a delay in the implementation of the project. The cost
containment measures have seen the department realising a saving that now serves as a base for budgeting as there is a
reduction in Subsistence and Travel through the introduction of, video conferencing for meetings and utilisation of the
departments and entities boardrooms for meetings.
Capital Payments:
The variance on the expenditure is as a result of social Infrastructure projects implemented, challenges faced by the
communities within the area on housing, there were no approved beneficial list from the NMBM. Also challenges with
retaining walls and storm water drains and water meter implementation.
Transfers and subsidies
LRED transfers to beneficiaries were delayed due to a number of proposals that were incomplete not submitted in line with the
departmental policy requirements and through the due diligence process had to be rejected. This caused a delay in payment
and awarding as the number of projects to be awarded was reduced hence the underspending although there was a positive
response to the call for projects to be awarded.
56
3.3 Programme 3: Environmental Affairs
Environmental Affairs administers environmental policies that are cascaded down from national level in line with the
mandate of the Department. Importantly, it regulates environmental management through instruments such as the
environmental impact assessments, compliance and enforcement and biodiversity management tools.
The programme is structured as follows:
Sub-programme Sub-programme purpose
3.1: Policy Co-ordination and Environmental
Planning
To establish legislation, policies, programmes, procedures and systems that will effectively
empower and support the core functional programmes.
3.2: Compliance and Enforcement To ensure that environmental legislation is effectively used to protect the environment and its
resources from unlawful and unsustainable exploitation and negative impact.
3.3: Environmental Quality Management To strive towards a safe and healthy environment through effective environmental impact
assessment, air quality management, waste and pollution management for the people of the
Eastern Cape.
3.4: Biodiversity Management To conserve the diversity of landscapes, ecosystems, habitats, biological communities, populations,
spices & genes and promote conservation and sustainable use of natural resources in the Eastern
Cape.
3.5: Environmental Empowerment Services To empower and capacitate the external stakeholders of the Department to meaningfully
participate in and contribute to effective environmental management.
Strategic Objectives
SO3: Sustainable energy solutions promoted and carbon footprint reduced
SO4: Environmental management systems established and maintained to enhance sustainable development
Strategic objectives indicators, planned targets and actual achievements
Performance indicators planned targets and actual achievements
No. Performance Indicator
Actual
Achievement
2014/2015
Actual
Achievement
2015/2016
Actual
Achievement
2016/2017
Planned
Target
2017/2018
Actual
Achievement
2017/2018
Deviation from
Planned Target
to Actual
Achievement
for 2017/2018
Sub-programme: Environmental Policy, Planning and Co-ordination
Intergovernmental Coordination, Spatial and Development Planning
3.1 Number of
intergovernmental sector
tools reviewed
45 45 0 39 39 0
35 An erratum was issued within the regulated timeframe by the MEC for Economic Development, Environmental Affairs and Tourism on 15
September 2017 removing the indicators following the outcome of the previous audit. Although the calculation formula for the indicator was clear,
data sources were not credible hence a decision was made to remove the indicator from the plan. 36 An erratum was issued within the regulated timeframe by the MEC for Economic Development, Environmental Affairs and Tourism on 15
September 2017 removing the indicators following the outcome of the previous audit. Although the calculation formula for the indicator was clear,
data sources were not credible hence a decision was made to remove the indicator from the plan.
Programme Name: Environmental Affairs
Strategic Objectives Strategic Objective
Indicator
Actual
Achievement
2016/2017
Planned Target
2017/2018
Actual
Achievement
2017/2018
Deviation from
Planned Target to
Actual Achievement
for 2017/2018
SO 3: Sustainable energy solutions
promoted and carbon footprint reduced
1 CO2 Emission 37 915 38 700 Indicator
removed35 -
SO 4: Environmental management
systems established and maintained to
enhance sustainable development
2
Status of
ecosystems and
species
- - Indicator
removed36 -
57
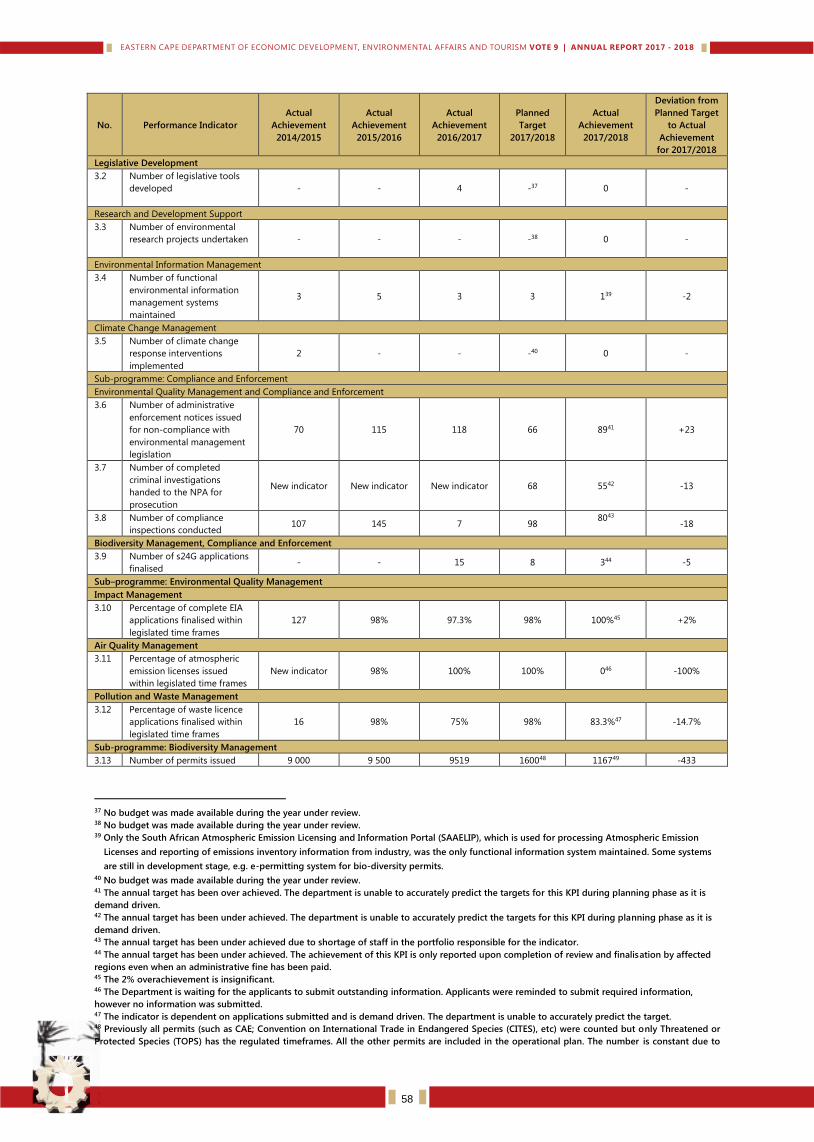
No. Performance Indicator
Actual
Achievement
2014/2015
Actual
Achievement
2015/2016
Actual
Achievement
2016/2017
Planned
Target
2017/2018
Actual
Achievement
2017/2018
Deviation from
Planned Target
to Actual
Achievement
for 2017/2018
Legislative Development
3.2 Number of legislative tools
developed - - 4 -37
0
-
Research and Development Support
3.3 Number of environmental
research projects undertaken - - - -38
0
-
Environmental Information Management
3.4 Number of functional
environmental information
management systems
maintained
3 5 3 3 139 -2
Climate Change Management
3.5 Number of climate change
response interventions
implemented
2 - - -40
0
-
Sub-programme: Compliance and Enforcement
Environmental Quality Management and Compliance and Enforcement
3.6 Number of administrative
enforcement notices issued
for non-compliance with
environmental management
legislation
70 115 118 66
8941
+23
3.7 Number of completed
criminal investigations
handed to the NPA for
prosecution
New indicator New indicator New indicator 68
5542
-13
3.8 Number of compliance
inspections conducted 107 145 7 98
8043
-18
Biodiversity Management, Compliance and Enforcement
3.9 Number of s24G applications
finalised - - 15 8 344 -5
Sub–programme: Environmental Quality Management
Impact Management
3.10 Percentage of complete EIA
applications finalised within
legislated time frames
127 98% 97.3% 98%
100%45
+2%
Air Quality Management
3.11 Percentage of atmospheric
emission licenses issued
within legislated time frames
New indicator 98% 100% 100%
046
-100%
Pollution and Waste Management
3.12 Percentage of waste licence
applications finalised within
legislated time frames
16 98% 75% 98%
83.3%47
-14.7%
Sub-programme: Biodiversity Management
3.13 Number of permits issued 9 000 9 500 9519 160048 116749 -433
37 No budget was made available during the year under review. 38 No budget was made available during the year under review. 39 Only the South African Atmospheric Emission Licensing and Information Portal (SAAELIP), which is used for processing Atmospheric Emission
Licenses and reporting of emissions inventory information from industry, was the only functional information system maintained. Some systems
are still in development stage, e.g. e-permitting system for bio-diversity permits. 40 No budget was made available during the year under review. 41 The annual target has been over achieved. The department is unable to accurately predict the targets for this KPI during planning phase as it is
demand driven. 42 The annual target has been under achieved. The department is unable to accurately predict the targets for this KPI during planning phase as it is
demand driven. 43 The annual target has been under achieved due to shortage of staff in the portfolio responsible for the indicator. 44 The annual target has been under achieved. The achievement of this KPI is only reported upon completion of review and finalisation by affected
regions even when an administrative fine has been paid. 45 The 2% overachievement is insignificant. 46 The Department is waiting for the applicants to submit outstanding information. Applicants were reminded to submit required information,
however no information was submitted. 47 The indicator is dependent on applications submitted and is demand driven. The department is unable to accurately predict the target. 48 Previously all permits (such as CAE; Convention on International Trade in Endangered Species (CITES), etc) were counted but only Threatened or
Protected Species (TOPS) has the regulated timeframes. All the other permits are included in the operational plan. The number is constant due to
58
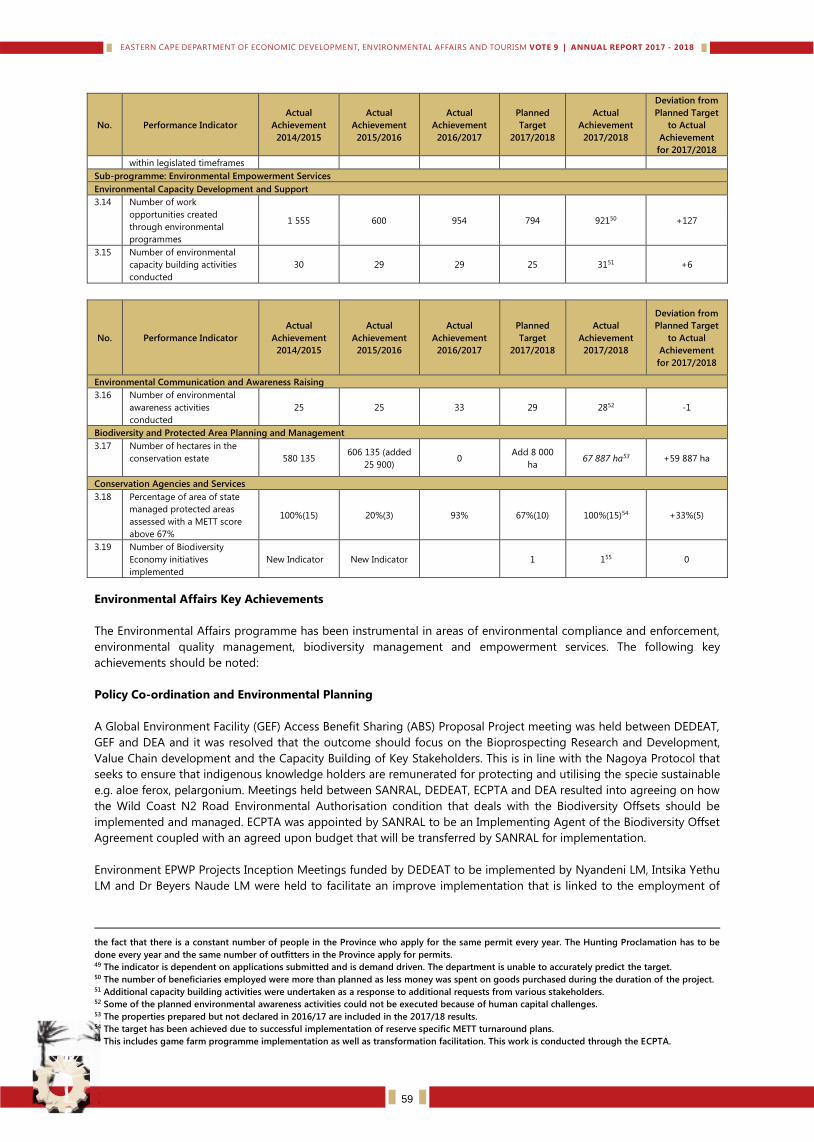
No. Performance Indicator
Actual
Achievement
2014/2015
Actual
Achievement
2015/2016
Actual
Achievement
2016/2017
Planned
Target
2017/2018
Actual
Achievement
2017/2018
Deviation from
Planned Target
to Actual
Achievement
for 2017/2018
within legislated timeframes
Sub-programme: Environmental Empowerment Services
Environmental Capacity Development and Support
3.14 Number of work
opportunities created
through environmental
programmes
1 555 600 954 794
92150
+127
3.15 Number of environmental
capacity building activities
conducted
30 29 29 25
3151
+6
No. Performance Indicator
Actual
Achievement
2014/2015
Actual
Achievement
2015/2016
Actual
Achievement
2016/2017
Planned
Target
2017/2018
Actual
Achievement
2017/2018
Deviation from
Planned Target
to Actual
Achievement
for 2017/2018
Environmental Communication and Awareness Raising
3.16 Number of environmental
awareness activities
conducted
25 25 33 29
2852
-1
Biodiversity and Protected Area Planning and Management
3.17 Number of hectares in the
conservation estate 580 135 606 135 (added
25 900) 0
Add 8 000
ha
67 887 ha53
+59 887 ha
Conservation Agencies and Services
3.18 Percentage of area of state
managed protected areas
assessed with a METT score
above 67%
100%(15) 20%(3) 93% 67%(10) 100%(15)54 +33%(5)
3.19 Number of Biodiversity
Economy initiatives
implemented
New Indicator New Indicator 1 155 0
Environmental Affairs Key Achievements
The Environmental Affairs programme has been instrumental in areas of environmental compliance and enforcement,
environmental quality management, biodiversity management and empowerment services. The following key
achievements should be noted:
Policy Co-ordination and Environmental Planning
A Global Environment Facility (GEF) Access Benefit Sharing (ABS) Proposal Project meeting was held between DEDEAT,
GEF and DEA and it was resolved that the outcome should focus on the Bioprospecting Research and Development,
Value Chain development and the Capacity Building of Key Stakeholders. This is in line with the Nagoya Protocol that
seeks to ensure that indigenous knowledge holders are remunerated for protecting and utilising the specie sustainable
e.g. aloe ferox, pelargonium. Meetings held between SANRAL, DEDEAT, ECPTA and DEA resulted into agreeing on how
the Wild Coast N2 Road Environmental Authorisation condition that deals with the Biodiversity Offsets should be
implemented and managed. ECPTA was appointed by SANRAL to be an Implementing Agent of the Biodiversity Offset
Agreement coupled with an agreed upon budget that will be transferred by SANRAL for implementation.
Environment EPWP Projects Inception Meetings funded by DEDEAT to be implemented by Nyandeni LM, Intsika Yethu
LM and Dr Beyers Naude LM were held to facilitate an improve implementation that is linked to the employment of
the fact that there is a constant number of people in the Province who apply for the same permit every year. The Hunting Proclamation has to be
done every year and the same number of outfitters in the Province apply for permits. 49 The indicator is dependent on applications submitted and is demand driven. The department is unable to accurately predict the target. 50 The number of beneficiaries employed were more than planned as less money was spent on goods purchased during the duration of the project. 51 Additional capacity building activities were undertaken as a response to additional requests from various stakeholders. 52 Some of the planned environmental awareness activities could not be executed because of human capital challenges. 53 The properties prepared but not declared in 2016/17 are included in the 2017/18 results. 54 The target has been achieved due to successful implementation of reserve specific METT turnaround plans. 55 This includes game farm programme implementation as well as transformation facilitation. This work is conducted through the ECPTA.
59
local beneficiaries. The Eastern Cape 3rd Environmental Implementation Plan (EIP) is being developed in line with
NEMA Chapter 3 and it will be gazetted in the 2018-19 financial year.
Compliance and enforcement
The compliance and enforcement unit issued 89 administrative notices to bring unlawful developers into compliance.
This included issuing removal and rehabilitation notices for unlawful structures along the Wild Coast that threaten
sustainable nodal development.
55 criminal cases were registered for prosecution. The escalation of illegal hunting with dogs on farms, state land and
communal property across the province is cause for concern, but together with the SAPS Stock theft units, DEDEAT
compliance and enforcement conducted successful arrests and carried out regular patrols.
80 compliance monitoring inspections were performed by the team to ensure that conditions of permits and
environmental authorisations were being complied with.
12 Rhino were poached in the Eastern Cape in 2017. This is fewer than the 19 of 2016 and is the result of joint
operations with SAPS, SANParks, ECPTA and honorary officers. The joint operations resulted in the successful arrest of
24 suspects involved in rhino related crimes.
DEDEAT Compliance and Enforcement took part in quarterly Phakisa operations with the focus on environmental
crimes occurring along our coast. Whilst these joint operations mainly focussed on illegal fishing, netting and abalone
smuggling, assistance was also rendered to DAFF with the ongoing problem of forest destruction and unlawful
occupation of their land in Port St. Johns. Fines were also issued to unlawful sand miners who persist in large-scale
unauthorised mining operations along the Wild Coast leading to irreparable environmental damage that threatens
coastal livelihoods and tourism.
Environmental quality management
Environmental Impact Management (EIM)
With reference to the processing of EIA applications, a total of 155 EIA applications were finalized, 37 by virtue of
either lapsing or being withdrawn by the applicant and 118 through environmental authorizations/refusals issued. All
118 authorizations/refusals were issued within legislated time-frames, meaning a 100% achievement for the year. It
must be emphasized that only the applications finalized via authorizations/refusals are formally reported, as that is
what the relevant TIERM requires and to what the target in the Annual Performance Plan refers.
In addition, the average time taken to finalize the 118 applications referred to above was consistently below the
legislated time-frame of 107 days. The implication of the above performance is that the Department is not delaying
essential development in the province by failing to meet legislated time-frames.
During the reporting period the EIM Directorate continued to administer and review appeals to the MEC against
environmental authorisations or refusals and to make recommendations to the MEC as required. This is strictly
speaking a function of the Office of the MEC, but the EIM unit has always been tasked with his responsibility. This is a
very challenging task due to the legal implications of any incorrect recommendations made to the MEC. During this
reporting period there was only one appeal issue subjected to litigation [in the form of a High Court judicial review]
and in this case the latest court judgement was in favour of the MEC. DEDEAT has an extremely low number of EIA
appeal issues that lead to litigation against the Department, compared to some other Provinces.
In all quarters of this reporting period meetings of the EQM Technical Committee took place as planned. This structure
serves as a key co-ordinating mechanism between Head Office and Regions and is an important factor in service
delivery as reported in Point 1 above.
Planned quarterly meetings of the EQM Forum took place as envisaged in the Operational Plan. This forum facilitates
communication and co-ordination between the Department and external stakeholders, including Environmental
Assessment Practitioners [EAP’s] and Organs of State such as National and Provincial Government Departments, State-
Owned Enterprises and Municipalities. Although the forum is usually very well attended in terms of numbers, it
remains a serious concern that many EAP’s and Organs of State do not participate, which means that they do not
receive information that is critically important for their own fields of work. Participation by Eastern Cape Provincial
60
Departments is especially poor, while DEDEAT hardly ever fails to participate in forums and structures established by
such Departments.
The EIM unit fully participated in national environmental impact management structures, including MINTECH Working
Group 5 and its task teams and working groups. The unit played a leading role in several of these structures, most
significantly through a staff member being appointed on the board of EAPASA, the recently established national
registration body for Environmental Assessment Practitioners in the RSA. The same staff member has also been
appointed as an EAPASA Assessor and will review registration applications from practitioners.
During this reporting period a high priority was placed on fostering integration between Programmes 2 and 3 in
DEDEAT, inclusive of cross-cutting issues such as Shale-gas Development and Renewable Energy, in particular wind-
farm related issues. It for example became clear that the possible conflict between windfarm developments and the
conservation of threatened/endangered vulture species was becoming a major issue. In consultation with the
Renewable Energy Programme in Economic Development it was decided to arrange a stakeholder working session
involving all the various interests, ranging from NGO’s that are bird conservation activists to representatives of the
wind energy industry. The working session attracted great interest and, with the exception of National DEA all key
role-players participated. This was more than likely the first workshop that managed to bring all opposing role-players
to the table for constructive discussion.
Air Quality & Climate Change
Air Quality
During the Year Sarah Baartman and OR Tambo District Municipality developed their Air Quality Management Plan
which were duly approved by their respective Councils Both Nelson Mandela Bay Metropolitan Municipality and Chris
Hani District Municipality are currently developing second generation Air Quality Management Plans.
Nelson Mandela Bay Metropolitan Municipality; Buffalo City Metropolitan Municipality and Coega networks are all
operational. In Port Elizabeth an exceedance of the PM10 standard was reported on two occasions. Investigations
revealed that the cause of the exceedance was due to residential fuel burning in the Markman township which was
exacerbated by calm weather conditions and the winter invasion resulted in a daily average being recorded of
125mg/m3 which is 50mg/m3 above the standard of 75mg/m3. The second exceedance was as a result of the terrible
veld fires reported in the Kouga and Koukamma Local Municipalities.
The South African Air Quality Information System (SAAQIS) is currently being upgraded and as part of the upgrade live
reporting of data is now being facilitated on the system. Nelson Mandela, Buffalo City and Coega are now reporting
live to the System and this data can now be viewed on a person’s cell phone utilising the SAAQIS APP.
No Atmospheric Emission Licenses (AEL) were finalised in this quarter the reason for this being that there is
outstanding information on the two current applications. All AEL holders have submitted reports to the National
Atmospheric Emission Inventory System. The Department has completed two audits and others are underway.
Climate Change
The Department expanded the Provincial Air Quality Forum to include climate change. This expanded format has been
seen as a success because the number and types of role players has generally expanded from forum to forum.
So far during this winter season three major veld fires have occurred in the Province. The first being in the Koukamma;
Kouga and Nelson Mandela Bay areas. This fire burnt out 16 000 hectares of forest and shrub. It resulted in an
exceedance of the National Air Quality Ambient standards which was recorded as far away as in Coega. This fire
caused damage and the financial losses are significant.
The second fire was in the Cathcart area in the Amahlati Local Municipality. This was a rapidly burning fire and
destroyed 50 000 hectares of grassland. Weather conditions made managing this fire extremely difficult due to the
high wind speeds. This fanned the fire which spread at a rate of 30m/s. The impacts of this fire are significant and
exacerbate the hardships being experienced by farmers who are still reeling from the effects of inadequate summer
and autumn rains. There is no local air quality monitoring station to record what the impact is on air quality but the
plume can clearly be seen on satellite imaginary circled in red.
61
The last significant fire was in the Barkly East Area this fire burnt out approximately 20 000 hectares of veld. The fire
was slow burning but could not be extinguished quickly due to the very strong winds and the fact that the fire was
burning in inaccessible gorges where access is severely limited. The impacts of this fire are significant and exacerbate
the hardships being experienced by farmers who are still reeling from the effects of inadequate summer and autumn
rains.
During the course of the year the Department worked on a Local Government Climate Change Response Strategies
project. This project aimed to assist all the District Municipalities to develop Climate Change Response Strategies
which are incorporated into the Municipal IDP’s. In this regard all District Municipal Climate Change Response
Strategies were developed with associated response projects. All that is required is for the Councils to adopt the
response strategies and incorporate the draft projects into the Municipal Integrated Development Plans.
On the 29th September 2017 the Department assisted the National Department of Transport to workshop the Green
Transport Strategy in East London. Both public and private stakeholders were invited to the workshop. Approximately
50 people participated in the workshop. Currently Transport accounts for over 10% of the nation’s Green House Gas
emissions profile. The Green Transport Strategy aims are to make the transport sector more environmentally friendly.
Actions identified in the strategy include:
In the OR Tambo Region a program called “Building Inclusive Green Municipalities (BIGM)” is being implemented. The
role players include both Port St Johns and King Sabata Dalindyebo Local Municipality the City of Surrey (from
Canada) and SALGA. The programme is focused on Greening Municipalities and climate change is a big consideration.
In terms of this programme climate change capacity building has been the focus in Port St Johns while in KSD the
focus is on building mitigation and adaptation potential of all planned development projects.
During the course of the year both drought and runaway fires had significant impacts on Province. The intensity of
both these types of impacts have been exacerbated by Climate Change. The costs of addressing the impacts are
estimated to run into billions of Rands with the drought having the potential to paralyse the economy.
Currently the drought is affecting a large part of the province with some or all of the supply dams reflecting critical low
levels in Nelson Mandela Bay Metropolitan Municipality; Sarah Baartman District Municipality; Amatole District
Municipality; Chris Hani District Municipality; Joe Gqabi District Municipality and OR Tambo District Municipality.
While three significant fires impacted the province burning an estimated 80 000 hectares in Kouga, Koukamma,
Amahlati and Senqu regions.
The Department has assisted; where requested; by fast tracking environmental authorisations through the use of
section 30A as envisaged in NEMA and co-ordinating activities through engagements with the Provincial and Regional
Disaster Management Structures.
Waste Management
The Department finalised five (5) Waste Management Licence applications and all were issued within legislated
timeframe, and that resulting in a 100% achievement for the year. It must be noted that all the waste management
licences issued were for the waste recycling initiatives and composting facility in various Regions (OR Tambo, Chris
Hani, and Amathole). These facilities will promote and improve the rate of waste recycling in the province, an
alternative method for waste management other than disposal of waste to land (landfilling). Besides waste
management licensing process, waste registration certificates, through norms and standards, were issued to facilities
that handle waste mainly for temporary storage.
Municipalities and industries were supported through engagements held in the form of bilateral meetings and forums
such as the Provincial Waste Officers Forums, and SALGA’s Climate Change, Waste and Environment Forum
(constituted of Portfolio Councillors attached mainly in the municipal’s community services departments responsible
for waste management and Environment). Internal staff were also attended to through the Technical Committee
meeting. The Waste Management unit also forms part of the National Working Group IX that deals with Waste
Management including its other structures and the Phakisa Waste Lab.
Some waste management facilities are required by law to report the volumes of waste they handle to South African
Waste Information Systems (SAWIS) for the recording, collection, management and analysis of data and information.
A number of municipalities were given refresher course on reporting to the system and others verified if they report
correctly. Performance audits on a number of waste management facilities especially in municipalities were conducted
62
and performance was met with mixed reactions on facility performance by the department as many are non-compliant
and few others are improving with their performance.
The review of the EC Integrated Waste Management Plan (IWMP) and the development of the Recycling Strategy is
underway. This responds to the NEM: Waste Act 2008 as amended and Waste Management Hierarchy which requires
all provincial departments and municipalities responsible for waste management to prepare IWMPs. In complying
with this requirement, a number of municipalities have been engaged and assisted with the development and review
of their IWMPs with a few submitting for endorsement by the MEC, such as Emalahleni, Intsika Yethu etc. Also, some
(municipalities) have started updating the waste by-laws to align to the Waste Act 2008 as amended.
In a bid to raise awareness and to educate people on sustainable living, the department held the Greenest
Municipality Competition 2017. This competition has been developed to work towards a sustainable future, a healthy
environment, and a high quality of life for all citizens. Five districts in the Province submitted the names of their
winning local municipalities during the district competitions to the province, which also held the provincial
competition. The winners were as follows:
Elundini LM – R500 000.00
Umzimvubu LM – R300 000.00, and
Port St Johns – R200 000.00.
Biodiversity and Coastal Management
Biodiversity Management
In 2017/18 Biodiversity Sub-Programme committed to deliver on number of targets including;
Review of Provincial Biodiversity Strategy and Action Plan; the plan is in final stage and will be Gazetted for comments
and implementation in 2018/19.
Participation on Implementation of CITES Resolutions
Provincial participation on Implementation of CITES resolutions on management of African Grey Parrots continues.
One inspection was conducted for a facility breeding with African Grey Parrots in Gulu near East London which has
applied to be registered for international trade with CITES Secretariat in Geneva. The application has been
recommended and was submitted to DEA. The application will further be published for comments in the CITES website
Biodiversity Permits
There has been continuous outcry on lack of Departmental system to manage our permit administration. Everything
has been captured manually and as a result it was always difficult for Auditors to do verification of our output. In the
current financial year Sub-Programme has been involved in development of a system whilst managing the outflow of
permits.
The development of the E-permit Phase one was done which took into preference the Provincial Permits. Phase 2
which include TOPs permits has been initiated by the Department with SITA and will be implemented in 2018/19
Financial Year. Responses on clarity seeking questions and inputs from public towards the development of Phase 2
have been considered sent to SITA. Permitting is a management system for monitoring natural resources that are
available and are harvested in the Province of the Eastern Cape.
Department of Environmental Affairs DEA has developed a Policies and Strategy on Biodiversity Economy which seeks
to support Game Transformation including Trade of Natural Resources including both Faunal and Floral Species. The
Province of the Eastern Cape has been fully participating in the Programme on permit administration for
Bioprospecting of Floral Species as well as Wildlife Permitting including Taxidermy Management.
The set target for TOPS Permits during the reporting year was 1600. The total number of permits that were issued
within regulated timeframe was 1167.
Biodiversity Economy Indaba 2018
Province with DEA and ECPTA hosted the 2018 Biodiversity Indaba. Highlights of the Indaba was realisation of the
Communities of their roles and responsibilities in ensuring that we have a common vision in Conservation in the
63
Province of the Eastern Cape. That was demonstrated by the attitude and response from number of Traditional
Leaders including The Abathembu Tribal Authority at Bumbane, Qunu under King Azenthi Dalindyebo who
immediately invited DEDEA for consideration of possible declaration of protected environment within his Tribal
Authority. Consultation and site visits will be done in the new year but commitment to start the process has been
registered under the reporting period.
Biodiversity Working Group1 Policy Issues that have direct implications to the Province
MinTECH Working Group1 meetings and sub-committees have been honoured and was attended during the reporting
year. Provincial inputs and comments were made on Policy Matters raised in Working groups.
Crucial meetings on intervention on Management and Trade on Bontebok were held between DEDEAT, Cape Nature
(Western Cape), DEA and the Industry. Purpose was to iron out issues of misunderstanding with the Bontebok BMP
which was published by DEA for comment. Any Policy Document has to be reviewed if it is to be adopted as National
Policy. Bontebok BMP will have to follow same processes hence there was such engagements. The. Further
consultation will be done and concluded in 18/19.
Wildlife Translocation in the Province
Provincial Stakeholder engagements with the wildlife industry as outlined in the Service Delivery Agreement is
ongoing. The Department gave the industry an opportunity to work on a proposal for the amendment of the
Translocation Policy which was presented in Stakeholder meeting and due to gaps in what was presented the Industry
has been given another chance to review their inputs on the matter and to present to the Department in the new
financial year.
Species and Ecosystem Management
The Honey Bush Tea Industry Community of Practice held the 4th meeting during the year. The Community of Practise
is chaired by the Eastern Cape and Western Cape Official. The roll out of the Implementation of Guidelines for
sustainable harvesting of Cyclopia intermedia was endorsed. National DEA through their BIOPANZA (Bio Products
Advancement Network South Africa) has identified need for biodiversity management plans (BMPs) for key species
including two Cyclopia species and Aloe ferox.
Implementation of the Pelargonium sidoides and Encepharlatos latifrons Biodiversity Management Plans continues
in the Province.
Annual Falco Count with EWT and Cycad monitoring was conducted in major Regions where th Species occur. About
800 birds were recorder as opposed to, 1000 in 2017. There has been a noticeable decline in the population over the
years.
Eco-Systems Management
Wetlands Conservation and habitat restoration continue to get attention. However, we have a challenge in funding for
proper management and risk reduction in all our eco-systems. Partnering and coordination of Provincial Wetlands
Forum Sessions and Thicket Restoration Forums have had great effects on our management of these systems.
Coastal Zone Management
The sub-programme has provided support to coastal municipalities on the management of public launching sites.
Meetings were facilitated with all Local Municipalities. Guidance was also given Site operators in order to facilitate a
process for development and signing of MoAs for management of the launch sites by the operators. Draft Standard
MoA was produced from these meetings and was accepted by the GKLM and the majority of the launch site operators.
One Provincial Coastal Committee (PCC) meetings were held during the reporting year . PCC as part of it’s role to
ensure alignment of provincial and municipal Coastal Management Programmes (CMP). PCC has adopted the OR
Tambo District Municipality’s CMP. The CMP will be submitted to the MEC for publishing in the provincial gazette for
public comments in the new year 2018/19.
64
An inception meeting for the development of the Sarah Baartman District Coastal Management Programme was also
initiated during the year. The Department stressed out the stakeholder consultation requirements that needed to be
met in order for the CMP to be accepted and be taken ownership of by the MEC.
Coastal Zone Management and Provincial Coastal Management Technical Committee (PCMTC) meetings were held
during the year. This is a platform that seeks to identify gaps in skills in our Local Municipalities. The Group discuss
technical areas that need immediate attention to improve on delivery. Challenge is that only 3 municipalities out of 14
coastal municipalities attended the meeting, which primarily was established to provide support to them for coastal
management and planning. Regional Coastal Management Forums have been encouraged and an effort to make sure
that Regions co-ordinate and facilitate such will be a priority for DEDEA for 2018/19.
The sub-programme, in collaboration with the EIM undertook site inspection in order to assist the Ndlambe Local
Municipality with the hosting of the Amanzi Festival, which is in line with Marine and Oceans Operation Pakisa Tourism
Initiative.
The sup-programme continues to support municipalities and provide technical support to the Tourism Blue Flag
Programmes.
Environmental Empowerment Services
Environmental Awards Competition
The Provincial finals were held at Fish River Sun where both category regional winners compete against each other and
results announced. The standard of competition was very high as evidenced by the high level of presentations. The
themes were: Primary Schools Category: “LIVING IN HARMONY WITH THE ENVIRONMENT” and for High Schools
Category: “STRIKING A BALANCE BETWEEN THE ENVIRONMENTAL MANAGEMENT AND ECONOMIC GROWTH”
PROVINCIAL ENVIRONMENTAL AWARDS 2017 RESULTS
PRIMARY SCHOOLS: “LIVING IN HARMONY WITH THE ENVIRONMENT”
Name of the School Region Position Prize Amount
Didi Senior Primary School Alfred Nzo 1 R115 000 - 00
Ngwenyeni Junior Secondary School OR Tambo 2 R85 000 – 00
Luyteville Primary School Amatole 3 R60 000 – 00
Seplan Junior Secondary School Chris Hani 4 R40 000 – 00
Elufefeni Primary School Sarah Baartman 5 R30 000 – 00
Zandise Junior Secondary School Joe Gqabi 6 R25 000 - 00
HIGH SCHOOLS: STRIKING A BALANCE BETWEEN THE ENVIRONMENTAL MANAGEMENT AND ECONOMIC
GROWTH”
Name of the School Region Position Prize Amount
Marillier’s Learning Academy OR Tambo 1 R115 000 - 00
St Christopher’s Private School Amathole 2 R85 000 – 00
Jamangile High School Joe Gqabi 3 R60 000 – 00
Bergview College Alfred Nzo 4 R40 000 – 00
Ndyebo High School Sarah Baartman 5 R30 000 – 00
A.M. Zantsi High School Chris Hani 6 R25 000 - 00
EPWP Projects
Municipality Name of the Project WO Amount
Intsika Yethu LM Waste Management 84 R2 400 000
Nyandeni LM Alien and Invasive Plants Eradication 651 R6 084 000
Dr Beyers Naude LM Waste Management 102 R2 554 000
65
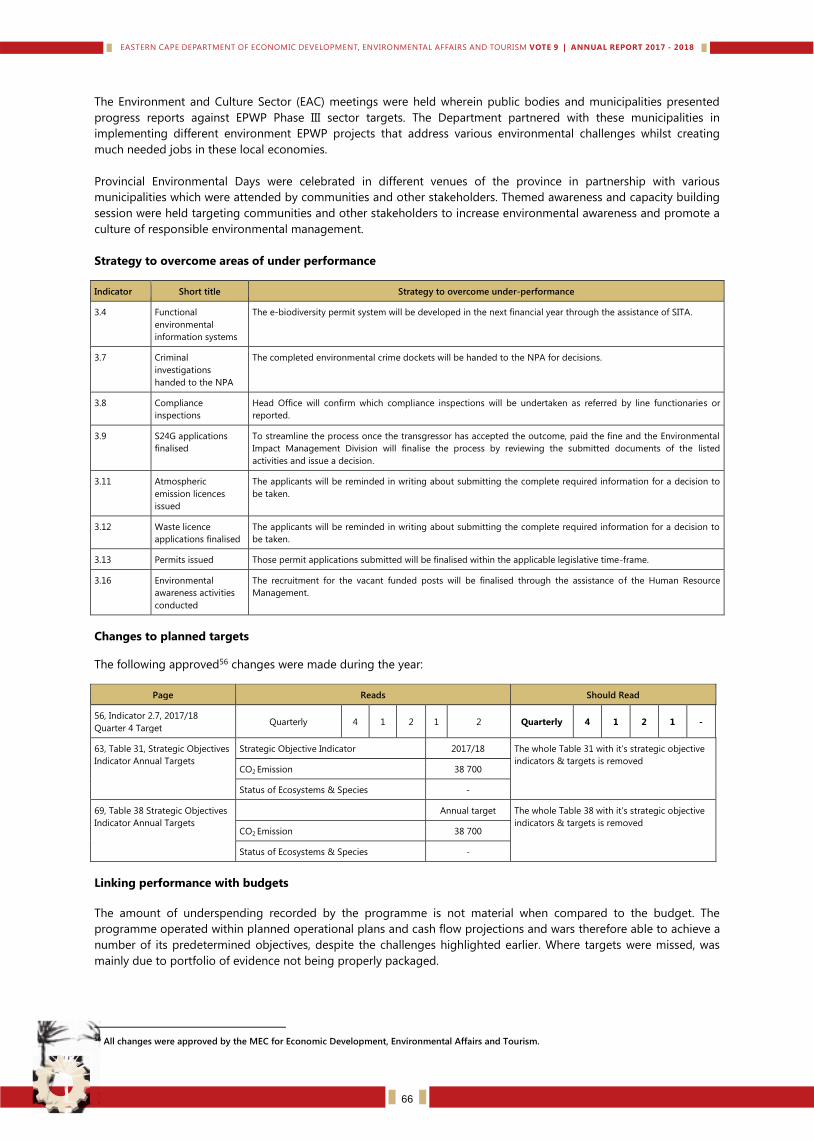
The Environment and Culture Sector (EAC) meetings were held wherein public bodies and municipalities presented
progress reports against EPWP Phase III sector targets. The Department partnered with these municipalities in
implementing different environment EPWP projects that address various environmental challenges whilst creating
much needed jobs in these local economies.
Provincial Environmental Days were celebrated in different venues of the province in partnership with various
municipalities which were attended by communities and other stakeholders. Themed awareness and capacity building
session were held targeting communities and other stakeholders to increase environmental awareness and promote a
culture of responsible environmental management.
Strategy to overcome areas of under performance
Indicator Short title Strategy to overcome under-performance
3.4 Functional
environmental
information systems
The e-biodiversity permit system will be developed in the next financial year through the assistance of SITA.
3.7 Criminal
investigations
handed to the NPA
The completed environmental crime dockets will be handed to the NPA for decisions.
3.8 Compliance
inspections
Head Office will confirm which compliance inspections will be undertaken as referred by line functionaries or
reported.
3.9 S24G applications
finalised
To streamline the process once the transgressor has accepted the outcome, paid the fine and the Environmental
Impact Management Division will finalise the process by reviewing the submitted documents of the listed
activities and issue a decision.
3.11 Atmospheric
emission licences
issued
The applicants will be reminded in writing about submitting the complete required information for a decision to
be taken.
3.12 Waste licence
applications finalised
The applicants will be reminded in writing about submitting the complete required information for a decision to
be taken.
3.13 Permits issued Those permit applications submitted will be finalised within the applicable legislative time-frame.
3.16 Environmental
awareness activities
conducted
The recruitment for the vacant funded posts will be finalised through the assistance of the Human Resource
Management.
Changes to planned targets
The following approved56 changes were made during the year:
Page Reads Should Read
56, Indicator 2.7, 2017/18
Quarter 4 Target Quarterly 4 1 2 1 2 Quarterly 4 1 2 1 -
63, Table 31, Strategic Objectives
Indicator Annual Targets
Strategic Objective Indicator 2017/18 The whole Table 31 with it’s strategic objective
indicators & targets is removed CO2 Emission 38 700
Status of Ecosystems & Species -
69, Table 38 Strategic Objectives
Indicator Annual Targets
Annual target The whole Table 38 with it’s strategic objective
indicators & targets is removed CO2 Emission 38 700
Status of Ecosystems & Species -
Linking performance with budgets
The amount of underspending recorded by the programme is not material when compared to the budget. The
programme operated within planned operational plans and cash flow projections and wars therefore able to achieve a
number of its predetermined objectives, despite the challenges highlighted earlier. Where targets were missed, was
mainly due to portfolio of evidence not being properly packaged.
56 All changes were approved by the MEC for Economic Development, Environmental Affairs and Tourism.
66
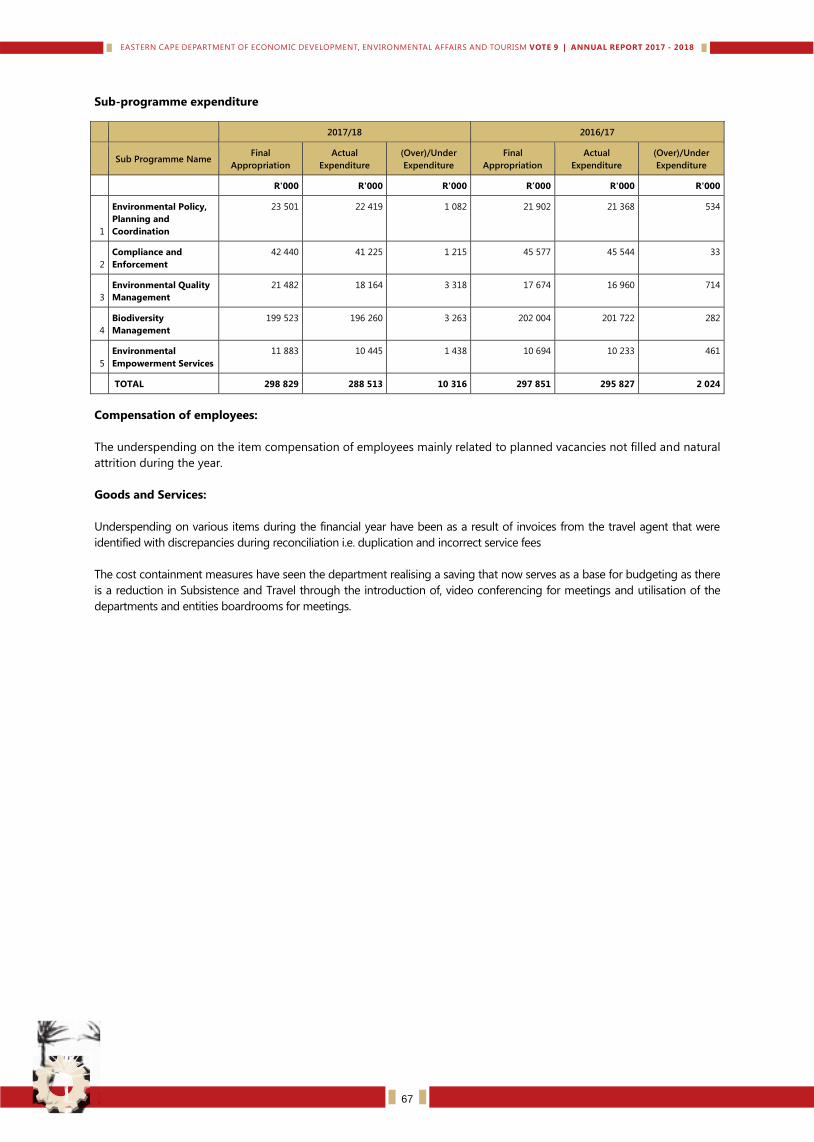
Sub-programme expenditure
2017/18 2016/17
Sub Programme Name Final
Appropriation
Actual
Expenditure
(Over)/Under
Expenditure
Final
Appropriation
Actual
Expenditure
(Over)/Under
Expenditure
R'000 R'000 R'000 R’000 R'000 R'000
1
Environmental Policy,
Planning and
Coordination
23 501 22 419 1 082 21 902 21 368 534
2
Compliance and
Enforcement
42 440 41 225 1 215 45 577 45 544 33
3
Environmental Quality
Management
21 482 18 164 3 318 17 674 16 960 714
4
Biodiversity
Management
199 523 196 260 3 263 202 004 201 722 282
5
Environmental
Empowerment Services
11 883 10 445 1 438 10 694 10 233 461
TOTAL 298 829 288 513 10 316 297 851 295 827 2 024
Compensation of employees:
The underspending on the item compensation of employees mainly related to planned vacancies not filled and natural
attrition during the year.
Goods and Services:
Underspending on various items during the financial year have been as a result of invoices from the travel agent that were
identified with discrepancies during reconciliation i.e. duplication and incorrect service fees
The cost containment measures have seen the department realising a saving that now serves as a base for budgeting as there
is a reduction in Subsistence and Travel through the introduction of, video conferencing for meetings and utilisation of the
departments and entities boardrooms for meetings.
67
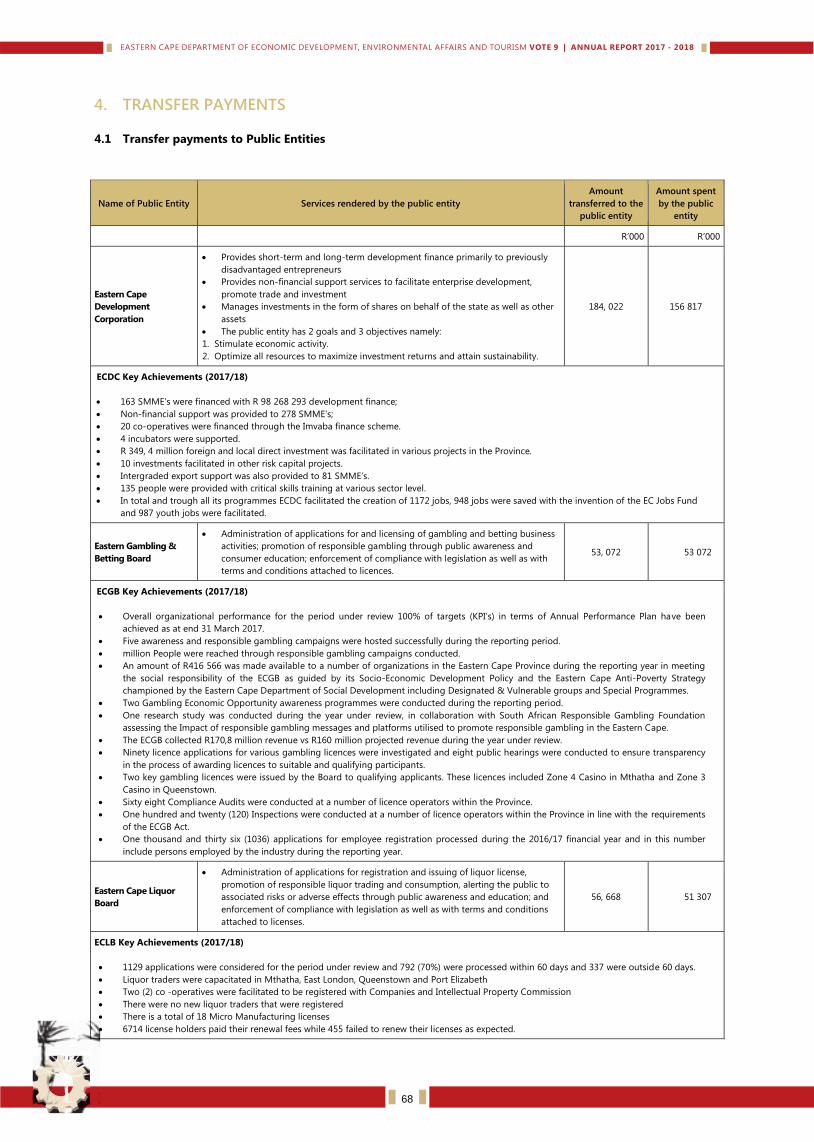
4. TRANSFER PAYMENTS
4.1 Transfer payments to Public Entities
Name of Public Entity Services rendered by the public entity
Amount
transferred to the
public entity
Amount spent
by the public
entity
R’000 R’000
Eastern Cape
Development
Corporation
Provides short-term and long-term development finance primarily to previously
disadvantaged entrepreneurs
Provides non-financial support services to facilitate enterprise development,
promote trade and investment
Manages investments in the form of shares on behalf of the state as well as other
assets
The public entity has 2 goals and 3 objectives namely:
1. Stimulate economic activity.
2. Optimize all resources to maximize investment returns and attain sustainability.
184, 022 156 817
ECDC Key Achievements (2017/18)
163 SMME’s were financed with R 98 268 293 development finance;
Non-financial support was provided to 278 SMME’s;
20 co-operatives were financed through the Imvaba finance scheme.
4 incubators were supported.
R 349, 4 million foreign and local direct investment was facilitated in various projects in the Province.
10 investments facilitated in other risk capital projects.
Intergraded export support was also provided to 81 SMME’s.
135 people were provided with critical skills training at various sector level.
In total and trough all its programmes ECDC facilitated the creation of 1172 jobs, 948 jobs were saved with the invention of the EC Jobs Fund
and 987 youth jobs were facilitated.
Eastern Gambling &
Betting Board
Administration of applications for and licensing of gambling and betting business
activities; promotion of responsible gambling through public awareness and
consumer education; enforcement of compliance with legislation as well as with
terms and conditions attached to licences.
53, 072 53 072
ECGB Key Achievements (2017/18)
Overall organizational performance for the period under review 100% of targets (KPI’s) in terms of Annual Performance Plan have been
achieved as at end 31 March 2017.
Five awareness and responsible gambling campaigns were hosted successfully during the reporting period.
million People were reached through responsible gambling campaigns conducted.
An amount of R416 566 was made available to a number of organizations in the Eastern Cape Province during the reporting year in meeting
the social responsibility of the ECGB as guided by its Socio-Economic Development Policy and the Eastern Cape Anti-Poverty Strategy
championed by the Eastern Cape Department of Social Development including Designated & Vulnerable groups and Special Programmes.
Two Gambling Economic Opportunity awareness programmes were conducted during the reporting period.
One research study was conducted during the year under review, in collaboration with South African Responsible Gambling Foundation
assessing the Impact of responsible gambling messages and platforms utilised to promote responsible gambling in the Eastern Cape.
The ECGB collected R170,8 million revenue vs R160 million projected revenue during the year under review.
Ninety licence applications for various gambling licences were investigated and eight public hearings were conducted to ensure transparency
in the process of awarding licences to suitable and qualifying participants.
Two key gambling licences were issued by the Board to qualifying applicants. These licences included Zone 4 Casino in Mthatha and Zone 3
Casino in Queenstown.
Sixty eight Compliance Audits were conducted at a number of licence operators within the Province.
One hundred and twenty (120) Inspections were conducted at a number of licence operators within the Province in line with the requirements
of the ECGB Act.
One thousand and thirty six (1036) applications for employee registration processed during the 2016/17 financial year and in this number
include persons employed by the industry during the reporting year.
Eastern Cape Liquor
Board
Administration of applications for registration and issuing of liquor license,
promotion of responsible liquor trading and consumption, alerting the public to
associated risks or adverse effects through public awareness and education; and
enforcement of compliance with legislation as well as with terms and conditions
attached to licenses.
56, 668 51 307
ECLB Key Achievements (2017/18)
1129 applications were considered for the period under review and 792 (70%) were processed within 60 days and 337 were outside 60 days.
Liquor traders were capacitated in Mthatha, East London, Queenstown and Port Elizabeth
Two (2) co -operatives were facilitated to be registered with Companies and Intellectual Property Commission
There were no new liquor traders that were registered
There is a total of 18 Micro Manufacturing licenses
6714 license holders paid their renewal fees while 455 failed to renew their licenses as expected.
68
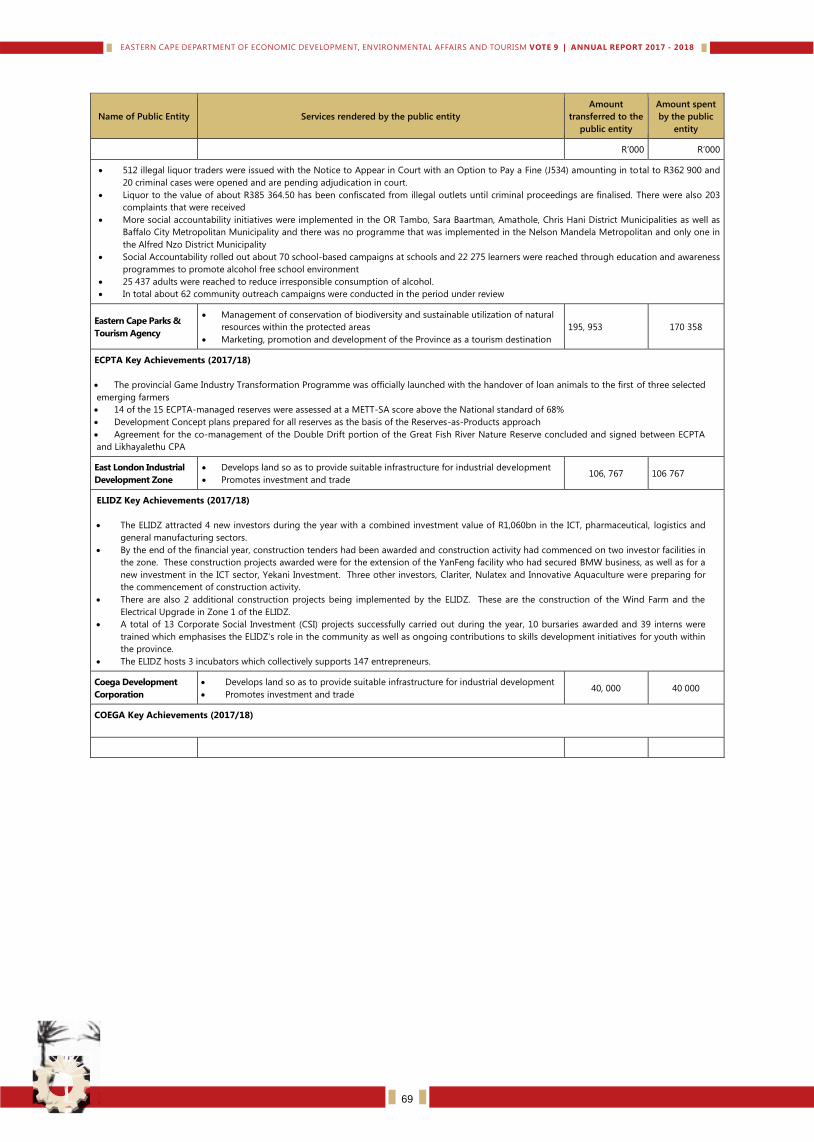
Name of Public Entity Services rendered by the public entity
Amount
transferred to the
public entity
Amount spent
by the public
entity
R’000 R’000
512 illegal liquor traders were issued with the Notice to Appear in Court with an Option to Pay a Fine (J534) amounting in total to R362 900 and
20 criminal cases were opened and are pending adjudication in court.
Liquor to the value of about R385 364.50 has been confiscated from illegal outlets until criminal proceedings are finalised. There were also 203
complaints that were received
More social accountability initiatives were implemented in the OR Tambo, Sara Baartman, Amathole, Chris Hani District Municipalities as well as
Baffalo City Metropolitan Municipality and there was no programme that was implemented in the Nelson Mandela Metropolitan and only one in
the Alfred Nzo District Municipality
Social Accountability rolled out about 70 school-based campaigns at schools and 22 275 learners were reached through education and awareness
programmes to promote alcohol free school environment
25 437 adults were reached to reduce irresponsible consumption of alcohol.
In total about 62 community outreach campaigns were conducted in the period under review
Eastern Cape Parks &
Tourism Agency
Management of conservation of biodiversity and sustainable utilization of natural
resources within the protected areas
Marketing, promotion and development of the Province as a tourism destination
195, 953 170 358
ECPTA Key Achievements (2017/18)
The provincial Game Industry Transformation Programme was officially launched with the handover of loan animals to the first of three selected
emerging farmers
14 of the 15 ECPTA-managed reserves were assessed at a METT-SA score above the National standard of 68%
Development Concept plans prepared for all reserves as the basis of the Reserves-as-Products approach
Agreement for the co-management of the Double Drift portion of the Great Fish River Nature Reserve concluded and signed between ECPTA
and Likhayalethu CPA
East London Industrial
Development Zone
Develops land so as to provide suitable infrastructure for industrial development
Promotes investment and trade 106, 767 106 767
ELIDZ Key Achievements (2017/18)
The ELIDZ attracted 4 new investors during the year with a combined investment value of R1,060bn in the ICT, pharmaceutical, logistics and
general manufacturing sectors.
By the end of the financial year, construction tenders had been awarded and construction activity had commenced on two investor facilities in
the zone. These construction projects awarded were for the extension of the YanFeng facility who had secured BMW business, as well as for a
new investment in the ICT sector, Yekani Investment. Three other investors, Clariter, Nulatex and Innovative Aquaculture were preparing for
the commencement of construction activity.
There are also 2 additional construction projects being implemented by the ELIDZ. These are the construction of the Wind Farm and the
Electrical Upgrade in Zone 1 of the ELIDZ.
A total of 13 Corporate Social Investment (CSI) projects successfully carried out during the year, 10 bursaries awarded and 39 interns were
trained which emphasises the ELIDZ’s role in the community as well as ongoing contributions to skills development initiatives for youth within
the province.
The ELIDZ hosts 3 incubators which collectively supports 147 entrepreneurs.
Coega Development
Corporation
Develops land so as to provide suitable infrastructure for industrial development
Promotes investment and trade 40, 000 40 000
COEGA Key Achievements (2017/18)
69
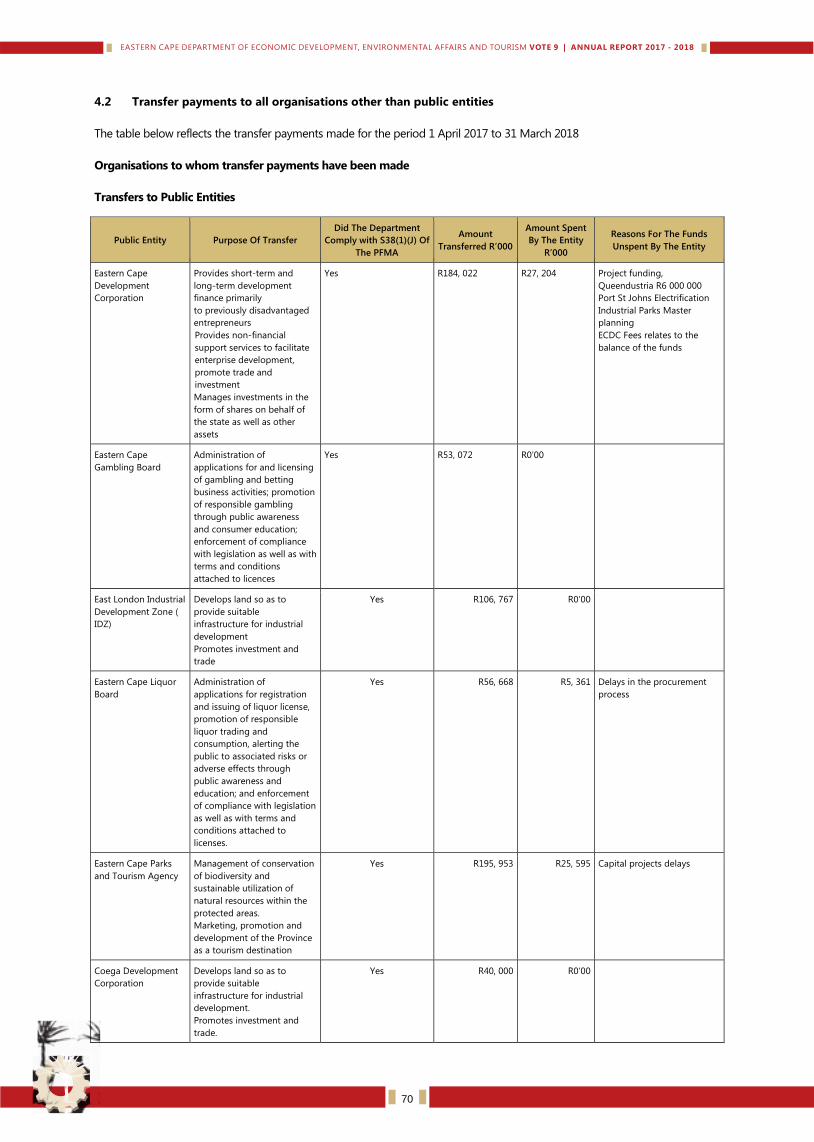
4.2 Transfer payments to all organisations other than public entities
The table below reflects the transfer payments made for the period 1 April 2017 to 31 March 2018
Organisations to whom transfer payments have been made
Transfers to Public Entities
Public Entity Purpose Of Transfer
Did The Department
Comply with S38(1)(J) Of
The PFMA
Amount
Transferred R’000
Amount Spent
By The Entity
R’000
Reasons For The Funds
Unspent By The Entity
Eastern Cape
Development
Corporation
Provides short-term and
long-term development
finance primarily
to previously disadvantaged
entrepreneurs
Provides non-financial
support services to facilitate
enterprise development,
promote trade and
investment
Manages investments in the
form of shares on behalf of
the state as well as other
assets
Yes R184, 022 R27, 204 Project funding,
Queendustria R6 000 000
Port St Johns Electrification
Industrial Parks Master
planning
ECDC Fees relates to the
balance of the funds
Eastern Cape
Gambling Board
Administration of
applications for and licensing
of gambling and betting
business activities; promotion
of responsible gambling
through public awareness
and consumer education;
enforcement of compliance
with legislation as well as with
terms and conditions
attached to licences
Yes R53, 072 R0’00
East London Industrial
Development Zone (
IDZ)
Develops land so as to
provide suitable
infrastructure for industrial
development
Promotes investment and
trade
Yes R106, 767 R0’00
Eastern Cape Liquor
Board
Administration of
applications for registration
and issuing of liquor license,
promotion of responsible
liquor trading and
consumption, alerting the
public to associated risks or
adverse effects through
public awareness and
education; and enforcement
of compliance with legislation
as well as with terms and
conditions attached to
licenses.
Yes R56, 668 R5, 361 Delays in the procurement
process
Eastern Cape Parks
and Tourism Agency
Management of conservation
of biodiversity and
sustainable utilization of
natural resources within the
protected areas.
Marketing, promotion and
development of the Province
as a tourism destination
Yes R195, 953 R25, 595 Capital projects delays
Coega Development
Corporation
Develops land so as to
provide suitable
infrastructure for industrial
development.
Promotes investment and
trade.
Yes R40, 000 R0’00
70
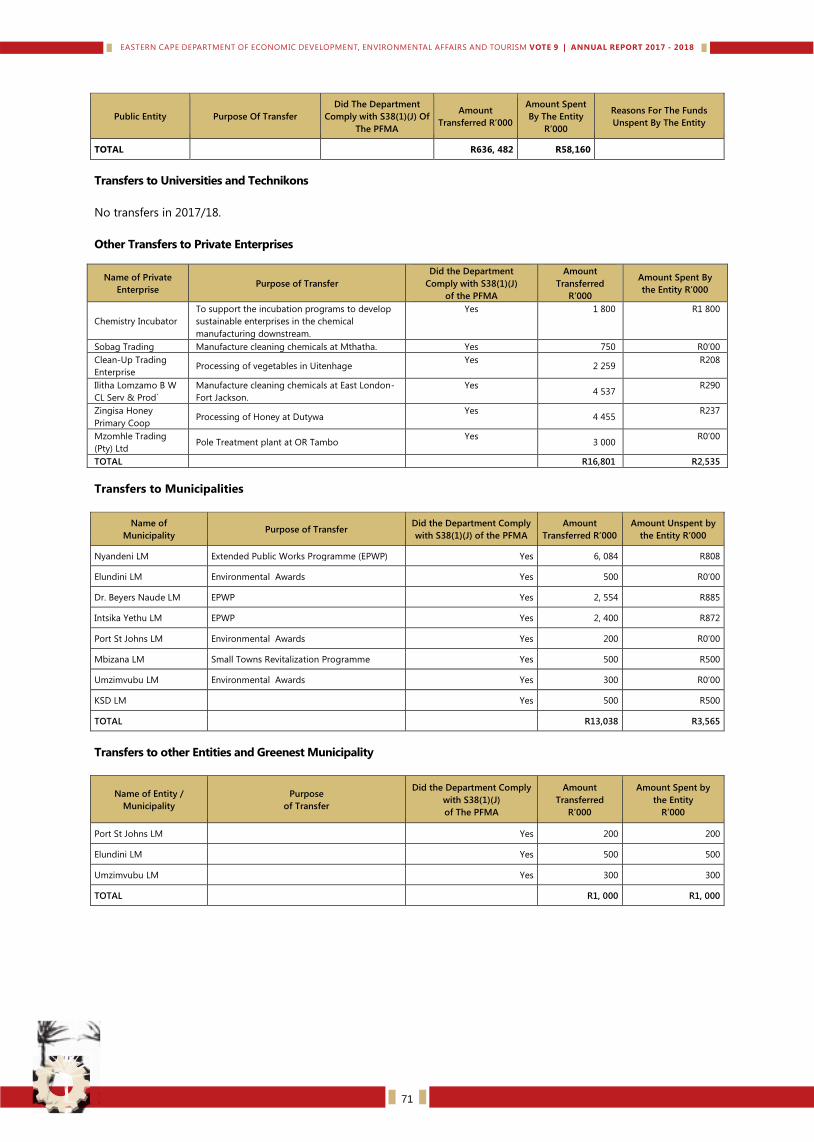
Public Entity Purpose Of Transfer
Did The Department
Comply with S38(1)(J) Of
The PFMA
Amount
Transferred R’000
Amount Spent
By The Entity
R’000
Reasons For The Funds
Unspent By The Entity
TOTAL R636, 482 R58,160
Transfers to Universities and Technikons
No transfers in 2017/18.
Other Transfers to Private Enterprises
Name of Private
Enterprise Purpose of Transfer
Did the Department
Comply with S38(1)(J)
of the PFMA
Amount
Transferred
R’000
Amount Spent By
the Entity R’000
Chemistry Incubator
To support the incubation programs to develop
sustainable enterprises in the chemical
manufacturing downstream.
Yes 1 800 R1 800
Sobag Trading Manufacture cleaning chemicals at Mthatha. Yes 750 R0’00
Clean-Up Trading
Enterprise Processing of vegetables in Uitenhage
Yes 2 259
R208
Ilitha Lomzamo B W
CL Serv & Prod`
Manufacture cleaning chemicals at East London-
Fort Jackson.
Yes 4 537
R290
Zingisa Honey
Primary Coop Processing of Honey at Dutywa
Yes 4 455
R237
Mzomhle Trading
(Pty) Ltd Pole Treatment plant at OR Tambo
Yes 3 000
R0’00
TOTAL R16,801 R2,535
Transfers to Municipalities
Name of
Municipality Purpose of Transfer
Did the Department Comply
with S38(1)(J) of the PFMA
Amount
Transferred R’000
Amount Unspent by
the Entity R’000
Nyandeni LM Extended Public Works Programme (EPWP) Yes 6, 084 R808
Elundini LM Environmental Awards Yes 500 R0’00
Dr. Beyers Naude LM EPWP Yes 2, 554 R885
Intsika Yethu LM EPWP Yes 2, 400 R872
Port St Johns LM Environmental Awards Yes 200 R0’00
Mbizana LM Small Towns Revitalization Programme Yes 500 R500
Umzimvubu LM Environmental Awards Yes 300 R0’00
KSD LM Yes 500 R500
TOTAL R13,038 R3,565
Transfers to other Entities and Greenest Municipality
Name of Entity /
Municipality
Purpose
of Transfer
Did the Department Comply
with S38(1)(J)
of The PFMA
Amount
Transferred
R’000
Amount Spent by
the Entity
R’000
Port St Johns LM Yes 200 200
Elundini LM Yes 500 500
Umzimvubu LM Yes 300 300
TOTAL R1, 000 R1, 000
71
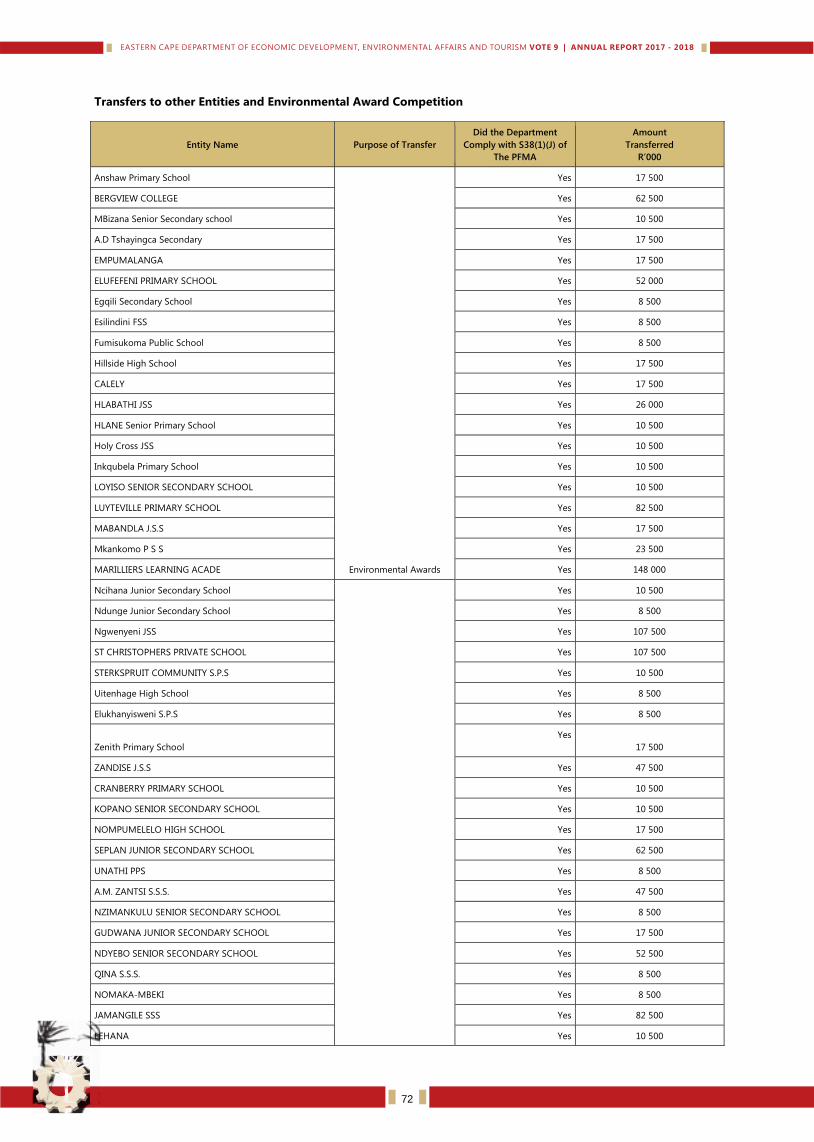
Transfers to other Entities and Environmental Award Competition
Entity Name Purpose of Transfer
Did the Department
Comply with S38(1)(J) of
The PFMA
Amount
Transferred
R’000
Anshaw Primary School
Environmental Awards
Yes 17 500
BERGVIEW COLLEGE Yes 62 500
MBizana Senior Secondary school Yes 10 500
A.D Tshayingca Secondary Yes 17 500
EMPUMALANGA Yes 17 500
ELUFEFENI PRIMARY SCHOOL Yes 52 000
Egqili Secondary School Yes 8 500
Esilindini FSS Yes 8 500
Fumisukoma Public School Yes 8 500
Hillside High School Yes 17 500
CALELY Yes 17 500
HLABATHI JSS Yes 26 000
HLANE Senior Primary School Yes 10 500
Holy Cross JSS Yes 10 500
Inkqubela Primary School Yes 10 500
LOYISO SENIOR SECONDARY SCHOOL Yes 10 500
LUYTEVILLE PRIMARY SCHOOL Yes 82 500
MABANDLA J.S.S Yes 17 500
Mkankomo P S S Yes 23 500
MARILLIERS LEARNING ACADE Yes 148 000
Ncihana Junior Secondary School
Yes 10 500
Ndunge Junior Secondary School Yes 8 500
Ngwenyeni JSS Yes 107 500
ST CHRISTOPHERS PRIVATE SCHOOL Yes 107 500
STERKSPRUIT COMMUNITY S.P.S Yes 10 500
Uitenhage High School Yes 8 500
Elukhanyisweni S.P.S Yes 8 500
Zenith Primary School
Yes
17 500
ZANDISE J.S.S Yes 47 500
CRANBERRY PRIMARY SCHOOL Yes 10 500
KOPANO SENIOR SECONDARY SCHOOL Yes 10 500
NOMPUMELELO HIGH SCHOOL Yes 17 500
SEPLAN JUNIOR SECONDARY SCHOOL Yes 62 500
UNATHI PPS Yes 8 500
A.M. ZANTSI S.S.S. Yes 47 500
NZIMANKULU SENIOR SECONDARY SCHOOL Yes 8 500
GUDWANA JUNIOR SECONDARY SCHOOL Yes 17 500
NDYEBO SENIOR SECONDARY SCHOOL Yes 52 500
QINA S.S.S. Yes 8 500
NOMAKA-MBEKI Yes 8 500
JAMANGILE SSS Yes 82 500
LEHANA Yes 10 500
72
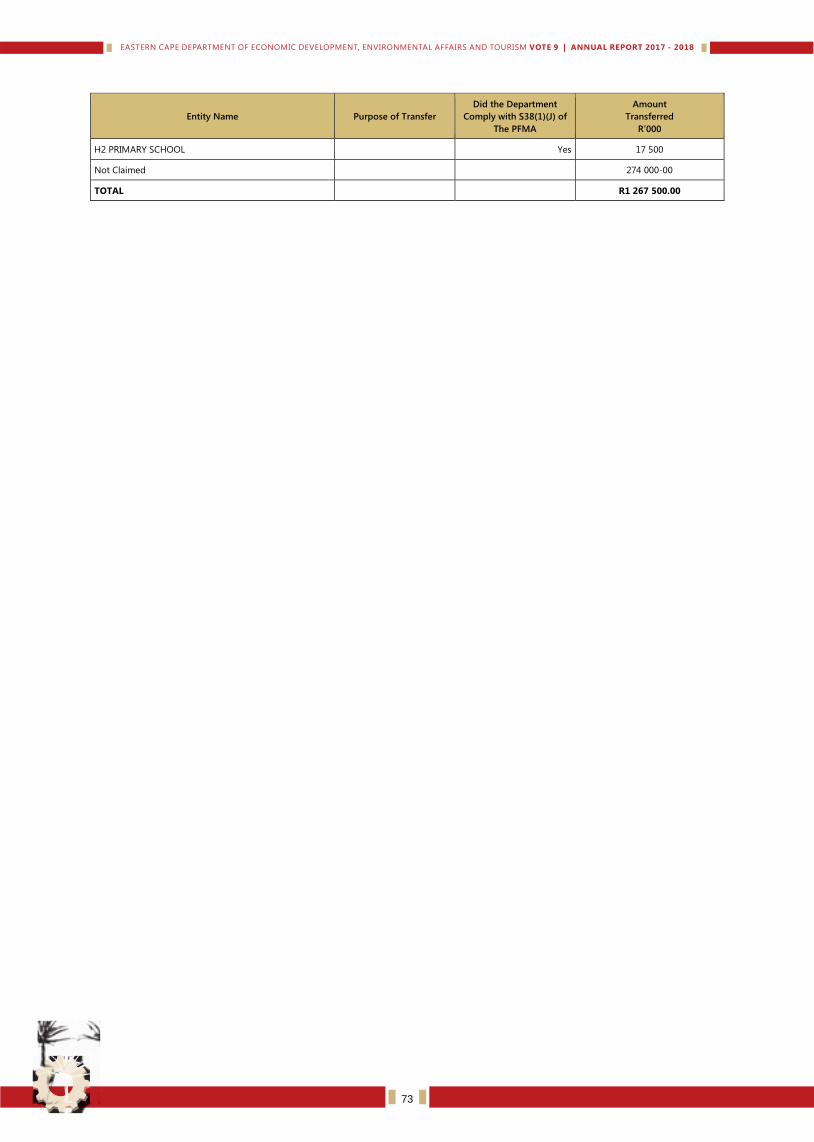
Entity Name Purpose of Transfer
Did the Department
Comply with S38(1)(J) of
The PFMA
Amount
Transferred
R’000
H2 PRIMARY SCHOOL Yes 17 500
Not Claimed 274 000-00
TOTAL R1 267 500.00
73
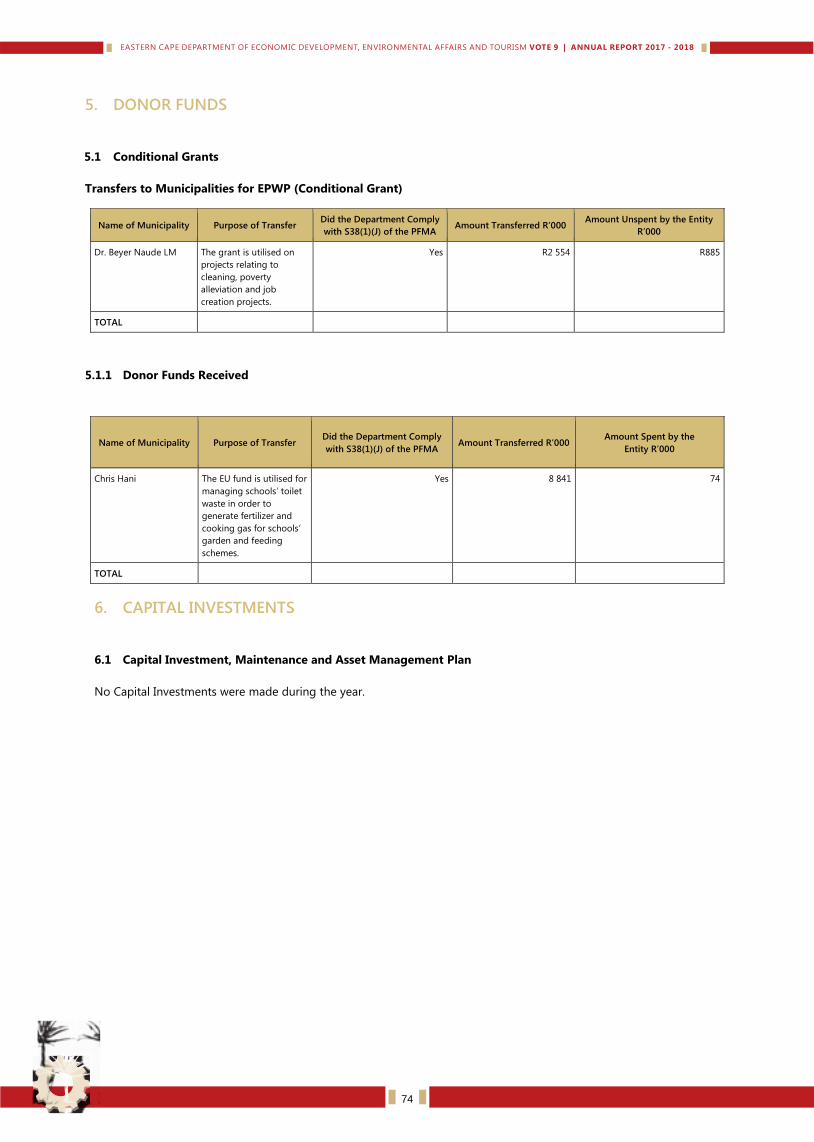
5. DONOR FUNDS
5.1 Conditional Grants
Transfers to Municipalities for EPWP (Conditional Grant)
Name of Municipality Purpose of Transfer Did the Department Comply
with S38(1)(J) of the PFMA Amount Transferred R’000
Amount Unspent by the Entity
R’000
Dr. Beyer Naude LM The grant is utilised on
projects relating to
cleaning, poverty
alleviation and job
creation projects.
Yes
R2 554 R885
TOTAL
5.1.1 Donor Funds Received
Name of Municipality Purpose of Transfer Did the Department Comply
with S38(1)(J) of the PFMA Amount Transferred R’000
Amount Spent by the
Entity R’000
Chris Hani The EU fund is utilised for
managing schools’ toilet
waste in order to
generate fertilizer and
cooking gas for schools’
garden and feeding
schemes.
Yes 8 841 74
TOTAL
6. CAPITAL INVESTMENTS
6.1 Capital Investment, Maintenance and Asset Management Plan
No Capital Investments were made during the year.
74
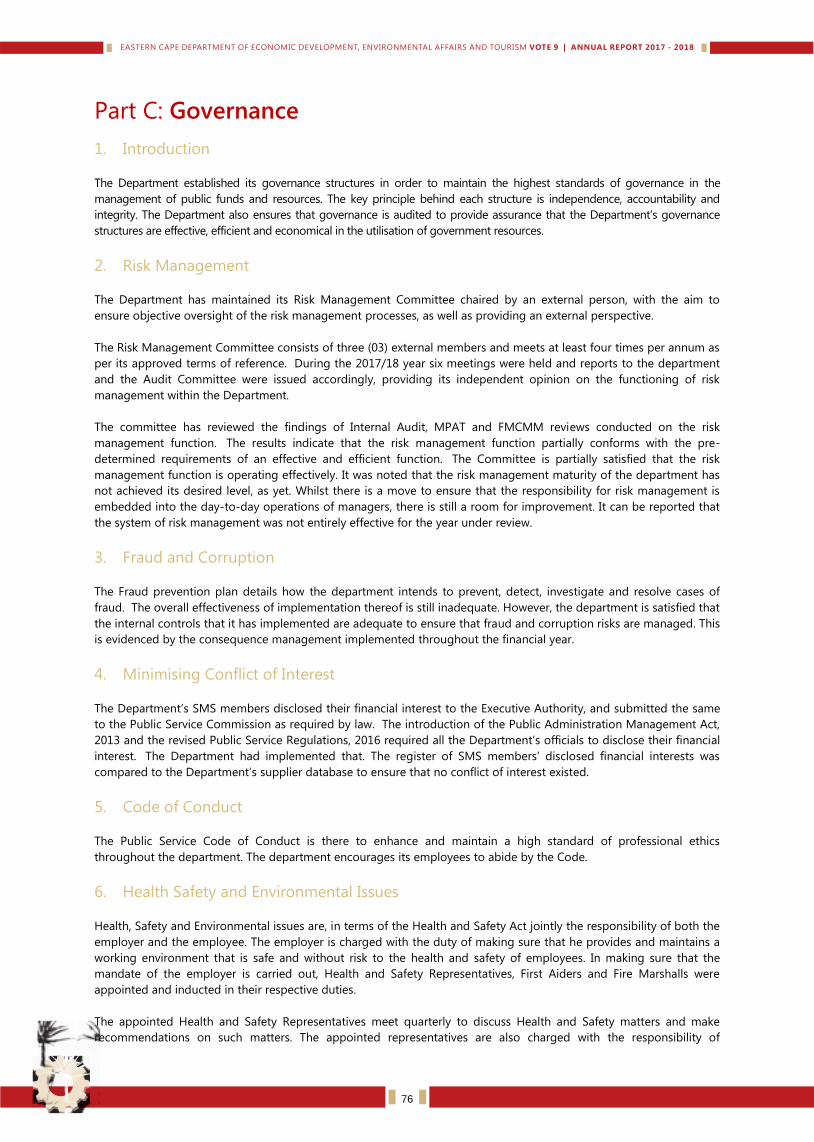
Part C: Governance
1. Introduction
The Department established its governance structures in order to maintain the highest standards of governance in the
management of public funds and resources. The key principle behind each structure is independence, accountability and
integrity. The Department also ensures that governance is audited to provide assurance that the Department’s governance
structures are effective, efficient and economical in the utilisation of government resources.
2. Risk Management
The Department has maintained its Risk Management Committee chaired by an external person, with the aim to
ensure objective oversight of the risk management processes, as well as providing an external perspective.
The Risk Management Committee consists of three (03) external members and meets at least four times per annum as
per its approved terms of reference. During the 2017/18 year six meetings were held and reports to the department
and the Audit Committee were issued accordingly, providing its independent opinion on the functioning of risk
management within the Department.
The committee has reviewed the findings of Internal Audit, MPAT and FMCMM reviews conducted on the risk
management function. The results indicate that the risk management function partially conforms with the pre-
determined requirements of an effective and efficient function. The Committee is partially satisfied that the risk
management function is operating effectively. It was noted that the risk management maturity of the department has
not achieved its desired level, as yet. Whilst there is a move to ensure that the responsibility for risk management is
embedded into the day-to-day operations of managers, there is still a room for improvement. It can be reported that
the system of risk management was not entirely effective for the year under review.
3. Fraud and Corruption
The Fraud prevention plan details how the department intends to prevent, detect, investigate and resolve cases of
fraud. The overall effectiveness of implementation thereof is still inadequate. However, the department is satisfied that
the internal controls that it has implemented are adequate to ensure that fraud and corruption risks are managed. This
is evidenced by the consequence management implemented throughout the financial year.
4. Minimising Conflict of Interest
The Department’s SMS members disclosed their financial interest to the Executive Authority, and submitted the same
to the Public Service Commission as required by law. The introduction of the Public Administration Management Act,
2013 and the revised Public Service Regulations, 2016 required all the Department’s officials to disclose their financial
interest. The Department had implemented that. The register of SMS members’ disclosed financial interests was
compared to the Department’s supplier database to ensure that no conflict of interest existed.
5. Code of Conduct
The Public Service Code of Conduct is there to enhance and maintain a high standard of professional ethics
throughout the department. The department encourages its employees to abide by the Code.
6. Health Safety and Environmental Issues
Health, Safety and Environmental issues are, in terms of the Health and Safety Act jointly the responsibility of both the
employer and the employee. The employer is charged with the duty of making sure that he provides and maintains a
working environment that is safe and without risk to the health and safety of employees. In making sure that the
mandate of the employer is carried out, Health and Safety Representatives, First Aiders and Fire Marshalls were
appointed and inducted in their respective duties.
The appointed Health and Safety Representatives meet quarterly to discuss Health and Safety matters and make
recommendations on such matters. The appointed representatives are also charged with the responsibility of
76
inspecting their respective worksites for hazards and risks which may be detrimental to the health and safety of
employees.
Appointed First Aiders were provided with first aid boxes to provide first aid to injured employees. Fire Extinguishers
and Hose Reels, on which training has been provided to Health and Safety Representatives, are serviced annually.
Awareness campaigns on health and safety issues were done in the department by means of staff information
sessions.
7. Portfolio Committees
The department and its programmes were given consistent oversight by the Portfolio Committee on Economic
Development, Environmental Affairs and Tourism chaired by the Honourable Tony Duba. After the tabling of the
department’s policy speech in April 2017, the Portfolio Committee organised intensive meetings where the
department’s three programmes and six entities gave detailed presentations of their performance plans and budgets
for the 2017/18 financial year. These were eventually adopted by the legislature and thus approved for
implementation.
Later in the year, the Department and its entities went back to the committee to make presentation on the 2016/17
annual reports and these were adopted.
The Office of the MEC and the Strategic Management Unit ensured that the department was compliant in the
submission of regular reports such as quarterly reports, annual reports and half-yearly financial oversight reports.
Legislature questions for both written and oral reply were sufficiently responded to in line with the Rules of the Eastern
Cape Legislature.
8. Scopa Resolutions
The following SCOPA recommendations and responses were made during the reporting period:
Committee Recommendations
(a)
(i) The Accounting Officer must ensure that effective and appropriate steps are taken to prevent irregular expenditure in line with
the provisions of section 38(1 (c) (ii) of the PFMA. A plan to clear the irregular expenditure that has accumulated in the
previous years must be developed with immediate effect. Effective and appropriate disciplinary steps must be taken against
responsible officials as required by provisions of section 38 1) (h) of the PFMA.
(ii) The Department and Provincial Treasury must consider having an indaba with the implementing agencies to ensure that the
Department is part of the bidding process when procurement is conducted in order to curb the occurrence of irregular
expenditure.
(b) The Accounting Officer must comply fully with the provisions of section 38(1)(c) of the PFMA. In all cases, where there is non-
compliance with the provisions of the PFMA, consequence management must be applied as required by section 38(1)(h) of
the PFMA.
(c) The Accounting Officer must see that mechanisms are put in place to ensure that financial statements are free from
misstatements. A proper plan must be developed to ensure working relations are strengthened between government officials
and officials from implementing agents in order to avoid shifting of responsibility.
(d) The Accounting Officer must prepare accurate financial statements for each financial year in accordance with the generally
recognised accounting practise as required in terms of section 40(1)(b) of the PFMA. In addition, disciplinary actions must be
taken against officials who failed to comply with the PFMA. A report in this regard must be submitted to the Committee
within 30 days after the adoption of this report.
(e) The Accounting Officer must ensure that the finance division is fully capacitated and strengthened so that it fulfils its
functions effectively and ensuring that the quality of work is not compromised.
(f) The Accounting Officer must ensure that investigations into financial misconduct are instituted within 30 days from the date
of discovery of the alleged financial misconduct as contained in Treasury Regulation 4.1.2. A progress report in this regard
must be submitted to the Committee within 30 days after the tabling of this report.
77
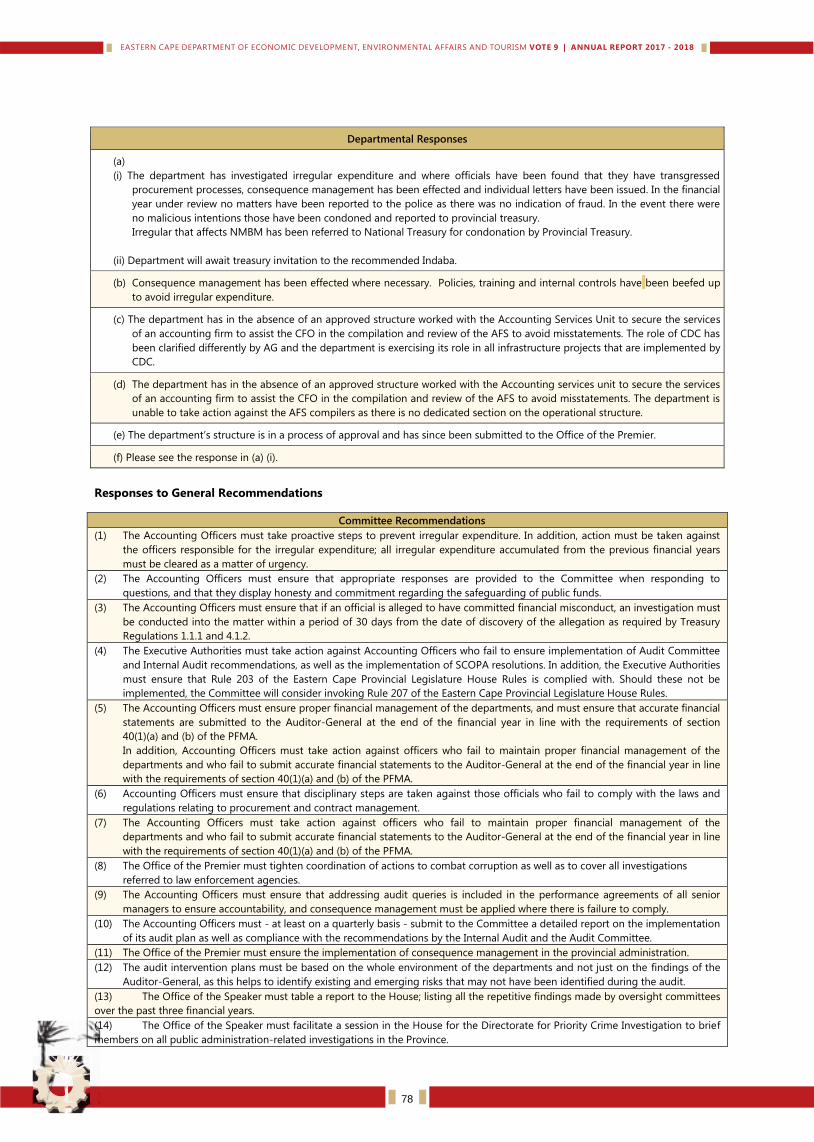
Departmental Responses
(a)
(i) The department has investigated irregular expenditure and where officials have been found that they have transgressed
procurement processes, consequence management has been effected and individual letters have been issued. In the financial
year under review no matters have been reported to the police as there was no indication of fraud. In the event there were
no malicious intentions those have been condoned and reported to provincial treasury.
Irregular that affects NMBM has been referred to National Treasury for condonation by Provincial Treasury.
(ii) Department will await treasury invitation to the recommended Indaba.
(b) Consequence management has been effected where necessary. Policies, training and internal controls have been beefed up
to avoid irregular expenditure.
(c) The department has in the absence of an approved structure worked with the Accounting Services Unit to secure the services
of an accounting firm to assist the CFO in the compilation and review of the AFS to avoid misstatements. The role of CDC has
been clarified differently by AG and the department is exercising its role in all infrastructure projects that are implemented by
CDC.
(d) The department has in the absence of an approved structure worked with the Accounting services unit to secure the services
of an accounting firm to assist the CFO in the compilation and review of the AFS to avoid misstatements. The department is
unable to take action against the AFS compilers as there is no dedicated section on the operational structure.
(e) The department’s structure is in a process of approval and has since been submitted to the Office of the Premier.
(f) Please see the response in (a) (i).
Responses to General Recommendations
Committee Recommendations
(1) The Accounting Officers must take proactive steps to prevent irregular expenditure. In addition, action must be taken against
the officers responsible for the irregular expenditure; all irregular expenditure accumulated from the previous financial years
must be cleared as a matter of urgency.
(2) The Accounting Officers must ensure that appropriate responses are provided to the Committee when responding to
questions, and that they display honesty and commitment regarding the safeguarding of public funds.
(3) The Accounting Officers must ensure that if an official is alleged to have committed financial misconduct, an investigation must
be conducted into the matter within a period of 30 days from the date of discovery of the allegation as required by Treasury
Regulations 1.1.1 and 4.1.2.
(4) The Executive Authorities must take action against Accounting Officers who fail to ensure implementation of Audit Committee
and Internal Audit recommendations, as well as the implementation of SCOPA resolutions. In addition, the Executive Authorities
must ensure that Rule 203 of the Eastern Cape Provincial Legislature House Rules is complied with. Should these not be
implemented, the Committee will consider invoking Rule 207 of the Eastern Cape Provincial Legislature House Rules.
(5) The Accounting Officers must ensure proper financial management of the departments, and must ensure that accurate financial
statements are submitted to the Auditor-General at the end of the financial year in line with the requirements of section
40(1)(a) and (b) of the PFMA.
In addition, Accounting Officers must take action against officers who fail to maintain proper financial management of the
departments and who fail to submit accurate financial statements to the Auditor-General at the end of the financial year in line
with the requirements of section 40(1)(a) and (b) of the PFMA.
(6) Accounting Officers must ensure that disciplinary steps are taken against those officials who fail to comply with the laws and
regulations relating to procurement and contract management.
(7) The Accounting Officers must take action against officers who fail to maintain proper financial management of the
departments and who fail to submit accurate financial statements to the Auditor-General at the end of the financial year in line
with the requirements of section 40(1)(a) and (b) of the PFMA.
(8) The Office of the Premier must tighten coordination of actions to combat corruption as well as to cover all investigations
referred to law enforcement agencies.
(9) The Accounting Officers must ensure that addressing audit queries is included in the performance agreements of all senior
managers to ensure accountability, and consequence management must be applied where there is failure to comply.
(10) The Accounting Officers must - at least on a quarterly basis - submit to the Committee a detailed report on the implementation
of its audit plan as well as compliance with the recommendations by the Internal Audit and the Audit Committee.
(11) The Office of the Premier must ensure the implementation of consequence management in the provincial administration.
(12) The audit intervention plans must be based on the whole environment of the departments and not just on the findings of the
Auditor-General, as this helps to identify existing and emerging risks that may not have been identified during the audit.
(13) The Office of the Speaker must table a report to the House; listing all the repetitive findings made by oversight committees
over the past three financial years.
(14) The Office of the Speaker must facilitate a session in the House for the Directorate for Priority Crime Investigation to brief
members on all public administration-related investigations in the Province.
78
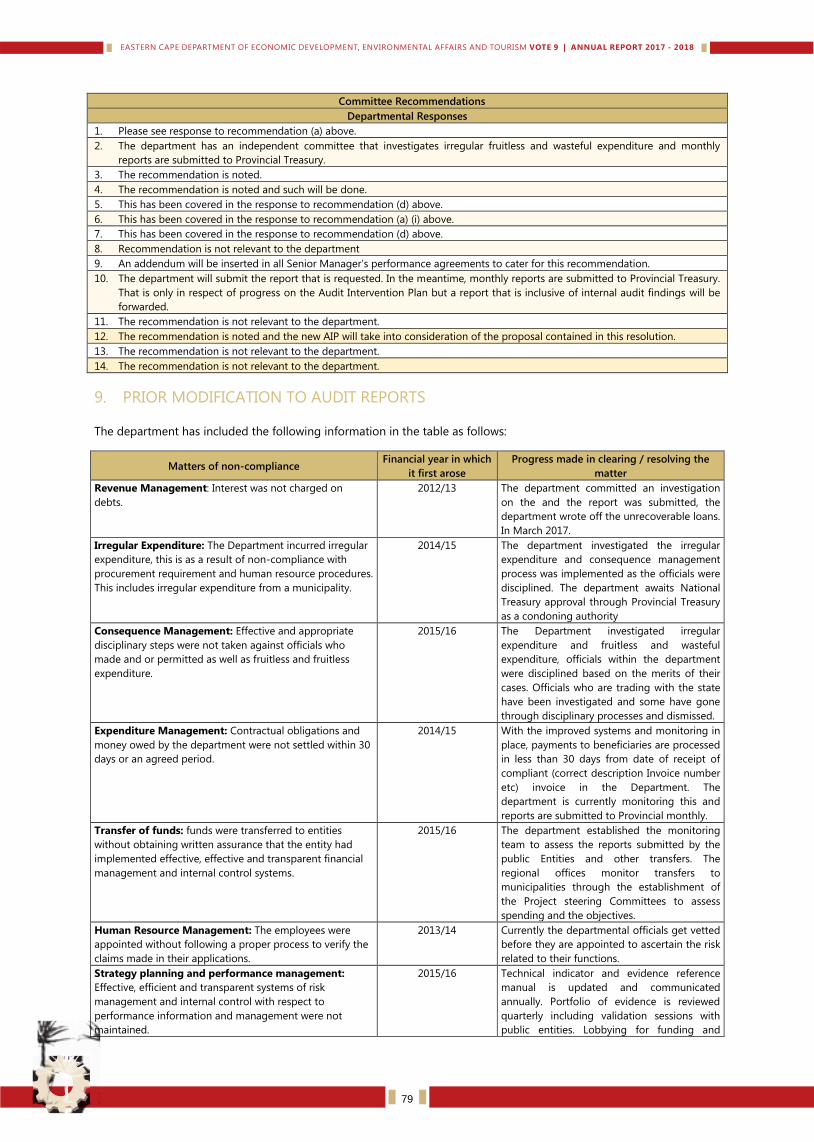
Committee Recommendations
Departmental Responses
1. Please see response to recommendation (a) above.
2. The department has an independent committee that investigates irregular fruitless and wasteful expenditure and monthly
reports are submitted to Provincial Treasury.
3. The recommendation is noted.
4. The recommendation is noted and such will be done.
5. This has been covered in the response to recommendation (d) above.
6. This has been covered in the response to recommendation (a) (i) above.
7. This has been covered in the response to recommendation (d) above.
8. Recommendation is not relevant to the department
9. An addendum will be inserted in all Senior Manager’s performance agreements to cater for this recommendation.
10. The department will submit the report that is requested. In the meantime, monthly reports are submitted to Provincial Treasury.
That is only in respect of progress on the Audit Intervention Plan but a report that is inclusive of internal audit findings will be
forwarded.
11. The recommendation is not relevant to the department.
12. The recommendation is noted and the new AIP will take into consideration of the proposal contained in this resolution.
13. The recommendation is not relevant to the department.
14. The recommendation is not relevant to the department.
9. PRIOR MODIFICATION TO AUDIT REPORTS
The department has included the following information in the table as follows:
Matters of non-compliance Financial year in which
it first arose
Progress made in clearing / resolving the
matter
Revenue Management: Interest was not charged on
debts.
2012/13 The department committed an investigation
on the and the report was submitted, the
department wrote off the unrecoverable loans.
In March 2017.
Irregular Expenditure: The Department incurred irregular
expenditure, this is as a result of non-compliance with
procurement requirement and human resource procedures.
This includes irregular expenditure from a municipality.
2014/15 The department investigated the irregular
expenditure and consequence management
process was implemented as the officials were
disciplined. The department awaits National
Treasury approval through Provincial Treasury
as a condoning authority
Consequence Management: Effective and appropriate
disciplinary steps were not taken against officials who
made and or permitted as well as fruitless and fruitless
expenditure.
2015/16 The Department investigated irregular
expenditure and fruitless and wasteful
expenditure, officials within the department
were disciplined based on the merits of their
cases. Officials who are trading with the state
have been investigated and some have gone
through disciplinary processes and dismissed.
Expenditure Management: Contractual obligations and
money owed by the department were not settled within 30
days or an agreed period.
2014/15 With the improved systems and monitoring in
place, payments to beneficiaries are processed
in less than 30 days from date of receipt of
compliant (correct description Invoice number
etc) invoice in the Department. The
department is currently monitoring this and
reports are submitted to Provincial monthly.
Transfer of funds: funds were transferred to entities
without obtaining written assurance that the entity had
implemented effective, effective and transparent financial
management and internal control systems.
2015/16 The department established the monitoring
team to assess the reports submitted by the
public Entities and other transfers. The
regional offices monitor transfers to
municipalities through the establishment of
the Project steering Committees to assess
spending and the objectives.
Human Resource Management: The employees were
appointed without following a proper process to verify the
claims made in their applications.
2013/14 Currently the departmental officials get vetted
before they are appointed to ascertain the risk
related to their functions.
Strategy planning and performance management:
Effective, efficient and transparent systems of risk
management and internal control with respect to
performance information and management were not
maintained.
2015/16 Technical indicator and evidence reference
manual is updated and communicated
annually. Portfolio of evidence is reviewed
quarterly including validation sessions with
public entities. Lobbying for funding and
79
Matters of non-compliance Financial year in which
it first arose
Progress made in clearing / resolving the
matter
resources to develop systems as well as
accessing filing space is ongoing.
Internal Audit: the departmental internal audit function
did not assess the operational procedure and monitoring
mechanisms relating to all transfers made and received.
10. INTERNAL CONTROL UNIT
The Department has maintained its Risk Management Committee chaired by an external person, with the aim to
ensure objective oversight of the risk management processes, as well as providing an external perspective.
The Risk Management Committee consists of three (03) external members and meets at least four times per annum as
per its approved terms of reference. During the 2017/18 year six meetings were held and reports to the department
and the Audit Committee were issued accordingly, providing its independent opinion on the functioning of risk
management within the Department.
The committee has reviewed the findings of Internal Audit, MPAT and FMCMM reviews conducted on the risk
management function. The results indicate that the risk management function partially conforms with the pre-
determined requirements of an effective and efficient function. The Committee is partially satisfied that the risk
management function is operating effectively. It was noted that the risk management maturity of the department has
not achieved its desired level, as yet. Whilst there is a move to ensure that the responsibility for risk management is
embedded into the day-to-day operations of managers, there is still a room for improvement. It can be reported that
the system of risk management was not entirely effective for the year under review.
11. INTERNAL AUDIT AND AUDIT COMMITTEES
OBJECTIVE ASSURANCE RESPONSIBILITIES
Internal Audit Function must evaluate and contribute to the improvement of governance, risk management, and
control processes using a systematic and disciplined approach in the following areas:
Governance Processes
Internal Audit Function should contribute to the Departments’ governance processes by evaluating and improving
the governance processes in its accomplishment of the following objectives:-
Promoting appropriate ethics and values within the departments of Economic Development, Environmental Affairs
& Tourism;
Ensuring effective organisational performance management and accountability;
Communicating risk and control information to appropriate areas of the department;
Co-ordinating the activities of and communicating information among the management, external and internal
audit;
Internal Audit Function must evaluate the design, implementation, and effectiveness of DEDEAT’s ethics-related
programmes and activities.
Internal Audit Function must assess whether information technology governance of the department supports the
organization’s strategies and objectives.
Risk Management
Internal Audit Function must evaluate the adequacy and effectiveness and contribute to the improvement of the risk
management process. Internal Audit Function must evaluate risk exposures relating to Departments’ governance,
operations and information systems regarding the:
Reliability and integrity of financial and operational information;
Effectiveness and efficiency of operations;
Safeguarding of assets; and
Compliance with laws, regulations, policies, procedures and contracts.
The Head of Department established the Risk Management Committee (RMC) to exercise certain responsibilities, as
set out in the approved RMC Terms of Reference.
80
The RMC is chaired by an external Chairperson who brings a lot of valuable experience in Governance matters.
The RMC reviewed risk management processes during the year. The following policy related documents on Risk
Management were approved, such as, Risk Management Policy, Risk Appetite Framework, 2018/19 Strategic Risk
Assessment Report and the Risk Management Implementation Plan. The Fraud Prevention Plan and Business
Continuity Plan are yet to be completed and approved.
The Head of Department committed management of the Department to comply with all relevant Corporate
Governance processes. Risk management and Internal Audit of the department reports at an appropriate level
(administratively report to the Head of Department and functionally to the Audit Committee).
All governance structures were established, such as Risk Management and IT Governance Committees.
There continues to be an increase in risk management awareness in the Department with the integration of risk
management in reporting processes.
For risk management maturity of the Department to improve, it is critical that recommendations made by the RMC are
implemented timely by management and effective monitoring of implementation take place.
Control
Internal Audit Function must assist the Department in maintaining effective controls by evaluating their effectiveness
and efficiency and by promoting continuous improvement. Internal Audit Function must evaluate the adequacy and
effectiveness of controls in responding to risks within the Departments’ governance, operations and information
systems regarding the:
Reliability and integrity of financial and operational information;
Effectiveness and efficiency of operations;
Safeguarding of assets; and
Compliance with laws, regulations, policies, procedures and contracts
CONSULTING ACTIVITIES RESPONSIBILITIES
To provide consulting services which will contribute to the better management of the Departments’ significant
risks, without assuming management responsibilities.
The CAE will conduct an assessment of the consulting services’ impact on the objective assurance services and
reach a formal agreement with the Accounting Officer of the relevant Department. The required services will be
presented to the relevant Audit Committee for approval.
The internal audit function performed reviews in accordance with the approved annual audit plan.
AUDIT COMMITTEE AUTHORITY
The Audit Committee is authorised to request an investigation into any activity within its powers, as identified
in this Terms of Reference. The Audit Committee has the right to seek independent advice and must be
provided with the resources necessary to investigate such matters, following due process.
The Audit Committee shall have unrestricted access to departmental staff and records containing information
needed to properly perform its duties and execute its powers, following due process and protocols.
The Audit Committee will safeguard all the information supplied to it, in full compliance with the law.
The Audit Committee will be afforded direct and unobstructed lines of communication to the relevant
Provincial Minister, Accounting Officer, Senior Management Team of the Department, the Provincial Treasury as
well as AGSA and the Internal Audit Function.
81
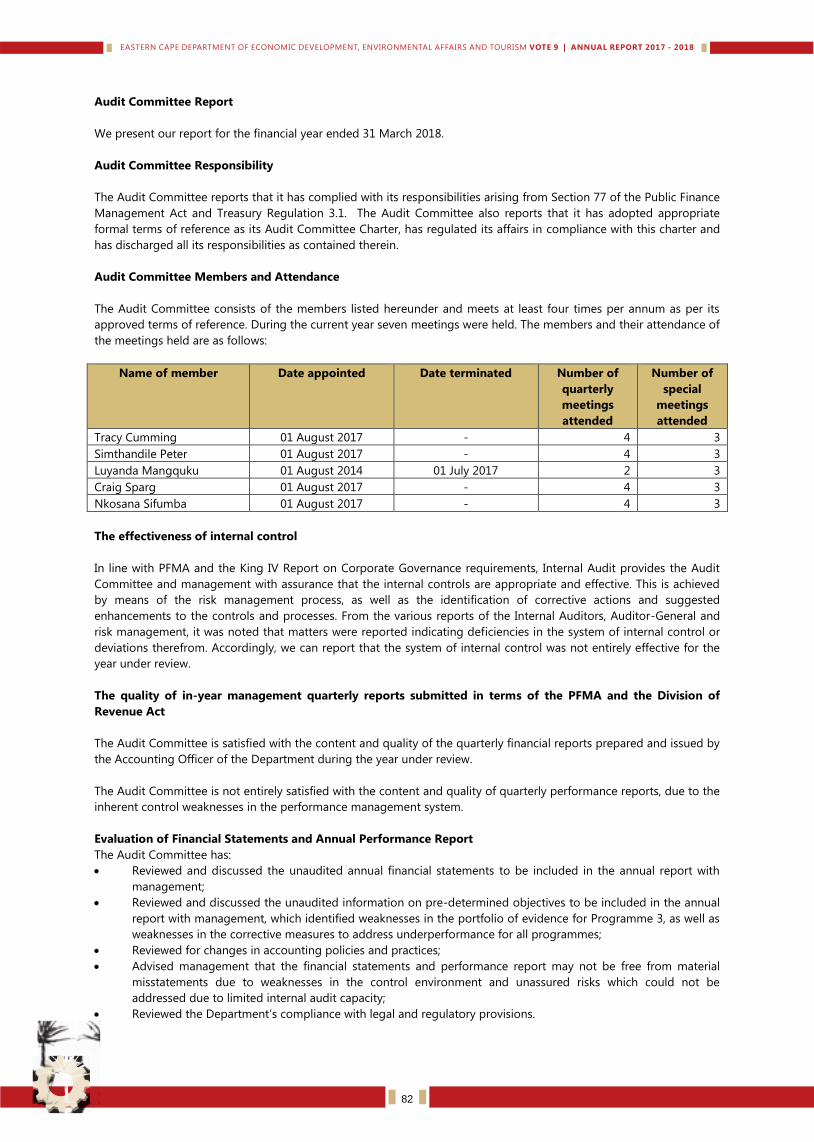
Audit Committee Report
We present our report for the financial year ended 31 March 2018.
Audit Committee Responsibility
The Audit Committee reports that it has complied with its responsibilities arising from Section 77 of the Public Finance
Management Act and Treasury Regulation 3.1. The Audit Committee also reports that it has adopted appropriate
formal terms of reference as its Audit Committee Charter, has regulated its affairs in compliance with this charter and
has discharged all its responsibilities as contained therein.
Audit Committee Members and Attendance
The Audit Committee consists of the members listed hereunder and meets at least four times per annum as per its
approved terms of reference. During the current year seven meetings were held. The members and their attendance of
the meetings held are as follows:
Name of member Date appointed Date terminated Number of
quarterly
meetings
attended
Number of
special
meetings
attended
Tracy Cumming 01 August 2017 - 4 3
Simthandile Peter 01 August 2017 - 4 3
Luyanda Mangquku 01 August 2014 01 July 2017 2 3
Craig Sparg 01 August 2017 - 4 3
Nkosana Sifumba 01 August 2017 - 4 3
The effectiveness of internal control
In line with PFMA and the King IV Report on Corporate Governance requirements, Internal Audit provides the Audit
Committee and management with assurance that the internal controls are appropriate and effective. This is achieved
by means of the risk management process, as well as the identification of corrective actions and suggested
enhancements to the controls and processes. From the various reports of the Internal Auditors, Auditor-General and
risk management, it was noted that matters were reported indicating deficiencies in the system of internal control or
deviations therefrom. Accordingly, we can report that the system of internal control was not entirely effective for the
year under review.
The quality of in-year management quarterly reports submitted in terms of the PFMA and the Division of
Revenue Act
The Audit Committee is satisfied with the content and quality of the quarterly financial reports prepared and issued by
the Accounting Officer of the Department during the year under review.
The Audit Committee is not entirely satisfied with the content and quality of quarterly performance reports, due to the
inherent control weaknesses in the performance management system.
Evaluation of Financial Statements and Annual Performance Report
The Audit Committee has:
Reviewed and discussed the unaudited annual financial statements to be included in the annual report with
management;
Reviewed and discussed the unaudited information on pre-determined objectives to be included in the annual
report with management, which identified weaknesses in the portfolio of evidence for Programme 3, as well as
weaknesses in the corrective measures to address underperformance for all programmes;
Reviewed for changes in accounting policies and practices;
Advised management that the financial statements and performance report may not be free from material
misstatements due to weaknesses in the control environment and unassured risks which could not be
addressed due to limited internal audit capacity;
Reviewed the Department’s compliance with legal and regulatory provisions.
82
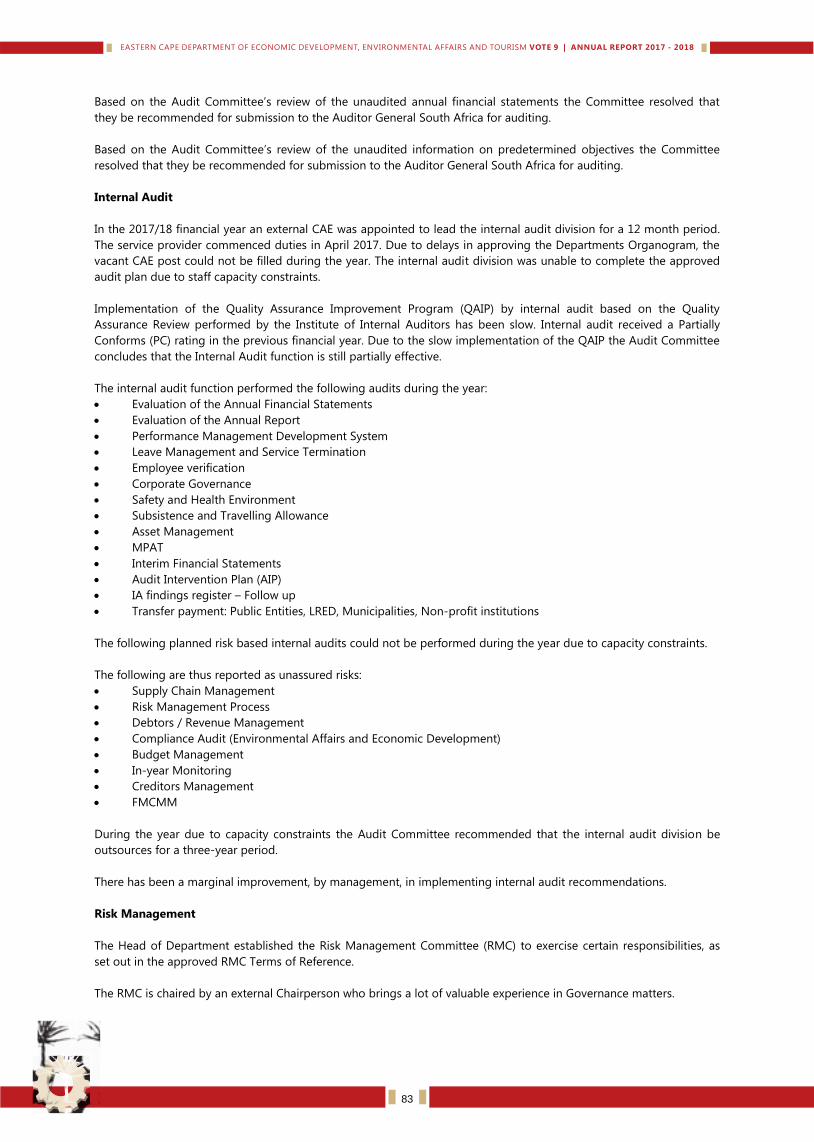
Based on the Audit Committee’s review of the unaudited annual financial statements the Committee resolved that
they be recommended for submission to the Auditor General South Africa for auditing.
Based on the Audit Committee’s review of the unaudited information on predetermined objectives the Committee
resolved that they be recommended for submission to the Auditor General South Africa for auditing.
Internal Audit
In the 2017/18 financial year an external CAE was appointed to lead the internal audit division for a 12 month period.
The service provider commenced duties in April 2017. Due to delays in approving the Departments Organogram, the
vacant CAE post could not be filled during the year. The internal audit division was unable to complete the approved
audit plan due to staff capacity constraints.
Implementation of the Quality Assurance Improvement Program (QAIP) by internal audit based on the Quality
Assurance Review performed by the Institute of Internal Auditors has been slow. Internal audit received a Partially
Conforms (PC) rating in the previous financial year. Due to the slow implementation of the QAIP the Audit Committee
concludes that the Internal Audit function is still partially effective.
The internal audit function performed the following audits during the year:
Evaluation of the Annual Financial Statements
Evaluation of the Annual Report
Performance Management Development System
Leave Management and Service Termination
Employee verification
Corporate Governance
Safety and Health Environment
Subsistence and Travelling Allowance
Asset Management
MPAT
Interim Financial Statements
Audit Intervention Plan (AIP)
IA findings register – Follow up
Transfer payment: Public Entities, LRED, Municipalities, Non-profit institutions
The following planned risk based internal audits could not be performed during the year due to capacity constraints.
The following are thus reported as unassured risks:
Supply Chain Management
Risk Management Process
Debtors / Revenue Management
Compliance Audit (Environmental Affairs and Economic Development)
Budget Management
In-year Monitoring
Creditors Management
FMCMM
During the year due to capacity constraints the Audit Committee recommended that the internal audit division be
outsources for a three-year period.
There has been a marginal improvement, by management, in implementing internal audit recommendations.
Risk Management
The Head of Department established the Risk Management Committee (RMC) to exercise certain responsibilities, as
set out in the approved RMC Terms of Reference.
The RMC is chaired by an external Chairperson who brings a lot of valuable experience in Governance matters.
83
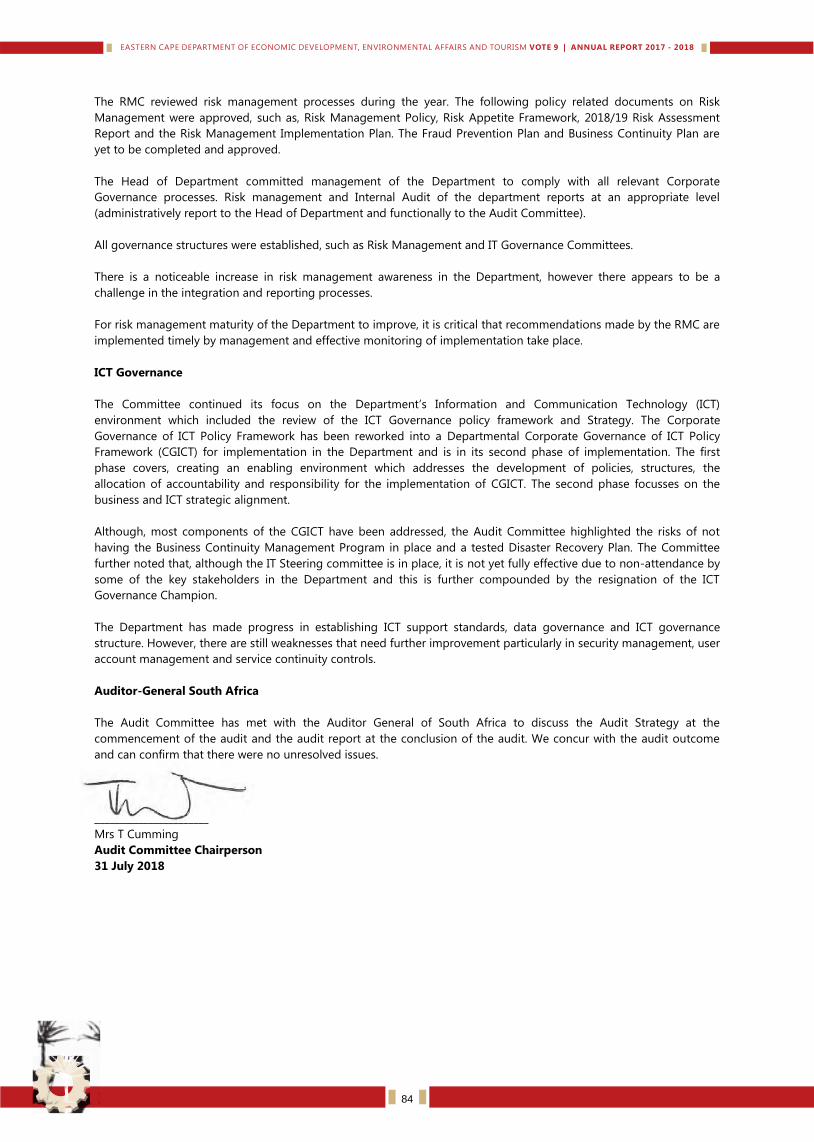
The RMC reviewed risk management processes during the year. The following policy related documents on Risk
Management were approved, such as, Risk Management Policy, Risk Appetite Framework, 2018/19 Risk Assessment
Report and the Risk Management Implementation Plan. The Fraud Prevention Plan and Business Continuity Plan are
yet to be completed and approved.
The Head of Department committed management of the Department to comply with all relevant Corporate
Governance processes. Risk management and Internal Audit of the department reports at an appropriate level
(administratively report to the Head of Department and functionally to the Audit Committee).
All governance structures were established, such as Risk Management and IT Governance Committees.
There is a noticeable increase in risk management awareness in the Department, however there appears to be a
challenge in the integration and reporting processes.
For risk management maturity of the Department to improve, it is critical that recommendations made by the RMC are
implemented timely by management and effective monitoring of implementation take place.
ICT Governance
The Committee continued its focus on the Department’s Information and Communication Technology (ICT)
environment which included the review of the ICT Governance policy framework and Strategy. The Corporate
Governance of ICT Policy Framework has been reworked into a Departmental Corporate Governance of ICT Policy
Framework (CGICT) for implementation in the Department and is in its second phase of implementation. The first
phase covers, creating an enabling environment which addresses the development of policies, structures, the
allocation of accountability and responsibility for the implementation of CGICT. The second phase focusses on the
business and ICT strategic alignment.
Although, most components of the CGICT have been addressed, the Audit Committee highlighted the risks of not
having the Business Continuity Management Program in place and a tested Disaster Recovery Plan. The Committee
further noted that, although the IT Steering committee is in place, it is not yet fully effective due to non-attendance by
some of the key stakeholders in the Department and this is further compounded by the resignation of the ICT
Governance Champion.
The Department has made progress in establishing ICT support standards, data governance and ICT governance
structure. However, there are still weaknesses that need further improvement particularly in security management, user
account management and service continuity controls.
Auditor-General South Africa
The Audit Committee has met with the Auditor General of South Africa to discuss the Audit Strategy at the
commencement of the audit and the audit report at the conclusion of the audit. We concur with the audit outcome
and can confirm that there were no unresolved issues.
_______________________
Mrs T Cumming
Audit Committee Chairperson
31 July 2018
84
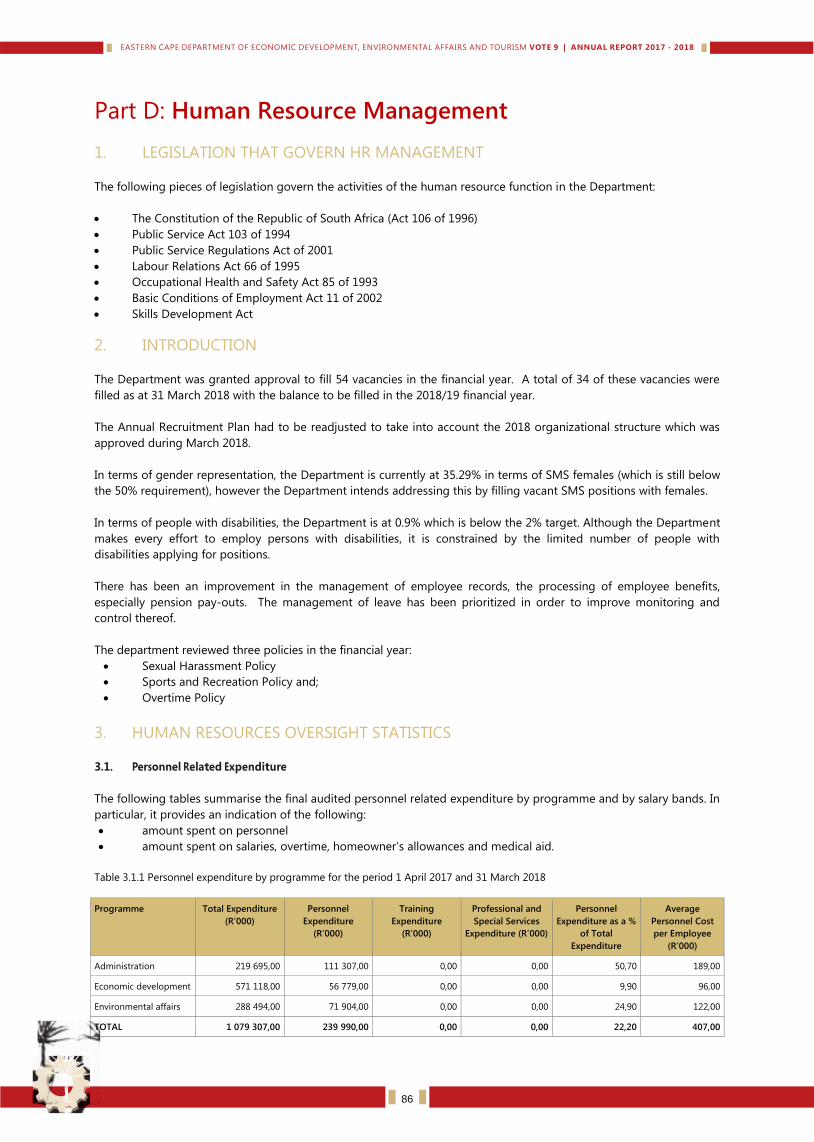
Part D: Human Resource Management
1. LEGISLATION THAT GOVERN HR MANAGEMENT
The following pieces of legislation govern the activities of the human resource function in the Department:
The Constitution of the Republic of South Africa (Act 106 of 1996)
Public Service Act 103 of 1994
Public Service Regulations Act of 2001
Labour Relations Act 66 of 1995
Occupational Health and Safety Act 85 of 1993
Basic Conditions of Employment Act 11 of 2002
Skills Development Act
2. INTRODUCTION
The Department was granted approval to fill 54 vacancies in the financial year. A total of 34 of these vacancies were
filled as at 31 March 2018 with the balance to be filled in the 2018/19 financial year.
The Annual Recruitment Plan had to be readjusted to take into account the 2018 organizational structure which was
approved during March 2018.
In terms of gender representation, the Department is currently at 35.29% in terms of SMS females (which is still below
the 50% requirement), however the Department intends addressing this by filling vacant SMS positions with females.
In terms of people with disabilities, the Department is at 0.9% which is below the 2% target. Although the Department
makes every effort to employ persons with disabilities, it is constrained by the limited number of people with
disabilities applying for positions.
There has been an improvement in the management of employee records, the processing of employee benefits,
especially pension pay-outs. The management of leave has been prioritized in order to improve monitoring and
control thereof.
The department reviewed three policies in the financial year:
Sexual Harassment Policy
Sports and Recreation Policy and;
Overtime Policy
3. HUMAN RESOURCES OVERSIGHT STATISTICS
3.1. Personnel Related Expenditure
The following tables summarise the final audited personnel related expenditure by programme and by salary bands. In
particular, it provides an indication of the following:
amount spent on personnel
amount spent on salaries, overtime, homeowner’s allowances and medical aid.
Table 3.1.1 Personnel expenditure by programme for the period 1 April 2017 and 31 March 2018
Programme
Total Expenditure
(R’000)
Personnel
Expenditure
(R’000)
Training
Expenditure
(R’000)
Professional and
Special Services
Expenditure (R’000)
Personnel
Expenditure as a %
of Total
Expenditure
Average
Personnel Cost
per Employee
(R’000)
Administration 219 695,00 111 307,00 0,00 0,00 50,70 189,00
Economic development 571 118,00 56 779,00 0,00 0,00 9,90 96,00
Environmental affairs 288 494,00 71 904,00 0,00 0,00 24,90 122,00
TOTAL 1 079 307,00 239 990,00 0,00 0,00 22,20 407,00
86
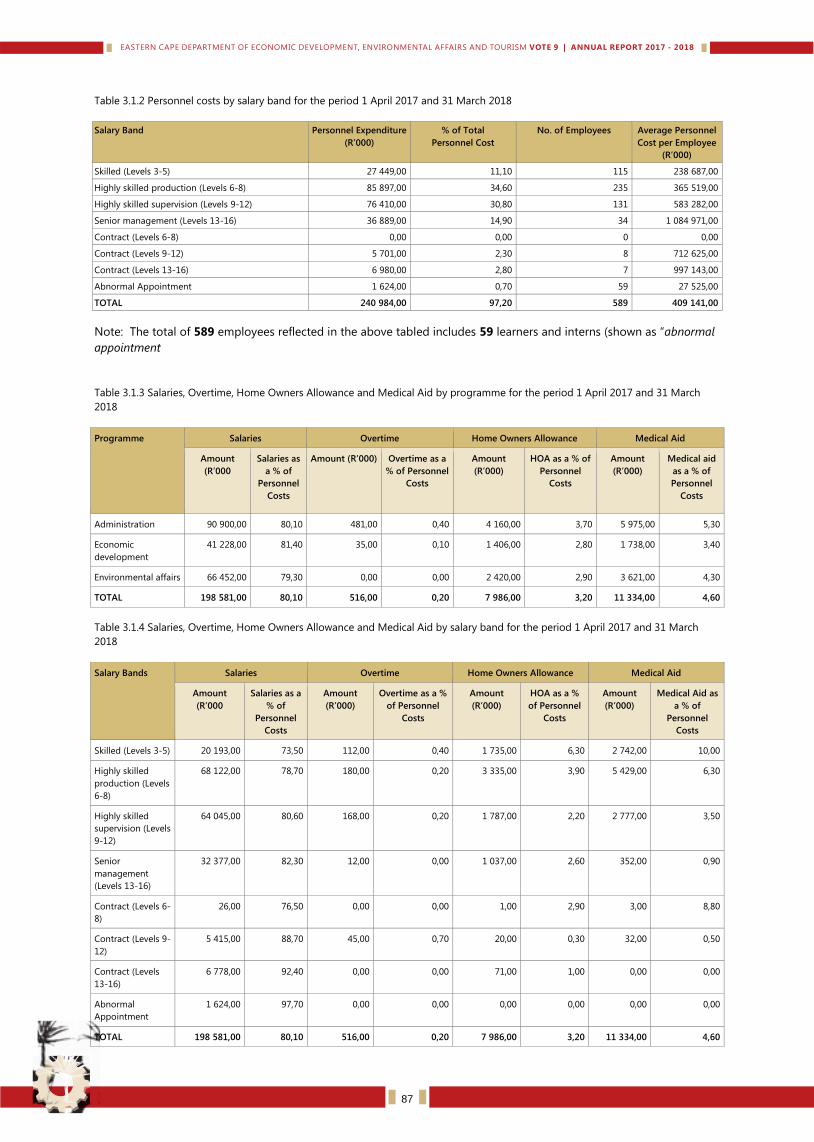
Table 3.1.2 Personnel costs by salary band for the period 1 April 2017 and 31 March 2018
Salary Band
Personnel Expenditure
(R’000)
% of Total
Personnel Cost
No. of Employees
Average Personnel
Cost per Employee
(R’000)
Skilled (Levels 3-5) 27 449,00 11,10 115 238 687,00
Highly skilled production (Levels 6-8) 85 897,00 34,60 235 365 519,00
Highly skilled supervision (Levels 9-12) 76 410,00 30,80 131 583 282,00
Senior management (Levels 13-16) 36 889,00 14,90 34 1 084 971,00
Contract (Levels 6-8) 0,00 0,00 0 0,00
Contract (Levels 9-12) 5 701,00 2,30 8 712 625,00
Contract (Levels 13-16) 6 980,00 2,80 7 997 143,00
Abnormal Appointment 1 624,00 0,70 59 27 525,00
TOTAL 240 984,00 97,20 589 409 141,00
Note: The total of 589 employees reflected in the above tabled includes 59 learners and interns (shown as “abnormal
appointment
Table 3.1.3 Salaries, Overtime, Home Owners Allowance and Medical Aid by programme for the period 1 April 2017 and 31 March
2018
Programme
Salaries Overtime Home Owners Allowance Medical Aid
Amount
(R’000
Salaries as
a % of
Personnel
Costs
Amount (R’000) Overtime as a
% of Personnel
Costs
Amount
(R’000)
HOA as a % of
Personnel
Costs
Amount
(R’000)
Medical aid
as a % of
Personnel
Costs
Administration 90 900,00 80,10 481,00 0,40 4 160,00 3,70 5 975,00 5,30
Economic
development
41 228,00 81,40 35,00 0,10 1 406,00 2,80 1 738,00 3,40
Environmental affairs 66 452,00 79,30 0,00 0,00 2 420,00 2,90 3 621,00 4,30
TOTAL 198 581,00 80,10 516,00 0,20 7 986,00 3,20 11 334,00 4,60
Table 3.1.4 Salaries, Overtime, Home Owners Allowance and Medical Aid by salary band for the period 1 April 2017 and 31 March
2018
Salary Bands
Salaries Overtime Home Owners Allowance Medical Aid
Amount
(R’000
Salaries as a
% of
Personnel
Costs
Amount
(R’000)
Overtime as a %
of Personnel
Costs
Amount
(R’000)
HOA as a %
of Personnel
Costs
Amount
(R’000)
Medical Aid as
a % of
Personnel
Costs
Skilled (Levels 3-5) 20 193,00 73,50 112,00 0,40 1 735,00 6,30 2 742,00 10,00
Highly skilled
production (Levels
6-8)
68 122,00 78,70 180,00 0,20 3 335,00 3,90 5 429,00 6,30
Highly skilled
supervision (Levels
9-12)
64 045,00 80,60 168,00 0,20 1 787,00 2,20 2 777,00 3,50
Senior
management
(Levels 13-16)
32 377,00 82,30 12,00 0,00 1 037,00 2,60 352,00 0,90
Contract (Levels 6-
8)
26,00 76,50 0,00 0,00 1,00 2,90 3,00 8,80
Contract (Levels 9-
12)
5 415,00 88,70 45,00 0,70 20,00 0,30 32,00 0,50
Contract (Levels
13-16)
6 778,00 92,40 0,00 0,00 71,00 1,00 0,00 0,00
Abnormal
Appointment
1 624,00 97,70 0,00 0,00 0,00 0,00 0,00 0,00
TOTAL 198 581,00 80,10 516,00 0,20 7 986,00 3,20 11 334,00 4,60
87
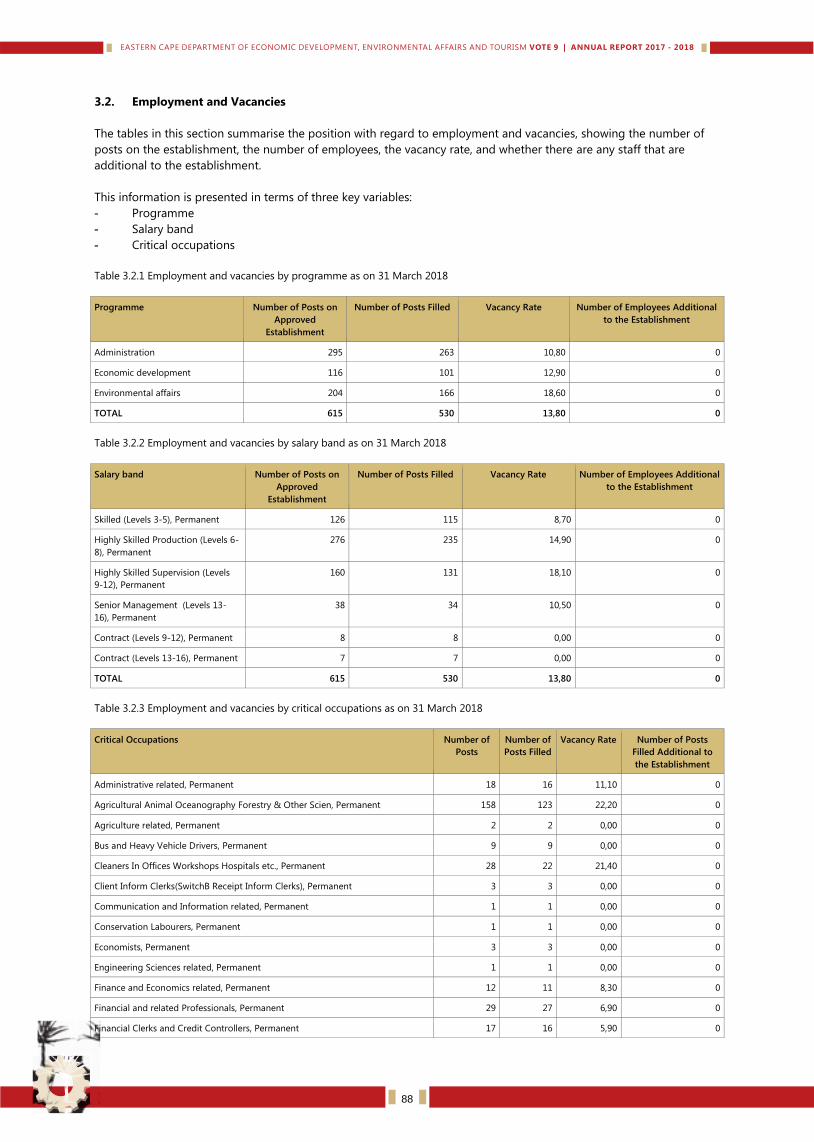
3.2. Employment and Vacancies
The tables in this section summarise the position with regard to employment and vacancies, showing the number of
posts on the establishment, the number of employees, the vacancy rate, and whether there are any staff that are
additional to the establishment.
This information is presented in terms of three key variables:
- Programme
- Salary band
- Critical occupations
Table 3.2.1 Employment and vacancies by programme as on 31 March 2018
Programme Number of Posts on
Approved
Establishment
Number of Posts Filled Vacancy Rate Number of Employees Additional
to the Establishment
Administration 295 263 10,80 0
Economic development 116 101 12,90 0
Environmental affairs 204 166 18,60 0
TOTAL 615 530 13,80 0
Table 3.2.2 Employment and vacancies by salary band as on 31 March 2018
Salary band
Number of Posts on
Approved
Establishment
Number of Posts Filled Vacancy Rate Number of Employees Additional
to the Establishment
Skilled (Levels 3-5), Permanent 126 115 8,70 0
Highly Skilled Production (Levels 6-
8), Permanent
276 235 14,90 0
Highly Skilled Supervision (Levels
9-12), Permanent
160 131 18,10 0
Senior Management (Levels 13-
16), Permanent
38 34 10,50 0
Contract (Levels 9-12), Permanent 8 8 0,00 0
Contract (Levels 13-16), Permanent 7 7 0,00 0
TOTAL 615 530 13,80 0
Table 3.2.3 Employment and vacancies by critical occupations as on 31 March 2018
Critical Occupations
Number of
Posts
Number of
Posts Filled
Vacancy Rate Number of Posts
Filled Additional to
the Establishment
Administrative related, Permanent 18 16 11,10 0
Agricultural Animal Oceanography Forestry & Other Scien, Permanent 158 123 22,20 0
Agriculture related, Permanent 2 2 0,00 0
Bus and Heavy Vehicle Drivers, Permanent 9 9 0,00 0
Cleaners In Offices Workshops Hospitals etc., Permanent 28 22 21,40 0
Client Inform Clerks(SwitchB Receipt Inform Clerks), Permanent 3 3 0,00 0
Communication and Information related, Permanent 1 1 0,00 0
Conservation Labourers, Permanent 1 1 0,00 0
Economists, Permanent 3 3 0,00 0
Engineering Sciences related, Permanent 1 1 0,00 0
Finance and Economics related, Permanent 12 11 8,30 0
Financial and related Professionals, Permanent 29 27 6,90 0
Financial Clerks and Credit Controllers, Permanent 17 16 5,90 0
88
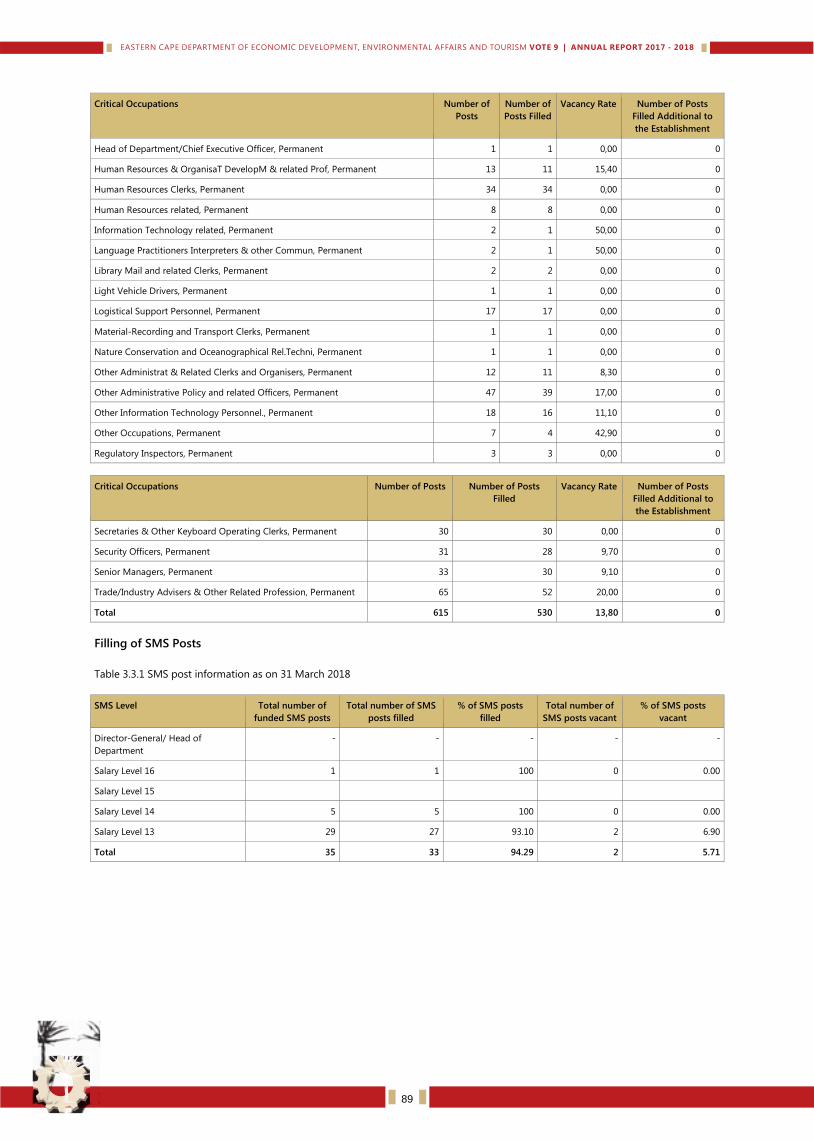
Critical Occupations
Number of
Posts
Number of
Posts Filled
Vacancy Rate Number of Posts
Filled Additional to
the Establishment
Head of Department/Chief Executive Officer, Permanent 1 1 0,00 0
Human Resources & OrganisaT DevelopM & related Prof, Permanent 13 11 15,40 0
Human Resources Clerks, Permanent 34 34 0,00 0
Human Resources related, Permanent 8 8 0,00 0
Information Technology related, Permanent 2 1 50,00 0
Language Practitioners Interpreters & other Commun, Permanent 2 1 50,00 0
Library Mail and related Clerks, Permanent 2 2 0,00 0
Light Vehicle Drivers, Permanent 1 1 0,00 0
Logistical Support Personnel, Permanent 17 17 0,00 0
Material-Recording and Transport Clerks, Permanent 1 1 0,00 0
Nature Conservation and Oceanographical Rel.Techni, Permanent 1 1 0,00 0
Other Administrat & Related Clerks and Organisers, Permanent 12 11 8,30 0
Other Administrative Policy and related Officers, Permanent 47 39 17,00 0
Other Information Technology Personnel., Permanent 18 16 11,10 0
Other Occupations, Permanent 7 4 42,90 0
Regulatory Inspectors, Permanent 3 3 0,00 0
Critical Occupations
Number of Posts Number of Posts
Filled
Vacancy Rate Number of Posts
Filled Additional to
the Establishment
Secretaries & Other Keyboard Operating Clerks, Permanent 30 30 0,00 0
Security Officers, Permanent 31 28 9,70 0
Senior Managers, Permanent 33 30 9,10 0
Trade/Industry Advisers & Other Related Profession, Permanent 65 52 20,00 0
Total 615 530 13,80 0
Filling of SMS Posts
Table 3.3.1 SMS post information as on 31 March 2018
SMS Level Total number of
funded SMS posts
Total number of SMS
posts filled
% of SMS posts
filled
Total number of
SMS posts vacant
% of SMS posts
vacant
Director-General/ Head of
Department
- - - - -
Salary Level 16 1 1 100 0 0.00
Salary Level 15
Salary Level 14 5 5 100 0 0.00
Salary Level 13 29 27 93.10 2 6.90
Total 35 33 94.29 2 5.71
89
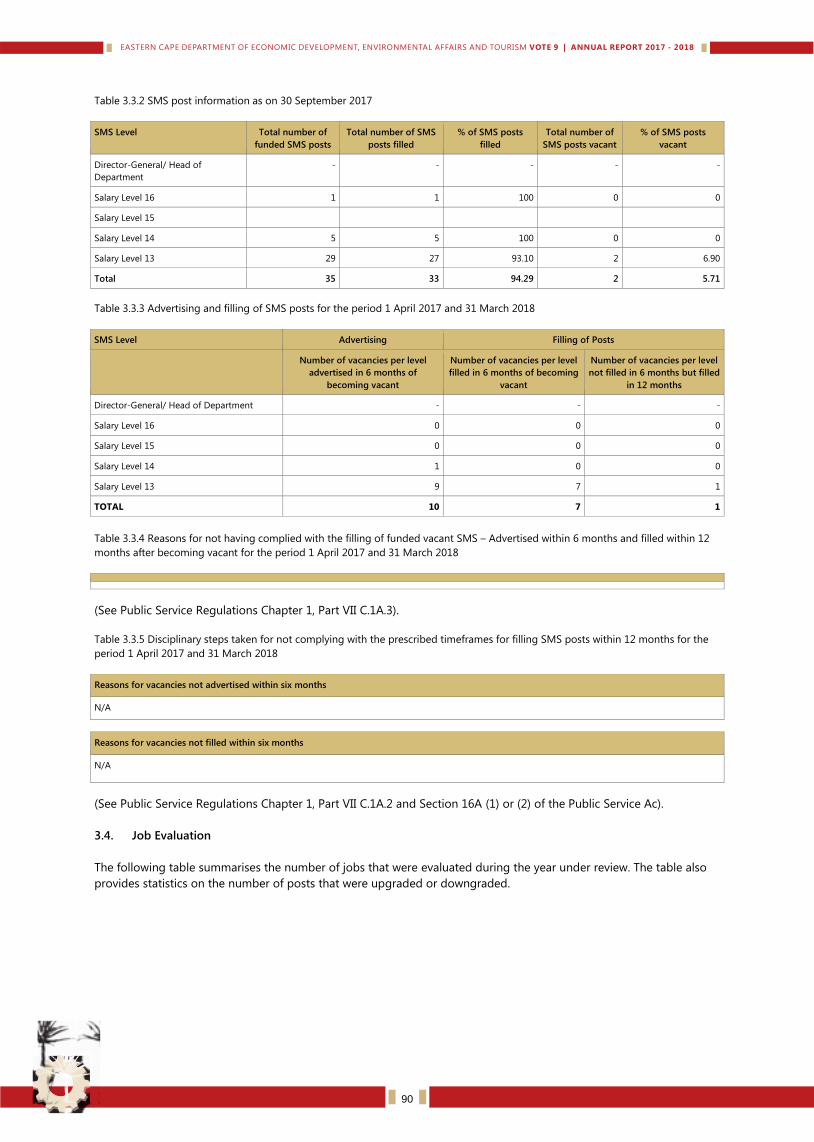
Table 3.3.2 SMS post information as on 30 September 2017
SMS Level Total number of
funded SMS posts
Total number of SMS
posts filled
% of SMS posts
filled
Total number of
SMS posts vacant
% of SMS posts
vacant
Director-General/ Head of
Department
- - - - -
Salary Level 16 1 1 100 0 0
Salary Level 15
Salary Level 14 5 5 100 0 0
Salary Level 13 29 27 93.10 2 6.90
Total 35 33 94.29 2 5.71
Table 3.3.3 Advertising and filling of SMS posts for the period 1 April 2017 and 31 March 2018
SMS Level Advertising Filling of Posts
Number of vacancies per level
advertised in 6 months of
becoming vacant
Number of vacancies per level
filled in 6 months of becoming
vacant
Number of vacancies per level
not filled in 6 months but filled
in 12 months
Director-General/ Head of Department - - -
Salary Level 16 0 0 0
Salary Level 15 0 0 0
Salary Level 14 1 0 0
Salary Level 13 9 7 1
TOTAL 10 7 1
Table 3.3.4 Reasons for not having complied with the filling of funded vacant SMS – Advertised within 6 months and filled within 12
months after becoming vacant for the period 1 April 2017 and 31 March 2018
Reasons for vacancies not filled within twelve months
Department had to seek approval from the MEC to Head Hunt for the position of Senior Manager: Economist
Post of Senior Manager: OD will be re-advertised as no suitable Female candidate was found (See Public Service Regulations Chapter 1, Part VII C.1A.3).
Table 3.3.5 Disciplinary steps taken for not complying with the prescribed timeframes for filling SMS posts within 12 months for the
period 1 April 2017 and 31 March 2018
Reasons for vacancies not advertised within six months
N/A
Reasons for vacancies not filled within six months
N/A
(See Public Service Regulations Chapter 1, Part VII C.1A.2 and Section 16A (1) or (2) of the Public Service Ac).
3.4. Job Evaluation
The following table summarises the number of jobs that were evaluated during the year under review. The table also
provides statistics on the number of posts that were upgraded or downgraded.
90

Table 3.4.1 Job evaluation by salary band for the period 1 April 2017 and 31 March 2018
Salary Band
Number of Posts
on Approved
Establishment
Number of
Jobs
Evaluated
% of Posts
Evaluated by
Salary Bands
Posts Upgraded Posts downgraded
Number
% of Posts
Evaluated
Number % of Posts
Evaluated
Lower skilled (Levels1-2)
Skilled (Levels 3-5) 127 127 100 0 0 0 0
Highly skilled production
(Levels 6-8)
270 270 100 0 0 0 0
Highly skilled supervision
(Levels 9-12)
158 158 100 0 0 0 0
Senior management Service
band A
32 32 100 0 0 0 0
Senior management Service
band B
5 5 100 0 0 0 0
Senior Management Service
Band C
1 1 100 0 0 0 0
Contract (Levels 3-5) - - - - - - -
Contract (Levels 6-8) - - - - - - -
Contract (Levels 9-12) 9 9 100 0 0 0 0
Contract (Band A) 7 7 100 0 0 0 0
Contract (Band B) 1 1 100 0 0 0 0
TOTAL 610 610 100 0 0 0 0
The following table provides a summary of the number of employees whose positions were upgraded due to their
post being upgraded.
Table 3.4.2 Profile of employees whose positions were upgraded due to their posts being upgraded for the period 1 April 2017 and
31 March 2018
Gender African Asian Coloured White Total
Female
Male
Total N/A
Employees with a disability
The following table summarises the number of cases where remuneration bands exceeded the grade determined by
job evaluation. Reasons for the deviation are provided in each case.
Table 3.4.3 Employees with salary levels higher than those determined by job evaluation by occupation for the period 1 April 2017
and 31 March 2018
Occupation Number of
Employees
Job Evaluation
Level
Remuneration
level
Reason for
deviation
Administrative related, Permanent N/A
Administrative officers
Agriculture animal oceanography forestry & other
science, Permanent
Audit manager (Internal)
Consumer advisors
Economists, Permanent
Economists, Permanent
Finance and economics related, Permanent
91
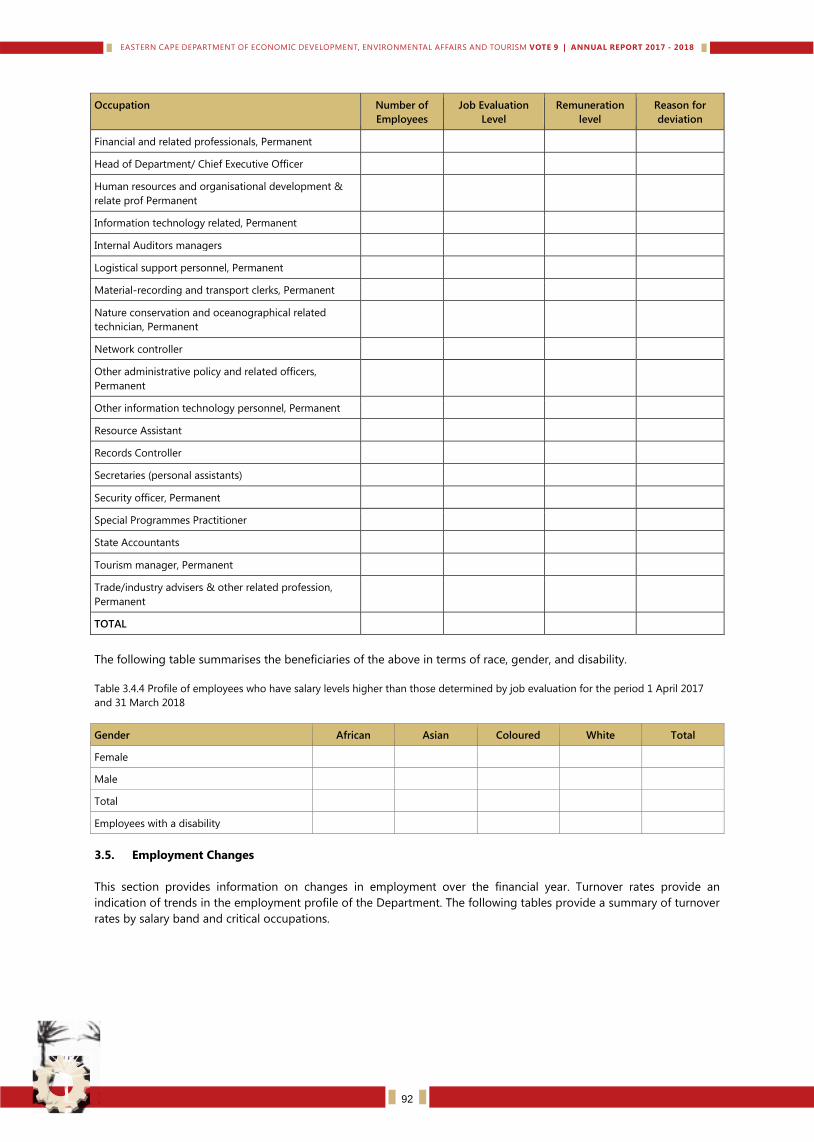
Occupation Number of
Employees
Job Evaluation
Level
Remuneration
level
Reason for
deviation
Financial and related professionals, Permanent
Head of Department/ Chief Executive Officer
Human resources and organisational development &
relate prof Permanent
Information technology related, Permanent
Internal Auditors managers
Logistical support personnel, Permanent
Material-recording and transport clerks, Permanent
Nature conservation and oceanographical related
technician, Permanent
Network controller
Other administrative policy and related officers,
Permanent
Other information technology personnel, Permanent
Resource Assistant
Records Controller
Secretaries (personal assistants)
Security officer, Permanent
Special Programmes Practitioner
State Accountants
Tourism manager, Permanent
Trade/industry advisers & other related profession,
Permanent
TOTAL
The following table summarises the beneficiaries of the above in terms of race, gender, and disability.
Table 3.4.4 Profile of employees who have salary levels higher than those determined by job evaluation for the period 1 April 2017
and 31 March 2018
Gender African Asian Coloured White Total
Female
Male
Total
Employees with a disability
3.5. Employment Changes
This section provides information on changes in employment over the financial year. Turnover rates provide an
indication of trends in the employment profile of the Department. The following tables provide a summary of turnover
rates by salary band and critical occupations.
92
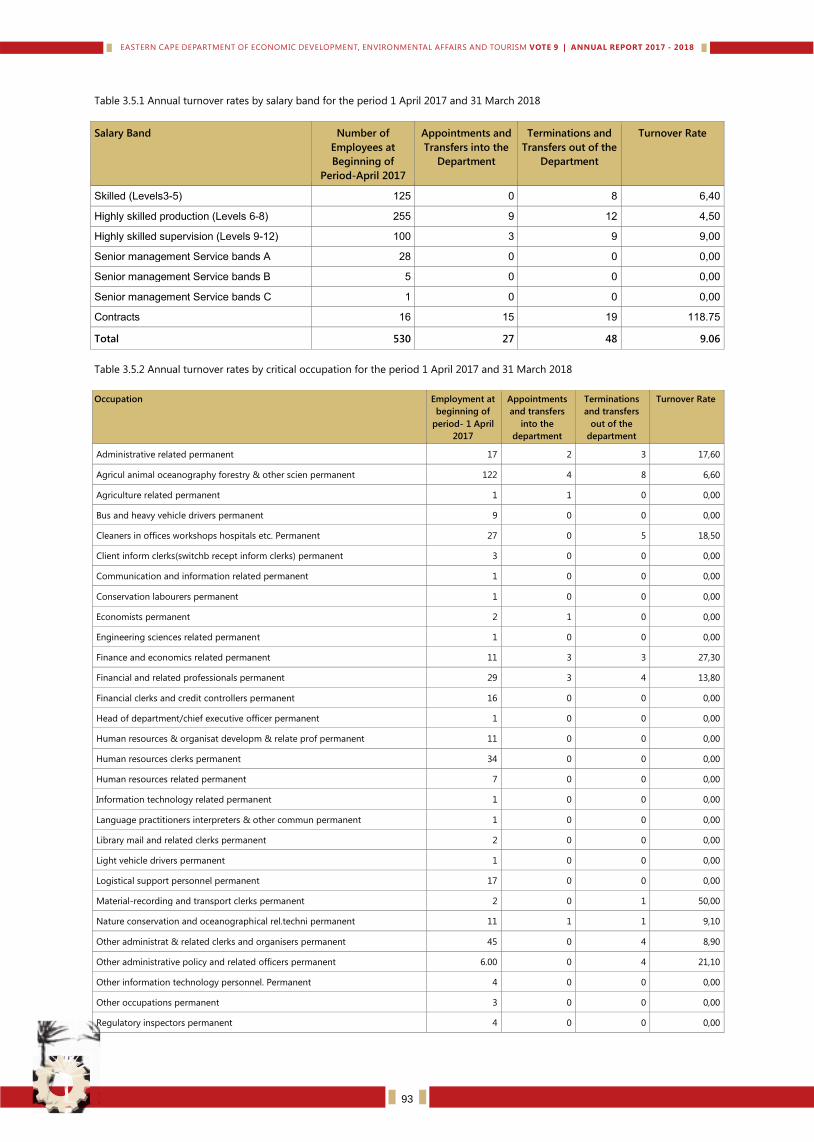
Table 3.5.1 Annual turnover rates by salary band for the period 1 April 2017 and 31 March 2018
Salary Band Number of
Employees at
Beginning of
Period-April 2017
Appointments and
Transfers into the
Department
Terminations and
Transfers out of the
Department
Turnover Rate
Skilled (Levels3-5) 125 0 8 6,40
Highly skilled production (Levels 6-8) 255 9 12 4,50
Highly skilled supervision (Levels 9-12) 100 3 9 9,00
Senior management Service bands A 28 0 0 0,00
Senior management Service bands B 5 0 0 0,00
Senior management Service bands C 1 0 0 0,00
Contracts 16 15 19 118.75
Total 530 27 48 9.06
Table 3.5.2 Annual turnover rates by critical occupation for the period 1 April 2017 and 31 March 2018
Occupation Employment at
beginning of
period- 1 April
2017
Appointments
and transfers
into the
department
Terminations
and transfers
out of the
department
Turnover Rate
Administrative related permanent 17 2 3 17,60
Agricul animal oceanography forestry & other scien permanent 122 4 8 6,60
Agriculture related permanent 1 1 0 0,00
Bus and heavy vehicle drivers permanent 9 0 0 0,00
Cleaners in offices workshops hospitals etc. Permanent 27 0 5 18,50
Client inform clerks(switchb recept inform clerks) permanent 3 0 0 0,00
Communication and information related permanent 1 0 0 0,00
Conservation labourers permanent 1 0 0 0,00
Economists permanent 2 1 0 0,00
Engineering sciences related permanent 1 0 0 0,00
Finance and economics related permanent 11 3 3 27,30
Financial and related professionals permanent 29 3 4 13,80
Financial clerks and credit controllers permanent 16 0 0 0,00
Head of department/chief executive officer permanent 1 0 0 0,00
Human resources & organisat developm & relate prof permanent 11 0 0 0,00
Human resources clerks permanent 34 0 0 0,00
Human resources related permanent 7 0 0 0,00
Information technology related permanent 1 0 0 0,00
Language practitioners interpreters & other commun permanent 1 0 0 0,00
Library mail and related clerks permanent 2 0 0 0,00
Light vehicle drivers permanent 1 0 0 0,00
Logistical support personnel permanent 17 0 0 0,00
Material-recording and transport clerks permanent 2 0 1 50,00
Nature conservation and oceanographical rel.techni permanent 11 1 1 9,10
Other administrat & related clerks and organisers permanent 45 0 4 8,90
Other administrative policy and related officers permanent 6.00 0 4 21,10
Other information technology personnel. Permanent 4 0 0 0,00
Other occupations permanent 3 0 0 0,00
Regulatory inspectors permanent 4 0 0 0,00
93
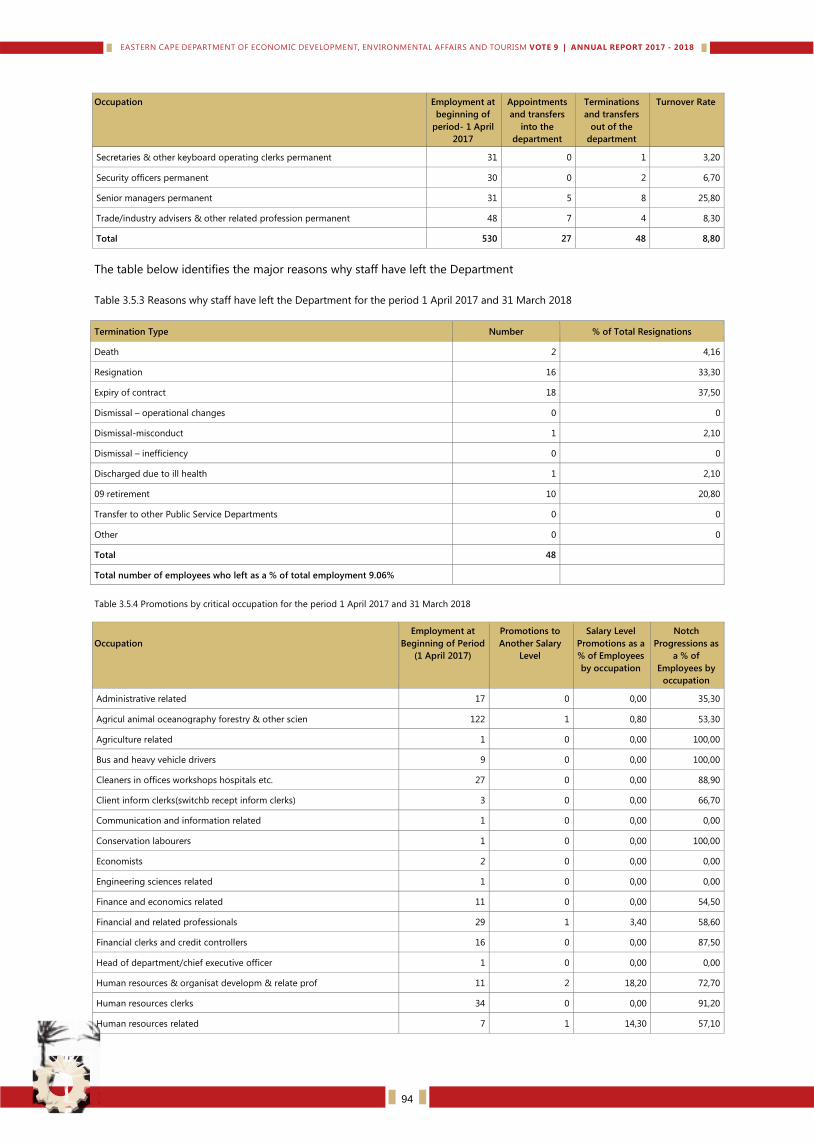
Occupation Employment at
beginning of
period- 1 April
2017
Appointments
and transfers
into the
department
Terminations
and transfers
out of the
department
Turnover Rate
Secretaries & other keyboard operating clerks permanent 31 0 1 3,20
Security officers permanent 30 0 2 6,70
Senior managers permanent 31 5 8 25,80
Trade/industry advisers & other related profession permanent 48 7 4 8,30
Total 530 27 48 8,80
The table below identifies the major reasons why staff have left the Department
Table 3.5.3 Reasons why staff have left the Department for the period 1 April 2017 and 31 March 2018
Termination Type Number % of Total Resignations
Death 2 4,16
Resignation 16 33,30
Expiry of contract 18 37,50
Dismissal – operational changes 0 0
Dismissal-misconduct 1 2,10
Dismissal – inefficiency 0 0
Discharged due to ill health 1 2,10
09 retirement 10 20,80
Transfer to other Public Service Departments 0 0
Other 0 0
Total 48
Total number of employees who left as a % of total employment 9.06%
Table 3.5.4 Promotions by critical occupation for the period 1 April 2017 and 31 March 2018
Occupation
Employment at
Beginning of Period
(1 April 2017)
Promotions to
Another Salary
Level
Salary Level
Promotions as a
% of Employees
by occupation
Notch
Progressions as
a % of
Employees by
occupation
Administrative related 17 0 0,00 35,30
Agricul animal oceanography forestry & other scien 122 1 0,80 53,30
Agriculture related 1 0 0,00 100,00
Bus and heavy vehicle drivers 9 0 0,00 100,00
Cleaners in offices workshops hospitals etc. 27 0 0,00 88,90
Client inform clerks(switchb recept inform clerks) 3 0 0,00 66,70
Communication and information related 1 0 0,00 0,00
Conservation labourers 1 0 0,00 100,00
Economists 2 0 0,00 0,00
Engineering sciences related 1 0 0,00 0,00
Finance and economics related 11 0 0,00 54,50
Financial and related professionals 29 1 3,40 58,60
Financial clerks and credit controllers 16 0 0,00 87,50
Head of department/chief executive officer 1 0 0,00 0,00
Human resources & organisat developm & relate prof 11 2 18,20 72,70
Human resources clerks 34 0 0,00 91,20
Human resources related 7 1 14,30 57,10
94
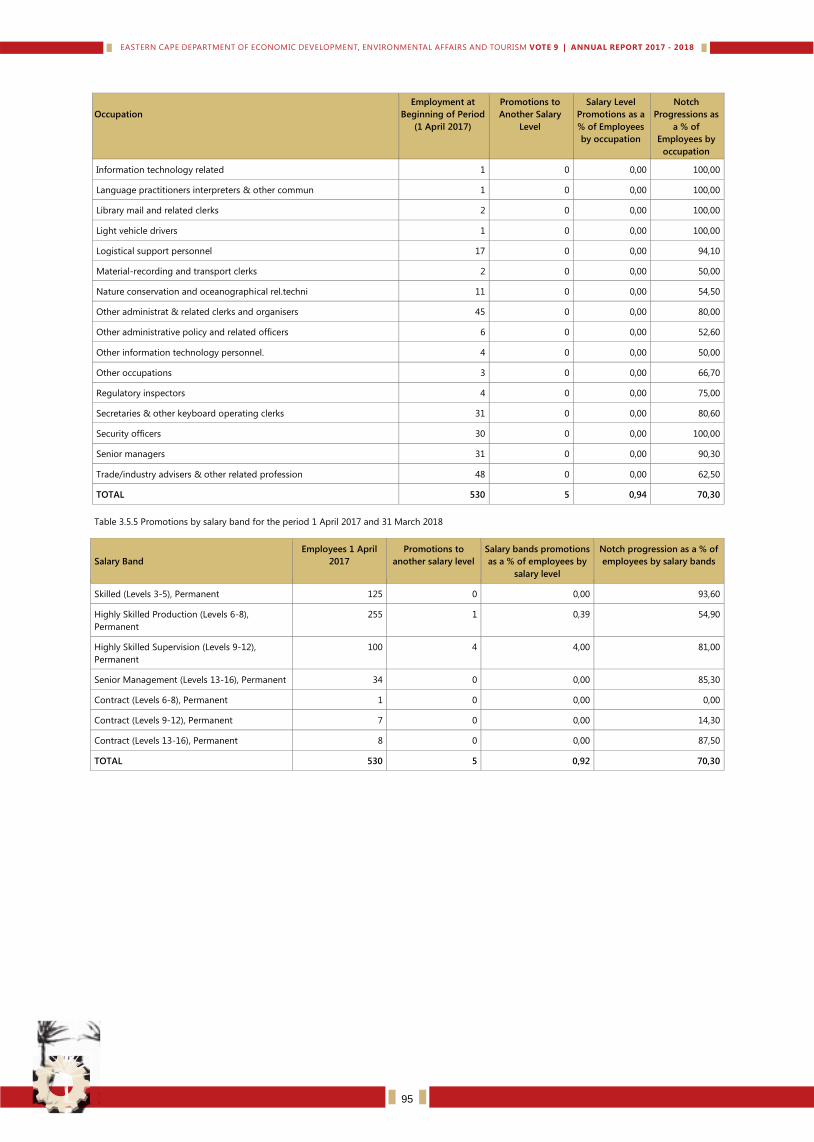
Occupation
Employment at
Beginning of Period
(1 April 2017)
Promotions to
Another Salary
Level
Salary Level
Promotions as a
% of Employees
by occupation
Notch
Progressions as
a % of
Employees by
occupation
Information technology related 1 0 0,00 100,00
Language practitioners interpreters & other commun 1 0 0,00 100,00
Library mail and related clerks 2 0 0,00 100,00
Light vehicle drivers 1 0 0,00 100,00
Logistical support personnel 17 0 0,00 94,10
Material-recording and transport clerks 2 0 0,00 50,00
Nature conservation and oceanographical rel.techni 11 0 0,00 54,50
Other administrat & related clerks and organisers 45 0 0,00 80,00
Other administrative policy and related officers 6 0 0,00 52,60
Other information technology personnel. 4 0 0,00 50,00
Other occupations 3 0 0,00 66,70
Regulatory inspectors 4 0 0,00 75,00
Secretaries & other keyboard operating clerks 31 0 0,00 80,60
Security officers 30 0 0,00 100,00
Senior managers 31 0 0,00 90,30
Trade/industry advisers & other related profession 48 0 0,00 62,50
TOTAL 530 5 0,94 70,30
Table 3.5.5 Promotions by salary band for the period 1 April 2017 and 31 March 2018
Salary Band
Employees 1 April
2017
Promotions to
another salary level
Salary bands promotions
as a % of employees by
salary level
Notch progression as a % of
employees by salary bands
Skilled (Levels 3-5), Permanent 125 0 0,00 93,60
Highly Skilled Production (Levels 6-8),
Permanent
255 1 0,39 54,90
Highly Skilled Supervision (Levels 9-12),
Permanent
100 4 4,00 81,00
Senior Management (Levels 13-16), Permanent 34 0 0,00 85,30
Contract (Levels 6-8), Permanent 1 0 0,00 0,00
Contract (Levels 9-12), Permanent 7 0 0,00 14,30
Contract (Levels 13-16), Permanent 8 0 0,00 87,50
TOTAL 530 5 0,92 70,30
95
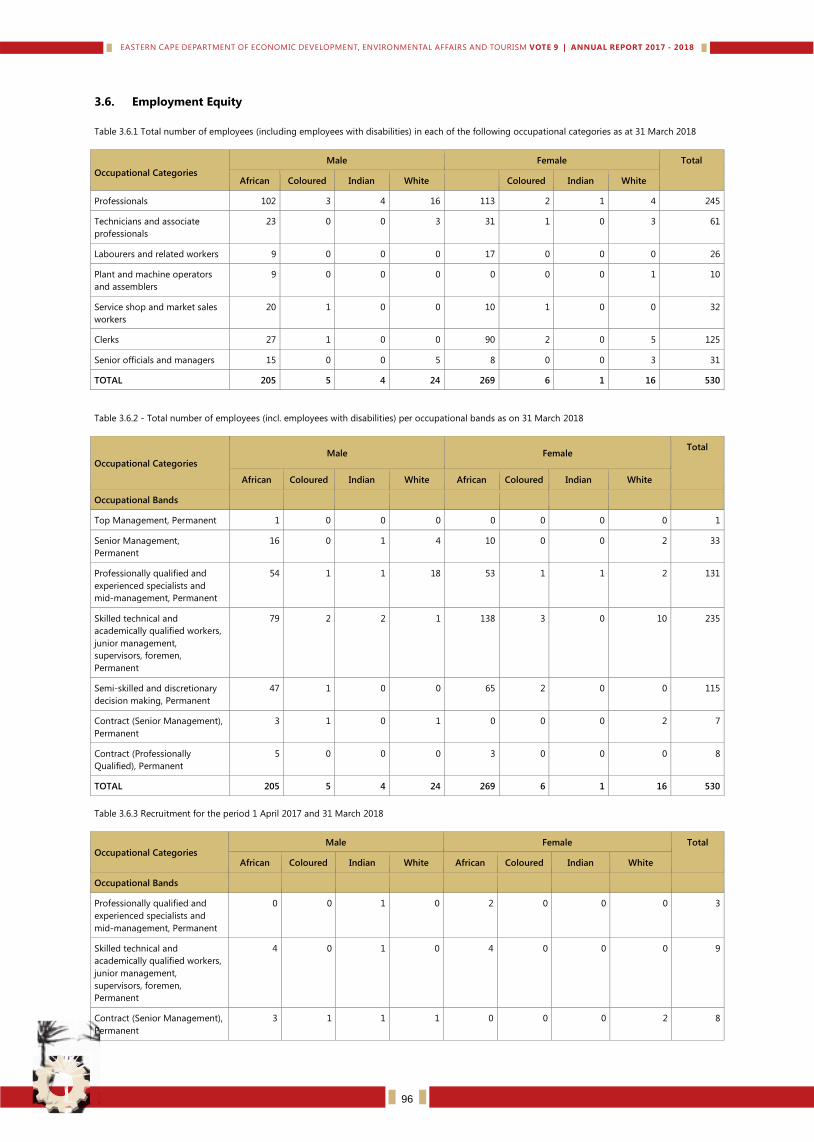
3.6. Employment Equity
Table 3.6.1 Total number of employees (including employees with disabilities) in each of the following occupational categories as at 31 March 2018
Occupational Categories
Male Female Total
African Coloured Indian White Coloured Indian White
Professionals 102 3 4 16 113 2 1 4 245
Technicians and associate
professionals
23 0 0 3 31 1 0 3 61
Labourers and related workers 9 0 0 0 17 0 0 0 26
Plant and machine operators
and assemblers
9 0 0 0 0 0 0 1 10
Service shop and market sales
workers
20 1 0 0 10 1 0 0 32
Clerks 27 1 0 0 90 2 0 5 125
Senior officials and managers 15 0 0 5 8 0 0 3 31
TOTAL 205 5 4 24 269 6 1 16 530
Table 3.6.2 - Total number of employees (incl. employees with disabilities) per occupational bands as on 31 March 2018
Occupational Categories Male Female
Total
African Coloured Indian White African Coloured Indian White
Occupational Bands
Top Management, Permanent 1 0 0 0 0 0 0 0 1
Senior Management,
Permanent
16 0 1 4 10 0 0 2 33
Professionally qualified and
experienced specialists and
mid-management, Permanent
54 1 1 18 53 1 1 2 131
Skilled technical and
academically qualified workers,
junior management,
supervisors, foremen,
Permanent
79 2 2 1 138 3 0 10 235
Semi-skilled and discretionary
decision making, Permanent
47 1 0 0 65 2 0 0 115
Contract (Senior Management),
Permanent
3 1 0 1 0 0 0 2 7
Contract (Professionally
Qualified), Permanent
5 0 0 0 3 0 0 0 8
TOTAL 205 5 4 24 269 6 1 16 530
Table 3.6.3 Recruitment for the period 1 April 2017 and 31 March 2018
Occupational Categories Male Female Total
African Coloured Indian White African Coloured Indian White
Occupational Bands
Professionally qualified and
experienced specialists and
mid-management, Permanent
0 0 1 0 2 0 0 0 3
Skilled technical and
academically qualified workers,
junior management,
supervisors, foremen,
Permanent
4 0 1 0 4 0 0 0 9
Contract (Senior Management),
Permanent
3 1 1 1 0 0 0 2 8
96
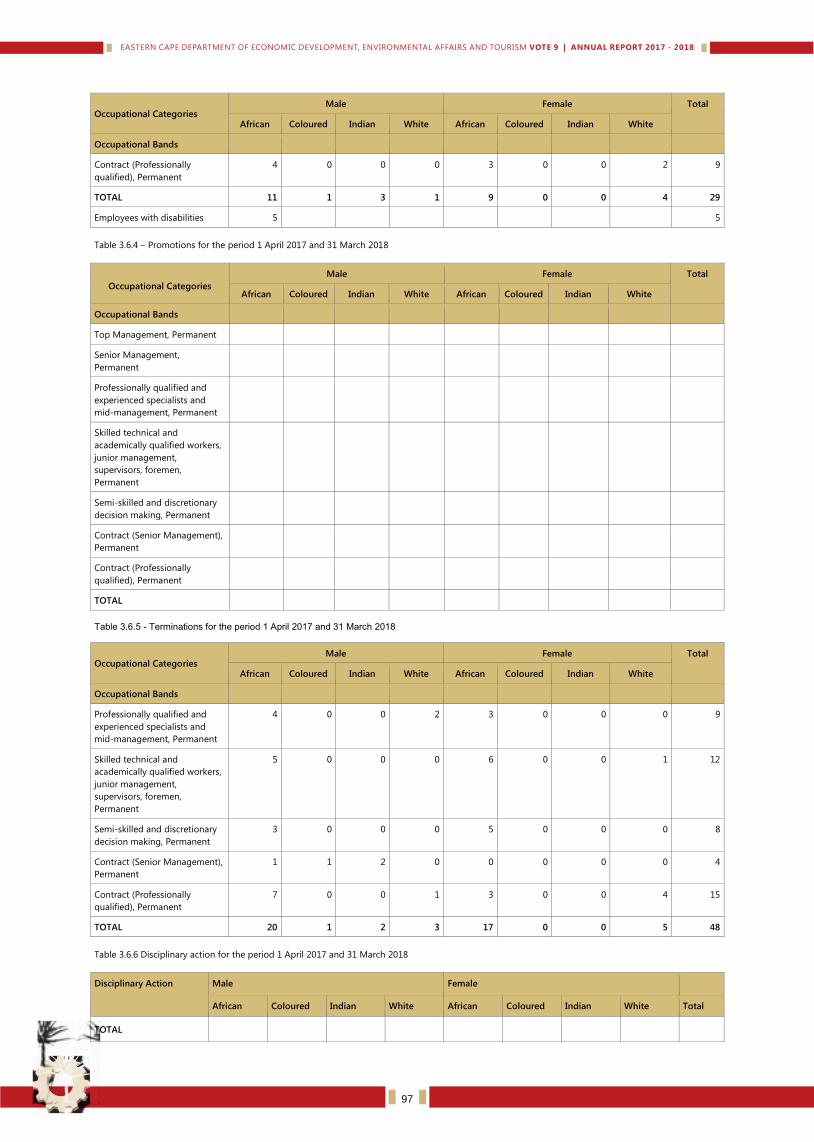
Occupational Categories Male Female Total
African Coloured Indian White African Coloured Indian White
Occupational Bands
Contract (Professionally
qualified), Permanent
4 0 0 0 3 0 0 2 9
TOTAL 11 1 3 1 9 0 0 4 29
Employees with disabilities 5 5
Table 3.6.4 – Promotions for the period 1 April 2017 and 31 March 2018
Occupational Categories
Male Female Total
African Coloured Indian White African Coloured Indian White
Occupational Bands
Top Management, Permanent
Senior Management,
Permanent
Professionally qualified and
experienced specialists and
mid-management, Permanent
Skilled technical and
academically qualified workers,
junior management,
supervisors, foremen,
Permanent
Semi-skilled and discretionary
decision making, Permanent
Contract (Senior Management),
Permanent
Contract (Professionally
qualified), Permanent
TOTAL
Table 3.6.5 - Terminations for the period 1 April 2017 and 31 March 2018
Occupational Categories Male Female Total
African Coloured Indian White African Coloured Indian White
Occupational Bands
Professionally qualified and
experienced specialists and
mid-management, Permanent
4 0 0 2 3 0 0 0 9
Skilled technical and
academically qualified workers,
junior management,
supervisors, foremen,
Permanent
5 0 0 0 6 0 0 1 12
Semi-skilled and discretionary
decision making, Permanent
3 0 0 0 5 0 0 0 8
Contract (Senior Management),
Permanent
1 1 2 0 0 0 0 0 4
Contract (Professionally
qualified), Permanent
7 0 0 1 3 0 0 4 15
TOTAL 20 1 2 3 17 0 0 5 48
Table 3.6.6 Disciplinary action for the period 1 April 2017 and 31 March 2018
Disciplinary Action
Male
Female
African
Coloured
Indian
White
African
Coloured
Indian
White
Total
TOTAL
97
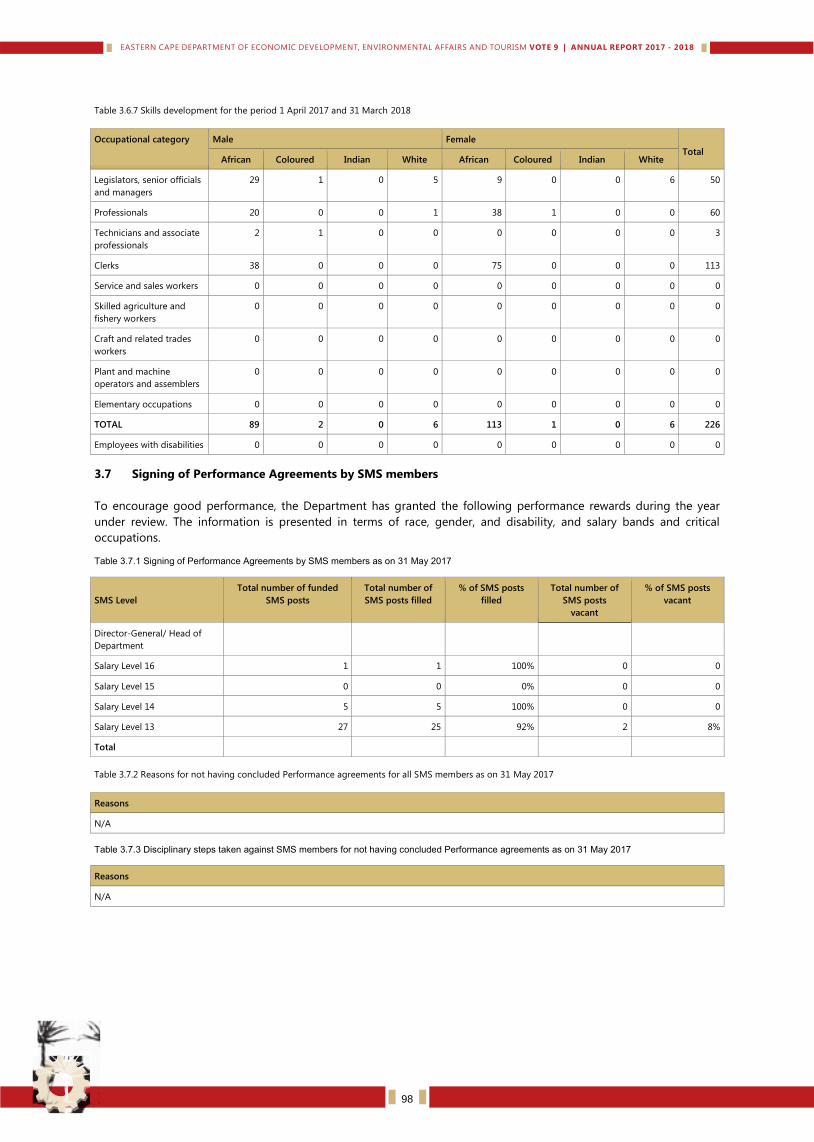
Table 3.6.7 Skills development for the period 1 April 2017 and 31 March 2018
Occupational category Male Female
Total African Coloured Indian White African Coloured Indian White
Legislators, senior officials
and managers
29 1 0 5 9 0 0 6 50
Professionals 20 0 0 1 38 1 0 0 60
Technicians and associate
professionals
2 1 0 0 0 0 0 0 3
Clerks 38 0 0 0 75 0 0 0 113
Service and sales workers 0 0 0 0 0 0 0 0 0
Skilled agriculture and
fishery workers
0 0 0 0 0 0 0 0 0
Craft and related trades
workers
0 0 0 0 0 0 0 0 0
Plant and machine
operators and assemblers
0 0 0 0 0 0 0 0 0
Elementary occupations 0 0 0 0 0 0 0 0 0
TOTAL 89 2 0 6 113 1 0 6 226
Employees with disabilities 0 0 0 0 0 0 0 0 0
3.7 Signing of Performance Agreements by SMS members
To encourage good performance, the Department has granted the following performance rewards during the year
under review. The information is presented in terms of race, gender, and disability, and salary bands and critical
occupations. Table 3.7.1 Signing of Performance Agreements by SMS members as on 31 May 2017
SMS Level
Total number of funded
SMS posts
Total number of
SMS posts filled
% of SMS posts
filled
Total number of
SMS posts
vacant
% of SMS posts
vacant
Director-General/ Head of
Department
Salary Level 16 1 1 100% 0 0
Salary Level 15 0 0 0% 0 0
Salary Level 14 5 5 100% 0 0
Salary Level 13 27 25 92% 2 8%
Total
Table 3.7.2 Reasons for not having concluded Performance agreements for all SMS members as on 31 May 2017
Reasons
N/A
Table 3.7.3 Disciplinary steps taken against SMS members for not having concluded Performance agreements as on 31 May 2017
Reasons
N/A
98
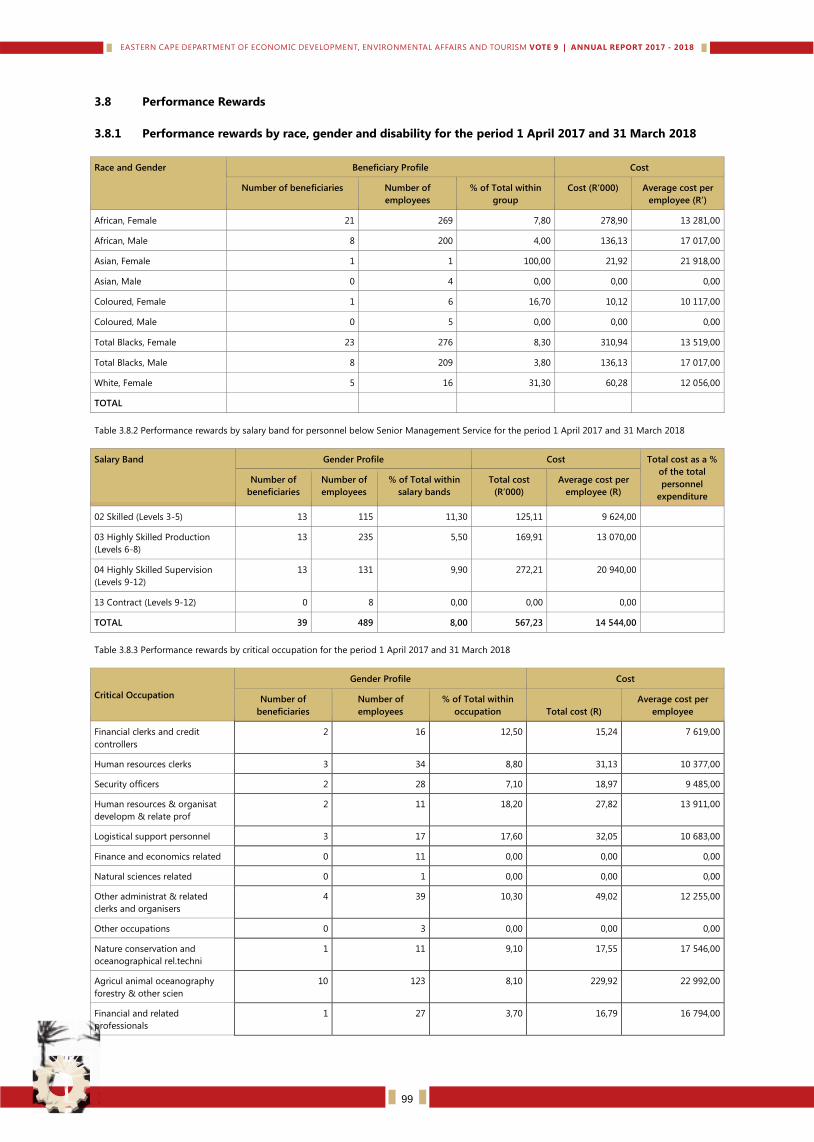
3.8 Performance Rewards
3.8.1 Performance rewards by race, gender and disability for the period 1 April 2017 and 31 March 2018
Race and Gender Beneficiary Profile Cost
Number of beneficiaries Number of
employees
% of Total within
group
Cost (R’000) Average cost per
employee (R’)
African, Female 21 269 7,80 278,90 13 281,00
African, Male 8 200 4,00 136,13 17 017,00
Asian, Female 1 1 100,00 21,92 21 918,00
Asian, Male 0 4 0,00 0,00 0,00
Coloured, Female 1 6 16,70 10,12 10 117,00
Coloured, Male 0 5 0,00 0,00 0,00
Total Blacks, Female 23 276 8,30 310,94 13 519,00
Total Blacks, Male 8 209 3,80 136,13 17 017,00
White, Female 5 16 31,30 60,28 12 056,00
TOTAL
Table 3.8.2 Performance rewards by salary band for personnel below Senior Management Service for the period 1 April 2017 and 31 March 2018
Salary Band Gender Profile Cost Total cost as a %
of the total
personnel
expenditure
Number of
beneficiaries
Number of
employees
% of Total within
salary bands
Total cost
(R’000)
Average cost per
employee (R)
02 Skilled (Levels 3-5) 13 115 11,30 125,11 9 624,00
03 Highly Skilled Production
(Levels 6-8)
13 235 5,50 169,91 13 070,00
04 Highly Skilled Supervision
(Levels 9-12)
13 131 9,90 272,21 20 940,00
13 Contract (Levels 9-12) 0 8 0,00 0,00 0,00
TOTAL 39 489 8,00 567,23 14 544,00
Table 3.8.3 Performance rewards by critical occupation for the period 1 April 2017 and 31 March 2018
Critical Occupation
Gender Profile Cost
Number of
beneficiaries
Number of
employees
% of Total within
occupation
Total cost (R)
Average cost per
employee
Financial clerks and credit
controllers
2 16 12,50 15,24 7 619,00
Human resources clerks 3 34 8,80 31,13 10 377,00
Security officers 2 28 7,10 18,97 9 485,00
Human resources & organisat
developm & relate prof
2 11 18,20 27,82 13 911,00
Logistical support personnel 3 17 17,60 32,05 10 683,00
Finance and economics related 0 11 0,00 0,00 0,00
Natural sciences related 0 1 0,00 0,00 0,00
Other administrat & related
clerks and organisers
4 39 10,30 49,02 12 255,00
Other occupations 0 3 0,00 0,00 0,00
Nature conservation and
oceanographical rel.techni
1 11 9,10 17,55 17 546,00
Agricul animal oceanography
forestry & other scien
10 123 8,10 229,92 22 992,00
Financial and related
professionals
1 27 3,70 16,79 16 794,00
99
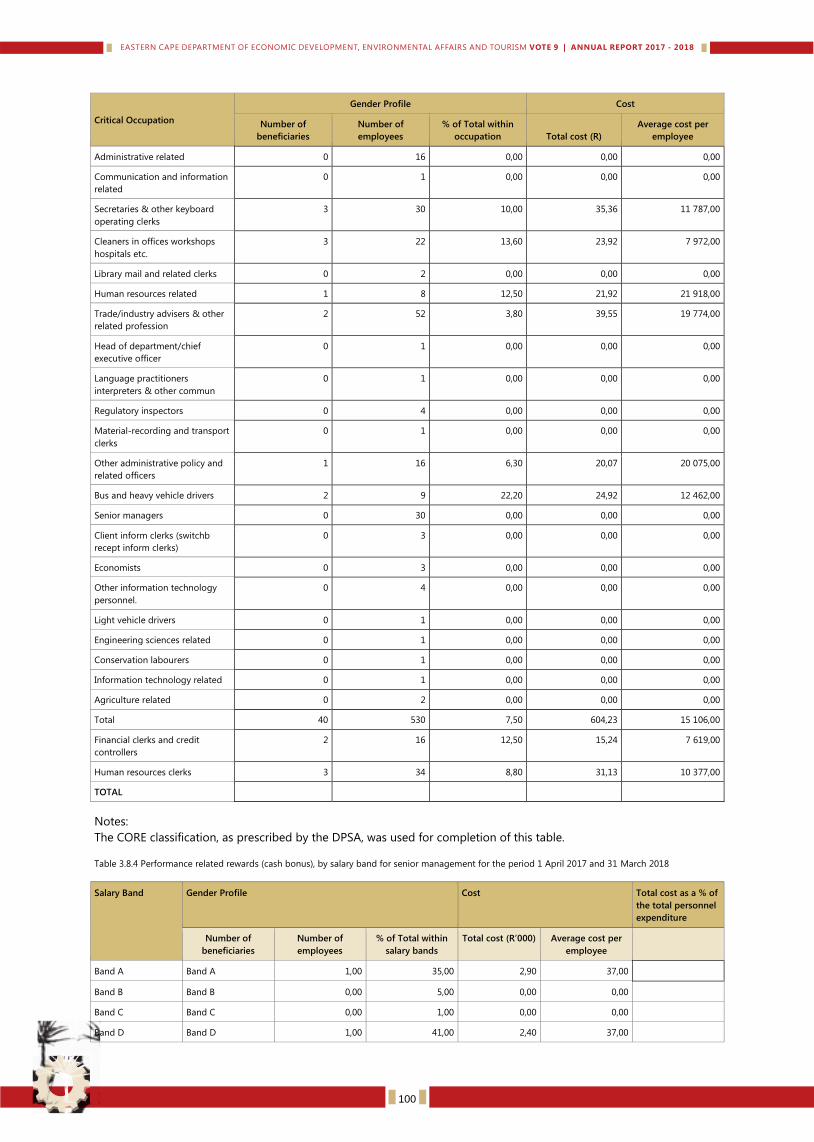
Critical Occupation
Gender Profile Cost
Number of
beneficiaries
Number of
employees
% of Total within
occupation
Total cost (R)
Average cost per
employee
Administrative related 0 16 0,00 0,00 0,00
Communication and information
related
0 1 0,00 0,00 0,00
Secretaries & other keyboard
operating clerks
3 30 10,00 35,36 11 787,00
Cleaners in offices workshops
hospitals etc.
3 22 13,60 23,92 7 972,00
Library mail and related clerks 0 2 0,00 0,00 0,00
Human resources related 1 8 12,50 21,92 21 918,00
Trade/industry advisers & other
related profession
2 52 3,80 39,55 19 774,00
Head of department/chief
executive officer
0 1 0,00 0,00 0,00
Language practitioners
interpreters & other commun
0 1 0,00 0,00 0,00
Regulatory inspectors 0 4 0,00 0,00 0,00
Material-recording and transport
clerks
0 1 0,00 0,00 0,00
Other administrative policy and
related officers
1 16 6,30 20,07 20 075,00
Bus and heavy vehicle drivers 2 9 22,20 24,92 12 462,00
Senior managers 0 30 0,00 0,00 0,00
Client inform clerks (switchb
recept inform clerks)
0 3 0,00 0,00 0,00
Economists 0 3 0,00 0,00 0,00
Other information technology
personnel.
0 4 0,00 0,00 0,00
Light vehicle drivers 0 1 0,00 0,00 0,00
Engineering sciences related 0 1 0,00 0,00 0,00
Conservation labourers 0 1 0,00 0,00 0,00
Information technology related 0 1 0,00 0,00 0,00
Agriculture related 0 2 0,00 0,00 0,00
Total 40 530 7,50 604,23 15 106,00
Financial clerks and credit
controllers
2 16 12,50 15,24 7 619,00
Human resources clerks 3 34 8,80 31,13 10 377,00
TOTAL
Notes:
The CORE classification, as prescribed by the DPSA, was used for completion of this table.
Table 3.8.4 Performance related rewards (cash bonus), by salary band for senior management for the period 1 April 2017 and 31 March 2018
Salary Band Gender Profile Cost Total cost as a % of
the total personnel
expenditure
Number of
beneficiaries
Number of
employees
% of Total within
salary bands
Total cost (R’000) Average cost per
employee
Band A Band A 1,00 35,00 2,90 37,00
Band B Band B 0,00 5,00 0,00 0,00
Band C Band C 0,00 1,00 0,00 0,00
Band D Band D 1,00 41,00 2,40 37,00
100
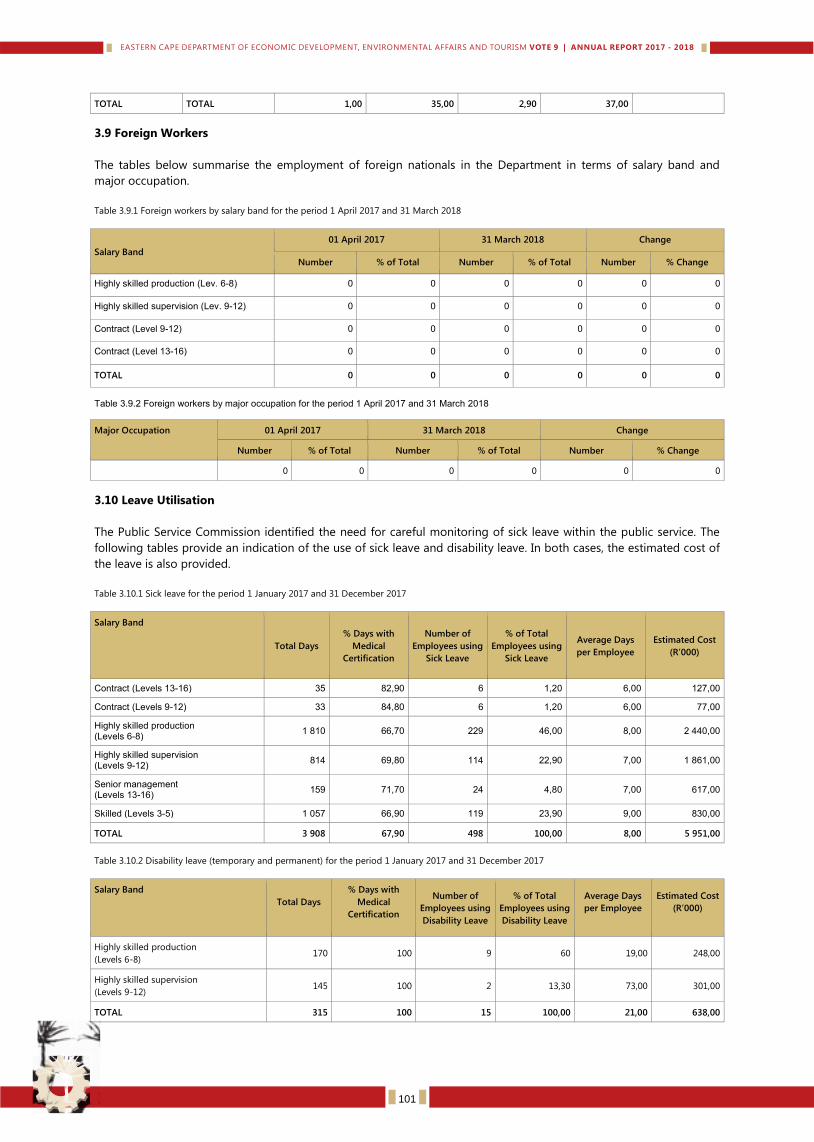
TOTAL TOTAL 1,00 35,00 2,90 37,00
3.9 Foreign Workers
The tables below summarise the employment of foreign nationals in the Department in terms of salary band and
major occupation.
Table 3.9.1 Foreign workers by salary band for the period 1 April 2017 and 31 March 2018
Salary Band
01 April 2017 31 March 2018
Change
Number
% of Total
Number
% of Total
Number
% Change
Highly skilled production (Lev. 6-8) 0 0 0 0 0 0
Highly skilled supervision (Lev. 9-12) 0 0 0 0 0 0
Contract (Level 9-12) 0 0 0 0 0 0
Contract (Level 13-16) 0 0 0 0 0 0
TOTAL
0 0 0 0 0 0
Table 3.9.2 Foreign workers by major occupation for the period 1 April 2017 and 31 March 2018
Major Occupation 01 April 2017 31 March 2018 Change
Number % of Total Number % of Total Number % Change
0 0 0 0 0 0
3.10 Leave Utilisation
The Public Service Commission identified the need for careful monitoring of sick leave within the public service. The
following tables provide an indication of the use of sick leave and disability leave. In both cases, the estimated cost of
the leave is also provided.
Table 3.10.1 Sick leave for the period 1 January 2017 and 31 December 2017
Salary Band
Total Days
% Days with
Medical
Certification
Number of
Employees using
Sick Leave
% of Total
Employees using
Sick Leave
Average Days
per Employee
Estimated Cost
(R’000)
Contract (Levels 13-16) 35 82,90 6 1,20 6,00 127,00
Contract (Levels 9-12) 33 84,80 6 1,20 6,00 77,00
Highly skilled production (Levels 6-8) 1 810 66,70 229 46,00 8,00 2 440,00
Highly skilled supervision (Levels 9-12) 814 69,80 114 22,90 7,00 1 861,00
Senior management (Levels 13-16) 159 71,70 24 4,80 7,00 617,00
Skilled (Levels 3-5) 1 057 66,90 119 23,90 9,00 830,00
TOTAL 3 908 67,90 498 100,00 8,00 5 951,00
Table 3.10.2 Disability leave (temporary and permanent) for the period 1 January 2017 and 31 December 2017
Salary Band
Total Days
% Days with
Medical
Certification
Number of
Employees using
Disability Leave
% of Total
Employees using
Disability Leave
Average Days
per Employee
Estimated Cost
(R’000)
Highly skilled production
(Levels 6-8) 170 100 9 60 19,00 248,00
Highly skilled supervision
(Levels 9-12) 145 100 2 13,30 73,00 301,00
TOTAL 315 100 15 100,00 21,00 638,00
101
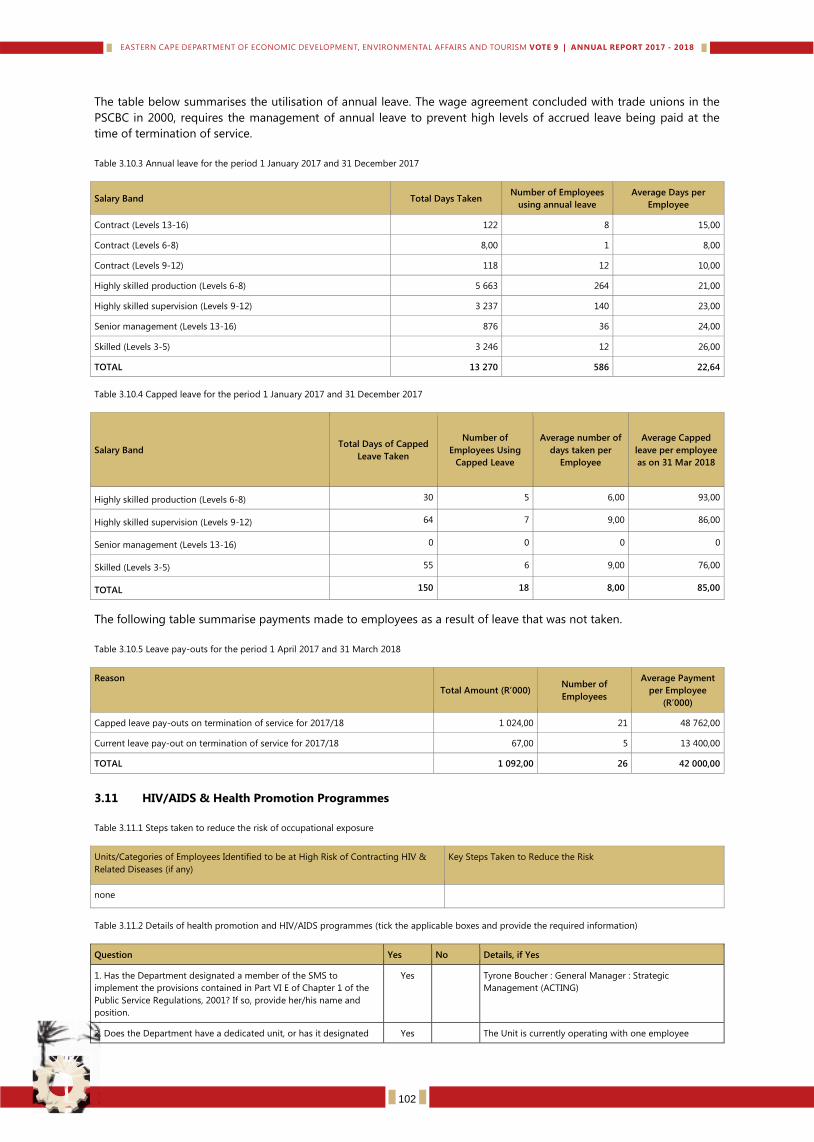
The table below summarises the utilisation of annual leave. The wage agreement concluded with trade unions in the
PSCBC in 2000, requires the management of annual leave to prevent high levels of accrued leave being paid at the
time of termination of service.
Table 3.10.3 Annual leave for the period 1 January 2017 and 31 December 2017
Salary Band Total Days Taken Number of Employees
using annual leave
Average Days per
Employee
Contract (Levels 13-16) 122 8 15,00
Contract (Levels 6-8) 8,00 1 8,00
Contract (Levels 9-12) 118 12 10,00
Highly skilled production (Levels 6-8) 5 663 264 21,00
Highly skilled supervision (Levels 9-12) 3 237 140 23,00
Senior management (Levels 13-16) 876 36 24,00
Skilled (Levels 3-5) 3 246 12 26,00
TOTAL 13 270 586 22,64
Table 3.10.4 Capped leave for the period 1 January 2017 and 31 December 2017
Salary Band Total Days of Capped
Leave Taken
Number of
Employees Using
Capped Leave
Average number of
days taken per
Employee
Average Capped
leave per employee
as on 31 Mar 2018
Highly skilled production (Levels 6-8) 30 5 6,00 93,00
Highly skilled supervision (Levels 9-12) 64 7 9,00 86,00
Senior management (Levels 13-16) 0 0 0 0
Skilled (Levels 3-5) 55 6 9,00 76,00
TOTAL 150 18 8,00 85,00
The following table summarise payments made to employees as a result of leave that was not taken.
Table 3.10.5 Leave pay-outs for the period 1 April 2017 and 31 March 2018
Reason
Total Amount (R’000) Number of
Employees
Average Payment
per Employee
(R’000)
Capped leave pay-outs on termination of service for 2017/18 1 024,00 21 48 762,00
Current leave pay-out on termination of service for 2017/18 67,00 5 13 400,00
TOTAL 1 092,00 26 42 000,00
3.11 HIV/AIDS & Health Promotion Programmes
Table 3.11.1 Steps taken to reduce the risk of occupational exposure
Units/Categories of Employees Identified to be at High Risk of Contracting HIV &
Related Diseases (if any)
Key Steps Taken to Reduce the Risk
none
Table 3.11.2 Details of health promotion and HIV/AIDS programmes (tick the applicable boxes and provide the required information)
Question Yes No Details, if Yes
1. Has the Department designated a member of the SMS to
implement the provisions contained in Part VI E of Chapter 1 of the
Public Service Regulations, 2001? If so, provide her/his name and
position.
Yes Tyrone Boucher : General Manager : Strategic
Management (ACTING)
2. Does the Department have a dedicated unit, or has it designated Yes The Unit is currently operating with one employee
102
specific staff members, to promote the health and well-being of
employees? If so, indicate the number of employees who are
involved in this task and the annual budget that is available for this
purpose.
because another one is on suspension, according to the
organogram there supposed to be 2.
The annual Budget that is available is 195 500.00
103
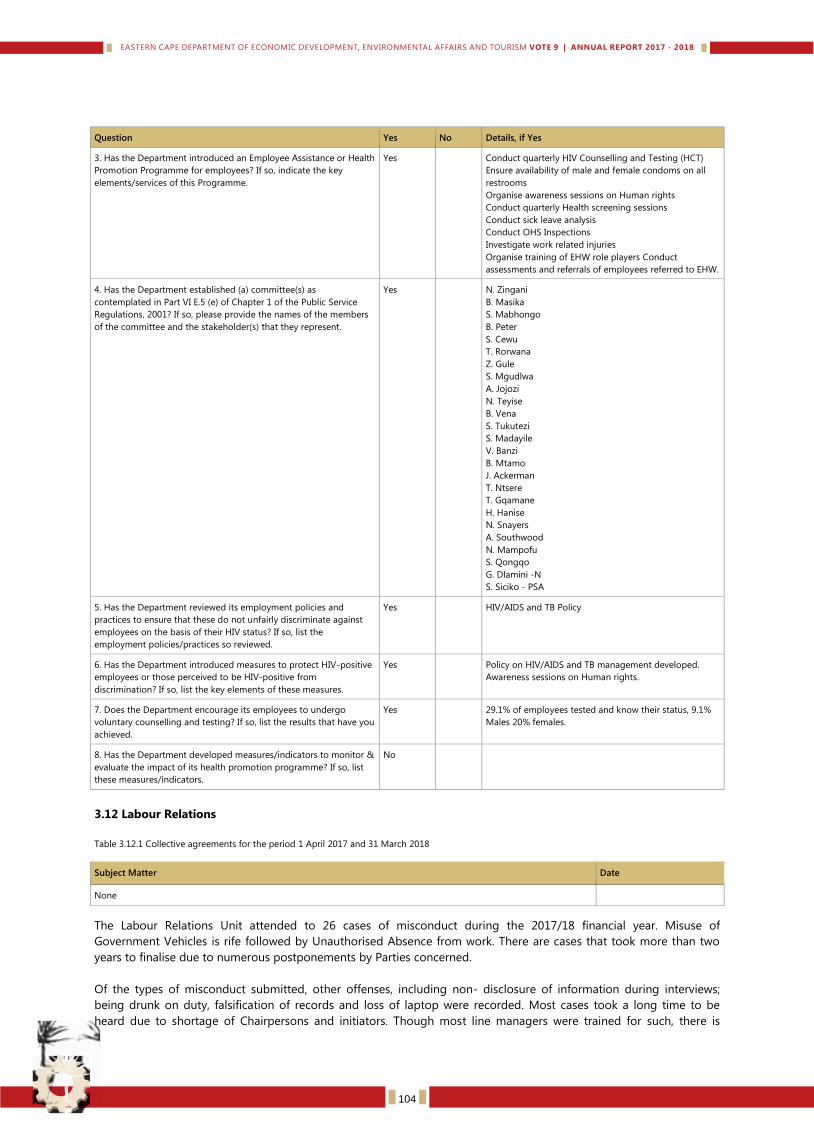
Question Yes No Details, if Yes
3. Has the Department introduced an Employee Assistance or Health
Promotion Programme for employees? If so, indicate the key
elements/services of this Programme.
Yes Conduct quarterly HIV Counselling and Testing (HCT)
Ensure availability of male and female condoms on all
restrooms
Organise awareness sessions on Human rights
Conduct quarterly Health screening sessions
Conduct sick leave analysis
Conduct OHS Inspections
Investigate work related injuries
Organise training of EHW role players Conduct
assessments and referrals of employees referred to EHW.
4. Has the Department established (a) committee(s) as
contemplated in Part VI E.5 (e) of Chapter 1 of the Public Service
Regulations, 2001? If so, please provide the names of the members
of the committee and the stakeholder(s) that they represent.
Yes N. Zingani
B. Masika
S. Mabhongo
B. Peter
S. Cewu
T. Rorwana
Z. Gule
S. Mgudlwa
A. Jojozi
N. Teyise
B. Vena
S. Tukutezi
S. Madayile
V. Banzi
B. Mtamo
J. Ackerman
T. Ntsere
T. Gqamane
H. Hanise
N. Snayers
A. Southwood
N. Mampofu
S. Qongqo
G. Dlamini -N
S. Siciko - PSA
5. Has the Department reviewed its employment policies and
practices to ensure that these do not unfairly discriminate against
employees on the basis of their HIV status? If so, list the
employment policies/practices so reviewed.
Yes HIV/AIDS and TB Policy
6. Has the Department introduced measures to protect HIV-positive
employees or those perceived to be HIV-positive from
discrimination? If so, list the key elements of these measures.
Yes Policy on HIV/AIDS and TB management developed.
Awareness sessions on Human rights.
7. Does the Department encourage its employees to undergo
voluntary counselling and testing? If so, list the results that have you
achieved.
Yes 29.1% of employees tested and know their status, 9.1%
Males 20% females.
8. Has the Department developed measures/indicators to monitor &
evaluate the impact of its health promotion programme? If so, list
these measures/indicators.
No
3.12 Labour Relations
Table 3.12.1 Collective agreements for the period 1 April 2017 and 31 March 2018
Subject Matter
Date
None
The Labour Relations Unit attended to 26 cases of misconduct during the 2017/18 financial year. Misuse of
Government Vehicles is rife followed by Unauthorised Absence from work. There are cases that took more than two
years to finalise due to numerous postponements by Parties concerned.
Of the types of misconduct submitted, other offenses, including non- disclosure of information during interviews;
being drunk on duty, falsification of records and loss of laptop were recorded. Most cases took a long time to be
heard due to shortage of Chairpersons and initiators. Though most line managers were trained for such, there is
104
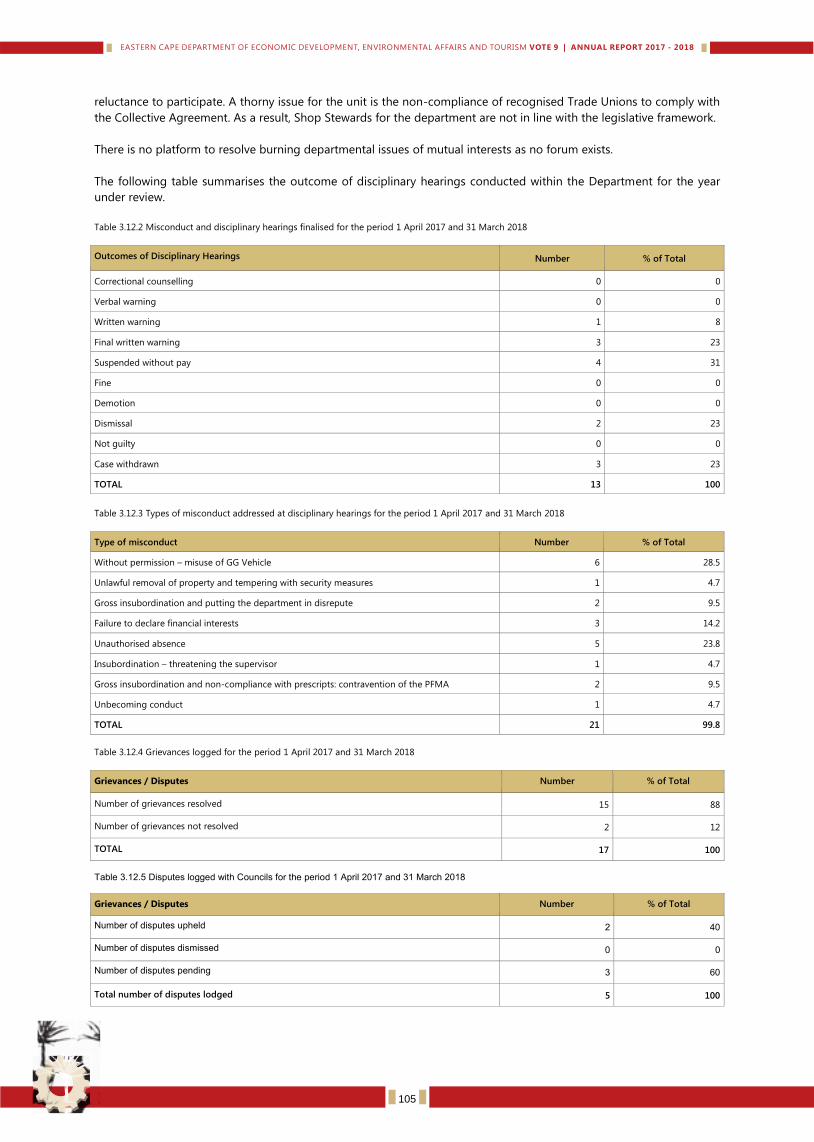
reluctance to participate. A thorny issue for the unit is the non-compliance of recognised Trade Unions to comply with
the Collective Agreement. As a result, Shop Stewards for the department are not in line with the legislative framework.
There is no platform to resolve burning departmental issues of mutual interests as no forum exists.
The following table summarises the outcome of disciplinary hearings conducted within the Department for the year
under review.
Table 3.12.2 Misconduct and disciplinary hearings finalised for the period 1 April 2017 and 31 March 2018
Outcomes of Disciplinary Hearings Number % of Total
Correctional counselling 0 0
Verbal warning 0 0
Written warning 1 8
Final written warning 3 23
Suspended without pay 4 31
Fine 0 0
Demotion 0 0
Dismissal 2 23
Not guilty 0 0
Case withdrawn 3 23
TOTAL 13 100
Table 3.12.3 Types of misconduct addressed at disciplinary hearings for the period 1 April 2017 and 31 March 2018
Type of misconduct Number % of Total
Without permission – misuse of GG Vehicle 6 28.5
Unlawful removal of property and tempering with security measures 1 4.7
Gross insubordination and putting the department in disrepute 2 9.5
Failure to declare financial interests 3 14.2
Unauthorised absence 5 23.8
Insubordination – threatening the supervisor 1 4.7
Gross insubordination and non-compliance with prescripts: contravention of the PFMA 2 9.5
Unbecoming conduct 1 4.7
TOTAL 21 99.8
Table 3.12.4 Grievances logged for the period 1 April 2017 and 31 March 2018
Grievances / Disputes Number
% of Total
Number of grievances resolved
Number of
15 88
Number of grievances not resolved
2 12
TOTAL
17 100
Table 3.12.5 Disputes logged with Councils for the period 1 April 2017 and 31 March 2018
Grievances / Disputes Number
% of Total
Number of disputes upheld
2 40
Number of disputes dismissed
0 0
Number of disputes pending 3 60
Total number of disputes lodged
5 100
105
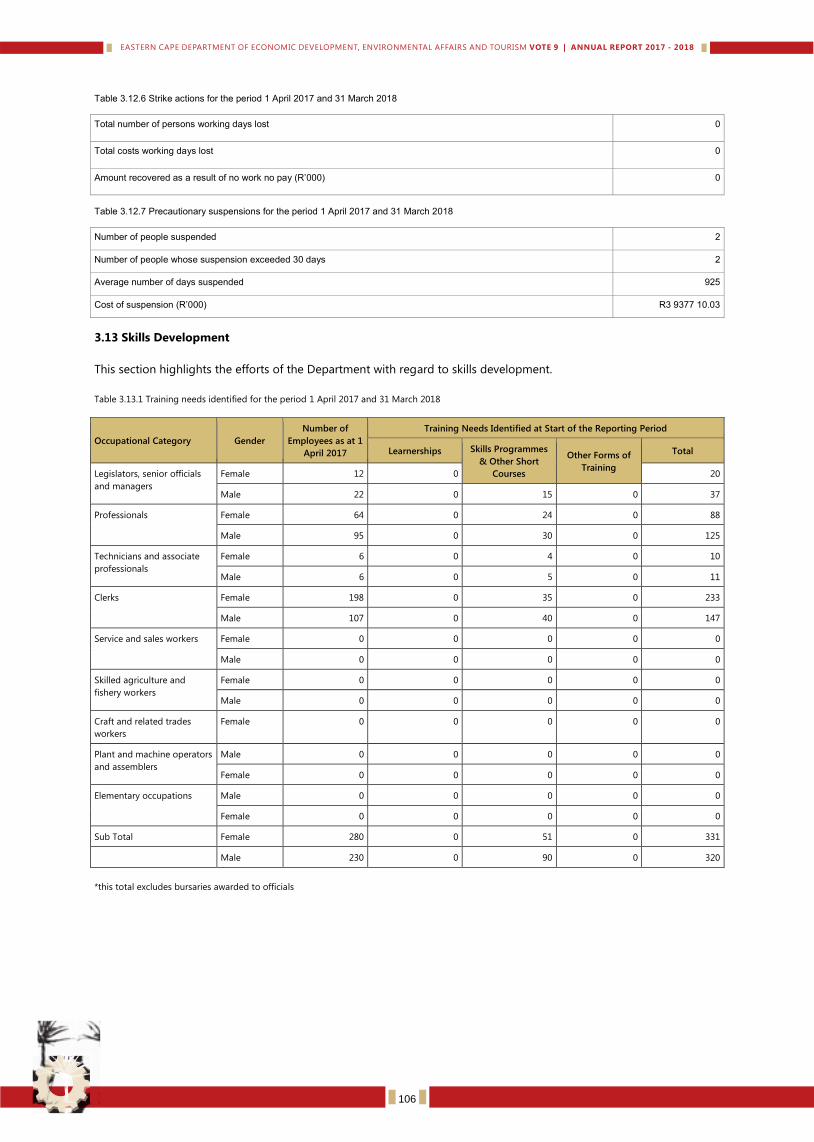
Table 3.12.6 Strike actions for the period 1 April 2017 and 31 March 2018 Total number of persons working days lost 0
Total costs working days lost 0
Amount recovered as a result of no work no pay (R’000) 0
Table 3.12.7 Precautionary suspensions for the period 1 April 2017 and 31 March 2018 Number of people suspended
2
Number of people whose suspension exceeded 30 days
2
Average number of days suspended
925
Cost of suspension (R’000)
R3 9377 10.03
3.13 Skills Development
This section highlights the efforts of the Department with regard to skills development.
Table 3.13.1 Training needs identified for the period 1 April 2017 and 31 March 2018
Occupational Category Gender
Number of
Employees as at 1
April 2017
Training Needs Identified at Start of the Reporting Period
Learnerships Skills Programmes
& Other Short
Courses
Other Forms of
Training
Total
Legislators, senior officials
and managers
Female 12 0 20
Male 22 0 15 0 37
Professionals Female 64 0 24 0 88
Male 95 0 30 0 125
Technicians and associate
professionals
Female 6 0 4 0 10
Male 6 0 5 0 11
Clerks Female 198 0 35 0 233
Male 107 0 40 0 147
Service and sales workers Female 0 0 0 0 0
Male 0 0 0 0 0
Skilled agriculture and
fishery workers
Female 0 0 0 0 0
Male 0 0 0 0 0
Craft and related trades
workers
Female 0 0 0 0 0
Plant and machine operators
and assemblers
Male 0 0 0 0 0
Female 0 0 0 0 0
Elementary occupations Male 0 0 0 0 0
Female 0 0 0 0 0
Sub Total Female 280 0 51 0 331
Male 230 0 90 0 320
*this total excludes bursaries awarded to officials
106
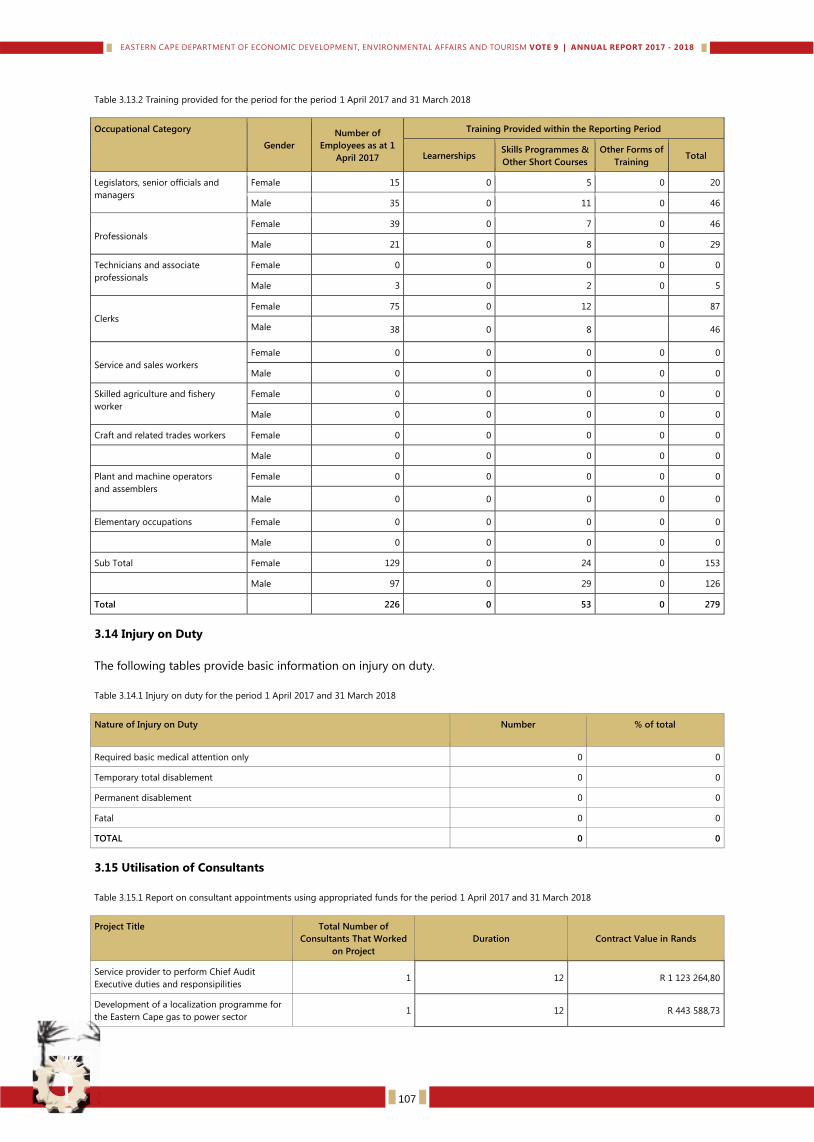
Table 3.13.2 Training provided for the period for the period 1 April 2017 and 31 March 2018
Occupational Category
Gender
Number of
Employees as at 1
April 2017
Training Provided within the Reporting Period
Learnerships Skills Programmes &
Other Short Courses
Other Forms of
Training Total
Legislators, senior officials and
managers
Female 15 0 5 0 20
Male 35 0 11 0 46
Professionals
Female 39 0 7 0 46
Male 21 0 8 0 29
Technicians and associate
professionals
Female 0 0 0 0 0
Male 3 0 2 0 5
Clerks
Female 75 0 12 87
Male 38 0 8 46
Service and sales workers
Female 0 0 0 0 0
Male 0 0 0 0 0
Skilled agriculture and fishery
worker
Female 0 0 0 0 0
Male 0 0 0 0 0
Craft and related trades workers Female 0 0 0 0 0
Male 0 0 0 0 0
Plant and machine operators
and assemblers
Female 0 0 0 0 0
Male 0 0 0 0 0
Elementary occupations Female 0 0 0 0 0
Male 0 0 0 0 0
Sub Total Female 129 0 24 0 153
Male 97 0 29 0 126
Total 226 0 53 0 279
3.14 Injury on Duty
The following tables provide basic information on injury on duty.
Table 3.14.1 Injury on duty for the period 1 April 2017 and 31 March 2018
Nature of Injury on Duty
Number
% of total
Required basic medical attention only 0 0
Temporary total disablement 0 0
Permanent disablement 0 0
Fatal 0 0
TOTAL 0 0
3.15 Utilisation of Consultants
Table 3.15.1 Report on consultant appointments using appropriated funds for the period 1 April 2017 and 31 March 2018
Project Title
Total Number of
Consultants That Worked
on Project
Duration Contract Value in Rands
Service provider to perform Chief Audit
Executive duties and responsipilities 1 12 R 1 123 264,80
Development of a localization programme for
the Eastern Cape gas to power sector 1 12 R 443 588,73
107
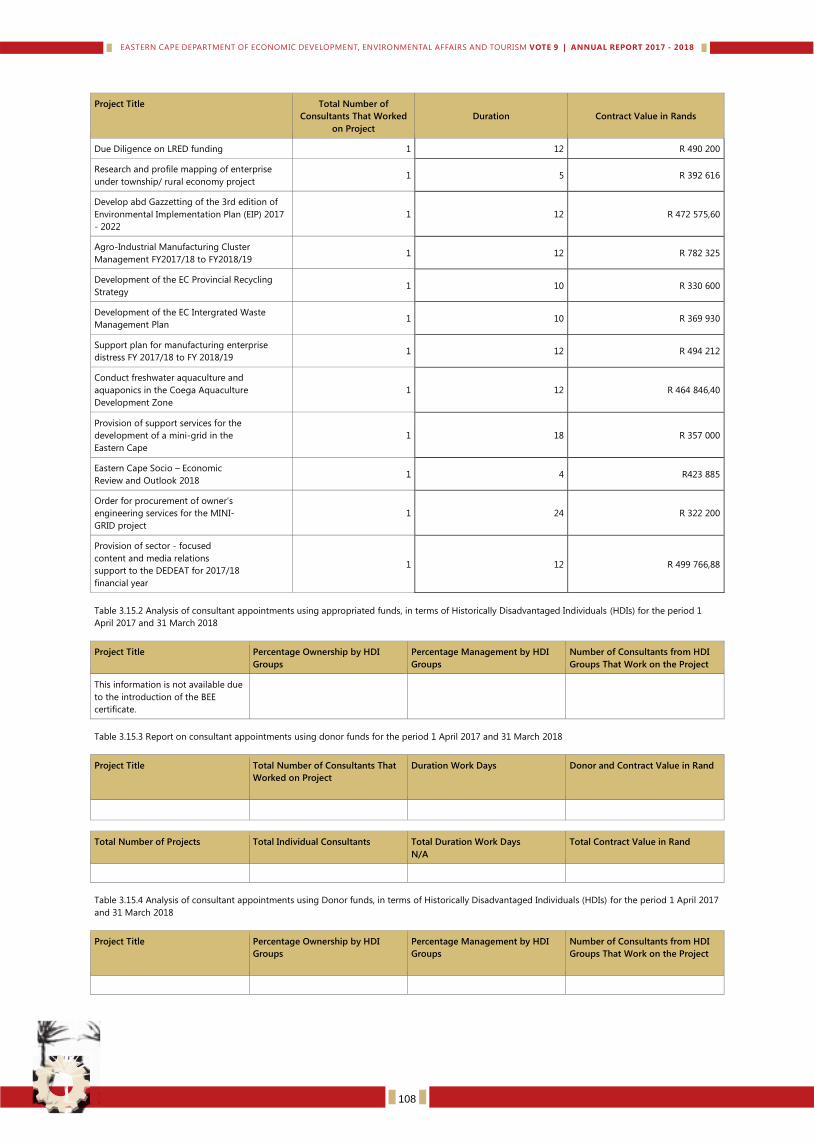
Project Title
Total Number of
Consultants That Worked
on Project
Duration Contract Value in Rands
Due Diligence on LRED funding 1 12 R 490 200
Research and profile mapping of enterprise
under township/ rural economy project 1 5 R 392 616
Develop abd Gazzetting of the 3rd edition of
Environmental Implementation Plan (EIP) 2017
- 2022
1 12 R 472 575,60
Agro-Industrial Manufacturing Cluster
Management FY2017/18 to FY2018/19 1 12 R 782 325
Development of the EC Provincial Recycling
Strategy 1 10 R 330 600
Development of the EC Intergrated Waste
Management Plan 1 10 R 369 930
Support plan for manufacturing enterprise
distress FY 2017/18 to FY 2018/19 1 12 R 494 212
Conduct freshwater aquaculture and
aquaponics in the Coega Aquaculture
Development Zone
1 12 R 464 846,40
Provision of support services for the
development of a mini-grid in the
Eastern Cape
1 18 R 357 000
Eastern Cape Socio – Economic
Review and Outlook 2018 1 4 R423 885
Order for procurement of owner's
engineering services for the MINI-
GRID project
1 24 R 322 200
Provision of sector - focused
content and media relations
support to the DEDEAT for 2017/18
financial year
1 12 R 499 766,88
Table 3.15.2 Analysis of consultant appointments using appropriated funds, in terms of Historically Disadvantaged Individuals (HDIs) for the period 1
April 2017 and 31 March 2018
Project Title
Percentage Ownership by HDI
Groups
Percentage Management by HDI
Groups
Number of Consultants from HDI
Groups That Work on the Project
This information is not available due
to the introduction of the BEE
certificate.
Table 3.15.3 Report on consultant appointments using donor funds for the period 1 April 2017 and 31 March 2018
Project Title
Total Number of Consultants That
Worked on Project
Duration Work Days
Donor and Contract Value in Rand
Total Number of Projects
Total Individual Consultants
Total Duration Work Days
N/A
Total Contract Value in Rand
Table 3.15.4 Analysis of consultant appointments using Donor funds, in terms of Historically Disadvantaged Individuals (HDIs) for the period 1 April 2017
and 31 March 2018
Project Title
Percentage Ownership by HDI
Groups
Percentage Management by HDI
Groups
Number of Consultants from HDI
Groups That Work on the Project
108
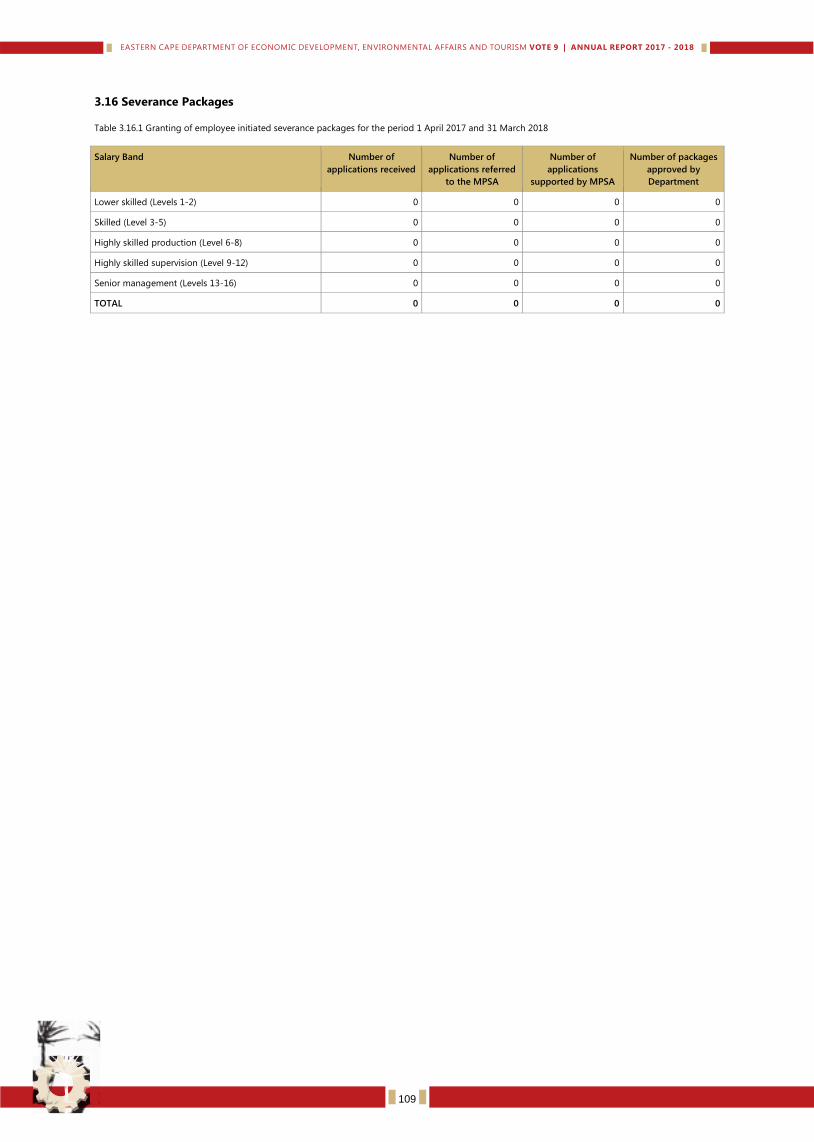
3.16 Severance Packages
Table 3.16.1 Granting of employee initiated severance packages for the period 1 April 2017 and 31 March 2018
Salary Band
Number of
applications received
Number of
applications referred
to the MPSA
Number of
applications
supported by MPSA
Number of packages
approved by
Department
Lower skilled (Levels 1-2) 0 0 0 0
Skilled (Level 3-5) 0 0 0 0
Highly skilled production (Level 6-8) 0 0 0 0
Highly skilled supervision (Level 9-12) 0 0 0 0
Senior management (Levels 13-16) 0 0 0 0
TOTAL 0 0 0 0
109

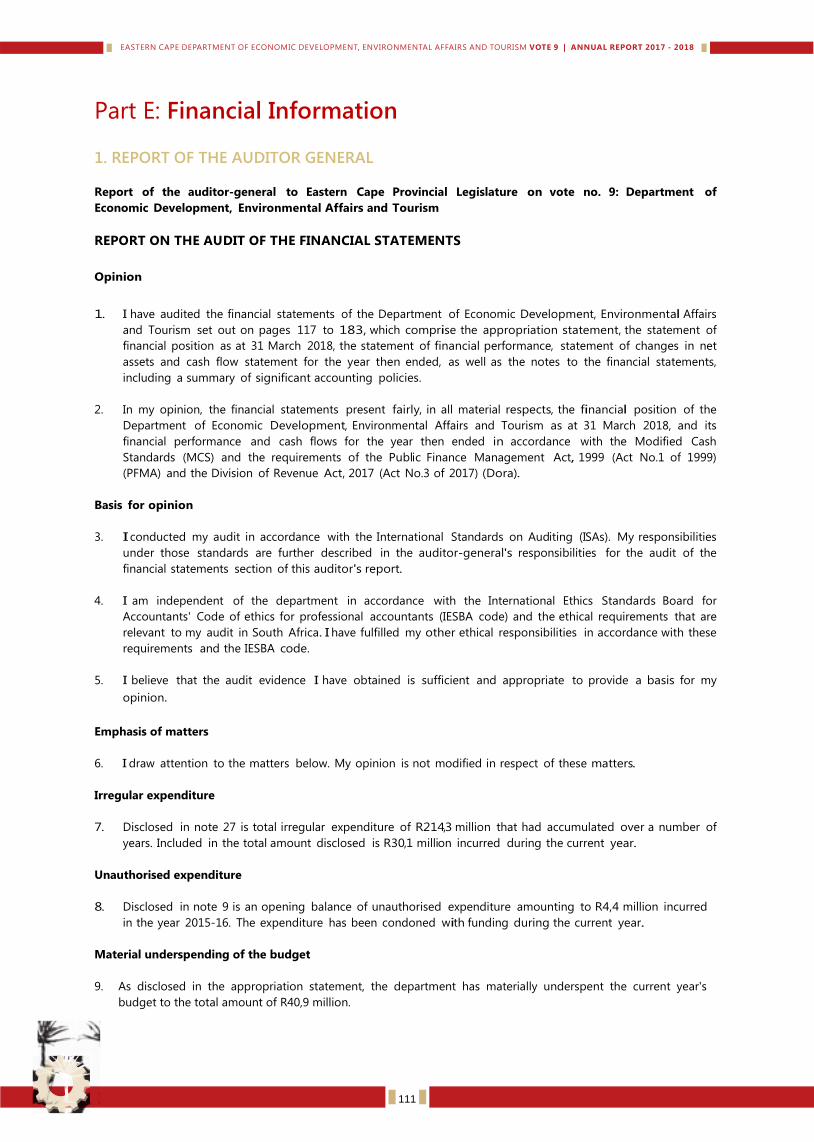
Part E: Financial Information
1. REPORT OF THE AUDITOR GENERAL
Report of the auditor-general to Eastern Cape Provincial Legislature on vote no. 9: Department of
Economic Development, Environmental Affairs and Tourism
REPORT ON THE AUDIT OF THE FINANCIAL STATEMENTS
Opinion
1. I have audited the financial statements of the Department of Economic Development, Environmental Affairs
and Tourism set out on pages 117 to 183, which comprise the appropriation statement, the statement of
financial position as at 31 March 2018, the statement of financial performance, statement of changes in net
assets and cash flow statement for the year then ended, as well as the notes to the financial statements,
including a summary of significant accounting policies.
2. In my opinion, the financial statements present fairly, in all material respects, the financial position of the
Department of Economic Development, Environmental Affairs and Tourism as at 31 March 2018, and its
financial performance and cash flows for the year then ended in accordance with the Modified Cash
Standards (MCS) and the requirements of the Public Finance Management Act, 1999 (Act No.1 of 1999)
(PFMA) and the Division of Revenue Act, 2017 (Act No.3 of 2017) (Dora).
Basis for opinion
3. I conducted my audit in accordance with the International Standards on Auditing (ISAs). My responsibilities
under those standards are further described in the auditor-general's responsibilities for the audit of the
financial statements section of this auditor's report.
4. I am independent of the department in accordance with the International Ethics Standards Board for
Accountants' Code of ethics for professional accountants (IESBA code) and the ethical requirements that are
relevant to my audit in South Africa. I have fulfilled my other ethical responsibilities in accordance with these
requirements and the IESBA code.
5. I believe that the audit evidence I have obtained is sufficient and appropriate to provide a basis for my
opinion.
Emphasis of matters
6. I draw attention to the matters below. My opinion is not modified in respect of these matters.
Irregular expenditure
7. Disclosed in note 27 is total irregular expenditure of R214,3 million that had accumulated over a number of
years. Included in the total amount disclosed is R30,1 million incurred during the current year.
Unauthorised expenditure
8. Disclosed in note 9 is an opening balance of unauthorised expenditure amounting to R4,4 million incurred
in the year 2015-16. The expenditure has been condoned with funding during the current year.
Material underspending of the budget
9. As disclosed in the appropriation statement, the department has materially underspent the current year's
budget to the total amount of R40,9 million.
111
Restatement of corresponding figures
10. As disclosed in note 35 to the financial statements, the corresponding figures for 31 March 2017 were restated
as a result of an error in the financial statements of the department at, and for the year ended, 31 March 2018.
Other matter
11. I draw attention to the matter below. My opinion is not modified in respect of this matter.
Unaudited supplementary information
12. The supplementary information set out on pages 184 to 199 does not form part of the financial statements
and is presented as additional information. I have not audited these schedules and, accordingly, I do not
express an opinion on them.
Responsibilities of accounting officer for the financial statements
13. The accounting officer is responsible for the preparation and fair presentation of the financial statements in
accordance with the MCS and the requirements of the PFMA and Dora, and for such internal control as the
accounting officer determines is necessary to enable the preparation of financial statements that are free from
material misstatement, whether due to fraud or error.
14. In preparing the financial statements, the accounting officer is responsible for assessing the Department of
Economic Development, Environmental Affairs and Tourism's ability to continue as a going concern, disclosing,
as applicable, matters relating to going concern and using the going concern basis of accounting unless the
accounting officer either intends to liquidate the department or to cease operations, or has no realistic
alternative but to do so.
Auditor-general's responsibilities for the audit of the financial statements
15. My objectives are to obtain reasonable assurance about whether the financial statements as a whole are free from
material misstatement, whether due to fraud or error, and to issue an auditor's report that includes my opinion.
Reasonable assurance is a high level of assurance, but is not a guarantee that an audit conducted in accordance
with the ISAs will always detect a material misstatement when it exists. Misstatements can arise from fraud or
error and are considered material if, individually or in aggregate, they could reasonably be expected to influence
the economic decisions of users taken on the basis of these financial statements.
16. A further description of my responsibilities for the audit of the financial statements is included in the annexure to
this auditor's report.
17.
Report on the audit of the annual performance report
Introduction and scope
17. In accordance with the Public Audit Act of South Africa, 2004 (Act No. 25 of 2004) (PAA) and the general
notice issued in terms thereof, I have a responsibility to report material findings on the reported
performance information against predetermined objectives for selected programmes presented in the
annual performance report. I performed procedures to identify findings but not to gather evidence to
express assurance.
18. My procedures address the reported performance information, which must be based on the approved
performance planning documents of the department. I have not evaluated the completeness and
appropriateness of the performance indicators included in the planning documents. My procedures also
did not extend to any disclosures or assertions relating to planned performance strategies and information
in respect of future periods that may be included as part of the reported performance information.
Accordingly, my findings do not extend to these matters.
19. I evaluated the usefulness and reliability of the reported performance information in accordance with the
criteria developed from the performance management and reporting framework, as defined in the general
notice, for the following selected programmes presented in the annual performance report of the
department for the year ended 31 March 2018:
112
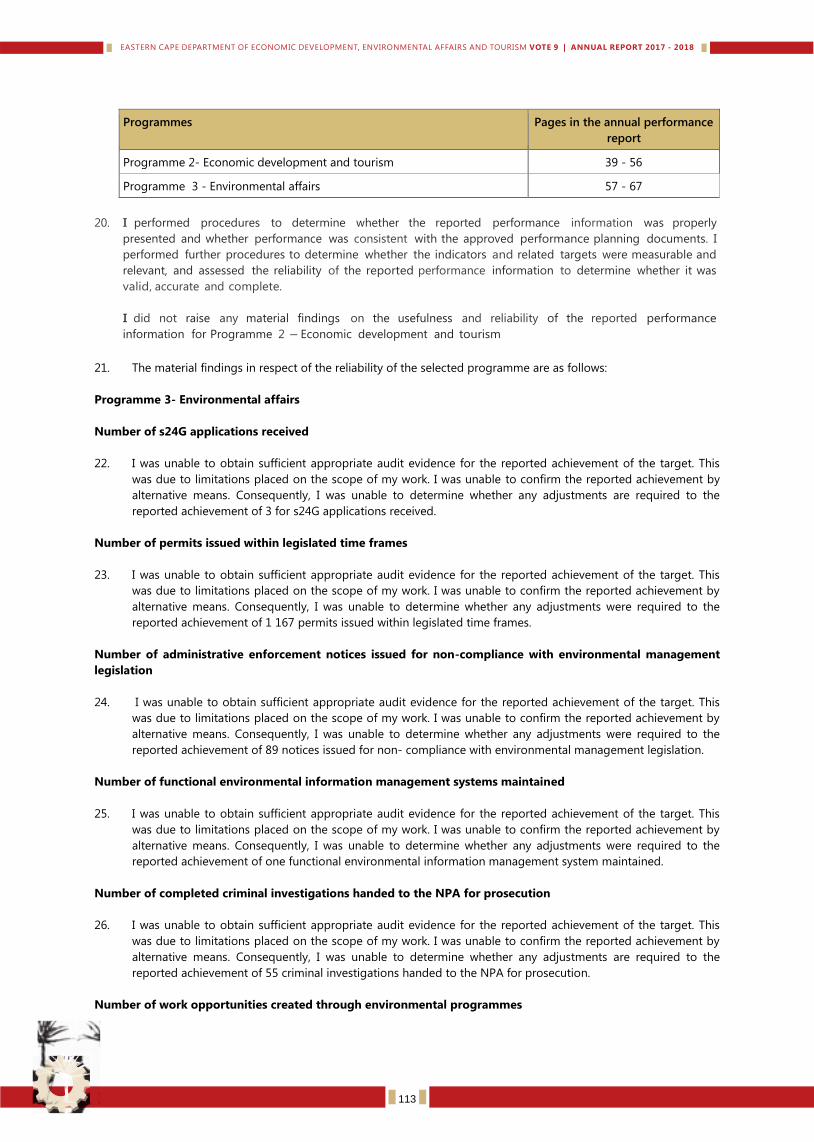
Programmes Pages in the annual performance
report
Programme 2- Economic development and tourism 39 - 56
Programme 3 - Environmental affairs 57 - 67
20. I performed procedures to determine whether the reported performance information was properly
presented and whether performance was consistent with the approved performance planning documents. I
performed further procedures to determine whether the indicators and related targets were measurable and
relevant, and assessed the reliability of the reported performance information to determine whether it was
valid, accurate and complete.
I did not raise any material findings on the usefulness and reliability of the reported performance
information for Programme 2 - Economic development and tourism
21. The material findings in respect of the reliability of the selected programme are as follows:
Programme 3- Environmental affairs
Number of s24G applications received
22. I was unable to obtain sufficient appropriate audit evidence for the reported achievement of the target. This
was due to limitations placed on the scope of my work. I was unable to confirm the reported achievement by
alternative means. Consequently, I was unable to determine whether any adjustments are required to the
reported achievement of 3 for s24G applications received.
Number of permits issued within legislated time frames
23. I was unable to obtain sufficient appropriate audit evidence for the reported achievement of the target. This
was due to limitations placed on the scope of my work. I was unable to confirm the reported achievement by
alternative means. Consequently, I was unable to determine whether any adjustments were required to the
reported achievement of 1 167 permits issued within legislated time frames.
Number of administrative enforcement notices issued for non-compliance with environmental management
legislation
24. I was unable to obtain sufficient appropriate audit evidence for the reported achievement of the target. This
was due to limitations placed on the scope of my work. I was unable to confirm the reported achievement by
alternative means. Consequently, I was unable to determine whether any adjustments were required to the
reported achievement of 89 notices issued for non compliance with environmental management legislation.
Number of functional environmental information management systems maintained
25. I was unable to obtain sufficient appropriate audit evidence for the reported achievement of the target. This
was due to limitations placed on the scope of my work. I was unable to confirm the reported achievement by
alternative means. Consequently, I was unable to determine whether any adjustments were required to the
reported achievement of one functional environmental information management system maintained.
Number of completed criminal investigations handed to the NPA for prosecution
26. I was unable to obtain sufficient appropriate audit evidence for the reported achievement of the target. This
was due to limitations placed on the scope of my work. I was unable to confirm the reported achievement by
alternative means. Consequently, I was unable to determine whether any adjustments are required to the
reported achievement of 55 criminal investigations handed to the NPA for prosecution.
Number of work opportunities created through environmental programmes
113
27. The reported achievement for the target of 921 work opportunities created was misstated as the evidence
provided indicated 239 and not 921 as reported.
Other matters
28. I draw attention to the matters below. Achievement of planned targets
29. Refer to the annual performance report on pages ... to ... for information on the achievement of planned targets
for the year and explanations provided for the under/ over achievement of a significant number of targets. This
information should be considered in the context of the material findings on the reliability of the reported
performance information in paragraphs [x to x] of this report.
Adjustment of material misstatements
30. I identified material misstatements in the annual performance report submitted for auditing.
These material misstatements were on the reported performance information of Economic Development and
Tourism programme. As management subsequently corrected the misstatements, I did not raise any material
findings on the usefulness and reliability of the reported performance information.
Report on the audit of compliance with legislation
Introduction and scope
31. In accordance with the PAA and the general notice issued in terms thereof, I have a responsibility to report
material findings on the compliance of the department with specific matters in key legislation. I performed
procedures to identify findings but not to gather evidence to express assurance.
32. The material findings on compliance with specific matters in key legislations are as follows:
Annual financial statements, performance report and annual report
33. The financial statements submitted for auditing were not prepared in accordance with the prescribed financial
reporting framework and supported by full and proper records as required by section 40(1)(a) and (b) of the
PFMA. Material misstatements of Immovable Tangible Capital Assets identified by the auditors in the submitted
financial statement were corrected and the supporting records were provided subsequently, resulting in the
financial statements receiving an unqualified audit opinion.
Expenditure management
34. Effective steps were not taken to prevent irregular expenditure amounting to R30,1 million as disclosed in note
27 of the AFS, as required by section 38(1) (c)(ii) of the PFMA and treasury regulation 9.1.
Strategic planning and performance management
35. Specific information systems were not established to enable the monitoring of progress made towards
achieving targets, core objectives and service delivery as required by public service regulation 25(1)(e)(i)
and (iii).
Other information
36. The accounting officer is responsible for the other information. The other information comprises the
information included in the annual report. The other information does not include the financial statements,
the auditor's report and those selected programmes presented in the annual performance report that have
been specifically reported in this auditor's report.
37. My opinion on the financial statements and findings on the reported performance information and
compliance with legislation do not cover the other information and I do not express an audit opinion or
any form of assurance conclusion thereon.
114
38. In connection with my audit, my responsibility is to read the other information and, in doing so, consider
whether the other information is materially inconsistent with the financial statements and the selected
programmes presented in the annual performance report, or my knowledge obtained in the audit, or
otherwise appears to be materially misstated.
39. I did not receive the other information prior to the date of this auditor's report. After I receive and read
this information, and if I conclude that there is a material misstatement, I am required to communicate the
matter to those charged with governance and request that the other information be corrected. If the other
information is not corrected, I may have to retract this auditor's report and re-issue an amended report as
appropriate. However, if it is corrected this will not be necessary.
Internal control deficiencies
40. I considered internal control relevant to my audit of the financial statements, reported performance
information and compliance with applicable legislation; however, my objective was not to express any
form of assurance on it. The matters reported below are limited to the significant internal control
deficiencies that resulted in the findings on the annual performance report and the findings on
compliance with legislation included in this report.
• Leadership did not adequately perform their oversight responsibilities relating to the general control
environment by ensuring that policies and procedures for monitoring and reporting in the financial
statements, performance report and compliance with key legislation were implemented. This is evidenced
by repeat findings on key controls, deficiencies on reported information in the annual performance
report and non-compliance with legislation and is directly linked to inadequate consequence
management.
• Some instances of non-compliance have again been noted during the financial year as a result of
inadequate review of the financial statements and performance report for validity, accuracy and
completeness.
• The department did not have an effective internal control system to monitor compliance with legislation,
as repeat findings were identified in this area.
and follow-up actions were not always implemented by management, thereby limiting the department's
ability to mitigate its strategic and operational risks. This was partly caused by the capacity issues in the
internal audit unit.
East-London
31 July 2018
115
Annexure - Auditor-general's responsibility for the audit
1. As part of an audit in accordance with the ISAs, I exercise professional judgement and maintain
professional scepticism throughout my audit of the financial statements, and the procedures performed
on reported performance information for selected programmes and on the department's compliance
with respect to the selected subject matters.
Financial statements
2. In addition to my responsibility for the audit of the financial statements as described in this auditor's
report, I also:
• identify and assess the risks of material misstatement of the financial statements whether due to fraud or
error, design and perform audit procedures responsive to those risks, and obtain audit evidence that is
sufficient and appropriate to provide a basis for my opinion. The risk of not detecting a material
misstatement resulting from fraud is higher than for one resulting from error, as fraud may involve
collusion, forgery, intentional omissions, misrepresentations, or the override of internal control
• obtain an understanding of internal control relevant to the audit in order to design audit procedures that
are appropriate in the circumstances, but not for the purpose of expressing an opinion on the
effectiveness of the department’s internal control
• evaluate the appropriateness of accounting policies used and the reasonableness of accounting
estimates and related disclosures made by the accounting officer
• conclude on the appropriateness of the accounting officer's use of the going concern basis of accounting
in the preparation of the financial statements. I also conclude, based on the audit evidence obtained,
whether a material uncertainty exists related to events or conditions that may cast significant doubt on
the Department of Economic Development, Environmental Affairs and Tourism's ability to continue as a
going concern. If I conclude that a material uncertainty exists, I am required to draw attention in my
auditor's report to the related disclosures in the financial statements about the material uncertainty or, if
such disclosures are inadequate, to modify the opinion on the financial statements. My conclusions are
based on the information available to me at the date of this auditor's report. However, future events or
conditions may cause a department to cease continuing as a going concern
• evaluate the overall presentation, structure and content of the financial statements, including the
disclosures, and whether the financial statements represent the underlying transactions and events in a
manner that achieves fair presentation
Communication with those charged with governance
3. I communicate with the accounting officer regarding, among other matters, the planned scope and
timing of the audit and significant audit findings, including any significant deficiencies in internal control
that I identify during my audit.
4. I also confirm to the accounting officer that I have complied with relevant ethical requirements regarding
independence, and communicate all relationships and other matters that may reasonably be thought to
have a bearing on my independence and, where applicable, related safeguards.
116
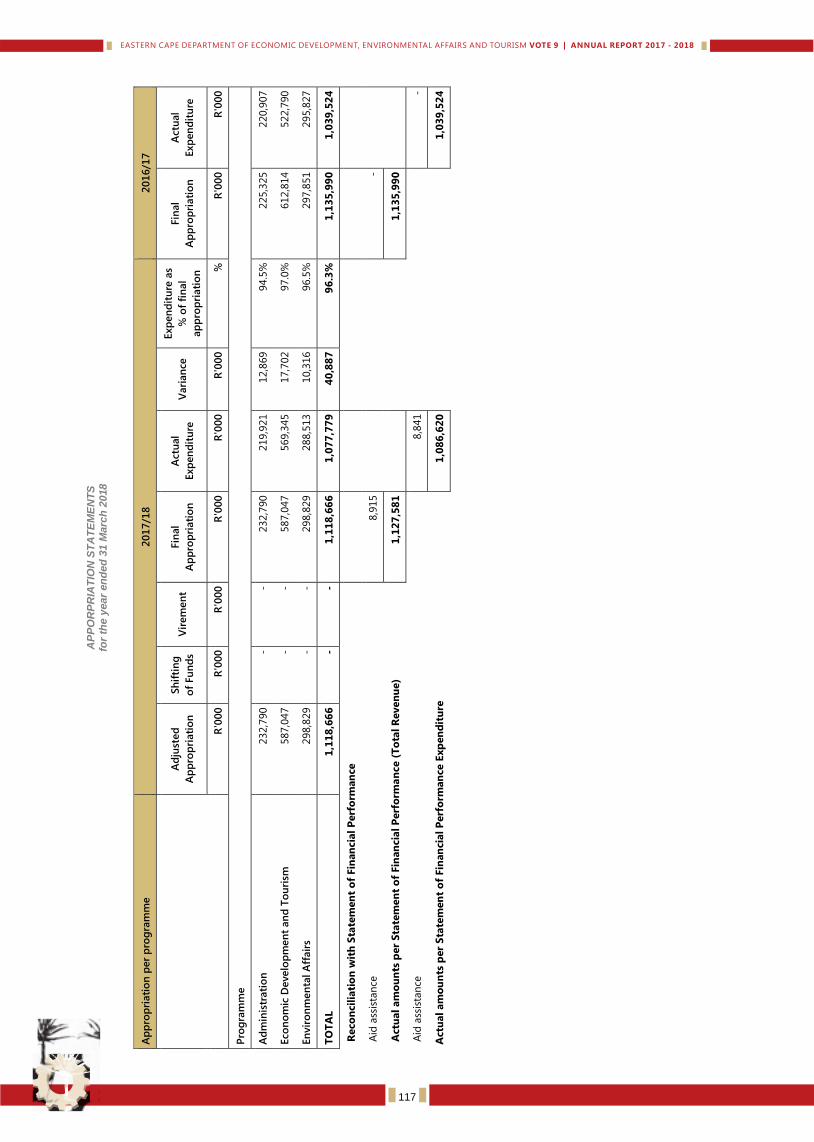
Dep
art
men
t o
f E
co
no
mic
Develo
pm
en
t, E
nv
iro
nm
en
tal A
ffair
s a
nd
To
uri
sm
V
OT
E 9
AP
PO
RP
RIA
TIO
N S
TA
TE
ME
NT
S
for
the
year
en
de
d 3
1 M
arc
h 2
018
Ap
pro
pri
ati
on
per
pro
gra
mm
e
201
7/1
8
201
6/1
7
Ad
just
ed
Ap
pro
pri
ati
on
Sh
ifti
ng
of
Fu
nd
s V
irem
en
t Fin
al
Ap
pro
pri
ati
on
Actu
al
Exp
en
dit
ure
V
ari
an
ce
Exp
en
dit
ure
as
% o
f fi
nal
ap
pro
pri
ati
on
Fin
al
Ap
pro
pri
ati
on
Actu
al
Exp
en
dit
ure
R'0
00
R
'000
R
'000
R
'000
R
'000
R
'000
%
R
'000
R
'000
Pro
gra
mm
e
Ad
min
istr
ati
on
232,7
90
-
-
232,7
90
219,9
21
12,8
69
94.5
%
225,3
25
220,9
07
Eco
no
mic
Develo
pm
en
t an
d T
ou
rism
587,0
47
-
-
587,0
47
569,3
45
17,7
02
97.0
%
612,8
14
522,7
90
En
vir
on
men
tal A
ffair
s
298,8
29
-
-
298,8
29
288,5
13
10,3
16
96.5
%
297,8
51
295,8
27
TO
TA
L
1,1
18
,66
6
- -
1,1
18
,66
6
1,0
77
,77
9
40
,88
7
96
.3%
1
,13
5,9
90
1
,03
9,5
24
Reco
ncil
iati
on
wit
h S
tate
men
t o
f Fin
an
cia
l P
erf
orm
an
ce
A
id a
ssis
tan
ce
8,9
15
-
Actu
al
am
ou
nts
per
Sta
tem
en
t o
f Fin
an
cia
l P
erf
orm
an
ce (
To
tal
Reven
ue)
1
,12
7,5
81
1,1
35
,99
0
Aid
ass
ista
nce
8,8
41
-
Actu
al
am
ou
nts
per
Sta
tem
en
t o
f Fin
an
cia
l P
erf
orm
an
ce E
xp
en
dit
ure
1
,08
6,6
20
1,0
39
,52
4
117
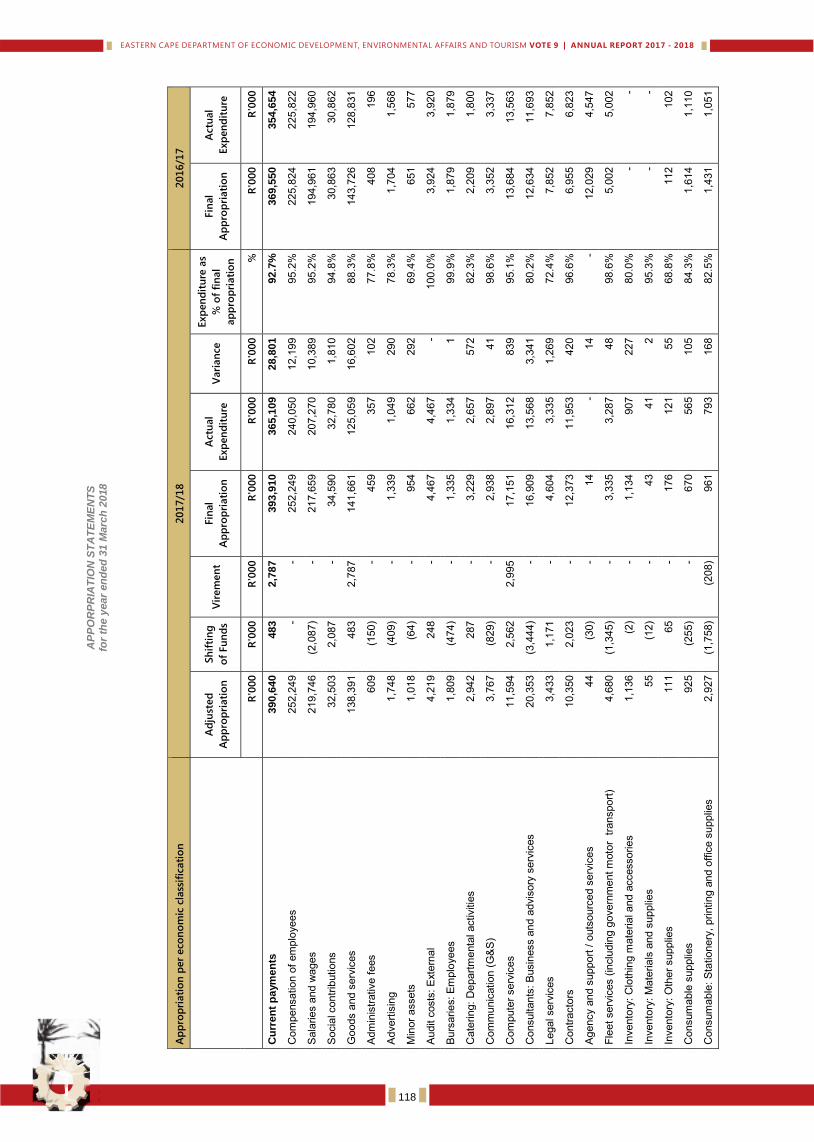
Dep
art
men
t o
f E
co
no
mic
Develo
pm
en
t, E
nv
iro
nm
en
tal A
ffair
s a
nd
To
uri
sm
V
OT
E 9
AP
PO
RP
RIA
TIO
N S
TA
TE
ME
NT
S
for
the
year
en
de
d 3
1 M
arc
h 2
018
Ap
pro
pri
ati
on
per
eco
no
mic
cla
ssif
icati
on
2
01
7/1
8
201
6/1
7
Ad
just
ed
Ap
pro
pri
ati
on
Sh
ifti
ng
of
Fu
nd
s V
irem
en
t Fin
al
Ap
pro
pri
ati
on
Actu
al
Exp
en
dit
ure
V
ari
an
ce
Exp
en
dit
ure
as
% o
f fi
nal
ap
pro
pri
ati
on
Fin
al
Ap
pro
pri
ati
on
Actu
al
Exp
en
dit
ure
R'0
00
R
'000
R
'000
R
'000
R
'000
R
'000
%
R
'000
R
'000
Cu
rren
t p
aym
en
ts
390,6
40
483
2,7
87
393,9
10
365,1
09
28,8
01
92.7
%
369,5
50
354,6
54
Com
pens
atio
n of
em
ploy
ees
252,
249
- -
252,
249
240,
050
12,1
99
95.2
%
225,
824
225,
822
Sal
arie
s an
d w
ages
21
9,74
6 (2
,087
) -
217,
659
207,
270
10,3
89
95.2
%
194,
961
194,
960
Soc
ial c
ontri
butio
ns
32,5
03
2,08
7 -
34,5
90
32,7
80
1,81
0 94
.8%
30
,863
30
,862
Goo
ds a
nd s
ervi
ces
138,
391
483
2,78
7 14
1,66
1 12
5,05
9 16
,602
88
.3%
14
3,72
6 12
8,83
1
Adm
inis
trativ
e fe
es
609
(150
) -
459
357
102
77.8
%
408
196
Adv
ertis
ing
1,74
8 (4
09)
- 1,
339
1,04
9 29
0 78
.3%
1,
704
1,56
8
Min
or a
sset
s 1,
018
(64)
-
954
662
292
69.4
%
651
577
Aud
it co
sts:
Ext
erna
l 4,
219
248
- 4,
467
4,46
7 -
100.
0%
3,92
4 3,
920
Bur
sarie
s: E
mpl
oyee
s 1,
809
(474
) -
1,33
5 1,
334
1 99
.9%
1,
879
1,87
9
Cat
erin
g: D
epar
tmen
tal a
ctiv
ities
2,
942
287
- 3,
229
2,65
7 57
2 82
.3%
2,
209
1,80
0
Com
mun
icat
ion
(G&
S)
3,76
7 (8
29)
- 2,
938
2,89
7 41
98
.6%
3,
352
3,33
7
Com
pute
r ser
vice
s 11
,594
2,
562
2,99
5 17
,151
16
,312
83
9 95
.1%
13
,684
13
,563
Con
sulta
nts:
Bus
ines
s an
d ad
viso
ry s
ervi
ces
20,3
53
(3,4
44)
- 16
,909
13
,568
3,
341
80.2
%
12,6
34
11,6
93
Lega
l ser
vice
s 3,
433
1,17
1 -
4,60
4 3,
335
1,26
9 72
.4%
7,
852
7,85
2
Con
tract
ors
10,3
50
2,02
3 -
12,3
73
11,9
53
420
96.6
%
6,95
5 6,
823
Age
ncy
and
supp
ort /
out
sour
ced
serv
ices
44
(3
0)
- 14
-
14
- 12
,029
4,
547
Flee
t ser
vice
s (in
clud
ing
gove
rnm
ent m
otor
tra
nspo
rt)
4,68
0 (1
,345
) -
3,33
5 3,
287
48
98.6
%
5,00
2 5,
002
Inve
ntor
y: C
loth
ing
mat
eria
l and
acc
esso
ries
1,13
6 (2
) -
1,13
4 90
7 22
7 80
.0%
-
-
Inve
ntor
y: M
ater
ials
and
sup
plie
s 55
(1
2)
- 43
41
2
95.3
%
- -
Inve
ntor
y: O
ther
sup
plie
s 11
1 65
-
176
121
55
68.8
%
112
102
Con
sum
able
sup
plie
s 92
5 (2
55)
- 67
0 56
5 10
5 84
.3%
1,
614
1,11
0
Con
sum
able
: Sta
tione
ry, p
rintin
g an
d of
fice
supp
lies
2,92
7 (1
,758
) (2
08)
961
793
168
82.5
%
1,43
1 1,
051
118
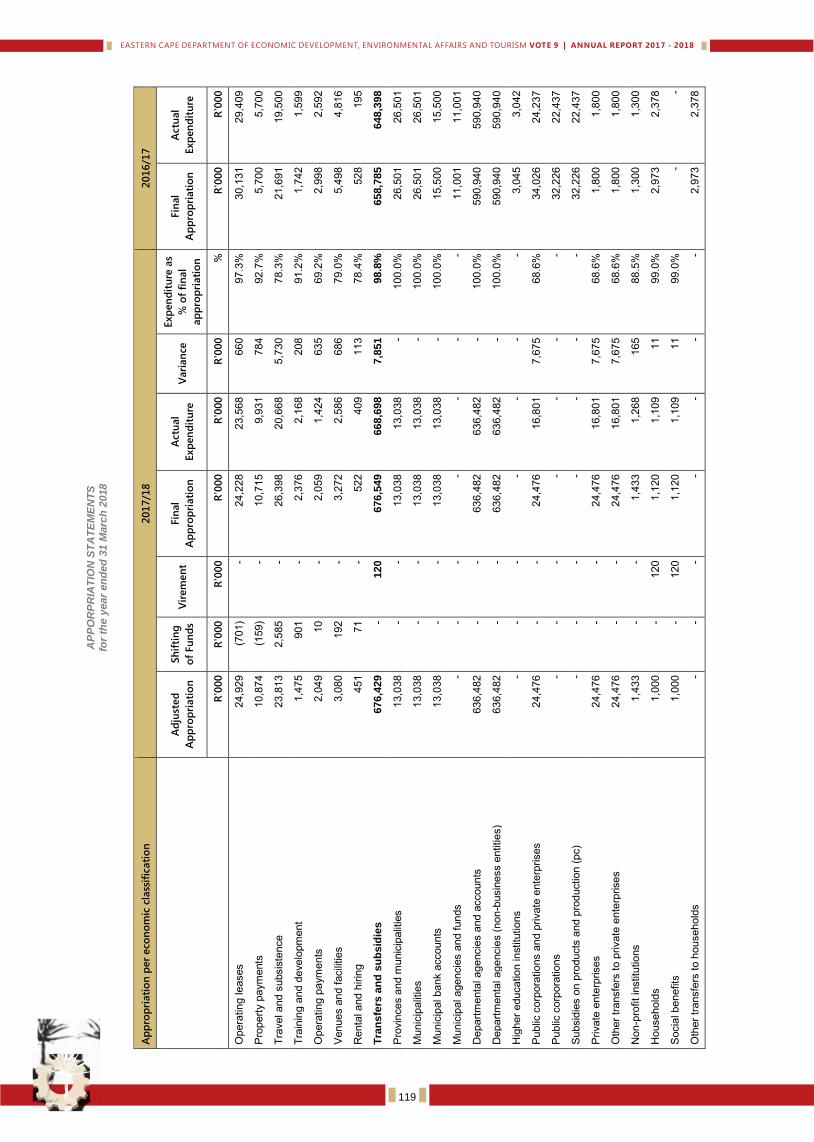
Dep
art
men
t o
f E
co
no
mic
Develo
pm
en
t, E
nv
iro
nm
en
tal A
ffair
s a
nd
To
uri
sm
V
OT
E 9
AP
PO
RP
RIA
TIO
N S
TA
TE
ME
NT
S
for
the
year
en
de
d 3
1 M
arc
h 2
018
Ap
pro
pri
ati
on
per
eco
no
mic
cla
ssif
icati
on
2
01
7/1
8
201
6/1
7
Ad
just
ed
Ap
pro
pri
ati
on
Sh
ifti
ng
of
Fu
nd
s V
irem
en
t Fin
al
Ap
pro
pri
ati
on
Actu
al
Exp
en
dit
ure
V
ari
an
ce
Exp
en
dit
ure
as
% o
f fi
nal
ap
pro
pri
ati
on
Fin
al
Ap
pro
pri
ati
on
Actu
al
Exp
en
dit
ure
R'0
00
R
'000
R
'000
R
'000
R
'000
R
'000
%
R
'000
R
'000
Ope
ratin
g le
ases
24
,929
(7
01)
- 24
,228
23
,568
66
0 97
.3%
30
,131
29
,409
Pro
perty
pay
men
ts
10,8
74
(159
) -
10,7
15
9,93
1 78
4 92
.7%
5,
700
5,70
0
Trav
el a
nd s
ubsi
sten
ce
23,8
13
2,58
5 -
26,3
98
20,6
68
5,73
0 78
.3%
21
,691
19
,500
Trai
ning
and
dev
elop
men
t 1,
475
901
- 2,
376
2,16
8 20
8 91
.2%
1,
742
1,59
9
Ope
ratin
g pa
ymen
ts
2,04
9 10
-
2,05
9 1,
424
635
69.2
%
2,99
8 2,
592
Ven
ues
and
faci
litie
s 3,
080
192
- 3,
272
2,58
6 68
6 79
.0%
5,
498
4,81
6
Ren
tal a
nd h
iring
45
1 71
-
522
409
113
78.4
%
528
195
Tra
ns
fers
an
d s
ub
sid
ies
676,4
29
- 120
676,5
49
668,6
98
7,8
51
98.8
%
658,7
85
648,3
98
Pro
vinc
es a
nd m
unic
ipal
ities
13
,038
-
- 13
,038
13
,038
-
100.
0%
26,5
01
26,5
01
Mun
icip
aliti
es
13,0
38
- -
13,0
38
13,0
38
- 10
0.0%
26
,501
26
,501
Mun
icip
al b
ank
acco
unts
13
,038
-
- 13
,038
13
,038
-
100.
0%
15,5
00
15,5
00
Mun
icip
al a
genc
ies
and
fund
s -
- -
- -
- -
11,0
01
11,0
01
Dep
artm
enta
l age
ncie
s an
d ac
coun
ts
636,
482
- -
636,
482
636,
482
- 10
0.0%
59
0,94
0 59
0,94
0
Dep
artm
enta
l age
ncie
s (n
on-b
usin
ess
entit
ies)
63
6,48
2 -
- 63
6,48
2 63
6,48
2 -
100.
0%
590,
940
590,
940
Hig
her e
duca
tion
inst
itutio
ns
- -
- -
- -
- 3,
045
3,04
2
Pub
lic c
orpo
ratio
ns a
nd p
rivat
e en
terp
rises
24
,476
-
- 24
,476
16
,801
7,
675
68.6
%
34,0
26
24,2
37
Pub
lic c
orpo
ratio
ns
- -
- -
- -
- 32
,226
22
,437
Sub
sidi
es o
n pr
oduc
ts a
nd p
rodu
ctio
n (p
c)
- -
- -
- -
- 32
,226
22
,437
Priv
ate
ente
rpris
es
24,4
76
- -
24,4
76
16,8
01
7,67
5 68
.6%
1,
800
1,80
0
Oth
er tr
ansf
ers
to p
rivat
e en
terp
rises
24
,476
-
- 24
,476
16
,801
7,
675
68.6
%
1,80
0 1,
800
Non
-pro
fit in
stitu
tions
1,
433
- -
1,43
3 1,
268
165
88.5
%
1,30
0 1,
300
Hou
seho
lds
1,00
0 -
120
1,12
0 1,
109
11
99.0
%
2,97
3 2,
378
Soc
ial b
enef
its
1,00
0 -
120
1,12
0 1,
109
11
99.0
%
- -
Oth
er tr
ansf
ers
to h
ouse
hold
s -
- -
- -
- -
2,97
3 2,
378
119
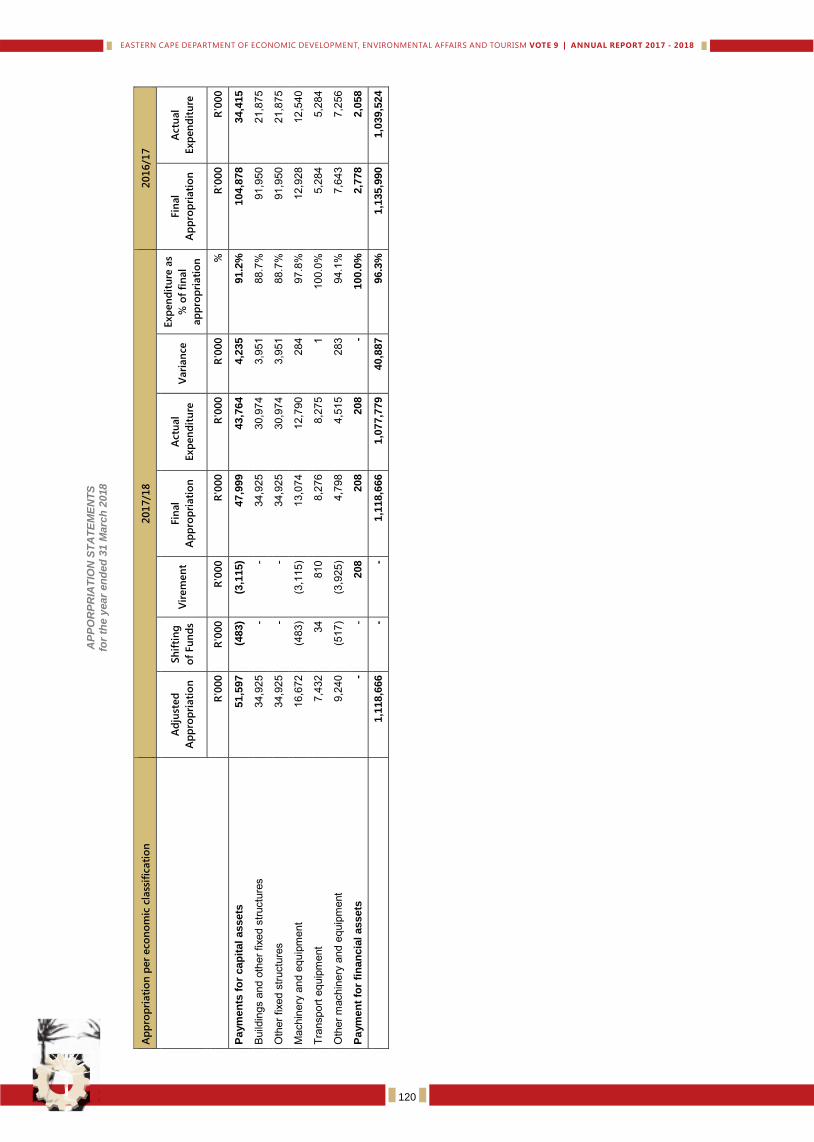
Dep
art
men
t o
f E
co
no
mic
Develo
pm
en
t, E
nv
iro
nm
en
tal A
ffair
s a
nd
To
uri
sm
V
OT
E 9
AP
PO
RP
RIA
TIO
N S
TA
TE
ME
NT
S
for
the
year
en
de
d 3
1 M
arc
h 2
018
Ap
pro
pri
ati
on
per
eco
no
mic
cla
ssif
icati
on
2
01
7/1
8
201
6/1
7
Ad
just
ed
Ap
pro
pri
ati
on
Sh
ifti
ng
of
Fu
nd
s V
irem
en
t Fin
al
Ap
pro
pri
ati
on
Actu
al
Exp
en
dit
ure
V
ari
an
ce
Exp
en
dit
ure
as
% o
f fi
nal
ap
pro
pri
ati
on
Fin
al
Ap
pro
pri
ati
on
Actu
al
Exp
en
dit
ure
R'0
00
R
'000
R
'000
R
'000
R
'000
R
'000
%
R
'000
R
'000
Pa
ym
en
ts f
or
cap
ital
assets
51,5
97
(483)
(3,1
15)
47,9
99
43,7
64
4,2
35
91.2
%
104,8
78
34,4
15
Bui
ldin
gs a
nd o
ther
fixe
d st
ruct
ures
34
,925
-
- 34
,925
30
,974
3,
951
88.7
%
91,9
50
21,8
75
Oth
er fi
xed
stru
ctur
es
34,9
25
- -
34,9
25
30,9
74
3,95
1 88
.7%
91
,950
21
,875
Mac
hine
ry a
nd e
quip
men
t 16
,672
(4
83)
(3,1
15)
13,0
74
12,7
90
284
97.8
%
12,9
28
12,5
40
Tran
spor
t equ
ipm
ent
7,43
2 34
81
0 8,
276
8,27
5 1
100.
0%
5,28
4 5,
284
Oth
er m
achi
nery
and
equ
ipm
ent
9,24
0 (5
17)
(3,9
25)
4,79
8 4,
515
283
94.1
%
7,64
3 7,
256
Pa
ym
en
t fo
r fi
na
ncia
l assets
-
- 208
208
208
- 100.0
%
2,7
78
2,0
58
1,1
18,6
66
- -
1,1
18,6
66
1,0
77,7
79
40,8
87
96.3
%
1,1
35,9
90
1,0
39,5
24
120
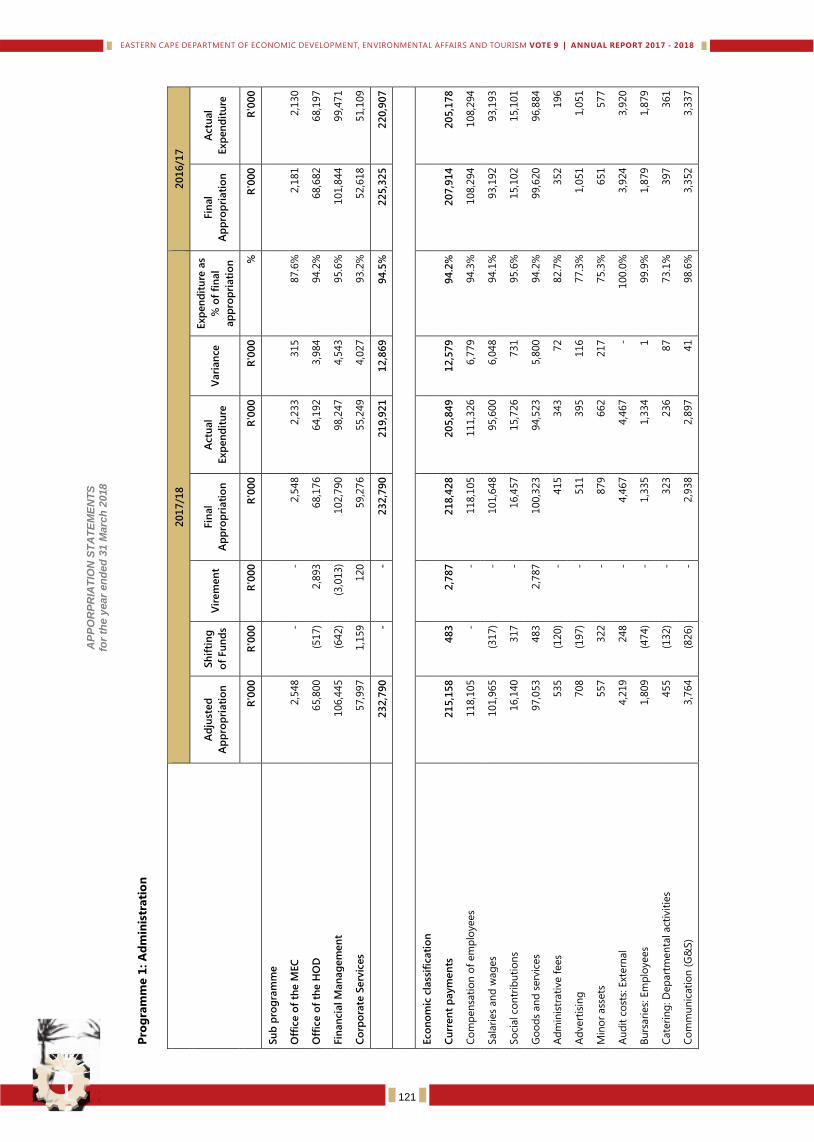
Dep
art
men
t o
f E
co
no
mic
Develo
pm
en
t, E
nv
iro
nm
en
tal A
ffair
s a
nd
To
uri
sm
V
OT
E 9
AP
PO
RP
RIA
TIO
N S
TA
TE
ME
NT
S
for
the
year
en
de
d 3
1 M
arc
h 2
018
Pro
gra
mm
e 1
: A
dm
inis
trati
on
201
7/1
8
201
6/1
7
Ad
just
ed
Ap
pro
pri
ati
on
Sh
ifti
ng
of
Fu
nd
s V
irem
en
t Fin
al
Ap
pro
pri
ati
on
Actu
al
Exp
en
dit
ure
V
ari
an
ce
Exp
en
dit
ure
as
% o
f fi
nal
ap
pro
pri
ati
on
Fin
al
Ap
pro
pri
ati
on
Actu
al
Exp
en
dit
ure
R'0
00
R
'000
R
'000
R
'000
R
'000
R
'000
%
R
'000
R
'000
Su
b p
rog
ram
me
Off
ice o
f th
e M
EC
2,5
48
- -
2,5
48
2,2
33
315
87.6
%
2,1
81
2,1
30
Off
ice o
f th
e H
OD
65,8
00
(517)
2,8
93
68,1
76
64,1
92
3,9
84
94.2
%
68,6
82
68,1
97
Fin
an
cial M
an
ag
em
en
t 106,4
45
(642)
(3,0
13)
102,7
90
98,2
47
4,5
43
95.6
%
101,8
44
99,4
71
Co
rpo
rate
Serv
ices
57,9
97
1,1
59
120
59,2
76
55,2
49
4,0
27
93.2
%
52,6
18
51,1
09
2
32
,79
0
- -
23
2,7
90
2
19
,92
1
12
,86
9
94
.5%
2
25
,32
5
22
0,9
07
Eco
no
mic
cla
ssif
icati
on
Cu
rren
t p
aym
en
ts
21
5,1
58
4
83
2
,78
7
21
8,4
28
2
05
,84
9
12
,57
9
94
.2%
2
07
,91
4
20
5,1
78
Co
mp
en
sati
on
of
em
plo
yees
118,1
05
- -
118,1
05
111,3
26
6,7
79
94.3
%
108,2
94
108,2
94
Sala
ries
an
d w
ag
es
101,9
65
(317)
- 101,6
48
95,6
00
6,0
48
94.1
%
93,1
92
93,1
93
So
cial co
ntr
ibu
tio
ns
16,1
40
317
- 16,4
57
15,7
26
731
95.6
%
15,1
02
15,1
01
Go
od
s an
d s
erv
ices
97,0
53
483
2,7
87
100,3
23
94,5
23
5,8
00
94.2
%
99,6
20
96,8
84
Ad
min
istr
ati
ve f
ees
535
(120)
- 415
343
72
82.7
%
352
196
Ad
vert
isin
g
708
(197)
- 511
395
116
77.3
%
1,0
51
1,0
51
Min
or
ass
ets
557
322
- 879
662
217
75.3
%
651
577
Au
dit
co
sts:
Ext
ern
al
4,2
19
248
- 4,4
67
4,4
67
- 100.0
%
3,9
24
3,9
20
Bu
rsari
es:
Em
plo
yees
1,8
09
(474)
- 1,3
35
1,3
34
1
99.9
%
1,8
79
1,8
79
Cate
rin
g: D
ep
art
men
tal act
ivit
ies
455
(132)
- 323
236
87
73.1
%
397
361
Co
mm
un
icati
on
(G
&S)
3,7
64
(826)
- 2,9
38
2,8
97
41
98.6
%
3,3
52
3,3
37
121
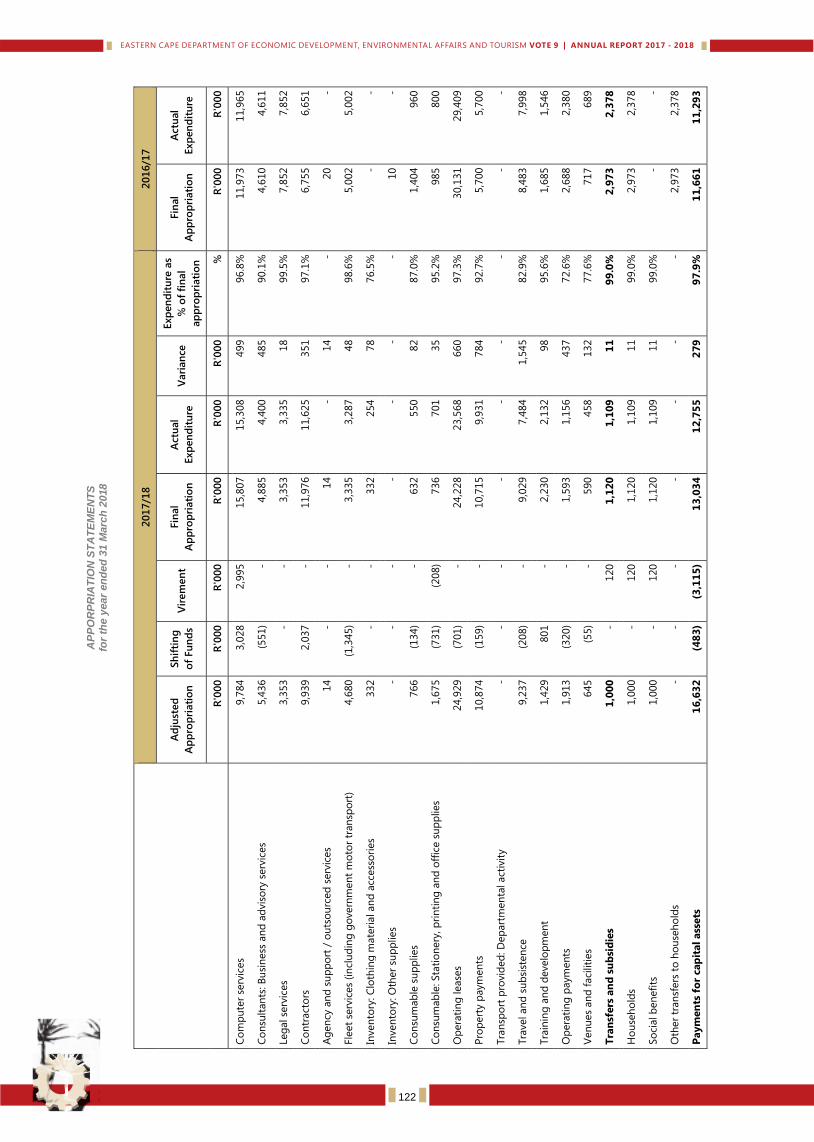
Dep
art
men
t o
f E
co
no
mic
Develo
pm
en
t, E
nv
iro
nm
en
tal A
ffair
s a
nd
To
uri
sm
V
OT
E 9
AP
PO
RP
RIA
TIO
N S
TA
TE
ME
NT
S
for
the
year
en
de
d 3
1 M
arc
h 2
018
201
7/1
8
201
6/1
7
Ad
just
ed
Ap
pro
pri
ati
on
Sh
ifti
ng
of
Fu
nd
s V
irem
en
t Fin
al
Ap
pro
pri
ati
on
Actu
al
Exp
en
dit
ure
V
ari
an
ce
Exp
en
dit
ure
as
% o
f fi
nal
ap
pro
pri
ati
on
Fin
al
Ap
pro
pri
ati
on
Actu
al
Exp
en
dit
ure
R'0
00
R
'000
R
'000
R
'000
R
'000
R
'000
%
R
'000
R
'000
Co
mp
ute
r se
rvic
es
9,7
84
3,0
28
2,9
95
15,8
07
15,3
08
499
96.8
%
11,9
73
11,9
65
Co
nsu
ltan
ts: B
usi
ness
an
d a
dvis
ory
serv
ices
5,4
36
(551)
- 4,8
85
4,4
00
485
90.1
%
4,6
10
4,6
11
Leg
al se
rvic
es
3,3
53
- -
3,3
53
3,3
35
18
99.5
%
7,8
52
7,8
52
Co
ntr
act
ors
9,9
39
2,0
37
- 11,9
76
11,6
25
351
97.1
%
6,7
55
6,6
51
Ag
en
cy a
nd
su
pp
ort
/ o
uts
ou
rced
serv
ices
14
- -
14
- 14
- 20
-
Fle
et
serv
ices
(in
clu
din
g g
overn
men
t m
oto
r tr
an
spo
rt)
4,6
80
(1,3
45)
- 3,3
35
3,2
87
48
98.6
%
5,0
02
5,0
02
Inven
tory
: C
loth
ing
mate
rial an
d a
ccess
ori
es
332
- -
332
254
78
76.5
%
- -
Inven
tory
: O
ther
sup
plies
- -
- -
- -
- 10
-
Co
nsu
mab
le s
up
plies
766
(134)
- 632
550
82
87.0
%
1,4
04
960
Co
nsu
mab
le: Sta
tio
nery
, p
rin
tin
g a
nd
off
ice s
up
plies
1,6
75
(731)
(208)
736
701
35
95.2
%
985
800
Op
era
tin
g lease
s 24,9
29
(701)
- 24,2
28
23,5
68
660
97.3
%
30,1
31
29,4
09
Pro
pert
y p
aym
en
ts
10,8
74
(159)
- 10,7
15
9,9
31
784
92.7
%
5,7
00
5,7
00
Tra
nsp
ort
pro
vid
ed
: D
ep
art
men
tal act
ivit
y
- -
- -
- -
- -
-
Tra
vel an
d s
ub
sist
en
ce
9,2
37
(208)
- 9,0
29
7,4
84
1,5
45
82.9
%
8,4
83
7,9
98
Tra
inin
g a
nd
develo
pm
en
t 1,4
29
801
- 2,2
30
2,1
32
98
95.6
%
1,6
85
1,5
46
Op
era
tin
g p
aym
en
ts
1,9
13
(320)
- 1,5
93
1,1
56
437
72.6
%
2,6
88
2,3
80
Ven
ues
an
d f
aci
liti
es
645
(55)
- 590
458
132
77.6
%
717
689
Tra
nsf
ers
an
d s
ub
sid
ies
1,0
00
-
120
1,1
20
1
,10
9
11
9
9.0
%
2,9
73
2
,37
8
Ho
use
ho
lds
1,0
00
- 120
1,1
20
1,1
09
11
99.0
%
2,9
73
2,3
78
So
cial b
en
efi
ts
1,0
00
- 120
1,1
20
1,1
09
11
99.0
%
- -
Oth
er
tran
sfers
to
ho
use
ho
lds
- -
- -
- -
- 2,9
73
2,3
78
Paym
en
ts f
or
cap
ital ass
ets
1
6,6
32
(4
83
) (3
,11
5)
13
,03
4
12
,75
5
27
9
97
.9%
1
1,6
61
1
1,2
93
122
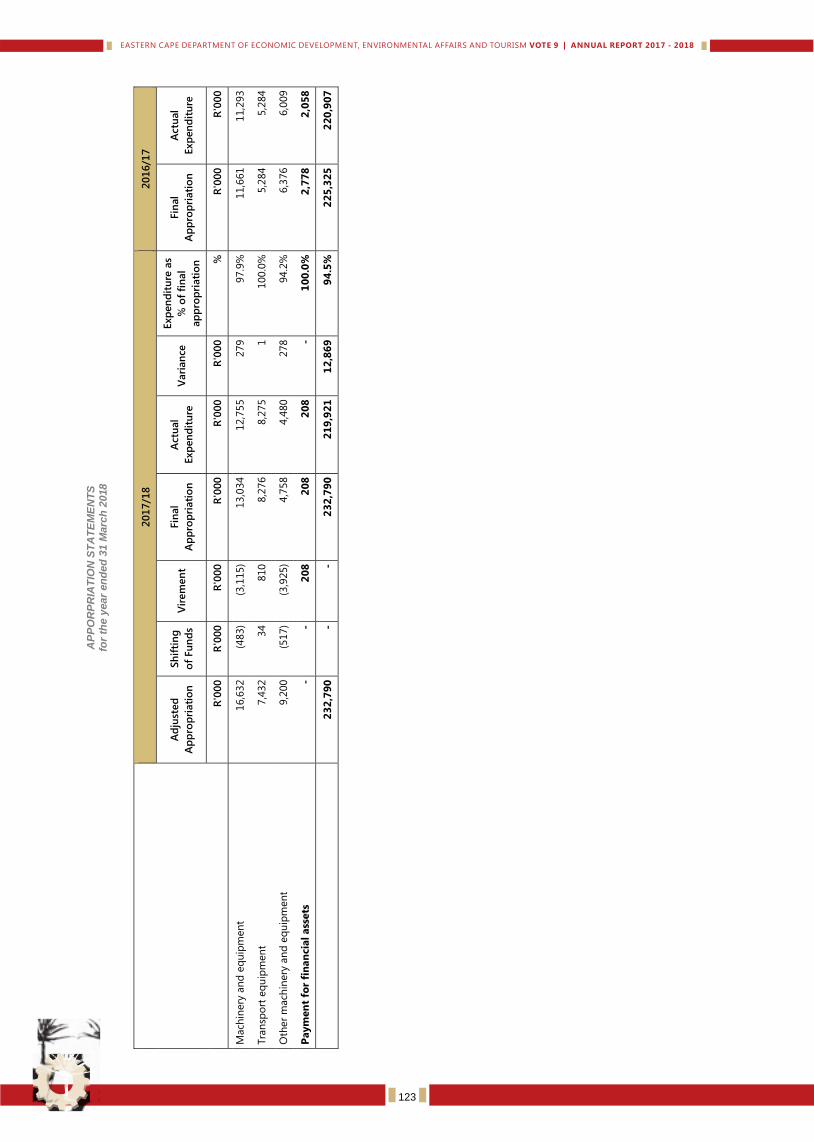
Dep
art
men
t o
f E
co
no
mic
Develo
pm
en
t, E
nv
iro
nm
en
tal A
ffair
s a
nd
To
uri
sm
V
OT
E 9
AP
PO
RP
RIA
TIO
N S
TA
TE
ME
NT
S
for
the
year
en
de
d 3
1 M
arc
h 2
018
201
7/1
8
201
6/1
7
Ad
just
ed
Ap
pro
pri
ati
on
Sh
ifti
ng
of
Fu
nd
s V
irem
en
t Fin
al
Ap
pro
pri
ati
on
Actu
al
Exp
en
dit
ure
V
ari
an
ce
Exp
en
dit
ure
as
% o
f fi
nal
ap
pro
pri
ati
on
Fin
al
Ap
pro
pri
ati
on
Actu
al
Exp
en
dit
ure
R'0
00
R
'000
R
'000
R
'000
R
'000
R
'000
%
R
'000
R
'000
Mach
inery
an
d e
qu
ipm
en
t 16,6
32
(483)
(3,1
15)
13,0
34
12,7
55
279
97.9
%
11,6
61
11,2
93
Tra
nsp
ort
eq
uip
men
t 7,4
32
34
810
8,2
76
8,2
75
1
100.0
%
5,2
84
5,2
84
Oth
er
mach
inery
an
d e
qu
ipm
en
t 9,2
00
(517)
(3,9
25)
4,7
58
4,4
80
278
94.2
%
6,3
76
6,0
09
Paym
en
t fo
r fi
nan
cia
l ass
ets
-
- 2
08
2
08
2
08
-
10
0.0
%
2,7
78
2
,05
8
2
32
,79
0
- -
23
2,7
90
2
19
,92
1
12
,86
9
94
.5%
2
25
,32
5
22
0,9
07
123
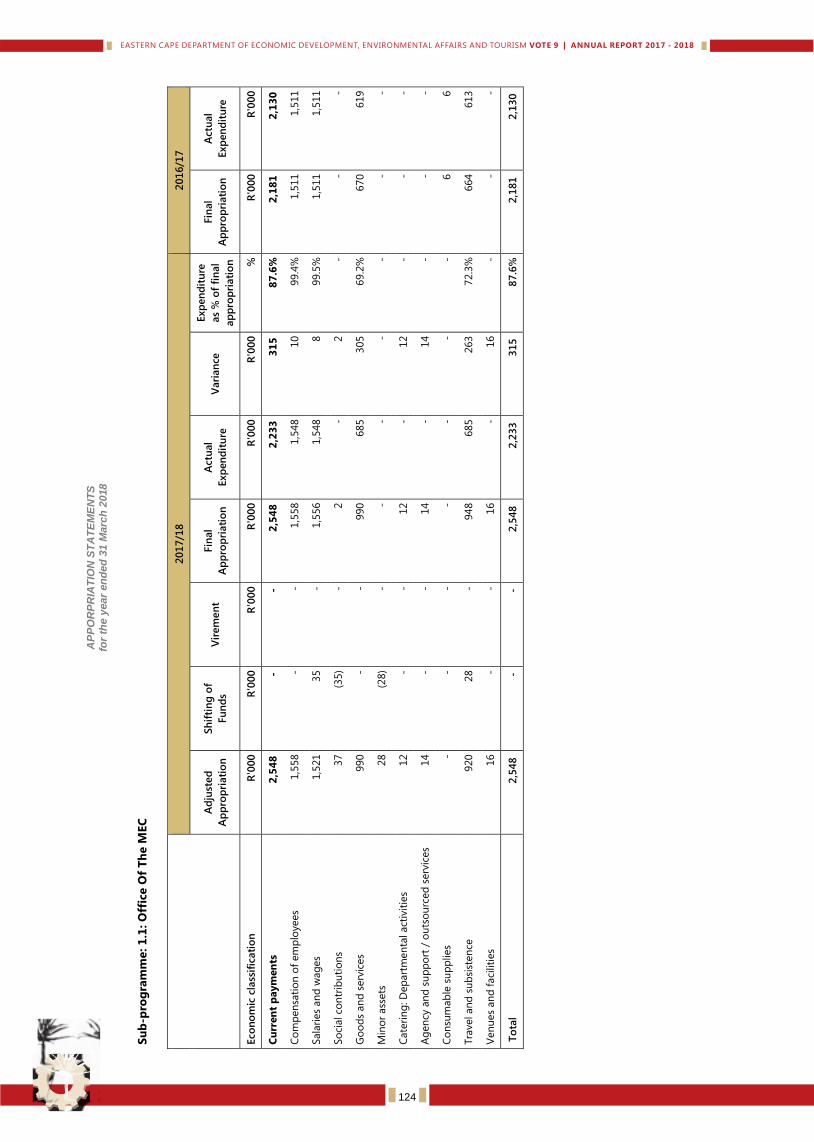
Dep
art
men
t o
f E
co
no
mic
Develo
pm
en
t, E
nv
iro
nm
en
tal A
ffair
s a
nd
To
uri
sm
V
OT
E 9
AP
PO
RP
RIA
TIO
N S
TA
TE
ME
NT
S
for
the
year
en
de
d 3
1 M
arc
h 2
018
Su
b-p
rog
ram
me: 1
.1: O
ffic
e O
f T
he M
EC
201
7/1
8
201
6/1
7
Ad
just
ed
Ap
pro
pri
ati
on
Sh
ifti
ng
of
Fu
nd
s V
irem
en
t Fin
al
Ap
pro
pri
ati
on
Actu
al
Exp
en
dit
ure
V
ari
an
ce
Exp
en
dit
ure
as
% o
f fi
nal
ap
pro
pri
ati
on
Fin
al
Ap
pro
pri
ati
on
Actu
al
Exp
en
dit
ure
Eco
no
mic
cla
ssif
icati
on
R
'000
R
'000
R
'000
R
'000
R
'000
R
'000
%
R
'000
R
'000
Cu
rren
t p
aym
en
ts
2
,54
8
-
-
2
,54
8
2
,23
3
3
15
8
7.6
%
2
,18
1
2
,13
0
Co
mp
en
sati
on
of
em
plo
yees
1,5
58
- -
1,5
58
1,5
48
10
99.4
%
1,5
11
1,5
11
Sala
ries
an
d w
ag
es
1,5
21
35
- 1,5
56
1,5
48
8
99.5
%
1,5
11
1,5
11
So
cial co
ntr
ibu
tio
ns
37
(35)
- 2
- 2
- -
-
Go
od
s an
d s
erv
ices
990
- -
990
685
305
69.2
%
670
619
Min
or
ass
ets
28
(28)
- -
- -
- -
-
Cate
rin
g: D
ep
art
men
tal act
ivit
ies
12
- -
12
- 12
- -
-
Ag
en
cy a
nd
su
pp
ort
/ o
uts
ou
rced
serv
ices
14
- -
14
- 14
- -
-
Co
nsu
mab
le s
up
plies
- -
- -
- -
- 6
6
Tra
vel an
d s
ub
sist
en
ce
920
28
- 948
685
263
72.3
%
664
613
Ven
ues
an
d f
aci
liti
es
16
- -
16
- 16
- -
-
To
tal
2
,548
-
-
2
,548
2
,233
3
15
8
7.6
%
2
,181
2
,13
0
124
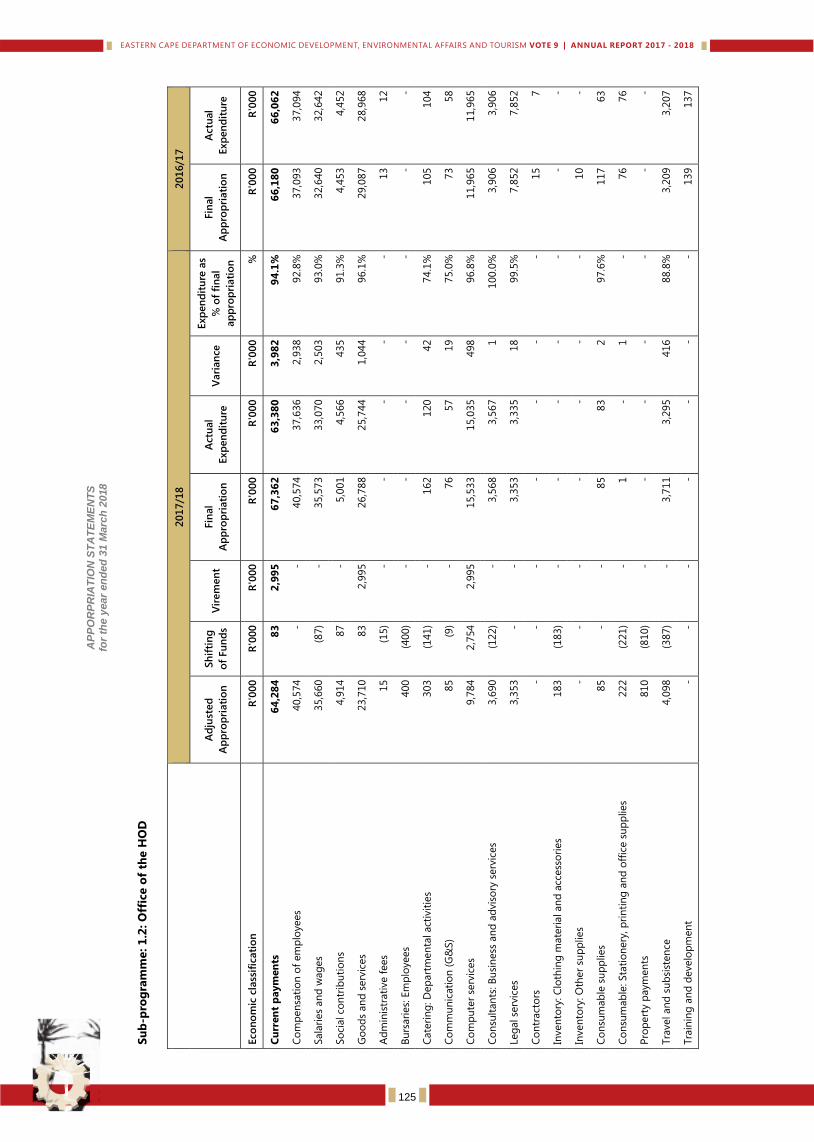
Dep
art
men
t o
f E
co
no
mic
Develo
pm
en
t, E
nv
iro
nm
en
tal A
ffair
s a
nd
To
uri
sm
V
OT
E 9
AP
PO
RP
RIA
TIO
N S
TA
TE
ME
NT
S
for
the
year
en
de
d 3
1 M
arc
h 2
018
Su
b-p
rog
ram
me: 1
.2: O
ffic
e o
f th
e H
OD
201
7/1
8
201
6/1
7
Ad
just
ed
Ap
pro
pri
ati
on
Sh
ifti
ng
of
Fu
nd
s V
irem
en
t Fin
al
Ap
pro
pri
ati
on
Actu
al
Exp
en
dit
ure
V
ari
an
ce
Exp
en
dit
ure
as
% o
f fi
nal
ap
pro
pri
ati
on
Fin
al
Ap
pro
pri
ati
on
Actu
al
Exp
en
dit
ure
Eco
no
mic
cla
ssif
icati
on
R
'000
R
'000
R
'000
R
'000
R
'000
R
'000
%
R
'000
R
'000
Cu
rren
t p
aym
en
ts
64
,28
4
83
2
,99
5
67
,36
2
63
,38
0
3,9
82
9
4.1
%
66
,18
0
66
,06
2
Co
mp
en
sati
on
of
em
plo
yees
40,5
74
- -
40,5
74
37,6
36
2,9
38
92.8
%
37,0
93
37,0
94
Sala
ries
an
d w
ag
es
35,6
60
(87)
- 35,5
73
33,0
70
2,5
03
93.0
%
32,6
40
32,6
42
So
cial co
ntr
ibu
tio
ns
4,9
14
87
- 5,0
01
4,5
66
435
91.3
%
4,4
53
4,4
52
Go
od
s an
d s
erv
ices
23,7
10
83
2,9
95
26,7
88
25,7
44
1,0
44
96.1
%
29,0
87
28,9
68
Ad
min
istr
ati
ve f
ees
15
(15)
- -
- -
- 13
12
Bu
rsari
es:
Em
plo
yees
400
(400)
- -
- -
- -
-
Cate
rin
g: D
ep
art
men
tal act
ivit
ies
303
(141)
- 162
120
42
74.1
%
105
104
Co
mm
un
icati
on
(G
&S)
85
(9)
- 76
57
19
75.0
%
73
58
Co
mp
ute
r se
rvic
es
9,7
84
2,7
54
2,9
95
15,5
33
15,0
35
498
96.8
%
11,9
65
11,9
65
Co
nsu
ltan
ts: B
usi
ness
an
d a
dvis
ory
serv
ices
3,6
90
(122)
- 3,5
68
3,5
67
1
100.0
%
3,9
06
3,9
06
Leg
al se
rvic
es
3,3
53
- -
3,3
53
3,3
35
18
99.5
%
7,8
52
7,8
52
Co
ntr
act
ors
-
- -
- -
- -
15
7
Inven
tory
: C
loth
ing
mate
rial an
d a
ccess
ori
es
183
(183)
- -
- -
- -
-
Inven
tory
: O
ther
sup
plies
- -
- -
- -
- 10
-
Co
nsu
mab
le s
up
plies
85
- -
85
83
2
97.6
%
117
63
Co
nsu
mab
le: Sta
tio
nery
, p
rin
tin
g a
nd
off
ice s
up
plies
222
(221)
- 1
- 1
- 76
76
Pro
pert
y p
aym
en
ts
810
(810)
- -
- -
- -
-
Tra
vel an
d s
ub
sist
en
ce
4,0
98
(387)
- 3,7
11
3,2
95
416
88.8
%
3,2
09
3,2
07
Tra
inin
g a
nd
develo
pm
en
t -
- -
- -
- -
139
137
125
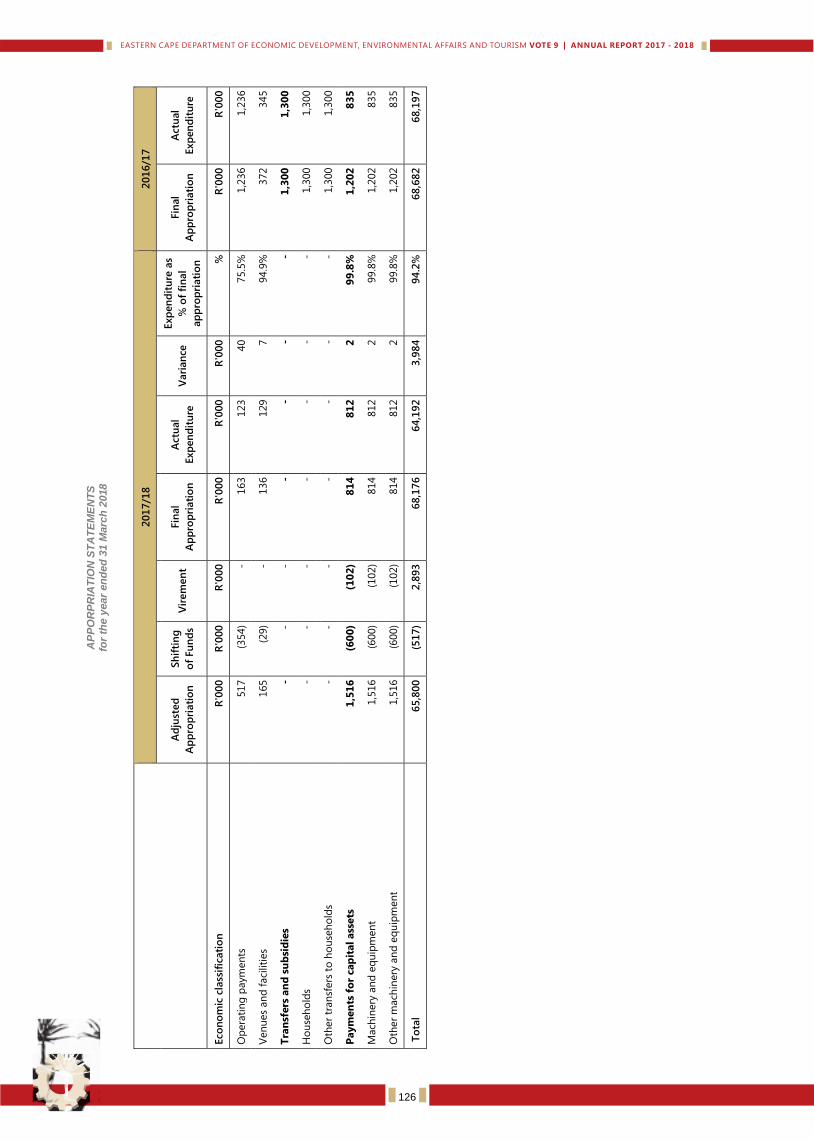
Dep
art
men
t o
f E
co
no
mic
Develo
pm
en
t, E
nv
iro
nm
en
tal A
ffair
s a
nd
To
uri
sm
V
OT
E 9
AP
PO
RP
RIA
TIO
N S
TA
TE
ME
NT
S
for
the
year
en
de
d 3
1 M
arc
h 2
018
201
7/1
8
201
6/1
7
Ad
just
ed
Ap
pro
pri
ati
on
Sh
ifti
ng
of
Fu
nd
s V
irem
en
t Fin
al
Ap
pro
pri
ati
on
Actu
al
Exp
en
dit
ure
V
ari
an
ce
Exp
en
dit
ure
as
% o
f fi
nal
ap
pro
pri
ati
on
Fin
al
Ap
pro
pri
ati
on
Actu
al
Exp
en
dit
ure
Eco
no
mic
cla
ssif
icati
on
R
'000
R
'000
R
'000
R
'000
R
'000
R
'000
%
R
'000
R
'000
Op
era
tin
g p
aym
en
ts
517
(354)
- 163
123
40
75.5
%
1,2
36
1,2
36
Ven
ues
an
d f
aci
liti
es
165
(29)
- 136
129
7
94.9
%
372
345
Tra
nsf
ers
an
d s
ub
sid
ies
- -
- -
- -
- 1
,30
0
1,3
00
Ho
use
ho
lds
- -
- -
- -
- 1,3
00
1,3
00
Oth
er
tran
sfers
to
ho
use
ho
lds
- -
- -
- -
- 1,3
00
1,3
00
Paym
en
ts f
or
cap
ital ass
ets
1
,51
6
(60
0)
(10
2)
81
4
81
2
2
99
.8%
1
,20
2
83
5
Mach
inery
an
d e
qu
ipm
en
t 1,5
16
(600)
(102)
814
812
2
99.8
%
1,2
02
835
Oth
er
mach
inery
an
d e
qu
ipm
en
t 1,5
16
(600)
(102)
814
812
2
99.8
%
1,2
02
835
To
tal
65
,80
0
(51
7)
2,8
93
6
8,1
76
6
4,1
92
3
,98
4
94
.2%
6
8,6
82
6
8,1
97
126

Dep
art
men
t o
f E
co
no
mic
Develo
pm
en
t, E
nv
iro
nm
en
tal A
ffair
s a
nd
To
uri
sm
V
OT
E 9
AP
PO
RP
RIA
TIO
N S
TA
TE
ME
NT
S
for
the
year
en
de
d 3
1 M
arc
h 2
018
Su
b-p
rog
ram
me: 1
.3: Fin
an
cia
l M
an
ag
em
en
t
201
7/1
8
201
6/1
7
Ad
just
ed
Ap
pro
pri
ati
on
Sh
ifti
ng
of
Fu
nd
s V
irem
en
t Fin
al
Ap
pro
pri
ati
on
Actu
al
Exp
en
dit
ure
V
ari
an
ce
Exp
en
dit
ure
as
% o
f fi
nal
ap
pro
pri
ati
on
Fin
al
Ap
pro
pri
ati
on
Actu
al
Exp
en
dit
ure
Eco
no
mic
cla
ssif
icati
on
R
'000
R
'000
R
'000
R
'000
R
'000
R
'000
%
R
'000
R
'000
Cu
rren
t p
aym
en
ts
9
1,3
29
(
75
9)
(2
08
)
90
,36
2
8
6,0
96
4
,26
6
95
.3%
8
8,6
08
8
6,9
55
Co
mp
en
sati
on
of
em
plo
yees
39,7
90
- -
39,7
90
37,5
15
2,2
75
94.3
%
36,3
94
36,3
94
Sala
ries
an
d w
ag
es
33,9
73
133
- 34,1
06
32,0
50
2,0
56
94.0
%
31,1
74
31,1
74
So
cial co
ntr
ibu
tio
ns
5,8
17
(133)
- 5,6
84
5,4
65
219
96.1
%
5,2
20
5,2
20
Go
od
s an
d s
erv
ices
51,5
39
(759)
(208)
50,5
72
48,5
81
1,9
91
96.1
%
52,2
13
50,5
61
Ad
min
istr
ati
ve f
ees
440
(85)
- 355
343
12
96.6
%
289
166
Ad
vert
isin
g
9
- -
9
- 9
- -
-
Min
or
ass
ets
176
657
- 833
641
192
77.0
%
477
477
Au
dit
co
sts:
Ext
ern
al
4,2
19
248
- 4,4
67
4,4
67
- 100.0
%
3,9
24
3,9
20
Cate
rin
g: D
ep
art
men
tal act
ivit
ies
88
1
- 89
67
22
75.3
%
96
60
Co
mp
ute
r se
rvic
es
- 274
- 274
273
1
99.6
%
- -
Co
nsu
ltan
ts: B
usi
ness
an
d a
dvis
ory
serv
ices
1,0
33
(119)
- 914
622
292
68.1
%
162
162
Co
ntr
act
ors
9,5
75
2,0
91
- 11,6
66
11,5
08
158
98.6
%
6,5
83
6,5
83
Fle
et
serv
ices
(in
clu
din
g g
overn
men
t m
oto
r tr
an
spo
rt)
4,6
80
(1,3
45)
- 3,3
35
3,2
87
48
98.6
%
5,0
02
5,0
02
Inven
tory
: C
loth
ing
mate
rial an
d a
ccess
ori
es
- 75
- 75
- 75
- -
-
Co
nsu
mab
le s
up
plies
364
97
- 461
431
30
93.5
%
646
505
Co
nsu
mab
le: Sta
tio
nery
, p
rin
tin
g a
nd
off
ice s
up
plies
1,4
53
(510)
(208)
735
701
34
95.4
%
909
724
Op
era
tin
g lease
s 24,9
29
(701)
- 24,2
28
23,5
68
660
97.3
%
30,1
31
29,4
09
Pro
pert
y p
aym
en
ts
1,6
14
(1,6
14)
- -
- -
- -
-
Tra
vel an
d s
ub
sist
en
ce
2,3
97
(392)
- 2,0
05
1,8
71
134
93.3
%
3,1
23
2,6
95
Tra
inin
g a
nd
develo
pm
en
t -
267
- 267
267
- 100.0
%
- -
127
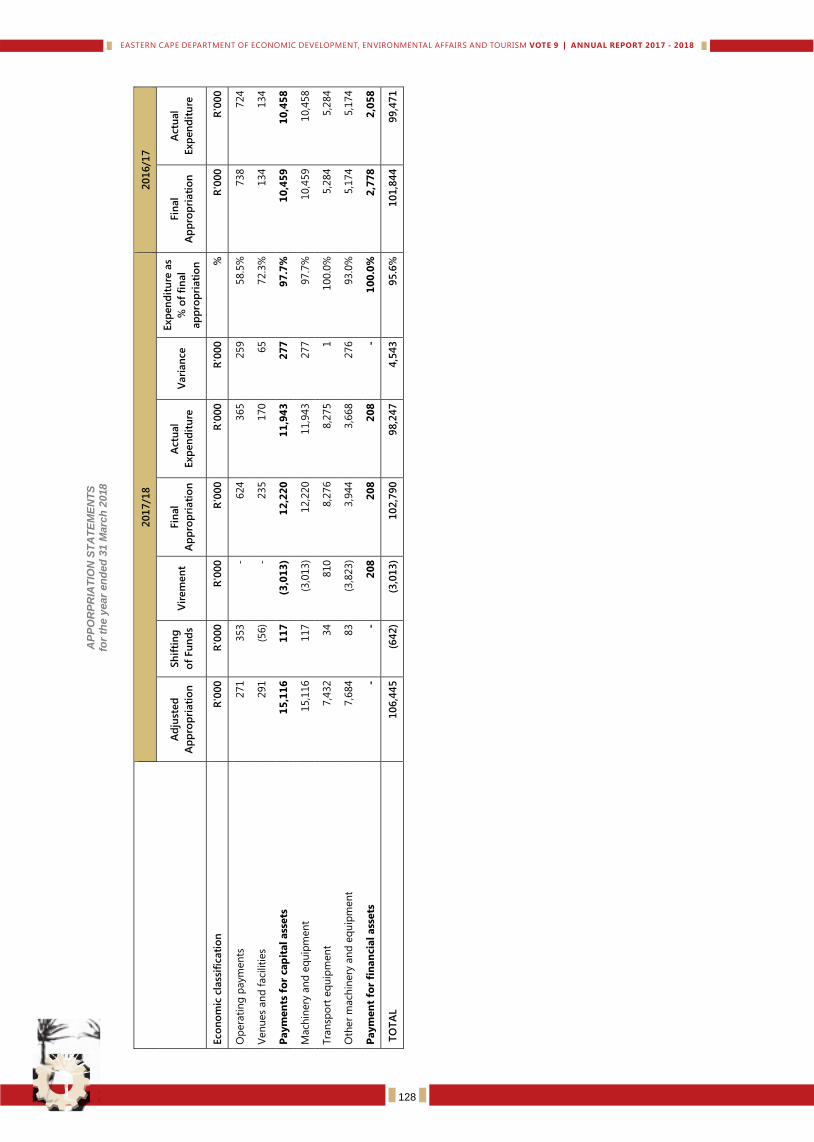
Dep
art
men
t o
f E
co
no
mic
Develo
pm
en
t, E
nv
iro
nm
en
tal A
ffair
s a
nd
To
uri
sm
V
OT
E 9
AP
PO
RP
RIA
TIO
N S
TA
TE
ME
NT
S
for
the
year
en
de
d 3
1 M
arc
h 2
018
201
7/1
8
201
6/1
7
Ad
just
ed
Ap
pro
pri
ati
on
Sh
ifti
ng
of
Fu
nd
s V
irem
en
t Fin
al
Ap
pro
pri
ati
on
Actu
al
Exp
en
dit
ure
V
ari
an
ce
Exp
en
dit
ure
as
% o
f fi
nal
ap
pro
pri
ati
on
Fin
al
Ap
pro
pri
ati
on
Actu
al
Exp
en
dit
ure
Eco
no
mic
cla
ssif
icati
on
R
'000
R
'000
R
'000
R
'000
R
'000
R
'000
%
R
'000
R
'000
Op
era
tin
g p
aym
en
ts
271
353
- 624
365
259
58.5
%
738
724
Ven
ues
an
d f
aci
liti
es
291
(56)
- 235
170
65
72.3
%
134
134
Paym
en
ts f
or
cap
ital ass
ets
1
5,1
16
1
17
(3
,01
3)
12
,22
0
11
,94
3
27
7
97
.7%
1
0,4
59
1
0,4
58
Mach
inery
an
d e
qu
ipm
en
t 15,1
16
117
(3,0
13)
12,2
20
11,9
43
277
97.7
%
10,4
59
10,4
58
Tra
nsp
ort
eq
uip
men
t 7,4
32
34
810
8,2
76
8,2
75
1
100.0
%
5,2
84
5,2
84
Oth
er
mach
inery
an
d e
qu
ipm
en
t 7,6
84
83
(3,8
23)
3,9
44
3,6
68
276
93.0
%
5,1
74
5,1
74
Paym
en
t fo
r fi
nan
cia
l ass
ets
-
- 2
08
2
08
2
08
-
10
0.0
%
2,7
78
2
,05
8
TO
TA
L
10
6,4
45
(6
42
) (3
,013
) 1
02
,79
0
98
,24
7
4,5
43
9
5.6
%
10
1,8
44
9
9,4
71
128
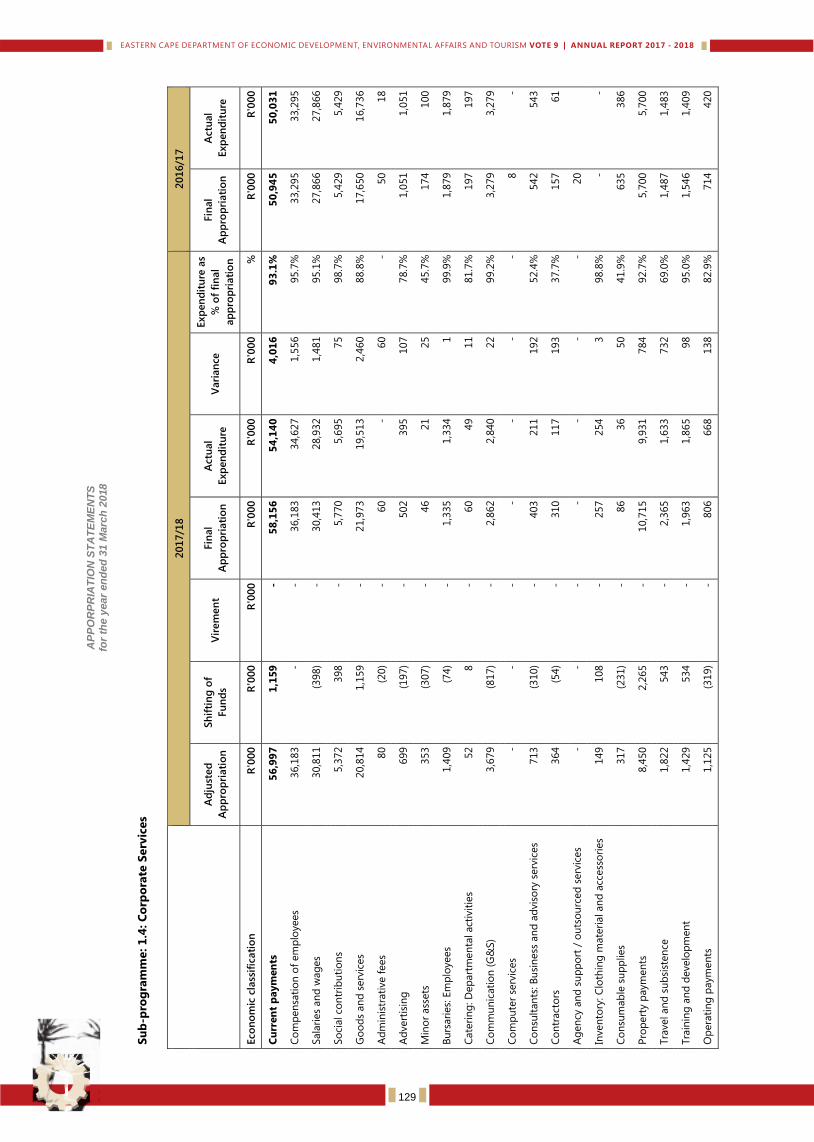
Dep
art
men
t o
f E
co
no
mic
Develo
pm
en
t, E
nv
iro
nm
en
tal A
ffair
s a
nd
To
uri
sm
V
OT
E 9
AP
PO
RP
RIA
TIO
N S
TA
TE
ME
NT
S
for
the
year
en
de
d 3
1 M
arc
h 2
018
Su
b-p
rog
ram
me: 1
.4: C
orp
ora
te S
erv
ices
201
7/1
8
201
6/1
7
Ad
just
ed
Ap
pro
pri
ati
on
Sh
ifti
ng
of
Fu
nd
s V
irem
en
t Fin
al
Ap
pro
pri
ati
on
Actu
al
Exp
en
dit
ure
V
ari
an
ce
Exp
en
dit
ure
as
% o
f fi
nal
ap
pro
pri
ati
on
Fin
al
Ap
pro
pri
ati
on
Actu
al
Exp
en
dit
ure
Eco
no
mic
cla
ssif
icati
on
R
'000
R
'000
R
'000
R
'000
R
'000
R
'000
%
R
'000
R
'000
Cu
rren
t p
aym
en
ts
56
,99
7
1,1
59
-
58
,15
6
54
,14
0
4,0
16
9
3.1
%
50
,94
5
50
,03
1
Co
mp
en
sati
on
of
em
plo
yees
36,1
83
- -
36,1
83
34,6
27
1,5
56
95.7
%
33,2
95
33,2
95
Sala
ries
an
d w
ag
es
30,8
11
(398)
- 30,4
13
28,9
32
1,4
81
95.1
%
27,8
66
27,8
66
So
cial co
ntr
ibu
tio
ns
5,3
72
398
- 5,7
70
5,6
95
75
98.7
%
5,4
29
5,4
29
Go
od
s an
d s
erv
ices
20,8
14
1,1
59
- 21,9
73
19,5
13
2,4
60
88.8
%
17,6
50
16,7
36
Ad
min
istr
ati
ve f
ees
80
(20)
- 60
- 60
- 50
18
Ad
vert
isin
g
699
(197)
- 502
395
107
78.7
%
1,0
51
1,0
51
Min
or
ass
ets
353
(307)
- 46
21
25
45.7
%
174
100
Bu
rsari
es:
Em
plo
yees
1,4
09
(74)
- 1,3
35
1,3
34
1
99.9
%
1,8
79
1,8
79
Cate
rin
g: D
ep
art
men
tal act
ivit
ies
52
8
- 60
49
11
81.7
%
197
197
Co
mm
un
icati
on
(G
&S)
3,6
79
(817)
- 2,8
62
2,8
40
22
99.2
%
3,2
79
3,2
79
Co
mp
ute
r se
rvic
es
- -
- -
- -
- 8
-
Co
nsu
ltan
ts: B
usi
ness
an
d a
dvis
ory
serv
ices
713
(310)
- 403
211
192
52.4
%
542
543
Co
ntr
act
ors
364
(54)
- 310
117
193
37.7
%
157
61
Ag
en
cy a
nd
su
pp
ort
/ o
uts
ou
rced
serv
ices
- -
- -
- -
- 20
Inven
tory
: C
loth
ing
mate
rial an
d a
ccess
ori
es
149
108
- 257
254
3
98.8
%
- -
Co
nsu
mab
le s
up
plies
317
(
231)
-
8
6
3
6
5
0
41.9
%
635
386
Pro
pert
y p
aym
en
ts
8,4
50
2,2
65
-
10,7
15
9,9
31
784
92.7
%
5,7
00
5,7
00
Tra
vel an
d s
ub
sist
en
ce
1,8
22
543
-
2,3
65
1,6
33
732
69.0
%
1,4
87
1,4
83
Tra
inin
g a
nd
develo
pm
en
t
1,4
29
534
-
1,9
63
1,8
65
9
8
95.0
%
1,5
46
1,4
09
Op
era
tin
g p
aym
en
ts
1,1
25
(
319)
-
806
668
138
82.9
%
714
420
129
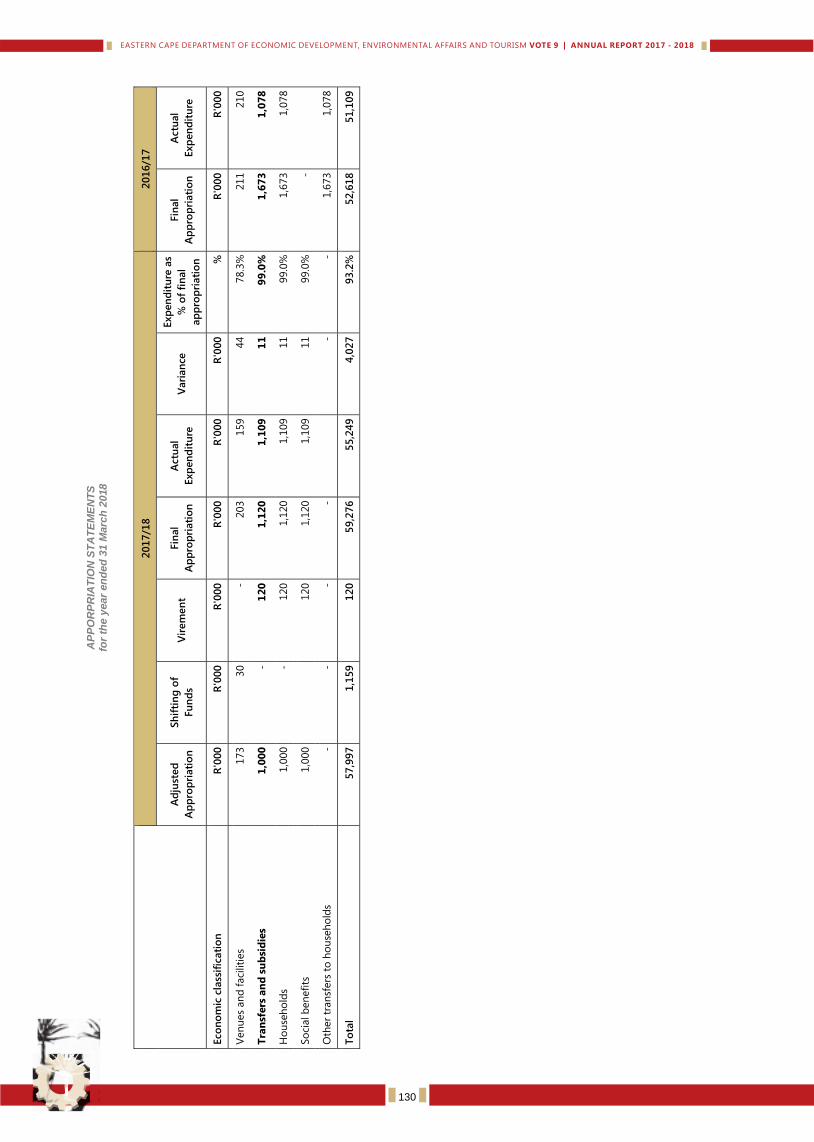
Dep
art
men
t o
f E
co
no
mic
Develo
pm
en
t, E
nv
iro
nm
en
tal A
ffair
s a
nd
To
uri
sm
V
OT
E 9
AP
PO
RP
RIA
TIO
N S
TA
TE
ME
NT
S
for
the
year
en
de
d 3
1 M
arc
h 2
018
201
7/1
8
201
6/1
7
Ad
just
ed
Ap
pro
pri
ati
on
Sh
ifti
ng
of
Fu
nd
s V
irem
en
t Fin
al
Ap
pro
pri
ati
on
Actu
al
Exp
en
dit
ure
V
ari
an
ce
Exp
en
dit
ure
as
% o
f fi
nal
ap
pro
pri
ati
on
Fin
al
Ap
pro
pri
ati
on
Actu
al
Exp
en
dit
ure
Eco
no
mic
cla
ssif
icati
on
R
'000
R
'000
R
'000
R
'000
R
'000
R
'000
%
R
'000
R
'000
Ven
ues
an
d f
aci
liti
es
173
3
0
-
203
159
4
4
78.3
%
211
210
Tra
nsf
ers
an
d s
ub
sid
ies
1,0
00
-
12
0
1,1
20
1
,10
9
11
9
9.0
%
1,6
73
1
,07
8
Ho
use
ho
lds
1,0
00
- 120
1,1
20
1,1
09
11
99.0
%
1,6
73
1,0
78
So
cial b
en
efi
ts
1,0
00
120
1,1
20
1,1
09
11
99.0
%
-
Oth
er
tran
sfers
to
ho
use
ho
lds
- -
- -
-
- 1,6
73
1,0
78
To
tal
57
,99
7
1,1
59
1
20
5
9,2
76
5
5,2
49
4
,02
7
93
.2%
5
2,6
18
5
1,1
09
130
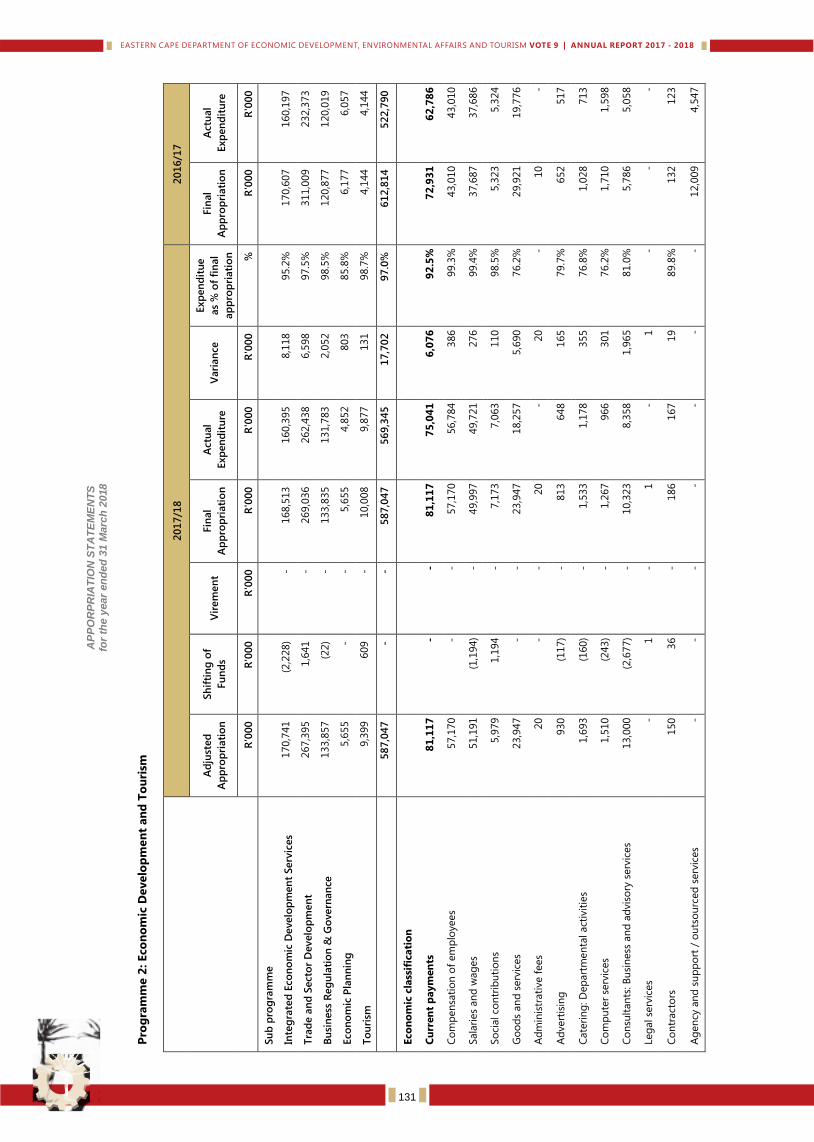
Dep
art
men
t o
f E
co
no
mic
Develo
pm
en
t, E
nv
iro
nm
en
tal A
ffair
s a
nd
To
uri
sm
V
OT
E 9
AP
PO
RP
RIA
TIO
N S
TA
TE
ME
NT
S
for
the
year
en
de
d 3
1 M
arc
h 2
018
Pro
gra
mm
e 2
: Eco
no
mic
Develo
pm
en
t an
d T
ou
rism
201
7/1
8
201
6/1
7
Ad
just
ed
Ap
pro
pri
ati
on
Sh
ifti
ng
of
Fu
nd
s V
irem
en
t Fin
al
Ap
pro
pri
ati
on
Actu
al
Exp
en
dit
ure
V
ari
an
ce
Exp
en
dit
ue
as
% o
f fi
nal
ap
pro
pri
ati
on
Fin
al
Ap
pro
pri
ati
on
Actu
al
Exp
en
dit
ure
R'0
00
R
'000
R
'000
R
'000
R
'000
R
'000
%
R
'000
R
'000
Su
b p
rog
ram
me
Inte
gra
ted
Eco
no
mic
Develo
pm
en
t Serv
ices
170,7
41
(2,2
28)
- 168,5
13
160,3
95
8,1
18
95.2
%
170,6
07
160,1
97
Tra
de a
nd
Secto
r D
evelo
pm
en
t 267,3
95
1,6
41
- 269,0
36
262,4
38
6,5
98
97.5
%
311,0
09
232,3
73
Bu
sin
ess
Reg
ula
tio
n &
Go
vern
an
ce
133,8
57
(22)
- 133,8
35
131,7
83
2,0
52
98.5
%
120,8
77
120,0
19
Eco
no
mic
Pla
nn
ing
5,6
55
- -
5,6
55
4,8
52
803
85.8
%
6,1
77
6,0
57
To
uri
sm
9,3
99
609
- 10,0
08
9,8
77
131
98.7
%
4,1
44
4,1
44
5
87
,04
7
- -
58
7,0
47
5
69
,34
5
17
,70
2
97
.0%
6
12
,81
4
52
2,7
90
Eco
no
mic
cla
ssif
icati
on
Cu
rren
t p
aym
en
ts
81
,11
7
- -
81
,11
7
75
,04
1
6,0
76
9
2.5
%
72
,93
1
62
,78
6
Co
mp
en
sati
on
of
em
plo
yees
57,1
70
- -
57,1
70
56,7
84
386
99.3
%
43,0
10
43,0
10
Sala
ries
an
d w
ag
es
51,1
91
(1,1
94)
- 49,9
97
49,7
21
276
99.4
%
37,6
87
37,6
86
So
cial co
ntr
ibu
tio
ns
5,9
79
1,1
94
- 7,1
73
7,0
63
110
98.5
%
5,3
23
5,3
24
Go
od
s an
d s
erv
ices
23,9
47
- -
23,9
47
18,2
57
5,6
90
76.2
%
29,9
21
19,7
76
Ad
min
istr
ati
ve f
ees
20
- -
20
- 20
- 10
-
Ad
vert
isin
g
930
(117)
- 813
648
165
79.7
%
652
517
Cate
rin
g: D
ep
art
men
tal act
ivit
ies
1,6
93
(160)
- 1,5
33
1,1
78
355
76.8
%
1,0
28
713
Co
mp
ute
r se
rvic
es
1,5
10
(243)
- 1,2
67
966
301
76.2
%
1,7
10
1,5
98
Co
nsu
ltan
ts: B
usi
ness
an
d a
dvis
ory
serv
ices
13,0
00
(2,6
77)
- 10,3
23
8,3
58
1,9
65
81.0
%
5,7
86
5,0
58
Leg
al se
rvic
es
- 1
- 1
- 1
- -
-
Co
ntr
act
ors
150
36
- 186
167
19
89.8
%
132
123
Ag
en
cy a
nd
su
pp
ort
/ o
uts
ou
rced
serv
ices
- -
- -
- -
- 12,0
09
4,5
47
131
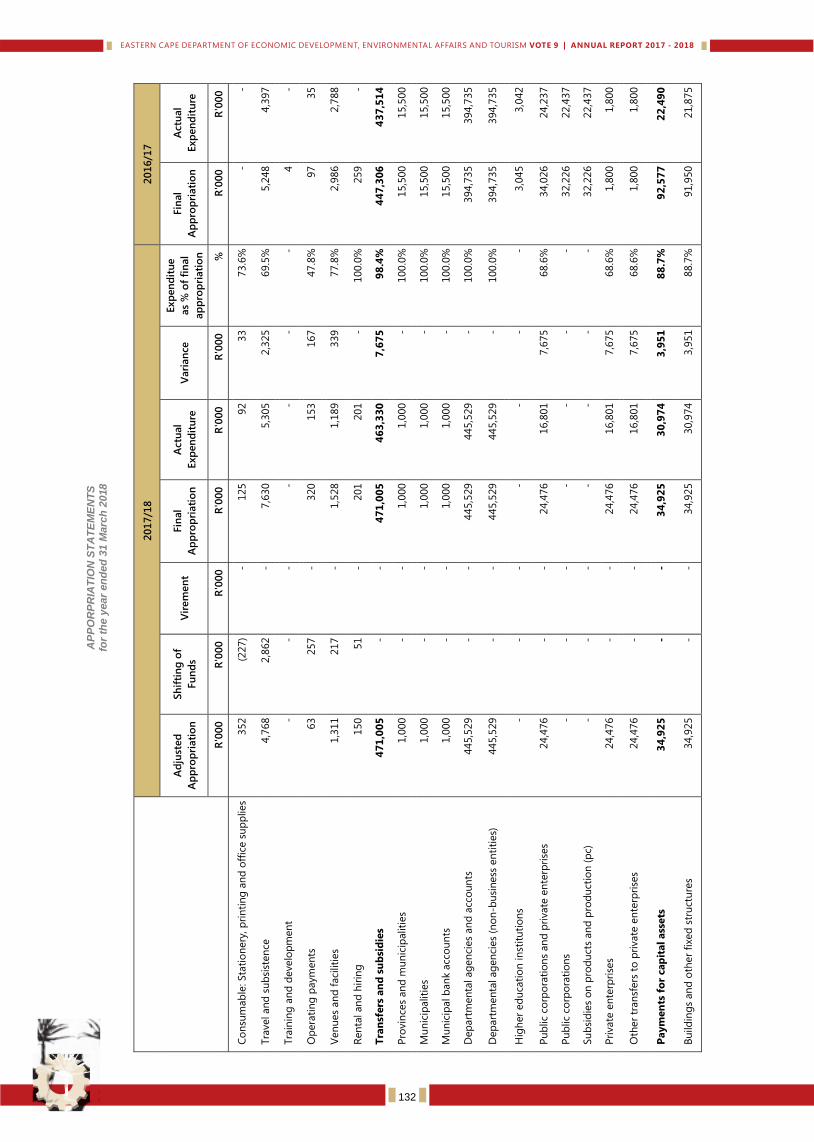
Dep
art
men
t o
f E
co
no
mic
Develo
pm
en
t, E
nv
iro
nm
en
tal A
ffair
s a
nd
To
uri
sm
V
OT
E 9
AP
PO
RP
RIA
TIO
N S
TA
TE
ME
NT
S
for
the
year
en
de
d 3
1 M
arc
h 2
018
201
7/1
8
201
6/1
7
Ad
just
ed
Ap
pro
pri
ati
on
Sh
ifti
ng
of
Fu
nd
s V
irem
en
t Fin
al
Ap
pro
pri
ati
on
Actu
al
Exp
en
dit
ure
V
ari
an
ce
Exp
en
dit
ue
as
% o
f fi
nal
ap
pro
pri
ati
on
Fin
al
Ap
pro
pri
ati
on
Actu
al
Exp
en
dit
ure
R'0
00
R
'000
R
'000
R
'000
R
'000
R
'000
%
R
'000
R
'000
Co
nsu
mab
le: Sta
tio
nery
, p
rin
tin
g a
nd
off
ice s
up
plies
352
(227)
- 125
92
33
73.6
%
- -
Tra
vel an
d s
ub
sist
en
ce
4,7
68
2,8
62
- 7,6
30
5,3
05
2,3
25
69.5
%
5,2
48
4,3
97
Tra
inin
g a
nd
develo
pm
en
t -
- -
- -
- -
4
-
Op
era
tin
g p
aym
en
ts
63
257
- 320
153
167
47.8
%
97
35
Ven
ues
an
d f
aci
liti
es
1,3
11
217
- 1,5
28
1,1
89
339
77.8
%
2,9
86
2,7
88
Ren
tal an
d h
irin
g
150
51
- 201
201
- 100.0
%
259
-
Tra
nsf
ers
an
d s
ub
sid
ies
47
1,0
05
-
- 4
71
,00
5
46
3,3
30
7
,67
5
98
.4%
4
47
,30
6
43
7,5
14
Pro
vin
ces
an
d m
un
icip
aliti
es
1,0
00
- -
1,0
00
1,0
00
- 100.0
%
15,5
00
15,5
00
Mu
nic
ipaliti
es
1,0
00
- -
1,0
00
1,0
00
- 100.0
%
15,5
00
15,5
00
Mu
nic
ipal b
an
k a
cco
un
ts
1,0
00
- -
1,0
00
1,0
00
- 100.0
%
15,5
00
15,5
00
Dep
art
men
tal ag
en
cies
an
d a
cco
un
ts
445,5
29
- -
445,5
29
445,5
29
- 100.0
%
394,7
35
394,7
35
Dep
art
men
tal ag
en
cies
(no
n-b
usi
ness
en
titi
es)
445,5
29
- -
445,5
29
445,5
29
- 100.0
%
394,7
35
394,7
35
Hig
her
ed
uca
tio
n in
stit
uti
on
s -
- -
- -
- -
3,0
45
3,0
42
Pu
blic
corp
ora
tio
ns
an
d p
rivate
en
terp
rise
s 24,4
76
- -
24,4
76
16,8
01
7,6
75
68.6
%
34,0
26
24,2
37
Pu
blic
corp
ora
tio
ns
- -
- -
- -
- 32,2
26
22,4
37
Su
bsi
die
s o
n p
rod
uct
s an
d p
rod
uct
ion
(p
c)
- -
- -
- -
- 32,2
26
22,4
37
Pri
vate
en
terp
rise
s 24,4
76
- -
24,4
76
16,8
01
7,6
75
68.6
%
1,8
00
1,8
00
Oth
er
tran
sfers
to
pri
vate
en
terp
rise
s 24,4
76
- -
24,4
76
16,8
01
7,6
75
68.6
%
1,8
00
1,8
00
Paym
en
ts f
or
cap
ital ass
ets
3
4,9
25
-
- 3
4,9
25
3
0,9
74
3
,95
1
88
.7%
9
2,5
77
2
2,4
90
Bu
ild
ing
s an
d o
ther
fixe
d s
tru
ctu
res
34,9
25
- -
34,9
25
30,9
74
3,9
51
88.7
%
91,9
50
21,8
75
132
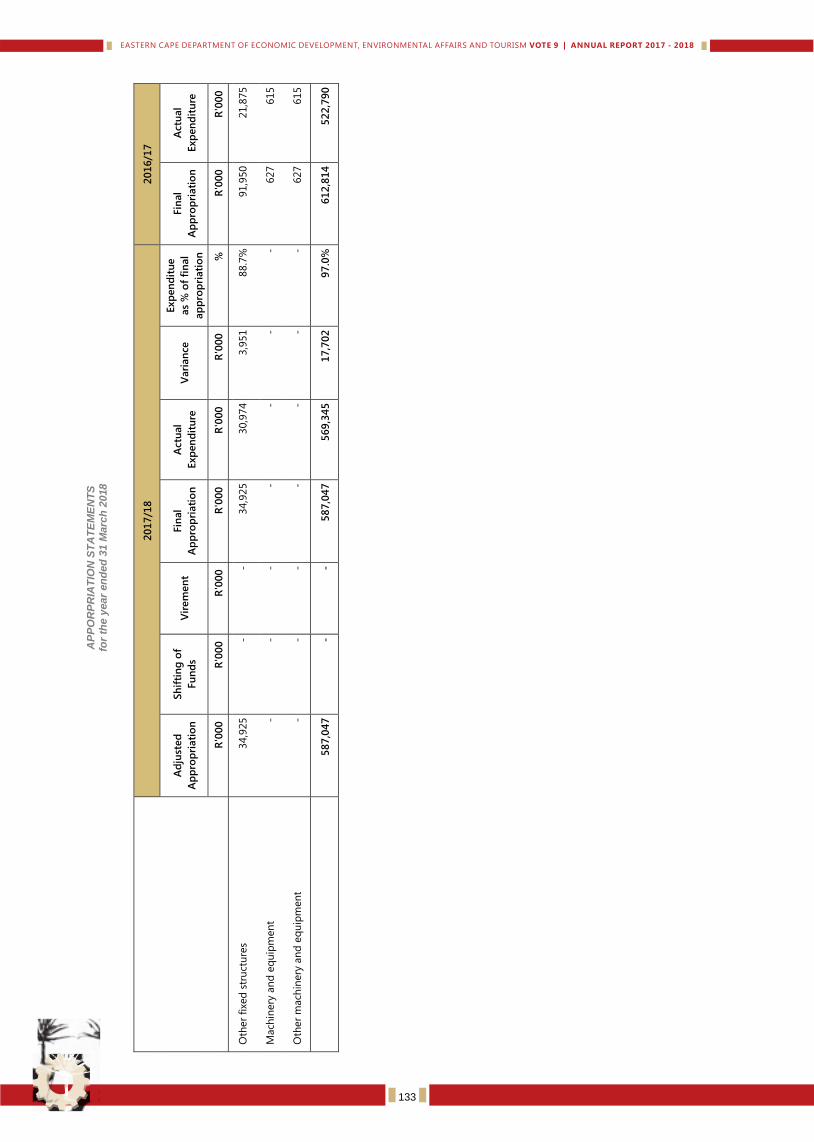
Dep
art
men
t o
f E
co
no
mic
Develo
pm
en
t, E
nv
iro
nm
en
tal A
ffair
s a
nd
To
uri
sm
V
OT
E 9
AP
PO
RP
RIA
TIO
N S
TA
TE
ME
NT
S
for
the
year
en
de
d 3
1 M
arc
h 2
018
201
7/1
8
201
6/1
7
Ad
just
ed
Ap
pro
pri
ati
on
Sh
ifti
ng
of
Fu
nd
s V
irem
en
t Fin
al
Ap
pro
pri
ati
on
Actu
al
Exp
en
dit
ure
V
ari
an
ce
Exp
en
dit
ue
as
% o
f fi
nal
ap
pro
pri
ati
on
Fin
al
Ap
pro
pri
ati
on
Actu
al
Exp
en
dit
ure
R'0
00
R
'000
R
'000
R
'000
R
'000
R
'000
%
R
'000
R
'000
Oth
er
fixe
d s
tru
ctu
res
34,9
25
- -
34,9
25
30,9
74
3,9
51
88.7
%
91,9
50
21,8
75
Mach
inery
an
d e
qu
ipm
en
t -
- -
- -
- -
627
615
Oth
er
mach
inery
an
d e
qu
ipm
en
t -
- -
- -
- -
627
615
5
87
,04
7
- -
58
7,0
47
5
69
,34
5
17
,70
2
97
.0%
6
12
,81
4
52
2,7
90
133
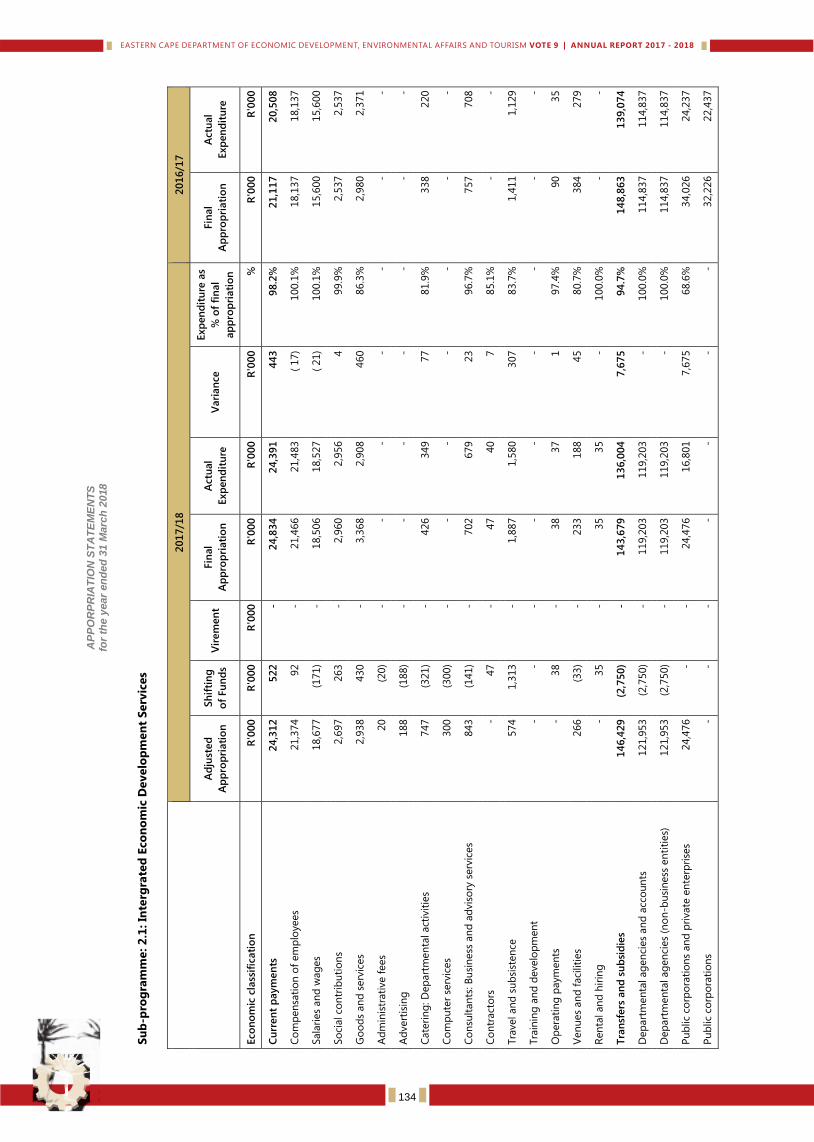
Dep
art
men
t o
f E
co
no
mic
Develo
pm
en
t, E
nv
iro
nm
en
tal A
ffair
s a
nd
To
uri
sm
V
OT
E 9
AP
PO
RP
RIA
TIO
N S
TA
TE
ME
NT
S
for
the
year
en
de
d 3
1 M
arc
h 2
018
Su
b-p
rog
ram
me
: 2
.1: In
terg
rate
d E
co
no
mic
Develo
pm
en
t S
erv
ices
201
7/1
8
201
6/1
7
Ad
just
ed
Ap
pro
pri
ati
on
Sh
ifti
ng
of
Fu
nd
s V
irem
en
t Fin
al
Ap
pro
pri
ati
on
Actu
al
Exp
en
dit
ure
V
ari
an
ce
Exp
en
dit
ure
as
% o
f fi
nal
ap
pro
pri
ati
on
Fin
al
Ap
pro
pri
ati
on
Actu
al
Exp
en
dit
ure
Eco
no
mic
cla
ssif
icati
on
R
'000
R
'000
R
'000
R
'000
R
'000
R
'000
%
R
'000
R
'000
Cu
rren
t p
aym
en
ts
24
,31
2
52
2
- 2
4,8
34
2
4,3
91
4
43
9
8.2
%
21
,11
7
20
,50
8
Co
mp
en
sati
on
of
em
plo
yees
21,3
74
92
- 21,4
66
21,4
83
(
17)
100.1
%
18,1
37
18,1
37
Sala
ries
an
d w
ag
es
18,6
77
(171)
- 18,5
06
18,5
27
( 21)
100.1
%
15,6
00
15,6
00
So
cial co
ntr
ibu
tio
ns
2,6
97
263
- 2,9
60
2,9
56
4
99.9
%
2,5
37
2,5
37
Go
od
s an
d s
erv
ices
2,9
38
430
- 3,3
68
2,9
08
460
86.3
%
2,9
80
2,3
71
Ad
min
istr
ati
ve f
ees
20
(20)
- -
- -
- -
-
Ad
vert
isin
g
188
(188)
- -
- -
- -
-
Cate
rin
g: D
ep
art
men
tal act
ivit
ies
747
(321)
- 426
349
77
81.9
%
338
220
Co
mp
ute
r se
rvic
es
300
(300)
- -
- -
- -
-
Co
nsu
ltan
ts: B
usi
ness
an
d a
dvis
ory
serv
ices
843
(141)
- 702
679
23
96.7
%
757
708
Co
ntr
act
ors
-
47
- 47
40
7
85.1
%
- -
Tra
vel an
d s
ub
sist
en
ce
574
1,3
13
- 1,8
87
1,5
80
307
83.7
%
1,4
11
1,1
29
Tra
inin
g a
nd
develo
pm
en
t -
- -
- -
- -
- -
Op
era
tin
g p
aym
en
ts
- 38
- 38
37
1
97.4
%
90
35
Ven
ues
an
d f
aci
liti
es
266
(33)
- 233
188
45
80.7
%
384
279
Ren
tal an
d h
irin
g
- 35
- 35
35
- 100.0
%
- -
Tra
nsf
ers
an
d s
ub
sid
ies
14
6,4
29
(2
,750
) -
14
3,6
79
1
36
,00
4
7,6
75
9
4.7
%
14
8,8
63
1
39
,07
4
Dep
art
men
tal ag
en
cies
an
d a
cco
un
ts
121,9
53
(2,7
50)
- 119,2
03
119,2
03
- 100.0
%
114,8
37
114,8
37
Dep
art
men
tal ag
en
cies
(no
n-b
usi
ness
en
titi
es)
121,9
53
(2,7
50)
- 119,2
03
119,2
03
- 100.0
%
114,8
37
114,8
37
Pu
blic
corp
ora
tio
ns
an
d p
rivate
en
terp
rise
s 24,4
76
- -
24,4
76
16,8
01
7,6
75
68.6
%
34,0
26
24,2
37
Pu
blic
corp
ora
tio
ns
- -
- -
- -
- 32,2
26
22,4
37
134
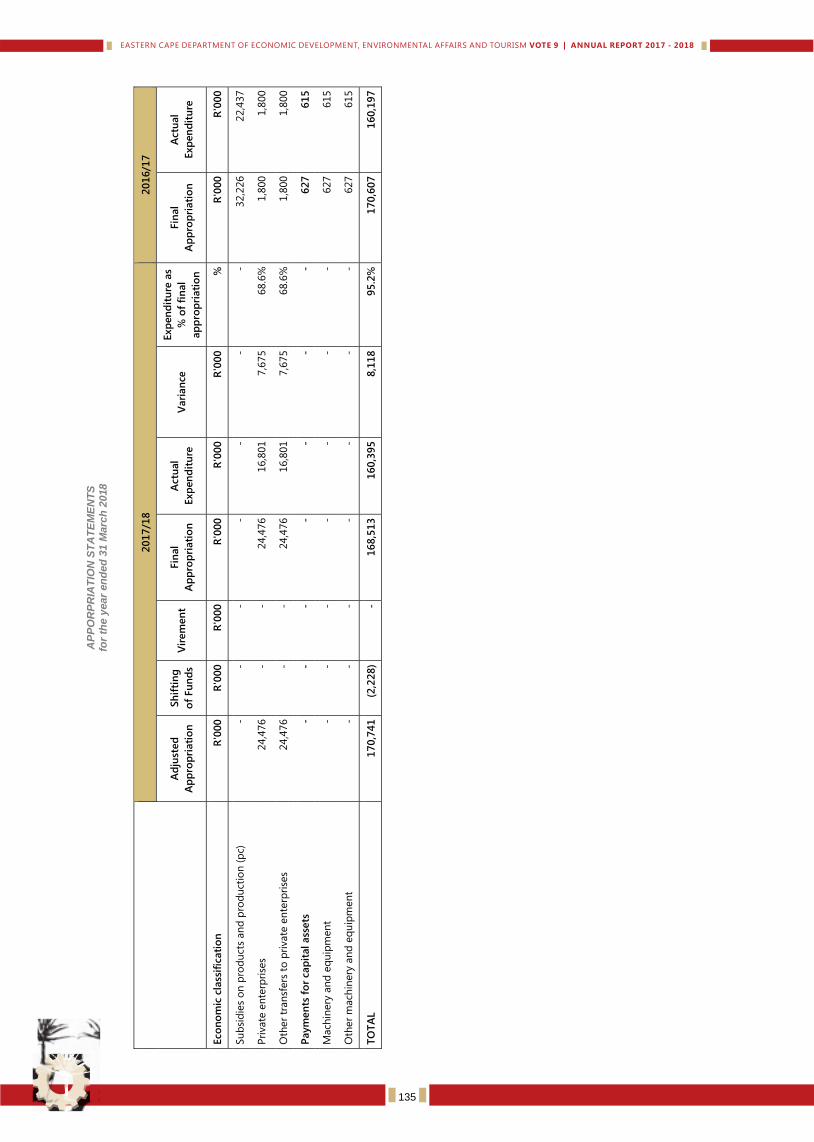
Dep
art
men
t o
f E
co
no
mic
Develo
pm
en
t, E
nv
iro
nm
en
tal A
ffair
s a
nd
To
uri
sm
V
OT
E 9
AP
PO
RP
RIA
TIO
N S
TA
TE
ME
NT
S
for
the
year
en
de
d 3
1 M
arc
h 2
018
201
7/1
8
201
6/1
7
Ad
just
ed
Ap
pro
pri
ati
on
Sh
ifti
ng
of
Fu
nd
s V
irem
en
t Fin
al
Ap
pro
pri
ati
on
Actu
al
Exp
en
dit
ure
V
ari
an
ce
Exp
en
dit
ure
as
% o
f fi
nal
ap
pro
pri
ati
on
Fin
al
Ap
pro
pri
ati
on
Actu
al
Exp
en
dit
ure
Eco
no
mic
cla
ssif
icati
on
R
'000
R
'000
R
'000
R
'000
R
'000
R
'000
%
R
'000
R
'000
Su
bsi
die
s o
n p
rod
uct
s an
d p
rod
uct
ion
(p
c)
- -
- -
- -
- 32,2
26
22,4
37
Pri
vate
en
terp
rise
s 24,4
76
- -
24,4
76
16,8
01
7,6
75
68.6
%
1,8
00
1,8
00
Oth
er
tran
sfers
to
pri
vate
en
terp
rise
s 24,4
76
- -
24,4
76
16,8
01
7,6
75
68.6
%
1,8
00
1,8
00
Paym
en
ts f
or
cap
ital ass
ets
-
- -
- -
- -
62
7
61
5
Mach
inery
an
d e
qu
ipm
en
t -
- -
- -
- -
627
615
Oth
er
mach
inery
an
d e
qu
ipm
en
t -
- -
- -
- -
627
615
TO
TA
L
17
0,7
41
(2
,228
) -
16
8,5
13
1
60
,39
5
8,1
18
9
5.2
%
17
0,6
07
1
60
,19
7
135

Dep
art
men
t o
f E
co
no
mic
Develo
pm
en
t, E
nv
iro
nm
en
tal A
ffair
s a
nd
To
uri
sm
V
OT
E 9
AP
PO
RP
RIA
TIO
N S
TA
TE
ME
NT
S
for
the
year
en
de
d 3
1 M
arc
h 2
018
Su
b-p
rog
ram
me
: 2
.2: T
rad
e a
nd
Secto
r D
evelo
pm
en
t
201
7/1
8
201
6/1
7
Ad
just
ed
Ap
pro
pri
ati
on
Sh
ifti
ng
of
Fu
nd
s V
irem
en
t Fin
al
Ap
pro
pri
ati
on
Actu
al
Exp
en
dit
ure
V
ari
an
ce
Exp
en
dit
ure
as
% o
f fi
nal
ap
pro
pri
ati
on
Fin
al
Ap
pro
pri
ati
on
Actu
al
Exp
en
dit
ure
Eco
no
mic
cla
ssif
icati
on
R
'000
R
'000
R
'000
R
'000
R
'000
R
'000
%
R
'000
R
'000
Cu
rren
t p
aym
en
ts
23
,63
4
(1
,10
9)
-
22
,52
5
1
9,8
78
2
,64
7
88
.2%
2
1,9
37
13
,37
6
Co
mp
en
sati
on
of
em
plo
yees
14,3
65
(
896)
-
13,4
69
13,3
75
9
4
99.3
%
3
,957
3,9
57
Sala
ries
an
d w
ag
es
1
3,9
61
(2,0
72)
-
11,8
89
11,8
33
5
6
99.5
%
3,7
73
3,7
73
So
cial co
ntr
ibu
tio
ns
404
1,1
76
-
1,5
80
1,5
42
3
8
97.6
%
184
184
Go
od
s an
d s
erv
ices
9,2
69
(
213)
-
9,0
56
6,5
03
2,5
53
71.8
%
17,9
80
9,4
19
Ad
vert
isin
g
-
-
-
-
-
-
-
87
-
Cate
rin
g: D
ep
art
men
tal act
ivit
ies
161
150
-
311
150
161
48.2
%
9
4
7
9
Co
mp
ute
r se
rvic
es
460
(
243)
-
217
6
2
155
28.6
%
-
-
Co
nsu
ltan
ts: B
usi
ness
an
d a
dvis
ory
serv
ices
6,7
00
(1,0
14)
-
5,6
86
4,4
18
1,2
68
77.7
%
3,6
53
2,9
75
Leg
al se
rvic
es
-
1
-
1
-
1
-
-
-
Ag
en
cy a
nd
su
pp
ort
/ o
uts
ou
rced
serv
ices
-
-
-
-
-
-
-
12,0
09
4,5
47
Tra
vel an
d s
ub
sist
en
ce
1,4
85
1,0
15
-
2,5
00
1,5
37
963
61.5
%
1,2
09
1,2
09
Tra
inin
g a
nd
develo
pm
en
t -
- -
- -
- -
4
-
Op
era
tin
g p
aym
en
ts
63
- -
63
59
4
93.7
%
- -
Ven
ues
an
d f
aci
liti
es
250
28
- 278
277
1
99.6
%
679
609
Ren
tal an
d h
irin
g
150
(150)
- -
- -
- 245
-
Tra
nsf
ers
an
d s
ub
sid
ies
20
8,8
36
2
,75
0
- 2
11
,58
6
21
1,5
86
-
10
0.0
%
19
7,1
22
1
97
,12
2
Pro
vin
ces
an
d m
un
icip
aliti
es
- -
- -
- -
- 15,0
00
15,0
00
Mu
nic
ipaliti
es
- -
- -
- -
- 15,0
00
15,0
00
Mu
nic
ipal b
an
k a
cco
un
ts
- -
- -
- -
- 15,0
00
15,0
00
136
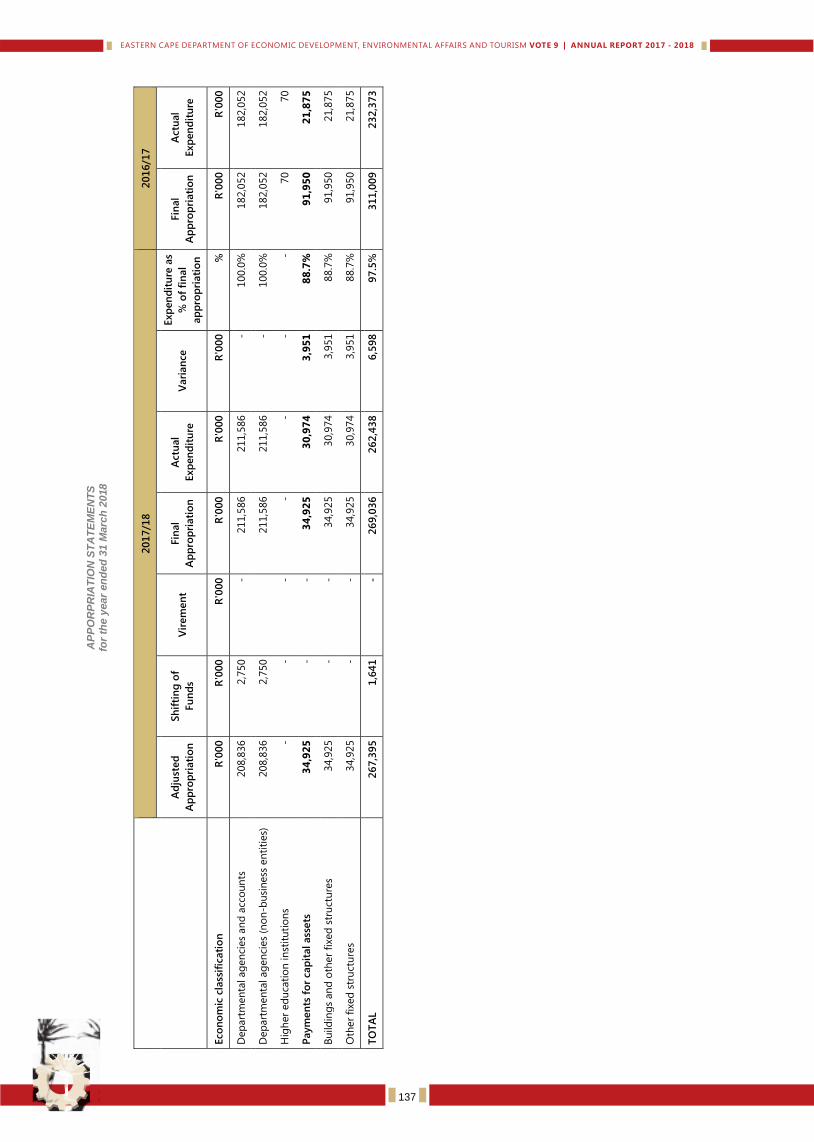
Dep
art
men
t o
f E
co
no
mic
Develo
pm
en
t, E
nv
iro
nm
en
tal A
ffair
s a
nd
To
uri
sm
V
OT
E 9
AP
PO
RP
RIA
TIO
N S
TA
TE
ME
NT
S
for
the
year
en
de
d 3
1 M
arc
h 2
018
201
7/1
8
201
6/1
7
Ad
just
ed
Ap
pro
pri
ati
on
Sh
ifti
ng
of
Fu
nd
s V
irem
en
t Fin
al
Ap
pro
pri
ati
on
Actu
al
Exp
en
dit
ure
V
ari
an
ce
Exp
en
dit
ure
as
% o
f fi
nal
ap
pro
pri
ati
on
Fin
al
Ap
pro
pri
ati
on
Actu
al
Exp
en
dit
ure
Eco
no
mic
cla
ssif
icati
on
R
'000
R
'000
R
'000
R
'000
R
'000
R
'000
%
R
'000
R
'000
Dep
art
men
tal ag
en
cies
an
d a
cco
un
ts
208,8
36
2,7
50
- 211,5
86
211,5
86
- 100.0
%
182,0
52
182,0
52
Dep
art
men
tal ag
en
cies
(no
n-b
usi
ness
en
titi
es)
208,8
36
2,7
50
211,5
86
211,5
86
- 100.0
%
182,0
52
182,0
52
Hig
her
ed
uca
tio
n in
stit
uti
on
s -
- -
- -
- -
70
70
Paym
en
ts f
or
cap
ital ass
ets
3
4,9
25
-
- 3
4,9
25
3
0,9
74
3
,95
1
88
.7%
9
1,9
50
2
1,8
75
Bu
ild
ing
s an
d o
ther
fixe
d s
tru
ctu
res
34,9
25
- -
34,9
25
30,9
74
3,9
51
88.7
%
91,9
50
21,8
75
Oth
er
fixe
d s
tru
ctu
res
34,9
25
- -
34,9
25
30,9
74
3,9
51
88.7
%
91,9
50
21,8
75
TO
TA
L
26
7,3
95
1
,64
1
- 2
69
,03
6
26
2,4
38
6
,59
8
97
.5%
3
11
,00
9
23
2,3
73
137
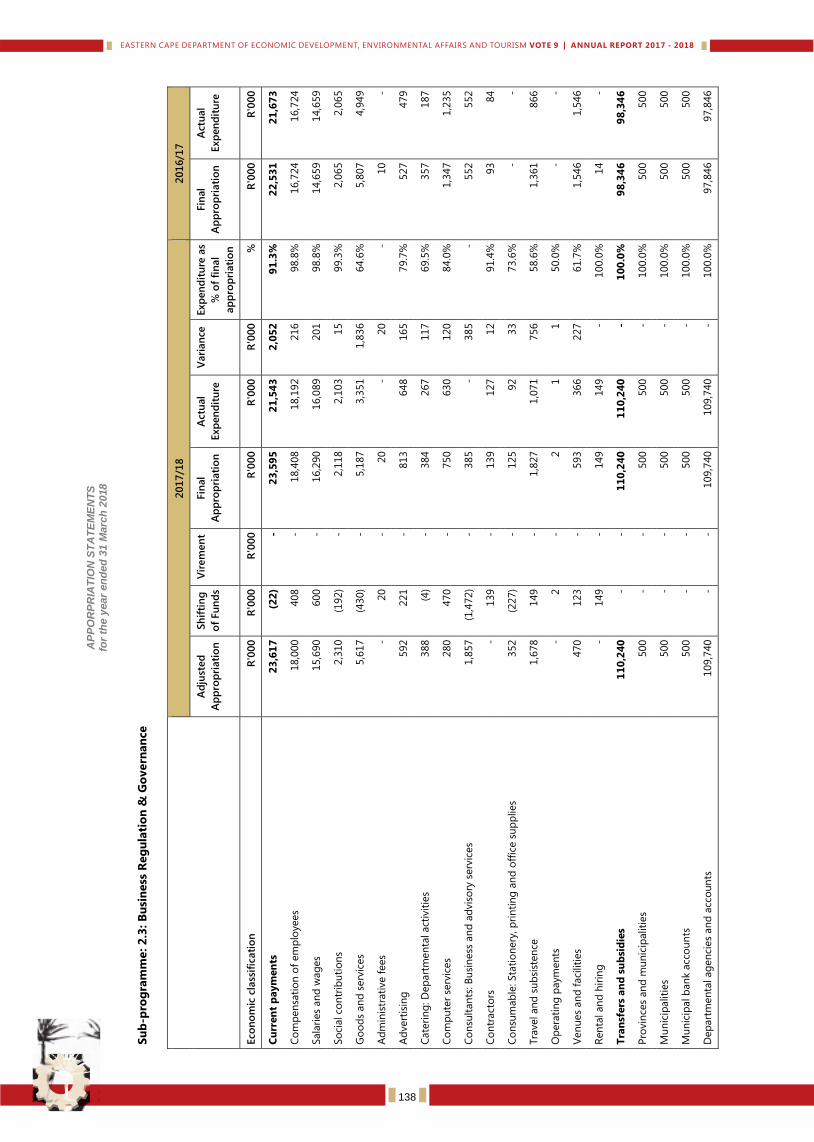
Dep
art
men
t o
f E
co
no
mic
Develo
pm
en
t, E
nv
iro
nm
en
tal A
ffair
s a
nd
To
uri
sm
V
OT
E 9
AP
PO
RP
RIA
TIO
N S
TA
TE
ME
NT
S
for
the
year
en
de
d 3
1 M
arc
h 2
018
Su
b-p
rog
ram
me
: 2
.3: B
usi
ness
Reg
ula
tio
n &
Go
vern
an
ce
201
7/1
8
201
6/1
7
Ad
just
ed
Ap
pro
pri
ati
on
Sh
ifti
ng
of
Fu
nd
s
Vir
em
en
t Fin
al
Ap
pro
pri
ati
on
Actu
al
Exp
en
dit
ure
Vari
an
ce
Exp
en
dit
ure
as
% o
f fi
nal
ap
pro
pri
ati
on
Fin
al
Ap
pro
pri
ati
on
Actu
al
Exp
en
dit
ure
Eco
no
mic
cla
ssif
icati
on
R
'000
R
'000
R
'000
R
'000
R
'000
R
'000
%
R
'000
R
'000
Cu
rren
t p
aym
en
ts
23
,61
7
(22
) -
23
,59
5
21
,54
3
2,0
52
9
1.3
%
22
,53
1
21
,67
3
Co
mp
en
sati
on
of
em
plo
yees
18,0
00
408
- 18,4
08
18,1
92
216
98.8
%
16,7
24
16,7
24
Sala
ries
an
d w
ag
es
15,6
90
600
- 16,2
90
16,0
89
201
98.8
%
14,6
59
14,6
59
So
cial co
ntr
ibu
tio
ns
2,3
10
(192)
- 2,1
18
2,1
03
15
99.3
%
2,0
65
2,0
65
Go
od
s an
d s
erv
ices
5,6
17
(430)
- 5,1
87
3,3
51
1,8
36
64.6
%
5,8
07
4,9
49
Ad
min
istr
ati
ve f
ees
- 20
- 20
- 20
- 10
-
Ad
vert
isin
g
592
221
- 813
648
165
79.7
%
527
479
Cate
rin
g: D
ep
art
men
tal act
ivit
ies
388
(4)
- 384
267
117
69.5
%
357
187
Co
mp
ute
r se
rvic
es
280
470
- 750
630
120
84.0
%
1,3
47
1,2
35
Co
nsu
ltan
ts: B
usi
ness
an
d a
dvis
ory
serv
ices
1,8
57
(1,4
72)
- 385
- 385
- 552
552
Co
ntr
act
ors
-
139
- 139
127
12
91.4
%
93
84
Co
nsu
mab
le: Sta
tio
nery
, p
rin
tin
g a
nd
off
ice s
up
plies
352
(227)
- 125
92
33
73.6
%
- -
Tra
vel an
d s
ub
sist
en
ce
1,6
78
149
- 1,8
27
1,0
71
756
58.6
%
1,3
61
866
Op
era
tin
g p
aym
en
ts
- 2
- 2
1
1
50.0
%
- -
Ven
ues
an
d f
aci
liti
es
470
123
- 593
366
227
61.7
%
1,5
46
1,5
46
Ren
tal an
d h
irin
g
- 149
- 149
149
- 100.0
%
14
-
Tra
nsf
ers
an
d s
ub
sid
ies
11
0,2
40
-
- 1
10
,24
0
11
0,2
40
-
10
0.0
%
98
,34
6
98
,34
6
Pro
vin
ces
an
d m
un
icip
aliti
es
500
- -
500
500
- 100.0
%
500
500
Mu
nic
ipaliti
es
500
- -
500
500
- 100.0
%
500
500
Mu
nic
ipal b
an
k a
cco
un
ts
500
- -
500
500
- 100.0
%
500
500
Dep
art
men
tal ag
en
cies
an
d a
cco
un
ts
109,7
40
- -
109,7
40
109,7
40
- 100.0
%
97,8
46
97,8
46
138
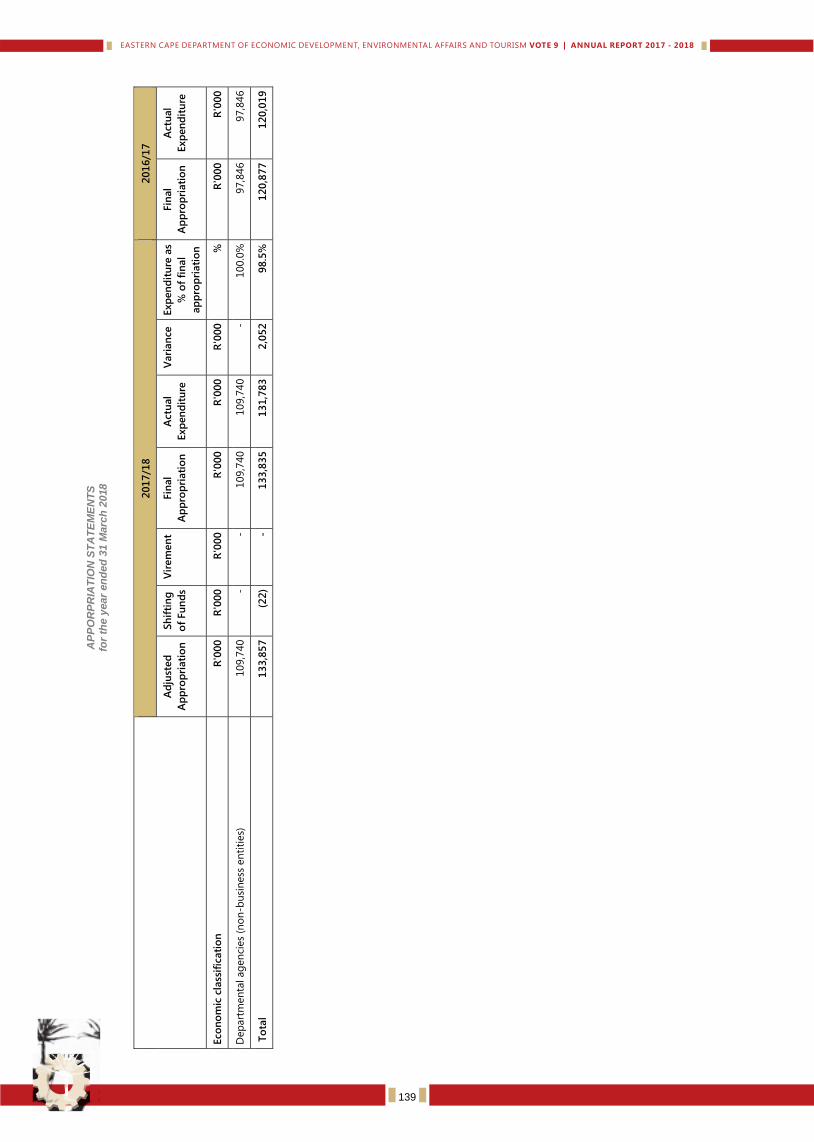
Dep
art
men
t o
f E
co
no
mic
Develo
pm
en
t, E
nv
iro
nm
en
tal A
ffair
s a
nd
To
uri
sm
V
OT
E 9
AP
PO
RP
RIA
TIO
N S
TA
TE
ME
NT
S
for
the
year
en
de
d 3
1 M
arc
h 2
018
201
7/1
8
201
6/1
7
Ad
just
ed
Ap
pro
pri
ati
on
Sh
ifti
ng
of
Fu
nd
s
Vir
em
en
t Fin
al
Ap
pro
pri
ati
on
Actu
al
Exp
en
dit
ure
Vari
an
ce
Exp
en
dit
ure
as
% o
f fi
nal
ap
pro
pri
ati
on
Fin
al
Ap
pro
pri
ati
on
Actu
al
Exp
en
dit
ure
Eco
no
mic
cla
ssif
icati
on
R
'000
R
'000
R
'000
R
'000
R
'000
R
'000
%
R
'000
R
'000
Dep
art
men
tal ag
en
cies
(no
n-b
usi
ness
en
titi
es)
109,7
40
- -
109,7
40
109,7
40
- 100.0
%
97,8
46
97,8
46
To
tal
13
3,8
57
(2
2)
- 1
33
,83
5
13
1,7
83
2
,05
2
98
.5%
1
20
,87
7
12
0,0
19
139
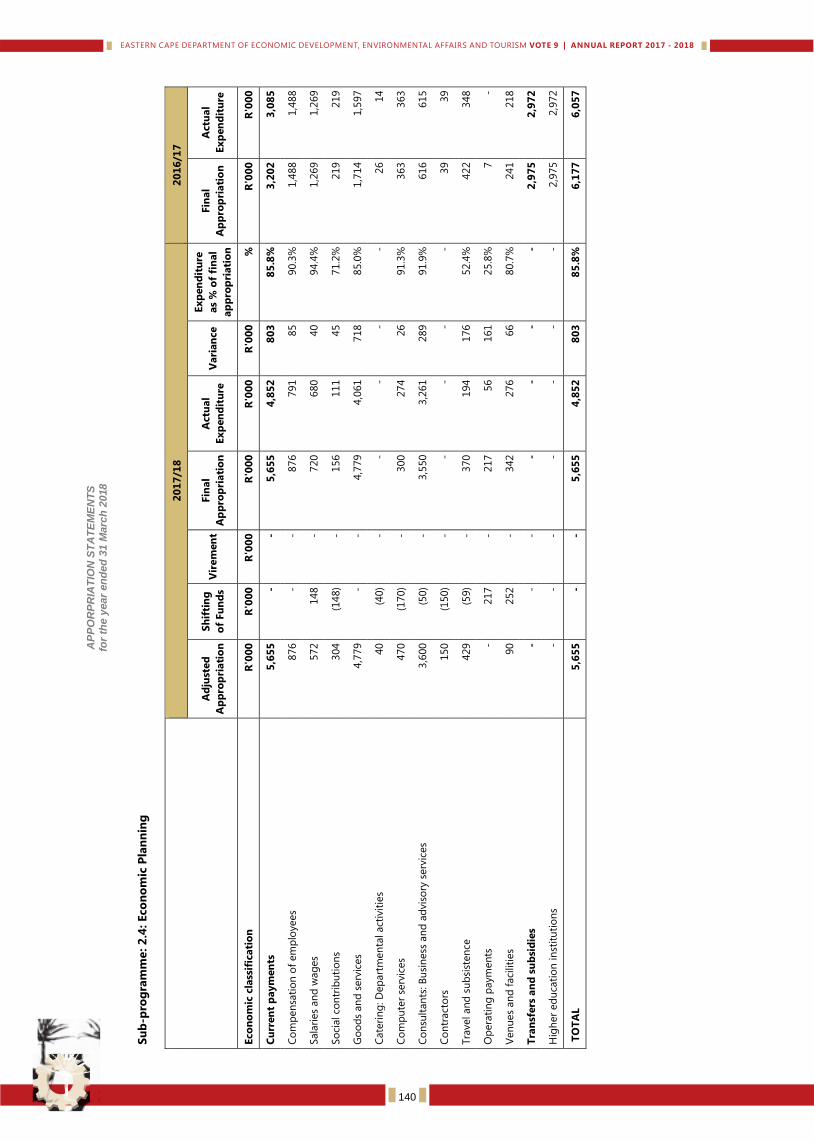
Dep
art
men
t o
f E
co
no
mic
Develo
pm
en
t, E
nv
iro
nm
en
tal A
ffair
s a
nd
To
uri
sm
V
OT
E 9
AP
PO
RP
RIA
TIO
N S
TA
TE
ME
NT
S
for
the
year
en
de
d 3
1 M
arc
h 2
018
Su
b-p
rog
ram
me
: 2
.4: Eco
no
mic
Pla
nn
ing
20
17
/18
2
01
6/1
7
Ad
just
ed
Ap
pro
pri
ati
on
Sh
ifti
ng
of
Fu
nd
s V
irem
en
t Fin
al
Ap
pro
pri
ati
on
Actu
al
Ex
pen
dit
ure
V
ari
an
ce
Ex
pen
dit
ure
as
% o
f fi
nal
ap
pro
pri
ati
on
Fin
al
Ap
pro
pri
ati
on
Actu
al
Ex
pen
dit
ure
Eco
no
mic
cla
ssif
icati
on
R
'00
0
R'0
00
R
'00
0
R'0
00
R
'00
0
R'0
00
%
R
'00
0
R'0
00
Cu
rren
t p
aym
en
ts
5,6
55
-
- 5
,65
5
4,8
52
8
03
8
5.8
%
3,2
02
3
,08
5
Co
mp
en
sati
on
of
em
plo
yees
876
- -
876
791
85
90.3
%
1,4
88
1,4
88
Sala
ries
an
d w
ag
es
572
148
- 720
680
40
94.4
%
1,2
69
1,2
69
So
cial co
ntr
ibu
tio
ns
304
(148)
- 156
111
45
71.2
%
219
219
Go
od
s an
d s
erv
ices
4,7
79
- -
4,7
79
4,0
61
718
85.0
%
1,7
14
1,5
97
Cate
rin
g: D
ep
art
men
tal act
ivit
ies
40
(40)
- -
- -
- 26
14
Co
mp
ute
r se
rvic
es
470
(170)
- 300
274
26
91.3
%
363
363
Co
nsu
ltan
ts: B
usi
ness
an
d a
dvis
ory
serv
ices
3,6
00
(50)
- 3,5
50
3,2
61
289
91.9
%
616
615
Co
ntr
act
ors
150
(150)
- -
- -
- 39
39
Tra
vel an
d s
ub
sist
en
ce
429
(59)
- 370
194
176
52.4
%
422
348
Op
era
tin
g p
aym
en
ts
- 217
- 217
56
161
25.8
%
7
-
Ven
ues
an
d f
aci
liti
es
90
252
- 342
276
66
80.7
%
241
218
Tra
nsf
ers
an
d s
ub
sid
ies
- -
- -
- -
- 2
,97
5
2,9
72
Hig
her
ed
uca
tio
n in
stit
uti
on
s -
- -
- -
- -
2,9
75
2,9
72
TO
TA
L
5,6
55
-
- 5
,65
5
4,8
52
8
03
8
5.8
%
6,1
77
6
,05
7
140
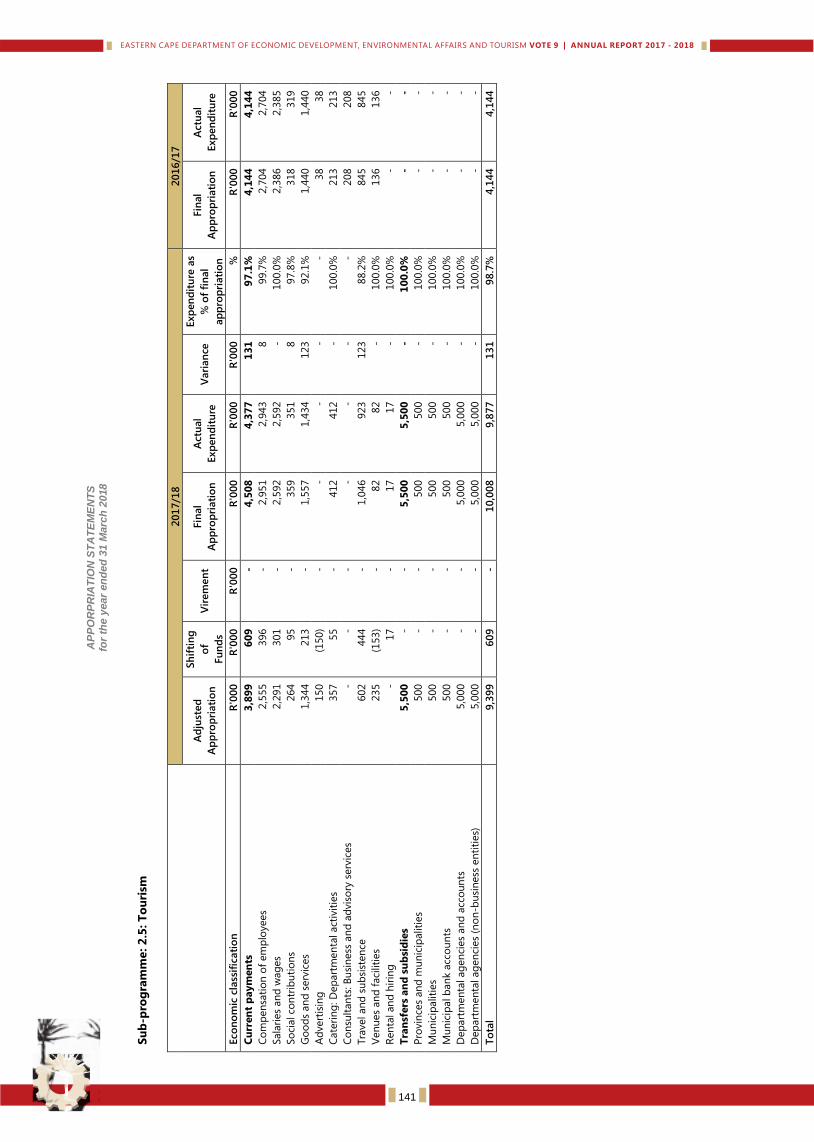
Dep
art
men
t o
f E
co
no
mic
Develo
pm
en
t, E
nv
iro
nm
en
tal A
ffair
s a
nd
To
uri
sm
V
OT
E 9
AP
PO
RP
RIA
TIO
N S
TA
TE
ME
NT
S
for
the
year
en
de
d 3
1 M
arc
h 2
018
Su
b-p
rog
ram
me
: 2
.5: T
ou
rism
201
7/1
8
201
6/1
7
Ad
just
ed
Ap
pro
pri
ati
on
Sh
ifti
ng
of
Fu
nd
s
Vir
em
en
t Fin
al
Ap
pro
pri
ati
on
Actu
al
Exp
en
dit
ure
V
ari
an
ce
Exp
en
dit
ure
as
% o
f fi
nal
ap
pro
pri
ati
on
Fin
al
Ap
pro
pri
ati
on
Actu
al
Exp
en
dit
ure
Eco
no
mic
cla
ssif
icati
on
R
'000
R
'000
R
'000
R
'000
R
'000
R
'000
%
R
'000
R
'000
Cu
rren
t p
aym
en
ts
3,8
99
6
09
-
4,5
08
4
,37
7
13
1
97
.1%
4
,14
4
4,1
44
Co
mp
en
sati
on
of
em
plo
yees
2,5
55
396
- 2,9
51
2,9
43
8
99.7
%
2,7
04
2,7
04
Sala
ries
an
d w
ag
es
2,2
91
301
- 2,5
92
2,5
92
- 100.0
%
2,3
86
2,3
85
So
cial co
ntr
ibu
tio
ns
264
95
- 359
351
8
97.8
%
318
319
Go
od
s an
d s
erv
ices
1,3
44
213
- 1,5
57
1,4
34
123
92.1
%
1,4
40
1,4
40
Ad
vert
isin
g
150
(150)
- -
- -
- 38
38
Cate
rin
g: D
ep
art
men
tal act
ivit
ies
357
55
- 412
412
- 100.0
%
213
213
Co
nsu
ltan
ts: B
usi
ness
an
d a
dvis
ory
serv
ices
- -
- -
- -
- 208
208
Tra
vel an
d s
ub
sist
en
ce
602
444
- 1,0
46
923
123
88.2
%
845
845
Ven
ues
an
d f
aci
liti
es
235
(153)
- 82
82
- 100.0
%
136
136
Ren
tal an
d h
irin
g
- 17
- 17
17
- 100.0
%
- -
Tra
nsf
ers
an
d s
ub
sid
ies
5,5
00
-
- 5
,50
0
5,5
00
-
10
0.0
%
- -
Pro
vin
ces
an
d m
un
icip
aliti
es
500
- -
500
500
- 100.0
%
- -
Mu
nic
ipaliti
es
500
- -
500
500
- 100.0
%
- -
Mu
nic
ipal b
an
k a
cco
un
ts
500
- -
500
500
- 100.0
%
- -
Dep
art
men
tal ag
en
cies
an
d a
cco
un
ts
5,0
00
- -
5,0
00
5,0
00
- 100.0
%
- -
Dep
art
men
tal ag
en
cies
(no
n-b
usi
ness
en
titi
es)
5,0
00
- -
5,0
00
5,0
00
- 100.0
%
- -
To
tal
9,3
99
6
09
-
10
,00
8
9,8
77
1
31
9
8.7
%
4,1
44
4
,14
4
141
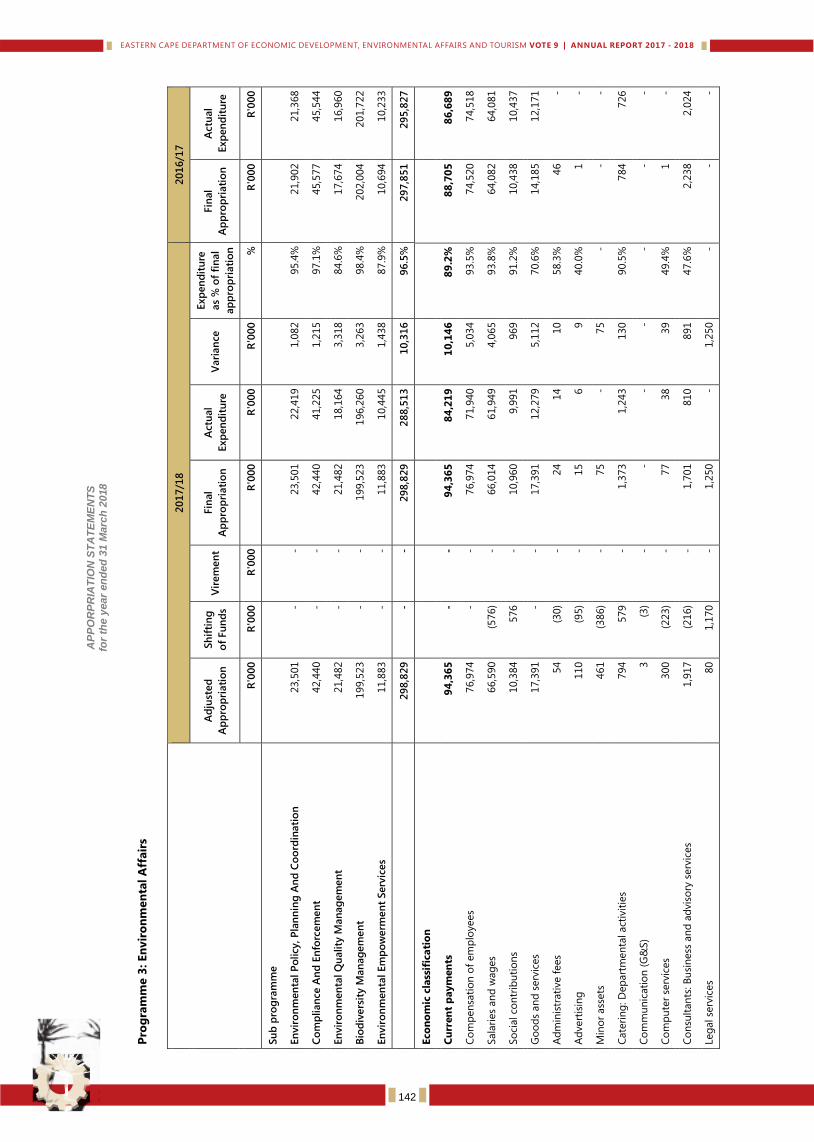
Dep
art
men
t o
f E
co
no
mic
Develo
pm
en
t, E
nv
iro
nm
en
tal A
ffair
s a
nd
To
uri
sm
V
OT
E 9
AP
PO
RP
RIA
TIO
N S
TA
TE
ME
NT
S
for
the
year
en
de
d 3
1 M
arc
h 2
018
Pro
gra
mm
e 3
: En
vir
on
men
tal
Aff
air
s
20
17
/18
2
01
6/1
7
Ad
just
ed
Ap
pro
pri
ati
on
Sh
ifti
ng
of
Fu
nd
s V
irem
en
t Fin
al
Ap
pro
pri
ati
on
Actu
al
Exp
en
dit
ure
V
ari
an
ce
Exp
en
dit
ure
as
% o
f fi
nal
ap
pro
pri
ati
on
Fin
al
Ap
pro
pri
ati
on
Actu
al
Exp
en
dit
ure
R'0
00
R
'000
R
'000
R
'000
R
'000
R
'000
%
R
'000
R
'000
Su
b p
rog
ram
me
En
vir
on
men
tal P
olicy, P
lan
nin
g A
nd
Co
ord
inati
on
23,5
01
- -
23,5
01
22,4
19
1,0
82
95.4
%
21,9
02
21,3
68
Co
mp
lian
ce A
nd
En
forc
em
en
t 42,4
40
- -
42,4
40
41,2
25
1,2
15
97.1
%
45,5
77
45,5
44
En
vir
on
men
tal Q
uality
Man
ag
em
en
t 21,4
82
- -
21,4
82
18,1
64
3,3
18
84.6
%
17,6
74
16,9
60
Bio
div
ers
ity M
an
ag
em
en
t 199,5
23
- -
199,5
23
196,2
60
3,2
63
98.4
%
202,0
04
201,7
22
En
vir
on
men
tal Em
po
werm
en
t Serv
ices
11,8
83
- -
11,8
83
10,4
45
1,4
38
87.9
%
10,6
94
10,2
33
2
98
,82
9
- -
29
8,8
29
2
88
,51
3
10
,31
6
96
.5%
2
97
,85
1
29
5,8
27
Eco
no
mic
cla
ssif
icati
on
Cu
rren
t p
aym
en
ts
94
,36
5
- -
94
,36
5
84
,21
9
10
,14
6
89
.2%
8
8,7
05
8
6,6
89
Co
mp
en
sati
on
of
em
plo
yees
76,9
74
- -
76,9
74
71,9
40
5,0
34
93.5
%
74,5
20
74,5
18
Sala
ries
an
d w
ag
es
66,5
90
(576)
- 66,0
14
61,9
49
4,0
65
93.8
%
64,0
82
64,0
81
So
cial co
ntr
ibu
tio
ns
10,3
84
576
- 10,9
60
9,9
91
969
91.2
%
10,4
38
10,4
37
Go
od
s an
d s
erv
ices
17,3
91
- -
17,3
91
12,2
79
5,1
12
70.6
%
14,1
85
12,1
71
Ad
min
istr
ati
ve f
ees
54
(30)
- 24
14
10
58.3
%
46
-
Ad
vert
isin
g
110
(95)
- 15
6
9
40.0
%
1
-
Min
or
ass
ets
461
(386)
- 75
- 75
- -
-
Cate
rin
g: D
ep
art
men
tal act
ivit
ies
794
579
- 1,3
73
1,2
43
130
90.5
%
784
726
Co
mm
un
icati
on
(G
&S)
3
(3)
- -
- -
- -
-
Co
mp
ute
r se
rvic
es
300
(223)
- 77
38
39
49.4
%
1
-
Co
nsu
ltan
ts: B
usi
ness
an
d a
dvis
ory
serv
ices
1,9
17
(216)
- 1,7
01
810
891
47.6
%
2,2
38
2,0
24
Leg
al se
rvic
es
80
1,1
70
- 1,2
50
- 1,2
50
- -
-
142
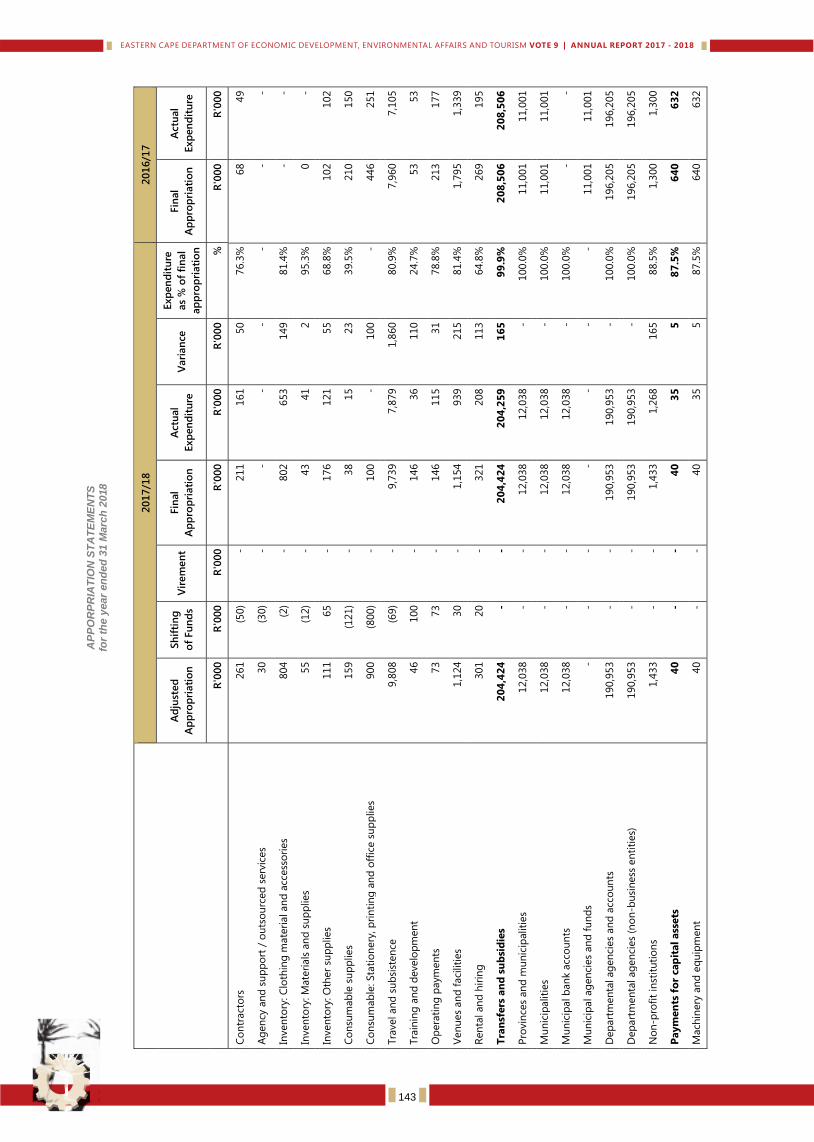
Dep
art
men
t o
f E
co
no
mic
Develo
pm
en
t, E
nv
iro
nm
en
tal A
ffair
s a
nd
To
uri
sm
V
OT
E 9
AP
PO
RP
RIA
TIO
N S
TA
TE
ME
NT
S
for
the
year
en
de
d 3
1 M
arc
h 2
018
20
17
/18
2
01
6/1
7
Ad
just
ed
Ap
pro
pri
ati
on
Sh
ifti
ng
of
Fu
nd
s V
irem
en
t Fin
al
Ap
pro
pri
ati
on
Actu
al
Exp
en
dit
ure
V
ari
an
ce
Exp
en
dit
ure
as
% o
f fi
nal
ap
pro
pri
ati
on
Fin
al
Ap
pro
pri
ati
on
Actu
al
Exp
en
dit
ure
R'0
00
R
'000
R
'000
R
'000
R
'000
R
'000
%
R
'000
R
'000
Co
ntr
act
ors
261
(50)
- 211
161
50
76.3
%
68
49
Ag
en
cy a
nd
su
pp
ort
/ o
uts
ou
rced
serv
ices
30
(30)
- -
- -
- -
-
Inven
tory
: C
loth
ing
mate
rial an
d a
ccess
ori
es
804
(2)
- 802
653
149
81.4
%
- -
Inven
tory
: M
ate
rials
an
d s
up
plies
55
(12)
- 43
41
2
95.3
%
0
-
Inven
tory
: O
ther
sup
plies
111
65
- 176
121
55
68.8
%
102
102
Co
nsu
mab
le s
up
plies
159
(121)
- 38
15
23
39.5
%
210
150
Co
nsu
mab
le: Sta
tio
nery
, p
rin
tin
g a
nd
off
ice s
up
plies
900
(800)
- 100
- 100
- 446
251
Tra
vel an
d s
ub
sist
en
ce
9,8
08
(69)
- 9,7
39
7,8
79
1,8
60
80.9
%
7,9
60
7,1
05
Tra
inin
g a
nd
develo
pm
en
t 46
100
- 146
36
110
24.7
%
53
53
Op
era
tin
g p
aym
en
ts
73
73
- 146
115
31
78.8
%
213
177
Ven
ues
an
d f
aci
liti
es
1,1
24
30
- 1,1
54
939
215
81.4
%
1,7
95
1,3
39
Ren
tal an
d h
irin
g
301
20
- 321
208
113
64.8
%
269
195
Tra
nsf
ers
an
d s
ub
sid
ies
20
4,4
24
-
- 2
04
,42
4
20
4,2
59
1
65
9
9.9
%
20
8,5
06
2
08
,50
6
Pro
vin
ces
an
d m
un
icip
aliti
es
12,0
38
- -
12,0
38
12,0
38
- 100.0
%
11,0
01
11,0
01
Mu
nic
ipaliti
es
12,0
38
- -
12,0
38
12,0
38
- 100.0
%
11,0
01
11,0
01
Mu
nic
ipal b
an
k a
cco
un
ts
12,0
38
- -
12,0
38
12,0
38
- 100.0
%
- -
Mu
nic
ipal ag
en
cies
an
d f
un
ds
- -
- -
- -
- 11,0
01
11,0
01
Dep
art
men
tal ag
en
cies
an
d a
cco
un
ts
190,9
53
- -
190,9
53
190,9
53
- 100.0
%
196,2
05
196,2
05
Dep
art
men
tal ag
en
cies
(no
n-b
usi
ness
en
titi
es)
190,9
53
- -
190,9
53
190,9
53
- 100.0
%
196,2
05
196,2
05
No
n-p
rofi
t in
stit
uti
on
s 1,4
33
- -
1,4
33
1,2
68
165
88.5
%
1,3
00
1,3
00
Paym
en
ts f
or
cap
ital ass
ets
4
0
- -
40
3
5
5
87
.5%
6
40
6
32
Mach
inery
an
d e
qu
ipm
en
t 40
- -
40
35
5
87.5
%
640
632
143
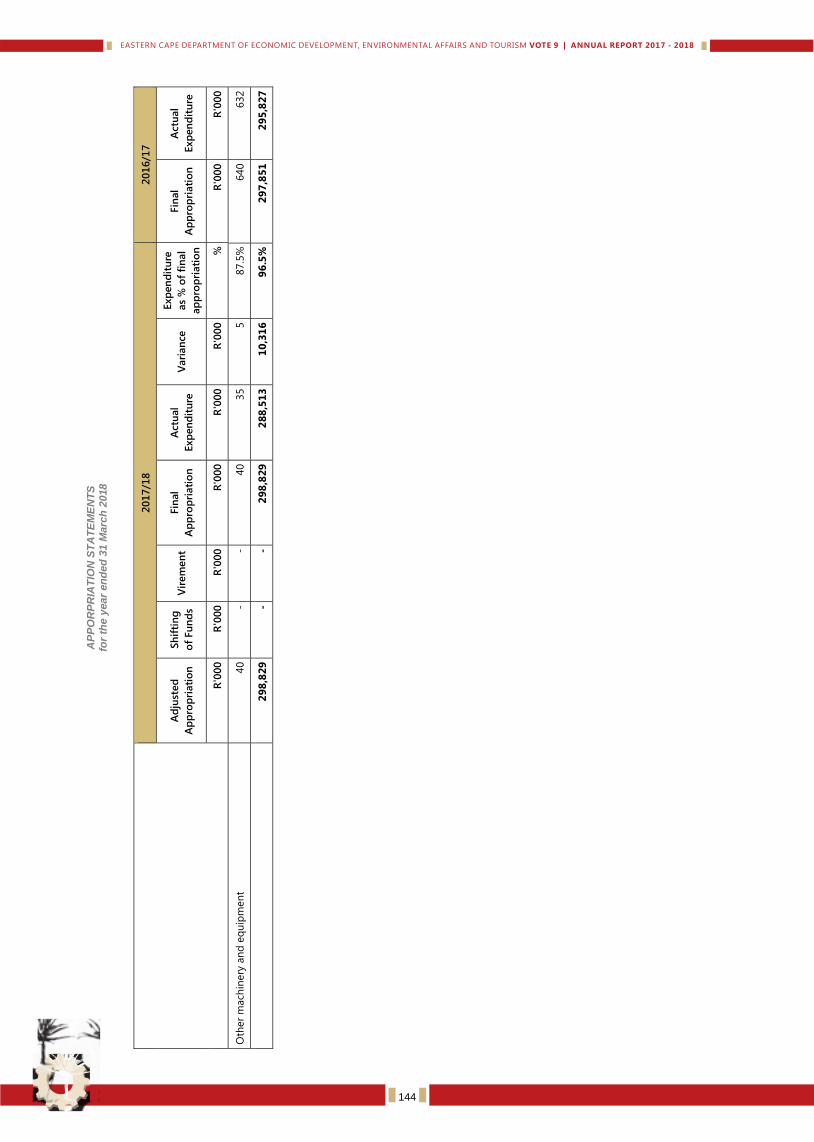
Dep
art
men
t o
f E
co
no
mic
Develo
pm
en
t, E
nv
iro
nm
en
tal A
ffair
s a
nd
To
uri
sm
V
OT
E 9
AP
PO
RP
RIA
TIO
N S
TA
TE
ME
NT
S
for
the
year
en
de
d 3
1 M
arc
h 2
018
20
17
/18
2
01
6/1
7
Ad
just
ed
Ap
pro
pri
ati
on
Sh
ifti
ng
of
Fu
nd
s V
irem
en
t Fin
al
Ap
pro
pri
ati
on
Actu
al
Exp
en
dit
ure
V
ari
an
ce
Exp
en
dit
ure
as
% o
f fi
nal
ap
pro
pri
ati
on
Fin
al
Ap
pro
pri
ati
on
Actu
al
Exp
en
dit
ure
R'0
00
R
'000
R
'000
R
'000
R
'000
R
'000
%
R
'000
R
'000
Oth
er
mach
inery
an
d e
qu
ipm
en
t 40
- -
40
35
5
87.5
%
640
632
2
98
,82
9
- -
29
8,8
29
2
88
,51
3
10
,31
6
96
.5%
2
97
,85
1
29
5,8
27
144
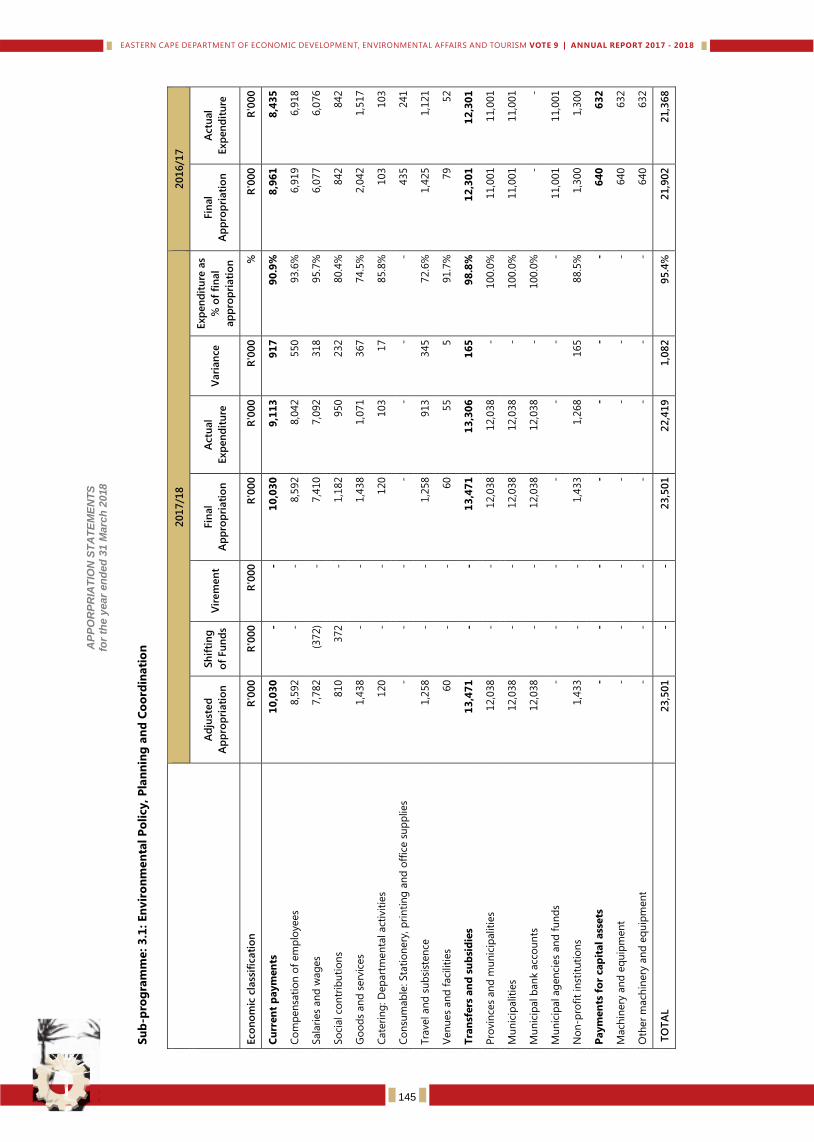
Dep
art
men
t o
f E
co
no
mic
Develo
pm
en
t, E
nv
iro
nm
en
tal A
ffair
s a
nd
To
uri
sm
V
OT
E 9
AP
PO
RP
RIA
TIO
N S
TA
TE
ME
NT
S
for
the
year
en
de
d 3
1 M
arc
h 2
018
Su
b-p
rog
ram
me
: 3
.1: En
vir
on
men
tal
Po
licy, P
lan
nin
g a
nd
Co
ord
inati
on
201
7/1
8
201
6/1
7
Ad
just
ed
Ap
pro
pri
ati
on
Sh
ifti
ng
of
Fu
nd
s V
irem
en
t Fin
al
Ap
pro
pri
ati
on
Actu
al
Exp
en
dit
ure
V
ari
an
ce
Exp
en
dit
ure
as
% o
f fi
nal
ap
pro
pri
ati
on
Fin
al
Ap
pro
pri
ati
on
Actu
al
Exp
en
dit
ure
Eco
no
mic
cla
ssif
icati
on
R
'000
R
'000
R
'000
R
'000
R
'000
R
'000
%
R
'000
R
'000
Cu
rren
t p
aym
en
ts
10
,03
0
- -
10
,03
0
9,1
13
9
17
9
0.9
%
8,9
61
8
,43
5
Co
mp
en
sati
on
of
em
plo
yees
8,5
92
- -
8,5
92
8,0
42
550
93.6
%
6,9
19
6,9
18
Sala
ries
an
d w
ag
es
7,7
82
(372)
- 7,4
10
7,0
92
318
95.7
%
6,0
77
6,0
76
So
cial co
ntr
ibu
tio
ns
810
372
- 1,1
82
950
232
80.4
%
842
842
Go
od
s an
d s
erv
ices
1,4
38
- -
1,4
38
1,0
71
367
74.5
%
2,0
42
1,5
17
Cate
rin
g: D
ep
art
men
tal act
ivit
ies
120
- -
120
103
17
85.8
%
103
103
Co
nsu
mab
le: Sta
tio
nery
, p
rin
tin
g a
nd
off
ice s
up
plies
- -
- -
- -
- 435
241
Tra
vel an
d s
ub
sist
en
ce
1,2
58
- -
1,2
58
913
345
72.6
%
1,4
25
1,1
21
Ven
ues
an
d f
aci
liti
es
60
- -
60
55
5
91.7
%
79
52
Tra
nsf
ers
an
d s
ub
sid
ies
13
,47
1
- -
13
,47
1
13
,30
6
16
5
98
.8%
1
2,3
01
1
2,3
01
Pro
vin
ces
an
d m
un
icip
aliti
es
12,0
38
- -
12,0
38
12,0
38
- 100.0
%
11,0
01
11,0
01
Mu
nic
ipaliti
es
12,0
38
- -
12,0
38
12,0
38
- 100.0
%
11,0
01
11,0
01
Mu
nic
ipal b
an
k a
cco
un
ts
12,0
38
- -
12,0
38
12,0
38
- 100.0
%
- -
Mu
nic
ipal ag
en
cies
an
d f
un
ds
- -
- -
- -
- 11,0
01
11,0
01
No
n-p
rofi
t in
stit
uti
on
s 1,4
33
- -
1,4
33
1,2
68
165
88.5
%
1,3
00
1,3
00
Paym
en
ts f
or
cap
ital ass
ets
-
- -
- -
- -
64
0
63
2
Mach
inery
an
d e
qu
ipm
en
t -
- -
- -
- -
640
632
Oth
er
mach
inery
an
d e
qu
ipm
en
t -
- -
- -
- -
640
632
TO
TA
L
23
,50
1
- -
23
,50
1
22
,41
9
1,0
82
9
5.4
%
21
,90
2
21
,36
8
145

Dep
art
men
t o
f E
co
no
mic
Develo
pm
en
t, E
nv
iro
nm
en
tal A
ffair
s a
nd
To
uri
sm
V
OT
E 9
AP
PO
RP
RIA
TIO
N S
TA
TE
ME
NT
S
for
the
year
en
de
d 3
1 M
arc
h 2
018
Su
b-p
rog
ram
me
: 3
.2: C
om
plian
ce a
nd
En
forc
em
en
t
201
7/1
8
201
6/1
7
Ad
just
ed
Ap
pro
pri
ati
on
Sh
ifti
ng
of
Fu
nd
s
Vir
em
en
t Fin
al
Ap
pro
pri
ati
on
Actu
al
Exp
en
dit
ure
Vari
an
ce
Exp
en
dit
ure
as
% o
f fi
nal
ap
pro
pri
ati
on
Fin
al
Ap
pro
pri
ati
on
Actu
al
Exp
en
dit
ure
Eco
no
mic
cla
ssif
icati
on
R
'000
R
'000
R
'000
R
'000
R
'000
R
'000
%
R
'000
R
'000
Cu
rren
t p
aym
en
ts
42
,40
0
- -
42
,40
0
41
,19
0
1,2
10
9
7.1
%
45
,57
7
45
,54
4
Co
mp
en
sati
on
of
em
plo
yees
39,1
94
- -
39,1
94
38,3
75
819
97.9
%
43,1
77
43,1
77
Sala
ries
an
d w
ag
es
33,1
00
236
- 33,3
36
32,9
53
383
98.9
%
37,0
77
37,0
77
So
cial co
ntr
ibu
tio
ns
6,0
94
(236)
- 5,8
58
5,4
22
436
92.6
%
6,1
00
6,1
00
Go
od
s an
d s
erv
ices
3,2
06
- -
3,2
06
2,8
15
391
87.8
%
2,4
00
2,3
68
Ad
min
istr
ati
ve f
ees
30
(30)
- -
- -
- -
-
Ad
vert
isin
g
50
(35)
- 15
6
9
40.0
%
1
-
Min
or
ass
ets
146
(120)
- 26
- 26
- -
-
Cate
rin
g: D
ep
art
men
tal act
ivit
ies
20
(20)
- -
- -
- -
-
Leg
al se
rvic
es
80
(80)
- -
- -
- -
-
Ag
en
cy a
nd
su
pp
ort
/ o
uts
ou
rced
serv
ices
30
(30)
- -
- -
- -
-
Inven
tory
: C
loth
ing
mate
rial an
d a
ccess
ori
es
189
(2)
- 187
187
- 100.0
%
- -
Inven
tory
: M
ate
rials
an
d s
up
plies
55
(12)
- 43
41
2
95.3
%
0
-
Inven
tory
: O
ther
sup
plies
111
65
- 176
121
55
68.8
%
102
102
Co
nsu
mab
le s
up
plies
39
(21)
- 18
7
11
38.9
%
17
-
Tra
vel an
d s
ub
sist
en
ce
2,2
20
251
- 2,4
71
2,1
85
286
88.4
%
2,0
52
2,0
53
Op
era
tin
g p
aym
en
ts
23
52
- 75
74
1
98.7
%
140
135
Ven
ues
an
d f
aci
liti
es
213
(18)
- 195
194
1
99.5
%
88
78
Paym
en
ts f
or
cap
ital
ass
ets
4
0
- -
40
3
5
5
87
.5%
-
-
Mach
inery
an
d e
qu
ipm
en
t 40
- -
40
35
5
87.5
%
- -
146
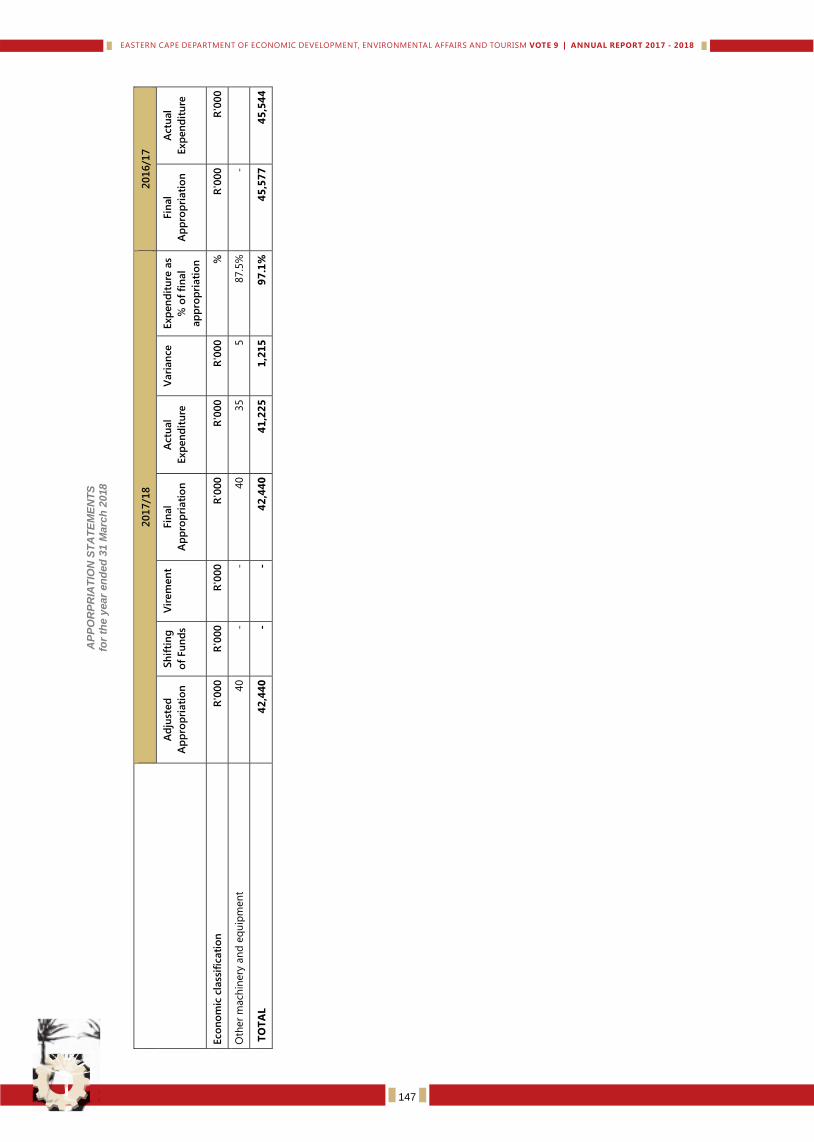
Dep
art
men
t o
f E
co
no
mic
Develo
pm
en
t, E
nv
iro
nm
en
tal A
ffair
s a
nd
To
uri
sm
V
OT
E 9
AP
PO
RP
RIA
TIO
N S
TA
TE
ME
NT
S
for
the
year
en
de
d 3
1 M
arc
h 2
018
201
7/1
8
201
6/1
7
Ad
just
ed
Ap
pro
pri
ati
on
Sh
ifti
ng
of
Fu
nd
s
Vir
em
en
t Fin
al
Ap
pro
pri
ati
on
Actu
al
Exp
en
dit
ure
Vari
an
ce
Exp
en
dit
ure
as
% o
f fi
nal
ap
pro
pri
ati
on
Fin
al
Ap
pro
pri
ati
on
Actu
al
Exp
en
dit
ure
Eco
no
mic
cla
ssif
icati
on
R
'000
R
'000
R
'000
R
'000
R
'000
R
'000
%
R
'000
R
'000
Oth
er
mach
inery
an
d e
qu
ipm
en
t 40
- -
40
35
5
87.5
%
-
TO
TA
L
42
,44
0
- -
42
,44
0
41
,22
5
1,2
15
9
7.1
%
45
,57
7
45
,54
4
147
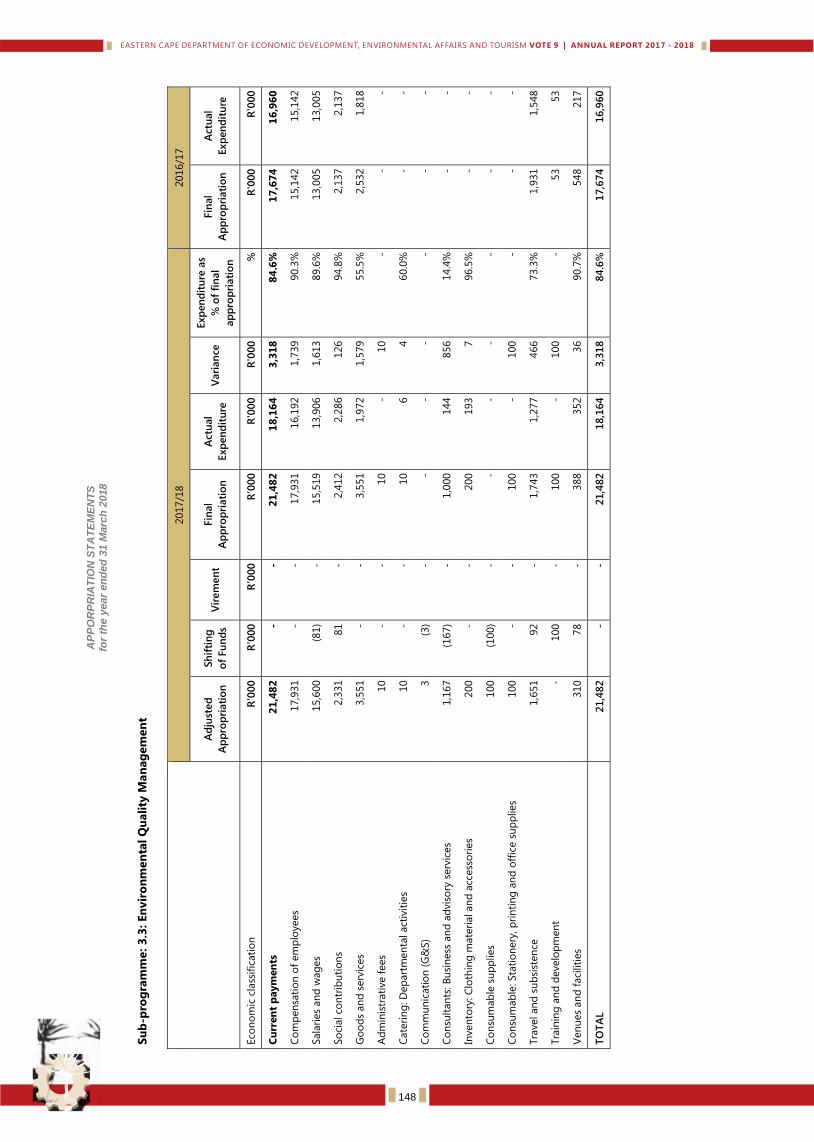
Dep
art
men
t o
f E
co
no
mic
Develo
pm
en
t, E
nv
iro
nm
en
tal A
ffair
s a
nd
To
uri
sm
V
OT
E 9
AP
PO
RP
RIA
TIO
N S
TA
TE
ME
NT
S
for
the
year
en
de
d 3
1 M
arc
h 2
018
Su
b-p
rog
ram
me
: 3
.3: En
vir
on
men
tal
Qu
ali
ty M
an
ag
em
en
t
2017/1
8
2016/1
7
Ad
just
ed
Ap
pro
pri
ati
on
Sh
ifti
ng
of
Fu
nd
s V
irem
en
t Fin
al
Ap
pro
pri
ati
on
Actu
al
Exp
en
dit
ure
V
ari
an
ce
Exp
en
dit
ure
as
% o
f fi
nal
ap
pro
pri
ati
on
Fin
al
Ap
pro
pri
ati
on
Actu
al
Exp
en
dit
ure
Eco
no
mic
cla
ssif
icati
on
R
'000
R
'000
R
'000
R
'000
R
'000
R
'000
%
R
'000
R
'000
Cu
rren
t p
aym
en
ts
21
,48
2
- -
21
,48
2
18
,16
4
3,3
18
8
4.6
%
17
,67
4
16
,96
0
Co
mp
en
sati
on
of
em
plo
yees
17,9
31
- -
17,9
31
16,1
92
1,7
39
90.3
%
15,1
42
15,1
42
Sala
ries
an
d w
ag
es
15,6
00
(81)
- 15,5
19
13,9
06
1,6
13
89.6
%
13,0
05
13,0
05
So
cial co
ntr
ibu
tio
ns
2,3
31
81
- 2,4
12
2,2
86
126
94.8
%
2,1
37
2,1
37
Go
od
s an
d s
erv
ices
3,5
51
- -
3,5
51
1,9
72
1,5
79
55.5
%
2,5
32
1,8
18
Ad
min
istr
ati
ve f
ees
10
- -
10
- 10
- -
-
Cate
rin
g: D
ep
art
men
tal act
ivit
ies
10
- -
10
6
4
60.0
%
- -
Co
mm
un
icati
on
(G
&S)
3
(3)
- -
- -
- -
-
Co
nsu
ltan
ts: B
usi
ness
an
d a
dvis
ory
serv
ices
1,1
67
(167)
- 1,0
00
144
856
14.4
%
- -
Inven
tory
: C
loth
ing
mate
rial an
d a
ccess
ori
es
200
- -
200
193
7
96.5
%
- -
Co
nsu
mab
le s
up
plies
100
(100)
- -
- -
- -
-
Co
nsu
mab
le: Sta
tio
nery
, p
rin
tin
g a
nd
off
ice s
up
plies
100
- -
100
- 100
- -
-
Tra
vel an
d s
ub
sist
en
ce
1,6
51
92
- 1,7
43
1,2
77
466
73.3
%
1,9
31
1,5
48
Tra
inin
g a
nd
develo
pm
en
t -
100
- 100
- 100
- 53
53
Ven
ues
an
d f
aci
liti
es
310
78
- 388
352
36
90.7
%
548
217
TO
TA
L
21
,48
2
- -
21
,48
2
18
,16
4
3,3
18
8
4.6
%
17
,67
4
16
,96
0
148
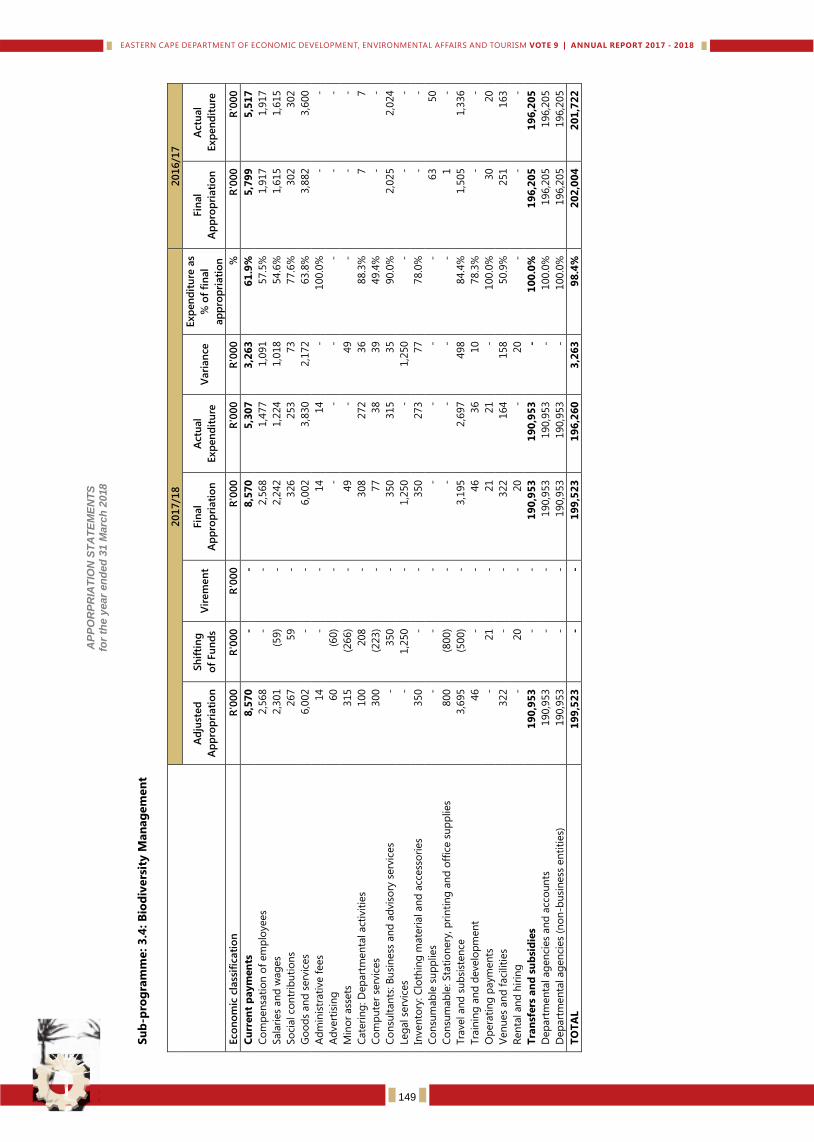
Dep
art
men
t o
f E
co
no
mic
Develo
pm
en
t, E
nv
iro
nm
en
tal A
ffair
s a
nd
To
uri
sm
V
OT
E 9
AP
PO
RP
RIA
TIO
N S
TA
TE
ME
NT
S
for
the
year
en
de
d 3
1 M
arc
h 2
018
Su
b-p
rog
ram
me
: 3
.4: B
iod
ivers
ity M
an
ag
em
en
t
201
7/1
8
201
6/1
7
Ad
just
ed
Ap
pro
pri
ati
on
Sh
ifti
ng
of
Fu
nd
s V
irem
en
t Fin
al
Ap
pro
pri
ati
on
Actu
al
Exp
en
dit
ure
V
ari
an
ce
Exp
en
dit
ure
as
% o
f fi
nal
ap
pro
pri
ati
on
Fin
al
Ap
pro
pri
ati
on
Actu
al
Exp
en
dit
ure
Eco
no
mic
cla
ssif
icati
on
R
'000
R
'000
R
'000
R
'000
R
'000
R
'000
%
R
'000
R
'000
Cu
rren
t p
aym
en
ts
8,5
70
-
- 8
,57
0
5,3
07
3
,26
3
61
.9%
5
,79
9
5,5
17
Co
mp
en
sati
on
of
em
plo
yees
2,5
68
- -
2,5
68
1,4
77
1,0
91
57.5
%
1,9
17
1,9
17
Sala
ries
an
d w
ag
es
2,3
01
(59)
- 2,2
42
1,2
24
1,0
18
54.6
%
1,6
15
1,6
15
So
cial co
ntr
ibu
tio
ns
267
59
- 326
253
73
77.6
%
302
302
Go
od
s an
d s
erv
ices
6,0
02
- -
6,0
02
3,8
30
2,1
72
63.8
%
3,8
82
3,6
00
Ad
min
istr
ati
ve f
ees
14
- -
14
14
- 100.0
%
- -
Ad
vert
isin
g
60
(60)
- -
- -
- -
-
Min
or
ass
ets
315
(266)
- 49
- 49
- -
-
Cate
rin
g: D
ep
art
men
tal act
ivit
ies
100
208
- 308
272
36
88.3
%
7
7
Co
mp
ute
r se
rvic
es
300
(223)
- 77
38
39
49.4
%
- -
Co
nsu
ltan
ts: B
usi
ness
an
d a
dvis
ory
serv
ices
- 350
- 350
315
35
90.0
%
2,0
25
2,0
24
Leg
al se
rvic
es
- 1,2
50
- 1,2
50
- 1,2
50
- -
-
Inven
tory
: C
loth
ing
mate
rial an
d a
ccess
ori
es
350
- -
350
273
77
78.0
%
- -
Co
nsu
mab
le s
up
plies
- -
- -
- -
- 63
50
Co
nsu
mab
le: Sta
tio
nery
, p
rin
tin
g a
nd
off
ice s
up
plies
800
(800)
- -
- -
- 1
-
Tra
vel an
d s
ub
sist
en
ce
3,6
95
(500)
- 3,1
95
2,6
97
498
84.4
%
1,5
05
1,3
36
Tra
inin
g a
nd
develo
pm
en
t 46
- -
46
36
10
78.3
%
- -
Op
era
tin
g p
aym
en
ts
- 21
- 21
21
- 100.0
%
30
20
Ven
ues
an
d f
aci
liti
es
322
- -
322
164
158
50.9
%
251
163
Ren
tal an
d h
irin
g
- 20
- 20
- 20
- -
-
Tra
nsf
ers
an
d s
ub
sid
ies
19
0,9
53
-
- 1
90
,95
3
19
0,9
53
-
10
0.0
%
19
6,2
05
1
96
,20
5
Dep
art
men
tal ag
en
cies
an
d a
cco
un
ts
190,9
53
- -
190,9
53
190,9
53
- 100.0
%
196,2
05
196,2
05
Dep
art
men
tal ag
en
cies
(no
n-b
usi
ness
en
titi
es)
190,9
53
- -
190,9
53
190,9
53
- 100.0
%
196,2
05
196,2
05
TO
TA
L
19
9,5
23
-
- 1
99
,52
3
19
6,2
60
3
,26
3
98
.4%
2
02
,00
4
20
1,7
22
149
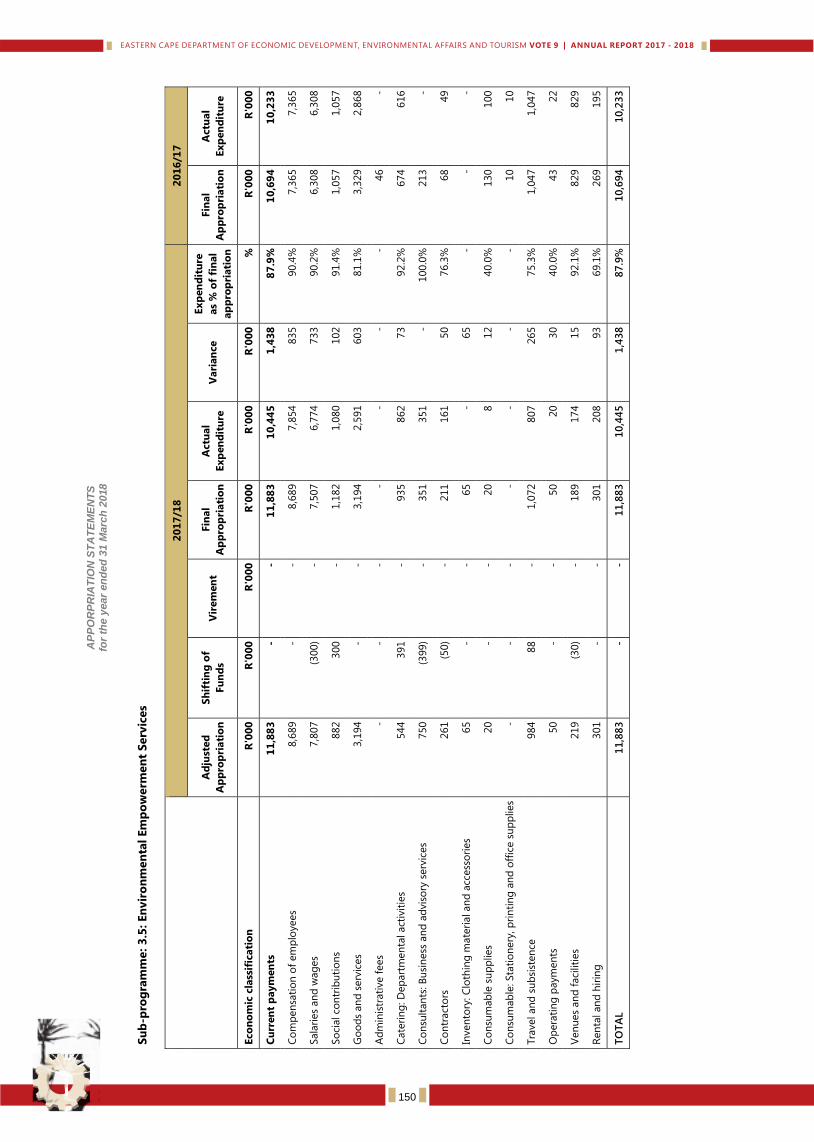
Dep
art
men
t o
f E
co
no
mic
Develo
pm
en
t, E
nv
iro
nm
en
tal A
ffair
s a
nd
To
uri
sm
V
OT
E 9
AP
PO
RP
RIA
TIO
N S
TA
TE
ME
NT
S
for
the
year
en
de
d 3
1 M
arc
h 2
018
Su
b-p
rog
ram
me
: 3
.5: En
vir
on
men
tal
Em
po
werm
en
t S
erv
ices
20
17
/18
2
01
6/1
7
Ad
just
ed
Ap
pro
pri
ati
on
Sh
ifti
ng
of
Fu
nd
s V
irem
en
t Fin
al
Ap
pro
pri
ati
on
Actu
al
Ex
pen
dit
ure
V
ari
an
ce
Ex
pen
dit
ure
as
% o
f fi
nal
ap
pro
pri
ati
on
Fin
al
Ap
pro
pri
ati
on
Actu
al
Ex
pen
dit
ure
Eco
no
mic
cla
ssif
icati
on
R
'00
0
R'0
00
R
'00
0
R'0
00
R
'00
0
R'0
00
%
R
'00
0
R'0
00
Cu
rren
t p
aym
en
ts
11
,88
3
- -
11
,88
3
10
,44
5
1,4
38
8
7.9
%
10
,69
4
10
,23
3
Co
mp
en
sati
on
of
em
plo
yees
8,6
89
- -
8,6
89
7,8
54
835
90.4
%
7,3
65
7,3
65
Sala
ries
an
d w
ag
es
7,8
07
(300)
- 7,5
07
6,7
74
733
90.2
%
6,3
08
6,3
08
So
cial co
ntr
ibu
tio
ns
882
300
- 1,1
82
1,0
80
102
91.4
%
1,0
57
1,0
57
Go
od
s an
d s
erv
ices
3,1
94
- -
3,1
94
2,5
91
603
81.1
%
3,3
29
2,8
68
Ad
min
istr
ati
ve f
ees
- -
- -
- -
- 46
-
Cate
rin
g: D
ep
art
men
tal act
ivit
ies
544
391
- 935
862
73
92.2
%
674
616
Co
nsu
ltan
ts: B
usi
ness
an
d a
dvis
ory
serv
ices
750
(399)
- 351
351
- 100.0
%
213
-
Co
ntr
act
ors
261
(50)
- 211
161
50
76.3
%
68
49
Inven
tory
: C
loth
ing
mate
rial an
d a
ccess
ori
es
65
- -
65
- 65
- -
-
Co
nsu
mab
le s
up
plies
20
- -
20
8
12
40.0
%
130
100
Co
nsu
mab
le: Sta
tio
nery
, p
rin
tin
g a
nd
off
ice s
up
plies
- -
- -
- -
- 10
10
Tra
vel an
d s
ub
sist
en
ce
984
88
- 1,0
72
807
265
75.3
%
1,0
47
1,0
47
Op
era
tin
g p
aym
en
ts
50
- -
50
20
30
40.0
%
43
22
Ven
ues
an
d f
aci
liti
es
219
(30)
- 189
174
15
92.1
%
829
829
Ren
tal an
d h
irin
g
301
- -
301
208
93
69.1
%
269
195
TO
TA
L
11
,88
3
- -
11
,88
3
10
,44
5
1,4
38
8
7.9
%
10
,69
4
10
,23
3
150
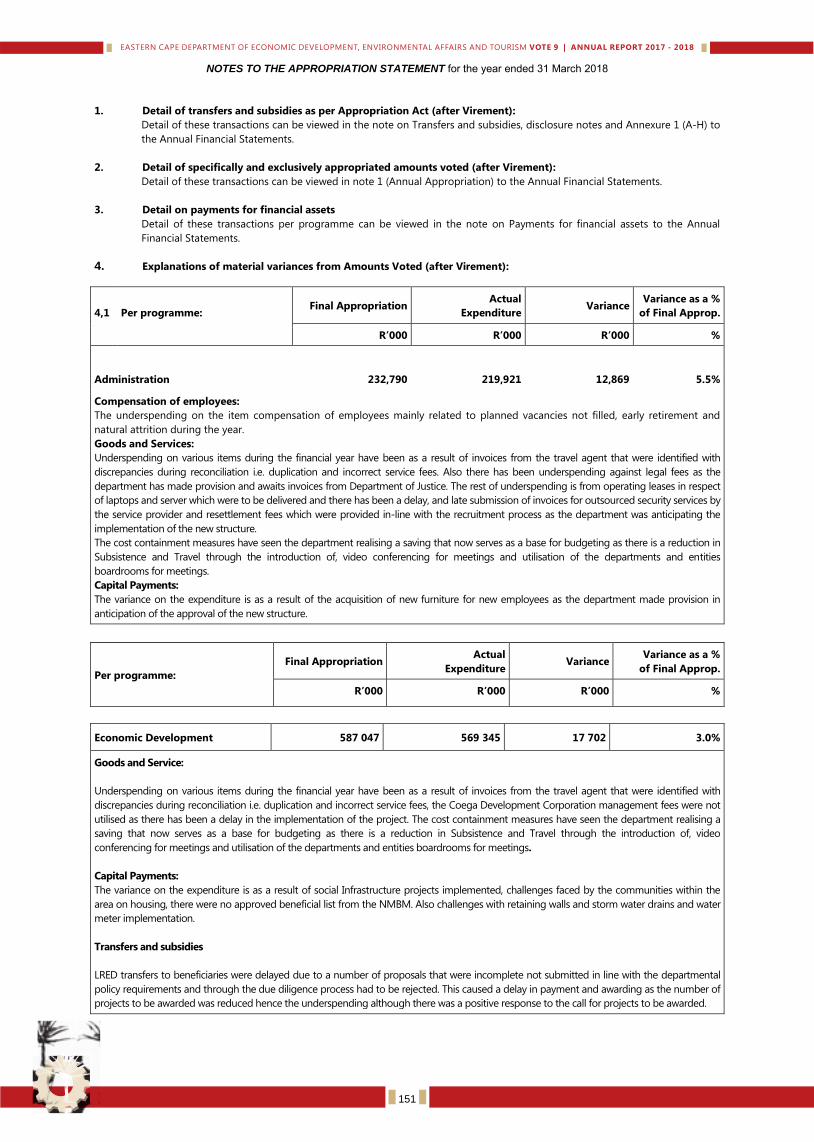
NOTES TO THE APPROPRIATION STATEMENT for the year ended 31 March 2018
1. Detail of transfers and subsidies as per Appropriation Act (after Virement):
Detail of these transactions can be viewed in the note on Transfers and subsidies, disclosure notes and Annexure 1 (A-H) to
the Annual Financial Statements.
2. Detail of specifically and exclusively appropriated amounts voted (after Virement):
Detail of these transactions can be viewed in note 1 (Annual Appropriation) to the Annual Financial Statements.
3. Detail on payments for financial assets
Detail of these transactions per programme can be viewed in the note on Payments for financial assets to the Annual
Financial Statements.
4. Explanations of material variances from Amounts Voted (after Virement):
4,1 Per programme: Final Appropriation
Actual
Expenditure Variance
Variance as a %
of Final Approp.
R’000 R’000 R’000 %
Administration 232,790 219,921 12,869 5.5%
Compensation of employees:
The underspending on the item compensation of employees mainly related to planned vacancies not filled, early retirement and
natural attrition during the year.
Goods and Services:
Underspending on various items during the financial year have been as a result of invoices from the travel agent that were identified with
discrepancies during reconciliation i.e. duplication and incorrect service fees. Also there has been underspending against legal fees as the
department has made provision and awaits invoices from Department of Justice. The rest of underspending is from operating leases in respect
of laptops and server which were to be delivered and there has been a delay, and late submission of invoices for outsourced security services by
the service provider and resettlement fees which were provided in-line with the recruitment process as the department was anticipating the
implementation of the new structure.
The cost containment measures have seen the department realising a saving that now serves as a base for budgeting as there is a reduction in
Subsistence and Travel through the introduction of, video conferencing for meetings and utilisation of the departments and entities
boardrooms for meetings.
Capital Payments:
The variance on the expenditure is as a result of the acquisition of new furniture for new employees as the department made provision in
anticipation of the approval of the new structure.
Per programme:
Final Appropriation Actual
Expenditure Variance
Variance as a %
of Final Approp.
R’000 R’000 R’000 %
Economic Development 587 047 569 345 17 702 3.0%
Goods and Service:
Underspending on various items during the financial year have been as a result of invoices from the travel agent that were identified with
discrepancies during reconciliation i.e. duplication and incorrect service fees, the Coega Development Corporation management fees were not
utilised as there has been a delay in the implementation of the project. The cost containment measures have seen the department realising a
saving that now serves as a base for budgeting as there is a reduction in Subsistence and Travel through the introduction of, video
conferencing for meetings and utilisation of the departments and entities boardrooms for meetings.
Capital Payments:
The variance on the expenditure is as a result of social Infrastructure projects implemented, challenges faced by the communities within the
area on housing, there were no approved beneficial list from the NMBM. Also challenges with retaining walls and storm water drains and water
meter implementation.
Transfers and subsidies
LRED transfers to beneficiaries were delayed due to a number of proposals that were incomplete not submitted in line with the departmental
policy requirements and through the due diligence process had to be rejected. This caused a delay in payment and awarding as the number of
projects to be awarded was reduced hence the underspending although there was a positive response to the call for projects to be awarded.
151
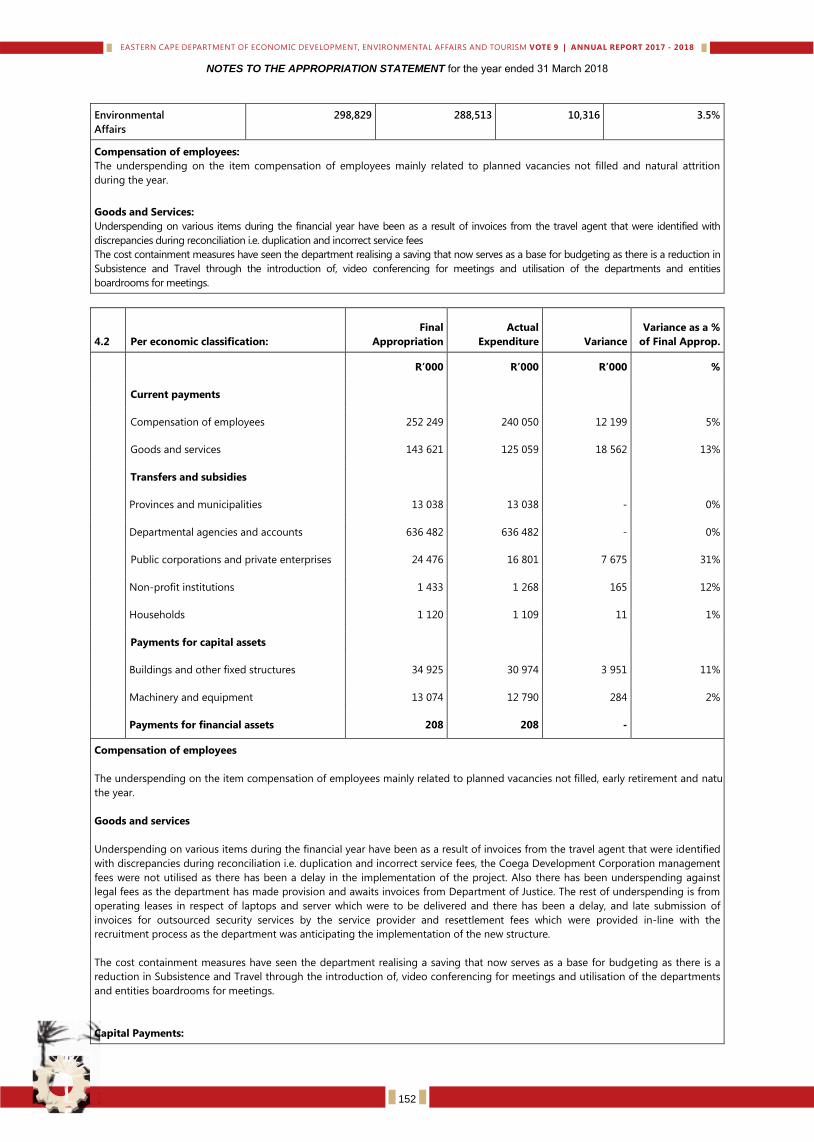
NOTES TO THE APPROPRIATION STATEMENT for the year ended 31 March 2018
Environmental
Affairs
298,829 288,513 10,316 3.5%
Compensation of employees:
The underspending on the item compensation of employees mainly related to planned vacancies not filled and natural attrition
during the year.
Goods and Services:
Underspending on various items during the financial year have been as a result of invoices from the travel agent that were identified with
discrepancies during reconciliation i.e. duplication and incorrect service fees
The cost containment measures have seen the department realising a saving that now serves as a base for budgeting as there is a reduction in
Subsistence and Travel through the introduction of, video conferencing for meetings and utilisation of the departments and entities
boardrooms for meetings.
4.2 Per economic classification:
Final
Appropriation
Actual
Expenditure Variance
Variance as a %
of Final Approp.
R’000 R’000 R’000 %
Current payments
Compensation of employees 252 249 240 050 12 199 5%
Goods and services 143 621 125 059 18 562 13%
Transfers and subsidies
Provinces and municipalities 13 038 13 038 - 0%
Departmental agencies and accounts 636 482 636 482 - 0%
Public corporations and private enterprises 24 476 16 801 7 675 31%
Non-profit institutions 1 433 1 268 165 12%
Households 1 120 1 109 11 1%
Payments for capital assets
Buildings and other fixed structures 34 925 30 974 3 951 11%
Machinery and equipment 13 074 12 790 284 2%
Payments for financial assets 208 208 -
Compensation of employees
The underspending on the item compensation of employees mainly related to planned vacancies not filled, early retirement and natural attrition during
the year.
Goods and services
Underspending on various items during the financial year have been as a result of invoices from the travel agent that were identified
with discrepancies during reconciliation i.e. duplication and incorrect service fees, the Coega Development Corporation management
fees were not utilised as there has been a delay in the implementation of the project. Also there has been underspending against
legal fees as the department has made provision and awaits invoices from Department of Justice. The rest of underspending is from
operating leases in respect of laptops and server which were to be delivered and there has been a delay, and late submission of
invoices for outsourced security services by the service provider and resettlement fees which were provided in-line with the
recruitment process as the department was anticipating the implementation of the new structure.
The cost containment measures have seen the department realising a saving that now serves as a base for budgeting as there is a
reduction in Subsistence and Travel through the introduction of, video conferencing for meetings and utilisation of the departments
and entities boardrooms for meetings.
Capital Payments:
152
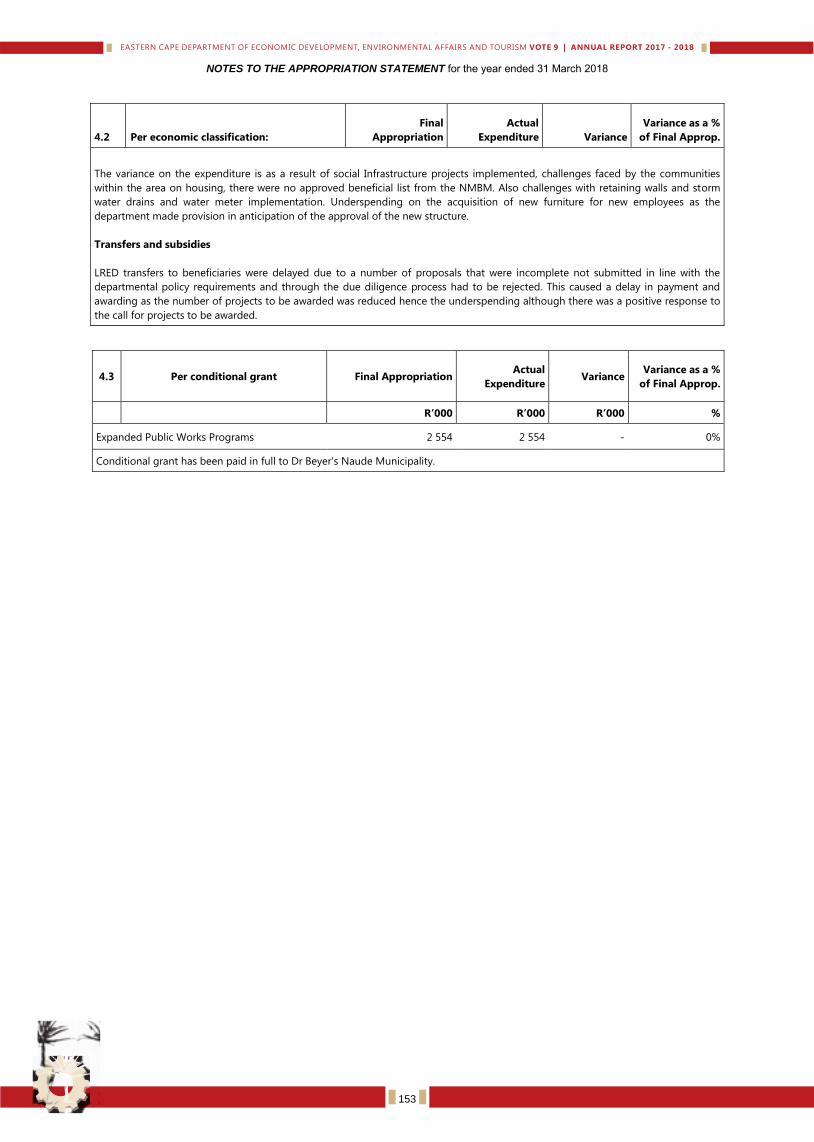
NOTES TO THE APPROPRIATION STATEMENT for the year ended 31 March 2018
4.2 Per economic classification:
Final
Appropriation
Actual
Expenditure Variance
Variance as a %
of Final Approp.
The variance on the expenditure is as a result of social Infrastructure projects implemented, challenges faced by the communities
within the area on housing, there were no approved beneficial list from the NMBM. Also challenges with retaining walls and storm
water drains and water meter implementation. Underspending on the acquisition of new furniture for new employees as the
department made provision in anticipation of the approval of the new structure.
Transfers and subsidies
LRED transfers to beneficiaries were delayed due to a number of proposals that were incomplete not submitted in line with the
departmental policy requirements and through the due diligence process had to be rejected. This caused a delay in payment and
awarding as the number of projects to be awarded was reduced hence the underspending although there was a positive response to
the call for projects to be awarded.
4.3 Per conditional grant Final Appropriation Actual
Expenditure Variance
Variance as a %
of Final Approp.
R’000 R’000 R’000 %
Expanded Public Works Programs 2 554 2 554 - 0%
Conditional grant has been paid in full to Dr Beyer’s Naude Municipality.
153
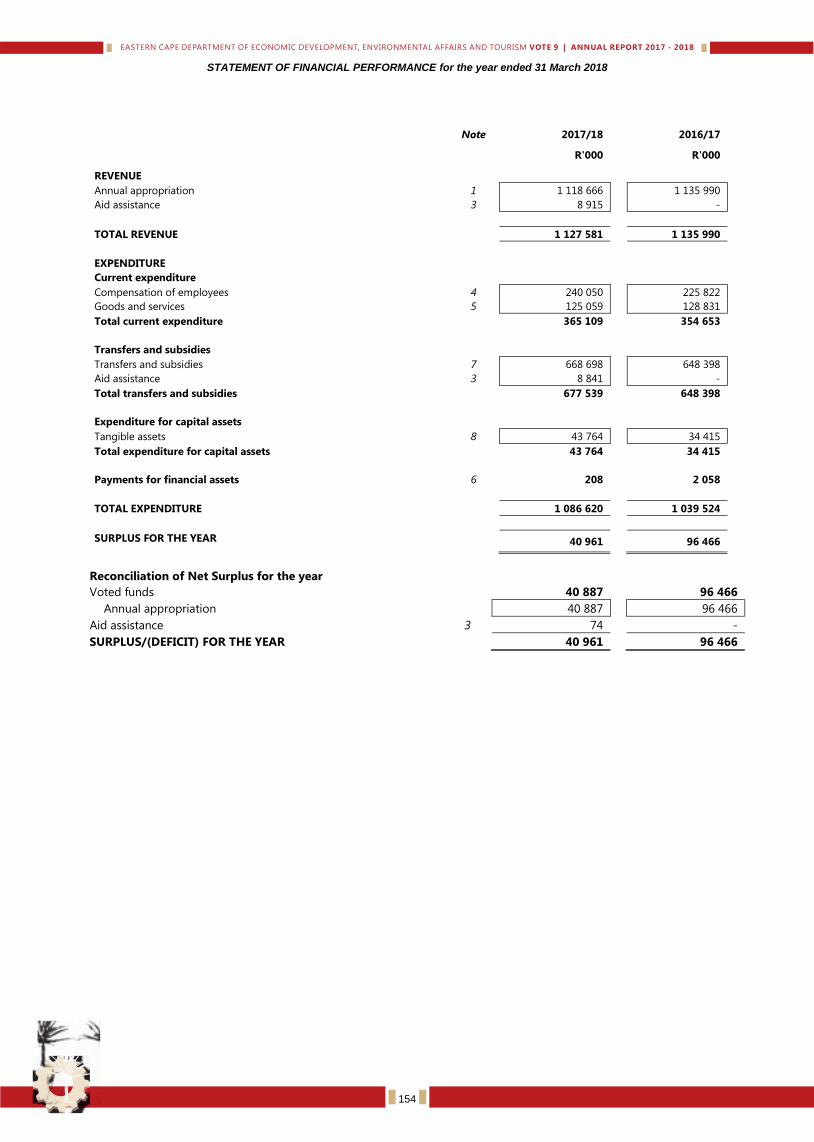
STATEMENT OF FINANCIAL PERFORMANCE for the year ended 31 March 2018
Note 2017/18 2016/17
R'000
R'000
REVENUE
Annual appropriation 1 1 118 666 1 135 990
Aid assistance 3 8 915 -
TOTAL REVENUE 1 127 581 1 135 990
EXPENDITURE
Current expenditure
Compensation of employees 4 240 050 225 822
Goods and services 5 125 059 128 831
Total current expenditure 365 109 354 653
Transfers and subsidies
Transfers and subsidies 7 668 698 648 398
Aid assistance 3 8 841 -
Total transfers and subsidies 677 539 648 398
Expenditure for capital assets
Tangible assets 8 43 764 34 415
Total expenditure for capital assets 43 764 34 415
Payments for financial assets 6 208 2 058
TOTAL EXPENDITURE 1 086 620 1 039 524
SURPLUS FOR THE YEAR 40 961 96 466
Reconciliation of Net Surplus for the year
Voted funds 40 887 96 466
Annual appropriation 40 887 96 466
Aid assistance 3 74 -
SURPLUS/(DEFICIT) FOR THE YEAR 40 961 96 466
154
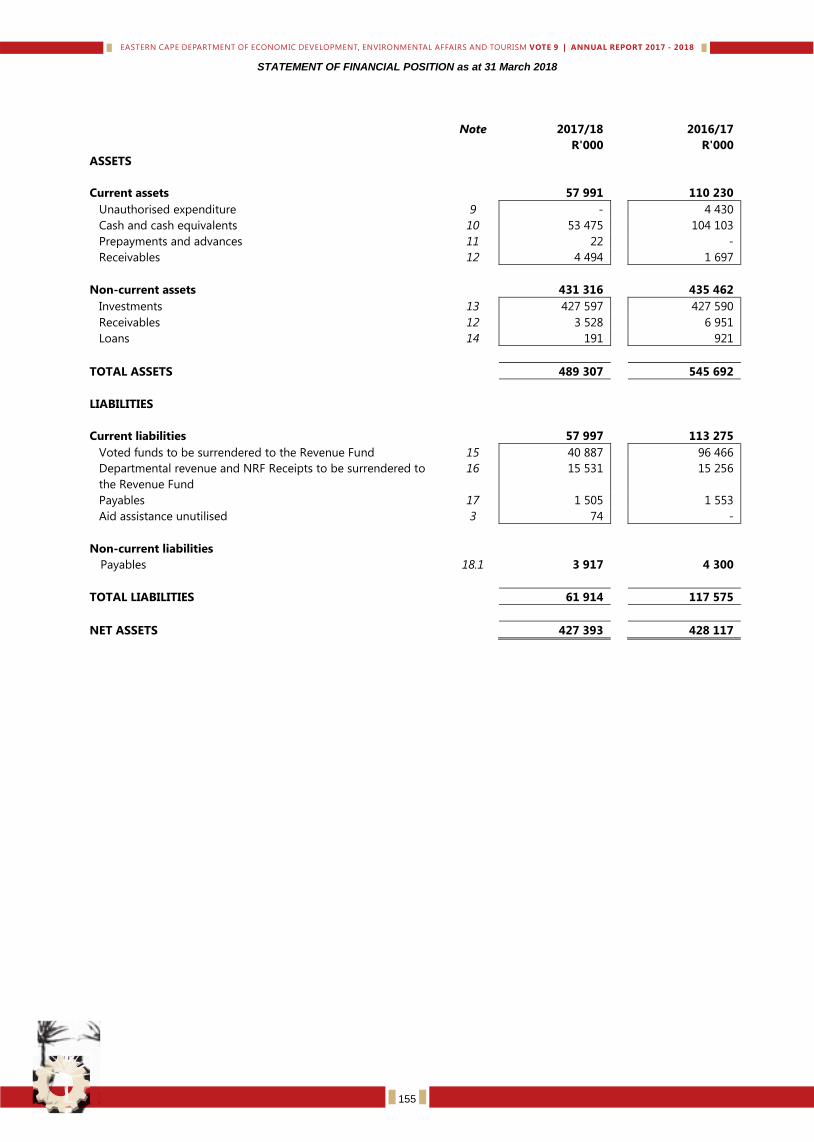
STATEMENT OF FINANCIAL POSITION as at 31 March 2018
Note 2017/18 2016/17
R'000 R'000
ASSETS
Current assets 57 991 110 230
Unauthorised expenditure 9 - 4 430
Cash and cash equivalents 10 53 475 104 103
Prepayments and advances 11 22 -
Receivables 12 4 494 1 697
Non-current assets 431 316 435 462
Investments 13 427 597 427 590
Receivables 12 3 528 6 951
Loans 14 191 921
TOTAL ASSETS 489 307 545 692
LIABILITIES
Current liabilities 57 997 113 275
Voted funds to be surrendered to the Revenue Fund 15 40 887 96 466
Departmental revenue and NRF Receipts to be surrendered to
the Revenue Fund
16 15 531 15 256
Payables 17 1 505 1 553
Aid assistance unutilised 3 74 -
Non-current liabilities
Payables 18.1 3 917 4 300
TOTAL LIABILITIES 61 914 117 575
NET ASSETS 427 393 428 117
155
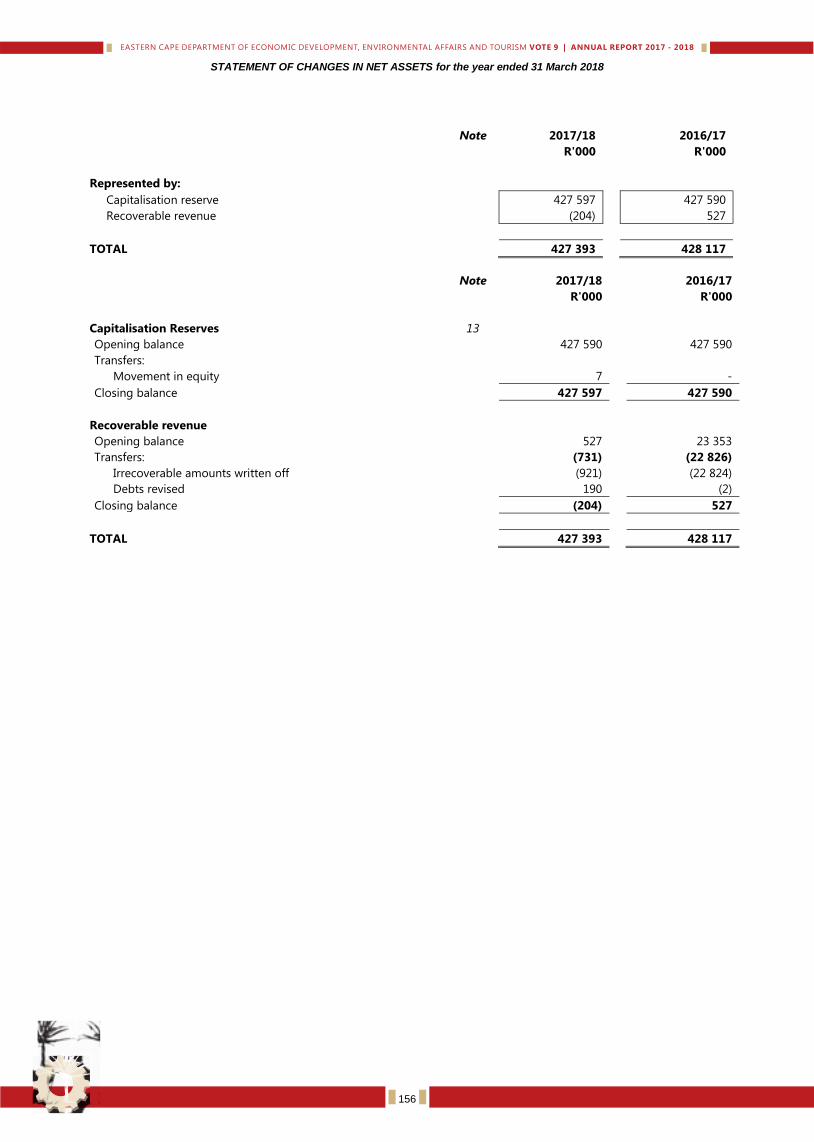
STATEMENT OF CHANGES IN NET ASSETS for the year ended 31 March 2018
Note 2017/18 2016/17
R'000 R'000
Represented by:
Capitalisation reserve 427 597 427 590
Recoverable revenue (204) 527
TOTAL 427 393 428 117
Note 2017/18 2016/17
R'000 R'000
Capitalisation Reserves 13
Opening balance 427 590 427 590
Transfers:
Movement in equity 7 -
Closing balance 427 597 427 590
Recoverable revenue
Opening balance 527 23 353
Transfers: (731) (22 826)
Irrecoverable amounts written off (921) (22 824)
Debts revised 190 (2)
Closing balance (204) 527
TOTAL 427 393 428 117
156
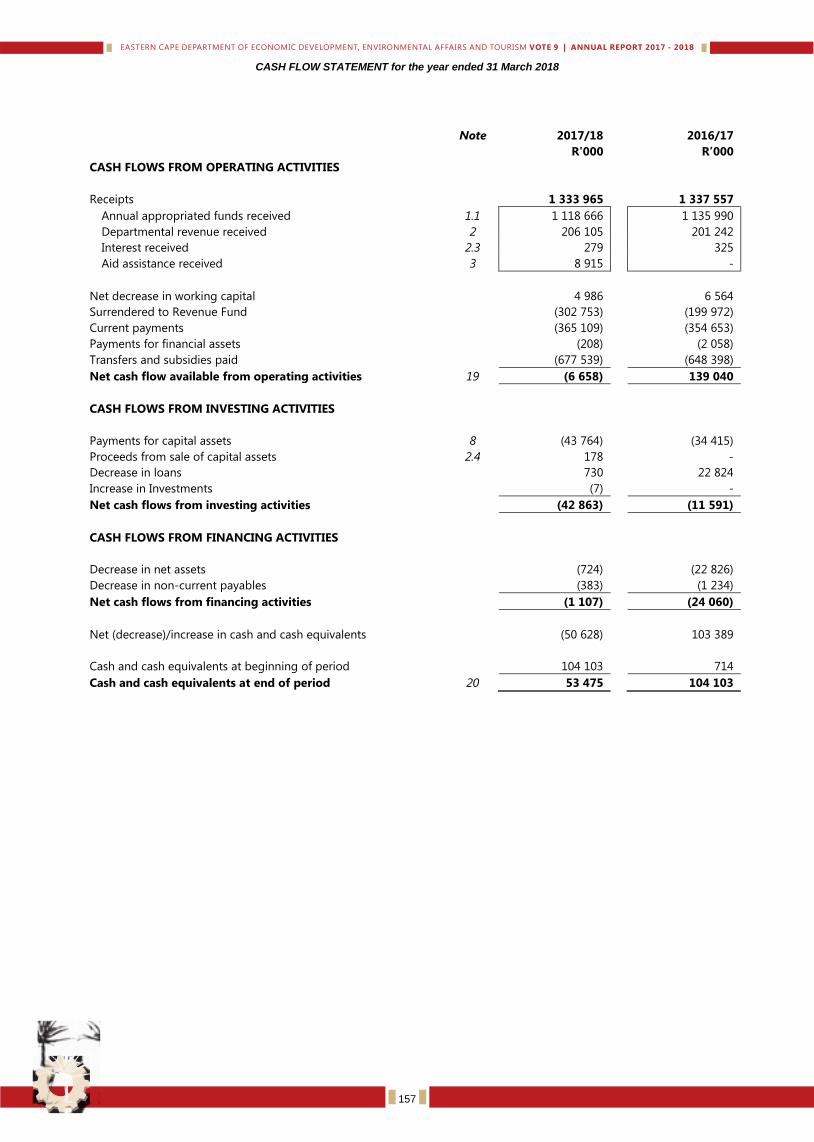
CASH FLOW STATEMENT for the year ended 31 March 2018
Note 2017/18 2016/17
R'000 R’000
CASH FLOWS FROM OPERATING ACTIVITIES
Receipts 1 333 965 1 337 557
Annual appropriated funds received 1.1 1 118 666 1 135 990
Departmental revenue received 2 206 105 201 242
Interest received 2.3 279 325
Aid assistance received 3 8 915 -
Net decrease in working capital 4 986 6 564
Surrendered to Revenue Fund (302 753) (199 972)
Current payments (365 109) (354 653)
Payments for financial assets (208) (2 058)
Transfers and subsidies paid (677 539) (648 398)
Net cash flow available from operating activities 19 (6 658) 139 040
CASH FLOWS FROM INVESTING ACTIVITIES
Payments for capital assets 8 (43 764) (34 415)
Proceeds from sale of capital assets 2.4 178 -
Decrease in loans
Increase in Investments
730
(7)
22 824
-
Net cash flows from investing activities (42 863) (11 591)
CASH FLOWS FROM FINANCING ACTIVITIES
Decrease in net assets (724) (22 826)
Decrease in non-current payables (383) (1 234)
Net cash flows from financing activities (1 107) (24 060)
Net (decrease)/increase in cash and cash equivalents (50 628) 103 389
Cash and cash equivalents at beginning of period 104 103 714
Cash and cash equivalents at end of period 20 53 475 104 103
157
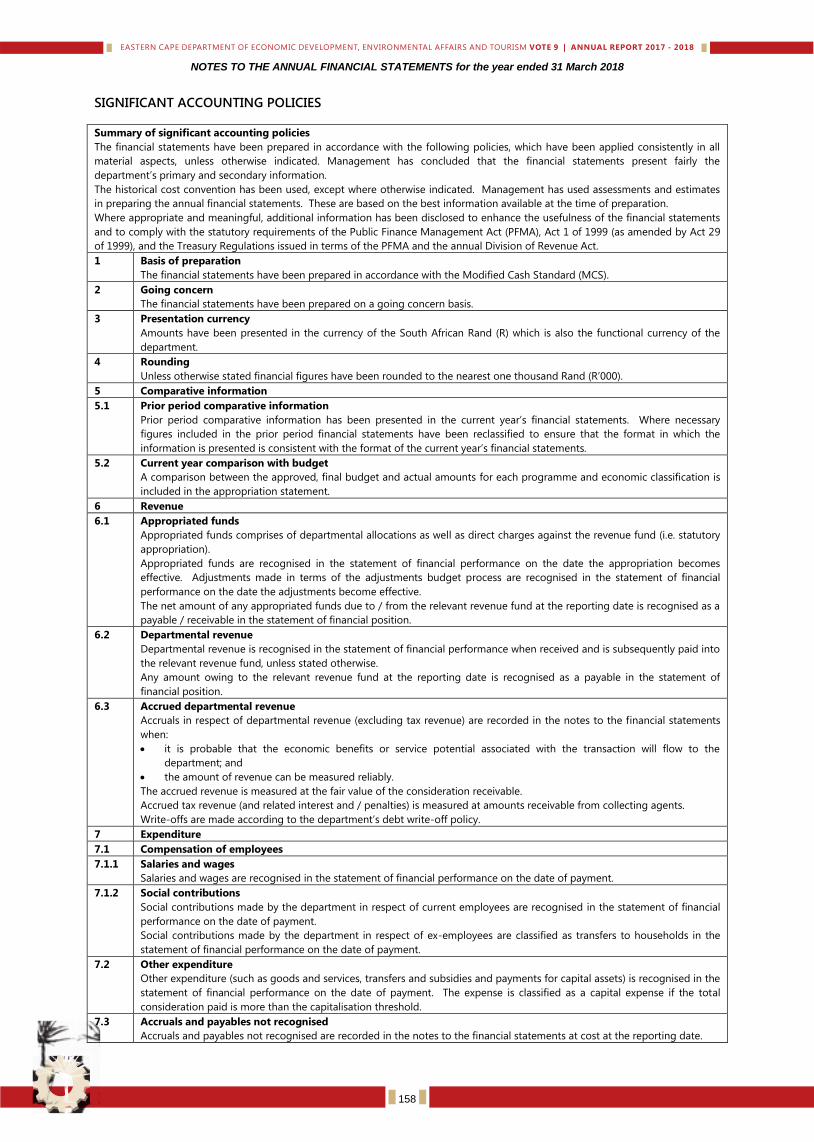
NOTES TO THE ANNUAL FINANCIAL STATEMENTS for the year ended 31 March 2018
SIGNIFICANT ACCOUNTING POLICIES Summary of significant accounting policies
The financial statements have been prepared in accordance with the following policies, which have been applied consistently in all
material aspects, unless otherwise indicated. Management has concluded that the financial statements present fairly the
department’s primary and secondary information.
The historical cost convention has been used, except where otherwise indicated. Management has used assessments and estimates
in preparing the annual financial statements. These are based on the best information available at the time of preparation.
Where appropriate and meaningful, additional information has been disclosed to enhance the usefulness of the financial statements
and to comply with the statutory requirements of the Public Finance Management Act (PFMA), Act 1 of 1999 (as amended by Act 29
of 1999), and the Treasury Regulations issued in terms of the PFMA and the annual Division of Revenue Act.
1 Basis of preparation
The financial statements have been prepared in accordance with the Modified Cash Standard (MCS).
2 Going concern
The financial statements have been prepared on a going concern basis.
3 Presentation currency
Amounts have been presented in the currency of the South African Rand (R) which is also the functional currency of the
department.
4 Rounding
Unless otherwise stated financial figures have been rounded to the nearest one thousand Rand (R’000).
5 Comparative information
5.1 Prior period comparative information
Prior period comparative information has been presented in the current year’s financial statements. Where necessary
figures included in the prior period financial statements have been reclassified to ensure that the format in which the
information is presented is consistent with the format of the current year’s financial statements.
5.2 Current year comparison with budget
A comparison between the approved, final budget and actual amounts for each programme and economic classification is
included in the appropriation statement.
6 Revenue
6.1 Appropriated funds
Appropriated funds comprises of departmental allocations as well as direct charges against the revenue fund (i.e. statutory
appropriation).
Appropriated funds are recognised in the statement of financial performance on the date the appropriation becomes
effective. Adjustments made in terms of the adjustments budget process are recognised in the statement of financial
performance on the date the adjustments become effective.
The net amount of any appropriated funds due to / from the relevant revenue fund at the reporting date is recognised as a
payable / receivable in the statement of financial position.
6.2 Departmental revenue
Departmental revenue is recognised in the statement of financial performance when received and is subsequently paid into
the relevant revenue fund, unless stated otherwise.
Any amount owing to the relevant revenue fund at the reporting date is recognised as a payable in the statement of
financial position.
6.3 Accrued departmental revenue
Accruals in respect of departmental revenue (excluding tax revenue) are recorded in the notes to the financial statements
when:
it is probable that the economic benefits or service potential associated with the transaction will flow to the
department; and
the amount of revenue can be measured reliably.
The accrued revenue is measured at the fair value of the consideration receivable.
Accrued tax revenue (and related interest and / penalties) is measured at amounts receivable from collecting agents.
Write-offs are made according to the department’s debt write-off policy.
7 Expenditure
7.1 Compensation of employees
7.1.1 Salaries and wages
Salaries and wages are recognised in the statement of financial performance on the date of payment.
7.1.2 Social contributions
Social contributions made by the department in respect of current employees are recognised in the statement of financial
performance on the date of payment.
Social contributions made by the department in respect of ex-employees are classified as transfers to households in the
statement of financial performance on the date of payment.
7.2 Other expenditure
Other expenditure (such as goods and services, transfers and subsidies and payments for capital assets) is recognised in the
statement of financial performance on the date of payment. The expense is classified as a capital expense if the total
consideration paid is more than the capitalisation threshold.
7.3 Accruals and payables not recognised
Accruals and payables not recognised are recorded in the notes to the financial statements at cost at the reporting date.
158
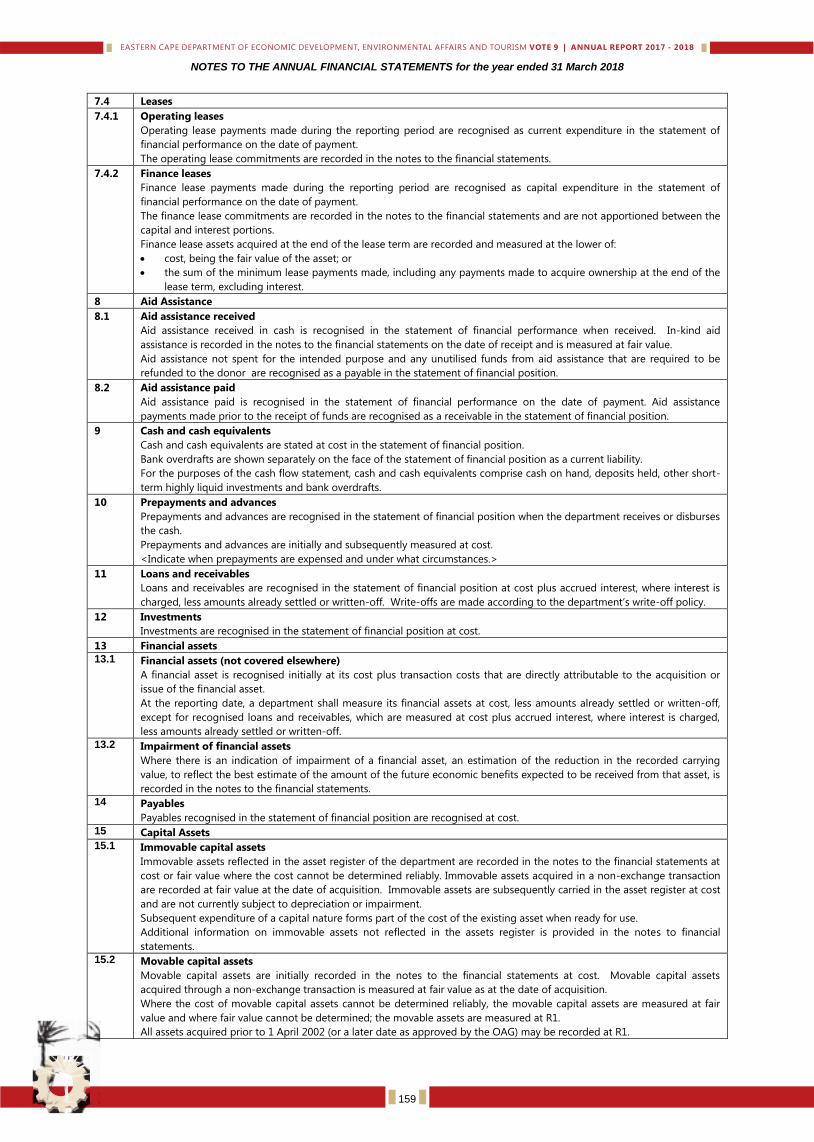
NOTES TO THE ANNUAL FINANCIAL STATEMENTS for the year ended 31 March 2018
7.4 Leases
7.4.1 Operating leases
Operating lease payments made during the reporting period are recognised as current expenditure in the statement of
financial performance on the date of payment.
The operating lease commitments are recorded in the notes to the financial statements.
7.4.2 Finance leases
Finance lease payments made during the reporting period are recognised as capital expenditure in the statement of
financial performance on the date of payment.
The finance lease commitments are recorded in the notes to the financial statements and are not apportioned between the
capital and interest portions.
Finance lease assets acquired at the end of the lease term are recorded and measured at the lower of:
cost, being the fair value of the asset; or
the sum of the minimum lease payments made, including any payments made to acquire ownership at the end of the
lease term, excluding interest.
8 Aid Assistance
8.1 Aid assistance received
Aid assistance received in cash is recognised in the statement of financial performance when received. In-kind aid
assistance is recorded in the notes to the financial statements on the date of receipt and is measured at fair value.
Aid assistance not spent for the intended purpose and any unutilised funds from aid assistance that are required to be
refunded to the donor are recognised as a payable in the statement of financial position.
8.2 Aid assistance paid
Aid assistance paid is recognised in the statement of financial performance on the date of payment. Aid assistance
payments made prior to the receipt of funds are recognised as a receivable in the statement of financial position.
9 Cash and cash equivalents
Cash and cash equivalents are stated at cost in the statement of financial position.
Bank overdrafts are shown separately on the face of the statement of financial position as a current liability.
For the purposes of the cash flow statement, cash and cash equivalents comprise cash on hand, deposits held, other short-
term highly liquid investments and bank overdrafts.
10 Prepayments and advances
Prepayments and advances are recognised in the statement of financial position when the department receives or disburses
the cash.
Prepayments and advances are initially and subsequently measured at cost.
<Indicate when prepayments are expensed and under what circumstances.>
11 Loans and receivables
Loans and receivables are recognised in the statement of financial position at cost plus accrued interest, where interest is
charged, less amounts already settled or written-off. Write-offs are made according to the department’s write-off policy.
12 Investments
Investments are recognised in the statement of financial position at cost.
13 Financial assets
13.1 Financial assets (not covered elsewhere)
A financial asset is recognised initially at its cost plus transaction costs that are directly attributable to the acquisition or
issue of the financial asset.
At the reporting date, a department shall measure its financial assets at cost, less amounts already settled or written-off,
except for recognised loans and receivables, which are measured at cost plus accrued interest, where interest is charged,
less amounts already settled or written-off.
13.2 Impairment of financial assets
Where there is an indication of impairment of a financial asset, an estimation of the reduction in the recorded carrying
value, to reflect the best estimate of the amount of the future economic benefits expected to be received from that asset, is
recorded in the notes to the financial statements.
14 Payables
Payables recognised in the statement of financial position are recognised at cost.
15 Capital Assets
15.1 Immovable capital assets
Immovable assets reflected in the asset register of the department are recorded in the notes to the financial statements at
cost or fair value where the cost cannot be determined reliably. Immovable assets acquired in a non-exchange transaction
are recorded at fair value at the date of acquisition. Immovable assets are subsequently carried in the asset register at cost
and are not currently subject to depreciation or impairment.
Subsequent expenditure of a capital nature forms part of the cost of the existing asset when ready for use.
Additional information on immovable assets not reflected in the assets register is provided in the notes to financial
statements.
15.2 Movable capital assets
Movable capital assets are initially recorded in the notes to the financial statements at cost. Movable capital assets
acquired through a non-exchange transaction is measured at fair value as at the date of acquisition.
Where the cost of movable capital assets cannot be determined reliably, the movable capital assets are measured at fair
value and where fair value cannot be determined; the movable assets are measured at R1.
All assets acquired prior to 1 April 2002 (or a later date as approved by the OAG) may be recorded at R1.
159
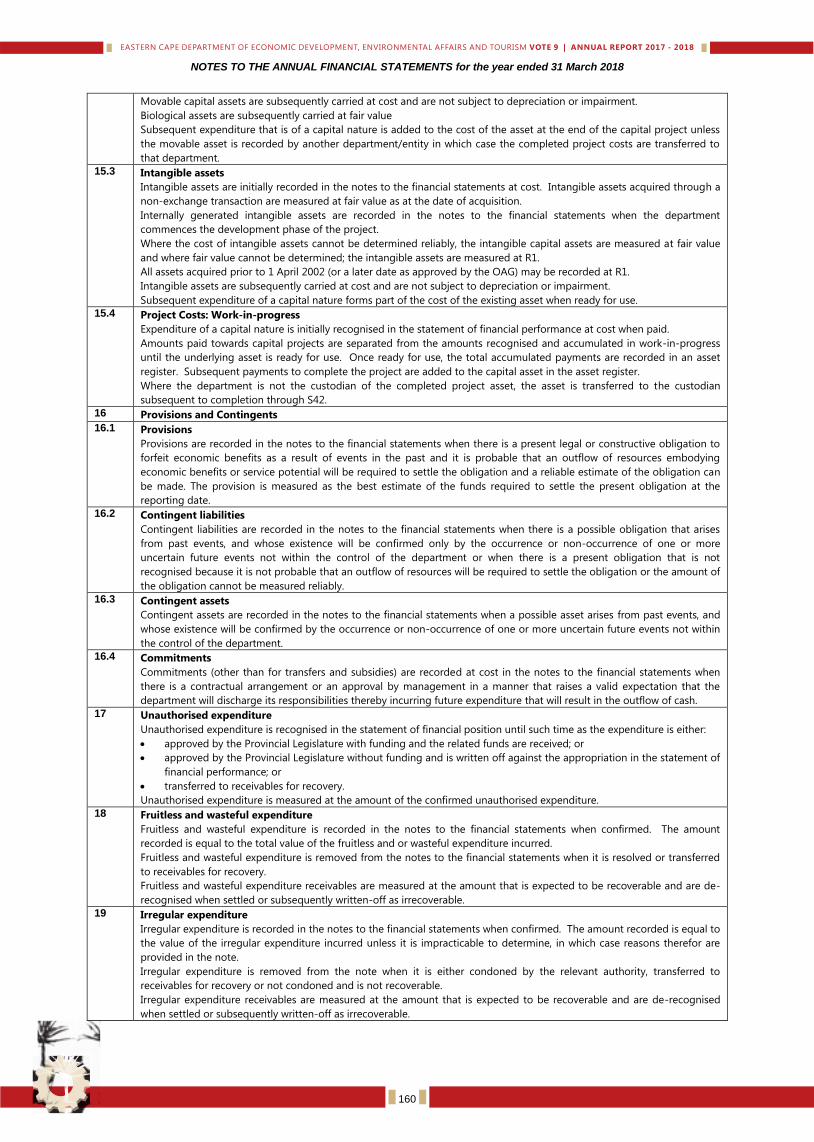
NOTES TO THE ANNUAL FINANCIAL STATEMENTS for the year ended 31 March 2018
Movable capital assets are subsequently carried at cost and are not subject to depreciation or impairment.
Biological assets are subsequently carried at fair value
Subsequent expenditure that is of a capital nature is added to the cost of the asset at the end of the capital project unless
the movable asset is recorded by another department/entity in which case the completed project costs are transferred to
that department.
15.3 Intangible assets
Intangible assets are initially recorded in the notes to the financial statements at cost. Intangible assets acquired through a
non-exchange transaction are measured at fair value as at the date of acquisition.
Internally generated intangible assets are recorded in the notes to the financial statements when the department
commences the development phase of the project.
Where the cost of intangible assets cannot be determined reliably, the intangible capital assets are measured at fair value
and where fair value cannot be determined; the intangible assets are measured at R1.
All assets acquired prior to 1 April 2002 (or a later date as approved by the OAG) may be recorded at R1.
Intangible assets are subsequently carried at cost and are not subject to depreciation or impairment.
Subsequent expenditure of a capital nature forms part of the cost of the existing asset when ready for use.
15.4 Project Costs: Work-in-progress
Expenditure of a capital nature is initially recognised in the statement of financial performance at cost when paid.
Amounts paid towards capital projects are separated from the amounts recognised and accumulated in work-in-progress
until the underlying asset is ready for use. Once ready for use, the total accumulated payments are recorded in an asset
register. Subsequent payments to complete the project are added to the capital asset in the asset register.
Where the department is not the custodian of the completed project asset, the asset is transferred to the custodian
subsequent to completion through S42.
16 Provisions and Contingents
16.1 Provisions
Provisions are recorded in the notes to the financial statements when there is a present legal or constructive obligation to
forfeit economic benefits as a result of events in the past and it is probable that an outflow of resources embodying
economic benefits or service potential will be required to settle the obligation and a reliable estimate of the obligation can
be made. The provision is measured as the best estimate of the funds required to settle the present obligation at the
reporting date.
16.2 Contingent liabilities
Contingent liabilities are recorded in the notes to the financial statements when there is a possible obligation that arises
from past events, and whose existence will be confirmed only by the occurrence or non-occurrence of one or more
uncertain future events not within the control of the department or when there is a present obligation that is not
recognised because it is not probable that an outflow of resources will be required to settle the obligation or the amount of
the obligation cannot be measured reliably.
16.3 Contingent assets
Contingent assets are recorded in the notes to the financial statements when a possible asset arises from past events, and
whose existence will be confirmed by the occurrence or non-occurrence of one or more uncertain future events not within
the control of the department.
16.4 Commitments
Commitments (other than for transfers and subsidies) are recorded at cost in the notes to the financial statements when
there is a contractual arrangement or an approval by management in a manner that raises a valid expectation that the
department will discharge its responsibilities thereby incurring future expenditure that will result in the outflow of cash.
17 Unauthorised expenditure
Unauthorised expenditure is recognised in the statement of financial position until such time as the expenditure is either:
approved by the Provincial Legislature with funding and the related funds are received; or
approved by the Provincial Legislature without funding and is written off against the appropriation in the statement of
financial performance; or
transferred to receivables for recovery.
Unauthorised expenditure is measured at the amount of the confirmed unauthorised expenditure.
18 Fruitless and wasteful expenditure
Fruitless and wasteful expenditure is recorded in the notes to the financial statements when confirmed. The amount
recorded is equal to the total value of the fruitless and or wasteful expenditure incurred.
Fruitless and wasteful expenditure is removed from the notes to the financial statements when it is resolved or transferred
to receivables for recovery.
Fruitless and wasteful expenditure receivables are measured at the amount that is expected to be recoverable and are de-
recognised when settled or subsequently written-off as irrecoverable.
19 Irregular expenditure
Irregular expenditure is recorded in the notes to the financial statements when confirmed. The amount recorded is equal to
the value of the irregular expenditure incurred unless it is impracticable to determine, in which case reasons therefor are
provided in the note.
Irregular expenditure is removed from the note when it is either condoned by the relevant authority, transferred to
receivables for recovery or not condoned and is not recoverable.
Irregular expenditure receivables are measured at the amount that is expected to be recoverable and are de-recognised
when settled or subsequently written-off as irrecoverable.
160
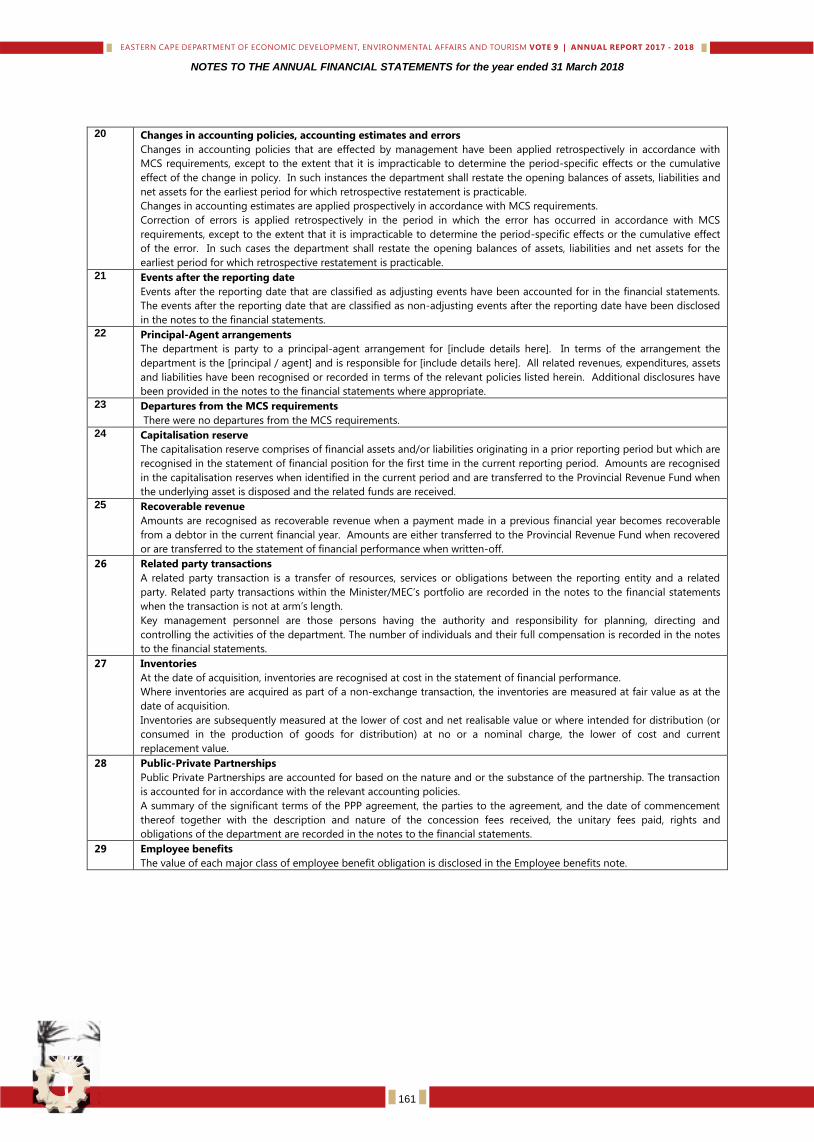
NOTES TO THE ANNUAL FINANCIAL STATEMENTS for the year ended 31 March 2018
20 Changes in accounting policies, accounting estimates and errors
Changes in accounting policies that are effected by management have been applied retrospectively in accordance with
MCS requirements, except to the extent that it is impracticable to determine the period-specific effects or the cumulative
effect of the change in policy. In such instances the department shall restate the opening balances of assets, liabilities and
net assets for the earliest period for which retrospective restatement is practicable.
Changes in accounting estimates are applied prospectively in accordance with MCS requirements.
Correction of errors is applied retrospectively in the period in which the error has occurred in accordance with MCS
requirements, except to the extent that it is impracticable to determine the period-specific effects or the cumulative effect
of the error. In such cases the department shall restate the opening balances of assets, liabilities and net assets for the
earliest period for which retrospective restatement is practicable. 21 Events after the reporting date
Events after the reporting date that are classified as adjusting events have been accounted for in the financial statements.
The events after the reporting date that are classified as non-adjusting events after the reporting date have been disclosed
in the notes to the financial statements.
22 Principal-Agent arrangements
The department is party to a principal-agent arrangement for [include details here]. In terms of the arrangement the
department is the [principal / agent] and is responsible for [include details here]. All related revenues, expenditures, assets
and liabilities have been recognised or recorded in terms of the relevant policies listed herein. Additional disclosures have
been provided in the notes to the financial statements where appropriate.
23 Departures from the MCS requirements
There were no departures from the MCS requirements.
24 Capitalisation reserve
The capitalisation reserve comprises of financial assets and/or liabilities originating in a prior reporting period but which are
recognised in the statement of financial position for the first time in the current reporting period. Amounts are recognised
in the capitalisation reserves when identified in the current period and are transferred to the Provincial Revenue Fund when
the underlying asset is disposed and the related funds are received.
25 Recoverable revenue
Amounts are recognised as recoverable revenue when a payment made in a previous financial year becomes recoverable
from a debtor in the current financial year. Amounts are either transferred to the Provincial Revenue Fund when recovered
or are transferred to the statement of financial performance when written-off.
26 Related party transactions
A related party transaction is a transfer of resources, services or obligations between the reporting entity and a related
party. Related party transactions within the Minister/MEC’s portfolio are recorded in the notes to the financial statements
when the transaction is not at arm’s length.
Key management personnel are those persons having the authority and responsibility for planning, directing and
controlling the activities of the department. The number of individuals and their full compensation is recorded in the notes
to the financial statements.
27 Inventories
At the date of acquisition, inventories are recognised at cost in the statement of financial performance.
Where inventories are acquired as part of a non-exchange transaction, the inventories are measured at fair value as at the
date of acquisition.
Inventories are subsequently measured at the lower of cost and net realisable value or where intended for distribution (or
consumed in the production of goods for distribution) at no or a nominal charge, the lower of cost and current
replacement value.
28 Public-Private Partnerships
Public Private Partnerships are accounted for based on the nature and or the substance of the partnership. The transaction
is accounted for in accordance with the relevant accounting policies.
A summary of the significant terms of the PPP agreement, the parties to the agreement, and the date of commencement
thereof together with the description and nature of the concession fees received, the unitary fees paid, rights and
obligations of the department are recorded in the notes to the financial statements.
29 Employee benefits
The value of each major class of employee benefit obligation is disclosed in the Employee benefits note.
161
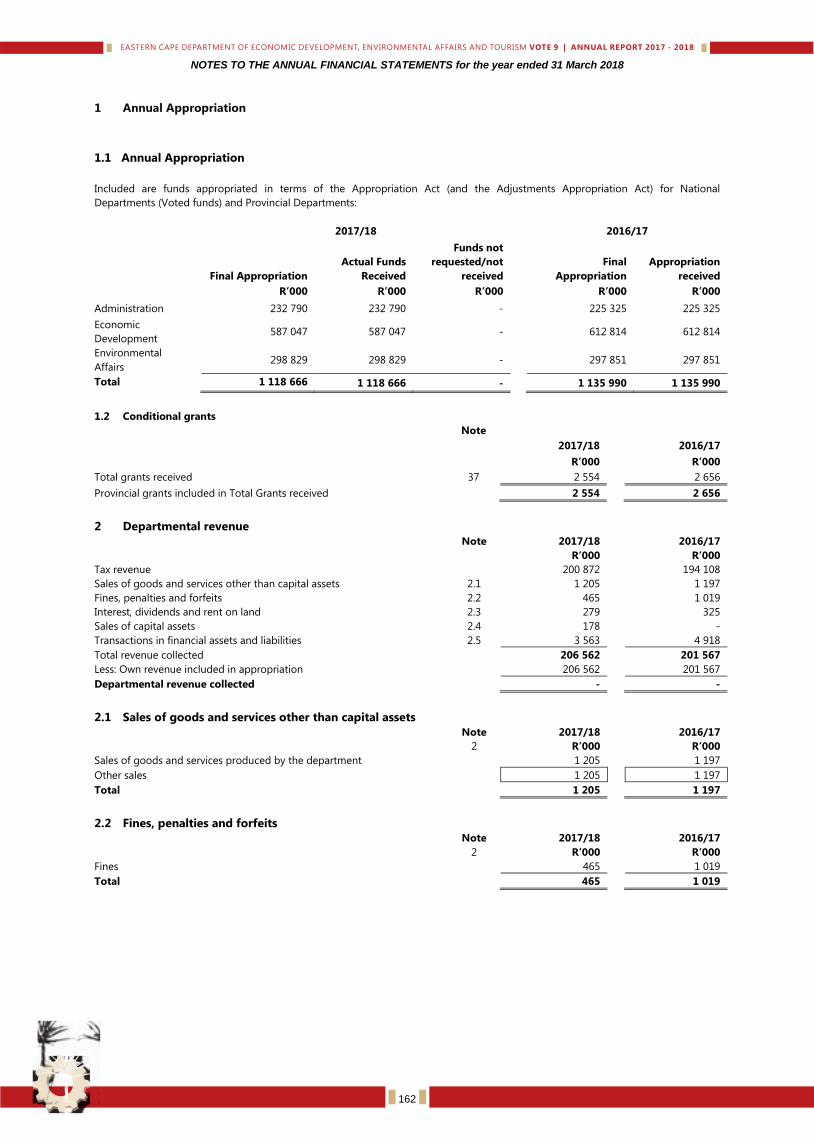
NOTES TO THE ANNUAL FINANCIAL STATEMENTS for the year ended 31 March 2018
1 Annual Appropriation
1.1 Annual Appropriation
Included are funds appropriated in terms of the Appropriation Act (and the Adjustments Appropriation Act) for National
Departments (Voted funds) and Provincial Departments:
1.2 Conditional grants
Note
2017/18 2016/17
R’000 R’000
Total grants received 37 2 554 2 656
Provincial grants included in Total Grants received 2 554 2 656
2 Departmental revenue
Note 2017/18 2016/17
R’000 R’000
Tax revenue 200 872 194 108
Sales of goods and services other than capital assets 2.1 1 205 1 197
Fines, penalties and forfeits 2.2 465 1 019
Interest, dividends and rent on land 2.3 279 325
Sales of capital assets 2.4 178 -
Transactions in financial assets and liabilities 2.5 3 563 4 918
Total revenue collected 206 562 201 567
Less: Own revenue included in appropriation 206 562 201 567
Departmental revenue collected - -
2.1 Sales of goods and services other than capital assets
Note 2017/18 2016/17
2 R’000 R’000
Sales of goods and services produced by the department 1 205 1 197
Other sales 1 205 1 197
Total 1 205 1 197
2.2 Fines, penalties and forfeits
Note 2017/18 2016/17
2 R’000 R’000
Fines 465 1 019
Total 465 1 019
2017/18 2016/17
Final Appropriation
Actual Funds
Received
Funds not
requested/not
received
Final
Appropriation
Appropriation
received
R’000 R’000 R’000 R’000 R’000
Administration 232 790 232 790 - 225 325 225 325
Economic
Development 587 047 587 047 - 612 814 612 814
Environmental
Affairs 298 829 298 829 - 297 851 297 851
Total 1 118 666 1 118 666 - 1 135 990 1 135 990
162
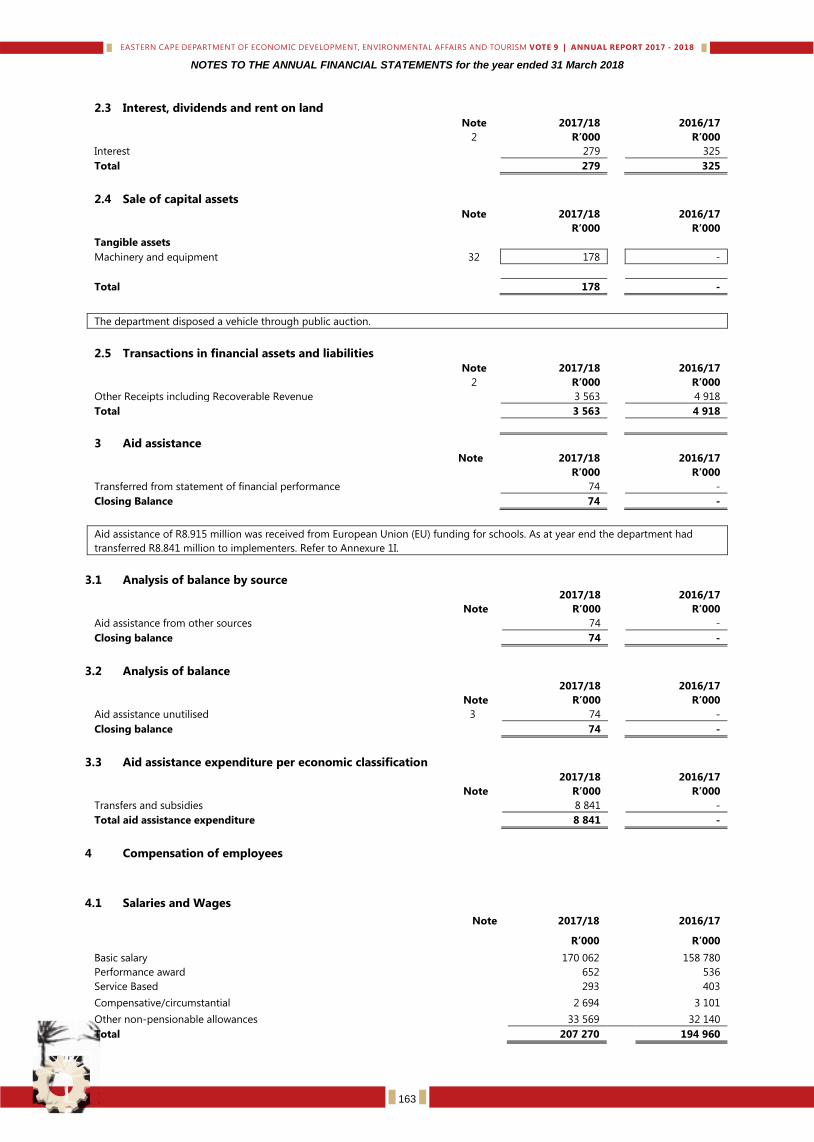
NOTES TO THE ANNUAL FINANCIAL STATEMENTS for the year ended 31 March 2018
2.3 Interest, dividends and rent on land
Note 2017/18 2016/17
2 R’000 R’000
Interest 279 325
Total 279 325
2.4 Sale of capital assets
Note 2017/18 2016/17
R’000 R’000
Tangible assets
Machinery and equipment 32 178 -
Total 178 -
The department disposed a vehicle through public auction.
2.5 Transactions in financial assets and liabilities
Note 2017/18 2016/17
2 R’000 R’000
Other Receipts including Recoverable Revenue 3 563 4 918
Total 3 563 4 918
3 Aid assistance
Note 2017/18 2016/17
R’000 R’000
Transferred from statement of financial performance 74 -
Closing Balance 74 -
Aid assistance of R8.915 million was received from European Union (EU) funding for schools. As at year end the department had
transferred R8.841 million to implementers. Refer to Annexure 1I.
3.1 Analysis of balance by source
2017/18 2016/17
Note R’000 R’000
Aid assistance from other sources 74 -
Closing balance 74 -
3.2 Analysis of balance
2017/18 2016/17
Note R’000 R’000
Aid assistance unutilised 3 74 -
Closing balance 74 -
3.3 Aid assistance expenditure per economic classification
2017/18 2016/17
Note R’000 R’000
Transfers and subsidies 8 841 -
Total aid assistance expenditure 8 841 -
4 Compensation of employees
4.1 Salaries and Wages
Note 2017/18
2016/17
R’000
R’000
Basic salary
170 062
158 780
Performance award
652
536
Service Based
293
403
Compensative/circumstantial
2 694
3 101
Other non-pensionable allowances
33 569
32 140
Total
207 270
194 960
163
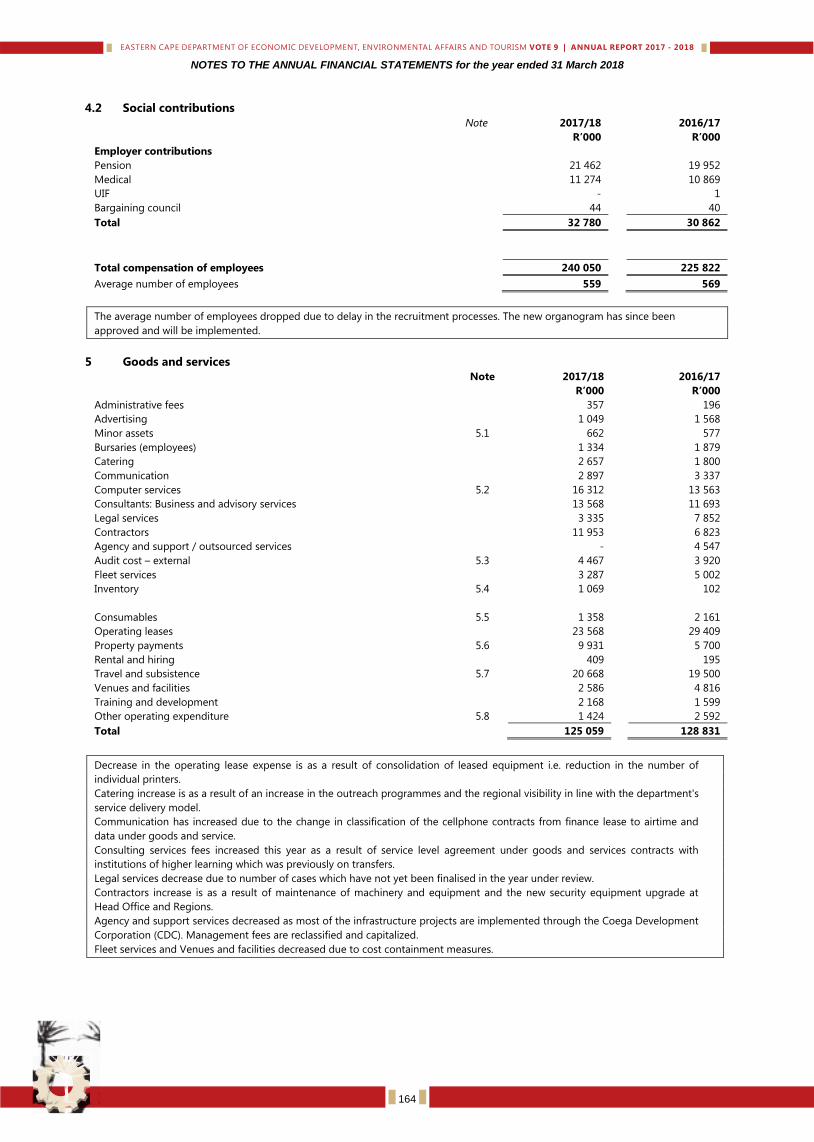
NOTES TO THE ANNUAL FINANCIAL STATEMENTS for the year ended 31 March 2018
4.2 Social contributions
Note 2017/18 2016/17
R’000 R’000
Employer contributions
Pension 21 462 19 952
Medical 11 274 10 869
UIF - 1
Bargaining council 44 40
Total 32 780 30 862
Total compensation of employees 240 050 225 822
Average number of employees 559 569
The average number of employees dropped due to delay in the recruitment processes. The new organogram has since been
approved and will be implemented.
5 Goods and services
Note 2017/18 2016/17
R’000 R’000
Administrative fees 357 196
Advertising 1 049 1 568
Minor assets 5.1 662 577
Bursaries (employees) 1 334 1 879
Catering 2 657 1 800
Communication 2 897 3 337
Computer services 5.2 16 312 13 563
Consultants: Business and advisory services 13 568 11 693
Legal services 3 335 7 852
Contractors 11 953 6 823
Agency and support / outsourced services - 4 547
Audit cost – external 5.3 4 467 3 920
Fleet services 3 287 5 002
Inventory 5.4 1 069 102
Consumables 5.5 1 358 2 161
Operating leases 23 568 29 409
Property payments 5.6 9 931 5 700
Rental and hiring 409 195
Travel and subsistence 5.7 20 668 19 500
Venues and facilities 2 586 4 816
Training and development 2 168 1 599
Other operating expenditure 5.8 1 424 2 592
Total 125 059 128 831
Decrease in the operating lease expense is as a result of consolidation of leased equipment i.e. reduction in the number of
individual printers.
Catering increase is as a result of an increase in the outreach programmes and the regional visibility in line with the department's
service delivery model.
Communication has increased due to the change in classification of the cellphone contracts from finance lease to airtime and
data under goods and service.
Consulting services fees increased this year as a result of service level agreement under goods and services contracts with
institutions of higher learning which was previously on transfers.
Legal services decrease due to number of cases which have not yet been finalised in the year under review.
Contractors increase is as a result of maintenance of machinery and equipment and the new security equipment upgrade at
Head Office and Regions.
Agency and support services decreased as most of the infrastructure projects are implemented through the Coega Development
Corporation (CDC). Management fees are reclassified and capitalized.
Fleet services and Venues and facilities decreased due to cost containment measures.
164
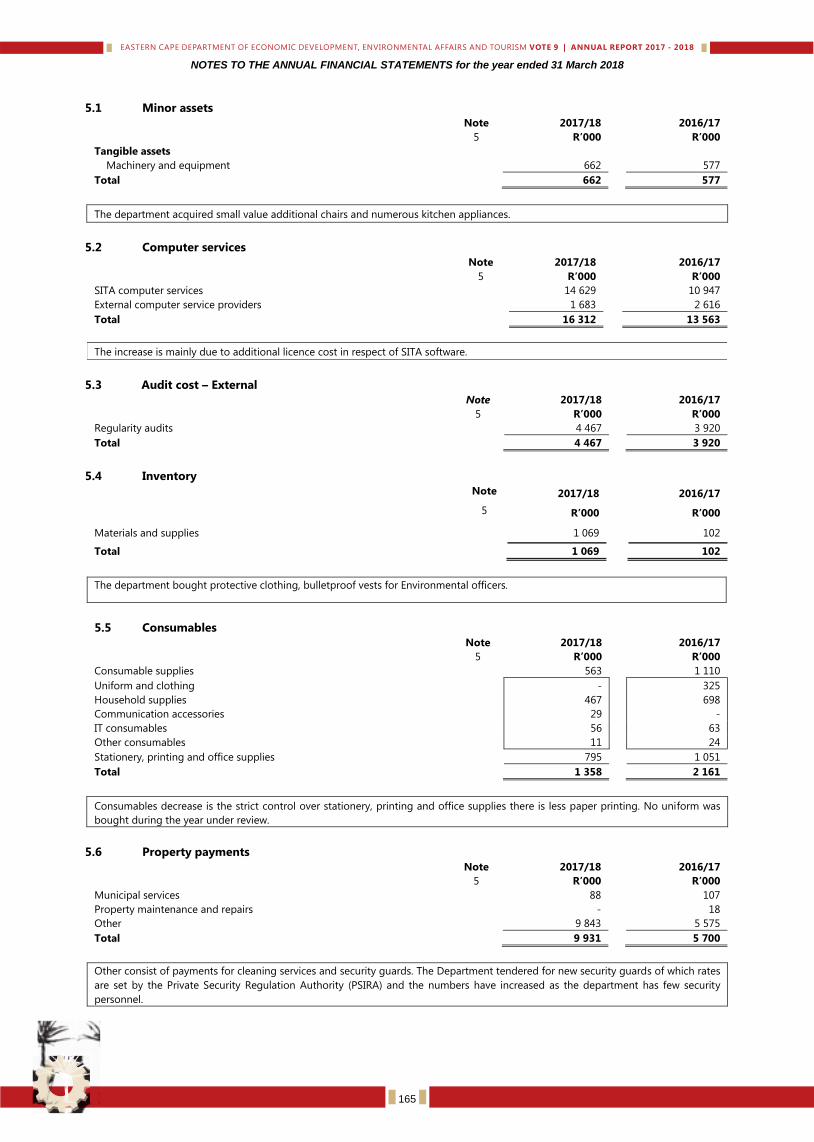
NOTES TO THE ANNUAL FINANCIAL STATEMENTS for the year ended 31 March 2018
5.1 Minor assets
Note 2017/18 2016/17
5 R’000 R’000
Tangible assets
Machinery and equipment 662 577
Total 662 577
The department acquired small value additional chairs and numerous kitchen appliances.
5.2 Computer services
Note 2017/18 2016/17
5 R’000 R’000
SITA computer services 14 629 10 947
External computer service providers 1 683 2 616
Total 16 312 13 563
The increase is mainly due to additional licence cost in respect of SITA software.
5.3 Audit cost – External
Note 2017/18 2016/17
5 R’000 R’000
Regularity audits 4 467 3 920
Total 4 467 3 920
5.4 Inventory
Note 2017/18
2016/17
5 R’000
R’000
Materials and supplies
1 069
102
Total
1 069
102
The department bought protective clothing, bulletproof vests for Environmental officers.
5.5 Consumables
Note 2017/18 2016/17
5 R’000 R’000
Consumable supplies 563 1 110
Uniform and clothing - 325
Household supplies 467 698
Communication accessories 29 -
IT consumables 56 63
Other consumables 11 24
Stationery, printing and office supplies 795 1 051
Total 1 358 2 161
Consumables decrease is the strict control over stationery, printing and office supplies there is less paper printing. No uniform was
bought during the year under review.
5.6 Property payments
Note 2017/18 2016/17
5 R’000 R’000
Municipal services 88 107
Property maintenance and repairs - 18
Other 9 843 5 575
Total 9 931 5 700
Other consist of payments for cleaning services and security guards. The Department tendered for new security guards of which rates
are set by the Private Security Regulation Authority (PSIRA) and the numbers have increased as the department has few security
personnel.
165
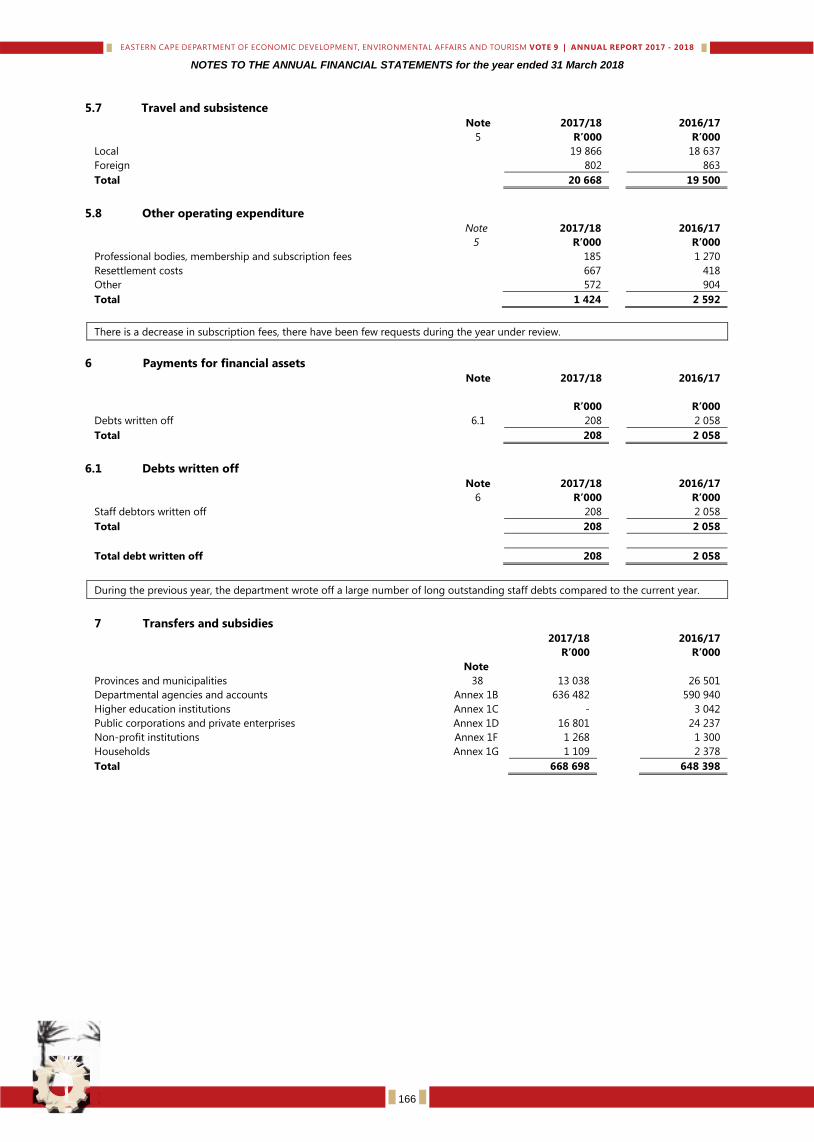
NOTES TO THE ANNUAL FINANCIAL STATEMENTS for the year ended 31 March 2018
5.7 Travel and subsistence
Note 2017/18 2016/17
5 R’000 R’000
Local 19 866 18 637
Foreign 802 863
Total 20 668 19 500
5.8 Other operating expenditure
Note 2017/18 2016/17
5 R’000 R’000
Professional bodies, membership and subscription fees 185 1 270
Resettlement costs 667 418
Other 572 904
Total 1 424 2 592
There is a decrease in subscription fees, there have been few requests during the year under review.
6 Payments for financial assets
Note 2017/18 2016/17
R’000 R’000
Debts written off 6.1 208 2 058
Total 208 2 058
6.1 Debts written off
Note 2017/18 2016/17
6 R’000 R’000
Staff debtors written off 208 2 058
Total 208 2 058
Total debt written off 208 2 058
During the previous year, the department wrote off a large number of long outstanding staff debts compared to the current year.
7 Transfers and subsidies
2017/18 2016/17
R’000 R’000
Note
Provinces and municipalities 38 13 038 26 501
Departmental agencies and accounts Annex 1B 636 482 590 940
Higher education institutions Annex 1C - 3 042
Public corporations and private enterprises Annex 1D 16 801 24 237
Non-profit institutions Annex 1F 1 268 1 300
Households Annex 1G 1 109 2 378
Total 668 698 648 398
166
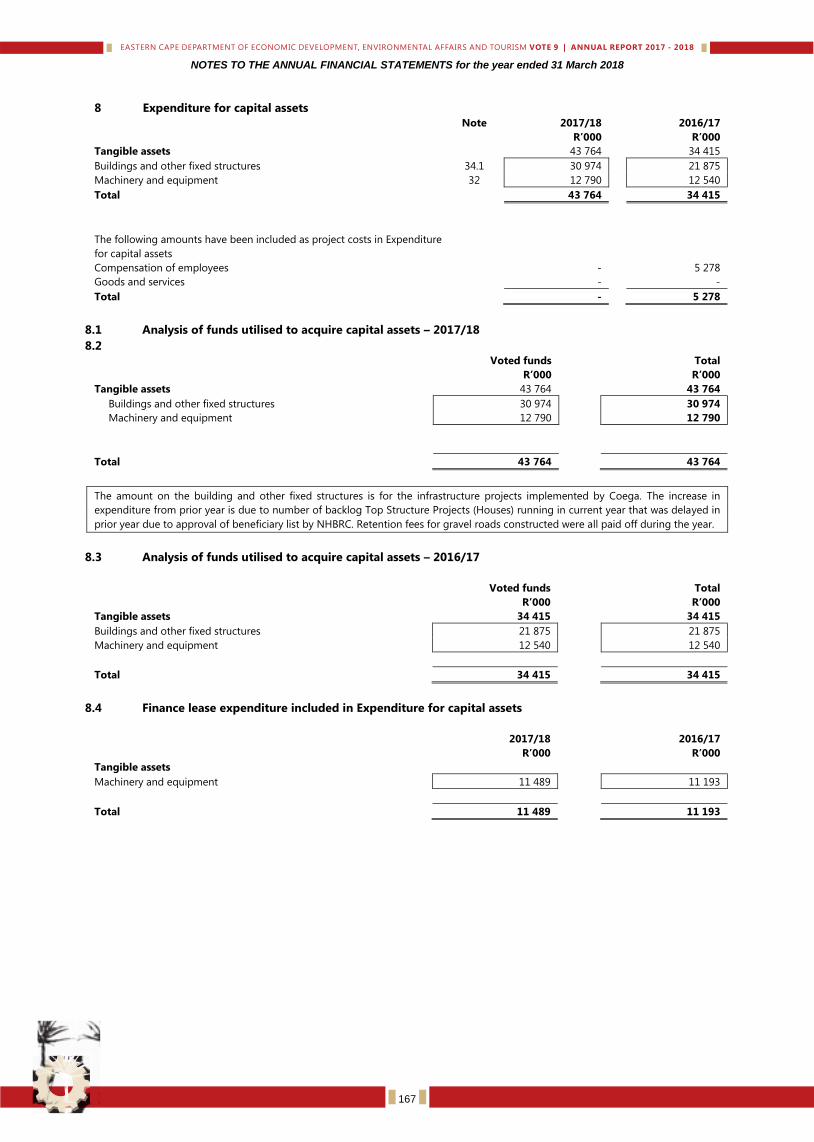
NOTES TO THE ANNUAL FINANCIAL STATEMENTS for the year ended 31 March 2018
8 Expenditure for capital assets
Note 2017/18 2016/17
R’000 R’000
Tangible assets 43 764 34 415
Buildings and other fixed structures 34.1 30 974 21 875
Machinery and equipment 32 12 790 12 540
Total 43 764 34 415
The following amounts have been included as project costs in Expenditure
for capital assets
Compensation of employees - 5 278
Goods and services - -
Total - 5 278
8.1 Analysis of funds utilised to acquire capital assets – 2017/18
8.2
Voted funds Total
R’000 R’000
Tangible assets 43 764 43 764
Buildings and other fixed structures 30 974 30 974
Machinery and equipment 12 790 12 790
Total 43 764 43 764
The amount on the building and other fixed structures is for the infrastructure projects implemented by Coega. The increase in
expenditure from prior year is due to number of backlog Top Structure Projects (Houses) running in current year that was delayed in
prior year due to approval of beneficiary list by NHBRC. Retention fees for gravel roads constructed were all paid off during the year.
8.3 Analysis of funds utilised to acquire capital assets – 2016/17
Voted funds Total
R’000 R’000
Tangible assets 34 415 34 415
Buildings and other fixed structures 21 875 21 875
Machinery and equipment 12 540 12 540
Total 34 415 34 415
8.4 Finance lease expenditure included in Expenditure for capital assets
2017/18 2016/17
R’000 R’000
Tangible assets
Machinery and equipment 11 489 11 193
Total 11 489 11 193
167
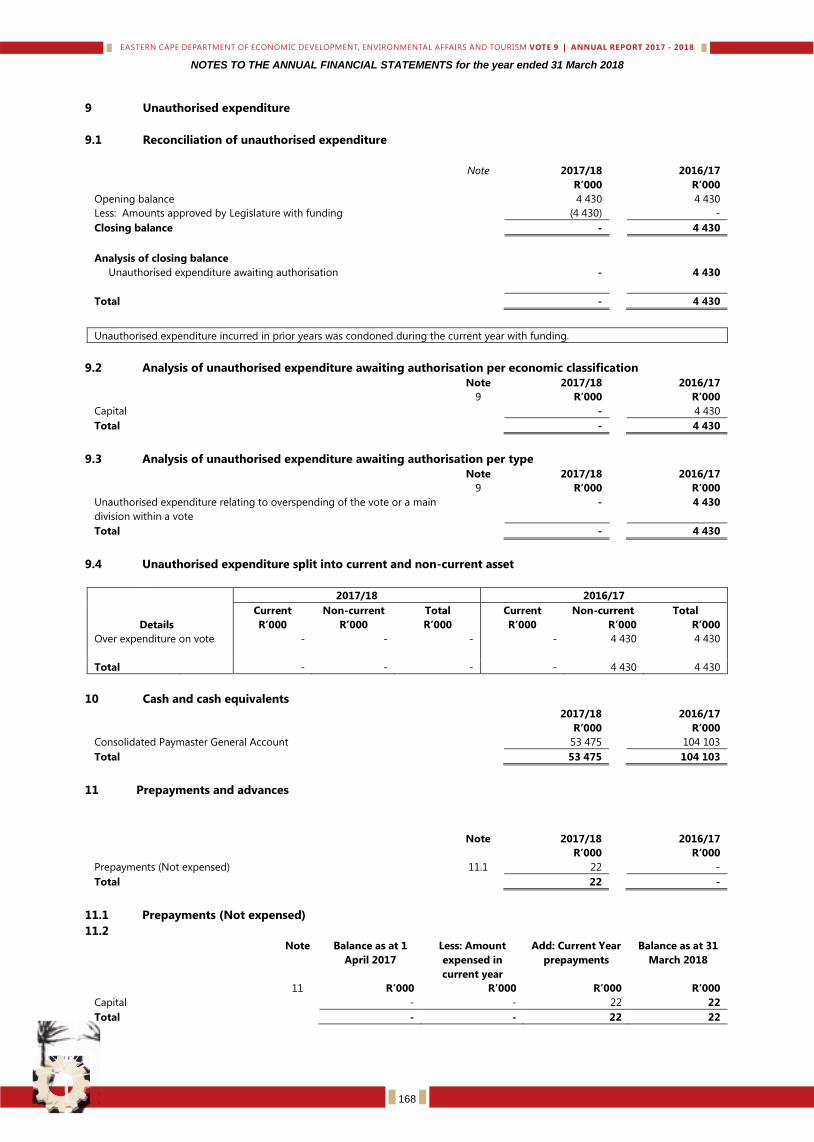
NOTES TO THE ANNUAL FINANCIAL STATEMENTS for the year ended 31 March 2018
9 Unauthorised expenditure
9.1 Reconciliation of unauthorised expenditure
Note 2017/18 2016/17
R’000 R’000
Opening balance 4 430 4 430
Less: Amounts approved by Legislature with funding (4 430) -
Closing balance - 4 430
Analysis of closing balance
Unauthorised expenditure awaiting authorisation - 4 430
Total - 4 430
Unauthorised expenditure incurred in prior years was condoned during the current year with funding.
9.2 Analysis of unauthorised expenditure awaiting authorisation per economic classification
Note 2017/18 2016/17
9 R’000 R’000
Capital - 4 430
Total - 4 430
9.3 Analysis of unauthorised expenditure awaiting authorisation per type
Note 2017/18 2016/17
9 R’000 R’000
Unauthorised expenditure relating to overspending of the vote or a main
division within a vote
- 4 430
Total - 4 430
9.4 Unauthorised expenditure split into current and non-current asset
2017/18 2016/17
Current Non-current Total Current Non-current Total
Details R’000 R’000 R’000 R’000 R’000 R’000
Over expenditure on vote -
-
- - 4 430 4 430
Total - - - - 4 430 4 430
10 Cash and cash equivalents
2017/18 2016/17
R’000 R’000
Consolidated Paymaster General Account 53 475 104 103
Total 53 475 104 103
11 Prepayments and advances
Note 2017/18 2016/17
R’000 R’000
Prepayments (Not expensed) 11.1 22 -
Total 22 -
11.1 Prepayments (Not expensed)
11.2
Note Balance as at 1
April 2017
Less: Amount
expensed in
current year
Add: Current Year
prepayments
Balance as at 31
March 2018
11 R’000 R’000 R’000 R’000
Capital - - 22 22
Total - - 22 22
168
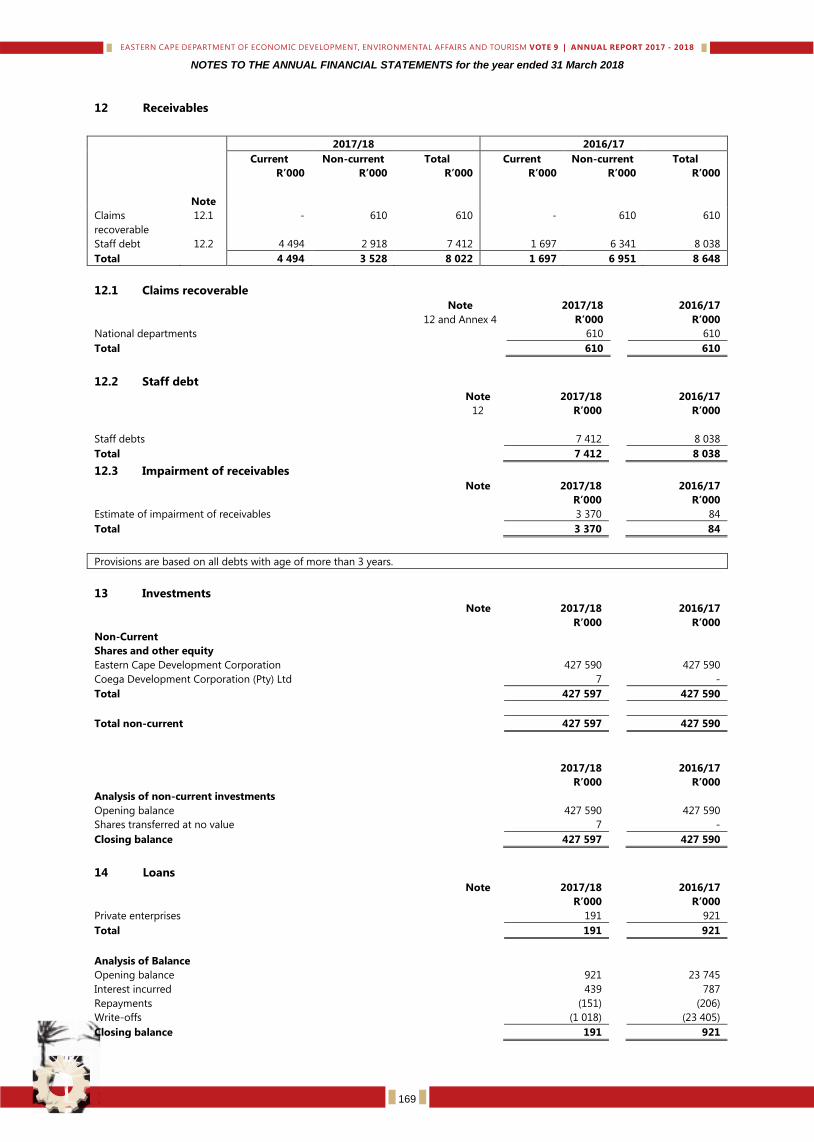
NOTES TO THE ANNUAL FINANCIAL STATEMENTS for the year ended 31 March 2018
12 Receivables
2017/18 2016/17
Current Non-current Total Current Non-current Total
Note
R’000 R’000 R’000 R’000 R’000 R’000
Claims
recoverable
12.1
- 610 610 - 610 610
Staff debt 12.2 4 494 2 918 7 412 1 697 6 341 8 038
Total 4 494 3 528 8 022 1 697 6 951 8 648
12.1 Claims recoverable
Note 2017/18 2016/17
12 and Annex 4 R’000 R’000
National departments 610 610
Total 610 610
12.2 Staff debt
Note 2017/18 2016/17
12 R’000 R’000
Staff debts 7 412 8 038
Total 7 412 8 038
12.3 Impairment of receivables
Note 2017/18 2016/17
R’000 R’000
Estimate of impairment of receivables 3 370 84
Total 3 370 84
Provisions are based on all debts with age of more than 3 years.
13 Investments
Note 2017/18 2016/17
R’000 R’000
Non-Current
Shares and other equity
Eastern Cape Development Corporation 427 590 427 590
Coega Development Corporation (Pty) Ltd 7 -
Total 427 597 427 590
Total non-current 427 597 427 590
2017/18 2016/17
R’000 R’000
Analysis of non-current investments
Opening balance 427 590 427 590
Shares transferred at no value 7 -
Closing balance 427 597 427 590
14 Loans
Note 2017/18 2016/17
R’000 R’000
Private enterprises 191 921
Total 191 921
Analysis of Balance
Opening balance 921 23 745
Interest incurred 439 787
Repayments (151) (206)
Write-offs (1 018) (23 405)
Closing balance 191 921
169
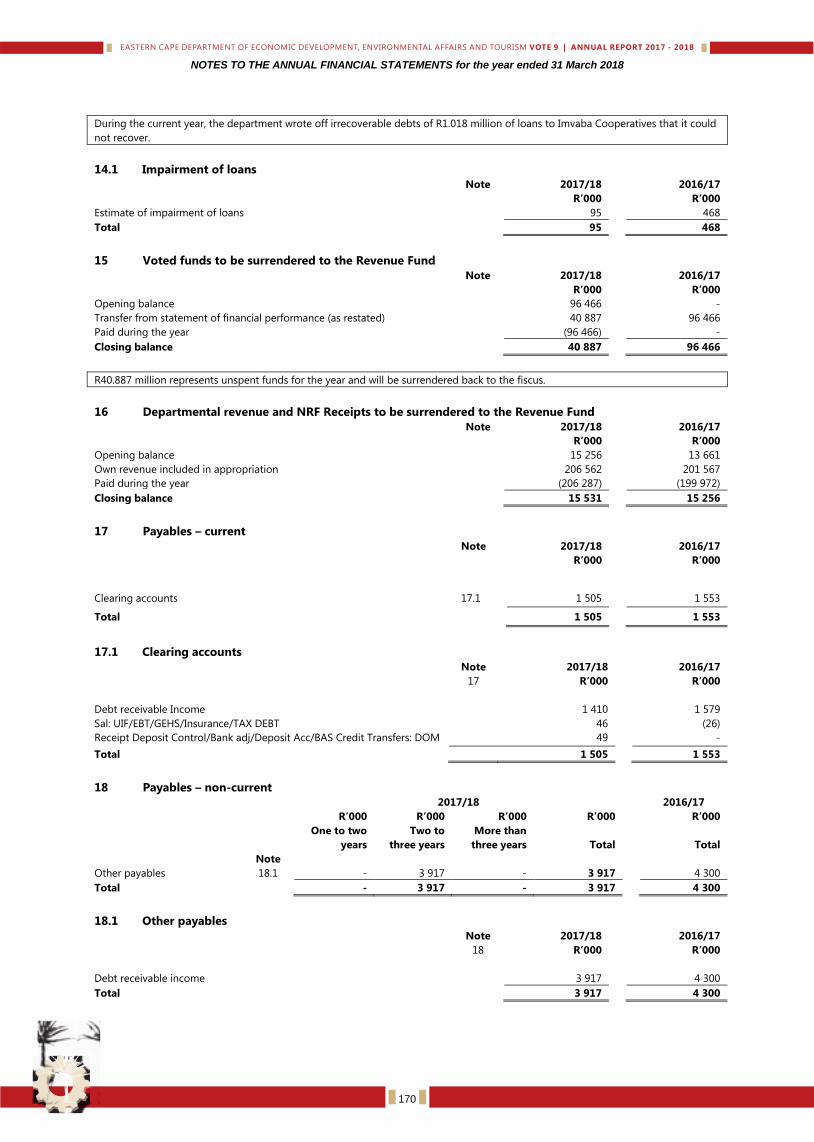
NOTES TO THE ANNUAL FINANCIAL STATEMENTS for the year ended 31 March 2018
During the current year, the department wrote off irrecoverable debts of R1.018 million of loans to Imvaba Cooperatives that it could
not recover.
14.1 Impairment of loans
Note 2017/18 2016/17
R’000 R’000
Estimate of impairment of loans 95 468
Total 95 468
15 Voted funds to be surrendered to the Revenue Fund
Note 2017/18 2016/17
R’000 R’000
Opening balance 96 466 -
Transfer from statement of financial performance (as restated) 40 887 96 466
Paid during the year (96 466) -
Closing balance 40 887 96 466
R40.887 million represents unspent funds for the year and will be surrendered back to the fiscus.
16 Departmental revenue and NRF Receipts to be surrendered to the Revenue Fund
Note 2017/18 2016/17
R’000 R’000
Opening balance 15 256 13 661
Own revenue included in appropriation 206 562 201 567
Paid during the year (206 287) (199 972)
Closing balance 15 531 15 256
17 Payables – current
Note 2017/18 2016/17
R’000 R’000
Clearing accounts 17.1 1 505 1 553
Total 1 505 1 553
17.1 Clearing accounts
Note 2017/18 2016/17
17 R’000 R’000
Debt receivable Income
Sal: UIF/EBT/GEHS/Insurance/TAX DEBT
Receipt Deposit Control/Bank adj/Deposit Acc/BAS Credit Transfers: DOM
1 410
46
49
1 579
(26)
-
Total 1 505 1 553
18 Payables – non-current
2017/18 2016/17
R’000 R’000 R’000 R’000 R’000
Note
One to two
years
Two to
three years
More than
three years Total
Total
Other payables 18.1 - 3 917 - 3 917 4 300
Total - 3 917 - 3 917 4 300
18.1 Other payables
Note 2017/18 2016/17
18 R’000 R’000
Debt receivable income 3 917 4 300
Total 3 917 4 300
170
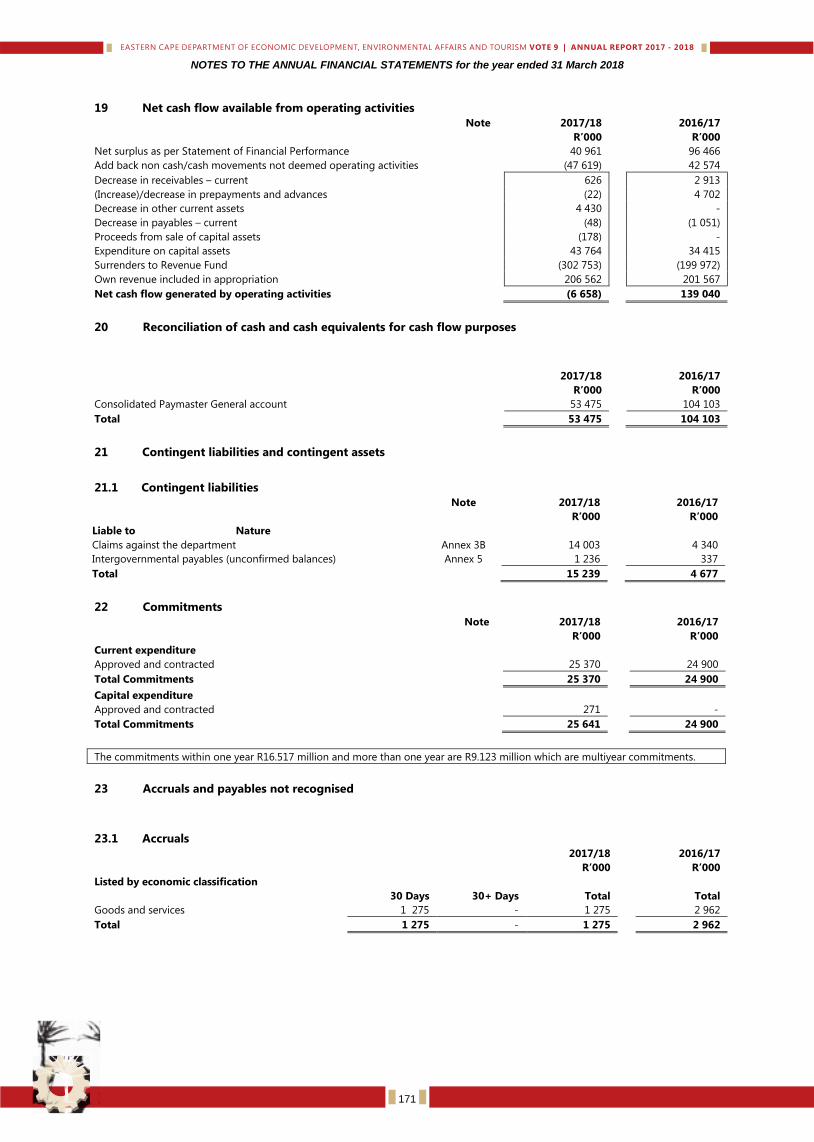
NOTES TO THE ANNUAL FINANCIAL STATEMENTS for the year ended 31 March 2018
19 Net cash flow available from operating activities
Note 2017/18 2016/17
R’000 R’000
Net surplus as per Statement of Financial Performance 40 961 96 466
Add back non cash/cash movements not deemed operating activities (47 619) 42 574
Decrease in receivables – current 626 2 913
(Increase)/decrease in prepayments and advances (22) 4 702
Decrease in other current assets 4 430 -
Decrease in payables – current (48) (1 051)
Proceeds from sale of capital assets (178) -
Expenditure on capital assets 43 764 34 415
Surrenders to Revenue Fund (302 753) (199 972)
Own revenue included in appropriation 206 562 201 567
Net cash flow generated by operating activities (6 658) 139 040
20 Reconciliation of cash and cash equivalents for cash flow purposes
2017/18 2016/17
R’000 R’000
Consolidated Paymaster General account 53 475 104 103
Total 53 475 104 103
21 Contingent liabilities and contingent assets
21.1 Contingent liabilities
Note 2017/18 2016/17
R’000 R’000
Liable to Nature
Claims against the department Annex 3B 14 003 4 340
Intergovernmental payables (unconfirmed balances) Annex 5 1 236 337
Total 15 239 4 677
22 Commitments
Note 2017/18 2016/17
R’000 R’000
Current expenditure
Approved and contracted 25 370 24 900
Total Commitments 25 370 24 900
Capital expenditure
Approved and contracted 271 -
Total Commitments 25 641 24 900
The commitments within one year R16.517 million and more than one year are R9.123 million which are multiyear commitments.
23 Accruals and payables not recognised
23.1 Accruals
2017/18 2016/17
R’000 R’000
Listed by economic classification
30 Days 30+ Days Total Total
Goods and services 1 275 - 1 275 2 962
Total 1 275 - 1 275 2 962
171

NOTES TO THE ANNUAL FINANCIAL STATEMENTS for the year ended 31 March 2018
Note 2017/18 2016/17
R’000 R’000
Listed by programme level
Administration 897 2 567
Economic Development 72 217
Environmental Affairs 306 178
Total 1 275 2 962
The accruals decreased significantly as the department took measures to ensure that payments are processed on time.
23.2 Payables not recognised
2017/18 2016/17
R’000 R’000
Listed by economic classification
30 Days 30+ Days Total Total
Goods and services 2 903 - 2 903 3 052
Total 2 903 - 2 903 3 052
Note 2017/18 2016/17
R’000 R’000
Listed by programme level
Administration 2 284 533
Economic Development 365 2 519
Environmental Affairs 254 -
Total 2 903 3 052
Most of the invoices not paid within 30 days period were incorrect charges and incorrect description on invoice submitted by service
providers resulting in late payments.
2017/18 2016/17
Included in the above totals are the following: R’000 R’000
Confirmed balances with other departments Annex 5 84 -
Total 84 -
24 Employee benefits
Note 2017/18 2016/17
R’000 R’000
Leave entitlement 9 559 9 451
Service bonus (Thirteenth cheque) 6 917 6 372
Performance awards 1 082 424
Capped leave commitments 19 464 19 209
Other 314 461
Total 37 336 35 918
Included in the leave entitlement and capped leave commitment balances are negative leave balances to the value of R0.350 million
and R0,031 respectively. These negative leave balances came about when leave was taken by employees, based on the PERSAL leave
credit (opening yearly balance) allocated at the beginning of the leave cycle, whereas such officials had not accumulated those days,
per month worked.
172
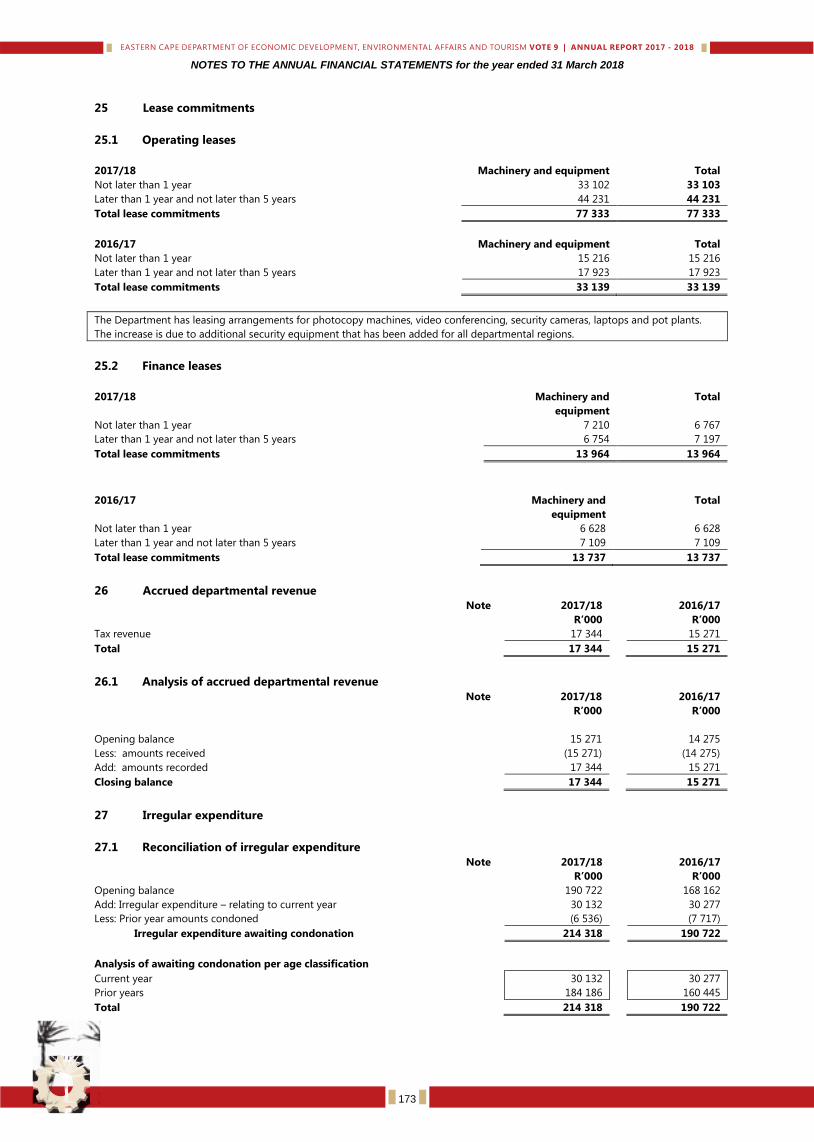
NOTES TO THE ANNUAL FINANCIAL STATEMENTS for the year ended 31 March 2018
25 Lease commitments
25.1 Operating leases
2017/18 Machinery and equipment Total
Not later than 1 year 33 102 33 103
Later than 1 year and not later than 5 years 44 231 44 231
Total lease commitments 77 333 77 333
2016/17 Machinery and equipment Total
Not later than 1 year 15 216 15 216
Later than 1 year and not later than 5 years 17 923 17 923
Total lease commitments 33 139 33 139
The Department has leasing arrangements for photocopy machines, video conferencing, security cameras, laptops and pot plants.
The increase is due to additional security equipment that has been added for all departmental regions.
25.2 Finance leases
2017/18 Machinery and
equipment
Total
Not later than 1 year 7 210 6 767
Later than 1 year and not later than 5 years 6 754 7 197
Total lease commitments 13 964 13 964
2016/17 Machinery and
equipment
Total
Not later than 1 year 6 628 6 628
Later than 1 year and not later than 5 years 7 109 7 109
Total lease commitments 13 737 13 737
26 Accrued departmental revenue
Note 2017/18 2016/17
R’000 R’000
Tax revenue 17 344 15 271
Total 17 344 15 271
26.1 Analysis of accrued departmental revenue
Note 2017/18 2016/17
R’000 R’000
Opening balance 15 271 14 275
Less: amounts received (15 271) (14 275)
Add: amounts recorded 17 344 15 271
Closing balance 17 344 15 271
27 Irregular expenditure
27.1 Reconciliation of irregular expenditure
Note 2017/18 2016/17
R’000 R’000
Opening balance 190 722 168 162
Add: Irregular expenditure – relating to current year 30 132 30 277
Less: Prior year amounts condoned (6 536) (7 717)
Irregular expenditure awaiting condonation 214 318 190 722
Analysis of awaiting condonation per age classification
Current year 30 132 30 277
Prior years 184 186 160 445
Total 214 318 190 722
173
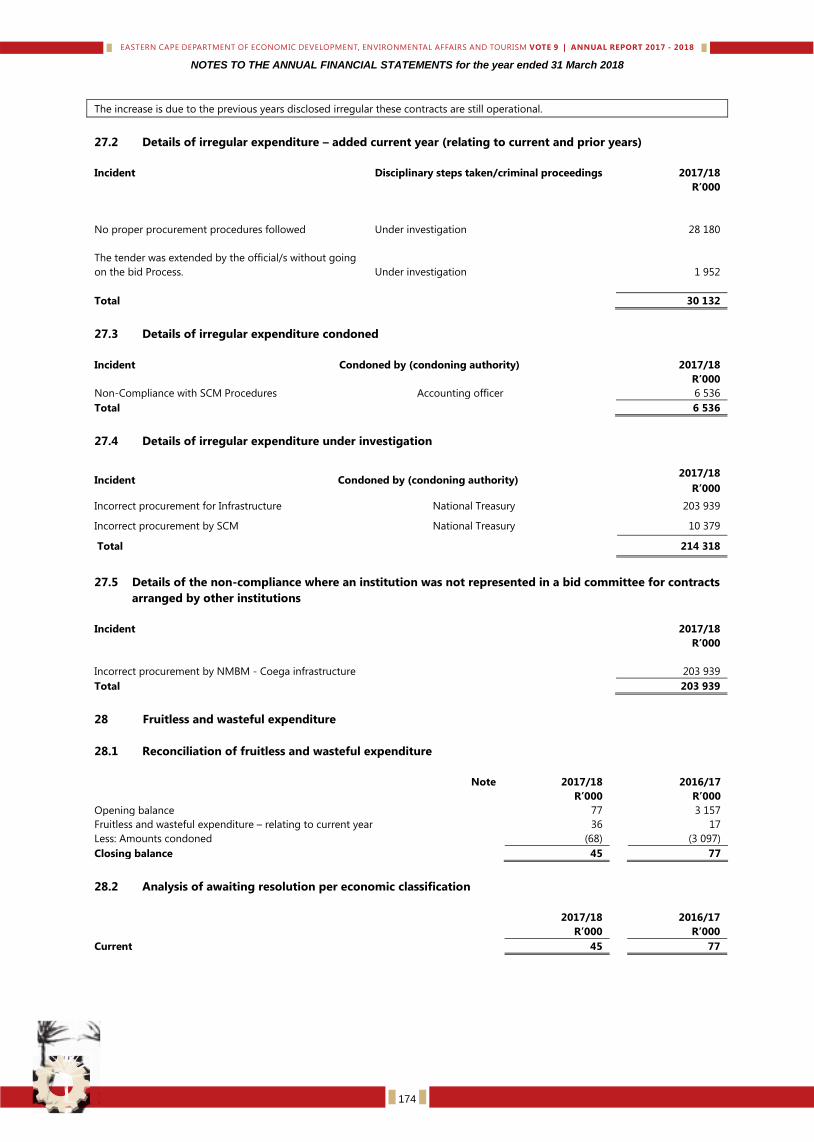
NOTES TO THE ANNUAL FINANCIAL STATEMENTS for the year ended 31 March 2018
The increase is due to the previous years disclosed irregular these contracts are still operational.
27.2 Details of irregular expenditure – added current year (relating to current and prior years)
Incident Disciplinary steps taken/criminal proceedings 2017/18
R’000
No proper procurement procedures followed
Under investigation
28 180
The tender was extended by the official/s without going
on the bid Process.
Under investigation
1 952
Total 30 132
27.3 Details of irregular expenditure condoned
Incident Condoned by (condoning authority) 2017/18
R’000
Non-Compliance with SCM Procedures Accounting officer 6 536
Total 6 536
27.4 Details of irregular expenditure under investigation
Incident Condoned by (condoning authority) 2017/18
R’000
Incorrect procurement for Infrastructure National Treasury 203 939
Incorrect procurement by SCM National Treasury 10 379
Total
214 318
27.5 Details of the non-compliance where an institution was not represented in a bid committee for contracts
arranged by other institutions
Incident 2017/18
R’000
Incorrect procurement by NMBM - Coega infrastructure 203 939
Total 203 939
28 Fruitless and wasteful expenditure
28.1 Reconciliation of fruitless and wasteful expenditure
Note 2017/18 2016/17
R’000 R’000
Opening balance 77 3 157
Fruitless and wasteful expenditure – relating to current year 36 17
Less: Amounts condoned (68) (3 097)
Closing balance 45 77
28.2 Analysis of awaiting resolution per economic classification
2017/18 2016/17
R’000 R’000
Current 45 77
174
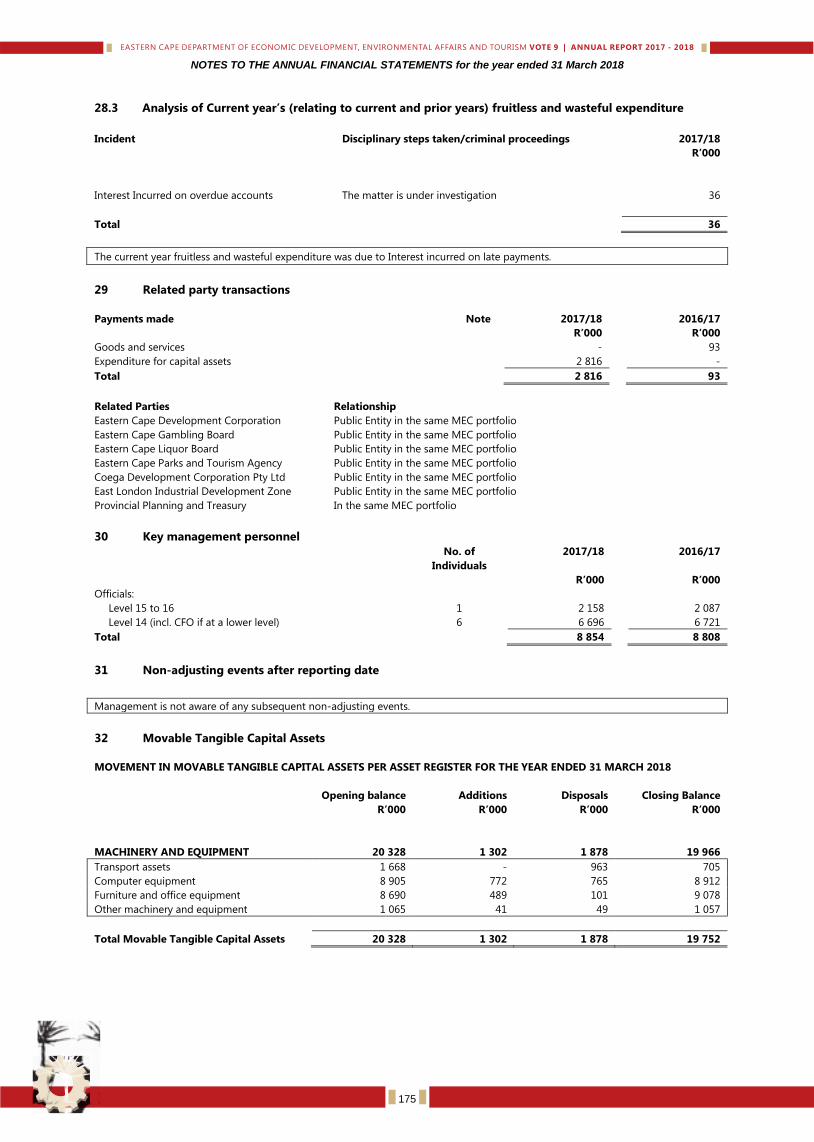
NOTES TO THE ANNUAL FINANCIAL STATEMENTS for the year ended 31 March 2018
28.3 Analysis of Current year’s (relating to current and prior years) fruitless and wasteful expenditure
Incident Disciplinary steps taken/criminal proceedings 2017/18
R’000
Interest Incurred on overdue accounts The matter is under investigation 36
Total 36
The current year fruitless and wasteful expenditure was due to Interest incurred on late payments.
29 Related party transactions
Payments made
Note
2017/18
2016/17
R’000 R’000
Goods and services - 93
Expenditure for capital assets 2 816 -
Total 2 816 93
Related Parties Relationship
Eastern Cape Development Corporation Public Entity in the same MEC portfolio
Eastern Cape Gambling Board Public Entity in the same MEC portfolio
Eastern Cape Liquor Board Public Entity in the same MEC portfolio
Eastern Cape Parks and Tourism Agency Public Entity in the same MEC portfolio
Coega Development Corporation Pty Ltd Public Entity in the same MEC portfolio
East London Industrial Development Zone Public Entity in the same MEC portfolio
Provincial Planning and Treasury In the same MEC portfolio
30 Key management personnel
No. of
Individuals
2017/18 2016/17
R’000 R’000
Officials:
Level 15 to 16 1 2 158 2 087
Level 14 (incl. CFO if at a lower level) 6 6 696 6 721
Total 8 854 8 808
31 Non-adjusting events after reporting date
Management is not aware of any subsequent non-adjusting events.
32 Movable Tangible Capital Assets
MOVEMENT IN MOVABLE TANGIBLE CAPITAL ASSETS PER ASSET REGISTER FOR THE YEAR ENDED 31 MARCH 2018
Opening balance Additions Disposals Closing Balance
R’000 R’000 R’000 R’000
MACHINERY AND EQUIPMENT 20 328 1 302 1 878 19 966
Transport assets 1 668 - 963 705
Computer equipment 8 905 772 765 8 912
Furniture and office equipment 8 690 489 101 9 078
Other machinery and equipment 1 065 41 49 1 057
Total Movable Tangible Capital Assets 20 328 1 302 1 878 19 752
175
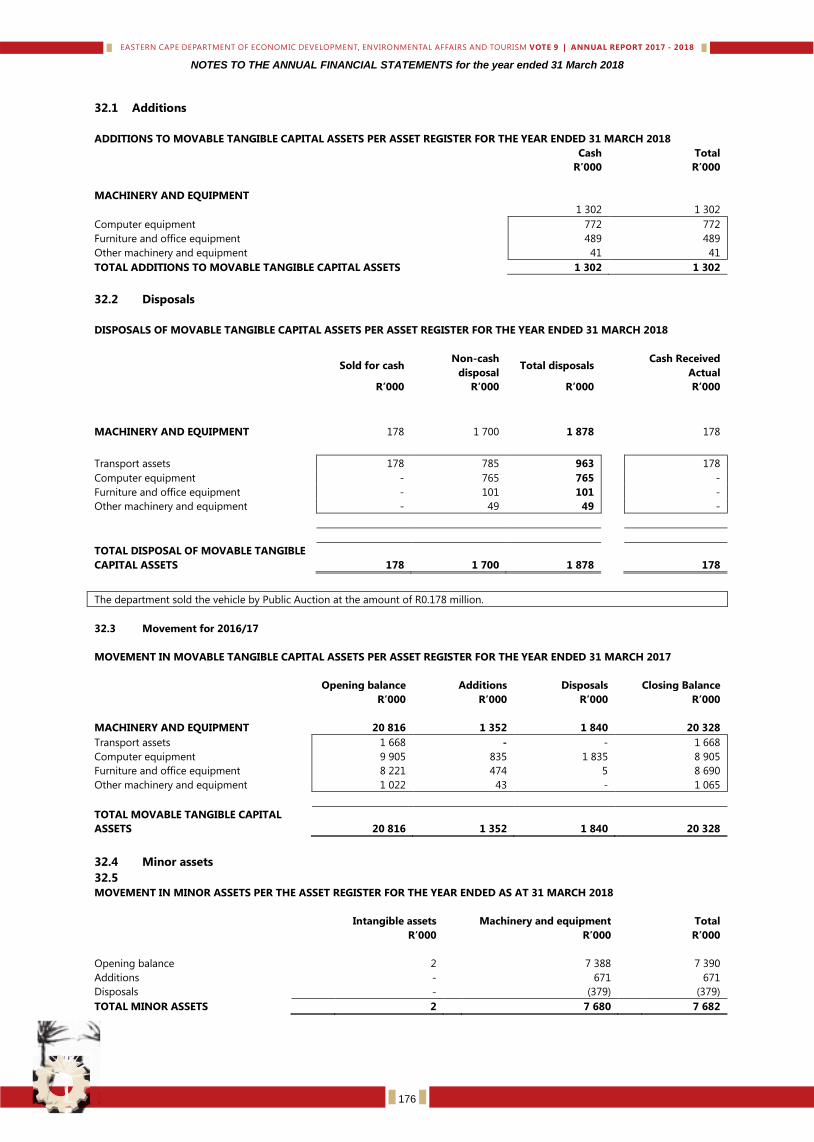
NOTES TO THE ANNUAL FINANCIAL STATEMENTS for the year ended 31 March 2018
32.1 Additions
32.2 Disposals
DISPOSALS OF MOVABLE TANGIBLE CAPITAL ASSETS PER ASSET REGISTER FOR THE YEAR ENDED 31 MARCH 2018
Sold for cash
Non-cash
disposal Total disposals
Cash Received
Actual
R’000 R’000 R’000 R’000
MACHINERY AND EQUIPMENT 178 1 700 1 878 178
Transport assets 178 785 963 178
Computer equipment - 765 765 -
Furniture and office equipment - 101 101 -
Other machinery and equipment - 49 49 -
TOTAL DISPOSAL OF MOVABLE TANGIBLE
CAPITAL ASSETS
178
1 700
1 878
178
The department sold the vehicle by Public Auction at the amount of R0.178 million.
32.3 Movement for 2016/17
MOVEMENT IN MOVABLE TANGIBLE CAPITAL ASSETS PER ASSET REGISTER FOR THE YEAR ENDED 31 MARCH 2017
Opening balance Additions Disposals Closing Balance
R’000 R’000 R’000 R’000
MACHINERY AND EQUIPMENT 20 816 1 352 1 840 20 328
Transport assets 1 668 - - 1 668
Computer equipment 9 905 835 1 835 8 905
Furniture and office equipment 8 221 474 5 8 690
Other machinery and equipment 1 022 43 - 1 065
TOTAL MOVABLE TANGIBLE CAPITAL
ASSETS
20 816
1 352
1 840
20 328
32.4 Minor assets
32.5
MOVEMENT IN MINOR ASSETS PER THE ASSET REGISTER FOR THE YEAR ENDED AS AT 31 MARCH 2018
Intangible assets Machinery and equipment Total
R’000 R’000 R’000
Opening balance 2 7 388 7 390
Additions - 671 671
Disposals - (379) (379)
TOTAL MINOR ASSETS 2 7 680 7 682
ADDITIONS TO MOVABLE TANGIBLE CAPITAL ASSETS PER ASSET REGISTER FOR THE YEAR ENDED 31 MARCH 2018
Cash Total
R’000 R’000
MACHINERY AND EQUIPMENT
1 302
1 302
Computer equipment 772 772
Furniture and office equipment 489 489
Other machinery and equipment 41 41
TOTAL ADDITIONS TO MOVABLE TANGIBLE CAPITAL ASSETS 1 302 1 302
176
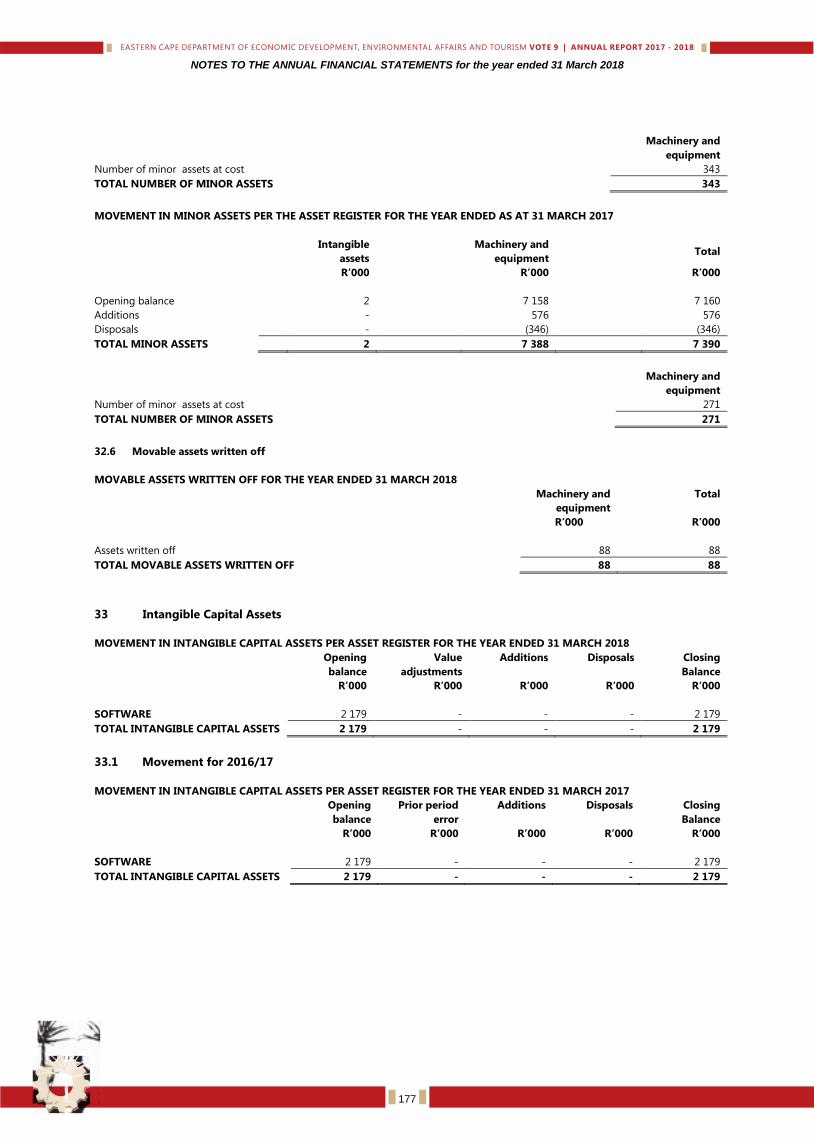
NOTES TO THE ANNUAL FINANCIAL STATEMENTS for the year ended 31 March 2018
Machinery and
equipment
Number of minor assets at cost 343
TOTAL NUMBER OF MINOR ASSETS 343
MOVEMENT IN MINOR ASSETS PER THE ASSET REGISTER FOR THE YEAR ENDED AS AT 31 MARCH 2017
Intangible
assets
Machinery and
equipment Total
R’000 R’000 R’000
Opening balance 2 7 158 7 160
Additions - 576 576
Disposals - (346) (346)
TOTAL MINOR ASSETS 2 7 388 7 390
Machinery and
equipment
Number of minor assets at cost 271
TOTAL NUMBER OF MINOR ASSETS 271
32.6 Movable assets written off
MOVABLE ASSETS WRITTEN OFF FOR THE YEAR ENDED 31 MARCH 2018
Machinery and
equipment
Total
R’000 R’000
Assets written off
88
88
TOTAL MOVABLE ASSETS WRITTEN OFF 88 88
33 Intangible Capital Assets
MOVEMENT IN INTANGIBLE CAPITAL ASSETS PER ASSET REGISTER FOR THE YEAR ENDED 31 MARCH 2018
Opening
balance
Value
adjustments
Additions Disposals Closing
Balance
R’000 R’000 R’000 R’000 R’000
SOFTWARE 2 179 - - - 2 179
TOTAL INTANGIBLE CAPITAL ASSETS 2 179 - - - 2 179
33.1 Movement for 2016/17
MOVEMENT IN INTANGIBLE CAPITAL ASSETS PER ASSET REGISTER FOR THE YEAR ENDED 31 MARCH 2017
Opening
balance
Prior period
error
Additions Disposals Closing
Balance
R’000 R’000 R’000 R’000 R’000
SOFTWARE 2 179 - - - 2 179
TOTAL INTANGIBLE CAPITAL ASSETS 2 179 - - - 2 179
177
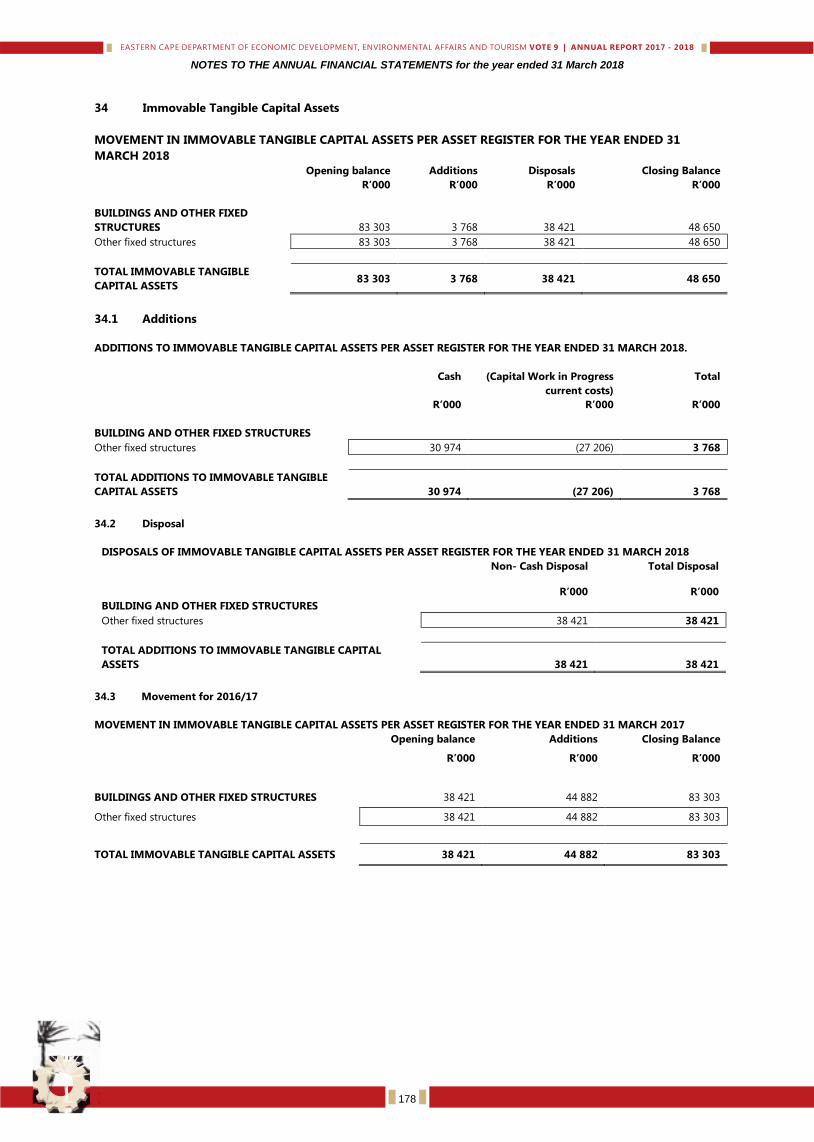
NOTES TO THE ANNUAL FINANCIAL STATEMENTS for the year ended 31 March 2018
34 Immovable Tangible Capital Assets
MOVEMENT IN IMMOVABLE TANGIBLE CAPITAL ASSETS PER ASSET REGISTER FOR THE YEAR ENDED 31
MARCH 2018
Opening balance Additions Disposals Closing Balance
R’000 R’000 R’000 R’000
BUILDINGS AND OTHER FIXED
STRUCTURES
83 303
3 768
38 421
48 650
Other fixed structures 83 303 3 768 38 421 48 650
TOTAL IMMOVABLE TANGIBLE
CAPITAL ASSETS 83 303 3 768 38 421 48 650
34.1 Additions
ADDITIONS TO IMMOVABLE TANGIBLE CAPITAL ASSETS PER ASSET REGISTER FOR THE YEAR ENDED 31 MARCH 2018.
Cash (Capital Work in Progress
current costs)
Total
R’000 R’000 R’000
BUILDING AND OTHER FIXED STRUCTURES
Other fixed structures 30 974 (27 206) 3 768
TOTAL ADDITIONS TO IMMOVABLE TANGIBLE
CAPITAL ASSETS
30 974
(27 206)
3 768
34.2 Disposal
DISPOSALS OF IMMOVABLE TANGIBLE CAPITAL ASSETS PER ASSET REGISTER FOR THE YEAR ENDED 31 MARCH 2018
Non- Cash Disposal Total Disposal
R’000 R’000
BUILDING AND OTHER FIXED STRUCTURES
Other fixed structures 38 421 38 421
TOTAL ADDITIONS TO IMMOVABLE TANGIBLE CAPITAL
ASSETS
38 421
38 421
34.3 Movement for 2016/17
MOVEMENT IN IMMOVABLE TANGIBLE CAPITAL ASSETS PER ASSET REGISTER FOR THE YEAR ENDED 31 MARCH 2017
Opening balance Additions Closing Balance
R’000 R’000 R’000
BUILDINGS AND OTHER FIXED STRUCTURES 38 421 44 882 83 303
Other fixed structures 38 421 44 882 83 303
TOTAL IMMOVABLE TANGIBLE CAPITAL ASSETS 38 421 44 882 83 303
178
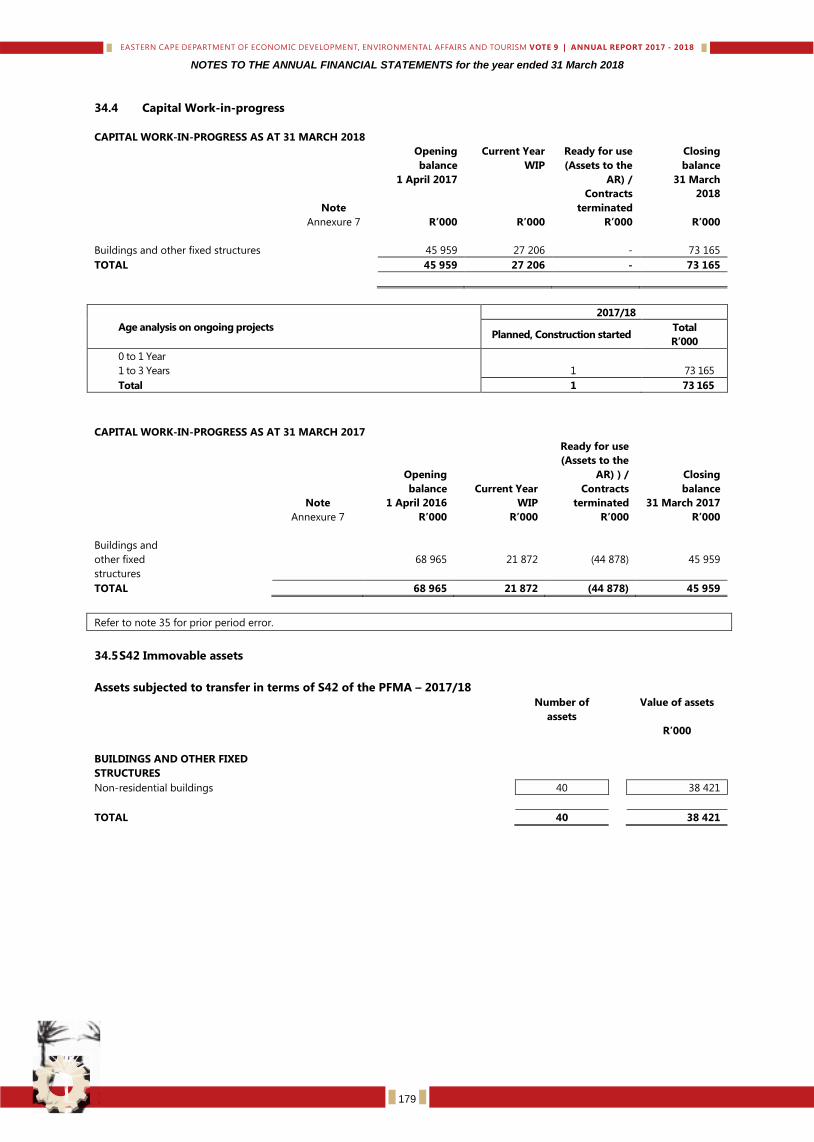
NOTES TO THE ANNUAL FINANCIAL STATEMENTS for the year ended 31 March 2018
34.4 Capital Work-in-progress
CAPITAL WORK-IN-PROGRESS AS AT 31 MARCH 2018
Note
Opening
balance
1 April 2017
Current Year
WIP
Ready for use
(Assets to the
AR) /
Contracts
terminated
Closing
balance
31 March
2018
Annexure 7 R’000 R’000 R’000 R’000
Buildings and other fixed structures 45 959 27 206 - 73 165
TOTAL 45 959 27 206 - 73 165
Age analysis on ongoing projects
2017/18
Planned, Construction started Total
R’000
0 to 1 Year
1 to 3 Years 1 73 165
Total 1 73 165
CAPITAL WORK-IN-PROGRESS AS AT 31 MARCH 2017
Note
Opening
balance
1 April 2016
Current Year
WIP
Ready for use
(Assets to the
AR) ) /
Contracts
terminated
Closing
balance
31 March 2017
Annexure 7 R’000 R’000 R’000 R’000
Buildings and
other fixed
structures
68 965
21 872
(44 878)
45 959
TOTAL 68 965 21 872 (44 878) 45 959
Refer to note 35 for prior period error.
34.5 S42 Immovable assets
Assets subjected to transfer in terms of S42 of the PFMA – 2017/18
Number of
assets
Value of assets
R’000
BUILDINGS AND OTHER FIXED
STRUCTURES
Non-residential buildings 40 38 421
TOTAL 40 38 421
179
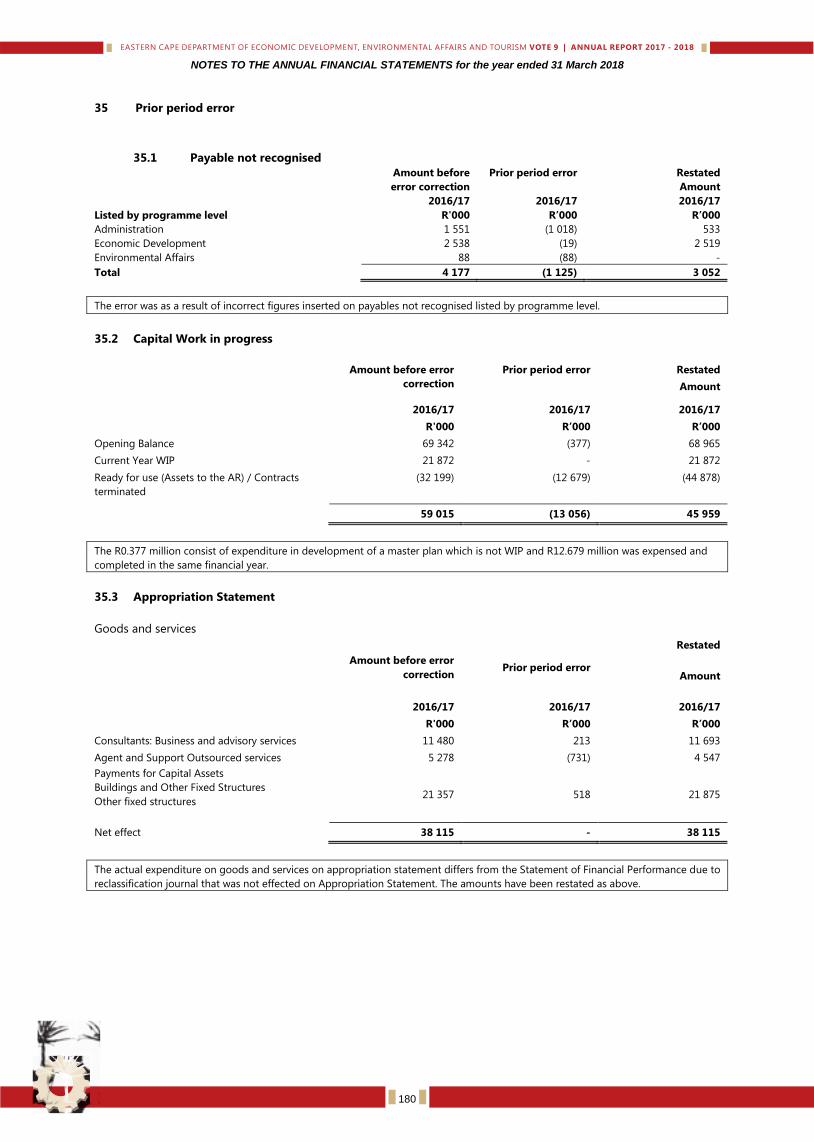
NOTES TO THE ANNUAL FINANCIAL STATEMENTS for the year ended 31 March 2018
35 Prior period error
35.1 Payable not recognised
Amount before
error correction
Prior period error Restated
Amount
2016/17 2016/17 2016/17
Listed by programme level R'000 R’000 R’000
Administration 1 551 (1 018) 533
Economic Development 2 538 (19) 2 519
Environmental Affairs 88 (88) -
Total 4 177 (1 125) 3 052
The error was as a result of incorrect figures inserted on payables not recognised listed by programme level.
35.2 Capital Work in progress
Amount before error
correction
Prior period error Restated
Amount
2016/17 2016/17 2016/17
R'000 R’000 R’000
Opening Balance 69 342 (377) 68 965
Current Year WIP 21 872 - 21 872
Ready for use (Assets to the AR) / Contracts
terminated
(32 199) (12 679) (44 878)
59 015 (13 056) 45 959
The R0.377 million consist of expenditure in development of a master plan which is not WIP and R12.679 million was expensed and
completed in the same financial year.
35.3 Appropriation Statement
Goods and services
Amount before error
correction Prior period error
Restated
Amount
2016/17 2016/17 2016/17
R'000 R’000 R’000
Consultants: Business and advisory services 11 480 213 11 693
Agent and Support Outsourced services 5 278 (731) 4 547
Payments for Capital Assets
Buildings and Other Fixed Structures
Other fixed structures
21 357 518 21 875
Net effect 38 115 - 38 115
The actual expenditure on goods and services on appropriation statement differs from the Statement of Financial Performance due to
reclassification journal that was not effected on Appropriation Statement. The amounts have been restated as above.
180
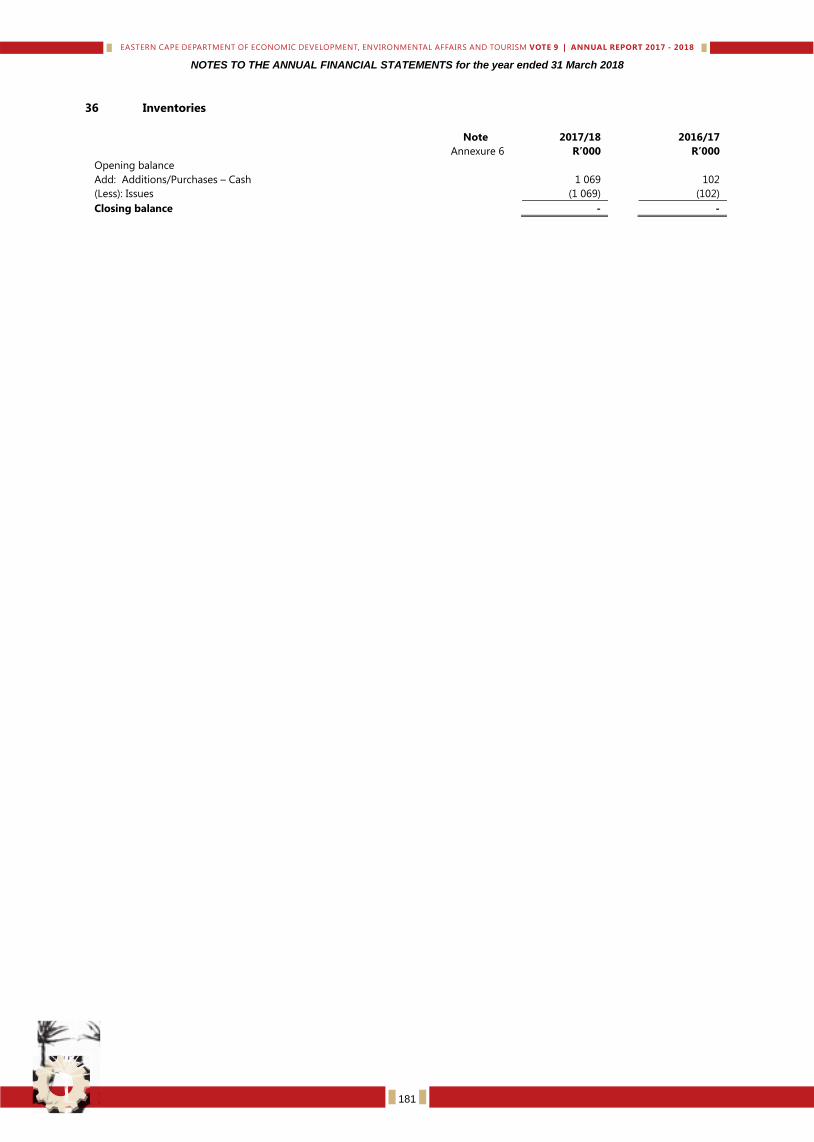
NOTES TO THE ANNUAL FINANCIAL STATEMENTS for the year ended 31 March 2018
36 Inventories
Note 2017/18 2016/17
Annexure 6 R’000 R’000
Opening balance
Add: Additions/Purchases – Cash 1 069 102
(Less): Issues (1 069) (102)
Closing balance - -
181
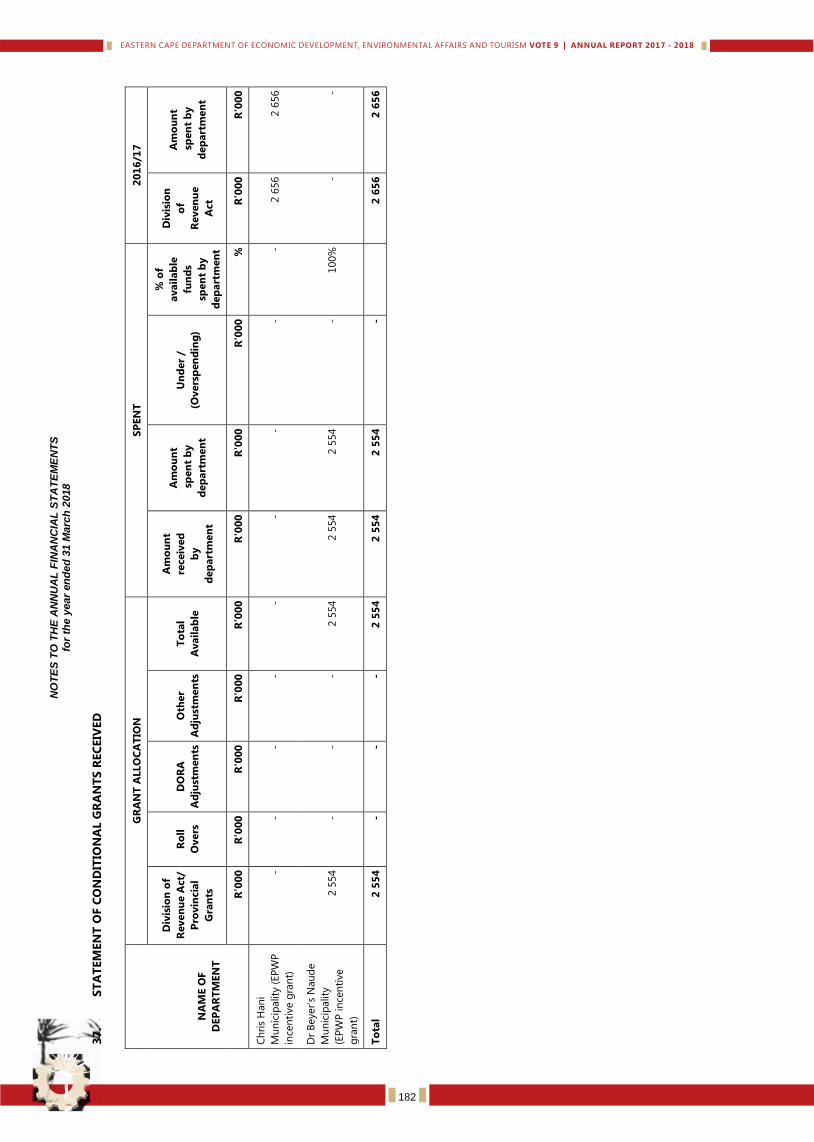
NO
TE
S T
O T
HE
AN
NU
AL
FIN
AN
CIA
L S
TA
TE
ME
NT
S
for
the
year
en
de
d 3
1 M
arc
h 2
018
37
.
ST
AT
EM
EN
T O
F C
ON
DIT
ION
AL G
RA
NT
S R
EC
EIV
ED
NA
ME O
F
DEP
AR
TM
EN
T
GR
AN
T A
LLO
CA
TIO
N
SP
EN
T
20
16
/17
Div
isio
n o
f
Reven
ue A
ct/
Pro
vin
cia
l
Gra
nts
Ro
ll
Overs
DO
RA
Ad
just
men
ts
Oth
er
Ad
just
men
ts
To
tal
Avail
ab
le
Am
ou
nt
receiv
ed
by
dep
art
men
t
Am
ou
nt
sp
en
t b
y
dep
art
men
t
Un
der
/
(Overs
pen
din
g)
% o
f
avail
ab
le
fun
ds
spen
t b
y
dep
art
men
t
Div
isio
n
of
Reven
ue
Act
Am
ou
nt
sp
en
t b
y
dep
art
men
t
R’0
00
R
’00
0
R'0
00
R
'00
0
R’0
00
R
'00
0
R'0
00
R
'00
0
%
R’0
00
R
’00
0
Ch
ris
Han
i
Mu
nic
ipality
(EP
WP
ince
nti
ve g
ran
t)
- -
- -
- -
- -
- 2 6
56
2 6
56
Dr
Beyer’
s N
au
de
Mu
nic
ipality
(EP
WP
in
cen
tive
gra
nt)
2 5
54
- -
- 2 5
54
2 5
54
2 5
54
- 100%
-
-
To
tal
2 5
54
-
- -
2 5
54
2
55
4
2 5
54
-
2
65
6
2 6
56
182
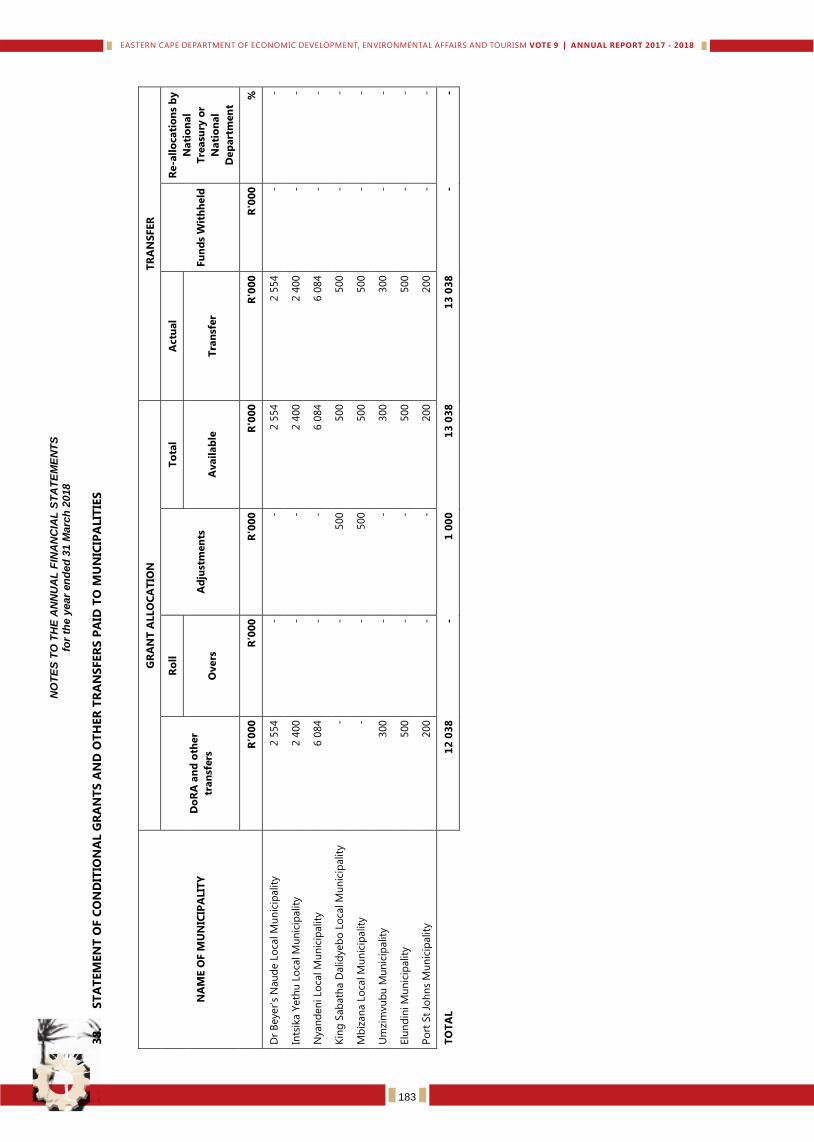
NO
TE
S T
O T
HE
AN
NU
AL
FIN
AN
CIA
L S
TA
TE
ME
NT
S
for
the
year
en
de
d 3
1 M
arc
h 2
018
38
. S
TA
TEM
EN
T O
F C
ON
DIT
ION
AL G
RA
NT
S A
ND
OT
HER
TR
AN
SFER
S P
AID
TO
MU
NIC
IPA
LIT
IES
NA
ME O
F M
UN
ICIP
ALIT
Y
GR
AN
T A
LLO
CA
TIO
N
TR
AN
SFER
Do
RA
an
d o
ther
tran
sfers
Ro
ll
Ad
just
men
ts
To
tal
Actu
al
Fu
nd
s W
ith
held
Re-a
llo
cati
on
s b
y
Nati
on
al
Tre
asu
ry o
r
Nati
on
al
Dep
art
men
t
Overs
A
vail
ab
le
Tra
nsf
er
R’0
00
R
’00
0
R'0
00
R
'00
0
R'0
00
R
'00
0
%
Dr
Beyer’
s N
au
de L
oca
l M
un
icip
ality
2 5
54
- -
2 5
54
2 5
54
- -
Ints
ika Y
eth
u L
oca
l M
un
icip
ality
2 4
00
- -
2 4
00
2 4
00
- -
Nyan
den
i Lo
cal M
un
icip
ality
6 0
84
- -
6 0
84
6 0
84
- -
Kin
g S
ab
ath
a D
alid
yeb
o L
oca
l M
un
icip
ality
-
- 500
500
500
- -
Mb
izan
a L
oca
l M
un
icip
ality
-
- 500
500
500
- -
Um
zim
vu
bu
Mu
nic
ipality
300
- -
300
300
- -
Elu
nd
ini M
un
icip
ality
500
- -
500
500
- -
Po
rt S
t Jo
hn
s M
un
icip
ality
200
- -
200
200
- -
TO
TA
L
12
03
8
- 1
00
0
13
03
8
13
03
8
- -
183
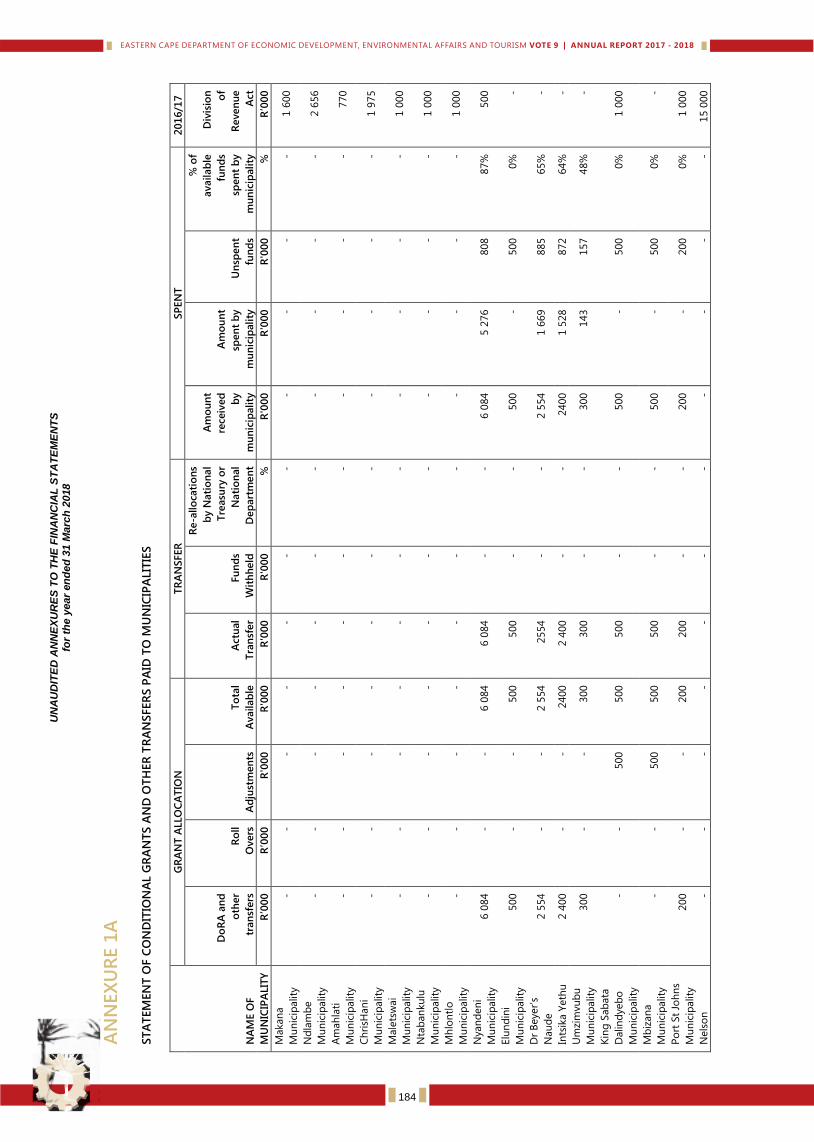
UN
AU
DIT
ED
AN
NE
XU
RE
S T
O T
HE
FIN
AN
CIA
L S
TA
TE
ME
NT
S
for
the
year
en
de
d 3
1 M
arc
h 2
018
AN
NEX
UR
E 1
A
ST
ATEM
EN
T O
F C
ON
DIT
ION
AL G
RA
NTS A
ND
OTH
ER
TR
AN
SFER
S P
AID
TO
MU
NIC
IPA
LIT
IES
NA
ME O
F
MU
NIC
IPA
LIT
Y
GR
AN
T A
LLO
CA
TIO
N
TR
AN
SFER
SP
EN
T
201
6/1
7
Do
RA
an
d
oth
er
tran
sfers
Ro
ll
Overs
A
dju
stm
en
ts
To
tal
Availab
le
Actu
al
Tra
nsf
er
Fu
nd
s
Wit
hh
eld
Re-a
llo
cati
on
s
by N
ati
on
al
Tre
asu
ry o
r
Nati
on
al
Dep
art
men
t
Am
ou
nt
receiv
ed
by
mu
nic
ipality
Am
ou
nt
spen
t b
y
mu
nic
ipality
Un
spen
t
fun
ds
% o
f
availab
le
fun
ds
spen
t b
y
mu
nic
ipality
Div
isio
n
of
Reven
ue
Act
R’0
00
R
’00
0
R'0
00
R
'000
R
'000
R
'000
%
R
'000
R
'000
R
'000
%
R
’00
0
Makan
a
Mu
nic
ipality
-
- -
- -
- -
- -
- -
1 6
00
Nd
lam
be
Mu
nic
ipality
-
- -
- -
- -
- -
- -
2 6
56
Am
ah
lati
Mu
nic
ipality
-
- -
- -
- -
- -
- -
770
Ch
risH
an
i
Mu
nic
ipality
-
- -
- -
- -
- -
- -
1 9
75
Male
tsw
ai
Mu
nic
ipality
-
- -
- -
- -
- -
- -
1 0
00
Nta
ban
ku
lu
Mu
nic
ipality
-
- -
- -
- -
- -
- -
1 0
00
Mh
lon
tlo
Mu
nic
ipality
-
- -
- -
- -
- -
- -
1 0
00
Nyan
den
i
Mu
nic
ipality
6 0
84
- -
6 0
84
6 0
84
- -
6 0
84
5 2
76
808
87%
500
Elu
nd
ini
Mu
nic
ipality
500
- -
500
500
- -
500
- 500
0%
-
Dr
Beyer’
s
Nau
de
2 5
54
- -
2 5
54
2554
- -
2 5
54
1 6
69
885
65%
-
Ints
ika Y
eth
u
2 4
00
- -
2400
2 4
00
- -
2400
1 5
28
872
64%
-
Um
zim
vu
bu
Mu
nic
ipality
300
- -
300
300
- -
300
143
157
48%
-
Kin
g S
ab
ata
Dalin
dyeb
o
Mu
nic
ipality
- -
500
500
500
- -
500
- 500
0%
1 0
00
Mb
izan
a
Mu
nic
ipality
-
- 500
500
500
- -
500
- 500
0%
-
Po
rt S
t Jo
hn
s
Mu
nic
ipality
200
- -
200
200
- -
200
- 200
0%
1 0
00
Nels
on
-
- -
- -
- -
- -
- -
15 0
00
184
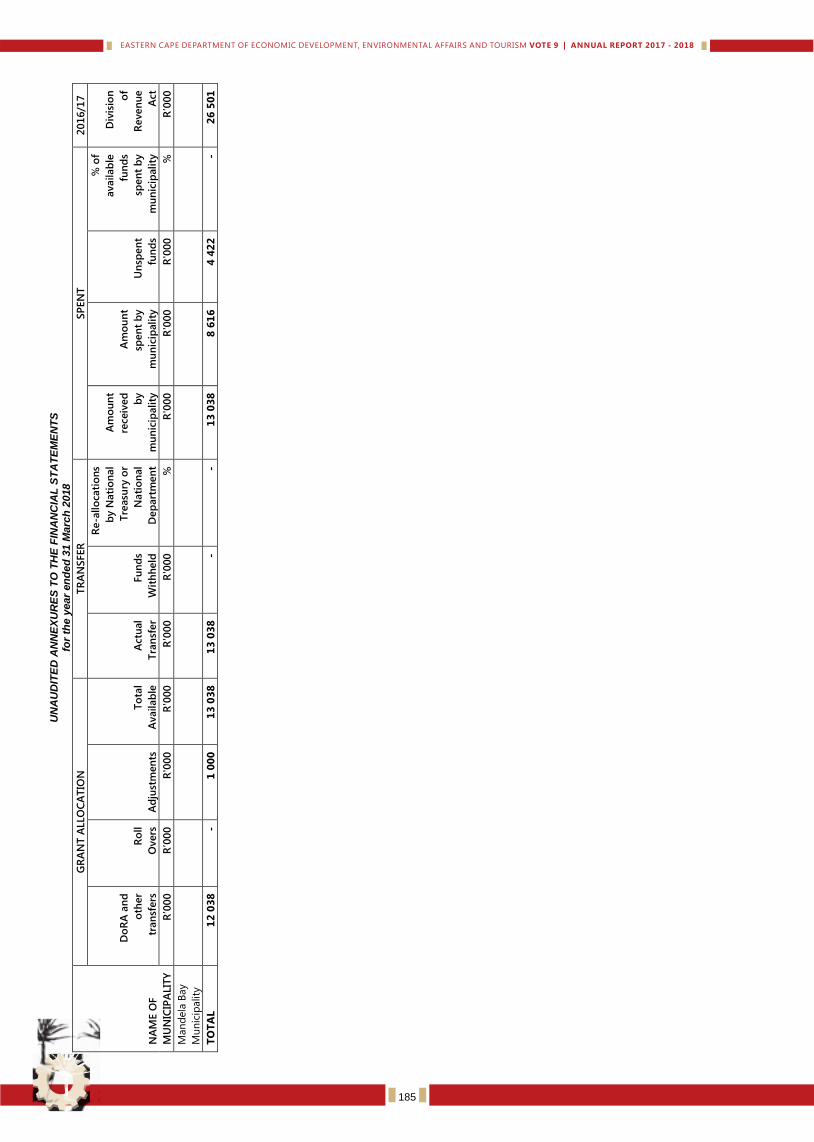
UN
AU
DIT
ED
AN
NE
XU
RE
S T
O T
HE
FIN
AN
CIA
L S
TA
TE
ME
NT
S
for
the
year
en
de
d 3
1 M
arc
h 2
018
NA
ME O
F
MU
NIC
IPA
LIT
Y
GR
AN
T A
LLO
CA
TIO
N
TR
AN
SFER
SP
EN
T
201
6/1
7
Do
RA
an
d
oth
er
tran
sfers
Ro
ll
Overs
A
dju
stm
en
ts
To
tal
Availab
le
Actu
al
Tra
nsf
er
Fu
nd
s
Wit
hh
eld
Re-a
llo
cati
on
s
by N
ati
on
al
Tre
asu
ry o
r
Nati
on
al
Dep
art
men
t
Am
ou
nt
receiv
ed
by
mu
nic
ipality
Am
ou
nt
spen
t b
y
mu
nic
ipality
Un
spen
t
fun
ds
% o
f
availab
le
fun
ds
spen
t b
y
mu
nic
ipality
Div
isio
n
of
Reven
ue
Act
R’0
00
R
’00
0
R'0
00
R
'000
R
'000
R
'000
%
R
'000
R
'000
R
'000
%
R
’00
0
Man
dela
Bay
Mu
nic
ipality
TO
TA
L
12
03
8
- 1
00
0
13
03
8
13
03
8
- -
13
03
8
8 6
16
4
42
2
- 2
6 5
01
185
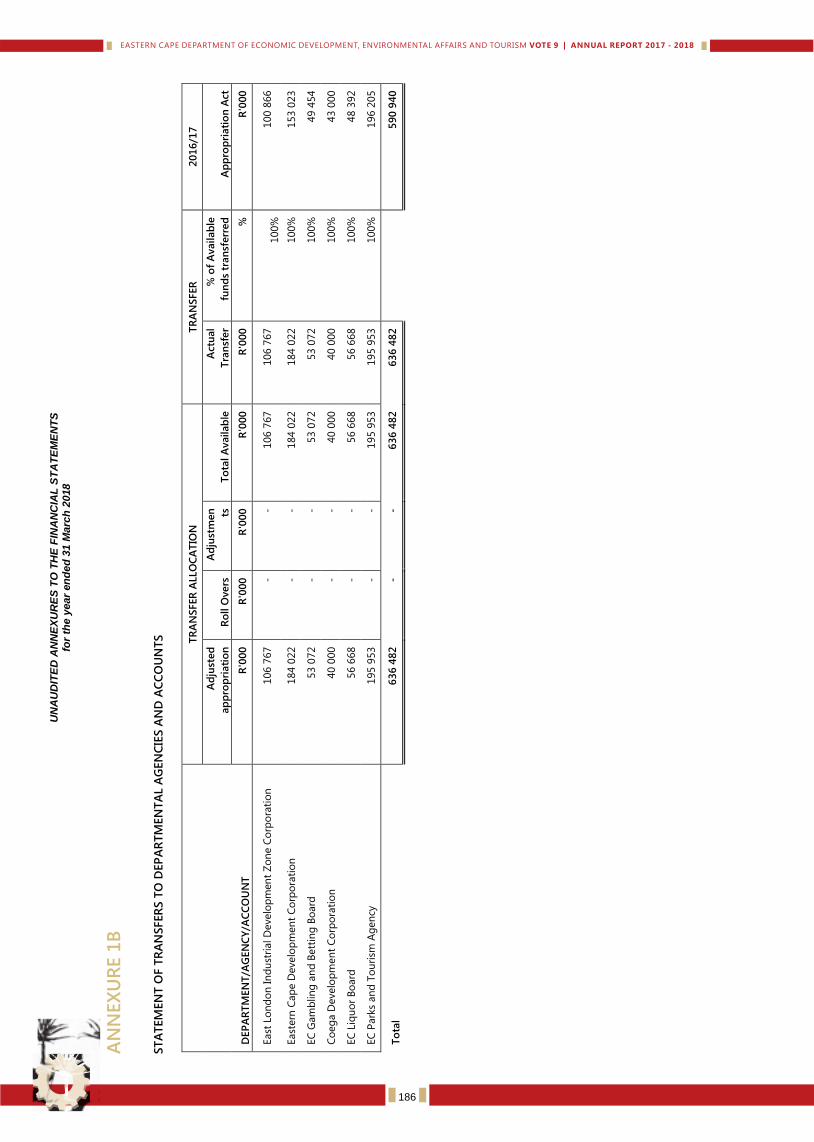
UN
AU
DIT
ED
AN
NE
XU
RE
S T
O T
HE
FIN
AN
CIA
L S
TA
TE
ME
NT
S
for
the
year
en
de
d 3
1 M
arc
h 2
018
AN
NEX
UR
E 1
B
ST
ATEM
EN
T O
F T
RA
NSFER
S T
O D
EP
AR
TM
EN
TA
L A
GEN
CIE
S A
ND
AC
CO
UN
TS
DEP
AR
TM
EN
T/A
GEN
CY
/AC
CO
UN
T
TR
AN
SFER
ALLO
CA
TIO
N
TR
AN
SFER
2
01
6/1
7
Ad
just
ed
ap
pro
pri
ati
on
R
oll O
vers
Ad
just
men ts
T
ota
l A
vailab
le
Actu
al
Tra
nsf
er
% o
f A
vailab
le
fun
ds
tran
sferr
ed
A
pp
rop
riati
on
Act
R'0
00
R
'000
R
'000
R
'000
R
'000
%
R
'000
East
Lo
nd
on
In
du
stri
al D
evelo
pm
en
t Z
on
e C
orp
ora
tio
n
106 7
67
- -
106 7
67
106 7
67
100%
100 8
66
East
ern
Cap
e D
evelo
pm
en
t C
orp
ora
tio
n
184 0
22
- -
184 0
22
184 0
22
100%
153 0
23
EC
Gam
blin
g a
nd
Bett
ing
Bo
ard
53 0
72
- -
53 0
72
53 0
72
100%
49 4
54
Co
eg
a D
evelo
pm
en
t C
orp
ora
tio
n
40 0
00
- -
40 0
00
40 0
00
100%
43 0
00
EC
Liq
uo
r B
oard
56 6
68
- -
56 6
68
56 6
68
100%
48 3
92
EC
Park
s an
d T
ou
rism
Ag
en
cy
195 9
53
- -
195 9
53
195 9
53
100%
196 2
05
To
tal
636
482
-
- 6
36
482
6
36
482
590
940
186
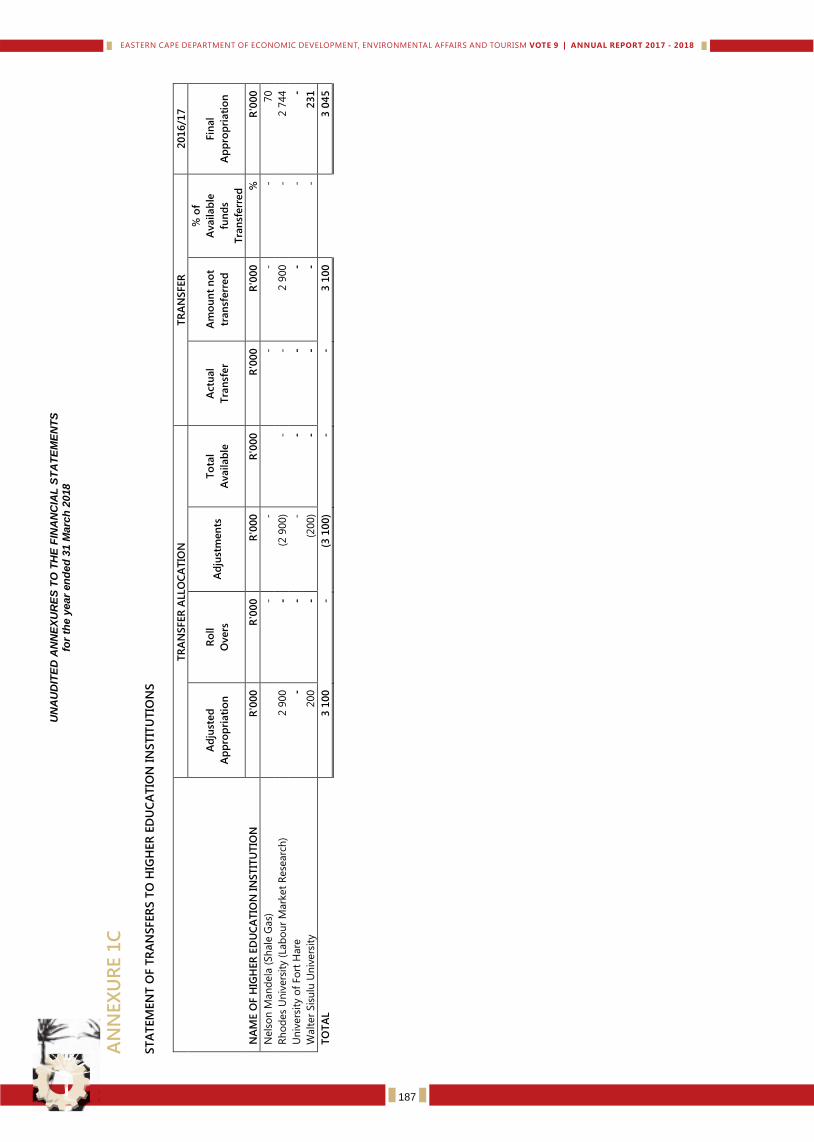
UN
AU
DIT
ED
AN
NE
XU
RE
S T
O T
HE
FIN
AN
CIA
L S
TA
TE
ME
NT
S
for
the
year
en
de
d 3
1 M
arc
h 2
018
AN
NEX
UR
E 1
C
ST
ATEM
EN
T O
F T
RA
NSFER
S T
O H
IGH
ER
ED
UC
ATIO
N I
NST
ITU
TIO
NS
NA
ME O
F H
IGH
ER
ED
UC
AT
ION
IN
ST
ITU
TIO
N
TR
AN
SFER
ALLO
CA
TIO
N
TR
AN
SFER
2
01
6/1
7
Ad
just
ed
Ap
pro
pri
ati
on
Ro
ll
Overs
A
dju
stm
en
ts
To
tal
Availab
le
Actu
al
Tra
nsf
er
Am
ou
nt
no
t
tran
sferr
ed
% o
f
Availab
le
fun
ds
Tra
nsf
err
ed
Fin
al
Ap
pro
pri
ati
on
R'0
00
R
'000
R
'000
R
'000
R
'000
R
'000
%
R
'000
Nels
on
Man
dela
(Sh
ale
Gas)
- -
-
- -
70
Rh
od
es
Un
ivers
ity (
Lab
ou
r M
ark
et
Rese
arc
h)
2 9
00
- (2
900)
- -
2 9
00
- 2 7
44
Un
ivers
ity o
f Fo
rt H
are
-
- -
- -
- -
-
Walt
er
Sis
ulu
Un
ivers
ity
200
- (2
00)
- -
- -
23
1
TO
TA
L
3 1
00
-
(3 1
00
) -
- 3
100
3 0
45
187
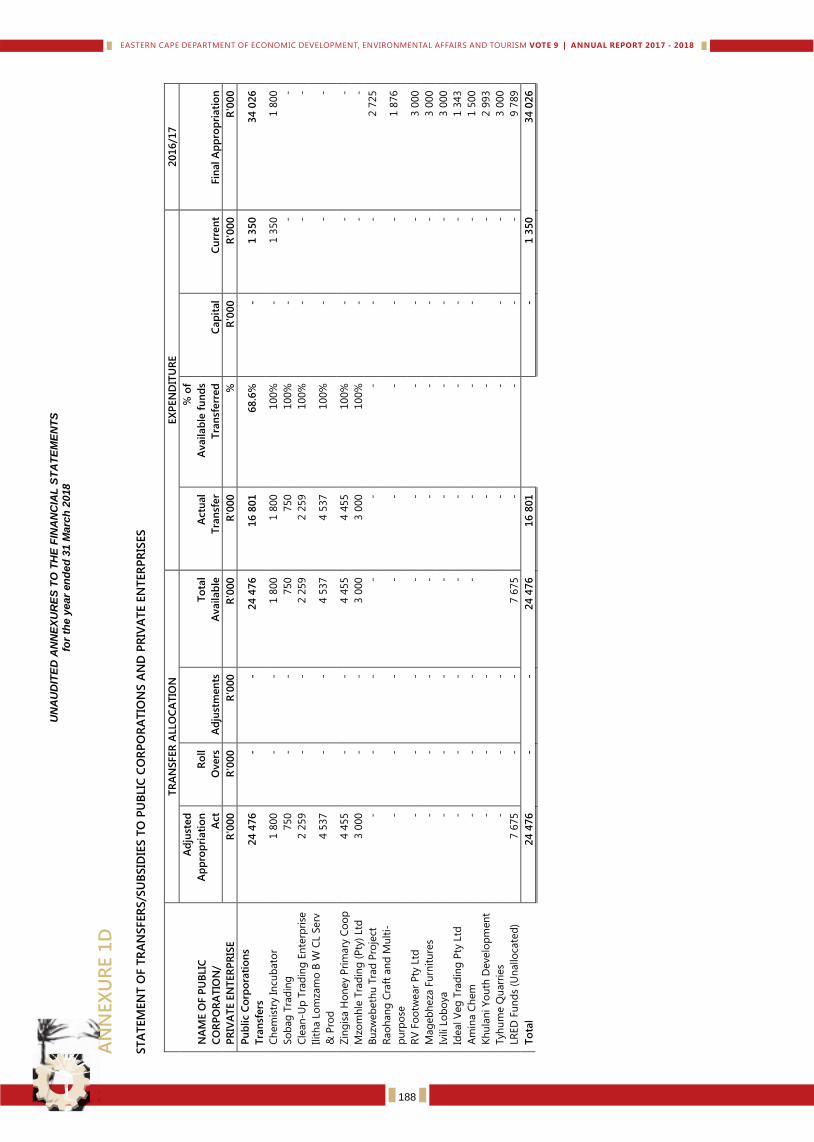
UN
AU
DIT
ED
AN
NE
XU
RE
S T
O T
HE
FIN
AN
CIA
L S
TA
TE
ME
NT
S
for
the
year
en
de
d 3
1 M
arc
h 2
018
AN
NEX
UR
E 1
D
STA
TEM
EN
T O
F T
RA
NSFER
S/S
UB
SID
IES T
O P
UB
LIC
CO
RP
OR
ATIO
NS A
ND
PR
IVA
TE E
NTER
PR
ISES
NA
ME O
F P
UB
LIC
CO
RP
OR
AT
ION
/
PR
IVA
TE E
NT
ER
PR
ISE
TR
AN
SFER
ALLO
CA
TIO
N
EX
PEN
DIT
UR
E
201
6/1
7
Ad
just
ed
Ap
pro
pri
ati
on
Act
Ro
ll
Overs
A
dju
stm
en
ts
To
tal
Availab
le
Actu
al
Tra
nsf
er
% o
f
Availab
le f
un
ds
Tra
nsf
err
ed
Cap
ital
Cu
rren
t Fin
al A
pp
rop
riati
on
R'0
00
R
'000
R
'000
R
'000
R
'000
%
R
'000
R
'000
R
'000
Pu
blic C
orp
ora
tio
ns
Tra
nsf
ers
2
4 4
76
-
- 2
4 4
76
1
6 8
01
6
8.6
%
- 1
350
3
4 0
26
Ch
em
istr
y In
cub
ato
r 1 8
00
- -
1 8
00
1 8
00
100%
-
1 3
50
1 8
00
So
bag
Tra
din
g
750
- -
750
750
100%
-
- -
Cle
an
-Up
Tra
din
g E
nte
rpri
se
2 2
59
- -
2 2
59
2 2
59
100%
-
- -
Ilit
ha L
om
zam
o B
W C
L S
erv
& P
rod
4 5
37
- -
4 5
37
4 5
37
100%
-
- -
Zin
gis
a H
on
ey P
rim
ary
Co
op
4 4
55
- -
4 4
55
4 4
55
100%
-
- -
Mzo
mh
le T
rad
ing
(P
ty)
Ltd
3 0
00
- -
3 0
00
3 0
00
100%
-
- -
Bu
zweb
eth
u T
rad
Pro
ject
-
- -
- -
- -
- 2 7
25
Rao
han
g C
raft
an
d M
ult
i-
pu
rpo
se
- -
- -
- -
- -
1 8
76
RV
Fo
otw
ear
Pty
Ltd
-
- -
- -
- -
- 3 0
00
Mag
eb
heza
Fu
rnit
ure
s -
- -
- -
- -
- 3 0
00
Ivili Lo
bo
ya
- -
- -
- -
- -
3 0
00
Ideal V
eg
Tra
din
g P
ty L
td
- -
- -
- -
- -
1 3
43
Am
ina C
hem
-
- -
- -
- -
- 1 5
00
Kh
ula
ni Y
ou
th D
evelo
pm
en
t -
- -
-
-
- 2 9
93
Tyh
um
e Q
uarr
ies
- -
-
- -
- -
3 0
00
LR
ED
Fu
nd
s (U
nallo
cate
d)
7 6
75
- -
7 6
75
- -
- -
9 7
89
To
tal
24 4
76
-
- 2
4 4
76
1
6 8
01
- 1
350
3
4 0
26
188
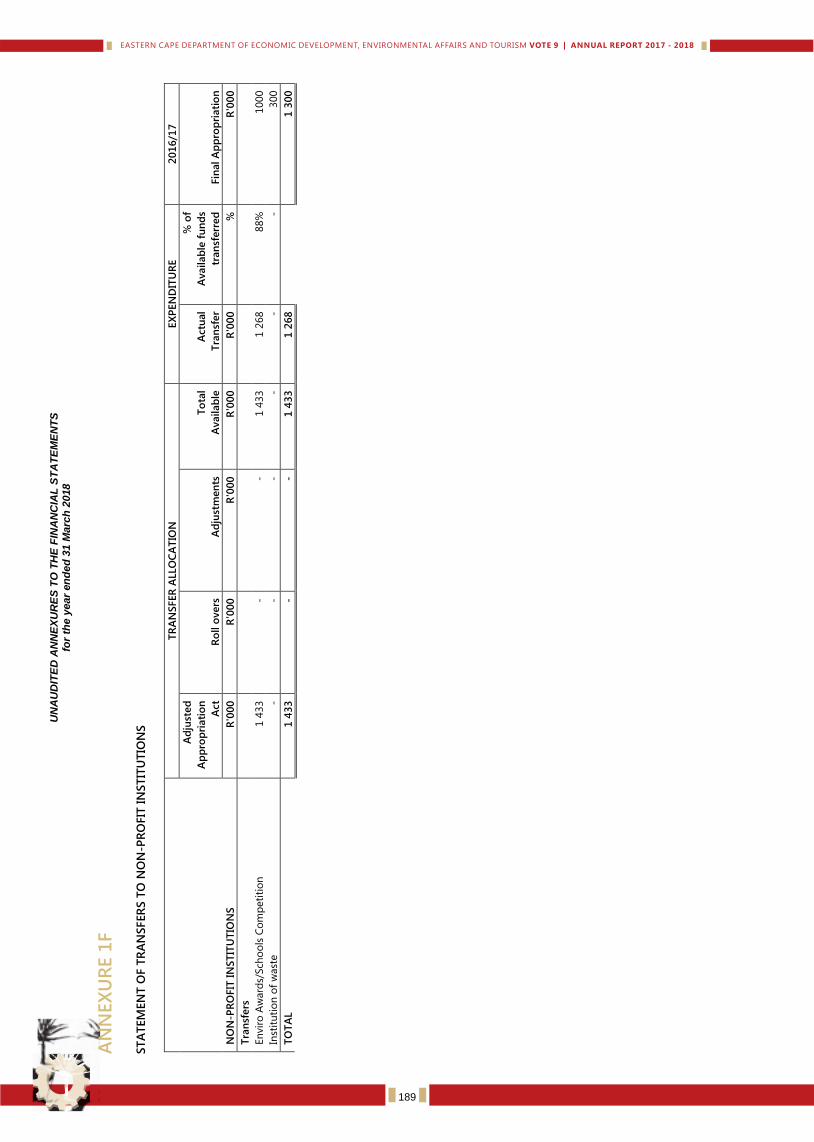
UN
AU
DIT
ED
AN
NE
XU
RE
S T
O T
HE
FIN
AN
CIA
L S
TA
TE
ME
NT
S
for
the
year
en
de
d 3
1 M
arc
h 2
018
AN
NEX
UR
E 1
F
ST
ATEM
EN
T O
F T
RA
NSFER
S T
O N
ON
-PR
OFIT
IN
ST
ITU
TIO
NS
NO
N-P
RO
FIT
IN
ST
ITU
TIO
NS
TR
AN
SFER
ALLO
CA
TIO
N
EX
PEN
DIT
UR
E
201
6/1
7
Ad
just
ed
Ap
pro
pri
ati
on
Act
Ro
ll o
vers
A
dju
stm
en
ts
To
tal
Availab
le
Actu
al
Tra
nsf
er
% o
f
Availab
le f
un
ds
tran
sferr
ed
Fin
al A
pp
rop
riati
on
R'0
00
R
'000
R
'000
R
'000
R
'000
%
R
'000
Tra
nsf
ers
En
vir
o A
ward
s/Sch
oo
ls C
om
peti
tio
n
1 4
33
- -
1 4
33
1 2
68
88%
1000
Inst
itu
tio
n o
f w
ast
e
- -
- -
- -
300
TO
TA
L
1 4
33
-
- 1
433
1
268
1 3
00
189
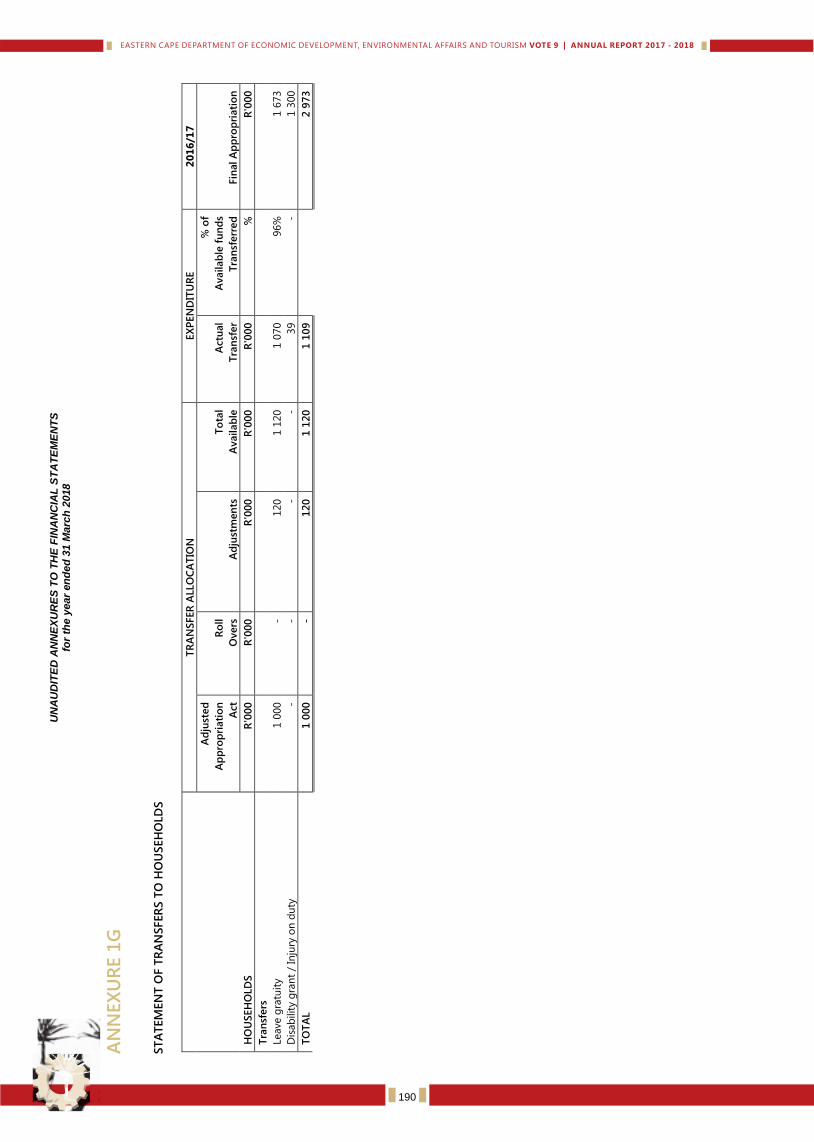
UN
AU
DIT
ED
AN
NE
XU
RE
S T
O T
HE
FIN
AN
CIA
L S
TA
TE
ME
NT
S
for
the
year
en
de
d 3
1 M
arc
h 2
018
AN
NEX
UR
E 1
G
ST
ATEM
EN
T O
F T
RA
NSFER
S T
O H
OU
SEH
OLD
S
HO
USEH
OLD
S
TR
AN
SFER
ALLO
CA
TIO
N
EX
PEN
DIT
UR
E
20
16
/17
Ad
just
ed
Ap
pro
pri
ati
on
Act
Ro
ll
Overs
A
dju
stm
en
ts
To
tal
Availab
le
Actu
al
Tra
nsf
er
% o
f
Availab
le f
un
ds
Tra
nsf
err
ed
Fin
al A
pp
rop
riati
on
R'0
00
R
'000
R
'000
R
'000
R
'000
%
R
'000
Tra
nsf
ers
Leave g
ratu
ity
1 0
00
- 120
1 1
20
1 0
70
96%
1 6
73
Dis
ab
ilit
y g
ran
t /
Inju
ry o
n d
uty
-
- -
- 39
- 1 3
00
TO
TA
L
1 0
00
-
12
0
1 1
20
1
109
2 9
73
190
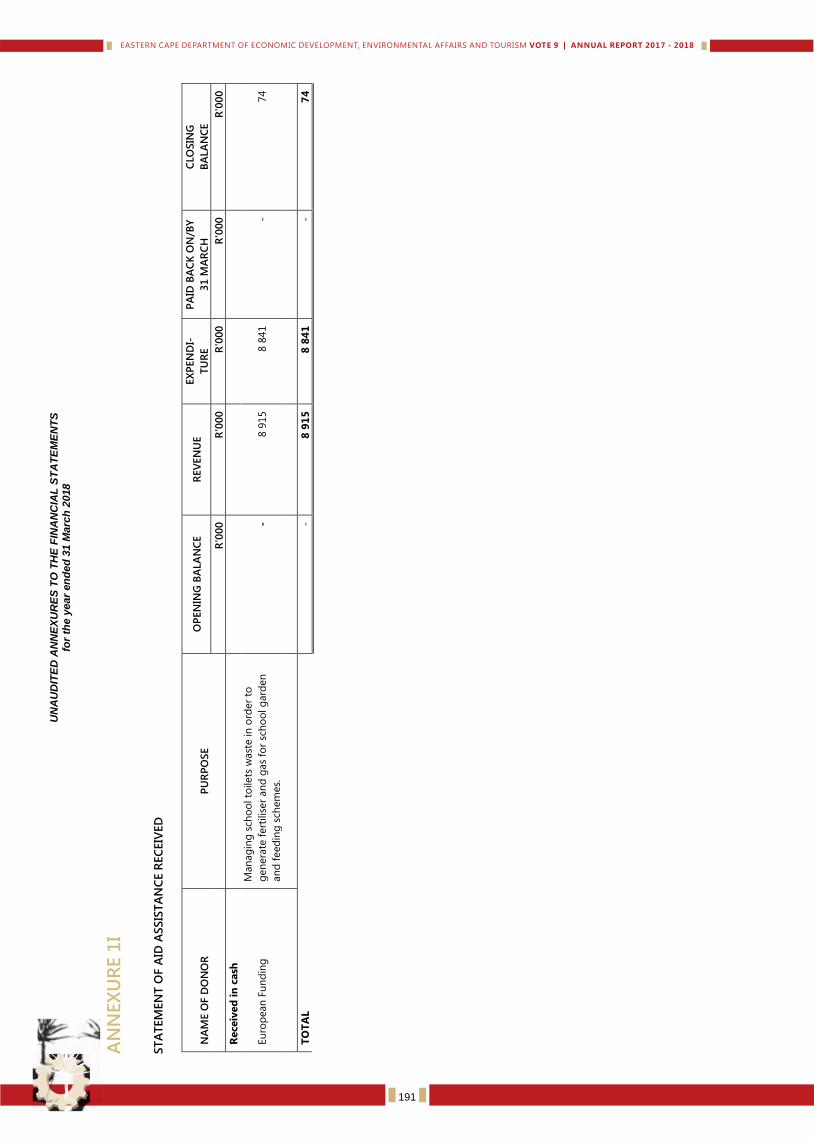
UN
AU
DIT
ED
AN
NE
XU
RE
S T
O T
HE
FIN
AN
CIA
L S
TA
TE
ME
NT
S
for
the
year
en
de
d 3
1 M
arc
h 2
018
AN
NEX
UR
E 1
I
ST
ATEM
EN
T O
F A
ID A
SSIS
TA
NC
E R
EC
EIV
ED
NA
ME O
F D
ON
OR
P
UR
PO
SE
OP
EN
ING
BA
LA
NC
E
REV
EN
UE
EX
PEN
DI-
TU
RE
PA
ID B
AC
K O
N/B
Y
31 M
AR
CH
CLO
SIN
G
BA
LA
NC
E
R'0
00
R
'000
R
'000
R
'000
R
'000
Receiv
ed
in
cash
Eu
rop
ean
Fu
nd
ing
Man
ag
ing
sch
oo
l to
ilets
wast
e in
ord
er
to
gen
era
te f
ert
ilis
er
an
d g
as
for
sch
oo
l g
ard
en
an
d f
eed
ing
sch
em
es.
- 8 9
15
8 8
41
- 74
TO
TA
L
-
8 9
15
8
84
1
- 7
4
191
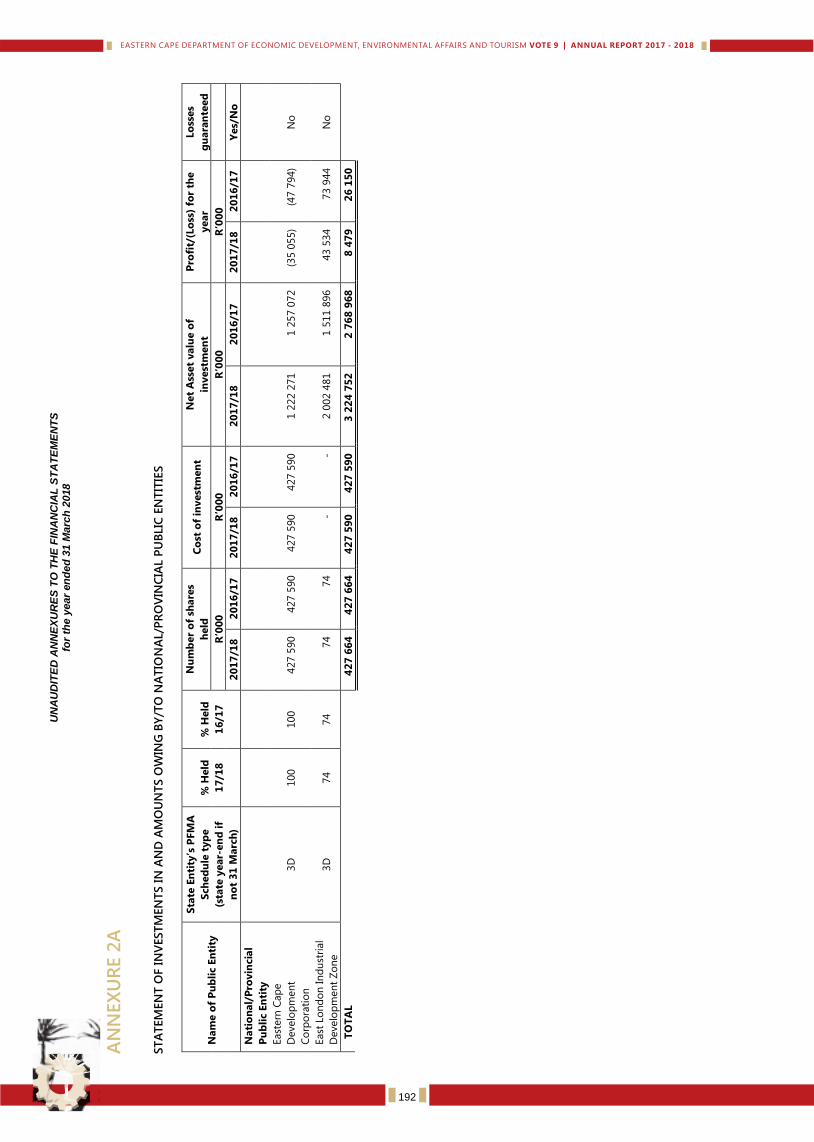
UN
AU
DIT
ED
AN
NE
XU
RE
S T
O T
HE
FIN
AN
CIA
L S
TA
TE
ME
NT
S
for
the
year
en
de
d 3
1 M
arc
h 2
018
AN
NEX
UR
E 2
A
ST
ATEM
EN
T O
F I
NV
EST
MEN
TS I
N A
ND
AM
OU
NTS O
WIN
G B
Y/T
O N
ATIO
NA
L/P
RO
VIN
CIA
L P
UB
LIC
EN
TIT
IES
Nam
e o
f P
ub
lic E
nti
ty
Sta
te E
nti
ty’s
PFM
A
Sch
ed
ule
typ
e
(sta
te y
ear-
en
d i
f
no
t 3
1 M
arc
h)
% H
eld
17
/18
% H
eld
16
/17
Nu
mb
er
of
share
s
held
C
ost
of
invest
men
t N
et
Ass
et
valu
e o
f
invest
men
t
Pro
fit/
(Lo
ss)
for
the
year
Lo
sses
gu
ara
nte
ed
R‘0
00
R
‘00
0
R‘0
00
R
‘00
0
20
17
/18
2
01
6/1
7
20
17
/18
2
01
6/1
7
20
17
/18
2
01
6/1
7
20
17
/18
2
01
6/1
7
Yes/
No
Nati
on
al/
Pro
vin
cia
l
Pu
bli
c E
nti
ty
East
ern
Cap
e
Develo
pm
en
t
Co
rpo
rati
on
3D
100
100
427 5
90
427 5
90
427 5
90
427 5
90
1 2
22 2
71
1 2
57 0
72
(35 0
55)
(47 7
94)
No
East
Lo
nd
on
In
du
stri
al
Develo
pm
en
t Z
on
e
3D
74
74
74
74
- -
2 0
02 4
81
1 5
11 8
96
43 5
34
73 9
44
No
T
OT
AL
4
27
66
4
42
7 6
64
4
27
59
0
42
7 5
90
3
22
4 7
52
2
76
8 9
68
8
47
9
26
15
0
192
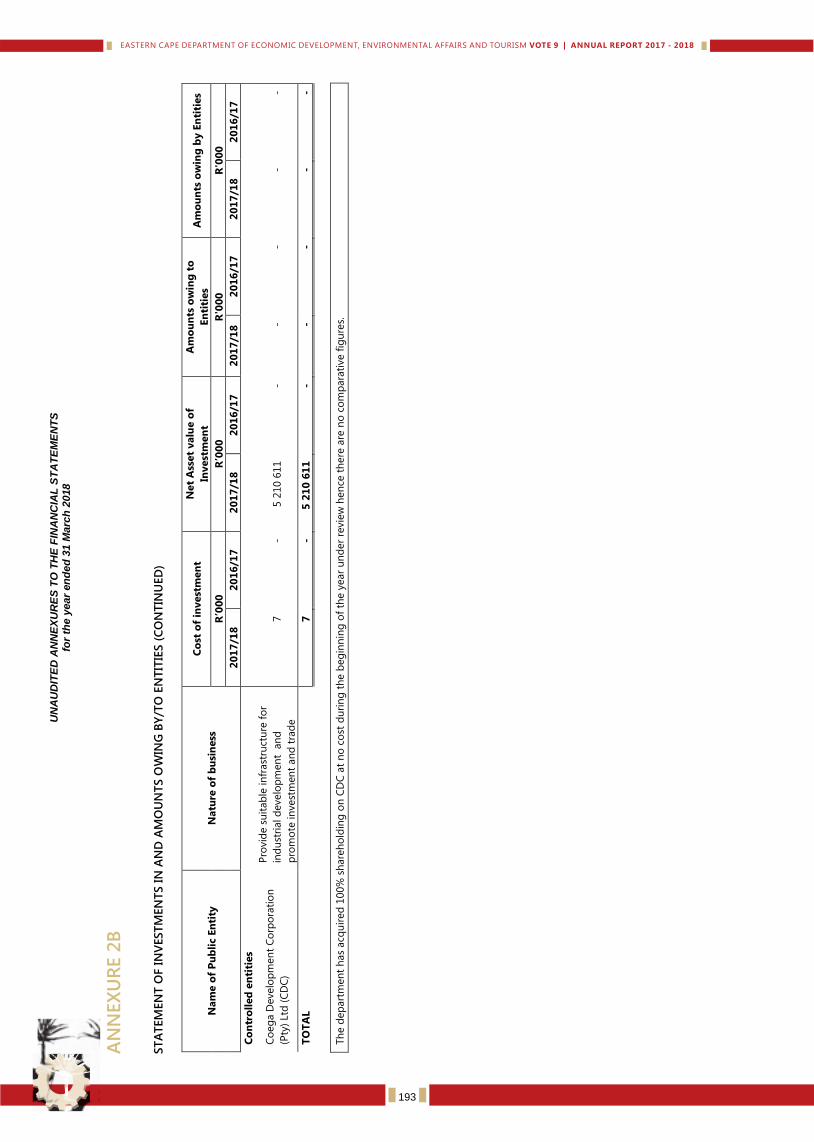
UN
AU
DIT
ED
AN
NE
XU
RE
S T
O T
HE
FIN
AN
CIA
L S
TA
TE
ME
NT
S
for
the
year
en
de
d 3
1 M
arc
h 2
018
AN
NEX
UR
E 2
B
ST
ATEM
EN
T O
F I
NV
EST
MEN
TS I
N A
ND
AM
OU
NTS O
WIN
G B
Y/T
O E
NTIT
IES (
CO
NTIN
UED
)
Nam
e o
f P
ub
lic E
nti
ty
Natu
re o
f b
usi
ness
Co
st o
f in
vest
men
t N
et
Ass
et
valu
e o
f
Invest
men
t
Am
ou
nts
ow
ing
to
En
titi
es
Am
ou
nts
ow
ing
by E
nti
ties
R’0
00
R
’00
0
R'0
00
R
'00
0
20
17
/18
2
01
6/1
7
20
17
/18
2
01
6/1
7
20
17
/18
2
01
6/1
7
20
17
/18
2
01
6/1
7
Co
ntr
oll
ed
en
titi
es
Co
eg
a D
evelo
pm
en
t C
orp
ora
tio
n
(Pty
) Ltd
(C
DC
)
Pro
vid
e s
uit
ab
le in
frast
ruct
ure
fo
r
ind
ust
rial d
evelo
pm
en
t a
nd
pro
mo
te in
vest
men
t an
d t
rad
e
7
- 5 2
10 6
11
- -
- -
-
TO
TA
L
7
-
5 2
10
61
1
- -
- -
-
Th
e d
ep
art
men
t h
as
acq
uir
ed
100%
sh
are
ho
ldin
g o
n C
DC
at
no
co
st d
uri
ng
th
e b
eg
inn
ing
of
the y
ear
un
der
revie
w h
en
ce t
here
are
no
co
mp
ara
tive f
igu
res.
193
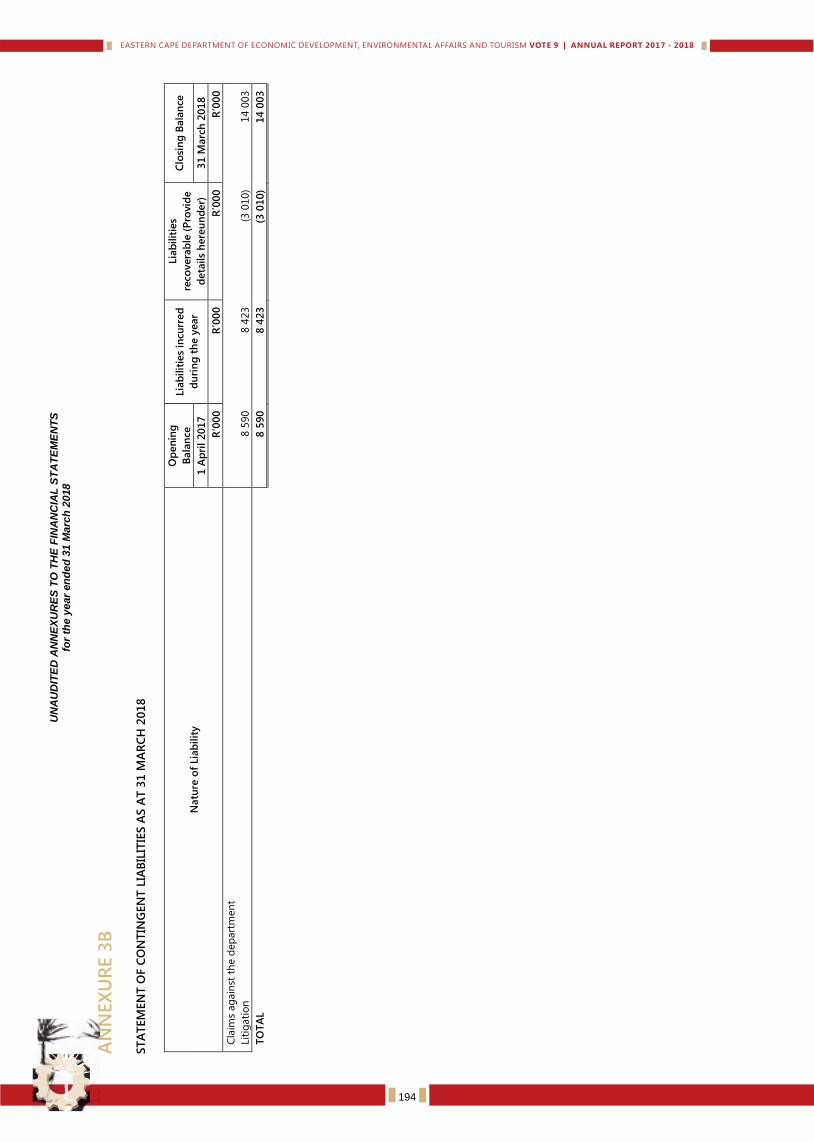
UN
AU
DIT
ED
AN
NE
XU
RE
S T
O T
HE
FIN
AN
CIA
L S
TA
TE
ME
NT
S
for
the
year
en
de
d 3
1 M
arc
h 2
018
AN
NEX
UR
E 3
B
ST
ATEM
EN
T O
F C
ON
TIN
GEN
T L
IAB
ILIT
IES A
S A
T 3
1 M
AR
CH
20
18
Natu
re o
f Lia
bilit
y
Op
en
ing
Bala
nce
Lia
bilit
ies
incu
rred
du
rin
g t
he y
ear
Lia
bilit
ies
reco
vera
ble
(P
rovid
e
deta
ils
here
un
der)
Clo
sin
g B
ala
nce
1 A
pri
l 2
01
7
31 M
arc
h 2
01
8
R’0
00
R
’00
0
R’0
00
R
’00
0
Cla
ims
ag
ain
st t
he d
ep
art
men
t
Lit
igati
on
8 5
90
8 4
23
(3 0
10)
14 0
03
TO
TA
L
8 5
90
8
423
(3
01
0)
14 0
03
194
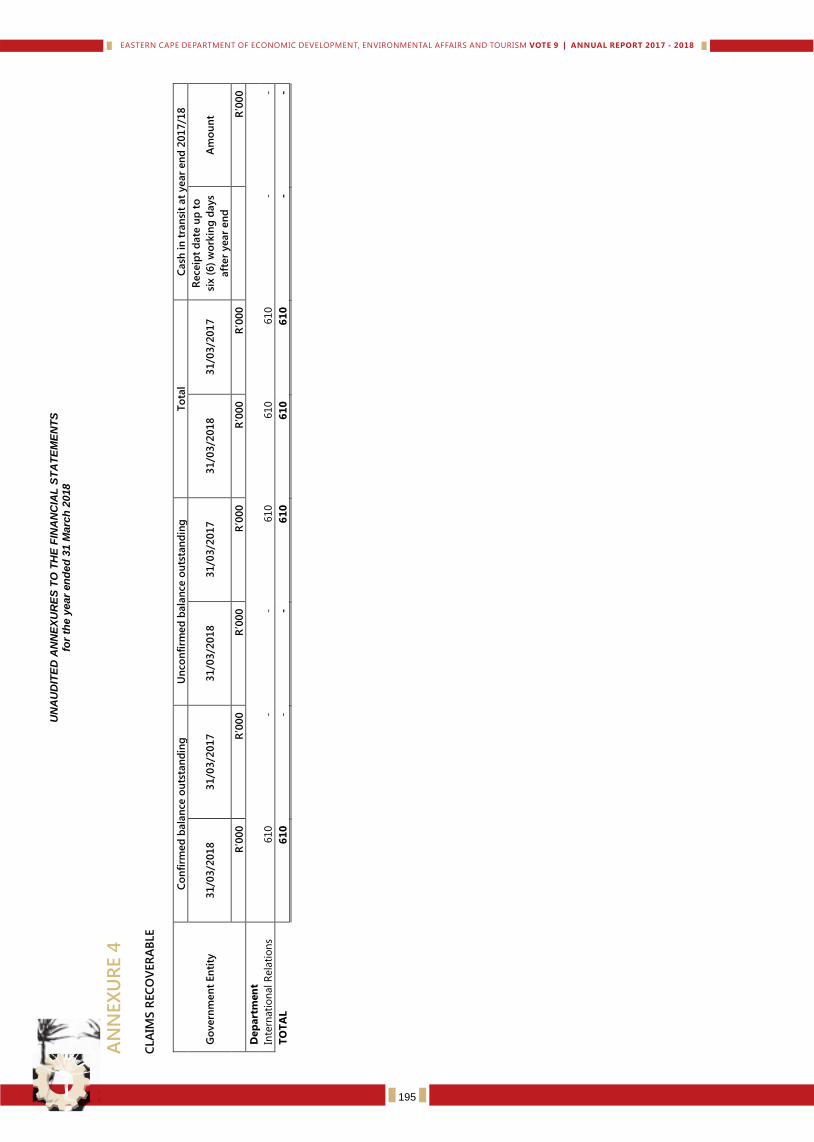
UN
AU
DIT
ED
AN
NE
XU
RE
S T
O T
HE
FIN
AN
CIA
L S
TA
TE
ME
NT
S
for
the
year
en
de
d 3
1 M
arc
h 2
018
AN
NEX
UR
E 4
C
LA
IMS R
EC
OV
ER
AB
LE
Go
vern
men
t En
tity
Co
nfi
rmed
bala
nce
ou
tsta
nd
ing
U
nco
nfi
rmed
bala
nce o
uts
tan
din
g
To
tal
Cash
in
tra
nsi
t at
year
en
d 2
01
7/1
8
31/0
3/2
01
8
31/0
3/2
01
7
31/0
3/2
01
8
31/0
3/2
01
7
31/0
3/2
01
8
31/0
3/2
01
7
Receip
t d
ate
up
to
six (
6)
wo
rkin
g d
ays
aft
er
year
en
d
Am
ou
nt
R’0
00
R
’00
0
R’0
00
R
’00
0
R’0
00
R
’00
0
R
’00
0
Dep
art
men
t
In
tern
ati
on
al R
ela
tio
ns
610
- -
610
610
610
- -
TO
TA
L
61
0
- -
61
0
61
0
61
0
- -
195
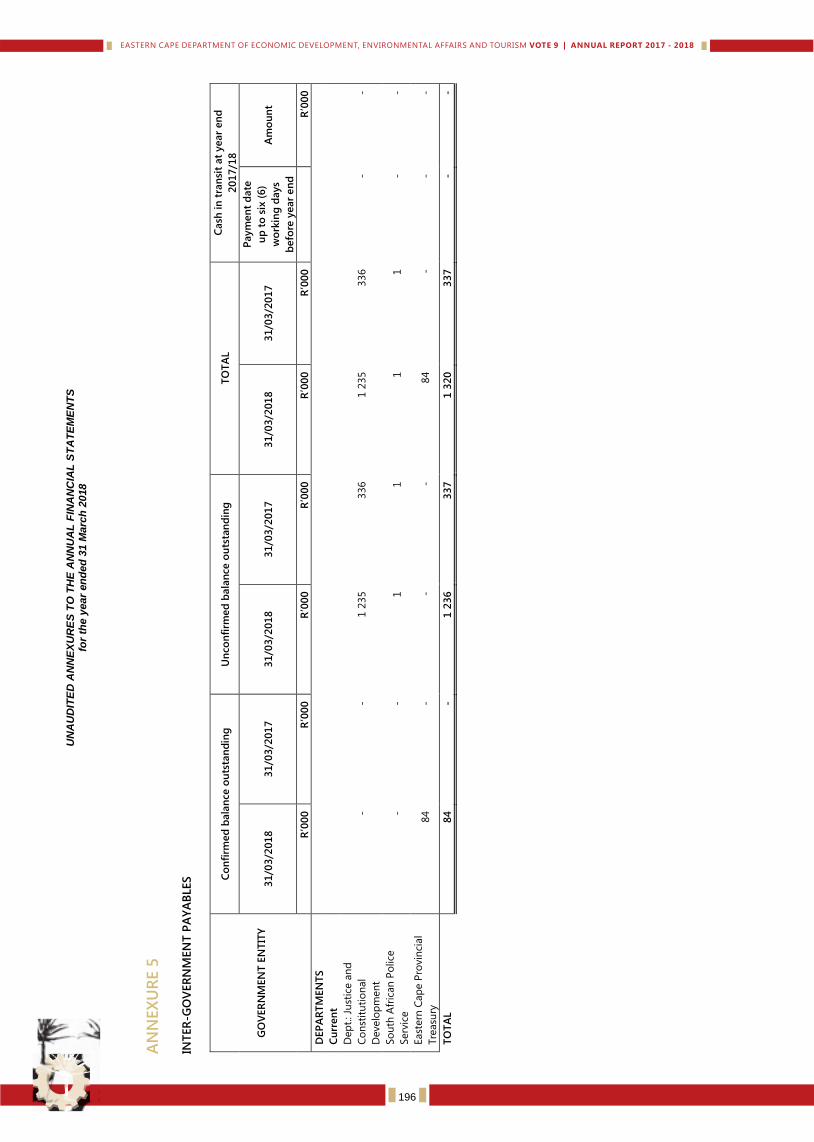
UN
AU
DIT
ED
AN
NE
XU
RE
S T
O T
HE
AN
NU
AL
FIN
AN
CIA
L S
TA
TE
ME
NT
S
for
the
year
en
de
d 3
1 M
arc
h 2
018
AN
NEX
UR
E 5
IN
TER
-GO
VER
NM
EN
T P
AY
AB
LES
GO
VER
NM
EN
T E
NT
ITY
Co
nfi
rmed
bala
nce
ou
tsta
nd
ing
U
nco
nfi
rmed
bala
nce o
uts
tan
din
g
TO
TA
L
Cash
in
tra
nsi
t at
year
en
d
201
7/1
8
31/0
3/2
01
8
31/0
3/2
01
7
31
/03/2
01
8
31/0
3/2
01
7
31/0
3/2
01
8
31/0
3/2
01
7
Paym
en
t d
ate
up
to
six
(6
)
wo
rkin
g d
ays
befo
re y
ear
en
d
Am
ou
nt
R’0
00
R
’00
0
R’0
00
R
’00
0
R’0
00
R
’00
0
R
’00
0
DEP
AR
TM
EN
TS
Cu
rren
t
D
ep
t.: Ju
stic
e a
nd
Co
nst
itu
tio
nal
Develo
pm
en
t
- -
1 2
35
336
1 2
35
336
- -
So
uth
Afr
ican
Po
lice
Serv
ice
- -
1
1
1
1
- -
East
ern
Cap
e P
rovin
cial
Tre
asu
ry
84
- -
- 84
- -
-
TO
TA
L
84
-
1 2
36
3
37
1
320
3
37
-
-
196
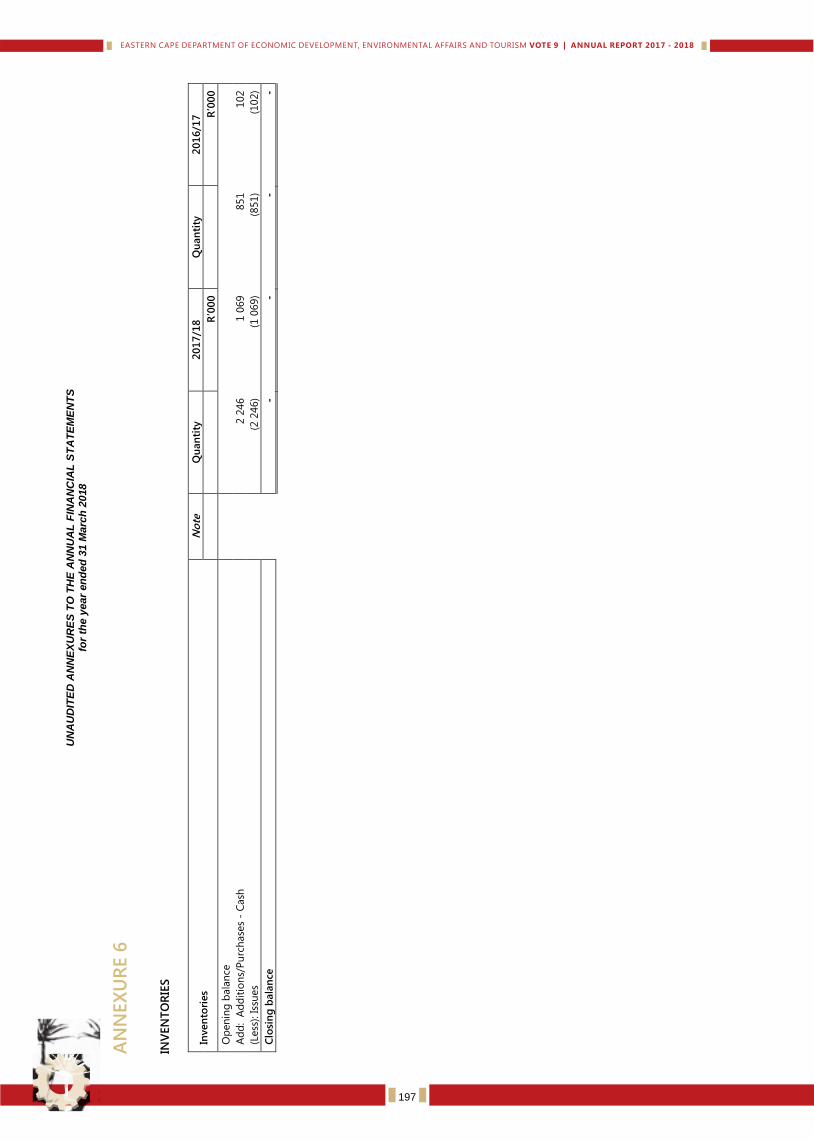
UN
AU
DIT
ED
AN
NE
XU
RE
S T
O T
HE
AN
NU
AL
FIN
AN
CIA
L S
TA
TE
ME
NT
S
for
the
year
en
de
d 3
1 M
arc
h 2
018
AN
NEX
UR
E 6
INV
EN
TO
RIE
S
Inven
tori
es
No
te
Qu
an
tity
2
01
7/1
8
Qu
an
tity
2
01
6/1
7
R’0
00
R’0
00
Op
en
ing
bala
nce
Ad
d: A
dd
itio
ns/
Pu
rch
ase
s -
Cash
2 2
46
1 0
69
851
102
(Less
): Iss
ues
(2
246)
(1 0
69)
(851)
(102)
Clo
sin
g b
ala
nce
- -
- -
197
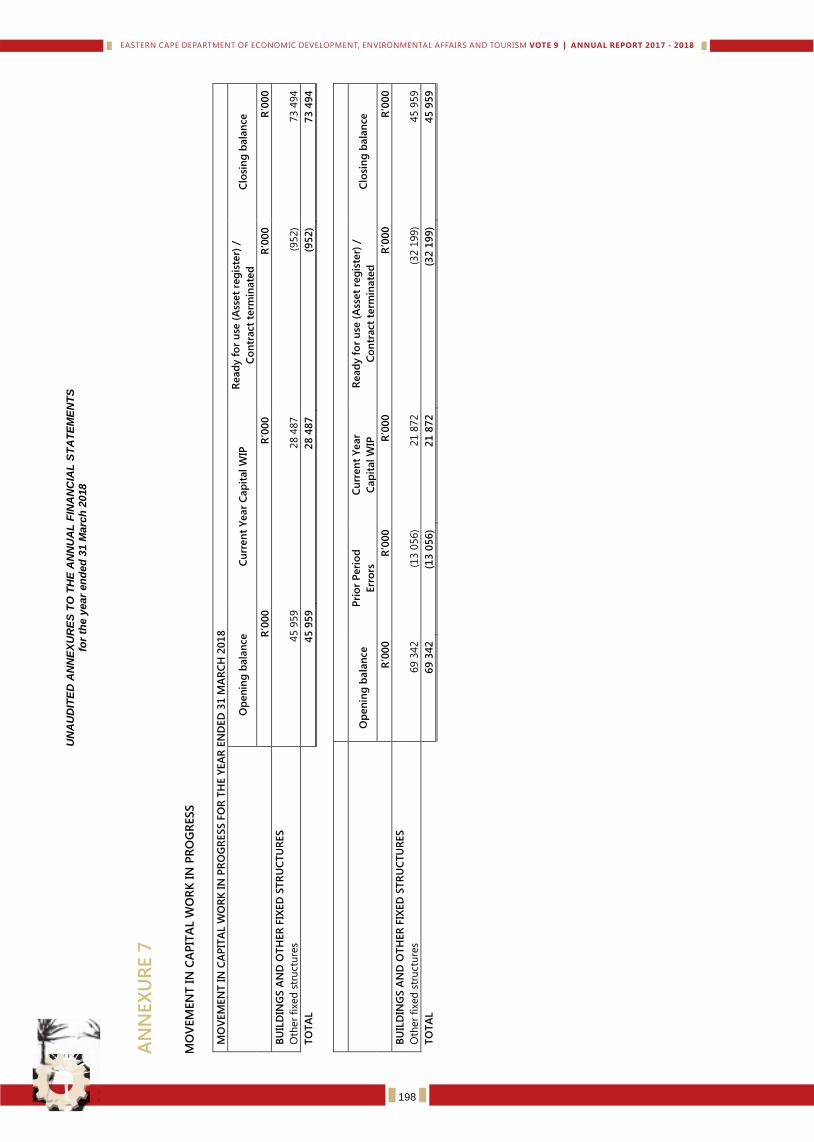
UN
AU
DIT
ED
AN
NE
XU
RE
S T
O T
HE
AN
NU
AL
FIN
AN
CIA
L S
TA
TE
ME
NT
S
for
the
year
en
de
d 3
1 M
arc
h 2
018
AN
NEX
UR
E 7
MO
VEM
EN
T I
N C
AP
ITA
L W
OR
K I
N P
RO
GR
ESS
MO
VEM
EN
T I
N C
AP
ITA
L W
OR
K I
N P
RO
GR
ESS F
OR
TH
E Y
EA
R E
ND
ED
31 M
AR
CH
201
8
O
pen
ing
bala
nce
Cu
rren
t Y
ear
Cap
ital W
IP
Read
y f
or
use
(A
sset
reg
iste
r) /
Co
ntr
act
term
inate
d
Clo
sin
g b
ala
nce
R’0
00
R
’00
0
R’0
00
R
’00
0
BU
ILD
ING
S A
ND
OT
HER
FIX
ED
ST
RU
CTU
RES
Oth
er
fixe
d s
tru
ctu
res
45 9
59
28 4
87
(952)
73 4
94
TO
TA
L
45 9
59
2
8 4
87
(9
52
) 7
3 4
94
O
pen
ing
bala
nce
Pri
or
Peri
od
Err
ors
Cu
rren
t Y
ear
Cap
ital W
IP
Read
y f
or
use
(A
sset
reg
iste
r) /
Co
ntr
act
term
inate
d
Clo
sin
g b
ala
nce
R’0
00
R
’00
0
R’0
00
R
’00
0
R’0
00
BU
ILD
ING
S A
ND
OT
HER
FIX
ED
ST
RU
CTU
RES
Oth
er
fixe
d s
tru
ctu
res
69 3
42
(13 0
56)
21 8
72
(32 1
99)
45 9
59
TO
TA
L
69 3
42
(1
3 0
56
) 2
1 8
72
(3
2 1
99
) 4
5 9
59
198
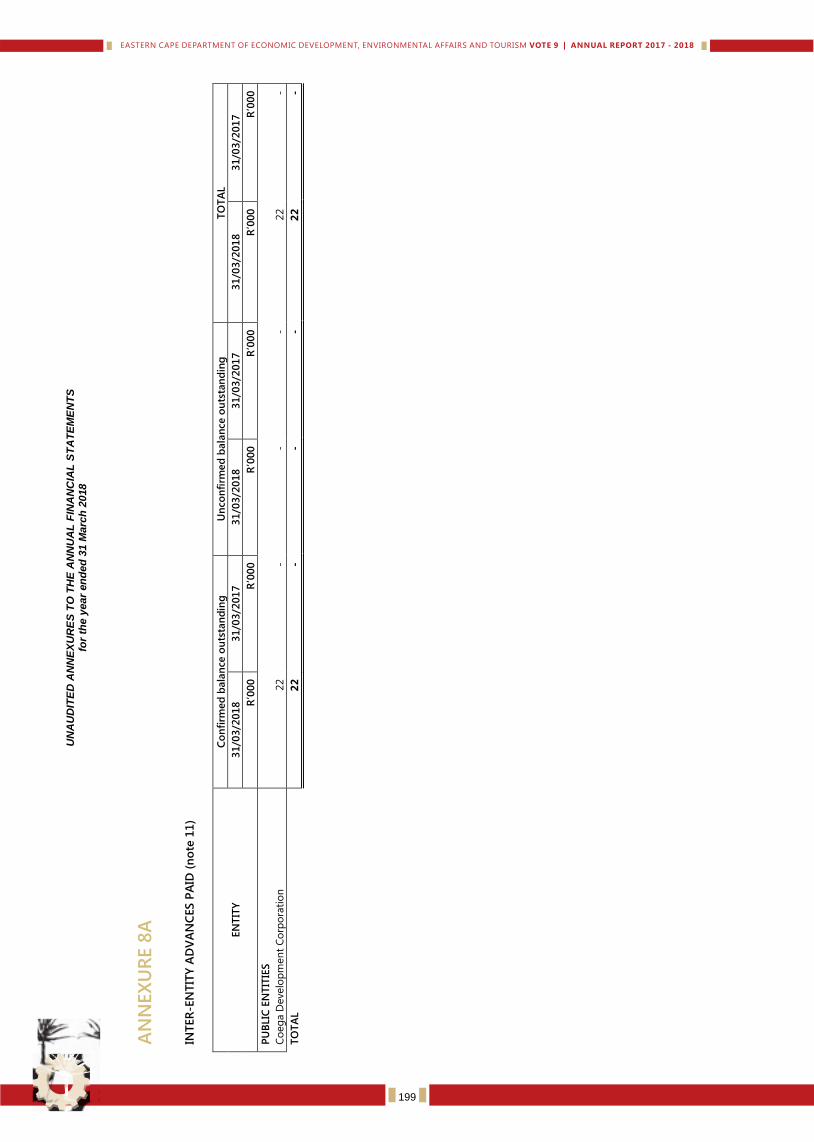
UN
AU
DIT
ED
AN
NE
XU
RE
S T
O T
HE
AN
NU
AL
FIN
AN
CIA
L S
TA
TE
ME
NT
S
for
the
year
en
de
d 3
1 M
arc
h 2
018
A
NN
EX
UR
E 8
A
INTER
-EN
TIT
Y A
DV
AN
CES P
AID
(n
ote
11
)
EN
TIT
Y
Co
nfi
rmed
bala
nce
ou
tsta
nd
ing
U
nco
nfi
rmed
bala
nce o
uts
tan
din
g
TO
TA
L
31/0
3/2
01
8
31/0
3/2
01
7
31/0
3/2
01
8
31/0
3/2
01
7
31/0
3/2
01
8
31/0
3/2
01
7
R’0
00
R
’00
0
R’0
00
R
’00
0
R’0
00
R
’00
0
PU
BLIC
EN
TIT
IES
Co
eg
a D
evelo
pm
en
t C
orp
ora
tio
n
22
- -
- 22
-
TO
TA
L
22
-
- -
22
-
199