The Provincial Indices of Multiple Deprivation for South Africa 2001
44
Transcript of The Provincial Indices of Multiple Deprivation for South Africa 2001


1

2
The Provincial Indices of Multiple Deprivation for South Africa 2001
Technical Report
Michael Noble, Miriam Babita, Helen Barnes, Chris Dibben, Wiseman Magasela, Stefan Noble, Phakama Ntshongwana, Heston Phillips, Sharmla Rama, Benjamin Roberts, Gemma
Wright and Sibongile Zungu

3
Published by
Centre for the Analysis of South African Social Policy
Department of Social Policy and Social Work
University of Oxford
Suggested citation:
Noble, M., Babita, M., Barnes, H., Dibben, C., Magasela, W., Noble, S.,
Ntshongwana, P., Phillips, H., Rama, S., Roberts, B., Wright, G. and Zungu, S. (2006)
The Provincial Indices of Multiple Deprivation for South Africa 2001 Technical Report, University of Oxford, UK.
Disclaimer:
The University of Oxford and the Human Sciences Research Council have taken
reasonable care to ensure that the information in this report and the accompanying
data are correct. However, no warranty, express or implied, is given as to its accuracy
and the University of Oxford and the Human Sciences Research Council do not
accept any liability for error or omission. The University of Oxford and the Human
Sciences Research Council are not responsible for how the information is used, how it
is interpreted or what reliance is placed on it. The University of Oxford and the
Human Sciences Research Council do not guarantee that the information in this report
or in the accompanying file is fit for any particular purpose. The University of Oxford
and the Human Sciences Research Council do not accept responsibility for any
alteration or manipulation of the report or the data once it has been released.
Statistics South Africa has taken care to ensure that the information provided in this
report and the accompanying data are correct. However, this report and the
methodology followed represent 'work-in-progress' and the information presented
here may change in subsequent reports.
© University of Oxford, Human Sciences Research Council, Statistics South Africa, 2006
ISBN 978-0-9552753-1-9
0-9552753-1-8

4
Contents
Introduction 5
Section 1: Domains and Indicators 6
Income and Material Deprivation Domain: imputation of the income variable 6
Income and Material Deprivation Domain: equivalence scales 11
Income and Material Deprivation Domain: income thresholds 15
Employment Deprivation Domain: definition of unemployment 16
Health Deprivation Domain: shrinkage estimation 17
Living Environment Deprivation Domain: choice of indicators 22
Section 2: Methodology 24
Exponential transformation 24
Correlations between domain scores and PIMD 27
Section 3: Maps 31
References 32

5
Introduction
This technical report has been produced to provide further detail on the sensitivity
testing carried out and the main methodological issues considered during the
construction of the Provincial Indices of Deprivation for South Africa 2001 (PIMD
2001). This report should be read in conjunction with the PIMD 2001 report (Noble et
al., 2005).
The PIMD 2001 has been produced by a group of researchers at the Centre for the
Analysis of South African Social Policy (CASASP) in the Department of Social
Policy and Social Work at the University of Oxford, the Human Sciences Research
Council (HSRC) and Statistics South Africa (Stats SA). The project team comprised
Michael Noble, Helen Barnes, Chris Dibben, Wiseman Magasela, Stefan Noble,
Phakama Ntshongwana and Gemma Wright from CASASP at the University of
Oxford; Benjamin Roberts and Sharmla Rama from the HSRC; and Miriam Babita,
Heston Phillips and Sibongile Zungu from Stats SA.
Each PIMD is a relative measure of multiple deprivation for a particular province in
South Africa and has been produced at ward level using the 2001 Census.
This report is divided into two sections. Section 1 covers sensitivity testing relating to
the domains and indicators used in the PIMD, and Section 2 discusses methodological
issues. The sensitivity testing in Section 1 was carried out at municipality level on the
10% sample of the Census as there was only limited access to the 100% Census. The
analysis in Section 2 was carried out at ward level using the 100% Census.
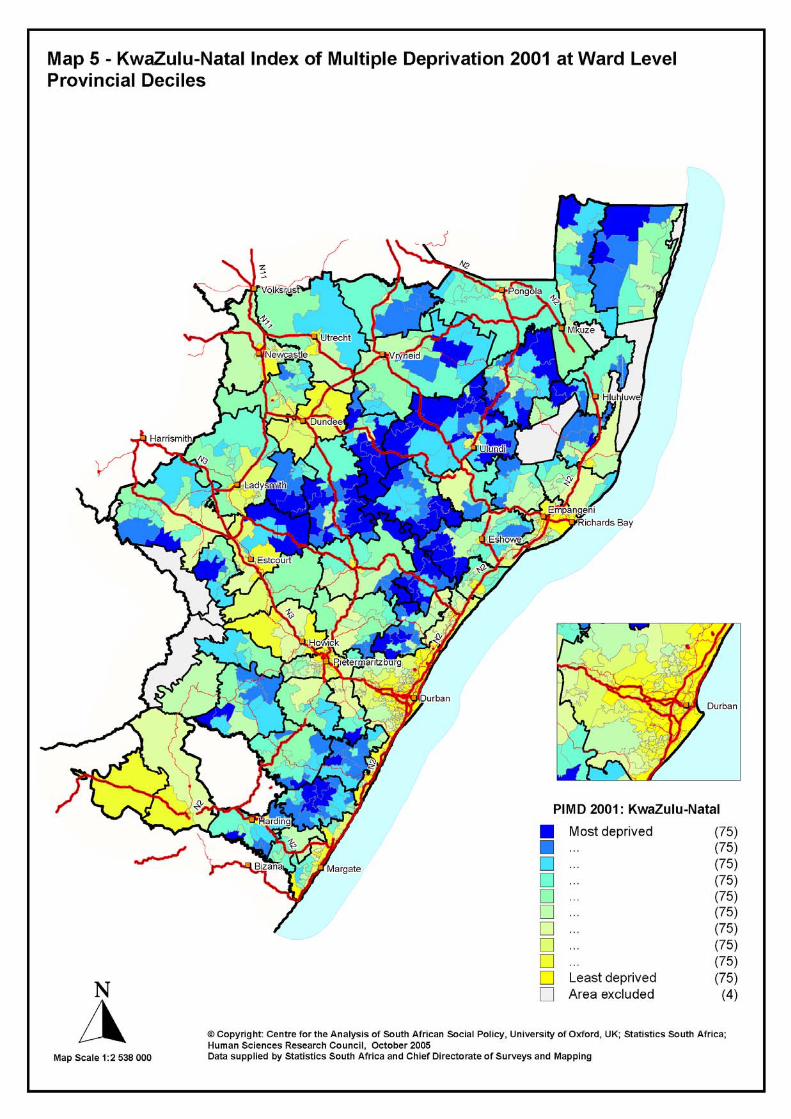
In Section 3 maps showing the ward level PIMD 2001 for each province in South
Africa are presented. These are more detailed than the maps presented in the full
report as they show the major roads in each province (the deciles and boundaries are
exactly the same as the maps in the full report however)1.
1 If this report has been obtained from the internet, the maps are instead available as separate files for
downloading.

6
Section 1: Domains and Indicators
Income and Material Deprivation Domain: imputation of the income variable
One of the main difficulties in producing indicators of well-being (e.g. the low
income indicator in the Income and Material Deprivation Domain) from the 2001
Census is the large proportion of missing values on a number of key variables such as
age, education and income. In the 2001 Census, data on personal income were
obtained by asking each person in the household “What is the income category that
best describes the gross income of (this person) before tax?” The answer was recorded
in income bands for each person. The use of the income data from the Census is
problematic as there is a large proportion of missing income data (16% of individuals
in the 10% sample) and a large proportion of incomes reported to be zero (50.1% of
individuals aged 18 and over). It is difficult to determine a priori whether reported
zero incomes are actual observed levels or whether it is due to the reluctance of
people to reveal their true income. Non-response or invalid income values can bias
well-being indicators if data are not missing completely at random.2
There are various ways of dealing with missing data. Davern et al. (2001) describe
four main methods used:
1. Analyse complete cases only;
2. Only use cases with reported data on the problematic item;
3. Weight complete cases to make up for missing cases;
4. Impute missing data values.
Imputation is generally preferred when (a) there is a substantial proportion of non-
response or missing data (more than 10%); (b) imputation can correct for potential
distributional differences between respondents with missing data and those with
reported data; and (c) it is possible to maintain relationships among associated
variables. Given that the proportion of missing data is large in the 2001 Census, the
preferred solution to the problem is to impute the missing values. There are various
methods for imputing data and the best imputation method depends on the type of
missing data.
Before releasing any Census products Statistics South Africa (Stats SA) adjusted for
non-response using a logical imputation method and a single ‘hot-deck’ imputation.
The former replaces missing data using information from other variables available in
the dataset. Single hot-deck imputation involves matching, as closely as possible,
individuals with missing data on some variables to individuals who have complete
records, and using the information from the latter to replace the missing values in the
former. This procedure is particularly suitable when data are missing at random
2 Missing completely at random means that the probability of an item being missing is unrelated to any
observed or unobserved characteristic for that unit.

7
(MAR)3 and when the number of outliers is small. When these conditions are not met
individuals with missing data may be inappropriately matched to individuals with
complete records who are outliers or for whom the information recorded is incorrect.
Although the pattern of missing data fulfils the MAR assumption required by the hot-
deck imputation method (and in general by other imputation methods), there is no
way to assess a priori the reliability of the data imputed, that is whether there is a
large proportion of outliers in the data that could potentially bias the imputed values.
Furthermore, single hot-deck imputations do not provide a measure of the variance
introduced with the imputation process.
The total variance introduced by imputing values can be estimated by repeating the
imputation process a number of times, and the possible bias caused by the outliers in
the data can be minimised. This technique is known as multiple imputation. To assess
the reliability of the reported zero income, zero values can be set to missing and the
values imputed, thereby checking whether the original value of zero was accurate.
The imputation analysis on the income variable in the Census for the PIMD 2001 was
performed on both original missing incomes and ‘implausible’ zero incomes. The
implausible zero incomes were defined according to rules given by Ardington et al.
(2005):
1. If household income was zero, income was set to missing for household
members aged 15 and older and to zero for those younger than 15.
2. For those younger than 15 with recorded income greater than R6 400 per
month, income was set to missing.
3. For those recorded as being employed but with zero income, income was set to
missing.
In total, 27.1% of individuals in the 10% sample had either missing or implausible
income data.4
This analysis used the sequential regression multiple imputation (SRMI) method
developed by Raghunathan et al. (2001) to impute the missing values. The software
used in the imputation was IVEware, which was developed exclusively to perform
SRMI imputations.5 There are three main reasons why SRMI is preferred to other
multiple imputation methods. First, SRMI is a multiple imputation technique which
allows estimation of the variance introduced in the imputations. Second, SRMI can
handle very complex data structures (e.g. count, binary, continuous and categorical
variables) that other imputation methods find problematic. Third, given that SRMI
imputes values through a sequence of multiple regressions, covariates include all
other variables observed and imputed from previous rounds. This sequence of
3 Missing at random means that the probability of an item being missing depends only on other items
that have been observed for that unit and no additional information as to the probability of being
missing would be obtained from the unobserved values of the missing items. 4 Although a high proportion of individuals reported zero income, not all of these were defined as
implausible and recoded as missing according to Ardington et al’s rules. 5 The imputation was run on the Unix computer at the Oxford Supercomputing Centre (OSC),
University of Oxford. The team wish to acknowledge OSC for the use of their resources and in
particular to thank Jon Lockley and his team at OSC for their help and support.

8
imputing missing values builds interdependence among imputed values and exploits
the correlation structure among covariates (Raghunathan et al., 2001).
For this analysis, the aim was not only to impute missing income, but also to impute
the variables that could be used as explanatory variables of income such as age,
gender, years of education, population group, province, etc. In this case the SRMI
method divides the dataset into two matrices, one composed of all the variables that
contain missing data, denoted by Y and another matrix composed of variables that
have no missing data, denoted by X.
All variables included in the matrix Y are ordered from least to most missing values,
i.e. Y1, Y2, Y3, Y4, Yn and all Y variables are considered to be dependent variables to
which missing values are imputed by maximizing the joint conditional density of
matrix Y given matrix X. Each of the variables included in matrix Y can have a
different type of distribution, such as dichotomous (e.g. gender), categorical (e.g.
banded income) or continuous (e.g. age). These dependent variables are estimated
using the type of regression model that most suits them. For instance, dichotomous
variables are estimated using logit regression models, continuous variables are
estimated using OLS regression models and so on.
In this method the imputation is performed in a series of steps and rounds. The first
step is to estimate the missing values of Y1 given the variables in the X matrix. This
step consists of up to 250 maximum likelihood iterations, which are needed for
maximizing the joint conditional density of Y1 given matrix X. This is then followed
by an estimate of Y2 given X and the newly derived 1 which contains both observed
and imputed values (in other words 1 is included in the X matrix). The first round of
imputations, R=1
, is completed once each of the variables included in the Y matrix is
estimated, as in the steps explained above. This first round of imputation contains no
missing values and is equivalent to the single vector of hot deck imputations derived
by Stats SA.
In the second round, Y1 is re-estimated including all first round R=1
imputations on
the right hand side. The first round missing value imputations for Y1 are replaced by a
new set of imputations derived from this re-estimation. The new imputed values are
conditional on the previously imputed values of the preceding imputation round.
Figure 1.1 shows the variables that were imputed and the regression types that were
used.
Each round of imputations produces individual values of matrix , which contain no
missing values and from which it is then possible to carry out further analysis such as
measuring poverty or inequality. The imputed values for each variable may differ
from round to round, and hence the estimated level of poverty, for example, may also
differ from one round to another. The uncertainty about the actual level of poverty,
say, is overcome by obtaining an estimate of poverty from every round, and then
averaging over these estimates. The standard error of the resulting estimate of
(average) poverty is obtained using the multiple imputation rule developed by Little
and Rubin (2000). This rule applies to the derived measures only, like poverty and
inequality, and not to the imputed values that were obtained.

9
Figure 1.1: Variables with missing data to be imputed
The imputation results produced in this work are very similar to those of Stats SA and
of Ardington et al. (2005). Ardington et al. also employed the SRMI imputation
method, but used different types of regression in the sequence of imputation and
different software than in the analysis for the PIMD 2001.
The tables below compare the proportion of cases in each income band obtained by
the PIMD 2001 analysis and Stats SA’s hot deck imputation (the last column in the
first table shows the proportion in each income band when no imputation or recoding
of implausible zeros had taken place). The first table shows the distribution of income
for all cases (i.e. imputed and not imputed cases), while the second table shows the
distribution for the imputed cases only (i.e. the missing and implausible zero cases).
All three methods (Ardington et al’s results are not shown) assign roughly the same
proportion of people overall to the first three income bands (84 to 85%). For the
imputed cases only the proportion of people in the first three income bands ranges
from 90 to 98%. In terms of the zero incomes, for each method between 65 and 69%
of people overall either reported having no income or were placed in the zero income
band by the imputation process. For the imputed cases only the proportion of people
assigned to the zero income band is very similar for all three methods (79 to 81%).
The similarity between the results of Ardington et al. and this work is reassuring, but
more surprising is the fact that the imputation results are also similar to those obtained
using the single hot-deck imputation method. This is likely to reflect the fact that the
number of outliers among the observations on the variables used for imputation was
not large. Therefore, the large number of zero incomes reported are indeed reasonably
accurate and do not represent outliers. Given the similarity in the results it was felt it
would be acceptable to produce the Income and Material Deprivation Domain using
Stats SA’s hot deck imputations, rather than run the sequential regression multiple
imputation on the full Census. See page 17 of the full report.
Y Matrix* Regression Type X Matrix
Age OLS Province
Gender Logit Location
Population group Logit
Employment status Logit
Occupation Logit
Education OLS
Income Logit
* Variables ordered from least to most number of missing cases.

10
Table 1.1: Observed and imputed cases
SRMI Hot deck
imputation
No imputation
PIMD on 10%
Census with 10
imputations
(imputation 10)
Stats SA on 10%
Census with 1
imputation
10% Census
Income
band % Cum % % Cum % % Cum %
1 66.66 66.66 69.34 69.34 67.20 67.20
2 6.70 73.36 5.33 74.68 5.57 72.78
3 11.94 85.30 9.67 84.35 10.42 83.19
4 5.04 90.34 5.14 89.49 5.60 88.80
5 4.18 94.52 4.43 93.93 4.77 93.57
6 3.01 97.53 3.28 97.21 3.49 97.06
7 1.55 99.08 1.73 98.94 1.83 98.89
8 0.57 99.65 0.65 99.59 0.68 99.57
9 0.20 99.85 0.22 99.81 0.24 99.81
10 0.08 99.93 0.09 99.90 0.09 99.90
11 0.06 99.99 0.07 99.97 0.07 99.97
12 0.02 100.00 0.03 100.00 0.03 100.00
Table 1.2: Imputed cases only
PIMD on 10% Census
with 10 imputations
(imputation 10)
Stats SA on 10%
Census with 1
imputationIncome
band % Cum % % Cum %
1 79.00 79.00 80.95 80.95
2 7.35 86.35 4.03 84.98
3 11.61 97.96 5.62 90.61
4 1.15 99.11 2.67 93.27
5 0.57 99.68 2.59 95.86
6 0.22 99.90 2.12 97.98
7 0.05 99.95 1.21 99.19
8 0.01 99.96 0.47 99.66
9 0.00 99.96 0.15 99.81
10 0.00 99.96 0.07 99.88
11 0.03 99.99 0.09 99.98
12 0.00 100.00 0.02 100.00

11
Income and Material Deprivation Domain: equivalence scales
The living standard of an individual depends not only on their own income, but also
on the income of others in the household. In the South African context this is
especially true and it is well documented that household resources are often pooled.
Since households vary by size and demographic composition, simply using total
household income as an indicator would produce misleading results. Consequently, it
has become customary to use some form of adjustment to take into account variations
in household size and/or composition (usually age i.e. whether people are adults or
children). It is argued that the needs of a household increase with each additional
member, but not in a proportional way due to economies of scale. In order to enjoy a
comparable standard of living, a household with several adults will need a higher
income than a single person living alone. However, the needs of a household with
three members will not be three times higher than those of a single person.
The simplest type of adjustment entails dividing total household income by household
size to produce a per capita measure. However, while this takes into account
household size, it does not adjust for structure, thus assigning equal values for adults
and children alike under the assumption that there is no sharing of resources within
the household.
More complex equivalence scales assign values to each household in proportion to its
needs, taking into account both size of the household and the age of its members
(number of adults and children). Equivalence scales conventionally take a couple as
the reference point and assign an equivalence value of one. The process then increases
relatively the income of single person households and reduces relatively the incomes
of households with more than one person.
Since there are a wide variety of possible equivalence scales, the selection of a
particular one is premised upon a set of assumptions about economies of scale and
value judgements about the priority of the differential needs of individuals (children
versus adults). As such judgements may affect results, sensitivity testing was
conducted to determine whether relative ranking is affected by the use of different
equivalence scale parameters. This work had to be undertaken at the municipality
level on the 10% sample of the Census as there was limited access to the 100%
Census.
Five different equivalence scales were tested to see what, if any, impact they had on
the overall Income and Material Deprivation Domain. These are explained in more
detail below, and their impact analysed.

12
(i) Household equivalent income of less than 40% of mean equivalent household
income (equivalised using the modified OECD equivalence scale)
To calculate this income measure, logarithmic mean values6 were assigned to the
income bands. Next an annual household income was calculated by summing the
individual income of each person in the household. The modified OECD scale7 was
then used to create an equivalence factor:
Equivalence factor = 1 + (number of people over 14 years * 0.5) + (number of people
under 14 years * 0.3)
This gives greatest weight to the first adult and less to subsequent adults and children
over 14 years. The lowest weight goes to children under 14 years. The annual
household income was divided by the equivalence factor to give a household
equivalent income. Finally, any person with a household equivalent income of less
than 40% of mean equivalent household income was defined as income deprived.
(ii) Household equivalent income of less than 40% of mean equivalent household
income (equivalised using the old OECD equivalence scale)
This measure was calculated in exactly the same way as for (i). The old OECD
equivalence factor is:
Equivalence factor = 1 + (number of adults * 0.7) + (number of children * 0.5)
This gives greatest weight to the first adult and less to subsequent adults. The lowest
weight goes to children.
(iii) Household equivalent income of less than 40% of mean equivalent household
income (equivalised using the square root scale)
This equivalence scale is different to the above two as it does not take into account the
size and composition of the household in the same way. The scale divides household
income by the square root of household size rather than assigning specific weights to
adults and children:
Equivalence factor = annual household income / square root of household size
This implies that, for example, a household of four people has needs twice as large as
a single person household.
(iv) Per capita income of less than R 4 800 pa8
Annual household income was calculated in the same way as for the above three
measures. Per capita income was calculated by dividing the annual household income
6 See Census 2001 Metadata (information on households and housing) released by Stats SA for more
information. 7 First proposed by Haagenars et al. (1994). 8 Both (iv) and (v) are used by Ardington et al. (2005) in their sensitivity testing of estimates of
changes in poverty and inequality to imputation of the income variable in the Census.

13
by the number of people in the household. Any person with a per capita income of
less than R 4 800 was defined as having low income.
Equivalence factor = annual household income / number of people in household
(v) Per capita income of less than R 1 488 pa
This measure was calculated in exactly the same way as for (iv), but any person with
a per capita income of less than R 1 488 was defined as having low income.
Equivalence factor = annual household income / number of people in household
The tables below show the proportion captured by the low income indicator alone
using the different equivalence scales9 and the correlations between the five versions
of the Income and Material Deprivation Domain. The income indicator for the first
four versions captures approximately the same proportion of the population (between
67 and 73%). The per capita income of less than R 1488 pa is a more extreme
measure and only captures 41% of the population. The Income and Material
Deprivation Domains produced using the five different equivalence scales correlate
very highly at municipality level across the country. The lowest correlations are the
per capita measures (iv) and (v) with the other three measures, but even these are
above 0.9. As mentioned above, the per capita equivalence scales do not adjust for
household structure and so are a more crude measure than equivalence scales that take
into account household size and structure. They were included in the sensitivity
testing as an additional comparison only and not because it was felt that a per capita
scale should possibly be used in the final PIMD 2001. The use of different
equivalence scales appears to have little impact on the overall Income and Material
Deprivation Domain and therefore little impact on the PIMD 2001.
Table 1.3: Proportion of the population captured when using different
equivalence scales
Version Proportion of
population captured
(i) modified OECD 71.93
(ii) old OECD 72.53
(iii) square root scale 68.50
(iv) per capita income < R 4800 pa 67.93
(v) per capita income < R 1488 pa 41.11
9 Figures are from the 10% sample of the Census (people in institutions excluded) and are not weighted
to give a national figure.

14
Table 1.4: Income and Material Deprivation Domain correlations (Spearman’s
rho) for each equivalence scale
(i) (ii) (iii) (iv) (v)
(i) 1.000 0.999 0.995 0.997 0.949
(ii) 0.999 1.000 0.994 0.996 0.946
(iii) 0.995 0.994 1.000 0.996 0.961
(iv) 0.997 0.996 0.996 1.000 0.962
(v) 0.949 0.946 0.961 0.962 1.000
All correlations are significant at the 0.01 level
The modified OECD equivalence scale was used in the Income Domain in the PIMD
2001 because it is widely used internationally. See pages 17-18 of the full report.

15
Income and Material Deprivation Domain: income thresholds
Income deprivation is often measured as the proportion of households living below a
particular low income threshold, most often the proportion below various fractions
(usually ranging from 40 to 60 %) of median or mean income. Before selecting a
particular threshold, sensitivity testing was conducted to determine whether relative
ranking was changed by employing different income thresholds (20%, 30% and 40%
of equivalised household mean income). The modified OECD equivalence scale (see
previous section) was applied in all cases. This work had to be undertaken at the
municipality level on the 10% sample of the Census as there was limited access to the
100% Census.
The following table shows the proportion of the population captured by the low
income indicator alone using different income thresholds.10
The correlations between
the three versions are high (Table 1.6), which suggests that the use of different income
thresholds appears to have little impact on the overall Income and Material
Deprivation Domain and therefore little impact on the PIMD 2001.
Table 1.5: Proportion of the population captured when using different income
thresholds
Version Proportion of
population captured
20% equivalised household mean income 55.97
30% equivalised household mean income 66.30
40% equivalised household mean income 71.93
Table 1.6: Income and Material Deprivation Domain correlations (Spearman’s
rho) for each income threshold
20% 30% 40%
20% 1.000 0.989 0.977
30% 0.989 1.000 0.994
40% 0.977 0.994 1.000
All correlations are significant at the 0.01 level
The 40% threshold was used for the low income indicator in the PIMD 2001 because
it is one of the most commonly used thresholds internationally. The other
internationally recognised thresholds (50% and 60%) would have captured too great a
proportion of the population for many wards and therefore would have been
insufficiently discriminating. See page 17 of the full report.
10 Figures are from the 10% sample of the Census (people in institutions excluded) and are not
weighted to give a national figure.

16
Employment Deprivation Domain: definition of unemployment
Sensitivity testing was conducted to determine whether relative ranking was changed
by using the expanded definition of unemployment rather than the official definition.
This work had to be undertaken at the municipality level on the 10% sample of the
Census as there was limited access to the 100% Census.
The official definition of employment defines the unemployed as people within the
economically active population who (a) did not work in the seven days prior to
Census night, (b) wanted to work and were available to start work within a week of
Census night, and (c) had taken active steps to look for work or start some form of
self-employment in the four weeks prior to Census night (e.g. registration at an
employment exchange, applications to employers, checking at work sites or farms,
placing or answering newspaper advertisements, seeking assistance of friends, etc).
The expanded definition of unemployment defines the unemployed as people who
fulfil (a) and (b) above but did not take active steps to seek work. This broad
definition captures discouraged work seekers, and those without the resources to take
active steps to seek work.
Two versions of the Employment Deprivation Domain were created; one using the
official definition, and one using the expanded definition. The two versions correlate
very highly (0.990 Spearman’s rho, p=0.01). The use of the different unemployment
definitions appears to have little impact on the overall Employment Deprivation
Domain and therefore little impact on the PIMD 2001.
The proportion of the relevant population (people aged 15-65 inclusive) captured by
the official definition of unemployment is 15.27% (this is the figure for the
unemployed only and not the additional people included in the numerator who are not
working because they are ill or disabled). For the expanded definition of
unemployment the proportion is 18.71%.11
Therefore, even using the expanded
definition, only approximately 3.5% more of the relevant population are captured.
The official definition of unemployment was used in the PIMD 2001 as it is more
commonly used by the main potential users of Indices (the three spheres of
Government) and the difference in relative terms between the official and the
expanded definitions was negligible. See page 19 of the full report.
11 Figures are from the 10% sample of the Census (people in institutions excluded) and are not
weighted to give a national figure.

17
Health Deprivation Domain: shrinkage estimation
The technique of shrinkage estimation was applied to the Health Deprivation Domain
only. In some areas, particularly where populations at risk are small, data may be
‘unreliable’, that is more likely to be affected by measurement error or sampling error,
with particular wards getting unrepresentatively low or high scores on certain
indicators. The extent of a score’s ‘unreliability’ can be measured by calculating its
standard error.
This problem emerged in the construction of other indices in the past and this
prompted the use of the signed chi squared statistic (see for example Robson, 1994).
However, this technique has been much criticised for its use in this context because it
conflates population size with levels of deprivation (see for example Connolly and
Chisholm, 1999). Given the problems with the signed chi squared approach, another
technique - ‘shrinkage estimation’ (i.e. empirical Bayesian estimation) - has been used
subsequently to deal with the problem.12
Shrinkage involves moving unreliable ward scores (i.e. those with a high standard
error) towards another more robust score. This may be towards more deprivation or
less deprivation. There are many possible candidates for the more robust score to
which an unreliable score could move. The municipality mean has been selected for
this purpose but others could, in theory, include the South African mean, the province
mean or the means of areas with similar characteristics.
Arguably, the movement of unreliable scores towards the mean score for South Africa
would be inappropriate because of the large variation across the country and because
it would be preferable to take into account local circumstances. ‘Borrowing strength’
from adjacent wards, though superficially attractive, could be problematic especially
near the edges of towns. Though shrinking to the mean of wards with similar
characteristics is attractive there are no recognised ward classification systems
currently available.
It was concluded that shrinkage to the municipality mean was the best and most
reliable procedure. This is in essence the same as shrinking to the population weighted
ward mean for a municipality.
The actual mechanism of the procedure is to estimate deprivation in a particular ward
using a weighted combination of (a) data from that ward and (b) data from the
municipality. The weight attempts to increase the efficiency of the estimation, while
not increasing its bias. If the ward has a high standard error and a municipality
appears to be an unbiased estimation of the ward score then the ward score moves
towards the municipality score.
12 For England see Noble, Smith et al, 2000a p16; Noble, Wright et al, 2004 p16; for Wales see Noble,
Smith, Wright et al, 2000 p8; for Northern Ireland see Noble, Smith, Wright et al, 2001 p11; Noble,
Barnes et al, 2005a p7; and for Scotland see Noble, Wright et al, 2003b p15.

18
Although most scores move a small amount, only unreliable scores, that is those with
a large standard error, move significantly. The amount of movement depends on both
the size of the standard error and the amount of heterogeneity amongst the wards in a
municipality.
The ‘shrunken’ estimate of a ward-level proportion (or ratio) is a weighted average of
the two ‘raw’ proportions for the ward and for the corresponding municipality.13
The
weights used are determined by the relative magnitudes of within-ward and between-
ward variability.
The ‘shrunken’ ward-level estimate is the weighted average
zwzwz jjjj )1(* [1]
where zj is the ward level proportion, z is the municipality level proportion, wj is the
weight given to the ‘raw’ ward-j data and (1 wj) the weight given to the overall
proportion for the municipality. The formula used to determine wj is
22
2
11
1
ts
sw
j
j
j [2]
where sj is the standard error of the ward level proportion, and t2 is the inter-ward
variance for the k wards in the municipality, calculated as
t2 =
k
jk 11
1( jz z)
2 [3]
The impact of shrinkage was tested on early versions of all domains, but it was found
that there was very little movement in the scores, and so for transparency of method,
the ‘unshrunk’ scores were used for all indicators, other than the Years of Potential
Life Lost indicator in the Health Deprivation Domain where the ‘shrunk’ score was
used.
The following scatterplots compare the shrunk (Y axis) and unshrunk (X axis)
versions of each domain. For all domains except the Health Deprivation Domain, the
line on the graph is fairly straight and there are few outliers. The unshrunk and shrunk
scores for each of these four domains correlate 0.99 (Spearman’s rho, p=0.01).
13 Where appropriate the weighted average is calculated on the logit scale, for technical reasons,
principally because the logit of a proportion is more nearly normally distributed than the proportion
itself.
ppj )*


22
Living Environment Deprivation Domain: choice of indicators
The Census 2001 contains information on a variety of aspects relating to the living
environment. From this information a number of potential indicators for the Living
Environment Deprivation Domain were developed. However, the aim for each
domain was to include a parsimonious (i.e. economical in number) collection of
indicators that comprehensively captured the deprivation for each domain, but within
the constraints of the data available from the Census. Therefore, decisions had to be
made on which indicators to keep in the final PIMD 2001.
The following table shows the proportion of the population captured by each indicator
used in the final PIMD, and also the proportion captured by other indicators
considered (in italics).15
The proportion captured ranges from 10% to almost 60%.
Table 1.7: Proportion of the population captured by Living Environment
Deprivation Domain indicators
Indicator Proportion of
population captured
No pit latrine with ventilation or flush toilet 46.12
No piped water inside dwelling or yard or within 200m 31.59
No electricity for lighting 29.99
Live in a shack 12.95
No access to a telephone 10.02
Two or more people per room 31.40
No rubbish removal by the local authority 47.72
One or more people per room 59.42
Three or more people per room 13.47
No flush toilet 52.52
While it is useful to know the proportion captured by each indicator in isolation, it is
perhaps more helpful to know the proportion extra each indicator contributes to the
overall proportion of deprived people within an area. This of course depends on the
order in which the indicators are added. The table below shows the proportion extra of
the population captured by each successive indicator, starting with the indicator
measuring the lack of adequate toilet facility. Indicators are added (arguably) in order
of importance.
15Figures are from 10% sample of the Census (people in institutions excluded) and are not weighted
to give a national figure.

23
Table 1.8: Proportion extra captured by adding more indicators
Indicator Proportion extra of
population captured
No pit latrine with ventilation or flush toilet 46.12
No piped water inside dwelling or yard or within 200m 5.03
No electricity for lighting 3.82
Live in a shack 3.06
No access to a telephone 0.68
Two or more people per room 8.07
No rubbish removal by the local authority 2.92
The rubbish removal indicator was dropped as there was concern about bias against
urban areas and in any event it did not capture many additional people. See pages 23-
24 of the full report.

24
Section 2: Methodology
Exponential transformation
Once the domains had been constructed, it was necessary to combine them into an
overall index for each province. In order to do this the domain indices were
standardised by ranking. They were then transformed to an exponential distribution.
The exponential distribution was selected for the following reasons. First, it
transforms each domain so that they each have a common distribution, the same range
and identical maximum/minimum value, so that when the domains are combined into
a single index of multiple deprivation the (equal) weighting is explicit; that is there is
no implicit weighting as a result of the underlying distributions of the data. Second, it
is not affected by the size of the ward’s population. Third, it effectively spreads out
the part of the distribution in which there is most interest; that is the most deprived
wards in each domain.
Each transformed domain has a range of 0 to 100, with a score of 100 for the most
deprived ward. The research team judged that the exponential transformation that
stretched out or emphasised the most deprived 25% of wards would be most
appropriate. When transformed scores from different domains are combined by
averaging them, the skewness of the distribution reduces the extent to which
deprivation on one domain can be cancelled by lack of deprivation on another. For
example, if the transformed scores on two domains are averaged with equal weights, a
(hypothetical) ward that scored 100 on one domain and 0 on the other would have a
combined score of 50 and would thus be ranked at the 75th percentile. (Averaging the
untransformed ranks, or after transformation to a normal distribution, would result in
such a ward being ranked instead at the 50th percentile: the high deprivation in one
domain would have been fully cancelled by the low deprivation in the other). Thus the
extent to which deprivation in some domains can be cancelled by lack of deprivation
in others is, by design, reduced.
The transformation used is as follows. For any ward, denote its rank on the domain,
scaled to the range [0,1], by R (with R=1/N for the least deprived, and R=N/N, i.e.
R=1, for the most deprived, where N=the number of wards in the province).
The transformed domain X = - *log{1 - R*[1 - exp(-100/ )]}
where log denotes natural logarithm and exp the exponential or antilog transformation
and is a constant which determines the slope of the exponential. For the PIMD
(where the most deprived 25% of wards are emphasised) =45.5.
The chosen exponential distribution is one of an infinite number of possible
distributions. Two other exponentials were explored: stretching out the most deprived
10% of wards (used in UK Indices) and stretching out the most deprived 30% of
wards. The three exponentials are compared below for two example provinces, the
Western Cape and KwaZulu-Natal.

25
Western Cape
Chart 2.1: PIMD (25%) with version accentuating 10% most deprived (pimd10)
Chart 2.2: PIMD (25%) with version accentuating 30% most deprived (pimd30)

26
KwaZulu-Natal
Chart 2.3: PIMD (25%) with version accentuating 10% most deprived (pimd10)
Chart 2.4: PIMD (25%) with version accentuating 30% most deprived (pimd30)
See pages 29-30 of the full report.

27
Correlations between domain scores and PIMD
The tables below show the correlations between the five domains and the PIMD for
each province. In each province, all domains correlate fairly highly with the overall
PIMD for that province. In all cases, the Income Deprivation Domain has the highest
correlation with the PIMD (0.914 to 0.974) and also correlates highly with the Living
Environment Deprivation Domain. In nearly all provinces the Employment
Deprivation, Education Deprivation and Living Environment Deprivation Domains all
have a correlation of over 0.7 with their respective PIMD, but the intra-domain
correlations are not always as high. In most provinces the Health Deprivation Domain
has the lowest correlation with its PIMD and all other domains.
Domain correlations (Spearman’s rho) for each PIMD
Table 2.1:
Western
Cape
Income
Deprivation
Employment
Deprivation
Health
Deprivation
Education
Deprivation
Living
Environment
Deprivation
PIMD
Income
Deprivation
1.000 0.596 0.678 0.788 0.889 0.973
Employment
Deprivation
0.596 1.000 0.403 0.171 0.580 0.637
Health
Deprivation
0.678 0.403 1.000 0.474 0.573 0.771
Education
Deprivation
0.788 0.171 0.474 1.000 0.736 0.767
Living
Environment
Deprivation
0.889 0.580 0.573 0.736 1.000 0.915
PIMD 0.973 0.637 0.771 0.767 0.915 1.000
Table 2.2:
Eastern
Cape
Income
Deprivation
Employment
Deprivation
Health
Deprivation
Education
Deprivation
Living
Environment
Deprivation
PIMD
Income
Deprivation
1.000 0.847 0.667 0.859 0.897 0.960
Employment
Deprivation
0.847 1.000 0.560 0.649 0.768 0.855
Health
Deprivation
0.667 0.560 1.000 0.626 0.679 0.790
Education
Deprivation
0.859 0.649 0.626 1.000 0.795 0.888
Living
Environment
Deprivation
0.897 0.768 0.679 0.795 1.000 0.929
PIMD 0.960 0.855 0.790 0.888 0.929 1.000

28
Table 2.3:
Northern
Cape
Income
Deprivation
Employment
Deprivation
Health
Deprivation
Education
Deprivation
Living
Environment
Deprivation
PIMD
Income
Deprivation
1.000 0.568 0.523 0.732 0.672 0.934
Employment
Deprivation
0.568 1.000 0.462 0.123* 0.128* 0.587
Health
Deprivation
0.523 0.462 1.000 0.428 0.266 0.676
Education
Deprivation
0.732 0.123* 0.428 1.000 0.746 0.781
Living
Environment
Deprivation
0.672 0.128* 0.266 0.746 1.000 0.715
PIMD 0.934 0.587 0.676 0.781 0.715 1.000
Table 2.4:
Free State
Income
Deprivation
Employment
Deprivation
Health
Deprivation
Education
Deprivation
Living
Environment
Deprivation
PIMD
Income
Deprivation
1.000 0.599 0.537 0.668 0.838 0.937
Employment
Deprivation
0.599 1.000 0.575 0.062* 0.412 0.614
Health
Deprivation
0.537 0.575 1.000 0.305 0.422 0.697
Education
Deprivation
0.668 0.062* 0.305 1.000 0.698 0.700
Living
Environment
Deprivation
0.838 0.412 0.422 0.698 1.000 0.869
PIMD 0.937 0.614 0.697 0.700 0.869 1.000
Table 2.5:
KwaZulu-
Natal
Income
Deprivation
Employment
Deprivation
Health
Deprivation
Education
Deprivation
Living
Environment
Deprivation
PIMD
Income
Deprivation
1.000 0.855 0.545 0.874 0.913 0.962
Employment
Deprivation
0.855 1.000 0.495 0.682 0.787 0.870
Health
Deprivation
0.545 0.495 1.000 0.463 0.478 0.674
Education
Deprivation
0.874 0.682 0.463 1.000 0.854 0.890
Living
Environment
Deprivation
0.913 0.787 0.478 0.854 1.000 0.920
PIMD 0.962 0.870 0.674 0.890 0.920 1.000

29
Table 2.6:
North West
Province
Income
Deprivation
Employment
Deprivation
Health
Deprivation
Education
Deprivation
Living
Environment
Deprivation
PIMD
Income
Deprivation
1.000 0.704 0.602 0.825 0.716 0.958
Employment
Deprivation
0.704 1.000 0.492 0.371 0.564 0.733
Health
Deprivation
0.602 0.492 1.000 0.535 0.283 0.715
Education
Deprivation
0.825 0.371 0.535 1.000 0.544 0.821
Living
Environment
Deprivation
0.716 0.564 0.283 0.544 1.000 0.751
PIMD 0.958 0.733 0.715 0.821 0.751 1.000
Table 2.7:
Gauteng
Income
Deprivation
Employment
Deprivation
Health
Deprivation
Education
Deprivation
Living
Environment
Deprivation
PIMD
Income
Deprivation
1.000 0.854 0.688 0.871 0.849 0.974
Employment
Deprivation
0.854 1.000 0.719 0.632 0.626 0.849
Health
Deprivation
0.688 0.719 1.000 0.614 0.464 0.787
Education
Deprivation
0.871 0.632 0.614 1.000 0.846 0.901
Living
Environment
Deprivation
0.849 0.626 0.464 0.846 1.000 0.842
PIMD 0.974 0.849 0.787 0.901 0.842 1.000
Table 2.8:
Mpumalanga
Income
Deprivation
Employment
Deprivation
Health
Deprivation
Education
Deprivation
Living
Environment
Deprivation
PIMD
Income
Deprivation
1.000 0.691 0.504 0.821 0.807 0.941
Employment
Deprivation
0.691 1.000 0.379 0.434 0.592 0.741
Health
Deprivation
0.504 0.379 1.000 0.494 0.334 0.638
Education
Deprivation
0.821 0.434 0.494 1.000 0.682 0.836
Living
Environment
Deprivation
0.807 0.592 0.334 0.682 1.000 0.835
PIMD 0.941 0.741 0.638 0.836 0.835 1.000

30
Table 2.9:
Limpopo
Income
Deprivation
Employment
Deprivation
Health
Deprivation
Education
Deprivation
Living
Environment
Deprivation
PIMD
Income
Deprivation
1.000 0.727 0.292 0.661 0.734 0.915
Employment
Deprivation
0.727 1.000 0.043* 0.443 0.636 0.734
Health
Deprivation
0.292 0.043* 1.000 0.240 0.156 0.456
Education
Deprivation
0.661 0.443 0.240 1.000 0.455 0.748
Living
Environment
Deprivation
0.734 0.636 0.156 0.455 1.000 0.783
PIMD 0.915 0.734 0.456 0.748 0.783 1.000
All correlations are significant at the 0.01 level (2-tailed) except where indicated by *
See page 52 of the full report.

31
Section 3: Maps


32
References
Ardington, C., Lam, D., Leibbrandt, M. and Welch, M. (2005) ‘The sensitivity of
estimates of post-apartheid changes in South African poverty and inequality to key
data imputations’, CSSR Working Paper No.016, Cape Town: University of Cape
Town Centre for Social Science Research.
Connolly, C. and Chisholm, M. (1999) ‘The use of indicators for targeting public
expenditure: the Index of Local Deprivation’, Environment and Planning C:
Government and Policy, 17: 463-482.
Davern, M., Blewett, L., Bershadsky, B. and Arnold, N. (2001) ‘Possible Bias in the
Census Bureau’s State Income and Health Insurance Estimates’, Working Paper,
University of Minnesota.
Hagenaars, A., de Vos, K. and Zaidi, M.A. (1994) Poverty Statistics in the Late
1980s: Research Based on Micro-data, Luxembourg: Office for Official Publications
of the European Communities.
Little, R.J. and Rubin, D.B. (2000) Statistical Analysis with Missing Data, New York:
Wiley.
Noble, M., Babita, M., Barnes, H., Dibben, C., Magasela, W., Noble, S.,
Ntshongwana, P., Phillips, H., Rama, S., Roberts, B., Wright, G. and Zungu, S. (2005)
The Provincial Indices of Multiple Deprivation for South Africa 2001, University of
Oxford, UK.
Noble, M., Barnes, H., Smith, G.A.N., McLennan, D., Dibben, C., Avenell, D., Smith,
T., Anttila, C., Sigala, M. and Mokhtar, C. (2005a) Northern Ireland Multiple
Deprivation Measures 2005, Belfast: Northern Ireland Statistics and Research
Agency.
Noble, M., Smith, G.A.N., Penhale, B., Wright, G., Dibben, C., Owen, T. and Lloyd,
M. (2000a) Measuring Multiple Deprivation at the Small Area Level: The Indices of
Deprivation 2000, London: Department of the Environment, Transport and the
Regions.
Noble, M., Smith, G.A.N., Wright, G., Dibben, C., Lloyd, M. and Penhale, B. (2000b)
Welsh Index of Multiple Deprivation, National Statistics.
Noble, M., Smith, G.A.N., Wright, G., Dibben, C., and Lloyd, M. (2001) The
Northern Ireland Multiple Deprivation Measure 2001, Occasional Paper No 18,
Belfast: Northern Ireland Statistics and Research Agency.
Noble, M., Wright, G., Dibben, C., Smith, G., McLennan, D., Anttila, C., Barnes, H.,
Mokhtar, C., Noble, S., Avenell, D., Gardner, J., Covizzi, I. and Lloyd, M. (2004) The
English Indices of Deprivation 2004, London: Office of the Deputy Prime Minister,
London.

33
Noble, M., Wright, G., Lloyd, M., Dibben, C., Smith, G.A.N., Ratcliffe, A.,
McLennan, D., Sigala, M. and Anttila, C. (2003) Scottish Indices of Deprivation,
Scottish Executive.
Raghunathan, T., Lepkowski, J., van Hoewyk, J. and Solenberger, P. (2001) ‘A
Multivariate Technique for Multiply Imputing Missing Values Using a Sequence of
Regression Models’, in Survey Methodology June 2001: 85-95.
Robson, B. (1994) Relative Deprivation in Northern Ireland, Belfast: Northern
Ireland Statistics and Research Agency.