Annual Report 2021 - VGP Group
314
Annual Report 2021
-
Upload
khangminh22 -
Category
Documents
-
view
1 -
download
0
Transcript of Annual Report 2021 - VGP Group

Annual Report
2021


Content
PAGES 7
Key fi gures
PAGES 12 — 15
Profi le
PAGES 24 — 65
VGP in 2021Summary
Business review
General market overview
German market
Spanish market
Dutch market
Italian market
Portuguese market
French market
PAGES 106 — 111
Board of Directors and ManagementBoard of Directors
Executive Management Team
PAGES 16 — 23
Strategy
PAGES 66 — 105
Report of the Board of DirectorsCorporate governance statement
Risk factors
Summary of the accounts and comments
Information about the share
Outlook 2022
PAGES 8 — 11
Letter to the shareholders
I. Company Report
PAG
E 2
—
V
GP
NV
An
nu
al
Re
po
rt 2
02
1 /
Co
mp
an
y R
ep
ort
/ R
ep
ort
of
the
Bo
ard
of
Dir
ec
tors

II. Corporate Responsibility Report
PAGES 112 — 189
III. Portfolio
PAGES 190 — 235
IV. Financial Review
PAGES 237 — 310PA
GE
3
—
VG
P N
V A
nn
ua
l R
ep
ort
20
21
/ C
om
pa
ny
Re
po
rt /
Re
po
rt o
f th
e B
oa
rd o
f D
ire
cto
rs


Company report


Key fi guresIn thousands of €
INVESTMENT PROPERTIES 2021 2020 2019 2018 2017
Own portfolio
Total lettable area (m²) 765,783 205,069 146,079 288,372 445,958
Occupancy rate (%) 99.3% 100.0% 100.0% 99.2% 100.0%
Fair value of property portfolio 2,200,119 920,151 792,944 576,143 627,737
Joint Ventures’ portfolio (100%)
Total lettable area (m²) 2,326,149 2,236,306 1,764,640 1,333,476 830,905
Occupancy rate (%) 99.4% 98.4% 99.8% 99.4% 100.0%
Fair value of property portfolio¹ 3,545,582 2,922,563 1,978,266 1,360,263 877,761
BALANCE SHEET 2021 2020 2019 2018 2017
Shareholders’ equity 2,175,565 1,305,736 699,781 543,467 466,230
Gearing
Net debt/total assets 29.8% 25.2% 37.2% 34.6% 42.3%
INCOME STATEMENT 2021 2020 2019 2018 2017
Gross rental income 17,618 12,078 11,653 16,627 17,046
Property operating expenses (2,219) (3,784) (2,556) (1,123) (1,941)
Net rental and related income 15,399 8,294 9,097 15,504 15,105
Property and facility management/development income
21,303 14,699 10,492 9,965 8,057
Net valuation gains/(losses) on investment property
610,261 366,361 188,165 98,552 94,628
Administrative costs (52,112) (29,296) (18,100) (18,167) (19,353)
Share in the results of joint ventures and associates
186,703 63,338 65,703 45,220 29,229
Other expenses (5,000) (4,000) (3,000) — —
Operating profit 776,554 419,396 252,357 151,074 127,666
Net financial result (12,654) (8,592) (14,238) (13,970) (10,466)
Taxes (113,845) (39,865) (32,506) (15,998) (21,205)
Profit for the year 650,055 370,939 205,613 121,106 95,995
RESULT PER SHARE 2021 2020 2019 2018 2017
Net result per share (in €) – Basic 31.41 18.58 6.52 5.17 4.91
Net result per share (in €) – Diluted 31.41 18.58 6.52 5.17 4.91
1 Includes buildings under construction and development land which are/will be developed by VGP on behalf
of the First and Second Joint Venture. PAG
E 7
—
V
GP
NV
An
nu
al
Re
po
rt 2
02
1 /
Co
mp
an
y R
ep
ort
/ K
ey
fig
ure
s

Letter to the shareholders

During 2021 we have signed nearly € 80 million of annu-
alized rental income, an increase of 76% in comparison
to the year before. Extrapolating this in terms of portfolio
growth in today’s yields: a growth of nearly € 2 billion once
completed which we were able to contract in one year
time. This trend has so far continued in 2022, with sev-
eral big new long-term leases being signed or under final
negotiations.
During last year we have delivered 652.000 m² of pre-let
buildings to our customers, most of which we have con-
structed with our own construction management. At the
end of the year we had almost 1.5 million m² of new build-
ings under construction – the bulk of that (more than 83%)
was pre-let.
The technical competence we built up over the years
enables us to provide complex and integrated solutions to
our customers. This is a big asset in today’s world, where
there is a fast change to more automation and robotization
inside our buildings. Together with our customers we have
learned a lot about these evolutions, and I am convinced
that going forward, it will become standard that technol-
ogy will make the biggest part of the building in terms of
investment.
Dear fellow share- and bond holders of VGP,VGP can today look back on a very positive and fruitful 2021. We set new records across all our business goals and built solid foundations for our future business growth.
PAG
E 9
—
V
GP
NV
An
nu
al
Re
po
rt 2
02
1 /
Co
mp
an
y R
ep
ort
/ L
ett
er
to t
he
sh
are
ho
lde
rs

Our employeesThe past year’s success is the product of a talented, smart,
committed group of individuals. I would like to express a
word of gratitude towards my colleagues and their fami-
lies, and I take great pride in being a part of this team.
These results are a direct reflection of the energy and
enthusiasm of our people and the support of their families,
for which I would like to sincerely thank them.
VGP becomes a member of BEL20 On 28 March 2022, VGP was welcomed by Vincent Van
Dessel, Chief Executive Officer of Euronext Brussels as
new member of the BEL20 and honoured with a “bell ring-
ing” ceremony at the Brussels Stock exchange. This is
another significant milestone for our company, and again
could not have been achieved without the dedication of
our employees.
VGP is truly pan-EuropeanSince the inception of VGP, it has always been our mantra
to become a truly pan-European company. This needs to
be done carefully and slowly, with the right attention for
capital deployment and opportunities in each of the so dif-
ferent countries of Europe. That is why it has taken us so
long to grow from the Czech Republic, my home, into the
twenty countries we are now active in. Recently we have
appointed new country managers for Denmark and Swe-
den – together with France, Greece, Serbia, and Croatia
which we added last year we are now close to having a
footprint in which we can provide our services to all our
pan-European customers.
As I wrote last year already, local culture and de-centrali-
sation remains a key business principle in the organization
of VGP. We continue to strengthen our local teams across
Europe to provide our clients with a local and customized
approach while safeguarding the uniformity of VGP’s busi-
ness model through the strengthening and support of our
management on European level.
Big growth brings along big capital needs in our sector Our model, developing our assets on our own balance
sheet and then selling them to a 50/50 joint venture
with Allianz has helped us a lot in terms of recycling
our working capital thus being able to invest in new
development opportunities.
However, the pace at which we are growing now, and
the consequent capex requirements have urged us to
build up capital buffers, strong enough to handle that
growth. That is why in November last year we have done
a capital increase of € 300 million to strengthen our bal-
ance sheet on the back of which we have issued in the
beginning of this year two bonds, one with a five-year and
one with an eight-year term with an aggregate amount of
€ 1 billion at what looks now in retrospect at very attractive
interest rates.
Together with our continued operation with Allianz, with
which we have agreed several significant closings in the
year to come, we are now well financed to cover all our
capex requirements.
Turn of timeAn event, unseen of in our recent history in Europe, has
happened: the barbaric invasion of Russia in Ukraine,
a country which has borders with three countries in which
VGP is active. Ukraine has suffered horrific attacks. Inno-
cent people – including children – have lost their lives. As
I write this letter already more than three million people
have fled their country.
Our model of free trade, our concept of peaceful
cooperation to produce across borders and continents
in the most efficient way, close to raw materials or
competences and thus sharing the benefit through which
we have created prosperity and price stability is shaking
on its foundations.
I recall my early years in Central Europe, just after the
fall of the Berlin wall, where there was a climate of enthu-
siasm and optimism for a brighter future. With the recent
events unfolding this positive climate has turned into a
climate of fear and uncertainty, where Moscow has once
again become, so many years after the end of the cold war,
the villain as I remember it to be from my childhood. This
has all resulted in a chain reaction of economic sanctions,
never-seen before, being imposed on Russia, the main
supplier of our energy sources and the real economic
impact of these events are only starting to unfold slowly.
How this will affect our beloved Europe in the future is
unknown. We will probably choose to be less naïve, and
more self-sufficient in strategic resources like food and
energy. This will create loads of challenges, as currently
nobody knows, how to resolve this conflict.
Nevertheless we have all spent our last days clustered
to the news channels, shocked by the faith of those poor
people who see their families torn apart, their homes
destroyed in a heroic move to try and remain free from
dictatorship and authoritarian rule over their country.
Now fi rst is a time to help, a time to put pressure on the
Russian regime to stop this war so that we can rebuilt, in
trust and confi dence a cooperation with the people aff ected.
VGP has already donated € 3 million through the United
Nations which will be spend on refugee help in the three
neighbouring countries we are active in i.e. Slovakia, Hun-
gary and Romania. It is heart-warming to see how our peo-
ple in VGP are actively helping too, how Europe has pulled
together and we will continue to do so.
PAG
E 1
0
—
VG
P N
V A
nn
ua
l R
ep
ort
20
21
/ C
om
pa
ny
Re
po
rt /
Le
tte
r to
th
e s
ha
reh
old
ers

Goals for 2022Being an entrepreneur means looking forward. We are
active in challenging markets where development oppor-
tunities become more and more scarce and occupancy
levels have grown to historic records in almost all the
countries we operate in. The team itself has grown sub-
stantially throughout all the countries, and our employees
have, with a lot of enthusiasm and commitment neverthe-
less been able to secure many iconic new land plots, a
solid base for future growth and diversification.
The European green deal with its objective to transform-
ing our economy and societies and turning the EU into the
first climate neutral continent by 2050 is now becoming
more relevant than ever, as the most recent geopolitical
events in the Ukraine are demonstrating.
This is not only helping us with the enhanced roll out of
our locally produced energy supplies, but it also incentiv-
ises our clients to move to new energy efficient buildings
in an urge to save on energy costs and achieve their car-
bon neutrality targets.
In closing2021 was indeed an incredible year. We at VGP are grate-
ful to our customers for their business. Finally, on behalf
of VGP and its management, I want to express again my
deepest gratitude to all those who have worked with us,
suppliers, financing partners and customers, for their trust
and cooperation. It will be necessary in the times ahead of
us to stand together and to listen to each other more than
ever and we are very much looking forward to continuing
supporting you and working together.
I am confident that we will all come out stronger thanks
to a more united Europe and I hope we can soon concen-
trate again on further growth and prosperity.
Yours sincerely,
Jan Van Geet
PAG
E 1
1 —
V
GP
NV
An
nu
al
Re
po
rt 2
02
1 /
Co
mp
an
y R
ep
ort
/ L
ett
er
to t
he
sh
are
ho
lde
rs

ph
oto
© T
rilu
x

Profi le

VGP (www.vgpparks.eu) is a pan-European pure-play
logistics real estate group specialised in the acquisition,
development, and management of logistic real estate, i.e.
buildings suitable for logistical purposes and light indus-
trial activities. The Group focuses on strategically located
plots of land in Germany, Austria, the Netherlands, Spain,
Portugal, Italy, the Czech Republic, the Slovak Republic,
Hungary, Romania, Latvia and Serbia, suitable for develop-
ment of logistic business parks of a certain size, so as to
build up an extensive and well-diversified land bank on top
locations. The Group is currently expanding into France,
Greece and Croatia, and aims to expand further into other
European markets in the future.
The Group has a track record of successful land acquisi-
tions being converted into fully operational business parks
consisting of high-end logistic real estate and ancillary
offices. The Group constructs and develops such parks
for its own account and for its Joint Ventures, which are
subsequently rented out to reputable clients by means of
long-term commercial lease contracts.
The Group had an in-house team of more than 320 peo-
ple as at 31 December 2021 which manages all the activi-
ties of the fully integrated business model: from the
identification and acquisition of the land to the concep-
tualisation and design of the project, the supervision of
the construction works, the contacts with potential ten-
ants and the asset- and property management of the real
estate portfolio. VGP focuses on top locations which are
located in the vicinity of highly concentrated living and/
or production centres, with an optimal access to transport
infrastructure.
VGP owns a property portfolio of € 2,200.1 million
(in full ownership) as at 31 December 2021 which con-
sists of 29 completed buildings with a total lettable area
of over 766,000 m² (€ 745.8 million), 40 buildings under
construction representing 1,244,000 m² of lettable area
(€ 1,015.9 million) and remaining development land in the
amount of € 438.4 million.
The Joint Ventures own a property portfolio of
€ 3,545.6 million as at 31 December 2021 which consists
of 122 completed buildings with a total lettable area of
over 2,326,000 m² (€ 2,893.3 million), 10 buildings being
developed by VGP representing 235,000 m² of lettable
area (€ 525,9 million) and development land in the amount
of € 126.4 million.
As at 31 December 2021 VGP has a remaining own
development land bank in full ownership of 5,852,000 m².
This land bank allows VGP to develop besides the cur-
rent completed projects and projects under construction
(in total 2,009,000 m²) a further 2,644,000 m² of lettable
area of which 313,000 m² in Germany, 192,000 m² in the
Czech Republic, 311,000 m² in Spain, 181,000 m² in the
Netherlands, 14,000 m² in Latvia, 307,000 m² in Slovakia,
469,000 m² in Romania, 233,000 m² in Hungary, 75,000 m²
in Italy, 49,000 m² in Austria, 13,000 m² in Portugal and
487,000 m² in Serbia.
Besides this, VGP had another 3,981,000 m² of new
committed plots of land as at 31 December 2021, which
are located in Germany, the Czech Republic, the Nether-
lands, Spain, Slovakia, Romania, Hungary, Italy, Austria
and Portugal. These land plots allow for the development
of approx. 1,685,000 m² of new projects. It is currently
expected that these remaining land plots will be acquired,
subject to permits, during the next 12 to 24 months.
The Joint Ventures have a remaining owned land bank of
circa 1,105,000 m² as at 31 December 2021, of which 73%
is located in the Netherlands. This land bank allows the
Joint Ventures to develop – in addition to the current com-
pleted projects and projects under construction (total-
ling 2,561,000 m²) – a further 654,000 m² of lettable area
of which 48,000 m² in Germany, 18,000 m² in the Czech
Republic, 58,000 m² in Spain, 515,000 m² in the Nether-
lands, 10,000 m² in Slovakia and 5,000 m² in Hungary.
Reference is also made to section Business review –
Land bank evolution.
Profi le
PAG
E 1
4
—
VG
P N
V A
nn
ua
l R
ep
ort
20
21
/ C
om
pa
ny
Re
po
rt /
Pro
file

Since its initial IPO in 2007, the Group developed more
than 5.4 million m² of lettable area.
TOTAL SQUARE METERS DEVELOPED OVER THE PAST EIGHT YEARS (in m²)
Rental income
Incremental increase
in rental income
Number of contracts
Projects held
directly by VGP
Projects held
by Joint Ventures
Projects divested
An
nu
ali
se
d r
en
t in
co
me
('0
00
€)
Nu
mb
er
of
co
ntr
ac
ts
EVOLUTION OF THE GROUP’S COMMITTED ANNUALISED RENT INCOME AND NUMBER OF LEASE CONTRACTS (INCLUDING JOINT VENTURES AT 100%) OVER THE PAST EIGHT YEARS
PAG
E 1
5
—
VG
P N
V A
nn
ua
l R
ep
ort
20
21
/ C
om
pa
ny
Re
po
rt /
Pro
file

Strategy
ph
oto
© T
rilu
x

The Group focuses on (i) strategically located plots of
land suitable for development of logistic business parks
of a certain size, so as to build up an extensive and well-
diversified land bank and property portfolio on top loca-
tions; (ii) striving to optimise the operational performance
of the portfolio and the activities of our tenants through
dedicated teams which provide asset- property and deve-
lopment management services; (iii) growing the different
strategic partnerships entered into with Allianz Real Estate
or with other local partners (see below) and (iv) offering
solutions and act as an enabler to help the Group’s clients
in their green energy transition through a.o. the roll-out of
the renewable energy business line.
These elements should allow the Group to provide
attractive return for our shareholders through progressive
dividend and net asset value growth over time.
VGP’s goal is to be a leading pan-European logistics real estate group specialised in the acquisition, development, and management of logistic real estate, i.e. buildings suitable for logistical purposes and light industrial activities.
PAG
E 1
7 —
V
GP
NV
An
nu
al
Re
po
rt 2
02
1 /
Co
mp
an
y R
ep
ort
/ S
tra
teg
y

Strategic partnerships
Strategic partnership with Allianz
In order to sustain its growth over the medium term, VGP
entered into four 50:50 joint ventures with the well-known
Allianz SE Group, a worldwide leading insurance group.
These joint venture structures allow VGP to partially recy-
cle its initial invested capital when completed projects are
acquired by the respective joint ventures and allow VGP to
re-invest the sales proceeds in the continued expansion of
the development pipeline, including the further expansion
of the land bank, thus allowing VGP to concentrate on its
core development activities.
First Joint VentureThe First Joint Venture was established in May 2016 with
an objective to build a platform of new, grade A logistics
and industrial properties with a key focus on expansion
in core German markets and high growth CEE markets
(of Hungary, the Czech Republic and the Slovak Republic)
with the aim of delivering stable income-driven returns
with potential for capital appreciation. The First Joint Ven-
ture aimed to increase its portfolio size (i.e. the gross asset
value of the acquired income generating assets) to circa
€ 1.7 billion by May 2021 at the latest, via the contribution
to the First Joint Venture of new logistics developments
carried out by VGP. The First Joint Venture’s strategy is
therefore primarily a hold strategy.
Since its establishment, eight closings with the First
Joint Venture have occurred. On 15 June 2021, the First
Joint Venture completed its eighth and final closing,
whereby the First Joint Venture acquired 4 logistic build-
ings, including 1 building in 2 new VGP parks and another
2 newly completed buildings (in parks which were previ-
ously transferred to the First Joint Venture), for an aggre-
gate transaction value in excess of € 68.2 million and
resulting into net cash proceeds of € 49.6 million. Follow-
ing this eighth closing, the First Joint Venture’s property
portfolio consists of 98 completed buildings represent-
ing a total lettable area of over 1,834,000 m² and has it
reached its expanded investment target. The First Joint
Venture will maintain its existing portfolio with VGP, con-
tinuing to act as property, facility and asset manager.
Some add-on closings related to existing tenant extension
options may still occur in the future.
Following the end of the investment period of the First
Joint Venture, VGP and Allianz have established a new
joint venture with the same geographical scope as the
First Joint Venture (see below – Fourth Joint Venture).
Second Joint VentureThe Second Joint Venture was established in July 2019
with the objective to build a platform of core, prime logistic
assets in Austria, Italy, the Netherlands Portugal, Romania
and Spain with the aim of delivering stable income-driven
returns with potential for capital appreciation. The Sec-
ond Joint Venture aims to increase its portfolio size to circa
€ 1.7 billion by July 2024 at the latest, via the contribution to
the Second Joint Venture of new or recently built logistics
developments carried out by VGP. The Second Joint Ven-
ture’s strategy is therefore primarily a hold strategy.
The Second Joint Venture has the exclusive right of first
refusal in relation to acquiring the income generating
assets located in Austria, Italy, the Netherlands, Portugal,
Romania and Spain.
Since its establishment, two closings with the Second
Joint Venture have occurred. The development pipeline
and future development of other new projects within its
geographical scope will continue to be developed at VGP’s
own risk to be subsequently acquired by the Second Joint
Venture if the right of first refusal is exercised subject to
pre-agreed completion and lease parameters. The acqui-
sition of any building by the Second Joint Venture will
always occur on the basis of the prevailing market rates at
the moment of such acquisition. VGP carries 100% of the
development risk of the Second Joint Venture. In respect
of the expansion of the Second Joint Venture, a further
closing (third closing) occured during the first half of 2022
with a transaction value of € 363.5 million.
Third Joint VentureThe Third Joint Venture was established in June 2020 with
an objective to develop VGP Park München. Once fully
developed, VGP Park München will consist of five logistic
buildings, two stand-alone parking houses and one office
building for a total gross lettable area of approx. 314,000
m². The park is entirely pre-let.
Since its establishment, two closings with the Third Joint
Venture have occurred.
The financing of the development capex of the Third
Joint Venture occurs through shareholder loans and/or
capital contributions by the shareholders in proportion to
their respective shareholding.
Upon completion of the respective building(s), a clos-
ing with the Third Joint Venture occurs which allows the
Group to receive the proportional share price allocated to
the building(s) from Allianz and to partially/totally recy-
cle its initially invested capital in respect of the building(s)
included in such closing through the refinancing of such
invested capital by external bank debt. As at 31 Decem-
ber 2021, the consideration to be received in respect of
the Third Joint Venture by the Group from Allianz stood
at € 73.1 million (unchanged compared to 31 December
2020). This amount will become due and payable by Alli-
anz during 2022 i.e. at the moment of completion of the
respective buildings.
PAG
E 1
8
—
VG
P N
V A
nn
ua
l R
ep
ort
20
21
/ C
om
pa
ny
Re
po
rt /
Str
ate
gy

Fourth Joint VentureAs the First Joint Venture reached its investment capacity,
Allianz and VGP entered into a new joint venture agree-
ment in December 2021 with a view to establish a new
Fourth Joint Venture. The Fourth Joint Venture will become
effective at the moment of its first closing, currently
expected to occur during the second half of 2022. The
Fourth Joint Venture’s objective is to build a platform of
new, grade A logistics and industrial properties with a key
focus on expansion within the same geographical scope
as the First Joint Venture, i.e. core German markets and
high growth CEE markets (of Hungary, the Czech Republic
and the Slovak Republic), with the aim of delivering stable
income-driven returns with potential for capital apprecia-
tion. The Fourth Joint Venture will target the implementa-
tion of a comprehensive ESG strategy on a best-efforts
basis, as there are currently no clear definitions (legal, reg-
ulatory or otherwise) available. Criteria have been defined
around the Carbon Risk Real Estate Monitor (“CCREM”)
Assessment Tool, the EU Sustainable Finance Taxonomy,
achieving most efficient EPC or similar rating, sustain-
able certification of buildings, photovoltaic systems, green
lease and ESG portfolio data and reporting.
The Fourth Joint Venture aims to increase its portfo-
lio size (i.e. the gross asset value of the acquired income
generating assets) to circa € 2.8 billion by 2027 at the
latest, via the contribution to the Fourth Joint Venture
of new logistics developments carried out by VGP. The
Fourth Joint Venture’s strategy will therefore be primarily
a hold strategy.
The Fourth Joint Venture has the exclusive right of first
refusal in relation to acquiring the income generating
assets located in Germany, the Czech Republic, the
Slovak Republic and Hungary.
A first closing with the Fourth Joint Venture is antici-
pated in the second half of 2022.
Development Joint Ventures
To allow VGP to acquire land plots on prime locations for
future development, the Group has entered into three
strategic partnerships, i.e. (i) a 50:50 joint venture with
Roozen (the LPM Joint Venture), (ii) a 50:50 joint venture
with VUSA (the VGP Park Belartza Joint Venture), and (iii)
a 50:50 joint venture with Revikon (the VGP Park Siegen
Joint Venture) (together, the Development Joint Ventures).
The Group considers these Development Joint Ventures
as an add-on source of land sourcing for land plots which
would otherwise not be accessible to the Group.
Similar to the Third Joint Venture, the Development
Joint Ventures allow the Group to partially recycle its ini-
tial invested capital when buildings are completed by
the Development Joint Ventures through refinancing of
the invested capital by external bank debt and allows the
Group to re-invest these monies in the continued expan-
sion of the development pipeline, including the further
expansion of the land bank, thus allowing VGP to concen-
trate on its core development activities.
Currently, the development of the buildings within the
Development Joint Ventures has not yet started.
LPM Joint VentureThe LPM Joint Venture is set up as a 50:50 partnership
between VGP and Roozen Landgoederen Beheer, whereby
both partners, in addition to being co-owners, provide
development management services and acts as asset,
property and facility manager (including leasing services)
in respect of the portfolio.
The LPM Joint Venture was established in November
2020 with an objective to develop Logistics Park Moerdijk
together with the Port Authority Moerdijk on a 50:50 basis.
Logistics Park Moerdijk is situated in between the Port of
Rotterdam (the Netherlands) and the Port of Antwerp (Bel-
gium) and is one of the few locations in the Netherlands
where large-scale value-added logistics and value-added
services distribution centres can be developed and built.
The total development land of this park amounts to circa
140 ha with total development potential of ca. 900,000 m²
of lettable area. It is currently foreseen that Logistics Park
Moerdijk will be jointly developed in four different phases
and that the first developments in this park will be initiated
during the fourth quarter of 2022. The objective is to build
a platform of new, grade A logistics and industrial proper-
ties of which 50% (VGP Park Moerdijk) for account of the
LPM Joint Venture (i.e. LPM Holding B.V. and its subsidi-
aries) and the other 50% directly for account of the Port
Authority Moerdijk.
The LPM Joint Venture has the right to sell and VGP the
right to acquire the income generating assets developed
by the LPM Joint Venture.
VGP Park Belartza Joint VentureThe VGP Park Belartza Joint Venture is set up as a 50:50
joint venture with VUSA. The objective of this joint venture
is to provide an additional source of land to the Group for
land plots which would otherwise not be accessible to it.
The VGP Park Belartza Joint Venture aims to develop ca.
35,000 m² of logistics lettable area.
The VGP Park Belartza Joint Venture focuses on the
development of a mixed (logistics/commercial) park
whereby VGP will lead the logistic development and VUSA
will lead the commercial development. The VGP Park
Belartza Joint Venture has the right to sell and VGP the
right to acquire the logistics income generating assets
developed by VGP Park Belartza Joint Venture. VUSA has
the right to acquire the commercial income generating
assets developed by VGP Park Belartza Joint Venture. PAG
E 1
9
—
VG
P N
V A
nn
ua
l R
ep
ort
20
21
/ C
om
pa
ny
Re
po
rt /
Str
ate
gy

VGP Park Siegen Joint VentureThe VGP Park Siegen Joint Venture is set up as a 50:50
joint venture with Revikon. The objective of this joint ven-
ture is to provide an additional source of land to the Group
for land plots which would otherwise not be accessible to
it. The VGP Park Siegen Joint Venture aims to develop ca.
27,000 m² of lettable space.
The VGP Park Siegen Joint Venture focuses on the devel-
opment of a land plot located in Siegen, Germany. The
VGP Park Siegen Joint Venture has the right to sell and
VGP the right to acquire the income generating assets
developed by the VGP Park Siegen Joint Venture.
Sustainability and renewable energy
SustainabilityVGP is focused on continuously optimizing its buildings in
accordance with the demands of the market and the lat-
est technical developments. This means that energy effi-
ciency, sustainability and renewable energy are among the
Group’s top priorities.
Therefore, a high quality and sustainable building stand-
ard is included in the Group’s building protocol, which
also applies to the Joint Ventures. As part of a comprehen-
sive strategy to advance environmentally sustainable solu-
tions for VGP’s tenants and its own operations, VGP has
enhanced its building standard in order to obtain BREEAM
(Building Research Establishment Environmental Assess-
ment Method) “Very Good” certificates (or equivalent) for
all the construction projects since 2020 onwards.
Its multi-criteria approach distinguishes BREEAM
from other methods. The building certification process
evaluates land use, environmental aspects, the build-
ing process, water consumption, waste, contaminations,
transport, equipment and materials, health and com-
fort, alongside energy consumption. Whilst all new-build
projects in the past were already completed as energy
efficient as possible, separately from the certification
process, since January 2020 VGP has ensured that a certi-
fication for BREEAM “Very Good” or equivalent is obtained
for every new building. As from 1 January 2022, VGP strives
to improve the certification of its newly built projects to
BREEAM “Excellent” or equivalent, but with due consider-
ation of any other reasonable elements.
When combined with buildings previously certified, this
has resulted in 4,570,000 m² total lettable area, or 54% of
the total portfolio, being certified or having its certificate
pending as at 31 December 2021. VGP has accomplished
an occupancy rate benchmark above 97% across its port-
folio since 2016 (measured at the end of the respective
year). For VGP a high occupancy rate represents good
business and sustainable use of the buildings created.
Reference is also made to the Corporate Responsibility
Report included in this annual report.
Renewable energyThe VGP renewable energy business line (acting through
its wholly owned subsidiary VGP Renewable Energy NV
and its respective subsidiaries) has been setup by the
Group in 2020 to broaden the ability of the Group to assist
VGP’s tenants or other stakeholders in making their busi-
nesses more sustainable in a cost-effective way. The objec-
tive of the VGP renewable energy business line is to serve
the Group’s tenant base and other stakeholders, by offering
such tenants and other stakeholders an ability to assist
with their green energy transition including (i) an ability
to offer green energy (produced on or off site), (ii) smart
energy management (including use of batteries and smart
local grids), and (iii) offering green electric and hydrogen
charging facilities and infrastructure at VGP parks.
As of 31 December 2021, the roofs of VGP’s building
portfolio enabled a photovoltaic power generation capac-
ity of 74.7 MWp installed or under construction (compared
to 42.5MWp as at 31 December 2020), with additional
74.5 MWp in the pipeline.
Reference is also made to the Corporate Responsibility
Report included in this annual report.
PAG
E 2
0
—
VG
P N
V A
nn
ua
l R
ep
ort
20
21
/ C
om
pa
ny
Re
po
rt /
Str
ate
gy

Development activitiesGreenfield developments are the core activity of the VGP
Group with brown field developments gradually becoming
more important as greenfield developments in some tar-
geted prime locations become increasingly scarce. Devel-
opments are undertaken primarily for the Group’s own
account and to a lesser extent for the Joint Ventures.
The Group pursues a growth strategy in terms of devel-
opment of a strategic land bank which is suitable for the
development of turnkey and ready-to-be-let logistic pro-
jects. The plots are zoned for logistic activities. The man-
agement of VGP is convinced that the top location of the
land and the high-quality standards of its real estate pro-
jects contribute to the long-term value of its portfolio.
The Group concentrates on the sector of logistic and
light industrial accommodation projects situated across
Continental Europe. The Group is active in 14 countries
and aims to expand into other European markets in the
near future.
High quality projects are always developed on the basis of
VGP building standards, with adaptations to meet specifi c
requirements of future tenants but always ensuring multi-
ple purpose use and easy future re-leasability. In their initial
phase of development, some projects are being developed
at the Group’s own risk (i.e., without being pre-let).
The constructions, which respond to the latest modern
quality standards, are leased under long-term lease agree-
ments to tenants which are active in the logistic sector,
including storing but also assembling, reconditioning, final
treatment of the goods before they go to industrial clients
or retailers. The land positions are located in the vicinity of
highly concentrated living and/or production centres, with
an optimal access to transport infrastructure.
Portfolio ancillary services providedThe Group provides property management, asset manage-
ment and facility management services to its portfolio and
the Joint Ventures.
Property management services are exclusively pro-
vided to the Group’s own portfolio and the Joint Ventures
whereby the respective Group property management com-
pany is responsible for managing the proper and undis-
turbed operation of the buildings. As part of its offered
services the VGP property management companies also
provide project management services and leasing services.
The asset management services entail giving advice
and recommendations to the Joint Ventures on the Joint
Ventures’ asset management and strategy, thereby opti-
mising the value of the Joint Ventures’ assets. As part of
the provided services, VGP is responsible for standard
corporate administration, financing, business planning,
reporting, budgeting, management of tax and legal affairs,
controlling, etc.
Facility management services are carried out in the
Czech Republic and Germany by specific dedicated teams
which are focused on managing the proper and undis-
turbed operation of the buildings and performing all
actions such as maintenance services, waste manage-
ment services, maintenance greenery that may be neces-
sary in this respect.
Other services include providing green energy gener-
ated through roof-fixed solar panels, smart energy man-
agement and green electric or hydrogen charging facilities
and infrastructure.


Primary focus on development activities and asset- and property management activities
Key principles of VGP’s investment strategy
Strategically located plots of land
Focus on business parks with a view to realising economies of scale
High quality standardised and sustainable logistic real estate
In-house competences enabling a fully integrated business model
PAG
E 2
3
—
VG
P N
V A
nn
ua
l R
ep
ort
20
21
/ C
om
pa
ny
rep
ort
/ S
tra
teg
y


VGP in 2021

2021 was another successful year for VGP with develop-
ment and leasing activities breaking previous record levels.
Lease activitiesThe strong lease growth resulted in the signing of
€ 74.6 million¹ of new lease contracts (excluding the
renewals of existing lease contract). The growth was
recorded in all markets where the Group is active with
Germany continuing to remain the centre of gravity with
Germany accounting for 50% the total newly signed
leases. The other countries also saw a very strong growth
on the back of the start of the development of new parks.
The Czech Republic strongly rebounded taking 14% of
the signed annualised committed leases growth for its
account. The remaining growth was spread more or less
evenly between the remaining countries i.e. Spain 7%,
Hungary 6%, Romania 5%, Italy 4%, Austria 4%, Portugal
3%, Latvia 3%, Slovakia 3% and the Netherlands 2%.
The signed annualised committed leases increased to
€ 256.1 million² at the end of December 2021 (compared
to € 185.2 million² at the end of 2020) representing a
total of 4,458,000 m² of lettable area. Of this total space
1,913,000 m² belong to the own portfolio (809,000 m² as at
31 December 2020) and 2,545,000 m² to the Joint Ventures
(2,407,000 m² at 31 December 2020).
VGP in 2021
Summary
1 € 66.6 million related to the own portfolio and € 8.0 million related to the Joint Ventures.
2 Including the Joint Ventures at 100%. As at 31 December 2021 the annualised committed leases for the Joint Ventures stood at € 151.1 million
(2020: € 143.5 million).
During the year 2021 VGP signed € 74.6 million of new leases
PAG
E 2
6
—
VG
P N
V A
nn
ua
l R
ep
ort
20
21
/ C
om
pa
ny
Re
po
rt /
VG
P i
n 2
02
1

Development activitiesDuring 2021, 26 buildings were completed totalling
652,000 m² of lettable area which represent an annual-
ised rent income of € 32.0 million. These buildings were
for 99.8% let.
At year-end 50 projects were under construction repre-
senting 1,478,000 m² of future lettable area, which, once
delivered and fully let, will generate € 93.9 million of annu-
alised committed rental income; the portfolio under con-
struction at year-end was 83.8% pre-let1.
Land bank evolutionVGP acquired 4,037,000 m² of new development land
representing a development potential of 1,776,000 m²
and a further 3,981,000 m² of land plots were committed,
pending permits, which have a development potential of
at least 1,685,000 m² of future lettable area, bringing the
total owned and committed land bank to 10,938,000 m²
(+ 43.0% year-over-year), supporting a minimum of
4,983,000 m² of future lettable area.
In addition to the owned and committed land bank,
VGP has signed non-binding agreements (“land under
option”) and is currently performing due diligence inves-
tigations, on an exclusive basis, on the potential acquisi-
tions of in total circa 2,859,000 m² of new land plots with
a development potential of circa 1,304,000 m². This brings
the land bank of owned, committed and under option to
13,797,000 m² supporting circa 6,287,000 m² of future let-
table area.
1 Calculated based on the contracted rent and estimated market rent for the vacant space.
At the end of December 2021 — under construction 1,478,000 m² of lettable area
At the end of December 2021 —
secured land bank10,938,000 m²
with 4,983,000 m² development potential
PAG
E 2
7 —
V
GP
NV
An
nu
al
Re
po
rt 2
02
1 /
Co
mp
an
y R
ep
ort
/ V
GP
in
20
21

VGP team expansionThe in-house team expanded to > 320 people1 as 60 addi-
tional people were hired during the year. In view of the
continued growth VGP expects that it will continue the
expansion of its team but currently expects that this will be
at a more moderate rate.
Strategic partnerships through joint venturesIn December 2021, VGP expanded its strategic partnership
with Allianz and entered into a fourth 50:50 joint venture
with Allianz Real Estate (Fourth Joint Venture). This Fourth
Joint Venture succeeds the First Joint Venture which
reached its investment capacity during the year. (See sec-
tion Strategy for further information)
An eighth closing was made with the First Joint Venture
in which the First Joint Venture acquired 4 logistic build-
ings, including 1 building in 2 new VGP parks and another
2 newly completed buildings (in parks which were previ-
ously transferred to the First Joint Venture),
In order to enable VGP to gain access and acquire land
plots on prime locations for future development, the Group
entered into two additional development joint ventures i.e.
the VGP Park Belartza Joint Venture and the VGP Park Sie-
gen Joint Venture.
Strengthening of capital and financial positionVGP was able to put in place some solid financial founda-
tions to support its current and anticipated future growth
through a mix of strengthening of its capital base and
attracting some long-term bond financing.
In April 2021, VGP successfully issued its first public
benchmark green bond for an aggregate nominal amount
of € 600 million, paying a coupon of 1.50%. p.a. and matur-
ing on 8 April 2029.
In November 2021, VGP successfully completed an offer-
ing of new shares (1,250,000 new shares were issued) for
a total gross consideration of € 300 million (net proceeds:
€ 294.9 million) by means of a private placement via an
accelerated bookbuild offering to international institu-
tional investors.
After year-end (January 2022) VGP successfully issued
its second public benchmark green bonds for an aggre-
gate nominal amount of € 1.0 billion, in two tranches, with
a € 500 million 5-year bond paying a coupon of 1.625% p.a.
and maturing on 17 January 2027 and a € 500 million 8-year
bond paying a coupon of 2.250% p.a. and maturing on 17
January 2030.
Finally, VGP managed to increase and extend the exist-
ing committed credit facilities to an aggregate amount of
€ 200 million. As at 31 December 2021 these credit facili-
ties were undrawn.
Expansion of the Group’s European footprintThe Group further expanded its European footprint with the
acquisition of a fi rst land plot in Serbia, where a 1.1 million m²
land position was acquired near the Belgrade Airport.
The Group has opened its first office in France (Lyon). In
the coming period the focus will be on identifying suitable
development locations. Other continental European coun-
tries, including Sweden, Denmark and Greece, remain in
focus for potential future expansion.
Significant growth in renewable energy generationAt year-end a total solar power generation capacity of
74.7MWp is installed or under construction through
57 roof-projects. This is being realised through a €38.4 mil-
lion investment to date. In addition, the currently identified
pipeline of 37 projects equates to an additional power gen-
eration capacity of 74.5 MWp.
Progress towards VGP’s sustainable development goalsSignificant progress was made towards VGP’s sustainable
development goals and the Group is currently on track to
achieve carbon neutrality by 2025 and 50% gross reduc-
tion by 2030 under scope 1 and 2.
With regards to the sustainable building target, the
Group aims for BREEAM Excellent or equivalent for all
new builds initiated as from 2022 (requirement minimum
BREEAM Very Good).
As of 1 January 2022, all of VGP’s European offices
switched to renewable energy as a Virtual Power Purchase
Agreement was reached with Scholt Energy B.V., the inde-
pendent energy supplier, and ACT Commodities B.V., the
European energy trading house, to provide solar energy
from VGP’s existing solar farm on the roofs of VGP Park
Nijmegen, Netherlands, to VGP offices across Europe. The
agreement covers VGP’s 20 offices across 13 countries.
Additionally, it is envisaged to also include VGP’s new
offices in France and Serbia this year.
Please also refer to the section – Corporate Responsibil-
ity Report.
COVID-19The COVID 19 pandemic did not have any material impact
on the Group’s operations including rent collection. (See
also section Risk factors – 2.6 Risks and uncertainties
linked to the outbreak of a pandemic as COVID-19).
2 On a Full Time Equivalent (FTE) basis.PAG
E 2
8
—
VG
P N
V A
nn
ua
l R
ep
ort
20
21
/ C
om
pa
ny
Re
po
rt /
VG
P i
n 2
02
1

Commercial activities
The increase in demand of lettable area resulted in the
signing of new lease contracts in excess of € 79.7 mil-
lion (own and Joint Ventures’ portfolio) in total of which
€ 74.6 million related to new or replacement leases and
€ 5.1 million related to renewals of existing lease con-
tracts. During the year lease contracts for a total amount
of € 3.7 million were terminated.
The strong lease growth was recorded in all mar-
kets where the Group is active with Germany continuing
to remain the centre of gravity with Germany account-
ing for € 37.3 million (50%) the total newly signed leases.
The other countries also saw a very strong growth on the
back of the start of the development of new parks. The
Czech Republic strongly rebounded taking € 10.2 (13%)
of the signed annualised committed leases growth for
its account. The remaining growth was spread more or
less evenly between the remaining countries i.e. Spain
+ € 5.4 million (7%), Hungary + € 4.2 million (6%), Roma-
nia + € 3.5 million (5%), Italy + € 3.3 million (4%), Austria
+ € 3.2 million (4%), Portugal+ € 3.5 million (3%), Latvia+
€ 1.9 million (3%), Slovakia+ € 2.1 million (3%) and the Neth-
erlands + € 1.1 million (2%)
The annualised committed leases (on an aggregate own
and Joint Ventures’ portfolio basis) therefore increased to
€ 256.1 million¹ at the end of December 2021 (compared to
€ 185.2 million¹ as at the end of December 2020).
The signed lease agreements as at 31 December 2021
represent a total of 4,458,000 m² of lettable area and cor-
respond to 399 different tenants’ lease or future lease
agreements (on an aggregate own and Joint Ventures’
portfolio basis).
The weighted average term of the annualised commit-
ted leases of the combined own and Joint Ventures’ port-
folio stood at 8.6 years at the year-end (8.5 years as at
31 December 2020) and the occupancy rate (own and Joint
Ventures’ portfolio) reached 99.4 % at year-end (compared
to 98.5% at the end of 2020).
Business review
1 Including the Joint Ventures at 100%. As at 31 December 2021 the annualised committed leases for the Joint Ventures stood
at € 151.1 million (2020: € 143.5 million).
TENANT PORTFOLIO BREAKDOWN BY INDUSTRY 31 December 2021 (in m²)
COMMITTED LEASE MATURITY31 December 2021 (in m²)
< 1 year 3%
1–2 years 5%
> 2–5 years 22%
> 5 years 70%
Light industrial 32.3%
Logistics 38.6%
E-commerce 25.2%
Other 3.9%
PAG
E 2
9
—
VG
P N
V A
nn
ua
l R
ep
ort
20
21
/ C
om
pa
ny
Re
po
rt /
VG
P i
n 2
02
1

Own portfolio
During the year 2021 VGP signed new annualised com-
mitted leases in excess of € 66.6 million in total, of which
were all related to new leases. During the year lease con-
tracts for a total amount of € 1.5 million were terminated.
Germany was the main driver of the increases in annu-
alised committed leases with more than € 35.4 million of
new leases signed during the year. The other countries
also performed very well with new leases being signed
in Spain + € 2.9 million, the Czech Republic + € 8.4 mil-
lion, Romania + € 2.7 million, Hungary +€ 3.7 million, Lat-
via + € 1.9 million, Slovakia + € 2.0 million, the Netherlands
+ € 0.7 million, Italy + € 3.3 million, Austria + € 3.2 million,
and finally Portugal + € 2.4 million.
This brings the annualised committed leases to
€ 104.9 million as at 31 December 2021.
The signed lease agreements represent a total of
1,913,000 m² of lettable area and correspond to 123 differ-
ent tenants’ lease or future lease agreements.
The weighted average term of the annualised commit-
ted leases stood at 10.2 years at the year-end (9.6 years to
first break).
Joint Ventures’ portfolio
During the year 2021 VGP negotiated for its Joint Ven-
tures new annualised committed leases in excess of
€ 13.0 million in total of which € 8.0 million related to new
or replacement leases and € 5.0 million to the renewal of
existing leases. During the year lease contracts for a total
amount of € 2.2 million were terminated.
Spain was the main driver of the increases in annual-
ised committed leases with more than € 2.5 million of new
leases signed during the year. In the other countries, new
leases were signed in Germany +€ 1.9 million, the Czech
Republic + € 1.9 million, Romania + € 0.8 million, Hungary +
€ 0.5 million and finally the Netherlands + € 0.4 million.
The signed lease agreements represent a total of
2,545,000 m² of lettable area and correspond to 276 differ-
ent tenants’ lease or future lease agreements.
The weighted average term of the annualised committed
leases stood at 7.4 years at the year-end (7.1 years to first
break).
TENANT PORTFOLIO BREAKDOWN BY INDUSTRY 31 December 2021 (in m²)
TENANT PORTFOLIO BREAKDOWN BY INDUSTRY 31 December 2021 (in m²)
COMMITTED LEASE MATURITY31 December 2021 (in m²)
COMMITTED LEASE MATURITY31 December 2021 (in m²)
Light industrial 22.6%
Logistics 44.5%
E-commerce 26.2%
Other 6.7%
Light industrial 38.9%
Logistics 34.5%
E-commerce 24.6%
Other 2.0%
< 1 year 4%
1–2 years 6%
> 2–5 years 28%
> 5 years 61%
< 1 year 1%
1–2 years 4%
> 2–5 years 13%
> 5 years 82%
PAG
E 3
0
—
VG
P N
V A
nn
ua
l R
ep
ort
20
21
/ C
om
pa
ny
Re
po
rt /
VG
P i
n 2
02
1

Development activities
During 2021, 26 buildings were completed totalling
652,000 m² of lettable area which represent an annualised
rent income of € 32.0 million. These buildings were for
99.8% let.
At year-end 50 projects were under construction repre-
senting 1,478,000 m² of future lettable area, which, once
delivered and fully let, will generate € 93.9 million of annu-
alised committed rental income; the portfolio under con-
struction at year-end was 83.8% pre-let¹.
COMPLETED31 December 2021 (in m²)
RENT POTENTIAL 31 December 2021 (in €)
NUMBER OF PROJECTS COMPLETED31 December 2021
UNDER CONSTRUCTION31 December 2021 (in m²)
RENT POTENTIAL31 December 2021 (in €)
NUMBER OF PROJECTS UNDER CONSTRUCTION 31 December 2021
1 Calculated based on the contracted rent and estimated market rent for the vacant space.
652,000 m²
26 projects
1,450,000 m²
50 projects
€ 32.0 million99.8% let
€ 93.9 million83.8% already contracted
Germany 40%
Czech Republic 15%
Spain 10%
Netherlands 7%
Slovakia 9%
Romania 6%
Italy 9%
Portugal 4%
Germany 42%
Czech Republic 14%
Spain 11%
Netherlands 6%
Slovakia 7%
Romania 5%
Italy 11%
Portugal 4%
Germany 8
Czech Republic 5
Spain 4
Netherlands 1
Slovakia 1
Romania 2
Italy 4
Portugal 1
Germany 53%
Czech Republic 9%
Spain 9%
Netherlands 7%
Latvia 3%
Slovakia 6%
Romania 7%
Hungary 4%
Austria 2%
Germany 61%
Czech Republic 7%
Spain 7%
Netherlands 5%
Latvia 4%
Slovakia 4%
Romania 5%
Hungary 3%
Austria 4%
Germany 21
Czech Republic 6
Spain 6
Netherlands 2
Latvia 2
Slovakia 3
Romania 4
Hungary 4
Austria 2
Completed during the year 2021 Incl. Joint Ventures at 100%
Under construction as at 31 December 2021Incl. Joint Ventures at 100%
PAG
E 3
1 —
V
GP
NV
An
nu
al
Re
po
rt 2
02
1 /
Co
mp
an
y R
ep
ort
/ V
GP
in
20
21

Own portfolio
As at 31 December 2021 the investment property port-
folio consists of 29 completed buildings representing
766,000 m² of lettable area.
During the year 26 buildings were completed total-
ling 652,000 m² of lettable area (of which 5 buildings –
235,000 m² for account of the Joint Ventures).
For its own account VGP delivered 21 buildings i.e. In
Germany: 1 building of 80,200 m² in VGP Park Göttingen
2, 1 building of 26,800 m² in VGP Park Halle, 1 building of
41,600 m² in VGP Park Magdeburg, 3 buildings in VGP Park
Laatzen totalling 72,300 m² and 1 building of 26,300 m²
in VGP Park Erfurt. In Italy: 1 building of 23,300 m² in VGP
Park Calcio, 1 building of 12,000 m² in VGP Park Sordio
and 2 buildings in VGP Park Padova totalling 22,500 m². In
Spain: 1 building of 25,400 m² in VGP Park Valencia Cheste
and 1 building of 22,500 m² in VGP Park Zaragoza. In the
Czech Republic: 2 buildings in VGP Park Prostejov totalling
40,200 m² and 1 building of 28,900 m² in VGP Park Vyskov.
In Romania: 1 building of 30,800 m² in VGP Park Timisoara
2 and 1 building of 9,600 m² in VGP Park Brasov. In other
countries: 1 building of 57,300 m² in VGP Park Bratislava
(Slovakia), 1 building of 42,800 m² in VGP Park Nijmegen 2
(the Netherlands), and finally 1 building of 29,800 m² in
VGP Park Santa Maria da Feira (Portugal).
The occupancy rate of the own portfolio reached 99.3%
at the end of 2021 (compared to 100% at the end of 2020).
At the end of December 2021 VGP has 50 buildings (of
which 10 buildings on behalf of the Joint Ventures) under
construction. The new buildings under construction,
which are already pre-let for 83.8%¹, represent € 93.9 mil-
lion of annualised rental income when fully built and let.
For its own account VGP had therefore 40 buildings
under construction totalling 1,244,000 m² of lettable area
representing € 70.8 million annualised rental income when
fully built and let. These projects under construction are
located in Czech Republic: 1 building in VGP Park Olo-
mouc, 1 building in VGP Park Hradek and Nisou 2, 1 build-
ing in VGP Park Ceske Budejovice and 2 buildings in VGP
Park Kladno. In Latvia: 1 building in VGP Park Riga and
1 building in VGP Park Tiraines. In Romania: 1 building in
VGP Park Sibiu, 1 building in VGP Park Brasov, 1 building
in VGP Park Arad and 1 building in VGP Park Bucharest. In
Hungary: 1 building in VGP Park Kecskemet, 1 building in
VGP Park Gyor Beta and 1 building in VGP Park Budapest
Aerozone. In Slovakia: 3 buildings in VGP Park Bratislava.
In Germany: 1 building in VGP Park Halle, 3 buildings in
VGP Park Gießen Am Alten Flughafen, 2 buildings in VGP
Park Magdeburg, 1 building in VGP Park Laatzen, 3 build-
ings in VGP Park Oberkraemer, 1 building in VGP Park
Rostock, 1 building in VGP Park Leipzig Flughafen and
1 building in VGP Park Berlin. In Spain: 1 building in VGP
Park Fuenlabrada, 1 building in VGP Park Valencia Cheste,
2 buildings in VGP Park Zaragoza, 1 building in VGP Park
Dos Hermanas and 1 building in VGP Park Granollers. In
the Netherlands: 2 buildings in VGP Park Nijmegen and
finally in Austria: 2 buildings in VGP Park Graz.
REMAINING DEVELOPMENT LAND – OWN 31 December 2021 (in m²)
TOTAL COMPLETED AND PIPELINE – OWN 31 December 2021 (in m²)
REMAINING DEVELOPMENT POTENTIAL – OWN31 December 2021 (in m²)
1 Calculated based on the contracted rent and estimated market rent for the vacant space.
Source: Company information.
Note: The above figures relate to the current secured land bank. The development
potential has been calculated by reference to existing or similar developed logistic
projects.
Germany 19%
Czech Republic 8%
Spain 7%
Netherlands 3%
Slovakia 9%
Romania 15%
Hungary 10%
Italy 10%
Austria 3%
Portugal 4%
Serbia 12%
Germany 43%
Czech Republic 10%
Spain 10%
Netherlands 7%
Latvia 7%
Slovakia 7%
Romania 7%
Hungary 4%
Italy 3%
Austria 1%
Portugal 1%
Germany 21%
Czech Republic 7%
Spain 8%
Netherlands 4%
Slovakia 8%
Romania 16%
Hungary 9%
Italy 9%
Austria 3%
Portugal 4%
Serbia 11%
PAG
E 3
2
—
VG
P N
V A
nn
ua
l R
ep
ort
20
21
/ C
om
pa
ny
Re
po
rt /
VG
P i
n 2
02
1

Joint Ventures
As at 31 December 2021 the investment property port-
folio consists of 122 completed buildings representing
2,326,000 m² of lettable area with another 10 buildings
being developed by VGP, on behalf of the Joint Ventures,
representing 235,000 m² of lettable area.
For the Joint Ventures, VGP completed 5 buildings (in
total 59,500 m²) i.e. in the Czech Republic: 1 building of
23,300 m² in VGP Park Olomouc, 1 building of 5,800 m²
in VGP Park Plzen. In the other countries: 1 building of
11,000 m² in VGP Park Wustermark (Germany) and 2 build-
ings in VGP Park San Fernando de Henares (Spain) total-
ling 19,400 m².
The occupancy rate of the own portfolio reached 99.4%
at the end of 2021 (compared to 99.3% at the end of 2020).
At the end of December 2020 VGP is constructing
10 new buildings on behalf of the Joint Ventures, totalling
235,000 m² of lettable area. These buildings represent
€ 23.1 million of annualised rental income when fully built
and let.
The buildings under construction are located in Ger-
many: 2 buildings in VGP Park Leipzig and 6 buildings in
VGP Park München. In the other countries: 1 building in
VGP Park Chomutov (Czech Republic) and 1 building in
VGP Park Alsonemedi (Hungary).
REMAINING DEVELOPMENT LAND – JV 31 December 2021 (in m²)
TOTAL COMPLETED AND PIPELINE – JV 31 December 2021 (in m²)
REMAINING DEVELOPMENT POTENTIAL – JV31 December 2021 (in m²)
Source: Company information.
Note: The above figures relate to the current secured land bank. The development
potential has been calculated by reference to existing or similar developed logistic
projects.
Germany 56%
Czech Republic 21%
Spain 7%
Netherlands 4%
Slovakia 3%
Romania 4%
Hungary 3%
Italy 1%
Austria 1%
Germany 7%
Czech Republic 3%
Spain 9%
Netherlands 79%
Slovakia 1%
Hungary 1%
Germany 12%
Czech Republic 3%
Spain 9%
Netherlands 73%
Slovakia 2%
Hungary 1%
PAG
E 3
3
—
VG
P N
V A
nn
ua
l R
ep
ort
20
21
/ C
om
pa
ny
Re
po
rt /
VG
P i
n 2
02
1

Land bank evolution
In 2021, VGP acquired 4,037,000 m² of new development
land. Of these land plots, 309,000 m² (8%) are located in
Germany, 212,000 m² (5%) are located in the Czech Repub-
lic, 537,000 m² (13%) are located in Spain, 220,000 m²
(5%) are located in the Netherlands, 182,000 m² (5%) are
located in Latvia, 353,000 m² (9%) are located in Slova-
kia, 250,000 m² (6%) are located in Romania, 468,000 m²
(12%) are located in Hungary, 219,000 m² (5%) are located
in Italy, 120,000 m² (3%) are located in Austria, 27,000 m²
(1%) are located in Portugal and 1,140,000 m² (28%) are
located in Serbia. These new land plots have a develop-
ment potential of 1,776,000 m² of future lettable area.
Besides this, VGP had another 3,981,000 m² of com-
mitted plots of land as at 31 December 2021, which are
located in Germany, the Czech Republic, the Nether-
lands, Spain, Slovakia, Romania, Hungary, Italy, Austria
and Portugal. These land plots allow for the development
of approx. 1,685,000 m² of new projects. It is currently
expected that these remaining land plots will be acquired,
subject to permits, during the next 12 to 24 months.
As a result, VGP (own and Joint Ventures’portfolio)
has a remaining secured development land bank of
10,938,000 m² as at 31 December 2021 (+ 43% year-on-
year) of which which 64% or 6,957,000 m² in full ownership.
The own portfolio has a remaining secured development
land bank of 9,833,000 m² as at 31 December 2021, of
which 60% or 5,852,000 m² in full ownership. This secured
land bank allows VGP to develop – in addition to the cur-
rent completed projects and projects under construction
(totalling 2,009,000 m²) – a further 4,329,000 m² of lettable
area of which 894,000 m² (20.7%) in Germany, 303,000 m²
(7.0%) in the Czech Republic, 337,000 m² (7.8%) in Spain,
181,000 m² (4.2%) in the Netherlands, 14,000 m² (0.3%) in
Latvia, 367,000 m² (8.5%) in Slovakia, 697,000 m² (16.1%) in
Romania, 373,000 m² (8.6%) in Hungary, 371,000 m² (8.6%)
in Italy, 136,000 m² (3.1%) in Austria, 169,000 m² (3.9%) in
Portugal and 487,000 m² (11.2%) in Serbia.
The Joint Ventures have a remaining owned land bank
(all fully owned) of 1,105,000 m² as at 31 December 2021,
of which 73% is located in the Netherlands. This land bank
allows the Joint Ventures to develop – in addition to the
current completed projects and projects under construc-
tion (totalling 2,561,000 m²) – a further 654,000 m² of letta-
ble area of which 48,000 m² (7.3%) in Germany, 18,000 m²
(2.8%) in the Czech Republic, 58,000 m² (8.9%) in Spain,
515,000 m² (78.8%) in the Netherlands, 10,000 m² (1.5%) in
Slovakia and 5,000 m² (0.8%) in Hungary.
In addition to the owned and committed land bank,
VGP has signed non-binding agreements and is currently
performing due diligence investigations, on an exclu-
sive basis, on the potential acquisitions of in total circa
2,859,000 m² of new land plots with a development poten-
tial of 1,304,000 m².
REMAINING LAND BANK EVOLUTION 31 December 2021 (in m²)
* Joint Ventures hold 1,105,000 m² in full ownership as at 31 Dec-21 (73% located in the Netherlands)PAG
E 3
4
—
VG
P N
V A
nn
ua
l R
ep
ort
20
21
/ C
om
pa
ny
Re
po
rt /
VG
P i
n 2
02
1

Capital and financial position
During 2021, VGP took advantage of favourable capital
markets environment and financing conditions to continue
improving VGP’s capital structure.
Further strengthening of capital
In November 2021, VGP increased its capital by success-
fully completing an offering of new shares for a total gross
consideration of € 300 million (net proceeds: € 294.9 mil-
lion) by means of a private placement via an accelerated
bookbuild offering to international institutional investors.
The capital increase consisted of 1,250,000 new shares
at an issue price of € 240 per share. Following this issu-
ance VGP has now in total 21,833,050 of issued shares.
Financing
2021In April 2021, VGP successfully issued its first public
benchmark green bond for an aggregate nominal amount
of € 600 million, paying a coupon of 1.50%. p.a. and matur-
ing on 8 April 2029.
During the last quarter of the year VGP extended and
increased its committed credit facilities. In November
2021 the existing € 75 million KBC revolving credit facil-
ity was extended to 31 December 2026 and the Belfius
revolving credit facility was increased to € 75 million and
also extended to 31 December 2026. A new 3-year revolv-
ing credit facility with BNP Paribas Fortis was entered into
for an amount of € 50 million. All of these aforementioned
committed credit facilities are unsecured and remained
undrawn at year-end.
Finally, the existing € 25 million JP Morgan revolving
credit facility with initial expiry date at 8 November 2022
was terminated as at 31 December 2021.
As a result, the Group’s main source of funding as at
31 December is composed of bonds (€ 1,320.0 million1
as at 31 December 2021). Besides bonds, the Group is
financed by the Schuldschein Loans (€ 33.5 million¹ as at
31 December 2021) and to a lesser extent by bank debt pro-
vided by Swedbank in Latvia (€ 19.0 million as at 31 Decem-
ber 2021). In addition, VGP has undrawn committed
facilities totalling € 200 million as at 31 December 2021.
At 31 December 2021, the only debt maturity falling due
within 12 months is the € 19.0 million Swedbank secured
bank loan which matures on 31 March 2022 and € 4.5 mil-
lion of Schuldschein loans which fall due in October 2022.
The weighted average maturity of the gross borrowings
of the Group was 4.6 years (31 December 2020: 3.7 years)
and average cost of debt (excluding commitment fees)
was 2.55% (31 December 2020: 3.36%).
Financing after year-endAfter year-end (January 2022) VGP successfully issued its
second public benchmark green bonds for an aggregate
nominal amount of € 1.0 billion, in two tranches, with a
€ 500 million 5-year bond paying a coupon of 1.625% p.a.
and maturing on 17 January 2027 and a € 500 million 8-year
bond paying a coupon of 2.250% p.a. and maturing on
17 January 2030.
Maturity profile as at 31 December 2021 (on a pro forma basis)When taking the gross borrowings as at 31 December 2021
adjusted for the bonds issued in January 2022, we find fol-
lowing financial debt maturity profile on a pro forma basis.
The weighted average maturity of the gross borrowings
of the Group on a pro forma basis is 5.4 years (31 Decem-
ber 2021: 4.6 years) and average cost of debt (exclud-
ing commitment fees) on a pro forma basis is 2.29%
(31 December 2021: 2.55%).
MATURITY PROFILE FINANCIAL DEBT – PRO FORMA31 December 2021 (in € million)
1 Excluding capitalised finance costs.
Bonds
Schuldschein
Bank debt
Bond issued in Jan 22
PAG
E 3
5
—
VG
P N
V A
nn
ua
l R
ep
ort
20
21
/ C
om
pa
ny
Re
po
rt /
VG
P i
n 2
02
1

CEE + France, Germany, Italy, Netherlands, Portugal, France and Spain – Key market indicators
General market overview1
1 Source: Jones Lang LaSalle – 2021 Industrial Investment Report CEE & Western Europe – February 2022
Source: JLL Research, January 2022
WAREHOUSING
PRIME RENTm² per annum
RENTAL CHANGEy-o-y (%)
PRIME YIELD(%)
YIELD CHANGEy-o-y (bp)
Amsterdam € 87.5 2.9 3.1 – 50.0
Barcelona € 84.0 2.9 3.8 – 70.0
Berlin € 66.0 0.0 3.0 – 32.0
Bratislava € 72.0 22.0 5.3 – 75.0
Budapest € 57.0 0.0 5.8 – 115.0
Bucharest € 48.0 -2.4 7.8 – 25.0
Frankfurt/M € 78.0 4.8 3.0 – 32.0
Lisbon € 72.0 0.0 5.8 0.0
Madrid € 71.0 7.6 3.8 – 70.0
Milan € 57.0 0.0 3.6 – 85.0
Munich € 90.0 5.6 3.0 – 32.0
Paris € 61.0 10.9 3.3 – 50.0
Prague € 69.0 21.1 4.3 – 100.0
Warsaw € 46.0 0.0 4.3 – 125.0
PAG
E 3
6
—
VG
P N
V A
nn
ua
l R
ep
ort
20
21
/ C
om
pa
ny
Re
po
rt /
VG
P i
n 2
02
1

The breakdown of volumes for 2021 is as follows:
Source: JLL Research, January 2022
COUNTRY 2021 VOLUME€ million
2020 VOLUME€ million
2019 VOLUME€ million
2018 VOLUME€ million
Poland 6,400 5,370 7,750 7,200
Czech Republic 1,640 1,500 3,100 2,510
Romania 900 900 680 950
Slovakia 760 520 720 820
Hungary 1,300 1,240 1,740 1,840
Total CEE 11,000 9,530 13,990 13,320
France 25,800 28,200 39,160 31,840
Germany 110,700 81,600 91,900 79,000
Spain 12,100 9,110 15,360 12,080
Portugal 2,020 2,580 3,060 3,260
The Netherlands 18,400 15,900 16,360 18,690
Italy 9,670 8,340 11,380 8,710
Grand Total 178,690 145,730 177,220 153,580
PAG
E 3
7 —
V
GP
NV
An
nu
al
Re
po
rt 2
02
1 /
Co
mp
an
y R
ep
ort
/ V
GP
in
20
21

Western Europe
Focus on Germany
As expected, the German investment market concluded
2021 with a record result, a total transaction volume
(including the residential segment) of €111 billion, up 36%
on the 2020 result. €77 billion worth of real estate changed
hands in the second half of the year alone. While the
record result demonstrates the attractiveness of the Ger-
man market across all segments, it is still evidence of a
lack of higher-yielding alternatives. Nonetheless, one thing
is certain, all issues that brought uncertainty to the market
in 2021 including the Coronavirus, supply bottlenecks, ris-
ing inflation, sustainability and the future of (office) work,
remain unresolved in 2022.
The biggest question mark at the moment is still infla-
tion which, according to the Federal Statistical Office,
reached 5.3% in December. Not only was this an annual
high, but it was also the highest level recorded since June
1992. For 2021 as a whole, the inflation rate rose by 3.1%.
However, there will not be a return to times of near-zero
inflation any time soon. While the losses caused by the
pandemic were too severe for many companies, they will
try to compensate for lost sales in part through higher
prices, according to the ifo Institute, more companies than
ever in Germany plan to raise their prices. Conversely, the
economy remains on a growth path which is also driving
up prices. The European Central Bank (ECB) will also con-
tinue its expansionary monetary and fiscal policy, albeit at
a slower pace, although, in view of the current economic
situation and the national debt, it is not yet in a position to
increase interest rates again.
Capital pressure from investors will remain high in the
coming years and increase further. Over the next four
years, German government bonds with a total volume of
almost €1 trillion will mature. Even if interest rates rise by
then, part of this capital will be reinvested in real estate.
At present, capital-raising activities are running very suc-
cessfully and as the pandemic subsides, additional inter-
national capital will flow into the German market. There is
currently some catch-up potential here.
Source: JLL, January 2022
€52.2 billion, or around 47% of the total transaction vol-
ume, was invested in residential real estate, nursing
homes or student accommodation. Office properties
follow with a share of almost 25% (€27.5 billion) and an
increase of no less than 12% compared to 2020.
TRANSACTION VOLUME IN GERMANY (€mn) 2018 2019 2020 2021 19–20 % 20–21 %
Single assets 50,700 56,800 44,000 52,600 -23% 20%
Portfolios 28,300 35,000 37,600 58,500 7% 55%
Total 79,000 91,800 81,600 111,100 -11% 36%
PAG
E 3
8
—
VG
P N
V A
nn
ua
l R
ep
ort
20
21
/ C
om
pa
ny
Re
po
rt /
VG
P i
n 2
02
1

Logistics still has a lot of growth potential in storeLogistic properties have continued to develop dynamically
in the shadow of the two dominant real estate segments.
With a total of €10.2 billion (share of 9.3%), more capital
than ever before has flowed into distribution, production
and warehousing facilities. In addition to further surges in
demand from the eCommerce, healthcare and life science
segments, JLL expects that production sites will move
closer to Germany as the market place, thereby optimising
the generally global supply chains. Whether production
will be reshored to Germany itself remains to be seen, but
in view of recent production issues, globally networked
industrial companies in particular will build up strategic
buffers to better withstand temporary supply chain disrup-
tions. There is still significant growth potential here.
With a volume of €70.7 billion, the Big 7 cities accounted
for 64% of the total transaction volume, which corre-
sponds to 75% growth compared to 2020. Berlin has
significantly expanded its dominance as a national and
international investment destination. More than € 37 bil-
lion flowed into real estate in the German capital, a three-
fold increase compared to 2020. Although residential
investors in particular focused on Berlin, there were also
a number of high-volume transactions in other real estate
segments. The other six strongholds pale in the statistics
compared to Berlin, but it should nevertheless be noted
that the transaction volume in Cologne grew by 160% to
€4.5 billion and that Stuttgart, Munich and Frankfurt also
achieved an increase in their annual results. Only Ham-
burg and Düsseldorf were unable to match their 2020 per-
formance. While the transaction volume in the Hanseatic
city declined only moderately by 9% to €6.2 billion, in Düs-
seldorf the result was just €2.9 billion, down 23% on the
previous year.
Prime yields continue to decline moderatelyDespite the continuing risks related to global political
and economic developments, yields for most real estate
segments continued to fall at the end of 2021. The larg-
est decline was observed in food-anchored retail parks,
where yields fell by a further 25 bps in the final quarter of
2021, to 3.50%. Despite difficult conditions, prime yields
for high-street retail properties have remained stable over
the year at an average of 2.91% across the Big 7. In addi-
tion to food-specific properties, logistic properties were
among the winners in terms of value last year. Overall,
yields have fallen by 35 bps since the end of 2020 to their
current level of 3.03%. Given the volume of the capital that
has flowed into this real estate segment, a price increase
would not be surprising. We expect this dynamic trend to
continue and forecast yields of below 3.00% for 2022. The
most expensive investment product in the market remains
the premium office property. The average yield for such
properties fell by 17 bps over the year and now stands at
2.64% across the Big 7. Given the discussions surrounding
the future of work and therefore the future of offices, this
development may come as a surprise; however, after an
initial consolidation period, the widely held view is that the
office will retain its role as a central place of work, and ris-
ing new take-up figures bear this out.
Rental prospects justify further declining yields
Although capital pressure, competition and therefore
prices for top products will continue to rise, there is no
sign of a bubble forming. In simple terms, there is a lack of
product, especially in the office and logistics segments,
which is keeping the pressure on rents high. Since rising
rents are realistic, lower yields are therefore also justified
and this situation will only change again once the product
pipeline has caught up.
TRANSACTION VOLUME GERMANY BY TYPE OF USE
*Other: Hotels, Sites, Special Properties
Source: JLL, January 2022
Office 30%
Living 31%
Retail 13%
Logitics/Industrial 11%
Mixed 10%
Other 5%
Office 25%
Living 47%
Retail 8%
Logitics/Industrial 9%
Mixed 5%
Other 6%
2020: 81.5 €bn
2021: 111.1 €bn

Focus on Spain
Economic activity in Spain has rebounded during 2021.
In the fourth quarter, the Spanish economy grew by 1.7%,
according to data from Oxford Economics, driven by private
consumption, bringing annual GDP growth to 4.9%. The
restrictions resulting from the sixth wave of the coronavi-
rus have slightly lowered the growth expectations forecast
a few months ago. By 2022, GDP will grow by 5.5% and is
expected to be back to pre-pandemic levels by early 2023.
During the month of December, inflation rose to 6.7%
year-on-year, driven mainly by the increase in energy
prices, which was also felt in the shopping basket. This is
the highest figure in three decades and could affect pri-
vate consumption. Inflation is expected to start moderat-
ing in the second half of the year.
The volume of logistics investment in 2021 reached
around € 2.35 billion, an increase of 65% compared to
2020. This is the best investment volume figure since 2017
(as in previous years the cumulative volume was around
€ 1.4–1.6 billion) and also the highest year-on-year growth
in the last five years.
In 2021, investor interest has continued to grow in the
logistics sector, which has led to a continued compres-
sion of prime yields throughout the year, reaching 3.8% in
both Madrid and Barcelona, reflecting a decline of 70 basis
points compared to the end of 2020 in both markets and
a decline of 25 basis points in the quarterly comparison.
As a result, prime yields in logistics are at the lowest lev-
els ever recorded by the sector and for the first time below
4%. Yield compression and the resilience of prime rents
have driven up capital values in the last year, increasing by
around 28% in Madrid and 22% in Barcelona by the end
of 2021. By 2022, yields are expected to continue to com-
press due to the weight of investor demand and rental
growth expectations, albeit more moderately than in 2021.
Capital values will continue their upward trend, but will
also moderate their growth.
The results of JLL’s recent study on the Future of Global
Logistics Real Estate suggest that the current growth
of the logistics sector is likely to continue in the coming
years, with a positive outlook on the fundamentals that will
drive user and investor demand. E-commerce will continue
to be a key driver of logistics demand, although growth is
also expected to be strong in other industry sectors such
as express parcel delivery, Third Party Logistics (3PL),
Healthcare & Life Sciences and Construction & Materi-
als. The market will be increasingly demanding in terms of
quality, efficiency and sustainability criteria for logistics
assets. In turn, smart technologies and automation and
robotics are expected to have the biggest impact on ware-
house design and operations in the next five years.
INVESTMENT VOLUME AND PRIME YIELDS IN SPAIN
Investment volume Spain
Madrid prime yield
Barcelona prime yield
Source: JLL EMEA, January 2022
PAG
E 4
0
—
VG
P N
V A
nn
ua
l R
ep
ort
20
21
/ C
om
pa
ny
Re
po
rt /
VG
P i
n 2
02
1

Focus on the Netherlands
Instead of loosening the anti-pandemic measures, the
Netherlands headed into another hard lockdown in
November 2021, which lasted until almost the end of Janu-
ary 2022. However, the recently released fourth-quarter
economic growth results produced a surprising 0.9%
quarter-on-quarter growth. This was better than expected,
as investment expanded significantly, household con-
sumption barely fell, and imports dropped. Specialised
business services and manufacturing provided most of the
expansion. Obviously, risks concerning possible new Covid
variants are still present, but for now, there are plenty of
reasons to stay optimistic. Even though the Netherlands
ended its lockdown on 26 January, it is expected that the
Dutch government will reduce Covid containment meas-
ures even more on 28 February. This may boost household
consumption further, up to the point that it may surpass
its pre-pandemic peak soon. GDP is forecast to grow by
3.3% in 2022 and 2.6% in 2023, which is supported by the
fiscal policy of the new government that will keep elevated
inflation from falling back to pre-pandemic levels. Headline
inflation surged further to 6.4% y/y in January 2022, which
was the highest in 40 years, primarily due to gas prices
pushing energy price inflation to over 58%. The reason is
that the Dutch economy is heavily dependent on natu-
ral gas and has a high pass-through of prices to consum-
ers. The ongoing pandemic and the geopolitical crisis in
Ukraine mean that energy price inflation will remain at a
high level for some time. To offset the impact on real dis-
posable incomes, the government cut household energy
taxes on 1 January 2022.
The investment market remained resilient during
the last quarter of the year, though total volume in Q4
2021 decreased 20% compared to the remarkable last
quarter of 2020, just before the real estate transfer tax
changed. This tax increased the percentage of tax to be
paid from 6% to 8% for all sectors except residential,
which increased from 2% to 8%. However, the strength
of Q3 coupled with multiple large office transactions
in Q4 2021 led to the y-o-y decrease of less than 1%. As
expected, the fourth quarter of the year was the strongest,
with an investment volume of € 6.5 billion.
Unlike the previous four quarters, the office sector was
the most dominant sector in Q4 2021, reaching nearly
€ 2.5 billion, double the volume from Q4 2020. When con-
sidering the entire year, the industrial sector remained on
top, totaling € 5.7 billion. The office and industrial sectors
totaled 57% of the transaction volume.
The bounce back for the offices market mostly occurred
within the big 5 cities, and large volumes were also wit-
nessed within science parks, providing further evidence
for growing interest in this sector. Substantial industrial
investments took place in the Amsterdam and Rotterdam
regions, and notably in the region of Noord-Limburg.

Given the increased rent levels in premium CBD offices
in the G5 cities, we expect investor appetite to remain in
this sector. Interest in the healthcare sector will also per-
sist, and given the rental growth witnessed in the last mile
and logistics markets, investor demand is expected to con-
tinue to grow.
Given the unforeseen challenges throughout 2021, the
Dutch investment market remained resilient and attrac-
tive to investors. A slightly subdued first quarter may be
observed, but as restrictions ease, we expect interest from
domestic and international investors to continue.
Logistics investment reached € 1.3 billion in 2021 Q4
alone, making the total volume in 2021 almost €4 billion.
This is the highest investment volume in logistics real
estate ever. The largest deal in the last quarter of 2021 is
the sale of SmartlogMaasvlakte from DHG to Patrizia for
€ 230 million.
Prime net initial yields are continuing to drop in the
Netherlands and currently stand at 3.1%. Slight yield com-
pression is expected; however, stabilization of the prime
yield is near.
The last quarter of 2021 has shown again just how strong
the logistics market is. It is expected that supply will further
decrease, and that more creative solutions are required.
One of the problems that occupiers of distribution
warehouses are facing is finding the right staff. This has
become increasingly more difficult. Continued labor short-
ages have caused acceleration towards automation and
robots in warehousing and transport to reduce reliance
on people. Implementation of robotics and automation
in logistics buildings have an impact on specification of
buildings and their location.
This would also mean that here is a growing need for
adequate power supply, which is already a challenge. For
example, automation can lead to greater productivity per m²
and therefore, could lead to a lower m² demand. Moreover,
in many cases today, the choice of location is a compro-
mise between the availability of labor and proximity to the
end user. In a world of automation, the proximity to the end
user will become leading, allowing customers to off er faster
delivery times and optimize transportation costs.
Source: JLL EMEA, January 2022
Source: JLL EMEA, January 2022
INVESTMENT VOLUME AND PRIME YIELDS IN THE NETHERLANDS
Office
Living
Industrial
Retail
Hotel
Helthcare
Alternatives
Mixed-use
PAG
E 4
2
—
VG
P N
V A
nn
ua
l R
ep
ort
20
21
/ C
om
pa
ny
Re
po
rt /
VG
P i
n 2
02
1

Focus on Italy
The Italian economy accelerated in the second part of
2021 and grew by 6.5% in 2021, considerably higher than
previous forecasts. Italy’s GDP is expected to reach its pre-
pandemic level by mid-2022, slightly later than European
pairs. While COVID infections surged in the first weeks of
2022, high vaccination rates are likely to prevent a signifi-
cant tightening of containment measures and real output
from contracting in the early months of this year.
Driven by energy prices, HICP inflation increased signifi-
cantly in the second half of 2021 and averaged 1.9% over
the whole year. Energy prices are expected to peak in the
first quarter of 2022 and are set to remain at elevated lev-
els throughout the year, with higher energy costs likely to
further push up food prices. Inflation is set to rise to 3.8%
this year, before falling back to 1.6% in 2023
In Italy, 2021 recorded 214 investments deals for a total of
around € 9.8 billion, up by 18% on 2020. Logistics sector
confirmed as the most dynamic investment category in
terms of volumes, amounting to € 2.9 billion (+81% y-o-y).
It is the best result in the last ten years for investment into
logistics sector. Both investors with a long--standing pres-
ence in the market and major European and global prop-
erty companies are looking at Italy as a high potential new
European logistics destination. Investors also showed con-
fidence in the office sector which totaled at €2.7 billion,
supported by strong occupational market with office take-
up growing by 28% y-o-y in Milan and 13% y-o-y in Rome.
In terms of transactions, in total there were recorded
62 deals out of which were 22 portfolio transactions.
In 2021, industrial rental levels remained mostly stable
while prime yield registered sharp compression driven by
abudance of liquidity in most locations.
The abundance of liquidity from European and Global
investors, targeting product across the risk profile curve
has pushed yields downwards with a strong premium for
a combination of asset quality, location, covenant and
security of income. In Q4 2021, prime logistics yields
sharply compressed by 85 bps y-o-y reaching 3.60%;
prime rents reached € 4.75/m²/month due to supply-
demand discrepancy.
Source: JLL EMEA, January 2022
YIELDS IN ITALY (in %)
Industrial & logistics
Office
Retail parks
Shopping centres
High street Retail – Milan
PAG
E 4
3
—
VG
P N
V A
nn
ua
l R
ep
ort
20
21
/ C
om
pa
ny
Re
po
rt /
VG
P i
n 2
02
1

Focus on Portugal
Although the Portuguese economy got negatively affected
by the pandemic over the past 2 years, the policy response
and the progress in vaccination is triggering a fast and
sustainable recovery mainly driven by domestic demand
and boosted by EU funds. In spite of the fact that GDP
decreased 8.4% in 2020, it sprang back stronger than
expected in the last two quarters of the year due to private
consumption. Therefore forecasts point out for a GDP
growth of 4.8% in 2021 and 5.8% in 2022, surpassing pre
crisis level around mid-2022, while tourism industry is
recovering and consumer confidence improves.
One of the most important factors to boost the Portuguese
economy are the grants from the EU Recovery and Resil-
ience Plan, the so called RRF, which is expected to amount
1.3% of the GDP in 2022 and 1.5% of the GDP in 2023.
Although the wave of restrictions and lockdowns
resulting from the Covid-19 outbreak has hampered the
investment market, 2021 turnover volume has reached
€ 2.02 bln. with a very positive performance. Invest-
ment turnover has surpassed the threshold of € 3 bln. in
2018 and 2019, which have been record years. 2020 has
recorded a backdrop which was explained by the pan-
demic effect although surpassing the € 2.7 bln. edge due
to a first quarter that exceeded € 1.4 bln. Despite the head-
winds throughout 2021, volatility in equity market and
low fixed income returns have highlighted the value of
property, as liquidity is high and total turnover stood at
€ 2.02 bln. (28% decrease y-o-y).
Retail and Office were the traditional focus of investment
accounting on average for c. 60% of the total turnover over
the past 6 years. In 2021 Offices are still the main sector,
representing 40% of the total investment volume. Retail
has a weight of only 10%, totaling €212 million of which
more than a half concentrated in food retail, followed by
high street retail transactions and 3 shopping centres,
including the Saldanha Residence. Hotels represent 15%
of the turnover due to some important transactions in the
Algarve, such as the Tivoli Marina Vilamoura & Tivoli Car-
voeiro and Vilalara Thalassa Resort Algarve, the Oporto
Palacio Hotel and the Intercontinental Estoril.
Despite the headwinds and the different performance
across sectors, prime yields have remained quite stable
across sectors with adjustments in the Industrial & Logis-
tics market and also Food Retail, due to the scarcity of
qualified investable stock in the former and the great
demand for the later. With the exclusion of retail assets
(except for food retail) all sectors are in minimum lows.
On the Living Alternatives, prime yields stand at the end of
2021 at 4.5% for Multifamily, 5.0% for Student Housing and
5.5% for Senior Living.
The outlook for 2022 from an investment perspective
is positive: there is a significant rise of dry powder (capi-
tal that has been raised but not yet deployed), the gap
between bonds and real estate yields persist and interest
rates remain low. With this as a backdrop, real estate is per-
ceived as being able to generate acceptable returns which
fuel investors’ appetite. The outlook for investment turno-
ver for 2022 surpass the one in 2021, as at the beginning of
the year a number of big transactions and portfolios is on
the market and pipeline is robust. Logistics and operational
assets are core this year but JLL envisages that Hospital-
ity will re-emerge as one of the strongest asset classes due
to key fundamentals and market opportunities, while shop-
ping centres are seen as recovering throughout the year
as sales volumes are predicted to grow. On the office seg-
ment, a lack of suitable product may impact the capital allo-
cation in 2022. But prospects are rather positive as soon as
the buildings in pipeline enter the market as capital chas-
ing the office sector is robust.
Source: JLL EMEA, January 2022
Source: JLL EMEA, January 2022
INVESTMENT VOLUME EVOLUTION (in millions €)
PRIME YIELDS (in %)
Industrial & logistics
Office
Retail parks
Shopping centres
High street Retail – Lisbon
PAG
E 4
4
—
VG
P N
V A
nn
ua
l R
ep
ort
20
21
/ C
om
pa
ny
Re
po
rt /
VG
P i
n 2
02
1

Focus on France
Many economies in the European Union, but also around
the world, are growing again after several months of dif-
ficulties. France's economy grew by 7% in 2021, the most
in 52 years, compared to an average of 5.0% for the Euro-
zone. Despite slowing sharply from Q3 2021, in Q4 2021
GDP surprised on the upside by growing 0.7% q-o-q and
lifting activity slightly above pre-crisis levels, one of the
best performances in the eurozone. French GDP rose by
+3.0% over Q3 2021; this was largely due to household
consumption (+5% following +1.3%) which returned to pre-
crisis levels in September.
Commercial real estate investment in France in 2021
came in at € 25.8 billion, down 8.5% year-on-year. Follow-
ing the health crisis and the drop in office take-up last
year, investors have been cautious, preferring to wait and
see, particularly with the Ile-de-France office market.
Investment in commercial real estate in France ran at two
different speeds throughout the year: on the one hand, allo-
cations to office and retail premises slowed dramatically;
on the other, the boom for industrial assets continued.
The office market accounted for just under 60% of
investment in France in 2021, there was a 17% fall in invest-
ment in offices to € 14.7 billion, compared to 2020.
After almost grinding to a halt in H1 2021, investment in
retail picked up in H2, although it was not enough to make
up the shortfall. A total of € 3.1 billion was invested in Retail
in 2021, over half of the capital was invested in the retail
warehouses and retail parks with over . € 1.5 billion.
Nearly € 2.2 billion was invested in the French logis-
tics real estate market in Q4 2021, bringing the total
amount invested over the whole year to almost € 5.1 bil-
lion in 86 transactions. The logistics investment volume
increased by 44% year-on-year and is 66% higher than the
five-year average, which was the best performance in his-
tory after 2019. Around 60% of the sum was transacted in
portfolio transfers.
Two main trends have emerged for prime yields, which
have held steady for offices and retail. In the absence of a
major deal in the street-level segment, the prime yield for
retail has changed little and is now estimated at around
3.0%. Conversely, the prime yield for Logistics continues
to contract, finishing 2021 at 3.25%. The robust trend in
this asset category suggest further compression in 2022.
Source: JLL EMEA, January 2022
Source: JLL EMEA, January 2022
LOGISTICS INVESTMENT VOLUME (in millions €) PRIME YIELDS (in %)
< € 30 mil.
€ 30-70 mil.
€ 70-150 mil.
> = € 150 mil.
Industrial & logistics
Office
Retail parks
Shopping centres
High street Retail – Paris
PAG
E 4
5
—
VG
P N
V A
nn
ua
l R
ep
ort
20
21
/ C
om
pa
ny
Re
po
rt /
VG
P i
n 2
02
1

CEE Real estate investment Market overview 2021
In 2021, the CEE investment market totalled €11.0 billion.
Poland secured its position among CEE countries, cov-
ering 58% of total investment transactions, follow by the
Czech Republic (15%) and Hungary (12%). Industrial and
Logistics sector secured 41% of the total transaction vol-
ume, followed by offices (34%) and Retail (14%).
The CEE markets continue to attract strong interest from
investors, both international and domestic. However, with
a shortage of available product and the impact of Covid-19,
there have been volume declines compared to 2019 across
nearly all markets.
The results observed in 2021 prove that the market seems
to be recovering after being exposed to the uncertainty of
the pandemic in 2020. The industrial sector is the lead-
ing one in the majority of the CEE markets with record-
breaking volumes recorded in Poland. Whilst the outlook
for 2022 is promising, the market is still depending on the
changing economic scene.
CEE INVESTMENT VOLUMES BY COUNTRIES(in millions €)
CEE INVESTMENT VOLUMES BY SECTOR
CEE SECTOR SPLIT 2019
CEE SECTOR SPLIT 2020
CEE SECTOR SPLIT 2021
Office 48%
Industrial 16%
Retail 24%
Hotel 9%
Living 2%
Other 1%
Office 46%
Industrial 34%
Retail 12%
Hotel 3%
Living 3%
Other 1%
Office 34%
Industrial 41%
Retail 14%
Hotel 2%
Living 8%
Other 1%
Source: JLL EMEA, January 2022
Source: JLL EMEA, January 2022
Czech Republic
Slovakia
Romania
Hungary
Poland
PAG
E 4
6
—
VG
P N
V A
nn
ua
l R
ep
ort
20
21
/ C
om
pa
ny
Re
po
rt /
VG
P i
n 2
02
1

Focus on the Czech Republic
The Czech economy is forecasted to grow by 3.4% in 2022
as first quarter of 2022 is expected to be weaker than
originally predicted due to the rapidly spreading Omicron
variant. Oxford Economics predicted GDP growth of 2.7%
in 2021 following an upward revision to Q2 and Q3 data.
On the other hand, forecasted Q4 growth has been cut to
0.3% q-o-q due to weaker consumer spending as the lat-
est wave of the pandemic took its toll. Despite increasing
vaccinations and the booster roll-outs the overall levels of
vaccine coverage are still relatively low in comparison to
Western Europe countries.
The silver lining remains the continued prominence of
the industrial sector. Industrial production, confidence and
expectations improved in the month of November as car
manufacturers resumed output, but this is unlikely to fully
offset the Q4 weakness in general.
Headline inflation rose to 6.6% in December 2021, y-o-
y. The average inflation rate reached 3.8% in 2021, which
was by 60 bps higher compared to 2020. The develop-
ment of inflation in 2021 was mainly influenced by the
growth of prices in the divisions transport, housing,
water, electricity, gas and other fuels. It is expected infla-
tion will continue to rise in the coming months, peaking
in Q1 before moderating throughout the rest of the 2022.
In response to rising inflation, the Czech National Bank
(CNB) further increased the policy rate from 2.75% in
November to 3.75% in December 2021. In February 2022
the CNB continued with further increase to 4.50% which
is the highest rate since 2002.
The second half of 2021 provided transactional volumes
of €991 million. This represents an increase of 36% on the
same period in the previous year and 52% increase on
H1 2021. The total investment volume for the whole 2021
reached €1.64 billion which is by 11% above 2020 results
(excluding Residomo portfolio of apartment housing,
which traded at €1.3 billion).
The office sector was the second most dominant and
represented 26% of the investment volume during H2
2021. The total office investment volume recorded for H2
2021 reached €254 million, representing a decrease of
30% compared with H1 2021.
The retail sector had the third largest share with 15%.
We continue to experience investor cautiousness when
it comes to retail assets. In H2 2021, the retail sector wit-
nessed ten transactions. Total retail investment volume
recorded in H2 2021 reached €150 million which is more
than twice as much as recorded in H1 2021.
PAG
E 4
7 —
V
GP
NV
An
nu
al
Re
po
rt 2
02
1 /
Co
mp
an
y R
ep
ort
/ V
GP
in
20
21

The industrial & logistics sector was the most active
during H2 2021 with 44% share on the total volumes. Alto-
gether, there were 15 transactions. The largest transac-
tions included the European Apex portfolio sold by P3 to
CNIC (CGL Investment Holdings) where the Czech part
amounted to ca. € 85 million, followed by Logistics Park
Nošovice (Moravia-Silesia region) sold by Consens/J&T to
EQT Exeter for approx. € 75 million and two buildings (hall
1 and 3) within Ostrava Airport Multimodal Park (Moravia-
Silesia region) for ca. € 75 million, also transacted between
Consens/J&T and EQT Exeter. Total industrial investment
volume reached € 437 million in H2 2021, representing
more than fivefold increase against H1 2021 results.Inves-
tor activity and appetite for this investment product contin-
ues to be very strong, however, the market is characterized
by shortage of opportunities.
The residential market in H2 2021 recorded only two
residential transactions recorded in H2 2021, both of a
regional nature. Overall, the residential sector reached an
investment volume of € 19 million representing 2% share
on the total volumes during H2 2021.
Our views on prime yields as of H2 2021 are 4.25% in
the office sector, prime industrial&logistics assets are at
4.25% and retail parks at 5.75%. Prime shopping centre
yields are at 5.25% and high-street properties remain at
4.00%. In H1 2022, we expect continued downward pres-
sure on industrial yields in premium locations.
Focus on Hungary
The Hungarian investment market generated a volume of
ca. € 1.3 billion in 2021. Although this volume is 7% above
the 2020 record, it is still significantly below the pre-pan-
demic levels of € 1.7–1.8 billion. The underperformance of
the market was mainly due to the significant undersupply
of available products for sale (especially in an open-market
tender), which was particularly critical during the first half
of 2021. From the middle of the year we recorded an uptick
in the investment activity, however it wasn’t enough to
boost the annual statistics to levels formerly seen.
More than 85% of annual volume was generated by
transactions covering income producing assets, whereas
the rest by development site sales and disposals of prop-
erties suitable for re-development purposes. We recorded
a significant, 25% rise in the volume of development site
sales compared to 2020. The majority of these sites allow
for large scale logistics developments, yet some residen-
tial and office plots were sold as well. Active logistics
developers continue their land-banking, and new market
players have entered the market as well.
While the number of available products was low, a large
array of potential purchasers wished to invest during
2021. The supply-demand imbalance created fierce com-
petition among investors and pushed up prices, especially
in the logistics and office sectors. We recorded a mas-
sive, 115 bps yield compression in the logistics asset class
(5.75% vs. 6.90% by year end 2021 vs. 2021) and a 45 bps
yield compression in offices (4.80% vs. 5.25% by year end
2021 vs. 2021).
Similarly to the previous years, the strongest activity
was recorded in the office asset class, which generated
ca. 70% of the annual investment volume. It is followed
by logistics assets (11%) and surprisingly, re-development
opportunities and development sites with also 11%. As in
the previous year, there was minimal activity in the hotel
and retail asset categories in 2021.
CZECH REPUBLIC PRIME INDUSTRIAL YIELD
CZECH REPUBLIC PRIME INDUSTRIAL RENT & VACANCY RATE (€/m²/year)
Source: JLL EMEA, January 2022
Source: JLL EMEA, January 2022
Prime rent
Vacancy rate
PAG
E 4
8
—
VG
P N
V A
nn
ua
l R
ep
ort
20
21
/ C
om
pa
ny
Re
po
rt /
VG
P i
n 2
02
1

In spite of the home office trend becoming generalised
and the doubts surrounding the future of offices, 2021
was the year of office transactions. Office deals generated
a historic record just shy of € 1 billion, indicating a 20%
increase on the 2020 volume. We see the prime office yield
strengthening 45 bps year-on-year and standing at 4.80%.
Although industrial & logistics is a very sought-after
asset class, due to the characteristics of the Hungarian
logistics market (majority of stock concentrated in the
hands of a few landlords who do not intend to sell) there
is a very limited investment activity in the sector. During
2021, the asset class generated ca. € 145 million in deals,
a magnitude which comparable to the past 3 years. Almost
70% of the volume was related to acquisitions carried out
by CTP, who became the most influential logistics player
on the market with assets all over Hungary. Unlike most
landlords, the Czech developer has a significant coun-
tryside portfolio in Hungary, on top of their high quality
parks around Budapest. In 2021, they managed to acquire
a fully occupied 46,000 m² shed in Nagytarcsa (10 km from
Budapest), and a one-of-a-kind, city-logistics park, Office
Campus, offering value through its fully-leased operating
building and significant development capacity. Due to lim-
ited availability, the asset class generates a strong bidding
competition amongst investors, which results in continu-
ous yield compression and price increase. We recorded a
year-on-year yield compression of 115 bps and we foresee
further yield compression in the course of 2022. We see
the prime logistics yield currently standing at 5.75%.
There was minimal activity in the hotel and retail asset
classes. We see the prime retail yield standing at 6.25% for
shopping centres.
HUNGARY PRIME INDUSTRIAL YIELD
HUNGARY PRIME INDUSTRIAL RENT & VACANCY RATE
Source: JLL EMEA, January 2022
Source: JLL EMEA, January 2022
Prime rent
Vacancy rate
PAG
E 4
9
—
VG
P N
V A
nn
ua
l R
ep
ort
20
21
/ C
om
pa
ny
Re
po
rt /
VG
P i
n 2
02
1

Focus on Romania
The property investment volume for Romania in 2021 is
estimated at approximately € 900 million, a value margin-
ally higher than the one registered in 2020. In H2 2021,
the total volume reached almost €600 million, a value 25%
higher than the one recorded in H2 2020.
The real estate investment market managed to remain at
a healthy level both in 2020 and 2021, despite the Covid-
19 outbreak, which had a strong impact on the Romanian
macro-economic environment. Several transaction which
were started before the pandemic were closed in H2 2021,
while several processes initiated during the late 2020 and
2021 were finalized by December 2021. Investors have
regained their appetite for commercial properties, espe-
cially for offices and logistics, in Romania, encouraged
by the swift macro-economic recovery and the appeal-
ing returns they are offering. Compared to last year, the
number of transactions increased, with the average deal
size decreasing to € 32 million. Bucharest continues to
be the preferred investment destination in Romania and
accounted for around 65% of the total transaction volume
in 2021, followed by Timisoara, Oradea, Arad and Iasi. The
investment volumes were dominated by office transac-
tions, with close to 45% of the total, followed by industrial
(30%), retail (20%) and hotels and residential (5%).
The largest industrial transaction concluded in 2021 was
the acquisition of the Olympian industrial portfolio, con-
sisting of 3 assets, in Bucharest, Timisoara and Brasov.
The properties were bought by CTP, the largest player on
the Romanian market, from Helios Phoenix. Other major
logistic/industrial transactions in Romania were the acqui-
sition of Zacaria portfolio of 4 properties (in Sibiu, Craiova
and Oradea) by CTP from Zacaria Group for € 60 million
and the sale of Eli Park 1, by Element Industrial and Paval
Holding to Fortress REIT for around € 30 million. Smaller
investment and sale & leaseback transactions were signed
in Timisoara, Targu Mures, Dej, Arad, Oradea and Iasi.
Prime office yields are at 6.75%, prime retail yields at
7.25%, while prime industrial yields are at 7.75%.
Yields for office and industrial decreased by 25 bps over
the past 12 months ago, while retail yields have increased
by 25 bps over the year. Romania is still well positioned
from a yield perspective, as the current values are still well
above those registered in the last peak (2007) and those
currently quoted in the rest of the region.
We expect that investment volumes in 2022 will be close
to the total registered in 2021, although in this period
marked by the uncertainty of the various waves of the
pandemic, accurate predictions continue to be difficult to
make. Prime yield may come under pressure for logistic
and potentially office, in line with regional evolutions, but
this will also depend on debt availability and terms.
ROMANIA PRIME INDUSTRIAL YIELD (%)
HUNGARY PRIME INDUSTRIAL RENT & VACANCY RATE(€/m²/year)
Source: JLL EMEA, January 2022
Source: JLL EMEA, January 2022
Prime rent
Vacancy rate

Focus on Slovakia
Commercial real estate as one of the major asset classes
proved to be resilient in the times of uncertainty and vola-
tility. Institutional and private capital alike continues to be
allocated in the class, resulting to the total investment vol-
umes of € 760 million in 2021.
From annual perspective, second half of the year with
ca. € 210 million traded was roughly half of the volumes in
H1. Lower volumes are not caused by lack of activity, the
opposite is true. The market is very active with high and
ever-increasing level of liquidity. Domestic and regional
capital is strong and abundant, able to compete with long
time established international capital. In 2021, the domes-
tic/regional capital accounted for 70% of transaction
volumes. This high proportion is mostly caused by the big-
gest transaction of the year – sale of the Aupark Bratislava
shopping centre acquired by local players. Otherwise,
three-year average proportion of Slovak and Czech capi-
tal on transaction volumes is less than 40%, expected to
sustain or increase its share. Overall, ten major deals were
closed in H2 at average size of a deal at ca. € 20 million.
Highest activity was witnessed in industrial sector with
€ 145 million transacted. Two major deals took place in
the sector in H2. Karimpol Group, privately held property
developer sold its Hall D to German institutional investor
Union Investment in joint venture with Garbe. JLL acted on
sell-side and managed to set a new record yield for prime
single asset industrial properties in Slovakia. The major
share on the volumes had the largest industrial transac-
tion of the year – sale of the Accentis Namestovo indus-
trial park to industrial developer CTP for over € 90 million.
Accentis Namestovo is the light industrial scheme with
tenant mix focused on automotive sector. Strengthening
e-commerce and increased demand for warehouses is still
the major driver for interest in the sector. Light industrial
sub – sector is also targeted. The major driver is strong
position of Slovakia as industrial country, likely to further
benefit from supply chain reconsideration and nearshor-
ing. We can therefore witness another strong year for the
industrial sector if product is available.
Our view on prime yields as of Q4 2021 is as follows:
Offices: 5.50% – 5.75%; Logistics/warehouses: 5.25% –
5.50%; Light industrial: 5.90% – 6.15%; Shopping malls:
6.25% – 6.50%; Retail parks: 25% – 7.50%
SLOVAKIA PRIME INDUSTRIAL YIELD (%)
Source: JLL EMEA, January 2022
PAG
E 5
1 —
V
GP
NV
An
nu
al
Re
po
rt 2
02
1 /
Co
mp
an
y R
ep
ort
/ V
GP
in
20
21

Leading Logistics area
Germany is the largest economy in Europe and the world’s
second largest exporter. It is also ranked number one glob-
ally in terms of its overall ‘logistic performance’ according
to the World Bank’s Logistics Performance Index (2018).
With the eastwards expansion of the EU, Germany became
even more centrally positioned within Europe and ben-
efits from its geographical location as well as its excellent
global connectivity.
Germany's logistics locations are highly fragmented with
17 established logistics locations of various sizes. Tradi-
tionally, the principal markets are located around:
— Hamburg, largely driven by the port, Europe's second
largest container seaport;
— Frankfurt-Rhein Main, driven by freight activities sur-
rounding the airport as well as the large customer base
in the metropolitan area;
— Ruhr area & Düsseldorf-Cologne corridor, which are
still largely manufacturing based;
— Munich, focused on the high-tech sector;
— Berlin, the national capital.
There are also several smaller logistics locations which
have emerged only over the last few years such as the
Kassel / Bad Hersfeld area (the most centrally located
area in Europe) and Leipzig/Halle (benefitting from airport
development) - offering a higher availability of develop-
ment sites in combination with lower land prices and
lower rental values. Other smaller regional markets are the
Rhein-Neckar area, Hanover/Brunswick, Stuttgart/Heil-
bronn, Osnabrück/Münster, Nuremberg, Erfurt, Bremen
and Mönchengladbach.
Over the next few years, JadeWeserPort container port
could also see an acceleration in local activity, provided
the area can overcome limitations in transport infrastruc-
ture and initial occupier caution.
German market for logistics space achieved a new annual record in 2021The total take-up in the German market for warehousing
and logistics space of around 8.67 million m² in 2021 was
a new record. This was a year-on-year increase of 25%
(2020: 6.95 million m²), and almost 1.5 million m² (20%)
above the previous record from 2018 (7.21 million m²).
There was particularly strong take-up in the fourth quar-
ter, which was the first three-month period with a take-
up of over 2.5 million m². Whilst take-up attributable to
owner-occupiers fell by 10%, lettings rose by 39% year-on-
year. The total demand for logistics space has increased
across the board, logistics services providers as well as
retailers and manufacturing companies were more active
during 2021 compared to the previous year. Some com-
panies are suffering the negative effects of the COVID-19
pandemic with delivery problems and shortages of materi-
als due to breakdowns in global supply chains. For these
companies, it is sensible to extend storage capacities on
site to reduce their dependency on those networks. Other
companies, such as online retailers, are benefiting from
the changes in many customers’ shopping behaviours, as
customers ordered more online during the course of the
pandemic, rather than visiting local shops. Those com-
panies require greater amounts of space to service the
increased demand. According to a current forecast by the
Bundesverband Paket und Expresslogistik (BIEK) e.V., the
number of parcels transported are expected to increase by
8% to 5.7 billion p.a. in the period up to 2025. The demand
for space amongst online retailers remains a significant
driver in terms of take-up. As a result of the strong demand
for space, we expect take-up to exceed 7 million m² again
in 2022. The scarcity of space remains a challenging topic.
Many regions are characterised by a shortage of mod-
ern logistics space and sites available in the short term.
This is also reflected in the lack of construction activity
and hikes in rental prices. Companies are either shifting
their attention to wider peripheral areas around the major
conurbations or extending their existing leases. Even the
development of brownfield sites will play a more important
role in future.
German market1
1 Source: Jones Lang LaSalle – 2021 Industrial Investment Report CEE & Western Europe – February 2022PAG
E 5
2
—
VG
P N
V A
nn
ua
l R
ep
ort
20
21
/ C
om
pa
ny
Re
po
rt /
VG
P i
n 2
02
1

New records in the Big 5 regions Frankfurt and Berlin
Total take-up in the Big 5 conurbations (Berlin, Düsseldorf,
Frankfurt, Hamburg and Munich) was around 2.42 mil-
lion m² in 2021. This is another record and 170,000 m²
above the previous record in 2011. It is a year-on-year
increase of 27% and around 23% above both the 5 and
10-year averages. Take-up in the Frankfurt region
increased by 47% year-on-year with a new record of
around 695,000 m². There was also a new record in the
Berlin region with around 616,000 m² (increase of 36%
compared to 2020), around 120,000 m² above the previous
record from 2019. There was also growth in the Düsseldorf
(+38%) and Hamburg (+26%) regions. The only downturn
was in the Munich region: a fall of 21%. The strongest
demand came from companies in the distribution/ logis-
tics sector with a share of around 38% of total-take-up.
Retail companies accounted for a further 32% and manu-
facturing companies contributed 19%. Around 620,000 m²
of new warehousing space was completed in the Big 5
regions in 2021, and just 28% of the space was still unlet
at the point of completion. A further approx. 1.3 million m²
is currently under construction, of which 70% has already
been prelet or is being constructed for owner-occupiers.
The majority of construction activity is in the Hamburg
region where around 450,000 m² is under construction.
PAG
E 5
3
—
VG
P N
V A
nn
ua
l R
ep
ort
20
21
/ C
om
pa
ny
Re
po
rt /
VG
P i
n 2
02
1

Outside the Big 5, the Ruhr area dominates
There was a take-up of around 6.25 million m² outside the
Big 5 conurbations* in 2021. This is above 6 million m² for
the first time ever, and is a year-on-year increase of 24%
(2020: 5.04 million m²) and 30% above the 5-year average.
The strongest demand came from retail and e-commerce
companies, which accounted for around 2.7 million m² or
43% of total take-up, having benefited from a number of
large volume deals in the ≥50,000 m² size category. All
transactions of areas in the ≥100,000 m² size category
involved retail companies.
These included Edeka (owner- occupier approx.
100,000 m²) in Marktredwitz, the Berlin Brands Group (let-
ting of around 100,000 m²) in Werne and XXXLutz (owner-
occupier approx. 105,000 m²) in Uffenheim. By far the
largest deals of the year were attributable to e-commerce
companies. Zalando decided in favour of a location in
Giessen where it leased an area of around 130,000 m² in
the VGP Park for a new logistics centre. Another high-pro-
file online retailer signed a lease for an area of 189,000 m²
in Grossenkneten.
The total turnover involving e-commerce companies
was around 1.4 million m², which was a new record, and for
the second year in succession there was a take-up of over
1 million m² (2020: 1.2 million m²). A further 35% (2.2 mil-
lion m²) of total take-up was attributable to companies in
the distribution/logistics sector and the largest registered
lettings were to BLG Logistik in Bremen (95,000 m²) and
Rhenus in Wesel (84,000 m²). 18% of take-up was attribut-
able to manufacturing companies, including large-scale
transactions such as the letting of around 90,000 m² to
a battery manufacturer in Sülzetal near Magdeburg. The
majority of take-up outside the Big 5 regions was again
in the Ruhr area at around 788,000 m². The largest letting
was to an e-commerce company, the Berlin Brands Group,
which leased an area of around 100,000 m² in Werne in the
fourth quarter. In second and third places were the Leip-
zig/Halle region (approx. 500,000 m²) and the Hannover/
Braunschweig region (around 385,000 m²). Three-quarters
of all space take-up was in new-build space and develop-
ment projects, and in the case of takeup in the ≥50,000 m²
size category, that share increases to 97%.
WAREHOUSING TAKE-UP GERMANY* (millions m²)
* Outside the Big 5 only deals = 5,000 m², in the Big 5 (Berlin, Düsseldorf, Hamburg, Frankfurt and Munich) deals = and < 5,000 m²
Status: February 2022, Source: JLL
Warehousing Take-up in millions m²
Average (2016 Q1-2021 Q3): 1.74 million m²
PAG
E 5
4
—
VG
P N
V A
nn
ua
l R
ep
ort
20
21
/ C
om
pa
ny
Re
po
rt /
VG
P i
n 2
02
1

Upswing in prime rents
Prime rents for warehousing space in the ≥5,000 m² size category
have risen by between 1.6% and 9.1% year-on-year in four of the Big
5 regions. The exception is the Berlin region, where the prime rent
remained stable at € 5.50/m²/month in 2021. The strongest increase
was in Düsseldorf (+ € 0.50 to its current level of 6.00/m²/month)
and the highest prime rent is still paid in Munich at € 7.50/m²/month
(increase of 5.6% or € 0.40). Prime rents rose by € 0.30 and € 0.10 in
Frankfurt and Hamburg, respectively, to € 6.50/m²/month. Further
hikes are expected in 2022.
PRIME RENT IN GERMANY (€/m²/year)
Status: February 2022, Source: JLL
2020
2021
PAG
E 5
5
—
VG
P N
V A
nn
ua
l R
ep
ort
20
21
/ C
om
pa
ny
Re
po
rt /
VG
P i
n 2
02
1

WAREHOUSE TAKE-UP TOTAL (m²) 2020 2021
Berlin 451,700 615,900
Düsseldorf 173,000 239,100
Frankfurt 472,500 694,800
Hamburg 498,300 630,300
Cologne only space ≥ 5,000 m² 187,400 211,300
Munich 307,200 242,600
Stuttgart only space ≥ 5,000 m² 107,700 141,900
Ruhr area only space ≥ 5,000 m² 844,500 787,900
WAREHOUSE TAKE-UP TOTAL (≥ 5,000 m²) 2020 2021
Berlin 251,500 404,900
Düsseldorf 108,400 122,400
Frankfurt 329,500 534,500
Hamburg 345,500 498,100
Cologne 187,400 211,300
Munich 205,800 102,400
Stuttgart 107,700 141,900
Ruhr area 844,500 787,900
PRIME RENTS FOR WAREHOUSING SPACE (≥ 5,000 m²) (€/m²/month) 2020 2021
Berlin 5.50 5.50
Düsseldorf 5.50 6.00
Frankfurt 6.20 6.50
Hamburg 6.40 6.50
Cologne 5.80 5.80
Munich 7.10 7.50
Stuttgart 6.80 7.20
Ruhr area 5.25 5.50
COMPLETIONS (m²) 2020 2021
Berlin 349,800 203,000
Düsseldorf 151,600 52,300
Frankfurt 129,100 170,700
Hamburg 9,000 161,500
Cologne 38,800 82,600
Munich 35,000 31,000
Stuttgart 119,500 48,900
Ruhr area 405,900 491,800
Source: JLL – Logistics and Industrial Market Overview / Germany / H2 2021 / February 2022VV
PAG
E 5
6
—
VG
P N
V A
nn
ua
l R
ep
ort
20
21
/ C
om
pa
ny
Re
po
rt /
VG
P i
n 2
02
1


Leading logistics areas
The logistics markets in both Madrid and Barcelona are
laid out in three concentric rings, each of which reflects a
different type of activity or product managed by logistics
platforms.
Operators are concentrated along the primary logis-
tics routes. These include the A-2, A-3, A-4 and A-42 roads
heading out of Madrid and the A-2 and AP-7 in Barcelona.
These roads in both cities pass through all three rings.
Operators are located along various stretches depending
on the type of freight traffic and whether they are focused
on local, regional or national/international transport.
Take-up
Take-up in 2021 in Madrid was around 1,115,000 m², an
increase of 21% compared to 2020, the highest figure
recorded in five years. In the fourth quarter, take-up stood
at around 245,500 m², a decrease of 5% quarter-on-quar-
ter and year-on-year.
Take-up in 2021 in Barcelona was around 885,000 m², an
increase of 129% compared to 2020, also representing the
highest figure in the last five years. In the fourth quarter,
take-up was around 240,000 m², a year-on-year increase
of 150%.
Spanish market¹
1 Source: Jones Lang LaSalle – 2021 Industrial Investment Report CEE & Western Europe – February 2022
Source: JLL EMEA, January 2022
INDUSTRIAL TAKE-UP (m²)
Madrid Barcelona
PAG
E 5
8
—
VG
P N
V A
nn
ua
l R
ep
ort
20
21
/ C
om
pa
ny
Re
po
rt /
VG
P i
n 2
02
1

Completions and Availability
Completions in Madrid during 2021 totalled 780,000 m²,
representing a decrease of 11% compared to 2020. In
the fourth quarter, completions in the capital added
190,000 m², 55% less than in the previous quarter. In Bar-
celona, completions totalled 330,000 m² in 2021 (+15%
compared to 2020) and 120,000 m² in the fourth quarter
(+220% compared to the third quarter).
The availability rate in Madrid increased to 9.6% at the
end of 2021, while in Barcelona it rose to 3%. However,
availability remains limited to meet growing demand.
By 2022, it is expected around 600,000 m² of new logis-
tics product under construction to be added to the market
in Madrid and 300,000 m² in Barcelona. Madrid is domi-
nated by warehouses that are still available (67%), while
Barcelona is dominated by warehouses that are already
committed (54%) and therefore will not add availability to
the market.
Prime RentDuring 2021, the growing demand for logistics space gen-
erated by the ecommerce boom and limited supply levels
have added upward pressure on rents. In Madrid, rents
have grown progressively during 2021. Prime rents stood
at €5.95/m²/month at the end of 2021, a slight quarterly
increase and a significant increase (+8%) in the annual
comparison. This level of rents is the highest since 2009.
Upward pressure on rents is expected to persist through-
out 2022, as strong demand will continue to offset the
shortage of supply. By 2023, we expect demand to grow,
driven by the recovery in global economic activity, but we
will also see more supply and therefore more competi-
tion in the market, so rents in prime areas are expected to
increase slightly compared to 2022, resulting in a "healthy
market" that is growing slightly and steadily.
Catalonia remains attractive to both national and inter-
national operators and investors, and there is still unsat-
isfied demand due to a lack of available, quality and sized
product. This has driven an annual increase in prime rents
of 3% over 2021 to €7/m²/month. This is the highest level
of rents since 2011.
Given the strength of demand and relatively limited avail-
ability, prime rents are expected to increase slightly during
2022 and 2023.
The availability of land for logistics development remains
scarce especially in areas closer to cities, which is likely to
limit the future pipeline of projects. Rising land values and
construction costs will also continue to put upward pres-
sure on rents in these areas. PAG
E 5
9
—
VG
P N
V A
nn
ua
l R
ep
ort
20
21
/ C
om
pa
ny
Re
po
rt /
VG
P i
n 2
02
1
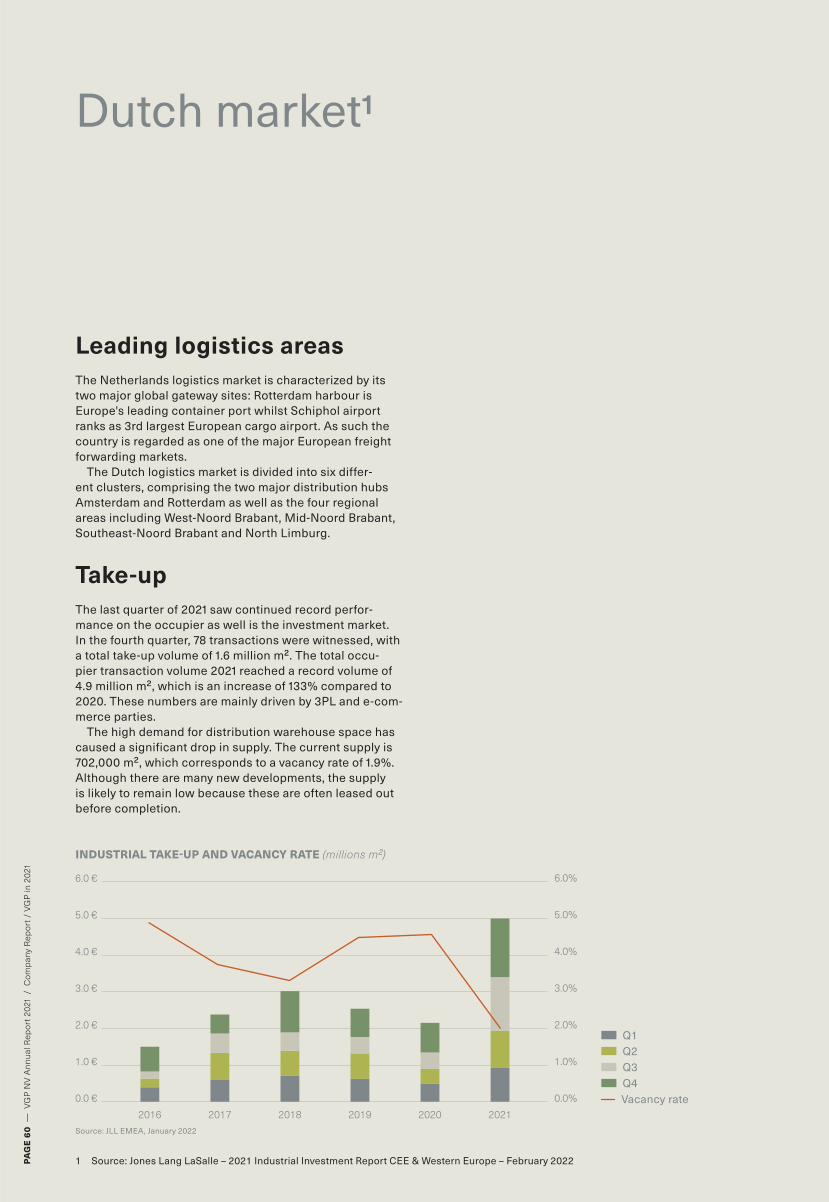
Leading logistics areas
The Netherlands logistics market is characterized by its
two major global gateway sites: Rotterdam harbour is
Europe's leading container port whilst Schiphol airport
ranks as 3rd largest European cargo airport. As such the
country is regarded as one of the major European freight
forwarding markets.
The Dutch logistics market is divided into six differ-
ent clusters, comprising the two major distribution hubs
Amsterdam and Rotterdam as well as the four regional
areas including West-Noord Brabant, Mid-Noord Brabant,
Southeast-Noord Brabant and North Limburg.
Take-up
The last quarter of 2021 saw continued record perfor-
mance on the occupier as well is the investment market.
In the fourth quarter, 78 transactions were witnessed, with
a total take-up volume of 1.6 million m². The total occu-
pier transaction volume 2021 reached a record volume of
4.9 million m², which is an increase of 133% compared to
2020. These numbers are mainly driven by 3PL and e-com-
merce parties.
The high demand for distribution warehouse space has
caused a significant drop in supply. The current supply is
702,000 m², which corresponds to a vacancy rate of 1.9%.
Although there are many new developments, the supply
is likely to remain low because these are often leased out
before completion.
Dutch market1
1 Source: Jones Lang LaSalle – 2021 Industrial Investment Report CEE & Western Europe – February 2022
INDUSTRIAL TAKE-UP AND VACANCY RATE (millions m²)
Source: JLL EMEA, January 2022
Q1
Q2
Q3
Q4
Vacancy rate
PAG
E 6
0
—
VG
P N
V A
nn
ua
l R
ep
ort
20
21
/ C
om
pa
ny
Re
po
rt /
VG
P i
n 2
02
1

Prime rent
In 2021, as a result of limited supply and strong demand,
prime rents rose in most Dutch submarkets. Prime rents
for the whole country at € 87.50/m²/year are held by the
Schiphol Airport area. At the same time, with an increase
to € 75/m²/year Utrecht overtook Rotterdam, which regis-
tered an increase of 4% p.a. to € 72.50/m²/year.
PRIME AND VACANCY RATE (€/m²/year)
Source: JLL EMEA, January 2022
Prime rent
Vacancy rate
PAG
E 6
1 —
V
GP
NV
An
nu
al
Re
po
rt 2
02
1 /
Co
mp
an
y R
ep
ort
/ V
GP
in
20
21

Leading logistics areas
The logistics stock in Italy consists of around 45 million
of m² and more than 2,000 assets. The modern stock (built
in the last 10 years) represents just the 17% of the total, cor-
responding to approximately 300 assets which are owned
mainly by institutional players (71%) and end--users (22%).
Among the main consolidated geographies, Veneto and
Rome result to have the most recent developments (both
23% of the total), while Milan, Bologna and Torino are in
line with the Italian average total), while Milan, Bologna
and Torino are in line with the Italian average.
Moreover, more than 1 million square meters are already
under construction and expected to be completed by the
end of 2022 with majority to be situated in the Milan area.
Take-up
The logistics sector has continued to present strong fun-
damentals and is expected to be resilient moving for-
ward. Take-up in 2021 reached record levels with around
2.47 million m², showing an increase of 9% on 2020 and
about 76% up on the 10-year average. Geographically,
Milan continued to be the main destination, attracting
the 40% share of the total take-up. However, other des-
tinations are gaining ground such as Veneto (10%) and
Bologna (8%). The capital city recorded 6% share on the
total take-up. The market was driven by 3PLs, retail, and
e-commerce demand. Pre-lets formed 39% of the take-up,
down form 48% in 2020. Owner-occupiers accounted for
7% share of the total.
As in all other real estate sectors, even Logistics is show-
ing increasing attention for Environmental, Social and Gov-
ernance (ESG) elements and sustainability with carbon
neutral goals. Majority of new developments are designed
to achieve a green certification, mainly BREEAM and
LEED. In 2021, total completions grew by 23% y-o-y and
amounted to 1,650 mil m², the share of speculative con-
struction was approximately 30%.
Italian market1
1 Source: Jones Lang LaSalle – 2021 Industrial Investment Report CEE & Western Europe – February 2022
TAKE-UP IN ITALY (thousands m²)
Status: February 2022, Source: JLL
Q1
Q3
Q2
Q4
10 years average
10 years quaterly avg
PAG
E 6
2
—
VG
P N
V A
nn
ua
l R
ep
ort
20
21
/ C
om
pa
ny
Re
po
rt /
VG
P i
n 2
02
1

Prime rents
Prime industrial rents in Milan and Rome area remained
stable compared to 2020 reaching € 4.75/m²/month in
Q4 2021. In Bologna, the prime rents grew by 1.8% to
€ 4.67/m²/month and in Veneto region remained unchaged
at € 4.10/m²/month.
Prime Rent in Italy
Source: JLL EMEA, February 2022
MARKET PRIME RENT 2020 PRIME RENT 2021
Milan 57/m²/year 57/m²/year
Rome 57/m²/year 57/m²/year
Bologna 55/m²/year 56/m²/year
Veneto region 49/m²/year 49/m²/year
PAG
E 6
3
—
VG
P N
V A
nn
ua
l R
ep
ort
20
21
/ C
om
pa
ny
Re
po
rt /
VG
P i
n 2
02
1

The pandemic brought a significant impact on the global
logistics market. The change in consumption habits has
led to the rapid growth of e-commerce and triggered the
need for areas for last-mile distribution, which implies
greater speed and flexibility in delivery. Along with the
increase on the demand side, requirements for a more
innovative supply have grown likewise. Investors and
occupiers are focusing on areas and projects that take into
consideration decarbonization, digitization, design and
technology aspects, as more than ever, regional and local
policies are moving towards this direction.
2021 was a record year in terms of take-up. It was
strongly shaped by operations involving area expansions
and pre-lets. According to Industrial Prime Index (IPI), at
least, 580,000 m² was absorbed. Of those, 69% were con-
centrated in Lisbon region and 15% in Porto region. Devel-
opers could not keep pace with the high levels of specific
demand, which coupled with the obsolescence of exist-
ent supply, have restricted to some extent the absorption
levels. Several projects that were launched in the market
had already been taken up or committed. Products located
within a radius of 10 km from the centres of large cities
such as Lisbon and Porto, served by good access, are
strongly sought after. Moreover, 3PL and freight operators
are in a continuous growth rate and therefore demanding
additional quality space.
Take-up
2021 ended up to be one of the strongest years in terms
of space occupation for Industrial & Logistics purposes.
At least, 580,000 m² is reported to have been occupied
in 2021, an impressive 140% increase y-o-y. From the
absorbed area, more than 65% is considered new stock.
This high percentage is expected as existing supply no
longer meets the rising demand and occupiers’ require-
ments. Among the identified operations, the major-
ity of the occupied area was rented out and occupied
within 6 months; Lisbon registered more than half of the
total reported area. With the sharp increase on demand,
whether coming from new players or by expansion pro-
cesses from existing players, the supply hasn’t been able
to keep up and developers struggle at this point to pro-
duce leasable area at demand pace.
As near 70% of the annual area occupation was reported
in Lisbon, the total area for the region peaked in 2021 –
a new record over the last years. Among the 8 registered
zones, occupiers had solid preference for Alverca-Azam-
buja (zone 1), followed by Palmela-Setúbal (zone 5). In Lis-
bon, take-up volume has more than doubled on a y-o-y
analysis. In Porto, take-up volume is comparable to levels
of 2020. Among the 5 registered zones for this region, tha
major absorbed area was registered in Porto South (zone
11), followed by Zone East (zone 13).
Prime rents
Throughout the year, rents increased in some zones due to
evidences of occupations closed at higher levels. Sacavém
(zone 2) increased from € 4 to € 4.50/m²/ month, Palmela-
Setúbal (zone 5) from € 3 to € 3.25/m²/month, and Carnax-
ide-Alfragide (zone 6), from € 5 to € 6/m²/month. Prime
rent in Porto is at€ 4/m²/month.
Prime Rent in Portugal
Source: JLL EMEA, February 2022
Portuguese market1
1 Source: Jones Lang LaSalle – 2021 Industrial Investment Report CEE & Western Europe – February 2022
MARKET PRIME RENT 2020 PRIME RENT 2021
Lisbon 57/m²/year 72/m²/year
Porto 46.20/m²/year 48/m²/year
ph
oto
© T
rilu
x
PAG
E 6
4
—
VG
P N
V A
nn
ua
l R
ep
ort
20
21
/ C
om
pa
ny
Re
po
rt /
VG
P i
n 2
02
1

The high level of leasing activity demonstrates the strong
resilience of the sector as a whole, and foolproof adapt-
ability in the face of the uncertainties generated by the
health crisis. The main logistics activities in France are
situated in the corridor running from Lille in the North,
through the Paris region and Lyon to Marseille on the
South coast. The E-commerce players are actively and
increasingly participating at a very high level of demand
for warehouses in France. The excellent shape of the
French rental market is also reflected in the number of
signed transactions, more than 144 transactions were
recorded over the whole of 2021, which was, 4% higher
than last year and 29% higher than 10-years average.
Take-up
In 2021, 3,596,300 m² was let in the French logistics
rental market (>10,000 m²), the volume of take-up rose by
8% year on year. Structural changes, such as relocations
and e-commerce activity, are driving activity in the logis-
tics sector. The occupier demand was strongest in the
medium-sized warehouse segment (10,000 – 20,000 m²)
with 86 deals, it was a record number and surpassed
the record set in 2017 with 84 transactions. The 20,000 –
40,000 m² segment achieved the same number of transac-
tions as in 2020 (38 transactions). In the XXL warehouse
segment (>40,000 m²), 20 transactions were recorded,
including three transactions of over 100,000 m². These
included the lease of LA REDOUTE’s lease of 110,000 m²
in Haynecourt, near Cambrai, SEB’s lease of 100,640 m² in
Bully-les-Mines and the LIDL’s transaction for 100,600 m²
in Ablis. The main markets along the logistics corridor
(Paris, Lille, Lyon and Marseille) have accounted for 54% of
the transaction volume in 2021. Paris and Lille, where per-
formance improved year on year, accounted for 25% and
18% of activity respectively. The Lyon region accounted for
8%, while the Marseille region’s share fell to 5%.
Prime rents
The prime rent in the Paris region stood at € 61 per m²/
year, the highest in the country. Elsewhere, rents stood at
€ 55 in the Lyon region, € 48 in the Marseille region and
€ 46 in the Lille market.
Prime Rent in France
Source: JLL EMEA, February 2022
French market1
1 Source: Jones Lang LaSalle – 2021 Industrial Investment Report
CEE & Western Europe – February 2022
MARKET PRIME RENT 2020 PRIME RENT 2021
Paris 55/m²/year 61/m²/year
Lyon 50/m²/year 55/m²/year
Marseille 48/m²/year 48/m²/year
Lille 44/m²/year 46/m²/year


Report of the Board of Directors

Principles
VGP adopts the Belgian Code on Corporate Governance
(hereinafter the “Belgian Corporate Governance Code” or
the “Code 2020”) as its reference code on corporate gov-
ernance. The Code 2020 is available on the website of the
Belgian Corporate Governance Committee (www.corporat-
egovernancecommittee.be).
As required by the Code 2020, the Board of Directors
has drawn up the VGP Corporate Governance Charter
according to the recommendations of the Code 2020 pub-
lished on 9 May 2019 and taking into account the provi-
sions of the Code on Companies and Associations (“CCA”)
introduced by the law of 23 March 2019.
As required by the Code 2020, the Company’s Corpo-
rate Governance Charter describes the main aspects of its
corporate governance policy. The Corporate Governance
Charter was first approved by the Board of Directors of
the Company in its meeting of 20 April 2010 and has been
updated by the Board of Directors of the Company in its
meetings of 8 December 2016, 9 October 2017, 8 May 2020
and 14 May 2021. The current version of the Corporate
Governance Charter, approved by the Board of Directors of
the Company on 5 January 2022, supersedes and replaces
all previous versions.
Report of the Board of Directors
Corporate governance statement
PAG
E 6
8
—
VG
P N
V A
nn
ua
l R
ep
ort
20
21
/ C
om
pa
ny
Re
po
rt /
Re
po
rt o
f th
e B
oa
rd o
f D
ire
cto
rs

However, the Board of Directors is of the opinion that the
Company is justified in not adhering to certain principles
of the Code 2020, considering the Company’s particular
situation. These deviations are explained below:
i. The Company does not intend to set up a nomination
committee. By doing so, the Company, as a smaller
listed company (in terms of employees), deviates from
the principles 4.19 and further of the Code 2020. Given
its relatively small size and the small size of the Compa-
ny’s Board of Directors, the Company believes setting
up a nomination committee would at this stage overly
complicate its decision-making processes.
ii. The Company deviates from principle 7.12 of the Code
2020 by not including contractual provisions to delay
payment or clawback provisions in relation to the
variable remuneration of the Executive Management
Team. The Board of Directors is of the opinion that its
remuneration policy and practices sufficiently address
the underlying objective of this principle, as any pay-
ment of variable remuneration is only made follow-
ing the finalisation of the financial results. In addi-
tion, the Board of Directors can reduce the amount
of short-term variable remuneration of an Executive
Management Team member based on its individual
performance. With regards to long term variable remu-
neration, the LTIP also includes certain malus pro-
visions. Finally, the Company may in certain events
use legal remedies that may be available to it under
applicable law to withhold payment or reclaim variable
remuneration.
iii. The Company deviates from principle 7.6 of the Code
2020 by not requiring its non-executive directors
to receive part of their remuneration in the form of
shares in the Company and by not setting a mini-
mum holding period for shares in the Company held
by such persons. Considering that the Chairman of
the Board of Directors and the CEO are reference
shareholders, the Board of Directors is of the opin-
ion that the long-term perspective of shareholders is
adequately represented. Not requiring the other three
(independent) directors to receive remuneration in
shares in the Company allows for an outside perspec-
tive during the deliberations of the Board of Direc-
tors. The Board of Directors is of the opinion that this
balanced composition contributes to long term value
creation and is beneficial to the Company.
iv. The Company deviates from principle 7.9 of the Code
2020 by not requiring a minimum threshold of shares
to be held by the executive management. The Com-
pany believes that its current operational structure
and remuneration policy sufficiently incentivises its
Executive Management Team to focus on long term
value creation, given that: (i) the CEO is the main
shareholder of the Company, (ii) the Board of Directors
avoids setting performance criteria that could encour-
age the Executive Management Team to give prefer-
ence to short-term goals that influence their variable
remuneration but would have an adverse impact on
VGP in the medium and long-term, and (iii) the mem-
bers of the Executive Management Team (other than
the CEO) participate in the LTIP, which is based on the
net asset value growth of the Company spread over
several years and includes a lock-up of 5 years.
Governance structure
The Company has opted for a monistic governance model
with a Board of Directors in accordance with article 7:85
and further of the CCA. The Company deems this model to
be best suited for the needs and functioning of the Com-
pany and its business.
The Board of Directors is authorised to perform all oper-
ations that are considered necessary or useful to achieve
the Company’s purpose, except those reserved to the
shareholders' meeting by law or as set out in the articles of
association.

Board of Directors
The Board of Directors consists of five members, who are
appointed by the General Meeting of Shareholders. The
Chairman and the Chief Executive Officer are never the
same individual. The Chief Executive Officer is the only
Board member with an executive function. All other mem-
bers are non-executive Directors.
Three of the Directors are independent: Mrs Katherina
Reiche (first appointed in 2019), Mrs Vera Gäde-Butzlaff
(first appointed in 2019) and Mrs Ann Gaeremynck (first
appointed in 2019).
The biographies for each of the current directors (see
Board of Directors and Management), indicate the breadth
of their business, financial and international experience.
This gives the directors the range of skills, knowledge and
experience essential to govern VGP.
For a detailed description of the operation and respon-
sibilities of the Board of Directors we refer to the VGP Cor-
porate Governance Charter, which is published on the
company’s website (https://www.vgpparks.eu/investors/
corporate-governance/).
The Board of Directors did not appoint a company secre-
tary for the financial year 2021. By doing so, the Company,
as a smaller listed company, departs from the princi-
ples 3.19 and further of the Code 2020. Given its relatively
small size and the small size of the Company’s board of
directors, the function of the Company secretary was
taken up by the Company’s CFO. However, following the
appointment of a new CFO (Mr Piet Van Geet) on 10 Janu-
ary 2022, the Board of Directors appointed the previous
CFO (Mr Dirk Stoop) as Company secretary and hence no
longer departs from the principles 3.19 and further of the
Code 2020.
The Board of Directors held 8 board meetings in 2021.
The most important points on the agenda were:
— approval of the 2020 annual accounts and 2021
semi-annual accounts;
— approval of budgets;
— review and discussion of the COVID-19 pandemic’s
impact on the activities of the Group;
— review and discussion of the eighth closing with
the First Joint Venture, the evolution of the VGP
Park Moerdijk joint venture and the entering of new
Development Joint Ventures
— review and discussion of a new joint venture with
Allianz (the Fourth Joint Venture)
— review and discussion on related party transaction
procedure of Article 7:97 CCA
— review, discussion and approval of the 2020 Corporate
Responsibility Report;
— review, discussion on the VGP foundation and
approval to make a further contribution to the
VGP foundation;
— review, discussion and approval to issue a first public
€ 600 million benchmark green bond;
— review and discussion of the property portfolio
(i.e. investments, tenant issues etc.);
— review, discussion and approval of the investments
and expansion of the land bank;
— approval of allocations and delegated authorities in
respect of the Long-Term Incentive Plan;
— review, discussion and approval to delist from the
Prague Stock Exchange;
— review and approval of an € 300 million capital
increase through an accelerated book building
procedure;
— review, discussion and decisions on changes to the
corporate governance charter.
NAME YEAR APPOINTED
NEXT DUE FOR RE-ELECTION
MEETINGS ATTENDED
Executive director and Chief Executive Officer
Jan Van Geet s.r.o. represented by Jan Van Geet 2021 2025 8
Non-executive director
VM Invest NV represented by Bart Van Malderen 2021 2025 8
Independent, non-executive directors
GAEVAN BV represented by Ann Gaeremynck 2019¹ 2023 8
Katherina Reiche 2019 2023 7
Vera Gäde-Butzlaff 2019 2023 8
1 Until the Annual General Meeting of May 2020 Mrs Ann Gaeremynck office was in personal name.
Mrs Katherina Reiche, Mrs Vera Gäde-Butzlaff and
Mrs Ann Gaeremynck are independent directors, in
accordance with article 7:87 of the CCA.
The Annual General Meeting of Shareholders of 14 May
2021 approved the renewal of the mandates of the Execu-
tive Director (Jan Van Geet s.r.o.) and the Non-Executive
Director (VM Invest NV) for a new term of 4 years.
The composition of the Board of Directors meets the
gender diversity requirement laid down in article 7:86 of
the CCA.
PAG
E 7
0
—
VG
P N
V A
nn
ua
l R
ep
ort
20
21
/ C
om
pa
ny
Re
po
rt /
Re
po
rt o
f th
e B
oa
rd o
f D
ire
cto
rs

Committees of the Board of Directors
The Board of Directors has also established two advisory
committees: an Audit Committee and a Remuneration
Committee.
Audit Committee
The members of the Audit Committee are appointed by the
Board of Directors.
The Audit Committee is composed of three members
who are all non-executive Directors. Two members, Mrs
Ann Gaeremynck and Mrs Vera Gäde-Butzlaff, are inde-
pendent directors.
The members of the committee have sufficient relevant
expertise, especially in accounting, auditing and financial
matters, to effectively perform their functions.
The duration of the appointment of a member of the
Audit Committee may not exceed the duration of his/her
directorship. Committee members’ terms of office may be
renewed at the same time as their directorships.
The Audit Committee is chaired by one of its members.
The chairman of the board of directors may not chair the
Audit Committee.
For a detailed description of the operation and respon-
sibilities of the Audit Committee we refer to the VGP Cor-
porate Governance Charter, which is published on the
company’s website (https://www.vgpparks.eu/investors/
corporate-governance/).
The Audit Committee meets at least four times a year
and whenever circumstances require, at the request of its
chairman, one of its members, the chairman of the Board
of Directors, the CEO or the CFO. It decides if and when
the CEO, CFO, the Statutory Auditor(s) or other people
should attend its meetings.
The Audit Committee meets at least twice a year with
the statutory auditor to consult on matters falling under
the power of the Audit Committee and on any matters aris-
ing from the audit. The CEO and CFO also attend the meet-
ings of the Audit Committee.
Given the size of the Group no internal audit function
has currently been created.
The Audit Committee met four times in 2021. The Chair-
woman of the Audit Committee reported the outcome of
each meeting to the Board of Directors. The most impor-
tant points on the agenda were:
— discussion on the 2020 annual accounts and 2021
semi-annual accounts and business updates;
— analysis of the recommendations made by the
statutory auditor;
— the different closings with the Allianz Joint Ventures;
— financing structure of the Group;
— the capital increase through an accelerated book
building procedure;
— assessment and discussion on the need to create an
internal audit function;
— discussion, review and approval of proposed scope
and fees for audit and non-audit work carried out by
Deloitte.
NAME YEAR APPOINTED
EXECUTIVE OR NON-EXECUTIVE
INDEPENDENT NEXT DUE FOR RE-ELECTION
MEETINGS ATTENDED
GAEVAN BV represented by Ann Gaeremynck (Chairwoman)
2019 Non-executive Independent 2023 4
Vera Gäde-Butzlaff 2019 Non-executive Independent 2023 4
VM Invest NVrepresented by Bart Van Malderen
2021 Non-executive — 2025 4
PAG
E 7
1 —
V
GP
NV
An
nu
al
Re
po
rt 2
02
1 /
Co
mp
an
y R
ep
ort
/ R
ep
ort
of
the
Bo
ard
of
Dir
ec
tors

Remuneration Committee
The members of the Remuneration Committee are
appointed by the Board of Directors.
The Remuneration Committee is composed of three
members who are all non-executive Directors. Two mem-
bers, Mrs Ann Gaeremynck and Mrs Katherina Reiche are
independent directors.
The members of the Remuneration Committee possess
the necessary independence, skills, knowledge, experi-
ence and capacity to execute their duties effectively.
The duration of the appointment of a member of the
Remuneration Committee may not exceed the duration of
his/her directorship. Committee members’ terms of office
may be renewed at the same time as their directorships.
The Remuneration Committee is chaired by the
Chairman of the Board of Directors or by another non-
executive director.
For a detailed description of the operation and
responsibilities of the Remuneration Committee we
refer to the VGP Corporate Governance Charter, which
is published on the company’s website (https://www.
vgpparks.eu/investors/corporate-governance/).
The Remuneration Committee meets at least two
times per year, as well as whenever the committee
needs to address imminent topics within the scope of its
responsibilities.
The CEO and CFO participate in the meetings when the
remuneration plan proposed by the CEO for members of
the management team is discussed, but not when their
own remunerations are being decided.
In fulfilling its responsibilities, the Remuneration Com-
mittee has access to all resources that it deems appro-
priate, including external advice or benchmarking as
appropriate.
The Remuneration Committee met two times in 2021.
The most important points on the agenda were:
— assessment of the impact of the implementation
of the Shareholders Rights Directive II (SRD II) on
remuneration policy and report;
— assessment and determination of the achievement
of the 2020 performance criteria and performance
targets and criteria for the CEO, other members of the
Executive Committee and senior managers for the
financial year 2021;
— allocation of variable remuneration;
— allocations under the long-term incentive plan;
— changes in the remuneration of board and committee
members;
— discussion on the drafting of the new 2021 remunera-
tion policy.
In order to maintain a flexible remuneration policy that
enables it to attract, reward, incentivize and retain the
necessary talent, the Company departs from the following
principles of the Code 2020 in the framework of its
remuneration policy:
— by not requiring its non-executive directors to receive
part of their remuneration in the form of shares in
the Company and by not setting a minimum holding
period for shares in the Company held by such
persons, if any, the Company departs from principle
7.6 of the Code 2020;
— by not setting a minimum threshold of shares to be
held by the executive management as part of their
remuneration, the Company departs from principle
7.9 of the Code 2020.
NAME YEAR APPOINTED
EXECUTIVE OR NON-EXECUTIVE
INDEPENDENT NEXT DUE FOR RE-ELECTION
MEETINGS ATTENDED
VM Invest NV, represented by Bart Van Malderen (Chairman)
2021 Non-executive — 2025 2
Katherina Reiche 2019 Non-executive Independent 2023 1
GAEVAN BV represented by Ann Gaeremynck
2019 Non-executive Independent 2023 2
PAG
E 7
2
—
VG
P N
V A
nn
ua
l R
ep
ort
20
21
/ C
om
pa
ny
Re
po
rt /
Re
po
rt o
f th
e B
oa
rd o
f D
ire
cto
rs

Nomination Committee
The company has not set up a Nomination Committee.
The Company does not intend to set up a nomination
committee. By doing so, the Company, as a smaller listed
company, departs from the principles 4.19 and further of
the Code 2020. Given its relatively small size and the small
size of the Company’s Board of Directors, the Company
believes setting up a nomination committee would at this
stage overly complicate its decision-making processes.
Evaluation of the Board of Directors and its committees
In accordance with the VGP Corporate Governance Char-
ter, the Board of Directors shall, every three years, conduct
an evaluation of its size, composition and performance,
and the size, composition and performance of its Commit-
tees, as well as the interaction with the executive manage-
ment.
The Board of Directors and its Committees carried out a
self-assessment in February 2022 with satisfactory result. p
ho
to ©
Tri
lux
PAG
E 7
3
—
VG
P N
V A
nn
ua
l R
ep
ort
20
21
/ C
om
pa
ny
Re
po
rt /
Re
po
rt o
f th
e B
oa
rd o
f D
ire
cto
rs

Remuneration report
Introduction
This remuneration report has been drafted in accordance
with the provisions of article 3:6, §3 of the Code of Compa-
nies and Associations and the VGP Corporate Governance
Charter (Annex 5), and takes into account the VGP Remu-
neration Policy (see Annex 7 of the VGP Corporate Govern-
ance Charter on https://www.vgpparks.eu/investors/
corporate-governance/).
The VGP Remuneration Policy was submitted to and
approved by the annual shareholders’ meeting of 14 May
2021 with a large majority (93.13% of the votes present
gave their approval). This new remuneration policy took
effect on 1 January 2021. This remuneration report must be
read together with the VGP Remuneration Policy which, to
the extent necessary, should be regarded as forming part
of this remuneration report. The remuneration granted to
the directors, the CEO and the other members of the Exec-
utive Management Team with respect to financial year
2021 is in line with the VGP Remuneration Policy.
The remuneration report for the performance year 2020
was also approved by a large majority of 97.08% of the
votes present. And there were no specific comments to be
taken into account in the remuneration for performance
year 2021.
VGP 2021 highlights
2021 was another year of record growth for VGP with net
profit for the financial year 2021 soaring to € 650.1 million
(compared to a net profit of € 370.9 million for the financial
year 2020).
VGP recorded a solid business growth across its prop-
erty portfolio with signed and renewed rental income
of € 79.7 million (+ 76% YoY) bringing total signed rental
income to € 256.1 million (+ 76% YoY).
During the year 26 buildings were completed totalling
652,000 m² of lettable area representing € 32.0 million of
annualised committed leases (99.8%-let). At the end of
the year 50 buildings were under construction represent-
ing 1,478,000 m² of lettable area – 1.7x level of December
2020 - representing € 93.9 million of annualised commit-
ted rental income (83.8% pre-let at year-end).
The weighted average term of the annualised commit-
ted leases of the combined own and Joint Ventures’ port-
folio stood at 8.6 years at the year-end (8.5 years as at 31
December 2020) and the occupancy rate (own and Joint
Ventures’ portfolio) reached 99.4 % at year-end (compared
to 98.5% at the end of 2020).
The land further expanded with the acquisition of
4,037,000 m² of new development land with a further
3,981,000 m² of committed land plots, pending permits,
bringing the total secured (own and committed) land bank
to 10,938,000 m² (+ 43.0% YoY).
Operations were started in France, Serbia and Croatia.
A new Fourth Joint Venture with Allianz Real Estate was
entered into following the reaching of the First Joint Ven-
ture’s investment capacity. During 2021 there was 1 closing
with the respective Allianz joint ventures which resulted in
net cash proceeds totalling € 49.6 million.
As of 31 December 2021, the roofs of VGP’s building
portfolio enabled a photovoltaic power generation capac-
ity of 74.7MWp installed or under construction (compared
to 42.5MWp as at the end of December 2020).
At the end of the year 4,570,000 m² total lettable area,
or 54% of the total portfolio, was certified (BREEAM “Very
Good” or equivalent) or having its certificate pending.
ph
oto
© T
rilu
x
PAG
E 7
4
—
VG
P N
V A
nn
ua
l R
ep
ort
20
21
/ C
om
pa
ny
Re
po
rt /
Re
po
rt o
f th
e B
oa
rd o
f D
ire
cto
rs

Total remuneration
Total remuneration of the directorsThe remuneration paid to non-executive directors consists
solely of an annual fixed component plus the fee received
for each meeting attended These fees were approved
by the annual shareholders’ meeting of 8 May 2020 and
remained unchanged for 2021. The non-executive direc-
tors receive an annual fixed remuneration of € 75,000. The
chairman does not receive any additional fixed remunera-
tion for its chair. The non-executive directors also receive
an attendance fee of € 2,000 for each meeting of the board
of directors and € 2,000 for each meeting of the Audit
Committee or the Remuneration Committee they attend.
Non-executive directors do not receive any variable
compensation linked to results or other performance cri-
teria. They are not entitled to stock options or shares (see
Corporate Governance Statement – Principles regarding
the deviation from Principle 7 6 of the 2020 Belgian Corpo-
rate Governance Code), nor to any supplementary pension
scheme.
1 The remuneration that Jan Van Geet s.r.o. receives in his capacity of CEO is reflected in tables B and C below.
TABLE A – REMUNERATION OF THE BOARD OF DIRECTORS FOR THE REPORTED FINANCIAL YEAR 2021
2021 REMUNERATION
(in €)
FIXED REMUNERATION
VARIABLE REMUNERATION
EXTRA-ORDINARY
ITEMS
PENSION TOTAL REMUNE-
RATION
PROPORTION OF FIXED AND
VARIABLE REMUNERATION
BASE SALARY
ATTEN-DANCE
FEES
OTHER BENEFITS
ONE-YEAR
VARIABLE
MULTI-YEAR
VARIABLE
FIXED VARI-ABLE
Non-executive directors
VM Invest NV represented by Bart Van Malderen Chair of the Board of Directors and Remuneration Committee
75,000 28,000 n.a. n.a. n.a. n.a. n.a. 103,000 100% 0%
GAEVAN BV represented by Ann GaeremynckIndependent director and chair of the Audit Committee
75,000 28,000 n.a. n.a. n.a. n.a. n.a. 103,000 100% 0%
Katherina ReicheIndependent director
75,000 16,000 n.a. n.a. n.a. n.a. n.a. 91,000 100% 0%
Vera Gäde-ButzlaffIndependent director
75,000 24,000 n.a. n.a. n.a. n.a. n.a. 99,000 100% 0%
Executive directors
Jan Van Geet s.r.o. represented by Jan Van Geet Executive director¹
75,000 16,000 n.a. n.a. n.a. n.a. n.a. 91,000 100% 0%
Total 375,000 112,000 n.a. n.a. n.a. n.a. n.a. 487,000 100% 0%
PAG
E 7
5
—
VG
P N
V A
nn
ua
l R
ep
ort
20
21
/ C
om
pa
ny
Re
po
rt /
Re
po
rt o
f th
e B
oa
rd o
f D
ire
cto
rs

Total remuneration of the Executive Management Team
General¹The Executive Management Team consists of Jan Van
Geet (Chief Executive Officer), Piet Van Geet (Chief
Financial Officer)², Dirk Stoop (Company Secretary)³,
Tomas Van Geet (Chief Commercial Officer), Miquel-David
Martinez (Chief Technical Officer), Matthias Sander (Chief
Operating Officer – Eastern Europe), Jonathan Watkins
(Chief Operating Officer – Western Europe) and Martijn
Vlutters (Vice President – Business Development &
Investor Relations).
The remuneration for the Executive Management Team
consists of:
— A fixed remuneration: the base salary is determined in
function of the individual responsibilities and skills of
each member of the Executive Management Team.
The CEO receives a base salary in his capacity as CEO
as well as in his capacity as executive director.
— A short-term variable remuneration: linked to the
performance criteria as described below.
— A long-term variable remuneration: through
participation to the long-term incentive plan (the
“LTIP”).
The CEO does not participate in the LTIP.
— A contribution for retirement benefits: although
the members of the Executive Management Team
are, in principle, responsible for their own pension
arrangements, some members (depending on status
and function) benefit from a pension allowance.
The CEO does not benefit from any pension
contribution.
— Other benefits in kind (such as, amongst others,
car allowance and related expenses)
Performance criteria short-term variable remuneration
For financial year 2021, the performance of the Executive
Management Team was appraised on the basis of the fol-
lowing performance criteria:
1 The natural persons listed here are the respective permanent representatives of (i) Jan Van Geet s.r.o., (ii) Urraco BV, (iii) Dirk Stoop BV,
(iii) Tomas Van Geet s.r.o., (iv) Matthias Sander s.r.o., (v) Havbo Consulting Ltd. and (vi) MB Vlutters BV. Mr Jan Prochazka
(COO- Czech Republic) terminated his term of office at the end of 2020.
2 As from 10 January 2022.
3 As from 10 January 2022. Until 10 January 2022 CFO.PAG
E 7
6
—
VG
P N
V A
nn
ua
l R
ep
ort
20
21
/ C
om
pa
ny
Re
po
rt /
Re
po
rt o
f th
e B
oa
rd o
f D
ire
cto
rs

1 Pay-out level expressed as a multiple of the "target" bonus
PERFORMANCE CRITERIA
Relative weighting of the performance criteria
A) Minimum performance target B) corresponding award payment level¹
A) Maximum performance target B) corresponding award payment level¹
A) Measured performanceB) corresponding award payment level¹
Jan Van Geet s.r.o., represented by Jan Van Geet, CEO
Net profit of the Group 50% a) 75%b) 0.38
a) 125%b) 0.50
a) 260%b) 0.50
Growth in committed annualised lease agreements
20% a) 80%b) 0.16
a) 125%b) 0.20
a) 205%b) 0.20
— Cash flow from operations and divestments to joint ventures
— Occupancy rate— Buildings completed
and started-up— Pre-lets under
construction— Land acquisition— Other
20% a) 80%b) 0.16
a) 125%b) 0.20
a) 207%b) 0.20
— ESG— Health and safety— Human resources
management— Other
10% a) 80%b) 0.08
a) 125%b) 0.10
a) 125%b) 0.10
Total bonus payment level 0.78 1.00 1.00
Total variable remuneration 2021
€ 600,000
PERFORMANCE CRITERIA
Relative weighting of the performance criteria
A) Minimum performance target B) corresponding award payment level¹
A) Maximum performance target B) corresponding award payment level¹
A) Measured performanceB) corresponding award payment level¹
Other members of the Executive Management Team
Net profit of the Group 50% a) 75%b) 0.38
a) 125%b) 0.87
a) 260%b) 0.87
Growth in committed annualised lease agreements
20% a) 80%b) 0.16
a) 125%b) 0.35
a) 205%b) 0.35
— Cash flow from operations and divestments to joint ventures
— Occupancy rate— Buildings completed
and started-up— Pre-lets under
construction— Land acquisition— Other
20% a) 80%b) 0.16
a) 125%b) 0.35
a) 207%b) 0.35
— ESG— Health and safety— Human resources
management— Other
10% a) 80%b) 0.08
a) 125%b) 0.17
a) 125%b) 0.17
Total bonus payment level 0.78 1.74 1.74
Total variable remuneration 2021
€ 1,735,000
The Company does not disclose the actual targets per
criterion, as this would require the disclosure of commer-
cially sensitive information.
PAG
E 7
7 —
V
GP
NV
An
nu
al
Re
po
rt 2
02
1 /
Co
mp
an
y R
ep
ort
/ R
ep
ort
of
the
Bo
ard
of
Dir
ec
tors

Reported financial year 2021
Taking into account the achievement of the abovemen-
tioned performance criteria in respect of the short-term
variable remuneration, as well as the other aspects of
the total remuneration package, the Board of Directors
awarded the Executive Management Team with the follow-
ing total remuneration for the financial year 2021:
ConclusionThe total amount of remuneration as set out above is in
line with the VGP Remuneration Policy. More in particular,
the remuneration package allows the Group to attract,
retain and motivate selected profiles, taking account
of the Group’s characteristics and challenges, while
maintaining coherence between the remuneration of
the members of the Board of Directors, the Executive
Management Team and of all staff, properly and
effectively managing risk and keeping the costs of the
various remunerations under control.
The total amount of remuneration, and more in particu-
lar, the variable fraction of the total remuneration package,
contributes to the long-term performance of the Group by
setting performance criteria that focus on the long-term
objectives of the Group.
1 Relates to the LTIP variable remuneration vested during the financial year. During 2021 no LTIP variable remuneration was vested for the EMT.
2 The remuneration that Jan Van Geet s.r.o. receives in his capacity of executive director is reflected in table A above
TABLE B – REMUNERATION OF THE EXECUTIVE MANAGEMENT TEAM FOR THE REPORTED FINANCIAL YEAR 2021
2021 REMUNERATION
(in €)
FIXED REMUNERATION
VARIABLE REMUNERATION
EXTRA-ORDINARY
ITEMS
PENSION TOTAL REMUNE-
RATION
PROPORTION OF FIXED AND
VARIABLE REMUNERATION
BASE SALARY
ATTEN-DANCE
FEES
OTHER BENEFITS
ONE-YEAR
VARIABLE
MULTI-YEAR
VARIABLE¹
FIXED VARI-ABLE
Executive Management Team
Jan Van Geet s.r.o., represented by Jan Van Geet, CEO²
600,000 n.a. 35,987 600,000 n.a. n.a. n.a. 1,235,987 51% 49%
Other members of Executive Management Team
1,420,429 n.a. 80,301 1,735,000 n.a. n.a. 39,900 3,275,630 47% 53%
Total 2,020,429 n.a. 116,288 2,335,000 n.a. n.a. 39,900 4,511,617 48% 52%
PAG
E 7
8
—
VG
P N
V A
nn
ua
l R
ep
ort
20
21
/ C
om
pa
ny
Re
po
rt /
Re
po
rt o
f th
e B
oa
rd o
f D
ire
cto
rs

Share-based remuneration
For the financial year 2021, no share-based remuneration
was granted.
Severance payments
For the financial year 2021, no severance payments were
made in relation to the termination of management or
employment agreements of any members of the Executive
Management Team.
Claw-back
The Company deviates from principle 7.12 of the Code
2020 by not including contractual provisions to delay
payment or clawback provisions in relation to the vari-
able remuneration of the Executive Management Team.
The Board of Directors is of the opinion that its remunera-
tion policy and practices sufficiently address the underly-
ing objective of this principle, as any payment of variable
remuneration is only made following the finalisation of the
financial results. In addition, the Board of Directors can
reduce the amount of short-term variable remuneration
of an Executive Management Team member based on its
individual performance. With regards to long term variable
remuneration, the LTIP also includes certain malus provi-
sions. Finally, the Company may in certain events use legal
remedies that may be available to it under applicable law
to withhold payment or reclaim variable remuneration.
Derogations from the remuneration policyFor the remuneration in respect of financial year 2021, VGP
did not derogate from its existing remuneration practices.
Changes in 2022
During a meeting held on 5 January 2022, the Board of
Directors based on the recommendations of the remunera-
tion committee took the decision to appoint Piet Van Geet
as CFO in replacement of Dirk Stoop. In order to ensure
continuity and a smooth transition process as well as fur-
ther strengthening of the Group’s corporate governance,
the Board decided to appoint Dirk Stoop as Company
Secretary. The incoming CFO has the same remuneration
package as the outgoing CFO.
During the same meeting, the Board of Directors
decided to terminate the services agreement between Lit-
tle Rock SA and the Company. Under the terms and condi-
tions of this services agreement the Company called upon
Little Rock SA for the purpose of the support and manage-
ment and execution of the activities of the VGP Group and
Little Rock SA in turn called upon the services of Jan Van
Geet s.r.o., the CEO of the Company, and Tomas Van Geet
s.r.o., the Chief Commercial Officer of the Company, for
the performance of the services provided to the Company.
In order to simplify the above arrangements, the Board of
Directors decided to engage Jan Van Geet s.r.o., with Mr
Jan Van Geet as its permanent representative, and Tomas
Van Geet s.r.o., with Mr Tomas Van Geet as its permanent
representative, directly. Reference is also made to section
Policies of conduct – Conflict of interest.
PAG
E 7
9
—
VG
P N
V A
nn
ua
l R
ep
ort
20
21
/ C
om
pa
ny
Re
po
rt /
Re
po
rt o
f th
e B
oa
rd o
f D
ire
cto
rs

Comparative information on the change of remuneration and company performance
With a view to increasing transparency of past, current and
future remuneration programs and in alignment with inves-
tor interest and the legislative framework, the following table
demonstrates the annual change, over a period of 5 years, in
(i) the remuneration of members of the Board of Directors and
the Executive Management Team, (ii) the performance of the
Group on a consolidated basis and (iii) the average remunera-
tion of the employees of VGP NV.
As requested by the Belgian Code of Companies and Associa-
tions, VGP reports the pay ratio of the CEO remuneration ver-
sus the lowest FTE employee remuneration in its legal entity
VGP NV. The 2021 pay ratio is 20.7.
TABLE C – COMPARATIVE INFORMATION ON THE CHANGE OF REMUNERATION AND COMPANY PERFORMANCE
2016 2017 2018 2019 2020 2021
Remuneration of non-executive directors
Total annual remuneration 85,500 82,500 182,000¹ 396,500 ² 412,000 396,000
Year-on-year difference (%) 6% – 4% 121% 118% 4% – 4%
Number of non-executive directors under review 4 4 4 4 4 4
Remuneration of CEO and executive director
Total annual remuneration as executive director 16,000 15,000 16,000 93,000 91,000 91,000
Year-on-year difference (%) 7% – 6% 7% 481% – 2% 0%
Total annual remuneration as CEO 335,160 336,562 ³ 336,380 837,212 1,234,936 1,235,987
Year-on-year difference (%) – 43% 0% 0% 149% 48% 0%
Remuneration of the Executive Management Team
Total annual remuneration 1,373,283 1,218,679 1,621,658 5,739,044 ⁴ 4,467,293 3,275,630
Year-on-year difference (%) 35% – 11% 33% 254% – 22% – 27%
Number of non-executive directors under review 4 4 6 7 7 7
Company performance
Net profit attributable to shareholders (’000 €) 91,286 95,995 121,106 205,613 370,939 650,055
Year-on-year difference (%) 5% 5% 26% 70% 80% 75%
Average remuneration per employee
Average salary per employee⁵ n.a. 59,160 72,715 76,065 74,512 79,565
Year-on-year difference (%) 23% 5% – 2% 7%
1 The annual shareholders’ meeting of 11 May 2018 approved the payment of an extraordinary fee of € 33,000 to all independent directors to
reflect to reflect their contribution to the further growth of the Group.
2 The increase in financial year 2019 is due to (i) the increase in base salary from € 10,000 to € 40,000 and (ii) a one-off extraordinary fee, granted
to all members of the board of directors to reflect the contribution of the directors to the further growth of the Group and to ensure that their
total remuneration for financial year 2019 was aligned to a more market-based remuneration. This increase and additional remuneration was
approved by the annual shareholders meeting of 10 May 2019.
3 This overview of annual change in remuneration for the financial year 2017 of the CEO does not take into account the exceptional termination
benefits received by Little Rock SA, a company controlled by Jan Van Geet, in view of the termination of the agreement entered into in the
course of April 2015 for the rendering of services relating to the Group’s daily, financial and commercial management. For more detailed
information, please see Remuneration Report included in the Annual Report of 2017 – page 47.
4 The increase was mainly due to the early termination of the VGP Misv incentive plan which resulted in the early vesting of the long-term
incentives under this plan. The early termination of the VGP Misv plan had also some spill over effects on 2020 as for certain managers new
allocations were granted under the new LTIP for a corresponding number of Units and with a lock-up period reflecting the remaining initial lock
up period as applicable under the initial VGP MISV Plan. This resulted in a further vesting at the end of 2020. For more detailed information,
please see table B included in the Annual Report of 2020 – page 69.
5 The average remuneration of employees is calculated on the basis of the “total annual gross wages” excluding company cars, divided by the
number of employees of VGP NV on year over year bases for continues operations. These numbers do not take into account the remuneration
of employees of the other Group companies.PAG
E 8
0
—
VG
P N
V A
nn
ua
l R
ep
ort
20
21
/ C
om
pa
ny
Re
po
rt /
Re
po
rt o
f th
e B
oa
rd o
f D
ire
cto
rs

Policies of conduct
Code of ConductDuring 2019 a formal Code of Conduct was introduced.
This Code of Conduct describes the key principles of con-
duct for the business environment, in which the Group
operates. At the same time, a training program has been
rolled out throughout the countries in which the Group
operates in order to preserve the compliance culture
across the Group.
The Code of Conduct sets out the shared values of
integrity, compliance with local and international law,
respect for employees and customers, the willingness to
accept social responsibility, environmental awareness
and an unequivocal stand against bribery and corruption.
The Code of Conduct describes in clear terms the princi-
ples which the VGP Group must adhere to and provides a
number of examples of potential violations as well as good
practice.
The Code of Conduct is made available to all VGP staff.
VGP uses in-person training to familiarise employees with
its contents and application in everyday scenarios. This
training is mandatory for all employees having managerial
responsibilities and is carried out progressively through-
out the countries, in which VGP operates.
There are a number of channels for reporting possible
violations of the Code of Conduct, including a compliance
hotline, which allows anonymous reports.
Transparency of transactions involving shares of VGPThe Board of Directors has adopted a Dealing Code on
17 January 2007 which has been updated by the Board of
Directors of the Company on 8 December 2016 to prevent
the illegal use of inside information by VGP staff members
and connected persons, and further updated on 8 May
2020 to implement changes following the adoption of the
new Code on Companies and Associations.
The purpose of this Dealing Code is to ensure that such
persons do not abuse, nor place themselves under suspi-
cion of abusing, and maintain the confidentiality of infor-
mation that may be considered as Inside Information,
especially in periods leading up to an announcement of
financial results or of price sensitive events or decisions.
Reference is also made to Annex 4 Rules preventing
market abuse (Dealing Code) of the VGP Corporate Gov-
ernance Charter on https://www.vgpparks.eu/investors/
corporate-governance/.
Duty to report effective dealingsVGP staff members1 must inform the Compliance Offi cer
immediately within three (3) business days after they or a
connected person have dealt in any of the Company’s fi nan-
cial instruments, mentioning the date of the transaction, the
nature of the dealing (purchase, sale, etc), the amount of
fi nancial instrument and the total price of the dealing.
Simultaneously, a notification has to be made to the
FSMA by an executive staff member or connected person
thereof by way of a form that is available on the website of
the FSMA (www.fsma.be) and that can also be requested
from the Compliance Officer.
1 As defined in Annex 4 – Rules preventing market abuse (Dealing code) of the Company’s Corporate Governance Charter PAG
E 8
1 —
V
GP
NV
An
nu
al
Re
po
rt 2
02
1 /
Co
mp
an
y R
ep
ort
/ R
ep
ort
of
the
Bo
ard
of
Dir
ec
tors

Closed dealing periodsDuring so-called “closed” periods (being 30 calendar days
before the announcement of an interim financial report or
a year-end report which the Company is obliged to make
public), directors, members of the Executive Management
Team and employees may not trade in VGP financial instru-
ments.
Insider transactions during 2021During 2021 no insider transactions occurred
Transparency notifications 2021Due to the application of the double voting rights and the
capital increase of November 2021, a number of transpar-
ency declarations were received and published by the
Company during 2021. For further details we refer the
Company’s website: https://www.vgpparks.eu/investors/
shareholding/.
For further details on the Company’s shareholder struc-
ture as at 31 December 2021 as well as the description of
authorisation in respect of authorised capital, delegated to
the Board of Directors, we refer to the section Information
about the Share.
Conflict of interestIn accordance with Article 7:96 of the new Code on Compa-
nies and Associations, a member of the Board of Directors
should give the other members prior notice of any agenda
items in respect of which he has a direct or indirect conflict
of interest of a financial nature with the Company.
No conflict of interests arose during 2021 but one
conflict of interest arose in January 2022.
Excerpt from the minutes of the Board of Directors
meeting of 5 January 2022
Prior to any deliberations on the items of the agenda of the
meeting, Jan Van Geet s.r.o., with Jan Van Geet as its per-
manent representative, informed the other directors of the
Company that it has a conflict of interests with respect to
the approval by the Company of the termination of the ser-
vices agreement with Little Rock S.A. and the conclusion
of consultancy agreements with Jan Van Geet s.r.o. and
Tomas Van Geet s.r.o. (the “Conflicted Decision”) within
the meaning of article 7:96 of the Code of Companies and
Associations (the “CCA”).
The confl ict of interests arises because Jan Van Geet s.r.o,
(i) is the counterparty to the aforementioned consultancy
agreement and, hence, the benefi ciary of any remuneration
included therein, and (ii) also controls Little Rock S.A.
Consequently, pursuant to article 7:96, §1, fourth par-
agraph of the CCA, Jan Van Geet s.r.o. and its perma-
nent representative Mr Jan Van Geet are excluded from
any deliberation and vote by the board of directors on or
related to the Conflicted Decision.
Jan Van Geet s.r.o. and Tomas Van Geet s.r.o. currently
provide services to the Company indirectly, under the ser-
vices agreement between the Company and Little Rock
S.A. It is now proposed to terminate the services agree-
ment between the Company and Little Rock S.A. and to
enter into new consultancy agreements with each of Jan
Van Geet s.r.o. and Tomas Van Geet s.r.o. directly, on the
same terms and conditions. The non-conflicted direc-
tors are of the opinion that the approval and the entering
into the consultancy agreement with Jan Van Geet s.r.o. is
in the interest of the Company as it helps to simplify the
Company’s governance since the consultancy agreements
with Jan Van Geet s.r.o. and Tomas Van Geet s.r.o. replace
the current services agreement with Little Rock S.A.. As
the consultancy agreements will be entered into on the
same terms and conditions as the current services agree-
ment with Little Rock S.A., the Conflicted Decision has no
financial consequences for the Company.
None of the other directors declared to have an inter-
est in the Conflicted Decision that would require the
application of the procedure set out in the provisions of
article 7:96 CCA.
Risk management and internal controlsVGP is exposed to a wide variety of risks within the context
of its business operations that can result in the objectives
being affected or not achieved. Controlling those risks is a
core task of the Board of Directors, the Executive Manage-
ment and all other employees with managerial responsi-
bilities.
The risk management and control systems have been set
up to reach the following goals:
— achievement of objectives related to effectiveness
and efficiency of operations;
— reliability of financial reporting, and;
— compliance with applicable laws and regulations.
The principles of the Committee of Sponsoring Organisa-
tions of the Treadway Commission (“COSO”) reference
framework has served as a basis in the set-up of VGP’s risk
management and control system.
CONTROL ENVIRONMENT
VGP strives for an overall compliance and a risk-aware-
ness attitude by defining clear roles and responsibilities
in all relevant domains. This way, the company fosters an
environment in which its business objectives and strate-
gies are pursued in a controlled manner. This environment
is created through the implementation of different policies
and procedures, such as:
— Code of ethics and conduct;
— Decision and signatory authority limits;
— Quality management and financial reporting system
Given the size of the company and required flexibility
these policies and procedures are not always formally doc-
umented. PAG
E 8
2
—
VG
P N
V A
nn
ua
l R
ep
ort
20
21
/ C
om
pa
ny
Re
po
rt /
Re
po
rt o
f th
e B
oa
rd o
f D
ire
cto
rs

The Executive Management ensures that all VGP team
members are fully aware of the policies and procedures
and ensures that all VGP team members have sufficient
understanding or are adequately informed in order to
develop sufficient risk management and control at all lev-
els and in all areas of the Group.
RISK MANAGEMENT SYSTEM
Risk management and process and methodology
All employees are accountable for the timely identification
and qualitative assessment of the risks (and significant
changes to them) within their area of responsibility.
Within the different key, management, assurance,
and supporting processes, the risks associated with
the business are identified, analysed, pre-evaluated
and challenged by internal and occasionally by external
assessments.
In addition to these integrated risk reviews, periodic
assessments are performed to check whether proper
risk review and control measures are in place and to dis-
cover unidentified or unreported risks. These processes
are driven by the CEO, COO’s and CFO which monitor and
analyse on an on-going basis the various levels of risk and
develop any action plan as appropriate. In addition, control
activities are embedded in all key processes and systems
in order to assure proper achievement of the company
objectives.
Any identified risks, which could have a material impact
on the financial or operational performance of the Group
are reported to the Board of Directors for further discus-
sion and assessment and to allow the Board to decide
whether such risks are acceptable from a level of risk
exposure.
Most important risk factors
VGP has identified and analysed all its key corporate risks
as disclosed in the ‘Risk Factors’ section in this annual
report. These corporate risks are communicated through-
out VGP’s organisation.
Statutory auditorDELOITTE Bedrijfsrevisoren BV having its offices at Gate-
way Building, Luchthaven Nationaal 1 J, 1930 Zaventem,
Belgium represented by Mrs. Kathleen De Brabander has
been appointed as Statutory Auditor.
The Statutory Auditor’s term of office expires immedi-
ately after the annual shareholders’ meeting to be held in
2023 and at which the decision will be taken to approve
the annual accounts closed on 31 December 2022. For
further details we refer the section Financial Review –
note 28 included in this annual report.
PAG
E 8
3
—
VG
P N
V A
nn
ua
l R
ep
ort
20
21
/ C
om
pa
ny
Re
po
rt /
Re
po
rt o
f th
e B
oa
rd o
f D
ire
cto
rs

The following risk factors that could influence the Group’s
activities, its financial status, its results and further devel-
opment, have been identified by the Group.
The Group takes and will continue to take the necessary
measures to manage those risks as effectively as possible.
The Group is amongst others exposed to:
1. Risks related to the Group’s growth strategy
1.1 The Group may not be able to continue its development activities in a sustained and profitable way, for which it depends on its ability to execute new lease agreements and dispose of its real estate assets to the Second and Fourth Joint VentureThe Group’s revenues are determined by the ability to sign
new lease contracts and by the disposal of real estate
assets, in particular to the Second Joint Venture and
Fourth Joint Venture. The Group’s short-term cash flow
may be affected if it is unable to continue successfully
signing new lease contracts and successfully dispose of
real estate assets, which could have an adverse effect on
the Group’s business, financial condition and results of
operations.
As a result, the Group’s solvability depends on its abil-
ity to create a healthy financial structure in the long term
with (i) a sufficiently large recurring income stream from
leasing agreements for the developed logistic property
(at both the Group’s and the Joint Ventures’ level) vis-à-
vis the debt that is issued for financing the acquisition
and the development of that logistic property, and (ii) the
Group’s ability to continue its development activities in a
sustained and profitable way in order to produce income
generating properties which once they have reached a
mature stage can be sold to the Joint Ventures or eventu-
ally to a third party.
The Group is largely dependent on the income stream
from the Joint Ventures, as the majority of the mature
assets are sold to the Second Joint Venture and Fourth
Joint Venture or being developed by the Third and Devel-
opment Joint Ventures. As a result, the Group receives
fee and dividend income from the Joint Ventures instead
of leasing income from mature assets. Hence it is impor-
tant that a sufficiently large recurrent income at the Joint
Ventures’ level is created in order to upstream cash to
the Group. Those dividend streams are important for the
liquidity and the solvability of the Group for the purpose of
cash recycling and repayment of shareholders loans.
The Group’s current income stream from the Joint Ven-
tures as well as fee income from the Joint Ventures is
rapidly increasing but still relatively limited compared to
the considerable amount of debt (at both the Group’s as
well as Joint Ventures’ level), as (i) the First Joint Venture
has reached its investment capacity, (ii) the Second Joint
Venture is still in its initial 5-year investment phase, (iii)
the Fourth Joint Venture – which is intended to replace
the investment capacity of the First Joint Venture – will
only become effective as from its first closing, currently
expected to take place during the second half of 2022, (iv)
the Third Joint Venture is in an advanced stage of its devel-
opment phase of VGP Park München and (v) the Devel-
opment Joint Ventures are in the initial phases of their
development planning.
Please also refer to the following risk factors, which
are related hereto and which deal with certain aspects in
more detail: risk factor 2.2 “The Group’s development pro-
jects require large initial investments while they will start
generating income only after a period in time”, risk factor
3.1 “The Group’s business, operations and financial con-
ditions are significantly affected by the Joint Ventures”,
risk factor 4.1 “The Group’s debt levels have substantially
increased over the last years and the Group is exposed
to a (re)financing risk” and risk factor 4.3 “The Group is
exposed to risk of financing from its Joint Ventures”.
1.2 The Group may not have the required human and other resources to manage growth or may not continue to adequately and efficiently monitor its portfolioThe Group’s success depends in part on its ability to man-
age future expansion and to identify attractive invest-
ment opportunities. Such expansion is expected to place
significant demands on management, support functions,
accounting and financial control, sales and marketing and
other resources and involves a number of risks, including:
the difficulty of assimilating operations and personnel in
the Group’s operations, the potential disruption of ongoing
business and distraction of management.
As at 31 December 2021, the Group had over 320
employees. The Group’s aim is to have a sufficiently large
team to support the current growth rate of the Group.
Risk factors
PAG
E 8
4
—
VG
P N
V A
nn
ua
l R
ep
ort
20
21
/ C
om
pa
ny
Re
po
rt /
Re
po
rt o
f th
e B
oa
rd o
f D
ire
cto
rs

2. Risks related to the Group’s business activities and industry
2.1 The Group’s development projects may experience delays and other difficulties, especially in respect of receiving necessary permitsThe strategy of the Group is focused on the development
of income generating logistic property and on the
potential disposal of such property once it has reached
a mature stage.
Development projects tend to be subject to a variety of
risks, each of which could cause late delivery of a project
and, consequently, increase the development period lead-
ing up to its contemplated sale to or completion by the
Joint Ventures, trigger a budget overrun, cause a loss or
decrease of expected income from a project or even, in
some cases, its actual termination.
The Group adopts a “first mover” strategy in respect
of securing or acquiring land plots on strategic locations
without necessarily having already identified a specific
future tenant. The Group typically contractually secures
land plots to develop its projects prior to the granting
of the required permits. The secured land plots are only
acquired once the necessary permits have been obtained.
The Group’s projects are therefore subject to the risk of
changes in the relevant urban planning regulations and
environmental, zoning and construction permits being
obtained in a form consistent with the project plan and
concept. The realisation of any project may, therefore, be
adversely affected by (i) the failure to obtain, maintain or
renew necessary permits, (ii) delays in obtaining, main-
taining or renewing relevant permits and (iii) the failure
to comply with the terms and conditions of the permits.
Furthermore, a permit may be subject to an appeal by an
interested party. Any such procedure could further delay
the development and, ultimately, the sale of a project to
or completion by the Joint Ventures and negatively impact
the financial condition of the Group.
Over the past 12 to 16 months, the Group has experi-
enced a significant lengthening of the period required for
receiving zoning permits. This is due to strong construc-
tion activity in all asset classes and local authorities which
are unable to timely process all the permit requests. It can
currently take between 24 to 36 months in order to receive
the necessary permits.
Other factors which may have an adverse effect on the
development activities of the Group are, amongst others,
unfamiliarity with local regulations, contract and labour
disputes with construction contractors or subcontractors,
unforeseen site conditions which may require additional
work and construction delays or destruction of projects
during the construction phase (e.g. due to fire or flooding).
In addition, when considering property development
investments, the Group makes certain estimates as to the
economic, market and other conditions, including esti-
mates relating to the value or potential value of a property
and the potential return on investment. These estimates
may prove to be incorrect, rendering the Group’s strat-
egy inappropriate with consequent negative effects on the
Group’s business, results of operations, financial condi-
tions and prospects.
Taking into account all the aforementioned risks, the
Group does not have the full assurance that all of its devel-
opment projects can be completed in the expected time
frame or within the expected budgets. If any of the risks
highlighted above materialise and adversely impact the suc-
cessful development of the development projects, this could
have a material adverse eff ect on the Group’s future busi-
ness, fi nancial condition, operating results and cash fl ows. PAG
E 8
5
—
VG
P N
V A
nn
ua
l R
ep
ort
20
21
/ C
om
pa
ny
Re
po
rt /
Re
po
rt o
f th
e B
oa
rd o
f D
ire
cto
rs

At the end of December 2021, the Group has a remaining
development land bank in full ownership of 6,957,000 m²
which allows the Group to develop 3,298,000 m² of future
lettable area. This includes the remaining 1,105,000 m²
development land bank held by the Joint Ventures1 with a
development potential of circa 654,000 m² of new letta-
ble area. In addition, the Group has another 3,981,000 m²
of committed land plots which are expected to be pur-
chased during the next 12 to 24 months, subject to obtain-
ing the necessary permits. This brings the remaining
total owned and committed land bank for development to
10,938,000 m² which represents a remaining development
potential of 4,983,000 m².
2.2 The Group’s development projects require large initial investments while they will start generating income only after a period of timeDuring the first phase of the development of a new pro-
ject, no income will be generated by the new develop-
ment until such project is completed and delivered to
a tenant. During such phase, the Group already makes
significant investments in relation to the development of
such project. The development phase of a VGP park typi-
cally takes between 12 to 36 months and depends on the
size of the park and its development potential. Once the
construction of a building is initiated, it takes about 6 to
9 months to complete, with longer periods applying to
large (> 50,000 m²) and more complex buildings in terms
of fit-out. The size of the park will also impact the timing
of a future sale to the Second Joint Venture as in general
a park needs to be 75% developed prior to being offered
to the Second Joint Venture. The timing of a future sale
to the Fourth Joint Venture depends on the pre-let status
of the income generating assets: 75% of the completed
assets within a park need to be pre-let prior to such park
being offered to the Fourth Joint Venture, irrespective of
the development status of the park. Given the scale of the
developments undertaken by the Third Joint Venture and
the anticipated developments by the Development Joint
Ventures, the buildings being constructed by these Joint
Ventures will take between 9 to 24 months to complete,
once the necessary permits are obtained.
As at 31 December 2021, the Group had contractual obli-
gations to develop new projects which were not yet rent
income generating for a total amount of € 685.6 million
(compared to € 342.7 million as at 31 December 2020). Any
delay in the development of such projects or the lease
thereof could have an adverse effect on the Group’s busi-
ness, financial condition and results of operations.
2.3 The Group could experience a lower demand for logistic space due to fluctuating economic conditions in certain marketsThe Group’s revenues depend to a large extent on the vol-
ume of development projects. Hence the results and cash
flows of the Group may fluctuate significantly depending
on the number of projects that can be developed and sold
to the Second or Fourth Joint Ventures or developed by the
Third Joint Venture and the Development Joint Ventures.
The volume of the Group’s development projects
depends largely on national and regional economic con-
ditions and other events and occurrences that affect
the markets in which the Group’s Property Portfolio and
development activities are located. The Group is currently
active in Germany, Austria, the Netherlands, Spain, Portu-
gal, Italy, the Czech Republic, the Slovak Republic, Hun-
gary, Romania, Latvia and Serbia, and is also currently
expanding to France, Greece and Croatia.
A change in the general economic conditions of the
countries where the Group is present or will be present in
the near future could result in lower demand for logistic
space, rising vacancy rates and higher risks of default by
tenants and other counterparties. The Group’s main coun-
try exposure is Germany, with 50% of the Group’s Property
1 Of which 73% is located in the Netherlands through the LPM Joint Venture.PAG
E 8
6
—
VG
P N
V A
nn
ua
l R
ep
ort
20
21
/ C
om
pa
ny
Re
po
rt /
Re
po
rt o
f th
e B
oa
rd o
f D
ire
cto
rs

Portfolio and projects under construction (own and Joint
Ventures at 100% combined) located there as at 31 Decem-
ber 2021 (compared to 54% as at 31 December 2020).
2.4 The fair market value of the property portfolio might not be realised and is subject to competitionThe Group’s revenues depend on the fair market value of
its real estate projects. The results and cash flows of the
Group may fluctuate significantly depending on the num-
ber of projects that can be developed and sold to the Joint
Ventures and their respective fair market values.
The own Property Portfolio, excluding development
land but including the assets being developed on behalf
of the First Joint Venture and Second Joint Venture, is
valued by a valuation expert at 31 December 2021 based
on a weighted average yield of 4.64% (compared to 5.51%
as at 31 December 2020) applied to the contractual rents
increased by the estimated rental value of unlet space.
A 0.10% variation of this market rate would give rise to a
variation of the total portfolio value of € 52.3 million.
The markets in which the Group operates are also
exposed to local and international competition. Com-
petition among property developers and operators may
result in, amongst others, increased costs for the acqui-
sitions of land for development, increased costs for raw
material, shortages of skilled contractors, oversupply of
properties and/or saturation of certain market segments,
reduced rental rates, decrease in property prices and a
slowdown in the rate at which new property developments
are approved, any of which could have a material adverse
effect on the Group’s business, financial condition and
results of operations.
2.5 The Group may lose key management and personnel or fail to attract and retain skilled personnelThe Group continues to depend to a large degree on the
expertise and commercial qualities of its management,
commercial and technical team and in particular on its
Chief Executive Officer, Jan Van Geet.
In particular, if Jan Van Geet, as Chief Executive Officer
of the Group, would no longer devote sufficient time to
the development of the portfolio of the Allianz Joint Ven-
tures, Allianz can stop the acquisition process of income-
generating assets (in relation to the Second Joint Venture)
and/or suspend the delivery period (in relation to the Third
Joint Venture) until he has been replaced to the satisfac-
tion of Allianz.
Experienced technical, marketing and support personnel
in the real estate development industry are in high demand
and competition for their talent is intense. In order to retain
personnel, a long-term incentive plan is in place.
The loss of services of any members of the management
or failure to attract and retain sufficiently qualified person-
nel may have a material adverse effect on the Group’s busi-
ness, financial condition, operating results and cash flows.
2.6 Risks and uncertainties linked to the outbreak of a pandemic as COVID-19 The Group's business could be materially adversely
affected by the effects of pandemics, epidemics or other
health crises, including the outbreak of COVID-19 in the
countries where the Group is active. In March 2020, the
World Health Organisation characterized COVID-19 as a
pandemic, which resulted in lockdown measures imple-
mented by governments across Europe to combat the
spread of the virus resulted in widespread disruption
across many sectors of the economy. In particular, gov-
ernments of the countries where the Group is active have
taken measures to protect the health of citizens, slow
down the spread of the virus and combat the rise of new
variants of the virus, such as most recently the Omicron
variant.
As a result, the economic and financial situation of cer-
tain tenants may deteriorate, and they may be in default of
paying their rent in due time. Requests for rent relief from
tenants mainly focussed on short-term deferral of rental
payment (to be paid back within a scheduled period).
These requests were mainly seen during the first wave of
measures in the first half of 2020 but have not repeated
during the second half of 2020 nor during 2021. VGP has
worked constructively to support tenants facing genu-
ine cash flow challenges by offering to reschedule rental
payments or reprofiling. In some limited cases, this has
affected the level of rent the Group was able to collect
from such tenants.
In addition, the COVID-19 pandemic may have an impact
on the projects in progress of the Group due to amongst
other delays or third-party defaults. VGP recorded no
impacts on the timing of its developments during 2021,
despite some shortages of materials. The Group has been
able to mitigate any effects of such shortages by manag-
ing and optimising the sourcing of such materials on a
Group wide cross border basis, but there is no guarantee
that it will be able to continue to do so should such short-
ages worsen.
The continuing impact of the COVID-19 outbreak or any
similar health pandemic or epidemic is highly uncertain
and subject to rapid change. Any significant worsening
of the outbreak (including through the rising of more
contagious or more dangerous variants of the virus) and a
tightening of the measures implemented by governments
of the countries where the Group is active may adversely
impact the income stream from leasing agreements or
the successful development of the development projects,
any of which may have a material adverse effect on the
Group’s business, financial condition and results of
operations.

3 Risks related to the Group’s Joint Ventures
3.1 The Group’s business, operations and financial conditions are significantly affected by the Joint Ventures In order to enable the Group to continue to invest in its
development pipeline whilst at the same time being ade-
quately financed, the Group has currently entered into four
50:50 joint ventures with Allianz (the Allianz Joint Ven-
tures) and three 50:50 joint ventures with other partners
(the Development Joint Ventures). The first two Allianz
Joint Ventures and the most recent Allianz Joint Venture
(the First Joint Venture, the Second Joint Venture and the
Fourth Joint Venture) are mainly focused on acquiring
income generating assets which are being developed by
the Group. The Fourth Joint Venture is intended to replace
the First Joint Venture, which has recently reached its
investment capacity of € 2,000 million. The third Allianz
Joint Venture (the Third Joint Venture) relates to the devel-
opment of VGP Park München. The Development Joint
Ventures consist of (i) the 50:50 joint venture with Roozen
(the LPM Joint Venture), which relates to the develop-
ment of VGP Park Moerdijk, (ii) the 50:50 joint venture with
VUSA (the VGP Park Belartza Joint Venture), which relates
to VGP Park Belartza, and (iii) the 50:50 joint venture with
Revikon (the VGP Park Siegen Joint Venture), which relates
to VGP Park Siegen.
These Joint Ventures allow the Group to partially recy-
cle its initial invested capital when completed projects are
acquired by the Second or Fourth Joint Venture or when
buildings are completed by the Third Joint Venture or the
Development Joint Ventures through refinancing of the
invested capital by external bank debt and allow the Group
to re-invest these monies in the continued expansion of
the development pipeline, including the further expansion
of the land bank, thus allowing VGP to concentrate on its
core development activities.
The Group may therefore be signifi cantly aff ected by the
Joint Ventures, which are subject to additional risks such as:
(i) the Second and Fourth Joint Venture may discontinue
acquiring the completed assets from the Group as these
joint ventures have no contractual or legal binding
obligation to acquire the income generating assets
offered by the Group;
The Second and Fourth Joint Venture do not have any con-
tractual or legal obligation to acquire the income gener-
ating assets proposed by VGP. There is therefore a risk
that these joint ventures would discontinue acquiring the
completed assets from the Group. In such an event, VGP is
entitled under the terms of the AZ JVAs to dispose of such
income-generating assets itself. Any delay in the disposal
of such income-generating assets could have a mate-
rial adverse effect on the short-term cash position of VGP
which may in turn have a negative impact on the Group’s
business, financial condition and results of operations.
The properties that have on the date of this annual report
already been sold to the Second and Fourth Joint Ventures
generated a significant contribution to the income and
result of the Group. Prior to their sale, and their deconsoli-
dation has resulted and will further result in a decrease of
the reported gross rental income of the Group.
If Jan Van Geet, as CEO of the Group, would no longer
devote sufficient time to the development of the portfo-
lio of the Allianz Joint Ventures, Allianz can, upon notice
thereof, stop the acquisition process of the proposed
income-generating assets (in case of the Second or Fourth
PAG
E 8
8
—
VG
P N
V A
nn
ua
l R
ep
ort
20
21
/ C
om
pa
ny
Re
po
rt /
Re
po
rt o
f th
e B
oa
rd o
f D
ire
cto
rs

Joint Venture) or suspend the delivery period (in case
of the Third Joint Venture), until Jan Van Geet has been
replaced to the satisfaction of Allianz. Such temporary
standstill of Allianz’s investment or development obliga-
tion might negatively impact the short-term cash position
of the Group. Prospective investors should furthermore
note that the Allianz Joint Venture Agreement between
VGP and Allianz may be subject to amendment or may
be terminated in accordance with the provisions thereof.
Any such amendment or termination may have a material
adverse impact on VGP’s financial position and income.
(ii) the Group has recognised that it has a constructive
obligation towards the Joint Ventures:
The Group has recognized that it has a de facto construc-
tive obligation towards the Joint Ventures (of up to its pro-
portional share) as it will always seek to ensure that the
Joint Ventures and its subsidiaries will be in a position to
fulfill their respective obligations, since the proper func-
tioning is material for the Group in realizing its expected
capital gains. There is however no contractual obliga-
tion to provide capital contributions or funds to financially
support the Joint Ventures, other than what is set out in
the JVA, i.e. the Group’s funding obligations under the
JVA towards the Joint Ventures as mentioned in this sec-
tion “Risk Factors – The Group’s business, operations and
financial conditions are significantly affected by the Joint
Ventures – Risks related to the Group’s industry, properties
and operations”.
This entails that ultimately any payment due by a Joint
Venture to the Group will either be borne by such Joint
Venture’s shareholders, i.e. (i) VGP and Allianz, pro rata
their shareholding, or will lead to VGP being diluted by
Allianz in accordance with the provisions of the rele-
vant Allianz JVA or alternatively Allianz providing fund-
ing to the Allianz Joint Venture on preferential interest
terms and repayment conditions; and (ii) VGP and the
shareholders of the Development Joint Ventures, pro rata
their shareholding, or in the event that a shareholder of
a Development Joint Venture does not comply with its
aforementioned funding obligations under the respec-
tive Development JVA, will lead to VGP providing funding
to the Development Joint Venture on preferential interest
terms and repayment conditions.
As at 31 December 2021, the “Investments in joint ven-
tures and associates” showed a positive balance of € 858.1
million.
(iii) the sale of properties to the Second and Fourth
Joint Ventures could result in a decrease of the reported
gross rental income of the Group as some of the sold
properties may make a significant contribution to the
income of the Group prior to their sale and their respective
deconsolidation:
The properties that have on the date of this annual report
already been sold to the First, Second and Fourth Joint
Venture generated a significant contribution to the income
and result of the Group. Prior to their sale, and their
deconsolidation has resulted and will further result in a
decrease of the reported gross rental income of the Group.
The portfolio sold to the Joint Ventures during 2021
represented € 0.4 million of rent for the period 1 January
2021 to 15 June 2021 related to the property portfolio sold
during the eighth closing with the First Joint Venture on
15 June 2021. During the year 2020 the gross rental income
included (i) € 0.3 million of rent for the period 1 January
2020 to 15 October 2020 related to the property portfolio
sold during the seventh closing with the First Joint Ven-
ture on 15 October 2020, and (ii) € 3.7 million of rent for the
period 1 January 2020 to 16 November 2020 related to the
property portfolio sold during the second closing with the
Second Joint Venture on 16 November 2020.
(iv) Allianz may stop the acquisition process of proposed
income-generating assets or suspend the delivery period
of assets being developed, and the Allianz Joint Venture
Agreements may be amended or terminated in accord-
ance with the provisions thereof:
The Group is required to comply with the provisions of
several management agreements pursuant to which it is
acting as exclusive asset manager, property manager and
development manager of the Allianz Joint Ventures and of
the Allianz Joint Ventures’ subsidiaries. Should a mem-
ber of the Group materially breach its obligations under
a management agreement which is not remedied within
a certain period in time following a notification thereof,
or should the Company breach its exclusivity obligations
under the Allianz Joint Venture Agreements in relation to
the offering or development of income-generating assets,
then Allianz is entitled to terminate all the management
agreements with immediate effect, to terminate the Allianz
Joint Venture Agreements and/or to exercise a call option
on all the shares the Company holds in the Allianz Joint
Ventures against payment of a purchase price of 90% of
the fair market value of these shares, which entails a dis-
count of 10% of the fair market value of these shares. The
occurrence of any of the aforementioned events might
materially impact VGP’s ability to generate sufficient divi-
dend income out of the Allianz Joint Ventures and/or to
retain joint control over the Allianz Joint Ventures and in
turn could have a material adverse effect on the Group’s
business, financial condition and results of operations.
(v) the Group may incur additional liabilities as a result of
cost overrun on developments made on behalf of the Alli-
anz Joint Ventures:
The Group acts as development manager vis-à-vis the
Allianz Joint Ventures and in such capacity, the Group is
responsible for ensuring that any development is being
made within the initially agreed construction price/
budget. In case the actual construction cost would be
higher than the initial construction budget, any top-up
ph
oto
© T
rilu
x
PAG
E 8
9
—
VG
P N
V A
nn
ua
l R
ep
ort
20
21
/ C
om
pa
ny
Re
po
rt /
Re
po
rt o
f th
e B
oa
rd o
f D
ire
cto
rs

payment to which VGP would be entitled under the terms
of its agreements with the Allianz Joint Ventures and Alli-
anz will be adversely affected. In case the actual con-
struction costs would be higher than the market value of
the completed building, then such difference would need
to be fully borne by the Group (provided this was due to
the Group), which could have a material adverse effect on
the Group’s business, financial condition and results of
operations.
(vi) the Group may be unable to provide funds to the Alli-
anz Joint Ventures which were previously committed under
the terms of the relevant Allianz Joint Venture Agreements,
which may result in the dilution of the Group:
Any failure by the Company to provide funds to the Allianz
Joint Ventures that were committed under the terms of the
Allianz Joint Venture Agreements towards Allianz (i.e. for
financing of the relevant top-up payment (if any), the repay-
ment of construction and development loans to the Group
upon the acquisition by the Second or Fourth Joint Venture
of completed assets or at the moment of completion of
developed assets by the Third Joint Venture, capital expen-
ditures in relation to repairs and maintenance of such
assets and the purchase price for any future completed
assets which the Second or Fourth Joint Venture would
acquire or any other financing required by Allianz or VGP
under the terms of the AZ JVA (such as replacement of
bank debt) and acknowledged by an appointed third-party
financial expert), entitles Allianz to either exclusively sub-
scribe to three times the number of shares that represents
the amount of the funds not provided by the Company or
alternatively to provide itself funding to the Allianz Joint
Venture on preferential interest terms and repayment con-
ditions. For instance: if there are five hundred (500) issued
shares, and if the default amount (the amount which
would have otherwise been financed by VGP for exam-
ple) is equal to 2% of the fair market value of the Allianz
Joint Venture, Allianz shall be entitled to subscribe for and
acquire, following payment therefore in cash, thirty (three
times ten) newly issued shares of the Joint Venture, which
is equal to three times 2% of the outstanding shares of the
Allianz Joint Venture on a pre-dilution basis. This might
impact the Company’s ability to retain joint control over
the Allianz Joint Venture and its ability to generate suffi-
cient dividend income out of the Allianz Joint Venture and
in turn could have a material adverse effect on the Group’s
business, financial condition and results of operations.
(vii) changes in consolidation rules and regulations may
trigger a consolidation obligation at the level of Allianz
which may result in the dilution of the Group:
In the event that Allianz would be subject to an obliga-
tion to consolidate the Allianz Joint Ventures (for instance
after a change in accounting rules or other regulations)
within its companies’ group, the Allianz Joint Venture
Agreements provide that Allianz has the right to replace
the existing debt financing in the Allianz Joint Ventures
by equity, which might result in a dilution of the Company
if the Company is unable to fund its commensurate part
of the equity. This might impact the Company’s ability to
retain joint control over the Allianz Joint Ventures and its
ability to generate sufficient dividend income out of the
Allianz Joint Ventures and in turn could have a material
adverse effect on the Group’s business, financial condition
and results of operations. However, as the debt position
of the Allianz Joint Ventures would be replaced by equity
financing by Allianz on a 1:1 basis, in such case, the Net
Asset Value of the Company’s stake in the Allianz Joint
Ventures would not be affected.
(viii) in case of a material breach by the Group or in case
the participation that Jan Van Geet holds in the Company
would fall below 25%, Allianz may terminate the Joint Ven-
tures Agreements in respect of the First Joint Venture,
Second Joint Venture and Third Joint Venture, or may exer-
cise a call option on the Group’s shares in the First Joint
Venture, Second Joint Venture and Third Joint Venture, at a
discounted purchase price:
If at any time during the term of the Joint Venture Agree-
ment, in respect of the First Joint Venture, Second Joint
Venture and Third Joint Venture ,the participation that
Jan Van Geet, directly or indirectly, holds in the Company
falls below 25% of the total outstanding Shares (other
than due to the dilution of his participation as a result of
capital increases or similar transactions at the level of the
Company in which he would not participate), then Allianz
is entitled to terminate all the management agreements,
in respect of the First Joint Venture, Second Joint Ven-
ture and Third Joint Venture, with immediate effect and to
terminate the Joint Venture Agreement, in respect of the
First Joint Venture, Second Joint Venture and Third Joint
Venture. The occurrence of such aforementioned event
might materially impact VGP’s ability to generate sufficient
dividend income out of the the First Joint Venture, Sec-
ond Joint Venture and Third Joint Venture and/or to retain
joint control over the the First Joint Venture, Second Joint
Venture and Third Joint Venture and in turn could have a
material adverse effect on the Group’s business, financial
condition and results of operations.

(ix) the Joint Ventures or any of their subsidiaries may be
in default under the development and construction loans
granted by the Group which may have a negative impact
on the Group:
The Group has granted significant development and con-
struction loans to the project companies of the Joint Ven-
tures in a total amount of € 271.8 million1 as at 31 Decem-
ber 2021 (€ 181.6 million as at 31 December 2020). The
purpose of the Joint Ventures is only to invest in income
generating assets and the joint ventures’ partners have
agreed that as a result, any development undertaken
within the Joint Ventures will be in first instance pre-
financed by VGP, except for the Third Joint Venture and
the Development Joint Ventures where the joint ventures’
partners have agreed that the developments would be
financed on a 50:50 basis. The repayment of these con-
struction and development loans as well as the share-
holder loans granted for the purpose of financing the
proportional development costs for the Third Joint Venture
and the Development Joint Ventures will be principally
driven by the subsequent refinancing of the Joint Ven-
tures’ assets upon their completion. Should the proceeds
of such refinancing be significantly lower than the devel-
opment costs, VGP may be unable to recover the total
amount of these construction and development loans
granted to the Joint Ventures, as the Joint Ventures would
not be able to draw the entire amount of such construc-
tion and development loans under their respective existing
credit facilities. As a result, such shortfall would have to
be funded by additional shareholder loans granted to the
Joint Ventures by the respective shareholders of the Joint
Ventures pro rata their shareholding, which could have a
material adverse effect on the Group’s business, financial
condition and results of operations.
Any or all such risks could have a material adverse effect
on the Joint Ventures’ business, financial condition and
results of operations, which in turn could have a material
adverse effect on the Group’s business, financial condi-
tion and results of operations. In addition, the Joint Ven-
tures are exposed to many of the risks to which the Group
is exposed, including amongst others the risks for the
Group as described in the following sections: risk factor
1.1 “The Group may not be able to continue its develop-
ment activities in a sustained and profitable way, for which
it depends on its ability to execute new lease agreements
and dispose of its real estate assets to the Second and
Fourth Joint Venture” (but only in relation to the ability to
execute new lease agreements, not the ability to dispose
of assets), risk factor 2.3 “The Group could experience a
lower demand for logistic space due to fluctuating eco-
nomic conditions in certain markets”, and risk factor 2.1
“The Group’s development projects may experience delays
and other difficulties, especially in respect of receiving
necessary permits”, all as in this part Risk Factors.
3.2 The Company is a holding company with no operating income and is hence solely dependent on distributions made by, and the financial performance of, the Joint Ventures and the members of the GroupThe Company is a holding company of which the sole
activity is the holding and managing of its only asset,
i.e. its participations in its subsidiaries and in the Joint
Ventures. The real estate portfolios of the Group are
owned through specific asset companies which are 100%
subsidiaries of the Group or which are subsidiaries of the
Joint Ventures.
Accordingly, the Company’s ability to meet its financial
obligations will largely depend on the cash flows from the
members of the Group and the distributions paid to it by
members of the Group or the Joint Ventures. The ability of
the subsidiaries and the Joint Ventures to make distribu-
tions to the Company depends on the rental income gener-
ated by their respective portfolios.
The net rental and related income generated by the Joint
Ventures as at 31 December 2021 amounted to 78% of the
net rental and related income of the Group (compared to
85% as at 31 December 2020). The share in result of the
Joint Ventures amounted to 24% of the Group’s operating
result as at 31 December 2021 (compared to 15% as at 31
December 2020).
The financing arrangements of the Joint Ventures, and
to a lesser extent the Group’s subsidiaries, are subject to a
number of covenants and restrictions which could restrict
the ability to upstream cash to the Group. The bank facili-
ties require the Joint Ventures and the Group’s Subsidiar-
ies to maintain specified financial ratios and meet specific
financial tests. A failure to comply with these covenants
could result in an event of default that, if not remedied
or waived, could result in a Joint Venture or the members
of the Group being required to repay these borrowings
before their due date.
3.3 The Group may be unable to recover their loans granted to the Joint Ventures and their subsidiariesThe Group have granted significant loans to the Joint Ven-
tures and to the Joint Ventures’ subsidiaries.
As at 31 December 2021 these loans amount to
€ 346.9 million (compared to € 266.6 million as at
31 December 2020).
These outstanding loans carry the risk of late, partial or
non-repayment in the event of underperformance by any of
the Joint Ventures or their subsidiaries.
1 € 83.0 million relating to the First and Second Joint Ventures and € 188.8 million relating to the Third and Development Joint Ventures. PAG
E 9
1 —
V
GP
NV
An
nu
al
Re
po
rt 2
02
1 /
Co
mp
an
y R
ep
ort
/ R
ep
ort
of
the
Bo
ard
of
Dir
ec
tors

4. Risks related to the Group’s financial situation
4.1 The Group’s debt levels have substantially increased over the last years and the Group is exposed to a (re)financing riskIn view of the geographic expansion, accelerated growth
of the Group and more generally, the sustained growth
of the demand for logistic warehouse space, the Group
has incurred significant borrowings in recent years. VGP
expects that debt levels in (nominal terms) will continue to
increase but is convinced that it will be able to execute its
growth strategy within a Gearing Ratio of 65%.
VGP is continuously optimising its capital structure with
an aim to maximise shareholder value while keeping the
desired flexibility to support its growth. During 2020, VGP
successfully completed two share placements resulting in
a net increase of the Group’s equity with € 295.4 million.
In November 2021, VGP successfully completed another
share placement resulting in a net increase of the Group’s
equity with € 294.9 million. The Group operates within and
applies a maximum Gearing Ratio of 65%.
As of 31 December 2021, the net debt amounted to
€ 1,158.8 million (compared to € 560.9 million at 31 Decem-
ber 2020). The Gearing Ratio was 29.8% (compared to
25.2% as at 31 December 2020).
On 31 December 2021, the Group had bonds outstanding
for a total amount of € 1,311.7 million¹ (all being unsecured
bonds) and had a remaining financial debt of € 73.1 mil-
lion², of which € 19.0 million was related to secured bank
debt, € 33.4 million to Schuldschein loans and € 20.7 mil-
lion related to accrued interest.
Considering the model of the Joint Ventures, additional
short-term bank debt might occasionally be needed to
cover temporary cash shortfalls due to timing of recycling
of shareholder loans granted to the Joint Ventures. These
shareholder loans are repaid when projects are acquired
by the Second or Fourth Joint Venture or when adequate
bank credit facilities are available to allow partial refinanc-
ing of invested equity in respect of the Third Joint Venture
or the Development Joint Ventures.
The Group is currently constructing substantially more
than previously anticipated and has a number of large
developments which have recently been or will shortly be
initiated and which will require some time before being
able to be sold to the Second or Fourth Joint Venture or
being eligible for refinancing through bank debt in respect
of the Third Joint Venture or the Development Joint Ven-
tures. As a result, higher peak funding needs may arise
between the various Joint Venture closings. In order to
allow the Group to comfortably bridge these periods the
Group has arranged additional revolving credit facilities.
As at 31 December 2021 the maturity profile of the Group’s
financial debt is as follows:
Note: The figures shown in the chart exclude capitalised finance costs on bank
borrowings schuldschein loans and bonds.1 Including € 9.4 million of capitalised finance costs.
2 Including € 0.2 million of capitalised finance costs.
MATURITY PROFILE FINANCIAL DEBT (in € million)
Bonds
Schuldschein
Bank debt
PAG
E 9
2
—
VG
P N
V A
nn
ua
l R
ep
ort
20
21
/ C
om
pa
ny
Re
po
rt /
Re
po
rt o
f th
e B
oa
rd o
f D
ire
cto
rs

After year-end (January 2022) VGP successfully issued
its second public benchmark green bonds for an aggre-
gate nominal amount of € 1.0 billion, in two tranches, with
a € 500 million 5-year bond paying a coupon of 1.625% p.a.
and maturing on 17 January 2027 and a € 500 million 8-year
bond paying a coupon of 2.250% p.a. and maturing on
17 January 2030.
Please also refer to section “Business Review – Capital
and financial position – Maturity profile as at 31 December
2021 (on a pro forma basis)” in order to assess the effects
of the issuance of these bonds on the debt maturity profile
of the Group.
4.2 The Group’s borrowings are subject to certain restrictive covenantsUnder the terms of the bonds, schuldschein loans and
bank credit facilities, the Group needs to ensure that it all
times complies with the respective covenants set forth
therein. Failing to do so will result in the Group being in
default under several (if not all) of the outstanding bonds,
schuldschein loans and/or bank credit facilities. This may
lead to an obligation of the Group to repay in full all out-
standing financial indebtedness thereunder, which might
have a material adverse effect on the Group’s business,
financial condition, operating results and cash flows.
While the Group monitors its covenants on an on-going
basis in order to ensure compliance and to anticipatively
identify any potential problems of non-compliance for
action, there can be no assurances that the Group will at
all times be able to comply with these covenants. During
2021, the Group remained well within its covenants.
The terms and conditions of the Apr-23 Bond, the Sep-
23 Bond, the Jul-24 Bond, the Mar-25 Bond, the Mar-
26 Bond, Apr-29 Bond and the Schuldschein Loans have
all the same financial covenants. Please also refer to
“Financial Review – Note 17.2 Key terms and covenants”.
As at 31 December 2021 the Consolidated Gearing¹
stood at 30.0% compared to 25.2% as at 31 December
2020. The Interest Cover Ratio was 9.08 as at 31 December
2021 compared to 11.3 as at 31 December 2020 and finally
the Debt Service Cover Ratio was 12.53 as at 31 December
2021 compared to 25.9 as at 31 December 2020.
4.3 The Group is exposed to risk of financing from its Joint VenturesConsidering the model of the Joint Ventures, VGP depends
on the ability of each of the Joint Ventures to have suf-
ficient long-term financing in place to allow the Second
Joint Venture and Fourth Joint Venture to acquire income
generating assets developed by VGP and to allow the Third
Joint Venture and the Development Joint Ventures to refi-
nance the development costs incurred when developing
the respective parks of these Joint Ventures.
The First Joint Venture has been able to secure 10-year
committed credit facilities (all maturing at the end of
May 2026), in Germany, the Czech Republic, the Slo-
vak Republic and Hungary. As at 31 December 2021,
the aggregate outstanding credit facilities amounted
to € 913.1 million which were drawn for an amount of
€ 854.1 million. The undrawn amount of € 59.0 million will
be applied towards the financing of the acquisition of
additional income generating assets developed by VGP
and which mainly relate to some smaller top-up buildings
or remaining extension options of existing tenants. The
investment period of the First Joint Venture has ended
in May 2021. The Loan to Value ratio as at 31 December
2021 stood at 40.5%.
The Second Joint Venture has been able to secure a
10-year € 333.9 million committed credit facility (matur-
ing at the end of July 2029), in respect of the assets to be
acquired in Spain, Austria, Italy and the Netherlands and
a 5-year € 29.3 million committed credit facility (matur-
ing in June 2024) in respect of the assets to be acquired
in Romania. As at 31 December 2021, the aggregate out-
standing credit facilities amounted to € 363.2 million
which were drawn for an amount of € 214.9 million. The
undrawn amount of € 148.3 million will be applied towards
the financing of the acquisition of additional income gen-
erating assets developed by VGP over the remaining
investment period of 2 years. The Loan to Value ratio as at
31 December 2021 stood at 48.9%.
The Third Joint Venture has been able to secure a
committed credit facility (maturing on 22 June 2029) in
respect of the financing of the first two completed build-
ings in VGP Park München. As at 31 December 2021, there
were no drawings outstanding under this facility and it is
expected that during 2022 the total amount of the facility
will be drawn. Additional bank financing will be arranged
upon completion of the respective other buildings which
are currently under construction.
As at 31 December 2021, no bank debt or credit facilities
were outstanding in respect of the Fourth Joint Venture
and the Development Joint Ventures.
The Joint Ventures may not be able to refinance their
financial debt or may be unable to attract new financing or
to negotiate and enter into new financing agreements on
terms which are commercially desirable. If the Joint Ven-
tures are unable to receive financing or financing against
favourable terms, this may have an impact on the Group’s
cash flow and results and, thus, the Group may be unable
to proceed with or to execute certain developments and
may have to delay the initiation of certain projects.
4.4 The Company's public financial rating may be suspended, reduced or withdrawnThe Group has a public financial rating determined by an
independent rating agency. On 26 March 2021, Fitch gave
VGP a long-term investment grade rating of ‘BBB-’ (stable
outlook). This rating may be suspended, reduced or with-
drawn at any time.
A rating downgrade would have a direct effect on the
Group's cost of financing. A rating downgrade could also
have an indirect effect on the appetite of credit providers
to deal with VGP or an indirect effect on its financing cost
or on its ability to finance its growth and activities. If the
Group is unable to receive financing or financing against
favourable terms, this may have an impact on VGP’s cash
flow and results and, thus, the Group may be unable to
proceed with or to execute certain developments and may
have to delay the initiation of certain projects.
1 Calculated by reference to the terms and conditions of the bonds and schuldschein loan documentation. PAG
E 9
3
—
VG
P N
V A
nn
ua
l R
ep
ort
20
21
/ C
om
pa
ny
Re
po
rt /
Re
po
rt o
f th
e B
oa
rd o
f D
ire
cto
rs

5. Political, legal and regulatory risks
5.1 The Group has to comply with a broad and diverse regulatory frameworkAs the Group is active and intends to further develop
business in the mid-European countries (whereby the
Group’s current focus is on Germany, Austria, the Nether-
lands, Spain, Portugal, Italy, the Czech Republic, the Slo-
vak Republic, Hungary, Romania, Latvia, Serbia, France,
Greece and Croatia), the Group is subject to a wide range
of EU, national and local laws and regulations. These
include requirements in terms of building and occupancy
permits (which must be obtained in order for projects to
be developed and let), as well as zoning, health and safety,
monument protection, tax, planning, foreign ownership
limitations and other laws and regulations.
Because of the complexities involved in procuring and
maintaining numerous licenses and permits, there can be
no assurance that the Group will at all times be in compli-
ance with all of the requirements imposed on properties
and the Group’s business. Any failure to, or delay in, com-
plying with applicable laws and regulations or failure to
obtain and maintain the requisite approvals and permits
could have a material adverse effect on the Group’s busi-
ness, results of operations, financial condition and pros-
pects. In this respect, please also refer to risk factor 2.1:
“The Group’s development projects may experience delays
and other difficulties, especially in respect of receiving
necessary permits”.
Furthermore, changes in laws and governmental regu-
lations, or their interpretation by agencies or the courts,
could occur. Such regulatory changes and other economic
and political factors, including civil unrest, war, govern-
mental changes and restrictions on the ability to trans-
fer capital in the foreign countries in which the Group has
invested, could have a materially adverse effect on the
Group’s business, financial condition, operating results
and cash flows.
5.2 The Group may be subject to litigation and other disputesThe Group may face contractual disputes which may or
may not lead to legal proceedings as the result of a wide
range of events, especially during the construction and
development phase. The most likely disputes include: (i)
actual or alleged deficiencies in its execution of construc-
tion projects (including relating to the design, installation
or repair of works); (ii) defects in the building materials;
and (iii) deficiencies in the goods and services provided by
suppliers, contractors, and sub-contractors.
In addition, after the development phase, the Group may
become subject to disputes with tenants, commercial con-
tractors or other parties in relation to the leasing.
As a result, disputes, accidents, injuries or damages at
or relating to one of the Group’s ongoing or completed
projects resulting from the Group’s actual or alleged
deficient actions could result in significant liability, war-
ranty or other civil and criminal claims, as well as reputa-
tional harm. These liabilities may not be insurable or could
exceed the Group’s insurance coverage limit.
At 31 December 2021, no governmental, legal or arbi-
tration proceedings have been started or are threatened
against VGP which may have, or have had in the recent
past, significant effects on the Group’s financial position
or profitability.
PAG
E 9
4
—
VG
P N
V A
nn
ua
l R
ep
ort
20
21
/ C
om
pa
ny
Re
po
rt /
Re
po
rt o
f th
e B
oa
rd o
f D
ire
cto
rs

6. Environmental sustainability and climate change risksClimate transition and the environmental footprint in gen-
eral holds a series of risks for VGP.
Laws, regulations, policies, taxation, obligations, cus-
tomer preferences and social attitudes relating to climate
change continue to evolve. Non-compliance with laws and
regulations, reporting requirements, increased costs of
tax and energy could cause loss of value to the Group. Not
keeping pace with social attitudes and customer behav-
iours and preferences could additionally cause reputa-
tional damage and reduce the attractiveness and value
of our assets. A lack of strong environmental credentials
may reduce access to capital or increase cost as these are
increasingly important criteria to investors and lenders.
Climate-related risks, their time horizon and the corpo-
rate strategy and financial planning response are further
detailed in the Corporate Responsibility Report included in
this Annual Report 2021.
This report also sets out the corporate responsibility
strategy, medium and long-term commitments and also
reports on the implementation of the strategy and pro-
gress against our stated sustainability targets.

Summary of the accounts and comments
Income statement
INCOME STATEMENT (in thousands of €) 2021 2020
Revenue¹ 44,255 29,558
Gross rental income 17,618 12,078
Property operating expenses (2,219) (3,784)
Net rental income 15,399 8,294
Joint ventures’ management fee income 21,303 14,699
Net valuation gains/(losses) on investment properties 610,261 366,361
Administration expenses (52,112) (29,296)
Share in result of joint ventures and associates 186,703 63,338
Other expenses (5,000) (4,000)
Operating profit 776,554 419,396
Finance income 12,322 9,319
Finance costs (24,976) (17,911)
Finance costs – net (12,654) (8,592)
Profit before taxes 763,900 410,804
Taxes (113,845) (39,865)
Profit for the period 650,055 370,939
Attributable to:
Shareholders of VGP NV 650,055 370,939
Non-controlling interests — —
RESULT PER SHARE (in €) 2021 2020
Basic earnings per share 31.41 18.58
Diluted earnings per share 31.41 18.58
1 Revenue is composed of gross rental income, service charge income, property and facility management income and property development
income.PAG
E 9
6
—
VG
P N
V A
nn
ua
l R
ep
ort
20
21
/ C
om
pa
ny
Re
po
rt /
Re
po
rt o
f th
e B
oa
rd o
f D
ire
cto
rs

Balance sheet
ASSETS (in thousands of €) 2021 2020
Intangible assets 1,046 557
Investment properties 1,852,514 920,151
Property, plant and equipment 32,141 16,944
Investments in joint ventures and associates 858,116 654,773
Other non-current receivables 264,905 264,038
Deferred tax assets 1,953 1,786
Total non-current assets 3,010,675 1,858,249
Trade and other receivables 148,022 44,828
Cash and cash equivalents 222,160 222,356
Disposal group held for sale 501,882 102,309
Total current assets 872,064 369,493
Total assets 3,882,739 2,227,742
SHAREHOLDERS’ EQUITY AND LIABILITIES (in thousands of €) 2021 2020
Share capital 78,458 72,225
Other reserves 574,088 285,420
Retained earnings 1,523,019 948,092
Shareholders’ equity 2,175,565 1,305,737
Non-current financial debt 1,340,609 748,796
Other non-current liabilities 32,459 10,461
Deferred tax liabilities 112,295 43,813
Total non-current liabilities 1,485,363 803,070
Current financial debt 44,147 34,468
Trade debts and other current liabilities 107,510 77,725
Liabilities related to disposal group held for sale 70,154 6,742
Total current liabilities 221,811 118,935
Total liabilities 1,707,174 922,005
Total shareholders’ equity and liabilities 3,882,739 2,227,742
PAG
E 9
7 —
V
GP
NV
An
nu
al
Re
po
rt 2
02
1 /
Co
mp
an
y R
ep
ort
/ R
ep
ort
of
the
Bo
ard
of
Dir
ec
tors

Comments on the accounts
Income statement
Net rental incomeThe net rental income increased with € 7.1 million to
€ 15.4 million after taking into effect the income generating
assets delivered during 2021 offset with the impact of the
eighth closing with the First Joint Venture in June 2021.
Including VGP’s share of the Joint Ventures and looking
at net rental income on a “look-through” basis net rental in
total increased by € 15.4 million (from € 55.3 million for the
period ending 31 December 2020 to € 70.7 million for the
period ending 31 December 2021)1.
Income from Joint VenturesThe Joint Ventures’ management fee income increased
by € 6.6 million to € 21.3 million. The increase was mainly
due to the growth of the Joint Ventures’ portfolio and the
development activities undertaken on behalf of the Joint
Ventures.
This fee was composed of (i) property and facility man-
agement fee income, which increased from € 10.7 million
for the period ending 31 December 2020 to € 14.2 million
for the period ending 31 December 2021, and (ii) devel-
opment management fee income generated during the
period which was € 7.1 million compared to € 4.0 million for
the period ending 31 December 2020.
Net valuation gain on investment propertiesAs at 31 December 2021 the net valuation gains on the
property portfolio reached € 610.3 million compared to a
net valuation gain of € 366.4 million for the period ended
31 December 2020.
The low yields in real estate valuations continued to per-
sist during the year. The own property portfolio, excluding
development land but including the buildings being con-
structed on behalf of the Joint Ventures, is valued by the
valuation expert at 31 December 2021 based on a weighted
average yield of 4.64% (compared to 5.51% as at 31 Decem-
ber 2020) applied to the contractual rents increased by the
estimated rental value on unlet space.
The (re)valuation of the own portfolio was based on the
appraisal report of the property expert Jones Lang LaSalle.
Administrative costsThe administrative costs for the period were € 52.1 million
compared to € 29.3 million for the period ended 31 Decem-
ber 2020, reflecting the continued growth of the develop-
ment activities of the Group and its geographic expansion
as well as the increased costs of the long-term incentive
plan (LTIP) which is directly proportionally linked to the net
asset value growth of the Group. During the year an addi-
tional accrual in an amount of € 16.0 million was booked in
respect of the LTIP.
Other administrative expenses include € 3.5 million of
travel costs for the year 2021. Such costs were included
under property operating expenses in the previous year in
an amount of € 1.9 million. These travel costs are directly
linked to the development activities such as sourcing of
development land.
As at 31 December 2021 the VGP team comprised more
than 320 people active in 14 different countries.1 See Financial Review section ‘Supplementary notes not part
of the audited financial statements’ for further details

Share in result of joint ventures and associatesVGP’s share of the Joint Ventures’ profit for the period
increased significantly from € 63.3 million for the period
ending 31 December 2020 to € 186.7 million for the period
ending 31 December 2021, primarily reflecting higher unre-
alised valuation gains on investment properties driven by
further contraction of the yield on the investment portfo-
lio, and continued increase of the net rental income which
increased
Net rental income at share increased to € 55.3 mil-
lion for the period ending 31 December 2021 compared
to € 47.0 million for the period ended 31 December 2020.
The increase reflects the underlying income growth of the
Joint Ventures’ portfolio resulting from the full year con-
tribution of rents following the different closings made
between the Joint Ventures and VGP.
At the end of December 2021, the Joint Ventures (100%
share) had € 151.1 million of annualised committed leases
representing 2,545,000 m² of lettable area compared to
€ 143.5 million of annualised committed leases represent-
ing 2,407,000 m² at the end of December 2020.
The net valuation gains on investment properties at
share increased to € 186.7 million for the period end-
ing 31 December 2021 (compared to € 48.1 million for the
period ending 31 December 2020). The Joint Ventures’
portfolio, excluding development land and the buildings
being constructed by VGP on behalf of the Joint Ventures,
was valued at a weighted average yield of 4.28% as at
31 December 2021 (compared to 4.76% as at 31 Decem-
ber 2020) mainly reflecting the further contraction of the
yields during 2021. The (re)valuation of the Joint Venture
portfolio was based on the appraisal report of the property
expert Jones Lang LaSalle, except for VGP Park München
(please refer to the Financial Review section ‘3.2 Critical
judgements in applying accounting policies’)
The net financial expenses of the Joint Ventures at
share for the period ending 31 December 2021 decreased
to € 15.3 million from € 17.8 million for the period end-
ing 31 December 2020. For the period ending 31 Decem-
ber 2021, the financial income at share was € 0.7 million
(€ 2.0 million for the period ending 31 December 2020)
and included € 0.6 million unrealised gains on interest rate
derivatives (compared to € 1.9 million for the period ending
31 December 2020).
The financial expenses at share decreased from
€ 19.7 million for the period ending 31 December 2020
to € 16.0 million for the period ending 31 December 2021
and included € 4.4 million interest on shareholder debt
(€ 5.9 million as at 31 December 2020), € 10.2 million inter-
est on bank debt (€ 8.7 million as at 31 December 2020),
€ 2.8 million other financial expenses (€ 5.5 million as at
31 December 2020) and a positive impact of € 1.4 million
(€ 0.5 million per 31 December 2020) related to capital-
ised interests.
Other expensesThe other expenses relate to the 2021 contribution to the
VGP Foundation which will be paid out during the course
of 2022. For further information on the VGP Foundation,
reference is made to the Corporate Responsibility Report
included in this annual report.
Net financial costsFor the period ending 31 December 2021, the financial
income was € 12.3 million (€ 9.3 million for the period end-
ing 31 December 2020) and included € 12.3 million interest
income on loans granted to the Joint Ventures (€ 9.3 mil-
lion as at 31 December 2020) and some residual other
financial income.
The reported financial expenses as at 31 December 2021
of € 25.0 million (€ 17.9 million as at 31 December 2020)
are mainly made up of € 34.1 million expenses related to
financial debt (€ 26.6 million as at 31 December 2020),
€ 3.3 million other financial expenses (€ 2.9 million as at
31 December 2020) and a positive impact of € 13.2 million
(€ 11.9 million for the period ending 31 December 2020)
related to capitalised interests.
As a result, the net financial costs reached € 12.7 mil-
lion for the period ending 31 December 2021 compared to
€ 8.6 million at the end of December 2020.
Shareholder loans to the Joint Ventures amounted
to € 346.9 million as at 31 December 2021 (compared
to € 266.6 million as at 31 December 2020) of which
€ 271.8 million (€ 181.7 million as at 31 December 2020) was
related to financing of the buildings under construction
and development land held by the Joint Ventures.
TaxesThe Group is subject to tax at the applicable tax rates of
the respective countries in which it operates. Addition-
ally, a deferred tax charge is provided for on the fair value
adjustment of the property portfolio.
The change in the tax line is mainly due to the variance
of the fair value adjustments of the property portfolio and
has therefore only residual cash effect.
For the period ending 31 December 2021, the taxes
were € 113.8 million (2020: € 39.9 million) and included
€ 113.6 million deferred taxes (2020: € 39.0 million).
Profit for the yearProfit for the year increased from € 370.9 million
(€ 18.51 per share) for 2020 to € 650.1 million (€ 31.41 per
share) for the financial year ended 31 December 2021. PAG
E 9
9
—
VG
P N
V A
nn
ua
l R
ep
ort
20
21
/ C
om
pa
ny
Re
po
rt /
Re
po
rt o
f th
e B
oa
rd o
f D
ire
cto
rs

Balance sheet
Investment propertiesInvestment properties relate to completed properties, pro-
jects under construction as well as land held for develop-
ment. The fluctuations from one year to the other reflect
the timing of the completion and delivery as well as the
divestments or acquisitions of such assets.
As at 31 December 2021 the investment property port-
folio consists of 29 completed buildings representing
766,000 m² of lettable area with another 50 buildings
under construction representing 1,478,000 m² of lettable
area, of which 10 buildings (235,000 m²) are being devel-
oped for the Joint Ventures.
During the year 26 buildings were completed totalling
652,000 m² of lettable area. For its own account VGP deliv-
ered 21 buildings representing 592,000 m² of lettable area
and 5 buildings (60,000 m²) were delivered on behalf of
the Joint Ventures.
Investment in joint ventures and associatesAt the end of December 2021, the investments in the joint
ventures and associates increased to € 858.1 million from
€ 654.8 million as at 31 December 2020.
The investments in joint ventures and associates as at
the end of 2021 reflect the Allianz Joint Ventures and the
Development Joint Ventures, all of which are accounted for
using the equity method. For further information see sec-
tion Strategy – Strategic partnerships.
Disposal group held for saleThe balance of the Disposal group held for sale increased
from € 102.3 million as at 31 December 2020 to € 501.9 mil-
lion as at 31 December 2021.
This balance relates to (i) the assets under construction
and development land (at fair value) which are being/will be
developed by VGP on behalf of the First and Second Joint
Venture in an amount of € 136.8 million, and (ii) assets reclas-
sifi ed as held for sale and related to the third closing with
the Second Joint Venture in an amount of € 365.1 million.
This third closing occurred during the month of March 2022.
The First-, Second- and Fourth Joint Venture have an
exclusive right of first refusal in relation to acquiring the
income generating assets developed by VGP.
The First Joint Venture and subsequent Fourth Joint Ven-
ture has the exclusive right of first refusal in relation to
acquiring the income generating assets located in Ger-
many, the Czech Republic, the Slovak Republic and Hun-
gary. The Second Joint Venture has the exclusive right of
first refusal in relation to acquiring the income generat-
ing assets located in Austria, Italy, the Netherlands, Portu-
gal, Romania and Spain. The development pipeline which
is transferred to the Joint Ventures as part of the different
closings between First, Second and Fourth Joint Venture
and VGP is being developed at VGP’s own risk and subse-
quently acquired and paid for by these joint ventures sub-
ject to pre-agreed completion and lease parameters.
The development pipeline which is being developed
by the Development Joint Ventures are being developed
at the respective joint venture partners’ risk and conse-
quently not reclassified as ‘Disposal group held for sale’.
Total non-current and current financial debtThe financial debt increased from € 783.3 million as at
31 December 2020 to € 1,384.8 million as at 31 December
2021.
The increase was mainly driven by (i) increase in non-
current financial debt through the issuance of a new
bond in the amount of € 600 million, (ii) an increase of
the accrued interest on bonds and Schuldschein loans
(+ € 6.6 million) and (iii) amortisation of capitalised finance
costs (+ € 2.1 million), off-set by the repayment of bank
debt in an amount of € 1.3 million and € 5.9 million paid
finance costs.
The gearing ratio¹ of the Group as of 31 December 2021
amounted to 29.8% compared to 25.2% as at 31 December
2020.
Cash fl ow statement
The changes in the cash flow from investing activities was
mainly due to: (i) € 680.1 million (2020: € 428.2 million) of
expenditure incurred for the development activities and
land acquisition; (ii) € 49.6 million cash in from the eighth
closing with the First Joint Venture (compared to several
closing in 2020 totalling € 405.6 million).
The changes in the cash flow from financing activities
were driven by: (i) € 75.1 million dividend paid out in May
2021 (2020: € 60.3 million); (ii) € 294.9 million net pro-
ceeds from the capital increase in November 2021 (2020:
€ 198.3), (iii) € 97.0 million net proceeds from the sale of
treasury shares in September 2020, and (iv) € 594.1 million
net proceeds from the issuance of the Apr-29 Bond.
Events after the balance sheet date
On 17 January 2022, VGP successfully issued its second
public benchmark green bonds for an aggregate nominal
amount of € 1.0 billion (€ 991.2 million net proceeds), in two
tranches, with a €500 million 5-year bond paying a cou-
pon of 1.625% p.a. and maturing on 17 January 2027 and a
€ 500 million 8-year bond paying a coupon of 2.250% p.a.
and maturing on 17 January 2030.
In March 2022, the third closing with the Second Joint Ven-
ture took place with a transaction value of € 363.5 million.
With the outbreak of the war between Russia and
Ukraine we are finding ourselves in uncertain economic
and political waters. It is unclear whether this war will not
turn into a prolonged war which could have significant
economic spill over effects for the short to medium term.
One of the immediate consequences of the war in
Ukraine is surging energy costs and shortages of building
materials. Whether this trend, which we have been able to
remedy for the time being, is a lasting one will depend on
how the conflict develops further.
It is therefore currently not possible to assess the impact
on our Group and different stakeholders. What is clear is
that there will be an adverse economic and market disrup-
tive impact but how this will evolve and what the impact
will be for our Group is currently impossible to say.
SUMMARY (in thousands of €) 2021 2020
Cash flow from operating activities (87,473) (52,168)
Cash flow from investing activities (720,423) (134,530)
Cash flow from financing activities 812,589 233,584
Net increase/(decrease) in cash and cash equivalents
4,693 46,886
1 Calculated as Net debt / Total equity and liabilitiesPAG
E 1
00
—
V
GP
NV
An
nu
al
Re
po
rt 2
02
1 /
Co
mp
an
y R
ep
ort
/ R
ep
ort
of
the
Bo
ard
of
Dir
ec
tors

ph
oto
© T
rilu
x

Listing of shares
Euronext Brussels
VGP share VGP ISIN BE0003878957
Market capitalisation 31 Dec-21 .............. 5,589,260,800 €
Highest capitalisation ................................ 5,763,925,200 €
Lowest capitalisation ................................... 2,611,232,780 €
Share price 31 Dec-20 .............................................. 122.60 €
Share price 31 Dec-21 .............................................. 256.00 €
Shareholder structure
As at 31 December 2021 the share capital of VGP was rep-
resented by 21,833,050 shares.
Ownership of the Company’s shares is as follows:
Little Rock SA, Alsgard SA and Tomanvi SCA are
companies controlled by Mr. Jan Van Geet.
VM Invest NV is a company controlled by
Mr. Bart Van Malderen.
Information about the share
SHAREHOLDERS¹ NUMBER OF SHARES
% OF TOTAL SHARES
NUMBER OF VOTING RIGHTS¹
% OF TOTAL VOTING RIGHTS
Little Rock SA 4,063,999 18.61% 7,936,102 24.49%
Alsgard SA 2,409,914 11.04% 4,819,828 14.87%
Tomanvi SCA 484,205 2.22% 484,205 1.49%
Sub-total Jan Van Geet Group 6,958,118 31.87% 13,240,135 40.85%
VM Invest NV 4,149,171 19.00% 7,895,179 24.36%
Public 10,725,761 49.13% 11,275,144 34.79%
Total 21,833,050 100.00% 32,410,458 100.00%
1 As at 31 December 2021, on the basis of transparency declarations, information received from the shareholders or press releases issued by
the Company in respect of Voting rights and denominator published on the Company’s website.PAG
E 1
02
—
V
GP
NV
An
nu
al
Re
po
rt 2
02
1 /
Co
mp
an
y R
ep
ort
/ R
ep
ort
of
the
Bo
ard
of
Dir
ec
tors

The Extraordinary General Shareholders’ Meeting of 8 May
2020 approved the introduction of the double voting right.
A double voting right is therefore granted to each VGP
share that has been registered for at least two years with-
out interruption under the name of the same shareholder
in the register of shares in registered form, in accordance
with the procedures detailed in article 29 of the Articles of
Association. In accordance with Belgian law, dematerial-
ised shares do not benefit from the double voting right.
VGP has not issued any other class of shares, such as
non-voting or preferential shares.
In accordance with Article 15 of the law of 2 May 2007
regarding the publication of major shareholdings (“trans-
parency law”) VGP must publish, its (i) total share capital,
(ii) the total number of securities granting voting rights
and (iii) the total number of voting rights, at the latest by
the end of each month during which these numbers have
increased or decreased.
Authorised capital
The Board of Directors has been authorized by the Extraor-
dinary Shareholders’ Meeting held on 8 May 2020 to
increase the Company's subscribed capital in one or more
times by an aggregate maximum amount of € 92,666,815
(before any issue premium). The authority is valid for five
years from 14 May 2020 and can be renewed in accord-
ance with the applicable statutory provisions. Pursuant to
this authorization, the Board of Directors may, among oth-
ers, effect a capital increase under the authorized capital
by means of issuing ordinary shares, subscription rights or
convertible bonds and may limit or disapply the preferen-
tial subscription right of the Company's shareholders.
Furthermore, the Board of Directors has been author-
ized, for a period of three years from 8 May 2020, to make
use of the authorized capital upon receipt by the Company
of a notice from the FSMA of a public takeover bid for the
Company’s securities.
Liquidity of the shares
To improve the liquidity of its shares VGP NV concluded
a liquidity agreement with KBC Bank.
This agreement ensures that there is increased liquidity
of the shares which should be to the benefit of the Group
in the future as more liquidity allows new shares to be
more easily issued in case of capital increases.
Financial calendar
2022 first quarter trading update .................... 13 May 2022
Annual shareholders’ meeting ........................ 13 May 2022
2022 half year results .................................. 26 August 2022
2022 third quarter trading update ....... 18 November 2022
PAG
E 1
03
—
V
GP
NV
An
nu
al
Re
po
rt 2
02
1 /
Co
mp
an
y R
ep
ort
/ R
ep
ort
of
the
Bo
ard
of
Dir
ec
tors


2022 should benefit from client demand and shortage of
supply of grade A logistics and industrial buildings sup-
porting rent- and occupancy levels. The underlying funda-
mentals for logistics and semi-industrial real estate remain
robust with e-commerce continuing to be a big driver for
demand of new lettable space.
Based on the strong leasing activities as reported over
the course of 2021 and indications of interest received for
the coming period, development activities are expected to
continue to operate at elevated levels well into 2022.
In the longer-term development activities will continue
to be driven by client-led demand and our ability to meet
these opportunities with a.o. VGP’s readily available prime
land bank locations.
With regards to VGP Renewable Energy, VGP focuses
on an expansion of the service offering through increased
production of green energy used for self-consumption
and facilitating our clients in their transitioning towards
green energy.
Nevertheless, with the outbreak of the war between Rus-
sia and Ukraine we are finding ourselves in uncertain
economic and political waters. It is unclear whether this
war will not turn into a prolonged war which could have
significant economic spill over effects for the short to
medium term.
One of the immediate consequences of the war in
Ukraine is surging energy costs and shortages of building
materials. Whether this trend, which we have been able to
remedy for the time being, is a lasting one will depend on
how the conflict develops further.
It is therefore currently not possible to assess the impact
on our Group and different stakeholders. What is clear is
that there will be an adverse economic and market disrup-
tive impact but how this will evolve and what the impact
will be for our Group is currently impossible to say.
For the medium term we believe that VGP remains well
equipped to weather the current uncertain times hav-
ing (i) sufficiently large cash buffers in its own and Joint
Ventures’ portfolios topped-up by a significant amount of
available undrawn committed credit; (ii) a strong balance
sheet with a low gearing level and (iii) a strong partnership
with Allianz putting solid foundations underneath VGP’s
business model.
Outlook 2022
PAG
E 1
05
—
V
GP
NV
An
nu
al
Re
po
rt 2
02
1 /
Co
mp
an
y R
ep
ort
/ R
ep
ort
of
the
Bo
ard
of
Dir
ec
tors


Board of Directors and Management

Board of Directors and Management
Board of DirectorsCOMPOSITION ON 31 DECEMBER 2021
NAME YEAR APPOINTED
EXECUTIVE OR NON-EXECUTIVE
INDEPENDENT NEXT DUE FOR RE-ELECTION
Chairman VM Invest NV represented by Bart Van Malderen
2021 Non-executive and reference shareholder
— 2025
CEO Jan Van Geet s.r.o. represented by Jan van Geet
2021 Executive and reference shareholder
— 2025
Directors GAEVAN BVrepresented byAnn Gaeremynck
2019¹ Non-executive Independent 2023
Katherina Reiche 2019 Non-executive Independent 2023
Vera Gäde-Butzlaff 2019 Non-executive Independent 2023
1 Until the Annual General Meeting of May 2020 Mrs Ann Gaeremynck office was in personal name.PAG
E 1
08
—
V
GP
NV
An
nu
al
Re
po
rt 2
02
1 /
Co
mp
an
y R
ep
ort
/ B
oa
rd o
f D
ire
cto
rs a
nd
Ma
na
ge
me
nt

Bart Van Malderen
*1966 Bart Van Malderen founded Drylock Technologies in 2012. Drylock
Technologies is an hygienic disposable products manufacturer which introduced
the revolutionary flufless diaper in 2013. Prior to this, Bart Van Malderen held
different management positions at Ontex, a leading European manufacturer
of hygienic disposable products where he became CEO in 1996 and Chairman
of the Board in 2003, a mandate which he occupied until mid-July 2007.
Jan Van Geet
*1971 Jan Van Geet is the founder and CEO of VGP. He has overall daily as
well as strategic management responsibilities of the Group. He started in
the Czech Republic in 1993 and was manager of Ontex in Turnov, a producer
of hygienic disposables. Until 2005, he was also managing director of WDP
Czech Republic. WDP is a Belgian Real Estate Investment Trust.
Katherina Reiche
*1973 Katherina Reiche is Chairwomen of the Management Board of Westenergie AG,
Germany's leading energy infrastructure company, since 2020. Prior to this Katherina
Reiche chaired the board of the Association of Municipal Enterprises (VKU) in Germany
from 2015 to 2019 and chaired the European Association of Public Employers and
Enterprises (CEEP) since June 2016. She was a member of the German Bundestag
from 1998 to 2015. She served as State Secretary in the German Federal Ministry
of Environment from 2009 to 2013 and as State Secretary in the Federal Ministry of
Transport and Digital Infrastructure from 2013 to 2015. In 2020 she was appointed
by the German federal cabinet as Chairwoman of the National Hydrogen Council.
Ann Gaeremynck
*1966 Ann Gaeremynck is full professor of Accounting and Governance at the
KULeuven, Faculty of Economics and Business Administration. Since April 2017
she is member of the board and the audit committee of Retail Estates, a Belgian
listed company which invests mainly in retail properties located in the periphery
of residential areas or along access roads to urban centres. She currently is also
a member of the board of directors and chair of the audit committee of Vives,
a university college of the Association KULeuven. In the past she fulfilled a position
as an external member of the Audit Committee at the hospital AZ Delta.
Vera Gäde-Butzlaff
*1954 Vera Gäde-Butzlaff is currently member of several boards a.o Supervisory
board member of Berliner Volksbank, Supervisory board member Nehlsen AG,
Chairwoman of the Bürgerstiftung Berlin. Prior to this Vera Gäde-Butzlaff was Deputy
State Secretary for Environment and Agriculture at the Ministry of Regional Planning,
Agriculture and Environment of Saxony-Anhalt from 2001 to 2002. From 2003 to
2014, she was a member of the Board of Directors and since 2007 CEO of Berlin’s
city cleaning and waste management companies (BSR). From 2015 to 2018 she was
CEO of GASAG AG, one of Germany’s largest regional energy suppliers. From 2018
to 2020, she has chaired the Supervisory Board of Vivantes, the hospital group.
PAG
E 1
09
—
V
GP
NV
An
nu
al
Re
po
rt 2
02
1 /
Co
mp
an
y R
ep
ort
/ B
oa
rd o
f D
ire
cto
rs a
nd
Ma
na
ge
me
nt

Executive Management Team
COMPOSITION ON 31 DECEMBER 2021
Jan Van Geet¹ Chief Executive Officer
Piet Van Geet² Chief Financial Officer
Dirk Stoop³ Company Secretary
Tomas Van Geet⁴ Chief Commercial Officer
Miquel-David Martinez Chief Technical Officer
Matthias Sander⁵ Chief Operating Officer – Eastern Europe
Jonathan Watkins⁶ Chief Operating Officer – Western Europe
Martijn Vlutters⁷ Vice President – Business Development & Investor Relations
1 As permanent representative of Jan Van Geet s.r.o.
2 As permanent representative of Urraco BV as from 10 January 2022.
3 As permanent representative of Dirk Stoop BV as from 10 January 2022.
4 As permanent representative of Tomas Van Geet s.r.o.
5 As permanent representative of Matthias Sander s.r.o.
6 As permanent representative of Havbo Consulting Ltd.
7 As permanent representative of MB Vlutters BV.PAG
E 1
10
—
VG
P N
V A
nn
ua
l R
ep
ort
20
21
/ C
om
pa
ny
Re
po
rt /
Bo
ard
of
Dir
ec
tors
an
d M
an
ag
em
en
t

Mr. Piet Van Geet
*1985 Joined VGP in 2021 and was appointed CFO in
January 2022. He is responsible for all finance matters
of the VGP Group. Prior to joining VGP, Piet Van Geet
has been 8 years the CFO of Drylock Technologies, a
leading disposable hygiene manufacturer with operations
in Europe, Russia, USA and Brazil. After his studies
he joined VGP as a project manager in the Baltics and
Romania and continued his career at VGD in auditing and
finance consulting prior to joining Drylock Technologies.
Piet holds degrees at the University of Antwerp of
Applied economical sciences and a Master of Tax law.
Mr. Dirk Stoop
*1961 Joined VGP in 2007 and held the position of
CFO until January 2022 whereafter he was appointed
Company Secretary. Prior to joining VGP Dirk worked
at Ontex for 5 years as Group Treasurer where he was
also responsible for tax and insurance matters. Prior
to this he worked at CHEP Europe based in London
as Treasurer Europe, South America & Asia. Dirk
holds a Master’s Degree in Financial and Commercial
Sciences from VLEKHO (HUB) in Belgium.
Mr. Tomas Van Geet
*1976 Joined VGP in 2005. He takes responsibility
for all commercial strategic matters and commercial
co-ordination of VGP’s key accounts. Prior to joining VGP,
Tomas held several positions in the planning and logistics
departments of Domo in Germany, Spain, Czech Republic
and South Africa, Associated Weavers and Ontex.
Mr. Miquel-David Martinez
*1978 He is civil engineer and joined VGP’s team in
2016. He takes responsibility for technical concepts and
contract execution. Prior to this position, Miquel-David
was the technical director and partner in Inel Group, a
construction management and engineering company
mainly focused on building projects for the tertiary sector.
Mr. Matthias Sander
*1970 He is a mechanical and economic bachelor
and joined VGP in 2018. He takes responsibility for the
expansion into new countries, sourcing land plots across
Europe and coordinating of the development pipeline.
Matthias spent the last 11 years in several leading roles
with Knorr Bremse (a leading German industrial Group)
and was its Managing Director in the Czech Republic.
Mr. Jonathan Watkins
*1975 Joined VGP in December 2019. Mr Watkins
was previously head of UK and German Ops Real
Estate at Amazon. Prior to this he held several
leading roles in acquisition and construction of new
stores and warehouses at Lidl Denmark, UK and
Germany. Jon holds a Master’s Degree, Surveying of
the University College of Estate Management and a
BSc Surveying from Sheffield Hallam University.
Mr. Martijn Vlutters
*1979 Joined VGP in 2018. He takes responsibility for busi-
ness development and investor relations. Prior to join-
ing VGP, Martijn worked 13 years at J.P. Morgan based
in London and New York in various roles in Capital Mar-
kets and Corporate Finance. Within this period, he spent
2 years in New York as Investor Relations for J.P. Mor-
gan Chase. Martijn holds a Master degree in Civil Engi-
neering from Delft University and Business Administra-
tion from Erasmus/Rotterdam School of Management.
PAG
E 1
11
—
VG
P N
V A
nn
ua
l R
ep
ort
20
21
/ C
om
pa
ny
Re
po
rt /
Bo
ard
of
Dir
ec
tors
an
d M
an
ag
em
en
t


Corporate responsibility report

Green roof of VGP Park Berlin – facilitating water retention, bio-diversity stimulation and insulation.

Ratings
LOW RISK
ISSUER RATING: BBB-
ESG Ratings
Credit rating
UN Global Compact commitment

VGP Park Nijmegen with green walls and water retention bassin around the park.

PAG
E 1
17
—
VG
P N
V C
orp
ora
te R
es
po
ns
ibil
ity
Re
po
rt 2
02
1 /
Co
mp
an
y a
t a
gla
nc
e
VGP is a pan-European developer, manager and owner of high-quality logistics
and semi-industrial real estate. VGP operates a fully integrated business model
with capabilities and longstanding expertise across the value chain. The company
has a development land bank (owned or committed) of 10.94 million m² and the
strategic focus is on the development of business parks. Founded in 1998 as a
Belgian family-owned real estate developer in the Czech Republic, VGP with a staff
of circa 350 employees today owns and operates assets in 14 European countries
directly and through several 50:50 joint ventures. As of December 2021, the Gross
Asset Value of VGP, including the joint ventures at 100%, amounted to € 5.75 billion
and the company had a Net Asset Value (EPRA NTA) of € 2.33 billion. VGP is listed
on Euronext Brussels (ISIN: BE0003878957).
Company at a glance
INVESTMENT PORTFOLIO BREAKDOWN1
COUNTRY BREAKDOWN
59% Germany
13% Czech Republic
8% Spain
7% Netherlands
3% Slovakia
3% Romania
3% Hungary
4% Other
1 Including the joint venture at 100%
Total GAV € 5.75 bn

St. Petersburg
Barcelona
Granada
Málaga
Valencia
Zaragoza
Bilbao
Burgos
Valladolid
BelartzaPorto
Genova
Firenze
Naples
Palermo
Split
TimisoaraNovi Sad
Subotnica
Niš
Čačak
Kosovo
Sibiu
Arad
Brașov
ClujGraz
Győr
Brno
Ostrava
Zvolen
Nürnberg
Leipzig
Köln a. R.
Rotterdam
Den Haag
Hamburg
Karlsruhe
Zürich
Stuttgart
Munich
Innsbruck
Salzburg
Turin
Frankfurt a. M.
Rijeka
Venice
Bologna
Parma
Seville
Milan
Sordio
Bayonne
Bordeaux
Limoches
Tours
Toulouse
Lyon
Clermont-Ferrand
Dijon
Brest
Strasbourg
Geneva
Nantes
Rennes
Le Havre
Lile
Marseille
Heraklion
Thessaloniki
Larissa
IoanniaLamia
Patras
Tripoli
Sparti
Helsinki
Tallinn
Riga
Kaunas
Warsaw
Copenhagen
StockholmOslo
Berlin
Prague
Bratislava
Vienna
Bucharest
Sofia
Monaco
Brussels
Amsterdam
Bern
Ljubljana
Zagreb
Budapest
Paris
MadridLisbonRome
Athens
London
Dublin
Podgorica
Tirana
Skopje
Sarajevo
Belgrade
Luxembourg
Helsinki
Tallinn
Riga
Kaunas
Warsaw
Copenhagen
StockholmOslo
Berlin
Prague
Bratislava
Vienna
Bucharest
Sofia
Monaco
Brussels
Amsterdam
Bern
Ljubljana
Zagreb
Budapest
Paris
MadridLisbonRome
Athens
London
Dublin
Podgorica
Tirana
Skopje
Sarajevo
Belgrade
Luxembourg CZ
DE
SK
HU
SRB
RO
LV
ESP
BEL
NL
LUX
PTIT
ATFR
GR
100 Parks
4,570,000 m² Gross leasable area¹1 Completed gross leasable area including under construction (areas held through JVs accounted for at 100%)

PAG
E 1
19
—
VG
P N
V C
orp
ora
te R
es
po
ns
ibil
ity
Re
po
rt 2
02
1 /
Co
mp
an
y a
t a
gla
nc
e
2 Including the joint venture at 100%
3 Enabled green energy production through PV installations owned by third parties installed on roofs of VGP Parks (Including operational and installations under construction)
4 Enabled green energy production through own PV installations and PV installations owned by third parties installed on roofs of VGP Parks for which heads of terms have been agreed
5 Full-time equivalent; number of employees was ca. 350 at YE2021
6 Installed or under construction
€ 256.1 Mio.Committed Annualised rental income2
399Number of tenancy contracts
54.3%of portfolio green certifi ed
74.7 MWpGreen energy production installed³
74.5 MWpGreen energy production pipeline⁴
322Number of FTEs539%
% female employees
60%% female board members
57buildings with solar panels
on the roof6
60%% independent directors
For more information, please visit www.vgpparks.eu
Our key fi gures in 2021

Building Tomorrow Today

As a family-owned business we think in partnerships and across generations.
Building Tomorrow Today together has since long been our guiding principle. We are building to create future-proof value.
For our clients, partners, shareholders and for the communities in which we operate.
By doing the right thing today and by doing business in a responsible manner VGP hopes to create a better tomorrow: by moving towards a circular, low-carbon economy, fully integrating business activities within the local communities, investing in the environment and empowering our teams on sustainability and diversity.
Building the foundations today we are working towards a brighter tomorrow. In that way we are constructing a happier, sustainable future for coming generations.
We do this by challenging ourselves and adapting to changing needs every day.

PAG
E 1
22
—
V
GP
NV
Co
rpo
rate
Re
sp
on
sib
ilit
y R
ep
ort
20
21
/ C
on
ten
t
Content
PAGES 124 — 125
Letter from the CEO
PAGE 126 — 127
Key ESG achievements and highlights 2021
PAGE 128 — 129
Our Approach to ESGAbout This Report
PAGE 130 — 131
Stakeholder engagement
PAGE 132 — 155
Commitments
The 2030 Sustainable Development Goals
Climate change strategy
Sustainable Properties
People, culture and employee well-being
Workforce
Supply Chain Management
VGP in the community
Employee well being
PAGE 156 — 157
VGP Foundation

PAG
E 1
23
—
V
GP
NV
Co
rpo
rate
Re
sp
on
sib
ilit
y R
ep
ort
20
21
/ C
on
ten
t
PAGE 158 — 170
ESG Risk Management
Managing Environmental Risks: Environmental Management System
Business ethics
Health, safety security and well-being of people in our properties
Human Capital
Local municipal acceptability
Environmental pollution
Responsible Supply chain
Energy and greenhouse gases
Identifying, Assessing and Managing Climate-related risks and opportunities
Governance
PAGE 171 — 185
Green fi nancing of the Group activities
Green bond issuance
Eligible Assets
Current Allocation of Green Bond Proceeds
Audited criteria
Criteria of the use of proceeds reporting
Independent Third Party’s report on Green Bond criteria
PAGE 186 — 189
Additional information
Reporting
Global Reporting Initiative (GRI) Index

PAG
E 1
24
—
V
GP
NV
Co
rpo
rate
Re
sp
on
sib
ilit
y R
ep
ort
20
21
/ L
ett
er
fro
m t
he
CE
O
Letter from the CEO
At VGP, we have always considered
ourselves and everyone associated
with us as family. In the wake of the
coronavirus pandemic, this sense of
community is more important and
meaningful than ever. I know this is a
diffi cult time for all of us. I feel it with
my family, with loved ones who live
abroad, far from us.
In the past few weeks we have also
seen how quickly things can change.
The Russian invasion of Ukraine
means war has returned to Europe.
This is fi rst and foremost a human
tragedy, but these events will also have
profound and lasting implications for
business and society as we know it
today. The new reality has already put
some of our convictions to the test.
Among all the uncertainty and need
for immediate and pragmatic solutions
to pressing issues, the dependency
on Russian oil and gas has made the
necessity of the shift towards effi cient
energy use, energy independency
and green energy sources even more
apparent. Europe has the chance to
change this crisis into an opportunity
for accelerated change and become
globally one of the front-leaders in
terms of technical competence with
regards to transition technologies and
renewable energy roll-out, a path VGP
is actively supporting.
These unsettling days are also a
wake-up call, a fi rm reminder that
human well-being is inextricably linked
to the health of our planet and can only
be achieved if we all work together –
whether it's war, climate change, forest
fi res, emergent tropical diseases,
pandemics, loss of freshwater, etc.
Protecting biodiversity and our
environment nature is really about
protecting ourselves.
Over our 24-year history, VGP has
faced many challenges. Our approach
has been to focus on the path
ahead, building upon the technical
competence of our teams to do what
is right for our clients in the most
sustainable way, acting quickly and
with responsibility. We have been
able to do so because of the actions
and investments we have made over
many years to build a strong, resilient
business. This includes maintaining
robust risk, fi nancial and operating
controls; maintaining continuous
focus on the interests of our clients
and communities; advance an
inclusive economic recovery; investing
in our employees and fostering a
diverse and inclusive workplace;
upholding a culture that reinforces
integrity, fairness and responsibility;
and advancing sustainability in our
business and operations. Today, this
is frequently described as Corporate
Responsibility. We like to think of it
simply as the smart and right way of
doing business – Building Tomorrow
Today together.

Our Group’s environmental strategy
to help accelerate the shift to a more
sustainable, circular and low-carbon
future is one example of our work
in action. All of our offi ces across
Europe have switched to 100 percent
renewable energy as of January 1,
2022, and we have made signifi cant
investments into photovoltaic
installations in our parks. We have
made a commitment to reduce the
net relative carbon emissions of our
“in-use” portfolio with 55% by 2030
and we have increased our targeted
building standard to DGNB Gold
or equivalent, in addition we have
several pilot projects for “DGNB Klima
Positiv”-certifi cation underway. We aim
to align our portfolios’ performance
with the goals of the Paris Agreement
and working with our clients to help
them realize their decarbonization
strategies – eff orts that are intended to
drive near-term actions that will help
set the world on a path to achieving
net-zero carbon emissions by 2050.
The VGP Foundation is helping in
the conservation of biodiversity and
engaged in unlocking opportunities
for underserved communities. We also
continue to work on a more equitable
and representative workforce within
our own company.
Ultimately, our long-term business
success depends on the success of
the communities we serve. In this
report, I invite you to learn more about
the ways we strive to operate a thriving
company that we can be proud of, and
all the ways VGP is putting its business
to work for our stakeholders.
Jan Van Geet
CEO & Founder
PAG
E 1
25
—
V
GP
NV
Co
rpo
rate
Re
sp
on
sib
ilit
y R
ep
ort
20
21
/ L
ett
er
fro
m t
he
CE
O
Several area-sized bog remnants in the districts of Rotenburg (Wümme) and Stade, Germany, with a total area of about 3,000 ha are protected by NABU and supported by VGP Foundation

PAG
E 1
26
—
V
GP
NV
Co
rpo
rate
Re
sp
on
sib
ilit
y R
ep
ort
20
21
/ K
ey
ES
G a
ch
ieve
me
nts
an
d h
igh
lig
hts
20
21
Carbon footprint scope 1 and 2 reduction
On track to achieve net carbon
neutrality by 2025 and 50%
gross reduction by 2030
All VGP offi ces green energy PPA
contract as of 1 January 20221
Carbon footprint Scope 3 reduction
Engaging with tenants on self-
consumption renewable energy
Aim for net 55% reduction of
“in use” scope 3 carbon
emissions by 2030
VGP Renewable Energy
74.7 MWp installed or under
construction and 74.5 MWp in pipeline
Increase capacity by 2025 to 300 MWp
Supporting tenants in switch to
green drive-train technologies
Key ESG achievements and highlights 2021
1 https://www.vgpparks.eu/en/newsroom/investor-news/vgp-announces-pan-european-corporate-solar-energy-deal-to-power-alll-vgp-offices-with-100-renewable-electricity/
Green buildings certification
54.3% of portfolio green certifi ed
Aiming for BREEAM Excellent/
DGNB Gold for all new builds in
2022 on a best-eff orts basis
Buildings life-cycle management
Several pilot projects DGNB
Klima Positiv life-cycle
certifi cation under way
EBRD joint research on
circular materials
Pan-European corporate solar energy
deal with Scholt Energy B.V. and
ACT Commodities B.V. to power all
VGP offi ces with 100% renewable
electricity – Power supplied from
VGP's existing solar farm on the roof
of VGP Park Nijmegen, Netherlands,
to VGP offi ces across Europe.

PAG
E 1
27
—
VG
P N
V C
orp
ora
te R
es
po
ns
ibil
ity
Re
po
rt 2
02
1 /
Ke
y E
SG
ac
hie
vem
en
ts a
nd
hig
hli
gh
ts 2
02
1
GovernanceImplemented principles 3.19 of
the Belgian Code on Corporate
Governance by appointing Company
Secretary
Updating charter and various policies
and guidelines to demonstrate highest
standards of business conduct and
integrity
Diversity and talent management
Board continues diversity lead with
60% female board members
Various training/development
initiatives being implemented
Conducted inaugural annual group
employee satisfaction survey
VGP Foundation19 environmental, 5 culture and
5 social projects supported thus far
€ 7 million commitment made
available until 2021
Climate change managementEvaluating Carbon Risk Real Estate
Monitor 2050 pathway analysis for
portfolio compliance on a best
eff orts basis
ESG disclosureGRI compliant CR disclosure
Annual CDP and GRESB submission
Initial Sustainalytics score; plan to
initiate MSCI ESG score in 2022

PAG
E 1
28
—
VG
P N
V C
orp
ora
te R
es
po
ns
ibil
ity
Re
po
rt 2
02
1 /
Ou
r A
pp
roa
ch
to
ES
G
At VGP, ESG matters are an important
consideration in how we do business,
including our corporate governance
systems, risk management and
controls, human capital management,
approach to serving clients, support
for local communities – including
through the VGP Foundation – and
management of our construction and
portfolio management operations.
We recognize the potential for ESG-
related risks, which we work to identify
and manage just as we manage risk
in all areas of our business. Equally
important, we believe companies
like ours have an obligation to put
their businesses to work for all of
their stakeholders. For our Group,
this means we are leveraging our
business, capital and pan-European
presence to help expand access to
economic opportunity and accelerate
sustainability and climate solutions.
About This Report
VGP communicates regularly about
how we manage and conduct our
business. We share information
about our ESG performance through
a number of channels — including
our Annual Corporate Responsibility
Report, various other reports and
presentations, regulatory fi lings, press
releases and direct conversations with
stakeholders. We maintain a dedicated
ESG Information page on our website
to facilitate access to information that
we publish on these topics.
This annual Corporate Responsibility
Report is designed to consolidate and
summarize our work on key topics
that are important to our business and
stakeholders, and guide readers to
where they can access more detailed
information about specifi c topics of
interest. All data in this report are as of
Dec. 31, 2021, unless otherwise noted.
This applies specifically to the CO₂
emissions and energy consumption
data of our portfolio for which last
available full-year data has been
used (as referenced in the respective
tables).
All the energy consumption data,
as well as the carbon emission
calculations used in this report have
been third-party validated by CO2Logic
(https://www.co2logic.com/) based on
PAS 2060 and the GHG protocol.
This Corporate Responsibility Report
has been prepared in accordance with
the GRI Standards: Core Option. Apart
from the Green Finance Framework
and Proceeds section which has been
reviewed by Cicero, the remainder
of this report has not been externally
audited. The GRI Content Index can be
found on page 189-191.
Our Approach to ESG
VGP N.V. (“VGP,” “we” or “the Group”) has built its reputation based on technical competence and being there for our clients and communities. The continued events of 2021 – the global COVID-19 pandemic and the increasingly visible eff ects of climate change – underscore why understanding, anticipating and eff ectively managing environmental, social and governance (ESG) matters is critical to delivering on our mission to serve our clients and communities. Now, more than ever, a strong focus on ESG is a business imperative – and a key driver of long-term business success.

ph
oto
© T
rilu
x

PAG
E 1
30
—
V
GP
NV
Co
rpo
rate
Re
sp
on
sib
ilit
y R
ep
ort
20
21
/ O
ur
Ap
pro
ac
h t
o E
SG
We maintain an open dialogue with our
stakeholders, including our investors,
customers, employees, suppliers
and the communities in which we
operate. We seek feedback during our
investor updates and client meetings
or as part of our annual client and
employee surveys. This has helped us
to determine material sustainability
priorities and the social impacts of
our business. This in turn allows us to
calibrate our targets and systems to
manage, review and report on our ESG
performance.
Our Global Reporting Initiative
(GRI) index at the end of this report
demonstrates the full view of our
updated 2021 ESG topics.
Stakeholder engagement

PAG
E 1
31
—
VG
P N
V C
orp
ora
te R
es
po
ns
ibil
ity
Re
po
rt 2
02
1 /
Ou
r A
pp
roa
ch
to
ES
G
VGP IN DIALOGUE
Dialogue, conferences, meetings and calls
with investors and analystsCapital markets
Dialogue in context of joint projects,
supplier due diligence, forums & conferencesSuppliers
Dialogue through meetings and conferences
as member of local and pan-European associations
Networks
and associations
Dialogue in the context of press releases,
information events on new parks, trade fairsMedia
Dialogue in context of new initiatives
and existing partnerships
Business and
joint venture partners
Personal meetings, park visits,
neighborhood conversationsLocal stakeholders
One-on-one meetings/dialogue,
answering questionsCivil society and NGOs
Dialogue with employees, driving forces,
idea management, internal mediaEmployees
Dialogue (including in context of park/building
design), social media, trade fairsClients

PAG
E 1
32
—
V
GP
NV
Co
rpo
rate
Re
sp
on
sib
ilit
y R
ep
ort
20
21
/ C
om
mit
me
nts
The Sustainable Development Goals (SDGs) were adopted
in 2015 by the 193 United Nations (UN) member states. They
have helped to inform our thinking about where VGP can
play a role. VGP contributes in diff erent ways and to diff erent
degrees to all the SDGs. In line with UN Global Compact
guidance, we have identifi ed which goals are particularly
relevant to us: where expectations, risks and opportunities
for VGP are greatest, and where we can make the most
signifi cant contribution.
We list these priority SDGs in the table below, vis-à-vis last
year the changes to the sections and newly introduced main
targets include:
— New target aiming to reduce the net Scope 3 ‘in use’
emissions by 55% by 2030
— Increased renewable energy production target from
200 MWp to 300 MWp by 2025 – equivalent to nearly
2.0 × the total energy consumption of our tenants in 2020
— We have updated our building target to 100% DGNB
Gold or equivalent¹ for new builds since January 1, 2022
(previously the target was set at BREEAM Very Good and
DGNB Silver)
— Aim for development projects to be connected to public
transport solutions
— 100% of development projects with biodiversity stakes to
implement a biodiversity action plan
— GRI, CDP, GRESB and Sustainalytics aligned disclosure
were already provided last year. From 2022 onwards our
ambition is to initiate an MSCI ESG rating as well
1 Aim for BREEAM Excellent (which is set above in-house minimum requirement as part of Group Environmental
Management System of BREEAM Very Good/DGNB Gold)
Commitments
The 2030 Sustainable Development Goals


PAG
E 1
34
—
VG
P N
V C
orp
ora
te R
es
po
ns
ibil
ity
Re
po
rt 2
02
1 /
Co
mm
itm
en
ts
TARGET PROGRESS
Achieve carbon neutrality under scope 1 and 2 by 2025 and
reduce gross emissions by 50% by 2030
On track – major step all VGP offices switching to 100% renewable
energy as of January 1, 2022.
For 2022 the intention is to have all the Group’s reduction targets
approved by the Science Based Targets initiative (sBTi)
Aim for 55% net relative reduction of “in-use” Scope 3 carbon
emissions by 2030
Analysed CO₂ footprint of our building users over FY2020
and set target to aim for a net relative 55% reduction of “in use”
Scope 3 emissions caused by tenant operations by 2030 compared
to base year 2020
Doubling (300MWp) of solar PV in operation or under
construction by 2025
On track for revised target with approximately 74.7 MWp
installed or under construction across Europe
Projects representing 74.5 MWp are currently
in the pipeline (up 53% YoY)
Aim for DGNB Gold or equivalent¹ sustainability certification
for all newly constructed buildings as of January 1, 2022
100% of new construction projects across Europe are being
environmentally certified. Combined with buildings previously
certified this has resulted in 54.3% of the total portfolio certified or
with certificate pending as of December 2021
Efficient use of buildings:
maintain >95% historical occupancy rate
As of Dec 2021, the average occupancy rate for the completed
portfolio was 99.4%
Aim for development projects to be connected
to public transport solutions
100% of development projects in 2021
Safe working environment: targeting zero workforce fatalities Zero workforce fatalities in 2021
We request employees, contracted workforce as well as suppliers of
VGP to adhere to our VGP Health and Safety Policy
The progress for each target has been updated to reflect steps taken in 2021:
1 Target DGNB Gold or aim for equivalent (BREEAM Excellent). The aim for BREEAM Excellent is set above in-house minimum requirement as part of Group Environmental
Management System of BREEAM Very Good / DGNB Gold

PAG
E 1
35
—
VG
P N
V C
orp
ora
te R
es
po
ns
ibil
ity
Re
po
rt 2
02
1 /
Co
mm
itm
en
ts
TARGET PROGRESS
Supply chain ethics We conduct a supplier due diligence and request to adhere to Code
of Conduct
Gender equality, diversity and inclusiveness Our board consists of 60% female members and overall gender ratio
of the group is 39% female
100% of new employees follow sustainable development training In addition to Code of Conduct training the aim is to ensure 100%
of new employees complete sustainable development training
100% of employees involved in a culture of trust,
evolution and sharing
Create an environment encouraging the development of each
individual’s talent and in which each employee can find himself or
herself, by promoting diversity, ethics, well-being and parity
Charitable contributions The VGP Foundation received € 7 million capital support
from VGP up to 2021 with projects supported (€ 6.5 million
has been committed thus far) in the field of environmental
protection, social projects and European cultural heritage.
A contribution of € 5million is provisioned by VGP for 2022.
POST BALANCE SHEET EVENT
Charitable contributions after the year end In 2022 VGP donated € 3 million for Ukrainian refugee support
in neighbouring countries. The donation is to be deployed in
collaboration with relief organisations recognized by the UNHCR.

PAG
E 1
36
—
V
GP
NV
Co
rpo
rate
Re
sp
on
sib
ilit
y R
ep
ort
20
21
/ C
om
mit
me
nts
As part of our ESG strategy, the Group
commits to cutting carbon emissions
across its value chain. This strong
commitment, marks a broadening of
the scope, by introducing, in addition
to Scope 1 & 2 emissions, the Group’s
Scope 3 emissions, including:
— Greenhouse gas (GHG) emissions
generated in the construction of
development projects; and
— GHG emissions due to the private
energy consumption of our tenants
In 2020, the Scope 3 emissions
represented 99% of the Group’s
emissions according to the market-
based method. The Group’s carbon
reduction target between 2018 and
2030 breaks down into the following
four complementary objectives:
— Reduce emissions from own
operations by 50% by 2030
— Fully compensate all remaining
emissions from own operations
from 2025 onwards
— Aim for a net relative 55% reduction
(compared to base year 2020) of “in
use” Scope 3 emissions by 2030
— Reduce emissions from
construction activities
(target being analysed in 2022)
The Group remains on track to
achieve its Scope 1 and Scope 2
carbon reduction target through the
initiatives taken in the course of 2021
including transitions to lower carbon
transport modalities across the Group.
Most importantly, as of January 1,
2022 all VGP offi ces switched to
100% renewable energy usage
through the setup of a virtual Power
Purchase Agreement (PPA) spanning
14 countries with ACT Commodities
and Scholt Energy. The power being
used is generated through the
photovoltaic installation at VGP Park
Nijmegen. Please see the case study
on VGP Park Nijmegen. In addition, for
the company car park the policy has
been revised and only fully electric or
hybrid vehicles are allowed for new
leases and replacements in existing
leases.
In 2022, all the Group’s reduction
targets (except for the one for
construction which will not yet be
submitted) will be analysed by the
Science Based Targets initiative (SBTi)
in order to confi rm consistency with
the levels required to meet the goals of
the Paris agreement. The aim for:
— The targets covering GHG
emissions from the Group’s
operations (scopes 1 and 2) to be
consistent with the reductions
required to limit global warming to
1.5°C, the most ambitious goal of
the Paris Agreement
— The targets for the emissions from
the Group’s value chain to meet the
SBTi’s criteria for ambitious value
chain goals, meaning they are in
line with current best practice.
Climate change strategy

PAG
E 1
37
—
VG
P N
V C
orp
ora
te R
es
po
ns
ibil
ity
Re
po
rt 2
02
1 /
Co
mm
itm
en
ts
Total energy consumption within the organization
For the analysis of our full Scope 1 and 2 emissions and Scope 3 emissions
concerning i) own operations and ii) portfolio usage the Bilan Carbone®
methodology has been used for the calculation of the carbon footprint. The
methodology is recognized by the PAS 2060 standard for carbon neutrality, is
compliant with the ISO 14064 standard and the GHG Protocol.
Based on the analysis the total CO₂e emissions (direct + indirect) for VGP Group
over the year 2020 were estimated at 1,984 tCO₂e compared to 2,308 tCO₂e
a year earlier. This emission equates to a total CO₂e emission per FTE employee
and per m² offi ce surface of 7.9 tCO₂e/FTE (compared to 9.7 a year earlier) and
0.4 tCO₂e/m² (compared to 0.6 a year earlier).
Whilst the year over year trend is encouraging and is showing the eff ect of
various measures introduced (most importantly the car fl eet switch to 100%
electric or PHEV mobility for new vehicles) these measures will take time to take
meaningful eff ect and as such the currently visible decline is mostly driven by
corona measures and travel restrictions.
GHG emissions data
ENERGY DATA 2019 2020
Gas (GJ) 166.11 187.33
Grey Electricity (MWh) 993.98 286.19
Renewable Electricity (MWh) 485.62 129.55
Fuels (diesel and gasoline) (GJ) 23,226,26 15,164.17
Total energy GJ 24,871.97 16,381.76
ENERGY UNITS 2019 2020
Scope 1 tonnes CO₂ 691 841
Scope 2 (market based) tonnes CO₂ 95 105
Scope 2 (location based) tonnes CO₂ 95 127
Scope 3¹ (portfolio – “in-use”)) tonnes CO₂ 1,522 1,038
Total tonnes CO₂ 2,308 1,984
Operational emissions per employee tCO₂e/ FTE 9.7 7.9
Operational emissions per square
meter office space
tCO₂e/m² 0.60 0.36
Scope 3¹ (portfolio – “in use”) tonnes CO₂ n/a 73,003
Usage emissions per square meter in
completed portfolio
CO₂e/m² n/a 29.9
Scope 3¹ (developments)² tonnes CO₂ n/a 274,439
Development related emissions per
square meter delivered portfolio
tCO₂e/m² n/a 0.52
Total gross tonnes CO₂ n/a 349,425
Offset emissions tonnes CO₂ n/a 10,453
Total net tonnes CO₂ 338,973
The scope of VGP’s carbon footprint calculations
Scope 1, which includes direct
emissions related to:
— Heating of our own buildings
and offi ces (natural gas /
fuel)
— Leased & owned vehicles
— Cooling systems GHG losses
Scope 2, including indirect
emissions related to:
— Grid electricity (grey)
— District heating
Scope 3 – split into three
components:
a) Own operations, including
indirect emissions related to:
— Upstream emissions from
scope 1 & 2
— Business travels (air-train)
— Commuting (excl. leased
& owned vehicles which
are already captured under
scope 1)
— Waste from our offi ces
— Paper consumption
b) Tenants/portfolio – ‘in use’,
including indirect emissions
related to tenants usage of
portfolio:
— Grid electricity (grey)
— District heating
c) Portfolio – development
activities, estimated based on an
initial assessment of a building in
VGP Park Giessen-Lützellinden
and a building in VGP Park
Münich. Portfolio assessment
based on extrapolation for
total projects delivered in 2020
(531,000 m²). Analysis to be
expanded for 2021 data.
1 Scope 3 emissions for ease of comparison split into three components –
see for definition call-out box “The scope of VGP’s carbon footprint calculations”
2 Estimate based on embedded carbon in projects delivered during the reported year –
see for definition call-out box “The scope of VGP’s carbon footprint calculations”

PAG
E 1
38
—
V
GP
NV
Co
rpo
rate
Re
sp
on
sib
ilit
y R
ep
ort
20
21
/ C
om
mit
me
nts
PRESS RELEASE 21 December 2021
VGP NV will switch as of 1 January
2022 all its European offi ce locations
to renewable energy as an agreement
was reached with Scholt Energy B.V.,
the independent energy supplier, and
ACT Commodities B.V., the European
energy trading house, to purchase
100% renewable electricity for all its
European offi ce locations.
The Virtual Power Purchase
Agreement (VPPA) will provide
power supplied from VGP’s existing
solar farm on the roofs of VGP Park
Nijmegen, Netherlands, to VGP offi ces
across Europe. The solar farm at VGP
Park Nijmegen today has a combined
power output of almost 4,400 MWh in
total of which 2,100 MWh is currently
being utilised by local tenants. Of the
remaining output circa 450 MWh will
be allocated to VGP’s offi ces across
Europe and the rest is off ered for
purchase to Dutch companies and
households by Greenchoice, the green
energy provider.
This agreement covers VGP’s
20 offices across 13 countries¹.
Additionally, it is envisaged to include
VGP’s new offices in France and
Serbia next year also.
VGP’s Chief Executive Offi cer, Jan
Van Geet, said: “As a developer of
prime logistics real estate, we know
that sustainability is not just part
of our business, it is our business.
From off ering green leases to our
new tenants, making use of circular
building materials and eliminating
unnecessary waste at our building
sites to supporting environmental
projects through VGP Foundation,
we are continuously looking for ways
to reduce our environmental impact
and aiming to ultimately have a net
positive eff ect.”
Jan Van Geet concluded: “This
is why we are very excited today to
announce this partnership with Scholt
Energy and to add new European
solar capacity through additional
photovoltaic projects on the roofs
of VGP Parks. As we welcome the
European Green Deal, we now ask
our customers, colleagues, business
partners and fellow companies to
join us in shifting towards renewable
power – we are committed to making
our own 100% renewable electricity
generated on roofs of VGP Parks
available to our tenants where this is
feasible and hope that we all together
can support this positive change.”
First of its kind, pan-European corporate solar energy deal to power all VGP offi ces with 100% renewable electricity

PAG
E 1
39
—
VG
P N
V C
orp
ora
te R
es
po
ns
ibil
ity
Re
po
rt 2
02
1 /
Co
mm
itm
en
ts
Rob van Gennip CEO at Scholt
Energy, said: “Developers like VGP
are a driving force in the green
energy transition and, with regards
to the operational and real estate
footprint of their clients, can help play
a part in combatting climate change
through the offering of renewable
energy sources. We are proud to be
supporting VGP in their renewable
energy transition and to help make
affordable, reliable and sustainable
energy available to their offices
across Europe.”
The operation will be eff ectuated for
all VGP offi ces by January 1st 2022. For
the VGP offi ces in those countries with
existing Scholt Energy operations it is
the aim to switch to the new renewable
energy contracts by the earliest
contractual opportunity. Until this time
ACT Commodities will provide VGP
with the local delivery of Guarantees
of Origin for the equivalent power
consumption. Guarantees of Origin will
also be delivered by ACT Commodities
to the VGP offi ces in those countries
in which Scholt Energy cannot deliver
energy directly².
As the solar farm on the roof of VGP
Park Nijmegen is already operational
the green energy supply can be
established as of January 1st 2022,
however as Southern Europe enjoys
higher solar irradiation, the plan is to
switch to delivery from photovoltaic
installations on roofs of VGP Parks in
Italy which are currently still in design
phase.
1 The offices in the following countries are covered: Belgium (HQ), Germany, Spain, Czech Republic, Romania,
Luxembourg (VGP Asset Management), Hungary, Slovakia, Portugal, Italy, Latvia, Netherlands and Austria
2 Scholt Energy is expected to deliver energy directly to VGP offices in Belgium, Netherlands, Germany and Austria
Virtual Power Purchase Agreement (VPPA) will provide power supplied from VGP's existing solar farm at VGP Park Nijmegen to VGP offi ces across Europe

PAG
E 1
40
—
V
GP
NV
Co
rpo
rate
Re
sp
on
sib
ilit
y R
ep
ort
20
21
/ C
om
mit
me
nts
As part of our sustainable properties strategy, we aim to:
— Design sustainable buildings and minimize the environmental
impact through innovative design and construction
— Improve the eco-effi ciency of our buildings by collaborating
with our tenants and contractors for effi cient resource use
— Develop connectivity and sustainable mobility by ensuring access
to public transport and sustainable mobility solutions for our tenants
— Integrate nature and stimulate biodiversity
Design sustainable buildings
Brownfi elds
To maintain our concentration of
strategic locations, VGP commonly
transforms older sites into modern
spaces. This is known as a ‘brownfi eld
development’ – as opposed to building
on a new site – known as a ‘greenfi eld’
site. Close to 40% of our development
projects acquired in 2021 have been
brownfi eld sites, placing our clients
closer to their clients and customers
and improving their supply chain
effi ciency and last mile delivery. While
these projects can be challenging,
they lead to environmentally friendly
and visually attractive sites that often
benefi t the broader community too.
Circular building materialsIn 2021 the Group launched a project
to setup a low carbon and circular
design framework including a low
carbon building design methodology
and circular building design toolkit.
This practical framework will allow
the teams to better understand and
apply the right circular economy
solutions for their projects. A
pilot development project will be
considered to test the circular
design framework and as part of the
resource audit prior to development
to identify the materials that could
be reused on-site or off -site, and sold
for a second life. Thanks to reuse of
second-hand steel at our VGP Park
La Naval we expect the equivalent
to 40,710 tons CO₂ emissions¹ and
17,700 tons of waste to be saved.
Sustainable Properties

PAG
E 1
41
—
VG
P N
V C
orp
ora
te R
es
po
ns
ibil
ity
Re
po
rt 2
02
1 /
Co
mm
itm
en
ts
1 The most energy efficient BF-BOFs emit about 1.8 tonnes CO₂ per tonne of steel made, but the global average is
roughly 2.3 tonnes of CO₂e per tonne of steel (oecd.org)
2 DGNB Gold or BREEAM Excellent. Target at BREEAM Excellent is set above in-house minimum requirement as part
of Group Environmental Management System of BREEAM Very Good / DGNB Gold
3 https://www.dgnb-system.de
VGP Park Giessen-Lützellinden – DGNB Klima Positiv certifi cation “in progress”
Example energy saving measures:
— Energy-effi cient cooling
through well-insulated cold
stores in the warehouse, so
that energy/cold does not
escape unnecessarily to the
outside
— Energy-saving LED lighting
in the offi ces, hallways and
warehouse to save energy
usage
— 650 KV PV system fi tted on
the roof
— Use of 100% green PV
electricity by the tenant
— Electricity savings by
reducing cooling in the
offi ces through external solar
shading in summer
Other sustainability highlights:
— Electric charging points (with
PV electricity) for cars
— Rainwater use for toilet
fl ushing and outdoor
irrigation
— Daily updated display of
electricity generation by a PV
monitor in the building visible
to users and visitors
— Evaluation of CO₂ balance
underway
— DGNB Gold award, “Klima
Positiv” assessment in
progress
Certifi cation
100% of new construction
projects across Europe are being
environmentally certifi ed with the
target to achieve DGNB Gold² or
equivalent. Combined with buildings
previously certifi ed this has resulted
in 54.3% of the total portfolio certifi ed
or with certifi cate pending as of
December 2021.
By 2050, Europe’s building stock
must be climate neutral. But even
today we can plan good, economical
buildings and implement them in
such a way that they are also climate
neutral in operation. In order to
distinguish such buildings that already
demonstrably meet this requirement
and achieve climate neutrality in
operation, the DGNB has introduced
the “Klima Positiv” certifi cate. It is
awarded by the DGNB for a period of
one year to buildings that meet the
technical requirements and provide
the relevant evidence as part of a
certifi cation for buildings in operation.
So far across real estate asset-classes,
16 buildings in Germany have achieved
such certifi cation³. VGP has several
German pilot projects underway
which aim for such certifi cation
and, once achieved, we will draw
on our sustainability assessment
experts to rapidly identify the easiest
additional credits to attain, creating
recommended changes to the VGP
Building Standard to embed improved
performance across the portfolio.
In October 2021, VGP had the pleasure to host a DGNB-ceremony at our stand at Expo Real in Munich. During the ceremony we received the DGNB Mehrfachzertifi zierung for our VGP standard way of building which shows our engagement towards sustainability.

PAG
E 1
42
—
VG
P N
V C
orp
ora
te R
es
po
ns
ibil
ity
Re
po
rt 2
02
1 /
Co
mm
itm
en
ts
Improving eco efficiency
By collaborating with our tenants and contractors we aim to achieve effi cient use
of resources. We have made a commitment to have a net relative reduction of
55% of carbon emissions of our “in-use” portfolio by 2030 (compared to base year
2020). We can support our customers by procuring off -site renewable energy and,
where possible, generate renewable energy on-site. Our target is to increase the
installed capacity for photovoltaic installations to 300 MWp – at close to 2.0x the
current energy usage of our tenants.
As part of the eco effi ciency drive the plan is to introduce energy effi ciency
and energy management plans in all standing assets, involving daily energy
optimisation actions as well as investments. The environmental management
system is designed to help improve the environmental performance of assets,
including through a shift towards electricity supply from renewable energy
sources for all assets where feasible (including projects in pipeline a total 94
photovoltaic roof projects have so far been identifi ed versus a total buildings
portfolio of 151 as of December 2021). The aim is to develop suffi cient on-site
renewable energy production to be able to at least cover the energy need of
our clients. This strategy is an integral part of the life-cycle assessment of
development projects.
In order to improve the energy effi ciency and be able to improve the self-
consumption of renewable energy sourced on-site we are engaging with
stakeholders, including tenants and suppliers (e.g. green leases, PPA contracts,
and energy performance contracts with maintenance providers).
Total energy consumption by tenants within the portfolio
Whilst energy usage within the portfolio is closely monitored and eff ectively
managed downward as of Dec 2021, the average occupancy rate for the
completed portfolio was 99.4% and VGP accomplished an occupancy rate
benchmark above 95% across its portfolio since 2010 (measured on a 6-months
average). For us a high occupancy rate represents good business and sustainable
use of the buildings we have created. It suggests our properties are well-located,
adaptable to a variety of uses and are continuing to meet the needs of our
customers.
The yearly tenant satisfaction surveys in each park were pursued in 2021, as well
as one-on-one meetings with tenants, to secure that the tenants are aware of the
Group’s strategy and feel supported in their transition strategy.
ENERGY DATA FY 2019 FY 2020
Gas (MWh) n/a 83,695
Electricity (MWh) – grey n/a 137,501
Renewable Electricity (MWh) – self-consumption 911
Fuels (diesel and gasoline) (GJ) n/a —
Total energy MWh consumed n/a 222,107
Total energy consumed kWh / m² 102.08
Renewable Electricity (MWh) – grid injection n/a 13,983

PAG
E 1
43
—
V
GP
NV
Co
rpo
rate
Re
sp
on
sib
ilit
y R
ep
ort
20
21
/ C
om
mit
me
nts
Renewable energy roll-out
The roll-out of the photovoltaic
installations is aimed at improving
self-consumption of renewable energy
within our buildings and making
renewable energy available to the local
community. The revised installation
target is set at 300 MWp – this equates
to a power production capacity
equivalent to almost 2.0× the total
energy consumption of our tenants
in 2020. We anticipate increasing
demand for green energy from our
tenants over the coming years as
drive trains of cars, vans and trucks
will increasingly rely on battery and
other green powertrains which, we
believe, will signifi cantly increase
the demand for green energy in our
parks. The Group remains on track
to achieve the revised target with
approximately 74.7 MWp installed or
under construction across Europe
(through 57 roof projects) and projects
representing 74.5 MWp are currently
in the pipeline (in total up 53% YoY).
This would bring the total to 94 roof
projects (compared to 151 buildings in
the portfolio in total).
ENERGY DATA FY 2020 FY 2021A
Own consumption (MWh) 911 3,971
Own consumption (number of clients –
PPA or lease / total client contracts)
18/289 36/399
Grid injection (MWh) 13,983 25,016
Total green energy generation MWh 14,894 28,155
Renewable energy – Potential
Photovoltaic projects – roll-out to date and forward view
MWp installed power
Total renewable energy production and consumption
2020
Number of building sites 21
26.7
2021
57
48
74.7
Pipeline
94
74.5
149.2
Previous target
151
50.8
200
New target 2025
>151
100
300
Data for 2021 includes projects under construction.
Pipeline includes projects for which contracts with tenants or feed-in PPA
are agreed and construction works is to start in the coming period

Develop connectivity and sustainable mobility
We aim to ensure that our develop projects have public transport access, thereby
reducing the emissions from transport for employees of our tenants.
For new construction projects, we aim for electric recharging stations to be
provided for at least 3% of the total car parking capacity for the building, thereby
lowering the CO₂ emissions for employees and visitors of our tenants. In addition,
during the preparation of the design, the design team usually consults with the
local authority on the state of the local cycling network and how the new park
development could improve bicycle usage of the park users. Where appropriate,
the design team consults with the local community in selecting and implementing
additional solutions to enhance the access to the local bicycle network.
VGP Renewable Energy N.V. has been setup by the Group in 2020 to broaden
the ability of the Group to assist our clients in making their businesses more
sustainable in a cost-eff ective way. The objective of the Renewable Energy
business line is to serve the Group’s client base, by off ering such clients an ability
to assist with their green energy transition including
Facilitate our clients in their transition towards a green (forklift-) truck and car fl eet by off ering green electric and hydrogen charging facilities and infrastructure at our parks.
Smart energy management (including use of batteries and smart local grids).
An ability to off er green energy (produced on or off site).
Green compensation area at VGP Park Berlin – Ludwigsfelde which includes breeding areas for ground nesting birds (fi eld larks),
replacement habitats for sand lizards and breeding net mounds for sand martins

PAG
E 1
45
—
V
GP
NV
Co
rpo
rate
Re
sp
on
sib
ilit
y R
ep
ort
20
21
/ C
om
mit
me
nts
Integrate nature and stimulate biodiversity
The EU’s biodiversity strategy for
2030 is a comprehensive, ambitious,
and long-term plan to protect nature
and reverse the degradation of
ecosystems. The strategy aims to
put Europe's biodiversity on a path
to recovery by 2030 and contains
specifi c actions and commitments.
We see an urgent need to address the
biodiversity crisis that’s endangering
species and farmlands the world over.
Every natural environment preserved is
a small win in the larger movement to
preserve biodiversity.
With regards to our development
projects, we always involve ecologists
in the design and construction
process. The new commitments and
recommendations for the integration
of biodiversity in development projects
were integrated in the Group’s design
process through the environmental
management system (see section on
ESG Risk Management). This may
result in green shelters, improved
water management, increased
greenery ratios on sites, bird houses,
native plants, beehives or full-scale
urban ecological water preservations
areas or forests. We depend heavily on
their recommendations to help nature
to thrive and grow alongside our
buildings and facilities.
A preliminary environmental impact
assessment is always conducted,
including an environmental/
biodiversity component, which is a
prerequisite for obtaining a building
permit and commercial planning
permission in some countries. A public
consultation may also be carried out
as part of this process.
As cities continue to grow further
out into nature, we consider it
a responsibility to reintroduce
green space into urban areas. To
contribute to this effort and to
support biodiversity in our parks
2,086 additional trees were planted
in existing VGP Parks in all the
countries the Group is already active
in 2021. The VGP Foundation carries
protecting biodiversity as one its
three key focus areas as part of the
environmental projects.
In keeping with our commitment
to turn our parks into more
sustainable places, the Group has
begun research and development
into urban beekeeping projects at a
number of VGP Parks. Other than the
benefi ts incurred from diversifying
surface usage and infl uencing food
consumption trends, this type of
project also has a positive impact on
promoting biodiversity in cities.
Biodiversity
Biodiversity is also addressed
by the development projects
through the “Land Use
and Ecology” section in
the BREEAM certifi cation
or “Biodiversity” in DGNB.
For example, for the
project VGP Park Gießen
am Alten Flughafen the
recommendations for the
protection and enhancement
of the local biosphere – for
which the park scored an
additional 30 points under
DGNB certifi cation - included
in an ecology report written
by a qualifi ed ecologist and
the required biodiversity
protection measures were
implemented – including living
space for the ’fence’-lizzard
Beekeepers on the roof of a building in VGP Park in Lliça d’Amunt, Spain
VGP Park Giesen am Alten Flughafen – „fence“-lizzard protected living space VGP Park Gießen am Alten Flughafen –
rain water retention basin

PAG
E 1
46
—
V
GP
NV
Co
rpo
rate
Re
sp
on
sib
ilit
y R
ep
ort
20
21
/ C
om
mit
me
nts
The family ownership of the business
transpires into a collegial team
spirit across the company. Integrity
means honesty and sincerity in what
VGP does and adhering to open
communication with issues being
openly discussed and addressed
as soon as possible. Mutual trust,
respect for everyone and opportunity
to grow with room for own initiative are
important for our employees to feel
rewarded and enjoy their work. We like
to encourage 'out of the box'-thinking
– even if it sometimes goes wrong –
because we still can learn from it. We
have a no fear of mistakes culture,
but encouragement of initiative and
responsibility. This is critical in order
to be able to execute on the ambitious
goals VGP has set for the years ahead.
We operate in culturally diverse
markets, and we celebrate our
diff erences. We support an inclusive
and transparent workplace, free of
harassment and discrimination, where
all our people can contribute equally to
our commercial goals. VGP believes in
equal opportunities for all employees.
VGP does not make any distinction on
the grounds of gender, religion, ethnic
background or sexual orientation in
its HR, recruitment and promotion
policies or remuneration systems.
Performance and career
development reviews are encouraged
by senior management. These reviews
are conducted on a constructive
basis and personal level and
generally always conducted by line
management.
Business travel
The Group travel policy aims to reduce
the associated carbon footprint.
Employees are encouraged to travel
by train when possible and give
preference to videoconferencing
rather than physical meetings
involving travel.
CO₂ emissions from employees’
business travel by train and plane
The indicator is given both as an
absolute value and as the ratio
between CO₂ emissions from
business travel and the average
number of employees.
In 2020, the Group carbon emissions
related to business travels were
signifi cantly reduced compared to
2019, due to travel restrictions linked
with the COVID-19 pandemic and the
reorganisation of Group’s ways of
working. In addition, since 2021 and as
part of our Climate Change Strategy,
all new company vehicles or renewed
lease contracts must either be hybrid
or electric vehicles.
People, culture and employee well-being
BUSINESS TRAVEL 2019 2020
Total emissions (ton CO₂ eq) 951.5 647.6
Kg CO₂ eq/employee 4,758 2,698

PAG
E 1
47
—
VG
P N
V C
orp
ora
te R
es
po
ns
ibil
ity
Re
po
rt 2
02
1 /
Co
mm
itm
en
ts
Occupational Health and Safety
Since the start of the COVID-19 crisis in 2020 and to protect VGP’s employees’
safety, several measures have been taken and continue to remain in place in all
the countries where we operate. We have been working from home since early
2020, and continued to do so in 2021, depending on local authorities’ decisions
and regulations. During lockdowns, communication was maintained through
video conferences. If and where a return to the offi ce is possible, extraordinary
sanitary measures are enforced at VGP offi ces and construction sites, including
increased cleaning/ decontamination frequency, stock of masks, hydroalcoholic
gel stations, physical distancing, etc. VGP remains committed to safeguarding
the health and safety of our employees as we potentially enter a new phase of the
COVID-19 pandemic, and of course beyond.
Causes of any work-related accidents are analysed and measures are taken to
prevent a recurrence.
Accident type:
Workforce as at 31 December 2021:
2019 2020
Work-related accident causing injury 2 2
Work-related/commuting accidents causing death 0 0
2021
Proportion of VGP development projects covered
by VGP Health and Safety Framework
100%
ph
oto
© T
rilu
x

PAG
E 1
48
—
V
GP
NV
Co
rpo
rate
Re
sp
on
sib
ilit
y R
ep
ort
20
21
/ C
om
mit
me
nts
Human rights and labour conditions
VGP complies with the labour
standards set by the International
Labour Organization (“ILO”). The
Group only operates in countries
where social regulations are well
developed through democratic
frameworks. Internally, specifi c
frameworks set up by the Group defi ne
and manage additional regulations
that reinforce employee rights and
strongly endorse respect and ethical
conduct in business dealings (Code of
Conduct, Anti-bribery and Corruption
Policy, Political Activity Policy (as
part of our Code of Conduct), Dealing
Code, etc.). Since January 2022,
VGP has been a member of the UN’s
Global Compact, which promotes
ethical conduct and fundamental
moral values in business. VGP strives
to adopt, support, and apply in its
sphere of infl uence the ten principles
of the Global Compact concerning
human rights, labour, environment,
and anti-corruption. VGP respects
local labour laws. As at 31 December
2021 no employees were covered by a
collective bargaining agreement.
Ethical culture
Earning and maintaining the trust of
the communities in which we operate,
our clients, and other stakeholders is
essential to our business. To do this,
we strive to maintain the highest ethi-
cal standards, as encompassed by our
Code of Conduct and other internal
policies. Every employee is responsi-
ble for upholding these standards in
their work. We reinforce these expec-
tations through various channels,
including our Code of Conduct train-
ings, and by encouraging our man-
agers to communicate about these
issues clearly with their employees. In
addition, as part of the annual review
process, all employees are evaluated
against common performance dimen-
sions that include delivering business
results; addressing the needs of cli-
ents and stakeholders; fostering a col-
laborative and inclusive environment;
driving a robust risk and control envi-
ronment; and acting with integrity.
We recognize that clear
expectations, policies, and processes
are critical to supporting ethical
behaviour, and building a culture
that reinforces these expectations
is equally important. We work to
create an environment that not only
supports ethical behaviour but also
allows employees to feel safe and
empowered to speak up if they have
concerns about unethical behaviour.
We have implemented employee
training, protocols, and reporting
mechanisms to help prevent behaviour
that is not in line with our business
principles, Code of Conduct and other
internal standards.
The fi rm prohibits retaliation
against any individual who reports a
concern or assists with an inquiry or
investigation.
We have a Code of Conduct Hotline,
which is a channel for employees,
clients, and suppliers to raise conduct
concerns if they see, hear, or suspect
something that violates our fi rmwide
Code of Conduct. The Conduct
Hotline is open 24/7, with the option
to submit inquiries by phone or online.
The Conduct Hotline helps promote
integrity, fairness, and accountability.
The fi rm’s Code of Conduct is our
shared commitment to preserve and
build on these values and to maintain
exceptional relationships with our
clients, shareholders, colleagues, and
our communities.
Ethics and culture are key focus
areas of our Board of Directors. The
Board oversees the governance
framework that underpins our fi rmwide
culture of ethics and receives regular
updates from management, including
on signifi cant conduct issues if any
should occur.

Political engagement and public policyAs outlined in our Political Activity
Policy, VGP has a principal policy of no
political engagement. Employees may
participate in political activities in their
own free time and should in no way
suggest VGP support. Vacation leave
may be requested to conduct such
activities.
VGP prohibits political donations
and in principle does not allow
attendance at political events of VGP
representatives. Exceptions may be
granted by the Group, after careful
consideration by Management.

PAG
E 1
50
—
V
GP
NV
Co
rpo
rate
Re
sp
on
sib
ilit
y R
ep
ort
20
21
/ C
om
mit
me
nts
Workforce
Key figures
Employment by country
Workforce at YE 2020, 2021 comparison
The Group has 322 FTEs as of December 31, 2021
Permanent
Fixed-term
2020 2021
Full-time
Part-time
2020 2021
Proportion of employees entitled to parental leave 100% 100%
Employment contracts
Workforce at YE 2020, 2021 comparison
Employment by activity
Workforce at YE 2020, 2021 comparison
The Company’s mission – Building Tomorrow Today together – represents the
excellence in the Group’s standards and culture. Together at VGP means that we
empower all our employees to work together to become sustainability and diversity
change-makers. Employee performance is measured against the fi rst value in the
annual Performance Reviews and appropriate review contribution
is being considered for the second value.
Technical/on-site 61.1%
Support functions 26.8%
Commercial 12.1%

PAG
E 1
51
—
VG
P N
V C
orp
ora
te R
es
po
ns
ibil
ity
Re
po
rt 2
02
1 /
Co
mm
itm
en
ts
Diversity and inclusion
Employment by Gender
Proportion of senior management level positions held by women
Workforce at YE 2020, 2021 comparison
Workforce at YE 2020, 2021 comparison
VGP operates in industries where jobs have traditionally been predominantly fi lled
by male employees. The percentage of board female leadership provides a strong
signal to our commitment to diversity. We realise there are still considerable steps
to be taken within the organization.
To this end, and to track progress, this performance indicator for senior/
management level positions has been introduced. To further stimulate diversifying
skills and competency profi les at all levels within the organization, VGP introduced
a new framework – the VGP Diversity Policy – to fully embed the Group’s
commitment to Diversity and Inclusion at all levels within the organization.
Ratio average compensation men/women 2021
Diff erences in average compensation are being analysed and can be explained by
the structure (presence of more males at the highest responsibility levels), not by
company remuneration policy or practices.
Tools are being developed to monitor these ratios, and talent management and
remuneration policies are already in place to keep reducing these potential gaps.
Diversity and Inclusion forms a key part of the Group’s human capital strategy.
VGP commits to ensuring full equal opportunities (e.g. gender, nationality, sexual
orientation) in HR practices and processes Groupwide.
100% of VGP countries ensure full equal opportunities by having the VGP Equal
Opportunity statement included in formalized HR policies relating to Recruitment
practices, Compensation & Benefi ts, Talent Review and Learning & Development.
The VGP Diversity Policy and VGP Talent Development Program ensures that
HR policies and processes are applied without discrimination on the basis of
race, colour, religion, sex, sexual orientation, gender identity, marital status, age,
disability, national or ethnic origin, military service status, citizenship, or other
protected characteristics.
2020 2021
Proportion of the board level positions held by women 60% 60%
2020 2021
Proportion of senior/management level positions
held by women
13% 16%
Women Men < 30 years 30-50 years > 50 years
Employment by Age

PAG
E 1
52
—
VG
P N
V C
orp
ora
te R
es
po
ns
ibil
ity
Re
po
rt 2
02
1 /
Co
mm
itm
en
ts
The ESG strategy of the Group
addresses fundamental challenges
and encompasses a much wider
footprint than its direct actions. Being
a substantial buyer, the Group is aware
of the importance of driving industry
standards. We strive to drive our
suppliers and service providers
toward more sustainable operations.
Given the size of its portfolio, the
Group works with many suppliers and
contractors. This ensures that VGP is
not exposed to the risk of depending
on only a few main strategic suppliers.
Purchasing mapping
Purchases at VGP can be split into
three categories:
— Corporate overheads, including
offi ce management, business
travel, consultancy and audit fees,
corporate communication and
public relations costs, ICT, and
other administrative costs. This
covers all Group staff and country
offi ces;
— Operating costs, services
provided to properties for daily
onsite operations, such as
maintenance, landscaping and
garden maintenance, waste
management (if applicable),
energy and water provision (OPEX
paid by VGP as the property owner
or as manager in case of the joint
ventures and mostly passed onto
tenants as service charges);
— Land and capitalised construction
works invested in properties
for three main purposes: new
development or enhancement
works, maintenance works or
reletting works (CAPEX paid by
VGP as the property owner); these
include mainly purchases from
constructors, fees for architects,
designers and engineering fi rms,
and insurance premiums.
The varied nature of procurements
and the diverse locations of the
Group’s properties result in having
most of the supply chain consisting of
local companies or subsidiaries that
support the local economy. In addition,
wherever possible, the purchasing
policy favours local purchases in the
catchment area of the Group’s assets
to contribute to employment and local
economic development. Purchases
consist principally of OPEX and CAPEX
for the operation and development of
properties (overheads being a small
part of the overall expenses).
Operating expenses are spent
locally. OPEX and CAPEX costs are
mostly comprised of labour-intensive
services and to that extent are
purchases that cannot be relocated.
Capitalised construction works are
non-recurring expenses depending on
development activity.
Sustainable Procurement
VGP’s procurement strategy is
designed to comply with the following
rules: fairness, focus on quality,
long-term partnerships, reduced
risk, and the respect for applicable
regulations. Moreover, the Group must
honour the trust placed in it through
property management contracts
which aim to be transparent and cost-
effi cient.
In addition to the principles and
rules detailed in the Group’s Anti-
Bribery and Corruption policy and
in the Code of Conduct as revised
in 2022, all purchases must comply
with the applicable local laws and
regulations, especially labour and
environmental laws. These local laws
and regulations notably include the
respect of the Modern Slavery Act or
anti-discrimination clauses.
The ESG approach is fully
integrated at each step of the supplier
procurement and referencing process
of VGP. Suppliers are to sign and
comply with the Supplier Code of
Conduct which includes requirements
related to the conservation of the
environment, the working environment
and social conditions, and business
ethics and compliance. Furthermore,
suppliers are subject to a due
diligence analysis to ensure ethical
work practices related to sustainability,
work environment, labour legislation,
human rights, among others.
Supply Chain Management

PAG
E 1
53
—
V
GP
NV
Co
rpo
rate
Re
sp
on
sib
ilit
y R
ep
ort
20
21
/ C
om
mit
me
nts
Selection of suppliers
VGP chooses its contractors with
great care and ensures that they
comply with the procurement
policy. Group-wide, the purchasing
procedures aim to achieve an
optimised price for the best level
of service while securing an equal
treatment among providers/
suppliers. Based on the procedure,
suppliers of all goods and services
must be selected fairly on the basis
of objective, comparable criteria
and, when relevant, according to
procedures relating to invitations to
tender. Prospective business partners
are screened in line with the “Know
Your Partner” procedure of the Group.
This due diligence process aims at
assessing the partners exposure to
corruption risk, but also enable the
Group to identify past international
labour law or human rights breaches.
Before a new service provider joins
the approved list, a substantial amount
of information is required, including
an overview of its ESG strategy and
practices. These environmental
and social factors are of particular
importance in informing the Group’s
choice of suppliers: they form part of
the criteria considered in any tender
process used to select suppliers. Each
purchasing step is duly documented
for traceability.
A web-based NetSuite solution
for purchasing management was
launched in 2021. The use of this
purchasing platform makes the
procedures of VGP more robust,
ensures the transparency required
for all purchasing decisions, helps
operational teams to select providers,
and facilitates the sharing of best
practices and risks mitigation for local
as well as pan-European purchasing
decisions. This solution secures the
administrative management for the
whole purchasing cycle and ultimately
should also generate productivity
gains.
Inclusion of ESG criteria in contractual clauses
Inclusion of ESG criteria in contractual
clauses apply for all the countries
in which VGP operates, although
they can vary according to local
requirements.
A clause is also automatically
included in these conditions, requiring
suppliers to abide by the Group’s Code
of Conduct provisions, including:
complying with applicable laws and
regulation, prevention of all forms of
corruption, prevention of all forms
of discrimination, respect for human
dignity and for employees’ work,
conservation of the environment and
reporting practices that are in breach
of these principles using the contact
procedure provided by the Group. The
procedure ensures the protection of
social and labour rights, including
a commitment to comply with the
conventions of the International
Labour Organisation (“ILO”) and with
local employment legislation.
Suppliers are required to comply
with all relevant safety (we generally
expect our general contractors
and health-and-safety coordination
partners to comply with ISO45001),
labour and environment (including
but not restricted to waste and
water management) legislation.
We expect our general contractors
and engineering partners to have
a site environmental management
accreditation (ISO 14001), including
operating with best practices.
Suppliers are required not to engage
in any direct or indirect form of
human traffi cking, slavery, forced or
involuntary labour.
Raising awareness amongst existing suppliers
To encourage existing suppliers and
contractors to improve sustainable
operating practices and the use
environmentally sustainable materials,
the Group is evaluating ways to
further raise the awareness amongst
existing suppliers. These include, but
are not limited to, sharing the ESG
policy and related environmental and
social targets with all of main service
providers Group-wide through offi cial
communication letters (including
contents and ambitions of the Group
ESG strategy) and the announcement
of further supplier engagement
on ESG topics, including ESG
assessments

Today, more than ever, the Group aims to come together with its communities and
stakeholders, building on each other’s strengths to create shared value. Anchored
in the local areas where it operates, each of the Group’s parks has built a network
of local partnerships, working closely together to identify and tackle issues which
are crucial for the local population and businesses. By building these strong
and long-term relationships with local stakeholders, the Group can coordinate
common answers, use its technical competence to connect people, commerce,
and the build environment.
On 21 April 2021, VGP Portugal organized a volunteering event in Santa Maria
de Feira at the Set + Pessao Association. The association supports and develops
culture and handicraft projects to promote the reintegration of people in socially
vulnerable circles.
VGP in the community
In November 2021 a total of 250 trees were planted by 18 VGP volunteers accompanied
by the Ivan Dejmal Foundation in Jizera mountains, Czech Republic.
On 21 April 2021, VGP Portugal organized
a volunteering event in Santa Maria de Feira at
the Set + Pessao Association. The association
supports and develops culture and handicraft
projects to promote the reintegration of people in
socially vulnerable circles.

VGP Community Day
The VGP Community Day is an
initiative designed to engage many
employees in volunteering for a local
community or charity. In 2021, the
pilot projects in Czech Republic and
Portugal were very well received
and the concept is being rolled out
to VGP’s other markets in 2022. In
November 2021 a total of 250 trees
were planted by 18 VGP volunteers
accompanied by the Ivan Dejmal
Foundation in Jizera mountains,
Czech Republic.
VGP for jobs
In many of the concrete targets of
VGP parks have been agreed with the
local municipality in terms of number
and type of jobs created. This is often
part of an overall agreement with the
local municipality to create a new
park that is fully integrated in the local
community, fostering the social fabric
and the environment. Following the
development of a park, VGP continues
to work with existing tenants and
the local community, for example
by facilitating job secondments and
internships for local schools, colleges
and universities. An example of such
program has been setup with the
HAN – University of Applied Sciences
in Arnhem to promote or facilitate
logistics jobs for students with tenants
at our VGP Park Nijmegen. Finally,
at Group level, several community
initiatives are supported by the VGP
Foundation. For further details on
these initiatives please refer to section
VGP Foundation. In total, philanthropic
contributions from VGP amounted to
€6.45 million group-wide in 2021.
Employee well being
Employee retention remains high due
to an eff ective remuneration plan,
internal growth opportunities that
reward and advance high potential
employees and challenging, yet
exciting, projects. In 2021 VGP
conducted an inaugural employee
satisfaction survey which received
excellent scores. VGP has a strong
culture which is shared across all
countries in which we operate and
which we believe is a critical part of
our business success.
The key elements of our culture:
— Workplace safety
— Eff ective Group and Country
leadership as culture carriers
— Working in partnership – “we like
simple projects but are never
scared of a challenge”
— ESG performance targets
— Diversity and inclusion
— Seeking regular feedback from
our employees
— Promotion of VGP values
— Client well-being
A sustainable work environment is
implemented as part of initiatives
related to managing Scope 1 and
Scope 2 footprint. Out German
headquarters is currently running a
pilot ergonomics policy. In the last
year, the Group has improved its
policy to allow cross-border learning
and development opportunities. In
order to encourage a healthy lifestyle,
a “healthy snack”-program has been
introduced in those offi ce locations
where available. The annual, company-
wide ‘VGP Community Day’, allows our
employees to volunteer to support a
cause close to them or their team, or to
work with a local charity that the VGP
Foundation has recently funded.


PAG
E 1
57—
V
GP
NV
Co
rpo
rate
Re
sp
on
sib
ilit
y R
ep
ort
20
21
/ V
GP
Fo
un
da
tio
n
The VGP Foundation was established in September 2019, on the belief that responsible entrepreneurship goes beyond the day-to-day activities.
VGP Foundation
Case study: Example VGP Foundation project in SlovakiaFor a vulnerable child, a BUDDY can
make a diff erence
VGP Foundation was one
of several main corporate
supporters of PROVIDA BUDDY
programme in 2021. PROVIDA
and its main programme, BUDDY,
were established in Slovakia
to match dysfunctional young
people in-need with caring adult
volunteers who want to fulfi l that
supporting role. There presently
are 100 such BUDDY pairs
The BUDDY programme’s
professional staff and volunteers
fi nd, screen, train, and support
BUDDY volunteers. Only about
10–15% of applicants ultimately
enrol in the programme. The
organisation asks volunteers to
make a long-term and regular
commitment - typically, a BUDDY
volunteer and BUDDY youth get
together about once a week.
The contribution by the VGP
Foundation helped to establish
several new BUDDY relationships,
as well as to fi nance research
evaluating the programme’s long-
term impacts on children.
The foundation focuses on three main areas: supporting the education
for children and young people in need, the preservation and creation
of biospheres and nature conservation zones and the protection of
European cultural assets and heritage sites. VGP has committed to
donating a part of its profi ts each year to the VGP Foundation to ensure
that it has suffi cient fi nancial resources to carry out its charitable causes.
The VGP Foundation received €3 million start-up capital from VGP
in the year 2020 and € 4 million in 2021. For the year 2022 VGP has
provisioned €5 million additional contribution. Additionally, VGP offers
in-kind funding through the provision of expert volunteers, community
volunteers, products, and services. It also provides office space, IT and
travel support, and hosts the Foundation’s website.
As of December 31, 2021 a total of 29 projects were approved with
funds allocated to 26 projects so far. For further details please refer
to the VGP Foundation Annual Report 2021 which is available at
www.vgp-foundation.eu
Funding areas since inception
FOR THE YEAR ENDED 31 DECEMBER 2020 AND FOR THE YEAR ENDED 31 DECEMBER 2021 COMBINED
Cultural heritage 66%
Nature conservation 23%
Social 11%

PAG
E 1
58
—
V
GP
NV
Co
rpo
rate
Re
sp
on
sib
ilit
y R
ep
ort
20
21
/ E
SG
Ris
k M
an
ag
em
en
t
The Group’s Risk Management
framework is presented in the Group’s
annual report. ESG risks were analysed
at Group level. This section presents a
detailed analysis of the climate change
risks and ESG risks for the Group.
In addition to addressing climate
change risks, this section also
covers climate change adaptation
through the resilience of our assets
to climate change: the Group targets
for 100% of its development projects
to include long-term climate change
risk assessments while minimising
resource use. This climate change
risk assessment enables VGP to
have a clear view on the future risks
of climate change at the asset level.
In addition, VGP performed its fi rst
CRREM study (Carbon Risk Real
Estate Monitor) in 2021 to analyse
stranding risks across the portfolio.
The pilot study encompassed the
entire portfolio, a deep dive into the
existing assets in the German portfolio
and into ways how the implementation
can be improved as some of the
asset defi nitions applicable are not
yet available in the tool. Results are
encouraging, as with the German
portfolio less than 30% of assets
(in gross fl oor area) are considered
as stranded in 2030 and circa 50%
in 2050 (using the market-based
approach energy consumption). It
must be noted that this is a purely
theoretical approach that does
not integrate any further reduction
measures that are planned in the next
10 to 30 years and that is based on
2020 energy consumptions. Please
fi nd additional details in the CRREM
Reporting section in the Additional
Information chapter of this report.
Furthermore, and on a shorter
time horizon, the Group complies
with regulatory requirements in each
country regarding fl ooding risks, water
management, and drainage systems
for exceptionally heavy rainfall.
Regarding our development
projects, specifi c requirements
including the analysis of climate
change physical risks, comfort and
energy effi ciency topics are already
integrated in our sustainability
framework (see Environmental
Management System (EMS)).
VGP’s due diligence process for
acquisitions and greenfi eld/brownfi eld
development projects covers the
analysis of risks and opportunities
related to fi nancial and operational
issues. For example, the process
includes a complete audit of technical,
regulatory, environmental and Health
& Safety (H&S) performance. The
potential fi nancial impact of identifi ed
risks is taken into account during the
due diligence phase. Issues covered
include risks associated with climate
change, soil pollution, protection of
wetlands, asbestos, legionella and
electromagnetic radiation.
ESG Risk Management

PAG
E 1
59
—
V
GP
NV
Co
rpo
rate
Re
sp
on
sib
ilit
y R
ep
ort
20
21
/ E
SG
Ris
k M
an
ag
em
en
t
Managing Environmental Risks: Environmental Management SystemThe Group’s environmental Management System (EMS), aims at reducing the environmental impact
of our assets at every stage of their life cycle, from initial design to daily operation.
The Group has defi ned and monitors several indicators to manage the environmental
performance of its standing assets and development projects, in line with the objectives
of our ESG strategy. Some of these indicators are incorporated into the budget
review processes for standing assets and development projects to ensure alignment
between ESG objectives and business decisions. For more information on the Group’s
Environmental Management System (EMS) please refer to the online policy document
(https://www.vgpparks.eu/en/investors/corporate-governance/)
Sustainable Design Framework – breeam/dgnb
Sustainable Management Framework – breeam/dgnb in-use
Review
Analyse and review performance
with tenants and stakeholders
Land sourcing
Sustainable check-list and
environmental due diligence
Track performance
Annual reporting
Project review
Detailed design guidelines
Action plan
Environmental
action plan
Construction
Green certifi cation
Policy & targetsLeasing
Green leases
2
1
3
4
6
7
8
5

PAG
E 1
60
—
V
GP
NV
Co
rpo
rate
Re
sp
on
sib
ilit
y R
ep
ort
20
21
/ E
SG
Ris
k M
an
ag
em
en
t
Bribery and corruption risk
The VGP Code of Conduct describes the key principles of conduct for the
business environment, in which the Group operates, including the zero tolerance
of bribery. The VGP anti-bribery and anti-corruption policy further details the
principles as outlined in the VGP Code of Conduct and sets out the practices and
VGP’s fi rm commitment in fi ghting against and preventing corruption and bribery
conduct.
Non-transparency in reporting of lobbying activities
As outlined in our Political Activity Policy, VGP has a principal policy of no political
engagement and participating in political activities
Breach of personal data and cyber security
VGP has a Data Privacy Protection programme compliant with EU regulations. In
addition, VGP has a data protection governance framework at corporate level in
place to ensure internal alerts.
The main Management Information System and operating system which we use
for email and fi le exchange is compliant with ISO 27001. We are currently in the
roll-out of a new ERP, operating metrics, billing and payment system which is fully
compliant to ISO 27001 and ISO 27018. We only use reputable service providers for
network maintenance.
2021
Number of sanctions imposed by regulators in 2021
linked to corruption incidents
0
Percentage of employees trained on corruption prevention c. 100%
2021
Number of reported lobbying actions 0
2021
Percentage of employees trained on cyber security and data protection 100%
Business ethics

PAG
E 1
61
—
VG
P N
V C
orp
ora
te R
es
po
ns
ibil
ity
Re
po
rt 2
02
1 /
ES
G R
isk
Ma
na
ge
me
nt
Health, safety security and well-being of people in our properties
The Environmental Management System (EMS) elaborates how Health and Safety
risks are addressed in both development projects and standing assets portfolio.
The Group makes use of dedicated Health & Safety management frameworks
at development projects, where the work site is always monitored by a Health
& Safety Coordinator, supplemented with procedures that comply with local
regulations. Contractual requirements for contractors are overseen by the
construction management contractor to make the necessary provisions for site
safety and comply with the relevant Health & Safety legislation.
Furthermore, maintenance and inspection is conducted for all relevant
equipment subject to regulation and third-party audits of Health & Safety risks are
conducted at asset level and associated action plans. Routine property tours are
organized to identify hazardous conditions and implement corrective actions. The
number of incidents (see section Occupational Health and Safety) is monitored as
well as sanctions for non-compliance related to building health and safety.
As part of the response to the COVID-19 pandemic, strong sanitation and
hygiene standards have been implemented at all of the Group’s parks, building
projects, and own offi ces.

PAG
E 1
62
—
V
GP
NV
Co
rpo
rate
Re
sp
on
sib
ilit
y R
ep
ort
20
21
/ E
SG
Ris
k M
an
ag
em
en
t
Non-engagement of employeesThe turnover rate of employees
may increase as employees are not
engaged on VGP’s ESG agenda in
general and at their place of work
specifi cally. In addition to employing
strict policies on inclusion, diversity
and human rights, the Group is
implementing people-oriented policies
designed to make VGP a great place
to work, including in order to promote
work-life balance. A sustainable work
environment is implemented as part
of initiatives related to managing
scope 1 and scope 2 carbon footprint,
as well as a pilot ergonomics policy
in the main offi ce in Germany.
Throughout the last year, the Group
has improved its policy to allow cross-
border learning and development
opportunities. To encourage a healthy
life style, the “healthy snack”-program
has been introduced in those offi ce
locations where available.
Participation in the Group’s local
volunteering program’s is encouraged
(see also “VGP Community Day”) as
well as participation in the annual
employee satisfaction survey.
Lack of attractiveness for employeesA lack of attractiveness for employees
or a loss of key competencies
for the execution of the Group’s
strategy is addressed through the
Group’s recruitment, retention and
succession planning included in
formalised HR policies relating to
recruitment, compensation and
benefi ts, talent review and learning
and development. The Group’s
Diversity and Inclusion policy is a
commitment to improvement of
employee engagement on diversity
and inclusion. The development of
the international group culture is
further supported by a matrix reporting
structure with strong international
ties across local organizations, cross-
border cooperation and mobility.
The Group has a strong partnership
with reputable head-hunting fi rms to
map and target best external talent.
The Group is working on a setting up
a new graduate recruitment program
with a pilot program being setup in
2022 in Romania.
Lack of profi le diversity
A lack of profi le diversity could result
in the Group becoming less innovative,
though the board of the Group – with
60% female members – sends a strong
signal throughout the organization.
The diversity and inclusion policy
sets the commitment to and improve
employee engagement on diversity
and inclusion, the awareness
throughout the organization is to
continue to be encouraged further.
The Group Code of Conduct and
whistleblowing procedure are in-line
with zero tolerance principle for
discrimination or harassment.
Identifying and managing human rights risksVGP supports fundamental principles
of human rights across all our lines
of business and in each country in
which we operate. As outlined in our
Human Rights Statement as included
in our Code of Conduct, our approach
to protecting and preserving human
rights is guided by the United Nations
Universal Declaration of Human
Rights. We also acknowledge the
Guiding Principles on Business and
Human Rights as the recognized
framework for corporations to
respect human rights in their own
operations and through their business
relationships. We have a range of
policies, procedures and trainings
that pertain to human rights issues,
including modern slavery, across our
business and supply chain. Please see
our Group Code of Conduct for more
detail.
Human Capital

With regards to new developments public consultations are held for all
development projects. By building long-term partnerships with local
stakeholders (residents, public authorities and associations) an enhancement
of the socio-economic impact of the Group’s assets can be accomplished, by
supporting business creation (e.g. provision of land plots) for specific locally
anchored tenancies, often focused on creating employment in manufacturing
and technical jobs and which support local taxes and social contributions
paid. The increasing emphasis on brownfield developments also leads towards
more environmentally friendly and visually attractive sites that often benefit the
broader community as well.
Anchored in the local areas where it operates, each of the Group’s existing
parks has built a network of local partnerships, working closely together to identify
and tackle issues which are crucial for the local population and businesses. By
building these strong and long-term relationships with local stakeholders, the
Group can coordinate common answers, use its technical competence to connect
people, commerce and the build environment.
Local municipal acceptability
PAG
E 1
63
—
V
GP
NV
Co
rpo
rate
Re
sp
on
sib
ilit
y R
ep
ort
20
21
/ E
SG
Ris
k M
an
ag
em
en
t
VGP Park Leipzig – nature compensation area

PAG
E 1
64
—
V
GP
NV
Co
rpo
rate
Re
sp
on
sib
ilit
y R
ep
ort
20
21
/ E
SG
Ris
k M
an
ag
em
en
t
Environmental pollution
Water, soil and air pollution linked with development projectsBrownfi eld projects may contact
contaminated soil for which soil
decontamination during works on
development is required. In order to
minimize pollution for the contractors
working on-site, the neighbouring
area, and the natural environment,
the Group’s Considerate Construction
Charter is applicable to all new
development projects. Furthermore,
inspections are regularly conducted,
as well as continuous maintenance
and improvement of existing buildings
and technical equipment liable, to
have an impact on the environment or
on personal safety (including air and
water quality, soil and air pollution).
For development projects, third-
party audits of Health, Safety and
Environmental risks are conducted
in order to monitor and update the
associated action plans as required.
Not identifying existing pollution in acquired development projectsTo avoid pollution risks a due
diligence process is conducted which
includes environmental risks and soil
pollution analysis. If identified as a
risk, soil decontamination activities
are budgeted (so expenses can be
taken into account pre-acquisition)
and executed.
Demolition works at brownfi eld VGP Park Wiesloch-Walldorf with recyclable materials and soil being sorted and separated

PAG
E 1
65
—
V
GP
NV
Co
rpo
rate
Re
sp
on
sib
ilit
y R
ep
ort
20
21
/ E
SG
Ris
k M
an
ag
em
en
t
Controversies linked with service providers, suppliers or subcontractors
VGP screens its business partners
in order to minimize the risk that
the Group contracts with service
providers, suppliers or subcontractors
not complying with regulations or
standards of their profession (e.g.
fundamental human and labour rights)
or having a negative ESG image/
performance. Business partners are
subject to the Group Code of Conduct
and the inhouse whistleblowing
procedure has been made accessible
to all contractors. The Group’s
purchasing conditions, and standard
contracts include environmental and
social terms, such as complying with
the ILO conventions and local labour
laws in Europe.
The Group’s Considerate
Construction Charter is applicable for
all development projects describing
the Group’s requirements and
recommendations to optimize the
environmental quality of worksites.
With regards to the development
of projects, compliance of providers
to professional standards is ensured
through the tender process, the
contract documents, and the
monitoring of compliance by the
operations supervisor, with sanctions
in case of non-compliance according
to severity (formal notice, penalties,
dismissal).
The Group has a policy to use timber
from certifi ed, sustainably managed
forests with FSC or PEFC certifi cation
in development projects. Furthermore,
several pilot projects are underway
to plan additional circular building
materials concepts.
Controversies linked with tenant activityVGP screens its tenants in order to
minimize the risk that the Group leases
premises to a corporation active in a
controversial industry (for example
arms production) or not complying
with regulations or standards of their
profession (e.g. fundamental human
and labour rights). The group is also
pro-actively reaching out to tenants to
support transition towards renewable
energy consumption as part of green
lease concept and as such the Group
monitors the percentage of green
leases signed among new and active
leases.
Responsible Supply chain

PAG
E 1
66
—
V
GP
NV
Co
rpo
rate
Re
sp
on
sib
ilit
y R
ep
ort
20
21
/ E
SG
Ris
k M
an
ag
em
en
t
Price volatility and limited availability of fossil fuels
Energy effi ciency targets and
energy management action plans
are increasingly being rolled out in
standing assets, involving energy
consumption optimisation actions as
well as investments in energy effi cient
equipment in new construction
projects. The Environmental
Management System of the Group
supports the objective to improve
environmental performance of all
standing and development assets of
the Group. This is also supported by
a shift towards sourcing electricity
from renewable energy sources for all
assets, driven by the development of
on-site renewable energy production
capacity. For several development
projects a life-cycle assessment is
being conducted which will help
the Group to identify opportunities
to reduce the amount of materials
used and their carbon footprint. This
assessment will also provide lessons
learned for the entire Group portfolio.
The Group is actively engaging with
stakeholders to improve energy
effi ciency and source renewable
energy, including tenants and
suppliers (e.g. Green leases, PPA
contracts, and energy performance
contracts with maintenance providers).
A new main performance indicator
has been introduced to monitor the
energy intensity per square meter
of use (kWh/sqm), as well as the
carbon intensity linked with energy
consumption of standing assets
(Scope 3 “in use”). Please fi nd more in
the section on Sustainable Properties
in the Commitments chapter.
Increased regulation on building energy effi ciency
The Group has invested in energy
effi ciency measures in the majority
of the standing portfolio and makes
such investments standardized
in development projects. Energy
management action plans are being
rolled out in all standing assets,
involving energy optimisation actions
as well as investments in renewable
energy production. The Group’s
Environmental management system
aims to improve the environmental
performance of assets and the Group
engages with stakeholders to improve
energy effi ciency, including with
tenants and service providers (e.g.
green leases, and energy performance
contracts with maintenance providers).
Energy and greenhouse gases

PAG
E 1
67
—
VG
P N
V C
orp
ora
te R
es
po
ns
ibil
ity
Re
po
rt 2
02
1 /
ES
G R
isk
Ma
na
ge
me
nt
Climate change is among the most critical challenges facing society today. VGP is
committed to understanding how climate change may drive or infl uence the risks
we identify and manage.
As illustrated in the chart below, we have developed an internal classifi cation
system that describes how climate-related risks can translate into potential
impacts for our clients, the communities in which we operate and the Group
itself — such as changes in supply or demand, fi nancial costs and/or business
disruptions, among others — and how those impacts could manifest as risks to
our Group. We also assess these impacts against considerations such as time
horizon, industry segment and geography as a means of better understanding
how these risks emerge within our Group. This classifi cation framework informs
our risk identifi cation process, which will continue to evolve as we deepen our
understanding of how climate-related drivers could manifest as risks to the Group.
Identifying, Assessing and Managing Climate-related risks and opportunities
Climate risk
VGP RISK TYPESCategories of risks
for VGP
Strategic Risk
Development Risk
Market Risk
Operational Risk
CLIMATE RISK DRIVERSPotential factors that could
cause a risk to occur
TRANSITION RISK
PHYSICAL RISK
Regulatory and/or
governmental policy
change
Technological evolution
Market preference
Acute Physical Risk
(e.g. floods, wildfires)
Chronic Physical Risk
(e.g. sea level, water stress,
temperature warming)
IMPACT TRANSMISSION CHANNELSAvenues of potential impacts
through which climate risk
drivers manifest into risk types
Supply/Demand/Price
Financial Costs
Macroeconomic
Country and/or business
competitiveness
Reputational Damage
and/or Litigation
Socioeconomic
Physical Damages
Business disruption

PAG
E 1
68
—
V
GP
NV
Co
rpo
rate
Re
sp
on
sib
ilit
y R
ep
ort
20
21
/ E
SG
Ris
k M
an
ag
em
en
t
Transition risks cover a range of
potential impacts that stem from how
society responds to climate change.
These include volatility in energy and
carbon pricing and possible changes
in energy and climate policy as well
as regulation, which could lead to
economic impacts or drive other
changes, such as the restriction of
certain land use for developments
and the development of low-carbon
technologies. Transition risks
also include shifts in consumer
preferences toward low-carbon
goods and services, and clients’
shift towards a need for zero carbon
emissions production and logistics
facilities. All of these risks could
impact our clients. Transition risks
could also be further accelerated by
changes in the physical climate.
Physical risks include both acute
weather events and chronic shifts
in the climate, such as altered
distribution and intensity of rainfall,
prolonged droughts or flooding,
increased frequency of wildfires,
rising sea levels or extreme heat.
These physical risks could have an
impact on the Group’s own operations
and our clients’ operations (e.g.,
interruptions to business operations
or supply chains). The physical
effects of climate change are likely
to increase in frequency and severity
over time.
In the absence of significant
global action to curtail the effects
of climate change, risk drivers such
as extreme heat, sea level rise and
increased frequency of extreme
weather events are expected to
impact and exacerbate existing
risks to infrastructure, ecosystems
and social systems. Transition and
physical climate-related risks could
also lead to financial impacts such
as interruptions to supply chains,
declines in asset values or significant
shifts in demand for certain products
or services.
As noted above, the key drivers
of transition risk and physical risk
can manifest themselves in a variety
of ways. The table below provides
selected examples of different types
of climate-related transition and
physical risks and how they could
materialize across the four major
risk types we manage: strategic risk,
development risk, market risk and
operational risk.
TRANSITION RISK PHYSICAL RISK
STRATEGIC RISK
Risk to earnings, liquidity, reputation associated
with poorly designed or failed business
plans or inadequate response to change
in the operating environment
Stakeholder perceptions
of business (e.g. clients,
communities, partners) of
inadequate response could
result in reputational impacts
Parks in areas susceptible to
climate-related events face valuation
risk, inability to obtain appropriate
insurance for property and ultimately
business continuity risk
DEVELOPMENT RISK
Risks associated with the development activities,
risks with the default of a supplier, health and safety
related risks amplified by climate change
Shift in client preference for
more sustainable building
practices, requirements (for
example smart and sub-meterings)
and certification levels
Temporary disruption in
development activities leads to
delayed deliveries and loss in
profitability
MARKET RISK
Risks associated with the effect of changes in
market factors, such as appraisal value market yields,
renewable energy and carbon-offset prices
Changes in demand for renewable
energy and carbon offsets leads
to price volatility and with respect
to property valuations, forward-
looking climate risk analysis and
assessment increasingly
impacting asset values
Certain events can lead to a long-
lasting decline in property prices in
geographies that have heretofore
been relatively unexposed to
extreme weather or climate events,
or where intensity and frequency
have appreciably increased.
OPERATIONAL RISK
Risk associated with an adverse outcome resulting
from inadequate or failed internal processes or
systems; human factors; or external events impacting
the Group’s processes or systems.
New legislation and/or regulatory
requirements lead to significant
changes in operational processes
and costs
Extreme weather causes direct
damage to existing buildings
and or infrastructure
Azure Stonecrop (Sedum caeruleum L.) growing on green roof at VGP Park Berlin

PAG
E 1
69
—
V
GP
NV
Co
rpo
rate
Re
sp
on
sib
ilit
y R
ep
ort
20
21
/ E
SG
Ris
k M
an
ag
em
en
t
Climate Scenario Analysis Scenario analysis is a useful tool
for understanding risks across a
variety of economic, market and
other conditions. Scenarios can be
designed to monitor a wide range of
stress events to give our management
insight into the drivers behind risk
factors or potential losses. An eff ective
scenario analysis framework creates
transparency into the scale and source
of hypothetical losses, in order to make
business decisions and compare risk
appetite with business opportunities.
The Group uses a set of scenarios
that are relevant to our development
and portfolio management business,
risk positions, funding and capital
management practices. They
represent a wide range of severities
as well as both broad drivers (e.g.,
general economic downturn) and
specifi c events (e.g., acute weather
events or a credit squeeze).
Leveraging scenario analysis to
better understand climate-related
risks is a relatively new and rapidly
evolving area. We are continuing to
consider comprehensive climate-
based scenarios as we build our
knowledge of climate-related drivers,
impacts and potential losses, and
we plan to evolve our approach to
climate scenario analysis over time,
especially as data availability and
modelling techniques progress.
We recognize our business is
exposed to both transition and
physical climate risks, and we are
working to understand how climate-
driven impacts may emerge. The
fi nancial impacts of climate-related
risks can diff er across clients and
geographies due to numerous factors
including but not limited to:
— A client’s strategy for developing
low-carbon transition plans
— Time horizon associated with the
transition and physical risks
— Impacts on the specifi c markets
where clients have business
activity
— Susceptibility to price fl uctuations
of construction materials
(e.g.,steel, concrete, FSC certifi ed
wood)
— Geographical concentrations of
operations
— Availability of low-carbon
technologies
— Changes in European policies
Transition risksOver the past year we have further
improved our building standard to
ensure all current and anticipated
climate change requirements are
embedded in the design. At the same
time, we are conducting pilot projects
aiming for CO₂-neutrality (under
DGNB certifi cation). Furthermore, we
are conducting a consultancy study
into building circular materials. The
results of these studies will allow us to
implement and improve best practices
within our Group-wide building
standard.
The roll-out of the renewable energy
availability across our existing portfolio
and the off er to our tenants to switch
to renewable energy will answer to
the anticipated changing demand for
green energy. Our renewable energy
roll-out over the coming years should
allow the reduction of our gross Scope
3 in-use emissions. More details on
the renewable energy roll-out can be
found in the section on Sustainable
Properties.
It will be important for the Group to
continue to showcase improvement
and demonstrate environmental
qualities of assets (environmental
certifi cation, carbon footprint, etc) and
maintain or improve our ESG ratings
in order to maintain access to green
fi nancing.
Physical risksOver the past year, we have analysed
exposures to physical climate risks in
pilot studies and also are taking the
eff ects into account with regards to
new land purchases. For example, in
all of our land purchasing studies we
typically include 100-year probability
heavy rainfall models. Also we have
started to analyse the eff ects of
sea-level rise on our portfolio. With
regards to sea level rises our work to
this point has used IPCC scenarios of
projected areas that will be impacted
by sea-level rise¹ up to 0.6 m above
current levels, to assess property level
impacts and inform our approach to
understanding potential losses if rising
sea levels were deemed imminent and
were accelerating.
Mapping Our Path to Integrated Climate Risk Management
VGP is on a journey to further integrate
climate risk into our existing fi rmwide
risk management framework. We have
identifi ed the following deliverables
that will be used to defi ne success:
— Enhance climate risk
capabilities to include climate
risk identifi cation and scenario
analysis
— Incorporate data and analytics
to assess, monitor and measure
climate risk
— Adapt existing risk management
frameworks to incorporate
climate-based transition and
physical risks where appropriate
— Include, where relevant, climate
risk into our policies and
standards to provide eff ective
governance
— Evaluate representative stress
scenarios across transition and
physical risk to add to the Group’s
established scenarios
1 Under the IPCC Special Report on Emission Scenarios (SRES) A1B scenario by the mid-2090s, for instance, global sea level reaches 0.22 to 0.44 m above 1990 levels, and is rising
at about 4 mm yr. As in the past, sea level change in the future will not be geographically uniform, with regional sea level change varying within about ±0.15 m of the mean in a
typical model project

PAG
E 1
70
—
VG
P N
V C
orp
ora
te R
es
po
ns
ibil
ity
Re
po
rt 2
02
1 /
ES
G R
isk
Ma
na
ge
me
nt
Governance
Lack of resources or ownership for managing ESG risksThe Group ESG agenda has been defi ned and overviewed at the highest
governance levels: Group CEO, Management Team, and the Board.
The Group has integrated the ESG agenda into the core business processes
both for standing assets as well as development projects: due diligence process,
environmental management system for both development projects and existing
assets, ESG information integrated in asset budget reviews, ESG objectives set for
all country teams in the assessment process of individual performance and ESG
training module rolled-out to all employees.
The Group is aligning initiatives, action plans and targets with the ESG
program in all countries and departments (sales, development/technical, etc.),
with a dedicated ESG team responsible for overseeing and supporting the
implementation of the Group ESG strategy with a specifi c governance involving
top management and operational managers in all country teams.

PAG
E 1
71
—
VG
P N
V C
orp
ora
te R
es
po
ns
ibil
ity
Re
po
rt 2
02
1 /
Gre
en
fin
an
cin
g o
f th
e G
rou
p a
cti
viti
es
Green bond issuanceThe VGP Green fi nance framework was introduced in 2019 as part of our strategy
to diversify fi nancing sources. The Group has decided to develop a Green Bond
framework to fi nance new development projects, and/or standing assets which
meet the environmental criteria for the construction and operational phases as
defi ned in the “Use of Proceeds” procedure, and specifi ed hereafter. Green Bonds
are only used to fi nance resilient eligible assets, in line with a clear procedure for
allocating funds.
VGP issued its fi rst Green Bond on the Euro market in March 2021. In January
2022, the Group issued its second Green Bond (split into two tranches) on the
Euro market. These issuances are testament to the success of the Group’s
integral focus on ESG as part of the organization, investments, and fi nancing.
In total, the two issuances raised €1.60 billion.
Eligible AssetsThe ESG criteria associated with the Green Bonds were approved by CICERO.
They are (i) aligned with the “Green Bond Principles” (GBP) updated in March
2015 and (ii) fi t in with the Group’s ESG strategy. Proceeds from Green Bonds
issued under this framework will be used exclusively to fi nance and/or refi nance,
in whole or in part, “Eligible Assets”, described in the Green Finance Framework.
Proceeds can be allocated to refi nance existing projects as well as fi nance new
developments.
Eligible projects include:
— renewable energy projects (i.e., onshore and off shore renewable energy
facilities, including primarily solar and wind projects, but also hydrogen and
geothermal energy projects)
— Category of green buildings (i.e., real estate assets with BREAAM “Very Good”
certifi cation or equivalent DGNB/LEED rating)
— Other eligible project categories include energy effi ciency (i.e., for existing or
new (logistics) buildings, warehouses and technologies-related services and
products), waste management (i.e., projects, investments and expenditures
which promote better recycling rates), clean transportation (i.e., electric
vehicle charging stations, bike facilities), and sustainable water management
(i.e., reduce freshwater consumption, capturing and recycling rainwater,
green roofi ng)
Additional criteria and indicators to be monitored for eligible assets – including
EU Taxonomy and CCREM, also referring to the section on EU Taxonomy and
CRREM respectively in the Additional Information Chapter – are published on
the Investor Relations’ website under the following link:
https://www.vgpparks.eu/en/investors/fi nancial-debt/
Green fi nancing of the Group activities

PAG
E 1
72
—
VG
P N
V C
orp
ora
te R
es
po
ns
ibil
ity
Re
po
rt 2
02
1 /
Gre
en
fin
an
cin
g o
f th
e G
rou
p a
cti
viti
es
Current Allocation of Green Bond ProceedsIn line with the Group’s internal Green Bond analysis, selection and monitoring
procedure, the funds generated by Green Bonds issuances are allocated to the
selected assets based on a previously defi ned list of “eligible assets”. The criteria
are presented above and explained in detail in the Green Finance Framework as
available on the Group website.
In the case of an asset disposal (both in full or partially) to one of the Group’s
Joint Ventures during the funding period (i.e. prior to the bond issue maturity), the
proceeds initially allocated to the disposed asset shall be reallocated to another
“eligible asset” held by the Group, based on the same process. In case of a full
disposal the equivalent asset base shall be reallocated and in case of a disposal
to one of the Joint Ventures the remaining equity interest shall be refl ected in the
pro-rata asset allocation.
The allocation of the proceeds from the outstanding Green Bonds is illustrated
below:
The allocation of the proceeds for Green buildings split between CAPEX fi nancing
and refi nancing:
GREEN BOND – APRIL 2029 GREEN BOND – JAN 2027 GREEN BOND – JAN 2030
USE OF CATEGORIES NET BOND PROCEEDS
ALLOCATION (€)
% OF TOTAL NET BOND PROCEEDS
NET BOND PROCEEDS
ALLOCATION (€)
% OF TOTAL NET BOND PROCEEDS
NET BOND PROCEEDS
ALLOCATION (€)
% OF TOTAL NET BOND PROCEEDS
Renewable Energy 24,420,753 4.1 — 0.0% — 0.0
Green buildings 572,552,336 95.4 282,134,217 56.4% 290,714,049 58.1
Energy Efficiency — 0.0 — 0.0% — 0.0
Waste Management — 0.0 — 0.0% — 0.0
Clean Transportation — 0.0 — 0.0% — 0.0
Sustainable Water
Management
3,746,700 0.6 — 0.0% — 0.0
(over)/ unallocated (719,789) – 0.1 217,865,783 43.6% 209,285,951 41.9
Total gross proceeds 600,000,000 100.0 500,000,000 100.0% 500,000,000 100.0
TYPE OF FINANCING GRAND TOTAL (€) %
CAPEX financing 656,853,160 56
Refinancing 516,714,894 44
Total 1,173,568,054 100

PAG
E 1
73
—
VG
P N
V C
orp
ora
te R
es
po
ns
ibil
ity
Re
po
rt 2
02
1 /
Gre
en
fin
an
cin
g o
f th
e G
rou
p a
cti
viti
es
Green Bond – April 2029
Green buildings allocation by certifi cation type €
COUNTRY BREEAMEXCELLENT
BREEAM VERY GOOD
DGNBGOLD
DGNBSILVER
LEED SILVER
GRAND TOTAL
%
Austria — 11,165,410 9,872,193 — 21,037,603 2
Czech Republic 4,382,952 — — — 4,382,952 0
Germany — 96,845,417 235,027,061 — 331,872,478 29
Hungary 39,569,136 — — — 39,569,136 3
Italy 10,259,626 31,787,666 — — — 42,047,292 4
Latvia 2,293,462 — — — 2,293,462 0
Netherlands — — — — — 0
Portugal — — — — — 0
Romania 44,623,963 — — — 44,623,963 4
Serbia — — — — — 0
Slovakia 57,662,488 — — — 57,662,488 5
Spain 29,062,961 — — — 29,062,961 3
Grand Total 10,259,626 209,382,629 108,010,827 244,899,254 — 572,552,336
% of total 1 18 9 21 0
RENEWABLE ENERGY SPECIFICATION (€ proceeds allocation)
Netherlands 5,309,425
Italy 1,744
Germany 19,109,584
Total 24,420,753
SUSTAINABLE WATER MANAGEMENT (€ proceeds allocation)
Netherlands 175,000
Germany 3,571,700
Total 3,746,700

PAG
E 1
74
—
VG
P N
V C
orp
ora
te R
es
po
ns
ibil
ity
Re
po
rt 2
02
1 /
Gre
en
fin
an
cin
g o
f th
e G
rou
p a
cti
viti
es
Green Bond – Jan 2027
Green buildings allocation by certifi cation type €
Green Bond – Jan 2030
Green buildings allocation by certifi cation type €
Audited criteriaVGP engaged an independent auditor to verify that the assets fi nanced meet the eligibility criteria. The reporting on these
criteria and the independent auditor’s attestation on the information related to the allocation of funds are presented in the
following section.
COUNTRY BREEAMEXCELLENT
BREEAM VERY GOOD
DGNBGOLD
DGNBSILVER
LEED SILVER
GRAND TOTAL
%
Austria — — — — — — 0
Czech Republic — 62,474,383 — — — 62,474,383 5
Germany — — — 194,533,303 — 194,533,303 17
Hungary — — — — — — 0
Italy — — — — — — 0
Latvia — — — — — — 0
Netherlands — — — — — — 0
Portugal — 14,350,305 — — — 14,350,305 1
Romania — — — — — — 0
Serbia — — — — — — 0
Slovakia — — — — — — 0
Spain — 10,776,224 — — — 10,776,224 1
Grand Total — 87,600,913 — 194,533,303 — 282,134,217
% of total 0 8 0 17 0
COUNTRY BREEAMEXCELLENT
BREEAM VERY GOOD
DGNBGOLD
DGNBSILVER
LEED SILVER
GRAND TOTAL
%
Austria — — — — — — 0
Czech Republic — 5,751,291 — — 7,048,214 12,799,505 1
Germany — — — 78,270,995 — 78,270,995 7
Hungary — — — — — — 0
Italy — 9,566,403 — — — 9,566,403 1
Latvia — — — — — — 0
Netherlands — 100,437,160 — — — 101,839,379 9
Portugal — — — — — — 0
Romania — — — — — — 0
Serbia — — — — — — 0
Slovakia — — — — — — 0
Spain — 89,639,987 — — — 89,639,987 8
Grand Total — 205,394,840 — 78,270,995 — 290,714,049
% of total 0 18 0 7 1

PAG
E 1
75
—
VG
P N
V C
orp
ora
te R
es
po
ns
ibil
ity
Re
po
rt 2
02
1 /
Gre
en
fin
an
cin
g o
f th
e G
rou
p a
cti
viti
es
Criteria of the use of proceeds reporting
Renewable Energy
The fi nancing and/or refi nancing of projects, investments and expenditures in products, technologies
and services ranging from the generation and transmission of energy to the manufacturing of related
equipment including among others onshore and off shore renewable energy facilities. This includes
among others solar, wind, hydro and geothermal energy projects.
List of all eligible photovoltaic investment projects and allocation per green bond (only eligible photovoltaic projects have
been included):
PARK BUILDING PV PRODUCTION (KWP) BOND ALLOCATION
OPERATIONAL UNDER CONSTRUCTION Apr.-29 Jan.-27 Jan.-30
VGP Park Nijmegen NLDNIJ – A3 2,279 ×
NLDNIJ – A1/2 1,518 ×
NLDNIJ – A4/5 1,012 ×
NLDNIJ – B1/B2 3,082 ×
NLDNIJ – B3/B4 5,940 ×
NLDNIJ – C1/2 3,779 ×
VGP Park Roosendaal NLDROO – A1/A2 3,899 ×
VGP Park München GERMUE – A1 748 ×
GERMUE – A2/A3 1,696 ×
GERMUE – B 3,789 ×
GERMUE – C 3,031 ×
GERMUE – E 1,894 ×
GERMUE – F 109 ×
GERMUE – PHS 311 ×
VGP Park Göttingen GERGOE – A 750 ×
GERGOE – A 747 ×
GERGOE2 – C 3,870 ×
GERGOE2 – C 497 ×
GERGOE2 – C 2,244 ×
VGP Park Wustermark GERWUS – A1 745 ×
VGP Park Berlin GERBER – A 745 ×
GERBER2 – B 746 ×
GERBER2 – C 750 ×
VGP Park Giessen-Buseck GERBUS – A 749 ×
VGP Park Lützellinden GERLUE – A 748 ×
VGP Park Chemnitz GERCHE – A 746 ×
VGP Park Magdeburg GERMAG – A (ph I) 750 ×
GERMAG – A (ph II) 1,798 ×
GERMAG – B 2,244 ×
VGP Park Erfurt GERERF – A 750 ×
VGP Park Hamburg GERHAM – A1 748 ×
GERHAM – A2 750 ×
GERHAM2 – B2 750 ×
GERHAM3 – C 750

PAG
E 1
76
—
VG
P N
V C
orp
ora
te R
es
po
ns
ibil
ity
Re
po
rt 2
02
1 /
Gre
en
fin
an
cin
g o
f th
e G
rou
p a
cti
viti
es
PARK BUILDING PV PRODUCTION (KWP) BOND ALLOCATION
OPERATIONAL UNDER CONSTRUCTION Apr.-29 Jan.-27 Jan.-30
VGP Park Rodgau GERROD – C 746 ×
VGP Park Borna GERBOR-A 748 ×
VGP Park Ginsheim GERGIN – A 748 ×
VGP Park Schwalbach GERSCH – A 645 ×
VGP Park Soltau GERSOL – A 749 ×
VGP Park Berlin Oberkrämer GEROBK – A 299 ×
VGP Park Höchstadt GERHOE – A 748 ×
The eligible photovoltaic investments have generated green energy in 2021 for in
total 8,216 MWh, equivalent to 3,020 TCO₂e. For calculating the equivalent CO₂
emissions the average grid factor of the VGP Parks portfolio of 0.368 tCO₂ / MWh
has been used:
RENEWABLE ELECTRICITY (MWh) FY 2021
Total green energy generation 8,216
CO₂ reduction (TCO₂e) 3,020

PAG
E 1
77
—
VG
P N
V C
orp
ora
te R
es
po
ns
ibil
ity
Re
po
rt 2
02
1 /
Gre
en
fin
an
cin
g o
f th
e G
rou
p a
cti
viti
es
Green buildings
The fi nancing and/or refi nancing of projects, investments and expenditures in relation to real estate
assets which have received, or are designed and intended to receive, BREAAM “Very Good” certifi cation
(or equivalent DGNB Silver/LEED Silver rating)
In total 80 eligible building projects have been identifi ed and allocated to the three outstanding green bonds according to the
following split between the bonds, highlighting the certifi cation level as well as status of the certifi cation process (see table
below). Due to employed certifi cation pre-checks and uniform VGP building standard being employed for all construction
projects across Europe a very high degree of confi dence can be expressed for expected realisation of the targeted
certifi cation level in case this is not yet completed. In case of project would not achieve the required certifi cation level it will
be removed from the eligible green buildings investments portfolio.
NAME RENTABLE SPACE – TOTAL (in m²)
CERTIFICATION LEVEL
CERTIFICATION STATUS
BOND ALLOCATION
Apr.-29 Jan.-27 Jan.-30
AUTGRA2 – B 7,822 DGNB – Silver ongoing ×
AUTGRA2 – C 14,520 DGNB – Gold initialising ×
CZECEB – C 9,409 BREEAM – Very Good ongoing ×
CZEHNN – H1 40,361 Leed Silver realized ×
CZEHNN2 – H6 29,566 BREEAM – Very Good initialising ×
CZEKLA – A 15,805 BREEAM – Very Good initialising ×
CZEKLA – B 11,250 BREEAM – Very Good initialising ×
CZEOLO5 – F 65,966 BREEAM – Very Good initialising ×
CZEPIL – E 5,775 BREEAM – Very Good ongoing ×
CZEPRO – A 15,199 BREEAM – Very Good ongoing ×
CZEPRO – B 26,850 BREEAM – Very Good ongoing ×
CZEVYS – A 28,199 BREEAM – Very Good pre-checked ×
ESPDOH – B 26,630 BREEAM – Very Good pre-checked ×
ESPFUE – A 41,745 BREEAM – Very Good pre-checked ×
ESPGRA – A 8,323 BREEAM – Very Good pre-checked ×
ESPLLI – A 13,639 BREEAM – Very Good ongoing ×
ESPLLI – D 7,204 BREEAM – Very Good ongoing ×
ESPLLI – E 22,193 BREEAM – Very Good ongoing ×
ESPSFH – C1 8,251 BREEAM – Very Good realized ×
ESPSFH – C2 5,165 BREEAM – Very Good realized ×
ESPSFH – D1 11,453 BREEAM – Very Good ongoing ×
ESPVAL – A 13,944 BREEAM – Very Good ongoing ×
ESPVAL – B 25,547 BREEAM – Very Good ongoing ×
ESPZAR – A 18,073 BREEAM – Very Good realized ×
ESPZAR – B 20,736 BREEAM – Very Good ongoing ×
ESPZAR – C1 22,556 BREEAM – Very Good pre-checked ×
ESPZAR – C2 13,615 BREEAM – Very Good pre-checked ×
GERBER4 – M 17,327 DGNB – Silver ongoing ×
GERERF – A 26,562 DGNB – Silver partially realized ×
GERGAF – A 153,272 DGNB – Gold ongoing ×
GERGAF – B 49,626 DGNB – Silver ongoing ×
GERGOE2 – C 79,900 DGNB – Silver realized ×
GERHAL – B 26,846 DGNB – Silver ongoing ×
GERHAL – C 37,841 DGNB – Silver ongoing ×
GERLAA – A+B 54,728 DGNB – Silver ongoing ×

PAG
E 1
78
—
VG
P N
V C
orp
ora
te R
es
po
ns
ibil
ity
Re
po
rt 2
02
1 /
Gre
en
fin
an
cin
g o
f th
e G
rou
p a
cti
viti
es
NAME RENTABLE SPACE – TOTAL (in m²)
CERTIFICATION LEVEL
CERTIFICATION STATUS
BOND ALLOCATION
Apr.-29 Jan.-27 Jan.-30
GERLAA – C 50,769 DGNB – Silver realized ×
GERLAA – D 8,518 DGNB – Silver realized ×
GERLEI – C1 2,397 DGNB – Silver ongoing ×
GERLFH – A 21,411 DGNB – Silver ongoing ×
GERLUE – A 14,156 DGNB – Gold realized ×
GERMAG – A 40,037 DGNB – Silver ongoing ×
GERMAG – B 64,768 DGNB – Silver ongoing ×
GERMAG – C1 43,202 DGNB – Silver ongoing ×
GERMAG – F 56,974 DGNB – Gold realized ×
GERMUE – A2 19,248 DGNB – Gold realized ×
GERMUE – B 81,548 DGNB – Silver ongoing ×
GERMUE – C 48,470 DGNB – Silver ongoing ×
GERMUE – E 39,351 DGNB – Silver ongoing ×
GERMUE – F 7,486 DGNB – Silver ongoing ×
GEROBK – A 13,759 DGNB – Silver realized ×
GEROBK – B 13,986 DGNB – Silver ongoing ×
GEROBK – C 22,753 DGNB – Silver ongoing ×
GERROS – A 23,335 DGNB – Silver ongoing ×
GERSOL – A 55,812 DGNB – Silver realized ×
GERWUS – A1 10,997 DGNB – Silver realized ×
HUNBUD – B1 62,669 BREEAM – Very Good initialising ×
HUNGYO2 – B 13,162 BREEAM – Very Good pre-checked ×
HUNKEC – A 16,942 BREEAM – Very Good pre-checked ×
ITACAL – A 23,689 BREEAM – Very Good realized ×
ITAPAD – A 15,301 BREEAM – Very Good pre-checked ×
ITAPAD – B 7,246 BREEAM – Very Good pre-checked ×
ITASOR – A 12,034 BREEAM – Very Good pre-checked ×
ITAVAL – A/B 6,677 BREEAM – Excellent realized ×
LVATIR – A 28,816 BREEAM – Very Good pre-checked ×
NLDNIJ – A 67,352 BREEAM – Very Good realized ×
NLDNIJ – E 19,200 BREEAM – Very Good initialising ×
NLDNIJ2 – B1/B2 42,835 BREEAM – Very Good ongoing ×
NLDNIJ2 – B3/B4 60,062 BREEAM – Very Good ongoing ×
NLDNIJ2 – C 37,384 BREEAM – Very Good ongoing ×
NLDROO1 – A 41,958 BREEAM – Very Good pre-checked ×
PRTSMF – A 29,813 BREEAM – Very Good ongoing ×
ROMARA – A 28,810 BREEAM – Very Good pre-checked ×
ROMBRA – A 27,726 BREEAM – Very Good ongoing ×
ROMBRA – E 9,989 BREEAM – Very Good ongoing ×
ROMBUC – C 28,508 BREEAM – Very Good pre-checked ×
ROMTIM D 31,399 BREEAM – Very Good ongoing ×
SVKBRA – A 43,336 BREEAM – Very Good pre-checked ×
SVKBRA – F 57,329 BREEAM – Very Good ongoing ×
SVKBRA – G 23,748 BREEAM – Very Good initialising ×
SVKBRA – H 18,576 BREEAM – Very Good ongoing ×

Sustainable Water Management
The financing and/or refinancing of projects, investments and expenditures which promote a
sustainable water management (reduce freshwater consumption, capturing and recycling rain water,
green roofing etc.).
Selected eligible projects:
SUSTAINABLE WATER MANAGEMENT
VGP PARK PROJECT GREEN BONDAPRIL 2029
GREEN BONDJAN 2027
GREEN BONDJAN 2030
VGP Park
München
Infiltration basin south incl. plants/vegetation ×
VGP Park
Göttingen
Rainwater channels with rainwater retention basin ×
VGP Park
Giessen-
Buseck
Use of rainwater for toilet facilities (cistern, piping, separation
systems, technology) and Infiltration of rainwater in the rainwater
retention basin
×
VGP Park
Magdeburg
Rainwater channels with large rainwater retention basin combined
and connected (through transport trenches) with several smaller
basins with overflow and throttling system
×
VGP Park
Roosendaal
Infiltration crates, installation built under building for water overflow
and retention (independent of public sewerage)
×
VGP Park
Berlin
Entire green Roof for water retention and bio-diversity stimulation ×

PAG
E 1
80
—
V
GP
NV
Co
rpo
rate
Re
sp
on
sib
ilit
y R
ep
ort
20
21
/ G
ree
n f
ina
nc
ing
of
the
Gro
up
ac
tivi
tie
s
CICERO Green has reviewed the elements of VGP’s Corporate Responsibility Report 2021 (“Report”) relating to its green fi nancing activities. We review project allocation against the Green Finance Framework criteria and impact metrics for relevance and transparency.
CICERO Green considers VGP’s
Report to be aligned with VGP’s
Green Finance Framework, but notes
a discrepancy with the allocation
of proceeds anticipated by VGP.
Specifi cally, we noted in our Second
Opinion that VGP expects most
proceeds to be allocated in a balanced
way between renewable energy and
green building investments. However,
only a minor share (less than 5%) has
so far been allocated to renewable
energy projects. We encourage VGP
to have a more balanced allocation
towards Dark and Light Green projects
going forward and welcome that
VGP informed us that it anticipates
that it will make substantially more
renewable energy investments from its
second bond in the course of 2022.
VGP provides transparent,
quantitative information about the
climate and environmental impacts
of its green bond investments, using
relevant indicators. For renewable
energy projects, VGP reports on total
installed capacity on a project level,
as well as total energy generated and
avoided CO₂ emissions on a portfolio
basis. For green buildings, VGP
reports the environmental certifi cation
obtained for each building. While
investments in sustainable water
management projects represent a
very small share of VGP’s green bond
investments, it has not reported any
impacts for this project category.
Project allocation
VGP has issued two green bonds
under its Green Finance Framework,
totaling EUR 1.60 billion. The fi rst
was issued in March 2021 and raised
EUR 600 million, and the second
was issued in January 2022 and
raised EUR 1 billion in two EUR 500
million tranches. Use of proceeds are
reported as of December 31, 2021.
CICERO Green fi nds no discrepancies
with regards to the project allocation.
See Table 1 for a detailed review.
We assigned an overall shading
of Medium Green to VGP’s Green
Finance Framework in our Second
Opinion dated March 28, 2021¹.
Project categories were shaded Dark
Green (renewable energy, waste
management, clean transportation,
and sustainable water and wastewater
management projects), Light to
Medium Green (energy effi ciency) and
Light Green (green buildings). For the
fi rst issuance, most of the proceeds
(approx. 95.4%) have been allocated
to Light Green investments (green
buildings), and a small share of the
proceeds (approx. 4.7%) have been
allocated to Dark Green investments
(renewable energy and sustainable
water management). All proceeds
from the fi rst issuance have been
allocated. For the second issuance
most of the proceeds (approx. 56.4%
of the fi rst tranche and approx. 58.1%
of the second tranche) have been
allocated to Light Green investments
(green buildings). The remaining
(approx. 43.6% of the fi rst tranche and
approx. 41.9% of the second tranche)
are unallocated proceeds. VGP
informed us that unallocated proceeds
only apply to the Bonds which were
issued post the balance sheet date,
and that it anticipates that it will have
substantially more renewable energy
investments in the course of 2022.
These allocations align with VGP’s
expectation noted in our Second
Opinion that most proceeds would
be allocated to green buildings and
renewable energy investments (see
Figure 1).
We fi nd a discrepancy in the allocation
of proceeds where we noted in our
Second Opinion that VGP expects
most proceeds to be allocated in a
balanced way between renewable
energy projects and green buildings.
However, only a minor share (less than
5%) has been allocated to renewable
energy projects. To be a representative
Medium Green framework, the
issuer is encouraged to have a more
balanced allocation towards Dark and
Light Green projects (see Figure 1).
VGP informed us that it anticipates
that it will make substantially more
renewable energy investments from its
second bond in the course of 2022.
1 Second Opinion (cicero.oslo.no)
Independent Third Party’s report on Green Bond criteriaMarch 28, 2022

PAG
E 1
81
—
VG
P N
V C
orp
ora
te R
es
po
ns
ibil
ity
Re
po
rt 2
02
1 /
Gre
en
fin
an
cin
g o
f th
e G
rou
p a
cti
viti
es
VGP’s Report satisfi es the commit-
ments in respect of allocation report-
ing contained in its Green Finance
Framework. The Report, for example,
sets out:
— The total outstanding amount
of green fi nance instruments
issued under the Green Finance
Framework (EUR 1.60 billion);
— The allocation of the proceeds of
issued green fi nance instruments
by project category and linked to
the individual bonds;
— The amount of unallocated
proceeds (approx. 30%); and
— The geographic distribution of
green building investments.
VGP reports allocation of the
proceeds for all investments split
between CAPEX fi nancing (56%) and
refi nancing (44%).
VGP confi rms in the Report that the
selection process for allocations of
proceeds from the green bonds was
undertaken as described in its Green
Finance Framework.
Impact metrics
VGP reports impacts as of
December 31, 2021.
In respect of renewable energy pro-
jects. fi nanced by green bond pro-
ceeds, VGP reports three metrics:
i) total installed capacity for both oper-
ational projects and projects under
construction in Kwp, ii) energy gen-
erated in MWh, and iii) avoided CO₂
emissions in tCO₂e. Installed capac-
ity is reported on a project level, while
energy generation and avoided emis-
sions are reported on a portfolio basis.
VGP discloses the methodology
used for calculating avoided CO₂ emis-
sions from renewable energy projects
using the average grid factor of the
VGP Parks portfolio of 0.368 tCO₂/
MWh generated. VGP uses the aver-
age grid factor of the 14 diff erent
European countries in which it oper-
ates. While annual reduced emissions
represent a relevant metric, there is
always uncertainty around emissions
data and especially avoided emis-
sions where there are less developed
guidelines.
In respect of green buildings fi nanced
by green bond proceeds, VGP lists the
environmental certifi cation level linked
to each green building investment.
Reporting on environmental
certifi cates is a fair way to report
impact of green building investments,
however given these schemes do not,
for example, guarantee, guarantee low
energy performance, they are best
reported with other metrics such as
energy performance.
VGP’s Green Finance Framework
contains additional indicators it would
endeavor to report on, subject to the
availability of data, e.g., freshwater
savings. VGP has not reported any
impacts for its sustainable water
management investments. It is a
weakness that no such impacts have
been reported, notwithstanding that
these investments are a very small
share of overall investments from the
green bond proceeds. The inclusion
of metrics commonly used for green
bond reporting allows investors to
better compare across issuances in
the same sectors. Investors should,
however, use caution when making
these comparisons as methodologies,
assumptions and baselines are
typically not uniform.
VGP stated in its Green Finance
Framework that it would pro-rate
according to the ownership of a
facility, which has occurred according
to the issuer.
FIGURE 1
Allocation by SPO Shade of Green for the fi rst issuance and the two tranches of the
second issuance. Shading is based on evaluation at time of issuance and does not
refl ect ex-post project verifi cation.
FIRST ISSUANCE SECOND ISSUANCE THIRD ISSUANCE
Light green 95.40%
Dark green 4.60%
Light green 56.40%
Unlocated proceeds
43.60%
Light green 58.10%
Unlocated proceeds
41.90%

PAG
E 1
82
—
V
GP
NV
Co
rpo
rate
Re
sp
on
sib
ilit
y R
ep
ort
20
21
/ G
ree
n f
ina
nc
ing
of
the
Gro
up
ac
tivi
tie
s
Alignment with principles for impact reportingCICERO Green reviews the Report
against the ICMA Handbook¹,
Harmonized Framework for Impact
Reporting and concludes that the
Report follows its recommendations².
Terms
CICERO Shades of Green provides
the elements of VGP’s Corporate
Responsibility Report 2021 relating
to its green fi nancing activities
based on documentation provided
by VGP and information gathered
during teleconferences and e-mail
correspondence with VGP. VGP
is solely responsible for providing
accurate information. All fi nancial
aspects of the sustainable fi nance
reporting – including the fi nancial
performance of the bond and the
value of any investments in the
bond – are outside of our scope, as
are general governance issues such
as corruption and misuse of funds.
CICERO Shades of Green does not
validate nor certify the existence of
the projects fi nanced and does not
validate nor certify the climate eff ects
of the projects. Our objective has
been to provide an assessment of
the extent to which the bond has met
the allocation and reporting criteria
established in VGP’s 2021 Green
Finance Framework. The review is
intended to inform VGP management,
investors and other interested
stakeholders and has been made
based on the information provided to
us. CICERO Shades of Green cannot
be held liable if estimates, fi ndings,
opinions, or conclusions are incorrect.
Our review does not follow verifi cation
or assurance standards and we can
therefore not provide assurance that
the information presented does not
contain material discrepancies.
1 https://www.icmagroup.org/assets/documents/Sustainable-finance/2021-updates/Handbook-Harmonised-Framework-for-Impact-Reporting-June-2021-100621.pdf
2 ICMA Handbook, Harmonized Framework for Impact Reporting

PAG
E 1
83
—
V
GP
NV
Co
rpo
rate
Re
sp
on
sib
ilit
y R
ep
ort
20
21
/ G
ree
n f
ina
nc
ing
of
the
Gro
up
ac
tivi
tie
s
CRITERIA DESCRIPTION REVIEW AGAINST FRAMEWORK CRITERIA
IMPACT METRICS
RELEVANCE OF METRICS
TRANSPARENCY CONSIDERATIONS
Renewable
Energy
— Projects, in-
vestments and expen-
ditures in products,
technologies and
services ranging
from the generation
and transmission of
energy to the manu-
facturing of related
equipment inclu-
ding among others
onshore and offshore
renewable energy fa-
cilities. This includes
among others solar,
wind, hydro, and
geothermal energy
projects.
DISCREPANCY
IDENTIFIED
— In our Second Opi-
nion, we noted that VGP
expects most proceeds
to be allocated in a ba-
lanced way between re-
newable energy projects
and green buildings. Ho-
wever, only a minor share
(less than 5%) has been
allocated to renewable
energy projects.
— The issuer confirmed
that only solar PV pro-
jects have been financed.
— Annual
production
capacity (KWp)
— Total green
energy generated
(MWh)
— Avoided CO₂
emissions (tCO₂e).
The metrics
provide a fair
indication of the
environmental
impact of the
investment.
The metric is
commonly used
in green finance
reporting and are
core indicators
in the ICMA
Handbook.
Energy
generation and
avoided emissions
are reported on a
portfolio basis, while
production capacity
is reported at a
project-level.
VGP reports
on capacity of both
installed projects
and those under
construction.
This is helpful
and transparent
information.
Methodology,
including grid factor,
is disclosed for
calculating avoided
emissions.
Green
Buildings
— Projects,
investments, and ex-
penditures in relation
to real estate assets
which have received,
or are designed and
intended to receive,
BREAAM “Very Good”
certification (or equi-
valent DGNB/LEED
rating).
NO DISCREPANCIES
IDENTIFIED
— The largest share
of proceeds has been
allocated to this project
category.
— VGP has selected
DGNB Silver, and LEED
Silver as equivalent to
BREEAM Very Good.
The company bases the
equivalence on a paper
dated 2014³. Investors
should note there is no
consensus about the
equivalence of different
certification schemes.
— The company
confirmed that if
any buildings fail to
receive environmental
certification as above
mentioned, they will be
removed from the green
bond portfolio.
— The company
informed us that that
no proceeds have been
allocated to gas heating
systems and that no oil-
-fired heating systems
have been installed
in any of its buildings
included under the Green
Framework.
— Environmental
certification
achieved or
expected to be
achieved.
The metric in-
dicates which buil-
dings have attained
what environmental
certifications (or
are expected to do
so). However, given
that environmental
certifications do
not guarantee e.g.,
a specific energy
use, use of additio-
nal indicators such
as energy use is
encouraged.
Reporting
on environmental
certifications is
common in green
finance reporting
and is a core
indicator in the
ICMA Handbook.
VGP is
reporting on the
level of certification
achieved on a
project-by-project
basis.
VGP could
provide more
transparency by
reporting on other
relevant metrics
contained in the
ICMA Handbook.
Detailed ReviewTable 1
3 A comparison between BREEAM, LEED, and DGNB rating levels Source: DGNB... | Download Scientific Diagram (researchgate.net)

PAG
E 1
84
—
V
GP
NV
Co
rpo
rate
Re
sp
on
sib
ilit
y R
ep
ort
20
21
/ G
ree
n f
ina
nc
ing
of
the
Gro
up
ac
tivi
tie
s
CRITERIA DESCRIPTION REVIEW AGAINST FRAMEWORK CRITERIA
IMPACT METRICS
RELEVANCE OF METRICS
TRANSPARENCY CONSIDERATIONS
Sustainable
water and
wastewater
management
— Reduction
of freshwater
consumption.
— Capturing and
recycling rainwater.
— Green roofing.
NO DISCREPANCIES
IDENTIFIED
— A minor share has
been allocated to this
project category.
— The Report menti-
ons different projects
financed bin this project
category, including: the
construction of infiltra-
tion basins including
plants/vegetation; the
construction of rainwater
channels with rainwa-
ter retention basin; the
utilization of rainwater
for toilet facilities; the
creation of rainwater cha-
nnels with large rainwa-
ter retention basins; the
installation of infiltration
crates; and the develop-
ment of green roofs for
water retention.
— N/A – no
impacts reported.
N/A – no
impacts reported.
We encourage VGP
to report impacts for
this project category.
Indicators should
ideally align with the
ICMA Handbook.

PAG
E 1
85
—
VG
P N
V C
orp
ora
te R
es
po
ns
ibil
ity
Re
po
rt 2
02
1 /
Gre
en
fin
an
cin
g o
f th
e G
rou
p a
cti
viti
es
Examples of biodiversity initiatives on VGP Parks
VGP Park Berlin – Bird boxes
VGP Park Nijmegen – Wood wall provides living space for many
smalller animals
VGP Park Vyškov – Insect hotel
VGP Park Berlin – Water trenches to retain excess rainwater and ecoductVGP Park Frankenthal – Beehives

PAG
E 1
86
—
V
GP
NV
Co
rpo
rate
Re
sp
on
sib
ilit
y R
ep
ort
20
21
/ A
dd
itio
na
l in
form
ati
on
Reporting
TCFD Disclosure
GovernanceDisclose the organisation’s
governance around climate-
related risks and opportunities.
The Board has overall responsibility for
ensuring that risks, including climate-
related risks and opportunities, are
eff ectively and consistently managed
throughout the Group. The Board
delegates the execution of the risk
management process to the Chief
Executive Offi cer. On the operational
level, the management team defi nes
implementation strategies and
priorities with respect to group-wide
Environmental targets. The respective
Country Manager, supported by
the Chief Technical Offi cer, is
responsible for ensuring that our
environmental (and other) targets are
met on both existing assets and new
developments.
The Chief Technical Offi cer has
Group-wide responsibility related to
sustainability in our building practices
on a day-to-day basis and works with
a network of representatives across
the business with the sustainable
certifi cation team, that support VGP’s
sustainability objectives by sharing
best practice and providing legislative
and technical guidance for their
respective areas of the business.
For further information on
Governance, please refer to: page 170
and the Annual Report 2021
StrategyDisclose the actual and potential
impacts of climate-related
risks and opportunities on the
organisation’s businesses,
strategy, and financial planning
where such information is material
As a long-term property owner, we
need to ensure that our buildings are
fi t for purpose, now and in the future.
One of the ways we do this is to build
relatively generic buildings conform
“the VGP Standard”, suited to more
than one type of client. This ensures a
longer lifespan for the building as well
as reducing the risk of vacancy and
future refurbishment costs.
In order to ensure that our buildings
are fi t for purpose and meet the
requirements of our clients for the long
term we have integrated adaptation
and mitigation into our standard
building design. With the potential for
a changing climate across Europe, we
ensure that aspects such as heating
and sustainable drainage are assessed
as part of the design. Although these
adaptations involve additional cost, we
believe that buildings with enhanced
sustainability aspects will increasingly
be valued more highly than those
without.
Climate Change adaptation is now
a standard process of our design and
maintenance programme. We have
identifi ed climate change as a risk to
the ongoing operation of our buildings
and are considering implications in
prioritisation including enhanced
drainage.
EU Taxonomy
VGP is currently assessing the
implications of EU Taxonomy
compliance requirements for its
portfolio. Whilst the EU rule setting
is mostly determined, the fi nal
requirements will depend on local
implementation by EU countries with
respect to the nearly zero-energy
building (NZEB) requirements in
national measures implementing
Directive 2010/31/EU.
Although this leaves a level of
uncertainty, we believe this to be
manageable and, on this basis, can
commit to aim to be compliant with EU
Taxonomy on a portfolio basis once
the rules are implemented on the
following basis:
1) To update the Green Finance
Framework with EU Taxonomy
once fi nally implemented
2) Plan to monitor assets compliance
with the “Use of Proceeds”-table
which will be made available
as part of the annual Corporate
Responsibility Reporting
3) Aim to be compliant with EU
Taxonomy for new buildings on
a best-eff orts basis
With respect to broader stakeholder
engagement, EU Taxonomy
compliance has also been agreed as
part of the ESG framework within the
4th Joint Venture with Allianz Real
Estate.
CRREM pathway
Good cooperation with tenants
is a critical part of the success
in improving the environmental
standards as the Group is determined
to continue to work towards a more
sustainable and resilient real estate
portfolio. VGP considers using CRREM
benchmark energy and CO₂ reduction
pathways for measuring transitional
risks and setting emission reduction
targets for its real estate portfolio.
Over the last few months we have
been working with the CRREM Tool to
analyse and fi ne-tune logistic-specifi c
pathways particularly in order to refl ect
the subsector specifi cs (e.g. diff erent
energy consumption profi les for light
industrial users versus e-commerce
fulfi lment versus ‘straightforward’
warehousing versus cooling facilities,
etc.). Our plan is to ultimately adopt
the CRREM Tool to be able to identify
and separate the stranded versus
non-stranded assets for the coming
years in order to ensure our portfolio
remains compliant with the 1.5oC GHG
pathway.
We have assessed diff erent target-
setting options using the CRREM
Additional information

PAG
E 1
87
—
VG
P N
V C
orp
ora
te R
es
po
ns
ibil
ity
Re
po
rt 2
02
1 /
Ad
dit
ion
al
info
rma
tio
n
pathways and are also considering pathways from other sources and providers.
Although further work remains to be done, particularly in order to refl ect the
subsector specifi cs, we believe that CRREM provides a good reference framework
for setting emission reduction targets for our real estate portfolio.
The results of the CRREM support us in analysing our portfolio performance,
identifying scenarios and the setting of future emission reduction targets for our
portfolio as part of TCFD reporting.
With respect to broader stakeholder engagement, CRREM compliance has
also been agreed as part of the ESG framework within the 4th Joint Venture with
Allianz Real Estate.
Global Reporting Initiative (GRI) Index
This Corporate Responsibility Report describes how we address corporate
sustainability, how we implement our sustainability strategy, the policies
and guidelines we observe, the targets we have set ourselves including the
Sustainable Development Goals (SDGs) and our main achievements.
This Corporate Responsibility Report has been prepared in accordance with the
GRI Standards: Core Option. and has not been externally audited. The GRI Content
Index can be found below.
CRITERIA DESCRIPTION REFERENCE
102-1 Name of the organization VGP NV
102-2 Activities, brands, products and services VGP is a pan-European developer, manager and owner of high-
quality logistics and semi-industrial real estate. VGP operates a
fully integrated business model with capabilities and longstanding
expertise across the value chain. The company has a development
land bank (owned or committed) of 10.94 million m² and the strategic
focus is on the development of business parks. Founded in 1998 as
a Belgian family-owned real estate developer in the Czech Republic,
VGP with a staff of circa 350 employees today owns and operates
assets in 14 European countries directly and through several 50:50
joint ventures.
102-3 Location of headquarters Generaal Lemanstraat 55 bus 4, B-2018 Antwerp, Belgium
102-4 Location of operations Office locations (for park locations refer to our website:
www.vgpparks.eu/en/properties/):
Vienna, Austria;
Prague, Czech Republic;
Jenišovice u Jablonce nad Nisou, Czech Republic;
Lyon, France;
Dusseldorf, Germany;
Athens, Greece;
Budapest; Hungary;
Gyor, Hungary;
Rome, Italy;
Segrate (Milan), Italy;
Riga, Latvia;
Luxembourg, Luxembourg;
's-Hertogenbosch, Netherlands
Lisbon, Portugal;
Porto, Portugal;
Bucharest, Romania;
Novi Beograd, Serbia;
Bratislava, Slovakia;
Barcelona, Spain;
Madrid, Spain;
Zaragoza, Spain
102-5 Ownership and legal form Ownership information can be found on our website:
https://www.vgpparks.eu/en/investors/shareholding/
Legal form of the group is Naamloze Vennootschap (“NV”) which is a
type of public limited company defined by business law in Belgium
102-6 Markets served https://www.vgpparks.eu/en/about-us/
102-7 Scale of the organization https://www.vgpparks.eu/en/about-us/
102-8 Information on employees and other workers See disclosure in relation to People on page 150
102-9 Supply chain See section on Supply chain ethics on page 152-153

PAG
E 1
88
—
V
GP
NV
Co
rpo
rate
Re
sp
on
sib
ilit
y R
ep
ort
20
21
/ A
dd
itio
na
l in
form
ati
on
CRITERIA DESCRIPTION REFERENCE
102-10 Significant changes to the organization
and supply chain
Change includes VGP and Allianz entering a fourth joint venture
which will become effective after the first closing (expected in 2022)
102-11 Precautionary Principle or approach VGP applies the precautionary principle to risk management
102-12 External initiatives United Nations Sustainable Development Goals
United Nations Global Compact
GRI
PAS 2060 standard for carbon neutrality and the GHG Protocol
GRESB
TCFD disclosure
102-13 Membership of associations Professional membership of various associations in the countries in
which we operate
Professional member of European Public Real Estate Association
102-14 Statement from senior decision-maker CEO letter on page 124-125
102-16 Values, principles, standards and norms of
behaviour
Refer to page 134-135 for our commitmenst to the SDG principles
Refer to page 136-137 for our commitment to climate change
strategy
Refer to page 140-141 for our commitment to sustainable properties
Refer to page 146-147 for our commitment to people, culture and
employee well-being
Refer to page 160 for Business Ethics
102-18 Governance structure https://www.vgpparks.eu/en/investors/corporate-governance/
102-40 List of all stakeholder groups See section on Engaging with stakeholders on page 130-131
102-41 Collective bargaining agreements Refer to ‘Human Rights labour conditions’ Page 148
102-42 Identifying and selecting stakeholders See section on Engaging with stakeholders on page 130-131
102-43 Approach to stakeholder engagement See section on Engaging with stakeholders on page 130-131
102-44 Key topics and concerns raised Captured in our material aspects
102-45 Entities included in the consolidated financial
statements
See annual report
102-46 Defining report content and topic boundaries See section Additional Informationt on page 186-187
102-47 List of material topics See page 134 and page 135
102-48 Restatements of information No restatements have been made compared to the prior year
Corporate Responsibility report
102-49 Changes in reporting The list of material topics is substantially the same as last year
except six updates as described on page 132
The section Commitments has been extended (ref page 130-155),
An ESG Risk Management section has been added to the report.
(ref. page 158-170)
102-50 Reporting period Reporting period is 12 months, applying the calendar year
102-51 Date of most recent report The previous report is the Corporate Responsibility report 2020
which was published on 2 March 2021. The report is available on
the website: https://www.vgpparks.eu/media/2921/vgp_corporate-
responsility-2020_eng_web_secured.pdf
102-52 Reporting cycle We foresee to continue publishing a Corporate Responsibility report
on an annual basis. Our financial reporting is on a semi-annual basis.
102-53 Contact person for questions regarding the report [email protected]
102-54 Claims of reporting in accordance with the GRI
standard
This report has been prepared in accordance with the GRI
standards: Core option
102-55 GRI content index Included
102-56 External assurance All the energy consumption data, as well as the carbon emission
calculations used in this report have been third-party validated
(see the About This Report section on page 128). VGP engaged an
independent auditor to verify the assets financed under the Green
Finance Framework meet the eligibility criteria (See Independent
Third Party's Report on Green Bond criteria on page 180-184).
201-1 Direct economic value generated and distributed See FY 2021 results press release as released dd 23 February 2022
201-2 Financial implications and other risks and
opportunities due to climate change
See Addressing Climate Risk on pages 136-137
205-1 Operations assessed for risks related to corruption See section on resilience and integrity on pages 148-149

PAG
E 1
89
—
V
GP
NV
Co
rpo
rate
Re
sp
on
sib
ilit
y R
ep
ort
20
21
/ A
dd
itio
na
l in
form
ati
on
CRITERIA DESCRIPTION REFERENCE
205-2 Communication and training about anti-corruption
policies and procedures
Refer to ‘human rights and labour conditions’ Page 148 and refer to
‘supply chain management’ page 150-151
205-3 Confirmed incidents of corruption and actions
taken
Refer to ‘Business Ethics’ page 160
206-1 Legal actions for anti-competitive behaviour,
anti-trust, and monopoly practices
VGP is not subject to legal actions related to anti-competitive
behaviour, anti-trust, and monopoly practices
302-1 Energy consumption within the organization See section on sustainable energy usage pages 136-137
302-4 Reduction of energy consumption See section on sustainable energy usage pages 136-137
304-4 IUCN Red List species and national conservation
list species with habitats in areas affected by
operations
Ecologists are engaged to research, identify and report on
threatened species, terrestrial or aquatic, on development sites
(refer to page 145)
305-1 Direct (scope 1) GHG emissions See Total CO₂ footprint on page 136-137
305-2 Energy indirect (scope 2) GHG emissions See Total CO₂ footprint on page 136-137
305-3 Other indirect (scope 3) GHG emissions See Total CO₂ footprint on page 136-137
305-5 Reduction of greenhouse gas emissions See Total CO₂ footprint on page 134-135
306-2 Management of significant waste related impacts See Long-term target to reach carbon neutrality under scope 1
and 2 before 2025 on page 134-135
306-3 Composition of waste generated Total waste emissions are 4.8 tCO₂e, or 0.2% of total emissions.
82% of waste emissions result from residual waste, while only
representing 32% of the generated waste. Whereas paper waste
caused only 16% of waste emissions and 64% of waste generation.
Waste emissions are mainly calculated based on an extrapolation
of data from the Belgian office (residual, paper and plastic waste)
or benchmark data when extra fractions were sorted
306-5 Waste directed to disposal VGP does not transport hazardous waste as part of day-to-day
operations. If remediation is required, within the development of
a project, VGP appoints principal contractors to complete works in
accordance with applicable law and regulations.
No occurrences of significant spills were identified
307-1 Non-compliance with environmental laws and
regulations
No significant breaches of environmental laws
401-3 Parental leave See page 150 ‘Workforce’ ; information on parental leave take-up and
return rates is not available at this stage
403-1 Occupational health and safety management
system
See section on ‘occupational Health and Safety’ page 147 and
‘Health, safety, security and wellbeing of people in our properties’
page 161
403-2 Hazard identification, risk assessment
and incident investigation
See section on ‘the Environmental management system’page 161
403-3 Occupational health services See section on ‘occupational Health and Safety’ page 147 and ‘Health,
safety, security and wellbeing of people in our properties’ page 161
403-4 Worker participation, consultation and
communication on occupational health and safety
See section on ‘the Environmental management system’ page 161
403-5 Worker training on occupational health and safety See section on Occupational Health and Safety, page 147
403-9 Work-related injuries See section on ‘occupational Health and Safety’ page 147
404-3 Percentage of employees receiving regular
performance and career development reviews
See section on ‘people, culture and employee well-being’ page 146
405-1 Diversity of governance bodies and employees See section on ‘workforce’ page 151
407-1 Operations and suppliers in which the right to
freedom of association and collective bargaining
may be at risk
See section on ‘political engagement and public policy’ page 149
413-1 Operations with local community engagement,
impact assessments, and development programs
See section on ‘VGP Foundation’ on pages 156-157
414-1 New suppliers that were screened using
social criteria
See section on 'supply chain management’ on pages 150-151
418-1 Substantiated complaints concerning breaches of
customer privacy and losses of customer data
There were no reported incidents


Portfolio

The Netherlands82 VGP Park Nijmegen
83 VGP Park Roosendaal
84 VGP Park Moerdijk
Germany01 VGP Park Hamburg
02 VGP Park Soltau
03 VGP Park Leipzig
04 VGP Park Leipzig Flughafen
05 VGP Park Berlin
06 VGP Park Berlin Oberkrämer
07 VGP Park Ginsheim
08 VGP Park Schwalbach
09 VGP Park München
10 VGP Park Bingen
11 VGP Park Rodgau
12 VGP Park Höchstadt
13 VGP Park Borna
14 VGP Park Bobenheim-Roxheim
15 VGP Park Frankenthal
16 VGP Park Wustermark
17 VGP Park Göttingen
18 VGP Park Göttingen 2
19 VGP Park Wetzlar
20 VGP Park Halle
21 VGP Park Dresden - Radeburg
22 VGP Park Bischofsheim
23 VGP Park Giessen-Buseck
24 VGP Park Giessen-Lützellinden
25 VGP Park Giessen Am alten Flughafen
26 VGP Park Chemnitz
27 VGP Park Magdeburg
28 VGP Park Laatzen
29 VGP Park Einbeck
30 VGP Park Erfurt
31 VGP Park Rostock
32 VGP Park Erfurt 2
33 VGP Park Erfurt 3
34 VGP Park Wiesloch-Walldorf
Spain51 VGP Park San Fernado de Henares
52 VGP Park Lliçà d’Amunt
53 VGP Park Fuenlabrada
54 VGP Park Valencia Cheste
55 VGP Park Zaragoza
56 VGP Park Sevilla Dos Hermanas
57 VGP Park Sevilla Ciudad de la Imagen
58 VGP Park Granollers
59 VGP Park Martorell
60 VGP Park La Naval
61 VGP Park Burgos
62 VGP Park Belartza
Portugal91 VGP Park Santa Maria da Feira
92 VGP Park Sintra

Austria80 VGP Park Graz
81 VGP Park Laxenburg
Czech Republic35 VGP Park Tuchoměřice
36 VGP Park Ústí nad Labem
37 VGP Park Český Újezd
38 VGP Park Liberec
39 VGP Park Olomouc
40 VGP Park Jeneč
41 VGP Park Chomutov
42 VGP Park Brno
43 VGP Park Hrádek nad Nisou
44 VGP Park Hrádek nad Nisou 2
45 VGP Park Plzeň
46 VGP Park Prostějov
47 VGP Park Vyškov
48 VGP Park České Budějovice
49 VGP Park Kladno
50 VGP Park Ústí nad Labem City
Latvia63 VGP Park Kekava
64 VGP Park Riga
65 VGP Park Tiraines
Slovakia77 VGP Park Malacky
78 VGP Park Bratislava
79 VGP Park Zvolen
Italy85 VGP Park Calcio
86 VGP Park Valsamoggia
87 VGP Park Valsamoggia 2
88 VGP Park Sordio
89 VGP Park Padova
90 VGP Park Paderno Dugnano
Romania66 VGP Park Timișoara
67 VGP Park Sibiu
68 VGP Park Brașov
69 VGP Park Arad
70 VGP Park Bucharest
Hungary71 VGP Park Győr
72 VGP Park Győr Béta
73 VGP Park Alsónémedi
74 VGP Park Hatvan
75 VGP Park Kecskemét
76 VGP Park Budapest Aerozone
Serbia93 VGP Park Belgrade Dobanovice

Hamburg
LeipzigBonn
Hannover
Frankfurt am Main
Nürnberg
Stuttgart
München
Karlsruhe
2124 254 255
23 26
27
18
10
03
07
09
06
2
13
14 3411141411111111115
20
28
29
30
31
0322222
33
18
17
12
01
02
FFFFF777
08
05
zigg
030303030303000000000004
00
000005
16
2323232222222222219
11
022
Berlin

Germany01 VGP Park Hamburg
02 VGP Park Soltau
03 VGP Park Leipzig
04 VGP Park Leipzig Flughafen
05 VGP Park Berlin
06 VGP Park Berlin Oberkrämer
07 VGP Park Ginsheim
08 VGP Park Schwalbach
09 VGP Park München
10 VGP Park Bingen
11 VGP Park Rodgau
12 VGP Park Höchstadt
13 VGP Park Borna
14 VGP Park Bobenheim-Roxheim
15 VGP Park Frankenthal
16 VGP Park Wustermark
17 VGP Park Göttingen
18 VGP Park Göttingen 2
19 VGP Park Wetzlar
20 VGP Park Halle
21 VGP Park Dresden - Radeburg
22 VGP Park Bischofsheim
23 VGP Park Giessen-Buseck
24 VGP Park Giessen-Lützellinden
25 VGP Park Giessen Am alten Flughafen
26 VGP Park Chemnitz
27 VGP Park Magdeburg
28 VGP Park Laatzen
29 VGP Park Einbeck
30 VGP Park Erfurt
31 VGP Park Rostock
32 VGP Park Erfurt 2
33 VGP Park Erfurt 3
34 VGP Park Wiesloch-Walldorf PAG
E 1
95
—
V
GP
NV
An
nu
al
Re
po
rt 2
02
1 /
Po
rtfo
lio
/ G
erm
an
y

Germany
VGP Park BerlinBUILDING F
tenant DD Logistik Vertriebs GmbH
lettable area 24,860 m² built 2020
Germany
VGP Park BerlinBUILDING E
tenant DD Logistik Vertriebs GmbH
lettable area 20,537 m² built 2020
Germany
VGP Park BerlinBUILDING D
tenant Lidl Digital FC GmbH & Co. KG; Solardach LLG GmbH
lettable area 53,675 m² built 2017
Germany
VGP Park BerlinBUILDING C
tenant SSW Stolze Stahl Waren GmbH; DefShop GmbH;
Pets Deli Tonius GmbH, VGP PM Services GmbH,
VGP Renewable Energy S.à r.l.
lettable area 26,062 m² built 2018
Germany
VGP Park BerlinBUILDING B
tenant Lillydoo Services GmbH, VGP Renewable Energy S.à r.l.
lettable area 9,717 m² built 2018
Germany
VGP Park BerlinBUILDING A
tenant Emons Logistik GmbH; Barsan Global Logistik GmbH;
Emsland-Stärke GmbH; Isringhausen GmbH & Co. KG,
VGP Renewable Energy S.à r.l.
lettable area 23,853 m² built 2015
PAG
E 1
96
—
V
GP
NV
An
nu
al
Re
po
rt 2
02
1 /
Po
rtfo
lio
/ G
erm
an
y

Germany
VGP Park FrankenthalBUILDING A
tenant Amazon Logistik Frankenthal GmbH;
PV Frankenthal GmbH & Co KG
lettable area 146,898 m² built 2018
Germany
VGP Park BornaBUILDING A
tenant Lekkerland SE; VGP Renewable Energy S.à.r.l.
lettable area 13,618 m² built 2016
Germany
VGP Park Bobenheim-RoxheimBUILDING A
tenant Lekkerland SE; Energie Südwest – Grüne Energie GmbH
lettable area 23,270 m² built 2016
Germany
VGP Park BingenBUILDING A
tenant Custom Chrome Europe GmbH
lettable area 6,400 m² built 2014
Germany
VGP Park BerlinBUILDING H
tenant Zalando Lounge Logistics SE & Co. KG
lettable area 23,094 m² built 2019
Germany
VGP Park BerlinBUILDING G
tenant Logit Services GmbH; Pietsch GmbH; Alfred Kärcher
Vertriebs-GmbH; Messenger Fullfillment GmbH
lettable area 11,725 m² built 2020
PAG
E 1
97
—
VG
P N
V A
nn
ua
l R
ep
ort
20
21
/ P
ort
foli
o /
Ge
rma
ny

Germany
VGP Park HamburgBUILDING A4
tenant LZ Logistik GmbH; Energie Südwest-Grüne Energie GmbH
lettable area 14,471 m² built 2016
Germany
VGP Park Hamburg BUILDING A3
tenant Zebco Europe GmbH; Hausmann Logistik GmbH
lettable area 9,471 m² built 2015
Germany
VGP Park HamburgBUILDING A2
tenant MH Handel GmbH, VGP Renewable Energy S.à r.l.
lettable area 20,064 m² built 2015
Germany
VGP Park HamburgBUILDING A1
tenant Hausmann Logistik GmbH; Drive Medical GmbH & Co. KG;
CHEP Deutschland GmbH, VGP Renewable Energy S.à r.l.
lettable area 24,750 m² built 2014–2016
Germany
VGP Park HamburgBUILDING A0
tenant GEODIS CL Germany GmbH; Nippon Express (Deutschland)
GmbH; Weidner & Neese GmbH; EGC Energie- und
Gebäudetechnik Control GmbH & Co. KG; MH Handel GmbH
lettable area 29,885 m² built 2013
Germany
VGP Park GinsheimBUILDING A
tenant INDAT Robotics GmbH; Greenyard Fresh Germany GmbH;
4PX Express GmbH; Vicampo.de GmbH;
VGP Renewable Energy S.à.r.l.
lettable area 35,636 m² built 2017
PAG
E 1
98
—
V
GP
NV
An
nu
al
Re
po
rt 2
02
1 /
Po
rtfo
lio
/ G
erm
an
y

Germany
VGP Park HamburgBUILDING D1
tenant AO Deutschland Ltd.
lettable area 2,502 m² built 2015
Germany
VGP Park HamburgBUILDING C
tenant Rieck Projekt Kontrakt Logistik Hamburg GmbH & Co. KG,
VGP Renewable Energy S.à r.l.
lettable area 23,680 m² built 2017
Germany
VGP Park HamburgBUILDING B3
tenant CARGO-PARTNER GmbH;
Lagerei und Spedition Dirk Vollmer GmbH,
VGP PM Services GmbH
lettable area 9,455 m² built 2017
Germany
VGP Park HamburgBUILDING B2
tenant Geis Industrie-Service GmbH; Karl Heinz Dietrich
GmbH & Co KG; Lagerei und Spedition Dirk Vollmer GmbH;
VGP Renewable Energy S.à.r.l.
lettable area 40,587 m² built 2017
Germany
VGP Park HamburgBUILDING B1
tenant Rhenus Warehousing Solution SE & Co.KG
lettable area 57,471 m² built 2015–2017
Germany
VGP Park HamburgBUILDING A5
tenant Landgard eG; Kohivo Green-Investment GmbH & Co. KG
lettable area 13,167 m² built 2018
PAG
E 1
99
—
V
GP
NV
An
nu
al
Re
po
rt 2
02
1 /
Po
rtfo
lio
/ G
erm
an
y

Germany
VGP Park RodgauBUILDING B
tenant Rhenus Warehousing Solution SE & Co.KG
lettable area 43,375 m² built 2016
Germany
VGP Park RodgauBUILDING A
tenant A & O GmbH, Geis Ersatzteil-Service GmbH;
PTG Lohnabfüllung GmbH; toom Baumarkt GmbH
lettable area 24,878 m² built 2016
Germany
VGP Park LeipzigBUILDING B1
tenant USM operations GmbH; Solardach LLG GmbH
lettable area 24,630 m² built 2017
Germany
VGP Park LeipzigBUILDING A2
tenant Flaschenpost Leipzig GmbH;
Energie Südwest – Grüne Energie GmbH
lettable area 9,630 m² built 2019
Germany
VGP Park LeipzigBUILDING A1
tenant Deine Tür GmbH; Kohivo Green-Investment GmbH & Co. KG
lettable area 7,231 m² built 2019
Germany
VGP Park HöchstadtBUILDING A
tenant C&A Mode GmbH & Co. KG; VGP Renewable Energy S.à.r.l.
lettable area 15,002 m² built 2015
PAG
E 2
00
—
V
GP
NV
An
nu
al
Re
po
rt 2
02
1 /
Po
rtfo
lio
/ G
erm
an
y

Germany
VGP Park RodgauBUILDING C
tenant toom Baumarkt GmbH, VGP Renewable Energy S.à r.l.
lettable area 19,783 m² built 2015
Germany
VGP Park WetzlarBUILDING A
tenant Ancla Logistik GmbH
lettable area 19,016 m² built 2018–2019
Germany
VGP Park SoltauBUILDING A
tenant AUDI AG; VGP Renewable Energy S.à r.l.
lettable area 55,812 m² built 2016
Germany
VGP Park SchwalbachBUILDING A
tenant Stronghold Germany GmbH; VGP Renewable Energy S.à.r.l.
lettable area 8,387 m² built 2017
Germany
VGP Park RodgauBUILDING E
tenant PTG Lohnabfüllung GmbH
lettable area 8,734 m² built 2015
Germany
VGP Park RodgauBUILDING D
tenant EBARA Pumps Europe S.p.A.;
ASENDIA Operations GmbH & Co KG
lettable area 7,062 m² built 2016
PAG
E 2
01
—
VG
P N
V A
nn
ua
l R
ep
ort
20
21
/ P
ort
foli
o /
Ge
rma
ny

Germany
VGP Park WustermarkBUILDING A1
tenant Colossus Logistics GmbH & Co. KG, L&B leit- und
Sicherungstechnische Dienstleistungs, SEREDA GmbH,
VGP PM Services GmbH, VGP Renewable Energy S.à r.l.
lettable area 10,998 m² built 2021
Germany
VGP Park GöttingenBUILDING C
tenant MediaMarktSaturn Beschaffung und Logistik GmbH,
VGP Renewable Energy S.à r.l.
lettable area 80,158 m² built 2021
Germany
VGP Park GöttingenBUILDING E
tenant Van Waveren Saaten GmbH
lettable area 6,046 m² built 2019
Germany
VGP Park GöttingenBUILDING B
tenant Amazon EU S.a.r.l.; Niederlassung Deutschland
lettable area 38,381 m² built 2019
Germany
VGP Park GöttingenBUILDING A
tenant Friedrich ZUFALL GmbH & Co. KG; Amazon EU S.a.r.l.;
Niederlassung Deutschland; VGP Renewable Energy S.à.r.l.
lettable area 43,001 m² built 2018
Germany
VGP Park WetzlarBUILDING B
tenant POCO Einrichtungsmärkte GmbH; Global Cargo Service
GmbH; Strieder Transport Logistik GmbH;
ILIOS Energie PV3 GmbH, Ancla Logistik GmbH
lettable area 19,265 m² built 2018
PAG
E 2
02
—
V
GP
NV
An
nu
al
Re
po
rt 2
02
1 /
Po
rtfo
lio
/ G
erm
an
y

Germany
VGP Park WustermarkBUILDING B1
tenant Schulze Logistik Berlin GmbH; Gläser und Flaschen GmbH;
box at Work gmbH; Teppich Tetik GmbH
lettable area 29,624 m² built 2020
Germany
VGP Park WustermarkBUILDING C1
tenant Wepoba Wellpappenfabrik GmbH
lettable area 12,800 m² built 2018
Germany
VGP Park WustermarkBUILDING C2
tenant TA Technix GmbH
lettable area 6,382 m² built 2018
Germany
VGP Park DresdenBUILDING A
tenant Schenker Deutschland AG;
Kohivo Green-Investment GmbH & Co. KG
lettable area 20,285 m² built 2018
Germany
VGP Park BischofsheimBUILDING A
tenant Bettmer GmbH; Wendel Energie UG
lettable area 6,659 m² built 2019
Germany
VGP Park WustermarkBUILDING A2
tenant Wardow GmbH
lettable area 11,916 m² built 2019
PAG
E 2
03
—
V
GP
NV
An
nu
al
Re
po
rt 2
02
1 /
Po
rtfo
lio
/ G
erm
an
y

Germany
VGP Park Giessen-LützellindenBUILDING A
tenant BiUno GmbH; VGP Renewable Energy S.a.r.l.
lettable area 14,156 m² built 2020
Germany
VGP Park Giessen-BuseckBUILDING A
tenant PROLIT Verlagsauslieferung GmbH;
JingDong Development Deutschland GmbH,
VGP Renewable Energy S.à r.l.
lettable area 17,357 m² built 2020
Germany
VGP Park ChemnitzBUILDING A
tenant ThyssenKrupp System Engineering GmbH,
VGP Renewable Energy S.à r.l.
lettable area 12,590 m² built 2019
Germany
VGP Park EinbeckBUILDING A
tenant Burgsmüller GmbH
lettable area 8,883 m² built 2020
Germany
VGP Park HalleBUILDING B
tenant Landgard eG; Ceha Deutschland GmbH;
Schenker Deutschland AG
lettable area 26,847 m² built 2020–2021
Germany
VGP Park HalleBUILDING A
tenant L’ISOLANTE K-FLEX GmbH; TTM GmbH Internationale
Spedition
lettable area 21,262 m² built 2019, 2020
PAG
E 2
04
—
V
GP
NV
An
nu
al
Re
po
rt 2
02
1 /
Po
rtfo
lio
/ G
erm
an
y

Germany
VGP Park MünchenBUILDING A1
tenan Bayerische Motoren Werke Aktiengesellschaft, VGP Renewable
Energy S.à r.l., VGP Renewable Energy Deutschland GmbH
lettable area 37,625 m² built 2020
Germany
VGP Park LaatzenBUILDING C
tenant Connox GmbH
lettable area 51,261 m² built 2021
Germany
VGP Park MünchenBUILDING PH NORD
tenant Bayerische Motoren Werke Aktiengesellschaft;
Krauss Maffei Technologies GmbH
lettable area 22,850 m² built 2020
Germany
VGP Park LaatzenBUILDING D
tenant EDEKA Einkaufskontor GmbH
lettable area 8,519 m² built 2021
Germany
VGP Park MagdeburgBUILDING A
tenant REWE Markt GmbH, VGP Renewable Energy S.à r.l.
lettable area 31,870 m² built 2020
Germany
VGP Park MagdeburgBUILDING B
tenant Imperial Logistics & Services GmbH, Hörmann Logistic Solutions
GmbH, APM Autoteile GmbH, VGP Renewable Energy S.à r.l.
lettable area 41,559 m² built 2021
PAG
E 2
05
—
V
GP
NV
An
nu
al
Re
po
rt 2
02
1 /
Po
rtfo
lio
/ G
erm
an
y

Germany
VGP Park ErfurtBUILDING A
tenant Emons Logistik GmbH, JOST-Werke Logistics GmbH, KOMSA AG,
VGP Renewable Energy S.à r.l.
lettable area 26,280 m² built 2021
Germany
VGP Park LaatzenBUILDING PH OST
tenant Krauss Maffei Extrusion GmbH, EDEKA Einkaufskontor GmbH
lettable area 12,478 m² built 2021
PAG
E 2
06
—
V
GP
NV
An
nu
al
Re
po
rt 2
02
1 /
Po
rtfo
lio
/ C
ou
ntr
y

VGP PARK OWNER LAND AREA
(m²)
LETTABLE AREA (m²) CONTRACTEDANNUAL
RENT(in million €)
COMPLETED UNDER CONSTRUC-
TION
POTENTIAL TOTAL
VGP Park Hamburg VGP 32,362 — — 9,700 9,700 —
VGP Park Göttingen 2 VGP 173,375 86,203 — — 86,203 4.9
VGP Park Halle VGP 165,888 48,108 37,855 — 85,964 3.8
VGP Park Gießen Am
alten Flughafen
VGP 316,603 — 246,403 — 246,403 16.1
VGP Park Magdeburg VGP 604,858 73,428 116,818 103,894 294,140 8.0
VGP Park Laatzen VGP 284,987 72,258 66,538 — 138,796 10.1
VGP Park Erfurt VGP 50,265 26,280 — — 26,280 1.3
VGP Park Erfurt 2 VGP 76,443 — — 39,282 39,282 —
VGP Park Erfurt 3 VGP 46,840 — — 28,356 28,356 —
VGP Park Berlin
Oberkrämer
VGP 180,052 — 34,293 24,099 58,391 4.3
VGP Park Rostock VGP 105,217 — 20,160 28,024 48,184 —
VGP Park Leipzig
Flughafen
VGP 47,361 — 16,285 — 16,285 0.9
VGP Park Wiesloch-
Walldorf
VGP 129,867 — — 74,746 74,746 —
VGP Park Berlin 4 VGP 54,816 — 17,328 4,879 22,207 0.9
TOTAL VGP 2,268,934 306,277 555,680 312,980 1,174,936 50.3
PAG
E 2
07
—
VG
P N
V A
nn
ua
l R
ep
ort
20
21
/ P
ort
foli
o /
Co
un
try

VGP PARK OWNER LAND AREA
(m²)
LETTABLE AREA (m²) CONTRACTEDANNUAL
RENT(in million €)
COMPLETED UNDER CONSTRUC-
TION
POTENTIAL TOTAL
VGP Park Bingen JV1 15,000 6,400 — — 6,400 0.4
VGP Park Hamburg JV1 537,112 245,501 — — 245,501 14.0
VGP Park Soltau JV1 119,868 55,812 — — 55,812 1.9
VGP Park Rodgau JV1 212,740 103,861 — — 103,861 6.2
VGP Park Höchstadt JV1 45,680 15,002 — — 15,002 0.9
VGP Park Berlin JV1 460,029 183,573 — 9,950 193,523 9.5
VGP Park Frankenthal JV1 243,124 146,898 — — 146,898 9.2
VGP Park Bobenheim-
Roxheim
JV1 56,655 23,270 — — 23,270 1.8
VGP Park Borna JV1 42,533 13,618 — — 13,618 0.9
VGP Park Leipzig JV1 105,885 41,491 4,776 — 46,267 2.4
VGP Park Schwalbach JV1 19,587 8,387 — — 8,387 0.5
VGP Park Wetzlar JV1 67,336 38,280 — — 38,280 2.0
VGP Park Ginsheim JV1 59,845 35,636 — — 35,636 2.3
VGP Park Dresden -
Radeburg
JV1 32,383 20,285 — — 20,285 0.9
VGP Park Goettingen JV1 138,297 81,382 — — 81,382 3.2
VGP Park Wustermark JV1 132,680 71,721 — — 71,721 3.5
VGP Park Bischofsheim JV1 13,457 6,659 — — 6,659 0.5
VGP Park Chemnitz JV1 40,421 12,591 — — 12,591 1.1
VGP Park Einbeck JV1 20,300 8,883 — — 8,883 0.7
VGP Park Giessen-
Buseck
JV1 36,549 17,357 — — 17,357 0.9
VGP Park Giessen-
Lützellinden
JV1 23,379 14,155 — — 14,155 1.0
VGP Park München JV3 674,248 60,475 215,521 37,878 313,875 25.6
TOTAL JV'S 3,097,108 1,211,237 220,298 47,828 1,479,362 89.4
TOTAL GERMANY 5,366,042 1,517,513 775,977 360,808 2,654,299 139.7
PAG
E 2
08
—
V
GP
NV
An
nu
al
Re
po
rt 2
02
1 /
Po
rtfo
lio
/ G
erm
an
y


PAG
E 2
10
—
VG
P N
V A
nn
ua
l R
ep
ort
20
21
/ P
ort
foli
o /
Cze
ch
Re
pu
bli
c
Prague
OlomoucOstrava
Ústí nad Labem Liberec
Plzeň
České Budějovice
Brno
42
39
35
41
45
ceeeeeeeeeeeeceee
48
43434344
44
46
47
LL38
36
d L
66 503333333636333333337
49353333333333333
40
Czech Republic35 VGP Park Tuchoměřice
36 VGP Park Ústí nad Labem
37 VGP Park Český Újezd
38 VGP Park Liberec
39 VGP Park Olomouc
40 VGP Park Jeneč
41 VGP Park Chomutov
42 VGP Park Brno
43 VGP Park Hrádek nad Nisou
44 VGP Park Hrádek nad Nisou 2
45 VGP Park Plzeň
46 VGP Park Prostějov
47 VGP Park Vyškov
48 VGP Park České Budějovice
49 VGP Park Kladno
50 VGP Park Ústí nad Labem City

Czech Republic
VGP Park Hrádek nad NisouBUILDING H1
tenant Drylock Technologies s.r.o.
lettable area 40,361 m² built 2012–2014
Czech Republic
VGP Park Český ÚjezdBUILDING II.
tenant FIA ProTeam s.r.o.
lettable area 2,753 m² built 2016
Czech Republic
VGP Park Český ÚjezdBUILDING I.
tenant Yusen Logistics (Czech) s.r.o.; Spedice Kudrová s.r.o.
lettable area 12,789 m² built 2018
Czech Republic
VGP Park BrnoBUILDING III.
tenant HARTMANN – RICO a.s.
lettable area 8,621 m² built 2013
Czech Republic
VGP Park BrnoBUILDING II.
tenant NOTINO, s.r.o.; SUTA s.r.o.
lettable area 14,253 m² built 2013–2016
Czech Republic
VGP Park BrnoBUILDING I.
tenant KARTON P+P, spol. s r.o.; Igepa velkoobchod papírem spol. s r.o.
lettable area 12,226 m² built 2017
PAG
E 2
11
—
VG
P N
V A
nn
ua
l R
ep
ort
20
21
/ P
ort
foli
o /
Cze
ch
Re
pu
bli
c

Czech Republic
VGP Park OlomoucBUILDING C
tenant SGB Czech Trafo s.r.o.; Edwards, s.r.o.
lettable area 11,142 m² built 2018
Czech Republic
VGP Park OlomoucBUILDING B
tenant John Crane a.s.
lettable area 12,029 m² built 2017
Czech Republic
VGP Park OlomoucBUILDING A
tenant Nagel Česko s.r.o.
lettable area 7,807 m² built 2017
Czech Republic
VGP Park LiberecBUILDING L1
tenant KNORR-BREMSE Systémy pro užitková vozidla ČR, s.r.o.
lettable area 11,436 m² built 2016
Czech Republic
VGP Park Hrádek nad NisouBUILDING H5
tenant Drylock Technologies s.r.o.
lettable area 27,218 m² built 2018
Czech Republic
VGP Park Hrádek nad NisouBUILDING H4
tenant Drylock Technologies s.r.o.
lettable area 14,848 m² built 2020
PAG
E 2
12
—
VG
P N
V A
nn
ua
l R
ep
ort
20
21
/ P
ort
foli
o /
Cze
ch
Re
pu
bli
c

Czech Republic
VGP Park OlomoucBUILDING J
tenant ARDON SAFETY s.r.o.
lettable area 14,043 m² built 2019
Czech Republic
VGP Park OlomoucBUILDING H
tenant Mürdter Dvořák, lisovna, spol. s r.o.
lettable area 14,254 m² built 2019
Czech Republic
VGP Park OlomoucBUILDING G2
tenant Euro Pool System CZ s.r.o.; FENIX solutions s.r.o.
lettable area 19,859 m² built 2015
Czech Republic
VGP Park OlomoucBUILDING I
tenant RTR - TRANSPORT A LOGISTIKA s.r.o,
HELLA AUTOTECHNIK NOVA, s.r.o., Pilulka Lékárny a.s
lettable area 23,281 m² built 2021
Czech Republic
VGP Park OlomoucBUILDING G1
tenant Benteler Automotive Rumburk s.r.o.; Gerflor CZ s.r.o; PROZK s.r.o.;
SUTA s.r.o.
lettable area 12,084 m² built 2017
Czech Republic
VGP Park OlomoucBUILDING D
tenant MedicProgress, a.s.
lettable area 2,600 m² built 2019
PAG
E 2
13
—
VG
P N
V A
nn
ua
l R
ep
ort
20
21
/ P
ort
foli
o /
Cze
ch
Re
pu
bli
c

Czech Republic
VGP Park PilsenBUILDING D
tenant COPO CENTRAL EUROPE s.r.o.; TRANSTECHNIK CS, spol. s r.o.
lettable area 3,640 m² built 2015–2016
Czech Republic
VGP Park PilsenBUILDING C
tenant Excell Czech s.r.o.; FAIVELEY TRANSPORT CZECH a.s.
lettable area 9,868 m² built 2014–2015
Czech Republic
VGP Park PilsenBUILDING E
tenant Verhoek Europe s.r.o., DHL Express (Czech Republic) s.r.o.
lettable area 5,790 m² built 2021
Czech Republic
VGP Park PilsenBUILDING B
tenant FAIVELEY TRANSPORT CZECH a.s.
lettable area 21,918 m² built 2015
Czech Republic
VGP Park PilsenBUILDING A
tenant ASSA ABLOY ES Production s.r.o.
lettable area 8,711 m² built 2014
Czech Republic
VGP Park OlomoucBUILDING L
tenant Nissens Cooling Solutions Czech s.r.o.
lettable area 18,235 m² built 2020
PAG
E 2
14
—
VG
P N
V A
nn
ua
l R
ep
ort
20
21
/ P
ort
foli
o /
Cze
ch
Re
pu
bli
c

Czech Republic
VGP Park TuchoměřiceBUILDING A
tenant CAAMANO CZ INTERNATIONAL GLASS CORPORATION, s.r.o.;
Invelt – s.r.o.; FC MORELO CZ s.r.o.; EFACEC PRAHA s.r.o.
lettable area 6,577 m² built 2013
Czech Republic
VGP Park TuchoměřiceBUILDING B
tenant HARTMANN – RICO a.s.; ESA s.r.o.; Lidl Česká republika v.o.s.
lettable area 18,604 m² built 2014–2017
Czech Republic
VGP Park Ústí nad LabemBUILDING P4
tenant Treves CZ s.r.o.
lettable area 6,134 m² built 2018
Czech Republic
VGP Park Ústí nad LabemBUILDING P3
tenant Treves CZ s.r.o.
lettable area 8,725 m² built 2017
Czech Republic
VGP Park Ústí nad LabemBUILDING P2
tenant Ligman Europe s.r.o.
lettable area 6,368 m² built 2018
Czech Republic
VGP Park Ústí nad LabemBUILDING P1
tenant JOTUN CZECH a.s., Advanced Supply Chain (CR) s.r.o.
lettable area 5,351 m² built 2014
PAG
E 2
15
—
VG
P N
V A
nn
ua
l R
ep
ort
20
21
/ P
ort
foli
o /
Cze
ch
Re
pu
bli
c

Czech Republic
VGP Park JenečBUILDING D1
tenant 4PX Express CZ s.r.o.
lettable area 1,885 m² built 2017
Czech Republic
VGP Park JenečBUILDING C
tenant 4PX Express CZ s.r.o., SUTA s.r.o.
lettable area 11,698 m² built 2018
Czech Republic
VGP Park JenečBUILDING AB
tenant 4PX Express CZ s.r.o.
lettable area 52,582 m² built 2017
Czech Republic
VGP Park Ústí nad LabemBUILDING P6.2
tenant SSI Technologies s.r.o.
lettable area 4,803 m² built 2020
Czech Republic
VGP Park Ústí nad LabemBUILDING P6.1
tenant SSI Technologies s.r.o.
lettable area 6,080 m² built 2015
Czech Republic
VGP Park Ústí nad LabemBUILDING P5
tenant JOTUN CZECH a.s.; SUTA s.r.o.
lettable area 3,503 m² built 2020
PAG
E 2
16
—
VG
P N
V A
nn
ua
l R
ep
ort
20
21
/ P
ort
foli
o /
Cze
ch
Re
pu
bli
c

Czech Republic
VGP Park ChomutovBUILDING A
tenant Geis Solutions CZ s.r.o., Beinbauer Automotive CZ s.r.o., SUTA s.r.o.
lettable area 15,550 m² built 2018
Czech Republic
VGP Park ProstějovBUILDING A
tenant ITAB Shop Concept CZ, a.s., twd CZ, s.r.o.
lettable area 15,200 m² built 2021
Czech Republic
VGP Park VyškovBUILDING A
tenant ALFA – RENT PENTE s.r.o.
lettable area 28,868 m² built 2021
Czech Republic
VGP Park JenečBUILDING D2
tenant 4PX Express CZ s.r.o.
lettable area 3,725 m² built 2019
Czech Republic
VGP Park ChomutovBUILDING BC
tenant Magna Automotive (CZ) s.r.o.; Geis Solutions CZ s.r.o.
lettable area 36,095 m² built 2018
Czech Republic
VGP Park ProstějovBUILDING B
tenant ALFA – RENT PENTE s.r.o.
lettable area 24,996 m² built 2021
PAG
E 2
17
—
VG
P N
V A
nn
ua
l R
ep
ort
20
21
/ P
ort
foli
o /
Cze
ch
Re
pu
bli
c

VGP PARK OWNER LAND AREA
(m²)
LETTABLE AREA (m²) CONTRACTEDANNUAL
RENT(in million €)
COMPLETED UNDER CONSTRUC-
TION
POTENTIAL TOTAL
VGP Park Olomouc VGP 132,567 — 65,966 — 65,966 3.2
VGP Park
Hrádek nad Nisou 2
VGP 105,082 — 29,566 7,488 37,054 1.4
VGP Park Prostějov VGP 139,661 40,196 — 9,969 50,165 1.7
VGP Park Vyškov VGP 54,353 28,868 — — 28,868 1.1
VGP Park
České Budějovice
VGP 380,588 — 9,634 121,422 131,056 0.4
VGP Park Kladno VGP 68,705 — 27,050 — 27,050 0.9
VGP Park
Ústí nad Labem City
VGP 108,000 — — 52,754 52,754 —
TOTAL VGP 988,956 69,064 132,216 191,633 392,913 8.8
VGP Park Tuchoměřice JV1 58,701 25,181 — — 25,181 1.2
VGP Park Český Újezd JV1 45,383 15,542 — — 15,542 0.8
VGP Park Liberec JV1 36,062 11,436 — 2,304 13,740 0.6
VGP Park Brno JV1 63,974 35,099 — — 35,099 2.0
VGP Park
Hrádek nad Nisou
JV1 180,638 85,427 — — 85,427 4.9
VGP Park Plzeň JV1 102,044 49,926 — — 49,926 2.7
VGP Park Ústí nad Labem JV1 133,209 40,964 — — 40,964 2.6
VGP Park Olomouc JV1 347,186 135,334 — 16,054 151,388 6.5
VGP Park Jeneč JV1 173,859 69,889 — — 69,889 2.7
VGP Park Chomutov JV1 106,791 51,645 5,817 — 57,462 2.7
TOTAL JV 1,247,846 520,442 5,817 18,358 544,617 26.8
TOTAL CZECH REPUBLIC 2,236,803 589,506 138,033 209,991 937,531 35.6
PAG
E 2
18
—
VG
P N
V A
nn
ua
l R
ep
ort
20
21
/ P
ort
foli
o /
Cze
ch
Re
pu
bli
c


Spain51 VGP Park San Fernado de Henares
52 VGP Park Lliçà d’Amunt
53 VGP Park Fuenlabrada
54 VGP Park Valencia Cheste
55 VGP Park Zaragoza
56 VGP Park Sevilla Dos Hermanas
57 VGP Park Sevilla Ciudad de la Imagen
58 VGP Park Granollers
59 VGP Park Martorell
60 VGP Park La Naval
61 VGP Park Burgos
62 VGP Park Belartza
Madrid
Seville
Zaragoza
Burgos
La Naval
Valencia
Barcelona
57
522222
58
na
5555555555552
59
53
MMMMMMMMMMMMMMMMMMMMMMMMMMMMMMMMM33 51
SSSSSS56
54
goza
55
Navaava
60
62
urgrgo
61
PAG
E 2
20
—
V
GP
NV
An
nu
al
Re
po
rt 2
02
1 /
Po
rtfo
lio
/ S
pa
in

Spain
VGP Park Lliça d’AmuntBUILDING A
tenant Picking Farma S.A.
lettable area 13,639 m² built 2020
Spain
VGP Park San Fernando de HenaresBUILDING B1
tenant Rhenus Logistics, S.A.U.; Noatum Logistics Spain, S.A.U.;
Logwin Solutions Spain, S.A.
lettable area 19,671 m² built 2019
Spain
VGP Park San Fernando de HenaresBUILDING A
tenant ThyssenKrupp Elevadores, S.L.U.; Rhenus Logistics S.A.U.
lettable area 22,962 m² built 2018
Spain
VGP Park Lliça d’AmuntBUILDING E
tenant Maskokotas, S.L., Gotex, S.A.U.
lettable area 22,194 m² built 2020
Spain
VGP Park Lliça d’AmuntBUILDING D
tenant Moldstock, S.L.
lettable area 7,205 m² built 2020
Spain
VGP Park Lliça d’AmuntBUILDING C
tenant Noatum logistics Spain, S.A.U.; DistriCenter, S.A.U.; ,
Vivace Logística, S.A.; Luís Simões Logística Integrada, S.A.,
Gepanetrans Operador Logistico, S.L.
lettable area 32,170 m² built 2019
PAG
E 2
21
—
VG
P N
V A
nn
ua
l R
ep
ort
20
21
/ P
ort
foli
o /
Sp
ain

Spain
VGP Park San Fernando de HenaresBUILDING E
tenant DSV Road Spain, S.A.U.
lettable area 12,176 m² built 2019
Spain
VGP Park San Fernando de HenaresBUILDING C2
tenant Digi Spain Telecom, S.L.
lettable area 5,165 m² built 2020
Spain
VGP Park San Fernando de HenaresBUILDING C1
tenant Huawei Technologies Espana, S.L.
lettable area 7,947 m² built 2021
Spain
VGP Park San Fernando de HenaresBUILDING D1
tenant Paack Logistics Iberia, S.L.U.
lettable area 11,453 m² built 2021
Spain
VGP Park San Fernando de HenaresBUILDING B2
tenant Rhenus Logistics, S.A.U.
lettable area 12,267 m² built 2019
Spain
VGP Park ZaragozaBUILDING A
tenant Cotrali Zaragoza, S.L.
lettable area 18,074 m² built 2020
PAG
E 2
22
—
V
GP
NV
An
nu
al
Re
po
rt 2
02
1 /
Po
rtfo
lio
/ S
pa
in

Spain
VGP Park ZaragozaBUILDING C1
tenant Kuehne & Nagel, S.A.
lettable area 22,556 m² built 2021
Spain
VGP Park Valencia ChesteBUILDING B
tenant Dia Retail España, S.A.U., Aza Logistics, S.L.U., Furnilogik, S.L.U.
lettable area 25,409 m² built 2021
PAG
E 2
23
—
V
GP
NV
An
nu
al
Re
po
rt 2
02
1 /
Po
rtfo
lio
/ S
pa
in

VGP PARK OWNER LAND AREA
(m²)
LETTABLE AREA (m²) CONTRACTEDANNUAL
RENT(in million €)
COMPLETED UNDER CONSTRUC-
TION
POTENTIAL TOTAL
VGP Park Fuenlabrada VGP 80,223 — 41,735 — 41,735 1.0
VGP Park Valencia Cheste VGP 113,104 25,409 13,944 26,696 66,049 1.5
VGP Park Zaragoza VGP 147,488 40,630 34,352 19,113 94,095 2.6
VGP Park Dos Hermanas VGP 103,000 — 28,880 25,669 54,549 0.4
VGP Park Sevilla Ciudad
de la Imagen
VGP 54,991 — — 28,803 28,803 —
VGP Park Granollers VGP 14,385 — 8,727 — 8,727 —
VGP Park Martorell VGP 18,999 — — 10,245 10,245 0.1
VGP Park La Naval VGP 279,020 — — 123,490 123,490 —
VGP Park Burgos VGP 128,190 — — 77,411 77,411 —
TOTAL VGP 939,400 66,039 127,638 311,427 505,104 5.6
VGP Park San Fernando JV2 222,750 91,641 — 25,395 117,035 7.2
VGP Park Lliçà d'Amunt JV2 149,597 75,207 — — 75,207 4.4
VGP Park Belartza JV5 66,400 — — 32,548 32,548 —
TOTAL JV'S 438,747 166,848 — 57,943 224,791 11.6
TOTAL SPAIN 1,378,147 232,888 127,638 369,370 729,895 17.2
PAG
E 2
24
—
V
GP
NV
An
nu
al
Re
po
rt 2
02
1 /
Po
rtfo
lio
/ S
pa
in


Other countriesin Europe
Latvia63 VGP Park Kekava
64 VGP Park Riga
65 VGP Park Tiraines
Romania66 VGP Park Timișoara
67 VGP Park Sibiu
68 VGP Park Brașov
69 VGP Park Arad
70 VGP Park Bucharest
Hungary71 VGP Park Győr
72 VGP Park Győr Béta
73 VGP Park Alsónémedi
74 VGP Park Hatvan
75 VGP Park Kecskemét
76 VGP Park Budapest Aerozone
Slovakia77 VGP Park Malacky
78 VGP Park Bratislava
79 VGP Park Zvolen
Austria80 VGP Park Graz
81 VGP Park Laxenburg
The Netherlands82 VGP Park Nijmegen
83 VGP Park Roosendaal
84 VGP Park Moerdijk
Italy85 VGP Park Calcio
86 VGP Park Valsamoggia
87 VGP Park Valsamoggia 2
88 VGP Park Sordio
89 VGP Park Padova
90 VGP Park Paderno Dugnano
Portugal91 VGP Park Santa Maria da Feira
92 VGP Park Sintra
Serbia93 VGP Park Belgrade Dobanovice
LisbonLiLiLiL sis
92
91

Verona Timişoara
GyőrGraz
Milan
Budapest
Rome
Vienna Bratislava
Amsterdam
BucharestBelgrade
63
AA84
6768
77
BBBBBBBBBBBBBBBBBBBBBBBBBBBBBBBBBBBBBBBBBBBBBBBBBBB78
issssslllllllllalal
79
BraBBBBBBBBBB71
az
80
aaaaaaa81
AmAAAAAA82
848
83
73 BuudB
aaaaa74
BBBBBBBBBBBBBBBBBBBBBBB
aaaavvvvavavavavavvvv33 BBBBBBBBBBBBBBBBBBBBBBBBBBBB
aaaa76
Győőőőr
71717772
75
8588888890
e86
onanananaaaaaaaaonanaaaa
89
n88
69
66
BeBeBeBBBBB lBBBBBB
93
336444 65
Riga
haraaa eh
70eroe87

Hungary
VGP Park HatvanBUILDING A1
tenant LKH LEONI Kft.
lettable area 16,664 m² built 2019
Hungary
VGP Park KecskemétBUILDING B
tenant Flisom Hungary kft.; Bohnenkamp Korlátolt Felelösségü Társaság,
HunTex Recycling Kft.
lettable area 17,046 m² built 2020
Hungary
VGP Park GyőrBUILDING C
tenant Dana Hungary Kft.
lettable area 6,463 m² built 2011
Hungary
VGP Park GyőrBUILDING B
tenant Lear Corporation Hungary Kft.; TI Automotive (Hungary) Kft.
lettable area 24,741 m² built 2012, 2017
Hungary
VGP Park GyőrBUILDING A
tenant SKINY Gyártó Korlátolt Felelösségü Társaság;
Waberer’s-Szemerey Kft.; Gebrüder Weiss Szállítmányozási Kft.
lettable area 20,290 m² built 2009
Hungary
VGP Park AlsónémediBUILDING A1.1
tenant Nagel Hungária Logisztikai Korlátolt Felelösségü Társaság
lettable area 22,905 m² built 2016
PAG
E 2
28
—
V
GP
NV
An
nu
al
Re
po
rt 2
02
1 /
Po
rtfo
lio
/ O
the
r c
ou
ntr
ies
in
Eu
rop
e

Slovakia
VGP Park MalackyBUILDING A
tenant Benteler Automotive SK s.r.o.; SPP – distribuce, a.s.
lettable area 14,863 m² built 2009
Slovakia
VGP Park MalackyBUILDING B
tenant Benteler Automotive SK s.r.o.; Cipher Europe s.r.o.;
PLP Facility, a.s., ASSA ABLOY Opening Solutions Slovakia s. r. o.
lettable area 19,656 m² built 2016
Slovakia
VGP Park MalackyBUILDING C
tenant FROMM SLOVAKIA, a.s.; Tajco Slovakia s. r. o.
lettable area 15,255 m² built 2015
Slovakia
VGP Park MalackyBUILDING D
tenant Volkswagen Konzernlogistik GmbH & Co. OHG
lettable area 25,692 m² built 2015
Slovakia
VGP Park MalackyBUILDING E1
tenant IDEAL Automotive Slovakia, s.r.o.
lettable area 12,756 m² built 2016
Slovakia
VGP Park BratislavaBUILDING F
tenant Continental Barum s.r.o.
lettable area 57,329 m² built 2021
PAG
E 2
29
—
V
GP
NV
An
nu
al
Re
po
rt 2
02
1 /
Po
rtfo
lio
/ O
the
r c
ou
ntr
ies
in
Eu
rop
e

Romania
VGP Park TimişoaraBUILDING B2
tenant DHL International Romania SRL; RESET EMS srl; S.C.; NEFAB
PACKAGING ROMANIA SRL; HELBAKO ELECTRONICA SRL;
OVT LOGISTICZENTRUM SRL; LOSAN DEPOT SRL,
SZW AUTOMOTIVE S.R.L., D.B. GROUP ROMANIA S.R.L.
lettable area 18,105 m² built 2015, 2019
Romania
VGP Park TimişoaraBUILDING B1
tenant QUEHENBERGER LOGISTICS ROU SRL; UPS Romania SRL;
World Media Trans SRL; PROFI ROM FOOD SRL; Acila SRL;
Arhivatorul Plus SRL; Ericsson Antenna Technology Romania SRL;
VGP Proiecte Industriale SRL
lettable area 17,905 m² built 2014
Romania
VGP Park TimişoaraBUILDING A2
tenant SC FAN COURIER EXPRESS SRL; ITC LOGISTIC ROMANIA S.R.L.;
KLG Europe Logistics SRL; INTER CARS ROMANIA SRL
lettable area 18,085 m² built 2016
Romania
VGP Park TimişoaraBUILDING A1
tenant QUEHENBERGER LOGISTICS ROU SRL
lettable area 17,613 m² built 2016
Latvia
VGP Park KekavaBUILDING B
tenant MMD Serviss SIA
lettable area 26,988 m² built 2019
Latvia
VGP Park KekavaBUILDING A
tenant MMD Serviss SIA, SIA “BMJ Latvia” , SIA “Mikrotīkls”, Hanzas
Maiznīca AS, SIA “CONSTRUCTION TRADE”, Atlas Premium SIA
lettable area 35,512 m² built 2018
PAG
E 2
30
—
V
GP
NV
An
nu
al
Re
po
rt 2
02
1 /
Po
rtfo
lio
/ O
the
r c
ou
ntr
ies
in
Eu
rop
e

Romania
VGP Park TimişoaraBUILDING C1
tenant cargo-partner Expeditii s.r.l.; EUROCCOPER SRL; DELIVERY
SOLUTIONS S.A.; DYNAMIC PARCEL DISTRIBUTION S.A.
lettable area 21,879 m² built 2018
Romania
VGP Park TimişoaraBUILDING C2
tenant Hafele Romania SRL; ROFAM TECHNOLOGY S.R.L.;
KATHREIN BROADCAST SRL; CONTINENTAL AUTOMOTIVE
PRODUCTS SRL; Ericsson Anteena Technology Romania SRL;
ITC LOGISTIC ROMANIA S.R.L., DHL International Romania SRL
lettable area 21,581 m² built 2018
Romania
VGP Park TimişoaraBUILDING D
tenant RPW LOGISTICS SRL, World Media Trans S.R.L.,
RUS-SAVITAR S.A.
lettable area 30,775 m² built 2021
Romania
VGP Park BraşovBUILDING E
tenant FILDAS TRADING SRL, ITC LOGISTIC ROMANIA S.R.L.
lettable area 9,556 m² built 2021
Austria
VGP Park GrazBUILDING A
tenant MAGNA Steyr Fahrzeugtechnik AG & Co KG
lettable area 17,737 m² built 2018
Netherlands
VGP Park NijmegenBUILDING A
tenant Conpax Beheer B.V.; ESTG B.V.; Ahold Europe Real Estate &
Construction B.V.; Nippon Express (Nederland) B.V.; OTC Medical
B.V.; VGP Renewable Energy Netherlands BV
lettable area 67,353 m² built 2019–2020
PAG
E 2
31
—
VG
P N
V A
nn
ua
l R
ep
ort
20
21
/ P
ort
foli
o /
Oth
er
co
un
trie
s i
n E
uro
pe

Netherlands
VGP Park NijmegenBUILDING B1B2
tenant Holding Geurtsen Thomassen B.V.
lettable area 42,835 m² built 2021
Netherlands
VGP Park RoosendaalBUILDING A
tenant Active Ants B.V.; BAS Warehousing B.V.;
VGP Renewable Energy Netherlands BV
lettable area 41,959 m² built 2020
Italy
VGP Park ValsamoggiaBUILDING A
tenant Macron S.p.a., VGP Renewable Energy Italy SRL
lettable area 6,679 m² built 2020
Italy
VGP Park CalcioBUILDING A
tenant FGC S.r.l., General Light, S.L., Skill, S.P.A.,
VGP Renewable Energy Italy SRL
lettable area 23,303 m² built 2021
Italy
VGP Park ValsamoggiaBUILDING B
tenant Macron S.p.a.
lettable area 16,106 m² built 2019
Italy
VGP Park SordioBUILDING A
tenant General Logistics Systems Italy SRL
lettable area 12,034 m² built 2021
PAG
E 2
32
—
V
GP
NV
An
nu
al
Re
po
rt 2
02
1 /
Po
rtfo
lio
/ O
the
r c
ou
ntr
ies
in
Eu
rop
e

Italy
VGP Park PadovaBUILDING B
tenant Gruppo Executive Societa Consortile a r.l.
lettable area 7,246 m² built 2021
Portugal
VGP Santa Maria da FeiraBUILDING A
tenant Rádio Popular – Electrodomésticos, S.A.
lettable area 29,813 m² built 2021
Italy
VGP Park PadovaBUILDING A
tenant Carlini Gomme s.r.l., Gruber Logistics S.p.A.
lettable area 15,301 m² built 2021
PAG
E 2
33
—
V
GP
NV
An
nu
al
Re
po
rt 2
02
1 /
Po
rtfo
lio
/ O
the
r c
ou
ntr
ies
in
Eu
rop
e

VGP PARK OWNER LAND AREA
(m²)
LETTABLE AREA (m²) CONTRACTEDANNUAL
RENT(in million €)
COMPLETED UNDER CONSTRUC-
TION
POTENTIAL TOTAL
ROMANIA
VGP Park Timișoara 2 VGP 40,285 30,775 — — 30,775 1.2
VGP Park Sibiu VGP 219,636 — 16,527 75,881 92,408 0.1
VGP Park Brașov VGP 383,758 9,556 28,701 142,011 180,268 1.5
VGP Park Arad VGP 389,922 — 28,811 167,265 196,076 0.3
VGP Park Bucharest VGP 250,148 — 28,930 84,492 113,422 0.7
1,283,749 40,331 102,969 469,649 612,949 3.9
HUNGARY
VGP Park Hatvan VGP 57,584 16,664 — 9,317 25,981 1.0
VGP Park Győr Béta VGP 104,373 — 14,033 37,744 51,777 0.2
VGP Park Kecskemét VGP 255,031 17,046 26,246 72,818 116,110 1.5
VGP Park Budapest
Aerozone
VGP 380,480 — 10,787 113,114 123,901 3.0
797,469 33,710 51,066 232,993 317,769 5.6
SLOVAKIA
VGP Park Bratislava VGP 643,519 57,329 85,660 153,048 296,037 4.8
VGP Park Bratislava 2 VGP 284,593 — — 101,589 101,589 —
VGP Park Zvolen VGP 102,074 — — 52,281 52,281 —
1,030,186 57,329 85,660 306,918 449,907 4.8
NETHERLANDS
VGP Park Nijmegen VGP 435,716 42,835 94,955 180,945 318,735 3.6
ITALY¹
VGP Park Calcio VGP 48,593 23,303 — — 23,303 1.1
VGP Park Sordio VGP 26,811 12,034 — — 12,034 1.0
VGP Park Padova VGP 50,091 22,547 — — 22,547 1.5
VGP Park Paderno
Dugnano
VGP 94,222 — — 42,250 42,250 —
VGP Park
Valsamoggia 2
VGP 125,184 — — 32,748 32,748 —
344,901 57,885 — 74,998 132,883 3.5
AUSTRIA
VGP Park Graz 2 VGP 91,674 — 22,712 — 22,712 3.2
VGP Park Laxenburg VGP 120,247 — — 48,600 48,600 —
211,921 — 22,712 48,600 71,312 3.2
LATVIA
VGP Park Kekava VGP 148,442 62,500 — — 62,500 3.3
VGP Park Riga VGP 119,030 — 41,789 14,060 55,849 2.3
VGP Park Tiraines VGP 63,149 — 28,816 — 28,816 1.7
330,621 62,500 70,605 14,060 147,165 7.3
PORTUGAL¹
1 Exluding 2 new parks for which € 1.3 million of contracted annualised rent has already been signed. The landplots of these parks were
secured in 2021 and will be acquired during the course of 2022.PAG
E 2
34
—
V
GP
NV
An
nu
al
Re
po
rt 2
02
1 /
Po
rtfo
lio
/ O
the
r c
ou
ntr
ies
in
Eu
rop
e

VGP PARK OWNER LAND AREA
(m²)
LETTABLE AREA (m²) CONTRACTEDANNUAL
RENT(in million €)
COMPLETED UNDER CONSTRUC-
TION
POTENTIAL TOTAL
VGP Park Santa Maria
Da Feira
VGP 73,518 29,813 — — 29,813 1.3
VGP Park Sintra VGP 27,290 — — 13,198 13,198 —
100,808 29,813 — 13,198 43,011 1.3
SERBIA
VGP Park Belgrade
Dobanovice
VGP 1,140,401 — — 486,572 486,572 —
TOTAL VGP 5,675,772 324,403 427,967 1,827,933 2,580,302 33.2
VGP PARK OWNER LAND AREA
(m²)
LETTABLE AREA (m²) CONTRACTEDANNUAL
RENT(in million €)
COMPLETED UNDER CONSTRUC-
TION
POTENTIAL TOTAL
ROMANIA
VGP Park Timisoara JV2 259,149 115,168 — — 115,168 5.5
HUNGARY
VGP Park Győr JV1 121,798 51,494 — — 51,494 2.9
VGP Park Alsónémedi JV1 85,349 22,905 8,723 4,900 36,528 1.9
207,147 74,399 8,723 4,900 88,022 4.8
SLOVAKIA
VGP Park Malacky JV1 220,492 88,223 — 9,880 98,103 4.2
NETHERLANDS
VGP Park Nijmegen JV2 162,368 67,352 — 19,200 86,552 4.0
VGP Park Roosendaal JV2 86,511 41,959 — 9,576 51,535 2.1
VGP Park Moerdijk JV4 754,592 — — 486,695 486,695 —
1,003,471 109,311 — 515,471 624,782 6.1
ITALY
VGP Park Valsamoggia JV2 52,776 22,784 — — 22,784 1.5
AUSTRIA
VGP Park Graz JV2 38,239 17,737 — — 17,737 1.2
TOTAL JV'S 1,781,274 427,621 8,723 530,251 966,595 23.3
TOTAL OTHER
COUNTRIES
7,457,046 752,024 436,690 2,358,184 3,546,897 56.5
1 Exluding 1 new park for which € 1.1 million of contracted annualised rent has already been signed. The land plot of this park was secured
in 2021 and will be acquired during the course of 2022. PAG
E 2
35
—
V
GP
NV
An
nu
al
Re
po
rt 2
02
1 /
Po
rtfo
lio
/ O
the
r c
ou
ntr
ies
in
Eu
rop
e


Financial review
PAGE 238 — 242
Consolidated fi nancial statements
PAGE 243 — 296
Notes to and forming part of the fi nancial statement
PAGE 297 — 298
Supplementary notes not part of the audited fi nancial statements
PAGE 299 — 301
Parent company information
PAGINA 302 — 305
Auditor’s report
PAGINA 306 — 308
Glossary of terms
PAG
E 2
37
—
VG
P N
V A
nn
ua
l R
ep
ort
20
21
/ F
ina
nc
ial
pa
rt
/ C
on
ten
t

Consolidated income statement
For the year ended 31 December 2021
Income statement (in thousands of €) Note 2021 2020
Revenue¹ 5 44,255 29,558
Gross rental income 5 17,618 12,078
Property operating expenses 6 (2,219) (3,784)
Net rental income 15,399 8,294
Joint ventures’ management fee income 5 21,303 14,699
Net valuation gains/(losses) on investment properties 7 610,261 366,361
Administration expenses 8 (52,112) (29,296)
Share in result of joint ventures and associates 9 186,703 63,338
Other expenses (5,000) (4,000)
Operating profit 776,554 419,396
Finance income 10 12,322 9,319
Finance costs 10 (24,976) (17,911)
Finance costs – net (12,654) (8,592)
Profit before taxes 763,900 410,804
Taxes 11 (113,845) (39,865)
Profit for the period 650,055 370,939
Attributable to:
Shareholders of VGP NV 12 650,055 370,939
Non-controlling interests — —
Result per share (in €) Note 2021 2020
Basic earnings per share 12 31.41 18.58
Diluted earnings per share 12 31.41 18.58
The consolidated income statement should be read in conjunction with the accompanying notes.
1 Revenue is composed of gross rental income, service charge income, property and facility management income
and property development income.PAG
E 2
38
—
V
GP
NV
An
nu
al
Re
po
rt 2
02
1 /
Fin
an
cia
l p
art
/
Co
ns
oli
da
ted
fin
an
cia
l s
tate
me
nts

Consolidated statement ofcomprehensive income
For the year ended 31 December 2021
Statement of comprehensive income (in thousands of €) 2021 2020
Profit for the year 650,055 370,939
Other comprehensive income to be reclassified to profit or loss in subsequent periods — —
Other comprehensive income not to be reclassified to profit or loss in subsequent periods — —
Other comprehensive income for the period — —
Total comprehensive income/(loss) of the period 650,055 370,939
Attributable to:
Shareholders of VGP NV 650,055 370,939
Non-controlling interest — —
PAG
E 2
39
—
V
GP
NV
An
nu
al
Re
po
rt 2
02
1 /
Fin
an
cia
l p
art
/
Co
ns
oli
da
ted
fin
an
cia
l s
tate
me
nts
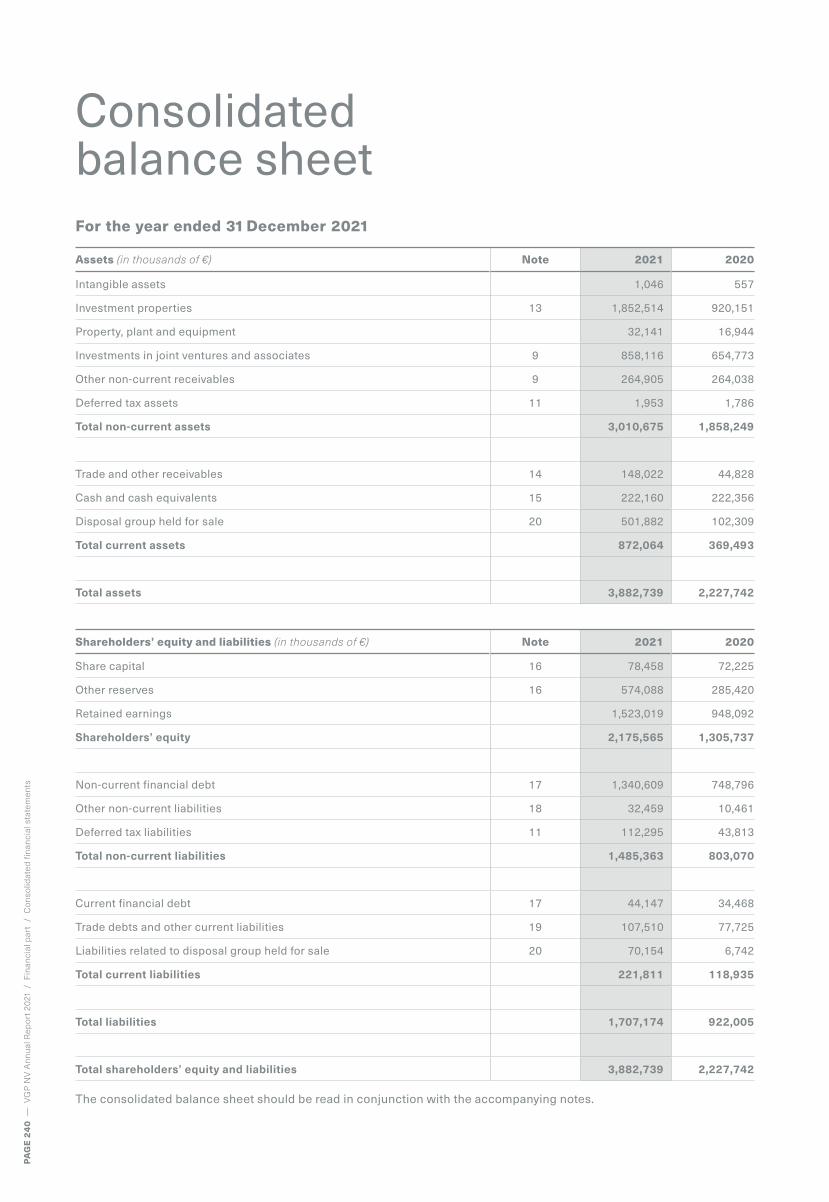
For the year ended 31 December 2021
Assets (in thousands of €) Note 2021 2020
Intangible assets 1,046 557
Investment properties 13 1,852,514 920,151
Property, plant and equipment 32,141 16,944
Investments in joint ventures and associates 9 858,116 654,773
Other non-current receivables 9 264,905 264,038
Deferred tax assets 11 1,953 1,786
Total non-current assets 3,010,675 1,858,249
Trade and other receivables 14 148,022 44,828
Cash and cash equivalents 15 222,160 222,356
Disposal group held for sale 20 501,882 102,309
Total current assets 872,064 369,493
Total assets 3,882,739 2,227,742
Shareholders’ equity and liabilities (in thousands of €) Note 2021 2020
Share capital 16 78,458 72,225
Other reserves 16 574,088 285,420
Retained earnings 1,523,019 948,092
Shareholders’ equity 2,175,565 1,305,737
Non-current financial debt 17 1,340,609 748,796
Other non-current liabilities 18 32,459 10,461
Deferred tax liabilities 11 112,295 43,813
Total non-current liabilities 1,485,363 803,070
Current financial debt 17 44,147 34,468
Trade debts and other current liabilities 19 107,510 77,725
Liabilities related to disposal group held for sale 20 70,154 6,742
Total current liabilities 221,811 118,935
Total liabilities 1,707,174 922,005
Total shareholders’ equity and liabilities 3,882,739 2,227,742
The consolidated balance sheet should be read in conjunction with the accompanying notes.
Consolidatedbalance sheet
PAG
E 2
40
—
V
GP
NV
An
nu
al
Re
po
rt 2
02
1 /
Fin
an
cia
l p
art
/
Co
ns
oli
da
ted
fin
an
cia
l s
tate
me
nts

For the year ended 31 December 2021
Statement of changes in equity (in thousands of €)
Statutory share
capital
Capital reserve
(see note 16)
IFRS share
capital
Other reserves
Retained earnings
Total equity
Balance as at 1 January 2020 92,667 (30,416) 62,251 69 637,461 699,781
Other comprehensive income/(loss) — — — — — —
Result of the period — — — — 370,939 370,939
Total comprehensive income/(loss) — — — — 370,939 370,939
Capital and share premium increase net of transaction costs (see note 16)
9,974 — 9,974 188,346 — 198,320
Sale of treasury shares (see note 16) — — 97,005 — 97,005
Dividends — — — — (60,308) (60,308)
Balance as at 31 December 2020 102,641 (30,416) 72,225 285,420 948,092 1,305,737
Balance as at 1 January 2021 102,641 (30,416) 72,225 285,420 948,092 1,305,737
Other comprehensive income/(loss) — — — — — —
Result of the period — — — — 650,055 650,055
Total comprehensive income/(loss) — — — — 650,055 650,055
Capital and share premium increase net of transaction costs (see note 16)
6,233 — 6,233 288,668 — 294,901
Dividends — — — — (75,128) (75,128)
Balance as at 31 December 2021 108,874 (30,416) 78,458 574,088 1,523,019 2,175,565
Statement ofchanges in equity
PAG
E 2
41
—
VG
P N
V A
nn
ua
l R
ep
ort
20
21
/ F
ina
nc
ial
pa
rt
/ C
on
so
lid
ate
d f
ina
nc
ial
sta
tem
en
ts

For the year ended 31 December 2021
Cash flow statement (in thousands of €) Note 2021 2020
Cash flows from operating activities 21
Profit before taxes 763,900 410,804
Adjustments for:
Depreciation 2,431 2,076
Unrealised (gains)/losses on investment properties 7 (598,726) (200,221)
Realised (gains)/losses on disposal of subsidiaries and investment properties 7 (11,535) (166,140)
Unrealised (gains)/losses on financial instruments and foreign exchange 786 282
Interest (income) (12,322) (9,319)
Interest expense 24,190 17,629
Share in (profit)/loss of joint ventures and associates 9 (186,703) (63,338)
Operating profit before changes in working capital and provisions (17,979) (8,227)
Decrease/(Increase) in trade and other receivables (51,472) (28,240)
(Decrease)/Increase in trade and other payables 10,932 10,401
Cash generated from the operations (58,519) (26,066)
Interest income 4 27
Interest paid (28,726) (25,259)
Income taxes paid (232) (870)
Net cash from operating activities (87,473) (52,168)
Cash flows from investing activities 21
Proceeds from disposal of tangible assets and other 36 14
Proceeds from disposal of subsidiaries and investment properties 22 49,647 405,644
Investment property and investment property under construction (680,028) (428,244)
Distribution by/(investment in) joint ventures and associates (4,060) (10,759)
Loans provided to joint ventures and associates (99,511) (116,506)
Loans repaid by joint ventures and associates 13,493 15,321
Net cash used in investing activities (720,423) (134,530)
Cash flows from financing activities 21
Dividends paid (75,128) (60,308)
Net proceeds capital and share premium increase 16 294,901 198,320
Net proceeds sale of treasury shares 16 — 97,005
Proceeds from loans 17 594,149 —
Loan repayments 17 (1,333) (1,433)
Net cash used in financing activities 812,589 233,584
Net increase/(decrease) in cash and cash equivalents 4,693 46,886
Cash and cash equivalents at the beginning of the period 222,356 176,148
Effect of exchange rate fluctuations (1,132) (678)
Reclassification to (–)/from held for sale (3,757) —
Cash and cash equivalents at the end of the period 222,160 222,356
The consolidated cash flow statement should be read in conjunction with the accompanying notes.
Consolidatedcash fl ow statement
PAG
E 2
42
—
VG
P N
V A
nn
ua
l R
ep
ort
20
21
/ F
ina
nc
ial
pa
rt
/ C
on
so
lid
ate
d f
ina
nc
ial
sta
tem
en
ts

For the year ended 31 December 2021
1. General information
VGP NV (the “Company”) is a limited liability company and
was incorporated under Belgian law on 6 February 2007 for
an indefinite period of time with its registered office located
at Generaal Lemanstraat 55 box 4, 2018 Antwerp, Belgium
and the Company is registered under enterprise num-
ber 0887.216.042 (Register of Legal Entities of Antwerp –
Division Antwerp).
The Group is a pure-play real estate group specialised in
the acquisition, development, and management of logistic
real estate, i.e. buildings suitable for logistical purposes
and light industrial activities. The Group focuses on
strategically located plots of land suitable for development
of logistic business parks of a certain size, so as to build
up an extensive and well-diversified land bank on top
locations, i.e. locations in the vicinity of highly concentrated
living and/or production centres, with an optimal access to
transport infrastructure.
The aim of the Group is to become a leading pan-European
specialised developer and owner of high-quality logistic
and light industrial property logistic property. The Group is
currently active in Germany, Austria, the Netherlands, Spain,
Portugal, Italy, the Czech Republic, the Slovak Republic,
Hungary, Romania, Latvia and Serbia, and is also currently
expanding to France, Greece and Croatia.
The Company’s consolidated financial statements include
those of the Company and its subsidiaries (together referred
to as “Group”). The consolidated financial statements were
approved for issue by the board of directors on 8 April 2022.
2. Summary of principal accounting policies
2.1 Statement of compliance
The consolidated financial statements have been prepared
in accordance with the requirements of International Finan-
cial Reporting Standards (IFRS) which have been adopted
by the European Union.
These standards comprise all new and revised standards
and interpretations published by the International Accounting
Standards Board (IASB) and interpretations issued by the
International Financial Interpretations Committee of the
IASB, as far as applicable to the activities of the Group and
eff ective as from 1 January 2021.
New standards and interpretations applicable during 2021A number of new standards, amendments to standards and
interpretations became effective during the financial year:
— Amendments to IFRS 9, IAS 39, IFRS 7, IFRS 4 and
IFRS 16 Interest Rate Benchmark Reform – Phase 2
— Amendment to IFRS 16 Leases: COVID-19-Related Rent
Concessions (applicable for annual periods beginning
on or after 1 June 2020)
— Amendments to IFRS 4 Insurance Contracts – Extension
of the Temporary Exemption from Applying IFRS 9
to 1 January 2023 (applicable for annual periods
beginning on or after 1 January 2021)
The above new standards, amendments to standards and
interpretations did not give rise to any material changes in
the presentation and preparation of the consolidated finan-
cial statements of the year.
New standards and interpretations not yet effective during 2021A number of new standards, amendments to standards
and interpretations are not yet effective for the year ended
31 December 2021, and have not been applied when prepar-
ing financial statements:
— Amendment to IFRS 16 Leases: COVID-19-Related
Rent Concessions beyond 30 June 2021 (applicable for
annual periods beginning on or after 1 April 2021)
— Amendments to IAS 16 Property, Plant and Equipment:
Proceeds before Intended Use (applicable for annual
periods beginning on or after 1 January 2022)
— Amendments to IAS 37 Provisions, Contingent
Liabilities and Contingent Assets: Onerous
Contracts — Cost of Fulfilling a Contract (applicable for
annual periods beginning on or after 1 January 2022)
Notes to and forming part of the fi nancial statement
PAG
E 2
43
—
V
GP
NV
An
nu
al
Re
po
rt 2
02
1 /
Fin
an
cia
l p
art
/
No
tes
to
th
e c
on
so
lid
ate
d f
ina
nc
ial
sta
tem
en
ts

— Amendments to IFRS 3 Business Combinations:
Reference to the Conceptual Framework (applicable for
annual periods beginning on or after 1 January 2022)
— Annual Improvements to IFRS Standards 2018–2020
(applicable for annual periods beginning on or after
1 January 2022)
— IFRS 17 Insurance Contracts (applicable for annual
periods beginning on or after 1 January 2023)
— Amendments to IAS 1 Presentation of Financial
Statements: Classifi cation of Liabilities as Current or
Non-current (applicable for annual periods beginning on
or after 1 January 2023, but not yet endorsed in the EU)
— Amendments to IAS 1 Presentation of Financial
Statements and IFRS Practice Statement 2: Disclosure
of Accounting Policies (applicable for annual periods
beginning on or after 1 January 2023, but not yet
endorsed in the EU)
— Amendments to IAS 8 Accounting policies, Changes
in Accounting Estimates and Errors: Defi nition of
Accounting Estimates (applicable for annual periods
beginning on or after 1 January 2023, but not yet
endorsed in the EU)
— Amendments to IAS 12 Income Taxes: Deferred Tax
related to Assets and Liabilities arising from a Single
Transaction (applicable for annual periods beginning on
or after 1 January 2023, but not yet endorsed in the EU)
The initial application of the above standards, amendments
to standards and interpretation is estimated not to give rise
to any material changes in the presentation and preparation
of the consolidated financial statements.
2.2 Basis of preparation
The consolidated financial statements are prepared on a
historic cost basis, with the exception of investment prop-
erties and financial derivatives which are stated at fair
value. All figures are in thousands of Euros (in thousands
of €), unless stated otherwise. Minor rounding differences
might occur.
2.3 Principles of consolidation
SubsidiariesSubsidiaries are entities over which VGP NV exercises con-
trol, which is the case when the Company is exposed, or
has rights, to variable returns from its involvement with the
entity and has the ability to affect these returns through its
power over the entity.
Intercompany transactions, balances and unrealised
gains on transactions between group companies are
eliminated. Unrealised losses are also eliminated unless
the transaction provides evidence of an impairment of the
asset transferred. Accounting policies of subsidiaries have
been changed where necessary to ensure consistency with
the policies adopted by the Group.
Subsidiaries are fully consolidated from the date
on which control is transferred to the Group. They are
de-consolidated from the date that control ceases. Losses
within a subsidiary are attributed to the non-controlling
interest even if that results in a deficit balance. A change
in the ownership interest of a subsidiary, without a loss of
control, is accounted for as an equity transaction. If the
Group loses control over a subsidiary, it:
— Derecognises the assets (including goodwill) and liabili-
ties of the subsidiary
— Derecognises the carrying amount of any non-control-
ling interest
— Derecognises the cumulative translation differences,
recorded in equity
— Recognises the fair value of the consideration received
— Recognises the fair value of any investment retained
— Recognises any surplus or deficit in profit or loss
— Reclassifies the parent’s share of components previ-
ously recognised in other comprehensive income to
profit or loss or retained earnings, as appropriate.
Joint ventures and associatesA joint venture exists when VGP NV has contractually
agreed to share control with one or more other parties,
which is the case only when decisions about the relevant
activities require the unanimous consent of the parties
sharing control.
Associates are companies in which VGP NV, directly or
indirectly, has a significant influence and which are neither
subsidiaries nor joint ventures. This is presumed if the
Group holds at least 20% of the voting rights attaching to
the shares. The financial information included for these
companies is prepared using the accounting policies of the
Group. When the Group has acquired joint control in a joint
venture or significant influence in an associate, the share in
the acquired assets, liabilities and contingent liabilities is
initially re-measured to fair value at the acquisition date and
accounted for using the equity method. Any excess of the
purchase price over the fair value of the share in the assets,
liabilities and contingent liabilities acquired is recognized
as goodwill. When the goodwill is negative, it is immediately
recognized in profit or loss. Subsequently, the consolidated
financial statements include the Group's share of the
results of joint ventures and associates accounted for
using the equity method until the date when joint control
or significant influence ceases. If the Group’s share of the
losses of a joint venture or associate exceeds the carrying
amount of the investment, the investment is carried at
nil value and recognition of additional losses is limited
except to the extent that VGP has incurred constructive or
contractual obligations in respect of the associate.
Unrealized gains arising from transactions with joint
ventures and associates are set against the investment in
the joint venture or associate concerned to the extent of
the Group’s interest. The carrying amounts of investments
in joint ventures and associates are reassessed if there
are indications that the asset has been impaired or that
impairment losses recognized in prior years have ceased
to apply. The investments in joint ventures and associates
in the balance sheet include the carrying amount of any
related goodwill.
IAS 28.28 only permits recognition of the gain or loss
from downstream transactions “to the extent of unrelated
investors’ interests in the associate or joint venture”.
However, the standard does not specifically address the
treatment of revenue derived from transactions with equity-
method investees (e.g. revenue from the sale of goods,
or interest revenue) and whether that revenue should be
eliminated from the consolidated financial statements.
In respect of the treatment of revenues derived from
transactions with joint ventures and associates (e.g. sales
services, interest revenue, …), the Group has opted not to
eliminate its interest in these transactions. As a matter of
example, VGP receives € 100 interest income on a loan
provided to a 50/50 joint venture. Under the accounting
policy adopted by VGP this interest income would be
accounted for as € 100 interest income of the Group. The
cost incurred by the joint venture would be accounted
for on a proportional (50%) basis through “results in joint
ventures and associates” without making any adjustment
for the proportional interest held by VGP. By doing so the
Group will only recognise its proportional profit or loss in its PAG
E 2
44
—
V
GP
NV
An
nu
al
Re
po
rt 2
02
1 /
Fin
an
cia
l p
art
/
No
tes
to
th
e c
on
so
lid
ate
d f
ina
nc
ial
sta
tem
en
ts

consolidated figures and ensure that it does not recognise
a higher profit or loss than its share in the “results in joint
ventures and associates”.
In contrast, according to IFRS 10.25 upon loss of control
of a subsidiary, a parent de-recognises the assets and
liabilities of the subsidiary (including non-controlling
interests) in full and measures any investment retained
in the former subsidiary at its fair value. In the absence
of any other relevant guidance, entities have, in effect, an
accounting policy choice of applying either the approach
in IFRS 10 or the approach in IAS 28. VGP has made the
accounting policy choice to recognize the gain or loss on
the disposal of a subsidiary to a joint venture or associate
in full in profit or loss.
2.4 Foreign currency translation
Items included in the fi nancial statements of each of the
Group’s entities are measured using the currency of the pri-
mary economic environment in which the entity operates
(the “functional currency”). The consolidated fi nancial state-
ments are presented in euros (€), which is the Company’s
functional currency and the Group’s presentation currency.
Transactions in foreign currencies are translated to
Euro at the foreign exchange rate ruling at the date of
the transaction. Consequently, non-monetary assets and
liabilities are presented at Euro using the historic foreign
exchange rate. Monetary assets and liabilities denominated
in a currency other than Euro at the balance sheet date are
translated to Euro at the foreign exchange rate ruling at that
date. Foreign exchange differences arising on translation
are recognised in the consolidated income statement.
2.5 Goodwill
When VGP acquires the control over an integrated set of
activities and assets, as defined in IFRS 3 Business Com-
binations, the identifiable assets, obligations and condi-
tional obligations of the acquired company will be booked
to their fair value on the purchase date. The goodwill repre-
sents the positive difference between the acquisition cost
and the part of the group in the fair value of the acquired
net assets. If this difference is negative (negative goodwill)
it is immediately booked in the result after a re-evaluation
of the values.
After the initial take-up the goodwill is not written
down, but subject to an impairment test, which is carried
out each year on the cash flow generating units to which
the goodwill is allocated. If the book value of a cash flow
generating unit exceeds the operating value, the loss of
value following from this will be booked in the result and in
the first instance included in the reduction of the possible
goodwill and then subsequently to the other assets of the
unit, in proportion to their book value. A write-down on the
goodwill cannot be reversed in a subsequent financial year.
2.6 Intangible assets
Intangible assets are measured at cost or fair value less
accumulated amortization and any accumulated impair-
ment losses. Intangible assets are amortized on a straight-
line basis over the best estimate of their useful lives. The
amortization period and method are reviewed at each
financial year-end.
2.7 Investment properties
Completed projectsCompleted properties are initially measured at cost (includ-
ing transaction costs). After initial recognition, investment
property is carried at fair value. An external independent
valuation expert with recognised professional qualifica-
tions and experience in the location and category of the
property being valued, values the portfolio at least annu-
ally. The fair values are based on market values, being the
estimated amount for which a property could be exchanged
on the date of valuation between a willing buyer and a will-
ing seller in an arm’s length transaction after proper mar-
keting wherein the parties had each acted knowledgeably,
prudently and without compulsion.
Any gain or loss arising from a change in fair value is
recognised in the consolidated income statement.
Property under constructionProperty that is being constructed or developed is also
stated at fair value. The properties under construction are
also valued by an external independent valuation expert
using the same valuation methodology as used for the valu-
ations of the completed projects but deducting the remain-
ing construction costs from the calculated market value of
the respective projects.
Any gain or loss arising from a change in fair value is
recognised in the consolidated income statement.
All costs directly associated with the purchase and
construction of a property and all subsequent capital
expenditure qualifying as acquisition costs are capitalised.
Development landLand of which the Group has the full ownership i.e. regis-
tered in the respective land registry as owner and on which
the Group intends to start construction (so called “develop-
ment land”) is immediately valued at fair value. The devel-
opment land is valued by an external independent valuation
expert using the valuation sales comparative approach.
Any gain or loss arising from a change in fair value is
recognised in the consolidated income statement.
All costs directly associated with the purchase of the
development land are capitalised.
Land which is not yet in full ownership but which is
secured by a future purchase agreement or purchase option
is not recognised as investment property until the Group
has become full owner of this land.
The Group will be required to make from time to time
down payments when entering into such future purchase
agreements or purchase options. The down payments
of the land will be recorded as other receivables unless
such amounts are immaterial, in which case the Board
of Directors may elect to classify such amounts under
investment properties.
Infrastructure works are not included in the fair value of
the development land but are recognised as investment
property and valued at cost.
In case the Board of Directors is of the opinion that
the fair value of the development land cannot be reliable
determined the Board may elect to value the development
land at cost less impairment until the fair value becomes
reliably determinable.
PAG
E 2
45
—
V
GP
NV
An
nu
al
Re
po
rt 2
02
1 /
Fin
an
cia
l p
art
/
No
tes
to
th
e c
on
so
lid
ate
d f
ina
nc
ial
sta
tem
en
ts

2.8 Capitalisation of borrowing costsInterest and other financial expenses relating to the acqui-
sition of fixed assets incurred until the asset is put in use
are capitalised. Subsequently, they are recorded as finan-
cial expenses.
2.9 Leases
VGP as lesseeAt the start of the lease period, the leases (except for leases
with a maximum term of twelve months and leases whose
underlying assets are of low value) are recognised on the
balance sheet as rights of use and lease liabilities at the
present value of the future lease payments. Next, all rights
of use that qualify as investment properties are valuated at
fair value, in accordance with the valuation rules detailed
under 2.7 Investment properties. The minimum lease pay-
ments are recognised in part as financing costs and in part
as settlement of the outstanding liability, in a manner result-
ing in a constant periodic interest rate on the remaining bal-
ance of the liability. The cost of financing is offset directly
against the result. Conditional lease payments are incorpo-
rated as costs in the periods in which they were made.
VGP as lessorIf a lease meets the conditions of a financial lease (accord-
ing to IFRS 16), VGP as the lessor will recognise the lease
from its start date as a receivable in the balance sheet at an
amount equal to the net investment in the lease. The differ-
ence between this latter amount and the book value of the
leased property (exclusive of the value of the residual right
held by VGP) at the start of the lease will be recognised in
the profit and loss account for that period. Each periodic
payment made by the lessee will be partly recognised by
VGP as a repayment of the capital and partly as financial
income based on a constant periodic return for VGP. The
residual right held by VGP will be recognised at its fair value
on each balance sheet date. This value will increase every
year and will correspond to the market value of the full right
of ownership at the end of the lease. These increases will
be recognised in Net valuation gains/(losses) on invest-
ment properties in the profit and loss account.
Group company is the lessor –fees paid in connection with arranging leases and lease incentivesThe Group makes payments to agents for services in con-
nection with negotiating lease contracts with the Group’s
lessees. The letting fees are capitalised within the carrying
amount of the related investment property and amortised
over the lease term. Lease incentives are recognised as a
reduction of rental income on a straight-line basis over the
lease term.
2.10 Property, plant and equipment
Property, plant and equipment are valued at their cost price
less the accumulated depreciations and write-downs. The
cost price includes all directly attributable costs and the rel-
evant part of the indirect costs incurred to make the asset
ready for use. Future disbursements for repairs are immedi-
ately recorded in the result unless they increase the future
financial profits of the asset. The straight-line depreciation
method is applied over the estimated lifetime of the assets.
The useful life and the depreciation method are revised at
least annually at the end of each financial year. The tangible
fixed assets are depreciated in accordance with the follow-
ing percentages:
— software: 33%;
— IT equipment: 10–33%;
— office furniture and fittings: 7–20%;
— cars: 25%;
— photovoltaic panels: 5%
2.11 Financial assets at amortised costFinancial assets at amortized cost include trade receiva-
bles, other receivables and cash and cash equivalents and
represent non-derivative financial instruments which are
held within a business model with the purpose to receive
contractual cashflows (held to collect) and the contractual
terms of the financial asset give rise to cashflows at fixed
dates which represent solely payments of principal and
interest (SPPI). Such financial assets are stated at amor-
tised cost with any difference between cost and redemp-
tion value being recognised in the consolidated income
statement over the period of the borrowings on an effective
interest basis.
Trade receivables do not carry any interest and are stated
at amortised cost as reduced by appropriate bad debt
allowances. Such allowances are based on the expected
credit losses, calculated in accordance with IFRS 9. The
group has not developed a provision matrix based on
historical credit loss experience as historical credit losses
are insignificant. In case there has been a significant
increase in credit risk since initial recognition, the Group
recognises lifetime expected credit losses. This is the case
when there is objective evidence that the company will not
be able to collect all amounts due according to the original
terms of the receivables. Significant financial difficulties
of the debtor, probability that the debtor will enter into
bankruptcy or financial reorganization, and default or
delinquency in payments are considered indicators that the
default risk has significantly increased. An impairment loss
is recognized in the statement of income, as are subsequent
recoveries of previous impairments.
Other financial assets at amortized cost include mainly
loan to joint ventures and associates. These financial
assets are accounted for at amortized cost and the Group
recognizes a loss allowance for expected credit losses in
accordance with IFRS 9. The amount of expected credit
losses is updated at each reporting date to reflect changes
in credit risk since initial recognition of the respective
financial asset.
Cash and cash equivalents comprise cash balances and
call deposits. Such cash balances are only held with banks
with high credit ratings, as such expected credit losses are
not deemed significant. Bank overdrafts that are repayable
on demand and form an integral part of the Group’s cash
management are included as a component of cash and
cash equivalents for the purpose of the consolidated cash-
flow statement.
2.12 Non-current assets held for sale and discontinued operationsA non-current asset or disposal group is classified as held
for sale if its carrying amount will be recovered principally
through a sale transaction rather than through continu-
ing use. This condition is regarded as met only when the
sale is highly probable and the asset (or disposal group)
is available for immediate sale in its present condition. A
discontinued operation is a component of an entity which PAG
E 2
46
—
V
GP
NV
An
nu
al
Re
po
rt 2
02
1 /
Fin
an
cia
l p
art
/
No
tes
to
th
e c
on
so
lid
ate
d f
ina
nc
ial
sta
tem
en
ts

the entity has disposed of or which is classified as held for
sale, which represents a separate major line of business or
geographical area of operations and which can be distin-
guished operationally and for financial reporting purposes.
For a sale to be highly probable, the entity should be
committed to a plan to sell the asset (or disposal group),
an active program to locate a buyer and complete the
plan should be initiated, and the asset (or disposal group)
should be actively marketed at a price which is reasonable
in relation to its current fair value, and the sale should be
expected to be completed within one year from the date of
classification. Assets (or disposal group) classified as held
for sale are measured at the lower of their carrying amount
and fair value less costs necessary to make the sale. Any
excess of the carrying amount over the fair value less costs
to sell is included as an impairment loss. Depreciation of
such assets is discontinued as from their classification as
held for sale.
Comparative balance sheet information for prior periods
is not restated to reflect the new classification in the
balance sheet.
2.13 Interest bearing borrowings
Interest-bearing borrowings are recognised initially at fair
value less attributable transaction costs. Subsequent to
initial recognition, interest-bearing borrowings are stated
at amortised cost with any difference between cost and
redemption value being recognised in the consolidated
income statement over the period of the borrowings on an
effective interest basis. The Group classifies as a current
portion any part of long-term loans that is due to be settled
within one year from the balance sheet date.
2.14 Trade and other payables
Trade and other payables are stated at amortised cost.
2.15 Derivative fi nancial instrumentsThe Group does not apply hedge accounting in accord-
ance with IFRS 9. Derivative financial assets and liabilities
are classified as financial assets or liabilities at Fair Value
through Profit or Loss (FVPL). Derivative financial assets
and liabilities comprise mainly interest rate swap and for-
ward foreign exchange contracts for hedging purposes
(economic hedge). Recognition of the derivative financial
instruments takes place when the economic hedging con-
tracts are entered into. They are measured initially and
subsequently at fair value; transaction costs are included
directly in finance costs. Gains or losses on derivatives are
recognised in profit or loss in net change in fair value of
financial instruments at FVPL.
2.16 Impairment on property, plant and equipment and intangible assetsThe carrying amounts of the Group’s property, plant and
equipment and intangible assets are reviewed at each bal-
ance sheet date to determine whether there is any indica-
tion of impairment. If any such indication exists, the asset’s
recoverable amount is estimated.
An impairment loss is recognised whenever the carrying
amount of an asset or its cash-generating unit exceeds its
recoverable amount. Impairment losses are recognised in
the consolidated income statement.
Impairment losses recognised in respect of cash-
generating units reduce the carrying amount of the assets
in the unit (group of units) on a pro-rata basis.
2.17 Reversal of impairment
An impairment loss is reversed in the consolidated income
statement if there has been a change in the estimates
used to determine the recoverable amount to the extent it
reverses an impairment loss of the same asset that was rec-
ognised previously as an expense.
2.18 Provisions
A provision is recognised in the consolidated balance sheet
when the Group has a present legal or constructive obli-
gation as a result of a past event, and it is probable that
an outflow of economic benefits will be required to settle
the obligation. If the effect is material, provisions are deter-
mined by discounting the expected future cash flows at a
pre-tax rate that reflects the current market assessments of
the time value of money and, where appropriate, the risks
specific to the liability.
2.19 Revenue recognition
Revenue includes rental income, property and facility man-
agement income, development management income and
service charge income.
Rental income from operating leases is recognised on
a straight-line basis over the lease term. When the Group
provides incentives to its tenants, the cost of the incentives
is recognised over the lease term, on a straight-line basis,
as a reduction of rental income.
Revenue from service and property, facility and
development management is recognised in the accounting
period in which control of the services are passed to the
customer, which is when the service is rendered. For
certain service contracts, revenue is recognised based
on the actual service provided to the end of the reporting
period as a proportion of the total services to be provided
because the customer receives and uses the benefits
simultaneously.
Some property management contracts may include
multiple elements of service, which are provided to tenants.
The Group assesses whether the individual elements of
service in contracts are separate performance obligations.
Where the contracts include multiple performance
obligations, and/or lease and non-lease components, the
transaction price will be allocated to each performance
obligation (lease and non-lease component) based on the
stand-alone selling prices. Where these selling prices are not
directly observable, they are estimated based on an expected
cost, plus margin. In the case of fixed price contracts,
the customer pays the fi xed amount based on a payment
schedule. If the services rendered exceed the payment, a
contract asset is recognised. If the payments exceed the
services rendered, a contract liability is recognised.
Revenue is measured at the transaction price agreed
under the contract. Amounts disclosed as revenue are
net of variable consideration and payments to customers,
which are not for distinct services, this consideration may
include discounts, trade allowances, rebates and amounts
collected on behalf of third parties.
PAG
E 2
47
—
VG
P N
V A
nn
ua
l R
ep
ort
20
21
/ F
ina
nc
ial
pa
rt
/ N
ote
s t
o t
he
co
ns
oli
da
ted
fin
an
cia
l s
tate
me
nts

A receivable is recognised when services are provided
as this is the point in time that the consideration is
unconditional because only the passage of time is required
before the payment is due.
When the Group is acting as an agent, the commission
rather than gross income is recorded as revenue.
2.20 Expenses
Service costs and property operating expensesService costs for service contracts entered into and prop-
erty operating expenses are expensed as incurred.
Net financial resultNet financial result comprises interest payable on borrow-
ings and interest rate swaps calculated using the effective
interest rate method net of interest capitalised, interest
receivable on funds invested and interest rate swaps, for-
eign exchange and interest rate swap gains and losses that
are recognised in the consolidated income statement.
Income taxIncome tax on the profit or loss for the year comprises cur-
rent and deferred tax. Income tax is recognised in the con-
solidated income statement except to the extent that it
relates to items recognised directly in equity, in which case
it is recognised in equity.
Current tax is the expected tax payable on the taxable
income for the year, using tax rates enacted or substantially
enacted at the balance sheet date, and any adjustment to
tax payable in respect of previous years.
Deferred tax is provided using the balance sheet liability
method, providing for temporary differences between
the carrying amounts of assets and liabilities for financial
reporting purposes and the amounts used for taxation
purposes. The amount of deferred tax provided is based
on the expected manner of realisation or settlement of the
carrying amount of assets and liabilities, using tax rates
enacted or substantially enacted at the balance sheet date.
A deferred tax asset is recognised only to the extent that
it is probable that future taxable profits will be available
against which the asset can be utilised. Deferred tax assets
and deferred tax liabilities have been offset, pursuant to the
fulfilment of the criteria of IAS 12 § 74. Deferred tax assets
are reduced to the extent that it is no longer probable that
the related tax benefit will be realised.
3. Critical accounting estimates and judgements and key sources of estimation uncertainty
3.1 General business risk
We refer to the chapter “Risk factors” for an overview of the
risks affecting the businesses of the VGP Group.
3.2 Critical judgements in applying accounting policiesThe following are the critical judgments made by manage-
ment, apart from those involving estimations (see note 3.3.
below), that have a significant effect on the amounts
reported in the consolidated financial statements:
— Determining whether control, joint control or a signif-
icant influence is exercised over investments. In this
respect management concluded that it has joint control
over the Joint Ventures and hence these Joint ventures
and the related associates are accounted for using the
equity method;
— VGP has made the accounting policy choice to recog-
nize the gain or loss on the disposal of a subsidiary to
a joint venture or associate in full in profit or loss. In
respect of the treatment of revenues derived from trans-
actions with joint ventures and associates (e.g. sales
services, interest revenue, …), the Group has opted not
to eliminate its interest in these transactions nor to
make any adjustment for the proportional adjustment
to the joint venture corresponding figures. By doing so
the Group will only recognise its proportional profit or
loss in its consolidated figures and ensure that it does
not recognise a higher profit or loss than its share in the
“results in joint ventures and associates”. (See note 2.3
for further information).
— In June 2020 VGP sold 50% of the shares of VGP Park
München GmbH to Allianz Real Estate, thereby losing
control over VGP Park München in 2020 (the “Trans-
action”). The completion of the development of VGP
Park München is expected to take several years. As a
result of the loss of control over VGP Park München,
VGP has deconsolidated all assets and liabilities of
VGP Park München and has recognized a gain on
the disposal which has been calculated as the differ-
ence between: (i) the carrying value (= equity value) of
all assets and liabilities of VGP Park München at the
Transaction Date, and (ii) the fair market value of 100%
of the shares of VGP Park München (the “Fair Value”).
The gain on the Transaction has been recognized in
full (100%), consistent with the accounting policies of
VGP and IFRS 10 (See note 2.3 – Principles of consoli-
dation – Joint venture and associates – in this section
further information).
Until the completion of the majority of the buildings
such buildings will be measured at their proportional
agreed purchase price with Allianz Real Estate, as this
is considered to be the best reflection of their fair value.
Following the completion of the majority of the buildings
such buildings will continue to be carried at fair value
and revalued by an external independent valuation
PAG
E 2
48
—
V
GP
NV
An
nu
al
Re
po
rt 2
02
1 /
Fin
an
cia
l p
art
/
No
tes
to
th
e c
on
so
lid
ate
d f
ina
nc
ial
sta
tem
en
ts

expert at least annually in accordance with the Group’s
valuation rules. (See note 2.7 – Investment properties –
in this section further information). As the majority of
the buildings are expected to be delivered during the
course of the second half of 2022 the Board of Directors
has elected to continue to measure these buildings at
their respective proportional agreed purchase price as
at 31 December 2021 as it considers this to be the best
reflection of the fair value of these assets.
— In November 2020, VGP entered into a 50:50 joint ven-
ture (“LPM Joint Venture”) with Roozen Landgoederen
Beheer in respect of the development of the Logistics
Park Moerdijk. The land which is currently in ownership
of this joint venture will be exchanged for a perpetual
leasehold in the future. The exact timing and impact of
this exchange is uncertain. The Board of Directors has
therefore concluded that the fair value of this develop-
ment land cannot reliably be determined at this stage.
This development land has thus been measured at cost.
3.3 Key sources of estimation uncertainty— VGP’s portfolio is valued at least annually by independent
real estate experts. This valuation by real estate experts
is intended to determine the market value of a prop-
erty at a certain date, as a function of the market evolu-
tion and the characteristics of the property concerned.
The property portfolio is recorded at the fair value estab-
lished by the real estate experts in the Group’s consoli-
dated accounts. (see note 13)
4. Segment reporting
The chief operating decision maker is the person that allo-
cates resources to and assesses the performance of the
operating segments. The Group has determined that its chief
operating decision-maker is the chief executive offi cer (CEO)
of the Company. He allocates resources to and assesses the
performance at business line and country level.
The segmentation for segment reporting within VGP is
primarily by business line and secondly by geographical
region.
4.1 Business lines
For management purpose, the Group also presents finan-
cial information according to management breakdowns,
based on these functional allocations of revenues and
costs. These amounts are based on a number of assump-
tions, and accordingly are not prepared in accordance with
IFRS audited consolidated financial statements of VGP NV
for the years ended 31 December 2021 and 2020.
As the First Joint Venture reached its investment capacity,
Allianz and VGP entered into a new joint venture agreement
in December 2021 with a view to establish a new Fourth Joint
Venture. The Fourth Joint Venture will become eff ective at the
moment of its fi rst closing, currently expected to occur during
the second half of 2022. Consequently, such Fourth Joint
Venture was not refl ected in the business lines at year-end.
To allow VGP to acquire land plots on prime locations for
future development, the Group entered into two additional
strategic partnerships during 2021, i.e. in (i) a 50:50 joint
venture with VUSA (the VGP Park Belartza Joint Venture),
and (ii) a 50:50 joint venture with Revikon (the VGP Park
Siegen Joint Venture).
Consequently, as from 2021 onwards the business
lines have been amended to take these new two new
development joint ventures into consideration.
Investment businessThe Group's investment or so-called rental business con-
sists of operating profit generated by the completed and
leased out projects of the Group’s portfolio and the propor-
tional share of the operating profit (excluding net valuation
gains) of the completed and leased out projects of the Joint
Ventures’ portfolio. Revenues and expenses allocated to
the rental business unit include 10% of the Group's prop-
erty operating expenses; other income; other expenses,
after deduction of expenses allocated to property develop-
ment; and share in result of the joint ventures, excluding
any revaluation result.
Property developmentThe Group's property development business consists of
the net development result on the Group’s development
activities. Valuation gains (losses) on investment properties
outside the First, Second and Fourth Joint Venture perime-
ter i.e. Latvia and Serbia are excluded, as they are assumed
to be non-cash generating, on the basis that these assets
are assumed to be kept in the Group’s own portfolio for the
foreseeable future. In addition, 90% of total property oper-
ating expenses are allocated to the property development
business, as are administration expenses after rental busi-
ness and property management expenses.
Property and asset managementProperty and asset management revenue includes asset
management, property management and facility manage-
ment income. Associated operating, administration and
other expenses include directly allocated expenses from
the respective asset management, property management
and facility management service companies. The adminis-
trative expenses of the Czech and German property man-
agement companies have been allocated on a 50:50 basis
between the rental business and the property and asset
management business.
PAG
E 2
49
—
V
GP
NV
An
nu
al
Re
po
rt 2
02
1 /
Fin
an
cia
l p
art
/
No
tes
to
th
e c
on
so
lid
ate
d f
ina
nc
ial
sta
tem
en
ts

Breakdown summary of the business lines
in thousands of € 2021 2020
Investment EBITDA 67,454 55,452
Property development EBITDA 552,341 342,536
Property management and asset management EBITDA 14,326 9,342
Total operating EBITDA 634,121 407,330
in thousands of € For the year ended 31 December 2021
Investment Development Property and asset
management
Total
Gross rental income 17,618 — — 17,618
Property operating expenses (222) (1,997) — (2,219)
Net rental income 17,396 (1,997) — 15,399
Joint venture management fee income — — 21,303 21,303
Net valuation gains/(losses) on investment properties destined to the joint ventures
— 592,772 — 592,772
Administration expenses (4,270) (38,434) (6,977) (49,681)
Share of joint ventures’ adjusted operating profit after tax¹ 54,328 — — 54,328
Operating EBITDA 67,454 552,341 14,326 634,121
Other expenses (5,000)
Depreciation and amortisation (28) (2,334) (74) (2,436)
Earnings before interest and tax 67,426 550,007 14,252 626,685
Net finance costs – Own (12,653)
Net finance costs – Joint ventures and associates (15,987)
Profit before tax 598,045
Current income taxes – Own (232)
Current income taxes – Joint ventures and associates (2,600)
Recurrent net income 595,213
Net valuation gains/(losses) on investment properties – other countries²
17,491
Net valuation gains/(losses) on investment properties – Joint ventures and associates
186,668
Net fair value gain/(loss) on interest rate swaps and other derivatives – Joint ventures and associates
645
Deferred taxes – Own (113,613)
Deferred taxes – Joint ventures and associates (36,349)
Reported profit for the period 650,055
1 The adjustments to the share of profit from the joint ventures (at share) are composed of € 186.7 million of net valuation gains/(losses) on
investment properties, € 1.0 million of net fair value loss on interest rate derivatives and € 36.4million of deferred taxes in respect of these
adjustments.
2 Relates to developments in countries outside of the JV perimeters i.e. Latvia and Serbia.PAG
E 2
50
—
V
GP
NV
An
nu
al
Re
po
rt 2
02
1 /
Fin
an
cia
l p
art
/
No
tes
to
th
e c
on
so
lid
ate
d f
ina
nc
ial
sta
tem
en
ts

in thousands of € For the year ended 31 December 2020
Investment Development Property and asset
management
Total
Gross rental income 12,078 — — 12,078
Property operating expenses (378) (3,406) — (3,784)
Net rental income 11,700 (3,406) — 8,294
Joint venture management fee income — — 14,699 14,699
Net valuation gains/(losses) on investment properties destined to the joint ventures
— 365,682 — 365,682
Administration expenses (2,123) (19,740) (5,357) (27,220)
Share of joint ventures’ adjusted operating profit after tax¹ 45,875 — — 45,875
Operating EBITDA 55,452 342,536 9,342 407,330
Other expenses (4,000)
Depreciation and amortisation — (1,996) (85) (2,081)
Earnings before interest and tax 55,452 340,540 9,257 401,249
Net finance costs – Own (8,592)
Net finance costs – Joint ventures and associates (19,613)
Profit before tax 373,044
Current income taxes – Own (870)
Current income taxes – Joint ventures and associates (1,792)
Recurrent net income 370,383
Net valuation gains/(losses) on investment properties – other countries²
679
Net valuation gains/(losses) on investment properties – Joint ventures and associates
48,072
Net fair value gain/(loss) on interest rate swaps and other derivatives – Joint ventures and associates
1,862
Deferred taxes – Own (38,995)
Deferred taxes – Joint ventures and associates (11,062)
Reported profit for the period 370,939
1 The adjustments to the share of profit from the joint ventures (at share) are composed of € 48.1 million of net valuation gains/(losses) on
investment properties, € 1.9 million of net fair value loss on interest rate derivatives and € 11.1million of deferred taxes in respect of these
adjustments.
2 Relates to developments in countries outside of the JV perimeters i.e. Latvia. PAG
E 2
51
—
VG
P N
V A
nn
ua
l R
ep
ort
20
21
/ F
ina
nc
ial
pa
rt
/ N
ote
s t
o t
he
co
ns
oli
da
ted
fin
an
cia
l s
tate
me
nts

4.2 Geographical markets
This basic segmentation reflects the geographical markets in Europe in which VGP operates. VGP’s operations are split
into the individual countries where it is active. This segmentation is important for VGP as the nature of the activities and the
customers have similar economic characteristics within those segments.
1 Capital expenditures includes additions and acquisition of investment properties and development land but does not include tenant incentives,
letting fees, and capitalised interest. Capital expenditure directly incurred for the own portfolio amounts to € 719.3 million (of which € 299.1
related to land acquisition) and amounts to € 23.9 million on development properties of the First and Second Joint Venture.
2 Other includes the Group central costs and costs relating to the operational business which are not specifically geographically allocated.
in thousands of € 31 December 2021
Gross rental income(Incl. JV
at share)
Net rental income(Incl. JV
at share)
Share of joint ventures' operating
EBITDA
Operating EBITDA (Incl. JV
at share)
Investment properties
(Incl. JVat share)
Total assets (Incl. JV
at share)
Capital expenditure¹
Western Europe
Germany 42,442 33,297 29,721 317,886 2,169,350 2,249,782 244,805
Spain 6,267 3,979 3,836 49,137 392,795 409,536 100,921
Austria 663 280 506 26,359 61,825 66,709 33,312
Netherlands 3,445 3,072 2,426 68,180 306,143 326,511 61,449
Italy 1,476 744 598 10,710 93,070 110,591 35,252
France — (19) — (19) — 100 —
Portugal — (228) — 5,150 24,873 29,754 13,056
Luxembourg — — — — — 160,676 —
Belgium — — — — — 381,379 —
54,293 41,125 37,087 477,403 3,048,056 3,735,037 488,794
Central and Eastern Europe
Czech Republic 13,507 12,529 11,765 97,861 488,585 504,922 65,284
Slovakia 2,056 1,003 1,795 40,045 190,729 197,004 68,568
Hungary 4,075 3,548 2,012 20,305 126,706 140,346 40,548
Romania 3,227 1,754 2,316 3,124 132,705 156,090 41,424
22,865 18,834 17,888 161,335 938,725 998,361 215,824
Baltics and Balkan
Latvia 2,891 2,691 — 2,558 72,840 76,796 15,288
Serbia 4 (51) — (213) 23,950 25,176 23,269
2,895 2,640 — 2,345 96,790 101,972 38,557
Other² — 8,119 (647) (6,962) 73 864 —
Total 80,053 70,718 54,328 634,121 4,083,644 4,836,234 743,176
PAG
E 2
52
—
VG
P N
V A
nn
ua
l R
ep
ort
20
21
/ F
ina
nc
ial
pa
rt
/ N
ote
s t
o t
he
co
ns
oli
da
ted
fin
an
cia
l s
tate
me
nts

1 Capital expenditures includes additions and acquisition of investment properties and development land but does not include tenant incentives,
letting fees, and capitalised interest. Capital expenditure directly incurred for the own portfolio amounts to € 416.1 million (of which € 140.1
related to land acquisition) and amounts to € 63.7 million on development properties of the First and Second Joint Venture.
2 Other includes the Group central costs and costs relating to the operational business which are not specifically geographically allocated.
in thousands of € 31 December 2020
Gross rental income(Incl. JV
at share)
Net rental income(Incl. JV
at share)
Share of joint ventures' operating
EBITDA
Operating EBITDA (Incl. JV
at share)
Investment properties
(Incl. JVat share)
Total assets (Incl. JV
at share)
Capital expenditure¹
Western Europe
Germany 33,501 27,475 27,072 313,131 1,442,030 1,507,310 294,362
Spain 3,966 2,352 2,126 21,849 216,202 222,260 44,189
Austria 602 434 504 103 25,584 26,581 755
Netherlands 2,574 1,497 127 42,496 168,004 177,789 30,348
Italy 1,053 1,424 (19) 2,515 31,164 39,873 21,706
Portugal — (67) — (516) 17,511 22,215 1,666
Luxembourg — — — — — 93,376 —
Belgium — — — — — 391,164 —
41,695 33,114 29,809 379,576 1,900,494 2,480,567 393,026
Central and Eastern Europe
Czech Republic 11,713 10,900 10,729 21,775 298,892 311,031 39,087
Slovakia 1,847 1,360 1,625 5,517 77,235 80,706 13,183
Hungary 3,179 2,779 1,954 1,901 64,059 67,229 9,199
Romania 2,630 1,765 2,273 2,154 86,324 94,699 24,396
19,368 16,804 16,580 31,346 526,510 553,664 85,865
Baltics
Latvia 3,109 2,921 — 2,790 40,519 43,100 931
Other² — 2,415 (515) (6,383) — 1,541 —
Total 64,172 55,253 45,874 407,330 2,467,523 3,078,872 479,823
PAG
E 2
53
—
V
GP
NV
An
nu
al
Re
po
rt 2
02
1 /
Fin
an
cia
l p
art
/
No
tes
to
th
e c
on
so
lid
ate
d f
ina
nc
ial
sta
tem
en
ts

5. Revenue
The Group leases out its investment property under operating leases. The operating leases are generally for terms of more
than 5 years. The gross rental income reflects the full impact of the income generating assets delivered during 2021. Dur-
ing 2021 rental income included € 0.4 million of rent for the period 1 January 2021 to 15 June 2021 related to the property
portfolio sold during the eighth closing with the First Joint Venture on 15 June 2021. During the year 2020 the gross rental
income included (i) € 0.3 million of rent for the period 1 January 2020 to 15 October 2020 related to the property portfolio
sold during the seventh closing with the First Joint Venture on 15 October 2020, and (ii) € 3.7 million of rent for the period
1 January 2020 to 16 November 2020 related to the property portfolio sold during the second closing with the Second Joint
Venture on 16 November 2020.
At the end of December 2021, the Group (including the joint ventures) had annualised committed leases of € 256.1 million¹
compared to € 185.2 million² as at 31 December 2020.
The breakdown of future lease income on an annualised basis for the own portfolio was as follows:
in thousands of € 2021 2020
Rental income from investment properties 12,478 10,087
Straight lining of lease incentives 5,140 1,991
Total gross rental income 17,618 12,078
Property and facility management income 14,213 10,743
Development management income 7,090 3,956
Joint ventures’ management fee income 21,303 14,699
Service charge income 5,334 2,781
Total revenue 44,255 29,558
in thousands of € 2021 2020
Less than one year 104,759 41,713
Between one and five years 397,792 155,977
More than five years 563,840 215,843
Total 1,066,391 413,533
1 € 151.1 million related to the JV Property Portfolio and € 105.0 million related to the Own Property Portfolio.
2 € 143.5 million related to the JV Property Portfolio and € 41.7 million related to the Own Property Portfolio.PAG
E 2
54
—
V
GP
NV
An
nu
al
Re
po
rt 2
02
1 /
Fin
an
cia
l p
art
/
No
tes
to
th
e c
on
so
lid
ate
d f
ina
nc
ial
sta
tem
en
ts

6. Property operating expenses
7. Net valuation gains/(losses) on investment properties
The own property portfolio, excluding development land but including the assets being developed on behalf of the Joint
Ventures, is valued by the valuation expert at 31 December 2021 based on a weighted average yield of 4.64% (compared to
5.51% as at 31 December 2020) applied to the contractual rents increased by the estimated rental value on unlet space. A
0.10% variation of this market rate would give rise to a variation of the total portfolio value of € 52.3 million.
8. Administration expenses
in thousands of € 2021 2020
Repairs and maintenance 178 (318)
Letting, marketing, legal and professional fees (487) (496)
Real estate agents (861) (366)
Service charge income 5,334 2,781
Service charge expenses (5,431) (3,073)
Other income 2,150 1,904
Other expenses (3,102) (4,216)
Total (2,219) (3,784)
in thousands of € 2021 2020
Unrealised valuation gains/(losses) on investment properties 464,478 188,863
Unrealised valuation gains/(losses) on disposal group held for sale 134,248 11,358
Realised valuation gains/(losses) on disposal of subsidiaries and investment properties 11,535 166,140
Total 610,261 366,361
in thousands of € 2021 2020
Wages and salaries (22,441) (9,876)
Audit, legal and other advisors (19,810) (15,593)
Other administrative expenses (7,430) (1,751)
Depreciation (2,431) (2,076)
Total (52,112) (29,296)
Increase in wages, salaries and other advisors mainly relate additional set up of variable remuneration and LTIP accruals in
an amount of € 16.0 million for the year ended 31 December 2021 (see note 24).
The other administrative expenses include € 3.5 million of travel costs. Such costs were included under property operating
expenses in the previous year in an amount of € 1.9 million.
PAG
E 2
55
—
V
GP
NV
An
nu
al
Re
po
rt 2
02
1 /
Fin
an
cia
l p
art
/
No
tes
to
th
e c
on
so
lid
ate
d f
ina
nc
ial
sta
tem
en
ts

9. Investments in Joint Ventures
9.1 Profi t from Joint Ventures
The table below presents a summary Income Statement of the Group’s joint ventures with (i) Allianz Joint Ventures and the
associates; and (ii) the Development Joint Ventures, all of which are accounted for using the equity method. For a detailed
overview of the Joint Ventures, please refer to section Strategy – Strategic partnerships included in the first part of this
annual report.
VGP NV holds 50% in all Joint Ventures and holds another 5.1% in the subsidiaries of the First Joint Venture (10.1% in the sub-
sidiaries of the Fourth Joint Venture) holding assets in Germany. The Fourth Joint Venture – which is intended to replace the
investment capacity of the First Joint Venture – will only become eff ective as from its fi rst closing, currently expected to take
place during the second half of 2022, and consequently the below mentioned table does not include the Fourth Joint Venture.
in thousands of € First Joint Venture
excl. minorities)
at 100%
Second Joint
Ventureat 100%
Third Joint
Ventureat 100%
Development Joint
Ventures at 100%
Joint Ventures
at 50%
First Joint Venture's
German Asset Companies
at 5.1%
2021
Gross rental income 92,432 23,021 3,152 — 59,302 3,132 62,435
Property Operating expenses
— underlying property operating expenses
(1,157) (1,064) (56) 45 (1,116) (34) (1,150)
— property management fees (7,913) (2,814) (626) — (5,676) (289) (5,966)
Net rental income 83,362 19,143 2,470 45 52,510 2,809 55,319
Net valuation gains/(losses) on investment properties
304,442 46,771 — — 175,606 11,063 186,670
Administration expenses (1,474) (274) (89) (73) (955) (40) (995)
Operating profit 386,330 65,640 2,381 (28) 227,161 13,832 240,994
Net financial result (21,423) (7,955) 493 (231) (14,558) (784) (15,342)
Taxes (62,623) (14,175) 2,944 — (36,927) (2,022) (38,949)
Profit for the period 302,283 43,510 5,818 (259) 175,676 11,027 186,703
in thousands of € First Joint Venture
(excl. minorities)
at 100%
Second Joint
Ventureat 100%
Third Joint
Ventureat 100%
Development Joint
Ventures at 100%
Joint Ventures
at 50%
First Joint Venture's
German Asset Companies
at 5.1%
2020
Gross rental income 84,896 12,251 1,283 — 49,215 2,880 52,095
Property Operating expenses
— underlying property operating expenses
(419) (730) (154) (48) (675) (11) (687)
— property management fees (6,850) (1,311) (241) — (4,201) (246) (4,447)
Net rental income 77,626 10,210 888 (48) 44,338 2,624 46,962
Net valuation gains/(losses) on investment properties
82,403 5,847 — — 44,125 3,947 48,072
Administration expenses (1,440) (327) (75) (270) (1,056) (36) (1,092)
Operating profit 158,589 15,730 813 (318) 87,407 6,535 93,942
Net financial result (24,855) (6,054) (2,878) — (16,893) (857) (17,751)
Taxes (20,909) (2,864) (195) — (11,984) (869) (12,853)
Profit for the period 112,826 6,812 (2,260) (318) 58,530 4,808 63,338
PAG
E 2
56
—
V
GP
NV
An
nu
al
Re
po
rt 2
02
1 /
Fin
an
cia
l p
art
/
No
tes
to
th
e c
on
so
lid
ate
d f
ina
nc
ial
sta
tem
en
ts

9.2 Summarised balance sheet information in respect of Joint Ventures
in thousands of € First Joint Venture
(excl. minorities)
at 100%
Second Joint
Venture
Third Joint
Ventureat 100%
Development Joint
Ventures at 100%
Joint Ventures
at 50%
First Joint Venture’s
German Asset Companies at
5.1%
2021
Investment properties 2,215,851 451,500 551,441 105,322 1,662,057 84,713 1,746,770
Other assets 41 54 3,531 75 1,850 — 1,851
Total non-current assets 2,215,892 451,554 554,972 105,397 1,663,908 84,713 1,748,620
Trade and other receivables 10,920 8,044 5,257 1,247 12,734 395 13,129
Cash and cash equivalents 59,747 19,192 16,691 421 48,025 1,836 49,862
Total current assets 70,667 27,236 21,948 1,668 60,760 2,231 62,990
Total assets 2,286,560 478,790 576,920 107,065 1,724,667 86,943 1,811,611
Non-current financial debt 892,941 239,304 271,522 53,774 728,771 35,325 764,095
Other non-current financial liabilities
399 (15) — — 192 — 192
Other non-current liabilities 6,158 2,709 — 950 4,909 141 5,049
Deferred tax liabilities 207,402 40,578 2,408 583 125,486 7,331 132,816
Total non-current liabilities 1,106,901 282,576 273,930 55,307 859,357 42,796 902,153
Current financial debt 23,588 5,033 — — 14,310 744 15,055
Trade debts and other current liabilities
18,505 7,203 41,459 4,604 35,885 402 36,288
Total current liabilities 42,093 12,236 41,459 4,604 50,196 1,146 51,342
Total liabilities 1,148,994 294,812 315,389 59,911 909,553 43,942 953,495
Net assets 1,137,566 183,978 261,531 47,154 815,114 43,001 858,116
PAG
E 2
57
—
VG
P N
V A
nn
ua
l R
ep
ort
20
21
/ F
ina
nc
ial
pa
rt
/ N
ote
s t
o t
he
co
ns
oli
da
ted
fin
an
cia
l s
tate
me
nts

VGP entered into four 50:50 joint ventures with Allianz which are set up according to a similar structure. The First Joint Ven-
ture recorded one closing during the year. On 15 June 2021, the First Joint Venture completed its eighth and final closing,
whereby the First Joint Venture acquired 4 logistic buildings, including 2 buildings in a new VGP parks and another 2 newly
completed buildings (in parks which were previously transferred to the First Joint Venture). Following this closing the First
Joint Venture reached its expanded investment target. The First Joint Venture will maintain its existing portfolio with VGP
continuing to act as property, facility and asset manager.
As the First Joint Venture reached its investment capacity, Allianz and VGP entered into a new joint venture agreement
in December 2021 with a view to establish a new Fourth Joint Venture. The Fourth Joint Venture will become effective at
the moment of its first closing, currently expected to occur during the second half of 2022. The Fourth Joint Venture’s
objective is to build a platform of new, grade A logistics and industrial properties with a key focus on expansion within the
same geographical scope as the First Joint Venture, i.e. core German markets and high growth CEE markets (of Hungary,
the Czech Republic and the Slovak Republic), with the aim of delivering stable income-driven returns with potential for
capital appreciation.
To allow VGP to acquire land plots on prime locations for future development, the Group has entered into three strategic
partnerships, i.e. in (i) a 50:50 joint venture with Roozen (the LPM Joint Venture) entered into during 2020, (ii) a 50:50 joint
venture with VUSA (the VGP Park Belartza Joint Venture), and a 50:50 joint venture with Revikon (the VGP Park Siegen Joint
Venture) both entered into during 2021. The Group considers these Development Joint Ventures as an add-on source of land
sourcing for land plots which would otherwise not be accessible to the Group.
in thousands of € First Joint Venture
(excl. minorities)
at 100%
SecondJoint
Ventureat 100%
ThirdJoint
Ventureat 100%
Development Joint
Ventures at 100%
Joint Ventures
at 50%
First Joint Venture's
German Asset Companies
at 5.1%
2020
Investment properties 1,847,545 403,423 418,918 80,496 1,375,191 69,871 1,445,062
Other assets 353 113 — — 233 19 252
Total non-current assets 1,847,898 403,536 418,918 80,496 1,375,424 69,890 1,445,314
Trade and other receivables 11,372 8,157 8,451 24 14,002 449 14,451
Cash and cash equivalents 56,724 17,284 14,368 15 44,196 1,945 46,140
Total current assets 68,096 25,441 22,819 39 58,198 2,394 60,591
Total assets 1,915,995 428,977 441,737 80,535 1,433,622 72,283 1,505,905
Non-current financial debt 898,911 245,188 165,528 49,779 679,703 34,574 714,277
Other non-current financial liabilities
1,537 108 — — 823 — 823
Other non-current liabilities 6,819 2,561 1,727 — 5,553 164 5,718
Deferred tax liabilities 143,377 27,749 1,821 — 86,474 5,165 91,638
Total non-current liabilities 1,050,644 275,606 169,076 49,779 772,552 39,903 812,456
Current financial debt 22,509 3,532 — — 13,020 707 13,728
Trade debts and other current liabilities
17,888 9,370 16,947 4,750 24,477 471 24,949
Total current liabilities 40,396 12,902 16,947 4,750 37,498 1,179 38,676
Total liabilities 1,091,040 288,508 186,023 54,529 810,050 41,082 851,132
Net assets 824,955 140,469 255,714 26,006 623,572 31,201 654,773
PAG
E 2
58
—
V
GP
NV
An
nu
al
Re
po
rt 2
02
1 /
Fin
an
cia
l p
art
/
No
tes
to
th
e c
on
so
lid
ate
d f
ina
nc
ial
sta
tem
en
ts

The Joint Ventures’ property portfolio, excluding development land and buildings being constructed by VGP on behalf of
the Joint Ventures, is valued at 31 December 2021 based on a weighted average yield of 4.28%¹ (compared to 4.76% as at
31 December 2020). A 0.10% variation of this market rate would give rise to a variation of the Joint Venture portfolio value
(at 100%) of € 79.2 million.
The (re)valuation of the First and Second Joint Ventures’ portfolio was based on the appraisal report of the property
expert Jones Lang LaSalle.
VGP provides certain services, including asset-, property- and development advisory and management, for the Joint Ven-
tures and receives fees from the Joint Ventures for doing so. Those services are carried out on an arms-length basis and
do not give VGP any control over the relevant Joint Ventures (nor any unilateral material decision-making rights). Significant
transactions and decisions within the Joint Ventures require full Board and/or Shareholder approval, in accordance with the
terms of the Joint Venture agreement.
9.3 Other non-current receivables
Other non-current receivables relate to non-current balance due by the co-shareholder of the LPM Joint Venture. The 2020
balance related to the non-current balance due by Allianz Real Estate in respect of the acquisition of VGP Park München
and which shall become payable by Allianz Real Estate in different instalments based on the completion dates of the
respective buildings. As it is expected that these buildings will be completed during the second half of 2022 this balance
was reclassified as Other current receivables in 2021. (see also note 22 Cash flow from disposal of subsidiaries and invest-
ment properties and note 14 Trade and Other Receivables).
9.4 Investments in joint ventures and associates
in thousands of € 2021 2020
Shareholder loans to First Joint Venture 42,183 51,672
Shareholder loans to Second Joint Venture 15,963 15,351
Shareholder loans to Third Joint Venture 135,908 82,911
Shareholder loans to Development Joint Ventures 52,940 29,030
Shareholder loans to associates (subsidiaries of First Joint Venture) 16,976 17,871
Construction and development loans to subsidiaries of First Joint Venture 36,769 32,507
Construction and development loans to subsidiaries of Second Joint Venture 46,192 37,226
Construction and development loans reclassified as assets held for sale (82,961) (69,733)
Other non-current receivables 935 67,203
Total 264,905 264,038
in thousands of € 2021 2020
As at 1 January 654,773 387,246
Additions 23,770 211,091
Result of the year 186,703 63,338
Repayment of equity (7,130) (6,902)
As at the end of the period 858,116 654,773
1 The First and Second Joint Venture have been valued by an independent valuation expert. The valuation of the Third Joint Venture is based
on the agreed proportional purchase price with Allianz Real Estate. The LPM Joint Venture and VGP Park Belartza Joint Venture only hold
development land and hence have been excluded from the weighted average yield calculation. PAG
E 2
59
—
V
GP
NV
An
nu
al
Re
po
rt 2
02
1 /
Fin
an
cia
l p
art
/
No
tes
to
th
e c
on
so
lid
ate
d f
ina
nc
ial
sta
tem
en
ts

10. Net financial result
in thousands of € 2021 2022
Bank and other interest income — 2
Interest income - loans to joint ventures and associates 12,318 9,292
Other financial income 4 25
Financial income 12,322 9,319
Bond interest expense (31,251) (24,706)
Bank interest expense – variable debt (2,825) (1,871)
Interest capitalised into investment properties 13,212 11,881
Net foreign exchange expenses (786) (282)
Other financial expenses (3,326) (2,933)
Financial expenses (24,976) (17,911)
Net financial costs (12,654) (8,592)
PAG
E 2
60
—
V
GP
NV
An
nu
al
Re
po
rt 2
02
1 /
Fin
an
cia
l p
art
/
No
tes
to
th
e c
on
so
lid
ate
d f
ina
nc
ial
sta
tem
en
ts

11. Taxation
11.1 Income tax expense recognised in the consolidated income statement
11.2 Reconciliation of eff ective tax rate
The majority of the Group’s profit before taxes is earned in Germany. Hence the effective corporate tax rate in Germany is
applied for the reconciliation. The change of the 2021 effective tax rate (compared to 2020) is mainly due to the one-off-tax
effect of the sale of VGP Park München which occurred in 2020.
The expiry of the tax loss carry-forward of the Group can be summarised as follows:
in thousands of € 2021 2020
Current tax (232) (870)
Deferred tax (113,613) (38,995)
Total (113,845) (39,865)
2021 — in thousands of € < 1 year 2–5 years > 5 years
Tax loss carry forward 488 8,928 69,655
2020 — in thousands of € < 1 year 2–5 years > 5 years
Tax loss carry forward 104 2,950 39,753
in thousands of € 2021 2020
Profit before taxes 763,903 410,804
Adjustment for share in result of joint ventures and associates (186,703) (63,338)
Result before taxes and share in result of joint ventures and associates 577,200 347,466
Income tax using the German corporate tax rate 15.8% (91,342) 15.8% (54,986)
Difference in tax rate non-German companies (15,892) 19,736
Non-tax-deductible expenditure (2,305) (1,057)
Losses/Notional interest deduction (5,326) (3,765)
Other 1,020 207
Total 19.7% (113,845) 11.5% (39,865)
PAG
E 2
61
—
VG
P N
V A
nn
ua
l R
ep
ort
20
21
/ F
ina
nc
ial
pa
rt
/ N
ote
s t
o t
he
co
ns
oli
da
ted
fin
an
cia
l s
tate
me
nts

11.3 Deferred tax assets and liabilities
The deferred tax assets and liabilities are attributable to the following:
A total deferred tax asset of € 12,962k (€ 7,313k in 2020) was not recognised.
12. Earnings per share
12.1 Earnings per ordinary share (EPS)
in thousands of € Assets Liabilities Net
2021 2020 2021 2020 2021 2020
Investment properties — — (160,893) (47,253) (160,893) (47,253)
Currency hedge accounting/Derivatives — — (473) (1,541) (473) (1,541)
Tax losses carried-forward 2,144 1,211 2,144 1,211
Capitalised interest — — (1,266) (917) (1,266) (917)
Capitalised cost — — (37) (87) (37) (87)
Other 348 — — (183) 348 (183)
Tax assets/liabilities 2,492 1,211 (162,668) (49,981) (160,175) (48,770)
Set-off of assets and liabilities (539) 574 539 (574) — —
Reclassification to liabilities related to disposal group held for sale
— — 49,834 6,742 49,834 6,742
Net tax assets/liabilities 1,953 1,786 (112,295) (43,813) (110,341) (42,028)
in number 2021 2020
Weighted average number of ordinary shares (basic) 20,696,064 19,960,099
Dilution — —
Weighted average number of ordinary shares (diluted) 20,696,064 19,960,099
in thousands of € 2021 2020
Result for the period attributable to the Group and to ordinary shareholders 650,055 370,939
Earnings per share (in €) – basic 31.41 18.58
Earnings per share (in €) – diluted 31.41 18.58
PAG
E 2
62
—
V
GP
NV
An
nu
al
Re
po
rt 2
02
1 /
Fin
an
cia
l p
art
/
No
tes
to
th
e c
on
so
lid
ate
d f
ina
nc
ial
sta
tem
en
ts

12.2 EPRA NAV’s – EPRA NAV’s per share
In October 2019, the EPRA published its new Best Practice Recommendations which set out the financial indicators listed
real estate companies should disclose so as to provide more transparency across the European listed sector. The EPRA
NAV and EPRA NNNAV were consequently replaced by three new Net Asset Value indicators: Net Reinstatement Value
(NRV), Net Tangible Assets (NTA) and Net Disposal Value (NDV). The EPRA NAV indicators are obtained by adjusting the
IFRS NAV in such a way that stakeholders get the most relevant information about the fair value of assets and liabilities. The
three different EPRA NAV indicators are calculated on the basis of the following scenarios:
(i) Net Reinstatement Value: based on the assumption that entities never sell assets and aims to reflect the value needed
to build the entity anew. The purpose of this indicator is to reflect what would be required to reconstitute the com-
pany through the investment markets based on the current capital and financing structure, including Real Estate
Transfer Taxes. EPRA NRV per share refers to the EPRA NRV based on the number of shares in circulation as at the
balance sheet date. See www.epra.com.
(ii) Net Tangible Assets: assumes that entities buy and sell assets, thereby realising certain levels of deferred taxation.
This pertains to the NAV adjusted to include property and other investments at fair value and to exclude certain items
that are not expected to be firmly established in a business model with long-term investment properties. EPRA NTA
per share refers to the EPRA NTA based on the number of shares in circulation as at the balance sheet date. See
www.epra.com.
(iii) Net Disposal Value: provides the reader with a scenario of the sale of the company's assets leading to the realization
of deferred taxes, financial instruments and certain other adjustments. This NAV should not be considered a liquida-
tion NAV as in many cases the fair value is not equal to the liquidation value. The EPRA NDV per share refers to the
EPRA NDV based on the number of shares in circulation as at the balance sheet date. See www.epra.com.
in thousands of € 31 December 2021
EPRA NRV EPRA NTA EPRA NDV EPRA NAV EPRA NNNAV
IFRS NAV 2,175,565 2,175,565 2,175,565 2,175,565 2,175,565
IFRS NAV per share (in €) 99.65 99.65 99.65 99.65 99.65
NAV at fair value (after the exercise of options, convertibles and other equity)
2,175,565 2,175,565 2,175,565 2,175,565 2,175,565
To exclude:
Deferred tax 160,176 160,176 — 160,176 —
Intangibles as per IFRS balance sheet — (1,051) — —
Subtotal 2,335,741 2,334,690 2,175,565 2,335,741 2,175,565
Fair value of fixed interest rate debt — — (7,470) — (7,470)
Real estate transfer tax 63,285 — — — —
NAV 2,399,026 2,334,690 2,168,095 2,335,741 2,168,095
Number of shares 21,833,050 21,833,050 21,833,050 21,833,050 21,833,050
NAV/share (in €) 109.88 106.93 99.30 106.98 99.30
in thousands of € 31 December 2020
EPRA NRV EPRA NTA EPRA NDV EPRA NAV EPRA NNNAV
IFRS NAV 1,305,737 1,305,737 1,305,737 1,305,737 1,305,737
IFRS NAV per share (in €) 63.44 63.44 63.44 63.44 63.44
NAV at fair value (after the exercise of options, convertibles and other equity)
1,305,737 1,305,737 1,305,737 1,305,737 1,305,737
To exclude:
Deferred tax 48,770 48,770 — 48,770 —
Intangibles as per IFRS balance sheet — (557) — —
Subtotal 1,354,507 1,353,950 1,305,737 1,354,507 1,305,737
Fair value of fixed interest rate debt — — (8,021) — (8,021)
Real estate transfer tax 25,019 — — — —
NAV 1,379,526 1,353,950 1,297,716 1,354,507 1,297,716
Number of shares 20,583,050 20,583,050 20,583,050 20,583,050 20,583,050
NAV/share (in €) 67.02 65.78 63.05 65.81 63.05
PAG
E 2
63
—
V
GP
NV
An
nu
al
Re
po
rt 2
02
1 /
Fin
an
cia
l p
art
/
No
tes
to
th
e c
on
so
lid
ate
d f
ina
nc
ial
sta
tem
en
ts

13. Investment properties
As at 31 December 2021 investment properties totalling € 30.8 million (same as at 31 December 2020) were pledged in
favour the Group’s banks (see note 17).
in thousands of € 2021
Completed Under Construction
Development land
Total
As at 1 January 166,410 456,681 297,060 920,151
Capex 163,678 231,983 24,499 420,160
Acquisitions — 17,935 281,211 299,146
Capitalised interest 777 12,435 — 13,212
Capitalised rent free and agent’s fee 7,995 2,045 676 10,716
Sales and disposals (36,419) — — (36,419)
Transfer on start-up of development — 177,545 (177,545) —
Transfer on completion of development 318,947 (318,947) — —
Net gain from value adjustments in investment properties
124,443 436,253 12,457 573,153
Reclassification to held for sale (183,100) (160,770) (3,735) (347,605)
As at 31 December 562,730 855,160 434,624 1,852,514
in thousands of € 2020
Completed Under Construction
Development land
Total
As at 1 January 94,056 338,266 360,623 792,945
Capex 67,452 201,226 7,353 276,031
Acquisitions — 9,851 130,256 140,107
Capitalised interest 3,902 7,934 45 11,881
Capitalised rent free and agent’s fee 3,245 2,351 32 5,628
Sales and disposals (191,596) (292,107) (10,083) (493,786)
Transfer on start-up of development — 193,574 (193,574) —
Transfer on completion of development 155,018 (155,018) — —
Net gain from value adjustments in investment properties
36,477 150,604 2,408 189,489
Reclassification to held for sale (2,144) — — (2,144)
As at 31 December 166,410 456,681 297,060 920,151
PAG
E 2
64
—
V
GP
NV
An
nu
al
Re
po
rt 2
02
1 /
Fin
an
cia
l p
art
/
No
tes
to
th
e c
on
so
lid
ate
d f
ina
nc
ial
sta
tem
en
ts

13.1 Fair value hierarchy of the Group’s investment properties
All of the Group’s properties are level 3, as defined by
IFRS 13, in the fair value hierarchy as at 31 December
2021 and there were no transfers between levels during
the year. Level 3 inputs used in valuing the properties are
those which are unobservable, as opposed to level 1 (inputs
from quoted prices) and level 2 (observable inputs either
directly, i.e. as prices, or indirectly, i.e. derived from prices).
13.2 Property valuation techniques and related quantitative information
(i) Valuation processThe Group’s investment property is initially carried at cost
plus transaction cost. It is subsequently measured at fair
value and is valued at least once per year. In view of the
rapid growth of the portfolio the Group has in recent years
opted to perform the valuations twice per year i.e. as at
30 June and 31 December. Valuations are performed by
independent external property appraisers. The Group ordi-
narily uses Jones Lang LaSalle as the Group’s valuator.
From time to time, at the discretion of the Company, a small
part of the portfolio may be valued by another external inde-
pendent valuator. For the 31 December 2021 valuations, all
valuations were carried out by Jones Lang LaSalle. As a
result, the value of the Group’s assets depends on develop-
ments in the local real estate market in each of the Group’s
countries of operations and is subject to change. Gains
and losses from changes in fair value are recognized in the
Group’s income statement as valuation results and are also
a component of the Group’s indirect result.
The Group's valuation contracts are typically entered into
for a term of one year and the fees of the property experts
are fixed for the term of their appointment and are not
related to the value of the properties for which a valuation is
made. The valuations are prepared in accordance with the
RICS Valuation – Professional Standards (incorporating the
International Valuation Standards) Global edition July 2017
(same approach as for the previous period end valuations).
The basis of valuation is the market value of the property,
as at the date of valuation, defined by the RICS as: “The
estimated amount for which an asset or liability should
exchange on the valuation date between a willing buyer
and a willing seller in an arm’s length transaction after
proper marketing and where the parties had each acted
knowledgeably, prudently and without compulsion.”
(ii) Valuation methodology
Discounted cash flow approachIn view of the nature of the portfolio and the bases of valua-
tion Jones Lang LaSalle has adopted the income approach,
discounted cash flow technique, analysed over a 10- or
15-year period for each property. The cash flow assumes a
ten-year hold period with the exit value calculated on ERV.
To calculate the exit value Jones Lang Lasalle has used the
exit yield which represents their assumption of the possible
yield in the 10th year.
The cash flow is based upon the rents payable under
existing lease agreements until the agreed lease end. In
case of early break option, the valuator has assumed that
the break will be exercised only if the penalty is less than
the valuator’s assumed expiry void period.
After the lease termination the valuator has assumed a
certain expiry void period and a 5 year new lease contract.
For currently vacant premises the valuator has assumed
a certain initial void period and 5 year lease contract. For
the properties that are under construction, the valuator
has adopted an initial void starting as of the valuation date.
The assumed rental income was calculated on the basis of
estimated rental value (ERV).
The assumed voids are used to cover the time and
the relocated cost of marketing, re-letting and possible
reconstruction. The voids were adopted to each of the
buildings within the portfolio.
In order to calculate the net rental income the valuators
have deducted capital expenditures (contribution to the
sinking fund) from the gross rental income.
Equivalent yield approachFor the properties in Spain, the valuator has adopted the
equivalent yield approach.
The equivalent yield approach calculates the gross
market value by applying a capitalisation rate (equivalent
yield) to the net rental income as of the valuation date and
capitalising the income into perpetuity.
The abovementioned assumptions are more thoroughly
specified below section of the valuation assumptions.
Valuation assumptionsThe following main assumptions, together with the quan-
titative information included in section “(iv) Quantitative
information about fair value measurements using unob-
servable inputs”; were made by the valuator.
— Jones Lang LaSalle’s analyses adopts a 10- or 15-years
cash flow approach to reflect the initial income and any
agreed rent indexation reverting to the estimated rental
value after expiry of the current leases. For the purpose
of the valuation the valuator has assumed that the cur-
rent tenants will stay in the premises until the agreed
lease end. In case of early break option, the valuator has
assumed that the break will be exercised only if the pen-
alty is less than valuator’s assumed expiry void period.
— The valuator has assumed that after termination (first
possible break) of the current lease contracts new
5-year leases will be signed and the valuator’s ERV will
be applied and the rent will be indexed each lease anni-
versary in line with EU CPI, if not mentioned otherwise
in the lease agreements.
— The range of used estimated rental values has been
detailed in below section “(iv) Quantitative information
about fair value measurements using unobservable
inputs”.
— After the termination of existing leases (first break
option) the valuator has adopted an expiry void of 2–12
months. The assumed voids are used to cover the time
and the cost of marketing, re-letting and possible recon-
struction. The voids were adopted to each of the build-
ing within the portfolio.
— After the termination of existing leases (first break
option) the valuator has adopted an expiry void of 3–12
months. The assumed voids are used to cover the time
and the cost of marketing, re-letting and possible recon-
struction. The voids were adopted to each of the build-
ing within the portfolio.
— For properties that are vacant and under construction,
the valuator has adopted an initial void starting at the
valuation date.
— From the gross income the valuator has deducted a con-
tribution to a sinking fund at 0.50%–3.95%.
— The rents were indexed in line with the indexation that
was agreed in the lease agreements. Therefore, the
PAG
E 2
65
—
V
GP
NV
An
nu
al
Re
po
rt 2
02
1 /
Fin
an
cia
l p
art
/
No
tes
to
th
e c
on
so
lid
ate
d f
ina
nc
ial
sta
tem
en
ts

rents are subject to the indexation according to German,
Spanish CPI, EU CPI, EICP or HICP. The EICP indexation
was assumed at the level of 2.12%.
— The rents after reversion have been indexed on an
annual basis each lease anniversary in line with the EU
CPI indexation, which is assumed to be at 2.12%.
— The exit value was calculated on ERV.
— The cash flow that was used for the calculation was dis-
counted either quarterly or monthly depending on the
frequency of the rent payments.
— Based on the location, projected achievable rental
income stream and position in the market the valuator
has applied exit yields and discount rates (see below sec-
tion “(iv) Quantitative information about fair value meas-
urements using unobservable inputs”; for further details).
Property that is being constructed or developed for future
use as investment property is also stated at fair market
value, and investment properties under construction are
also valued by an independent valuation expert. For the
properties under construction the valuation expert has
used the same approach as applicable for the completed
properties but deducting the remaining construction
costs from the calculated market value, whereby “remain-
ing construction costs” means overall pending develop-
ment cost, which include all hard costs, soft costs, financ-
ing costs and developer profit. Developer profit takes into
account the level of risk connected with individual prop-
erty and is mainly dependent on development stage and
pre-letting status.
Land held for development is valued using the valuation
sales comparison approach. The sales comparison approach
produces a value indication by comparing the subject
property to similar properties and applying adjustments
to reflect advantages and disadvantages to the subject
property. This is most appropriate when a number of similar
properties have recently been sold or are currently for sale
in the market.
Valuation reviewThe valuations made are reviewed internally by the CEO,
CFO and Financial Controller and discussed with the inde-
pendent valuator as appropriate. The CFO and CEO report
on the outcome of the valuation processes and results to
the audit committee and take any comments or decision in
consideration when performing the subsequent valuations.
At each semi-annual period end, the financial controller
together with the CFO: (i) verify all major inputs to the
independent valuation report; (ii) assess property valuation
movements when compared to the prior semi-annual and
annual period; (iii) holds discussions with the independent
valuer.
(iii) Climate risk legislation
The EU is currently producing legislation on the transi-
tion to net zero which is likely to include an update to the
Minimum Energy Efficiency Standards and also the inten-
tion to introduce an operational rating. Whilst the nature
of the legislation is not yet clear it could have a potential
impact to future asset value. The introduction of mandatory
climate related disclosures in the EU (including ‘Sustain-
able Finance Disclosure Regulations’ (SFDR) and ‘Corpo-
rate Sustainability Reporting Directive’ (CSRD) in the EU),
including the assessment of physical and transition climate
risks, may potentially have an impact on how the market
views such risks and incorporates them into the sale and
letting of assets. Sustainability and climate risk legislation
has an impact on the value of an asset, even if not explicitly
recognised. Valuers reflect markets, they do not lead them.
Where the valuers recognise the value impacts of sustain-
ability and legislation, they are reflecting their understand-
ing of how market participants include sustainability and
legislation requirements in their bids and the impact on
market valuations. For further actions being taken by the
VGP Group in respect of climate transition and environmen-
tal footprint in general reference is made to the “Corporate
Responsibility Report” included in this Annual Report 2021.
(iv) Quantitative information about fair value measurements using unobservable inputs
The quantitative information in the following tables is taken
from the different reports produced by the independent
real estate experts. The figures provide the range of values
and the weighted average of the assumptions used in the
determination of the fair value of investment properties.
PAG
E 2
66
—
V
GP
NV
An
nu
al
Re
po
rt 2
02
1 /
Fin
an
cia
l p
art
/
No
tes
to
th
e c
on
so
lid
ate
d f
ina
nc
ial
sta
tem
en
ts

Region Segment Fair value 31 Dec-21
(€ ‘000)
Valuation technique Level 3 – Unobservable inputs Range
Czech Republic IP 58,900 Discounted cash flow ERV per m² (in €) 38–51
Discount rate 5.00%–5.50%
Exit yield 5.00%
Weighted average yield 4.82%
Cost to completion (in '000 €) 1,050
Properties valued (aggregate m²) 69,064
WAULT (until maturity) (in years) 6.27
WAULT (until first break) (in years) 6.27
IPUC 88,900 Discounted cash flow ERV per m² (in €) 48–56
Discount rate 4.25%–6.00%
Exit yield 4.25%–5.00%
Weighted average yield 4.96%
Cost to completion (in '000 €) 46,200
Properties valued (aggregate m²) 132,216
DL 35,530 Sales comparison Price per m² (in €)
Germany IP 358,330 Discounted cash flow ERV per m² (in €) 39–62
Discount rate 4.70%–5.75%
Exit yield 3.30%–4.35%
Weighted average yield 4.07%
Cost to completion (in '000 €) 20,350
Properties valued (aggregate m²) 294,554
WAULT (until maturity) (in years) 7.27
WAULT (until first break) (in years) 6.77
IPUC 536,030 Discounted cash flow ERV per m² (in €) 41–144
Discount rate 4.50%–7.00%
Exit yield 3.15%–4.40%
Weighted average yield 3.78%
Cost to completion (in '000 €) 359,600
Properties valued (aggregate m²) 517,285
DL 93,625 Sales comparison Price per m² (in €)
Spain IP 61,450 Equivalent yield ERV per m² (in €) 44–50
Equivalent yield 4.90%–5.10%
Reversionary yield 5.15%–5.40%
Weighted average yield 4.96%
Cost to completion (in '000 €) 0
Properties valued (aggregate m²) 66,039
WAULT (until maturity) (in years) 7.50
WAULT (until first break) (in years) 3.48
IPUC 105,530 Equivalent yield ERV per m² (in €) 43–56
Exit yield 4.20%–5.40%
Weighted average yield 4.91%
PAG
E 2
67
—
VG
P N
V A
nn
ua
l R
ep
ort
20
21
/ F
ina
nc
ial
pa
rt
/ N
ote
s t
o t
he
co
ns
oli
da
ted
fin
an
cia
l s
tate
me
nts

Region Segment Fair value 31 Dec-21
(€ ‘000)
Valuation technique Level 3 – Unobservable inputs Range
Cost to completion (in '000 €) 19,600
Properties valued (aggregate m²) 127,638
DL 68,094 Sales comparison Price per m² (in €)
Romania IP 20,700 Discounted cash flow ERV per m² (in €) 38–50
Discount rate 8.25%–8.50%
Exit yield 7.75%–8.50%
Weighted average yield 7.83%
Cost to completion (in '000) 550
Properties valued (aggregate m²) 40,330
WAULT (until maturity) (in years) 3.59
WAULT (until first break) (in years) 3.59
IPUC 36,900 Discounted cash flow ERV per m² (in €) 44–58
Discount rate 8.75%–9.90%
Exit yield 7.75%–9.00%
Weighted average yield 9.68%
Cost to completion (in '000) 15,650
Properties valued (aggregate m²) 103,122
DL 41,055 Sales comparison Price per m² (in €)
Netherlands IP 51,700 Discounted cash flow ERV per m² (in €) 45
Discount rate 3.95%
Exit yield 4.80%
Weighted average yield 3.69%
Cost to completion (in '000) 0
Properties valued (aggregate m²) 42,157
WAULT (until maturity) (in years) 9.75
WAULT (until first break) (in years) 9.75
IPUC 92,000 Discounted cash flow ERV per m² (in €) 49–53
Discount rate 4.00%–4.80%
Exit yield 4.50%–5.30%
Weighted average yield 4.22%
Cost to completion (in '000) 21,500
Properties valued (aggregate m²) 93,260
DL 37,720 Sales comparison Price per m² (in €)
Italy IP 56,610 Discounted cash flow ERV per m² (in €) 47–87
Discount rate 6.25%–6.85%
Exit yield 5.00%–5.75%
Weighted average yield 5.73%
Cost to completion (in '000) 5,200
Properties valued (aggregate m²) 56,578
WAULT (until maturity) (in years) 6.92
WAULT (until first break) (in years) 6.25
DL 22,160 Sales comparison Price per m² (in €)
PAG
E 2
68
—
V
GP
NV
An
nu
al
Re
po
rt 2
02
1 /
Fin
an
cia
l p
art
/
No
tes
to
th
e c
on
so
lid
ate
d f
ina
nc
ial
sta
tem
en
ts

Region Segment Fair value 31 Dec-21
(€ ‘000)
Valuation technique Level 3 – Unobservable inputs Range
Austria IPUC 47,360 Discounted cash flow ERV per m² (in €) 76–193
Discount rate 5.00%–5.50%
Exit yield 3.50%–4.25%
Weighted average yield 3.89%
Cost to completion (in '000 €) 40,700
Properties valued (aggregate m²) 22,706
DL 25,324 Sales comparison Price per m² (in €)
Hungary IP 28,790 Discounted cash flow ERV per m² (in €) 58–64
Discount rate 7%
Exit yield 6.50%
Weighted average yield 7.16%
Cost to completion (in '000 €) 0
Properties valued (aggregate m²) 33,713
WAULT (until maturity) (in years) 7.80
WAULT (until first break) (in years) 6.87
IPUC 33,080 Discounted cash flow ERV per m² (in €) 50–53
Discount rate 6.50%–7.00%
Exit yield 6.00%–6.50%
Weighted average yield 6.83%
Cost to completion (in '000 €) 5,500
Properties valued (aggregate m²) 51,066
DL 25,447 Sales comparison Price per m² (in €)
Latvia IP 43,300 Discounted cash flow ERV per m² (in €) 51–59
Discount rate 7.25%–7.35%
Exit yield 7.15%–7.25%
Weighted average yield 7.35%
Cost to completion (in '000) 3,700
Properties valued (aggregate m²) 62,500
WAULT (until maturity) (in years) 7.36
WAULT (until first break) (in years) 7.36
IPUC 27,900 Discounted cash flow ERV per m² (in €) 58–61
Discount rate 7.00%
Exit yield 7.00%
Weighted average yield 7.54%
Cost to completion (in '000) 28,100
Properties valued (aggregate m²) 70,605
DL 1,640 Sales comparison Price per m² (in €)
Slovakia IP 45,310 Discounted cash flow ERV per m² (in €) 40
Discount rate 5.35%
Exit yield 5.35%
Weighted average yield 4.90%
Cost to completion (in '000 €) 1,400
PAG
E 2
69
—
V
GP
NV
An
nu
al
Re
po
rt 2
02
1 /
Fin
an
cia
l p
art
/
No
tes
to
th
e c
on
so
lid
ate
d f
ina
nc
ial
sta
tem
en
ts

Region Segment Fair value 31 Dec-20
(€ ‘000)
Valuation technique Level 3 – Unobservable inputs Range
Czech Republic IPUC 8,400 Discounted cash flow ERV per m² (in €) 49
Discount rate 7.15%
Exit yield 5.90%
Weighted average yield 6.70%
Cost to completion (in '000 €) 2,567
Properties valued (aggregate m²) 14,882
DL 43,503 Sales comparison Price per m² (in €)
Germany IP 88,280 Discounted cash flow ERV per m² (in €) 46–74
Discount rate 5.30%–6.00%
Exit yield 4.50%–5.00%
Weighted average yield 5.17%
Cost to completion (in '000 €) 3,587
Properties valued (aggregate m²) 90,737
WAULT (until maturity) (in years) 5.87
WAULT (until first break) (in years) 5.72
IPUC 302,740 Discounted cash flow ERV per m² (in €) 45–95
Discount rate 5.00%–7.75%
Exit yield 3.70%–4.60%
Region Segment Fair value 31 Dec-21
(€ ‘000)
Valuation technique Level 3 – Unobservable inputs Range
Properties valued (aggregate m²) 57,329
WAULT (until maturity) (in years) 10.04
WAULT (until first break) (in years) 10.04
IPUC 48,230 Discounted cash flow ERV per m² (in €) 47–54
Discount rate 5.35%–7.50%
Exit yield 5.35%–5.50%
Weighted average yield 5.94%
Cost to completion (in '000) 22,900
Properties valued (aggregate m²) 85,660
DL 59,682 Sales comparison Price per m² (in €)
Portugal IP 20,740 Discounted cash flow ERV per m² (in €) 45
Discount rate 7.22%
Exit yield 5.75%
Weighted average yield 6.08%
Cost to completion (in '000) 1,250
Properties valued (aggregate m²) 29,813
WAULT (until maturity) (in years) 14.83
WAULT (until first break) (in years) 9.83
DL 4,132 Sales comparison Price per m² (in €)
Serbia DL 23,950 Sales comparison Price per m² (in €)
Total 2,200,119
PAG
E 2
70
—
VG
P N
V A
nn
ua
l R
ep
ort
20
21
/ F
ina
nc
ial
pa
rt
/ N
ote
s t
o t
he
co
ns
oli
da
ted
fin
an
cia
l s
tate
me
nts

Region Segment Fair value 31 Dec-20
(€ ‘000)
Valuation technique Level 3 – Unobservable inputs Range
Weighted average yield 4.80%
Cost to completion (in '000 €) 132,108
Properties valued (aggregate m²) 339,619
DL 103,039 Sales comparison Price per m² (in €)
Spain IP 13,350 Equivalent yield ERV per m² (in €) 44
Equivalent yield 5.75%
Reversionary yield (nominal) 5.97%
Weighted average yield 5.75%
Cost to completion (in '000 €) 548
Properties valued (aggregate m²) 18,074
WAULT (until maturity) (in years) 5.86
WAULT (until first break) (in years) 2.42
IPUC 64,431 Equivalent yield ERV per m² (in €) 48–50
Equivalent yield 4.90–5.80%
Reversionary yield (nominal) n.a.
Weighted average yield 5.57%
Cost to completion (in '000 €) 26,272
Properties valued (aggregate m²) 103,779
DL 23,115 Sales comparison Price per m² (in €)
Romania IPUC 17,300 Discounted cash flow ERV per m² (in €) 43–53
Discount rate 9.25%–10.00%
Exit yield 7.75%–9.00%
Weighted average yield 9.96%
Cost to completion (in '000) 8,251
Properties valued (aggregate m²) 56,548
DL 35,373 Sales comparison Price per m² (in €)
Netherlands IPUC 30,300 Discounted cash flow ERV per m² (in €) 45
Discount rate 4.65%
Exit yield 5.20%
Weighted average yield 4.29%
Cost to completion (in '000) 14,136
Properties valued (aggregate m²) 42,157
DL 21,858 Sales comparison Price per m² (in €)
Italy IPUC 26,710 Discounted cash flow ERV per m² (in €) 44–86
Discount rate 6.30–6.95%
Exit yield 5.65–6.00%
Weighted average yield 6.17%
Cost to completion (in '000) 12,766
Properties valued (aggregate m²) 44,660
DL 4,454 Sales comparison Price per m² (in €)
Hungary IP 24,980 Discounted cash flow ERV per m² (in €) 58–63
Discount rate 7.65%
PAG
E 2
71
—
VG
P N
V A
nn
ua
l R
ep
ort
20
21
/ F
ina
nc
ial
pa
rt
/ N
ote
s t
o t
he
co
ns
oli
da
ted
fin
an
cia
l s
tate
me
nts

IP = completed investment property
IPUC = investment property under construction
DL = development land
(v) Sensitivity of valuationsThe sensitivity of the fair value based on changes to the significant non-observable inputs used to determine the fair value
of the properties classified in level 3 in accordance with the IFRS fair value hierarchy is as follows (all variables remaining
constant):
non observable input Impact on fair value in case of
Fall Rise
ERV (in €/m²) Negative Positive
Discount rate Positive Negative
Exit yield Positive Negative
Remaining lease term (until first break) Negative Positive
Remaining lease term (until final expiry) Negative Positive
Occupancy rate Negative Positive
Inflation Negative Positive
Region Segment Fair value 31 Dec-20
(€ ‘000)
Valuation technique Level 3 – Unobservable inputs Range
Exit yield 7.25%
Weighted average yield 7.95%
Cost to completion (in '000) 733
Properties valued (aggregate m²) 33,711
WAULT (until maturity) (in years) 8.64
WAULT (until first break) (in years) 7.71
DL 8,438 Sales comparison Price per m² (in €)
Latvia IP 39,800 Discounted cash flow ERV per m² (in €) 50–58
Discount rate 7.75–8.25%
Exit yield 7.75%
Weighted average yield 8.52%
Cost to completion (in '000) 500
Properties valued (aggregate m²) 62,545
WAULT (until maturity) (in years) 4.63
WAULT (until first break) (in years) 3.34
DL 719 Sales comparison Price per m² (in €)
Slovakia IPUC 6,800 Discounted cash flow ERV per m² (in €) 54
Discount rate 7.50%
Exit yield 6.50%
Weighted average yield 7.46%
Cost to completion (in '000) 6,622
Properties valued (aggregate m²) 18,576
DL 38,456 Sales comparison Price per m² (in €)
Austria DL 13,009 Sales comparison Price per m² (in €)
Portugal DL 5,096 Sales comparison Price per m² (in €)
Total 920,151
PAG
E 2
72
—
VG
P N
V A
nn
ua
l R
ep
ort
20
21
/ F
ina
nc
ial
pa
rt
/ N
ote
s t
o t
he
co
ns
oli
da
ted
fin
an
cia
l s
tate
me
nts

Issued and fully paid Number of shares Par value of shares (€ ‘000)
Ordinary shares issued at 1 January 2021 20,583,050 72,225
Issue of new shares 1,250,000 6,233
Ordinary shares issued at 31 December 2020 21,833,050 78,458
in thousands of € 2021 2020
Trade receivables 9,283 7,781
Tax receivables – VAT 64,417 27,865
Accrued income and deferred charges 1,592 1,469
Other receivables 86,490 7,713
Reclassification to (–)/ from held for sale (13,760) —
Total 148,022 44,828
A decrease in the estimated annual rent will decrease the fair value.
An increase in the discount rates and the capitalisation rates used for the terminal value i.e. the exit yield of the discounted
cash flow method will decrease the fair value.
There are interrelationships between these rates as they are partially determined by market rate conditions.
For investment properties under construction, the cost to completion and the time to complete will reduce the fair values
whereas the consumption of such cost over the period to completion will increase the fair value.
In addition, the sensitivity of the fair value of the portfolio can be estimated as follows: the eff ect of a rise (fall) of 1% in rental
income results in a rise (fall) in the fair value of the portfolio of approximately € 24.8 million (all variables remaining constant).
The effect of a rise (fall) in the weighted average yield (see note 7) of 25 basis points results in a fall (rise) in the fair value of
the portfolio of approximately € 126.6 million (all variables remaining constant).
14. Trade and other receivables
The increase in VAT receivables is due to the increased development activities of the Group. As at 31 December 2021 there
were 50 buildings under construction (1,478,000 m²).
Other receivables mainly relate to the remaining current balance (€ 73.1 million) due by Allianz Real Estate in respect of
the acquisition of VGP Park München and the current balance by the shareholder of the LPM Joint Venture (€ 4.1 million).
See also note 9 Investments in Joint Ventures – 9.3 Other non-current receivable.
15. Cash and cash equivalents
The Group’s cash and cash equivalents comprise primarily cash deposits of which 73% held at Belgian banks.
16. Share capital and other reserves
16.1 Share capital
On 29 November 2021 the Company successfully placed 1,250,000 of ordinary shares in the capital of the Company at a
price of € 240.00 per share. The Company raised € 300.0 million, before the € 5.1 million expenses and as a result the Com-
pany’s share capital increased by € 6.2 million and share premium by € 288.7 million (see note 16.2).
The statutory share capital of the Company after the capital increase amounts to € 108,873k. The € 30.4 million capital
reserve included in the Statement of Changes in Equity, relates to the elimination of the contribution in kind of the shares
of a number of Group companies and the deduction of all costs in relation to the issuing of the new shares and the stock
exchange listing of the existing shares from the equity of the company, at the time of the initial public offering (“IPO”) in
2007 (see also “Statement of changes in equity”).
PAG
E 2
73
—
VG
P N
V A
nn
ua
l R
ep
ort
20
21
/ F
ina
nc
ial
pa
rt
/ N
ote
s t
o t
he
co
ns
oli
da
ted
fin
an
cia
l s
tate
me
nts

16.2 Other reserves
In September 2020 VGP (through its 100% subsidiary VGP Belgium NV) successfully placed 929,153 existing ordinary VGP
NV shares by means of a private placement via an accelerated bookbuild offering to international institutional investors.
The gross sales proceeds were in an amount of € 109.2 million. The realised net gain on this transaction (€ 97 million) was
directly booked in other reserves (see also Financial Review – Statement of changes in equity).
As at 31 December 2021, the Group did not hold any treasury shares.
17. Current and non-current financial debt
The contractual maturities of interest-bearing loans and borrowings (current and non-current) are as follows:
in thousands of € 2021 2020
As at 1 January 285,420 69
Share premium arising on the issue of new shares 288,668 188,346
Gain on the sale of treasury shares (net) — 97,005
As at 31 December 574,088 285,420
Maturityin thousands of €
2021
Outstanding balance < 1 year > 1–5 year > 5 year
Non-current
Bank borrowings
Schuldschein loans 28,939 26,940 1,999
Bonds
2.75% bonds Apr-23 149,492 — 149,492 —
3.90% bonds Sep-23 223,890 — 223,890 —
3.25% bonds Jul-24 74,702 — 74,702 —
3.35% bonds Mar-25 79,825 — 79,825 —
3.50% bonds Mar-26 189,076 — 189,076 —
1.50% bonds Apr-29 594,684 — 594,684
1,311,669 — 716,985 594,684
Total non-current financial debt 1,340,609 — 743,925 596,684
Current
Bank borrowings 18,918 18,918
Schuldschein loans 4,496 4,496
Accrued interest 20,733 20,733 — —
Total current financial debt 44,147 44,147 — —
Total current and non-current financial debt 1,384,756 44,147 743,925 596,684
PAG
E 2
74
—
VG
P N
V A
nn
ua
l R
ep
ort
20
21
/ F
ina
nc
ial
pa
rt
/ N
ote
s t
o t
he
co
ns
oli
da
ted
fin
an
cia
l s
tate
me
nts

The above 31 December 2021 balances include capitalised finance costs of (i) € 147k on bank borrowings and schuldschein
loans (2020: € 263k) and (ii) € 8,331k on bonds (2020: € 4,456k).
The accrued interest relates to the 6 issued bonds (€ 20.4 million) and the Schuldschein loans (€ 0.2 million). The coupons
of the bonds are payable annually on 2 April for the Apr-23 Bond, 21 September for the Sep-23 Bond, 6 July for the Jul-24
Bond, 30 March for the Mar-25 Bond, 19 September for the Mar-26 Bond and 8 April for the Apr-29 Bond
The interests on the Schuldschein loans are payable on a semi-annual basis on 15 April and 15 October for the variable
rate Schuldschein loans and annually on 15 October for the fixed rate Schuldschein loans
17.1 Overview
17.1.1 Bank loansThe loans and credit facilities granted to the VGP Group are all denominated in € can be summarised as follows (all figures
below are stated excluding capitalised finance costs):
Maturityin thousands of €
2020
Outstanding balance < 1 year > 1–5 year > 5 year
Non-current
Bank borrowings — — — —
Schuldschein loans 33,252 — 7,262 25,990
Bonds
2.75% bonds Apr-23 149,088 — 149,088 —
3.90% bonds Sep-23 223,246 — 223,246 —
3.25% bonds Jul-24 74,583 — 74,583 —
3.35% bonds Mar-25 79,771 — 79,771 —
3.50% bonds Mar-26 188,857 — — 188,857
715,544 — 526,687 188,857
Total non-current financial debt 748,796 — 533,949 214,847
Current
Bank borrowings 20,318 20,318 — —
Accrued interest 14,150 14,150 — —
Total current financial debt 34,468 34,468 — —
Total current and non-current financial debt 783,264 34,468 533,949 214,847
2021in thousands of €
Facility amount
Facility expiry date
Outstanding balance
< 1 year > 1–5 years > 5 years
Swedbank AS – Latvia 19,000 31-Mar-22 19,000 19,000 — —
KBC Bank NV 75,000 31-Dec-26 — — — —
Belfius Bank NV 75,000 31-Dec-26 — — — —
BNP Paribas Fortis NV 50,000 31-Dec-24 — — — —
Total bank debt 219,000 19,000 19,000 — —
2020in thousands of €
Facility amount
Facility expiry date
Outstanding balance
< 1 year > 1–5 years > 5 years
Swedbank AS – Latvia 20,333 31-Aug-21 20,333 20,333 — —
KBC Bank NV 75,000 31-Dec-22 — — — —
Belfius Bank NV 50,000 31-Dec-22 — — — —
JP Morgan AG 25,000 08-Nov-22 — — — —
Total bank debt 170,333 20,333 20,333 — —
PAG
E 2
75
—
VG
P N
V A
nn
ua
l R
ep
ort
20
21
/ F
ina
nc
ial
pa
rt
/ N
ote
s t
o t
he
co
ns
oli
da
ted
fin
an
cia
l s
tate
me
nts

17.1.2 Schuldschein loansOn 10 October 2019, VGP completed a Schuldscheindarlehen private placement (“Schuldschein loans”) for an aggregate
amount of EUR 33.5 million (excluding capitalised finance costs) which was used to finance the current development pipe-
line of the Group.
The Schuldschein loans represents a combination of fixed and floating notes whereby the variable rates represent a
nominal amount of EUR 21.5 million which is not hedged. The current average interest rate is 2.73 per cent per annum. The
loans have a maturity of 3,5,7 and 8 years (for more information on covenants see note 17.2.2.).
17.1.3 BondsAs at 31 December 2021 VGP has following 6 bonds outstanding:
— the € 150 million fixed rate bond maturing on 2 April 2023 which carries a coupon of 2.75% per annum (listed on the
regulated market of Euronext Brussels with ISIN Code: BE0002677582 – Common Code: 208152149) (“Apr-23 Bond”);
— € 225 million fi xed rate bonds due 21 September 2023 carry a coupon of 3.90% per annum. The bonds have been listed on
the regulated market of NYSE Euronext Brussels (ISIN Code: BE0002258276 – Common Code: 148397694). (“Sep-23 Bond”)
— € 75 million fixed rate bonds due 6 July 2024 which carry a coupon of 3.25% per annum. The bonds have been listed on
the regulated market of NYSE Euronext Brussels (ISIN Code: BE0002287564 – Common Code: 163738783). (“Jul-24 Bond”)
— € 80 million fixed rate bonds due 30 March 2025 carry a coupon of 3.35% per annum. The bonds are not listed (ISIN
Code: BE6294349194 – Common Code: 159049558). (“Mar-25 Bond”)
— € 190 million fixed rate bonds due 19 March 2026 carry a coupon of 3.50% per annum. The bonds have been listed on the
regulated market of NYSE Euronext Brussels (ISIN Code: BE0002611896 – Common Code: 187793777). (“Mar-26 Bond”)
— € 600 million fixed rate bonds due 8 April 2029 carry a coupon of 1.50% per annum. The bonds have been listed on the
Euro MFT Market Luxemburg (ISIN Code: BE6327721237 – Common Code: 232974028). (“Apr-29 Bond”)
17.2 Key terms and covenants
17.2.1 Bank loansAs a general principle, loans are entered into by the Group in EUR at a floating rate, converting to a fixed rate through inter-
est rate swaps in compliance with the respective loan agreements.
For further information on financial instruments we refer to note 23.
VGP Latvia sia (owner of the VGP Park Kekava) entered into a two year EUR 22 million investment loan with Swedbank AS
(Latvia) in 2019. These funds were used to partially repay the invested equity made available by the Company. The invest-
ment loan is subject to certain covenants i.e.:
— Equity of VGP Latvia sia to remain at above 20% of its balance sheet;
— Debt service cover ratio of at least 1.20; and
— Loan to value not to exceed 70%.
VGP Latvia sia pledged its asset in favour of Swedbank AS. As at 31 December 2021 the outstanding amount under the
investment loan was € 19.0 million. It is the Group’s intention to repay this loan at its expiry date of 31 March 2022.
There were no other credit facilities outstanding at the level of the Subsidiaries as at 31 December 2021.
In order to bridge temporary funding peaks between the different closings with the Joint Ventures, the Company has
arranged following committed credit facilities:
— On 2 November 2021, the Company entered into a 5-year revolving credit facility with Belfius Bank SA/NV for an amount
of EUR 75 million which will mature on 31 December 2026.
— On 10 November 2021, the Company entered into a 5-year revolving credit facility for an amount of EUR 75 million with
KBC Bank NV which will mature on 31 December 2026.
— On 21 December 2021, the Company entered into a 3-year revolving credit facility with BNP Paribas Fortis SA/NV for an
amount of EUR 50 million which will mature on 31 December 2024.
2021in thousands of €
Loan amount
Loan expiry date
Outstanding balance
< 1 year > 1–5 years > 5 years
Schuldschein loans 33,500 Oct-22 to Oct-27 33,500 4,500 27,000 2,000
2020in thousands of €
Loan amount
Loan expiry date
Outstanding balance
< 1 year > 1–5 years > 5 years
Schuldschein loans 33,500 Oct-22 to Oct-27 33,500 — 7,500 26,000
PAG
E 2
76
—
VG
P N
V A
nn
ua
l R
ep
ort
20
21
/ F
ina
nc
ial
pa
rt
/ N
ote
s t
o t
he
co
ns
oli
da
ted
fin
an
cia
l s
tate
me
nts

All of the above revolving credit facilities are unsecured.
The interest rate on the credit facilities granted by Belfius Bank SA/NV, KBC Bank NV and BNP Paribas Fortis SA/NV are
at floating interest rate plus a margin.
All aforementioned revolving credit facilities are subject to the same covenants as the current issued bond except for
the Consolidated gearing which is limited to 55% with the possibility of going up to 60% on two test dates ("gearing spike")
provided these two test dates do not follow each other.
During the year the Group operated well within its loan covenants and there were no events of default nor were there any
breaches of covenants with respect to loan agreements noted.
17.2.2 Schuldschein loansThe Schuldschein loans represents a combination of fixed and floating notes whereby the variable rates represent a nomi-
nal amount of EUR 21.5 million which is not hedged. The current average interest rate is 2.73 per cent. per annum.
The Schuldschein loans are unsecured and are subject to the same covenants as the bonds (see note 17.2.3.).
During the year the Group operated well within its Schuldschein loan covenants and there were no events of default nor
were there any breaches of covenants with respect to Schuldschein loans noted.
17.2.3 BondsAll bonds are unsecured and at fixed interest rate.
The terms and conditions of the bonds include following financial covenants:
— Consolidated gearing to equal or to be below 65%
— Interest cover ratio to equal or to be above 1.2
— Debt service cover ratio to equal or to be above 1.2
The abovementioned ratios are tested semi-annually based on a 12-month period and are calculated as follows:
— Consolidated gearing means consolidated total net debt divided by the sum of the equity and total liabilities;
— Interest cover ratio means the aggregate net rental income (increased with the available cash and cash equivalents)
divided by the net finance charges;
— Debt service cover ratio means cash available for debt service divided by net debt service
During the year the Group operated well within its bond covenants there were no events of default nor were there any
breaches of covenants with respect to the bonds noted.
17.3 Reconciliation debt movement to cash fl ows
The cash movements relate to: (i) net proceeds from the issuance of the new Apr-29 Bond and (ii) repayment of bank debt
in the amount of € 1.3 million.
The non-cash movements relate to: (i) € 4.5 million of transfer of Schuldschein loan debt from non-current financial
to current financial debt, (ii) € 6.6 million relating to changes in accrued interest on bonds and schuldschein loans; and
(iii) € 2.1 million relating to amortisation of capitalised finance costs.
2021in thousands of €
01-Jan-21 Cash Flows
Non-cash movement 31-Dec-21
Acquisitions/(Divestments)
Foreign exchange movement
Fair value changes
Other
Non-current financial debt 748,797 594,149 — — — (2,337) 1,340,609
Other non-current financial liabilities
— — — — — — —
Current financial debt 34,467 (1,333) — — — 11,013 44,147
783,264 592,816 — — — 8,676 1,384,756
Non-current financial assets — — — — — — —
Total liabilities from financing activities
783,264 592,816 — — — 8,676 1,384,756
PAG
E 2
77
—
VG
P N
V A
nn
ua
l R
ep
ort
20
21
/ F
ina
nc
ial
pa
rt
/ N
ote
s t
o t
he
co
ns
oli
da
ted
fin
an
cia
l s
tate
me
nts

The cash movements relate to: (i) repayment of bank debt in the amount of € 1.3 million and (ii) € 0.1 million of paid fi nance costs.
The non-cash movements relate to: (i) € 18.9 million of transfer of bank debt from non-current financial to current financial
debt, (ii) € 2.8 million relating to changes in accrued interest on bonds and schuldschein loans; and (iii) € 1.6 million relating
to amortisation of capitalised finance costs.
18. Other non-current liabilities
Deposits are received from tenants. Retentions are amounts withheld from constructors’ invoices. It is common to pay only
90 percent of the total amount due. 5 percent is due upon final delivery of the building; the remaining part is paid, based on
individual agreements, most commonly after 3 or 5 years.
The increase in other non-current liabilities is mainly due to the (re)classification of the LTIP liabilities in an amount of
€ 19.8 million (see note 24). In 2020 these liabilities (€ 7.2 million) were classified under other current liabilities. (see note 19).
19. Trade debts and other current liabilities
The increase in trade payables reflects the strong on-going development activities of the Group.
2020in thousands of €
01-Jan-20 Cash Flows
Non-cash movement 31-Dec-20
Acquisitions/(Divestments)
Foreign exchange movement
Fair value changes
Other
Non-current financial debt 767,673 (1,433) — — — (17,443) 748,797
Other non-current financial liabilities
— — — — — — —
Current financial debt 12,673 — — — — 21,794 34,467
780,346 (1,433) — — — 4,351 783,264
Non-current financial assets — — — — — — —
Total liabilities from financing activities
780,346 (1,433) — — — 4,351 783,264
in thousands of € 2021 2020
Deposits 5,072 2,392
Retentions 4,775 5,549
Other non-current liabilities 24,908 2,520
Reclassification to liabilities related to disposal group held for sale (2,296) —
Total 32,459 10,461
in thousands of € 2021 2020
Trade payables 95,185 58,102
Deposits — —
Retentions 12,053 884
Accrued expenses and deferred income 7,861 5,228
Other payables 10,435 13,511
Reclassification to liabilities related to disposal group held for sale (18,025) —
Total 107,509 77,725
PAG
E 2
78
—
VG
P N
V A
nn
ua
l R
ep
ort
20
21
/ F
ina
nc
ial
pa
rt
/ N
ote
s t
o t
he
co
ns
oli
da
ted
fin
an
cia
l s
tate
me
nts

20. Assets classified as held for sale and liabilities associated with those assets
In order to sustain its growth over the medium term, VGP entered into four 50:50 joint ventures with Allianz. The First, Sec-
ond and Fourth Joint Venture act as an exclusive take-out vehicle of the income generating assets developed by VGP, allow-
ing VGP to partially recycle its initially invested capital when completed projects are acquired by these joint ventures. VGP
is then able to re-invest the proceeds in the continued expansion of its development pipeline, including the further expan-
sion of its land bank, allowing VGP to concentrate on its core development activities.
Each of these joint ventures have an exclusive right of first refusal in relation to acquiring the following income generating
assets of the Group: (i) for the First Joint Venture: the assets located in the Czech Republic, Germany, Hungary and the
Slovak Republic; and (ii) for the Second Joint Venture: the assets located in Austria, Italy, the Benelux, Portugal, Romania
and Spain. As the First Joint Venture reached its investment capacity, Allianz and VGP entered into a new joint venture
agreement in December 2021 with a view to establish a new Fourth Joint Venture. The Fourth Joint Venture will become
effective at the moment of its first closing, currently expected to occur during the second half of 2022. The Fourth Joint
Venture’s objective is to build a platform of new, grade A logistics and industrial properties with a key focus on expansion
within the same geographical scope as the First Joint Venture, i.e. core German markets and high growth CEE markets (of
Hungary, the Czech Republic and the Slovak Republic).
The development pipeline which will be transferred as part of any future acquisition transaction between the First,
Second or Fourth Joint Venture and VGP is being developed at VGP’s own risk and subsequently acquired and paid for by
these joint ventures subject to pre-agreed completion and lease parameters.
As at 31 December 2021 the assets of the respective project companies which were earmarked to be transferred to the
First and Second Joint Venture in the future, including the next March 2022 closing were therefore reclassified as disposal
group held for sale.
The investment properties correspond to the fair value of the asset under construction which are being developed by VGP
on behalf of these joint ventures. This balance includes € 83.0 million of interest-bearing development and construction
loans (2020: € 69.7 million) granted by VGP to the First and/or Second Joint Venture to finance the development pipeline of
the First and/or Second Joint Venture. (See also note 9.3)
in thousands of € 2021 2020
Intangible assets 5 —
Investment properties 484,360 102,309
Property, plant and equipment — —
Deferred tax assets — —
Trade and other receivables 13,760 —
Cash and cash equivalents 3,757 —
Disposal group held for sale 501,882 102,309
Non-current financial debt — —
Other non-current financial liabilities — —
Other non-current liabilities (2,296) —
Deferred tax liabilities (49,834) (6,742)
Current financial debt — —
Trade debts and other current liabilities (18,025) —
Liabilities associated with assets classified as held for sale (70,155) (6,742)
Total net assets 431,727 95,567
PAG
E 2
79
—
VG
P N
V A
nn
ua
l R
ep
ort
20
21
/ F
ina
nc
ial
pa
rt
/ N
ote
s t
o t
he
co
ns
oli
da
ted
fin
an
cia
l s
tate
me
nts

21. Cash flow statement
The changes in the cash flow from investing activities was mainly due to: (i) € 680.1 million (2020: €428.2 million) of expendi-
ture incurred for the development activities and land acquisition; (ii) € 49.6 million cash in from the eighth closing with the
First Joint Venture (compared to several closing in 2020 totalling € 405.6 million).
The changes in the cash flow from financing activities were driven by: (i) € 75.1 million dividend paid out in May 2021
(2020: € 60.3 million); (ii) € 294.9 million net proceeds from the capital increase in November 2021 (2020: € 198.3) and
(iii) € 594.1 million net proceeds from the issuance of the Apr-29 Bond. The cash flow from financing activities in 2020
included € 97.0 million net proceeds from the sale of treasury shares in September 2020.
22. Cash flow from disposal of subsidiariesand investment properties
The cash flow from disposal of subsidiaries and investment properties relate to the different closings with the Allianz Joint
Ventures. In 2021 an eight closing of the First Joint Venture took place.
Summary in thousands of € 2021 2020
Cash flow from operating activities (87,473) (52,168)
Cash flow from investing activities (720,423) (134,530)
Cash flow from financing activities 812,589 233,584
Net increase/(decrease) in cash and cash equivalents 4,693 46,886
in thousands of € 2021 2020
Investment property 54,496 608,483
Trade and other receivables 678 16,011
Cash and cash equivalents 2,172 24,057
Non-current financial debt — —
Shareholder Debt (41,658) (372,515)
Other non-current financial liabilities (502) (2,229)
Deferred tax liabilities (2,192) (31,459)
Trade debts and other current liabilities (1,108) (26,637)
Total net assets disposed 11,886 215,711
Realised valuation gain on sale 12,136 167,111
Total non-controlling interest retained by VGP (1,108) (1,989)
Shareholder loans repaid at closing 40,362 313,415
Equity contribution (11,457) (191,454)
Total consideration 51,819 502,794
Consideration to be received – Third Joint Venture — (73,093)
Consideration paid in cash 51,819 429,701
Cash disposed (2,172) (24,057)
Net cash inflow from divestments of subsidiaries and investment properties 49,647 405,644
PAG
E 2
80
—
V
GP
NV
An
nu
al
Re
po
rt 2
02
1 /
Fin
an
cia
l p
art
/
No
tes
to
th
e c
on
so
lid
ate
d f
ina
nc
ial
sta
tem
en
ts

23. Financial risk management and financial derivatives
23.1 Terms, conditions and risk management
Exposures to foreign currency, interest rate, liquidity and credit risk arise in the normal course of business of VGP.
The company analyses and reviews each of these risks and defines strategies to manage the economic impact on the
company’s performance. The results of these risk assessments and proposed risk strategies are reviewed and approved by
the Board of Directors on regular basis.
Some of the risk management strategies include the use of derivative financial instruments which mainly consists of
forward exchange contracts and interest rate swaps. The company holds no derivative instruments nor would it issue any
for speculative purposes.
As at 31 December 2021 there were no derivative financial instruments outstanding (same as for 31 December 2020).
23.2 Foreign currency risk
VGP incurs principally foreign currency risk on its capital expenditure as well as some of its borrowings and net interest
expense/income.
VGP’s policy is to economically hedge its capital expenditure as soon as a firm commitment arises, to the extent that the
cost to hedge outweighs the benefit and in the absence of special features which require a different view to be taken.
The table below summarises the Group’s main net foreign currency positions at the reporting date. Since the Group has
elected not to apply hedge accounting, the following table does not include the forecasted transactions. However, the
derivatives the Group has entered into, to economically hedge the forecasted transactions are included. As at 31 December
2021 there were no foreign currency derivatives outstanding (same as for 2020).
in thousands 2021
CZK HUF RON RSD
Trade & other receivables 68,958 2,042,276 77,477 72,129
Non-current liabilities and trade & other payables (470,932) (2,718,017) (22,964) (3,254)
Gross balance sheet exposure (401,974) (675,741) 54,513 68,875
Forward foreign exchange — — — —
Net exposure (401,974) (675,741) 54,513 68,875
in thousands 2020
CZK HUF RON
Trade & other receivables 74,670 288,184 24,484
Non-current liabilities and trade & other payables (64,927) (559,588) (6,277)
Gross balance sheet exposure 9,744 (271,404) 18,207
Forward foreign exchange — — —
Net exposure 9,744 (271,404) 18,207
PAG
E 2
81
—
VG
P N
V A
nn
ua
l R
ep
ort
20
21
/ F
ina
nc
ial
pa
rt
/ N
ote
s t
o t
he
co
ns
oli
da
ted
fin
an
cia
l s
tate
me
nts

23.3 Interest rate risk
The Group applies a dynamic interest rate hedging approach whereby the target mix between fixed and floating rate debt is
reviewed periodically. These reviews are carried out within the confines of the existing loan agreements should such loan
agreements require that interest rate exposure is to be hedged when certain conditions are met.
Where possible the Group will apply IFRS 9 to reduce income volatility whereby some of the interest rate swaps may be
classified as cash flow hedges. Changes in the value of a hedging instrument that qualifies as highly effective cash flow
hedges are recognised directly in shareholders’ equity (hedging reserve).
The Group also uses interest rate swaps that do not satisfy the hedge accounting criteria under IFRS 9 but provide
effective economic hedges. Changes in fair value of such interest rate swaps are recognised immediately in the income
statement. (Interest rate swaps held for trading).
The following significant exchange rates applied during the year:
SensitivityA 10 percent strengthening of the euro against the following currencies at 31 December 2021 would have increased/
(decreased) equity and profit or loss by the amounts shown below. This analysis assumes that all variables, in particular
interest rates, remain constant. The analysis is performed on the same basis for 2020.
A 10 percent weakening of the euro against the above currencies at 31 December 2021 would have had the equal but oppo-
site effect on the above currencies to amounts shown above, on the basis that all other variables remain constant.
Effectsin thousands of €
2021
Equity Profit or (Loss)
CZK — 1,470
HUF — 166
RON — (1,002)
RSD — (53)
Total — 582
Effectsin thousands of €
2020
Equity Profit or (Loss)
CZK — (34)
HUF — 68
RON — (340)
Total — (306)
1 € = 2021 2020
Closing rate Closing rate
CZK 24.86000 26.24500
HUF 369.19000 363.89000
RON 4.94810 4.86940
RSD 117.58210 n.a.
PAG
E 2
82
—
V
GP
NV
An
nu
al
Re
po
rt 2
02
1 /
Fin
an
cia
l p
art
/
No
tes
to
th
e c
on
so
lid
ate
d f
ina
nc
ial
sta
tem
en
ts

in thousands of € – nominal amounts 2021 2020
Financial debt
Fixed rate
Schuldschein loans 12,000 12,000
Bonds 1,320,000 720,000
Variable rate
Bank debt 19,000 20,333
Schuldschein loans 21,500 21,500
Interest rate hedging
Interest rate swaps
Held for trading n.a. n.a.
Financial debt after hedging
Variable rate
Bank debt 19,000 20,333
Schuldschein loans 21,500 21,500
Total variable debt (A) 40,500 41,833
Fixed rate
Bonds 1,320,000 720,000
Bank debt — —
Schuldschein loans 12,000 12,000
Total fixed rate debt (B) 1,332,000 732,000
Total financial debt (C) = (A) + (B) 1,372,500 773,833
Fixed rate/total financial debt (B)/(C) 97.0% 94.6%
At the reporting date the Group interest rate profile of the Group’s (net of any capitalised financing costs) was as follows:
The effective interest rate on financial debt (bank debt, schuldschein loans and bonds), including all bank margins and cost
of interest rate hedging instruments was 2.69% for the year 2020 (3.35% in 2020).
Sensitivity analysis for change in interest rates or profitIn case of an increase/decrease of 100 basis points in the interest rates, profit before taxes would have been € 405k lower/
higher (2020: € 418k). This impact comes from a change in the floating rate debt, with all variables held constant.
Sensitivity analysis for changes in interest rate of other comprehensive incomeFor 2021 there is no impact given the fact that there are no interest rate swaps outstanding classified as cash flow hedges
as at the reporting date. The same situation applied at the 31 December 2020 reporting date.
23.4 Credit risk
Credit risk is the risk of financial loss to VGP if a customer or counterparty to a financial instrument fails to meet its contrac-
tual obligations and arises principally from VGP’s receivables from customers and bank deposits.
The management has a credit policy in place and the exposure to credit risk is monitored on an on-going basis. Each new
tenant is analysed individually for creditworthiness before VGP offers a lease agreement. In addition, the Group applies a
strict policy of rent guarantee whereby, in general, each tenant is required to provide a rent guarantee for 6 months. This
period will vary in function of the creditworthiness of the tenant.
For the credit risk in respect of other non-current receivables please refer to the section “Risk Factors” in this annual report.
At the balance sheet date there were no significant concentrations of credit risk.
PAG
E 2
83
—
V
GP
NV
An
nu
al
Re
po
rt 2
02
1 /
Fin
an
cia
l p
art
/
No
tes
to
th
e c
on
so
lid
ate
d f
ina
nc
ial
sta
tem
en
ts

The maximum exposure to credit risk is represented by the carrying amount of each financial asset. The maximum expo-
sure to credit risk at the reporting date was:
As at 31 December 2021 there was € 3.0 million of restricted cash held in a bank account (2020: € 0.1 million). The group’s
cash and cash equivalents comprise primarily cash deposits of which 73% held at Belgian Banks (See note 15).
The aging of trade receivables as at the reporting date was:
23.5 Liquidity risk
Liquidity risk is the risk that the Group will be unable to meet its obligations as they come due because of an inability to
liquidate assets or obtain adequate funding. The company manages its liquidity risk by ensuring that it has sufficient cash
available and that it has sufficient available credit facilities and by matching as much as possible its receipts and payments.
As at 31 December 2021 the Group, in addition to its available cash, has several committed credit lines at its disposal up to
a maximum equivalent of € 200 million (2020: € 150 million) at floating interest rates with fixed margins.
After year-end (January 2022) VGP substantially increased its liquidity position through the successful issuance of its
second public benchmark green bonds for an aggregate nominal amount of € 1.0 billion. (net proceeds: € 991.2 million)
The following are contractual maturities of financial assets and liabilities, including interest payments and derivative
financial assets and liabilities. The amounts disclosed in the tables below are the contractual undiscounted cash flows.
Undiscounted cash flows in respect of balances due within 12 months generally equal their carrying amounts in the
statement of financial position, as the impact of discounting is not significant.
in thousands of € 2021 2020
Carrying amount Carrying amount
Other non-current receivables 264,905 264,038
Trade & other receivables 95,773 15,494
Cash and cash equivalents 225,917 222,356
Reclassification to liabilities related to disposal group held for sale (5,293)
Total 581,302 501,888
in thousands of € 2021 2020
Carrying amount Carrying amount
Gross trade receivables
Gross trade receivables not past due 8,827 7,206
Gross trade receivables past due 456 575
Bad debt and doubtful receivables — —
Provision for impairment of receivables (–) —
Total 9,283 7,781
PAG
E 2
84
—
V
GP
NV
An
nu
al
Re
po
rt 2
02
1 /
Fin
an
cia
l p
art
/
No
tes
to
th
e c
on
so
lid
ate
d f
ina
nc
ial
sta
tem
en
ts

23.6 Capital management
VGP is continuously optimising its capital structure targeting to maximise shareholder value while keeping the desired
flexibility to support its growth. The Group targets to operate within maximum gearing ratio of net debt/total shareholders’
equity and liabilities at 65%.
in thousands of € 2021
Carrying amount
Contractual Cash flow
< 1 year 1–2 years 2–5 years More than 5 years
Assets
Cash and cash equivalents 225,917 225,917 225,917 — — —
Trade and other receivables 95,773 95,773 95,773 — — —
Reclassified to (–)/ from held for sale (5,293) (5,293) (5,293) — — —
316,397 316,397 316,397 — — —
Liabilities
Secured bank loans 18,917 19,000 19,000 — — —
Unsecured Schuldschein loans 33,436 37,645 5,426 830 29,329 2,059
Unsecured bonds 1,311,669 1,469,083 33,668 408,668 399,748 627,000
Trade and other payables 148,661 148,661 114,110 8,069 21,141 5,340
Reclassification to liabilities relatedto disposal group held for sale
(19,601) (19,601) (17,162) — (132) (2,307)
1,493,082 1,654,787 155,042 417,567 450,085 632,092
in thousands of € 2020
Carrying amount
Contractual Cash flow
< 1 year 1–2 years 2–5 years More than 5 years
Assets
Cash and cash equivalents 222,286 222,286 222,286 — — —
Trade and other receivables 15,494 15,494 15,494 — — —
237,780 237,780 237,780 — — —
Liabilities
Secured bank loans 20,318 20,597 20,597 — — —
Unsecured Schuldschein loans 33,252 38,571 926 5,426 5,411 26,807
Unsecured bonds 715,544 821,750 24,668 24,668 575,765 196,650
Trade and other payables 78,744 78,744 68,284 5,657 2,798 2,005
847,858 959,662 114,475 35,751 583,974 225,462
PAG
E 2
85
—
V
GP
NV
An
nu
al
Re
po
rt 2
02
1 /
Fin
an
cia
l p
art
/
No
tes
to
th
e c
on
so
lid
ate
d f
ina
nc
ial
sta
tem
en
ts

As at 31 December 2021 the Group’s gearing was as follows:
23.7 Fair value
The following tables list the different classes of financial assets and financial liabilities with their carrying amounts in the
balance sheet and their respective fair value and analyzed by their measurement category under IFRS 9.
Abbreviations used in accordance with IFRS 9 are:
AC Financial assets or financial liabilities measured at amortised cost
FVTPL Financial assets measured at fair value through profit or loss
HFT Financial liabilities Held for Trading
in thousands of € 2021 2020
Non-current financial debt 1,340,609 748,796
Current financial debt 44,147 34,468
Financial debt classified under liabilities related to disposal group held for sale — —
Total financial debt 1,384,756 783,264
Cash and cash equivalents (222,160) (222,356)
Cash and cash equivalents classified as disposal group held for sale (3,757) —
Total net debt (A) 1,158,839 560,908
Total shareholders’ equity and liabilities (B) 3,882,739 2,227,742
Gearing ratio (A)/(B) 29.8% 25.2%
31 December 2021in thousands of €
Category in accordance with IFRS 9
Carrying amount
Fair value Fair value hierarchy
Assets
Other non-current receivables AC 264,905 264,905 Level 2
Trade receivables AC 9,283 9,283 Level 2
Other receivables AC 86,490 86,490 Level 2
Derivative financial assets FVTPL — — Level 2
Cash and cash equivalents AC 222,935 222,935 Level 2
Reclassification to (–) from held for sale (5,295) (5,295)
Total 578,318 578,318
Liabilities
Financial debt
Bank debt AC 52,353 52,353 Level 2
Bonds AC 1,311,669 1,331,248 Level 1
Trade payables AC 95,185 95,185 Level 2
Other liabilities AC 57,244 57,244 Level 2
Derivative financial liabilities HFT — — Level 2
Reclassification to (–) from held for sale (19,646) (19,646)
Total 1,496,805 1,516,384
PAG
E 2
86
—
V
GP
NV
An
nu
al
Re
po
rt 2
02
1 /
Fin
an
cia
l p
art
/
No
tes
to
th
e c
on
so
lid
ate
d f
ina
nc
ial
sta
tem
en
ts

The following methods and assumptions were used to estimate the fair values:
— Cash and cash equivalents and trade and other receivables, primarily have short terms to maturity; hence, their carrying
amounts at the reporting date approximate the fair values;
— The Other non-current receivables are evaluated by the Group based on parameters such as interest rates, individual
creditworthiness of the counterparty and the risk characteristics of the financed project. As at 31 December 2021, the
carrying amounts of these receivables, are assumed not to be materially different from their calculated fair values.
— Trade and other payables also generally have short times to maturity and, hence, their carrying amounts also approxi-
mate their fair values.
— The fair value of financial instruments is determined based on quoted prices in active markets. When quoted prices in
active markets are not available, valuation techniques are used. Valuation techniques make maximum use of market
inputs but are affected by the assumptions used, including discount rates and estimates of future cash flows. Such
techniques include amongst others market prices of comparable investments and discounted cash flows. The principal
methods and assumptions used by VGP in determining the fair value of financial instruments are obtained from active
markets or determined using, as appropriate, discounted cash flow models and option pricing models.
The Group uses the following hierarchy for determining and disclosing the fair value of financial instruments by valuation
technique:
Level 1: quoted (unadjusted) prices in active markets for identical assets or liabilities.
Level 2: other techniques for which all inputs which have a significant effect on the recorded fair value are observable,
either directly or indirectly.
Level 3: techniques which use inputs which have a significant effect on the recorded fair value that are not based on
observable market data.
During the reporting period ending 31 December 2021, there were no transfers between Level 1 and Level 2 fair value meas-
urements, and no transfers into and out of Level 3 fair value measurements.
Financial assets amounting to € 30.8 million as at 31 December 2021 (same as in 2020) were pledged in favour of VGP’s
financing banks.
31 December 2020in thousands of €
Category in accordance with IFRS 9
Carrying amount
Fair value Fair value hierarchy
Assets
Other non-current receivables AC 264,038 264,038 Level 2
Trade receivables AC 7,781 7,781 Level 2
Other receivables AC 7,713 7,713 Level 2
Derivative financial assets FVTPL — — Level 2
Cash and cash equivalents AC 222,286 222,286 Level 2
Total 501,818 501,818
Liabilities
Financial debt
Bank debt AC 53,570 53,570 Level 2
Bonds AC 715,544 732,763 Level 1
Trade payables AC 58,102 58,102 Level 2
Other liabilities AC 24,856 24,859 Level 2
Derivative financial liabilities HFT — — Level 2
Total 852,076 869,294
PAG
E 2
87
—
VG
P N
V A
nn
ua
l R
ep
ort
20
21
/ F
ina
nc
ial
pa
rt
/ N
ote
s t
o t
he
co
ns
oli
da
ted
fin
an
cia
l s
tate
me
nts

24. Personnel
Long-term incentive plan (“LTIP”) for VGP team
The board of directors has set up a long-term incentive plan. The LTIP allocates profit sharing units (“Units”) to the respec-
tive VGP team members (the other members of the Executive Management Team and designated senior managers). One
Unit represents an amount equal to the net asset value of VGP divided by the total amount of issued VGP shares. After an
initial lock-up period of 5 years (from the respective award date), each participant may return the Units against cash pay-
ment of the proportional net asset value growth of such Units. This LTIP is therefore directly and solely based on the net
asset value growth of the Group and has no direct nor indirect link to the evolution of the share price of the VGP shares. At
any single point in time, the number of Units outstanding (i.e. awarded and not yet vested) cannot exceed 5% of the total
amount of shares issued by the Company.
During the financial year 2021 there were 255,000 Units allocated to the VGP team and 61,583 Units were vested. The
vested Units represented a net pay-out of € 1.6 million.
Consequently, the total aggregate Units allocated as at 31 December 2021 (after vesting) amount to 620,911 Units. Based
on the 31 December 2021 financial figures these Units represent an aggregate net asset value growth of € 20.7 million
(2020: € 7.2 million) which was provided for in the 2021 accounts (see Remuneration Report for further details).
25. Contingencies and commitments
As at 31 December 2021, the important contingencies and commitments were:
Contingent liabilities mainly relate to bank guarantees linked to land plots and built out of infrastructure on development land.
The commitment to purchase land relates to contracts concerning the future purchase of 3,981,000 m² of land for which
deposits totalling € 13.0 million (2020: 2,184,000 m² with deposits amounting to € 9.1 million). The € 13.0 million down
payment on land was classified under investment properties as at 31 December 2021 (same classification treatment applied
for 2020). The deposits made mainly relate to land plots in Germany (€ 8.9 million) of which most of them are expected to
be acquired during the course of 2022.
26. Related parties
Unless otherwise mentioned below, the settlement of related party transactions occurs in cash, there are no other out-
standing balances which require disclosure, the outstanding balances are not subject to any interest unless specified
below, no guarantees or collaterals provided and no provisions or expenses for doubtful debtors were recorded.
26.1 Shareholders
ShareholdingAs at 31 December 2021 the main shareholders of the company are:
— Little Rock SA (18.61%): a company controlled by Mr. Jan Van Geet;
— Alsgard SA (11.04%): a company controlled by Mr. Jan Van Geet;
— Tomanvi SCA (2.22%): a company controlled by Mr. Jan Van Geet;
— VM Invest NV (20.16%): a company controlled by Mr. Bart Van Malderen
The Extraordinary General Shareholders’ Meeting of 8 May 2020 approved the introduction of the double voting right. A
double voting right is therefore granted to each VGP share that has been registered for at least two years without interrup-
tion under the name of the same shareholder in the register of shares in registered form, in accordance with the procedures
detailed in article 29 of the Articles of Association. In accordance with Belgian law, dematerialised shares do not benefit
from the double voting right.
The two main ultimate reference shareholders of the company are therefore (i) Mr Jan Van Geet who holds 40.85% of the
voting rights of VGP NV and who is CEO and an executive director and (ii) Mr Bart Van Malderen who holds 24.36% of the
voting rights of VGP NV and who is a non-executive director.
The full details of the shareholding of VGP can be found in the section “Information about the share” of this annual report.
in thousands of € 2021 2020
Contingent liabilities 6,266 1,391
Commitments to purchase land 402,094 179,567
Commitments to develop new projects 685,574 342,747
PAG
E 2
88
—
V
GP
NV
An
nu
al
Re
po
rt 2
02
1 /
Fin
an
cia
l p
art
/
No
tes
to
th
e c
on
so
lid
ate
d f
ina
nc
ial
sta
tem
en
ts

Lease activitiesDrylock Technologies s.r.o, a company controlled by Bart Van Malderen, leases warehouses from VGP and the First Joint Ven-
ture under long term lease contracts. The rent received over the year 2021 amounts to € 4.4 million (2020: € 3.7 million).
Jan Van Geet s.r.o. leases out office spaces to the VGP Group in the Czech Republic used by the VGP operational team. The
leases run until 2026 and 2023 respectively. During 2021 aggregate amount paid under these leases was € 104k equivalent
(2020: € 98k).
All lease agreements have been concluded on an arm’s length basis.
Other servicesThe table below provides the outstanding balances with Jan Van Geet s.r.o.. The payable balance relates to unsettled
invoices. The receivable balances relate to cash advances made to cover representation costs.
VGP occasionally also provides real estate support services to Jan Van Geet s.r.o. (and vice versa). During 2021 VGP recorded
a € 13k revenue for these activities (2020: € 12k).
26.2 Subsidiaries
The consolidated financial statements include the financial statements of VGP NV and the subsidiaries listed in note 29.
Transactions between the Company and its subsidiaries, which are related parties, have been eliminated in the
consolidation and are accordingly not disclosed in this note.
26.3 Joint Ventures
The table below presents a summary of the related transactions with the Group’s Joint Ventures.
26.4 Key Management
Key Management includes the Board of Directors and the executive management. The details of these persons can be
found in the section Board of Directors and Management of this Annual Report. Key management personnel compensation
is shown in the table below:
The disclosures relating to the Belgian Corporate Governance Code are included in the Corporate Governance Statement
of this annual report.
For 2021 no post-employment benefits were granted.
in thousands of € 2021 2020
Trade receivable/(payable) — (23)
in thousands of € 2021 2020
Loans outstanding at year end 346,931 266,568
Investments in Joint Ventures 23,770 211,091
Equity distributions received (7,130) (6,902)
Net proceeds from sales to Joint Ventures 49,647 405,644
Management fee income 14,213 10,743
Interest and similar income from joint ventures and associates 12,318 9,292
in thousands of € 2021 2020
Basic remuneration and short-term incentives and benefits 4,999 4,733
Long term variable remuneration — 1,472
Total gross remuneration 4,999 6,205
PAG
E 2
89
—
V
GP
NV
An
nu
al
Re
po
rt 2
02
1 /
Fin
an
cia
l p
art
/
No
tes
to
th
e c
on
so
lid
ate
d f
ina
nc
ial
sta
tem
en
ts

Subsidiaries Registered seat address %
VGP NV Antwerpen, Belgium Parent (1)
VGP Belgium NV Antwerpen, Belgium 100 (5)
VGP Renewable Energy NV Antwerpen, Belgium 100 (1)
VGP CZ X a.s.. Jenišovice u Jablonce nad Nisou,Czech Republic 100 (1)
VGP Park Olomouc 5 a.s. Jenišovice u Jablonce nad Nisou,Czech Republic 100 (2)
VGP Park Prostejov a.s. Jenišovice u Jablonce nad Nisou,Czech Republic 100 (2)
VGP Park Ceske Budejovice a.s. Jenišovice u Jablonce nad Nisou,Czech Republic 100 (2)
VGP Park Mnichovo Hradiste a.s. Jenišovice u Jablonce nad Nisou,Czech Republic 100 (2)
VGP Park Hradek nad Nisou 2 a.s. Jenišovice u Jablonce nad Nisou,Czech Republic 100 (2)
VGP Park Rochlov a.s. Jenišovice u Jablonce nad Nisou,Czech Republic 100 (2)
VGP Park Vyskov a.s. Jenišovice u Jablonce nad Nisou,Czech Republic 100 (2)
VGP Park Kladno a.s. Jenišovice u Jablonce nad Nisou,Czech Republic 100 (2)
VGP – industrialni stavby s.r.o. Jenišovice u Jablonce nad Nisou,Czech Republic 100 (3)
SUTA s.r.o. Prague, Czech Republic 100 (3)
VGP FM Services s.r.o. Jenišovice u Jablonce nad Nisou,Czech Republic 100 (3)
VGP Renewable Energy s.r.o. Jenišovice u Jablonce nad Nisou,Czech Republic 100 (2)
VGP Industriebau GmbH Düsseldorf, Germany 100 (3)
VGP PM Services GmbH Düsseldorf, Germany 100 (3)
FM Log.In. GmbH Düsseldorf, Germany 100 (3)
27. Events after the balance sheet date
On 17 January 2022, VGP successfully issued its second public benchmark green bonds for an aggregate nominal amount of
€ 1.0 billion (€ 991.2 million net proceeds), in two tranches, with a €500 million 5-year bond paying a coupon of 1.625% p.a. and
maturing on 17 January 2027 and a €500 million 8-year bond paying a coupon of 2.250% p.a. and maturing on 17 January 2030.
In March 2022, the third closing with the Second Joint Venture took place with a transaction value of € 363.5 million.
With the outbreak of the war between Russia and Ukraine we are finding ourselves in uncertain economic and political
waters. It is unclear whether this war will not turn into a prolonged war which could have significant economic spill over
effects for the short to medium term.
One of the immediate consequences of the war in Ukraine is surging energy costs and shortages of building materials.
Whether this trend, which we have been able to remedy for the time being, is a lasting one will depend on how the confl ict
develops further.
It is therefore currently not possible to assess the impact on our Group and diff erent stakeholders. What is clear is that there
will be an adverse economic and market disruptive impact but how this will evolve and what the impact will be for our Group
is currently impossible to say.
28. Services provided by the statutory auditorand related persons
The audit fees for VGP NV and its fully controlled subsidiaries amounted to € 203k and additional non-audit services were
performed during the year by Deloitte for which a total fee of € 33k was incurred. Audit fees for jointly controlled entities
amounted to € 220k and additional non-audit services for jointly controlled entities were performed for which a total fee of
€ 254k was incurred.
29. Subsidiaries, joint ventures and associates
29.1 Full consolidation
The following companies were included in the consolidation perimeter of the VGP Group as at 31 December 2021 and were
fully consolidated:
PAG
E 2
90
—
V
GP
NV
An
nu
al
Re
po
rt 2
02
1 /
Fin
an
cia
l p
art
/
No
tes
to
th
e c
on
so
lid
ate
d f
ina
nc
ial
sta
tem
en
ts

Subsidiaries Registered seat address %
VGP Renewable Energy Deutschland GmbH Düsseldorf, Germany 100 (3)
VGP Park Hamburg 4 S.à r.l. Luxembourg, Grand Duchy of Luxembourg 100 (2)
VGP Park Halle S.à r.l. Luxembourg, Grand Duchy of Luxembourg 100 (2)
VGP Park Rostock S.à r.l. Luxembourg, Grand Duchy of Luxembourg 100 (2)
VGP Park Goettingen 2 S.à r.l. Luxembourg, Grand Duchy of Luxembourg 100 (2)
VGP Park Magdeburg S.à r.l. Luxembourg, Grand Duchy of Luxembourg 100 (2)
VGP Park Laatzen S.à r.l. Luxembourg, Grand Duchy of Luxembourg 100 (2)
VGP Park Ottendorf-Okrilla S.à r.l. Luxembourg, Grand Duchy of Luxembourg 100 (2)
VGP Park Berlin Oberkraemer S.à r.l. Luxembourg, Grand Duchy of Luxembourg 100 (2)
VGP Park Erfurt S.à r.l. Luxembourg, Grand Duchy of Luxembourg 100 (2)
VGP Park Berlin Bernau S.à r.l. Luxembourg, Grand Duchy of Luxembourg 100 (2)
VGP Park Erfurt 2 S.à r.l. Luxembourg, Grand Duchy of Luxembourg 100 (2)
VGP Park Gießen Am alten Flughafen S.à r.l. Luxembourg, Grand Duchy of Luxembourg 100 (2)
VGP Park Leipzig Flughafen S.à r.l Luxembourg, Grand Duchy of Luxembourg 100 (2)
VGP Park Berlin 4 S.à r.l. Luxembourg, Grand Duchy of Luxembourg 100 (2)
VGP DEU 32 S.à r.l. Luxembourg, Grand Duchy of Luxembourg 100 (2)
VGP Park Berlin-Hönow S.à r.l. Luxembourg, Grand Duchy of Luxembourg 100 (2)
VGP Park Wiesloch-Walldorf S.à r.l. Luxembourg, Grand Duchy of Luxembourg 100 (2)
VGP Park Frankenthal 2 S.à r.l. Luxembourg, Grand Duchy of Luxembourg 100 (2)
VGP Park Hochheim S.à r.l. Luxembourg, Grand Duchy of Luxembourg 100 (2)
VGP Park Erfurt 3 S.à r.l. Luxembourg, Grand Duchy of Luxembourg 100 (2)
VGP Park Halle 2 S.à r.l. Luxembourg, Grand Duchy of Luxembourg 100 (2)
VGP DEU 45 S.à r.l. Luxembourg, Grand Duchy of Luxembourg 100 (2)
VGP DEU 46 S.à r.l. Luxembourg, Grand Duchy of Luxembourg 100 (2)
VGP DEU 47 S.à r.l. Luxembourg, Grand Duchy of Luxembourg 100 (2)
VGP DEU 48 S.à r.l. Luxembourg, Grand Duchy of Luxembourg 100 (2)
VGP DEU 49 S.à r.l. Luxembourg, Grand Duchy of Luxembourg 100 (2)
VGP DEU 50 S.à r.l. Luxembourg, Grand Duchy of Luxembourg 100 (2)
VGP Logistics S.à r.l. Luxembourg, Grand Duchy of Luxembourg 100 (2)
VGP Asset Management S.à r.l. Luxembourg, Grand Duchy of Luxembourg 100 (3)
VGP Renewable Energy S.à r.l. Luxembourg, Grand Duchy of Luxembourg 100 (2)
VGP Park Graz 2 S.à r.l. Luxembourg, Grand Duchy of Luxembourg 100 (2)
VGP DEU 27 S.à r.l. Luxembourg, Grand Duchy of Luxembourg 100 (2)
VGP DEU 38 S.à r.l. Luxembourg, Grand Duchy of Luxembourg 100 (2)
VGP DEU 39 S.à r.l. Luxembourg, Grand Duchy of Luxembourg 100 (2)
VGP DEU 42 S.à r.l. Luxembourg, Grand Duchy of Luxembourg 100 (2)
VGP European Logistics 3 S.à r.l. Luxembourg, Grand Duchy of Luxembourg 100 (2)
VGP Industriebau Österreich GmbH Vienna, Austria 100 (3)
VGP Latvia ,SIA Riga, Latvia 100 (2)
VGP Park Riga ,SIA Riga, Latvia 100 (2)
VGP Park Tiraines ,SIA Riga, Latvia 100 (2)
VGP Industrial Development Latvia ,SIA Riga, Latvia 100 (3)
VGP Park Rae OÜ Tallin, Estonia 100 (2)
VGP Park Timisoara 2 S.R.L. Bucharest, Romania 100 (2)
PAG
E 2
91
—
VG
P N
V A
nn
ua
l R
ep
ort
20
21
/ F
ina
nc
ial
pa
rt
/ N
ote
s t
o t
he
co
ns
oli
da
ted
fin
an
cia
l s
tate
me
nts

Subsidiaries Registered seat address %
VGP Zone Brasov S.R.L. Bucharest, Romania 100 (2)
VGP Park Sibiu S.R.L. Bucharest, Romania 100 (2)
VGP Park Arad S.R.L. Bucharest, Romania 100 (2)
VGP Park Bucharest S.R.L. Bucharest, Romania 100 (2)
VGP Park Bucharest Two SRL Bucharest, Romania 100 (2)
VGP Park Timisoara Three S.R.L. Bucharest, Romania 100 (2)
VGP Park Timisoara Four S.R.L. Bucharest, Romania 100 (2)
VGP Proiecte Industriale S.R.L. Bucharest, Romania 100 (3)
VGP Park Bratislava a.s. Bratislava, Slovakia 100 (2)
VGP Park Zvolen s.r.o. Bratislava, Slovakia 100 (2)
VGP Park Slovakia 2 s.r.o. Bratislava, Slovakia 100 (2)
D61 Logistics a.s. Bratislava, Slovakia 100 (2)
VGP – industrialne stavby s.r.o. Bratislava, Slovakia 100 (3)
VGP Service Kft. Györ, Hungary 100 (3)
VGP Park Hatvan Kft. Györ, Hungary 100 (2)
VGP Park Gÿor Beta Kft. Györ, Hungary 100 (2)
VGP Park Kecskemet Kft. Györ, Hungary 100 (2)
VGP Park BUD Aerozone KFT Györ, Hungary 100 (2)
VGP Nederland BV Tilburg, The Netherlands 100 (2)
VGP Renewable Energy Netherlands BV Tilburg, The Netherlands 100 (2)
VGP Park Nederland 2 BV Tilburg, The Netherlands 100 (2)
VGP Park Nederland 3 BV Tilburg, The Netherlands 100 (2)
VGP Park Nederland 4 BV Tilburg, The Netherlands 100 (2)
VGP Park Nederland 5 BV Tilburg, The Netherlands 100 (2)
VGP Park Nederland 6 BV Tilburg, The Netherlands 100 (2)
VGP Park Nederland 7 BV Tilburg, The Netherlands 100 (2)
VGP Naves Industriales Peninsula, S.L.U. Barcelona, Spain 100 (1)
VGP Park Fuenlabrada S.L.U. Barcelona, Spain 100 (2)
VGP Park Valencia Cheste S.L.U. Barcelona, Spain 100 (2)
VGP Park Zaragoza S.L.U. Barcelona, Spain 100 (2)
VGP Park Dos Hermanes S.LU Barcelona, Spain 100 (2)
VGP Park Sevilla Ciudad de la Imagen S.L.U. Barcelona, Spain 100 (2)
VGP Park Granollers S.L.U. Barcelona, Spain 100 (2)
VGP Park Martorell S.L.U. Barcelona, Spain 100 (2)
VGP (Park) Espana 12 S.L.U. Barcelona, Spain 100 (2)
VGP (Park) Espana 13 S.L.U. Barcelona, Spain 100 (2)
Daisen Investments 2020, S.L.U Barcelona, Spain 100 (2)
Maliset Investments 2020, S.L.U. Barcelona, Spain 100 (2)
Urlau Proyectos y Servicios, S.L.U. Bilbao, Spain 100 (2)
VGP (Park) Espana 17 S.L.U. Barcelona, Spain 100 (2)
VGP (Park) Espana 18 S.L.U. Barcelona, Spain 100 (2)
VGP (Park) Espana 19 S.L.U. Barcelona, Spain 100 (2)
VGP (Park) Espana 20 S.L.U. Barcelona, Spain 100 (2)
VGP (Park) Espana 21 S.L.U. Barcelona, Spain 100 (2)
PAG
E 2
92
—
VG
P N
V A
nn
ua
l R
ep
ort
20
21
/ F
ina
nc
ial
pa
rt
/ N
ote
s t
o t
he
co
ns
oli
da
ted
fin
an
cia
l s
tate
me
nts

29.2 Companies to which the equity method is applied
Joint Venture Registered seat address %
VGP European Logistics S.à r.l. Luxembourg, Grand Duchy of Luxembourg 50.00 (4)
VGP European Logistics 2 S.à r.l. Luxembourg, Grand Duchy of Luxembourg 50.00 (4)
VGP Park München GmbH Baldham, Germany 50.00 (4)
LPM Holding BV Tilburg, The Netherlands 50.00 (4)
Belartza Alto SXXI SL Bilbao, Spain 50.00 (4)
Grekon 11 GmbH Lahau, Germany 50.00 (4)
Subsidiaries Registered seat address %
VGP (Park) Espana 22 S.L.U. Barcelona, Spain 100 (2)
VGP (Park) Espana 23 S.L.U. Barcelona, Spain 100 (2)
VGP Italy SRL Milan, Italy 100 (3)
VGP Park Verona SRL Milan, Italy 100 (2)
VGP Park Calcio SRL Milan, Italy 100 (2)
VGP Park Sordio SRL Milan, Italy 100 (2)
VGP Park Italy 5 SRL Milan, Italy 100 (2)
VGP Park Italy 6 SRL Milan, Italy 100 (2)
VGP Park Padova SRL Milan, Italy 100 (2)
VGP Park Italy 8 SRL Milan, Italy 100 (2)
VGP Park Italy 9 SRL Milan, Italy 100 (2)
VGP Park Italy 10 SRL Milan, Italy 100 (2)
VGP Park Milano Paderno Dugnano SRL Milan, Italy 100 (2)
VGP Park Italy 12 SRL Milan, Italy 100 (2)
VGP Park Italy 13 SRL Milan, Italy 100 (2)
VGP Park Italy14 SRL Milan, Italy 100 (2)
VGP Renewable Energy Italia SRL Milan, Italy 100 (2)
VGP Construção Industrial, Unipessoal Lda Lisbon, Portugal 100 (3)
VGP Park Portugal 1, S.A. Lisbon, Portugal 100 (2)
VGP Park Portugal 2, S.A. Lisbon, Portugal 100 (2)
VGP Park Loures S.A. Lisbon, Portugal 100 (2)
VGP Park Portugal 4, S.A. Lisbon, Portugal 100 (2)
VGP Park Portugal 5, S.A. Lisbon, Portugal 100 (2)
VGP Park Portugal 6, S.A. Lisbon, Portugal 100 (2)
VGP Park Portugal 7, S.A. Lisbon, Portugal 100 (2)
VGP Constructions Industrielles SAS Lyon, France 100 (3)
VGP France SAS Lyon, France 100 (2)
VGP Industrial Development d.o.o. Beograd Belgrade, Serbia 100 (3)
VGP Park One d.o.o. Beograd Belgrade, Serbia 100 (2)
VGP Industrial Development Croatia d.o.o. Zagreb, Croatia 100 (3)
VGP Park Lučko d.o.o. Zagreb, Croatia 100 (2)
PAG
E 2
93
—
V
GP
NV
An
nu
al
Re
po
rt 2
02
1 /
Fin
an
cia
l p
art
/
No
tes
to
th
e c
on
so
lid
ate
d f
ina
nc
ial
sta
tem
en
ts

(1) Holding and service company
(2) Existing or future asset company.
(3) Services company
(4) Holding company (including its respective subsidiaries as applicable)
(5) Dormant
(6) The remaining 94.9% are held directly by VGP European Logistics S.a r.l.
29.3 Changes in 2021
(i) New Investments
Associates Registered seat address %
VGP Park Bingen GmbH Düsseldorf, Germany 5.1 (6)
VGP Park Hamburg GmbH Düsseldorf, Germany 5.1 (6)
VGP Park Hamburg 2 S.à r.l. Luxembourg, Grand Duchy of Luxembourg 5.1 (6)
VGP Park Hamburg 3 S.à r.l. Luxembourg, Grand Duchy of Luxembourg 5.1 (6)
VGP Park Rodgau GmbH Düsseldorf, Germany 5.1 (6)
VGP Park Höchstadt GmbH Düsseldorf, Germany 5.1 (6)
VGP Park Berlin GmbH Düsseldorf, Germany 5.1 (6)
VGP Park Berlin 2 S.à r.l Luxembourg, Grand Duchy of Luxembourg 5.1 (6)
VGP Park Berlin 3 S.à r.l Luxembourg, Grand Duchy of Luxembourg 5.1 (6)
VGP Park Frankenthal S.à r.l. Luxembourg, Grand Duchy of Luxembourg 5.1 (6)
VGP Park Leipzig S.à r.l. Luxembourg, Grand Duchy of Luxembourg 5.1 (6)
VGP Park Leipzig GmbH Düsseldorf, Germany 5.1 (6)
VGP DEU 3 S.à r.l. Luxembourg, Grand Duchy of Luxembourg 5.1 (6)
VGP Park Wetzlar S.à r.l Luxembourg, Grand Duchy of Luxembourg 5.1 (6)
VGP Park Ginsheim S.à r.l Luxembourg, Grand Duchy of Luxembourg 5.1 (6)
VGP Park Dresden S.à r.l. Luxembourg, Grand Duchy of Luxembourg 5.1 (6)
VGP Park Goettingen S.à r.l. Luxembourg, Grand Duchy of Luxembourg 5.1 (6)
VGP Park Berlin Wustermark S.à r.l. Luxembourg, Grand Duchy of Luxembourg 5.1 (6)
VGP Park Bischofsheim S.à r.l. Luxembourg, Grand Duchy of Luxembourg 5.1 (6)
VGP Park Einbeck S.à r.l. Luxembourg, Grand Duchy of Luxembourg 5.1 (6)
VGP Park Chemnitz S.à r.l. Luxembourg, Grand Duchy of Luxembourg 5.1 (6)
VGP Park Gießen S.à r.l. Luxembourg, Grand Duchy of Luxembourg 5.1 (6)
Subsidiaries Registered seat address %
VGP Park Nederland 5 BV Tilburg, The Netherlands 100
VGP Park Nederland 6 BV Tilburg, The Netherlands 100
VGP Park Nederland 7 BV Tilburg, The Netherlands 100
VGP (Park) Espana 10 S.L.U. Barcelona, Spain 100
VGP (Park) Espana 11 S.L.U. Barcelona, Spain 100
VGP (Park) Espana 12 S.L.U. Barcelona, Spain 100
VGP (Park) Espana 13 S.L.U. Barcelona, Spain 100
VGP Park Rae OÜ Tallinn, Estonia 100
VGP Park BUD Aerozone Kft. Györ, Hungary 100
Urlau Proyectos y Servicios, S.L.U. Bilbao, Spain 100
VGP Park Bucharest Two SRL Bucharest, Romania 100
VGP DEU 41 S.à r.l. Luxembourg, Grand Duchy of Luxembourg 100
PAG
E 2
94
—
V
GP
NV
An
nu
al
Re
po
rt 2
02
1 /
Fin
an
cia
l p
art
/
No
tes
to
th
e c
on
so
lid
ate
d f
ina
nc
ial
sta
tem
en
ts

Subsidiaries Registered seat address %
VGP DEU 42 S.à r.l. Luxembourg, Grand Duchy of Luxembourg 100
VGP DEU 43 S.à r.l. Luxembourg, Grand Duchy of Luxembourg 100
VGP DEU 44 S.à r.l. Luxembourg, Grand Duchy of Luxembourg 100
VGP DEU 45 S.à r.l. Luxembourg, Grand Duchy of Luxembourg 100
VGP Renewable Energy Italia SRL Milan, Italy 100
VGP Industrial Development d.o.o.Beograd Belgrade, Serbia 100
VGP Park One d.o.o. Beograd Belgrade, Serbia 100
Retail Park Antica Fonderia S.r.l Milan, Italy 100
VGP DEU 46 S.à r.l. Luxembourg, Grand Duchy of Luxembourg 100
VGP DEU 47 S.à r.l. Luxembourg, Grand Duchy of Luxembourg 100
VGP DEU 48 S.à r.l. Luxembourg, Grand Duchy of Luxembourg 100
VGP DEU 49 S.à r.l. Luxembourg, Grand Duchy of Luxembourg 100
VGP DEU 50 S.à r.l. Luxembourg, Grand Duchy of Luxembourg 100
Belartza Alto SXXI SL Bilbao, Spain 50
D61 Logistics a.s. Bratislava, Slovakia 100
VGP Park Portugal 6, S.A. Lisbon, Portugal 100
VGP Park Portugal 7, S.A. Lisbon, Portugal 100
VGP Constructions Industrielles SAS Lyon, France 100
VGP France SAS Lyon, France 100
Grekon 11 GmbH Lahau, Germany 50
VGP Park Italy 12 S.r.l. Milan, Italy 100
VGP Park Italy 13 S.r.l. Milan, Italy 100
VGP Park Italy 14 S.r.l. Milan, Italy 100
VGP Renewable Energy s.r.o. Jenišovice, Czech Republic 100
VGP Industrial Development Croatia d.o.o. Zagreb, Croatia 100
VGP Park Lučko d.o.o. Zagreb, Croatia 100
VGP Park Timisoara Three SRL Bucharest, Romania 100
VGP Park Timisoara Four SRL Bucharest, Romania 100
VGP (Park) Espana 17 S.L.U. Barcelona, Spain 100
VGP (Park) Espana 18 S.L.U. Barcelona, Spain 100
VGP (Park) Espana 19 S.L.U. Barcelona, Spain 100
VGP (Park) Espana 20 S.L.U. Barcelona, Spain 100
VGP (Park) Espana 21 S.L.U. Barcelona, Spain 100
VGP (Park) Espana 22 S.L.U. Barcelona, Spain 100
VGP (Park) Espana 23 S.L.U. Barcelona, Spain 100
PAG
E 2
95
—
V
GP
NV
An
nu
al
Re
po
rt 2
02
1 /
Fin
an
cia
l p
art
/
No
tes
to
th
e c
on
so
lid
ate
d f
ina
nc
ial
sta
tem
en
ts

(ii) Name change
(iii) Subsidiaries sold to First Joint Venture
(iv) Registered numbers of the Belgian companies
New Name Former Name
VGP Park Frankenthal 2 S.à r.l. VGP DEU 37 S.à r.l.
VGP Park Heidelberg S.à r.l. VGP DEU 36 S.à r.l.
VGP Park Dos Hermanas S.LU VGP (Park) Espana 7 S.LU.
VGP Park Sevilla Ciudad de la Imagen S.L.U. VGP (Park) Espana 8 S.L.U.
VGP Italy S.r.l. VGP Costruzioni Industriali S.r.l.
VGP Park Padova S.r.l. VGP Park Italy 7 S.r.l.
VGP Park Wiesloch-Walldorf S.à r.l. VGP DEU 36 S.à r.l.
VGP Park Hochheim S.á r.l. VGP DEU 40 S.à r.l.
VGP Park Berlin Bernau S.á r.l. VGP DEU 26 S.à r.l.
VGP Park Erfurt 3 S.á r.l. VGP DEU 41 S.à r.l.
VGP Park Halle 2 S.à r.l. VGP DEU 43 S.à r.l.
VGP Park Granollers S.L.U. VGP (Park) Espana 10 S.L.U.
VGP Park Martorell S.L.U. VGP (Park) Espana 11 S.L.U.
VGP Park Loures S.A. VGP Park Portugal 3, S.A.
VGP Park Milano Paderno Dugnano S.r.l. Retail Park Antica Fonderia S.r.l
VGP European Logistics 3 S.à r.l. VGP DEU 44 S.à r.l.
Subsidiaries Registered seat address %
VGP Park Gießen S.à r.l. Luxembourg, Grand Duchy of Luxembourg 94.9
Companies Company number
VGP NV BTW BE 0887.216.042 RPR – Antwerp (Division Antwerp)
VGP Renewable Energy NV BTW BE 0894.188.263 RPR – Antwerp (Division Antwerp)
VGP Belgium NV BTW BE 0894.442.740 RPR – Antwerp (Division Antwerp)
PAG
E 2
96
—
V
GP
NV
An
nu
al
Re
po
rt 2
02
1 /
Fin
an
cia
l p
art
/
No
tes
to
th
e c
on
so
lid
ate
d f
ina
nc
ial
sta
tem
en
ts

1. Income statement, proportionally consolidated
The table below includes the proportional consolidated income statement interest of the Group in the Joint Ventures. The
interest held directly by the Group (5.1%) in the German asset companies of the Joint Ventures have been included in the
50% Joint Ventures’ figures (share of VGP).
in thousands of € 2021 2020
Group Joint Ventures
Total Group Joint Ventures
Total
Gross rental income 17,618 62,435 80,053 12,078 52,095 64,173
Property operating expenses (2,219) (7,116) (9,335) (3,784) (5,133) (8,917)
Net rental and related income 15,399 55,319 70,718 8,294 46,962 55,256
Joint venture management fee income 21,303 — 21,303 14,699 — 14,699
Net valuation gains/(losses) on investment properties
610,261 186,670 796,931 366,361 48,072 414,433
Administration expenses (52,112) (995) (53,107) (29,296) (1,092) (30,388)
Other expenses (5,000) — (5,000) (4,000) — (4,000)
Operating profit/(loss) 589,851 240,994 830,845 356,058 93,942 450,000
Net financial result (12,654) (15,342) (27,996) (8,593) (17,751) (26,344)
Taxes (113,845) (38,949) (152,794) (39,865) (12,853) (52,718)
Profit for the period 463,352 186,703 650,055 307,600 63,338 370,938
Supplementary notesnot part of the auditedfi nancial statementsFor the year ended 31 December 2021
PAG
E 2
97
—
VG
P N
V A
nn
ua
l R
ep
ort
20
21
/ F
ina
nc
ial
pa
rt
/ S
up
ple
me
nta
ry n
ote
s n
ot
pa
rt o
f th
e a
ud
ite
d f
ina
nc
ial
sta
tem
en
ts

2. Balance sheet, proportionally consolidated
The table below includes the proportional consolidated balance sheet interest of the Group in the Joint Ventures. The inter-
est held directly by the Group (5.1%) in the German asset companies of the Joint Ventures have been included in the 50%
Joint Ventures’ figures (share of VGP).
in thousands of € 2021 2020
Group Joint Ventures
Total Group Joint Ventures
Total
Investment properties 1,852,514 1,746,770 3,599,284 920,151 1,445,062 2,365,213
Investment properties included in assets held for sale
484,360 — 484,360 102,309 — 102,309
Total investment properties 2,336,874 1,746,770 4,083,644 1,022,460 1,445,062 2,467,522
Other assets 300,050 1,851 301,901 283,325 252 283,575
Total non-current assets 2,636,924 1,748,620 4,385,544 1,305,785 1,445,314 2,751,097
Trade and other receivables 148,022 13,129 161,151 44,828 14,451 59,279
Cash and cash equivalents 222,160 49,862 272,022 222,356 46,140 268,496
Disposal group held for sale 17,517 — 17,517 — — —
Total current assets 387,699 62,990 450,689 267,184 60,591 327,775
Total assets 3,024,623 1,811,611 4,836,234 1,572,969 1,505,905 3,078,872
Non-current financial debt 1,340,609 764,095 2,104,704 748,796 714,277 1,463,073
Other non-current financial liabilities — 192 192 — 823 823
Other non-current liabilities 32,459 5,049 37,508 10,461 5,718 16,179
Deferred tax liabilities 112,295 132,816 245,111 43,813 91,638 135,451
Total non-current liabilities 1,485,363 902,153 2,387,516 803,070 812,456 1,615,526
—
Current financial debt 44,147 15,055 59,202 34,468 13,728 48,196
Trade debts and other current liabilities 107,510 36,288 143,798 77,725 24,949 102,677
Liabilities related to disposal group held for sale
70,154 — 70,154 6,742 — 6,742
Total current liabilities 221,811 51,342 273,153 118,935 38,676 157,614
Total liabilities 1,707,174 953,495 2,660,669 922,005 851,132 1,773,140
Net assets 1,317,449 858,116 2,175,565 650,964 654,773 1,305,737
PAG
E 2
98
—
V
GP
NV
An
nu
al
Re
po
rt 2
02
1 /
Fin
an
cia
l p
art
/
Su
pp
lem
en
tary
no
tes
no
t p
art
of
the
au
dit
ed
fin
an
cia
l s
tate
me
nts

1. Financial statements VGP NV
1.1 Parent company accounts
The financial statements of the parent company VGP NV, are presented below in a condensed form.
In accordance with Belgian company law, the directors’ report and financial statements of the parent company VGP NV,
together with the auditor’s report, have been deposited at the National Bank of Belgium.
They are available on request from:
VGP NV
Generaal Lemanstraat 55 bus 4
B-2018 Antwerp (Berchem)
Belgium
www.vgpparks.eu
The statutory auditor issued an unqualified opinion on the financial statements of VGP NV.
1.2 Condensed income statement
in thousands of € 2021 2020
Other operating income 9,729 9,124
Operating profit or loss (18,555) (9,820)
Financial result 20,984 35,906
Non-recurrent income financial assets 19,659 256,616
Current and deferred income taxes (55) (138)
Profit for the year 22,033 282,564
Parent companyinformation
PAG
E 2
99
—
V
GP
NV
An
nu
al
Re
po
rt 2
02
1 /
Fin
an
cia
l p
art
/
Pa
ren
t c
om
pa
ny
info
rma
tio
n

1.3 Condensed balance sheet after profi t appropriation
Valuation principlesValuation and foreign currency translation principles applied in the parent company’s financial statements are based on
Belgian accounting legislation.
in thousands of € 2021 2020
Formation expenses, intangible assets 15,446 6,431
Tangible fixed assets 184 112
Financial fixed assets 2,296,328 1,429,880
Other non-current receivables 934 67,203
Total non-current assets 2,312,892 1,503,626
Trade and other receivables 88,329 9,816
Cash & cash equivalents 66,528 101,472
Total current assets 154,857 111,288
Total assets 2,467,749 1,614,914
Share capital 108,873 102,640
Share premium 483,794 190,027
Non-distributable reserves 10,887 10,264
Retained earnings 313,368 441,515
Shareholders’ equity 916,922 744,446
Amounts payable after one year 1,352,926 758,533
Amounts payable within one year 197,901 111,935
Creditors 1,550,827 870,468
Total equity and liabilities 2,467,749 1,614,914
in thousands of € 2021 2020
Profit for the year for appropriation 22,033 282,564
Profit brought forward 441,515 235,076
Profit to be appropriated 463,548 517,640
Transfer to statutory reserves 623 997
Profit to be carried forward 313,369 441,515
Gross dividends 149,556 75,128
Total 463,548 517,640
2. Proposed appropriation of VGP NV 2021 result
The Board of Directors of VGP NV will propose to the Annual Shareholders’ Meeting to distribute a gross dividend of € 6.85
per share corresponding to a total gross dividend amount of € 149,556,392.50.
PAG
E 3
00
—
V
GP
NV
An
nu
al
Re
po
rt 2
02
1 /
Fin
an
cia
l p
art
/
Pa
ren
t c
om
pa
ny
info
rma
tio
n

PAG
E 3
01
—
VG
P N
V A
nn
ua
l R
ep
ort
20
21
/ F
ina
nc
ial
pa
rt
/ P
are
nt
co
mp
an
y in
form
ati
on

In the context of the statutory audit of the consolidated
financial statements of VGP NV (“the company”) and its
subsidiaries ( jointly “the group”), we hereby submit our
statutory audit report. This report includes our report on
the consolidated financial statements and the other legal
and regulatory requirements. These parts should be con-
sidered as integral to the report.
We were appointed in our capacity as statutory auditor by
the shareholders’ meeting of 8 May 2020, in accordance with
the proposal of the board of directors (“bestuursorgaan” /
“organe d’administration”) issued upon recommendation of
the audit committee. Our mandate will expire on the date
of the shareholders’ meeting deliberating on the financial
statements for the year ending 31 December 2022. We have
performed the statutory audit of the consolidated financial
statements of VGP NV for 15 consecutive periods.
Report on the consolidated fi nancial statements
Unqualified opinionWe have audited the consolidated financial statements of
the group, which comprise the consolidated balance sheet
as at 31 December 2021, the consolidated income statement,
the consolidated statement of comprehensive income, the
consolidated statement of changes in equity and the con-
solidated cash flow statement for the year then ended, as
well as the summary of significant accounting policies and
other explanatory notes. The consolidated balance sheet
shows total assets of 3,882,739 (000) EUR and the consoli-
dated statement of comprehensive income shows a profit
for the year then ended of 650,055 (000) EUR.
In our opinion, the consolidated fi nancial statements give
a true and fair view of the group’s net equity and fi nancial
position as of 31 December 2021 and of its consolidated
results and its consolidated cash flow for the year then
ended, in accordance with International Financial Reporting
Standards (IFRS) as adopted by the European Union and with
the legal and regulatory requirements applicable in Belgium.
Basis for the unqualified opinionWe conducted our audit in accordance with International
Standards on Auditing (ISA), as applicable in Belgium. In
addition, we have applied the International Standards on
Auditing approved by the IAASB applicable to the cur-
rent financial year, but not yet approved at national level.
Our responsibilities under those standards are further
described in the “Responsibilities of the statutory audi-
tor for the audit of the consolidated financial statements”
section of our report. We have complied with all ethical
requirements relevant to the statutory audit of consolidated
financial statements in Belgium, including those regarding
independence.
We have obtained from the board of directors and the
company’s officials the explanations and information
necessary for performing our audit.
We believe that the audit evidence obtained is sufficient
and appropriate to provide a basis for our opinion.
Auditor’sreport
Statutory auditor’s report to the shareholders’ meeting for the year ended 31 December 2021 – Consolidated financial statements
The original text of this report is in Dutch
PAG
E 3
02
—
V
GP
NV
An
nu
al
Re
po
rt 2
02
1 /
Fin
an
cia
l p
art
/
Au
dit
or’
s r
ep
ort

Key audit mattersKey audit matters are those matters that, in our professional judgment, were of most significance in our audit of the con-
solidated financial statements of the current period. These matters were addressed in the context of our audit of the con-
solidated financial statements as a whole and in forming our opinion thereon, and we do not provide a separate opinion on
these matters.
Key audit matter
Valuation of investment properties
VGP develops, owns and manages a portfolio of logis-
tic and industrial warehousing properties, located
mainly across Europe. The property portfolio is val-
ued at 1,852,514 (000) EUR as at 31 December 2021,
1,746,770 (000) EUR is held by joint ventures at share
and 484,360 (000) EUR is presented under “disposal
group held for sale”.
The portfolio includes completed investments
and properties under construction (“development
properties”) and is valued using the income approach
in accordance with IAS 40 which is based on expected
future cash fl ows. Development properties are valued
using the same methodology with a deduction for all
costs necessary to complete the development. Key inputs
into the valuation exercise are yields and estimated rental
values, which are infl uenced by prevailing market forces,
comparable transactions and the specifi c characteristics
of each property in the portfolio. The Group uses
professionally qualifi ed external valuers to fair value the
Group’s portfolio at six-monthly intervals.
The valuation of the portfolio is a signifi cant judgement
area, underpinned by a number of assumptions which
can involve judgements and the existence of estimation
uncertainty. Coupled with the fact that only a small
percentage diff erence in individual property valuations,
when aggregated, could result in a material misstatement
on the income statement and balance sheet, warrants
specifi c audit focus in this area.
Reference to disclosuresThe methodology applied in determining the valuation
is set out in note 2.7 of the consolidated financial state-
ments. In addition we refer to note 13 of the consoli-
dated financial statements containing the investment
property roll-forward, note 20 in relation to the disposal
group held for sale and note 9 in relation to investments
in joint ventures and associates.
How our audit addressed the key audit matter
Assessing the valuer’s expertise and objectivity
— We assessed the competence, independence and integ-
rity of the external valuers.
— We assessed management’s process for reviewing and
challenging the work of the external valuers.
Testing the valuations
— We compared the amounts per the valuation reports to
the accounting records and from there we agreed the
related balances through to the financial statements.
— We involved internal valuation specialists to assist the
fi nancial audit team to discuss and challenge the signif-
icant assumptions and critical judgement areas for spe-
cifi c properties, including yields and estimated rental val-
ues and compared to other data we have knowledge of;
— We obtained the external valuation reports and confi rmed
that the valuation approach is in accordance with RICS in
determining the carrying value in the balance sheet.
— For development properties we also confirmed that
the supporting information for construction contracts
and budgets was consistent with the cost to complete
deducted from the valuation of development properties.
— Capitalized expenditure was tested on a sample basis
to invoices, and budgeted costs to complete were com-
pared to supporting evidence (for example by inspect-
ing original construction contracts).
Information and standing data
— We tested the standing data the Group provided to the
valuers for use in the performance of the valuation,
relating to rental income, key rent contract characteris-
tics and occupancy.
— We considered the internal controls implemented by
management and we tested the design and implemen-
tation of controls over investment properties.
PAG
E 3
03
—
V
GP
NV
An
nu
al
Re
po
rt 2
02
1 /
Fin
an
cia
l p
art
/
Au
dit
or’
s r
ep
ort

Responsibilities of the board of directors for the preparation of the consolidated financial statementsThe board of directors is responsible for the preparation
and fair presentation of the consolidated financial state-
ments in accordance with International Financial Reporting
Standards (IFRS) as adopted by the European Union and
with the legal and regulatory requirements applicable in
Belgium and for such internal control as the board of direc-
tors determines is necessary to enable the preparation of
consolidated financial statements that are free from mate-
rial misstatement, whether due to fraud or error.
In preparing the consolidated financial statements,
the board of directors is responsible for assessing the
group’s ability to continue as a going concern, disclosing,
as applicable, matters to be considered for going concern
and using the going concern basis of accounting unless the
board of directors either intends to liquidate the group or to
cease operations, or has no other realistic alternative but
to do so.
Responsibilities of the statutory auditor for the audit of the consolidated financial statementsOur objectives are to obtain reasonable assurance about
whether the consolidated financial statements as a whole
are free from material misstatement, whether due to fraud or
error, and to issue a statutory auditor’s report that includes
our opinion. Reasonable assurance is a high level of assur-
ance, but is not a guarantee that an audit conducted in
accordance with ISA will always detect a material misstate-
ment when it exists. Misstatements can arise from fraud or
error and are considered material if, individually or in the
aggregate, they could reasonably be expected to influence
the economic decisions of users taken on the basis of these
consolidated financial statements.
During the performance of our audit, we comply with the
legal, regulatory and normative framework as applicable to
the audit of consolidated financial statements in Belgium.
The scope of the audit does not comprise any assurance
regarding the future viability of the company nor regarding
the efficiency or effectiveness demonstrated by the board
of directors in the way that the company’s business has
been conducted or will be conducted.
As part of an audit in accordance with ISA, we exercise
professional judgment and maintain professional
skepticism throughout the audit. We also:
— identify and assess the risks of material misstatement
of the consolidated financial statements, whether due
to fraud or error, design and perform audit procedures
responsive to those risks, and obtain audit evidence that
is sufficient and appropriate to provide a basis for our
opinion. The risk of not detecting a material misstate-
ment resulting from fraud is higher than for one result-
ing from an error, as fraud may involve collusion, forgery,
intentional omissions, misrepresentations, or the over-
ride of internal control;
— obtain an understanding of internal control relevant to
the audit in order to design audit procedures that are
appropriate in the circumstances, but not for the pur-
pose of expressing an opinion on the effectiveness of
the group’s internal control;
— evaluate the appropriateness of accounting policies
used and the reasonableness of accounting estimates
and related disclosures made by the board of directors;
— conclude on the appropriateness of the use of the going
concern basis of accounting by the board of directors
and, based on the audit evidence obtained, whether a
material uncertainty exists related to events or condi-
tions that may cast significant doubt on the group’s abil-
ity to continue as a going concern. If we conclude that
a material uncertainty exists, we are required to draw
attention in our statutory auditor’s report to the related
disclosures in the consolidated financial statements or,
if such disclosures are inadequate, to modify our opin-
ion. Our conclusions are based on the audit evidence
obtained up to the date of our statutory auditor’s report.
However, future events or conditions may cause the
group to cease to continue as a going concern;
— evaluate the overall presentation, structure and content
of the consolidated financial statements, and whether
the consolidated financial statements represent the
underlying transactions and events in a manner that
achieves fair presentation.
— obtain sufficient appropriate audit evidence regarding
the financial information of the entities and business
activities within the group to express an opinion on the
consolidated financial statements. We are responsible
for the direction, supervision and performance of the
group audit. We remain solely responsible for our audit
opinion.
We communicate with the audit committee regarding,
amongst other matters, the planned scope and timing of
the audit and significant audit findings, including any sig-
nificant deficiencies in internal control that we identify dur-
ing our audit.
We also provide the audit committee with a statement
that we have complied with relevant ethical requirements
regarding independence, and we communicate with
them about all relationships and other matters that may
reasonably be thought to bear on our independence, and
where applicable, related safeguards.
From the matters communicated to the audit committee,
we determine those matters that were of most significance
in the audit of the consolidated financial statements of the
current period and are therefore the key audit matters. We
describe these matters in our report unless law or regulation
precludes any public disclosure about the matter.
Other legal and regulatory requirements
Responsibilities of the board of directorsThe board of directors is responsible for the preparation
and the content of the annual report and the directors’
report on the consolidated financial statements.
Responsibilities of the statutory auditorAs part of our mandate and in accordance with the Belgian
standard complementary to the International Standards on
Auditing (ISA) as applicable in Belgium, our responsibility
is to verify, in all material respects, the director’s report on
the consolidated financial statements, as well as to report
on these matters.
Aspects regarding the directors’ report on the consolidated financial statements In our opinion, after performing the specific procedures on
the directors’ report on the consolidated financial state-
ments, this report is consistent with the consolidated finan-
cial statements for that same year and has been estab-
lished in accordance with the requirements of article 3:32
of the Code of companies and associations.
In the context of our statutory audit of the consolidated
financial statements we are responsible to consider, in
particular based on information that we became aware of
during the audit, if the directors’ report on the consolidated
financial statements and other information disclosed in the
annual report on the consolidated financial statements, i.e.:
PAG
E 3
04
—
V
GP
NV
An
nu
al
Re
po
rt 2
02
1 /
Fin
an
cia
l p
art
/
Au
dit
or’
s r
ep
ort

— the required components of the VGP annual report in
accordance with Articles 3:6 and 3:32 of the Code of
companies and associations, which appear in the chap-
ter “Report of the Board of Directors”.
are free of material misstatements, either by information
that is incorrectly stated or otherwise misleading. In the
context of the procedures performed, we are not aware of
such a material misstatement.
Statements regarding independence— Our audit firm and our network have not performed any
prohibited services and our audit firm has remained
independent from the group during the performance of
our mandate.
— The fees for the additional non-audit services compat-
ible with the statutory audit, as defined in article 3:65
of the Code of companies and associations, have been
properly disclosed and disaggregated in the notes to
the consolidated financial statements.
Single European Electronic Format (ESEF)In accordance with the draft standard on the audit of the
compliance of the financial statements with the Single Euro-
pean Electronic Format ("ESEF"), we have also performed
the audit of the compliance of the ESEF format and of the
tagging with the technical regulatory standards as defined
by the European Delegated Regulation No. 2019/815 of 17
December 2018 ("Delegated Regulation").
The board of directors is responsible for the preparation, in
accordance with the ESEF requirements, of the consolidated
financial statements in the form of an electronic file in
ESEF format (“digital consolidated financial statements”)
included in the annual financial report.
Our responsibility is to obtain sufficient and appropriate
evidence to conclude that the format and the tagging of
the digital consolidated financial statements comply, in all
material respects, with the ESEF requirements as stipulated
by the Delegated Regulation.
Based on our work, in our opinion, the format and the
tagging of information in the official version of the digital
consolidated financial statements included in the annual
financial report of VP NV as of 31 December 2021 are, in all
material respects, prepared in accordance with the ESEF
requirements as stipulated by the Delegated Regulation.
Other statements— This report is consistent with our additional report to
the audit committee referred to in article 11 of Regula-
tion (EU) No 537/2014.
Signed in Antwerp, 12 April 2022
The statutory auditor
Deloitte Bedrijfsrevisoren/Réviseurs d’Entreprises BV/SRL
Represented by Kathleen De Brabander PAG
E 3
05
—
V
GP
NV
An
nu
al
Re
po
rt 2
02
1 /
Fin
an
cia
l p
art
/
Au
dit
or’
s r
ep
ort

Allianz or Allianz Real EstateMeans, (i) in relation to the First
Joint Venture, Allianz AZ Finance
VII Luxembourg S.A., SAS Allianz
Logistique S.A.S.U. and Allianz
Benelux SA (all affiliated companies
of Allianz Real Estate GmbH)
taken together, (ii) in relation to
the Second Joint Venture, Allianz
AZ Finance VII Luxembourg S.A.,
(iii) in relation to the Third Joint
Venture, Allianz Pensionskasse
A.G., Allianz Versorgungskasse
Versicherungsverein A.G., Allianz
Lebensversicherungs A.G. and
Allianz Private Krankenversicherungs
A.G., and (iv) in relation to the
Fourth Joint Venture, Allianz
Finance IX Luxembourg S.A. and
YAO NEWREP Investments S.A.;
Allianz Joint Ventures or AZ JVsMeans either and each of (i) the First
Joint Venture; (ii) the Second Joint
Venture; (iii) the Third Joint Venture;
and (iv) the Fourth Joint Venture;
AZ JVA(s) or Allianz Joint Venture Agreement(s)Means either and each of (i) the joint
venture agreement made between
Allianz and VGP NV in relation to
the First Joint Venture; (ii) the joint
venture agreement made between
Allianz and VGP NV in relation to the
Second Joint Venture; (iii) the joint
venture agreement made between
Allianz and VGP NV in relation to
the Third Joint Venture; and (iv)
the joint venture agreement made
between Allianz and VGP NV in
relation to the Fourth Joint Venture;
Annualised committed leasesor annualised rent incomeThe annualised committed leases
or the committed annualised rent
income represents the annualised
rent income generated or to be
generated by executed lease –
and future lease agreements.
AssociatesMeans either and each of the
subsidiaries of the First Joint
Venture or Fourth Joint Venture
in which VGP NV holds a direct
5.1% (10.1%) participation,
Apr-23 Bondthe € 150 million fixed rate bond
maturing on 2 April 2023 which
carries a coupon of 2.75% per annum
(listed on the regulated market of
Euronext Brussels with ISIN Code:
BE0002677582 – Common Code:
208152149).
Apr-29 BondMeans the € 600 million fixed
rate bond maturing on 8 April
2029 which carries a coupon of
1.50% per annum (listed on the
Euro MFT Market in Luxembourg
with ISIN Code: BE6327721237 –
Common Code: 232974028.
Belgian Code of Companies and AssociationsMeans the Belgian Code of
Companies and Associations
dated 23 March 2019 (Wetboek
van vennootschappen en
verenigingen / Code des sociétés
et associations), as amended or
restated from time to time.
Belgian Corporate Governance CodeDrawn up by the Corporate
Governance Commission and
including the governance practices
and provisions to be met by
companies under Belgian Law which
shares are listed on a regulated
market (the“2020 Code”). The
Belgian Corporate Governance
Code is available online at www.
corporategovernancecommittee.be.
BreakFirst option to terminate a lease.
Contractual rentThe gross rent as contractually
agreed in the lease on
the date of signing.
Contribution in kindThe non-cash assets contributed to
a company at the time of formation
or when the capital is increased.
Dealing CodeThe code of conduct containing
rules that must be complied with
by the members of the Board
of Directors, the members of
executive management, and all
employees of the VGP Group, who
by virtue of their position, possess
information they know or should
know is insider information.
DerivativesAs a borrower, VGP wishes to protect
itself from any rise in interest rates.
This interest rate risk can be partially
hedged by the use of derivatives
(such as interest rate swap contracts).
Development Joint Venture(s)Means either and each of (i) the
LPM Joint Venture; (ii) the VGP Park
Belartza Joint Venture; and (iii) the
VGP Park Siegen Joint Venture.
Development JVA(s)Means either and each of (i) the
joint venture agreement made
between Roozen and VGP in
relation to the LPM Joint Venture;
(ii) the joint venture agreement
made between Revikon and VGP
in relation to the VGP Park Siegen
Joint Venture; and (iii) the joint
venture agreement made between
VUSA and the VGP in relation to the
VGP Park Belartza Joint Venture
Discounted cash flowThis is a valuation method based on a
detailed projected revenue flow that
is discounted to a net current value
at a given discount rate based on
the risk of the assets to be valued.
Glossary of terms
PAG
E 3
06
—
V
GP
NV
An
nu
al
Re
po
rt 2
02
1 /
Fin
an
cia
l p
art
/
Glo
ss
ary
of
term
s

EPRAThe European Public Real Estate
Association, a real estate industry
body, which has issued Best
Practices Recommendations
Guidelines in order to provide
consistency and transparency in real
estate reporting across Europe.
Equivalent yield(true and nominal)Is a weighted average of the net
initial yield and reversionary yield
and represents the return a property
will produce based upon the timing
of the income received. The true
equivalent yield assumes rents are
received quarterly in advance. The
nominal equivalent assumes rents
are received annually in arrears.
Estimated rental value (“ERV”)Estimated rental value (ERV) is the
external valuers’ opinion as to the
open market rent which, on the date
of valuation, could reasonably be
expected to be obtained on a new
letting or rent review of a property.
Exit yieldIs the capitalisation rate applied
to the net income at the end of the
discounted cash flow model period
to provide a capital value or exit
value which an entity expects to
obtain for an asset after this period.
Fair valueMeans the amount for which an
asset could be exchanged between
knowledgeable, willing parties
in an arm’s length transaction,
as defined in IAS 40. In addition,
market value must reflect current
rental agreements, the reasonable
assumptions in respect of potential
rental income and expected costs;
First Joint VentureVGP European Logistics
S.à r.l., the 50:50 joint venture
between VGP and Allianz.
Fourth Joint VentureVGP European Logistics 3 S.à.r.l.
(currently named VGP DEU 44
S.à.r.l.), the future 50:50 joint
venture between VGP and Allianz.
FSMAMeans the Financial Services
and Markets Authority (Autoriteit
voor Financiële Diensten en
Markten / Autorité des services
et marchés financiers).
Gearing ratioIs a ratio calculated as consolidated
net financial debt divided by total
equity and liabilities or total assets.
IAS/IFRSInternational Accounting Standards /
International Financial Reporting
Standards. The international
accounting standards drawn up
by the International Accounting
Standards Board (IASB), for the
preparation of financial statements.
IndexationThe rent is contractually adjusted
annually on the anniversary of
the contract effective date on
the basis of the inflation rate
according to a benchmark index
in each specific country.
Insider informationAny information not publicly
disclosed that is accurate and
directly or indirectly relates to
one or more issuers of financial
instruments or one or more
financial instruments and that, if
it were publicly disclosed, could
significantly affect the price of those
financial instruments (or financial
instruments derived from them).
Investment valueThe value of the portfolio, including
transaction costs, as appraised by
independent property experts
Joint VenturesMeans either and each of (i) the
Allianz Joint Ventures; and (ii) the
Development Joint Ventures.
Jul-24 BondMeans the € 75 million fixed rated
bond maturing on 6 July 2024
which carries a coupon of 3.25%
per annum (listed on the regulated
market of Euronext Brussels
with ISIN Code: BE0002287564 –
Common Code: 163738783.
JVA(s) or Joint Venture Agreement(s)Means either and each of (i) the
Allianz Joint Venture Agreements
and; (ii) the Development JVA’s.
Lease expiry dateThe date on which a lease
can be cancelled.
LPM Joint VentureMeans LPM Holding B.V., the
50:50 joint venture between
VGP and Roozen.
Mar-25 BondMeans the € 80 million fixed
rate bond maturing on 30 March
2025 which carries a coupon
of 3.35% per annum (unlisted
with ISIN Code: BE6294349194 –
Common Code: 159049558).
Mar-26 BondMeans the € 190 million fixed rate
bond maturing on 19 March 2026
which carries a coupon of 3.50%
per annum (listed on the regulated
market of Euronext Brussels
with ISIN Code: BE0002611896 –
Common Code: 187793777).
Market capitalisationClosing stock market price
multiplied by the total number of
outstanding shares on that date.
PAG
E 3
07
—
VG
P N
V A
nn
ua
l R
ep
ort
20
21
/ F
ina
nc
ial
pa
rt
/ G
los
sa
ry o
f te
rms

Net asset valueThe value of the total assets minus
the value of the total liabilities.
Net financial debtTotal financial debt minus
cash and cash equivalents.
Net Initial YieldIs the annualised rents generated
by an asset, after the deduction
of an estimate of annual recurring
irrecoverable property outgoings,
expressed as a percentage
of the asset valuation (after
notional purchaser’s costs).
Occupancy rateThe occupancy rate is calculated by
dividing the total leased out lettable
area (m²) by the total lettable area
(m²) including any vacant area (m²).
Prime yieldThe ratio between the (initial)
contractual rent of a purchased
property and the acquisition
value at a prime location.
Project managementManagement of building and
renovation projects. VGP
employs an internal team of
project managers who work
exclusively for the company.
Property expertIndependent property expert
responsible for appraising
the property portfolio.
Property portfolioThe property investments, including
property for lease, property
investments in development
for lease, assets held for sale
and development land.
Reversionary YieldIs the anticipated yield, which the
initial yield will rise to once the
rent reaches the ERV and when the
property is fully let. It is calculated
by dividing the ERV by the valuation.
RevikonMeans Revikon GmbH.
Roozen or Roozen Landgoederen BeheerMeans in relation to the
LPM Joint Venture, Roozen
Landgoederen Beheer B.V.
Second Joint VentureVGP European Logistics 2
S.à r.l., the 50:50 joint venture
between VGP and Allianz.
Sep-23 Bondthe € 225 million fixed rate bond
maturing on 21 September 2023
which carries a coupon of 3.90%
per annum (listed on the regulated
market of Euronext Brussels with
ISIN Code: BE0002258276 – Common
Code: 148397694).
Take-upLetting of rental spaces to
users in the rental market
during a specific period.
Third Joint VentureVGP Park München GmbH,
the 50:50 joint venture
between VGP and Allianz.
VGP Park Belartza Joint VentureMeans Belartza Alto SXXI,
S.L, the 50:50 joint venture
between VGP and VUSA..
VGP Park Moerdijkor LPM joint ventureMeans the LPM Joint Venture.
VGP Park München or VGP Park München joint ventureMeans the Third Joint Venture.
VGP Park Siegen Joint VentureMeans Grekon 11 GmbH, the
50:50 joint venture between
VGP and Revikon.
VusaMeans Valeriano Urrutikoetxea,
S.L.U.; Galdakarra XXI, S.L.;
Saibigain XXI, S.L.U.; and
Belartza Garaia, S.L.U.;
Weighted average term of financial debtThe weighted average term of
financial debt is the sum of the
current financial debt (loans
and bonds) multiplied by the
term remaining up to the final
maturity of the respective loans
and bonds divided by the total
outstanding financial debt.
Weighted average term of the leases (“WAULT”)The weighted average term of leases
is the sum of the (current rent and
committed rent for each lease
multiplied by the term remaining up
to the final maturity of these leases)
divided by the total current rent and
committed rent of the portfolio
Weighted average yieldThe sum of the contractual rent of a
property portfolio to the acquisition
price of such property portfolio.
PAG
E 3
08
—
V
GP
NV
An
nu
al
Re
po
rt 2
02
1 /
Fin
an
cia
l p
art
/
Glo
ss
ary
of
term
s

DisclaimerThis report may contain forward-looking statements. Such statements reflect
the current views of management regarding future events, and involve known
and unknown risks, uncertainties and other factors that may cause actual results
to be materially different from any future results, performance or achievements
expressed or implied by such forward-looking statements. VGP is providing the
information in this report as of this date and does not undertake any obligation
to update any forward-looking statements contained in this report in light of new
information, future events or otherwise. The information in this report does not
constitute an offer to sell or an invitation to buy securities in VGP or an invitation
or inducement to engage in any other investment activities. VGP disclaims any
liability for statements made or published by third parties and does not under-
take any obligation to correct inaccurate data, information, conclusions or opin-
ions published by third parties in relation to this or any other report or press
release issued by VGP.
Statement ofresponsible persons
Jan Van Geet
as permanent representative of
Jan Van Geet s.r.o.
CEO
Piet Van Geet
as permanent representative of
Urraco BV
CFO
The undersigned declare that, to the best of their knowledge:
— The annual accounts, which are in line with the standards applicable for
annual accounts, give a true and fair view of the capital, the financial situa-
tion and the results of the Company and the consolidated subsidiaries;
— The annual report gives a true and fair view of the development and the
results of the Company and of the position of the Company and the consoli-
dated companies, as well as a description of the main risks and uncertainties
they are faced with.
PAG
E 3
09
—
V
GP
NV
An
nu
al
Re
po
rt 2
02
1 /
Fin
an
cia
l p
art
/
Sta
tem
en
t o
f re
sp
on
sib
le p
ers
on
s

Notes
PAG
E 3
10
—
VG
P N
V A
nn
ua
l R
ep
ort
20
21
/ F
ina
nc
ial
pa
rt /
No
tes


VGP NV
Generaal Lemanstraat 55 box 4
2018 Antwerp
Belgium
tel +32 3 289 14 30
fax +32 3 289 14 39
e-mail [email protected]
www.vgpparks.eu
Follow us on