Analysis of voltage profile problems due to the penetration of distributed generation in low-voltage...
9
1 Abstract--This paper presents a comprehensive analysis of the possible impacts of different penetration levels of distributed generation (DG) on voltage profile in low-voltage secondary distribution networks. Detailed models of all system components are utilized in a study that performs hundreds of time-domain simulations of large networked distribution systems using the EMTP. DGs are allocated in a probabilistic fashion to account for the uncertainties of future installations. The main contribution of this paper is the determination of the maximum amount of DG that secondary distribution networks can withstand without exhibiting under- and over-voltage problems or unexpected load disconnections. This information is important for network planning engineers to facilitate the extension of the maximum penetration limit. The results show that depending on the location, type and size of the installed DGs, small amounts of DG may cause over-voltage problems. However, large amounts of DG may not cause any voltage problems when properly selected. Index Terms--Distributed Generation. Low-Voltage Secondary Networks. Voltage Quality. Maximum Penetration of DG. I. INTRODUCTION ISTRIBUTED Generation (DG) is becoming a increasingly viable option for the future of power systems. Despite its higher price, the installation of DG in distribution systems offers advantages over the traditional unidirectional flow of power from a distant generator. For example, DG reduces the load that needs to be supplied from the substation. Although not generalized today, DG could be used to control voltage [1]-[5] or dampen power oscillations [6]. There are, however, several challenges that DG pose to the safe and reliable operation of a distribution system [7]- [15]. A comprehensive literature review revealed that there are no systematic studies reporting the effects of DG penetration in meshed low-voltage secondary networks. There are, however, a considerable number of research papers reporting the advantages and disadvantages of DG for radial distribution systems; see for example [16]-[23]. The operation strategies of radial and networked systems are quite different from each other. For example, radial systems allow for bi-directional load-flow, but may require a different coordination of P.-C. Chen, R. Salcedo, Q. Zhu, F. de Leon, D. Czarkowski, Z.-P. Jiang, V. Spitsa, and Z. Zabar are with the Electrical and Computer Engineering Department of Polytechnic Institute of New York University. Six Metrotech Center, Brooklyn, NY 11201 USA (e-mails: [email protected], [email protected], [email protected], [email protected], [email protected], [email protected], [email protected], [email protected]). R. Uosef is with Consolidated Edison Inc., 4 Irving Pl., New York, NY 10003 USA, (e-mail: [email protected]). protections. However, in secondary networks, reverse power form the low-voltage network to the MV feeders is not possible. For safety reasons, all network transformers include network protectors that trip when reverse power is sensed. The requirement for the unidirectional active power flow in the secondary networks imposes additional constraints that are not present in radial systems and vice versa. This paper presents the first attempt to quantify the possible negative impacts on the voltage profile of different penetration levels of DG in secondary networked distribution systems. The study is intended to elucidate what will happen if customers are allowed to freely install DGs on their premises and DGs become widespread. In our analysis, we focus on the situation when the maximum DG output coincides with light (minimum) load conditions. This case is recognized in the literature as the worst-case scenario [24], [25]. To simulate possible future scenarios we have probabilistically allocated DG in increments of 10% of the light load. The study is carried out using a very detailed representation of the system components. Hundreds of time-domain simulations with the Electromagnetic Transients Program (EMTP) are performed to determine if a given allocation of DGs would produce voltage profile problems. We have found (Section IV) that even with very small DG penetration, there may be unacceptably low or high voltages at certain loads when DG units are installed at the wrong location. However, very large amounts of DG power (up to 100% of light load) installed with the adequate strategy allow acceptable operating conditions. Under the present operating strategy of secondary networks, no power can be exported from the network to the system. Intermittent DG technologies such as solar photovoltaic (PV) or wind conversion system could also affect secondary voltage profiles due to flicker. Additionally, intermittent DG technologies frequently require optimal management strategies to maximize power delivery since the maximum power output may fluctuate [26]. However, this topic is beyond the scope of a first study on the effects of DG penetration in secondary networks. The issues related to intermittent DG are to be studied in future research. II. SECONDARY NETWORK UNDER STUDY A. Description of Low-Voltage Secondary Networks A low-voltage secondary network is a distribution system configuration typical of the downtown cores of most cities in North America. An area substation commonly supplies power to two (or more) independent underground networks through a number of medium voltage radial feeders. Each feeder delivers Analysis of Voltage Profile Problems due to the Penetration of Distributed Generation in Low-Voltage Secondary Distribution Networks Po-Chen Chen, Reynaldo Salcedo, Student Member IEEE, Qingcheng Zhu, Student Member IEEE, Francisco de León, Senior Member IEEE, Dariusz Czarkowski, Member IEEE, Zhong-Ping Jiang, Fellow IEEE, Vitaly Spitsa, Member, IEEE, Zivan Zabar, Senior Member IEEE, and Resk Ebrahem Uosef, Member IEEE D
Transcript of Analysis of voltage profile problems due to the penetration of distributed generation in low-voltage...
1
Abstract--This paper presents a comprehensive analysis of the possible impacts of different penetration levels of distributed generation (DG) on voltage profile in low-voltage secondary distribution networks. Detailed models of all system components are utilized in a study that performs hundreds of time-domain simulations of large networked distribution systems using the EMTP. DGs are allocated in a probabilistic fashion to account for the uncertainties of future installations. The main contribution of this paper is the determination of the maximum amount of DG that secondary distribution networks can withstand without exhibiting under- and over-voltage problems or unexpected load disconnections. This information is important for network planning engineers to facilitate the extension of the maximum penetration limit. The results show that depending on the location, type and size of the installed DGs, small amounts of DG may cause over-voltage problems. However, large amounts of DG may not cause any voltage problems when properly selected.
Index Terms--Distributed Generation. Low-Voltage Secondary Networks. Voltage Quality. Maximum Penetration of DG.
I. INTRODUCTION ISTRIBUTED Generation (DG) is becoming a increasingly viable option for the future of power
systems. Despite its higher price, the installation of DG in distribution systems offers advantages over the traditional unidirectional flow of power from a distant generator. For example, DG reduces the load that needs to be supplied from the substation. Although not generalized today, DG could be used to control voltage [1]-[5] or dampen power oscillations [6]. There are, however, several challenges that DG pose to the safe and reliable operation of a distribution system [7]-[15]. A comprehensive literature review revealed that there are no systematic studies reporting the effects of DG penetration in meshed low-voltage secondary networks. There are, however, a considerable number of research papers reporting the advantages and disadvantages of DG for radial distribution systems; see for example [16]-[23]. The operation strategies of radial and networked systems are quite different from each other. For example, radial systems allow for bi-directional load-flow, but may require a different coordination of
P.-C. Chen, R. Salcedo, Q. Zhu, F. de Leon, D. Czarkowski, Z.-P. Jiang, V. Spitsa, and Z. Zabar are with the Electrical and Computer Engineering Department of Polytechnic Institute of New York University. Six Metrotech Center, Brooklyn, NY 11201 USA (e-mails: [email protected], [email protected], [email protected], [email protected], [email protected], [email protected], [email protected], [email protected]).
R. Uosef is with Consolidated Edison Inc., 4 Irving Pl., New York, NY 10003 USA, (e-mail: [email protected]).
protections. However, in secondary networks, reverse power form the low-voltage network to the MV feeders is not possible. For safety reasons, all network transformers include network protectors that trip when reverse power is sensed. The requirement for the unidirectional active power flow in the secondary networks imposes additional constraints that are not present in radial systems and vice versa.
This paper presents the first attempt to quantify the possible negative impacts on the voltage profile of different penetration levels of DG in secondary networked distribution systems. The study is intended to elucidate what will happen if customers are allowed to freely install DGs on their premises and DGs become widespread. In our analysis, we focus on the situation when the maximum DG output coincides with light (minimum) load conditions. This case is recognized in the literature as the worst-case scenario [24], [25]. To simulate possible future scenarios we have probabilistically allocated DG in increments of 10% of the light load. The study is carried out using a very detailed representation of the system components. Hundreds of time-domain simulations with the Electromagnetic Transients Program (EMTP) are performed to determine if a given allocation of DGs would produce voltage profile problems. We have found (Section IV) that even with very small DG penetration, there may be unacceptably low or high voltages at certain loads when DG units are installed at the wrong location. However, very large amounts of DG power (up to 100% of light load) installed with the adequate strategy allow acceptable operating conditions. Under the present operating strategy of secondary networks, no power can be exported from the network to the system. Intermittent DG technologies such as solar photovoltaic (PV) or wind conversion system could also affect secondary voltage profiles due to flicker. Additionally, intermittent DG technologies frequently require optimal management strategies to maximize power delivery since the maximum power output may fluctuate [26]. However, this topic is beyond the scope of a first study on the effects of DG penetration in secondary networks. The issues related to intermittent DG are to be studied in future research.
II. SECONDARY NETWORK UNDER STUDY
A. Description of Low-Voltage Secondary Networks A low-voltage secondary network is a distribution system
configuration typical of the downtown cores of most cities in North America. An area substation commonly supplies power to two (or more) independent underground networks through a number of medium voltage radial feeders. Each feeder delivers
Analysis of Voltage Profile Problems due to the Penetration of Distributed Generation in
Low-Voltage Secondary Distribution Networks Po-Chen Chen, Reynaldo Salcedo, Student Member IEEE, Qingcheng Zhu, Student Member IEEE, Francisco de León, Senior Member IEEE, Dariusz Czarkowski, Member IEEE, Zhong-Ping Jiang, Fellow IEEE, Vitaly Spitsa,
Member, IEEE, Zivan Zabar, Senior Member IEEE, and Resk Ebrahem Uosef, Member IEEE
D
2
power through several tens of network transformers that reduce the voltage to utilization level (say 208/120 V). All transformer secondaries and loads are tied together in a highly-meshed low-voltage network as shown in Fig. 1. This arrangement offers the highest levels of reliability of any standard configuration in use today [22].
Fig. 1. Schematic of a low-voltage secondary network. Loads and network transformers are tied together in a highly-meshed network.
Important components of a low-voltage secondary network
are the network protectors [27], [28]. These protective devices are installed on the secondary side of the network transformers and automatically disconnect them from the secondary grid when the power starts to flow in the reverse direction; i.e. from the low-voltage network to the feeders. The network protectors automatically reclose when the conditions for the direct power flow in the system are restored.
B. Description of the Sutton Network The selected network for the study is one of the 34 networks
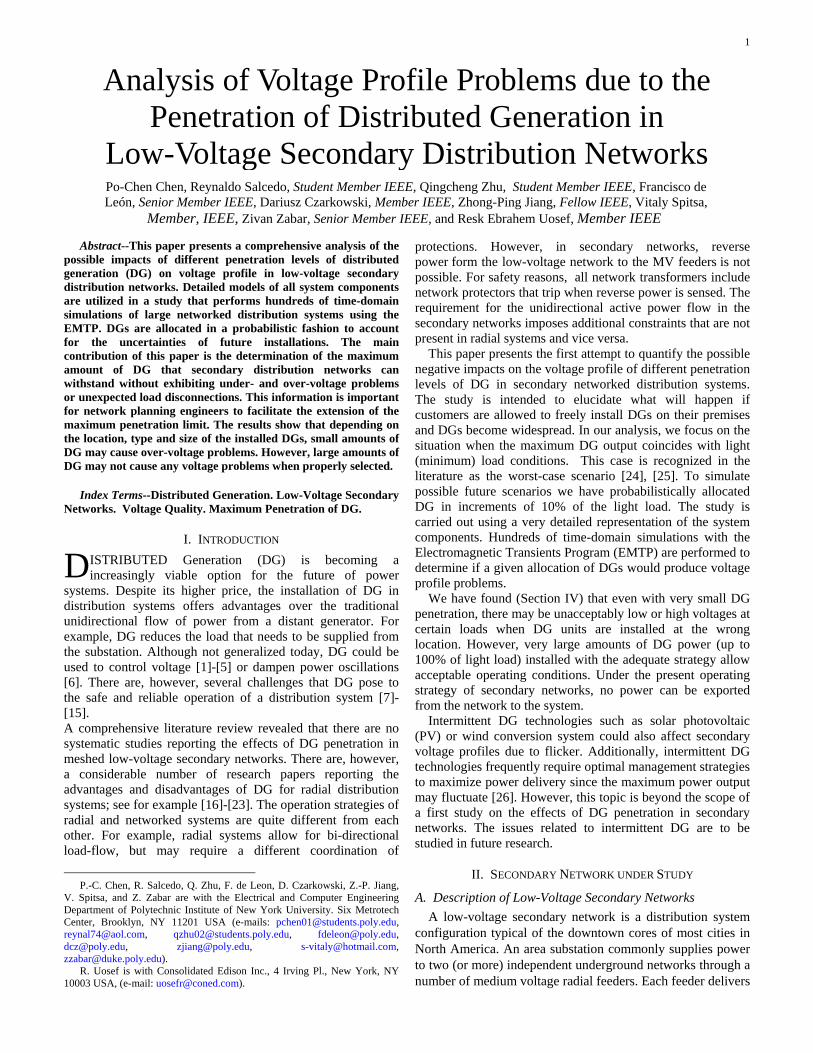
that supply the Manhattan service area. It has 12 primary feeders, 1,041 feeder cable sections, 1,375 secondary cable sections, 27 substation breakers, 224 transformers, 224 network protections, 1,375 secondary grid sections and 311 aggregated loads. These loads correspond to 284 independent customers, 17 spot networks mostly at 460 V, and 1 isolated spot network connected at 208 V. The overall geographical map is shown in Fig. 2.
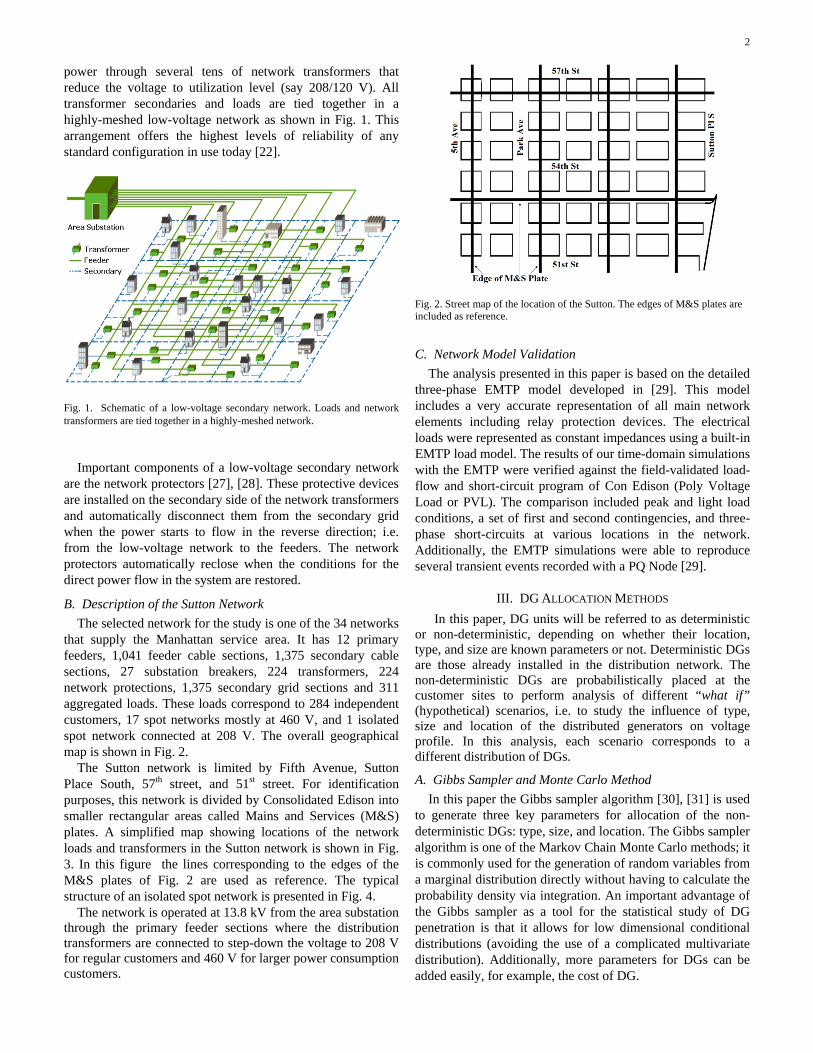
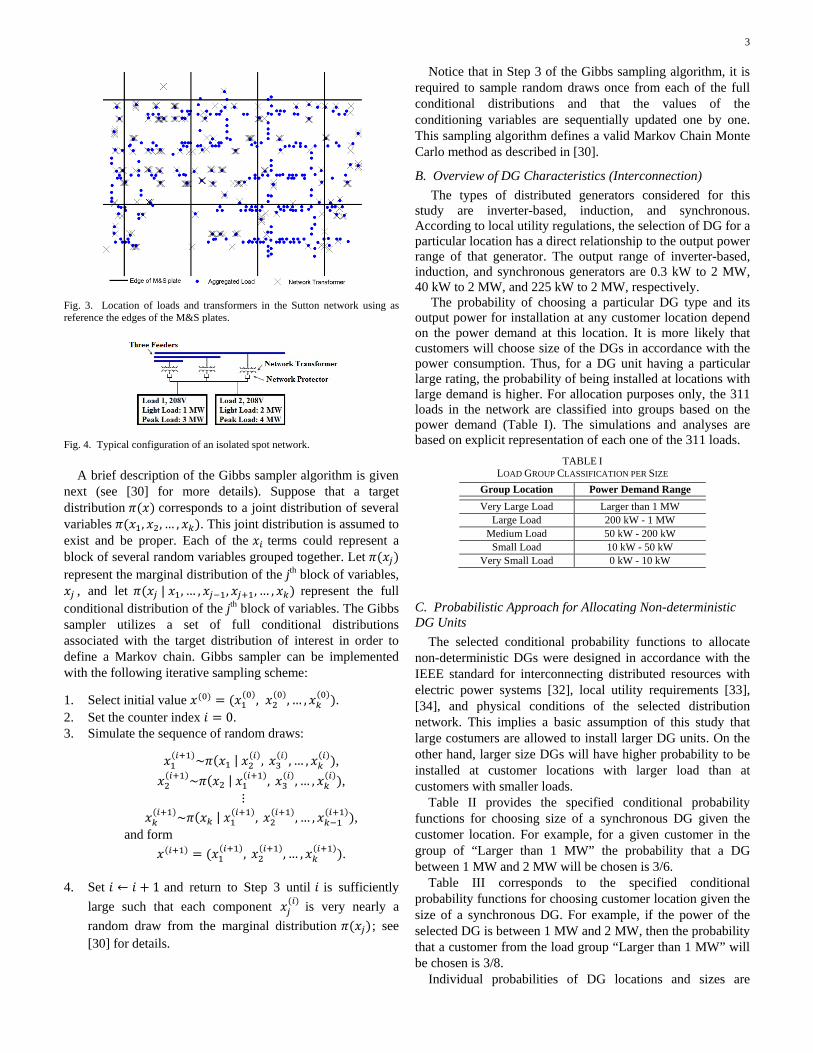
The Sutton network is limited by Fifth Avenue, Sutton Place South, 57th street, and 51st street. For identification purposes, this network is divided by Consolidated Edison into smaller rectangular areas called Mains and Services (M&S) plates. A simplified map showing locations of the network loads and transformers in the Sutton network is shown in Fig. 3. In this figure the lines corresponding to the edges of the M&S plates of Fig. 2 are used as reference. The typical structure of an isolated spot network is presented in Fig. 4.
The network is operated at 13.8 kV from the area substation through the primary feeder sections where the distribution transformers are connected to step-down the voltage to 208 V for regular customers and 460 V for larger power consumption customers.
Fig. 2. Street map of the location of the Sutton. The edges of M&S plates are included as reference.
C. Network Model Validation The analysis presented in this paper is based on the detailed
three-phase EMTP model developed in [29]. This model includes a very accurate representation of all main network elements including relay protection devices. The electrical loads were represented as constant impedances using a built-in EMTP load model. The results of our time-domain simulations with the EMTP were verified against the field-validated load-flow and short-circuit program of Con Edison (Poly Voltage Load or PVL). The comparison included peak and light load conditions, a set of first and second contingencies, and three-phase short-circuits at various locations in the network. Additionally, the EMTP simulations were able to reproduce several transient events recorded with a PQ Node [29].
III. DG ALLOCATION METHODS In this paper, DG units will be referred to as deterministic
or non-deterministic, depending on whether their location, type, and size are known parameters or not. Deterministic DGs are those already installed in the distribution network. The non-deterministic DGs are probabilistically placed at the customer sites to perform analysis of different “what if” (hypothetical) scenarios, i.e. to study the influence of type, size and location of the distributed generators on voltage profile. In this analysis, each scenario corresponds to a different distribution of DGs.
A. Gibbs Sampler and Monte Carlo Method In this paper the Gibbs sampler algorithm [30], [31] is used
to generate three key parameters for allocation of the non-deterministic DGs: type, size, and location. The Gibbs sampler algorithm is one of the Markov Chain Monte Carlo methods; it is commonly used for the generation of random variables from a marginal distribution directly without having to calculate the probability density via integration. An important advantage of the Gibbs sampler as a tool for the statistical study of DG penetration is that it allows for low dimensional conditional distributions (avoiding the use of a complicated multivariate distribution). Additionally, more parameters for DGs can be added easily, for example, the cost of DG.
3
Fig. 3. Location of loads and transformers in the Sutton network using as reference the edges of the M&S plates.
Fig. 4. Typical configuration of an isolated spot network.
A brief description of the Gibbs sampler algorithm is given
next (see [30] for more details). Suppose that a target distribution 𝜋(𝑥) corresponds to a joint distribution of several variables 𝜋(𝑥1, 𝑥2, … , 𝑥𝑘). This joint distribution is assumed to exist and be proper. Each of the 𝑥𝑖 terms could represent a block of several random variables grouped together. Let 𝜋(𝑥𝑗) represent the marginal distribution of the jth block of variables, 𝑥𝑗 , and let 𝜋(𝑥𝑗 | 𝑥1, … , 𝑥𝑗−1, 𝑥𝑗+1, … , 𝑥𝑘) represent the full conditional distribution of the jth block of variables. The Gibbs sampler utilizes a set of full conditional distributions associated with the target distribution of interest in order to define a Markov chain. Gibbs sampler can be implemented with the following iterative sampling scheme:
1. Select initial value 𝑥(0) = (𝑥1(0), 𝑥2
(0), … , 𝑥𝑘(0)).
2. Set the counter index 𝑖 = 0. 3. Simulate the sequence of random draws:
𝑥1(𝑖+1)~𝜋(𝑥1 | 𝑥2
(𝑖), 𝑥3(𝑖), … , 𝑥𝑘
(𝑖)), 𝑥2
(𝑖+1)~𝜋(𝑥2 | 𝑥1(𝑖+1), 𝑥3
(𝑖), … , 𝑥𝑘(𝑖)),
⋮ 𝑥𝑘
(𝑖+1)~𝜋(𝑥𝑘 | 𝑥1(𝑖+1), 𝑥2
(𝑖+1), … , 𝑥𝑘−1(𝑖+1)),
and form 𝑥(𝑖+1) = (𝑥1
(𝑖+1), 𝑥2(𝑖+1), … , 𝑥𝑘
(𝑖+1)).
4. Set 𝑖 ← 𝑖 + 1 and return to Step 3 until 𝑖 is sufficiently large such that each component 𝑥𝑗
(𝑖) is very nearly a random draw from the marginal distribution 𝜋(𝑥𝑗); see [30] for details.
Notice that in Step 3 of the Gibbs sampling algorithm, it is required to sample random draws once from each of the full conditional distributions and that the values of the conditioning variables are sequentially updated one by one. This sampling algorithm defines a valid Markov Chain Monte Carlo method as described in [30].
B. Overview of DG Characteristics (Interconnection) The types of distributed generators considered for this
study are inverter-based, induction, and synchronous. According to local utility regulations, the selection of DG for a particular location has a direct relationship to the output power range of that generator. The output range of inverter-based, induction, and synchronous generators are 0.3 kW to 2 MW, 40 kW to 2 MW, and 225 kW to 2 MW, respectively.
The probability of choosing a particular DG type and its output power for installation at any customer location depend on the power demand at this location. It is more likely that customers will choose size of the DGs in accordance with the power consumption. Thus, for a DG unit having a particular large rating, the probability of being installed at locations with large demand is higher. For allocation purposes only, the 311 loads in the network are classified into groups based on the power demand (Table I). The simulations and analyses are based on explicit representation of each one of the 311 loads.
TABLE I LOAD GROUP CLASSIFICATION PER SIZE
Group Location Power Demand Range
Very Large Load Larger than 1 MW Large Load 200 kW - 1 MW
Medium Load 50 kW - 200 kW Small Load 10 kW - 50 kW
Very Small Load 0 kW - 10 kW
C. Probabilistic Approach for Allocating Non-deterministic DG Units
The selected conditional probability functions to allocate non-deterministic DGs were designed in accordance with the IEEE standard for interconnecting distributed resources with electric power systems [32], local utility requirements [33], [34], and physical conditions of the selected distribution network. This implies a basic assumption of this study that large costumers are allowed to install larger DG units. On the other hand, larger size DGs will have higher probability to be installed at customer locations with larger load than at customers with smaller loads.
Table II provides the specified conditional probability functions for choosing size of a synchronous DG given the customer location. For example, for a given customer in the group of “Larger than 1 MW” the probability that a DG between 1 MW and 2 MW will be chosen is 3/6.
Table III corresponds to the specified conditional probability functions for choosing customer location given the size of a synchronous DG. For example, if the power of the selected DG is between 1 MW and 2 MW, then the probability that a customer from the load group “Larger than 1 MW” will be chosen is 3/8.
Individual probabilities of DG locations and sizes are
4
obtained by applying the Gibbs sampling algorithm with the conditional probability functions described above. These probabilities are shown in Tables IV and V respectively. For example, the individual probability of selecting a synchronous type DG of size 1 MW – 2 MW is 0.231. It should be noted that Tables II, III, IV, and V are the examples for the synchronous type DGs; similar tables exist for other types of DG and are not presented due to space constraints.
TABLE II
CONDITIONAL PROBABILITY FUNCTIONS FOR CHOOSING A SIZE OF THE SYNCHRONOUS DG GIVEN THE SIZE OF THE CUSTOMER LOAD
Given Size of Customer Load
Probability of Choosing a Size of DG 1 to 2 MW
500 kW to 1 MW
200 to 500 kW
Larger than 1 MW 3/6 2/6 1/6 200 kW to 1 MW 1/6 3/6 2/6 50 kW to 200 kW 1/6 2/6 3/6 10 kW to 50 kW 1/6 1/6 4/6 0 kW to 10 kW 1/8 1/8 6/8
TABLE III
CONDITIONAL PROBABILITY FUNCTIONS FOR CHOOSING A CUSTOMER IN THE LOAD GROUP GIVEN THE SIZE OF THE SYNCHRONOUS DG
Given Size of DG
Probability of Choosing a Customer in the Load Group Larger than
1 MW 200 kW to
1 MW 50 kW to 200 kW
10 kW to 50 kW
0 kW to 10 kW
1 to 2 MW 3/8 2/8 1/8 1/8 1/8 500 kW to
1 MW 2/9 3/9 2/9 1/9 1/9
200 kW to 500 kW 1/9 2/9 3/9 2/9 1/9
TABLE IV
INDIVIDUAL PROBABILITY FUNCTIONS OF SYNCHRONOUS DG SIZE
1 MW – 2 MW 500 kW – 1 MW 200 kW – 500 kW 0.2312 0.3267 0.4421
TABLE V
INDIVIDUAL PROBABILITY FUNCTIONS OF SYNCHRONOUS DG LOCATION
Larger than 1 MW
200 kW to 1 MW
50 kW to 200 kW
10 kW to 50 kW
0 kW to 50 kW
0.2084 0.2649 0.2489 0.1634 0.1144 The following constraints are considered for the allocation
of the DGs: (1) a DG can only be installed at customer locations; (2) only “small” DG units are permitted in low-voltage networks. It means that a DG unit cannot exceed 2 MW output power [33], [34]; (3) only one type of the DG is allowed per location; (4) each location may have multiple DG units of the same type; (5) the DG units supplying 460 V loads cannot exceed their light load demand for that particular location; (6) the DG units supplying 208 V loads cannot exceed their maximum of the light load demand and 85% of the peak load demand for that particular location; (7) the total DG power in a spot network cannot exceed the total light load demand.
The above mentioned constraints are based on regulatory requirements and physical limitations of the distribution networks in the metropolitan areas. Operation of these networks under completely deregulated power markets raises
concerns of reliability, stability, and power quality. Massive reinforcements of the existing urban networks to accommodate new generation units in the low-voltage secondary grid are very time-consuming and require tremendous investments. At the same time, there exists a persistently growing requirement to allow for the large-scale penetration of the distributed generation. As a result, an approach based on “connect and forget” principle becomes more attractive. According to this approach, newly connected DG units should not drive the network beyond its current operation and physical constraints. The constraints must assure service continuity and reliability. For example, if constraint (6) is applied to the spot network in Fig. 4 without constraint (7), then the total maximum DG power that can be allocated would be greater than the total light load demand. Therefore, the spot network would be disconnected by the network protectors when sensing back-feed power.
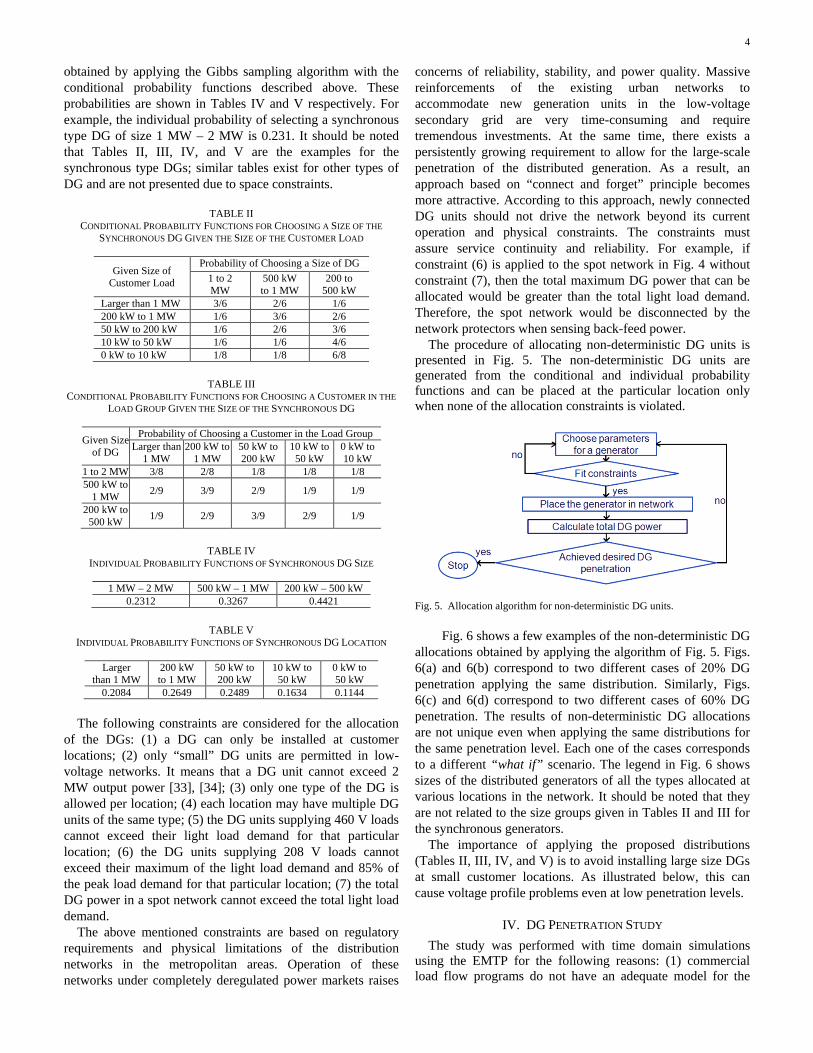
The procedure of allocating non-deterministic DG units is presented in Fig. 5. The non-deterministic DG units are generated from the conditional and individual probability functions and can be placed at the particular location only when none of the allocation constraints is violated.
Fig. 5. Allocation algorithm for non-deterministic DG units.
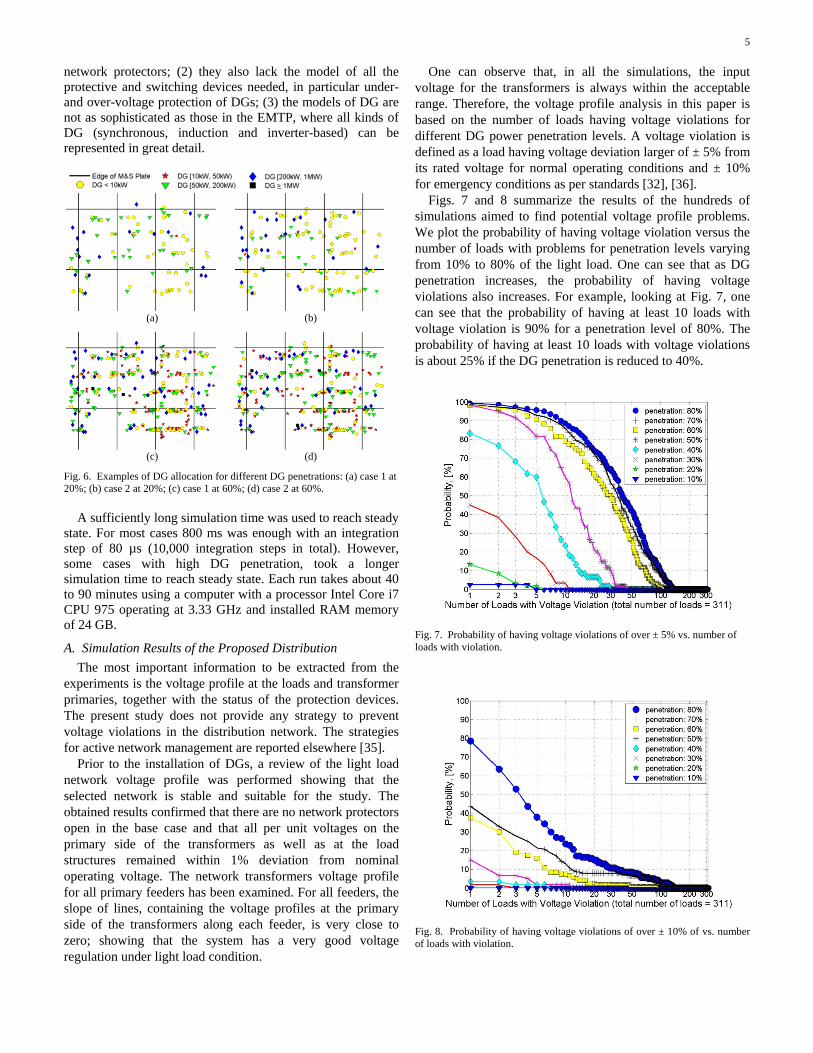
Fig. 6 shows a few examples of the non-deterministic DG allocations obtained by applying the algorithm of Fig. 5. Figs. 6(a) and 6(b) correspond to two different cases of 20% DG penetration applying the same distribution. Similarly, Figs. 6(c) and 6(d) correspond to two different cases of 60% DG penetration. The results of non-deterministic DG allocations are not unique even when applying the same distributions for the same penetration level. Each one of the cases corresponds to a different “what if” scenario. The legend in Fig. 6 shows sizes of the distributed generators of all the types allocated at various locations in the network. It should be noted that they are not related to the size groups given in Tables II and III for the synchronous generators.
The importance of applying the proposed distributions (Tables II, III, IV, and V) is to avoid installing large size DGs at small customer locations. As illustrated below, this can cause voltage profile problems even at low penetration levels.
IV. DG PENETRATION STUDY The study was performed with time domain simulations
using the EMTP for the following reasons: (1) commercial load flow programs do not have an adequate model for the
5
network protectors; (2) they also lack the model of all the protective and switching devices needed, in particular under- and over-voltage protection of DGs; (3) the models of DG are not as sophisticated as those in the EMTP, where all kinds of DG (synchronous, induction and inverter-based) can be represented in great detail.
(a) (b)
(c) (d)
Fig. 6. Examples of DG allocation for different DG penetrations: (a) case 1 at 20%; (b) case 2 at 20%; (c) case 1 at 60%; (d) case 2 at 60%.
A sufficiently long simulation time was used to reach steady
state. For most cases 800 ms was enough with an integration step of 80 µs (10,000 integration steps in total). However, some cases with high DG penetration, took a longer simulation time to reach steady state. Each run takes about 40 to 90 minutes using a computer with a processor Intel Core i7 CPU 975 operating at 3.33 GHz and installed RAM memory of 24 GB.
A. Simulation Results of the Proposed Distribution The most important information to be extracted from the
experiments is the voltage profile at the loads and transformer primaries, together with the status of the protection devices. The present study does not provide any strategy to prevent voltage violations in the distribution network. The strategies for active network management are reported elsewhere [35].
Prior to the installation of DGs, a review of the light load network voltage profile was performed showing that the selected network is stable and suitable for the study. The obtained results confirmed that there are no network protectors open in the base case and that all per unit voltages on the primary side of the transformers as well as at the load structures remained within 1% deviation from nominal operating voltage. The network transformers voltage profile for all primary feeders has been examined. For all feeders, the slope of lines, containing the voltage profiles at the primary side of the transformers along each feeder, is very close to zero; showing that the system has a very good voltage regulation under light load condition.
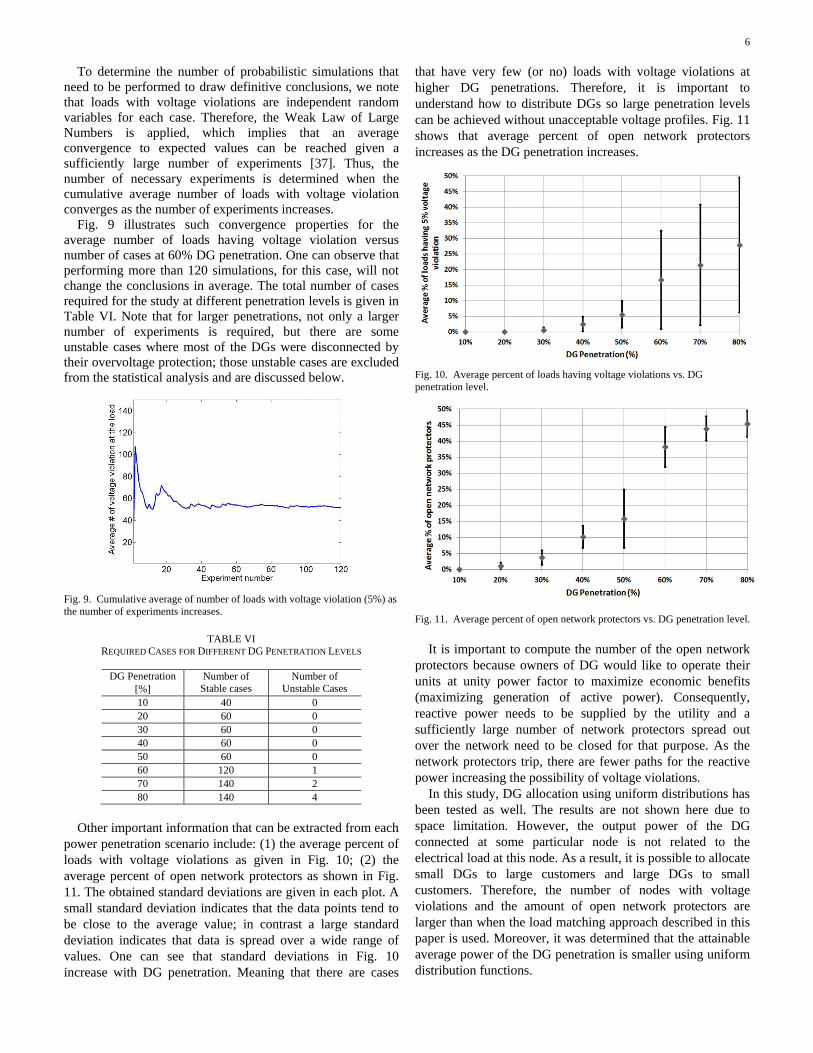
One can observe that, in all the simulations, the input voltage for the transformers is always within the acceptable range. Therefore, the voltage profile analysis in this paper is based on the number of loads having voltage violations for different DG power penetration levels. A voltage violation is defined as a load having voltage deviation larger of ± 5% from its rated voltage for normal operating conditions and ± 10% for emergency conditions as per standards [32], [36].
Figs. 7 and 8 summarize the results of the hundreds of simulations aimed to find potential voltage profile problems. We plot the probability of having voltage violation versus the number of loads with problems for penetration levels varying from 10% to 80% of the light load. One can see that as DG penetration increases, the probability of having voltage violations also increases. For example, looking at Fig. 7, one can see that the probability of having at least 10 loads with voltage violation is 90% for a penetration level of 80%. The probability of having at least 10 loads with voltage violations is about 25% if the DG penetration is reduced to 40%.
Fig. 7. Probability of having voltage violations of over ± 5% vs. number of loads with violation.
Fig. 8. Probability of having voltage violations of over ± 10% of vs. number of loads with violation.
6
To determine the number of probabilistic simulations that need to be performed to draw definitive conclusions, we note that loads with voltage violations are independent random variables for each case. Therefore, the Weak Law of Large Numbers is applied, which implies that an average convergence to expected values can be reached given a sufficiently large number of experiments [37]. Thus, the number of necessary experiments is determined when the cumulative average number of loads with voltage violation converges as the number of experiments increases.
Fig. 9 illustrates such convergence properties for the average number of loads having voltage violation versus number of cases at 60% DG penetration. One can observe that performing more than 120 simulations, for this case, will not change the conclusions in average. The total number of cases required for the study at different penetration levels is given in Table VI. Note that for larger penetrations, not only a larger number of experiments is required, but there are some unstable cases where most of the DGs were disconnected by their overvoltage protection; those unstable cases are excluded from the statistical analysis and are discussed below.
Fig. 9. Cumulative average of number of loads with voltage violation (5%) as the number of experiments increases.
TABLE VI
REQUIRED CASES FOR DIFFERENT DG PENETRATION LEVELS
DG Penetration [%]
Number of Stable cases
Number of Unstable Cases
10 40 0 20 60 0 30 60 0 40 60 0 50 60 0 60 120 1 70 140 2 80 140 4
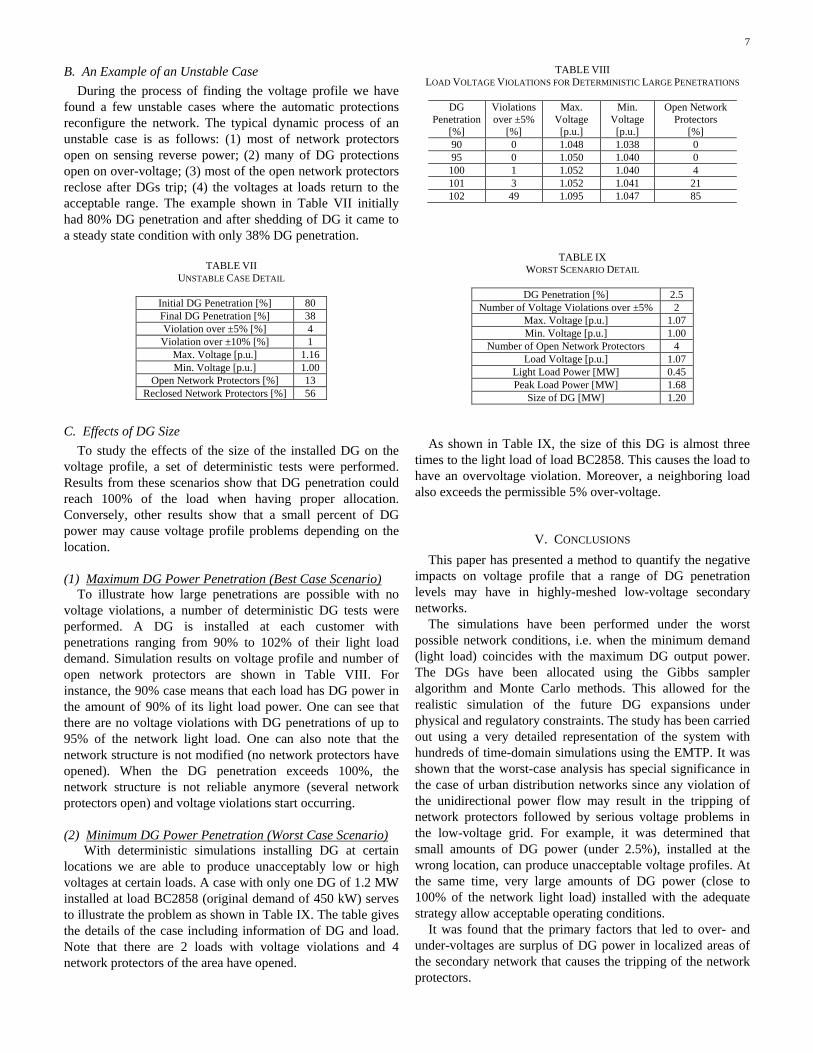
Other important information that can be extracted from each
power penetration scenario include: (1) the average percent of loads with voltage violations as given in Fig. 10; (2) the average percent of open network protectors as shown in Fig. 11. The obtained standard deviations are given in each plot. A small standard deviation indicates that the data points tend to be close to the average value; in contrast a large standard deviation indicates that data is spread over a wide range of values. One can see that standard deviations in Fig. 10 increase with DG penetration. Meaning that there are cases
that have very few (or no) loads with voltage violations at higher DG penetrations. Therefore, it is important to understand how to distribute DGs so large penetration levels can be achieved without unacceptable voltage profiles. Fig. 11 shows that average percent of open network protectors increases as the DG penetration increases.
Fig. 10. Average percent of loads having voltage violations vs. DG penetration level.
Fig. 11. Average percent of open network protectors vs. DG penetration level.
It is important to compute the number of the open network
protectors because owners of DG would like to operate their units at unity power factor to maximize economic benefits (maximizing generation of active power). Consequently, reactive power needs to be supplied by the utility and a sufficiently large number of network protectors spread out over the network need to be closed for that purpose. As the network protectors trip, there are fewer paths for the reactive power increasing the possibility of voltage violations.
In this study, DG allocation using uniform distributions has been tested as well. The results are not shown here due to space limitation. However, the output power of the DG connected at some particular node is not related to the electrical load at this node. As a result, it is possible to allocate small DGs to large customers and large DGs to small customers. Therefore, the number of nodes with voltage violations and the amount of open network protectors are larger than when the load matching approach described in this paper is used. Moreover, it was determined that the attainable average power of the DG penetration is smaller using uniform distribution functions.
7
B. An Example of an Unstable Case During the process of finding the voltage profile we have
found a few unstable cases where the automatic protections reconfigure the network. The typical dynamic process of an unstable case is as follows: (1) most of network protectors open on sensing reverse power; (2) many of DG protections open on over-voltage; (3) most of the open network protectors reclose after DGs trip; (4) the voltages at loads return to the acceptable range. The example shown in Table VII initially had 80% DG penetration and after shedding of DG it came to a steady state condition with only 38% DG penetration.
TABLE VII
UNSTABLE CASE DETAIL
Initial DG Penetration [%] 80 Final DG Penetration [%] 38 Violation over ±5% [%] 4 Violation over ±10% [%] 1
Max. Voltage [p.u.] 1.16 Min. Voltage [p.u.] 1.00
Open Network Protectors [%] 13 Reclosed Network Protectors [%] 56
C. Effects of DG Size To study the effects of the size of the installed DG on the
voltage profile, a set of deterministic tests were performed. Results from these scenarios show that DG penetration could reach 100% of the load when having proper allocation. Conversely, other results show that a small percent of DG power may cause voltage profile problems depending on the location.
(1) Maximum DG Power Penetration (Best Case Scenario) To illustrate how large penetrations are possible with no
voltage violations, a number of deterministic DG tests were performed. A DG is installed at each customer with penetrations ranging from 90% to 102% of their light load demand. Simulation results on voltage profile and number of open network protectors are shown in Table VIII. For instance, the 90% case means that each load has DG power in the amount of 90% of its light load power. One can see that there are no voltage violations with DG penetrations of up to 95% of the network light load. One can also note that the network structure is not modified (no network protectors have opened). When the DG penetration exceeds 100%, the network structure is not reliable anymore (several network protectors open) and voltage violations start occurring.
(2) Minimum DG Power Penetration (Worst Case Scenario)
With deterministic simulations installing DG at certain locations we are able to produce unacceptably low or high voltages at certain loads. A case with only one DG of 1.2 MW installed at load BC2858 (original demand of 450 kW) serves to illustrate the problem as shown in Table IX. The table gives the details of the case including information of DG and load. Note that there are 2 loads with voltage violations and 4 network protectors of the area have opened.
TABLE VIII LOAD VOLTAGE VIOLATIONS FOR DETERMINISTIC LARGE PENETRATIONS
DG
Penetration [%]
Violations over ±5%
[%]
Max. Voltage
[p.u.]
Min. Voltage
[p.u.]
Open Network Protectors
[%] 90 0 1.048 1.038 0 95 0 1.050 1.040 0
100 1 1.052 1.040 4 101 3 1.052 1.041 21 102 49 1.095 1.047 85
TABLE IX WORST SCENARIO DETAIL
DG Penetration [%] 2.5
Number of Voltage Violations over ±5% 2 Max. Voltage [p.u.] 1.07 Min. Voltage [p.u.] 1.00
Number of Open Network Protectors 4 Load Voltage [p.u.] 1.07
Light Load Power [MW] 0.45 Peak Load Power [MW] 1.68
Size of DG [MW] 1.20
As shown in Table IX, the size of this DG is almost three
times to the light load of load BC2858. This causes the load to have an overvoltage violation. Moreover, a neighboring load also exceeds the permissible 5% over-voltage.
V. CONCLUSIONS This paper has presented a method to quantify the negative
impacts on voltage profile that a range of DG penetration levels may have in highly-meshed low-voltage secondary networks.
The simulations have been performed under the worst possible network conditions, i.e. when the minimum demand (light load) coincides with the maximum DG output power. The DGs have been allocated using the Gibbs sampler algorithm and Monte Carlo methods. This allowed for the realistic simulation of the future DG expansions under physical and regulatory constraints. The study has been carried out using a very detailed representation of the system with hundreds of time-domain simulations using the EMTP. It was shown that the worst-case analysis has special significance in the case of urban distribution networks since any violation of the unidirectional power flow may result in the tripping of network protectors followed by serious voltage problems in the low-voltage grid. For example, it was determined that small amounts of DG power (under 2.5%), installed at the wrong location, can produce unacceptable voltage profiles. At the same time, very large amounts of DG power (close to 100% of the network light load) installed with the adequate strategy allow acceptable operating conditions.
It was found that the primary factors that led to over- and under-voltages are surplus of DG power in localized areas of the secondary network that causes the tripping of the network protectors.
8
VI. ACKNOWLEDGMENTS This work has been supported in part by NSF grant DMS-
0906659 and Consolidated Edison Company of New York. The authors wish to thank Messrs. Li Yu and Xuanchang Ran for the development of the EMTP models of the DGs and network protectors. We also thank Mr. Yu Jiang for his help with the Gibbs sampling algorithm. Last, but not least, we would like to thank Messrs. Tianming Zhu, Ankur Rane, and Abhishek Ramakrishnan for their help running the EMTP hundreds of times.
REFERENCES [1] R. O'gorman and M. Redfern, "The impact of distributed generation on
voltage control in distribution systems," 2005.CIRED 18th International Conf. and Exhibition Electricity Distribution, pp. 1-6, Jun. 6-9 2005.
[2] A. Kanicki, “Voltage Control in Distribution Systems,” Handbook of Power Quality, Wiley Online Library, pp.59-77, Jun. 2008.
[3] M. H. J. Bollen and A. Sannino, "Voltage control with inverter-based distributed generation," IEEE Trans. Power Del., vol. 20, no. 1, pp. 519-520, Jan. 2005.
[4] F. A. Viawan and D. Karlsson, "Voltage and Reactive Power Control in Systems With Synchronous Machine-Based Distributed Generation," IEEE Trans. Power Del., vol. 23, no. 2, pp. 1079-1087, Apr. 2008.
[5] P. Chiradeja and R. Ramakumar, "Voltage profile improvement with distributed wind turbine generation-a case study," 2003 IEEE Power Engineering Society General Meeting, vol. 4, Jul. 13-17 2003.
[6] F. de León and B. T. Ooi, “Damping Power System Oscillations by Unidirectional Control of Alternative Power Generation Plants,” 2001 IEEE Power Engineering Society Winter Meeting, vol. 2, pp. 747-752, Jan. 28-Feb.1 2001.
[7] I. S. Bae and J. O. Kim, “Reliability evaluation of distributed generation based on operation mode,” IEEE Trans. Power Syst., vol. 22, pp. 785-790, May 2007.
[8] H. M. Ayres, W. Freitas, M. C. De Almeida, and L. C. P. Da Silva, "Method for determining the maximum allowable penetration level of distributed generation without steady-state voltage violations," IET Generation, Transmission & Distribution, vol. 4, no. 4, pp. 495-508, Apr. 2010.
[9] R. C. Dugan, T. E. McDermott, and G. J. Ball, "Planning for distributed generation," IEEE Ind. Appl. Mag., vol. 7, no. 2, pp. 80-88, Mar.-Apr. 2001.
[10] C. L. T. Borges and D. M. Falcao, "Impact of distributed generation allocation and sizing on reliability, losses and voltage profile," in Proc. 2003 IEEE Bologna Power Tech Conf., vol. 2, pp. 5, Jun. 23-26 2003.
[11] L. F. Ochoa, A. Padilha-Feltrin, and G.P. Harrison, "Evaluating distributed generation impacts with a multiobjective index,” IEEE Trans. Power Del., vol. 21, no. 3, pp. 1452-1458, Jul. 2006.
[12] N. Jenkins, R. Allan, P. Crossley, D. Kirschen, and G. Strbac, “Embedded generation,” 1st ed., Institute of Electrical Engineering, London, UK, 2000.
[13] V. H. M. Quezada, J. R. Abbad, and T. G. S. Roman, "Assessment of energy distribution losses for increasing penetration of distributed generation," IEEE Trans. Power Syst., vol. 21, no. 2, pp. 533-540, May 2006.
[14] R. C. Dugan and T. E. McDermott, "Distributed generation," IEEE Ind. Appl. Mag., vol. 8, no. 2, pp. 19-25, Mar.-Apr. 2002.
[15] S. Conti, S. Raiti, and G. Tina, "Small-scale embedded generation effect on voltage profile: an analytical method," in Proc. IEE Generation, Transmission and Distribution, vol. 150, no. 1, pp. 78- 86, Jan. 2003.
[16] D. Y. Wang, M. Jolly, and W. J. Lee, "Policy and practice of distributed generation interconnection in the Con Edison distribution system," 2009. APSCOM 8th International Conf. Advances in Power System Control, Operation and Management, pp.1-6, Nov. 8-11 2009.
[17] P. P. Barker and R. W. De Mello, "Determining the impact of distributed generation on power systems. I. Radial distribution systems," 2000 IEEE Power Engineering Society Summer Meeting, vol. 3, pp. 1645-1656, Jul. 16-20 2000.
[18] H. Falaghi and M. R. Haghifam, "Distributed Generation Impacts on Electric Distribution Systems Reliability: Sensitivity Analysis," 2005. EUROCON The International Conf. Computer as a Tool, vol. 2, pp. 1465-1468, Nov. 21-24 2005.
[19] P. Fuangfoo, W. J. Lee, and M. T. Kuo, "Impact Study on Intentional Islanding of Distributed Generation Connected to a Radial Subtransmission System in Thailand's Electric Power System," IEEE Trans. Ind. Appl., vol. 43, no. 6, pp. 1491-1498, Nov.-Dec. 2007.
[20] P. Chiradeja and R. Ramakumar, "An approach to quantify the technical benefits of distributed generation," IEEE Trans. Energy Convers., vol. 19, no. 4, pp. 764- 773, Dec. 2004.
[21] R. A. Shayani and M. A. G. de Oliveira, "Photovoltaic Generation Penetration Limits in Radial Distribution Systems," IEEE Trans. Power Syst., vol. 26, no. 3, pp. 1625-1631, Aug. 2011.
[22] Electrical Transmission and Distribution Reference Book, Electric Systems Technology Institute, ABB Power T&D Company Inc., 1997.
[23] M. Begovic, A. Pregelj, A. Rohatgi, and D. Novosel, "Impact of renewable distributed generation on power systems,” Proceedings of the 34th Hawaii International Conference on System Sciences, pp. 654-663, 3-6 Jan. 2001.
[24] A. Keane, L. F. Ochoa, E. Vittal, C. J. Dent, and G. P. Harrison, ”Enhanced Utilization of Voltage Control Resources With Distributed Generation,” IEEE Trans. Power Syst., vol. 26, no. 1, pp. 252-260, Feb. 2011.
[25] A. Keane, and M. O’Malley, “Optimal Utilization of Distribution Networks for Energy Harvesting,” IEEE Trans. Power Syst., vol. 22, no. 1, pp. 467-475, Feb. 2007.
[26] Y. She, X. She, and M. E. Baran, “Universal Tracking Control of Wind Conversion System for Purpose of Maximum Power Acquisition Under Hierarchical Control Structure,” IEEE Trans. Energy Convers., vol. 26, no. 3, pp. 766-775, Sep. 2011.
[27] W. J. Lee, J. Cultrera, and T. Maffetone, “Application and testing of a microcomputer-based network protector,” IEEE Trans. Ind. Appl., vol. 36, no. 2, pp. 691-696, Mar.-Apr. 2000.
[28] IEEE Standard Requirements for Secondary Network Protectors, IEEE Standard C57.12.44, 2005.
[29] V. Spitsa, R. Salcedo, X. Ran, J. Martinez, R. E. Uosef, F. de León, D. Czarkowski, and Z. Zabar, “Three-phase time-domain simulation of very large distribution network,” IEEE Transactions on Power Del., vol. 27, no. 2, pp. 677-687, April 2012.
[30] D. P. M. Scollnik, “An introduction to Markov Chain Monte Carlo methods and their actuarial applications,” Proceedings of the Casualty Actuarial Society, vol. 83, pp. 114-165, 1996.
[31] G. Casella and E. I. George, “Explaining the Gibbs sampler,” American Statistician, pp. 167-174, 1992.
[32] IEEE Standard for Interconnecting Distributed Resources with Electric Power Systems, IEEE Standard 1547, 2003.
[33] Handbook of General Requirements for Electrical Service to Dispersed Generation Customers Consolidated Edison Company of New York, Inc., New York, NY, 2006.
[34] New York State Standardized Interconnection Requirements and Application Process for New Distributed Generators 2 MW or Less Connected in Parallel with Utility Distribution Systems, New York State Public Service Commission, Dec. 2010.
[35] L. Yu, D. Czarkowski, and F. de León, "Optimal Distributed Voltage Regulation for Secondary Networks with DGs," IEEE Trans. Smart Grid, accepted for publication, 2012.
[36] Voltage Ratings for Electric Power Systems and Equipment, National Electrical Manufacturers Association (NEMA), American National Standards Institute (ANSI) C84.1-2006, Rosslyn, VA, 2006.
[37] A. Papoulis and S. U. Pillai, Probability, Random Variables, and Stochastic Processes, vol.196, New York: McGraw-hill, 1965.
1
Po-Chen Chen received his B. Sc. and M. Sc. degree in electrical engineering
from Polytechnic Institute of New York University, Brooklyn, NY, in 2010
and 2012, respectively.
He is currently pursuing his Ph.D. degree in electrical engineering at Texas
A&M University. His areas of interest include distributed generation, power
system analysis, system control, and optimization methods.
Reynaldo Salcedo (S’09) received his B. Sc. and M. Sc. degree in electrical
engineering from Polytechnic Institute of NYU, Brooklyn, NY in 2010 and
2012, respectively..
Currently, he is pursuing his Ph.D. degree in electrical engineering at the
same institution. His current research area is power system modeling and
analysis.
Qingcheng Zhu received his B. Sc. and M. Sc. degree in electrical
engineering from Polytechnic Institute of New York University.
His research interests include distributed generation, optimization methods,
planning, and power economics.
Francisco de León (S’86–M’92–SM’02) received the B.Sc. and the M.Sc.
(Hons.) degrees in electrical engineering from the National Polytechnic
Institute, Mexico City, Mexico, in 1983 and 1986, respectively, and the Ph.D.
degree from the University of Toronto, Toronto, ON, Canada, in 1992.
He has held several academic positions in Mexico and has worked for the
Canadian electric industry. Currently, he is an Associate Professor at the
Polytechnic Institute of NYU, Brooklyn, NY. His research interests include
the analysis of power definitions under nonsinusoidal conditions, the transient
and steady-state analyses of power systems, the thermal rating of cables and
transformers, and the calculation of electromagnetic fields applied to machine
design and modeling.
Dariusz Czarkowski (M’97) received the M.Sc. degree in electronics from
the University of mining and Metallurgy, Krakow, Poland, in 1989, the M. Sc.
degree in electrical engineering from Wright State university, Dayton, OH, in
1993, and the Ph. D. degree in electrical engineering from the University of
Florida, Gainesville, in 1996.
In 1996, he joined the Polytechnic Institute of New York University,
Brooklyn, NY, where he is currently an Associate professor of electrical and
computer engineering. He is a coauthor of Resonant Power Converters, 2nd
ed., Wiley Interscience, 2011. His research interests are in the areas of power
electronics, electric drives, and power quality.
Dr. Czarkowski has served as an Associate Editor for the IEEE
Transactions on Circuit and Systems.
Zhong-Ping Jiang (M’94–SM’02–F’08) received the B.Sc. degree in
mathematics from the University of Wuhan, Wuhan, China, in 1988, the
M.Sc. degree in statistics from the University of Paris XI, France, in 1989, and
the Ph.D. degree in automatic control and mathematics from the Ecole des
Mines de Paris, France, in 1993.
Currently, he is a Professor at the Polytechnic Institute of NYU, and an
affiliated Changjiang Chair Professor at Beijing University. His research
interests include stability theory, nonlinear control theory and their
applications to smart grids, biological and mechanical systems.
Vitaly Spitsa (M’10) received the M. Sc. and Ph. D. degrees in electrical
engineering from Technion – Israel Institute of Technology, Haifa, Israel, in
2002 and 2009, respectively.
He has been a Control and Algorithm Engineer with a motion control
company in Israel. Currently, he is a Research Assistant Professor at
Polytechnic Institute of New York University, Brooklyn, NY. His research
interests are in the areas of power system analysis, electrical machines, drives
and robust control.
Zivan Zabar (S’76–M’81–SM’81) was born in Hadera, Israel, in 1939. He
received the B.Sc., M.Sc., and D.Sc. degrees from Technion—Israel Institute
of Technology, Haifa, in 1965, 1968, and 1972, respectively.
He is Professor of electrical engineering at the Polytechnic Institute of New
York University, Brooklyn. He served as the Head of ECE Department at Poly
for three years (from 1995 to 1998). He has six patents and more than 50
papers published in technical journals. His areas of interest are electric power
systems, electric drives, and power electronics.
Dr. Zabar is a Member of Sigma Xi.
Resk E. Uosef (M’01) received his B.Sc. and M. Sc. degrees in electrical
engineering from Alexandria University Faculty of Engineering, Alexandria,
Egypt, in 1979 and 1981, respectively. He received a second M.Sc. degree in
electrical engineering from Polytechnic University, Brooklyn, NY, in 2007,
along with the Ph.D. degree in 2011.
He was an Engineer in a hydropower generating station in Egypt, and then
he was the Owner of a consulting firm for an electric construction company in
Egypt. He joined Con Edison’s Distribution Engineering Department in 2003
and is currently responsible for Con Edison’s distribution system design and
analysis.
Dr. Uosef is a registered professional engineer in the state of New York.