Analysis of Traffic Characteristics in Sylhet City and ...
14
Modern Applied Science; Vol. 10, No. 8; 2016 ISSN 1913-1844 E-ISSN 1913-1852 Published by Canadian Center of Science and Education 173 Analysis of Traffic Characteristics in Sylhet City and Development of Utility Function Amit Yadav 1 , Mohsin Ali 1,2 , Dipak Kumar Das 3 & Maira Anis 1 1 School of Management & Economics, University of Electronic Science & Technology of China, Chengdu, China 2 Department of Environmental Science, FBAS, International Islamic University Islamabad, Pakistan 3 Department of Civil and Environmental Engineering, Shahjalal University of Science and Technology, Bangladesh Correspondence: Amit Yadav, School of Management & Economics, University of Electronic Science & Technology of China, Chengdu, China. Tel: 861-878-224-0306. E-mail: [email protected]/ [email protected] Received: April 2, 2016 Accepted: May 6, 2016 Online Published: June 18, 2016 doi:10.5539/mas.v10n8p173 URL: http://dx.doi.org/10.5539/mas.v10n8p173 Abstract Sylhet is a Metropolitan city of north east part of Bangladesh, aspect severe traffic problem due to speedy and unrestrained development. This happens due to intolerable level of inequity in transportation demand and supply scenario. To assess the asperity of the existing traffic system engrossed by enormous traffic problem in Sylhet city a study was steered by Civil and Environmental Engineering department. Purpose of this study to show the traffic characteristic in Sylhet City and developed utility function of numerous modes of vehicles. Floating car or Moving observer method were used to determine the traffic characteristics and multiple regression is used to develop utility function. Results shows that center of city (Bondor to Amborkhana) have highest traffic flow and overcrowding. It is conceived that this outcome will assist in the development of future traffic model and prevent from traffic congestion of Sylhet City. Keywords: congestion, floating car method, utility function, traffic flow 1. Introduction Cities are the power houses of economic growth for any country and transportation system provides the convenient way for movements as well as medium to reach destination. Inappropriate transportation system effects on economic activities and creates hindrances for development. The volume of traffic in past several years has rapidly increased and has become increasingly necessary to understand the dynamics of traffic flow as well as to obtain mathematical description of the process. Lack of management in developing country like Bangladesh often fails to cope with the pressure of increasing growth of population and economic activities in the cities causing uncontrolled expansion of urban areas. Sylhet city is located at the Northeast hilly region of Bangladesh and from time of establishment the city is growing. High migration rate of Sylhet city especially population growth rate of 4%/annum is observed in comparison to the population growth rate of 2.01%/annum in Bangladesh (Rahman, 2000; Ahmed, 1994). The population of Sylhet city was about 0.2 million in 1991 but at 2005 the population was about 0.7 million and also known as 4 th populous city in Bangladesh (BBS, 1991; SCC, 2005). Banik (2009) had stated in paper that traffic congestion is terrible in Sylhet city and also further suggested that future studies with better results can bring better solutions. The floating car method also known as moving observer method, can be applied to investigate it for the better results (Arai & Sentinuwo, 2013; Banik, 2009). This paper attempts to enrich the moving observer method (floating car method) in order to analyze present traffic characteristic as well as to know future condition from result, evaluate selective alternative strategies for traffic flow problems in the Sylhet city and using multiple regression analysis findings of utility function for rickshaw, auto rickshaw, and city bus were done. Research paper is divided into six section, 1 st is introduction where general study and its motivation is mentioned, 2 nd is literature which covers the previous studies, 3 rd is methodology explains the method followed for analysis, 4 th data analysis represents the detail of results from our
-
Upload
khangminh22 -
Category
Documents
-
view
2 -
download
0
Transcript of Analysis of Traffic Characteristics in Sylhet City and ...

Modern Applied Science; Vol. 10, No. 8; 2016 ISSN 1913-1844 E-ISSN 1913-1852
Published by Canadian Center of Science and Education
173
Analysis of Traffic Characteristics in Sylhet City and Development of Utility Function
Amit Yadav1, Mohsin Ali1,2, Dipak Kumar Das3 & Maira Anis1 1 School of Management & Economics, University of Electronic Science & Technology of China, Chengdu, China 2 Department of Environmental Science, FBAS, International Islamic University Islamabad, Pakistan 3 Department of Civil and Environmental Engineering, Shahjalal University of Science and Technology, Bangladesh Correspondence: Amit Yadav, School of Management & Economics, University of Electronic Science & Technology of China, Chengdu, China. Tel: 861-878-224-0306. E-mail: [email protected]/ [email protected] Received: April 2, 2016 Accepted: May 6, 2016 Online Published: June 18, 2016 doi:10.5539/mas.v10n8p173 URL: http://dx.doi.org/10.5539/mas.v10n8p173 Abstract Sylhet is a Metropolitan city of north east part of Bangladesh, aspect severe traffic problem due to speedy and unrestrained development. This happens due to intolerable level of inequity in transportation demand and supply scenario. To assess the asperity of the existing traffic system engrossed by enormous traffic problem in Sylhet city a study was steered by Civil and Environmental Engineering department. Purpose of this study to show the traffic characteristic in Sylhet City and developed utility function of numerous modes of vehicles. Floating car or Moving observer method were used to determine the traffic characteristics and multiple regression is used to develop utility function. Results shows that center of city (Bondor to Amborkhana) have highest traffic flow and overcrowding. It is conceived that this outcome will assist in the development of future traffic model and prevent from traffic congestion of Sylhet City. Keywords: congestion, floating car method, utility function, traffic flow 1. Introduction Cities are the power houses of economic growth for any country and transportation system provides the convenient way for movements as well as medium to reach destination. Inappropriate transportation system effects on economic activities and creates hindrances for development. The volume of traffic in past several years has rapidly increased and has become increasingly necessary to understand the dynamics of traffic flow as well as to obtain mathematical description of the process. Lack of management in developing country like Bangladesh often fails to cope with the pressure of increasing growth of population and economic activities in the cities causing uncontrolled expansion of urban areas. Sylhet city is located at the Northeast hilly region of Bangladesh and from time of establishment the city is growing. High migration rate of Sylhet city especially population growth rate of 4%/annum is observed in comparison to the population growth rate of 2.01%/annum in Bangladesh (Rahman, 2000; Ahmed, 1994). The population of Sylhet city was about 0.2 million in 1991 but at 2005 the population was about 0.7 million and also known as 4th populous city in Bangladesh (BBS, 1991; SCC, 2005). Banik (2009) had stated in paper that traffic congestion is terrible in Sylhet city and also further suggested that future studies with better results can bring better solutions. The floating car method also known as moving observer method, can be applied to investigate it for the better results (Arai & Sentinuwo, 2013; Banik, 2009). This paper attempts to enrich the moving observer method (floating car method) in order to analyze present traffic characteristic as well as to know future condition from result, evaluate selective alternative strategies for traffic flow problems in the Sylhet city and using multiple regression analysis findings of utility function for rickshaw, auto rickshaw, and city bus were done. Research paper is divided into six section, 1st is introduction where general study and its motivation is mentioned, 2nd is literature which covers the previous studies, 3rd is methodology explains the method followed for analysis, 4th data analysis represents the detail of results from our
www.ccsenet.org/mas Modern Applied Science Vol. 10, No. 8; 2016
174
data, 5th is result and discussion and at last is conclusion & recommendation. 2. Literature Review In transportation engineering and planning, transportation demand analysis plays several important roles. This helps to understand the long range social and environmental implementations of decisions about the transportation systems very clearly. For short range predictions of passenger or vehicular flows that are used by designers to develop operation, size facilities, control strategies, assess the impact of land development and transportation project. The main goals of transportation demand analysis is to explain about the travel condition in meaningful term, explain travel behavior and to predict demand for various types of transportation services. The transportation system in Sylhet city is predominantly read based. Sylhet city had several types of vehicles and different transports are used as income wise such as higher income group (car, taxi service, micro bus and other private vehicles), middle income group (rickshaw, bicycle, motor cycle, carriage, car, bus and minibus), lower income group (tempo, bus) and good delivery (truck, pick up, van, human driven van). Increasing population make rise in vehicle flow and which cause congestion in traffic flow. The theoretical aspect that involves driver demeanor into the transportation model, which some researchers focus on (Arai & Sentinuwo, 2013). Study was conducted in India to inquire the effect of variation of traffic composition, magnitude of upgrade, road width and its length on highway capacity (Arasan & Arkatkar, 2011). There are two approaches for the moving observer method which are floating car procedure and other is for urban traffic measurements developed by Wardrop and Charlesworth (1954). The “moving observer method” is the way of estimating the average flow and travel time of traffic travelling in either direction over a road link entirely from measurements made from a moving vehicle with and against the stream for non-congestion conditions. Methods based on the vehicle location (Floating Car Data) which are assuring cost-effective solution to cope with some limitations from fixed detectors. The method appears to be its capability to estimate average traffic parameters on the highway and for long time periods of measurements rather than obtaining measurements at a point. Many researcher conducted study on traffic flow to solves various problems such as the cost of the infrastructure is high for installing detectors for cutting down the cost, single presence of detectors, accuracy and determining the speeds is not very high. The harmonic mean speed calculated may considerably diverge from the mean space speed because it is unknown how many vehicles don’t cross the entire section (Gartner, 1997). Most traffic design manuals accept that average capacity of each highway is equal but through empirical research showed that average capacity per lane decreases with increase in number lf lanes (Yang & Zhang, 2005). The study on relationship between free-flow speed, posted speed limit and the geometric design variables on 35 four-lane urban streets in Virginia had been conducted (Ali et al., 2007). Kerner et al. (2006) explained that qualitative study of data from a series of point detectors could reveal the dominating traffic characteristics of long highway sections. 3. Methodology Transportation demand analysis plays various important roles in transportation engineering and transportation planning. Short range predictions of passenger or vehicular flow that are used by transportation designer to facility size, control strategies and develop operating, assess the impact of land development and transportation project. The goal of transportation demand analysis is to account travel in meaningful term, explain travel behavior, and on the basis of an understanding of travel behavior to predict demand for various types of transportation. Traffic engineer main target is to analysis the behavior of traffic and to design the smooth, safe and economical operation of traffic. To know the traffic behaviors, it needs exhaustive knowledge of traffic stream parameters and their mutual relationships which had been detailed explained by Tom (2006). Speed is one of the basic parameters of traffic flow and there are two representations of speed (time mean speed & space mean speed). To detect opposing vehicles on a two way road by using a travelling public transport vehicle, the floating car observer is proposed (Hoyer et al., 2006). This similar steps is followed for data collection for this paper. Representation of speed and relationship between them, relationship between the fundamental parameters of traffic flow and relationship graphical form resulting in the fundamental diagrams of traffic flow have been detailed by Tom (2006). One of the new traffic approach called DYNAMIC, which was developed by DLR to combine the advantages of Floating Car Observer with wireless radio based technologies (Ruppe et al., 2012; Gurczik et al., 2012). Bluetooth based Floating Cr Observers used for traffic monitoring, which is also known as detector. Later, Interlaced Scan Mode was implemented a new modelling, which is modified version of the detecting probability distribution function (Gurczik & Behrisch, 2015).
www.ccsenet.org/mas Modern Applied Science Vol. 10, No. 8; 2016
175
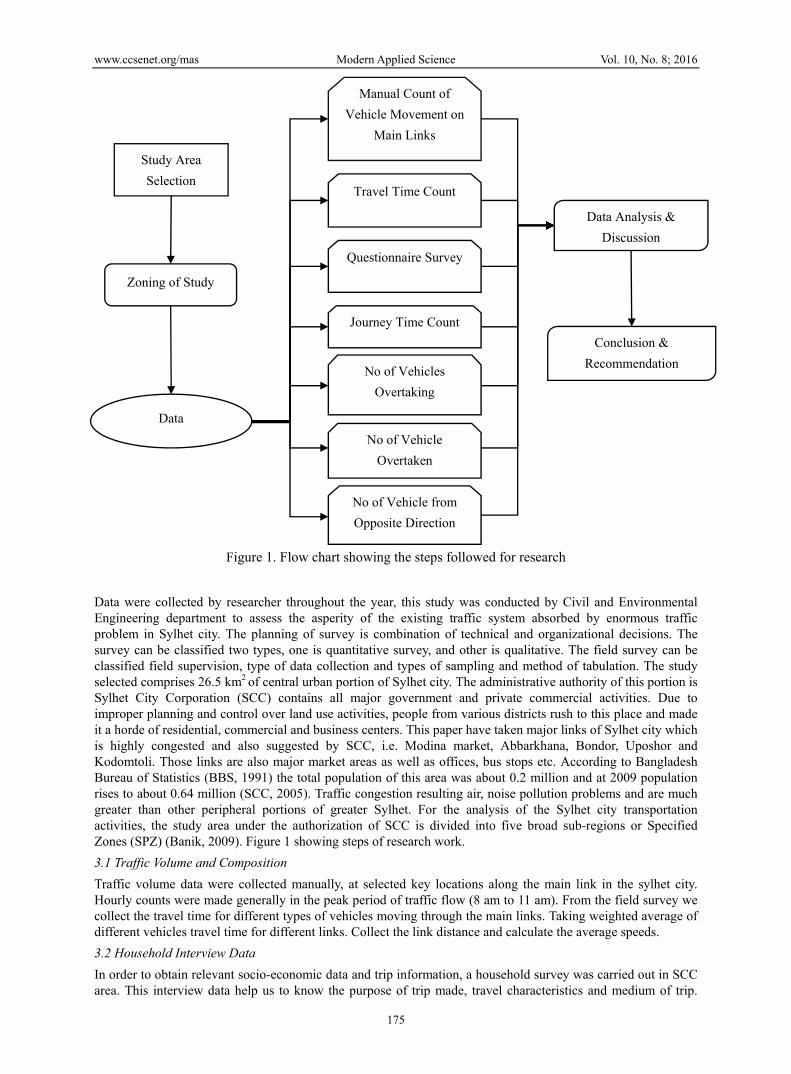
Figure 1. Flow chart showing the steps followed for research Data were collected by researcher throughout the year, this study was conducted by Civil and Environmental Engineering department to assess the asperity of the existing traffic system absorbed by enormous traffic problem in Sylhet city. The planning of survey is combination of technical and organizational decisions. The survey can be classified two types, one is quantitative survey, and other is qualitative. The field survey can be classified field supervision, type of data collection and types of sampling and method of tabulation. The study selected comprises 26.5 km2 of central urban portion of Sylhet city. The administrative authority of this portion is Sylhet City Corporation (SCC) contains all major government and private commercial activities. Due to improper planning and control over land use activities, people from various districts rush to this place and made it a horde of residential, commercial and business centers. This paper have taken major links of Sylhet city which is highly congested and also suggested by SCC, i.e. Modina market, Abbarkhana, Bondor, Uposhor and Kodomtoli. Those links are also major market areas as well as offices, bus stops etc. According to Bangladesh Bureau of Statistics (BBS, 1991) the total population of this area was about 0.2 million and at 2009 population rises to about 0.64 million (SCC, 2005). Traffic congestion resulting air, noise pollution problems and are much greater than other peripheral portions of greater Sylhet. For the analysis of the Sylhet city transportation activities, the study area under the authorization of SCC is divided into five broad sub-regions or Specified Zones (SPZ) (Banik, 2009). Figure 1 showing steps of research work. 3.1 Traffic Volume and Composition Traffic volume data were collected manually, at selected key locations along the main link in the sylhet city. Hourly counts were made generally in the peak period of traffic flow (8 am to 11 am). From the field survey we collect the travel time for different types of vehicles moving through the main links. Taking weighted average of different vehicles travel time for different links. Collect the link distance and calculate the average speeds. 3.2 Household Interview Data In order to obtain relevant socio-economic data and trip information, a household survey was carried out in SCC area. This interview data help us to know the purpose of trip made, travel characteristics and medium of trip.
Study Area Selection
Zoning of Study A
Data C ll i
Manual Count of Vehicle Movement on
Main Links
Travel Time Count
Questionnaire Survey
Journey Time Count
No of Vehicles Overtaking
No of Vehicle Overtaken
No of Vehicle from Opposite Direction
Data Analysis & Discussion
Conclusion & Recommendation
www.ccsenet.org/mas Modern Applied Science Vol. 10, No. 8; 2016
176
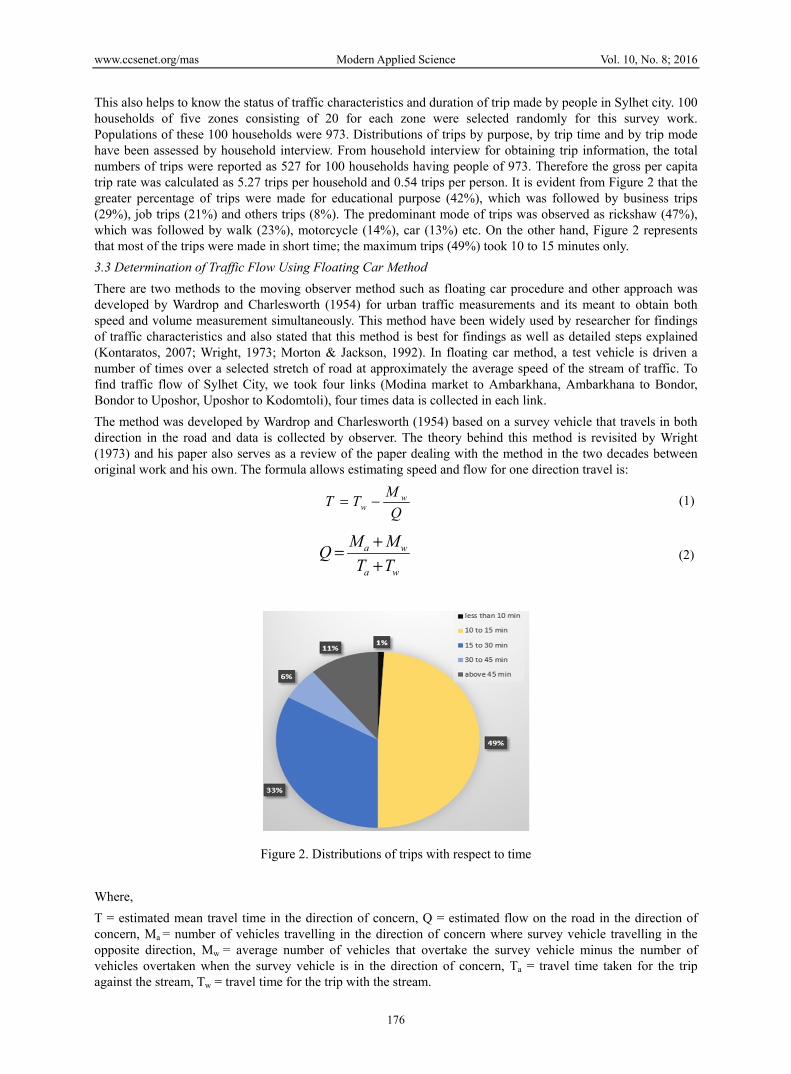
This also helps to know the status of traffic characteristics and duration of trip made by people in Sylhet city. 100 households of five zones consisting of 20 for each zone were selected randomly for this survey work. Populations of these 100 households were 973. Distributions of trips by purpose, by trip time and by trip mode have been assessed by household interview. From household interview for obtaining trip information, the total numbers of trips were reported as 527 for 100 households having people of 973. Therefore the gross per capita trip rate was calculated as 5.27 trips per household and 0.54 trips per person. It is evident from Figure 2 that the greater percentage of trips were made for educational purpose (42%), which was followed by business trips (29%), job trips (21%) and others trips (8%). The predominant mode of trips was observed as rickshaw (47%), which was followed by walk (23%), motorcycle (14%), car (13%) etc. On the other hand, Figure 2 represents that most of the trips were made in short time; the maximum trips (49%) took 10 to 15 minutes only. 3.3 Determination of Traffic Flow Using Floating Car Method There are two methods to the moving observer method such as floating car procedure and other approach was developed by Wardrop and Charlesworth (1954) for urban traffic measurements and its meant to obtain both speed and volume measurement simultaneously. This method have been widely used by researcher for findings of traffic characteristics and also stated that this method is best for findings as well as detailed steps explained (Kontaratos, 2007; Wright, 1973; Morton & Jackson, 1992). In floating car method, a test vehicle is driven a number of times over a selected stretch of road at approximately the average speed of the stream of traffic. To find traffic flow of Sylhet City, we took four links (Modina market to Ambarkhana, Ambarkhana to Bondor, Bondor to Uposhor, Uposhor to Kodomtoli), four times data is collected in each link. The method was developed by Wardrop and Charlesworth (1954) based on a survey vehicle that travels in both direction in the road and data is collected by observer. The theory behind this method is revisited by Wright (1973) and his paper also serves as a review of the paper dealing with the method in the two decades between original work and his own. The formula allows estimating speed and flow for one direction travel is:
ww
MT TQ
= − (1)
a w
a w
M MQT T
+=+
(2)
Figure 2. Distributions of trips with respect to time Where, T = estimated mean travel time in the direction of concern, Q = estimated flow on the road in the direction of concern, Ma = number of vehicles travelling in the direction of concern where survey vehicle travelling in the opposite direction, Mw = average number of vehicles that overtake the survey vehicle minus the number of vehicles overtaken when the survey vehicle is in the direction of concern, Ta = travel time taken for the trip against the stream, Tw = travel time for the trip with the stream.
www.ccsenet.org/mas Modern Applied Science Vol. 10, No. 8; 2016
177
3.4 Development of an Utility Model Utility function expresses the transportation’s indifference between various alternative choices or attributes of these choices (Sathish, 2013) and the generalized Utility equation is shown in eq. 1. The overall structure of the utility function (UF) is traditional in terms of the sequences of the structural form i.e. trip distribution, trip generation & attraction, utility model and trip assignment stages (Chiu, 2007). We have followed Multiple Regression Analysis to find out the utility model and for this we have divided Sylhet City into five zones (i.e. Modina market, Ambarkhana, Bondor, Kadamtoli, Uposhar). Generally we used Rickshaw, Auto-rickshaw and City-bus is taken for our findings because these are most used vehicles in this city. For those vehicles, we have taken three independent variable i.e. speed, travel cost and comfort and for speed, travel cost taken five data in each link, for comfort taken from household interview. With the help of stop watch we found time taken by vehicle in each link and length is measured manually, speed from formula (speed=distance/time). This step is followed for five times then from this we did average to find out actual average speed, for each vehicle cost is also taken five times and converted into per kilometer.
U= β – α1A – α2B – α3C (3)
Where, β = calibrated mode specific constant, α1, α2 and α3 = constants for cost, speed and comfort respectively, A= Travel cost (tk/km), B= Speed (m/s), C= Comfort. 3.5 Multiple Regressions It is a statistical technique that admits us to predict someone’s score on one variable on the basis of their scores on several other variables. If we collected data on all of these variables by surveying one month (few days’ intervals) traffic flow then we could see that how many and which of these variables gave rise to the most accurate prediction of utility function. We can also find that utility function is most accurately predicted by type of speed cost and comfort in full time traffic flow but with other variables not helping us to predict job satisfaction. Using multiple regression in psychology then we use term independent variables to identify those variables that they think will influence some other dependent variable. It is applied to linear prediction of one outcome from several predictors and the general form of linear regression is:
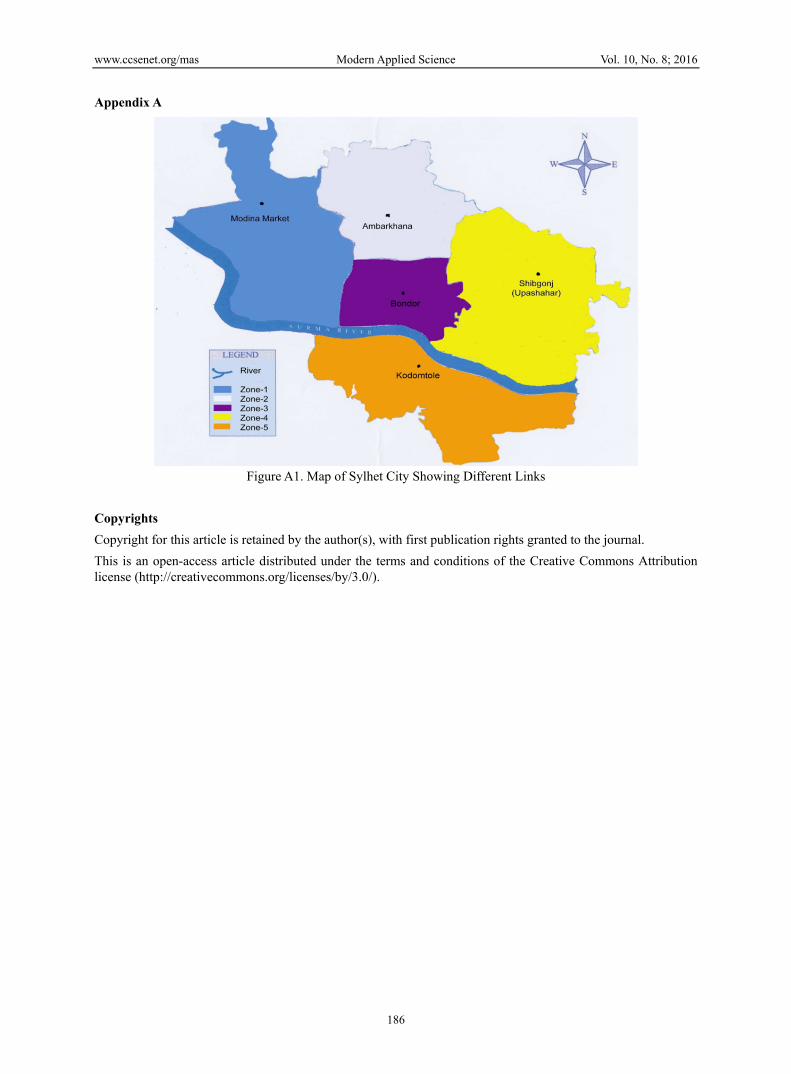
Y' = b0 + b1x1 + b2x2 + ... + bkxk (4) Where, Y' = the predicted outcome value for the linear model with regression coefficients b1 to bk., Y' intercept bo when the values for the predictor variables are x1 to k and the regression coefficient are analogous to the slope of a simple linear regression. 4. Data Analysis Data analysis is done under discussion with SCC and it is believed that this result as well as developed utility models will be helpful for minimizing traffic congestion. Surveys were undertaken for identification of major roads in Sylhet city for traffic flow, manual count of vehicle movement through the main links (hourly for three days), a travel time and cost survey along major link for different vehicle, questionnaire survey of some 100 households within the city area to determine the travel characteristic, calculate the journey time, No of vehicle overtaking ,No of vehicle overtaken ,No of vehicle from opposite direction for determine the traffic flow in Sylhet City. Traffic volume data were collected manually at selected key location along the main link and hourly counts were made generally in the peak period of traffic flow (8 am to 11 am). The travel time for different types vehicles moving through the main links, taking weighted average of different vehicles travel time, measured each link distance and calculated the average speeds. Average running speed is calculated [(number of vehicle * average speed)/total number of vehicle], where during peak period each number of vehicle pass at each link were counted and average speed of each vehicle were calculated to find average running speed. This process is followed for all major links taken for study in this paper (table 2). Traffic flow data are collected at the different links of the Sylhet City. Those main link of Sylhet City are Modinamarket to Amborkhana (M-A), Amborkhana to Modinamarket (A-M), Amborkhana to Bondor (A-B), Bondor to Amborkhana (B-A), Bondor to Upashahar (B-U), Upashahar to Bondor (U-B), Upashahar to Kodomtole (U-K) and Kodomtole to Uposhor (K-U). Map of Sylhet city showing different links had been shown in appendix A. Vehicles taken for data collection are rickshaw, car, auto rickshaw, motor bike, city bus and tampoo (three wheeler vehicle bigger than auto rickshaw). Moving observer method is one in which both speed and traffic flow data are obtained by a single experiment (O’Flaherty & Simons, 1970). We are found the maximum flow, density, average running speed and draw Flow- Density- Speed (Q-K-U) curves. On the other hand we again count the number of vehicle movement along the main links and calculate the average running
www.ccsenet.org/mas Modern Applied Science Vol. 10, No. 8; 2016
178
speed (table 2). Also manually calculated the average running speed of different modes of vehicles as mention above and at last moving observer method result as well as manual calculation is compared. Table 1. Traffic flow at main link of Sylhet City
Fig. #
Traffic flow Link
*AJTDTAS (hr)
Average Journey
Time (Tw, hr)
Average Traffic
Flow (Q, Veh/hr)
Average Running
Speed (U, km/hr)
Maximum Flow (Qmax,
Veh/hr)
Optimum Speed (Uo,
km/hr)
Optimum Density
(Ko , Veh/km)
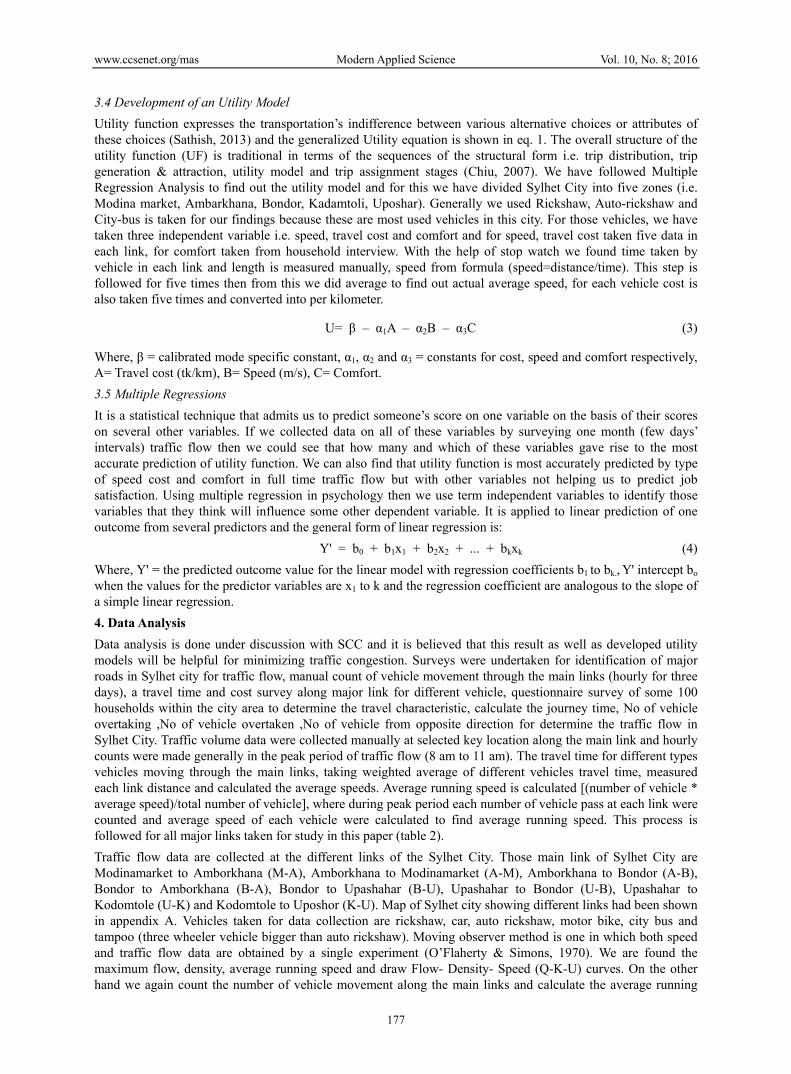
3 M-A 0.1610 0.2747 1201 29.64 1256 26.5 63 4 A-M 0.2747 0.1610 1192.5 20.56 1257 19.5 62.5 5 A-B 0.2540 0.2842 1312 30.24 1353 26 55 6 B-A 0.2842 0.2540 1323.6 14.48 1401 13.8 99.8 7 B-U 0.2380 0.2345 1213 12.07 1226 10.25 99.8 8 U-B 0.2345 0.2380 1234.75 13.6 1322 12.25 109 9 U-K 0.1600 0.2490 1086.15 11.95 43 49 70
10 K-U 0.2490 0.1600 1086.15 10.93 43 49 70 *Average journey time during trip against stream (AJTDTAS) The figure shown below (figure 3-10) represents the fundamental diagram of traffic flow (relationship between speed-flow, speed- density and flow-density), these are the vital tools which enables analysis of fundamental relationships. Flow and density varies with time and location. Similarly, speed-density curves varies as speed will be maximum refer to as the free flow speed and when density is maximum then speed will be zero. In speed flow relationship, when there are no vehicles or there are too many vehicles so that they cannot move means flow is zero.
Figure 3. Flow-Density –speed (Q-K-U) curves for Modinamarket to Amborkhana

www.ccsenet.org/mas Modern Applied Science Vol. 10, No. 8; 2016
179
Figure 4. Flow-Density –speed (Q-K-U) curves for Amborkhana to Modinamarket
Figure 5. Flow-Density –speed (Q-K-U) curves for Amborkhana to Bondor
www.ccsenet.org/mas Modern Applied Science Vol. 10, No. 8; 2016
180
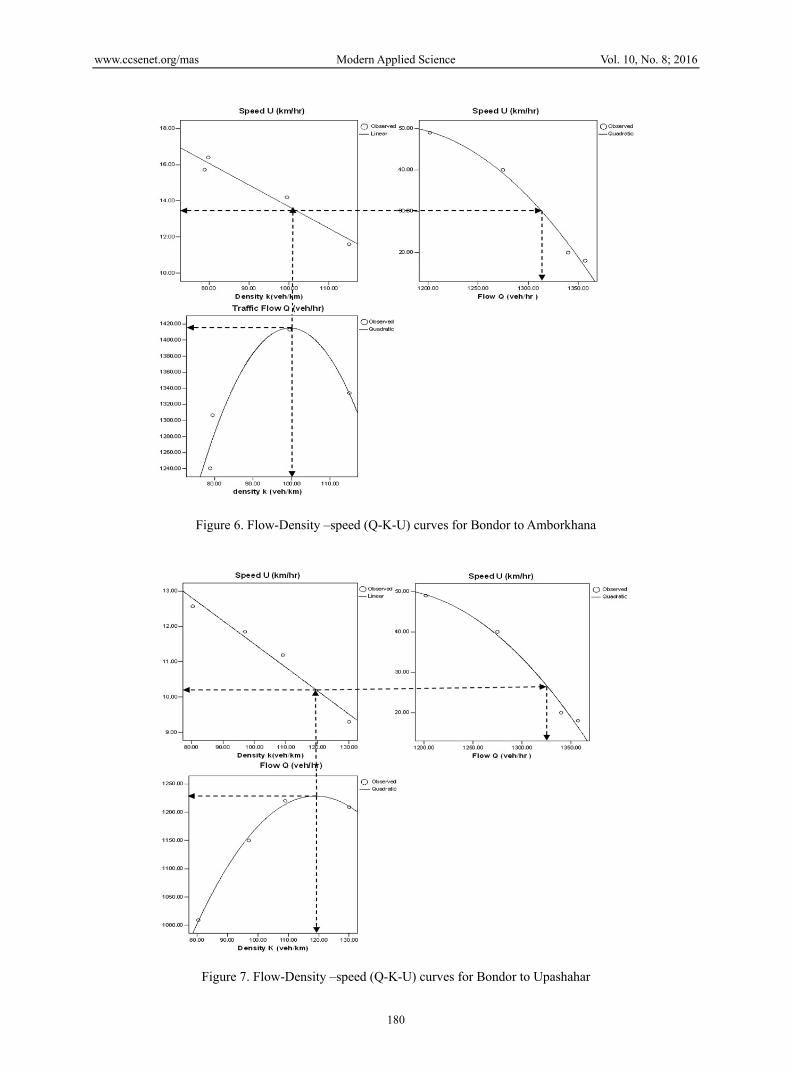
Figure 6. Flow-Density –speed (Q-K-U) curves for Bondor to Amborkhana
Figure 7. Flow-Density –speed (Q-K-U) curves for Bondor to Upashahar
www.ccsenet.org/mas Modern Applied Science Vol. 10, No. 8; 2016
181
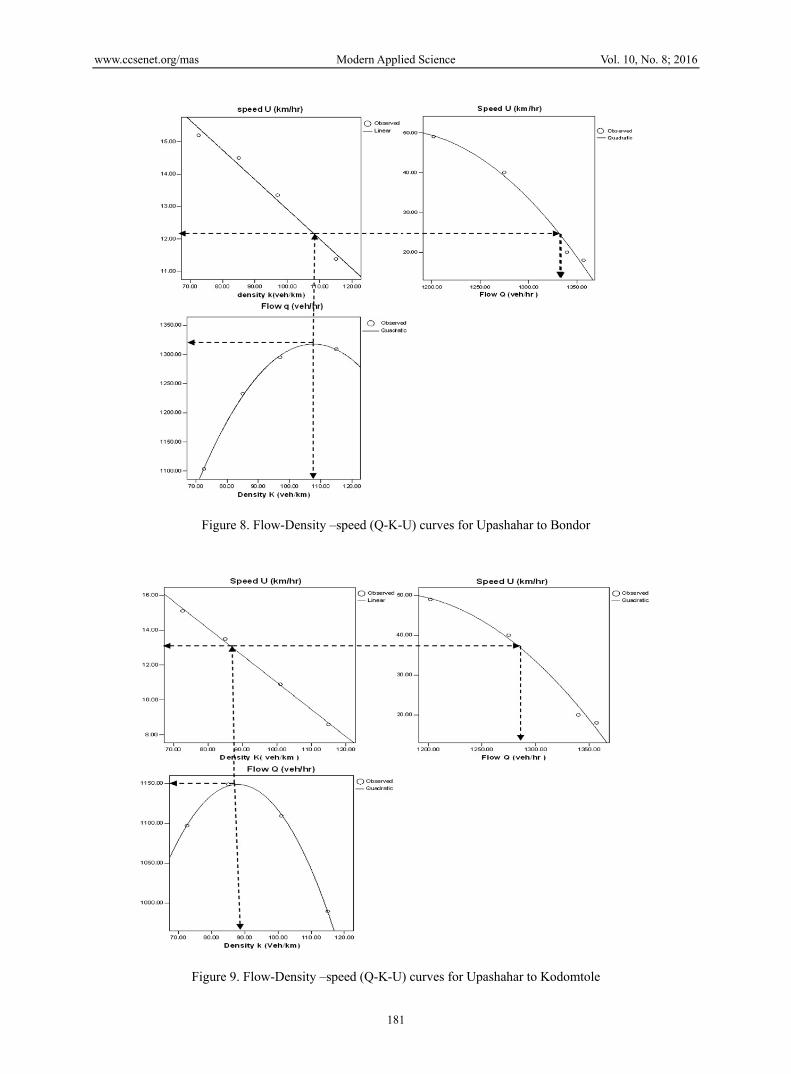
Figure 8. Flow-Density –speed (Q-K-U) curves for Upashahar to Bondor
Figure 9. Flow-Density –speed (Q-K-U) curves for Upashahar to Kodomtole
www.ccsenet.org/mas Modern Applied Science Vol. 10, No. 8; 2016
182
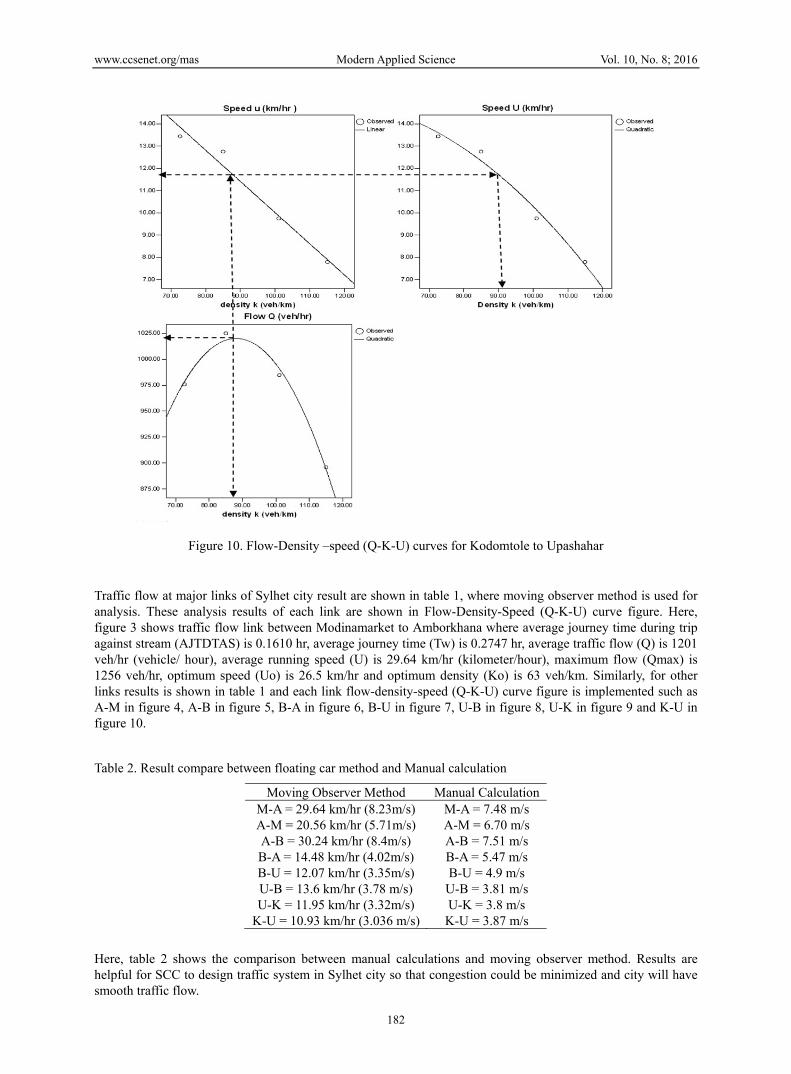
Figure 10. Flow-Density –speed (Q-K-U) curves for Kodomtole to Upashahar
Traffic flow at major links of Sylhet city result are shown in table 1, where moving observer method is used for analysis. These analysis results of each link are shown in Flow-Density-Speed (Q-K-U) curve figure. Here, figure 3 shows traffic flow link between Modinamarket to Amborkhana where average journey time during trip against stream (AJTDTAS) is 0.1610 hr, average journey time (Tw) is 0.2747 hr, average traffic flow (Q) is 1201 veh/hr (vehicle/ hour), average running speed (U) is 29.64 km/hr (kilometer/hour), maximum flow (Qmax) is 1256 veh/hr, optimum speed (Uo) is 26.5 km/hr and optimum density (Ko) is 63 veh/km. Similarly, for other links results is shown in table 1 and each link flow-density-speed (Q-K-U) curve figure is implemented such as A-M in figure 4, A-B in figure 5, B-A in figure 6, B-U in figure 7, U-B in figure 8, U-K in figure 9 and K-U in figure 10.
Table 2. Result compare between floating car method and Manual calculation
Moving Observer Method Manual CalculationM-A = 29.64 km/hr (8.23m/s) M-A = 7.48 m/s A-M = 20.56 km/hr (5.71m/s) A-M = 6.70 m/s A-B = 30.24 km/hr (8.4m/s) A-B = 7.51 m/s B-A = 14.48 km/hr (4.02m/s) B-A = 5.47 m/s B-U = 12.07 km/hr (3.35m/s) B-U = 4.9 m/s U-B = 13.6 km/hr (3.78 m/s) U-B = 3.81 m/s U-K = 11.95 km/hr (3.32m/s) U-K = 3.8 m/s
K-U = 10.93 km/hr (3.036 m/s) K-U = 3.87 m/s Here, table 2 shows the comparison between manual calculations and moving observer method. Results are helpful for SCC to design traffic system in Sylhet city so that congestion could be minimized and city will have smooth traffic flow.

www.ccsenet.org/mas Modern Applied Science Vol. 10, No. 8; 2016
183
4.1 Development of Utility Model Household interview were taken to develop utility function of different modes of vehicles (rickshaw, auto rickshaw and city bus). With the help of SPSS software, we found the regression parameter from data collected. From household interview for obtaining trip information, the total numbers of trips were reported as 527 for 100 households having people of 973. This has been elaborately explained in methodology part of this paper. From origin zone to destination zone six numbers of trips were taken and the average travel time was taken. This procedure was also followed for the every destination zone, for the analysis of regional transportation activities, the study area which is under the authorization of Sylhet City Corporation (SCC), is divided into five broad sub-regions or Specified Zones (SPZ) (Banik, 2009). To estimate the comfort level public interview was taken according to table 3 and most of the people described about their preference. On the basis of their preference comfort level was detected. But different parameter (cost, time, security, road condition) was influential in this aspect. By using SPSS software we find the regression parameter. Table 3. Comfort Level
Range Level100-80%80-70% 70-60% 60-50% <50%
5 4 3 2 1
Table 4. Utility Model
Vehicle Utility Function Rickshaw Ur= 0.491 -0.022A-0.034B +0.081CAuto Rickshaw Ua = 0.704-0.16A-0.052B-0.075C City Bus Uc =0.114+0.016A+0.008B-0.032C
Where, Ur = Utility function for rickshaw, Ua = Utility function for auto rickshaw, Uc = Utility function for city bus, A = Travel cost (taka/Km), B = Speed (m/s) & C = Comfort 5. Result & Discussion Due to lack of capacity of the majority of the intersection is the major feature limiting the capacity of the main road system and creating traffic congestion as well as obstruction in traffic flow. Narrow intersection, encroachment by hawkers, road side parked vehicles and poor management of intersection is the factors contributing to this problem. From our research we also came to know that Ambarkhana intersection is the busiest and most critical intersection of Sylhet with four major junctions, Bondor is same as most congested and also all over the Sylhet city vehicles comes to stop- start from that point. Heavy vehicles (tuck, bus etc.) movement on the pick hour makes more congestion in the city. In the entrance part of Sylhet is almost all roads are occupied by floating shops, mobile hawkers, artisans and temporary traders of different goods, commodities, unauthorized parking which causes major traffic congestion. Most of the divisional head offices, business, shopping complex and industries are at Zindabazar, Bondor and Ambarkhana. These areas are overcrowded but only few links are recently managed by making one-way traffic flow. Even though problem is not solved and this can only be solved by increasing road width and managed traffic condition. Motorized and non-motorized vehicles occupy the same lane at same time; rickshaw pullers as well as pedestrian don’t have knowledge about traffic rules. From our data analysis, we found that maximum average traffic flow is in Bondor-Amborkhana (1323.605veh/hr.) lane where, average running speed (U) is 14.48km.hr, average density (K) is 93.30veh/km, optimum speed (Uo) is 13.8km.hr, optimum density (Ko) is 99.80veh/km. This is because of the improper traffic management, road with is according to desire and improper installation of traffic signals at the intersection which leads to traffic congestion as well as mostly occurs accident at those section. Same as we found that minimum average traffic flow is at Upashahar- Kodomtole (1086.15veh/hr.) lane where average running speed (U) is 10.93km/hr, average density (K) is 93.4veh/km, optimum speed (Uo) is 49km/hr. and optimum density (Ko) is 70veh/km. This is because this section lies outside main city area, market is also not dense, width of road is
www.ccsenet.org/mas Modern Applied Science Vol. 10, No. 8; 2016
184
larger than central city and traffic is well managed. 6. Conclusion & Recommendation The study was motivated for the traffic flow prevailing in Sylhet city and from previous research study, although there is plethora of opinions regarding improvement of the situation. Insufficient scientific and engineering basis most of the measures undertaken in order to improve the situation but failed to produce desire result. The main aim of the study is to know the traffic flow condition of Sylhet city, which gives solution to the SCC on traffic improvement, reducing congestion and future traffic design. Development of utility function for the major vehicles (rickshaw, auto-rickshaw, city bus) which mostly people uses, helps to find the most suitable vehicle to be used inside city. The overall analysis of 5 major links of the Sylhet city, whose total length is 9.4 km was considered for finding of traffic flow. Results shows that most congested link is kodomtole to Upashahar because in this link traffic flow is 3.036 m/s which is lowest than other link. K-U link traffic congestion is high and need to improve traffic flow by expending lane, making one way traffic flow or making some changes in traffic rules etc. Due to time limitation, the developed function is not computer based and it is suggested that if the model would be computer based then the consequences of alternative planning options could be easily evaluated. As for the quick fight against traffic congestion, study suggest to widening of roads that can be possible, SCC can enforce some rules on developing high infrastructure, blockage on roads should be removed, improvement in traffic management, add number of traffic police at the road junction or busy places, lane which can’t be widen should be made one way traffic flow and non-motorized vehicle should have separate lane. This study data were taken throughout the year and now it is believed that the population has increased much more. Using same methodology or more recent technique can be known recent traffic condition of those areas. Due to time limitation it was not possible to count vehicles at intersection points and if those data were taken for analysis then more proper result can be found. In view of constraints such as time, information resource and computational adeptness’s this all study is dedicated to only central urban portion of Sylhet city (area under jurisdiction of SCC) and evaluation of some selected alternative planning options. It is also accredited that changes in transportation system have always long term effects with corresponding land use pattern changes. Such long term effects on land use are not in the scope of this study. It is believe that from this study it is known traffic flow condition in Sylhet city, factors affected to it, precaution need to be taken and better plan for future. Development of Utility model for rickshaw, auto-rickshaw and city bus, it can be compared those vehicles traffic controls based on utility function values and choose best one for transportation. It is believed that from those findings it will help to overcome the traffic flow problem, short and long term solution for efficient traffic management in Sylhet city. References Ahmed, M. F. (1994). Municipal waste management in Bangladesh with emphasis on recycling, Aspect of Solid
waste management Bangladesh context (pp.113-131). In H. Mofizul & Mrs. H. Lechner (Eds.), German Cultural Institute, Dhaka.
Ali, A. T., Flannery, A., & Venigalla, M. M. (2007, 1992). Prediction Models for Free Flow Speed on Urban Streets (pp. 199–207). Transportation Research Record, Transportation Research Board, National Research Council, Washington, D.C.
Arai, K., & Sentinuwo, S. R. (2013). Validity of Spontaneous Braking and Lane Changing with Scope of Awareness by Using Measured Traffic Flow. Int. J. Adv. Res. Artif. Intell, 2(7), 13–17. http://dx.doi.org/10.14569/IJARAI.2013.020703
Arasan, V. T., & Arkatkar, S. S. (2011). Derivation of Capacity Standards for Intercity Roads Carrying Heterogeneous Traffic using Computer Simulation, Procedia 16, 218-229. http://dx.doi.org/10.1016/j.sbspro.2011.04.444
Bangladesh Bureau of Statistics (BBS). (1991). Statistical Year Book of Bangladesh, Dhaka Reproduction Documentation and Publication Wing, BBS.
Banik, B. K. (2005). Evaluation of Traffic Congestion in Sylhet city and a Development of Mathematical Model. B. Sc. Engg. Thesis, Department of Civil and Environmental Engineering, Shah Jalal University of Science and Technology, Sylhet, Bangladesh.
Banik, B., Chowdhury, A. I., & Sarkar, S. K. A. (2009). Study of Traffic Congestion in Sylhet City. Journal of the Indian Roads Congress, 70(1), 75-86.
www.ccsenet.org/mas Modern Applied Science Vol. 10, No. 8; 2016
185
Chiu, D. M. & Tam, A. S. W. (2007). Fairness of traffic controls for inelastic flows in the Internet. Computer Networks, 51(11), 2938-2957. http://dx.doi.org/10.1016/j.comnet.2006.12.006
Gartner, N. H., Messer, C. J., & Rathi, A. K. (Eds.). (1997). Monograph on traffic flow theory. Federal Highway Administration.
Gurczik, G., & Behrisch, M. (2015). Modelling and Simulating Bluetooth-based Moving Observers. 4th International Conference on Models and Technologies for Intelligent Transportation Systems (MT-ITS 2015), Accepted Abstract, Budapest, Hungary. http://dx.doi.org/10.1109/MTITS.2015.7223260
Gurczik, G., Junghans, M., & Ruppe, S. (2012). Conceptual Approach for Determining Penetration Rates for Dynamic Indirect Traffic Detection Based on Bluetooth. In Proceedings of the 19th ITS World Congress, Vienna, Austria.
Hoyer, R., Czogalla O., Naumann S. (2006). Improvement of real time passenger information by floating car observers. In Proceedings of the 13th Its World Congress on Intelligent Transport Systems (ITS2006), London, UK, 8-12 October.
Kerner, B. S., Klenov, S. L., Hiller, A., & Rehborn, H. (2006). Microscopic features of moving traffic jams. Physical Review E, 73(4), 046107. http://dx.doi.org/10.1103/PhysRevE.73.046107
Kontaratos, M. (2007). The moving observer method revisited. Advances in Transportation Studies an international Journal Section A&B 13, pp. 5-26.
Morton, T. W., & Jackson, C. P. (1992). Speed/Flow Geometry Relationships for Rural Dual-Carriageways and Motorways. TRRL Contractor Report, 279. Transport and Road Research Laboratory, Crowthorne, Berkshire, England.
O'flaherty, C. A., & Simons, F. (1970). An evaluation of the moving observer method of measuring traffic speeds and flows. In Australian Road Research Board (ARRB) Conference, 5th, (Vol. 5, No. 3, pp.40-54). Canberra
Rahman, G., & Islam, M. M. (2000). Urban Growth Pattern in Dhaka City and its problem of urban solid waste management. Bangladesh Environment, 436-443.
Ruppe, S., Junghans, M., Haberjahn, M., & Troppenz, C. (2012). Augmenting the floating car data approach by dynamic indirect traffic detection. Procedia-Social and Behavioral Sciences, 48, 1525-1534. http://dx.doi.org/10.1016/j.sbspro.2012.06.1128
Sathish, H. S., Jagadeesh, H. S., & Kumar. S. (2013). Travel Delay and Modal Split Analysis-A Case Study. IOSR Journal of Mechanical and Civil Engineering (IOSR-JMCE). E-ISSN: 2278-1684. Volume 5, Issue 2, pp. 40-45. http://dx.doi.org/10.9790/1684-0524045
SCC. (2005). Sylhet City Corporation, Sylhet, Bangladesh. Tom, V. M., & Krishna, K. V. R. (2006). Introduction to Transportation Engineering (pp. 30.1-30.8 & 31.1-31.8).
Fundamental Relation of traffic flow. Wardrop, J. G., & Charlesworth, G. (1954). A Method of Estimating Speed and Flow of Traffic from a Moving
Vehicle. Proceedings of the Institution of Civil Engineers, Part II, 3, 158-171. http://dx.doi.org/10.1680/ipeds.1954.11628
Wright, C. (1973). A theoretical analysis of the moving observer method. Transport. Res. 7(3), 293-311. http://dx.d oi.org/10.1016/0041-1647(73)90019-1
Yang, X., & Zhang, N. (2005). The marginal decrease of lane capacity with the number of lanes on highway. In Proceedings of the Eastern Asia Society for Transportation Studies (Vol. 5, pp. 739-749).
www.ccsenet.org/mas Modern Applied Science Vol. 10, No. 8; 2016
186
Appendix A
Figure A1. Map of Sylhet City Showing Different Links
Copyrights Copyright for this article is retained by the author(s), with first publication rights granted to the journal. This is an open-access article distributed under the terms and conditions of the Creative Commons Attribution license (http://creativecommons.org/licenses/by/3.0/).