MODIS land cover and LAI Collection 4 product quality across ...
Upload
independentCategory
view
0download
0
2340 IEEE TRANSACTIONS ON GEOSCIENCE AND REMOTE SENSING, VOL. 43, NO. 10, OCTOBER 2005
Analysis of the NPOESS VIIRS Land SurfaceTemperature Algorithm Using MODIS Data
Yunyue Yu, Jeffrey L. Privette, Member, IEEE, and Ana C. Pinheiro
Abstract—The Visible Infrared Imaging Radiometer Suite(VIIRS) will replace the National Oceanic and AtmosphericAdministration’s (NOAA) Advanced Very High Resolution Ra-diometer (AVHRR) and the National Aeronautics and SpaceAdministration’s (NASA) Moderate Resolution Imaging Spec-trometer (MODIS) as the nation’s wide-swath multispectral sensorfollowing the launch of the National Polar Orbiting EnvironmentalSensor Suite (NPOESS) Preparatory Project (NPP) in about 2008.Through the follow-on NPOESS program, VIIRS data will be theprimary source of systematic land remote sensing products untilabout 2022. Together, the AVHRR/MODIS/VIIRS satellite serieswill provide a critical long-term data record for Earth studies.In the NPP/NPOESS program, the product algorithms and pro-duction environments are developed and managed by privateindustry. This is a significant change from the current NOAAand NASA programs, and NPOESS algorithm deviations fromsuccessful heritage approaches (e.g., Earth Observation System)warrant comprehensive independent testing. The current baselineVIIRS land surface temperature (LST) algorithm represents onesuch deviation. In the present study, we evaluated the VIIRS LSTby adapting it for use with 60 scenes of MODIS Level 1b radiancedata. Algorithm coefficients were derived from MODTRAN4radiative transfer model simulations. Using the validated MODISLST (MYD11_L2) product as a reference, we found that precisionerrors in the VIIRS dual split window (DSW) algorithm (thecurrent “main” approach) significantly exceed those of the VIIRSsplit window (SW) algorithm (the current “backup” approach) inboth daytime and nighttime conditions. Performance of both isbetter for nighttime cases than for daytime cases with all surfacetypes. We attribute the larger errors in the DSW approach toits use of short middle infrared wavelengths which, comparedto thermal infrared wavelengths, exhibit greater variability insurface emissivity and susceptibility to solar contamination. Weconclude that a traditional SW algorithm, such as the currentVIIRS backup algorithm, would provide superior performance tothe DSW approach. An SW approach would also provide moreseamless continuity with heritage products. Although this is notan NPOESS requirement, it is a key objective for multimissionclimate data records and Earth system data records.
Index Terms—Land surface temperature (LST), Moderate Res-olution Imaging Spectrometer (MODIS), National Polar OrbitingEnvironmental Sensor Suite (NPOESS), NPOESS PreparatoryProject (NPP), split window (SW), Visible Infrared Imager Ra-diometer Sensor (VIIRS).
Manuscript received November 19, 2004; revised May 13, 2005. This studywas supported through the National Aeronautics and Space Adminsitration’sNASA’s NPOESS Preparatory Project Science Team.
Y. Yu is with the Earth System and Geoinformation Sciences Program,George Mason University, Fairfax, VA 22030 USA and also with theNASA Goddard Space Flight Center, Greenbelt, MD 20771 USA (e-mail:[email protected]).
J. L. Privette and A. C. Pinheiro are with the NASA Goddard SpaceFlight Center, Greenbelt, MD 20771 USA (e-mail: [email protected];[email protected]).
Digital Object Identifier 10.1109/TGRS.2005.856114
I. INTRODUCTION
LAND surface temperature (LST) is a key proxy of Earthsurface energy and is used in a range of hydrological, me-
teorological, and climatological applications (e.g., [1]). The Na-tional Aeronautics and Space Administration’s (NASA) EarthObserving System (EOS) underscored the importance of a long-term global LST record by including this variable in its “24 EOSMeasurements” [2].
The moderate-resolution LST time-series originated, andcontinues to present, with the Advanced Very High ResolutionRadiometer (AVHRR) brightness temperature record from theNational Oceanic and Atmospheric Administration’s (NOAA)polar orbiting satellites (1982 to present; [3], [4]). In2000, NASAinitiated an atmospherically corrected LST record based onModerate Resolution Imaging Spectrometer (MODIS) data [5].Beginning in about 2008, these series will be continued by datafrom the Visible Infrared Imager Radiometer Sensor (VIIRS)sensoronboardtheNationalPolarOrbitingEnvironmentalSensorSuite (NPOESS), and the “bridge” satellite linking the EOS andNPOESS programs: the NPOESS Preparatory Project (NPP) [6].
The NPP/NPOESS program represents a major transition inthe development and production of LST and other geophysicalproductsfromU.S.environmentalsatellites.IntheNPP/NPOESSera, the satellites, algorithms, and production facilities are devel-oped and operated in the commercial sector to meet performancecriteria that were bid to the government in a competitive pro-posal. Additionally, the government has formed algorithm teamscomposed of science community experts to support the programthrough technical interchange. It is within the latter context thatwe evaluate the VIIRS LST algorithms in the present study.
Multiple LST algorithms have been developed and applied tosatellite data. Physics-based approaches include the two-temper-ature method [7], the temperature emissivity separation method[8], [9], and the day/night method [10]. Physics-based algorithmstypically require samples frommiddleand thermal infrared (TIR)spectral bands or multiple orbits. For example, the MODIS LandTeam currently uses the day/night method to produce a Level 3gridded LST product. The day/night algorithm dynamically es-timates both emissivity and LST, since these parameters varydifferently in time and space. However, to execute successfully,the algorithm requires non-cloudy observations in a consecutiveday and night pair. This limits its applicability.
To simplify processing and data needs, most LST algorithmsuse the split window (SW) [3] approach, a technique adaptedfrom sea surface temperature (SST) algorithms. The SWmethod corrects for atmospheric effects in TIR bands by ex-ploiting the differential absorption of atmospheric water vaporbetween adjacent bands [3], [11]–[14]. The basic functionalform of SW methods is a first-order Taylor series expansion
0196-2892/$20.00 © 2005 IEEE
YU et al.: ANALYSIS OF THE NPOESS VIIRS LST ALGORITHM 2341
of Planck’s equation—a method both rapid and robust in op-eration. Most published SW equations, including the MODISLevel 2 swath algorithm [14], also attempt to compensate forsurface emissivity through the use of ancillary information (e.g.,land cover maps). The resulting formulae estimate the surfacekinetic temperature, sometimes called the “skin” temperature.
The current VIIRS LST main algorithm, which is developedand tested by private industry using model data [15], is a majorvariant of traditional SW approaches. Specifically, the algorithmemploys a “dual split window” (DSW) approach that depends ontwo middle infrared and two thermal infrared bands. DifferentDSW algorithmic forms are used for day and night; however,neither has an operational heritage. To our knowledge, this wasthe first application of DSW approach to LST. Further, VIIRScurrently retains a new SW algorithm as a backup algorithm [15].According to the VIIRS system specification [16], these algo-rithmsmustachieveaprecisionerror (standarddeviation)of 0.5K, an accuracy (mean bias) error of 2.4 K, and an uncertainty(root mean square) error of 2.5 K. In this terminology, uncer-tainty is equivalent to the square root of the sum of the squaresof the accuracy and precision values achieved in operation.
The VIIRS LST algorithms have been tested with model data[17]. However, the new LST approaches have not been testedextensively with real satellite data. Real data are critical sincemodels unavoidably have biases, and since the Earth’s complexnatural variability cannot be fully simulated. The MODIS LandDiscipline Team, for instance, found that simulated data hadlimited use in exposing shortcomings in its algorithms (E. Ver-mote, personal communication, 2003).
In the present study, we conducted a prelaunch evaluation ofthe VIIRS LST by adapting its algorithms to work with MODISLevel 1b top-of-atmosphere (TOA) radiance data. We sought todetermine the following:
• characteristics of the VIIRS DSW algorithm, such as itsvulnerability to solar contamination, water vapor, and nat-ural variability in surface emissivity;
• how the current VIIRS LST products compare to the vali-dated MODIS LST products [5] for daytime and nighttimescenes ( km km each) and different surfacetypes;
• if the current VIIRS main and backup algorithms are suf-ficiently consistent that they could be applied seamlesslywithin a scene;
• if the VIIRS LST algorithm is well suited for climatedata records (CDRs) [28] and Earth system data records(ESDRs).
The outline of this paper is as follows. In Section II, we pro-vide details of the VIIRS sensor and LST algorithms. In Sec-tion III, we describe our adaptation of the VIIRS LST algorithmsto work with MODIS data and our approach to evaluating algo-rithm performance. Section IV gives quantitative comparisonsof the VIIRS LST and the operational MODIS LST products.We conclude this paper with a discussion and conclusions inSections V and VI, respectively.
II. VIIRS SENSOR ALGORITHMS
A. Sensor Design
VIIRS has 22 spectral bands, including 16 moderate-resolu-tion (750-m pixels) and five imagery resolution (375-m pixels)
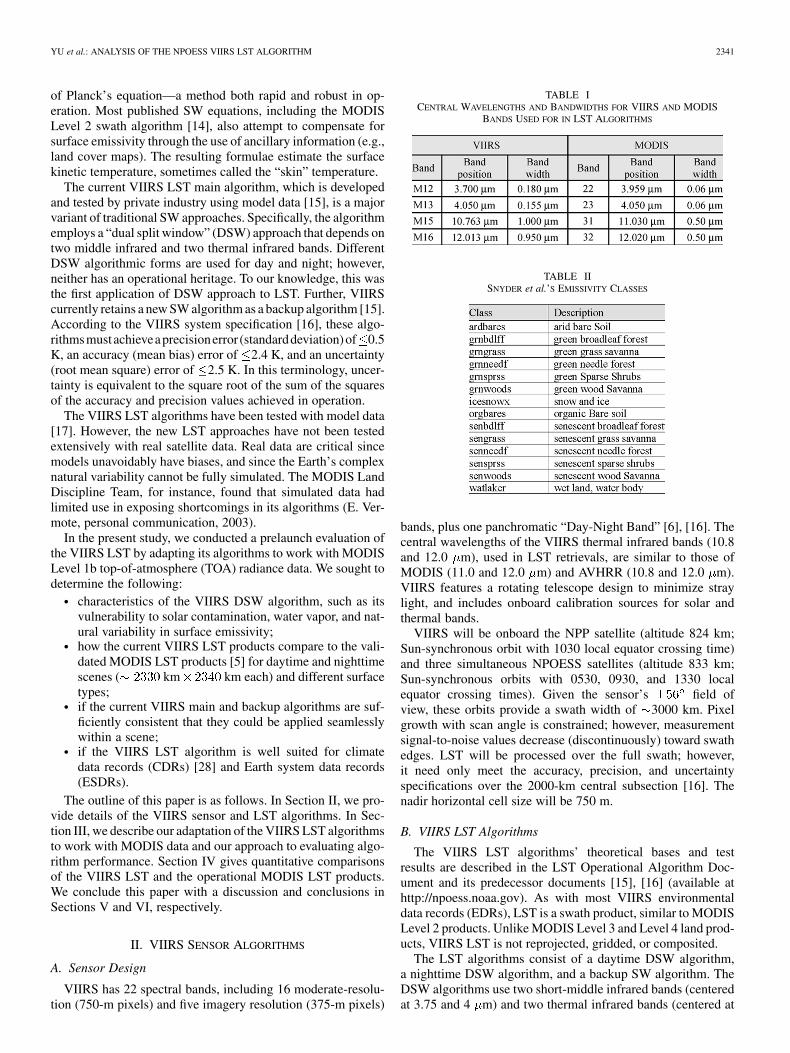
TABLE ICENTRAL WAVELENGTHS AND BANDWIDTHS FOR VIIRS AND MODIS
BANDS USED FOR IN LST ALGORITHMS
TABLE IISNYDER et al.’S EMISSIVITY CLASSES
bands, plus one panchromatic “Day-Night Band” [6], [16]. Thecentral wavelengths of the VIIRS thermal infrared bands (10.8and 12.0 m), used in LST retrievals, are similar to those ofMODIS (11.0 and 12.0 m) and AVHRR (10.8 and 12.0 m).VIIRS features a rotating telescope design to minimize straylight, and includes onboard calibration sources for solar andthermal bands.
VIIRS will be onboard the NPP satellite (altitude 824 km;Sun-synchronous orbit with 1030 local equator crossing time)and three simultaneous NPOESS satellites (altitude 833 km;Sun-synchronous orbits with 0530, 0930, and 1330 localequator crossing times). Given the sensor’s field ofview, these orbits provide a swath width of 3000 km. Pixelgrowth with scan angle is constrained; however, measurementsignal-to-noise values decrease (discontinuously) toward swathedges. LST will be processed over the full swath; however,it need only meet the accuracy, precision, and uncertaintyspecifications over the 2000-km central subsection [16]. Thenadir horizontal cell size will be 750 m.
B. VIIRS LST Algorithms
The VIIRS LST algorithms’ theoretical bases and testresults are described in the LST Operational Algorithm Doc-ument and its predecessor documents [15], [16] (available athttp://npoess.noaa.gov). As with most VIIRS environmentaldata records (EDRs), LST is a swath product, similar to MODISLevel 2 products. Unlike MODIS Level 3 and Level 4 land prod-ucts, VIIRS LST is not reprojected, gridded, or composited.
The LST algorithms consist of a daytime DSW algorithm,a nighttime DSW algorithm, and a backup SW algorithm. TheDSW algorithms use two short-middle infrared bands (centeredat 3.75 and 4 m) and two thermal infrared bands (centered at
2342 IEEE TRANSACTIONS ON GEOSCIENCE AND REMOTE SENSING, VOL. 43, NO. 10, OCTOBER 2005
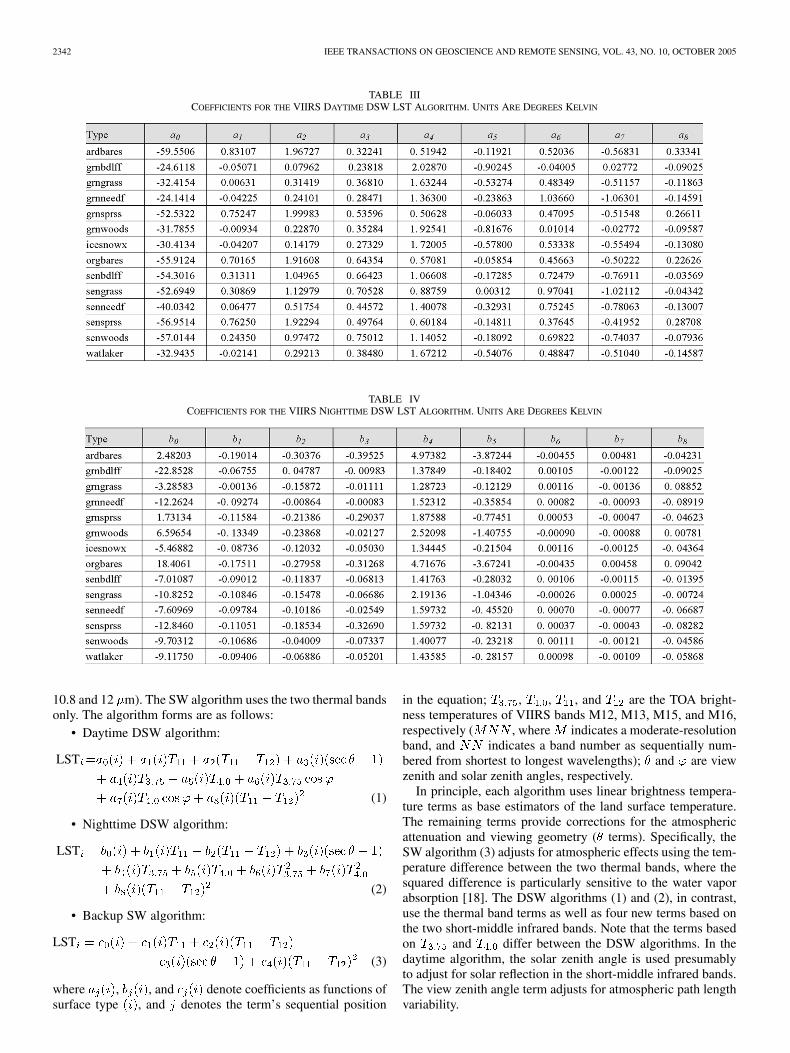
TABLE IIICOEFFICIENTS FOR THE VIIRS DAYTIME DSW LST ALGORITHM. UNITS ARE DEGREES KELVIN
TABLE IVCOEFFICIENTS FOR THE VIIRS NIGHTTIME DSW LST ALGORITHM. UNITS ARE DEGREES KELVIN
10.8 and 12 m). The SW algorithm uses the two thermal bandsonly. The algorithm forms are as follows:
• Daytime DSW algorithm:
LST
(1)
• Nighttime DSW algorithm:
LST
(2)
• Backup SW algorithm:
LST
(3)
where , , and denote coefficients as functions ofsurface type , and denotes the term’s sequential position
in the equation; , , , and are the TOA bright-ness temperatures of VIIRS bands M12, M13, M15, and M16,respectively ( , where indicates a moderate-resolutionband, and indicates a band number as sequentially num-bered from shortest to longest wavelengths); and are viewzenith and solar zenith angles, respectively.
In principle, each algorithm uses linear brightness tempera-ture terms as base estimators of the land surface temperature.The remaining terms provide corrections for the atmosphericattenuation and viewing geometry ( terms). Specifically, theSW algorithm (3) adjusts for atmospheric effects using the tem-perature difference between the two thermal bands, where thesquared difference is particularly sensitive to the water vaporabsorption [18]. The DSW algorithms (1) and (2), in contrast,use the thermal band terms as well as four new terms based onthe two short-middle infrared bands. Note that the terms basedon and differ between the DSW algorithms. In thedaytime algorithm, the solar zenith angle is used presumablyto adjust for solar reflection in the short-middle infrared bands.The view zenith angle term adjusts for atmospheric path lengthvariability.
YU et al.: ANALYSIS OF THE NPOESS VIIRS LST ALGORITHM 2343
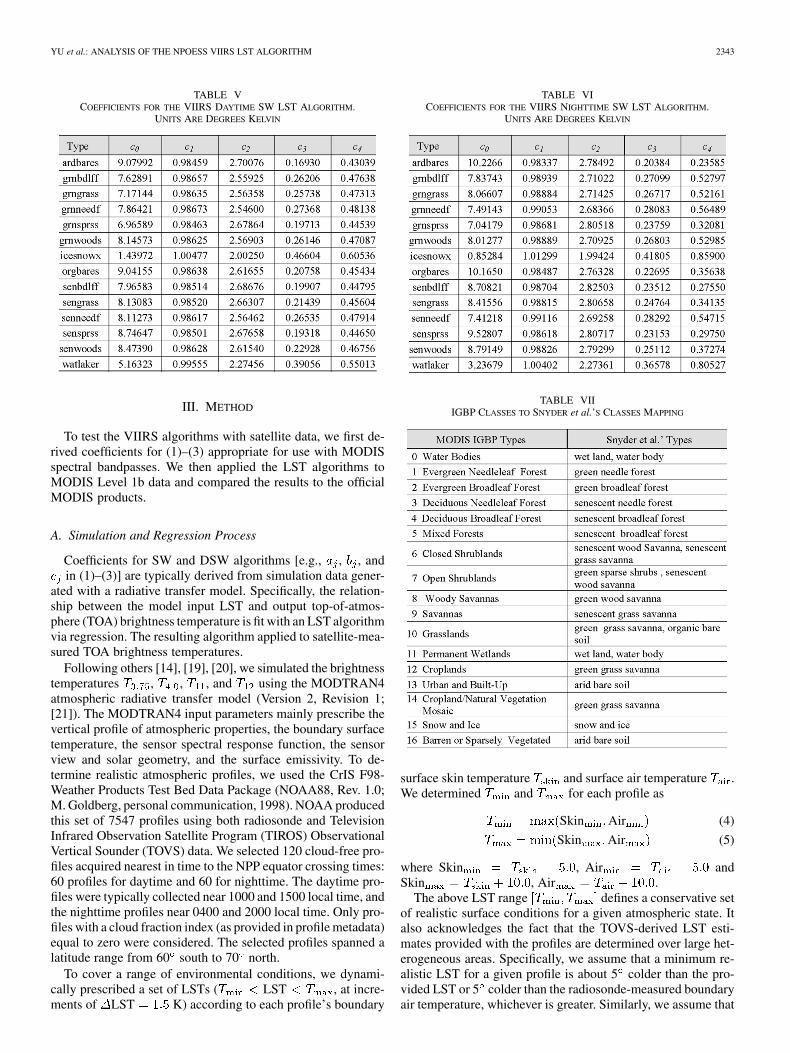
TABLE VCOEFFICIENTS FOR THE VIIRS DAYTIME SW LST ALGORITHM.
UNITS ARE DEGREES KELVIN
III. METHOD
To test the VIIRS algorithms with satellite data, we first de-rived coefficients for (1)–(3) appropriate for use with MODISspectral bandpasses. We then applied the LST algorithms toMODIS Level 1b data and compared the results to the officialMODIS products.
A. Simulation and Regression Process
Coefficients for SW and DSW algorithms [e.g., , , andin (1)–(3)] are typically derived from simulation data gener-
ated with a radiative transfer model. Specifically, the relation-ship between the model input LST and output top-of-atmos-phere (TOA) brightness temperature is fit with an LST algorithmvia regression. The resulting algorithm applied to satellite-mea-sured TOA brightness temperatures.
Following others [14], [19], [20], we simulated the brightnesstemperatures , , , and using the MODTRAN4atmospheric radiative transfer model (Version 2, Revision 1;[21]). The MODTRAN4 input parameters mainly prescribe thevertical profile of atmospheric properties, the boundary surfacetemperature, the sensor spectral response function, the sensorview and solar geometry, and the surface emissivity. To de-termine realistic atmospheric profiles, we used the CrIS F98-Weather Products Test Bed Data Package (NOAA88, Rev. 1.0;M. Goldberg, personal communication, 1998). NOAA producedthis set of 7547 profiles using both radiosonde and TelevisionInfrared Observation Satellite Program (TIROS) ObservationalVertical Sounder (TOVS) data. We selected 120 cloud-free pro-files acquired nearest in time to the NPP equator crossing times:60 profiles for daytime and 60 for nighttime. The daytime pro-files were typically collected near 1000 and 1500 local time, andthe nighttime profiles near 0400 and 2000 local time. Only pro-files with a cloud fraction index (as provided in profile metadata)equal to zero were considered. The selected profiles spanned alatitude range from 60 south to 70 north.
To cover a range of environmental conditions, we dynami-cally prescribed a set of LSTs ( LST , at incre-ments of LST K) according to each profile’s boundary
TABLE VICOEFFICIENTS FOR THE VIIRS NIGHTTIME SW LST ALGORITHM.
UNITS ARE DEGREES KELVIN
TABLE VIIIGBP CLASSES TO SNYDER et al.’S CLASSES MAPPING
surface skin temperature and surface air temperature .We determined and for each profile as
Skin Air (4)
Skin Air (5)
where Skin , Air andSkin , Air .
The above LST range defines a conservative setof realistic surface conditions for a given atmospheric state. Italso acknowledges the fact that the TOVS-derived LST esti-mates provided with the profiles are determined over large het-erogeneous areas. Specifically, we assume that a minimum re-alistic LST for a given profile is about 5 colder than the pro-vided LST or 5 colder than the radiosonde-measured boundaryair temperature, whichever is greater. Similarly, we assume that

2344 IEEE TRANSACTIONS ON GEOSCIENCE AND REMOTE SENSING, VOL. 43, NO. 10, OCTOBER 2005
Fig. 1. Daytime VIIRS SW LST derived from a MODIS 5-min scene data onJune 7, 2004. Sun glint pixels are marked between the black lines.
Fig. 2. Daytime VIIRS DSW LST derived from the same MODIS 5-min scenedata as in Fig. 1. Sun glint pixels are marked between the black lines.
the maximum realistic surface temperatures are 10 warmerthan the LST provided with the profile, or 15 warmer than theradiosonde-measured boundary air temperature, whichever islower. This approach ensures that the range endpoints are closerto the profile’s surface temperature rather than to its boundaryair temperature.
We set the view zenith angle to the following values: {0.1 ,10.0 , 20.0 , 30.0 , 40.0 , 50.0 , 60.0 }. Solar zenith angleswere calculated from the time and location of the daytime pro-files.
In our analysis, we used the MODIS bands (22, 23, 31, and32) that are spectrally nearest to VIIRS bands M12, M13, M15,and M16, respectively (see Table I). To determine mean surfaceemissivity for each band, we convolved the MODIS spectralresponse functions with surface emissivity spectra for 14 surfacetypes [22]. A brief description of the Snyder et al.’s surfaceemissivity classes is provided in Table II.
The parameter sets described above yielded 4640 uniqueMODTRAN4 configurations for each surface type. For each
Fig. 3. Daytime difference between the VIIRS SW LST and the MODIS LSTover the same MODIS scene as in Fig. 1.
Fig. 4. Daytime difference between the VIIRS DSW LST and the MODISLST over the same MODIS scene as in Fig. 1.
configuration, we simulated the daytime and the nighttimesatellite-observed brightness temperatures in each of the fourMODIS bands. Random noise was added to the modeled bright-ness temperatures to better simulate sensor measurements. Thenoise values followed a Gaussian distribution with a zero meanand the standard deviation set to the MODIS noise-equivalenttemperature difference (NE for bands 22 and 23, and0.05 K for bands 31 and 32). Finally, we determined the algo-rithm coefficients [ , , and in (1)–(3)] by regressing thesimulated brightness temperatures with the LST input values.
Since no radiative transfer model is able to perfectly simulatenature, we assume that all modeled brightness temperatures maybe biased [23]. Sources of bias include inaccurate sensor char-acterization, shortcomings in model physics, and spectroscopicand atmospheric profile data. To help compensate, we estimatedthe bias by determining the difference between MODIS obser-vations and our simulated observations. We used 16 MODISscenes in year 2003, including eight to estimate the daytime biasand eight for the nighttime. These scenes were subsequently

YU et al.: ANALYSIS OF THE NPOESS VIIRS LST ALGORITHM 2345
Fig. 5. Nighttime VIIRS SW LST derived from a MODIS 5-min scene dataon June 2, 2004.
Fig. 6. Nighttime VIIRS DSW LST derived from the same MODIS 5-minscene data as in Fig. 5.
disqualified from further use in our study. We added the biasestimates for each algorithm and surface type to the zeroeth-order coefficients ( , , and ). The resulting coef-ficient sets are provided in Tables III–VI for the various VIIRSalgorithms.
B. Comparison of VIIRS and MODIS LST Products
We applied our adapted VIIRS algorithm to 60 scenes ofMODIS Level 1b TOA radiance data (MOD021SS) acquiredonboard NASA’s Aqua satellite in 2003 and 2004. Each suchscene covers approximately 2340 2330 km of Earth area andrepresents 5 min of sensor data collection. Most scenes wereacquired during non-winter months over North America. About50% of the scenes were acquired during the daytime, and theremainders were acquired at night. We only used scenes wheremore than 50% of the pixels were cloud-free as determined bythe MODIS Level 2 Cloud Mask product (MYD35). Only the“confident cloud-free” (a cloud mask index value) pixels wereused. We determined the surface type for each pixel (required
Fig. 7. Nighttime difference between the VIIRS SW LST and the MODIS LSTover the same MODIS scene as in Fig. 5.
Fig. 8. Nighttime difference between the VIIRS DSW LST and the MODISLST over the same MODIS scene as in Fig. 5.
to determine the applicable coefficient set) by reprojecting theMODIS land cover map (17 International Geosphere-BiosphereProgramme (IGBP) classes, 1-km resolution) into the MODISswath geometry (available in the MODIS MYD03 product). Wealso remapped the 17 IGBP classes into Snyder’s 14 emissivityclasses (see Table VII). Because the performance of DSW algo-rithms could be negatively biased through solar contamination,we excluded sun glint areas, i.e., pixels where the photon scat-tering angle is from the specular reflection angle, in ourstatistical analysis.
To evaluate performance, we compared the VIIRS LST withthe MODIS Level 2 LST swath product (MYD11_L2; [5], here-after referred to as the “MODIS LST product.” The MODIS LSTis derived from an SW algorithm [14]; we did not use the griddedproduct from the day/night algorithm. The MODIS SW algo-rithm differs from the VIIRS equivalent (3) in that the MODISalgorithm coefficients do not vary with surface type. Instead, thealgorithm uses surface emissivity as an independent variable in
2346 IEEE TRANSACTIONS ON GEOSCIENCE AND REMOTE SENSING, VOL. 43, NO. 10, OCTOBER 2005
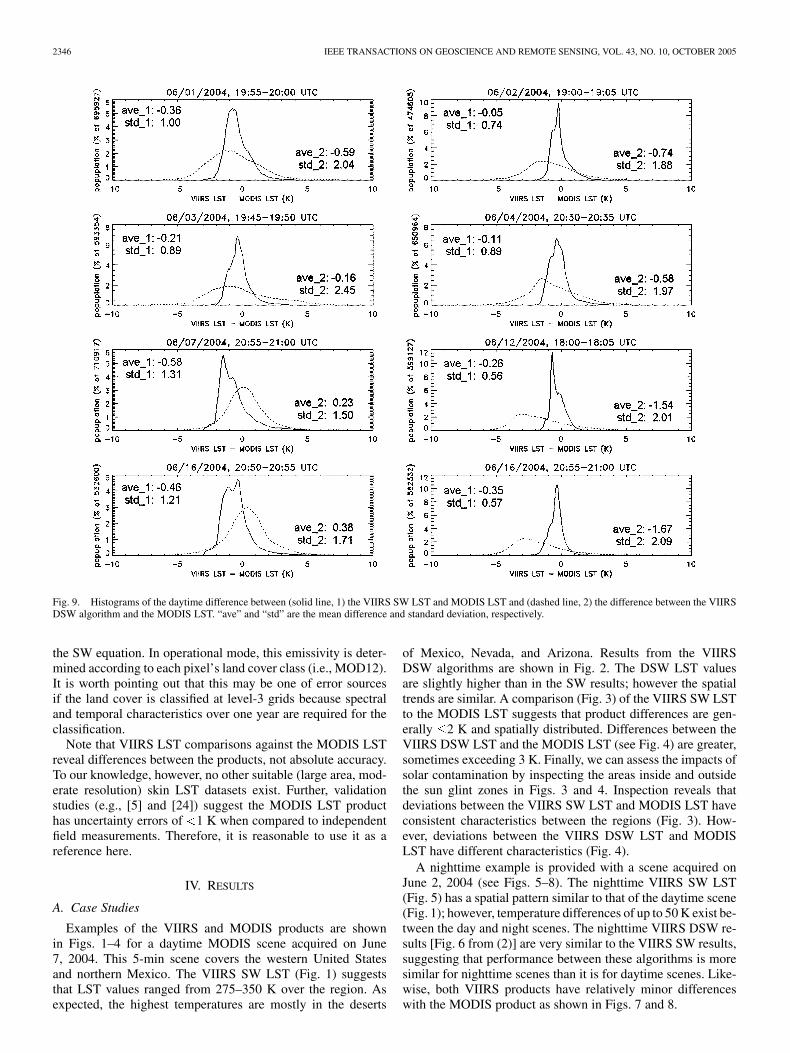
Fig. 9. Histograms of the daytime difference between (solid line, 1) the VIIRS SW LST and MODIS LST and (dashed line, 2) the difference between the VIIRSDSW algorithm and the MODIS LST. “ave” and “std” are the mean difference and standard deviation, respectively.
the SW equation. In operational mode, this emissivity is deter-mined according to each pixel’s land cover class (i.e., MOD12).It is worth pointing out that this may be one of error sourcesif the land cover is classified at level-3 grids because spectraland temporal characteristics over one year are required for theclassification.
Note that VIIRS LST comparisons against the MODIS LSTreveal differences between the products, not absolute accuracy.To our knowledge, however, no other suitable (large area, mod-erate resolution) skin LST datasets exist. Further, validationstudies (e.g., [5] and [24]) suggest the MODIS LST producthas uncertainty errors of 1 K when compared to independentfield measurements. Therefore, it is reasonable to use it as areference here.
IV. RESULTS
A. Case Studies
Examples of the VIIRS and MODIS products are shownin Figs. 1–4 for a daytime MODIS scene acquired on June7, 2004. This 5-min scene covers the western United Statesand northern Mexico. The VIIRS SW LST (Fig. 1) suggeststhat LST values ranged from 275–350 K over the region. Asexpected, the highest temperatures are mostly in the deserts
of Mexico, Nevada, and Arizona. Results from the VIIRSDSW algorithms are shown in Fig. 2. The DSW LST valuesare slightly higher than in the SW results; however the spatialtrends are similar. A comparison (Fig. 3) of the VIIRS SW LSTto the MODIS LST suggests that product differences are gen-erally 2 K and spatially distributed. Differences between theVIIRS DSW LST and the MODIS LST (see Fig. 4) are greater,sometimes exceeding 3 K. Finally, we can assess the impacts ofsolar contamination by inspecting the areas inside and outsidethe sun glint zones in Figs. 3 and 4. Inspection reveals thatdeviations between the VIIRS SW LST and MODIS LST haveconsistent characteristics between the regions (Fig. 3). How-ever, deviations between the VIIRS DSW LST and MODISLST have different characteristics (Fig. 4).
A nighttime example is provided with a scene acquired onJune 2, 2004 (see Figs. 5–8). The nighttime VIIRS SW LST(Fig. 5) has a spatial pattern similar to that of the daytime scene(Fig. 1); however, temperature differences of up to 50 K exist be-tween the day and night scenes. The nighttime VIIRS DSW re-sults [Fig. 6 from (2)] are very similar to the VIIRS SW results,suggesting that performance between these algorithms is moresimilar for nighttime scenes than it is for daytime scenes. Like-wise, both VIIRS products have relatively minor differenceswith the MODIS product as shown in Figs. 7 and 8.

YU et al.: ANALYSIS OF THE NPOESS VIIRS LST ALGORITHM 2347
Fig. 10. Histograms of the nighttime difference between (solid line, 1) the VIIRS SW LST and MODIS LST and (dashed line, 2) the difference between theVIIRS DSW algorithm and the MODIS LST. “ave” and “std” are the mean and standard deviation of the differences, respectively.
Although not shown here, winter scenes yielded similar re-sults. Since winter and summer represent the extremes of theatmosphere’s moisture holding capacity, this finding suggeststhat seasonal moisture differences have no significant effects onalgorithm performance.
B. Statistical Analysis
We statistically analyzed the VIIRS algorithms by com-paring the histograms of the differences between the VIIRSand MODIS LSTs. Histograms for eight example of daytimescenes are shown in Fig. 9. In these figures, solid lines depictthe difference between the VIIRS SW LST and the MODISLST, and dashed lines depict the difference between the VIIRSDSW LST and the MODIS LST. These results suggest thestandard deviation of the differences is consistently andsignificantly smaller with the VIIRS SW LST than it is withthe DSW LST. Specifically, for the SW algorithm, it rangedfrom K, while for the DSW algorithm, itranged from K. Note that the mean differencebetween the results is less meaningful since our VIIRS algo-rithm coefficients include a bias correction (Tables III–VI andSection III-A) and since the accuracy of the MODIS LST is notprecisely known and is likely nonzero.
Similar histogram plots for eight examples of nighttimescenes are shown in Fig. 10. Again, the standard deviation forthe VIIRS SW LST is consistently smaller than that of theDSW LST. Specifically, the standard deviation of the nighttimeSW LST varies as K, while that of the DSWLST varies as K.
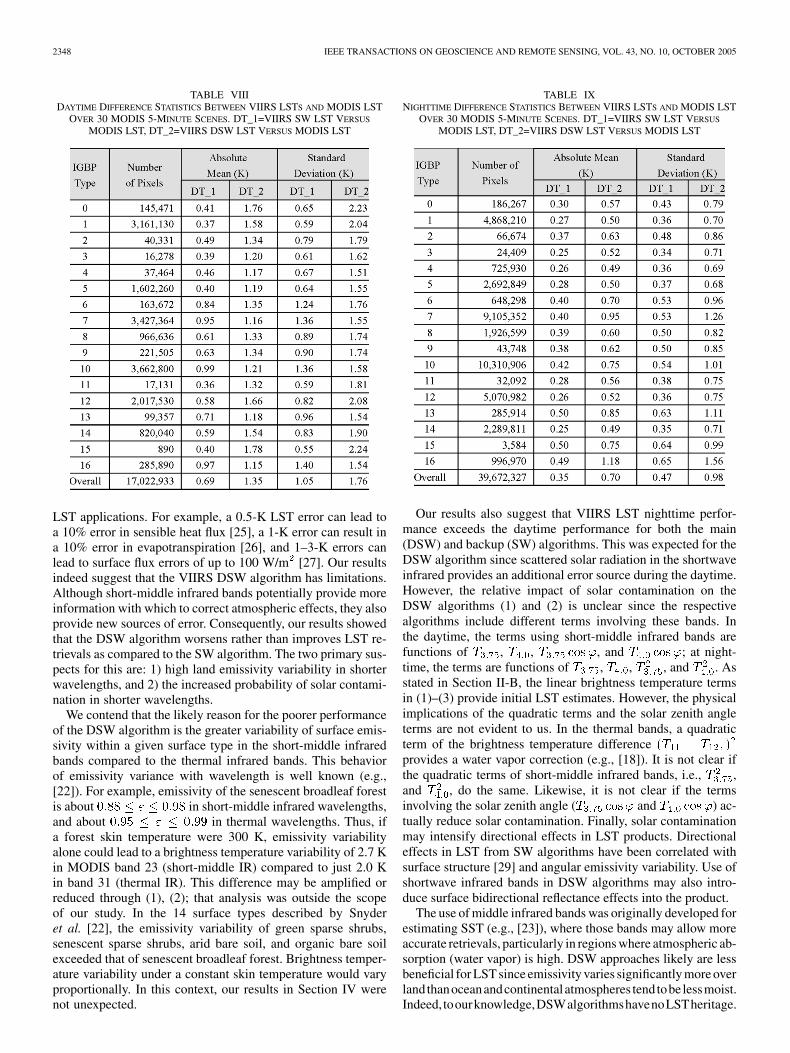
Similar results were obtained for each of the 44 remainingscenes in our analysis. Tables VIII and IX provide the absolutemean and standard deviations from the MODIS LSTs over the60 scenes. The results confirm that differences between theVIIRS SW LST and MODIS LST (DT_1 in the tables) aresmaller than those between the VIIRS DSW LST and MODISLST (DT_2 in the tables), and that the nighttime differences(Table IX) are smaller compared to the daytime differences(Table VIII). It is interesting to notice that the above character-ization is not only true over all scenes, it is also true over all17 IGBP classes. The smaller standard deviations over all thesurface types strongly suggest that the results were mainly dueto differences in the respective algorithms’ functional formsrather than to emissivity or surface classification mismatches.
V. DISCUSSION
Although LST precision differences of 1 K between al-gorithms may seem small, one must consider these in light of
2348 IEEE TRANSACTIONS ON GEOSCIENCE AND REMOTE SENSING, VOL. 43, NO. 10, OCTOBER 2005
TABLE VIIIDAYTIME DIFFERENCE STATISTICS BETWEEN VIIRS LSTS AND MODIS LST
OVER 30 MODIS 5-MINUTE SCENES. DT_1=VIIRS SW LST VERSUS
MODIS LST, DT_2=VIIRS DSW LST VERSUS MODIS LST
LST applications. For example, a 0.5-K LST error can lead toa 10% error in sensible heat flux [25], a 1-K error can result ina 10% error in evapotranspiration [26], and 1–3-K errors canlead to surface flux errors of up to 100 W/m [27]. Our resultsindeed suggest that the VIIRS DSW algorithm has limitations.Although short-middle infrared bands potentially provide moreinformation with which to correct atmospheric effects, they alsoprovide new sources of error. Consequently, our results showedthat the DSW algorithm worsens rather than improves LST re-trievals as compared to the SW algorithm. The two primary sus-pects for this are: 1) high land emissivity variability in shorterwavelengths, and 2) the increased probability of solar contami-nation in shorter wavelengths.
We contend that the likely reason for the poorer performanceof the DSW algorithm is the greater variability of surface emis-sivity within a given surface type in the short-middle infraredbands compared to the thermal infrared bands. This behaviorof emissivity variance with wavelength is well known (e.g.,[22]). For example, emissivity of the senescent broadleaf forestis about in short-middle infrared wavelengths,and about in thermal wavelengths. Thus, ifa forest skin temperature were 300 K, emissivity variabilityalone could lead to a brightness temperature variability of 2.7 Kin MODIS band 23 (short-middle IR) compared to just 2.0 Kin band 31 (thermal IR). This difference may be amplified orreduced through (1), (2); that analysis was outside the scopeof our study. In the 14 surface types described by Snyderet al. [22], the emissivity variability of green sparse shrubs,senescent sparse shrubs, arid bare soil, and organic bare soilexceeded that of senescent broadleaf forest. Brightness temper-ature variability under a constant skin temperature would varyproportionally. In this context, our results in Section IV werenot unexpected.
TABLE IXNIGHTTIME DIFFERENCE STATISTICS BETWEEN VIIRS LSTS AND MODIS LST
OVER 30 MODIS 5-MINUTE SCENES. DT_1=VIIRS SW LST VERSUS
MODIS LST, DT_2=VIIRS DSW LST VERSUS MODIS LST
Our results also suggest that VIIRS LST nighttime perfor-mance exceeds the daytime performance for both the main(DSW) and backup (SW) algorithms. This was expected for theDSW algorithm since scattered solar radiation in the shortwaveinfrared provides an additional error source during the daytime.However, the relative impact of solar contamination on theDSW algorithms (1) and (2) is unclear since the respectivealgorithms include different terms involving these bands. Inthe daytime, the terms using short-middle infrared bands arefunctions of , , , and ; at night-time, the terms are functions of , , , and . Asstated in Section II-B, the linear brightness temperature termsin (1)–(3) provide initial LST estimates. However, the physicalimplications of the quadratic terms and the solar zenith angleterms are not evident to us. In the thermal bands, a quadraticterm of the brightness temperature differenceprovides a water vapor correction (e.g., [18]). It is not clear ifthe quadratic terms of short-middle infrared bands, i.e., ,and , do the same. Likewise, it is not clear if the termsinvolving the solar zenith angle ( and ) ac-tually reduce solar contamination. Finally, solar contaminationmay intensify directional effects in LST products. Directionaleffects in LST from SW algorithms have been correlated withsurface structure [29] and angular emissivity variability. Use ofshortwave infrared bands in DSW algorithms may also intro-duce surface bidirectional reflectance effects into the product.
The use of middle infrared bands was originally developed forestimating SST (e.g., [23]), where those bands may allow moreaccurate retrievals, particularly in regions where atmospheric ab-sorption (water vapor) is high. DSW approaches likely are lessbeneficial for LST since emissivity varies significantly more overland thanoceanandcontinentalatmospheres tend tobe lessmoist.Indeed, toourknowledge,DSWalgorithmshavenoLSTheritage.
YU et al.: ANALYSIS OF THE NPOESS VIIRS LST ALGORITHM 2349
VI. CONCLUDING REMARKS
Our results strongly suggest that the VIIRS SW LST algo-rithm is superior to the VIIRS DSW LST algorithm both for day-time and nighttime conditions. Specifically, differences betweenthe VIIRS SW LST and the validated MODIS LST had lowervariances than did those of the DSW algorithm. Thus, the SW al-gorithm leads to smaller precision and uncertainty errors (whereuncertainty is the root sum of squares of accuracy and precisionerrors). Precision errors and uncertainty for both VIIRS algo-rithms were greater in the daytime compared to the nighttime.The consistency of the differences over the 60 MODIS 5-minscenes suggests that the VIIRS LST algorithms are stable in day-time and nighttime.
Our results also suggest the current VIIRS algorithm will pro-vide inconsistent results in scenes with sun glint areas (from specular reflectance angle), where solar contamination inshort-middle infrared measurements can be significant. In ourtests, sun glint pixels occurred in up to 25% of all pixels ina daytime scene. In the current VIIRS LST algorithm design,the backup SW algorithm is used over sun glint areas. The re-quired algorithm “switching” (from DSW to SW and back) forthis within such scenes undoubtedly will introduce variability inspatial error characteristics—an undesirable artifact of the cur-rent design. The VIIRS DSW approach is also inconsistent withheritage algorithms used with AVHRR, MODIS, and GOES.Although not an NPOESS program requirement, these incon-sistencies will challenge efforts to build seamless multimissiondata records per NASA’s and NOAA’s goals [28].
Given the likely longevity of the NPOESS data record, weconclude that the currently planned use of dual SW algorithmsis thus far not justified. Barring further algorithm development(e.g., increased stratification of surface types, dynamic emis-sivity estimation, or better global surface type maps), we suggestthat the VIIRS LST algorithm design be reconsidered.
ACKNOWLEDGMENT
The authors thank J. Qu, Z. Wan, W. C. Snyder, D. Sun,and R. Slonaker for their help. The MODIS products used hereare available from the Goddard Earth Sciences Distributed Ac-tive Archive Center (DAAC) and the Land Processes DAACin Sioux Falls, SD. The authors acquired the MODIS surfacetype data online from the Department of Geography, BostonUniversity.
REFERENCES
[1] Z.-L. Li and F. Becker, “Feasibility of land surface temperature andemissivity determination from AVHRR data,” Remote Sens. Environ.,vol. 43, pp. 67–85, 1993.
[2] EOS Science Plan: The State of Science in the EOS, M. D. King, R.Greenstone, and W. Bandeen, Eds., NASA Goodard Space Flight Center,Greenbelt, MD, 1999.
[3] J. C. Price, “Land surface temperature measurements from the splitwindow channels of the NOAA-7/AVHRR,” J. Geophys. Res., vol. 89,pp. 7231–7237, 1984.
[4] D. Gutman, D. Tarpley, A. Ignatov, and S. Olson, “The enhancedNOAA global land dataset from the Advanced Very High ResolutionRadiometer,” Bull. Amer. Meteorol. Soc., vol. 76, no. 7, pp. 1141–1156,1995.
[5] Z. Wan, Y. Zhang, Q. Zhang, and Z.-L. Li, “Validation of the land-sur-face temperature products retrieved from Terra Moderate ResolutionImaging Spectroradiometer data,” Remote Sens. Environ., vol. 83, pp.163–181, 2002.
[6] R. E. Murphy, W. Barnes, A. Lyapustin, J. Privette, C. Welsch, F. DeLuccia, H. Swenson, C. Schueler, P. Ardanuy, and P. Kealy, “UsingVIIRS to provide data continuity with MODIS,” in Proc. IGARSS, vol.3, 2001, pp. 1212–1214.
[7] K. Watson, “Two temperature method for measuring emissivity,” RemoteSens. Environ., vol. 42, pp. 117–121, 1992.
[8] P. S. Kealy and S. J. Hook, “Separating temperature and emissivity inthermal infrared multispectral scanner data: Implications for recoveringland surface temperature,” IEEE Trans. Geosci. Remote Sens., vol. 31,no. 6, pp. 1155–1164, Nov. 1993.
[9] S. Liang, “An optimization algorithm for separating land surface temper-ature and emissivity from multispectral thermal infrared imagery,” IEEETrans. Geosci. Remote Sens., vol. 39, no. 2, pp. 264–274, Feb. 2001.
[10] Z. Wan and Z.-L. Li, “A physics-based algorithm for retrieving land sur-face emissivity and temperature from EOS/MODIS data,” IEEE Trans.Geosci. Remote Sens., vol. 35, no. 4, pp. 980–996, Jul. 1997.
[11] F. Becker and Z. L. Li, “Toward a local split window method over landsurfaces,” Int. J. Remote Sens., vol. 11, pp. 369–393, 1990.
[12] F. Becker and Z.-L. Li, “Surface temperature and emissivity at variousscales: Definition, measurements and related problems,” Remote Sens.Rev., vol. 12, pp. 225–253, 1995.
[13] J. A. Sobrino, C. Coll, and V. Caselles, “Atmospheric corrections forland surface temperature using AVHRR channel 4 and 5,” Remote Sens.Environ., vol. 38, pp. 19–34, 1991.
[14] Z. Wan and J. Dozier, “A generalized split-window algorithm forretrieving land-surface temperature measurement from space,” IEEETrans. Geosci. Remote Sens., vol. 34, no. 4, pp. 892–905, Jul. 1996.
[15] R. J. Sikorski, P. S. Kealy, and W. J. Emery, “Land surface temperaturevisible/infrared image radiometer suite ,” Raytheon Syst., Aurora, CO,[Online]. Available: http://npoesslib.ipo.noaa.gov/atbd/viirs/, AlgorithmTheoretical Basis Document, Version 5, 2002.
[16] Northrop Grumman Space and Mission Systems Corp., “NPOESSSystem Specification,” Northrop Grumman, Redondo Beach, CA, DOCSY15-007, Rev F, Aug. 20, 2002.
[17] J. Ip, Land surface temperature algorithm test plan and report, NorthropGrumman, Redondo Beach, CA, Jun. 17, 2004.
[18] W. J. Emery, Y. Yu, G. A. Wick, P. Schluessel, and R. W. Reynolds,“Correcting infrared satellite estimates of sea surface temperature foratmospheric water vapor attenuation,” J. Geophys. Res., vol. 99, pp.5219–5236, 1994.
[19] J. Ip, Operational algorithm description document for the VIIRSland surface temperature (LST) EDR software, Northrop Grumman,Redondo Beach, CA, Jun. 2004.
[20] H. Ouaidrari, S. N. Goward, K. P. Czajkowski, J. A. Sobrino, and E.Vermote, “Land surface temperature estimation from AVHRR thermalinfrared measurements: An assessment for the AVHRR Land PathfinderII data set,” Remote Sens. Environ., vol. 81, no. 1, pp. 114–228, 2002.
[21] A. Berk, G. P. Anderson, P. K. Acharya, J. H. Chetwynd, M. L. Hoke,L. S. Bernstein, E. P. Shettle, M. W. Matthew, and S. M. Alder-Golden,MODTRAN4 Version 2 Users’s Manual. Hanscom AFB, MA: SpaceVehicles Directorate, Apr. 2000.
[22] W. C. Snyder, Z. Wan, and Y. Z. Feng, “Classification-based emissivityfor land surface temperature measurement from space,” Int. J. RemoteSens., vol. 19, no. 14, pp. 2753–2774, 1998.
[23] E. Maturi, A. Harris, C. Merchant, N. Nalli, and X. Li, “Operational al-gorithms for the NOAA sea surface temperature products for POES andGOES,” in Proc. 2002 Eumetsat Meteorological Satellite Data Users’Conf., Dublin, Ireland, 2002.
[24] Z. Wan. (2003, Jun.) MODIS land surface temperature products users’guide. [Online]. Available: http://www.icess.ucsb.edu/modis/LstUsr-Guide/usrguide.html.
[25] W. Brutsaert, A. Hsu, and T. J. Schmugge, “Parameterization of surfaceheat fluxes above forest with satellite thermal sensing and boundary-layer soundings,” J. Appl. Meteorol, vol. 32, no. 5, pp. 909–917, 1993.
[26] M. S. Moran and R. D. Jackson, “Assessing the spatial-distribution ofevapotranspiration using remotely sensed inputs,” J. Environ. Quality,vol. 20, no. 4, pp. 725–737, 1991.
[27] W. P. Kustas and J. M. Norman, “Use of remote sensing for evapotran-spiration monitoring over land surfaces,” Hydrol. Sci., vol. 41, no. 4, pp.495–515, 1996.
[28] NRC Committee on Earth Studies, Ensuring the climate record from theNPP and NPOESS meteorological satellites. Washington, DC: Nat.Acad. Press, 2000.
[29] A. C. Pinheiro, J. L. Privette, R. Mahoney, and C. J. Tucker, “Directionalbiases in a five-year r daily AVHRR land surface temperature productover Africa,” IEEE Trans. Geosci. Remote Sens., vol. 42, no. Sep., pp.1941–1954, 2004.
2350 IEEE TRANSACTIONS ON GEOSCIENCE AND REMOTE SENSING, VOL. 43, NO. 10, OCTOBER 2005
Yunyue Yu received the B.A. degree in physicsfrom the Ocean University of Qingdao, Qingdao,China, and the Ph.D. degree from the University ofColorado, Boulder, in 1982 and 1996, respectively.
After completing the Ph.D. degree, he studiedsatellite remote sensing for Earth surface applica-tions as a Principal Scientist of Raytheon ITSS atthe NASA Goddard Space Flight Center (GSFC),Greenbelt, MD. He is now working for the NPOESSPreparatory Project at GSFC as a Senior ResearchScientist of George Mason University, Fairfax, VA.
Jeffrey L. Privette (M’95) received the B.A. degreefrom The College of Wooster, Wooster, OH, the B.S.degree from the University of Michigan, Ann Arbor,and the M.S. and Ph.D. degrees in aerospace engi-neering sciences from the University of Colorado,Boulder.
After postdoctoral work with the University ofMaryland, he joined the Biospheric Sciences Branch(Code 614.4), NASA Goddard Space Flight Center,Greenbelt, MD, in 1996. His research has focusedon the retrieval of land biophysical parameters via
solar-reflective and thermal infrared remote sensing, and he has been activein SAFARI 2000, the MODIS Land Validation Program, the CEOS WorkingGroup for Calibration and Validation, and the NPP/NPOESS project. He cur-rently is Deputy Project Scientist and a science team member for the NPOESSPreparatory Project.
Ana C. T. Pinheiro received the B.S. degree in envi-ronmental engineering from the New University ofLisbon, Lisbon, Portugal, in 1995, the M.Eng. de-gree in civil and environmental engineering from theMassachusetts Institute of Technology, Cambridge,in 1998, and the Ph.D. degree in environmental engi-neering from the New University of Lisbon, in 2003.She conducted her doctoral research as a Visiting Sci-entist in the Biospheric Sciences Branch, NationalAeronautics and Space Administration (NASA) God-dard Space Flight Center (GSFC), Greenbelt, MD.
She is currently a National Research Council Postdoctoral Researcher at theHydrological Sciences Branch, NASA GSFC.
Copyright © 2022 FDOKUMEN