A comparison between cluster busting technique and a classification tree algorithm of a moderate...
15
This article was downloaded by: [Utah State University Libraries] On: 14 December 2011, At: 13:42 Publisher: Taylor & Francis Informa Ltd Registered in England and Wales Registered Number: 1072954 Registered office: Mortimer House, 37-41 Mortimer Street, London W1T 3JH, UK Geocarto International Publication details, including instructions for authors and subscription information: http://www.tandfonline.com/loi/tgei20 A comparison between cluster busting technique and a classification tree algorithm of a moderate resolution imaging spectrometer (MODIS) land cover map of Honduras Samuel Rivera a , John H. Lowry b , Alexander J. Hernandez a , R. Douglas Ramsey a , Ricardo Lezama c & Miguel A. Velasquez c a GIS/Remote Sensing Laboratories, Wildland Resources, Utah State University, Logan, 84322-5230, USA b School of Geography, Earth Science and Environment, University of the South Pacific, Laucala Campus, Suva, Fiji c ESNACIFOR, Siguatepeque, Honduras Available online: 27 Oct 2011 To cite this article: Samuel Rivera, John H. Lowry, Alexander J. Hernandez, R. Douglas Ramsey, Ricardo Lezama & Miguel A. Velasquez (2011): A comparison between cluster busting technique and a classification tree algorithm of a moderate resolution imaging spectrometer (MODIS) land cover map of Honduras, Geocarto International, DOI:10.1080/10106049.2011.622050 To link to this article: http://dx.doi.org/10.1080/10106049.2011.622050 PLEASE SCROLL DOWN FOR ARTICLE Full terms and conditions of use: http://www.tandfonline.com/page/terms-and- conditions This article may be used for research, teaching, and private study purposes. Any substantial or systematic reproduction, redistribution, reselling, loan, sub-licensing, systematic supply, or distribution in any form to anyone is expressly forbidden. The publisher does not give any warranty express or implied or make any representation that the contents will be complete or accurate or up to date. The accuracy of any instructions, formulae, and drug doses should be independently verified with primary
Transcript of A comparison between cluster busting technique and a classification tree algorithm of a moderate...
This article was downloaded by: [Utah State University Libraries]On: 14 December 2011, At: 13:42Publisher: Taylor & FrancisInforma Ltd Registered in England and Wales Registered Number: 1072954 Registeredoffice: Mortimer House, 37-41 Mortimer Street, London W1T 3JH, UK
Geocarto InternationalPublication details, including instructions for authors andsubscription information:http://www.tandfonline.com/loi/tgei20
A comparison between cluster bustingtechnique and a classification treealgorithm of a moderate resolutionimaging spectrometer (MODIS) landcover map of HondurasSamuel Rivera a , John H. Lowry b , Alexander J. Hernandez a , R.Douglas Ramsey a , Ricardo Lezama c & Miguel A. Velasquez ca GIS/Remote Sensing Laboratories, Wildland Resources, UtahState University, Logan, 84322-5230, USAb School of Geography, Earth Science and Environment, Universityof the South Pacific, Laucala Campus, Suva, Fijic ESNACIFOR, Siguatepeque, Honduras
Available online: 27 Oct 2011
To cite this article: Samuel Rivera, John H. Lowry, Alexander J. Hernandez, R. Douglas Ramsey,Ricardo Lezama & Miguel A. Velasquez (2011): A comparison between cluster busting technique anda classification tree algorithm of a moderate resolution imaging spectrometer (MODIS) land covermap of Honduras, Geocarto International, DOI:10.1080/10106049.2011.622050
To link to this article: http://dx.doi.org/10.1080/10106049.2011.622050
PLEASE SCROLL DOWN FOR ARTICLE
Full terms and conditions of use: http://www.tandfonline.com/page/terms-and-conditions
This article may be used for research, teaching, and private study purposes. Anysubstantial or systematic reproduction, redistribution, reselling, loan, sub-licensing,systematic supply, or distribution in any form to anyone is expressly forbidden.
The publisher does not give any warranty express or implied or make any representationthat the contents will be complete or accurate or up to date. The accuracy of anyinstructions, formulae, and drug doses should be independently verified with primary

sources. The publisher shall not be liable for any loss, actions, claims, proceedings,demand, or costs or damages whatsoever or howsoever caused arising directly orindirectly in connection with or arising out of the use of this material.
Dow
nloa
ded
by [
Uta
h St
ate
Uni
vers
ity L
ibra
ries
] at
13:
42 1
4 D
ecem
ber
2011

A comparison between cluster busting technique and a classification
tree algorithm of a moderate resolution imaging spectrometer (MODIS)
land cover map of Honduras
Samuel Riveraa*, John H. Lowryb, Alexander J. Hernandeza, R. Douglas Ramseya,Ricardo Lezamac and Miguel A. Velasquezc
aGIS/Remote Sensing Laboratories, Wildland Resources, Utah State University, Logan 84322-5230, USA; bSchool of Geography, Earth Science and Environment, University of the South
Pacific, Laucala Campus, Suva, Fiji; cESNACIFOR, Siguatepeque, Honduras
(Received 24 May 2011; final version received 6 September 2011)
A national land cover map derived from moderate resolution imagingspectrometer (MODIS) imagery products was developed for Honduras, CentralAmerica. We compared two methods of image classification: a cluster busting(CB) classification technique and a classification and regression tree (CART)algorithm. Field data samples were used to validate the resulting classifications.In the classification process, we used: a Google EarthTM sampling scheme, atime series of MODIS’s Enhanced Vegetation Index (EVI) and digital elevationdata (shuttle radar topography mission, SRTM). The CART classificationmethod provided a more accurate classification (Kappa coefficient, K¼ 74%,overall model accuracy¼ 79.6%) while compared to the CB classification(Kappa coefficient, K¼ 9%, overall model accuracy¼ 25.1%). The findings areuseful to design more accurate MODIS classification protocols in tropicalcountries.
Keywords: mapping; MODIS; tropics; Google Earth; EVI
1. Introduction
Developing countries in the tropics are experiencing a rapid land use conversion.Forests lands are being cleared for pasture and agriculture at an alarming rate.Approximately 10 million hectares of tropical forests were converted to agricultureand pasture in the last five years (FAO 2005). Central America and Mexico havethe second highest global deforestation rate after the huge Amazon reserve(Eggen-McIntosh et al. 1994, Global Forest Watch 2010). Deforestation is causingenormous environmental disruption, jeopardizing the already weak economy(DeFries et al. 2004) and the well-being of the countries.
In the1990s, the country of Honduras produced a land cover map using Landsat5 TM imagery with the help of the German government (COHDEFOR 1996). Thisforest resources map contained eight land cover classes (dense conifer forest,sparse conifer forest, mangrove forest, broadleaf forest, mixed forest, water bodies,
*Corresponding author. Email: [email protected]
Geocarto International
2011, 1–13, iFirst article
ISSN 1010-6049 print/ISSN 1752-0762 online
� 2011 Taylor & Francis
http://dx.doi.org/10.1080/10106049.2011.622050
http://www.tandfonline.com
Dow
nloa
ded
by [
Uta
h St
ate
Uni
vers
ity L
ibra
ries
] at
13:
42 1
4 D
ecem
ber
2011

neighbouring country, non-forestlands) and was produced by a team of experts usingan ocular inspection of Landsat imagery. The methodology to produce the map wastime-consuming and not easily replicable, thus making it a useful product at a singlemoment in time, but not useful for monitoring purposes.
Over the last decade, there have been other attempts to create a national landcover map in Honduras. In 2001, a land cover map was developed by a World Banksponsored initiative and another one by the Tropical Agricultural Centre for HigherEducation and Research, CATIE (Ordonez and House 2002). Neither of them hada transparent and replicable methodology and the government was still uncertainabout how much area was covered by forest or other lands. In 2005, a forestinventory was conducted throughout the country. Around 300 sampling plots wereestablished systematically all over the country. Due to the lack of funding, theinventory was not complemented with the remote sensing assessment and soonbecame obsolete (AFE-COHDEFOR 2006).
The lack of proven scientific methods of forest cover estimation has producedambiguous results, with large discrepancies. Stonich (1993) suggests that thedeforestation rate in Honduras is currently 80,000 ha per year, which is one of thehighest deforestation rates in the Western hemisphere. According to the Food andAgriculture Organization’s global assessment of forest resources, Honduras lostsome 186,000 ha of forest between 2000 and 2005, the highest annual deforestationrate in Central America (FAO 2005). In summary, both studies suggest that forestsin Honduras are being cleared rapidly.
The objective of this project was to create a contemporary land cover map for thecountry of Honduras using free and readily available imagery from the moderateresolution imaging spectrometer (MODIS) sensor. Our contemporary map wouldfollow the design of the 1990s map produced from Landsat imagery with the aidof the German government. Given the availability of MODIS imagery, and thefrequency with which it is available, MODIS offers an excellent imagery source formonitoring purposes.
Specifically, the objectives for this project were to:
(1) Develop a national-level land cover map for the country of Honduras thatwould form a baseline dataset from which forest monitoring could be carriedout.
(2) Evaluate the accuracy of the land cover map using two avenues of imageclassification: cluster busting (CB) and a classification and regression tree(CART) algorithm.
Data and methods
Study area
Honduras is placed in the middle of the Central American isthmus, between 138 and168 latitude North and 838 and 89.58 longitude West (Figure 1). It has an area of112,088 square kilometres. It is a rich country in terms of natural resources andhas the largest forest cover among the other Central American nations(AFE-COHDEFOR 2006). Approximately 50% of the country is still covered byundisturbed forests (Gutierrez 1992, Laboranti 1992, Richards 1996) which includehumid tropical forests, arid or deciduous tropical forests, cloud forests, mangrovewetlands and pine forests.
2 S. Rivera et al.
Dow
nloa
ded
by [
Uta
h St
ate
Uni
vers
ity L
ibra
ries
] at
13:
42 1
4 D
ecem
ber
2011

Land use classification
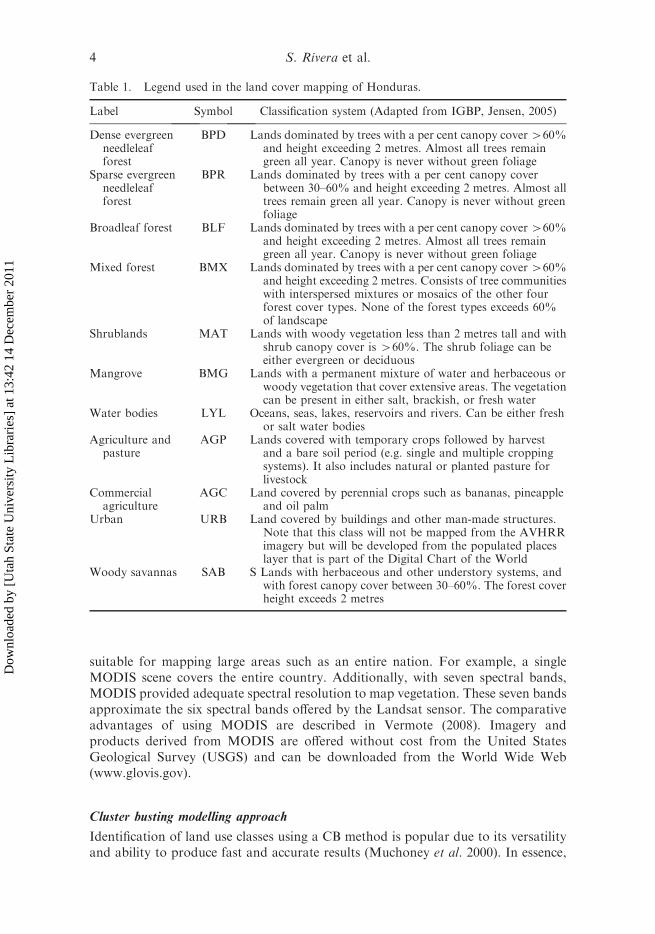
We used a modified land use classification system used by the InternationalGeosphere – Biosphere Programme (IGBP) (UNESCO 1973, Jensen 2005). Thisclassification system was selected because it has been used by the Hondurangovernment authorities and because it approximated the land cover legend from themap produced in the 1990s. This classification system has also been largely usedby other projects either globally (Loveland et al. 2000, Friedl et al. 2002) or in theCentral and South American regions (Latifovic et al. 2000, Muchoney et al. 2000,Brown et al. 2007), due to its capacity to fit the MODIS resolution.
In the final map, 11 classes were delineated (Table 1). Initially, our intention wasto map eight classes (dense and sparse pine forest, broadleaf forest, mixed forest,urban, mangrove forest, water bodies and agriculture farms/pasture), however,through the process of field sampling, three more classes were added to theclassification (commercial agriculture, shrublands and savannas).
Image selection and preparation
The MODIS sensor provides an ideal remotely sensed platform for developing anational-level land cover/resource monitoring programme (Loveland et al. 2000,Muchoney et al. 2000, Brown et al. 2007). With 500 m pixel resolution it wasconsidered a moderate resolution imaging sensor and could not be used for highlydetailed land cover mapping (by comparison, the Landsat sensor offers 30 m pixelresolution). However, MODIS has several key advantages that make it highly
Figure 1. Location of Honduras, Central America.
Geocarto International 3
Dow
nloa
ded
by [
Uta
h St
ate
Uni
vers
ity L
ibra
ries
] at
13:
42 1
4 D
ecem
ber
2011
suitable for mapping large areas such as an entire nation. For example, a singleMODIS scene covers the entire country. Additionally, with seven spectral bands,MODIS provided adequate spectral resolution to map vegetation. These seven bandsapproximate the six spectral bands offered by the Landsat sensor. The comparativeadvantages of using MODIS are described in Vermote (2008). Imagery andproducts derived from MODIS are offered without cost from the United StatesGeological Survey (USGS) and can be downloaded from the World Wide Web(www.glovis.gov).
Cluster busting modelling approach
Identification of land use classes using a CB method is popular due to its versatilityand ability to produce fast and accurate results (Muchoney et al. 2000). In essence,
Table 1. Legend used in the land cover mapping of Honduras.
Label Symbol Classification system (Adapted from IGBP, Jensen, 2005)
Dense evergreenneedleleafforest
BPD Lands dominated by trees with a per cent canopy cover460%and height exceeding 2 metres. Almost all trees remaingreen all year. Canopy is never without green foliage
Sparse evergreenneedleleafforest
BPR Lands dominated by trees with a per cent canopy coverbetween 30–60% and height exceeding 2 metres. Almost alltrees remain green all year. Canopy is never without greenfoliage
Broadleaf forest BLF Lands dominated by trees with a per cent canopy cover460%and height exceeding 2 metres. Almost all trees remaingreen all year. Canopy is never without green foliage
Mixed forest BMX Lands dominated by trees with a per cent canopy cover460%and height exceeding 2 metres. Consists of tree communitieswith interspersed mixtures or mosaics of the other fourforest cover types. None of the forest types exceeds 60%of landscape
Shrublands MAT Lands with woody vegetation less than 2 metres tall and withshrub canopy cover is 460%. The shrub foliage can beeither evergreen or deciduous
Mangrove BMG Lands with a permanent mixture of water and herbaceous orwoody vegetation that cover extensive areas. The vegetationcan be present in either salt, brackish, or fresh water
Water bodies LYL Oceans, seas, lakes, reservoirs and rivers. Can be either freshor salt water bodies
Agriculture andpasture
AGP Lands covered with temporary crops followed by harvestand a bare soil period (e.g. single and multiple croppingsystems). It also includes natural or planted pasture forlivestock
Commercialagriculture
AGC Land covered by perennial crops such as bananas, pineappleand oil palm
Urban URB Land covered by buildings and other man-made structures.Note that this class will not be mapped from the AVHRRimagery but will be developed from the populated placeslayer that is part of the Digital Chart of the World
Woody savannas SAB S Lands with herbaceous and other understory systems, andwith forest canopy cover between 30–60%. The forest coverheight exceeds 2 metres
4 S. Rivera et al.
Dow
nloa
ded
by [
Uta
h St
ate
Uni
vers
ity L
ibra
ries
] at
13:
42 1
4 D
ecem
ber
2011

CB classification involves using a clustering algorithm such as ISODATA (iterativeself-organizing data analysis technique algorithm) in an unsupervised fashion toproduce a set of spectral clusters. The analyst assigns labels to the clusters, so he/shecan confidently label, and return all remaining unclassified pixels to be clusteredonce again with the clustering algorithm. The process continues until the analyst nolonger feels confident in labelling additional clusters. Any remaining pixels remainunknown, or unclassified.
Classification and regression tree (CART) modelling approach
CART was developed by Breiman et al. (1984) and was quickly recognized as avaluable tool for discriminating complex relationships among environmentalvariables (Friedl et al. 2002, Falzarano et al. 2005). Classification decision treesreadily accept a variety of measurement scales in addition to categorical variables,and have demonstrated improved accuracies over the use of traditional classifiers(Hansen et al. 1996, Pal and Mather 2003).
Several predicting layers were used in the primary classification. Spatial datalayers used to map land cover included image-derived and ancillary datasets such asMODIS images from 2007 and 2008 (seven bands), the Enhanced Vegetation Index(EVI) and the 30-m digital elevation models (DEM) obtained from the NASA’sshuttle radar topography mission (SRTM) (http://www2.jpl.nasa.gov/srtm/).
Using the National Land Cover Dataset (NLCD) mapping tool (Homer et al.2004), decision tree models were generated in See5� (RuleQuest Research 2004) withthe boosting option, and then spatially applied in ERDAS Imagine�. Modelling wasiterative and subsequent iterations were tested using different combinations ofpredictor datasets, or additional samples in an attempt to improve the model. Aniterative process of adding/subtracting predictive layers from the model produceda more refined map.
Sampling training data using Google EarthTM
Our sampling approach can be described as a systematic-selective hybrid samplingdesign. There were 311 site areas on a grid covering the entire country, used by paststudies (AFE-COHDEFOR 2006). Between 10–15 points were chosen for each sitearea. Image interpretation was conducted using Landsat ETM with ArcGIS� ver9.3.1 and high resolution orthophotography using Google Earth. The imageinterpretation of Landsat ETM involved the assigning label attribute to each pointlocation on a systematic grid of site areas. Table 1 identifies the classes that weanticipated would be identifiable with the sampling method (Jensen 2005). A total of5616 samples were collected to build the training dataset.
Ground truth data and model validation
We collected 240 ground-based field samples by traversing navigable roads in threedifferent mapping areas (North coast, South and Western part of the country) andopportunistically selecting plots that met criteria of appropriate size (500 by 500 mor 25-ha minimum) and composition (stand homogeneity). Each plot was identifiedwith a UTM coordinate using a GPS. Field data were recorded onto paper fieldforms and subsequently entered into a database. Due to accessibility and economic
Geocarto International 5
Dow
nloa
ded
by [
Uta
h St
ate
Uni
vers
ity L
ibra
ries
] at
13:
42 1
4 D
ecem
ber
2011

constraints, only nine classes out of eleven were field sampled. After the classificationprocess, the 240 samples were dropped over the classified layers (CB and CART).
Model validation has the purpose of objectively measuring the accuracy of themap. Usually this is given by providing a measure of map accuracy (Gopal andWoodcock 1994, Congalton and Green 1999). The map validation was conductedusing the Kappa Index (K) described by Jensen (2005). It is calculated from an errormatrix table where the classes of reference data are horizontally arranged while theclassified classes are vertically arranged. The Kappa Index is calculated as follows(Equation (1)):
K ¼ NPk
i¼1 xii �Pk
i¼1 ðxi þ Xxþ iÞN2 �Pk
i¼1 ðxi þ Xxþ iÞð1Þ
where xii represents the number of combinations along the diagonal, xiþ is the totalobservations in row i, xþi total observations in column i and N is the total numberof cells.
Results
Land cover map
The most relevant mapped classes were broadleaf forest (BLF) and pine forest(sparse and dense) (BPD, BPR) that cover close to 60% of the country (Table 2,Figures 2 and 3). These forest types are located following the steep terrain that runsfrom west to east and north to south in the central part of the country. The broadleafforest is located along the north coast and in a corridor that goes from the middleto the north-western part of the country, following areas of higher precipitation.Pine forests are located in drier areas in smaller patches scattered all over the centraland western part of the country.
In between these patches, subsistence agriculture and pasture lands areas arefound, forming a mosaic of agricultural and forest patches. In bigger patches, agro-
Table 2. Areas of land use and cover as a result of the land cover mapping of Honduras.
Legend (name – code)
Area from CARTclassification
Area from clusterbusting classification
km2 % km2 %
Commercial agriculture – AGC 4135 3.71 8895.3 7.98Agriculture pasture –AGP 28,961 25.98 36,377.5 32.63Dense pine forest – BPD 13,859 12.43 8169.3 7.33Sparse pine forest – BPR 11,919 10.69 9071.0 8.14Broadleaf forest – BLF 39,249 35.21 35,038.7 31.43Mangrove forest – BMG 1067 0.96 1454.8 1.31Mixed forest – BMX 673 0.60 0.0 0.00Waters bodies – LYL 689 0.62 10,759.8 9.65Shrublands – MAT 8592 7.71 1103.5 0.99Urban – URB 204 0.18 0.0 0.00Woody savanna – SAB 2121 1.91 598.1 0.54Total 111,468 100.00 111,468 100.00
6 S. Rivera et al.
Dow
nloa
ded
by [
Uta
h St
ate
Uni
vers
ity L
ibra
ries
] at
13:
42 1
4 D
ecem
ber
2011

Figure 2. Land use and cover obtained from a cluster-busting classification of MODIS datafrom Honduras, Central America.
Figure 3. Land use and cover obtained from a CART classification of MODIS data fromHonduras, Central America.
Geocarto International 7
Dow
nloa
ded
by [
Uta
h St
ate
Uni
vers
ity L
ibra
ries
] at
13:
42 1
4 D
ecem
ber
2011
commercial activities (AGC) are located in the intermountain larger valleys. Theseareas are dedicated to high yield crops. Mangrove forest was mapped in the pacificcoast where most of this coastal ecosystem is located. We were able to identity theselarge areas. Shrublands (MAT) were also located mostly in the western and centralregions and are often seen as areas of transitions where the forest has been clearedand/or burned and most of the cleared areas have remained untouched to produce asecondary forest. This is true for most of the cleared and/or burned areas for eitherpine or broadleaf forest.
The urban class (URB) identified only when urban settlements were large (morethan 200,000 inhabitants). Smaller urban centres were not mapped given the spatialand spectral resolution of the MODIS signal. All urban settlements were not mappedwith CB method. The mixed forest was detected in the transitional zones betweenthe pine forest and BLF. Due to its foliar composition, its detection was not veryaccurate. An explanation for this is discussed later in this article.
Honduras has only two important lakes (LYL): they both are located in thecentral part of the country and were accurately mapped. The last class detected bythe MODIS sensor was the woody savanna. A peculiar ecosystem located in thenorthern and eastern portion of the country, close to the Caribbean coast. This istypically composed by grass and shrub vegetation accompanied by sparse pine trees.
Model validation
Cluster busting
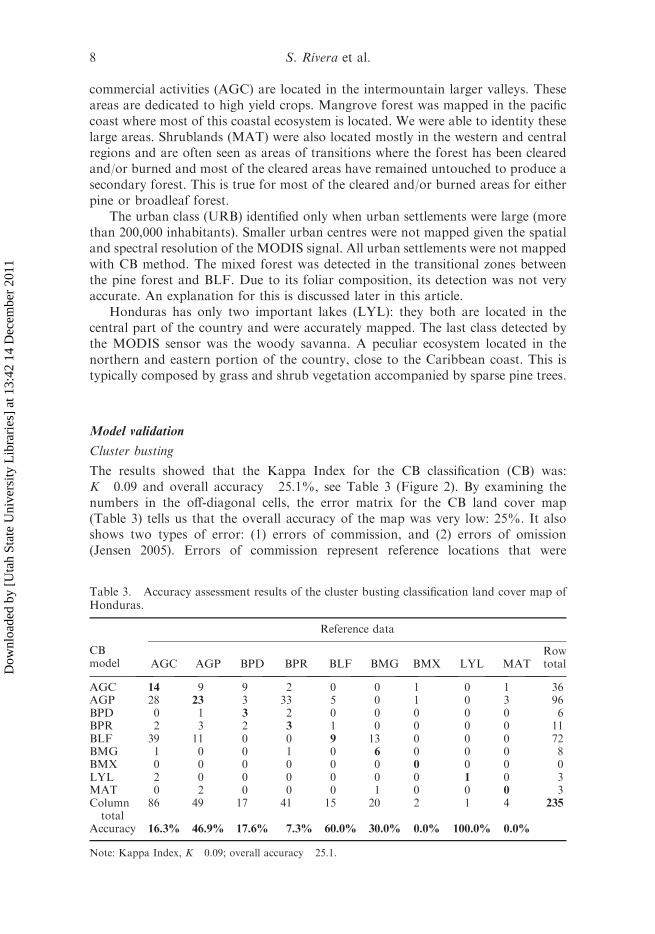
The results showed that the Kappa Index for the CB classification (CB) was:K¼ 0.09 and overall accuracy¼ 25.1%, see Table 3 (Figure 2). By examining thenumbers in the off-diagonal cells, the error matrix for the CB land cover map(Table 3) tells us that the overall accuracy of the map was very low: 25%. It alsoshows two types of error: (1) errors of commission, and (2) errors of omission(Jensen 2005). Errors of commission represent reference locations that were
Table 3. Accuracy assessment results of the cluster busting classification land cover map ofHonduras.
CBmodel
Reference data
AGC AGP BPD BPR BLF BMG BMX LYL MATRowtotal
AGC 14 9 9 2 0 0 1 0 1 36AGP 28 23 3 33 5 0 1 0 3 96BPD 0 1 3 2 0 0 0 0 0 6BPR 2 3 2 3 1 0 0 0 0 11BLF 39 11 0 0 9 13 0 0 0 72BMG 1 0 0 1 0 6 0 0 0 8BMX 0 0 0 0 0 0 0 0 0 0LYL 2 0 0 0 0 0 0 1 0 3MAT 0 2 0 0 0 1 0 0 0 3Column
total86 49 17 41 15 20 2 1 4 235
Accuracy 16.3% 46.9% 17.6% 7.3% 60.0% 30.0% 0.0% 100.0% 0.0%
Note: Kappa Index, K¼ 0.09; overall accuracy¼ 25.1.
8 S. Rivera et al.
Dow
nloa
ded
by [
Uta
h St
ate
Uni
vers
ity L
ibra
ries
] at
13:
42 1
4 D
ecem
ber
2011

incorrectly mapped as other mapped classes, and are presented as the percentages atthe right of the row totals. Tables 2 and 3 tell us that the CB classification mappedbetter the following classes: BLF with 60% accuracy followed by agriculture-pasture(AGP) 47%. Table 2 also confirms that these two classes were better mapped whencompared to the CART classification. Water bodies (LYL) resulted with 100%accuracy; however, we had only one sample that fell in this class. There was 30%accuracy when mapping mangrove forest (BMG). The other classes (AGC, BPD,BPR, BMX and MAT) showed less than 20% accuracy.
CART classification
The results showed that the Kappa Index for the CART classification (CART) was:K¼ 0.74 and overall accuracy¼ 79.6%, see Table 4 (Figure 3). The error matrix forthe CART land cover map (Table 4, Figure 3) tells us that the overall accuracy of themap was 79.6%. Errors of commission represent reference locations that wereincorrectly mapped as other mapped classes, and are presented as the percentages atthe right of the row totals (Jensen 2005). For example, there were 86 referencesamples that ‘landed on’ AGC, but only 81 of those were AGC. The four samplesthat were not AGC, but landed on AGC, these are considered errors of commission.Errors of omission represent locations on the map that were not mapped correctly,and are presented as the percentages at the bottom of the column totals. Forexample, there were a total of 86 AGC reference locations, but only 84 (94.2%) werein locations mapped as AGC. The remaining 5.8% were mapped as something elseand are considered errors of omission.
By examining the error matrices for the map, we can see that some land coverclasses were mapped very well, while others were mapped quite poorly. If weconsider any class mapped with accuracy greater than 80% (mapped well), we notethat AGC, AGP, BLF, BMG and LYL were all mapped very well. Classes mappedmoderately well (50–80%) were BPD, BMX and MAT. Classes mapped poorly(550%) were only BPR. For example, in the map, we noted that almost 50%
Table 4. Accuracy assessment results of the CART classification land cover map ofHonduras.
CARTmodel
Reference data
AGC AGP BPD BPR BLF BMG BMX LYL MATRowtotal
AGC 81 0 0 0 0 0 0 0 81AGP 4 47 1 4 3 0 1 0 1 61BPD 0 0 13 1 0 0 0 0 0 14BPR 0 0 1 10 0 0 0 0 0 11BLF 1 0 2 1 12 0 0 0 0 16BMG 0 0 0 0 0 20 0 0 1 21BMX 0 1 0 22 0 0 1 0 0 24LYL 0 0 0 0 0 0 0 1 0 1MAT 0 1 0 3 0 0 0 0 2 6Columntotal
86 49 17 41 15 20 2 1 4 235
Accuracy 94.2% 95.9% 76.5% 24.4% 80.0% 100.0% 50.0% 100.0% 50.0%
Note: Kappa Index, K¼ 0.74; overall accuracy¼ 79.6.
Geocarto International 9
Dow
nloa
ded
by [
Uta
h St
ate
Uni
vers
ity L
ibra
ries
] at
13:
42 1
4 D
ecem
ber
2011
(22 samples) of BPR reference locations were erroneously mapped as BMX. Ingeneral, we can conclude that BPR was ‘confused’ with BMX, and that morereference samples are needed to make a better assessment of CART classificationperformance on the MAT and BMX classes.
Discussion
The CART classifier made a more accurate MODIS image classification. Eventhough the CART method was considerably a more time-consuming one, wefound that it performed much better than the CB method. The CART classifiersare a more powerful tool for discriminating land cover classes. Our results werevery consistent with other investigations (Latifovic et al. 2000, Friedl et al. 2002).They are also a very interpretable and explicit method, because their hierarchicaldecision rules and splits can be revealed and explained (Lowry et al. 2007). TheGoogle Earth sampling scheme proved to be a very cost-effective procedure. Noreferences were found on the previous use of this approach for training datacollection of a land map use.
Although the CB method resulted in a less accurate image classification, we wereable to identify some advantages over the CART method. With sufficient expertknowledge of the area, the CB classification method was able to identify anddiscriminate classes represented by large and continuous patches, for instance, BLFand AGP classes. The resulting areas of these two classes are similar to the onesfound for the CART classification (see Table 2). They were able to be discriminatedin a short time, with relative easiness and moderated accuracy – between 45% and60%. This proved that the CB method can be used for a preliminary classification,targeting the large and continuous classes. These findings coincide with other studiesusing unsupervised approaches (Muchoney et al. 2000, Lotsch et al. 2003).
By examining the error matrices for the map we can observe that some land coverclasses were mapped very well, while others were difficult to mapped. If we considerany class mapped with accuracy greater than 80% mapped well, we note that AGC,BPD, BLF and BMG are all mapped very well. Classes mapped moderately well(50–80%) are AGP, LYL, URB and SAB. Classes mapped poorly (550%) are BPR,BMX and MAT.
MODIS capability and the classification procedure exceeded the project expectedgoals. At the beginning of the study, eight classes were set up in such way that canpotentially be discriminated and mapped. As the project progressed, three (3) moreclasses were added to the classification algorithm. The accuracy assessment of themap was very high particularly for some classes such as BLF, mangrove forest(BMG) and commercial agriculture (AGC).
We also found that MODIS data had some disadvantages, especially atdiscrimination of some classes such as: sparse pine forest (BPR), mixed forest(BMX) and shrublands (MAT). This is basically a limitation of the sensor to clearlydetect these classes at a moderate resolution of 500 m, which are transitional classes;however, these classes are considered a transition of secondary forest which isconstantly growing to become primary forest or fully grown forest. In the case ofshrublands, they will grow until they become adult trees. Similarly, in the mixedforest (BMX), trees will mature until either conifer or broadleaf species becomedominant. Therefore, we believe that the MODIS signal does not work very well atdiscriminating different vegetation stages at this resolution, although it does very
10 S. Rivera et al.
Dow
nloa
ded
by [
Uta
h St
ate
Uni
vers
ity L
ibra
ries
] at
13:
42 1
4 D
ecem
ber
2011

well differentiates fully grown or developed vegetation classes and types. Others havefound these MODIS limitations in the past (Latifovic et al. 2000, Muchoney et al.2000). Similarly Eggen-McIntosh et al. (1994) found the same obstacles using courseresolution imagery such as AVHRR imagery.
Summary
The use of MODIS imagery and the procedure employed for classification providedoutstanding results in term of classification accuracy. MODIS imagery proved to bevery affordable and successful by identifying and discriminating land use classes at thecountry level. The accuracy assessment of the map was very high particularly forsome classes such as BLF, mangrove forest and commercial agriculture. The objectiveof the accuracy assessment was to quantitatively measure the accuracy of a MODISderived land cover map product. Eleven land cover classes were mapped and theiragreement assessed with an error matrix and Kappa statistics. Overall accuracy was76% for the CART map product. This level of accuracy was found similar to othermapping efforts at a country level scale (Laba et al. 2002, Lotsch et al. 2003).
The Google Earth sampling protocol seems very promising as a cost-effectivemethod to collect training samples without needing costly field visits. It showed ahigh accuracy as was used to collect the sampling training data. This has ascientific and environmental visualization tool and has been increasingly usedsince its launch in 2005 (Sheppard and Cizek 2009). With minor training sessions,analysts were able to operate and collect samples. Despite the tedious workinvolved in the sampling collection, very few mistakes were made wheninterpreting the images.
We can conclude that classes with large and continuous patches can be moreeasily mapped using a CB classification approach. These classes can be BLF andAGP. Then, a CART classification approach can be better used to map classes suchas BPD, BPR, AGC and BMG, which represent smaller, but more solid and moreheterogeneous patches. Fully grown vegetation classes such as AGC, BPD, BLF andBMG were all mapped very well using the CART approach. Transitional vegetationclasses such as BMX, BPR and MAT were very poorly mapped and were highlyconfused among them. We detected that the cause may be attributed to a MODISsensor limitation. We suggest that using a higher resolution image such as Landsator ASTER images may be a more viable option to map these confusing classes.
The present study also demonstrates that it is possible to perform a national landcover mapping procedure with an acceptable level of accuracy and publicly availablemoderate resolution satellite data.
Acknowledgements
The authors acknowledge the financial support for this research through a grant awarded toThe Utah State University’s Remote Sensing and GIS Laboratories and the National Schoolof Forest Sciences by the World Bank and the Government of Honduras.
References
AFE-COHDEFOR, 2006. Evaluacion Nacional Forestal de Honduras 2005–2006. ProyectoApoyo al Inventario y Evaluacion de Bosques y Arboles TC-HON-3001 (A). Resultatdosdel Inventrio de Bosques y Arboles 2005–2006. Honduras. Octubre 2006, 127.
Breiman, L., et al., 1984. Classification and regression trees. Belmont, CA: Wadsworth, Inc.
Geocarto International 11
Dow
nloa
ded
by [
Uta
h St
ate
Uni
vers
ity L
ibra
ries
] at
13:
42 1
4 D
ecem
ber
2011

Brown, J.C., et al., 2007. Using MODIS to detect cropping frequency variation in mechanizedagriculture in Amazonia. Anais XIII Simposio Brasileiro de Sensoriamento Remoto,Florianopolis, Brasil, 21–26 abril 2007, INPE, 99-101.
COHDEFOR, 1996. Plan de accion forestal de largo plazo 1996–2015. PLANFOR. Borrador.Unidad de Planificacion Institucional. AFE-COHDEFOR. Tegucigalpa MDC, Honduras,127 p.
Congalton, R.G. and Green, K., 1999. Assessing the accuracy of remotely sensed data:principles and practices. Boca Raton: Lewis Publishers.
DeFries, R.S., Foley, J.A., and Asner, G.P., 2004. Land-use choices: balancing human needsand ecosystem function. Frontiers in Ecology and Environment, 2 (5), 249–257.
Eggen-McIntosh, S.K., Lannon, B., and Jacobs, D.M., 1994. Mapping distributions of centralAmerica and Mexico. New Orleans, LA, USA: USDA-USFS. Southern ExperimentStation. Proceeding reprint.
Falzarano, S., Thomas, K., and Lowry, J.L., 2005. Using decision tree modeling in GAPanalysis land cover mapping: preliminary results for northeastern Arizona. In: C. vanRiper III and D.J. Mattson, eds. The Colorado plateau II: biophysical, socioeconomic, andcultural research. Tucson, Arizona: The University of Arizona Press.
FAO, 2005. Forest resources assessment. Rome, Italy: FAO.Friedl, M.A., et al., 2002. Global land cover mapping from MODIS: algorithms and early
results. Remote Sensing of Environment, 83, 287–302.Global Forest Watch, 2010. [online]. Available from: http://www.globalforestwatch.org/
[Accessed 21 June 2010].Gopal, S. and Woodcock, C., 1994. Theory and methods for accuracy assessment of
thematic maps using fuzzy sets. Photogrammetric Engineering and Remote Sensing, 60 (2),181–188.
Gutierrez, L.A., 1992. Diagnostico de las cuencas hidrograficas de Honduras. Informe deConsultoria: Banco Interamericano de Desarrollo. Tegucigalpa, Honduras, 124.
Hansen, J., et al., 1996. Global surface air temperature in 1995: return to pre-Pinatubo level.Geophysical Research Letters, 23, 1665–1668.
Homer, C., et al., 2004. Development of a 2001 national land-cover database for the UnitedStates. Photogrammetric Engineering & Remote Sensing, 70 (7), 829–840.
Jensen, J.R., 2005. Introductory digital image processing: a remote sensing perspective. 3rd ed.Upper Saddle River, New Jersey: Pearson-Prentice Hall, 526.
Laba, M.L., et al., 2002. Conventional and fuzzy accuracy assessment of the New York gapanalysis project land cover map. Remote Sensing of Environment, 82, 443–456.
Laboranti, C., 1992. Diagnostico hidrologico de las cuencas hidrograficas de Honduras.Programa Nacional de Manejo de Cuencas. OEA-Gobierno de Honduras, 126.
Latifovic, R., et al., 2000. Land cover mapping of North and Central America-global landcover. Remote Sensing of Environment, 89 (2004), 116–127.
Lotsch, A., et al., 2003. Land cover mapping in support of LAI and FPAR retrievals fromEOS-MODIS and MISR: classification methods and sensitivities to errors. InternationalJournal of Remote Sensing, 24 (10), 1997–2016.
Loveland, T.R., et al., 2000. Development of a global land cover characteristics databaseand IGBP DISCover from 1 km AVHRR data. International Journal of Remote Sensing,21 (6), 1303–1330.
Lowry, J.L., et al., 2007. Mapping moderate-scale land-cover over very, large geographic areaswithin a collaborative framework: a case study of the Southwest regional gap analysisproject (SWReGAP). Remote Sensing of Environment, 108, 59–73.
Muchoney, D., et al., 2000. Application of the MODIS global supervised classification modelto vegetation and land cover mapping of Central America. International Journal of RemoteSensing, 21 (6), 1115–1138.
Ordonez, T.M.M. and House, P., 2002. Mapa de Ecosistemas Vegetales de Honduras: manualde Consulta. Proyecto P.A.A.R., Tegucigalpa, Honduras.
Pal, M. and Mather, M., 2003. An assessment of the effectiveness of decision tree methods forland cover classification. Remote Sensing of Environment, 86, 554–565.
Richards, M., 1996. Protected areas, people and incentives in the search for sustainable forestconservation in Honduras. Environmental Conservation, 23 (3), 207–217.
12 S. Rivera et al.
Dow
nloa
ded
by [
Uta
h St
ate
Uni
vers
ity L
ibra
ries
] at
13:
42 1
4 D
ecem
ber
2011

RuleQuest Research, 2004. [online]. Available from: http://www.rulequest.com/index.html[Accessed 21 June 2010].
Sheppard, S.R.J. and Cizek, P., 2009. The ethics of Google Earth: crossing thresholds fromspatial data to landscape visualization. Journal of Environmental Management, 90 (2009),2102–2117.
Stonich, S.C., 1993. I am destroying the land. The political ecology of poverty and environmentaldestruction in Honduras. Boulder, CO: Westview Press, 204.
UNESCO, 1973. International classification and mapping of vegetation. Paris, France: UnitedNations Educational, Scientific and Cultural Organization.
Vermote, E.F., 2008. MODIS surface reflectance user’s guide. MODIS land use reflectancescience computing facility. [online]. Prepared by E.F. Vermote, S.Y. Kotchenova andJ.P. Ray. Available from: http://modis-sr.ltdri.org. 26.
Geocarto International 13
Dow
nloa
ded
by [
Uta
h St
ate
Uni
vers
ity L
ibra
ries
] at
13:
42 1
4 D
ecem
ber
2011