Land surface temperature variation in relation to vegetation type using MODIS satellite data in...
18
PLEASE SCROLL DOWN FOR ARTICLE This article was downloaded by: [Indian Institute of Remote Sensing] On: 10 August 2009 Access details: Access Details: [subscription number 908695327] Publisher Taylor & Francis Informa Ltd Registered in England and Wales Registered Number: 1072954 Registered office: Mortimer House, 37-41 Mortimer Street, London W1T 3JH, UK International Journal of Remote Sensing Publication details, including instructions for authors and subscription information: http://www.informaworld.com/smpp/title~content=t713722504 Land surface temperature variation in relation to vegetation type using MODIS satellite data in Gujarat state of India B. R. Parida a ; B. Oinam b ; N. R. Patel c ; N. Sharma d ; R. Kandwal e ; M. K. Hazarika f a Max Planck Institute for Meteorology, D-20146 Hamburg, Germany b Department of Hydraulic Engineering and Water Resources Management, University of Stuttgart, Germany c Indian Institute of Remote Sensing, Dehradun, India d Water Resource Department and Management, IIT-Roorkee, India e Department of Civil Engineering, IIT-Roorkee, India f Geoinformatics Centre, Asian Institute of Technology (AIT), Thailand Online Publication Date: 01 January 2008 To cite this Article Parida, B. R., Oinam, B., Patel, N. R., Sharma, N., Kandwal, R. and Hazarika, M. K.(2008)'Land surface temperature variation in relation to vegetation type using MODIS satellite data in Gujarat state of India',International Journal of Remote Sensing,29:14,4219 — 4235 To link to this Article: DOI: 10.1080/01431160701871096 URL: http://dx.doi.org/10.1080/01431160701871096 Full terms and conditions of use: http://www.informaworld.com/terms-and-conditions-of-access.pdf This article may be used for research, teaching and private study purposes. Any substantial or systematic reproduction, re-distribution, re-selling, loan or sub-licensing, systematic supply or distribution in any form to anyone is expressly forbidden. The publisher does not give any warranty express or implied or make any representation that the contents will be complete or accurate or up to date. The accuracy of any instructions, formulae and drug doses should be independently verified with primary sources. The publisher shall not be liable for any loss, actions, claims, proceedings, demand or costs or damages whatsoever or howsoever caused arising directly or indirectly in connection with or arising out of the use of this material.
Transcript of Land surface temperature variation in relation to vegetation type using MODIS satellite data in...
PLEASE SCROLL DOWN FOR ARTICLE
This article was downloaded by: [Indian Institute of Remote Sensing]On: 10 August 2009Access details: Access Details: [subscription number 908695327]Publisher Taylor & FrancisInforma Ltd Registered in England and Wales Registered Number: 1072954 Registered office: Mortimer House,37-41 Mortimer Street, London W1T 3JH, UK
International Journal of Remote SensingPublication details, including instructions for authors and subscription information:http://www.informaworld.com/smpp/title~content=t713722504
Land surface temperature variation in relation to vegetation type using MODISsatellite data in Gujarat state of IndiaB. R. Parida a; B. Oinam b; N. R. Patel c; N. Sharma d; R. Kandwal e; M. K. Hazarika f
a Max Planck Institute for Meteorology, D-20146 Hamburg, Germany b Department of Hydraulic Engineeringand Water Resources Management, University of Stuttgart, Germany c Indian Institute of Remote Sensing,Dehradun, India d Water Resource Department and Management, IIT-Roorkee, India e Department of CivilEngineering, IIT-Roorkee, India f Geoinformatics Centre, Asian Institute of Technology (AIT), Thailand
Online Publication Date: 01 January 2008
To cite this Article Parida, B. R., Oinam, B., Patel, N. R., Sharma, N., Kandwal, R. and Hazarika, M. K.(2008)'Land surfacetemperature variation in relation to vegetation type using MODIS satellite data in Gujarat state of India',International Journal ofRemote Sensing,29:14,4219 — 4235
To link to this Article: DOI: 10.1080/01431160701871096
URL: http://dx.doi.org/10.1080/01431160701871096
Full terms and conditions of use: http://www.informaworld.com/terms-and-conditions-of-access.pdf
This article may be used for research, teaching and private study purposes. Any substantial orsystematic reproduction, re-distribution, re-selling, loan or sub-licensing, systematic supply ordistribution in any form to anyone is expressly forbidden.
The publisher does not give any warranty express or implied or make any representation that the contentswill be complete or accurate or up to date. The accuracy of any instructions, formulae and drug dosesshould be independently verified with primary sources. The publisher shall not be liable for any loss,actions, claims, proceedings, demand or costs or damages whatsoever or howsoever caused arising directlyor indirectly in connection with or arising out of the use of this material.
Land surface temperature variation in relation to vegetation type usingMODIS satellite data in Gujarat state of India
B. R. PARIDA{*, B. OINAM{, N. R. PATEL§, N. SHARMA", R. KANDWAL{{and M. K. HAZARIKA{{
{Max Planck Institute for Meteorology, Bundesstraße 53, D-20146 Hamburg, Germany
{Department of Hydraulic Engineering and Water Resources Management, University
of Stuttgart, Germany
§Indian Institute of Remote Sensing, Dehradun, India
"Water Resource Department and Management, IIT-Roorkee, India
{{Department of Civil Engineering, IIT-Roorkee, India
{{Geoinformatics Centre, Asian Institute of Technology (AIT), Thailand
(Received 28 March 2006; in final form 13 December 2007 )
The Moderate Resolution Imaging Spectroradiometer (MODIS) has provided an
improved capability for moderate resolution land surface monitoring and for
studying surface temperature variations. Surface temperature is a key variable in
the surface energy balance. To investigate the temporal variation of surface
temperature in relation to different vegetation types, MODIS data from 2000–04
were used, especially in the reproductive phase of crops (September–October).
The vegetation types used for this study were agriculture in desert areas, rainfed
agriculture, irrigated agriculture, and forest. We found that among the different
vegetation types, the desert-based agriculture showed the highest surface
temperature followed by rainfed agriculture, irrigated agriculture, and forest.
The variation in surface temperature indicates that the climatic variation is
mostly determined by the different types of vegetation cover on the Earth’s
surface rather than rapid climate change attributable to climatic sources. The
mean land surface temperature (LST) and air temperature (Ta) were plotted for
each vegetation type from September to October during 2000 and 2004. Higher
temperatures were observed for each vegetation type in 2000 as compared to 2004
and lower total rainfall was observed in 2000. The relationship between MODIS
LST and Ta measurements from meteorological stations was established and
illustrated that years 2000 and 2004 had a distinct climatic variability within the
time-frame in the study area. In all test sites, the study found that there was a
high correlation (r50.80–0.98) between LST and Ta.
1. Introduction
In the contemporary world, aerospace information gathered by different sensors
and observation missions has become a necessity in various investigations and
application fields. Remote sensing technologies are used for natural resources
management, ecosystem change detection, environment preservation and in many
other significant world problems. Vegetation monitoring is among the priorities of
these investigations. One important parameter that controls the ground thermal
*Corresponding author. Email: [email protected]
International Journal of Remote Sensing
Vol. 29, No. 14, 20 July 2008, 4219–4235
International Journal of Remote SensingISSN 0143-1161 print/ISSN 1366-5901 online # 2008 Taylor & Francis
http://www.tandf.co.uk/journalsDOI: 10.1080/01431160701871096
Downloaded By: [Indian Institute of Remote Sensing] At: 07:28 10 August 2009

regime in vegetation areas is the surface heat balance. Satellite remote sensing
provides a means of mapping/monitoring the surface heat balance at the spatial and
temporal resolutions required for regional to continental scale vegetation investiga-
tions. Analysis of past climate variations is a vital part of understanding climate
change, and an important indicator of climate is the surface temperature. The
Intergovernmental Panel on Climate Change (IPCC; Houghton et al. 2001)
emphasized the urgent need for long-term remote sensing-based land surface skin
temperature data in global warming studies to improve the limits of the
conventional 2-m World Meteorological Organization (WMO) surface air
temperature observations. Monitoring of vegetation is improving with the wider
availability of satellite remote sensing data and especially with improved moderate
resolution satellite sensors, such as the Moderate Resolution Imaging
Spectroradiometer (MODIS) instruments onboard the Terra and Aqua platforms.
The MODIS provides information about the Earth’s surface in 36 wavebands
covering the visible, near-infrared, shortwave infrared (SWIR) and thermal ranges.
Several forthcoming spaceborne sensors will have multiple thermal infrared bands
that will enable us to estimate land surface temperature (LST) and emissivity
simultaneously. The MODIS currently has multiple thermal bands in the 3.5–4.2 mm
and the 8–13.5 mm ranges (Salomonson et al. 1989), and the Advanced Spaceborne
Thermal Emission and Reflection Radiometer (ASTER) has five thermal bands in
the 8–12 mm range. The design for land imaging combines and improves upon the
strengths of the existing Advanced Very High Resolution Radiometer (AVHRR)
sensor including finer spatial resolution as well as high-spectral resolution, allowing
significantly better atmospheric profiling, atmospheric correction and more accurate
LST computation.
There is a fundamental difference between climate change and climate
variability. Climate change constitutes a shift in meteorological conditions that
lasts for a long period of time, usually centuries. Climate variability comprises
short-term fluctuations that occur from year to year (Burroughs 2001). The
underlying concept is that global climate changes cause local scale impacts and
that it is not possible to treat variability separately from climate change (Mearns
et al. 1997, Smit et al. 1999, 2000). Assessing the future impact of global
environmental change is an uncertain and important issue. An integrated study of
the human driving forces and implications of environmental change has been
undertaken by the Southeast Asian Regional Committee for START (SARCS) to
look into the issue of rapid environmental change, its causes and consequences, in
Southeast Asia regions (Lebel 1998). The thrust of the study is ‘living with global
change’ in a sustainable way, and focusing on the close interconnection between
sustainable (and unsustainable) development and global change feedback. Many
parts of the Southeast Asia region and the Indian subcontinent have undergone
rapid social, economic and environmental transformations giving rise, more
recently, to economic problems. Industrialization, urbanization and high rates of
population and economic growth, together with the ongoing modifications to
desert, coastal areas and tropical rainforests, make the Southeast Asia region a
‘hot spot’ from both sustainable development and global change perspectives.
Changes in climate will interact with stresses that result from actions to increase
agricultural production, affecting crop yields and productivity in different ways,
depending on the types of agricultural practices and systems in place. Hence, there
is a need to focus on this area of research to assess the effect/impact of the
4220 B. R. Parida et al.
Downloaded By: [Indian Institute of Remote Sensing] At: 07:28 10 August 2009
dynamics of the LST regime to different land cover features on the Earth’s
surface.
1.1 Satellite-derived LST
LST is generally defined as the skin temperature of the ground. For the bare soil
surface, LST is the soil surface temperature; for dense vegetated ground, LST can
be viewed as the canopy surface temperature of the vegetation; and for sparse
vegetated ground, LST is determined by the temperature of the vegetation
canopy, vegetation body and the soil surface (Qin and Karnieli 1999). LST is a
very useful input for modelling energy balance components and mapping
evapotranspiration (ET). Retrieval of LST using thermal infrared bands of
satellite images is the most effective way of deriving energy balance and ET on a
regional basis. The LST is an important factor controlling most physical, chemical
and biological processes of the Earth. Knowledge of the LST is necessary for
many environmental studies and management activities of the Earth’s surface
resources (Li and Becker 1993). It is one of the key parameters in the physics of
land surface processes on regional and global scales, combining the results of all
surface–atmosphere interactions and energy fluxes between the atmosphere and
the ground (Mannstein 1987).
1.2 Objectives
The aim of this research was to assess the suitability of MODIS data for examining
the temporal variation of surface temperature for different vegetation types between
2000 and 2004. We wanted to determine how the surface temperature dynamics
correlate to local land use types, namely vegetation in desert areas, rainfed
agriculture, irrigated agriculture and forest, as a result of climatic variation within
the time-frame in Gujarat state. To study the climatic variability, this particular time
frame was chosen as a representative test case.
2. Study area and data used
Gujarat state is located in the north-west of India between 20u19 N and 24u79 N
latitude and 68u49 E and 74u49 E longitude (figure 1). The Tropic of Cancer passes
through the northern border of the state. It is bounded by the Arabian Sea on the
west, Pakistan and Rajasthan in the north and north-east, respectively, Madhya
Pradesh in the south-east and Maharashtra in the south. The two deserts, one north
of Kutch and the other between Kutch and the mainland Gujarat, are saline wastes.
Gujarat state covers a total geographical area of 196 024 sq km (75 685 sq m) and
accounts for 6.19% of the total area of the country. It has about 1600 km of
coastline, which is about a third of India’s total coastline and the longest coastline of
all Indian states. This coastline includes the Gulf of Kutch and the Gulf of Cambay.
The state comprises three geographical regions:
N a peninsula, traditionally known as Saurashtra, which is essentially a hilly tract
sprinkled with low mountains;
N Kutch on the north-east is barren and rocky and contains the famous Rann
(desert) of Kutch, the big Rann in the north and the little Rann in the east;
Land surface temperature variation in Gujarat state of India 4221
Downloaded By: [Indian Institute of Remote Sensing] At: 07:28 10 August 2009
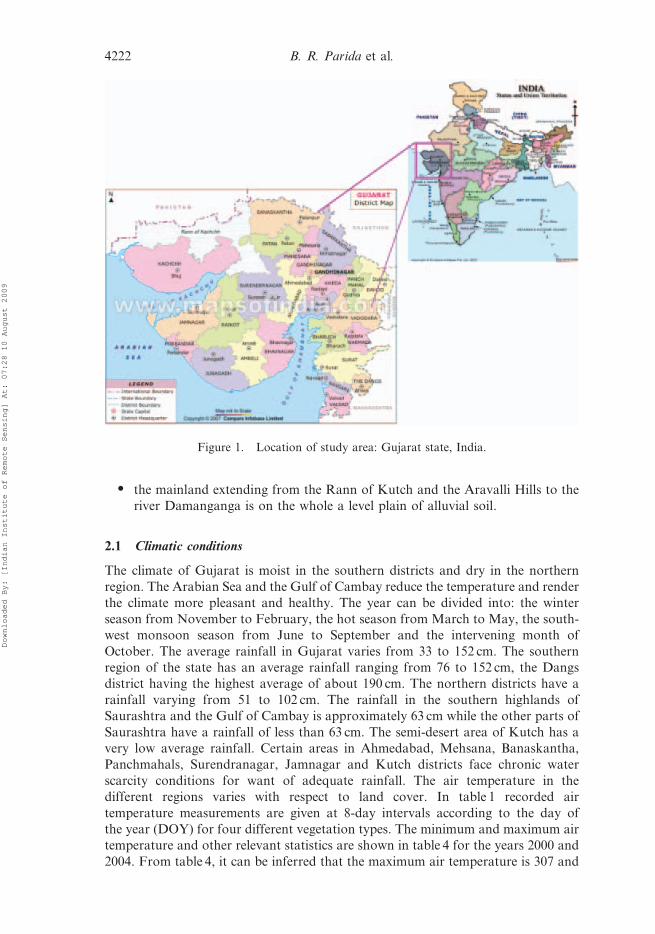
N the mainland extending from the Rann of Kutch and the Aravalli Hills to the
river Damanganga is on the whole a level plain of alluvial soil.
2.1 Climatic conditions
The climate of Gujarat is moist in the southern districts and dry in the northern
region. The Arabian Sea and the Gulf of Cambay reduce the temperature and render
the climate more pleasant and healthy. The year can be divided into: the winter
season from November to February, the hot season from March to May, the south-
west monsoon season from June to September and the intervening month of
October. The average rainfall in Gujarat varies from 33 to 152 cm. The southern
region of the state has an average rainfall ranging from 76 to 152 cm, the Dangs
district having the highest average of about 190 cm. The northern districts have a
rainfall varying from 51 to 102 cm. The rainfall in the southern highlands of
Saurashtra and the Gulf of Cambay is approximately 63 cm while the other parts of
Saurashtra have a rainfall of less than 63 cm. The semi-desert area of Kutch has a
very low average rainfall. Certain areas in Ahmedabad, Mehsana, Banaskantha,
Panchmahals, Surendranagar, Jamnagar and Kutch districts face chronic water
scarcity conditions for want of adequate rainfall. The air temperature in the
different regions varies with respect to land cover. In table 1 recorded air
temperature measurements are given at 8-day intervals according to the day of
the year (DOY) for four different vegetation types. The minimum and maximum air
temperature and other relevant statistics are shown in table 4 for the years 2000 and
2004. From table 4, it can be inferred that the maximum air temperature is 307 and
Figure 1. Location of study area: Gujarat state, India.
4222 B. R. Parida et al.
Downloaded By: [Indian Institute of Remote Sensing] At: 07:28 10 August 2009
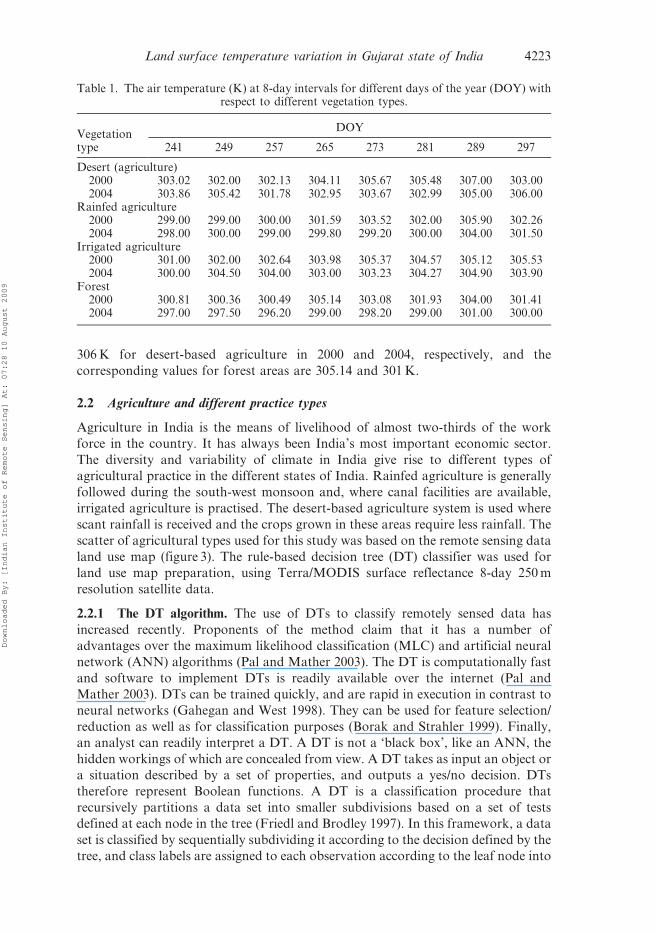
306 K for desert-based agriculture in 2000 and 2004, respectively, and the
corresponding values for forest areas are 305.14 and 301 K.
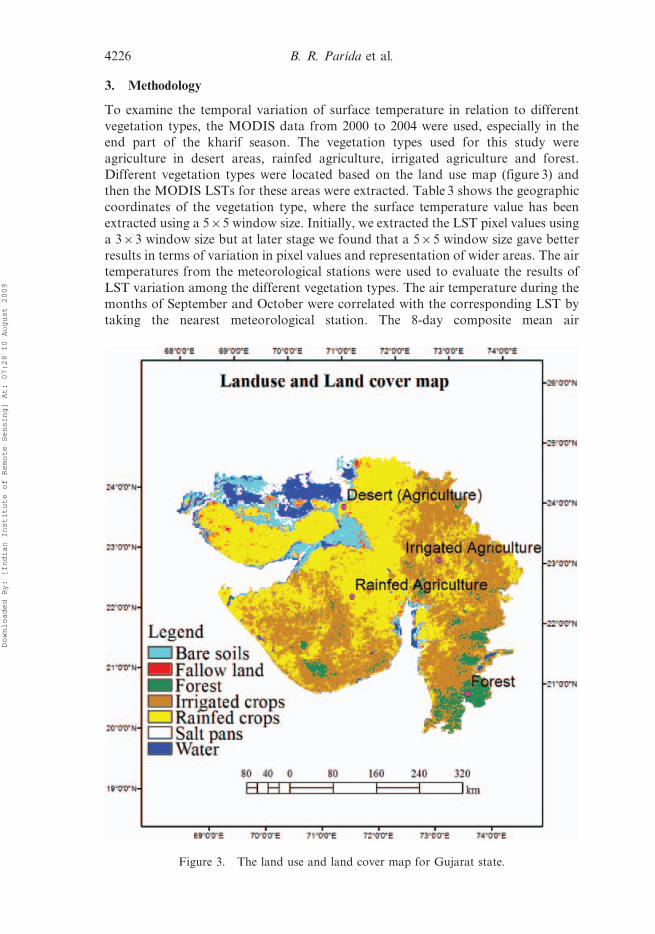
2.2 Agriculture and different practice types
Agriculture in India is the means of livelihood of almost two-thirds of the work
force in the country. It has always been India’s most important economic sector.
The diversity and variability of climate in India give rise to different types of
agricultural practice in the different states of India. Rainfed agriculture is generally
followed during the south-west monsoon and, where canal facilities are available,
irrigated agriculture is practised. The desert-based agriculture system is used where
scant rainfall is received and the crops grown in these areas require less rainfall. The
scatter of agricultural types used for this study was based on the remote sensing data
land use map (figure 3). The rule-based decision tree (DT) classifier was used for
land use map preparation, using Terra/MODIS surface reflectance 8-day 250 m
resolution satellite data.
2.2.1 The DT algorithm. The use of DTs to classify remotely sensed data has
increased recently. Proponents of the method claim that it has a number of
advantages over the maximum likelihood classification (MLC) and artificial neural
network (ANN) algorithms (Pal and Mather 2003). The DT is computationally fast
and software to implement DTs is readily available over the internet (Pal and
Mather 2003). DTs can be trained quickly, and are rapid in execution in contrast to
neural networks (Gahegan and West 1998). They can be used for feature selection/
reduction as well as for classification purposes (Borak and Strahler 1999). Finally,
an analyst can readily interpret a DT. A DT is not a ‘black box’, like an ANN, the
hidden workings of which are concealed from view. A DT takes as input an object or
a situation described by a set of properties, and outputs a yes/no decision. DTs
therefore represent Boolean functions. A DT is a classification procedure that
recursively partitions a data set into smaller subdivisions based on a set of tests
defined at each node in the tree (Friedl and Brodley 1997). In this framework, a data
set is classified by sequentially subdividing it according to the decision defined by the
tree, and class labels are assigned to each observation according to the leaf node into
Table 1. The air temperature (K) at 8-day intervals for different days of the year (DOY) withrespect to different vegetation types.
Vegetationtype
DOY
241 249 257 265 273 281 289 297
Desert (agriculture)2000 303.02 302.00 302.13 304.11 305.67 305.48 307.00 303.002004 303.86 305.42 301.78 302.95 303.67 302.99 305.00 306.00
Rainfed agriculture2000 299.00 299.00 300.00 301.59 303.52 302.00 305.90 302.262004 298.00 300.00 299.00 299.80 299.20 300.00 304.00 301.50
Irrigated agriculture2000 301.00 302.00 302.64 303.98 305.37 304.57 305.12 305.532004 300.00 304.50 304.00 303.00 303.23 304.27 304.90 303.90
Forest2000 300.81 300.36 300.49 305.14 303.08 301.93 304.00 301.412004 297.00 297.50 296.20 299.00 298.20 299.00 301.00 300.00
Land surface temperature variation in Gujarat state of India 4223
Downloaded By: [Indian Institute of Remote Sensing] At: 07:28 10 August 2009

which the observation falls (figure 2). The generalized land use classification was
constructed using the hierarchical rule-based DT supervised classification method in
ENVI (Environmental Visualization) marketed by ITT Corporation. This classifica-
tion was made by taking the actual values of various thresholds of the Normalized
Difference Vegetation Index (ND) image and hence it does not require any training
samples. Classification criteria/rules used for generalized land use classification are
given in table 2.
The south-west monsoon is crucial to the development of Indian agricultural
production. It provides 80% of India’s total precipitation and is important in the
development of its major food and commercial crops such as rice, coarse grains,
pulses, peanuts, soybeans and cotton. The south-west monsoon typically enters the
mainland over Kerala in the first week of June and continues up to September. It
moves northwards to cover the whole of India by mid-July. Planting of the largely
rainfed kharif (monsoon season) crops, which include rice, sorghum, corn, millet,
peanut, soybean and cotton, begins after the monsoon is firmly established in the
state and continues throughout July and in early August. According to the local
crop calendar the sowing starts after the onset of the monsoon and varies
according to the arrival of the monsoon. Rice is largely grown under rainfed
conditions during July and August and is harvested during November and
December, whereas other rainfed crops are sown during July and harvesting
Figure 2. A decision tree classifier. Each box is a node at which tests (T) are applied torecursively split the data into successively smaller groups. The labels A, B and C at each leafnode refer to the class label assigned to each observation (Source: Friedl and Brodley 1997).
Table 2. The criteria/rules used for generalized land use classification.
Rules Class
ND.0.74 Forest0.74,ND.0.46 Irrigated crops0.46,ND.0.20 Rainfed crops0.20,ND.0.15 Fallow land0.15,ND.0.05 Bare soils0.05,ND.0.001 Salt pansND,20.001 Water
ND is the 8-day composite MODIS-derived ND image during 15 October 2004 (DOY 281).
4224 B. R. Parida et al.
Downloaded By: [Indian Institute of Remote Sensing] At: 07:28 10 August 2009
depends upon the length of the growing period in the state. The western and
central parts of Gujarat are dominated by the cotton crop, which lasts up to theend of November to mid-December. In brief, the critical growth phase of the
major crops falls in the months of September and October. Thus, depending upon
the rate of precipitation, the general agriculture practised in the state is rainfed
agriculture, irrigated agriculture and desert-based agriculture. Agriculture in
Gujarat forms a vital sector of the state’s economy. It provides the required food
grains for the state’s population and raw materials for most of the agrobased
industries. Unsuitable climatic conditions in some parts and rocky terrain have
limited the area suitable for cultivation. The difficulty of drainage in coastal areasand in the two Ranns has made a large part of the state agriculturally
unproductive.
2.3 LST data
The satellite data used for this study were MODIS LSTs and the product was the 8-
day 1 km MOD11A2, averaging LSTs in the daily product MOD11A1 over 8 days.
The 8-day composites were the product downloaded from the EOS data gateway for
the period from September to October from 2000 to 2004. This time series represents
the reproductive phase of the crops (the end part of the kharif season). The LSTs inMOD11A1 were retrieved by the generalized split-window algorithm (Wan and
Dozier 1996). The emissivities in bands 31 and 32 were estimated by the
classification-based emissivity method (Snyder et al. 1998) according to land cover
types in the pixel determined by the input data in quarterly land cover (MOD12Q1)
and daily snow cover (MOD10_L2) products.
2.4 Surface reflectance data
The surface reflectance 8-day composite data on 15 October 2004 (product
MOD09Q1) were downloaded from the EOS data gateway and used for land use/land cover mapping in the state. The surface reflectance product is an atmo-
spherically corrected product generated from the MODIS level 1B radiances data
(Vermote and Vermeulen 1999). The compositing technique is based on the
minimum-blue criterion, which selects the clearest conditions over the period. This
product is a composite of eight consecutive daily 250 m images.
Using the surface reflectance bands, we computed ND for land use/land cover
mapping:
ND~ NI{Rð Þ= NIzRð Þ ð1Þ
where NI and R are the reflectance in the near-infrared and red bands of the MODIS
satellite data. ND is a good indicator of green biomass, leaf area index, and patterns
of production (Thenkabail et al. 2004). ND is the most commonly used vegetation
index and it varies from + 1 to 21.
2.5 Air temperature data
The daily air temperature data, namely the minimum and maximum temperatures,
were collected for the four regions in the years 2000 and 2004 (Gujarat Agriculture
University, Anand). The daily data sets were converted to 8-day composite data forcomparison with the LSTs. The air temperature data, especially those obtained in
September and October, were used for statistical analysis.
Land surface temperature variation in Gujarat state of India 4225
Downloaded By: [Indian Institute of Remote Sensing] At: 07:28 10 August 2009
3. Methodology
To examine the temporal variation of surface temperature in relation to different
vegetation types, the MODIS data from 2000 to 2004 were used, especially in the
end part of the kharif season. The vegetation types used for this study were
agriculture in desert areas, rainfed agriculture, irrigated agriculture and forest.
Different vegetation types were located based on the land use map (figure 3) and
then the MODIS LSTs for these areas were extracted. Table 3 shows the geographic
coordinates of the vegetation type, where the surface temperature value has been
extracted using a 565 window size. Initially, we extracted the LST pixel values using
a 363 window size but at later stage we found that a 565 window size gave better
results in terms of variation in pixel values and representation of wider areas. The air
temperatures from the meteorological stations were used to evaluate the results of
LST variation among the different vegetation types. The air temperature during the
months of September and October were correlated with the corresponding LST by
taking the nearest meteorological station. The 8-day composite mean air
Figure 3. The land use and land cover map for Gujarat state.
4226 B. R. Parida et al.
Downloaded By: [Indian Institute of Remote Sensing] At: 07:28 10 August 2009
temperature was computed from the daily maximum air temperature for each
station, and only September and October monthly air temperatures were used for
the analysis. The meteorological stations as named in table 3 were near to the four
types of vegetation. Bhuj-Rudramat station was taken as the example for agriculture
in the desert area (the northern Gujarat/Kutch region), which is mainly situated in
the drought prone area. Similarly, the other stations, Rajkot, Ahmedabad and
Gandevi, were taken as examples for rainfed agriculture, irrigated agriculture and
forest, respectively. This study also exemplifies the rainfall pattern for each
vegetation type in order to determine the effect of rainfall variation on land surface
characteristics and local land use types. The rainfall measured in the corresponding
meteorological stations was compared with the respective vegetation types. For the
analysis of rainfall variation, the total rainfall from 22–43 standard meteorological
weeks (June to October) was used.
4. Results and discussion
In this section we present some results to prove the potential value of LST variation
in relation to vegetation types. In addition, evaluation of LST is presented by
comparing MODIS LST with the surface air temperature in a particular time-frame
as a representative test case for study of the climatic variability. The rainfall
variation in different types of vegetation was also analysed to determine the climatic
variability within a certain time-frame, that is 2000 and 2004. By contrast, a global
climatic change study requires long-term data to determine the global environment
change, such as global warming and its impact on local-scale land use types. The
spatial distribution of surface temperature is shown in the map for the years 2000
and 2004 for the entire state and it was found that the surface temperature changes
at different times, and is highly dependent on the climatic conditions and different
land use types. The variation also assessed whether the climatic change was within
the normal range or was due to changes in vegetation types.
Cloud contamination in satellite images is a significant obstacle to land surface
studies. Undetected clouds distort the reflectivity of the land surface and
consequently develop into an additional source of error. Clouds in satellite images
must therefore be identified precisely prior to any further analysis. It was noted that
the few images obtained during the months of July and August were covered with
cloud in the study area, which presents a difficulty in the study for the whole kharif
season. Hence the present study focused only on the months of September to
October instead of an earlier attempt from June to October.
Table 3. The vegetation types, reference location and meteorological stations.
Type of vegetation Location Referenced location Meteorological station
Desert agriculture 23u50940.180 N71u09914.450 E
Northern Gujarat Bhuj-Rudramat
Rainfed agriculture 22u21923.430 N71u22904.310 E
Saurashtra/western partof Gujarat
Rajkot
Irrigated agriculture 23u00949.850 N72u55936.960 E
Middle/eastern Gujarat Ahmedabad
Forest 20u48932.650 N73u31912.660 E
Southern Gujarat Gandevi
Land surface temperature variation in Gujarat state of India 4227
Downloaded By: [Indian Institute of Remote Sensing] At: 07:28 10 August 2009
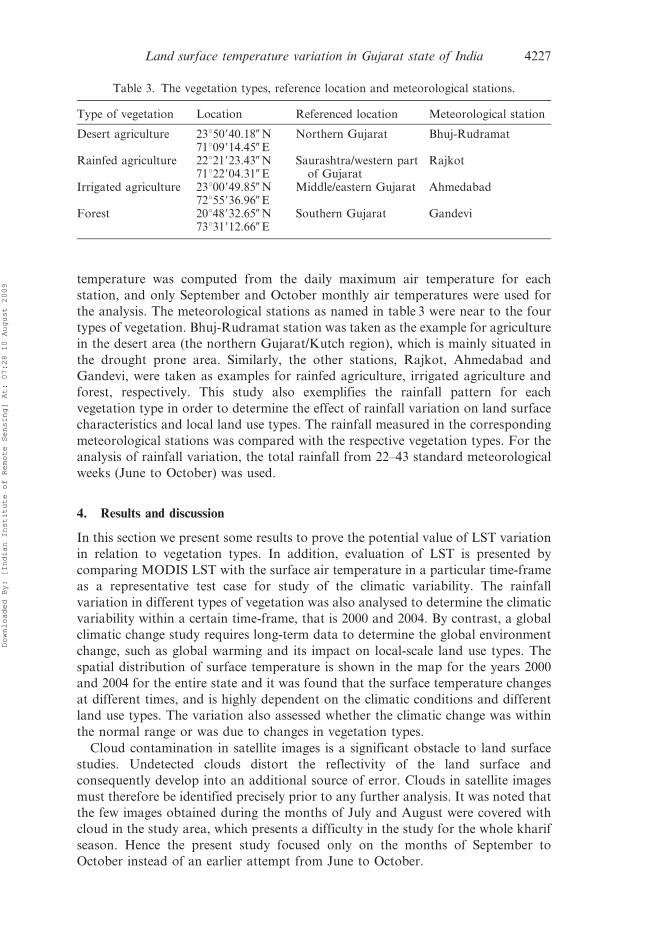
4.1 Spatial variation of MODIS LST
Figure 4 shows that the surface temperature varies with respect to vegetation cover
and at different times. The surface temperature in the forest area shows the least
temperature variation in the year during both 2000 and 2004. The surface
temperature in irrigated agriculture and rainfed agriculture is higher than the forest
cover. The southern district of the state shows a lower surface temperature than the
other parts of the state. The northern part of the state shows a higher surface
temperature, and is a desert-prone area. As a result the agriculture practised in the
desert area shows a higher temperature. In general, the temperature pattern varies
from month to month in different years. In most of the areas the LSTs in
MOD11A2.A2000257 (21 September 2000) were generally in the range 36.85–
46.85uC (but some were .46.85uC) whereas the LSTs in MOD11A2.A2004281 (15
October 2004) were in the range 31.85–41.85uC. This figure shows that 2000 was
hotter than 2004. This result can be compared with the actual ground conditions,
that is 2000 was a drought year whereas 2004 was normal for the Gujarat state. The
white patch in figure 4 indicates no data because of cloud cover in the data set.
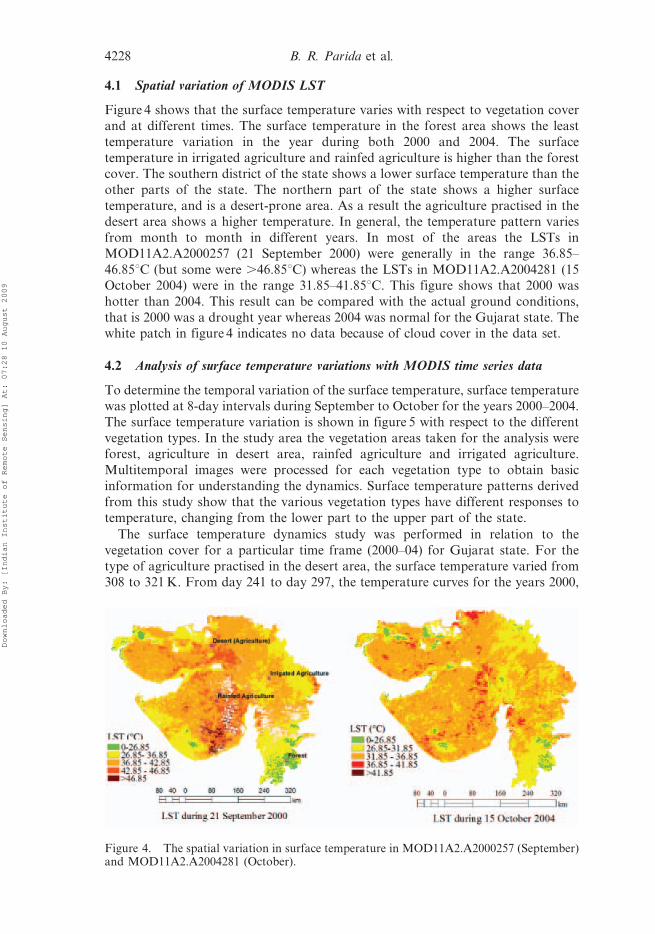
4.2 Analysis of surface temperature variations with MODIS time series data
To determine the temporal variation of the surface temperature, surface temperature
was plotted at 8-day intervals during September to October for the years 2000–2004.
The surface temperature variation is shown in figure 5 with respect to the different
vegetation types. In the study area the vegetation areas taken for the analysis were
forest, agriculture in desert area, rainfed agriculture and irrigated agriculture.
Multitemporal images were processed for each vegetation type to obtain basic
information for understanding the dynamics. Surface temperature patterns derived
from this study show that the various vegetation types have different responses to
temperature, changing from the lower part to the upper part of the state.
The surface temperature dynamics study was performed in relation to the
vegetation cover for a particular time frame (2000–04) for Gujarat state. For the
type of agriculture practised in the desert area, the surface temperature varied from
308 to 321 K. From day 241 to day 297, the temperature curves for the years 2000,
Figure 4. The spatial variation in surface temperature in MOD11A2.A2000257 (September)and MOD11A2.A2004281 (October).
4228 B. R. Parida et al.
Downloaded By: [Indian Institute of Remote Sensing] At: 07:28 10 August 2009
2001 and 2002 follow a similar pattern to those in 2003 and 2004. At the beginning
of the three years, the curve is above the 2003 and 2004 curves except for 241–249
DOY for 2004. This shows that the beginning of the three years had a hotter climate
or higher temperature as compared to the years 2003 and 2004 across the 8 days
difference. On the contrary, the 2003 and 2004 curves are lower, indicating a lower
surface temperature. This is because of the non-drought year and 2000–03 were
drought years in the study area.
In rainfed agriculture the surface temperature varied from 302 to 321 K, which
indicates that the temperature is lower than the desert-based agriculture area. One
distinct feature we can note is that the 2004 curve is lower, which indicates a lower
temperature as compared to the other year. Overall, all of this class show a lower
surface temperature pattern as compared to desert-based agriculture.
In irrigated agriculture the surface temperature varied from 299 to 315 K, which
indicates that it was cooler. We noted that the surface temperature variation in
irrigated agriculture was lower than the desert-based agriculture and the rainfed
agriculture. The 2000, 2001 and 2002 curves show similar surface temperature
patterns to the desert-based agriculture and the only difference is related to the lower
LST values, although the variation curve is similar. 2003 and 2004 show lower curves,
indicating lower temperatures as compared to the beginning of the three years.
In the forest-type vegetation the surface temperature varied from 295.6 to 306 K,
which indicates the lowest temperature as compared to all other vegetation types for
all the years across the DOY. However, all of the curves do not change across the
year distinctly as compared to the other vegetation classes. We note that the 2003
and 2004 curves are in the lower part of the graph representing lower LSTs.
4.3 Statistical analysis between LST and air temperature (Ta)
In the following we summarize the results of the comparison between the MODIS
LST daily global 1 km product from Terra and air/near-surface ground temperature
measurements from meteorological stations. From the results described above, we
found that the years 2000 and 2004 show a distinct variation in terms of LST for each
Figure 5. The surface temperature variations for different vegetation types during 2000–04.
Land surface temperature variation in Gujarat state of India 4229
Downloaded By: [Indian Institute of Remote Sensing] At: 07:28 10 August 2009
vegetation type due to the climatic variability in the study area. Hence we illustrate the
temperature variation statistical result for 2000 as higher LST and 2004 as lower LST
in table 4. In this study we have also computed the minimum, maximum, mean,
standard deviation (SD) and correlation coefficient (r) for LST and air temperature
from September to October by taking 8-day composite values.
The results from the Bhuj-Rudramat site in northern Gujarat show good
agreement between LST values extracted from MODIS pixels on these sites and
those measured at the stations in 2000 and 2004. The maximum LST was 321 K (307
Ta) during 2000 and 314.4 K (306 Ta) during 2004. The lower SD shows the higher
consistency of the result. A higher standard deviation is often interpreted as higher
volatility. In comparison, a lower standard deviation would most likely be an
indicator of stability. The most consistent values are usually the set of numbers with
the lowest standard deviation. This site is located in a desert area where agriculture
shows a lower yield compared to other parts of Gujarat state. In this station the
weather conditions are very erratic and scanty rainfall is received. The correlation
coefficient determines the relationship between two properties. The surface
temperature of MODIS and air temperature show high correlation: r50.88 (2000)
and 0.83 (2004).
At Rajkot, where rainfed agriculture is predominant, the maximum LST was
321.8 K (305 Ta) during 2000 and 313 K (304 Ta) during 2004. The mean
temperatures observed were 314.6 K in 2000 and 308.6 K in 2004, which are lower
than those in northern Gujarat. At Ahmedabad the maximum LST was 315 K (305
Ta) during 2000 and 307 K (304.9 Ta) during 2004. However, the mean temperature
difference in irrigated agriculture (i.e. at Ahmedabad station) was 5.94 and 1.38 K
for 2000 and 2004, respectively. This difference in mean temperature is due to the
fact that in 2000 the state was severely affected by drought, which also affected the
irrigated zone of agriculture. As a result, the temperature difference in the irrigated
zone shows a positive instead of a negative value. At Gandevi the maximum LST
was 305.9 K (305 Ta) during 2000 and 302.2 K (301 Ta) during 2004. Thus, the
results reveal that the mean LST gives a lower value, which is in decreasing order
from desert-based agriculture followed by rainfed agriculture, irrigated agriculture
and forest, respectively. The surface temperature obtained by MODIS and Ta show
good correlation for Rajkot, Ahmedabad and Gandevi.
A correlation coefficient (r) was derived using the two temperatures. As these
relationships vary with different land types and topography, separate correlation
coefficients were determined for each vegetation type. The surface temperature
variation mainly depends on the surface vegetation cover, topographical properties,
soil moisture and atmospheric conditions.
The mean surface temperature and air temperature were computed for each
vegetation type from September to October during 2000 and 2004. These were plotted
in figure 6, which reveals that the year 2000 showed a higher surface temperature for
each vegetation type as compared to the year 2004. This figure also reveals that the
desert-based agriculture crops show the highest temperature and forest the lowest
surface temperature for both years. In addition, the rainfed agriculture shows a higher
surface temperature than irrigated agriculture. This could be due to the higher
moisture content in irrigated agriculture than rainfed agriculture. The mean air
temperature was also plotted and the results show that there was a higher temperature
during 2000 than in 2004. The mean LST (Ts) and Ta show a similar pattern of
temperature variation. The difference in temperature (Ts–Ta) varies with time of day,
4230 B. R. Parida et al.
Downloaded By: [Indian Institute of Remote Sensing] At: 07:28 10 August 2009

Table 4. Relationship between air temperatures measured at meteorological stations and land surface temperatures retrieved from Terra-MODIS.
Minimum temperature(K)
Maximum temperature(K) Mean temperature (K) SD
Correlation coefficient(R)
Desert (agriculture) (Northern) – Bhuj-Rudramat2000 LST 314.80 321.10 317.83 2.24 0.88 **
Air temperature 302.00 307.00 304.05 1.832004 LST 307.96 314.42 311.53 2.19 0.83*
Air temperature 301.78 306.00 303.96 1.42Rainfed agriculture (Saurashtra) – Rajkot2000 LST 302.00 321.88 314.60 7.19 0.84**
Air temperature 299.00 305.90 301.66 2.362004 LST 305.56 313.10 308.63 2.99 0.84**
Air temperature 298.00 304.00 300.19 1.84Irrigated agriculture (Middle) – Ahmedabad2000 LST 302.00 315.26 309.72 4.91 0.84**
Air temperature 301.00 305.53 303.78 1.702004 LST 301.38 307.38 304.85 1.97 0.80*
Air temperature 300.00 304.90 303.48 1.54Forest (Southern) – Gandevi2000 LST 300.00 305.90 302.83 2.46 0.82*
Air temperature 300.36 305.14 302.15 1.752004 LST 297.16 302.24 299.80 1.83 0.98**
Air temperature 296.20 301.00 298.49 1.59
*Correlation is significant at the 0.05 level (two-tailed).**Correlation is significant at the 0.01 level (two-tailed).
La
nd
surfa
cetem
pera
ture
varia
tion
inG
uja
rat
state
of
Ind
ia4
23
1
Downloaded By: [Indian Institute of Remote Sensing] At: 07:28 10 August 2009
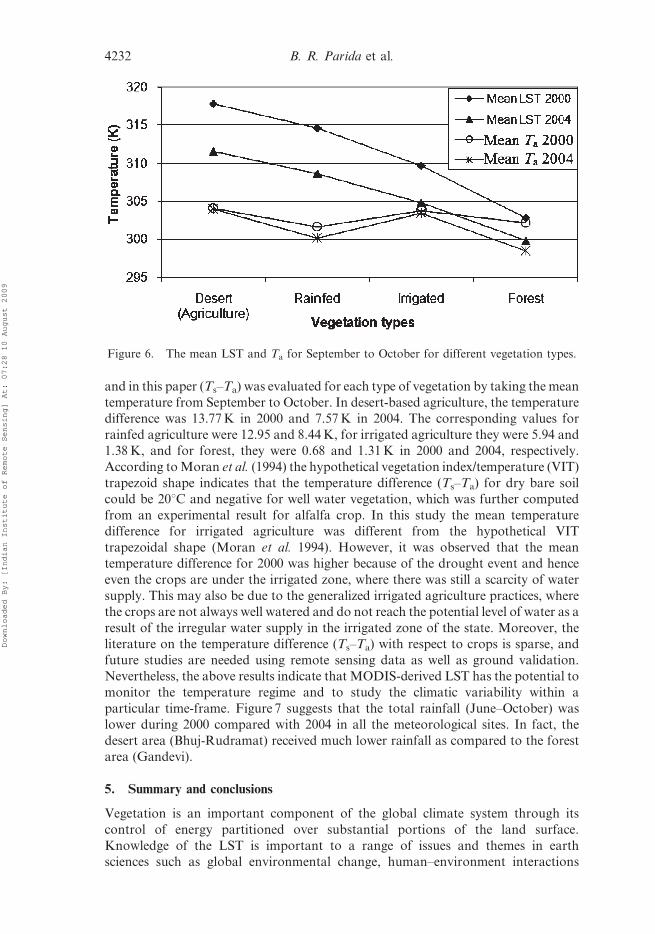
and in this paper (Ts–Ta) was evaluated for each type of vegetation by taking the mean
temperature from September to October. In desert-based agriculture, the temperature
difference was 13.77 K in 2000 and 7.57 K in 2004. The corresponding values for
rainfed agriculture were 12.95 and 8.44 K, for irrigated agriculture they were 5.94 and
1.38 K, and for forest, they were 0.68 and 1.31 K in 2000 and 2004, respectively.
According to Moran et al. (1994) the hypothetical vegetation index/temperature (VIT)
trapezoid shape indicates that the temperature difference (Ts–Ta) for dry bare soil
could be 20uC and negative for well water vegetation, which was further computed
from an experimental result for alfalfa crop. In this study the mean temperature
difference for irrigated agriculture was different from the hypothetical VIT
trapezoidal shape (Moran et al. 1994). However, it was observed that the mean
temperature difference for 2000 was higher because of the drought event and hence
even the crops are under the irrigated zone, where there was still a scarcity of water
supply. This may also be due to the generalized irrigated agriculture practices, where
the crops are not always well watered and do not reach the potential level of water as a
result of the irregular water supply in the irrigated zone of the state. Moreover, the
literature on the temperature difference (Ts–Ta) with respect to crops is sparse, and
future studies are needed using remote sensing data as well as ground validation.
Nevertheless, the above results indicate that MODIS-derived LST has the potential to
monitor the temperature regime and to study the climatic variability within a
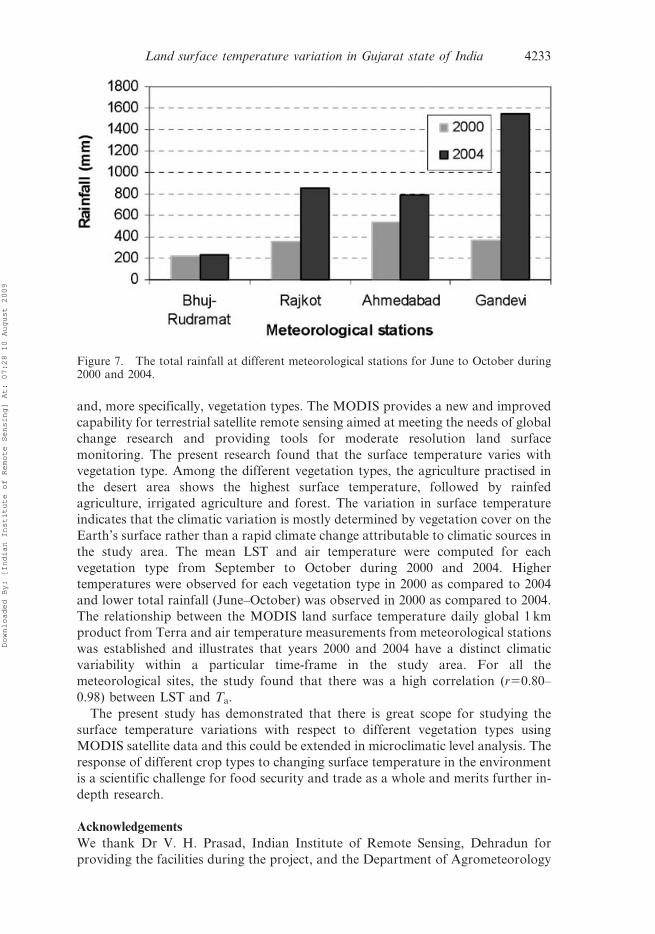
particular time-frame. Figure 7 suggests that the total rainfall (June–October) was
lower during 2000 compared with 2004 in all the meteorological sites. In fact, the
desert area (Bhuj-Rudramat) received much lower rainfall as compared to the forest
area (Gandevi).
5. Summary and conclusions
Vegetation is an important component of the global climate system through its
control of energy partitioned over substantial portions of the land surface.
Knowledge of the LST is important to a range of issues and themes in earth
sciences such as global environmental change, human–environment interactions
Figure 6. The mean LST and Ta for September to October for different vegetation types.
4232 B. R. Parida et al.
Downloaded By: [Indian Institute of Remote Sensing] At: 07:28 10 August 2009
and, more specifically, vegetation types. The MODIS provides a new and improved
capability for terrestrial satellite remote sensing aimed at meeting the needs of global
change research and providing tools for moderate resolution land surface
monitoring. The present research found that the surface temperature varies with
vegetation type. Among the different vegetation types, the agriculture practised in
the desert area shows the highest surface temperature, followed by rainfed
agriculture, irrigated agriculture and forest. The variation in surface temperature
indicates that the climatic variation is mostly determined by vegetation cover on the
Earth’s surface rather than a rapid climate change attributable to climatic sources in
the study area. The mean LST and air temperature were computed for each
vegetation type from September to October during 2000 and 2004. Higher
temperatures were observed for each vegetation type in 2000 as compared to 2004
and lower total rainfall (June–October) was observed in 2000 as compared to 2004.
The relationship between the MODIS land surface temperature daily global 1 km
product from Terra and air temperature measurements from meteorological stations
was established and illustrates that years 2000 and 2004 have a distinct climatic
variability within a particular time-frame in the study area. For all the
meteorological sites, the study found that there was a high correlation (r50.80–
0.98) between LST and Ta.
The present study has demonstrated that there is great scope for studying the
surface temperature variations with respect to different vegetation types using
MODIS satellite data and this could be extended in microclimatic level analysis. The
response of different crop types to changing surface temperature in the environment
is a scientific challenge for food security and trade as a whole and merits further in-
depth research.
Acknowledgements
We thank Dr V. H. Prasad, Indian Institute of Remote Sensing, Dehradun for
providing the facilities during the project, and the Department of Agrometeorology
Figure 7. The total rainfall at different meteorological stations for June to October during2000 and 2004.
Land surface temperature variation in Gujarat state of India 4233
Downloaded By: [Indian Institute of Remote Sensing] At: 07:28 10 August 2009
(AAU, Anand), Gujarat, for sharing meteorological data. We also thank the
anonymous reviewers for their constructive comments and suggestions.
ReferencesBORAK, J.S. and STRAHLER, A.H., 1999, Feature selection and land cover classification of a
MODIS-like data set for semi-arid environment. International Journal of Remote
Sensing, 20, pp. 919–938.
BURROUGHS, W.J., 2001, Climate Change: A Multidisciplinary Approach (Cambridge:
Cambridge University Press).
FRIEDL, M.A. and BRODLEY, C.E., 1997, Decision tree classification of land cover from
remotely sensed data. Remote Sensing of Environment, 61, pp. 399–409.
GAHEGAN, M. and WEST, G., 1998, The classification of complex data sets: an operational
comparison of artificial neural networks and decision tree classifiers. In Proceedings of
the 3rd International Conference on Geocomputation, 17–19 September 1998,
University of Bristol, UK. Available online at http://divcom.otago.ac.nz/SIRC/
GeoComp/GeoComp9861/gc_61.htm (accessed 10 April 2003).
HOUGHTON, J.T., DING, Y., GRIGGS, D.J., NOGUER, M., LINDEN, P.J., and XIAOSU, D. (Eds),
2001, Climate Change 2001: The Scientific Basis (Cambridge: Cambridge University
Press).
LEBEL, L., 1998, Environmental change in Southeast Asia: causes and consequences. GCTE
Core Project Office, CSIRO Division of Wildlife and Ecology.
LI, Z.L. and BECKER, F., 1993, Feasibility of land surface temperature and emissivity
determination from AVHRR data. Remote Sensing of Environment, 43, pp. 67–85.
MANNSTEIN, H., 1987, Surface energy budget, surface temperature and thermal inertia. In
Remote Sensing Applications in Meteorology and Climatology, R.A. Vaughan and D.
Reidel (Eds). NATO Advanced Study Institutes Series. Series C, Mathematical and
Physical Sciences, Vol. 201, pp. 391–410 (Dordrecht, the Netherlands: D. Reidel
Publishing Company).
MEARNS, L.O., ROSENZWEIG, C. and GOLDBERG, R., 1997, Mean and variance change in
climate scenarios: methods, agricultural applications, and measures of uncertainty.
Climatic Change, 35, pp. 367–396.
MORAN, M.S., CLARKE, T.R., INOUE, Y. and VIDAL, A., 1994, Estimating crop water deficit
using the relation between surface-air temperature and spectral vegetation index.
Remote Sensing of Environment, 49, pp. 246–263.
PAL, M. and MATHER, P.M., 2003, An assessment of the effectiveness of decision tree
methods for land cover classification. Remote Sensing of Environment, 86, pp.
554–565.
QIN, Z. and KARNIELI, A., 1999, Progress in the remote sensing of land surface temperature
and ground emissivity using NOAA-AVHRR data. International Journal of Remote
Sensing, 20, pp. 2367–2393.
SALOMONSON, V., BARNES, W., MAYMON, P., MONTGOMERY, H. and OSTROW, H., 1989,
MODIS: advanced facility instrument for studies of the Earth as a system. IEEE
Transactions on Geoscience and Remote Sensing, 27, pp. 145–153.
SMIT, B., BURTON, I., KLEIN, R.J.T. and STREET, R., 1999, The science of adaptation: a
framework for assessment. Mitigation and Adaptation Strategies for Global Change, 4,
pp. 199–213.
SMIT, B., BURTON, I., KLEIN, R.J.T. and WANDEL, J., 2000, An anatomy of adaptation to
climate change and variability. Climatic Change, 45, pp. 223–251.
SNYDER, W.C., WAN, Z., ZHANG, Y. and FENG, Y.Z., 1998, Classification-based emissivity
for land surface temperature measurement from space. International Journal of
Remote Sensing, 19, pp. 2753–2774.
THENKABAIL, P.S., GAMAGE, M.S.D.N. and SMAKHTIN, V.U., 2004, The use of remote
sensing data for drought assessment and monitoring in Southwest Asia. International
4234 B. R. Parida et al.
Downloaded By: [Indian Institute of Remote Sensing] At: 07:28 10 August 2009

Water Management Institute (IWMI) Report, Colombo. Available online at:
www.iwmi.cgiar.org/pubs/pub085/RR85.pdf (accessed on 10 April 2007).
VERMOTE, E.F. and VERMEULEN, A., 1999, Atmospheric correction algorithm: spectral
reflectances (MOD09), Version 4.0, April 1999. MODIS algorithm technical
background document.
WAN, Z. and DOZIER, J., 1996, A generalized split-window algorithm for retrieving land-
surface temperature from space. IEEE Transactions on Geoscience and Remote
Sensing, 34, pp. 892–905.
Land surface temperature variation in Gujarat state of India 4235
Downloaded By: [Indian Institute of Remote Sensing] At: 07:28 10 August 2009