Botany Journal.pdf - Gujarat University
265
-
Upload
khangminh22 -
Category
Documents
-
view
0 -
download
0
Transcript of Botany Journal.pdf - Gujarat University

1
Proceeding of Conference : Evolving Paradigm to Improve Productivity for Plant Genetic Resoyrces

2
Proceeding of Conference : Evolving Paradigm to Improve Productivity for Plant Genetic Resoyrces

3
Proceeding of Conference : Evolving Paradigm to Improve Productivity for Plant Genetic Resoyrces

4
Proceeding of Conference : Evolving Paradigm to Improve Productivity for Plant Genetic Resoyrces

5
Proceeding of Conference : Evolving Paradigm to Improve Productivity for Plant Genetic Resoyrces
KEY-NOTE ADDRESSES
Theme-A Key-note addressTriggering a knowledge and action network [KAN] for conserving
biodiversity and associated knowledge systems
Vivek Kumar, Vipin Kumar, Ramesh Patel, Chetan Patel,Nirmal Sahay and Anil K Gupta
National Innovation Foundation (NIF), Ahmedabad, Indiae-mail: [email protected]
ABSTRACT:Over two decades of persistent efforts to create a constituency for conservation of biodiversityand associated knowledge systems has triggered many interesting possibilities such as: [a] creatingincentives for conservation of biodiversity by stimulating demand for less preferred or less marketedcrops through attractive food recipes offered in traditional food festivals, [b] identifying theneutraceutical properties of those cultivated or uncultivated specie which are already consumedby local communities in different regions of the country though on a limited scale, [c] commercializingfood products based on local diversity, [d] creating incentives [non-monetary as well as monetary,collective as well as individual] for conserving endangered food crops or varieties, [d] identifyinglocal common property institutions which help in conserving the diversity and [e] support variousmechanisms of seed exchange among local communities in different parts of the country. Similarefforts have been made by Honey Bee Network towards conservation of wild habitats primarilyfocusing on academic studies of biodiversity as well as documentation of traditional institutions andknowledge for the purpose.NIF (National Innovation Foundation) has pooled tens of thousands of knowledge practices fromaround the country signifying a very vibrant and on going folkloric contribution of the communities.SRISTI (Society for Research and Initiatives for Sustainable Technologies and Institutions) tooklead in early 90’s in initiating various efforts which NIF has taken to much larger scale and scope.Given the enormity of the tasks ahead, it is proposed to create a knowledge and action network[KAN] for conservation of biodiversity and associated knowledge and institutional systems throughbotany and other life sciences departments of various universities in India and abroad. This networkbased on Honey Bee Network philosophy will share with the local communities whatever it learnsfrom the people, protect their knowledge rights and share the benefits, if any arising out of thatwork with the people in fair and just manner. The students during their course work as well as invacations go around in the nearby villages and urban areas and document biodiversity, identifyoutstanding knowledge experts, inventorize more than hundred year old trees and take up various

6
Proceeding of Conference : Evolving Paradigm to Improve Productivity for Plant Genetic Resoyrces
other activities to track both the conservation and erosion of biodiversity and knowledge system.It is hoped that such a network will evolve its own horizontal mechanism for governance throughactive involvement of young conservation champions.

7
Proceeding of Conference : Evolving Paradigm to Improve Productivity for Plant Genetic Resoyrces
Theme-B Key-note address
Fusarium oxysporum, the wilt pathogen as a model system for plant– pathogen interaction
Dr R B Subramanian
B. R. D. School of Biosciences, Sardar Patel University, Vallabh Vidyanagar, India
ABSTRACT:Fusarium oxysporum is a ubiquitous soil borne pathogen causing the wilt disease in a number ofeconomically important plant species. There are a number of formae speciali within the speciesand many races within the formae speciali, making this pathogen host specific. Since the fungusshows both a broad host range and host specificity, it is an ideal model system to understand itsinteraction with the host. Such studies lead to a broadening in the understanding of the infectionmechanism and thus help in planning strategies for efficient control of this pathogenic fungus.Host – pathogen interaction is a dynamic and complex phenomenon involving an intricate battle forsupremacy between the host and the pathogen. The attempts of the pathogen to invade the host toobtain nutrition for its survival are negated by a multilayered plant defense mechanism which fightsback the pathogen attack. This process is also a classical example of co-evolution between thehost and pathogen.In our laboratory, we are attempting to unravel the process of host mediated resistance against thewilt disease, in selected economically important crops like, Tomato, Chick pea, Ginger and Castor.The responses of the host to the pathogen are being addressed at the structural. Biochemical andMolecular levels to understand the mechanism of resistance and susceptibility. Attempts are alsoon to isolate and clone important genes involved in resistance against fungal pathogens.

8
Proceeding of Conference : Evolving Paradigm to Improve Productivity for Plant Genetic Resoyrces
Theme-C
APPLICATION OF EDIBLE COATINGS IN IMPROVING NUTRITIONALATTRIBUTES AND EXTENDING THE SHELF-LIFE OF FRESH
HORTICULTURAL PRODUCE
T. V. RAMANA RAO
B. R. D. School of Biosciences, Sardar Patel University, Vallabh Vidyanagar 388 120.Email: [email protected]
ABSTRACT:In the last decades consumer demands in the field of food production have changed considerably.Consumers more and more believe that fruits contribute directly to their health. Fresh fruits andvegetables are important source of nutrients, including vitamins (B6, C, thiamin, niacin), minerals,dietary fibers and significant amounts of phytochemicals that play important roles in human health.The primary goals of postharvest biology and technology research and extension are to maintainthe quality and safety of fresh fruits between harvest and consumption and to reduce postharvestlosses. During the past 20 years, numerous advances have been made in understanding the biologicaland environmental factors influencing deterioration of harvested fruits. Fruits and vegetables undergomany physiological changes during postharvest storage. However, much more research is neededto produce additional improvements in the quality and safety and their maintenance in fresh fruitsand fresh-cut fruit products for the benefit of the consumers. Several storage techniques have beendeveloped to extend the postharvest shelf life of horticultural products. These include controlledatmosphere (CA), modified atmosphere (MA), chemical treatments, ethylene absorbents as wellas CA and MA packaging. Another interesting method involves the use of edible or biodegradablecoatings. Such coatings are made of biological materials that are used to coat fresh products,providing a semipermeable barrier to water vapour and gases, e.g. O2 and CO2. Biodegradablecoatings can provide an alternative to controlled or modified atmosphere storage by reducingquality changes and quantity losses through modification and control of the respiration rates, thusdelaying the ripening of fruits and vegetables. Additionally, edible films and coatings are importantfrom an environmental point of view. Since their use helps to decrease the environmental impact ofhighly polluting production and packaging processes.Key words: Edible coatings, fruit, nutritional quality, postharvest, shelf-life

9
Proceeding of Conference : Evolving Paradigm to Improve Productivity for Plant Genetic Resoyrces
Theme-D Key-note address
Salinity Stress in Plants - Recent Understanding of Sodium Chloride - InducedPhysiological and Biochemical Adaptations during Seed Germination and Seedling
Growth in Sunflower
Dr. S. C. Bhatla
Department of Botany, University of Delhi, Delhi 110007Email: [email protected]
ABSTRACT:Sodium has been classified as a functional element or an essential micronutrient for some C4 speciesbut is not considered as essential nutrient for all plants because it does not meet the strict definition of"essentiality". Sodium ions may be important for maintaining electrical equilibrium and electrical potentialof cell membrane. Most plants growing in non-saline soils have very little sodium in their leaves butin plants growing in saline soils, sodium content in plant organs can reach several millimoles on dryweight basis. Chloride ions are recognized as "essential micronutrient" for plant growth. It hasimportant functions in photosynthesis in plants. It may play a general role in maintaining electricalequilibrium in plants. Normal chloride content in plants varies between 2 to 20 mg.g-1 dry weight.NaCl salinity can cause injury to plants due to absorption of toxic levels of sodium and chloride ionsby roots and their transport to shoots. Deleterious effect of NaCl salinity on plant growth andnutrition are, thus, attributed to a decrease in osmotic potential of root growth medium, specific iontoxicity, nutrient imbalance and deficiency as a result of disruption of ion uptake. One of the majorimpacts of exposure of plants to salinity in the nutrient medium is the accumulation of high levels ofcompatible solutes in plant organs in order to create a water potential gradient for inward watermovement. NaCl salinity also alters various apoplastic enzymatic activities in plant roots.Sunflower plants exposed to saline conditions tend to behave as moderately tolerant to NaClsalinity at 20-30 days of growth. During the earlier stages of seedling growth, sunflower appearsto be less tolerant than during the later phase of growth. This modeate tolerance to NaCl seems tobe due to exclusion of sodium from young leaves at the later stage of growth. Less tolerance atearly seedling growth seems to be because of high rates of Na+ and Cl- uptake and transport. Ofthe various plant parts, old leaves and buds exhibit maximum and minimum sensitivity index tosalinity, respectively. Irrespective of plant parts, sunflower plants exhibit considerable tolerance toNaCl up to 40 mM NaCl. Buds exhibit maximum growth reduction because of water deficiencyat high salinity. Cl- uptake, transport, and accumulation rate in all concentrations of NaCl in allplant parts and at all stages of growth are more than those of sodium. Under moderate salinity,about 65% of Na+ and Cl- ions are restricted to root cells. An increase in solute concentration inroot cells is sufficient to balance the salinity of the external medium, and is adequate for osmotic

10
Proceeding of Conference : Evolving Paradigm to Improve Productivity for Plant Genetic Resoyrces
adjustment in roots. Cortical cells in sunflower roots act as accumulators of Na+ and Cl- ions.Subcellular distribution of these ions under saline conditions mainly occurs in vacuoles. As aconsequence of large number and volume of cortical cells, they could provide a considerablyextended Na+ and Cl- storage facility in sunflower roots. It seems that under saline conditions,cell wall of cortical cells has an important role in providing potassium and calcium for the cytoplasm.This phenomenon may be able to increase salt tolerance in sunflower roots exposed to salinity.Present work highlights the involvement of endogenous nitric oxide in sodium chloride inducedbiochemical regulation of seedlings growth in sunflower. The growth response is dependent on NaClconcentration to which seedlings are exposed, they being tolerant to 40 mM NaCl and showing areduction in extension growth at 120 mM NaCl. NaCl sensitivity of sunflower seedlings accompaniesa fourfold increase in Na+/K+ ratio in roots and rapid transport of Na+ to the cotyledons, therebyenhancing Na+/K+ ratio in cotyledons as well. A transient increase in endogenous NO content,primarily contributed by putative nitric oxide synthase (NOS) activity in the nitric oxide roots of 4-days-old seedlings subjected to NaCl stress and the relative reduction in Na+/K+ ratio after 4 days,indicates that NO regulates Na+ accumulation, probably by affecting the associated transporterproteins. Root tips exhibit an early and transient enhanced expression of 4, 5-diaminofluoresceindiacetate positive NO signal in the presence of 120 mM NaCl. Oil bodies from 2-day-old seedlingcotyledons exhibit enhanced localization of NO signal in response to 120 mM NaCl treatment,coinciding with a greater retention of the principal oil body membrane proteins, i.e. oleosins. Abolitionof DAF positive fluorescence by the application of specific NO scavenger authenticates the presenceof endogenous NO. These novel findings provide evidence for a possible protective role of NOduring proteolytic degradation of oleosins prior to/accompanying lipoysis.References:1. David A, Yadav S, and Bhatla S. C. (2010) Sodium chloride stress induces nitric oxide
accumulation in root tips and oil body surface accompanying slower oleosin degradation insunflower seedlings
Physiologia Plantarum, 140:242-2542. Ebrahimi, Reza and Bhatla S. C. (2011) ‘Effect of sodium chloride levels on growth, water
status, uptake, transport, and accumulation pattern of sodium and chloride ions in youngsunflower plants’.
Communications in Soil Science and Plant Analysis, 42:7, 815-831

11
Proceeding of Conference : Evolving Paradigm to Improve Productivity for Plant Genetic Resoyrces
Theme-E Key-note address
Deciphering the Plant Transcriptomics and its Role in Regulating Biological Pathways
Dr Surendra K Chikara
Chief Scientifc Officer, Xcelris Genomics, Ahmedabad, IndiaEmail: [email protected]
ABSTRACT:Plant transcriptome analysis is the study of total set of transcript/mRNA and non coding RNA inone or population of cells under specific condition. Now a days most of the research is focused ondeciphering the effect of environment on gene expression profiling in crops, trees, BioEnergy andmedicinal plants. Complete and draft genome sequences have become available for several plantspecies such as rice, sorghum, poplar, grape, papaya, medicago and soyabean. Whole genomeand transcriptome profiling (both re-sequencing and de novo) is in progress for several othercrops including non model plant.Several biotic stresses (insects, bacterial, fungal etc) and abiotic stresses (drought, heat, salinityand growth) that affect crop productivity is major conern. Next generation sequencing methodsfor high throughput RNA sequencing (transcriptome) is becoming increasingly utilized as thetechnology of choice to detect and quantify known and novel transcripts in plants. Multiple next-generation sequencing (NGS) platforms are available including long read Roche GS-FLX 454Genome Sequencer, highthroughput Illumina and ABI SOLiD Genome analyzer. The NGStechnology is more robust then hybridization based microarray palteform for digital gene expressionstudy.Gene sequences must be known in advance and limited sensitivity due to hybridization majordrawback of microarray. In contrast NGS methods do not required prior genome information.The transcriptome profiling of plant through NGS plateform have been able to precisely quantifyknown transcripts, to discover new transcribed regions within intronic or intergenic regions, tocharacterize the antisense transcription, to identify alternative splicing with new combinations ofknown exon sequences or new transcribed exons, to evaluate the expression of repeat elementsand to analyze a wide number of known and possible new candidate expressed SNPs, as well asto identify fusion transcripts and other new RNA categories. The sequence data generated can bealigned to a reference genome so that variants between genotypes can be identified either on agenome-wide scale or by comparison to the reference genotype. In the absence of referencegenome de novo assembling produce a genome-scale transcriptional map for non model crop.NGS can have significant implications for crop genetics and breeding.The development of large-scale genomic resources, including transcript and sequence data, molecular

12
Proceeding of Conference : Evolving Paradigm to Improve Productivity for Plant Genetic Resoyrces
markers and genetic and physical maps, is significant, in addition to other potential applications.Moreover, the availability of large numbers of genetic markers developed through NGS technologiesis facilitating trait mapping and making marker- assisted breeding more feasible.
13
Proceeding of Conference : Evolving Paradigm to Improve Productivity for Plant Genetic Resoyrces
Theme F: Key note Address
Tissue Culture Technology – Boon to National Productivity
Dr.Geeta Patel
Vice President – Agro Division, Cadila Pharmaceuticals Limited, Ahmedabad, Gujarat.
ABSTRACT:Tissue culture research in India is been done in universities for last few decades and have led tocommercialization of the technology. We all know the advantages of tissue culture technology andit’s usage in commercial laboratory. Today India has around 150 tissue culture labs ranging from1lac to 300 lac plants/annum capacities. Commercially banana, potato, sugarcane, pomegranate,teak and ornamental crops are produced by these laboratories. In order to increase productivityper unit area planting material produced by tissue culture has proved its merit in crops grown inlarge acreages. To substantiate this claim banana is a good example. Conventionally grown bananaby using traditional sucker as planting material yields between 35 to 40 MT/hectare and hasseasonal limitation of availability. Tissue cultured banana plants have given yield up to 100 MT/hectare and improving product quality thus giving better returns for farmers. Cleaning of plantingmaterial by tissue culture technology also has many examples where yields have improvedconsiderably. All this is possible after long years of research and commercialization along withuntiring efforts of extension workers and farmers.

14
Proceeding of Conference : Evolving Paradigm to Improve Productivity for Plant Genetic Resoyrces
Theme-G Key-note address
Taxonomic Monographs and Plant Genetic Resources
Prof. M K Janarthanam
Department of Botany, Goa University, Goa – 403206Email: [email protected]
ABSTRACTTaxonomic works such as Floras and Monographs / Revisions provide enormous informationon Plant Genetic Resources. Though Floras provide essential input to monographs, the variabletreatments and ever increasing numbers make data gathering from Floras an arduous task forother workers. Hence, taxonomic monographs and revisions are considered the only sourceof comprehensive information on any taxonomic group. However, the number of monographic/revisionary works that were published from our country in the last few decades is abysmallylow. Hurdles exist in the form of low priority funding, multiple collection permit requirements,strenuous field work, difficulty in tracing type specimens and lack of trained man power tosupervise the interested candidates. Only during monographic /revisionary studies oneunderstands the patterns of morphological variations, biogeography, hybridization, speciesdelimitation, application of nomenclature, threat status, phylogeny, existing collections andgaps that provide valuable information. There are examples such as Taxol containing genusTaxus, wherein good taxonomic works have contributed in identifying alternate source of thedrug that resulted in sustainable harvesting and conservation of genetic resources on one sideand bringing down the cost of drug on the other. In another extreme example, there is no clearphylogenetic relationship shown among the members of Camptothecin yielding plant familyIcacinaceae, and the position of the family itself is doubtful; the family appears as ‘unplaced’in recent classifications. Though, fungi are being looked into as the source of drug, deepertaxonomic studies of the family Icacinaceae probably would have yielded better results. Theusefulness of Phyllanthus is well known in the country and interestingly there is no originalrevisionary work on the genus for the country. The alkaloid rich Solanaceae is also known inthe country for the lack of a comprehensive taxonomic treatment. Wherever good revisionarystudies have appeared, several species have been later added as new to science as thoserevisions formed solid base for further findings. The works on Ceropegia, Eriocaulaceae andBladderworts fall under this category. There are groups such as Dioscorea which are lifesustaining resources for tribals and rural folks, and consumed extensively by our forefathers(prior to the introduction of Potato). The genus Dioscorea is an important source of saponinand cardiac glycosides whose diversity is not understood. Recent studies show that there areseveral entities of the genus in the wild that could not be referred to the known taxa. There are

15
Proceeding of Conference : Evolving Paradigm to Improve Productivity for Plant Genetic Resoyrces
several other such examples which help us to conclude that taxonomic monographic studiesare very important in understanding the plant genetic resources; understanding leads to valueaddition and management.

16
Proceeding of Conference : Evolving Paradigm to Improve Productivity for Plant Genetic Resoyrces
Theme F:
Recent Advances in Molecular Cytogenetics
R. C. Verma
School of Studies in Botany, Vikram University, Ujjain 456010
Received Date :
Published Date :
ABSTRACT:In the recent years, the study of cytogenetics has undergone tremendous changes. The use ofmolecular biology techniques and recombinant DNA technology has opened a new discipline ofmolecular cytogenetics. Some of the recent techniques and their usefulness would be presented.Flow cytometry has replaced the older methods of nuclear DNA content estimation, and is moreprecise and accurate. PCR (Polymerase Chain Reaction) based techniques like RAPD (RandomAmplified Polymorphic DNA), SSR (Simple Sequence Repeats), ITS (Inter Transcribed Spacers)and other kinds of markers are being used routinely to supplement cytogenetic analyses. Use ofITS marker in understanding genome relationship would be dealt in detail. FISH (Fluorescence insitu hybridization), GISH (Genomic in situ hybridization) and McFISH (Multicolour Fluorescencein situ Hybridization) are also very useful techniques for physical mapping of specific DNA sequenceon chromosome and also for genome analysis. All the above mentioned aspects and some morenew developments would be presented.

17
Proceeding of Conference : Evolving Paradigm to Improve Productivity for Plant Genetic Resoyrces
Theme-H Key Note Address
Gujarat Institute of Desert Ecology, Bhuj, India
S. F. Wesley
ABSTRACT:The Gujarat Institute of Desert Ecology (GUIDE) was established at Bhuj–Kachchh district as itsheadquarters, in May 1995 and also was registered as a public trust and a society. The mission ofthe GUIDE is to catalyze the process of ameliorating human misery in desert ecosystems, followingsound ecological principles and carefully using scientific knowledge, imaginative technology andcapital.GUIDE deals ecology with special reference to arid and semi-arid regions involving managementaspects is an up-coming discipline in our country. Traditionally, this subject formed a small part ofthe natural resource science. Studies on the arid ecology have been largely confined to CentralArid Zone Research Institute (CAZRI), AFRI, BSI (Regional Station) and ZSI (Regional Station)which are mainly working in the Rajasthan State. However, nothing tangible was done in this fieldin the State of Gujarat. The Gujarat Department of Forest and Environment of GoG is carrying outabove said activities through the State Forest Department (GSFD), however, their activities mainlyare centered at plantations and protections. In order to organize research and education in ecologyof arid and semi-arid regions in the Gujarat State on a strong scientific footing and to foster thedevelopment of this new science, the Gujarat Ecology Commission - a body set up by GujaratDepartment Forest and Environment of Government of Gujarat signed a MOU with Jacob BlausteinInstitute of Desert Research, Israel in September 1993 for setting up an institute for research,education and training on Arid and Semi-arid ecology and related issues. As a follow-up, Prof.Uriel Safriel, Head of the Mitrani Centre for Desert Ecology, Israel visited Kachchh district inMay, 1994 and based on his recommendations, the Gujarat Department of Forest and Environment(Govt. of Gujarat) accorded administrative sanction to start an autonomous institute in January1995.

18
Proceeding of Conference : Evolving Paradigm to Improve Productivity for Plant Genetic Resoyrces
Theme-H
FLORISTIC STUDIES IN GUJARAT: THE PATH AHEAD
A. S. Reddy
Department of Biosciences, Sardar Patel University, Vallabh Vidyanagar-388120
ABSTRACT:The history of plant explorations, either with a purpose or out of curiosity, is as old as human’sarrival on this planet. However, systematic plant collections for documentation of their charactersand classification; and scientific naming, precisely for taxonomic studies, were initiated somewherein 17th century and still being continued today. Such collections will also continue as long ashuman beings exist on this globe. The rich phytodiversity of Gujarat, which is the result of variedgeographical and climatic conditions, is reflected through the wide range of ecosystems such asdesert, semiarid hill ranges and plains, mangroves, grasslands, wetlands, forests of dry deciduousand moist deciduous type, and fertile agriculture lands. Several botanists and many non-botanistswere attracted to collect and study the plants from time to time. Thus, today numerous floristicrecords are accumulated in the botanical literature. Floristic studies in Gujarat were initiated wayback in 18th century. Toren, Sonnerat, Hove, Nimmo, Gibson, Palin of 18th and 19th centurieswere known to attempt plant collections in Gujarat. T. Cooke, E. Blatter, W.T. Saxton and J. I.Thaker were well known for their floristic contributions in Gujarat in pre-independent India. Laterseveral field botanists from scientific organizations such as Botanical Survey of India and variousacademic institutions contributed a lot in the area of floristics. The plant surverys carried out by Fr.H. Santapau, S.K. Jain A.R. Chavan, G.L. Shah and their associates became so prominent during1950s -‘70s and resulted into about 700 publications in the area of Floristics of Gujart. Throughall these publications around 2200 species of angiosperms have been recorded for GujaratState.Later in 1980s and ‘90s developed a vacuum and the number of publications in the area offloristics was greatly reduced due to the influence other modern branches of plant sciences. Onlyfew individuals in few institutions, either by force or preference, are remained to be in this field.The prominent plant taxonomists known from Gujarat has greatly declined. Eventually, the PlantTaxonomy has become the skill deficit area in Gujarat as also it is true for the whole world.However,2000 onwards, again the interest in the field botany is revitalized as its significance in the area ofbiodiversity documentation and conservation has been realized by both Government and Non-Government Organisations besides the academic fraternity. The talk presents a telescopic view offloristic investigations in Gujarat and offers suggestions to make these studies more strengthened.

19
Proceeding of Conference : Evolving Paradigm to Improve Productivity for Plant Genetic Resoyrces
Theme-I Key-note address
Bioinformatics – opportunities and challenges
Desh Deepak Singh
Indian Institute of Advanced Research, Koba, Gandhinagar, Gujarat-382007
ABSTRACT:Bioinformatics is the field of science in which biology, computer science, and informationtechnology merge to form a single discipline. More specifically the field conceptualizes biologyin terms of Physico-chemical aspects of molecules and then applies informatics techniques(Maths, computer science and statistics) to understand and organize this information on alarge-scale. The ultimate goal of the field is to enable the discovery of new biological insightsas well as to create a global perspective from which unifying principles in biology can bediscerned. The field of bioinformatics has evolved such that the most pressing task nowinvolves the analysis and interpretation of various types of data, including nucleotide andamino acid sequences, protein domains, and protein structures.Some of the important domains of bioinformatics study are database resource generation,comparative and functional genomics, phylogeny, modeling and designing and systems biology.National centre for biological information (NCBI), European Bioinformatics Institute (EBI),Swissprot, Sanger Research Centre, Kyoto encyclopedia of genes and genomes (KEGG)and protein data bank (PDB), a repository of experimentally solved structures are some ofthe important repositories of databases and bioinformatics tools which contain usefulinformation on genome sequences, conserved domains, taxonomy, etc. With the rapidavailability of genome sequences (available on Genomes online database) of diverseorganisms, analysis of the information for prediction of homologues across different specieshas become a very important part of bioinformatics under comparative genomics. Homologsexist amongst organisms due to a common evolutionary history and important tools havebeen developed which are being widely used for their identification.But still major challenges remain in the field and the prime reason is lack of sufficient datathough a major effort is underway in the experimental areas. Once a sufficient data resourceis available, we may then be able to discern the underlying principles and postulate somebasic hypothesis on the inter connectivity of life forms and their fundamental principles whichwill originate from bioinformatics research.

20
Proceeding of Conference : Evolving Paradigm to Improve Productivity for Plant Genetic Resoyrces
Theme-I Invited addressRNA interference as a Novel Biotechnological Tool for Crop
Improvement
M. V. Rajam
Plant Polyamine, Transgenic and RNAi Research Lab, Department of Genetics,University of Delhi South Campus, Benito Juarez Road, New Delhi 110021
Email: [email protected]
ABSTRACT:The crop yield is affected by several diseases caused by viruses, bacterial and fungal pathogensand also by insect pests and nematode parasites. Various approaches have been explored tocontrol these pathogens and pests, which include the application of different agro-chemicals,development of resistant crops by breeding and transgenic approaches. However, there are certainlimitations with these existing strategies, and therefore the development of novel alternative strategiesare required for developing stress tolerant plants. Indeed, RNA interference (RNAi) approachhas proven to be novel and potential for disease and pest control. Therefore, we have beenengineering some important crop plants, including tomato, brinjal, tobacco and cotton for resistanceagainst fungal infections and/or insect pests by using RNAi strategies. RNAi strategy essentiallyinvolves the production of hairpin loop of double-stranded RNA (dsRNA) in transgenic plantstargeting some important genes of pathogens and pests, which are essential for their growth anddevelopment. We have identified polyamine biosynthetic pathway as the RNAi target for the controlof fungal diseases, since polyamines (putrescine, spermidine and spermine) are absolutely essentialfor growth and development of fungal pathogens. Our work involves the specific targeting ofpolyamine biosynthesis genes, particularly ornithine decarboxylase (odc) of plant pathogenic fungiusing RNAi for their effective control. As a prelude to these investigations, initially we haveundertaken in vitro work to silence odc gene of Aspergillus nidulans by using chemically synthesizedsiRNA (23 nt long), which are the effector molecules of RNAi machinery. Five differentconcentrations of siRNA (5, 10, 15, 20 and 25 nM) and an unrelated siRNA having no sequencehomology with the fungal odc gene were tested for their effect on the germinating spores by addingthem in the culture medium and incubating for 72 h. This has resulted in specific silencing effectsleading to significant reduction in fungal germ tube and mycelial growth, sporulation, target mRNAtiters and cellular polyamine content in the fungal odc-siRNA treated samples, whereas no adverseeffects were observed in unrelated siRNA treated samples as well as untreated control samples.Further, we have also developed transgenic tomato plants expressing dsRNA of odc gene ofFusarium oxysporum, which cause wilt disease in tomato, and the results showed that suchtransgenic plants exhibited increased resistance to Fusarium wilt.
special issue Botany/i/18-5-18/20

21
Proceeding of Conference : Evolving Paradigm to Improve Productivity for Plant Genetic Resoyrces
In addition, we have been exploring RNAi technology for engineering crop plants for insectresistance. We have identified the acetylcholinesterase (AChE) gene of Helicoverpa armigera,a notorious insect pest of several important crop plants, including cotton, chickpea, red gram andtomato, as a novel RNAi target as this gene is involved in neurotransmission and absolutely importantfor insect growth and development. In fact, AChE enzyme is also the target for several pesticidesused for insect control. Initially, we have applied siRNA molecules, which are specific to AChEgene into the artificial diet, which was fed to the larvae of H. armigera, and this has resulted intheir mortality, growth inhibition, developmental abnormalities and drastically reduced fecundity.Transgenic RNAi tobacco and tomato plants expressing dsRNA of H. armigera AChE genewere also developed, and insect bioassays on tobacco leaves and tomato fruits of RNAi plantsshowed insect resistance. Further, we have also used RNAi approaches for developing delayedripening tomato plants by suppressing three isoforms of ACC synthase during fruit development,and male sterile tomato lines by silencing three isoforms of a key polyamine gene, S-adenosylmethione decarboxylase in tapetal tissue by RNAi. These results demonstrate that RNAiapproaches are a very promising for the control of plant fungal pathogens and insect pests as wellas engineering crop plants for delayed ripening and male sterility.The RNAi work in my laboratory is generously supported by grants from Department ofBiotechnology, New Delhi.

22
Proceeding of Conference : Evolving Paradigm to Improve Productivity for Plant Genetic Resoyrces
Research Paper
ISSN: 2321-1520
Fusarium equiseti - The Causal Organism of Wilt Disease in Cumin
Ramchandra S. Suthar, * P. N. Bhatt And * D. P. Bhatt
Department of Biotechnology, P. S. Science & H. D. Patel Arts College, Kadi-382517. KSVUniversity, Gujarat, India *Sun Agrigenetics P. Ltd, Vadodara, India.
E-mail:[email protected]
ABSTRACTCumin (Cuminum cyminum) is an important dry land spices in north Gujarat and Rajasthan,covering an area of about 2,64,000 and 2,10,000 hectares respectively. A survey carried and theloss from vascular wilt disease estimated to vary between 10 to 45% in North Gujarat. Productionof this crop is often limited due to several biotic stresses of which wilt disease is the most serious.Cumin wilt disease has known to be cause primarily by Fusarium oxysporum but other Fusariumspecies implicated. Three hundred and twenty four samples collected from different areas of Gujaratduring disease season in 2010 & 2011. ITS 1 & 2 markers were used to confirmed Fusariumspecies at a local BLAST server, in FUSARIUMID v. 1.0, query sequence was aligned 99.78%sequence similarity with Fusarium incarnatum-equiseti species complex. Further Koch’s postulateis confirmed using purified strain of Fusarium equiseti.Keywords: Fusarium equiseti, wilt and sequence.INTRODUCTIONCumin is an annual herb of the family Apiaceae (Umbelliferae) and grows to about 30-50 cm tall.It has dissected leaves with white or rose-colored flowers. Its seeds come in three colors: ayellowish brown color white or black. The seeds have abundant essential oil content between 2.5and 4.5 % essential oil on a dry weight basis. Cumin is originally cultivated in Iran, India, and theMediterranean region. Cumin is used primarily in curry pastes. It is an essential ingredient in manymixed spices, chutneys, and chili and curry powders. In the Middle East, it is a familiar spice asflavor over meat and vegetables, while in Europe, cumin flavors certain Portuguese sausages, and

23
Proceeding of Conference : Evolving Paradigm to Improve Productivity for Plant Genetic Resoyrces
is used to spice cheese. Currently the major sources of cumin are Iran, India, Syria, Pakistan, andTurkey. It is also found in Morocco, Egypt, Palestine, Iraq, Afghanistan, North America, andChile. India is a large producer and an earlier growing season than Syria, but 90% of nationalproduction is consumed internally.MATERIALS AND METHODSPathogen isolates: - 210 wilted plants were collected from different areas of Gujarat (India).Total of 70 cumin fields of 7 districts were sampled during disease season (fig-1). Each field wasarbitrarily divided into five circular plots approximately 100 m in diameter and two to four sampleswere randomly taken from each plot. Samples were pooled in each field and two infected plantfrom each field were selected and used for pathogen isolation. A total of 35 Fusarium isolateswere recovered from 70 samples collected from different geographic regions.Fusarium isolate: - Infected stem sections were surface-sterilized for 3 min with a 0.01% sodiumhypochlorite solution, rinsed twice in sterile distilled water and dried in a laminar flow cabinet.Potato Dextrose Agar (PDA) was used for fungal isolations. The plates were incubated at 25ºC inthe dark for 3-4 days. Fusarium isolates were subcultured on PDA, using a single spore technique(Leslie and Summerell, 2006). Cultural characters were observed by eye and by microscopicexamination. Colony morphology was observed from PDA plates. Morphological identificationsof isolates were made using the criteria of Gerlach and Nirenberg (1982) and Leslie and Summerell(2006).Pure culture: - pure culture of Fusarium was obtained from single spore of 6 days old culture ofpathogen isolates. Pathogen isolates were mix culture of different two or three types of fungus (fig-2). Wilt pathogen was selected for pure culture (fig-3).Selected fusrium isolate:- PR-3 was selected for further experiment (fig-4). It was fast growingFusarium rather than other 35 isolates.DNA Extraction: - Fusarium isolate PR-3 mycelium was harvested. Genomic DNA was extractedfrom ground mycelium of isolate (~100 mg wet weight) using a Genei fungal DNA extraction Kit(Genei, India) according to the manufacturer’s instructions.
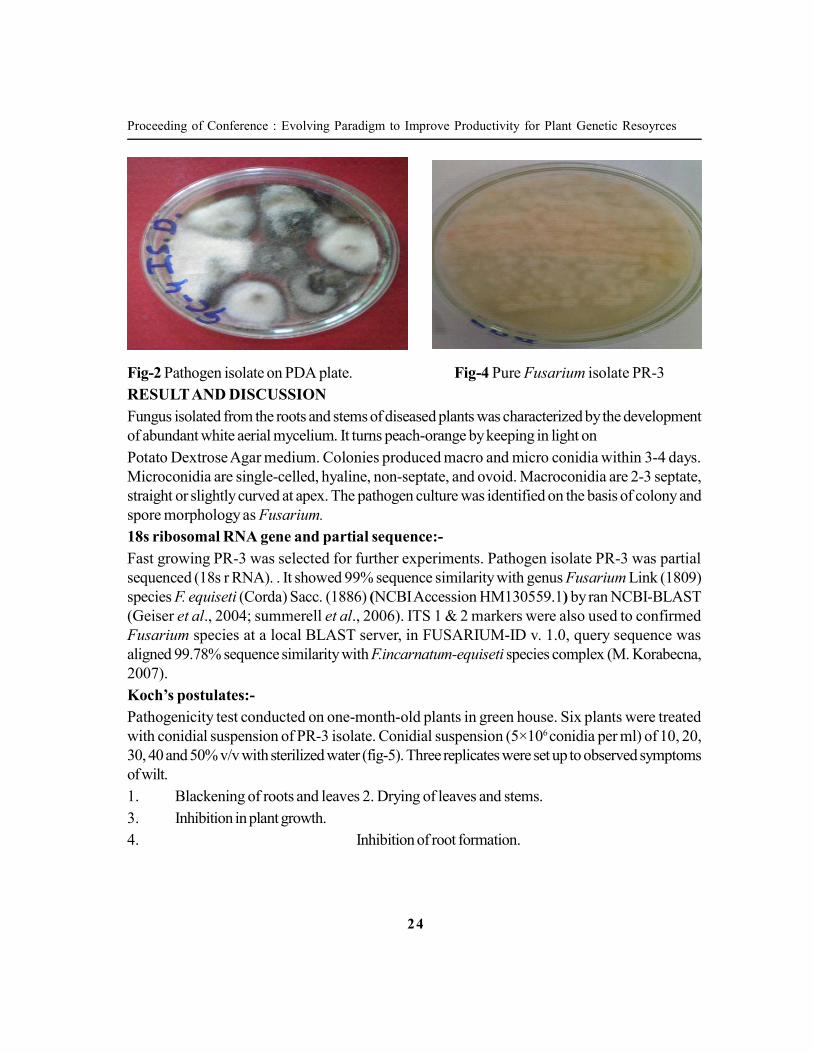
Fig-1 pathogen isolates collected from Fig-3 Fusarium isolate on PDA plate. marked regions of Gujarat.
24
Proceeding of Conference : Evolving Paradigm to Improve Productivity for Plant Genetic Resoyrces
Fig-2 Pathogen isolate on PDA plate. Fig-4 Pure Fusarium isolate PR-3RESULT AND DISCUSSIONFungus isolated from the roots and stems of diseased plants was characterized by the developmentof abundant white aerial mycelium. It turns peach-orange by keeping in light onPotato Dextrose Agar medium. Colonies produced macro and micro conidia within 3-4 days.Microconidia are single-celled, hyaline, non-septate, and ovoid. Macroconidia are 2-3 septate,straight or slightly curved at apex. The pathogen culture was identified on the basis of colony andspore morphology as Fusarium.18s ribosomal RNA gene and partial sequence:-Fast growing PR-3 was selected for further experiments. Pathogen isolate PR-3 was partialsequenced (18s r RNA). . It showed 99% sequence similarity with genus Fusarium Link (1809)species F. equiseti (Corda) Sacc. (1886) (NCBI Accession HM130559.1) by ran NCBI-BLAST(Geiser et al., 2004; summerell et al., 2006). ITS 1 & 2 markers were also used to confirmedFusarium species at a local BLAST server, in FUSARIUM-ID v. 1.0, query sequence wasaligned 99.78% sequence similarity with F.incarnatum-equiseti species complex (M. Korabecna,2007).Koch’s postulates:-Pathogenicity test conducted on one-month-old plants in green house. Six plants were treatedwith conidial suspension of PR-3 isolate. Conidial suspension (5×10⁶ conidia per ml) of 10, 20,30, 40 and 50% v/v with sterilized water (fig-5). Three replicates were set up to observed symptomsof wilt.1. Blackening of roots and leaves 2. Drying of leaves and stems.3. Inhibition in plant growth.4. Inhibition of root formation.

25
Proceeding of Conference : Evolving Paradigm to Improve Productivity for Plant Genetic Resoyrces
Fig-5 cumin plants effected with 10% to 50% of conidial suspension.New root formation was seen in the plants inoculated in 10% and 20%v/v culture filtrate. With theincrease in concentration of culture filtrate plants showed increasing symptoms of wilt within fivedays. Symptoms of wilt were observed in lower concentration of 10 and 20% culture filtrate afterprolonged incubation of 10 days.The symptoms were observed similar to fields which were seemed. Control plants were remainedunaffected and healthy.Re-isolation of fungus:-Koch’s postulates were fulfilling by reisolating the fungal pathogen, which was identified as Fusariumequiseti causing wilt on cumin.CONCLUSIONThis is the first finding in Gujarat indicating that Fusarium equiseti is also pathogenic agent forcumin wilt (Suthar R.S. and Bhatt P.N.,2011) and (Reuveni,R. 1982). Reports till date recordFusarium oxysporum as casual organism of wilt in cumin. The interesting finding of the study wasthat even the toxin released by the Fusarium equiseti is responsible to cause wilt in cumin.ACKNOWLEDGEMENTThe authors are grateful to Dr.Ajay Gor, principal of P. S. Science & H. D. Patel Arts College,Kadi for provide facility of Plant tissue culture laboratory. Authors are also thankful to Departmentof Biotechnology, kadi.REFERENCES Leslie, J.F. and Summerrell, B.A. (2006) the Fusarium Laboratory Manual. Blackwell Publishing,Ames, IA, USA. 388 pp. M. Korabecna,2007. The Variability in the Fungal Ribosomal DNA (ITS1, ITS2, and 5.8 S

26
Proceeding of Conference : Evolving Paradigm to Improve Productivity for Plant Genetic Resoyrces
rRNA Gene) Communicating Current Research and Educational Topics and Trends in AppliedMicrobiology,783-787.Geiser DM, Jiménez-Gasco M, Kang S, Makalowska I, Veerarahavan N, Ward TJ, ZhangN,Kuldau GA, O’Donnell K (2004) FUSARIUM-ID v. 1.0: a DNA sequence database foridentifying Fusarium. Eur J Plant Pathology110:473–479. Reuveni,R. 1982. Fusarium equiseti-A new cause of cumin spice plant wilt in Israel. Plant Disease/Vol-66 /No-6:498-49Ramchandra , S. Suthar and Bhatt, P.N. (2011). Morphological and molecular identification ofFusarium isolated from cumin wilt. Internat. J. Plant Protec., 4(2): 359-362.

27
Proceeding of Conference : Evolving Paradigm to Improve Productivity for Plant Genetic Resoyrces
Phytoplankton Diversity of Tapi, Surat with Special References toAquatic Nutrients
Maheshwari Solanki And Kapila Manoj
Dept. of aquatic biologyVeer Narmad South Gujarat University
ABSTRACTThe Present study has been carried out to estimate the Phytoplankton diversity of Tapi River. Thechemical variables with special reference to nutrients (Silica, Phosphorus, Nitrate and Ammonicalnitrogen) were estimated during Jan-2009 to Dec-2009.During monitoring three different samplingstations in Tapi were selected. The aim of the study was to observe the effect of nutrients on thequality of the phytoplankton. Phytoplankton assemblage was dominated by members ofBacillariophyceae, Cyanophyceae, Chlorophyceae and desmids.Keywords: Tapi, phytoplankton communities, NutrientsINTRODUCTIONAlgae are natural inhabitants of water. It serves as the basic food within an aquatic ecosystem.Algae are involved in water pollution in different ways but the selective algae, in polluted water arealso being used as indicators of pollution.Phytoplankton community comprises of a heterogeneous group of tiny plants adapted to variousaquatic environments. Their nature and distribution varies considerably with respect to seasonsand water quality. Their dominance also leads to qualitative changes of aquatic systems. Quality ofan aquatic ecosystem is dependent on the physical and chemical qualities of water as also onbiological diversity of the system. (Tripathi and Gupta, 2002). The plankton is the indicator ofecological conditions and chemical nature show recent conditions. If the environmental conditionsare altered then the change in the plankton population is inevitable which is replaced by species to

28
Proceeding of Conference : Evolving Paradigm to Improve Productivity for Plant Genetic Resoyrces
species. The utility of plankton as direct or indirect food for fishes and their utility in assessing thewater quality have now-been well established. (Salodia, 1996). Therefore, the investigation hasbeen conducted to assess the impact of pollution through the evaluation of physico-chemical aswell as biological parameters of Tapi river.METHODOLOGYTo, fulfill the objectives and aims of the study, monthly collection was carried out from differentstations at selected sites. The samples were collected monthly from Jan-2009 to Dec-2009.Threelocations were selected on the Tapi on the basis of fresh water and sea water intrusion, anthropogenicand domestic sewage inlets. Ashwani kumar (Freshwater Zone, Inlet of Domestic Sewage and Cremation ground drainage).[1] Nanpura (Intermediate Zone, Anthropogenic pollution and Inlet of Sewage).[2] Umara (Estuarine Zone, Anthropogenic pollution and Inlet of Sewage and cremation ground
drainage). Subsurface water samples for Physico-Chemical and Biological parameters were collectedbetween 7:00 to 9:30 A.M, in 5 lit. container, which were previously cleaned with diluted HNO
3
and detergent followed by distilled water. Before sampling, they were again rinsed with samplingwater. After collection they were brought to the laboratory. Phytoplankton sample were collected from river by using silk bolting phytoplankton net.50 liter ofwater was filtered through the net and preserved immediately with 4% formalin and Lugol’s iodinesolution. Plankton were collected as described in APHA (2005). Phytoplankton identification wasdone by using Desikachary (1987) and Sarode and Kamat (1984).RESULT AND DISCUSSION
Parameter Minimum Maximum Silicate 10.01 mg/l Site 3 Feb 2009
Amphora coffeaformis, Anabaena plactonica, Cosmarium portianum,
Chlorella valgaris, Cyclotella comata, Cyclotella glomerata, Fragillaria intermedia, Fragillaria capucina,
Gomphonema purvulum, Gomphonema quadripunctatum, Gyrosigma
acuminatus, Tabellaria fenestrata, Melosira granulata, Microcystis
aerugenosa,Navicula symmetrica, Navicula radiosa, Navicula
confervacea, Nitzschia palea, Nitzschia closterium, Oscillatoria princeps, Spirogyra sp, Surirella elegans, Synedra ulna, Spirulina platensis, Nostoc sp, Pandorina
moram, Pediastrum simplex, Pleurosigma elongatum,Closterium malmei and Mastagloea sp
40.16 mg/l Site 3Oct 2009 Anabaena sperica, Anabaena affinis,
Anabaena flos-aquae, Ankistrodesmus falcatus, Cocconeis plcentula,
Coscinodiscus radiatus, Cosmarium depressum, Chlorella vulgaris,
Chlorella pyrenoidosa, Fragillaria intermedia, Gomphonema
quadripunctatum, Melosira varins, Microcystis aerugenosa,
Merismopodia sp, Microspora sp, Navicula radiosa, Nitzschia
closterium, Oscillatoria princeps, Scenedesmus quadricauda, Scenedesmus obliqus, Spirogyra sp,
Surirella elegans, Surirella capronii, Synedra ulna, Thallassionema sp,
Nostoc sp, Pandorina morum, Pediastrum simplex, Pleurosigma
elongatum, Mastagloea sp, Closterium attenutum and Closterium
malmei

29
Proceeding of Conference : Evolving Paradigm to Improve Productivity for Plant Genetic Resoyrces
Most of the surface water in India, including both rivers and lakes are getting increasingly polluteddue to on sought of human activities of diverse nature. Phytoplankton respond rapidly to thechanges in the aquatic environment particularly in relation to nutrients like nitrate, phosphate andsilicate. Most of the phytoplankton in the marine and estuarine ecosystems is nutrient limited,meaning that their production is held below maximum levels by low concentration of one or moreessential nutrients of which silicate is the most important nutrient for diatoms (Eggs and Aksnes,1992). The results obtained from the study showed that some regional and seasonal variationsdepend upon the pollutants dumping into aquatic ecosystems.
Phosphorus 0.066 mg/l Site 1May 2009 Achnanthes minutissima, Amphora acutiuscula, Amphora coffeaformis,
Anabaena sperica, Anabaena planctonica, Ankistrodesmus falcatus,
Cosmarium depressum, Chlorella vulgaris, Cyclotella meneghiniana,
Cymbella minuta, Fragillaria intermedia, Melosira granulata,
Microcystis aerugenosa, Navicula radiosa, Navicula symmetrica,
Nitzschia closterium, Nitzschia sigma, Oscillatoria princeps, Scenedesmus quadricauda, Spirogyra sp, Synedra ulna,Thallassionema sp, Nostoc sp,
Pandorina moram, Pediastrum duplex, Pleurosigma elongatum and
Mastagloea sp
3.63 mg/l Site 3 Aug 2009 Anabaena sperica, Anabaena
planctonica, Ankistrodesmus falcatus, Euglena sp, Cocconeis placentula, Cosmarium depressum, Chlorella vulgaris, Chlorella pyrenoidosa,
Cyclotella meneghiniana, Cyclotella comata, Cymbella tumida, Fragillaria biceps, Gomphonema purvulam,
Melosira granulata, Microcystis aeruginosa, Merismopodia sp,
Navicula radiosa, Navicula confervacea, Navicula forcipata,
Nitzschia palea, Nitzschia tubicolla, Oscillatoria princeps, Odentella sp, Scenedesmus quadricauda, Surella elegans, Synedra ulna, Nostoc sp, Pediastrum duplex, Pleurosigma
directum, Mastagloea sp and Closterium malmei.
Nitrate 0.014 mg/l Site 1 March 2009 Achnanthes lanceolata, Achnanthes holsatica, Amphora coffeaformis, Anabaena planctonica, Cocconeis placentula, Coscinodiscus radiosa, Cosmarium portianum, Chlorella
vulgaris, Cyclotella meneghiniana, Cymbella minuta, Fragillaria
intermedia, Gomphonema purvulum, Gomphonema quadripunctatum, Gyrosigma acuminatus, Hydrodictyon sp,
Lyngbya sp, Microcystis aerugenosa, Navicula radiosa,
Navicula forcipata, Nitzschia palea, Nitzschia Closterium, Scenedesmus obliqus, Scenedesmus quadricauda, Synedra ulna, Spirulina platensis,
Nostoc sp, Pleurosigma elongatum and Mastagloea sp
4.73 mg/l Site 1 Dec 2009 Achnanthes minutissima, Achnanthes salvadoriana, Anabaena flos-aquae,
Anabaena plactonica, Ankistrodesmus falcatus, Cocconeis placentula,
Cosmarium portianum, Chlorella vulgaris, Fragillaria intermedia,
Gomphonema purvulum, Oedogonium sp, Hydrodictyon sp, Lyngbya sp, Microcystis aerugenosa, Melosira granulate, Navicula confervacea,
Navicula radiosa, Nitzschia closterium, Scenedesmus
quadricauda, Spirogyra sp, Surirella capronii, Oscillatoria princes,
Spirogyra sp, Synedra ulna, Spirulina sp, Volvox globerator, Volvox aureus, Pediastrum duplex, Ulothrix zonata, Nostoc sp and Closterium malmei

30
Proceeding of Conference : Evolving Paradigm to Improve Productivity for Plant Genetic Resoyrces
The high levels of silicate in almost all the sites can be attributed to the sources of industrial pollution.The concentration of silicate relative to other nutrients can determine the abundance of diatomsthan the other groups as suggested by (Officer and Ryther, 1980).Silicate is an important chemical nutrient required for the growth and development of Diatoms.Abundant in sand will enter the inland waters by land run off from the catchment areas duringprecipitation (Kumar, 2002 and Quasim and Sengupta, 1980).Generally Phosphate, Nitrate and Nitrite are together referred as nutrients. They are most importantfor the growth and maintenance of aquatic life in ecosystem. The presence of phosphate in anestuary can be taken as an index of potential fertility of the ecosystem as a whole (Gupta andPankaj, 2006).Phosphate is one of the most important factors that control the algal production. Phosphate wasfound in high concentration, where a many sewage are dumping their domestic wastes. Sewage isconsidered as the principle source of phosphate and other nutrients. (Edmondson, 1972) gavethe most detailed data on the study of effect of sewage effluents, on the aquatic habitat. He foundthat sewage effluents are good source of phosphorus. (Himanshu and Kapila, 1999) observedthat over 80 % of phosphorus entered from sewage in Tapi.The significant direct relationship emerged between phosphate and Bacillariophyceae andChlorophyceae shows higher phosphate concentration favored their growth (Kumar and Azis,1999). Nitrate the end product of nitrification is generally recorded in natural waters at levelshigher than nitrite and ammonia. Nitrate is the main nutrient which limits the growth of plankton.Nitrate is the highest oxidized form of nitrogen. Domestic sewage, natural run off and agriculturalwastes are the important sources of nitrates in the aquatic ecosystem (Saxena, 1987).The minimum nitrate value observed in sites was probably due to the growth of phytoplanktonwhich might have consumed it as reported by (Gonzalves and Joshi, 1946 and Singh, 1965).As suggested by Trivedy et al., 1990 that nitrate can serve as useful indicator of organic pollutionof aquatic environments. Low concentration in summer was due to utilization by plankton andaquatic plants. Similar results were observed by (Kannan, 1978).Nitrite is the intermediate state of nitrogen. Oxidation of ammonia first produces nitrite and thennitrate. The nitrite concentration was relatively lower during the entire investigation period. Thenitrite content showed distinct seasonal cycle with relatively higher values in winter and lower insummer and monsoon. The lower concentration of nitrite in summer and monsoon may be due tothe utilized by Cyanophyceae. Highly negative correlation of nitrite was found with Cyanophyceaewhich indicated higher consumption of nitrite by members of Cyanophyceae. A positive correlationwas obtained for Chlorophyceae and Bacillariophyceae. Similar results were observed by (Bhattet al; 1999).Ammonia in natural waters is generally absent or present at very low levels. Water pollution bysewage or industrial wastes containing nitrogenous organic water may contain high concentrationof ammonia (Goel, 1997). (Wetzel, 1983). Stated that ammonia is generated by heterotrophic
31
Proceeding of Conference : Evolving Paradigm to Improve Productivity for Plant Genetic Resoyrces
microbes as a primary end product of decomposition of organic matter either directly from proteinor from the organic compounds. Correlation between ammonia and Cyanophyceae was found tobe highly positive but it showed highly negative correlation with Chlorophyceae andBacillariophyceae.Among the Cyanophyceae Microcystis sp, Anabaena sp, and Oscillatoria sp were presentthroughout the year whereas Spirulina sp was found only during rainy season. Vasisht and Sra(1979) have recorded that dominant and regular presence of Microcystis sp as an indicator ofpollution and eutrophication of water body. Among the Chlorophyceae Chlorella sp,Ankistridesmus sp and Scenedesmus sp were present throughout the year. Among theBacillariophyceae Fragillaria sp, Navicula sp, Gomphonema sp, Niztschia sp and Cyclotellasp were observed throughout the year.CONCLUSIONResults obtained suggest that Tapi is moderately polluted and showed a trend of increasingeutrophication. Richness in nitrogen and phosphate were favourable for the growth of phytoplankton.With reference to Qualitative changes it is observed that Melosira sp, Nitzschia sp, Navicula sp,Oscillatoria sp, Spirulina sp, Fragillaria sp,Cyclotella sp, Skeletonema sp, Chlorella, Cymbella sp, Gomphonema sp, spirogyra sp,Pleurosigma sp, Gyrosigma sp, Coscinodiscus sp, Ankistrodesmus sp, Scenedesmus sp,Surirella sp, Turbellaria sp, Anabaena sp, Closterium sp. etc. were found.REFERENCESAPHA, (2005). Standard Method for the Examination of Water and Wastewater (21th ed.), NewYork.Bhatt, L.R, Lacoul, P., Lekhak, H.D. and Jha, P.K.(1999). Physico-chemical characteristic andphytoplanktons of Taudaha lake, Kathmandu.Poll. Res. 18(4) pp: 353358.Desikacharya, T.V., (1987-1991). Atlas of Diatoms Fasc. 1-6. Madras Science foundation.Edmondson, W.T., (1972). Water quality management and Lake Eutrophication. Water resourcesmanagement and public policy. pp: 139-178.Eggs, J. K., and Aksnes, D. L., (1992). Silicate as regulating nutrient in Phytoplankton competition.Mar. Ecol.Prog. Ser. 83. pp: 281-289.Goel, P.K., (1997), Water Pollution causes, Effects and control, New Age international publishers.New Delhi. pp: 143-149.Gonzalves, E. A. and Joshi, D. B., (1946). Fresh water algal flora of temporary water aroundBombay 1&2 seasonal succession of the algae in a tank of Bandra. J. Bomb. Hist. Soc. 46. pp:154-176.Gupta, A. K. and Pankaj, P.K., (2006). Comparative study on Eutrophication and heavy metalpollution in river Ganga and Gomati with reference to human activities. Natl. Environ. Poll. Technol.5(2) pp: 229-232.

32
Proceeding of Conference : Evolving Paradigm to Improve Productivity for Plant Genetic Resoyrces
Himanshu, H. R. and Kapila, M., (1999). Physico-chemical Evaluation of Lentic Habitat createdby the Weir Cum Causeway in Tapi River, Surat. Asian Jr. of Microbiol. Biotech & Env. Sc. Vol.1, No 1-2. pp: 121-125.Kannan, V., (1978). The limnology of Sathiar: A fresh water impoundment. Phd. Thesis, MaduraiKamraj University, Madurai. In: Indian hydrobiology 8(2). pp: 187-192.Kumar, A., (2002). Ecology of polluted water volume-2. A.P.H. Publishing Corporation. NewDelhi.Kumar, A. and Azis, P.K., (1999). Primary production in the Anchuthengy. Kadinam kulam estuarinesystem, Kerala. Poll. Res. 18(3). pp: 309-314.Officer, C.B. and Ryther, J. H., (1980). The Possible importance of Silicon in Marine Euthrofication.Mar. Ecol. Progr. Ser. 3. pp: 83-91.Quasim, S.Z. and Sengupta, R. (1980). Environmental characteristics of the Mandovi and Zuaririver system in Goa. In: Asian Jr. of Microbiol. Biotech & Env. Sc. Vol. 1, No. 1-2.pp: 121-125.Salodia, P.K., (1996). Fresh water Biology, Surabhi Publication Rastasinghiji, S.M.S., Highacay,Jaipur 302003.Sarode, P.T. and Kamant, N.D., (1984). Freshwater diatoms of Maharastra, Saikrupa Prakasan,Aurangabad.Saxena, M. M., (1987). Environmental Analysis of Water, Soil and Air. Agrobotanical Publisher(India). pp: 22.Singh, M., (1965). Phytoplankton periodicity in a small lake near Delhi-1 seasonal fluctuation ofphysico-chemical characteristics. Phykos. 4. pp: 61-68.Tripathi, D. M. and Gupta, R. K., (2002). An alarming scientific research report on various causesof river Mandakini ware pollution at Keddar Velley in the district Rudraprayag of UttaranchalIndia. In: Ecology of pollution water by Arvind Kumar. A.P.H. Publishing Corporation.Trivedy, R. K., Srotri, A. C. and Hatavkar, S. D., (1990). Physico-Chemical Characteristics andphytoplankton of the river panchaganga near Kolhapur, Maharastra. In: River. Poll. In India Trivedy,R. K. pp: 159-177.Vasista, H.S. and Sra, G. S. (1979). The biological characteristic of chandigraph waste waters inrelation to physico-chemical factors. Proc. ASymp. Environ. Biol. Pp: 429-440Wetzel, R. G., (1983). Limnology WB Saunders Co. Philadelphia, USA. pp: 35.

33
Proceeding of Conference : Evolving Paradigm to Improve Productivity for Plant Genetic Resoyrces
Spatial and Temporal Variations in Phytoplankton Bio-Diversity ofArabian Sea
Gunjan Motwani1, Mini Raman
2, Hitesh Solanki
1, Sushma Parab
3, Suraksha Pednekar
3
And Prabhu Matondkar3
1 Department of Botany, Gujarat University, Ahmedabad. 2 Space Application Centre, ISRO,Ahmedabad. 3 National Institute of Oceanography, Goa. Email: [email protected]
ABSTRACTPhytoplankton samples of North Eastern Arabian Sea were collected during remote sensing cruisefrom 2003-2009. Phytoplankton types were studied and its community organization and distributionwas analyzed using Shannon’s Diversity Index. The results showed that Chaetoceros, Naviculaand Rhizosolenia were most abundant among the diatoms. Ceratium and Protoperidinium werethe dominant dinoflgellates. Noctiluca (dinoflagellate) dominated the open ocean waters whereasTrichodesmium (cyanobacteria) dominated the shallow coastal waters.Keywords: Phytoplankton, Shannon’s Diversity Index, dinoflgellates, chlorophyllINTRODUCTIONPhytoplankton are predominantly single celled and microscopic (0.5 to 250 µm). They are greenplants with chlorophyll pigments for photosynthesis and are mostly confined to the surface illuminatedlayers of the ocean. They are ubiquitous and abundant upto 105 cells per ml. It controls the colorof water and is detectable from space. It consumes CO
2 and controls the ocean carbon cycles and
climate.Phytoplankton plays two important ecological roles. Firstly, they fix inorganic carbon and convertsolar (light) energy to chemical energy. In this process they convert CO
2 to organic carbon. Their
rate of growth and carbon fixation is called primary production. As the phytoplankton die, theysink into the abyss and sequester carbon in the deep ocean, in a process called the biologicalpump. Secondly, they form the base of the marine food web. Small oceanic animals such aszooplankton derive their energy by grazing on phytoplankton. In turn larger species of fishes and

34
Proceeding of Conference : Evolving Paradigm to Improve Productivity for Plant Genetic Resoyrces
mammals consume these zooplanktons.Although 70% of the Earth's surface is occupied by the oceans, our knowledge of biodiversitypatterns in marine phytoplankton is very limited in comparison to that of the biodiversity of plantson the land (Irigoien et al., 2004). It is well established that diversity enhances productivity andstability in communities of higher organisms; however, knowledge of such relationships betweenunicellular organisms like phytoplankton, which contribute to about 50% to the global primaryproductivity, is still lacking (Ptacnik et al., 2008).In this study we have tried to analyze phytoplankton richness, its spatial and temporal variabilityfor winter and inter monsoon seasons, along with its community structure using Shannon’s DiversityIndex. Chlorophyll-a concentration was studied as a function of phytoplankton diversity andcorrelated with phytoplankton cell counts at various light levels for both winter and inter monsoonseason. Remote sensing was additionally used as a tool to support the in-situ data for phytoplanktondistribution and chlorophyll concentration.Study areaThe Site selected for this study was Northern and Eastern section of Arabian Sea, which occupyingan area 6.225 x 10⁶ km Sq. and extends from 0º to 25ºN and 50º to 80ºE (Qasim 1977). It isbordered by Oman at the west, Iran at the North-West and the India at the east.Periyar, Bharathapuzha and Pamba rivers from Kerala; Kali, Netravati and Sharavati rivers from
Karnataka, Tiracol, Chapora, Baga, Mandovi andZuari rivers from Goa; Shastri, Gad, Vashishti, Savitri,Patalganga, Ulhas and Vaitarna rivers fromMaharashtra; Tapti, Narmada, Mahi and Sabarmatirivers from Gujarat and Indus from Pakistan bring freshwater into Arabian Sea (www.museumstuff.com).Phytoplankton samples of North Eastern Arabian Seawere collected during ship cruises organized for oceancolour satellite validation from 2003-2007 as shownin figure 1. The details of samples collected andanalyzed for various cruises are summarized in table1.
Fig-1 Map of stations at various cruises showing sitesof sample

35
Proceeding of Conference : Evolving Paradigm to Improve Productivity for Plant Genetic Resoyrces
Table-1 Details of the cruise, season, sampling stations and depths
Cruise Id Period of Study/season No. of stations analysed
Sampling Depths
FORV- 212
27th February to 5th March 2003, Winter-Monsoon
5 100% light level (Surface) only.
FORV- 222
21 th February to 11th March 2004, Winter-Monsoon
3 100% light level (Surface) only.
FORV- 244
15th April to 28th April 2006, Inter-Monsoon
15 100% light level (Surface), to 1 % light level.
FORV- 253
28th February to 11th March 2007, Winter-Monsoon
8 100% light level (Surface), to 1 % light level.
METHODOLOGY AND DATA ANALYSISThe water samples were collected from various sampling stations, which were decided on thebasis of percent light intensity/ penetration with reference to the surface irradiance in the watercolumn. Satlantic under water Hyper-spectral radiometer was used to measure the light levels atthe sampling sites.For microscopic identification and cell counts 500 ml of sea water was fixed with 1% lugol’sIodine and preserved in 3 % buffered formaldehyde solution and stored under dark and coolconditions till analysis. Samples were concentrated approximately to 5-10 ml by siphoning the toplayer of the sample carefully with a tube, 1ml of sample were transferred to a SedgwickRafter slideand identified and counted using an Olympus Inverted Microscope (Model IX 50) at 200 %magnification. Standard taxonomic keys (Tomas, 1997) were used for identification. The cruiseswere temporally categorized into winter-monsoon (Dec-March) and inter-monsoon (April-May)to better understand the seasonal variation in phytoplankton type and concentration. Surfacediversity (at 0m depth) was evaluated for FORV-212 and FORV-22 whereas surface as well asdepth wise (vertical profile) evaluation of diversity was carried out for FORV-244 and FORV-253. For analyzing the community structure of phytoplankton in the North-Eastern Arabian Seathe index was calculated as follows:Shannon Diversity Index:This index is applied to biological systems very commonly for calculating diversity. It was derivedfrom a mathematical formula by Shannon in 1948 (Mandaville 2002).H’ = -Σ [(ni / N) x ln (ni / N)]Where : H’: Shannon Diversity Index ni: Number of individuals belonging to i species N: Total number of individualsRESULT AND DISCUSSIONPhytoplankton Richness

36
Proceeding of Conference : Evolving Paradigm to Improve Productivity for Plant Genetic Resoyrces
The phytoplankton community structure of the Arabian Sea was highly diverse with 274 speciesidentified. Diatoms (Bacillariophyceae) exhibited the greatest diversity with 142 species followedby dinoflagellates (Dinophyceae) 129 species; other Algae (Cyanophyceae) with 3 species. Diatomsand dinoflagellates were the most diverse groups. Out of 142 species of diatoms 28% was contributedby three genera: Chaetoceros (18 species), Navicula (12 species), Rhizosolenia (11 species).Of the 129 species of dinoflagellates, 30% were represented by two genera: Ceratium (21 species)and Protoperidinium (17 species). As a whole, a pronounced prevalence of diatoms was typicalfor the phytoplankton community in the Arabian Sea during the period of analysis. On an average,diatoms contributed 52% to the total species diversity as shown in figure 2. Their prevalence wasat a maximum (70.2%) during the winter-monsoon period, in February and March, and reducedto 65% during the Inter-monsoon period (April to May). Dinoflagellates contributed only 47% tothe total species diversity, with 25.4% during the winter-monsoon period, and reduced to 19.24%during the Inter-monsoon period. The remaining 1% was contributed by other algae. 2 Species ofTrichodesmium represented this category.
Temporal variation in phytoplankton concentration at surface Total phytoplankton cells observed at the surface (0m depth) of the Arabian Sea ranged from (11cells/lit to 10440 cells/lit) during 2003 to 2007. This shows that the waters of Arabian Sea arehighly productive. Their concentrations in winter monsoon and inter monsoon periods is summarizedin table 2 and figures 3 and 4 illustrate their group wise concentration in the two periods. Morethan half (60%) of the total diatoms was contributed by Rhizosolenia alata (10779 cells/lit),Rhizosolenia shrubsolei (6552 cells/lit), Navicula sp. (4500 cells/lit) and Rhizosolenia hebatata(3710 cells/lit). Noctiluca scintillans (10440 cells/lit) alone contributed to 68% of the totaldinoflagellates in the winter monsoon period. Trichodesmium erythraeum (6316 cells/lit) wasthe greatest contributor (72%) among other algae (Cyanophyceae), in the inter monsoon period.Among dinoflagellates observed in the inter monsoon period, 21% was formed by Scripsiellatrachoidea (2220 cells/lit) and 14% was formed by Prorocentrum minimus (1462 cells/lit).

37
Proceeding of Conference : Evolving Paradigm to Improve Productivity for Plant Genetic Resoyrces
Among diatoms that occurred in the inter monsoon period, Navicula sp. (5782 cells/lit);Thalassiothrix frauenfeldii (2504 cells/lit) and Rhizosolenia fragilissima (2220 cells/lit) werethe major ones.
Table-2 Phytoplankton cell concentration and percent contribution, in winter monsoon and intermonsoon periods and their group wise concentration and percent contribution in the two periods
Total cell Concentration (116525 cells/lit)
Winter monsoon period Inter monsoon period (60867 cells/lit) 52% (55658 cells/lit) 48%
Diatoms Dinoflagellates Other Algae Diatoms Dinoflagellates Other Algae (42568cells/lit) (15407cells/lit) (2892cells/lit) (36170cells/lit) (10714cells/lit) (8774cells/lit) 70% 25% 5% 65% 19% 16%
Fig-3 and 4 Percent contribution of diatoms, dinoflagellates and other algae in winter and intermonsoon periods
Spatial variation in phytoplankton concentration at surfaceTo study the spatial distribution of phytoplankton Arabian Sea was categorized as Coastal (< 50mdepth), shelf (50-200m depth), slope (200-500m depth) and Open Ocean (>500m depth).Noctiluca scintillans formed massive blooms in the open ocean of northern Arabian Sea coveringa large area from 17º19.40’N and 70º11.95’E to 20º28.72’N and 67º30.51’E during wintermonsoon period as shown in figure 5. Whereas Trichodesmium erythraeum formed bloom in thecoastal waters at 20º31.87’N and 70º34.77’E during inter monsoon period as shown in figure 6.

38
Proceeding of Conference : Evolving Paradigm to Improve Productivity for Plant Genetic Resoyrces
Fig - 5 and 6 Spatial distribution of phytoplankton cells over the Arabian Sea during winter and
Winter monsoon Inter monsoon
inter monsoon periods. The colour bar shows cell concentration (cells/lit); green to red colour inthe map shows the region covered by the bloom.ACKNOWLEDGEMENTThis work is supported under the Meteorology and Oceanography (MOP) II program of IndianSpace Research Organization (ISRO). In this valuable advice and encouragement of Dr. Ajai,Group Director, MPSG and Dr. Prakash Chauhan, Head of the Division, MPD of SpaceApplications Center (ISRO), Ahmedabad is greatly acknowledged.REFERENCESIrigoien, X., Huisman, J. and Harris, R. P. (2004). Global biodiversity patterns of marinephytoplankton and zooplankton. Nature 429, 863-867.Mandaville, S. M. 2002. Benthic Macro-invertebrates in Freshwater – Taxa Tolerance Values,Metrics and Protocols, Project H - 1. (Nova Scotia: Soil & Water Conservation Society ofMetro Halifax).Ptacnik, R., Solimini, A. G., Andersen, T., Tamminen, T., Brettum, P., Lepisto, L., Wille´n E. andRekolainen S. (2008). Diversity predicts stability and resource use efficiency in natural phytoplanktoncommunities. Proceedings of the national academy of Sciences 105(13), 51345138.Qasim, S. Z., (1977). Biological productivity of the Indian ocean. Indian Journal of Marine Sciences6,122-137.Tomas, C. R., (1997). Identified Marine phytoplankton. Academic Press, New York, 858.Internet Référencehttp://www.museumstuff.com/learn/topics/List_of_rivers_of_India::sub::Rivers_Flowing_Into_Arabian_Sea. Accessed on 01/11/2010, 8:15 am.Evolving Paradigm to Improve Productivity for Plant Genetic Resources

39
Proceeding of Conference : Evolving Paradigm to Improve Productivity for Plant Genetic Resoyrces
Ethno-Medicinal Plants used to Cure Different Diseases by Tribalsof Jhalod Taluka of Dhahod District, Gujarat, India.
R. N. Maru* And Dr. R. S. Patel
*Department Of Biology, Government Science College, Gandhinagar, (Gujarat), India.Department Of Biology, KKSJ Maninagar Science College, Ahmedabad, (Gujarat), India.
E-mail: [email protected]
ABSTRACTDahod district is one of the tribal districts of the Gujarat state. It is situated in the north-east fringeof the Gujarat state, adjoins with Rajasthan and Madhya Pradesh state. Total forest area of Jhalodtaluka is 788.39 sq. Km. Area. Ethno botanical studies were carried out to collect information onthe use of some plants by local communities in Jhalod taluka of Dahod district, Gujarat, India.These area lies under bio-geographic zone-4 – the semi arid - biotic province -4b gujarat-rajwada,sub category 4b
5-plains in central Gujarat. Main tribes are machhaar, sangada, baria, ninama,
vasaiya, vasava, parmar, chauhan etc.during this study. The authors have conducted an extensivefield survey in the tribal belts and other interior villages adjoining forest areas in the district tocollect ethno botanical lore. First hand information was gathered through interactions with tribaland rural people including members of forest protection committees. A number of group discussionswere also conducted during the period of investigation. In the following enumeration, plant nameshave been arranged alphabetically in disease wise. The study provides information on 36 plantspecies.Keywords: ethnobotany, ethnomedicine, jhalod taluka, tradional uses and tribal.INTRODUCTIONThe study area, popularly known as jalod forest and its surrounding areas. Jhalod taluka is locatedbetween 23ΪΩ-6ΪΩ.07΄ N and 74ΪΩ.9΄ to 74.46ΪΩ E in the district Dahod, Gujarat state. Thevegetation and forests are tropical mixed dry deciduous type of the area. The forest area is hilly,

40
Proceeding of Conference : Evolving Paradigm to Improve Productivity for Plant Genetic Resoyrces
most of the hills run in east to west direction and only some in north to east direction. The flat landin between are under cultivation by tribal. In this area fresh water resources availability is verypoor. The drainage from hillhocks has been dammed at several places in forest. Jhalod taluka inthe dahod district in the state of Gujarat. Jhalod taluka is situated between the banks of the TintodiRiver. The district head quarters are located at Dahod. The district occupies an area of 2749 km²and has a population of 3, 68,484 (2001 census). It is the third-most backward district in Gujarat.It was only 6.96% urban as of 2001. Ethnobotanical studies were carried out to collect informationon the use of medicinal plants by local communities of Jhalod taluka of Dahod district. The utilizationof plants for medicine is an ancient, global tradition that represents the cornerstone of health carefor many rural communities and citizens in developing countries (Robbins, 2000). Earlier works onan ethnobotanical and medicinal aspects of plants were carried out by a good number of workersnamely Thaker (1910), Saxton and Sedgwick (1918), Nadkarni(1926), Santapau (1954), Patel(1971), Shah (1978), Jain (1991), Shashtri (1996), Punjani(1997), Patel (2001), Bhatt,et.al.(2003), Jangid (2003). Dahod district is one of the tribal district of the Gujarat state. It is situatedin the North-East fringe of the Gujarat state, adjoins with Rajasthan and Madhya Pradesh state.The district occupies an area of 2749 km² and has a population of 3, 68,484 (2001 census).Study AreaDahod District consists of Seven Talukas, having 696 villages / Towns. The total population is16,35,374 as per 2001 Censes having total occupational area of 3,63,277.16 Hectors. Thesurrounding of the district can be mentioned as here: North Side- Banaskantha District & VanswadaDistrict of Rajasthan.West Side- Godhara District East Side - Part of Vadodara District & ZabuaDistrict of M.P. South Side-Part of Vadodara District & Zabua District of M.P. Map of theStudy Area

41
Proceeding of Conference : Evolving Paradigm to Improve Productivity for Plant Genetic Resoyrces
MATERIALS AND METHODSDuring the present works I had gone in the various villages and forests area including hill andhillocks for collection of angiosperm plants taxa. Good number of the trips where arrange inconnection of the season. During monsoon and end the frequency was more because of goodnumber of plant taxa were available in collection. The collected plants were brought to the laboratory,identified up to species level wherever it is possible and then dried with customary method whichwas mounted on herbarium sheet and label. The field study centered on villages in jhalod. Informantswere asked about the ritual importance of the plant, why it is respected, which parts are used, andfor what purposes. The informants were mainly chosen according to their knowledge of commontraditions and/or religious status.RESULTS AND DISCUSSIONThe tribal people of the jhalod used different plant materials in various diseases like fevercough,headache,backache,daibetis,diarrhea,leucorrhea,stomachcramps,teethpain,ulcer,stomachache,hepatitis, constipation ,scorpion bite, muscular pain, asthma, abscess, snakebite total 36ethnomedicinal plants belonging 26 families . Recent efforts have been made to elucidate theefficacy of herbal remedies that are used to treat snakebites (Houghton and Osibogun, 1993). Ina study by (Mors et al., 1989). In view of the importance of traditional medicine which provideshealth services to 75-80% of the world population, increased demand of herbal drugs by thepharmaceuticals and depleting natural plant resources, it is high time to document the medicinalutility of less known plants available in remote areas of country (Zaidi and Crow 2005).Differentphotos of plants were taken and documented in Plate1-6(fig 1-36).Table-1 Enumeration of Ethnomedicinal Plants of Jhalod Taluka
Sr. no
Botanical Name
Local Name Family Uses
1 Abrus precatorius L.
CHANOTHI Fabaceae A paste of the leaves is used to cure mouth ulcer. Fresh leaves dropped in cataract
eyes for good sight.
2 Achyranthes aspera L. ANDHEDO Amaranthaceae The boiled leaves are consumed to relieve internal piles and the roots are used as a brush to relieve pain and clean the teeth.
Crushed roots are used on scorpion bites to easy irritat ion. "kheer" is made from seed powder with ghee and jiggery, it is taken orally ,tribal believe that when its
taken there is no necessary to eat anything long time
3 Aegle marmelos (L.) Corr. BILI Rutaceae Decoction of pulp of fruits use to cure dysentery and pain of abdomen

42
Proceeding of Conference : Evolving Paradigm to Improve Productivity for Plant Genetic Resoyrces
4 Alhagi psedalhagi L. JAVASO Fabaceae Dry powdered stem and leaf sarso oil is used for treating muscle pain
5 Aloe vera (Linn.) Burm KUVARPAT HU
Liliaceae Fresh juice is used as cathartic and for cooling. It is also used in treating fever eye
infections and ulcer.
6 Andrographis paniculata (Brum. f.) Wall.
KARIYATU Acanthaceae Decoction of leaves used in malaria and other fever.
7 Annona sqamosa L. SITAPHAL Annonaceae Dry leaves and seeds powder is apply on hair for remove teak and dandruff.
8 Argemone Mexicana L. SAFED DARUDI
Papavraceae Seed pest is used in snake bite. Root pest apply to the stung by scorpions for relief from pain. The yellow latex is used to cure ulcers of the lips, pimples and
for wound healing.
9 Argyreia nervosa (Brum. f.)Boj.
SAMUDRAS OS
Convolvulacea e Whole plant is crushed and pest applied on abscess.
10 Aristolochia bracteolata Lam.
NAGTUMDI Aristolochiacea e Root pest is used in snake bite and scorpions bite. Fresh leaves are ground in to a paste and mixed with butter milk and applied topically on the itches and rashes until cure.
11 Bambusa arundinacea (Willd).
VANS Poaceae Paste made from young leaves and apical bud of bamboo along and the leaves Aloe Vera is applied to the fractured bones bound with bamboo strip for two to three weeks to join quickly.
12 Bauhinia racemosa Lam. ASATRI Caesalpiniacea e Pulp of Cucumis and stem bark of bauhinia is mixed with water and one cup is taken orally for easy delivery.
13 Boerhavia verticillata Poir.
MOTO SATODO
Nyctaginaceae Root pieces are kept in the mouth to cure mouth ulcers.
14 Bombex ceiba. SYN.B.MALABARICU
M D.C.,
SIMLO Bomambacace ae Paste of the prickles is useful in treatment of the pimple.
15 Boswellia serrata Roxb. ex. Colebr.
SALADI GUGAL
Burseraceae Stem bark used for bleeding diarrhea with curd. Gum used as tonic for
backache
16 Butea monosperma (Lam.) Taub.
KHAKHRO, PALASH
Fabaceae The flowers are boiled in water and the obtained juice is used as cooling agent.
17 Cassia auriculata L.
Aval Caesalpiniacea e Fresh flowers juice and given to the pregnant women to cure for vomiting
18 Cleome gynandra LINN.,Syn
Gyanandropsis pentaphylla,Dc
GHANDHAT U
Capparaceae Fresh pest of leaves is used on boil to prevent the infection.

43
Proceeding of Conference : Evolving Paradigm to Improve Productivity for Plant Genetic Resoyrces
19 Commiphora wightii (Arn.) Bhandari.
GUGAL Burseraceae Gum is used as air purifier and for exorcizing insect.
20 Delonix elata (L.) Gamble.
SANDESAR O
Caesalpiniacea e Stem bark juice is use is taken orally to cure bone fracture
21 Desmodium gangeticum (L.) DC. var. gangeticum
SALPARNI Fabaceae Plant is used in gynaec diseases and prepared “Salampak” for tonic.
22 Eucalyptus globulus Labill.
NILGIRI Myrtaceae Smog of boil leaves is taken through nostril for close nose.
23 Gymnema sylvestris (Retz) Schult.
MADUNASH INI
Asclepiadaceae Leaves powder use as an anti diabetic.
24 Hemidesmus indicus (R. Br). Nannari.
ANANT MULI
Periplocaceae The leaf, root extract is used for blood purification.
25 Holarrhena antidysenterica (L.) Wall ex G.
INDRAJAV Apocynaceae Stem bark is used for bleeding diarrhea.
26 Madhuca Indica J. F. Gmel
MAHUDO Sapotaceae Seed oil applied on body to cure cough,
27 Mentha longfolia L. FUDINO Labiateae Leaves are carminative used for diarrhea and gastric problem, Fresh leaves with tea is taken to relieve stomach-ache and head-ache.
28 Pergularia daemia (Forsk.) Chiov.
CHAMAR DUDHELI
Asclepiadaceae One teaspoonful Powder of fruits given orally progeny less couple.
29 Polygonum glabrum Willd.
POLIGONU M Polygonaceae Equal Mixture of variyali, khadi sakar and dry root powder of plant given orally for
progeny less.
30 Saraca asoca (Roxb.) de Wilde.
ASHOK Caesalpiniacea e One cup Decoction of stem bark is taken orally to cure leucorrhea “rakt pradar”.
31 Senna italica Miller SONA MUKHI
Caesalpiniacea e A solution made from boiling the leaves in water is used for treating constipation
and stomach cramps
32 Solanum indicum L. UBHI RINGANI
Solanaceae One teaspoonful dry Powder Whole plant is used to cure asthma, hooping cough.
33 Solanum surattense Burm. f.
BHORINGNI Solanaceae Decoction of whole plant is used for fever, asthma and hepatitis.
34 Sterculia urens Roxb. KADAI,KAD AYO
Sterculiaceae Decoction of stem bark is taken orally to cure relief body pain
35 Tecomella undulata (Sm.) Seem
Ragat rohido Bignoniaceae One cup Decoction of stem bark is taken orally to cure “rakt pradar”
36 Terminalia crenulata Roth.
SADAD Combretaceae Dry stem bark pest powder is taken orally to cure heart problems.

44
Proceeding of Conference : Evolving Paradigm to Improve Productivity for Plant Genetic Resoyrces
CONCLUSIONPlants play an important role in every aspect of our lives. Plants not only regulate the concentrationof gases in the air and various forms of life ultimately depend upon.This paper throws some lighton the aspect of utilization of local plants as medicine in various diseases and ailments by the tribalpeople of Jhalod. This paper also highlights dependence of local tribal on various medicinal plantsand shows how their life is interwoven with them.ACKNOWLEDGEMENTI am very thankful to all informators of my study area for giving me valuable information, I m alsothankful to my guide Dr.R.S.Patel for providing me important and useful suggestions.REFERENCESHoughton, PJ., Osibogun, IM., 1993. Flowering plants used against snakebite. Journal ofEthnopharmacology. 39: 1–29.Jain, S.K. (1991). Dictionary of Indian Folk Medicine and Ethnobotany Deep Publications,New Delhi.Jain, SK., 2001. Ethnobotany in Modern India. Phytomorphology Golden Jubilee Issue: Trends inPlant Sciences 39-54.Jangid, M.S. (2003). Ph.D. Thesis: Ethnomedicinal uses of some selected climbers of Modasatalukain N.G. Adv. Bio. Sci.Vol.2 (39-40).Nadkarni, K.M. (1926). Indian Materia Medica, Vol. I and II, Popular Prakashan. Ltd. Mumbai.Patel, N.K. (2001). Study of angiospermic plants with relation to phytosociological andEthnobotanical study of Danta taluka, Di. B.K. Ph.D.thesis. H.N.G.Uni, PatanPunjani, B.L. (1997). An Ethnobotanical study of tribal areas of district S.K. (N.G.).Ph.D.Thesis,H.N.G.Uni, Patan.Robbins, C. 2000. Comparative analysis of management regimes and medicinal planttrademonitoring mechanism for American Ginseng and Goldenseal.Conservation Biology. 14 (5): 1422-1434.Santapau, H. (1954). Contribution to the botany of Dangs forest in Gujarat. Guj. Res.Soc. 16:204-320 and 17:1-59.Saxton, W.T. and Sedgwick, L.J. (1918). Plants of Northern Gujarat Ibid. 6 (7): 209-326 and I- Xiii.Shah, G.L. (1978). Flora of Gujarat State. Part I and II, Sardar Patel University, VallabhVidhyanagar.Zaidi, MA., Crow, SA., 2005. Biologically active traditional medicinal herbs from Balochistan,Pakistan. J. Ethnopharmacol. 96: 331-334.

45
Proceeding of Conference : Evolving Paradigm to Improve Productivity for Plant Genetic Resoyrces

46
Proceeding of Conference : Evolving Paradigm to Improve Productivity for Plant Genetic Resoyrces

47
Proceeding of Conference : Evolving Paradigm to Improve Productivity for Plant Genetic Resoyrces
Taxo-Ethnobotanical Significance of Certain Angiospermic PlantSpecies of R.D.F. Poshina Forest Range of Sabarkantha District,
North Gujarat, India.
¹ Hitesh R. Patel And ² R.S.Patel
¹ Smt. B.C.J. Science College, Khambhat E-mail: [email protected]² K.K.S.J. Maninagar Science College, Ahmedabad. E-mail: [email protected]
ABSTRACTThe present article reports about the taxonomical and ethno botanical study of the research area.Sabarkantha District having hilly and forest area near the range of Arvalli hills. Sabarkantha districttake it name from the river Sabarmati which flows through it. The Sabarkantha district is located inthe southern part of Gujarat. This district had a population of 2,082,531 according to the 2001census. It covers an area of 7,390sq. km. The Poshina forest range is a tribal area located inKhedbrahma taluka of Sabarkantha district of North Gujarat, India. Poshina range is divided intotwo ranges, Poshina forest range and R.D.F. (Rehabilitation of degraded forest range) Poshinaforest ranges. R.D.F. Poshina Forest is inhabited by a variety of ethnic groups including the tribes.About 12 plant species belonging to 10 families were observed during my research work. Plantspecies like SARAGVO- Moringa oleifera (Lam.), KOTHI- Limonia acidissima (L.), MOTOARDUSO- Ailanthus excelsa (Roxb.), BAVAL - Acacia nilotica(L.), KESUDO-Butea monosperma (Lam.), SANDESARO-Delonix elata(L.) Gamble, DHAOAnogeissuspendula (Wall.), MAHUDO-Madhuca indica J. F. Gmel., GUNDA- Cordia dichotoma (Forst.f.), RAGAT ROHIDO- Tecomella undulata (Sw.) Seem. ARNI- Clerodendrum multiflorum(Burm. f.), KHAJURI- Phoenix sylvestris (L.) were collected through various field trips duringthe year 2010-2011. The firsthand information on the medicinal plants used by the villagers wasarranged alphabetically by genus and species name following as. During the present researchwork, different areas of R.D.F. Poshina Forest range forest were frequently visited and specimens
48
Proceeding of Conference : Evolving Paradigm to Improve Productivity for Plant Genetic Resoyrces
were collected and identified. The present paper enumerated in this study is 12 plant species. Eachplant species discussed with its scientific name, local name, family name and its uses. The name ofthe resource person for each use is also appended.Keywords: Taxo - ethnobotanical, plant species, R.D.F. Poshina Forest range, Sabarkanthadistrict and North Gujarat.INTRODUCTION
Indigenous knowledge is as old as human civilization but the term ethnobotany was first coined byan American botanist, John Harshburger (1896).The utilization of plants for medicine is an ancient,global tradition that represents the cornerstone of health care for many rural communities andcitizens in developing countries (Robbins, 2000). Several taxonomists and ethno-botanists continuedto survey many areas of North Gujarat in length and breadth such as, plants of North Gujarat(Saxton and Sedgwick, 1918), Addition to Gujarat Flora (Ahuja and Pataskar, 1970), NorthGujarat Flora and Ethnobotany (Yogi 1970, Patel 2002, Patel and Reddy, 2007).
About the Study Area
Sabarkantha district is the backward district of Gujarat state. The rural commonly are Brahmin,Patel, Vania, Rajput and Muslims etc. The adivasi commonly are Bhils, Parmar, Pardhi, Sarar,Dabhi, Angari, Kher, Kapedia, Rohisa, Bangadia, Lakhumada, chunara, Damors and many more.Their principal means of livelihood is agriculture and live stalk. The main crops raised are maize,whete, chana, peddy, tuvar, bajra, and rajko.
Poshina forest range is situated in Khedbrahma taluka and 12 km away from AmbajiKhedbrahmahighway The R.D.F. Poshina forest range is a tribal area located in Khedbrahma taluka ofSabarkantha district of North Gujarat, India. The R.D.F. Poshina forest range belongs toSabarkantha forest division of Gujarat state. The total area of R.D.F. Poshina forest range is8156.03 H.A., of which reserve forest under section-20 is 921.43 H.A. and un-classed forestunder section-4 is 7234.60 H.A. The total 25 villages in the study area.
MATERIALS AND METHODS
Extensive field trips were organized during the year 2010-2011 in R.D.F. Poshina Forest rangearea of Sabarkantha district in North Gujarat. Forest areas and villages of such regions werefrequently visited, to collect the information about the forest wealth and uses of plant species werenoted. Village wise men, experienced informants, elderly people, head man of the hamlets, tribalmedicine men, ‘vaidya’, ‘bhagat’, ‘bhuwa’, etc. were contact and by repeat queries data wasgathered. These people are the only source of information about the local plant names and theirethnobotanical uses. This is the original and ancient knowledge, which was not documentedsystematically earlier but from last few decades several ethnobotanical workers have been workedon this subject.
RESULT AND DISCUSSION
(1) Local name: SARAGAVO

49
Proceeding of Conference : Evolving Paradigm to Improve Productivity for Plant Genetic Resoyrces
Bot. Name: Moringa oleifera (Lam.) (Moringaceae)
Taxonomical identification:5-10 m tall with rough brown corky bark. Compound leaves15-40cm long, leaflets ovate or oblong, panicle 20-25 cm long, seeds 1-1.5 cm long triangular wingedon angles. Throughout and common. [Exiccata:HRP 13- (Tebda),
HRP 33- (Vinchi)]
Uses: Gum is diluted into water or milk and given one teaspoonful twice in a day to curediarrhea. (Sunderben-57 year old, Tebdi village) .Fruit is used as a vegetable thrice in a week tocure decrease the eye numbers. (Babubhai-50 year old, Tebda village)
(2) Local name: KOTHI
Bot. Name: Limonia acidissima (L.) (Rutaceae)
Taxonomical identification:8-10 cm tall tree with greyish brown branches. Compound leaves2.6-5.6 cmlong, alternate,leaflets 1-1.8 cm obovate. Flower pale greenish yellow, 4-7 cm long panicles.Berries 6-8 cm across globose, many seeded with greenish white rind. Throughout. [Exiccata:HRP 49- (Tebda), HRP 71- (Malvas)]
Uses: Leaves are crushed with seeds of Foeniculum vulgare (Mill.)-VARIYALI into water,filtered with cotton cloth, filtrate is taken two times in a day to cure gas trouble and acidity. (Somiben-35 years old, Tebda village)
(3) Local name: MOTO ARDUSO
Bot. Name: Ailanthus excelsa (Roxb.)(Simaroubaceae)
Taxonomical identification:10-20 cm long deciduous tree with grey smooth bark. Compoundleaves 60-100 cm long, leaflets 10-28 cm sub opposite, lanceolate. Flowers yellow 17-40 cmlong, terminal and auxiliary, hairy panicles. Samara 2.6 x 1.5 spindle shaped glabrous, one seeded,articulately veined. Seeds glabrous, oblong. Throughout and frequent. [Exiccata: HRP 51- (Ganva)]
Uses: Stem bark is crushed in water filtrate is given to snake bite patient once in a day to curesnake poison. (Vastabhai- 42 years old, Ganva Village)
(4) Local name: BAVAL
Bot. Name: Acacia nilotica (L.) (Leguminosae, sub-fam.-Mimosae)
Taxonomical identification:3-8 m tall, straight or crooked, armed trees, with dark blackish-brown, irregularly, longitudinally fissured bark. Leaves 2-4.5 cm long; pinnae, 4-8 pairs; leaflets10-25 pairs, minute, linear-oblong, glabrous. Heads yellow, in auxiliary panicles. Pods 8-12x1-1.5 cm, linear oblong, glucose-green, jointed, joints nearly orbicular, compressed and minutelyhairy. Seeds brownish-black, oblong, compressed, smooth, glabrous. Throughout and common.[Exiccata: HRP 89- (Kotda), HRP 93-
(Chochar)]
Uses:Acacia gum, coconut fruit and sugar mixed with half teaspoon ghee applied twice a day on
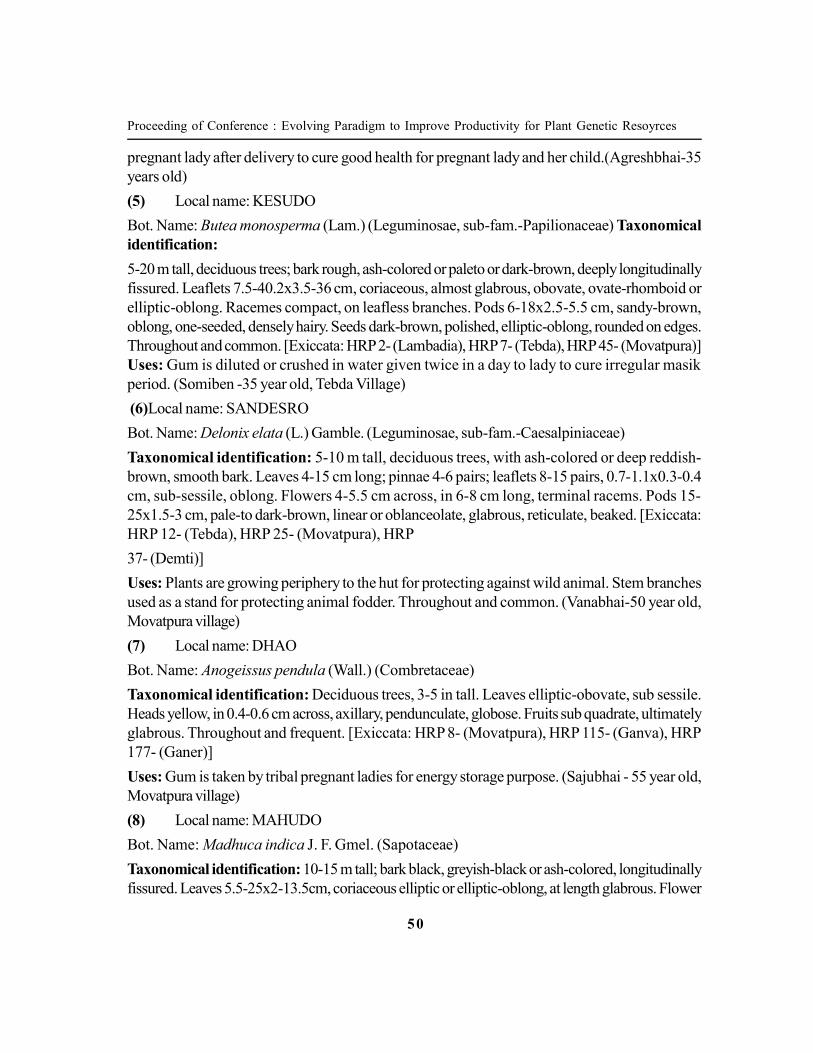
50
Proceeding of Conference : Evolving Paradigm to Improve Productivity for Plant Genetic Resoyrces
pregnant lady after delivery to cure good health for pregnant lady and her child.(Agreshbhai-35years old)
(5) Local name: KESUDO
Bot. Name: Butea monosperma (Lam.) (Leguminosae, sub-fam.-Papilionaceae) Taxonomicalidentification:
5-20 m tall, deciduous trees; bark rough, ash-colored or paleto or dark-brown, deeply longitudinallyfissured. Leaflets 7.5-40.2x3.5-36 cm, coriaceous, almost glabrous, obovate, ovate-rhomboid orelliptic-oblong. Racemes compact, on leafless branches. Pods 6-18x2.5-5.5 cm, sandy-brown,oblong, one-seeded, densely hairy. Seeds dark-brown, polished, elliptic-oblong, rounded on edges.Throughout and common. [Exiccata: HRP 2- (Lambadia), HRP 7- (Tebda), HRP 45- (Movatpura)]Uses: Gum is diluted or crushed in water given twice in a day to lady to cure irregular masikperiod. (Somiben -35 year old, Tebda Village)
(6)Local name: SANDESRO
Bot. Name: Delonix elata (L.) Gamble. (Leguminosae, sub-fam.-Caesalpiniaceae)
Taxonomical identification: 5-10 m tall, deciduous trees, with ash-colored or deep reddish-brown, smooth bark. Leaves 4-15 cm long; pinnae 4-6 pairs; leaflets 8-15 pairs, 0.7-1.1x0.3-0.4cm, sub-sessile, oblong. Flowers 4-5.5 cm across, in 6-8 cm long, terminal racems. Pods 15-25x1.5-3 cm, pale-to dark-brown, linear or oblanceolate, glabrous, reticulate, beaked. [Exiccata:HRP 12- (Tebda), HRP 25- (Movatpura), HRP
37- (Demti)]
Uses: Plants are growing periphery to the hut for protecting against wild animal. Stem branchesused as a stand for protecting animal fodder. Throughout and common. (Vanabhai-50 year old,Movatpura village)
(7) Local name: DHAO
Bot. Name: Anogeissus pendula (Wall.) (Combretaceae)
Taxonomical identification: Deciduous trees, 3-5 in tall. Leaves elliptic-obovate, sub sessile.Heads yellow, in 0.4-0.6 cm across, axillary, pendunculate, globose. Fruits sub quadrate, ultimatelyglabrous. Throughout and frequent. [Exiccata: HRP 8- (Movatpura), HRP 115- (Ganva), HRP177- (Ganer)]
Uses: Gum is taken by tribal pregnant ladies for energy storage purpose. (Sajubhai - 55 year old,Movatpura village)
(8) Local name: MAHUDO
Bot. Name: Madhuca indica J. F. Gmel. (Sapotaceae)
Taxonomical identification: 10-15 m tall; bark black, greyish-black or ash-colored, longitudinallyfissured. Leaves 5.5-25x2-13.5cm, coriaceous elliptic or elliptic-oblong, at length glabrous. Flower

51
Proceeding of Conference : Evolving Paradigm to Improve Productivity for Plant Genetic Resoyrces
creamy-white in dense, axillary fascicles. Berries 2.5x1.8x1 cm, ovoid, fleshy, yellow when ripe.Seeds 2.5-1.46 in, long, ovoid, smooth, shining, brownish-black. Planted. [Exiccata: HRP 5-(Lambadia), HRP 91- (Kotda)]
Uses: Wood is used to make agriculture and house hold things, Flowers are used to make wine bydistillation method flowers are also used as a vegetable. (Ajitsing-37, Lambadia village)
(9) Local name: GUNDA
Bot. Name: Cordia dichotoma (Forst. f.) (Ehretiaceae)
Taxonomical identification: 9-13.5 m tall trees, with ash colored or blackish-brown, roughbark. Leaves 7-18.5x5-13 cm, broadly ovate, elliptic-oblong or sub orbicular, coriaceous,andglabrous. Flowers creamy-yellow or nearly white in axillary and terminal cymes. Ripe drupes 1.5-2.2 cm across, ovoid or rounded, glabrous, mucilaginous, brightyellow with pinkish tinge.Planted.[Exiccata: HRP 6- (Lambadia), HRP 159- (Gunbhankhari)]
Uses: Flowers are mixed with curd applied two times in a day to protect body against heavy sunheat waves. (Minabhai-42 year old, Ganva village)
(10) Local name: RAGAT ROHIDO
Bot. Name: Tecomella undulate (Sw.) Seem. (Bignoniaceae)
Taxonomical identification:Deciduous shrubs or small trees, 5-7 m tall, withgreyishbrown,glabrous bark. Leaves 2.5-7.2x0.5-2.5cm, narrowly in corymbs racemes. Capsule20-50 cm long, flat, slightly curved, linear-oblong, glabrous. Throughout and common. [Exiccata:HRP 40- (Demti)]
Uses: Root is crushed with water and boiled applied on joint pains; powder of the stem bark isused to treat in diarrhea. (Minabhai-42 year old, Ganva village)
(11)Local name: ARNI
Bot. Name: Clerodendrum multiflorum (Burm. f.) (Verbenaceae)
Taxonomical identification: a large shrub or a small tree, 2.5-4 m tall with creamy white to greybark. Leaves 0.6-8.3x0.3-6.5 cm, broadly ovate, deltoid ovate or ovate rhomboid, rarely nearsub orbicular, thinly hairy flower creamy white at time with pinkish tinge, in auxiliary, dichotomouscymes and terminal panicles. Drupes 0.4-0.6 cm across abovoid, glabrous or sparsely hairy.Throughout and frequent. [Exiccata: HRP 179- (Gandhishan), HRP 31- (Vinchi)
Uses: Leaf extract is applied on eye of domestic animals to cure gas trouble and breathing problems.(Anilbhai-56 year old, Tebda village)
(12) Local name: KHAJURI
Bot. Name: Phoenix sylvestris (L.)(Palmae)
Taxonomical identification: 8-15 m tall trees; trunk straight or crooked. Leaves 1.8-3 m long;leaflets 20-30x1-1.4 cm linear-lanceolate, conduplicate, coriaceous and glabrous. Flower sessile,

52
Proceeding of Conference : Evolving Paradigm to Improve Productivity for Plant Genetic Resoyrces
minute, spikelet on primary branches of compound spadix. Ripe berries
2.5-3x1.5-2.4 cm ellipsoid-oblong, orange-colored. Very common in this forest. [Exiccata: HRPHRP 3- (Lambadia), HRP 69- (Malvas), HRP 198- (Mithivedi)] Uses: Leaves are usedto makecleaning brush and for covering house terrace. The stem is used to horizontal support of theterrace of the house. (Ajitsing-37 year old, Lambadia village)
ACKNOWLEDGEMENT
Authors are heartily thankful to the research guide, resource person of the study area and Forestofficers of the Department of Forest research guide.
REFERENCES
Ahuja, K. K. and Pataskar R. D. (1970). Additions to the Flora of Gujarat. Indian forester,96(8): 628-629.
Bole P. V. and Pathak J. M. (1988). Flora of Saurashtra. Part 2 and 3. Director, botanicalSurvey of India.
Cooke, Theodore. (1958). Flora of the Presidency of Bombay. Vol. 1, 2, and 3. BotanicalSurvey of India, Calcutta (reprint).
Harshburger, J.W. (1896). Purpose of Ethnobotany. Botanical Gazette, 21: 146-154.
Patel, R.S. (2002). Floristic and Ethnobotanical Studies of Ambaji Forest on North Gujarat;Ph.D. thesis submitted to Sardar Patel University, Vallabh Vidyanagar.
Patel, K. C. and Reddy A. S. (2007). Observations on Ethnomedicinal Plants of Dantaforest in North Gujarat. Herbal Technology: Recent Trends and Progress. Scientific Publishers(India), Jodhpur: 45-52.
Robbins, C. (2000). Comparative analysis of management regimes and medicinal plant trademonitoring mechanism for American Ginseng and Goldenseal. Conservation Biology. 14 (5):1422-1434.
Santapau, H. (1962). The Flora of Saurashtra. Part-I. Ranunculaceae to Rubiaceae. SaurashtraResearch Society, Rajkot.
Shah, G. L. (1978). Flora of Gujarat State. Vol. I and II. Sardar Patel University Press, VallabhVidyanagar.
Saxton, W. T. and L. J. Sedgwick (1918). Plants of Northern Gujarat. Rec. Bot. Surv. India, 9:207-323.
Yogi, D. V. (1970). A contribution to the flora of North Gujarat. Ph.D. Thesis, S.P. University,Vallabh Vidyanagar.

53
Proceeding of Conference : Evolving Paradigm to Improve Productivity for Plant Genetic Resoyrces
Photographs of the plants and some informators

54
Proceeding of Conference : Evolving Paradigm to Improve Productivity for Plant Genetic Resoyrces
Some Ethnobotanical Plants Observed in local Markets (Haat) ofJhalod Taluka Indistrict Dahod, Gujarat, India.
R. N. Maru* And Dr. R. S. Patel
*Department Of Biology, Government Science College, Gandhinagar, (Gujarat), India.E- mail: [email protected]
Department Of Biology, KKSJ Maninagar Science College, Ahmedabad, (Gujarat), India.E- mail: [email protected]
ABSTRACTDahod district is one of the tribal district of the Gujarat state. It is situated in the north-east fringeof the Gujarat state, adjoins with Rajasthan and Madhya Pradesh state. Total forest area of Jhalodtaluka is 788.39 sq. Km. Area. Ethno botanical studies were carried out to collect information onthe use of some plants by local communities in jhalod taluka of dahod district, gujarat, India. Thesearea lies under bio-geographic zone-4 –the semi arid- biotic province -4b gujarat-rajwada, subcategory 4b
5-plains in central Gujarat. Main tribes are machhaar, sangoda, baria, ninama,
vasaiya,vasava, parmar, chauhan etc.during this study. The authors have conducted an extensivefield survey in the tribal belts and other interior villages adjoining forest areas in the district tocollect ethno botanical lore. First hand information was gathered through interactions with tribaland rural people including members of forest protection committees. A number of group discussionswere also conducted during the period of investigation. In the following enumeration, plant nameshave been arranged alphabetically in market uses wise. Acacia chundra (Roxb. ex. Rott).Willd.,Acacia nilotica (L.) Del. Subsp. Indica (Bth.) Brenan. ,Allium cepa L.,Allium sativumL.Aloe vera L.,Annona squamosaL. Argemone maxicana L,Azadirachta indica A. Juss,Boerhavia diffusa L.Boswellia serrata Roxb.ex Colebr.,Butea monosperma(Lam.) Taub.,Caesalpinia crista L.,Casia Italica

55
Proceeding of Conference : Evolving Paradigm to Improve Productivity for Plant Genetic Resoyrces
L.,Chrysanthemum Indicum L. ,Citrus medica L.,Commiphora wightii L,Cucumis callosus(Rottl.) Cogn. Ex. Cogn. & Harms,Curcuma longa L.,Diospyros melanoxylonRoxb.,Eucalyptus globulus Labill.,Jatropa curcas L., ,Madhuca indica J. F. Gmel.,Mangiferaindica L., Melia azedarach L.Pithecellobium dulce (Roxb.) Bth., Rosa indica Linn.,Solanumxenthocarpum L. ,Sterculia urens Roxb. ,Syzygium cumini (L.) Skeels,Tagetes erectaL.,Tagetes patula L. ,Tamarindus indica L., Terminalia arjuna (Roxb). W. & A. ,Terminaliabellirica (Gaerth.) Roxb,Tinospora cordifolia (Willd.) Miers ex Hk. f. & Th.,Zingiber officinalBlatt.Zizyphus nummularia (Burm. f.) W. & A.,Zizyphus xylopyra (L.) The study providesinformation on 39 plant species use in local market.Keywords: Ethnomarketing, Haat Culture Marketing, Jhalod and forest productINTRODUCTIONThe study area, popularly known as jalod forest and its surrounding areas. Jhalod taluka is locatedbetween 23ΪΩ-6ΪΩ.07΄ N and 74ΪΩ.9΄ to 74.46ΪΩ E in the district Dahod, Gujarat state.. Thevegetation and forests are tropical mixed dry deciduous type of the area. The forest area is hilly,most of the hills run in east to west direction and only some in north to east direction. The flat landin between are under cultivation by tribal. In this area fresh water resources available it is verypoor. The drainage from hills have been dammed at several places in forest. Jhalod taluka in thedahod district in the state of Gujarat. Jhalod taluka is situated between the banks of the Tintodiriver. The district head quarters are located at Dahod. The district occupies an area of 2749 km²and has a population of 3,68,484 (2001 census). It is the thirdmost backward district in Gujarat.It was only 6.96% urban as of 2001. Ethnobotanical studies were carried out to collect informationon the use of medicinal plants by local communities of Jhalod taluka of Dahod district. The utilizationof plants for medicine is an ancient, global tradition that represents the cornerstone of health carefor many rural communities and citizens in developing countries (Robbins, 2000). Data were collectedmainly in the local Market of town Limdi, Jhalod, Sukhsar, Dahod and Sanjeli. Data were collectedby interviewing different people who sell or buy plant products. Direct observations, interviewsand survey of traders, vendors and consumers were used to obtain data of socio-economic,ecological and cultural aspect of plant products of the study area. The community in the areaobtains different plant and plant products which are not grown or cultivated in the area from themarket. Many ayurvedic and pharmaceutical industries in different state like Madhya Pradesh,Uttaranchal,Uttar Pradesh, and Gujarat are using medicinal plants.Parts likeleaves,flower,bark,stem,root,rhizome,and gum as raw material. Dahod district is one of the tribaldistrict of the Gujarat state. It is situated in the North-East fringe of the Gujarat state, adjoins withRajasthan and Madhya Pradesh state. The district occupies an area of 2749 km² and has a populationof 3, 68,484 (2001 census).Review of LiteratureSeveral taxonomists and ethno-botanists continued to survey many areas of North Gujarat in

56
Proceeding of Conference : Evolving Paradigm to Improve Productivity for Plant Genetic Resoyrces
length and breadth such as, plants of North Gujarat (Saxton and Sedgwick, 1918), Addition toGujarat Flora. Champion and Seth (1968), Thaker (1926), Jain (1989), Shah et al (1981), Punjani(1997), Patel(2001,2002,2003), Jangid-2003).
Study Area
Dahod District consists of Seven Talukas, having 696 City / Towns. The total population is16,35,374 as per 2001 Censes having total occupational area of 3,63,277.16 Hectors. Thesurrounding of the district can be mentioned as below:
North Side- Banaskantha District & Vanswada District of Rajasthan. West Side- GodharaDistrict East Side - Part of Vadodara District & Zabua District of M.P. South Side-Part of VadodaraDistrict & Zabua District of M.P.Map of the study area
MATERIALS AND METHODSDuring the present works I had gone in the various villages and forests area including hill andhillocks for collection of angiosperm plants taxa. Good number of the trips where arrange inconnection of the season. During monsoon and end the frequency was more because of goodnumber of plant taxa were available in collection. The collected plants were brought to the laboratory,

57
Proceeding of Conference : Evolving Paradigm to Improve Productivity for Plant Genetic Resoyrces
identified up to species level wherever it is possible and then dried with us to many method whichwas mounted on herbarium sheet and label. The field study (Jan-2011 Aug2012) centered onvillages in Jhalod. The informants were mainly chosen according to their knowledge of commontraditions status, There were about 39 species of such plants recorded following market observation.RESULT AND DISCUSSIONMarket Survey:The community in the area obtains different plant and plant products which are not grown orcultivated in the area from the market. Market data were collected mainly in the local town, dahodjhalod limdi, sanjeli. and sukhsar,Data were collected by interviewing different people who sell orbuy plant products . Direct observations, interviews and survey of traders, vendors and consumerswere used to obtain data of socio-economic, ecological and cultural aspect of plant products ofthe study area. During the market survey the local communities pointed out that the price of haveincreased. Although this could be viewed as an additional input to improve the livelihood of thelocal community at a first glance, its contribution is significant.Many Ayurvedic PharmaceuticalIndustries In Different State Like Madhaya Pradesh, Conducted Suggests That AmongThe Medicinal .Plants Used By Pharmaceutical Industry, Solanum xenthocarpum L. Tinosporacordifolia (Willd.) Miers ex Hk. F. & Th,Azadirachta Indica, Terminalia arjuna (Roxb). W. & A. ,Terminalia bellirica (Gaerth.) Roxb,Sterculia urens Roxb. , Aloe Vera L. Were Used By All. The Survey Revealed That The IndustryExperienced The Shortage Of A Number Of Species Which Included Which AreUsed By 80% Of Pharmaceutical Industries. In local market "HAAT" different people who sell orbuy plant products of agriculture implements, hunting material ,house hold, crops, fruits, vegetables,spices plant products and daily use material other plant products for animals uses dry grassand sell or buy goat, hen, fish etc. According to the survey, 90% of these medicinal plant speciesare collected from wild mostly forest areas.CONCLUSIONLocal community are dependent directly or indirectly on forest resource for various purposes.Thetribal people largely depend on plants for the food,fodder,medicine,house hold and agriculturepurposes. Plants play most important role in every aspect of our lives , without them life is notpossible Tribal people prefer plants and plants product use in daily life which are easily availablefrom forest area and also use for earning they sell or bay useable things in market.ACKNOWLEDGEMENTAuthors are thankful to tribal and rural people of this area for their kind co operation. I would liketo sincerely thank my research Guide Dr. R. S. Patel for their valuable guidance.REFERENCESAmbastsa, S. P. (1986). The useful plants of India. Publication and Information Directorate, CSIR,New Delhi.

58
Proceeding of Conference : Evolving Paradigm to Improve Productivity for Plant Genetic Resoyrces
Bole P. V. & Pathak J. M. (1988): Flora of Saurashtra. Part 2 & 3. Director, botanical Surveyof India.Champion, H. G. & Seth, S. K. (1968): A Revised Survey of Forest Types of India, ForestResearch of India, Dehradun.Cooke, Theodore. (1958): Flora of the Presidency of Bombay. Vol. 1, 2, & 3. Botanical Surveyof India, Calcutta (reprint).GEC. (1996): Biological Diversity of Gujarat: Current knowledge. Gujarat Ecology Commission,Vadodara.Jain, S. K. (1991). Dictionary of Indian Folk Medicine and Ethnobotany, Deep publications, NewDelhi. Jangid, M. S. (2003). Ethnomedicinal uses of some selected climbers of Modasa District inN.G. Ph.D. Thesis.Pandey, C.N., B.R. Raval, Seema Mali and Harshad Salvi. (2005): Medicinal Plants of Gujarat.GEER Foundation, Gandhinagar.Patel, K.C. (2003): Floristics and Ethnobotanical Studies on Danta Forest of North Gujarat;Ph.D. thesis submitted to Sardar Patel University, Vallabh Vidyanagar.Patel, N.K. (2001).Study of angiospermic plants with relation to phytosociological andethnobotanical study of Danta District, Di. B.K. Ph.D. thesis H.N.G.U. Patan(North Gujarat).Patel, R.S. (2002): Floristics and Ethnobotanical Studies of Ambaji Forest on North Gujarat;Ph.D. thesis submitted to Sardar Patel University, Vallabh Vidyanagar.Punjani B. L. (1997). An ethnobotanical study of tribal areas of district Sabarkantha (North Gujarat).Ph.D. thesis, North Gujarat University, PatanRaghavan, R.S., B.M.Wadhwa, M.Y. Ansari and Rao, R.S. (1981): A checklist of the Plants ofGujarat. Rec. Bot. Surv. India. 21(2) 1-127.Reddy, A. S. (1987): Flora of Dharampur Forest Part 1 & 2. PH. D. Thesis, Department ofBiosciences, S.P.University, Vallabh Vidyanagar, Gujarat- INDIA.Santapau, H. (1962): The Flora of Saurashtra. Part-I. Ranunculaceae to Rubiaceae. SaurashtraResearch Society, Rajkot.Saxton, W. T. and Sedgwick, L. J. (1918): Plants of Northern Gujarat. Rec. Bot. Surv. India,6(7): 209-323.Shah, G. L. (1978). Flora of Gujarat State. University Press, Sardar Patel University. VallabhVidyanagar.Sutaria, R.N. 1966. A text of systematic Botany. Publishers Khadayata book depot. Ahmedabad.

59
Proceeding of Conference : Evolving Paradigm to Improve Productivity for Plant Genetic Resoyrces
Sr. No Name Of Plant
Family Local name Useful part
Approximately price per k.g Rs.
Uses and purpose
1 Acacia chundra (Roxb. ex. Rott). Willd.
Mimosaceae Khair Baval
Gum, wood
15-35 House Hold, Agriculture Medicinal,
2 Acacia nilotica (L.) Del. Subsp. Indica (Bth.) Brenan
Mimosaceae Baval Gum, wood
10-20 House Hold, Agriculture, Medicinal,
3 Allium Cepa L.
Liliaceae Kanda, Dungli Corm 5-15 Food
4 Allium sativum L.
Liliaceae Lasan Corm 15-40 Food
5 Aloe vera L. Liliaceae Kuvarpathu Leaves N.A Medicinal, Food,
6 Annona squamosa L.
Annonaceae Sitafal Fruits 10-40 Food
7 Argemone maxicana L.
Papaveracea e
Darudi Seed 8-15 Industrial
8 Azadirachta indica A. Juss
Meliaceae Limdo Fruits 8-15 Medicinal
9 Boerhavia diffusa L.
Nyctaginace ae
Satodi Whole Plant
N.A Medicinal
10 Boswellia serrata Roxb. ex Colebr.
Burseraceae Saladi,Hale di, Gugal
Gum 250-450 Medicinal
11 Butea monosperm a(Lam.) Taub.
Fabaceae Khakhro, Kesudo,Pala s
Whole Tree
15-35 HouseHold Agriculture Medicinal,
12 Caesalpinia crista L.
Caesalpiniac eae
Kachka Seed 12-30 Medicinal
13 Casia Italica,L.
Caesalpiniac eae
Casia Leaves N.A Medicinal
14 Chrysanthe mum Indicum L.
Asteraceae Sevanti Flowers 5-25 Earning
15 Citrus medica L.
Rutaceae Bijoru Fruits 15-40 Medicinal
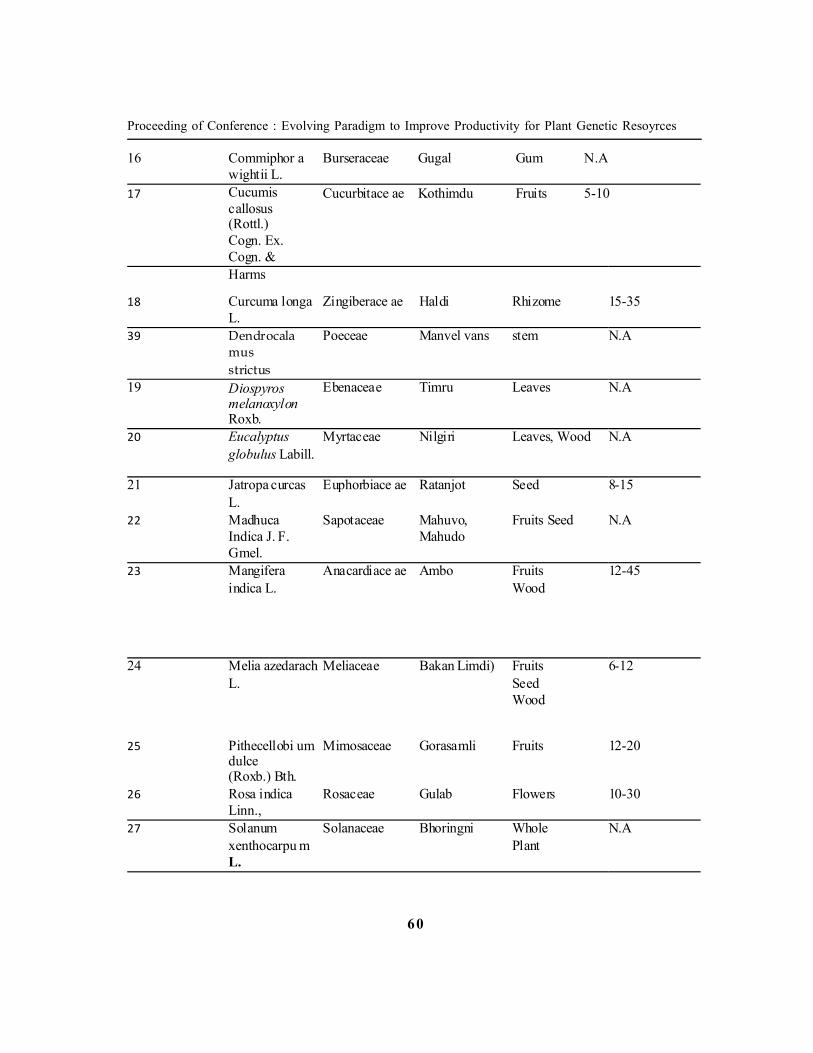
60
Proceeding of Conference : Evolving Paradigm to Improve Productivity for Plant Genetic Resoyrces
16 Commiphor a wightii L.
Burseraceae Gugal Gum N.A
17 Cucumis callosus (Rottl.) Cogn. Ex. Cogn. &
Cucurbitace ae Kothimdu Fruits 5-10
Harms
18 Curcuma longa L.
Zingiberace ae Haldi Rhizome 15-35
39 Dendrocala mus strictus
Poeceae Manvel vans stem N.A
19 Diospyros melanoxylon Roxb.
Ebenaceae Timru Leaves N.A
20 Eucalyptus globulus Labill.
Myrtaceae Nilgiri Leaves, Wood N.A
21 Jatropa curcas L.
Euphorbiace ae Ratanjot Seed 8-15
22 Madhuca Indica J. F. Gmel.
Sapotaceae Mahuvo, Mahudo
Fruits Seed N.A
23 Mangifera indica L.
Anacardiace ae Ambo Fruits Wood
12-45
24 Melia azedarach L.
Meliaceae Bakan Limdi) Fruits Seed Wood
6-12
25 Pithecellobi um dulce (Roxb.) Bth.
Mimosaceae Gorasamli Fruits 12-20
26 Rosa indica Linn.,
Rosaceae Gulab Flowers 10-30
27 Solanum xenthocarpu m L.
Solanaceae Bhoringni Whole Plant
N.A

61
Proceeding of Conference : Evolving Paradigm to Improve Productivity for Plant Genetic Resoyrces
28 Sterculia urens Roxb.
Sterculiacea e
Kadayo Gum 250-450 Medicinal
29 Syzygium cumini (L.) Skeels
Myrtaceae Jambu Fruits Seed 15-25 Food
30 Tagetes erecta L.
Asteraceae Hajarigota Flowers 7-25 Earning
31 Tagetes Patula L.
Asteraceae Galgota Flowers 7-25 Earning
32 Tamarindus indica L.
Caesalpiniac eae
Amli Fruits 10-25 Food,
33 Terminalia arjuna (Roxb). W. & A. ,
Myrtaceae Arjun sadad Bark, N.A Medicinal
34 Terminalia bellirica (Gaerth.)
Myrtaceae Beda Fruits Seed N.A Medicinal
35 Tinospora cordifolia (Willd.) Miers ex Hk. f. & Th.
Menisperma ceae
Galo Root N,A Medicinal
36 Zingiber officinale Linn.
Zingiberace ae Aadu Rhizome 20-40 Medicinal Food
37 Zizyphus nummularia (Burm. f.) W. & A.
Rhamnacaae Chani Bor Fruits wood 12-25 Food
38 Zizyphus xylopyra (L.)
Rhamnacaae Mota Bor Fruits wood 12-35 Food
N. A: - Not AvailableTable-1 Enumeration of Plants and Plants Product Use Marketing Purpose Of Jhalod Taluka
Asteraceae
Ceasapiniaceae
Mimosaceae
Myrtaceae
Zingiberaceae
Liliaceae
Rhamnaceae
Meliaceae
Fabaceae
Sterculaceae

62
Proceeding of Conference : Evolving Paradigm to Improve Productivity for Plant Genetic Resoyrces

63
Proceeding of Conference : Evolving Paradigm to Improve Productivity for Plant Genetic Resoyrces

Medicinal Plants – Cultivation to Value Addition: Problems andIssues
Vikas Kumar 1. Rina B. Desai 2, Yogesh T Jasrai3 And Bimal S. Desai 4
1 & 4 Department of Forestry, ASPEE College of Horticulture & Forestry Navsari AgriculturalUniversity. Navsari-396 450, Gujarat
2 Legend Pharmaceuticals, Surat, Gujarat3 Prof. and Head. Department of Botany, School of Life Sciences. Gujarat University, Ahmedabad
-ABSTRACTNatural products (crude drugs, extracts and pure compounds) have been derived from higherplants, microbes and animals. The medicinal preparations are based upon these raw materials.The journey of raw materials from its origin to finished product goes like: Cultivator – Collector –FDC – Pharmacy – Retailer – User. The pharmaceutical research has received much attention andhas been recognized as complex and multidisciplinary activity. On a global scale alone USA andJapan contributes over 50 % new drugs. It is estimated that India contributes to Rs. 100 millionout of about 2500 million markets of pharma based industries. This comes to merely 1 %, thefigure that does not seem to be considerably significant. The state of Gujarat has approximatelysome 900 pharmaceutical units that contribute very little to this 1 % global share of India, in spiteof it being bestowed with variations in topographical features, rainfall pattern and diversified agroclimatic and agro ecological zones. The total number of medicinal plant lore comes to 18,000species in India (MoEF, 2010). Gujarat too has rich medicinal plant diversity with 1500 speciesroutinely used by different pharmaceutical companies. The advancements and scientific inputs arenot sufficient to combat the problem of quality assurance, continuous supply for the ever increasingdemands of medicinal plants. The problems arises at several stages of the journey from non availabilityof planting material, conventional methods for agricultural packaging practices, cultivation as perGAP norms and the most prominent problem of lacunae in getting technically skilled man power.Further the issues like adulteration and substitution of drugs, manipulations in quality controlparameters do affect the theme of "Co-operative management" and "Combination of Techno –Economy" in spite of tremendous advances made in field of herbal technology. There are still alarge number of issues like market potential, marketing channels, buy back guarantee for whichsuitable drugs filtered under GMP and GAP rules is not available or if available is not reaching torequired persons. The present compilation highlights all such problems and issues from source rawmaterial to finished product available in market.

Keywords: Medicinal plant, pharmaceutical, value additionINTRODUCTION1. Background- Need for Good Agricultural Practices
I. India has a rich tradition of plant based health care systems contained in its classicaltexts like Charak Samhita and Sushruta Samhita. In recognition of the diversity ofhealth care practices, the Government of India have recognized Ayurveda, Yoga &Naturopathy, Siddha, Unnani and Homoeopathy as the alternative systems of medicineunder the National Health Policy.
II. Department of Ayurveda, Yoga and Naturopathy, Siddha, Unnani and Homoeopathy(AYUSH) in the Ministry of Health and Family Welfare has the responsibility for qualityassurance and standardization of the production processes of Ayurveda, Siddha andUnnani (ASU) medicines and disseminate the guidelines for production of raw materialused in ASU medicines.
III. To ensure and enhance the quality of ASU medicines, the Government of India havenotified Good Manufacturing Practices under Schedule ‘T’ of the Drugs and CosmeticsAct 1940. These guidelines for Good Agricultural Practices seek to lay down standardsfor production of raw material that goes in to the making of the ASU medicines andstandardize the production processes from farm to factory.
2. Scope:i. This document is designed to play a facilitator role and shall be recommended to all
stake holders.ii. In the current form, these GAPs are essentially meant for and applicable to commercial
scale of farming.3. Soil and climatic conditions:
I. The grower should identify the best possible environment where the plant can expressits full potential in terms of both quality and quantity during its entire growth period(germination, growth and maturity). Meteorological data collated for preceding threeyears should be taken into account while judging the suitability of the site.
II. In general sites designated with high-degree stress factors (salinity, acidity and toxicity),water logging conditions, industrial wastes and affluent.
III. The sites in proximity to grave yards, crematoria or having a traceable history of suchusage.
IV. A well drained fertile soil with optimum level of water holding capacity and productivitystatus should be used for medicinal plants cultivation.
V. In soils with low fertility levels use of soil amendments as per the specific site andrequirement of species are to be followed. The latest soil test report on physico-chemicalparameters and nutrient profile should be obtained to decide the nature and quantity of

66
Proceeding of Conference : Evolving Paradigm to Improve Productivity for Plant Genetic Resoyrces
soil amendments required.VI. The site must be in proximity to a reliable source of irrigation water.VII. The quality of irrigation water should have been adequately understood and classified in
the context of both soil type and the target crop in terms of total salt concentration,Sodium absorption ratio, Bicarbonate and Boron concentration etc.
VIII.When the end-product is required to conform to standards of residual contaminants, theirrigation water must be analyzed for heavy metals and residual pesticides also.
IX. When shade-loving crop is planned for, availability of shade across the field should beascertained. Provision for artificial shading should be examined in the light of cropeconomics.
4. Seeds and propagation material:1. The seed/planting material should be accompanied with the following information:- •
Name as per pharmacopoeias nomenclature and trade name• Botanical name• Cultivar/ Selection / Phenotype/ Chemo type/ Genotype• Projected quality of crop in terms of Physico-chemical analysis/ marker based
analysis – on the basis of earlier data/ reports2. Precautions
i. Seedii. Stem cuttingiii. Root cutting
5. Crop management for cultivation:i. Field preparationii. Sowing and transplantingiii. Manures and fertilizersiv. Irrigationv. Weeding and intercultural operationsvi. Crop protection
6. Harvest and post harvest management:• Harvesting• Primary processing• Packaging, storage and transportation:
7. Documentation:

67
Proceeding of Conference : Evolving Paradigm to Improve Productivity for Plant Genetic Resoyrces
Fig-1 Uses of Medicinal PlantsValue addition of the medicinal plants is very much essential for commercial exploitation as well asthe medicinal value of the raw drugs. Even authenticated plant material may not be of desiredquality and strength and not conforming to the physicochemical parameters or the concentration ofthe active constituents or marker compounds as per the pharmacopoeial standards or the consumer/ industry requirements. Such material is liable to be rejected or accepted at very low price causingnot only economic loss to the cultivators or collectors of the medicinal plants but also entailsdoubtful efficacy or the potency of the raw drug in the alleviation of the human suffering. Valueaddition of the medicinal plants can be achieved directly by improving the quality of the cultivatedor collected plant material and indirectly by quality assurance of the plant material or the semi-processing of the material to a value added product.I. Direct Value Addition Collection in the proper seasonsSeasonal variation in the concentration of secondary metabolites present in the plant and which areof medicinal importance is found to be a common phenomenon and consequently the efficacy orthe potency of the raw drugs may not be the same all round the year or at different stages of plantgrowth. This need to be very much considered and the collection of the material should be madein the appropriate season as per the guidelines given in the annexure.

68
Proceeding of Conference : Evolving Paradigm to Improve Productivity for Plant Genetic Resoyrces
Harvesting and processing of the plant material (Annexure I)A few guidelines followed as given in the annexure for the harvesting and processing of the differentparts of the plant material would increase the shelf life and help in the value addition of medicinalplants instead of indiscriminate and nonjudicious harvesting. Grading and sortingInstead of assorted material, which may include infested, immature and other kinds of unacceptablematerial, sorting and grading will be a means of value addition and market potential.Any soil, stones, sand, dust and other foreign inorganic matter must be removed before medicinalplant materials are cut or ground for testing. Packaging The container and its closure must not interact physically or chemically in any way thatwould alter its quality. A well-closed container must protect the contents from extraneous matteror from loss of the material under normal conditions of handling, shipment or storage. StorageMedicinal plant materials must be stored under specified conditions in order to avoid contaminationand deterioration. Avoid formation of moulds, which may produce aflatoxins. Materials that needto be stored at temperatures other than room temperature should be stored at low temperatures toavoid decomposition of phyto constituents or deterioration of quality. Low humidity may bemaintained using a desiccant in the container if necessary. Medicinal plant materials requiringprotection from light should be kept in a light resistant container or the container may be placedinside a suitable light-resistant (opaque) covering.Information on proper storage practices of medicinal plants is rather sketchy and has not receiveddue attention from experts till date. As is in the case of other plant materials exposure to air,moisture, light, dust, etc… cause deterioration in the keeping quality of medicinal plant raw drugs.However this can be minimized by proper cleaning, packing and storage.General Tips on storage of raw drugs
1. Enough and right space –dry and free from dampness or humidity.2. Prevention of rodents, insects and birds etc.3. Separate area for different categories of raw drugs e.g. hygroscopic, volatile materials
etc.4. Storage space should allow free movement of people and equipments.5. Separate sections for "approved", "rejected" and "untested" raw drugs.6. Separation of physically similar looking raw drugs so that identity do not get mixed up.7. Labeling raw drugs as per the following format:
• Part (seed, bark, leaf etc)• Part (seed, bark, leaf etc)• Date of arrival and consignment no• Time of collection• Geographical region of collection

69
Proceeding of Conference : Evolving Paradigm to Improve Productivity for Plant Genetic Resoyrces
• Name of the supplier• Inspection report (approved, rejected and untested)• Test report no and date• Best use before date (stage for retesting)
8. Name of the raw drug Keep authenticated samples as " reference standards" for eachdrug in stores.
9. Use raw drugs on a first in first out basis (FIFO).10. Place packed raw drugs on wooden or plastic pallets. Keep one raw drug in one pallet.11. Use appropriate packing material for storing raw drugs.Always avoid :1. Storing in open spaces2. Storing on the surface directly3. Storing alike raw drugs in close vicinity.4. Using inappropriate packing material.5. Storing the material for long time.6. Keeping the material exposed to heat and moisture.7. Storing inadequately processed materials.
Macroscopic and Microscopic examinationMedicinal plant materials are categorized according to sensory, macroscopic and microscopiccharacteristics. Visual inspection provides the simplest and quickest means to establish identity,purity and possibly, quality. Macroscopic identity of medicinal plant materials is based on shape,size, color, surface characteristics, texture, fracture and appearance of the cut surface. However,since these characteristics are judged subjectively and substitutes or adulterants may closely resemblethe genuine material, it is often necessary to substantiate the findings by microscopy or physicochemical analysis. Microscopic inspection of medicinal plant materials is indispensable for theidentification of broken or powdered materials.II. Indirect Value AdditionQuality testing for purity and strengthTesting for the Physico-chemical standards (Moisture, FOM, Ash Content, Extractives) MOISTURE:An excess of water in medicinal plant materials will encourage microbial growth and also causesdeterioration following hydrolysis. This is especially important for materials that absorb moistureor deteriorate quickly in the presence of water. The test for loss on drying can be carried out eitherby heating to 100-1050 C or in a desiccator over phosphorus pentoxide for a specified period oftime. FOREIGN MATTER:

70
Proceeding of Conference : Evolving Paradigm to Improve Productivity for Plant Genetic Resoyrces
Medicinal plant materials should be entirely free from visible signs of contamination by moulds orinsects, and other animal contamination, including animal excreta. Macroscopic examination canconveniently be employed for determining the presence of foreign matter in whole or cut plantmaterials. However, microscopy is indispensable for powdered materials.Foreign matter consists of any or all of the following:
• Parts of the medicinal plant material or materials other than those named with the limitsspecified for the plant material concerned;
• Any organism, part or product of an organism, other than that named in the specificationand description of the plant material concerned:
• Mineral admixtures not adhering to the medicinal plant materials, such as soil, stonessand and dust.
For some medicinal plant materials where the foreign matter may closely resemble the materialitself, it may be necessary to take a pooled sample of the plant material and apply a critical test,either chemical, physical or by microscopy. The proportion of foreign matter is calculated fromthe sum of portions that fail to respond to the test. ASH CONTENT:Ignition of medicinal plant material yields total ash constituting both physiological (from the planttissue) and non-physiological (extraneous matter adhering to the plant) ash. Acid insoluble ashrepresents sand and silicious earth. EXTRACTIVES:It is the amount of soluble constituents (active or otherwise) extracted with solvents like alcoholand water from a given amount of medicinal plant material. It is employed for materials for whichas yet not suitable chemical or biological assay exists. Pharmacopoeial standards of some rawdrugs native to Andhra Pradesh are given in Annexure IV. o Thin layer chromatography (TLC)identity test for the active / marker compounds.o Quantitative assay of the active/marker compounds PESTICIDE RESIDUES:Medicinal plant materials are liable to contain pesticide residues, which accumulate from agriculturalpractices such as spraying and treatment of soils and fumigation during storage.Since many medicinal preparations of plant origin are taken over long periods of time, the intake ofresidues from medicinal plants. Should not be more than 1% of the total intake from all the sourcesincluding food and drinking water. MICROORGANISMS:While a large range of bacteria and fungi form the naturally occurring micro flora of herbs, aerobicspore forming bacteria frequently predominate. Current practices of harvesting, handling andproduction may cause additional contamination and microbial growth. The determination ofEscherichia coli and moulds may indicate the quality of production and harvesting practices. Certification of the quality.

71
Proceeding of Conference : Evolving Paradigm to Improve Productivity for Plant Genetic Resoyrces
III. Semi-processing of the medicinal plants to value added products Powder: -Thoroughly cleaned and dried plant material is powdered in a pulveriser and sieved to obtain ahomogenous powder of the desired particle size. Tablets / capsules: -The homogenous powder is mixed with a suitable binding agent and compressed to a tablet orfilled into a capsule of desired dosage. Extracts:The dried and clean plant material free from foreign organic matter substitutes or adulterants ispowdered and extracted with a suitable solvent like pure ethyl alcohol or methyl alcohol or solventsdiluted with water in a percolator for cold extraction or in a soxhlet extractor under reflux for hotextraction.The extracts are distilled under reduced pressure at low temperatures to remove thesolvent and the concentrated extracts are spray dried.These extracts can be also standardised toa required strength of the active/marker compounds.This simple or semiprocessing of the medicinalplant material adds to the value may fold.CONSTRAINTS TO THE DEVELOPMENT OF TRADECultivation of medicinal plants faces a number of problems, partly due to the typically small scaleof operation. These include the following:
• The majority of farmers have small land holdings;• Shortage of labour in rural high altitude areas;• Long period between crop growing and harvesting;• Bureaucratic difficulties in obtaining permits for cultivating restricted species;• Lack of technology and difficulties in cultivating medicinal plants (particularly in high
altitude areas);• Even if cultivation technologies are developed, problems with packaging, storage,
transportation and quality control persist and are neglected;• Experiences as well as the needs of farmers are often not included in the research activities
of the laboratories;• The link between research institutes and industry is weak;• The lack of planting material and the poor quality of planting material; and ? Prices are
too low to make cultivation attractive.• Poor harvesting (indiscriminate) and post-harvest treatment practices;• Lack of research on development of high-yielding varieties, domestication, etc.;• Inefficient processing techniques leading to low yields and poor quality products;• Poor quality control procedures;• Lack of research and development on product and process development;• Difficulties in marketing;• Lack of local markets for primary processed products;

72
Proceeding of Conference : Evolving Paradigm to Improve Productivity for Plant Genetic Resoyrces
• Lack of access to latest technological and market information;• Lack of knowledge of their supply capabilities;• Limited knowledge of plant properties;• Intellectual property rights Areas for Improvement
Establish a critical mass of cultivable land in order to guarantee larger consistent supply. Reducethe number of intermediaries involved in the distribution and marketing chain and increase thenegotiating power of the producers and collectors. Improvements are needed in the areas of postcollection handling, value addition and product presentation. Research and development on thechemical composition and the effect of poor practices on the active ingredients of the selectedspecies. Country authorities to develop effective strategies to support improved cultivation, qualitycontrols systems, provision of high quality planting materials, and then encouragement of investmentsin new technologies. Undertake a more indepth global overview of the demand and supply ofmedicinal plants, herbal products and herbal drugs in order to clarify market issues, and considermore effective solutions. Developing countries should aim to cultivate their resources in a sustainablemanner and enter markets at the early stages of the value chain by first supplying developedcountry manufacturers with unprocessed raw materials. Identify products which would be mostamenable to sustainable commercial development and industrial processing in the supplying countries.Value-addition through processing, and improved marketing of the medicinal plants. It is alsoimportant that the benefits of the expanded interest in medicinal plants be more equitably shared.Value-addition through processing, and improved marketing of the medicinal plants. It is alsoimportant that the benefits of the expanded interest in medicinal plants be more equitably shared.CONCLUSIONContinued loss of habitat in the future due to deforestation and development can be expected toremain a threat to many medicinal and aromatic species in both developing and industrializedcountries (Shanley and Luz 2003). In tropical areas such as Amazonia and West Africa, changingland use from logging, ranching, mining, and agriculture have been identified as responsible forchanges in forest composition and structure (Ekpe 2002), frequently creating environmentsunfavourable to growing native medicinal and aromatic species and posing detrimental effects ontraditional healthcare (Ekpe 2002). Such destruction in natural ecosystems and the resultant lossesin medicinal and aromatic species will surely increase pressure for preservation and cultivation ofendangered flora. Shortages of available plant material for collection in the natural environment ofmedicinal and aromatic plants can be expected to lead to increased costs for plant material untilcultivation systems are in place. Estimates suggest the number of plant species used for medicinalpurposes, most of which are collected in the wild, is more than 52,000 (Schippman et al. 2006).Some key features of the trade in medicinal plants are highlighted by this review:
• Pressure on the natural resource is increasing for the plants which are in greatest demand.• The increasing market for the plant materials that are used in health and medical products.• International trade in medicinal plants is expanding.

73
Proceeding of Conference : Evolving Paradigm to Improve Productivity for Plant Genetic Resoyrces
• Regulation is increasing.• There is a lack of detailed, accurate, information available.
REFERENCESBooksDoreswamy, R.; Panwar, S. D. and Sharma, D. (eds.) (2006). Medicinal and aromatic plantsabstracts, Vol. 28. National Institute of Science Communication and Information Resources,TheCouncil of Scientific & Industrial Research, New Delhi, India.Indian Herbal Pharmacopoeia, Vol I, (1998), Regional Research Laboratory, Jammu Tawi &Indian Drug manufacturers Association, Mumbai.Indian Herbal Pharmacopoeia, Vol II, (1999), Regional Research Laboratory, Jammu Tawi &Indian Drug manufacturers Association, Mumbai.Pharmacopoeia of India [The Indian Pharmacopoeia], II Edn., (1996), Ministry of Health, Govt.ofIndia, New Delhi.Quality Control Methods for Medicinal Plant Materials, (1998), World Health Organisation,Geneva.Standardisation of Single Drugs of Unani Medicine, Part II, (1992), Central Council for Researchin Unani Medicine, Ministry of Health and Family Welfare, Govt. of India, New Delhi.Standardisatiion of Botanicals, Testing and Extraction Methods of Medicinal Herbs, Vol I, (2002),Eastern Publishers, New Delhi.The Ayurvedic Pharmacopoeia of India, Vol I, Part I, (1986), Ministry of Health and FamilyWelfare, Govt.of India, New Delhi.The Ayurvedic Pharmacopoeia of India, Vol II, Part I, (1999), Ministry of Health and FamilyWelfare, Govt.of India, New Delhi.The Ayurvedic Pharmacopoeia of India, Vol III, Part I, (2001), Ministry of Health and FamilyWelfare, Govt.of India, New Delhi.The Indian Pharmaceutical Codex, Vol I, (1953), Council of Scientific and Industrial Research,New Delhi.ArticlesShanley, P. And Luz, L. (2003). Eastern Amazonian Medicinals: Marketing, Use and Implicationsof Forest Loss. Bio Science. Vol 53 (6): 573-584.Online documentationEkpe, H. (2002). Forest loss in Ghana and its impact on access to wild medicinal plants. p. 6– 8.In: H. Gillett (ed.), Conservation and sustainable use of medicinal plants in Ghana. Proc.Conservation Rpt., Ghana. May 2002. www.unep-wcmc.org/species/plants/ghana.WorkshopsSchippmann, U.; Leaman, D. and Cunningham A. B. (2006). A comparison of cultivation and wildcollection of medicinal and aromatic plants under sustainability aspects. p. 75–95. In: R.J. Bogers,

74
Proceeding of Conference : Evolving Paradigm to Improve Productivity for Plant Genetic Resoyrces
L.E. Craker, and D. Lange (eds.), Medicinal and aromatic plants. Proc. FrontisWorkshop on Medicinal and Aromatic Plants, Wageningen, The Netherlands, 17–20, April 2005.Nucleus for Strategic Expertise Wageningen University and Research Centre, Wageningen.ANNEXURE - IGeneral Guidelines for harvesting and processing of Medicinal Plants ? Collect only mature parts.
• Do not collect the herbs from Roadsides, Sea Shores, Anthills, near Sewerage etc.• Start drying process immediately after collection.• Ensure complete drying before packing and storage.• Dry aromatic herbs, delicate fruits etc. in shade.• Store the herbs in properly constructed stores to minimize losses on storage.
Guidelines for collection of different parts of the medicinal plants: I. Underground Parts & WholePlants:
• Collect the whole plants after seed shedding.• Collect underground parts when the mother plant is fully mature.• Dry fleshy parts before packing and storing. Cut large parts into smaller pieces.
II. Bark and Stem:• Do not harvest from immature Plants.• Collect from the Branches instead of Main Trunk.• Strip the bark longitudinally & not all over the circumference of Trunk/Branches.• Cut into small pieces to facilitate complete drying.• Harvest only mature branches or stem.
III. Leaves Flowers, Fruits, Seeds and Floral Parts etc.:• Harvest only mature parts.• Do not collect from unhealthy plants.• Do not collect parts manifested with insects, fungi etc.• Dry flowers and floral parts in shade. Fleshy flowers may be dried in Sun.• Rotten and diseased fruits should be segregated from rest of the supply.
IV. Gums, Oils, Resins, Galls etc.:• Make vertical incisions only on some portions of the tree.• Do not collect the gums or resins from a tree continuously.• Collect the gum/resin in the right season.

75
Proceeding of Conference : Evolving Paradigm to Improve Productivity for Plant Genetic Resoyrces
Morphology and Physiology of Petal Cells
Renuka Desai, Darshana Sanja And Archana Mankad
Department of Botany, School of Sciences,Gujarat University, Ahmedabad-380009, Gujarat, India
ABSTRACTPost harvest physiology of flowers relies largely on the turgidity of the petals which is maintainedby various preservatives. Studying petal morphology and physiology of its cells helps understandthe how and why of the delicate water relation of petals. Experiments were conducted with petaldiscs to find out the osmotic concentration of the preservative best suitable for particular flowers.Tagetes and Chrysanthemum flowers were selected. Microscopic measurements of the epidermalpeels were helpful in examining the optimum osmotic concentration of the protoplasm for maximumuptake of water and / or preservative solution.Keywords: Petal, Physiology, Tagetes, Chrysanthemum.INTRODUCTIONPost harvest physiology and cut flower longevity of flowers is largely related to the maintenance ofthe turgidity of the petals which is maintained by various preservatives (Halevy et al.,1981). Anotherimportant aspect is the water relationship of the flowers. Marousky (1971) showed an increase infresh weight of cut flowers by improving water balance is a major factor in determining the qualityand longevity of the cut flowers. When water is being removed from a cell, the turgor pressuredecrease until the cytoplasm is no longer pressing hard on the cell wall. When the cytoplasm startsto pull away from the cell wall is called "incipient plasmolysis"- full plasmolysis is reached when thecytoplasm has completely withdrawn from the cell wall. Microscopic measurements of the epidermalpeels were helpful in examining the optimum osmotic concentration of the protoplasm for maximumuptake of water and / or preservative solution. Sucrose is commonly added to keeping solutionbecause it decreases respiration rate, fresh weigh and dry weight. (Goszgynska et al.,1990).MATERIALS AND METHODSStudying morphology and physiology of Tagetes and Chrysanthemum petal cells helps understandthe how and why of the delicate flower relation of petals. Experiments were conducted with petaldiscs to find out the osmotic concentration of the preservative best suitable for particular flowerswere selected. Generally, the flowers were collected from the Botanical garden of the department.

76
Proceeding of Conference : Evolving Paradigm to Improve Productivity for Plant Genetic Resoyrces
Here, preservative solution was taken in small watch glass and flower petals were put after removingepidermal peels in different concentrations of sucrose. The whole set was kept at room temperature(27+ 1) æ%C. The slide was observed under microscope after every hour. Camera lucida sketcheswere taken at the end of hour. This was done at 100X magnification. Then stained photographswere also taken at different time intervals. The various sucrose concentrations tested for find outthe osmotic concentration of the petal cells are as follows:-
PLANT SUCROSE CONCENTRATION
Tagetes 0.1% to 10%
Chrysanthemum 1% to 20%
RESULT AND DISCUSSIONMicroscopic measurement of the epidermal peels were helpful in examining the optimum osmoticconcentration of the protoplasm for maximum uptake of water and/or preservative solution (sucrose).During the study plasmolysis was noticed in different concentration of sucrose but the best result ofincipient plasmolysis was obtained in Tagetes in 1% sucrose after 1 hour and in Chrysanthemumin 10% sucrose after 24 hours. Thus, optimum concentration of sucrose on the cytoplasm wasfound. It varies from species to species. Sucrose in high concentration (5%-20%) supplied as ashort treatment to cut flowers accumulates in the cells, increasing the osmotic potential of thepetals. This enables the treated flowers to absorb much more water compared to untreated flowers.Several metabolic sugars are equally effective in this response but the non metabolic sugar manitolis not effective. Osmotic adjustment has also been observed with several mineral salts like KCL,KNO
3 and NH
4NO
3.
REFERENCESGoszczynska D M, Zaki H, Boroehov A and Halevy (1990) Effect of sugar on physical andcomposition properties of rose petals membranes, Scientia Hort. 43: 313-320.Halevy A H and Mayak S (1981) Senescence and post harvest physiology of cut flowers, Hort.Rev. 3: 59-143.Marousky F J (1971) Inhibition of vascular, blockage and increased moisture retention in cutroses induced by PH, 8-hydraxyamindino and sucrose, J. Am. Soc. Hort. Sci. 96: 3841.Murali T P and Reddy T V (1993) Post harvest life of gladiolous as influenced by sucrose andmetal salts, Acta. Hort. 343-313.

77
Proceeding of Conference : Evolving Paradigm to Improve Productivity for Plant Genetic Resoyrces
Germination Treatments for Watermelon Seeds
Jay B. Pandya* And Kalpesh J. Mehta
Navjivan Science College, Affiliated to Gujarat University,Dahod, Gujarat
Corresponding Author E-mail: [email protected]
ABSTRACT
The need of different treatments is to solve the problem of seed germination percentages, whichhelps farmers to increase the more number of seedlings and for that requiring less number of seeds.The present study deals with the different germination treatments for watermelon [Citrullus lanatus(Thunb.) Matsum and Nakai] seeds. To increase the germination percentages and production ofhealthy seedlings Watermelon seeds of the cucurbitaceae family is selected; the reason for that isless number of seed germination ratio and and also the chances of disease occurrence. To overcomethese problems physical (socking, nicking) and chemical (hydrogen peroxide, potassium nitrate,gibberellic acid, benzyl adenine) treatments were given with respect to the control (without anyphysical or chemical treatments). The treatments were given at different concentrations and keptfor the germination in seed germination chamber by controlling environmental conditions andobservations recorded after every 24 hrs up to four days. The highest seed germination ratio isobtained in H2O2 treatment followed by nicking socking control; KNO3, GA3 and BA. Healthygerminated seeds are observed in H2O2, socking, nicking, and control; in KNO3 the growth isnormal while in GA3 and BA seed germination is quite abnormal.
Keywords: chemical treatments, physical treatments, seed germination, watermelon.
INTRODUCTION
Poor seed germination in watermelon is generally correlated with thick seed coat; poor embryoand high moisture content (Grange et al., 2000). In many seeds, germination can be inhibited bymechanical restriction exerted by the seed coat. Permeability limitation of water and gases istypical due to hard seed coat. The imbibed coat and large seed cavity in the watermelon form acontinuous wet layer around the embryo by which the oxygen must transverse (Grange et al.,2003). Seed treatments have enhanced germination in various field crops and vegetables.Combined application of ethephon and GA4-7 has improved germination in diploid watermelon(Nelson and Sharples, 1980). Germination and emergence of watermelon seed was also improved

78
Proceeding of Conference : Evolving Paradigm to Improve Productivity for Plant Genetic Resoyrces
by priming in salt solution (Sachs, 1977) and redrying after priming was a critical step formaintaining seed quality (Parera and Cantliffe, 1992). Seed priming permits pre-germinationphysiological and biochemical changes to occur (Bradford, 1986). Mechanical weakening ofthe seed coat structure such as scarification, seed nicking and seed coat removal has beenreported to successfully enhance germination of watermelon seed (Grange et al., 2000). Seedcoat adherence to cotyledons in polyploid seeds is another problem in seedling emergence;however, seed orientation with the radicle end up decreased seed coat adherence (Maynard,1989) but did not improve emergence. It is well known that the establishment of a good seedlingstand is a prerequisite for improved yield and quality (Wurr and Fellows, 1983). This researchwas conducted to determine the effectiveness of seed alteration and chemical treatments onwatermelon seed germination and seedling stand.
MATERIALS AND METHODS
Seed material: The diploid watermelon seeds of GEN-108 line was obtained from market andused for the experiment purpose.
Seed germination treatments: For each line, seed treatments included were control, nicking, andsoaking (non-aerated) in distilled water, gibberellic acid (GA
3, 0.5 or 5 mM), benzyl adenine (BA,
0.5 or 5 mM), hydrogen peroxide (H2O
2, 1 or 2%), and potassium nitrate (KNO
3, 3%) solution
for 4 hr at 24ºC. In case of nicking, seeds were nicked at radicle end avoiding any damage toembryo. Each treatment was replicated four times. After each soaking treatment, seeds werewashed thoroughly in running tap water and dried at 20°C with 40% humidity for 5 days beforegermination tests were conducted. Distilled water (4 ml) was added for 20 seeds placed in 9 cmPetri dishes and incubated at 30°C in a dark growth chamber. Germination was observed forthree days after incubation. Seeds were considered germinated when the radicle protruded (H"2mm) from the seed coat. (Muhammad et al., 2006)
RESULT AND DISCUSSION
The thick seed coat and a large airspace between the underdeveloped embryo and seed coattissues appear to have a major role in limiting seed germination of watermelon. However, seednicking results indicate that polyploid seed germination is not inhibited by the seed coat alone(Grange et al., 2003) but also is very sensitive to increased moisture contents (Grange et al.,2000). Although soaking or nicking, the seed coat significantly increased seed germination (Grangeet al., 2003). H
2O
2 was the best among other treatments as it increases availability of oxygen to
seeds at high temperatures by providing supplemental oxygen for respiration and metabolic activities(Figure 1 & 2) (Katzman et al., 2001). The improved germination in the presence of 1% or 2%H
2O
2 may result from weakening of the seed coat (Chien and Lin, 1994) as H
2O
2 reacts with the
seed coat. Batak et al., (2002) reported that nitrogenous compounds, such as potassium nitrate,potentiate germination of different species of light-requiring seeds; however, in our case KNO3did not improve germination of watermelon seed. Seed treatments using GA
3 and benzyl adenine
(BA), not show the proper growth of seedlings (Figure 1 & 2) (Cantliffe et al., 1987).

79
Proceeding of Conference : Evolving Paradigm to Improve Productivity for Plant Genetic Resoyrces
CONCLUSION
The results of the present studies would suggest that seed soaking, nicking and H2O
2 enhanced
seed germination of watermelon seeds.
REFERENCES
Batak, I., M. Devic, Z. Giba, A. Grubisic, K.L. Poff and R. Konjevic. 2002. The effects ofpotassium nitrate and NO-donors on phytochrome A- and phytochrome B-specific inducedgermination of Arabidopsis thaliana seeds. Seed Sci. Res., 12: 253-259.
Bradford, K.J. 1986. Manipulation of seed water relations via osmotic priming to improvegermination under stress conditions. HortScience, 21: 1105-1112.
Cantliffe, D.J., M. Elballa and A. Guedes. 1987. Improving stand establishment of direct seededvegetables in Florida. Proc. Fla. State Hort. Soc., 100: 213-216.
Chien, H. and T.P. Lin. 1994. Mechanism of hydrogen peroxide in improving the germination ofCinnamomum camphora seed. Seed Sci. Technol., 22: 231-236.
Grange, S., D.I. Leskovar, L.M. Pike and B.G. Cobb. 2000. Excess moisture and seedcoatalteration influence germination of triploid watermelon. HortScience, 35: 1355-1356.
Grange, S., D.I. Leskovar, L.M. Pike and B.G. Cobb. 2003. Seedcoat structure andoxygenenhanced environments affect germination of triploid watermelon. J. Amer. Soc. Hort.Sci.,128: 253-259.
Katzman, L.S., A.G. Taylor and R.W. Langhans. 2001. Seed enhancements to improve spinachgermination. HortScience, 36: 979-981.
Maynard, D. 1989. Triploid watermelon seed orientation affects seedcoat adherence on emergedcotyledons. HortScience, 24: 603-604.
Muhammad J. J., Sung W. K., Kim D.H. and Haider A. 2006. Seed treatments and orientationaffects germination and seedling emergence in tetraploid watermelon Pak. J. Bot., 38(1): 8998,2006.
Nelson, J.M. and G.C. Sharples. 1980. Effects of growth regulators on germination of cucumberand other cucurbit seeds at suboptimal temperatures. HortScience, 15: 253-254.
Parera, C.A. and D.J. Cantliffe. 1992. Enhanced emergence and seedling vigor in shrunken-2sweet corn via seed disinfection and solid matrix priming. J. Amer. Soc. Hort. Sci., 117: 400403.
Sachs, M. 1977. Priming of watermelon seeds for low temperature germination. J. Amer. Soc.Hort. Sci., 102: 175-178.
Wurr, D. and J. Fellows. 1983. The effect of the time of seedling emergence of crisp lettuce onthe time of maturity and head weight at maturity. J. Hortic. Sci., 58: 561-566.

80
Proceeding of Conference : Evolving Paradigm to Improve Productivity for Plant Genetic Resoyrces
Control
Sock Nick
H 2O
2 % 1
H 2 O
2 % 2 KNO
3
GA 3
0.5 mM GA
3 5mM
BA 0.5 mM
BA mM 5
Fig-1 Watermelon seed germination
Fig-2 Seed germination ratio

81
Proceeding of Conference : Evolving Paradigm to Improve Productivity for Plant Genetic Resoyrces
Impact of Micronutrient Boron on PhenolMetabolism of Brinjal (Solanum Melongena L.) Plant
Urvi Gupta And Hitesh Solanki
Department of Botany University School of SciencesGujarat University Ahmedabad
E-mail: [email protected] and [email protected]
ABSTRACTAll plants produce an amazing diversity of secondary metabolites. One of the most importantgroups of these metabolites is phenolic compounds. Because of their antioxidative capability phenolsare important naturally occurring compounds. The aim of the experiment was to determine theeffect of B on the phenol content and metabolism, for which different B treatments were applied.Boron is an essential micro nutrient required for nutrition and growth of all plants. Adequate Boronnutrition is critical for high yield and quality of crop. Four treatments comprising of foliar applicationof Boron at four concentrations viz. 5ppm, 10ppm, 15ppm and 20ppm with one control weretested and parameters were studied with the use of standard methods. Higher phenol concentrationwas recorded in the controlled plants and among B treated plans it was maximum in plants treatedwith 5ppm. While it decreased with the higher Boron concentrations. This indicates phenolaccumulation induced by the minimum B treatment. And the exact opposite results were found inpolyphenol oxidase activity where the least enzyme activities were recorded in controlled plantsand it goes on increasing with the higher B concentration, which indicates the oxidation of thephenols induced by the higher B treatments.INTRODUCTIONPhenolic compounds are one of the most important groups of secondary metabolites produced byplants. They are widely distributed in the plant kingdom and abundantly present in our diet. Thisclass of phytochemicals got much attention in the last decade and many experiments have beenconducted by various scientific communities. Phenolic compounds have a range of functions inplant life and their concentration varies under different environmental factors and stress conditions(Diáz et al, 2001; Sakiha Ma and Ya, 2002; Grac and Logan, 2000; Lavola et al, 2000). Isoflavonesand some other flavonoids production is induced when plants are infected or injured or under lowtemperature and low nutrient conditions (Takahama and Oniki, 2000; Sakiha ma and Ya Masakih, 2002; Ruiz, 2003).
82
Proceeding of Conference : Evolving Paradigm to Improve Productivity for Plant Genetic Resoyrces
Boron (B) is a crucial element for plants and the only non-metal among the eight plant micronutrients.The requirement of boron for plant growth was demonstrated in the early 1920s (Marschner1995; Warington, 1923). It plays diverse important roles in plant metabolism (Parr andLoughman, 1983). Many experimental reports have revealed its involvement and importance insugar and starch metabolism, cell division, cell wall synthesis, lignifications, cell wall structureintegrity, RNA metabolism, nucleic acid metabolism, protein metabolism, flower formation, seedproduction, membrane function, IAA and phenol metabolism (Barker and Pilbeam, 2007; Li andLing, 1997).The objective of the present work is to investigate the changes in the phenol metabolism on Solanummelongena plant by application of different boron concentrations. Eggplant or brinjal (Solanummelongena L.) is an important and widely consumed vegetable crop of India grown round theyear. The brinjal is of much importance in the warm areas of Asia, parts of Europe and Africa(Karihaloo and Gottileb, 1995), being grown extensively in India, Bangladesh, Pakistan, Chinaand the Philippines. It is also well-liked in Egypt, France, Italy and United States. In India, it is oneof the most widespread, popular and primary vegetable crops grown all over the country excepthigher altitudes.MATERIALS AND METHODSFor the experiments seeds of Solanum melongena L. cultivar longum were utilized, purchasedfrom an agricultural product supplier in Ahmedabad. These seeds were grown in pots at greenhouse of Botany Department of Gujarat University. Pots were filled with farm yard manure andsoil. After the one month of seed sowing small saplings were transplanted in other pots containing4 plants each pot.As borax is the most suitable B salt for foliar application, it was selected as the B source fortreatments. Four different B concentrations were used for foliar application viz. 5ppm, 10ppm,15ppm, 20ppm. One set of plants were kept as control i.e. without any B application. Due to theimmobility of B, repeated applications are necessary. Because of this, foliar feeding of different Bconcentrations was given to the plants at the interval of 15 days.Metabolites and biochemical parameters were studied in different plant parts like leaves, stem,buds, flowers and fruits. These plant parts were collected at the different stages of plant life andtaken to laboratory for analysis. Changes in various bio-chemicals and metabolites of brinjal inresponse to different concentration of B were studied using spectrophotometric quantification.Total phenols were determined by using method of Bray et al. (1954). Polyphenol oxidase activitywas determined by the method given by Kar et al. (1976).RESULT AND DISCUSSIONTotal PhenolsPhenol content was calculated in different plant parts i.e. leaves, stem, buds, flowers and fruits andcompared with the phenol content of plants kept under controlled condition. Lower phenol contentwas determined in all the plants treated with boron concentrations while the plants kept under

83
Proceeding of Conference : Evolving Paradigm to Improve Productivity for Plant Genetic Resoyrces
controlled conditions possesses the highest amount of phenol content. It has been observed thatphenol content was decreased with the increased B concentrations (Graph 1-5).
0 0.2 0.4 0.6 0.8
5 ppm 10 ppm 15 ppm 20 ppm Conc
entr
atio
n (m
g)
B treatments
Phenols - Leaves
Treated Control
Graph-1 Comparison between phenol concentrations in leaves of treated and controlled plantsfor 5-25ppm treatment of Boron
0 0.2 0.4 0.6 0.8
5 ppm 10 ppm 15 ppm 20 ppm Conc
entr
atio
n (m
g)
B Treatments
Phenols - Stem
Treated Control
Graph-2 Comparison between total phenol concentrations in stem of treated and controlled plantsfor 5-25ppm treatment of Boron
0
0.2
0.4
0.6
ppm 5 10 ppm 15 ppm 20 ppm Conc
entr
atio
n (m
g)
B treatments
Phenols - Buds
Treated Control
Graph-3 Comparison between phenol concentrations in buds of treated and controlled plants for5-25ppm treatment of Boron

84
Proceeding of Conference : Evolving Paradigm to Improve Productivity for Plant Genetic Resoyrces
0 0.1 0.2 0.3 0.4 0.5
5 ppm 10 ppm 15 ppm 20 ppm Conc
entr
atio
n (m
g)
B Treatments
Phenols - Flowers
Treated Control
Graph-4 Comparison between phenol concentrations in flowers of treated and controlled plantsfor 5-25ppm treatment of Boron
0 0.1 0.2 0.3 0.4 0.5
5 ppm 10 ppm 15 ppm 20 ppm
Conc
entr
atio
n (m
g)
B Treatments
Phenols - Fruits
Treated
Control
Graph-5 Comparison between phenol concentrations in fruits of treated and controlled plants for5-25ppm treatment of Boron
All the B treated plants recorded with lower phenol content in compare to control. Many reportsare available which shows that phenol level increases in B deficient plants and this accumulation isform due to the stimulation of the enzyme phenylalanine-ammonium lyase (PAL) (Zehirov andGeorgiev, 2000; Cakmak et al. 1995; Ruiz et al. 1998; Camacho-Cristóbal et al. 2002). Resultsof present study support the above mentioned statement as all the plants which received regular Btreatments have lower phenol content. While plants kept under controlled conditions shows themaximum content of phenols. This may be result of borate complex formation which develops tocontrol the rate of free phenols (Lewis, 1980; Pilbeam and Kirkby, 1983; Shkolnik, 1984). Infact, it is well known that B deficiency causes an accumulation of phenolics through the stimulationof the enzyme phenylalanine-ammonium lyase (PAL) (Cakmak et al. 1995; Ruiz et al. 1998b;Camacho-Cristóbal et al. 2002). Zehirov and Georgiev (2000) reported that the long-term absenceof B was found to increase total soluble phenol content in root apoplast exudates.

85
Proceeding of Conference : Evolving Paradigm to Improve Productivity for Plant Genetic Resoyrces
Polyphenol Oxidase ActivityLeast polyphenol oxidase activity was recorded in plants kept under controlled conditions incompared to treated plants. While plants treated with 20ppm B concentration i.e. highest Bconcentration recorded with maximum activity which shows the highest rate of degradation ofphenolic compounds. (Graph: 6-10)
0
0.2
0.4
0.6
ppm 5 10 ppm 15 ppm 20 ppm Conc
entr
atio
n (m
g)
B Treatments
Plyphenol oxidase - Leaves
Treated Control
Graph-6 Comparison between polyphenol oxidase activities in leaves of treated and controlledplants for 5-25ppm treatment of Boron
0
0.2
0.4
0.6
ppm 5 10 ppm 15 ppm 20 ppm Conc
entr
atio
n (m
g)
B Treatments
Polyphenol oxidase - Stem
Treated Control
Graph-7 Comparison between polyphenol oxidase activities in stem of treated and controlledplants for 5-25ppm treatment of Boron
0 0.2 0.4 0.6 0.8
5 ppm 10 ppm 15 ppm 20 ppm Conc
entr
atio
n (m
g)
B Treatments
Ployphenol oxidase - Buds
Treated Control
Graph-8 Comparison between polyphenol oxidase activities in buds of treated and controlledplants for 5-25ppm treatment of Boron

86
Proceeding of Conference : Evolving Paradigm to Improve Productivity for Plant Genetic Resoyrces
0 0.2 0.4 0.6 0.8
5 ppm 10 ppm 15 ppm 20 ppm Conc
entr
atio
n (m
g)
B Treatments
Polyphenol oxidase - Flowers
Treated Control
Graph-9 Comparison between polyphenol oxidase activities in flowers of treated and controlledplants for 5-25ppm treatment of Boron
0 0.2 0.4 0.6 0.8
1
5 ppm 10 ppm 15 ppm 20 ppm Conc
entr
atio
n (m
g)
B Treatments
Polyphenol oxidase - Fruits
Treated Control
Graph-10 Comparison between polyphenol oxidase activity in fruits of treated and controlledplants for 5-25ppm treatment of BoronPolyphenol oxidase activity was recorded highest in plants treated with 20ppm B concentrationand phenol content was recorded the least phenol content in these plants. This shows the maximumdegradation of phenols in the plants treated with 20ppm B concentration. It is known thatmicronutrient deficiency often leads to increased content of phenols and decreased lignifications.Shkolnik et al. (1981) related an increased content of phenols to boron (B) deficiency. Results ofpresent study supports the above statement as phenol content was recorded highest in controlledplants i.e. without B treatments. And polyphenol oxidase activity is recorded lowest in controlledplants which shows lower degradation rate of phenols. Some studies also reported that B deprivationalso increased the activity of polyphenoloxidase activity (PPO) (Pfeffer et al., 1998; Camacho-Cristóbal et al., 2002), enzyme that catalyses the oxidation of phenolic compounds into quinones.But the results of present study are not supported by this.

87
Proceeding of Conference : Evolving Paradigm to Improve Productivity for Plant Genetic Resoyrces
ACKNOWLEDGEMENT
We are thankful to Prof. Dr. Y. T. Jasrai, Head of Botany Department, School of Sciences, GujaratUniversity, Ahmedabad for providing all facilities and encouragement.
REFERENCES
Barker A V and Pilbeam D J (2007). Handbook of Plant Nutrition. CRC Press. Pp; 241-268(ISBN: 0-8247-5904-4).
Bray H G and Thorpe W V T (1954). Analysis of phenolic compounds of interest in metabolism.Biochemical Analysis, 1: 2752.
Cakmak I, Kurz H and Marschner H (1995). Short-term effects of boron, germanium and highlight intensity on membrane permeability in boron deficient leaves of sunflower. Physiol. Plant.,95: 11–18.
Camacho-Cristóbal J J, Anzelotti D and González-Fontes A (2002). Changes in phenolicmetabolism of tobacco plants during short-term boron deficiency. Plant Physiol. Biochem., 40:997-1002.
Diáz j, Bernal A, P Omar F and Merino F (2001). Induction of shikimate dehydrogenase andperoxidase in pepper (Capsicum annum L.) seedlings in response to copper stress and its relationto lignification. Plant Sci., 161-179.
Grace S C and Logan B A (2000). Energy dissipation and radical scavenging by the plantphenylopropanoid pathway. Phil. Trans. R. Soc. Lond., 355, 1499.
Kar M and Mishra D (1976). Catalase, Peroxidase and polyphenol oxidase activities during leafsenescence. Plant Physiology, 57: 315-319.
Karihaloo J L and Gottlieb L D (1995). Allozyme variation in the eggplant, Solanum melongenaL. (Solanaceae). Theor Appl Genet, 90: 578-583.
Lavola A, Julkun en-Tiitto R, De la rosa T M, Lehto T and Aphalo P J (2000). Allocation ofcarbon to growth and secondary metabolites in birch seedlings under UV-B radiation and CO2exposure. Physiol. Plant., 109, 260.
Lewis O H (1980). Boron, lignification and the origin of vascular plants:a unified hypothesis. NewPhytologist, 84: 209-229.
Lewis O H (1980). Are there inter- relation between the metabolic role of boron. Synthesis ofphenolic phytoalexins and the the germination of pollen! New Phytol., 84: 261-270
Li Y and Ling H (1997). Soil boron content and the effect of boron application on yield of maize,soybean, rice and sugar beet in Heilonjian Province, P.R. China. In: boron in soil and plants, RWBeli and B Perksem (Eds), pp: 17-21.
Marschner H (1995). Boron. Mineral Nutrition of Higher Plants, Academic Press San Diego,Vol 2, pp 379 - 396.Parr AJ and Loughman BC (1983). Boron and membrane function in plants. In Metals and

88
Proceeding of Conference : Evolving Paradigm to Improve Productivity for Plant Genetic Resoyrces
Micronutrients. Uptake and Utilization by Plants. Edited by Robb DA and Pierpoint WS. AcademicPress, New York, pp 87 – 107.Pfeffer H, Dannel F and Römheld V (1998). Are there connections between phenol metabolism,ascorbate metabolism and membrane integrity in leaves of borondeficient sunflower plants? Physiol.Plant.; 104: 479-485.Pilbeam DJ and Kirkby EA (1983). The physiological role of boron in plants. Journal of PlantNutrition; 6: 563-582.Ruiz J M, Bretones G, Baghour M, Ragala L, Belakbir A and Romero L (1998) Relationshipbetween boron and phenolic metabolism in tobacco leaves. Phytochemistry; 48: 269-272.Ruiz J M., Riv ero R M, Lop ez-cantar ero I and Romero L(2003) . Role of Ca2+ in metabolismof phenolic compounds in tabacco leaves (Nicotiana tabacum L .). Plant Growth Reg., 41, 173.Sakiha Ma Y and Ya Masaki H (2002). Lipid peroxidation induces by phenolics in cinjunctionwith aluminium ions. Biol. Plantarum, 45, 249.Shkolnik M Y (1984). Trace elements in plants. Amsterdam: Elsevier: pp-463.Shkolnik M Y, Krupnikova T K, and Smirnov Y S (1981). Activity of polyphenol oxidase andsensitivity to boron deficiency in monocots and dicots. Sov. Plant Physiol., 28: 279-283.Takaha Ma U and Oniki T (2000). Flavonoid and some other phenolics as substrates of peroxidase:physiological significance of the redox reactions. J. Plant Res. 113, 301.Warington K (1923). The effect of boric acid and borax on the broad bean and certain otherplants. Annals of Botany, 37: 629-672.Zehirov G and Georgiev G I (2000). Effects of boron deficiency on the contents of lignin, solublephenols, sugars and water related to nodulation and N2 fixation of soybean plants, Compt. rend.Acad. bulg. Sci., 53(10): 55–58.

89
Proceeding of Conference : Evolving Paradigm to Improve Productivity for Plant Genetic Resoyrces
Comparative Study of Changes in Sugars under Senescence and PostHarvest Conditions in Cosmos Bipinnatus Sonata Pink Series
Goral Jani And Archana Mankad
Department of Botany, School of Sciences, Gujarat University,Ahmedabad-380009, Gujarat.
ABSTRACTVarious parameters of sugar metabolism such as total sugars, reducing sugars and non-reducingsugars metabolites and corresponding enzymic activity of invertase was studied from the petals(petals) of flowers of Cosmos bipinnatus Cav. Sonata Pink series under uncut (flowers thatremain attached to the plant) and cut (post-harvest) conditions after a regular interval of 24 hoursfrom the time flowers opened or harvested till the end of the petal life under corresponding conditions.The amount of total sugars, reducing and non-reducing sugars were found to be higher under uncutconditions as compared to the cut conditions. This was mainly because of the fact that after theflowers were cut from the mother plant there was no other source of nutrition other that theirinternal reserves. The invertase activity was found to be decreasing with the progressing stagesunder cut conditions whereas under uncut conditions the decrease was noted from stage 4. Thissuggests that here probably the trigger of senescence as a result of pollination had taken place andthe sugars were no longer required inside the petals but started mobilizing to developing ovary.Keywords: Petal senescence, uncut flowers, cut flowers, Sugars, Cosmos.INTRODUCTIONA flower, sometimes known as a bloom or blossom, is the reproductive structure found in floweringplants. The biological function of a flower is to effect reproduction and hence play a crucial role inthe perpetuation of the earth’s most dominant group of plants. During flower bud opening, variousevents take place in a well defined sequence, representing all aspects of plant development, suchas cell division, cellular differentiation, cell elongation or expansion and a wide spectrum of geneexpression. So, the complexity of flower bud opening illustrates that various biological mechanismsare involved at different stages. However, it has been reported that the larger and more attractivethe petals, the more resources are needed for their preservation (Ashman and Schoen 1997).Thus, once a flower has been pollinated or is no longer receptive to pollination, the programmedsenescence of petals allows for the removal of a metabolically costly tissue. Hence, this process of

90
Proceeding of Conference : Evolving Paradigm to Improve Productivity for Plant Genetic Resoyrces
petal senescence is an active one that is executed via a defined genetic program representing thelast stage of floral development and resulting into wilting or abscission of whole flowers or flowerparts (Stead and Van Doorn 1994). As the flower petals are often the plant organs with theshortest life span they provide an excellent model system for the study of underlying mechanismand control of senescence as it is generally rapid and predictable. It is thus possible to studysenescence without applying artificial "senescence-inducing" treatments, as is used in studies ofleaf senescence (Halevy and Mayak 1979).Cosmos bipinnatus Cav. Sonata Series ‘Sonata Pink’ is an attractive annual plant with large,showy, long peduncled and solitary pink flowers. It is generally grown as a garden plant. Inspite ofhaving such a beautiful ornamental flower, it is not at all seen in the commercial market. Also, littleinformation is available about the shelf life of the flower under cut and uncut conditions. Moreover,petal senescence in uncut flowers has rarely been studied (Van Doorn 2004). Hence, the need ofthe present study was felt with the aim to study the changes taking place during petal (ray floret)senescence in uncut and cut flowers of Cosmos bipinnatus.Petal senescence is generally accompanied by a loss of dry matter due to hydrolysis ofmacromolecules such as starch, protein and nucleic acids and the redistribution of carbon andnitrogen compounds to other parts of the flower. Flowers of most plants are heterotrophic, therefore,they require carbohydrates for their development. The flower bud is a major sink for assimilatesunder favourable growth conditions, whereas a shortage of carbohydrates often leads to the arrestof the flower development (Halevy 1987). Thus, carbohydrate status of the flower petals is one ofthe factors, which ultimately determines their longevity (Coorts 1973) and hence, in the presentstudy sugar metabolism is focused.MATERIALS AND METHODSIn order to study the carbohydrate status and the changes in it during the senescence period inuncut and cut Cosmos flowers, biochemical estimations were done from 100 mg fresh or drypetals of flowers. The plants grown in the experimental plots of the botanical garden of the departmentserved as the source of the material.Various Stages Identified :Stages for Uncut Conditions : It was observed that the uncut flowers of Cosmos bipinnatusremained on the plant for 5 days with 6th day as the senescent day at which the petals startedabscising. Thus, 6 stages were defined as follows for the uncut flowers :Stage 1 : Flowers that had just opened (Day 1)Stage 2 : After 24 hours (Day 2)Stage 3 : After 48 hours (Day 3)Stage 4 : After 96 hours (Day 4)Stage 5 : After 120 hours (Day 5)Stage 6 (Senescent stage) : After 144 hours (Day 6)Stages for Cut Conditions :In case of cut flowers of Cosmos, a shelf life of 7 days was observed.

91
Proceeding of Conference : Evolving Paradigm to Improve Productivity for Plant Genetic Resoyrces
The flowers were completely unacceptable on 8th day with the petals completely wilted and dried.Hence, in case of cut flowers 7 stages were defined as follows (Plates – 3A,3B and 3C)Stage 1 : Day when the flowers were cut and placed in DW as holding solution (Day 1)Stage 2 : After 24 hours (Day 2)Stage 3 : After 48 hours (Day 3)Stage 4 : After 96 hours (Day 4)Stage 5 : After 120 hours (Day 5)Stage 6 : After 144 hours (Day 6)Stage 7(Senescent stage) : After 168 hours (Day 7)Collection and preparation of material for Biochemical estimations : In order to carry outthe estimations from dry material, the petals were collected from the plant during the season. Thus,to study the changes occurring within the flower which lead to its senescence, petals from everystage (every 24 hours) of flower were collected starting from the day it opened till its senescence.Every day the field was surveyed in the morning and the flowers which had just opened weretagged. These flowers were considered as Stage 1 (0 hr.) flowers. Petals from some of the Stage1 flowers were collected and packed separately with proper labels. Similarly, petals for Stage 2(24 hrs), Stage 3 (48 hrs), Stage 4 (96 hrs), Stage 5 (120 hrs) and Stage 6 (144 hrs) (senescentstage) flowers were also collected. These petals were then placed in the oven at 80°C for drying.For the estimations from the fresh material, the flower petals of appropriate stage were freshlycollected in the morning from the field.For the cut conditions, the fresh flowers of Stage 1(flowers that had just opened) were cut diagonallyfrom the plant in the morning. They were immediately placed in the beaker containing water andwere brought to the laboratory. Leaves, if any, were removed from the flowering twig, were recutagain diagonally and were immediately placed in a definite volume of DW. The length of the twigwas kept 10 cms to overcome the influence of flower stalk length on vase life (Sangama and Singh,1999). The twigs were placed in a cool place in the laboratory at room temperature. The tubescontaining DW were covered with transparent polythene pieces to prevent loss by evaporation.(Venkatarayappa et. al., 1980). Once the flowers that had just opened were placed in the testtubes, they were labeled as and considered at Stage 1 (0 hr.). After 24 hours, they were consideredas Stage 2 (24 hrs) flowers; after 48 hours, they were considered as Stage 3 (96 hrs) flowers andso on till the end of their shelf life. Petals from each of the stage were handled in the same way asmentioned above for the petals under uncut conditions.In order to study the changes in the carbohydrates, the biochemical estimations of reducing andtotal sugars were done from the 100 mg dry material of all stages of Cosmos whereas the estimationfor the activity of invertase enzyme was done from the 100 mg fresh material of all stages ofCosmos under both cut and uncut conditions. Reducing and total sugars were estimated by Nelson’smethod (Nelson 1944), the results of which are expressed as mg glucose equivalents per g petals.

92
Proceeding of Conference : Evolving Paradigm to Improve Productivity for Plant Genetic Resoyrces
Invertase activity was estimated by the method of Hatch and Glasziou (1963) and the results wereexpressed as glucose equivalents per g fresh petals.For statistical analysis, means were based on 3 replicates for each stage and the standard errorwas computed. It was also statistically examined by ANOVA and the values of C.D. were calculatedat 5% level of significance.RESULT AND DISCUSSIONTotal Sugars:During first 24 hours, the amount of total sugars was found to have significantly increased underuncut conditions whereas they significantly decreased under cut conditions. Thereafter, the amountswere stabilized till stage 3 in uncut flower petals whereas the level was almost maintained till stage4 in cut flowers. A significant drop in the amount was noted at stage 5 in both the conditions whereafter the amounts increased in uncut conditions and under cut conditions they were almost stabilizedin-between before this rise at senescent stage.Figure-1The sugars are used for building structures for the plant organs and contribute to the cell wallsynthesis that stimulates floret expansion (Ichimura 1998). Under uncut conditions, florets showenlargement with the progressing stages till stage 4. Thus, probably the sugars were being used inthe enlargement and development of the florets during this period and hence the more requirementof the sugars was supplied by the mother plant under uncut conditions and hence the level wasstabilized in the ray florets of uncut flowers By stage 5 possibly the process of pollination hadtaken place. Presence of lots of pollens on the ray florets indirectly indicates the conformation ofthe above fact that the disc florets could have been pollinated. This possibly acted as a triggermechanism thereby leading to flower senescence. Many workers have reported this type ofpollination induced senescence (Lovell et al. 1987, Pech et al. 1987, Porat 1994). It is reportedthat following pollination a signal passes from the style to the petals through ovary and initiates aburst of ethylene production which subsequently triggers a second, autocatalytic burst of ethylenein the petals (Jones and Woodson 1997, Shibuya et al. 2000, Van Doorn and Woltering 2007,Borochov and Woodson 1989). Pollination and ethylene promotes transport within the flowerfrom the petals to the ovary (Hsiang 1951, Nichols 1976, Nichols and Ho 1975a, 1975b). Thedeclining trend in the total sugar content at the senescenct stage was also probably because thereserves were being mobilized within the flower from the petals to the developing ovary or to theother growing areas in the plant. Similar trend of decline in the content of carbohydrates and dryweight of petals during the final stages of flower development have also been reported by manyworkers (Coorts 1973, Halevy and Mayak 1979).Under cut conditions, the higher amount of total sugars at the harvest stage (stage 1) showed aremarkable decrease during the period of first 24 hours itself. Yakimova et al., (1997) and Koizukaet al., (1995) have suggested that in stress situations cells require more sugars to fulfill the energyand carbon needs for the defensive response to stresses and the drastic decrease in the present

93
Proceeding of Conference : Evolving Paradigm to Improve Productivity for Plant Genetic Resoyrces
case could be because of the stress caused due to the detachment from the mother plant. Further,this amount of total sugars was found to have almost stabilized till stage 4 after which it starteddecreasing significantly. This indicates the operation of some metabolism which helped the petalsto maintain their sugar reserves inspite of have been detached from the mother plant. Further afterthe stage 4 there was a drop in the amount which is possibly because of the trigger of senescenceat the cellular level. Moreover, once the flowers were cut from the mother plant they were no morein any connection with their natural source of nutrition. In addition to this, they were placed inholding solution which contained only distilled water. Thus, the flower petals had no source ofcarbohydrate nutrition except its internal reserves and possibly the sugar stores of the petals werebeing used by them in various metabolic activities in order to sustain during the later phase of theirshelf life which was probably a stressful condition for them or the sugars had started remobilizingunder the stress condition created. As a result of this, the size of the sugar pool kept reducing.Coorts (1973) reported that lack of availability of substrate for respiratory metabolism leads topetal senescence. Van Doorn and Woltering (2007) have reported that a temporary decrease inthe sugar levels may act as a trigger of senescence caused due to inaccurate separation of tissuesand cells at various stages of senescence. Thus, under cut conditions the reduction in the amount ofsugars could have caused trigger of senescence which might have led to the death of the cells dueto lack of energy and structure. Similar trend of decline in the content of carbohydrates and dryweight of petals during the final stages of flower development have also been reported by manyworkers (Aarts 1957, Coorts 1973, Halevy and Mayak 1979, Mayak and Halevy, 1974; Nichols,1973; Weinstein, 1951).Reducing Sugars and Non-reducing Sugars :The amount of reducing sugars under uncut conditions was also found to have increased during thefirst 24 hours of opening of the flower. After this, from stage 2 the amount was almost maintainedwithin the ray florets till the senescent stage. At stage 6 the decrease in the amount was set in,however the amount was still found to be more as compared to the amount at stage 1. The rise inthe reducing sugars suggests that they were possibly translocated to the ray florets either after theirsynthesis at other place or as a result of breakdown of macromolecules releasing them. Figueroaet al. (2005) reported that sucrose hydrolysis occur in these organs. However, the exact locationis still not clear. Under uncut conditions it seems that since the flower was on the mother plant thelevel of reducing sugars were maintained by the supply from the plant because the level of non-reducing sugars were also maintained and later increased which was mainly because of the loweredactivity of invertase enzyme. At the senescent stage, the values of reducing sugars were remarkablyless or found to be decreasing suggesting that once the process of senescence is triggered with nopoint of return the reducing sugars are either drained to the developing ovary or to other parts withno further accumulation in petals. Decrease in reducing sugars with senescence was also reportedin day lily (Bieleski and Reid 1992), rose (Sharma 1981) and carnation (Halevy and Mayak1979).Figure- 2 and 3
94
Proceeding of Conference : Evolving Paradigm to Improve Productivity for Plant Genetic Resoyrces
Non-Reducing Sugars were calculated by subtracting the values of reducing sugars from the total.Under uncut conditions, it was found that out of the entire pool of sugars, the amount of non-reducing sugars were less as compared to the reducing sugars. This goes in agreement with thefindings of Weinstein (1951) and Nichols(1968) who reported that the main constituents of thesugar pool of mature petals of carnation and rose were the reducing sugars, rather than nonreducingsucrose. The amount of non-reducing sugars was almost maintained till stage4 after which a significantrise in the amount was observed. But this rise was not associated with the equally significant rise inthe amount of reducing sugars. However, the same phase showed decrease in activity of theenzyme invertase. Later, at senescent stage the values non-reducing sugars showed decrease. Theabove observations suggest that the maintenance and rise in the amount of non-reducing sugarswas mainly due to their accumulation as a result of lowered activity of invertase enzyme and thedecreasing trend at the senescent stage was possibly due to translocation of the reserves out of theray florets.
Under cut conditions, it was found that the amount of reducing sugars had a decreasing trend tillstage 4. This suggests that reducing sugars were probably being used up in order to carry outmetabolic activities of the flower as there was no other source of nutrition for the cut flowers orwere possibly used up in the synthesis of non-reducing sugars as suggested by the increasingvalues of non-reducing sugars during the phase. Later at stage 5 a rise in the amounts of reducingsugars was observed. This rise in the values was possibly because of breakdown of non-reducingsugars as a simultaneous decrease in the amounts of non-reducing sugars was observed at stage 5.As suggested earlier the trigger of senescence could have taken place after stage 4 and hence thebalance started shifting towards catabolic processes yielding more reducing sugars. This wasprobably catalysed by some hydrolytic enzyme which was synthesized as a part of senescenceprocess (Mayak and Halevy, 1980). But at stage 6 again fall in the values of reducing sugars wasobserved which was again associated with increase in the amounts of non-reducing sugars. Thissuggests that possibly the petals were preparing for the remobilization of the molecules in form ofnon-reducing sugars. There have been many reports on mechanism of rescuing resources from thedegenerating organs such as petals and diverting them to other parts of the plant such as developingovary (Stead and van Doorn, 1994; Winkenbach, 1970a; Baumgartner et al., 1975; Wiemken etal., 1976). Van Doorn and Woltering (2007) have also reported that the carbohydrates transportedin the phloem are mainly sucrose.
Invertase : The invertase activity was measured in terms of reducing sugars produced in mg pergram fresh ray florets. Invertase is known to cleave sucrose (non-reducing sugar) to form glucoseand fructose (reducing sugars). Under uncut conditions, at stage 2, there was a slight decreasefound in the activity of enzyme invertase. Later at stage 3 the activity of invertase was found toincrease causing breakdown of non-reducing sugar. After this stage, a continuous reduction in theactivity of invertase was found.

95
Proceeding of Conference : Evolving Paradigm to Improve Productivity for Plant Genetic Resoyrces
Figure 4The initial decrease in the activity probably caused accumulation of sucrose at this stage owing topossible sufficient supply of carbohydrates from the mother plant. This is further supported by theobserved increase in total sugars, which possibly helped in the growth and developmental of rayflorets. Koch (1996) also reported that the abundant presence of sugars promotes the growth andcarbohydrate storage. At stage 3, possibly there was more requirement of reducing sugars andhence the breakdown of non-reducing sugars was brought about by the enzyme. Further, theactivity was found to decrease. Woodson and Wang (1987) have also reported decrease in invertaseactivity with increasing age. According to Halaba and Rudnicki (1986), this can be linked with denovo synthesis of invertase inhibitor which makes the oxidation products of sucrose available fortransport in Carnation and Ipomoea during wilting. This decrease in the activity of the enzymepossibly caused the accumulation of sucrose as reflected by higher values of non-reducing sugars.However, more research is required in this direction to understand the exact mechanism.Under cut conditions, it was found that the Invertase activity kept decreasing till stage 5. But this isnot reflected by the values of reducing sugars. This suggests their utilization or mobilization fromthe petals. As there was simultaneous increase in the values of non-reducing sugars, the reducingsugars were possibly used up in the formation of non-reducing sugars and the lesser activity of theInvertase enzyme resulted in accumulation of the non-reducing sugars. Woodson and Wang (1987)have also reported decrease in invertase activity with increasing age. According to Halaba andRudnicki (1986), this can be linked with de novo synthesis of invertase inhibitor which makes theoxidation products of sucrose available for transport in Carnation and Ipomoea during wilting.Van Doorn and Woltering (2007) reported that the sugar transport from Ipomoea petal cells tothe phloem was correlated with inactivation of an invertase, probably localized to the cell walls.The increase of an invertase inhibitor protein in several flowers undergoing senescence such asCarnation, Alstroemeria, Dahlia, Gladiolus and Petunia have also been reported (Halaba andRudnicki, 1986).Thus, it can be concluded that the amount of total sugars in cut flowers of Cosmos decreasedduring their shelf life as a result of their usage in different metabolic activities with no other sourceof nutrition to them. This lack of respiratory substrate possibly hastened the process of senescence.The amount of reducing sugars was also found to have been decreasing. Nonreducing sugars werefound to have increased with a drop in the levels at stage 5. This increase in values was possiblydue to their accumulation because of lesser breakdown as a result of enzyme inactivation or productionof enzyme inhibitor. The invertase activity was found to have been decreasing. This was possiblydue to inactivation of invertase or increase in invertase inhibitor protein. Inspite of these adverseconditions the flowers under cut conditions could survive for more possibly because of lack ofpollination which probably greatly triggered senescence in flowers kept on the mother plant.REFERENCESAarts, J. F. Th. (1957) : Over de houdbaarheid van snijbloemen, Meded LandbouwhogeschWageningen, 57 : 1-62.

96
Proceeding of Conference : Evolving Paradigm to Improve Productivity for Plant Genetic Resoyrces
Ashman T.-L. D. J. Schoen (1997) : The cost of floral longevity in Clarkia tembloriensis: anexperimental investigation. Evolutionary Ecology 11: 289-300.Baumgartner, B.; H. Kende and P. Matile (1975) : Ribonuclease in senescing morning glory. PlantPhysiol. 55 : 734-737.Bieleski, R. L. and Reid, M.S. (1992) : ‘Physiological changes accompanying senescence inephemeral day lily flower’ Plant Physiol. 98 : 1042-1049.Borochov A and W. R. Woodson (1989) : Physiology and biochemistry of flower petal senescence.In : Horticultural Review Vol II J. Janick (Ed.), Westport, Conn, USA : AVI publishing, 15-43.Coorts, G. D. (1973) : Internal metabolic changes in flowers. Hort Science 8 : 195-198.Figueroa I., M. T. Colinas, J. Mejia and F. Ramirez (2005) : Post harvest physiological changes inRoses of Different vase life; Ciencia e investigacion agrarian 32(3) : 167-176.Halaba, J. and R. M. Rudnicki (1986) : ‘The role of enzymes during senescence of cut flowers’.Acta Hort. 181 : 65-74.Halevy, A. H. (1987) : Assimilate allocation and flower development. In: Manipulation of flowering.Atherton, J. G. (Ed.), Butterworth, London. pp : 363-378.Halevy, A. H. and S. Mayak (1979) : ‘Senescence and post harvest physiology of cut flowers PartI’. Hort. Rev. 1 : 204-236.Hatch, M. D. and K. T. Glasziou (1963) : Sugar accumulation cycle in sugarcane II. Relationshipof invertase activity controlled environments. Plant Physiol. 38 : 344-348.Hsiang, T. H. T. (1951) : Physiological and biochemical changes accompanying pollination inorchid flowers II Respiration, Catalase activity and chemical constituents, Plant Physiol. , 26 :708-721.Ichimura, K. (1998) : cited In : Post harvest technology and Physiology of cut flowers : Role ofsugars by A. Singh, S. Mallik and P. Kumar, National Symposium on Recent Advances inFloriculture, Navsari Agricultural University, Navsari.- 4 to6 2008.Jones M. L. and W. R. Woodson (1997) : Pollination-induced ethylene in carnation : role of stylarethylene in corolla senescence. Plant Physiology 115: 205-212.Koch, K. (1996) : Carbohydrate modulated gene expression in plants. Ann. Rev. Plant Physiol.Plant Mol. Biol. 47 : 509-540.Koizuka, N., Y. Tanaka, Y. Morochashi (1995) : Expression of α-amylase in response to woundingin mung bean. Planta. 195 : 530-534.Lovell, P. J., P. H. Lovell and R. Nichols (1987) : The importance of stigma in flower senescencein petunia (Petunia hybrida). Ann. Bot. 60 : 41-47.Mayak S and A H. Halevy (1974) : The action of kinetin in improving the water balance anddelaying senescence processes of cut rose flowers. Physiol. Plant. 32 : 330-336.Mayak, S. and A. H. Halevy (1980) : Cited in Flower senescence In : Senescence in Plants, K. V.Thimann (Ed.), CRC Press, Boca Raton, Florida. 131-156.

97
Proceeding of Conference : Evolving Paradigm to Improve Productivity for Plant Genetic Resoyrces
Nelson, N. (1944) : A photometric adaptation of the Somogyi method for the determination ofglucose. J. Biol. Chem. 153 : 375-380.Nichols, R. (1968) : The response of carnations (Dianthus caryophyllus) to ethylene, J. Hortic.Sci. 43 : 335-349.Nichols, R. (1973) : Senescence of cut carnation flower. Respiration and sugar status. J. HortSci.48 : 111-121.Nichols, R. (1976) : Cell enlargement and sugar accumulation in the gynoecium of the glasshousecarnation (Dianthus caryophyllus) induced by ethylene. Planta 130 : 47-52.Nichols, R. and Ho, L. C. (1975a) : Effects of ethylene and sucrose on translocation of dry matterand 14C- sucrose in the cut flower of the glasshouse carnation (Dianthus caryophyllus) duringsenescence, Ann. Bot. (London), 39 : 286-296.Nichols, R. and Ho, L. C. (1975b) : An effect of ethylene on distribution of 14C- sucrose from thepetals to other flower parts in the senescence cut inflorescence of Dianthus caryophyllus, Ann.Bot. (London), 39 : 433-438.Pech, J. C., Latche, A., Larriggandiere, C. and Reid, M. S. (1987) : Control of early ethylenesynthesis in pollinated petunia flowers. Plant Physiol. Biochem. 25 : 431-437.Porat, R. (1994) : Comparison of emasculation and pollination of Phalaenopsis flowers and theireffects on flower longevity, ethylene production and sensitivity to ethylene. Lindleyana. 9 : 8592.Sangama and K. P. Singh (1999) : Effect of spike length on post harvest quality of gladiolus. J. ofOrn. Hort. 2(2) : 144-145.Sharma, V. (1981) : Biochemical changes accompanying petal development in ‘Rosa damascena.Plant Biochem. J. 8 : 13-16.Shibuya, K.; Yoshioka T., Hashiba, T., Satoh S. (2000) : Role of the gynoecium in natural senescenceof carnation (Dianthus caryophyllus L.) flowers. J. of Expt. Bot. 51 : 2067-2073.Stead, A. D. and van Doorn, W. G. (1994) : Strategies of flower senescence – a review In :Molecular and Cellular Aspects of Plant Reproduction Scott, R. J. and Stead, A. D. (Eds.) Societyfor Experimental Biology, Cambridge, U.K. : Cambridge University Press, Seminar Series 55 :215-237.Van Doorn, W. G. (2004) : Is petal Senescence due to sugar starvation? Plant Physiol. 134 :3542.Van Doorn W.G. and E. J. Woltering (2007) : Physiology and molecular biology of petal senescence.J. of Expt. Bot. 59(3) : 453-480.Venkatarayappa, T., M. Tsuita and D. P. Murs (1980) : Influence of cobaltous ions (Co+2) on thepost-harvest behavious of ‘Samantha’ roses. J. Am. Soc. Hort. Sci. 105(2) : 148-151.Wiemken, V, A. Wiemken and P. Matile (1976) : Physiologie der Blutenvon Ipomoea tricolor(Cav) : Untersuchungen an abgeschnittenen Bluten and Gewinning eines Phloemexudates.Biochemie and Physiologie der Pflanzen 169 : 363-376.

98
Proceeding of Conference : Evolving Paradigm to Improve Productivity for Plant Genetic Resoyrces
Winkenbach F. (1970a) : Zum Stoffwechsel der aufbluhenden und welkenden korolle derPrunkwinde Ipomoea purpurea I. Beziehungen zwischer Getaltwande 1, Stofftransport, Atmungund Invertaseaktivitat. Berichte der schweizerischen botanischen Gesellschaft 80 : 374-390.Winkenbach F. (1970b) : Zum Stoffwechsel der aufbluhenden und welkenden korolle derPrunkwinde Ipomoea purpurea II. Funktion und de novo synthese lysosomaler Enzyme beimWelken. Berichte der schweizerischen botanischen Gesellschaft 80 : 391-406.Weinstein, L. H. (1951) : Senescence of roses. I. Chemical changes associated with senescenceof cut ‘Better Times’ roses, Contrib. Boyce Thompson Inst. 19 : 33-48.Woodson, W. R. and H. Wang (1987) : Invertase of carnation petals and changes in activityduring petal growth. Physiol. Plant 71 : 224-228.Yakimova, E., B. Atanassova and V. Kapchina-Toteva (1997) : Longevity and some metabolicevents in post harvest spray carnation (D. caryophyllus F. Spray, Hort.) Flowers. Bulg. J. PlantPhysiol., 23 (3-4), 57-65.
Fig-1 Total Sugars under uncut and cut conditions

99
Proceeding of Conference : Evolving Paradigm to Improve Productivity for Plant Genetic Resoyrces
Fig-2 Reducing Sugars under uncut and cut conditions
Fig-3 Non-Reducing Sugars under uncut and cut conditions

100
Proceeding of Conference : Evolving Paradigm to Improve Productivity for Plant Genetic Resoyrces
Fig-4 Invertase activity under uncut and cut conditions

101
Proceeding of Conference : Evolving Paradigm to Improve Productivity for Plant Genetic Resoyrces
Physiology of Petal Senescence in Calendula Officinalis L.
Pratiksha Patel And Archana Mankad
Department of Botany, University School of Sciences,Gujarat University, Ahmedabad-380009, Gujarat
ABSTRACTThe appearance, quality and longevity of cut flowers depend upon the conditions of cultivation,proper harvest time, product transport conditions and postharvest handling. Postharvest physiologydeals with the functional processes in plant material after it has been harvested. The biochemicalchanges during postharvest include synthesis and degradation of primary and secondary metabolites.In this study, flower life of Calendula officinalis L. was assigned six distinct stages and flowerpetals were collected at each stage from uncut and cut flowers, and physiological changes in petalsof both uncut and cut flowers were studied. On comparison of total proteins, amino acids andprotease activity in the petals from uncut and cut flowers, significant differences were observed.Keywords: petal senescence, postharvest physiology, total proteins, amino acids and proteaseINTRODUCTIONThe most important aspect of floriculture is to deliver the cut flowers in garden-fresh conditions tothe faraway market place (Randhawa and Mukhopahyay, 1986). After being detached from themother plants, the cut plant parts can carry on all the life processes at the expense of storedreserve food in the form of carbohydrates, proteins and fats for their longevity for a few moredays. Senescence occurs at every stage of plant development and is considered to be the lastliving phase in which a series of normally irreversible events is initiated that leads to cellular breakdownand ultimate death (Sacher, 1973).The physiological processes associated the senescence and death of flowers is much complex andpoorly understood. Flower petal serve as an excellent model for study of senescence process notrelated to and influenced by the presence of chloroplasts as in leaves. During the course of petalaging there is a drop in the level of macromolecular components: starch (Ho and Nichols, 1977),cell wall polysaccharides (Wiemken-Gehring et al., 1974), proteins (Borochov et al., 1976; Paulin,1971; Paulin, 1977) and nucleic acids. The drop in macromolecules, protease activity increaseslipid fluidity in the membranes while increasing the respiration rate (van Doorn and Stead, 1997).However, the petal senescence in uncut flowers has rarely been studied. Besides, seldom has a

102
Proceeding of Conference : Evolving Paradigm to Improve Productivity for Plant Genetic Resoyrces
comparison been made between senescent petals on cut flowers and senescent petals that remainattached to the plant (van Doorn, 2004).Cut flowers of an ornamental plant - Calendula officinalis L., belonging to the family Asteraceae,have a significant vase life; the plants require very little care in growing.However, akin to the other tropical flowers, publications on the physiology of Calendula officinalisL. are limited and past studies have only focused on species such as Carnation (Dianthuscaryophyllus L.), Asiatic lily (Lilium hybrid), Rose (Rosa hybrid) and Sandersonia (Sandersoniaaurantiaca Hook.). Considering these factors, changes in the status of total proteins, amino acidsand protease during senescence in petals of both un-cut and cut Calendula flowers have beentargeted for this study.MATERIALS AND METHODSPlant materialCalendula officinalis L. or Pot Marigold, (Family: Asteraceae) is an ornamental cut flower oftenused for bedding, cutting, potting and for window boxes. Besides it is used widely as a traditionalmedicinal plant (Bailey and Bailey, 1976). Calendula plants were grown under standard agro-techniques at the botanical garden of the Department of Botany at Gujarat University campus inAhmedabad.Estimation of Total Proteins, Amino acids and ProteaseEstimations of total proteins (Lowry et al. 1951), amino acids (Lee and Takahashi, 1966) andprotease (Penner and Ashton, 1967; Cruz et al. 1970) were done to determine the changes inpetals. Usually, the flower has a life time of 4-5 days and the post harvest vase life in distilled wateris up to 3-4 days. Therefore, for the collection of petals for biochemical estimations, flower lifewas assigned six different stages as viz. 0 (the day flower opens), I (one day old flower), II (pre-senescence phase), III (first visible symptoms of senescence appears), IV (mid-phase of senescence)and V (senescence over; Picture 1). Petals at each stage were collected from uncut flowers onplant (Control) and cut flowers (Post harvest).Total proteins and amino acids were estimated from 100 mg dried flower petals and proteaseactivity (cytoplasmic enzymes and wall bound enzymes) was estimated from 100 g fresh flowerpetals. For the estimation of total proteins, residue obtained by centrifuging 100 mg dry petalshomogenized with 80% alcohol, was used while supernatant, was used for the estimation of aminoacids. Calculations were done using standard methods and results were expressed as milligramper gram plant material.For protease estimation, 100 g plant material was homoginised with 3 ml chilled Phosphate buffer(0.02 M, pH = 6.4) in pre-cooled mortar-pestle and was centrifuged at -4 °C for 20 minutes. Thesupernatant was used for the estimation of Cytoplasmic enzymes and the residue for Wall boundenzymes. Calculations were done using standard methods and results were expressed as milligramper gram plant material. Calculations were done using standard methods and results were expressedas milligram protein reduced per gram plant material.

103
Proceeding of Conference : Evolving Paradigm to Improve Productivity for Plant Genetic Resoyrces
RESULT AND DISCUSSIONTotal proteins showed significant decline in the petals collected from flowers senescing on plantand during post harvest Total proteins showed significant decline in the petals collected fromflowers senescing on plant and during post harvest in dstilled water (Table 1; Figure 1). However,on plant during Stage III there is sudden increase indicating de novo synthesis of the hydrolyticenzymes playing role in the advancement of senescence. Total proteins in petals again declined atStage V, due to further degradation. During post harvest it was observed that total proteins sharplydeclined from Stage 0 to Stage I, perhaps due to initial shock as the flowers were harvested fromthe mother plant. But, from Stage II to Stage IV the decline was much slower in the petals from theflowers placed in distill water, as compared with that in flowers on plant. However, Stage V,protein content increased, pointing at the de novo synthesis of hydrolytic enzymes.In petals of the flowers senescing on plants, amino acids increased at Stage I (Table 2; Figure 2)and then after a minor decline had almost constant levels of till Stage III, which sharply increasedat Stage IV and V. This increase is perhaps due to the degradation of proteins as it also correspondswith the decline in total proteins in the petals senescing on plant. The reduction in protein contentwas also reported by Butcher et al., (1977) and Parups (1971) involving degradation to a mixtureof smaller polypeptides and amino acids (Parups, 1971). Opposite to the petals of flowers senescingon plant, during postharvest amino acid content initially increased and then decreased. The declinein amino acid contents is perhaps due to the mobilization of amino acids to the other parts of theplants as also reported by out of Wiemken et al., (1976) or to the developing gynoecium (Nichols,1976; Paulin, 1977).In the wall bound fraction, protease activity showed insignificant changes on plant as well as duringpostharvest (Table 3; Figure 3). But, in cytoplasmic fraction, protease activity showed gradualincrease in the petals of flowers on plant (Table 4; Figure 4), dropping at the onset of senescence,increasing again at Stage IV and declined at Stage V. In petals from the flowers placed in distillwater protease activity showed a sharp increase at Stage I; decreased little at stage II and remainedalmost constant from Stage II to IV and again increased as the flower perished The changesobserved are in accordance with van Doorn and Stead (1997), who reported an increase proteaseactivity in petals of cut flowers undergoing senescence.Where programmed cell death (apoptosis) is well investigated in case of animal cells, thephenomenon of senescence in plants at macromolecular and cellular level is still poorly understood.In depth studies on petal senescence can enhance understanding of the phenomenon in plants.Moreover, the knowledge of macromolecular and cellular status of senescent petals of cut flowersand its comparison with that in uncut flowers helps in working out appropriate strategies for prolongingpostharvest vase life of cut flowers. In conclusion, the vase life of 3-4 days in distilled water isindicative that the Calendula officinalis L. cut flower has the potential and appropriate vase solutionsmay be explored for extension of the same. More work in this direction is under progress.ACKNOWLEDGEMENTAuthors are thankful to Dr. Yogesh T. Jasrai, Professor and Head of Department of Botany,

104
Proceeding of Conference : Evolving Paradigm to Improve Productivity for Plant Genetic Resoyrces
Gujarat University, for providing necessary laboratory facilities.REFERENCESBorochov A, Mayak S and Halevy AH (1976) Combined effects of acid and sucrose on growthand senescence of rose flowers, Physiol. Plant. 36: 221-224Butcher HC, Wagner GJ and Siegelman HW (1977) Localisation of acid hydralases in protoplasts,Plant Physiology 59: 1098- 10Cruz LJ, Cagampany BG and Beinveindo DJ (1970) Biochemical factors affecting proteinaccumulation in rice grains. Plant Physiol. 46: 743-747Ho LC and Nichols R (1977) Translocation of Sucrose in relation to changes in carbohydratecontent in rose corollas cut at different stages of development, Ann. Bot. (London) 41: 227242Lee YP and Takahashi T (1966) An improved colorimetric determination of amino acids with theuse of ninhydrin. Anal Biochem.14:71Lowry OH, Rosebrough NJ, Farr AL and Randall RJ (1951) Protein measurement with the Folin-Phenol reagents, J. Biol. Chem.193: 265–275.Parups EV (1971) Disc electrophoresis of proteins of senescing and fresh leaves and petals ofcertain ornamental plants, J. Am, Soc. Hortic. Sci. 55: 775-781Paulin A (1971) Influence de la composition de la solution nutritive sur la teneur en divers acidesamines libres et en ammoniac des pet ales de fleurs couples, Ann. Technol. Agric. 20: 283-303Paulin A (1977) Metabolism glucidique et proteique de la fleur d'oecillet alimentee ou non avec'une solution de saccharose, Acta Hortic. 71: 241-257Penner D and Ashton FM (1967) Hormonal control of proteinase activity in squash cotyledons,Plant Physiol. 42: 791–796Randhawa GS and Mukhopadhyay A (1986) Floriculture in India Allied Publishers Limited,New Delhi.Sacher JA (1973) Senescence and postharvest physiology, Annu. Rev. Plant Physiol., 24: 197-310van Doorn WG and Stead AD (1997) Abscission – flowers and flower parts, J. Exp. Bot. 48:821-837van Doorn, WG (2004) Is Petal Senescence Due to Sugar Starvation? Plant Physiology 134: 35-42Wiemken-Gehring, V, Wiemken A and Matile P (1974) Mobilisation von zeTlwandstoffen in derwelkenden Bluten yon Ipomoea tricolor (Cav.), Planta 115: 297-307Wiemken V, Wiemken A and Matile P (1976) Physiologie der Bluten yon Ipomoea tricolor(Cav.) Untersuchungen an abgeschnittenen Bluten und gewinnung eines Phloemexudates, Biochem.Physiol., Pflanz. 169: 363-376.

105
Proceeding of Conference : Evolving Paradigm to Improve Productivity for Plant Genetic Resoyrces
Tables and FiguresPicture-1 Stages 0 to V of flower life of Calendula officinalis L.
Table-1 Estimation of total proteins
On Plant Post harvest
Stage 0 61.53 + 0.32 61.53 + 0.32
Stage I 51.44 + 0.41 42.78 + 0.33
Stage II 46.63 + 0.44 41.82 + 0.40
Stage III 38.94 + 0.31 40.86 + 0.42
Stage IV 44.23 + 0.46 38.46 + 0.39
Stage V 38.46 + 0.32 40.86 + 0.38
Values are means + S.E.M.; n=5
Fig-1 Estimation of total proteins
Estimation of total proteins
0
10
20
30
40
50
60
70
On Plant Postharvest
prot
ein
in m
g/g
pla
nt m
ater
ial
Stage 0 Stage I StageII Stage III Stage IV Stage V

106
Proceeding of Conference : Evolving Paradigm to Improve Productivity for Plant Genetic Resoyrces
Table-2 Estimation of amino acids
On Plant Post harvest
Stage 0 21.81 + 0.52 21.81 + 0.52
Stage I 20.25 + 0.51 71.52 + 0.42
Stage II 19.26 + 0.54 51.97 + 0.46
Stage III 20.67 + 0.56 49.28 + 0.45
Stage IV 39.51 + 0.51 42.91 + 0.47
Stage V 51.64 + 0.49 23.22 + 0.48
Values are means + S.E.M.; n=5
Fig-2 Estimation of amino acids
Estimation of amino acids
0
10 20
30 40
50 60
70
80
On Plant Postharvest
Am
ino
acid
s in
m
g/g
plan
t mat
eria
l
Stage 0 Stage I StageII Stage III Stage IV Stage V
Table-3 Estimation of protease in wall bound fraction
On Plant Post harvest Stage 0 49.17 + 0.58 49.17 + 0.58 Stage I 43.90+ 0.84 52.68+ 1.04
Stage II 50.83+ 0.25 50.23+ 1.45
Stage III 50.82+ 0.45 52.06+ 1.65
Stage IV 52.68+ 0.25 47.60+ 1.09 Stage V 50.82+ 0.89 52.39+ 1.62
Values are means + S.E.M.; n=5

107
Proceeding of Conference : Evolving Paradigm to Improve Productivity for Plant Genetic Resoyrces
Fig-3 Estimation of protease in wall bound fraction
Estimation of wall bound protease
0
10
20
30
40
50
60
Stage 0 Stage I StageII Stage III Stage IV Stage V mg
pro
tein
red
uce
d/g
pla
nt
ma
teri
a
On Plant Postharvest
Table-4 Estimation of protease in cytoplasmic fraction
On Plant Post harvest Stage 0 25.56 + 0.85 25.56 + 0.85 Stage I 41.80+ 0.45 60.31+ 1.78 Stage II 53.57+ 0.65 55.78+ 1.54
Stage III 47.42+ 0.98 56.81+ 1.65
Stage IV 62.70+ 0.77 55.46+ 1.78 Stage V 57.22+ 0.24 60.26+ 1.56
Values are means + S.E.M.; n=5Fig-4 Estimation of protease in cytoplasmic fraction
Estimation of cytoplasmic protease
0 10
20 30
40 50 60 70
Stage 0 Stage I StageII Stage III Stage IV Stage V mg
pro
tein
red
uced
/g p
lan
t mat
eria
On Plant Postharvest

108
Proceeding of Conference : Evolving Paradigm to Improve Productivity for Plant Genetic Resoyrces
Evaluation of Antimicrobial Activity of In Vivo and In VitroProduced Saponins of Convolvulus Pluricaulis Choicsy
Santoshkumar Singh1, Zankhana Rathod2 And O. P. Saxena3
Shri C N P F Arts and D N Science College, Dabhoi, Vadodara M.G. Science Institute, Navrangpura,Ahmedabad 380 009
Formerly Head Botany Department, University School of Sciences,Gujarat University, Ahmedabad-09
E-mail:- [email protected]
ABSTRACTThe development of resistant microorganisms on prolonged exposure to existing antimicrobialagents has been known for a long time. This has led to the continual search for ways of eradicatingresistant strains of micro organisms. Convolvulus pluricaulis Choicsy a well known medicinalplant of Convolvulaceae family is used in India for hundreds of years. Tissue culture protocol wasdeveloped for in vitro production of saponins through leaf culture on MS media with 1 mg/l 2, 4-D and 1 mg/l kinetin. Analysis of in vivo and in vitro produced saponins of Convolvulus pluricaulisthrough HPTLC revealed 13 fluorescent zones in UV-200 nm and 11 fluorescent zones in UV-254 nm. The antimicrobial activity of in vivo and in vitro produced saponins investigated againstEscherichia coli (gram negative), Staphylococcus aureus and Bacillus subtilis (gram positive)bacteria revealed that activity of in vivo produced saponin was especially higher againstStaphylococcus aureus followed by Bacillus subtilis and Escherichia coli on the basis of inhibitionzone area but in case of in vitro produced saponins Escherichia coli was most sensitive incomparison to other two microorganisms.Keywords: Convolvulus pluricaulis, Saponins, Antimicrobial activityINTRODUCTIONMedicinal plants have been used for centuries as remedies for human diseases because they containcomponents of therapeutic values. About 80% of the world population relies on the use of traditionalmedicine which is predominantly based on plant material (WHO, 1993). The scientific studiesavailable on a good number of medicinal plants indicates that promising phytochemicals can bedeveloped for many human health problems (Gupta, 1994), including diabetes, cancer and infectiousdiseases. The continued investigation into the secondary plant metabolites for antiinfective agents

109
Proceeding of Conference : Evolving Paradigm to Improve Productivity for Plant Genetic Resoyrces
has gained importance because of the alarming increase in the rate of resistance of pathogenicmicroorganism to existing antibiotics. Therefore the need to develop efficient, safe and inexpensivedrugs from plant sources is of great importance.Plant tissue culture technology offers an alternative to fulfill the demand of raw material with continuessupply and also in conservation of the endangered medicinal plants (Erdei et al. 1981, Shoyama et al.1983, Huang et al. 2000). Callus culture is an effective tool to obtain the pharmaceutically importantcompounds in in-vitro condition which enables the plants to be preserved in their natural habitat.Convolvulus pluricaulis (L.) Choicy (Shankhpushpi) of family Convolvulaceae is an importantand well known traditional source of medhya rasayan drug (that counteract stress and improveintelligence and memory) used for rejuvenation of brain and mental health and to promote intellectand memory (Dixit, 1971; Kapoor, 1990). It is also used as a psycho-stimulant and tranquilizer. Itis reported to reduce mental tension (Barar and Sharma, 1965 and Mudgal, 1972). Saponins areimportant active substances of this plant known for eml v lidi cidem. In view of the growing demandof the plant, their short supply and threats of losing them in future tissue culture studies wereconducted. Saponins were extracted form in vivo leaf and in vitro callus produced materials,quantified and were tested for its antimicrobial activity on the bacterium strain Escherichia coli,Bacillus subtilis and Staphylococus aureus.MATERIALS AND METHODSPlants of Convolvulus pluricaulis were collected from the Gujarat University Botanical Garden.Collected material was thoroughly washed with water followed by double distilled water. Leaveswere surface sterilized with 0.1% (w/v) systemic fungicide - bavistin followed by 0.1 % (w/v)HgCl
2, 5% (v/v) sodium hypochlorite (NaOCl) and 5% (v/v) Tween-20 solution respectively and
finally rinsed for 4-5 times with sterile double distilled water and used for culture on MS mediadescribed by Murashige and Skoog (1962) medium supplemented with 2,4-D and kinetin incombination of 1:1, 2:2, 3:3, 4:4 and 5:5 mg/l and 4% (w/v) sucrose and 0.8% (w/v) agar-agar.The cultures were maintained in culture room at 25?1? C and exposure of 12 hr. to fluorescentlight. The callus was harvested at the end of 8 weeks. Saponins were extracted from the leavesand the callus using standard method of Daniel, 1991.For Antimicrobial activities of in vivo and in vitro produced saponins were performed using theagar diffusion method of Boakye and Yiadom, 1979. E. coli, S. aureus and B. subtilis wasinoculated on nutrient agar plate and spread uniformly using a glass spreader. These test organismswere obtained from Microbiology Department of Gujarat University. With the help of sterilizedpipette, 0.8 ml extracts was introduced into the well bored onto the surface of the culture. Controlexperiments with methanol, solvent ether and ethyl acetate were set up against in vivo and in vitroproduced saponins. The plates were allowed to stand for one hour at room temperature to allowthe diffusion of the substances to proceed before the growth of organism commenced. The plateswere finally incubated at 370C for 24hrs.RESULT AND DISCUSSIONOf the various combination tried MS media supplemented with 1 mg/l 2,4-D and 1 mg/l kinetinproved to be the best for callus growth from the leaf of C. pluricaulis. Study of in vivo and in vitro
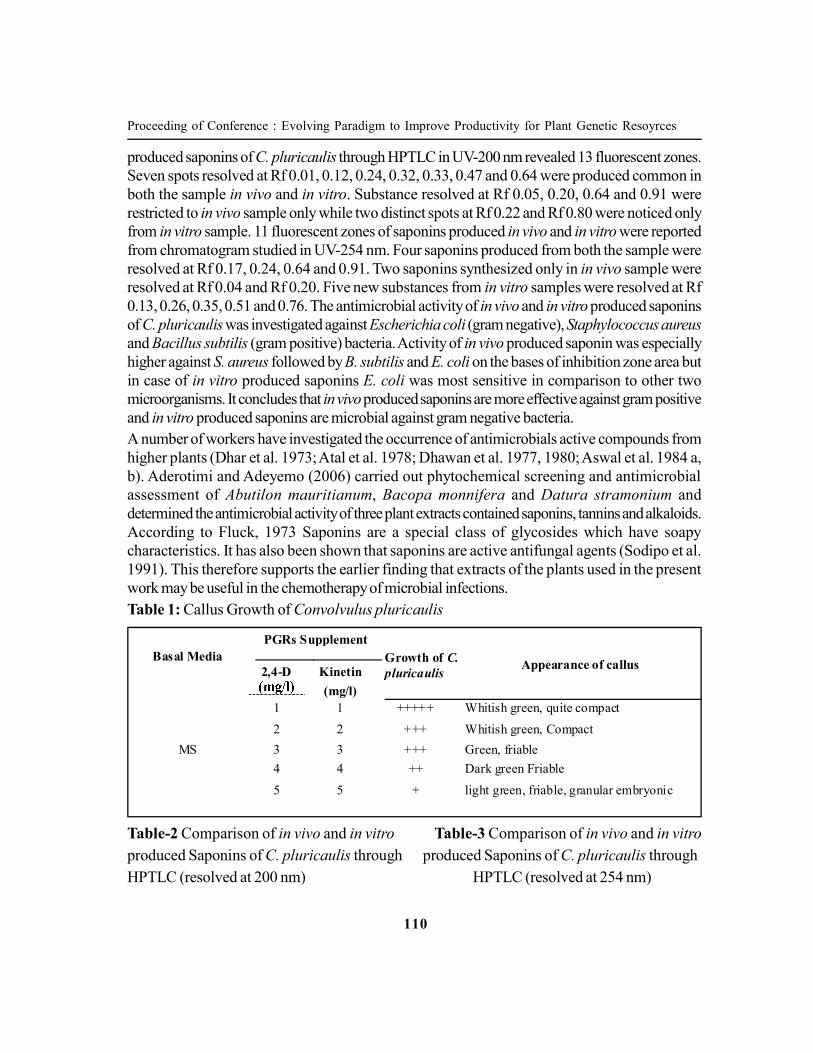
110
Proceeding of Conference : Evolving Paradigm to Improve Productivity for Plant Genetic Resoyrces
produced saponins of C. pluricaulis through HPTLC in UV-200 nm revealed 13 fluorescent zones.Seven spots resolved at Rf 0.01, 0.12, 0.24, 0.32, 0.33, 0.47 and 0.64 were produced common inboth the sample in vivo and in vitro. Substance resolved at Rf 0.05, 0.20, 0.64 and 0.91 wererestricted to in vivo sample only while two distinct spots at Rf 0.22 and Rf 0.80 were noticed onlyfrom in vitro sample. 11 fluorescent zones of saponins produced in vivo and in vitro were reportedfrom chromatogram studied in UV-254 nm. Four saponins produced from both the sample wereresolved at Rf 0.17, 0.24, 0.64 and 0.91. Two saponins synthesized only in in vivo sample wereresolved at Rf 0.04 and Rf 0.20. Five new substances from in vitro samples were resolved at Rf0.13, 0.26, 0.35, 0.51 and 0.76. The antimicrobial activity of in vivo and in vitro produced saponinsof C. pluricaulis was investigated against Escherichia coli (gram negative), Staphylococcus aureusand Bacillus subtilis (gram positive) bacteria. Activity of in vivo produced saponin was especiallyhigher against S. aureus followed by B. subtilis and E. coli on the bases of inhibition zone area butin case of in vitro produced saponins E. coli was most sensitive in comparison to other twomicroorganisms. It concludes that in vivo produced saponins are more effective against gram positiveand in vitro produced saponins are microbial against gram negative bacteria.A number of workers have investigated the occurrence of antimicrobials active compounds fromhigher plants (Dhar et al. 1973; Atal et al. 1978; Dhawan et al. 1977, 1980; Aswal et al. 1984 a,b). Aderotimi and Adeyemo (2006) carried out phytochemical screening and antimicrobialassessment of Abutilon mauritianum, Bacopa monnifera and Datura stramonium anddetermined the antimicrobial activity of three plant extracts contained saponins, tannins and alkaloids.According to Fluck, 1973 Saponins are a special class of glycosides which have soapycharacteristics. It has also been shown that saponins are active antifungal agents (Sodipo et al.1991). This therefore supports the earlier finding that extracts of the plants used in the presentwork may be useful in the chemotherapy of microbial infections.Table 1: Callus Growth of Convolvulus pluricaulis
PGRs Supplement Basal Media 2,4-D Kinetin
(mg/l)
Growth of C. pluricaulis
Appearance of callus
1 1 +++++ Whitish green, quite compact
2 2 +++ Whitish green, Compact
MS 3 3 +++ Green, friable
4 4 ++ Dark green Friable
5 5 + light green, friable, granular embryonic
Table-2 Comparison of in vivo and in vitro Table-3 Comparison of in vivo and in vitroproduced Saponins of C. pluricaulis through produced Saponins of C. pluricaulis throughHPTLC (resolved at 200 nm) HPTLC (resolved at 254 nm)

111
Proceeding of Conference : Evolving Paradigm to Improve Productivity for Plant Genetic Resoyrces
Spot No. Rf C. pluricaulis in vivo in vitro
1 0.01 P P 2 0.05 P 3 0.12 P P 4 0.20 P
5 0.22 P 6 0.24 P P 7 0.32 P P 8 0.33 P P 9 0.47 P P
10 0.61 P 11 0.64 P P 12 0.80 P 13 0.91 P
REFERENCESAderotimi B and Adeyemo S (2006) Phytochemical screening and antimicrobial assessment ofAbutilon mauritianum, Bacopa monnifera and Datura stramonium; Biokemistry 18(1):39-44Aswal B S, Bhakani D S, Goel A K, Kar K, Mehrotra B N and Mukherjee K C (1984): Screeningof India plants for biological activity Part X. Ind. J. Exp. Biol. 22: 312-339Aswal B S, Bhakani D S, Goel A K, Kar K, Mehrotra B N and Mukherjee K C (1984a)Screening of India plants for biological activity Part XI. Ind. J. Exp. Biol. 22: 487-504Atal C K, Srivastava T B, Wali B K, Chakravarti R B, Dhawan B M J and Rastogi R D (1978)Screening of Indian plants for biological activity. Part VIII, Ind. J. Exp. Biol. 16: 230-349Boakye–Yiadom K (1979) Antimicrobial properties of some West African Medicinal Plants IIAntimicrobial activity of Aqueous Extracts of Crytolepsis sanguinolenta. Lind Schelecter Quart.J.Crude Drug Res 170:78-80Daniel M (1991) Methods in Plant Chemistry and Economic Botany Kalyani Publishers, NewDelhi, LudhianaDhar M L, Dhar M M, Dhawan B N, Mehrotra B N, Srimal R C and Tondon J S (1973)Screening of Indian plants for biological activity. Part IV. Ind. J. Exp. Biol. 11: 43-54Dhawan B N, Dubey M P, Mehrotra B N, Rastogi R P and Tondon J S (1980): Screening ofIndian plants for biological activity. Ind. J. Exp. Biol. 18: 594-606
Spot No. Rf C. pluricaulis in vivo in vitro
1 0.04 P 2 0.13 P 3 0.17 P P
4 0.20 P 5 0.24 P P 6 0.26 P 7 0.35 P 8 0.51 P
9 0.64 P P 10 0.76 P 11 0.91 P P

112
Proceeding of Conference : Evolving Paradigm to Improve Productivity for Plant Genetic Resoyrces
Dhawan B N, Pathak G K, Rastogi R P, Singh K K and Tondon, J S (1977) Screening of Indianplants for biological activity. Part VI. Ind. J. Exp. Biol. 15: 208-219Erdei I, Kiss Z and Maliga P (1981) Rapid clonal multiplication of Digitalis lanata in tissueculture, Plant Cell reports 1:34-35Fluck H (1973) Medicinal plants and their uses. W. Feulshom and comp. Ltd, New York.Hill (1967): success to achieve shoot regeneration of Convolvulus arvensis through stem cultureusing 0.2mg/l 2,4-D and 4.7 mg/l kinetin.Kapoor L D (1990) CRC Handbook of Ayurvedic Medicinal Plants. Boca Raton: CRC PressMudgal V (1972) Studies on medicinal properties of Boerhaavia diffusa and Convolvuluspluricaulis, Planta Medica 28, 62Murashige T and Skoog F (1962) A revised medium for rapid growth and bio-assays with tobaccotissue cultures, Physiologia Plantarum 15: 473-497Shoyama Y, Hatano K and Nishioka I (1983) Clonal multiplication of Pinellia ternate by tissueculture, Planta Medica 49:14-16Sodipo O A, Akanji M A, Kolawole F B and Odutuga A A (1991) Saponin is the active antifungalprinciple in Garcinia kola, heckle seed, Biosci. Res. Commun. 3:171

113
Proceeding of Conference : Evolving Paradigm to Improve Productivity for Plant Genetic Resoyrces
Plantlet Regeneration from Leaf Explant of ClerodendrumPhlomidis via Somatic Embryogenesis
Zankhana Rathod1, Santoshkumar Singh2 And O. P. Saxena3
M.G. Science Institute, Navrangpura, Ahmedabad 380 009Shri C N P F Arts and D N Science College, Dabhoi, Vadodara.
Formerly Head Botany Department, Gujarat University, Ahmedabad 380 009.E-mail:- [email protected]
ABSTRACTPlants have been an important source of medicine for thousands of years. It is estimated thatapproximately one quarter of prescribed drugs contain plant extracts or active ingredients fromplant. It is important to select, multiply and conserve the critical genotypes of medicinal plants.Clerodendrum phlomidis L. (Arani) is a medicinal plant used in the treatment of Diabetes mellitus.In vitro experiments were conducted using leaf as an explant. Callus was cultured on MS basalmedium supplemented with various combinations of 2, 4-D and Kinetin (1 : 1, 2 : 2, 3 : 3, 4 : 4, 5: 5, 6: mg/l 2,4-D : Kinetin). Of various concentrations tried, the leaf explant of Clerodendrumphlomidis showed embryoids formation on medium containing 4:4 and 6:6 mg/l concentrations ofKin and 2,4-D each. The embryoids were further subcultured for plantlet regeneration on MSbasal medium supplemented with combination of 0.25 mg/l NAA and 1, 2, 3, 4, 5, mg/l kinetin.Maximum numbers of embryoids germinated successfully on MS with 0.25 mg NAA + 3 mg/lkinetin.Keywords: Clerodendrum phlomidis, plant tissue culture, somatic embryoids, plantletsINTRODUCTIONClerodendrum phlomidis L. (Arani) is a medicinal plant used in the treatment of Diabetes mellitus.It is used in the treatment of diabetes, gonorrhea, measles etc. This plant has aromatic, astringent,demulcent, anti-convulsion, anti-diarrheal activities. In India parts of the plant are used in post-natal conditions in women and in gastrointestinal disorders. The roots are employed as an appetitestimulant (Kirtikar and Basu, 1933; Sheba Rani et al. 1999). There are reports on the presence offlavonone and their glycosides (Anam, 1999) and sterols (Joshi et al. 1999) in Clerodendrumphlomidies.Plant tissue culture technology may help to conserve rare and endangered medicinal plants. Avariety of the plant species can be conveniently propagated through the techniques of cell, tissue ororgan culture (Erdei et al. 1981, Hatano et al. 1986, Hiraoka and Oyanagi 1988, Nishioka 1988,Tsay et al. 1989, Huang et al. 2000, Chueh et al. 2001). For the regeneration of a whole plantfrom a cell or callus tissue, cytodifferentiation is not enough and there should be a differentiationleading to shoot bud or embryo formation. This may occur either through organogenesis or through

114
Proceeding of Conference : Evolving Paradigm to Improve Productivity for Plant Genetic Resoyrces
somatic embryogenesis. Somatic embryogenesis offers the possibility of rapid, easy productionand selection of elite plant.MATERIALS AND METHODSPlant material of C. phlomidis required for tissue culture studies was collected from the BotanicalGarden of Gujarat University Campus. Leaves were used as explants. Explants were sterilizedusing sterilizing reagents e.g. 2% Tween-20 solution, 5% Sodium hypochlorite, 0.1% HgCl
2,
followed by washing with sterile double distilled water to remove the traces of chemicals. Sterilizedexplants were inoculated on basal media (Murashige and Skoog 1962) supplemented with differentcombinations of 2, 4-D and Kinetin (1 : 1, 2 : 2, 3 : 3, 4 : 4, 5 : 5 mg/l 2,4-D : Kinetin). The cultureswere incubated in culture room. They were observed regularly for any sign of contamination,swelling and initiation of results. The explants swelled within three days of inoculation. At the endof three week depending of the hormonal concentrations the callus showed morphological variationsin terms of colour, texture and mass and after growth of four weeks differentiated into embryogenicor nonembryogenic callus. The embryonic callus produced distinguishable somatic embryoids.These embryoids were sub-cultured on MS basal medium supplemented with BAP and NAA incombination ratio of 1:0.25, 2:0.25, 3:0.25, 4:0.25 and 5:0.25 mg/l for its germination anddifferentiation as root and shoot.RESULT AND DISCUSSIONThe leaf explants cultured on hormonal media swelled within three days of inoculation. At the endof three week depending of the hormonal concentrations the callus showed morphological variationsin terms of colour, texture and mass and after growth of four weeks differentiated into embryogenicor non-embryogenic callus. The embryonic callus produced distinguishable somatic embryoids.Callus obtained on the medium with higher hormonal concentration 4 and 5 mg/l 2, 4-D + 4 and 5mg/l kinetin resulted in somatic embryoids while lower concentrations 1:1, 2:2, 3:3 mg/l, 2,4-D :kinetin resulted in non-embryonic cells. The embryonic callus was cream, friable and globular inshape. These embryoids germinated on MS media with NAA 0.25/l and 1 to 5 mg/l kinetin.However embryoids germination was best achieved with 3mg/l of Kin. Plant regeneration viasomatic embryogenesis from single cells, that can be induced to produce an embryo and then acomplete plant, has been demonstrated in many medicinal plant species. Arumugam and Bhojwaninoted the development of somatic embryos from zygotic embryos of Podophyllum hexandrumon MS medium containing 2 µM BA and 0.5 µM IAA (Arumugam and Bhojwani, 1990).Embryogenic calluses and germination of somatic embryos in nine varieties of Medicago sativahas been achieved (Fuentes, 1993).

115
Proceeding of Conference : Evolving Paradigm to Improve Productivity for Plant Genetic Resoyrces
Table-1 Effect of 2,4-D and kinetin on callus induction from leaf explant
Media 2,4-D
Kinetin (mg/l) Callus Induction Remarks
1 1 ++++ Non embryonic, green, friable
2 2 Non embryonic, whitish green,
+++ friable
MS 3 3
Non embryonic whitish yellow, +++ mucilaginous
4 4 ++ Embryonic whitish green compact
5 5 Embryonic, compact, globular,
++ green, with pink pigmentation
Table- 2 In vitro responses of embryoids germination
Media NAA (mg/l) Kinetin (mg/l) % Germination of embryoids
MS Basal
0.25 1 50 0.25 2 60 0.25 3 65 0.25 4 43 0.25 5 25
REFERENCESAnam E M (1999) I. J. of Chem. 3813: 1307-1310Arumugam N and Bhojwani S S (1990) Somatic embryogenesis in tissue cultures of Podophyllumhexandrum. J Botany; 68: 487-91Chueh F S, Chen C C, Sagare A P and Tsay H S (2001) Quantitatiave determination of secoiridoidglucosides in in vitro propagated plants of G. davidii var. formosana by high performance liquidchromatography. Planta Medica 67: 70-73Erdei I, Kiss Z and Maliga P (1981) Rapid clonal multiplication of Digitalis lanata in tissueculture. Plant Cell reports 1: 34-35Fuentes S I, Suarez R, Villegas T, Acero L C and Hernandez G (1993) Embryogenic response ofMexican alfalfa (Medicago sativa) varieties. Plant Cell Tissue Organ Cult. 34: 299- 302Hatano K, Shoyama Y and Nishioka I (1986): Multiplication of Pinellia ternate by callus cultureof leaf segment. Shoyakugaku Zasshi 40: 188-192

116
Proceeding of Conference : Evolving Paradigm to Improve Productivity for Plant Genetic Resoyrces
Hiraoka N and Oyanagi M (1988) In vitro propagation of Glehnia littoralis from shoot-tips.Plant Cell Reports 7: 39-42Huang C L, Hsieh M T, Hsieh W C, Sagare A P and Tsay H S (2000) In vitro propagation ofLimonium wrightii (Hance) Ktze. (Plumbaginaceae), an ethno-medicinal plant, from shoottip,leaf- and inflorescence-node explants. In vitro Cellular and Developmental Bio. Plant, 36:220-224Joshi K C, Singh P and Mehra A (1979) Chemical Investigation of the Roots of DifferentClerodendron species Medica plant research, 37: 4-6Kirtikar K R and Basu B D (1933) Indian Medicinal Plants, vol. III, 2nd ed.Murashige T and Skoog F (1962) A revised medium for rapid growth and bio-assays with tobaccotissue cultures. Physiol. Plant. 15: 473-497Nishioka I (1988) Clonal multiplication of medicinal plants by tissue culture. Shoyakugaku Zasshi42: 1-11Sheba R, Ahmed N, Rajaram S, Sauja R, Thenmozhi S, Murugesan T(1999) Anti-diarrhoealevaluation of Clerodendrum phlomidis L. Leaf extract in rats; J. Ethnopharmacology 68(13)315-319Tsay H S, Gau T G and Chen C C (1989) Rapid clonal propagation of Pinellia ternate by tissueculture. Plant Cell Reports 8: 450-454

117
Proceeding of Conference : Evolving Paradigm to Improve Productivity for Plant Genetic Resoyrces
Antioxidant Activity Screening and Hptlc Phyto-ChemicalFingerprinting of Ten Indian Medicinal Plant Extracts
Riddhi M. Patel* And Yogesh T Jasrai
Department of Botany, University School of Sciences, Gujarat University, Ahmedabad- 380009,Gujarat, India. *Corresponding author e-mail: [email protected]
ABSTRACTAntioxidant compounds in food play an important role as a health-protecting factor. Scientific evidencesuggests that antioxidants reduce risk for chronic diseases including cancer and heart disease. Presentresearch carried out to find the presence of an antioxidant activity and developing HPTLC phyto-chemical fingerprint of ten important Indian medicinal plant extracts and to relate it with their medicinaland disease curing ability. Plants extracted in various polarity solvents like water, methanol, chloroformand petroleum ether. Antioxidant activity screening performed using assays, % Phenol by Folin-Ciocalteu method, % DPPH radical scavenging activity and % Ferrous ion chelating activity, wherecomparative study of various solvent extracts successfully demonstrated the nature and polarity ofantioxidant phyto-chemicals. All plants demonstrated presence of antioxidant activity and an excellentactivity in all three assays recorded with extracts of Lawsonia inermis, Murraya koenigii, Piperbetel, Curcuma longa and Camellia sinensis. The study results supports that the medicinal propertyof plants correlates with antioxidant nature of their active phyto-chemicals.Keywords: Antioxidant, phyto-chemicals, polarity, chronic diseasesINTRODUCTION The main characteristic of an antioxidant is its ability to trap free radicals. Free radicals likehydroxyl and reactive oxygen radicals produced in our body during the normal metabolism areextremely reactive in nature and damage almost every molecule found in living cells, affect humanhealth and lead to several degenerative diseases including atherosclerosis, hypertension, heartattack, diabetes, immunosuppression, neurodegenerative diseases, parkinson and alzheimerdiseases, arthritis, cancer as well as premature body aging (Porwal et al, 2010). The plant kingdom is constitutes most widely distributed extremely heterogeneous groups of thesubstances also called as PSMs (Plant Secondary Metabolites) (Patel and Jasrai, 2011; 2009;Harborne, 1984). Antioxidant compounds like phenolic acids, polyphenols and flavonoids scavengefree radicals such as peroxide, hydroperoxide or lipid peroxyl and thus inhibit the oxidative mechanismsthat lead to degenerative diseases. Many spices, fruits, vegetables and medicinal plants contain potentialantioxidant compounds, such as vitamins A, C and E, β-carotene, α-tocopherol, carotenoids,flavonoids, isoflavones, flavones, flavonols, anthocyanins, proanthocyanidins, coumarins, lignans,polyphenols, catechins, isocatechins, tannins and other phenolics constituents etc (Ghasemi et al,2009). PSMs present in various plants and their extracts have been demonstrated in various in vitroassays that the compounds extracted from plant materials reported to be excellent radical scavengers

118
Proceeding of Conference : Evolving Paradigm to Improve Productivity for Plant Genetic Resoyrces
and inhibitors of lipid peroxidation (Patel and Jasrai, 2012; Nahar et al, 2009). An antioxidantactivity of plants is often correlated with its medicinal and disease curing ability in the body. Scientificstudies have demonstrated that antioxidant activity exhibited by phyto-chemicals or PSMs found toplay important role in various pharmacological activities by inhibition of free radical induced damagefor instance antibacterial, antiviral, anti-aging, anti-inflammatory, antiatherosclerosis, anti-canceractivities. Also stimulate immune system, regulate gene expression in cell proliferation and apoptosis,hormone metabolism and can also effectively reduce coronary heart disease and cancer mortality(Ghafar et al, 2010). More precisely, bio-chemically they function as singlet or triplet oxygenquenchers, free radical scavengers, peroxide decomposers, enzyme inhibitors and synergists (Mandalet al, 2009). Antioxidant secondary metabolites play an important role in long term health, reductionin the risk of chronic and degenerative diseases and preventing cellular damage, supplementation ofantioxidants has become an attractive therapeutic strategy for reducing the risk of diseases. Medicinalplants and herbal drugs containing free radical scavengers are found importance in preventing thedeleterious consequences of oxidative stress and treating such diseases (Aquil et al, 2006). In thepresent investigation, considering the highly significant therapeutic role of antioxidant phyto-chemicals,effort was made to find out the antioxidant capacity of various polarity extracts of ten Indian medicinalplants (Fig. 1).The extracts were also evaluated for HPTLC based finger printing to develop a digital phytochemicalprofile of plant extracts. HPTLC- High Performance Thin Layer Chromatography is a sophisticated,reliable, efficient and automated form of TLC having the latest technical developments for qualityassessment and evaluation of botanical materials (Khushboo et al, 2009; Saraswathy et al, 2010).A chromatographic fingerprint of extract represents a chromatographic pattern of pharmacologicallyactive or chemically characteristic constituents present in the extract (Bhise and Salunkhe, 2009;Sanja et al, 2009). Moreover, in HPTLC phyto-chemical analysis technique, many samples ofdivergent nature can be run in a single analysis with simultaneous processing of sample and standard(Harborne, 1984; Cimpoiu, 2006).
Azadirachta indica Camellia sinensis Cassia fistula Curcuma longa Datura stramonium
Lawsonia inermis Moringa oleifera Murraya koenigii Piper betel Sphaeranthus indicus
Fig-1 Medicinal plants used in the present study

119
Proceeding of Conference : Evolving Paradigm to Improve Productivity for Plant Genetic Resoyrces
MATERIALS AND METHODSCollection and extraction of plant material:Plants used in the present study were Azadirachta indica A Juss, Camellia sinensis (L) O.Kuntze,Cassia fistula L, Curcuma longa L, Datura stramonium L, Lawsonia inermis L, Moringaoleifera Lam, Murraya koenigii (L) Sprengel, Piper betel L and Sphaeranthus indicus L (Fig.1). The plants were collected from the campus of Gujarat University, Ahmedabad and environs.Collected plant material was washed and air dried under shade (one week). The dried plant partsfinely powdered using electric grinder, sieved (mesh size 500µ) and subjected for the extraction.All plant samples extracted in four solvents of different polarity viz water, methanol, chloroformand petroleum ether. For aqueous extracts, powdered plant material (50 g) extracted in 1000 mlof distilled water at 50°C temperature until the volume reduces to half. The content then filteredthrough whatman filter paper (no 1). The filtrate evaporated till complete dryness in oven (40°C)(Harborne, 1984; Daniel, 1991; Patel and Jasrai, 2010). For organic solvent extraction in solventslike methanol, chloroform and petroleum ether, fine powdered plant material (100 g) soakedovernight in solvent (400 ml) in air tight erlenmeyer flask. The residues repeatedly extracted (threetimes) in 200 ml of solvent (Souri et al, 2008; Khan and Nasreen, 2010). The extracts filteredthrough a whatman filter paper (no 1). The filtrate was evaporated to dryness to yield a dark-residue. Each sample was then transferred to glass vials (6 ×2 cm) and % yield of extractscalculated (Table 1).Table-1 % Yield of plant materials extracted in different solvents
Plants Family
Azadirachta indica A Juss Meliaceae
Camellia sinensis (L) O.Kuntze Theaceae
Cassia fistula L Caesalpinaceae
Curcuma longa L Zingiberaceae
Datura stramonium L Solanaceae
Lawsonia inermis L Lythraceae
Moringa oleifera Lam Moringaceae
Murraya koenigii (L) Sprengel Rutaceae
Piper betel L Piperaceae
Sphaeranthus indicus L Asteraceae
Plant Part Used
% Extract Yield *
WT ME CH PE
Leaves
3.17 Cured leaves 0.28
Fruit pulp
0.16
Rhizome 3.17
Twigs
3.27
Leaves 5.84
Twigs
2.06
Leaves 7.47
Leaves
0.98
Aerial part 3.88
27.66 13.85 10.42 19.78 7.30 4.42
34.83 14.74 6.36 29.33 16.96 17.32
25.47 12.00 12.00 68.04 28.96 14.58
48.04 27.03 0.33 7.53 6.68 10.43
28.70 13.70 9.10 21.47 17.84 1.17
[Note: * represents g extract/100g dry powder, WT= Water; ME= Methanol; CH= Chloroform;PE= Petroleum ether]

120
Proceeding of Conference : Evolving Paradigm to Improve Productivity for Plant Genetic Resoyrces
Screening antioxidant activity:All the plant extracts were subjected for the screening antioxidant activity by implementingstandardized protocols of three different assays. The chemicals utilized were of pure and analyticalgrade. Readings were taken in six replicates for each sample and calculated for their standarderrors. The detailed procedure of the in vitro assays is mentioned below.(a) Phenol estimation by Folin-Ciocalteau method: To 6 ml of double dist. water added2 mg sample, 0.5 ml Folin-Ciocalteau reagent and 1.5 ml 20% Na
2CO
3 (Sodium Carbonate)
solution. Total volume made up to 10 ml by addition of dist. water. The mixture incubated for 30min. at 25ºC and then OD taken at 760nm. % phenol calculated using % extract yield and Gallicacid equivalents (GAE) with reference to standard curve (Ghasemi et al, 2009).(b) DPPH radical scavenging assay: 2 ml 0.5 mM methanolic solution of DPPH (1,1-Diphenyl-2picrylhydrazyl) mixed with the 2 ml methanolic solution containing 3 mg extract. Themixture shaken vigorously and allowed to incubate in dark for 30 min. and the OD taken at517nm. Ascorbic acid (vitamin C) was used as a reference compound with IC
50 at 0.35 mg/4 ml.
The calculation performed using the formula (Ghasemi et al, 2009).% DPPH Radical scavenging activity (RSA) = A control -A sample × 100 A control[Note: A control = OD of DPPH solution without extract or standard, A sample = OD of DPPHsolution with extract or standard](c) Ferrous ion chelating activity assay: 3 mg of extract was mixed with the 2 ml of 0.04mM Fecl
2 and 2ml of 0.5 mM aqueous ferrozine solution. The mixture was shaken vigorously and
left standing at room temperature for 10 min. and the OD taken at 562nm. BHT (Butylated HydroxyToluene) was used as a reference compound with and exhibited best chelating activity at IC
50 at 6
mg/4 ml.The calculation performed using following formula (Dinis et al, 1994).% Inhibition of Ferrozine - Fe2+ complex = 1-A
1 sample × 100
A0 control
[Note: A0 control = OD of Fecl
2 and Ferrozine solution without extract or standard, A
1 sample=
OD of Fecl2 and Ferrozine solution with extract or standard]
HPTLC Fingerprinting of extracts:A standard methodology for the sample preparation and analysis was followed for the HPTLC(Camag, Muttenz, Switzerland) analysis of extracts. Each extract was redissolved at 50 mg/mlconcentration in their respective extraction solvent. The sample extracts were streaked (2 µl) inform of narrow bands on the precoated silica gel 60F
254 aluminum TLC plate (Wagner and Bladt,
2007). The plates were subjected to linear ascending development, in selected solvent system andthe densitometric scanning of the developed chromatograms was carried out in the absorbancemode at 200- 450 nm wavelength. The digital photographs of the chromatograms were taken atthree different wavelengths i.e. 254 nm through UV lamp, 366 nm through Mercuric lamp; and

121
Proceeding of Conference : Evolving Paradigm to Improve Productivity for Plant Genetic Resoyrces
400- 800 nm through Tungsten lamp.RESULT AND DISCUSSIONAntioxidant activity screening: The antioxidant activity of phenolic compounds is mainly due toredox properties, which allow them to act as reducing agents, hydrogen donors, singlet oxygenquenchers, heavy metal chelators and hydroxyl radical quenchers (Patel and Jasrai, 2012). Thekey role of phenolic compounds as scavengers of free radicals is emphasized in several reports. Afair correlation between antioxidant and free radical scavenging activity and phenolic content wasobserved in an antioxidant assay by Aquil et al, 2006 and Singh et al, 2009. Phenolic antioxidantspresent in herbs have the ability to reduce lipid peroxidation, prevent DNA oxidative damage andscavenge ROS (Reactive oxygen species) like superoxide, hydrogen peroxide and hydroxyl radicals(Yoo et al, 2008). According to Nahak and Sahu (2010) polar solvents like methanol and ethanolare helpful to better isolate the phenolic compounds. Bushra et al (2009) investigated in the studyand found that, higher extract yields, phenolic contents and antioxidant activity were obtainedusing aqueous organic solvents like 80% methanol and 80% ethanol, as compared to the absoluteorganic solvents like ethanol and methanol extracts. Several studies with varied protocols of analysishave been conducted in this field to find newer and newer plant sources as a resource of antioxidants.Variety of solvents has been used for plant extraction, which helps to find the nature of antioxidantphyto-chemicals and their better extraction. Studies using different solvents of medicinal plants toscreen the total phenol content includes, Murraya koenigii fresh water extract (Huda-Faujan etal, 2007); Lawsonia inermis water and methanol extract (Botros et al, 2004; Khodaparast andDezashibi, 2007) Camellia sinensis L. var. assamica ethanol extract (Gong et al, 2009).C.sinensis 70% aqueous methanol extract (Yoo et al, 2008); Azadirachta indica ethanolic extract(Nahak and Sahu, 2010); Piper betel chloroform fraction (Sharma et al, 2009); turmeric oil(Jayaprakasha et al, 2002); Piper betel Mysore pan variety ethanol extract (Rathee et al, 2006);Moringa oleifera leaves 80% methanol extract (Bushra et al, 2009). Moringa oleifera aqueous,methanol and aqueous ethanol extracts (Siddhuraju and Becker, 2003) and Sphaeranthus indicuschloroform extract (Sangeetha et al, 2010).In the present study, standard gallic acid at 0.01 mg/ml concentration exhibited 0.00010% phenolcontent (0.50 mg/10 ml) estimated by Folin-Ciocalteau method. The % phenol of plant extractscalculated considering the standard gallic acid and the value thus defined as GAE (Gallic acidequivalent) and % yield of plant extracts (Table 1). Phenols are polar in nature and can be betterextracted in polar solvents like water, methanol, ethanol etc. The highest % phenol recorded amongmedicinal plants was in water extracts of Camellia sinensis (4.96 ±0.05), followed by Lawsoniainermis (3.71 ±0.04), Piper betel (3.26 ±0.04) and Murraya koenigii (3.04 ±0.03) as well withmethanol extracts of Piper betel (2.96 ±0.05) and Camellia sinensis (2.36 ±0.24) GAE, which isquite high and appreciable quantity of phenol. The lowest % phenol obtained with the petroleumether extracts of Cassia fistula (0.0004 ±0.03) followed by Camellia sinensis (0.0016 ±0),Azadirachta indica (0.005 ±0.001) and Datura stramonium (0.01 ±0.001) GAE (Fig. 2). Thushere methanol and water proved efficient solvents to extract phenols from plant materials.

122
Proceeding of Conference : Evolving Paradigm to Improve Productivity for Plant Genetic Resoyrces
The DPPH scavenging ability and reducing power assays provides preliminary information on thereactivity of the test compound with a free radical and its hydrogen-donating tendency and thereduction capability of the DPPH radical (Rathee et al, 2006). Many researchers have reportedpositive correlation and observed that high reduction of DPPH is related to the high scavengingactivity and higher amount of antioxidants present in the sample (Ghafar et al, 2010). The reductionof DPPH radicals can be observed by the decrease in absorbance at 517 nm and on the degree ofdiscoloration due to the radical scavenging ability of antioxidant (Aquil et al, 2006; Sreelatha andPadma, 2009). The potential DPPH radical scavenging activity exhibited by various solvent extractsin reported works includes, Azadirachta indica leaf butanol fraction (Ghimeray et al, 2009);Azadirachta indica ethanol extract (Nahak and Sahu, 2010); Curcuma longa, essential oil (Zhaoet al, 2010); Murraya Koenigii boiled leaves and 80% ethanolic extract (Chan et al, 2008).Murraya koenigii leaf ethanol extract (Mohammed et al, 2009); Moringa oleifera leaves 80%methanol extract (Bushra et al, 2009); Piper betel essential oil (Li-Ching and Jiau-Ching, 2009);Piper betel cold ethanolic extract, hot water extract and essential oil (Arambewela et al, 2006)and Piper betel ethanol extract (Rathee et al, 2006). A positive ferrous ion reducing and chelatingactivity have been observed in Azadirachta indica leaf butanol, ethyl acetate and hexane fraction(Ghimeray et al, 2009).In the present study, % DPPH RSA (Radical scavenging activity) IC
50 value for standard BHA
observed at 0.08 mg/ml concentration. The highest % DPPH RSA was recorded in water extractsof Camellia sinensis (93.28 ±0.01) followed by Lawsonia inermis (92.20 ±0.09), methanolextracts of Lawsonia inermis (87.69 ±0.08) and chloroform extract of Curcuma longa (86.82±0.31) and Piper betel (86.10 ±0.08). While overall lowest % DPPH RSA recorded in petroleumether extracts of Cassia fistula (12.41 ±0.24) and Sphaeranthus indicus (16.35 ±0.43) followedby and water extract of Datura stramonium (25.79 ±0.32) (Fig. 2).In metal ion chelating assay, the extract and standard compounds interfered with the formation offerrous and ferrozine complex and are able to capture ferrous ion before the formation of ferrozineby their chelating activity. Ferrozine can quantitatively form complexes with Fe2+. In the presenceof chelating agents, the complex formation is disrupted, resulting in decrease of the red coloredcomplex. Thus reduction of the color is equal to the metal chelating activity (Singh et al, 2009).In the present study, % FICA (Ferrous ion chelating activity) IC
50 value for standard ascorbic acid
observed at 1.5 mg/ml concentration. The maximum % FICA was observed with petroleum etherextract of Curcuma longa (126.15 ±0.15) followed by water extracts of Curcuma longa (105.71±0.11), Datura stramonium (105.15 ±0.10) and chloroform extract of Sphaeranthus indicus(102.23 ±0.22). While overall the lowest % FICA recorded in case of petroleum ether extract ofMurraya koenigii (30.44 ±0.26) followed by methanol extract of Datura stramonium (34.22±0.35) and Moringa oleifera (38.79 ±0.05) and chloroform extract of Datura stramonium(38.86 ±0.90) (Fig. 2).

123
Proceeding of Conference : Evolving Paradigm to Improve Productivity for Plant Genetic Resoyrces
Fig-2 Antioxidant activity exhibited by plant extracts in different assays[Note: AI= Azadirachta indica, CS= Camellia sinensis, CF= Cassia fistula, CL= Curcumalonga DS=, Datura stramonium, LI= Lawsonia inermis, MO= Moringa oleifera, MK=Murraya koenigii, PB= Piper betel and SI= Sphaeranthus indicus]Better quantity of phenols can be isolated using polar solvents like water, methanol, ethanol etc. inthe present study chloroform and petroleum ether extracts demonstrated appreciable quantity ofphenols but comparatively lower than the water and methanol extracts. The present study hasrevealed that, Camellia sinensis, Lawsonia inermis, Piper betel and Murraya koenigii extractsfound to possess good amount of % phenol content and intermediate amount of % RSA and %FICA activity. While extract wise antioxidant activity results indicates that overall, water extractsof Curcuma longa and Datura stramonium demonstrated appreciably good amount of % FICAactivity but found to possess minor amount of % RSA and % phenol content. While in case of
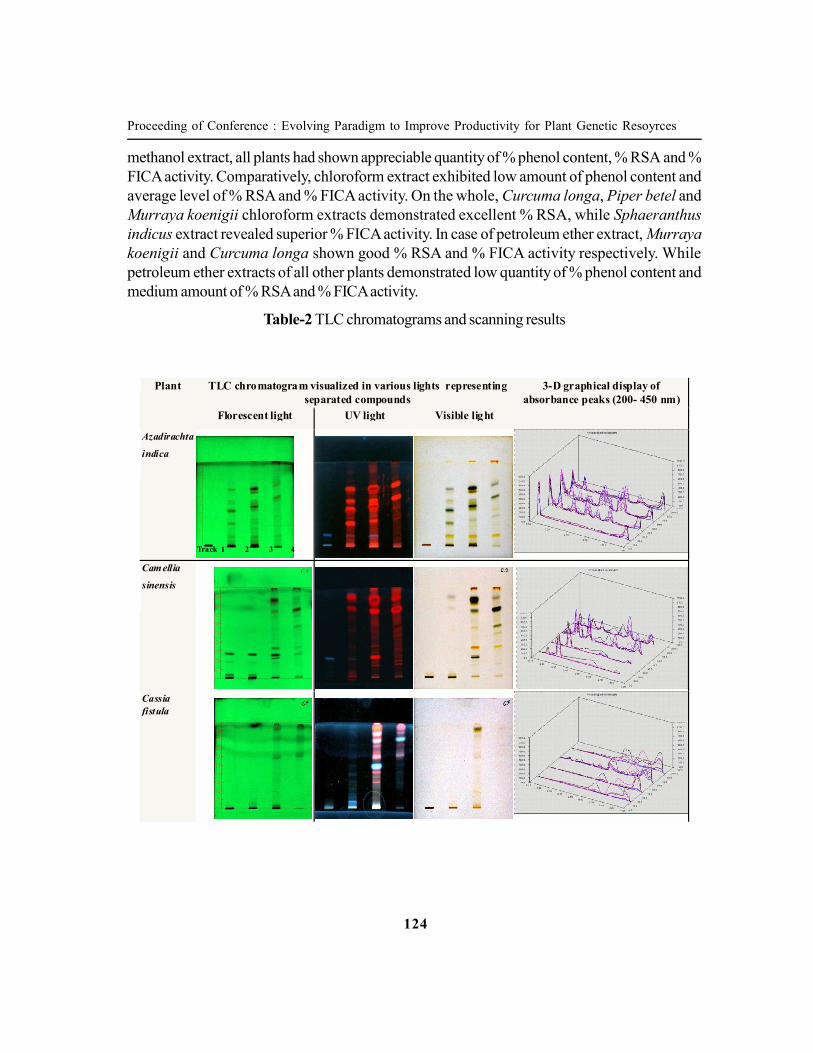
124
Proceeding of Conference : Evolving Paradigm to Improve Productivity for Plant Genetic Resoyrces
methanol extract, all plants had shown appreciable quantity of % phenol content, % RSA and %FICA activity. Comparatively, chloroform extract exhibited low amount of phenol content andaverage level of % RSA and % FICA activity. On the whole, Curcuma longa, Piper betel andMurraya koenigii chloroform extracts demonstrated excellent % RSA, while Sphaeranthusindicus extract revealed superior % FICA activity. In case of petroleum ether extract, Murrayakoenigii and Curcuma longa shown good % RSA and % FICA activity respectively. Whilepetroleum ether extracts of all other plants demonstrated low quantity of % phenol content andmedium amount of % RSA and % FICA activity.
Table-2 TLC chromatograms and scanning results
Plant TLC chromatogram visualized in various lights representing separated compounds
3-D graphical display of absorbance peaks (200- 450 nm)
Florescent light UV light Visible light
Azadirachta
indica
Camellia
sinensis
Cassia fistula
Track 1 2 3 4

125
Proceeding of Conference : Evolving Paradigm to Improve Productivity for Plant Genetic Resoyrces
[Note: Vertical scale represents Distance between two bars indicates 0.10 Rf value]
Piper betel
Sphaeranthus indicus
Curcuma longa
Datura stramonium
Lawsonia inermis
Moringa oleifera
Murraya koenigii
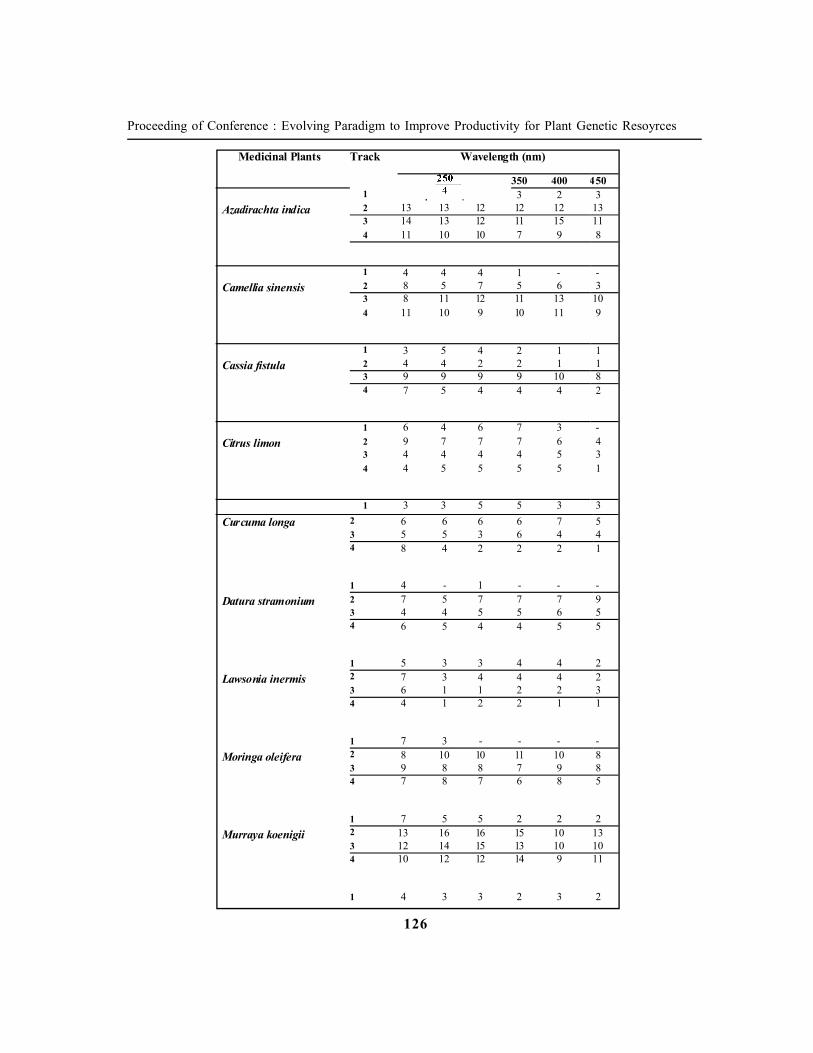
126
Proceeding of Conference : Evolving Paradigm to Improve Productivity for Plant Genetic Resoyrces
Medicinal Plants Track Wavelength (nm)
350 400 450
Azadirachta indica
1 3 2 3 2 13 13 12 12 12 13 3 14 13 12 11 15 11 4 11 10 10 7 9 8
Camellia sinensis
1 4 4 4 1 - - 2 8 5 7 5 6 3 3 8 11 12 11 13 10 4 11 10 9 10 11 9
Cassia fistula
1 3 5 4 2 1 1 2 4 4 2 2 1 1 3 9 9 9 9 10 8 4 7 5 4 4 4 2
Citrus limon
1 6 4 6 7 3 - 2 9 7 7 7 6 4 3 4 4 4 4 5 3 4 4 5 5 5 5 1
1 3 3 5 5 3 3
Curcuma longa 2 6 6 6 6 7 5 3 5 5 3 6 4 4 4 8 4 2 2 2 1
Datura stramonium
1 4 - 1 - - - 2 7 5 7 7 7 9 3 4 4 5 5 6 5 4 6 5 4 4 5 5
Lawsonia inermis
1 5 3 3 4 4 2 2 7 3 4 4 4 2 3 6 1 1 2 2 3 4 4 1 2 2 1 1
Moringa oleifera
1 7 3 - - - - 2 8 10 10 11 10 8 3 9 8 8 7 9 8 4 7 8 7 6 8 5
Murraya koenigii
1 7 5 5 2 2 2 2 13 16 16 15 10 13 3 12 14 15 13 10 10 4 10 12 12 14 9 11
1 4 3 3 2 3 2

127
Proceeding of Conference : Evolving Paradigm to Improve Productivity for Plant Genetic Resoyrces
HPTLC Phyto-chemical profiling of plant extracts: The phyto-chemical constituents in a plantmaterial form a characteristic fingerprint, representing the quantity of active constituents. Moreover,this helps to standardize the mixture unlike formulated herbal drug and market samples (Paramasivamet al, 2008). In various reports some of the plants and various solvent extracts were analyzed byTLC method. However the HPTLC technique is having precision over TLC method and thus aneffort was made in the present study to develop comparative HPTLC phyto-chemical profiles offour solvent extracts of all selected eleven medicinal plants (Table 2, 3).Table-3 Densitometric scanning results and number of bands detected at respective scanningwavelengths (200- 450 nm) on chromatograms[Note: Track 1 =Water extract, Track 2 =Methanol extract, Track 3 =Chloroform extract,Track 4 =Petroleum ether extract]The chromatographic development of the TLC plates in the standardized solvent system and theirHPTLC densitometric scanning results observed in the present study are stated below. Separatedcompounds in methanol and chloroform extracts of Azadirachta indica detected very well in theentire scanned wavelength, with maximum number of separated bands compared to water andpetroleum ether extracts. Among all four extracts, water extracts showed lowest number of bands inthe solvent system toluene: ethyl acetate: methanol (45: 3.5: 1: 5, v/v). Camellia sinensiscchromatograms developed in the solvent system toluene: ethyl acetate: methanol (45: 3.5: 6, v/v),bands of water extract were not detected in the 400 and 450nm range of wavelengths and showedlowest number of quench bands, followed by methanol extract. While chloroform and petroleumether extracts revealed good number of bands and detected in entire scanned wavelengths. Cassiafistula plate developed in toluene: ethyl acetate: methanol: butanol (36: 4: 8: 1, v/v) where chloroformextract revealed maximum numbers of separated bands, followed by petroleum ether, methanol andwater extracts. 200- 300nm wavelength detected good amount of separated bands. For Curcumalonga, all four extracts demonstrated good number of separated bands in the solvent system-chloroform: methanol: acetic acid (94: 5: 1, v/v). Datura stramonium water extract was poorlyseparated in the solvent system toluene: ethyl acetate (7: 3, v/v) while other extracts demonstratedaverage number of quench bands about 4- 7 in number. Lawsonia inermis chloroform and petroleumether extracts demonstrated low amount of separated bands compared to methanol and water extractsin the solvent system toluene: ethyl acetate: formic acid (27.5: 20: 2.5, v/v).Moringa oleifera bands in water extract, detected at 200 and 250nm wavelengths during thescan. While other extracts had shown 7- 10 number of quench bands, detected at whole range ofscanned wavelengths viz. 200- 450nm with toluene: ethyl acetate: methanol (43: 4: 3, v/v) solventsystem. Murraya koenigii other extracts apart from water extract, were having excellent bandsabout 9- 16 in number, in the solvent system toluene: ethyl acetate: methanol (45: 3.5: 1.5, v/v).Piper betel all four extracts, showed 3- 7 quenching bands on the developed chromatogram usingsolvent system toluene: ethyl acetate: methanol (40: 20: 1, v/v) and detected at 200- 450nmwavelengths. Sphaeranthus indicus chromatogram developed using toluene: ethyl acetate: formicacid (25: 22.5: 2.5, v/v) solvent system, revealed nice separation of the compounds of all fourextracts. Maximum number of quench bands was detected at 200 nm range.

128
Proceeding of Conference : Evolving Paradigm to Improve Productivity for Plant Genetic Resoyrces
A comparative HPTLC analysis of different polar (water, methanol) to non-polar (chloroform,petroleum ether) solvent extracts represents comparative account of the presence, polar or non-polar nature and amount of phyto-chemicals. The phyto-chemical profiles of the plant extractshelps in understanding the amount of antioxidant activity in the assays. Furthermore all four solventextracts demonstrated positive antioxidant activity in the assays at different level. Therefore all themedicinal plants taken for the present study were proved highly important in terms of presence ofantioxidant metabolites. The study hence supports and correlates the antioxidant activity of plantswith their beneficial medicinal effects on the body.REFERENCESAquil F, Ahmad I and Mehmood Z (2006) Antioxidant and free radical scavenging properties oftwelve traditionally used Indian medicinal plants. Turkish Journal of Biology, 30: 177 - 183.Arambewela L, Arawwawala M and Rajapaksa D (2006) Piper betle: A potential naturalantioxidant. International Journal of Food Science and Technology, 41 (1): 10 - 14.Bhise SB and Salunkhe VR (2009) Formulation of health drinks using natural sweetener, its HPTLCmethod development and validation. Journal of Pharmacognosy and Phytotherapy, 1: 014-020.Botros RM, Farid AB, Galal TM and Mohamed MAA (2004) Antioxidant and immunomodulatoryconstituents of henna leaves. Z. Naturforsch., 59c: 468 - 476.Bushra S, Farooq A and Muhammad A (2009) Effect of extraction solvent/technique on theantioxidant activity of selected medicinal plant extracts. Molecules, 14: 2167 - 2180.Chan LW, Cheah ELC, Saw CLL, Weng W and Heng PWS (2008) Antimicrobial and antioxidantactivities of cortex Magnoliae officinalis and some other medicinal plants commonly used insoutheast Asia. Chinese Medicine, 3 (15): 1 - 10.Cimpoiu C (2006) Analysis of some natural antioxidants by thin-layer chromatography and highperformance thin-layer chromatography. Journal of Liquid Chromatography & RelatedTechnologies, 29: 1125- 1142.Dinis TCP, Madeira VMC and Almeida LM (1994) Action of phenolic derivates (acetoaminophen,salycilate and 5- aminosalycilate) as inhibitors of membrane lipid peroxidation and as peroxylradical scavengers. Archive Biochemistry Biophysics, 315: 161- 169.Ghafar MFA, Prasad KN, Weng KK and Ismail A (2010) Flavonoid, hesperidine, total phenoliccontents and antioxidant activities from citrus species. African Journal of Biotechnology, 9 (3):326 - 330.Ghasemi K, Ghasemi Y and Ebrahimzadeh MA (2009) Antioxidant activity, phenol and flavanoidcontents of 13 citrus species peels and tissues. Pakistan Journal of Pharmaceutical Sciences,22 (3): 277 - 281.Gong JS, Peng CX, He X, Li JH, Li BC and Zhou HJ (2009) Antioxidant activity of extracts ofPuerh tea and its material. Asian Journal of Agricultural Sciences, 1 (2): 48 - 54.Harborne JB (1984) A Guide to Modern Techniques of Plant Analysis. In: Phytochemical Methods.

129
Proceeding of Conference : Evolving Paradigm to Improve Productivity for Plant Genetic Resoyrces
3rd ed. Harborne JB (ed.). Chapman and Hall, Hong Kong.Huda-Faujan N, Noriham A, Norrakiah AS and Babji AS (2007) Antioxidative activities of waterextracts of some Malaysian herbs. ASEAN Food Journal, 14 (1): 61 - 68.Jayaprakasha GK, Jena BS, Negi PS and Sakariah KK (2002) Evaluation of antioxidant activitiesand antimutagenicity of turmeric oil: A byproduct from Curcumin production. Z. Naturforsch.,57c: 828 - 835.Khan ZS and Nasreen S (2010) Phytochemical analysis, antifungal activity and mode of action ofmethanol extracts from plants against pathogens. Journal of Agricultural Technology, 6: 793 -805.Khodaparast HMH and Dezashibi Z (2007) Phenolic compounds and antioxidant activity of hennaleaves extracts (Lawsonia inermis). World Journal of Dairy & Food Sciences, 2 (1): 38- 41.Khushboo PS, Jadhav VM and Kadam VJ (2009) Development and validation of a HPTLCmethod for determination of psoralen in Psoralea corylifolia (Bavachi). International Journalof PharmTech Research, 1: 1122- 1128.Li-Ching MR and Jiau-Ching H (2009) The antimicrobial activity, mosquito larvicidal activity,antioxidant property and tyrosinase inhibition of Piper betle. Journal of the Chinese ChemicalSociety, 56: 653 - 658.Mandal S, Yadav S, Yadav S, Nema RK (2009) Antioxidants: A review. Journal of Chemicaland Pharmaceutical Research, 1 (1): 102 - 104.Mohammed FN, Mohamed S, Aini NI and Ismail R (2009) Antioxidative properties of Murrayakoenigii leaf extracts in accelerated oxidation and deep-frying studies. International Journal ofFood Sciences and Nutrition, 60 (1): 1 - 11.Nahak G and Sahu R (2010) In vitro antioxidative activity of Azadirachta indica and Meliaazedarach leaves by DPPH scavenging assay. Nature and Science, 8 (4): 22 - 28.Nahar L, Ripa FA, Rokonuzzaman and Alim Al- Bari MA (2009) Investigation on antioxidantactivities of six indigenous plants of Bangladesh. Journal of Applied Sciences Research, 5 (12):2285 - 2288.Paramasivam M, Aktar Md. W, Poi R, Banerjee H and Bandyopadhyay A (2008) Occurrence ofcurcuminoids in Curcuma longa: A quality standardization by HPTLC. Bangladesh Journal ofPharmacology, 3: 55 - 58.Patel RM and Jasrai YT (2009) Plant secondary metabolites and their commercial production.South Asian Journal of Social and Political Sciences, 9 (2): 115 - 122.Patel RM and Jasrai YT (2010) Botanical fungicides: An eco-friendly approach for plant pathogens.The Botanica 58: 10 - 16.Patel RM and Jasrai YT (2011) Emerging trends in Phyto-medicine. In: Chapter 19: Bio-controlagents (BCAs) as a potential tool to uphold sustainability of Environment: Types, Methodsand Commercialization). Editors: M. Deniel and Arun Arya. Published by Scientific Publishers(Jodhpur, India).

130
Proceeding of Conference : Evolving Paradigm to Improve Productivity for Plant Genetic Resoyrces
Patel RM and Jasrai YT (2012) Antioxidant activity of medicinal spices and aromatic herbs. Annalsof Phytomedicine, 1 (1): 75-80.Porwal P, Shukla K, Mishra DK, Mahajan SC and Tiwari A (2010) comparative in vitro antioxidantactivity of Pongamia pinnata Linn. leaves extracts and isolated compound. International Journalof Pharmaceutical & Biological Archives, 1 (1): 69 - 75.Rathee JS, Patro BS, Mula S, Gamre S and Chattopadhyay S (2006) Antioxidant activity ofPiper betel leaf extract and its constituents. Journal of Agriculture and. Food Chemistry, 54:9046 - 9054.Sangeetha S, Marimuthu P, Doraisamy P and Sarada DVL (2010) Evaluation of antioxidant activityof the antimicrobial fraction from Sphaeranthes indicus. International Journal of Applied Biologyand Pharmaceutical Technology, I (2): 431 - 436.Sanja SD, Sheth NR, Patel NK, Patel D and Patel B (2009) Characterization and evaluation ofantioxidant activity of Portulaca oleracea. International Journal of Pharmacy andPharmaceutical Sciences, 1: 74- 84.Saraswathy A, Shakila R and Sunilkumar KN (2010) HPTLC fingerprint profile of someCinnamomum species. Pharmacognosy Journal, 2: 211- 215.Sharma S, Khan IA, Ali I, Ali F, Kumar M, Kumar A, Johri RK, Abdullah ST, Bani S, Pandey A,Suri KA, Gupta BD, Satti NK, Dutt P and Qazi GN (2009) Evaluation of the antimicrobial,antioxidant, and anti-Inflammatory activities of hydroxychavicol for its potential use as an oral careagent. Antimicrobial agents and Chemotherapy, 53 (1): 216 - 222.Siddhuraju P and Becker K (2003) Antioxidant properties of various solvent extracts of totalphenolic constituents from three different agroclimatic origins of drumstick tree (Moringa oleiferaLam.) leaves. Journal of Agriculture and Food Chemistry, 51: 2144 - 2155.Singh R, Singh B, Singh S, Kumar N, Kumar S and Arora S (2009) Investigation of ethyl acetateextract/fractions of Acacia nilotica willd. Ex Del as potent antioxidant. Records of NaturalProducts, 3 (3): 131 - 138.Souri E, Amin G, Farsam H and Barazandeh TM (2008) Screening of antioxidant activity andphenolic content of 24 medicinal plant extracts. DARU, 16 (2): 83 - 87.Sreelatha S and Padma PR (2009) Antioxidant activity and total phenolic content of Moringaoleifera leaves in two stages of maturity. Plant Foods Human Nutrition, 64: 303 - 311.Wagner H and Bladt S (2007) Plant Drug Analysis – A Thin Layer Chromatography Atlas.Sringer- Verlag berlin Heidelberg, New York. Printed by Thomson press, New Delhi, India.Yoo KM, Lee CH, Lee H, Moon BK and Lee CY (2008) Relative antioxidant and cytoprotectiveactivities of common herbs. Food Chemistry, 106: 929 - 936.Zhao J, Zhang JS, Yang B, Li GP and Li SP (2010) Free radical scavenging activity andcharacterization of Sesquiterpenoids in four species of Curcuma using a TLC Bioautographyassay and GC-MS analysis. Molecules, 15: 7547 - 7557.

131
Proceeding of Conference : Evolving Paradigm to Improve Productivity for Plant Genetic Resoyrces
Preliminary Phytochemical Evaluation of Leaves Extracts ofAsparagus Racemosus Willd.
Lina S. Patel And Rajesh S. Patel
Jagdishprasad Jhabarmal Tibrewala University, Jhunjhunu, Rajasthan. Maninagar Science College, Ahmedabad, Gujarat.
Email: [email protected]
ABSTRACTAsparagus racemosus Willd, is commonly known as Shatavari, means "she who possesses ahundred husbands" belongs to family Liliaceae; has been used as a medicine since centuries. Thepresent study deals with Pharmacognostical evaluation including examination of morphological,determination of quality control parameters such as ash value, extractive value and loss on dryingwere carried out. The preliminary phytochemical screening of various leaf extracts like petroleumether, methanol, chloroform, acetone, ethyl acetate and water was also carried out and phytochemicalsceening showed the presence of various phytoconstituents like alkaloids, anthroquinone, glycosides,carbohydrates, flavonoids, protein and amino acids, tannins, phytosterols and saponins. The resultof this study can be useful in setting some diagnostic indices for the identification and the preparationof the monographs of the medicinal plants.Keywords: Asparagus racemosus, extraction, phytochemical sceening,INTRODUCTION Asparagus racemosus Willd. (Family: Liliaceae) (Madhavan et al., 2010) is an important monocotmedicinal plant which is distributed in tropical and subtropical forest and in central parts of India.The leaves are reduced to small scales or needle like spines called cladodes. The plant-based,traditional medicine systems continue to play an essential role in health care, with about 80% of theworld’s inhabitants relying mainly on traditional medicines for their primary health care. Which arealso used to rectify the gynecological problems like irregularities in menstrual cycle and promotemilk secretion, as demulscent, diuretic, aphrodisiac and galactogogue (Goyal et al., 2003). Thisspecies contains diosgenin, glycosides, sterols and their glycosidese so are very important for thetreatment of diarrhoea, dysentery, diabetes, jaundis and other urinary disorders (Ghani, 1998).The herb contains several active constituents which are useful in treating many diseases. It mainlycontains steroidal saponins (Hayes et al., 2006 and 2008). Leaves mainly contain rutin, diosgeninand a flvonoid as quercetin 3- glucuronide (Mandal et al., 2006). Thus taking in to the view of thisplant, the present investigation is directed to remain some pharmacognostic parameters andphytochemical screening of the leaves for strengthening the traditional knowledge with scientificbases. MATERIALS AND METHODS

132
Proceeding of Conference : Evolving Paradigm to Improve Productivity for Plant Genetic Resoyrces
Collection, Authentication and Extraction of Plant MaterialThe leaves of Asparagus racemosus (Family: Liliaceae) were collected in the month of April2011 from Patan district, Gujarat, India. The plant material were identified and authenticated by ataxonomist Dr. R.S. Patel senior scale lecturer of Maninagar science college Ahmadabad. Thecollected leaves were washed; shade dried and was pulverized with mechanical pulveriser for sizereduction. It was then passed through whattmen filter; the fine powder was collected and stored inair tight container for the preparation of extract.Pharmacognostic Studies (Khandelwal et al., 1996)Morphological Studies were carried out by using simple determination technique, the Width ofblade, Length of leaf, Characters shape and number of leaves. Powder of leaves treated withvarious chemical reagents and then observed for change in colour.Physico-chemical parameters (Indian Pharmacopia, 1996; Khandelwal et al., 1996 and Kokateet al., 2008 and 2009)The parameter was done to evaluate the percentage of total ash, water soluble, acid insoluble ash;loss on drying were calculated as per Indian Pharmacopoeia The extract of the powdered leaveswere prepared with the different solvents like Petroleum ether, Chloroform, Ethyl acetate, Ethanol,Methanol and finally with Aqueous for the study of extractive value. Fluorescence analysis wasalso carried out for the powder.Preliminary phytochemical analysis (Kokate et al., 2008 and 2009)For the Preliminary phyto-chemical analysis, the extract was prepared by weighing 20gm of driedleaf powdered and were subjected to maceration with different solvents like Petroleum ether,Chloroform, Ethyl acetate, Ethanol, Methanol and finally with Aqueous successively in a soxhletextractor. The presence and absence of the primary and secondary phytoconstituents like Alkaloids(Harborne, 1998; Evans and Trease 2002), Glycosides, Cardiac Glycosides, Saponin, Tannins &Phenolic Compounds, Flavonoids, Anthroquinone, Proteins & Amino Acids, Sterols & Triterpenoids,and Carbohydrates were detected by usual prescribed methods.RESULT AND DISCUSSIONMorphological studiesThe macroscopical examination of the leaves is presented in Table 1.
Table-1 macroscopic characters of asparagus racemosus leaves
Constants Features Width of blade Minute Length of leaf 5-13 ± 2.0 cm Characters Scaly, triangular stift acuminate reduced to suberect or subcurved
spines.
No of leaves Numerous

133
Proceeding of Conference : Evolving Paradigm to Improve Productivity for Plant Genetic Resoyrces
Table-2 powdered drug analysis of leaves of asparagus racemosus with different chemical reagents
Reagents Observation Powder as such Greyish white
Powder with acetic acid Greyish Powder with conc. sulphuric acid Brownish black
Powder with conc. nitric acid Reddish Powder with conc. hydrochloric acid Light white Powder with ferric chloride solution Brownish black
Powder with 5% iodine solution Reddish Powder with antimony trichloride solution Light brown
Powder with aqueous sodium hydroxide solution (I N) Yellowish Powder with picric acid solution Greenish yellow
Physicochemical ParametersThe leaves powdered were evaluated for its physico-chemical parameters like total Ash values,water soluble ash and Acid insoluble ash; extractive values; loss on drying. All the results aretabulated below in table 3.
Table-3 Physical constant values of asparagus racemosus leaves.
Sr.No. Parametrs Values (%)w/w 1 Ash Values
Total Ash 12.8 Water soluble Ash 6.5 Acid soluble Ash 5.5
2 Extractive Values
Petroleum Ether Extractive 49.50 Methanol Extractive 39.42
Chloroform Extractive 45.54 Acetone Extractive 40.75
Ethyl Acetate Extractive 50.20 Water Extractive 30.56
3. Loss on Drying 4.5
*Each value is an average of three determinations

134
Proceeding of Conference : Evolving Paradigm to Improve Productivity for Plant Genetic Resoyrces
Fluorescence AnalysisThe powder were subjected to fluorescence analysis as per the standard procedure. The resultsare listed below in Table 4.
Table-4 fluorescence analysis of leaves powder of asparagus racemosus.
Reagents UV Short light ( 254 nm)
UV Long light (366 nm)
Visible light
Powder as such White Light white Greyish white Powder with (IN) NaOH Greenish
brown Green Brownish green
Powder with picric acid Grey Light grey Yellowish grey Powder with acetic acid Light brown Light brown Light grey
Powder with (IN) HCl solution Dark red Light red Reddish Powder with 5% FeCl3 solution Blackish brown Light brown Reddish brown
Powder with HNO3 & NH3
solution Dark brown Light brown Coffee brown
Powder with IN NaOH in methanol
Brownish yellow
Light brown Brown
Powder with methanol Deep brown Blackish brown Brown Powder with 50% HNO3
solution. Brownish Light brown Light brown
Preliminary Phyto-chemical AnalysisDifferent extracts were subjected to preliminary phyto-chemical analysis to determine the presenceof various phytoconstituents and results are tabulated in Table 5.Table-5 phytochemical screening of extractives for the presence of active constituents in asparagusracemosus leaves.
Sr . N o.
Name of the Test Petroleum ether extract
Methanol extracts
Chlorofor m extracts
Acetone extracts
Ethyl acetate extract s
Water extracts
1 Test for Alkaloids
A. Dragendroff’s Test + + + + + + B. Mayer’s Test - + - - + - C. Wagner’s Test + + + + + + D. Hager’s Test - - - - - -

135
Proceeding of Conference : Evolving Paradigm to Improve Productivity for Plant Genetic Resoyrces
2 Test for Glycosides
A. Legal’s Test - + - + + - B. Baljet’s Test - - + + + + C. Raymond’s Test - - - - - - D. Modified
Borntrager's test + + + + + +
3 Test for Cardiac Glycosides
A. Kedd’s Test - + + - - - B. Keller-Killiani Test - + + + + - 4 Test for Saponins
A. Forth Test - + + - + + B. Hemolytic Test - - + - + - 5 Test for
Flavanoids
A. Shinoda Test - + - - - - B. Zn-HCl Test - - + - - + C. Alkaline reagent - + - + - -
Test
D. Lead acetate test - + + - - + E. Ammonia Test - + + - - - 6 Test for Tannins
A. Gelatin Test - + - + - - B. Ferric Chloride Test - - + - + + C. Vanillin-HCl Test - - + - + - D. Lead acetate Test - + + - - + 7 Test for Sterols
A. Libermann- Buchard test + - + - - +
B. Salkowaski Test - + + + + - C. Sulphur Test - + + + + - 8 Test for
Anthroquinone +
+ + + + +
9 Test for Triterpinoids
A. Libermann- Buchard test - + - + + -
B. Salkowaski Test + - - - - + 10 Test for Proteins
A. Xanthoproteic Test - - - + - - B. Millon's Test - + - + - + C. Biuret Test - + + - - - D. Ninhydrin Test + + - - - -
11 Test for Charbohydrates
A. Molisch's Test + + - + + - B. Barfoed's Test + + - - - - C. Benedict's Test + + - - - -

136
Proceeding of Conference : Evolving Paradigm to Improve Productivity for Plant Genetic Resoyrces
+ indicates the presence of active constituents,- indicates the absence of active constituents
CONCLUSIONThe plant Asparagus racemosus is used widely for curing various diseases like diarrhoea, dysentery,diabetes, jaundis and other urinary disorders and gives a helping hand to the Humans. The resultsof different pharmacognostic analysis, physical constant values and extractive values determination,powder analysis with different reagents and preliminary phytochemical screening is an essentialstep towards discovery of new drugs and will help in future for proper identification andauthentification of plant.
ACKNOWLEDGEMENTI sincerely thanks to my Guide Dr. R. S. Patel Assistant professor in Botany, Maninagar ScienceCollege, Ahmadabad (Gujarat) for taxonomic identification of the plant and their support forproviding necessary facilities.
REFERENCESEvans WC and Trease GE (2002) Trease and Evans pharmacognosy by W.B. Saunders, China,pp 193-407.Ghani A (1998) Medicinal plants of Bangladesh chemical constituents and uses. Asiatic Society ofBangladesh. pp 91-92Goyal RK, Singh J and Lal H (2003) Asparagusracemosus- An update, Indian Journal of MedicalSciences, 57(9): 407-414Harborne JB (1998) Phytochemical methods. A guide to modern technique of plant analysis.3rd
edition Chapman and Hill Int. Ed., New York.Hayes PY, Jahidin AH, Lehmann R, Penman K, Kitching W and De Voss JJ. (2006) Asparinis,asparosides, curillins, curillosides and shatavarins: structural clarification with the isolation ofshatavarin V, a new steroidal saponin from the roots of Asparagus racemosus, TetrahedronLetters, 47: 8683-8687.Hayes PY, Jahidin AH, Lehmann R, Penman K, Kitching W and De Voss JJ. (2006) Structuralrevision of shatavarinsI and IV, the major components from the roots of Asparagus racemosus,Tetrahedron Letters, 47: 6965-6969.Hayes PY, Jahidin AH, Lehmann R, Penman K, Kitching W and De Voss JJ. (2008) Steroidalsaponins from the roots of Asparagus racemosus, Phytochemistry, 69(3):796-804.Indian Pharmacopoeia 2 (1996) Government of India, Ministry of health and family welfare,controller of publication, New Delhi, pp A53-A54.Khandelwal KR, Kokate CK and Gokhale SB (1996) Practical pharmacognosy techniques andexperiments, Nirali Prakashan, Pune, pp 45-95.Kokate CK (2008) Practical Pharmacognosy, Vallabh Prakashan, Delhi, pp 110-111.

137
Proceeding of Conference : Evolving Paradigm to Improve Productivity for Plant Genetic Resoyrces
Kokate CK, Purohit AP and Gokhale SB (2009) Pharmacognosy. Nirali Prakashan, pp 616-617.Madhavan V, Tijare RD, Mythreyi R, Gurudeva MR and Yoganarasimhan SN (2010).Pharmacognostical studies on the root tubers of Asparagus gonoclados Baker- Alternate sourcefor the Ayurvedic drug satavari. Indian. J. nature. Resour. 1(1): 5762.Mandal D, Banerjee S, Mondal NB, Chakravarty AK and Sahu NP (2006) Steroidal Saponinsfrom the fruits of Asparagus racemosus., Phytochemistry, 67: 1316-1321.

138
Proceeding of Conference : Evolving Paradigm to Improve Productivity for Plant Genetic Resoyrces
Prilimnary Phytochemical Analysis and Pharmacognostical Studieson the Leaf Extracts of Tecomella Undulata (Sm.) Seem.
Manisha B. Patel And Rajesh S. Patel
Jagdishprasad Jhabarmal Tibrewala University, Jhunjhunu, Rajasthan. Maninagar Science College, Ahmedabad, Gujarat. E-mail:- [email protected]
ABSTRACTThe leaves of Tecomella undulata (Sm.) Seem., a members of Bignoniaceae family is reported tohave good medicinal values in the traditional system of medicine for healing various diseases. Thepresent study deals with pharmacognostical examination include the morphological characters andphysical constants of Tecomell undulata leaves including determination of loss on drying, ash valuesand extractive values. The preliminary phytochemical screening of various leaf extracts like petroleumether, methanol, chloroform, acetone, ethyl acetate and water was also carried out and it is revealedthe presence of various phytoconstituents like alkaloids, anthroquinone, glycosides, carbohydrates,flavonoids, protein and amino acids, tannins, phytosterols and saponins. The determination ofthese characters will aid in future for pharmacological analysis of this plant species.Keywords: Tecomella undulata, pharmacognostic, Physicochemical parameters, extractsphytochemical screening.INTRODUCTIONTecomella undulata (Sm.) Seem. is commonly known as Rohida is an important medicinal shrubor tree belongs to the family Bignoniaceae, is one of the co-dominant species of Drier parts ofIndia in the desert of western Rajasthan and Gujarat. It is an important agro-forestry, deciduous ornearly evergreen tree. It has been used since ancient times for the treatment of human ailments. Itis reported to have important properties like anticancer activity, hepatoprotective activity (Khatriet al., 2009), analgesic activity (Ahmed F et al., 1994), antibacterial activity (Parekh et al.,2005), mild relaxant, cardiotonic and chloretic activities etc. The bark obtained from the stem iscontains certain secondary metabolites like tecomin, alkenes, alkanols, β-sitosterols, esterglycosides,(Pandey et al., 1970),chromone glycosides (Gujral et al., 1979), undulatoside, A andB, iridoid glucosides (Verma et al., 1986) , tecomelloside, tecoside, lapachol, veratric acid (Rastogi RP and Mehrotra BN, 2006; Joshi C, 1972; Nadkarni KM and Nadkarni AK, 2006)and is employed for the treatment of various diseases of skin, central nerves system, urinarydisorders, enlargement of spleen, gonorrhoea, leucoderma, liver diseases, jaundice, diabetes, cancerand swellings. Seeds are used against abscess.Leaves shows significant antimicrobial activity and contains certain chemical constituents liketriacontanol, betulinic acid, oleanolic acid and ursolic acid. Triacontanol is an effective plant growthregulator while both betulinic acid and ursolic acid is potent antihuman immunodeficiency virus

139
Proceeding of Conference : Evolving Paradigm to Improve Productivity for Plant Genetic Resoyrces
(HIV) and are used in treatment of AIDS (Azam, M. M., 1999). The plant constituted reputeddrug of Ayurveda and its multiple uses have also been made to avoid their excessive exploitationfor their in situ conservation.The present study deals with the pharmacognostical and phytochemicalscreening of Tecomella undulata (Sm.) Seem., leaves.MATERIALS AND METHODSCollection and Authentication of Plant MaterialThe leaves of Tecomella undulata (Sm.) Seem were collected from Balaram sanctuary ofBanaskhantha District Gujarat (India) in the month of March 2011. The plant material were identifiedand authenticated by a taxonomist Dr. R.S. Patel senior scale lecturer of Maninagar science collegeAhmadabad.Drying of plant materialThe leaves of Tecomell undulata (Sm.) Seem were first washed with water and subjected toshade drying for about 15 weeks. The shade dried leaf material was further milled into coarsepowder using a mechanical grinder and stored in air tight container for further analysis.Determination of physicochemical parameters: (Indian Pharmacopia, 1996;Khandelwal KR et al., 1996 and Kokate CK , 2008)The dried leaf material was subjected for determination of physicochemical parameters such astotal ash value, acid insoluble ash value, water soluble ash value, loss on drying and extractivevalues like petroleum ether soluble extractive, methanol soluble extractive, chloroform solubleextractive, acetone soluble extractive, ethyl acetate soluble extractive and water soluble extractivevalues were calculated as per the Indian pharmacopoeia.Ash ValuesTotal ash: 2g of accurately weighed dried leaf powdered of T. undulata was taken in a tarredsilica crucible and incinerated at a temperature not exceeding 4500C until free from carbon, cooledand weighed. Calculate the percentage of total ash with reference to dried leaf powder.Acid-insoluble ash: Boiled the ash with 25 ml of dilute Hydrochloric acid for five minutes. Theinsoluble matter was collected on an ash-less filter paper, washed with hot water and ignited,cooled and weighed. The percentage of acid insoluble ash was calculated with reference to driedleaf powder.Water-soluble ash : Boiled the for 5 minutes with 25ml of distilled water, collect the insolublematter on an ash-less filter paper, washed with hot water and ignited for 15 minutes at temperaturenot exceeding 4500C. Subtracted the weight of the insoluble ash. The percentage of water-solubleash was calculated with reference to dried powder.Loss on DryingAn accurately weighed quantity of the dried leaf powder of Tabernaemontana undulata. wastaken in a tarred glass bottle and the initial weight was taken. The crude drug was heated at 1050Cin an oven and weighed. This procedure was repeated utill a constant weight was obtained. Themoisture content of the sample was calculated as percentage with reference to the dried material.

140
Proceeding of Conference : Evolving Paradigm to Improve Productivity for Plant Genetic Resoyrces
Extractive ValuesOrganic solvent soluble extractive value: The dried leaf powder of Tabernaemontanaundulata were subjected to sequential soxhlet extraction using the solvents of different polaritysuch as petroleum ether, methanol, chloroform, acetone and ethyl acetate for 48 hrs. The extractswere filtered individually, evaporated to dryness and the percent yields of all the extracts weredetermined.Water soluble extractive value: 5g of Powder was macerated with 100 ml of water in a closedflask, shaking frequently during the first 6hrs and allowed to stand for 18hrs and filtered. Evaporated25ml of filtrate to dryness in a tarred flat bottom shallow dish dried at 1050C and weighed.Percentages of extractive values were calculated with reference to the dried powder.Pharmacognostic studies: (Khandelwal KR et al., 1996)Macroscopy: The following macroscopic characters for the fresh leaves were noted: size andshape, colour, venation, the apex, margin.Powder analysis: powder of leaf of T. undulata was examined for colour, odour and taste.Powder of drug treated with various chemical reagents and then observed for change in colour.Phytochemical investigation: ( Kokate CK et al., 2008 and 2009)Preparation of extracts: 20 g of powder leaf material was extracted with petroleum ether,methanol, chloroform, acetone, ethyl acetate and water successively in a soxhlel extractor.Preliminary phytochemical analysis : It involves testing of all extracts of leaf powder for theircontents of different classes of compounds. The methods used for detection of variousphytochemicals were followed by qualitative chemical test to give general idea regarding the natureof constituents present in crude drug. The qualitative chemical tests for various phytoconstituentswere carried out for all the extracts of T. undulata as explained below.A.Test for Alkaloids (Harborne JB, 1998; Evans WC, 2002)1.Mayer’s testAlkaloids give cream color precipitate with Mayer's reagent [Potassium mercuric iodide solution].2.Dragendorff’s testAlkaloids give reddish brown precipitate with Dragendorff’s reagent [Potassium bismuth iodidesolution].3.Wagner's testAlkaloids give a reddish brown precipitate with Wagner's reagent [Solution of iodine in potassiumiodide].4.Hager's testAlkaloids give yellow color precipitate with Hager's reagent [saturated solution of Picric acid].B. Test for Glycosides 1.Raymond’s testTest solution when treated with dinitro- benzene in hot methanolic alkali, gives violet color. 2.Legal’stest
141
Proceeding of Conference : Evolving Paradigm to Improve Productivity for Plant Genetic Resoyrces
Treat the extract with pyridine and add alkaline sodium nitroprusside solution, blood red colorappears. 3. Baljet’s test
Test solution when treated with sodium picrate formation of yellow to orange colour reveal thepresence of glycosides.
4.Modified Borntrager's test
The extracts were treated with ferric chloride solution and heated on boiling water bath for about5 mins. The mixture was cooled and shaken with volume of benzene. The benzene layer wasseparated and treated with half of its volume of ammonia solution. The formation of cherry redcolour in the ammonical layer indicated the presence of anthranol glycosides.
c.Test for Cardiac Glycosides 1.Kedde’s test
Extract the drug with chloroform, evaporate to dryness, add one drop of 90% alcohol and 2drops of Kedde's reagent. Make alkaline with 20% sodium hydroxide solution. A purple color isproduced.
2.Keller killiani test [test for Deoxy sugars]
Extract the drug with chloroform and evaporate it to dryness. Add 0.4ml of glacial acetic acidcontaining a trace amount of ferric chloride. Transfer to a small test tube; add carefully 0.5ml ofconcentrated sulphuric acid by the side of the test tube, blue color appears in the acetic acid layer.
D.Test for Saponin 1.Froth Test
Place 1ml solution of drug in water in a semi-micro tube and shaken well and noted for a stablefroth.
2.Hemolysis test
Add 0.2ml solution of saponin (prepared in 1% normal saline) to 0.2ml of v/v blood in normalsaline and mix well,centrifuge and note the red supernatant compare with control tube containing0.2ml of 10% blood in normal saline diluted with 0.2ml of normal saline.
E. Test for Tannins & Phenolic Compounds 1.Gelatin test
Test solution with 1 % gelatin solution containing 10% sodium Chloride gives white precipitate.
2.Ferric chloride test
Test solution gives blue green color with ferric chloride.
3.Vanillin Hydrochloride test
Test solution when treated with few drops of vanillin hydrochloride reagent gives purplish redcolor. 4.Alkaline reagent test
Test solution with sodium hydroxide solution gives yellow to red precipitate within short time.
F. Test for Flavonoids 1.Shinoda test (Magnesium Hydrochloride reduction test)
To the test Solution, add few fragments of Magnesium ribbon and add concentrated Hydrochloricacid drop wise, pink scarlet, crimson red or occasionally green to blue color appears after fewminutes.

142
Proceeding of Conference : Evolving Paradigm to Improve Productivity for Plant Genetic Resoyrces
2.Zinc Hydrochloride reduction testTo the test solution add a mixture of Zinc dust and conc. Hydrochloric acid. It gives red color afterfew minutes. 3.Alkaline reagent testTo the test solution add few drops of sodium hydroxide solution; formation of an intense yellowcolor, which turns to Colorless on addition of few drops of dil. acid, indicates presence of Flavonoids.G. Test for AnthroquinoneThe powder drug was heated in water containing 10% FeCl
3 solution and 1ml of conc.
HCl. The aqueous layerwas separated and shaken with diethyl ether. The ether extract was furtherwith strong ammonia. Pink or deep red colouration of aqueous layer indicated the presence ofantroquinone. H. Test for Proteins & Amino Acids1.Millons testTest solution with 2ml of Millons reagent , white precipitate appears, which turns red upon gentleheating.2. Xanthprotic testTest solution treated with conc HNO
3 and boil yellow precipitate is formed. After cooling it, add
40% NaOH solution orange colour is formed indicates presence of protein.3.Biuret testTake 1ml of 40% NaOH solution and 2 drops of 1% CuSO
4 solution till a blue colour is produced
, and then add to 1ml of test solution, formation of pinkish or purple violet colour indicates thepresence of protein.4.Ninhydrin testThe test solution boiled with 0.2% solution of Ninhydrin, purpul colour appears indicates presenceof amino acid.I. Test for Sterols & Triterpenoids 1.Libermann- Buchard testExtract is treated with few drops of acetic anhydride, boil and cool, con. Sulfuric acid is addedfrom the sides of the test tube, shows a brown ring at the junction of two layers and the upper layerturns green which shows the presence of Steroids and formation of deep red color indicates thepresence of triterpenoids.2.Salkowski testTreat extract in Chloroform with few drops of cone. Sulfuric acid, shake well and allow standingfor some time, red color appears at the lower layer indicates the presence of Steroids and formationof yellow colored lower layer indicates the presence of Triterpenoids.J. Test for Carbohydrates 1.Molisch's testTreat the test solution with few drops of alcoholic alpha napthol. Add 0.2ml of con. Sulfuric acidslowly through the sides of the test tube, a purple to violet color ring appears at the junction.2.Benedict's testTreat the test solution with few drops of Benedict's reagent and heated on boiling water bath,reddish brown precipitate forms if reducing sugars are present.

143
Proceeding of Conference : Evolving Paradigm to Improve Productivity for Plant Genetic Resoyrces
3.Fehling's testEqual volume of Fehling's A and Fehling's B reagents are mixed and few drops of sample is addedand Boiled, a brick red precipitate of cuprous oxide forms, if reducing sugars are present.4.Barfoed’s testTreat the test solution with few drops of Barfoed’s reagent heated on boiling water bath,redprecipitate indicates the presence of sugar.RESULT AND DISCUSSIONMorphological studiesThe macroscopical examination of the leaves is presented in Table 1.Physicochemical parametersDifferent physicochemical parameters for the purpose of standardization such as loss on drying,ash value (total ash, water soluble ash, acid insoluble ash)and extractive values (petroleum ether,methanol, chloroform, acetone, ethyl acetate and water )for leaves of T.undulata were determined and given in Table 2.Powder AnalysisTreatment of Leaf powder of T. undulata with different chemical reagents has revealed that thepresence of different phytocontituents are tabulated in Table 3.Preliminary phytochemical screeningThe extracts were subjected to preliminary phytochemical analysis to determine the presence ofvarious phytoconstituents and results are tabulated in Table 4.CONCLUSIONIn the present study, the pharmacognostical investigations are helpful for the future identificationand authentification of the plant in the herbal industry. The physical parameters will be useful toidentify and authenticity of the drug even from the powder material and it can also serve as animportant source of information to determine the quality and purity of the plant material in thefuture. The qualitative phytochemical screening is an essential step towards discovery of newdrugs.ACKNOWLEDGEMENTI sincerely thanks to my Guide Dr. R. S. Patel Assistant professor in Botany, Maninagar ScienceCollege, Ahmedabad (Gujarat) for taxonomic idetitification of the plant and their support for providingnecessary facilities.

144
Proceeding of Conference : Evolving Paradigm to Improve Productivity for Plant Genetic Resoyrces
Table-1 macroscopical examination of leaves of tecomella undulata
Sr.No. Observation Leaves 1 Size Lengh 5-
12cm, Width 1-3cm
2 Coluor Outer surface Inner surface
Dark green Light green
3 Apex Obtuse 4 Margins Undulate 5 Venetion Reticulate 6 Taste Tasteless 7 Odour Odourless
Table-2 physical evaluation of powdered drug of leaves of tecomella undulata
Sr.No. Parametrs Values (%)w/w
1 Ash Values
Total Ash 14.3 Water soluble Ash 6.5 Acid insoluble Ash 9.2
2 Extractive Values
Peroleum Ether Extractive 48.48 Methanol Extractive 40.42 Chloroform Extractive 42.54 Acetone Extractive 49.75 Ethyl Acetate Extractive 52.20 Water Extractive 23.56
3. Loss on Drying 8.5

145
Proceeding of Conference : Evolving Paradigm to Improve Productivity for Plant Genetic Resoyrces
Table-3 powdered drug analysis of leaves of tecomella undulata with different chemicalreagents
Sr. No.
Treatment Colour Observed
1 Powder such as Green 2 Powder + Conc. H 2SO4 Dark Brown 3 Powder + Conc. HNO3 Dark Green 4 Powder + Conc. HCl Orange Yellow 5 Powder + Glacial acetic acid Yellow 6 Powder + 1N NaOH in water Green 7 Powder + NaOH in Methanol Yellowish Green 8 Powder + 5% Ferric chloride Greenish Yellow 9 Powder + 1N KOH Light Brown
10 Powder + Picric acid Yellow 11 Powder + Ammonia solution Yellowish Green 12 Powder + HNO3 +Ammonia solution Yellow
Table-4 qualitative phytochemical tests of extracts of leaves of tecomella undulata
Sr. No. Name of the Test P. E. extracts
MET. extracts
CHL. extracts
ACE. extracts
E. A. extract s
Water extracts
1 Test for Alkaloids
A. Dragendroff’s Test + - + - - - B. Mayer’s Tes - + + - - - C. Wagner’s Test + + + - - -
D. Hager’s Test - - - - - -
2 Test for Glycosides
A. Legal’s Test + - + + + - B. Baljet’s Test + + - - + + C. Raymond’s Test - - - - - -
D. Modified Borntrager's test + - + - + +
4 Test for Cardiac Glycosides
A. Kedd’s Test - + - - + -
B. Keller-Killiani Test + + - - + - 5 Test for Saponins A. Forth Test - + + - - -
B. Hemolytic Test - + + + - -

146
Proceeding of Conference : Evolving Paradigm to Improve Productivity for Plant Genetic Resoyrces
(+) indicates presence (-) indicates absence
( P.E.- Petroleum ether, MET- Methanol, CHL- Chloroform, ACE- Acetone, E.A.- Ethyl acetae)
REFERENCESAhmad F, Khan RA and Rasheed S (1994) Preliminary screening of methanolic extracts of Celastruspaniculatus and Tecomella undulata for analgesic and anti-inflammatory activities. J Ethnopharmacol, 3:193-198.Ambasta, SP (2000) The Useful Plants of India, National Institute of Science and Communicationand Information Resources, New Delhi, pp 623-625.
6 Test for Flavanoids
A. Shinoda Test - + - + - -
B. Zn-HCl Test - - + - - - C. Alkaline reagent Test + - + + + - D. Lead acetate test + + - + - -
E. Ammonia Test + - - + + +
7 Test for Tannins
A. Gelatin Test - - + - - -
B. Ferric Chloride Test - - + - + - C. Vanillin-HCl Test + - + - - + D. Lead acetate Test + + + - + +
8 Test for Sterols A. Libermann- Buchard
test + + + - - + B. Salkowaski Test + + + - - - C. Sulphur Test - + + + - +
9 Test for Anthroquinone + + + + + +
10 Test for Triterpinoids
A. Libermann- Buchard test - - - + + -
B. Salkowaski Test - + - - - +
11 Test for Proteins
A. Xanthoproteic Test - - - + + +
B. Millon's Test - + - - - -
C. Biuret Test + - + - - -
D. Ninhydrin Test + - + - + +
12 Test for Charbohydrates
A. Molisch's Test - + + - - +
B. Barfoed's Test - + - - - -
C. Benedict's Test - + - - - -
D. Fehling's Test - - - - - -
E. Phloroglucinol Test + - - - - -

147
Proceeding of Conference : Evolving Paradigm to Improve Productivity for Plant Genetic Resoyrces
Azam MM (1999) Anti-HIV agents and other compounds from Tecomella undulata. Orient.J.Chem. 15:375–377.Evans WC, Trease GE (2002) Trease and Evans pharmacognosy by W.B. Saunders, China, pp193-407.Gujral VK, Gupta SR and Verma KS (1979) A New chromone glucoside from Tecomellaundulata. Phytochemistry, 18:181-182.Harborne JB (1998) Phytochemical methods. A guide to modern technique of plant analysis.3rd
edition Chapman and Hill Int. Ed., New York.Indian Pharmacopoeia 2 (1996) Government of India, Ministry of health and family welfare,controller of publication, New Delhi, A53-A54.Joshi KC, Prakash L and Singh LB (1972) Lapachol and other constituents from the bignoniaceaePhytochemistry, 11(4):1498.Khandelwal KR, Kokate CK and Gokhale SB (1996) Practical pharmacognosy techniques andexperiments, Nirali Prakashan, Pune, pp 45-95.Khatri A, Garg A and Agrawal SS (2009) Evaluation of hepatoprotective activity of aerial parts ofTephrosia purpurea L. and stem bark of Tecomella undulata. J Ethno Pharmacol, 122 (1):1-5.Kokate CK (2008) Practical Pharmacognosy, Vallabh Prakashan, Delhi, pp 110-111. KokateCK, Purohit AP and Gokhale SB (2009) Pharmacognosy. Nirali Prakashan, pp 616-617.Nadkarni KM and Nadkarni AK (2006) Indian Materia Medica, Vol. I, 3rd ed., PopularPrakashan, Mumbai, pp 1197-1199.Pandey VB and Dasgupta B (1970) A new ester glucoside from the bark of Tecomella undulata.Cellular and Molecular Life Sciences , 26(11):1187-8.Parekh JJ and Chanda DS (2005) Efficacy of aqueous and methanol extracts of some medicinalplants for potential antibacterial activity. Turk J Biol, 29:203-210.Rastogi RP and Mehrotra BN (2006) Compendium of Indian Medicinal Plants, Vol. I, CentralDrug Research Institute, Lucknow, 711-12.Verma KS, Jain AK and Gupta SR (1986) Structure of Undulatin: A New Iridoid Glucoside fromTecomella undulata. Planta Medica, 52(5):359-362.

148
Proceeding of Conference : Evolving Paradigm to Improve Productivity for Plant Genetic Resoyrces
Statistical analysis of spectral separability of mangroves in visibleand infrared region: a case study in tada talav village near
Khambhat, Gujarat
Alpana Shukla+,, Manish Thaker+, S.S. Manjul* And H.B. Chauhan*
+ M.G. Science Institute, Ahmedabad,India*Space Applications Center, Ahmedabad, India E-mail:- [email protected]
ABSTRACTMangroves are trees of various species of several families occurring at the tropical or sub tropicalseas, in the bays, lagoons and estuarine region (Gerlech, 1973) They are a very important ecosystem,having many economical and ecological uses. The Mangroves are threatened by the expansion ofhuman settlements, the boom in commercial aquaculture, the impact of industries, recreationalactivities, etc. Such threats are leading to an increasing demand for detailed mangrove maps forthe purpose of measuring the extent of the decline of mangrove ecosystems. Remote sensing,because of its repetitive, synoptic, multi-band, multi-sensor capabilities becomes an ideal choicefor mapping and monitoring the mangroves. It allows information to be gathered from the forbiddingenvironment of mangrove forests, which otherwise, logistically and practically speaking would beextremely difficult to survey. Because of high reflectance in IR band it is used with green and redband for identification of mangroves. SWIR in Middle IR is used for recording water content in theleaf. In the present study, two Ground Truth Radiometers (GTR), indigenously built at SAC andhaving visible, NIR and MIR bands, were used to further identify specific bandwidth to separatemangroves from mudflats. Tada talav area in the Bhavnagar taluka was selected for the presentstudy and Radiometer readings were taken at the mangrove patches present. Observations wereanalyzed and radiance values were plotted against the different bands. It was observed that in NIRregion, wavelength 754nm (BW 720nm-788nm) gives better separation of mudflat and mangrovethan 863 nm (BW 825nm – 900nm). In the MIR region, Bands 1500 (BW 50nm) and 1640 (BW30nm) give better separation than Band 1625 (BW 63). This shows that the bands with narrowbandwidth and higher number of bands are more useful for separating coastal features likemangroves, mudflats and other vegetations. Further, applying Statistical Analysis measures likeANOVA and‘t’-test, it could be seen very clearly that radiance value of mud is significantly higherthan that of land with mangroves and mixed vegetation. Statistics indeed has a positive effect onscientific research which ultimately leads to decisions for the betterment of the Society.Keywords: Mangroves, Ecosystem, Remote Sensing, Band, Coastal, RadiometerINTRODUCTIONMangroves are the most interesting but endangered salt tolerant higher groups of plants(Angiosperms) found in coastal regions, generally inundated during high tides and exposed during

149
Proceeding of Conference : Evolving Paradigm to Improve Productivity for Plant Genetic Resoyrces
the low tides. They grow on the waterlogged soils that are often lacking in oxygen, in regions ofEstuaries and Broad Muddy Tidal Flats. In the field they are distinguishable due to their AerialRoot Systems, which is an adaptation to the environment for their successful growth.They provide habitat for other flora and fauna like algae, crabs, fishes, marine invertebrates, mollusks,etc. They also stabilize the coastline which is otherwise subject to erosion and loss. They act asNatural Barrier against storm-tide that would otherwise have a more damaging effect on low-lyingland areas. They are very important "land builders" which help form islands and extend shores.Mangrove Forests help in maintaining the quality of the coastal water by extracting chemical pollutantsfrom the water. World over, the coastal population depend on mangroves for their day to dayliving.Mangroves are a source of several important items like, wood, medicines, alcohol, cigarette andcigar substitutes, condiments, cooking oil, cork, dyes, fodder, glue, herbal teas, paper tannins,vegetables, vinegar etc. (IUCN, 1993).The distribution of Mangroves on the Gujarat coast line indicates major areas in Kori creek, Gulfof Kachchh, and Gulf of Khambhat. Mangroves in Kori creek area are fully grown and other thanthis area, average height of the mangrove in Gujarat coast is not more than 1 to 1.5 m. Densitywise also, generally it is moderately dense, making it difficult to properly demarcate mangroves inmuddy substrate.Mangroves are under constant threat of natural or man-made activities. Man made threats likesIndustries Development. Port Activities, Construction, Sewage treatment, Recreational activities,Aquaculture activities and energy development are highly affecting mangroves. Natural threatslikes, Change in salinity, Sedimentation, Sea-level rise, Change in temperature are also affectingmangroves. Since Mangroves are an integral part of human life directly or indirectly, sustainable &integrated development is necessary.Remote Sensing data has been used for the study of the threat on the mangrove, because of itsrepetitive, multispectral and synoptic nature has proved to be extremely useful in providinginformation on various components of the coastal environment, including Mangroves.The Mangroves are under constant threat- natural or man-made. Man-made threats Natural threats• Industry Development Change in temperature• Port Activities Change in salinity• Construction Sedimentation• Sewage treatment Sea-level rise• Recreational activities• Aquaculture activities• Energy development

150
Proceeding of Conference : Evolving Paradigm to Improve Productivity for Plant Genetic Resoyrces
Objective and study area• The present work aims to study the spectral separability of Mangroves in visible and
infra red region.• It also aims to study the impact of Statistics on the observations and inferences. •
The area of study-Tada Talav, is situated near Khambhat in Gujarat. ( Fig.1) •L a r g estretch of mudflats and mangrove are present in this region.
• Mainly it has Avicennia sp. but Rhizophora sp. also is present.• As it was not possible to physically reach Rhizophora, readings of only Avicennia sp.
were recorded.
Fig-1 Location MapMethodology
• Field visit was carried out for three times (Once every other month) during the low tideperiod.
• Every time in the field,• Radiometer reading of reflected flat panel surface was taken first and then observation
from Mangrove, mudflats, soil and Sueada sp. were taken.• These observations were taken during 11.00 am to 12.00 noon.• Ground truth radiometers namely Multiband GT
Radiometers, having 12 and 9 bands respectively, in visible and IR region were used. (Table-1and 2)

151
Proceeding of Conference : Evolving Paradigm to Improve Productivity for Plant Genetic Resoyrces
Table-1 Band Specifications of Radiometer1:
Band Number Center wavelength Band width (nm)
B1 90.000 46.000
B2 302.000 162.000
B3 863.000 543.000
B4 1097.000 690.500
B5 1920.000 1282.000
B6 1555.000 1053.000
B7 2314.000 1633.000
B8 1415.000 1029.000
B9 1419.000 1002.500
B10 1056.000 704.000
B11 1907.000 1272.500
B12 1036.000 697.000
Table-2 Band Specifications of Radiometer2:
Band Band width
B1 444
B2 478
B3 578
B4 668
B5 754
B6 445
B7 517
B8 715
B9 863

152
Proceeding of Conference : Evolving Paradigm to Improve Productivity for Plant Genetic Resoyrces
Observations: These are as per Table-3.
IRS Ground Truth Radiometer(GTR) Readings
Date : - Village : - Tada Talav
Lat. : - 22.15'55.588N
Long. : -
Band Mangroves (10 - 5) Grass(10 - 5) Suaeda(10 - 5
Suaeda Purple(10 - Mud(10 - 5) 5
B1 6.800 8.212 ) 8.232
) 5.735
16.4
B2 13.200 13.225 13.262 8.451 28.3
B3 4.383 4.372 4.375 4.379 22.18
B4 2.585 2.578 2.578 2.581 24.83
B5 7.415 7.399 7.401 7.406 25.54
B6 3.269 3.260 3.26 3.263 24.81
B7 3.901 3.893 3.891 3.895 19.96
B8 1.689 1.684 1.684 1.686 16.95
B9 11.305 11.285 11.295 11.293 113.09
B10 0.061 0.066 0.054 0.02 0.4
B11 0.064 0.081 0.057 0.03 0.4
B12 0.077 0.09 0.062 0.045 0.44
Statistical analysis techniques:• Analysis of Variance – ANOVA• ANOVA, developed by Prof R.A. Fisher in 18th century, helps to test the significance
difference among several means.• If ANOVA gives significant results then Tucky-HSD a post hoc analysis is adopted to
find which mean differs significantly from the rest.
RESULT AND DISCUSSION
The results of this exercise were very interesting and fulfilling the objectives. They are shown in Fig2 and Fig 3 as well as Tables 3, 4, and 5.

153
Proceeding of Conference : Evolving Paradigm to Improve Productivity for Plant Genetic Resoyrces
Radiometer values of different coastal features
14.000
Band number
Mud (10 - 4)
Mangroves (10 - 5)
Grass(10 - 5)
Suaeda(10 - 5)
Suaeda Purple(10 5)
Ra
dian
ce v
alu
e
Fig-2 Graph showing radiance values of Radiometer1
0 1 2 3 4 5 6 7 8 9
10
1 2 3 4 5 6 7 8 9
Soil Mudflat Mangrove
Fig-3 Graph showing radiance values from Radiometer 2
Table-3 ANOVA 1
Source Type III Sum of Squares df Mean Square F Sig.
Model 12234.809a 16 764.676 5.220 .000
landclass 3822.079 4 955.520 6.523 .000
Band no. 4092.524 11 372.048 2.540 .014
Error 6445.267 44 146.483
Total 18680.076 60
Table-4 Multiple Comparisons – Dependent Variable : Radiance

154
Proceeding of Conference : Evolving Paradigm to Improve Productivity for Plant Genetic Resoyrces
- .1163
- .1168
- 14.1692
- 14.1697
.1163 4.94104
- 14.0533
- 13.4394
- 13.9360 .1 168 4.94104
- 14.0523
- 13.4389
- 14.5499 - .4971 4.94104
- 14.6663
- 14.6668 - .6139
19.8792 * 4.94104
Mean Std. (I) landclass (J) landclass Difference Error
(I-J)
Sig.
95% Confidence Interval
Lower Bound
Upper Bound
Grass(10 - 5) 4.94104
Suaeda(10 - 5) 4.94104 Mangroves
1.000
1.000
13.9365
13.9360
(10 - 5) Suaeda Purple(10 - .4971 4.94104 5)
1.000 -13.5558 14.5499
Mud(10^-5 -19.8792* 4.94104
Mangroves (10 - 5)
1.000
-5.8264
14.1692
Suaeda(10 - 5) -.0005 4.94104 Grass (10 - 5) Suaeda Purple(10 - .6134 4.94104
5)
1.000
1.000
14.0523
14.6663
Mud(10^-5 -19.7629* 4.94104
Mangroves (10 - 5)
.002 1.000-33.8158 -5.7101
14.1697
Grass(10 - 5) .0005 4.94104 Tukey HSD Suaeda (10 - 5) Suaeda Purple(10 - .6139 4.94104
5)
1.000
1.000
14.0533
14.6668
Mud(10^-5 -19.7624* 4.94104
Mangroves (10 - 5)
.002 1.000-33.8153 -5.7096
13.5558
Suaeda Grass(10 - 5) -.6134 4.94104 Purple
(10 - 5) Suaeda(10 - 5) 4.94104
1.000
1.000
13.4394
13.4389
Mud(10^-5 -20.3763* 4.94104
Mangroves (10 - 5)
.001 -34.4292 -6.3235
33.9321
Grass(10 - 5) 19.7629* 4.94104 Mud .002 5.7101 33.8158
(10^-5) Suaeda(10 - 5) 19.7624* 4.94104 .002 5.7096 33.8153
Suaeda Purple(10 - 20.3763* 4.94104 5)
.001 6.3235 34.4292
.002 5.82 64
.002 - 33.9321
- 13.9365

155
Proceeding of Conference : Evolving Paradigm to Improve Productivity for Plant Genetic Resoyrces
Table -5 Statistical analysis:
Radiance:
Land class N Subset
1 2
Tukey HSDa,,b
Suaeda Purple(10 - 5) 12 4.0653
Mangroves (10 - 5) 12 4.5624
Grass(10 - 5) 12 4.6788
Suaeda(10 - 5) 12 4.6793
Mud(10^-5 12
24.4417
Sig. 1.000 1.000
CONCLUSION
• From present exercise it can be concluded that:• Mangrove can be separated from mud and Sand in band number 9 (863nm)• Though, dry Sueada sp. could be separated from mangrove and grass in band 2 (478nm),
in IR region band 9 (863nm) it was difficult to separate mangrove, grass and Sueada sp.• For further separation, different methods like Band ratio or Principal component analysis
can be tried.• Ellipsoidal separability and Hyperspectral data will also be tried.• To test the significant difference of radiance amongst various land classes and impact of
band wavelength on radiance, two way ANOVA techniques were applied and from theresults it may be concluded beyond doubt that mud flat has maximum radiance ascompared to other land classes studied in this case.
• Out of the various bands studied, the band wavelength 1419nm showed maximumseparation of land classes on the basis of radiance.
• It can thus be concluded that there is indeed a positive impact of Statistics on the presentstudy and similar studies, leading to better management solutions for the society.

156
Proceeding of Conference : Evolving Paradigm to Improve Productivity for Plant Genetic Resoyrces
ACKNOWLEDGEMENT• Dr.B.K.Jain – Principal, M.G. Sc. Institute and the Ahmedabad Education Society, for
their help and support.• Our profound sense of gratitude to Dr.Ajai, Group Director, MESG, Space Applications
Centre, for his encouragement, valuable counsel and constructive criticism throughoutour work.
• We are also thankful to Shri R.M.Dwivedi, Head, MCED, SAC, Ahmedabad, forproviding all the necessary help during the work.
• Dr. Manjul , Scientist, SAC for providing the ground truth radiometers.REFERENCESChauhan, H. B. et al., 2004a. Land use Mapping of the West Bengal Coastal Regulation Zone.Scientific Note: SAC/RESIPA/MSCED/CRZ/SN/21/04.SAC, Ahmedabad. pp. 72Chauhan, H. B., et al., 2004b. Land use Mapping of the Karnataka Coastal RegulationZone. Scientific Note: SAC/ RESIPA/MWRG/MSCED/CRZ/SN/23/04. SAC, Ahmedabad. pp.35Nayak Shailesh, 1997. Information needs of integrated coastal zone management: Role of RemoteSensing and Geographic Information System. In the proceedings: Workshop on integrated coastalzone management, April 2-4, 1997, Gandhinagar. pp. 6-26.

157
Proceeding of Conference : Evolving Paradigm to Improve Productivity for Plant Genetic Resoyrces
Study of the effect of metal ions present in plant and water samplesat vatva gidc (phase -1) industrial zone
S. Menon, C. J. Patel, S. Jain And P. Tripathi
Biology department, k.k.shah jarodwala maninagar science college, rambaug, maninagar,ahmedabad-380008. E-mail: – [email protected]
ABSTRACTThe pollution of ground water is a subject of a major concern because of its increasing utilizationfor human needs and secondly because of the ill effects of the increased industrial activity especiallyin the Urban climate. Plants are excellent receptors and accumulators of metals. Absorption ofmetals varies with the plant species and different parts of plants. Analysis of plant tissues such asleaves, twigs, wood and bark show elevated metal content at polluted sites. Aerial parts of theplants can easily capture trace metals, while roots absorb metallic compounds. The study carriedout shows the concentration of sodium, potassium and calcium ions in post rainy season inAhmedabad district which affects water and plant growth. Thus a further study requires to bedone.Keywords: Effluents, toxicants, seedlingINTRODUCTION
Vatva-gidc=industrial hub

158
Proceeding of Conference : Evolving Paradigm to Improve Productivity for Plant Genetic Resoyrces
The word ‘pollution’ is derived from the Latin word ‘pollutionem’, meaning defilement. Todaywater resources have been the most exploited natural system since man strode the earth. Pollutionof water bodies is increasing steadily due to rapid population growth, industrial proliferations,urbanizations, increasing living standards and wide spheres of human activities.Ground water, rivers, seas, lakes, ponds and streams are finding it more and more difficult toescape from pollution. Many rivers of the world receive heavy flux of sewage, industrial effluents,domestic and agricultural wastes which consist of substances varying from simple nutrient to highlytoxic hazardous chemicals. Effluents containing acids and alkalies make the water corrosive.Excessive addition of Nitrates and phosphate in a aquatic system, causes "eutrophication" in water.It leads to depletion of oxygen due to excessive algal growth, thereby increasing BOD (Biologicaloxygen demand) of water. It also leads to death of fish and other aquatic life (Sharma, Kaur,1995)The problem of disposal of industrial waste whether solid, liquid or gas all three types of wasteshas the potential of ultimately polluting water (Uzair et.al, 2009).The untreated industrial effluents are discharged directly into the neighboring water bodies or ontoagricultural land. The water thus contaminated is used by farmers to irrigate their crop field (Shreshta,Niroula, 2003).Urbanization and Industrialization has posed a major problem of safe disposal of sewage andindustrial effluents in different parts of country (Shah et.al)The quality of water is of vital concern for mankind since it is directly linked with human welfare((De, 1987)AIMS AND OBJECTIVES
1. To collect water samples from different sites at Vatva GIDC (Phase – 1)2. To collect plant samples from different sites at Vatva GIDC (Phase – 1)3. To study the amount of metal ions in water and plant samples.4. To analyze the data.
MATERIALS AND METHODSAhmedabad is the leading industrial center of Gujarat state, comprising two GIDC estates, i.e.Vatva GIDC and Naroda GIDC. In these areas, ground water is found in unconfined aquifers. Itis mainly obtained through bore wells. The ground water is being over exploited due to industrialuse. The polluted water has direct impact on flora, fauna and human population (Rawal, 2011)Water samples were collected from different sites at Vatva GIDC-phase-1 in three months March,July and August, 2011 respectively. Plant species were collected from the same sites as watersamples were collected (Table 2). Water samples were analyzed using ‘Flame photometer’ (ELICOCL 354). Plant samples were also weighed and analyzed using ‘Flame photometer’. Flamephotometer consists of many components such as burner, monochromator, slit system, detectorsystem and recording output of the detector (Agarwala and Lal, 2011).

159
Proceeding of Conference : Evolving Paradigm to Improve Productivity for Plant Genetic Resoyrces
RESULT AND DISCUSSIONThe observation Table – 1 indicates different types of ions already present in different types of soil.The observations from Table – 2 explains that the plant species collected belonged to familiesPoaceae, Mimosaceae, Solanaceae, Asclepiadaceae and Amarantaceae. The plant collectedshowed different values of Sodium, Potassium and Calcium ions respectively.The observation Table – 3 explains that Sodium ions are highest in Launaea species, Potassiumions are highest in Amarantus species and Calcium ions are highest in Prosopis species.The observation Table – 4 shows nine different water samples collected in March – 2011, June –2011 and August – 2011respectively. These samples were collected on the basis of onset ofmonsoon and afterwards. The mean value of Sodium ions were highest in the water samplescollected in August, 2011. The mean value of Potassium ions were highest in the water samplescollected in August, 2011. The mean value of Calcium ions were highest in the water samplescollected in August, 2011.The observation Table – 5 explains that in water samples, Sodium ions are highest in months ofJune – 2011 and August – 2011.The presence of Sodium ions are lowest in month of March –2011. The presence of Potassium ions are highest in month of June – 2011 and lowest in monthsMarch – 2011 and August – 2011 respectively. The presence of Calcium ions are highest in monthof March – 2011Calcium and Magnesium values were found above permissible limits in ground water of industrialareas especially during monsoon. Disposal of sewage and industrial waste are the most possiblesources of Calcium and Magnesium.Sodium ions were remarkably higher in water in the industrial area throughout the year. Dischargeof domestic and commercial effluents to open water bodies is the possible source of sodium inwater. The higher concentration of sodium is related to cardiovascular diseases and toxemia inwomen associated during pregnancy (Rawal, 2011).CONCLUSIONThe presence of Sodium, Potassium and Calcium ions in the water samples disturb the physiologicalphenomenon in plants. The amount of Sodium, Potassium and Calcium ions are useful up to acertain limit and when excess hinders the growth of plants. Vatva industrial zone is turning out to bea major area of concern in years ahead. Implementation of strict rules and regulation is the need ofthe hour.Pollution is generally associated with heavy industrialization and dense population and is one of theprincipal ecological problems of the River Nile system (Ali and Soltan, 1996)ACKNOWLEDGEMENTThe authors are indebted and thankful to Principal Dr R.R.Shah and Biology staff of K.K.ShahJarodwala Maninagar Science College, Maninagar, Ahmedabad for their constant support andadmiration. The authors are extremely thankful to Prof. C. J. Patel (Chemistry Department) for hisguidance and invaluable contribution in our data analysis. We are also thankful to Chemistry staff

160
Proceeding of Conference : Evolving Paradigm to Improve Productivity for Plant Genetic Resoyrces
for their valuable support. The students whoever have helped us have been a source of inspiration.The authors are also thankful to GUJCOST for providing financial assistance for the Project.REFERENCESBooksAgarwala S.K and Lal.K, 2011. Advanced Inorganic analysis.Pragati Prakashan, Meerut. pp -361De A.K.1987. Environmental Chemistry. Wiley Eastern Limited, New Delhi, pp-135.Shah,G.L, 1978. Flora of Gujarat State, Sardar Patel University, Vallabh Vidyanagar.Sharma.B.K and Kaur.H, 1995. Environmental Chemistry.Krishna Prakashan Mandir, Meerut.ArticlesAli, M.M and Soltan, M.E, 1996. The impact of three industrial effluents on submerged plants inthe River Nile, Egypt. Hydrobiologia, 340: 77 – 83.Rawal,K.G, 2011. Physico – Chemical properties of ground water of Ahmedabad region,Gujarat,India. BioScience Guardian, 1(2), pp- 647-652Shah.A.N, Ghariya.A.S, Puranik.A.D, Suthar.M.B, 2008. A Preliminary study on water quqlityfrom Kharicut canal passing through Vatva area of Ahmedabad city, Gujarat State. ElectronicJournal of Environmental Sciences, Vol-1, pp-49-56.Shreshta.M.K and Niroula.B, 2003. Germination Behaviour of Pea seeds on Municipality sewageand some Industrial effluents of Biratnagar, Nepal. Our Nature, 1:33-36.Uzair.M, Ahmed.M and Nazim.K, 2009. Effect of Industrial Waste on Seed Bank and Growth ofWild plants in Dhabeji area, Karachi, Pakistan. Pakistan Journal of Botany, 41(4): 1659 – 1665.Table-1 Nature of pollutants in water and soil (sharma,kaur, 1995)
SOURCE GASES COLLOIDS SUSPENDED PARTICLES
DISSOLVED IONS
Cations Anions
Soil & Mineral
CO2 Clay Fe2O3, Al2O3, MnO2
Clay, Silt, Sand
Na+,K+,Ca2+,
Mg2+, Fe3+,
Mn2+, Co2+
CO32,HCO-3,Cl,SO42-
,OH-
Decomposed Organic Matter
H2, SO2,CH4,NH3
Organic wastes
Humus Organic Waste
H+,Na+,NH4+ Organic
radicals Cl-, HCO3
-
,SO42,NO3-

161
Proceeding of Conference : Evolving Paradigm to Improve Productivity for Plant Genetic Resoyrces
Table-2 Presence of metal ions in plant species (shah, 1978)
Sr.no Sample no (Plant extract) Name of plant species Sodium (Na+) ppm
Potassium (K+) ppm
Calcium (Ca+) ppm
1. 1 Prosopis juliflora (Sw), DC
33 31 04
2. 2 Tridax procumbens 16 25 01
3. 3 Launaea procumbens (Roxb)
46 10 01
4. 4 Amarantus spinosus.L
15 50 01
5. 5 Datura innoxia Mill, Grdn
29 20 00
6. 6 Calotropis procera (Ait), R. Br
21 20 03
Table-3 Data showing metal ions in plant species
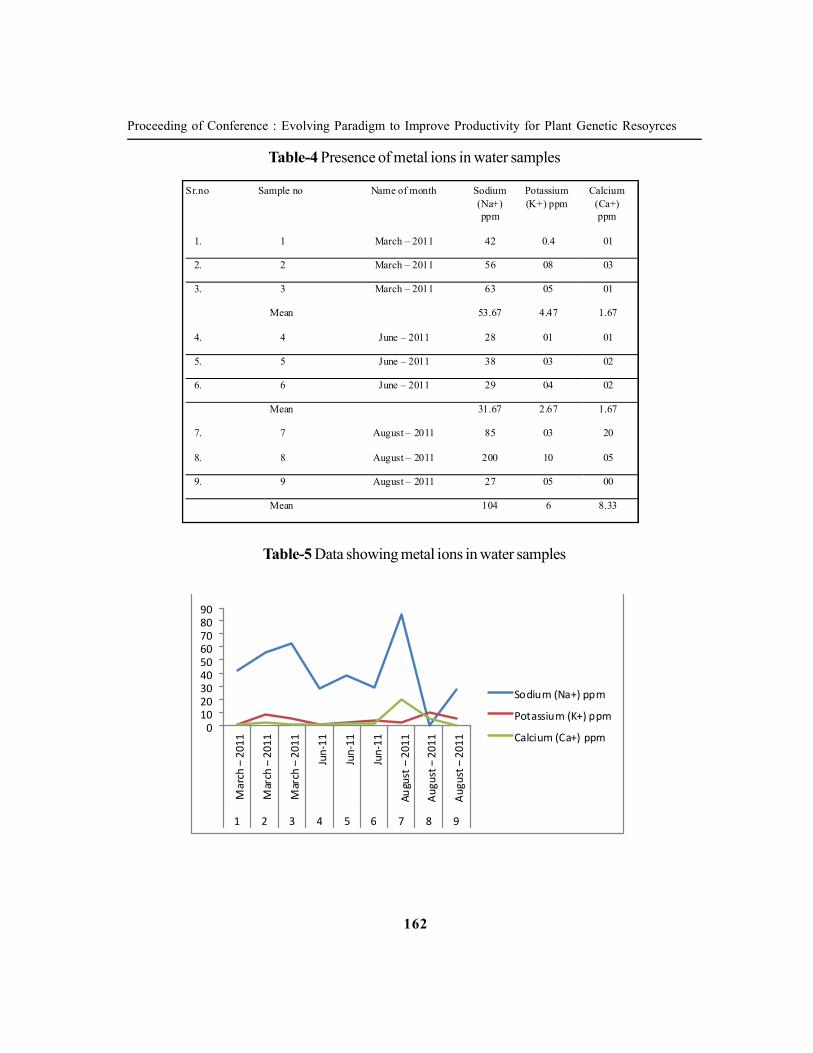
162
Proceeding of Conference : Evolving Paradigm to Improve Productivity for Plant Genetic Resoyrces
Table-4 Presence of metal ions in water samples
Sr.no Sample no Name of month Sodium (Na+) ppm
Potassium (K+) ppm
Calcium (Ca+) ppm
1. 1 March – 2011 42 0.4 01
2. 2 March – 2011 56 08 03
3. 3 March – 2011 63 05 01
Mean 53.67 4.47 1.67
4. 4 June – 2011 28 01 01
5. 5 June – 2011 38 03 02
6. 6 June – 2011 29 04 02
Mean 31.67 2.67 1.67
7. 7 August – 2011 85 03 20
8. 8 August – 2011 200 10 05
9. 9 August – 2011 27 05 00
Mean 104 6 8.33
Table-5 Data showing metal ions in water samples
0 10 20 30 40 50 60 70 80 90
Mar
ch –
2011
Mar
ch –
201
1
Mar
ch –
201
1
Jun -
11
Jun -
11
Jun -
11
Augu
st –
201
1
Augu
st –
2011
Augu
st –
201
1
1 2 3 4 5 6 7 8 9
Sodium (Na+) ppm
Potassium (K+) ppm
Calcium (Ca+) ppm

163
Proceeding of Conference : Evolving Paradigm to Improve Productivity for Plant Genetic Resoyrces
Photograph – 1 plants affected by dyes used in chemical factory
Photograph – 2 water effluents thrown into open soil area.
Photograph – 3 student - punit tripathi collecting soil samples

164
Proceeding of Conference : Evolving Paradigm to Improve Productivity for Plant Genetic Resoyrces
Photograph – 4 student – sweta jain collecting water samples

165
Proceeding of Conference : Evolving Paradigm to Improve Productivity for Plant Genetic Resoyrces
Seasonal variation in the water quality of Gota Lake
Pradeep U. Verma, Deepika K. Chandawat And Hitesh A. Solanki
Department of botany, school of sciences, gujarat university, ahmedabad 380009E-mail:- [email protected] and [email protected]
ABSTRACTThe objective of this work is to evaluate the water quality of Gota lake. Seasonal variation ofsome physical parameters such as pH, Turbidity, Electrical conductivity, Total dissolve solid, andsome of the chemical parameter such as Alkalinity, Dissolved oxygen, Biological oxygen demand,Total Hardness, Calcium, Magnesium, Chloride, Carbon dioxide, Sulphate, Nitrate and Phosphatewere studied. The study was carried out from March 2009 to February 2010. Analysis of physicaland chemical parameters were carried out by using the method suggested by APHA (1985),Kumar and Rabindranath (1998) and Trivedy and Goel (1984). The variation found during theanalysis was as a result of human activity and the discharge of waste water to the lake. The wastewater of complete Gota village is directed into the Gota lake and because of this reason very soonGota lake would become ecological inactiveKeywords: Water, Gota Lake, Pollution, Ahmedabad, Physico-chemical parameter.INTRODUCTIONThe condition of a lake at a given time isthe result of the interaction of manyfactors—its watershed, climate, geology,human influence, and character istics of thelake itself. With constantly expandingdatabases and increased knowledge,limnologists and hydrologists are able tobetter understand problems that developin particular lakes, and further developcomprehensive models that can be usedto predict how lakes might change in thefuture. While the development of alimnological database and knowledge isimportant, no amount of generalization canprovide a full understanding or predictconditions of any particular lake. Each lakesystem is unique, and its dynamics can beunderstood only to a limited degree based on information from other lakes. Just as a physician would
GOTA LAKE

166
Proceeding of Conference : Evolving Paradigm to Improve Productivity for Plant Genetic Resoyrces
not diagnose an individual’s medical condition or prescribe treatment without a personal medicalexamination, a limnologist or hydrologist cannot accurately assess a lake system or suggest amanagement strategy without data and analysis from that particular lake and its environment.In Ahmedabad there are many number of water bodies, among all these water bodies many ofthem are natural and many of them are artificial. Initially all the water bodies in Ahmedabad werenatural, but now some of this lake were improved by "Ahmedabad Urban Development Authority"(AUDA) and "Ahmedabad Municipal Corporation" (AMC) to restore the rain water and to rechargeunderground aquifers. The present study was carried on Gota lake. Gota lake is located in thewestern part of Ahmedabad city. The lake is natural lake and is located in the center of Gotavillage. The sewage waste of complete Gota village is directly discharge into this lake, and peopleof the village also use to wash their cloth in this lake. The cattle of the villagers also take bath in thislake. The lake covers an area of 20,298 m2. And its latitude and longitude are 23005’41.20" Nand 72032’13.87" E.MATERIALS AND METHODSThe present study was carried out for Gota Lake, located in Ahemdabad city. In the present studythe sampling was done during morning hour. The water samples were collected in the polyethylenebottles. The closed bottle was dipped in the lake at the depth of 0.5 to 0.7 m, and then a bottlewas opened inside and was closed again to bring it out at the surface. The samples were collectedfrom five different points and were mixed together to prepare an integrated sample. From the timeof sample collection to the time of actually analyses, many physical and chemical reactions wouldchange the quality of the water sample; therefore to minimize this change the sample were preservedsoon after the collection. The water samples were preserved by adding chemical preservativesand by lowering the temperature. The water temperature, pH, DO, EC and TDS were analyzedimmediately on the spot after the collection, whereas the analyses of remaining parameters weredone in the laboratory.The study was carried for a period of 1 year (March 2009 to February 2010). Monthly data wascollected, but results were represented season wise. Four month make one season [March to Junesummer season, July to October monsoon season, and November to February winter season].Thecollected water samples were brought to the laboratory and relevant analysis was performed. pHwas determined electrometrically using digital pH meter, electrical conductivity was measured byconductivity meter, dissolved oxygen is measured by DO meter, total dissolve solid was measured byusing TDS meter and similarly turbidity is measured by Nepthalo turbidity meter. Alkalinity, chloride,TDS, calcium, magnesium, total hardness, nitrate and phosphate were determined by method suggestedby APHA (1985), Kumar and Rabindranath (1998) and Trivedy and Goel (1984). Estimation ofsodium was done by Flame Photometric method. The mean value of the monthly data was calculatedas season wise and standard error was also calculated by using following formula
Standard deviation

167
Proceeding of Conference : Evolving Paradigm to Improve Productivity for Plant Genetic Resoyrces
Standard error
RESULT AND DISCUSSIONTemperature Desai (1995) suggested that the water temperature may depend on the season, geographic locationand sampling time. The temperature plays a crucial role in physico-chemical and biological behaviorof aquatic system (Dwivedi and Pandey, 2002). Whereas according to Singh and Mathur (2005)temperature is one of the most important factors in the aquatic environment.The temperature of Gota lake ranges between 16 ±1.22 oC to 28 ±1.47 oC the maximum temperaturewere noted during the summer season and the minimum was noted during winter season. Similarresult was observed by Saha (1980). According to Bohra (1975) in winter the water temperatureremain low due to low atmospheric temperature. Water temperature influence aquatic weeds andalgal blooms (Zafar, 1964).Electric conductivityElectrical conductivity in the water is due to salt present in water and current produced by them. Itmeasures the electric current which is proportional to mineral matter present in water. Electricconductivity recorded in Gota lake ranges between 2.64 ±0.07 mhos/cm to 3.78 ±0.11 mhos/cm. The high value of conductivity was recorded during the summer season were as low value wasrecorded during winter season. Due to evaporation the water in the Gota lake decreases duringsummer. Addition of sewage waste from the surrounding village into lake result into the increase inthe value of electrical conductivity during summer season. Ahluwalia (1999) and Solanki (2001)observed similar type of result.TurbidityTurbidity is the measure of the light scattered by suspended particles. The substances not presentin the form of solution cause it. Turbidity in Gota lake recorded ranges between 18 ±1.83 NTU to24 ±1.41 NTU. The maximum turbidity in water was recorded during monsoon season whereasminimum turbidity was recorded during summer season. According to Mariappan and Vasudevan(2002) high turbidity shows presence of large amount of suspended solids. Suber (1953) ; Vermaet al., (1978) suggested that higher turbidity affects the life indirectly, as its cut of light to beutilized by the plants for photosynthesis there by lowering the rate of primary productivityTotal dissolve solidEsmaeili and Johal (2005) dissolve solids are composed mainly of carbonates, bicarbonates,chloride, sulphate, nitrate, calcium, magnesium potassium iron and manganese in natural water.Due to contamination of domestic waste water, garbage, fertilizer, etc in the natural surface waterbody the value of TDS was reported to be high. The amount of total dissolve solid in Gota lakeranges between 1576 ±17.4 ppm to 1824 ±40.3 ppm. The maximum amount of total dissolvesolid was recorded during winter season and minimum was recorded during monsoon. The amount

168
Proceeding of Conference : Evolving Paradigm to Improve Productivity for Plant Genetic Resoyrces
of TDS recorded is above the desirable limit, given by BIS (1991) and WHO (1984). The increasein the amount of TDS is due to addition of sewage waste and detergent from the surroundingregion. This addition of waste in lake release organic substance in the water which results into highvalue of TDS. The decrease in the amount of TDS during monsoon season was also recorded thismight be due to dilution of water by the rain water. This result is supported by Gonzalves and Joshi(1946). Similar result was also observed by Freeda et al., (2006) and Murugesan et al., (2006).pHVerma et al., (1978) and Sharma et al., (1981) have reported that generally in India many smallconfined water pockets particularly are alkaline in nature. The water of Gota lake also remainalkaline throughout the year. The pH value recorded ranges between 8.3 ±0.13 to 9.1 ±0.18. Themaximum pH was recorded during summer season and the minimum pH was recorded duringmonsoon season. Wani and Subla (1990) reported that the pH value above 8 in natural water areproduced by photosynthetic rate that demand more CO
2 than quantities furnished by respiration
and decomposition. The pH of water also depend on the relative quantities of calcium, carbonateand bicarbonate. Moitra and Bhattacharya (1965) observed that high pH value was related toheavy bloom of phytoplankton. According to Bridge and Jaday (1911) pH value of water dependslargely on the amount of free CO
2.
Total alkalinityThe alkalinity of water depends on the carbonate and bicarbonate solely and to lesser degree withmagnesium, sodium and potassium. The amount of total alkalinity recorded in Gota lake rangesbetween 224 ±6.48 ppm to 246±11 ppm. The minimum value of alkalinity was recorded duringmonsoon season and the maximum value of alkalinity was recorded during summer season. Themain source of alkalinity in the water of Gota lake is the addition of soap and detergent used byvillager for bathing and washing purpose. Similar result was observed by Wani and Subla (1990)and Ahmad and Singh (1993).Total hardnessHardness of water is not a specific constituent but is a variable and complex mixture of cations andanions. It is caused by dissolved polyvalent-metallic ions. Water hardness is the traditional measureof the capacity of water to react with soap, hard water requiring a considerable amount of soap toproduce lather. The total hardness recorded in the water of Gota lake ranges between 314±10.4ppm to 346±8.87 ppm. The maximum amount of total hardness in the water of Gota lake wasrecorded during summer season and the minimum amount of total hardness was recorded duringmonsoon season. The high value of hardness during summer may be due to evaporation of waterand addition of calcium and magnesium salts by mean of plants and living organism. Bagde andVerma (1985) observed similar result in J.N.U lake. The above result was also supported byUdhayakumar et al., (2006). High values of hardness are probably due to regular addition of largequantities of sewage and detergent into lakes from the nearby residential localities. Similar observationwas made by Kaur et al., (1996) and Mohanta and Patra (2000).CalciumJhingran (1975) suggested that calcium is most abundant ions in freshwater and is important in

169
Proceeding of Conference : Evolving Paradigm to Improve Productivity for Plant Genetic Resoyrces
shell construction, bone building and plant precipitation of lime. The amount of calcium in thewater of Gota lake ranges between 68 ±3.65 ppm to 84 ±4.24 ppm. The maximum amount ofcalcium recorded in water was during summer season, whereas the minimum amount of calcium inwater was recorded during monsoon season. Calcium is present in water naturally, but the additionof sewage waste might also be responsible for the increase in amount of calcium. Udhayakumar etal., (2006) and Angadi et al., (2005) also observed similar result in their studies of water bodies.The amount of calcium increases during summer season due to rapid oxidation /decomposition oforganic matter. Billore (1981) observed similar result.MagnesiumMagnesium is also present with calcium in natural water albeit in lower concentration than calciumand has similar source of entry. Govindan and Devika (1991) have suggested that the considerableamount of magnesium influence water quality. The amount of magnesium recorded in the water ofGota lake ranges between 33 ±2.65 ppm to 35 ±3.87 ppm the maximum amount of magnesiumin the water was recorded during monsoon season where as the minimum value was recordedduring summer season. Magnesium in absolutely essential for chlorophyll bearing algae plant.Magnesium enters into combination with anions other than CO
2 in lakes such as chloride and
sulphate ( Jhingran, 1975).Dissolved oxygenAddition of oxygen demanding wastes consumes the dissolved oxygen present in water. The organismin water required a particular concentration of dissolved oxygen. Measurement of dissolved oxygenis a primary parameter in all pollution studies. Dissolve oxygen value is higher in those lake wherethere was good aquatic life. The amount of dissolved oxygen recorded in the water of Gota lakeranges between 3.12 ±0.07 ppm to 6.64 ±0.32 ppm. The minimum amount of dissolved oxygenin the water of Gota lake was recorded during summer season, whereas the maximum amount ofdissolved in the water of Gota lake was recorded during monsoon season. Seasonal fluctuation ofdissolve oxygen with high value observed during monsoon may be as a result of the increasedsolubility of oxygen at lower temperature (Prasannakumari et al., 2003). The low value duringsummer and high value during monsoon is because of the phenomenon of reoxygenation of waterduring monsoon may be due to circulation and mixing by inflow after monsoon rain. Similarobservation was made by Kumar (1996) and Unni (1996).Biochemical oxygen demandBiochemical oxygen demand depends on aquatic life; variation in BOD indicates dynamism inaquatic life present in the pond. BOD refers the oxygen used by the microorganism in the aerobicoxidation of organic matter. Therefore with the increase in the amount of organic matter in thewater the BOD increases. The BOD value in Gota lake ranges between 2.10 ±0.11 ppm to 3.96±0.2 ppm. The minimum demand of oxygen in the water was recorded during summer season,whereas the maximum demand was recorded during monsoon season. The higher value of BODduring monsoon was due to input of organic wastes and enhanced bacterial activity. Similar resultwas observed by Campbell (1978).

170
Proceeding of Conference : Evolving Paradigm to Improve Productivity for Plant Genetic Resoyrces
ChlorideSirsath et al., (2006) observed that the most important source of chloride in the water is thedischarge of domestic sewage. The amount of chloride recorded in the water of Gota lake rangesbetween 102 ±4.69 ppm to 116 ±3.83 ppm . The minimum amount of chloride in lake water wasrecorded during the monsoon season and the maximum amount was recorded during winter season.Chloride in water influences salinity balance and ion exchange and is contributed by dissolution ofsalt deposits, sewage discharges, effluents from chemical industries and irrigation drainage to naturalwater. The higher concentration of chloride during summer month may be associated with frequentlyrun-off loaded with contaminated water from the surrounding. Sunder (1988) and Kumar (1995)also observed similar result in their study.SodiumSodium is a natural constituent of raw water, but its concentration is increased by pollutionalsources such as rock salt, precipitation runoff, soapy solution and detergent. The amount of sodiumrecorded in the water of Gota lake ranges between 37 ±4.2 ppm to 56 ±2.94 ppm. The minimumamount of sodium in the water of Gota lake was recorded during monsoon season and the maximumamount was recorded during winter season. The high level of sodium and calcium may be broughtby input to the reservoir water and low level of these elements may be due to the bioaccumulationby living organism.NitrateNitrates are contributed to freshwater through discharge of sewage and industrial wastes and runoff from agricultural fields. The amount of nitrate recorded in the water of Gota lake ranges between6.4 ±0.42 ppm to 9.14 ±0.09 ppm. The minimum amount of nitrate in the water of Gota lake wasrecorded during summer season, whereas the maximum amount of nitrate in water was recordedduring winter season. Lower concentration during summer was due to its utilization by planktonand aquatic plants. Similar result was observed by Kannan (1978). Nitrate in natural water islikely to vary.PhosphateAlgae require only small amount of phosphate. Excess amount of phosphate may causeeutrophication leading to extensive algal growth called algal blooms. Phosphate is one of the limitingfactor for phytoplankton productivity because of geochemical shortage of phosphate in drainagebasin. The amount of phosphate recorded in the water of Gota lake ranges between 1.38 ±0.04ppm to 2.12 ±0.07 ppm. The minimum amount of phosphate recorded in the water of the lakewas during summer season and the maximum amount was recorded during monsoon season.Phosphate is considered to be the most significant among the nutrients responsible for eutrophicationof lakes, as it is the primary initiating factor. The water body receives the influx of sewage effluentsand decomposed organic matter. It might also be due to addition of human waste and release ofdetergent into the aquatic environment. Kumar and Gupta (2002) made similar type of observation.CONCLUSIONThe result obtained during study was compared with WHO (1971) and BIS (1991) standards

171
Proceeding of Conference : Evolving Paradigm to Improve Productivity for Plant Genetic Resoyrces
and it was found that maximum number of parameters in Gota lake were above desirable limit in allthe three season. This result shows that in Gota lake very high amount of sewage waste wasdischarge by the villagers. And the water of lake is highly contaminated. And If the similar conditioncontinue for the longer period, Gota lake may soon become ecological inactive.ACKNOWLEDGEMENTWe take this opportunity to express my sincere thanks to our head and soul of the BotanyDepartment, Prof. Dr. Y.T. Jasrai. He encourages us with all the supports including that ofinfrastructural facilities. We thank him from the depth of our heart for all that he had done to guideus.REFERENCESAhluwalia, A.A. 1999. Limnological Study of wetlands under Sardar Sarovar command area.Ph.D. Thesis. Gujarat University, Ahmedabad.Ahmad, S.H. and Singh, A.K. 1993. Diurnal variations in physic-chemical factors and Zooplanktonin surface niche of a perennial tank of patna (Bihar). India. J. Ecobiol., 5: 111-120.Angadi , S.B., Shiddamaliayya, N. and Patil, P.C. 2005. Limnological study of papnash pond,Bidar (Karnataka). J. Env. Biol., 26: 213-216.APHA, AWWA 1985. Standard. Methods for the examination of water & waste water. WashingtonDC 18th Edition.Bagde, U.S. And Verma, A.K. 1985. Limnological studies on JNU Lake, New Delhi, India. Bull.Bot. Soc. Sagar, 32: 16-23.Billore, D.K. 1981. Ecological studies of Pichhola lake, Ph.D. Thesis, Univ. of UdaipurBirge, E.A. and Juday. C. 1991. The inland lakes of Wisconsin. The dissolved gases of the waterand their biological significances. Wisconsin Geol. Nat. Hist. Surv. Bull. 22: 257-259.BIS, 1991. Indian Standards for Drinking Water, Bureau of Indian Standards, New Delhi, IS:10500Campbell, I.C. 1978. A biological investigation of an organically polluted urban stream in Victoria.Aust. Mar. Freshwater Res. 29: 275-291.Desai, P.V. 1995. Water quality of Dudhasagar river at Dudhasagar (Goa), India. Poll Res. 14(4):337-382.Dwivedi, B.K.and Pandey, G.C. 2002. Physico-chemical factors and algal diversity of two pondsin Faizabad, India Poll.Res. 21(3): 361-370.Esmaeili H.R. and Johal, M.S. 2005. Study of physicochemical parameter of water of Gobindsagarreservoir, India. In Proceeding of National Seminar on New Trends in Fishery Development inIndia. Punjab University, Chandigarh , India.Freeda, D.G.R., Arunkumar, K. and Valarmathy 2006. Portability of drinking water sources ofEleven Villages in Perambalur District, Tamil Nadu. Poll Res. 25(1): 171-174.Gonzalves, E.A. and Joshi, D.B. 1946. Fresh water algae near Bombay. The seasonal successionof algae in a tank of Bandra. J. Bomb. Nat. Hist. Soc. 46: 154-176.Govindan, V.S. and Devika, R. 1991. Studies on Heavy metal profiles of Adyar river and waste

172
Proceeding of Conference : Evolving Paradigm to Improve Productivity for Plant Genetic Resoyrces
stabilization pond. J. Ecotoxicol. Environ. Monit., 1(1): 53-58.Jhingran, V.G. 1975. Fish and Fisheries of India Hindustan Publ. Corp. (India) Delhi, pp: 954.Kannan, V., 1978. The limnology of Sathiar: A freshwater impoundment Ph.d., Thesis, MaduraiKamraj University, Madurai.Kaur, H., Dhillon S.S., Bath and Mander, G. 1996. Analysis of the Elements pollution river Gaggarin the region of Punjab. Journal of Environment and Pollution. 3(2): 65 – 68.Kumar, A. (1996). Comparitive study on diel variation of abiotic factor in lentic and loticfreshwaterecosystems of Santal Paragana (Bihar). J. Environ. Pollut. 3: 83-89.Kumar, A. 1995. Observation on the diel variations in abiotic and biotiuc components of the riverMayurrakshi (Santal Pargana). Bihar. Indian .J. Ecol. 22 (1): 39-43.Kumar, A. & Gupta, H. P. 2002. Bacteriological studies on some sewage-fed wetlands ofJharkhand. In: Ecology of Polluted Waters (Ed. A. Kumar), Ashish Publ. Corporation, New Delhi.Pp. 925 –936.Kumar, S.M. and Ravindranath, S., 1998. "Water Studies – Methods for monitoring waterquality". Published by Center for Environment Education (CEE), Banglore, Karnataka, India,pp: 191.Mariappan, P. and Vasudevan, T. (2002): Correlation of some physico-chemical parameters ofdrinking water ponds in Eastern Parts of Sivagangai district, Tamil Nadu. Poll Res. 21(4): 403407.Mohanta, B.K. and Patra, A.K. 2000. Studies on the Water Quality index of riverSanamachhakandana at Keonjhar Garh, Orrisa, Poll. Res. 19(3): 377-385.Moitra, S. K. and Bhattacharya, B. K. 1965. Some hydrological factors affecting planktonproduction in fish pond in Kalyani, West Bengal, India. Icthyalogia 4 (1& 2): 8 – 12.Murugesan, A., Ramu, A., and Kannan, N. 2006. Water quality assessment fromUthamapalayam municipality in Theni District, Tamil Nadu, India. Poll Res. 25(1): 163 – 166.Prasannakumari, A.A., Ganaga Devi, T., and Sukesh Kumar, C.P. 2003. Surface water qualityof river Neyyar- Thiruvananthapuram, Kerala, India. Poll Res. 22(4): 515 – 525.Saha, S.K. 1980. Limnological surve of thermal springof Bhimbandh, Monghyr. Ph.D. Thesis,Bhagalpur University, India. pp: 179.Sharma, K.D., Lal, N. and Pathak, P.D. 1981. Water quality of sewage drains entering Yamuna atAgra. Indian J. Environ Hlth., 23: 118-122.Singh, R.P. and Mathur, P. 2005. Investigation of variations in physicochemical characteristics of afresh water reservoir of Ajmer city, Rajesthan, Ind. J. Environ. Science, 9: 57-61.Sirsath, D.B., Ambore, N.E., Pulle, J.S., and Thorat, D.H. 2006. Studies on the concentration ofion in freshwater pond at Dharampuri, Dist, Beed, India Poll. Res. 25(3): 507-509.Solanki, H.A. 2001. Study on pollution of soils and water reservoirs near industrial areas ofBaroda. Ph.D Thesis submitted to Bhavnagar University, Bhavnagar.Suber, E.W. 1953. Biological effect of pollution in Michigan Waters, Sew Industr. Wastes. 25:79-86.Sunder, S. 1988. Mounting the water quality in a stretch of river Jhelum. Kashmir. In Book" Ecol

173
Proceeding of Conference : Evolving Paradigm to Improve Productivity for Plant Genetic Resoyrces
and Poll. Of Indian rivers " Ashish Publishing House. New Delhi. pp: 1312-161.Trivedy R.K. and Goel P.K. 1984. In: Chemical and biological methods for water pollutionstudies. Published by Environmental Publication, Karad, Maharashtra (India) UdhayaKumar, J., Natarajan, D., Srinivasan, K., Mohansundari, C. and Balasurami, M., 2006.Physicochemical and Bacteriological Analysis of water from Namakkal and Erode Districts,Tamilnadu, India. Poll Res. 25(3): 495-498.Unni, K.S. 1996. Ecology of river narmad. A.P.H. Publishing corporation. New Delhi. pp: 371.Verma, S.R., Tyagi, A.K. and Delela, R.C. 1978. Physico-Chemical and Biological characteristicsof Kadrabad in Uttar Pardesh, Ind. J. Environ. Hlth. 20: 1-13.Wani, I.A. and Subla, 1990. Physicochemical features of two shallow Himalayan lakes. BullEviron. Sci., 8: 33-49.WHO, 1971. International Standards for drinking water, 3rd Ed. Geneva, World HealthOrganization.Zafar, A.R. 1964. Ecology of algae in certain fish ponds of Hyderabad, India. I-Physicochemicalcomplex. Hydrobiologia. 23: 176-196.
Table-1
Sr. no.
PARAMETERS
YEAR 2009 - 2010
Summer Mean + S.E.
Monsoon Mean + S.E.
Winter Mean + S.E.
1. Temperature in 0C 28 ±1.47 22 ±1.47 16 ±1.22
2. Electrical conductivity in mhos/cm
3.78 ±0.11 3.15 ±0.15 2.64 ±0.07
3. Turbidity in NTU
24 ±1.41 22 ±0.91
4. Total Dissolve Solid in ppm 1576 ±17.4 1824 ±40.3
5. pH 9.1 ±0.18 8.3 ±0.13 8.8 ±0.17
6. Alkalinity in ppm 246 ±11 224 ±6.48 232 ±10.3
7. Total Hardness in ppm 346 ±8.87 314 ±10.4 326 ±11.6
8. Calcium in ppm 84 ±4.24 68 ±3.65 73 ±4.34
9. Magnesium in ppm 33 ±2.65 35 ±3.87 35 ±2.08
10. Dissolved Oxygen in ppm 3.12 ±0.07 6.64 ±0.32 5.28 ±0.19
11. Biochemical Oxygen Demand in ppm
2.10 ±0.11 3.96 ±0.2 2.68 ±0.15
12. Chloride in ppm 108 ±6.27 102 ±4.69 116 ±3.83
13. Sodium in ppm 48 ±5.77 37 ±4.2 56 ±2.94
14. Nitrate in ppm 6.4 ±0.42 7.64 ±0.24 9.14 ±0.09
15. Phosphate in ppm 1.38 ±0.04 2.12 ±0.07 1.80 ±0.06

174
Proceeding of Conference : Evolving Paradigm to Improve Productivity for Plant Genetic Resoyrces
Studies on the Physico-Chemical Status of Two Lakes- Deliya Lakeand Pindhariya Lake, under Biotic Stress" of Visnagar Taluka in
Mehsana District, Gujarat, India.
1H. V. Joshi And 2Dr. R. S. Patel
1Department of Biology, Gujarat arts & science college.2Department of Biology , kksj science college, maninagar , Ahmedabad, Gujarat, India.
E.mail: [email protected]
ABSTRACTVisnagar city is located in north Gujarat (72 30 n and 73 30 n 23 0 e and 23 35 e). Visnagar talukais popularly known as ‘Shikshan Nagari’ and also known as Copper city. The climate of visnagaris tropical arid to marginal semi-arid. It is strongly periodic and seasonal. There are many freshwater bodies are situated at and around Visnagar taluka. The present study deals with the physico-chemical status of two lakes, deliya lake and pindhariya lake, under biotic stress". Deliya lake isnatural fresh water body having 19 hector area & circular in shape. It is located between latitude230
41’ 60’’N longitude720 32’ 60’’ E. it is oldest lake of visnagar. It is also known as hanuman templetalav. Constructed before 10’th century. Another historical lake is pindhariya lake , is also situatednear Visnagar. Pindhariya lake lake is natural fresh water body having 8 hector area. These waterbodies has dense growth of algae and planktons in its. Physicochemical status of two lakesbelongs to Visnagar Taluka were studied in year January to June 2011. Both the lakes are bioticallyaffected by various anthropogenic activities. In the present study water characteristics of twolakes have been compared the water quality. Different Parameters carried out like temperature,pH, Fluoride, COD, BOD, Phosphate, Sodium, Chloride, Alkalinity, Total Hardness, Calcium,DO and TDS. The result indicates that the both lakes are in polluted condition. It is evident thatDeliya Lake was found to be more polluted in compare to Pindhariya Lake. Mittal & Sengar(1990) investigated phytoplankton diversity in relation to certain physico-chemical characteristicsand observed direct correlation with conductivity, dissolved solids, suspended solids, turbidity,D.O. and B.O.D. Tripathi and Pandey (1990) observed higher value of total hardness and statedthat it may be due to polluted water of the ponds. Various physico-chemical parameter likeDifferent Parameters analyzed like pH, Fluoride, COD, BOD, Chloride, Alkalinity, Total Hardness,Calcium, Calcium Hardness, Magnesium, Magnesium Hardness, DO, EC and TDS. The resultindicates that the both lakes are in polluted condition phosphate, chloride, done and measuredhere data where analyzed by standard international method mentioned in APHA (2005).Keywords: Water characteristics , physico -chemical status, biotic stress.INTRODUCTIONFresh water habitats occupy relatively small portion of the earth’s surface as compare to marine

175
Proceeding of Conference : Evolving Paradigm to Improve Productivity for Plant Genetic Resoyrces
and terrestrial habitats but their importance to man is far greater than their areas. Fresh water arethe most suitable and cheapest source for domestic and industrial needs and they provide convenientwaste disposal systems. The increased demand of water as consequence of population growthagriculture and industrial development has forced environmentalist to determined chemical physicaland biological characteristics of natural water resource( Regina and Nabi,2003) water is one ofthe important source, to sustain life and has long been suspected of being the source of muchhuman illness source of surface water and ground water have became increasingly contaminateddue to increase industrial and agricultural activity the public desires water that is low in hardnessand total solids non-corrosive and non scale farming. Pollution is most burning problems beforethe mankind. It causes damages to the human being on the one hand and is property on the otherhand. In some of the cases it has became the root cause of their destruction of human being byproducing various kinds of pollution resulting in various types of diseases. Deterioration in thequality and quantity of the crops. Pollution is an undesirable change in the physical biological orchemical characteristics of air, water and soils that have affected on the living organisms. The manis abusing natural water resources at large scale the efforts to conserve this resources is the presentneed. Factors the influence the sustainability of such lentic systems are temperature transparencysalinity biogenic salts dissolved gases etc. (Munawar, 1970, Mishra and Yadav, 1978) since lakesare favorable habitats for a variety of Flora- Fauna and also used by the anthropogenic society. Soits regular monitoring is necessary for control recently lot of work has been done on changingecological behavior of lakes (Mahanada et al.2005, Kanungo et al. 2006, Gupta et al 2008.Banerjee and Mandal 2009) in the present study two important.Study areaVisnagar taluka is popularly known as ‘Shikshan Nagari’ and also known as Copper city islocated between Latitude: 23° 41' 60 N, Longitude: 72° 32' 60 E. There are many fresh waterbodies are situated at and around Visnagar taluka, Dist. Mehsana, Gujarat, India. These waterbodies has dense growth of algae and planktons in its. The area have several water bodies out of2 water bodies are selected viz.,• Deliya lake (mostly used for domestic purpose)• Pindhariya lake (mostly used for domestic purpose)

176
Proceeding of Conference : Evolving Paradigm to Improve Productivity for Plant Genetic Resoyrces
Study Area Map
Maps showing

177
Proceeding of Conference : Evolving Paradigm to Improve Productivity for Plant Genetic Resoyrces
• Gujarat state map• Mehsana district map• Visnagar city ( Study areas) map• Satellite imageMETHODOLOGYIn deliya and pindhariya lake was selected because which is affected by domestic sewage scaleindustrial effluents and worshiping activities. Water samples were collected from both lakes oncein month from January-2011 to june-2011 in between 9:00am to 11:00am at on regular interval of30 days. The analysis of physico-chemical parameters was done by following the standard method(APHA.2005) The deliya lake is named as lake-1 and the pindhariya lake was named as lake -2.The water sample were collected from surface near the margins of the pond between 9-00 to 11-00 AM. The analysis of physicochemical parameters was done by following the slandered methods(APHA,1985) Quality of water is depended on various affecting climatic factors the data of variousfactors are collected from different source and own observation To determine physic-chemicaland biological parameters samples collected at regular interval from selected water bodies byproper method. Different parameters like Temperature, pH, Alkalinity, Total hardness, TDS,Dissolved oxygen (DO), Fluoride ,Phosphate, Sodium Chloride, Ca, BOD, COD For the analysisof above parameters standard methods and suggested in various text books reference books,paper etc applied for this paper. I have taken photographs of the lakes in various views to showtheir real situation.

178
Proceeding of Conference : Evolving Paradigm to Improve Productivity for Plant Genetic Resoyrces
DELIYA LAKE
Sr .no parameters Period of analysis
Jan.11 Mar.1
Feb.11 1 Apr.11 May.1
1 Jun.11 1 pH
8.1 2 Temp 32.1
3 Calcium
41.8 4 Fluoride 2.3
5 COD
79.6 6 BOD 0.4
7 Phosphate 0.019
0.176
0.193 8 Sodium 113
9 Chloride
130.1 10 Alkalinity 290
11 Total Hardness 160 163 178 176 185 181 12 DO 1.9 2.1 2.1 2.2 2.4 2.1 13 TDS 480 510 540 620 690 670
130.6 132.2 280 310
270.4 260.2 180.6 170 192 215
0.18 110 118
0.029 0.1 28 96 98 102
78.4 79.9 0.5 0.6
62.1 61.8 68.4 1.2 1.3 1.2
41.7 42.2 2.2 2.4
52.2 49.8 45.6 1.8 1.9 2.1
7.3 7.9 36.1 37.2
7.3 7.2 7.3 20.2 23.8 26.4

179
Proceeding of Conference : Evolving Paradigm to Improve Productivity for Plant Genetic Resoyrces
DELIYA LAKEAll the parameters are in mg/l except pH and TEMP
PINDHARIYA LAKE
Sr.no parameters Period of analysis
Jan.11 Feb.11 Mar.11 Apr.11 May.11 Jun.11
1 pH 7.3 7.4 7.4 7.4 7.9 8.2
2 Temp 19.8 20.4 24.2 36.0 36.8 34.1
3 Floride 1.2 1.4 1.6 1.8 1.9 1.9
4 COD 36.0 38.0 41.0 47.0 49.0 48.0
5 BOD 1.1 1.3 1.2 1.4 1.5 1.8
6 Phosphate 0.0 0.1 0.1 0.3 0.3 0.4
7 Sodium 38.0 36.0 41.0 48.0 49.0 51.0
8 Cloride 30.9 30.7 20.9 22.7 22.9 23.4
9 Alkalinity 62.0 68.0 69.0 72.0 73.0 72.0
10 Total Hardness 57.0 60.0 65.0 68.0 72.0 68.0
11 Calcium 18.6 19.8 19.9 20.8 21.4 20.9
12 DO 4.8 5.2 5.8 6.0 5.6 5.2
13 TDS 139.0 139.0 200.0 200.0 240.0 265.0
All the parameters are in mg/l except pH and TEMP

180
Proceeding of Conference : Evolving Paradigm to Improve Productivity for Plant Genetic Resoyrces
RESULT AND DISCUSSIONThe physico-chemical parameter of Delia and pindhariya lakes were analyzed from January-2011 tojune 2011.and are presented in table 1&2 and fig. 1&2. The temperature in lake 1&2 various from20.20c to 37.20c. And 19.80c to 36.80c. Respectively. The temperature affects the me to biotic rateof living organism (gupta et al 2008). The pH of both lakes indicate the alkaline nature of lakes andit’s various from 7.2 to 8.1 and 7.3 to 8.2 pH. the dissolved oxygen various from 1.9 mg/l to 2.4 mg/l and 4.8 mg/l to 6.0 mg/l low content of dissolved oxygen assign of organic pollution. It’s also due toinorganic feductants lake hydrogen sulphide ,ammonia ,nitride, ferrous ion and other such ox disablesubstance(are at 2003).the alklinity in the both lake various from. 170 mg/l to 310 mg/l and 62 mg/lto 73 mg/l respectively. The high alkalinity is a function of ions exchange that is calcium ions arereplace by sodium ion and later contributed to alkalinity (sharam and john 2009) alkalinity may alsocaused due to evolution of co
2 during decomposition of organic matter. The chloride contents in both
lakes various from 130.1mg/l to 270.4mg/l. and 20.9mg/l to 30.9mg/l. the chloride is one of theimportant indicators of pollution (khare at 2007). The calcium contents in both lakes various from41.7mg/l to 52.2mg/l and 18.6mg/l to 21.4mg/l respectively calcium is linked with the carbon dioxideand is an important constituent of the skeletal structure of organisms.Calcium from the most abundant ions in fresh water (thilaga et al.2005). Sodium recorded highestvalue was 118mg/l at lake 1 during May 2011 and lowest was 96mg/l in january 2011 and lake 2highest value was 51 mg/l and lowest value was 36mg/l during February 2011. During june 2011the fluoride content in both lake various from 1.8 mg/l to 2.4 mg/l and 1.20mg/l to 1.91mg/lfluoride causes dental florists bending of vertebral column deformation of knee joint and of thebone of the body. Total dissolved solids content in both lake various from 480 mg/l to 690mg/l and139mg/l to 265mg/l respectively. Total hardness of the water sample was observed inn both lake

181
Proceeding of Conference : Evolving Paradigm to Improve Productivity for Plant Genetic Resoyrces
various from 160mg/l to 185mg/l and 57mg/l to 72mg/l. the hardness of water id for indicateswater quality. From the result obtained it can be concluded that both lakes are polluted fresh waterbodies due to the continuous discharged of domestic sewage and run of high amount of nutrientslead to eutrophication. The result also indicates the Delia Lake is more comparatively more polluteddue to greater biotic stress. Different views of both lakes indicate in plate 1(fig1-4) and plate2(fig1-4). Table 1 is shown different parameters of Deliya lake and Table 2 is shown differentparameters of pindhariya lake.REFERENCESAgarkar,S.V.:- Physico chemical aspect of ground water quality in chikhli town of buldana districtpoll.res.17(3):pp291-292.1998.APHA and AWWA (1985). Standard Methods for Examination of Water and Wastewater. 16th
American Public Health Association, Washigton, DC.Ara, S.,M.A. Khan and M.Y.Zagar(2003). Physico-chemical characteristics of Dal lake water. In: Kumar(Ed.) Aqu.Env.Toxicol., Daya Publishing House, Delhi, 128-134Banejee, D. and S.Mandal (2009). Water quality aspects of some pounds in asansol. Ecol.Env &Cons., 15(1) : 145-152.Bhatt,S.D.and Pathak,J.K.Aseessment of water quality and aspect of pollution in stretch of rivergomti(kumaun: lesser Himalaya),j,env.boil13(2):pp.113-126,1992.Gupta, S.K., N.P. Tiwari and Mohd. Noor Alam (2008). Studies on Physco-Chemical status oftwo ponds at Patan in relation to growth of fishes. Nat.Env & Poll. Tech., 7(4) : 729-732.Kangugo, V.K., J.N. Verma and D.K.Patel (2006). Physico-Chemical Characteristics ofdoodhadahri pond of Rainpur, Chattisgarh. Eco.Env.& Cons., 12(2) : 207-209Khare, S.L., S.R. Paul and Anita Dubey (2007). A Study of water quality of KhomphNiwari lakeat Chhatarpur, M.P. Nat.Env.& Poll.Tech.,6(3) : 539-540. Mahananda, H.B., M.R. Mahananda B.P. Mohanty (2005). Studies on the physciochemical andbiological parameters of a fresh water pond ecosystem as an indicator of water pollution. Eco.Env.& Cons., 11(3-4) : 537-541.Misra,G .P. andf A.K.YADAV(1978). A comparative study of physico- chemical characteristicsof river and lake water in central india.hydroboil.59(3):275-278. Munawar,M. (1970). Limnologicalstudies of freshwater ponds of Hyderabad, India. I – Biotope. Hydrobiol., 35 : 127-162.Regina,B.and B.nabi(2003). physico- chemical spectrum of the bhavani river water collectedfrom the kalingaryan dam, tamilnadu. Indian j. envin&ecoplan,7(3):633-636 Sharma, G. and R.V.John (2009). Study of Physcio-Chemical Parameters of waste water from dyeing units in Agracity. Poll, Res., 28(3) : 439-442.Solanki, V.R., S.Murthy, S.Samba, A.Kaur and S.S.Raya(2007). Variations in dissolved oxygenand biochemical oxygen demand in two fresh water lakes of Bonhan, A.P., India. Nat.Env. &Poll. Tech., 6(4) : 623-628.Thilaga, A.,Subhashini, S.Sobhana and K.L.Kumar (2005). Studies on nutrient content of theOoty lake with reference to pollution. Nat.Env. & Poll. Tech.,4(2) : 299-302.

182
Proceeding of Conference : Evolving Paradigm to Improve Productivity for Plant Genetic Resoyrces
Contamination of Toxic Metals in Chandlodia Lake, Ahmadabad,Gujarat, India.
*Satish S. Patel And Sanjay D. Vediya
P.G. Center in Botany, Sir P.T. Science Collage, Modasa (Gujarat), India.E-Mail:[email protected], [email protected]
ABSTRACTPresent study was focused on the Contamination of Toxic metals in water bodies Of ChandlodiyaLake Ahmadabad. During drought period the water level decreased and the concentrations of themost Toxic Heavy Metal parameters were increased. Heavy metals parameters include (As, Cd,and Pb). In Water of Chandlodia lake during January-2009 to December-2009. The minimumand maximum values of surface water As, Cd, and Pb were: 7.44-0.11ppm; 21.57-0.47 ppm;2.66-0.0ppm; respectively.Keywords: Chandlodiya Lake, Water bodies, Heavy Toxic Metals.INTRODUCTIONThe problem and major environmental concerns associated with the dispersal or disposal ofIndustrial and urban wastes generated by human activities are the contamination of the water andsoil and Aquatic Ecosystem. Pollution occurs when a product added to our natural environmentadversely affects nature’s ability to dispose it off. A pollutant is something which adversely interfereswith health, comfort, property or environment of the people. Generally, most pollutants areintroduced in the environment as sewage, waste, accidental discharge and as compounds used toprotect plants and animals. There are many types of pollution such as air pollution, soil pollution,water pollution and oil pollution (Misra, S.G. and D. Mani, 1991)Municipal wastewater effluents may contain a number of toxic elements, including heavy metals,Because under practical conditions wastes from many small and informal industrial sites are directlydischarged into the common sewer system. These toxic elements are normally present in smallamounts and, hence, they are called trace elements. Some of them may be removed during thetreatment process but others will persist and could present phytotoxic problems. Thus, municipalwastewater effluents should be checked for trace element toxicity hazards, particularly when traceelement contamination is suspected (Pescod, M.B., 1992).Controlled and uncontrolled disposal of wastes, accidental and process spillage, mining and smeltingof metalliferous ores, sewage sludge application to agricultural soils are responsible for the migrationof contaminants into noncontaminated sites as dust or leachates and contribute towardscontamination of our ecosystem (Ghosh and Singh, 2005). A wide range of inorganic and organiccompounds cause contamination especially when they are exposed to rain, its decompositionproduces noxious odour, thereby, constituting a health hazard (Weiss, 1974; Ogbonna et al.,

183
Proceeding of Conference : Evolving Paradigm to Improve Productivity for Plant Genetic Resoyrces
2006). Major components of these compounds include heavy metals, combustible and putrisciblesubstances, hazardous wastes, explosives and petroleum products (Adriano, 1986; Alloway, 1990).Soil and sediments microorganisms can degrade organic contaminants, while metals needimmobilization or physical removal because metals at higher concentrations are toxic and cancause oxidative stress by formation of free radicals (Henry, 2000) and thus may render the landunsuitable for plant growth and destroy the biodiversity. Soils provide a suitable natural environmentfor biodegradation of wastes and therefore serve as a sink for the adsorption and absorption ofions and as a medium for the restoration of vegetation and normal land use (Ekundayo, 2003).Because of the shallowness of water table and nature of soil types in Port Harcourt municipality. Ahmadabad is unique in the whole of India in matter of environmental neatness and flourishingconditions and it is superior to other cities in the excellence of its monuments. Ahmadabad Urbandevelopment Authority (AUDA) carried out a survey of 645 lakes and identified 22 lakes whichhave been severely degraded. AUDA proposes to undertake works for revival, development ofcatchments area and beautification of lakes under the present project. Of these, Chandlodia Lakewere studied which are located at Chandlodia Village its total storage capacity is 13.6 Caoreliters. Lake Desalting Area is 880 m3 and peripheral development works including landscaping:recreation facilities are such as Amphi children park facilities and percolation wells to rechargeground water table; AUDA has commenced work on this lake also through own resources. In thestudy area Heavy metal weathering is predominate. Climatic features of Chandlodia are characterizedby dry climate, uncertain rainfall pattern and great variation in higher ranged for toxic metals duringJanuary-2009 to December-2009.MATERIALS AND METHODSThe sampling were Collocated at different Point of the Chandlodia Lake. The present study isfocused on water quality assessment for period of one year i.e January 2009 to December 2009.Month wise sampling is done i.e. January to December) for testing the water samples were collectedin different sterile Plastics bottles. After collection of the samples the bottles were tightly cappedand were immediately transported to the laboratory to avoid any unpredictable changes in thecharacteristics. Suitable preservation techniques were adopted as per the standard methods, APHA(1998). Water samples were digested using the method described in APHA (1998) As; Pb andCd. are determined by Atomic Absorption Spectrophotometer.RESULT AND DISCUSSIONThe highest concentration of Arsenic was recorded at Chandlodia lake in December 2009(7.44ppm)and lowest concentration was recorded in August -2009(0.11ppm), during January-2009 toDecember-2009 Arsenic is a toxic and carcinogenic semi-metal whose sources in nature includemineral dissolution and volcanic eruption (Bhumbla et al., 1994). Surface water (rivers, lakes,reservoirs and ponds), ground water (aquifers) and rain water. These sources are very variable interms of arsenic risk. Alongside obvious point sources of arsenic contamination, high concentrationsare mainly found in groundwater. These are where the greatest number of, as yet unidentified;sources are likely to be found. This review therefore focuses on the factors controlling arsenic

184
Proceeding of Conference : Evolving Paradigm to Improve Productivity for Plant Genetic Resoyrces
concentrations in groundwater (Pauline L Smedley and David G Kinniburgh).Hazardous wastedisposal is another major source of arsenic contamination of soil and aquatic systems. Arsenicleaching from a landfill can be transported through soil to ground water and contaminate lakesediments (Lackovic et al., 1997; Hounslow, 1980). Lake sediments can accumulate a significantquantity of arsenic due to arsenic migration in anoxic ground waters (Subramanian et al., 1997).The highest concentration of Lead was recorded at Chandlodia lake in June -2009(2.66 ppm)and lowest concentration was in December -2009 (0.0ppm), during January-2009 to December-2009. This is an indication of lead pollution onshore. The water from Lake Chandlodia hadsignificantly higher lead content than the lake water. This is an indication that there was substantiallead pollution along the Lake course. Lead content in all the water samples from different Point,including Surface water, was above the World Health Organization (WHO) maximum safe limitsfor drinking water of 10 μg/L.The highest concentration of Cadmium was recorded at Chandlodia lake in April -2009(21.57ppm) and lowest concentration was in July -2009 (0.47ppm), during January-2009 toDecember2009. The most important sources of Cd are metal industry, plastics and sewages (Allen,1989) and some special phosphate fertilizers that contain Cd. Because of its high toxicity and greatsolubility in water Cd is a dangerous pollutant (Liu et al., 2006). It is very toxic to animals andplants and plants’ exposure to Cd causes reductions in photosynthesis, water and nutrient uptake(Sanita di Toppi & Gabbrielli, 1999). Kashyap, Sahi, Shukla and Gupta, 2000: Reported toCadmium is regarded as one of the most toxic elements in the environment. Its persistence in theenvironment, rapid uptake and accumulation in the food-chain contributes to its potential hazards.Recommended level of cadmium in drinking water is 0.01 g/ml (US and Indian Standards) and0.005g/ml according to WHO guideline values.SUMMARY AND CONCLUSIONAhmedabad city is situated on the River bank of Sabarmati and in Around Industrial Areas atGujarat. The Water samples were collected from Different Point of Chandlodi Lake. The higherranged of Cadmium , Arsenic and Lead were above BSI and WHO Standards .The Heavy metalContamination like Cd>As and >Pb Were studied comparatively during January-2009 toDecember-2009. The results suggested that water was not suitable for Drinking Purpose.ACKNOWLEDGMENTWe gratefully acknowledge The Sir P.T. Science college P.G. Center of Biology Department andspatial planning for Support and Laboratory facility this study.*corresponding author:[email protected], A.M.; A.A. Elewa,; A.K.T. Mekki, and M.E. Gohar(2003) Some aspects on traceelements and major cations of Lake Qarun sediment, Egypt. Bull. Fac. Sci., Zagazig Univ., 25(2):77 – 97Adriano, DC (1986) Trace elements in the terrestrial environment. Springer Verlag, New York,533pp

185
Proceeding of Conference : Evolving Paradigm to Improve Productivity for Plant Genetic Resoyrces
A.K. Kashyap, A.N. Sahi, S.P. Shukla And R.K. Gupta(2000) Metal Concentrations In WaterBodies Of Schirmacher Oasis, Antarctica : An Assessment, Seventeenth Indian Expedition toAntarctica, Scientific Report, Department of Ocean Development, Technical Publication No. 15,PP 211-219Allen, S.E.(1989) Analysis of Ecological Material. Blackwell Scientific Publications, OxfordAlloway, B J (1990) Heavy metals in soils (ed.Alloway, B J), Blackie, GlasgowA.P.H.A. (1998) Standard Methods for Examination of Water and Waste water: 20th Ed.American Public Health Association, Washington, D.C.Bhumbla, D.K., Keefer, R.F (1994) Arsenic mobilization and bioavailability in soil. In: Nriagu,J.O. (Ed.), Arsenic in the Environment, Part I: Cycling and Characterization. John Wiley and Sons,New York, pp. 62–66Ekundayo, EO (2003) Suitability of waste disposal sites for refuse disposal in Benin city, NigeriaGhosh, M; Singh, SP (2005)A review of phytoremediation of heavy metals and utilization of it’s byproducts. Applied Ecology and Environmental Research 3(1): 1 – 18Henry, JR (2000) An Overview of Phytoremediation of Lead and Mercury – NNEMS Report,Washington, D.C. p 3 – 9Hounslow, A.W (1980) Ground water geochemistry: arsenic in landfills. Ground Water 18 (4),331–333IARC and WHO (1990) Chromium, nickel and welding Lyon: International Agency for researchon cancer: Distributed for the international agency for research on cancer by the secretariate of theWorld Health Organization. p. 677Lackovic, J.A., Nikolaidis, N.P (1997) Technical Report ERI-97.01: Mobility of Arsenic in aGlaciated Aquifer. University of Connecticut, Storrs, CTLiu, D.H.M., M. Wang, J.H. Zou and W.S. Jiang(2006) Uptake and accumulation of cadmiumand some nutrient ions by roots and shoots of maize (Zea mays). Pak. J. Bot., 38 (3): 701-709Misra, S.G. and D. Mani (1991) Soil Pollution: Efficient offset Printer ABC, New Delhi, India,pp:6- 42Ogbonna, D N; Igbenijie, M ; Isirimah, N O(2006)Studies on the inorganic chemicals and microbialcontamination of health importance in ground water resources in Port Harcourt, Rivers State.Journal of Applied Science 10:2257-2262Pauline L Smedley and David G Kinniburgh: Chapter 1. Source and behaviour of arsenic innatural waters, British Geological Survey, Wallingford, Oxon OX10 8BB, U.KPescod, M.B., (1992) Wastewater Treatment and Use in Agriculture. Food and AgricultureOrganization (FAO).Sanita di Toppi. L and R. Gabbrielli(1999) Response to cadmium in higher plants. Environ.Exp.Bot., 41: 105-130Subramanian, K.S., Viraraghavan, T., Phommavong, T., Tanjore, S(1997) Manganese greensand

186
Proceeding of Conference : Evolving Paradigm to Improve Productivity for Plant Genetic Resoyrces
for removal of arsenic in drinking water.Canadian Journal ofWater Quality Research 32 (3),551–561Weiss, A (1974) Sanitary Landfill Technology:Noyes Data Corporation, England 204ppWHO/IPCS (1991) Environmental Health Criteria: Inorganic Mercury. World HealthOrganization, Geneva-118A.K. Kashyap, A.N. Sahi, S.P. Shukla And R.K. Gupta(2000)Metal Concentrations In WaterBodies Of Schirmacher Oasis, Antarctica : An Assessment, Seventeenth Indian Expedition toAntarctica, Scientific Report, Department of Ocean Development, Technical Publication No. 15,PP 211-219Table-1 Analysis of Heavy Toxic Metals (ppm) in water of Chandlodia Lake during the year 2009for comparative study of pollution.
parameters Jan-
Feb-
Mar-
Apr-
May-
Jun- Jul-
Aug-
Sep-
Oct-
Nov- Dec09
As 7.44
Cd 1.47
1.74
8.2 Pb 0
7.31 14.71 21.57 5.77 3.44 0.47 8.11 6.44 4.33 12.4 2.5 0.048 0.027 1.44 2.66 2.44 0.022 0.024 0.017 0.021
09 09 09 09 09 09 09 09 09 09 09 0.89 0.18 0.47 0.14 0.41 0.51 0.23 0.11 0.78 1.44 3.11

187
Proceeding of Conference : Evolving Paradigm to Improve Productivity for Plant Genetic Resoyrces
Gujarat University Campus Carbon Stock Study
Aparna Rathore And Yogesh. T. Jasrai Department of Botany
University School of SciencesGujarat University
Ahmedabad-380009E-mail: [email protected]
ABSTRACTVegetation stands next only to soil in sequestering carbon. Owing to an increase in the concentrationof greenhouse gases (GHGs) especially carbon dioxide (CO
2) due to human interventions it has
become important that the tree carbon sinks are identified for maximum carbon sequestration sothat their plantations are promoted to bring down the level of CO
2, the main GHG. Gujarat University
has a rich diversity of both flora and fauna in its campus. Gujarat University has a number of treespecies totaling to 3379 in number. The carbon stock of the tree species was calculated. Theheight was measured using an altimeter. The total carbon stock of the trees was measured by non-destructive method using equations involving the volume, biomass, percentage of carbon sequesteredand wood density. Simultaneously, the soil was also analyzed for the organic carbon content.Thus, the total carbon stock in the trees and soil of Gujarat University campus was calculated.Keywords: Carbon stock, tree species, Gujarat University.INTRODUCTIONAnthropogenic activities, especially fossil fuel burning and deforestation (Pandey, 2002) have resultedin an increase in the concentration of GHGs particularly CO2 which is accumulating at a rate of 3.5billion metric tons per annum (Jina et al, 2008) resulting in global warming (Phani Kumar et al.2009). Since the beginning of the industrial revolution, carbon dioxide concentration in theatmosphere has been rising alarmingly. Prior to the industrial revolution carbon concentration wasaround 270 ppm which increased to 372 ppm in 2005 (Kumar et al, 2006; Ramachandran et. al.2007). Impact of CC on the ecology, economy and society is increasing (Pandey, 2002).Carbon sequestration involves the capture and storage of the carbon from the atmosphere whichwould otherwise go on accumulating in the atmosphere. Carbon dioxide is captured and storednaturally by the plants by the process of photosynthesis where they take in CO
2 and sequester it in
the form of sugars and finally contribute to organic matter in the soil (Phani Kumar et al. 2009).Hence, estimation of this C content both in vegetation and in soil becomes imperative to access theCarbon sequestration potential. The trees, as they grow sequester the CO
2 in their body (trunk,
branches and roots) and this results in an increase in their biomass, indicative of an increase incarbon sequestered by them (Ramachandran et al, 2007). Soil-vegetation systems play an importantrole in the global carbon cycle. Soil contains about three times more organic carbon than vegetation

188
Proceeding of Conference : Evolving Paradigm to Improve Productivity for Plant Genetic Resoyrces
and about twice as much carbon than is present in the atmosphere (Dinakaran et al, 2008; Kumaret al, 2006; Batjes & Sombroek, 1997)). Terrestrial vegetation and soil currently absorb 40% ofglobal CO2 emission from human activities (Sheikh, MA, 2010).Global warming risks from emissions of greenhouse gases (GHGs) by anthropogenic activitieshave increased the need for the identification of ecosystems with high carbon sink capacity as analternative mitigation strategy of terrestrial carbon sequestration (Phani Kumar et al. 2009). Thispresent study deals with the estimation of the total carbon stock of the trees of Gujarat Universityby non-destructive method using equations involving the volume, biomass, percentage of carbonsequestered and wood density. Simultaneously, the soil was also analyzed for the organic carboncontent. Thus, the total carbon stock in the trees and soil of Gujarat University campus wascalculated.Study AreaGujarat University, situated in Ahmedabad has a campus which spreads over an area of 1.1km2. Itis situated between 23°02'11.44"N latitude and 72°32'46.63"E longitude at an elevation of 180feet. It is subjected to a dry semi-arid type of the climate according to the Koppen system ofclassification. The average summer minimum to maximum temperature varies from 23 to 45°C.The south-western monsoon results in a humid climate from mid-June to mid-September and theaverage annual rainfall is about 76.0cms (Figure 1).The Gujarat University campus has a rich floral diversity. The main tree species comprise ofAzadirachta indica (neem), Peltophorum ferrugineum (copper pod tree), Alianthus excelsa(arduso), Ficus sp., Cassia fistula (amaltas), Polialthia longifolia (asopalav), Limoniaacidissima (wood apple) and Pongamia pinnata (karanj).MATERIALS AND METHODSFor the carbon stock estimation of each tree, the tree was measured for its height using Haga’saltimeter, bole, GBH (girth at breast height) and diameter of the canopy using a measuring tape.The total carbon stock of the trees was therefore measured by non-destructive method usingequations involving the total volume, total biomass, percentage of carbon sequestered and wooddensity.The GBH of the trees was measured. The total biomass was determined by analyzing both theabove ground biomass (AGB), below ground biomass (BGB) and tree canopy biomass valuesspecific to each tree species. The AGB was measured using the method of Phani Kumar et al,(2009). The BGB is calculated by the method of MacDicken, (1997). The biomass of leaf andbranch cover of each tree was calculated with the help of crown volume according to PhaniKumar et al, (2009). The total volume was then multiplied by the specific density of the tree to getthe total biomass. The specific density of the trees was taken from The Indian Woods (Chowdhury,K.A. and Ghosh S.S., 1958). The carbon percentage of the trees was calculated by multiplyingthe total biomass by 50% (Pettersen, 1984; and Chan 1982).A total of 33 soil samples were collected from different sites by random sampling method. Three

189
Proceeding of Conference : Evolving Paradigm to Improve Productivity for Plant Genetic Resoyrces
soil samples were taken sequentially up to a depth of 20cm (surface sample, sample at a depth of10cm and sample at a depth of 20 cm). It was dried and sieved through 2mm sieve. The undisturbedsoil clumps were used to determine the bulk density. The soil was further ground with pestle andmortar and sieved through the 0.5mm sieve. The soil organic carbon was determined (Walkey andBlack, 1934) for each soil sample. The soil was also analyzed for the pH, nitrogen, phosphorousand potassium. The total soil carbon stock was determined by the method given by MacDicken,(1997).RESULT AND DISCUSSIONThe total number of trees in the Gujarat University was counted to be 3379 belonging to 60species of trees belonging to 28 families and their carbon stock (Table-1) was measured by theabove mentioned method. Azadirachta indica A Juss trees were most dominant followed byPeltophorum pterocarpum (DC) Baker, Polyalthia longifolia (Sonner) Thwaites, Pongamiapinnata, Ailanthus excelsa Roxb and Eucalyptus globulus Labill. Considering the girth, height,canopy cover and specific density, the trees identified as sequestering maximum carbon areTerminalia chebula Retz followed by Pithecellobium dulce (Roxb) Bth Limonia acidissima L, Ficus benghalensis L , Tamarindus indica L , Morus alba L, Ailanthus excelsa Roxb, Syzygiumcumini (L) Skeel, Azadirachta indica A Juss, F. religiosa L, Albizzia lebbeck (L) Bth followedby Terminalia arjuna (Roxb) W & A, Eucalyptus globulus Labill, Mangifera indica L,Casuarina equisetifolia L have the maximum carbon sequestration capability and therefore areideal selection for sequestering CO
2 in the present scenario to prevent climate change. While the
trees like Acacia nilotica (L) Del and the members of family Palmae like Phoenix sylvestris (L)Roxb, Roystonea regia, Musa paradisiaca, Dicrostachys are found to sequester least amountof carbon. Figure 2 shows the largest trees of Gujarat University campus.Table-1 Carbon stock of tree species of Gujarat University
Sr. No. Family Scientific name of tree
No. of Trees
Carbon stock (kg)
1 Annonaceae Polyalthia longifolia (Sonner) Thwaites 504 2012.13
2 Malvaceae Thespesia populnea (L) Sol ex Correa 6 96.80
3 Bombacaceae Bombax ceiba L 2 107.12
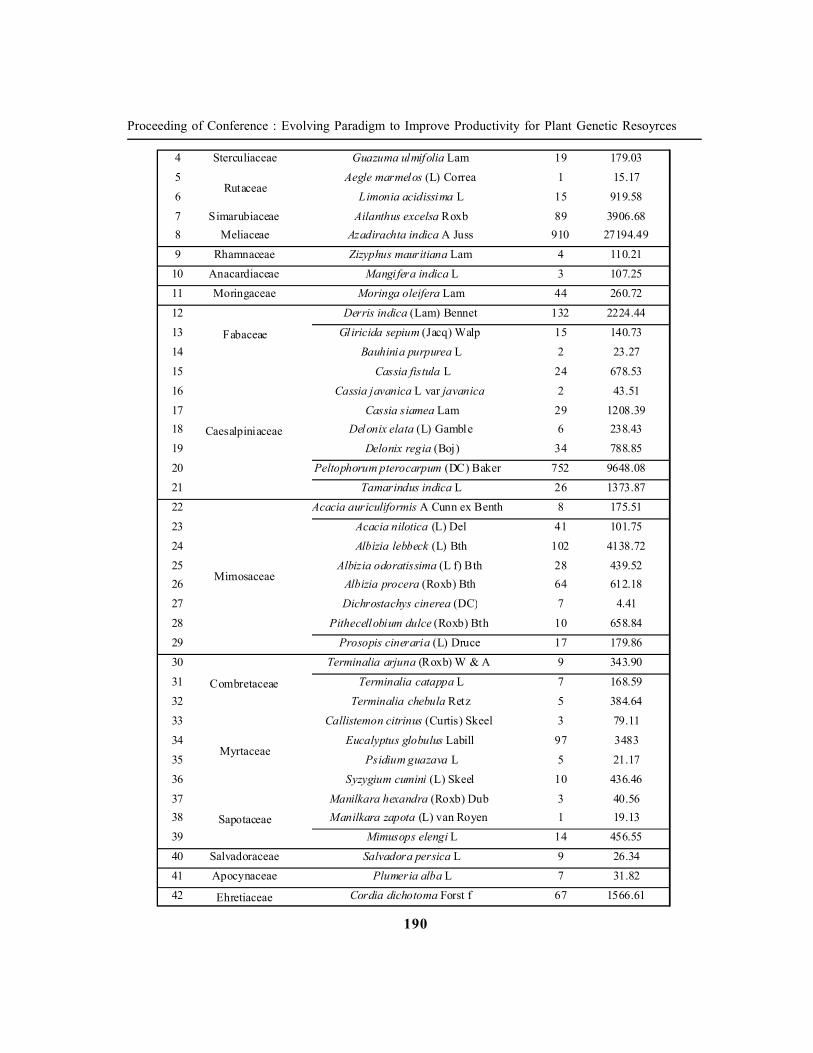
190
Proceeding of Conference : Evolving Paradigm to Improve Productivity for Plant Genetic Resoyrces
4 Sterculiaceae Guazuma ulmifolia Lam 19 179.03
5 Rutaceae
Aegle marmelos (L) Correa 1 15.17
6 Limonia acidissima L 15 919.58
7 Simarubiaceae Ailanthus excelsa Roxb 89 3906.68
8 Meliaceae Azadirachta indica A Juss 910 27194.49
9 Rhamnaceae Zizyphus mauritiana Lam 4 110.21
10 Anacardiaceae Mangifera indica L 3 107.25
11 Moringaceae Moringa oleifera Lam 44 260.72
12
Fabaceae
Derris indica (Lam) Bennet 132 2224.44
13 Gliricida sepium (Jacq) Walp 15 140.73
14 Bauhinia purpurea L 2 23.27
15
Caesalpiniaceae
Cassia fistula L 24 678.53
16 Cassia javanica L var javanica 2 43.51
17 Cassia siamea Lam 29 1208.39
18 Delonix elata (L) Gamble 6 238.43
19 Delonix regia (Boj) 34 788.85
20 Peltophorum pterocarpum (DC) Baker 752 9648.08
21 Tamarindus indica L 26 1373.87
22
Mimosaceae
Acacia auriculiformis A Cunn ex Benth 8 175.51
23 Acacia nilotica (L) Del 41 101.75
24 Albizia lebbeck (L) Bth 102 4138.72
25 Albizia odoratissima (L f) Bth 28 439.52
26 Albizia procera (Roxb) Bth 64 612.18
27 Dichrostachys cinerea (DC) 7 4.41
28 Pithecellobium dulce (Roxb) Bth 10 658.84
29 Prosopis cineraria (L) Druce 17 179.86
30
Combretaceae
Terminalia arjuna (Roxb) W & A 9 343.90
31 Terminalia catappa L 7 168.59
32 Terminalia chebula Retz 5 384.64
33
Myrtaceae
Callistemon citrinus (Curtis) Skeel 3 79.11
34 Eucalyptus globulus Labill 97 3483
35 Psidium guazava L 5 21.17
36 Syzygium cumini (L) Skeel 10 436.46
37
Sapotaceae
Manilkara hexandra (Roxb) Dub 3 40.56
38 Manilkara zapota (L) van Royen 1 19.13
39 Mimusops elengi L 14 456.55
40 Salvadoraceae Salvadora persica L 9 26.34
41 Apocynaceae Plumeria alba L 7 31.82
42 Ehretiaceae Cordia dichotoma Forst f 67 1566.61

191
Proceeding of Conference : Evolving Paradigm to Improve Productivity for Plant Genetic Resoyrces
Table-2 Physicochemical properties of the soil of Gujarat University
Parameters Mean ± SE Bulk density (g/cm3) 1.18±0.20
pH 7.8±0.78 Organic carbon (%) 1.06±0.61
Nitrogen (%) 15.23±0.87 Phosphorous (kg/ha) 17.37±0.17
Potassium (kg/ha) 604.8±0.29 Electrical Conductivity 0.72±0.86
The soil pH value of 7.8 is normal. The electrical conductivity of the soil is also normal with a valueof 0.72. The organic carbon of the soil shows a high value of 1.06%. The phosphorous content isvery low, while potassium content is very high and nitrogen content is normal. The bulk density of1.18 g/cm3 is also very high (Table-2).The total carbon stock in the soil was calculated to be 2501.60 t/ha and the total carbonstock in the trees of Gujarat University was calculated to be 661.30 t/ha. Hence, the totalcarbon stock of Gujarat University is 3162.9 t/ha. This result is in accordance with earlierstudies which have proved that soil contains about three times more organic carbon than vegetationand about twice as much carbon than is present in the atmosphere (Batjes & Sombroek, 1997;Kumar et al, 2006; Dinakaran et al, 2008).CONCLUSIONThe carbon sequestration capacity of a tree species depends upon its height, girth size, biomassaccumulation capacity, canopy diameter and most important wood specific density. The carbonstock determined for various tree species shows that trees like Terminalia chebula Retz followedby Pithecellobium dulce (Roxb) Bth Limonia acidissima L , Ficus benghalensis L, Tamarindusindica L , Morus alba L, Ailanthus excelsa Roxb, Syzygium cumini (L) Skeel, Azadirachtaindica A Juss, F. religiosa L, Albizzia lebbeck (L) Bth followed by Terminalia arjuna (Roxb)W & A, Eucalyptus globulus Labill, Mangifera indica L, Casuarina equisetifolia L have themaximum carbon sequestration capability and therefore are ideal selection for sequestering CO
2 in
the present scenario to prevent climate change. While the trees like Acacia nilotica (L) Del andthe members of family Palmae like Phoenix sylvestris (L) Roxb, Roystonea regia, Musaparadisiaca, Dicrostachys are found to sequester least amount of carbon.So, the trees to be chosen for sequestering maximum amount of carbon in the scenario of climatechange with high levels of carbon dioxide in the atmosphere, should be chosen with properties ofhighest specific density, they should be fast growing increasing biomass at a fast rate and shouldhave a huge canopy (Jana et al, 2009). The CDM, as under the Kyoto Protocol is encouraging theplantation of trees with a high carbon sequestration capability so as to bring down the concentration

192
Proceeding of Conference : Evolving Paradigm to Improve Productivity for Plant Genetic Resoyrces
of CO2 in the atmosphere. It is justified that soil-vegetation systems play an important role in the
global carbon cycle by sequestering carbon emitted in the atmosphere thereby helping in reducingglobal warming.REFERENCESPhani Kumar, G., Murkute, A.A., Gupta, S. and Singh, B.S., (2009) Carbon sequestration withspecial reference to agroforestry in cold deserts of Ladakh Current Science 97: 1063-1068.MacDicken, K.G., (1997) A Guide to Monitoring Carbon Storage in Forestry and AgroforestryProjects, Winrock International Institute for Agricultural Development, USA. 1-87Pettersen, R.C. (1984) The Chemical Composition of Wood. In: The chemistry of solid wood.Advances in chemistry series 207. eds. Rowell, R. M., American Chemical Society, Washington,DCManhas, R.K., Negi, J.D.S., Kumar, R. and Chauhan, P.S. (2006).Temporal assessment of growing stock, biomass and carbon stock of Indian Forests. Climatechange, 74: 191-221.Moura-Coasta, P.H. (1996) Tropical forestry practices for carbon sequestration. In: Dipterocarpforest ecosystem: Towards sustainable management. Eds Schulte, A. and Schone, D., WorldScientific, NJRamachandran, A., Jayakumar, S., Haroon, R.M., Bhaskaran, A. and Arockiasamy, D. I. (2007)Carbon sequestration: estimation of carbon stock in natural forests using geospacial technology inthe Eastern Gats of Tamil Nadu, India. Current Science, 92: 323-331Lal, M. and Singh, R. (2000) Carbon sequestration potential of Indian forests. EnvironmentalMonitoring Assessment, 60: 315–327.Tritton, L.M., Hornbeck, J.W. (1982) Biomass equations for major tree species of the Northeast,General Technical Report NE-69, United States Department of Agriculture.Negi, J.D.S., Manhas, R.K. and Chauhan, P.S. (2003). Carbon allocation in different componentsof some tree species of India: A new approach for carbon estimation. Current Science, 85: 101104.Jana B.K., Biswas, S., Majumder, M., Roy, P.K. and Majumdar, A. (2009) Carbon sequestrationrate and above ground biomass carbon potential of four young species. Journal of ecology andnatural environment 1: 015-024Brown, S. and Lugo, A.E. (1984). Biomass of Tropical Forests: A New Estimate Based on ForestVolumes. Science, 223: 1290–1293.Chowdhury, K.A. and Ghosh S.S. (1958) Indian Woods: Their identification, properties and useVolume I Lilleniaceae to Elaeocarpaceae pp:1-304Chowdhury, K.A. and Ghosh S.S. (1963) Indian Woods: Their identification, properties and useVolume II Linaceae to Moringaceae pp: 1-329Ramesh Rao, K. and Purkayastha, S.K. (1972) Indian Woods: Their identification, propertiesand use Volume III Leguminosae to Combretaceae pp: 1-262

193
Proceeding of Conference : Evolving Paradigm to Improve Productivity for Plant Genetic Resoyrces
Pandey, D.N. (2002) Global climate change and carbon management in multifunctional forests.Current Science 83: 593-602Dinakaran, J. and Krishnayya, N.S.R. (2008) Variations in type of vegetal cover and heterogeneityof soil organic carbon in affecting sink capacity of tropical soils. Current Science, 94:1144-1150Kumar,R. Pandey,S. and Pandey, A. (2006) Plant roots and carbon sequestration. Current Science,91: 885-890Jina, B.S., Sah, P., Bhatt, M.D. and Rawat, Y.S. (2008) Estimating carbon sequestration ratesand total carbon stockpile in degraded and non-degraded sites of oak and pine forests of Kumauncentral Himalaya. Ecoprint 15: 75-81Sheikh, MA. and Kumar, M. (2010) Carbon sequestration potential of trees on two aspects insub tropical forest. International Journal of Conservation Science 1:143-148Batjes, N.H. and Sombroek W.G. (1997) Possibilities for carbon sequestration in tropical andsubtropical soiels. Global Change Biology 3: 161-173
Fig-1 Study Area - Gujarat University campus

194
Proceeding of Conference : Evolving Paradigm to Improve Productivity for Plant Genetic Resoyrces
Azadirachta indica A Juss largest tree
with a girth of 4.1 m Ficus benghalensis L tree with a girth of 3.1
m
Bombax ceiba L tree with a girth of 3 m
Fig-2 Showing the largest trees of Gujarat University Campus
195
Proceeding of Conference : Evolving Paradigm to Improve Productivity for Plant Genetic Resoyrces
Dust Capturing Efficiency of Road-Side Plants Growing atAhmedabad Cross-Roads
*Deepika Chandawat, Pradeep Verma and Hitesh Solanki
Department Of Botany, University School Of Sciences,Gujarat University, Ahmedabad (Gujarat- India) – 380009.
Department of Botany, M.N.Science College, Visnagar,,Gujarat, India.E-mail:[email protected]
ABSTRACTThe air pollutants which cause plant injury are primarily gases, but some particulate matter or dustsdo affect vegetation. Ambient Air constitutes various size ranges of solid particles commonlyrecognized as Particulates or Dust, which are continuously agglomerated and deposited, on varioussurfaces. Foliar surface of plants is continuously exposed to the surrounding atmosphere and is,therefore, the main receptor of dust. This physical trait can be used to determine the level of dustin the surroundings, as well as the ability of individual plant species to intercept and mitigate particulatepollutants.In the present study, five common roadside plant species growing at the cross-roads of Ahmedabadcity namely Ficus benghalensis, F. religiosa, F. glomerata, Azadirachta. indica and Polyalthialongifolia were studied to find dust trapping efficiency and morphological characters responsiblefor their dust trapping efficiency.Keyword: Ahmedabad, Dust, Plants, Morphology,Trapping efficiencyINTRODUCTIONAhmedabad city is highly polluted due to rapid growth of industries and heavy vehicular traffic.Particles of all types cause dust pollution in the environment. Industrial and combustion processes,cement dust, dust from grinding and crushing factories, fly ash from power plants, agriculturalwaste burning as well as automobile exhaust, rise of chemical dust from the surface of industrialsolid waste in dry windy weather also increases the particulate pollution problems.Human health is very closely linked to environmental quality, as the Etiology of most of the humandiseases being related to the status of the living environment of man. According to statistics, 25%of all preventable illnesses are caused by detrimental environmental factors [UNEP, United NationsChildren’s Fund, WHO 2002].Our respiratory system has a number of mechanisms that help in protecting us from air pollution.The hair in our nose filters out large particles. The sticky mucus in the lining of the upper respiratorytract captures smaller particles and dissolves some gaseous pollutants. When the upper respiratorysystem is irritated by pollutants sneezing and coughing expel contaminated air and mucus. Prolongedsmoking or exposure to air pollutants can overload or breakdown these natural defences causing

196
Proceeding of Conference : Evolving Paradigm to Improve Productivity for Plant Genetic Resoyrces
or contributing to diseases such as lung cancer, asthma, chronic bronchitis and emphysema.Researchers have shown that Plants (including trees) can act as biological filters, removing largequantities of particles from the urban atmosphere. This is predominately due to their large leafareas relative to the ground on which they stand, and the physiological properties of their surfacesi.e. the presence of trichomes or waxy cuticles on the leaves of some species. Interception ofparticles by vegetation has been shown to be much greater for street trees due to their proximity tohigh intensities of road traffic.MATERIALS AND METHODSDry technique (Das & Pattanayak, 1977)From each plant, ten matured leaves were collected in the separate polythene bags during winter,summer and rainy season. Leaves were collected at the height of three to four meters from eightdifferent polluted cross-roads of Ahmedabad city. In this technique first the intact leaf was weighted(in mg) then dust particulates from leaf surfaces were gently collected with the help of camel hairbrushes and the weight of leaf was measured again. The amount of dust deposition in mg/cm2 wascalculated as:- Dust content (mg/cm2) =
Wt of intact leaf- initial wt of leaf-----------------------------------------
Total surface area of leaf (cm2)Finally average was taken and graph was plotted to find the amount of dust deposition on variousplant species.RESULT AND DISCUSSION According to Bernatzky (1974) urban air usually contains significant amounts of dust. Differentreasons were given by different researchers for the dust holding capacity of plants. Dust interceptionand retention depends upon leaf orientation, age, roughness and wettebility of the surface Beckettet al., (2000) and Neinhuis and Barthlott (1998).It also depends on the strength and constancy ofwind, the porosity of the vegetation with respect to air movement and the amount and intensity ofrain according to Raupach et al (2001). It has been established that leaves and exposed parts ofa plant generally act as persistent absorbers in a polluted environment Samal and Santra (2002).In the present study we observed that F. benghalensis showed maximum dust trapping efficiencyamong all the plants which may be due to its habitat and morphological characters. It is an evergreenplant with big and horizontally arranged leaves. It has rough leaf surface due to the presence ofhairs, vein is thick, large and many on the lower surface all these characters help dust to adheremore on leaves. Ahmed and Yunus (1981) reported that larger and more vein lets are the maincharacters of a leaf which help for dust collection. Once the dust particles settled down there areless chance to rid of as it has small petiole, which reduces the movement of leaf. Anatomicalfeatures of leaves also play an important role of high dust capturing capacity. F. benghalensis havesunken stomata and is having hairy presence which helps in condensation of water vapors taking

197
Proceeding of Conference : Evolving Paradigm to Improve Productivity for Plant Genetic Resoyrces
place during transpiration process. This helps in maintaining moisture condition on leaf surface andincreases the capturing of dust by these plants.While in the case of F. religiosa less dust is observedcompared to F. benghalensis may be due to long petioles that help the leaves to flutter duringwind, and the vertical position of the leaves which prevents dust retention. Leaf petioles are moreefficient particulate impactors than either twigs (stems) or leaf lamina Garg et al (2000). Also theleaves of F. religiosa are smooth and partially pendulous; therefore, the dust settled on the leafsurface due to gravitational force or even by wind may slip down. Dust found on the leaf surface ismainly due to many and thick veins. F. glomerata has glossy and glabrous surface, petiole is small,and leaves are not horizontally arranged which prevent dust to settle down but vein lets are large,very sparsely pubescent and surface is sticky that holds dusts. A. indica is an evergreen tree.Leaves are horizontally oriented with small petiole having thin veins which help in dust accumulation.But surface of leaf is smooth and glossy so dust particles slip down. Lower dust accumulation forP. longifolia may be due to the thin lamina of their leaves and vertical position of the leaf. Alsothough leaf is large the surface is glossy and leaves are vertically suspended due to which dust slipdown. Dust accumulation occurs mainly at the margins that are wavy.The influence of leaf characteristics on dust accumulation has also been studied Garg et al (2000),Somashekar et al (1999) and Vora et al (1986). Leaf morphology plays an important role intrapping the dust from the environment. Ahmad et al (1981) reported that the dust trapping efficiencyof plants depends on the morphological traits of leaves such as epidermal and cuticular features,surface geometry, phyllotaxy, orientation, size and area of a leaf etc. Shetye and Chaphekar (1980)observed that evergreen plants with horizontally oriented leaves are good dust trappers thandeciduous or evergreen plants with vertically suspended glabrous leaves. Das et al (1981) alsoconcluded that evergreen trees with simple and rough surfaced leaves are better dust collectorsthan those of deciduous trees with compound and smooth surfaced leaves. Similar finding wereobtained in the present investigation. With all these morphological characters position/location oftree also plays an important role. If the tree is nearer to the road chance of getting more dustincreases. Therefore, on the basis of their dust trapping efficiencies selected plants can be categorizedas high (Ficus benghalensis), medium (Ficus religiosa and Ficus glomerata), and low(Azadirachta indica and Polyalthia longifolia) dust trappers respectively. Crust formation onthe leaf surfaces of F. benghalensis and F. religiosa, was observed at site- 2, 4, & 5(Paldi, STand Naroda) due to continuous spraying of unbrunt residues of diesel and petrol by the vehicles onthe leaves. Similar result of crust formation on leaves was obtained by Bhatnagar (1986). Accordingto him the urban and industrial dust gets stick on unburnt oil residues already present on leaves inpolluted area and combindly they turn into a crust layer on the leaves of such plants.CONCLUSIONOn the basis of their dust trapping efficiencies selected plants can be categorized as high (Ficusbenghalensis), medium (Ficus religiosa and Ficus glomerata), and low (Azadirachta indicaand Polyalthia longifolia) dust trappers respectively.

198
Proceeding of Conference : Evolving Paradigm to Improve Productivity for Plant Genetic Resoyrces
ACKNOWLEDGEMENTWe express our sincere thanks to our head of the Botany Department, Prof. Dr. Y.T. Jasrai. forproviding necessary laboratory facilities and encouragement.REFERENCESAhmed K J and Yunus M (1981): Studies on epidermal characteristics of leaf in response of airpollution in the symposium on "Methods in plants responses to pollutants". ITRC, Lucknow, India.Beckett K P, Freer-Smith P H and Taylor G (2000): Particulate pollution capture by urban trees:effect of species and wind speed. Global Change Biology. 6:995 –1003.Bernatzky, A. (1974): Le rôle des arbres dans la ville (in L’Écosystéme urbain, ColloqueInternat.Organisé par l’agglomeration de Bruxelles, Bruxelles, pp 79 – 84.Bhatnagar A R (1986): Effects of air pollution on plants in Ahmedabad. PhD Thesis, GujaratUniversity, Ahmedabad, Gujarat.Das T M, Bhaumik A, Ghosh A and Chakravarty A (1981): Trees as dust filters. Science Today.19; 19 – 21.Das T N and Pattanayak P. (1977): The nature and pattern of deposition of air borne particles onleaf surface of plants. Proc. Seminar on aforestation, Inst. of P.H.P. pp 56 – 62. Garg S S, KumarN, and Das G. (2000): Ind. J. Environ. Prot.20; 326–328.Neinhuis C and Barthlott W (1998): Seasonal changes of leaf surface contamination in beech, oakand ginkgo in relation to leaf micromorphology and wettability. New Phytologist.138; 91– 98.Raupach M R, Woods N, Dorr G, Leys J F and Cleugh H A (2001): The entrapment of particlesby windbreaks. Atmospheric Environment. 35; 3373 – 3383.Samal A K and Santra S C (2002): Air quality of Kalyani Township (Nadia, West Bengal) and itsimpact on surrounding vegetations, Ind. J. Environ. Health. 44(1);71 – 76.Shetye R P and Chaphekar S. B. (1980): Some estimation on dust fall in the city of Bombay, usingPlants. Proc. Seminar on progress in Ecology, Today and Tomorrows Publication, New Delhi.4;61 – 70.Somashekar R K, Ravikumar R, and Ramesh A M. (1999): Impact of granite mining on someplant species around quarries and crusher of Bangalore district. Pollution Research.18; 445 - 451.Vora A B, Bhattnagar A R, and Patel T S (1986): Comparative study of dustfall on the leaves inHigh Pollution and Low Pollution areas of Ahmedabad. II. Effect on Carbohydrates. J. ofEnvironmental Biology. 7(3); 155 – 163.

199
Proceeding of Conference : Evolving Paradigm to Improve Productivity for Plant Genetic Resoyrces
Graph-1 Average Dust capture of Leaf of Plant Species
0.27
0.21
0.19
0.16
0.14
F.benghalensis
F.religiosa
F.glomerata
A.indica
P.longifolia
Dustfall (mg/cm 2 )
Graph-1 shows significantly that Ficus benghalensis to have maximum dust accumulation whilePolyalthialongifolia to have minimum dust accumulation. The trend of dust deposition among all the specieswas as follow F. benghalensis > F. religiosa > F. glomerata > A. indica > P. longifolia.

200
Proceeding of Conference : Evolving Paradigm to Improve Productivity for Plant Genetic Resoyrces
Studies on Marine Phytoplankton Abundance Through RemoteSensing and Climate Change Impacts
Meghal Shah1, Himanshu Pandya1 And Neera Chaturvedi2
1 Department of Botany, Gujarat University, Ahmedabad2Biological and Planetary Sciences and applications Group,
Space Applications Centre (ISRO), Ahmedabad 380 015 IndiaEmail: [email protected]
ABSTRACTOcean colour Remote Sensing is a key parameter to understand the variation in Marinephytoplankton richness. In order to study the long-term changes in phytoplankton concentration,monthly composite of chlorophyll images for two decade’s period were studied on seasonal,Inter-annual and Intra annual bases for the Indian Ocean (IO). TheCZCS (1980’s) and SeaWiFS (2000’s) sensors derived chlorophyll images with 9 km resolution,level-3 global gridded product, were used for analysis on seasonal bases. In general chlorophyllvalue is higher in September then declined and again shows an increase from January to March forboth the decade (1980’s and 2000’s). Average value of chlorophyll within the study area whenplotted for the months September to April shows seasonal variability with a peak during Februaryand gradual decline afterwards. A comparison of average chlorophyll image during 1997 – 2010with that of 1978 – 86 shows substantially higher chlorophyll throughout the study period duringthe recent years (2000’s). To understand the year to year variability in chlorophyll pattern, datahas been analysed on monthly basis from 1997- 98 to 2009 -10. In general chlorophyll valuesshows peak in September and February for the years 1997-98 to 2007-08. During 1998-99,2008-09 and 2009-10. The chlorophyll absolute chlorophyll values may differ during the studyperiod but peak is observed at the same period. However, during recent years the secondarypeak is also observed during 2008-09. This shows the potential of observing shift in phenology/periodicity in marine phytoplankton might be due to alteration in Climate.INTRODUCTIONThe biological processes in the ocean are largely controlled by the presence of phytoplankton,which forms the base of food chain, and is responsible for CO
2 fixation. All the anticipated alterations
due to climate change can potentially affect the rate of photosynthesis and the amount of carbonfixed through primary production, the signature of which may possibly appear in the satellite oceancolor observations. The observed reductions in ocean productivity during the recent post-1999warming period provide insight on how future climate change can alter marine food webs (Behrenfeldet al., 2006). The analysis of representative open ocean locations and three different zonal analysis(oligotrophic. mesotrophic, eutrophic) in the Arabian Sea and Bay of Bengal show that the chlorophyll

201
Proceeding of Conference : Evolving Paradigm to Improve Productivity for Plant Genetic Resoyrces
concentration is much higher in the northern and central Arabian Sea during 2000’s as comparedto that during 1980’s (Chaturvedi et al., 2013). In present study the effort has been made tounderstand the effect of two decades on chlorophyll concentration in the Arabian Sea and Bay ofBengal using Satellite data.CZCS (1978 –86) derived chlorophyll data was used as representation of 1980’s while SeaWiFSderived chlorophyll data is used as representation of 2000’s situation. The Indian Peninsula dividesthe northern portion of Indian Ocean into two great gulfs: the Arabian Sea (AS) and the Bay ofBengal (BOB). In the present work Chl-a variability in the AS and BOB is analyzed. The objectiveis to study the variability of the chlorophyll concentrations in two decades time on spatial andtemporal basis. In the present paper, we discuss the distribution pattern and comparison of thechlorophyll concentrations in different regions as well as effect of two decades on climate change.MATERIALS AND METHODSIn order to understand the chlorophyll variability, the SeaWiFS derived level –3 processed datahas been used to analysed the recent period (1997-2010). The Chl-a images were generated, byusing Ocean Color- 4 (OC4) algorithm (O’Reilly et al.,1998). Monthly average, chlorophyll imageshave been analysed. This is level-3 global gridded product with 9 km resolution. The StandardMapped Images (SMI) generated from SeaWiFS data has been used. The cloud free data(September-April) has been analysed for the period of 1997-2010. The Coastal Zone ColorScanner (CZCS) derived processed data of Chlorophyll has been used to study the condition in80’s. This data has been obtained from DAAC, NASA, USA. The Chl-a images, have beenregenerated by using Ocean Color- 4 (OC4) algorithm. Therefore, the comparison is possible.Ten years average data of 1979-86 from September to April has been analyzed. The region ofIndian Ocean (30° N to 30° S and 30° E to 30° W) has been extracted from global coverageimage and geo referencing has been done with the use of ENVI-4.4 and SeaDAS software. Thechlorophyll values >10 mg m-3 were masked and after that the final classification of the image wasdone. CZCS and SeaWiFS derived chlorophyll images for the same period were studied tounderstand the change in chlorophyll concentration over the decades and seasonal variability in theIndian Ocean (fig.1).RESULTS AND DISCUSSIONAn effort has been made to understand the chlorophyll variability in relation to climate change.Chlorophyll pattern shows, in general, high chlorophyll concentration during recent years ascompared to 20 years back. It is known that Arabian Sea is more productive than the Bay ofBengal therefore; both the regions were analyzed independently. Arabian Sea and Bay of Bengal,shows high chlorophyll values throughout all the months in the recent decade (2000’s) as comparedto that of 1980’s. In order to understand seasonal distribution pattern of Chlorophyll in the IndianOcean the average value of chlorophyll in the Indian Ocean was plotted against each month i.e.September to April (cloud free months) for the years 1997 – 2010. Though the periodicity ofchlorophyll pattern is clearly observed the inter-annual variability in terms of quantitative changesis seen during the study period (1997 to 2010). In general chlorophyll value is higher in September

202
Proceeding of Conference : Evolving Paradigm to Improve Productivity for Plant Genetic Resoyrces
then declined and again shows an increase from January to March. Seasonal pattern of totalstudied period of 14 years is given in fig.2 this gives a general idea of periodicity in chlorophyllseasonal pattern and quantitative changes from year to year which may be related to physicalparameters. In general chlorophyll values shows peak in September and February for all the yearsfrom 1997-98 to 2007-08 except 1998-99, 2008-09 and 2009-10. The values of chlorophyllwere different for all the years but it shows peak in same months. In recent years the secondarypeak has also observed in 2008-09 and 2009-10.The decadal analysis shows high chlorophyll concentration in AS and BOB throughout all themonths in recent year’s data (2000’s) as compared with two decade back data (1980’s). Eutrophicwaters, i.e nutrient rich water show maximum increase from December to February in 2000’s ascompared to that during 80’s particularly in the Arabian Sea. However, in the Bay of Bengal themesotrophic waters seem to decrease to some extent. Arabian Sea is more productive than theBay of Bengal is previously very well understood. and the area under eutrophic zone i.e. chlorophyllrich waters has increased in spatial extent (Chaturvedi et al.,2013) therefore, chlorophyll values inArabian sea and Bay of Bengal were analysed independently. Its observed that Arabian Seashows higher chlorophyll (Chaturvedi et al., 2012) value throughout the study period during thepresent decade as compared to that of 1980’s. Since February shows highest chlorophyll withinthe studied period for last 12 years from 1997 – 2010 (Shah Et al., 2012). From 1997 to 2007-08, peak was observed in September and then it shows deep fall which once again reach the peakfrom February to April. This may be due to presence of an ample of nutrients during February-March (winter monsoon), the northern latitudes become more productive due to winter coolingand convective mixing (Madhupratap et al., 1996). The BOB also shows similar kind of pattern,where values are higher in recent years as compared to twenty years back . The high influx offreshwater brings lots of nutrients which makes BOB more productive near to Northern region ascompared to Southern regions. In BOB the values are not as higher as in AS. But when it comparedwith 1980’s, recent decade shows higher chlorophyll values. . In general chlorophyll values observedhigher in recent years throughout all the months from September to April.CONCLUSIONThe study revealed that the chlorophyll concentration in general high for both the study area, ASand BOB during the current period as compared to that of 1980’s. The chlorophyll distributionpattern shows high concentration during February March in the Arabian Sea due to winter coolingand convective mixing, as against the Bay of Bengal which shows high concentration duringNovember December associated with river runoff from a large number of rivers. High chlorophyllvalues observed throughout in 2000’s as compared to 80’s in AS and BOB. An increase inchlorophyll concentration in recent decade indicates a positive sign, against reported global warming.REFERENCESBehrenfeld, M. J., T O’M. Robert, D. A. Siegel, McClain., J. L. Sarmiento, G. C. Feldman, A. J.Milligan, P. G. Falkowski, R. M. Letelier, and E. Boss. 2006. Climate-

203
Proceeding of Conference : Evolving Paradigm to Improve Productivity for Plant Genetic Resoyrces
driven trends in contemporary ocean productivity: Nature, 4 4 4 ,doi:10.1038/nature05317.Chaturvedi, N., Ajai., Shah, M. N and Y. T. Jasrai, 2012 "Chlorophyll Atlas of Indian Ocean",Space Applications Centre, Ahmedabad, India.Chaturvedi, N., M. Shah, Ajai and Y. Jasrai. 2013. Is there impact of climate change on biologicalproductivity in the Indian Ocean: Indian Journal of Geo Marine Science 42(1):50-57.Madhupratap, M., S. Prasanna Kumar, P. M. A. Bhattathiri, M. Dileep Kumar, S. Raghukumar,K.K.C. Nair, and N. Ramaiah. 1996. Mechanism of the biological response to winter cooling inthe northeastern Arabian Sea. Nature 384:549-552.O’Reilly, J., S. Maritorena, B. G. Mitchel, D. A. Seigal, K. L. Carder, S. A. Garver, M. Kahru,and C.R. Mc Clain. 1998. Ocean Color chlorophyll algorithms for SeaWiFS. Journal ofGeophysical Research 103(C11):24937-24953.Shah, M. N., Chaturvedi, N., Jasrai, Y. T and Ajai. 2012 "Chlorophyll variability in the ArabianSea and Bay of Bengal during last decade (1997-2007)", Journal of Geomatics, 6(2), 65-69.ILLUSTRATIONS

204
Proceeding of Conference : Evolving Paradigm to Improve Productivity for Plant Genetic Resoyrces
Fig-2 Seasonal chlorophyll distribution pattern from 1997-2009

205
Proceeding of Conference : Evolving Paradigm to Improve Productivity for Plant Genetic Resoyrces
Floristic Diversity of Bahedj Zone, Megharj Range Forest DistrictSabarkantha, Gujarat, India
H. S. Kharadi And S. D. Vediya
P.G. Centre in Botany, Sir P.T. Science College Modasa,Gujarat, India.E-mail: [email protected]
ABSTRACTThe present work has been done to collect the Information about different plant species of Megharjrange forest in particular zone of Bahedj. The data obtained from these studies have botanicalimportance of the particular zone Bahedj. During the field work we have consisted of total 67Agiospermic families are belonging 220 genera and 324 species were collected and recorded.Herbs are dominated. Herbs 128 and 90 shurbs, 32 climbers and 74 trees. We have also noted 4ptreidophytes and 3 bryophytes. The dominant species are Prosopis chilensis, Holarrhenaantidysenterica, Tactona grandis, Lantana camara etc.Keywords: Floristic composition, dominant species, Megharj-BahedjINTRODUCTIONFloristic studies have acquired increasing importance in recent years in response to the need ofdeveloping and under developing countries to assess their plant wealth. The rich botanical wealthof this Megharj range forest in particular zone Bahedj is being continuously over exploited fortimber and non timber forest products such as fodder, grasses, gums, grazing etc. The earlier workon floristic part of North Gujarat has been carried out Sexton & Sejweek (1918). Later on therewas on gap were from 1917 onward Patel (2000), Ant (2001), Jangid (2003).Desai (2007).They were worked in selected different area of North Gujarat. During our field trip visit have takenvarious photographs of rare plant species in Bahedj forest. From this region we have reported 324plant species. Looking to the importance of the floristic study this study was under taken.MATERIALS AND METHODSThe Sabarkantha district is situated in the North West part of Gujarat between latitudes 20 13’15’’ and 24 34’ 30" North and Longitudes 72 47’ 0" and 73 37’ 30" east. Part of the westernAravallis Mountain in Sabarkantha. The Megharj forest is situated on latitude23 30’ 40" Northand Longitude 73 30’ 40" North and Longitude 73 30’ 40" east.The present work is the output of the continuous field study during the season winter 2010 to2011.Collected plant species were identified with the help of "The flora of Gujarat state" and flora of"The Presidency of Bombay".RESULT AND DISCUSSIONThe total number of 63 Angiospermic families is belonging 223 genera and 324 species reported

206
Proceeding of Conference : Evolving Paradigm to Improve Productivity for Plant Genetic Resoyrces
from this area. We have also noted the dominant species are Prosopis chilensis, Holarrhenaantidysenterica, Tactona grandis, Lantana camara etc. in particular region Bahedj.
Table-1 Floral richness of the Bahedj forest.
Types of the plants Genera Species Families
Dicots 202 301 54
Monocots 21 23 9
Total 223 324 63
0
50
100
150
200
250
300
350
Genera Species Families
Dicots
Monocots Total
Fig-A Floral richness of the Bahedj forest
Table-2 Dominant plants in the Bahedj forest
Family Plant name Total number of plants Verbinaceae Lantana camara 1536 Mimosaceae Prosopis chilensis 1045
Apocynaceae Holarrhena antidysenterica 892 Verbinaceae Tectona grandis 866
Total number of plant

207
Proceeding of Conference : Evolving Paradigm to Improve Productivity for Plant Genetic Resoyrces
Verbinaceae Lantana camara
Mimosaceae Prosopis chilensis
Apocynaceae Holarrhena antidysenterica
Verbinaceae Tectona grandis
35 %
24 %
21 %
20 %
Fig-B Dominant plant in the Bahedj forest
Fig-C Plant diver
Table - 3 Plant diversity of Bahedj
Types of the plant s Tree Shrubs Herbs Climbers Number of species 7 4 90 12 8 3 2
Tree 23 %
Shrubs % 28
Herbs 39 %
Climbers 10 %
Plant diversity of Bahedj
Fig-C Plant diversity of BahedjWe have recorded 202 genera of Dicots and 21 genera of Monocots, 301 species of Dicot& 23 species of Monocots, belonging to 54 dicot & 9 monocot families.(table-1 & fig. A). Table2 and Fig. B shows dominant families and plant and also shows that total no. of plant in particular

208
Proceeding of Conference : Evolving Paradigm to Improve Productivity for Plant Genetic Resoyrces
zone Bahedj. Table 2 and fig. B shows that 4 genera are dominant in the Bahedj rangeforest.Table.3. and Fig. 3 shows plant diversity of Bahedj zone. Fig. 3 indicates that 39 % ofherbs, 28 % shrubs, 23 % trees and 10 % of climbers.REFERENCESBhanderi, M.M. (1929 Flora of the Indian Desert: Dhriti Printers, New DelhiBraun-Blanquet, J (1932) Plant sociology, trans. By Fuller and Conard. Mc Graw Hill Book Co.Inc. New York and LondonCook, T. (1908) The flora of the presidency of the Bombay. Vol. I and II, Bishan SinghMahedrapalsingh, DahradunJain, S.K and U.R Deshpande(1964) Observation on the vegetation of Khandes (Maharashtra).Proc. Nat. Acad. Sci. India, 34 (3): 322 – 333Karntik, C.R.(1955) A contribution to the biogeographical studies of Khandes with specialreference to Satpuda range. Bombay Geogr. Mar. , 2: 65 -72Kotiwar, O.M (1995) Ecological and Taxonomical study of dry deciduous Gir forest. Ph.D. Thesis,Bhavnagar University, Bhavnagar.Mathew, Varghese (1988) Forest flora of Dhule district part I and II , Ph.D. thesis, Sardar patelUniversity, Vallabh VidyanagarMaheshwari, J.K(1963) The flora of Delhi: C.S.I.R., New DelhiOosting, H. J(1958) The study of Plants communities: W. H. Frceman and co. San Francisco.U.S.APandit B. R.‚ Mahesh Kumar R., Kotiwar, O. S. and Patel, B. P( 1995) "Biological Spectrum ofReserved forest near Bhavnagar, Gujarat." Ad. Plant. Sci." 8(2): 319-322Pandit B. R.‚ Kotiwar, O. S. and Pahurkar, A. J(1996) "Life forms and biological spectrum of theflora of Gir Forest, Gujarat." Geobios new Reports 15(1): 17 - 20Patel, B.P(1982) Ecological Survey of the Reserved forest (Victoria Park) near Bhavnagar. Ph.D.thesis, Bhavnagar University, BhavnagarPatel, R.S. (2002) Floristics and Ethnobotanical studies of Ambaji Forest on North Gujarat; Ph.Dthesis submitted to Sardar patel University, Vallabh VidyanagarPandeya, S.C., Pandya, S.M., Murthy, M.S and Kuruvilla, K(1967) Forest ecosystem.Classification of forest vegetation with reference to forests in the River Narmada catchment Area.J. Ind. Bot. Soc.46: 412-427Santapau, H. (1951) The genus Dioscoera in Bombay state. J. Bombay Nat. Hist. Soc., 49 :624636Saxton, W.T. and L.J. Sedwick (1918) Plant of Northan Gujarat Ibid. 6(7) : 209 -326Santapau, H and Janardhanan, K.P( 1966) The flora of Saurashtra: Bull. Bot. Surv. India. 8: 1-58 Smith A. P (1973) Stratification in temperate and tropical forests. Am. Nat. 107: 671-683

209
Proceeding of Conference : Evolving Paradigm to Improve Productivity for Plant Genetic Resoyrces
Shah, G.L. (1978). Flora of Gujarat state. Part I and II, Sardar patel University, Vallabh VidyanagarThakkar, J.I(1910) Vanaspati Shashtra: Reprint , Pravin Pustak Bhandar, RajkotVediya & Kharadi.(2011) Study of plant diversity in Meghraj range forest District Sabarkantha,North Gujarat, India. IJPLS 2(7): 903-908Vora , U.A and Patel, B.K(1981) The vegetation of Goghamahal and its biological spectrum.Geobios, 8: 211-214Yadav, S.R. (1979) A contribution to the floristic and phytosociology of some parts of SouthGujarat. Ph.D. Thesis, S. P. University, Vallabh Vidhyanagar

210
Proceeding of Conference : Evolving Paradigm to Improve Productivity for Plant Genetic Resoyrces
Poisonous plants of the lalpur taluka of Jamnagar district,Gujarat, India.
Nitin Solanki1, Manali Vaghela1, K. V. Kanjariya2 And R. S. Patel2
1Students, S. Y. B. Sc. (Botany)2Assistant Professors, KKSJ, Maninagar Science College, Rambaug, Maninagar, Ahmedabad,
Gujarat, India.Corresponding Authors: email: [email protected],
ABSTRACTThe information about the poisonous plants was really helpful to us through which we can takesome precautions. It is proposed to develop some technique for the tribal and rural people throughwhom we can give the demonstration after having a night meeting so that the people are aware ofpoisonous plants. An account of 32 plant species belonging 31 genera and 19 families. Theinformation on the poisonous plant species has been gathered from the local people duringethnobotanical field survey. Jamnagar district consists of 14 talukas, 756 villages and 56 nesses. Inthis present work, a brief account of poisonous plants of Lalpur taluka, which lies between220-15’ N latitudes and 700-25’ E longitudes. Ethno botanical information. Poisonous plantsenumerated here were arranged alphabetically in their scientific name followed by family’s name,local name and poisonous part. Poisonous plants have been arranged alphabetically in Table 1.Some of these poisonous plants as Annona, Argemone , Mukia, Alangium, Plumbago, Datura,Jatropha, Agave, and Gloriosa have been used for therapeutically uses since Vedic period. Theenumerated plants are wild and they have proved handy and easily available remedy materialswhich give quick results also.Keywords: Poisonous Plants, Lalpur Taluka, Flowering Plants, Ethno botanical.INTRODUCTIONJamnagar district consists of 14 talukas, 756 villages and 56 nesses. Total population of the districtis 1904278. The present study is restricted to only three talukas viz. Lalpur, Bhanvad andJamjodhpur. Southern part of Lalpur taluka covers by Bhanvad and Khambhalia taluka andNorthern part covers by Jamnagar and Kalavad talukas. It is 36 km. away from Jamnagar. Lalpurtaluka lies between 220-15’ N latitudes and 700-25’ E longitudes. Taluka consist of 73 villages.Total population of Lalpur taluka is 101637 with rural population of 101637. Total area of talukais 1078 Sq. Km and covers 6177 hectares forest area. Major River of this region is Sasoi, Dhandhar,Mokhavati, Rangmati and Phuljhar River. Lalpur taluka is also popular for ground nut and cottoncultivation. Perticularly children’s are prone to be victimized by eating poisonous plants accidentlly.The poisonous parts may be root,l atex, bark, seeds or even whole plant(Chopra(1949), Chopra,etal.(1965) and Fowler(1980).

211
Proceeding of Conference : Evolving Paradigm to Improve Productivity for Plant Genetic Resoyrces
Study area Map
MATERIALS AND METHODSThe plants were collected from the various villages and forests area including hill and hillocks of thetaluka Lalpur A good number of the trips were arranged in accordance with the different seasonsthroughout the whole year. The collected plants were brought to the laboratory, identified andclassified to their respective species level with the help of flora (Bhandari, 1978; Cooke, 1903-1908; Shah, 1978 and Sutaria, 1941). The plant specimens were dried up with customary methodand were mounted on herbarium sheets and labeled. The information were collected through thedialogue, discussion and arranged meetings with local tribal, who have sufficient knowledgeable ofthe plants. Poisonous plants have been arranged alphabetically in

212
Proceeding of Conference : Evolving Paradigm to Improve Productivity for Plant Genetic Resoyrces
Table-1 Showing Poisonous plants of Taluka Lalpur
Sr No.
Scientific Name Local Name Family Poisonous Part
1 Annona squamosa L. Sitafal Annonaceae Leaves, Roots, Seeds 2 Argemone mexicana L. Darudi Papaveraceae Larex, Seeds
3 M e lia a ze da ra c h L. B a k a n lim do M e lia c ea e L e av e s, S te m ba r k ,
S e e ds 4 A bru s pr e c ato rius L . c h a no thi F a b a c ea e S e e d 5 P as siflor a e du lis
S im s. K r ish a na ka m al P a s sif lor a c e ae F r uit
6 C a ric a p ap ay a L . P a p a yu C a ric a c e a e S e e ds 7 C itr ul lu s c olo c yn th is (L . )
S c h ra d . I nd r a v a rn a C uc u rb i ta c e ae F r uit
8 L u ffa a c uta ng ula ( L .) va r . a m ar a R o xb .
K a dv a tu ri ya C uc u rb ita c e ae F r u it
9 C te no le pis ce r asifo rm is ( S to c ks) H k.
A nk hf u ta m a n i
C uc u rb ita c e ae F r uit
10 Ala ng ium sa lv ifoli um (L . f .) W a ng in . P fr e ic h.
A nk ol A la ng ia c e ae R o ot b ar k
11 Pa rth e niu m h y ste ro pho ru s L.
C o ngr e ss g r a ss A s te ra c e a e W ho le p la nt
12 Plu m ba go ze y lan ic a L . C h itr a k P lum ba gin a c e a e R o ot 13 C ath ar ant hus r os eu s
(L . ) G . B a r m a s i A p oc y na c e a e L a te x & S e ed s
14 N e r ium ind ic um M ill. L a l ka r e n A p oc y na c e a e W ho le p la nt 15 P lu m e ria a c ut ifo lia L . L al k ha d
c ha m po A p oc y na c e a e L a te x
16 P lum e ria rub ra L .
S a f e d k ha d c ha m po
A p oc y na c e a e L a te x
17 T h e v et i a pe ru v ian a (P e r s. ) M e r rill
P il i ka r e n A p oc y na c e a e W ho le p la nt
18 C a lotr op is g ig an te an ( L .) R . B r .
M o toa k do A s cl ep ia da c e a e L a te x
19 C a lotr op is pro c e ra ( A i t.) R . B r .
N a n oa k do A s cl ep ia da c e a e L a te x
20 C r y pto ste gia g ra nd i flor a R . B r .
R ub be r ve l P er ip loc a c e a e W ho le p la n t
21 I po m oe a fis tulo sa M a rt.
N a f f t v e l C o nv olv ula c e a e W ho le p la nt
22 D atu ra in n ox ia M ill.
D h a tur o S ola n a ce a e W ho le p la nt
23 N ic oti an a tab ac u m L .
T a m b a ku S ola n a ce a e Le a v e s
24 E up ho rb ia ni vu lia S a a d o tho r E up ho rb ia c e a e L a te x B u c h- H a m in T r a ns.

213
Proceeding of Conference : Evolving Paradigm to Improve Productivity for Plant Genetic Resoyrces
RESULT AND DISCUSSIONThere are several poisonous plants as far as the plant communities are concerned of which 32species occur in Lalpur taluka only those include some plants which are deadly poisonous. Theinformation about the poisonous plants was really helpful to us through which we can take someprecautions. It is proposed to develop some technique for the tribal and rural people throughwhom we can give the demonstration after having a night meeting so that the people are aware ofpoisonous plants. It was observed that some of these particular plants are not even grazed by thecattlels. However, some of these poisonous plants as Abrus, Calotropis, Datura, Euphorbia,Nicotiana, Ricinus, Passiflora, Plumbago and Gloriosa have been used for therapeuticallyuses since Vedic period. Sometime in normal talk the people are using the word that they are notgiving the time. But if we think in plant world and look at the nature and if we keep constant thanand then only we would have good result.CONCLUSIONThe enumerated plants are wild and they have proved handy and easily available remedy materialswhich give quick results also. The tribal and rural people of these taluka do not run to the doctorsas and when they have any complaint they treat them solves with fresh plant parts only.ACKNOWLEDGEMENTAuthors are thankful to tribal and rural people of this area for their kind co-operation.Life sciences Leas 14:462 – 465, 2011. FREE DOWNLOAD ISSN 0976 - 98tREFERENCES Bhandari, M.M. (1978): Flora of the India Desert, Scientific publisher, Jodhpur, Rajasthan.Bhatt, D.C., Mitaliya, K.D., Jangid, M.S., Lashkari, P.I. and Patel, Y.M. (2003): Observation ontraditional herbal remedies for asthma in Gujarat. Ad. Plant sci. 16(II) 385-387Chopra,R N.et al.(1949):Poisonous plants of India, Calcutta.C.S.I.R.(1948-1976).Wealth ofIndia (Raw materials).1-10,New Delhi.Chopra,R N.,R.L.Badhwar and S.Ghosh(1965):Leguminosae, In:Kurup, C.R.R.(Ed.). Poisonousplant of India.Vol.I. ICAR, New Delhi.Cook, T. (1908): The flora of the presidency of the Bombay, Vol. I and II, Bishan Singh MahindraPal Singh, Dehradun.Dastur, J.F. (1952): Useful plants of India and Pakistan, D.B. Taraporewala Sons and Co.Ltd., Bombay.Fowler,M.E.(1980): Plant Poisoning in Small Companion Animals, Ralston Purina Co., St.Louis,MO.Jain, S.K. (1991): Dictionary of Indian Folk Medicine and Ethnobotany, Deep Publication,Delhi.Jangid, M.S. (2005): Texoethnobotanical studies of angiosperms of Modasa taluka, dist, S.K.(N.G.). Ph.D. thesis, H.N.G.Uni, Patan.

214
Proceeding of Conference : Evolving Paradigm to Improve Productivity for Plant Genetic Resoyrces
Nadkarni, K.M. (1926): Indian Materia Medica, Vol. I and II, Popular Prakashan. Ltd. Mumbai.Patel, R.I. (1971): Forest Flora of Gujarat State Published by Gujarat State Forest Department,Gujarat state, Baroda.Thaker, J.I. (1910): Vanaspati shastra, (Flora of Bardahill) Reprint, Pravin Pustak, Bhandar,Rajkot.Punjani, B.L. (1997): An Ethnobotanical study of tribal areas of district S.K. (N.G.). Ph.D.Thesis,H.N.G.Uni, Patan.Santapau, H. (1954): Contribution to the botany of Dangs forest in Gujarat. Guj. Res.Soc. 16:204-320 and 17:1-59.Saxton, W.T. and Sedgwick, L.J. (1918): Plants of Northern Gujarat, Ibid. 6 (7): 209-326 andI - Xiii.Shah, G.L. (1978): Flora of Gujarat State. Part I and II, Sardar Patel University, VallabhVidhyanagar.Shashtri, S.D. (1996): Aryabhishak. "Hindustan no Vaidraj." Sastu Sahitya Vardhak KaryalayAhmedabad and Mumbai.Sutaria, R.N. (1941): The vegetation of Vireshwar flora of the Gujarat state, Natural HistorySociety.Patel, N.K. (2001). Study of angiospermic plants with relation to phytosociological andEthnobotanical study of Danta taluka, Dist. B.K., Ph.D.thesis. H.N.G.Uni, Patan.Life sciences Leaflets 14:462 – 465, 2011. FREE DOWNLOAD ISSN 0976 - 1098 http://lifesciencesleaflets.

215
Proceeding of Conference : Evolving Paradigm to Improve Productivity for Plant Genetic Resoyrces
Studies on Phenological Characteristics of Different Forest Trees ofSouth Gujarat
Ruchit Patel 1, Vikas Kumar 2 And Bimal S. Desai 3
1, 2 & 4 Department of Forestry,ASPEE College of Horticulture and Forestry Navsari Agricultural University.
Navsari-396 450, Gujarat
ABSTRACTPhenology has been defined as the study of the timing of recurring biological events, the causes oftheir timing with regard to abiotic and biotic forces and the interrelation among phases of the sameor different event. The role of phenology in forest ecosystems has been discussed for severaldecades. Recently, understanding of tree phenology is quantitatively related to environment is evenmore important because of anticipated global environmental climate change.The present studydescribes the phenology such as leaf drop, leaf flush, vegetative growth, fruit formation and seedmaturation of different tree species of South Gujarat. Random sampling of the site to assess theabundance of individuals was followed by tagging / marking the individuals with five adult individuals(>20 cm girth over bark) was selected. Four major branches (one in each direction) were markedand observations were taken at fifteen days interval. Vegetative growth which started with leafflushes in March to April was completed by May in 72.4 % of the species studied. For mostspecies studied, leaf drop and simultaneous leafing occurred during warm-day period of the year.About 68.0% of species showed multiple leafing. In deciduous trees, flower (17.2 %) and fruitformation (3.4 %) occurred in March, a month earlier than evergreen trees. Fruit maturation betweenMarch and June was again ahead by one month in deciduous species. In all fifteen observationsviz; leaf flush initiation, leaf flush completion, leaf fall initiation, leaf fall completion, leaf less condition,initiation of flowering, flowering (full bloom), completion of flowering, time lag between start ofvegetative (first leaf flush) and reproductive (first visible flower), initiation of fruiting, time of fruitripening, completion of fruiting, fruit fall initiation, completion of fruit fall and any pest and diseasesincidence were recorded. The overall purpose of such study is to provide base line data for thoseworking on tree improvement, silviculture and to initiate a progressive step to establish co-relationof climate change with phenograms.Keywords: Phenophases, temperature, deciduous and evergreen.INTRODUCTIONThe term Phenology is derived from the Greek word "phaino", meaning to show or to appear, isthe science concerned with periodic biological events in the animal and plant world as they areinfluenced by climate and weather. The main purpose of these studies was to compile annual "plantcalendars" of leaf opening, flowering, fruiting and leaf fall together with climatological observations

216
Proceeding of Conference : Evolving Paradigm to Improve Productivity for Plant Genetic Resoyrces
"so as to show how areas differ". Phenology has been defined as the study of the timing of recurringbiological events, the causes of their timing in context to changes in abiotic and biotic forces andthe interrelationship among phases of the same or different events (Reichle, 1973; Leith, 1974).Vegetative and flowering phenology of trees in dry tropics is primarily affected by the periodicity ofrainfall, soil water availability, duration and intensity of light, temperature and also topographicalfactors like elevation and altitude. Occurrence of leaf-flushing as well as flowering during summerin majority of Indian tropical trees, when drought is severe, seems to be a unique adaptation tosurvive under strong and adverse climate having a short growth promoting wet period and a longgrowth constraining dry period. The key phenological thematic areas that need research focus inthe dry tropics are duration of deciduousness, timing of vegetative bud break, leaf strategy, waterrelations, seasonal flowering types and asynchrony. Analysis of functional types based on theduration of deciduousness and timing of bud break may enable better assessment of future climatechange impact. There is a need for long-term quantitative documentation of tree Phenologicalpatterns in India through a phenological station network in diverse climatic/vegetation/agro ecologicalzones.Global climate change may force variations in timing, duration and synchronization of phenologicalevents in tropical forests (Reich, 1995). Precise phenological information in relation to floweringand fruiting, evaluated against leafing and leafless periods, is scarce in tropical deciduous forests inIndia, which account for approx. 46% of the forested land in the country (Singh and Singh, 1988).So is the information on onset dates of different phenological events, duration of events andasynchrony in tropical forest trees. In these forests common tree species show a wide range ofleafless periods due to differing timings of leaf fall within the annual cycle (Kushwaha and Singh,2005). The hypothesis was tested that in tropical deciduous forest trees flowering periodicity hasevolved as an adaptation to the annual leafless duration (affecting rate and period of vegetativegrowth) and the time required for fruit development.MATERIALS AND METHODSThe experimental research carried out from December 2010 to November 2011. It was SimpleRandom Sampling Sampling design with two sites [S
1: Navsari Agricultural University Campus,
Navsari (It situated at 200 58’ North latitude and 720 54’ East longitudes and at altitude of about12 meters above the mean sea level); S
2: Waghai Botanical Garden, Waghai (It located at 200
77’ North latitude, 730 48’ East longitude and about 170 meters altitude above the sea level)] infigure 2.1. The selected species such as Tectona grandis L. f., Terminalia arjuna (Roxb. exDC.) Wight. & Arn, Acacia auriculiformis A. Cunn. Ex Benth. and Azadirachta indica A.Juss. Five adult individuals (>30 cm GBH and >6m height) of each of the species were marked.On each marked individual, four major branches (one in each direction) were selected, and oneach branch four twigs (currently growing shoots of last-order branches) were marked withtags.

217
Proceeding of Conference : Evolving Paradigm to Improve Productivity for Plant Genetic Resoyrces
Fig - 2.1 : Map of selec ted sites
SITE - 2 WAGHAI BOTANICAL GARDEN
SITE - 1 NAVSARI AGRICULTURAL UNIVERSITY CAMPUS
The year is divisible into three seasons: summer (February to May), monsoon (June to September)and winter (October to January).Observations were made during the interval between two sampling dates (usually 30 days). In aselected tree species a particular Phenophases began before, or continued beyond, the date of thefirst/last record by a one-half sampling interval. For example, in this study the flowering period foreach species was calculated from 15 days before the date on which the event was recorded forthe first time in any individual to 15 days after the date on which the event was recorded the lasttime amongst individuals. Fruiting period of a species was the duration (days) from the first fruitformation to the last amongst its individuals. In the same way, the fruit-fall period of a speciesrepresented the time duration from the first fruit fall amongst individuals to the last. For eachindividual of a species flowering, fruiting and fruitfall durations were calculated from 15 days beforethe date on which the event was recorded for the first time to 15 days after the date on which theevent was recorded for the last time.RESULT AND DISCUSSION1. Tectona grandisA. Phenological behavior of Tectona grandis at Navsari Agricultural University Campus Longestphenophase observed was fruiting initiation to ripening/maturation lasting for 184 days, whereasthe shortest phenophase was leaf less period, existed only for 31 days (Table-3.1). Leaf fallinitiation started in the third week of December and extended up to second week of March. Themaximum leaf fall occurred between month of January and February (third week of January tosecond week February). Leaf fall period continued for 89 days, and the peak leaf fall was observedfor 31 days (Fig-3.1). Total leaf less condition occurred only for one month (March). Leaf flushinitiation started in the first week of April and continued end of May.The peak in the leaf flush was set in the third week of April till second week of May (1 Month).Out of 61 days of total leaf flush duration, peak leaf flush was observed for 30 days on all taggedbranches (Fig-3.1). Flowering was the second longest phenophase after fruiting, extending up to

218
Proceeding of Conference : Evolving Paradigm to Improve Productivity for Plant Genetic Resoyrces
138 days. Flowering initiation started from third week of May and ended in the last week ofSeptember. The full bloom commenced from first week of July till last week of August. Tectonagrandis was in full bloom only for 62 days, out of total 138 days of flowering phenophase (Fig-3.1).Table-3.1Period of various Phenophases (in days) - Tectona grandis
Phenophase Total Days
SITE-1 SITE-2 Leaf Fall period
(Initiation to completion) 89 Days 74 Days
Leaf less period 31 Days 31 Days Leaf-Flush period
(Initiation to completion) 61 Days 61 Days
Flowering period (Initiation to completion)
138 Days 122 Days
Fruiting period (Initiation to Fruit ripening)
184 Days 184 Days
Fruit fall period (Initiation to completion)
74 Days 75 Days
Fig-3.1 Period of various phenophases (in days)- Tectona grandis
89
31
61
138
184
74 74
31
61
122
184
75
0
20
40
60
80
100
120
140
160
180
200
Leaf fall Period
Leaf less period
Leaf flush period
Flowering period
Fruting period
Fruit fall period
Tot
al D
ays
SITE - I
SITE - II
Phenophases

219
Proceeding of Conference : Evolving Paradigm to Improve Productivity for Plant Genetic Resoyrces
Fruiting observed for 184 days, from initiation to ripening of fruits occurred between first week ofJuly and last week of December. Fruit ripening initiated from third week of October and continuedlast week of December. Out of 184 days of fruiting period, fruit initiation lasted for 107 days andripening of fruit lasted for 77 days (Fig-3.1). Fruit fall period started from first week of Januaryand completed in the second week of March. The peak in the fruit fall was set from first week ofFebruary to second week of March. Fruit fall period was observed for 74 days. (Table 3.1)B. Phenological behavior of Tectona grandis at Waghai botanical garden Longest phenophase observed was fruiting initiation to ripening/maturation lasting for 184 days,whereas the shortest phenophase was leaf less period, existed only for 31 days (Table-3.1). Leaffall initiation started in the first week of January and extended upto second week of March. Themaximum leaf fall occurred between month of February (1 Month). Leaf fall period continued for74 days, and the peak leaf fall was observed for 28 days (Fig-3.1). Total leaf less conditionoccurred only for one month (Third week of March to second week of April). Leaf flush initiationstarted in the third week of April and continued second week of June. The peak in the leaf flushwas observed throughout the month of May (1 Month). Out of 61 days of total leaf flush duration,peak leaf flush was observed for 31 days on all tagged branches (Fig-3.1). Flowering was thesecond longest phenophase after fruiting, extending upto 122 days. Flowering initiation startedfrom first week of June with first shower of rain and ended in the last week of September. The fullbloom commenced from first week of July till second week of September. Tectona grandis wasin full bloom only for 77 days, out of total 122 days of flowering phenophase (Fig-3.1).Fruitingobserved for 184 days, from initiation to ripening of fruits occurred between third week of Julyand first week of January. Fruit ripening initiated from first week of November and continuedsecond week of January. Out of 184 days of fruiting period, fruit initiation lasted for 108 days andripening of fruit lasted for 76 days (Fig-3.1).Fruit fall period started from third week of Januaryand was completed in the last week of March. The peak in the fruit fall phenophase was set fromfirst week of February to second week of March. There was no fruit fall observed immediatelyafter ripening 15 days interval prevailed between fruit ripening and fruit fall. Fruit fall period wasobserved for 75 days (Table 3.1).The patterns of leaf fall in both site studied is similar to the pattern observed in dry deciduous forestof Sagar (M.P) by Bhatnagar (1968), Joseph (1977) and Tripathi (1987). Alike present study,they have also observed two major period of leaf fall viz., winter leaf fall period and summer leaffall period. Various workers investigated factors having impact on leaf fall has been related towater stress (Whitmore, 1975). Gupta and Rout (1992) suggested that the leaf fall in differentspecies could be attributed to differing physiological response to water stress and leaf longevity asthe leaves of Lannea coromandelica Merr. Fell by the middle of winter reason. According toBrasell et al. (1980) the seasonal pattern of litter fall is determined by leaf senescence and abscission,leaf longevity, period of water stress and intensity of rain.2. Terminalia arjunaA. Phenological behavior of Terminalia arjuna at Navsari Agricultural University

220
Proceeding of Conference : Evolving Paradigm to Improve Productivity for Plant Genetic Resoyrces
Longest phenophase observed was fruiting initiation to ripening/maturationlasting for 245 days, whereas the shortest phenophase was leaf less period, existed only for 16days (Table-3.2). Leaf fall initiation started in the third week of December and extended uptosecond week of March. The maximum leaf fall occurred between Month of third week of Januaryand second week of March. Leaf fall period continued for 89 days, and the peak leaf fall wasobserved for 59 days (Fig-3.2). Total leaf less condition occurred only for 16 days (Last twoweek of March). Leaf flush initiation started in the first week of April and continued last week ofMay. The peak in the leaf flush was set in the third week of April till second week of May (1Month). Out of 61 days of total leaf flush duration, peak leaf flush was observed for 30 days on alltagged branches (Fig-3.2). Leaf initiation peak in May, may be attributed to hot month of the yearbefore rains. Leaf production towards the end of the dry season and before rains has also beenobserved in tree species by several workers (Frankie et al. 1974; Kikim and Yadava 2001;Shukla and Ramakrishnan 1982; Sundriyal 1990) . Flowering initiation started from third week of May and ended in the last week of July. The fullbloom commenced from first week of June till second week of July. Terminalia arjuna was in fullbloom only for 45 days, out of total 77 days of flowering phenophase (Fig-3.2). Fruiting observedfor 245 days, from initiation to ripening of fruits occurred between first week of June and last weekof January. Fruit ripening initiated from first week of November and continued last week of January.Out of 245 days of fruiting period, fruit initiation lasted for 153 days and ripening of fruit lasted for92 days respectively (Fig-3.2). Fruit fall period initiated from first week of January and wascompleted in the last week of April. The peak in the fruit fall phenophase was recorded from firstweek of February to last week of March. Fruit fall period was observed for 120 days (Table 3.2).Table-3.2 Period of various Phenophases (in days) - Terminalia arjuna
Phenophase Total Days
SITE-1 SITE-2
Leaf Fall period (Initiation to Completion)
89 Days 74 Days
Leaf less period 16 Days 31 Days
Leaf-Flush period (Initiation to Completion)
61 Days 61 Days
Flowering period (Initiation to Completion)
77 Days 76 Days
Fruiting period (Initiation to Fruit ripening)
245 Days 230 Days
Fruit fall period (Initiation to Completion)
120 Days 90 Days

221
Proceeding of Conference : Evolving Paradigm to Improve Productivity for Plant Genetic Resoyrces
B. Phenological behavior of Terminalia arjuna at Waghai botanical gardenLongest phenophase observed was fruiting initiation to ripening/maturationlasting for 230 days, whereas the shortest phenophase was leaf less period, existed only for 31days (Table-3.2). Leaf fall initiation started in the first week of January and extended up to secondweek of March. The maximum leaf fall occurred between month of February and March (firstweek of February to second week of March). Leaf fall period continued for 74 days, and thepeak leaf fall was observed for 43 days (Fig-3.2).Total leaf less condition occurred only for 31days (Third week of March to second week of April). Leaf flush initiation started in the third weekof April and continued second week of June. The peak in the leaf flush was observed throughoutthe month of May (1 Month). Out of 61 days of total leaf flush duration, peak leaf flush wasobserved for 31 days on all tagged branches (Fig-3.2). Flowering initiation started from first weekof June and ended in the second week of August.The full bloom commenced from third week of June till last week of July. Terminalia arjuna wasin full bloom only for 46 days, out of total 76 days of flowering phenophase (Fig-3.2).Fig-3.2 Period of various phenophases (in days)- Terminalia arjuna
89 16 61 77
245
120 74
31 61 76
230
90
0
50
100
150
200
250
300
Leaf fall Period
Leaf less period
Leaf flush period
Flowering period
Fruting period
Fruit fall period
Tot
al D
ays
SITE - I SITE - II
PhenophasesFruiting observed for 230 days, from initiation to ripening of fruits occurredbetween first week of July and second week of February. Fruit ripening initiated from first week ofDecember and continued second week of February. Out of 230 days of fruiting period, fruitinitiation lasted for 153 days and ripening of fruit lasted for 77 days (Fig-3.2). Fruit fall periodstarted from third week of January and was completed in the second week of April. The peak inthe fruit fall phenophase was set from third week of February to last week of March. Fruit fallperiod was observed for 90 days (Table 3.2).

222
Proceeding of Conference : Evolving Paradigm to Improve Productivity for Plant Genetic Resoyrces
III. Acacia auriculiformisA. Phenological behavior of Acacia auriculiformis at Navsari Agricultural University CampusLongest phenophase observed was fruiting initiation to ripening/maturationlasting for 138 days, whereas the shortest phenophase was fruit fall period, existed only for 75days (Table-3.3). Flowering was the second longest phenophase after fruiting, extending upto 123days. Flowering initiation started from third week of July and ended in the second week ofNovember. The full bloom commenced from first week of September till second week of October.Acacia auriculiformis was in full bloom only for 45 days, out of total 123 days of floweringphenophase (Fig-3.3). Fruiting observed for 138 days, from initiation to ripening of fruits occurredbetween third week of August and last week of December. Fruit ripening initiated from third weekof October and continued last week of December. Out of 138 days of fruiting period, fruit initiationlasted for 61 days and ripening of fruit lasted for 77 days (Fig-3.3).
Table-3.3 Period of various Phenophases (in days)-Acacia auriculiformis
Phenophase Total Days
SITE-1 SITE-2 Flowering period (Initiation to Completion)
123 Days 107 Days
Fruiting period (Initiation to Fruit ripening)
138 Days 122 Days
Fruit fall period (Initiation to Completion)
75 Days 59 Days
Fig- 3.3 Period of various phenophases (in days)-Acacia auriculiformis
123 138
75
107 122
59
0 20 40 60 80
100 120 140 160
Flowering period Fruting period Fruit fall period
Tot
al D
ays
SITE - I SITE - II
PhenophasesFruit fall period started from third week of December and was completed in the last week of

223
Proceeding of Conference : Evolving Paradigm to Improve Productivity for Plant Genetic Resoyrces
February. The peak in the fruit fall phenophase was set from first week of January to second weekof February. Fruit fall period was observed for 75 days. (Table 3.3)B. Phenological behavior of Acacia auriculiformis at Waghai Botanical Garden Longestphenophase observed was fruiting initiation to ripening/maturation lasting for 122 days, whereasthe shortest phenophase was fruit fall period, existed only for 59 days (Table-3.3). Flowering wasthe second longest phenophase after fruiting, extending upto 107 days. Flowering initiation startedfrom first week of August and ended in the second week of November. The full bloom commencedfrom third week of September till last week of October. Acacia auriculiformis was in full bloomonly for 45 days, out of total 107 days of flowering phenophase (Fig-3.3). Fruiting observed for122 days, from initiation to ripening of fruits occurred between first week of September and lastweek of December. Fruit ripening initiated from first week of November and continued last weekof December. Out of 122 days of fruiting period, fruit initiation lasted for 61 days and ripening offruit lasted for 61 days (Fig-3.3). Fruit fall period started from first week of January and wascompleted in the last week of February. The peak in the fruit fall phenophase was set from thirdweek of January to second week of February. Fruit fall period was observed for 59 days (Table3.3).4. Azadirachta indicaA. Phenological behavior of Azadirachta indica at Navsari Agricultural University CampusLongest phenophase observed was leaf fall initiation to completion lasting for90 days, whereas the shortest phenophase was leaf less period, existed only for 15 days (Table-3.4). Leaf fall initiation started in the first week of December and extended upto last week ofFebruary. The maximum leaf fall occurred between month of January and February (first week ofJanuary to second week of February). Leaf fall period continued for 90 days, and the peak in theleaf fall observed for 46 days (Fig-3.4). Total leaf less condition occurred only for 15 days (Firsttwo week of March). Leaf flush initiation started in the third week of March and continued secondweek of May. The peak in the leaf flush was observed throughout the month of April (1 Month).Out of 61 days of total leaf flush duration, peak leaf flush was observed for 30 days on all taggedbranches (Fig-3.4). Flowering initiation started from first week of April and ended in the last weekof May. The full bloom commenced from third week of April till second week of May. Azadirachtaindica was in full bloom only for 30 days, out of total 61 days of flowering phenophase (Fig-3.4).Fruiting observed for 76 days, from initiation to ripening of fruits occurred between first week ofMay and second week of July. Ripening of fruit was initiated from first week of June and continuedsecond week of July. Out of 76 days of fruiting period, fruit initiation lasted for 31days and ripeningof fruit lasted for 45 days (Fig-3.4). Fruit fall period started from first week of July and wascompleted in the second week of August. The peak in the fruit fall phenophase was set from thirdweek of July to second week of August. Fruit fall period was observed for 46 days (Table 3.4).B. Phenological behavior of Azadirachta indica at Waghai Botanical GardenLongest phenophase observed was fruiting initiation to ripening/maturation

224
Proceeding of Conference : Evolving Paradigm to Improve Productivity for Plant Genetic Resoyrces
lasting for 92 days, whereas the shortest phenophase was leaf less period, existed only for 15 days(Table-3.4). Leaf fall initiation started in the first week of January and extended upto last week ofFebruary. The maximum leaf fall occurred in month of January to February (third week of Januaryto second week of February). Leaf fall period continued for 59 days, and the peak leaf fall wasobserved for 31 days (Fig-3.4). Total leaf less condition occurred only for 15 days (First twoweek of March).Table-3.4 Period of various Phenophases (in days) - Azadirachta indica
Phenophase Total Days
SITE-1 SITE-2
Leaf Fall period (Initiation to Completion)
90 Days 59 Days
Leaf less period 15 Days 15 Days
Leaf-Flush period (Initiation to Completion)
61 Days 61 Days
Flowering period (Initiation to Completion)
61 Days 61 Days
Fruiting period 76 Days 92 Days
(Initiation to Fruit ripening)
Fruit fall period (Initiation to Completion)
46 Days 62 Days
Fig- 3.4 Period of various phenophases (in days)- Azadirachta indica
90
15
61 61
76
46 59
15
61 61
92
62
0 10 20 30 40 50 60 70 80 90
100
Leaf fall Period
Leaf less period
Leaf flush period
Flowering period
Fruting period
Fruit fall period
Tot
al D
ays
SITE - I
SITE - II
Phenophases

225
Proceeding of Conference : Evolving Paradigm to Improve Productivity for Plant Genetic Resoyrces
Leaf flush initiation started in the third week of March and continued second week of May. Thepeak in the leaf flush was observed throughout the month of April (1 Month). Out of 61 days oftotal leaf flush duration, peak leaf flush was observed for 30 days on all tagged branches (Fig-3.4).Flowering initiation started from first week of April and ended in the last week of May. The fullbloom commenced from third week of April till second week of May. Azadirachta indica was infull bloom only for 30 days, out of total 61 days of flowering phenophase (Fig-3.4). Fruitingobserved for 92 days, from initiation to ripening of fruits occurred between first week of May andlast week of July. Fruit ripening initiated from third week of June and continued last week of July.Out of 92 days of fruiting period, fruit initiation lasted for 46 days and ripening of fruit lasted for 46days (Fig-3.4). Fruit fall period started from first week of July and was completed in the last weekof August. The peak in the fruit fall phenophase was set from third week of July to last week ofAugust. Fruit fall period was observed for 62 days (Table 3.4).CONCLUSIONThe present investigation on Studies on Phenological Events of Some Agroforestry Tree Specieswas carried out to get an insight into the phenological behaviour of tree species under SouthGujarat conditions (Heavy rainfall zone) in context to climatic data, synchronization andasynchronization among species and between the individuals. The wide diversity of seasonal floweringtime and fruiting duration, with linkages to leafing and leafless durations, observed in selected treespecies suggest a variety of reproductive and survival strategies evolved under a monsoonal bioclimate in India. The drought stress is not only reflected in terms of the leafless period, but is alsoevident from greater seasonal separation between leafing and flowering. Flowering time and timelag between the onset of leafing and flowering affect the degree of separation of resource use forvegetative and reproductive events within tree species. In tropical deciduous tree species floweringperiodicity has evolved as an adaptation to annual leafless duration (affecting rate and period ofvegetative growth) and time required for fruit development. Predominance of summer flowering inassociation with summer leaf flushing seems to be a unique adaptation to survive under a seasonalclimate. Since environmental characteristics affect flowering and fruiting either directly (e.g. throughconditions in the habitat) or indirectly (e.g. through the leafless period), probable global climaticchange will have serious implications on future reproductive success of dry-tropical trees.This study was carried out with a hope that it will prove an important baseline data for treeimprovement and management programmes. More research on this aspect will not only lead us totill up the lacunae in phenological patterns of species, but will also the inter-relationship betweenvegetative and reproductive Phenophases. The study will also enrich our knowledge of understandingforest dynamics and more precisely the natural associations of one species to another.REFERENCESArticles*Brasell, H. M.; Unwin, G. L. and Stoker, G. C. (1980). The quality, temporal distribution andmineral element content of litter in two sites in tropical Australia. J.Ecol., 68 : 101-157.

226
Proceeding of Conference : Evolving Paradigm to Improve Productivity for Plant Genetic Resoyrces
*Frankie, G. W.; Baker, H. G. and Opler, P. A. (1974). Comparative phenological studies of treesin tropical wet and dry forests in the low lands of Costa Rica. Journal of Ecology, 62: 881-919.Kikim, A. and Yadava, P. S. (2001). Phenology of tree species in subtropical forests of Manipurin North Eastern India. Tropical Ecology, 42:269-276.Kushwaha, C. P. and Singh, K. P. (2005) Diversity of leaf phenology in a tropical deciduous forestin India. Journal of Tropical Ecology, 21: 47–56.Leith, H. (1974). Phenology and Seasonality Modeling-Springer, NY. (New York. USA) Reich,P. B. (1995). Phenology of tropical forests: patterns, causes, and consequences. Canadian Journalof Botany, 73: 164–174.Reichle, D. G. (1973). Analysis of Temperate Forest Ecosystems. Springer, NY.Singh K. P, Singh J. S. (1988). Certain structural and functional aspects of dry tropical forest andsavanna. International Journal of Ecology and Environmental Sciences, 14: 31–45.*Shukla, R. P. and Ramakrishnan, P. S. (1982). Phenology of trees in a sub-tropical humid forestin North - Eastern India. Vegetatio, 49: 103 -109.*Sundriyal, R. C. (1990). Phenology of some temperate woody species of the Garhwal Himalaya.International Journal of Ecology and Environmental Sciences, 6: 107-117.Tripathi, J. P. (1987). A Note on phonological observations on Anogeissus Pendula Edgew. Indianforester, 104: 587-588.Thesis*Bhatnagar, S. (1968). Ecological studies of forests of sagar with special reference to litter andground flora. Ph.D. Thesis, Sagar University*Joseph, R. N. (1977). An ecological study of organic layer of some forests of Sagar. Ph.D.Thesis, Sagar University, Sagar.Books*Whitmore, T. C. (1975). Tropical rain forests of the Far East. Oxford university press, London.*Gupta, S. R. and Rout, S. K. (1992). Litter dynamics and nutrient turnover in a mixed deciduousforest. In: tropical Ecosystem: Ecology and management. Wiley eastern limited, New Delhi. pp.443-459.

227
Proceeding of Conference : Evolving Paradigm to Improve Productivity for Plant Genetic Resoyrces
Data Analysis of Fungal Mycelial Radial Growth on DifferentNutritional Media Using Statistical Tools.
Vijaya Nadagouda*, Dr. Manish Thaker*, Dr. S. A. Bhatt** And Dr. M. D. Shukla*
* M.G. Science Institute, Ahmedabad.** Hemchandracharya North Gujarat University, Patan.
ABSTRACTThe effect of different nutritional media on the growth of two fungi of Ganoderma species wasstudied. The two fungi sp. are referred to as MTCC GANO & MG-GANO. Mycelial growthwas studied on 15 different agar media on 100 mm petriplates. The mycelial growth rate in termsof diameter of mycelial growth in mm/day was measured after inoculation of 6mm circular fungalplug at the center of the petriplates. The measurements for each media were done in triplicatesafter every 24 hours. Days taken for the full growth (days taken for the mycelial growth to fill theentire petriplates) was noted. Statistical analysis was carried out on this data using ANOVAtechnique. From this analysis it was concluded that there is a significant difference in the growthamongst different nutritional media.Keywords: Mycelial growth, ANOVA technique, Nutritional media, FungiINTRODUCTIONIt is a well known fact that different fungi require different growth conditions (M. L. Lomberh,2002).There is a wealth of information on growth requirements for the type species Ganodermalucidum. Use of various nutritional media, growth conditions & their effects on the growth ofGanoderma lucidum & some of the other species of Ganoderma has been published in literature.(Z Nasreen, 2005, Saleh Ahmed, 2009, CHIU-YEH WU, 2008). However there is no evidencethat show even the same genus requires the same growth & nutritional factors. In addition isolatesof same species from different regions may not grow under the same conditions. In fact studiesshow that both fungi of same species & even the same genus require different growth & nutritionalfactors (Ofodile etal, 2005). More so, there is a significant variation in mycelium growth rate evenin different strains of the same fungi grown in a media. (A. J. Kakon, 2009.)Hence to know the optimum condition for any new isolate it becomes imperative that growth studyunder diverse conditions be done & not depend on the data of even similar fungi available in theliterature.The effect of different nutritional media on the growth of two fungi of Ganoderma species wasstudied. The two fungi species is referred to as MTCC GANO & MG-GANO. Fifteen differentagar media were taken in 100 mm petriplates & the mycelial growth rate in terms of diameter ofmycelial growth in mm/day was measured after inoculation of 6mm circular fungal plug at thecenter of the petriplates. The radial measurements for each media were done in triplicates after

228
Proceeding of Conference : Evolving Paradigm to Improve Productivity for Plant Genetic Resoyrces
every 24 hours. Days taken for the full growth (days taken for the mycelial growth to fill the entirepetriplates) was noted. Statistical analysis was carried out on this data using ANOVA technique.The quality & quantity of mycelial production can change with the change in the media composition(Fang QH, Zhong JJ 2002, Leandro Papinutti,2010). The media that may support growth may ormay not necessarily enhance the production of components of our interest. In addition, increase ofcertain metabolites in Ganoderma sinense has been reported under certain growth conditions(Gao-Qiang, 2010.). Chiu-Yeh Wu, 2008 S.W. Kim, 2002 demonstrate the effect of differentmedia have varying effect on the composition of the fungi. All these studies indicate that varying thegrowth conditions, affects the metabolism there by, producing certain metabolites in varyingconcentrations. So it is possible that the mycelia may show biological activity when grown on onetype of growth media while it may not be active when grown on other. Also cultures varying in theage have shown difference in their metabolite concentration. (Leandro Papinutti, 2010)Using statistical tools (using SPSS Software) the media were compared with respect to their effecton the mycelial growth.MATERIALS AND METHODSStudy of mycelial growth on different nutritional media:Total fifteen different agar media were investigated for their effect on mycelial growth. Afterpreparation all the media were autoclaved at 15 pounds for 15 minutes. As the optimum pHobtained for MG-GANO isolate and MTCC GANO was 5.5, the pH of all the media forMGGANO and MTCC GANO was taken 5.5. The optimum temperature range for both thecultures was between 25-35 ºC, so the incubation of both cultures was done at 30ºC temperature.A 6 mm diameter agar growth plug was removed from 5 day-old cultures grown on potato dextroseagar (PDA) and placed in the centre of a new plate containing 20 ml of different media. This wasdone in triplicates.For all inoculations, special care was taken of growth plug that was removed from the motherculture for placing in the media plate. It was removed from the same radial distance from thecolony center, in order to guarantee that different inoculate contain the same amount of myceliumat the same stage of development.The Radial growth of mycelia on each Petri plate was measured every 24 hours after inoculation inmillimeter. Measurements were done in 3 directions and the average value was calculated fromthese measurements. (Ahmed Imtiaj, 2008, Miyashira, C.H, 2010). The measurements were carriedout till the mycelial growth reached the perimeter of the plate i.e. the Petri plates was full.Media for growth study:Two basal media were used for this study. The composition of the first basal media, designated asBM-1is given in Table 1. This was the basal medium for the carbon sources testing.PDA was taken as the second basal media designated as BM-2. This media was prepared accordingto manufacturers (Himedia) specifications, where in 39 grams of PDA power was dissolved in 1liters of distilled water.

229
Proceeding of Conference : Evolving Paradigm to Improve Productivity for Plant Genetic Resoyrces
Both the basal media were modified as shown in the Table 2 & were investigated for their effect onthe mycelial growth & their ability to produce antimicrobial activity.In all 15 different media (Table 2) were investigated. After preparation all the media were autoclavedat 15 pounds for 15 minutes.Table-1 Basal media no. 1 composition & was designated as BM-1
Carbohydrate source* 50.0g Malt extract 10.0g Yeast extract 2.0g
Bacto-peptone 2.0g KH2PO4 5.0g MgSO4 2.5g
Agar-agar 30g
Water 1000ml pH 5.0
Table-2 media used for growth study:
Sr.No of media
MEDIA pH
1 BM-1+ GLUCOSE 5.5 8 BM-1+FRUCTOSE 5.5
3 BM-1+MALTOSE 5.5 2 BM-1+LACTOSE 5.5 9 BM-1+STARCH 5.5
10 BM-1+GLUCOSE+ WHEAT STRAW (0.5g %) finely ground wheat straw 5.5 11 BM-1*+ WHEAT STRAW (0.5g %) finely ground wheat straw 5.5
12 BM-1+GLUCOSE +COTTON STRAW (0.5g %) finely ground cotton straw 5.5 13 BM-1*+ COTTON STRAW (0.5g %) finely ground cotton straw 5.5 14 BM-1+GLUCOSE + UREA (0.5g %) 5.5 15 BM-1+GLUCOSE + (NH4)2SO4 (0.5g %) 5.5 4 PDA(BM-2) 5.5 5 PDA(BM-2)+ MALT EXTRACT (0.5g %) 5.5 6 PDA(BM-2)+ YEAST EXTRACT (0.5g %) 5.5
7 PDA(BM-2)+ PEPTONE EXTRACT (0.5g %) 5.5

230
Proceeding of Conference : Evolving Paradigm to Improve Productivity for Plant Genetic Resoyrces
In case of media number 11*& 13* no carbohydrate source was added.Statistical analysis:The results thus obtained for MGSC-GANO and MTCC-GANO was analyzed using statisticaltools.The number of days taken for the mycelial grow to fill the plate was noted. Using ANOVA technique(using SPSS software) it was attempted to find which media gives significantly faster growth.Using statistical tools the media were compared with respect to their effect on the mycelial growthand their ability to produce antimicrobial activity against S.aureus and B.subtilis.RESULT AND DISCUSSIONThe Table-3 and Table 4 show ANOVA table for MGSC-GANO and MTCC-GANO respectively,which shows significant F-ratio hence we may conclude that at least one medium, gives significantlyfaster growth (or slower growth).Table-3 AnovaDayfull for MGSC-gano.
Sum of Squares Df
Mean Square F Sig.
Between Groups
131.644 14 9.403 204.518 .000
Within Groups
1.333 29 .046
Total 132.977 43
Table-4 AnovaDay full for MTCC-gano
Sum of Squares Df
Mean Square F Sig.
Between Groups
242.027 14 17.288 126.275 .000
Within Groups
3.833 28 .137
Total 245.860 42
To decide for the better media Tuckey-cramer post-hoc analysis is used, the results are presentedin table 5 and table 6. By this method all 15 base media at MGSC-GANO is divided in to 6homogenous sub groups. The first sub group indicate that media 9 (BM-1+STARCH) and media11 (BM-1*+ WHEAT STRAW (0.5g %)) gives significantly fastest growth (plates were full on

231
Proceeding of Conference : Evolving Paradigm to Improve Productivity for Plant Genetic Resoyrces
6th day) as compared to all other media.Whereas media 14 (BM-1+GLUCOSE + UREA(0.5g%)) gives slowest growth (plates were full on 13th day).Table-5 Homogenous subgroups with respect to day full growth on different media for Mgsc-gano. TukeyHSDa,b
MEDIA
N
Subset for alpha = 0.05
1 2 3 4 5 6
9.00 3 6.0000
11.00 3 6.0000
3.00 3 7.0000
4.00 3 7.0000
5.00 3 7.0000
6.00 3 7.0000
13.00 3 7.0000
7.00 3 8.0000
8.00 3 8.0000
10.00 3 8.0000
12.00 3 8.0000
1.00 3 8.6667
15.00 3 9.6667
2.00 2 10.0000
14.00 3 13.0000
Sig. 1.000 1.000 1.000 1.000 .848 1.000
By Tuckey-cramer post-hoc analysis the MTCC- Gano(Table 6) is divided in to 5 homogenoussubgroups as shown in the table 6. Media 4 to 9, 11 and 13 gives full growth in 6 days which issignificantly least (i.e. fastest growth) as compared to all other media. Whereas media 14 givessignificantly slowest growth, it took almost 14 days to full the plate with the growth of Ganoderma. Table-6 Homogenous subgroups with respect to day full growth on different media for Mtcc-gano.TukeyHSDa,b

232
Proceeding of Conference : Evolving Paradigm to Improve Productivity for Plant Genetic Resoyrces
Media
N
Subset for alpha = 0.05
1 2 3 4 5
4.00 3 5.0000 5.00 3 5.0000
6.00 3 5.0000
9.00 3 5.0000
7.00 3 6.0000 8.00 3 6.0000
11.00 3 6.0000
13.00 3 6.0000
3.00 3 7.6667
10.00 3 8.0000 8.0000
12.00 3 8.0000 8.0000 2.00 2 8.5000 8.5000 8.5000
1.00 2 9.0000 9.0000
15.00 3 9.3333
14.00 3 14.0000
Sig. .145 .370 .145 .370 1.000
REFERENCESShah M,Fadia D and Patel VT (2008) Effect of sucroseduring in vitro pollen germination in Gladiolus,Nature442: 317 – 321J. Kakon, Kamal Hossain, Nirod Chandra Sarker, Mahbuba Moonmoon and Saleh Ahmed (2009) Performance of Six Strains of Reishi Mushroom (Ganoderma lucidum) on Different Amounts ofSubstrate, Bangladesh J. Mushroom 3(2): 33-38Ahmed Imtiaj, Chandana Jayasinghe, Geon Woo Lee, Mi Ja Shim1, Hyun-Su Rho2, Hyun SookLee2,Hyun Hur3, Min Woong Lee3, U-Youn Lee and Tae-Soo Lee (2008) Vegetative Growth ofFour Strains of Hericium erinaceus Collected from Different Habitats , Mycobiology 36(2) : 8892Chiu-Yeh Wu1, Zeng-Chin Liang2*, Chian-Ping Lu3 And Shiu-Hsiung Wu3, Wu3 (2008) Effectof Carbon and Nitrogen Sources on the Production and Carbohydrate Composition ofExopolysaccharide by Submerged Culture of Pleurotus citrinopileatus, Journal of Food and DrugAnalysis, 16, No. 2E Saleh Ahmed, Kysun Rafat Howlader, Kamal Hossain, Md. Rezaul Haque1 andNirod ChandraSarker (2009) Effect of Different Supplements and their Levels on Growth and Yield of ReishiMushroom (Ganoderma lucidum), Bangladesh J. Mushroom 3(2): 13-18,

233
Proceeding of Conference : Evolving Paradigm to Improve Productivity for Plant Genetic Resoyrces
Fang QH, Zhong JJ (2002a) Effect of initial pH on production of ganoderic acid and polysaccharideby submerged fermentation of Ganoderma lucidum. Process Biochem. 37: 769-774.Gao-Qiang Liu1,2*, Xiao-Ling Wang1,2, Yong-Guang Zhang2,Yao-Hui Wu2, Wen-Jun Han2and Huai-Yun (2101) Promotion of ganoderic acid production in Ganoderma sinense by the addtionof an ether extract from Eupolyphaga sinensis, a medicinal insect African Journal of Biotechnology,9(37), 6129-6134,L N Ofodile,N U Uma, T Kokubun, R J Grayer, O T Ogundipe & M.S.J. Simmonds (2005)Antimicrobial activity of some Ganoderma species from Nigeria.Phytotherapy Research, 19,310313Leandro Papinutti (2010) Effects of nutrients, pH and water potential on exopolysaccharidesproductionby a fungal strain belonging to Ganoderma lucidum complex,Bioresource Technology101, 1941–1946M. L. Lomberh, E. F. Solomko, A. S. Buchalo, B. Kirchhoff (2002) Studies Of MedicinalMushrooms In Submerged Cultures, Mushroom Biology & Mushroom Products Sanchez( Eds),2002Miyashira, C.H.1; Tanigushi, D.G.1; Gugliotta, A.M.2; Santos, D.Y.A.C.1 (2010) ComparisonOf Radial Growth Rate Of The Mutualistic Fungus Of Atta Sexdens Rubropilosa Forel In TwoCulture Media, Brazilian Journal of Microbiology 41: 506-511Perez C, Paul M, Bazerque P (1990). An antibiotic assay by the agar well diffusion method. ActaBiol. Med. Exp. 15: 113-115.S.W. Kim, H.J. Hwang, J.P. Park, Y.J. Cho, C.H. Song and J.W. Yun(2002) Mycelial growth andexo-biopolymer production by submerged culture of various edible mushrooms under differentmedia S.Letters in Applied Microbiology, 34, 56-61Z Nasreen ,T Kausar, M Nadeem,R Bajwa, 2005 Study of different growth parameters inganoderma lucidu, Micologia Aplicada Internacional, 17(1), 5-8.

234
Proceeding of Conference : Evolving Paradigm to Improve Productivity for Plant Genetic Resoyrces
In silico analysis of Phytochemicals to TreatEstrogen positive Breast Cancer
Drushti H. Bhatt1, Himanshu A. Pandya1 And Yogesh T. Jasarai1
1 Department of Bioinformatics, Applied Botany Centre, Gujarat University,Ahmedabad - 380 009, Gujarat, India.
* Corresponding Author : [email protected]
ABSTRACTEstrogen is the imperative factor that has implications in breast cancer. The over expression oractivation of estrogen occur frequently in breast, ovarian and lung cancer prove them an importanttherapeutic target for breast cancer studies. Hormone therapy was focused for detailed analysisfor estrogen positive breast cancer. The presence of dietary agents was evident and identified fromfruits and vegetables source, can act on estrogen positive breast cancer and can be potentiallyused as therapeutic drug based on their affinity toward target receptor in this therapy. MolegroVirtual Docker tool was used for analysis of binding energy and hydrogen binding etc. The promisingeffects of phytochemicals present in dietary products on breast cancer could be determined.Keywords: Estrogen, Estrogen receptor, Hormone therapy, Phytochemicals, Molegro VirtualDockerINTRODUCTIONBreast cancer is the most common type of diagnosed cancers and the second major cause ofdeath among women in Occidental countries. Large majorities of breast cancers are sporadic butup to 10% can be attributed to genetic predisposition. Breast cancer cells can spread by breakingaway from the original tumor. They enter blood vessels or lymph vessels, which branch into all thetissues of the body. The cancer cells may be found in lymph nodes near the breast. The cancercells may attach to other tissues and grow to form new tumors that may damage those tissues.Hormones exist naturally in the body. They help to control how cells grow and what they do in thebody. Hormones, particularly estrogen, can encourage some breast cancer cells to grow.Hormonaltherapy medicines treat hormone-receptor-positive breast cancers in two ways: 1). by loweringthe amount of the hormone estrogen in the body 2). by blocking the action of estrogen on breastcancer cells. Estrogen makes hormone-receptor-positive breast cancers grow. So reducing theamount of estrogen or blocking its action can reduce the risk of early-stage hormone-receptor-positive breast cancers coming back (recurring) after surgery.Hormonal therapy medicines can also be used to help shrink or slow the growth of advancedstageor metastatic hormone-receptor-positive breast cancers. Hormonal therapy medicines are noteffective against hormone-receptor-negative breast cancers. There are several types of hormonaltherapy medicines, including aromatase inhibitors, selective estrogen receptor modulators, andestrogen receptor downregulators. Before and after menopause, the patient may be offered hormone

235
Proceeding of Conference : Evolving Paradigm to Improve Productivity for Plant Genetic Resoyrces
therapy with tamoxifen, it behaves as an agonist/antagonist. The tamoxifen competes with estrogento bind with estrogen receptor and restrict the change in shape of receptor, which further binds tocoactivators.being paid to the possibility of applying cancer chemopreventive es, - tumor propertiesand have provided ntified from -carbinol (apples, black and green tea, biloba leaves,widely ,Ginsenoside (Ginseng plant) etc. micals) from PubChem and docked with shape of receptor,which further binds to coactivators.Increasing attention is agents for individuals at high risk of neoplastic development. For this purposeby natural compounds have practical advantages with regard to availability, suitability for oralapplication, regulatory approval and mechanisms of action. Candidate substances such asphytochemicals present in foods and their derivatives have been identified by a combination ofepidemiological and experimental studies. Plant constituents include vitamin derivativ phenolic andflavonoid agents, organic sulfur compounds, isothiocyanates, curcumins, fatty acids and d-limonene.Phytochemicals have potent anti multiple active compounds in the past.Although there is an increasing focus on designer therapeutic anticancer agents, the broad spectrumof activity of natural products across multiple signalling pathways remains inadequately explored.Here, we briefly present evidence that dietary agents ide fruits and vegetables can act to modulatethe effects of deregulated cell cycle checkpoints, and this may contribute to the prevention ofcancer. The agents include Indole 3 (cruciferous vegetables), Theaflavin (tea leaves), Quercetincapers) and epigallocatechin-3-gallate (green tea), Ginkgetin (ginkgo cultivated tree), Hyperoside(Drosera rotundifolia)We have taken eighteen natural ligands (phytoche estrogen receptor using Molegro VirtualDocker (MVD) toolComputational method:Several offline tools, online tools and databases were used to accomplish this work. The processwas started by retrieving crystal structure of estrogens receptor (PDB ID: 1A52) from ProteinData Bank. Next, the eighteen natural compounds were derived from PubChem. This databasecontains substance database, compound database and BioAssay database. The library of ligandswas obtained from Compound Pubchem. The detailed information like molecular weight, 2D and3D structures, IUPAC name and H-donor/acceptor of compounds can be obtained from PubChem.Further, the interacting residues within the pocket of receptor had been identified by PDBSum.So, the probable binding site, which has been made between ligand and protein, number of residuesof protein and type of proteins for docking the molecules can be known. Finally, Docking studiesand Absorption,Distribution, Metabolism, Excretion and Toxicity (ADMET) properties or drug likeliness of naturalcompounds and estrogen receptor (PDB ID: 1A52) were observed using MVD and FAF Drug2respectively.RESULT AND DISCUSSIONAfter docking, the natural compounds bind estrogen receptor same as Tamoxifin binds, which is

236
Proceeding of Conference : Evolving Paradigm to Improve Productivity for Plant Genetic Resoyrces
drug available in market to treat the breast cancer as of now. Tamoxifin and other compoundsembedded within cavity of receptor and form hydrogen bonds at Arg 394, His 524 and Leu 525position (Figure 1). The some of the ligands out of eighteen natural ligands require lower energycompare to Tamoxifin to form stable conformation (Table 1). Tamoxifin requires -117.917 Kcal/mol energy but Ginsenoside and Hyperoside require -140.071 Kcal/mol and -137.124 Kcal/mol respectively. And also found Epigallocatechin gallate and Ginkgetin require -135.747 Kcal/mol and -134.482 Kcal/mol respectively (Table 1).Out of 18 compounds, there are 4 compounds, which showed lower energy. But before the usethese compounds as therapeutics we have to check them in ADMET (Absorption, Distribution,Metabolism, Excretion and Toxicity) properties. The insilico ADMET analysis qualifies the entirenatural product fit as drug like molecule by FAF drug. From the result of the ADMET test ofselected 4 compounds, which gives lower binding energy to targeted receptor, all these compoundscomes in the normal range and qualifies as drug like molecule (Table 2). The different propertieslike Molecular weight, hydrogen donors and accepter, flexible and rigid bonds, ring number, ringsize, carbon atoms, heavy atoms, number of charges and Log P values etc (Table 2). The out of4 natural ligands, Ginsenoside has lower Molecular weight compare to others. It is near to Tamoxifin(Table 2).
Natural ligands
B A C
Fig-1 (A) The surface view of estrogen receptor forms hydrogen bonds with Tamoxifin atArg 394, His 524 and Leu 525 position. Yellow color represent Tamoxifin, green dotted linepresents hydrogen bond within surface environment. (B) Secondary structure of estrogen receptorwith natural ligands and Tamoxifin. Red color represents helices of receptor and white colorrepresents chains. Gray colored ball and stick represent natural ligands with Tamoxifin (Green).(C) The cluster of natural compounds within cavity.

237
Proceeding of Conference : Evolving Paradigm to Improve Productivity for Plant Genetic Resoyrces
Table-1 Docking result of Tamoxifin and four ligands showing good result out of 18 natural ligandswith estrogen receptor (1A52).
No. Ligand Name MolDock Score Kcal/mol
Rerank Score HBond
Reported Molecule
1 Tamoxifin -117.917 -86.9124 -2.5 Natural Compounds
2 Epigallocatechin gallate
-135.747 -80.917 0.3520
3 Ginkgetin -134.482 -46.3557 -3.3677 4 Hyperoside -137.124 -111.244 -4.8442 5 Ginsenoside -140.071 -69.1009 -0.8654
Table-2 the drug Likeliness properties of selected natural compounds along with Tamoxifin
Tamoxifin Epigallo- catechin gallate
Ginkgetin Hyperoside Ginsenoside
Mol.Weight (200-600)
371.51 458.37 566.51 464.38 444.73
H-Donors (0.0-6.0)
0 8 4 8 2
H-Acceptor (0.0-12.0)
2 11 10 12 2
Flexible Bonds (0.0-15.0)
8 4 5 4 4
Rigid bonds (0-50)
19 24 36 24 21
Ring number (0.0-7.0)
3 3 4 3 1
Ring Size (0.0-12.0)
6 10 10 10 17
Carbons (>5.0) 26 22 32 21 30
Heavy Atom (>2.0)
28 33 42 33 32
Ratio of Hetero atom/carbons
(0.1-1.0)
0.08 0.50 0.31 0.57 0.07
No of charges (0.0-3.0)
1 0 0 0 0
Total charges (-2.0-2.0)
1 0 0 0 0
Log P (-2.0-6.0)
7.14 2.23 5.69 0.36 8.54
Status Accepted Accepted Accepted Accepted Accepted

238
Proceeding of Conference : Evolving Paradigm to Improve Productivity for Plant Genetic Resoyrces
CONCLUSIONThe structure based docking approach play significant role to propose novel drug or ligand to treatestrogen positive breast cancer. The study indicate that Ginsenoside showing better interactionefficiency against existing drug and having optimal drug like properties. We conclude that thiscompound may be used as therapeutic agent for treatment of estrogen positive breast cancer.REFERENCESSerra K. P., Sarian L. O., Rodrigues-Peres R. M., Vassallo J., Soares F. A., Pinto G. A., CunhaI. W., Shinzato J. Y. and Derchain S. F.; Expression of cyclooxygenase-2 (COX-2) and p53 inneighboring invasive and in situ components of breast tumors ; Acta Histochemica ; 2012; 114:226– 231Mishra A.K., Agrawal U., Negi S., Bansal A., Mohil R., Chintamani C., Bhatnagar A., BhatnagarD. and Saxena S.; Expression of androgen receptor in breast cancer & its correlation with othersteroid receptors & growth factors; Indian journal Medicinal Research; 2012; 27: 843-852.Goodsell D. S.; The Molecular Perspective: Tamoxifen and the Estrogen Receptor; The Oncologist; 2007; 7:163-164.Ellis M. J., Coop A., Singh B., Louis M., Llombert-Cussac A., Ja¨nicke F., Miller W. R., EvansD. B., Dugan M., Brady C., Quebe-Fehling E. and Borgs M.; Letrozole Is MoreEffective Neoadjuvant Endocrine Therapy Than Tamoxifen for ErbB-1– and/or ErbB-2– Positive,Estrogen Receptor–Positive Primary Breast Cancer: Evidence From a Phase III RandomizedTrial; Journal of Clinical Oncology; 2001; 19(18):3808-3816.Jingmei L., Petra S., Jenny-Chang C., Flesch-Janys D., Liu J., Czene K., Humphreys K. and PerH.; Coffee consumption modifies risk of estrogen receptor negative breast cancer; Breast CancerResearch; 2011; 13.Jeong E., chung K., Wonshik H., Sung-won K., Seok W. K., Hyuk J. S., Bae J. Y. and NohD.Y.; Effect of Estrogen, Tamoxifen and Epidermal Growth Factor on the Transcriptional Regulationof Vascular Endothelial Growth Factor in Breast Cancer Cells; Anticancer Research; 2004; 24:3961-3964.http://www.ncbi.nlm.nih.gov/pccompoundhttp://www.ncbi.nlm.nih.gov/http://www.ncbi.nlm.nih.gov/pubmed/http://www.rcsb.org/pdb/home/home.dohttp://www.chemspider.com/http://www.ebi.ac.uk/pdbsum/http://mobyle.rpbs.univ-paris-diderot.fr:8080/cgi-bin/portal.py?form=FAFDrugs#forms::FAF-Drugs2http://www.molegro.com/mvd-product.phpPruitt K. D., Tatusova T. and Maglott D. R.;NCBI reference sequences (RefSeq): a curated non-

239
Proceeding of Conference : Evolving Paradigm to Improve Productivity for Plant Genetic Resoyrces
redundant sequence database of genomes, transcripts and proteins Nucleic Acids Research; 2007;35:61–65.Berman H. M., Westbrook J., Feng Z., Gilliland G., Bhat T. N. , Weissig H., Shindyalov I. N.and Boune P. E.; The Protein Data Bank; Nucleic Acid research; 2000; 28: 235-242.Laskowski R. A., Chistyakov V. V. and Thornton J. M.; PDBsum more: new summaries andanalyses of the known 3D structures of proteins and nucleic acids; Nucleic Acids Research; 2005;33: 266–268.Wang Y., Xiao J., Suzek T. O., Zhang J., Wang J. and Bryant S. H.; PubChem: a public informationsystem for analyzing bioactivities of small molecules; Nucleic Acids Research; 2007; 35: 61–65.

240
Proceeding of Conference : Evolving Paradigm to Improve Productivity for Plant Genetic Resoyrces
Bioinformatic Analysis on Maize Sugary 1 (Su1) Gene
Vishal H. Desai, Chirag N. Patel, Vijay P. Mehta, S. Prasanth Kumar,Yogesh T. Jasrai* And Himanshu A. Pandya
Bioinformatics Laboratory, Department of Botany, Gujarat University, Ahmedabad-380009,Gujarat. *Corresponding author: [email protected]
ABSTRACTMaize (Zea mays Linn.) holds a unique position in the global agricultural ground due to its highcarbohydrate content. Maize sugary 1 (su1) gene encodes an essential starch debranching enzyme(SBEIIb) which hydrolysis α-(1’!6) glycosidic bonds involved in starch biosynthesis. In the presentstudy, su1 gene was analyzed using Bioinformatics approaches. We made attempts to search forhomologs in other sugar-rich plants. The maize su1 gene was predicted to be the characteristicfeature promoting starch content and no evolutionary trace was identified. Further, maize cultivarsdistributed throughout the world showed a conserved pattern. We also noticed that the contents ofGC bases are found to be relatively higher showing signs of highly deregularized gene structure(CpG Island). Conceptual translation of gene sequence provided an insight of ordered structurewith a single stretch of disorderness at its N-terminal. Thus, we emphasize that the de-regularizedgene structure of su1 makes its own way to diverge from other plant genera and the protein(enzyme) secondary structure level information showed that it is dense with high helix- rich contentand a member of isoamylase enzyme family.Keywords: Sugary 1 gene, Starch debranching enzyme, Bioinformatics, GC content, Disorderness.INTRODUCTIONMaize (Zea mays) is a major world crop and important model monocot for plant for studyinggenetics, genomics and molecular biology. Many maize mutants are known that alter the compositionof endosperm carbohydrates. The sugary (su) genotype commonly known as sweet corn, hasmore sucrose than starchy maize. Two isoforms of starch branching enzyme have been identified instarch storing organs of maize. In maize, two isoforms of SBE II exist (SBE IIa and SBE IIb).Starch is composed of a single monomer type glucose, polymerized into large molecules through acombination of both α(1’!4) and α(1’!6) linkages. The polydisperse molecules of starch are generallyclassified as belonging to two component fractions, known as amylose and amylopectin, on thebasis of their degree of polymerization (DP) and the ratio of α(1’!6) to α(1’!4) linkages. Typically,amylose molecules constitute 20–30% of the mass of starch, have a DP of between 500 and5000, and contain less than 1% α(1’!6) linkages. By contrast, amylopectin contributes 70–80%of the dry weight of starch, is a much larger molecule with DP ranging from 5000 to 50 000 andcontains 4–5% α(1’!6) linkages. The sugary-l (sul) mutant of maize, Zea mays L., which is theusual sweet corn of commerce, has been known and utilized and specific efforts to improve particularvarieties of sweet.
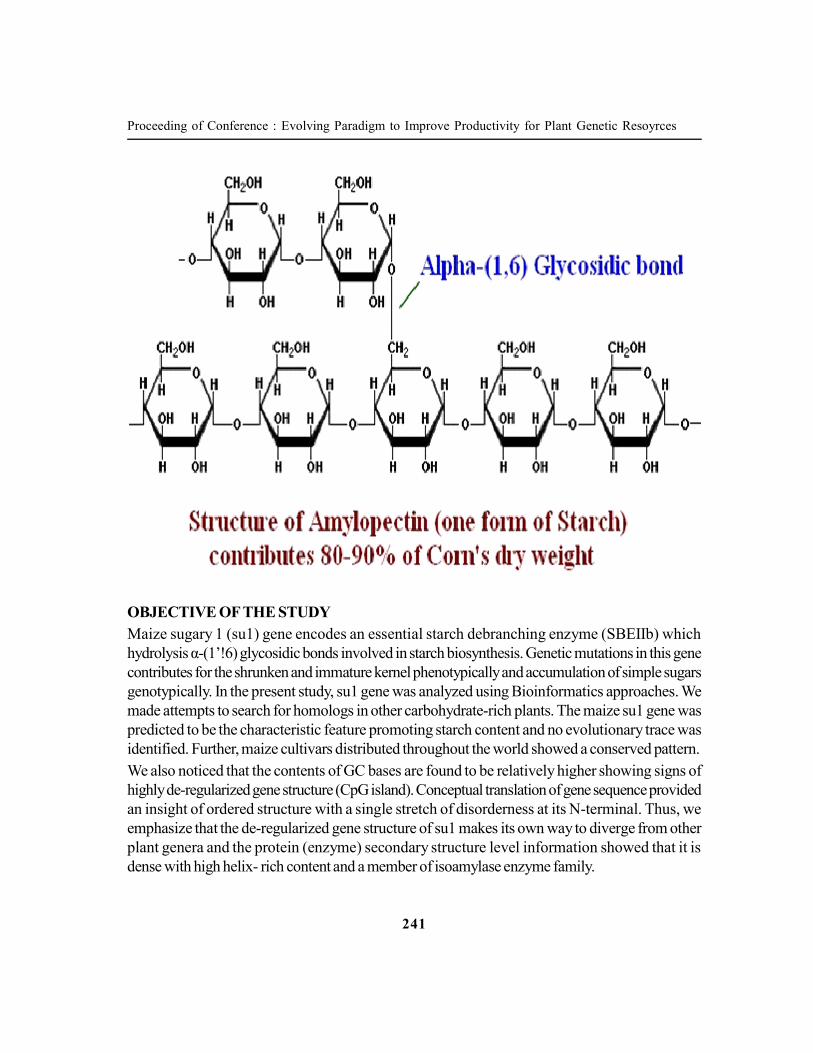
241
Proceeding of Conference : Evolving Paradigm to Improve Productivity for Plant Genetic Resoyrces
OBJECTIVE OF THE STUDYMaize sugary 1 (su1) gene encodes an essential starch debranching enzyme (SBEIIb) whichhydrolysis α-(1’!6) glycosidic bonds involved in starch biosynthesis. Genetic mutations in this genecontributes for the shrunken and immature kernel phenotypically and accumulation of simple sugarsgenotypically. In the present study, su1 gene was analyzed using Bioinformatics approaches. Wemade attempts to search for homologs in other carbohydrate-rich plants. The maize su1 gene waspredicted to be the characteristic feature promoting starch content and no evolutionary trace wasidentified. Further, maize cultivars distributed throughout the world showed a conserved pattern.We also noticed that the contents of GC bases are found to be relatively higher showing signs ofhighly de-regularized gene structure (CpG island). Conceptual translation of gene sequence providedan insight of ordered structure with a single stretch of disorderness at its N-terminal. Thus, weemphasize that the de-regularized gene structure of su1 makes its own way to diverge from otherplant genera and the protein (enzyme) secondary structure level information showed that it isdense with high helix- rich content and a member of isoamylase enzyme family.

242
Proceeding of Conference : Evolving Paradigm to Improve Productivity for Plant Genetic Resoyrces
Methodology Overview
RESULT AND DISCUSSIONSequence-based homolog search of su1 gene from Zea mays to find neighbor genera usingBLAST provided grass plant (remote homolog) but manual inspection on the region of alignmentdrew in entropical regions i.e repeated base pairs at the 3’end of the su1 gene (Fig. A). Genomewidecomparison was made using plant genomes available in GRAMENE database (PG 2011 release)yielded alignment over Oryza indica (Indian Rice; Fig B) with built-in BLAT program. Examinationover alignment was encompassed in repeated sequences. We further masked therepeat sequence using engineered Repeat Masker which ultimately gave no similarity. Hence,search for CpG island was carried out using CpG.Island Searcher & resulted in CpG island at the 5’ end of the su1 gene (Fig C and D). To explorethe contribution of sequence-based complexity of su1 gene, we retrieved corresponding geneproducts (protein) from UCSC and analyzed how much extent of complexity dense regioncontributes for its tertiary structure. UCL Disopred predicted su1 protein sequence as globularprotein and found to be helical protein with long coiled conformation at both of its terminals,respectively (Fig. C & E). Phylogenetic analysis was performed with su1 gene sequences obtainedfrom known Zea mays cultivars around the world from UCSC leading to a relationship ofevolutionary divergence (Fig F). Moreover, multiple sequence alignment showed that alignmentwas conserved in the complexity regions.

243
Proceeding of Conference : Evolving Paradigm to Improve Productivity for Plant Genetic Resoyrces
( A) BLAST search on GenBank NR Database (B ) Sequence based Genome Comparison: Oryzaexcluding Zea mays indicagenome in GRAMENE database usingBLAT algorithm
(C) Sequence logo of su1 gene showing high magnitude of CG dinucleotides (first 100 ntsshown for clarity)

244
Proceeding of Conference : Evolving Paradigm to Improve Productivity for Plant Genetic Resoyrces
(C) CpG Island Detection at 5’ end of the su 1 gene
H
(C) Helical protein predicted by secondary (F) Phylogenetic tree (NJ algorithm) depicting theStructure analysis using PSIPRED divergence of su1 gene product Zea mays
CONCLUSIONWe emphasize that su1 gene and protein sequence are conserved among their own species/isolates.The relationship with other carbohydrate-rich plants gave no insight. Additionally, gene- and protein-based sequence analysis revealed that genetic evolution is conserved in their genera followingprotein biochemical function (debranching enzymatic activity) remains unaffected. Hence, su1 is acharacteristic feature of Zea mays in the starch biosynthesis.REFERENCESJames et al. (1995)Purification, characterization, and cDNA structure of isoamylase from developingendosperm of rice. Plant Cell 7: 417-429.Prasanna & Hoisington(2001)Molecular Breeding for Maize Improvement: An Overview, IJBT 1:85-98

245
Proceeding of Conference : Evolving Paradigm to Improve Productivity for Plant Genetic Resoyrces
Gonzales et al.(1976)Analysis of Endosperm Sugars in a Sweet Corn Inbred (Illinois677a) WhichContains the Sugary Enhancer (se) Gene andComparison of se with Other Corn Genotypes1.Plant Physiol 58: 28-32.Pan & Nelson (1984)What Controls the Amount and Structure of Starch in Storage Organs?Plant Physiol 74: 324-328.Cobe & Hannah(1988)Shrunken-i Encoded Sucrose Synthase Is Not Required for SucroseSynthesis in the Maize Endosperm. Plant Phyiol 88: 1219-1221.

246
Proceeding of Conference : Evolving Paradigm to Improve Productivity for Plant Genetic Resoyrces
Plant Bioactive Driven Fragment-based Drug Designing andEpitope-based Immunoinformatics Study of EspC protein of
Mycobacterium tuberculosis
Saumya K. Patel1*, S. Prasanth Kumar1, Ravi G. Kapopara1,Yogesh T. Jasrai1 And Himanshu A. Pandya1
Department of Bioinformatics, Applied Botany Centre,University School of Sciences, Gujarat University,
Ahmedabad- 380 009
*Correspondence: [email protected]
ABSTRACTMulti-drug resistant Mycobacterium tuberculosis is one of the major obstacles for the treatmentof tuberculosis. ESX-1 secretion system establishes infection in host cells by secreting virulencefactors. Genes belonging ESX-1 secretion system are attenuated in currently used BCG vaccinestrain and are no longer proven efficacy in treating tuberculosis. In the present study, vasicine, aplant bioactive from Vasaka herb having known antitubercular properties is used to developinhibitors against a chief component of the ESX-1 secretory pathway, called EspC through fragment-based drug designing approach. Epitope-based immunoinformatics study of EspC protein is alsocarried out which showed regions of interest for developing vaccines with due consideration acrossall the genetically heterogeneous inheritance.Keywords: Mycobacterium tuberculosis, Immunoinformatics, Fragment-based Drug DesigningINTRODUCTIONA major mechanism used for disabling host defenses by pathogenic bacteria is secretion of virulenceproteins. These proteins acting as effectors are often transported by specialized secretion system.There are atleast four pathways known to secrete proteins in Mycobacteria – Sec, SecA2, twin-arginine translocase and the early secretory antigenic target 6 (ESAT-6) system 1 (ESX-1). ESX-1 also called Type VII secretion system. Much attention has been focused on this secretion pathwaybecause it is required for virulence and for the secretion of ESAT-6 and culture filtrate protein 10(CFP-10) in host cells, the two major targets of the immune response in Mycobacteriumtuberculosis (MTB) infected individuals (McLaughlin et al., 2007). Besides the function of ESX-1 in secretion system present in Mycobacterium and other Gram-positive genera, it is required formultiple phenotypes related to the pathogenesis of the MTB infection.M. tuberculosis ESX-1 is required for virulence in mice, growth in macrophages, suppression ofmacrophage inflammatory and immune responses, arrest of phagosome maturation and reduced

247
Proceeding of Conference : Evolving Paradigm to Improve Productivity for Plant Genetic Resoyrces
expression of interleukin-12 (IL-12) and tumor necrosis factor (TNF-α) (Stanley et al., 2003). InM. marinum, ESX-1 is required for ESAT-6 and CFP-10 secretion (also reported in M.tuberculosis), cytolysis, cell-to-cell spreading, macrophage aggregation and granuloma formation(Volkman et al., 2004). It is essential for induction of immunosuppressive type I interferons andrepresses conjugation in donor cells (M. smegmatis) (Flint et al., 2004).MATERIALS AND METHODSI. Structure Modeling of EspC proteinThe protein sequence of EspC protein from Mycobacterium tuberculosis (ID: P65087) wasretrieved from UniProt KB database in Fasta format.(http://www.uniprot.org/uniprotkb)Anattempt was made to construct a ab initio modeling of EspC protein wereusing Swiss Model.(: http://www.bioinfo.rpi.edu/bystrc/hmmstr/about.html)No suitable template was found bythe template identification program facilitated with Gapped Blast, Profile Blast and HHSearchwith the significant cutoffs (BLAST: evalue = 0.0001; HHSearch: evalue = 0.0001 and pvalue =50).Therefore, an ab initio model was constructed using I-sites/HMMSTR/ROSETTA server. Themodeling protocol has different stages which are discussed below (Bystroff and Shao, 2002).(i). Finding distant homologs using PSI-BLASTTo find distant homologs of known structure, PSI-BLAST was used. Position-specific iterativeBLAST (PSI-BLAST) builds profiles and performs database searches in an iterative fashion. Asingle query protein sequence is used to perform a normal BLAST search to generate initial hits.The high-scoring hits are used to build multiple sequence alignment, from which a profile is createdcalled a position-specific scoring matrix (PSSM) and this profile is now utilized for identifyingdistant members of the same family. The process is repeated until no new sequence hits are found.No homolog of known structure was found in this step (Stephen et al; 2002).(ii). Finding fragments using I-sites I-sites Web Link: http://www.bioinfo.rpi.edu/bystrc/hmmstr/server.phpI-sites v.2 was used to identify fragments for which the secondary structure information is available.This approach is based on the sequence-structure motifs derived from statistical models at fivelevels of structural complexity. The I-sites (folding Initiation sites) library models short local structuremotifs. Each level is built on a statistical model, as follows: HMMSTR (Hidden Markov Model forSTRucture) is an HMM for extended motifs, HMMSTR-CM (Contact Maps) is a model forpairwise interactions between motifs and SCALI-HMM (HMMs for Structural Core ALIgnments)is a set of HMMs for the spatial arrangements of motifs. 1,877 fragments were generated in thisprocess and fragments with high confidence interval were selected to guide modeling (Bystroff andShao, 2002).(iii). Probabilistic secondary or local structure predictions using HMMSTRProbabilistic secondary or local structure was predicted using HMMSTR based upon the generatedI-sites fragments. HMMSTR is a hidden Markov model for local sequence-structure correlations

248
Proceeding of Conference : Evolving Paradigm to Improve Productivity for Plant Genetic Resoyrces
in proteins derived from I-sites library of sequence-structure motifs. It captures local features ofprotein sequences and structures that transcend protein family boundaries with the help of highlybranched topology. In this step, contact map predictions (also known as contact map potentials)based on the inter-residue contacts, its hydrogen bond acceptor-donor energies and other empiricalenergies were performed (Bystroff and Shao, 2002).(iv). Protein folding using Rosetta Rosetta Web Link: http://boinc.bakerlab.org/rosetta/Protein folding was carried out using Rosetta with information from selected I-sites fragments andits corresponding contact map potentials. Rosetta utilizes a scoring functions built upon theindependent and dependent protein sequence and structure features to identify native-like proteinstructures in large ensembles of compact decoys. The scoring function has the following formalism,Decomposition P(structure/sequence) α P(sequence/structure) * P(structure)where P denotes protein, P(sequence/structure) term accounts for sequence dependent featuresof protein structures, such as the burial of hydrophobic residues in the core and P(structure) termconsiders universal sequence independent features, such as the assembly of beta-strands intobeta- sheets. 5 lowest-energy models were generated based on the genetic algorithm.Modeled EspC structure was validated for structure correctness and stereochemistry usingRamachandran plot from Structural Analysis and Verification Server (SAVS) (http://nihserver.mbi.ucla.edu/SAVES/). Ramachandran plot displays the phi-psi angle distribution ofamino acids in the protein structure and is distinguished into allowed and nonallowed regions ofalpha helices and beta strands. The highly occupied areas of these plots have a goodcorrespondence with low energy conformation of amino acid residues. The validated structurewas subjected to energy minimization using YASARA Energy minimization server( http://www.yasara.org/). It utilizes knowledge-based potentials derived from dihedral angle potentialsand force.To study the accuracy of secondary structure prediction performed by I-sites/HMMSTR/ROSETTA server for modeling EspC protein, sequence-based secondary structure predictionwas performed in Psipred server. PSIPRED is a web-based program that predicts protein secondarystructures using a combination of evolutionary information and neural networks(http://bioinf.cs.ucl.ac.uk/psipred/). Retrieved EspC protein sequence was queried and the secondarystructure information sorted on confidence interval was analyzed.II. Fragment-based drug designing for EspC proteinFragment-based drug designing was carried out to design inhibitors for EspC using e-LEA3Dprogram(http://chemoinfo.ipmc.cnrs.fr/lea.html). Different stages of designing are discussedbelow.(i). Selection of chemical scaffoldA phytochemical called Vasicine having antitubercular activities from Vasaka, an Indian herb wasselected as a chemical scaffold. It is an alkaloid and a chemical constituent of leaf extract besidesvolatile oils. The 3D structure of vasicine (CID: 667496) was retrieved from PubChem database.

249
Proceeding of Conference : Evolving Paradigm to Improve Productivity for Plant Genetic Resoyrces
(http://pubchem.ncbi.nlm.nih.gov/)(ii). de novo drug designde novo drug design module is based on LEA3D engine. The vasicine structure was given as user-defined scaffold to initiate fragment-based drug designing. Ligand-binding sites prediction usingQSiteFinder was performed to detect potential cavities. Best cavity was manually selected basedupon the two parameters (http://bmbpcu36.leeds.ac.uk/qsitefinder/.html). The solventaccessibleregion should be high to facilitate ligand binding and the cavity should not encompass the N-terminal and C-terminal residues as it can be readily cleaved for signal transduction mechanisms.(iii). Fragment selection and optimizationThe above selected cavity was defined for constructing fragments. The fragments were thenconstructed upon the reference ligand (i.e vasicin) guided by genetic algorithm to select fragmentrelied on the user-defined geometry constrained space. In each iteration step, the fragments wereoptimized to reproduce best candidate molecule with low energy.50 conformers were generated for each candidate using the embedded FROG program and virtuallydocked with defined EspC protein cavity using PLANTS docking program implemented in e-LEA3D(http://bioserv.rpbs.jussieu.fr/cgi-bin/Frog2, http://www.tcd.unikonstanz.de/research/plants.php).(iv). Scoring function and evaluationThen, the fitness of each molecule is evaluated via a function which takes as input the molecularstructure and returns a numeric score. The evaluation can integrate a selected number of molecularproperties and/or a protein–ligand docking score calculated by the program PLANTS. The bestdesigned ligand was selected based on the ranking and score. Additionally, PLANTS dockingscore and energy minimized score were analyzed.III. Epitope-based immunoinformatics study of EspC protein Epitope predictionparametersThe location of continuous epitopes has been correlated with various parameters (such ashydrophilicity, flexibility, accessibility, turns, exposed surface, polarity and antigenic propensity ofpolypeptide chain). The epitope predictions are based on propensity scales for each of the 20amino acids. The retrieved EspC protein sequence was queried against all the prediction parameters.Assessment of solvent accessibility regions The prediction for regions of surface accessibilityis based on Emini’s surface accessibility scale. Accessibility profile is predicted using the formulaeSn
= (
i-1"6 δn+4+i)(0.37)-6 where Sn is the surface probability, δn is the fractional surface probability
value, and i vary from 1 to 6. A hexapeptide sequence with Sn greater than 1.0 indicates anincreased probability for being found on the surface (Emini et al., 1985).Epitope flexibility predictionTo strengthen the prediction accuracy, Karplus and Schulz flexibility scale was used. This scale isderived from the mobility of protein segments based on the known temperature B factors of thealpha carbons of 31 proteins of known structure. The calculation is performed taking the center

250
Proceeding of Conference : Evolving Paradigm to Improve Productivity for Plant Genetic Resoyrces
amino acid as the first amino acid of the six amino acid window length (threshold setting = 1.000)(Karplus and Schulz, 1985).Prediction of antigenicityPeptides could be predicted in such a manner that it should possess the antigenic characterand arelikely to be antibody responsive. Antigenicity prediction was carried out using Kolaskar andTongaonkar antigenicity scale. This prediction is based on a semi-empirical approach, developedon physicochemical properties of amino acid residues and their frequencies of occurrence inexperimentally known segmental epitopes and has the efficiency to detect antigenic peptides withabout 75% accuracy (threshold setting = 1.000) (Kolaskar and Tongaonkar, 1990). The locationof linear B-cell epitope was predicted using Bepipred linear epitope prediction which utilizes acombination of a hidden Markov model and a propensity scale method (threshold setting = 0.350)(Larsen et al., 2006).Hydrophobicity and hydrophilicity analysisThe amino acids making up the epitope are usually charged and hydrophilic in nature. Parkerhydrophilicity scale was applied to evaluate the hydrophilicity. It is based on peptide retention timein high-performance liquid chromatography (HPLC) on a reversed-phase column. Using a windowof seven residues, these experimental values are calibrated for each of the seven residues and thearithmetical mean of the seven residue value was assigned to the fourth, (i+3), residue in thesegment (threshold setting = 1.814) (Parker et al., 1986). To understand the distribution of polarand apolar residues along a protein sequence, hydrophobicity plot was studied using KyteDoolittlehydropathicity index (Kyte, J. and Doolittle, 1982) (threshold setting e" 0 are hydrophobic) availableat Expasy Protscale server (Gasteiger et al., 2005) . Kyte-Doolittle is a widely applied scales fordelineating hydrophobic character of a protein and useful in predicting membrane-spanning domains,potential antigenic sites and regions that are likely exposed on the protein's surface (Kyte, J. andDoolittle, 1982).HLA binding peptide predictionMajor histocompatibility complexes (MHC-I and MHC-II) display specificity for binding withtheir respective epitopes. In human, these MHC molecules are known by human leukocyte antigen(HLA) alleles. The HLA binding peptides were predicted (threshold setting = 3.000) using TmhcPredserver. This prediction is based on the virtual and quantitative matrices based on 97 MHC allelesusing position specific scoring matrices (PSSMs) and utilizes supervised learning method calledSupport Vector Machine (SVM) (Bhasin et al., 2003). Note that the predictions based on theabove mentioned scales viz. Emini, Karplus and Schulz, Kolaskar and Tongaonkar, Bepipredlinear epitope prediction and Parker are different web-based tools centralized in a repositoryimplemented by Immune Epitope Database and Analysis Resource (IEDB) for the prediction andanalysis of immune epitopes (Zhang et al., 2008).RESULT AND DISCUSSIONI. Protein structure modeling of EspC proteinAn ab initio model of EspC protein was constructed using I-sites/HMMSTR/Rosetta server.

251
Proceeding of Conference : Evolving Paradigm to Improve Productivity for Plant Genetic Resoyrces
PSIBLAST was employed to identify distant homologs spanning different protein families. It wasfound that PSI-BLAST could not identify proteins from other families as the multiple sequencealignment (Fig 1) with homologous proteins such as hypothetical protein Rv3615c [Mycobacteriumtuberculosis H37Rv], hypothetical protein ML0406 [Mycobacterium leprae TN] and hypotheticalprotein Rv3865 [Mycobacterium tuberculosis H37Rv] belonged to Mycobacterium family.QUERY 1MTENLTVQPERLGVLASHHDNAAVDASSGVEAAAGLGESVAITHGPYCSQFNDTLNVYLT 6015610751 1MTENLTVQPERLGVLASHHDNAAVDASSGVEAAAGLGESVAITHGPYCSQFNDTLNVYLT 6015827125 4MIDNLTVQSEHLNSLASQHENEAACASSGVSAAAGLANAVSTSHGSYCAQFNDTLKMYED 6315611001 1MTGFLGVVPSFLKVLAGMHNEIVGDIKRATDTVAGISGRVQLTHGSFTSKFNDTLQEFET 60QUERY 61 AHNALGSSLHTAGVDLAKSLRIAAKIYSEADEAWRKAIDGLFT 10315610751 61 AHNALGSSLHTAGVDLAKSLRIAAKIYSEADEAWRKAIDGLFT 10315827125 64 AHRTLGESLHTGGIDLARVLRVAAAMYCDADE----------- 9515611001 61 TRSSTGTGLQGVTSGLANNLLAAAGAYLKADDGLAGVIDKIF- 102Fig-1 Multiple sequence alignment by PSI-BLAST in SAF formatTo model the protein, the EspC protein sequence was divided into words (also known as bitsizes)to identify fragments for which the secondary structure information is available (Table 1). I-sitesgenerated fragments having α-helices with high density and some scatterings belonged to loopregions (Fig 2 A). Five stacks of α-helices were observed when the confidence interval is above0.5. But I-sites assigned secondary structure whose confidence interval was highest on theoverlapping fragments. For example, if a stack of α-helices was found in the confidence intervalrange of 0.3 to 0.7 and a loop at the confidence interval of 0.8 and 0.9 at a particular sequenceposition, the later will be considered to develop model. Hence, the I-sites overlapping fragmentsresulted in 4 α-helices connected by loops. HMMSTR scanned the probability of observing suchstructural information with sequence features using contact map potentials (Fig 2 B).It was observed graphically the preference of inter-residue contacts along the diagonal line.Additionally, blue colored patches above the diagonal line demonstrated the secondary structurepredictions with high confidence. Upon proper protein folding guided by genetic algorithm, Rosettagenerated 5 best models with low energy conformation.

252
Proceeding of Conference : Evolving Paradigm to Improve Productivity for Plant Genetic Resoyrces
(A) (B)Fig-2 (A) Graphical view of generated fragment by I-sites to build protein model. (B) Contactmap potentials by HMMSTR. Dots along the diagonal line denote the preference of inter-residuecontacts established. Regions with blue and green color indicate the high and moderateconfidence of local key structures generated by I-sitesAll the five modeled EspC protein was subjected to energy minimization using YASARA Energyminimization server. Best model was selected according to energy minimization value and Z-score.The first model (Fig 3 A) had the energy minimization value of -41475.5 kJ/mol compared to thetemplate having 2515.5 kJ/mol with Z-score of -1.97. Therefore, the first model was selected forsubsequent analysis.Table-1 Top scoring fragments* generated by I-sites
Sequence No.
Structure (position)
Structural Information
Cluster No. Confidence Interval
92 1hgx A (18) BHHHHHHH 8055 0.71
52 1hgx A (18) BHHHHHHH 8055 0.64
80 3tgl (25) HHHHH 5252 0.62
94 1xyz A (736) HHHHHHHH 8332 0.61
51 1xyz A (736) HHHHHHHH 8332 0.61
* Fragments shown for the first 5 characters (amino acids) of the given input.

253
Proceeding of Conference : Evolving Paradigm to Improve Productivity for Plant Genetic Resoyrces
The stereochemistry of the selected model was studied using Ramachandran plot which revealed98% of the amino acids were found to occur in the allowed regions (Fig 3 B). To understand theprediction accuracy of modeled protein, the protein sequence was queried in PSIPRED and showed4 segments of α-helices connected by loops (Fig 4). Hence, the overall prediction had a goodcorrespondence with sequence- and structure- level features.
(A) (B)Fig-3 (A) Energy minimized ab initio model of EspC protein.(B) Ramachandrandran plot revealed98% residues were in allowed regions.

254
Proceeding of Conference : Evolving Paradigm to Improve Productivity for Plant Genetic Resoyrces
Fig-4 Predicted secondary structure information of EspC proteinII. Fragment-based drug designing of EspC inhibitorsFragment-based drug designing was carried out to design inhibitors for EspC using e-LEA3Dprogram. Literature survey on phyochemical with proven antitubercular activity from Indian originshowed that an Indian herb called Vasaka (also known as Malabar nut tree) is used to treattuberculosis and this activity is due to the chief chemical ingredient known as Vasicine. Thus,vasicine was selected for designing inhibitors. With the help of QSiteFinder, potential cavities weredetected in the modeled EspC protein to conduct virtual screening. Cavity flanked with two α-helices was selected for two reasons. First, cavities surrounded with only loop regions were foundwhich will partially contribute to protein stability. Average surface accessibility area was found tobe greater for the above selected cavity than other cavities.Fragment-based drug designing with vasicine as reference ligand and the above selected cavity asdefined geometrical constraint region was conducted. Fragments were built upon the referenceligand with given geometrical space were built and subsequently docked to identify best moleculeswith better interaction and less energy. FROG enabled proper conformation and PLANTS dockinginspected significant interaction in each iteration. Upon generation of 50 conformers (running time:three days), the best five conformer was selected according to PLANTS score, X-score, overallscore (%) and the corresponding ranks provided by e-LEA3D. Manually, another parametercalled Rerank was specified for selecting best inhibitor molecules (Table 2).Table-2 Top scoring EspC designed inhibitors
Conformer No Rank Score (%) PLANTS Score
X-Score Molecular Weight
Rerank*
8 1 80.19 -90.560 7.22 412
9 1 80.33 -90.990 7.83 437
10 1 80.13 -90.390 7.83 437
11 1 80.26 -90.790 7.83 437
12 1 80.53 -91.580 4.67 467
13 1 80.70 -92.100 4.67 467 3
21 1 80.72 -92.150 6.19 426 2
24 1 80.69 -92.070 6.02 426 4
32 1 80.68 -92.040 5.81 392 5
36 1 81.22 -93.650 5.77 460 1
* Manually carried out to select best designed molecules

255
Proceeding of Conference : Evolving Paradigm to Improve Productivity for Plant Genetic Resoyrces
Best designed inhibitor molecules were manually studied using standard structure visualizer tounderstand the fragments-built (Table 3). Absorption, distribution, metabolism excretion and toxicity(ADMET) parameters were subsequently analyzed during the de novo fragment building andcombinatorial library screening. This step eliminated the need of studying ADMET properties asthe fragments built are primarily derived from drugs approved by Federal Drug Administration(FDA), U.S.Table-3 Structure of vasicine and designed EspC inhibitors
Conformer No. 2D Structure 3D Structure
-
Vasicine (Reference Ligand)
36
21
conformer no. 24
(Rerank: 2)
13
( Rerank: 3)
Note: This conformer is fine - tuned from
( Rerank: 1)
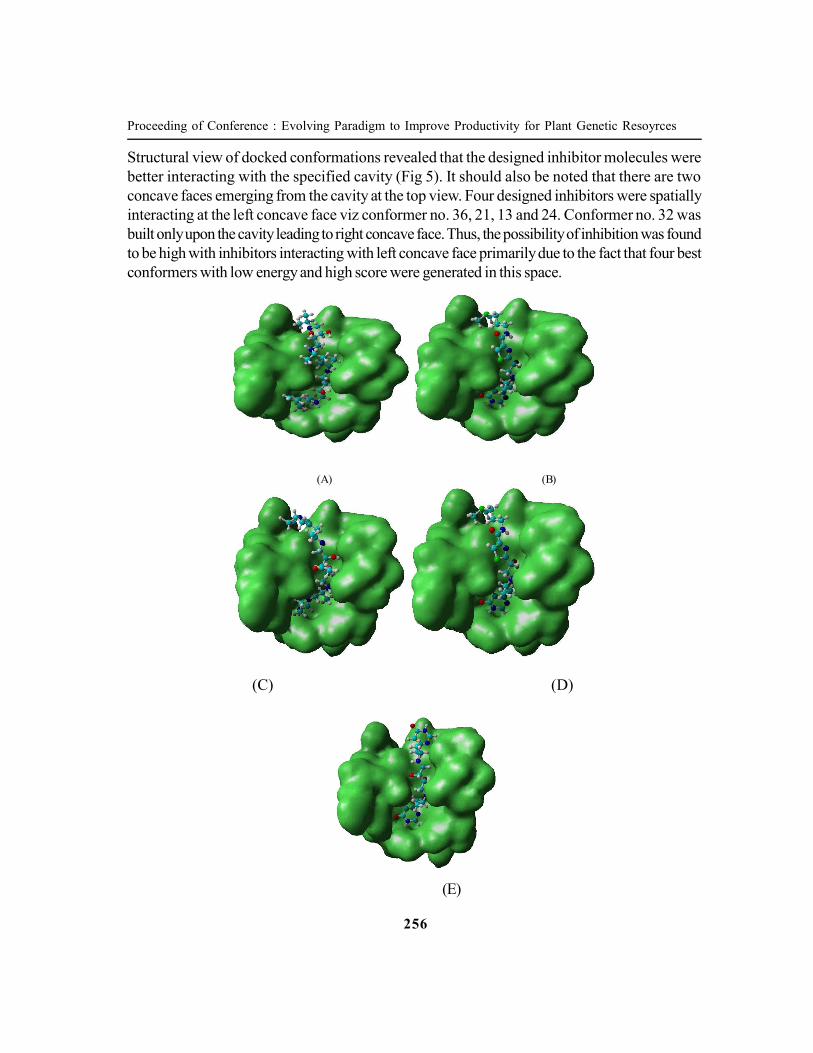
256
Proceeding of Conference : Evolving Paradigm to Improve Productivity for Plant Genetic Resoyrces
Structural view of docked conformations revealed that the designed inhibitor molecules werebetter interacting with the specified cavity (Fig 5). It should also be noted that there are twoconcave faces emerging from the cavity at the top view. Four designed inhibitors were spatiallyinteracting at the left concave face viz conformer no. 36, 21, 13 and 24. Conformer no. 32 wasbuilt only upon the cavity leading to right concave face. Thus, the possibility of inhibition was foundto be high with inhibitors interacting with left concave face primarily due to the fact that four bestconformers with low energy and high score were generated in this space.
(A) (B)
(C) (D)
(E)

257
Proceeding of Conference : Evolving Paradigm to Improve Productivity for Plant Genetic Resoyrces
Fig-5 Docked conformations of designed EspC inhibitor molecules. (A) Conf. No. 36 (B) Conf.No. 21 (C) Conf. No. 13 (D) Conf. No. 24 and (E) Conf. No. 32III. Epitope-based immunoinformatics study of EspC proteinEpitope prediction for the EspC protein showed regions spanning the sequence between positions80 to 100, and scored well when all the scales were considered (Figure 6 A-E). Kolaskar andTongaonkar antigenicity scale predicted two 15 and a 35 length peptides in the positions 21 to 35,37 to 51 and 54 to 88, respectively. When all the scales were taken into consideration, thispeptide did not show any significance in terms of surface accessibility, flexibility and hydrophobicity/hydrophilicity. But the 35 length peptide has antigenic properties at its Cterminal flank (sequenceposition 80-88) together with all parameters. Recent studies on EspC demonstrated that it containsmultiple and broadly recognized T-cell epitopes in MTB infection.Similar setback occurred when a Bepipred linear epitope prediction showed a 5 length peptide inthe positions of 46-50, which is in low significance region. An epitope with 18 residues (position20-37) showed significance when all the scales were taken into account. Further, Bepipred analysisrevealed a continuous predicted epitope with 9 amino acid residues in the sequence positions 87-95 (Table 4). Hence, the region spanning 80-103 will be of greater importance for epitope-basedvaccine design as this terminal region is required for secretion in ESX-1 secretion system.Table-4 Predicted epitopes of EspC protein via Kolaskar and Tongaonkar antigenicity scale(S.No. 1-4) and Bepipred continuous epitope predictions (S.No. 5-7)
S.No Start position
End position
Peptide Peptide length
1 5 18 LTVQPERLGVLASH 14
2 21 35 NAAVDASSGVEAAAG 15
3 37 51 GESVAITHGPYCSQF 15
4 54 88 TLNVYLTAHNALGSSLHTAGVDLAKSLRIAAKIYS 35
5 20 37 DNAAVDASSGVEAAAGLG 18
6 46 50 PYCSQ 5
7 87 95 YSEADEAWR 9
Promiscuous HLA binders are those peptides which bind most HLA alleles and its respective sub-alleles with increased affinity. EspC protein sequence generated 179 nanomers. Prediction ofpromiscuous HLA peptide binders displayed similarity as well as variation. Dissimilar pattern wasfound across major alleles. For example, HLA-A1 and HLA-B14 alleles expressed different

258
Proceeding of Conference : Evolving Paradigm to Improve Productivity for Plant Genetic Resoyrces
peptides, 36-LGESVAITH-44 and 24-VDASSGVEAAAGLGESVA-41. Similar peptideprediction was also observed. For example, H-2Dd and H-2Kb alleles exhibited similar peptide7-VQPERLGVL-15. Despite the use of scoring system of Tmhcpred server to rank its predictions,a better correlation study of all the predicted regions and respective peptides will help to detectpromiscuous HLA binders.
(A)
Threshold: 1.000(B)
Threshold: 1.000(C)
Threshold: 1.000(D)
Threshold: 1.814(E)
Threshold: 0.000

259
Proceeding of Conference : Evolving Paradigm to Improve Productivity for Plant Genetic Resoyrces
Fig-6 Epitope prediction of EspC protein using (A) Emini surface accessibility prediction (B)Karplus and Schulz flexibility prediction (C) Kolaskar and Tongaonkar antigenicity prediction (D)Parker hydrophilicity prediction and (E) Kyte and Doolittle hydrophobicity prediction.CONCLUSIONESX-1 secretion system Multi-drug resistant Mycobacterium tuberculosis establishes infectionin host cells by secreting virulence factors. Genes belonging to this system are attenuated in currentlyused BCG vaccine strain and are no longer proven efficacy in treating tuberculosis. In the presentstudy, vasicine, a plant bioactive from Vasaka herb is used to develop inhibitors against a chiefcomponent of the ESX-1 secretory pathway, called EspC through fragment-based drug designingapproach. Epitope-based immunoinformatics study of EspC protein showed regions of interestfor developing vaccines with due consideration across all the genetically heterogeneous inheritance.It is found that designing T-cell epitopes against the C-terminal region of EspC protein will havegreater benefits as compared to other regions as it acts as a recognition element for its cognateAAA ATPases and protein interaction. Hence, designing inhibitors based on plant bioactive withknown activity will direct to the generation of potential antitubercular lead molecules. In the otherhand, the in vitro expression studies of EspC in individuals with heterogeneous genetic inheritancewill helpful in choosing a better region for developing vaccine without any harm to the human.REFERENCESMcLaughlin B, Chon JS, MacGurn JA, Carlsson F, Cheng TL, Cox JS, Brown EJ. (2007) Amycobacterium ESX-1–secreted virulence factor with unique requirements for export. PLoS Pathog3(8): e1050-1061Stanley SA, Raghavan S, Hwang WW, Cox JS (2003) Acute infection and macrophage subversionby Mycobacterium tuberculosis require a specialized secretion system. Proc Natl Acad Sci U S A100: 13001–13006.Volkman HE, Clay H, Beery D, Chang JCW, Sherman DR, et al. (2004) Tuberculous GranulomaFormation Is Enhanced by a Mycobacterium Virulence Determinant. PLoS Biol 2(11): e367.doi:10.1371/journal.pbio.0020367Flint JL, Kowalski JC, Karnati PK, Derbyshire KM (2004) The RD1 virulence locus ofMycobacterium tuberculosis regulates DNA transfer in Mycobacterium smegmatis. Proc NatlAcad Sci U S A 101: 12598–12603.The UniProt Consortium Reorganizing the protein space at the Universal Protein Resource (UniProt)Nucleic Acids Res. 40: D71-D75 (2012).Bystroff C & Shao Y. (2002). Fully automated ab initio protein structure prediction using ISITES,HMMSTR and ROSETTA. Bioinformatics 18 Suppl 1, S54-61.Stephen F. Altschul, Thomas L. Madden, Alejandro A. Schäffer, Jinghui Zhang, Zheng Zhang,Webb Miller, and David J. Lipman (1997), "Gapped BLAST and PSI-BLAST: a new generationof protein database search programs", Nucleic Acids Res. 25:3389-3402.

260
Proceeding of Conference : Evolving Paradigm to Improve Productivity for Plant Genetic Resoyrces
Emini, E.A., Hughes, J.V., Perlow, D.S. and Boger, J., Induction of hepatitis A virus-neutralizingantibody by a virus-specific synthetic peptide. J. Virol., 1985, 55, 836-839.Karplus, P.A. and Schulz, G.E., Prediction of Chain Flexibility in Proteins - A tool for the Selectionof Peptide Antigens. Naturwissenschafren, 1985, 72, 212-213.Kolaskar, A.S. and Tongaonkar, P.C., A semi-empirical method for prediction of antigenicdeterminants on protein antigens. FEBS Lett., 1990, 276, 172-174.Larsen, J.E.P., Lund, O. and Nielsen, M., Improved method for predicting linear B-cell epitopes.Immunome Res., 2006, 2, 2-8.Parker, J.M., Guo, D. and Hodges, R.S., New hydrophilicity scale derived from highperformanceliquid chromatography peptide retention data: correlation of predicted surface residues withantigenicity and X-ray-derived accessible sites. Biochem., 1986 25, 5425-5432.Kyte, J. and Doolittle, R., A simple method for displaying the hydropathic character of a protein.J. Mol. Biol., 1982, 157, 105-132.Gasteiger, E., Hoogland, C., Gattiker, A., Duvaud, S., Wilkins, M.R., Appel, R.D. and Bairoch,A., Protein Identification and Analysis Tools on the ExPASy Server. In The Proteomics ProtocolsHandbook (ed. Walker, J.M.), Humana Press, 2005, pp. 571-607.Bhasin, M., Singh, H. and Raghava, G.P.S., MHCBN: a comprehensive database of MHC bindingand non-binding peptides. Bioinformatics, 2003, 19, 665-666.Zhang, Q., Wang, P., Kim, Y., Haste-Andersen, P., Beaver, J., Bourne, P.E., Bui, H.H., Buus, S.,Frankild, S., Greenbaum, J., Lund, O., Lundegaard, C., Nielsen, M., Ponomarenko, J., Sette, A.,Zhu, Z. and Peters, B., Immune epitope database analysis resource (IEDB-AR). Nucl. AcidsRes., 2008, 36, 513-518.

261
Proceeding of Conference : Evolving Paradigm to Improve Productivity for Plant Genetic Resoyrces
Big Data: Information Retrieval, Extraction and Mining
Mehta Krupa , Dr. Devarshi Mehta , Dr. Vishal Dahiya
1GLS University, Ahmedabad, Gujarat, India 2Indus University, Gujarat, India
ABSTRACTThe Internet has a huge collection of information. With the advent of big data, it is becoming easyto store any amount of information. As the name says "big data" is used to store the informationwith three characteristics i.e. volume, variety and velocity. The stored information is useful onlywhen it is extracted properly at the item of requirement with accuracy. To extract the informationfrom data source(s) is known as data mining. Accurately mined data produces the results that aredirectly applicable and useful to implement in real scenario. Such extracted information empowersthe analytical capability which facilitates decision making process by highlighting the minute andcrucial issues. The intended information is retrieved from various available data sources. Thisallows preparing a data source having related information and this data source becomes the basefor further extraction of the information.INTRODUCTIONLooking at current scenario of WWW, a large amount of information is generated every day.According to a survey, in 2012, Google received over 2 million search queries per minute. Fastforward to 2014 and that number has more than doubled. In January 2014, Google receives over4 million search queries per minute from the 2.4 billion strong global internet population [7].Considering usage of smart phones and latest technology, this number is going to increaseenormously. We are living in the era where huge information is available but still we are striving forknowledge. To store such huge amount of information and to retrieve this information is becomingvery crucial challenge. The information is of no use, if there is no mechanism to access relevantinformation with limited time span. To fulfil the need of extracting only relevant information,Information Extraction techniques are used. This paper presents an overview of InformationExtraction from Big Data. To make the flow of topic logical, the paper covers overview ofInformation Extraction and Information Retrieval, How Data mining can be helpful to extractinformation, overview of big data, mining a big data, challenges in mining big data.INFORMATION RETRIEVALInformation retrieval is the activity of obtaining information resources relevant to an informationneed from a collection of information resources. Searches can be based on metadata or on full-text indexing. Information retrieval is about returning the information that is relevant for a specificquery or field of interest. Note that this information could also be in the form of general documents,sure enough search engines are a notable example of such task. The most important entitiesrecognizable for information retrieval are the initial set of documents/information and the query thatspecify "what to search for". IR is used to select from a collection of textual documents a subset

which is relevant to a particular query. It generally returns ranked list of documents. IE and IRtechniques complement each other. Information Extraction requires to filter required documentsfrom huge collection [10]. After retrieval of related documents, required information is extractedfrom that available data source.DATA MINING FOR INFORMATION EXTRACTIONInformation extraction (IE) is the task of automatically extracting structured information fromunstructured and/or semi-structured machine-readable documents. Information extraction is moreabout extracting (or inferring) general knowledge (or relations) from a set of documents orinformation.IE is to identify a predefined set of concepts in a specific domain, ignoring other irrelevant information,where a domain consists of a corpus of texts together with a clearly specified information need. Itis deriving structured factual information from unstructured test [10]. IE is typically seen as a one-time process for the extraction of a particular kind of relationships of interest from a documentcollection [8].Data mining is core and most challenging step in information extraction. Typically, data mininguncovers interesting patterns and relationships hidden in a large volume of raw data, and the resultstapped out may help make valuable predictions or future observations in the real world [1].As the name says data mining techniques are used to mine the data from a bulk of data. Datamining techniques examines the data and tries to find out some pattern or relation among them, apattern is identified, using this pattern required information is extracted in a particular format bydeveloping an algorithm. Looking at current scenario of information generation, data mining isbecoming most important. Nowadays millions of MB of data is generated on internet. And withthe availability of mobile internet and latest technology, the number is going to constantly increasing.Moreover, the information generated is unstructured. The need to store such large amount of data,initiated the word "Big Data".HANDLING BIG DATA AND ITS ISSUESThe term 'Big Data' appeared for first time in 1998 in a Silicon Graphics (SGI) slide deck by JohnMashey with the title of "Big Data and the NextWave of InfraStress". Big Data mining was veryrelevant from the beginning, as the first book mentioning 'Big Data' is a data mining book thatappeared also in 1998 by Weiss and Indrukya [4]. However, the first academic paper with thewords 'Big Data' in the title appeared a bit later in 2000 in a paper by Diebold[4]. As the namesays the term big data represents the tremendous amount of information generated currently oninternet.The data generated are of two types [4]:
1. Structured data2. Unstructured data
Structured data includes numbers and word that can be easily extracted and analysed. Such kindof data can be generated by smart phones, electric gadgets, etc. Such data are easy to capture andprocess.

Unstructured data includes reviews, feedbacks, videos, audio clips, photographs, E-mails etc.Such data are difficult to categorize and analyse. Unstructured scattered data collections are full ofinformation.To extract information, a pattern is required. Based on the derived pattern the data can be categorizedand analysed. But if the data doesn’t follow any pattern it is hard to extract information from it. Toextract some information from news paper, a word or set of words can be identified. Later on toextract information, the document can be verified again identified word(s). But to extract informationfrom a photograph of the same news paper is not that much easy. For Example: If a news itemexplaining flood situation is to be analysed from the news paper, some keywords can becoined along with the news writing pattern. By this analysing some key parameters fromthat news story like: location, amount of rainfall, number of persons affected, etc is possiblebut through the photograph explaining flood situation, it is hard to extract such keyparameters.The data generated by internet is mainly falls into second category of data i.e. Unstructured data.Big data deals with this large volume, heterogeneous data. Every individual is contributing his/herbit in this large collection without any central control over the production of data. This decentralizationof data makes it more complex to handle as it is not possible to maintain any fix pattern which canlater on help in identifying pattern and analysing. Looking at the large collection of data and itscomplexity, three V's are associated with the Big Data:
• Volume: The amount of data. It is core characteristics defined by the word big dataitself. It refers to the quantity of data which is of prime focus.?
• Variety: This characteristic refers to the difference in nature of data and data sources. Itis the major reason behind the complexity of the big data. As all the data from varioussources are stored in big data, there is no particular pattern is followed which can help inmining process.?
• Velocity: It refers to the speed at which information is generated and added to the bigdata.?
From the above discussion it is clear that we are living in flood of information, but still we strive forrelevant information. Big data is used to store a large amount of data from different sources and ofdifferent nature which is constantly increasing at high rate. Day by day it is becoming very importantto extract some useful relevant information from the big data. As discussed, data mining techniquesare used to extract information. Big data is a tool to store large amount of information and datamining is a technique to generate meaningful data from it. A combination of both the techniquesenhances the user experience and helps to manage information properly which can be accessed asand when needed in no time. Some issues with big data mining are:
• Too much of data, how to relate it??Big data storage is going beyond zettabyte. To find relation between such huge amountsof information is very critical task. To make information access specific and fast, suchkind of relation generation is very important. To find relevance between information,relation generation is key step.

264
Proceeding of Conference : Evolving Paradigm to Improve Productivity for Plant Genetic Resoyrces
• Does not follow any specific pattern:?Information generation is decentralized; there is no single control over the informationgeneration. It means that information generated from various sources follows differentprocess which makes the task if pattern generation very complex. It may be possiblethat generated pattern works for some information while some important informationmay leave out.
• Which Information to extract:?The decision of which information to be extracted is important. When dealing with largeamount of data, it becomes very important to decide that which information is of vitalimportance and which one is not. It is also important to carry out the work for garbagecollection, to keep the information up to date and remove unnecessary information.
• Pace at which information is generated?Day by day, the rate at which information stored in big data is increasing rapidly. It isdifficult to manage this flood of information. It requires high scalability of mining techniques.
• Privacy?Privacy is considered as supreme issue since data mining has begun. With the use of social media,lot many personal information can be mined like location, activity, friendship. The use of onlinepayment is also becoming very common; mining applied to such data may cause serious issues, ifnot handled properly. As the Internet user’s increases, their personal information is also storedsomewhere around, to maintain such private information secret also becomes very important.REFERENCESDunren Che , Mejdl Safran , and Zhiyong Peng. Mining Big Data: Current Status, and Forecast tothe FutureAndrew Kehler, Jerry R. Hobbs, Douglas Appelt, John Bear, Matthew Caywood, David I s r a el ,Megumi Kameyama, David Martin, and Claire Monteleoni. Information Extraction Research AndApplications: Current Progress And Future Directions,Wei Fan,Albert Bifet. Mining Big Data: Current Status, and Forecast to the FutureBharti Thakur, Manish Mann. International Journal of Advanced Research in Computer Scienceand Software Engineering, 2014Ah-Hwee Tan. Text Mining: The state of the art and the challengesXindong Wu, Xingquan Zhu, Gong-Qing Wu, Wei Ding. Data Mining with Big Data. 2014http://aci.info/2014/07/12/the-data-explosion-in-2014-minute-by-minute-infographic/Luis Tari, Phan Huy Tu, Jorg Hakenberg, Yi Chen,Tran Cao Son, Graciela Gonzalez, and ChittaBaral. Incremental Information Extraction Using Relational Databases, 2012.Wei Fan, Albert Bifet. Mining Big Data: Current Status, and Forecast to the Future.J. Piskorski, R. Yangarber. Information Extraction: Past, Present and Future.