Analysis of the DVB-T Signal Variation for Indoor Portable Reception
9
IEEE TRANSACTIONS ON BROADCASTING, VOL. 55, NO. 1, MARCH 2009 11 Analysis of the DVB-T Signal Variation for Indoor Portable Reception Alain Martínez, Diana Zabala, Iván Peña, Pablo Angueira, Member, IEEE, Manuel M. Vélez, Amaia Arrinda, David de la Vega, and Juan Luis Ordiales Abstract—A study of DVB-T (Digital Video Broadcasting - Terrestrial) signal variability for indoor reception environments is stated in this paper. A commercial signal was measured and analyzed in order to obtain C/N threshold values that account time and space fluctuations. In this way, results increase the accuracy of the values provided by the ETSI (European Telecommunications Standards Institute) standard and other studies that assume static propagation channels. On the other hand, the fading influence due to people walking near the reception antenna has been proved as critical for correct reception. Characterization of this effect has been made in terms of its depth and duration. The results obtained results improve DVB-T network planning and could be also relevant for other technologies sharing similar frequencies and bandwidths. Index Terms—BER before Reed Solomon, C/N thresholds, channel propagation, DVB-T indoor portable reception, , space variability, time variability. I. INTRODUCTION I N the early 90’s, along with DAB (Digital Audio Broad- casting), DVB-T came up as the first system based on OFDM (Orthogonal Frequency Division Multiplexing) mod- ulation for digitalization of terrestrial broadcasting services. This technology was proposed by the DVB Consortium and standardized by the ETSI [1], [2]. Several studies have analyzed the quality of the digital signal for both outdoor and indoor reception in the past as can be found in references [3]–[13]. In both situations the reception was in- fluenced by multipath. This effect was especially critical for in- door environments where obstacles such as walls or windows increase the signal variability. This situation deserves a more exhaustive study. The signal variability due to temporal vari- ations of the channel was studied some years ago for outdoor reception (Class A as defined by the ETSI [2]). Specifically, the impact of moving vehicles close to the receiver was found to be a relevant cause of fading and synchronization loss [7], [8]. The work presented in this paper focuses on indoor portable recep- tion. The standard and related documents provide the criteria for correct signal reception and includes carrier to noise threshold Manuscript received May 15, 2008; revised August 01, 2008. Current version published February 25, 2009. A. Martínez, I. Peña, P. Angueira, M. M. Velez, A. Arrinda, D. de la Vega, and J. L. Ordiales are with the Department of Electronics and Telecommunications, Bilbao Engineering Faculty, University of the Basque Country, Bilbao 48013, Spain (e-mail: [email protected]). D. Zabala is with Dominion Engineering, Zamudio 48170, Spain. Digital Object Identifier 10.1109/TBC.2008.2006657 values for all the possible parameter configurations. However, these threshold values have been obtained under static condi- tions, meaning that no signal and impairment fluctuations occur during the observation period. Such assumption might not be realistic for certain situations such as the indoor portable re- ception analyzed in this paper. Under these circumstances, the thresholds recommended by the ETSI are too optimistic. A set of thresholds that take into account the time variations of the channel was proposed by the German institute IRT (Institut für Rundfunktechnik). This set of values was obtained by means of a series of laboratory tests using reference chipsets. The study concludes that there should be an increase of C/N thresholds for a variety of conditions [14]. This paper aims at studying in the field the potential increase of C/N thresholds to account for time variation in the case of portable indoor reception. Additionally, some specific perturba- tions, such as the effect of walking people close to the receiver antenna are studied, since critical fading was expected. This ef- fect has not been analyzed by previous studies [12], [14]. An analysis of DVB-T signal for indoor reception, providing C/N threshold values and fading characterization is presented in this paper. The study is based on a measurement campaign in a set of representative indoor reception locations and situations. The measurement system, methodology, and data processing, as well as the obtained results are described in the following sections. II. OBJECTIVES The time fluctuations of the DVB-T signal must be taken into account when defining the quality service. The main objective of this study is to analyze this effect providing realistic thresh- olds for correct reception. To this end, three phases have been considered. • Analysis of the DVB-T signal spatial behavior and the corresponding C/N threshold values related to space vari- ability. • Study of the time variability and derived C/N threshold values for both public (commercial) and private (house- hold) buildings. • Characterization of the fading occurrences due to people walking near the receiver antenna. Specifically, duration and depth of this type of fading has been calculated The corresponding results will be an additional reference to those provided either by the ETSI standard or other studies that have not considered the dynamic nature of the DVB-T signal reception indoors and will further help the planning of future digital networks. 0018-9316/$25.00 © 2009 IEEE
-
Upload
independent -
Category
Documents
-
view
2 -
download
0
Transcript of Analysis of the DVB-T Signal Variation for Indoor Portable Reception

IEEE TRANSACTIONS ON BROADCASTING, VOL. 55, NO. 1, MARCH 2009 11
Analysis of the DVB-T Signal Variationfor Indoor Portable Reception
Alain Martínez, Diana Zabala, Iván Peña, Pablo Angueira, Member, IEEE, Manuel M. Vélez, Amaia Arrinda,David de la Vega, and Juan Luis Ordiales
Abstract—A study of DVB-T (Digital Video Broadcasting -Terrestrial) signal variability for indoor reception environmentsis stated in this paper. A commercial signal was measured andanalyzed in order to obtain C/N threshold values that account timeand space fluctuations. In this way, results increase the accuracy ofthe values provided by the ETSI (European TelecommunicationsStandards Institute) standard and other studies that assume staticpropagation channels. On the other hand, the fading influencedue to people walking near the reception antenna has been provedas critical for correct reception. Characterization of this effecthas been made in terms of its depth and duration. The resultsobtained results improve DVB-T network planning and could bealso relevant for other technologies sharing similar frequenciesand bandwidths.
Index Terms—BER before Reed Solomon, C/N thresholds,channel propagation, DVB-T indoor portable reception, ����,space variability, time variability.
I. INTRODUCTION
I N the early 90’s, along with DAB (Digital Audio Broad-casting), DVB-T came up as the first system based on
OFDM (Orthogonal Frequency Division Multiplexing) mod-ulation for digitalization of terrestrial broadcasting services.This technology was proposed by the DVB Consortium andstandardized by the ETSI [1], [2].
Several studies have analyzed the quality of the digital signalfor both outdoor and indoor reception in the past as can be foundin references [3]–[13]. In both situations the reception was in-fluenced by multipath. This effect was especially critical for in-door environments where obstacles such as walls or windowsincrease the signal variability. This situation deserves a moreexhaustive study. The signal variability due to temporal vari-ations of the channel was studied some years ago for outdoorreception (Class A as defined by the ETSI [2]). Specifically, theimpact of moving vehicles close to the receiver was found to bea relevant cause of fading and synchronization loss [7], [8]. Thework presented in this paper focuses on indoor portable recep-tion.
The standard and related documents provide the criteria forcorrect signal reception and includes carrier to noise threshold
Manuscript received May 15, 2008; revised August 01, 2008. Current versionpublished February 25, 2009.
A. Martínez, I. Peña, P. Angueira, M. M. Velez, A. Arrinda, D. de la Vega, andJ. L. Ordiales are with the Department of Electronics and Telecommunications,Bilbao Engineering Faculty, University of the Basque Country, Bilbao 48013,Spain (e-mail: [email protected]).
D. Zabala is with Dominion Engineering, Zamudio 48170, Spain.Digital Object Identifier 10.1109/TBC.2008.2006657
values for all the possible parameter configurations. However,these threshold values have been obtained under static condi-tions, meaning that no signal and impairment fluctuations occurduring the observation period. Such assumption might not berealistic for certain situations such as the indoor portable re-ception analyzed in this paper. Under these circumstances, thethresholds recommended by the ETSI are too optimistic. A setof thresholds that take into account the time variations of thechannel was proposed by the German institute IRT (Institut fürRundfunktechnik). This set of values was obtained by means ofa series of laboratory tests using reference chipsets. The studyconcludes that there should be an increase of C/N thresholds fora variety of conditions [14].
This paper aims at studying in the field the potential increaseof C/N thresholds to account for time variation in the case ofportable indoor reception. Additionally, some specific perturba-tions, such as the effect of walking people close to the receiverantenna are studied, since critical fading was expected. This ef-fect has not been analyzed by previous studies [12], [14].
An analysis of DVB-T signal for indoor reception, providingC/N threshold values and fading characterization is presented inthis paper. The study is based on a measurement campaign in aset of representative indoor reception locations and situations.The measurement system, methodology, and data processing,as well as the obtained results are described in the followingsections.
II. OBJECTIVES
The time fluctuations of the DVB-T signal must be taken intoaccount when defining the quality service. The main objectiveof this study is to analyze this effect providing realistic thresh-olds for correct reception. To this end, three phases have beenconsidered.
• Analysis of the DVB-T signal spatial behavior and thecorresponding C/N threshold values related to space vari-ability.
• Study of the time variability and derived C/N thresholdvalues for both public (commercial) and private (house-hold) buildings.
• Characterization of the fading occurrences due to peoplewalking near the receiver antenna. Specifically, durationand depth of this type of fading has been calculated
The corresponding results will be an additional reference tothose provided either by the ETSI standard or other studies thathave not considered the dynamic nature of the DVB-T signalreception indoors and will further help the planning of futuredigital networks.
0018-9316/$25.00 © 2009 IEEE

12 IEEE TRANSACTIONS ON BROADCASTING, VOL. 55, NO. 1, MARCH 2009
Fig. 1. Impulse response for a Rician channel at one of the measurement loca-tions of this study.
Fig. 2. Impulse response for a Rayleigh channel at one of the measurementlocations of this study.
III. SIGNAL CHARACTERIZATION
This section introduces some of the factors that are taken intoaccount when studying the DVB-T indoor reception behavior.Specifically, the propagation channel assumption, the signalspace and time variability and Quality of Service thresholdcriteria are described.
Traditionally, two propagation channel models have beenconsidered when planning portable DVB-T services: Ricianand Rayleigh channels [2], [15]. The first one has a dominantcomponent that is much higher than the remaining multipathcomponents, so their influence does not significantly affect thereception. Fig. 1 shows an example of Rician channel impulseresponse at one of the locations of the measurement campaignassociated to this paper.
On the other hand, a Rayleigh channel implies strong multi-path components, close in amplitude to the main path and evenhigher. Fig. 2 shows a real impulse response recorded at one ofthe measurement locations.
ITU-R Recommendations [16] and ETSI documents providesystem thresholds for a variety of reception situations, whichare based on the assumptions related to Rician and Rayleighchannels. As previously mentioned, some studies [14] have sug-gested that today’s assumptions are optimistic and both time andspace variability might have to be also considered relevant fac-
tors for network planning. The impact of variability on the C/Nthresholds will be different depending on the channel.
The study of the appropriate C/N thresholds requires a pre-vious definition of correct vs. incorrect reception. This issue isnot trivial for portable reception and has also been studied in thedefinition phases of several broadcasting systems [1], [2], [17],[18]
During the last decade, two criteria have been applied widely:TOV (Threshold of Visibility) and QEF (Quasi Error Free) con-dition [19], [20]. The TOV is based on the subjective evaluationof the audio and video signals during intervals of 20 seconds.The Quasi Error Free criterion implies that the quality of recep-tion is good if no more than an error per hour in the MPEG dataoccurs. This corresponds with a BER before Reed Solomon of
[1]. Those evaluation criteria are no longer valid if thechannel is time varying and error bursts occur [14], which, aswill shown in following sections, is the case for indoor portablereception.
More recently, an additional quality assessment method, theso called (Erroneous Second Ratio), has been proposedin order to take into account reception situations that are likelyto suffer from sudden error bursts [21]–[23].
The is based on a division of the measurement in-terval into blocks of 20 seconds. If a block presents no morethan one erroneous second (errors in MPEG data), the block istagged as correct. If not, it is tagged as incorrect. This erroneoussecond within the 20 second block represents the 5% of the time.Anyway, these errors only correspond to MPEG-TS packet er-rors, severe transmission errors, such as synchronization loss,are not allowed.
The value is the ratio between the number of correctblocks and the total number of blocks.
(1)
The reception will be considered correct when thecriterion is fulfilled at least with a value of 0.99 (99% of thetime). Similar methodology, parameters and criteria such asframe error rates (FER and MFER) [24], [25] are being usedfor mobile television standards (DVB-H).
IV. MEASUREMENT CAMPAIGN
This study has been based on a measurement campaign, de-veloped in three different phases in 2006 and 2007. Tests weredesigned and planned as a function of the objectives describedin Section II. Details of the planning, equipment and method-ology of each phase are described in this section.
A. Measurement Planning
Two different commercial DVB-T signals broadcasted fromthe two major transmitter sites serving the city of Bilbao (Spain)on the upper UHF band have been considered as the basis forthis study. The first one, Artxanda, operates at 810 MHz andthe other one, Ganeta, at 794 MHz. In both cases, the signal ismodulated in the 8k mode with 64 QAM modulation, code rateof 2/3 and guard interval of 1/4. The location of both transmittersis shown in Fig. 3.
MARTÍNEZ et al.: ANALYSIS OF THE DVB-T SIGNAL VARIATION FOR INDOOR PORTABLE RECEPTION 13
Fig. 3. Transmitter and test points locations.
The objective of the first measurement phase was to study theinfluence of the space signal variability on minimum requiredC/N values and determine the corresponding threshold for cor-rect reception. This phase took place in the Bilbao EngineeringFaculty of the University of the Basque Country.
Tests consisted of measurements at 45 indoor reception pointswithin the faculty building, located in Bilbao downtown, 2.5 kmaway from the Artxanda transmitter. In this case, due to the ex-istence of unobstructed line of sight path, the signal from thistransmitter center was the one with highest levels inside thebuilding.
The C/N threshold associated to the time signal variabilitywas obtained from data recorded in a second measurementphase. Measurements were taken at 11 locations of the sameprevious building. Some of them are a subset of the firstcampaign points. Nevertheless a different methodology wasfollowed.
A third phase was planned to generalize the time variabilityresults obtained in the faculty building. In this case a set of 22 lo-cations distributed in 7 different buildings of Bilbao were mea-sured. Six of them can be described as residential houses locatedin an urban environment and surrounded by other ones made ofbrick or concrete (following the classification and terminologyfrom ITU-R BS.1203-1 Recommendation [26]). The remainingone was placed in a semiurban area. Locations inside this lastbuilding were used to make a comparison with results corre-sponding to the urban environment. During this measurementphase, the existence of line of sight from any of the transmittersdetermined which transmitter signal was recorded, Artxanda orGaneta.
Taking into account the three phases, the indoor reception wastested at a total of 78 locations.
B. Measurement System
For indoor portable reception (class B reception), there mightnot be a dominant path for every situation. Thus, an omnidirec-tional or quasi-omnidirectional antenna is frequently used. Plan-ning guidelines reports [2] recommend the use of this type of
Fig. 4. Microstrip antenna used during the measurement campaign.
Fig. 5. Simulated radiation pattern of the antenna.
antennas for indoor portable reception. Considering that the reg-ular DTV transmission is horizontally polarized, the receivingantenna was one of the key issues when defining the test system.
Several omnidirectional commercial TV antenna models de-signed for portable reception were tested. None of them showeda reasonable uniformity in the radiation pattern. On the otherhand, other non-commercial designs exist for DVB-T indoorreception but they were not proper for the DTV signals understudy [17]. With this in mind, it was decided to design specifi-cally an antenna for these tests, as shown in Fig. 4. After severalversions, the model with better frequency and gain responseswas a microstrip dipole antenna.
The operation frequency range of this antenna is from768 MHz to 900 MHz. Within this band, the antenna has aVSWR value (Voltage Standing Wave Ratio) 2. The max-imum gain at the frequencies of the measured DVB-T signals(794 MHz and 810 MHz) is 2 dBi which corresponds with anantenna factor value (also called K factor) of 24.5 dB [28].Fig. 5 shows the normalized radiation pattern of the antenna.
Nulls in the radiation pattern have been considered to havea small influence on the results. All measurements were carriedout after positioning the antenna in the best possible way at eachof the measurement locations, so that the maximum power levelwas received.
Two degradation sources that increase the noise figure at thereceiver must be taken into account: the impedance mismatchbetween the antenna and the front-end, and the noise added bythe equalizer of the receiver [9]. After several experiments, thenoise level introduced by the equalizer has been proved to beabout 6 or 7 dB; value in line with data provided by the FCC.On the other hand, the VSWR value due to the impedance mis-match between the antenna and the input of the tuner is equal orlower than 2. This implies an increase of the noise figure smaller
14 IEEE TRANSACTIONS ON BROADCASTING, VOL. 55, NO. 1, MARCH 2009
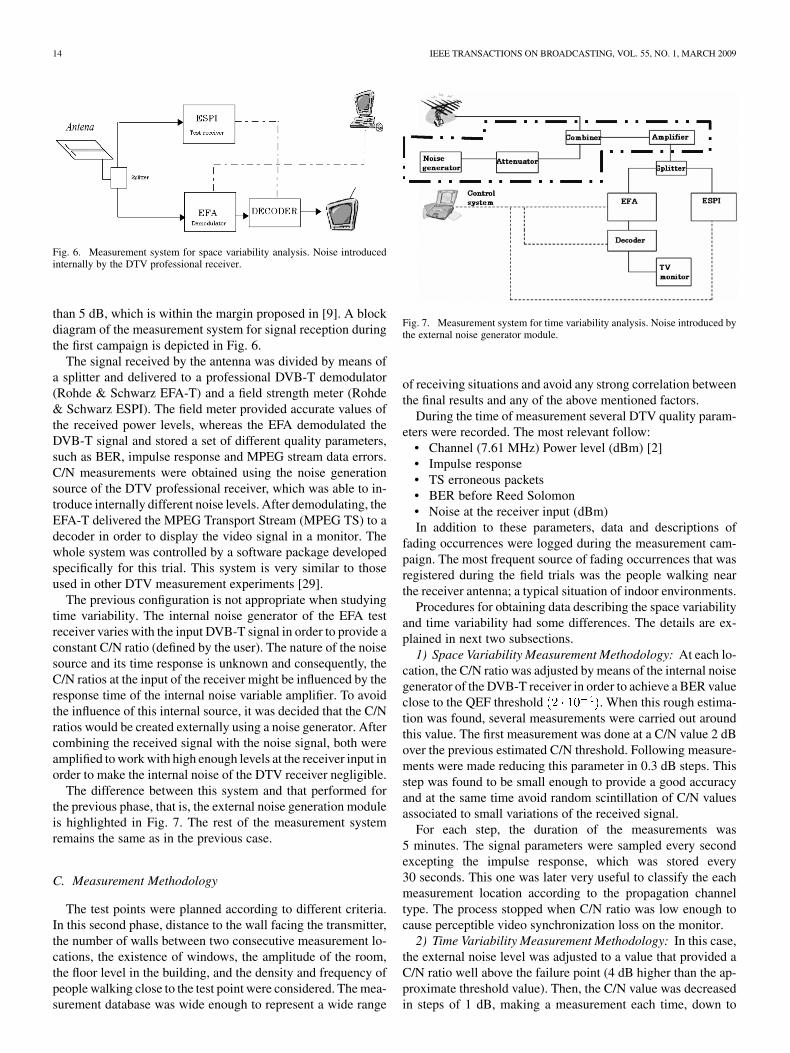
Fig. 6. Measurement system for space variability analysis. Noise introducedinternally by the DTV professional receiver.
than 5 dB, which is within the margin proposed in [9]. A blockdiagram of the measurement system for signal reception duringthe first campaign is depicted in Fig. 6.
The signal received by the antenna was divided by means ofa splitter and delivered to a professional DVB-T demodulator(Rohde & Schwarz EFA-T) and a field strength meter (Rohde& Schwarz ESPI). The field meter provided accurate values ofthe received power levels, whereas the EFA demodulated theDVB-T signal and stored a set of different quality parameters,such as BER, impulse response and MPEG stream data errors.C/N measurements were obtained using the noise generationsource of the DTV professional receiver, which was able to in-troduce internally different noise levels. After demodulating, theEFA-T delivered the MPEG Transport Stream (MPEG TS) to adecoder in order to display the video signal in a monitor. Thewhole system was controlled by a software package developedspecifically for this trial. This system is very similar to thoseused in other DTV measurement experiments [29].
The previous configuration is not appropriate when studyingtime variability. The internal noise generator of the EFA testreceiver varies with the input DVB-T signal in order to provide aconstant C/N ratio (defined by the user). The nature of the noisesource and its time response is unknown and consequently, theC/N ratios at the input of the receiver might be influenced by theresponse time of the internal noise variable amplifier. To avoidthe influence of this internal source, it was decided that the C/Nratios would be created externally using a noise generator. Aftercombining the received signal with the noise signal, both wereamplified to work with high enough levels at the receiver input inorder to make the internal noise of the DTV receiver negligible.
The difference between this system and that performed forthe previous phase, that is, the external noise generation moduleis highlighted in Fig. 7. The rest of the measurement systemremains the same as in the previous case.
C. Measurement Methodology
The test points were planned according to different criteria.In this second phase, distance to the wall facing the transmitter,the number of walls between two consecutive measurement lo-cations, the existence of windows, the amplitude of the room,the floor level in the building, and the density and frequency ofpeople walking close to the test point were considered. The mea-surement database was wide enough to represent a wide range
Fig. 7. Measurement system for time variability analysis. Noise introduced bythe external noise generator module.
of receiving situations and avoid any strong correlation betweenthe final results and any of the above mentioned factors.
During the time of measurement several DTV quality param-eters were recorded. The most relevant follow:
• Channel (7.61 MHz) Power level (dBm) [2]• Impulse response• TS erroneous packets• BER before Reed Solomon• Noise at the receiver input (dBm)In addition to these parameters, data and descriptions of
fading occurrences were logged during the measurement cam-paign. The most frequent source of fading occurrences that wasregistered during the field trials was the people walking nearthe receiver antenna; a typical situation of indoor environments.
Procedures for obtaining data describing the space variabilityand time variability had some differences. The details are ex-plained in next two subsections.
1) Space Variability Measurement Methodology: At each lo-cation, the C/N ratio was adjusted by means of the internal noisegenerator of the DVB-T receiver in order to achieve a BER valueclose to the QEF threshold . When this rough estima-tion was found, several measurements were carried out aroundthis value. The first measurement was done at a C/N value 2 dBover the previous estimated C/N threshold. Following measure-ments were made reducing this parameter in 0.3 dB steps. Thisstep was found to be small enough to provide a good accuracyand at the same time avoid random scintillation of C/N valuesassociated to small variations of the received signal.
For each step, the duration of the measurements was5 minutes. The signal parameters were sampled every secondexcepting the impulse response, which was stored every30 seconds. This one was later very useful to classify the eachmeasurement location according to the propagation channeltype. The process stopped when C/N ratio was low enough tocause perceptible video synchronization loss on the monitor.
2) Time Variability Measurement Methodology: In this case,the external noise level was adjusted to a value that provided aC/N ratio well above the failure point (4 dB higher than the ap-proximate threshold value). Then, the C/N value was decreasedin steps of 1 dB, making a measurement each time, down to

MARTÍNEZ et al.: ANALYSIS OF THE DVB-T SIGNAL VARIATION FOR INDOOR PORTABLE RECEPTION 15
Fig. 8. Measurement methodology for time variability analysis.
the C/N value associated to the failure point. This methodologyshown in Fig. 8 is similar as the one used by the IRT.
The signal parameters were recorded during a period of30 minutes for each C/N adjustment. In this case, the mea-surement time was increased significantly with respect to theprevious “spatial variation” methodology. This increase en-sured a number instantaneous time measurements large enoughto provide accurate time variation statistics. It should be notedthat the DTV quality time goal is close to 100 % and thus thenumber of data samples to provide a reliable result had to behigh.
The system recorded each parameter every second, excep-tion made for the impulse response, which was measured every5 minutes.
V. DATA PROCESSING
To analyze the data, three steps were established. First, thespatial variation of the signal was studied. In this case, time vari-ability was removed eliminating all the fading occurrences fromthe database. To this end, each time related event was identi-fied on a file by file inspection basis (i.e. fading occurrencesdue to scattering produced by people walking near the receiverantenna). Consequently, a probability curve of the minimum re-quired C/N ratio as a function of the percentage of locations wasobtained. Such curve was later analyzed to obtain the systemthreshold for a 99 % of the locations.
Secondly, time variability related to measurements was pro-cessed, so that the number of erroneous MPEG packets was an-alyzed. The C/N threshold was obtained as the minimum ratiothat ensured the fulfillment of the criterion during morethan a 99 % of time.
Finally, fading occurrences were characterized. Each one ofthem was well documented during the measurement phase and afading shape database was obtained from the identification madeduring the previous studies. This data include the correspondingdepths and durations of each occurrence and were very usefulfor characterizing their statistical features. Such events have ahigh relevance as they were found to be the main reason of re-ception failure. Also, a full correlation with people moving closeto the receiver antenna was obtained.
The fading depth was calculated by means of a 9 secondwindow that was shifted along the recording samples of each
Fig. 9. Example of fading occurrence: the median of the values inside thewindow must be 0.5 dB higher than the minimum value.
measurement file. At each position, the median and minimumvalues were calculated within the window so that a fading oc-currence was considered if the difference between both valueswas higher than 0.5 dB. The width of the window was empiri-cally chosen considering that it must be wide enough to comparethe samples and locate the minimum value of the field strengthlevel for the occurrence, but also, narrow enough not to changethe actual value of the sample due to the median applied withinthe window. On the other hand, a threshold of 0.5 dB was chosento identify fading occurrences after searching a common pat-tern among the different events. Also, it has been consideredthat signal fluctuations caused by other factors are less severethan 0.5 dB. An example of the computation process is shownin Fig. 9.
After having calculated the corresponding depth of eachfading occurrence, the duration was obtained following a twostep methodology. First, a 20 second window was centeredat the minimum value of the event. Then, the median valuewithin the window was computed. In this case, the width ofthe window was also empirically chosen in order to detect longfading occurrences. The fading duration was defined as thetime interval when the signal remains below the 85% of thedifference between the median received field strength and thefading depth. Again, this percentage was empirically obtainedafter searching a common pattern in the database. This valuewas considered to avoid that small signal fluctuations at thelimits of the event may influence the final value of the durationof the event.
VI. RESULTS
In this section, results from the field trials will be comparedwith thresholds proposed by the ETSI. The standardized min-imum C/N values are 18.1 dB for a Rician channel and 20.3 dBfor a Rayleigh one. However, these values are too optimistic andexpected to be several dB higher, as demonstrated in the fol-lowing subsections.
A. Spatial Variability
Fig. 10 shows the statistical cumulative distribution of theC/N ratios as a function of the percentage of the locations. Dataare depicted on a normal paper. Each point is a measurement

16 IEEE TRANSACTIONS ON BROADCASTING, VOL. 55, NO. 1, MARCH 2009
Fig. 10. Cumulative distribution of minimum C/N values.
TABLE IMINIMUM C/N VALUES AS A FUNCTION OF LOCATIONS FOR
RICIAN AND RAYLEIGH CHANNELS
of the minimum C/N ratio that ensures correct reception at thatlocation.
Two different sets of points can be observed around the 18 and20.5 dB values. The shape of a hypothetical interpolation curvesuggests two groups of test points with different characteristics.
It was found that the first group of measurements, centered at18 dB, corresponds to those locations where a dominant prop-agation component exists (Rician channel), whereas the seconddata set comprises measurement locations where the impulseresponse showed a significant amount of multipath propagationcomponents (Rayleigh channel).
A Gaussian distribution fits with each set of points. The meanvalue and the standard deviation for C/N threshold of each groupof locations are shown in Table I.
Also, the 99% location values have been obtained using thestandard formula:
(2)
Being m the median value and the standard deviation of themeasured values of a normal distribution.
Results are in line with those obtained at the IRT laboratoryand suggest that the mean value proposed by the standard isnot high enough to ensure correct reception at a majority ofthe locations. A comparison between all the data available sofar is shown in Table II. If planning for 99% coverage insidea building is desired, the C/N thresholds should be higher thanthose ones recommended by the ETSI (data in the table include1 dB of receiver implementation losses [14]).
The IRT laboratory tests provided results only for a Rayleighchannel. Unexpectedly, results of the field trials showed that asignificant amount of indoor measurements presented a Ricianbehavior and therefore thresholds were lower than expected.
TABLE IICOMPARISON BETWEEN MINIMUM C/N VALUES FROM DIFFERENT STUDIES
TABLE IIIMINIMUM C/N VALUES FOR A TIME-VARYING CHANNELIN A PUBLIC BUILDING
Later on, during the second measurement campaign, five ad-ditional locations were analyzed to check the spatial variationvalues. The results provided minimum C/N values between18.9 dB and 20.6 dB corroborating the results on Table II.
B. Time Variability
In this section results corresponding to the study of the signaltime variability are shown. These are presented separately foreach propagation channel and each one of the two types of build-ings: public (commercial, business) and private buildings (resi-dence flats). The results are based on the 99% criterion.
1) Public Building Results: Table III shows minimum C/Nvalues for each location in the Bilbao Engineering Facultybuilding. These values are separately represented as a functionof the propagation channel
It is observed that locations corresponding to a Rayleighchannel are very sensitive to time variability. In this case, min-imum C/N values can be as high as 29 dB. This value differssignificantly from the median one suggested by the ETSI stan-dard. Such high thresholds are caused by fading occurrencesthat are always due to people walking near the receiver antenna(in the range of one to three meters).
The difference between the results from this study and thevalues proposed so far for indoor portable reception will implythat the coverage goal of 99 % of the indoor locations within abuilding will be a challenging objective for most real networksat urban service areas.
2) Private Building Results: Following the same method-ology, values given above have been extended to private build-ings. Table IV includes the results corresponding to those mea-surements taken in residential flats and, therefore, with differentcharacteristics from the previous case.
It is remarkable that more points corresponding to a Ricianchannel than to a Rayleigh one have been obtained from thesemeasurements. During building selection process, usual pene-tration losses were proved to be too high in buildings withoutline of sight with the transmitter, and thus most of the indoorlocations of this experiment had Rician behavior.

MARTÍNEZ et al.: ANALYSIS OF THE DVB-T SIGNAL VARIATION FOR INDOOR PORTABLE RECEPTION 17
TABLE IVMINIMUM C/N VALUES FOR A TIME-VARYING
CHANNEL IN PRIVATE BUILDINGS
TABLE VCOMPARISON OF C/N VALUES FOR DIFFERENT CHANNELS
Here, results are consistent with those ones obtained for theprevious public building. A maximum value of 27 dB is obtainedfor the Rayleigh propagation channel, whereas in the case ofa Rician channel values are around 23 dB. Once again, resultsare higher than thresholds recommended by the standard, so itis suggested that they should be increased in order to ensure acorrect Quality of Service for Class B reception.
It was also found that locations in the building placed in asemiurban environment (locations 7001, 7002 and 7003), had alower minimum C/N values if compared with most of the loca-tions inside buildings of the urban area.
The first part of this study analyzed the spatial variability ofthe C/N thresholds. The measurement data for this purpose wasfiltered and processed conveniently in order to remove any in-fluence of time varying factors. The channel associated to thisdataset can be considered as “static”. The second part, aiming atanalysing the time variability took into account all the time vari-ation effects. If the static and dynamic situations are comparedthe minimum C/N values obtained from these field trials showa difference of around 7 dB in the case of Rayleigh channels.However, if the propagation channel is Rician the difference isonly approximately 2 dB.
These conclusions are summarized in Table V where staticvalues for 99% of the locations are compared with the thresholdsmeasured for time varying channels.
Summarizing, if the empirical results of this trial are com-pared with the values provided by the standard, the latter shouldincreased in approximately 2.5 dB for a Rician channel and 9 dBhigher for a Rayleigh one.
Results prove that current planning factors have not consid-ered deep fading produced by events such as people walkingnear the receiver antenna and any other potential time variabilityeffects. Some of the techniques being applied in other recentlydeveloped systems (DVB-H and others) will have to cope withthis fade margin.
Fig. 11. Fade depth histogram including cumulative values.
Fig. 12. Fade duration histogram including cumulative values.
C. Statistics of Fading Occurrences
Bearing in mind the relevance of the fading occurrences ef-fects, it was decided to carry out a statistical characterization ofthe duration and depth of these events.
1) Fade Depth Statistics: After having identified every event,all fade depth values were grouped in order to study their be-havior. Results are shown in Fig. 11 with a histogram.
The horizontal axis represents the fade depth in dB, whereasthe vertical axis on the left shows the number of times that acertain fade depth is observed. The vertical axis on the right in-dicates the cumulative frequency. It can be observed that fadingoccurrences follow an exponential distribution, being the 95 %of them 6.5 dB lower than the median received value.
It should be also mentioned that in certain cases the fadingdepth might be a function of the transmitter antenna height andthe distance to the receiver. In the case of the measurement cam-paign described in this paper, the range of the distances from thetransmitters to the receiver was limited to a few kilometers andno dependency with the distance was observed.
2) Time Statistics: Similar analysis was performed to mea-sure the statistical behavior of the fading duration. After ob-taining the histogram, an exponential distribution was again ob-served. The vertical axis of Fig. 12 represents the number ofoccurrences observed for certain fade duration. The horizontalaxis shows the time duration scale and a secondary vertical axis(right) corresponds to the cumulative frequency of the sample.
The histogram in Fig. 12 shows that the 99 % of the fadingoccurrences have a duration which is less than 12 seconds.

18 IEEE TRANSACTIONS ON BROADCASTING, VOL. 55, NO. 1, MARCH 2009
This value is apparently excessive. The reason is probably thesynchronization time required by the receiver, since most ofthe events entail receiver synchronization loss. It must be alsostressed that a 90 % of occurrences is below 6 seconds.
VII. CONCLUSIONS
The present study aims at improving the accuracy of recom-mended C/N threshold values of the DVB-T system, followingthe work developed not only for this standard but also for theATSC one [5], [30]. The analysis presented in this paper is anextension of several studies that have been developed for ob-taining DTV C/N thresholds [29], [31] Particularly this paper isbased on three different measurement phases, each one differentdata processing methodologies followed in order to provide re-sults concerning the quality and variability of the digital signalin terms of time and space.
The results suggest that threshold values proposed by theETSI are optimistic, being only appropriate for static propaga-tion channels. After analysing field data, it is recommended thatC/N thresholds should be increased to ensure correct portableindoor reception (Class B reception).
It is suggested that an increase of approximately 2.5 dB isneeded when propagation is modeled by means of a Rician timevarying channel. In the case of a Rayleigh one this value is 9 dB.Results are appropriate for commercial and household buildingswith concrete outside walls. Also, it was observed that time vari-ability is mainly due to people moving within a range of one tothree meters around the receiver antenna. This situation causesfading occurrences that have significant influence on the recep-tion. It has been found that fades follow an exponential distribu-tion. Most of them are characterized by a depth less than 6.5 dBand duration of less than 6 s.
Some of the results of this paper are valid not only for DVB-T,but also for technologies sharing similar frequencies and band-widths such as DVB-H. Therefore, more research in this fieldis needed. Specifically, other modes of the standard DVB-T, aswell as the use of gap fillers should be studied in depth.
ACKNOWLEDGMENT
The authors would like to thank the Basque Government andthe Spanish Ministry of Industry of for funding the work pre-sented in this paper.
REFERENCES
[1] Digital Video Broadcasting (DVB); Framing Structure, ChannelCoding and Modulation for Digital Terrestrial Television EuropeanTelecommunications Standards Institute. (ETSI), TR 300 744, 2004.
[2] Digital Video Broadcasting (DVB); Implementation Guidelines forDVB Terrestrial Services European Telecommunications StandardsInstitute. (ETSI), TS 101 190, 1997.
[3] C. R. Nokes et al., (BBC), “Evaluation of a DVB-T Compliant DigitalTerrestrial Television System,” in International Broadcasting Conven-tion, Amsterdam, Sep. 1997.
[4] O. Bendov et al., “DTV coverage and service prediction, measurementand performance indices,” IEEE Trans. Broadcasting, vol. 47, no. 3,pp. 207–217, Sep. 2001.
[5] R. E. Wetmore et al., “Joint VSB terrestrial digital TV indoor receptionproject,” IEEE Trans. Broadcasting, vol. 48, no. 4, pp. 261–273, Dec.2002.
[6] C.-C. Lin et al., “Analysis of ATSC field test results in Taiwan,” IEEETrans. Broadcasting, vol. 48, no. 1, pp. 38–43, Mar. 2002.
[7] P. Angueira, “DTV (COFDM) SFN signal variation field tests inurban environments for portable outdoor reception,” IEEE Trans.Broadcasting., vol. 49, no. 1, pp. 81–86, March 2003.
[8] P. Angueira et al., “Fading caused by moving vehicles near the receiveron DTV (COFDM) 8-MHz signals,” IEEE Communications Letters,vol. 6, no. 6, pp. 250–252, Jun. 2002.
[9] O. Bendov et al., “Planning factors for fixed and portable DTTV re-ception,” IEEE Trans. Broadcasting, vol. 50, no. 3, 2004.
[10] P. Angueira et al., “DTV reception quality field tests for portable out-door reception in a single frequency network,” IEEE Trans. Broad-casting, vol. 50, no. 1, pp. 42–48, Mar. 2004.
[11] G. Bedicks et al., “Results of the ISDB-T system tests, as part of digitalTV study carried out in Brazil,” IEEE Trans. Broadcasting, vol. 52, no.1, pp. 38–44, Mar. 2006.
[12] A. Wongkeeratikul et al., “Modeling and measurement of airplaneflutter phenomena on TV broadcasting signal,” IEEE Trans. Broad-casting, vol. 54, no. 2, pp. 173–181, Jun. 2008.
[13] S. I. Park et al., “Field test results of the E-VSB system in Korea,” IEEETrans. Broadcasting, vol. 53, no. 1, pt. 1, pp. 14–22, Mar. 2007.
[14] R. Schramm, “C/N values for portable single and diversity reception,”in EBU Technical Review. Germany: Institut für Rundfunktechnik,Apr. 2004.
[15] “Probability Distributions Relevant to Radiowave Propagation Mod-eling,” 1994, ITU-R P.1057.
[16] “Planning Criteria for Digital Terrestrial Television Services in theVHF/UHF Bands,” 2003, Rec. ITU-R BT 1368, ITU-R P.1057.
[17] ATSC Digital Television Standard, ATSC Standard A/53, Sep. 16,1995.
[18] ARIB, “Terrestrial Integrated Services Digital Broadcasting (ISDB-T)—Specifications of Channel Coding, Framing Structure, and Modu-lation,” Sep. 28, 1998.
[19] C. G. Eilers, “The development of a high definition television (HDTV)terrestrial broadcasting emission mask,” IEEE Trans. Broadcasting,vol. 41, no. 4, Dec. 1995.
[20] “Protection Ratios and Reference Receivers for DTTB Frequency Plan-ning,” Mar. 1999, ITU-R, Document 11C/46-E, Special Rapporteur -Region 1.
[21] “The ��� Criterion for the Assessment of DVB-T TransmissionQuality,” Apr. 2004, ITU-R, Document 6E/64-E.
[22] “Technical options for the use of a harmonized sub-band in the band470–862 MHz for fixed/mobile applications (including uplinks),”2007, CEPT Supplementary Report (to Report B) to ECC.
[23] G. Faria, “DVB-H: Digital TV in the hands!,” in Teamcast. Ams-terdam: IBC’05, 2005.
[24] D. Plets et al., “Evaluation of performance characteristics of a DVB-Hnetwork for different reception conditions,” in 57th annual IEEEBroadcasting Symposium, Washington, DC, Oct. 1st–Nov. 2nd 2007,EEUU.
[25] G. Faria et al., “DVB-H: Digital broadcast services to handheld de-vices,” Proceedings of the IEEE, vol. 94, no. 1, Jan. 2006.
[26] “Digital Sound Broadcasting to Vehicular, Portable and Fixed Re-ceivers Using Terrestrial Transmitters in the UHF-VHF Bands,” 1994,ITU-R BS.1203-1.
[27] S. C. Panagiotou, S. A. Mitilineos, T. D. Dimousios, and C. N. Capsalis,“A broadband, vertically polarized, circular switched parasitic array forindoor portable DVB-T applications at the IV UHF band,” IEEE Trans.Broadcasting, vol. 53, no. 2, Jun. 2007.
[28] “Method of measuring the field strength at fixed points in the frequencyrange 29.7–960 MHz,” Bucharest, 1999, CEPT/ERC Recommendation74-02 E.
[29] G. Guerra et al., “Field Measurement based characterization of thewideband urban multipath channel for portable DVB-T reception insingle frequency networks,” IEEE Trans. Broadcasting, vol. 51, no. 2,Jun. 2005.
[30] S. I. Park et al., “Field test results of the E-VSB system in Korea,” IEEETrans. Broadcasting, vol. 53, no. 1, Mar. 2007.
[31] C.-F. Huang, “Field evaluations in Taiwan of the DVB-T COFDM andATSC 8-VSB digital TV systems,” in EBU Technical Review. TatungUniversity, Taiwan: Graduate Institute of Communication Engineering,2003, The Nan Chang and Chau-Yun Hsu.

MARTÍNEZ et al.: ANALYSIS OF THE DVB-T SIGNAL VARIATION FOR INDOOR PORTABLE RECEPTION 19
Alain Martínez obtained the M.Sc. degree inTelecommunication Engineering at the Bilbao En-gineering Faculty, University of the Basque Countryin 2007. He has been involved in several researchprojects during the last three years in the area ofDigital Terrestrial Television and Digital Radiobroadcasting with the University of the BasqueCountry. Mr. Martinez is now as a Marie CurieResearcher with Supelec, in Paris, France.
Diana Zabala obtained the M.Sc. degree inTelecommunication Engineering at the Bilbao En-gineering Faculty, University of the Basque Countryin 2006. She has been involved in several researchprojects in the area of Digital Terrestrial Televisionwith the University of the Basque Country. Sheis now focused in the area of Terrestrial TrunkedRadio (TETRA) and Digital Terrestrial Televisionas RF engineer and project manager in DominionTecnologías S.L.U., in Bilbao, Spain.
Iván Peña received the M.S. degree in Telecom-munications Engineering from the University ofthe Basque Country, Spain, in 2004. He joined theTSR (Radiocommunications and Signal Processing)research group at the Department of Electronicsand Telecommunications of the University of theBasque Country in 2002 where has been involvedin several projects in the area of Digital TerrestrialTV and Digital Radio Broadcasting. Nowadays,he is working towards a PhD. Degree Thesis inradio propagation and network planning for digital
broadcasting services. His current research interests focus on these fields.
Pablo Angueira (M’03) received the M.S. and Ph.D.in Telecommunication Engineering at the Universityof the Basque Country (Spain) in 1997 and 2002 re-spectively. He has been involved for 10 years in re-search projects to evaluate digital broadcasting sys-tems in different frequency bands. He is now with theDpt. of Electronics and Telecommunications of theUniversity of the Basque Country at the Bilbao Fac-ulty of Engineering, where he is currently an Asso-ciate Professor. His research interests are in the areaof network planning for digital broadcasting services.
Manuel M. Vélez received the M.S. degree inTelecommunications Engineering from the Uni-versity of the Basque Country, Spain, in 1993. In1995 he joined the Department of Electronics andTelecommunications of the University of the BasqueCountry, where he is currently an assistant professor.His current interests are the research and applicationsof digital sound broadcasting systems.
Amaia Arrinda received the M.Sc. degree inTelecommunications Engineering from the Univer-sity of the Basque Country, Spain, in 1993. Beforereceiving the degree, she studied for a year at ENSTBretagne, and worked as a researcher at CNET, inboth cases in France. In September 1993 she joinedthe Department of Electronics and Telecommuni-cations of the University of the Basque Country,where she is currently an associate professor. InFebruary 2001 she presented her doctoral thesisdealing with interferences between terrestrial analog
and digital TV transmissions and she received the Ph. D. degree. Her currentresearch interests include Digital Radio Mondiale (DRM), signal propagation,measurements and simulations. She belongs to the TSR research group (Ra-diocommunications and Signal Processing). TSR group is a DRM associatedmember since December 2001.
David de la Vega received the M.S. degree inTelecommunications Engineering from the Uni-versity of the Basque Country, Spain, in 1996. In1998 he joined the TSR (Radiocommunicationsand Signal Processing) research group at the De-partment of Electronics and Telecommunicationsof the University of the Basque Country. He iscurrently an assistant professor at the University ofthe Basque Country teaching and researching oncircuit theory and radar and remote sensing systems.His research interests focuses on new digital TV and
radio broadcasting services and applications.
Juan Luis Ordiales is a full Professor at the Univer-sity of the Basque Country where he is working from1988. He obtained his M.Sc. in TelecommunicationsEngineering from the Universidad Politecnica deMadrid in 1987 and the Ph.D. from the BasqueCountry University in 1995. From 1994 to 2002 hewas Assistant Principal in the Bilbao EngineeringCollege of Bilbao. From 1995 he is researching inpropagation of DTV and DAB signals and nowadaysin DRM (Digital Radio Mondiale).