Appendix 2 - Report on DVB-T Trial
62
APPENDIX 2 REPORT ON DVB-T TRIAL Asia Television Limited (ATV) Television Broadcasts Limited (TVB) Office of the Telecommunications Authority (OFTA) HONG KONG November 1999
-
Upload
khangminh22 -
Category
Documents
-
view
1 -
download
0
Transcript of Appendix 2 - Report on DVB-T Trial

APPENDIX 2
REPORT ON DVB-T TRIAL
Asia Television Limited (ATV)
Television Broadcasts Limited (TVB)
Office of the Telecommunications Authority (OFTA)
HONG KONG
November 1999

TABLE OF CONTENTS
1. Introduction ……….…………………………………………... 1
2. Objective and Scope of the Trial ……………………………... 2
3. Field Test ………………………………………………………. 3
3.1 Field Test System …………………………………………………………….. 33.2 Field Test Parameters ………………………………………………………… 63.3 Equipment Setups and Measurement Procedures for Field Test ……………... 73.3.1 Propagation Behaviour and Coverage Test …………………………………... 73.3.1.1 Fixed Reception Test …………………………………………………………. 73.3.1.2 Indoor Reception Test ………………………………………………………... 143.3.1.3 Mobile Reception Test ……………………………………………………….. 153.3.1.4 Tidal Fading Test ……………………………………………………………... 163.3.2 In-Building Coaxial Cable Distribution System (IBCCDS) Test ……………. 163.3.3 Single Frequency Network (SFN) Test ………………………………………. 173.4 Field Test Results …………………………………………………………….. 183.4.1 Propagation Behaviour and Coverage Test Result …………………………… 183.4.1.1 Fixed Reception Test Result …………………………………………………. 183.4.1.2 Indoor Reception Test Result ………………………………………………… 243.4.1.3 Mobile Reception Test Result ………………………………………………... 273.4.1.4 Tidal Fading Test Result ……………………………………………………... 343.4.2 In-Building Coaxial Cable Distribution System (IBCCDS) Test Result …….. 373.4.3 Single Frequency Network (SFN) Test Result …………………….…………. 39
4. Laboratory Test ……………………………………………….. 42
4.1 Objectives of Laboratory Test ………………………………………………... 424.2 Equipment Setup for Laboratory Test ………………………………………... 434.3 Technical Characteristics of Test Signals …………………………………….. 444.4 Measurement Procedures for Laboratory Test ……………………………….. 474.4.1 PAL into DVB-T Interference ……………………………………………….. 474.4.2 DVB-T into PAL Interference ……………………………………………….. 494.4.3 DVB-T into DVB-T Interference …………………………………………… 514.4.4 Encoding/Decoding
Delay ………………………………………………………53
4.5 Results Summary of Laboratory Test ………………………………………… 54
5. Summary of Results …………………………………………... 59

1
1. INTRODUCTION
The purpose of this trial was to assess the performance of the Digital Video Broadcasting -Terrestrial (DVB-T) standard in Hong Kong environment. The trial consisted of two parts:the field test and the laboratory test. The aim of the field test was to find out theperformance of the DVB-T system under different reception conditions with reference to thePAL-I system and the aim of the laboratory test was to find out the practical protection ratiosrequired for future planning.
The DVB-T trial was successfully conducted from August to September 1999. The aim ofthis report is to present the test results of the DVB-T trial. Firstly, the objective and scope ofthe trial are set out in Section 2. Secondly, the configuration of the field test system as wellas the equipment setups and measurement procedures for the field test are described inSection 3. The results of the field test are presented in Section 3 as well. Section 4describes the equipment setups and measurement procedures for the laboratory test andpresents the test results. Finally, the results of the field test and laboratory test aresummarized in Section 5.

2
2. OBJECTIVE AND SCOPE OF THE TRIAL
The objective of the trial was to find out the performance of the DVB-T system in the realenvironment of Hong Kong.
The following aspects were assessed during the field test and laboratory test:
(i) the propagation behaviour and coverage of DVB-T transmission;
(ii) the ability of DVB-T signal to be conveyed by in-building coaxial cable distributionsystems and the compatibility with the existing analogue television equipment andNICAM service;
(iii) the support for single frequency network operation;
(iv) compatibility with the existing analogue television transmission, co-channel, adjacentchannel and image channel performance;
(v) picture and sound quality; and
(vi) the effect of overall encoding/decoding delay.

3
3. FIELD TEST
3.1 Field Test System
The field test system mainly consisted of three parts: the Master Station, the Slave Station andthe Survey Vehicle (Figure 1).
Figure 1 - Field Test System
The Master Station was located at Temple Hill (about 496 m above sea level) and its effectiveradiated power (ERP) was 100 W. The Slave Station was located at Sai Wan Shan, ChaiWan (about 199 m above sea level) and its ERP was 10 W. The distance between the MasterStation and the Slave Station was about 9 km. The antennas of the Master Station and theSlave Station were pointing to southeast and east respectively. Their radiation patterns areshown in Figures 2 and 3. Horizontal polarization was used in the field test and the testsignals were transmitted on Channel 32 (558 - 566 MHz).
Hong Kong
Island
Kowloon
Victoria Harbour
About 9 km
Master Station : Temple HillAntenna Height : 496 mTest Channel : 32 (558 - 566 MHz)ERP : 100 watts
Slave Station : Sai Wan ShanAntenna Height : 199 mTest Channel : 32 (558 - 566 MHz)ERP : 10 watts
Survey Vehicle

4
Figure 2 - Radiation Pattern of the Master Station (Temple Hill)
Figure 3 - Radiation Pattern of the Slave Station (Sai Wan Shan, Chai Wan)
The Slave Station was set up for the purpose of testing the single frequency network (SFN)operation. The schematic diagram of the DVB-T SFN is shown in Figure 4. A PAL-Itransmitter of ERP 100 W operating on the test channel (Channel 32) was also set up atTemple Hill. The picture and sound quality and the field strength of the PAL-I signal at thetest sites was used as reference.
5
Figure 4 - Schematic Diagram of DVB-T Single Frequency Network
Oscilloscope
SpectrumAnalyzer
PowerMeter
Oscilloscope
PowerMeter
Spectrum Analyzer
DVB-T25 watts
Transmitter
Note 1: PAL-I Channel 32 of 100 watts ERP was used as reference.
Note 2: Temple Hill DVB-T transmitting antenna system gain is about 10dB measured from point (A).
Temple Hill
Control System
ControlPSI/SIscheduling
PAL-IVTR
PAL-IExciter
IF-UHFCONV
Analogue Videoand Audio
UHF CH32Filter
Monitor level(+15dBm)
4 Dipoles 1 face1 stack Tx Antenna
Test Channel 32 (558-566 MHz)ERP = 100 watts
Horizontal polarization
TV RXMonitor
DummyLoad
DummyLoad
AutomaticChangeover
Unit
Point (A)
AC3
DVDplayer ADC
SD to HDUp-
converter
HDEncoder
SDEncoder
SDEncoder
SDEncoder
Digital Source
Digital Source
Digital Source
DMX
PTA ASI
MAE
PTA
MAE
PTA
MAE
Converter
LVDS
SFNAdapter
GPS
OFDMModulator
IF
PersonalComputer
DVB-T100 watts
Transmitter UHF Channel 32
Mobile TXDigital Link
Control Unit
Encoder
NetworkAdapter
MicrowaveBased G.703
Network
1.2m Disc7 GHz RxAntenna
Waveguide
Mobile RXDigital Link
Control Unit
Decoder
NetworkAdapter OFDM
Modulator
GPSAntenna
GPS
Minimum System Rateof 34 Mbit/s;
Standard PowerOutput = 600mW
Tx frequency = 7206 MHz;Co-polar Channel
Spacing = 28 MHz;Antenna = 1.2m
4 Dipoles 2 face 1stack Tx Antenna
Test Channel 32 (558-566 MHz)ERP = 10 watts
Horizontal polarization
UHFChannel
32
Master Station (Temple Hill)
Slave Station (Sai Wan Shan) Shan))Station
GPSAntenna
Waveguide
MUX

6
3.2 Field Test Parameters
Table 1 shows the field test parameters used for the DVB-T trial.
DVB-T (8 MHz)SDTV HDTV Mobile Mobile
Number of carriers 2k 2k 2k 2kModulation 64QAM 64QAM 16QAM QPSKGuard interval 1/8 1/8 1/4 1/4Code rate 2/3 2/3 1/2 1/2Information rate ( Mbit/s ) 22.12 22.12 11.06 4.98ERP of Master Station ( dBW ) 20 20 20 20ERP of Slave Station ( dBW ) 10 10 10 10Number of TV programmes 1-3 1 1 1
Table 1 - Field Test Parameters

7
10 m RG-214U cable
Log-periodicantenna
Fieldstrengthmeter PC
3.3 Equipment Setups and Measurement Procedures for Field
Test
3.3.1 Propagation Behaviour and Coverage Test
Test was carried out to evaluate the performance of the DVB-T system under differentreception conditions including fixed reception, indoor reception, mobile reception and tidalfading.
3.3.1.1 Fixed Reception Test
Fixed reception test was carried out on both street level and rooftop level. During the test,field strength, bit error rate (BER), carrier-to-noise (C/N) ratio, margin of threshold weremeasured and picture and sound quality was assessed.
Measurements Taken on Street Level
The equipment setups for measurements taken on street level are shown in Figures 5 - 7.
Figure 5 - Field Strength Measurement (Street Level)

8
Figure 6 - BER, C/N Ratio, Margin of Threshold Measurements and DVB-T Picture and Sound Quality Assessment (Street Level)
SDTVmonitor
HDTVdecoder
ADCunit
Decoder
MPEGaudio
ConverterChannel 32
filterMini-circuit
amplifierVariable
attenuator
Mini-circuit
1:4splitter
GPS receiver
Fieldstrengthmeter
Analoguereceiver
Personalcomputer
Printer Analoguemonitor
Oscilloscope
Spectrumanalyser
VHS VTRVideo
monitor(front seat)
GPS antenna
Picture screenof the monitor
AC3 audiodecoder/amplifier
Speakersystem
HDTVmonitor
Decoder
Waveformmonitor
Battery
Log periodicantenna
10 metertelescopic mast10 m RG214U
SDTVpicture
Speedmeter
RFspectrum
Roadcondition
DVB-T testreceiver

9
Figure 7 - PAL-I Picture and Sound Quality Assessment and Margin of ThresholdMeasurement (Street Level)
The measurement procedures were as follows:
(1) The equipment was connected as shown in Figure 5.(2) The antenna was raised to 10 m above ground level.(3) The antenna was oriented for maximum signal level if there was a clear line-of-sight
path to the transmitter. If the test site was obstructed by buildings or hills, the antennawas oriented for best PAL-I picture.
(4) The field strength of the DVB-T signal was measured. If the test signal wastransmitted from Temple Hill, the field strength of the PAL-I signal was measured aswell.
(5) The equipment was reconnected as shown in Figure 6 without altering the height andorientation of the antenna.
(6) The variable attenuator reading was set to zero.(7) DVB-T test signal for BER measurement was transmitted from Temple Hill/Sai Wan
Shan.(8) The RS switch of the DVB-T receiver was set to On and the BER was measured. (Note: The BER was measured after the RS decoder)(9) The RS switch of the DVB-T receiver was set to Off and the BER was measured.
(Note: The BER was measured before the RS decoder)(10) The power levels of the DVB-T signal and the noise were measured and the C/N ratio
was calculated.(11) The variable attenuator was adjusted until the BER was just 2E-4.(12) The variable attenuator reading was recorded and was taken as the margin of threshold.(13) HDTV programme was transmitted from Temple Hill/Sai Wan Shan and the HDTV
picture and sound quality was assessed based on ITU five-grade scale.
Log-periodicantenna
10 m RG-214U cableVariableattenuator
Analoguereceiver TV monitor VHS VTR
QUAD picturedisplayer

10
(14) SDTV programme was transmitted from Temple Hill/Sai Wan Shan and the SDTVpicture and sound quality was assessed based on ITU five-grade scale.
(15) If the test signal was transmitted from Temple Hill, steps (16) - (21) were performed toassess the picture and sound quality of the PAL-I signal and to measure the margin ofthreshold. Otherwise, step (22) was performed.
(16) The equipment was reconnected as shown in Figure 7 without altering the height andorientation of the antenna.
(17) The variable attenuator reading was set to zero.(18) PAL-I signal was transmitted from Temple Hill.(19) The picture and sound quality of the PAL-I signal was assessed based on ITU five-grade
scale.(20) If the picture quality of the PAL-I signal was above grade 4, step (21) was performed.
Otherwise, step (22) was performed.(21) The variable attenuator was adjusted until the picture quality was degraded to grade 4.
The variable attenuator reading was recorded and was taken as the margin of thresholdfor picture grade 4.
(22) The above steps were repeated at all other test sites.

11
Measurements Taken on Rooftop Level
The equipment setups for measurements taken on rooftop level (Figures 8 - 10) were the sameas that taken on street level (Figures 5 - 7) except that a "domestic antenna" (typical antennaavailable in Hong Kong market) was used instead of the log-periodic antenna and a 150-metrecable was required to carry the test signals received on rooftop to the Survey Vehicle and abandpass amplifier was used to compensate the cable loss.
Figure 8 - Field Strength Measurement (Rooftop Level)
Fieldstrengthmeter
Bandpassfilter
Amplifier
Yagi antenna
RG-214U 150m
Rooftop of Building
PC

12
Figure 9 - BER, C/N Ratio, Margin of Threshold Measurements and DVB-T Picture and Sound Quality Assessment (Rooftop Level)
SDTVmonitor
HDTVdecoder
ADCunit
Decoder
MPEGaudio
ConverterChannel 32
filterMini-circuit
amplifierVariable
attenuator
Mini-circuit
1:4splitter
GPS receiver
Fieldstrengthmeter
Analoguereceiver
Personalcomputer
Printer Analoguemonitor
Oscilloscope
Spectrumanalyser
Videomonitor
(front seat)
GPSantenna
Picture screenof the monitor
AC3 audiodecoder/amplifier
Speakersystem
HDTVmonitor
Decoder
Waveformmonitor
Bandpassfilter
Amplifier
Yagi antenna
RG-214U 150m
Rooftop ofbuilding
SDTVpicture
Speed-meter
RFspectrum
Roadcondition
VHS VTR
DVB-T testreceiver

13
Figure 10 - PAL-I Picture and Sound Quality Assessment and Margin of ThresholdMeasurement (Rooftop Level)
The measurement procedures were as follows:
(1) The equipment was connected as shown in Figure 8.(2) The height and orientation of the antenna were adjusted for maximum signal level if
there was a clear line-of-sight path to the transmitter. If the test site was obstructed bybuildings, the height and orientation of the antenna were adjusted for best PAL-Ipicture.
(3) The field strength levels of the DVB-T signal and the PAL-I signal were measured.(4) The equipment was reconnected as shown in Figure 9 without altering the height and
orientation of the antenna.(5) The variable attenuator reading was set to zero.(6) DVB-T test signal for BER measurement was transmitted from Temple Hill.(7) The RS switch of the DVB-T receiver was set to On and the BER was measured.
(Note: the BER was measured after the RS decoder)(8) The RS switch of the DVB-T receiver was set to Off and the BER was measured.
(Note: The BER was measured before the RS decoder)(9) The power levels of the DVB-T signal and the noise were measured and the C/N ratio
was calculated.(10) The variable attenuator was adjusted until the BER was just 2E-4.(11) The variable attenuator reading was recorded and was taken as the margin of threshold.(12) HDTV programme was transmitted from Temple Hill and the HDTV picture and sound
quality was assessed based on ITU five-grade scale.(13) SDTV programme was transmitted from Temple Hill and the SDTV picture and sound
Bandpassfilter
Amplifier
Yagi antenna
RG-214U 150mVariableattenuator
Analoguereceiver TV monitor VHS VTR
QUAD picturedisplayer
Rooftop of Building

14
quality was assessed based on ITU five-grade scale.(14) The equipment was reconnected as shown in Figure 10 without altering the height and
orientation of the antenna.(15) The variable attenuator reading was set to zero.(16) PAL-I signal was transmitted from Temple Hill.(17) The picture and sound quality of the PAL-I signal was assessed based on ITU five-grade
scale.(18) If the picture quality of the PAL-I signal was above grade 4, step (19) was performed.
Otherwise, step (20) was performed.(19) The variable attenuator was adjusted until the picture quality was degraded to grade 4.
The variable attenuator reading was recorded and was taken as the margin of thresholdfor picture grade 4.
(20) The above steps were repeated at all other test sites.
3.3.1.2 Indoor Reception Test
The equipment setup for indoor reception test (Figure 11) was the same as that for fixedreception test carried out on rooftop level except that an indoor antenna was used instead of aYagi antenna and a bandpass amplifier.
The measurement procedures for indoor reception test were similar to that for fixed receptiontest carried out on rooftop level (Refer to Section 3.3.1.1).
Figure 11 - Equipment Setup for Indoor Reception Test
Test equipment was installed in theSurvey Vehicle and the equipmentsetups were the same as that for fixedreception test carried out on rooftoplevel
Indoor antenna
Survey Vehicle
RG-214U 150 m
Minimum antenna gain = 0 dBMaximum antenna gain = 30 dBNoise figure = 3.0 dB

15
3.3.1.3 Mobile Reception Test
The equipment setup for mobile reception test is shown in Figure 12. The DVB-T signalwas fed to the spectrum analyzer, the SDTV decoder and the field strength meter via the 4-way splitter. The received signal level was measured by the field strength meter. Themeasured data were saved in a data file. A VHS video tape recorder (VTR) was used torecord the DVB-T picture, the speed of the Survey Vehicle, the RF spectrum of the receivedsignal and the road condition.
Figure 12 - Equipment Setup for Mobile Reception Test
SDTVmonitor
Decoder
MPEGaudio
ConverterChannel 32
filterMini-circuit
amplifierVariable
attenuator
Mini-circuit
1:4splitter
PortableVHF
radiophone
GPS receiver
Fieldstrength
meter
analoguereceiver
Personalcomputer
Printer Analoguemonitor
Oscilloscope
Spectrumanalyser
Video camera recordingspeed-meter's reading
Video camera recordingroad condition
VHS VTR
Mobile receivingantenna
(Channel 32)
Videomonitor
(front seat)
GPSantenna
VHF radiophoneantenna
Picture screenof the monitor
AC3 audiodecoder/amplifier
Speakersystem
Decoder
Waveformmonitor
Speakersystem
(front seat)
SDTVpicture
Speed-meter
Spectrum Roadcondition
DVB-T testreceiver

16
The measurement procedures were as follows:
(1) The equipment was connected as shown in Figure 12.(2) The DVB-T transmitter at Temple Hill was switched on.(3) The type of modulation was set to 16 QAM/QPSK.(4) The Survey Vehicle was driven along the test route.(5) The signal level, the location of the Survey Vehicle, the DVB-T picture, the speed of the
Survey Vehicle, the RF spectrum of the received signal and the road condition wererecorded during the trip.
(6) For SFN test carried out in Whampoa Garden and Kwun Tong Bypass, both DVB-Ttransmitters at Temple Hill and Sai Wan Shan were switched on.
(7) Steps (3) to (5) were repeated.(8) The video tape for each route was examined and the success rate (the percentage of time
that satisfactory reception was obtained) was measured.
3.3.1.4 Tidal Fading Test
The equipment setups and the measurement procedures for the tidal fading test were similar tothat for fixed reception test carried out on street level (Refer to Section 3.3.1.1). However,the antenna height was adjusted to see the tidal fading effect instead of setting the antennaheight to 10 metres above ground level (Step (2) of the measurement procedures for fixedreception test carried out on street level refers).
3.3.2 In-Building Coaxial Cable Distribution System (IBCCDS) Test
The equipment setup for the IBCCDS test is shown in Figure 13. The test signals werereceived by the antenna of the IBCCDS on rooftop. The test signals at the headend/TVoutlet of the IBCCDS were carried to the Survey Vehicle for measurement via a 150-metrecoaxial cable. The measurement procedures were similar to that for fixed reception testcarried out on rooftop level (Refer to Section 3.3.1.1).

17
Figure 13 - Equipment Setup for IBCCDS Test
3.3.3 Single Frequency Network (SFN) Test
The equipment setups and measurement procedures for SFN test were similar to that for fixedreception test carried out on street level (Refer to Section 3.3.1.1). Both transmitters atTemple Hill and Sai Wan Shan were switched on to test the SFN operation.
TV outlet
IBCCDSheadend
Test signalsfrom rooftop
antenna
Temporary2-way splitter
To buildingdistribution
TVoutlet
TVoutlet
TVoutlet
Survey Vehicle
RG-214U cable 150m
Test equipment was installed inthe Survey Vehicle and theequipment setups were similar tothat for fixed reception testcarried out on rooftop level
Building

18
3.4 Field Test Results
3.4.1 Propagation Behaviour and Coverage Test Result
3.4.1.1 Fixed Reception Test Result
Measurements were taken at 21 test sites of which 11 sites were line-of-sight to the TempleHill or Sai Wan Shan, 9 sites were obstructed by buildings and 1 site was obstructed by hills(Figure 14). The results revealed that the picture and sound quality of SDTV and HDTVreceived at the test sites was excellent and was much better than that of the PAL-I system,especially at sites obstructed by buildings or hills. DVB-T had a lower reception thresholdas compared to PAL-I. The test results are summarized in Table 2. It was noted that noadverse effect was caused to analogue reception and no complaint was received from thepublic during the trial period.
Figure 14 - Test Sites (Fixed Reception Test)
Sai Wan Shan
Temple Hill
Kowloon
4
2
17
14,15& 20 812
11
621
710
161
5
3
Hong Kong
Island
19
18
Victoria Harbour
13
9
Test site which was line-of-sight to the transmitter
Test site which was obstructed by buildings or hills

19
Location Conditions Test Items(Notes 1, 2 & 3)
PAL-I SDTVMode A (2k,64 QAM, GI = 1/8,CR = 2/3)
HDTVMode A (2k,64 QAM, GI = 1/8,CR = 2/3)
Remarks
Field strength(dBµV/m)
77 86.6
BER --- < 1E-9 (RS Off)< 1E-9 (RS On)
C/N ratio (dB) --- 47.1Picture grade 4.5 5Sound grade 5 5
1. Kowloon Bay(near AuxiliaryPolice Headquarter)
• Line-of-sight toTemple Hill
• Measurementswere taken onstreet level
Margin of threshold(dB)
4 (picturequality degradedto grade 4)
49 (BER increased to 2E-4 withRS Off)
Modes A to Dhad the samemargin
Field strength(dBµV/m)
69.9 78.3
BER --- < 1E-9 (RS Off)< 1E-9 (RS On)
C/N ratio (dB) --- 27.3Picture grade 3.5 5Sound grade 5 5
2. Sceneway Garden,Lam Tin
• Line-of-sight toTemple Hill
• Measurementswere taken onstreet level
Margin of threshold(dB)
--- 41 (BER increased to 2E-4 withRS Off)
Modes A to Dhad the samemargin
Field strength(dBµV/m)
--- 88
BER --- < 1E-9 (RS Off)< 1E-9 (RS On)
C/N ratio (dB) --- 38.3Picture grade --- 5Sound grade --- 5
3. Chai Wan Park,Chai Wan
• Line-of-sight toSai Wan Shan
• Measurementswere taken onstreet level
Margin of threshold(dB)
--- 52 (BER increased to 2E-4 withRS Off)
Field strength(dBµV/m)
--- 75
BER --- < 1E-9 (RS Off)< 1E-9 (RS On)
C/N ratio (dB) --- 36.7Picture grade --- 5Sound grade --- 5
4. Clear Water Bay,Sai Kung
• Line-of-sight toSai Wan Shan
• Measurementswere taken onstreet level
• Mode B was usedinstead of Mode A
Margin of threshold(dB)
--- 36 (BER increased to 2E-4 withRS Off)
During the test,the COFDMmodulator onlyworked well inMode B.Therefore,Mode B wasused for the test.
Note 1: Average field strength/RF level of the PAL-I signal was measured. A correction factor of about 6 dB should be added to theaverage value to obtain the peak sync value.
Note 2: The subjective assessment of picture and sound quality was based on the ITU five-grade scale:
Grade Quality Impairment5 Excellent Imperceptible4 Good Perceptible, but not annoying3 Fair Slightly annoying2 Poor Annoying1 Bad Very annoying
Note 3: Mode A (2k, 64 QAM, GI = 1/8, CR = 2/3);Mode B (2k, 64 QAM, GI = 1/4, CR = 2/3);Mode C (8k, 64 QAM, GI = 1/32, CR = 2/3);Mode D (8k, 64 QAM, GI = 1/16, CR = 2/3);Mode H (2k, 16 QAM, GI =1/4, CR = 1/2);Mode L (8k, 16 QAM, GI = 1/16, CR = 1/2).
Table 2 - Fixed Reception Test Results

20
Location Conditions Test Items PAL-I SDTVMode A (2k,64 QAM, GI = 1/8,CR = 2/3)
HDTVMode A (2k,64 QAM, GI = 1/8,CR = 2/3)
Remarks
Field strength(dBµV/m)
62 73
BER --- < 1E-9 (RS Off)< 1E-9 (RS On)
C/N ratio (dB) --- 30.9Picture grade 2.5 (ghosting
and withinterference)
5
Sound grade 5 5
5. Hong KongColiseum,Hung Hom
• Line-of-sight toTemple Hill
• Measurementswere taken onstreet level
Margin of threshold(dB)
--- 35 (BER increased to 2E-4 withRS Off)
Field strength(dBµV/m)
63.1 68.1
BER --- < 1E-9 (RS Off)< 1E-9 (RS On)
C/N ratio (dB) --- 18Picture grade 2 ("S" pattern
was seen onpicture)
5
Sound grade 5 5
6. Sai Ying Pun • Line-of-sight toTemple Hill
• Measurementswere taken onstreet level
Margin of threshold(dB)
--- 32 (BER increased to 2E-4 withRS Off)
Modes A to Dhad the samemargin
Field strength(dBµV/m)
75 82
BER --- < 1E-9 (RS Off)< 1E-9 (RS On)
C/N ratio (dB) --- 40.9Picture grade 4 5Sound grade 5 5
7. Tai Koo Shing,Lei King Wan
• Line-of-sight toTemple Hill
• Measurementswere taken onstreet level
Margin of threshold(dB)
--- 46 (BER increased to 2E-4 withRS Off)
Modes A to Dhad the samemargin
Field strength(dBµV/m)
77 84.3
BER --- < 1E-9 (RS Off)< 1E-9 (RS On)
C/N ratio (dB) --- 46.4Picture grade 4.5 5Sound grade 5 5
8. Fung Lai Court,Tsz Wan Shan
• Line-of-sight toTemple Hill
• Measurementswere taken onstreet level
Margin of threshold(dB)
6 (picturequality degradedto grade 4)
48 (BER increased to 2E-4 withRS Off)
Modes A to Dhad the samemargin
Field strength(dBµV/m)
70 79
BER --- < 1E-9 (RS Off)< 1E-9 (RS On)
C/N ratio (dB) --- 30.8Picture grade 4 5Sound grade 5 5
9. Kowloon City FerryPier, Kowloon City
• Line-of-sight toTemple Hill
• Measurementswere taken onstreet level
Margin of threshold(dB)
--- 42 (BER increased to 2E-4 withRS Off)
Modes A to Dhad the samemargin
Table 2 (Continued)

21
Location Conditions Test Items PAL-I SDTVMode A (2k,64 QAM, GI = 1/8,CR = 2/3)
HDTVMode A (2k,64 QAM, GI = 1/8,CR = 2/3)
Remarks
Field strength(dBµV/m)
68 77
BER --- < 1E-9 (RS Off)< 1E-9 (RS On)
C/N ratio (dB) --- 36.5Picture grade 3 5Sound grade 5 5
10. Pier 3 for outlyingislands, CentralDistrict
• Line-of-sight toTemple Hill
• Measurementswere taken onstreet level
Margin of threshold(dB)
--- 40 (BER increased to 2E-4 withRS Off)
Modes A to Dhad the samemargin
Field strength(dBµV/m)
57 65
BER --- 3E-6 (RS Off)< 1E-9 (RS On)
C/N ratio (dB) --- 21.7Picture grade 2 (noisy picture
and withinterference)
5 (loss of picture occurredintermittently)
Sound grade 5 5 (sound muted intermittently)
11. Stonecutters Island • Line-of-sight toTemple Hill
• Measurementswere taken onstreet level
Margin of threshold(dB)
--- 27 (BER increased to 2E-4 withRS Off)
Modes A to Dhad the samemargin
Field strength(dBµV/m)
65 74.3
BER --- < 1E-9 (RS Off)< 1E-9 (RS On)
C/N ratio (dB) --- 35.7Picture grade 3.5 5Sound grade 5 5
12. Fung Lai Court,Tsz Wan Shan
• Test signals fromTemple Hill
• Test site wasobstructed bybuildings
• Measurementswere taken onstreet level Margin of threshold
(dB)--- 35 (BER increased to 2E-4 with
RS Off)Modes A to Dhad the samemargin
Field strength(dBµV/m)
--- 70
BER --- < 1E-9 (RS Off)< 1E-9 (RS On)
C/N ratio (dB) --- 27.1Picture grade --- 5Sound grade --- 5
13. Heng Fa Chuen,Chai Wan
• Test signals fromSai Wan Shan
• Test site wasobstructed bybuildings
• Measurementswere taken onstreet level Margin of threshold
(dB)--- 30 (BER increased to 2E-4 with
RS Off)Field strength(dBµV/m)
60 70
BER --- < 1E-9 (RS Off)< 1E-9 (RS On)
C/N ratio (dB) --- 29.7Picture grade 3 5Sound grade 5 5
14. St. BonaventureCollege & HighSchool, Wong TaiSin
• Test signals fromTemple Hill
• Test site wasobstructed bybuildings
• Measurementswere taken onstreet level
• Antenna pointedto 260 degrees
Margin of threshold(dB)
--- 32 (BER increased to 2E-4 withRS Off)
Modes A to Dhad the samemargin
Table 2 (Continued)

22
Location Conditions Test Items PAL-I SDTVMode A (2k,64 QAM, GI = 1/8,CR = 2/3)
HDTVMode A (2k,64 QAM, GI = 1/8,CR = 2/3)
Remarks
Field strength(dBµV/m)
73 (peak synclevel)
69.5
BER --- 1E-4 (RS Off)< 1E-9 (RS On)
C/N ratio (dB) --- 19.94Picture grade 1 5Sound grade 5 5
15. St. BonaventureCollege & HighSchool, Wong TaiSin
• Test signal fromTemple Hill
• Test site wasobstructed bybuildings
• Measurementswere taken onstreet level
• Antenna pointedto 170 degrees
Margin of threshold(dB)
--- 10 (BER increased to 2E-4 withRS Off)
Field strength(dBµV/m)
51 64.8
BER --- 2E-7 (RS Off)< 1E-9 (RS On)
C/N ratio (dB) --- 27Picture grade 1.5 (noisy
picture andghosting)
5
Sound grade 5 5
16. Kowloon Bay SportCentre, KowloonBay
• Test signals fromTemple Hill
• Test site wasobstructed bybuildings
• Measurementswere taken onstreet level
Margin of threshold(dB)
--- 26 (BER increased to 2E-4 withRS Off)
Modes A to Dhad the samemargin
Field strength(dBµV/m)
54 60
BER --- < 1E-4 (RS Off)< 6E-5 (RS On)
Because of in-bandinterference, theBER sometimesexceeded 1E-4
C/N ratio (dB) --- 21.5Picture grade 3 (interference
was seen onpicture)
5
Sound grade 5 5
17. Tsui Yeung House,Tsui Ping Estate,Kwun Tong
• Test signals fromTemple Hill
• Test site wasobstructed bybuildings
• Measurementswere taken onstreet level
Margin of threshold(dB)
--- 21 (BER increased to 2E-4 withRS Off)
Because of in-bandinterference, theBER sometimesexceeded 1E-4
Field strength(dBµV/m)
54 62
BER --- < 2E-4 (RS Off)< 1E-9 (RS On)
Because of in-bandinterference, theBER sometimesexceeded 2E-4with RS Off.
C/N ratio (dB) --- 22.3Picture grade 2 (serious
interferenceexisted)
5 (loss of picture occurredintermittently)
Sound grade 5 5 (loss of sound occurredintermittently)
18. Sau Yuen House,Chuk Yuen Estate,Chuk Yuen
• Test signals fromTemple Hill
• Test site wasobstructed bybuildings
• Measurementswere taken onstreet level
Margin of threshold(dB)
--- 19 (BER increased to 2E-4 withRS Off)
Because of in-bandinterference, theBER sometimesexceeded 2E-4
Table 2 (Continued)

23
Location Conditions Test Items PAL-I SDTVMode A (2k,64 QAM, GI = 1/8,CR = 2/3)
HDTVMode A (2k,64 QAM, GI = 1/8,CR = 2/3)
Remarks
Field strength(dBµV/m)
27 53.6
BER --- 2.7E-4 (RS Off)< 1E-9 (RS On)
C/N ratio (dB) --- 14.3Picture grade --- 5 (picture unstable)Sound grade --- 5 (picture unstable)
19. New TV City Site,Tseung Kwan O
• Test signals fromTemple Hill
• Test site wasobstructed by hills
• Measurementswere taken onstreet level
Margin of threshold(dB)
--- 7 (BER increased to 2E-4 with RSOff);
RF signal level(dBµV)
29 38.5 Domesticreceivingantenna wasused
BER --- < 1E-9 (RS Off)< 1E-9 (RS On)
C/N ratio (dB) --- 21Picture grade 2 5Sound grade 5 5
20. St. BonaventureCollege & HighSchool, Wong TaiSin
• Test signal fromTemple Hill
• Test site wasobstructed bybuildings
• Measurementswere taken onrooftop level
Margin of threshold(dB)
--- 19 for Modes A, C & D (BERincreased to 2E-4 with RS Off);18 for Mode B (BER increased to2E-4 with RS Off)
RF signal level(dBµV)
40 44 Domesticreceivingantenna wasused
> 2E-4 (Modes A & B)BER ---For Mode H orL, BER was lessthan 1E-9 (RSOn or RS Off)
---
C/N ratio (dB) --- 10.6 ---Picture grade 1 (serious
interferenceexisted)
5 (Mode H or L) ---
Sound grade 5 5 (Mode H or L) ---
21. Sai Wan Ho • Test signal fromTemple Hill
• Test site wasobstructed bybuildings
• Measurementswere taken onrooftop level
Margin of threshold(dB)
--- 32 (Mode H orL, BERincreased to2E-4 with RSOff)
---
Table 2 (Continued)

24
3.4.1.2 Indoor Reception Test Result
Measurements were taken in four public housing estates with an indoor antenna. Test usingconsumer type set-top box was also carried out in three of the four estates (Figure 15). Thetest results are summarized in Table 3. The quality of the PAL-I pictures received at the testsites was poor but satisfactory DVB-T pictures could be received at the same sites. Betterreception could be obtained with 16 QAM or QPSK modulation.
Figure 15 – Indoor Reception Test Using Consumer Type Set-Top Box
Location Conditions Test Item(Notes 1, 2 & 3)
PAL-I SDTV HDTV Remarks
RF signal level(dBµV)
33 40.2
> 2E-4 (RS On) Modes A to D< 9E-6 (RS Off)< 1E-9 (RS On)
--- Mode F
< 2E-4 (RS Off)< 1E-9 (RS On)
--- Mode H
BER ---
< 2E-4 (RS Off)< 1E-9 (RS On)
--- Mode L
C/N ratio (dB) --- --- ---Picture grade 1 5 (Modes F, H
& L)---
Sound grade 5 5 (Modes F, H& L)
---
1. Room 1237, 12/F.,Block 1, Mei TungEstate, KowloonCity
• Test signals fromTemple Hill
• Test was carriedout with ModesA - D, F, H & L
Margin of threshold(dB)
--- 35 (Mode F);25 (Mode H);27 (Mode L)(BER increasedto 2E-4 with RSOff)
---
Note 1: Average RF level of the PAL-I signal was measured. A correction factor of about 6 dB should be added to the average valueto obtain the peak sync value.
Note 2: The subjective assessment of picture and sound quality was based on the ITU five-grade scale.
Note 3: Mode A (2k, 64 QAM, GI = 1/8, CR = 2/3);Mode B (2k, 64 QAM, GI = 1/4, CR = 2/3);Mode C (8k, 64 QAM, GI = 1/32, CR = 2/3);Mode D (8k, 64 QAM, GI = 1/16, CR = 2/3);Mode F (2k, QPSK, GI = 1/4, CR = 1/2);Mode H (2k, 16 QAM, GI = 1/4, CR = 1/2);Mode L (8k, 16 QAM, GI = 1/16, CR = 1/2).
Table 3 - Indoor Reception Test Results
RF in
Audio InAudio Out Video InVideo Out
Variableattenuator
Set-topbox TV set

25
Location Conditions Test Item PAL-I SDTV HDTV RemarksRF signal level(dBµV)
44 52
BER --- < 1E-9 (RS Off)< 1E-9 (RS On)
C/N ratio (dB) --- 23.5Picture grade 2.5 5Sound grade 5 5
2. Corridor of 1/F.,Ching Tak House,Tsz Ching Estate,Tsz Wan Shan
• Test signals fromTemple Hill
• Mode A was usedfor the test
Margin of threshold(dB)
--- 32 (BER increased to 2E-4 withRS Off)
RF signal level(dBµV)
70 Not measured
BER --- Not measuredC/N ratio (dB) --- Not measuredPicture grade 2.5 5Sound grade 5 5
Room 2014, 20/F.,Ching Tak House,Tsz Ching Estate,Tsz Wan Shan
• Test signals fromTemple Hill
• Mode A was usedfor the test
• A consumer typeset-top box wasused andmeasurementswere taken insideRoom 2014(equipment setupis shown in Figure15)
Margin of threshold(dB)
--- 30 (no more than one error wasvisible in the picture for anaverage observation time of 20seconds)
RF signal level(dBµV)
52 58 ---
< 1E-9 (RS Off)< 1E-9 (RS On)
--- Mode FBER ---
1E-4 (RS Off)< 1E-9 (RS On)
--- Mode H
C/N ratio (dB) 14.5 ---Picture grade 1 ~ 1.5 5 ---Sound grade 5 5 ---
3. Corridor of 19/F.,Sau Yuen House,Chuk Yuen Estate,Chuk Yuen
• Test signals fromTemple Hill
• Modes F & Hwere used becausereception failedfor Modes A & B
Margin of threshold(dB)
--- 51 (Mode F);21 (Mode H)(BER increasedto 2E-4 with RSOff)
---
RF signal level(dBµV)
--- Not measured ---
BER --- Not measured ---C/N ratio (dB) --- Not measuredPicture grade --- 5 ---Sound grade --- 5 ---
. • Test signals fromTemple Hill
• Modes F & Hwere used
• DVB-T signal wasreceived byconsumer type set-top box in thecorridor
Margin of threshold(dB)
--- 35 (Mode F);30 (Mode H)(no more thanone error wasvisible in thepicture for anaverageobservation timeof 20 seconds)
---
Table 3 - (Continued)

26
Location Conditions Test Item PAL-I SDTV HDTV RemarksRF signal level(dBµV)
43 51.6
BER --- < 1E-9 (RS Off)< 1E-9 (RS On)
C/N ratio (dB) 29.8Picture grade 2 5Sound grade 5 5
4. Corridor of 18/F.,Tsui Yeung House,Tsui Ping Estate,Kwun Tong
• Test signals fromTemple Hill
• Mode A was used
Margin of threshold(dB)
--- 34 (BER increased to 2E-4 withRS Off)
RF signal level(dBµV)
--- Not measured ---
BER --- Not measured ---C/N ratio (dB) --- Not measuredPicture grade --- 5 ---Sound grade --- 5 ---
. • Test signals fromTemple Hill
• Modes A & Bwere used
• DVB-T signal wasreceived by aconsumer type set-top box in thecorridor
Margin of threshold(dB)
--- 43 (Modes A &B);(no more thanone error wasvisible in thepicture for anaverageobservation timeof 20 seconds)
---
Table 3 (Continued)

27
3.4.1.3 Mobile Reception Test Result
Four different routes in the urban areas of Hong Kong were chosen for the field tests, one onthe Eastern Corridor, one on the Kwun Tong Bypass, one in Whampoa Garden and one inDiamond Hill. During the test, the survey vehicle was travelling at speeds less than 70km/hour which was the typical safety speed for the roads of Hong Kong. Figure 16 showsan example of a measured curve (RF signal level versus time) of the 16 QAM case. Figures17 - 21 show the routes for mobile reception test. The test results are summarized in Table 4.The reception of PAL-I signal along the test routes was unstable and the picture was noisy.The reception of the DVB-T signal was much better and satisfactory picture quality could beobtained.
Figure 16 - An Example of a Measured Curve
30
35
40
45
50
55
60
65
70
75
17:56
:36
17:56
:53
17:57
:11
17:57
:28
17:57
:46
17:58
:03
17:58
:20
17:58
:38
17:58
:55
17:59
:12
17:59
:30
17:59
:47
18:00
:04
18:00
:21
18:00
:38
18:11
:28
18:11
:44
18:12
:01
18:12
:18
18:12
:35
18:12
:52
18:13
:09
18:13
:26
18:13
:43
18:14
:00
18:14
:17
18:14
:34
18:14
:51
18:15
:08
Time
RF
sig
nal
leve
l (d
Bu
V)

28
Figure 17 - The Routes for Mobile Reception Test
Temple Hill
Sai Wan Shan
Kowloon
Hong Kong Island
EasternCorridor
Kwun TongBypass
WhampoaGarden
DiamondCircle
Victoria Harbour

29
Figure 18 - Test Route 1 (Kwun Tong Bypass)
S
S Starting Point

30
Figure 19 - Test Route 2 (Eastern Corridor)
S
S Starting Point

31
Figure 20 - Test Route 3 (Diamond Hill)
S
S Starting Point

32
Figure 21 - Test Route 4 (Whampoa Garden)
S
S Starting Point

33
Route Transmitter(s) Parameters used Success rate (%) (Note)1. Kwun Tong Bypass Temple Hill and
Sai Wan Shan(SFN)
QPSK,code rate = 1/2,guard interval = 1/4
100 (NDS receiver)
2. Kwun Tong Bypass Temple Hill QPSK,code rate = 1/2,guard interval = 1/4
98 (NDS receiver)
3. Kwun Tong Bypass Temple Hill andSai Wan Shan(SFN)
16 QAM,code rate = 1/2,guard interval = 1/4
91 (NDS receiver)
4. Diamond Hill Temple Hill QPSK,code rate = 1/2,guard interval = 1/4
99 (V-TER receiver)
5. Diamond Hill Temple Hill 16 QAM,code rate = 1/2,guard interval = 1/4
96.7 (V-TER receiver)
6. Whampoa Garden Temple Hill andSai Wan Shan(SFN)
QPSK,code rate = 1/2,guard interval = 1/4
4.5 (V-TER receiver)
7. Eastern Corridor Temple Hill QPSK,code rate = 1/2,guard interval = 1/4
99.6 (NDS receiver)
Note: Success rate was the percentage of time that satisfactory reception was obtained.
Table 4 - Mobile Reception Test Results

34
3.4.1.4 Tidal Fading Test Result
Measurements were taken at Sai Wan Ho Ferry Pier (Figure 22). At this location, theantenna could receive strong reflections from the sea as well as the direct signal. Typicalfield strength variation is shown in Figure 23. Severe multipath fading was experienced atSai Wan Ho Ferry Pier and the PAL-I picture was unstable. For DVB-T with 64 QAM,blocky picture and loss of picture occurred during the measurement periods. The frequencyof occurrence of blocky picture or loss of picture decreased when ERP of 1 kW was used.Better reception was obtained when 16 QAM or QPSK was used. The results are summarizedin Table 5.
Figure 22 - Test Sites (Tidal Fading Test)
Sai Wan Shan
Temple Hill
Kowloon
Hong Kong
Island
Victoria Harbour
Sai Wan Ho Ferry Pier
Test Site

35
40
45
50
55
60
65
70
75
15:31
:54
15:31
:58
15:32
:03
15:32
:07
15:32
:12
15:32
:17
15:32
:21
15:32
:26
15:32
:30
15:32
:35
15:32
:39
15:32
:44
15:32
:49
15:32
:53
15:32
:58
15:33
:02
15:33
:07
15:33
:11
15:33
:16
15:33
:21
15:33
:25
15:33
:30
15:33
:34
15:33
:39
15:33
:43
15:33
:48
15:33
:53
15:33
:57
15:34
:02
15:34
:06
15:34
:11
Time
Fie
ld s
tren
gth
(d
Bu
V)
Figure 23 - Typical Field Strength Variation (Sai Wan Ho)
Location Conditions Test Items(Notes 1 & 2)
PAL-I SDTV HDTV
Field strength (dBµV/m) Average: 55.5Maximum: 61.5Minimum: 48.7
Average: 62Maximum: 70.8Minimum: 56.7
BER --- 8.41E-5 (RS Off)< 1E-9 (RS On)
C/N ratio (dB) --- 22Picture grade 1.5 Loss of picture
occurredintermittently
Reception failed
1. Sai Wan Ho FerryPier
• Test signals fromTemple Hill
• Height of antennawas 10 m
• ERP of PAL-I andDVB-Ttransmitterswas100 W
• Mode A (2k, 64QAM, GI = 1/8,CR = 2/3) wasused
Sound grade 5 Loss of soundoccurredintermittently
Reception failed
Field strength (dBµV/m) --- Average: 83Maximum: 87Minimum: 79
BER --- No measurement for RS = Off< 1E-9 (RS On)
C/N ratio (dB) --- 29.9Picture grade --- Loss of picture and sound occurred
intermittently. The frequency ofoccurrence of loss of picture and sounddecreased when the ERP increased from100 W to 1 kW.
2. Sai Wan Ho FerryPier
• Test signal fromTemple Hill
• Height of antennawas 9.7 m
• ERP of DVB-Ttransmitter was1 kW
• Mode A (2k, 64QAM, GI = 1/8,CR = 2/3) wasused
Sound grade ---
Note 1: Average field strength of the PAL-I signal was measured. A correction factor of about 6 dB should be added to the averagevalue to obtain the peak sync value.
Note 2: The subjective assessment of picture and sound quality was based on the ITU five-grade scale.
Table 5 - Tidal Fading Test Results

36
Location Conditions Test Items PAL-I SDTV HDTVField strength (dBµV/m) --- ---BER --- ---C/N ratio (dB) --- ---Picture grade ---
3. Sai Wan Ho FerryPier
• Test signals fromTemple Hill
• Height of antennawas 9.2 m
• ERP of DVB-Ttransmitterwas100 W
• Mode A (2k, 64QAM, GI = 1/8,CR = 2/3) wasused
Sound grade ---Frozen picture andloss of soundoccurred frequently
Frozen picture andloss of soundoccurred frequently
Field strength (dBµV/m) --- --- ---BER --- --- ---C/N ratio (dB) --- --- ---Picture grade --- 5 ---
4. Sai Wan Ho FerryPier
• Test signal fromTemple Hill
• Height of antennawas 9.2 m
• ERP of DVB-Ttransmitter was100 W
• Mode F (2k,QPSK, GI = 1/4,CR = 1/2) wasused
Sound grade --- 5 ---
Field strength (dBµV/m) --- --- ---BER --- --- ---C/N ratio (dB) --- --- ---Picture grade --- 5 ---
5. Sai Wan Ho FerryPier
• Test signal fromTemple Hill
• Height of antennawas 9.2 m
• ERP of DVB-Ttransmitter was100 W
• Mode H (2k, 16QAM, GI = 1/4,CR = 1/2) wasused
Sound grade --- 5 ---
Table 5 (Continued)

37
3.4.2 In-Building Coaxial Cable Distribution System (IBCCDS) Test Result
Tests were carried out to evaluate whether the DVB-T signal could be received through theexisting IBCCDSs. Measurements were taken at the headends and TV outlets of theIBCCDSs of a commercial building, a hotel and four public housing estates. The resultsindicated that the DVB-T signal could be received well through the IBCCDSs under test whensufficient signal level was available. The picture quality of SDTV and HDTV was excellent.Better reception was obtained using DVB-T system as compared with the PAL-I system.The results are summarized in Table 6. It was noted that no adverse effect was caused to thereception of PAL-I channels through the IBCCDSs and no complaint was received from thepublic during the trial period.
Location Conditions Test Items(Notes 1 & 2)
PAL-I SDTVMode A (2k, 64 QAM,GI = 1/8, CR = 2/3)
HDTVMode A (2k, 64 QAM,GI = 1/8, CR = 2/3)
RF signal level (dBµV) 30 37BER --- 5E-6 (RS Off)
< 1E-9 (RS On)C/N ratio (dB) --- 17.8Picture grade 2 (in-band
interference)5
Sound grade 5 5
1. 22/F., PodiumCommercialBuilding, Tsim ShaTsui(Headend of theSMATV/CABDsystem)
• Test signals fromTemple Hill
Margin of threshold (dB) --- 16 (BER increased to 2E-4 with RS Off)RF signal level (dBµV) 36 42BER --- 4E-7 (RS Off)
< 1E-9 (RS On)C/N ratio (dB) --- 20.2Picture grade 2 (in-band
interference)5
Sound grade 5 5
G/F., PodiumCommercialBuilding, Tsim ShaTsui(TV outlet)
• Test signals fromTemple Hill
• The test signalswere carried fromthe TV outlet tothe Survey Vehicleby a 27-metrecable instead ofthe 150-metrecable
Margin of threshold (dB) --- 25 (BER increased to 2E-4 with RS Off)
RF signal level (dBµV) 60 66.6BER --- < 1E-9 (RS Off)
< 1E-9 (RS On)C/N ratio (dB) --- 37.4Picture grade 3.5 5Sound grade 5 5
2. 12/F., Block 1, MeiTung Estate,Kowloon City(Headend of theSMATV/CABDsystem)
• Test signals fromTemple Hill
Margin of threshold (dB) 15 (picture qualitydegraded to grade 3)
51 (BER increased to 2E-4 with RS Off)
RF signal level (dBµV) 46.9 (peak synclevel)
45.2
BER --- < 1E-9 (RS Off)< 1E-9 (RS On)
C/N ratio (dB) --- 23.7Picture grade 2 5Sound grade 5 5
Room 420, 4/F.,Block 1, Mei TungEstate, KowloonCity(TV outlet)
• Test signals fromTemple Hill
Margin of threshold (dB) --- 47 (BER increased to 2E-4 with RS Off)
Note 1: Average RF level of the PAL-I signal was measured. A correction factor of about 6 dB should be added to the average valueto obtain the peak sync value.
Note 2: The subjective assessment of picture and sound quality was based on the ITU five-grade scale.
Table 6 - IBCCDS Test Results
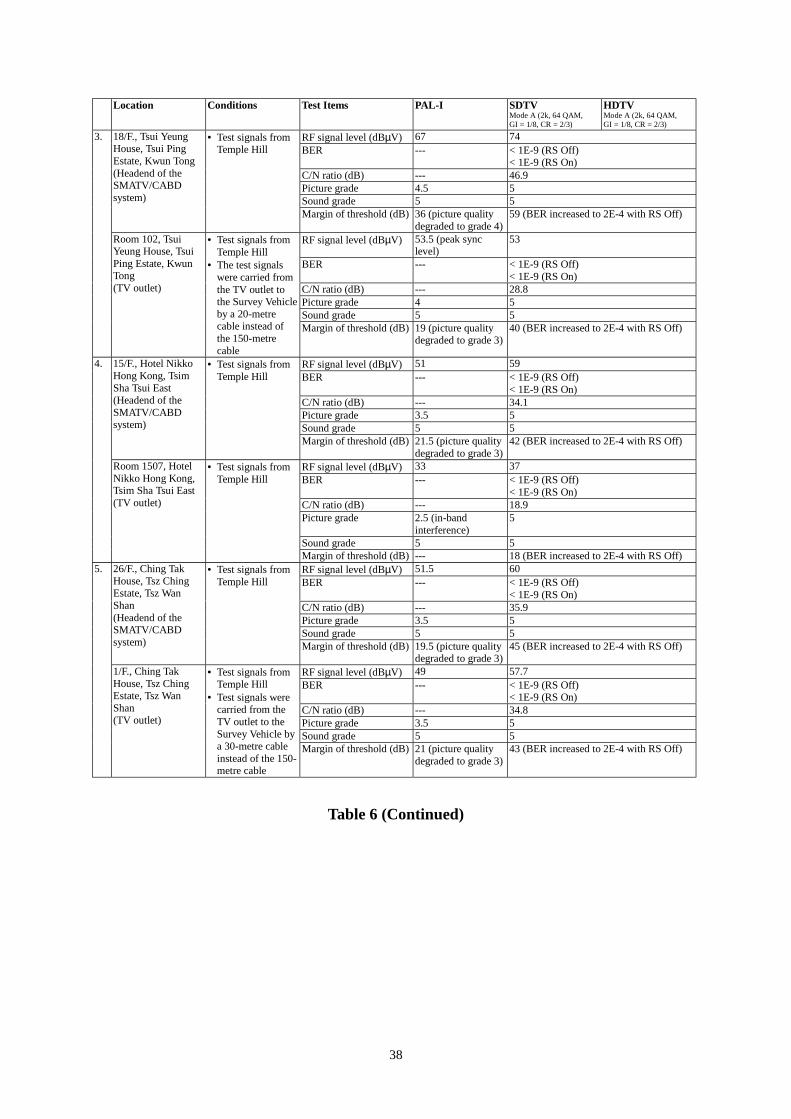
38
Location Conditions Test Items PAL-I SDTVMode A (2k, 64 QAM,GI = 1/8, CR = 2/3)
HDTVMode A (2k, 64 QAM,GI = 1/8, CR = 2/3)
RF signal level (dBµV) 67 74BER --- < 1E-9 (RS Off)
< 1E-9 (RS On)C/N ratio (dB) --- 46.9Picture grade 4.5 5Sound grade 5 5
3. 18/F., Tsui YeungHouse, Tsui PingEstate, Kwun Tong(Headend of theSMATV/CABDsystem)
• Test signals fromTemple Hill
Margin of threshold (dB) 36 (picture qualitydegraded to grade 4)
59 (BER increased to 2E-4 with RS Off)
RF signal level (dBµV) 53.5 (peak synclevel)
53
BER --- < 1E-9 (RS Off)< 1E-9 (RS On)
C/N ratio (dB) --- 28.8Picture grade 4 5Sound grade 5 5
Room 102, TsuiYeung House, TsuiPing Estate, KwunTong(TV outlet)
• Test signals fromTemple Hill
• The test signalswere carried fromthe TV outlet tothe Survey Vehicleby a 20-metrecable instead ofthe 150-metrecable
Margin of threshold (dB) 19 (picture qualitydegraded to grade 3)
40 (BER increased to 2E-4 with RS Off)
RF signal level (dBµV) 51 59BER --- < 1E-9 (RS Off)
< 1E-9 (RS On)C/N ratio (dB) --- 34.1Picture grade 3.5 5Sound grade 5 5
4. 15/F., Hotel NikkoHong Kong, TsimSha Tsui East(Headend of theSMATV/CABDsystem)
• Test signals fromTemple Hill
Margin of threshold (dB) 21.5 (picture qualitydegraded to grade 3)
42 (BER increased to 2E-4 with RS Off)
RF signal level (dBµV) 33 37BER --- < 1E-9 (RS Off)
< 1E-9 (RS On)C/N ratio (dB) --- 18.9Picture grade 2.5 (in-band
interference)5
Sound grade 5 5
Room 1507, HotelNikko Hong Kong,Tsim Sha Tsui East(TV outlet)
• Test signals fromTemple Hill
Margin of threshold (dB) --- 18 (BER increased to 2E-4 with RS Off)RF signal level (dBµV) 51.5 60BER --- < 1E-9 (RS Off)
< 1E-9 (RS On)C/N ratio (dB) --- 35.9Picture grade 3.5 5Sound grade 5 5
5. 26/F., Ching TakHouse, Tsz ChingEstate, Tsz WanShan(Headend of theSMATV/CABDsystem)
• Test signals fromTemple Hill
Margin of threshold (dB) 19.5 (picture qualitydegraded to grade 3)
45 (BER increased to 2E-4 with RS Off)
RF signal level (dBµV) 49 57.7BER --- < 1E-9 (RS Off)
< 1E-9 (RS On)C/N ratio (dB) --- 34.8Picture grade 3.5 5Sound grade 5 5
1/F., Ching TakHouse, Tsz ChingEstate, Tsz WanShan(TV outlet)
• Test signals fromTemple Hill
• Test signals werecarried from theTV outlet to theSurvey Vehicle bya 30-metre cableinstead of the 150-metre cable
Margin of threshold (dB) 21 (picture qualitydegraded to grade 3)
43 (BER increased to 2E-4 with RS Off)
Table 6 (Continued)

39
Location Conditions Test Items PAL-I SDTVMode A (2k, 64 QAM,GI = 1/8, CR = 2/3)
HDTVMode A (2k, 64 QAM,GI = 1/8, CR = 2/3)
RF signal level (dBµV) 68 (peak sync level) 67.7BER --- < 1E-9 (RS Off)
< 1E-9 (RS On)C/N ratio (dB) --- 36.8Picture grade 3.5 5Sound grade 5 5
6. 19/F., Sau YuenHouse, Chuk YuenEstate, Chuk Yuen(Headend of theSMATV/CABDsystem)
• Test signals fromTemple Hill
Margin of threshold (dB) 35.5 (picture qualitydegraded to grade 3)
55 (BER increased to 2E-4 with RS Off)
RF signal level (dBµV) 45 51.7BER --- < 1E-9 (RS Off)
< 1E-9 (RS On)C/N ratio (dB) --- 30Picture grade 2.5 5Sound grade 5 5
Room 240B, 2/F.,Sau Yuen House,Chuk Yuen Estate,Chuk Yuen(TV outlet)
• Test signals fromTemple Hill
• Test signals werecarried from theTV outlet to theSurvey Vehicle bya 30-metre cableinstead of the 150-metre cable
Margin of threshold (dB) --- 39 (BER increased to 2E-4 with RS Off)
Table 6 (Continued)
3.4.3 Single Frequency Network (SFN) Test
Both transmitters at Temple Hill and Sai Wan Shan were switched on to test the SFNoperation. Measurements were taken at Chivas Godown, Chai Wan (Figure 24). Theresults are summarized in Table 7. The results revealed that SFN operation was feasibleusing DVB-T system and the picture and sound quality was excellent.

40
Figure 24 - Test Site (SFN Test)
Sai Wan Shan
Temple Hill
Kowloon
Hong Kong
Island
Victoria Harbour
ChivasGodown
Test Site

41
Location Conditions(Note1)
Test Items(Note 2)
SDTV HDTV Remarks
Field strength(dBµV/m)
80 (Temple Hill - wanted station);81 (Sai Wan Shan - unwanted station)
D/U ratio (dB) -1BER < 1E-9 (RS Off)
< 1E-9 (RS On)C/N ratio (dB) 42.8Picture grade 5 5Sound grade 5 5
Chivas Godown,Chai Wan
• Receivingantenna pointedtowards TempleHill
• Static delaysetting was25 µs
• Modes A to Dwere used forthe test
Margin of threshold(dB)
44 (BER increased to 2E-4 with RS Off)
Field strength(dBµV/m)
90 (Sai Wan Shan - wanted station);69 (Temple Hill - unwanted station)
D/U ratio (dB) 21BER < 1E-9 (RS Off)
< 1E-9 (RS On)C/N ratio (dB) 52.9Picture grade 5Sound grade 5
• Receivingantenna pointedtowards SaiWan Shan
• Static delaysetting was25 µs
• Mode A wasused for the test Margin of threshold
(dB)54 (BER increased to 2E-4 with RS Off)
Note 1: Mode A (2k, 64 QAM, GI = 1/8, CR = 2/3);Mode B (2k, 64 QAM, GI = 1/4, CR = 2/3);Mode C (8k, 64 QAM, GI = 1/32, CR = 2/3);Mode D (8k, 64 QAM, GI = 1/16, CR = 2/3).
Note 2: The subjective assessment of picture and sound quality was based on the ITU five-grade scale.
Table 7 - SFN Test Results

42
4. LABORATORY TEST
4.1 Objectives of Laboratory Test
The objectives of the laboratory tests were as follows:
• to evaluate the performance of DVB-T signal in the presence of analogue co-channel/adjacent channel/image channel interference (PAL into DVB-T interference -Tables 11 - 14);
• to evaluate whether modifying the vestigial sideband (VSB) mask of existing PAL-Isystem to that of PAL-I1 could improve the spurious interference performance (PAL intoDVB-T interference - Table 11);
• to evaluate the performance of domestic analogue VCR/TV receivers in the presence ofDVB-T co-channel/adjacent channel/image channel interference (DVB-T into PALinterference - Tables 15 and 16);
• to evaluate the performance of DVB-T signal in the presence of DVB-T co-channel/adjacent channel interference (DVB-T into DVB-T interference - Tables 17 - 19);and
• to measure the overall video and audio delay time caused by DVB-T encoding/decodingand to evaluate the effect of this delay time on live broadcast (Encoding/Decoding Delay- Table 20).

43
4.2 Equipment Setup for Laboratory Test
Figure 25 shows the setup of the test rig for the PAL into DVB-T interference, DVB-T intoPAL interference and DVB-T into DVB-T interference measurements.
Nicam Encoder RF CommunicationTest Set
System I / K A1Select
Combiner
System I / I1 / KSelect
System I1 / K VSBFilter
UHFUp-Converter
Ch 23/31/32/33BPF
27dB GainAmplifier
Combiner
Divider
Spectrum Analyzer
PrinterTV/VCR Samples / DVB-Treceiver
UHF TV (Ch21) Modulator
FM SoundUHF Up-Converter
FM Sound(A1) IF
NICAM IF
Ch21 Analogue TV Signal
PAL-I A1Local Oscillator
A1Local Input
PAL-K A1Local Oscillator
I1 / K
A1 IFInput
-10 to -15 dBmI / I1 / K VSB
O/P 4
Analogue TV Level0 - 94dBuV
O/P 2
O/P 3
O/P 1
Analogue TV /DVB-T Signal
Level Adjust VR2
DVB-T SignalLevel Adjust VR1
DVB-T Test Gear
Figure 25 - Setup of the Test Rig

44
4.3 Technical Characteristics of Test Signals
The technical characteristics of the DVB-T signal used for the laboratory test is shown inTable 8. The DVB-T system BERs were measured before the Reed Solomon (RS) decoder.
Parameters SDTV-1 SDTV-2 SDTV-3Numbers of Carriers 2k 8k 8kModulation COFDM, 64 QAM COFDM, 64 QAM COFDM, 16 QAMGuard Interval 1/8 1/16 1/16Code Rate 2/3 2/3 1/2Information Rate 22.12 Mbps 23.42 Mbps 11.71 MbpsIF Center Frequency ( 0 Offset ) 37.15 MHz 37.15 MHz 37.15 MHzIF 3 dB Bandwidth 7.61 MHz 7.61 MHz 7.61 MHzNumber of TV Channel for Test 1 1 1
Table 8 - Technical Characteristics of DVB-T Signal for Laboratory Test
The technical characteristics of the audio and video signals used for the laboratory test isshown in Table 9. The technical characteristics of the PAL-I, PAL-I1 and PAL-K signals andthe VSB specifications of PAL-I, PAL-I1 and PAL-K used for the laboratory test are shown inFigures 26 - 28 and Table 10.
Video picture 625 PAL EBU Colour BarsAudio for FM sound 400 Hz, 0 dBm toneFM sound deviation 17.74 kHzAudio for NICAM sound 1 kHz, 0 dBm tone
Table 9 - Technical Characteristics of Audio and Sound Signals for Laboratory Test

45
Figure 26 - Technical Characteristics of PAL-I and PAL-I1 Signals for Laboratory Test
Figure 27 - Technical Characteristics of PAL-K Signal for Laboratory Test
Figure 28 - Typical Composite Test Signal for Laboratory Test

46
From Vision CarrierFrequency
( MHz )
Maximum( dB )
Minimum( dB )
PAL-I -5.5 -20-4.43 -30
-4 -20-3 -20-2 -8 -10-1 -1.25 -2.50 +1.5 -0.5
+1 +9.5 -0.5+2 Reference
PAL-I1 < -1.45 -45-1.25 -20-0.75 +0.5 -4-0.5 +0.5 -1.5
0 +0.5 -0.5+1.5 Reference
PAL-K -4.33 ± 0.1 MHz -30-1.25 -20-0.75 +0.5 -4-0.5 +0.5 -1.5
0 +0.5 -0.5+1.5 Reference
Table 10 - PAL-I, PAL-I1 and PAL-K VSB Specifications for Laboratory Test

47
4.4 Measurement Procedures for Laboratory Test
4.4.1 PAL into DVB-T Interference
The measurement procedures based on a target BER of 2E-4 were as follows:
(1) The DVB-T mode was set to SDTV-1.(2) The analogue TV system was set to PAL-I.(3) The vision carrier frequency of the analogue signal was set to 567.25 MHz (Channel
33).(4) The DVB-T frequency was set to 562 MHz (Channel 32).(5) The DVB-T power level at the input of the DVB-T receiver was set to -50 dBm by
adjusting variable attenuator VR1 (Figure 25).(6) The power level of the analogue signal at the input of the DVB-T receiver was set to -50
dBm by adjusting the variable attenuator VR2 (Figure 25). The variable attenuatorreading (R1) was recorded.
(7) The power level of the analogue signal at the input of the DVB-T receiver was adjusteduntil the BER was just 2E-4. The variable attenuator reading (R2) was recorded andR2 - R1 was calculated.
(8) The DVB-T frequency was set to 562 – 0.167 MHz (Channel 32)(9) Steps (5) to (7) were repeated.(10) The vision carrier frequency of the analogue signal was set to 551.25 MHz. (Channel
31).(11) Steps (4) to (7) were repeated.(12) The DVB-T frequency was set to 562 + 0.167 MHz (Channel 32)(13) Steps (5) to (7) were repeated.(14) The vision carrier frequency of the analogue signal was set to 559.25 MHz (Channel
32).(15) Steps (4) to (9), (12) and (13) were repeated.(16) The DVB-T frequency was set to 490 MHz (Channel 23).(17) Steps (5) to (7) were repeated.(18) The DVB-T frequency was set to 490 + 0.167 MHz (Channel 23).(19) Steps (5) to (7) were repeated.(20) The DVB-T frequency was set to 490 – 0.167 MHz (Channel 23).(21) Steps (5) to (7) were repeated.(22) The analogue TV system was set to PAL-I1.(23) Steps (3) to (21) were repeated.(24) The analogue TV system was set to PAL-K.(25) Steps (3) to (21) were repeated.

48
(26) The DVB-T mode was set to SDTV-2.(27) Steps (2) to (25) were repeated.(28) The DVB-T mode was set to SDTV-3.(29) Steps (2) to (25) were repeated.
For the NDS receiver, it was not possible to measure the BER and therefore another methodbased on subjective failure point (SFP) method was used for protection ratio measurements.The quality criterion for protection ratio measurements is to find a limit for just error freepicture at the TV screen. The RF protection ratio for the wanted DVB-T signal is a value ofwanted-to-unwanted signal ratio at the receiver input, determined by the SEP method. TheSFP method corresponds to the picture quality where no more than one error is visible in thepicture for an average observation time of 20 seconds.
The measurement procedures based on SEP method were as follows:
(1) The DVB-T mode was set to SDTV-1.(2) The DVB-T frequency was set to 562 MHz (Channel 32).(3) The DVB-T power level at the input of the DVB-T receiver was set to -50 dBm by
adjusting variable attenuator VR1.(4) The analogue TV system was set to PAL-I.(5) The vision carrier frequency of the analogue signal was set to 567.25 MHz (Channel
33).(6) The power level of the analogue signal at the input of the DVB-T receiver was set to -50
dBm by adjusting the variable attenuator VR2. The variable attenuator reading (R3)was recorded.
(7) The power level of the analogue signal at the input of the DVB-T receiver was adjusteduntil no more than one error was visible in the picture for an average observation timeof 20 seconds. The variable attenuator reading (R4) was recorded and R4 - R3 wascalculated.
(8) The vision carrier frequency of the analogue signal was set to 551.25 MHz. (Channel31).
(9) Steps (6) and (7) were repeated.(10) The vision carrier frequency of the analogue signal was set to 559.25 MHz (Channel
32).(11) Steps (6) and (7) were repeated.(12) The analogue TV system was set to PAL-I1.(13) Steps (5) to (11) were repeated.(14) The analogue TV system was set to PAL-K.(15) Steps (5) to (11) were repeated.

49
4.4.2 DVB-T into PAL Interference
The measurement procedures were as follows:
Upper Adjacent Channel Interference
(1) The vision carrier frequency of the analogue signal was set to 551.25 MHz (Channel31).
(2) The DVB-T mode was set to SDTV-1.(3) The DVB-T frequency was set to 562 MHz (Channel 32).(4) The analogue TV system was set to PAL-I.(5) The power level of the analogue signal at the input of the TV set/VCR was set to -43
dBm by adjusting the variable attenuator VR2.(6) The power level of the DVB-T signal at the input of the TV set/VCR was set to -43
dBm by adjusting the variable attenuator VR1. The variable attenuator reading (R5)was recorded.
(7) The power level of the DVB-T signal at the input of the TV set/VCR was adjusted untilthe picture, the FM sound or the NICAM sound quality of the analogue signal wasdegraded to grade 4. The variable attenuator reading (R6) was recorded and R6 - R5was calculated.
(8) The analogue TV system was set to PAL-I1.(9) Steps (5) to (7) were repeated.(10) The analogue TV system was set to PAL-K.(11) Steps (5) to (7) were repeated.(12) The DVB-T frequency was set to 562 + 0.167 MHz (Channel 32).(13) Steps (4) to (11) were repeated.(14) The DVB-T mode was set to SDTV-2.(15) Steps (3) to (13) were repeated.
Lower Adjacent Channel Interference
(1) The vision carrier frequency of the analogue signal was set to 567.25 MHz (Channel33).
(2) The DVB-T mode was set to SDTV-1.(3) The DVB-T frequency was set to 562 - 0.167 MHz (Channel 32).(4) The analogue TV system was set to PAL-I.(5) The power level of the analogue signal at the input of the TV set/VCR was set to -43
dBm by adjusting the variable attenuator VR2.(6) The power level of the DVB-T signal at the input of the TV set/VCR was set to -43
dBm by adjusting the variable attenuator VR1. The variable attenuator reading (R7)was recorded.

50
(7) The power level of the DVB-T signal at the input of the TV set/VCR was adjusted untilthe picture, the FM sound or the NICAM sound quality of the analogue signal wasdegraded to grade 4. The variable attenuator reading (R8) was recorded and R8 - R7was calculated.
(8) The analogue TV system was set to PAL-I1.(9) Steps (5) to (7) were repeated.(10) The analogue TV system was set to PAL-K.(11) Steps (5) to (7) were repeated.(12) The DVB-T frequency was set to 562 MHz (Channel 32).(13) Steps (4) to (11) were repeated.(14) The DVB-T mode was set to SDTV-2.(15) Steps (3) to (13) were repeated.
Co-Channel Interference
(1) The vision carrier frequency of the analogue signal was set to 559.25 MHz (Channel32).
(2) The DVB-T mode was set to SDTV-1.(3) The DVB-T frequency was set to 562 MHz (Channel 32).(4) The analogue TV system was set to PAL-I.(5) The power level of the analogue signal at the input of the TV set/VCR was set to -43
dBm by adjusting the variable attenuator VR2.(6) The power level of the DVB-T signal at the input of the TV set/VCR was set to -43
dBm by adjusting the variable attenuator VR1. The variable attenuator reading (R9)was recorded.
(7) The power level of the DVB-T signal at the input of the TV set/VCR was adjusted untilthe picture, the FM sound or the NICAM sound quality of the analogue signal wasdegraded to grade 4. The variable attenuator reading (R10) was recorded and R10 -R9 was calculated.
(8) The analogue TV system was set to PAL-I1.(9) Steps (5) to (7) were repeated.(10) The analogue TV system was set to PAL-K.(11) Steps (5) to (7) were repeated.(12) The DVB-T mode was set to SDTV-2.(13) Steps (3) to (11) were repeated.

51
Image Channel Interference
(1) The vision carrier frequency of the analogue signal was set to 487.25 MHz (Channel23).
(2) The DVB-T mode was set to SDTV-1.(3) The DVB-T frequency was set to 562 - 0.167 MHz (Channel 32).(4) The analogue TV system was set to PAL-I.(5) The power level of the analogue signal at the input of the TV set/VCR was set to - 43
dBm by adjusting the variable attenuator VR2.(6) The power level of the DVB-T signal at the input of the TV set/VCR was set to - 43
dBm by adjusting the variable attenuator VR1. The variable attenuator reading (R11)was recorded.
(7) The power level of the DVB-T signal at the input of the TV set/VCR was adjusted untilthe picture, the FM sound or the NICAM sound quality of the analogue signal wasdegraded to grade 4. The variable attenuator reading (R12) was recorded and R12 -R11 was calculated.
(8) The analogue TV system was set to PAL-I1.(9) Steps (5) to (7) were repeated.(10) The analogue TV system was set to PAL-K.(11) Steps (5) to (7) were repeated.(12) The DVB-T frequency was set to 562 MHz (Channel 32).(13) Steps (4) to (11) were repeated.(14) The DVB-T frequency was set to 562 + 0.167 MHz (Channel 32).(15) Steps (4) to (11) were repeated.(16) The DVB-T mode was set to SDTV-2.(17) Steps (3) to (15) were repeated.
4.4.3 DVB-T into DVB-T Interference
The measurement procedures based on a target BER of 2E-4 were as follows:
(1) The modes of the wanted signal and the unwanted signal were set to SDTV-1 andSDTV-2 respectively.
(2) The frequency of the unwanted signal was set to 570 MHz (Channel 33).(3) The frequency of the wanted signal was set to 562 - 0.167 MHz (Channel 32).(4) The power level of the wanted signal at the input of the DVB-T receiver was set to -50
dBm by adjusting the variable attenuator VR1.(5) The power level of the unwanted signal at the input of the DVB-T receiver was set to
-50 dBm by adjusting the variable attenuator VR2. The variable attenuator reading(R13) was recorded.

52
(6) The power level of the unwanted signal at the input of the DVB-T receiver was adjusteduntil a BER of 2E-4 was obtained. The variable attenuator reading (R14) was recordedand R14 - R13 was calculated.
(7) The frequency of the wanted signal was set to 562 MHz (Channel 32).(8) Steps (4) to (6) were repeated.(9) The frequency of the wanted signal was set to 562 + 0.167 MHz (Channel 32).(10) Steps (4) to (6) were repeated.(11) The frequency of the unwanted signal was set to 554 MHz. (Channel 31).(12) Steps (3) to (10) were repeated.(13) The frequency of the unwanted signal was set to 562 MHz (Channel 32).(14) Steps (3) to (10) were repeated.(15) The modes of the wanted signal and the unwanted signal were set to SDTV-2 and
SDTV-1 respectively.(16) Steps (2) to (14) were repeated.
The measurement procedures based on the SFP method were as follows:
(1) The modes of the wanted signal and the unwanted signal were set to SDTV-1 andSDTV-2 respectively.
(2) The frequency of the unwanted signal was set to 570 MHz (Channel 33).(3) The frequency of the wanted signal was set to 562 - 0.167 MHz (Channel 32).(4) The power level of the wanted signal at the input of the DVB-T receiver was set to -50
dBm by adjusting the variable attenuator VR1.(5) The power level of the unwanted signal at the input of the DVB-T receiver was set to
-50 dBm by adjusting the variable attenuator VR2. The variable attenuator reading(R15) was recorded.
(6) The power level of the unwanted signal at the input of the DVB-T receiver was adjusteduntil no more than one error was visible in the picture for an average observation timeof 20 seconds. The variable attenuator reading (R16) was recorded and R16 - R15 wascalculated.
(7) The frequency of the wanted signal was set to 562 MHz (Channel 32).(8) Steps (4) to (6) were repeated.(9) The frequency of the wanted signal was set to 562 + 0.167 MHz (Channel 32).(10) Steps (4) to (6) were repeated.(11) The frequency of the unwanted signal was set to 554 MHz. (Channel 31).(12) Steps (3) to (10) were repeated.(13) The frequency of the unwanted signal was set to 562 MHz (Channel 32).(14) Steps (3) to (10) were repeated.

53
4.4.4 Encoding/Decoding Delay
The measurement procedures were as follows:
(1) A video signal with time (or frame count) information was prepared.(2) The video signal was fed to the DVB-T encoder. After the whole DVB-T transmission
path, the video signal was obtained from the DVB-T decoder.(3) The original video signal and that passed through the DVB-T system were observed at
the same time on a picture by means of a 4-to-1 video combiner. The delay time of theDVB-T system was calculated by the time difference between the two video signals onthe picture.

54
4.5 Results Summary of Laboratory Test
The results of the laboratory test are summarized in Tables 11 - 14. The manufacturer of theV-TER receiver advised that the V-TER receiver used for the laboratory test was an oldversion receiver which had an inferior adjacent channel rejection performance. The resultsin Table 11 indicated that better protection ratio for upper adjacent channel interference couldbe obtained using modified VSB mask of PAL-I1 system as compared with that of PAL-Isystem.
Upper Adjacent Channel InterferenceAnalogue TV (unwanted) Channel 33/567.25 MHz Channel 33/567.25 MHz
PAL-I PAL-I1 PAL-K PAL-I PAL-I1 PAL-KDVB-T (wanted) Channel 32/562 MHz Channel 32/562 - 0.167 MHzSDTV-1 (2k, 64 QAM, CR = 2/3, GI = 1/8), V-TER receiver (Note 1) - 21 -21 -22 -21 -21 -22SDTV-2 (8k, 64 QAM, CR = 2/3, GI = 1/16), V-TER receiver (Note 1) -19 -20 -21 -19 -20 -21SDTV-3 (8k, 16 QAM, CR = 1/2, GI = 1/16), V-TER receiver (Note 1) -20 -20 -25 -22 -20 -24SDTV-1 (2k, 64 QAM, CR = 2/3, GI = 1/8), V-TER receiver (Note 2) - 21 -22 -21SDTV-1 (2k, 64 QAM, CR = 2/3, GI = 1/8), NDS receiver (Note 2) -34 -40 -39
Note 1: Measurement procedures based on a target BER of 2E-4
Note 2: Measurement procedures based on subjective failure point (SFP) method
Table 11 – PAL into DVB-T Interference (Upper Adjacent Channel Interference)
Lower Adjacent Channel InterferenceAnalogue TV (unwanted) Channel 31/551.25 MHz Channel 31/551.25 MHz
PAL-I PAL-I1 PAL-K PAL-I PAL-I1 PAL-KDVB-T (wanted) Channel 32/562 MHz Channel 32/562 + 0.167 MHzSDTV-1 (2k, 64 QAM, CR = 2/3, GI = 1/8), V-TER receiver (Note 1) - 22 -23 -23 -23 -24 -24SDTV-2 (8k, 64 QAM, CR = 2/3, GI = 1/16), V-TER receiver (Note 1) -22 -21 -23 -23 -24 -24SDTV-3 (8k, 16 QAM, CR = 1/2, GI = 1/16), V-TER receiver (Note 1) -20 -21 -27 -21 -22 -27SDTV-1 (2k, 64 QAM, CR = 2/3, GI = 1/8), V-TER receiver (Note 2) -22 -23 -23SDTV-1 (2k, 64 QAM, CR = 2/3, GI = 1/8), NDS receiver (Note 2) -36 -36 -35
Note 1: Measurement procedures based on a target BER of 2E-4
Note 2: Measurement procedures based on subjective failure point (SFP) method
Table 12 – PAL into DVB-T Interference (Lower Adjacent Channel Interference)
Co-Channel InterferenceAnalogue TV (unwanted) Channel 32/559.25 MHz Channel 32/559.25 MHz Channel 32/559.25 MHz
PAL-I PAL-I1 PAL-K PAL-I PAL-I1 PAL-K PAL-I PAL-I1 PAL-KDVB-T (wanted) Channel 32/562 – 0.167 MHz Channel 32/562 MHz Channel 32/562 + 0.167 MHzSDTV-1 (2k, 64 QAM, CR = 2/3, GI =1/8), V-TER receiver (Note 1)
9 9 6 8 8 6 9 9 8
SDTV-2 (8k, 64 QAM, CR = 2/3, GI =1/16), V-TER receiver (Note 1)
4 4 6 6 6 7 6 6 8
SDTV-3 (8k, 16 QAM, CR = 1/2, GI =1/16), V-TER receiver (Note 1)
-8 -9 -5 -4 -4 -8 -1 -2 -7
SDTV-1 (2k, 64 QAM, CR = 2/3, GI =1/8), V-TER receiver (Note 2)
4 4 3
SDTV-1 (2k, 64 QAM, CR = 2/3, GI =1/8), NDS receiver (Note 2)
2 2 0
Note 1: Measurement procedures based on a target BER of 2E-4
Note 2: Measurement procedures based on subjective failure point (SFP) method
Table 13 – PAL into DVB-T Interference (Co-Channel Interference)

55
Image Channel InterferenceAnalogue TV (unwanted) Channel 32/559.25 MHz Channel 32/559.25 MHz Channel 32/559.25 MHz
PAL-I PAL-I1 PAL-K PAL-I PAL-I1 PAL-K PAL-I PAL-I1 PAL-KDVB-T (wanted) Channel 23/490 – 0.167 MHz Channel 23/490 MHz Channel 23/490 + 0.167 MHzSDTV-1 (2k, 64 QAM, CR = 2/3, GI =1/8), V-TER receiver
< -46 < -42 < -46 < -46 < -42 < -46 < -46 < -42 < -46
SDTV-2 (8k, 64 QAM, CR = 2/3, GI =1/16) , V-TER receiver
< -46 < -42 < -46 < -46 < -42 < -46 < -46 < -42 < -46
SDTV-3 (8k, 16 QAM, CR = 1/2, GI =1/16), V-TER receiver
< -46 < -42 < -46 < -46 < -42 < -46 < -46 < -42 < -46
Note : Measurement procedures based on a target BER of 2E-4
Table 14 – PAL into DVB-T Interference (Image Channel Interference)
Parameters of DVB-T signal: 2k, 64 QAM, CR = 2/3, GI = 1/8
Upper Adjacent Channel Interference Lower Adjacent Channel InterferenceDVB-T (unwanted)
Channel 32/562 MHzDVB-T (unwanted)
Channel 32/562 + 0.167 MHzDVB-T (unwanted)
Channel 32/562 - 0.167 MHzDVB-T (unwanted)
Channel 32/562 MHzAnalogue TV (wanted)
Channel 31/551.25 MHzAnalogue TV (wanted)
Channel 31/551.25 MHzAnalogue TV (wanted)
Channel 33/567.25 MHzAnalogue TV (wanted)
Channel 33/567.25 MHz
Sample Number
PAL-I PAL-I1 PAL-K PAL-I PAL-I1 PAL-K PAL-I PAL-I1 PAL-K PAL-I PAL-I1 PAL-K1 -9.0 -7.3 5.7 7.0 9.0 7.3 6.0 8.72 0.0 -4.3 -1.7 -0.7 -1.7 0.0 -0.7 -1.73 -8.7 -4.0 -5.7 -10.0 -9.0 -11.3 -0.3 0.3 0.7 -1.3 0.7 2.74 -7.0 -9.3 1.0 1.0 1.0 1.3 1.0 0.75 -3.0 -5.3 4.0 3.7 2.7 2.7 3.0 3.76 -2.7 -2.0 -2.7 -1.7 -4.0 -1.3 -1.7 -3.77 -9.7 -8.7 -1.0 -1.3 -2.0 -0.7 -3.3 -1.08 -10.0 -7.7 -8.0 -10.0 -8.0 -9.0 12.3 10.0 12.3 12.0 12.3 12.39 -4.7 -3.0 6.3 5.7 6.7 6.7 7.0 7.0
10 -11.3 -9.3 5.3 6.0 7.3 7.3 6.3 7.311 -13.0 -10.0 -11.3 -11.7 -11.0 -11.7 -0.3 0.3 -1.0 -0.3 -0.3 -1.312 0.0 0.0 -8.3 -4.0 -4.3 -8.0 -1.0 -0.3 -1.0 -0.7 -0.7 -0.713 -7.7 -6.0 -12.7 -9.7 -11.3 -12.7 3.7 2.0 2.7 4.0 3.7 2.714 -12.7 -10.0 -12.7 -11.0 -10.3 -13.3 0.0 -0.3 -1.0 0.3 2.0 0.315 -9.7 -6.0 -10.3 -12.0 -10.7 -12.0 -0.7 0.0 0.0 -0.3 0.7 0.016 -5.0 -4.0 -8.3 -6.0 -5.7 -8.7 4.7 5.7 3.0 4.0 4.7 3.317 -9.0 -6.3 -7.7 -9.0 -8.0 -8.3 5.0 5.7 4.3 6.0 5.7 7.018 -4.0 -5.3 0.3 -0.7 -0.3 0.7 -1.3 -1.019 -4.0 -7.0 6.3 7.3 6.3 6.3 6.3 7.720 -6.0 -9.0 5.0 7.0 6.7 8.7 5.3 5.721 -2.0 -3.3 -0.7 -1.3 -1.3 0.0 -0.3 -1.722 -10.0 -8.3 -1.3 -1.7 -2.7 0.0 -0.3 -2.323 -7.3 -9.7 -3.0 -2.0 -2.0 -1.7 -1.3 -1.7
Count: 23 9 9 23 9 9 23 23 23 23 23 23Maximum: 0 0 -5.7 -2 -4.3 -8 12.3 10 12.3 12 12.3 12.3Minimum: -13 -10 -13 -12 -11 -13 -3 -2 -4 -1.7 -3.3 -3.7
Average: -6.8 -6 -9.4 -7.6 -8.7 -11 2.04 2.25 1.99 2.65 2.38 2.35Standard Deviation: 3.79 3.14 2.43 2.91 2.45 2.05 3.83 3.7 4.3 3.9 3.79 4.34
Parameters of DVB-T signal: 8k, 64 QAM, CR = 2/3, GI = 1/16
Upper Adjacent Channel Interference Lower Adjacent Channel InterferenceDVB-T (unwanted)
Channel 32/562 MHzDVB-T (unwanted)
Channel 32/562 + 0.167 MHzDVB-T (unwanted)
Channel 32/562 MHzDVB-T (unwanted)
Channel 32/562 - 0.167 MHzAnalogue TV (wanted)
Channel 31/551.25 MHzAnalogue TV (wanted)
Channel 31/551.25 MHzAnalogue TV (wanted)
Channel 33/567.25 MHzAnalogue TV (wanted)
Channel 33/567.25 MHz
Sample Number
PAL-I PAL-I1 PAL-K PAL-I PAL-I1 PAL-K PAL-I PAL-I1 PAL-K PAL-I PAL-I1 PAL-K12345678 -8.7 -9 -9.3 -9 -9 -9.7 12 12 11.7 11 10.3 13.39
101112 0 -1.7 -7.7 -4 -4.3 -8.3 -2.3 -1.7 -1.3 -2.7 -3.3 -213 -6.7 -7.3 -12 -10 -10 -13 4 2.67 3.33 1.33 0.67 2.3314 -10 -10 -12 -10 -10 -13 -1 0.33 0.33 -1 -2 -0.715 -7.7 -8 -12 -11 -9.7 -13 0.33 0.67 0 -1 -2 -116 -5 -5 -7.3 -5 -5.7 -7 4.33 5.33 1.67 5 6 317181920212223
Count: 6 6 6 6 6 6 6 6 6 6 6 6Maximum: 0 -1.7 -7.3 -4 -4.3 -7 12 12 11.7 11 10.3 13.3Minimum: -10 -10 -12 -11 -10 -13 -2.3 -1.7 -1.3 -2.7 -3.3 -2
Average: -6.3 -6.8 -10 -8.2 -8.2 -11 2.89 3.22 2.61 2.11 1.61 2.5Standard Deviation: 3.54 3.05 2.3 2.97 2.53 2.64 5.2 4.91 4.71 5.1 5.42 5.66
Table 15 - DVB-T into PAL Interference (Adjacent Channel Interference)

56
Parameters of DVB-T signal: 2k, 64 QAM, CR = 2/3, GI = 1/8
Co-Channel Interference Image Channel InterferenceChannel 32/562 MHz Channel 32/562 - 0.167 MHz Channel 32/562 MHz Channel 32/562 + 0.167 MHz
Channel 32/559.25 MHz Channel 23/487.25 MHz Channel 23/487.25 MHz Channel 23/487.25 MHz
Sample Number
PAL-I PAL-I1 PAL-K PAL-I PAL-I1 PAL-K PAL-I PAL-I1 PAL-K PAL-I PAL-I1 PAL-K1 53.3 -18.0 -23.7 -19.32 50.7 -5.7 -7.0 -7.03 50.0 51.7 49.0 -18.0 -19.7 -19.3 -17.7 -16.7 -22.0 -15.7 -15.7 -21.34 52.3 -7.0 -9.0 -8.35 50.7 -13.0 -15.3 -13.76 55.3 -6.3 -8.0 -9.07 55.0 -5.3 -8.3 -9.38 51.3 51.7 49.3 -23.0 -25.3 -26.7 -22.0 -25.0 -26.0 -21.7 -23.7 -27.39 52.3 -10.3 -13.0 -13.0
10 54.7 -12.0 -15.7 -16.011 52.7 51.3 48.0 -18.3 -21.3 -23.3 -18.7 -20.7 -20.7 -20.0 -21.3 -22.012 52.7 50.3 52.0 -5.0 -7.0 -6.7 -4.3 -5.3 -7.3 -6.7 -6.7 -6.013 52.3 54.7 49.7 -12.0 -15.0 -19.3 -13.7 -16.0 -21.0 -14.7 -13.7 -20.714 55.0 51.3 49.3 -13.3 -15.0 -18.3 -14.7 -14.3 -19.7 -13.7 -13.3 -19.715 49.7 50.0 49.0 -8.7 -12.0 -11.3 -10.3 -11.0 -14.0 -10.3 -10.3 -14.316 47.0 49.0 53.3 -9.0 -13.3 -12.7 -10.3 -8.7 -13.0 -10.7 -8.7 -13.717 59.3 53.7 49.3 -16.0 -17.0 -23.0 -17.7 -18.3 -21.3 -17.7 -18.0 -23.718 52.3 -10.0 -13.7 -12.719 56.0 -14.7 -15.7 -15.020 54.3 -19.3 -21.7 -19.321 52.0 -9.3 -12.3 -11.722 53.3 -5.3 -8.0 -8.323 48.3 -7.0 -11.7 -10.0
Count: 23 9 9 23 9 9 23 9 9 23 9 9Maximum: 59.3 54.7 53.3 -5 -7 -6.7 -4.3 -5.3 -7.3 -6.7 -6.7 -6Minimum: 47 49 48 -23 -25 -27 -24 -25 -26 -22 -24 -27
Average: 52.6 51.5 49.9 -12 -16 -18 -14 -15 -18 -13 -15 -19Standard Deviation: 2.69 1.76 1.67 5.24 5.43 6.46 5.12 6.09 5.74 4.38 5.69 6.4
Parameters of DVB-T signal: 8k, 64 QAM, CR = 2/3, GI = 1/16
Co-Channel Interference Image Channel InterferenceChannel 32/562 MHz Channel 32/562 - 0.167 MHz Channel 32/562 MHz Channel 32/562 + 0.167 MHz
Channel 32/559.25 MHz Channel 23/487.25 MHz Channel 23/487.25 MHz Channel 23/487.25 MHz
Sample Number
PAL-I PAL-I1 PAL-K PAL-I PAL-I1 PAL-K PAL-I PAL-I1 PAL-K PAL-I PAL-I1 PAL-K12345678 47.3 47.3 45 -31 -29 -26 -30 -31 -27 -31 -32 -299
101112 46.7 47 46 -8.7 -9.3 -8 -9.3 -9.7 -7 -10 -10 -8.713 47.3 47.3 48.7 -19 -19 -21 -20 -19 -20 -21 -21 -2014 47.3 45.7 47.7 -20 -18 -20 -20 -22 -19 -21 -23 -1915 46.7 46.7 47.3 -15 -12 -15 -14 -14 -13 -14 -13 -1416 47.7 46.3 46.7 -14 -15 -12 -15 -15 -13 -16 -16 -1417181920212223
Count: 6 6 6 6 6 6 6 6 6 6 6 6Maximum: 47.7 47.3 48.7 -8.7 -9.3 -8 -9.3 -9.7 -7 -10 -10 -8.7Minimum: 46.7 45.7 45 -31 -29 -26 -30 -31 -27 -31 -32 -29
Average: 47.2 46.7 46.9 -18 -17 -17 -18 -19 -16 -19 -19 -17Standard Deviation: 0.41 0.65 1.29 7.56 6.86 6.62 6.93 7.51 6.91 7.27 7.7 6.89
Table 16 - DVB-T into PAL Interference (Co-Channel & Image Channel Interference)

57
Upper Adjacent Channel Interference
Wanted DVB-T signalSDTV-1 (2k,64 QAM, CR = 2/3, GI = 1/8)
Channel 32/562 MHz Channel 32/562 – 0.167 MHz Channel 32/562 + 0.167 MHz
Unwanted DVB-T signalSDTV-2 (8k,64 QAM, CR = 2/3, GI = 1/16)
Channel 33/570 MHz Channel 33/570 MHz Channel 33/570 MHz
V-TER receiver (Note 1) -15 -15 -15V-TER receiver (Note 2) -16 -16 -15NDS receiver (Note 2) -29 -29 -27Wanted DVB-T signal
SDTV-2 (8k,64 QAM, CR = 2/3, GI = 1/16)Channel 32/562 MHz Channel 32/562 – 0.167 MHz Channel 32/562 + 0.167 MHz
Unwanted DVB-T signalSDTV-1 (2k,64 QAM, CR = 2/3, GI = 1/8)
Channel 33/570 MHz Channel 33/570 MHz Channel 33/570 MHz
V-TER receiver (Note 1) -15 -16 -15
Note 1: Measurement procedures based on a target BER of 2E-4
Note 2: Measurement procedures based on subjective failure point (SFP) method
Table 17 - DVB-T into DVB-T Interference (Upper Adjacent Channel Interference)
Lower Adjacent Channel Interference
Wanted DVB-T signalSDTV-1 (2k,64 QAM, CR = 2/3, GI = 1/8)
Channel 32/562 MHz Channel 32/562 – 0.167 MHz Channel 32/562 + 0.167 MHz
Unwanted DVB-T signalSDTV-2 (8k,64 QAM, CR = 2/3, GI = 1/16)
Channel 31/554 MHz Channel 31/554 MHz Channel 31/554 MHz
V-TER receiver (Note 1) -15 -15 -16V-TER receiver (Note 2) -15 -16 -17NDS receiver (Note 2) -33 -31 -33Wanted DVB-T signal
SDTV-2 (8k,64 QAM, CR = 2/3, GI = 1/16)Channel 32/562 MHz Channel 32/562 – 0.167 MHz Channel 32/562 + 0.167 MHz
Unwanted DVB-T signalSDTV-1 (2k,64 QAM, CR = 2/3, GI = 1/8)
Channel 31/554 MHz Channel 31/554 MHz Channel 31/554 MHz
V-TER receiver (Note 1) -15 -15 -16
Note 1: Measurement procedures based on a target BER of 2E-4
Note 2: Measurement procedures based on subjective failure point (SFP) method
Table 18 – DVB-T into DVB-T Interference (Lower Adjacent Channel Interference)
Co-Channel Interference
Wanted DVB-T signalSDTV-1 (2k,64 QAM, CR = 2/3, GI = 1/8)
Channel 32/562 MHz Channel 32/562 – 0.167 MHz Channel 32/562 + 0.167 MHz
Unwanted DVB-T signalSDTV-2 (8k,64 QAM, CR = 2/3, GI = 1/16)
Channel 32/562 MHz Channel 32/562 MHz Channel 32/562 MHz
V-TER receiver (Note 1) 20 20 21V-TER receiver (Note 2) 19 19 19NDS receiver (Note 2) 19 19 19Wanted DVB-T signal
SDTV-2 (8k,64 QAM, CR = 2/3, GI = 1/16)Channel 32/562 MHz Channel 32/562 – 0.167 MHz Channel 32/562 + 0.167 MHz
Unwanted DVB-T signalSDTV-1 (2k,64 QAM, CR = 2/3, GI = 1/8)
Channel 32/562 MHz Channel 32/562 MHz Channel 32/562 MHz
V-TER receiver (Note 1) 21 20 20
Note 1: Measurement procedures based on a target BER of 2E-4
Note 2: Measurement procedures based on subjective failure point (SFP) method
Table 19 – DVB-T into DVB-T Interference (Co-Channel Interference)

58
Item Transmitter Mode Modulation Code Rate Guard Interval V-TER Delay Time NDS Delay TimeFrames Seconds Frames Seconds
1 Main A 64 QAM 2/3 1/8 26 1.04 26 1.042 Main B 64 QAM 2/3 1/4 26 1.04 26 1.043 Main C 64 QAM 2/3 1/32 26 1.04 -- --4 Main D 64 QAM 2/3 1/16 26 1.04 -- --5 Main E QPSK 1/2 1/8 26 1.04 26 1.046 Main F QPSK 1/2 1/4 26 1.04 26 1.047 Main G 16 QAM 1/2 1/8 26 1.04 26 1.048 Main H 16 QAM 1/2 1/4 26 1.04 26 1.049 Main I QPSK 1/2 1/32 25 1.00 -- --
10 Main J QPSK 1/2 1/16 26 1.04 -- --11 Main K 16 QAM 1/2 1/32 26 1.04 -- --12 Main L 16 QAM 1/2 1/16 26 1.04 -- --13 Slave A 64 QAM 2/3 1/8 26 1.04 25 1.0014 Slave B 64 QAM 2/3 1/4 26 1.04 25 1.0015 Slave C 64 QAM 2/3 1/32 26 1.04 -- --16 Slave D 64 QAM 2/3 1/16 26 1.04 -- --17 Slave E QPSK 1/2 1/8 26 1.04 26 1.0418 Slave F QPSK 1/2 1/4 27 1.08 26 1.0419 Slave G 16 QAM 1/2 1/8 27 1.08 26 1.0420 Slave H 16 QAM 1/2 1/4 27 1.08 26 1.0421 Slave I QPSK 1/2 1/32 26 1.04 -- --22 Slave J QPSK 1/2 1/16 26 1.04 -- --23 Slave K 16 QAM 1/2 1/32 26 1.04 -- --24 Slave L 16 QAM 1/2 1/16 26 1.04 -- --
Table 20 – Encoding/Decoding Delay

59
5. SUMMARY OF RESULTS
The results of the field test and the laboratory test are summarized as follows:
(1) Field Test
(a) Fixed ReceptionThe quality of the DVB-T picture and sound (SDTV and HDTV) received at the testsites was excellent and was much better than that of the PAL-I system used in HongKong, especially at receiving locations obstructed by buildings or hills. Thereception threshold of DVB-T was lower than that of PAL-I.
(b) Indoor ReceptionThe quality of the DVB-T pictures received by professional type and consumer typereceivers at the test sites was satisfactory while the quality of the PAL-I pictures waspoor.
(c) Mobile ReceptionThe test result indicated that DVB-T supported mobile reception. Satisfactorypicture and sound quality could be obtained, whereas PAL-I system was not feasible.
(d) Tidal FadingWith 64 QAM, reception of DVB-T signal close to the shore was blocky and loss ofpicture occurred frequently due to the tidal fading. The frequency of occurrence ofblocky picture or loss of picture decreased when the ERP of Master Station wasincreased from 100 W to 1 kW. Better reception was obtained when 16 QAM orQPSK was used.
(e) Reception through IBCCDSDVB-T signal could be received well through the IBCCDSs under test whensufficient signal level was provided. The picture quality of SDTV and HDTV wasexcellent. Better reception was obtained using DVB-T system as compared to thePAL-I system. It was noted that no adverse effect was caused to the reception ofPAL-I signals through the IBCCDSs and no complaint was received during the trialperiod.
(f) SFN OperationThe result indicated that SFN operation was feasible.

60
(2) Laboratory Test
(a) Protection RatiosThe practical protection ratios of co-channel interference, adjacent channelinterference and image channel interference were found.
(b) VSB Mask of PAL-I1The result of laboratory test revealed that better protection ratio for upper adjacentchannel interference for DVB-T interfered with by PAL-I1 signal could be obtainedusing modified VSB mask.
(c) Encoding/Decoding DelayThe overall encoding/decoding delay of the test system was found to be ranging from1.00 to 1.08 seconds.