Determination of DVB-T Signal Quality in Nigeria - African ...
8
Nigerian Journal of Technology Vol. , No. , January, , pp. –. www.nijotech.com Print ISSN: - Electronic ISSN: - http://dx.doi.org/10.4314/njt.v40i1.12 Determination of DVB-T Signal Quality in Nigeria: A Case Study of Jos, Plateau State, Nigeria E. E. C. Igbonoba * , O. Omoifo Computer Engineering Department, University of Benin, Benin City, Edo State, NIGERIA. Abstract This study presents the evaluation of digital video broadcasting-terrestrial second generation (DVB-T2) Television signal quality in Jos using Integrated Television Services Limited signal. The delivery of quality Television signal remains problematic in Nigeria due to signal attenuation and degradation between the transmitter and receiver station. This is primarily due to environmental and atmospheric perturbations prevalent along the signal paths. This research aim is to determine the signal quality of DVB-T2 Television system in Jos, Plateau State. The simple field measurement methodology was adopted in measuring field strength and channel power parameters. These measurement parameters were used to calculate for carrier-to-noise ratio (CNR) and signal-to-noise ratio (SNR) through empirical method. Finally, CNR and SNR were used to determine the signal quality of DVB-T2 signal in Jos. The result of the research shows that DVB-T2 signal in the primary service areas has good and reliable signal apart from the rocky environments. Keywords: digital video broadcasting-terrestrial, atmospheric interference, carrier to noise ratio, signal to noise ratio . INTRODUCTION The second generation terrestrial broadcast transmission system (DVB-T2) was designed pur- posely to replace the analogue video broadcast- ing technology because of the problems of ghost images due to multipath distortion in the radio signals which degrades the quality of the ana- log broadcast signals [1]. The DVB-T2 is the world’s most advanced digital terrestrial Televi- sion (DTT) system, offering more robustness, flex- ibility and at least 50% more efficiency than any other DTT system [1]. The DVB-T2 supports stan- dard definition (SD), high definition (HD), ultra- high definition (UHD), mobile Television (MTV), or combination of both handheld and mobile de- vice. It allows the simultaneous transmission of multiple services with different configurations thereby producing different robustness and qual- ity. This system permits new type of reception scenarios for digital terrestrial signals, like mo- bile and handheld pedestrian reception scenarios, so DVB-T2 can be used for providing fixed out- door, handheld, indoor and mobile services within the same channel due to the number of config- urations supported [2]. The main goal of DVB- T2 standard is to achieve more bandwidth com- pared to DVB-T, targeting high definition Televi- sion (HDTV) services, improve single frequency * Corresponding author (Tel: +234 (0)805 823 4965) Email addresses: [email protected] (E. E. C. Igbonoba), [email protected] (O. Omoifo) networks (SFN), providing specific service target- ing robustness, and services for fixed and portable receivers with 50% capacity throughput improve- ment compared to DVB-T [3]. The DVB-T2 broadcast transmission system is designed to increase capacity, ruggedness and flexibility compared to the DVB-T system while DVB-T2 Lite is the DVB-T2 profile designed to efficiently deliver Television (TV) and radio ser- vices for mobile devices such as phones and tablets [4]. This has encouraged substantial growth in the mobile communication services over the last few years [5]. It has become inevitable to trans- mit high quality and capacity broadcast network in Nigeria. The prediction of coverage accuracy has become extremely important in broadcast- ing [6]. Therefore, for more accurate coverage design of modern Television broadcast networks; signal strength, power channel, carrier-to-noise ratio (CNR) and signal-to-noise ratio (SNR) mea- surements must be taken into consideration in or- der to provide an efficient and reliable coverage area with acceptable quality TV services. During the radio wave propagation, the signal strength decreases as the distance between the transmit- ter and receiver increases. Moreover, the mech- anisms of the electromagnetic wave propagation are diverse and can be generally classified as re- flection, diffraction, and scattering. The complex propagation environment makes the prediction of the received signal strength a very difficult [7]. This research addresses the comparisons be- tween the theoretical and the empirical propaga- © F E, UNN, .
-
Upload
khangminh22 -
Category
Documents
-
view
0 -
download
0
Transcript of Determination of DVB-T Signal Quality in Nigeria - African ...
Nigerian Journal of TechnologyVol. 40, No. 1, January, 2021, pp. 81–88.
www.nijotech.com
Print ISSN: 0331-8443Electronic ISSN: 2467-8821
http://dx.doi.org/10.4314/njt.v40i1.12
Determination of DVB-T2 Signal Quality in Nigeria: ACase Study of Jos, Plateau State, Nigeria
E. E. C. Igbonoba∗, O. OmoifoComputer Engineering Department, University of Benin, Benin City, Edo State, NIGERIA.
AbstractThis study presents the evaluation of digital video broadcasting-terrestrial second generation (DVB-T2) Televisionsignal quality in Jos using Integrated Television Services Limited signal. The delivery of quality Television signalremains problematic in Nigeria due to signal attenuation and degradation between the transmitter and receiverstation. This is primarily due to environmental and atmospheric perturbations prevalent along the signal paths.This research aim is to determine the signal quality of DVB-T2 Television system in Jos, Plateau State. The simplefield measurement methodology was adopted in measuring field strength and channel power parameters. Thesemeasurement parameters were used to calculate for carrier-to-noise ratio (CNR) and signal-to-noise ratio (SNR)through empirical method. Finally, CNR and SNR were used to determine the signal quality of DVB-T2 signal inJos. The result of the research shows that DVB-T2 signal in the primary service areas has good and reliable signalapart from the rocky environments.
Keywords: digital video broadcasting-terrestrial, atmospheric interference, carrier to noise ratio, signal tonoise ratio
1. INTRODUCTIONThe second generation terrestrial broadcast
transmission system (DVB-T2) was designed pur-posely to replace the analogue video broadcast-ing technology because of the problems of ghostimages due to multipath distortion in the radiosignals which degrades the quality of the ana-log broadcast signals [1]. The DVB-T2 is theworld’s most advanced digital terrestrial Televi-sion (DTT) system, offering more robustness, flex-ibility and at least 50% more efficiency than anyother DTT system [1]. The DVB-T2 supports stan-dard definition (SD), high definition (HD), ultra-high definition (UHD), mobile Television (MTV),or combination of both handheld and mobile de-vice. It allows the simultaneous transmissionof multiple services with different configurationsthereby producing different robustness and qual-ity. This system permits new type of receptionscenarios for digital terrestrial signals, like mo-bile and handheld pedestrian reception scenarios,so DVB-T2 can be used for providing fixed out-door, handheld, indoor and mobile services withinthe same channel due to the number of config-urations supported [2]. The main goal of DVB-T2 standard is to achieve more bandwidth com-pared to DVB-T, targeting high definition Televi-sion (HDTV) services, improve single frequency
∗Corresponding author (Tel: +234 (0)805 823 4965)Email addresses: [email protected] (E. E.
C. Igbonoba), [email protected] (O.Omoifo)
networks (SFN), providing specific service target-ing robustness, and services for fixed and portablereceivers with 50% capacity throughput improve-ment compared to DVB-T [3].The DVB-T2 broadcast transmission system is
designed to increase capacity, ruggedness andflexibility compared to the DVB-T system whileDVB-T2 Lite is the DVB-T2 profile designed toefficiently deliver Television (TV) and radio ser-vices formobile devices such as phones and tablets[4]. This has encouraged substantial growth inthe mobile communication services over the lastfew years [5]. It has become inevitable to trans-mit high quality and capacity broadcast networkin Nigeria. The prediction of coverage accuracyhas become extremely important in broadcast-ing [6]. Therefore, for more accurate coveragedesign of modern Television broadcast networks;signal strength, power channel, carrier-to-noiseratio (CNR) and signal-to-noise ratio (SNR) mea-surements must be taken into consideration in or-der to provide an efficient and reliable coveragearea with acceptable quality TV services. Duringthe radio wave propagation, the signal strengthdecreases as the distance between the transmit-ter and receiver increases. Moreover, the mech-anisms of the electromagnetic wave propagationare diverse and can be generally classified as re-flection, diffraction, and scattering. The complexpropagation environment makes the prediction ofthe received signal strength a very difficult [7].This research addresses the comparisons be-
tween the theoretical and the empirical propaga-
© Faculty of Engineering, UNN, 2020.
82 E. E. C. Igbonoba and O. Omoifo
tion analysis achievable with the most extensivelyused propagation data for digital television (DTV)broadcasting measurements recognized by the In-ternational Telecommunication Union (ITU). Thesignal attenuation and degradation may be dueto effects of, free space loss, refraction, diffraction,reflection, aperture-medium coupling loss and ab-sorption arising from both atmospheric and en-vironmental perturbations. These perturbationsare mostly prevalent within the terrain contours,environment (urban or rural, vegetation and fo-liage), propagation medium (dry or moist air), thesignal paths between the transmitter (TX) and thereceiver (RX), the height and location of antennas[8]. The coverage area of DTT can be influencedby many factors; the output power of the trans-mitter, the height of transmitting and receivingantenna, terrain between the transmitter and re-ceiver, effect of meteorological parameters and fo-liage amongst others [9].2. BACKGROUND AND LITERATURE SUR-
VEY2.1. DVB-T2 System and ModulationThe DVB-T2 system fulfilled technical function-
alities mainly from DVB-T [10] and digital videobroadcasting – satellite second generation (DVB-S2) [11]. The DVB-T2, system offers meaningfullyenhanced performance in mobile channels and itscoding schemes greatly outperforms the forwarderror correction (FEC) techniques used in DVB-Thigher order constellation, 256-Quadrature Am-plitude Modulation (QAM), which increases thespectral efficiency and bit rate [2]. The flexibilityof DVB-T2 offers other configurable parametersthat could provide numerous configurationmodes,providing different levels of protection and bi-trates for DVB-T2 signals that could increase therobustness of the signal optimize data transmis-sion capacity, and some combinations can be cho-sen to balance between robustness and transmis-sion capacity. The DVB-T2 also provides mobileand pedestrian reception with standard defini-tion, high definition and other services available.The DVB-T2 services and higher layer signalingdata are transmitted in physical layer pipes (PLP)[12]. The system permits the transmission of mul-tiple PLP at the same time, with different lev-els of coding, modulation, and time interleavingwhich permits one service for mobile receptionand other services for fixed high definition tele-vision (HDTV) reception.The DVB-T2 uses multiple carrier orthogonal
frequency division multiplexing (OFDM) tech-niques, adding forward error correction (FEC)produces coded OFDM (COFDM) which improvesthe robustness of transmission [1]. The 64-QAMand 256-QAMare themodulation techniques usedin DVB-T2 technology and Nigeria adopted 256-QAM technique, delivering a gross data rate of 8bits per symbol per carrier.2.2. Signal Quality Parameters PhilosophyIn this research, carrier-to-noise ratio (CNR)
and signal-to-noise ratio (SNR) were used to de-
termine the performance and signal quality ofDVB-T2 receiver.2.2.1. Carrier to noise ratio (CNR)The CNR measures the received carrier
strength relative to the strength of the receivednoise or CNR is defined as the ratio of therelative power level to the noise level in thesystem bandwidth. The High CNR ratios provideenhanced quality of reception, and largely highercommunications accuracy and reliability, thanlow CNR ratios [13]. The CNR is calculatedusing the following link budget formula:
CNR = Preceived
Pnoise= Preceived
F ×K ×To ×B(1)
where Pnoise = Received noise Input power; F =Received noise figure; Preceived = Minimum re-ceiver Input power; B = Received noise bandwidth(MHz); K = Boltzman constant; To = Absolutetemperature (290k); CNR = Carrier-to-noise ratio
Preceived(dB)=CNR(dB)+F(dB)10log10 B(MHz)−114
(2)
The CNR describes the robustness of transmis-sion systems with respect to noise and interfer-ence. In annex, CNR is used to define the signallevel required to receiving a viable signal in noiseand interference limited channels. Then, the de-termination of the CNR is very importance fornetwork planning as it gives a true picture of car-rier analysis recognition or if eliminated by ambi-ent and system noise. The CNR provides a ratefor the quality of a communication channel [1].2.2.2. Signal to noise ratio (SNR)The SNR is the ratio of the received signal
strength over the noise strength within the fre-quency range of operation. The noise strengthmay include the noise in the atmosphere or lo-cation and other unwanted signals (interference).The signal-to-noise ratio is an accepted parame-ter used to assess the quality of a communica-tion link and is measured in decibels (dB). Fur-thermore, SNR is calculated as the ratio of av-erage symbol power to noise power. The noisepower includes any factor that causes the sym-bol to differ from the ideal state position, includ-ing additive noise, distortion and inter-symbol-interference (ISI) [14]. The SNR is given as:
SNR = 10log(signal powernoise power
)(3)
SNR = CNR−10log10 m (4)where m = log2 M for M – QAM in DVB-T2, M =64 or 256; F = 6 dB and B = 7.71 MHz for carriermode 8 k for 8 MHz channel.The DVB-T2 signal was determined in this re-
search work using the combination of CNR andSNR calculated from the fieldmeasurements. Re-sults obtained from the measured channel powerin decibel millivolts (dBmV) were converted to re-ceive power in dBm.
Nigerian Journal of Technology (NIJOTECH) Vol. 40, No. 1, January 2021.
Determination of DVB-T2 Signal Quality in Nigeria 83
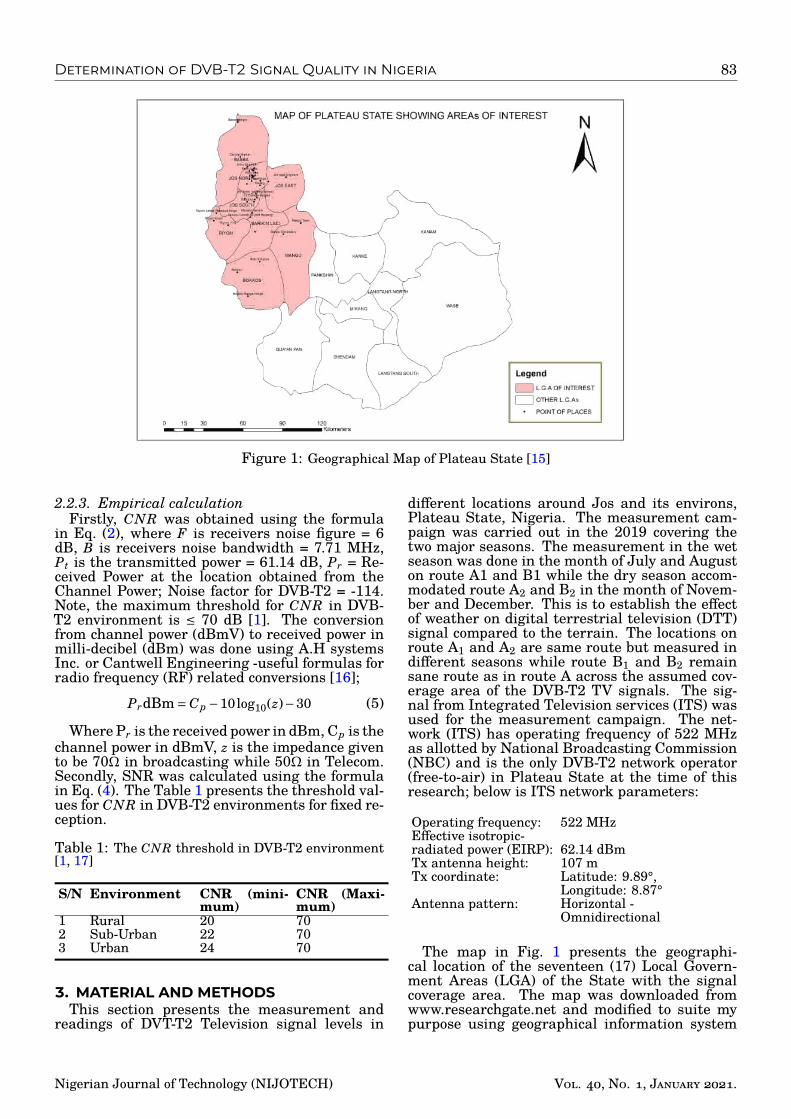
Figure 1: Geographical Map of Plateau State [15]
2.2.3. Empirical calculationFirstly, CNR was obtained using the formula
in Eq. (2), where F is receivers noise figure = 6dB, B is receivers noise bandwidth = 7.71 MHz,Pt is the transmitted power = 61.14 dB, Pr = Re-ceived Power at the location obtained from theChannel Power; Noise factor for DVB-T2 = -114.Note, the maximum threshold for CNR in DVB-T2 environment is ≤ 70 dB [1]. The conversionfrom channel power (dBmV) to received power inmilli-decibel (dBm) was done using A.H systemsInc. or Cantwell Engineering -useful formulas forradio frequency (RF) related conversions [16];
PrdBm= Cp −10log10(z)−30 (5)
Where Pr is the received power in dBm, Cp is thechannel power in dBmV, z is the impedance givento be 70Ω in broadcasting while 50Ω in Telecom.Secondly, SNR was calculated using the formulain Eq. (4). The Table 1 presents the threshold val-ues for CNR in DVB-T2 environments for fixed re-ception.
Table 1: The CNR threshold in DVB-T2 environment[1, 17]
S/N Environment CNR (mini-mum)
CNR (Maxi-mum)
1 Rural 20 702 Sub-Urban 22 703 Urban 24 70
3. MATERIAL AND METHODSThis section presents the measurement and
readings of DVT-T2 Television signal levels in
different locations around Jos and its environs,Plateau State, Nigeria. The measurement cam-paign was carried out in the 2019 covering thetwo major seasons. The measurement in the wetseason was done in the month of July and Auguston route A1 and B1 while the dry season accom-modated route A2 and B2 in the month of Novem-ber and December. This is to establish the effectof weather on digital terrestrial television (DTT)signal compared to the terrain. The locations onroute A1 and A2 are same route but measured indifferent seasons while route B1 and B2 remainsane route as in route A across the assumed cov-erage area of the DVB-T2 TV signals. The sig-nal from Integrated Television services (ITS) wasused for the measurement campaign. The net-work (ITS) has operating frequency of 522 MHzas allotted by National Broadcasting Commission(NBC) and is the only DVB-T2 network operator(free-to-air) in Plateau State at the time of thisresearch; below is ITS network parameters:
Operating frequency: 522 MHzEffective isotropic-radiated power (EIRP): 62.14 dBmTx antenna height: 107 mTx coordinate: Latitude: 9.89°,
Longitude: 8.87°Antenna pattern: Horizontal -
Omnidirectional
The map in Fig. 1 presents the geographi-cal location of the seventeen (17) Local Govern-ment Areas (LGA) of the State with the signalcoverage area. The map was downloaded fromwww.researchgate.net and modified to suite mypurpose using geographical information system
Nigerian Journal of Technology (NIJOTECH) Vol. 40, No. 1, January 2021.

84 E. E. C. Igbonoba and O. Omoifo
software (ArcGIS).In carrying out a detail DVB -T2 signal mea-
surement to establish the methodology usedin this research; the following componentsfor conducting measurement in the field wastaken seriously i.e. Measurement Environment,Measurement Parameters, Measurement Tool,Measurement Plans/layout, Measurement Proce-dures/Technique and Data presentation.The choice of plateau state for themeasurement
campaignwas predicated on the fact that the statewas used for the digital switch over (DSO) pi-lot programme in Nigeria. During the measure-ment exercise, the DTT signal was present inonly eight (8) Local Government Areas (Jos North,Jos East, Jos South, Bassa, Riyom, Barkin Ladi,Bokkos and Mangu) and the measured locationswere ninety six (96) across route A1, A2, B1 and B2(24 locations each). It was observed that the par-ent signal could not go beyond eight Local Govern-ment Area of Plateau State except with the helpof Direct-to-Home (DTH) service or the introduc-tion of repeater and booster station which was notavailable at the time of this measurement. How-ever, the perturbations that may affect the smoothtransmission of signal from the DVB-T2 transmit-ter to the receiver were put into consideration dur-ing the measurement.The key parameters measured with the Deviser
E8000A spectrum analyzer were field strength(dBµV/m – decibel microvolts per meter) andchannel power (dBVm – decibel volts meter) only.To ensure high stability and relative precision us-ing spectrum analyzer in carrying out field mea-surement in broadcasting, ITU recommendationson field measurement, relevant equipment andsettings specified in [15] were followed to adoptspecified ITU regulations The measurement toolfor the field test system comprise of test equip-ment carried in a Van and driven to test locationswithin the selected areas. The test equipmentused as presented in Fig. 2 include:A. A Deviser Spectrum analyzer E8000A series
parameterB. A Calibrated Logarithmic Antenna parame-
tersC. Dedicated decoder (Digital Terrestrial Re-
ceiver) capable of decoding SDTV and HDTV(DVB-T2) signals within 460 – 800 MHz car-rier frequencies.
D. A Television monitor capable of displayingSDTV and HDTV (DVB-T2) signals
E. Global positioning satellite (GPS) enablesmart phone
F. 75 Ω, 15 m RF cable and connectorsThe set-up for field strength, channel power
and reception quality measurement (ground androoftop level) procedure was carried out to achieveacceptable result as laid down by ITU; (fre-quency managers, monitoring services, broad-casters etc.). Below are the steps:
1. The equipment is connected as shown inFig. 2
2. The antenna was raised 10-meters aboveground level
3. The antenna was oriented for maximum sig-nal level considering the DVB-T2 transmitterclear line-of-sight and other obstacles on thetransmitter path
4. The field strength of DVB-T2 signal was mea-sured and recorded
5. The channel power of DVB-T2 signal and thenoise level were measured and recorded
6. The reception quality of the decoded signalwas assessed.
7. The coordinates of the location was takenwith Google earth map and recorded
8. The above steps were repeated three times ateach location.
Figure 2: Equipment Setup for Field Measurement
4. RESULT AND DISCUSSIONThe signal quality analysis was carried out us-
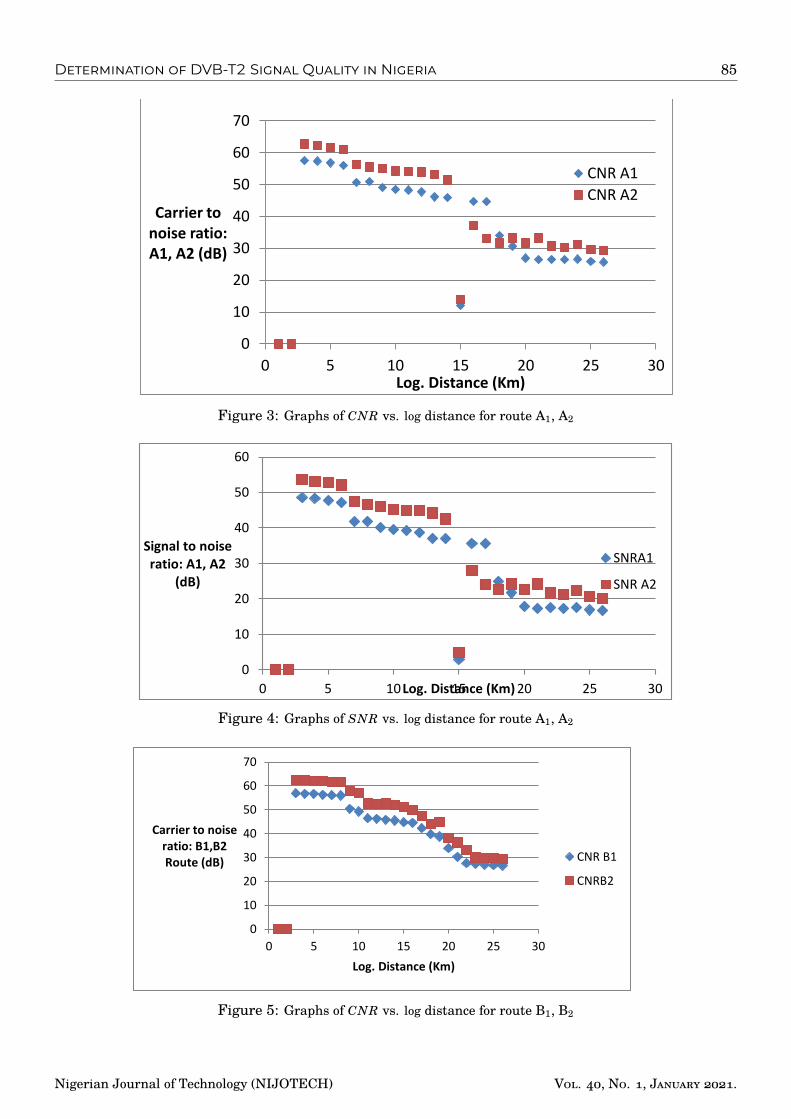
ing CNR and SNR parameters. The graphs inFig. 3 – 6 present the result of the CNR versus dis-tance and SNR distance in logarithm. The Fig. 3and 4 present results greatly influenced by ter-rain due to rocky hill at DU Community in JosSouth Local Government Area while Fig. 5 and 6were free from such influence because none of themeasured locations were located in such terrain.However, the general results presented in Fig. 3– 6 showed how weather influenced the measure-ment outcome (route A1 -– A2) and (B1 – B2) in re-lation to distance. The results obtained from thedifferent routes recorded the following values inTable 2 showing highest and lowest values in themeasured routes.
Nigerian Journal of Technology (NIJOTECH) Vol. 40, No. 1, January 2021.
Determination of DVB-T2 Signal Quality in Nigeria 85
0
10
20
30
40
50
60
70
0 5 10 15 20 25 30
Carrier to noise ratio: A1, A2 (dB)
Log. Distance (Km)
CNR A1
CNR A2
Figure 3: Graphs of CNR vs. log distance for route A1, A2
0
10
20
30
40
50
60
0 5 10 15 20 25 30
Signal to noise ratio: A1, A2
(dB)
Log. Distance (Km)
SNRA1
SNR A2
Figure 4: Graphs of SNR vs. log distance for route A1, A2
0
10
20
30
40
50
60
70
0 5 10 15 20 25 30
Carrier to noise ratio: B1,B2 Route (dB)
Log. Distance (Km)
CNR B1
CNRB2
Figure 5: Graphs of CNR vs. log distance for route B1, B2
Nigerian Journal of Technology (NIJOTECH) Vol. 40, No. 1, January 2021.
86 E. E. C. Igbonoba and O. Omoifo
0
10
20
30
40
50
60
0 5 10 15 20 25 30
Signal to noise ratio; B1, B2 Route (dB)
Log. Distance (Km)
SNS B1
SNR B2
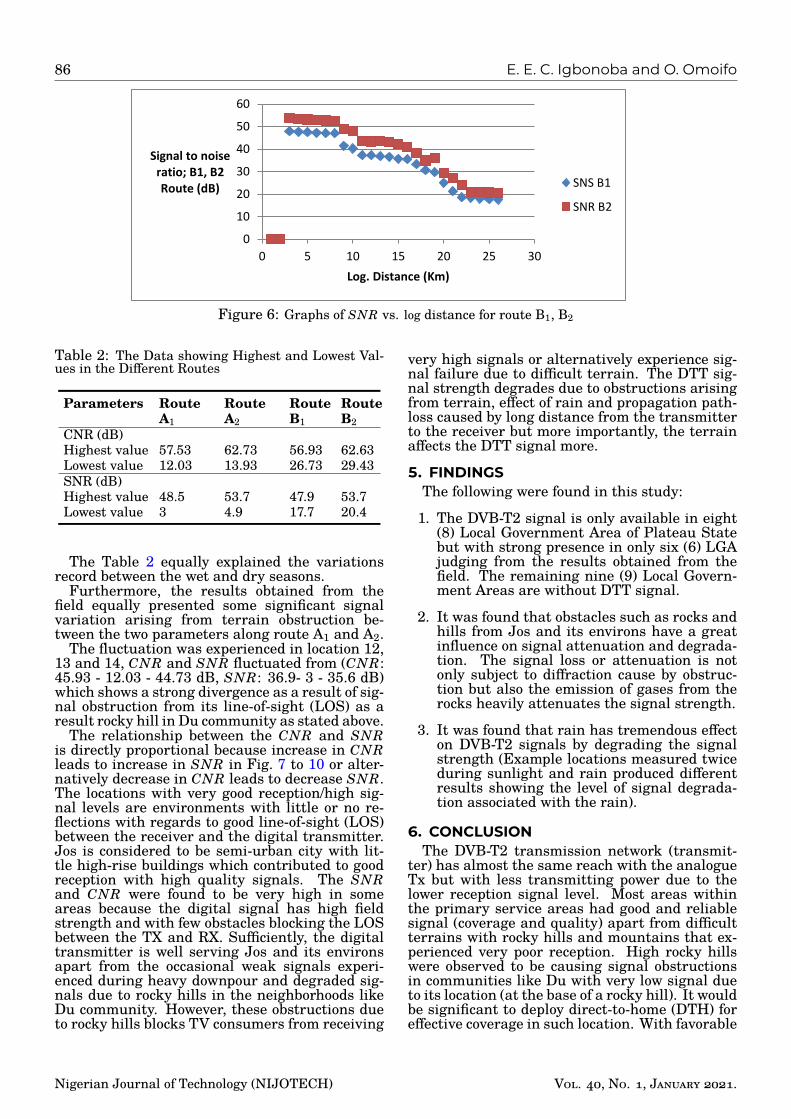
Figure 6: Graphs of SNR vs. log distance for route B1, B2
Table 2: The Data showing Highest and Lowest Val-ues in the Different Routes
Parameters Route Route Route RouteA1 A2 B1 B2
CNR (dB)Highest value 57.53 62.73 56.93 62.63Lowest value 12.03 13.93 26.73 29.43SNR (dB)Highest value 48.5 53.7 47.9 53.7Lowest value 3 4.9 17.7 20.4
The Table 2 equally explained the variationsrecord between the wet and dry seasons.Furthermore, the results obtained from the
field equally presented some significant signalvariation arising from terrain obstruction be-tween the two parameters along route A1 and A2.The fluctuation was experienced in location 12,
13 and 14, CNR and SNR fluctuated from (CNR:45.93 - 12.03 - 44.73 dB, SNR: 36.9- 3 - 35.6 dB)which shows a strong divergence as a result of sig-nal obstruction from its line-of-sight (LOS) as aresult rocky hill in Du community as stated above.The relationship between the CNR and SNR
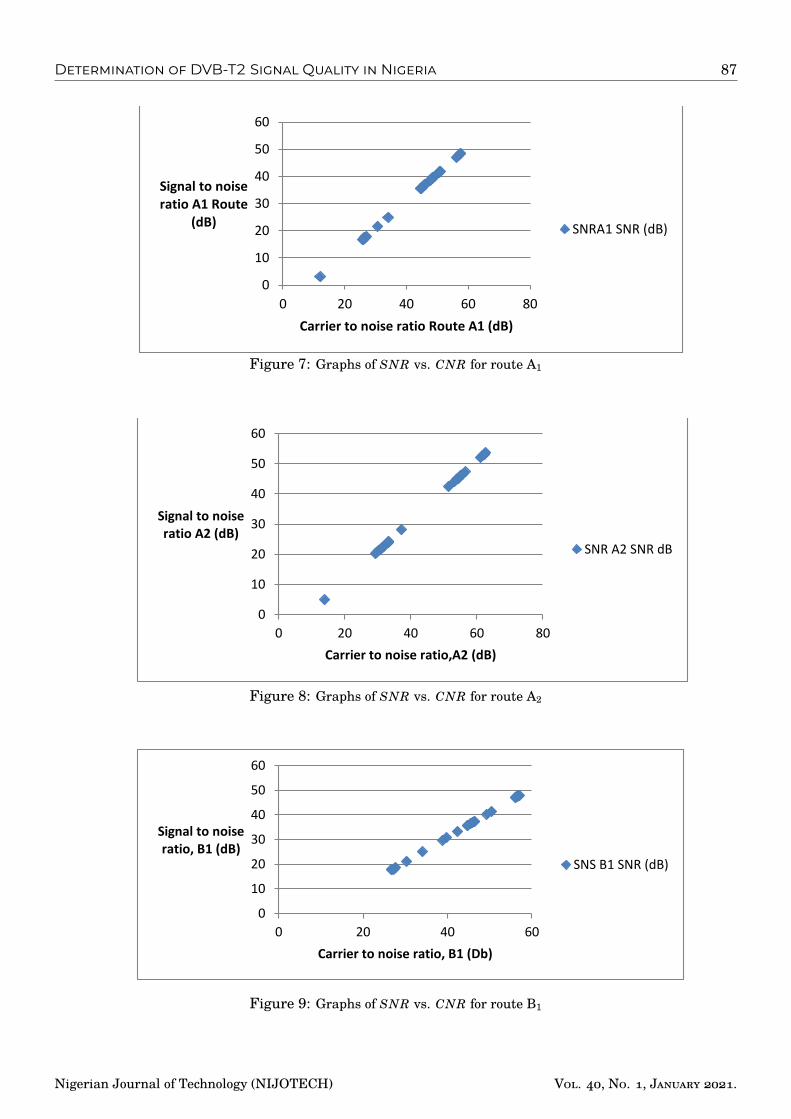
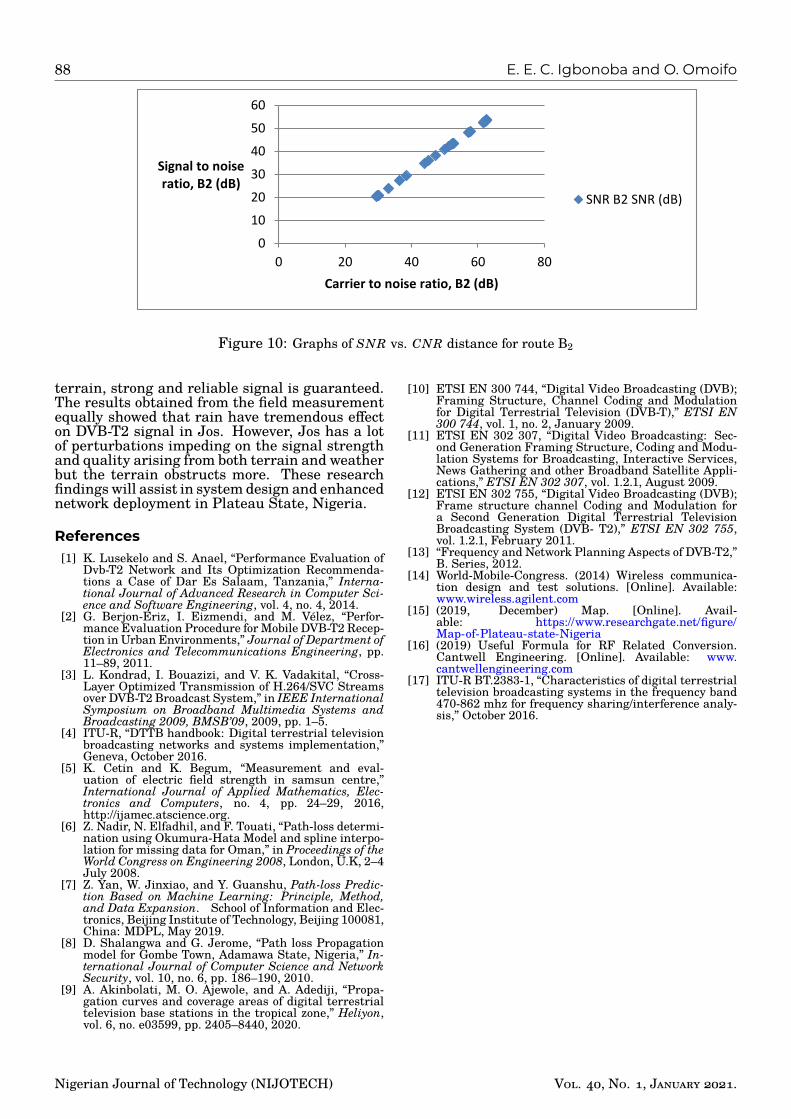
is directly proportional because increase in CNRleads to increase in SNR in Fig. 7 to 10 or alter-natively decrease in CNR leads to decrease SNR.The locations with very good reception/high sig-nal levels are environments with little or no re-flections with regards to good line-of-sight (LOS)between the receiver and the digital transmitter.Jos is considered to be semi-urban city with lit-tle high-rise buildings which contributed to goodreception with high quality signals. The SNRand CNR were found to be very high in someareas because the digital signal has high fieldstrength and with few obstacles blocking the LOSbetween the TX and RX. Sufficiently, the digitaltransmitter is well serving Jos and its environsapart from the occasional weak signals experi-enced during heavy downpour and degraded sig-nals due to rocky hills in the neighborhoods likeDu community. However, these obstructions dueto rocky hills blocks TV consumers from receiving
very high signals or alternatively experience sig-nal failure due to difficult terrain. The DTT sig-nal strength degrades due to obstructions arisingfrom terrain, effect of rain and propagation path-loss caused by long distance from the transmitterto the receiver but more importantly, the terrainaffects the DTT signal more.
5. FINDINGSThe following were found in this study:
1. The DVB-T2 signal is only available in eight(8) Local Government Area of Plateau Statebut with strong presence in only six (6) LGAjudging from the results obtained from thefield. The remaining nine (9) Local Govern-ment Areas are without DTT signal.
2. It was found that obstacles such as rocks andhills from Jos and its environs have a greatinfluence on signal attenuation and degrada-tion. The signal loss or attenuation is notonly subject to diffraction cause by obstruc-tion but also the emission of gases from therocks heavily attenuates the signal strength.
3. It was found that rain has tremendous effecton DVB-T2 signals by degrading the signalstrength (Example locations measured twiceduring sunlight and rain produced differentresults showing the level of signal degrada-tion associated with the rain).
6. CONCLUSIONThe DVB-T2 transmission network (transmit-
ter) has almost the same reach with the analogueTx but with less transmitting power due to thelower reception signal level. Most areas withinthe primary service areas had good and reliablesignal (coverage and quality) apart from difficultterrains with rocky hills and mountains that ex-perienced very poor reception. High rocky hillswere observed to be causing signal obstructionsin communities like Du with very low signal dueto its location (at the base of a rocky hill). It wouldbe significant to deploy direct-to-home (DTH) foreffective coverage in such location. With favorable
Nigerian Journal of Technology (NIJOTECH) Vol. 40, No. 1, January 2021.
Determination of DVB-T2 Signal Quality in Nigeria 87
0
10
20
30
40
50
60
0 20 40 60 80
Signal to noise ratio A1 Route
(dB)
Carrier to noise ratio Route A1 (dB)
SNRA1 SNR (dB)
Figure 7: Graphs of SNR vs. CNR for route A1
0
10
20
30
40
50
60
0 20 40 60 80
Signal to noise ratio A2 (dB)
Carrier to noise ratio,A2 (dB)
SNR A2 SNR dB
Figure 8: Graphs of SNR vs. CNR for route A2
0
10
20
30
40
50
60
0 20 40 60
Signal to noise ratio, B1 (dB)
Carrier to noise ratio, B1 (Db)
SNS B1 SNR (dB)
Figure 9: Graphs of SNR vs. CNR for route B1
Nigerian Journal of Technology (NIJOTECH) Vol. 40, No. 1, January 2021.
88 E. E. C. Igbonoba and O. Omoifo
0
10
20
30
40
50
60
0 20 40 60 80
Signal to noise ratio, B2 (dB)
Carrier to noise ratio, B2 (dB)
SNR B2 SNR (dB)
Figure 10: Graphs of SNR vs. CNR distance for route B2
terrain, strong and reliable signal is guaranteed.The results obtained from the field measurementequally showed that rain have tremendous effecton DVB-T2 signal in Jos. However, Jos has a lotof perturbations impeding on the signal strengthand quality arising from both terrain and weatherbut the terrain obstructs more. These researchfindingswill assist in systemdesign and enhancednetwork deployment in Plateau State, Nigeria.
References[1] K. Lusekelo and S. Anael, “Performance Evaluation of
Dvb-T2 Network and Its Optimization Recommenda-tions a Case of Dar Es Salaam, Tanzania,” Interna-tional Journal of Advanced Research in Computer Sci-ence and Software Engineering, vol. 4, no. 4, 2014.
[2] G. Berjon-Eriz, I. Eizmendi, and M. Vélez, “Perfor-mance Evaluation Procedure for Mobile DVB-T2 Recep-tion in Urban Environments,” Journal of Department ofElectronics and Telecommunications Engineering, pp.11–89, 2011.
[3] L. Kondrad, I. Bouazizi, and V. K. Vadakital, “Cross-Layer Optimized Transmission of H.264/SVC Streamsover DVB-T2 Broadcast System,” in IEEE InternationalSymposium on Broadband Multimedia Systems andBroadcasting 2009, BMSB’09, 2009, pp. 1–5.
[4] ITU-R, “DTTB handbook: Digital terrestrial televisionbroadcasting networks and systems implementation,”Geneva, October 2016.
[5] K. Cetin and K. Begum, “Measurement and eval-uation of electric field strength in samsun centre,”International Journal of Applied Mathematics, Elec-tronics and Computers, no. 4, pp. 24–29, 2016,http://ijamec.atscience.org.
[6] Z. Nadir, N. Elfadhil, and F. Touati, “Path-loss determi-nation using Okumura-Hata Model and spline interpo-lation for missing data for Oman,” in Proceedings of theWorld Congress on Engineering 2008, London, U.K, 2–4July 2008.
[7] Z. Yan, W. Jinxiao, and Y. Guanshu, Path-loss Predic-tion Based on Machine Learning: Principle, Method,and Data Expansion. School of Information and Elec-tronics, Beijing Institute of Technology, Beijing 100081,China: MDPL, May 2019.
[8] D. Shalangwa and G. Jerome, “Path loss Propagationmodel for Gombe Town, Adamawa State, Nigeria,” In-ternational Journal of Computer Science and NetworkSecurity, vol. 10, no. 6, pp. 186–190, 2010.
[9] A. Akinbolati, M. O. Ajewole, and A. Adediji, “Propa-gation curves and coverage areas of digital terrestrialtelevision base stations in the tropical zone,” Heliyon,vol. 6, no. e03599, pp. 2405–8440, 2020.
[10] ETSI EN 300 744, “Digital Video Broadcasting (DVB);Framing Structure, Channel Coding and Modulationfor Digital Terrestrial Television (DVB-T),” ETSI EN300 744, vol. 1, no. 2, January 2009.
[11] ETSI EN 302 307, “Digital Video Broadcasting: Sec-ond Generation Framing Structure, Coding and Modu-lation Systems for Broadcasting, Interactive Services,News Gathering and other Broadband Satellite Appli-cations,” ETSI EN 302 307, vol. 1.2.1, August 2009.
[12] ETSI EN 302 755, “Digital Video Broadcasting (DVB);Frame structure channel Coding and Modulation fora Second Generation Digital Terrestrial TelevisionBroadcasting System (DVB- T2),” ETSI EN 302 755,vol. 1.2.1, February 2011.
[13] “Frequency and Network Planning Aspects of DVB-T2,”B. Series, 2012.
[14] World-Mobile-Congress. (2014) Wireless communica-tion design and test solutions. [Online]. Available:www.wireless.agilent.com
[15] (2019, December) Map. [Online]. Avail-able: https://www.researchgate.net/figure/Map-of-Plateau-state-Nigeria
[16] (2019) Useful Formula for RF Related Conversion.Cantwell Engineering. [Online]. Available: www.cantwellengineering.com
[17] ITU-R BT.2383-1, “Characteristics of digital terrestrialtelevision broadcasting systems in the frequency band470-862 mhz for frequency sharing/interference analy-sis,” October 2016.
Nigerian Journal of Technology (NIJOTECH) Vol. 40, No. 1, January 2021.