Analysis of Sildenafil in Liquor and Health Wine Using Surface ...
13
International Journal of Molecular Sciences Article Analysis of Sildenafil in Liquor and Health Wine Using Surface Enhanced Raman Spectroscopy Shupei Xiao 1,2 and Yong He 1,2, * 1 College of Biosystems Engineering and Food Science, Zhejiang University, Hangzhou 310058, China; [email protected] 2 Key Laboratory of Spectroscopy Sensing, Ministry of Agriculture, Zhejiang University, Hangzhou 310058, China * Correspondence: [email protected]; Tel.: +86-0571-8898-2143 Received: 14 May 2019; Accepted: 31 May 2019; Published: 3 June 2019 Abstract: The illegal adulteration of sildenafil in herbal food supplements and alcoholic drinks immensely threatens human health due to its harmful side-effects. Therefore, it is important to accurately detect and identify the presence of sildenafil in alcoholic drinks. In this study, Opto Trace Raman 202 (OTR 202) was used as surface enhanced Raman spectroscopy (SERS) active colloids to detect sildenafil. The results demonstrated that the Raman enhancement factor (EF) of OTR 202 colloids reached 1.84 × 10 7 and the limits of detection (LODs) of sildenafil in health wine and liquor were found to be as low as 0.1 mg/L. Moreover, the SERS peaks of 645, 814, 1235, 1401, 1530 and 1584 cm -1 could be qualitatively determined as sildenafil characteristic peaks and the relationship between Raman peak intensity and sildenafil concentration in health wine and liquor were different. There was a good linear correlation between Raman peak intensity, and sildenafil concentration in health wine ranged 0.1–1 mg/L (0.9687< R 2 < 0.9891) and 1–10 mg/L(0.9701 < R 2 < 0.9840), and in liquor ranged 0.1–1 mg/L (0.9662 < R 2 < 0.9944) and 1–20 mg/L (0.9625 < R 2 < 0.9922). The relative standard deviations (RSD) were less than 5.90% (sildenafil in health wine) and 9.16% (sildenafil in liquor). The recovery ranged 88.92–104.42% (sildenafil in health wine) and 90.09–104.55% (sildenafil in liquor). In general, the sildenafil in health wine and liquor could be rapidly and quantitatively determined using SERS technique, which offered a simple and accurate alternative for the determination of sildenafil in alcoholic drinks. Keywords: sildenafil; surface-enhanced Raman spectroscopy; health wine; liquor; limit of detection; quantitative determination; linear relationship 1. Introduction Sildenafil is one of the inhibitors of phosphodiesterase type 5 (PDE-5), which is frequently added into health supplementary products for the treatment of erectile dysfunction (ED) in males [1]. Due to its side-effects such as headache, dyspepsia, back pain, rhinitis and flu syndrome, the usage of sildenafil must be strictly controlled by medical supervision [2,3]. Several investigations have indicated that sildenafil has been illegally adulterated into some dietary supplements, herbal medicines and alcoholic drinks [4–7]. Limited by the complicated sample processing and extraction, traditional methods for determining sildenafil mainly focus on high-performance liquid chromatography (HPLC) [8,9], ultraviolet spectrophotometry (UV) [10,11], gas chromatography-mass spectrometry (GC-MS) [12,13], thin layer chromatography (TLC) [14,15] and near infrared spectrometry (NIR) [16,17]. Ramirez et al. [18] quantified plasma levels of sildenafil and its metabolite by liquid chromatography (LC) with a C 18 reverse-phase column and UV detection; the limits of detection (LODs) and quantification were 1 and 10 ng/mL, respectively. Oris et al. [19] determined ardenafil, sildenafil, tadalafil, testosterone, procaine, Int. J. Mol. Sci. 2019, 20, 2722; doi:10.3390/ijms20112722 www.mdpi.com/journal/ijms
-
Upload
khangminh22 -
Category
Documents
-
view
4 -
download
0
Transcript of Analysis of Sildenafil in Liquor and Health Wine Using Surface ...

International Journal of
Molecular Sciences
Article
Analysis of Sildenafil in Liquor and Health WineUsing Surface Enhanced Raman Spectroscopy
Shupei Xiao 1,2 and Yong He 1,2,*1 College of Biosystems Engineering and Food Science, Zhejiang University, Hangzhou 310058, China;
[email protected] Key Laboratory of Spectroscopy Sensing, Ministry of Agriculture, Zhejiang University,
Hangzhou 310058, China* Correspondence: [email protected]; Tel.: +86-0571-8898-2143
Received: 14 May 2019; Accepted: 31 May 2019; Published: 3 June 2019�����������������
Abstract: The illegal adulteration of sildenafil in herbal food supplements and alcoholic drinksimmensely threatens human health due to its harmful side-effects. Therefore, it is important toaccurately detect and identify the presence of sildenafil in alcoholic drinks. In this study, Opto TraceRaman 202 (OTR 202) was used as surface enhanced Raman spectroscopy (SERS) active colloids todetect sildenafil. The results demonstrated that the Raman enhancement factor (EF) of OTR 202 colloidsreached 1.84 × 10⁷ and the limits of detection (LODs) of sildenafil in health wine and liquor werefound to be as low as 0.1 mg/L. Moreover, the SERS peaks of 645, 814, 1235, 1401, 1530 and 1584 cm−1
could be qualitatively determined as sildenafil characteristic peaks and the relationship betweenRaman peak intensity and sildenafil concentration in health wine and liquor were different. There wasa good linear correlation between Raman peak intensity, and sildenafil concentration in health wineranged 0.1–1 mg/L (0.9687< R2 < 0.9891) and 1–10 mg/L (0.9701 < R2 < 0.9840), and in liquor ranged0.1–1 mg/L (0.9662 < R2 < 0.9944) and 1–20 mg/L (0.9625 < R2 < 0.9922). The relative standarddeviations (RSD) were less than 5.90% (sildenafil in health wine) and 9.16% (sildenafil in liquor).The recovery ranged 88.92–104.42% (sildenafil in health wine) and 90.09–104.55% (sildenafil in liquor).In general, the sildenafil in health wine and liquor could be rapidly and quantitatively determinedusing SERS technique, which offered a simple and accurate alternative for the determination ofsildenafil in alcoholic drinks.
Keywords: sildenafil; surface-enhanced Raman spectroscopy; health wine; liquor; limit of detection;quantitative determination; linear relationship
1. Introduction
Sildenafil is one of the inhibitors of phosphodiesterase type 5 (PDE-5), which is frequently addedinto health supplementary products for the treatment of erectile dysfunction (ED) in males [1]. Due toits side-effects such as headache, dyspepsia, back pain, rhinitis and flu syndrome, the usage of sildenafilmust be strictly controlled by medical supervision [2,3]. Several investigations have indicated thatsildenafil has been illegally adulterated into some dietary supplements, herbal medicines and alcoholicdrinks [4–7]. Limited by the complicated sample processing and extraction, traditional methodsfor determining sildenafil mainly focus on high-performance liquid chromatography (HPLC) [8,9],ultraviolet spectrophotometry (UV) [10,11], gas chromatography-mass spectrometry (GC-MS) [12,13],thin layer chromatography (TLC) [14,15] and near infrared spectrometry (NIR) [16,17]. Ramirez et al. [18]quantified plasma levels of sildenafil and its metabolite by liquid chromatography (LC) with a C18
reverse-phase column and UV detection; the limits of detection (LODs) and quantification were 1 and10 ng/mL, respectively. Oris et al. [19] determined ardenafil, sildenafil, tadalafil, testosterone, procaine,
Int. J. Mol. Sci. 2019, 20, 2722; doi:10.3390/ijms20112722 www.mdpi.com/journal/ijms

Int. J. Mol. Sci. 2019, 20, 2722 2 of 13
lidocaine, prilocaine, and benzocaine in cosmetic creams by using HPLC method with ultraviolet diodearray (UV-DAD) and electrospray ionization mass spectrometry (ESI-MS). The results show a gooddetermination coefficient (R2
≥ 0.99) and the limits of quantification range 2.5–7.8 µg/g and 3.3–8.9 ng/gfor HPLC-UV-DAD assay and HPLC-ESI-MS assay, respectively. Kee et al. [20] differentiated two groupsof PDE-5 inhibitors including four sildenafil- and three thiosildenafil-like analogs by Orbitrap-massspectrometry, indicating that the identification of PDE-5 analogs in dietary supplements can be possiblydone in a wide concentration range. Liew et al. [21] applied ultra-fast liquid chromatography (UFLC)with ESI-MS/MS to quantify sildenafil and N-desmethyl sildenafil. The linear concentration rangesof sildenafil and N-desmethyl sildenafil are 10–800 ng/mL and 10–600 ng/mL, respectively, and thecorrelation coefficients are R2
≥ 0.9976 and R2≥ 0.9992 respectively. Yaroshenko et al. [22] determined
the sildenafil in blood plasma using HPLC with UV and mass-spectrometry (MS). The results showthat the limits of quantification of sildenafil are 20 and 5 ng/mL using HPLC-UV and HPLC-MSmethods, respectively.
Although the traditional methods for determining sildenafil achieve high sensibility, the complexand time-consuming sample pretreatment process, huge instruments and high cost limit theirdevelopments. Compared with the methods mentioned above, surface enhanced Raman spectroscopy(SERS) shows great potential on ultrasensitive and label-free chemical or biochemical analysisbased on its advantages of simple sample treatment and fast sample screening speed [23,24].Recently, some researchers applied SERS technique for the determination of sildenafil and its analogs.Lv et al. [25] proposed a SERS method based on a solid-phase dendritic Ag nanostructure for the tracedetection of sildenafil, and the superiority in practical application of SERS technique is verified throughthe Raman spectroscopy (RS) of sildenafil within 1150–1699 cm−1. Liu et al. [15] investigated thecharacteristics and influencing factors of sildenafil on the thin layers chromatographic surface-enhancedRaman spectroscopy (TLC-SERS). The results suggest that the peaks at 1563, 1530, 1405, 1240 and1272 cm−1 can be determined as sildenafil characteristic peaks. They did not mention the LOD ofsildenafil. Mao et al. [26] used the micro-Raman spectroscopy as a non-destructive technique to screensildenafil and tadalafil adulterated in the healthcare products, and confirms the detection results withwavelet transform (WT) by LC/MS measurements. Zhao et al. [27] used SERS technique to detect theillegally-added sildenafil in drugs. The results show that the sildenafil in aqueous solutions as low as1 mg/L can be semi-quantitatively detected with high signal uniformity (RSD = 3.77%). Zhang et al. [28]applied SERS analysis method for the simultaneous detection of five types of illegal chemical drugsadded in Chinese proprietary medicines. Wu et al. [29] applied SERS with sodium alginate (SA)-silvernanoparticles (AgNPs) substrates for the determination of vardenafil and rosiglitazone maleate (ROS)in natural healthcare products. The LOD and ROS of vardenafil are as low as 1.63 and 2.20 mg/L,respectively. Lin et al. [30] applied SERS to detect sildenafil in cocktail, and the LOD reaches 0.1 mg/L.However, in practice, there are few cases of sildenafil in cocktails, while there are many studies based onsildenafil determination in liquor and health wine. Although the partial least squares (PLS) nonlinearmodel effect is good, for the quantitative detection of SERS, the single peak used in this study wasmore convincing.
Based on the analysis mentioned above, it is important to accurately detect sildenafil in alcoholicdrinks such as health wine and liquor using SERS. In this study, the Opto Trace Raman 202 (OTR 202)was used as SERS active colloids. The characterization of OTR 202 colloids were studied and theRaman enhancement factor (EF) of OTR 202 colloids was calculated. Besides, the relationship betweenRaman peak intensity and sildenafil concentration in health wine and liquor were established to realizethe quantitative determination of sildenafil.

Int. J. Mol. Sci. 2019, 20, 2722 3 of 13
2. Results and Discussion
2.1. Characterization of Opto Trace Raman 202
Figure 1a,b presents representative TEM images of Opto Trace Raman 202 colloids at 200 nm scaleand 50 nm scale, respectively. The UV spectroscopy of OTR 202 colloids is given in Figure 1c.Int. J. Mol. Sci. 2019, 20, x FOR PEER REVIEW 3 of 13
Figure 1. Transmission electron microscopy (TEM) images of Opto Trace Raman 202 (OTR 202) at: 200 nm scale (a); and 50 nm scale (b). The ultraviolet spectrophotometry (UV) spectroscopy of OTR 202 (c).
It can be clearly seen that the diameter of OTR 202 colloids was not very uniform and the shape of OTR 202 colloids was not a regular sphere. The diameter of OTR 202 colloids was in the range of 20–50 nm and the UV/Visible characteristic absorption peaks of OTR 202 colloids was at 533 nm within the band of gold nanoparticles (AuNPs) ranging from 450 to 600 nm [31] (Figure 1c). Compared with the results of Dong et al. [32,33] (AuNPs: 27.8 nm; UV/Visible characteristic absorption peaks: 543 nm), Luo et al. [34] (AuNPs: 23–102 nm; UV/Visible characteristic absorption peaks: 525–549 nm) and He et al. [24] (AuNPs: 41–50 nm; UV/Visible characteristic absorption peaks: 525–540 nm), we could infer that the properties of OTR 202 colloids were consistent with AuNPs colloids. Therefore, the OTR 202 colloids was suitable as SERS substrate in this paper. Compared with Lin’s [30] study, the properties of OTR 202 data were more convincing.
2.2. The SERS Performance of Rhodamine 6G Substrate
In this study, Rhodamine 6G (R6G) was used as a probe to investigate SERS activity of OTR 202 colloids. Furthermore, the SERS spectra of R6G with different concentrations were obtained, as shown in Figure 2.
Figure 1. Transmission electron microscopy (TEM) images of Opto Trace Raman 202 (OTR 202) at: 200 nmscale (a); and 50 nm scale (b). The ultraviolet spectrophotometry (UV) spectroscopy of OTR 202 (c).
It can be clearly seen that the diameter of OTR 202 colloids was not very uniform and the shapeof OTR 202 colloids was not a regular sphere. The diameter of OTR 202 colloids was in the range of20–50 nm and the UV/Visible characteristic absorption peaks of OTR 202 colloids was at 533 nm withinthe band of gold nanoparticles (AuNPs) ranging from 450 to 600 nm [31] (Figure 1c). Compared withthe results of Dong et al. [32,33] (AuNPs: 27.8 nm; UV/Visible characteristic absorption peaks: 543 nm),Luo et al. [34] (AuNPs: 23–102 nm; UV/Visible characteristic absorption peaks: 525–549 nm) andHe et al. [24] (AuNPs: 41–50 nm; UV/Visible characteristic absorption peaks: 525–540 nm), we couldinfer that the properties of OTR 202 colloids were consistent with AuNPs colloids. Therefore, the OTR202 colloids was suitable as SERS substrate in this paper. Compared with Lin’s [30] study, the propertiesof OTR 202 data were more convincing.
2.2. The SERS Performance of Rhodamine 6G Substrate
In this study, Rhodamine 6G (R6G) was used as a probe to investigate SERS activity of OTR 202colloids. Furthermore, the SERS spectra of R6G with different concentrations were obtained, as shownin Figure 2.
As shown in Figure 2, the RS of 10−2 M R6G only had a faint signal. However, the LOD of R6Gcould reach 5 × 10⁻⁸ M when the R6G was mixed with OTR 202 colloids. The Raman EF was used tomeasure the enhancement effect, which was calculated as follows [35]:
EF =ISERSCRaman
IRamanCSERS
where ISERS is the integrated intensity of R6G molecules adsorbed on the colloids surface; IRaman is theintegrated intensity of the same Raman band obtained without the OTR 202 colloids; CSERS representsthe concentration of R6G adsorbed on OTR 202 colloids; and CRaman represents the concentration ofR6G that can be detected by ordinary RS.

Int. J. Mol. Sci. 2019, 20, 2722 4 of 13
Int. J. Mol. Sci. 2019, 20, x FOR PEER REVIEW 3 of 13
Figure 1. Transmission electron microscopy (TEM) images of Opto Trace Raman 202 (OTR 202) at: 200 nm scale (a); and 50 nm scale (b). The ultraviolet spectrophotometry (UV) spectroscopy of OTR 202 (c).
It can be clearly seen that the diameter of OTR 202 colloids was not very uniform and the shape of OTR 202 colloids was not a regular sphere. The diameter of OTR 202 colloids was in the range of 20–50 nm and the UV/Visible characteristic absorption peaks of OTR 202 colloids was at 533 nm within the band of gold nanoparticles (AuNPs) ranging from 450 to 600 nm [31] (Figure 1c). Compared with the results of Dong et al. [32,33] (AuNPs: 27.8 nm; UV/Visible characteristic absorption peaks: 543 nm), Luo et al. [34] (AuNPs: 23–102 nm; UV/Visible characteristic absorption peaks: 525–549 nm) and He et al. [24] (AuNPs: 41–50 nm; UV/Visible characteristic absorption peaks: 525–540 nm), we could infer that the properties of OTR 202 colloids were consistent with AuNPs colloids. Therefore, the OTR 202 colloids was suitable as SERS substrate in this paper. Compared with Lin’s [30] study, the properties of OTR 202 data were more convincing.
2.2. The SERS Performance of Rhodamine 6G Substrate
In this study, Rhodamine 6G (R6G) was used as a probe to investigate SERS activity of OTR 202 colloids. Furthermore, the SERS spectra of R6G with different concentrations were obtained, as shown in Figure 2.
Figure 2. (a) Raman spectroscopy (RS) of 10−2 M Rhodamine 6G (R6G); and surface enhanced Ramanspectroscopy (SERS) spectra of R6G with different concentrations: (b) 5× 10⁻⁸ M; (c) 10−7 M; and (d) 10−6 M.
In this work, the values of CSERS and CRaman were 10−7 M and 10−2 M, respectively. The conditionsfor Raman and SERS measurement were kept constant. The ratio of ISERS/IRaman from the Ramanintensities at 784, 1010, 1272 and 1330 cm−1 were calculated, as shown in Table 1. It can be clearly seenthat the OTR 202 colloids exhibited high EF of R6G, especially at 1331 cm−1 with an EF of 1.84 × 10⁷,which indicated that the SERS had high sensitivity and stability based on OTR 202 colloids.
Table 1. The enhancement factor (EF) of R6G based on OTR 202 colloids.
Wavenumber (cm−1) IRaman ISERS ISERS/IRaman CSERS/CRaman EF
785 17 2377 140
105
1.40 × 10⁷
1009 32 4697 149 1.49 × 10⁷
1271 102 3665 36 3.6 × 10⁶
1331 16 2928 184 1.84 × 10⁷
2.3. The SERS Performance of Sildenafil
To investigate the sensitivity and stability of the OTR 202 colloids for the detection of sildenafilin health wine and liquor, the normal RS of sildenafil (molecular formula: C22H30N6O4S) powder,the SERS of 100 mg/L solution mixed with methanol, the SERS of 100 mg/L sildenafil in liquor, and theSERS of 100 mg/L sildenafil in health wine were collected, as shown in Figure 3. The detailed vibrationalmodes of sildenafil are listed in Table 2.
Table 2. The proposed assignment of sildenafil Raman peaks.
RS of SildenafilPowder (cm−1)
SERS of SildenafilSolution (cm−1)
SERS of Sildenafilin Liquor (cm−1)
SERS of Sildenafil inHealth Wine (cm−1)
Assignments
472 474 470 490 υ carbonyl + δ phenetole553 553 557 553 υ carbonyl + δ phenetole647 647 645 645 υ carbonyl + δ phenetole + υ (C–S)744 723 723 730 υ carbonyl + δ phenetole + υ (C–S)812 812 814 814 υ Pyrazole pyridine926 926 923 923 δ (C–C) + υ (C–H)992 989 991 991 υ (C–H) in carbonyl
1027 1045 1043 1043 δ (C–C) + υ (C–H)1150 1159 1162 1151 υ (C–H) in carbonyl1232 1232 1232 1232 υ (C–H) in carbonyl1310 1301 1309 1309 δ (C–H) in ethyl1396 1401 1401 1401 δ (C–H) in methyl piperazine1487 1487 1487 1487 δ (C–H) in Pyrazole pyridine1528 1528 1530 1530 υ (C–H) in Pyrazole pyridine1583 1582 1582 1582 δ (C–H) in Pyrazole pyridine

Int. J. Mol. Sci. 2019, 20, 2722 5 of 13
Int. J. Mol. Sci. 2019, 20, x FOR PEER REVIEW 4 of 13
Figure 2. (a) Raman spectroscopy (RS) of 10-2 M Rhodamine 6G (R6G); and surface enhanced Raman spectroscopy (SERS) spectra of R6G with different concentrations: (b) 5 × 10⁻⁸ M; (c) 10−7 M; and (d) 10−6 M.
As shown in Figure 2, the RS of 10−2 M R6G only had a faint signal. However, the LOD of R6G could reach 5 × 10⁻⁸ M when the R6G was mixed with OTR 202 colloids. The Raman EF was used to measure the enhancement effect, which was calculated as follows [35]:
EF =𝐼 𝐶
𝐼 𝐶
where 𝐼 is the integrated intensity of R6G molecules adsorbed on the colloids surface; 𝐼 is the integrated intensity of the same Raman band obtained without the OTR 202 colloids; 𝐶 represents the concentration of R6G adsorbed on OTR 202 colloids; and 𝐶 represents the concentration of R6G that can be detected by ordinary RS .
In this work, the values of 𝐶SERS and 𝐶Raman were 10−7 M and 10−2 M, respectively. The conditions for Raman and SERS measurement were kept constant. The ratio of 𝐼SERS/𝐼Raman from the Raman intensities at 784, 1010, 1272 and 1330 cm−1 were calculated, as shown in Table 1. It can be clearly seen that the OTR 202 colloids exhibited high EF of R6G, especially at 1331 cm−1 with an EF of 1.84 × 10⁷, which indicated that the SERS had high sensitivity and stability based on OTR 202 colloids.
Table 1. The enhancement factor (EF) of R6G based on OTR 202 colloids.
Wavenumber (cm−1) 𝑰𝐑𝐚𝐦𝐚𝐧 𝑰𝐒𝐄𝐑𝐒 𝑰𝐒𝐄𝐑𝐒/𝑰𝐑𝐚𝐦𝐚𝐧 𝑪𝐒𝐄𝐑𝐒/𝑪𝐑𝐚𝐦𝐚𝐧 EF 785 17 2377 140
105
1.40 × 10⁷ 1009 32 4697 149 1.49 × 10⁷ 1271 102 3665 36 3.6 × 10⁶ 1331 16 2928 184 1.84 × 10⁷
2.3. The SERS Performance of Sildenafil
To investigate the sensitivity and stability of the OTR 202 colloids for the detection of sildenafil in health wine and liquor, the normal RS of sildenafil (molecular formula: C22H30N6O4S) powder, the SERS of 100 mg/L solution mixed with methanol, the SERS of 100 mg/L sildenafil in liquor, and the SERS of 100 mg/L sildenafil in health wine were collected, as shown in Figure 3. The detailed vibrational modes of sildenafil are listed in Table 2.
Figure 3. (a) RS of powder sildenafil; (b) SERS spectra of sildenafil in liquor; (c) SERS spectra ofsildenafil in health wine; and (d) SERS spectra of sildenafil solution mixed with methanol. Inset:The molecular structure of sildenafil.
Clearly, the SERS signals of sildenafil solution were stronger than those of sildenafil in liquorand health wine. The normal Raman peaks of sildenafil were in good agreement with the previousliterature [27], and the SERS of sildenafil in liquor and health wine were basically similar to theSERS of sildenafil solution, whose Raman shifts (less than 10 cm−1) were within a reasonable range,which indicated that the position of SERS peaks detected by SERS spectra based on OTR 202 colloidswere feasible and reliable.
According to density functional theory (DFT) calculation based on the B3LYP/6-31G (d,p) methodin Gaussian v.09 software [36], the peaks at 472 and 553 cm−1 could be assigned to carbonyl stretchingand phenetole breathing deformable vibration; the peaks at 647 and 723 cm−1 were derived fromthe carbonyl stretching, phenetole deformable vibration and C–S stretching in sulfamide; 812 cm−1
belonged to the pyrazole pyridine stretching; the peaks located at 926 and 1027 cm−1 were all relatedto C–C deformable vibration and C–H stretching in pyrazole pyridine group; the peaks at 989, 1159and 1232 cm−1 were the C–H stretching vibration in carbonyl; 1310 cm−1 was C–H stretching vibrationin ethyl; 1401 cm−1 was the C–H deformable vibration in methyl piperazine; and 1487, 1528 and1582 cm−1 were the C–H deformable vibration in pyrazole pyridine.
2.4. Detection of Sildenafil in Health Wine and Liquor
Furthermore, we investigated the accuracy and stability of OTR 202 colloids for the detection ofsildenafil in health wine and liquor. The representative SERS spectra of sildenafil in health wine andliquor with different concentrations are given in Figure 4. The SERS of sildenafil concentration rangedfrom 0 to 50 mg/L (0, 0.1, 0.2, 0.4, 0.6, 0.8, 1, 2, 4, 6, 8, 10, 15, 20, 25, 30, 35, 40, 45 and 50 mg/L) in healthwine and liquor were obtained and the SERS peaks at 645, 814, 1232, 1401, 1530 and 1582 cm−1 areshown in Figure 5.

Int. J. Mol. Sci. 2019, 20, 2722 6 of 13Int. J. Mol. Sci. 2019, 20, x FOR PEER REVIEW 6 of 13
Figure 4. SERS spectra of sildenafil in health wine (A) and liquor (B) with different concentrations (from a to t: 0, 0.1, 0.2, 0.4, 0.6, 0.8, 1, 2, 4, 6, 8, 10, 15, 20, 25, 30, 35, 40, 45 and 50 mg/L, respectively).
Figure 5. The SERS peak intensities of sildenafil concentration ranging from 0.1 mg/L to 50 mg/L in health wine (A) and liquor (B) at: 645 cm−1 (a); 814 cm−1 (b); 1232 cm−1 (c); 1401 cm−1 (d); 1530 cm−1 (e); and 1582 cm−1 (f).
As shown in Figures 4 and 5, with the increase of sildenafil in health wine from 0.1 mg/L to 50 mg/L, the SERS peaks at 645, 814, 1232, 1401, 1530 and 1582 cm−1 increased sharply within the range of 0.1–10 mg/L, while they slowly increased when the sildenafil concentration continued to increase from 10 to 50 mg/L. In addition, when the sildenafil concentration in health wine increased from 10 to 50 mg/L, the intensities of SERS peaks at 645, 814, 1232, 1401, 1530 and 1582 cm−1 basically did not change. It was found that the sildenafil in health wine could still be identified even when the sildenafil solution concentration was as low as 0.1 mg/L. Compared with the previous research [27,29] with LODs of 1, 1.63 and 2.20 mg/L, the LOD of sildenafil in this study was improved greatly; both were far lower than 1%. Thus, the presented method can be successfully applied for the quantification of real natural healthcare products. In addition, there were SERS peaks at 730, 940 and 1310 cm−1 when the sildenafil was not added in health wine (Figure 5Aa). Although these peaks belonged to sildenafil as well, they might be the Raman characteristic peaks of some kind of traditional Chinese medicines in health wine.
Similar to the SERS spectra of sildenafil in health wine, the SERS peaks at 645, 814, 1232, 1401, 1530 and 1582 cm−1 increased rapidly when the sildenafil concentration in liquor was increased from 0.1 to 20 mg/L, while those SERS peaks fluctuated greatly in the range of 20–50 mg/L. Moreover, it can be clearly seen that the SERS peak intensities of sildenafil in health wine were generally higher
Figure 4. SERS spectra of sildenafil in health wine (A) and liquor (B) with different concentrations(from a to t: 0, 0.1, 0.2, 0.4, 0.6, 0.8, 1, 2, 4, 6, 8, 10, 15, 20, 25, 30, 35, 40, 45 and 50 mg/L, respectively).
Int. J. Mol. Sci. 2019, 20, x FOR PEER REVIEW 6 of 13
Figure 4. SERS spectra of sildenafil in health wine (A) and liquor (B) with different concentrations (from a to t: 0, 0.1, 0.2, 0.4, 0.6, 0.8, 1, 2, 4, 6, 8, 10, 15, 20, 25, 30, 35, 40, 45 and 50 mg/L, respectively).
Figure 5. The SERS peak intensities of sildenafil concentration ranging from 0.1 mg/L to 50 mg/L in health wine (A) and liquor (B) at: 645 cm−1 (a); 814 cm−1 (b); 1232 cm−1 (c); 1401 cm−1 (d); 1530 cm−1 (e); and 1582 cm−1 (f).
As shown in Figures 4 and 5, with the increase of sildenafil in health wine from 0.1 mg/L to 50 mg/L, the SERS peaks at 645, 814, 1232, 1401, 1530 and 1582 cm−1 increased sharply within the range of 0.1–10 mg/L, while they slowly increased when the sildenafil concentration continued to increase from 10 to 50 mg/L. In addition, when the sildenafil concentration in health wine increased from 10 to 50 mg/L, the intensities of SERS peaks at 645, 814, 1232, 1401, 1530 and 1582 cm−1 basically did not change. It was found that the sildenafil in health wine could still be identified even when the sildenafil solution concentration was as low as 0.1 mg/L. Compared with the previous research [27,29] with LODs of 1, 1.63 and 2.20 mg/L, the LOD of sildenafil in this study was improved greatly; both were far lower than 1%. Thus, the presented method can be successfully applied for the quantification of real natural healthcare products. In addition, there were SERS peaks at 730, 940 and 1310 cm−1 when the sildenafil was not added in health wine (Figure 5Aa). Although these peaks belonged to sildenafil as well, they might be the Raman characteristic peaks of some kind of traditional Chinese medicines in health wine.
Similar to the SERS spectra of sildenafil in health wine, the SERS peaks at 645, 814, 1232, 1401, 1530 and 1582 cm−1 increased rapidly when the sildenafil concentration in liquor was increased from 0.1 to 20 mg/L, while those SERS peaks fluctuated greatly in the range of 20–50 mg/L. Moreover, it can be clearly seen that the SERS peak intensities of sildenafil in health wine were generally higher
Figure 5. The SERS peak intensities of sildenafil concentration ranging from 0.1 mg/L to 50 mg/L inhealth wine (A) and liquor (B) at: 645 cm−1 (a); 814 cm−1 (b); 1232 cm−1 (c); 1401 cm−1 (d); 1530 cm−1
(e); and 1582 cm−1 (f).
As shown in Figures 4 and 5, with the increase of sildenafil in health wine from 0.1 mg/L to50 mg/L, the SERS peaks at 645, 814, 1232, 1401, 1530 and 1582 cm−1 increased sharply within the rangeof 0.1–10 mg/L, while they slowly increased wh en the sildenafil concentration continued to increasefrom 10 to 50 mg/L. In addition, when the sildenafil concentration in health wine increased from 10 to50 mg/L, the intensities of SERS peaks at 645, 814, 1232, 1401, 1530 and 1582 cm−1 basically did notchange. It was found that the sildenafil in health wine could still be identified even when the sildenafilsolution concentration was as low as 0.1 mg/L. Compared with the previous research [27,29] with LODsof 1, 1.63 and 2.20 mg/L, the LOD of sildenafil in this study was improved greatly; both were far lowerthan 1%. Thus, the presented method can be successfully applied for the quantification of real naturalhealthcare products. In addition, there were SERS peaks at 730, 940 and 1310 cm−1 when the sildenafilwas not added in health wine (Figure 5Aa). Although these peaks belonged to sildenafil as well, theymight be the Raman characteristic peaks of some kind of traditional Chinese medicines in health wine.
Similar to the SERS spectra of sildenafil in health wine, the SERS peaks at 645, 814, 1232, 1401,1530 and 1582 cm−1 increased rapidly when the sildenafil concentration in liquor was increased from0.1 to 20 mg/L, while those SERS peaks fluctuated greatly in the range of 20–50 mg/L. Moreover, it canbe clearly seen that the SERS peak intensities of sildenafil in health wine were generally higher thanthat in liquor, which indicated that the background difference between health wine and liquor would
Int. J. Mol. Sci. 2019, 20, 2722 7 of 13
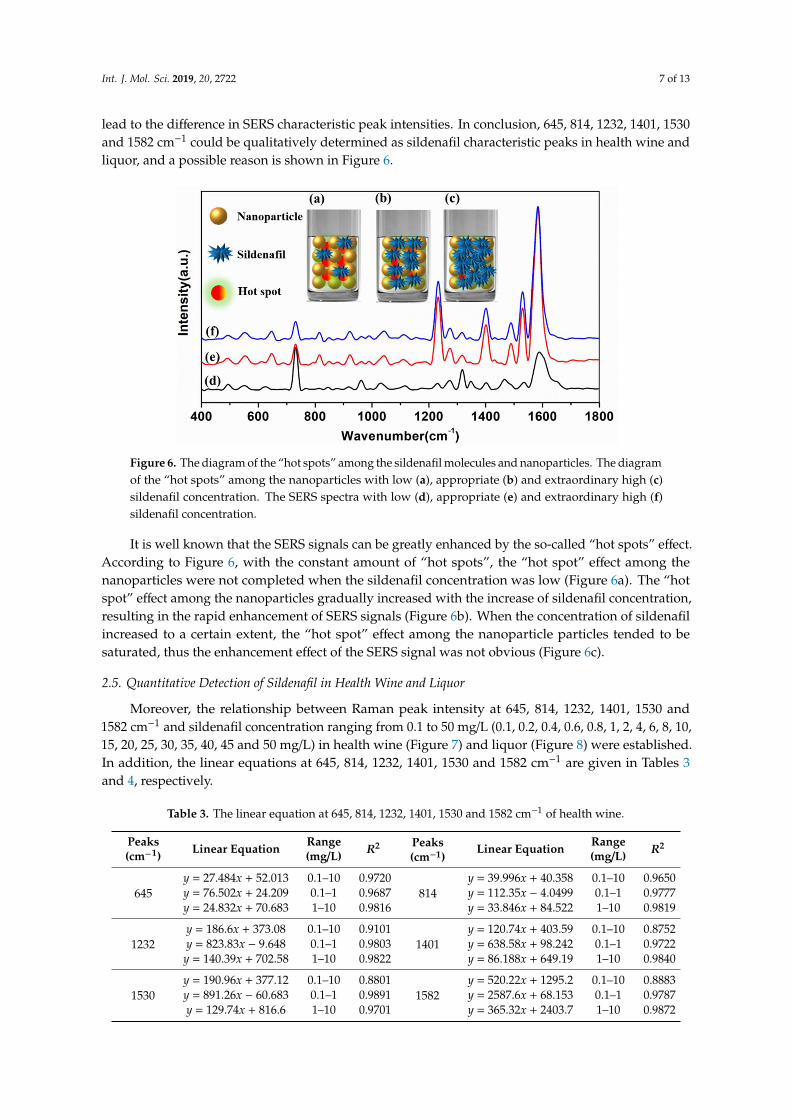
lead to the difference in SERS characteristic peak intensities. In conclusion, 645, 814, 1232, 1401, 1530and 1582 cm−1 could be qualitatively determined as sildenafil characteristic peaks in health wine andliquor, and a possible reason is shown in Figure 6.
Int. J. Mol. Sci. 2019, 20, x FOR PEER REVIEW 7 of 13
than that in liquor, which indicated that the background difference between health wine and liquor would lead to the difference in SERS characteristic peak intensities. In conclusion, 645, 814, 1232, 1401, 1530 and 1582 cm−1 could be qualitatively determined as sildenafil characteristic peaks in health wine and liquor, and a possible reason is shown in Figure 6.
Figure 6. The diagram of the “hot spots” among the sildenafil molecules and nanoparticles. The diagram of the “hot spots” among the nanoparticles with low (a), appropriate (b) and extraordinary high (c) sildenafil concentration. The SERS spectra with low (d), appropriate (e) and extraordinary high (f) sildenafil concentration.
It is well known that the SERS signals can be greatly enhanced by the so-called “hot spots” effect. According to Figure 6, with the constant amount of “hot spots”, the “hot spot” effect among the nanoparticles were not completed when the sildenafil concentration was low (Figure 6a). The “hot spot” effect among the nanoparticles gradually increased with the increase of sildenafil concentration, resulting in the rapid enhancement of SERS signals (Figure 6b). When the concentration of sildenafil increased to a certain extent, the “hot spot” effect among the nanoparticle particles tended to be saturated, thus the enhancement effect of the SERS signal was not obvious (Figure 6c).
2.5. Quantitative Detection of Sildenafil in Health Wine and Liquor
Moreover, the relationship between Raman peak intensity at 645, 814, 1232, 1401, 1530 and 1582 cm−1 and sildenafil concentration ranging from 0.1 to 50 mg/L (0.1, 0.2, 0.4, 0.6, 0.8, 1, 2, 4, 6, 8, 10, 15, 20, 25, 30, 35, 40, 45 and 50 mg/L) in health wine (Figure 7) and liquor (Figure 8) were established. In addition, the linear equations at 645, 814, 1232, 1401, 1530 and 1582 cm−1 are given in Tables 3 and 4, respectively.
According to Figure 7 and Table 3, there was a good linear correlation between Raman peak intensity and sildenafil concentration in health wine in each linear regression equation ranging 0.1–1 mg/L (0.9687 < R2 < 0.9891) and 1–10 mg/L (0.9701 < R2 < 0.9840). Although there was a good linear correlation in the range of 0.1–10 mg/L at 645 and 814 cm−1, the correlation coefficients were below 0.92 at 1232, 1401, 1530 and 1582 cm−1. Therefore, the sildenafil in health wine could be accurately and quantitatively detected by adopting different model in the range of 0.1–10 mg/L.
Figure 6. The diagram of the “hot spots” among the sildenafil molecules and nanoparticles. The diagramof the “hot spots” among the nanoparticles with low (a), appropriate (b) and extraordinary high (c)sildenafil concentration. The SERS spectra with low (d), appropriate (e) and extraordinary high (f)sildenafil concentration.
It is well known that the SERS signals can be greatly enhanced by the so-called “hot spots” effect.According to Figure 6, with the constant amount of “hot spots”, the “hot spot” effect among thenanoparticles were not completed when the sildenafil concentration was low (Figure 6a). The “hotspot” effect among the nanoparticles gradually increased with the increase of sildenafil concentration,resulting in the rapid enhancement of SERS signals (Figure 6b). When the concentration of sildenafilincreased to a certain extent, the “hot spot” effect among the nanoparticle particles tended to besaturated, thus the enhancement effect of the SERS signal was not obvious (Figure 6c).
2.5. Quantitative Detection of Sildenafil in Health Wine and Liquor
Moreover, the relationship between Raman peak intensity at 645, 814, 1232, 1401, 1530 and1582 cm−1 and sildenafil concentration ranging from 0.1 to 50 mg/L (0.1, 0.2, 0.4, 0.6, 0.8, 1, 2, 4, 6, 8, 10,15, 20, 25, 30, 35, 40, 45 and 50 mg/L) in health wine (Figure 7) and liquor (Figure 8) were established.In addition, the linear equations at 645, 814, 1232, 1401, 1530 and 1582 cm−1 are given in Tables 3and 4, respectively.
Table 3. The linear equation at 645, 814, 1232, 1401, 1530 and 1582 cm−1 of health wine.
Peaks(cm−1) Linear Equation Range
(mg/L) R2 Peaks(cm−1)
Linear Equation Range(mg/L) R2
645y = 27.484x + 52.013 0.1–10 0.9720
814y = 39.996x + 40.358 0.1–10 0.9650
y = 76.502x + 24.209 0.1–1 0.9687 y = 112.35x − 4.0499 0.1–1 0.9777y = 24.832x + 70.683 1–10 0.9816 y = 33.846x + 84.522 1–10 0.9819
1232y = 186.6x + 373.08 0.1–10 0.9101
1401y = 120.74x + 403.59 0.1–10 0.8752
y = 823.83x − 9.648 0.1–1 0.9803 y = 638.58x + 98.242 0.1–1 0.9722y = 140.39x + 702.58 1–10 0.9822 y = 86.188x + 649.19 1–10 0.9840
1530y = 190.96x + 377.12 0.1–10 0.8801
1582y = 520.22x + 1295.2 0.1–10 0.8883
y = 891.26x − 60.683 0.1–1 0.9891 y = 2587.6x + 68.153 0.1–1 0.9787y = 129.74x + 816.6 1–10 0.9701 y = 365.32x + 2403.7 1–10 0.9872

Int. J. Mol. Sci. 2019, 20, 2722 8 of 13
Int. J. Mol. Sci. 2019, 20, x FOR PEER REVIEW 8 of 13
Table 3. The linear equation at 645, 814, 1232, 1401, 1530 and 1582 cm−1 of health wine.
Peaks (cm−1) Linear Equation
Range
(mg/L) R2
Peaks
(cm−1) Linear Equation
Range
(mg/L) R2
645
y = 27.484x + 52.013 0.1–10 0.9720
814
y = 39.996x + 40.358 0.1–10 0.9650
y = 76.502x + 24.209 0.1–1 0.9687 y = 112.35x − 4.0499 0.1–1 0.9777
y = 24.832x + 70.683 1–10 0.9816 y = 33.846x + 84.522 1–10 0.9819
1232
y = 186.6x + 373.08 0.1–10 0.9101
1401
y = 120.74x + 403.59 0.1–10 0.8752
y = 823.83x − 9.648 0.1–1 0.9803 y = 638.58x + 98.242 0.1–1 0.9722
y = 140.39x + 702.58 1–10 0.9822 y = 86.188x + 649.19 1–10 0.9840
1530
y = 190.96x + 377.12 0.1–10 0.8801
1582
y = 520.22x + 1295.2 0.1–10 0.8883
y = 891.26x − 60.683 0.1–1 0.9891 y = 2587.6x + 68.153 0.1–1 0.9787
y = 129.74x + 816.6 1–10 0.9701 y = 365.32x + 2403.7 1–10 0.9872
Figure 7. The intensities of SERS peak versus sildenafil concentration in health wine at: 645 cm−1 (A); 814 cm−1 (B); 1232 cm−1 (C); 1401 cm−1 (D); 1530 cm−1 (E); and 1582 cm−1 (F). Inset: The linear calibration plotted in the concentration range: (a) 0.1–10 mg/L; (b) 0.1–1 mg/L; and (c) 1–10 mg/L.
Figure 7. The intensities of SERS peak versus sildenafil concentration in health wine at: 645 cm−1
(A); 814 cm−1 (B); 1232 cm−1 (C); 1401 cm−1 (D); 1530 cm−1 (E); and 1582 cm−1 (F). Inset: The linearcalibration plotted in the concentration range: (a) 0.1–10 mg/L; (b) 0.1–1 mg/L; and (c) 1–10 mg/L.
Table 4. The linear equation at 645, 814, 1232, 1401, 1530 and 1582 cm−1 of liquor.
Peaks(cm−1)
Linear Equation Range(mg/L) R2 Peaks
(cm−1)Linear Equation Range
(mg/L) R2
645y = 29.237x + 6.7438 0.1–20 0.9921
814y = 17.003x + 18.855 0.1–20 0.9812
y = 65.767x + 2.1908 0.1–1 0.9944 y = 29.237x + 6.749 0.1–1 0.9944y = 15.437x + 74.515 1–20 0.9625 y = 16.09x + 30.708 1–20 0.9747
1232y = 106.26x + 251.16 0.1–20 0.9353
1401y = 27.004x + 20.516 0.1–20 0.9944
y = 342.03x + 10.409 0.1–1 0.9726 y = 43.907x + 9.5066 0.1–1 0.9662y = 86.896x + 503.1 1–20 0.9652 y = 26.437x + 27.85 1–20 0.9922
1530y = 96.516x + 593.72 0.1–20 0.8629
1582y = 232.12x + 11.709 0.1–20 0.9896
y = 824.13x + 93.493 0.1–1 0.9734 y = 112.76x − 11.609 0.1–1 0.9835y = 70.364x + 931.57 1–20 0.9816 y = 223.49x + 138.28 1–20 0.982

Int. J. Mol. Sci. 2019, 20, 2722 9 of 13Int. J. Mol. Sci. 2019, 20, x FOR PEER REVIEW 9 of 13
Figure 8. The intensities of SERS peaks versus sildenafil concentration in liquor at: 645 cm−1 (A); 814 cm−1 (B); 1232 cm−1 (C); 1401 cm−1 (D); 1530 cm−1 (E); and 1582 cm−1 (F). Inset: The linear calibration plotted in the concentration range: (a) 0.1–20 mg/L; (b) 0.1–1 mg/L; and (c) 1–20 mg/L.
Table 4. The linear equation at 645, 814, 1232, 1401, 1530 and 1582 cm−1 of liquor.
Peaks (cm−1) Linear equation Range
(mg/L) R2 Peaks (cm−1) Linear equation Range
(mg/L) R2
645 y = 29.237x + 6.7438 0.1–20 0.9921
814 y = 17.003x + 18.855 0.1–20 0.9812
y = 65.767x + 2.1908 0.1–1 0.9944 y = 29.237x + 6.749 0.1–1 0.9944 y = 15.437x + 74.515 1–20 0.9625 y = 16.09x + 30.708 1–20 0.9747
1232 y = 106.26x + 251.16 0.1–20 0.9353
1401 y = 27.004x + 20.516 0.1–20 0.9944
y = 342.03x + 10.409 0.1–1 0.9726 y = 43.907x + 9.5066 0.1–1 0.9662 y = 86.896x + 503.1 1–20 0.9652 y = 26.437x + 27.85 1–20 0.9922
1530 y = 96.516x + 593.72 0.1–20 0.8629
1582 y = 232.12x + 11.709 0.1–20 0.9896
y = 824.13x + 93.493 0.1–1 0.9734 y = 112.76x − 11.609 0.1–1 0.9835 y = 70.364x + 931.57 1–20 0.9816 y = 223.49x + 138.28 1–20 0.982
According to Figure 8 and Table 4, there was a good linear correlation between Raman peak intensity and sildenafil concentration in liquor in each linear regression equation ranging 0.1–1 mg/L (0.9662 < R2 < 0.9944) and 1–20 mg/L (0.9625 < R2 < 0.9922). Although there was a good linear correlation at 814, 1401 and 1582 cm−1, the correlation coefficients were only 0.9494, 0.9353 and 0.8629
Figure 8. The intensities of SERS peaks versus sildenafil concentration in liquor at: 645 cm−1 (A); 814cm−1 (B); 1232 cm−1 (C); 1401 cm−1 (D); 1530 cm−1 (E); and 1582 cm−1 (F). Inset: The linear calibrationplotted in the concentration range: (a) 0.1–20 mg/L; (b) 0.1–1 mg/L; and (c) 1–20 mg/L.
According to Figure 7 and Table 3, there was a good linear correlation between Raman peakintensity and sildenafil concentration in health wine in each linear regression equation ranging0.1–1 mg/L (0.9687 < R2 < 0.9891) and 1–10 mg/L (0.9701 < R2 < 0.9840). Although there was agood linear correlation in the range of 0.1–10 mg/L at 645 and 814 cm−1, the correlation coefficientswere below 0.92 at 1232, 1401, 1530 and 1582 cm−1. Therefore, the sildenafil in health wine could beaccurately and quantitatively detected by adopting different model in the range of 0.1–10 mg/L.
According to Figure 8 and Table 4, there was a good linear correlation between Raman peakintensity and sildenafil concentration in liquor in each linear regression equation ranging 0.1–1 mg/L(0.9662 < R2 < 0.9944) and 1–20 mg/L (0.9625 < R2 < 0.9922). Although there was a good linearcorrelation at 814, 1401 and 1582 cm−1, the correlation coefficients were only 0.9494, 0.9353 and 0.8629at 645, 1232 and 1530 cm−1, respectively. Therefore, the sildenafil in liquor could be accurately andquantitatively detected by adopting different models in the range of 0.1–20 mg/L.
From the above analysis, although there were some differences in the detection of sildenafilin health wine and liquor by SERS technique, there was a good linear relationship between the

Int. J. Mol. Sci. 2019, 20, 2722 10 of 13
intensity and concentration of different Raman characteristic peaks in a certain concentration range,which indicated that it was feasible to use SERS technology for the detection of sildenafil in both healthwine and liquor.
2.6. Model Accuracy Verification
To verify the accuracy of this detection method of sildenafil, first different concentrations ofsildenafil in health wine (0.5, 5 mg/L) and liquor (0.5, 5 and 13 mg/L) were prepared; each concentrationcontained nine samples. Second, all samples were detected by SERS based on OTR 202 colloids.Third, the linear regression equations at 645, 814, 1232, 1401, 1530 and 1582 cm−1 were used to predictthe sildenafil concentration in health wine and liquor. Tables 5 and 6 present the precision and accuracyfor the determination of sildenafil in health wine and liquor, respectively.
Table 5. The precision and accuracy for the determination of sildenafil in health wine.
Sildenafil Peaks in HealthWine (cm−1)
Predicted (mg/L) Mean + a SD
645 814 1232 1401 1530 1582
Added (mg/L) 0.5 0.472 ± 0.026 0.522 ± 0.021 0.467 ± 0.031 0.470 ± 0.024 0.480 ± 0.013 0.444 ± 0.029a RSD (%) 5.51 3.92 6.78 5.14 2.89 6.66
Recovery (%) 94.41 104.42 93.5 94.08 96.11 88.92Added (mg/L) 5 4.89 ± 0.51 4.97 ± 0.37 4.93 ± 0.22 4.84 ± 0.22 5.02 ± 0.13 4.88 ± 0.42
a RSD (%) 5.11 7.65 4.51 4.62 2.53 4.21Recovery (%) 97.87 99.38 98.60 96.89 100.43 97.62
a SD (standard deviation); RSD (relative standard deviation).
Table 6. The precision and accuracy for the determination of sildenafil in liquor.
Sildenafil Peaks in HealthLiquor (cm−1)
Predicted (mg/L) Mean + SD
645 814 1232 1401 1530 1584
Added (mg/L) 0.5 0.483 ± 0.039 0.522 ± 0.036 0.498 ± 0.022 0.512 ± 0.043 0.534 ± 0.026 0.464 ± 0.025a RSD (%) 8.07 6.98 4.59 8.35 4.95 5.44
Recovery (%) 96.61 104.45 99.78 102.32 106.78 92.77Added (mg/L) 5 4.71 ± 0.32 4.77 ± 0.28 4.93 ± 0.23 4.50 ± 0.34 5.14 ± 0.34 4.89 ± 0.43
a RSD (%) 6.67 5.90 4.88 7.62 6.70 8.70Recovery (%) 94.31 95.44 98.60 90.09 102.80 97.86
Added (mg/L) 13 12.78 ± 0.85 12.08 ± 0.89 13.24 ± 0.63 12.33 ± 0.90 12.70 ± 0.97 12.69 ± 0.98a RSD (%) 6.72 7.38 4.66 7.61 7.62 7.68
Recovery (%) 98.36 92.99 101.84 94.90 97.73 97.64a SD (standard deviation); RSD (relative standard deviation).
According to Table 5, the sildenafil concentration in health wine could be well predicted using thelinear regression equations at 645, 814, 1232, 1401, 1530 and 1582 cm−1. The relative standard deviation(RSD) was less than 6.78% and 7.65% for two added concentrations, respectively. The recoveries were inthe ranges of 88.92–104.42% and 97.62–100.43%, respectively. Moreover, the linear regression equationsat 1530 cm−1 had the best precision and accuracy for 0.5 mg/L (predicted + SD: 0.480 ± 0.013; RSD: 2.89;Recovery: 96.11), 5 mg/L (predicted + SD: 5.02 ± 0.13; RSD: 2.53; Recovery: 100.43) and 13 mg/L.
According to Table 6, the sildenafil concentration in liquor could also be well predicted usingthe linear regression equations at 645, 814, 1232, 1401, 1530 and 1582 cm−1. The RSD were less than8.07%, 8.70% and 7.68%, respectively, at the three added concentrations. The recoveries were inthe ranges of 92.77–104.45%, 90.09–102.80% and 92.99–101.84%, respectively. Moreover, the linearregression equations at 1232 cm−1 had the best precision and accuracy for 0.5 mg/L (predicted + SD:0.498 ± 0.022; RSD: 4.59; Recovery: 99.78), 5 mg/L (predicted + SD: 4.93 ± 0.23; RSD: 4.88; Recovery:98.60) and 13 mg/L (predicted + SD: 13.24 ± 0.63; RSD: 4.66; Recovery: 101.84). From the results above,we conclude that the application of our method for sildenafil detection has excellent practical value.

Int. J. Mol. Sci. 2019, 20, 2722 11 of 13
3. Materials and Methods
3.1. Chemicals
The reagents used in this experiment included sildenafil (99.8% purity, Sigma-Aldrich, Beijing,China), methanol (chromatographically pure, Amethyst Chemicals, Beijing, China), R6G (96.01% purity,Sigma-Aldrich, Beijing, China), health wine (Jinpai Co., Ltd., DaYe, China) and liquor (Beijing Red StarCo., Ltd. Beijing, China). In addition, the OTR 202 colloids produced by Opto Trace Technologies, Inc.(Suzhou, China) were used as SERS substrate in this study.
3.2. Instruments
The experimental instruments included: (1) RmTracer-200-HS portable Raman spectrometercombined with a 785 nm excitation wavelength diode-stabilized stimulator (Opto Trace Technologies,Inc., Mountain View, CA, USA); (2) FEI Tecnai G2 F20 S-TWIN transmission electron microscope(FEI Company, Hillsboro, OR, USA); and (3) Vortex-Genie 2/2T vortex mixer (Shanghai Ling earlyEnvironmental Protection Instrument Co., Ltd, Shanghai, China).
3.3. Sample Preparation
The sample preparation process was as follows. First, the standard sildenafil was diluted to1000 mg/L with methanol. Second, the standard solution of 1000 mg/L was diluted to 0–50 mg/L withhealth wine and liquor, respectively. For each concentration the sample was prepared in triplicate.
3.4. SERS Measurement
Before Raman spectra acquisition, the instrument was calibrated using a 785 nm excitationwavelength. The parameters were set as follows: a power of 200 mw, a scanning range of 200–3300 cm−1,an optical resolution of 2 cm−1, an integration time of 10 s and an average spectral value of 3 times.When collecting the SERS of samples, 500 µL OTR 202 colloids and 100 µL test solution were added inturn into a 2 mL quartz bottle, and then it was placed at a liquid sample pool.
4. Conclusions
In this paper, we report a rapid and quantitative determination method of sildenafil in health wineand liquor based on SERS with OTR 202 colloids. We found that the Raman EF of OTR 202 colloidscould reach 1.84 × 10⁷ and the proposed method showed good performance for sildenafil in health wineand liquor detection and the LODs were found to be as low as 0.1 mg/L; both were far lower than 1%.Therefore, the presented method can be successfully applied for the quantification of natural healthcareproducts. Moreover, there was a good linear correlation between Raman peak intensity and sildenafilconcentration in both health wine (R2 = 0.9891) and liquor (R2 = 0.9944) at certain concentrationranges. It was indicated that the application of SERS technique for the rapid detection of sildenafilwas feasible and reliable. Overall, the SERS method with OTR 202 colloids enhancement developedthrough this study provides a novel, rapid and accurate approach to quantitatively determine sildenafilin health wine and liquor, which could meet the requirements of sildenafil determination in otheralcoholic drinks.
Author Contributions: S.X. and Y.H. conceived the idea and associated data. S.X. carried out the experimentalwork and drafted the manuscript. Y.H. co-wrote the paper with S.X. All authors contributed to reviewing andimproving the manuscript.
Funding: Funding was provided by major science and technology projects in Zhejiang (2015C02007) and NationalKey R&D program of China (2018YFD0101002).
Conflicts of Interest: The authors declare no conflict of interest.

Int. J. Mol. Sci. 2019, 20, 2722 12 of 13
References
1. Singh, S.; Prasad, B.; Savaliya, A.A.; Shah, R.P.; Gohil, V.M.; Kaur, A. Strategies for characterizing sildenafil,vardenafil, tadalafil and their analogues in herbal dietary supplements, and detecting counterfeit productscontaining these drugs. TrAC Trends Anal. Chem. 2009, 28, 13–28. [CrossRef]
2. Che, N.M.; Nor, N.M.; Lajis, R.; Harn, G.L. Identification of sildenafil, tadalafil and vardenafil by gaschromatography–mass spectrometry on short capillary column. J. Chromatogr. A 2009, 1216, 8426–8430.
3. Huang, C.A.; Yeh, K.-Y.; Cheng, Y.-Y.; Dubey, K.N.; Chiu, W.A.; Tsai, T.-H. Investigation of Interactive Activityof Electro-Acupuncture on Pharmacokinetics of Sildenafil and Their Synergistic Effect on Penile Blood Flowin Rats. Int. J. Mol. Sci. 2018, 19, 2153. [CrossRef] [PubMed]
4. Song, Y.; Wang, Y.Y.; Zhang, Y.; Wang, S. Development of enzyme-linked immunosorbent assay for rapiddetermination of sildenafil in adulterated functional foods. Food Agric. Immunol. 2012, 23, 338–351. [CrossRef]
5. Damiano, F.; Silva, C.; Gregori, A.; Vacondio, F.; Mor, M.; Menozzi, M.; Giorgio, D.D. Analysis of illicitdietary supplements sold in the Italian market: identification of a sildenafil thioderivative as adulterantusing UPLC-TOF/MS and GC/MS. Sci. Justice 2014, 54, 228–237. [CrossRef] [PubMed]
6. Vaysse, J.; Gilard, V.; Balayssac, S.; Zedde, C.; Martino, R.; Malet-Martino, M. Identification of a novelsildenafil analogue in an adulterated herbal supplement. J. Pharm. Biomed. Anal. 2012, 59, 58–66. [CrossRef]
7. Huang, Y.C.; Lee, H.C.; Lin, Y.L.; Lin, Y.T.; Tsai, C.F.; Cheng, H.F. Identification of a new sildenafil analogueadulterant, desethylcarbodenafil, in an herbal supplement. Food Addit. Contam. Part A Chem. Anal. ControlExpo. Risk Assess. 2016, 33, 1637–1642. [CrossRef]
8. Ying, Z.; Zhiqiang, H.; Li, D.; Hongfei, Y.; Meiling, W.; Shaohua, Z. Simultaneous determination ofyohimbine, sildenafil, vardenafil and tadalafil in dietary supplements using high-performance liquidchromatography-tandem mass spectrometry. J. Sep. Sci. 2015, 33, 2109–2114.
9. Challa, B.R.; Awen, B.Z.; Chandu, B.R.; Khagga, M.; Bannoth, C.K.; Kanala, K.; Shaik, R.P.; Peraman, R.;Gogineni, R. Sildenafil and N-desmethyl sildenafil quantification in human plasma by HPLC coupled withESI-MS/MS detection: Application to bioequivalence study. Anal. Methods 2010, 2, 1043–1050. [CrossRef]
10. Al-Hroub, H.; Alkhawaja, B.; Alkhawaja, E.; Arafat, T. Sensitive and rapid HPLC-UV method withback-extraction step for the determination of sildenafil in human plasma. J. Chromatogr. B Anal. Technol.Biomed. Life Sci. 2016, 1009–1010, 1–6. [CrossRef]
11. Altıokka, G.; Atkosar, Z.; Sener, E.; Tunçel, M. FIA of sildenafil citrate using UV-detection. J. Pharm. Biomed.Anal. 2001, 25, 339–342. [CrossRef]
12. Sabina, S.R.; Luca, A.; Xavier, D.L.T.; Francesco, B. A gas chromatography/mass spectrometry method for thedetermination of sildenafil, vardenafil and tadalafil and their metabolites in human urine. Rapid Commun.Mass Spectrom. 2010, 24, 1697–1706.
13. Jeong, Y.D.; Suh, S.I.; Jin, Y.K.; In, M.K.; Paeng, K.J. Simultaneous Determination of Sildenafil, Tadalafil, andVardenafil in Pharmaceutical Preparations by High-Temperature Gas Chromatography/Mass Spectrometry.Chromatographia 2016, 79, 1671–1678. [CrossRef]
14. Reddy, T.S.; Reddy, A.S.; Devi, P.S. Quantitative determination of sildenafil citrate in herbal medicinal formulationsby high-performance thin-layer chromatography. Jpc-J. Planar Chromatogr. -Mod. Tlc 2006, 19, 427–431. [CrossRef]
15. Liu, Y.R.; Hai-Sheng, G.E.; Zhao, K.H.; Ling, Y.U.; Zhang, C. Determination of sildenafil citrate added intraditional Chinese medicines and health care products by thin layer chromatographic surface-enhancedRaman spectroscopic method. Chin. J. Pharm. Anal. 2014, 34, 1241–1246.
16. Said, M.M.; Gibbons, S.; Moffat, A.C.; Zloh, M. Rapid detection of sildenafil analogue in Eurycomalongifolia products using a new two-tier procedure of the near infrared (NIR) spectra database. Food Chem.2014, 158, 296–301. [CrossRef]
17. Vredenbregt, M.J.; Blok-Tip, L.; Hoogerbrugge, R.; Barends, D.M.; Kaste, D.D. Screening suspected counterfeitViagra®; and imitations of Viagra®; with near-infrared spectroscopy. J. Pharm. Biomed. Anal. 2006, 40, 840–849.[CrossRef]
18. Ramirez-Mendiola, B.; Flores-Perez, C.; Garcia-Alvarez, R.; Juarez-Olguin, H.; Flores-Perez, J.; ChavezPacheco, J.L. A reliable method to quantify sildenafil and its metabolite N-demethylsildenafil by HPLC inplasma of children. Drug Res. 2013, 63, 473–476. [CrossRef]

Int. J. Mol. Sci. 2019, 20, 2722 13 of 13
19. Orsi, D.D.; Pellegrini, M.; Marchei, E.; Nebuloni, P.; Gallinella, B.; Scaravelli, G.; Martufi, A.; Gagliardi, L.;Pichini, S. High performance liquid chromatography-diode array and electrospray-mass spectrometryanalysis of vardenafil, sildenafil, tadalafil, testosterone and local anesthetics in cosmetic creams sold on theInternet web sites. J. Pharm. Biomed. Anal. 2009, 50, 362–369. [CrossRef]
20. Chee-Leong, K.; Xiaowei, G.; Min-Yong, L. Application of Orbitrap-mass spectrometry to differentiateisomeric sildenafil- and thiosildenafil-like analogues used for the adulteration of dietary supplements.Food Addit. Contam. Part A Chem. Anal. Control Expo. Risk Assess. 2015, 32, 1737–1748.
21. Liew, K.B.; Loh, G.O.; Tan, Y.T.; Peh, K.K. Simultaneous quantification of sildenafil and N-desmethyl sildenafilin human plasma by UFLC coupled with ESI-MS/MS and pharmacokinetic and bioequivalence studies inMalay population. Biomed. Chromatogr. 2015, 29, 953–960. [CrossRef] [PubMed]
22. Yaroshenko, D.V.; Grigoriev, A.V.; Sidorova, A.A.; Kartsova, L.A. Chromatographic determination of sildenafilin blood plasma using spectrophotometric and mass-spectrometric detection. J. Anal. Chem. 2013, 68, 801–808.[CrossRef]
23. Huiyuan, G.; Zhiyun, Z.; Baoshan, X.; Arnab, M.; Craig, M.; White, J.C.; Lili, H. Analysis of SilverNanoparticles in Antimicrobial Products Using Surface-Enhanced Raman Spectroscopy (SERS). Environ. Sci.Technol. 2015, 49, 4317–4324.
24. He, Y.; Xiao, S.; Dong, T.; Nie, P. Gold Nanoparticles for Qualitative Detection of Deltamethrin and CarbofuranResidues in Soil by Surface Enhanced Raman Scattering (SERS). Int. J. Mol. Sci. 2019, 20, 1731. [CrossRef][PubMed]
25. Meng, L.; Gu, H.; Yuan, X.; Gao, J.; Cai, T. Investigation of 3D silvernanodendrite@glass as surface-enhancedRaman scattering substrate for the detection of Sildenafil and GSH. J. Mol. Struct. 2012, 1029, 75–80.
26. Mao, D.Z.; Weng, X.X.; Yang, Y.J. Rapid screening of sildenafil and tadalafil adulterated in healthcare productsby Micro-Raman spectroscopy. J. Raman Spectrosc. 2012, 43, 1985–1990. [CrossRef]
27. Hang, Z.; Hasi, W.; Lin, B.; Han, S.; Sha, X.; Jia, S.; Lou, X.; Lin, D.; Lv, Z. Rapid Detection of SildenafilDrugs in Liquid Nutraceuticals Based on Surface-Enhanced Raman Spectroscopy Technology. Chin. J. Chem.2017, 35, 1522–1528.
28. Zhang, Y.; Huang, X.; Liu, W.; Cheng, Z.; Chen, C.; Yin, L. Analysis of Drugs Illegally Added into ChineseTraditional Patent Medicine Using Surface-enhanced Raman Scattering. Anal. Sci. 2013, 29, 985–990.[CrossRef]
29. Wu, J.; Zhang, L.; Bu, X.; Li, P.; Zhao, B.; Tian, Y. Determination of the illegal adulteration of natural healthcareproducts with chemical drugs using surface-enhanced Raman scattering. Analyst 2018, 143, 5202–5209.[CrossRef]
30. Lei, L.; Fangfang, Q.; Pengcheng, N.; Hui, Z.; Bingquan, C.; Yong, H. Rapid and Quantitative Determinationof Sildenafil in Cocktail Based on Surface Enhanced Raman Spectroscopy. Molecules 2019, 24, 1790.
31. Qin, X.; Guo, X.; Li, X.; Ye, Y.; Wu, Y.; Ying, W.; Yang, H. Template-Free Synthesis of SERS-Active GoldNanopopcorn for Rapid Detection of Chlorpyrifos Residues. Sens. Actuators B Chem. 2017, 241, 1008–1013.
32. Dong, T.; Lin, L.; He, Y.; Nie, P.; Qu, F.; Xiao, S. Density Functional Theory Analysis of Deltamethrin and ItsDetermination in Strawberry by Surface Enhanced Raman Spectroscopy. Molecules 2018, 23, 1458. [CrossRef][PubMed]
33. Lin, L.; Dong, T.; Nie, P.; Qu, F.; He, Y.; Chu, B.; Xiao, S. Rapid Determination of Thiabendazole Pesticides inRape by Surface Enhanced Raman Spectroscopy. Sensors 2018, 18, 1082. [CrossRef] [PubMed]
34. Luo, H.; Huang, Y.; Lai, K.; Rasco, B.A.; Fan, Y. Surface-enhanced Raman spectroscopy coupled with goldnanoparticles for rapid detection of phosmet and thiabendazole residues in apples. Food Control 2016, 68, 229–235.[CrossRef]
35. Xiaoyu, G.; Yichen, F.; Shuyue, F.; Hui, W.; Tianxi, Y.; Ying, W.; Haifeng, Y. Improving SERS activity of inositolhexaphosphate capped silver nanoparticles: Fe3+ as a switcher. Inorg. Chem. 2014, 53, 7227–7232.
36. Zhu, W.L.; Tan, X.J.; Puah, C.M.; Gu, J.D.; Jiang, H.L.; Chen, K.X.; Felder, C.E.; Silman, I.; Sussman, J.L. HowDoes Ammonium Interact with Aromatic Groups? A Density Functional Theory (DFT/B3LYP) Investigation.J. Phys. Chem. A 2000, 104, 9573–9580. [CrossRef]
© 2019 by the authors. Licensee MDPI, Basel, Switzerland. This article is an open accessarticle distributed under the terms and conditions of the Creative Commons Attribution(CC BY) license (http://creativecommons.org/licenses/by/4.0/).