Crystalline and magnetic structure-property relationship ... - Pure
Upload
independentCategory
view
1download
0
Journal of Thermal Analysis Vol. 46 (1996) 795-808
Dedicated to Professor Bernhard Wundertlch on the occasion of his 65th birt~hday
ANALYSIS OF MF~OPHASE FORMATION IN SIDE- CHAIN LIQUID CRYSTALLINE POLYCARBOSILANES
Maria Mucha and T. Ganicz*
Faculty of Process and Environmental Engineering L6d~ Technical University, W61czafiska 175, 90-924 L6d~ *Centre of Molecular and Maeromolecular Studies, Polish Academy of Sciences, Sienkiewicza 112, 90-363 L6d~, Poland
Abstract
This paper is concerned with an analysis of the thermodynamics and kinetics of mesophase formation by cooling from the isotropic state of side-chain liquid crystalline polycarbosilanes containing spacers in the range from 3 to 11 CHz-groups. The polymers are characterized by their thermotropic behaviour as far as temperature, enthalpy and entropy of the transitions are concerned. The kinetics was followed by optical and calorimetric methods. Longer spacer length leads to more perfect ordering in the mesophase, higher isotropization temperatures, and lower glass transition temperatures. The Avrami and Ozawa formalism to describe the transition kinet- ics to the mesophase from the isotropic state cannot be interpreted as the nucleation and growth mechanism known from crystallization.
Keywords: DSC, kinetics, liquid crystalline polymer, optical transmittance, polycarbosilane, side-chain mesogen, transition parameters
Introduction
Side-chain liquid crystalline polymers (SCLCPs) have received wide atten- tion since the first systematic synthesis in the late 1970's [1-3]. SCLCPs consist of a polymer backbone attached through some flexible hydrocarbon "spacers" to liquid crystal mesogenic groups in the side chain to form a "comb-like" struc- ture. This structure combines polymer advantages such as good film forming and mechanical properties, and also electro- and magneto-optical properties of low molecular mass liquid crystals. Such polymers are of considerable interest as potential material for a variety of applications in physical optics and display technology, especially in relation to reversible information storage devices [4-7].
In this paper discussion will be restricted to thermotropic properties and ki- netics of mesophase formation of side-chain polycarbosilanes having alternating length of flexible spacer.
0368-4466/96/$ 5.00
�9 1996 Akad~miai Kiadr, Blutapest John Wiley & Sons, L#nited
Chichester
796 MUCHA, GANICZ: LIQUID CRYSTALLINE POLYCARBOSILANES
E x p e r i m e n t a l
Linear polycarbosilane of the novel poly(silabutane) type was synthesized by ring opening polymerization of l-methyl-l-silacyclobutane. Side-chain liquid crystalline polycarbosilanes were prepared in the course of hydrosililation of mesogenic alkene with the linear polycarbosilane. The chemical structure of the resulting polymers is shown below:
Me
x = 3, 4, 5, 8, 11. The polymerization method was presented elsewhere [8]. The molecular
structure of the polymer (DPn = 85) was confirmed by IH-NMR and IR spec- troscopy. Differential scanning calorimetry measurements were taken with a Du Pont 910 Analyzer at various heating and cooling rates.
The measurements of the transmitted light intensity were made with a pho- todiode and recorded by a digital laser-power-meter device. He-Ne laser light of a wavelength of 632.8 nm was used as incident light, normal to the sample surface. The distance between ttie cell and the photodiode was 30 ram. In the presented work the change of the transmittance of the polarized light results from the formation of anisotropic mesomorphic domains having sizes of the or- der of the wavelength of the polarized laser light or greater. The scattering of the light is due to the appearance of nematic or smectic domains. The transmis- sion of polarized light by thin films of mesomorphic layers depends, thus, on the size, shape and arrangement of the constituent anisotropic regions.
The temperatures of isotropization of the polymers were monitored by DSC and thermooptical measurements using a Mettler hot stage. They were taken by heating or cooling with various rates from 2 to 20 K rain -1. The glass transitions (from mesophase to glass) and the crystallization temperatures (from meso- phase to crystalline phase) were determined by DSC.
The kinetics of mesomorphic phase formation was measured by isothermal light transmission and non-isothermal DSC techniques. During rapid cooling from the isotropic phase to N+I or S+I biphasic (or to the mesomorphic) re- gions the changes of the transmission light intensity with time at constant tem- peratures are measured. The DSC peaks measured during the transition from the isotropic phase to the mesophase were transformed into conversion curves at the chosen cooling rates. Avrami and Ozawa equations have been applied for description of the isotropic-mesophase transformation.
J. Thermal Anal., 46, 1996
MUCHA, GANICZ: LIQUID CRYSTALLINE POLYCARBOSILANES 797
Results and discussion
Transit ion characterist ics
1. Transition parameters vs. length of spacer
The order-disorder transition of liquid crystals and polymeric liquid crystals normally proceeds stepwise, from the crystalline to the isotropic state.
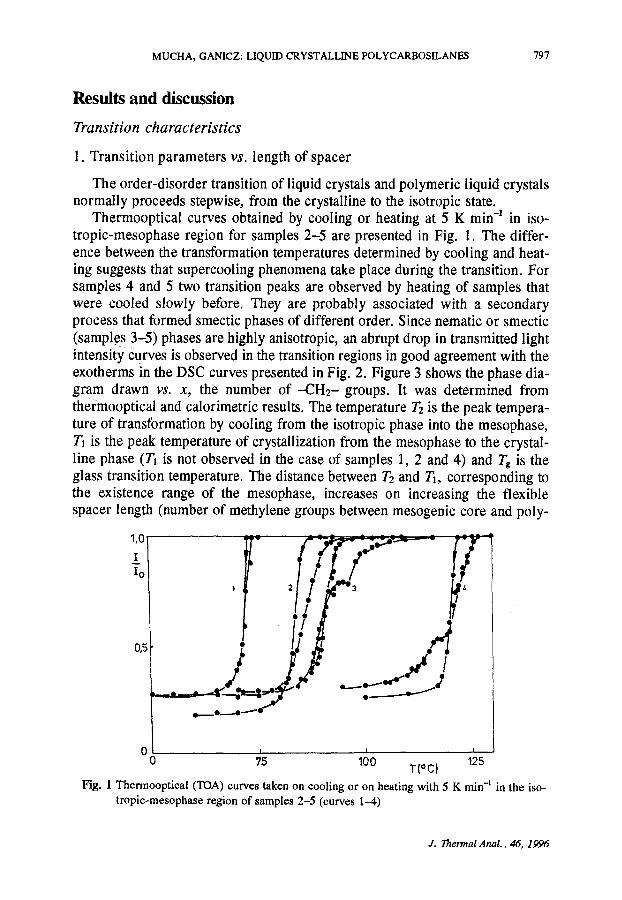
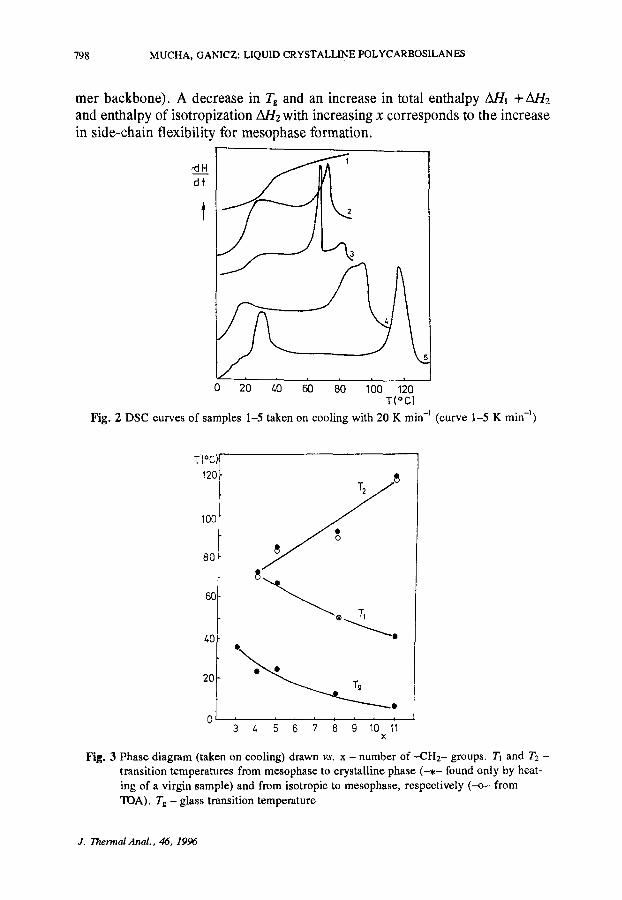
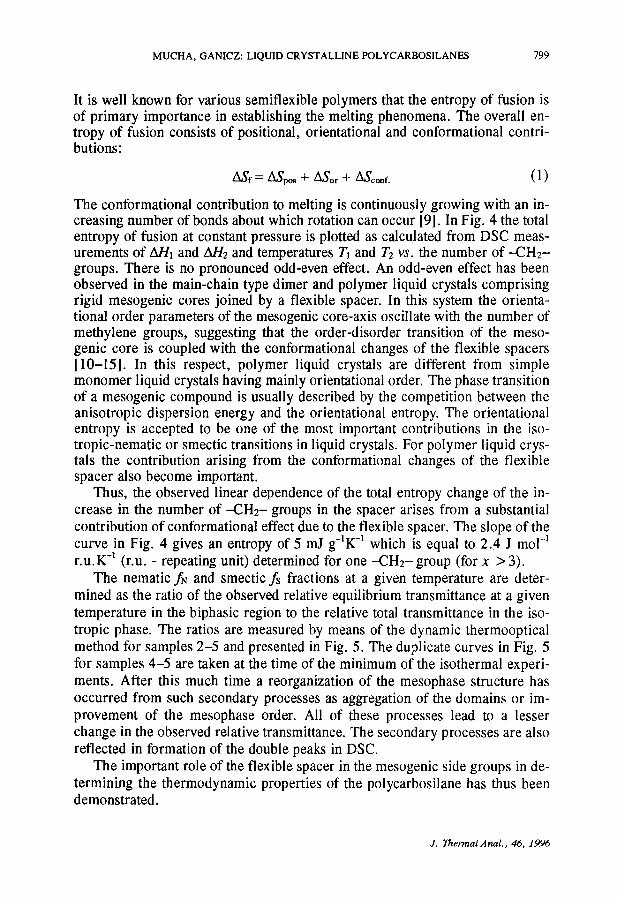
Thermooptical curves obtained by cooling or heating at 5 K min q in iso- tropic-mesophase region for samples 2-5 are presented in Fig. 1. The differ- ence between the transformation temperatures determined by cooling and heat- ing suggests that supercooling phenomena take place during the transition. For samples 4 and 5 two transition peaks are observed by heating of samples that were cooled slowly before. They are probably associated with a secondary process that formed smectic phases of different order. Since nematic or smectic (samples 3-5) phases are highly anisotropic, an abrupt drop in transmitted light intensity curves is observed in the transition regions in good agreement with the exotherms in the DSC curves presented in Fig. 2. Figure 3 shows the phase dia- gram drawn vs. x, the number of --CH2- groups. It was determined from thei:mooptical and calorimetric results. The temperature T2 is the peak tempera- ture of transformation by cooling from the isotropic phase into the mesophase, T1 is the peak temperature of crystallization from the mesophase to the crystal- line phase (T~ is not observed in the case of samples 1, 2 and 4) and T, is the glass transition temperature. The distance between T2 and/'1, corresponding to the existence range of the mesophase, increases on increasing the flexible spacer length (number of methylene groups between mesogenic core and p01y-
"
I I -- I
0 0 75 100 125 T(~
Fig. 1 Thermooptical ('IDA) curves taken on cooling or on heating with 5 K rain -I in the iso- tropic-mesophase region of samples 2-5 (curves 1-4)
J. Thermal Anal., 46, 1996
798 MUCHA, GANICZ: LIQUID CRYSTALLINE POLYCARBOSILANES
mer backbone). A decrease in T8 and an increase in total enthalpy AHt + AH2 and enthalpy of isotropization AH2 with increasing x corresponds to the increase in side-chain flexibility for mesophase formation.
-dHdtl ~ -~3
0 20 40 60 80 100 120 T(~ Fig. 2 DSC curves of samples 1-5 taken on cooling with 20 K rain -1 (curve 1-5 K min -l)
T(~ 120
100
eO
60
z,O
20
O
�9 �9 Tg 3 z, 5 6 7 8 9 10 11
X
Fig. 3 Phase diagram (taken on cooling) drawn vs. x - number of -CH2- groups. Tz and T2 - transition temperatures from mesophase to crystalline phase ( - , - found only by heat- ing of a virgin sample) and from isotropie to mesophase, respectively (--o- from "IDA). Tg - glass transition temperature
J. Thermal Anal., 46, 1996
MUCHA, GANICZ: LIQUID CRYSTALLINE POLYCARBOSILANES 799
It is well known for various semiflexible polymers that the entropy of fusion is of primary importance in establishing the melting phenomena. The overall en- tropy of fusion consists of positional, orientational and conformational contri- butions:
zXSf = AS0o~ + ~So. + A&oof. (1)
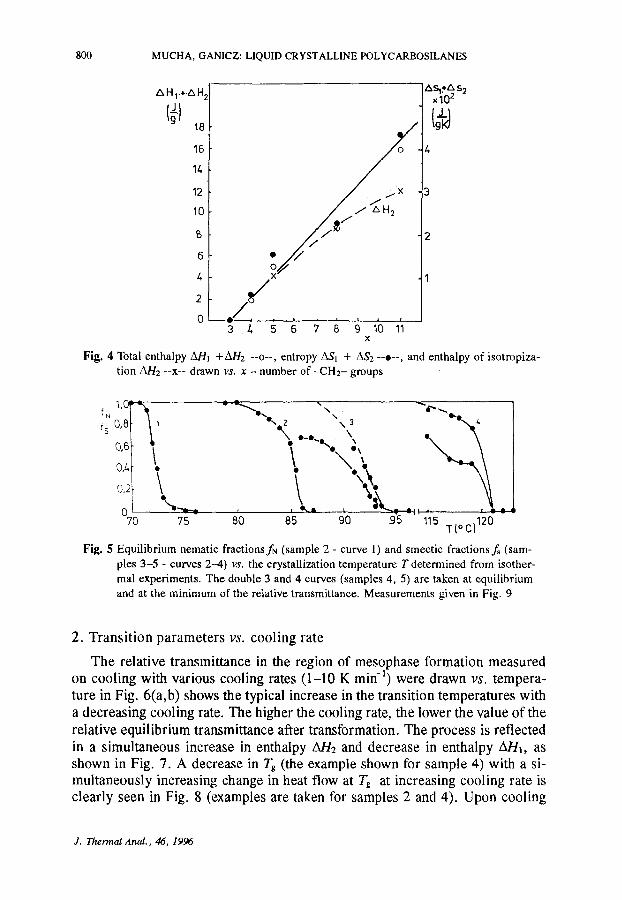
The conformational contribution to melting is continuously growing with an in- creasing number of bonds about which rotation can occur [9]. In Fig. 4 the total entropy of fusion at constant pressure is plotted as calculated from DSC meas- urements of AH1 and AH2 and temperatures 7"1 and 7"2 vs. the number of --CH2- groups. There is no pronounced odd-even effect. An odd-even effect has been observed in the main-chain type dimer and polymer liquid crystals comprising rigid mesogenic cores joined by a flexible spacer. In this system the orienta- tional order parameters of the mesogenic core-axis oscillate with the number of methylene groups, suggesting that the order-disorder transition of the meso- genic core is coupled with the conformational changes of the flexible spacers [10-15]. In this respect, polymer liquid crystals are different from simple monomer liquid crystals having mainly orientational order. The phase transition of a mesogenic compound is usually described by the competition between the anisotropic dispersion energy and the orientational entropy. The orientational entropy is accepted to be one of the most important contributions in the iso- tropic-nematic or smectic transitions in liquid crystals. For polymer liquid crys- tals the contribution arising from the conformational changes of the flexible spacer also become important.
Thus, the observed linear dependence of the total entropy change of the in- crease in the number of --CH2- groups in the spacer arises from a substantial contribution of conformational effect due to the flexible spacer. The slope of the curve in Fig. 4 gives an entropy of 5 mJ g-~K -~ which is equal to 2.4 J mol -~ r.u.K -~ (r.u. - repeating unit) determined for one --CH2- group (for x > 3).
The nematic fs and smectic 3~ fractions at a given temperature are deter- mined as the ratio of the observed relative equilibrium transmittance at a given temperature in the biphasic region to the relative total transmittance in the iso- tropic phase. The ratios are measured by means of the dynamic thermooptical method for samples 2-5 and presented in Fig. 5. The duplicate curves in Fig. 5 for samples 4-5 are taken at the time of the minimum of the isothermal experi- ments. After this much time a reorganization of the mesophase structure has occurred from such secondary processes as aggregation of the domains or im- provement of the mesophase order. All of these processes lead to a lesser change in the observed relative transmittance. The secondary processes are also reflected in formation of the double peaks in DSC.
The important role of the flexible spacer in the mesogenic side groups in de- termining the thermodynamic properties of the polycarbosilane has thus been demonstrated.
J. Thermal Anal., 46, 1996
800 MUCHA, GANICZ: LIQUID CRYSTALLINE POLYCARBOSILANES
AH~ +.AH
18
16
14
12
10
~5
6
2
0
i x
/~//1~ f -
3 4 5 6 7 8 9 I'0 11 X
xlO
Fig. 4 Total enthalpy AHI +AH2 --o--, entropy ASh + AS2 --e--, and enthalpy of isotropiza- tion AH2 --x-- drawn vs . x - number of --CH2- groups
fs 0,8'
0,6 1 0,4 �9
0,2 \
70 75 80 85 90 95 115 T (o C)120
Fig. 5 Equilibrium nematie fractionsfN (sample 2- curve 1) and smectic fractionsf~ (sam- ples 3-5 - curves 2-4) vs. the crystallization temperature T determined from isother- mal experiments. The double 3 and 4 curves (samples 4, 5) are taken at equilibrium and at the minimum of the relative transmittance. Measurements given in Fig. 9
2. Transition parameters vs . cooling rate
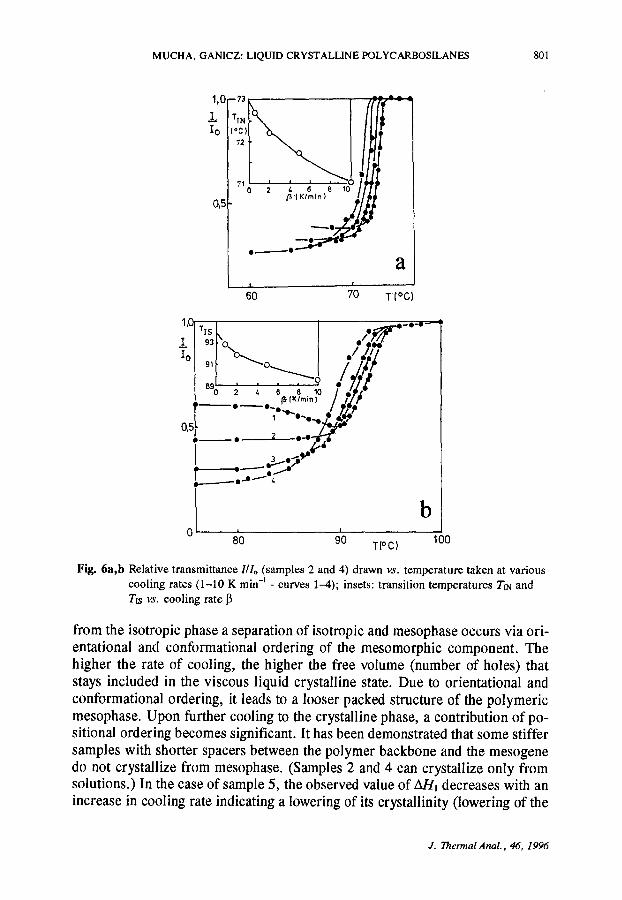
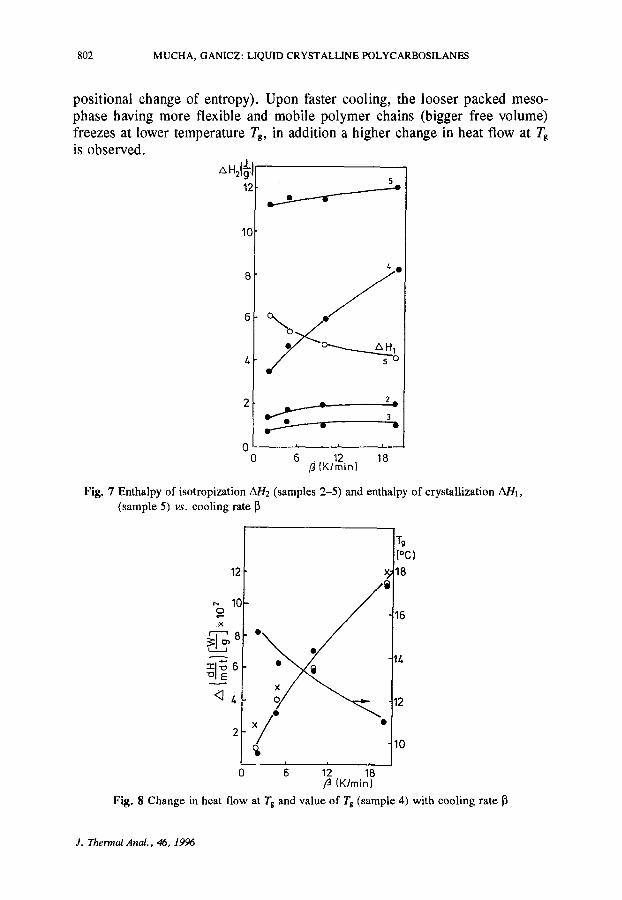
The relative transmittance in the region of mesophase formation measured on cooling with various cooling rates (1-10 K min -1) were drawn vs . tempera- ture in Fig. 6(a,b) shows the typical increase in the transition temperatures with a decreasing cooling rate. The higher the cooling rate, the lower the value of the relative equilibrium transmittance after transformation. The process is reflected in a simultaneous increase in enthalpy AH2 and decrease in enthalpy AH1, as shown in Fig. 7. A decrease in T~ (the example shown for sample 4) with a si- multaneously increasing change in heat flow at Tg at increasing cooling rate is clearly seen in Fig. 8 (examples are taken for samples 2 and 4). Upon cooling
J. T herma l A n a l . , 46, 1996
MUCHA, GANICZ: LIQUID CRYSTALLINE POLYCARBOSILANES 801
1,1 I.
0,5
a
I I 0 ..... 60 T[~
I I 931'b I e a o o
I t , i O - - I i~lK/mlnl I d i f l ; ' - ' - . - _ : . ; ' ; '
0,51" " "~,~" i ~ 2 ~
0 b 80 90 TPC) 100
Fig. 6a,b Relative transmittance 111o (samples 2 and 4) drawn vs. temperature taken at various cooling rates (1-10 K rain -I - curves 1-4); insets: transition temperatures TIN and Tls vs. cooling rate 1~
from the isotropic phase a separation of isotropic and mesophase occurs via ori- entational and conformational ordering of the mesomorphic component. The higher the rate of cooling, the higher the free volume (number of holes) that stays included in the viscous liquid crystalline state. Due to orientational and conformational ordering, it leads to a looser packed structure of the polymeric mesophase. Upon further cooling to the crystalline phase, a contribution of po- sitional ordering becomes significant. It has been demonstrated that some stiffer samples with shorter spacers between the polymer backbone and the mesogene do not crystallize from mesophase. (Samples 2 and 4 can crystallize only from solutions.) In the case of sample 5, the observed value of AHI decreases with an increase in cooling rate indicating a lowering of its crystallinity (lowering of the
J. Thermal AnaL , 46, 1996
802 MUCHA, GANICZ: LIQUID CRYSTALLINE POLYCARBOSILANES
positional change of entropy). Upon faster cooling, the looser packed meso- phase having more flexible and mobile polymer chains (bigger free volume) freezes at lower temperature Tg, in addition a higher change in heat flow at Tg is observed.
,,.21 J 5
12
10
8 ~ o
o\.Y
0 0 12 18 6 /j [K/min)
Fig. 7 Enthalpy of isotropization AH2 (samples 2-5) and enthalpy of crystallization AH1, (sample 5) vs. cooling rate 13
~o 10
�9 @
x// i
o- & 12 (K/min}
18
16
12
10
Fig. 8 Change in heat flow at Tg and value of Tg (sample 4) with cooling rate [I
J. Thermal Anal., 46, 1996
MUCHA, GANICZ: LIQUID CRYSTALLINE POLYCARBOSILANES 803
Kinetics of mesophase formation
1. Optical transmittance method
The light transmittance technique may be used to characterize the crystal- lization of the polymer during cooling from the isotropic state. It is a rapid and convenient method of measurement and was first used by the authors [16] to study crystallization kinetics of polymers. The use of transmission of linearly polarized light, measured photometrically, as a measure of progress of crystal- lization can cause some problems [9]. The optical retardation:
A = 360d (no - n~)/X (2)
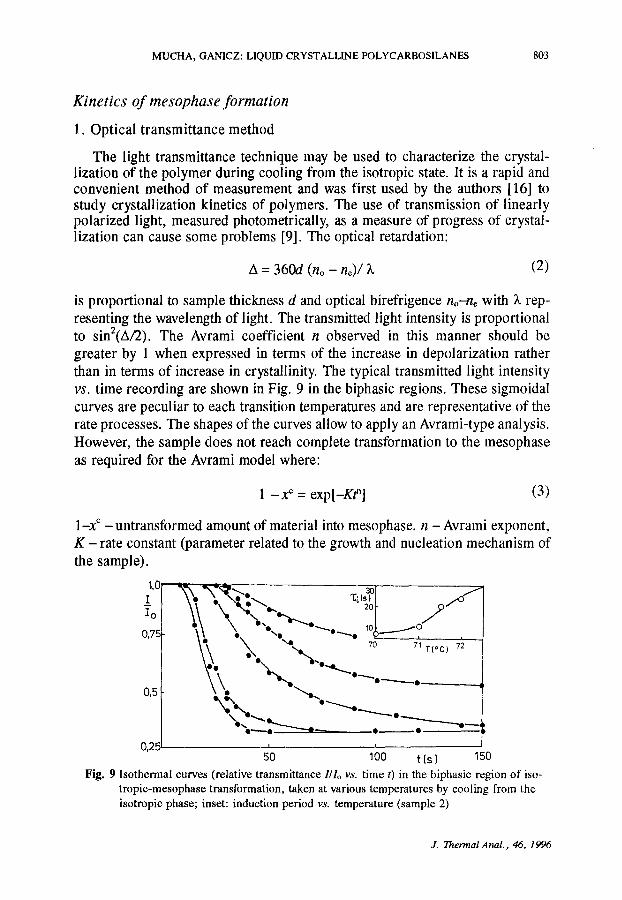
is proportional to sample thickness d and optical birefrigence no-ne with X rep- resenting the wavelength of light. The transmitted light intensity is proportional to sinZ(A/2). The Avrami coefficient n observed in this manner should be greater by 1 when expressed in terms of the increase in depolarization rather than in terms of increase in crystallinity. The typical transmitted light intensity vs. time recording are shown in Fig. 9 in the biphasic regions. These sigmoidal curves are peculiar to each transition temperatures and are representative of the rate processes. The shapes of the curves allow to apply an Avrami-type analysis. However, the sample does not reach complete transformation to the mesophase as required for the Avrami model where:
1 - x ~ = exp[-Kt ~1 (3)
1-x c -untransformed amount of material into mesophase, n - Avrami exponent, K - rate constant (parameter related to the growth and nucleation mechanism of the sample).
1,o / 1o ,,.,.,..,~,,,. o
;, : k �9 ~ . 1 0 / . ~ 0 , 7 5 'l~ =- "= " ~ a , 9 , ,
\ \ o- -%.
0,2,' I ,
50 100 t ( s ) 150
Fig. 9 Isothermal curves (relative transmittance// /o vs. t ime t) in the biphasie region of iso- tropie-mesophase transformation, taken at various temperatures by cooling from the isotropie phase; inset: induction period vs. temperature (sample 2)
J. Thermal Anal., 46, 1996
804 MUCHA, GANICZ: LIQUID CRYSTALLINE POLYCARBOS1LANES
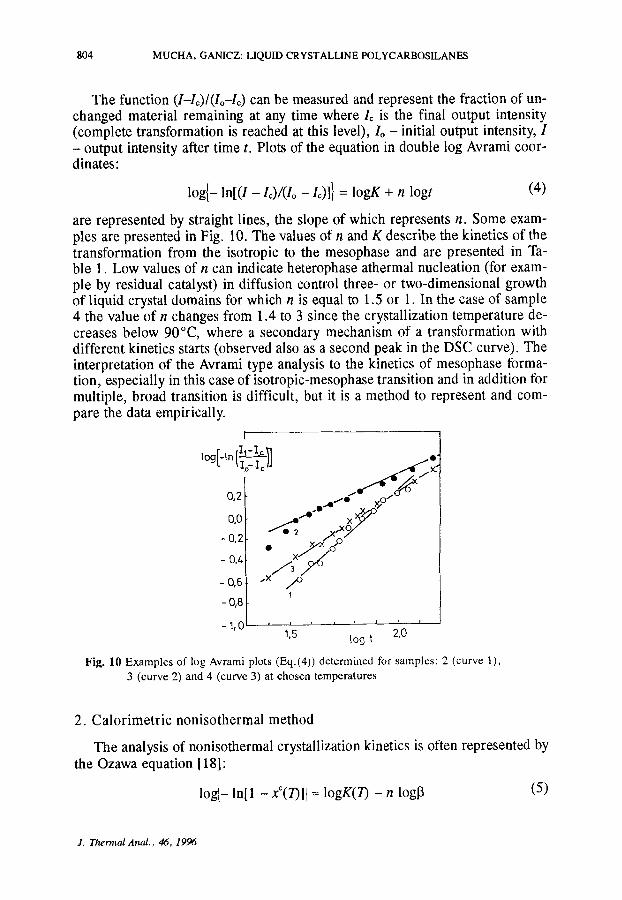
The function ( I - L ) / ( I o - I o ) can be measured and represent the fraction of un- changed material remaining at any time where Ic is the final output intensity (complete transformation is reached at this level), Io - initial output intensity, I - output intensity after time t. Plots of the equation in double log Avrami coor- dinates:
log{- In[ ( / - L ) / ( l o - L)]} = logK + n logt (4)
are represented by straight lines, the slope of which represents n. Some exam- ples are presented in Fig. 10. The values of n and K describe the kinetics of the transformation from the isotropic to the mesophase and are presented in Ta- ble 1. Low values of n can indicate heterophase athermal nucleation (for exam- ple by residual catalyst) in diffusion control three- or two-dimensional growth of liquid crystal domains for which n is equal to 1.5 or 1. In the case of sample 4 the value of n changes from 1.4 to 3 since the crystallization temperature de- creases below 90~ where a secondary mechanism of a transformation with different kinetics starts (observed also as a second peak in the DSC curve). The interpretation of the Avrami type analysis to the kinetics of mesophase forma- tion, especially in this case of isotropic-mesophase transition and in addition for multiple, broad transition is difficult, but it is a method to represent and com- pare the data empirically.
I
0 o
~ Ic," - , o ~ ~ x"
0,2 .e.-e ~e ' " :9
0,0 ) x o X ~ i . , , , , ~ ..-o . x e 2 ,,,x -o.2 �9
-o,, / / y - 0 , 5 . .x
1
-0,8
t i ~ ! I
- 1, 0 1.5 log t 2,0
Fig. 10 Examples of log Avrami plots (Eq.(4)) determined for samples: 2 (curve 1), 3 (curve 2) and 4 (curve 3) at chosen temperatures
2. Calorimetric nonisothermal method
The analysis of nonisothermal crystallization kinetics is often represented by the Ozawa equation [18]:
log{- In[1 -xC(T)]} = logK(T) - n log13 (5)
J, Thermal Anal., 46, 1996
MUCHA, GANICZ: LIQUID CRYSTALLINE POLYCARBOSILANES 805
where: 1-xC(T) - untransformed amount of material at temperature T, n - slope parameter, K(T) - cooling function at temperature T, 13 - cooling rate.
Taking the DSC measurements in the conditions of various cooling rates and drawing log{-ln[1-xC(T)]} vs. 1og13 at different temperatures, straight lines of the slope n should be obtained. From the intercept for log13 =0 the value of cooling function K(T) can be determined, which in the case of athermal nuclea- tion represents the dependence of the crystal growth rate on temperature. The
Table 1 Polymers characterization
Sample No x Tg/~ TI /~ 7"2/~ n(opt) n(DSC) K(opt)-103
1 3 35.6 . . . . .
1 .3-1.7 0 .3 -0 .4
2 4 20.7 - 73.6(71) (70.00-72.5 ~ ) (68~ ~ ) 0.6--6.0
0.9 0 .7 -0 .8
3 5 23.2 69.5 84.8(83) (85.5 ~ ) (820-86 ~ 50
1.4 0 .4 -0 .6
4 8 10.8 -[50] 93.5(90) (91.5~ ~ ) (890-94 ~ ) 2.5--6.3
1.3
5 11 - 7 . 0 37.1 121.0(119) (115~ ~ - 25
x - total number of -CH2- groups Tg - glass transition temperature taken on cooling at 20 K min -l 7"1, 7"2 -f irst (mesomorphic-crystalline) and second (isotropic-mesomorphic) transitions taken by DSC and TOA (in parentheses) on cooling at 10 K rain -1 n, K -Avrami parameters for the 7"2 transition by DSC or TOA studies [ ] - result obtained on heating of a virgin sample (crystallized from solution)
X c
C,B
0,6
0,s 60 70 80
T(oC)
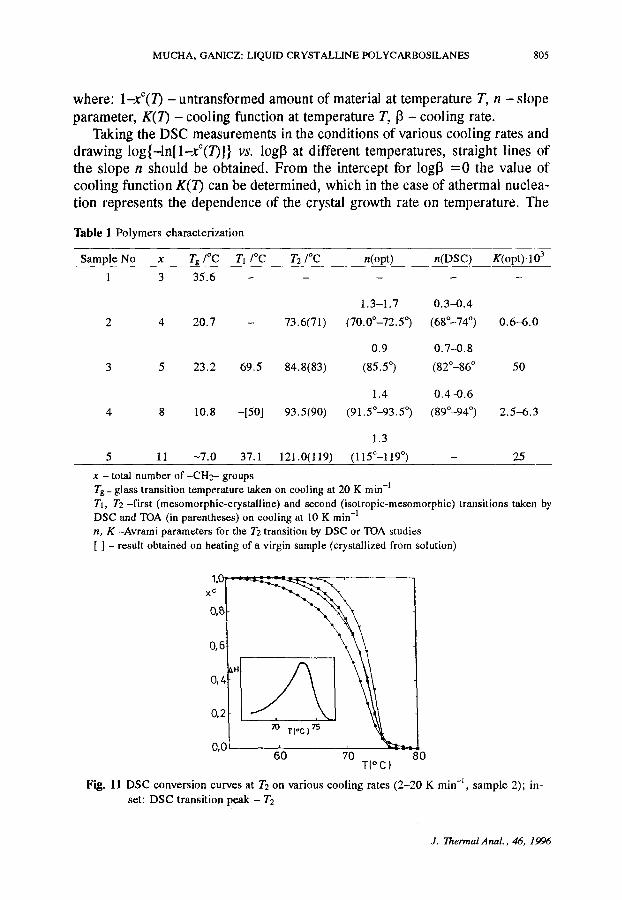
Fig. 11 DSC conversion curves at T2 on various cooling rates (2-20 K min -l, sample 2); in- set: DSC transition peak - / ' 2
J. Thermal Anal., 46, 1996
806 MUCHA, GANICZ: LIQUID CRYSTALLINE POLYCARBOSILANES
0,5
)< I
--~ 0
1
o ~ - - 0 , 5
- I ,C
~ o ~ O - ~ ' ~ ~o,,,... 1
I !
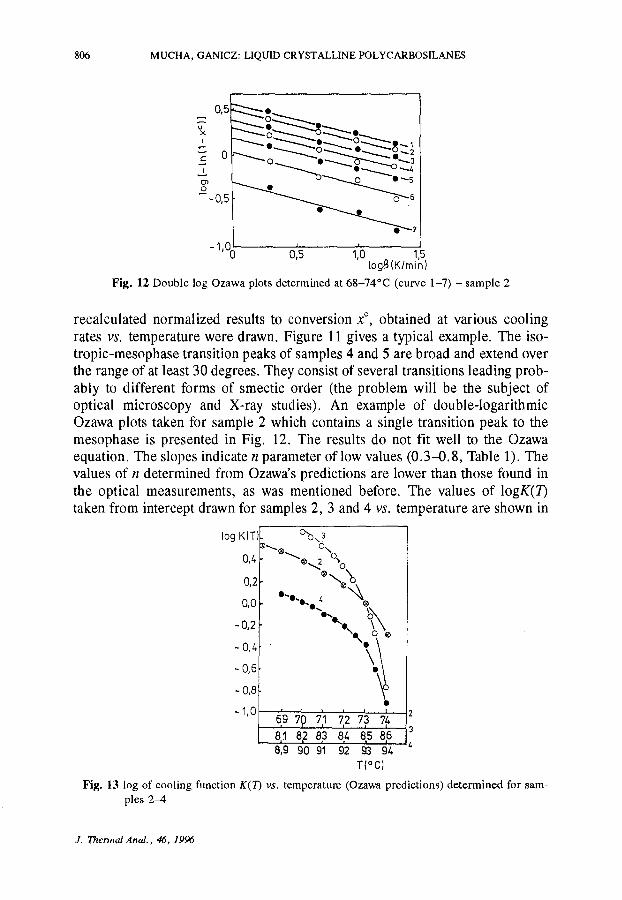
Fig. 12 Double log Ozawa plots determined at 68-74~ (curve 1-7) - sample 2
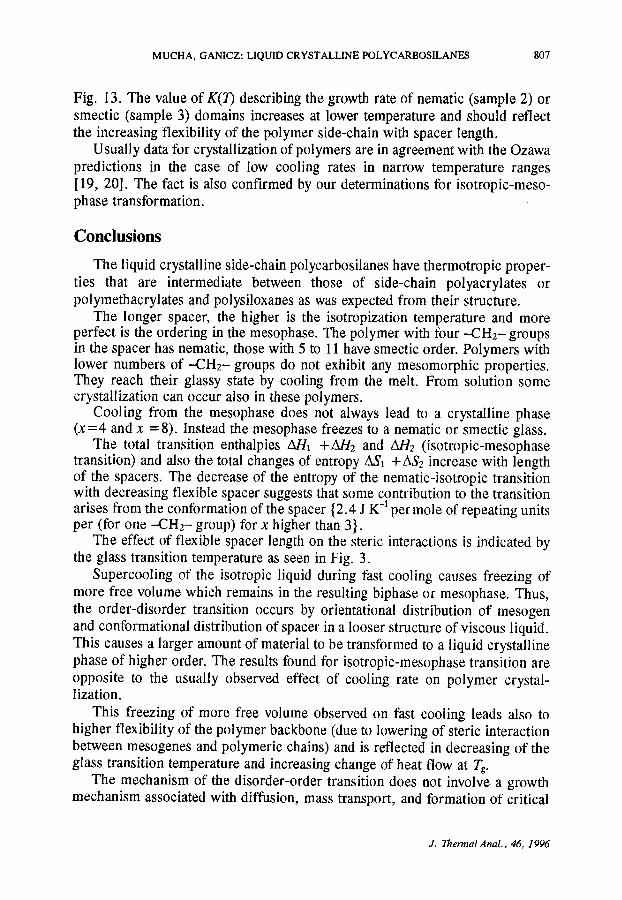
recalculated normalized results to conversion x ~ obtained at various cooling rates vs. temperature were drawn. Figure 11 gives a typical example. The iso- tropic-mesophase transition peaks of samples 4 and 5 are broad and extend over the range of at least 30 degrees. They consist of several transitions leading prob- ably to different forms of smectic order (the problem will be the subject of optical microscopy and X-ray studies). An example of double-logarithmic Ozawa plots taken for sample 2 which contains a single transition peak to the mesophase is presented in Fig. 12. The results do not fit well to the Ozawa equation. The slopes indicate n parameter of low values (0.3-0.8, Table 1). The values of n determined from Ozawa's predictions are lower than those found in the optical measurements, as was mentioned before. The values of logK(i0 taken from intercept drawn for samples 2, 3 and 4 vs. temperature are shown in
log K(T]. ~ ? ~@~ 0\~
0,4- %
0,2 , . k
0,0
- 0,2 ~o,,,. "~o"kr
-0,6
- 0,8 ~o -1,0 ' '
6,9 7~)71 i2 7 i 7 i 2
8,9 90 91 92 93 94 T{~
Fig. 13 log of cooling function K(T) vs. temperature (Ozawa predictions) determined for sam- ples 2-4
J. Thermal Anal., 46, 1996
MUCHA, GANICZ: LIQUID CRYSTALLINE POLYCARBOSILANES 807
Fig. 13. The value of K(T) describing the growth rate of nematic (sample 2) or smectic (sample 3) domains increases at lower temperature and should reflect the increasing flexibility of the polymer side-chain with spacer length.
Usually data for crystallization of polymers are in agreement with the Ozawa predictions in the case of low cooling rates in narrow temperature ranges [19, 20]. The fact is also confirmed by our determinations for isotropic-meso- phase transformation.
Conclusions
The liquid crystalline side-chain polycarbosilanes have thermotropic proper- ties that are intermediate between those of side-chain polyacrylates or polymethacrylates and polysiloxanes as was expected from their structure.
The longer spacer, the higher is the isotropization temperature and more perfect is the ordering in the mesophase. The polymer with four --CH2- groups in the spacer has nematic, those with 5 to 11 have smectic order. Polymers with lower numbers of --CH2- groups do not exhibit any mesomorphic properties. They reach their glassy state by cooling from the melt. From solution some crystallization can occur also in these polymers.
Cooling from the mesophase does not always lead to a crystalline phase (x=4 and x = 8). Instead the mesophase freezes to a nematic or smectic glass.
The total transition enthalpies AH1 +AH2 and AH2 (isotropic-mesophase transition) and also the total changes of entropy AS1 +ASz increase with length of the spacers. The decrease of the entropy of the nematic-isotropic transition with decreasing flexible spacer suggests that some contribution to the transition arises from the conformation of the spacer {2.4 J K -1 per mole of repeating units per (for one -CH2- group) for x higher than 3}.
The effect of flexible spacer length on the steric interactions is indicated by the glass transition temperature as seen in Fig. 3.
Supercooling of the isotropic liquid during fast cooling causes freezing of more free volume which remains in the resulting biphase or mesophase. Thus, the order-disorder transition occurs by orientational distribution of mesogen and conformational distribution of spacer in a looser structure of viscous liquid. This causes a larger amount of material to be transformed to a liquid crystalline phase of higher order. The results found for isotropic-mesophase transition are opposite to the usually observed effect of cooling rate on polymer crystal- lization.
This freezing of more free volume observed on fast cooling leads also to higher flexibility of the polymer backbone (due to lowering of steric interaction between mesogenes and polymeric chains) and is reflected in decreasing of the g/ass transition temperature and increasing change of heat flow at Tg.
The mechanism of the disorder-order transition does not involve a growth mechanism associated with diffusion, mass transport, and formation of critical
J. Thermal Anal., 46, 1996
808 MUCHA, GANICZ: LIQUID CRYSTALLINE POLYCARBOSILANES
size of nuclei, as commonly observed for crystallization processes. Thus an ap- plication of the Avrami or Ozawa equations leads only to comparison of the empirical data.
R e f e r e n c e s
1 H. Finkelmann, D. Naegele and H. Ringsdorf, Macromol. Chem., 180 (1979) 803. 2 N. A. Plate and V. P. Shibaev, Comb-Shaped Polymers and Liquid Crystals, Plenum Press,
New York 1989. 3 V. Perec and C. Pugh, Side-Chain Liquid Polymers, Chapman, New York 1989. 4 W. G. Gray, Side-Chain Liquid Crystal Polymers, C. B. MeArdle, Ed. Blaekie, Glasgow
1989. 5 J. Pinsl, C. Branchle and F. H. Kreuzer, J. Mol. Electronics, 3 (1987) 9. 6 H. Finkelmann and G. Rehage, Adv. Polym. Sci., 60/61 (1984) 99. 7 M. Mueha and T. Ganicz, Macromoleeular Symposia, in press. 8 E. Biatecka-Florjafiezyk, T. Ganicz, M. Pluta and W. Staficzyk, J. Organometallic Chemis-
try, 444 (1993) C9. 9 B. Wunderlich, Macromolecular Physics, vol. 2, Crystal Nucleation, Growth, Annealing,
Academic Press 1976. 10 A. Abe and H. Furuya, Maeromoleeules, 22 (1989) 99. 11 J. W. Emsley, G. R. Luekhurst and G. N. Shilstone, Mol. Cryst. Liq. Cryst., 102 (1984)
223. 12 A. Blumstein and O. Thomas, Maeromoleeules, 15 (1982) 1264. 13 H. Toriumi, H. Furuya and A. Abe, Polym. J., 17 (1985) 895. 14 A. Abe and S. Y. Nam, Maeromoleeules, 28 (1995) 90. 15 R. B. Blumstein and A. Blumstein, Mol. Cryst. Liq. Cryst., 165 (1988) 361. 16 J. H. Magill, Polymer, 2 (1961) 221. 17 M. Avrami, J. Chem. Phys., 9 (1941) 177. 18 T. Ozawa, Polymer, 12 (1971) 150. 19 A. Dutta, Polym. Comm., 31 (1990) 451. 20 G. L. Collins and J. D. Menczel, Polym. Eng. Sci., 32 (1992) 1270. 21 A. Abe, H. Furuya, R. N. Shimizu and S. Y. Nam, Maeromolecules, 28 (1995).96.
J. Thermal AnaL, 46, 1996
Copyright © 2022 FDOKUMEN