Individualizing neuro-anatomical atlases using a massively parallel computer
Upload
independentCategory
view
1download
0
Technical Report
Analysis of Ischemic Stroke MR Imagesby Means of Brain Atlases of Anatomy
and Blood Supply Territories1
Wieslaw L. Nowinski, DSc, PhD, Guoyu Qian, MSc, Bhanu Prakash Kirgaval Nagaraja, PhDArumugam Thirunavuukarasuu, MIT, Qingmao Hu, PhD, Nick Ivanov, PhD, Annamalai Sapayu Parimal, MTech
Val M. Runge, MD, Norman J. Beauchamp, MD, MHS
Rationale and Objectives. A method for atlas-assisted analysis of stroke magnetic resonance images that is a part of astroke computer-assisted diagnosis system supporting rapid and quantitative checking of thrombolysis conditions is pre-sented.
Materials and Methods. Two brain atlases are used for analysis: atlas of anatomy (AA) and atlas of blood supply territo-ries (BSTs). To map these atlases onto scans, two methods are used at present: (1) fast Talairach transformation and(2) midsagittal plane and brain’s bounding box matching. After atlas-to-scan mapping, both atlases are superimposed ontothe studied images and can be used to get their underlying anatomy and BSTs. To speed up the process of analysis, thesystem automatically analyzes entire regions occupied by the infarct and penumbra.
Results. By using both atlases, the system calculates the following values for each infarct and penumbra region:(1) names of all anatomic structures and BSTs within the region, (2) volumes of occupancy for each structure and terri-tory, and (3) percentages of occupancy for each structure and territory. In addition, the system calculates the infarct–middle cerebral artery (MCA) territory ratio for diffusion-weighted images and the penumbra-MCA territory ratio forperfusion images. Atlas-assisted analysis is fast, and calculations take less than 10 seconds.
Conclusion. This method potentially facilitates and speeds up stroke data analysis, as well as supports decision making.
Key Words. Brain atlas; stroke; blood supply territories; magnetic resonance imaging (MRI); diffusion; perfusion; analysis.© AUR, 2006
Stroke is the third leading cause of death and the majorcause of disability. To make the diagnosis and therapeuticdecisions, multiple studies need to be acquired. In thecase of magnetic resonance (MR), they may include dif-
Acad Radiol 2006; 13:1025–1034
1 From the Biomedical Imaging Lab, Agency for Science, Technology andResearch, 30 Biopolis Street, #07-01 Matrix, Singapore 138671 (W.L.N.,G.Q., B.P.K.N., A.T., Q.H., N.I., A.S.P.); Department of Radiology, Universityof Washington Medical Center, Seattle, WA (W.L.N., N.J.B.); and Depart-ment of Radiology, Scott and White Hospital, Temple, TX (V.M.R.). Re-ceived April 26, 2006; Revision received May 24; Revision accepted May25. Address correspondence to: W.L.N. e-mail: [email protected]
©
AUR, 2006doi:10.1016/j.acra.2006.05.009fusion-weighted imaging (DWI), perfusion imaging (PI),MR angiography, T2-weighted, T2*, fluid-attenuated in-version recovery (FLAIR), and others. In addition, perfu-sion maps have to be calculated from PI, including cere-bral blood flow (CBF), cerebral blood volume (CBV),mean transit time, and time to peak. In the case of acuteischemic stroke, these images are examined to: (1) ex-clude hemorrhagic stroke; (2) identify the acute infarct(s);(3) identify any chronic infarct(s); (4) identify the penum-bra, ie, the region at risk; and (5) identify or exclude ves-sel occlusion.
Our overall objective is to develop a computer-assisteddiagnosis (CAD) system for acute ischemic stroke. An
initial prototype for stroke MR was demonstrated at the1025

NOWINSKI ET AL Academic Radiology, Vol 13, No 8, August 2006
Radiological Society of North America Scientific Assem-bly infoRAD 2005 (1), and its enhanced version wasshown at the American Society of Neuroradiology 2006as a stand-alone computer exhibit (2). This CAD systemsupports the thrombolysis algorithm proposed in (3). Tomake decisions about thrombolysis, three conditions haveto be checked: (1) the size of the infarct versus that of themiddle cerebral artery (MCA) territory, (2) the presenceof diffusion-perfusion mismatch, and (3) the site of vesselocclusion, if any.
In this work, we address condition 1 extended to allanatomic structures and blood supply territories (BSTs)overlapped with the infarct region and also with the pen-umbra region. For atlas-assisted analysis, we use twobrain atlases: atlas of anatomy (AA) and atlas of BSTs.These atlases mapped onto the scans automatically andrapidly facilitate quantification of the underlying anatomyand BSTs in less than 10 seconds.
The goal of the report is to present a method of atlas-assisted analysis of acute ischemic stroke MR images anddescribe brain atlases currently used for this purpose.
MATERIALS AND METHODS
Two brain atlases are used for analysis: the AA andatlas of BSTs. To map these atlases onto scans, two rapidmethods are used at present: (1) fast Talairach transfor-mation (FTT) and (2) midsagittal plane (MSP) and brain’sbounding box (BBB) matching.
When using FTT, the method performs the followingsteps: (1) executes FTT to calculate the Talairach land-marks and warps the atlas piecewise linearly, (2) refor-mats scans and maps along the intercommissural plane (ifdata originally are acquired in the intercommissural plane,this operation just performs in-plane rotation[s] to havethe midsagittal line[s] vertical), (3) maps contours of theinfarct and penumbra into the reformatted data (segmenta-tion and editing of these contours on the original imagesis beyond the scope of this work, ie, it is assumed herethat these contours are given), and (4) calculates intersec-tions of the warped atlas structures and BSTs with theinfarct and penumbra regions.
FTT may reformat the data to fit them to the warpedatlas. When data are of low resolution (a high slice thick-ness), data reformatting is not advisable. In this situationor when FTT is not applicable (see BBB Matching), themethod fits the atlas to the data MSP(s) and BBB(s) with-
out reformatting.1026
Atlas of AnatomyAs the AA, we use the Cerefy brain atlas (4) (Figure 1).
It is derived from the Talairach-Tournoux brain atlas (5),which contains gross anatomy in axial, coronal, and sagit-tal orientations. Construction of the Cerefy brain atlas andits continuous enhancements were addressed elsewhere(6–8). In this work, we use 27 axial images of 660 �848 resolution each (Figure 1b). In addition, a contourrepresentation of this atlas is derived (Figure 1c) to facili-tate interatlas and atlas-to-data superimposition.
When interpreting stroke images, it is necessary to dis-tinguish a gray-matter infarct from a white-matter infarct.In the Cerefy AA (4), white matter is not complete. Itcontains a few structures, such as the corpus callosum,fornix, optic radiations, corticospinal tract, tapetum, ante-rior (AC) and posterior commissures (PC), and others.However, the majority of the white-matter region is miss-ing. Therefore, for this work, we extended the AA byadding the white matter. This was done by filling in thespace between the cortex and subcortical structures(Figure 1d). Because the atlas is uniquely color coded,every location can be labeled with anatomy (Figure 1e).
Atlas of BSTsVarious cerebral BST templates in tomographic repre-
sentation were created earlier, eg, (9–14). For example,(12) contains 12 BST tomographic templates in axial ori-entation. BST templates by Kretschmann and Weinrich(KW) (13) are constructed in axial, coronal, and sagittalorientations, as well as on medial and lateral surfaces.BSTs by Duvernoy (14) include only nine axial tem-plates, although with more detailed parcellation than thosein the other templates.
Existing BST templates have several limitations interms of their content and representation. They are static(deterministic); however, experiments showed that vari-ability of cerebral BSTs is significantly greater than previ-ously assumed (15). The main shortcoming is difficultymapping them into other brains (scans and atlases). Inaddition, they are not located in any stereotactic space.Finally, their print format and spatial sparseness limittheir use.
We constructed a new BST atlas, overcoming existinglimitations in representation. This is achieved by develop-ing an electronic BST atlas that fits the AA and is in itsformat. This means that both atlases: (1) have the sameimage size, number of the corresponding images, and im-
age resolution of 660 � 848 � 27; (2) are located in the
Figure 1. AA: (a) original (print) plate, (b) corre-sponding electronic image, (c) atlas image in con-tour representation, (d) atlas extended with thewhite matter, and (e) atlas with labeled structures.
1027

-282
NOWINSKI ET AL Academic Radiology, Vol 13, No 8, August 2006
same (Talairach) coordinate system and occupy the samelocations in it; (3) have the same shape of the cortex andventricular system; and (4) share outlines of the cerebel-lum and brainstem.
The BST atlas was derived partly from the KW BSTtemplates (13). These templates have several advantages,and, despite their sparseness, it is possible to approximatethe missing planes (or locations) from the other orienta-tions and views. The templates are parcellated into sevenBSTs: penetrating branches of the anterior cerebral artery,terminal branches of the anterior cerebral artery, penetrat-ing branches of the MCA, terminal branches of the MCA,penetrating braches of the posterior cerebral artery andposterior communicating artery, terminal branches of theposterior cerebral artery, and anterior choroidal artery.Axial templates contain 11 cuts (each �1 cm thick)through the brain from the base to vertex.
The BST atlas was constructed in five steps: (1)digitization of the KW axial print templates, (2) brainextraction from the digitized KW templates, (3) nonlin-ear registration of the brain-containing KW templateswith axial images of the AA, (4) enhancement of theKW-AA fit, and (5) interactive editing of the resultingimages (Figure 2).
The print KW axial templates were digitized with 150-dot per inch resolution, and the skull and scalp were re-moved from them manually. Templates were mapped intothe AA images in two stages: (1) by determining ana-tomic correspondence between 11 digitized KW BST ax-ial templates and 27 AA axial images, and then (2) warp-ing nonlinearly each KW BST template into the corre-sponding AA image by using radial base functions with
Figure 2. Construction of the BST atlas. (The KW templates fromspaces and structures in multiplanar parallel slices. In: Kretschmanomy. Third edition. Stuttgart: Thieme Medical Publishers; 2004:280
point landmarks. For each pair of the corresponding KW
1028
and AA images, these landmarks were placed interac-tively on the outlines of the cortex, interhemispheric fis-sure, splenium and rostrum of the corpus callosum, puta-men, head of the caudate nucleus, and ventricular system.The original shape of the AA cerebrum in the warpedBST templates and that of the ventricular system wererestored automatically by applying logical operations. Useof sparse KW material and automatic operations appliedresulted in some artifacts in the obtained images, includ-ing false structures and shapes. Therefore, finally, manualediting was performed to remove these artifacts, restoreproper shape of structures (based on available knowl-edge), recover missing structures, and generally smooththe BST images.
By applying this approach, we generated 27 BST atlasaxial images in the AA format. Figure 3 shows an exam-ple of a color-coded BST image with the legend explain-ing the meaning of the colors, and Figure 4 illustrates the
pter 5, Topography of the neurocranium and its intracranialand Weinrich KW. Cranial Neuroimaging and Clinical Neuroanat-
. Reprinted with permission.)
Figure 3. BST image with legend explaining the meaning of thecolors.
Chan HJ
spatial correspondence between both atlases.
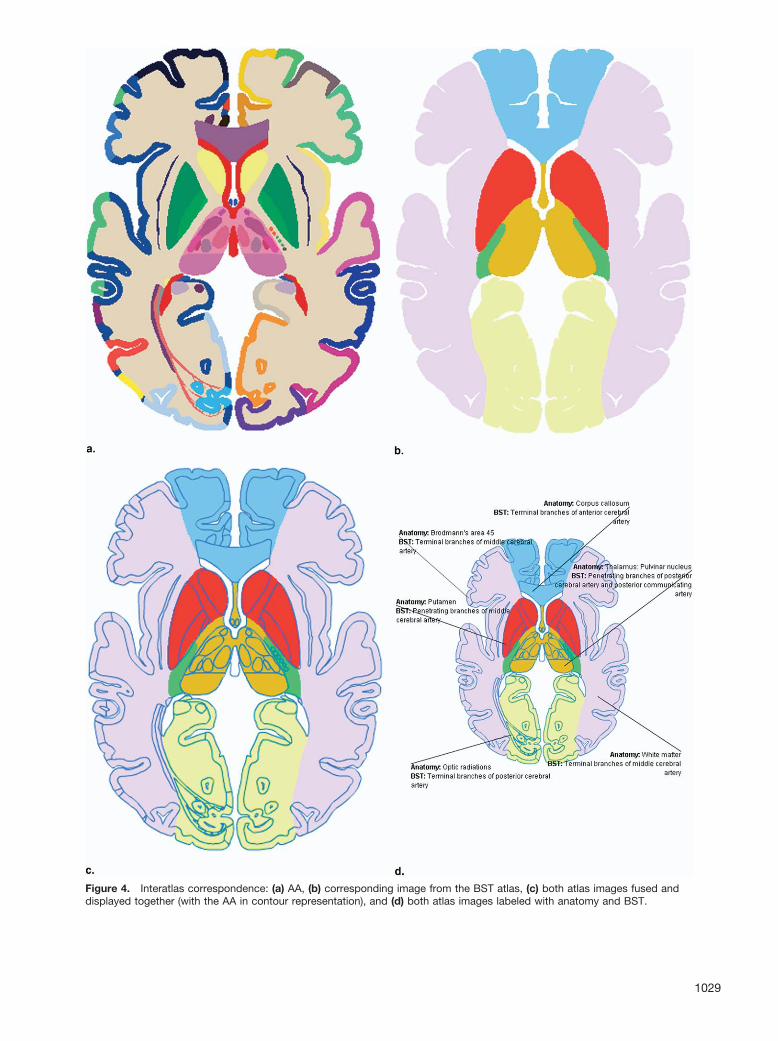
Figure 4. Interatlas correspondence: (a) AA, (b) corresponding image from the BST atlas, (c) both atlas images fused and
displayed together (with the AA in contour representation), and (d) both atlas images labeled with anatomy and BST.1029

NOWINSKI ET AL Academic Radiology, Vol 13, No 8, August 2006
Atlas to Scan Mapping
Fast Talairach transformationBecause the BST atlas is naturally in spatial register
with the AA, any transformation mapping the AA into thescan can be used. We previously developed FTT, whichmaps automatically the AA onto a T1-weighted or spoiledgradient recalled echo scan in about 5 seconds (16). FTTis a rapid version of the Talairach transformation (5) withthe modified Talairach landmarks (17). Identification oflandmarks is fully automatic and is done in three steps:(1) calculation of the MSP (18), (2) identification of theAC and PC point landmarks (19), and (3) calculation ofthe cortical landmarks (20). Having the MSP and land-marks calculated, the processed scan is reformatted in theAC-PC plane, and the atlases are scaled piecewise lin-early and superimposed on this scan.
BBB matchingFTT cannot be applied when data reformatting is not
advisable or T1-weighted scan is not available. In thissituation, diffusion and perfusion images and atlases arematched together by first aligning their MSPs (21) andthen scaling their BBBs to correspond. The largest con-nected component is taken as the brain, and the bondingbox is set to encompass it such that its sides are paralleland perpendicular to the calculated MSP.
Atlas-Assisted AnalysisAtlas-assisted analysis is the key component of this
work. After atlas-to-scan mapping, both atlases are super-imposed onto the studied images and can be used to gettheir underlying anatomy and BSTs. The user can point toany location in the displayed image and get the anatomyand BST labels, as well as inspect which anatomic struc-tures and BSTs are within the infarct and penumbra re-gions. This is a standard way of atlas use (at least for allour brain atlases).
However, to speed up the process of analysis, thestroke CAD system automatically analyzes entire regionsoccupied by the infarct and penumbra. For each infarctand penumbra region, the system calculates the followingfactors by simultaneously using both atlases: (1) namesof all anatomic structures and BSTs within the region,(2) volume of occupancy for each structure and territory,and (3) percentage of occupancy for each structure andterritory. In addition, the system calculates the infarct-MCA territory ratio for diffusion-weighted images and the
penumbra-MCA territory ratio for perfusion images.1030
RESULTS
Both atlases are constructed and the proposed methodis implemented as a part of our MR stroke CAD system(its version with FTT-based mapping was shown as aninfoRAD exhibit at the Radiological Society of NorthAmerica 2005 (1); an extended version with MSP-BBB–based mapping was presented at the American Societyof Neuroradiology 2006 as a stand-alone computerexhibit (2)). An example of atlas-assisted analysis of mul-tiple scans with the atlases automatically superimposed onthe scans by using the FTT-based approach is shown inFigure 5. The atlases are overlaid in contour representa-tion to not block the scans. Results of analysis also arepresented. Figure 6 is an illustration of atlas-assisted anal-ysis by means of the MSP-BBB–based approach in theinfarct (Figure 6a) and penumbra (Figure 6b) regions.
The accuracy of mapping the AA to the scan by usingFTT was studied earlier (22). Average distance errors inlocalization of the Talairach landmarks (5) were 1.16 mm(AC), 1.49 mm (PC), 0.08 mm (left), 0.13 mm (right),0.48 mm (anterior), 0.16 mm (posterior), 0.35 mm (supe-rior), and 0.52 mm (inferior). This mapping accuracyis valid for both atlases because they are in the sameformat.
Accuracy of MSP-BBB mm based mapping was ana-lyzed previously for the MSP only (21), yielding an aver-age angular error of less than 1° (�2°) for DWI (CBFand CBV), and the average distance error measured in theworst case (on the BBB) was less than 2.5 mm (�5.0 mm)for DWI (CBF and CBV).
Atlas-assisted analysis is fast and takes less than 10seconds. FTT needs about 5 seconds to calculate the Ta-lairach landmarks; data reformatting takes a few seconds,depending on the number of data sets and their sizes. TheMSP-BBB–based approach is even faster because it doesnot perform reformatting.
DISCUSSION
The key novelty of this work is atlas-assisted analysis.It goes beyond the standard use of atlases for interactivelabeling. Atlases are used for automatic and quantitativeassessment of the infarct and penumbra and to calculatethe ratio of infarct volume to that of MCA territory. Thisratio, computed by means of the BST atlas, is one of thequantitative conditions in the thrombolysis algorithm. We
believe that having this ratio computed rapidly and quan-
Academic Radiology, Vol 13, No 8, August 2006 ATLAS-ASSISTED STROKE MR IMAGE ANALYSIS
Figure 5. Atlas-assisted analysis by using the FTT-based approach. Multiple scans (DWI, T2-weighted, FLAIR, and T1-weighted ac-quired along the same plane) and the AA and BST atlas are displayed together, along with the outline of the infarct (in blue). Transpar-ency for each scan and each atlas is user controlled. (a) A DWI scan (blended slightly with a T1-weighted scan) and the delineated in-farct. Names of the anatomic structure and BST at the pointed location (arrow) are shown. Results of atlas-assisted analysis are shownon the right (lower panel), including names of structures and BSTs, and their volumes and percentages of contribution to the infarct re-gion. (b) The AA in contour representation overlaid on the blended scans. (c) The BST atlas in contour representation superimposed on
the blended scans.1031

NOWINSKI ET AL Academic Radiology, Vol 13, No 8, August 2006
Figure 6. Atlas-assisted analysis by using the MSP-BBB–based approach: (a) analysis of the infarct region (in blue) in a DWI scan of5-mm slice thickness, and (b) analysis of the penumbra region (in green) in a PI scan of 7.5-mm slice thickness. The atlases in contour
representation are superimposed with 50% data-atlas blending.1032

Academic Radiology, Vol 13, No 8, August 2006 ATLAS-ASSISTED STROKE MR IMAGE ANALYSIS
titatively enables a quick decision and provides moreflexibility in decision making, particularly that variousinvestigators formulated different criteria for hemorrhagictransformation prediction. For example, (3) predicts hem-orrhagic transformation for the ratio greater than one half,whereas (22), greater than one third. Moreover, ourmethod calculates this condition not only for the entireMCA territory, but also for its penetrating and terminalbranches, as well as for other territories. Having listedand quantified all anatomic structures and BSTs withinthe infarct and penumbra regions may facilitate decisionmaking regarding the structures and vessels involved. Inaddition, it may lead to formulation of more advancedconditions capturing the relationships among the infarct,penumbra, anatomy, and BSTs.
Another advantage of our approach is that the AA al-lows for quick assessment of which functions are alreadylost and which are at risk (because the original electronicatlas (4) provides a functional description of structures).
The concept of atlas-assisted analysis introduced herepractically holds across various atlases used and atlas-to-data mappings applied. However, results of this analysishighly depend on the quality of atlases and accuracy ofatlas warping. The current rapid solution supports a “timeis brain” paradigm with a very short time window left foranalysis in the primary stroke centers. Consequently, thissolution has some limitations in terms of the atlases andatlas-to-data mapping. At present, we reformat the data,not the atlases. For data with a high slice thickness (as inthe case from Figure 6), the atlas-data relationship pre-sented to the user may not be accurate (not only becauseof limited accuracy of atlas-to-data warping, but also be-cause of the near-neighbor interpolation of atlas images).Similarly, infarct contours projected onto the perfusionimages (of a slice thickness various than that of diffusion-weighted images) may not reflect the actual diffusion–perfusion relationship. To cope with these problems, weare in a process of building high-resolution brain atlasesthat can be reformatted in any plane (23).
The BST atlas is based on literature studies. Recentadvances in neuroimaging (24) eventually will make itpossible to acquire patient-specific BSTs. At present, it ismore feasible to determine some BSTs for healthy sub-jects and construct a probabilistic BST atlas. Then thecurrent version potentially can serve as the reference BSTatlas.
FTT operates on morphological images. It works so farfor T1-weighted and spoiled gradient recalled echo scan
sequences and has to be extended to other acquisitions,including T2-weighted and FLAIR. In case these imagesare not available, we apply the MSP-BBB–based ap-proach. Although it is fast and gives a useful initial ap-proximation, its accuracy is limited, particularly whendiffusion-weighted and perfusion images were acquired indifferent planes or the scans do not cover the entire cere-brum. The former case is unusual in current practice. Inthe latter case, the midway superior and inferior land-marks can be used (25). In addition, correction of geo-metric distortions, particularly for perfusion images, maybe necessary. Therefore, the present warping has to befollowed by more accurate (although more time consum-ing) nonlinear warping, along with application of the in-terpolated atlases. One of challenges of this task will beto determine in a clinical setting an acceptable balancebetween the required accuracy and time necessary toachieve it. With the rapid advancement in the field and aparadigm shift from “time is brain” to “penumbra isbrain,” more time-consuming analysis eventually could beaccepted (at least for cases with a longer time window fortreatment).
Atlas-assisted analysis captures only contributions ofthe structures and BSTs to the infarct and penumbra.However, contributions of the infarct and penumbra tocerebral structures and BSTs are not calculated yet, andwe plan to include them in the analysis.
The current method is automated for stroke MR andhas to be extended to stroke computed tomography. Thenthe usefulness of the atlases will be increased.
The accuracy of atlas-to-data mapping was studiedearlier only for (point and plane) landmarks, but not be-yond them. However, variability, particularly in the corti-cal areas, is very high. Similarly, variability of vascularanatomy is very high, impacting on variability of BSTs.For example, high variability existing in the circle ofWillis has a substantial impact on BST distribution. Tostudy these variabilities is a long and tedious process, andcurrently developed atlases and methods may be a goodstarting point toward achieving this objective.
Finally, the complete CAD has to be validated in aclinical setting to quantify its usefulness. Toward thisgoal, we are in a process of establishing clinical test beds.
In summary, to quantify MR stroke images, we usebrain atlases of anatomy and BSTs along with fast tech-niques of mapping them to the data. Atlas-assisted analy-sis provides the complete list of anatomic structures andBSTs, along with their volume and percentage of contri-butions to the infarct and penumbra regions. Calculation
of results is fast and takes less than 10 seconds (for cur-1033

NOWINSKI ET AL Academic Radiology, Vol 13, No 8, August 2006
rently applied warpings). Our method (as part of quantita-tive support to the thrombolysis algorithm) potentiallyfacilitates and speeds up data analysis, as well as supportsdecision making.
REFERENCES
1. Nowinski WL, Qian GY, Bhanu Prakash KN, et al. Atlas-assisted MRstroke image interpretation by using anatomical and blood supply terri-tories atlases. Presented at Program 91st Radiological Society of NorthAmerica (RSNA) Scientific Assembly and Annual Meeting RSNA 2005;Chicago, IL; November 27–December 2, 2005; 857.
2. Nowinski WL, Qian G, Bhanu Prakash KN, et al. A CAD system forstroke MR. Proc American Society of Neuroradiology (ASNR), 44th An-nual Meeting ASNR 2006; San Diego, CA; April 29–May 5, 2005; 425–426.
3. Parsons MW, Davis SM. Therapeutic impact of MRI in acute stroke. In:von Kummer R, Back T, eds. Magnetic Resonance Imaging in IschemicStroke. Berlin, Germany: Springer, 2006; 23–40.
4. Nowinski WL, Thirunavuukarasuu A. The Cerefy Clinical Brain Atlas onCD-ROM. New York: Thieme, 2004.
5. Talairach J, Tournoux P. Coplanar Stereotactic Atlas of the HumanBrain. Stuttgart, Germany: Thieme, 1988.
6. Nowinski WL, Fang A, Nguyen BT, et al. Multiple brain atlas databaseand atlas-based neuroimaging system. Comput Aided Surg 1997; 2:42–66.
7. Nowinski WL. Electronic brain atlases: features and applications. In:Caramella D, Bartolozzi C, eds. Medical Radiology: 3D ImageProcessing: Techniques and Clinical Applications. Berlin, Germany:Springer-Verlag, 2002; 79–93.
8. Nowinski WL. The Cerefy brain atlases: continuous enhancement ofthe electronic Talairach-Tournoux brain atlas. Neuroinformatics 2005;3:293–300.
9. Berman SA, Hayman LA, Hinck VC. Correlation of CT cerebral vascularterritories with function: 1. Anterior cerebral artery. AJR Am J Roentge-nol 1980; 135:253–257.
10. Berman SA, Hayman LA, Hinck VC. Correlation of CT cerebral vascular
territories with function: 3. Middle cerebral artery. AJR Am J Roentge-nol 1984; 142:1035–1040.1034
11. Hayman LA, Berman SA, Hinck VC. Correlation of CT cerebral vascularterritories with function. II. Posterior cerebral artery. Am J Radiol 1981;137:13–19.
12. Damasio H. A computed tomographic guide to the identification of ce-rebral vascular territories. Arch Neurol 1983; 40:138–142.
13. Kretschmann HJ, Weinrich W. Cranial Neuroimaging and Clinical Neu-roanatomy, 3rd ed. Stuttgart, Germany: Thieme, 2004.
14. Duvernoy HM. The Human Brain: Surface, Three-Dimensional SectionalAnatomy With MRI, and Blood Supply, 2nd ed. New York: Springer, 1999.
15. Van der Zwan A, Hillen B, Tulleken CA, Dujovny M. A quantitative in-vestigation of the variability of the major cerebral arterial territories.Stroke 1993; 24:1951–1959.
16. Nowinski WL, Qian G, Bhanu Prakash KN, et al. Fast Talairach trans-formation for magnetic resonance neuroimages. J Comput Assist To-mogr 2006 (in press).
17. Nowinski WL. Modified Talairach landmarks. Acta Neurochir 2001; 143:1045–1057.
18. Hu Q, Nowinski WL. A rapid algorithm for robust and automatic extrac-tion of the midsagittal plane of the human cerebrum from neuroimagesbased on local symmetry and outlier removal. Neuroimage 2003; 20:2154–2166.
19. Bhanu Prakash KN, Hu Q, Aziz A, et al. Rapid and automatic localiza-tion of the anterior and posterior commissure point landmarks in MRvolumetric neuroimages. Acad Radiol 2006; 13:36–54.
20. Hu Q, Qian G, Nowinski WL. Fast, accurate, and automatic extractionof the modified Talairach cortical landmarks from magnetic resonanceimages. Magn Reson Med 2005; 53:970–976.
21. Nowinski WL, Bhanu Prakash KN, Volkau I, et al. Rapid and automaticcalculation of the midsagittal plane in magnetic resonance diffusionand perfusion images. Acad Radiol 2006; 3:652–663.
22. Hacke W, Donnan G, Fieschi C, et al. Association of outcome withearly stroke treatment: pooled analysis of ATLANTIS, ECASS andNINDS rt-PA stroke trials. Lancet 2004; 363:768–774.
23. Liu J, Nowinski WL. A hybrid approach to shape-based interpolationof stereotactic atlases of the human brain. Neuroinformatics 2006; 4(2):177-198.
24. Van Laar PJ, Hendrikse J, Golay X, Lu H, van Osch MJ, van der GrondJ. In vivo flow territory mapping of major brain feeding arteries. Neuro-image 2006; 29:136–144.
25. Nowinski WL, Bhanu Prakash KN. Dorso-ventral extension of the Ta-
lairach transformation and its automatic calculation for MR neuroim-ages. J Comput Assist Tomogr 2005; 29:863–879.Copyright © 2022 FDOKUMEN